| | | FREE WRITING PROSPECTUS |
| | | FILED PURSUANT TO RULE 433 |
| | | REGISTRATION FILE NO.: 333-228375-06 |
| | | |
BANK 2021-BNK33
Free Writing Prospectus
Structural and Collateral Term Sheet
$1,004,949,683
(Approximate Total Mortgage Pool Balance)
$852,071,000
(Approximate Offered Certificates)
Banc of America Merrill Lynch Commercial Mortgage Inc.
as Depositor
Bank of America, National Association
Wells Fargo Bank, National Association
Morgan Stanley Mortgage Capital Holdings LLC
National Cooperative Bank, N.A.
as Sponsors and Mortgage Loan Sellers
Commercial Mortgage Pass-Through Certificates
Series 2021-BNK33
May 4, 2021
BofA SECURITIES Co-Lead Bookrunner Manager | MORGAN STANLEY Co-Lead Bookrunner Manager | WELLS FARGO SECURITIES Co-Lead Bookrunner Manager |
| | | |
Academy Securities, Inc. Co-Manager | | Drexel Hamilton Co-Manager |
STATEMENT REGARDING THIS FREE WRITING PROSPECTUS
The depositor has filed a registration statement (including a prospectus) with the SEC (File No. 333-228375) for the offering to which this communication relates. Before you invest, you should read the prospectus in that registration statement and other documents the depositor has filed with the SEC for more complete information about the depositor, the issuing entity and this offering. You may get these documents for free by visiting EDGAR on the SEC web site at www.sec.gov. Alternatively, the depositor or any underwriter or any dealer participating in the offering will arrange to send you the prospectus if you request it by calling toll free 1-866-294-1322 or by email to dg.Prospectus_Requests@baml.com.
This is not a research report and was not prepared by any Underwriter’s research department. Please see additional important information and qualifications at the end of this Term Sheet.
Neither this Term Sheet nor anything contained herein shall form the basis for any contract or commitment whatsoever. The information contained herein is preliminary as of the date hereof. This Term Sheet is subject to change, completion or amendment from time to time. The information contained herein supersedes information in any other communication relating to the securities described herein; provided, that the information contained herein will be superseded by similar information delivered to you as part of the Preliminary Prospectus. The information contained herein should be reviewed only in conjunction with the entire Preliminary Prospectus. All of the information contained herein is subject to the same limitations and qualifications contained in the Preliminary Prospectus. The information contained herein does not contain all relevant information relating to the underlying mortgage loans or mortgaged properties. Such information is described in the Preliminary Prospectus. The information contained herein will be more fully described in the Preliminary Prospectus. The information contained herein should not be viewed as projections, forecasts, predictions or opinions with respect to value. Prior to making any investment decision, prospective investors are strongly urged to read the Preliminary Prospectus in its entirety. Neither the Securities and Exchange Commission nor any state securities commission has approved or disapproved of these securities or determined if this Term Sheet is truthful or complete. Any representation to the contrary is a criminal offense.
Wells Fargo Securities is the trade name for the capital markets and investment banking services of Wells Fargo & Company and its subsidiaries, including but not limited to Wells Fargo Securities, LLC, a member of the New York Stock Exchange, the Financial Industry Regulatory Authority (“FINRA”), the National Futures Association (“NFA”) and the Securities Investor Protection Corporation (“SIPC”), Wells Fargo Prime Services, LLC, a member of FINRA, NFA and SIPC, and Wells Fargo Bank, National Association. Wells Fargo Securities, LLC and Wells Fargo Prime Services, LLC are distinct entities from affiliated banks and thrifts.
IMPORTANT NOTICE RELATING TO AUTOMATICALLY GENERATED EMAIL DISCLAIMERS
Any legends, disclaimers or other notices that may appear at the bottom of, or attached to, the email communication to which this Term Sheet may have been attached are not applicable to this Term Sheet and should be disregarded. Such legends, disclaimers or other notices have been automatically generated as a result of this Term Sheet having been sent via Bloomberg or another email system.
IMPORTANT NOTICE REGARDING THE CONDITIONS FOR THIS OFFERING OF ASSET-BACKED SECURITIES
THE ASSET-BACKED SECURITIES REFERRED TO IN THIS TERM SHEET ARE BEING OFFERED WHEN, AS AND IF ISSUED. IN PARTICULAR, YOU ARE ADVISED THAT THE ASSET-BACKED SECURITIES, AND THE ASSET POOL BACKING THEM, ARE SUBJECT TO MODIFICATION OR REVISION (INCLUDING, AMONG OTHER THINGS, THE POSSIBILITY THAT ONE OR MORE CLASSES OF SECURITIES MAY BE SPLIT, COMBINED OR ELIMINATED), AT ANY TIME PRIOR TO ISSUANCE OR AVAILABILITY OF A FINAL PROSPECTUS. AS A RESULT, YOU MAY COMMIT TO PURCHASE SECURITIES THAT HAVE CHARACTERISTICS THAT MAY CHANGE, AND YOU ARE ADVISED THAT ALL OR A PORTION OF THE SECURITIES MAY NOT BE ISSUED THAT HAVE THE CHARACTERISTICS DESCRIBED IN THIS TERM SHEET. OUR OBLIGATION TO SELL SECURITIES TO YOU IS CONDITIONED ON THE SECURITIES AND THE UNDERLYING TRANSACTION HAVING THE CHARACTERISTICS DESCRIBED IN THIS TERM SHEET. IF WE DETERMINE THAT THE FOREGOING CONDITION IS NOT SATISFIED IN ANY MATERIAL RESPECT, WE WILL NOTIFY YOU, AND NEITHER THE ISSUING ENTITY NOR ANY UNDERWRITER WILL HAVE ANY OBLIGATION TO YOU TO DELIVER ALL OR ANY PORTION OF THE SECURITIES WHICH YOU HAVE COMMITTED TO PURCHASE, AND THERE WILL BE NO LIABILITY BETWEEN US AS A CONSEQUENCE OF THE NON-DELIVERY.
This is not a research report and was not prepared by any Underwriter’s research department. Please see additional important information and qualifications at the end of this Term Sheet.
T-2
| BANK 2021-BNK33 | Structural Overview |
Offered Certificates
| | | | | | | | | |
| | | | | | | | | |
| Class | Expected Ratings
(Fitch/KBRA/Moody’s)(1) | Approximate Initial Certificate Balance or Notional Amount(2) | Approximate Initial Credit Support(3) | Pass-Through Rate Description | Expected Weighted Average Life (Years)(4) | Expected Principal
Window
(Months)(4) | Certificate Principal UW NOI Debt Yield(5) | Certificate
Principal
to Value
Ratio(6) |
| Class A-1 | AAAsf/AAA(sf)/Aaa(sf) | $10,500,000 | 30.000% | (7) | 2.91 | 1 – 59 | 19.1% | 35.0% |
| Class A-2 | AAAsf/AAA(sf)/Aaa(sf) | $46,312,000 | 30.000% | (7) | 4.90 | 59 – 59 | 19.1% | 35.0% |
| Class A-3 | AAAsf/AAA(sf)/Aaa(sf) | $66,408,000 | 30.000% | (7) | 6.90 | 83 – 83 | 19.1% | 35.0% |
| Class A-SB | AAAsf/AAA(sf)/Aaa(sf) | $21,799,000 | 30.000% | (7) | 7.35 | 59 – 115 | 19.1% | 35.0% |
| Class A-4(8) | AAAsf/AAA(sf)/Aaa(sf) | (8)(9) | 30.000% | (7)(8) | (9) | (9) | 19.1% | 35.0% |
| Class A-5(8) | AAAsf/AAA(sf)/Aaa(sf) | (8)(9) | 30.000% | (7)(8) | (9) | (9) | 19.1% | 35.0% |
| Class X-A | AAAsf/AAA(sf)/Aaa(sf) | $668,291,000(10) | N/A | Variable IO(11) | N/A | N/A | N/A | N/A |
| Class X-B | A-sf/AAA(sf)/NR | $183,780,000(10) | N/A | Variable IO(11) | N/A | N/A | N/A | N/A |
| Class A-S(8) | AAAsf/AAA(sf)/Aa2(sf) | $107,404,000(8) | 18.750% | (7)(8) | 9.99 | 120 – 120 | 16.4% | 40.7% |
| Class B(8) | AA-sf/AA-(sf)/NR | $38,188,000(8) | 14.750% | (7)(8) | 9.99 | 120 – 120 | 15.7% | 42.7% |
| Class C(8) | A-sf/A-(sf)/NR | $38,188,000(8) | 10.750% | (7)(8) | 9.99 | 120 – 120 | 15.0% | 44.7% |
Privately Offered Certificates(12)
| | | | | | | | | |
| | | | | | | | | |
| Class | Expected Ratings
(Fitch/KBRA/Moody’s)(1) | Approximate Initial Certificate Balance or Notional Amount(2) | Approximate
Initial Credit
Support(3) | Pass-Through Rate Description | Expected Weighted Average Life (Years)(4) | Expected Principal
Window (Months)(4) | Certificate
Principal UW NOI Debt
Yield(5) | Certificate
Principal
to Value
Ratio(6) |
| Class X-D | BBB-sf/BBB-(sf)/NR | $40,575,000(10) | N/A | Variable IO(11) | N/A | N/A | N/A | N/A |
| Class X-F | BB-sf/BB-(sf)/NR | $19,094,000(10) | N/A | Variable IO(11) | N/A | N/A | N/A | N/A |
| Class X-G | B-sf/B(sf)/NR | $9,547,000(10) | N/A | Variable IO(11) | N/A | N/A | N/A | N/A |
| Class X-H | NR/NR/NR | $33,415,199(10) | N/A | Variable IO(11) | N/A | N/A | N/A | N/A |
| Class D | BBBsf/BBB+(sf)/NR | $22,674,000 | 8.375% | (7) | 9.99 | 120 – 120 | 14.6% | 45.9% |
| Class E | BBB-sf/BBB-(sf)/NR | $17,901,000 | 6.500% | (7) | 9.99 | 120 – 120 | 14.3% | 46.8% |
| Class F | BB-sf/BB-(sf)/NR | $19,094,000 | 4.500% | (7) | 9.99 | 120 – 120 | 14.0% | 47.8% |
| Class G | B-sf/B(sf)/NR | $9,547,000 | 3.500% | (7) | 9.99 | 120 – 120 | 13.8% | 48.3% |
| Class H | NR/NR/NR | $33,415,199 | 0.000% | (7) | 9.99 | 120 – 120 | 13.4% | 50.1% |
Non-Offered Eligible Vertical Interest(12)
| Class | Expected Ratings
(Fitch/KBRA/Moody’s)(1) | Approximate Initial Certificate Balance or Notional Amount(2) | Approximate
Initial Credit
Support(3) | Pass-Through Rate Description | Expected Weighted Average Life (Years)(4) | Expected Principal
Window (Months)(4) | Certificate
Principal UW NOI Debt
Yield(5) | Certificate
Principal
to Value
Ratio(6) |
| RR Interest | NR/NR/NR | $50,247,484.17 | N/A | (13) | 9.23 | 1 – 120 | N/A | N/A |
| (1) | Ratings shown are those of Fitch Ratings, Inc. (“Fitch”), Kroll Bond Rating Agency, LLC (“KBRA”) and Moody’s Investors Service, Inc. (“Moody’s”). Certain nationally recognized statistical rating organizations that were not hired by the depositor may use information they receive pursuant to Rule 17g-5 under the Securities Exchange Act of 1934, as amended, or otherwise to rate the certificates. There can be no assurance as to what ratings a non-hired nationally recognized statistical rating organization would assign. See “Risk Factors—Other Risks Relating to the Certificates—Nationally Recognized Statistical Rating Organizations May Assign Different Ratings to the Certificates; Ratings of the Certificates Reflect Only the Views of the Applicable Rating Agencies as of the Dates Such Ratings Were Issued; Ratings May Affect ERISA Eligibility; Ratings May Be Downgraded” and “Ratings” in the Preliminary Prospectus to be dated on or about the date hereof (the “Preliminary Prospectus”). Capitalized terms used but not defined herein have the meanings assigned to such terms in the Preliminary Prospectus. |
| (2) | Approximate, subject to a permitted variance of plus or minus 5% and further subject to the discussion in footnote (9) below. In addition, the notional amounts of the Class X-A, Class X-B, Class X-D, Class X-F, Class X-G and Class X-H certificates may vary depending upon the final pricing of the classes of principal balance certificates or trust components whose certificate or principal balances comprise such notional amounts, and, if as a result of such pricing the pass-through rate of any class of the Class X-A, Class X-B, Class X-D, Class X-F, Class X-G or Class X-H certificates, as applicable, would be equal to zero at all times, such class of certificates will not be issued on the closing date of this securitization. |
| (3) | The approximate initial credit support percentages set forth for the certificates are approximate and, for the Class A-1, Class A-2, Class A-3, Class A-SB, Class A-4 and Class A-5 certificates, are presented in the aggregate, taking into account the principal balances of the Class A-4 and Class A-5 trust components. The approximate initial credit support percentage set forth for each class of the Class A-S, Class B and Class C certificates represents the approximate credit support for the underlying trust component with the same alphanumeric designation. The RR Interest provides credit support only to the limited extent that it is allocated a portion of any losses incurred on the underlying mortgage loans, which such losses are allocated between it, on the one hand, and to the Non-Retained Certificates, on the other hand, pro rata in accordance with their respective Percentage Allocation Entitlements (as defined below). See “Credit Risk Retention” in the Preliminary Prospectus. |
This is not a research report and was not prepared by any Underwriter’s research department. Please see additional important information and qualifications at the end of this Term Sheet.
T-3
| BANK 2021-BNK33 | Structural Overview |
| (4) | The Expected Weighted Average Life and Expected Principal Window during which distributions of principal would be received as set forth in the foregoing table with respect to each class of certificates having a certificate balance are based on the assumptions set forth under “Yield and Maturity Considerations—Weighted Average Life” in the Preliminary Prospectus and on the assumptions that there are no prepayments, modifications or losses in respect of the mortgage loans and that there are no extensions or forbearances of maturity dates or anticipated repayment dates of the mortgage loans. |
| (5) | Certificate Principal UW NOI Debt Yield for any class of principal balance certificates shown in the table above (other than the RR Interest) is calculated as the product of (a) the weighted average UW NOI Debt Yield for the mortgage pool, multiplied by (b) a fraction, the numerator of which is the aggregate initial certificate or principal balance of all the principal balance certificates, and the denominator of which is the sum of (x) the aggregate initial certificate or principal balance of the subject class of principal balance certificates (or, with respect to the Class A-4, Class A-5, Class A-S, Class B or Class C certificates, the trust component with the same alphanumeric designation) and all other classes of principal balance certificates (other than the RR Interest), if any, that are senior to such class and (y) the outstanding certificate balance of the RR Interest, multiplied by the applicable RR Interest Computation Percentage. The Certificate Principal UW NOI Debt Yields of the Class A-1, Class A-2, Class A-3, Class A-SB, Class A-4 and Class A-5 certificates are calculated in the aggregate for those classes as if they were a single class. With respect to any class of principal balance certificates, the “RR Interest Computation Percentage” is equal to a fraction, expressed as a percentage, the numerator of which is the total initial certificate or principal balance of the subject class of principal balance certificates (or, with respect to the Class A-4, Class A-5, Class A-S, Class B or Class C certificates, the trust component with the same alphanumeric designation) and all other classes of principal balance certificates (other than the RR Interest), if any, that are senior to such class, and the denominator of which is the sum of the aggregate initial certificate or principal balance of all the principal balance certificates (other than the RR Interest). |
| (6) | Certificate Principal to Value Ratio for any class of principal balance certificates shown in the table above (other than the RR Interest) is calculated as the product of (a) the weighted average Cut-off Date LTV Ratio of the mortgage pool, multiplied by (b) a fraction, the numerator of which is the sum of (x) the aggregate initial certificate or principal balance of the subject class of principal balance certificates (or, with respect to the Class A-4, Class A-5, Class A-S, Class B or Class C certificates, the trust component with the same alphanumeric designation) and all other classes of principal balance certificates (other than the RR Interest), if any, that are senior to such class and (y) the outstanding certificate balance of the RR Interest, multiplied by the applicable RR Interest Computation Percentage, and the denominator of which is the aggregate initial certificate or principal balance of all the principal balance certificates. The Certificate Principal to Value Ratios of the Class A-1, Class A-2, Class A-3, Class A-SB, Class A-4 and Class A-5 certificates are calculated in the aggregate for those classes as if they were a single class. Each Class of Class A-4, Class A-5, Class A-S, Class B and Class C Exchangeable Certificates will have the same ratings as the Class A-4, Class A-5, Class A-S, Class B and Class C certificates, respectively, shown in the table above. |
| (7) | The pass-through rate for each class of the Class A-1, Class A-2, Class A-3, Class A-SB, Class A-4, Class A-5, Class A-S, Class B, Class C, Class D, Class E, Class F, Class G and Class H certificates will be one of the following: (i) a fixed rate per annum, (ii) a variable rate per annum equal to the weighted average of the net mortgage interest rates on the mortgage loans for the related distribution date, (iii) a variable rate per annum equal to the lesser of (a) a fixed rate and (b) the weighted average of the net mortgage interest rates on the mortgage loans for the related distribution date or (iv) a variable rate per annum equal to the weighted average of the net mortgage interest rates on the mortgage loans for the related distribution date minus a specified percentage. For purposes of the calculation of the weighted average of the net mortgage interest rates on the mortgage loans for each distribution date, the net mortgage interest rates will be adjusted as necessary to a 30/360 basis. |
| (8) | The Class A-4-1, Class A-4-2, Class A-4-X1, Class A-4-X2, Class A-5-1, Class A-5-2, Class A-5-X1, Class A-5-X2, Class A-S-1, Class A-S-2, Class A-S-X1, Class A-S-X2, Class B-1, Class B-2, Class B-X1, Class B-X2, Class C-1, Class C-2, Class C-X1 and Class C-X2 certificates are also offered certificates. Such classes of certificates, together with the Class A-4, Class A-5, Class A-S, Class B and Class C certificates, constitute the “Exchangeable Certificates”. The Class A-1, Class A-2, Class A-3, Class A-SB, Class D, Class E, Class F, Class G and Class H certificates, together with the RR Interest and the Exchangeable Certificates with a certificate balance, are referred to as the “principal balance certificates.” Each class of Exchangeable Certificates will have the certificate balance or notional amount and pass-through rate described below under “Exchangeable Certificates.” |
| (9) | The exact initial principal balances or notional amounts of the Class A-4, Class A-4-X1, Class A-4-X2, Class A-5, Class A-5-X1 and Class A-5-X2 trust components (and consequently, the exact aggregate initial certificate balances or notional amounts of the Exchangeable Certificates with an “A-4” or “A-5” designation) are unknown and will be determined based on the final pricing of the certificates. However, the initial principal balances, weighted average lives and principal windows of the Class A-4 and Class A-5 trust components are expected to be within the applicable ranges reflected in the following chart. The aggregate initial principal balance of the Class A-4 and Class A-5 trust components is expected to be approximately $523,272,000, subject to a variance of plus or minus 5%. The Class A-4-X1 and Class A-4-X2 trust components will have initial notional amounts equal to the initial principal balance of the Class A-4 trust component. The Class A-5-X1 and Class A-5-X2 trust components will have initial notional amounts equal to the initial principal balance of the Class A-5 trust component. In the event that the Class A-5 trust component is issued with an initial certificate balance of $523,272,000, the Class A-4 trust component (and, correspondingly, the Class A-4 Exchangeable Certificates) will not be issued. |
| Trust Components | Expected Range of Initial Principal Balance | Expected Range of Weighted Average Life (Years) | Expected Range of Principal Window (Months) |
| Class A-4 | $0 - $350,000,000 | NAP – 9.58 | NAP / 106 – 119 |
| Class A-5 | $173,272,000 - $523,272,000 | 9.69 – 9.92 | 106 – 120 / 119 – 120 |
| (10) | The Class X-A, Class X-B, Class X-D, Class X-F, Class X-G and Class X-H certificates (collectively referred to as the “Class X certificates”) are notional amount certificates and will not be entitled to distributions of principal. The notional amount of the Class X-A certificates will be equal to the aggregate certificate or principal balance of the Class A-1, Class A-2, Class A-3 and Class A-SB certificates and the Class A-4 and Class A-5 trust components. The notional amount of the Class X-B certificates will be equal to the aggregate principal balance of the Class A-S, Class B and Class C trust components. The notional amount of the Class X-D certificates will be equal to the aggregate certificate balance of the Class D and Class E certificates. The notional amount of each class of the Class X-F, Class X-G and Class X-H certificates will be equal to the certificate balance of the class of principal balance certificates that, with the addition of “X-,” has the same alphabetical designation as the subject class of Class X certificates. |
| (11) | The pass-through rate for the Class X-A certificates for any distribution date will be a per annum rate equal to the excess, if any, of (a) the weighted average of the net mortgage interest rates on the mortgage loans for the related distribution date, over (b) the weighted average of the pass-through rates on the Class A-1, Class A-2, Class A-3 and Class A-SB certificates and the Class A-4, Class A-4-X1, Class A-4-X2, Class A-5, Class A-5-X1 and Class A-5-X2 trust components for the related distribution date, weighted on the basis of their respective certificate or principal balances or notional amounts outstanding immediately prior to that distribution date (but excluding trust components with a notional amount in the denominator of such weighted average calculation). The pass-through rate for the Class X-B certificates for any distribution date will be a per annum rate equal to the excess, if any, of (a) the weighted average of the net mortgage interest rates on the mortgage loans for the related distribution date, over (b) the weighted average of the pass-through rates on the Class A-S, Class A-S-X1, Class A-S-X2, Class B, Class B-X1, Class B-X2, Class C, Class C-X1 and Class C-X2 trust components for the related distribution date, weighted on the basis of their respective principal balances or notional amounts outstanding immediately prior to that distribution date (but excluding trust components with a notional amount in the denominator of such weighted average calculation). The pass-through rate for the Class X-D certificates for any distribution date will be a per annum rate equal to the excess, if any, of (a) the weighted average of the net mortgage interest rates on the mortgage loans for the related distribution date, over (b) the weighted average of the pass-through rates on the Class D and Class E certificates for the related distribution date, weighted on the basis of their respective certificate balances outstanding immediately prior to that distribution date. The pass-through rate for each class of the |
This is not a research report and was not prepared by any Underwriter’s research department. Please see additional important information and qualifications at the end of this Term Sheet.
T-4
| BANK 2021-BNK33 | Structural Overview |
Class X-F, Class X-G and Class X-H certificates for any distribution date will be a per annum rate equal to the excess, if any, of (a) the weighted average of the net mortgage interest rates on the mortgage loans for the related distribution date, over (b) the pass-through rate for the related distribution date on the class of principal balance certificates that, with the addition of “X-,” has the same alphabetical designation as the subject class of Class X certificates. For purposes of the calculation of the weighted average of the net mortgage interest rates on the mortgage loans for each distribution date, the net mortgage interest rates will be adjusted as necessary to a 30/360 basis.
| (12) | Not offered pursuant to the Preliminary Prospectus or this Term Sheet. Information provided in this Term Sheet regarding the characteristics of these certificates is provided only to enhance your understanding of the offered certificates. The privately offered certificates also include the Class V and Class R certificates, which do not have a certificate balance, notional amount, credit support, pass-through rate, rating, assumed final distribution date or rated final distribution date, and which are not shown in the chart. The Class V certificates represent a beneficial ownership interest held through the grantor trust in a specified percentage of certain excess interest in respect of mortgage loans having anticipated repayment dates, if any. The Class R certificates represent the beneficial ownership of the residual interest in each of the real estate mortgage investment conduits, as further described in the Preliminary Prospectus. |
| (13) | Although it does not have a specified pass-through rate (other than for tax reporting purposes), the effective pass-through rate for the RR Interest will be a variable rate per annum equal to the weighted average of the net mortgage interest rates on the mortgage loans for the related distribution date (in each case adjusted, if necessary, to accrue on the basis of a 360-day year consisting of twelve 30-day months). |
This is not a research report and was not prepared by any Underwriter’s research department. Please see additional important information and qualifications at the end of this Term Sheet.
T-5
| BANK 2021-BNK33 | Structural Overview |
Issue Characteristics
| Offered Certificates: | | $852,071,000 (approximate) monthly pay, multi-class, commercial mortgage pass-through certificates, consisting of 19 principal balance classes (Class A-1, Class A-2, Class A-3, Class A-SB, Class A-4, Class A-4-1, Class A-4-2, Class A-5, Class A-5-1, Class A-5-2, Class A-S, Class A-S-1, Class A-S-2, Class B, Class B-1, Class B-2, Class C, Class C-1 and Class C-2) and 12 interest-only classes (Class A-4-X1, Class A-4-X2, Class A-5-X1, Class A-5-X2, Class X-A, Class X-B, Class A-S-X1, Class A-S-X2, Class B-X1, Class B-X2, Class C-X1 and Class C-X2) |
| Co-Lead Managers and Joint Bookrunners: | | BofA Securities, Inc., Wells Fargo Securities, LLC and Morgan Stanley & Co. LLC |
| Co-Managers: | | Academy Securities, Inc. and Drexel Hamilton, LLC |
| Mortgage Loan Sellers: | | Bank of America, National Association, Wells Fargo Bank, National Association, Morgan Stanley Mortgage Capital Holdings LLC and National Cooperative Bank, N.A. |
| Rating Agencies: | | Fitch, KBRA and Moody’s |
| Master Servicers: | | Wells Fargo Bank, National Association and National Cooperative Bank, N.A. |
| Special Servicers: | | Rialto Capital Advisors, LLC and National Cooperative Bank, N.A. |
| Certificate Administrator/ Certificate Registrar/Custodian: | | Wells Fargo Bank, National Association |
| Trustee: | | Wilmington Trust, National Association |
| Operating Advisor: | | Park Bridge Lender Services LLC |
| Asset Representations Reviewer: | | Park Bridge Lender Services LLC |
| Initial Directing Certificateholder: | | RREF IV Debt AIV, LP |
| Risk Retention Consultation Party: | | Bank of America, National Association |
| U.S. Credit Risk Retention: | | For a discussion on the manner in which the U.S. credit risk retention requirements will be addressed by Bank of America, National Association, as the retaining sponsor, see “Credit Risk Retention” in the Preliminary Prospectus. |
| EU Risk Retention: | | None of the sponsors, the depositor or the underwriters or their respective affiliates, or any other person, intends to retain a material net economic interest in the securitization constituted by the issue of the certificates, or to take any other action in respect of such securitization, in a manner prescribed or contemplated by the EU Securitization Regulation or the UK Securitization Regulation. In particular, no such person undertakes to take any action which may be required by any potential investor or certificateholder for the purposes of its compliance with any requirement of the EU Securitization Regulation or the UK Securitization Regulation. In addition, the arrangements described under “Credit Risk Retention” in the Preliminary Prospectus have not been structured with the objective of ensuring compliance by any person with any requirement of the EU Securitization Regulation or the UK Securitization Regulation. Consequently, the Offered Certificates may not be a suitable investment for investors that are subject to any requirement of the EU Securitization Regulation or the UK Securitization Regulation. See “Risk Factors—Other Risks Relating to the Certificates—EU Securitization Regulation and UK Securitization Regulation” in the Preliminary Prospectus. |
| Cut-off Date: | | The mortgage loans will be considered part of the trust fund as of their respective cut-off dates. The cut-off date with respect to each mortgage loan is the respective due date for the monthly debt service payment that is due in May 2021 (or, in the case of any mortgage loan that has its first due date after May 2021, the date that would have been its due date in May 2021 under the terms of that mortgage loan if a monthly debt service payment were scheduled to be due in that month). |
| Expected Pricing Date: | | Week of May 3, 2021 |
| Expected Closing Date: | | May 20, 2021 |
| Determination Dates: | | The 11th day of each month or, if the 11th day is not a business day, then the business day immediately following such 11th day. |
| Distribution Dates: | | The 4th business day following each determination date. The first distribution date will be in June 2021. |
| Rated Final Distribution Date: | | The distribution date in May 2064 |
| Interest Accrual Period: | | Preceding calendar month |
| Payment Structure: | | Sequential pay |
| Tax Treatment: | | REMIC, except that the Exchangeable Certificates will evidence interests in a grantor trust |
| Optional Termination: | | 1.00% clean-up call |
| Minimum Denominations: | | $10,000 for each class of Offered Certificates (other than Class X-A and Class X-B certificates); $1,000,000 for the Class X-A and Class X-B certificates |
| Settlement Terms: | | DTC, Euroclear and Clearstream |
This is not a research report and was not prepared by any Underwriter’s research department. Please see additional important information and qualifications at the end of this Term Sheet.
T-6
| BANK 2021-BNK33 | Structural Overview |
| Legal/Regulatory Status: | | Each class of Offered Certificates is expected to be eligible for exemptive relief under ERISA. No class of Offered Certificates is SMMEA eligible. |
| Analytics: | | The certificate administrator is expected to make available all distribution date statements, CREFC® reports and supplemental notices received by it to certain modeling financial services as described in the Preliminary Prospectus. |
| Bloomberg Ticker: | | BANK 2021-BN33<MTGE><GO> |
| Risk Factors: | | THE CERTIFICATES INVOLVE CERTAIN RISKS AND MAY NOT BE SUITABLE FOR ALL INVESTORS. SEE THE “RISK FACTORS” SECTION OF THE PRELIMINARY PROSPECTUS. |
This is not a research report and was not prepared by any Underwriter’s research department. Please see additional important information and qualifications at the end of this Term Sheet.
T-7
| BANK 2021-BNK33 | Structural Overview |
Structural Overview
| Allocation Between the RR Interest and the Non-Retained Certificates: | | The aggregate amount available for distributions to the holders of the Certificates (including the RR Interest) on each distribution date (net of specified expenses of the issuing entity, including fees payable to, and costs and expenses reimbursable to, each applicable master servicer, primary servicer and special servicer, the certificate administrator, the trustee, the operating advisor, the asset representations reviewer and CREFC®) will be allocated between amounts available for distribution to the holders of the RR Interest, on the one hand, and to all other Certificates (other than the Class V and Class R Certificates), referred to herein as the “Non-Retained Certificates”, on the other hand. The portion of such amount allocable to (a) the RR Interest will at all times be the product of such amount multiplied by 5% and (b) the Non-Retained Certificates will at all times be the product of such amount multiplied by the difference between 100% and the percentage set forth in clause (a) (each, the respective “Percentage Allocation Entitlement”). |
| | | |
| Accrual: | | Each class of Offered Certificates will accrue interest on a 30/360 basis. |
| Amount and Order of Distributions: | | On each distribution date, the Non-Retained Certificates’ Percentage Allocation Entitlement of funds available for distribution from the mortgage loans, net of (i) any yield maintenance charges and prepayment premiums and (ii) any excess interest, will be distributed in the following amounts and order of priority: First, to the Class A-1, Class A-2, Class A-3, Class A-SB, Class X-A, Class X-B, Class X-D, Class X-F, Class X-G and Class X-H certificates and the Class A-4, Class A-4-X1, Class A-4-X2, Class A-5, Class A-5-X1 and Class A-5-X2 trust components, in respect of interest, up to an amount equal to, and pro rata in accordance with, the interest entitlements for those classes of certificates and trust components; Second, to the Class A-1, Class A-2, Class A-3 and Class A-SB certificates and the Class A-4 and Class A-5 trust components as follows, to the extent of applicable available funds allocated to principal: either (i)(a) first, to principal on the Class A-SB certificates, until the certificate balance of the Class A-SB certificates is reduced to the planned principal balance for the related distribution date set forth in Annex E to the Preliminary Prospectus, and (b) second, to principal on the Class A-1 certificates, the Class A-2 certificates, the Class A-3 certificates, the Class A-4 trust component, the Class A-5 trust component and the Class A-SB certificates, in that order, in each case until the certificate or principal balance of such class of certificates or trust component has been reduced to zero, or (ii) if the certificate or principal balance of each class of principal balance certificates and trust components other than the Class A-1, Class A-2, Class A-3 and Class A-SB certificates, the Class A-4 and Class A-5 trust components and the RR Interest has been reduced to zero as a result of the allocation of losses on the mortgage loans to those certificates, to principal on the Class A-1, Class A-2, Class A-3 and Class A-SB certificates and the Class A-4 and Class A-5 trust components, pro rata, without regard to the distribution priorities described above or the planned principal balance of the Class A-SB certificates; Third, to the Class A-1, Class A-2, Class A-3 and Class A-SB certificates and the Class A-4 and Class A-5 trust components, first, up to an amount equal to, and pro rata based on, any previously unreimbursed losses on the mortgage loans allocable to principal that were previously borne by each such class or trust component and then in the amount of interest thereon; Fourth, to the Class A-S, Class A-S-X1 and Class A-S-X2 trust components, as follows: (a) to each such trust component in respect of interest, up to an amount equal to, and pro rata in accordance with, the interest entitlements for those trust components; (b) to the extent of applicable available funds allocable to principal remaining after distributions in respect of principal to each class of certificates or trust component with a higher priority (as set forth in prior enumerated clauses set forth above), to principal on the Class A-S trust component until its principal balance has been reduced to zero; and (c) to reimburse the Class A-S trust component, first, in the amount of any previously unreimbursed losses on the mortgage loans that were previously allocated thereto, then in the amount of interest thereon; Fifth, to the Class B, Class B-X1 and Class B-X2 trust components, as follows: (a) to each such trust component in respect of interest, up to an amount equal to, and pro rata in accordance with, the interest entitlements for those trust components; (b) to the extent of applicable available funds allocable to principal remaining after distributions in respect of principal to each class of certificates or trust component with a higher priority (as set forth in prior enumerated clauses set forth above), to principal on the Class B trust component until its principal balance has been reduced to zero; and (c) to reimburse the Class B trust component, first, in the amount of any previously unreimbursed losses on the mortgage loans that were previously allocated thereto, then in the amount of interest thereon; Sixth, to the Class C, Class C-X1 and Class C-X2 trust components, as follows: (a) to each such trust component in respect of interest, up to an amount equal to, and pro rata in accordance with, the interest entitlements for those trust components; (b) to the extent of applicable available funds allocable to principal remaining after distributions in respect of principal to each class of certificates or trust component with a higher priority (as set forth in prior enumerated clauses set forth above), to principal on the Class C trust component until its principal balance has been reduced to zero; and (c) to reimburse the Class C trust component, first, in the amount of any previously unreimbursed losses on the mortgage loans that were previously allocated thereto, then in the amount of interest thereon; Seventh, to the Class D, Class E, Class F, Class G and Class H certificates in the amounts and order of priority described in “Description of the Certificates—Distributions” in the Preliminary Prospectus; and Eighth, to the Class R certificates, any remaining amounts. Principal and interest payable on each trust component will be distributed pro rata to the corresponding classes of Exchangeable Certificates representing interests therein in accordance with their Class Percentage Interests |
This is not a research report and was not prepared by any Underwriter’s research department. Please see additional important information and qualifications at the end of this Term Sheet.
T-8
| BANK 2021-BNK33 | Structural Overview |
| | | therein as described below under “Exchangeable Certificates.” |
| | | |
| Interest and Principal Entitlements: | | The interest entitlement of each class of Offered Certificates on each distribution date generally will be the interest accrued during the related interest accrual period on the related certificate balance or notional amount at the related pass-through rate, net of any prepayment interest shortfalls allocated to that class for such distribution date as described below. If prepayment interest shortfalls arise from voluntary prepayments on serviced mortgage loans during any collection period, the applicable master servicer is required to make a limited compensating interest payment to offset those shortfalls. See “Description of the Certificates—Prepayment Interest Shortfalls” in the Preliminary Prospectus. The remaining amount of prepayment interest shortfalls will be allocated between the RR Interest, on one hand, and the Non-Retained Certificates, on the other hand, in accordance with their respective Percentage Allocation Entitlements. The prepayment interest shortfalls allocated to the Non-Retained Certificates will be allocated among such classes of certificates (other than the Exchangeable Certificates) and trust components that are entitled to interest, on a pro rata basis, based on their respective amounts of accrued interest for the related distribution date, to reduce the interest entitlement on each such class of certificates and trust components. For any distribution date, prepayment interest shortfalls allocated to a trust component will be allocated among the related classes of Exchangeable Certificates, pro rata, in accordance with their respective class percentage interests for that distribution date. If a class of certificates or trust component receives less than the entirety of its interest entitlement on any distribution date, then the shortfall (excluding any shortfall due to prepayment interest shortfalls), together with interest thereon, will be added to its interest entitlement for the next succeeding distribution date. The aggregate principal distribution amount for each distribution date generally will be the aggregate amount of principal received or advanced in respect of the mortgage loans, net of any non-recoverable advances and interest thereon and any workout-delayed reimbursement amounts that are reimbursed to the applicable master servicer or the trustee during the related collection period. Non-recoverable advances and interest thereon are reimbursable from principal collections before reimbursement from other amounts. Workout-delayed reimbursement amounts will be reimbursable from principal collections. The Non-Retained Certificates and the RR Interest will be entitled to their respective Percentage Allocation Entitlements of the aggregate principal distribution amount. |
| Exchangeable Certificates: | | Certificates of each class of Exchangeable Certificates may be exchanged for certificates of the corresponding classes of Exchangeable Certificates set forth next to such class in the table below, and vice versa. Following any exchange of certificates of one or more classes of Exchangeable Certificates (the applicable “Surrendered Classes”) for certificates of one or more classes of other Exchangeable Certificates (the applicable “Received Classes”), the Class Percentage Interests (as defined below) of the outstanding principal balances or notional amounts of the Corresponding Trust Components that are represented by the Surrendered Classes (and consequently their related certificate balances or notional amounts) will be decreased, and those of the Received Classes (and consequently their related certificate balances or notional amounts) will be increased. The dollar denomination of the certificates of each of the Received Classes must be equal to the dollar denomination of the certificates of each of the Surrendered Classes. No fee will be required with respect to any exchange of Exchangeable Certificates. |
| | | Surrendered Classes (or Received Classes) of Certificates | Received Classes (or Surrendered Classes) of Certificates |
| | | Class A-4 | Class A-4-1, Class A-4-X1 |
| | | Class A-4 | Class A-4-2, Class A-4-X2 |
| | | Class A-5 | Class A-5-1, Class A-5-X1 |
| | | Class A-5 | Class A-5-2, Class A-5-X2 |
| | | Class A-S | Class A-S-1, Class A-S-X1 |
| | | Class A-S | Class A-S-2, Class A-S-X2 |
| | | Class B | Class B-1, Class B-X1 |
| | | Class B | Class B-2, Class B-X2 |
| | | Class C | Class C-1, Class C-X1 |
| | | Class C | Class C-2, Class C-X2 |
| | On the closing date, the issuing entity will issue the following “trust components,” each with the initial principal balance (or, if such trust component has an “X” suffix, notional amount) and pass-through rate set forth next to it in the table below. Each trust component with an “X” suffix will not be entitled to distributions of principal. |
| | | Trust Component | Initial Principal Balance
or Notional Amount | Pass-Through Rate |
| | | Class A-4 | See footnote (9) to the first table above under “Structural Overview” | Class A-4 certificate pass-through rate minus 1.00% |
| | | Class A-4-X1 | Equal to Class A-4 trust component principal balance | 0.50% |
| | | Class A-4-X2 | Equal to Class A-4 trust component principal balance | 0.50% |
| | | Class A-5 | See footnote (9) to the first table above under “Structural Overview” | Class A-5 certificate pass-through rate minus 1.00% |
| | | Class A-5-X1 | Equal to Class A-5 trust component principal balance | 0.50% |
| | | Class A-5-X2 | Equal to Class A-5 trust component principal balance | 0.50% |
This is not a research report and was not prepared by any Underwriter’s research department. Please see additional important information and qualifications at the end of this Term Sheet.
T-9
| BANK 2021-BNK33 | Structural Overview |
| | | Class A-S | $107,404,000 | Class A-S certificate pass-through rate minus 1.00% |
| | | Class A-S-X1 | Equal to Class A-S trust component principal balance | 0.50% |
| | | Class A-S-X2 | Equal to Class A-S trust component principal balance | 0.50% |
| | | Class B | $38,188,000 | Class B certificate pass-through rate minus 1.00% |
| | | Class B-X1 | Equal to Class B trust component principal balance | 0.50% |
| | | Class B-X2 | Equal to Class B trust component principal balance | 0.50% |
| | | Class C | $38,188,000 | Class C certificate pass-through rate minus 1.00% |
| | | Class C-X1 | Equal to Class C trust component principal balance | 0.50% |
| | | Class C-X2 | Equal to Class C trust component principal balance | 0.50% |
| | Each class of Exchangeable Certificates represents an undivided beneficial ownership interest in the trust components set forth next to it in the table below (the “Corresponding Trust Components”). Each class of Exchangeable Certificates has a pass-through rate equal to the sum of the pass-through rates of the Corresponding Trust Components and represents a percentage interest (the related “Class Percentage Interest”) in each Corresponding Trust Component, including principal and interest payable thereon (and reimbursement of losses allocable thereto), equal to (x) the certificate balance (or, if such class has an “X” suffix, notional amount) of such class of certificates, divided by (y) the principal balance of the Class A-4 trust component (if such class of Exchangeable Certificates has an “A-4” designation), the Class A-5 trust component (if such class of Exchangeable Certificates has an “A-5” designation), the Class A-S trust component (if such class of Exchangeable Certificates has an “A-S” designation), the Class B trust component (if such class of Exchangeable Certificates has a “B” designation), or the Class C trust component (if such class of Exchangeable Certificates has a “C” designation). |
| Group of Exchangeable Certificates | Class of Exchangeable Certificates | Corresponding Trust Components |
| “Class A-4 Exchangeable Certificates” | Class A-4 | Class A-4, Class A-4-X1, Class A-4-X2 |
| Class A-4-1 | Class A-4, Class A-4-X2 |
| Class A-4-2 | Class A-4 |
| Class A-4-X1 | Class A-4-X1 |
| Class A-4-X2 | Class A-4-X1, Class A-4-X2 |
| “Class A-5 Exchangeable Certificates” | Class A-5 | Class A-5, Class A-5-X1, Class A-5-X2 |
| Class A-5-1 | Class A-5, Class A-5-X2 |
| Class A-5-2 | Class A-5 |
| Class A-5-X1 | Class A-5-X1 |
| Class A-5-X2 | Class A-5-X1, Class A-5-X2 |
| “Class A-S Exchangeable Certificates” | Class A-S | Class A-S, Class A-S-X1, Class A-S-X2 |
| Class A-S-1 | Class A-S, Class A-S-X2 |
| Class A-S-2 | Class A-S |
| Class A-S-X1 | Class A-S-X1 |
| Class A-S-X2 | Class A-S-X1, Class A-S-X2 |
| “Class B Exchangeable Certificates” | Class B | Class B, Class B-X1, Class B-X2 |
| Class B-1 | Class B, Class B-X2 |
| Class B-2 | Class B |
| Class B-X1 | Class B-X1 |
| Class B-X2 | Class B-X1, Class B-X2 |
| “Class C Exchangeable Certificates” | Class C | Class C, Class C-X1, Class C-X2 |
| Class C-1 | Class C, Class C-X2 |
| Class C-2 | Class C |
| Class C-X1 | Class C-X1 |
| Class C-X2 | Class C-X1, Class C-X2 |
| | The maximum certificate balance or notional amount of each class of Class A-4 Exchangeable Certificates, Class A-5 Exchangeable Certificates, Class A-S Exchangeable Certificates, Class B Exchangeable Certificates or Class C Exchangeable Certificates that could be issued in an exchange is equal to the principal balance of the Class A-4, Class A-5, Class A-S, Class B or Class C trust component, respectively. The maximum certificate balances of Class A-4, Class A-5, Class A-S, Class B and Class C certificates (subject to the constraint on the aggregate initial principal balance of the Class A-4 and Class A-5 trust components discussed in footnote (9) to the first table above under “Structural Overview”) will be issued on the closing date, and the certificate balance or notional amount of each other class of Exchangeable Certificates will be equal to zero on the closing date. |
This is not a research report and was not prepared by any Underwriter’s research department. Please see additional important information and qualifications at the end of this Term Sheet.
T-10
| BANK 2021-BNK33 | Structural Overview |
| | | Each class of Class A-4 Exchangeable Certificates, Class A-5 Exchangeable Certificates, Class A-S Exchangeable Certificates, Class B Exchangeable Certificates and Class C Exchangeable Certificates will have a certificate balance or notional amount equal to its Class Percentage Interest multiplied by the principal balance of the Class A-4, Class A-5, Class A-S, Class B or Class C trust component, respectively. Each class of Class A-4 Exchangeable Certificates, Class A-5 Exchangeable Certificates, Class A-S Exchangeable Certificates, Class B Exchangeable Certificates and Class C Exchangeable Certificates with a certificate balance will have the same approximate initial credit support percentage, Expected Weighted Average Life, Expected Principal Window, Certificate Principal UW NOI Debt Yield and Certificate Principal to Value Ratio as the Class A-4, Class A-5, Class A-S, Class B or Class C certificates, respectively, shown above. |
| | | |
| Special Servicer Compensation: | | The principal compensation to be paid to a special servicer in respect of its special servicing activities will be the special servicing fee, the workout fee and the liquidation fee. The special servicing fee for each distribution date is calculated based on the outstanding principal balance of each serviced mortgage loan that is a specially serviced mortgage loan (and any related serviced companion loan) or as to which the related mortgaged property has become an REO property at the special servicing fee rate, which will be a rate equal to (a) with respect to Rialto Capital Advisors, LLC, the greater of 0.25000% per annum and the per annum rate that would result in a special servicing fee for the related month of $5,000, and (b) with respect to National Cooperative Bank, N.A., the greater of 0.25000% per annum and the per annum rate that would result in a special servicing fee of $1,000 for the related month. The special servicing fee will be payable monthly, first, from liquidation proceeds, insurance and condemnation proceeds, and other collections in respect of the related specially serviced mortgage loan or REO property and, then, from general collections on all the mortgage loans and any REO properties. Each applicable special servicer will also be entitled to (i) liquidation fees generally equal to 1.0% (or, if such rate would result in an aggregate liquidation fee less than $25,000, then the liquidation fee rate will be equal to the lesser of (i) 3.0% and (ii) such lower rate as would result in an aggregate liquidation fee equal to $25,000) of liquidation proceeds and certain other collections in respect of a specially serviced mortgage loan (and any related serviced companion loan) or related REO property and of amounts received in respect of mortgage loan repurchases by the related mortgage loan sellers and (ii) workout fees generally equal to 1.0% of interest (other than post-ARD excess interest on mortgage loans with anticipated repayment dates and other than default interest) and principal payments made in respect of a rehabilitated mortgage loan (and any related serviced companion loan), subject to a floor of $25,000 with respect to any mortgage loan, whole loan or related REO property, and in the case of each of clause (i) and (ii), subject to certain adjustments and exceptions as described in the Preliminary Prospectus under “Pooling and Servicing Agreement—Servicing and Other Compensation and Payment of Expenses—Special Servicing Compensation”. With respect to any non-serviced mortgage loan, the related special servicer under the related other pooling and servicing agreement pursuant to which such mortgage loan is being serviced will be entitled to similar compensation as that described above with respect to such non-serviced mortgage loan under such other pooling and servicing agreement as further described in the Preliminary Prospectus, although any related fees may accrue at a different rate and there may be a higher (or no) cap on liquidation and workout fees. |
| Prepayment Premiums/Yield Maintenance Charges: | | If any yield maintenance charge or prepayment premium is collected during any collection period with respect to any mortgage loan, then on the immediately succeeding distribution date, the certificate administrator will pay:
(1) to the Non-Retained Certificates, in the following amounts: |
| | | |
| | | (a) to the holders of each class of the Class A-1, Class A-2, Class A-3, Class A-SB, Class A-4, Class A-4-1, Class A-4-2, Class A-5, Class A-5-1, Class A-5-2, Class A-S, Class A-S-1, Class A-S-2, Class B, Class B-1, Class B-2, Class C, Class C-1, Class C-2, Class D and Class E certificates, the product of (x) the Non-Retained Certificates’ Percentage Allocation Entitlement of such yield maintenance charge or prepayment premium, (y) the related Base Interest Fraction for such class and the applicable principal prepayment, and (z) a fraction, the numerator of which is equal to the amount of principal distributed to such class for that distribution date, and the denominator of which is the total amount of principal distributed to the Class A-1, Class A-2, Class A-3, Class A-SB, Class D and Class E certificates and the Class A-4 Exchangeable Certificates, the Class A-5 Exchangeable Certificates, the Class A-S Exchangeable Certificates, the Class B Exchangeable Certificates and the Class C Exchangeable Certificates for that distribution date,
(b) to the holders of the Class A-4-X1 certificates, the product of (x) the Non-Retained Certificates’ Percentage Allocation Entitlement of such yield maintenance charge or prepayment premium, (y) a fraction, the numerator of which is equal to the amount of principal distributed to the Class A-4-1 certificates for that distribution date, and the denominator of which is the total amount of principal distributed to the Class A-1, Class A-2, Class A-3, Class A-SB, Class D and Class E certificates and the Class A-4 Exchangeable Certificates, the Class A-5 Exchangeable Certificates, the Class A-S Exchangeable Certificates, the Class B Exchangeable Certificates and the Class C Exchangeable Certificates for that distribution date, and (z) the difference between (1) the Base Interest Fraction for the Class A-4 certificates and the applicable principal prepayment and (2) the Base Interest Fraction for the Class A-4-1 certificates and the applicable principal prepayment,
(c) to the holders of the Class A-4-X2 certificates, the product of (x) the Non-Retained Certificates’ Percentage Allocation Entitlement of such yield maintenance charge or prepayment premium, (y) a fraction, the numerator of which is equal to the amount of principal distributed to the Class A-4-2 certificates for that distribution date, and the denominator of which is the total amount of principal |
This is not a research report and was not prepared by any Underwriter’s research department. Please see additional important information and qualifications at the end of this Term Sheet.
T-11
| BANK 2021-BNK33 | Structural Overview |
| | distributed to the Class A-1, Class A-2, Class A-3, Class A-SB, Class D and Class E certificates and the Class A-4 Exchangeable Certificates, the Class A-5 Exchangeable Certificates, the Class A-S Exchangeable Certificates, the Class B Exchangeable Certificates and the Class C Exchangeable Certificates for that distribution date, and (z) the difference between (1) the Base Interest Fraction for the Class A-4 certificates and the applicable principal prepayment and (2) the Base Interest Fraction for the Class A-4-2 certificates and the applicable principal prepayment,
(d) to the holders of the Class A-5-X1 certificates, the product of (x) the Non-Retained Certificates’ Percentage Allocation Entitlement of such yield maintenance charge or prepayment premium, (y) a fraction, the numerator of which is equal to the amount of principal distributed to the Class A-5-1 certificates for that distribution date, and the denominator of which is the total amount of principal distributed to the Class A-1, Class A-2, Class A-3, Class A-SB, Class D and Class E certificates and the Class A-4 Exchangeable Certificates, the Class A-5 Exchangeable Certificates, the Class A-S Exchangeable Certificates, the Class B Exchangeable Certificates and the Class C Exchangeable Certificates for that distribution date, and (z) the difference between (1) the Base Interest Fraction for the Class A-5 certificates and the applicable principal prepayment and (2) the Base Interest Fraction for the Class A-5-1 certificates and the applicable principal prepayment,
(e) to the holders of the Class A-5-X2 certificates, the product of (x) the Non-Retained Certificates’ Percentage Allocation Entitlement of such yield maintenance charge or prepayment premium, (y) a fraction, the numerator of which is equal to the amount of principal distributed to the Class A-5-2 certificates for that distribution date, and the denominator of which is the total amount of principal distributed to the Class A-1, Class A-2, Class A-3, Class A-SB, Class D and Class E certificates and the Class A-4 Exchangeable Certificates, the Class A-5 Exchangeable Certificates, the Class A-S Exchangeable Certificates, the Class B Exchangeable Certificates and the Class C Exchangeable Certificates for that distribution date, and (z) the difference between (1) the Base Interest Fraction for the Class A-5 certificates and the applicable principal prepayment and (2) the Base Interest Fraction for the Class A-5-2 certificates and the applicable principal prepayment,
(f) to the holders of the Class A-S-X1 certificates, the product of (x) the Non-Retained Certificates’ Percentage Allocation Entitlement of such yield maintenance charge or prepayment premium, (y) a fraction, the numerator of which is equal to the amount of principal distributed to the Class A-S-1 certificates for that distribution date, and the denominator of which is the total amount of principal distributed to the Class A-1, Class A-2, Class A-3, Class A-SB, Class D and Class E certificates and the Class A-4 Exchangeable Certificates, the Class A-5 Exchangeable Certificates, the Class A-S Exchangeable Certificates, the Class B Exchangeable Certificates and the Class C Exchangeable Certificates for that distribution date, and (z) the difference between (1) the Base Interest Fraction for the Class A-S certificates and the applicable principal prepayment and (2) the Base Interest Fraction for the Class A-S-1 certificates and the applicable principal prepayment,
(g) to the holders of the Class A-S-X2 certificates, the product of (x) the Non-Retained Certificates’ Percentage Allocation Entitlement of such yield maintenance charge or prepayment premium, (y) a fraction, the numerator of which is equal to the amount of principal distributed to the Class A-S-2 certificates for that distribution date, and the denominator of which is the total amount of principal distributed to the Class A-1, Class A-2, Class A-3, Class A-SB, Class D and Class E certificates and the Class A-4 Exchangeable Certificates, the Class A-5 Exchangeable Certificates, the Class A-S Exchangeable Certificates, the Class B Exchangeable Certificates and the Class C Exchangeable Certificates for that distribution date, and (z) the difference between (1) the Base Interest Fraction for the Class A-S certificates and the applicable principal prepayment and (2) the Base Interest Fraction for the Class A-S-2 certificates and the applicable principal prepayment,
(h) to the holders of the Class B-X1 certificates, the product of (x) the Non-Retained Certificates’ Percentage Allocation Entitlement of such yield maintenance charge or prepayment premium, (y) a fraction, the numerator of which is equal to the amount of principal distributed to the Class B-1 certificates for that distribution date, and the denominator of which is the total amount of principal distributed to the Class A-1, Class A-2, Class A-3, Class A-SB, Class D and Class E certificates and the Class A-4 Exchangeable Certificates, the Class A-5 Exchangeable Certificates, the Class A-S Exchangeable Certificates, the Class B Exchangeable Certificates and the Class C Exchangeable Certificates for that distribution date, and (z) the difference between (1) the Base Interest Fraction for the Class B certificates and the applicable principal prepayment and (2) the Base Interest Fraction for the Class B-1 certificates and the applicable principal prepayment,
(i) to the holders of the Class B-X2 certificates, the product of (x) the Non-Retained Certificates’ Percentage Allocation Entitlement of such yield maintenance charge or prepayment premium, (y) a fraction, the numerator of which is equal to the amount of principal distributed to the Class B-2 certificates for that distribution date, and the denominator of which is the total amount of principal distributed to the Class A-1, Class A-2, Class A-3, Class A-SB, Class D and Class E certificates and the Class A-4 Exchangeable Certificates, the Class A-5 Exchangeable Certificates, the Class A-S Exchangeable Certificates, the Class B Exchangeable Certificates and the Class C Exchangeable Certificates for that distribution date, and (z) the difference between (1) the Base Interest Fraction for the Class B certificates and the applicable principal prepayment and (2) the Base Interest Fraction for the Class B-2 certificates and the applicable principal prepayment,
(j) to the holders of the Class C-X1 certificates, the product of (x) the Non-Retained Certificates’ Percentage Allocation Entitlement of such yield maintenance charge or prepayment premium, (y) a fraction, the numerator of which is equal to the amount of principal distributed to the Class C-1 |
This is not a research report and was not prepared by any Underwriter’s research department. Please see additional important information and qualifications at the end of this Term Sheet.
T-12
| BANK 2021-BNK33 | Structural Overview |
| | | certificates for that distribution date, and the denominator of which is the total amount of principal distributed to the Class A-1, Class A-2, Class A-3, Class A-SB, Class D and Class E certificates and the Class A-4 Exchangeable Certificates, the Class A-5 Exchangeable Certificates, the Class A-S Exchangeable Certificates, the Class B Exchangeable Certificates and the Class C Exchangeable Certificates for that distribution date, and (z) the difference between (1) the Base Interest Fraction for the Class C certificates and the applicable principal prepayment and (2) the Base Interest Fraction for the Class C-1 certificates and the applicable principal prepayment,
(k) to the holders of the Class C-X2 certificates, the product of (x) the Non-Retained Certificates’ Percentage Allocation Entitlement of such yield maintenance charge or prepayment premium, (y) a fraction, the numerator of which is equal to the amount of principal distributed to the Class C-2 certificates for that distribution date, and the denominator of which is the total amount of principal distributed to the Class A-1, Class A-2, Class A-3, Class A-SB, Class D and Class E certificates and the Class A-4 Exchangeable Certificates, the Class A-5 Exchangeable Certificates, the Class A-S Exchangeable Certificates, the Class B Exchangeable Certificates and the Class C Exchangeable Certificates for that distribution date, and (z) the difference between (1) the Base Interest Fraction for the Class C certificates and the applicable principal prepayment and (2) the Base Interest Fraction for the Class C-2 certificates and the applicable principal prepayment,
(l) to the holders of the Class X-A certificates, the excess, if any, of (x) the product of (1) the Non-Retained Certificates’ Percentage Allocation Entitlement of such yield maintenance charge or prepayment premium and (2) a fraction, the numerator of which is equal to the total amount of principal distributed to the Class A-1, Class A-2, Class A-3 and Class A-SB certificates and the Class A-4 Exchangeable Certificates and the Class A-5 Exchangeable Certificates for that distribution date, and the denominator of which is the total amount of principal distributed to the Class A-1, Class A-2, Class A-3, Class A-SB, Class D and Class E certificates and the Class A-4 Exchangeable Certificates, the Class A-5 Exchangeable Certificates, the Class A-S Exchangeable Certificates, the Class B Exchangeable Certificates and the Class C Exchangeable Certificates for that distribution date, over (y) the total amount of such yield maintenance charge or prepayment premium distributed to the Class A-1, Class A-2, Class A-3 and Class A-SB certificates and the Class A-4 Exchangeable Certificates and the Class A-5 Exchangeable Certificates as described above,
(m) to the holders of the Class X-B certificates, the excess, if any, of (x) the product of (1) the Non-Retained Certificates’ Percentage Allocation Entitlement of such yield maintenance charge or prepayment premium and (2) a fraction, the numerator of which is equal to the total amount of principal distributed to the Class A-S Exchangeable Certificates, the Class B Exchangeable Certificates and the Class C Exchangeable Certificates for that distribution date, and the denominator of which is the total amount of principal distributed to the Class A-1, Class A-2, Class A-3, Class A-SB, Class D and Class E certificates and the Class A-4 Exchangeable Certificates, the Class A-5 Exchangeable Certificates, the Class A-S Exchangeable Certificates, the Class B Exchangeable Certificates and the Class C Exchangeable Certificates for that distribution date, over (y) the total amount of such yield maintenance charge or prepayment premium distributed to the Class A-S Exchangeable Certificates, the Class B Exchangeable Certificates and Class C Exchangeable Certificates as described above,
and (n) to the holders of the Class X-D certificates, any remaining portion of the Non-Retained Certificates’ Percentage Allocation Entitlement of such yield maintenance charge or prepayment premium not distributed as described above in this clause (1), |
| | | |
| | | and (2) to the RR Interest, its Percentage Allocation Entitlement of such yield maintenance charge or prepayment premium. All yield maintenance charges and prepayment premiums referred to above will be net of any liquidation fees payable therefrom.
No yield maintenance charges or prepayment premiums will be distributed to the holders of the Class X-F, Class X-G, Class X-H, Class F, Class G, Class H, Class V or Class R Certificates.
“Base Interest Fraction” means, with respect to any principal prepayment of any mortgage loan that provides for the payment of a yield maintenance charge or prepayment premium, and with respect to any class of principal balance certificates (other than the RR Interest), a fraction (A) the numerator of which is the greater of (x) zero and (y) the difference between (i) the pass-through rate on that class, and (ii) the applicable discount rate and (B) the denominator of which is the difference between (i) the mortgage interest rate on the related mortgage loan and (ii) the applicable discount rate; provided, that: under no circumstances will the Base Interest Fraction be greater than one; if the discount rate referred to above is greater than or equal to both the mortgage interest rate on the related mortgage loan and the pass-through rate on that class, then the Base Interest Fraction will equal zero; and if the discount rate referred to above is greater than or equal to the mortgage interest rate on the related mortgage loan and is less than the pass-through rate on that class, then the Base Interest Fraction will be equal to 1.0.
Consistent with the foregoing, the Base Interest Fraction is equal to: |
| | | (Pass-Through Rate – Discount Rate) | |
| | | (Mortgage Rate – Discount Rate) | |
This is not a research report and was not prepared by any Underwriter’s research department. Please see additional important information and qualifications at the end of this Term Sheet.
T-13
| BANK 2021-BNK33 | Structural Overview |
| Realized Losses: | | On each distribution date, immediately following the distributions to be made to the certificateholders on that date, the certificate administrator is required to calculate the amount, if any, by which (i) the aggregate stated principal balance of the mortgage loans, including any successor REO loans, expected to be outstanding immediately following that distribution date is less than (ii) the then aggregate certificate balance of the principal balance certificates after giving effect to distributions of principal on that distribution date. The Non-Retained Certificates’ Percentage Allocation Entitlement of such amount will be applied to the Class H, Class G, Class F, Class E and Class D certificates and the Class C, Class B and Class A-S trust components, in that order, in each case until the related certificate or principal balance has been reduced to zero, and then to the Class A-1, Class A-2, Class A-3 and Class A-SB certificates and the Class A-4 and Class A-5 trust components, pro rata based upon their respective certificate or principal balances, until their respective certificate or principal balances have been reduced to zero. The RR Interest’s Percentage Allocation Entitlement of such amount will be applied to the RR Interest until the related RR Interest balance has been reduced to zero. Any portion of such amount applied to the Class A-4, Class A-5, Class A-S, Class B or Class C trust component will reduce the certificate balance or notional amount of each class of certificates in the related group of Exchangeable Certificates by an amount equal to the product of (x) its certificate balance or notional amount, divided by the principal balance of such trust component prior to the applicable reduction, and (y) the amount applied to such trust component. |
| Serviced Whole Loans: | | Each of the following mortgaged properties or portfolio of mortgaged properties secures a mortgage loan and one or more pari passu promissory notes and, in some cases, one or more generally subordinate promissory notes (each, a “serviced companion loan”) that will be serviced pursuant to the related intercreditor agreement and the pooling and servicing agreement for this transaction: Miami Design District and 261-275 Amsterdam Avenue. With respect to each such mortgaged property or portfolio of mortgaged properties, the related mortgage loan, together with the related serviced companion loan(s), is referred to herein (for so long as it is serviced under the pooling and servicing agreement for this transaction) as a “serviced whole loan.” Each serviced companion loan is not part of the mortgage pool and may be contributed to one or more future securitization transactions (if not already securitized) or may be otherwise transferred at any time, subject to compliance with the related intercreditor agreement. See the table below entitled “Mortgage Loans with Pari Passu Companion Loans,” as well as “Description of the Mortgage Pool—The Whole Loans” in the Preliminary Prospectus, for additional information regarding each such whole loan. With respect to the Equus Industrial Portfolio whole loan (a “servicing shift whole loan”), the pooling and servicing agreement for this transaction will govern servicing of such whole loan until the securitization of the related Note A-1; however, servicing of such whole loan will generally be directed by the holder of the related control note (which is not included in this securitization), and such holder will have the right to replace the special servicer with respect to the related whole loan with or without cause. With respect to the servicing shift whole loan, after the securitization of the related Note A-1, such servicing shift whole loan will cease to be a serviced whole loan and will be serviced pursuant to the pooling and servicing agreement for another securitization transaction (see “—Non-Serviced Whole Loans” below). |
| Non-Serviced Whole Loans: | | Each of the following mortgaged properties or portfolio of mortgaged properties secures a mortgage loan (each, a “non-serviced mortgage loan”), one or more pari passu promissory notes and, in some cases, one or more generally subordinate promissory notes (each such promissory note, a “non-serviced companion loan”) that will be serviced pursuant to the related intercreditor agreement and the pooling and servicing agreement or trust and servicing agreement (referred to herein as a related “pooling and servicing agreement”) for another securitization transaction: 909 Third Avenue, Pathline Park 9 & 10, Extra Space Rock ‘N Roll Self Storage Portfolio and Grace Building. With respect to each such mortgaged property or portfolio of mortgaged properties, the related mortgage loan, together with the related non-serviced companion loan(s), is referred to herein (for so long as it is serviced under the pooling and servicing agreement for another securitization transaction) as a “non-serviced whole loan.” Each non-serviced companion loan is not part of the mortgage pool and may be contributed to one or more future securitization transactions (if not already securitized) or may be otherwise transferred at any time, subject to compliance with the related intercreditor agreement. Servicing of each non-serviced whole loan will generally be directed by the holder of the related control note (or, if such control note is included in a securitization, the directing certificateholder thereunder (or other party designated thereunder to exercise the rights of such control note)), and such holder will have the right to replace the special servicer with respect to the related whole loan with or without cause. See the tables below entitled “Mortgage Loans with Pari Passu Companion Loans” and “Mortgage Loans with Subordinate Debt,” as well as “Description of the Mortgage Pool—The Whole Loans” in the Preliminary Prospectus, for additional information regarding each such whole loan. |
| | | |
| Directing Certificateholder/ Controlling Class: | | The “Directing Certificateholder” will be (i) with respect to a servicing shift mortgage loan, the related Loan-Specific Directing Certificateholder, and (ii) with respect to each other mortgage loan, the Controlling Class Certificateholder (or its representative) selected by more than 50% (by certificate balance) of the Controlling Class Certificateholders; provided, that (1) absent that selection, (2) until a Directing Certificateholder is so selected or (3) upon receipt of a notice from a majority of the Controlling Class Certificateholders (by certificate balance) that a Directing Certificateholder is no longer designated, the Controlling Class Certificateholder that owns the largest aggregate certificate balance of the Controlling Class (or its representative) will be the Directing Certificateholder; provided, that (a) in the case of clause (3), if no one holder owns the largest aggregate certificate balance of the Controlling Class, then there will be no Directing Certificateholder until appointed in accordance with the terms of the pooling and servicing agreement, and (b) the certificate administrator and the other parties to the pooling and servicing agreement will be entitled to assume that the identity of the Directing Certificateholder has not changed until such parties receive written notice of a replacement of the Directing Certificateholder from a party holding the requisite interest in the Controlling Class (as confirmed by the |
This is not a research report and was not prepared by any Underwriter’s research department. Please see additional important information and qualifications at the end of this Term Sheet.
T-14
| BANK 2021-BNK33 | Structural Overview |
| | | certificate registrar), or the resignation of the then current Directing Certificateholder. As used herein, the term “Directing Certificateholder,” unless used in relation to a Servicing Shift Mortgage Loan, means the entity determined pursuant to clause (ii) of the definition of such term. The “Loan-Specific Directing Certificateholder” with respect to a servicing shift mortgage loan is the “controlling holder”, the “directing certificateholder”, the “directing holder”, “directing lender” or any analogous concept under the related intercreditor agreement. Prior to the securitization of the related control note, the Loan-Specific Directing Certificateholder with respect to a servicing shift mortgage loan will be the holder of the related control note. On and after the securitization of the related control note, there will be no Loan-Specific Directing Certificateholder under the PSA with respect to such servicing shift mortgage loan. The “Controlling Class” will be, as of any time of determination, the most subordinate class of Control Eligible Certificates then outstanding that has an aggregate certificate balance (as notionally reduced by any Cumulative Appraisal Reduction Amounts (as defined below) allocable to such class) at least equal to 25% of the initial certificate balance of that class; provided, that if at any time the certificate balances of the certificates other than the Control Eligible Certificates and the RR Interest have been reduced to zero as a result of principal payments on the mortgage loans, then the Controlling Class will be the most subordinate class of Control Eligible Certificates that has a certificate balance greater than zero without regard to any Cumulative Appraisal Reduction Amounts. The Controlling Class as of the closing date will be the Class H certificates. The “Control Eligible Certificates” will be any of the Class G and Class H certificates. |
| | | |
| Control Rights: | | Prior to a Control Termination Event, the Directing Certificateholder will have certain consent and consultation rights under the pooling and servicing agreement with respect to certain major decisions and other matters. A “Control Termination Event” will occur when (i) the Class G certificates have a certificate balance (taking into account the application of the allocable portion of any Cumulative Appraisal Reduction Amounts to notionally reduce the certificate balance thereof) of less than 25% of the initial certificate balance of that class or (ii) a holder of the Class G certificates is the majority Controlling Class Certificateholder and has irrevocably waived its right, in writing, to exercise any of the rights of the Controlling Class Certificateholder and such rights have not been reinstated to a successor controlling class certificateholder; provided that no Control Termination Event may occur with respect to the Loan-Specific Directing Certificateholder, and the term “Control Termination Event” will not be applicable to the Loan-Specific Directing Certificateholder; provided, further, that a Control Termination Event will be deemed not continuing in the event that the certificate balances of the principal balance certificates other than the Control Eligible Certificates and the RR Interest have been reduced to zero as a result of principal payments on the mortgage loans. After the occurrence of a Control Termination Event but prior to the occurrence of a Consultation Termination Event, the Directing Certificateholder will not have any consent rights, but the Directing Certificateholder will have certain non-binding consultation rights under the pooling and servicing agreement with respect to certain major decisions and other matters. A “Consultation Termination Event” will occur when (i) no class of Control Eligible Certificates has a certificate balance (without regard to the application of the allocable portion of any Cumulative Appraisal Reduction Amounts) at least equal to 25% of the initial certificate balance of that class; or (ii) a holder of the Class G certificates is the majority Controlling Class Certificateholder and has irrevocably waived its right, in writing, to exercise any of the rights of the Controlling Class Certificateholder and such rights have not been reinstated to a successor controlling class certificateholder; provided that no Consultation Termination Event resulting solely from the operation of clause (ii) will be deemed to have existed or be in continuance with respect to a successor holder of the Class G certificates that has not irrevocably waived its right to exercise any of the rights of the Controlling Class Certificateholder; provided, further, that no Consultation Termination Event may occur with respect to the Loan-Specific Directing Certificateholder, and the term “Consultation Termination Event” will not be applicable to the Loan-Specific Directing Certificateholder; provided, further, that a Consultation Termination Event will be deemed not continuing in the event that the certificate balances of the principal balance certificates other than the Control Eligible Certificates and the RR Interest have been reduced to zero as a result of principal payments on the mortgage loans. In the event of any transfer of the Class G certificates by a Controlling Class Certificateholder that had irrevocably waived its rights, the successor Controlling Class Certificateholder that purchased such Class G certificates, even if it does not waive its rights, will not have any consent rights with respect to any Mortgage Loan that became a Specially Serviced Loan prior to such successor Controlling Class Certificateholder’s purchase of such Class G certificates and had not become a Corrected Loan prior to such purchase until such Mortgage Loan becomes a Corrected Loan. After the occurrence of a Consultation Termination Event, the Directing Certificateholder will not have any consent or consultation rights, except with respect to any rights expressly set forth in the pooling and servicing agreement, and the operating advisor will retain certain non-binding consultation rights under the pooling and servicing agreement with respect to certain major decisions and other matters. Notwithstanding the proviso to the definitions of “Control Termination Event” and “Consultation Termination Event”, a Control Termination Event and a Consultation Termination Event will each be deemed to have occurred with respect to any Excluded Loan with respect to the Directing Certificateholder or the holder of the majority of the Controlling Class, and neither the Directing Certificateholder nor any Controlling Class Certificateholder will have any consent or consultation rights with respect to the servicing of such Excluded Loan. An “Excluded Loan” means (a) with respect to the Directing Certificateholder or the holder of the majority of the Controlling Class, a mortgage loan or whole loan with respect to which, as of any date of determination, the Directing Certificateholder or the holder of the majority of the Controlling Class is a Borrower Party or (b) with respect to the Risk Retention Consultation Party or the holder of the majority of the RR Interest, a mortgage loan or whole loan with respect to which, as of any date of determination, the Risk Retention Consultation Party |
This is not a research report and was not prepared by any Underwriter’s research department. Please see additional important information and qualifications at the end of this Term Sheet.
T-15
| BANK 2021-BNK33 | Structural Overview |
| | | or the holder of the majority of the RR Interest is a Borrower Party. It is expected that there will be no Excluded Loans with respect to this securitization on the closing date. “Borrower Party” means a borrower, a mortgagor, a manager of a mortgaged property, the holder of a mezzanine loan that has been accelerated or as to which foreclosure or enforcement proceedings have been commenced against the equity collateral pledged to secure the related mezzanine loan, or any Borrower Party Affiliate. With respect to a mortgage loan secured by a residential cooperative property, a person will not be considered a “Borrower Party” solely by reason of such person holding one or more cooperative unit loans that are secured by direct equity interests in the related borrower or owning one or more residential cooperative units comprising the related mortgaged property as a result of any foreclosure, transfer in lieu of foreclosure or other exercise of remedies with respect to any such unit loan(s). “Borrower Party Affiliate” means, with respect to a borrower, a mortgagor, a manager of a mortgaged property or the holder of a mezzanine loan that has been accelerated or as to which foreclosure or enforcement proceedings have been commenced against the equity collateral pledged to secure the related mezzanine loan, (a) any other person controlling or controlled by or under common control with such borrower, mortgagor, manager or mezzanine lender, as applicable, or (b) any other person owning, directly or indirectly, 25% or more of the beneficial interests in such borrower, mortgagor, manager or mezzanine lender, as applicable. For the purposes of this definition, “control” when used with respect to any specified person means the power to direct the management and policies of such person, directly or indirectly, whether through the ownership of voting securities, by contract or otherwise and the terms “controlling” and “controlled” have meanings correlative to the foregoing. Notwithstanding any of the foregoing to the contrary, if any mortgage loan is part of a whole loan, the Directing Certificateholder’s consent and/or consultation rights with respect thereto may be limited as described in the Preliminary Prospectus. In particular, with respect to each non-serviced whole loan and each servicing shift whole loan, the Directing Certificateholder (other than a Loan-Specific Directing Certificateholder) will only have certain consultation rights with respect to certain major decisions and other matters related to such whole loan, in each case only prior to a Control Termination Event or Consultation Termination Event, as applicable, and the Loan-Specific Directing Certificateholder will be entitled to similar consent and/or consultation rights with respect to such whole loan. In addition, with respect to any serviced A/B whole loan, for so long as the holder of the related subordinate companion loan is the controlling note holder, the holder of such subordinate companion loan (rather than the Directing Certificateholder) will be entitled to exercise such consent and consultation rights with respect to such whole loan. |
| | | |
| Appraisal Reduction Amounts and Collateral Deficiency Amounts: | | An “Appraisal Reduction Amount” generally will be created in the amount, if any, by which the principal balance of a required appraisal loan (which is a mortgage loan with respect to which certain defaults, modifications or insolvency events have occurred as further described in the Preliminary Prospectus) plus other amounts overdue or advanced in connection with such mortgage loan exceeds 90% of the appraised value of the related mortgaged property plus certain escrows and reserves (including letters of credit) held with respect to the mortgage loan. A mortgage loan will cease to be subject to an Appraisal Reduction Amount when it has been brought current for at least three consecutive months, no additional event of default is foreseeable in the reasonable judgment of the applicable special servicer and no other circumstances exist that would cause such mortgage loan or any related companion loan to be a specially serviced loan; however, a “Collateral Deficiency Amount” may exist with respect to any mortgage loan that is modified into an AB loan structure (an “AB Modified Loan”) and remains a corrected mortgage loan and, if so, will generally equal the excess of (i) the stated principal balance of such AB Modified Loan (taking into account the related junior note(s) and any pari passu notes included therein), over (ii) the sum of (in the case of a whole loan, solely to the extent allocable to the subject mortgage loan) (x) the most recent appraised value for the related mortgaged property or mortgaged properties, plus (y) solely to the extent not reflected or taken into account in such appraised value (or in the calculation of any related Appraisal Reduction Amount) and to the extent on deposit with, or otherwise under the control of, the lender as of the date of such determination, any capital or additional collateral contributed by the related borrower at the time the mortgage loan became (and as part of the modification related thereto) such AB Modified Loan for the benefit of the related mortgaged property or mortgaged properties (provided that in the case of an non-serviced mortgage loan, the amounts set forth in this clause (y) will be taken into account solely to the extent relevant information is received by the applicable special servicer), plus (z) any other escrows or reserves (in addition to any amounts set forth in the immediately preceding clause (y) and solely to the extent not reflected or taken into account in the calculation of any related Appraisal Reduction Amount) held by the lender in respect of such AB Modified Loan as of the date of such determination, which such excess, for the avoidance of doubt, will be determined separately from and exclude any related Appraisal Reduction Amounts. As used herein, a “Cumulative Appraisal Reduction Amount” will be the sum of any Appraisal Reduction Amounts and any Collateral Deficiency Amounts. Any Appraisal Reduction Amount in respect of any non-serviced mortgage loan generally will be calculated in accordance with the other servicing agreement pursuant to which such mortgage loan is being serviced, which calculations are expected to be generally similar to those provided for in the pooling and servicing agreement for this transaction. |
This is not a research report and was not prepared by any Underwriter’s research department. Please see additional important information and qualifications at the end of this Term Sheet.
T-16
| BANK 2021-BNK33 | Structural Overview |
| | | If any mortgage loan is part of a whole loan, any Appraisal Reduction Amount or Collateral Deficiency Amount will (or effectively will) be calculated in respect of such whole loan taken as a whole and allocated, to the extent provided in the related intercreditor agreement and the related pooling and servicing agreement, first, to any related subordinate companion loan, and second, to the related mortgage loan and any pari passu companion loan on a pro rata basis by unpaid principal balance. Appraisal Reduction Amounts will proportionately reduce the interest portion of debt service advances required to be made in respect of the related mortgage loan. Appraisal Reduction Amounts and Collateral Deficiency Amounts (in each case, to the extent of the Non-Retained Certificates’ Percentage Allocation Entitlement thereof) will be (i) taken into account in determining the identity of the controlling class entitled to appoint the Directing Certificateholder, the existence of a Control Termination Event and the allocation and/or exercise of voting rights for certain purposes (see “Directing Certificateholder/Controlling Class” above) and (ii) allocated to the following classes of certificates and trust components, in each case to notionally reduce their certificate balances or principal balances until the certificate balance or principal balance of each such class or trust component is notionally reduced to zero: the Class H, Class G, Class F, Class E and Class D certificates and the Class C, Class B and Class A-S trust components, in that order, and then pro rata to the Class A-1, Class A-2, Class A-3 and Class A-SB certificates and the Class A-4 and Class A-5 trust components. Appraisal Reduction Amounts and Collateral Deficiency Amounts allocated to the Class A-4, Class A-5, Class A-S, Class B or Class C trust component will be allocated to the corresponding classes of Exchangeable Certificates with certificate balances pro rata to notionally reduce their certificate balances in accordance with their Class Percentage Interests therein. Neither (i) a Payment Accommodation with respect to any mortgage loan or serviced whole loan nor (ii) any default or delinquency that would have existed but for such Payment Accommodation will constitute an appraisal reduction event, for so long as the related borrower is complying with the terms of such Payment Accommodation. A “Payment Accommodation” for any mortgage loan or serviced whole loan means the entering into of any temporary forbearance agreement as a result of the COVID-19 emergency (and qualification as a COVID-19 emergency forbearance will be determined by the special servicer in its sole and absolute discretion in accordance with the Servicing Standard) relating to payment obligations or operating covenants under the related mortgage loan documents or the use of funds on deposit in any reserve account or escrow account for any purpose other than the explicit purpose described in the related mortgage loan documents, that in each case (i) is entered into by September 30, 2021, (ii) defers no greater than 3 monthly debt service payments (but no greater than 9 monthly debt service payments in the aggregate with any other Payment Accommodations) and (iii) requires full repayment of deferred payments, reserves and escrows by the date that is 12 months following the date of the first Payment Accommodation for such mortgage loan or serviced whole loan. |
| | | |
| Appraised-Out Class: | | An “Appraised-Out Class” is any class of Control Eligible Certificates, the certificate balance of which (taking into account the application of the Non-Retained Certificates’ Percentage Allocation Entitlement of any Appraisal Reduction Amounts or Collateral Deficiency Amounts to notionally reduce the certificate balance of such class) has been reduced to less than 25% of its initial certificate balance. Any Appraised-Out Class may not exercise any direction, control, consent and/or similar rights of the Controlling Class until such time, if any, as such class is reinstated as the Controlling Class, and the rights of the Controlling Class will be exercised by the next most senior class of Control Eligible Certificates that is not an Appraised-Out Class, if any, during such period. |
| | | |
| Appraisal Remedy: | | The holders of the majority (by certificate balance) of an Appraised-Out Class (such holders, the “Requesting Holders”) will have the right, at their sole expense, to require the applicable special servicer to order (or, with respect to a non-serviced mortgage loan, require the applicable special servicer to request from the applicable non-serviced special servicer) a second appraisal of any mortgage loan (or serviced whole loan) for which an appraisal reduction event has occurred or as to which there exists a Collateral Deficiency Amount. With respect to any serviced mortgage loan, the applicable special servicer will be required to use its reasonable efforts to ensure that such appraisal is delivered within 30 days from receipt of the Requesting Holders’ written request and will be required to cause such appraisal to be prepared on an “as-is” basis by an MAI appraiser. With respect to any non-serviced mortgage loan, the applicable special servicer will be required to use commercially reasonable efforts to obtain such second appraisal from the applicable non-serviced special servicer. Upon receipt of such supplemental appraisal, the applicable special servicer will be required to determine, in accordance with the Servicing Standard, whether, based on its assessment of such supplemental appraisal, any recalculation of the applicable Appraisal Reduction Amount or Collateral Deficiency Amount is warranted and, if so warranted, such person will be required to recalculate such Appraisal Reduction Amount or Collateral Deficiency Amount, as applicable, based upon such supplemental appraisal as described above. If required by any such recalculation, the applicable Appraised-Out Class will be reinstated as the Controlling Class and each Appraised-Out Class will, if applicable, have its related certificate balance notionally restored to the extent required by such recalculation of the Appraisal Reduction Amount or Collateral Deficiency Amount, if applicable. In addition, the Requesting Holders of any Appraised-Out Class will have the right to challenge the Appraisal Reduction Amount and to require the applicable special servicer to order an additional appraisal of any serviced mortgage loan as to which there exists a Collateral Deficiency Amount if an event has occurred at, or with respect to, the related mortgaged property or mortgaged properties that would have a material effect on its or their appraised value, and such special servicer is required to use reasonable efforts to obtain an appraisal from an MAI appraiser reasonably acceptable to such special servicer within 30 days from receipt of the Requesting Holders’ written request. |
| Sale of Defaulted Loans: | | Under certain circumstances the applicable special servicer may be required to use reasonable efforts to solicit offers for a defaulted serviced mortgage loan (and any related companion loan (to the extent provided under |
This is not a research report and was not prepared by any Underwriter’s research department. Please see additional important information and qualifications at the end of this Term Sheet.
T-17
| BANK 2021-BNK33 | Structural Overview |
| | | the related intercreditor agreement) and/or related REO properties). The Directing Certificateholder will not have a right of first refusal to purchase a defaulted loan. |
| | | |
| | | If the applicable special servicer does not receive an offer at least equal to the outstanding principal balance plus all accrued and unpaid interest and outstanding costs and expenses and certain other amounts specified in the pooling and servicing agreement (the “Par Purchase Price”), the applicable special servicer may purchase the defaulted loan or REO property at the Par Purchase Price or may accept the first cash offer received from any person that is determined to be a fair price for such defaulted loan or REO property. If multiple offers are received during the period designated by the applicable special servicer for receipt of offers, such special servicer is generally required to select the highest offer. The applicable special servicer will be required to determine whether any cash offer constitutes a fair price for any defaulted loan or REO property if the highest offeror is a person other than a party to the pooling and servicing agreement for this transaction (the “PSA”), the Directing Certificateholder, the Risk Retention Consultation Party, any sponsor, any Borrower Party, any independent contractor engaged by a special servicer, the trustee for the securitization of a related companion loan (with respect to a whole loan if it is a defaulted loan), any related companion loan holder or its representative, any holder of a related mezzanine loan or any known affiliate of any of the preceding entities (each, an “Interested Person”). If an offer is made by an Interested Person, the trustee will be required to determine (based upon the most recent appraisal conducted in accordance with the terms of the PSA) whether the offer constitutes a fair price for the defaulted loan or REO property unless (i) the offer is equal to or greater than the applicable Par Purchase Price and (ii) the offer is the highest offer received. Absent an offer at least equal to the Par Purchase Price, no offer from an Interested Person will constitute a fair price unless (x) it is the highest offer received and (y) at least two other offers are received from independent third parties. Neither the trustee nor any of its affiliates may make an offer for or purchase any specially serviced loan or REO property. Notwithstanding any of the foregoing to the contrary, the applicable special servicer is not required to accept the highest offer and may accept a lower offer for a defaulted loan or REO property if such special servicer determines, in accordance with the Servicing Standard (and subject to the requirements of any related intercreditor agreement), that a rejection of such offer would be in the best interests of the certificateholders and any related companion loan holders as a collective whole as if they constituted a single lender (and with respect to a serviced A/B whole loan, taking into account the subordinate nature of any related subordinate companion loan), so long as such lower offer was not made by such special servicer or any of its affiliates. If title to any mortgaged property is acquired by the trust fund, the applicable special servicer will generally be required to sell such mortgaged property prior to the close of the third calendar year beginning after the year of acquisition. The foregoing applies to mortgage loans serviced under the PSA. With respect to any non-serviced whole loan, if the special servicer under the applicable pooling and servicing agreement determines to sell the related controlling companion loan if it becomes a defaulted loan, then the applicable special servicer will be required to sell the related whole loan, including the related mortgage loan included in the BANK 2021-BNK33 securitization trust and the related pari passu companion loan(s) and, under certain circumstances, any subordinate companion loan(s), as a single loan. In connection with any such sale, the special servicer under the applicable pooling and servicing agreement will be required to follow procedures substantially similar to those set forth above. |
| | | |
| Risk Retention Consultation Party: | | A risk retention consultation party may be appointed by the holder or holders of more than 50% of the RR Interest, by certificate balance. The majority RR Interest holder will have a continuing right to appoint, remove or replace the risk retention consultation party in its sole discretion. This right may be exercised at any time and from time to time. Except with respect to an Excluded Loan as to such party or the holder of the majority of the RR Interest, the risk retention consultation party will be entitled to consult with the applicable special servicer, upon request of the risk retention consultation party, with respect to certain material servicing actions proposed by such special servicer; provided, that prior to the occurrence and continuance of a Consultation Termination Event, such mortgage loan must also be a specially serviced mortgage loan. |
| | | |
| Appointment and Replacement of each Special Servicer: | | The Directing Certificateholder will appoint each initial special servicer as of the closing date. Prior to the occurrence and continuance of a Control Termination Event, any special servicer may generally be replaced by the Directing Certificateholder with or without cause at any time. After the occurrence and during the continuance of a Control Termination Event and upon (a) the written direction of holders of principal balance certificates evidencing not less than 25% of the voting rights of all classes of certificates (other than the RR Interest) entitled to principal (taking into account the application of Cumulative Appraisal Reduction Amounts to notionally reduce the certificate balances of classes to which such Cumulative Appraisal Reduction Amounts are allocable) requesting a vote to replace the applicable special servicer with a replacement special servicer, (b) payment by such requesting holders to the certificate administrator of all reasonable fees and expenses to be incurred by the certificate administrator in connection with administering such vote and (c) delivery by such holders of a rating agency confirmation from each applicable rating agency, the certificate administrator will be required to promptly post such notice on its internet website and by mail and conduct the solicitation of votes of all certificates in such regard, which requisite affirmative votes must be received within 180 days of the posting of such notice. Upon the written direction of holders of at least 66 2/3% of a Certificateholder Quorum, the trustee will be required to immediately replace the applicable special servicer with a qualified replacement special servicer designated by such holders of certificates. After the occurrence and during the continuance of a Consultation Termination Event, if the operating advisor determines that the applicable special servicer is not performing its duties as required under the pooling and servicing agreement or is otherwise not acting in accordance with the Servicing Standard, the operating advisor may also recommend the replacement of such special servicer. The operating advisor’s recommendation to |
This is not a research report and was not prepared by any Underwriter’s research department. Please see additional important information and qualifications at the end of this Term Sheet.
T-18
| BANK 2021-BNK33 | Structural Overview |
| | | replace such special servicer must be confirmed by an affirmative vote of holders of principal balance certificates evidencing at least a majority of the aggregate voting rights (taking into account the application of any Cumulative Appraisal Reduction Amounts to notionally reduce the respective certificate balances) of all principal balance certificates on an aggregate basis (which requisite affirmative vote must be received within 180 days of posting of the notice of the operating advisor’s recommendation to the certificate administrator’s website). A “Certificateholder Quorum” means, in connection with any solicitation of votes in connection with the replacement of a special servicer or the asset representations reviewer, the holders of certificates evidencing at least 50% of the aggregate voting rights (taking into account the application of realized losses and, other than with respect to the termination of the asset representations reviewer, any Cumulative Appraisal Reduction Amounts to notionally reduce the certificate balance of the certificates) of all classes of certificates entitled to principal (other than the RR Interest) on an aggregate basis. With respect to each serviced whole loan, any holder of a related pari passu companion loan, following a servicer termination event with respect to the applicable special servicer that affects such holder, will be entitled to direct the trustee (and the trustee will be required) to terminate such special servicer solely with respect to such serviced whole loan. A replacement special servicer will be selected by the trustee or, prior to a Control Termination Event, by the Directing Certificateholder; provided, that any successor special servicer appointed to replace the special servicer with respect to such whole loan cannot be the entity (or its affiliate) that was terminated at the direction of the holder of the related pari passu companion loan. Notwithstanding any of the foregoing to the contrary, with respect to each servicing shift whole loan and any serviced A/B whole loans as to which a subordinate companion loan holder is the related controlling note holder, the holder of the related control note will be entitled to replace the applicable special servicer with respect to such whole loan at any time, with or without cause, and while it is a serviced whole loan, no other party may replace the applicable special servicer for such whole loan unless there is a servicer termination event with respect thereto. With respect to any non-serviced whole loan, subject to conditions or restrictions in the applicable intercreditor agreement, the BANK 2021-BNK33 trust, as holder of the related mortgage loan, has the right to terminate the applicable special servicer under the related pooling and servicing agreement if a servicer termination event occurs, with respect to such special servicer that affects the trust in its capacity as such holder. Such rights may be exercised by the Directing Certificateholder prior to a Consultation Termination Event (or the applicable special servicer, following the occurrence and during the continuance of a Consultation Termination Event). The successor special servicer will be selected pursuant to the applicable pooling and servicing agreement by the related directing holder prior to a control termination event under such pooling and servicing agreement. |
| | | |
| Servicing Standard: | | Each applicable master servicer and each applicable special servicer is obligated to service and administer the mortgage loans (and, if applicable, the serviced companion loans) in accordance with the definition of the “Servicing Standard” described in the Preliminary Prospectus and the terms of the pooling and servicing agreement, provided that each non-serviced mortgage loan, if any, will be serviced by another master servicer or special servicer under the pooling and servicing agreement with respect to the securitization of a related companion loan, which entities will be obligated to service and administer such non-serviced mortgage loan pursuant to a similar standard set forth in the related pooling and servicing agreement. |
| Excluded Special Servicer: | | If a special servicer obtains knowledge that it has become a Borrower Party with respect to any mortgage loan (an “Excluded Special Servicer Loan”), such special servicer will be required to resign as special servicer of that Excluded Special Servicer Loan. Prior to the occurrence and continuance of a Control Termination Event, the Directing Certificateholder will be required to appoint (and may remove and replace with or without cause) a separate special servicer that is not a Borrower Party (an “Excluded Special Servicer”) with respect to any Excluded Special Servicer Loan, unless such Excluded Special Servicer Loan is also an Excluded Loan with respect to the Directing Certificateholder or the holder of the majority of the Controlling Class. For avoidance of doubt, with respect to a mortgage loan secured by a residential cooperative property, a person will not be considered a Borrower Party solely by reason of such person holding one or more cooperative unit loans that are secured by direct equity interests in the related borrower or owning one or more residential cooperative units comprising the related mortgaged property as a result of any foreclosure, transfer in lieu of foreclosure or other exercise of remedies with respect to any such unit loan(s). After the occurrence and during the continuance of a Control Termination Event, if at any time the applicable Excluded Special Servicer Loan is also an Excluded Loan with respect to the Directing Certificateholder or the holder of the majority of the Controlling Class or if the Directing Certificateholder is entitled to appoint the Excluded Special Servicer but does not so appoint within 30 days of notice of such resignation, the resigning special servicer will be required to use reasonable efforts to select the related Excluded Special Servicer. Any Excluded Special Servicer will be required to perform all of the obligations of the applicable special servicer and will be entitled to all special servicing compensation with respect to such Excluded Special Servicer Loan earned while the related mortgage loan is an Excluded Special Servicer Loan. |
| | | |
Liquidated
Loan Waterfall: | | On liquidation of any mortgage loan, all net liquidation proceeds related to the mortgage loan (but not any related companion loan) will be applied so that amounts allocated as a recovery of accrued and unpaid interest will not, in the first instance, include any delinquent interest that was not advanced as a result of Appraisal Reduction Amounts (or would not have been advanced in the absence of a non-recoverability determination) or accrued on the portion of the stated principal balance thereof equal to any related Collateral Deficiency Amount in effect from time to time and as to which no advance was made (collectively, the “Subordinated Interest Amount”). After the adjusted interest amount is so allocated, any remaining liquidation proceeds will be allocated to pay principal on the mortgage loan until the unpaid principal amount of the mortgage loan has been reduced to zero. Any remaining liquidation proceeds will then be allocated to pay the Subordinated Interest Amount. |
This is not a research report and was not prepared by any Underwriter’s research department. Please see additional important information and qualifications at the end of this Term Sheet.
T-19
| BANK 2021-BNK33 | Structural Overview |
| Operating Advisor: | | The operating advisor will be required to perform certain review duties if a Control Termination Event has occurred and is continuing, which will generally include a limited annual review of, and the preparation of a report regarding, certain actions of the applicable special servicer with respect to the resolution and/or liquidation of specially serviced loans. The review and report generally will be based on any asset status reports and additional information delivered to the operating advisor by such special servicer. In addition, if a Control Termination Event has occurred and is continuing, the applicable special servicer must consult with the operating advisor (in addition to the Directing Certificateholder if no Consultation Termination Event has occurred and is continuing) in connection with major decisions with respect to mortgage loans. Furthermore, under certain circumstances, but only if a Consultation Termination Event has occurred and is continuing, the operating advisor may recommend the replacement of the applicable special servicer as described above under “—Appointment and Replacement of each Special Servicer”; however, the operating advisor will not have any rights or obligations with respect to a non-serviced whole loan. If a Consultation Termination Event has occurred and is continuing, the operating advisor may be removed and replaced without cause upon the affirmative direction of certificates owners holding not less than 75% of the voting rights of all certificates (taking into account the application of Cumulative Appraisal Reduction Amounts), following a proposal from certificate owners holding not less than 25% of the voting rights of all certificates (taking into account the application of Cumulative Appraisal Reduction Amounts). The certificateholders who initiate a vote on a termination and replacement of the operating advisor without cause must cause the payment of the fees and expenses incurred in the replacement. In addition, in the event there are no classes of certificates outstanding other than the Control Eligible Certificates, the RR Interest and the Class X-F, Class F, Class X-G, Class X-H, Class V and Class R certificates, then all of the rights and obligations of the operating advisor under the PSA will terminate without payment of any penalty or termination fee (other than any rights or obligations that accrued prior to the date of such termination (including accrued and unpaid compensation) and other than indemnification rights arising out of events occurring prior to such termination). See “Pooling and Servicing Agreement—The Operating Advisor—Termination of the Operating Advisor Without Cause” in the Preliminary Prospectus. |
| Asset Representations Reviewer: | | The asset representations reviewer will be required to review certain delinquent mortgage loans (excluding a mortgage loan for which a Payment Accommodation has been made and the related borrower is complying with the terms of such Payment Accommodation) after a specified delinquency threshold has been met and the required percentage of certificateholders vote to direct a review as described below. The asset representations reviewer will be entitled to the Asset Representations Reviewer Fee with respect to such review. See “Pooling and Servicing Agreement—The Asset Representations Reviewer” in the Preliminary Prospectus. The certificate administrator will be required to notify certificateholders if the specified delinquency threshold has been met as described in the Preliminary Prospectus under “—The Asset Representations Reviewer”. If certificateholders evidencing not less than 5.0% of the voting rights request a vote to commence an asset review, and if subsequently (i) a majority of those certificateholders who cast votes and (ii) a majority of an Asset Review Quorum authorizes an asset review within 150 days of the request for a vote, the asset representations reviewer will be required to conduct an asset review of delinquent loans. The asset representations reviewer may be terminated and replaced without cause. Upon (i) the written direction of certificateholders evidencing not less than 25% of the voting rights (without regard to the application of any Cumulative Appraisal Reduction Amounts) requesting a vote to terminate and replace the asset representations reviewer with a proposed successor asset representations reviewer that is an eligible asset representations reviewer, and (ii) payment by such holders to the certificate administrator of the reasonable fees and expenses to be incurred by the certificate administrator in connection with administering such vote, the certificate administrator will be required to promptly provide notice to all certificateholders and the asset representations reviewer of such request by posting such notice on its internet website, and by mailing such notice to all certificateholders and the asset representations reviewer. Upon the written direction of certificateholders evidencing at least 75% of a Certificateholder Quorum (without regard to the application of any Cumulative Appraisal Reduction Amounts), the trustee will be required to terminate all of the rights and obligations of the asset representations reviewer under the pooling and servicing agreement (other than any rights or obligations that accrued prior to the date of such termination and other than indemnification rights arising out of events occurring prior to such termination) by written notice to the asset representations reviewer, and the proposed successor asset representations reviewer will be appointed. See “Pooling and Servicing Agreement—The Asset Representations Reviewer” in the Preliminary Prospectus. An “Asset Review Quorum” means, in connection with any solicitation of votes to authorize an Asset Review as described above, the holders of certificates evidencing at least 5.0% of the aggregate voting rights represented by all certificates that have voting rights. |
| Dispute Resolution Provisions: | | The mortgage loan sellers will be subject to the dispute resolution provisions set forth in the PSA to the extent those provisions are triggered with respect to any mortgage loan sold to the depositor by a mortgage loan seller, and such mortgage loan seller will be obligated under the related mortgage loan purchase agreement to comply with all applicable provisions and to take part in any mediation or arbitration proceedings that may result. Generally, in the event that a Repurchase Request is not “Resolved” within 180 days after the related mortgage loan seller receives such Repurchase Request, then the enforcing servicer will be required to send a notice to the first certificateholder (or beneficial owner) to deliver a certificateholder repurchase request with respect to the mortgage loan (the “Initial Requesting Certificateholder”) (if any) and to the certificate administrator (which will be required to make such notice available to certificateholders via the certificate administrator’s website) indicating the enforcing servicer’s intended course of action with respect to the Repurchase Request. If (a) the enforcing servicer’s intended course of action with respect to the Repurchase Request does not involve pursuing further action to exercise rights against the related mortgage loan seller with respect to the Repurchase Request |
This is not a research report and was not prepared by any Underwriter’s research department. Please see additional important information and qualifications at the end of this Term Sheet.
T-20
| BANK 2021-BNK33 | Structural Overview |
| | | and the Initial Requesting Certificateholder, if any, or any other certificateholder or certificate owner wishes to exercise its right to refer the matter to mediation (including nonbinding arbitration) or arbitration, or (b) the enforcing servicer’s intended course of action is to pursue further action to exercise rights against the related mortgage loan seller with respect to the Repurchase Request but the Initial Requesting Certificateholder, if any, or any other certificateholder or certificate owner does not agree with the dispute resolution method selected by the enforcing servicer, then the Initial Requesting Certificateholder, if any, or such other certificateholder or certificate owner may deliver a written notice to the enforcing servicer indicating its intent to exercise its right to refer the matter to either mediation or arbitration. “Resolved” means, with respect to a Repurchase Request, (i) that the related material defect or breach has been cured, (ii) the related mortgage loan has been repurchased in accordance with the related mortgage loan purchase agreement, (iii) a mortgage loan has been substituted for the related mortgage loan in accordance with the related mortgage loan purchase agreement, (iv) the applicable mortgage loan seller has made a loss of value payment, (v) a contractually binding agreement has been entered into between the enforcing servicer, on behalf of the issuing entity, and the related mortgage loan seller that settles the related mortgage loan seller’s obligations under the related mortgage loan purchase agreement, or (vi) the related mortgage loan is no longer property of the issuing entity as a result of a sale or other disposition in accordance with the pooling and servicing agreement. See “Pooling and Servicing Agreement—Dispute Resolution Provisions” in the Preliminary Prospectus. |
| | | |
| Investor Communications: | | The certificate administrator is required to include on any Form 10-D any request received from a certificateholder to communicate with other certificateholders related to certificateholders exercising their rights under the terms of the PSA. Any certificateholder wishing to communicate with other certificateholders regarding the exercise of its rights under the terms of the PSA will be able to deliver a written request signed by an authorized representative of the requesting investor to the certificate administrator. |
| | | |
| Deal Website: | | The certificate administrator will be required to maintain a deal website which will include, among other items: (a) summaries of asset status reports prepared by a special servicer, (b) inspection reports, (c) appraisals, (d) various “special notices” described in the Preliminary Prospectus, (e) the “Investor Q&A Forum” and (f) a voluntary “Investor Registry”. Investors may access the deal website following execution of a certification and confidentiality agreement. |
This is not a research report and was not prepared by any Underwriter’s research department. Please see additional important information and qualifications at the end of this Term Sheet.
T-21
| BANK 2021-BNK33 | Collateral Overview |
| Mortgage Loan Sellers | No. of
Mortgage
Loans | No. of
Mortgaged
Properties | Aggregate
Cut-off Date
Balance | % of
Pool(1) |
| Bank of America, National Association | 17 | 41 | $366,202,500 | 36.4% |
| Wells Fargo Bank, National Association | 12 | 30 | $307,237,181 | 30.6% |
| Morgan Stanley Mortgage Capital Holdings LLC | 11 | 44 | $236,248,870 | 23.5% |
| National Cooperative Bank, N.A.(2) | 28 | 28 | $95,261,132 | 9.5% |
| Total: | 68 | 143 | $1,004,949,683 | 100.0% |
| Pool Statistics | |
| Aggregate Cut-off Date Balance: | $1,004,949,683 |
| Number of Mortgage Loans: | 68 |
| Average Cut-off Date Balance per Mortgage Loan: | $14,778,672 |
| Number of Mortgaged Properties: | 143 |
| Average Cut-off Date Balance per Mortgaged Property: | $7,027,620 |
| Weighted Average Mortgage Rate: | 3.4238% |
| % of Pool Secured by 5 Largest Mortgage Loans: | 32.0% |
| % of Pool Secured by 10 Largest Mortgage Loans: | 53.0% |
| % of Pool Secured by ARD Loans(3): | 0.0% |
| Weighted Average Original Term to Maturity (months)(3): | 115 |
| Weighted Average Remaining Term to Maturity (months)(3): | 113 |
| Weighted Average Seasoning (months): | 2 |
| % of Pool Secured by Single Tenant Mortgaged Properties: | 17.3% |
| % of Pool Secured by Refinance Loans: | 64.7% |
| % of Pool Secured by Acquisition Loans: | 29.1% |
| % of Pool Secured by Recapitalization Loans: | 5.8% |
| % of Pool Secured by Acquisition/Recapitalization Loans: | 0.5% |
| Additional Debt | |
| % of Pool with Pari Passu Mortgage Debt: | 34.1% |
| % of Pool with Subordinate Mortgage Debt(4): | 22.9% |
| % of Pool with Mezzanine Debt: | 0.0% |
| Credit Statistics(5)(6) | |
| Weighted Average UW NOI DSCR: | 3.74x |
| Weighted Average UW NOI Debt Yield(7): | 13.4% |
| Weighted Average UW NCF DSCR: | 3.57x |
| Weighted Average UW NCF Debt Yield(7): | 12.8% |
| Weighted Average Cut-off Date LTV Ratio(7)(8): | 50.1% |
| Weighted Average Maturity Date LTV Ratio(3)(8): | 48.3% |
Footnotes are set forth on the following page.
This is not a research report and was not prepared by any Underwriter’s research departments. Please see additional important information and qualifications at the end of this Term Sheet.
T-22
| BANK 2021-BNK33 | Collateral Overview |
Amortization
| Weighted Average Original Amortization Term (months)(9): | 370 |
| Weighted Average Remaining Amortization Term (months)(9): | 370 |
| % of Pool Interest Only through Maturity: | 75.9% |
| % of Pool Interest Only followed by Amortizing Balloon: | 16.5% |
| % of Pool Amortizing Balloon: | 7.6% |
| Lockboxes | |
| % of Pool with Hard Lockboxes: | 56.2% |
| % of Pool with Springing Lockboxes: | 17.7% |
| % of Pool with No Lockboxes: | 13.2% |
| % of Pool with Soft Lockboxes: | 12.9% |
| Reserves | |
| % of Pool Requiring Tax Reserves: | 55.4% |
| % of Pool Requiring Insurance Reserves: | 17.6% |
| % of Pool Requiring Replacement Reserves: | 62.3% |
| % of Pool Requiring TI/LC Reserves(10): | 66.8% |
| Call Protection | |
| % of Pool with lockout period, followed by defeasance until open period: | 63.9% |
| % of Pool with lockout period, followed by greater of a prepayment premium and yield maintenance, followed by defeasance or the greater of a prepayment premium and yield maintenance until open period: | 9.5% |
| % of Pool with no lockout period. Greater of a prepayment premium and yield maintenance followed by prepayment premium until open period: | 9.5% |
| % of Pool with lockout period, followed by yield maintenance until open period: | 7.0% |
| % of Pool with lockout period, followed by the greater of a prepayment premium and yield maintenance until open period: | 5.3% |
| % of Pool with no lockout period. Greater of a prepayment premium and yield maintenance, followed by defeasance or the greater of a prepayment premium and yield maintenance until open period: | 3.5% |
| % of Pool with lockout period, followed by defeasance or the greater of a prepayment premium and yield maintenance until open period: | 1.5% |
| (1) | Unless otherwise indicated, all references to “% of Pool” in this Term Sheet reflect a percentage of the aggregate principal balance of the mortgage pool as of the Cut-off Date, after application of all payments of principal due during or prior to May 2021. |
| (2) | Twenty one (21) of the twenty eight (28) mortgage loans for which National Cooperative Bank, N.A. is the mortgage loan seller were originated by its parent company, National Consumer Cooperative Bank, and transferred to National Cooperative Bank, N.A. Each such mortgage loan originated by National Consumer Cooperative Bank was underwritten pursuant to National Cooperative Bank, N.A.’s underwriting guidelines. |
| (3) | With respect to any ARD Loan, unless otherwise indicated, references in this Term Sheet to the applicable “maturity date” or “maturity” refer to the applicable anticipated repayment date with respect to such ARD Loan, and such applicable anticipated repayment date is treated as its maturity date for all purposes hereof. |
| (4) | Twenty six (26) of the mortgage loans, each of which is secured by a residential cooperative property, currently have in place either (i) subordinate secured lines of credit to the related mortgage borrowers that permit future advances (such loans, collectively, the “Subordinate Coop LOCs”) or (ii) a subordinate wraparound mortgage to the related mortgage borrower that is currently held by the cooperative sponsor (such loan, the “Subordinate Wrap Mortgage”). The percentage figure expressed as “% of Pool with Subordinate Mortgage Debt” is determined as a percentage of the initial pool balance and does not take into account any Subordinate Coop LOCs and future subordinate debt (whether or not secured by the mortgaged property), if any, that may be permitted under the terms of any mortgage loan or the pooling and servicing agreement. See “Description of the Mortgage Pool—Additional Indebtedness—Other Secured Indebtedness” and “Description of the Mortgage Pool—Additional Debt Financing for Mortgage Loans Secured by Residential Cooperatives” in the Preliminary Prospectus. |
| (5) | With respect to any mortgage loan that is part of a whole loan, unless otherwise indicated, all LTV, DSCR and Debt Yield calculations in this Term Sheet include any related pari passu companion loans and exclude any subordinate companion loans, as applicable. Additionally, LTV, DSCR and Debt Yield figures in this Term Sheet are calculated for mortgage loans without regard to any additional indebtedness that may be incurred at a future date. For mortgaged properties securing residential cooperative mortgage loans all LTV, DSCR and Debt Yield calculations do not take into account any subordinate debt (whether or not secured by the related mortgaged property), that currently exists or is allowed under the terms of any mortgage loan. With respect to any leased fee loans, the SF/Units and Balance per SF/Unit figures in this Term Sheet are based on the size of the non-collateral improvements. |
| (6) | For mortgaged properties securing residential cooperative mortgage loans, all DSCR and Debt Yield calculations for each such mortgaged property is calculated using underwritten net operating Income or underwritten net cash flow, as applicable, for the related residential cooperative property which is the projected net operating income or net cash flow, as applicable, reflected in the most recent appraisal obtained by or otherwise in the possession of the related mortgage loan seller as of the Cut-off Date. All LTV ratio calculations are based upon the appraised value of the residential cooperative property determined as if such residential cooperative property is operated as a residential cooperative, inclusive of the amount of the underlying debt encumbering such residential cooperative property. |
| (7) | With respect to certain mortgage loans, debt yields and LTVs (such as, for example, UW NOI Debt Yield, UW NCF Debt Yield or Cut-off Date LTV Ratio) have been calculated based on a principal balance that is net of a holdback or earnout reserve. Such mortgage loans are identified under the definitions of “Underwritten NOI Debt Yield”, “Underwritten NCF Debt Yield” and “Cut-off Date LTV Ratio” set forth under “Description of the Mortgage Pool—Certain Calculations and Definitions” in the Preliminary Prospectus. |
| (8) | The LTV ratios set forth in this Term Sheet are generally based on the “as-is” values of the related mortgaged properties; provided that the “as-is” value for a portfolio of mortgaged properties may include a premium relating to the valuation of the mortgaged properties as a whole rather than as the sum of individually valued mortgaged properties; provided, further, that such LTV ratios may be based on “as-stabilized”, “as complete” or other contingent values in certain cases in which reserves have been established at origination for the applicable condition or circumstance that is expected to result in stabilization provided, further, that such LTV ratios may have been calculated based on a principal balance that is net of a holdback or earnout reserve. See the definition of “Appraised Value” under “Description of the Mortgage Pool—Certain Calculations and Definitions” in the Preliminary Prospectus. |
| (9) | Excludes mortgage loans that provide for payments of interest only through the related maturity date or anticipated repayment date, as applicable. |
| (10) | Excludes hospitality, multifamily, manufactured housing, leased fee and self storage properties. |
This is not a research report and was not prepared by any Underwriter’s research department. Please see additional important information and qualifications at the end of this Term Sheet.
T-23
| BANK 2021-BNK33 | Characteristics of the Mortgage Loans |
COVID-19 Update(1)
The following table contains information regarding the status of the mortgage loans and mortgaged properties provided by the respective borrowers as of the date set forth in the “Information as of Date” column. The cumulative effects of the COVID-19 emergency on the global economy may cause tenants to be unable to pay their rent and borrowers to be unable to pay debt service under the mortgage loans. As a result, we cannot assure you that the information in the following table is indicative of future performance or that tenants or borrowers will not seek rent or debt service relief (including forbearance arrangements) or other lease or loan modifications in the future. Such actions may lead to shortfalls and losses on the certificates. Any information in the following table will be superseded by the information contained under the heading “Description of the Mortgage Pool—COVID Considerations” in the Preliminary Prospectus.
| Loan No. | Mortgage
Loan
Seller | Information
as of Date | Origination
Date | Property Name | Property Type | Lease
Modification or
Rent Relief
Requested (Y/N) | Tenants Making Full
March Rent
Payment (%
NRA/Units)(2) | Tenants Making Full
March Rent
Payment (% of UW
rent)(2) | Tenants Making Full
April Rent Payment
(% NRA/Units)(2) | Tenants Making Full
April Rent Payment
(% of UW rent)(2) |
| 1 | BANA | 4/19/2021 | 2/28/2020 | Miami Design District(3) | Retail | Y(4) | 88.7% | 91.4% | 81.4% | 84.5% |
| 2 | MSMCH | 4/28/2021 | 4/8/2021 | Equus Industrial Portfolio | Industrial | Y(5) | 96.5% | 96.5% | 98.3% | 98.3% |
| 3 | MSMCH | 4/23/2021 | 4/27/2021 | 261-275 Amsterdam Avenue(6) | Mixed Use | Y(7) | 91.0% | 91.0% | 91.0% | 91.0% |
| 4 | BANA | 4/21/2021 | 3/18/2021 | Flushing Plaza | Office | Y(8) | 99.5% | 99.6% | 99.5% | 99.6% |
| 5 | BANA | 4/19/2021 | 3/26/2021 | 909 Third Avenue | Office | N | 99.9% | 100.0% | 99.9% | 100.0% |
| 6 | WFB | 4/27/2021 | 4/27/2021 | Village of Rochester Hills | Retail | Y(9) | 84.9% | 90.6% | 86.8% | 93.9% |
| 7 | WFB | 4/21/2021 | 4/2/2021 | Plaza East I & II | Office | Y(10) | 99.3% | 99.5% | 99.3% | 99.5% |
| 8 | WFB | 4/21/2021 | 2/2/2021 | Pathline Park 9 & 10 | Office | N | N/A(11) | N/A(11) | N/A(11) | N/A(11) |
| 9 | WFB | 4/21/2021 | 3/22/2021 | ExchangeRight 45 | Various | N | 100.0% | 100.0% | 100.0% | 100.0% |
| 10 | MSMCH | 4/19/2021 | 3/30/2021 | The Victoria(12)(13) | Multifamily | N | 98.0% | 98.0% | 98.0% | 98.0% |
| 11 | WFB | 4/26/2021 | 3/18/2021 | Vista Station 6 | Office | N | 100.0% | 100.0% | 100.0% | 100.0% |
| 12 | WFB | 3/8/2021 | 4/19/2021 | Springs at Country Club | Multifamily | N | 93.7% | 99.5% | 100.0% | 100.0% |
| 13 | BANA | 4/21/2021 | 3/25/2021 | Detroit Office Portfolio | Office | N | 100.0% | 100.0% | 100.0% | 100.0% |
| 14 | BANA | 5/3/2021 | 4/9/2021 | SMG Portfolio | Multifamily | N | 98.8% | 98.5% | 98.8% | 98.7% |
| 15 | BANA | 4/22/2021 | 4/26/2021 | Century Plaza Albuquerque | Office | N | 100.0% | 100.0% | 100.0% | 100.0% |
| 16 | MSMCH | 4/22/2021 | 4/6/2021 | Crescent Shopping Center | Retail | Y(14) | 100.0% | 100.0% | 100.0% | 100.0% |
| 17 | WFB | 4/22/2021 | 3/9/2021 | Las Casitas Apartments | Multifamily | N | 92.5% | 99.3% | 92.5% | 99.0% |
| 18 | WFB | 4/26/2021 | 3/29/2021 | Greenbriar Park North Apartments | Multifamily | Y(15) | 91.3% | 99.3% | 93.8% | 99.6% |
| 19 | MSMCH | 4/21/2021 | 4/26/2021 | 160-162 East 56th Street | Office | Y(16) | 94.2% | 92.6% | 94.2% | 92.6% |
| 20 | BANA | 4/20/2021 | 4/9/2021 | The Edgeworth Building | Office | N | 100.0% | 100.0% | 100.0% | 100.0% |
| 21 | BANA | 4/21/2021 | 3/1/2021 | Extra Space Rock ‘N Roll Self Storage Portfolio | Self Storage | N | 98.9% | 98.2% | 94.4% | 92.5% |
| 22 | BANA | 4/14/2021 | 11/17/2020 | Grace Building | Office | Y(17) | 98.0% | 97.1% | 98.0% | 97.1% |
| 23 | WFB | 4/23/2021 | 3/10/2021 | SoCal Industrial Portfolio | Industrial | N | 100.0% | 100.0% | 100.0% | 100.0% |
| 24 | NCB | 4/15/2021 | 4/27/2021 | Amalgamated Dwellings, Inc. | Multifamily | N | 98.7%(18) | N/A(19) | 85.0%(18) | N/A(19) |
| 25 | MSMCH | 4/15/2021 | 4/29/2021 | BJs Rochester, NY | Retail | N | 100.0% | 100.0% | 100.0% | 100.0% |
| 26 | WFB | 4/21/2021 | 4/1/2021 | Extra Space – San Bernadino | Self Storage | N | N/A(20) | 97.9% | N/A(20) | N/A(20) |
| 27 | BANA | 4/7/2021 | 4/21/2021 | Clayton Portfolio | Manufactured Housing | N | 99.6% | 99.2% | 99.6% | 99.2% |
| 28 | NCB | 4/16/2021 | 3/25/2021 | 79th Street Tenants Corp. | Multifamily | N | 98.4%(18) | N/A(19) | 93.5%(18) | N/A(19) |
| 29 | BANA | 4/20/2021 | 4/8/2021 | StoreRight Self Storage - Sebastian, FL | Self Storage | N | 93.6% | 90.6% | N/A(20) | N/A(20) |
| 30 | NCB | 4/16/2021 | 3/30/2021 | Lakeland Owners Corp. | Multifamily | N | 96.3%(18) | N/A(19) | 90.0%(18) | N/A(19) |
| 31 | MSMCH | 4/22/2021 | 4/23/2021 | Park Place Shopping Center | Retail | Y(21) | 100.0% | 100.0% | 100.0% | 100.0% |
| 32 | BANA | 4/20/2021 | 4/8/2021 | StoreRight Self Storage - Lakeland, FL | Self Storage | N | 84.4% | 82.2% | N/A(20) | N/A(20) |
| 33 | NCB | 4/19/2021 | 3/30/2021 | Quincy Owners, Inc. | Multifamily | N | 95.6%(18) | N/A(19) | 89.0%(18) | N/A(19) |
| 34 | MSMCH | 4/15/2021 | 4/16/2021 | Park Avenue Apartments | Multifamily | N | 94.0% | 94.0% | 94.0% | 94.0% |
| 35 | NCB | 4/15/2021 | 3/10/2021 | 830-832/834 Broadway Owner’s Corporation | Multifamily | N | 100.0%(18) | N/A(19) | 94.7%(18) | N/A(19) |
| 36 | MSMCH | 4/23/2021 | 4/28/2021 | Village at Rancharrah and Homecrafters Office | Office | N | 100.0% | 100.0% | 100.0% | 100.0% |
| 37 | BANA | 4/23/2021 | 4/14/2021 | Storage Star Modesto | Self Storage | N | 91.1% | 89.8% | N/A(20) | N/A(20) |
| 38 | BANA | 4/8/2021 | 4/23/2021 | Country Meadows MHC | Manufactured Housing | N | 98.9% | 98.7% | 98.9% | 98.7% |
| 39 | NCB | 4/16/2021 | 3/25/2021 | 870 Riverside Drive Housing Development Fund Corporation | Multifamily | N | 91.7%(18) | N/A(19) | 77.8%(18) | N/A(19) |
| 40 | NCB | 4/23/2021 | 3/17/2021 | 6810 Equities Inc. | Multifamily | N | 100.0%(18) | N/A(19) | 95.9%(18) | N/A(19) |
| 41 | NCB | 4/16/2021 | 3/29/2021 | 620 Tenants Corp. | Multifamily | N | 95.5%(18) | N/A(19) | 90.9%(18) | N/A(19) |
| 42 | BANA | 4/20/2021 | 4/8/2021 | StoreRight Self Storage Ruskin | Self Storage | N | 81.9% | 85.2% | N/A(20) | N/A(20) |
| 43 | MSMCH | 4/29/2021 | 4/27/2021 | 319 Main Street | Multifamily | N | 100.0% | 100.0% | 100.0% | 100.0% |
| 44 | MSMCH | 4/23/2021 | 4/20/2021 | 3061 South Riverside Avenue | Industrial | N | 100.0% | 100.0% | 100.0% | 100.0% |
| 45 | NCB | 4/20/2020 | 3/26/2021 | 8300 Talbot St. Owners Corp. | Multifamily | N | 89.3%(18) | N/A(19) | 88.0%(18) | N/A(19) |
| 46 | WFB | 4/21/2021 | 4/8/2021 | Walgreens - Kalamazoo | Retail | N | 100.0% | 100.0% | 100.0% | 100.0% |
| 47 | BANA | 4/22/2021 | 4/26/2021 | Quail Creek Self Storage | Self Storage | N | 100.0% | 100.0% | N/A(20) | N/A(20) |
| 48 | NCB | 4/19/2021 | 4/21/2021 | 555 McLean Apts. Corp. | Multifamily | N | 95.8%(18) | N/A(19) | 90.3%(18) | N/A(19) |
This is not a research report and was not prepared by any Underwriter’s research department. Please see additional important information and qualifications at the end of this Term Sheet.
T-24
| BANK 2021-BNK33 | Characteristics of the Mortgage Loans |
| Loan No. | Mortgage
Loan
Seller | Information
as of Date | Origination
Date | Property Name | Property Type | Lease
Modification or
Rent Relief
Requested (Y/N) | Tenants Making Full
March Rent
Payment (%
NRA/Units)(2) | Tenants Making Full
March Rent
Payment (% of UW
rent)(2) | Tenants Making Full
April Rent Payment
(% NRA/Units)(2) | Tenants Making Full
April Rent Payment
(% of UW rent)(2) |
| 49 | NCB | 4/15/2021 | 3/31/2021 | Mark Twain Owners’ Corp. | Multifamily | N | 100.0%(18) | N/A(19) | 95.0%(18) | N/A(19) |
| 50 | NCB | 4/26/2021 | 3/31/2021 | 420 West 206th Street Owners Corp. | Multifamily | N | 98.6%(18) | N/A(19) | 98.6%(18) | N/A(19) |
| 51 | BANA | 4/13/2021 | 4/21/2021 | 111 South Cambridge Avenue | Multifamily | N | 100.0% | 100.0% | 100.0% | 100.0% |
| 52 | NCB | 4/16/2021 | 3/30/2021 | 211 Terry Owners, Inc. | Multifamily | N | 100.0%(18) | N/A(19) | 88.9%(18) | N/A(19) |
| 53 | NCB | 4/16/2021 | 3/24/2021 | 260 Waverly Owners, Inc. | Multifamily | N | 97.2%(18) | N/A(19) | 87.5%(18) | N/A(19) |
| 54 | NCB | 4/16/2021 | 3/30/2021 | Park Terrace Owners Corp. | Multifamily | N | 97.2%(18) | N/A(19) | 93.1%(18) | N/A(19) |
| 55 | WFB | 3/8/2021 | 4/22/2021 | Spring Creek Apartments | Multifamily | N | 81.8% | 99.0% | 94.0% | 98.4% |
| 56 | NCB | 4/19/2021 | 4/21/2021 | Wellesley Gardens Owners Corp. | Multifamily | N | 95.6%(18) | N/A(19) | 90.1%(18) | N/A(19) |
| 57 | NCB | 4/18/2021 | 4/23/2021 | Oxford House Owners Corp. | Multifamily | N | 100.0%(18) | N/A(19) | 100.0%(18) | N/A(19) |
| 58 | NCB | 4/22/2021 | 4/26/2021 | 130 E. 94th Apartments Corp. | Multifamily | N | 100.0%(18) | N/A(19) | 97.8%(18) | N/A(19) |
| 59 | NCB | 4/19/2021 | 4/14/2021 | Bennett Avenue Owners Corp. | Multifamily | N | 97.1%(18) | N/A(19) | 93.3%(18) | N/A(19) |
| 60 | NCB | 4/15/2021 | 3/31/2021 | Bleecker & 11th Owners Corp. | Multifamily | N | 100.0%(18) | N/A(19) | 88.6%(18) | N/A(19) |
| 61 | NCB | 4/19/2021 | 4/21/2021 | 346-352 West 56th Street Residents, Inc. | Multifamily | N | 96.2%(18) | N/A(19) | 92.4%(18) | N/A(19) |
| 62 | NCB | 4/16/2021 | 3/29/2021 | Rhoda Apartments Corp. | Multifamily | N | 92.9%(18) | N/A(19) | 88.1%(18) | N/A(19) |
| 63 | NCB | 4/19/2021 | 3/29/2021 | West Third Street Apartment Corp. | Multifamily | N | 100.0%(18) | N/A(19) | 100.0%(18) | N/A(19) |
| 64 | NCB | 4/15/2021 | 4/26/2021 | Castleton Gardens Owner’s Corp. | Multifamily | N | 98.1%(18) | N/A(19) | 96.2%(18) | N/A(19) |
| 65 | NCB | 4/19/2021 | 4/9/2021 | One Grace Court Corporation | Multifamily | N | 100.0%(18) | N/A(19) | 94.7%(18) | N/A(19) |
| 66 | NCB | 4/14/2021 | 3/30/2021 | 52 Orange St. Owners Corp. | Multifamily | N | 94.1%(18) | N/A(19) | 94.1%(18) | N/A(19) |
| 67 | NCB | 4/15/2021 | 3/26/2021 | 27 Howard Owners Corp. F/K/A CJS Building & Development Corporation | Multifamily | N | 100.0%(18) | N/A(19) | 80.0%(18) | N/A(19) |
| 68 | NCB | 4/19/2021 | 4/22/2021 | 3660 Park Wantagh Owners, Inc. | Multifamily | N | 96.9%(18) | N/A(19) | 93.8%(18) | N/A(19) |
Footnotes are set forth on the following page.
This is not a research report and was not prepared by any Underwriter’s research department. Please see additional important information and qualifications at the end of this Term Sheet.
T-25
| BANK 2021-BNK33 | Characteristics of the Mortgage Loans |
All loans are current on their debt service payments or have a first payment date on June 1, 2021, and no forbearance or debt service relief has been requested by any related borrower except as noted in footnote 3 below. For all NCB mortgage loans, the first payment is either May 1, 2021 or June 1, 2021 (that payment is subject to a 10-day grace period and therefore may not be received until the 10th day of each month).
| (1) | Tenants Making Full March Rent Payment (% NRA/Units), Tenants Making Full April Rent Payment (% NRA/Units), Tenants Making Full March Rent Payment (% of UW rent) and Tenants Making Full April Rent Payment (% of UW rent) is based on occupied space. For multifamily, self storage and manufactured housing properties, Tenants Making Full March Rent Payment (% NRA/Units), Tenants Making Full April Rent Payment (% NRA/Units), Tenants Making Full March Rent Payment (% of UW rent) and Tenants Making Full April Rent Payment (% of UW rent) are based on the percentage of total billed rent collected. |
| (2) | With respect to the Miami Design District mortgaged property, as of April 29, 2020, the borrower entered into a loan modification to defer debt service payments for May, June and July 2020, which are payable on the earlier of the maturity date or when the loan is paid in full and will not be assets of the Trust. On December 1, 2020, the borrower deposited $10,474,740 (equal to 6.0 months of interest-only debt service on the Miami Design District Whole Loan) as a debt service reserve. The debt service reserve began being applied to debt service payments on January 1, 2021, and will continue to be applied to debt service payments on future payment dates, provided that no event of default is continuing. |
| (3) | With respect to the Miami Design District mortgaged property, two tenants (0.7% of NRA and 0.8% of underwritten base rent) received a full or partial rent abatement for March and April 2021 as previously agreed upon with the related borrower. Eight tenants (10.0% of NRA and 8.6% of underwritten base rent) did not make rent payments in March 2021. Fifteen tenants (16.4% of NRA and 15.5% of underwritten base rent) did not make rent payments in April 2021. |
| (4) | With respect to the Equus Industrial Portfolio mortgaged properties, four tenants (8.5% of NRA and 7.8% of underwritten rent) received rent relief ranging from three months to six months of rent deferment in relation to the COVID-19 pandemic. A payment plan was put in place with each tenant to repay the deferred rent amounts. With respect to the 1335 Northmeadow Parkway Property, the tenant Noble 1 (0.2% of portfolio NRA; 0.5% of portfolio underwritten rent) is currently in default and is not occupying the premises. |
| (5) | With respect to the 261-275 Amsterdam Avenue mortgaged property, there is no forbearance or modification on the current 261-275 Amsterdam Avenue mortgage loan. The borrower entered into a forbearance agreement with regard to the previous mortgage loan on the mortgaged property. The previous lender agreed to 6 months of forbearance of all interest payments and reserve fund payments due on the previous loan on the payment dates from April through September 2020, totaling approximately $1,345,367. Such amounts were repaid with the proceeds of the current mortgage loan. |
| (6) | With respect to the 261-275 Amsterdam Avenue mortgaged property, eight retail tenants and the building’s lobby tenant received rent relief in 2020 (17.3% of underwritten rent), of which 8 tenants had a portion of unpaid rent paid back using their security deposit and the remaining portion forgiven, and 1 tenant received a rent credit. There are six retail tenants as well as the building’s lobby tenant that are receiving ongoing rent relief (14.5% of underwritten rent) from January 2021 through June 2021. The tenants have remained current on their amended rent obligations and are expected to commence their full contractual rent obligations in July 2021. |
| (7) | With respect to the Flushing Plaza mortgaged property, six tenants (20.3% NRA and 18.7% of UW rent) received a full rent deferral from April through July of 2020. The deferred rent is required to be paid from January 2021 through June 2022. One tenant (0.5% NRA and 0.4% of UW rent), has received a rent abatement rent through October 2021. |
| (8) | With respect to The Village of Rochester Hills mortgaged property, 28 tenants accounting for 46.5% of net rentable area and 50.0% of underwritten base rent received rent relief including up to seven months of rent abatement and up to three months of rent deferral, with deferred rent required to be repaid on various terms. |
| (9) | With respect to Plaza East I & II mortgaged property, the Park at Plaza East, Inc. retail space (0.7% of net rentable area and 0.5% of underwritten base rent) has verbally requested to modify its lease and is currently in negotiations with the landlord. |
| (10) | With respect to the Pathline Park 9 & 10 mortgaged property, the sole tenant has free rent through May 2021. All outstanding rent abatements were reserved for at loan origination. |
| (11) | With respect to The Victoria mortgaged property, the mortgaged property includes 8 retail suites and a 112-space subterranean parking garage. The retail space and parking garage portion of the mortgaged property is master leased to the original sponsor of the coop conversion at a current annual base rent of $155,625. Rent on the master lease has been paid on time. No information is available on any subleases entered into by the master lessee. Further, March and April collections reflect maintenance payments, as opposed to rental payments. |
| (12) | With respect to The Victoria mortgaged property, according to the appraisal, it was reported that the residential occupancy at The Victoria mortgaged property was as low as approximately 40% during the COVID-19 pandemic and as of the appraisal date had recovered to approximately 60%. |
| (13) | With respect to the Crescent Shopping Center mortgaged property, six tenants (11.5% of NRA and 15.3% of underwritten rent) received rent relief in relation to the COVID-19 pandemic. A payment plan was executed with each tenant to repay the deferred rent amounts and the tenants have resumed paying their full contractual monthly rent. |
| (14) | With respect to the Greenbriar Park North Apartments mortgaged property, the mortgaged property participates in the Baker Ripley Rental Assistance Program for Harris County, Texas and the City of Houston, Texas. See “Description of the Mortgage Pool—Mortgage Pool Characteristics—Property Types—Multifamily Properties” in the Preliminary Prospectus for additional details. |
| (15) | With respect to the 160-162 East 56th Street mortgaged property, Laser & Microsurgery Institute (12.2% of NRA and 9.9% of underwritten rent) received a deferral of their April 2020 rent to June 2024. MD Performance Concepts (3.1% of NRA) entered into a lease modification in December 2020 that allowed the tenant to surrender 9,250 SF and keep 1,750 SF on a month-to-month lease. MD Performance Concepts remained current on its full rent through November 2020 and has paid its modified rent each month since its lease modification in December. MD Performance Concepts is in occupancy and utilizing its decreased space. The tenant has been underwritten as vacant. |
| (16) | With respect to the Grace Building mortgaged property, four retail tenants (2.0% of NRA and 2.9% of UW rent) have not made rent payments for the last few months. The borrower is in the process of negotiating rent deferrals with full rental payments anticipated to commence in late 2021 or early 2022. The parking tenant has not paid the required monthly rental payments since March 2020 and an event of default is continuing under the lease. The borrower has replaced the current operator, Icon Parking, with a new operator, City Parking, under a management agreement. The borrower deposited $1,608,940 with the lender at loan closing for anticipated parking rent shortfalls. |
| (17) | For residential cooperative properties, the percentages reported were determined based on available cooperative maintenance receivables reports provided from the borrowers (although the borrowers were not required, pursuant to the loan documents, to furnish those reports). Generally, this information is not tracked for residential cooperative properties and the borrowers are not required, pursuant to the loan documents, to report this data on a monthly basis. In addition, for residential cooperative properties, the figures reported were determined based on revenue derived from maintenance charges payable by tenant-shareholders, and not based on rental income for commercial units as to which cooperative shares have not been allocated. Further, with respect to certain residential cooperative properties, the related cooperative borrower may have entered into a primary master lease with a third-party or the cooperative’s sponsor. Generally, however, information regarding subleases under such primary master leases are not tracked for residential cooperative properties. |
This is not a research report and was not prepared by any Underwriter’s research department. Please see additional important information and qualifications at the end of this Term Sheet.
T-26
| BANK 2021-BNK33 | Characteristics of the Mortgage Loans |
| (18) | This information is not presented for residential cooperative properties. The base rent represented in the underwritten cash flow for residential cooperative properties is the hypothetical income derived from the appraisal. Residential cooperative properties are structured to allow for an increase in unit owner maintenance charges or the assessment of additional charges to cover operating deficits, including deficits resulting from unpaid or delinquent rents or maintenance charges. |
| (19) | Given the timing of collection and reporting, an accurate estimate of the percentage of tenants paying rent in March or April is not available. |
| (20) | With respect to the Park Place Shopping Center mortgaged property, ATC Fitness (14.1% of NRA and 20.4% of underwritten rent) received deferred rent for April through June 2020. Repayment commenced with the July 2020 rent payment and will continue at $443.38 per month for 102 months. The tenant is current. Two tenants (6.6% of NRA and 11.8% of underwritten rent) received a 50% rent deferral for April through June 2020. Both tenants have repayment plans in place and are current on their rent. M&W Beauty (7.0% of NRA and 8.2% of underwritten rent) received a 50% reduction in gross rent for 6 month period from December 2020 through May 2021 with regular rent payments resuming in June 2021. |
This is not a research report and was not prepared by any Underwriter’s research department. Please see additional important information and qualifications at the end of this Term Sheet.
T-27
| BANK 2021-BNK33 | Characteristics of the Mortgage Loans |
| Top 10 Mortgage Loans or Groups of Cross-Collateralized Mortgage Loans(1) |
| | | | | | | | | | | | | | |
Loan
No. | Mortgage
Loan
Seller | Property Name | City | State | Property
Type | Cut-off Date
Balance | % of
Pool | SF/Units | Cut-off Date
Balance per
SF/Unit | UW
NCF
DSCR | UW NOI
Debt
Yield | Cut-off
Date LTV | Maturity Date LTV |
| 1 | BANA | Miami Design District | Miami | FL | Retail | $95,000,000 | 9.5% | 497,094 | $804.68 | 2.14x | 9.3% | 46.7% | 46.7% |
| 2 | MSMCH | Equus Industrial Portfolio | Various | Various | Industrial | $69,903,870 | 7.0% | 5,959,157 | $39.10 | 5.10x | 14.0% | 39.9% | 39.9% |
| 3 | MSMCH | 261-275 Amsterdam Avenue | New York | NY | Mixed Use | $55,000,000 | 5.5% | 146 | $650,684.93 | 1.97x | 7.3% | 63.3% | 63.3% |
| 4 | BANA | Flushing Plaza | Flushing | NY | Office | $52,000,000 | 5.2% | 244,089 | $213.04 | 4.35x | 13.5% | 38.7% | 38.7% |
| 5 | BANA | 909 Third Avenue | New York | NY | Office | $50,000,000 | 5.0% | 1,350,756 | $174.42 | 4.05x | 14.1% | 34.9% | 34.9% |
| 6 | WFB | Village of Rochester Hills | Rochester Hills | MI | Retail | $49,950,000 | 5.0% | 253,254 | $197.23 | 1.84x | 10.2% | 67.5% | 58.2% |
| 7 | WFB | Plaza East I & II | Chantilly | VA | Office | $48,750,000 | 4.9% | 246,957 | $197.40 | 2.44x | 9.7% | 67.6% | 67.6% |
| 8 | WFB | Pathline Park 9 & 10 | Sunnyvale | CA | Office | $40,000,000 | 4.0% | 242,226 | $536.69 | 3.87x | 10.2% | 51.8% | 51.8% |
| 9 | WFB | ExchangeRight 45 | Various | Various | Various | $36,691,600 | 3.7% | 174,899 | $209.79 | 2.59x | 9.0% | 61.9% | 61.9% |
| 10 | MSMCH | The Victoria | New York | NY | Multifamily | $35,000,000 | 3.5% | 489 | $71,574.64 | 10.57x | 26.1% | 10.1% | 10.1% |
| | | Total/Wtd. Avg. | | | | $532,295,470 | 53.0% | | | 3.62x | 11.8% | 48.5% | 47.6% |
| (1) | With respect to any mortgage loan that is part of a whole loan, unless otherwise indicated, all LTV, DSCR, Debt Yield and Balance per SF/Unit calculations in this Term Sheet include any related pari passu companion loans and exclude any subordinate companion loans, as applicable. Additionally, LTV, DSCR, Debt Yield and Balance per SF/Unit figures in this Term Sheet are calculated for mortgage loans without regard to any additional indebtedness that may be incurred at a future date. With respect to any leased fee loans, the SF/Units and Balance per SF/Unit figures in this Term Sheet are based on the size of the non-collateral improvements. |
This is not a research report and was not prepared by any Underwriter’s research department. Please see additional important information and qualifications at the end of this Term Sheet.
T-28
| BANK 2021-BNK33 | Characteristics of the Mortgage Loans |
| Mortgage Loans with Pari Passu Companion Loans |
Loan
No. | Mortgage
Loan Seller | Property Name |
Mortgage
Loan Cut-
off Date
Balance | Aggregate Pari
Passu
Companion
Loan Cut-off
Date
Balance |
Combined
Cut-off Date Balance | Lead Servicing
Agreement | Master
Servicer | Special Servicer | Control Rights | Combined
UW NCF
DSCR(1) | Combined
UW NOI
Debt
Yield(1) | Combined
Cut-off
Date LTV(1) |
| 1 | BANA | Miami Design District | $95,000,000 | $305,000,000 | $400,000,000 | BANK 2021-BNK33 | Wells Fargo | Rialto | (2) | 2.14x | 9.3% | 46.7% |
| 2 | MSMCH | Equus Industrial Portfolio | $69,903,870 | $163,109,030 | $233,012,900 | (3) | (3) | | (3) | 5.10x | 14.0% | 39.9% |
| 3 | MSMCH | 261-275 Amsterdam Avenue | $55,000,000 | $40,000,000 | $95,000,000 | BANK 2021-BNK33 | Wells Fargo | Rialto | BANK 2021-BNK33 | 1.97x | 7.3% | 63.3% |
| 5 | BANA | 909 Third Avenue | $50,000,000 | $185,600,000 | $235,600,000 | NYC 2021-909 | KeyBank | KeyBank | NYC 2021-909 | 4.05x | 14.1% | 34.9% |
| 8 | WFB | Pathline Park 9 & 10 | $40,000,000 | $90,000,000 | $130,000,000 | BANK 2021-BNK32 | Wells Fargo | Rialto | BANK 2021-BNK32 | 3.87x | 10.2% | 51.8% |
| 21 | BANA | Extra Space Rock ‘N Roll Self Storage Portfolio | $18,000,000 | $90,000,000 | $108,000,000 | BANK 2021-BNK32 | Wells Fargo | Rialto | BANK 2021-BNK32 | 2.56x | 8.8% | 57.9% |
| 22 | BANA | Grace Building | $15,000,000 | $868,000,000 | $883,000,000 | GRACE 2020-GRCE | Wells Fargo | Situs | GRACE 2020-GRCE | 4.25x | 11.8% | 41.1% |
| (1) | DSCR, Debt Yield and LTV calculations include any related pari passu companion loans and exclude any subordinate companion loans, as applicable. |
| (2) | The initial directing holder is the holder of the related promissory note B until the occurrence of a control appraisal event under the related intercreditor agreement, at which time the directing holder will be the Directing Certificateholder (or other designated party) under the PSA. See “Description of the Mortgage Pool—The Whole Loans—The Miami Design District Pari Passu-A/B Whole Loan” in the Preliminary Prospectus. |
| (3) | The initial directing holder is the holder of more than 50% of the Equus Industrial Portfolio Subordinate Companion Loan (by principal balance) until the occurrence of a control appraisal period under the related intercreditor agreement, at which time the directing holder will be the holder of a majority of the related Note A-1. See “Description of the Mortgage Pool—The Whole Loans—The Equus Industrial Portfolio Pari Passu-A/B Whole Loan” in the Preliminary Prospectus. |
| Mortgage Loans with Subordinate Debt(1) |
Loan
No. | Mortgage
Loan Seller | Property Name |
Mortgage Loan
Cut-off Date
Balance | Cut-off Date Balance per SF |
Subordinate Debt Cut-off Date Balance | UW NCF
DSCR | UW NOI Debt
Yield | Cut-off Date
LTV | Whole Loan UW
NCF DSCR(2) | Whole Loan
UW NOI Debt
Yield(2) | Whole Loan
Cut-off Date
LTV(2) |
| 1 | BANA | Miami Design District | $95,000,000 | $804.68 | $100,000,000 | 2.14x | 9.3% | 46.7% | 1.72x | 7.4% | 58.4% |
| 2 | MSMCH | Equus Industrial Portfolio | $69,903,870 | $39.10 | $154,000,000 | 5.10x | 14.0% | 39.9% | 2.45x | 8.4% | 66.3% |
| 5 | BANA | 909 Third Avenue | $50,000,000 | $174.42 | $114,400,000 | 4.05x | 14.1% | 34.9% | 2.72x | 9.5% | 51.9% |
| 22 | BANA | Grace Building | $15,000,000 | $567.13 | $367,000,000 | 4.25x | 11.8% | 41.1% | 3.00x | 8.3% | 58.1% |
| (1) | In addition, twenty six (26) of the mortgage loans, each of which is secured by a residential cooperative property, currently have in place either (i) Subordinate Coop LOCs that permit future advances or (ii) a Subordinate Wrap Mortgage. See “Description of the Mortgage Pool—Additional Indebtedness—Other Secured Indebtedness” and “Description of the Mortgage Pool—Additional Debt Financing for Mortgage Loans Secured by Residential Cooperatives” in the Preliminary Prospectus. |
| (2) | Whole Loan UW NCF DSCR, Whole Loan UW NOI Debt Yield and Whole Loan Cut-off Date LTV figures shown above are calculated based on any related pari passu notes and any related subordinate note(s). |
This is not a research report and was not prepared by any Underwriter’s research department. Please see additional important information and qualifications at the end of this Term Sheet.
T-29
| BANK 2021-BNK33 | Characteristics of the Mortgage Loans |
Mortgage Loans with Scheduled Balloon Payments and Related Classes(1)
| Class A-2 ($46,312,000) |
Loan
No. | Mortgage
Loan
Seller | Property Name | State | Property Type | Cut-off
Date
Balance | % of
Pool | Maturity Date Balance | % of
Class A-2
Certificate
Principal
Balance | SF | Cut-off
Date
Balance per
SF | UW
NCF
DSCR | UW
NOI
Debt
Yield | Cut-off
Date
LTV | Maturity Date LTV | Rem. IO Period
(mos.) | Rem.
Term to
Maturity
(mos.) |
| 7 | WFB | Plaza East I & II | VA | Office | $48,750,000 | 4.9% | $48,750,000 | 105.3% | 246,957 | $197.40 | 2.44x | 9.7% | 67.6% | 67.6% | 59 | 59 |
| | | Total/Wtd. Avg. | | | $48,750,000 | 4.9% | $48,750,000 | 105.3% | | | 2.44x | 9.7% | 67.6% | 67.6% | 59 | 59 |
| (1) | The table above reflects the mortgage loans whose balloon payments will be applied to pay down the Class A-2 certificates, assuming (i) that none of the mortgage loans experience prepayments, defaults or losses; (ii) there are no extensions of maturity dates; and (iii) each mortgage loan is paid in full on its stated maturity date or, in the case of any mortgage loan with an anticipated repayment date, on such anticipated repayment date. The table above is otherwise based on the Structuring Assumptions set forth under “Yield and Maturity Considerations—Weighted Average Life” in the Preliminary Prospectus. |
Mortgage Loans with Scheduled Balloon Payments and Related Classes(1)
| Class A-3 ($66,408,000) |
Loan
No. | Mortgage
Loan
Seller | Property Name | State | Property Type | Cut-off
Date
Balance | % of
Pool | Maturity Date Balance | % of
Class A-3
Certificate
Principal
Balance | SF | Cut-off
Date
Balance per
SF | UW
NCF
DSCR | UW
NOI
Debt
Yield | Cut-off
Date
LTV | Maturity Date LTV | Rem. IO Period
(mos.) | Rem.
Term to
Maturity
(mos.) |
| 2 | MSMCH | Equus Industrial Portfolio | Various | Industrial | $69,903,870 | 7.0% | $69,903,870 | 105.3% | 5,959,157 | $39.10 | 5.10x | 14.0% | 39.9% | 39.9% | 83 | 83 |
| | | Total/Wtd. Avg. | | | $69,903,870 | 7.0% | $69,903,870 | 105.3% | | | 5.10x | 14.0% | 39.9% | 39.9% | 83 | 83 |
| (1) | The table above reflects the mortgage loans whose balloon payments will be applied to pay down the Class A-3 certificates, assuming (i) that none of the mortgage loans experience prepayments, defaults or losses; (ii) there are no extensions of maturity dates; and (iii) each mortgage loan is paid in full on its stated maturity date or, in the case of any mortgage loan with an anticipated repayment date, on such anticipated repayment date. The table above is otherwise based on the Structuring Assumptions set forth under “Yield and Maturity Considerations—Weighted Average Life” in the Preliminary Prospectus. |
This is not a research report and was not prepared by any Underwriter’s research department. Please see additional important information and qualifications at the end of this Term Sheet.
T-30
| BANK 2021-BNK33 | Characteristics of the Mortgage Loans |
| Prior Securitization History(1) |
Loan
No. | Mortgage
Loan
Seller | Property Name | City | State | Property
Type | Cut-off
Date
Balance | % of
Pool | SF/Unit | Cut-off
Date
Balance
per SF/Unit(2) | UW
NCF
DSCR(2)(3) | UW
NOI
Debt
Yield(2)(3) | Cut-off
Date
LTV(2)(3) | Maturity
Date
LTV(2)(3) | Prior Securitization |
| 4 | BANA | Flushing Plaza | Flushing | NY | Office | $52,000,000 | 5.2% | 244,089 | $213.04 | 4.35x | 13.5% | 38.7% | 38.7% | JPMCC 2011-C4 |
| 5 | BANA | 909 Third Avenue | New York | NY | Office | $50,000,000 | 5.0% | 1,350,756 | $174.42 | 4.05x | 14.1% | 34.9% | 34.9% | LCCM 2014-909, UBSBB 2012-C2 |
| 6 | WFB | Village of Rochester Hills | Rochester Hills | MI | Retail | $49,950,000 | 5.0% | 253,254 | $197.23 | 1.84x | 10.2% | 67.5% | 58.2% | WFRBS 2011-C5 |
| 14.01 | BANA | Oakbrook | Glen Allen | VA | Multifamily | $9,606,195 | 1.0% | 157 | $58,823.53 | 2.48x | 10.3% | 57.5% | 57.5% | CGMT 2012-GC8 |
| 14.02 | BANA | Royal Glen | Comstock Park | MI | Multifamily | $9,376,106 | 0.9% | 170 | $58,823.53 | 2.48x | 10.3% | 57.5% | 57.5% | GSMS 2012-GCJ9 |
| 14.03 | BANA | Amber Ridge | Henrico | VA | Multifamily | $7,017,699 | 0.7% | 115 | $58,823.53 | 2.48x | 10.3% | 57.5% | 57.5% | CGMT 2012-GC8 |
| 16 | MSMCH | Crescent Shopping Center | Austin | TX | Retail | $24,500,000 | 2.4% | 118,038 | $207.56 | 1.19x | 8.0% | 63.3% | 57.9% | HUNTC 2017-FL1 |
| 22 | BANA | Grace Building | New York | NY | Office | $15,000,000 | 1.5% | 1,556,972 | $567.13 | 4.25x | 11.8% | 41.1% | 41.1% | GRCE 2014-GRCE |
| 49 | NCB | Mark Twain Owners’ Corp. | New York | NY | Multifamily | $3,269,380 | 0.3% | 80 | $40,867.25 | 6.89x | 35.4% | 4.9% | 3.8% | WFRBS 2014-C23 |
| 56 | NCB | Wellesley Gardens Owners Corp. | Douglaston | NY | Multifamily | $2,700,000 | 0.3% | 91 | $29,670.33 | 8.91x | 47.5% | 7.6% | 5.9% | WFRBS 2013-C12 |
| 60 | NCB | Bleecker & 11th Owners Corp. | New York | NY | Multifamily | $2,497,408 | 0.2% | 35 | $71,354.51 | 5.99x | 27.3% | 14.0% | 12.1% | WFRBS 2013-C12 |
| | | Total | | | | $225,916,788 | 22.5% | | | | | | | |
| (1) | Includes mortgage loans for which all or a portion of the previously existing debt was most recently securitized in conduit securitizations, based on information provided by the related borrower or obtained through searches of a third-party database. The information has not otherwise been confirmed by the mortgage loan sellers. With respect to any mortgage loan that is part of a whole loan, unless otherwise indicated, all LTV, DSCR, Debt Yield and Cut-off Date Balance per SF/Unit calculations include any related pari passu companion loans and exclude any related subordinate companion loans, as applicable. |
| (2) | For properties that are part of a portfolio, the Cut-off Date Balance Per SF/Unit, UW NCF DSCR, UW NOI Debt Yield, Cut-off Date LTV and Maturity Date LTV calculations reflect the values of the portfolio as a whole. |
| (3) | For mortgaged properties securing residential cooperative mortgage loans, the UW NCF DSCR and UW NOI Debt Yield for each such mortgaged property is calculated using underwritten net operating income or underwritten net cash flow, as applicable, for the related residential cooperative property which is the projected net operating income or net cash flow, as applicable, reflected in the most recent appraisal obtained by or otherwise in the possession of the related mortgage loan seller as of the Cut-off Date. LTV calculations are based upon the appraised value of the residential cooperative property determined as if such residential cooperative property is operated as a residential cooperative, inclusive of the amount of the underlying debt encumbering such residential cooperative property. |
This is not a research report and was not prepared by any Underwriter’s research department. Please see additional important information and qualifications at the end of this Term Sheet.
T-31
| BANK 2021-BNK33 | Characteristics of the Mortgage Loans |
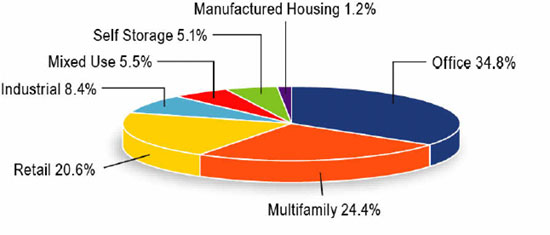
| Property Type Distribution(1) |
| Property Type | Number of
Mortgaged
Properties | Aggregate
Cut-off Date
Balance | % of
Pool | Wtd. Avg.
Mortgage
Rate | Wtd. Avg.
UW NCF
DSCR | Wtd. Avg.
UW NOI
Debt Yield | Wtd. Avg.
Cut-off
Date LTV | Wtd. Avg.
Maturity
Date LTV |
| Office | 20 | $349,599,932 | 34.8% | 3.2216% | 3.27x | 11.6% | 53.3% | 52.2% |
| CBD | 5 | $160,750,000 | 16.0% | 3.0812% | 3.92x | 13.2% | 43.2% | 43.2% |
| Suburban | 9 | $152,333,000 | 15.2% | 3.3461% | 2.77x | 10.5% | 63.2% | 60.8% |
| Medical | 6 | $36,516,932 | 3.6% | 3.3205% | 2.48x | 9.0% | 56.2% | 56.2% |
| Multifamily | 39 | $245,444,132 | 24.4% | 3.3497% | 5.66x | 21.7% | 36.7% | 34.5% |
| Cooperative | 29 | $130,261,132 | 13.0% | 3.0176% | 8.85x | 32.5% | 12.2% | 10.9% |
| Garden | 8 | $106,963,000 | 10.6% | 3.7316% | 2.00x | 9.3% | 64.7% | 61.1% |
| Low Rise | 1 | $5,220,000 | 0.5% | 3.3300% | 3.13x | 11.4% | 62.1% | 62.1% |
| Mid Rise | 1 | $3,000,000 | 0.3% | 4.1900% | 1.99x | 8.6% | 58.8% | 58.8% |
| Retail | 18 | $207,469,249 | 20.6% | 3.9954% | 1.97x | 9.4% | 56.7% | 53.2% |
| Luxury Retail | 1 | $95,000,000 | 9.5% | 4.1325% | 2.14x | 9.3% | 46.7% | 46.7% |
| Anchored | 3 | $80,375,000 | 8.0% | 3.9746% | 1.63x | 9.6% | 66.7% | 58.2% |
| Single Tenant | 14 | $32,094,249 | 3.2% | 3.6416% | 2.33x | 9.2% | 61.3% | 60.1% |
| Industrial | 37 | $83,983,870 | 8.4% | 2.6354% | 4.74x | 13.4% | 42.5% | 42.5% |
| Warehouse/Distribution | 14 | $51,192,169 | 5.1% | 2.4838% | 5.10x | 14.0% | 39.9% | 39.9% |
| Flex | 20 | $22,211,701 | 2.2% | 2.7716% | 4.63x | 13.3% | 43.0% | 43.0% |
| Warehouse | 3 | $10,580,000 | 1.1% | 3.0830% | 3.27x | 11.0% | 53.8% | 53.8% |
| Mixed Use | 1 | $55,000,000 | 5.5% | 3.5500% | 1.97x | 7.3% | 63.3% | 63.3% |
| Multifamily/Retail | 1 | $55,000,000 | 5.5% | 3.5500% | 1.97x | 7.3% | 63.3% | 63.3% |
| Self Storage | 22 | $50,952,500 | 5.1% | 3.7650% | 2.37x | 9.1% | 59.5% | 59.5% |
| Self Storage | 22 | $50,952,500 | 5.1% | 3.7650% | 2.37x | 9.1% | 59.5% | 59.5% |
| Manufactured Housing | 6 | $12,500,000 | 1.2% | 4.3958% | 1.50x | 9.1% | 67.1% | 59.2% |
| Manufactured Housing | 6 | $12,500,000 | 1.2% | 4.3958% | 1.50x | 9.1% | 67.1% | 59.2% |
| Total/Wtd. Avg. | 143 | $1,004,949,683 | 100.0% | 3.4238% | 3.57x | 13.4% | 50.1% | 48.3% |
| (1) | All numerical information concerning the mortgage loans is approximate and, in the case of mortgage loans secured by multiple properties, is based on allocated loan amounts with respect to such properties. All weighted average information regarding the mortgage loans reflects the weighting of the mortgage loans based on their outstanding principal balances as of the Cut-off Date or, in the case of mortgage loans secured by multiple properties, allocated loan amounts. The sum of numbers and percentages in columns may not match the “Total” due to rounding. With respect to any mortgage loan that is part of a whole loan, unless otherwise indicated, all LTV, DSCR and Debt Yield calculations include any related pari passu companion loans and exclude any related subordinate companion loans, as applicable. For mortgaged properties securing residential cooperative mortgage loans, the UW NCF DSCR and UW NOI Debt Yield for each such mortgaged property is calculated using underwritten net operating income or underwritten net cash flow, as applicable, for the related residential cooperative property which is the projected net operating income or net cash flow, as applicable, reflected in the most recent appraisal obtained by or otherwise in the possession of the related mortgage loan seller as of the Cut-off Date. LTV calculations are based upon the appraised value of the residential cooperative property determined as if such residential cooperative property is operated as a residential cooperative, inclusive of the amount of the underlying debt encumbering such residential cooperative property. |
This is not a research report and was not prepared by any Underwriter’s research department. Please see additional important information and qualifications at the end of this Term Sheet.
T-32
| BANK 2021-BNK33 | Characteristics of the Mortgage Loans |

| Geographic Distribution(1) |
| State or Other Jurisdiction | Number of
Mortgaged
Properties | Aggregate
Cut-off Date
Balance | % of
Pool | Wtd. Avg.
Mortgage
Rate | Wtd. Avg.
UW NCF
DSCR | Wtd. Avg.
UW NOI
Debt Yield | Wtd. Avg.
Cut-off
Date LTV | Wtd. Avg.
Maturity
Date LTV |
| New York | 36 | $331,921,377 | 33.0% | 3.1427% | 5.48x | 19.5% | 33.4% | 32.9% |
| Virginia | 19 | $128,999,915 | 12.8% | 3.3754% | 3.23x | 11.2% | 57.4% | 56.8% |
| Florida | 4 | $110,900,000 | 11.0% | 4.1451% | 2.12x | 9.2% | 48.3% | 48.3% |
| Michigan | 9 | $96,722,630 | 9.6% | 3.6596% | 2.01x | 11.0% | 66.3% | 57.4% |
| California | 13 | $96,695,000 | 9.6% | 3.0645% | 3.09x | 9.6% | 56.5% | 56.5% |
| Northern California(2) | 6 | $49,391,667 | 4.9% | 2.7400% | 3.59x | 10.0% | 53.4% | 53.4% |
| Southern California(2) | 7 | $47,303,333 | 4.7% | 3.4033% | 2.57x | 9.1% | 59.8% | 59.8% |
| Texas | 7 | $52,272,500 | 5.2% | 4.1463% | 1.56x | 8.9% | 64.4% | 59.6% |
| Utah | 2 | $36,853,000 | 3.7% | 3.5223% | 2.76x | 10.5% | 64.6% | 64.6% |
| Louisiana | 1 | $31,563,000 | 3.1% | 3.4450% | 1.70x | 9.3% | 71.5% | 64.4% |
| New Mexico | 1 | $25,700,000 | 2.6% | 3.2920% | 3.20x | 12.5% | 57.5% | 57.5% |
| Georgia | 19 | $18,711,701 | 1.9% | 2.4838% | 5.10x | 14.0% | 39.9% | 39.9% |
| Tennessee | 5 | $16,838,419 | 1.7% | 3.1299% | 3.88x | 12.9% | 51.8% | 46.8% |
| Missouri | 2 | $2,970,228 | 0.3% | 3.3840% | 2.59x | 9.0% | 61.9% | 61.9% |
| Illinois | 6 | $8,333,763 | 0.8% | 3.3553% | 2.58x | 8.9% | 59.9% | 59.9% |
| New Jersey | 2 | $7,250,000 | 0.7% | 4.4025% | 1.68x | 8.8% | 63.3% | 59.3% |
| Indiana | 1 | $6,064,216 | 0.6% | 3.3840% | 2.59x | 9.0% | 61.9% | 61.9% |
| Ohio | 3 | $5,646,717 | 0.6% | 3.7907% | 2.06x | 9.3% | 63.4% | 57.0% |
| Wisconsin | 2 | $5,074,140 | 0.5% | 3.3840% | 2.59x | 9.0% | 61.9% | 61.9% |
| Nevada | 2 | $4,950,000 | 0.5% | 4.7900% | 1.65x | 8.5% | 62.2% | 62.2% |
| Alabama | 2 | $4,269,703 | 0.4% | 3.3840% | 2.59x | 9.0% | 61.9% | 61.9% |
| West Virginia | 1 | $4,024,396 | 0.4% | 2.4838% | 5.10x | 14.0% | 39.9% | 39.9% |
| Connecticut | 1 | $3,750,000 | 0.4% | 4.8200% | 1.53x | 7.6% | 64.7% | 64.7% |
| North Dakota | 2 | $1,986,340 | 0.2% | 3.3840% | 2.59x | 9.0% | 61.9% | 61.9% |
| Colorado | 1 | $1,665,000 | 0.2% | 3.0830% | 3.27x | 11.0% | 53.8% | 53.8% |
| Pennsylvania | 1 | $1,129,306 | 0.1% | 3.3840% | 2.59x | 9.0% | 61.9% | 61.9% |
| South Carolina | 1 | $658,333 | 0.1% | 3.3255% | 2.56x | 8.8% | 57.9% | 57.9% |
| Total/Wtd. Avg. | 143 | $1,004,949,683 | 100.0% | 3.4238% | 3.57x | 13.4% | 50.1% | 48.3% |
| (1) | All numerical information concerning the mortgage loans is approximate and, in the case of mortgage loans secured by multiple properties, is based on allocated loan amounts with respect to such properties. All weighted average information regarding the mortgage loans reflects the weighting of the mortgage loans based on their outstanding principal balances as of the Cut-off Date or, in the case of mortgage loans secured by multiple properties, allocated loan amounts. The sum of numbers and percentages in columns may not match the “Total” due to rounding. With respect to any mortgage loan that is part of a whole loan, unless otherwise indicated, all LTV, DSCR and Debt Yield calculations include any related pari passu companion loans and exclude any related subordinate companion loans, as applicable. For mortgaged properties securing residential cooperative mortgage loans, the UW NCF DSCR and UW NOI Debt Yield for each such mortgaged property is calculated using underwritten net operating income or underwritten net cash flow, as applicable, for the related residential cooperative property which is the projected net operating income or net cash flow, as applicable, reflected in the most recent appraisal obtained by or otherwise in the possession of the related mortgage loan seller as of the Cut-off Date. LTV calculations are based upon the appraised value of the residential cooperative property determined as if such residential cooperative property is operated as a residential cooperative, inclusive of the amount of the underlying debt encumbering such residential cooperative property. |
| (2) | “California – Northern” includes zip codes above 93600, and “California – Southern” includes zip codes at or below 93600. |
This is not a research report and was not prepared by any Underwriter’s research department. Please see additional important information and qualifications at the end of this Term Sheet.
T-33
| BANK 2021-BNK33 | Collateral Statistics |
Collateral Statistics(1)
Cut-off Date Balance ($)
| | | | |
| | No. of
Mortgage
Loans | Aggregate
Cut-off Date
Balance ($) | % of
Pool |
| 1,400,000 - 5,000,000 | 34 | 104,384,987 | 10.4 |
| 5,000,001 - 15,000,000 | 13 | 103,498,226 | 10.3 |
| 15,000,001 - 25,000,000 | 6 | 122,875,000 | 12.2 |
| 25,000,001 - 35,000,000 | 6 | 176,896,000 | 17.6 |
| 35,000,001 - 55,000,000 | 7 | 332,391,600 | 33.1 |
| 55,000,001 - 75,000,000 | 1 | 69,903,870 | 7.0 |
| 75,000,001 - 95,000,000 | 1 | 95,000,000 | 9.5 |
| Total: | 68 | $1,004,949,683 | 100.0% |
Min: $1,400,000 Max: $95,000,000 Avg: $14,778,672 |
State or Other Jurisdiction(2)
| | | | |
| | No. of
Mortgaged
Properties | Aggregate
Cut-off Date
Balance ($) | % of Pool |
| New York | 36 | 331,921,377 | 33.0 |
| Virginia | 19 | 128,999,915 | 12.8 |
| Florida | 4 | 110,900,000 | 11.0 |
| Michigan | 9 | 96,722,630 | 9.6 |
| California | 13 | 96,695,000 | 9.6 |
| Northern California(3) | 6 | 49,391,667 | 4.9 |
| Southern California(3) | 7 | 47,303,333 | 4.7 |
| Texas | 7 | 52,272,500 | 5.2 |
| Utah | 2 | 36,853,000 | 3.7 |
| Louisiana | 1 | 31,563,000 | 3.1 |
| New Mexico | 1 | 25,700,000 | 2.6 |
| Georgia | 19 | 18,711,701 | 1.9 |
| Tennessee | 5 | 16,838,419 | 1.7 |
| Missouri | 2 | 2,970,228 | 0.3 |
| Illinois | 6 | 8,333,763 | 0.8 |
| New Jersey | 2 | 7,250,000 | 0.7 |
| Indiana | 1 | 6,064,216 | 0.6 |
| Ohio | 3 | 5,646,717 | 0.6 |
| Wisconsin | 2 | 5,074,140 | 0.5 |
| Nevada | 2 | 4,950,000 | 0.5 |
| Alabama | 2 | 4,269,703 | 0.4 |
| West Virginia | 1 | 4,024,396 | 0.4 |
| Connecticut | 1 | 3,750,000 | 0.4 |
| North Dakota | 2 | 1,986,340 | 0.2 |
| Colorado | 1 | 1,665,000 | 0.2 |
| Pennsylvania | 1 | 1,129,306 | 0.1 |
| South Carolina | 1 | 658,333 | 0.1 |
| Total: | 143 | $1,004,949,683 | 100.0% |
Property Type(2)
| | | | |
| | No. of
Mortgaged
Properties | Aggregate
Cut-off Date
Balance ($) | % of
Pool |
| Office | 20 | 349,599,932 | 34.8 |
| CBD | 5 | 160,750,000 | 16.0 |
| Suburban | 9 | 152,333,000 | 15.2 |
| Medical | 6 | 36,516,932 | 3.6 |
| Multifamily | 39 | 245,444,132 | 24.4 |
| Cooperative | 29 | 130,261,132 | 13.0 |
| Garden | 8 | 106,963,000 | 10.6 |
| Low Rise | 1 | 5,220,000 | 0.5 |
| Mid Rise | 1 | 3,000,000 | 0.3 |
| Retail | 18 | 207,469,249 | 20.6 |
| Luxury Retail | 1 | 95,000,000 | 9.5 |
| Anchored | 3 | 80,375,000 | 8.0 |
| Single Tenant | 14 | 32,094,249 | 3.2 |
| Industrial | 37 | 83,983,870 | 8.4 |
| Warehouse/Distribution | 14 | 51,192,169 | 5.1 |
| Flex | 20 | 22,211,701 | 2.2 |
| Warehouse | 3 | 10,580,000 | 1.1 |
| Mixed Use | 1 | 55,000,000 | 5.5 |
| Multifamily/Retail | 1 | 55,000,000 | 5.5 |
| Self Storage | 22 | 50,952,500 | 5.1 |
| Self Storage | 22 | 50,952,500 | 5.1 |
| Manufactured Housing | 6 | 12,500,000 | 1.2 |
| Manufactured Housing | 6 | 12,500,000 | 1.2 |
| Total: | 143 | $1,004,949,683 | 100.0% |
Mortgage Rate (%)
| | | | |
| | No. of
Mortgage
Loans | Aggregate
Cut-off Date
Balance ($) | % of
Pool |
| 2.3800 - 2.9999 | 5 | 211,903,870 | 21.1 |
| 3.0000 - 3.4999 | 38 | 333,988,157 | 33.2 |
| 3.5000 - 4.8200 | 25 | 459,057,656 | 45.7 |
| Total: | 68 | $1,004,949,683 | 100.0% |
| Min: 2.3800% Max: 4.8200% Wtd Avg: 3.4238% |
Original Term to Maturity or ARD (mos.)
| | | | |
| | No. of
Mortgage
Loans | Aggregate
Cut-off Date
Balance ($) | % of
Pool |
| 60 | 1 | 48,750,000 | 4.9 |
| 84 | 1 | 69,903,870 | 7.0 |
| 120 | 66 | 886,295,813 | 88.2 |
| Total: | 68 | $1,004,949,683 | 100.0% |
| Min: 60 mos. Max: 120 mos. Wtd Avg: 115 mos. |
Remaining Term to Maturity or ARD (mos.)
| | | | |
| | No. of
Mortgage
Loans | Aggregate
Cut-off Date
Balance ($) | % of
Pool |
| 59 | 1 | 48,750,000 | 4.9 |
| 83 | 1 | 69,903,870 | 7.0 |
| 106 - 120 | 66 | 886,295,813 | 88.2 |
| Total: | 68 | $1,004,949,683 | 100.0% |
| Min: 59 mos. Max: 120 mos. Wtd Avg: 113 mos. |
Original Amortization Term (mos.)
| | | | |
| | No. of
Mortgage
Loans | Aggregate
Cut-off Date
Balance ($) | % of
Pool |
| Interest Only | 37 | 762,980,970 | 75.9 |
| 360 | 24 | 221,380,098 | 22.0 |
| 480 | 7 | 20,588,616 | 2.0 |
| Total: | 68 | $1,004,949,683 | 100.0% |
| Min: 360 mos. Max: 480 mos. Wtd Avg: 370 mos. |
Remaining Amortization Term (mos.)
| | | | |
| | No. of
Mortgage
Loans | Aggregate
Cut-off Date
Balance ($) | % of
Pool |
| Interest Only | 37 | 762,980,970 | 75.9 |
| 359 - 360 | 24 | 221,380,098 | 22.0 |
| 361 - 480 | 7 | 20,588,616 | 2.0 |
| Total: | 68 | $1,004,949,683 | 100.0% |
| Min: 359 mos. Max: 480 mos. Wtd Avg: 370 mos. |
Mortgage Loan Sellers
| | | | |
| | No. of
Mortgage
Loans | Aggregate
Cut-off Date
Balance ($) | % of
Pool |
| BANA | 17 | 366,202,500 | 36.4 |
| WFB | 12 | 307,237,181 | 30.6 |
| MSMCH | 11 | 236,248,870 | 23.5 |
| NCB | 28 | 95,261,132 | 9.5 |
| Total: | 68 | $1,004,949,683 | 100.0% |
| | | | |
Amortization Type
| | | | |
| | No. of
Mortgage
Loans | Aggregate
Cut-off Date
Balance ($) | % of
Pool |
| Interest Only | 37 | 762,980,970 | 75.9 |
| Interest Only, Amortizing Balloon | 7 | 165,338,000 | 16.5 |
| Amortizing Balloon | 24 | 76,630,713 | 7.6 |
| Total: | 68 | $1,004,949,683 | 100.0% |
Cut-off Date LTV Ratio (%)
| | | | |
| | No. of
Mortgage
Loans | Aggregate
Cut-off Date
Balance ($) | % of
Pool |
| 2.9 - 30.0 | 27 | 121,219,924 | 12.1 |
| 30.1 - 40.0 | 5 | 180,945,078 | 18.0 |
| 40.1 - 50.0 | 3 | 113,419,581 | 11.3 |
| 50.1 - 60.0 | 11 | 159,132,500 | 15.8 |
| 60.1 - 65.0 | 14 | 234,719,600 | 23.4 |
| 65.1 - 73.7 | 8 | 195,513,000 | 19.5 |
| Total: | 68 | $1,004,949,683 | 100.0% |
| Min: 2.9% Max: 73.7% Wtd Avg: 50.1% |
Maturity Date or ARD LTV Ratio (%)
| | | | |
| | No. of
Mortgage
Loans | Aggregate
Cut-off Date
Balance ($) | % of
Pool |
| 2.5 - 30.0 | 29 | 130,261,132 | 13.0 |
| 30.1 - 45.0 | 5 | 190,323,451 | 18.9 |
| 45.1 - 55.0 | 7 | 177,405,000 | 17.7 |
| 55.1 - 60.0 | 12 | 199,427,500 | 19.8 |
| 60.1 - 67.6 | 15 | 307,532,600 | 30.6 |
| Total: | 68 | $1,004,949,683 | 100.0% |
| Min: 2.5% Max: 67.6% Wtd Avg: 48.3% |
UW NCF DSCR (x)
| | | | |
| | No. of
Mortgage
Loans | Aggregate
Cut-off Date
Balance ($) | % of
Pool |
| 1.19 - 1.70 | 9 | 105,838,000 | 10.5 |
| 1.71 - 2.10 | 8 | 157,669,581 | 15.7 |
| 2.11 - 2.50 | 9 | 235,050,000 | 23.4 |
| 2.51 - 3.50 | 9 | 152,322,213 | 15.2 |
| 3.51 - 4.50 | 10 | 178,282,303 | 17.7 |
| 4.51 - 21.84 | 23 | 175,787,586 | 17.5 |
| Total: | 68 | $1,004,949,683 | 100.0% |
| Min: 1.19x Max: 21.84x Wtd Avg: 3.57x |
UW NOI Debt Yield (%)
| | No. of
Mortgage
Loans | Aggregate
Cut-off Date
Balance ($) | % of
Pool |
| 7.3 - 9.0 | 13 | 208,541,600 | 20.8 |
| 9.1 - 10.0 | 10 | 232,413,000 | 23.1 |
| 10.1 - 11.0 | 7 | 167,507,581 | 16.7 |
| 11.1 - 14.0 | 9 | 220,426,370 | 21.9 |
| 14.1 - 24.0 | 8 | 74,280,607 | 7.4 |
| 24.1 - 83.2 | 21 | 101,780,525 | 10.1 |
| Total: | 68 | $1,004,949,683 | 100.0% |
| Min: 7.3% Max: 83.2% Wtd Avg: 13.4% |
| (1) | All numerical information concerning the mortgage loans is approximate. All weighted average information regarding the mortgage loans reflects the weighting of the mortgage loans based on their outstanding principal balances as of the Cut-off Date. The sum of numbers and percentages in columns may not match the “Total” due to rounding. With respect to any mortgage loan that is part of a whole loan, unless otherwise indicated, all LTV, DSCR and Debt Yield calculations include any related pari passu companion loans and exclude any related subordinate companion loans, as applicable. For mortgaged properties securing residential cooperative mortgage loans, the UW DSCR and UW NOI Debt Yield for each such mortgaged property is calculated using underwritten net operating income or underwritten net cash flow, as applicable, for the related residential cooperative property which is the projected net operating income or net cash flow, as applicable, reflected in the most recent appraisal obtained by or otherwise in the possession of the related mortgage loan seller as of the Cut-off Date. LTV calculations are based upon the appraised value of the residential cooperative property determined as if such residential cooperative property is operated as a residential cooperative, inclusive of the amount of the underlying debt encumbering such residential cooperative property. |
| (2) | In the case of mortgage loans secured by multiple properties, cut-off date balance information is based on allocated loan amounts with respect to such properties. |
| (3) | “California – Northern” includes zip codes above 93600, and “California – Southern” includes zip codes at or below 93600. |
This is not a research report and was not prepared by any Underwriter’s research department. Please see additional important information and qualifications at the end of this Term Sheet.
T-34
(THIS PAGE INTENTIONALLY LEFT BLANK)
This is not a research report and was not prepared by any Underwriter’s research department. Please see additional important information and qualifications at the end of this Term Sheet.
T-35
| Retail - Luxury Retail | Loan #1 | Cut-off Date Balance: | | $95,000,000 |
| 151 NE 40th Street | Miami Design District | Cut-off Date LTV: | | 46.7% |
| Miami, FL 33137 | | UW NCF DSCR: | | 2.14x |
| | | UW NOI Debt Yield: | | 9.3% |

This is not a research report and was not prepared by any Underwriter’s research department. Please see additional important information and qualifications at the end of this Term Sheet.
T-36
| Retail - Luxury Retail | Loan #1 | Cut-off Date Balance: | | $95,000,000 |
| 151 NE 40th Street | Miami Design District | Cut-off Date LTV: | | 46.7% |
| Miami, FL 33137 | | UW NCF DSCR: | | 2.14x |
| | | UW NOI Debt Yield: | | 9.3% |
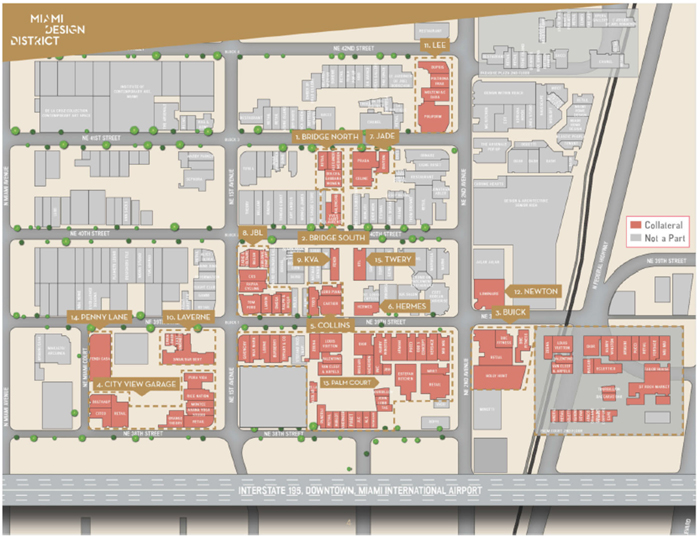
This is not a research report and was not prepared by any Underwriter’s research department. Please see additional important information and qualifications at the end of this Term Sheet.
T-37
| Retail - Luxury Retail | Loan #1 | Cut-off Date Balance: | | $95,000,000 |
| 151 NE 40th Street | Miami Design District | Cut-off Date LTV: | | 46.7% |
| Miami, FL 33137 | | UW NCF DSCR: | | 2.14x |
| | | UW NOI Debt Yield: | | 9.3% |
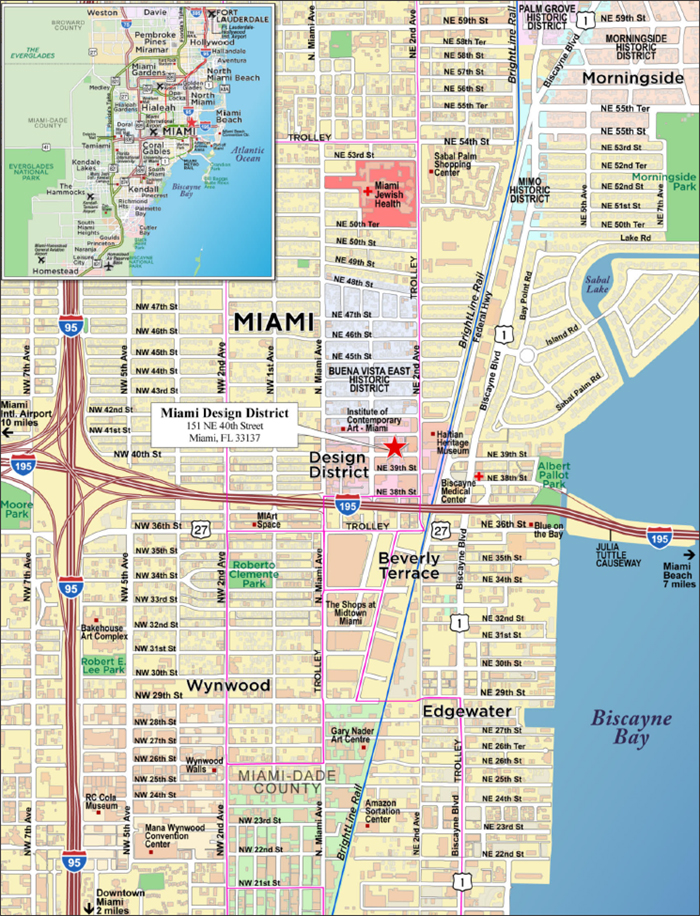
This is not a research report and was not prepared by any Underwriter’s research department. Please see additional important information and qualifications at the end of this Term Sheet.
T-38
| Mortgage Loan No. 1 – Miami Design District |
| Mortgage Loan Information | | Property Information |
| Mortgage Loan Seller: | BANA | | Single Asset/Portfolio: | Single Asset |
| Credit Assessment (Moody’s/Fitch/KBRA): | NR/NR/NR | | Location: | Miami, FL 33137 |
| Original Balance(1): | $95,000,000 | | General Property Type: | Retail |
| Cut-off Date Balance(1): | $95,000,000 | | Detailed Property Type: | Luxury Retail |
| % of Initial Pool Balance: | 9.5% | | Title Vesting: | Fee |
| Loan Purpose: | Refinance | | Year Built/Renovated: | 2014-2019 / NAP |
| Borrower Sponsor: | Miami Design District Associates, LLC | | Size: | 497,094 SF |
| Guarantor: | Miami Design District Associates, LLC | Cut-off Date Balance PSF(1): | $805 |
| Mortgage Rate: | 4.1325% | Maturity Date Balance PSF(1): | $805 |
| Note Date: | 2/28/2020 | | Property Manager: | Design District Management, Inc. |
| First Payment Date: | 4/1/2020 | | | (borrower-related) |
| Maturity Date: | 3/1/2030 | | | |
| Original Term to Maturity: | 120 months | | | |
| Original Amortization Term: | 0 months | | | |
| IO Period: | 120 months | | Underwriting and Financial Information(4) |
| Seasoning: | 14 months | | UW NOI: | $37,034,101 |
| Prepayment Provisions: | L(38),D(75),O(7) | | UW NOI Debt Yield(1): | 9.3% |
| Lockbox/Cash Mgmt Status: | Hard/Springing | | UW NOI Debt Yield at Maturity(1): | 9.3% |
| Additional Debt Type(1)(2): | Pari Passu/Subordinate | | UW NCF DSCR(1): | 2.14x |
| Additional Debt Balance(1)(2): | $305,000,000 / $100,000,000 | | Most Recent NOI: | $32,810,895 (12/31/2020) |
| Future Debt Permitted (Type): | No (NAP) | | 2nd Most Recent NOI: | $33,817,392 (12/31/2019) |
| Reserves(3) | | 3rd Most Recent NOI: | $32,133,624 (12/31/2018) |
| Type | Initial | Monthly | Cap | | Most Recent Occupancy(5): | 95.6% (2/28/2021) |
| RE Taxes: | $2,100,000 | $525,000 | NAP | | 2nd Most Recent Occupancy(5): | 92.4% (12/31/2019) |
| Insurance: | $0 | Springing | NAP | | 3rd Most Recent Occupancy(5): | 93.1% (12/31/2018) |
| Replacement Reserve: | $0 | $8,285 | NAP | | Appraised Value (as of)(6): | $856,000,000 (3/1/2020) |
| TI/LC Reserve: | $4,907,050 | $82,849 | NAP | | Appraised Value PSF(6): | $1,722 |
| Free/Gap Rent Reserve: | $1,724,567 | $0 | NAP | | Cut-off Date LTV Ratio(1)(6): | 46.7% |
| Debt Service Reserve: | $10,474,740 | $0 | NAP | | Maturity Date LTV Ratio(1)(6): | | 46.7% |
| | | | | | | | | |
| Sources and Uses |
| Sources | Proceeds | % of Total | | Uses | Proceeds | % of Total |
| Senior Loan Amount(1): | $400,000,000 | 80.0% | | Loan Payoff(7): | $476,005,977 | 95.2% |
| Subordinate Loan Amount(1): | $100,000,000 | 20.0% | | Return of Equity: | $11,474,730 | 2.3% |
| | | | | Reserves: | $8,731,617 | 1.7% |
| | | | | Closing Costs: | $3,787,676 | 0.8% |
| Total Sources: | $500,000,000 | 100.0% | | Total Uses: | $500,000,000 | 100.0% |
| (1) | The Miami Design District Mortgage Loan (as defined below) is part of the Miami Design District Whole Loan (as defined below), which is comprised of fifteen pari passu senior promissory notes and one subordinate note. The Cut-off Date Balance PSF, Maturity Date Balance PSF, UW NOI Debt Yield, UW NOI Debt Yield at Maturity, UW NCF DSCR, Cut-off Date LTV Ratio and Maturity Date LTV Ratio numbers presented above are based on the principal balance of the Miami Design District Senior Loan (as defined below). The Cut-off Date Balance PSF, Maturity Date Balance PSF, UW NOI Debt Yield, UW NOI Debt Yield at Maturity, UW NCF DSCR, Cut-off Date LTV Ratio and Maturity Date LTV Ratio based on the principal balance of the Miami Design District Whole Loan are $1,006, $1,006, 7.4%, 7.4%, 1.72x, 58.4% and 58.4%, respectively. |
| (2) | See “Additional Secured Indebtedness (not including trade debts)” below for further discussion of additional debt. |
| (3) | See “Escrows and Reserves” below for further discussion of reserve information. |
| (4) | The appraised value was determined prior to the emergence of the novel coronavirus and the economic disruption resulting from measures to combat the coronavirus. In addition, the novel coronavirus pandemic is an evolving situation and could impact the Miami Design District Whole Loan more severely than assumed in the underwriting of the Miami Design District Whole Loan and could adversely affect the NOI, NCF and occupancy information, as well as the appraised value and the DSCR, LTV and Debt Yield metrics presented above and herein. See “Risk Factors–Risks Related to Market Conditions and Other External Factors–The Coronavirus Pandemic Has Adversely Affected the Global Economy and Will Likely Adversely Affect the Performance of the Mortgage Loans” in the Preliminary Prospectus. |
| (5) | Most Recent Occupancy has been sourced from the February 28, 2021 borrower rent roll. 2nd Most Recent Occupancy and 3rd Most Recent Occupancy have been sourced from the historical underwritten rent rolls. |
| (6) | The appraisal also provided an “Upon Stabilization” value of $883,000,000 as of March 1, 2021, which value assumes physical and economic stabilization and results in an Appraised Value PSF, Cut-off Date LTV Ratio and Maturity Date LTV Ratio of $1,776, 45.3% and 45.3%, respectively, based on the principal balance of the Miami Design District Senior Loan. The appraisal also provided a “land” value of $600,000,000 for the land portion (assumed unimproved) of the Miami Design District Property (as defined below), which value would result in a Cut-off Date LTV Ratio and Maturity Date LTV Ratio of 66.7% and 66.7%, respectively, based on the principal balance of the Miami Design District Senior Loan. |
| (7) | Loan Payoff includes existing debt secured by components of the larger Miami Design District that are not collateral for the Miami Design District Whole Loan. |
This is not a research report and was not prepared by any Underwriter’s research department. Please see additional important information and qualifications at the end of this Term Sheet.
T-39
| Retail - Luxury Retail | Loan #1 | Cut-off Date Balance: | | $95,000,000 |
| 151 NE 40th Street | Miami Design District | Cut-off Date LTV: | | 46.7% |
| Miami, FL 33137 | | UW NCF DSCR: | | 2.14x |
| | | UW NOI Debt Yield: | | 9.3% |
The Mortgage Loan. The largest mortgage loan (the “Miami Design District Mortgage Loan”) is part of a whole loan (the “Miami Design District Whole Loan”) evidenced by fifteen pari passu senior promissory notes in the aggregate original principal amount of $400,000,000 (together, the “Miami Design District Senior Loan”) and one note in the original principal amount of $100,000,000 (the “Miami Design District Subordinate Companion Loan”) that is subordinate to the Miami Design District Senior Loan. The Miami Design District Whole Loan is secured by a first priority fee mortgage encumbering a 497,094 SF luxury retail development located in Miami, Florida (the “Miami Design District Property”). The Miami Design District Mortgage Loan is evidenced by the non-controlling Note A-1, A-12, Note A-14 and Note A-15 with an aggregate original principal amount of $95,000,000. The remaining promissory notes comprising the Miami Design District Whole Loan are summarized in the below table. The Miami Design District Whole Loan will be serviced pursuant to the pooling and servicing agreement for the BANK 2021-BNK33 securitization trust. See “Description of the Mortgage Pool—The Whole Loans—The Miami Design District Pari Passu-A/B Whole Loan” and “Pooling and Servicing Agreement” in the Preliminary Prospectus.
Miami Design District Whole Loan Summary |
Note | Original Balance | Cut-off Date Balance | Note Holder | Controlling Piece |
| A-1, A-12, A-14, A-15 | $95,000,000 | $95,000,000 | BANK 2021-BNK33 | No |
| A-2, A-7 | $80,000,000 | $80,000,000 | BANK 2021-BNK31 | No |
| A-3, A-6 | $75,000,000 | $75,000,000 | BANK 2020-BNK30 | No |
| A-4, A-8, A-10, A-11 | $90,000,000 | $90,000,000 | BANK 2021-BNK32 | No |
| A-5, A-9, A-13 | $60,000,000 | $60,000,000 | CSAIL 2021-C20 | No |
| B | $100,000,000 | $100,000,000 | Third Party Investor | Yes(1) |
| Total (Whole Loan) | $500,000,000 | $500,000,000 | | |
| (1) | Pursuant to the related co-lender agreement, the holder of Note B is the controlling noteholder unless a “control appraisal period” has occurred and is continuing under the co-lender agreement, in which case Note A-1 will become the controlling noteholder. |
The Borrower and the Borrower Sponsor. The borrower is Oak Plaza Associates (Del.) LLC (the “Miami Design District Borrower”), a Delaware limited liability company structured to be bankruptcy-remote with at least two independent directors.
The borrower sponsor and non-recourse carveout guarantor is Miami Design District Associates, LLC, a partnership between Dacra (38.75%), L Catterton Real Estate (38.75%) and Brookfield Property Partners (22.265%).
Dacra is a real estate development company founded in 1987 that has developed over 2.0 million SF of commercial, residential and mixed-use communities. Dacra has played an active role in revitalization efforts and redevelopment in Miami and Miami Beach. In addition to the Miami Design District, Dacra has developed real estate projects in South Beach’s Art Deco District and on Lincoln Road. In 2010, Dacra partnered with L Catterton Real Estate, a Catterton, LVMH and Groupe Arnault-sponsored global real estate development and investment fund specializing in creating luxury shopping destinations. The partnership brought LVMH brands, including Louis Vuitton, Dior, Fendi, Bulgari, Celine, Berluti, Hermes and Cartier to the Miami Design District, which paved the way for other global luxury brands and upscale contemporary brands to follow. Dacra and L Catterton Real Estate completed the first phase of the Miami Design District in 2012. In 2014, a joint venture between General Growth Properties (now Brookfield Property Partners (NASDAQ: BPY)) and Ashkenazy Acquisition Corp. acquired an interest in the Miami Design District. Brookfield Property Partners is a diversified global real estate company that owns, operates and develops one of the largest portfolios of office, retail, multifamily, industrial, hospitality, triple net lease, self-storage, student housing and manufactured housing assets.
The borrower sponsor owns approximately 20 acres (developed and available for future development) in the Miami Design District, of which the Miami Design District Property represents 7.4 acres. The Miami Design District Borrower covenanted that its affiliates will not, without the consent of the lender, (i) develop such parcels held for future development in a manner that would materially interfere with the continued use and operation of the Miami Design District Property, or (ii) engage in any leasing that would result in a material adverse effect to the Miami Design District Property.
The Property. The Miami Design District Property is a 497,094 SF portion of a Class A luxury retail development known as the Miami Design District in Miami, Florida. The Miami Design District is a LEED Neighborhood Development located at the northwest quadrant of Interstate 195 and N Federal Highway that was designed as a creative neighborhood for shopping, dining and contemporary public art exhibitions. The Miami Design District encompasses approximately 30 acres in a walkable urban environment, and is home to more than 120 flagship stores, including luxury brand retailers and jewelers Balenciaga, Hermes, Fendi, Dior, Cartier and Louis Vuitton. The Miami Design District also includes design showrooms, art galleries and cultural institutions, including The Institute of Contemporary Art Miami (ICA), de la Cruz Collection Contemporary Art Space, Locust Projects Alternative Art Space and the Haitian Heritage Museum. The buildings within the Miami Design District are arranged along a typical urban street block grid system, with on-street metered parking and a north/south running pedestrian-only corridor through the center, known as Paseo Ponti.
The Miami Design District Property consists of 15 buildings that were redeveloped between 2014 and 2019 from former warehouse, showroom and industrial space. The Miami Design District Property includes a total of 497,094 SF of rentable space plus 559 total parking spaces located in two garages. Many of the buildings are built-to-suit for luxury retailers, both with respect to the interior buildouts and exterior facades. According to the borrower rent roll, as of February 28, 2021, the Miami Design District Property was 95.6% leased. The largest tenants by underwritten base rent include Hermes, Harry Winston, Holly Hunt, Fendi Casa/Luxury Living and Tom Ford, with no other tenant representing more than 3.1% of underwritten base rent. Overall property sales for tenants who report at the Miami Design District Property increased 29.5% from 2018 to 2019 to $1,002 PSF ($231.5 million total sales). For year-end 2020, (including the months March through May 2020, when the Miami Design District Property was closed) the total sales for the tenants who report was $208.7 million ($947 PSF).
This is not a research report and was not prepared by any Underwriter’s research department. Please see additional important information and qualifications at the end of this Term Sheet.
T-40
| Retail - Luxury Retail | Loan #1 | Cut-off Date Balance: | | $95,000,000 |
| 151 NE 40th Street | Miami Design District | Cut-off Date LTV: | | 46.7% |
| Miami, FL 33137 | | UW NCF DSCR: | | 2.14x |
| | | UW NOI Debt Yield: | | 9.3% |
| Property Summary |
| Building | Year Built/ Renovated | Stories | Rentable SF | Occupancy | Major Tenants |
| Bridge South | 2017 | 2 | 7,076 | 100.0% | Yves Saint Laurent (4,183 SF) Balenciaga (2,893 SF) |
| Bridge North | 2017 | 2 | 12,603 | 100.0% | Dolce & Gabbana (5,320 SF) Alexander McQueen (4,460 SF) Mason Margiela (2,823 SF) |
| Buick | 1926/2015 | 4 | 82,396 | 97.1% | Holly Hunt (24,897 SF) Dacra (18,828 SF)(1) MDDA (Management Office) (10,776 SF)(1) |
| City View Garage | 2015 | 7 | 40,853 | 84.3% | Luxury Brand Partners (18,077 SF) Pura Vida (2,977 SF) Citco (2,614 SF) Rise Nation (2,613 SF) |
| Collins | 2015 | 2 | 17,026 | 100.0% | Cartier (7,735 SF) Loro Piana (4,767 SF) Tod’s (4,524 SF) |
| Hermes | 2015 | 3 | 13,500 | 100.0% | Hermes (13,500 SF) |
| Jade | 2017 | 3 | 15,324 | 100.0% | Prada (6,442 SF) Celine (5,191 SF) Okami (Ovation) (3,691 SF) |
| JBL | 2014 | 3 | 42,082 | 77.6% | Tom Ford (8,582 SF) COS (4,886 SF) Lanvin (3,367 SF) Omega (3,152 SF) |
| KVA | 2006 | 2 | 5,384 | 100.0% | Fendi (5,384 SF) |
| Laverne | 1961/2017 | 1 | 12,257 | 95.3% | Swan and Bar Bevy (10,180 SF) |
| Lee | 1955/2017 | 3 | 54,961 | 77.9% | Poliform (8,902 SF) Unifor, Inc. (Moltini) (7,384 SF) Dupuis (6,323 SF) Poltrona Frau (5,842 SF) |
| Newton | 1983/2018 | 2 | 15,000 | 100.0% | Luminaire (15,000 SF) |
| Palm Court | 2014 | 2 | 148,993 | 82.4% | Christian Dior (10,595 SF) Louis Vuitton (10,244 SF) St. Roche (MIA Market) (9,292 SF) Harry Winston (7,219 SF) Giorgio Armani (6,976 SF) |
| Penny Lane | 2017 | 3 | 22,439 | 100.0% | Fendi Casa/Luxury Living (22,439 SF) |
| Twery | 2006 | 2 | 7,200 | 100.0% | OTL (7,200 SF) |
Source: Appraisal and the underwritten rent roll dated September 2020.
| (1) | Sponsor-affiliated office space. |
Major Tenants.
Hermes (13,500 SF, 2.7% of NRA, 4.4% of underwritten base rent). Hermes International (“Hermes”) designs, produces and distributes personal luxury accessories and apparel. The company is over 183 years old and operates 311 boutiques worldwide under the Hermes name that sell items such as leather, scarves, men’s clothes, ties, women’s fashions, perfume, watches, stationery, shoes, hats, gloves and jewelry. Hermes occupies its own building on a lease that expires in February 2025, with two five-year renewal options each with six months’ notice. Hermes is currently paying an annual rent of $112.55 PSF, with annual rent increases of 3% each February. If at any time less than six of the permanent retail store tenants (including Armani, Balenciaga, Bulgari, Burberry, Carolina Herrera, Cartier, Celine, Chanel, Chloe, Christian Louboutin, DeBeers, Dior, Dunhill, Fendi, Givenchy, Gucci, Kiton, LV, Marc Jacobs, Prada, Pucci, Tag Heuer, Tiffany, Tomas Maier, Van Cleef, Versace, YSL, and Zegna) are open and operating for a period of six or more consecutive months, then Hermes will have the right to pay alternate rent of 6% of gross sales. If such co-tenancy event continues for an additional 12 months (18 months total), then Hermes will have the right, within 30 days after the expiration of the 18 month period, to terminate the lease. Sales for Hermes at the Miami Design District Property were reported at $2,012 PSF, $2,127 PSF and $1,713 PSF for 2018, 2019 and 2020, respectively.
Harry Winston (7,219 SF, 1.5% of NRA, 4.4% of underwritten base rent). Founded in 1932, Harry Winston is a jewelry retailer known for its expertise, fine craftsmanship, quality gems and innovative gemstone settings. In 2013, the Swatch Group Ltd. acquired Harry Winston. Harry Winston has retail salons around the world, including locations in New York, London, Paris, Geneva, Tokyo, Hong Kong and Shanghai. Harry Winston occupies 7,219 SF in the Palm Court building on a lease that expires in March 2025. Harry Winston is currently paying annual rent of $215.02 PSF, with annual rent increases of 3% each April. If at any time at least six of the permanent retail store tenants (including Bulgari, Cartier, Chanel, Dior, Dior Homme, Dolce G, Fendi, Giorgio, Gucci, Hermes, J.P. Tod’s, LV, Prada, Tag Heuer, Tiffany, Valentino, YSL, Zegna, and Zenith) (three of which must be Cartier, Dior, Hermes and LV) are not open and operating for a period of twelve consecutive months, then Harry Winston will have the right to pay alternate rent of 6% of gross sales or terminate the lease within 30 days after those twelve months. If such co-tenancy event continues for an additional 12 months (24 months total), then Harry Winston will have the right, within 30 days after the expiration of the 24 month period, to terminate the lease. Sales for Harry Winston at the Miami Design District Property were reported at $626 PSF, $505 PSF and $255 PSF for 2018, 2019 and 2020, respectively.
Holly Hunt (24,897 SF, 5.0% of NRA, 3.6% of underwritten base rent). Founded in 1983, Holly Hunt is a luxury home furnishing showroom with products including indoor and outdoor furniture, lighting, rugs, textiles and leathers. Holly Hunt partners with iconic modern brands such as Vladimir Kagan furniture designs and Assemblage bespoke wallcoverings. Holly Hunt renewed its lease in May 2020 for 24,897 SF of showroom/gallery space in the Buick building. The lease expires on April 30, 2025. Holly Hunt is currently paying annual rent of $39.14 PSF (after converting to a gross lease), with annual rent increases of 3.0% each May. The lease does not have any renewal or termination options.
This is not a research report and was not prepared by any Underwriter’s research department. Please see additional important information and qualifications at the end of this Term Sheet.
T-41
| Retail - Luxury Retail | Loan #1 | Cut-off Date Balance: | | $95,000,000 |
| 151 NE 40th Street | Miami Design District | Cut-off Date LTV: | | 46.7% |
| Miami, FL 33137 | | UW NCF DSCR: | | 2.14x |
| | | UW NOI Debt Yield: | | 9.3% |
Fendi Casa/Luxury Living (22,439 SF, 4.5% of NRA, 3.4% of underwritten base rent). Founded nearly 40 years ago, Fendi Casa/Luxury Living designs, manufactures in Italy, and distributes high-end furniture for international luxury brands. Luxury Living Group has been producing and distributing furniture for the collections of Fendi Casa, Bentley Home, Trussardi Casa, Bugatti Home, Paul Mathieu for Luxury Living Collections and Luxury Living Outdoor. Fendi Casa/Luxury Living occupies 22,439 SF in the Penny Lane building on a lease that expires on April 16, 2027. The lease requires current annual base rent of $54.08 PSF with annual rent increases of 4.0% each April. The lease does not have any renewal or termination options.
Tom Ford (8,582 SF, 1.7% of NRA, 3.4% of underwritten base rent). In April 2005, Tom Ford announced the creation of the Tom Ford brand for luxury clothing, accessories, fragrance and cosmetics. Ford was joined in this venture by former Gucci Group President and Chief Executive Officer Domenico De Sole, who serves as Chairman of the company. That same year, Ford announced his partnership with Marcolin Group to produce and distribute optical frames and sunglasses, as well as an alliance with Esteé Lauder to create the Tom Ford Beauty brand. Presently, there are 113 freestanding Tom Ford stores and shop-in-shops in locations such as New York, Toronto, Beverly Hills, Zurich, Milan, Hong Kong, Shanghai, Rome, London and Sydney. Tom Ford occupies 8,582 SF in the JBL building under a lease that expires in March 2025. Tom Ford is currently paying an annual rent of $140.17 PSF with 3% annual increases each March. The lease does not have any renewal or termination options. Sales for Tom Ford at the Miami Design District Property were reported at $563 PSF, $785 PSF and $634 PSF for 2018, 2019 and 2020, respectively.
The following table presents certain information relating to the major tenants at the Miami Design District Property:
| Tenant Summary(1) |
| | | | | | | % of | | 2020 Sales(2) | | |
| Tenant Name | Tenant Type | Credit Rating (Fitch/ Moody’s/ S&P) | Tenant SF | Approx. % of SF | Annual UW
Rent | Total Annual
UW
Rent | Annual UW Rent PSF | $ | PSF | Occ.
Cost % | Lease Exp. | Term. Options |
| Hermes | Fashion | NR/NR/NR | 13,500 | 2.7% | $1,519,425 | 4.4% | $112.55 | $23,119,936 | $1,713 | 10.2% | 2/23/2025 | N |
| Harry Winston | Jewelry/Watches | NR/NR/NR | 7,219 | 1.5% | $1,507,111 | 4.4% | $208.77 | $1,837,265 | $255 | 109.3% | 3/31/2025 | N |
| Holly Hunt | Showroom/Gallery | NR/NR/NR | 24,897 | 5.0% | $1,250,000 | 3.6% | $50.21 | NAV | NAV | NAV | 4/30/2025 | N |
| Fendi Casa/Luxury Living | Showroom/Gallery | NR/NR/NR | 22,439 | 4.5% | $1,166,828 | 3.4% | $52.00 | NAV | NAV | NAV | 4/16/2027 | N |
| Tom Ford | Fashion | NR/NR/NR | 8,582 | 1.7% | $1,156,342 | 3.4% | $134.74 | $5,441,943 | $634 | 30.1% | 3/31/2025 | N |
| Subtotal/Wtd. Avg. | | 76,637 | 15.4% | $6,599,706 | 19.2% | $86.12 | | | | | |
| | | | | | | | | | | | | |
| Other Tenants | | | 363,340 | 73.1% | $27,857,171 | 80.8% | $76.67 | | | | | |
| Vacant | | | 57,117 | 11.5% | $0 | 0.0% | $0.00 | | | | | |
| Total/Wtd. Avg.(3) | | 497,094 | 100.0% | $34,456,877 | 100.0% | $78.32 | | | | | |
| (1) | Information is based on the underwritten rent roll dated September 2020. Tenants ordered by % of Total Annual UW Rent. |
| (2) | Information is as of December 31, 2020, as provided by the borrower sponsors. The sales include the months March through May 2020, when the Miami Design District Property was closed due to COVID-19 restrictions. As of December 31, 2019, Hermes reported sales PSF and occupancy cost of $2,127 and 8.2%, respectively. As of December 31, 2019, Harry Winston reported sales PSF and occupancy cost of $505 and 55.0%, respectively. As of December 31, 2019, Tom Ford reported sales PSF and occupancy cost of $785 and 24.3%, respectively. |
| (3) | Total/Wtd. Avg. Annual UW Rent PSF excludes vacant space. |
This is not a research report and was not prepared by any Underwriter’s research department. Please see additional important information and qualifications at the end of this Term Sheet.
T-42
| Retail - Luxury Retail | Loan #1 | Cut-off Date Balance: | | $95,000,000 |
| 151 NE 40th Street | Miami Design District | Cut-off Date LTV: | | 46.7% |
| Miami, FL 33137 | | UW NCF DSCR: | | 2.14x |
| | | UW NOI Debt Yield: | | 9.3% |
The following table presents certain information relating to the lease rollover schedule at the Miami Design District Property:
| Lease Rollover Schedule(1)(2) |
| Year | # of
Leases Rolling | SF Rolling | UW Rent PSF Rolling | Approx. % of
Total SF Rolling | Approx.
Cumulative % of SF Rolling | Total UW Rent Rolling | Approx. % of
Total Rent
Rolling | Approx. Cumulative % of Total Rent
Rolling |
| MTM/2020 | 9 | 29,128 | $13.79 | 5.9% | 5.9% | $401,585 | 1.2% | 1.2% |
| 2021 | 8 | 18,240 | $41.38 | 3.7% | 9.5% | $754,850 | 2.2% | 3.4% |
| 2022 | 13 | 39,196 | $39.02 | 7.9% | 17.4% | $1,529,325 | 4.4% | 7.8% |
| 2023 | 8 | 39,034 | $29.29 | 7.9% | 25.3% | $1,143,141 | 3.3% | 11.1% |
| 2024 | 10 | 50,071 | $96.94 | 10.1% | 35.3% | $4,853,973 | 14.1% | 25.2% |
| 2025 | 29 | 143,457 | $108.13 | 28.9% | 64.2% | $15,511,582 | 45.0% | 70.2% |
| 2026 | 1 | 5,384 | $110.40 | 1.1% | 65.3% | $594,394 | 1.7% | 71.9% |
| 2027 | 7 | 43,506 | $95.57 | 8.8% | 74.0% | $4,157,724 | 12.1% | 84.0% |
| 2028 | 8 | 44,058 | $88.11 | 8.9% | 82.9% | $3,881,931 | 11.3% | 95.3% |
| 2029 | 2 | 9,300 | $63.60 | 1.9% | 84.8% | $591,460 | 1.7% | 97.0% |
| 2030 | 2 | 7,827 | $132.48 | 1.6% | 86.3% | $1,036,912 | 3.0% | 100.0% |
| 2031 & Beyond(3) | 1 | 10,776 | $0.00 | 2.2% | 88.5% | $0 | 0.0% | 100.0% |
| Vacant | 0 | 57,117 | $0.00 | 11.5% | 100.0% | $0 | 0.0% | 100.0% |
| Total/Wtd. Avg.(4) | 98 | 497,094 | $78.32 | 100.0% | | $34,456,877 | 100.0% | |
| (1) | Information is based on the underwritten rent roll dated September 2020. |
| (2) | Certain tenants may have lease termination options that are exercisable prior to the originally stated expiration date of the subject lease and that are not considered in the Lease Rollover Schedule. |
| (3) | 2031 & Beyond includes space for a management office that has no rent associated with it. |
| (4) | Total/Wtd. Avg. UW Rent PSF Rolling excludes vacant space. |
COVID-19 Update. The Miami Design District Whole Loan is current as of the April 2021 debt service payment. As of April 29, 2020, the Miami Design District Borrower entered into a loan modification to defer debt service payments for May, June and July 2020, which are payable on the earlier of the maturity date or when the loan is paid in full and will not be assets of the Trust. The Miami Design District Borrower also entered into a loan modification in October 2020, pursuant to which the Miami Design District Borrower deposited $10,474,740 (equal to 6.0 months of interest-only debt service on the Miami Design District Whole Loan) as a debt service reserve (see “Escrows and Reserves” below) and postponed any test for a Trigger Period (see “Lockbox and Cash Management” below) until the quarter commencing April 1, 2021. The debt service reserve began being applied to debt service payments on January 1, 2021, and will continue to be applied to debt service payments on future payment dates, provided that no event of default is continuing. The Miami Design District Property was closed between March 19 and May 18, 2020 due to COVID-19 restrictions, and was closed for ten days in June 2020 due to civil unrest, over which time no damage occurred. As of April 19, 2021, the borrower sponsor has reported that the Miami Design District Property is open and operating with safety precautions including reduced hours (Monday – Saturday: 11am – 7pm and Sunday: 12pm – 5pm), rigorous cleaning protocols, masks and hand sanitizer stations, complimentary in-house personal shoppers to shop and deliver goods to customers, and contactless parking and free valet service. Many retailers and restaurants are offering curbside pick-up. 91.1% of tenants by NRA and 91.8% of tenants by underwritten base rent paid their full February 2021 rent payments. 88.7% of tenants by NRA and 91.4% of tenants by underwritten base rent paid their full March 2021 rent payments.
The Market. The Miami Design District Property is located in the Buena Vista neighborhood, in the northeastern portion of Miami, Florida. According to the appraisal, the Miami-Fort Lauderdale-West Palm Beach metro area (“Miami MSA”) had a population of approximately 2.79 million, with a 3.4% unemployment rate and a 6.0% personal income growth rate for 2019. Major employers include University of Miami, Jackson Health System, Publix Super Markets, Inc., Baptist Health Systems of Southern Florida and American Airlines. The Miami MSA has an international draw, ranking first in the country in immigration by ratio to population, ranking second in the country in overseas visitors (after New York City) and ranking second in the country in international cargo receipts (after Anchorage). The Miami MSA is the only metro area in the country where more than half of its residents are foreign-born.
Primary access to the Miami Design District Property is by Interstates 95 and 195 via Biscayne Boulevard or Miami Avenue, and by neighborhood north/south roadways including NW 2nd Avenue, N Miami Avenue, NE 2nd Avenue and Federal Highway, between east/west roadways from NE 38th Street to NE 54th Street. The Miami International Airport is located approximately 7.0 miles west, the Miami central business district is located approximately 5.0 miles south, and South Beach is located approximately 6.5 miles southeast of the Miami Design District Property.
The Miami Design District is a part of the Wynwood-Design District commercial real estate submarket and is known to be a creative neighborhood and shopping destination dedicated to innovative fashion, design, art, architecture and dining. The area contains multiple retail, design and furniture showroom properties which together draw regional demand from both local shoppers and tourists. For 2019, the Wynwood-Design District submarket had approximately 3.5 million SF of inventory (71,010 SF of new completions), with a 10.2% vacancy rate and overall asking rents of $59.53 PSF. Within the 0.25-mile radius of the Miami Design District Property, 2019 inventory was approximately 1.2 million SF (43,327 SF of new completions), with a 6.7% vacancy rate and overall asking rents of $85.95 PSF.
According to the appraisal, the estimated 2019 population within a one-, three- and five-mile radius of the Miami Design District Property was 33,589, 216,668 and 572,510, respectively. The estimated 2019 average household income within the same radii was $68,975, $57,649 and $68,788, respectively.
This is not a research report and was not prepared by any Underwriter’s research department. Please see additional important information and qualifications at the end of this Term Sheet.
T-43
| Retail - Luxury Retail | Loan #1 | Cut-off Date Balance: | | $95,000,000 |
| 151 NE 40th Street | Miami Design District | Cut-off Date LTV: | | 46.7% |
| Miami, FL 33137 | | UW NCF DSCR: | | 2.14x |
| | | UW NOI Debt Yield: | | 9.3% |
The following table presents recent leasing data at comparable retail properties with respect to the Miami Design District Property:
| Comparable Lease Summary |
Property Address | Year Built | Distance
from
Subject | Center
NRA SF | Anchor/ Notable Tenants | Occupancy | Sales
PSF | NNN Rent
PSF |
Miami Design District 151 NE 40th Street Miami, FL | 2014-2019 | NAP | 497,094(1) | Hermes, Christian Dior, Louis Vuitton, Cartier, Tom Ford, Prada, Tiffany & Co., Van Kleef & Arpels, Dolce & Gabbana, Yves Saint Laurent, Tod’s, Omega, Fendi, A. Lange Sohne, Versace,Tag Heuer, Giorgio Armani, Bulgari, Valentino, IWC | 88.5%(1) | $947(2) | $50 - $125 |
Bal Harbour Shops 9700 Collins Avenue Bal Harbour, FL | 1965, 1982 | 9.0 miles | 463,114 | Saks 5th Avenue, Neiman Marcus, Dolce & Gabbana, Balenciaga, Gucci, Loro Piana, Prada, Ralph Lauren, Saint Laurent Paris, Valentino, Chanel, Dior, Fendi, Louis Vuitton, Jimmy Choo, Bulgari, Panerai, Van Cleef & Arpels, Tiffany & Co. | (+/-) 99% | $3,530 | $200 - $350 |
Aventura Mall 19501 Biscayne Boulevard Aventura, FL | 1983, 1997, 2008, 2017 | 15.0 miles | 2,086,948 | Nordstrom, Macy’s, Bloomingdales, JC Penney, Apple, Chanel, Louis Vuitton, Gucci, Cartier, Burberry, Fendi, Tag Heuer, Tiffani & Co., Givenchy, Rolex | (+/-) 98% | $1,625 | $150 - $250 |
Brickell City Center 701 S Miami Avenue Miami, FL | 2016-2017 | 5.0 miles | 483,372 | Saks 5th Avenue, Apple, Coach, Cole Haan, Boss, Intermix, IRO, Lululemon, Victoria’s Secret, Pandora, Kendra Scott, Zara | (+/-) 95% | $1,055 | $50 - $175 |
Worth Avenue Retail 100-300 Worth Avenue Palm Beach, FL | 1938, 1983, 2010 | 70.0 miles | 250,000(3) | Saks 5th Avenue, Neiman Marcus, Bruno Cucinelli, Ralph Lauren, Loro Piana, Jimmy Choo, Tiffany & Co., Chanel, Intermix, Michael Kors, Valentino, MaxMara, Torneau, Louis Vuitton, Panerai, Hublot, Gucci | (+/-) 98% | NAP | $100 - $250 |
Lincoln Road Pedestrian Mall 400-1100 Lincoln Road Miami Beach, FL | 1950, 2006, 2010 | 5.5 miles | 500,000(3) | Nike, Anthropologie, Athleta, Guess, Banana Republic, GAP, H&M, Intermix, J. Crew, Pandora, Lululemon, Sephora, Zadig & Voltaire, Zara, Victoria’s Secret, Macy’s, Ross Dress for Less and Marshals | (+/-) 90% | NAP | $150 - $300 |
Source: Appraisal.
| (1) | Information obtained from underwritten rent roll dated September 2020. |
| (2) | Information is as of December 31, 2020, as provided by the borrower sponsors, and only includes tenants reporting sales. The Sales PSF include the months March through May 2020, when the Miami Design District Property was closed due to COVID-19 restrictions. |
| (3) | Represents approximate gross leasable area. |
The following table presents certain information relating to the appraisal’s market rent conclusions for the Miami Design District Property:
| Market Rent Summary |
| | Market Rent (PSF) | Lease Term (Yrs) | Rental Increase Projection |
| Retail Fashion | $115 | 10 | 3% per annum |
| Retail General | $40 | 10 | 3% per annum |
| Retail Jewelry | $180 | 10 | 3% per annum |
| Retail Restaurant - Full Service | $45 | 10 | 3% per annum |
| Retail Restaurant - Limited Service | $30 | 10 | 3% per annum |
| Retail Restaurant - Drink | $45 | 10 | 3% per annum |
| Retail Showroom | $45 | 10 | 3% per annum |
| Retail Art Gallery | $140 | 10 | 3% per annum |
| Retail Services | $45 | 10 | 3% per annum |
| Office | $27 | 10 | 3% per annum |
| Storage | $30 | 5 | 0% |
This is not a research report and was not prepared by any Underwriter’s research department. Please see additional important information and qualifications at the end of this Term Sheet.
T-44
| Retail - Luxury Retail | Loan #1 | Cut-off Date Balance: | | $95,000,000 |
| 151 NE 40th Street | Miami Design District | Cut-off Date LTV: | | 46.7% |
| Miami, FL 33137 | | UW NCF DSCR: | | 2.14x |
| | | UW NOI Debt Yield: | | 9.3% |
Operating History and Underwritten Net Cash Flow. The following table presents certain information relating to the historical operating performance and Underwritten Net Cash Flow at the Miami Design District Property:
| Cash Flow Analysis |
| | 2017 | 2018 | 2019 | 2020(1) | UW(2) | UW PSF |
| Gross Potential Rent | $24,853,605 | $29,909,090 | $31,279,003 | $30,509,279 | $41,080,090 | $82.64 |
| Reimbursements | $12,575,427 | $14,238,369 | $15,158,900 | $14,515,124 | $14,928,995 | $30.03 |
| Other Income(3) | $3,986,235 | $3,979,719 | $4,136,244 | $1,811,327 | $3,655,678 | $7.35 |
| Vacancy and Concessions | $0 | $0 | $0 | $0 | ($6,623,213) | ($13.32) |
| Effective Gross Income | $41,415,267 | $48,127,178 | $50,574,148 | $46,835,731 | $53,041,550 | $106.70 |
| | | | | | | |
| Real Estate Taxes | $4,610,638 | $5,462,967 | $5,582,649 | $4,926,795 | $6,140,915 | $12.35 |
| Insurance | $611,547 | $718,405 | $691,057 | $634,954 | $775,000 | $1.56 |
| Other Operating Expenses | $10,578,921 | $9,812,182 | $10,483,050 | $8,463,086 | $9,091,534 | $18.29 |
| Total Operating Expenses | $15,801,105 | $15,993,554 | $16,756,756 | $14,024,835 | $16,007,449 | $32.20 |
| | | | | | | |
| Net Operating Income | $25,614,162 | $32,133,624 | $33,817,392 | $32,810,895 | $37,034,101 | $74.50 |
| TI/LC | $0 | $0 | $0 | $0 | $994,188 | $2.00 |
| CapEx | $0 | $0 | $0 | $0 | $99,419 | $0.20 |
| Net Cash Flow | $25,614,162 | $32,133,624 | $33,817,392 | $32,810,895 | $35,940,495 | $72.30 |
| | | | | | | |
| Occupancy % | 87.0% | 93.1% | 92.4% | 88.5%(4) | 88.6% | |
| NOI DSCR(5) | 1.53x | 1.92x | 2.02x | 1.96x | 2.21x | |
| NCF DSCR(5) | 1.53x | 1.92x | 2.02x | 1.96x | 2.14x | |
| NOI Debt Yield(5) | 6.4% | 8.0% | 8.5% | 8.2% | 9.3% | |
| NCF Debt Yield(5) | 6.4% | 8.0% | 8.5% | 8.2% | 9.0% | |
| (1) | The Miami Design District Property was closed between March 19 and May 18, 2020 due to COVID-19 restrictions, and was closed for ten days in June 2020 due to civil unrest, over which time no damage occurred. |
| (2) | UW Gross Potential Rent is based on the September 2020 rent roll with adjustments made for executed leases and tenants that have vacated or are expected to vacate after loan closing. UW Gross Potential Rent includes grossed up vacant space of $6,623,213 and contractual rent increases through March 2021. |
| (3) | Other Income consists of parking income, temporary tenant income, events revenue, % in lieu, and overage rent. The 2020 period did not have other income from temporary tenant income, % in lieu, or overage rent. |
| (4) | Occupancy shown is as of September 1, 2020. |
| (5) | Debt service coverage ratios and debt yields are based on the Miami Design District Senior Loan and exclude the Miami Design District Subordinate Companion Loan. |
Escrows and Reserves.
Real Estate Taxes – The Miami Design District Borrower deposited at loan origination $2,100,000 to the real estate tax reserve and is required to deposit monthly to the reserve 1/12 of the annual estimated real estate taxes.
Insurance – Unless the Miami Design District Property is covered by a blanket policy for which the premiums have been prepaid (as currently), the Miami Design District Borrower is required to deposit monthly 1/12 of the annual estimated insurance premiums to the insurance reserve.
Replacement Reserve – The Miami Design District Borrower is required to deposit monthly $8,285 for replacements to the Miami Design District Property.
TI/LC Reserve – The Miami Design District Borrower deposited at loan origination $4,907,050 for outstanding landlord obligations related to nine tenants and is required to deposit monthly $82,849 for future tenant improvements and leasing commissions. As of April 16, 2021, the TI/LC Reserve had a balance of $3,114,468.
Free/Gap Rent Reserve – The Miami Design District Borrower deposited at loan origination the amount of $1,724,567 for gap rent and free rent, which total reserve includes $460,756 of gap rent for periods of one to seven months related to four tenants (of which $64,320 remains on deposit as of April 16, 2021) and $1,263,811 of free rent through March 31, 2021 related to seven tenants (of which $44,692 remains on deposit as of April 16, 2021).
Debt Service Reserve – The Miami Design District Borrower deposited on December 1, 2020 $10,474,740 (equal to 6 months of interest-only debt service on the Miami Design District Whole Loan) as a debt service reserve. So long as no event of default is continuing, funds in the debt service reserve began being applied to debt service payments in January 1, 2021.
Lockbox and Cash Management. The Miami Design District Whole Loan is structured with a hard lockbox and springing cash management. All rents from the Miami Design District Property are required to be deposited directly to the lockbox account and so long as a Trigger Period (as defined below) is not continuing, funds in the lockbox account will be transferred to the borrower’s operating account. During a Trigger Period, the Miami Design District Borrower will not have access to the funds in the lockbox account and such funds will be transferred on each business day to the lender-controlled cash management account and disbursed according to the Miami Design District Whole Loan documents. During a Trigger Period, all excess cash is required to be held by the lender as additional security for the Miami Design District Whole Loan; however, provided no event of default is continuing as to which the lender has accelerated the Miami Design District Whole Loan or initiated an enforcement action, the Miami Design District Borrower is permitted to
This is not a research report and was not prepared by any Underwriter’s research department. Please see additional important information and qualifications at the end of this Term Sheet.
T-45
| Retail - Luxury Retail | Loan #1 | Cut-off Date Balance: | | $95,000,000 |
| 151 NE 40th Street | Miami Design District | Cut-off Date LTV: | | 46.7% |
| Miami, FL 33137 | | UW NCF DSCR: | | 2.14x |
| | | UW NOI Debt Yield: | | 9.3% |
use excess cash to pay the costs of replacements at the Miami Design District Property not otherwise included in the annual budget or to pay for leasing costs.
A “Trigger Period” will occur during either (a) the period commencing upon the occurrence of an event of default and ending upon the cure or waiver of the event of default, or (b) the period beginning when the trailing six month (annualized) debt yield on the Miami Design District Whole Loan is less than 6.50% (tested quarterly beginning with the quarter commencing April 1, 2021, for two consecutive quarters) and ending when the trailing six month (annualized) debt yield on the Miami Design District Whole Loan is at least 6.50% (tested quarterly for two consecutive quarters).
Additional Secured Indebtedness (not including trade debts). The Miami Design District Property also secures eleven pari passu senior promissory notes (the “Miami Design District Pari Passu Companion Loan”), which have an aggregate Cut-off Date principal balance of $305,000,000, and the Miami Design District Subordinate Companion Loan, which has a Cut-off Date principal balance of $100,000,000. The Miami Design District Pari Passu Companion Loan and the Miami Design District Subordinate Companion Loan accrue interest at the same rate as the Miami Design District Mortgage Loan. The Miami Design District Mortgage Loan is entitled to payments of interest on a pro rata and pari passu basis with the Miami Design District Pari Passu Companion Loan, which payments are senior in right of payment to the Miami Design District Subordinate Companion Loan. The holders of the promissory notes evidencing the Miami Design District Whole Loan have entered into a co-lender agreement that sets forth the allocation of collections on the Miami Design District Whole Loan. See “Description of the Mortgage Pool—The Whole Loans—The Miami Design District Pari Passu-A/B Whole Loan” and “Pooling and Servicing Agreement” in the Preliminary Prospectus.
Subordinate Note Summary |
| | Subordinate Note
Original Principal
Balance | Subordinate
Note Interest
Rate | Original
Term
(mos.) | Original
Amort.
Term
(mos.) | Original
IO Term
(mos.) | Whole
Loan UW
NCF DSCR | Whole
Loan UW
NOI Debt
Yield | Whole
Loan Cut-
off Date
LTV |
| Miami Design District Subordinate Companion Loan | $100,000,000 | 4.1325% | 120 | 0 | 120 | 1.72x | 7.4% | 58.4% |
Mezzanine Loan and Preferred Equity. Not permitted.
Release of Property. Not permitted.
Letter of Credit. None.
Right of First Offer/Right of First Refusal. None.
Ground Lease. None.
Terrorism Insurance. The Miami Design District Borrower is required to obtain and maintain property insurance that covers perils and acts of terrorism and is required to obtain and maintain business interruption insurance for 24 months plus a 12-month extended period of indemnity; provided that the Miami Design District Borrower will only be required to pay for terrorism insurance a maximum of two times the annual insurance premiums payable for the Miami Design District Property at the time with respect to the property and business interruption policies. See “Risk Factors—Risks Relating to the Mortgage Loans—Terrorism Insurance May Not Be Available for All Mortgaged Properties” in the Preliminary Prospectus.
This is not a research report and was not prepared by any Underwriter’s research department. Please see additional important information and qualifications at the end of this Term Sheet.
T-46
(THIS PAGE INTENTIONALLY LEFT BLANK)
This is not a research report and was not prepared by any Underwriter’s research department. Please see additional important information and qualifications at the end of this Term Sheet.
T-47
| Industrial – Various | Loan #2 | Cut-off Date Balance: | | $69,903,870 |
| Property Addresses - Various | Equus Industrial Portfolio | Cut-off Date LTV: | | 39.9% |
| | | U/W NCF DSCR: | | 5.10x |
| | | U/W NOI Debt Yield: | | 14.0% |
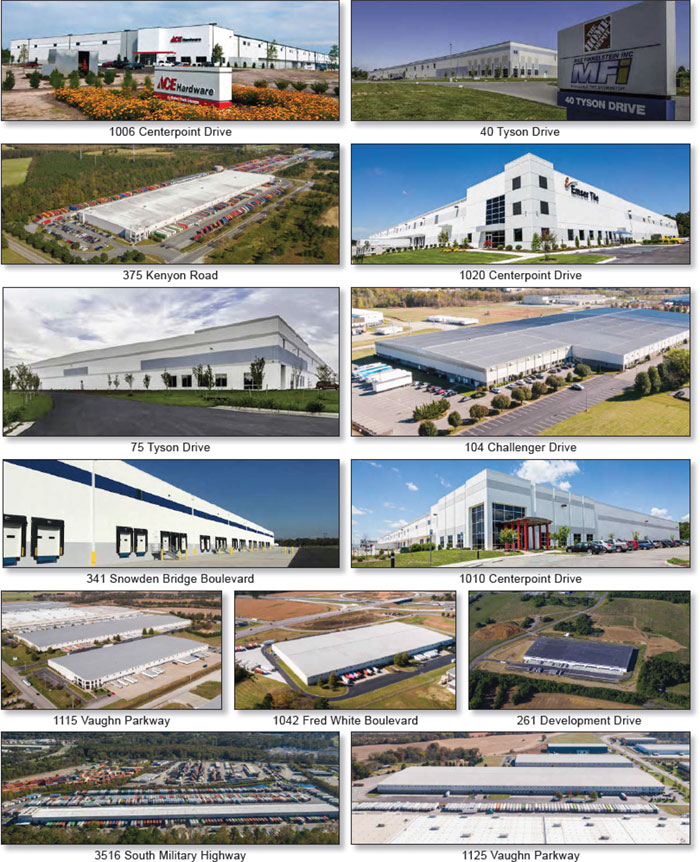
This is not a research report and was not prepared by any Underwriter’s research department. Please see additional important information and qualifications at the end of this Term Sheet.
T-48
| Industrial – Various | Loan #2 | Cut-off Date Balance: | | $69,903,870 |
| Property Addresses - Various | Equus Industrial Portfolio | Cut-off Date LTV: | | 39.9% |
| | | U/W NCF DSCR: | | 5.10x |
| | | U/W NOI Debt Yield: | | 14.0% |
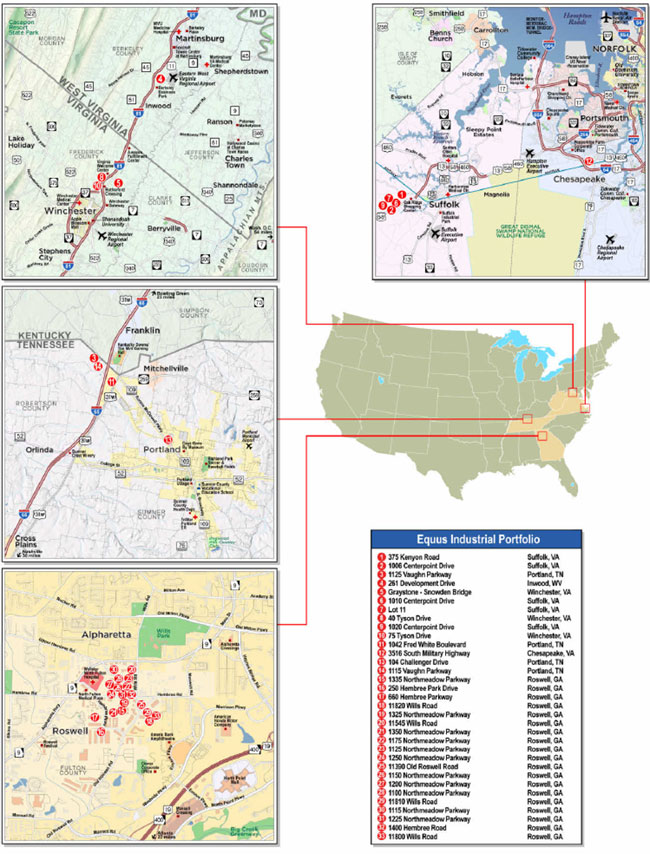
This is not a research report and was not prepared by any Underwriter’s research department. Please see additional important information and qualifications at the end of this Term Sheet.
T-49
| Mortgage Loan No. 2 – Equus Industrial Portfolio |
| Mortgage Loan Information | | Property Information |
| Mortgage Loan Seller: | MSMCH | | Single Asset/Portfolio: | Portfolio |
| Credit Assessment (Moody’s/Fitch/KBRA): | Baa1/BBB-sf/ A- | | Location: | Various |
| Original Balance(1): | $69,903,870 | | General Property Type: | Industrial |
| Cut-off Date Balance(1): | $69,903,870 | | Detailed Property Type: | Various |
| % of Initial Pool Balance: | 7.0% | | Title Vesting(6): | Fee |
| Loan Purpose: | Acquisition | | Year Built/Renovated: | Various / Various |
| Borrower Sponsors: | AIG Global Real Estate Investment | | Size: | 5,959,157 |
| | Corp. and Equus Capital Partners, Ltd. | | Cut-off Date Balance PSF(1): | $39 |
| Guarantors: | AIG Global Real Estate Investment | | Maturity Balance PSF(1): | $39 |
| | Corp. and Equus Capital Partners, Ltd. | | Property Manager: | BPG Management Company, L.P.; |
| Mortgage Rate(2): | 2.4838% | | | BPG Management Company-NC, LLC |
| Note Date: | 4/8/2021 | | |
| First Payment Date: | 5/9/2021 | | | |
| Maturity Date: | 4/9/2028 | | | |
| Original Term to Maturity: | 84 months | | | |
| Original Amortization Term: | 0 months | | | |
| IO Period: | 84 months | | Underwriting and Financial Information(7) |
| Seasoning: | 1 month | | UW NOI: | $32,553,381 |
| Prepayment Provisions(3): | L(25), YM(52), O(7) | | UW NOI Debt Yield(1): | 14.0% |
| Lockbox/Cash Mgmt Status: | Hard/Springing | | UW NOI Debt Yield at Maturity(1): | 14.0% |
| Additional Debt Type(1)(4): | Pari Passu/Subordinate Debt | | UW NCF DSCR(1): | 5.10x |
| Additional Debt Balance(1)(4): | $163,109,030/$154,000,000 | | Most Recent NOI: | $25,929,865 (12/31/2020) |
| Future Debt Permitted (Type): | No (NAP) | | 2nd Most Recent NOI: | $21,226,431 (12/31/2019) |
| Reserves(5) | | 3rd Most Recent NOI: | $21,046,296 (12/31/2018) |
| Type | Initial | Monthly | Cap | | Most Recent Occupancy: | 98.2% (Various) |
| RE Taxes: | $0 | Springing | NAP | | 2nd Most Recent Occupancy: | 98.6% (12/31/2020) |
| Insurance: | $0 | Springing | NAP | | 3rd Most Recent Occupancy: | 95.0% (12/31/2019) |
| Replacement Reserve: | $0 | Springing | NAP | | Appraised Value (as of): | $583,390,000 (Various) |
| TI/LC Reserve: | $0 | Springing | NAP | | Appraised Value PSF: | $98 |
| PILOT Reserve: | $0 | Springing | NAP | | Cut-off Date LTV Ratio(1): | 39.9% |
| Other: | $21,697,043 | $0 | NAP | | Maturity Date LTV Ratio(1): | 39.9% |
| | | | | | | | |
| Sources and Uses |
| Sources | Proceeds | % of Total | | Uses | Proceeds | % of Total |
| Senior Loan Amount(1): | $233,012,900 | 38.3% | | Purchase Price: | $585,904,000 | 96.3% |
| Subordinate Loan Amount(1): | $154,000,000 | 25.3% | | Closing Costs: | $988,601 | 0.2% |
| Borrower Equity: | $221,576,744 | 36.4% | | Reserves: | $21,697,043 | 3.6% |
| Total Sources: | $608,589,644 | 100.0% | | Total Uses: | $608,589,644 | 100.0% |
| (1) | The Equus Industrial Portfolio Mortgage Loan (as defined below) is part of the Equus Industrial Portfolio Whole Loan (as defined below), which is comprised of two pari passu senior promissory notes in the aggregate original principal amount of $233,012,900 (the “Equus Industrial Portfolio Senior Notes,” and collectively, the “Equus Industrial Portfolio Senior Loan”), and ten promissory notes in the aggregate original principal amount of $154,000,000 that are pari passu with each other and subordinate to the Equus Industrial Portfolio Senior Notes (collectively, the “Equus Industrial Portfolio Subordinate Companion Loan” and together with the Equus Industrial Portfolio Senior Loan, the “Equus Industrial Portfolio Whole Loan”). The Cut-off Date Balance PSF, Maturity Date Balance PSF, UW NCF DSCR, UW NOI Debt Yield, UW NOI Debt Yield at Maturity, Cut-off Date LTV Ratio and Maturity Date LTV Ratio numbers presented above are based on the Equus Industrial Portfolio Senior Loan. The Cut-off Date Balance PSF, Maturity Date Balance PSF, UW NCF DSCR, UW NOI Debt Yield, UW NOI Debt Yield at Maturity, Cut-off Date LTV Ratio and Maturity Date LTV Ratio based on the Equus Industrial Portfolio Whole Loan are $65, $65, 2.45x, 8.4%, 8.4%, 66.3% and 66.3%, respectively. The Equus Industrial Portfolio Whole Loan was co-originated by Morgan Stanley Bank, N.A. (“MSBNA”), Morgan Stanley Mortgage Capital Holdings LLC (“MSMCH”) (as to a portion of the Equus Industrial Portfolio Subordinate Companion Loan) and Goldman Sachs Bank USA (“GSB”). |
| (2) | Reflects the Equus Industrial Portfolio Senior Loan only. The Equus Industrial Portfolio Subordinate Companion Loan accrues interest at the rate of 4.0700% per annum. |
| (3) | In connection with the release of the Lot 11 property, the Equus Industrial Portfolio Whole Loan may be prepaid in an amount equal to the applicable release price at any time, without regard to the lockout period. Such prepayment must be accompanied by a yield maintenance premium, if made prior to the open period. |
| (4) | See “The Mortgage Loan” and “Additional Secured Indebtedness (not including trade debts)” below for further discussion of additional debt. |
| (5) | See “Escrows and Reserves” below for further discussion of reserve requirements. |
| (6) | In connection with a payment in lieu of taxes (“PILOT”) arrangement, the fee interests in the 1115 Vaughn Parkway property and the 1125 Vaughn Parkway property were conveyed to a local industrial development authority (the “IDA”) and ground leased back to the related borrower. The IDA subjected its fee interest to the mortgage on the related properties, and accordingly such properties are shown as fee herein. |
| (7) | The novel coronavirus pandemic is an evolving situation and could impact the Equus Industrial Portfolio Whole Loan more severely than assumed in the underwriting of the Equus Industrial Portfolio Whole Loan and could adversely affect the NOI, NCF and occupancy information, as well as the appraised value and the DSCR, LTV and Debt Yield metrics presented above and herein. See “Risk Factors—Risks Related to Market Conditions and Other External Factors—The Coronavirus Pandemic Has Adversely Affected the Global Economy and Will Likely Adversely Affect the Performance of the Mortgage Loans” in the Preliminary Prospectus. |
This is not a research report and was not prepared by any Underwriter’s research department. Please see additional important information and qualifications at the end of this Term Sheet.
T-50
| Industrial – Various | Loan #2 | Cut-off Date Balance: | | $69,903,870 |
| Property Addresses - Various | Equus Industrial Portfolio | Cut-off Date LTV: | | 39.9% |
| | | U/W NCF DSCR: | | 5.10x |
| | | U/W NOI Debt Yield: | | 14.0% |
The Mortgage Loan. The second largest mortgage loan (the “Equus Industrial Portfolio Mortgage Loan”) is part of the Equus Industrial Portfolio Whole Loan in the original principal amount of $387,012,900. The Equus Industrial Portfolio Whole Loan is secured by a first priority fee mortgage encumbering a portfolio of 33 industrial properties located in Georgia, Tennessee, Virginia and West Virginia (the “Equus Industrial Portfolio” or the “Equus Industrial Portfolio Properties”). The Equus Industrial Portfolio Whole Loan was co-originated by MSBNA, MSMCH and GSB. The Equus Industrial Portfolio Whole Loan is comprised of the Equus Industrial Portfolio Senior Notes, consisting of two pari passu senior promissory notes in the aggregate original principal amount of $233,012,900, and the Equus Industrial Portfolio Subordinate Companion Loan, consisting of ten subordinate promissory notes in the aggregate original principal amount of $154,000,000. The non-controlling senior Note A-2, with an original principal balance of $69,903,870, represents the Equus Industrial Portfolio Mortgage Loan and will be included in the BANK 2021-BNK33 securitization trust. The other senior promissory note, with an original principal amount of $163,109,030 (the “Equus Industrial Portfolio Pari Passu Companion Loan”), is expected to be contributed to one or more future securitization transactions. The Equus Industrial Portfolio Whole Loan will initially be serviced pursuant to the pooling and servicing agreement for the BANK 2021-BNK33 securitization; however, once the Note A-1 is contributed to a securitization trust, the Equus Industrial Portfolio Whole Loan will be serviced pursuant to the pooling and servicing agreement for the securitization to which the Note A-1 is contributed. See “Description of the Mortgage Pool—The Whole Loans—The Equus Industrial Portfolio Pari Passu-A/B Whole Loan” and “Pooling and Servicing Agreement—Servicing of the Servicing Shift Mortgage Loan” in the Preliminary Prospectus.
| Equus Industrial Portfolio Whole Loan Summary |
| Note | Original Balance | Cut-off Date Balance | Note Holder | Controlling Piece |
| A-1 | $163,109,030 | $163,109,030 | GSB | No |
| A-2 | 69,903,870 | 69,903,870 | BANK 2021-BNK33 | No |
B-1-A, B-1-B, B-1-C, B-1-D, B-1-E, B-2-A, B-2-B, B-2-C, B-2-D, B-2-E(1) | 154,000,000 | 154,000,000 | Third Party Investors | Yes(2) |
| Total (Whole Loan) | $387,012,900 | $387,012,900 | | |
| (1) | The Equus Industrial Portfolio Subordinate Companion Loan is subordinate to the Equus Industrial Portfolio Senior Loan. |
| (2) | Pursuant to the related co-lender agreement, the holder of more than 50% of the Equus Industrial Portfolio Subordinate Companion Loan (by principal balance) is the controlling noteholder unless a “control appraisal period” has occurred and is continuing under the co-lender agreement, in which case Note A-1 will become the controlling noteholder. See “Description of the Mortgage Pool—The Whole Loans—The Equus Industrial Portfolio Pari Passu-A/B Whole Loan” in the Preliminary Prospectus. |
The Borrowers and the Borrower Sponsors. The borrowers are SE Georgia Property Owner LLC, SE VA Interstate 81 Property Owner LLC, SE VA Suffolk Property Owner LLC and SE Tennessee Property Owner LLC, each a single purpose Delaware limited liability company structured to be bankruptcy remote with two independent directors in the organizational structure. The borrower sponsors and non-recourse carveout guarantors are Equus Capital Partners, Ltd. and AIG Global Real Estate Investment Corp. (the “Guarantors”); however, the Guarantors will only have liability with respect to voluntary bankruptcy filings and collusive involuntary bankruptcy filings, and only the single purpose entity borrowers (and not the Guarantors) are parties to the environmental indemnity. The Guarantors provided a completion guaranty in respect of remaining costs to complete work, including tenant improvements, at the Lot 11 property, as to which construction has not yet been completed.
The Properties. The Equus Industrial Portfolio consists of 33 industrial properties totaling approximately 6.0 million SF located throughout four states, including Virginia (51.4% of total NRA; 47.6% of underwritten base rent), Tennessee (22.4% of total NRA; 14.7% of underwritten base rent), Georgia (20.2% of NRA; 32.6% of underwritten base rent) and West Virginia (6.0% of NRA; 5.2% of underwritten base rent). On a property level, no single Equus Industrial Portfolio Property comprises more than 8.2% of the allocated loan amount or more than 8.7% of the underwritten base rent.
As of March 1, 2021, the Equus Industrial Portfolio was 98.2% leased to 77 tenants with no single tenant accounting for more than 8.9% of the Equus Industrial Portfolio’s NRA. The Equus Industrial Portfolio’s ten largest tenants comprise 65.1% of NRA and 57.8% of the underwritten base rent. The top three tenants in the Equus Industrial Portfolio, California Cartage Company, XPO Logistics and ACE Hardware, comprise 25.5% of total NRA and 25.1% of underwritten base rent.
This is not a research report and was not prepared by any Underwriter’s research department. Please see additional important information and qualifications at the end of this Term Sheet.
T-51
| Industrial – Various | Loan #2 | Cut-off Date Balance: | | $69,903,870 |
| Property Addresses - Various | Equus Industrial Portfolio | Cut-off Date LTV: | | 39.9% |
| | | U/W NCF DSCR: | | 5.10x |
| | | U/W NOI Debt Yield: | | 14.0% |
The following table presents certain information relating to the Top 20 properties in the Equus Industrial Portfolio.
| Portfolio Summary – Top 20 |
| Property Name | City, State | Property Sub-Type | Year Built / Renovated | SF | Clear Height | Occupancy | % of Allocated Loan Amount | % of Total UW Base Rent(1) |
| 375 Kenyon Road | Suffolk, VA | Warehouse/Distribution | 2008 / NAP | 385,320 | 32 | 100.0% | 8.2% | 8.7% |
| 1006 CenterPoint Drive | Suffolk, VA | Warehouse/Distribution | 2011 / 2017 | 475,020 | 32 | 100.0% | 7.2% | 6.2% |
| 1125 Vaughn Parkway | Portland, TN | Warehouse/Distribution | 2004 / NAP | 504,000 | 32 | 100.0% | 5.8% | 5.4% |
| 261 Development Drive | Inwood, WV | Warehouse/Distribution | 2019 / NAP | 356,700 | 32 | 100.0% | 5.8% | 5.2% |
| Graystone - Snowden Bridge | Winchester, VA | Warehouse/Distribution | 2020 / NAP | 348,500 | 32 | 100.0% | 5.7% | 5.3% |
| 1010 Centerpoint Drive | Suffolk, VA | Warehouse/Distribution | 2015 / NAP | 357,000 | 32 | 100.0% | 5.7% | 4.7% |
| Lot 11 | Suffolk, VA | Warehouse/Distribution | 2021 / NAP | 350,000 | 32 | 100.0% | 5.6% | 4.8% |
| 40 Tyson Drive | Winchester, VA | Warehouse/Distribution | 2016 / NAP | 330,497 | 32 | 100.0% | 5.6% | 5.2% |
| 1020 Centerpoint Drive | Suffolk, VA | Warehouse/Distribution | 2017 / NAP | 401,221 | 32 | 100.0% | 5.5% | 4.4% |
| 75 Tyson Drive | Winchester, VA | Warehouse/Distribution | 2018 / NAP | 287,000 | 32 | 100.0% | 4.8% | 4.4% |
| 1042 Fred White Boulevard | Portland, TN | Warehouse/Distribution | 2003 / NAP | 312,000 | 32 | 100.0% | 3.6% | 3.2% |
| 3516 South Military Highway | Chesapeake, VA | Warehouse/Distribution | 2007 / NAP | 130,860 | 24 | 100.0% | 3.6% | 3.9% |
| 104 Challenger Drive | Portland, TN | Warehouse/Distribution | 1996 / NAP | 300,000 | 24-32 | 100.0% | 3.2% | 3.2% |
| 1115 Vaughn Parkway | Portland, TN | Warehouse/Distribution | 2007 / NAP | 216,420 | 32 | 100.0% | 3.1% | 2.9% |
| 1335 Northmeadow Parkway | Roswell, GA | Flex | 1996 / NAP | 88,784 | 14 | 91.9% | 2.3% | 2.9% |
| 250 Hembree Park Drive | Roswell, GA | Flex | 1996 / NAP | 94,500 | 26 | 100.0% | 1.9% | 2.4% |
| 660 Hembree Parkway | Roswell, GA | Flex | 1998 / NAP | 94,500 | 22 | 100.0% | 1.9% | 2.4% |
| 11820 Wills Road | Roswell, GA | Flex | 1987 / NAP | 103,892 | 24 | 100.0% | 1.8% | 2.1% |
| 1325 Northmeadow Parkway | Roswell, GA | Flex | 1990 / 2020 | 70,050 | 14 | 66.7% | 1.8% | 1.8% |
| 11545 Wills Road | Roswell, GA | Flex | 1998 / NAP | 71,140 | 14 | 72.0% | 1.7% | 2.5% |
| Subtotal | | | | 5,277,404 | | | 84.6% | 81.5% |
| Remaining Properties | | | | 681,753 | | | 15.4% | 18.5% |
| Total | | | | 5,959,157 | | | 100.0% | 100.0% |
| | | | | | | | | |
| (1) | % of Total UW Base Rent is based on the underwritten rent roll dated as of March 1, 2021. |
This is not a research report and was not prepared by any Underwriter’s research department. Please see additional important information and qualifications at the end of this Term Sheet.
T-52
| Industrial – Various | Loan #2 | Cut-off Date Balance: | | $69,903,870 |
| Property Addresses - Various | Equus Industrial Portfolio | Cut-off Date LTV: | | 39.9% |
| | | U/W NCF DSCR: | | 5.10x |
| | | U/W NOI Debt Yield: | | 14.0% |
The following table presents a summary regarding the major tenants at the Equus Industrial Portfolio Properties:
| Tenant Summary |
| Tenant | Property Name | Credit Ratings (Moody’s/Fitch/S&P)(1) | NRA (SF) | % of NRA | UW Base Rent Per SF | % of Total UW Base Rent(2) | Lease Expiration |
| California Cartage Company | Various | NR / NR / NR | 516,180 | 8.7% | $8.18 | 12.6% | Various(3) |
| XPO Logistics | Various | Ba2 / NR / BB | 528,420 | 8.9% | $3.99 | 6.3% | Various(4) |
| Ace Hardware | 1006 CenterPoint Drive | NR / NR / NR | 475,020 | 8.0% | $4.40 | 6.2% | 10/31/2027 |
| Geodis | Graystone – Snowden Bridge | NR / NR / NR | 348,500 | 5.8% | $5.09 | 5.3% | 3/31/2026 |
| Procter & Gamble | 261 Development Drive | Aa3 / NR / AA- | 356,700 | 6.0% | $4.84 | 5.2% | 3/31/2024 |
| Massimo Zanetti Beverages USA | Lot 11 | NR / NR / NR | 350,000 | 5.9% | $4.56 | 4.8% | 9/30/2036(5) |
| Friant and Associates | 1010 CenterPoint Drive | NR / NR / NR | 357,000 | 6.0% | $4.45 | 4.7% | 6/30/2025 |
| Emser Tile | Various | NR / NR / NR | 409,357 | 6.9% | $3.79 | 4.6% | Various(6) |
| Rubbermaid | 75 Tyson Drive | NR / NR / NR | 287,000 | 4.8% | $5.09 | 4.4% | 1/31/2026 |
| Home Depot | 40 Tyson Drive | A2 / A / A | 250,305 | 4.2% | $5.05 | 3.8% | 12/31/2026 |
| Subtotal / Wtd. Avg. Major Tenants | | | 3,878,482 | 65.1% | $5.00 | 57.8% | |
| Remaining Tenants | | | 1,975,146 | 33.1% | $7.16 | 42.2% | |
| Subtotal / Wtd. Avg. Occupied | | | 5,853,628 | 98.2% | $5.73 | 100.0% | |
| Vacant Space | | | 105,529 | 1.8% | | | |
| Total | | | 5,959,157 | 100.0% | | | |
| | | | | | | | |
| | | | | | | | |
| (1) | Certain ratings are those of the parent company whether or not the parent guarantees the lease. |
| (2) | % of Total UW Base Rent is based on the underwritten rent roll dated as of March 1, 2021. |
| (3) | California Cartage Company occupies (i) 130,860 SF at the 3516 South Military Highway property with a lease expiration date of November 30, 2021 and (ii) 385,320 SF at the 375 Kenyon Road property with a lease expiration date of September 30, 2022. |
| (4) | XPO Logistics occupies (i) 312,000 SF at the 1125 Vaughn Parkway property with a lease expiration date of November 30, 2023 and (ii) 216,420 SF at the 1115 Vaughn Parkway property with a lease expiration date of June 30, 2024. |
| (5) | The Lot 11 property is still under construction, and the sole tenant, Massimo Zanetti Beverages USA (“MZB”), is not yet in occupancy. MZB has the right to terminate its lease if the project work required by the lease is not substantially completed by June 1, 2022. MZB is not required to pay rent until the lease commences, which will occur on the later of December 31, 2021 and the date the project work is substantially completed, and is entitled to three months of free rent following such commencement date. In addition, if the project work is not completed by December 31, 2021, or the tenant’s right to access the improvements occurs later than August 30, 2021, the tenant’s free rent period will be extended for such delay. Gap and free rent are not reserved for, but are required to be retained from amounts in the related earnout reserve. See “Description of the Mortgage Pool—Redevelopment, Renovation and Expansion” in the Preliminary Prospectus. |
| (6) | Emser Tile occupies (i) 8,136 SF at the 250 Hembree Park Drive property with a lease expiration date of January 31, 2022 and (ii) 401,221 SF at the 1020 CenterPoint Drive property with a lease expiration date of July 18, 2024. |
This is not a research report and was not prepared by any Underwriter’s research department. Please see additional important information and qualifications at the end of this Term Sheet.
T-53
| Industrial – Various | Loan #2 | Cut-off Date Balance: | | $69,903,870 |
| Property Addresses - Various | Equus Industrial Portfolio | Cut-off Date LTV: | | 39.9% |
| | | U/W NCF DSCR: | | 5.10x |
| | | U/W NOI Debt Yield: | | 14.0% |
The following table presents certain information relating to the lease rollover schedule at the Equus Industrial Portfolio Properties:
| Lease Rollover Schedule(1)(2) |
| Year | # of Leases Expiring | Total Expiring SF | % of Total SF Expiring | Cumulative SF Expiring | Cumulative % of SF Expiring | Annual UW Base Rent PSF | % UW Base Rent Rolling | Cumulative % of UW Base Rent |
| 2021 | 9 | 222,074 | 3.7% | 222,074 | 3.7% | $10.10 | 6.7% | 6.7% |
| 2022 | 11 | 586,046 | 9.8% | 808,120 | 13.6% | $8.50 | 14.9% | 21.6% |
| 2023 | 15 | 598,523 | 10.0% | 1,406,643 | 23.6% | $4.89 | 8.7% | 30.3% |
| 2024 | 17 | 1,181,017 | 19.8% | 2,587,660 | 43.4% | $4.92 | 17.3% | 47.6% |
| 2025 | 18 | 938,140 | 15.7% | 3,525,800 | 59.2% | $5.73 | 16.0% | 63.6% |
| 2026 | 5 | 916,675 | 15.4% | 4,442,475 | 74.5% | $5.26 | 14.4% | 78.0% |
| 2027 | 9 | 712,794 | 12.0% | 5,155,269 | 86.5% | $5.68 | 12.1% | 90.1% |
| 2028 | 3 | 72,924 | 1.2% | 5,228,193 | 87.7% | $10.67 | 2.3% | 92.4% |
| 2029 | 0 | 0 | 0.0% | 5,228,193 | 87.7% | $0.00 | 0.0% | 92.4% |
| 2030 | 2 | 272,000 | 4.6% | 5,500,193 | 92.3% | $3.47 | 2.8% | 95.2% |
| 2031 | 0 | 0 | 0.0% | 5,500,193 | 92.3% | $0.00 | 0.0% | 95.2% |
| 2032 & Thereafter | 2 | 353,435 | 5.9% | 5,853,628 | 98.2% | $4.52 | 4.8% | 100.0% |
| Vacant | 0 | 105,529 | 1.8% | 5,959,157 | 100.0% | $0.00 | 0.0% | 100.0% |
| Total / Wtd. Avg.(3) | 91 | 5,959,157 | 100.0% | | | $5.73 | 100.0% | |
| (1) | Information is based on the underwritten rent roll dated March 1, 2021. |
| (2) | Certain tenants may have lease termination options that are not reflected in the Lease Rollover Schedule. |
| (3) | Wtd. Avg. Annual UW Base Rent PSF excludes vacant space. |
COVID-19 Update. As of April 28, 2021, the Equus Industrial Portfolio Properties are open and operating. Four tenants (8.5% of NRA and 7.8% of underwritten rent) received rent relief ranging from three months to six months of rent deferment in relation to the COVID-19 pandemic. A payment plan was put in place with each tenant to repay the deferred rent amounts. With respect to the 1335 Northmeadow Parkway Property, the tenant Noble 1 (0.2% of portfolio NRA; 0.5% of portfolio underwritten rent) is currently in default and is not occupying the premises. The first debt service payment on the Equus Industrial Portfolio Whole Loan is due in May 2021 and, as of April 28, 2021, the Equus Industrial Portfolio Whole Loan is not subject to any forbearance, modification or debt service relief request.
The Market. The Equus Industrial Portfolio Properties are located throughout four states including Virginia (51.4% of NRA; 47.6% of underwritten base rent), Tennessee (22.4% of NRA; 14.7% of underwritten base rent), Georgia (20.2% of NRA; 32.6% of underwritten base rent), and West Virginia (6.0% of NRA; 5.2% of underwritten base rent).
| Geographic Summary(1) |
| State | # of Properties | SF | % of Total | Occupancy | Allocated
Loan
Amount(2) | % of Total | UW Base Rent | % of Total |
| VA | 9 | 3,065,418 | 51.4% | 100.0% | $200,717,114 | 51.9% | $15,961,232 | 47.6% |
| TN | 4 | 1,332,420 | 22.4% | 100.0% | $60,420,602 | 15.6% | $4,916,605 | 14.7% |
| GA | 19 | 1,204,619 | 20.2% | 91.2% | $103,594,686 | 26.8% | $10,918,402 | 32.6% |
| WV | 1 | 356,700 | 6.0% | 100.0% | $22,280,498 | 5.8% | $1,726,428 | 5.2% |
| Total | 33 | 5,959,157 | 100.0% | 98.2% | $387,012,900 | 100.0% | $33,522,668 | 100.0% |
| | | | | | | | | |
| (1) | Based on the underwritten rent roll dated March 1, 2021. |
| (2) | Allocated Loan Amount includes the Equus Industrial Portfolio Subordinate Companion Loan. |
The Equus Industrial Portfolio Properties are located in four markets, as set forth in the table below:
| Market Summary |
| Market | # of Properties | SF | % of Total | Allocated Loan Amount(1) | % of Total | UW Base Rent(2) | Occupancy | Market Rent PSF(3) | Market Vacancy(3) |
| Hampton Roads | 6 | 2,099,421 | 35.2% | $138,466,557 | 35.8% | $10,971,289 | 100.0% | $6.71 | 2.8% |
| Nashville | 4 | 1,332,420 | 22.4% | $60,420,602 | 15.6% | $4,916,605 | 100.0% | $6.41 | 3.3% |
| Washington D.C. | 4 | 1,322,697 | 22.2% | $84,531,055 | 21.8% | $6,716,371 | 100.0% | $9.40 | 10.6% |
| Atlanta | 19 | 1,204,619 | 20.2% | $103,594,686 | 26.8% | $10,918,402 | 91.2% | $11.38 | 5.5% |
| Total / Wtd. Avg. | 33 | 5,959,157 | 100.0% | $387,012,900 | 100.0% | $33,522,668 | 98.2% | $8.18 | 5.2% |
| | | | | | | | | | |
| (1) | Allocated Loan Amount includes the Equus Industrial Portfolio Subordinate Companion Loan. |
| (2) | UW Base Rent is based on the underwritten rent roll dated as of March 1, 2021. |
This is not a research report and was not prepared by any Underwriter’s research department. Please see additional important information and qualifications at the end of this Term Sheet.
T-54
| Industrial – Various | Loan #2 | Cut-off Date Balance: | | $69,903,870 |
| Property Addresses - Various | Equus Industrial Portfolio | Cut-off Date LTV: | | 39.9% |
| | | U/W NCF DSCR: | | 5.10x |
| | | U/W NOI Debt Yield: | | 14.0% |
The following table presents certain information relating to the submarkets for the Top 20 Equus Industrial Portfolio Properties:
| Top 20 Properties - Submarket Analysis |
| Property Name | Allocated Loan Amount(1) | % of Total Allocated Loan Amount | UW Base Rent(2) | % of Total UW Base Rent(2) | Market(3) | Submarket(3) | Sub-market Rent PSF(3) | Sub-market Vac.(3) |
| 375 Kenyon Road | $31,655,004 | 8.2% | $2,917,330 | 8.7% | Hampton Roads | South Suffolk | $3.75 | 4.2% |
| 1006 CenterPoint Drive | $27,802,466 | 7.2% | $2,089,939 | 6.2% | Hampton Roads | South Suffolk | $3.75 | 4.2% |
| 1125 Vaughn Parkway | $22,473,125 | 5.8% | $1,794,480 | 5.4% | Nashville | Robertson and Sumner Counties | $3.89 | 2.6% |
| 261 Development Drive | $22,280,498 | 5.8% | $1,726,428 | 5.2% | Washington D.C. | Berkeley County | $6.39 | 3.9% |
| Graystone - Snowden Bridge | $22,087,872 | 5.7% | $1,773,238 | 5.3% | Washington D.C. | Frederick County | $5.48 | 3.6% |
| 1010 Centerpoint Drive | $22,023,663 | 5.7% | $1,588,056 | 4.7% | Hampton Roads | South Suffolk | $3.75 | 4.2% |
| Lot 11 | $21,831,036 | 5.6% | $1,596,000 | 4.8% | Hampton Roads | South Suffolk | $3.75 | 4.2% |
| 40 Tyson Drive | $21,702,618 | 5.6% | $1,754,815 | 5.2% | Washington D.C. | Frederick County | $5.48 | 3.6% |
| 1020 Centerpoint Drive | $21,381,573 | 5.5% | $1,476,032 | 4.4% | Hampton Roads | South Suffolk | $3.75 | 4.2% |
| 75 Tyson Drive | $18,460,067 | 4.8% | $1,461,890 | 4.4% | Washington D.C. | Frederick County | $5.48 | 3.6% |
| 1042 Fred White Boulevard | $13,804,920 | 3.6% | $1,063,814 | 3.2% | Nashville | Robertson and Sumner Counties | $3.89 | 2.6% |
| 3516 South Military Highway | $13,772,815 | 3.6% | $1,303,932 | 3.9% | Hampton Roads | Cavalier | $6.43 | 3.3% |
| 104 Challenger Drive | $12,263,905 | 3.2% | $1,073,600 | 3.2% | Nashville | Robertson and Sumner Counties | $3.89 | 2.6% |
| 1115 Vaughn Parkway | $11,878,652 | 3.1% | $984,711 | 2.9% | Nashville | Robertson and Sumner Counties | $3.89 | 2.6% |
| 1335 Northmeadow Parkway | $9,066,301 | 2.3% | $972,344 | 2.9% | Atlanta | N. Fulton/Forsyth County | $13.40 | 4.6% |
| 250 Hembree Park Drive | $7,390,448 | 1.9% | $798,074 | 2.4% | Atlanta | N. Fulton/Forsyth County | $13.40 | 4.6% |
| 660 Hembree Parkway | $7,313,397 | 1.9% | $797,751 | 2.4% | Atlanta | N. Fulton/Forsyth County | $13.40 | 4.6% |
| 11820 Wills Road | $6,953,827 | 1.8% | $703,876 | 2.1% | Atlanta | N. Fulton/Forsyth County | $13.40 | 4.6% |
| 1325 Northmeadow Parkway | $6,844,672 | 1.8% | $590,412 | 1.8% | Atlanta | N. Fulton/Forsyth County | $13.40 | 4.6% |
| 11545 Wills Road | $6,497,944 | 1.7% | $843,111 | 2.5% | Atlanta | N. Fulton/Forsyth County | $13.40 | 4.6% |
| Total | $327,484,803 | 84.6% | $27,309,834 | 81.5% | | | | |
| (1) | Allocated Loan Amount includes the Equus Industrial Portfolio Subordinate Companion Loan. |
| (2) | UW Base Rent and % of Total UW Base Rent are based on the underwritten rent roll dated as of March 1, 2021. |
This is not a research report and was not prepared by any Underwriter’s research department. Please see additional important information and qualifications at the end of this Term Sheet.
T-55
| Industrial – Various | Loan #2 | Cut-off Date Balance: | | $69,903,870 |
| Property Addresses - Various | Equus Industrial Portfolio | Cut-off Date LTV: | | 39.9% |
| | | U/W NCF DSCR: | | 5.10x |
| | | U/W NOI Debt Yield: | | 14.0% |
Operating History and Underwritten Net Cash Flow. The following table presents certain information relating to the historic operating performance and Underwritten Net Cash Flow at the Equus Industrial Portfolio Properties:
| Cash Flow Analysis(1) |
| | 2018 | 2019 | 2020 | UW | UW PSF |
| Gross Potential Rent(2)(3) | $24,905,164 | $23,840,576 | $28,561,803 | $35,028,714 | $5.88 |
| Total Reimbursement Revenue | $4,159,873 | $4,453,695 | $6,980,159 | $7,101,403 | $1.19 |
| Other Income | $162,525 | $136,729 | $103,445 | $81,780 | $0.01 |
| Bad Debt/Abatements | ($1,465,300) | ($498,994) | ($1,056,366) | $0 | $0.00 |
| Vacancy | $0 | $0 | $0 | ($1,554,682) | ($0.26) |
| Effective Gross Income | $27,762,262 | $27,932,006 | $34,589,041 | $40,657,216 | $6.82 |
| | | | | | |
| Real Estate Taxes(4) | $2,367,344 | $1,899,693 | $2,747,919 | $3,058,730 | $0.51 |
| Insurance | $499,475 | $568,378 | $1,112,753 | $1,025,348 | $0.17 |
| Management Fees | $892,686 | $1,048,625 | $1,358,736 | $1,219,716 | $0.20 |
| Other Operating Expenses(5) | $2,956,462 | $3,188,881 | $3,439,768 | $2,800,040 | $0.47 |
| Total Operating Expenses | $6,715,966 | $6,705,576 | $8,659,176 | $8,103,834 | $1.36 |
| | | | | | |
| Net Operating Income(2) | $21,046,296 | $21,226,431 | $25,929,865 | $32,553,381 | $5.46 |
| TI/LC | $0 | $0 | $0 | $1,709,718 | $0.29 |
| Replacement Reserves | $0 | $0 | $0 | $893,874 | $0.15 |
| Net Cash Flow | $21,046,296 | $21,226,431 | $25,929,865 | $29,949,790 | $5.03 |
| | | | | | |
| Occupancy %(6) | 95.8% | 95.0% | 98.6% | 96.3% | |
| NOI DSCR(7) | 3.59x | 3.62x | 4.42x | 5.55x | |
| NCF DSCR(7) | 3.59x | 3.62x | 4.42x | 5.10x | |
| NOI Debt Yield(7) | 9.0% | 9.1% | 11.1% | 14.0% | |
| NCF Debt Yield(7) | 9.0% | 9.1% | 11.1% | 12.9% | |
| | | | | | | |
| (1) | For the avoidance of doubt, no COVID-19 specific adjustments have been made to the lender underwriting. |
| (2) | The increase in Gross Potential Rent and Net Operating Income between 2020 and UW is mainly due to (i) new leases that commenced in the beginning of 2021 totaling approximately $3,782,690 of rent, (ii) commercial rent abatements and concessions expiring, (iii) unrealized rent accounting for the Special T tenant lease that commences in the beginning of 2022 totaling approximately $250,439 and (iv) a reduction in other operating expenses of approximately $639,728. |
| (3) | UW Gross Potential Rent is based on the underwritten rent roll dated as of March 1, 2021, and includes straight-line average rent on investment grade tenants that have rent increases occurring during the applicable term ($189,391) and grossed up vacant space ($1,316,655). |
| (4) | For the 1115 Vaughn Parkway and 1125 Vaughn Parkway properties, real estate taxes were underwritten based on the PILOT arrangements for such properties, which expire in 2027 and 2024, respectively. See “Description of the Mortgage Pool--Real Estate and Other Tax Considerations” in the Preliminary Prospectus. |
| (5) | Other Operating Expenses include utilities, repairs and maintenance, janitorial, payroll and general and administrative expenses. |
| (6) | The Equus Industrial Portfolio Properties are 98.2% occupied as of March 1, 2021. |
| (7) | Debt service coverage ratios and debt yields are based on the Equus Industrial Portfolio Senior Loan and exclude the Equus Industrial Portfolio Subordinate Companion Loan. |
Escrows and Reserves.
Real Estate Taxes - On each due date during the continuance of an Equus Industrial Portfolio Trigger Period (defined below), the borrowers are required to fund 1/12 of the taxes that the lender reasonably estimates will be payable over the next-ensuing 12-month period.
Insurance - On each due date during the continuance of an Equus Industrial Portfolio Trigger Period, the borrowers are required to fund 1/12 of the insurance premiums that the lender reasonably estimates will be payable over the next-ensuing 12-month period.
PILOT Reserve – On each due date during the continuance of an Equus Industrial Portfolio Trigger Period, the borrowers are required to fund 1/12 of the PILOT payments that the lender reasonably estimates will be payable over the next-ensuing 12-month period.
Capital Expenditures Reserve - On each due date during the continuance of an Equus Industrial Portfolio Trigger Period, the borrowers are required to fund a capital expenditure reserve in the amount of $74,489.
TI/LC Reserve - On each due date during an Equus Industrial Portfolio Trigger Period, the borrowers are required to fund a tenant improvement and leasing commission reserve in the amount of $198,639 (subject to a cap equal to the product of (x) $1.20 times (y) the aggregate number of rentable square feet then contained in the Equus Industrial Portfolio Properties).
An “Equus Industrial Portfolio Trigger Period” means each period (a) beginning when the debt yield determined as of the last day of any fiscal quarter is less than 6.0% and ending when the debt yield, determined as of the last day of each of two consecutive fiscal quarters thereafter, is equal to or greater than 6.0% and (b) beginning when the financial reports required under the Equus Industrial Portfolio Whole Loan documents are not delivered to the lender as and when required (subject to any applicable notice and cure periods) and ending when such reports are delivered and they indicate, in fact, that no Equus Industrial Portfolio Trigger Period is ongoing. The borrowers have the right to avoid an Equus Industrial Portfolio Trigger Period under clause (a) of the definition of such term by either prepaying the Equus Industrial Portfolio Whole Loan (together with, if prior to the open period, the yield maintenance premium), or delivering a letter of credit to the lender, in each case in an amount that when subtracted from the outstanding
This is not a research report and was not prepared by any Underwriter’s research department. Please see additional important information and qualifications at the end of this Term Sheet.
T-56
| Industrial – Various | Loan #2 | Cut-off Date Balance: | | $69,903,870 |
| Property Addresses - Various | Equus Industrial Portfolio | Cut-off Date LTV: | | 39.9% |
| | | U/W NCF DSCR: | | 5.10x |
| | | U/W NOI Debt Yield: | | 14.0% |
principal balance of the Equus Industrial Portfolio Whole Loan for purposes of calculating debt yield would result in a debt yield that equals or exceeds 6.0%. Any such letter of credit is required to be returned to the borrowers if the debt yield equals or exceeds 6.0% for two consecutive calendar quarters without regard to such letter of credit.
Unfunded Obligations Reserve - At loan origination, the borrowers deposited approximately $2,877,520 into a reserve for certain unfunded obligations, including free rent, gap rent, tenant improvements, leasing commissions, landlord work and construction costs.
Earnout Reserve – At loan origination, the borrowers deposited approximately $18,819,523 into an Earnout Reserve. Provided that no event of default under the Equus Industrial Portfolio Whole Loan is continuing, at any time prior to April 8, 2024, upon satisfaction of the Earnout Release Conditions (defined below), the lender will be required to release the funds in the earnout reserve, less (i) the amount of any remaining free rent to which the Lot 11 Tenant (defined below) is entitled under its lease, (ii) the amount of any termination fees that are actually payable to any Lot 11 Tenant on account of the termination of its lease and (iii) 125% of the remaining cost to complete the Lot 11 punchlist items, to the borrowers on the due date following satisfaction of the Earnout Release Conditions. If at any time prior to April 8, 2024 (1) the Current Lot 11 Lease (defined below under “Earnout Release Conditions”) is terminated, modified or otherwise is no longer in full force and effect, (2) the borrowers have deposited with the lender the amounts specified in the Equus Industrial Portfolio Whole Loan documents (such that the earnout reserve contains the Release Price (defined below) for the Lot 11 property) and (3) the Earnout Release Conditions have been satisfied but for the condition in clause (vi) of the definition thereof, then the lender will be required, at the borrowers’ option, to release to the borrowers a portion of the earnout reserve in an amount sufficient to achieve a Lot 11 Debt Yield (defined below) equal to or greater than 7.17% (with the Lot 11 Debt Yield equaling, for purposes of this sentence, the percentage obtained by dividing the Lot 11 Projected NOI (defined below) by the amount of the earnout reserve to be so released). If, subsequently, at any time prior to April 8, 2024, the Lot 11 Debt Yield equals or exceeds 7.17%, the balance of the earnout reserve, less the amounts in clauses (i) – (iii) above, will be required to be released to the borrowers, or at the borrowers’ option, applied to prepay the Equus Industrial Portfolio Whole Loan, together with a yield maintenance premium. Notwithstanding the foregoing, if the Earnout Release Conditions have been satisfied but for the condition in clause (vi) of the definition thereof, at such time as (i) the Lot 11 Projected NOI is equal to or greater than $1,596,000, (ii) all free rent and/or gap rent to which the Lot 11 Tenant is entitled under its lease has burned off and (iii) all Lot 11 punchlist items are complete, any amounts then remaining in the earnout reserve will be required to be released to the borrowers.
“Earnout Release Conditions” means each of the following: (i) substantial completion of the Lot 11 project work; (ii) the Lot 11 Tenant has accepted its space and has delivered an estoppel certificate, (iii) 125% of the remaining cost to complete the Lot 11 punchlist items has been reserved with the lender; (iv) the amount of any remaining free rent or gap rent under the Lot 11 Tenant’s lease has been reserved with the lender; (v) there is no default by the Guarantors under the completion guaranty; (vi) either (x) MZB’s lease in place as of the origination date (the “Current Lot 11 Lease”) is in full force and effect and has not been amended or modified from the Current Lot 11 Lease (other than non-material amendments or modifications that do not impact the key terms of the Current Lot 11 Lease (economic or otherwise)) or (y) the Lot 11 Debt Yield is equal to or greater than 7.17%; and (vii) the borrowers’ obligation to pay the purchase price of the Lot 11 property (net of (i) certain offsets and (ii) certain funds escrowed pursuant to an escrow agreement among the borrowers, the property seller and a title company) has been satisfied (or will be satisfied simultaneously with the release of such portion of the earnout reserve).
“Lot 11 Tenant” means (i) MZB or (ii) any replacement tenant or tenants under a replacement lease.
“Lot 11 Debt Yield” means, as of any date of determination, the percentage obtained by dividing (x) the Lot 11 Projected NOI by (y) $22,260,000.
“Lot 11 Projected NOI” means, as of any date of determination, (x) the projected operating income from the Lot 11 property for the succeeding 12 month period, calculated to include the aggregate annualized rent (including reimbursements) projected to be received by the borrowers over the succeeding 12 month period from the Lot 11 Tenant on account of its lease, including any free rent to the extent the amount of such free rent is actually deposited into the prepaid rent reserve as of such date of determination, minus (y) the projected operating expenses for the Lot 11 property for such period, in each case as reasonably determined by the lender.
“Release Price” means, with respect to each Equus Industrial Portfolio property, the product of (x) its allocated loan amount times (y) the applicable Release Percentage (bifurcated, if applicable, in the manner set forth in the definition of “Release Percentage”).
“Release Percentage” means 110% until such time as the principal balance of the Equus Industrial Portfolio Whole Loan is reduced to 90% of the original principal balance, 115% until such time as the principal balance is further reduced to 80% of the original principal balance, and 125% thereafter; provided, that notwithstanding the foregoing, in the case of any property release that is not in connection with an arms’-length sale to an unaffiliated third party, the Release Percentage will be 125%. For avoidance of doubt, more than one Release Percentage may apply to the release of a single property in connection with an arms’-length sale to an unaffiliated third party.
Lockbox and Cash Management. The Equus Industrial Portfolio Whole Loan is structured with a hard lockbox and springing cash management. The borrowers were required to deliver tenant direction letters to all tenants of the Equus Industrial Portfolio Properties to directly deposit all rents into a lender-controlled lockbox account. In addition, the borrowers are required to cause all cash revenues relating to the Equus Industrial Portfolio Properties and all other money received by the borrowers or the property manager with respect to the Equus Industrial Portfolio Properties (other than tenant security deposits) to be deposited into such lockbox account or a lender-controlled cash management account within three business days of receipt thereof. On each business day that no Equus Industrial Portfolio Trigger Period or event of default under the Equus Industrial Portfolio Whole Loan is continuing, all funds in the lockbox account are required to be swept into a borrower-controlled operating account. On each business day that an Equus Industrial Portfolio Trigger Period or event of default under the Equus Industrial Portfolio Whole Loan is continuing, all funds in the lockbox account are required to be swept into the cash management account.
During the continuance of an Equus Industrial Portfolio Trigger Period or an event of default under the Equus Industrial Portfolio Whole Loan, all amounts on deposit in the cash management account after payment of debt service, required reserves and budgeted operating expenses are required to be deposited into an excess cash flow reserve account as additional collateral for the Equus Industrial Portfolio Whole Loan (subject to certain rights of the borrowers to use such funds for tenant improvement and leasing commissions expenses or real estate investment trust distributions of up to $250,000 annually).
Additional Secured Indebtedness (not including trade debts). The Equus Industrial Portfolio also secures the Equus Industrial Portfolio Pari Passu Companion Loan, which has a Cut-off Date principal balance of $163,109,030, and the Equus Industrial Portfolio Subordinate Companion Loan, which has a Cut-off Date principal balance of $154,000,000. The Equus Industrial Portfolio Mortgage Loan and the Equus Industrial Portfolio Pari Passu Companion Loan are pro rata and pari passu with each other in right of payment, and are generally senior in right of payment to the Equus Industrial Portfolio Subordinate Companion Loan; however, prior to an event of default, the Equus Industrial Portfolio Subordinate Companion Loan will be entitled to receive prepayments and repayments of principal on a pro rata basis with the Equus Industrial Portfolio Senior Loan. The holders of the promissory notes evidencing the Equus Industrial Portfolio Whole Loan have entered into a co-lender agreement that sets forth the allocation of collections on the Equus Industrial Portfolio Whole Loan. See “Description of the Mortgage Pool—The Whole Loans—The Equus Industrial Portfolio Pari Passu-A/B Whole Loan” and “Pooling and Servicing Agreement—Servicing of the Servicing Shift Mortgage Loans” in the Preliminary Prospectus.
Subordinate Note Summary |
| | Subordinate Note Original Principal Balance | Subordinate Note Interest Rate | Original Term (mos.) | Original Amort. Term (mos.) | Original IO Term (mos.) | Whole Loan UW NCF DSCR | Whole Loan UW NOI Debt Yield | Whole Loan Cut-off Date LTV |
| Equus Industrial Portfolio Subordinate Companion Loan | $154,000,000 | 4.070% | 84 | 0 | 84 | 2.45x | 8.4% | 66.3% |
| | | | | | | | | | |
This is not a research report and was not prepared by any Underwriter’s research department. Please see additional important information and qualifications at the end of this Term Sheet.
T-57
| Industrial – Various | Loan #2 | Cut-off Date Balance: | | $69,903,870 |
| Property Addresses - Various | Equus Industrial Portfolio | Cut-off Date LTV: | | 39.9% |
| | | U/W NCF DSCR: | | 5.10x |
| | | U/W NOI Debt Yield: | | 14.0% |
Mezzanine Loan and Preferred Equity. None.
Release of Property. In connection with a sale or transfer of an individual property to an unrelated third party, the borrowers may obtain the release of an individual property or properties from the lien of the Equus Industrial Portfolio Whole Loan after the lockout expiration date, upon prepayment of the applicable Release Price (as defined below) for the property or properties being released, together with, if prior to the open period, a yield maintenance premium, and satisfaction of the conditions set forth in the loan documents, including but not limited to: (a) the debt yield following the release being at least equal to (x) if the debt yield for the most recently ended 12 month period ending on the last day of a fiscal quarter (the “Test Period”) is less than 8.5%, the greater of 8.11% and the debt yield for the most recently ended Test Period, and (y) if the debt yield for the most recently ended Test Period is at least 8.5%, the debt yield for the most recently ended Test Period and (b) no event of default under the loan documents is continuing. The borrowers may make an additional prepayment of the Equus Industrial Portfolio Whole Loan, together with, if prior to the open period, a yield maintenance premium, in order to satisfy the foregoing debt yield test. In addition, no partial release will be permitted unless the lender determines that the value of the remaining properties (in the lender’s reasonable discretion based on a commercially reasonable valuation method permitted to a REMIC trust and which will exclude the value of personal property or going concern value, if any) is at least 80% of the Equus Industrial Portfolio Whole Loan’s adjusted issue price, or if the foregoing is not satisfied, then the borrowers will have prepaid the Equus Industrial Portfolio Whole Loan in an amount equal to the lesser of (x) the fair market value of the property or properties being released and (y) the amount sufficient to satisfy such test. Notwithstanding the foregoing, the borrowers may obtain the release of the Lot 11 property at any time, without regard to the lockout period and the other conditions above, provided that the REMIC test must be satisfied, upon prepayment of the applicable Release Price together with, if prior to the open period, a yield maintenance premium.
Letter of Credit. None.
Right of First Offer / Right of First Refusal. None.
Ground Lease. None.
Terrorism Insurance. The borrowers are required to maintain terrorism insurance in an amount equal to the full replacement cost of the Equus Industrial Portfolio Properties, as well as 24 months of rental loss and/or business interruption coverage, together with a 6-month extended period of indemnity following restoration. If TRIPRA or a subsequent statute is no longer in effect, then the borrower’s requirement will be capped at insurance premiums equal to two times the amount of the insurance premium payable in respect of the property and business interruption/rental loss insurance required under the related loan documents. See “Risk Factors—Risks Relating to the Mortgage Loans—Terrorism Insurance May Not Be Available for All Mortgaged Properties” in the Preliminary Prospectus.
This is not a research report and was not prepared by any Underwriter’s research department. Please see additional important information and qualifications at the end of this Term Sheet.
T-58
(THIS PAGE INTENTIONALLY LEFT BLANK)
This is not a research report and was not prepared by any Underwriter’s research department. Please see additional important information and qualifications at the end of this Term Sheet.
T-59
| Mixed Use – Multifamily/Retail | Loan #3 | Cut-off Date Balance: | | $55,000,000 |
| 261-275 Amsterdam Avenue | 261-275 Amsterdam Avenue | Cut-off Date LTV: | | 63.3% |
| New York, NY 10023 | | U/W NCF DSCR: | | 1.97x |
| | | U/W NOI Debt Yield: | | 7.3% |

This is not a research report and was not prepared by any Underwriter’s research department. Please see additional important information and qualifications at the end of this Term Sheet.
T-60
| Mixed Use – Multifamily/Retail | Loan #3 | Cut-off Date Balance: | | $55,000,000 |
| 261-275 Amsterdam Avenue | 261-275 Amsterdam Avenue | Cut-off Date LTV: | | 63.3% |
| New York, NY 10023 | | U/W NCF DSCR: | | 1.97x |
| | | U/W NOI Debt Yield: | | 7.3% |

This is not a research report and was not prepared by any Underwriter’s research department. Please see additional important information and qualifications at the end of this Term Sheet.
T-61
| Mortgage Loan No. 3 – 261-275 Amsterdam Avenue |
| Mortgage Loan Information | | Property Information |
| Mortgage Loan Seller: | MSMCH | | Single Asset/Portfolio: | Single Asset |
| Credit Assessment (Moody’s/Fitch/KBRA): | NR/NR/NR | | Location: | New York, NY 10023 |
| Original Balance(1): | $55,000,000 | | General Property Type: | Mixed Use |
| Cut-off Date Balance(1): | $55,000,000 | | Detailed Property Type: | Multifamily/Retail |
| % of Initial Pool Balance: | 5.5% | | Title Vesting: | Fee |
| Loan Purpose: | Refinance | | Year Built/Renovated: | 1906/1963 |
| Borrower Sponsor: | Michael E. Laub | | Size: | 146 Units |
| Guarantor: | Michael E. Laub | | Cut-off Date Balance per Unit(1): | $650,685 |
| Mortgage Rate: | 3.5500% | | Maturity Date Balance per Unit(1): | $650,685 |
| Note Date: | 4/27/2021 | | Property Manager: | MGA Management Corp. |
| First Payment Date: | 6/1/2021 | | | (borrower-related) |
| Maturity Date: | 5/1/2031 | | | |
| Original Term to Maturity: | 120 months | | | |
| Original Amortization Term: | 0 months | | | |
| IO Period: | 120 months | | | |
| Seasoning: | 0 months | | Underwriting and Financial Information(5) |
| Prepayment Provisions(2): | L(23),YM1(1),DorYM1(89),O(7) | | UW NOI: | $6,910,834 |
| Lockbox/Cash Mgmt Status: | Soft/Springing | | UW NOI Debt Yield(1): | 7.3% |
| Additional Debt Type(1)(3): | Pari Passu | | UW NOI Debt Yield at Maturity(1): | 7.3% |
| Additional Debt Balance(1)(3): | $40,000,000 | | UW NCF DSCR(1): | 1.97x |
| Future Debt Permitted (Type): | No (NAP) | | Most Recent NOI: | $5,999,545 (3/31/2021 TTM) |
| Reserves(4) | | 2nd Most Recent NOI: | $6,218,958 (12/31/2020) |
| Type | Initial | Monthly | Cap | | 3rd Most Recent NOI: | $6,503,066 (12/31/2019) |
| RE Taxes: | $1,586,430 | $317,286 | NAP | | Most Recent Occupancy: | 98.6% (4/28/2021) |
| Insurance: | $0 | Springing | NAP | | 2nd Most Recent Occupancy: | 97.9% (12/31/2020) |
| Deferred Maintenance: | $3,450 | $0 | NAP | | 3rd Most Recent Occupancy: | 97.3% (12/31/2019) |
| Replacement Reserve: | $0 | $3,627 | NAP | | Appraised Value (as of): | $150,100,000 (3/1/2021) |
| Facade Reserve: | $519,452 | $0 | NAP | | Appraised Value per Unit: | $1,028,082 |
| Unit Renovation Reserve: | $50,000 | $0 | NAP | | Cut-off Date LTV Ratio(1): | 63.3% |
| Rent Concession Reserve: | $154,448 | $0 | NAP | | Maturity Date LTV Ratio(1): | 63.3% |
| | | | | | | | |
| Sources and Uses |
| Sources | Proceeds | % of Total | | Uses | Proceeds | % of Total |
| Whole Loan Amount(1): | $95,000,000 | 100.0% | | Loan Payoff: | $89,355,143 | 94.1% |
| | | | | Upfront Reserves: | $2,313,780 | 2.4% |
| | | | | Return of Equity: | $2,216,302 | 2.3% |
| | | | | Closing Costs: | $1,114,775 | 1.2% |
| Total Sources: | $95,000,000 | 100.0% | | Total Uses: | $95,000,000 | 100.0% |
| (1) | The 261-275 Amsterdam Avenue Mortgage Loan (as defined below) is part of the 261-275 Amsterdam Avenue Whole Loan (as defined below) with an original aggregate principal balance of $95,000,000. The Cut-off Date Balance per unit, Maturity Date Balance per unit, UW NOI Debt Yield, UW NOI Debt Yield at Maturity, UW NCF DSCR, Cut-off Date LTV Ratio and Maturity Date LTV Ratio numbers presented above are based on the 261-275 Amsterdam Avenue Whole Loan. |
| (2) | The 261-275 Amsterdam Avenue Borrower (as defined below) has the right to defease the 261-275 Amsterdam Avenue Whole Loan, in whole or in part, on any date after the earlier to occur of (i) two years after the closing date of the securitization that includes the last pari passu note to be securitized and (ii) December 1, 2024. The assumed defeasance lockout period of 24 payments is based on the closing date of this transaction in May 2021. In addition, the 261-275 Amsterdam Avenue Whole Loan may be prepaid in whole at any time on and after May 1, 2023, provided that if prepayment is made prior to the open prepayment date, such prepayment must be accompanied by a prepayment fee equal to the greater of 1.00% of the amount prepaid and a yield maintenance premium. |
| (3) | See “The Mortgage Loan” and “Additional Secured Indebtedness (not including trade debts)” below for further discussion of additional debt. |
| (4) | See “Escrows and Reserves” below. |
| (5) | The novel coronavirus pandemic is an evolving situation and could impact the 261-275 Amsterdam Avenue Whole Loan more severely than assumed in the underwriting of the 261-275 Amsterdam Avenue Whole Loan and could adversely affect the NOI, NCF and occupancy information, as well as the appraised value and the DSCR, LTV and Debt Yield metrics presented above and herein. See “Risk Factors—Risks Related to Market Conditions and Other External Factors—The Coronavirus Pandemic Has Adversely Affected the Global Economy and Will Likely Adversely Affect the Performance of the Mortgage Loans” in the Preliminary Prospectus. |
The Mortgage Loan. The third largest mortgage loan (the “261-275 Amsterdam Avenue Mortgage Loan”) is part of a whole loan (the “261-275 Amsterdam Avenue Whole Loan”) that is evidenced by two pari passu promissory notes in the original aggregate principal amount of $95,000,000. The 261-275 Amsterdam Avenue Whole Loan is secured by a first priority fee mortgage encumbering a mixed use multifamily and retail building located in New York, New York (the “261-275 Amsterdam Avenue Property”). The 261-275 Amsterdam Avenue Mortgage Loan is evidenced by the controlling promissory Note A-1 in the original principal amount of $55,000,000. The non-controlling promissory Note A-2 (the “261-275 Amsterdam Avenue Serviced Pari Passu Companion Loan”), in the original principal amount of $40,000,000, is expected to be contributed to one or more future securitization transactions. The 261-275 Amsterdam Avenue Whole Loan will be serviced pursuant to the pooling and servicing agreement for the BANK 2021-BNK33 securitization trust. See “Description of the Mortgage Pool—The Whole Loans—The Serviced Pari Passu Whole Loans” and “Pooling and Servicing Agreement” in the Preliminary Prospectus.
This is not a research report and was not prepared by any Underwriter’s research department. Please see additional important information and qualifications at the end of this Term Sheet.
T-62
| Mixed Use – Multifamily/Retail | Loan #3 | Cut-off Date Balance: | | $55,000,000 |
| 261-275 Amsterdam Avenue | 261-275 Amsterdam Avenue | Cut-off Date LTV: | | 63.3% |
| New York, NY 10023 | | U/W NCF DSCR: | | 1.97x |
| | | U/W NOI Debt Yield: | | 7.3% |
| 261-275 Amsterdam Avenue Whole Loan Summary |
| Note | Original Balance | Cut-off Date Balance | Note Holder | Controlling Piece |
| A-1 | $55,000,000 | $55,000,000 | BANK 2021-BNK33 | Yes |
| A-2 | $40,000,000 | $40,000,000 | MSMCH | No |
| Total | $95,000,000 | $95,000,000 | | |
The Borrower and the Borrower Sponsor. The borrower is G & L Realty Delaware LLC (the “261-275 Amsterdam Avenue Borrower”), a single-purpose Delaware limited liability company with one independent director. Michael E. Laub is the borrower sponsor and non-recourse carveout guarantor. Michael E. Laub is the founder of Laub Realty, a real estate firm that owns, manages and leases commercial, residential and medical properties throughout the United States. Laub Realty currently owns and manages over 2,000 apartment units and in excess of 1.0 million SF of office and retail space.
The Property. The 261-275 Amsterdam Avenue Property is a 12-story mixed use multifamily and retail property, totaling 146 units, situated on a 0.56-acre site in New York, New York on Amsterdam Avenue between West 72nd Street and West 73rd Street. The 261-275 Amsterdam Avenue Property was built in 1906 and is comprised of 133 apartment units, totaling 160,738 SF, and 13 ground floor retail units, totaling 20,837 SF. There is an additional superintendent unit totaling 1,158 SF and five additional ancillary commercial units totaling 2,840 SF. The apartment unit mix is comprised of studios, one-, two-, three-, four-, five- and six-bedroom units. There are 66 market rate units, 60 rent stabilized units and seven rent-controlled units. Building amenities include a laundry room with 10 washers and 11 dryers and storage facilities. The 261-275 Amsterdam Avenue Property was renovated in 1963. Between 2019 and 2020, the borrower sponsor invested $2,671,827 into the 261-275 Amsterdam Avenue Property, which included overall improvements to the building and apartments including re-piping of gas lines on the 73rd Street side, electrical rewiring, hallway lighting and renovations on the 72nd Street side, and façade repairs. There are ongoing façade repairs with an estimated cost to complete of $851,265 of which $331,813 has already been spent (and the remaining cost has been reserved for), as well as one unit that is being renovated at a cost of $50,000. As of April 28, 2021, the 261-275 Amsterdam Avenue Property’s residential space was 98.5% leased. The retail space is fully leased by 12 tenants. The largest tenant by rent is Capital One (27.7% of retail NRA / 43.4% of total underwritten retail rent), the second largest tenant by rent is Chipotle Mexican Grill (10.7% of retail NRA / 9.6% of total underwritten retail rent), and the third largest tenant by rent is Utopia Diner (6.2% of retail NRA / 9.4% of total underwritten retail rent). Underwritten income is comprised approximately 46.5% from multifamily units and 53.5% from retail units. The 261-275 Amsterdam Avenue Property has been designated as a landmark by the New York City Landmarks Preservation Commission (the “LPC”), and is subject to the LPC’s prior approval for alterations, reconstruction, demolition and new construction.
The table below shows the residential apartment unit mix at the 261-275 Amsterdam Avenue Property:
| Apartment Unit Mix |
| Unit Mix / Type | Total Units | Occupied Units | % Occupied | Average SF per Unit | Monthly Average Rent per Unit(1) | Monthly Average Rent PSF(1) |
| Studio | 2 | 2 | 100.0% | 436 | $1,669 | $3.83 |
| One Bedroom | 22 | 22 | 100.0% | 720 | $2,708 | $3.76 |
| Two Bedroom | 64 | 63 | 98.4% | 1,028 | $2,934 | $2.85 |
| Three Bedroom | 21 | 21 | 100.0% | 1,454 | $4,248 | $2.92 |
| Four Bedroom | 7 | 6 | 85.7% | 1,634 | $4,763 | $2.92 |
| Five Bedroom | 12 | 12 | 100.0% | 2,018 | $7,163 | $3.55 |
| Six Bedroom | 5 | 5 | 100.0% | 2,409 | $5,790 | $2.40 |
| Total/Average | 133 | 131 | 98.5% | 1,209 | $3,667 | $3.03 |
Source: Borrower rent roll dated April 28, 2021.
| (1) | Monthly Average Rent per Unit and Monthly Average Rent PSF reflect rental rates for all of the different types of units; market rate, rent stabilized and rent controlled. According to the appraisal, market rate unit monthly average rents are $2,000 per unit ($6.64 PSF) for studio units, $3,169 per unit ($4.57 PSF) for one-bedroom units, $4,256 per unit ($4.31 PSF) for two-bedroom units, $5,945 per unit ($4.00 PSF) for three-bedroom units, $6,525 per unit ($4.08 PSF) for four-bedroom units (including one vacant unit with $6,500 market rent applied), $8,588 ($4.17 PSF) for five-bedroom units and $11,100 ($4.61 PSF) for six-bedroom units. According to the appraisal, rent stabilized units’ monthly rents range from $1,072 to $4,952 per unit (depending in part on unit size) and average $2,238 per month, and rent controlled units’ monthly rents range from $1,562 to $5,456 (depending in part on unit size) and average $4,055 per month. |
This is not a research report and was not prepared by any Underwriter’s research department. Please see additional important information and qualifications at the end of this Term Sheet.
T-63
| Mixed Use – Multifamily/Retail | Loan #3 | Cut-off Date Balance: | | $55,000,000 |
| 261-275 Amsterdam Avenue | 261-275 Amsterdam Avenue | Cut-off Date LTV: | | 63.3% |
| New York, NY 10023 | | U/W NCF DSCR: | | 1.97x |
| | | U/W NOI Debt Yield: | | 7.3% |
The following table presents a summary regarding the commercial tenants at the 261-275 Amsterdam Avenue Property:
| Commercial Tenant Summary(1) |
| Tenant Name | Credit Rating (Fitch/Moody’s /S&P)(2) | Tenant SF | Approx. % of SF | Annual UW Rent | Annual UW Rent PSF | Approx. % of Total Annual Commercial Rent | Lease Expiration | Renewal Options | Term. Option |
| Retail Tenants | | | | | | | | | |
| Capital One | A-/Baa1/BBB | 6,567 | 27.7% | $2,495,977 | $380.08 | 43.4% | 12/31/2027 | None | N |
| The Dorm | NR/NR/NR | 4,339 | 18.3% | $334,970 | $77.20 | 5.8% | 4/30/2024 | None | N |
| Chipotle Mexican Grill | NR/NR/NR | 2,525 | 10.7% | $554,288 | $219.52 | 9.6% | 2/28/2023 | None | N |
| The Paper House | NR/NR/NR | 2,000 | 8.4% | $264,000 | $132.00 | 4.6% | 9/30/2022 | None | N |
| Utopia Diner | NR/NR/NR | 1,479 | 6.2% | $537,600 | $363.49 | 9.4% | 8/31/2028 | None | N |
| L&H Nail & Spa | NR/NR/NR | 1,208 | 5.1% | $299,549 | $247.97 | 5.2% | 3/31/2029 | None | N |
| El Rojo NYC | NR/NR/NR | 650 | 2.7% | $265,253 | $408.08 | 4.6% | 1/31/2029 | None | N |
| Joe Coffee Company | NR/NR/NR | 596 | 2.5% | $236,357 | $396.57 | 4.1% | 4/30/2027 | 1 x5 Yr | N |
| Kitakata Ramen | NR/NR/NR | 530 | 2.2% | $170,465 | $321.63 | 3.0% | 9/30/2023 | 1 x 5 Yr | N |
| Haagen-Dazs | NR/NR/NR | 406 | 1.7% | $192,000 | $472.91 | 3.3% | 1/31/2031 | None | N |
| Amsterdam Tobacco House | NR/NR/NR | 314 | 1.3% | $134,292 | $427.68 | 2.3% | 9/30/2024 | None | N |
| Parades & Son | NR/NR/NR | 223 | 0.9% | $75,600 | $339.01 | 1.3% | 6/30/2023 | None | N |
| Retail Subtotal/Wtd. Avg. | | 20,837 | 88.0% | $5,560,351 | $266.85 | 96.7% | | | |
| | | | | | | | | | |
| Ancillary Commercial Tenants | | | | | | | | | |
| Susan Sussman & Robin Good | NR/NR/NR | 1,140 | 4.8% | $103,800 | $91.05 | 1.8% | 10/30/2024 | | |
| Hercules Corp. | NR/NR/NR | 500 | 2.1% | $24,000 | $48.00 | 0.4% | 8/31/2022 | | |
| T-Mobile | NR/NR/NR | 0 | 0.0% | $42,243 | NAP | 0.7% | 8/31/2025 | | |
| Donald Shaw Interiors | NR/NR/NR | 200 | 0.8% | $7,200 | $36.00 | 0.1% | MTM | | |
| Bargold Storage Systems | NR/NR/NR | 1,000 | 4.2% | $10,000 | $10.00 | 0.2% | 2/28/2027 | | |
| Ancillary Subtotal/Wtd. Avg. | | 2,840 | 12.0% | $187,243 | $65.93 | 3.3% | | | |
| | | | | | | | | | |
| Total/Wtd. Avg | | 23,677 | 100.0% | $5,747,594 | $242.75 | 100.0% | | | |
| (1) | Information is based on the underwritten rent roll. |
| (2) | Certain ratings are those of the parent company whether or not the parent guarantees the lease. |
COVID-19 Update. The 261-275 Amsterdam Avenue Whole Loan was originated on April 27, 2021, and as of such date is not subject to any modification or forbearance request. The first debt service payment is in June 2021. The 261-275 Amsterdam Avenue Borrower entered into a forbearance agreement with regard to the previous mortgage loan on the 261-275 Amsterdam Avenue Property. The previous lender agreed to 6 months of forbearance of all interest payments and reserve fund payments due on the previous loan on the payment dates from April through September 2020, totaling approximately $1,345,367. Such amounts were repaid with the proceeds of the 261-275 Amsterdam Whole Loan. As of April 23, 2021, the borrower sponsor has reported that the 261-275 Amsterdam Avenue Property is open and operating, with 91.0% of residential billed rent being collected for the month of April 2021. Eight retail tenants and the building’s lobby tenant received rent relief in 2020 (17.3% of total underwritten rent). There are six retail tenants as well as the building’s lobby tenant that are receiving ongoing rent relief (14.5% of total underwritten rent) from January 2021 through June 2021. The tenants have remained current on their amended rent obligations and are required to commence their full contractual rent payments in July 2021.
The Market. The 261-275 Amsterdam Avenue Property is located in New York, New York in the Upper West Side of Manhattan. The Upper West Side offers a variety of cultural centers including the Museum of Natural History, Hayden Planetarium, New York Historical Society, and Lincoln Center. Primary access to the 261-275 Amsterdam Avenue Property is provided by subway service and bus service available at a number of locations along Amsterdam Avenue, Columbus Avenue and 81st Street. The 261-275 Amsterdam Avenue Property is located in the Upper West Side multifamily and retail submarket and within the New York multifamily and retail market. According to the appraisal, as of the fourth quarter of 2020, the vacancy rate in the Upper West Side Manhattan multifamily submarket was approximately 5.5%, with average asking rents of $4,521 per unit and inventory of approximately 55,878 units. According to the appraisal, as of the fourth quarter of 2020, the vacancy rate in the Upper West Side Manhattan retail submarket was approximately 3.3%, with average asking rents of $168.22 PSF and inventory of approximately 4.0 million SF. According to the appraisal, as of the fourth quarter of 2020, the vacancy rate in the New York multifamily market was approximately 4.5%, with average asking rents of $2,713 per unit and inventory of approximately 1.4 million SF. According to the appraisal, as of the fourth quarter of 2020, the vacancy rate in the New York retail market was approximately 4.3%, with average asking rents of $42.26 PSF and inventory of approximately 609.2 million SF.
This is not a research report and was not prepared by any Underwriter’s research department. Please see additional important information and qualifications at the end of this Term Sheet.
T-64
| Mixed Use – Multifamily/Retail | Loan #3 | Cut-off Date Balance: | | $55,000,000 |
| 261-275 Amsterdam Avenue | 261-275 Amsterdam Avenue | Cut-off Date LTV: | | 63.3% |
| New York, NY 10023 | | U/W NCF DSCR: | | 1.97x |
| | | U/W NOI Debt Yield: | | 7.3% |
The following table presents certain information relating to comparable multifamily rental properties to the 261-275 Amsterdam Avenue Property:
| Comparable Rental Properties(1) |
| Property | Year Built | # Units | Unit Mix | Average SF per Unit | Average Monthly Rent per Unit | Average Monthly Rent PSF |
261-275 Amsterdam Avenue(2) New York (subject property) | 1906 | 133 | Studio 1BR 2BR 3BR 4BR 5BR 6BR | 436 720 1,028 1,454 1,634 2,018 2,409 | $1,669 $2,708 $2,934 $4,248 $4,763 $7,163 $5,790 | $3.83 $3.76 $2.85 $2.92 $2.92 $3.55 $2.40 |
175 West 79th Street New York, NY | 1927 | 75 | 1BR 2BR 3BR 4BR | 900 1,200 1,500 2,800 | $2,900 $4,500 $6,250 $12,500 | $3.22 $3.75 $4.17 $4.46 |
239 West 63rd Street New York, NY | 1907 | 41 | Studio 1BR 2BR 3BR 4BR | 400 500 600 700 800 | $1,700 $1,945 $2,287 $2,584 $4,471 | $4.25 $3.89 $3.81 $3.69 $5.59 |
235 West End Avenue New York, NY | 1929 | 148 | Studio 1BR 2BR 3BR 4BR | 400 775 950 1,955 1,800 | $1,895 $3,608 $5,225 $12,000 $8,500 | $4.74 $4.66 $5.50 $6.14 $4.72 |
321 Columbus Avenue New York, NY | 1898 | 76 | Studio 1BR 2BR 3BR 4BR | 650 802 1,350 1,350 1,950 | $2,345 $3,828 $6,746 $6,895 $13,675 | $3.61 $4.77 $5.00 $5.11 $7.01 |
6 West 107th Street New York, NY | 1901 | 20 | 1BR 3BR 4BR | 600 1,100 1,400 | $1,950 $3,863 $3,248 | $3.25 $3.51 $2.32 |
Source: Appraisal.
| (1) | The comparable properties are not rent restricted. |
| (2) | Based on the borrower rent roll dated April 28, 2021. |
The following table presents certain information relating to comparable retail properties to the retail portion of the 261-275 Amsterdam Avenue Property:
| Comparable Retail Rental Properties |
| Property | Total SF | Tenant | Tenant SF | Term Lease (Years) | Base Rent (PSF) | Lease Type |
261-275 Amsterdam Avenue(1) (subject property) | 20,837 | Capital One | 6,567 | 15 | $347.22 | Modified Gross |
| 240 Columbus Ave | 5,452 | Felice’ | 1,800 | 10 | $195.00 | Modified Gross |
| 2025 Broadway | 216,606 | J’s Cleaners | 700 | 10 | $171.00 | Modified Gross |
| 225-229 Columbus Ave | 30,446 | Manny’s Bistro | 1,100 | NAP | $210.00 | Modified Gross |
| 2091 Broadway | 8,040 | Beauty Box | 2,750 | 10 | $219.00 | Modified Gross |
| 348-354 Amsterdam Avenue | 280,723 | Soul Cycle | 2,032 | 11 | $187.02 | NNN |
| 462 Broadway | 102,000 | Wells Fargo | 4,880 | 10 | $425.00 | Modified Gross |
| 545 Madison Avenue | 153,583 | Wells Fargo | 4,000 | 10 | $485.00 | Modified Gross |
| 440 West 33rd Street | 2,633,636 | Citizens Bank | 1,538 | 15 | $300.00 | Modified Gross |
Source: Appraisal.
| (1) | Based on the borrower rent roll dated April 28, 2021. |
This is not a research report and was not prepared by any Underwriter’s research department. Please see additional important information and qualifications at the end of this Term Sheet.
T-65
| Mixed Use – Multifamily/Retail | Loan #3 | Cut-off Date Balance: | | $55,000,000 |
| 261-275 Amsterdam Avenue | 261-275 Amsterdam Avenue | Cut-off Date LTV: | | 63.3% |
| New York, NY 10023 | | U/W NCF DSCR: | | 1.97x |
| | | U/W NOI Debt Yield: | | 7.3% |
The following table presents certain information relating to the appraisal’s market rent conclusion for the multifamily portion of the 261-275 Amsterdam Avenue Property:
| Market Rent Summary(1) |
| Building | Units | Average Size (SF) | Avg. Monthly Rent per Unit | Avg. Monthly Rent PSF | Avg. Monthly Market Rent per Unit(2)(3) | Avg. Monthly Market Rent PSF(2)(3) |
| Studio | 2 | 436 | $1,669 | $3.83 | $2,000 | $6.64 |
| One Bedroom | 22 | 720 | $2,708 | $3.76 | $3,100 | $4.47 |
| Two Bedroom | 64 | 1,028 | $2,934 | $2.85 | $4,250 | $4.30 |
| Three Bedroom | 21 | 1,454 | $4,248 | $2.92 | $5,950 | $4.01 |
| Four Bedroom | 7 | 1,634 | $4,763 | $2.92 | $6,500 | $4.07 |
| Five Bedroom | 12 | 2,018 | $7,163 | $3.55 | $8,500 | $4.13 |
| Six Bedroom | 5 | 2,409 | $5,790 | $2.40 | $11,100 | $4.61 |
| (1) | Based on the borrower rent roll dated April 28, 2021. |
| (2) | Based on the appraisal. |
| (3) | Market Rent does not include rent stabilized or rent controlled units. |
The following table presents certain information relating to the appraisal’s market rent conclusion for the retail portion of the 261-275 Amsterdam Avenue Property:
| Market Rent Summary |
| | The Dorm | Capital One | Under 651 SF | Over 651 SF |
| Market Rent (PSF) | $100.00 | $400.00 | $325.00 | $250.00 |
| Lease Term (Yrs) | 5 | 5 | 5 | 5 |
| Rent Increase Projection | 3.0% per annum | 3.0% per annum | 3.0% per annum | 3.0% per annum |
Operating History and Underwritten Net Cash Flow. The following table presents certain information relating to the historical operating performance and Underwritten Net Cash Flow at the 261-275 Amsterdam Avenue Property:
| Cash Flow Analysis(1) |
| | 2017 | 2018 | 2019 | 2020 | 3/31/2021 TTM | UW | UW per Unit |
| Gross Potential Rent | $5,614,800 | $5,643,015 | $5,700,015 | $5,816,342 | $5,877,125 | $5,894,142 | $40,370.84 |
| Total Recoveries | $760,977 | $861,178 | $977,921 | $1,067,285 | $1,069,844 | $1,047,166 | $7,172.37 |
| Other Income(2)(3) | $5,164,726 | $5,094,170 | $4,968,802 | $4,358,494 | $4,178,066 | $5,460,214 | $37,398.73 |
| Vacancy & Credit Loss | ($10,019) | ($28,215) | ($228,001) | ($145,409) | ($146,855) | ($347,065) | ($2,377.16) |
| Effective Gross Income | $11,530,484 | $11,570,148 | $11,418,737 | $11,096,712 | $10,978,180 | $12,054,457 | $82,564.77 |
| | | | | | | | |
| Real Estate Taxes | $3,107,689 | $3,286,649 | $3,464,930 | $3,592,407 | $3,626,208 | $3,696,533 | $25,318.72 |
| Insurance | $82,093 | $102,938 | $124,194 | $80,109 | $84,951 | $102,152 | $699.67 |
| Other Expenses | $1,455,497 | $1,545,406 | $1,326,547 | $1,205,238 | $1,267,476 | $1,344,938 | $9,211.90 |
| Total Expenses | $4,645,279 | $4,934,993 | $4,915,671 | $4,877,754 | $4,978,635 | $5,143,623 | $35,230.29 |
| | | | | | | | |
| Net Operating Income | $6,885,205 | $6,635,155 | $6,503,066 | $6,218,958 | $5,999,545 | $6,910,834 | $47,334.48 |
| Capital Expenditures | $0 | $0 | $0 | $0 | $0 | $43,518 | $298.07 |
| TI/LC | $0 | $0 | $0 | $0 | $0 | $132,058 | $904.51 |
| Net Cash Flow | $6,885,205 | $6,635,155 | $6,503,066 | $6,218,958 | $5,999,545 | $6,735,257 | $46,131.90 |
| | | | | | | | |
| Occupancy % | 99.3% | 99.3% | 97.3% | 97.9% | 98.6% | 97.6% | |
| NOI DSCR(4) | 2.01x | 1.94x | 1.90x | 1.82x | 1.75x | 2.02x | |
| NCF DSCR(4) | 2.01x | 1.94x | 1.90x | 1.82x | 1.75x | 1.97x | |
| NOI Debt Yield(4) | 7.2% | 7.0% | 6.8% | 6.5% | 6.3% | 7.3% | |
| NCF Debt Yield(4) | 7.2% | 7.0% | 6.8% | 6.5% | 6.3% | 7.1% | |
| (1) | For the avoidance of doubt, no COVID-19 specific adjustments have been made to the lender underwriting. |
| (2) | Other Income is comprised of retail and other commercial income, adjusted for vacancy. |
| (3) | The increase between 3/31/2021 TTM and UW Other Income and Net Operating Income is primarily due to (i) rent steps totaling $111,162 (ii) straight line rent for Capital One totaling $215,791 and (iii) the 3/31/2021 TTM reflecting aggregate commercial rent reduction of $1,015,876 for tenants paying reduced rent due to COVID-19 relief (while the UW assumes such tenants have returned to paying full rent). |
| (4) | The debt service coverage ratios and debt yields are based on the 261-275 Amsterdam Avenue Whole Loan. |
This is not a research report and was not prepared by any Underwriter’s research department. Please see additional important information and qualifications at the end of this Term Sheet.
T-66
| Mixed Use – Multifamily/Retail | Loan #3 | Cut-off Date Balance: | | $55,000,000 |
| 261-275 Amsterdam Avenue | 261-275 Amsterdam Avenue | Cut-off Date LTV: | | 63.3% |
| New York, NY 10023 | | U/W NCF DSCR: | | 1.97x |
| | | U/W NOI Debt Yield: | | 7.3% |
Escrows and Reserves.
Real Estate Taxes – The 261-275 Amsterdam Avenue Whole Loan documents provide for an upfront reserve of approximately $1,586,430 for real estate taxes and ongoing monthly deposits into a reserve for real estate taxes in an amount equal to 1/12 of the real estate taxes that the lender estimates will be payable during the next twelve months for the 261-275 Amsterdam Avenue Property.
Insurance – The 261-275 Amsterdam Avenue Whole Loan documents provide for ongoing monthly deposits into a reserve for insurance premiums in an amount equal to 1/12 of the insurance premiums that the lender estimates will be payable for the renewal of coverage upon the expiration of the insurance policies; provided that such monthly deposits are not required so long as (i) no event of default is continuing, (ii) the liability and casualty insurance coverage for the 261-275 Amsterdam Avenue Property is included in a blanket policy approved by the lender in its reasonable discretion, and (iii) the 261-275 Amsterdam Avenue Borrower provides the lender with evidence of payment of the insurance premiums and provides evidence of renewals of the insurance policies, no later than ten days prior to the expiration of the current policy.
Required Repairs Reserve – The 261-275 Amsterdam Avenue Whole Loan documents provide for an upfront reserve of approximately $3,450 for required repairs.
Replacement Reserve – The 261-275 Amsterdam Avenue Whole Loan documents provide for ongoing monthly deposits of $3,627 into a reserve for approved capital expenditures.
Facade Repair Reserve – The 261-275 Amsterdam Avenue Whole Loan documents provide for an upfront reserve of $519,452 for façade work being done in accordance with New York City’s Local Law 11.
Unit Renovation Reserve – The 261-275 Amsterdam Avenue Whole Loan documents provide for an upfront reserve of $50,000 for renovation work being performed on Unit 5B at the 261-275 Amsterdam Avenue Property to convert from a rent-controlled unit to a fair market rental unit.
Commercial Rent Concession Reserve – The 261-275 Amsterdam Avenue Whole Loan documents provide for an upfront reserve of $154,448 for commercial tenants receiving rent concessions to be released upon such tenant occupying the space covered by the applicable lease past all free rent periods, paying full rent in accordance with the terms of the applicable lease past all free rent periods and providing a satisfactory estoppel to the lender.
Lockbox and Cash Management. The 261-275 Amsterdam Avenue Whole Loan is structured with a soft lockbox and springing cash management. The 261-275 Amsterdam Avenue Borrower and property manager are required to deposit any funds received by the 261-275 Amsterdam Avenue Borrower and property manager into the lockbox account within one business day of receipt. In addition, the 261-275 Amsterdam Avenue Borrower was required at origination to deliver to the lender, in escrow, tenant direction letters directing each tenant to send rents directly into the collection account, which the lender has the right to deliver to the tenants upon the occurrence of a Cash Sweep Event Period (as defined below), and is required to promptly deliver to the lender (or if requested by the lender after the occurrence of a Cash Sweep Event Period, directly to the tenants) additional tenant direction letters for tenants entering into new leases after the origination date. Upon the first occurrence of a Cash Sweep Event Period, the lender is required to establish, and the 261-275 Amsterdam Avenue Borrower is required to cooperate with the cash management bank to establish, a lender-controlled cash management account, into which all funds in the lockbox account will be required to be deposited, so long as the Cash Sweep Event Period is continuing. During the continuance of a Cash Sweep Event Period, provided no event of default under the 261-275 Amsterdam Avenue Whole Loan documents is continuing, all funds in the cash management account are required to be applied on each monthly payment date: (i) to make the monthly deposits into the real estate tax and insurance reserves as described above under “Escrows and Reserves,” (ii) to pay debt service on the 261-275 Amsterdam Avenue Whole Loan, (iii) to make the monthly deposit into the replacements reserve as described above under “Escrows and Reserves,” (iv) to pay operating expenses set forth in the annual budget (which is required to be reasonably approved by the lender) and lender-approved extraordinary expenses, and (v) to deposit any remainder into an excess cash flow reserve to be held as additional security for the 261-275 Amsterdam Avenue Whole Loan during the continuance of such Cash Sweep Event Period. To the extent that a Cash Sweep Event Period is in existence solely due to a Lease Expiration Event (as defined below) or a Trigger Tenant Credit Event (as defined below), the remaining funds in the cash management account will not be required to be deposited into the excess cash flow subaccount once the balance in the excess cash flow subaccount is equal to $1,500,000 and the balance over $1,500,000 is required to be disbursed to the 261-275 Amsterdam Avenue Borrower. If no Cash Sweep Event Period is continuing, all funds in the excess cash flow subaccount are required to be disbursed to the 261-275 Amsterdam Avenue Borrower.
“Cash Sweep Event Period” means a period commencing upon the occurrence of a Trigger Event (as defined below) and ending upon an Excess Cash Sweep Termination (as defined below).
“Trigger Event” means any one of the following: (i) the occurrence of an event of default, (ii) the occurrence of a DSCR Event (as defined below), (iii) a Trigger Tenant Credit Event, and/or (iv) a Lease Expiration Event.
“DSCR Event” means that the debt service coverage ratio for the 261-275 Amsterdam Avenue Property is less than 1.30x at the end of any calendar quarter, based upon the trailing 6 month operating statement and current in place rent roll. The 261-275 Amsterdam Avenue Borrower will have the right to cure a DSCR Event by depositing with the lender a letter of credit or cash funds in the amount which, if applied to the outstanding principal balance of the 261-275 Amsterdam Avenue Whole Loan, would result in the debt service coverage ratio being at least 1.30x for the immediately preceding six consecutive calendar months, each based upon a trailing 6-month operating statement and current in-place rent roll. Such letter of credit or cash is required to be returned to the 261-275 Amsterdam Avenue Borrower if the DSCR Event is cured without consideration of such letter of credit or cash.
“Trigger Tenant Credit Event” means (x) the bankruptcy of any Trigger Tenant (as defined below) or any guarantor of any lease with a Trigger Tenant and/or (y) any Trigger Tenant ceases to do business open to the public at the 261-275 Amsterdam Avenue Property.
“Trigger Tenant” means Capital One, and any successor tenant approved by the lender.
This is not a research report and was not prepared by any Underwriter’s research department. Please see additional important information and qualifications at the end of this Term Sheet.
T-67
| Mixed Use – Multifamily/Retail | Loan #3 | Cut-off Date Balance: | | $55,000,000 |
| 261-275 Amsterdam Avenue | 261-275 Amsterdam Avenue | Cut-off Date LTV: | | 63.3% |
| New York, NY 10023 | | U/W NCF DSCR: | | 1.97x |
| | | U/W NOI Debt Yield: | | 7.3% |
“Trigger Tenant Lease” means that certain lease by and between G & L Realty LLC, as landlord, and Capital One, as tenant, and all amendments, modifications and extensions thereto and any successor lease approved by the lender.
“Lease Expiration Event” means the date which is the earlier to occur of (a) the date on which a Trigger Tenant gives notice to vacate its space under its Trigger Tenant Lease and (b) the date which is 6 months prior to the expiration of the term of the Trigger Tenant Lease (unless the applicable Trigger Tenant has renewed or extended its lease, on terms and conditions reasonably approved by the lender, prior to such date).
“Excess Cash Sweep Termination” means (i) in the case of a Trigger Event due to an event of default, such event of default has been cured to the satisfaction of the lender in its sole discretion, (ii) in the case of a Trigger Event due to a DSCR Event, the debt service coverage ratio is at least 1.30x (based on the actual loan constant) for each of the immediately preceding 6 consecutive calendar months (or such event is cured as described in the definition of DSCR Event above), (iii) in the case of a Trigger Event due to a Lease Expiration Event, either (1) the Trigger Tenant has extended or renewed its Trigger Tenant Lease on terms and conditions approved by the lender in its sole discretion or (2) such space is leased to a new replacement tenant on terms and conditions approved by the lender, in its sole discretion, and an original tenant estoppel certificate evidencing that such new tenant is in occupancy, open for business to the public and paying full unabated rent and all tenant improvements and leasing commissions have been paid, is delivered to the lender (a “Replacement Tenant Cure”), (iv) in the case of a Trigger Event described in subsection (x) of the definition of Trigger Tenant Credit Event, either (1) the applicable lease is affirmed in bankruptcy or (2) a Replacement Tenant Cure occurs, and (v) in the case of a Trigger Event described in subsection (y) of the definition of Trigger Tenant Credit Event, either (1) the applicable Trigger Tenant has re-opened for business and is in occupancy of all its space and paying its contractual rent at the 261-275 Amsterdam Avenue Property or (2) a Replacement Tenant Cure occurs.
Additional Secured Indebtedness (not including trade debts). The 261-275 Amsterdam Avenue Property also secures the 261-275 Amsterdam Avenue Serviced Pari Passu Companion Loan, which has a Cut-off Date principal balance of $40,000,000. The 261-275 Amsterdam Avenue Serviced Pari Passu Companion Loan accrues interest at the same rate as the 261-275 Amsterdam Avenue Mortgage Loan. The 261-275 Amsterdam Avenue Mortgage Loan is entitled to payments of interest on a pro rata and pari passu basis with the 261-275 Amsterdam Avenue Serviced Pari Passu Companion Loan. The holders of the 261-275 Amsterdam Avenue Mortgage Loan and the 261-275 Amsterdam Avenue Serviced Pari Passu Companion Loan have entered into a co-lender agreement which sets forth the allocation of collections on the 261-275 Amsterdam Avenue Whole Loan. See “Description of the Mortgage Pool—The Whole Loans—The Serviced Pari Passu Whole Loans” in the Preliminary Prospectus.
Mezzanine Loan and Preferred Equity. Not permitted.
Release of Property. Not permitted.
Letter of Credit. None; however, the 261-275 Amsterdam Avenue Borrower has the right to provide a letter of credit to cure a DSCR Event.
Right of First Offer / Right of First Refusal. None.
Ground Lease. None.
Terrorism Insurance. The 261-275 Amsterdam Avenue Borrower is required to obtain and maintain an “all risk” or “special form” property insurance policy that covers perils of terrorism and acts of terrorism in an amount equal to the “full replacement cost” of the 261-275 Amsterdam Avenue Property, together with business income insurance covering not less than the 18-month period commencing at the time of loss, together with an extended period of indemnity endorsement of up to six months. Notwithstanding the foregoing, for so long as the Terrorism Risk Insurance Act of 2002, as extended and modified by the Terrorism Risk Insurance Program Reauthorization Act of 2015 (“TRIPRA”), is in effect (including any extensions thereof or if another federal governmental program is in effect relating to “acts of terrorism” which provides substantially similar protections as TRIPRA), the lender is required to accept terrorism insurance which covers against “covered acts” as defined by TRIPRA (or such other program) but only in the event that TRIPRA (or such other program) continues to cover both domestic and foreign acts of terrorism. See “Risk Factors—Risks Relating to the Mortgage Loans—Terrorism Insurance May Not Be Available for All Mortgaged Properties” in the Preliminary Prospectus.
This is not a research report and was not prepared by any Underwriter’s research department. Please see additional important information and qualifications at the end of this Term Sheet.
T-68
(THIS PAGE INTENTIONALLY LEFT BLANK)
This is not a research report and was not prepared by any Underwriter’s research department. Please see additional important information and qualifications at the end of this Term Sheet.
T-69
| Office - CBD | Loan #4 | Cut-off Date Balance: | | $52,000,000 |
| 41-61 Kissena Boulevard | Flushing Plaza | Cut-off Date LTV: | | 38.7% |
| Flushing, NY 11355 | | UW NCF DSCR: | | 4.35x |
| | | UW NOI Debt Yield: | | 13.5% |
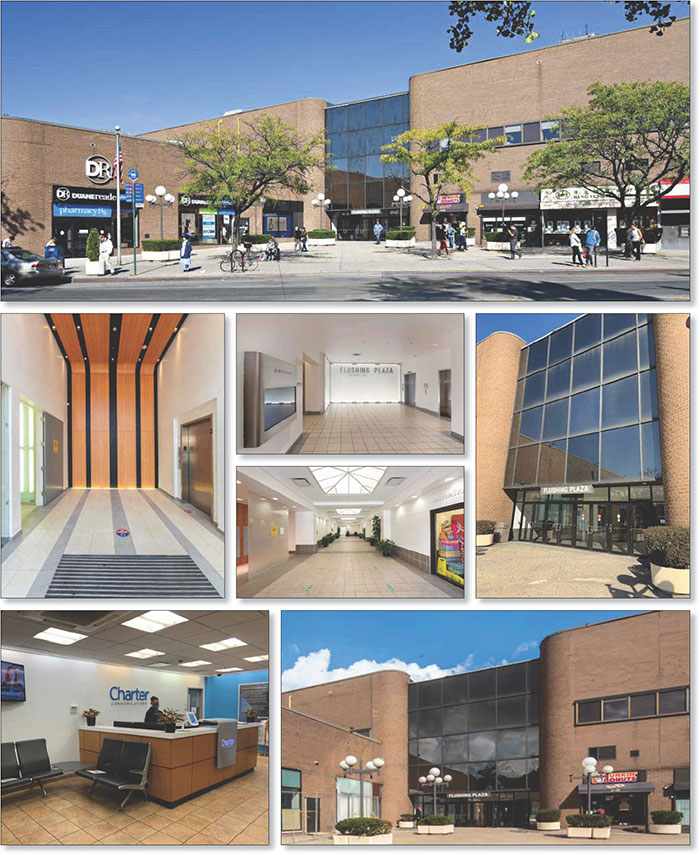
This is not a research report and was not prepared by any Underwriter’s research department. Please see additional important information and qualifications at the end of this Term Sheet.
T-70
| Office - CBD | Loan #4 | Cut-off Date Balance: | | $52,000,000 |
| 41-61 Kissena Boulevard | Flushing Plaza | Cut-off Date LTV: | | 38.7% |
| Flushing, NY 11355 | | UW NCF DSCR: | | 4.35x |
| | | UW NOI Debt Yield: | | 13.5% |

This is not a research report and was not prepared by any Underwriter’s research department. Please see additional important information and qualifications at the end of this Term Sheet.
T-71
| Office - CBD | Loan #4 | Cut-off Date Balance: | | $52,000,000 |
| 41-61 Kissena Boulevard | Flushing Plaza | Cut-off Date LTV: | | 38.7% |
| Flushing, NY 11355 | | UW NCF DSCR: | | 4.35x |
| | | UW NOI Debt Yield: | | 13.5% |

This is not a research report and was not prepared by any Underwriter’s research department. Please see additional important information and qualifications at the end of this Term Sheet.
T-72
| Mortgage Loan No. 4 – Flushing Plaza |
| Mortgage Loan Information | | Property Information |
| Mortgage Loan Seller: | BANA | | Single Asset/Portfolio: | Single Asset |
| Credit Assessment (Moody’s/Fitch/KBRA): | NR/NR/NR | | Location: | Flushing, NY 11355 |
| Original Balance: | $52,000,000 | | General Property Type: | Office |
| Cut-off Date Balance: | $52,000,000 | | Detailed Property Type: | CBD |
| % of Initial Pool Balance: | 5.2% | | Title Vesting: | Fee |
| Loan Purpose: | Refinance | | Year Built/Renovated: | 1973/1995 |
| Borrower Sponsor: | Muss Development, LLC | | Size: | 244,089 SF |
| Guarantor: | Joshua L. Muss | Cut-off Date Balance PSF: | $213 |
| Mortgage Rate: | 2.8250% | Maturity Date Balance PSF: | $213 |
| Note Date: | 3/18/2021 | | Property Manager: | Muss Development, LLC |
| First Payment Date: | 5/1/2021 | | | (borrower-related) |
| Maturity Date: | 4/1/2031 | | | |
| Original Term to Maturity: | 120 months | | | |
| Original Amortization Term: | 0 months | | Underwriting and Financial Information(2) |
| IO Period: | 120 months | | UW NOI: | $7,029,549 |
| Seasoning: | 1 month | | UW NOI Debt Yield: | 13.5% |
| Prepayment Provisions: | L(25),D(88),O(7) | | UW NOI Debt Yield at Maturity: | 13.5% |
| Lockbox/Cash Mgmt Status: | Hard/Springing | | UW NCF DSCR: | 4.35x |
| Additional Debt Type: | No | | Most Recent NOI: | $6,672,283 (12/31/2020) |
| Additional Debt Balance: | NAP | | 2nd Most Recent NOI: | $7,628,565 (12/31/2019) |
| Future Debt Permitted (Type): | No (NAP) | | 3rd Most Recent NOI: | $8,333,094 (12/31/2018) |
| Reserves(1) | | Most Recent Occupancy: | 85.4% (3/15/2021) |
| Type | Initial | Monthly | Cap | | 2nd Most Recent Occupancy: | 93.0% (12/31/2020) |
| RE Taxes: | $0 | Springing | NAP | | 3rd Most Recent Occupancy: | 93.0% (12/31/2019) |
| Insurance: | $0 | Springing | NAP | | Appraised Value (as of) (3): | $134,500,000 (2/9/2022) |
| Required Repairs: | $36,225 | $0 | NAP | | Appraised Value PSF(3): | $551 |
| Replacement Reserve: | $0 | Springing | NAP | | Cut-off Date LTV Ratio(3): | 38.7% |
| TI/LC Reserve: | $4,885,487 | Springing | $3,000,000 | | Maturity Date LTV Ratio(3): | 38.7% |
| | | | | | | | |
| Sources and Uses |
| Sources | Proceeds | % of Total | | Uses | Proceeds | % of Total |
| Loan Amount: | $52,000,000 | 100.0% | | Loan Payoff: | $30,579,275 | 58.8% |
| | | | | Return of Equity: | $15,206,025 | 29.2% |
| | | | | Reserves: | $4,921,712 | 9.5% |
| | | | | Closing Costs: | $1,292,988 | 2.5% |
| Total Sources: | $52,000,000 | 100.0% | | Total Uses: | $52,000,000 | 100.0% |
| (1) | See “Escrows and Reserves” below for further discussion of reserve information. |
| (2) | The coronavirus pandemic is an evolving situation and could impact the Flushing Plaza Mortgage Loan (as defined below) more severely than assumed in the underwriting of the Flushing Plaza Mortgage Loan and could adversely affect the NOI, NCF and occupancy information, as well as the Appraised Value and the DSCR, LTV and Debt Yield metrics presented above. See “Risk Factors—Risks Related to Market Conditions and Other External Factors—The Coronavirus Pandemic Has Adversely Affected the Global Economy and Will Likely Adversely Affect the Performance of the Mortgage Loans” in the Preliminary Prospectus. |
| (3) | The Appraised Value shown is the prospective market value “Upon Stabilization”, for which value the appraiser assumed the largest tenant, Spectrum New York Metro, LLC, would sign a five-year lease extension, which extension has been executed as of March 2021. The “As-Is” appraised value of $125,100,000 as of February 9, 2021 results in an Appraised Value PSF, Cut-off Date LTV Ratio and Maturity Date LTV Ratio of $513, 41.6% and 41.6%, respectively. |
The Mortgage Loan. The fourth largest mortgage loan (the “Flushing Plaza Mortgage Loan”) is evidenced by a promissory note in the original principal amount of $52,000,000 and secured by a first priority fee mortgage encumbering a 244,089 SF office building located in Flushing, Queens, New York (the “Flushing Plaza Property”).
The Borrower and the Borrower Sponsor. The borrower is Flushing Plaza Commercial, LLC (the “Flushing Plaza Borrower”), a single-purpose New York limited liability company with two independent directors. The borrower sponsor is Muss Development, LLC. Muss Development, LLC is a family owned and operated real estate development and investment company that was founded in 1906 and has developed more than 15 million SF of commercial, residential, industrial and retail space throughout the five boroughs of New York City. Muss Development, LLC is headquartered in Forest Hills, Queens. Joshua L. Muss, a principal of Muss Development, LLC, is the non-recourse carveout guarantor for the Flushing Plaza Mortgage Loan.
The Property. The Flushing Plaza Property consists of a 244,089 SF, two-story office building located in Flushing, Queens, New York. The Flushing Plaza Property was constructed in 1973 on a 2.79-acre site and was most recently renovated in 1995. The borrower sponsor has owned and operated the Flushing Plaza Property since January 1985. Within the last ten years, the borrower sponsor has invested approximately $2.35 million in capital improvements, including updates to the lobbies and mailroom, water tower and air conditioning installation, and elevator upgrades. The Flushing Plaza Property contains a total of 240,865 SF of office space and 3,233 SF of retail space. On a portion of the concourse level and one level below is an 808-space parking garage (approximately 3.3 spaces per 1,000 SF), which is fully operated and managed by an affiliate of the Flushing Plaza Borrower.
The Flushing Plaza Property has had a historical year-end occupancy average of 96.8% from 2015 to 2020. After a 17,120 SF tenant recently vacated, as of March 15, 2021, the Flushing Plaza Property was 85.4% occupied by 25 office and medical office tenants and one retail tenant. The underwritten
This is not a research report and was not prepared by any Underwriter’s research department. Please see additional important information and qualifications at the end of this Term Sheet.
T-73
| Office - CBD | Loan #4 | Cut-off Date Balance: | | $52,000,000 |
| 41-61 Kissena Boulevard | Flushing Plaza | Cut-off Date LTV: | | 38.7% |
| Flushing, NY 11355 | | UW NCF DSCR: | | 4.35x |
| | | UW NOI Debt Yield: | | 13.5% |
base rent for the office space is $48.33 PSF. The largest tenants include Spectrum New York Metro, LLC, Emblem Health Group of New York, Cyracom International, Inc., Social Security Administration and The Child Center of NY, Inc., with no other tenant representing more than 3.8% of NRA or 3.0% of underwritten rent.
Major Tenants.
Spectrum New York Metro, LLC (73,976 SF, 30.3% of NRA, 32.4% of underwritten rent). Spectrum New York Metro, LLC (“Spectrum”) (formerly Time Warner Entertainment Company, L.P.) is a brand of Charter Communications, Inc. (NASDAQ: CHTR, Moody’s/S&P: Ba2/BB+). Charter Communications, Inc. is a mass media telecommunications company and the second largest cable company in the United States, serving more than 31 million customers through the Spectrum brand. Spectrum reportedly uses its leased space at the Flushing Plaza Property as one of its main call centers within the New York City metropolitan area, and has reportedly made a multi-million dollar investment into its space over its nearly twenty year history at the property. Spectrum has been a tenant at the Flushing Plaza Property since April 2002, occupying suite 2000 (68,943 SF office) and suite 1040 (2,283 SF retail). In November 2010, Spectrum expanded to suite 28 (2,750 SF office). The Spectrum lease was most recently extended in March 2021 and expires on March 31, 2027, with two five-year renewal options remaining at fair market rent with a minimum of eight months’ notice. The lease does not contain any termination options.
Emblem Health Group of New York (42,982 SF, 17.6% of NRA, 22.6% of underwritten rent). Emblem Health Group of New York (“Emblem”) is a health and wellness company that provides insurance plans, primary and specialty care, and wellness solutions. As one of the nation’s largest not-for-profit health insurers, Emblem serves more than three million people in the New York tristate area. Emblem occupies suites 1020, 1025 and 1090 at the Flushing Plaza Property. Emblem has been a tenant at the Flushing Plaza Property since January 1985, initially leasing 28,463 SF, and expanded by 14,519 SF in 2019. The Emblem lease expires in December 2042, with two five-year renewal options remaining at fair market rent and with a minimum of six months’ notice. The lease does not contain any termination options.
Cyracom International, Inc. (23,000 SF, 9.4% of NRA, 11.8% of underwritten rent). Cyracom International, Inc. (“Cyracom”) provides language interpretation and translation services for thousands of clients, including some of the largest healthcare, insurance and financial services companies. Cryacom occupies suite 1010 at the Flushing Plaza Property. The lease commenced in August 2015 and has an expiration date in August 2027. Cyracom’s base rent will increase from $51.75 PSF to $59.51 PSF beginning on September 1, 2025.
The following table presents certain information relating to the major tenants at the Flushing Plaza Property:
| Tenant Summary(1) |
| Tenant Name | Credit Rating
(Fitch/Moody’s/
S&P)(2) | Tenant SF | Approx. % of SF | Annual UW Rent | % of Total Annual
UW Rent | Annual UW Rent PSF | Lease Expiration | Renewal Options | Term. Options (Y/N) |
| Spectrum New York Metro, LLC(3) | NR/Ba2/BB+ | 73,976(4) | 30.3% | $3,272,683 | 32.4% | $44.24 | 3/31/2027 | 2 x 5 Yr | N |
| Emblem Health Group of New York(5) | NR/NR/NR | 42,982 | 17.6% | $2,284,371 | 22.6% | $53.15 | 12/31/2042 | 2 x 5 Yr | N |
| Cyracom International, Inc. | NR/NR/NR | 23,000 | 9.4% | $1,190,250 | 11.8% | $51.75 | 8/31/2027 | NAP | N |
| Social Security Administration(6) | AAA/Aaa/AA+ | 17,930 | 7.3% | $1,134,826(7) | 11.2% | $63.29 | 12/31/2031 | NAP | N |
| The Child Center of NY, Inc.(8) | NR/NR/NR | 15,813 | 6.5% | $727,398 | 7.2% | $46.00 | 10/31/2034 | NAP | N |
| Subtotal/Wtd. Avg. | | 173,701 | 71.2% | $8,609,528 | 85.2% | $49.57 | | | |
| | | | | | | | | | |
| Other Office | | 33,852 | 13.9% | $1,412,691 | 14.0% | $41.73 | | | |
| Retail | | 950 | 0.4% | $85,500 | 0.8% | $90.00 | | | |
| Vacant Space | | 35,586 | 14.6% | $0 | 0.0% | $0.00 | | | |
| Total/Wtd. Avg.(9) | | 244,089 | 100.0% | $10,107,719 | 100.0% | $48.48 | | | |
| (1) | Information based on the underwritten rent roll. |
| (2) | Certain ratings are those of the parent company whether or not the parent company guarantees the lease. |
| (3) | In connection with its lease extension in March 2021, Spectrum New York Metro, LLC is entitled to $668,688 of leasing commissions, which amount has been fully reserved by the lender. |
| (4) | Tenant SF for Spectrum New York Metro, LLC includes 2,283 SF of retail space. |
| (5) | Emblem Health Group of New York is entitled to $1,051,648 for tenant improvements, which amount has been fully reserved by the lender. |
| (6) | Social Security Administration is entitled to $2,656,023 for tenant improvements and $121,534 for leasing commissions, which amounts have been fully reserved by the lender. |
| (7) | Annual UW Rent for Social Security Administration is the straight-lined average rent over the lease term. |
| (8) | The Child Center of NY, Inc. is entitled to $98,094 for leasing commissions, which amount has been fully reserved by the lender. |
| (9) | Wtd. Avg. Annual UW Rent PSF excludes vacant space. |
This is not a research report and was not prepared by any Underwriter’s research department. Please see additional important information and qualifications at the end of this Term Sheet.
T-74
| Office - CBD | Loan #4 | Cut-off Date Balance: | | $52,000,000 |
| 41-61 Kissena Boulevard | Flushing Plaza | Cut-off Date LTV: | | 38.7% |
| Flushing, NY 11355 | | UW NCF DSCR: | | 4.35x |
| | | UW NOI Debt Yield: | | 13.5% |
The following table presents certain information relating to the lease rollover schedule at the Flushing Plaza Property:
| Lease Rollover Schedule(1)(2) |
| Year | # of Leases
Rolling | SF Rolling | UW Rent PSF
Rolling | Approx. % of
Total SF
Rolling | Approx.
Cumulative % of
SF Rolling | Total UW
Rent Rolling | Approx. % of
Total Rent
Rolling | Approx.
Cumulative
% of Total
Rent
Rolling |
| MTM | 1 | 3,870 | $37.13 | 1.6% | 1.6% | $143,693 | 1.4% | 1.4% |
| 2021 | 8 | 7,300 | $45.80 | 3.0% | 4.6% | $334,326 | 3.3% | 4.7% |
| 2022 | 5 | 6,906 | $47.43 | 2.8% | 7.4% | $327,538 | 3.2% | 8.0% |
| 2023 | 2 | 10,368 | $33.80 | 4.2% | 11.7% | $350,417 | 3.5% | 11.4% |
| 2024 | 3 | 3,166 | $46.10 | 1.3% | 13.0% | $145,953 | 1.4% | 12.9% |
| 2025 | 2 | 3,192 | $61.49 | 1.3% | 14.3% | $196,264 | 1.9% | 14.8% |
| 2026 | 0 | 0 | $0.00 | 0.0% | 14.3% | $0 | 0.0% | 14.8% |
| 2027 | 2 | 96,976 | $46.02 | 39.7% | 54.0% | $4,462,933 | 44.2% | 59.0% |
| 2028 | 0 | 0 | $0.00 | 0.0% | 54.0% | $0 | 0.0% | 59.0% |
| 2029 | 0 | 0 | $0.00 | 0.0% | 54.0% | $0 | 0.0% | 59.0% |
| 2030 | 0 | 0 | $0.00 | 0.0% | 54.0% | $0 | 0.0% | 59.0% |
| 2031 & Beyond | 3 | 76,725 | $54.04 | 31.4% | 85.4% | $4,146,595 | 41.0% | 100.0% |
| Vacant | 0 | 35,586 | $0.00 | 14.6% | 100.0% | $0 | 0.0% | 100.0% |
| Total/Wtd. Avg.(3) | 26 | 244,089 | $48.48 | 100.0% | | $10,107,719 | 100.0% | |
| (1) | Information is based on the underwritten rent roll. |
| (2) | Certain tenants may have lease termination options that are exercisable prior to the originally stated expiration date of the subject lease and that are not considered in this Lease Rollover Schedule. |
| (3) | Wtd. Avg. UW Rent PSF Rolling excludes vacant space. |
COVID-19 Update. As of April 21, 2021, no loan modification or forbearance requests have been made on the Flushing Plaza Mortgage Loan. The first payment date of the Flushing Plaza Mortgage Loan is May 1, 2021. As of April 21, 2021, the Flushing Plaza Property is open and operating, with 99.5% of tenants by NRA and 99.6% of tenants by underwritten rent having made full rent payments in April 2021. During the COVID-19 pandemic, six tenants (20.3% NRA and 18.7% of UW rent) received a full rent deferral from April through July of 2020. The deferred rent is required to be paid from January 2021 through June 2022. One tenant (0.5% NRA and 0.4% of UW rent) has received a rent abatement through October 2021.
The Market. The Flushing Plaza Property is located at 41-61 Kissena Boulevard, on the northeast side of Kissena Boulevard between Barclay Avenue and Sanford Avenue in Flushing, Queens County, New York. Flushing is a large commercial and retail area mixed with a dense residential community in the central portion of Queens County that benefits from its wide access to public transportation, major area highways (including the Van Wyck and Whitestone Expressway, Grand Central Parkway and Long Island Expressway), and the LaGuardia and John F. Kennedy International airports. The Flushing Plaza Property is located two blocks from the intersection of Main Street and Roosevelt Avenue, considered the business center for Flushing. This intersection features the Flushing-Main Street station, with access to the New York City 7-train line. One block from the Flushing Plaza Property is the Flushing Main Street Long Island Rail Road station, providing access to New York City’s Penn Station in under 20 minutes.
The Flushing Plaza Property is located in the Northeast Queens submarket. As of the fourth quarter of 2020, the Northeast Queens submarket had approximately 12.7 million SF of inventory, with a 2.70% vacancy rate and $44.64 PSF average asking rent.
According to the appraisal, the 2020 population within a one-, three- and five-mile radius of the Flushing Plaza Property was 124,266, 741,060 and 1,628,712, respectively. The 2020 average household income within the same radii was $65,310, $87,466 and $90,068, respectively.
This is not a research report and was not prepared by any Underwriter’s research department. Please see additional important information and qualifications at the end of this Term Sheet.
T-75
| Office - CBD | Loan #4 | Cut-off Date Balance: | | $52,000,000 |
| 41-61 Kissena Boulevard | Flushing Plaza | Cut-off Date LTV: | | 38.7% |
| Flushing, NY 11355 | | UW NCF DSCR: | | 4.35x |
| | | UW NOI Debt Yield: | | 13.5% |
The following table presents recent leasing data with respect to comparable office properties to the Flushing Plaza Property:
| Comparable Office Lease Summary |
| Property/Location | Year
Built/Reno. | SF | Tenant Name | Lease
Size (SF) | Lease
Date | Lease Term
(Yrs.) | Rent PSF (Mod
Gross) |
| Office Leases | | | | | | | |
The Factory 30-30 47th Avenue Astoria, NY | 1926 / 2015 | 1,134,086 | Madewell New York City Dpt. of Health & Mental Hygiene | 19,008 47,522 | Oct 2019 Nov 2020 | 5 10.7 | $29.50 $38.02 |
16-16 Whitestone Expressway Whitestone, NY | 1981 / 2018 | 108,474 | E.E. Cruz & Company | 15,365 | May 2020 | 7 | $37.00(1) |
80-02 Kew Gardens Road New York, NY | 1989 / 2018 | 500,000 | Northwell Orlin & Cohen Federal Bureau of Investigations | 12,523 55,088 | May 2020 Sept 2019 | 10.1 10 | $40.00 $38.58 |
| Medical Office Leases | | | | | | | |
Flushing Commons 38-08 Union Street Flushing, NY | 2017 | 36,731 | Retina Center | 1,940 | Sept 2020 | 5 | $59.00 |
196-35 Horace Harding Expressway Fresh Meadows, NY | 1959 / 1998 | 44,877 | New York Presbyterian | 7,121 | Mar 2020 | 15 | $50.00(1) |
176-60 Union Turnpike New York City, NY | 2001 / 2007 | 118,186 | Jamaica Hospital | 15,000 | Feb 2020 | 10 | $42.00 |
The Factory 30-30 47th Avenue Astoria, NY | 1926 / 2015 | 1,134,086 | American Medical Alert | 6,733 | Oct 2019 | 7.5 | $29.71 |
13314 41st Ave New York, NY | 2014 | 40,795 | Confidential | 2,200 | May 2019 | 3 | $55.00 |
Bell Plaza 42-40 Bell Boulevard New York City, NY | 1971 | 61,620 | Tourette Association of America | 1,100 | April 2019 | 5 | $42.00 |
Source: Appraisal.
| (1) | Rent PSF is triple-net. |
The following table presents certain information relating to the appraisal’s market rent conclusions for the Flushing Plaza Property:
| Market Rent Summary |
| | Office | Medical Office | Concourse | Retail |
| Market Rent (PSF) | $50.00 | $55.00 | $50.00 | $85.00 |
| Lease Term (Yrs.) | 10 | 10 | 7 | 5 |
| Rent Increase Projection | 3.0% per annum | 3.0% per annum | 3.0% per annum | 3.0% per annum |
This is not a research report and was not prepared by any Underwriter’s research department. Please see additional important information and qualifications at the end of this Term Sheet.
T-76
| Office - CBD | Loan #4 | Cut-off Date Balance: | | $52,000,000 |
| 41-61 Kissena Boulevard | Flushing Plaza | Cut-off Date LTV: | | 38.7% |
| Flushing, NY 11355 | | UW NCF DSCR: | | 4.35x |
| | | UW NOI Debt Yield: | | 13.5% |
Operating History and Underwritten Net Cash Flow. The following table presents certain information relating to the historical operating performance and Underwritten Net Cash Flow at the Flushing Plaza Property:
| Cash Flow Analysis |
| | 2017 | 2018 | 2019 | 2020 | UW | UW PSF |
| Gross Potential Rent(1) | $10,368,910 | $10,442,256 | $10,514,086 | $10,932,890 | $12,201,949 | $49.99 |
| Expense Reimbursement | $2,211,931 | $2,330,174 | $1,969,055 | $2,277,568 | $2,229,647 | $9.13 |
| Parking Income | $1,084,416 | $1,018,823 | $899,803 | $598,440 | $621,554 | $2.55 |
| Other Income | $10,427 | $35,665 | $345,714 | $12,809 | $19,672 | $0.08 |
| Vacancy | ($96,171) | ($324,477) | ($680,366) | ($1,772,477) | ($2,094,230) | ($8.58) |
| Effective Gross Income | $13,579,513 | $13,502,441 | $13,048,292 | $12,049,230 | $12,978,592 | $53.17 |
| | | | | | | |
| Taxes | $2,478,141 | $2,589,877 | $2,728,179 | $2,912,823 | $2,975,799 | $12.19 |
| Insurance | $100,083 | $103,343 | $138,694 | $166,419 | $162,057 | $0.66 |
| Other Operating Expenses | $2,625,042 | $2,476,127 | $2,552,854 | $2,297,705 | $2,811,187 | $11.52 |
| Total Operating Expenses | $5,203,266 | $5,169,347 | $5,419,727 | $5,376,947 | $5,949,043 | $24.37 |
| | | | | | | |
| Net Operating Income | $8,376,247 | $8,333,094 | $7,628,565 | $6,672,283 | $7,029,549 | $28.80 |
| TI/LC | $0 | $0 | $0 | $0 | $488,178 | $2.00 |
| Capital Expenditures | $0 | $0 | $0 | $0 | $61,022 | $0.25 |
| Net Cash Flow | $8,376,247 | $8,333,094 | $7,628,565 | $6,672,283 | $6,480,349 | 26.55 |
| | | | | | | |
| Occupancy% | 99.0% | 98.0% | 93.0% | 93.0% | 85.5% | |
| NOI DSCR | 5.62x | 5.59x | 5.12x | 4.48x | 4.72x | |
| NCF DSCR | 5.62x | 5.59x | 5.12x | 4.48x | 4.35x | |
| NOI Debt Yield | 16.1% | 16.0% | 14.7% | 12.8% | 13.5% | |
| NCF Debt Yield | 16.1% | 16.0% | 14.7% | 12.8% | 12.5% | |
| (1) | UW Gross Potential Rent includes contractual rent increases through May 1, 2022 of $173,547 and straight-lined average rent for the Social Security Administration tenant of $287,634. |
Escrows and Reserves.
Real Estate Taxes - If the trailing twelve month amortizing debt service coverage ratio is less than 1.50x, the Flushing Plaza Borrower is required to reserve monthly 1/12 of the estimated annual property taxes that the lender estimates will be payable during the next twelve months.
Insurance - If the trailing twelve month amortizing debt service coverage ratio is less than 1.50x, and if the Flushing Plaza Property is not covered by a blanket policy acceptable to the lender, the Flushing Plaza Borrower is required to reserve monthly 1/12 of the annual insurance premiums.
Required Repairs Reserve - The Flushing Plaza Borrower deposited at loan origination $36,225, which amount equals 115% of the estimated cost of the immediate repairs identified in the property condition report completed in connection with loan origination.
Replacement Reserve - If the trailing twelve month amortizing debt service coverage ratio is less than 1.50x, the Flushing Plaza Borrower is required to reserve $5,085 monthly for replacement reserves.
TI/LC Reserve - The Flushing Plaza Borrower deposited at loan origination $4,885,487 for outstanding landlord obligations. Unless the trailing twelve month amortizing debt service coverage ratio equals or exceeds 1.50x, the Flushing Plaza Borrower is required to deposit monthly $40,682 for general leasing expenses until a reserve cap of $3,000,000 is reached.
Lockbox and Cash Management. The Flushing Plaza Mortgage Loan documents require a hard lockbox with springing cash management upon the occurrence of a Cash Sweep Period (as defined below). During the continuance of a Cash Sweep Period, all funds in the lockbox account are required to be swept each business day to a lender-controlled cash management account and disbursed in accordance with the Flushing Plaza Mortgage Loan documents. Also during a Cash Sweep Period, all excess cash is required to be collected by the lender as additional security for the Flushing Plaza Mortgage Loan.
A “Cash Sweep Period” means the earliest of the period:
| (i) | commencing when the trailing twelve month amortizing debt service coverage ratio is less than 1.50x for two consecutive calendar quarters and expiring upon the trailing twelve month amortizing debt service coverage ratio being greater than or equal to 1.55x for two consecutive calendar quarters; or |
| (ii) | when Spectrum (a) vacates or gives notice of its intent to vacate or terminate the lease, or fails to extend its lease term prior to the date required for such option pursuant to its lease (currently eight months’ notice prior to lease expiration), until a replacement tenant acceptable to the lender has replaced Spectrum, (b) has a monetary default until such default has been cured, or (c) becomes subject to any creditor’s rights laws, or has its lease guarantor become subject to any creditor’s rights laws, until Spectrum has assumed its lease without material alteration and Spectrum, or its lease guarantor, is no longer subject to any creditor’s rights laws. Additionally, a Cash Sweep Period will cease if triggered by any event under this clause (ii) when the amount collected as a result of any Cash Sweep Period is equal to $4,438,560 ($60 PSF of Spectrum’s leased |
This is not a research report and was not prepared by any Underwriter’s research department. Please see additional important information and qualifications at the end of this Term Sheet.
T-77
| Office - CBD | Loan #4 | Cut-off Date Balance: | | $52,000,000 |
| 41-61 Kissena Boulevard | Flushing Plaza | Cut-off Date LTV: | | 38.7% |
| Flushing, NY 11355 | | UW NCF DSCR: | | 4.35x |
| | | UW NOI Debt Yield: | | 13.5% |
space) or when the Flushing Plaza Borrower posts a letter of credit in form and substance reasonably acceptable to the lender equal to $4,438,560.
Additional Secured Indebtedness (not including trade debts). Not permitted.
Mezzanine Loan and Preferred Equity. Not permitted.
Release of Property. Not permitted.
Letter of Credit. None.
Right of First Offer / Right of First Refusal. None.
Ground Lease. None.
Terrorism Insurance. The Flushing Plaza Borrower is required to obtain and maintain property insurance that covers perils of terrorism and acts of terrorism in an amount equal to the full replacement cost of the Flushing Plaza Property and business interruption insurance for eighteen months with a six month extended period of indemnity; provided that if the Terrorism Risk Insurance Program Reauthorization Act (“TRIPRA”) is in effect, the provisions of TRIPRA will determine the acts of terrorism for which coverage will be required. See “Risk Factors—Risks Relating to the Mortgage Loans—Terrorism Insurance May Not Be Available for All Mortgaged Properties” in the Preliminary Prospectus.
This is not a research report and was not prepared by any Underwriter’s research department. Please see additional important information and qualifications at the end of this Term Sheet.
T-78
(THIS PAGE INTENTIONALLY LEFT BLANK)
This is not a research report and was not prepared by any Underwriter’s research department. Please see additional important information and qualifications at the end of this Term Sheet.
T-79
| Office – CBD | Loan #5 | Cut-off Date Balance: | | $50,000,000 |
| 909 Third Avenue | 909 Third Avenue | Cut-off Date LTV: | | 34.9% |
| New York, NY 10022 | | UW NCF DSCR: | | 4.05x |
| | | UW NOI Debt Yield: | | 14.1% |

This is not a research report and was not prepared by any Underwriter’s research department. Please see additional important information and qualifications at the end of this Term Sheet.
T-80
| Office – CBD | Loan #5 | Cut-off Date Balance: | | $50,000,000 |
| 909 Third Avenue | 909 Third Avenue | Cut-off Date LTV: | | 34.9% |
| New York, NY 10022 | | UW NCF DSCR: | | 4.05x |
| | | UW NOI Debt Yield: | | 14.1% |
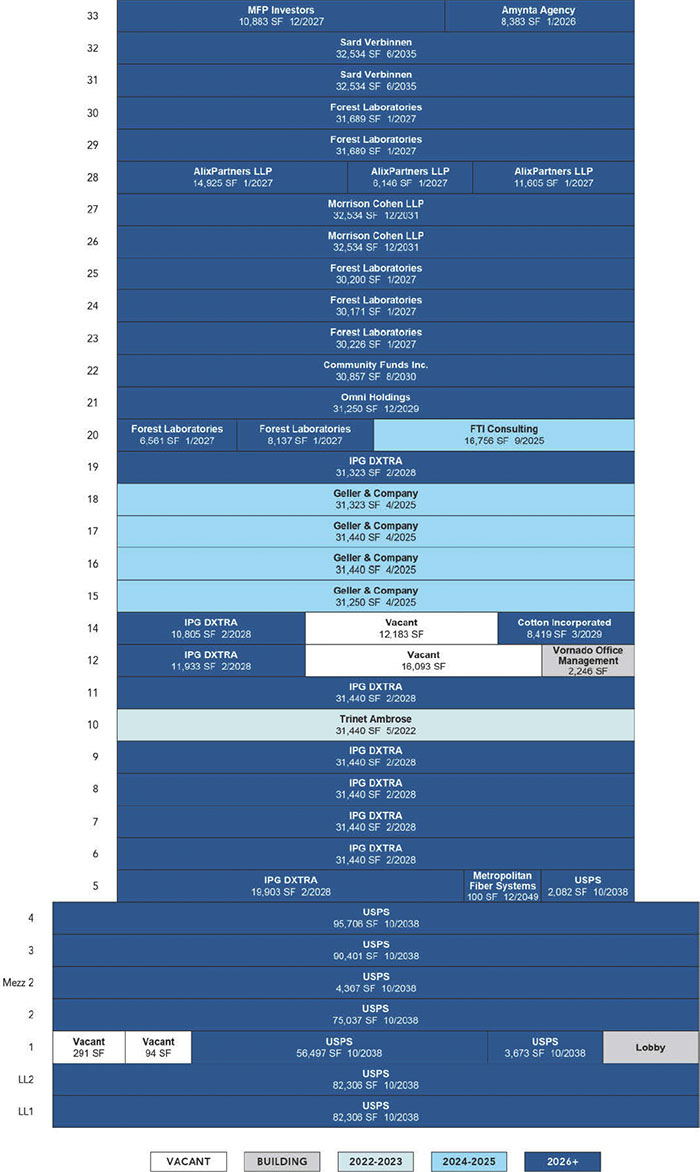
This is not a research report and was not prepared by any Underwriter’s research department. Please see additional important information and qualifications at the end of this Term Sheet.
T-81
| Office – CBD | Loan #5 | Cut-off Date Balance: | | $50,000,000 |
| 909 Third Avenue | 909 Third Avenue | Cut-off Date LTV: | | 34.9% |
| New York, NY 10022 | | UW NCF DSCR: | | 4.05x |
| | | UW NOI Debt Yield: | | 14.1% |

This is not a research report and was not prepared by any Underwriter’s research department. Please see additional important information and qualifications at the end of this Term Sheet.
T-82
| Mortgage Loan No. 5 – 909 Third Avenue |
| Mortgage Loan Information | | Property Information |
| Mortgage Loan Seller: | BANA | | Single Asset/Portfolio: | Single Asset |
| Credit Assessment (Moody’s/Fitch/KBRA): | Aa2/BBB+sf/A+ | | Location: | New York, NY 10022 |
| Original Balance(1): | $50,000,000 | | General Property Type: | Office |
| Cut-off Date Balance(1): | $50,000,000 | | Detailed Property Type: | CBD |
| % of Initial Pool Balance: | 5.0% | | Title Vesting: | Leasehold |
| Loan Purpose: | Refinance | | Year Built/Renovated: | 1968/2011 |
| Borrower Sponsor: | Vornado Realty Trust | | Size: | 1,350,756 SF |
| Guarantor(2): | NAP | | Cut-off Date Balance PSF(1): | $174 |
| Mortgage Rate: | 3.2300% | | Maturity Date Balance PSF(1): | $174 |
| Note Date: | 3/26/2021 | | Property Manager: | Vornado Office Management LLC |
| First Payment Date: | 5/6/2021 | | | (borrower-related) |
| Maturity Date: | 4/6/2031 | | | |
| Original Term to Maturity: | 120 months | | | |
| Original Amortization Term: | 0 months | | | |
| IO Period: | 120 months | | Underwriting and Financial Information(5) |
| Seasoning: | 1 month | | UW NOI: | $33,191,419 |
| Prepayment Provisions: | L(25),D(88),O(7) | | UW NOI Debt Yield(1): | 14.1% |
| Lockbox/Cash Mgmt Status: | Hard/Springing | | UW NOI Debt Yield at Maturity(1): | 14.1% |
| Additional Debt Type(1)(3): | Pari Passu/Subordinate | | UW NCF DSCR(1): | 4.05x |
| Additional Debt Balance(1)(3): | $185,600,000/$114,400,000 | | Most Recent NOI: | $29,078,712 (12/31/2020) |
| Future Debt Permitted (Type): | No (NAP) | | 2nd Most Recent NOI: | $27,045,850 (12/31/2019) |
| Reserves(4) | | 3rd Most Recent NOI: | $27,047,826 (12/31/2018) |
| Type | Initial | Monthly | Cap | | Most Recent Occupancy: | 97.9% (2/1/2021) |
| RE Taxes: | $0 | Springing | NAP | | 2nd Most Recent Occupancy: | 97.9% (12/31/2020) |
| Insurance: | $0 | Springing | NAP | | 3rd Most Recent Occupancy: | 98.6% (12/31/2019) |
| Replacement Reserve: | $0 | Springing | NAP | | Appraised Value (as of)(6): | $675,000,000 (3/1/2021) |
| TI/LC Reserve: | $0 | Springing | NAP | | Appraised Value PSF(6): | $500 |
| Unfunded Obligations Reserve: | $319,928 | $0 | NAP | | Cut-off Date LTV Ratio(1)(6): | 34.9% |
| Ground Rent Reserve: | $0 | Springing | NAP | | Maturity Date LTV Ratio(1)(6): | 34.9% |
| | | | | | | | |
| Sources and Uses |
| Sources | Proceeds | % of Total | | Uses | Proceeds | % of Total |
| Senior Loan Amount(1): | $235,600,000 | 66.8% | | Loan Payoff: | $350,000,000 | 99.2% |
| Subordinate Loan Amount: | $114,400,000 | 32.4% | | Closing Costs: | $2,562,133 | 0.7% |
| Borrower Equity: | $2,882,061 | 0.8% | | Reserves: | $319,928 | 0.1% |
| Total Sources: | $352,882,061 | 100.0% | | Total Uses: | $352,882,061 | 100.0% |
| (1) | The 909 Third Avenue Mortgage Loan (as defined below) is part of the 909 Third Avenue Whole Loan (as defined below), which is comprised of five pari passu senior promissory notes and three subordinate notes. The Cut-off Date Balance PSF, Maturity Date Balance PSF, UW NOI Debt Yield, UW NOI Debt Yield at Maturity, UW NCF DSCR, Cut-off Date LTV Ratio and Maturity Date LTV Ratio numbers presented above are based on the principal balance of the 909 Third Avenue Senior Loan (as defined below). The Cut-off Date Balance PSF, Maturity Date Balance PSF, UW NOI Debt Yield, UW NOI Debt Yield at Maturity, UW NCF DSCR, Cut-off Date LTV Ratio and Maturity Date LTV Ratio based on the principal balance of the 909 Third Avenue Whole Loan are $259, $259, 9.5%, 9.5%, 2.72x, 51.9% and 51.9%, respectively. |
| (2) | There is no non-recourse carveout guarantor or separate environmental indemnitor with respect to the 909 Third Avenue Whole Loan. |
| (3) | See “Additional Secured Indebtedness (not including trade debts)” below for further discussion of additional debt. |
| (4) | See “Escrows and Reserves” below for further discussion of reserve information. |
| (5) | The appraised value was determined prior to the emergence of the novel coronavirus and the economic disruption resulting from measures to combat the coronavirus. In addition, the novel coronavirus pandemic is an evolving situation and could impact the 909 Third Avenue Whole Loan more severely than assumed in the underwriting of the 909 Third Avenue Whole Loan and could adversely affect the NOI, NCF and occupancy information, as well as the appraised value and the DSCR, LTV and Debt Yield metrics presented above and herein. See “Risk Factors–Risks Related to Market Conditions and Other External Factors–The Coronavirus Pandemic Has Adversely Affected the Global Economy and Will Likely Adversely Affect the Performance of the Mortgage Loans” in the Preliminary Prospectus. |
| (6) | The appraised value assumes that the largest tenant at the 909 Third Avenue Property, USPS (as defined below), extends its current lease through October 2038 through the exercise of three, 5-year renewal options remaining under its lease. The appraisal also provided a hypothetical appraised value of $860,000,000 with a valuation date of March 1, 2021, which assumes USPS vacates after its current lease expiration date in October 2023, which value results in an Appraised Value PSF, Cut-off Date LTV Ratio and Maturity Date LTV Ratio of $637, 27.4% and 27.4%, respectively, based on the principal balance of the 909 Third Avenue Senior Loan. |
The Mortgage Loan. The fifth largest mortgage loan (the “909 Third Avenue Mortgage Loan”) is part of a whole loan (the “909 Third Avenue Whole Loan”) evidenced by five pari passu senior promissory notes in the aggregate original principal amount of $235,600,000 (together, the “909 Third Avenue Senior Loan”) and three notes in the original principal amount of $114,400,000 (the “909 Third Avenue Subordinate Companion Loan”) that are subordinate to the 909 Third Avenue Senior Loan. The 909 Third Avenue Whole Loan was originated by Bank of America, N.A., Citi Real Estate Funding Inc. and BMO Harris Bank N.A. The 909 Third Avenue Whole Loan is secured by the borrower’s leasehold interest in a Class A office building located in New York, New York (the “909 Third Avenue Property”). The 909 Third Avenue Mortgage Loan is evidenced by the non-controlling senior Note A-5 with an original principal amount of $50,000,000. The remaining promissory notes comprising the 909 Third Avenue Whole Loan are summarized in the below table. The 909 Third Avenue Whole Loan is being serviced pursuant to the trust and servicing agreement for the NYC 2021-909 securitization trust. See “Description of the Mortgage Pool—The Whole Loans—The 909 Third Avenue Pari Passu-A/B Whole Loan” and “Pooling and Servicing Agreement—Servicing of the Non-Serviced Mortgage Loans” in the Preliminary Prospectus.
This is not a research report and was not prepared by any Underwriter’s research department. Please see additional important information and qualifications at the end of this Term Sheet.
T-83
| Office – CBD | Loan #5 | Cut-off Date Balance: | | $50,000,000 |
| 909 Third Avenue | 909 Third Avenue | Cut-off Date LTV: | | 34.9% |
| New York, NY 10022 | | UW NCF DSCR: | | 4.05x |
| | | UW NOI Debt Yield: | | 14.1% |
| 909 Third Avenue Whole Loan Summary |
| Note | Original Balance | Cut-off Date Balance | Note Holder | Controlling Piece |
| A-1, A-2, A-3 | $135,600,000 | $135,600,000 | NYC 2021-909 | No |
| A-4 | $50,000,000 | $50,000,000 | Benchmark 2021-B25 | No |
| A-5 | $50,000,000 | $50,000,000 | BANK 2021-BNK33 | No |
| B-1, B-2, B-3 | $114,400,000 | $114,400,000 | NYC 2021-909 | Yes(1) |
| Total (Whole Loan) | $350,000,000 | $350,000,000 | | |
| (1) | Pursuant to the related co-lender agreement, the holder of Note B-1 is the controlling noteholder unless a “control appraisal period” has occurred and is continuing under the co-lender agreement, in which case Note A-1 will become the controlling noteholder. See “Description of the Mortgage Pool—The Whole Loans—The 909 Third Avenue Pari Passu-AB Whole Loan” in the Prospectus. |
The Borrower and the Borrower Sponsor. The borrower is 909 Third Company, L.P. (the “909 Third Avenue Borrower”), a single purpose entity and New York limited partnership structured with at least one independent director. There is no non-recourse carveout guarantor or separate environmental indemnitor with respect to the 909 Third Avenue Whole Loan.
The borrower sponsor is Vornado Realty Trust (NYSE: VNO) (“Vornado”). Vornado is a fully-integrated real estate investment trust, rated Baa3/BBB/BBB- by Moody’s/Fitch/S&P. Vornado is one of the largest owners and operators of commercial real estate in the United States with a portfolio of assets including 20.6 million SF of New York City office space (33 properties), 2.7 million SF of New York City street retail space (65 properties), 1,989 New York residential units, the 3.7 million SF theMART property in Chicago, and the 1.8 million SF 555 California Street complex in San Francisco. The borrower sponsor owns several nearby properties that compete with the 909 Third Avenue Property. The related 909 Third Avenue Whole Loan documents do not contain “anti-poaching” provisions to prevent the borrower or its affiliates from steering or directing existing or prospective tenants to the competing properties.
The Property. The 909 Third Avenue Property is a 32-story, 1,350,756 SF, Class A, LEED Gold certified office tower located in New York, New York. Built in 1968 and designed by Emery Roth & Sons, the 909 Third Avenue Property is situated between 54th and 55th Streets, occupying the entire eastern block of Third Avenue. The office tower sits atop approximately 490,000 SF of flex industrial space, leased to United States Parcel Service (“USPS”) which serves as a strategic NYC mail-handling facility and features private loading docks which run through-block from 54th to 55th Street. The 909 Third Avenue Property is anchored by high quality, national tenants, with 66.1% of total NRA leased to investment grade rated tenants.
The largest tenants at the 909 Third Avenue Property based on underwritten rent are IPG DXTRA, Inc. (a subsidiary of Interpublic Group), Allergan Sales, LLC (a pharmaceutical company owned by AbbVie Inc.), Geller & Company, USPS and Morrison Cohen LLP. Based on the underwritten rent roll (adjusted for known leasing developments through April 2021), the 909 Third Avenue Property is 97.9% leased to 15 tenants with a weighted average remaining lease term of approximately 10.8 years (weighted based on NRA and as of the Cut-off Date and assumes USPS remains at the 909 Third Avenue Property through October 10, 2038). From 2000 through year-end 2020, the 909 Third Avenue Property exhibited an average occupancy of 97.2%.
The 909 Third Avenue Borrower owns a leasehold interest in the 909 Third Avenue Property, under which it is required to pay a fixed $1.6 million annually in ground rent through the fully extended term in 2063 (no ground rent escalations or resets) (see “Ground Lease” below). Since acquisition, the borrower sponsor has invested approximately $184.0 million of capital into the 909 Third Avenue Property, including approximately $46.9 million of base building upgrades.
Major Tenants.
IPG DXTRA, Inc. (231,164 SF, 17.1% of NRA, 22.8% of underwritten rent). IPG DXTRA, Inc. (“IPG DXTRA”), is a subsidiary of Interpublic Group Companies (“IPG”, Moody’s/Fitch/S&P:Baa2/BBB+/BBB) which guarantees the lease. IPG is one of the world’s premier global advertising and marketing services companies. The company has approximately 51,200 employees and has offices in all major world markets. IPG DXTRA utilizes its space at the 909 Third Avenue Property as the IPG corporate headquarters. The IPG DXTRA lease has an expiration date of February 29, 2028, with one, five-year renewal option. IPG DXTRA has a one-time right to terminate its lease on November 1, 2023 with 18 months’ notice and payment of a termination fee. Such termination would commence a “Specified Tenant Trigger Period” which would trigger cash management under the 909 Third Avenue Whole Loan documents (see “Lockbox and Cash Management” below). In addition, IPG DXTRA has a one-time contraction option to reduce its leased space by 20,000 SF on March 1, 2024 with 12 months’ notice with payment of a contraction fee. IPG DXTRA currently subleases an additional 105,295 SF from Allergan Sales, LLC through January 30, 2027. IPG DXTRA is entitled to a rent abatement from the period ended November 1, 2023 through April 30, 2024, for a total amount of approximately $6,961,932, which amount was not reserved by the lender.
Allergan Sales, LLC (168,673 SF, 12.5% of NRA, 18.4% of underwritten rent). Allergan Sales, LLC (“Allergan”) was acquired by AbbVie Inc. (NYSE: ABBV; Moody’s/Fitch/S&P: Baa2/NR/BBB+) in 2020. AbbVie Inc. guarantees the lease. AbbVie Inc. is a market-leader in pharmaceuticals, with approximately 47,000 employees in more than 70 countries, with 22 primary research and manufacturing facilities across the world. Allergan has a lease expiration date of January 31, 2027, with one, five-year renewal option. Allergan currently subleases all of its space at the 909 Third Avenue Property through the term of its lease. IPG DXTRA subleases a portion of the 20th floor and the entire 23rd, 24th and 25th floors (105,295 SF) through January 30, 2027 and AlixPartners LLP subleases the entire 29th and 30th floors (63,378 SF) through January 30, 2027.
Geller & Company (125,453 SF, 9.3% of NRA, 13.0% of underwritten rent). Geller & Company is a strategic financial advisory and wealth management company that provides independent and cross-disciplinary advice to businesses, individuals and not-for-profit organizations. The company employs more than 500 professionals who provide Investment Management, CFO, Tax Advisory, Real Estate and Aviation services. Geller & Company has a lease expiration date of April 30, 2025, with one, five-year renewal option. Geller & Company has the ongoing right to contract its lease for either (i) the entirety of Floor 16 or portions thereof and (ii) either the entirety of Floor 17 or portions thereof. Geller & Company subleases a portion of the 15th floor (9,343 SF) to Pizzarotti IBC through April 2025.
USPS (492,375 SF, 36.5% of NRA, 11.2% of underwritten rent). The first four floors and sub-grade space at the 909 Third Avenue Property serve as a mail sorting facility for USPS (Moody’s/Fitch/S&P: Aaa/AAA/AA+). The mail sorting facility is purpose-built distribution space with private loading docks for USPS, which pays a net rental rate of $2.23 PSF or gross equivalent rate of approximately $14.08 PSF. USPS has been a tenant at the 909 Third Avenue Property since its delivery in 1968. Since the commencement of its original 30-year lease, USPS has exercised five, five-year renewal options and has
This is not a research report and was not prepared by any Underwriter’s research department. Please see additional important information and qualifications at the end of this Term Sheet.
T-84
| Office – CBD | Loan #5 | Cut-off Date Balance: | | $50,000,000 |
| 909 Third Avenue | 909 Third Avenue | Cut-off Date LTV: | | 34.9% |
| New York, NY 10022 | | UW NCF DSCR: | | 4.05x |
| | | UW NOI Debt Yield: | | 14.1% |
three, five-year extension options remaining, bringing the fully-extended lease expiration date to October 10, 2038. Due to the unique nature of the USPS space, strategic location in Midtown Manhattan, history of renewals at the 909 Third Avenue Property and below-market rent, the lender has assumed that USPS will continue to extend its lease through October 10, 2038. If USPS elects to extend its lease in 2023, its net rental rate will step down to $2.03 PSF and it will continue to reimburse for real estate taxes.
The following table presents certain information relating to the major tenants at the 909 Third Avenue Property:
| Tenant Summary(1)(2) |
| Tenant Name | Credit Rating (Fitch/Moody’s/ S&P)(3) | Tenant SF | Approx. % of SF | Annual UW Rent | % of Total Annual UW Rent | Annual UW Rent PSF | Lease Expiration | Renewal Options | Term. Option (Y/N) |
| IPG DXTRA, Inc.(4)(5) | BBB+/Baa2/BBB | 231,164 | 17.1% | $14,106,870 | 22.8% | $61.03 | 2/29/2028 | 1 x 5 Yr | Y(6) |
| Allergan Sales, LLC(5) | NR/Baa2/BBB+ | 168,673 | 12.5% | $11,413,477 | 18.4% | $67.67 | 1/31/2027 | 1 x 5 Yr | N |
| Geller & Company(7) | NR/NR/NR | 125,453 | 9.3% | $8,050,922 | 13.0% | $64.17 | 4/30/2025 | 1 x 5 Yr | Y(8) |
| USPS | AAA/Aaa/AA+ | 492,375 | 36.5% | $6,932,092 | 11.2% | $14.08 | 10/10/2038(9) | 3 x 5 Yr(9) | N |
| Subtotal/Wtd. Avg. | | 1,017,665 | 75.3% | $40,503,361 | 65.40% | $39.80 | | | |
| | | | | | | | | | |
| Other Tenants | | 304,430 | 22.50% | $21,464,249 | 34.60% | $70.51 | | | |
| Vacant Space | | 28,661 | 2.1% | $0 | 0.0% | | | | |
| Total/Wtd. Avg. (10) | | 1,350,756 | 100.0% | $61,967,610 | 100.0% | $46.87 | | | |
| (1) | Information is based on the underwritten rent roll (adjusted for known leasing developments through April 2021). |
| (2) | Tenants in order by % of Total Annual UW Rent. |
| (3) | Certain ratings are those of the parent company whether or not the parent company guarantees the lease. |
| (4) | IPG DXTRA, Inc. is entitled to a rent abatement from the period ended November 1, 2023 through April 30, 2024, for a total amount of approximately $6,961,932. |
| (5) | Allergan Sales, LLC subleases all of its space through the expiration of its lease term. 105,295 SF is subleased to IPG DXTRA, Inc. and 63,378 SF is subleased to AlixPartners LLP. |
| (6) | IPG DXTRA, Inc. has a one-time right to terminate its lease on November 1, 2023 with 18 months’ notice and payment of a termination fee (estimated at $20.4 million). In addition, IPG DXTRA has a one-time contraction option to reduce its leased space by 20,000 SF on March 1, 2024 with 12 months’ notice with payment of a contraction fee (estimated at $1.7 million). |
| (7) | Geller & Company subleases 9,343 SF to Pizzarotti IBC through April 2025. |
| (8) | Geller & Company has the ongoing right to contract its lease for either the entirety of Floor 16 or portions thereof and either the entirety of Floor 17 or portions thereof. |
| (9) | Assumes USPS continues to exercise its remaining lease extension options through October 10, 2038 (the current lease has been extended through October 10, 2023). |
| (10) | Total/Wtd. Avg. Annual UW Rent PSF excludes vacant space. |
The following table presents certain information relating to the lease rollover schedule at the 909 Third Avenue Property:
| Lease Rollover Schedule(1)(2) |
| Year | # of Leases Rolling | SF Rolling | UW Rent PSF Rolling | Approx. % of Total SF Rolling | Approx. Cumulative % of SF Rolling | Total UW Rent Rolling | Approx. % of Total Rent Rolling | Approx. Cumulative % of Total Rent Rolling |
| 2021 | 0 | 0 | $0.00 | 0.0% | 0.0% | $0 | 0.0% | 0.0% |
| 2022 | 1 | 31,440 | $60.00 | 2.3% | 2.3% | $1,886,400 | 3.0% | 3.0% |
| 2023 | 0 | 0 | $0.00 | 0.0% | 2.3% | $0 | 0.0% | 3.0% |
| 2024 | 0 | 0 | $0.00 | 0.0% | 2.3% | $0 | 0.0% | 3.0% |
| 2025 | 3 | 150,592 | $64.43 | 11.1% | 13.5% | $9,703,078 | 15.7% | 18.7% |
| 2026 | 0 | 0 | $0.00 | 0.0% | 13.5% | $0 | 0.0% | 18.7% |
| 2027 | 3 | 212,232 | $68.82 | 15.7% | 29.2% | $14,605,482 | 23.6% | 42.3% |
| 2028 | 1 | 231,164 | $61.03 | 17.1% | 46.3% | $14,106,870 | 22.8% | 65.0% |
| 2029 | 2 | 40,953 | $69.83 | 3.0% | 49.3% | $2,859,620 | 4.6% | 69.7% |
| 2030 | 1 | 30,857 | $65.82 | 2.3% | 51.6% | $2,030,930 | 3.3% | 72.9% |
| 2031 | 1 | 65,068 | $78.86 | 4.8% | 56.4% | $5,131,273 | 8.3% | 81.2% |
| 2032 & Beyond(3) | 4 | 559,789 | $20.80 | 41.4% | 97.9% | $11,643,957 | 18.8% | 100.0% |
| Vacant Space | 0 | 28,661 | $0.00 | 2.1% | 100.0% | $0 | 0.00% | 100.0% |
| Total/Wtd. Avg.(4) | 16 | 1,350,756 | $46.87 | 100.0% | | $61,967,610 | 100.0% | |
| (1) | Information is based on the underwritten rent roll dated February 1, 2021 (adjusted for known leasing developments through April 2021). |
| (2) | Certain tenants may have lease termination options that are exercisable prior to the stated expiration date of the subject lease or leases that are not considered in the lease rollover schedule. |
| (3) | 2032 & Beyond includes a 2,246 SF management office with a lease expiration date of December 31, 2049 with no gross rent attributable to the space. 2032 & Beyond also includes USPS, which tenant is assumed in the lender underwriting to continue to exercise its remaining lease extension options through October 10, 2038 (the current lease has been extended through October 10, 2023). |
| (4) | Total/Wtd. Avg. UW Rent PSF Rolling excludes vacant space. |
This is not a research report and was not prepared by any Underwriter’s research department. Please see additional important information and qualifications at the end of this Term Sheet.
T-85
| Office – CBD | Loan #5 | Cut-off Date Balance: | | $50,000,000 |
| 909 Third Avenue | 909 Third Avenue | Cut-off Date LTV: | | 34.9% |
| New York, NY 10022 | | UW NCF DSCR: | | 4.05x |
| | | UW NOI Debt Yield: | | 14.1% |
COVID-19 Update. As of April 19, 2021, no loan modifications or forbearance requests have been made on the 909 Third Avenue Whole Loan. The first payment date of the 909 Third Avenue Whole Loan is May 6, 2021. As of April 19, 2021, the 909 Third Avenue Property is open, and has remained open and operational during the COVID-19 pandemic, with most tenants working remotely. Collections for March and April 2021 were 99.9% by NRA.
The Market. The 909 Third Avenue Property occupies nearly a full city block along Third Avenue between 54th and 55th Streets within the Midtown East office district of New York, which is comprised of the Grand Central, Murray Hill and East Side/U.N. (the “East Side”) office submarkets. The 909 Third Avenue Property is located in the East Side submarket, which is generally delineated as the area between East 39th and East 72nd Streets, from the East River to Lexington Avenue. The 909 Third Avenue Property is in close proximity to various New York City landmarks, restaurants, hotels, retail shops and tourist attractions, made accessible by several major transportation hubs. The 909 Third Avenue Property is located within walking distance to Grand Central Terminal and subway service within close proximity includes the E, F, M, 4, 5, and 6 lines.
According to the appraisal, Class A office space in the Midtown East district had an inventory of approximately 62.0 million SF of office space, direct asking rents of $86.72 PSF and a direct vacancy rate of 12.9% as of the fourth quarter of 2020. According to the appraisal, the 909 Third Avenue Property is located within the East Side Class A office submarket. As of the fourth quarter of 2020, the East Side Class A office submarket had an inventory of approximately 17.7 million SF of office space and direct asking rents of $76.39 PSF.
The appraisal identified eight comparable office properties to determine the 909 Third Avenue Property’s estimated market rents. Direct occupancies for the eight properties ranged from 48.9% to 100.0% with a weighted average of 89.7%. Direct asking rents for the eight comparable properties ranged from $50.00 PSF to $76.00 PSF. Additionally, the appraisal identified several comparable industrial leases to tenants such as Amazon and FedEx in the Bronx, Brooklyn, Queens and Long Island City with average NNN asking rents ranging from $23.50 PSF to $53.56 PSF. Given the location of the 909 Third Avenue Property in midtown Manhattan, the appraisal concluded to a market rent for the USPS industrial flex space of $55.00 PSF NNN (compared to USPS’ UW Base Rent of $2.23 PSF).
Approximately 10.3 million SF of Class A office space is currently under construction in the Midtown office market. One Vanderbilt, located in the Grand Central submarket, was completed in the third quarter of 2020, adding nearly 1.7 million SF to the inventory. The majority of the space under construction is concentrated in the Hudson Yards area.
The following table presents certain information relating to the appraisal’s market rent conclusion for the 909 Third Avenue Property:
| Market Rent Summary |
| | Market Rent (PSF) | Lease Term (Years) | Lease Type (Reimbursements) | Rent Increase Projection |
| Office (Floors 5-12) | $61.00 | 10 | Modified Gross | 10% in year 5 |
| Office (Floors 14-22) | $66.00 | 10 | Modified Gross | 10% in year 5 |
| Office (Floors 23-33) | $71.00 | 10 | Modified Gross | 10% in year 5 |
| Industrial | $55.00 | 10 | Net | 3% per annum |
| Lobby/Other | $100.00 | 10 | Modified Gross | 3% per annum |
The following table presents recent leasing data with respect to comparable office properties with respect to the 909 Third Avenue Property:
| Comparable Office Lease Summary |
| Property/Location | Year Built | SF | Tenant Name | Size (SF) | Lease Date / Term | Initial Rent PSF (Mod Gross) | Free Rent / TI/LC PSF |
485 Lexington Avenue New York, NY | 1956 / 2006 | 733,173 | Trusted Media Brands | 14,959 | Dec 2020 / 11 Yrs | $58.00 | 12 mo / $120 |
800 Third Avenue New York, NY | 1972 | 530,000 | Cohen & Gresser Chicken Soup for the Soul | 33,900 20,010 | Dec 2020 / 11.25 Yrs Feb 2020 / 10.58 Yrs | $70.00 $61.00 | 15 mos / $20 7 mos / $0 |
750 Third Avenue New York, NY | 1958 | 686,356 | RSC Insurance Toga Ventures | 24,515 5,993 | Dec 2020 / 15.33 Yrs Apr 2020 / 5.25 Yrs | $63.00 $69.00 | 4 mos / $110 3 mos / $110 |
885 Third Avenue New York, NY | 1986 / 2006 | 581,339 | Reitler Kailas & Rosenblatt | 32,364 | Dec 2020 / 14.17 Yrs | $76.00 | 14 mos / $65 |
605 Third Avenue New York, NY | 1964 / 2015 | 802,675 | OneSky | 4,926 | Oct 2020 / 8.33 Yrs | $74.00 | 4 mos / $0 |
360 Lexington Avenue New York, NY | 1958 | 231,633 | Plaza Construction | 15,210 | Oct 2020 / 11 Yrs | $65.00 | 12 mos / $90 |
110 East 59th Street New York, NY | 1968 | 465,465 | Cantor Fitzgerald | 151,890 | Jan 2020 / 16.17 Yrs | $61.50 | 14 mos / $115 |
780 Third Avenue New York, NY | 1984 | 484,005 | Olive Tree Holdings | 8,647 | Jan 2020 / 10.75 Yrs | $86.00 | 9 mos / $0 |
Source: Appraisal.
This is not a research report and was not prepared by any Underwriter’s research department. Please see additional important information and qualifications at the end of this Term Sheet.
T-86
| Office – CBD | Loan #5 | Cut-off Date Balance: | | $50,000,000 |
| 909 Third Avenue | 909 Third Avenue | Cut-off Date LTV: | | 34.9% |
| New York, NY 10022 | | UW NCF DSCR: | | 4.05x |
| | | UW NOI Debt Yield: | | 14.1% |
Operating History and Underwritten Net Cash Flow. The following table presents certain information relating to the operating history and Underwritten Net Cash Flow at the 909 Third Avenue Property:
| Cash Flow Analysis |
| | 2017 | 2018 | 2019 | 2020 | UW(1) | UW PSF |
| Gross Potential Rent(2)(3) | $45,051,000 | $45,564,000 | $45,719,000 | $48,640,868 | $53,977,768 | $39.96 |
| Total Recoveries | $7,362,000 | $8,765,000 | $9,071,000 | $8,037,462 | $9,814,093 | $7.27 |
| Other Income(4) | $1,748,000 | $1,615,000 | $1,721,000 | $558,481 | $2,175,831 | $1.61 |
| Vacancy & Credit Loss | $0 | $0 | $0 | $0 | ($1,824,251) | ($1.35) |
| Effective Gross Income | $54,161,000 | $55,944,000 | $56,511,000 | $57,236,811 | $64,143,441 | $47.49 |
| | | | | | | |
| Real Estate Taxes | $13,148,813 | $13,977,677 | $14,760,324 | $15,393,810 | $15,784,150 | $11.69 |
| Insurance | $531,423 | $519,433 | $638,421 | $651,505 | $770,058 | $0.57 |
| Other Expenses | $13,987,911 | $14,399,064 | $14,066,405 | $12,112,784 | $14,397,815 | $10.66 |
| Total Expenses | $27,668,147 | $28,896,174 | $29,465,150 | $28,158,099 | $30,952,023 | $22.91 |
| | | | | | | |
| Net Operating Income | $26,492,853 | $27,047,826 | $27,045,850 | $29,078,712 | $33,191,419 | $24.57 |
| CapEx | $0 | $0 | $0 | $0 | $270,151 | $0.20 |
| TI/LC | $0 | $0 | $0 | $0 | $1,688,445 | $1.25 |
| Net Cash Flow | $26,492,853 | $27,047,826 | $27,045,850 | $29,078,712 | $31,232,823 | $23.12 |
| | | | | | | |
| Occupancy % | 96.8% | 98.6% | 98.6% | 97.9% | 97.1% | |
| NOI DSCR(5) | 3.43x | 3.51x | 3.51x | 3.77x | 4.30x | |
| NCF DSCR(5) | 3.43x | 3.51x | 3.51x | 3.77x | 4.05x | |
| NOI Debt Yield(5) | 11.2% | 11.5% | 11.5% | 12.3% | 14.1% | |
| NCF Debt Yield(5) | 11.2% | 11.5% | 11.5% | 12.3% | 13.3% | |
| (1) | The increase in UW Net Operating Income and UW Net Cash Flow compared to historical periods is primarily driven by recent leasing at the 909 Third Avenue Property. Sard Verbinnen (new lease; $4,701,905 of underwritten rent) had a lease commencement date of November 1, 2019, Community Funds Inc. (renewal lease; $2,030,930 of underwritten rent) had a lease renewal commencement date of May 1, 2020 and FTI Consulting (new lease; $1,031,201 of underwritten rent) had a lease commencement date of June 1, 2020. |
| (2) | Gross Potential Rent includes deductions for free rent for historical periods. |
| (3) | UW Gross Potential Rent is based on the in-place rent roll inclusive of known leasing developments through April 2021, annualized. UW Gross Potential Rent includes grossed up vacant space of $1,824,251 and contractual rent steps through March 30, 2022 of $985,282. UW Gross Potential Rent also includes straight-line average rent of $866,865 for investment grade tenants that were underwritten through the earlier of (i) each respective tenant’s lease expiration date or (ii) the 909 Third Avenue Mortgage Loan Maturity Date. |
| (4) | Other Income is comprised of miscellaneous recoveries, inclusion and sub-metered electric, sublease profit and miscellaneous income. |
| (5) | Debt service coverage ratios and debt yields are based on the 909 Third Avenue Senior Loan and exclude the 909 Third Avenue Subordinate Companion Loan. |
Escrows and Reserves.
Real Estate Taxes – During a Trigger Period (as defined below), the 909 Third Avenue Borrower is required to deposit monthly 1/12th of the taxes that the lender estimates will be payable over the next-ensuing 12-month period.
Insurance – During a Trigger Period, the 909 Third Avenue Borrower is required to deposit monthly 1/12th of the amount which would be sufficient to pay the insurance premium due for the renewal of the coverage afforded by the insurance policies; provided, however, such insurance reserve has been conditionally waived so long as the borrower maintains a blanket policy meeting the requirements of the 909 Third Avenue Whole Loan documents.
Replacement Reserve – During a Trigger Period, the 909 Third Avenue Borrower is required to deposit monthly an amount equal to 1/12th of $0.20 multiplied by the aggregate rentable SF at the 909 Third Avenue Property for capital expenditure reserves (initially calculated to be approximately $22,513).
TI/LC Reserve – During a Trigger Period, the 909 Third Avenue Borrower is required to deposit monthly an amount equal to approximately $140,704 for tenant improvements and leasing commissions. In lieu of such required monthly deposits, the 909 Third Avenue Borrower may provide (x) letters of credit or (y) a collateral support guaranty from an investment grade qualified guarantor with a net worth of at least $150,000,000 exclusive of any interest in the 909 Third Avenue Property, provided that the aggregate amount of the letters of credit and collateral support guaranties may not exceed 10% of the 909 Third Avenue Whole Loan amount unless the 909 Third Avenue Borrower delivers a new or updated non-consolidation opinion.
Unfunded Obligations Reserve – The 909 Third Avenue Borrower deposited at loan origination $319,928 for existing outstanding tenant improvement and leasing commission obligations.
Ground Rent Reserve – During a Trigger Period, the 909 Third Avenue Borrower is required to deposit monthly 1/12th of an amount that the lender reasonably estimates will be payable for ground rent during the next ensuing 12 months; provided, however, such ground lease reserve may be waived if the lender determines in its reasonable discretion that any tenants are paying the ground rent directly to the ground lessor.
Lockbox and Cash Management. The 909 Third Avenue Whole Loan is structured with a hard lockbox and springing cash management. All rents from the 909 Third Avenue Property are required to be deposited directly to the lockbox account and so long as a Trigger Period (as defined below) is not continuing, funds in the lockbox account will be transferred to the borrower’s operating account. During a Trigger Period, the 909 Third Avenue Borrower will not have access to the funds in the lockbox account and such funds will be transferred on each business day to the lender-controlled cash management account and disbursed according to the 909 Third Avenue Whole Loan documents. During a Trigger Period, all excess cash is required to be held by the
This is not a research report and was not prepared by any Underwriter’s research department. Please see additional important information and qualifications at the end of this Term Sheet.
T-87
| Office – CBD | Loan #5 | Cut-off Date Balance: | | $50,000,000 |
| 909 Third Avenue | 909 Third Avenue | Cut-off Date LTV: | | 34.9% |
| New York, NY 10022 | | UW NCF DSCR: | | 4.05x |
| | | UW NOI Debt Yield: | | 14.1% |
lender as additional security for the 909 Third Avenue Whole Loan; however, provided no event of default is continuing the 909 Third Avenue Borrower is permitted to use excess cash to pay for operating expenses incurred and not otherwise paid for by the disbursements from operating expense reserve account or to pay for leasing expenses then due and payable to the extent there are insufficient rollover reserve funds and specified tenant funds to pay the same.
A “Trigger Period” means a period:
| (i) | commencing upon an event of default and ending upon the cure of such event of default, |
| (ii) | during a Low Debt Yield Sweep Event (as defined below), or |
| (iii) | during a Specified Tenant Trigger Period (as defined below). |
A “Low Debt Yield Sweep Event” will commence when the debt yield falls below 6.50% (the “Debt Yield Threshold”) for two consecutive quarters; provided, however, that a Low Debt Yield Sweep Event will not exist if, within fifteen business days after the 909 Third Avenue Borrower’s receipt of notice that a Low Debt Yield Sweep Event has occurred, the 909 Third Avenue Borrower delivers as additional collateral, either (i) cash, or (ii) subject to the terms and conditions of the 909 Third Avenue Whole Loan documents, a letter of credit or a collateral support guaranty from a qualified guarantor, in each case, in an amount equal to the amount by which the then current outstanding balance of the 909 Third Avenue Whole Loan would need to be reduced in order for the debt yield to equal the Low Debt Yield Threshold. A Low Debt Yield Sweep Event will end when the debt yield exceeds the Debt Yield Threshold for two consecutive quarters.
A “Specified Tenant Trigger Period” will commence:
| (I) | upon any bankruptcy or similar insolvency of the Specified Tenant, ending upon the Specified Tenant affirming its lease following the termination of the applicable bankruptcy or similar insolvency proceeding or when the applicable lease has been assumed and assigned to a third party in a manner reasonably satisfactory to the lender or pursuant to an assignment approved in the bankruptcy proceeding by a non-appealable court order, |
| (II) | upon any surrender, cancellation or termination by Specified Tenant for all or any material portion of the Specified Tenant’s lease (excluding any termination or cancellation as a result of Specified Tenant’s contraction rights expressly set forth in its lease) or delivery of any notice in accordance with the terms of the Specified Tenant’s lease of any termination or cancellation by Specified Tenant for all or any material portion of the Specified Tenant’s lease (excluding any termination or cancellation as a result of Specified Tenant’s contraction rights expressly set forth in its lease), ending upon the Specified Tenant’s revocation or rescission of all termination notices with respect to the applicable Specified Tenant’s lease and reaffirmation that the applicable lease is in full force and effect, |
| (III) | upon the Specified Tenant being in monetary default of base rent or material non-monetary default under the Specified Tenant lease beyond applicable notice and cure periods (other than as a result of non-payment of rents up to $1,500,000 in the aggregate if (x) such non-payment is the result of a good faith dispute between a Specified Tenant and the 909 Third Avenue Borrower, (y) the 909 Third Avenue Borrower in a commercially reasonable manner pursues an expeditious and fair resolution of such dispute and (z) such good faith dispute will not otherwise result in a material adverse effect), ending upon the lender’s receipt of evidence satisfactory to it that the default under the applicable Specified Tenant’s lease has been cured, or |
| (IV) | with respect to IPG DXTRA only, upon Specified Tenant’s failure to provide written notice to the 909 Third Avenue Borrower of renewal of its lease for at least 150,000 rentable SF 12 months prior to the expiration date of the applicable lease, ending upon the lender’s receipt of evidence satisfactory to it that applicable Specified Tenant has renewed its lease prior to its then applicable lease expiration. |
A Specified Tenant Trigger Period will also end when if the Specified Tenant lease has been terminated or expired, the lender has received satisfactory evidence that (a) the applicable vacant space is re-leased for a minimum term of five years pursuant to one or more replacement leases and in accordance with the 909 Third Avenue Whole Loan documents, (b) the tenants under the replacement leases have accepted possession of the entire space, (c) the conditions to commencement of rent under the replacement lease(s) (other than the passage of time) have been satisfied or waived, (d) sufficient funds to pay any outstanding tenant improvement allowances and leasing commissions have been reserved with the mortgage lender or guaranteed by a qualified investment grade guarantor with a net worth of at least $150,000,000 and (e) each tenant has commenced paying full rent or sufficient funds to account for any outstanding free rent or rent abatements have been reserved with the mortgage lender or guaranteed by a qualified investment grade guarantor with a net worth of at least $150,000,000 or (vi) with respect to any Specified Tenant Trigger, the date on which the aggregate amounts deposited into the Specified Tenant reserve account in respect of such Specified Tenant Trigger, plus the amount of any letter of credit and/or collateral support guaranty delivered to the mortgage lender equals or exceeds $70.00 PSF with respect to the applicable vacant Specified Tenant space (less any termination, rejection or contraction payments received in respect of such space and any amounts reserved by reason of a Specified Tenant Trigger and in the unfunded obligations reserve account allocable to such space).
“Specified Tenant” means IPG DXTRA and each tenant replacing IPG DXTRA in accordance with the terms of the 909 Third Avenue Whole Loan documents and paying no less than 25% of the total gross rent payable at the 909 Third Avenue Property.
Additional Secured Indebtedness (not including trade debts). The 909 Third Avenue Property also secures four pari passu senior promissory notes (the “909 Third Avenue Pari Passu Companion Loan”), which have an aggregate Cut-off Date principal balance of $185,600,000, and the 909 Third Avenue Subordinate Companion Loan, which has a Cut-off Date principal balance of $114,400,000. The 909 Third Avenue Pari Passu Companion Loan and the 909 Third Avenue Subordinate Companion Loan accrue interest at the same rate as the 909 Third Avenue Mortgage Loan. The 909 Third Avenue Mortgage Loan is entitled to payments of interest on a pro rata and pari passu basis with the 909 Third Avenue Pari Passu Companion Loan, which payments are senior in right of payment to the 909 Third Avenue Subordinate Companion Loan. The holders of the promissory notes evidencing the 909 Third Avenue Whole Loan have entered into a co-lender agreement that sets forth the allocation of collections on the 909 Third Avenue Whole Loan. See “Description of the Mortgage Pool—The Whole Loans—The 909 Third Avenue Pari Passu-A/B Whole Loan” and “Pooling and Servicing Agreement—Servicing of the Non-Serviced Mortgage Loans” in the Preliminary Prospectus.
This is not a research report and was not prepared by any Underwriter’s research department. Please see additional important information and qualifications at the end of this Term Sheet.
T-88
| Office – CBD | Loan #5 | Cut-off Date Balance: | | $50,000,000 |
| 909 Third Avenue | 909 Third Avenue | Cut-off Date LTV: | | 34.9% |
| New York, NY 10022 | | UW NCF DSCR: | | 4.05x |
| | | UW NOI Debt Yield: | | 14.1% |
Subordinate Note Summary |
| | Subordinate Note
Original Principal
Balance | Subordinate
Note Interest
Rate | Original
Term
(mos.) | Original Amort. Term (mos.) | Original
IO Term (mos.) | Whole
Loan UW
NCF DSCR | Whole
Loan UW
NOI Debt
Yield | Whole
Loan Cut-
off Date
LTV(1) |
| 909 Third Avenue Subordinate Companion Loan | $114,400,000 | 3.2300% | 120 | 0 | 120 | 2.72x | 9.5% | 51.9% |
| | | | | | | | | | |
| (1) | Calculated based on the “as-is” appraised value of $675,000,000 with a valuation date of March 1, 2021 which value assumes the largest tenant at the 909 Third Avenue Property, USPS, extends its current lease through October 2038 through the exercise of three, 5-year renewal options remaining under its lease. |
Mezzanine Loan and Preferred Equity. Not permitted.
Release of Property. Not permitted.
Letter of Credit. None.
Right of First Offer / Right of First Refusal. None.
Ground Lease. The borrower sponsor owns a leasehold interest in the 909 Third Avenue Property. The related ground lease between the 909 Third Avenue Borrower, as ground lessee, and 909 Third Fee Owner LLC, as ground lessor, has an expiration date on May 31, 2041, with an extension option for 22.5 years to extend the term of the ground lease to November 30, 2063. Annual rent due under the ground lease is equal to $1,600,000 with no escalations or resets through the initial term or the extension term. Following an assignment of the ground lease to the holder of the 909 Third Avenue Mortgage Loan, the ground lease is further assignable by the holder of the 909 Third Avenue Whole Loan and its successors and assigns without the consent of the ground lessor, but, provided no event of default is occurring at the time of such assignment, during the continuance of the lease with USPS, subject to the consent of the United States government if legally required, to (i) a corporation authorized to do business in the State of New York, (ii) a partnership (as defined in the ground lease) with its principal place of business in New York County, (iii) an individual natural person, or (iv) any one of such parties as a trustee or nominee upon compliance with certain requirements set forth in the ground lease.
Terrorism Insurance. The 909 Third Avenue Whole Loan documents require that the “all-risk” insurance policy required to be maintained by the borrower provide coverage for terrorism in an amount equal to the full replacement cost of the 909 Third Avenue Property, plus the rental loss and/or business interruption coverage in an amount equal to 100% of the projected gross income for the 909 Third Avenue Property covering a period of restoration for the actual loss sustained up to 24 months and containing an extended period of indemnity endorsement which provides that after the physical loss to the improvements and personal property has been repaired, the continued loss of income will be insured until such income either returns to the same level it was at prior to the loss, or the expiration of 12 months from the date that the 909 Third Avenue Property is repaired or replaced and operations are resumed, whichever first occurs, provided that such coverage is commercially available. The “all-risk” policy containing terrorism insurance is required to contain a deductible that is no greater than $150,000. In the event that such coverage with respect to terrorist acts is not included as part of the “all risk” property policy required by clause (i) above, the borrower will be required to obtain coverage for terrorism (as standalone coverage) in the foregoing amount; provided that such coverage is commercially available. Notwithstanding the foregoing, the borrower is not required to spend on terrorism insurance coverage more than the greater of (i) the product of the rate of $0.10 per $100 times the lesser of (A) the outstanding principal balance of the 909 Third Avenue Whole Loan and (B) sum of 100% of the full replacement cost and the amount of rental loss and/or business income interruption insurance described above and (ii) two times the amount of the then-current insurance premium that is payable with respect to the required amount of property and rental loss and/or business income interruption insurance (without giving effect to the cost of terrorism coverage) required to be maintained under the 909 Third Avenue Whole Loan documents. See “Risk Factors—Risks Relating to the Mortgage Loans—Terrorism Insurance May Not Be Available for All Mortgaged Properties” in the Preliminary Prospectus.
This is not a research report and was not prepared by any Underwriter’s research department. Please see additional important information and qualifications at the end of this Term Sheet.
T-89
| Retail – Anchored | Loan #6 | Cut-off Date Balance: | | $49,950,000 |
| 104 North Adams Road | Village of Rochester Hills | Cut-off Date LTV: | | 67.5% |
| Rochester Hills, MI 48309 | | UW NCF DSCR: | | 1.84x (P&I) |
| | | UW NOI Debt Yield: | | 10.2% |
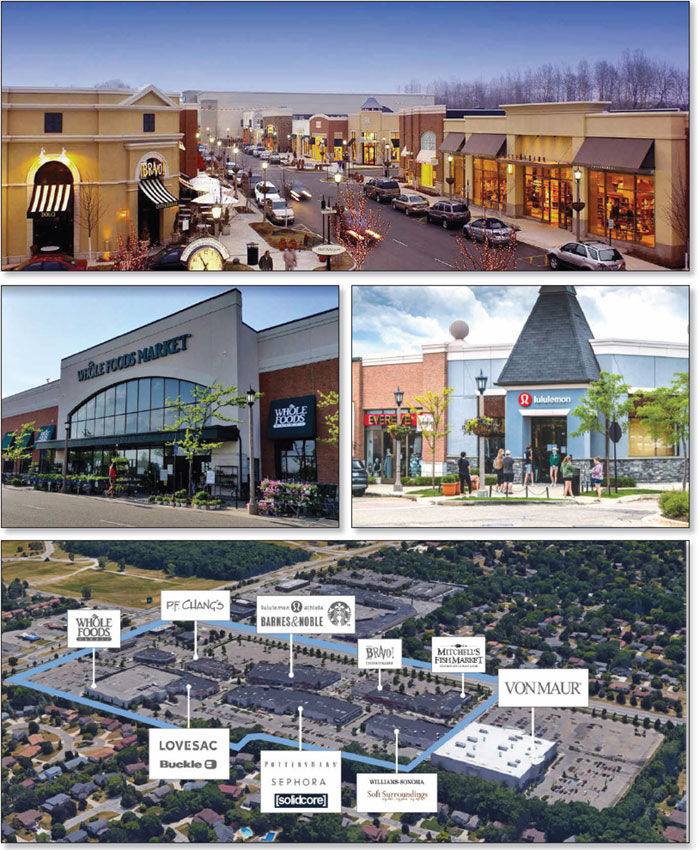
This is not a research report and was not prepared by any Underwriter’s research department. Please see additional important information and qualifications at the end of this Term Sheet.
T-90
| Retail – Anchored | Loan #6 | Cut-off Date Balance: | | $49,950,000 |
| 104 North Adams Road | Village of Rochester Hills | Cut-off Date LTV: | | 67.5% |
| Rochester Hills, MI 48309 | | UW NCF DSCR: | | 1.84x (P&I) |
| | | UW NOI Debt Yield: | | 10.2% |

This is not a research report and was not prepared by any Underwriter’s research department. Please see additional important information and qualifications at the end of this Term Sheet.
T-91
| Retail – Anchored | Loan #6 | Cut-off Date Balance: | | $49,950,000 |
| 104 North Adams Road | Village of Rochester Hills | Cut-off Date LTV: | | 67.5% |
| Rochester Hills, MI 48309 | | UW NCF DSCR: | | 1.84x (P&I) |
| | | UW NOI Debt Yield: | | 10.2% |

This is not a research report and was not prepared by any Underwriter’s research department. Please see additional important information and qualifications at the end of this Term Sheet.
T-92
| Mortgage Loan No. 6 – Village of Rochester Hills |
| Mortgage Loan Information | | Property Information |
| Mortgage Loan Seller: | WFB | | Single Asset/Portfolio: | Single Asset |
| Credit Assessment (Moody’s/Fitch/KBRA): | NR/NR/NR | | Location: | Rochester Hills, MI 48309 |
| Original Balance: | $49,950,000 | | General Property Type: | Retail |
| Cut-off Date Balance: | $49,950,000 | | Detailed Property Type: | Anchored |
| % of Initial Pool Balance: | 5.0% | | Title Vesting: | Fee |
| Loan Purpose: | Refinance | | Year Built/Renovated: | 2002/2020 |
| Borrower Sponsors: | Ann S. Aikens; Robert Bruce Aikens, Jr.; Geoffrey Scott Aikens | | Size: | 253,254 SF |
| Guarantor: | Meadowbrook Properties, LLC | | Cut-off Date Balance PSF: | $197 |
| Mortgage Rate: | 3.7470% | | Maturity Date Balance PSF: | $170 |
| Note Date: | 4/27/2021 | | Property Manager: | Robert B. Aikens & Associates, L.L.C. |
| First Payment Date: | 6/11/2021 | | | (borrower-related) |
| Maturity Date: | 5/11/2031 | | | |
| Original Term to Maturity: | 120 months | | |
| Original Amortization Term: | 360 months | | |
| IO Period: | 36 months | | |
| Seasoning: | 0 months | | Underwriting and Financial Information(3) |
| Prepayment Provisions: | L(24),D(92),O(4) | | UW NOI: | $5,118,792 |
| Lockbox/Cash Mgmt Status: | Hard/In Place | | UW NOI Debt Yield: | 10.2% |
| Additional Debt Type: | None | | UW NOI Debt Yield at Maturity: | 11.9% |
| Additional Debt Balance: | NAP | | UW NCF DSCR: | 1.84x (P&I) / 2.69x (IO) |
| Future Debt Permitted (Type)(1): | Yes (Mezzanine) | | Most Recent NOI: | $4,684,621 (12/31/2020) |
| Reserves(2) | | 2nd Most Recent NOI: | $4,826,330 (12/31/2019) |
| Type | Initial | Monthly | Cap | | 3rd Most Recent NOI: | $4,978,314 (12/31/2018) |
| RE Taxes: | $0 | Springing | NAP | | Most Recent Occupancy: | 87.7% (3/1/2021) |
| Insurance: | $0 | Springing | NAP | | 2nd Most Recent Occupancy: | 94.6% (12/31/2020) |
| Replacement Reserves: | $0 | $4,250 | $100,000 | | 3rd Most Recent Occupancy: | 94.1% (12/31/2019) |
| Leasing Reserve: | $3,150,000 | (2) | (2) | | Appraised Value (as of): | $74,000,000 (2/18/2021) |
| Debt Service Reserve: | $950,000 | $0 | NAP | | Appraised Value PSF: | $292 |
| Existing TI/LC Reserve: | $421,092 | $0 | NAP | | Cut-off Date LTV Ratio: | 67.5% |
| Whole Foods Trigger Period Reserve: | $0 | Springing | NAP | | Maturity Date LTV Ratio: | 58.2% |
| | | | | | | | | |
| Sources and Uses |
| Sources | Proceeds | % of Total | | Uses | Proceeds | % of Total |
| Loan Amount: | $49,950,000 | 96.4% | | Loan Payoff: | $46,517,250 | 89.8% |
| Borrower Equity | $1,850,532 | 3.6% | | Upfront Reserves: | $4,521,092 | 8.7% |
| | | | | Closing Costs: | $762,189 | 1.5% |
| Total Sources: | $51,800,532 | 100.0% | | Total Uses: | $51,800,532 | 100.0% |
| (1) | See “Mezzanine Loan and Preferred Equity” below for further discussion of future permitted mezzanine debt. |
| (2) | See “Escrows and Reserves” below for further discussion of reserve requirements. |
| (3) | The novel coronavirus pandemic is an evolving situation and could impact the Village of Rochester Hills Mortgage Loan (as defined below) more severely than assumed in the underwriting of the Village of Rochester Hills Mortgage Loan and could adversely affect the NOI, NCF and occupancy information, as well as the appraised value and the DSCR, LTV and Debt Yield metrics presented above and herein. See “Risk Factors-—Risks Related to Market Conditions and Other External Factors—The Coronavirus Pandemic Has Adversely Affected the Global Economy and Will Likely Adversely Affect the Performance of the Mortgage Loans” in the Preliminary Prospectus. |
The Mortgage Loan. The sixth largest mortgage loan (the “Village of Rochester Hills Mortgage Loan”) is evidenced by a promissory note in the original principal amount of $49,950,000 and secured by the fee interest in an anchored retail property located in Rochester Hills, Michigan (the “Village of Rochester Hills Property”).
The Borrower and the Borrower Sponsors. The borrower is VORH Associates, LLC, a Delaware limited liability company and single purpose entity with one independent director. The borrower sponsors are Ann S. Aikens, Robert Bruce Aikens, Jr., and Geoffrey Scott Aikens. The non-recourse carveout guarantor is Meadowbrook Properties, LLC, which owns 50% of the borrower and is wholly owned by The Ann S. Aikens Revocable Trust.
Robert Bruce Aikens, Jr. and Geoffrey Scott Aikens are the Vice Chairman and Director of Leasing, respectively, of Robert B. Aikens & Associates, L.L.C.; and Ann S. Aikens holds an ownership interest in such company. Over the past 40 years, Robert B. Aikens & Associates L.L.C. has developed over 20 million SF of retail, commercial and residential space. The company’s current portfolio comprises four retail properties totaling approximately 1.2 million SF and one office building totaling approximately 17,000 SF, all located in Michigan.
This is not a research report and was not prepared by any Underwriter’s research department. Please see additional important information and qualifications at the end of this Term Sheet.
T-93
| Retail – Anchored | Loan #6 | Cut-off Date Balance: | | $49,950,000 |
| 104 North Adams Road | Village of Rochester Hills | Cut-off Date LTV: | | 67.5% |
| Rochester Hills, MI 48309 | | UW NCF DSCR: | | 1.84x (P&I) |
| | | UW NOI Debt Yield: | | 10.2% |
The Property. The Village of Rochester Hills Property is a Class A, multi-tenant lifestyle center totaling 253,254 SF of rentable area. Built in 2002 and renovated in 2020, the property is situated on a 23.4-acre parcel and anchored by Whole Foods and shadow anchored by Von Maur (not part of the collateral; currently building out its space and not yet in occupancy). The collateral improvements comprise eight retail buildings with notable tenants including Pottery Barn, Barnes & Noble, Williams-Sonoma, Sephora, Lululemon, and Lovesac. The property contains 1,597 surface parking spaces, resulting in a parking ratio of 6.3 spaces per 1,000 SF of rentable area. As of March 1, 2021, the Village of Rochester Hills Property was 87.7% occupied by 42 tenants, and has averaged 92.6% occupancy since 2011.
The adjacent Von Maur department store box is owned by an affiliate of the borrower sponsors but is not part of the collateral for the Village of Rochester Hills Mortgage Loan. The loan documents contain anti-poaching provisions that prohibit the borrower (and its affiliates) from soliciting existing tenants at the Village of Rochester Hills Property to lease, sublease, or otherwise relocate to any space at any property owned by an affiliate of the borrower located within a five-mile radius of the Village of Rochester Hills Property; provided, however, that the anti-poaching provisions will not apply to (i) any tenant that accounts for less than either 1.5% of the NRA or 2,000 SF of rentable area at the Village of Rochester Hills Property; or (ii) any tenant that satisfies all of the following conditions: (a) such tenant’s lease term has expired or the tenant has not renewed its lease; (b) such tenant requires space that is either 20% larger or 20% smaller than its then-current demised premises; and (c) there is a lack of leasable space then available at the Village of Rochester Hills Property that would accommodate such tenant’s requirements.
Major Tenants.
Whole Foods (55,125 SF; 21.8% of NRA; 26.3% of underwritten base rent). Whole Foods is the world’s largest natural foods chain and was acquired by Amazon in 2017. Whole Foods has been a tenant at the Village of Rochester Hills Property since 2008 and has a lease expiring in August 2028 with 4, 5-year renewal options remaining. Whole Foods does not have any termination options and is not required to report sales.
Barnes & Noble (14,765 SF; 5.8% of NRA; 5.6% of underwritten base rent). Barnes & Noble has a retail presence in every state, with over 600 bookstores, and between its retail locations and online operations, sells approximately 155 million physical books per year. In addition, Barnes & Noble hosts approximately 100,000 community events every year. In 2016, Barnes & Noble began introducing new prototype stores in select markets across the country, featuring a contemporary aesthetic with books at the center, expanded food and beverage offerings, and comfortable seating for a welcoming customer experience. Barnes & Noble has been a tenant at the Village of Rochester Hills Property since April 2019 and has a lease expiring in April 2029 with two, 5-year renewal options remaining. Barnes & Noble does not have any termination options and is not required to report sales.
Pottery Barn (10,496 SF; 4.1% of NRA; 3.9% of underwritten base rent). Pottery Barn is a home furnishings and furniture store and a subsidiary of Williams-Sonoma, Inc. Pottery Barn has been a tenant at the Village of Rochester Hills Property since September 2002 and has a lease expiring in January 2023, with one, 6-year renewal option remaining. Pottery Barn does not have any termination options. Pottery Barn reported 2020 sales of $489 PSF, which were up approximately 15.5% from 2019 sales of $423 PSF.
The following table presents certain information relating to the tenancy at the Village of Rochester Hills Property:
| Tenant Summary |
| Tenant Name | Credit Rating (Fitch/Moody’s/ S&P)(1) | Tenant SF | Approx. % of SF | Annual UW Rent(2) | % of Total Annual UW Rent | Annual UW Rent PSF(2) | | Renewal Options |
| Termination Option (Y/N) | Lease Expiration |
| Anchor Tenants | | | | | | | | | |
| Whole Foods | A+/A2/AA- | 55,125 | 21.8% | $1,534,680 | 26.3% | $27.84 | N | 8/31/2028 | 4 x 5 Yr |
| Subtotal/Wtd. Avg. | | 55,125 | 21.8% | $1,534,680 | 26.3% | $27.84 | | | |
| | | | | | | | | | |
| Major Tenants | | | | | | | | | |
| Barnes & Noble | NR/NR/NR | 14,765 | 5.8% | $324,830 | 5.6% | $22.00 | N | 4/30/2029 | 2 x 5 Yr |
| Pottery Barn | NR/NR/NR | 10,496 | 4.1% | $230,000 | 3.9% | $21.91 | N | 1/31/2023 | 1 x 6 Yr |
| GAP | NR/Ba2/BB- | 9,055 | 3.6% | $28,525 | 0.5% | $3.15(3) | N | 1/31/2022 | None |
| Banana Republic | NR/Ba2/BB- | 7,483 | 3.0% | $148,278 | 2.5% | $19.82(4) | N | 1/31/2022 | None |
| Mitchell’s Fish Market | NR/NR/NR | 7,392 | 2.9% | $280,896 | 4.8% | $38.00 | N | 3/31/2023 | 2 x 5 Yr |
| Talbots | NR/NR/NR | 7,206 | 2.8% | $216,180 | 3.7% | $30.00 | N | 1/31/2025 | None |
| Bravo Cucina Italiana | NR/NR/NR | 7,029 | 2.8% | $281,160 | 4.8% | $40.00 | N | 12/31/2022 | 1x 5 Yr |
| Subtotal/Wtd. Avg. | | 63,426 | 25.0% | $1,509,869 | 25.9% | $23.81 | | | |
| | | | | | | | | | |
| Non-Major Tenants | | 103,615 | 40.9% | $2,782,427 | 47.8% | $26.85 | | | |
| Occupied Collateral Total | | 222,166 | 87.7% | $5,826,976 | 100.0% | $26.23 | | | |
| Vacant Space | | 31,088 | 12.3% | | | | | | |
| Total/Wtd. Avg. | | 253,254 | 100.0% | | | | | | |
| (1) | Certain ratings are those of the parent company whether or not the parent guarantees the lease. |
| (2) | Annual UW Rent and Annual UW Rent PSF include contractual rent steps through May 2022 totaling $450,256. |
| (3) | GAP’s contractual base rent is based on 2.0% of gross sales. The Annual UW Rent and Annual UW Rent PSF are based on 2.0% of 2019 gross sales. |
| (4) | Banana Republic’s contractual base rent is based on 9.0% of gross sales. The Annual UW Rent and Annual UW Rent PSF are based on 9.0% of 2019 gross sales. |
This is not a research report and was not prepared by any Underwriter’s research department. Please see additional important information and qualifications at the end of this Term Sheet.
T-94
| Retail – Anchored | Loan #6 | Cut-off Date Balance: | | $49,950,000 |
| 104 North Adams Road | Village of Rochester Hills | Cut-off Date LTV: | | 67.5% |
| Rochester Hills, MI 48309 | | UW NCF DSCR: | | 1.84x (P&I) |
| | | UW NOI Debt Yield: | | 10.2% |
The following table presents a summary of sales and occupancy costs for certain tenants at the Village of Rochester Hills Property.
| Sales and Occupancy Cost Summary(1) |
| | 2018 Sales (PSF) | 2019 Sales (PSF) | 2020 Sales (PSF) | 2019 Occupancy Cost | 2020 Occupancy Cost |
| Whole Foods | NAV | NAV | NAV | NAV | NAV |
| Barnes & Noble | NAV | NAV | NAV | NAV | NAV |
| Pottery Barn | $452 | $423 | $489 | 11.3% | 9.8% |
| GAP(2) | $162 | $158 | $88 | 2.0% | 2.0% |
| Banana Republic(3) | $210 | $220 | $134 | 9.0% | 9.0% |
| Mitchell’s Fish Market | $438 | $409 | $204 | 13.8% | 27.7% |
| Talbots | $223 | $229 | $88 | 19.9% | 51.7% |
| Bravo Cucina Italiana | $489 | $405 | $296 | 14.0% | 19.1% |
| (1) | Information obtained from the borrower. |
| (2) | GAP pays gross rent in an amount equal to 2.0% of gross sales. |
| (3) | Banana Republic pays gross rent in an amount equal to 9.0% of gross sales. |
The following table presents certain information relating to the lease rollover schedule at the Village of Rochester Hills Property:
| Lease Rollover Schedule(1)(2) |
| Year | # of Leases Rolling | SF Rolling | UW Rent PSF Rolling(3) | Approx. % of Total SF Rolling | Approx. Cumulative % of SF Rolling | Total UW Rent Rolling | Approx. % of Total Rent Rolling | Approx. Cumulative % of Total Rent Rolling |
| MTM | 0 | 0 | $0.00 | 0.0% | 0.0% | $0 | 0.0% | 0.0% |
| 2021 | 5 | 13,581 | $26.08 | 5.4% | 5.4% | $354,153 | 6.1% | 6.1% |
| 2022 | 9 | 41,716 | $22.59 | 16.5% | 21.8% | $942,487 | 16.2% | 22.3% |
| 2023 | 6 | 31,805 | $24.53 | 12.6% | 34.4% | $780,319 | 13.4% | 35.6% |
| 2024 | 6 | 17,539 | $31.81 | 6.9% | 41.3% | $557,835 | 9.6% | 45.2% |
| 2025 | 1 | 7,206 | $30.00 | 2.8% | 44.2% | $216,180 | 3.7% | 48.9% |
| 2026 | 1 | 1,024 | $30.00 | 0.4% | 44.6% | $30,720 | 0.5% | 49.5% |
| 2027 | 2 | 7,224 | $34.35 | 2.9% | 47.4% | $248,164 | 4.3% | 53.7% |
| 2028 | 4 | 68,107 | $27.82 | 26.9% | 74.3% | $1,894,594 | 32.5% | 86.2% |
| 2029 | 2 | 15,877 | $21.79 | 6.3% | 80.6% | $345,958 | 5.9% | 92.2% |
| 2030 | 3 | 8,820 | $23.66 | 3.5% | 84.1% | $208,668 | 3.6% | 95.7% |
| 2031 | 3 | 9,267 | $26.75 | 3.7% | 87.7% | $247,898 | 4.3% | 100.0% |
| 2032 & Beyond | 0 | 0 | $0.00 | 0.0% | 87.7% | $0 | 0.0% | 100.0% |
| Vacant | 0 | 31,088 | $0.00 | 12.3% | 100.0% | $0 | 0.0% | 100.0% |
| Total/Wtd. Avg.(3) | 42 | 253,254 | $26.23 | 100.0% | | $5,826,976 | 100.0% | |
| (1) | Information is based on the underwritten rent roll. |
| (2) | Certain tenants may have lease termination options that are exercisable prior to the originally stated expiration date of the related lease and are not considered in the rollover schedule. |
| (3) | Wtd. Avg. UW Rent PSF Rolling excludes vacant space. |
COVID-19 Update. As of April 27, 2021, tenants representing approximately 86.8% of the NRA made their full rent payment for April 2021, and approximately 93.9% of underwritten base rent was paid for April 2021. Twenty-eight tenants, representing approximately 53.2% of underwritten base rent, were granted rent relief related to COVID-19, including up to seven months of abated rent and up to three months of deferred rent, with deferred rent required to be repaid on various terms. As of April 23, 2021, all in-place tenants were open and operating with the exception of PF Chang’s, which was closed due to COVID-19 and was expected to re-open within two weeks of such date.
The Market. The Village of Rochester Hills Property is located in Rochester Hills, Oakland County, Michigan, approximately 26 miles northwest of the Detroit central business district. According to the appraisal, land uses in the surrounding area are predominantly retail and residential along secondary roads. Direct access to the property is provided by Adams Road and Walton Boulevard, and highway access is provided by M-59, which connects with Interstate 75 to the southwest. According to the appraisal, within a three- and five-mile radius of the Village of Rochester Hills Property, the 2020 average household income was approximately $129,526 and $118,374, respectively; and within the same radii, the 2020 estimated population was 56,367 and 144,322, respectively.
According to a third-party market research report, the property is situated within the Rochester submarket of the Detroit retail market. As of the April 2021, the submarket reported total inventory of approximately 5.4 million SF, with a 5.1% vacancy rate and average asking rent of $21.26 PSF. The appraisal concluded to market rents ranging from $17.50 PSF for inline space over 5,000 SF to $48.50 PSF for small restaurant space (see table below).
This is not a research report and was not prepared by any Underwriter’s research department. Please see additional important information and qualifications at the end of this Term Sheet.
T-95
| Retail – Anchored | Loan #6 | Cut-off Date Balance: | | $49,950,000 |
| 104 North Adams Road | Village of Rochester Hills | Cut-off Date LTV: | | 67.5% |
| Rochester Hills, MI 48309 | | UW NCF DSCR: | | 1.84x (P&I) |
| | | UW NOI Debt Yield: | | 10.2% |
The following table presents certain information relating to the appraisal’s market rent conclusion for the Village of Rochester Hills Property:
Market Rent Summary |
| Grocery Space | Inline Space (< 2.5k SF) | Inline Space (2.5k-5.0k SF) | Inline Space (>5k SF) | Restaurant – Small Space | Fast Casual Space | Restaurant – Large Space |
| Market Rent (PSF) | $24.25 | $26.75 | $24.25 | $17.50 | $48.50 | $29.00 | $34.00 |
| Lease Term (Years) | 10 | 10 | 10 | 10 | 10 | 10 | 10 |
| Lease Type (Reimbursements) | NNN + 10% | NNN + 15% | NNN + 15% | NNN + 15% | NNN + 15% | NNN + 15% | NNN + 15% |
| Rent Increase Projection | 10% every 5 years | 2% per annum | 2% per annum | 2% per annum | 2% per annum | 2% per annum | 2% per annum |
The table below presents certain information relating to comparable sales pertaining to the Village of Rochester Hills Property identified by the appraiser:
| Comparable Sales |
Property Name | Location | Rentable Area (SF) | Sale Date | Sale Price (PSF) | Appraiser’s Adjusted Sale Price (PSF) |
| Troy Commons | 781-931 East Big Beaver Rd Troy, MI | 129,461 | Sep-19 | $307.04 | $331.61 |
| Arborland Mall | 3521-3795 Washtenaw Ann Arbor, MI | 398,324 | Mar-17 | $256.07 | $310.36 |
| Millennium Park | 13110-13400 Middlebelt Livonia, MI | 264,629 | Dec-17 | $192.72 | $279.45 |
| Mount Pleasant Towne Center | 1608 Palmetto Grande Drive Mount Pleasant, SC | 489,240 | Feb-20 | $300.47 | $328.26 |
| Gateway Square | 9515 Research Blvd. Austin, TX | 512,161 | May-17 | $338.03 | $324.34 |
| Rookwood Commons & Pavilion | 2635 Edmondson Road Cincinnati, OH | 600,071 | Jan-17 | $316.63 | $335.79 |
| The Shops at Oak Brook Place | 2155 West 22nd Street Oak Brook, IL | 177,165 | Jan-20 | $425.03 | $323.02 |
Source: Appraisal.
This is not a research report and was not prepared by any Underwriter’s research department. Please see additional important information and qualifications at the end of this Term Sheet.
T-96
| Retail – Anchored | Loan #6 | Cut-off Date Balance: | | $49,950,000 |
| 104 North Adams Road | Village of Rochester Hills | Cut-off Date LTV: | | 67.5% |
| Rochester Hills, MI 48309 | | UW NCF DSCR: | | 1.84x (P&I) |
| | | UW NOI Debt Yield: | | 10.2% |
Operating History and Underwritten Net Cash Flow. The following table presents certain information relating to the historical operating performance and Underwritten Net Cash Flow at the Village of Rochester Hills Property:
| Cash Flow Analysis |
| | 2017 | 2018 | 2019 | 2020 | UW | UW PSF |
| Base Rent(1) | $5,721,771 | $5,735,822 | $5,716,743 | $5,317,558 | $5,826,976 | $23.01 |
| Grossed Up Vacant Space | $0 | $0 | $0 | $0 | $876,398 | $3.46 |
| Gross Potential Rent | $5,721,771 | $5,735,822 | $5,716,743 | $5,317,558 | $6,703,374 | $26.47 |
| Other Income | $127,634 | $124,044 | $147,310 | $112,338 | $118,837 | $0.47 |
| Percentage Rent | $93,541 | $96,784 | $97,621 | $41,203 | $235,396 | $0.93 |
| Total Recoveries | $2,819,858 | $2,836,762 | $2,705,594 | $2,683,427 | $2,778,133 | $10.97 |
| Net Rental Income | $8,762,804 | $8,793,412 | $8,667,268 | $8,154,526 | $9,835,740 | $38.84 |
| Vacancy & Credit Loss | $0 | $0 | $0 | $0 | ($876,398) | ($3.46) |
| Effective Gross Income | $8,762,804 | $8,793,412 | $8,667,268 | $8,154,526 | $8,959,342 | $35.38 |
| | | | | | | |
| Real Estate Taxes | $1,076,360 | $1,098,231 | $1,107,612 | $1,124,389 | $1,271,795 | $5.02 |
| Insurance | $76,536 | $76,894 | $74,295 | $79,158 | $79,158 | $0.31 |
| Management Fee | $285,562 | $312,667 | $297,747 | $240,789 | $268,780 | $1.06 |
| Other Operating Expenses | $2,226,702 | $2,327,306 | $2,361,284 | $2,025,569 | $2,220,817 | $8.77 |
| Total Operating Expenses | $3,665,160 | $3,815,098 | $3,840,938 | $3,469,905 | $3,840,550 | $15.16 |
| | | | | | | |
| Net Operating Income | $5,097,644 | $4,978,314 | $4,826,330 | $4,684,621 | $5,118,792 | $20.21 |
| Replacement Reserves | $0 | $0 | $0 | $0 | $51,200 | $0.20 |
| TI/LC | $0 | $0 | $0 | $0 | $278,579 | $1.10 |
| Upfront Reserve Credit | $0 | $0 | $0 | $0 | ($315,000) | ($1.24) |
| Net Cash Flow | $5,097,644 | $4,978,314 | $4,826,330 | $4,684,621 | $5,104,012 | $20.15 |
| | | | | | | |
| Occupancy % | 94.3% | 88.2% | 94.1% | 94.6% | 87.7%(2) | |
| NOI DSCR (P&I) | 1.84x | 1.79x | 1.74x | 1.69x | 1.84x | |
| NOI DSCR (IO) | 2.69x | 2.62x | 2.54x | 2.47x | 2.70x | |
| NCF DSCR (P&I) | 1.84x | 1.79x | 1.74x | 1.69x | 1.84x | |
| NCF DSCR (IO) | 2.69x | 2.62x | 2.54x | 2.47x | 2.69x | |
| NOI Debt Yield | 10.2% | 10.0% | 9.7% | 9.4% | 10.2% | |
| NCF Debt Yield | 10.2% | 10.0% | 9.7% | 9.4% | 10.2% | |
(1) UW Base Rent includes contractual rent steps through May 2022 totaling $450,256.
(2) The underwritten economic vacancy is 13.1%. The Village of Rochester Hills Property was 87.7% occupied as of March 1, 2021.
Escrows and Reserves.
Real Estate Taxes – Beginning on the monthly payment date occurring in August 2021, the loan documents require ongoing monthly deposits for real estate taxes of $98,384.
Insurance – The loan documents do not require ongoing monthly insurance reserve deposits as long as (i) no event of default is continuing; (ii) the Village of Rochester Hills Property is covered under a blanket or umbrella policy reasonably acceptable to the lender; (iii) the borrower provides the lender with evidence of renewal of such policies; and (iv) the borrower provides the lender with paid receipts for the insurance premiums no later than 10 business days prior to the policy expiration dates.
Replacement Reserve – The loan documents require ongoing monthly replacement reserve deposits of $4,250, subject to a cap of $100,000.
Leasing Reserve – The loan documents require an upfront general tenant improvements and leasing commissions (“TI/LC”) reserve of $3,150,000. In addition, on each monthly payment date, the borrower is required to deposit an amount equal to the sum of (i) $18,000 (subject to a cap of $1,000,000, provided no event of default is continuing; the “Leasing Reserve Cap”); and (ii) commencing on the monthly payment date in June 2021 and for each monthly payment date through and including May 2024, $72,000 (regardless of whether the Leasing Reserve Cap has been met).
In addition, the borrower has the right to use up to $650,000 of leasing reserve funds for replacement costs consisting of non-tenant-specific capital improvements (such as façade upgrades, courtyard or other common area upgrades, parking reconfiguration or re-striping, and other similar items).
Debt Service Reserve – The loan documents require an upfront deposit of $950,000, which represents six months of debt service. The debt service reserve funds may be used for disbursement to or for the payment of all or part of any monthly payment amount, if and only to the extent there is insufficient cash flow from the Village of Rochester Hills Property to make such monthly payments; provided, however, that the insufficiency of available debt service reserve funds available for disbursement will not relieve the borrower from its obligations to make any payment under the loan documents.
This is not a research report and was not prepared by any Underwriter’s research department. Please see additional important information and qualifications at the end of this Term Sheet.
T-97
| Retail – Anchored | Loan #6 | Cut-off Date Balance: | | $49,950,000 |
| 104 North Adams Road | Village of Rochester Hills | Cut-off Date LTV: | | 67.5% |
| Rochester Hills, MI 48309 | | UW NCF DSCR: | | 1.84x (P&I) |
| | | UW NOI Debt Yield: | | 10.2% |
On the monthly payment date occurring in June 2023, provided that no event of default is continuing, the lender will transfer remaining debt service reserve funds, if any, to the Leasing Reserve account, to be used for TI/LCs.
Existing TI/LC Reserve – The loan documents require an upfront deposit of $421,092 for TI/LCs payable by the borrower under two existing leases at the Village of Rochester Hills Property.
Whole Foods Trigger Period Reserve – During the continuation of a Cash Trap Event Period (as defined below) caused solely by a Whole Foods Trigger Period, the borrower is required to deposit all excess cash flow into the Whole Foods Trigger Period Reserve Fund account. Provided no event of default is continuing, funds in this account will be disbursed to the borrower solely for TI/LCs related to the Whole Foods space and will not be counted towards the Leasing Reserve Cap.
Lockbox and Cash Management. The Village of Rochester Hills Mortgage Loan is structured with an in-place hard lockbox with in-place cash management, into which the borrower and property manager are required to cause all rents to be deposited directly by tenants. In addition, any rents received by the borrower or property manager are required to be deposited into the lockbox account within two business days. In the absence of a Cash Trap Event Period, all excess funds in the cash management account after disbursements in accordance with the loan documents are required to be distributed to the borrower’s operating account. During a Cash Trap Event Period, all excess funds in the cash management account after disbursements in accordance with the loan documents will be swept to an excess cash flow subaccount controlled by the lender and held for so long as such Cash Trap Event Period continues.
A “Cash Trap Event Period” will commence upon the earlier of the following:
| (i) | the occurrence of an event of default; |
| (ii) | the net cash flow debt service coverage ratio being less than 1.30x (tested quarterly; based on 30-year amortization); or |
| (ii) | a Whole Foods Trigger Period. |
A Cash Trap Event Period will end upon the occurrence of the following:
| ● | with regard to clause (i), the cure of such event of default; |
| ● | with regard to clause (ii), the net cash flow debt service coverage ratio being equal to or greater than 1.35x (based on 30-year amortization) for two consecutive calendar quarters; or |
| ● | with regard to clause (iii), a Whole Foods Trigger Period Cure (as defined below). |
A “Whole Foods Trigger Period” will commence upon the earliest to occur of the following; provided, however, that all references to Whole Foods in the definition below (as well as the definition for Whole Foods Trigger Period Cure and Major Tenant Re-Tenanting Event below) will also apply to Whole Foods’ successors and assigns, any replacement tenant for at least 75% of the current Whole Foods space, and any person guaranteeing any lease meeting such requirements:
| (i) | the deadline to renew the Whole Foods lease (current expiration is August 31, 2028 with a renewal deadline of December 1, 2027); |
| (ii) | Whole Foods going dark, vacating or otherwise failing to occupy all or substantially all of its space; |
| (iii) | Whole Foods filing, or otherwise becoming involved as debtor in, a bankruptcy or similar insolvency proceeding; or |
| (iv) | Whole Foods terminating or canceling its lease (or any material portion thereof, or such lease failing or ceasing to be in full force and effect), or giving notice of any of the foregoing. |
A “Whole Foods Trigger Period Cure” will occur upon:
| ● | a Major Tenant Re-Tenanting Event (as defined below); |
| ● | with regard to clause (i) above, Whole Foods renewing its lease until at least August 31, 2033 with a rental rate of at least 75% of the amount payable under its lease immediately prior to such renewal; |
| ● | with regard to clause (ii) above, Whole Foods having resumed its normal business operations in its space and having been open during customary hours for a period of six consecutive months; |
| ● | with regard to clause (iii) above, the affirmation of the lease in the applicable bankruptcy proceeding and the tenant paying all rents and other amounts due under its lease; or |
| ● | with regard to clause (iv) above, the tenant revoking notice of any termination, cancellation or surrender of its lease, and delivering to the lender an estoppel certificate certifying that its lease is in full force and effect and that there are no existing circumstances that could reasonably be expected to give the tenant the right to terminate, cancel or surrender its lease. |
A “Major Tenant Re-Tenanting Event” will occur upon the lender receiving satisfactory evidence that (i) at least 75% of the Whole Foods space has been leased to one or more satisfactory replacement tenants, each pursuant to a satisfactory replacement lease (including without limitation, (a) total annual rent at least equal to 75% of the amount payable under the lease being replaced immediately prior to such replacement; (b) a term of at least five years; and (c) otherwise on terms that are reasonably acceptable to the lender); or (ii) Whole Foods has assigned its lease either (1) pursuant to a unilateral assignment right; or (2) to an assignee, and pursuant to an assignment, each reasonably satisfactory to the lender, and in either case (with respect to either i or ii above), the applicable tenant is in occupancy and paying full, unabated rent (or such amounts have been reserved with the lender), and all TI/LCs have been paid (or such amounts have been reserved with the lender), with evidence including, without limitation, a satisfactory estoppel certificate from each replacement tenant affirming the foregoing.
Additional Secured Indebtedness (not including trade debts). None.
Mezzanine Loan and Preferred Equity. Provided no event of default is continuing, the holders of 100% of the equity interests in the borrower have the right to obtain mezzanine debt secured by a pledge of 100% of the direct ownership interests in the borrower as long as, among other conditions pursuant to the loan documents: (i) the combined debt service coverage ratio is equal to or greater than 1.80x; (ii) the combined loan-to-value ratio is less than or equal to 67.5%; (iii) the combined net cash flow debt yield is equal to or greater than 10.0%; (iv) the mezzanine lender executes and delivers an intercreditor
This is not a research report and was not prepared by any Underwriter’s research department. Please see additional important information and qualifications at the end of this Term Sheet.
T-98
| Retail – Anchored | Loan #6 | Cut-off Date Balance: | | $49,950,000 |
| 104 North Adams Road | Village of Rochester Hills | Cut-off Date LTV: | | 67.5% |
| Rochester Hills, MI 48309 | | UW NCF DSCR: | | 1.84x (P&I) |
| | | UW NOI Debt Yield: | | 10.2% |
and standstill agreement reasonably acceptable to the lender; (v) the maturity date of the mezzanine debt is co-terminous with the Village of Rochester Hills Mortgage Loan; and (vi) rating agency confirmation is obtained from each applicable rating agency.
Release of Property. At any time after the defeasance lockout release date and provided no event of default or other Cash Trap Event Period then exists, the borrower has the right to release a certain portion of the Village of Rochester Hills Property (known as building F; currently occupied by Talbot’s, in addition to other tenants) not to exceed 36,000 SF of NRA from the lien of the Village of Rochester Hills Mortgage Loan in connection with the sale of the parcel to a person other than the borrower, subject to certain conditions, including but not limited to: (i) partial defeasance of the Village of Rochester Hills Mortgage Loan in the amount solely determined by the lender in order for the remaining loan collateral to exhibit (a) an acceptable loan-to-value ratio and/or debt yield (as may be determined by a new appraisal and the lender’s then-current underwritten cash flow); and (b) satisfaction of certain economic metrics and other REMIC requirements; (ii) any construction and/or change to parking (even temporarily) proposed for the release property must (1) not be in violation or conflict with any of the subject property’s remaining tenant leases (or such release request must be accompanied by such tenants’ approval); and (2) comply with each reciprocal easement agreement (“REA”) at the subject property; and (iii) rating agency confirmation.
In addition, at any time and provided no event of default then exists, the borrower has the right to release on one or more occasions certain unimproved portions of the Village of Rochester Hills Property not to exceed 3.5 acres in the aggregate with no associated defeasance or paydown in connection with the sale of such parcel(s) to a person other than the borrower, subject to certain conditions, including but not limited to: (i) the release parcel does not contain any rentable area; and (ii) the potential release property must include some form of replacement parking, such that the remaining portion of the Village of Rochester Hills Property will have access to a minimum parking ratio of 4.25 spaces per 1,000 SF; parking complies with each REA at the subject property; and such release has been approved by any tenant under a major lease (as outlined in the loan documents) and any tenants that have parking rights or other rights to the parcel being released.
Letter of Credit. None
Right of First Offer/Right of First Refusal. None.
Ground Lease. None.
Terrorism Insurance. The loan documents require that the “all risk” insurance policy required to be maintained by the borrower provides coverage for terrorism in an amount equal to the full replacement cost of the Village of Rochester Hills Property, as well as business interruption insurance covering no less than the 18-month period following the occurrence of a casualty event, together with a 6-month extended period of indemnity (provided that if TRIPRA or a similar statute is not in effect, the borrower will not be obligated to pay terrorism insurance premiums in excess of two times the premium for the casualty and business interruption coverage on a stand-alone basis). See “Risk Factors—Risks Relating to the Mortgage Loans—Terrorism Insurance May Not Be Available for All Mortgaged Properties” in the Preliminary Prospectus.
This is not a research report and was not prepared by any Underwriter’s research department. Please see additional important information and qualifications at the end of this Term Sheet.
T-99
| Office - Suburban | Loan #7 | Cut-off Date Balance: | | $48,750,000 |
| 14291-14295 Park Meadow Drive | Plaza East I & II | Cut-off Date LTV: | | 67.6% |
| Chantilly, VA 20151 | | UW NCF DSCR: | | 2.44x |
| | | UW NOI Debt Yield: | | 9.7% |

This is not a research report and was not prepared by any Underwriter’s research department. Please see additional important information and qualifications at the end of this Term Sheet.
T-100
| Office - Suburban | Loan #7 | Cut-off Date Balance: | | $48,750,000 |
| 14291-14295 Park Meadow Drive | Plaza East I & II | Cut-off Date LTV: | | 67.6% |
| Chantilly, VA 20151 | | UW NCF DSCR: | | 2.44x |
| | | UW NOI Debt Yield: | | 9.7% |
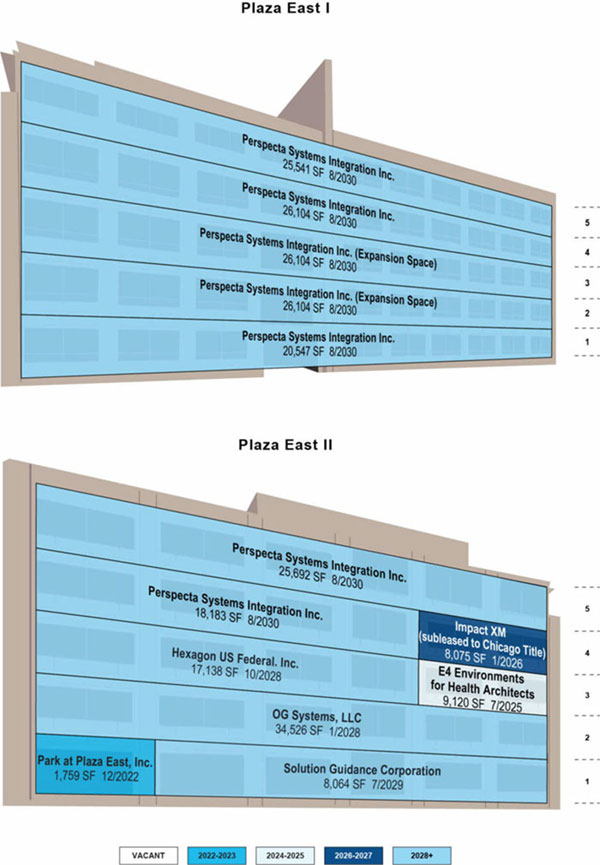
This is not a research report and was not prepared by any Underwriter’s research department. Please see additional important information and qualifications at the end of this Term Sheet.
T-101
| Office - Suburban | Loan #7 | Cut-off Date Balance: | | $48,750,000 |
| 14291-14295 Park Meadow Drive | Plaza East I & II | Cut-off Date LTV: | | 67.6% |
| Chantilly, VA 20151 | | UW NCF DSCR: | | 2.44x |
| | | UW NOI Debt Yield: | | 9.7% |

This is not a research report and was not prepared by any Underwriter’s research department. Please see additional important information and qualifications at the end of this Term Sheet.
T-102
| Mortgage Loan No. 7 – Plaza East I & II |
| Mortgage Loan Information | | Property Information |
| Mortgage Loan Seller: | WFB | | Single Asset/Portfolio: | Single Asset |
| Credit Assessment (Moody’s/Fitch/KBRA): | NR/NR/NR | | Location: | Chantilly, VA 20151 |
| Original Balance: | $48,750,000 | | General Property Type: | Office |
| Cut-off Date Balance: | $48,750,000 | | Detailed Property Type: | Suburban |
| % of Initial Pool Balance: | 4.9% | | Title Vesting: | Fee |
| Loan Purpose: | Acquisition | | Year Built/Renovated: | 2007/NAP |
| Borrower Sponsors: | Meridian Realty Partners IV, L.P.; Meridian Realty Partners NUS IV, L.P. | | Size: | 246,957 SF |
| Guarantors: | Meridian Realty Partners IV, L.P.; Meridian Realty Partners NUS IV, L.P. | | Cut-off Date Balance PSF: | $197 |
| Mortgage Rate: | 3.6720% | | Maturity Date Balance PSF: | $197 |
| Note Date: | 4/2/2021 | | Property Manager: | Meridian Management, L.L.C. |
| First Payment Date: | 5/11/2021 | | | (borrower-related) |
| Maturity Date: | 4/11/2026 | | | |
| Original Term to Maturity: | 60 months | | | |
| Original Amortization Term: | 0 months | | Underwriting and Financial Information(2) |
| IO Period: | 60 months | | UW NOI(3): | $4,723,351 |
| Seasoning: | 1 month | | UW NOI Debt Yield: | 9.7% |
| Prepayment Provisions: | L(25),D(31),O(4) | | UW NOI Debt Yield at Maturity: | 9.7% |
| Lockbox/Cash Mgmt Status: | Hard/Springing | | UW NCF DSCR: | 2.44x |
| Additional Debt Type: | No | | Most Recent NOI(3): | $3,800,768 (12/31/2020) |
| Additional Debt Balance: | NAP | | 2nd Most Recent NOI(3): | $4,355,425 (12/31/2019) |
| Future Debt Permitted (Type): | No (NAP) | | 3rd Most Recent NOI(3): | $3,336,378 (12/31/2018) |
| Reserves(1) | | Most Recent Occupancy: | 100.0% (2/12/2021) |
| Type | Initial | Monthly | Cap | | 2nd Most Recent Occupancy(4): | 100.0% (12/31/2020) |
| RE Taxes: | $299,689 | $59,939 | NAP | | 3rd Most Recent Occupancy(4): | 82.2% (12/31/2019) |
| Insurance: | $0 | Springing | NAP | | Appraised Value (as of): | $72,100,000 (3/8/2021) |
| Replacement Reserve: | $0 | $4,116 | NAP | | Appraised Value PSF: | $292 |
| TI/LC: | $0 | $20,580 | NAP | | Cut-off Date LTV Ratio: | 67.6% |
| TI/LC Obligations Reserve: | $3,732,000 | $0 | NAP | | Maturity Date LTV Ratio: | 67.6% |
| | | | | | | | |
| Sources and Uses |
| Sources | Proceeds | % of Total | | Uses | Proceeds | % of Total |
| Loan Amount: | $48,750,000 | 66.3% | | Purchase Price(5): | $72,100,000 | 98.1% |
| Borrower Equity: | $24,771,025 | 33.7% | | Seller Credit(5): | ($3,732,000) | (5.1%) |
| | | | | Upfront Reserves: | $4,031,689 | 5.5% |
| | | | | Closing Costs: | $1,121,336 | 1.5% |
| Total Sources: | $73,521,025 | 100.0% | | Total Uses: | $73,521,025 | 100.0% |
| (1) | See “Escrows and Reserves” below for further discussion of reserve requirements. |
| (2) | The novel coronavirus pandemic is an evolving situation and could impact the Plaza East I & II Mortgage Loan (as defined below) more severely than assumed in the underwriting of the Plaza East I & II Mortgage Loan and could adversely affect the NOI, NCF and occupancy information, as well as the appraised value and the DSCR, LTV and Debt Yield metrics presented above and herein. See “Risk Factors-—Risks Related to Market Conditions and Other External Factors—The Coronavirus Pandemic Has Adversely Affected the Global Economy and Will Likely Adversely Affect the Performance of the Mortgage Loans” in the Preliminary Prospectus. |
| (3) | See “Operating History and Underwritten Net Cash Flow” below for further discussion of the increase from Most Recent NOI to UW NOI, the decrease from 2nd Most Recent NOI to most Recent NOI, and the increase from 3rd Most Recent NOI to 2nd Most Recent NOI. |
| (4) | See “Operating History and Underwritten Net Cash Flow” below for further discussion of the increase from 3rd Most Recent Occupancy to 2nd Most Recent Occupancy. |
| (5) | Total purchase price is $72,100,000 less the seller’s TI/LC Obligation to Perspecta (as defined below) totaling $3,732,000. |
The Mortgage Loan. The seventh largest mortgage loan (the “Plaza East I & II Mortgage Loan”) is evidenced by a single promissory note secured by a first mortgage encumbering the fee interest in a 246,957 SF suburban office property located in Chantilly, Virginia (the “Plaza East I & II Property”).
The Borrower and the Borrower Sponsors. The borrower is TMG Plaza East, L.L.C. (the “Plaza East I & II Borrower”), a Delaware limited liability company and single purpose entity with two independent directors. The borrower sponsors are Meridian Realty Partners IV, L.P. and Meridian Realty Partners NUS IV, L.P., affiliates of The Meridian Group (“Meridian”).
Meridian focuses on value added acquisition, repositioning and development opportunities originated, structured, capitalized and managed in-house. Over its 26-year history, Meridian has acquired over 14 million SF of office, residential, hotel, and mixed-use space as well as over 800 acres for development valued at approximately $5.5 billion, primarily in the Washington, D.C. metropolitan area.
This is not a research report and was not prepared by any Underwriter’s research department. Please see additional important information and qualifications at the end of this Term Sheet.
T-103
| Office - Suburban | Loan #7 | Cut-off Date Balance: | | $48,750,000 |
| 14291-14295 Park Meadow Drive | Plaza East I & II | Cut-off Date LTV: | | 67.6% |
| Chantilly, VA 20151 | | UW NCF DSCR: | | 2.44x |
| | | UW NOI Debt Yield: | | 9.7% |
The Property. The Plaza East I & II Property comprises two, five-story Class A suburban office buildings totaling 246,957 SF located in Chantilly, Virginia, approximately 27.4 miles west of Washington, D.C. Constructed by Tishman Speyer in 2007, property amenities include a fitness center, café, and 875 surface parking spaces, resulting in a parking ratio of 3.5 spaces per 1,000 SF of NRA. Additionally, both buildings contain sensitive compartmented information facility space, which is a secure room for the U.S. Department of Defense. As of February 12, 2021, the property was 100.0% occupied by seven tenants and has averaged 88.0% occupancy since 2017.
Major Tenants.
Perspecta Systems Integration (168,275 SF, 68.1% of NRA; 69.3% of underwritten base rent) Perspecta Systems Integration (“Perspecta”) (Fitch/Moody’s/S&P: BB/Ba3/BB), which was formed in 2018 via a merger between DXC Technology’s U.S. with Vencore, Inc. and Keypoint Government Solutions, is a government contractor with a focus on operation-related services, mission and enterprise information technology. In 2020, Perspecta secured contracts with the U.S. Army, the State Department Bureau of Consular Affairs, and the Department of Homeland Security. In January 2021, Perspecta announced it had entered into an agreement to be purchased in an all cash transaction by Veritas Capital for $7.1 billion. Perspecta has been a tenant at the property, which serves as its corporate headquarters, since August 2020, and currently occupies 116,067 SF. Per the terms of the lease agreement, Perspecta will be obligated to take an additional 52,208 SF (the “Expansion Space”) when the borrower sponsor delivers the space on approximately January 15, 2023 with rent commencing on approximately July 16, 2023. Currently, the Expansion Space is leased to Chenega, who subleases it to Leidos, through December 31, 2022. Perspecta has a lease expiration of August 31, 2030 with no termination options and two 5-year options to renew with 12 months’ notice at the fair market rental rate.
OG Systems, LLC (34,526 SF, 14.0% of NRA; 13.6% of underwritten base rent) OG, Systems LLC (“OG Systems”) is a government contractor focused on counterintelligence threats, geospatial intelligence, and data analytics. OG Systems, which was acquired by Parsons Corporation in 2019, has contracts with the Department of Defense and the Intelligence Community. OG Systems has been in occupancy since July 2015, has a lease expiration of January 31, 2028, and has one 5-year option to renew with 12 months’ notice at the fair market rental rate.
Hexagon US Federal, Inc. (17,138 SF, 6.9% of NRA; 6.7% of underwritten base rent) Hexagon US Federal, Inc. (“Hexagon”) is a government contractor specializing in the geospatial and technical solutions fields. Hexagon consults to streamline costs while optimizing operational capability and protecting critical assets with recent contracts including Department of the Navy and Department of Defense. Hexagon took occupancy in November 2017, has a lease expiration of October 31, 2028 and has one 5-year extension option to renew with 12 months’ notice at the fair market rental rate.
The following table presents certain information relating to the tenancy at the Plaza East I & II Property:
| Tenant Summary |
| Tenant Name | Credit Rating (Fitch/Moody’s/ S&P) | Tenant SF | Approx. % of SF | Annual UW Rent(1) | % of Total Annual UW Rent | Annual UW Rent PSF(1) | | | |
| Lease Expiration | Term. Option (Y/N) | Renewal Options |
| Major Tenants | | | | | | | | | |
| Perspecta | BB/Ba3/BB(2) | 168,275(3) | 68.1% | $5,475,889(4) | 69.3% | $32.54(4) | 8/31/2030 | N | 2 x 5 Yr |
| OG Systems | NR/NR/NR | 34,526 | 14.0% | $1,071,059 | 13.6% | $31.02 | 1/31/2028 | Y(5) | 1 x 5 Yr |
| Hexagon | NR/NR/NR | 17,138 | 6.9% | $525,451 | 6.7% | $30.66 | 10/31/2028 | Y(6) | 1 x 5 Yr |
| E4 Environments for Health Architects | NR/NR/NR | 9,120 | 3.7% | $266,760 | 3.4% | $29.25 | 7/31/2025 | N | 1 x 5 Yr |
| Impact XM(7) | NR/NR/NR | 8,075 | 3.3% | $256,623 | 3.2% | $31.78 | 1/31/2026 | Y(8) | 1 x 5 Yr |
| Subtotal/Wtd. Avg. | | 237,134 | 96.0% | $7,595,782 | 96.2% | $32.03 | | | |
| | | | | | | | | | |
| Non-Major Tenants(15)(16)(17) | | 9,823 | 4.0% | $300,460 | 3.8% | $30.59 | | | |
| Occupied Collateral Subtotal | | 246,957 | 100.0% | $7,896,242 | 100.0% | $31.97 | | | |
| Vacant Space | | 0 | 0.0% | | | | | | |
| Total/Wtd. Avg. | | 246,957 | 100.0% | | | | | | |
| (1) | Annual UW Rent and Annual UW Rent PSF include contractual rent steps through January 2022 totaling $152,131. |
| (2) | Credit Ratings represent that of the tenant, Perspecta, Inc., which guarantees the lease. |
| (3) | Perspecta’s current space (116,067 SF) and future Expansion Space (52,208 SF) was underwritten. Perspecta currently occupies 116,067 SF and will be obligated to take an additional 52,208 SF in January 2023 with rent commencing in July 2023. The Expansion Space is currently leased to Chenega, who subleases the space to Leidos, through December 31, 2022. |
| (4) | Perspecta’s Annual UW Rent PSF and Annual UW Rent represents $32.29 PSF for the 116,067 SF it is currently occupying and $33.10 PSF, which represents the base rent for the Expansion Space in July 2023. Chenega’s current in-place base rent on the Expansion Space is $39.14 PSF and Leidos’ current in-place base rent is $26.80 PSF. |
| (5) | OG Systems has the right to terminate its lease on 12/31/2023 with 12 months’ notice and a termination fee equal to unamortized TI/LCs and abated rent, assuming amortization of such expenses over the initial lease term at an annual rate of 9.0%. |
| (6) | Hexagon has the ongoing right to terminate its lease after 4/30/2026 with 12 months’ notice and a termination fee equal to unamortized TI/LCs, legal fees and abated rent, assuming amortization of all such expenses over the initial lease term at an annual rate of 9.0%. |
| (7) | Impact XM subleases all of its space to Chicago Title for $27.00 PSF with 4% annual increases through January 31, 2024. Annual UW Rent represents Impact XM’s contractual rent. |
| (8) | Impact XM has the ongoing right to terminate its lease after 1/31/2024 with 12 months’ notice and a termination fee equal to $275,482, unamortized TI/LCs and abated rent, assuming amortization of all such expenses over the initial lease term at an annual rate of 8.0%. |
This is not a research report and was not prepared by any Underwriter’s research department. Please see additional important information and qualifications at the end of this Term Sheet.
T-104
| Office - Suburban | Loan #7 | Cut-off Date Balance: | | $48,750,000 |
| 14291-14295 Park Meadow Drive | Plaza East I & II | Cut-off Date LTV: | | 67.6% |
| Chantilly, VA 20151 | | UW NCF DSCR: | | 2.44x |
| | | UW NOI Debt Yield: | | 9.7% |
The following table presents certain information relating to the lease rollover schedule at Plaza East I & II Property:
| Lease Rollover Schedule(1)(2) |
| Year | # of Leases Rolling | SF Rolling | UW Rent PSF Rolling | Approx. % of
Total SF Rolling | Approx. Cumulative % of SF Rolling | Total UW Rent Rolling | Approx. % of Total Rent Rolling | Approx. Cumulative % of Total Rent Rolling |
| 2021 | 0 | 0 | $0.00 | 0.0% | 0.0% | $0 | 0.0% | 0.0% |
| 2022 | 1 | 1,759 | $20.26 | 0.7% | 0.7% | $35,638 | 0.5% | 0.5% |
| 2023 | 0 | 0 | $0.00 | 0.0% | 0.7% | $0 | 0.0% | 0.5% |
| 2024 | 0 | 0 | $0.00 | 0.0% | 0.7% | $0 | 0.0% | 0.5% |
| 2025 | 1 | 9,120 | $29.25 | 3.7% | 4.4% | $266,760 | 3.4% | 3.8% |
| 2026 | 1 | 8,075 | $31.78 | 3.3% | 7.7% | $256,623 | 3.2% | 7.1% |
| Thereafter | 4 | 228,003 | $32.18 | 92.3% | 100.0% | $7,337,221 | 92.9% | 100.0% |
| Vacant | 0 | 0 | $0.00 | 0.0% | 100.0% | $0 | 0.0% | 100.0% |
| Total/Wtd. Avg. | 7 | 246,957 | $31.97 | 100.0% | | $7,896,242 | 100.0% | |
| (1) | Information is based on the underwritten rent roll. |
| (2) | Certain tenants may have lease termination options that are exercisable prior to the originally stated expiration date of the related lease and are not considered in the rollover schedule. |
COVID-19 Update. As of April 13, 2021, the Plaza East I & II Property is open; however, most, if not all, office tenants are working remotely. Approximately 99.3% of the tenants by square footage and 99.5% of the tenants by underwritten base rent made their full April rent payments. As of April 23, 2021, one tenant, representing approximately 0.5% of underwritten base rent, has not paid base rent since January 2020. As of the date hereof, the Plaza East I & II Mortgage Loan is not subject to any modification or forbearance request and the first payment date is on May 11, 2021. See “Risk Factors—Risks Related to Market Conditions and Other External Factors—The Coronavirus Pandemic Has Adversely Affected the Global Economy and Will Likely Adversely Affect the Performance of the Mortgage Loans” in the Preliminary Prospectus.
The Market. The Plaza East I & II Property is located 0.4 miles south of Route 28, which provides access to I-66 and Route 657. According to the appraisal, Chantilly is predominately a commercial district with numerous business and industrial parks that were mostly originally constructed in the 1980s. The Plaza East I & II Property is located in the Dulles Technology Corridor, which is home to numerous Fortune 500 company headquarters including Freddie Mac, General Dynamics, Capital One Financial, Northrop Grumman, Leidos, and Hilton Worldwide Holdings. According to the appraisal, the estimated 2020 population within a three- and five-mile radius was approximately 92,189 and 209,457, respectively; and the estimated 2020 average household income within the same radii was approximately $152,657 and $172,853, respectively.
According to a third-party market research report, the Plaza East I & II Property is situated within the Route 28 Corridor South office submarket of the Washington, D.C. office market. As of the April 1, 2021, the office submarket reported a total inventory of approximately 14.1 million SF with a 15.1% vacancy rate and average asking rent of $28.23 PSF, gross. The appraiser concluded to a market rent for the Plaza East I & II Property of $33.50 PSF.
The following table presents certain information relating to the appraisal’s market rent conclusion for Plaza East I & II Property:
| Market Rent Summary |
| | Office | Retail |
| Market Rent (PSF) | $33.50 | $15.00 |
| Lease Term (Years) | 7 | 10 |
| Lease Type (Reimbursements) | Full service | Full service |
| Rent Increase Projection | 2.75% per annum | 2.75% per annum |
This is not a research report and was not prepared by any Underwriter’s research department. Please see additional important information and qualifications at the end of this Term Sheet.
T-105
| Office - Suburban | Loan #7 | Cut-off Date Balance: | | $48,750,000 |
| 14291-14295 Park Meadow Drive | Plaza East I & II | Cut-off Date LTV: | | 67.6% |
| Chantilly, VA 20151 | | UW NCF DSCR: | | 2.44x |
| | | UW NOI Debt Yield: | | 9.7% |
The table below presents certain information relating to comparable sales with respect to the Plaza East I & II Property:
| Comparable Sales |
Property Name | Location | Rentable Area (SF) | Sale Date | Sale Price (PSF) |
| Plaza East I & II (Subject) | Chantilly, VA | 246,957 | April-2021 | $292 |
| Monument II | Herndon, VA | 207,259 | Dec-2020 | $292 |
| 80 at Fairview | Falls Church, VA | 279,701 | Oct-2020 | $313 |
| 2941 Fairview Park | Falls Church, VA | 360,842 | Mar-2020 | $308 |
| Lincoln Park I | Herndon, VA | 204,087 | Jan-2020 | $245 |
| Parkridge V | Reston, VA | 203,297 | April-2019 | $277 |
Source: Appraisal.
The following table presents certain information relating to comparable office leases for the Plaza East I & II Property:
| Comparable Leases Summary |
| Property Name/Location | Year Built/ Renovated | Total GLA (SF) | Distance from Subject | Tenant Name | Lease Date/Term | Lease Area (SF) | Annual Base Rent PSF | Lease Type |
Ridgeview I 14900 Conference Center Drive Chantilly, VA | 1999/NAP | 125,565 | 1.8 miles | Peraton (renewal) | Nov. 2020 / 8.4 Yrs | 52,698 | $32.64 | FSG |
Greens II 15059 Conference Center Drive Chantilly, VA | 2000/NAP | 146,750 | 2.0 miles | Volant System High Corporation (renewal) | Nov. 2020 / 5.3Yrs May 2019 / 5.3Yrs | 10,856 11,420 | $34.00 $32.50 | FSG FSG |
Independence Center 2 15040 Conference Center Drive Chantilly, VA | 2006/NAP | 115,563 | 2.0 miles | CACI (renewal) Technology Management Associates, Inc. (renewal) | Sept. 2020 / 5.0 Yrs Aug. 2019 / 10.6 Yrs | 18,277 60,233 | $34.00 $37.24 | FSG FSG |
Independence Center 1 15036 Conference Center Drive Chantilly, VA | 1999/NAP | 274,223 | 1.9 miles | IBM (renewal) Strategic Mission Elements, Inc. GHD Engineering Trisept Corporation (renewal/expansion) Chicago Title | July 2020 / 3.3 Yrs Jan. 2020 / 11.0 Yrs Jan. 2020 / 5.5 Yrs Sep. 2019 / 11.0 Yrs Feb. 2019 / 7.6 Yrs | 12,066 14,556 9,783 25,419 89,872 | $34.00 $32.00 $33.75 $32.00 $32.00 | FSG FSG FSG FSG FSG |
Stoneleigh II 4840 Westfields Boulevard Chantilly, VA | 2007/NAP | 106,547 | 0.3 miles | AECOM (renewal) | Dec. 2019 / 6.2 Yrs | 45,608 | $31.50 | FSG |
Source: Appraisal.
This is not a research report and was not prepared by any Underwriter’s research department. Please see additional important information and qualifications at the end of this Term Sheet.
T-106
| Office - Suburban | Loan #7 | Cut-off Date Balance: | | $48,750,000 |
| 14291-14295 Park Meadow Drive | Plaza East I & II | Cut-off Date LTV: | | 67.6% |
| Chantilly, VA 20151 | | UW NCF DSCR: | | 2.44x |
| | | UW NOI Debt Yield: | | 9.7% |
Operating History and Underwritten Net Cash Flow. The following table presents certain information relating to the historical operating performance and Underwritten Net Cash Flow at the Plaza East I & II Property:
| Cash Flow Analysis |
| | 2018(1) | 2019(1)(2) | 2020(2)(3) | UW(3) | UW PSF |
| Gross Potential Rent | $5,581,503 | $6,531,249 | $6,014,616 | $7,896,242(4) | $31.97 |
| Total Recoveries | $187,052 | $212,431 | $155,378 | $284,511 | $1.15 |
| Vacancy & Credit Loss | $0 | $0 | $0 | ($789,624) | ($3.20) |
| Effective Gross Income | $5,768,555 | $6,743,680 | $6,169,993 | $7,391,129 | $29.93 |
| | | | | | |
| Real Estate Taxes(7) | $664,379 | $632,572 | $698,234 | $719,260 | $2.91 |
| Insurance | $37,825 | $33,582 | $44,005 | $46,695 | $0.19 |
| Management Fee | $166,995 | $204,649 | $182,404 | $221,734 | $0.90 |
| Other Operating Expenses | $1,562,978 | $1,517,452 | $1,444,582 | $1,680,089 | $6.80 |
| Total Operating Expenses | $2,432,177 | $2,388,255 | $2,369,225 | $2,667,778 | $10.80 |
| | | | | | |
| Net Operating Income | $3,336,378 | $4,355,425 | $3,800,768 | $4,723,351 | $19.13 |
| Capital Expenditures | $0 | $0 | $0 | $49,391 | $0.20 |
| TI/LC | $0 | $0 | $0 | $246,957 | $1.00 |
| Net Cash Flow | $3,336,378 | $4,355,425 | $3,800,768 | $4,427,003 | $17.93 |
| | | | | | |
| Occupancy % | 82.2% | 82.2%(5) | 100.0%(5) | 100.0% | |
| NOI DSCR | 1.84x | 2.40x | 2.09x | 2.60x | |
| NCF DSCR | 1.84x | 2.40x | 2.09x | 2.44x | |
| NOI Debt Yield | 6.8% | 8.9% | 7.8% | 9.7% | |
| NCF Debt Yield | 6.8% | 8.9% | 7.8% | 9.1% | |
| (1) | The increase in Net Operating Income from 2018 to 2019 was primarily due to two new leases (6.5% of NRA; 6.6% of underwritten base rent) being signed in July and August 2018 and rent concessions totaling $546,990 expiring. |
| (2) | The decrease in Net Operating Income from 2019 to 2020 was primarily due to Chenega terminating its lease on 72,191 SF in January 2020. The increase in occupancy between 2019 and 2020 was primarily due to Perspecta executing a lease totaling 68.1% of NRA, including the 17.8% of NRA which was previously vacant. |
| (3) | The increase in Net Operating Income from 2020 to UW was primarily due to Perspecta’s lease commencing in August 2020 and full base rent totaling $3,656,112 (excluding the Chenega space) being recognized in the UW and underwritten rent steps through January 2022 totaling $152,131. |
| (4) | UW Gross Potential Rent includes contractual rent steps through January 2022 totaling $152,131. |
Escrows and Reserves.
Real Estate Taxes – The loan documents require an upfront real estate tax reserve of $299,689 and ongoing monthly real estate tax reserves in an amount equal to one-twelfth of the real estate taxes that the lender estimates will be payable during the next 12 months (initially $59,939).
Insurance – The loan documents require ongoing monthly insurance reserves in an amount equal to one-twelfth of the insurance premiums that the lender estimates will be payable for the renewal of the coverage afforded policies upon the occurrence of an event of default, the policies maintained by the borrower covering the property not being part of a blanket or umbrella policy approved by lender, the borrower not providing lender with evidence of renewal of such polices at least 15 business days prior to policy expiration and payment of premiums at least 10 business days prior to policy expiration.
Recurring Replacements – The loan documents require ongoing monthly replacement reserves of $4,116 ($0.20 PSF annually).
TI/LC Reserve – The loan documents require ongoing monthly TI/LC reserves of $20,580 ($1.00 PSF annually).
Existing TI/LC Obligations Reserve – The loan documents require an upfront reserve of $3,732,000 related to outstanding landlord obligations pursuant to the lease with Perspecta.
Lockbox and Cash Management. The loan is structured with a hard lockbox, which is already in place, and springing cash management. Prior to the occurrence of a Cash Trap Event Period (as defined below), the loan documents require that all rents be deposited directly into the lockbox account and, if received by borrower, deposited within 2 business days of receipt, and all funds in the lockbox account are required to be distributed to the borrower. During a Cash Trap Event Period, funds in the lockbox account are required to be swept to a lender-controlled cash management account and disbursed according to the loan documents; and all excess funds are required to be swept to an excess cash flow subaccount controlled by the lender.
A “Cash Trap Event Period” will commence upon the earlier of the following:
| (i) | the occurrence of an event of default under the loan documents; |
| (ii) | the net cash flow debt yield (“NCF DY”) being less than 7.5%; or |
| (iii) | Perspecta (or any permitted sublessee of all or any portion of its space) (a) going dark or ceasing to occupy or do business at the property (or giving notice of its intent to do so) or (b) Perspecta filing (or otherwise becoming involved in as debtor in) a bankruptcy (or similar insolvency proceeding). |
This is not a research report and was not prepared by any Underwriter’s research department. Please see additional important information and qualifications at the end of this Term Sheet.
T-107
| Office - Suburban | Loan #7 | Cut-off Date Balance: | | $48,750,000 |
| 14291-14295 Park Meadow Drive | Plaza East I & II | Cut-off Date LTV: | | 67.6% |
| Chantilly, VA 20151 | | UW NCF DSCR: | | 2.44x |
| | | UW NOI Debt Yield: | | 9.7% |
A Cash Trap Event period related to clause (iii)(a) above will not be triggered for the first 6 month period following a government mandate ordering the closure of the business related to the COVID-19 pandemic, or if Perspecta subleases its premises pursuant to the permitted sublease per the loan documents.
A Cash Trap Event Period will end upon the occurrence of the following:
| ● | with regard to clause (i), the cure of such event of default; |
| ● | with regard to clause (ii), the NCF DY being greater than or equal to 7.5% for two consecutive calendar quarters; |
| ● | with regard to clause (iii)(a) and (b), the Perspecta premises having been leased to a replacement tenant approved by lender in its sole discretion pursuant to a reasonably acceptable replacement lease, and such replacement tenant having taken occupancy, being open for business, and paying full unabated rent; or |
| ● | with regard to clause (iii)(b), the related bankruptcy or insolvency proceeding having been terminated in a manner satisfactory to the lender. |
Additional Secured Indebtedness (not including trade debts). None.
Mezzanine Loan and Preferred Equity. Not permitted.
Property Release. Provided no event of default is ongoing, the Plaza East I & II Borrower has the right, at any time after 60 days from the securitization of the loan, to obtain the free release of an unimproved portion of the Plaza East I & II Property, which is currently surface parking, from the lien of the Plaza East I & II Mortgage Loan, without prepayment or defeasance, provided that certain conditions are satisfied, including, but not limited to, the following:
| (i) | the free release parcel and any remainder parcel is legally subdivided and a separate tax lot; |
| (ii) | evidence satisfactory to lender that the release parcel and remaining property will comply with land use and zoning laws post-release, and that easements benefiting the remaining property will be in-place; |
| (iii) | an opinion of counsel that the release complies with REMIC requirements; and |
| (iv) | if required by lender, a rating agency confirmation. |
Letter of Credit. None.
Right of First Offer/ Right of First Refusal. None.
Ground Lease. None.
Terrorism Insurance. The loan documents require that the “all risk” insurance policy required to be maintained by the borrower provides coverage for terrorism in an amount equal to the full replacement cost of the Plaza East I & II Property, as well as business interruption insurance covering no less than the 18-month period following the occurrence of a casualty event, together with a 6-month extended period of indemnity. See “Risk Factors—Risks Relating to the Mortgage Loans—Terrorism Insurance May Not Be Available for All Mortgaged Properties” in the Preliminary Prospectus.
This is not a research report and was not prepared by any Underwriter’s research department. Please see additional important information and qualifications at the end of this Term Sheet.
T-108
(THIS PAGE INTENTIONALLY LEFT BLANK)
This is not a research report and was not prepared by any Underwriter’s research department. Please see additional important information and qualifications at the end of this Term Sheet.
T-109
| Office – Suburban | Loan #8 | Cut-off Date Balance: | | $40,000,000 |
| 625 North Mary Avenue and 925 West | Pathline Park 9 & 10 | Cut-off Date LTV: | | 51.8% |
| Maude Avenue | | UW NCF DSCR: | | 3.87x |
| Sunnyvale, CA 94085 | | UW NOI Debt Yield: | | 10.2% |

This is not a research report and was not prepared by any Underwriter’s research department. Please see additional important information and qualifications at the end of this Term Sheet.
T-110
| Office – Suburban | Loan #8 | Cut-off Date Balance: | | $40,000,000 |
| 625 North Mary Avenue and 925 West | Pathline Park 9 & 10 | Cut-off Date LTV: | | 51.8% |
| Maude Avenue | | UW NCF DSCR: | | 3.87x |
| Sunnyvale, CA 94085 | | UW NOI Debt Yield: | | 10.2% |

This is not a research report and was not prepared by any Underwriter’s research department. Please see additional important information and qualifications at the end of this Term Sheet.
T-111
| Mortgage Loan No. 8 – Pathline Park 9 & 10 |
| Mortgage Loan Information | | Property Information |
| Mortgage Loan Seller: | WFB | | Single Asset/Portfolio: | Single Asset |
| Credit Assessment (Moody’s/Fitch/KBRA): | NR/NR/NR | | Location: | Sunnyvale, CA 94085 |
| Original Balance(1): | $40,000,000 | | General Property Type: | Office |
| Cut-off Date Balance(1): | $40,000,000 | | Detailed Property Type: | Suburban |
| % of Initial Pool Balance: | 4.0% | | Title Vesting: | Fee |
| Loan Purpose: | Recapitalization | | Year Built/Renovated: | 2020/NAP |
| Borrower Sponsor: | The Irvine Company LLC | | Size: | 242,226 SF |
| Guarantor: | TT Peery Park JV LLC | | Cut-off Date Balance PSF(1): | $537 |
| Mortgage Rate: | 2.5020% | | Maturity Balance PSF(1): | $537 |
| Note Date: | 2/2/2021 | | Property Manager: | Irvine Management Company |
| First Payment Date: | 3/11/2021 | | | (borrower-related) |
| Maturity Date: | 2/11/2031 | | | |
| Original Term to Maturity: | 120 months | | | |
| Original Amortization Term: | 0 months | | | |
| IO Period: | 120 months | | Underwriting and Financial Information(5) |
| Seasoning: | 3 months | | UW NOI: | $13,298,939 |
| Prepayment Provisions(2): | L(24),YM1(3),DorYM1(88),O(5) | | UW NOI Debt Yield(1): | 10.2% |
| Lockbox/Cash Mgmt Status: | Hard/Springing | | UW NOI Debt Yield at Maturity(1): | 10.2% |
| Additional Debt Type(1)(3): | Pari Passu | | UW NCF DSCR(1): | 3.87x |
| Additional Debt Balance(1)(3): | $90,000,000 | | Most Recent NOI(6): | NAP |
| Future Debt Permitted (Type): | No (NAP) | | 2nd Most Recent NOI(6): | NAP |
| Reserves(4) | | 3rd Most Recent NOI(6): | NAP |
| Type | Initial | Monthly | Cap | | Most Recent Occupancy: | 100.0% (5/1/2021) |
| RE Taxes: | $0 | Springing | NAP | | 2nd Most Recent Occupancy(6): | NAP |
| Insurance: | $0 | Springing | NAP | | 3rd Most Recent Occupancy(6): | NAP |
| Recurring Replacements: | $0 | Springing | $1,161,000 | | Appraised Value (as of)(7): | $251,000,000 (6/1/2021) |
| Rent Concession Reserve: | $3,451,721 | $0 | NAP | | Appraised Value PSF(7): | $1,036 |
| Leasing Event Period Springing Reserve: | $0 | Springing | NAP | | Cut-off Date LTV Ratio(1)(7): | 51.8% |
| Remaining Construction Payment Reserve: | $7,902,662 | $0 | NAP | | Maturity Date LTV Ratio(1)(7): | 51.8% |
| Sources and Uses |
| Sources | Proceeds | % of Total | | Uses | Proceeds | % of Total |
| Whole Loan Amount(1): | $130,000,000 | 100.0% | | Upfront Reserves: | $11,354,383 | 8.7% |
| | | | | Closing Costs: | $434,949 | 0.3% |
| | | | | Return of Equity(8): | $118,210,669 | 90.9% |
| Total Sources: | $130,000,000 | 100.0% | | Total Uses: | $130,000,000 | 100.0% |
| (1) | The Pathline Park 9 & 10 Mortgage Loan (as defined below) is part of the Pathline Park 9 & 10 Whole Loan (as defined below) with an original aggregate principal balance of $130,000,000. The Cut-off Date Balance PSF, Maturity Date Balance PSF, UW NOI Debt Yield, UW NOI Debt Yield at Maturity, UW NCF DSCR, Cut-off Date LTV Ratio and Maturity Date LTV Ratio numbers presented above are based on the Pathline Park 9 & 10 Whole Loan. |
| (2) | At any time on or after March 11, 2023 and prior to October 11, 2030, the Pathline Park 9 & 10 Borrower (as defined below) may prepay the Pathline Park 9 & 10 Whole Loan in whole, but not in part, upon payment of a yield maintenance premium in accordance with the loan documents. In addition, at any time after the earlier of (i) March 11, 2024 and (ii) two years from the closing date of the securitization that includes the last pari passu note of the Pathline Park 9 & 10 Whole Loan to be securitized, the Pathline Park 9 & 10 Borrower has the right to defease the Pathline Park 9 & 10 Whole Loan in whole, but not in part. The assumed prepayment premium period of 3 payments and prepayment/defeasance period of 88 payments are based on the closing date of this transaction in May 2021. |
| (3) | See “The Mortgage Loan” and “Additional Secured Indebtedness (not including trade debts)” below for further discussion of additional debt. |
| (4) | See “Escrows and Reserves” below for further discussion of reserve requirements. |
| (5) | The novel coronavirus pandemic is an evolving situation and could impact the Pathline Park 9 & 10 Whole Loan more severely than assumed in the underwriting of the Pathline Park 9 & 10 Whole Loan and could adversely affect the NOI, NCF and occupancy information, as well as the appraised value and the DSCR, LTV and Debt Yield metrics presented above and herein. See “Risk Factors—Risks Related to Market Conditions and Other External Factors—The Coronavirus Pandemic Has Adversely Affected the Global Economy and Will Likely Adversely Affect the Performance of the Mortgage Loans” in the Preliminary Prospectus. |
| (6) | The Pathline Park 9 & 10 Property (as defined below) was built in 2020; therefore, no historical operating history or occupancy is available. |
| (7) | The Appraised Value represents the Prospective Market Value at Stabilization as of June 1, 2021, which assumes Proofpoint Inc (“Proofpoint”) is paying full rent. Proofpoint is currently in a free rent period through and including May 2021, which was reserved for at origination. The appraisal also concluded to a Market Value As Is of $244,000,000 as of January 12, 2021, and a Go Dark Value of $172,000,000 as of January 12, 2021. The Market Value As Is results in a Cut-off Date LTV Ratio and Maturity Date LTV Ratio of 53.3%. |
| (8) | The Pathline Park 9 & 10 Property was previously unencumbered, as it was developed by The Irvine Company LLC for all cash. The Irvine Company LLC reported a total cost basis for the Pathline Park 9 & 10 Property of $196,592,139 ($812 PSF). |
This is not a research report and was not prepared by any Underwriter’s research department. Please see additional important information and qualifications at the end of this Term Sheet.
T-112
| Office – Suburban | Loan #8 | Cut-off Date Balance: | | $40,000,000 |
| 625 North Mary Avenue and 925 West | Pathline Park 9 & 10 | Cut-off Date LTV: | | 51.8% |
| Maude Avenue | | UW NCF DSCR: | | 3.87x |
| Sunnyvale, CA 94085 | | UW NOI Debt Yield: | | 10.2% |
The Mortgage Loan. The eighth largest mortgage loan (the “Pathline Park 9 & 10 Mortgage Loan”) is part of a whole loan (the “Pathline Park 9 & 10 Whole Loan”) that is evidenced by three pari passu promissory notes in the aggregate original principal amount of $130,000,000. The Pathline Park 9 & 10 Whole Loan is secured by a first priority fee mortgage encumbering two Class A office buildings located in Sunnyvale, California (the “Pathline Park 9 & 10 Property”). The Pathline Park 9 & 10 Mortgage Loan is evidenced by the non-controlling promissory Notes A-2 and A-3 in the aggregate original principal amount of $40,000,000. The controlling promissory Note A-1 (the “Pathline Park 9 & 10 Pari Passu Companion Loan), in the original principal amount of $90,000,000, was contributed to the BANK 2021-BNK32 securitization trust. The Pathline Park 9 & 10 Whole Loan will be serviced pursuant to the pooling and servicing agreement for the BANK 2021-BNK32 securitization trust. See “Description of the Mortgage Pool—The Whole Loans—The Non-Serviced Pari Passu Whole Loans” and “Pooling and Servicing Agreement—Servicing of the Non-Serviced Mortgage Loans” in the Preliminary Prospectus.
| Pathline Park 9 & 10 Whole Loan Summary |
| Note | Original Balance | Cut-off Date Balance | Note Holder | Controlling Piece |
| A-1 | $90,000,000 | $90,000,000 | BANK 2021-BNK32 | Yes |
| A-2 | $25,000,000 | $25,000,000 | BANK 2021-BNK33 | No |
| A-3 | $15,000,000 | $15,000,000 | BANK 2021-BNK33 | No |
| Total Whole Loan | $130,000,000 | $130,000,000 | | |
The Borrower and the Borrower Sponsor. The borrower is Pathline Park II LLC (the “Pathline Park 9 & 10 Borrower”), a Delaware limited liability company and single purpose entity with two independent directors. The borrower sponsor is The Irvine Company LLC (“The Irvine Company”), and the non-recourse carveout guarantor is TT Peery Park JV LLC, an affiliate of The Irvine Company.
The Irvine Company is a private real estate investment company governed by an independent board of directors that is committed to long-term ownership and operation of its real estate portfolio. The Irvine Company’s holdings consist of approximately 126 million SF and include more than 560 office buildings, 125 apartment communities with 65,000 units, 40 retail centers, one coastal resort, two hotels, three golf courses, and five marinas. The company’s investment property portfolio is largely located in Orange County, California, with approximately 35% of the portfolio in Silicon Valley, San Diego, West Los Angeles, Chicago, and New York City.
The Property. The Pathline Park 9 & 10 Property comprises two, three-story Class A office buildings totaling 242,226 SF and a parking structure located on an 8.8-acre parcel within the Pathline Park office campus in Sunnyvale, California. Built in 2020, the Pathline Park 9 & 10 Property consists of buildings 9 and 10 of the larger office campus and features 30‘x30’ column spacing, with floor plates of approximately 40,000 SF. The free standing parking garage contains 856 parking stalls, with 814 spaces allocated to the Pathline Park 9 & 10 Property, in addition to 37 surface parking spaces, resulting in a parking ratio of 3.5 spaces per 1,000 SF of rentable area. The Pathline Park 9 & 10 Property is 100.0% leased to Proofpoint through May 31, 2031.
The overall Pathline Park office campus comprises approximately 1.4 million SF of office space across 11 buildings situated on approximately 42 acres. The project includes nine, three-story office buildings ranging from 95,000 to 121,000 SF and two, four-story office buildings ranging from 140,000 to 167,000 SF. Communal spaces throughout the campus include ample open space, abundant indoor and outdoor seating with complimentary WiFi, and an amenity building, which contains food and beverage options and outdoor game areas. The Pathline Park development was previously improved with several older, low-rise office/R&D buildings. The Irvine Company acquired and assembled the properties over the past several years and received approvals for the redevelopment in 2016 with the adoption of the Peery Park Specific Plan by the City of Sunnyvale.
Major Tenant.
Proofpoint (242,226 SF; 100.0% of NRA; 100.0% of underwritten base rent). Proofpoint is a publicly traded (NASDAQ: PFPT) cyber security company founded in 2002 by Eric Hahn, the former Chief Technology Officer (CTO) of Netscape. Headquartered at the Pathline Park 9 & 10 Property with additional offices across 10 countries, the company has grown to more than 3,600 employees serving over 8,000 enterprises worldwide. With an integrated suite of cloud-based solutions, Proofpoint helps companies around the world stop targeted threats, safeguard their data, and make their users more resilient against cyber-attacks. Proofpoint’s products include email protection, cloud security, digital risk protection, advanced threat protection, and archive & compliance.
Proofpoint executed a 127-month lease at the Pathline Park 9 & 10 Property in October 2018, which had a lease commencement date of November 1, 2020 and has an expiration date of May 31, 2031. Proofpoint’s lease included a 7-month free rent period, which extends through and including May 2021 and was reserved for at the origination of the Pathline Park 9 & 10 Whole Loan. The tenant currently has a rental rate of $57.00 PSF with 3.0% annual escalations, one 5-year renewal option at fair market rent with 9 months’ notice, and no termination options.
This is not a research report and was not prepared by any Underwriter’s research department. Please see additional important information and qualifications at the end of this Term Sheet.
T-113
| Office – Suburban | Loan #8 | Cut-off Date Balance: | | $40,000,000 |
| 625 North Mary Avenue and 925 West | Pathline Park 9 & 10 | Cut-off Date LTV: | | 51.8% |
| Maude Avenue | | UW NCF DSCR: | | 3.87x |
| Sunnyvale, CA 94085 | | UW NOI Debt Yield: | | 10.2% |
The following table presents certain information relating to the tenancy at the Pathline Park 9 & 10 Property:
| Tenant Summary |
| Tenant Name | Credit Rating (Fitch/Moody’s/S&P) | Tenant SF | Approx. % of SF | Annual UW Rent(1) | % of Total Annual UW Rent | Annual UW Rent PSF(1) | Termination Option (Y/N) | Lease Expiration | Renewal Options |
| Proofpoint(2) | NR/NR/NR | 242,226 | 100.0% | $14,213,822 | 100.0% | $58.68 | N | 5/31/2031 | 1 x 5 Yr |
| Subtotal/Wtd. Avg. | | 242,226 | 100.0% | $14,213,822 | 100.0% | $58.68 | | | |
| | | | | | | | | | |
| Other Tenants | | 0 | 0.0% | $0 | 0.0% | $0.00 | | | |
| Vacant Space | | 0 | 0.0% | $0 | 0.0% | $0.00 | | | |
| Total/Wtd. Avg. | | 242,226 | 100.0% | $14,213,822 | 100.0% | $58.68 | | | |
| (1) | Proofpoint’s current contractual rental rate is $57.00 PSF, with 3.0% annual escalations. The Annual UW Rent and Annual UW Rent PSF include the contractual increase in November 2021. |
| (2) | Proofpoint is in occupancy but has not yet commenced paying rent. The tenant has a free rent period through and including May 2021, which was reserved for at loan closing (see “Escrows and Reserves” below). |
The following table presents certain information relating to the lease rollover schedule at the Pathline Park 9 & 10 Property:
| Lease Rollover Schedule(1) |
| Year | # of Leases Rolling | SF Rolling | Annual UW Rent PSF Rolling | Approx. % of Total SF Rolling | Approx. Cumulative % of SF Rolling | Total UW Rent Rolling | Approx. % of Total Rent Rolling | Approx. Cumulative % of Total Rent Rolling |
| 2021 | 0 | 0 | $0.00 | 0.0% | 0.0% | $0 | 0.0% | 0.0% |
| 2022 | 0 | 0 | $0.00 | 0.0% | 0.0% | $0 | 0.0% | 0.0% |
| 2023 | 0 | 0 | $0.00 | 0.0% | 0.0% | $0 | 0.0% | 0.0% |
| 2024 | 0 | 0 | $0.00 | 0.0% | 0.0% | $0 | 0.0% | 0.0% |
| 2025 | 0 | 0 | $0.00 | 0.0% | 0.0% | $0 | 0.0% | 0.0% |
| 2026 | 0 | 0 | $0.00 | 0.0% | 0.0% | $0 | 0.0% | 0.0% |
| 2027 | 0 | 0 | $0.00 | 0.0% | 0.0% | $0 | 0.0% | 0.0% |
| 2028 | 0 | 0 | $0.00 | 0.0% | 0.0% | $0 | 0.0% | 0.0% |
| 2029 | 0 | 0 | $0.00 | 0.0% | 0.0% | $0 | 0.0% | 0.0% |
| 2030 | 0 | 0 | $0.00 | 0.0% | 0.0% | $0 | 0.0% | 0.0% |
| 2031 | 1 | 242,226 | $58.68 | 100.0% | 100.0% | $14,213,822 | 100.0% | 100.0% |
| 2032 & Beyond | 0 | 0 | $0.00 | 0.0% | 100.0% | $0 | 0.0% | 100.0% |
| Vacant | 0 | 0 | $0.00 | 0.0% | 100.0% | $0 | 0.0% | 100.0% |
| Total/Wtd. Avg. | 1 | 242,226 | $58.68 | 100.0% | | $14,213,822 | 100.0% | |
| (1) | Information is based on the underwritten rent roll. |
COVID-19 Update. As of April 5, 2021, the Pathline Park 9 & 10 Whole Loan is current and is not subject to any forbearance, modification or debt service relief request. The Pathline Park 9 & 10 Property is open and operating; however, the majority of Proofpoint employees are working remotely. Proofpoint is in a free rent period through and including May 2021, which was reserved for at the origination of the Pathline Park 9 & 10 Whole Loan (see “Escrows and Reserves” below). There have not been any lease modification or rent relief requests from the tenant.
The Market. The Pathline Park 9 & 10 Property is situated within the 42-acre Pathline Park office campus in Sunnyvale, Santa Clara County, California, and is part of the larger Peery Park Specific Plan. During the 1970s, the area known as Peery Park was developed primarily with Class B and C one-story buildings, and the area has been largely redeveloped by The Irvine Company and others. The City of Sunnyvale is located in the northwestern portion of Santa Clara County, just west of San Jose, approximately 11 miles from downtown San Jose and 45 miles east of the Pacific Ocean. The Pathline Park 9 & 10 Property is located in the north-central portion of Downtown Sunnyvale in a predominantly commercial and office area with many corporations such as Yahoo!, Juniper Networks, AMD, Network Appliance, Spansion and Ariba. In addition, other notable corporations have regional offices in the city, including Google, Apple, Amazon, Facebook, LinkedIn, Honeywell, Northrop Grumman, and Lockheed Martin. The primary east-west highway in the market area is the Southbay Freeway (State Highway 237), which runs just north of the Pathline Park 9 & 10 Property. Major non-highway roadways within the market area include Mathilda Avenue, Sunnyvale Saratoga Road, Evelyn Avenue, and Fair Oaks Avenue. Rail and bus service to and from Sunnyvale is provided by Caltrain and the local light-rail system operated by the Santa Clara Valley Transportation Authority. The estimated 2021 population within a 3- and 5-mile radius of the Pathline Park 9 & 10 Property is 166,997 and 394,744, respectively; and the estimated 2021 median household income within the same radii is $215,494 and $223,153, respectively.
According to the appraisal, the Pathline Park 9 & 10 Property is situated within the Sunnyvale/Moffett Park office submarket. As of January 2021, the overall office submarket reported total inventory of approximately 20.0 million SF, with an 8.7% vacancy rate and average asking rent of $50.16 PSF. The Class A office submarket reported total inventory of approximately 12.8 million SF, with a 7.6% vacancy rate and average asking rent of $96.92 PSF. The appraisal concluded to a market rent for the Pathline Park 9 & 10 Property of $57.00 PSF.
This is not a research report and was not prepared by any Underwriter’s research department. Please see additional important information and qualifications at the end of this Term Sheet.
T-114
| Office – Suburban | Loan #8 | Cut-off Date Balance: | | $40,000,000 |
| 625 North Mary Avenue and 925 West | Pathline Park 9 & 10 | Cut-off Date LTV: | | 51.8% |
| Maude Avenue | | UW NCF DSCR: | | 3.87x |
| Sunnyvale, CA 94085 | | UW NOI Debt Yield: | | 10.2% |
The following table presents certain information relating to the appraisal’s market rent conclusion for the Pathline Park 9 & 10 Property:
| Market Leasing Assumptions |
| | Office |
| Market Rent (PSF) | $57.00 |
| Lease Term (Years) | 7 |
| Concessions | 6 months |
| Lease Type (Reimbursements) | Triple Net |
| Rent Increase Projection | 3.0% per annum |
The following table presents information relating to comparable office property sales for the Pathline Park 9 & 10 Property:
| Comparable Office Sales |
| Property Name/Location | Tenant | Sale Date | Year Built | Total NRA (SF) | Occupancy | Sale Price | Sale Price PSF | Appraiser’s Adjusted Sale Price PSF(1) |
620 National 620 National Ave. Mountain View, CA | Google | Sep-19 | 2016 | 151,064 | 100.0% | $190,000,000 | $1,258 | $1,069 |
Grove 221 221 N. Mathilda Ave. Sunnyvale, CA | 23andMe | Mar-19 | 2019 | 154,987 | 100.0% | $183,000,000 | $1,181 | $1,122 |
Campus at Lawson Lane 2215 Lawson Ln Santa Clara, CA | ServiceNow, Inc. | Feb-20 | 2012 | 328,867 | 100.0% | $276,300,000 | $840 | $1,050 |
Coleman Highline 1143-1155 Coleman Ave. San Jose, CA | Roku | Nov-20 | 2017 | 362,386 | 100.0% | $275,000,000 | $759 | $1,024 |
District 237 100 Headquarters Dr. San Jose, CA | Raytheon | Jun-20 | 2000 | 144,047 | 100.0% | $95,200,000 | $661 | $991 |
Source: Appraisal.
| (1) | Adjusted for location, access/exposure/visibility, building size, year built/condition, construction quality/design, parking ratio, and economic attributes (as applicable). |
The following table presents certain information relating to comparable office leases for the Pathline Park 9 & 10 Property:
| Comparable Office Leases |
| Property Name/Location | Tenant Name | Lease Date/Term | Lease Area (SF) | Annual Base Rent PSF | Lease Type |
Pathline Park 9 & 10 Property (subject) | Proofpoint | Nov-20 / 127 months | 242,226 | $57.00 | NNN |
Pathline Park 1-3 770-800 N Mary & 655 Palomar Ave. Sunnyvale, CA | Synopsis | Feb-20 / 12 years | 360,000 | $51.00 | NNN |
Crossroads Tech Center 465 N Mary Ave. Sunnyvale, CA | LinkedIn | Q3-2021 / 11 years | 194,850 | $54.60 | NNN |
Grove 221 221 N Mathilda Ave. Sunnyvale, CA | 23andMe, Inc. | Aug-19 / 12 years | 154,987 | $61.80 | NNN |
Sunnyvale CityLine 200 S Mathilda Ave. Sunnyvale, CA | Uber Technologies, Inc. | Jun-20 / 10.5 years | 156,960 | $72.00 | NNN |
Sunnyvale CityLine 190 Mathilda Pl. Sunnyvale, CA | Uber Technologies, Inc. | Jun-20 / 10.5 years | 133,221 | $72.00 | NNN |
Source: Appraisal.
This is not a research report and was not prepared by any Underwriter’s research department. Please see additional important information and qualifications at the end of this Term Sheet.
T-115
| Office – Suburban | Loan #8 | Cut-off Date Balance: | | $40,000,000 |
| 625 North Mary Avenue and 925 West | Pathline Park 9 & 10 | Cut-off Date LTV: | | 51.8% |
| Maude Avenue | | UW NCF DSCR: | | 3.87x |
| Sunnyvale, CA 94085 | | UW NOI Debt Yield: | | 10.2% |
Underwritten Net Cash Flow. The following table presents certain information relating to the Underwritten Net Cash Flow at the Pathline Park 9 & 10 Property:
| Cash Flow Analysis(1) |
| | UW | UW PSF |
| Gross Potential Base Rent | $13,806,882 | $57.00 |
| Contractual Rent Steps | $406,940 | $1.68 |
| Total Recoveries | $3,879,649 | $16.02 |
| Vacancy & Credit Loss(2) | ($710,691) | ($2.93) |
| Effective Gross Income | $17,382,780 | $71.76 |
| | | |
| Real Estate Taxes | $2,962,355 | $12.23 |
| Insurance | $97,997 | $0.40 |
| Other Operating Expenses | $1,023,489 | $4.23 |
| Total Expenses | $4,083,841 | $16.86 |
| | | |
| Net Operating Income | $13,298,939 | $54.90 |
| Capital Expenditures | $48,445 | $0.20 |
| TI/LC | $484,452 | $2.00 |
| Net Cash Flow | $12,766,041 | $52.70 |
| | | |
| Occupancy %(2) | 95.0% | |
| NOI DSCR(3) | 4.03x | |
| NCF DSCR(3) | 3.87x | |
| NOI Debt Yield(3) | 10.2% | |
| NCF Debt Yield(3) | 9.8% | |
| (1) | No historical operating or occupancy statements are available because the Pathline Park 9 & 10 Property was completed in 2020. No COVID-19 specific adjustments have been incorporated in the lender underwriting. |
| (2) | The underwritten economic vacancy is 5.0%. The Pathline Park 9 & 10 Property was 100.0% leased as of May 1, 2021. |
| (3) | The debt service coverage ratios and debt yields are based on the Pathline Park 9 & 10 Whole Loan. |
Escrows and Reserves.
Real Estate Taxes – During either a Cash Trap Event Period (see “Lockbox and Cash Management” below) or a Leasing Event Period (as defined below), or if the Pathline Park 9 & 10 Borrower fails to provide the lender with paid receipts or other satisfactory evidence that all taxes have been fully paid prior to the delinquency date, ongoing monthly real estate tax reserves are required in an amount equal to one-twelfth of the real estate taxes that the lender estimates will be payable during the next 12 months.
Insurance – Ongoing monthly insurance reserves are not required as long as either (i) (a) the Pathline Park 9 & 10 Property is insured pursuant to a blanket policy acceptable to the lender and (b) the Pathline Park 9 & 10 Borrower provides the lender with evidence of renewal of the policies at least 10 business days prior to expiration; or (ii) no Cash Trap Event Period is continuing and no Leasing Event Period is continuing.
Replacement Reserves – Ongoing monthly replacement reserves are required in an amount equal to $4,037 during either a Cash Trap Event Period or a Leasing Event Period (subject to a cap of $1,161,000, as long as no event of default is continuing).
Rent Concession Reserve – The Pathline Park 9 & 10 Borrower deposited an upfront reserve of $3,451,721 related to outstanding free rent for Proofpoint through and including May 2021.
Remaining Construction Payments Reserve – The Pathline Park 9 & 10 Borrower deposited an upfront reserve of $7,902,662 related to remaining payments payable to contractors in connection with the initial construction of the improvements.
Leasing Event Period Springing Reserve – Upon the occurrence of a Leasing Event Period, the Pathline Park 9 & 10 Borrower is required either to deposit with the lender (i) on the first monthly payment date following the occurrence of the Leasing Event Period, an amount equal to the Proofpoint Funds Amount (as defined below), or (ii) on the first monthly payment date occurring after the Leasing Event Period and on each monthly payment date thereafter, an amount equal to one-twelfth of the Proofpoint Funds Amount until the Pathline Park 9 & 10 Borrower has deposited an aggregate amount at least equal to the Proofpoint Funds Amount.
This is not a research report and was not prepared by any Underwriter’s research department. Please see additional important information and qualifications at the end of this Term Sheet.
T-116
| Office – Suburban | Loan #8 | Cut-off Date Balance: | | $40,000,000 |
| 625 North Mary Avenue and 925 West | Pathline Park 9 & 10 | Cut-off Date LTV: | | 51.8% |
| Maude Avenue | | UW NCF DSCR: | | 3.87x |
| Sunnyvale, CA 94085 | | UW NOI Debt Yield: | | 10.2% |
A “Leasing Event Period” will commence upon Proofpoint or any replacement tenant of at least 121,113 SF of the current Proofpoint space:
| (i) | canceling or terminating its lease prior to its then current expiration date (other than in connection with one or more new replacement leases being entered into), or providing notice of its intent to do so; |
| (ii) | committing a material default under its lease beyond any applicable notice and cure period; |
| (iii) | going dark in more than 121,113 SF of the office space at the Pathline Park 9 & 10 Property (excluding the discontinuation of operations due to compliance with governmental restrictions related to the COVID-19 pandemic or any other pandemic or epidemic, provided the tenant resumes operations in at least 121,113 SF within 90 days after the applicable restrictions are lifted or expire (or within 6 months if the tenant is reoccupying its space in stages and written notice is provided to the lender), as further outlined in the loan documents); |
| (iv) | filing, or any lease guarantor filing, for relief under creditors rights laws; and |
| (v) | (a) with respect to Proofpoint, failing to renew its lease by the earlier of (1) 12 months prior to the maturity date of the Pathline Park 9 & 10 Whole Loan and (2) the required notice period in its lease (Proofpoint’s lease currently requires 9 months’ notice); or (b) with respect to any replacement tenant that has an initial term (excluding extension options) that expires prior to the date that is 16 months after the maturity date of the Pathline Park 9 & 10 Whole Loan, failing to renew its lease by the earlier of (I) the monthly payment date that occurs in the month that is 16 months prior to such tenant’s lease expiration date and (II) the required notice period in the tenant’s lease. |
A Leasing Event Period will end upon the occurrence of the following:
| ● | All or substantially all of the Proofpoint space (or the space in which the applicable tenant has discontinued its business under clause (iii) above) has been leased pursuant to one or more leases acceptable to the lender with an initial term (excluding any renewal or extension options) of not less than five years and payment of a net effective rent of not less than 95% of the then prevailing effective fair market rent for similar properties and leases in the market area (after taking into account any free rent, construction allowances, tenant characteristics, and lease term, among other items (collectively, “Fair Market Rent Qualifications”)), with all tenant improvements and leasing commissions having been paid in full (or borrower having reserved with the lender such costs or delivered a letter of credit or guaranty for such costs), and all replacement tenants paying rent (or the borrower having reserved with the lender any remaining free rent, or having delivered a letter of credit or guaranty for such amounts); |
| ● | With regard to clause (ii) above, the cure of such event of default with no other material default under the lease for a period of three consecutive months following such cure; |
| ● | With regard to clause (iv) above, the lease being assumed or affirmed by the tenant in accordance with its terms and without any negative material change in the economics, scope or duration pursuant to a final unappealable order; |
| ● | With regard to clause (v) above, (1) as applicable, (a) Proofpoint having entered into a lease extension for all or substantially all of its space for a term of not less than five years, or (b) the replacement tenant having entered into a lease extension for its space for a term that expires no earlier than the date that is 16 months following the maturity date of the Pathline Park 9 & 10 Whole Loan; and (2) payment of a net effective rent during the extension term of not less than 95% of the then prevailing effective fair market rent for similar properties and leases in the market area (after taking into account the Fair Market Rent Qualifications). |
The “Proofpoint Funds Amount” means, with respect to a Leasing Event Period other than under clause (iii) of the definition of Leasing Event Period above, the product of (a) $40 multiplied by (b) the total amount of SF of space demised under the applicable lease (or, with respect to clause (iii) of the definition of Leasing Event Period above, the total amount of SF of space in which the tenant has discontinued its business).
In lieu of all or a portion of the reserve deposits required above, the Pathline Park 9 & 10 Borrower may deliver to the lender either (i) one or more letters of credit or (ii) a reserve guaranty from a guarantor that is an affiliate of the Pathline Park 9 & 10 Borrower that either (a) maintains an investment grade rating or (b) has been reasonably approved by the lender and for which the lender has received rating agency confirmation with respect to such event.
Lockbox and Cash Management. The Pathline Park 9 & 10 Whole Loan is structured with an in-place hard lockbox and springing cash management. The Pathline Park 9 & 10 Borrower is required to deposit all rents within three business days of receipt, and to direct all tenants to make direct rent deposits into the lockbox account. As long as a Cash Trap Event Period is not in effect, all funds in the lockbox account are required to be distributed to the Pathline Park 9 & 10 Borrower. During a Cash Trap Event Period, all funds in the lockbox account are required to be swept to a lender-controlled cash management account. Any excess cash flow remaining after satisfaction of the waterfall items outlined in the loan documents is required (i) if an Excess Cash Flow Sweep Stop (as defined below) is not in effect, to be swept to an excess cash flow subaccount controlled by the lender as additional security for the Pathline Park 9 & 10 Whole Loan or (ii) if an Excess Cash Flow Sweep Stop is in effect, to be disbursed to the Pathline Park 9 & 10 Borrower (excluding the $1,648,887.50 required to remain in the excess cash flow subaccount).
An “Excess Cash Flow Sweep Stop” will be in effect during a Cash Trap Event Period if, as of any monthly payment date during such Cash Trap Event Period, (i) no event of default is continuing and (ii) the total undisbursed funds then on deposit in the excess cash flow subaccount on such monthly payment date are at least $1,648,887.50.
A “Cash Trap Event Period” will commence upon the earlier of the following:
| (i) | the occurrence of an event of default; or |
| (ii) | the net cash flow debt service coverage ratio (based on a hypothetical 30-year amortization period) being less than 1.15x. |
A Cash Trap Event Period will end upon the occurrence of the following:
| ● | with regard to clause (i), the cure of such event of default; or |
| ● | with regard to clause (ii), the net cash flow debt service coverage ratio (based on a hypothetical 30-year amortization period) being equal to or greater than 1.20x for two consecutive calendar quarters. |
Additional Secured Indebtedness (not including trade debts). The Pathline Park 9 & 10 Property also secures the Pathline Park 9 & 10 Pari Passu Companion Loan, which has a Cut-off Date principal balance of $90,000,000. The Pathline Park 9 & 10 Pari Passu Companion Loan accrues interest at the same rate as the Pathline Park 9 & 10 Mortgage Loan. The Pathline Park 9 & 10 Mortgage Loan is entitled to payments of principal and interest on a pro rata and pari passu basis with the Pathline Park 9 & 10 Pari Passu Companion Loan. The holders of the Pathline Park 9 & 10 Mortgage Loan and the Pathline Park 9 & 10 Pari Passu Companion Loan have entered into a co-lender agreement which sets forth the allocation of collections on the Pathline Park 9 & 10 Whole Loan. See “Description of the Mortgage Pool—The Whole Loans—The Non-Serviced Pari Passu Whole Loans” in the Preliminary Prospectus.
Mezzanine Loan and Preferred Equity. Not permitted.
This is not a research report and was not prepared by any Underwriter’s research department. Please see additional important information and qualifications at the end of this Term Sheet.
T-117
| Office – Suburban | Loan #8 | Cut-off Date Balance: | | $40,000,000 |
| 625 North Mary Avenue and 925 West | Pathline Park 9 & 10 | Cut-off Date LTV: | | 51.8% |
| Maude Avenue | | UW NCF DSCR: | | 3.87x |
| Sunnyvale, CA 94085 | | UW NOI Debt Yield: | | 10.2% |
Release of Property. Not permitted.
Letter of Credit. None.
Right of First Offer/Right of First Refusal. None.
Ground Lease. None.
Terrorism Insurance. The Pathline Park 9 & 10 Whole Loan documents require that the “all risk” insurance policy required to be maintained by the Pathline Park 9 & 10 Borrower provide coverage for terrorism in an amount equal to the full replacement cost of the Pathline Park 9 & 10 Property, as well as business interruption insurance covering no less than the 18-month period following the occurrence of a casualty event, together with a 12-month extended period of indemnity (provided that if TRIPRA or a similar statute is not in effect, the Pathline Park 9 & 10 Borrower will not be obligated to pay terrorism insurance premiums in excess of two times the premium for the casualty and business interruption coverage on a stand-alone basis). See “Risk Factors—Risks Relating to the Mortgage Loans—Terrorism Insurance May Not Be Available for All Mortgaged Properties” in the Preliminary Prospectus.
This is not a research report and was not prepared by any Underwriter’s research department. Please see additional important information and qualifications at the end of this Term Sheet.
T-118
(THIS PAGE INTENTIONALLY LEFT BLANK)
This is not a research report and was not prepared by any Underwriter’s research department. Please see additional important information and qualifications at the end of this Term Sheet.
T-119
| Property Types – Various | Loan #9 | Cut-off Date Balance: | | $36,691,600 |
| Property Addresses – Various | ExchangeRight 45 | Cut-off Date LTV: | | 61.9% |
| | | U/W NCF DSCR: | | 2.59x |
| | | U/W NOI Debt Yield: | | 9.0% |
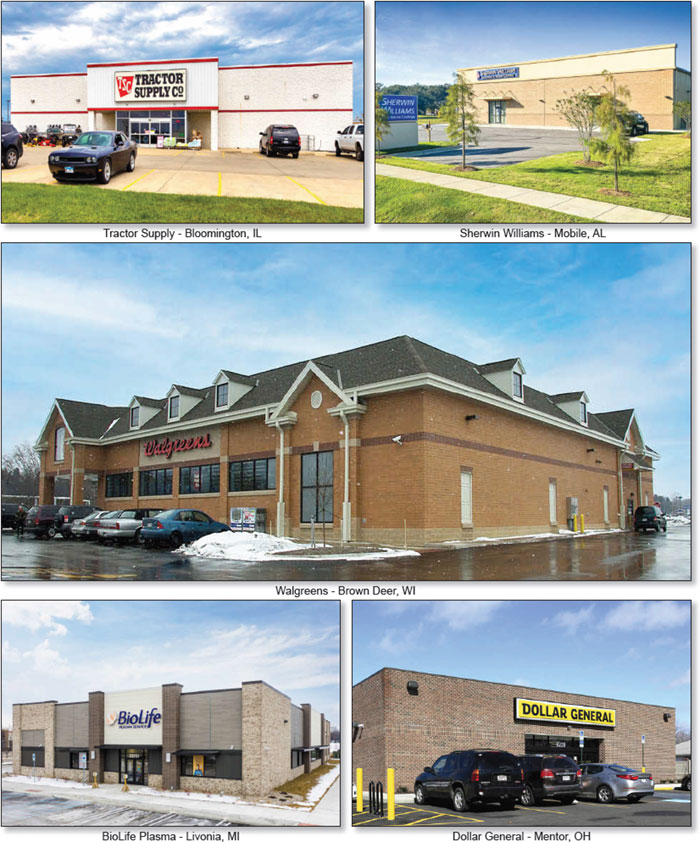
This is not a research report and was not prepared by any Underwriter’s research department. Please see additional important information and qualifications at the end of this Term Sheet.
T-120
| Property Types – Various | Loan #9 | Cut-off Date Balance: | | $36,691,600 |
| Property Addresses – Various | ExchangeRight 45 | Cut-off Date LTV: | | 61.9% |
| | | U/W NCF DSCR: | | 2.59x |
| | | U/W NOI Debt Yield: | | 9.0% |
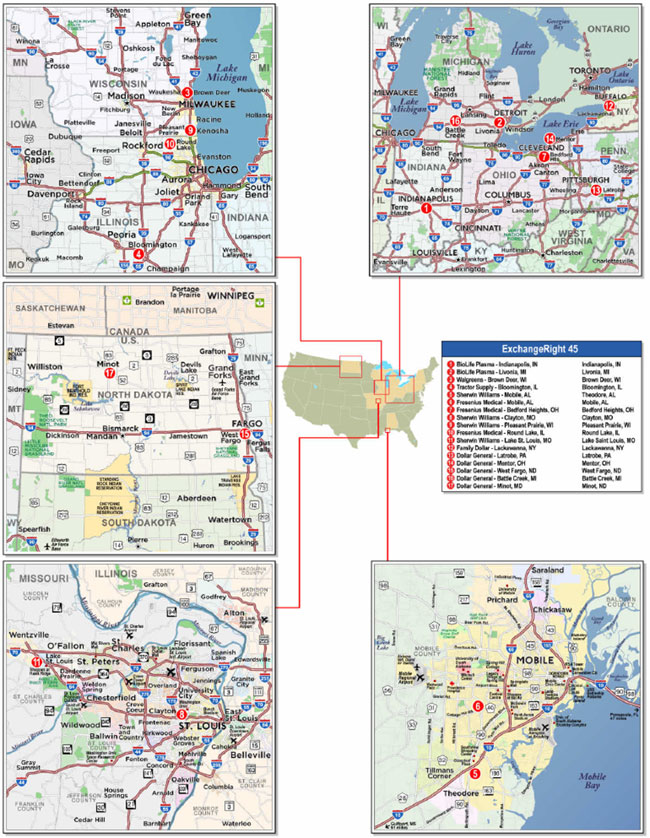
This is not a research report and was not prepared by any Underwriter’s research department. Please see additional important information and qualifications at the end of this Term Sheet.
T-121
| Mortgage Loan No. 9 – ExchangeRight 45 |
| Mortgage Loan Information | | Property Information |
| Mortgage Loan Seller: | WFB | | Single Asset/Portfolio: | Portfolio |
| Credit Assessment (Moody’s/Fitch/KBRA): | NR/NR/NR | | Location(2): | Various |
| Original Balance: | $36,691,600 | | General Property Type(2): | Various |
| Cut-off Date Balance: | $36,691,600 | | Detailed Property Type(2): | Various |
| % of Initial Pool Balance: | 3.7% | | Title Vesting: | Fee |
| Loan Purpose: | Acquisition | | Year Built/Renovated(2): | Various/Various |
| Borrower Sponsors: | David Fisher; Joshua Ungerecht; | | Size: | 174,899 SF |
| | Warren Thomas | | Cut-off Date Balance PSF: | $210 |
| Guarantors: | David Fisher; Joshua Ungerecht; | | Maturity Date Balance PSF: | $210 |
| | Warren Thomas | | Property Manager: | NLP Management, LLC |
| Mortgage Rate: | 3.3840% | | | (borrower-related) |
| Note Date: | 3/22/2021 | | | |
| First Payment Date: | 5/11/2021 | | | |
| Maturity Date: | 4/11/2031 | | | |
| Original Term to Maturity: | 120 months | | | |
| Original Amortization Term: | 0 months | | Underwriting and Financial Information(3) |
| IO Period: | 120 months | | UW NOI: | $3,299,647 |
| Seasoning: | 1 month | | UW NOI Debt Yield: | 9.0% |
| Prepayment Provisions: | L(25),D(91),O(4) | | UW NOI Debt Yield at Maturity: | 9.0% |
| Lockbox/Cash Mgmt Status: | Hard/Springing | | UW NCF DSCR: | 2.59x |
| Additional Debt Type: | No | | Most Recent NOI(4): | NAP |
| Additional Debt Balance: | NAP | | 2nd Most Recent NOI(4): | NAP |
| Future Debt Permitted (Type): | No (NAP) | | 3rd Most Recent NOI(4): | NAP |
| Reserves(1) | | Most Recent Occupancy: | 100.0% (5/1/2021) |
| Type | Initial | Monthly | Cap | | 2nd Most Recent Occupancy(4): | NAP |
| RE Taxes: | $117,659 | $22,514 | NAP | | 3rd Most Recent Occupancy(4): | NAP |
| Insurance: | $0 | Springing | NAP | | Appraised Value (as of): | $59,295,000 (Various) |
| Replacement Reserve: | $73,785 | $718 | NAP | | Appraised Value PSF: | $339 |
| TI/LC Reserve: | $500,000 | Springing | NAP | | Cut-off Date LTV Ratio: | 61.9% |
| Immediate Repairs: | $12,397 | $0 | NAP | | Maturity Date LTV Ratio: | 61.9% |
| | | | | | | | |
| Sources and Uses |
| Sources | Proceeds | % of Total | | Uses | Proceeds | % of Total |
| Loan Amount: | $36,691,600 | 59.8% | | Purchase Price: | $59,844,535 | 97.6% |
| Borrower Equity: | $24,654,378 | 40.2% | | Closing Costs: | $797,602 | 1.3% |
| | | | | Reserves: | $703,841 | 1.1% |
| Total Sources: | $61,345,978 | 100.0% | | Total Uses: | $61,345,978 | 100.0% |
| (1) | See “Escrows and Reserves” section below for further discussion of reserve requirements. |
| (2) | See “The Properties” section below. |
| (3) | The novel coronavirus pandemic is an evolving situation and could impact the ExchangeRight 45 Mortgage Loan (as defined below) more severely than assumed in the underwriting of the ExchangeRight 45 Mortgage Loan and could adversely affect the NOI, NCF and occupancy information, as well as the appraised value and the DSCR, LTV and Debt Yield metrics presented above and herein. See “Risk Factors—Risks Related to Market Conditions and Other External Factors—The Coronavirus Pandemic Has Adversely Affected the Global Economy and Will Likely Adversely Affect the Performance of the Mortgage Loans” in the Prospectus. |
| (4) | Historical occupancy and NOI are unavailable because the ExchangeRight Properties (as defined below) were acquired by the borrower sponsor between November 24, 2020 and March 2, 2021. |
The Mortgage Loan. The ninth largest mortgage loan (the “ExchangeRight 45 Mortgage Loan”) is evidenced by a promissory note in the original principal amount of $36,691,000 and secured by the fee interests in 17 retail and medical office properties in 10 states (the “ExchangeRight Properties”).
The Borrower and the Borrower Sponsors. The borrower is ExchangeRight Net-Leased Portfolio 45 DST (the “ExchangeRight 45 Borrower”), a Delaware statutory trust. The borrower sponsors and non-recourse carveout guarantors are David Fisher, Joshua Ungerecht, and Warren Thomas (collectively, the “Guarantors”), all of whom serve as managing partners of ExchangeRight Real Estate, LLC. ExchangeRight Real Estate, LLC has more than 14 million SF under management across over 800 properties in 40 states with a focus on investment grade, necessity-based retail and healthcare. Warren Thomas was subject to a prior foreclosure sale. See “Description of the Mortgage Pool–Loan Purpose; Default History, Bankruptcy Issues and Other Proceedings” in the Preliminary Prospectus.
The ExchangeRight 45 Borrower has master leased the ExchangeRight Properties to a master tenant (the “ExchangeRight Master Tenant”) owned by ExchangeRight Real Estate, LLC, which is in turn owned by the Guarantors. The ExchangeRight Master Tenant is a Delaware limited liability company structured to be bankruptcy-remote, with one independent director. The master lease generally imposes responsibility on the ExchangeRight Master Tenant for the operation, maintenance and management of the ExchangeRight Properties and payment of all expenses incurred in the maintenance and repair of the Exchange Right Properties, other than capital expenses. The ExchangeRight Master Tenant’s interest in all tenant rents was assigned to the ExchangeRight 45 Borrower, which in turn collaterally assigned its interest to the lender. The master lease is subordinate to the ExchangeRight 45 Mortgage Loan and, upon an event of default under the ExchangeRight 45 Mortgage Loan, the lender has the right to cause the ExchangeRight 45
This is not a research report and was not prepared by any Underwriter’s research department. Please see additional important information and qualifications at the end of this Term Sheet.
T-122
| Property Types – Various | Loan #9 | Cut-off Date Balance: | | $36,691,600 |
| Property Addresses – Various | ExchangeRight 45 | Cut-off Date LTV: | | 61.9% |
| | | U/W NCF DSCR: | | 2.59x |
| | | U/W NOI Debt Yield: | | 9.0% |
Borrower to terminate the master lease. A default under the master lease is an event of default under the ExchangeRight 45 Mortgage Loan and gives rise to recourse liability to the Guarantors for losses, unless such default arises solely in connection with the failure of the ExchangeRight Master Tenant to pay rent as a result of the ExchangeRight Properties not generating sufficient cash flow for the payment of such rent.
The lender has the right to require the ExchangeRight 45 Borrower to convert from a Delaware statutory trust to a limited liability company upon (i) an event of default or the lender’s good faith determination of imminent default under the ExchangeRight 45 Mortgage Loan, (ii) the lender’s good faith determination that the ExchangeRight 45 Borrower will be unable to make a material decision or take a material action required in connection with the operation and maintenance of any ExchangeRight Property, and (iii) 90 days prior to the maturity date of the ExchangeRight 45 Mortgage Loan, if an executed commitment from an institutional lender to refinance the ExchangeRight 45 Mortgage Loan is not delivered to the lender.
A “Qualified Transfer” means any time following March 22, 2022, the borrower sponsor has the right to effect a one-time transfer of all (but not less than all) of the outstanding ownership interests in the borrower to an Approved Transferee (as defined below) and to replace the non-recourse carveout guarantors as the persons who control the borrower with such Approved Transferee (or other approved replacement guarantor); provided that certain conditions are satisfied, including among others: (i) no event of default exists under the ExchangeRight 45 Mortgage Loan; (ii) the Approved Transferee executes a payment guaranty and environmental indemnity, pursuant to which it agrees to be liable for all indemnity obligations (including environmental liabilities and obligations) for which the existing non-recourse carveout guarantors are liable under the non-recourse carveout guaranty; (iii) immediately following a transfer, the Approved Transferee is in control of the borrower and owns (directly or indirectly) 100% of the legal and beneficial ownership interests in the borrower; and (iv) if required by the lender, rating agency confirmation from each applicable rating agency.
“Approved Transferee” means either (A) an eligible institution that is, or is wholly-owned and controlled by, a bank, savings and loan association, investment bank, insurance company, trust company, real estate investment trust, commercial credit corporation, pension plan, pension fund or pension advisory firm, mutual fund, government entity or plan or institution similar to any of the foregoing; or (B) any person that (1) is a Qualified Transferee (as defined below), (2) is regularly engaged in the business of owning or operating commercial properties, or interests therein, which are similar to the ExchangeRight Properties, (3) owns interests in, or operates, at least five retail properties with a minimum of 750,000 SF in the aggregate, (4) maintains either (i) a net worth of at least $200,000,000 and total assets of at least $400,000,000, or (ii) an investment grade rating by S&P or Moody’s, (5) at all times owns no less than 100% of the legal and beneficial ownership of the borrow, and (6) is not a Delaware statutory trust.
A “Qualified Transferee” means a transferee that (i) has never been indicted or convicted of, or pled guilty or no contest to a felony, (ii) has never been indicted or convicted of, or pled guilty or no contest to a Patriot Act offense, is not a sanctioned target, and is not on any government watch list, (iii) has never been the subject of a voluntary or involuntary (to the extent the same has not been discharged) bankruptcy proceeding, (iv) has no material outstanding judgments against it or its interests and (v) is not a crowdfunded entity and is not owned by a crowdfunded entity.
A “Qualified REIT Transfer” means any time following March 22, 2022, the borrower sponsor has the right to effect a one-time transfer of all (but not less than all) of the outstanding ownership interests in the borrower to an Approved REIT (as defined below) and to replace the non-recourse carveout guarantors as the persons who control the borrower with such Approved REIT (or other approved replacement guarantor); provided that certain conditions are satisfied, including among others: (i) no event of default exists under the ExchangeRight 45 Mortgage Loan; (ii) following a transfer, the existing borrower sponsor of the ExchangeRight 45 Mortgage Loan will (a) own at least a 1% direct or indirect equity ownership interest in each of the borrower and any SPE component entity, (b) control the borrower and SPE component entity, and (c) control the day-to-day operation of the ExchangeRight Properties; (iii) if required by the lender, rating agency confirmation from each applicable rating agency; (iv) if the transfer would cause the transferee to acquire or to increase its direct or indirect interest in the borrower to an amount equal to or greater than 20% (or 10% if such person is not formed, organized or incorporated in, or is not a citizen of the United States of America), such transferee and all other persons that would trigger such ownership thresholds in the borrower are required to be a Qualified Transferee; (v) the Approved REIT (or other approved replacement guarantor) executes a payment guaranty and environmental indemnity, pursuant to which it agrees to be liable for all indemnity obligations (including environmental liabilities and obligations) for which the existing non-recourse carveout guarantors are liable under the non-recourse carveout guaranty; and (vi) following a transfer, the Approved REIT will own, directly or indirectly, no less than 51% of the legal and beneficial ownership interests in the borrower and SPE component entity.
“Approved REIT” means a real estate investment trust that (i) meets the requirements of a Qualified Transferee and for whom the lender receives a reasonably acceptable credit check; (ii) is at all times (a) owned, directly or indirectly, by the borrower sponsor in an amount that is not less than 1% of all equity interests, and (b) under the control of one or more persons that (1) meet the requirements of a Qualified Transferee and for whom the lender receives a reasonably acceptable credit check, and (2) is at all times owned, directly or indirectly, by the borrower sponsor in an amount not less than 51% of all equity interests, and controlled by the borrower sponsor; and (iii) is otherwise reasonably acceptable to the lender in all respects.
A Cash Trap Event Period (see “Lockbox and Cash Management” below) will be triggered if a Qualified Transfer or Qualified REIT Transfer does not occur prior to the monthly payment date occurring in April 2028 (36 months prior to the maturity date of the ExchangeRight 45 Mortgage Loan).
The Properties. The ExchangeRight Properties comprise 12 single-tenant retail properties and 5 medical office properties totaling 174,899 SF and located across 10 states. The largest state concentrations by underwritten base rent are Michigan (19.1%), Indiana (16.8%), and Wisconsin (13.3%). The properties were built between 1927 and 2021 (with all properties built prior to 2004 having been renovated between 2008 and 2020) and range in size from 3,500 SF to 21,671 SF. The ExchangeRight Properties are net leased to the following seven nationally recognized tenants operating in diverse segments: Walgreens, Dollar General, Family Dollar, Tractor Supply, Fresenius Medical, BioLife Plasma, and Sherwin Williams. The ExchangeRight Properties have a weighted average remaining lease term of approximately 12.5 years. Leases accounting for 74.2% of NRA and 78.9% of the underwritten base rent expire after the maturity date of the ExchangeRight 45 Mortgage Loan. As of May 1, 2021, the ExchangeRight 45 Properties were 100.0% occupied.
This is not a research report and was not prepared by any Underwriter’s research department. Please see additional important information and qualifications at the end of this Term Sheet.
T-123
| Property Types – Various | Loan #9 | Cut-off Date Balance: | | $36,691,600 |
| Property Addresses – Various | ExchangeRight 45 | Cut-off Date LTV: | | 61.9% |
| | | U/W NCF DSCR: | | 2.59x |
| | | U/W NOI Debt Yield: | | 9.0% |
The following table presents certain information relating to the ExchangeRight Properties, which are presented in descending order of appraised value.
| | ExchangeRight Properties Summary |
Tenant Name City, State | Year Built/ Renovated | Tenant NRSF | %of Portfolio NRSF | Lease Expiration Date | Appraised Value | % of Portfolio Appraised Value | Annual UW Base Rent | Annual UW Base Rent PSF | % of Annual UW Base Rent | Renewal Options |
| BioLife Plasma – Indianapolis, IN(1) | 2021/NAP | 14,394 | 8.2% | 1/31/2036 | $9,800,000 | 16.5% | $589,727 | $40.97 | 16.8% | 3 x 5 Yr |
| BioLife Plasma – Livonia, MI(1) | 2020/NAP | 14,394 | 8.2% | 1/31/2036 | $9,650,000 | 16.3% | $573,908 | $39.87 | 16.4% | 3 x 5 Yr |
| Walgreens – Brown Deer, WI | 2008/NAP | 14,820 | 8.5% | 9/30/2033 | $6,050,000 | 10.2% | $348,000 | $23.48 | 9.9% | None |
| Tractor Supply – Bloomington, IL | 2004/NAP | 21,671 | 12.4% | 11/30/2031 | $4,800,000 | 8.1% | $287,760 | $13.28 | 8.2% | 3 x 5 Yr |
| Sherwin Williams – Mobile, AL | 2020/NAP | 18,828 | 10.8% | 6/30/2030 | $3,750,000 | 6.3% | $224,640 | $11.93 | 6.4% | 6 x 5 Yr |
| Fresenius Medical – Mobile, AL | 1998/2020 | 11,985 | 6.9% | 11/30/2035 | $3,150,000 | 5.3% | $179,775 | $15.00 | 5.1% | 3 x 5 Yr |
| Fresenius Medical – Bedford Heights, OH | 1988/2016 | 6,720 | 3.8% | 7/13/2030 | $2,850,000 | 4.8% | $164,608 | $24.50 | 4.7% | 3 x 5 Yr |
| Sherwin Williams – Clayton, MO | 1927/2020 | 5,889 | 3.4% | 10/31/2032 | $2,775,000 | 4.7% | $155,728 | $26.44 | 4.4% | 2 x 5 Yr |
| Sherwin Williams – Pleasant Prairie, WI | 2020/NAP | 4,000 | 2.3% | 11/30/2030 | $2,150,000 | 3.6% | $117,273 | $29.32 | 3.3% | 2 x 5 Yr |
| Fresenius Medical – Round Lake, IL | 1960/2008 | 6,500 | 3.7% | 2/28/2030 | $2,050,000 | 3.5% | $127,422 | $19.60 | 3.6% | 1 x 5 Yr |
| Sherwin Williams – Lake St. Louis, MO | 2015/NAP | 3,500 | 2.0% | 7/31/2031 | $2,025,000 | 3.4% | $114,000 | $32.57 | 3.3% | 2 x 5 Yr |
| Family Dollar – Lackawanna, NY | 2018/NAP | 8,481 | 4.8% | 6/30/2033 | $1,875,000 | 3.2% | $118,369 | $13.96 | 3.4% | 6 x 5 Yr |
| Dollar General – Latrobe, PA | 2020/NAP | 9,100 | 5.2% | 1/28/2036 | $1,825,000 | 3.1% | $112,480 | $12.36 | 3.2% | 3 x 5 Yr |
| Dollar General – Mentor, OH | 2015/NAP | 9,026 | 5.2% | 12/31/2030 | $1,710,000 | 2.9% | $104,344 | $11.56 | 3.0% | 3 x 5 Yr |
| Dollar General – West Fargo, ND | 2018/NAP | 9,002 | 5.1% | 12/31/2033 | $1,650,000 | 2.8% | $98,916 | $10.99 | 2.8% | 4 x 5 Yr |
| Dollar General – Battle Creek, MI | 2020/NAP | 9,100 | 5.2% | 1/31/2036 | $1,625,000 | 2.7% | $95,417 | $10.49 | 2.7% | 5 x 5 Yr |
| Dollar General – Minot, ND | 2018/NAP | 7,489 | 4.3% | 10/31/2033 | $1,560,000 | 2.6% | $93,612 | $12.50 | 2.7% | 4 x 5 Yr |
| Total/Weighted Average | | 174,899 | 100.0% | | $59,295,000 | 100.0% | $3,505,978 | $20.05 | 100.0% | |
| | | | | | | | | | | | |
Source: Appraisal and underwritten rent roll.
| (1) | Each of the two BioLife Plasma tenants has the right to terminate its lease at any time with 30 days’ notice and payment of a termination fee equal to the net present value of rent and CAM due over the remaining lease term. |
The following table presents a summary regarding the tenants at the ExchangeRight Properties:
| Tenant Summary(1) |
| Tenant Name | Credit Rating (S&P/ Moody’s/Fitch)(2) | No. of Properties | Tenant SF | Approx.% of SF | Annual UW Base Rent(3) | Annual UW Base Rent PSF | App. % of Total Annual UW base Rent |
| Dollar General | BBB/Baa2/NR | 5 | 43,717 | 25.0% | $504,769 | $11.55 | 14.4% |
| Sherwin Williams | BBB/Baa2/BBB | 4 | 32,217 | 18.4% | $611,641 | $18.99 | 17.4% |
| BioLife Plasma | NR/Baa2/NR | 2 | 28,788 | 16.5% | $1,163,635 | $40.42 | 33.2% |
| Fresenius Medical | BBB/Baa3/BBB- | 3 | 25,205 | 14.4% | $471,805 | $18.72 | 13.5% |
| Tractor Supply | BBB/Baa1/NR | 1 | 21,671 | 12.4% | $287,760 | $13.28 | 8.2% |
| Walgreens | BBB/Baa2/BBB- | 1 | 14,820 | 8.5% | $348,000 | $23.48 | 9.9% |
| Family Dollar | BBB/Baa2/NR | 1 | 8,481 | 4.8% | $118,369 | $13.96 | 3.4% |
| Subtotal/Wtd. Avg. | | 17 | 174,899 | 100.0% | $3,505,978 | $20.05 | 100.0% |
| | | | | | | | |
| Vacant Space | | 0 | 0 | 0.00% | $0 | $0.00 | 0.0% |
| Total/Wtd. Avg. | | 17 | 174,899 | 100.0% | $3,505,978 | $20.05 | 100.0% |
| (1) | Information is based on the underwritten rent roll. |
| (2) | Certain ratings are those of the parent company whether or not the parent guarantees the lease. |
| (3) | Annual UW Base Rent represents each tenant’s current contractual rental rate. The lender’s underwriting includes separate credit totaling $121,279 for straight-line rent averaging due the investment grade nature of the tenants (see “Underwritten Net Cash Flow” below). |
This is not a research report and was not prepared by any Underwriter’s research department. Please see additional important information and qualifications at the end of this Term Sheet.
T-124
| Property Types – Various | Loan #9 | Cut-off Date Balance: | | $36,691,600 |
| Property Addresses – Various | ExchangeRight 45 | Cut-off Date LTV: | | 61.9% |
| | | U/W NCF DSCR: | | 2.59x |
| | | U/W NOI Debt Yield: | | 9.0% |
The following table presents certain information relating to the lease rollover at the ExchangeRight Properties:
| Lease Rollover Schedule(1) |
| Year | # of Leases Rolling | SF Rolling | Annual UW Base Rent PSF Rolling | Approx. % of Total SF Rolling | Approx. Cumulative % of SF Rolling | Total UW Base Rent Rolling | Approx. % of Total UW Base Rent Rolling | Approx. Cumulative % of Total UW Base Rent Rolling |
| 2021 | 0 | 0 | $0.00 | 0.0% | 0.0% | $0 | 0.0% | 0.0% |
| 2022 | 0 | 0 | $0.00 | 0.0% | 0.0% | $0 | 0.0% | 0.0% |
| 2023 | 0 | 0 | $0.00 | 0.0% | 0.0% | $0 | 0.0% | 0.0% |
| 2024 | 0 | 0 | $0.00 | 0.0% | 0.0% | $0 | 0.0% | 0.0% |
| 2025 | 0 | 0 | $0.00 | 0.0% | 0.0% | $0 | 0.0% | 0.0% |
| 2026 | 0 | 0 | $0.00 | 0.0% | 0.0% | $0 | 0.0% | 0.0% |
| 2027 | 0 | 0 | $0.00 | 0.0% | 0.0% | $0 | 0.0% | 0.0% |
| 2028 | 0 | 0 | $0.00 | 0.0% | 0.0% | $0 | 0.0% | 0.0% |
| 2029 | 0 | 0 | $0.00 | 0.0% | 0.0% | $0 | 0.0% | 0.0% |
| 2030 | 5 | 45,074 | $16.38 | 25.8% | 25.8% | $738,287 | 21.1% | 21.1% |
| 2031 | 2 | 25,171 | $15.96 | 14.4% | 40.2% | $401,760 | 11.5% | 32.5% |
| 2032 & Beyond | 10 | 104,654 | $22.61 | 59.8% | 100.0% | $2,365,932 | 67.5% | 100.0% |
| Vacant | 0 | 0 | $0.00 | 0.0% | 100.0% | $0 | 0.0% | 100.0% |
| Total/Wtd. Avg. | 17 | 174,899 | $20.05 | 100.0% | | $3,505,978 | 100.0% | |
| (1) | Information is based on the underwritten rent roll. |
COVID-19 Update. As of April 15, 2021, the ExchangeRight Properties are open and operating, all tenants have remained current on all rent and lease obligations, and no lease modification or rent relief requests have been received. The first debt service payment on the ExchangeRight 45 Mortgage Loan is due on May 11, 2021 and, as of April 15, 2021, the ExchangeRight 45 Mortgage Loan is not subject to any forbearance, modification or debt service relief request.
This is not a research report and was not prepared by any Underwriter’s research department. Please see additional important information and qualifications at the end of this Term Sheet.
T-125
| Property Types – Various | Loan #9 | Cut-off Date Balance: | | $36,691,600 |
| Property Addresses – Various | ExchangeRight 45 | Cut-off Date LTV: | | 61.9% |
| | | U/W NCF DSCR: | | 2.59x |
| | | U/W NOI Debt Yield: | | 9.0% |
Underwritten Net Cash Flow. The following table presents certain information relating to the Underwritten Net Cash Flow at the ExchangeRight Properties:
| Cash Flow Analysis(1)(2) |
| | UW | UW PSF |
| Base Rent | $3,505,978 | $20.05 |
| IG Rent Averaging(3) | $121,279 | $0.69 |
| Gross Potential Rent | $3,627,257 | $20.74 |
| Total Recoveries | $447,236 | $2.56 |
| Net Rental Income | $4,074,493 | $23.30 |
| Vacancy & Credit Loss | ($181,363) | ($1.04) |
| Effective Gross Income | $3,893,131 | $22.26 |
| | | |
| Real Estate Taxes | $395,995 | $2.26 |
| Insurance | $42,205 | $0.24 |
| Management Fee | $116,794 | $0.67 |
| Other Operating Expenses | $38,490 | $0.22 |
| Total Operating Expenses | $593,484 | $3.39 |
| | | |
| Net Operating Income | $3,299,647 | $18.87 |
| Replacement Reserves | $8,613 | $0.05 |
| TI/LC | $30,989 | $0.18 |
| Net Cash Flow | $3,260,045 | $18.64 |
| | | |
| Occupancy %(4) | 100.0% | |
| NOI DSCR | 2.62x | |
| NCF DSCR | 2.59x | |
| NOI Debt Yield | 9.0% | |
| NCF Debt Yield | 8.9% | |
| (1) | Historical financial information is not available because the ExchangeRight Properties were acquired by the borrower sponsor between November 24, 2020 and March 2, 2021. |
| (2) | For the avoidance of doubt, no COVID-19 specific adjustments have been made to the lender underwriting. |
| (3) | IG Rent Averaging represents straight-line rent averaging over the lesser of the loan term and remaining lease term for all of the ExchangeRight Properties. |
| (4) | The underwritten economic occupancy is 95.0%. The ExchangeRight Properties were 100.0% occupied as of May 1, 2021. |
Escrows and Reserves.
Real Estate Taxes – The loan documents require an upfront reserve of $117,659 for real estate taxes plus ongoing monthly reserves of $22,514. Ongoing monthly reserves for real estate taxes related to any tenant that is required to pay taxes directly pursuant to its leases (“Tax Paying Tenants”) are not required as long as (i) no event of default is continuing; (ii) the borrower provides proof of payment directly to the taxing authority by 15 days prior to the delinquency date; (iii) the lease with the applicable Tax Paying Tenant is in full force and effect and not subject to any default beyond any applicable grace or notice and cure period; and (iv) no material change has occurred with respect to the applicable Tax Paying Tenant that would, in the lender’s reasonable determination, materially jeopardize such tenant’s ability to timely pay the taxes. Tax Paying Tenants currently include Tractor Supply – Bloomington, IL; BioLife – Indianapolis, IN; BioLife – Livonia, MI; Fresenius Medical – Mobile, AL; and Walgreens – Brown Deer, WI.
Insurance – Ongoing monthly reserves for insurance are not required as long as (i) no event of default is continuing; (ii) the ExchangeRight Properties are part of a blanket or umbrella policy approved by the lender; (iii) the borrower provides the lender with evidence of renewal of insurance policies; and (iv) the borrower provides the lender with paid receipts for insurance premiums by no later than 10 business days prior to the policy expiration dates. In addition, the borrower is not required to deposit ongoing monthly insurance reserves related to any tenant who pays all insurance premiums directly to the applicable insurance company pursuant to such tenant’s lease (“Insurance Paying Tenants”) as long as (i) no event of default is continuing; (ii) the borrower provides proof of payment by the applicable Insurance Paying Tenant (or borrower) directly to the insurance company by no later than 15 days prior to the due date for such premiums; (iii) the lease with the applicable Insurance Paying Tenant is in full force and effect and not subject to any default beyond any applicable grace or notice and cure period; and (iv) no material change has occurred with respect to the applicable Insurance Paying Tenant that would, in the lender’s reasonable determination, materially jeopardize such tenant’s ability to timely pay the insurance premiums. Insurance Paying Tenants currently include Tractor Supply – Bloomington, IL; Dollar General – Battle Creek, MI; Dollar General – Minot, ND; Dollar General – West Fargo, ND; Family Dollar – Lackawanna, NY; Dollar General – Mentor, OH; Dollar General – Latrobe, PA; and Walgreens – Brown Deer, WI.
Replacement Reserve – The loan documents require an upfront reserve of $73,785 for replacement reserves plus ongoing monthly replacement reserves in an amount equal to $718. In addition, the borrower is not required to deposit ongoing monthly replacement reserves related to any tenant that is obligated under its lease to pay replacements and/or alterations for its premises (“Replacement Reserve Paying Tenants”) as long as (a) no event of default is continuing; (b) the borrower provides proof of payment of replacements by all Replacement Reserve Paying Tenants; (c) the lease with the applicable Replacement Reserve Paying Tenant is in full force and effect and not subject to any default beyond any applicable grace or notice and cure period; and (d) no material change has occurred with respect to the applicable Replacement Reserve Paying Tenant that would, in the lender’s reasonable determination, materially jeopardize such tenant’s ability to timely pay the replacements for its premises. Replacement Reserve Paying Tenants currently include Tractor Supply – Bloomington, IL; BioLife – Indianapolis, IN; BioLife – Livonia, MI; Dollar General – Battle Creek, MI; Dollar General – Minot, ND;
This is not a research report and was not prepared by any Underwriter’s research department. Please see additional important information and qualifications at the end of this Term Sheet.
T-126
| Property Types – Various | Loan #9 | Cut-off Date Balance: | | $36,691,600 |
| Property Addresses – Various | ExchangeRight 45 | Cut-off Date LTV: | | 61.9% |
| | | U/W NCF DSCR: | | 2.59x |
| | | U/W NOI Debt Yield: | | 9.0% |
Dollar General – West Fargo, ND; Family Dollar – Lackawanna, NY; Dollar General – Mentor, OH; Dollar General – Latrobe, PA; and Walgreens – Brown Deer, WI.
TI/LC Reserve – The loan documents require an upfront reserve of $500,000 for general tenant improvements and leasing commissions (“TI/LC”). In addition, only upon the occurrence and continuance of an event of default, ongoing monthly TI/LC reserves are required in an amount equal to $10,931.
Immediate Repair Reserve – The loan documents require an upfront reserve of $12,397 for immediate repairs.
Lockbox and Cash Management. The ExchangeRight 45 Mortgage Loan is structured with an in-place hard lockbox with springing cash management, into which the tenants are required to directly deposit all rents. Prior to a Cash Trap Event Period (as defined below), all funds in the lockbox account are required to be distributed to the borrower’s operating account. During a Cash Trap Event Period, funds in the lockbox account are required to be swept to a lender-controlled cash management account. Any excess cash flow remaining after satisfaction of the waterfall items outlined in the loan documents is required to be swept to an excess cash flow subaccount controlled by the lender.
A Cash Trap Event Period will commence upon the earlier of the following:
| (i) | the occurrence of an event of default; |
| (ii) | the net cash flow debt service coverage ratio (tested quarterly) being less than 1.50x; and |
| (iii) | the monthly payment date occurring in April 2028 (unless a Qualified Transfer or Qualified REIT Transfer has occurred prior to such date; see “The Borrower and The Borrower Sponsors” above). |
A Cash Trap Event Period will end upon the occurrence of the following:
| ● | with regard to clause (i), the cure of such event of default; |
| ● | with regard to clause (ii), the net cash flow debt service coverage ratio being equal to or greater than 1.55x for two consecutive calendar quarters; or |
| ● | with regard to clause (iii), the date a Qualified Transfer or Qualified REIT Transfer occurs. |
Additional Secured Indebtedness (not including trade debts). None.
Mezzanine Loan and Preferred Equity. Not permitted.
Release of Property. Not permitted.
Letter of Credit. None.
Purchase Option and Rights of First Refusal. The single tenant at each of the following two properties has a right of first refusal (“ROFR”) to purchase the related property: Family Dollar – Lackawanna, NY; and Walgreens – Brown Deer, WI. Each ROFR is not extinguished by a foreclosure of the related property; however, each ROFR does not apply to foreclosure or deed-in-lieu thereof. See “Description of the Mortgage Pool—Tenant Leases—Purchase Options and Rights of First Refusal” in the Preliminary Prospectus.
Ground Lease. None.
Terrorism Insurance. The loan documents require that the property insurance policy required to be maintained by the borrower provide coverage for perils and acts of terrorism in an amount equal to 100% of the full replacement cost of the ExchangeRight Properties, as well as business interruption insurance covering no less than the 18-month period following the occurrence of a casualty event, together with a 6-month extended period of indemnity. See “Risk Factors—Risks Relating to the Mortgage Loans—Terrorism Insurance May Not Be Available for All Mortgaged Properties” in the Preliminary Prospectus.
This is not a research report and was not prepared by any Underwriter’s research department. Please see additional important information and qualifications at the end of this Term Sheet.
T-127
| Multifamily – Cooperative | Loan #10 | Cut-off Date Balance: | | $35,000,000 |
| 7 East 14th Street | The Victoria | Cut-off Date LTV: | | 10.1% |
| New York, NY 10003 | | U/W NCF DSCR: | | 10.57x |
| | | U/W NOI Debt Yield: | | 26.1% |
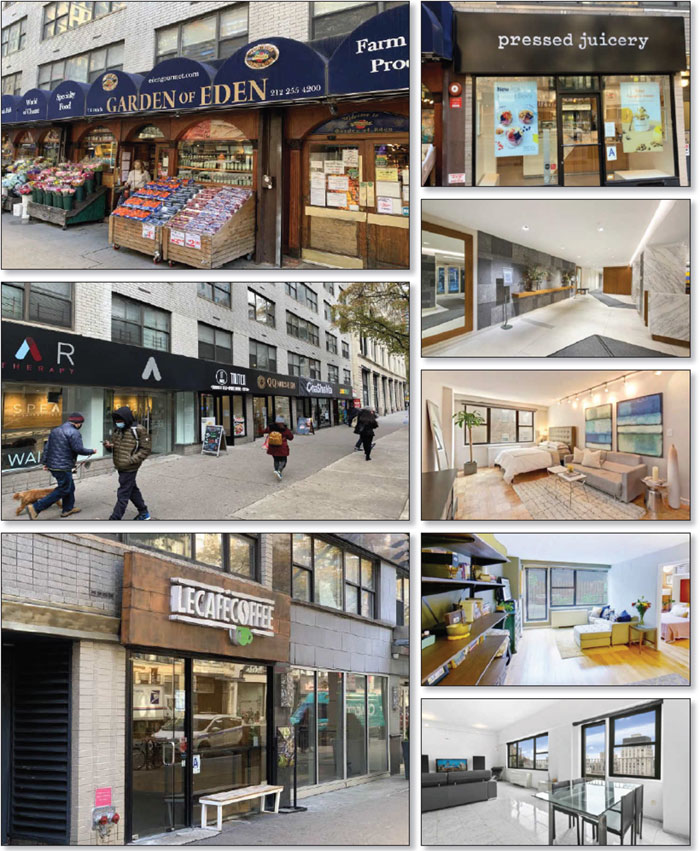
This is not a research report and was not prepared by any Underwriter’s research department. Please see additional important information and qualifications at the end of this Term Sheet.
T-128
| Multifamily – Cooperative | Loan #10 | Cut-off Date Balance: | | $35,000,000 |
| 7 East 14th Street | The Victoria | Cut-off Date LTV: | | 10.1% |
| New York, NY 10003 | | U/W NCF DSCR: | | 10.57x |
| | | U/W NOI Debt Yield: | | 26.1% |
This is not a research report and was not prepared by any Underwriter’s research department. Please see additional important information and qualifications at the end of this Term Sheet.
T-129
| Mortgage Loan No. 10 – The Victoria |
| Mortgage Loan Information | | Property Information |
| Mortgage Loan Seller: | MSMCH | | Single Asset/Portfolio: | Single Asset |
| Credit Assessment (Moody’s/Fitch/KBRA): | Aaa/AAAsf/AAA | | Location: | New York, NY 10003 |
| Original Balance: | $35,000,000 | | General Property Type: | Multifamily |
| Cut-off Date Balance: | $35,000,000 | | Detailed Property Type: | Cooperative |
| % of Initial Pool Balance: | 3.5% | | Title Vesting: | Fee |
| Loan Purpose: | Refinance | | Year Built/Renovated: | 1965 / NAP |
| Borrower Sponsor(1): | NAP | | Size: | 489 Units |
| Guarantor(1): | NAP | | Cut-off Date Balance per Unit: | $71,575 |
| Mortgage Rate: | 2.3800% | | Maturity Date Balance per Unit: | $71,575 |
| Note Date: | 3/30/2021 | | Property Manager: | Charles H. Greenthal |
| First Payment Date: | 5/1/2021 | | | Management Corp. |
| Maturity Date: | 4/1/2031 | | Underwriting and Financial Information(4) |
| Original Term to Maturity: | 120 months | | UW NOI(5): | $9,118,824 |
| Original Amortization Term: | 0 months | | UW NOI Debt Yield(5): | 26.1% |
| IO Period: | 120 months | | UW NOI Debt Yield at Maturity(5): | 26.1% |
| Seasoning: | 1 month | | UW NCF DSCR(5): | 10.57x |
| Prepayment Provisions: | YM1(25),DorYM1(88),O(7) | | Most Recent NOI(6): | NAP |
| Lockbox/Cash Mgmt Status: | None | | 2nd Most Recent NOI(6): | NAP |
| Additional Debt Type: | No | | 3rd Most Recent NOI(6): | NAP |
| Additional Debt Balance: | NAP | | Most Recent Occupancy(7): | NAP |
| Future Debt Permitted (Type)(2): | Yes (Subordinate Secured) | | 2nd Most Recent Occupancy(7): | NAP |
| | | | 3rd Most Recent Occupancy(7): | NAP |
| | | | Appraised Value (as of)(8): | $347,900,000 (3/1/2021) |
| | | | Appraised Value per Unit(8): | $711,452 |
| Reserves(3) | | Cut-off Date LTV Ratio(8): | 10.1% |
| Type | Initial | Monthly | Cap | | Maturity Date LTV Ratio(8): | 10.1% |
| RE Taxes: | $0 | Springing | NAP | | Coop-Rental Value(9): | $251,300,000 (3/1/2021) |
| Insurance: | $0 | Springing | NAP | | Coop-LTV as Rental(9): | 13.9% |
| | | | | | | | |
| Sources and Uses |
| Sources | Proceeds | % of Total | | Uses | Proceeds | % of Total |
| Loan Amount: | $35,000,000 | 100.0% | | Loan Payoff: | $13,906,494 | 39.7% |
| | | | | Return of Equity: | $18,686,807 | 53.4% |
| | | | | Closing Costs: | $2,406,699 | 6.9% |
| Total Sources: | $35,000,000 | 100.0% | | Total Uses: | $35,000,000 | 100.0% |
| (1) | The Victoria Property (as defined below) is owned by The Victoria Borrower (as defined below), which is a cooperative housing corporation. No individual or entity (other than The Victoria Borrower) has recourse obligations with respect to The Victoria Mortgage Loan (as defined below), including pursuant to any guaranty or environmental indemnity. |
| (2) | See “Additional Secured Indebtedness (not including trade debts)” below. |
| (3) | See “Escrows and Reserves” below. |
| (4) | The novel coronavirus pandemic is an evolving situation and could impact The Victoria Mortgage Loan more severely than assumed in the underwriting of The Victoria Mortgage Loan and could adversely affect the NOI, NCF and occupancy information, as well as the appraised value and the DSCR, LTV and Debt Yield metrics presented above and herein. See “Risk Factors—Risks Related to Market Conditions and Other External Factors—The Coronavirus Pandemic Has Adversely Affected the Global Economy and Will Likely Adversely Affect the Performance of the Mortgage Loans” in the Preliminary Prospectus. |
| (5) | See “Underwritten Net Cash Flow” below. |
| (6) | Most Recent NOI, 2nd Most Recent NOI and 3rd Most Recent NOI are not available. Residential cooperatives are not-for-profit entities that set maintenance fees to cover current expenses and plan for future capital needs. A residential cooperative can increase or decrease maintenance fees according to its anticipated expenses and level of cash reserves. The historical NOI figures are not representative of the cash flow generated by The Victoria Property if it were operated as a multifamily rental property. |
| (7) | Occupancy is not reported as all residential units are owned by tenant-shareholders or by the Coop Conversion Sponsor (as defined below). |
| (8) | For purposes of determining the Appraised Value, the Cut-off Date LTV Ratio and the Maturity Date LTV Ratio, the value estimate reflected in the appraisal of The Victoria Property is determined as if such residential cooperative property were operated as a residential cooperative and, in general, such value equals the gross sellout value of all residential cooperative units in such residential cooperative property, based in part on various comparable sales of cooperative apartment units in the market, plus the outstanding amount of the prior mortgage loan secured by The Victoria Property. Such value does not represent a market value. |
| (9) | The Coop-Rental Value and the Coop-LTV as Rental assumes The Victoria Property is operated as a multifamily rental property. |
The Mortgage Loan. The tenth largest mortgage loan (“The Victoria Mortgage Loan”) is evidenced by a promissory note in the original principal amount of $35,000,000 and secured by a first priority fee mortgage encumbering a cooperative apartment complex comprising 489 units in one, mixed use, 21-story building located in New York, New York (“The Victoria Property”). The proceeds of The Victoria Mortgage Loan were used to refinance existing debt, return equity to The Victoria Borrower and pay closing costs.
The Borrower. The borrower is Victoria Owners Corp., a cooperative housing corporation organized under the laws of the State of New York (“The Victoria Borrower”). The Victoria Property is owned in fee simple by The Victoria Borrower. No individual or entity (other than The Victoria Borrower) has recourse obligations with respect to The Victoria Mortgage Loan, including pursuant to any guaranty or environmental indemnity. The Victoria Borrower was not structured to be a bankruptcy remote entity.
This is not a research report and was not prepared by any Underwriter’s research department. Please see additional important information and qualifications at the end of this Term Sheet.
T-130
| Multifamily – Cooperative | Loan #10 | Cut-off Date Balance: | | $35,000,000 |
| 7 East 14th Street | The Victoria | Cut-off Date LTV: | | 10.1% |
| New York, NY 10003 | | U/W NCF DSCR: | | 10.57x |
| | | U/W NOI Debt Yield: | | 26.1% |
The Property. The Victoria Property is a cooperative apartment complex with 489 residential units, 8 retail suites, and a 112-space subterranean parking garage situated within a 21-story building in New York, New York. The Victoria Property was constructed in 1965 and converted to cooperative ownership in 1986. The residential component consists of 117 studio units, 357 one-bedroom units, and 15 two-bedroom units. The average residential unit size is 701 SF. Tenant shareholders presently own 401 units, and an affiliate of the sponsor of the 1986 cooperative conversion (the “Coop Conversion Sponsor”) owns the shares in the remaining 88 residential units, of which 75 are rent stabilized and 13 are market rate. The retail and parking garage portion of The Victoria Property are master leased to an affiliate of the Coop Conversion Sponsor at a current annual base rent of $155,625. At the time of conversion of The Victoria Property to a cooperative, the master lease was signed for a 20-year term with four 20-year extensions. The lease is currently in the first extension term. The Victoria Mortgage Loan is underwritten based on the master lease rent payment.
As of March 3, 2021, the Coop Conversion Sponsor leases 85 of the 88 residential units owned by it. As of March 3, 2021, with respect to units which are rent stabilized, such Coop Conversion Sponsor owned units are leased at a rate that is below their monthly maintenance payments, resulting in a monthly shortfall of $21,284 per month per unit. However, for the remaining Coop Conversion Sponsor owned units, which are market rate units, the Coop Conversion Sponsor receives an excess of rent over maintenance, resulting in the Coop Conversion Sponsor receiving a net excess of rents over maintenance of $102,726 annually in the aggregate for all units owned by the Coop Conversion Sponsor.
Amenities at The Victoria Property include a 24-hour attended lobby, a laundry room, storage units, and bicycle storage. Between 2014 and 2020, approximately $1.4 million was spent on capital expenditures, including a major lobby renovation, mechanical upgrades, exterior restoration and other renovations. The board of Victoria Owners Corp. is currently studying future capital projects that will seek to both enhance the value of The Victoria Property and achieve compliance with NYC Local Law 97, a.k.a. the Climate Mobilization Act. Various consultants have been retained, identifying capital needs totaling up to $20 million to address infrastructure needs over the next 10 years, focusing on reductions of carbon emissions and improved energy efficiency, with total anticipated costs ranging from $13.1 million to $19.0 million depending on the selection of HVAC systems, with remaining additional funds potentially being used to enhance building amenities, including proposed installation of a fitness center. Such renovations are not required or reserved for under The Victoria Mortgage Loan documents.
The table below shows the residential apartment unit mix at The Victoria Property:
| Unit Mix |
| Unit Type | Units | % of Total Units | Average SF per Unit | Total SF |
| Studio | 117 | 23.9% | 475 | 55,575 |
| 1 Bedroom | 357 | 73.0% | 750 | 267,750 |
| 2 Bedroom | 15 | 3.1% | 1,300 | 19,500 |
| Total/Wtd. Avg. | 489 | 100.0% | 701 | 342,825 |
Source: Appraisal
COVID-19 Update. The first debt service payment on The Victoria Mortgage Loan is due in May 2021 and as of April 19, 2021, The Victoria Mortgage Loan is not subject to any forbearance, modification or debt service relief request. As of April 19, 2021, The Victoria Borrower has reported that 98.0% of units have paid their April 2021 maintenance payments and 100% of master lease payments have been made. No rent relief requests were made. According to the appraisal, it was reported that the residential occupancy at The Victoria Property was as low as approximately 40% during the COVID-19 pandemic and at the time of the appraisal had recovered to approximately 60%.
The Market. The Victoria Property is located in the Union Square neighborhood of Manhattan. Union Square is roughly bounded by East 18th Street to the north, 6th Avenue to the west, East 14th Street to the south and Irving Place to the east. Union Square is located in close proximity to Union Square Park, Gramercy Park and Madison Square Park. Primary access to The Victoria Property is provided by major thoroughfares including East 14th Street, Broadway and Fifth Avenue. The Victoria Property is in close proximity to the 14th Street Union Square subway station, which provides access to the 4, 5, 6, L, N, Q, R and W lines. According to the appraisal, The Victoria Property is located within the Midtown West submarket of the New York City apartment market. According to the appraisal, as of the fourth quarter of 2020, the Midtown West submarket had an inventory of 33,519 units, a vacancy rate of 5.5% and average asking rent per month of $4,397. According to the appraisal, as of the fourth quarter of 2020, the New York City apartment market had an inventory of approximately 227,102 units, a vacancy rate of 4.5% and average asking rent per month of $3,337. According to the appraisal, the 2020 population within a 0.25-, 0.5- and one-mile radius of The Victoria Property was 16,568, 69,419 and 278,263, respectively. The 2020 median household income within the same 0.25-, 0.5- and one-mile radius was $158,755, $147,178 and $112,112, respectively.
This is not a research report and was not prepared by any Underwriter’s research department. Please see additional important information and qualifications at the end of this Term Sheet.
T-131
| Multifamily – Cooperative | Loan #10 | Cut-off Date Balance: | | $35,000,000 |
| 7 East 14th Street | The Victoria | Cut-off Date LTV: | | 10.1% |
| New York, NY 10003 | | U/W NCF DSCR: | | 10.57x |
| | | U/W NOI Debt Yield: | | 26.1% |
The following table presents certain information relating to multifamily rental properties comparable to The Victoria Property:
Comparable Rental Properties(1) |
| Property | Year Built | # Units | Occupancy | Average SF per Unit | Average Monthly Rent per Unit | Average Monthly Rent PSF |
| The Victoria | 1965 | 489 | 94.7%(2) | Studio: 475 1 BR: 750 2 BR: 1,300 | Studio: $2,513(3) 1 BR: $4,066(3) 2 BR: $5,836(3) | Studio: $5.29(3) 1 BR: $5.42(3) 2 BR: $4.49(3) |
| 1 University Place | 1930 | 263 | 97.3% | Studio: 475 1 BR: 775 2 BR:1,000 | Studio: $2,933 1 BR: $4,295 2 BR: $6,195 | Studio: $6.17 1 BR: $5.54 2 BR: $6.20 |
| 2 Cooper Square | 2009 | 143 | 98.5% | Studio: 501 1 BR: 662 2 BR: 1,099 | Studio: $4,144 1 BR: $5,564 2 BR: $8,795 | Studio: $8.27 1 BR: $8.40 2 BR: $8.00 |
| 150 East 18th Street | 1960 | 221 | 99.1% | Studio: 466 1 BR: 560 2 BR: 1,112 | Studio: $2,395 1 BR: $3,495 2 BR: $5,630 | Studio: $5.14 1 BR: $6.24 2BR: $5.06 |
| 201 East 19th Street | 1959 | 189 | 97.4% | Studio: 525 1 BR: 750 2BR: 1,100 | Studio: $2,810 1 BR: $3,795 2 BR: $5,395 | Studio: $5.35 1 BR: $5.06 2 BR: $4.90 |
| The Mayfair | 1964 | 209 | 98.1% | Studio: 496 1 BR: 783 2BR: 1,242 | Studio: $3,245 1 BR: $3,900 2 BR: $5,850 | Studio: $6.54 1 BR: $4.98 2 BR: $4.71 |
Source: Appraisal.
| (1) | The rents for the comparable properties are based on market rents for such properties, whether or not such properties include rent restricted units. |
| (2) | Occupancy reported reflects the vacancy assumption in the related appraisal for purposes of determining the appraised value of The Victoria Property as a multifamily rental property. |
| (3) | The average rent for The Victoria Property is based on estimated market rents as determined by the appraisal. However, approximately 75 of the sponsor-owned residential cooperative units are rent stabilized and all or a portion of the other units were rent stabilized or rent controlled prior to the cooperative conversion and accordingly would again be subject to rent restrictions if The Victoria Property were operated as a multifamily rental property. See “Risk Factors—Risks Relating to the Mortgage Loans—Residential Cooperative Properties Have Special Risks” in the Preliminary Prospectus. According to the appraisal, average contract rents for the rent-stabilized Coop Conversion Sponsor owned units are $1,099 for studio units, $1,231 for studio units with terraces, $1,449 for one bedroom units, $1,671 for one bedroom units with terraces, $2,581 for two bedroom units and $2,792 for two bedroom units with terraces |
This is not a research report and was not prepared by any Underwriter’s research department. Please see additional important information and qualifications at the end of this Term Sheet.
T-132
| Multifamily – Cooperative | Loan #10 | Cut-off Date Balance: | | $35,000,000 |
| 7 East 14th Street | The Victoria | Cut-off Date LTV: | | 10.1% |
| New York, NY 10003 | | U/W NCF DSCR: | | 10.57x |
| | | U/W NOI Debt Yield: | | 26.1% |
Underwritten Net Cash Flow. The following table presents certain information relating to the Underwritten Net Cash Flow at The Victoria Property:
| Cash Flow Analysis(1)(2) |
| | UW | UW Per Unit |
| Gross Potential Rent | $20,414,402 | $41,747.24 |
| Other Income | $255,000 | $521.47 |
| Vacancy & Credit Loss(3) | ($1,033,470) | ($2,113.44) |
| Effective Gross Income | $19,635,932 | $40,155.28 |
| | | |
| Real Estate Taxes | $6,321,979 | $12,928.38 |
| Insurance | $214,126 | $437.89 |
| Other Expenses | $3,981,003 | $8,141.11 |
| Total Expenses | $10,517,108 | $21,507.38 |
| | | |
| Net Operating Income | $9,118,824 | $18,647.90 |
| TI/LC | $72,189 | $147.63 |
| Capital Expenditures | $122,500 | $250.51 |
| Net Cash Flow | $8,924,135 | $18,249.76 |
| | | |
| Occupancy %(3) | 94.7% | |
| NOI DSCR | 10.80x | |
| NCF DSCR | 10.57x | |
| NOI Debt Yield | 26.1% | |
| NCF Debt Yield | 25.5% | |
| (1) | For the avoidance of doubt, no COVID-19 specific adjustments have been incorporated in the lender underwriting. |
| (2) | Residential cooperatives are generally organized and operated as not-for-profit entities that set maintenance fees to cover current expenses and plan for future capital needs. The UW Net Operating Income and the UW Net Cash Flow for The Victoria Property are the projected net operating income and the projected net cash flow, respectively, reflected in the appraisal. The projected net operating income, in general, equals projected effective gross income at The Victoria Property assuming that it is operated as a multifamily rental property with rents and other income set at the prevailing market rates (other than for the 75 Coop Conversion Sponsor owned rent stabilized units, as to which the rent stabilization was taken into account), reduced by underwritten property operating expenses and a market-rate vacancy assumption, in each case as determined by the appraiser. The projected net cash flow equals the projected net operating income reduced by the projected replacement reserves as determined by the appraiser. Such projected net operating income assumes The Victoria Property is rented at market rates (other than for the 75 Coop Conversion Sponsor owned rent stabilized units, as to which the rent stabilization was taken into account). However, in addition to the 75 Coop Conversion Sponsor owned units, all or a portion of the other units were rent stabilized or rent controlled prior to the cooperative conversion and accordingly would again be subject to rent restrictions if The Victoria Property were operated as a multifamily rental property. The projected rental income used in such determinations differs materially from the scheduled monthly maintenance payments from the tenant-shareholders at The Victoria Property. See “Risk Factors—Risks Relating to the Mortgage Loans—Residential Cooperative Properties Have Special Risks” in the Preliminary Prospectus. |
| (3) | Occupancy % and Vacancy & Credit Loss reported reflect the vacancy assumption in the related appraisal for purposes of determining the appraised value of The Victoria Property as a multifamily rental property. |
Escrows and Reserves.
Real Estate Taxes – The Victoria Mortgage Loan documents provide for ongoing monthly deposits into a reserve for real estate taxes in an amount equal to 1/12 of the real estate taxes that the lender estimates will be payable during the next twelve months; provided that such monthly deposits are not required so long as (i) no event of default is continuing and (ii) The Victoria Borrower provides the lender with reasonably satisfactory evidence that the applicable taxes have been paid in full on or before the due dates therefor.
Insurance – The Victoria Mortgage Loan documents provide for ongoing monthly deposits into a reserve for insurance premiums in an amount equal to 1/12 of the insurance premiums that the lender estimates will be payable for the renewal of coverage upon the expiration of the insurance policies; provided that such monthly deposits are not required so long as (i) no event of default is continuing and (ii) The Victoria Borrower provides the lender with reasonably satisfactory evidence that the applicable insurance premiums have been paid in full on or before the due dates therefor. In addition, The Victoria Borrower is not required to make such monthly deposits if (i) no event of default is continuing, (ii) the liability and casualty insurance coverage for The Victoria Property is included in a blanket policy approved by the lender in its reasonable discretion, and (iii) The Victoria Borrower provides the lender with evidence of payment of the insurance premiums and provides evidence of renewals of the insurance policies, no later than ten days prior to the expiration of the current policy.
Lockbox and Cash Management. The Victoria Mortgage Loan does not require a lockbox or cash management.
This is not a research report and was not prepared by any Underwriter’s research department. Please see additional important information and qualifications at the end of this Term Sheet.
T-133
| Multifamily – Cooperative | Loan #10 | Cut-off Date Balance: | | $35,000,000 |
| 7 East 14th Street | The Victoria | Cut-off Date LTV: | | 10.1% |
| New York, NY 10003 | | U/W NCF DSCR: | | 10.57x |
| | | U/W NOI Debt Yield: | | 26.1% |
Additional Secured Indebtedness (not including trade debts). The Victoria Mortgage Loan documents provide that The Victoria Borrower has the right to obtain additional subordinate financing (including a revolving or term line of credit) secured by The Victoria Property subject to the lender’s consent (not to be unreasonably withheld, conditioned or delayed) and the following conditions: (i) no event of default is continuing, (ii) the principal amount of such additional financing is not greater than the lesser of $15,000,000 or such amount as would result in a 35% aggregate loan-to-value ratio, (iii) the subordinate lender executes the lender’s standard subordination agreement, (iv) the maturity of the subordinate financing is co-terminous with or extends beyond the term of The Victoria Mortgage Loan and (v) The Victoria Borrower pays all of the lender’s actual out-of-pocket costs and expenses (including reasonable legal fees) in connection with such subordinate financing.
Mezzanine Loan and Preferred Equity. Not permitted.
Release of Property. Not permitted.
Letter of Credit. None.
Right of First Offer / Right of First Refusal. None.
Ground Lease. None.
Terrorism Insurance. The Victoria Borrower is required to obtain and maintain an “all risk” property insurance policy that covers perils of terrorism and acts of terrorism in an amount equal to the “full replacement cost” of The Victoria Property together with business income insurance covering not less than the 18-month period commencing at the time of loss, together with an extended period of indemnity endorsement of up to six months. Notwithstanding the foregoing, for so long as the Terrorism Risk Insurance Act of 2002, as extended and modified by the Terrorism Risk Insurance Program Reauthorization Act of 2015 (“TRIPRA”), is in effect (including any extensions thereof or if another federal governmental program is in effect relating to “acts of terrorism” which provides substantially similar protections as TRIPRA), the lender is required to accept terrorism insurance which covers against “covered acts” as defined by TRIPRA (or such other program) as full compliance with the loan documents, but only in the event that TRIPRA (or such other program) continues to cover both domestic and foreign acts of terrorism. In addition, if TRIPRA (or such subsequent statute, extension or reauthorization) is not in effect, The Victoria Borrower will not be required to pay annual premiums to obtain terrorism insurance in excess of an amount equal to two times the premium for a separate “special form” or “all risks” or equivalent policy insuring only The Victoria Property on a stand-alone basis (including the required property and business interruption insurance) at the time that terrorism coverage is excluded from any applicable insurance policies. See “Risk Factors—Risks Relating to the Mortgage Loans—Terrorism Insurance May Not Be Available for All Mortgaged Properties” in the Preliminary Prospectus.
This is not a research report and was not prepared by any Underwriter’s research department. Please see additional important information and qualifications at the end of this Term Sheet.
T-134
(THIS PAGE INTENTIONALLY LEFT BLANK)
This is not a research report and was not prepared by any Underwriter’s research department. Please see additional important information and qualifications at the end of this Term Sheet.
T-135
| Mortgage Loan No. 11 – Vista Station 6 |
| Mortgage Loan Information | | Mortgaged Property Information |
| Mortgage Loan Seller: | WFB | | Single Asset/Portfolio: | Single Asset |
| Credit Assessment (Moody’s/Fitch/KBRA): | NR/NR/NR | | Location: | Draper, UT 84020 |
| Original Balance: | $31,633,000 | | General Property Type: | Office |
| Cut-off Date Balance: | $31,633,000 | | Detailed Property Type: | Suburban |
| % of Initial Pool Balance: | 3.1% | | Title Vesting: | Fee |
| Loan Purpose: | Acquisition | | Year Built/Renovated: | 2016/NAP |
| Borrower Sponsors: | Vera Guerin; D. Gregory Scott | | Size: | 149,892 SF |
| | Vera Guerin; The Guerin Trust of | | Cut-off Date Balance PSF: | $211 |
| Guarantors: | 1989 (Restated); D. Gregory Scott; The Scott 2005 Family Trust | | Maturity Date Balance PSF: | $211 |
| Mortgage Rate: | 3.5540% | | Property Manager: | Silverado Management LLC |
| Note Date: | 3/18/2021 | | | (borrower-related) |
| First Payment Date: | 5/11/2021 | | | |
| Maturity Date: | 4/11/2031 | | | |
| Original Term to Maturity: | 120 months | | |
| Original Amortization Term: | 0 months | | Underwriting and Financial Information(5) |
| IO Period: | 120 months | | UW NOI: | $3,254,315 |
| Seasoning: | 1 month | | UW NOI Debt Yield: | 10.3% |
| Prepayment Provisions: | L(25),D(91),O(4) | | UW NOI Debt Yield at Maturity: | 10.3% |
| Lockbox/Cash Mgmt Status: | Hard/In Place | | UW NCF DSCR: | 2.70x |
| Additional Debt Type: | No | | Most Recent NOI: | $3,282,211 (12/31/2020) |
| Additional Debt Balance: | NAP | | 2nd Most Recent NOI: | $3,196,108 (12/31/2019) |
| Future Debt Permitted (Type): | No (NAP) | | 3rd Most Recent NOI: | $3,118,970 (12/31/2018) |
| Reserves | | Most Recent Occupancy: | 100.0% (5/1/2021) |
| Type | Initial | Monthly | Cap | | 2nd Most Recent Occupancy: | 100.0% (12/31/2019) |
| RE Taxes:(1) | $0 | Springing | NAP | | 3rd Most Recent Occupancy: | 100.0% (12/31/2018) |
| Insurance: | $4,344 | $543 | NAP | | Appraised Value (as of)(6): | $48,700,000 (4/23/2021) |
| Replacement Reserves:(2) | $0 | $2,498 | $89,934 | | Appraised Value PSF(6): | $325 |
| TI/LC Reserve:(3) | $0 | $18,733 | $674,370 | | Cut-off Date LTV Ratio(6): | 65.0% |
| Paving/Parking Lot Reserves:(4) | $640,000 | $0 | NAP | | Maturity Date LTV Ratio(6): | 65.0% |
| Sources and Uses |
| Sources | Proceeds | % of Total | | Uses | Proceeds | % of Total |
| Loan Amount: | $31,633,000 | 63.7% | | Purchase Price: | $48,400,000 | 97.5% |
| Borrower Equity: | $17,994,827 | 36.3% | | Upfront Reserves: | $644,344 | 1.3% |
| | | | | Closing Costs: | $583,483 | 1.2% |
| Total Sources: | $49,627,827 | 100.0% | | Total Uses: | $49,627,827 | 100.0% |
| (1) | The loan documents to do not require ongoing monthly tax reserves as long as (i) no event of default is continuing; (ii) the lease with Academy (as defined below) remains in full force and effect, Academy remains fully responsible for the taxes, and Academy is making the tax payments directly; (iii) no default has occurred under the lease beyond any applicable notice or cure periods; and (iv) at least 15 days prior to the due date, the Vista Station 6 Borrower (as defined below) has delivered evidence acceptable to the lender that the taxes have been paid for the corresponding period. |
| (2) | The replacement reserve will be capped at $89,934 so long as no event of default is continuing and the Vista Station 6 Property (as defined below) is being adequately maintained as determined by the lender based on annual site inspections. |
| (3) | The leasing reserve will be capped at $674,370, so long as no event of default is continuing. |
| (4) | The loan documents require an upfront parking lot reserve of $640,000 to complete the paving and striping of no less than 180 parking spaces, on the north section of the Vista Station 6 Property. Prior to August 1, 2021, whether or not an event of default then exists, the lender will release the funds upon receipt of an updated site plan, and reasonably satisfactory evidence that (a) the work has been completed including (i) an officer’s certificate stating that the work has been completed and all costs have been paid in full, (ii) copies of lien releases related to any contractor or subcontractor that performed the work, (iii) a certificate of substantial completion from an architect or engineer, (iv) a statement of final approval or completion from the City of Draper, and (v) a picture reasonably satisfactory to the lender showing completion of the work, and (b) the Vista Station 6 Borrower is obligated to pay the reserve funds to the seller. In addition, prior to August 1, 2021, the lender will not exercise any rights the lender may have pursuant to the loan documents to apply the parking lot reserve funds in any manner other than as described above. |
| (5) | The novel coronavirus pandemic is an evolving situation and could impact the Vista Station 6 Mortgage Loan (as defined below) more severely than assumed in the underwriting of the Vista Station 6 Mortgage Loan and could adversely affect the NOI, NCF and occupancy information, as well as the appraised value and the DSCR, LTV and Debt Yield metrics presented above and herein. See “Risk Factors-—Risks Related to Market Conditions and Other External Factors—The Coronavirus Pandemic Has Adversely Affected the Global Economy and Will Likely Adversely Affect the Performance of the Mortgage Loans” in the Preliminary Prospectus. |
| (6) | The Appraised Value reflects the “As Stabilized” value, which assumes a $600,000 parking lot expansion is completed, which is expected to be completed August 1, 2021. $640,000 was reserved with the lender upfront for the cost of the expansion. The appraisal also included a “Go Dark-As Complete” value of $34,700,000 as of April 23, 2021, which assumes the parking lot expansion has been completed. |
This is not a research report and was not prepared by any Underwriter’s research department. Please see additional important information and qualifications at the end of this Term Sheet.
T-136
| Office – Suburban | Loan #11 | Cut-off Date Balance: | | $31,633,000 |
| 339 West 13490 South | Vista Station 6 | Cut-off Date LTV: | | 65.0% |
| Draper, UT 84020 | | UW NCF DSCR: | | 2.70x |
| | | UW NOI Debt Yield: | | 10.3% |
The Mortgage Loan. The eleventh largest mortgage loan (the “Vista Station 6 Mortgage Loan”) is evidenced by a single promissory note in the original principal amount of $31,633,000 secured by a first priority fee mortgage encumbering a 149,892 SF, single tenant office building (the “Vista Station 6 Property”), located in Draper, Utah. The proceeds of the Vista Station 6 Mortgage Loan, in addition to a cash equity contribution from the borrower sponsors, were used to purchase the Vista Station 6 Property, pay closing costs and fund upfront reserves.
The Borrower and the Borrower Sponsors. The borrower is Vista Draper, LLC, a Delaware limited liability company and single purpose entity with one independent director (the “Vista Station 6 Borrower”). The Vista Station 6 Borrower sponsors are Vera Guerin and D. Gregory Scott and the non-recourse carveout guarantors are Vera Guerin, The Guerin Trust of 1989 (Restated), D. Gregory Scott and The Scott 2005 Family Trust.
Vera Guerin and D. Gregory Scott have ownership interests in AVG Partners. AVG Partners is a private equity group that was formed in 1997 and primarily invests in triple net leased commercial properties throughout the United States. AVG Partners has a current portfolio of more than 200 properties with over 10 million SF.
The Property. The Vista Station 6 Property is a Class A, five-story, plus basement, 149,892 SF office building located in Draper, Utah. Built in 2016, the property is situated on a 6.96-acre parcel and is 100% leased to Academy Mortgage. The lower level is considered a daylight basement, with access to street grade on the north side of the building, and includes a break room, fitness room, yoga/dance room and a locker room with showers.
The Vista Station 6 Property is located in a subdivision that includes four vacant parcels that are owned by the seller. The Vista Station 6 Property includes 280 dedicated parking spaces on its parcel, and has access to a total of 639 spaces within the subdivision. The seller is obligated to complete the paving and striping of no less than 180 additional parking spaces on the north side of the Vista Station 6 Property, bringing the total dedicated spaces to 460. Based on the usable area in the tenant’s lease of 124,910 SF, this equates to a parking ratio of 3.68 per 1,000 SF. The estimated cost to complete the parking lot is $630,706. An upfront parking lot reserve of $640,000 was funded at origination.
Major Tenant.
Academy Mortgage (149,892 SF; 100.0% of NRA; 100.0% of underwritten base rent). Academy Mortgage (“Academy”) is an independent mortgage lender that primarily originates conventional, FHA and VA loans. It was founded in 1988 and has more than 200 branches and 2,300 employees nationwide. Academy has grown its loan volume from $5.5 billion in 2014 to $15.4 billion in 2020, including a 65.4% increase from 2019 to 2020. EBITDA for 2020 was $262.3 million and has increased every year since 2017. In 2017, Academy moved its headquarters to the Vista Station 6 Property and signed a 15-year lease which expires December 1, 2032. The tenant has two, 5-year renewal options with 180 days’ notice, and no termination options.
The second floor, totaling 25,482 SF (17.0% of NRA), is currently subleased to GMS Medical Staffing, Inc. at a rate of $31.66 PSF (full service gross), on a 34 month lease through January 31, 2022, with one, 3-month extension option.
The following table presents certain information relating to the tenancy at the Vista Station 6 Property:
| Tenant Summary |
| Tenant Name | Credit Rating (Fitch/Moody’s/ S&P) | Tenant SF | Approx. % of SF | Annual UW Rent(1) | % of Total Annual UW Rent | Annual UW Rent PSF(1) | | Renewal Options |
| Termination Option (Y/N) | Lease Expiration |
| Academy Mortgage | NR/NR/NR | 149,892 | 100.0% | $3,466,899 | 100.0% | $23.13 | N | 12/1/2032 | 2 x 5 Yr |
| SubTotal/Wtd. Avg. | | 149,892 | 100.0% | $3,466,899 | 100.0% | $23.13 | | | |
| | | | | | | | | | |
| Other Tenants | | 0 | 0.0% | $0 | 0.0% | $0.00 | | | |
| Vacant Space | | 0 | 0.0% | | | | | | |
| Total/Wtd. Avg. | | 149,892 | 100.0% | | | | | | |
| (1) | Annual UW Rent and Annual UW Rent PSF include contractual rent steps through December 2021 totaling $84,559. |
This is not a research report and was not prepared by any Underwriter’s research department. Please see additional important information and qualifications at the end of this Term Sheet.
T-137
| Office – Suburban | Loan #11 | Cut-off Date Balance: | | $31,633,000 |
| 339 West 13490 South | Vista Station 6 | Cut-off Date LTV: | | 65.0% |
| Draper, UT 84020 | | UW NCF DSCR: | | 2.70x |
| | | UW NOI Debt Yield: | | 10.3% |
The following table presents certain information relating to the lease rollover schedule at the Vista Station 6 Property:
| Lease Rollover Schedule(1) |
| Year | # of Leases Rolling | SF Rolling | UW Rent PSF Rolling | Approx. % of Total SF Rolling | Approx. Cumulative % of SF Rolling | Total UW Rent Rolling | Approx. % of Total Rent Rolling | Approx. Cumulative % of Total Rent Rolling |
| 2021 | 0 | 0 | $0.00 | 0.0% | 0.0% | $0 | 0.0% | 0.0% |
| 2022 | 0 | 0 | $0.00 | 0.0% | 0.0% | $0 | 0.0% | 0.0% |
| 2023 | 0 | 0 | $0.00 | 0.0% | 0.0% | $0 | 0.0% | 0.0% |
| 2024 | 0 | 0 | $0.00 | 0.0% | 0.0% | $0 | 0.0% | 0.0% |
| 2025 | 0 | 0 | $0.00 | 0.0% | 0.0% | $0 | 0.0% | 0.0% |
| 2026 | 0 | 0 | $0.00 | 0.0% | 0.0% | $0 | 0.0% | 0.0% |
| 2027 | 0 | 0 | $0.00 | 0.0% | 0.0% | $0 | 0.0% | 0.0% |
| 2028 | 0 | 0 | $0.00 | 0.0% | 0.0% | $0 | 0.0% | 0.0% |
| 2029 | 0 | 0 | $0.00 | 0.0% | 0.0% | $0 | 0.0% | 0.0% |
| 2030 | 0 | 0 | $0.00 | 0.0% | 0.0% | $0 | 0.0% | 0.0% |
| 2031 | 0 | 0 | $0.00 | 0.0% | 0.0% | $0 | 0.0% | 0.0% |
| 2032 & Beyond | 1 | 149,892 | $23.13 | 100.0% | 100.0% | $3,466,899 | 100.0% | 100.0% |
| Vacant | 0 | 0 | $0.00 | 0.0% | 100.0% | $0 | 0.0% | 100.0% |
| Total/Wtd. Avg. | 1 | 149,892 | $23.13 | 100.0% | | $3,466,899 | 100.0% | |
| (1) | Information is based on the underwritten rent roll. |
COVID-19 Update. As of May 1, 2021, the Vista 6 Station Property is open and operating. 100% of tenants by underwritten rent and by SF paid rent for March and April 2021. The first payment date for the Vista Station 6 Mortgage Loan is 5/11/2021.
The Market. The Vista Station 6 Property is located in Draper, Utah, approximately 15 miles south of the Salt Lake City central business district. The property is situated off of UT-154 and approximately 0.7 miles to I-15, which provides access north to Salt Lake City, as well as connecting to the I-215 belt route. The Salt Lake City International Airport is located approximately 24.2 miles to the north. The area is also served by FrontRunner, which is a commuter rail system that runs along an 89-mile corridor, with the nearest station approximately 0.8 miles to the north. The immediate area is a master planned development known as Draper Pointe, which is a developing mixed-use project containing approximately 75 acres. The development is approximately 60% built out and there are several multifamily projects currently under construction. Within a three- and five-mile radius of the Vista Station 6 Property, the 2020 average household income was approximately $130,372 and $130,703, respectively; and within the same radii, the 2020 estimated population was 74,654 and 187,643, respectively.
According to a third-party market research report, the property is situated within the Draper submarket of the Salt Lake City office market. As of the fourth quarter of 2020, the submarket reported total inventory of approximately 6.7 million SF, with a 12.7% vacancy rate and average asking rents of $24.32 PSF. The appraisal identified five comparable properties, four of which had occupancy ranging from 93% to100%, and the remaining one was developed in 2020 and was 70% occupied.
The following table presents certain information relating to the appraisal’s market rent conclusion for the Vista Station 6 Property:
| Market Rent Summary |
| | Office |
| Market Rent (PSF) | $22.00 |
| Lease Term (Years) | 10 |
| Lease Type (Reimbursements) | NNN |
| Rent Increase Projection | 3% per annum |
This is not a research report and was not prepared by any Underwriter’s research department. Please see additional important information and qualifications at the end of this Term Sheet.
T-138
| Office – Suburban | Loan #11 | Cut-off Date Balance: | | $31,633,000 |
| 339 West 13490 South | Vista Station 6 | Cut-off Date LTV: | | 65.0% |
| Draper, UT 84020 | | UW NCF DSCR: | | 2.70x |
| | | UW NOI Debt Yield: | | 10.3% |
The table below presents certain information relating to comparable sales pertaining to the Vista Station 6 Property identified by the appraiser:
| Comparable Sales Summary |
Property Name | Location | Rentable Area (SF) | Sale Date | Sale Price (PSF) |
| Lehi Station | Lehi, UT | 136,525 | Under Contract | $314 |
| Thanksgiving Station | Lehi, UT | 748,844 | Jan-2020 | $322 |
| Vista Station Portfolio | Draper, UT | 400,000 | Jun-2019 | $277 |
| Sandy Towers-East | Sandy, UT | 150,000 | May-2019 | $294 |
| Towne Ridge Center | Sandy, UT | 250,000 | Apr-2019 | $346 |
| Vivint Office Building | Lehi, UT | 125,000 | Jan-2019 | $334 |
Source: Appraisal.
The following table presents certain information relating to comparable office leases for the Vista Station 6 Property:
| Comparable Leases Summary |
| Property Name/Location | Year Built/ Renovated | Total GLA (SF) | Distance from Subject | Tenant Name | Lease Date/Term | Lease Area (SF) | Annual Base Rent PSF | Lease Type |
Minuteman V Office Building 13907 South Minuteman Drive Draper, UT | 2019/NAP | 125,794 | 0.7 miles | NeoGov Panorama Point Mortgage Acima | Dec-2020 / 5.3Yrs Dec-2020 / 7.3Yrs Jun-2020 / 5.5Yrs | 4,400 10,630 77,600 | $27.85 $27.85 $27.00 | FSG FSG FSG |
136 Center 2 13707 South 200 West Draper, UT | 2020/NAP | 162,823 | 0.5 miles | Divy | Jul-2020 / 11.0Yrs | 50,000 | $29.73 | FSG |
Vista Station 8 12832 S Frontrunner Boulevard Draper, UT | 2017/NAP | 155,000 | 1.0 miles | Brex, Inc. | Jan-2020 / 2.9Yrs | 29,533 | $29.41 | FSG |
Pluralsight 42 Future Way, Draper, UT | 2020/NAP | 348,251 | 1.5 miles | Pluralsight | Jul-2020 / 15.0Yrs | 348,251’ | $22.61 | NNN |
Sojo Station 2 10377 S Jordan Gateway South Jordan, UT | 2020/NAP | 180,000 | 4.0 miles | Lucid Software | Mar-2020 / 3.0Yrs | 44,777 | $30.00 | FSG |
Source: Appraisal.
This is not a research report and was not prepared by any Underwriter’s research department. Please see additional important information and qualifications at the end of this Term Sheet.
T-139
| Office – Suburban | Loan #11 | Cut-off Date Balance: | | $31,633,000 |
| 339 West 13490 South | Vista Station 6 | Cut-off Date LTV: | | 65.0% |
| Draper, UT 84020 | | UW NCF DSCR: | | 2.70x |
| | | UW NOI Debt Yield: | | 10.3% |
Operating History and Underwritten Net Cash Flow. The following table presents certain information relating to the historical operating performance and Underwritten Net Cash Flow at the Vista Station 6 Property:
| Cash Flow Analysis |
| | 2018 | 2019 | 2020 | UW | UW PSF |
| Gross Potential Rent | $3,131,528 | $3,209,816 | $3,297,346 | $3,466,899(1) | $23.13 |
| Other Income | $0 | $0 | $0 | $0 | $0.00 |
| Total Recoveries | $362,000 | $407,000 | $419,320 | $745,541 | $4.97 |
| Net Rental Income | $3,493,528 | $3,616,816 | $3,716,666 | 4,212,440 | $28.10 |
| Vacancy & Credit Loss | $0 | $0 | $0 | ($173,345)(2) | ($1.16) |
| Effective Gross Income | $3,493,528 | $3,616,816 | $3,716,666 | $4,039,095 | $26.95 |
| | | | | | |
| Real Estate Taxes | $362,000 | $407,000 | $419,390 | $442,308 | $2.95 |
| Insurance | $11,048 | $12,198 | $13,555 | $29,121 | $0.19 |
| Management Fee | $0 | $0 | $0 | $99,000(3) | $0.66 |
| Other Operating Expenses | $1,510 | $1,510 | $1,510 | $214,351 | $1.43 |
| Total Operating Expenses | $374,558 | $420,708 | $434,455 | $784,780 | $5.24 |
| | | | | | |
| Net Operating Income | $3,118,970 | $3,196,108 | $3,282,211 | $3,254,315 | $21.71 |
| Replacement Reserves | $0 | $0 | $0 | $29,978 | $0.20 |
| TI/LC | $0 | $0 | $0 | $149,892 | $1.00 |
| Net Cash Flow | $3,118,970 | $3,196,108 | $3,282,211 | $3,074,444 | $20.51 |
| | | | | | |
| Occupancy % | 100.0% | 100.0% | 100.0% | 100.0%(2) | |
| NOI DSCR | 2.74x | 2.80x | 2.88x | 2.86x | |
| NCF DSCR | 2.74x | 2.80x | 2.88x | 2.70x | |
| NOI Debt Yield | 9.9% | 10.1% | 10.4% | 10.3% | |
| NCF Debt Yield | 9.9% | 10.1% | 10.4% | 9.7% | |
| (1) | UW Base Rent includes contractual rent steps through December 2021 totaling $84,559. The underwritten base rent is based on Academy’s rental rate for its leased space of 149,892 SF and does not take into account the sublease rental rate. |
| (2) | The Vista Station 6 Property was 100% occupied as of May 1, 2021, but was underwritten with 5% vacancy |
| (3) | The Management Fee is underwritten at $99,000, per the management agreement. |
This is not a research report and was not prepared by any Underwriter’s research department. Please see additional important information and qualifications at the end of this Term Sheet.
T-140
(THIS PAGE INTENTIONALLY LEFT BLANK)
This is not a research report and was not prepared by any Underwriter’s research department. Please see additional important information and qualifications at the end of this Term Sheet.
T-141
| Mortgage Loan No.12 – Springs at Country Club |
| Mortgage Loan Information | | Mortgaged Property Information |
| Mortgage Loan Seller: | WFB | | Single Asset/Portfolio: | Single Asset |
| Credit Assessment (Moody’s/ Fitch/KBRA): | NR/NR/NR | | Location: | Lake Charles, LA 70605 |
| Original Balance: | $31,563,000 | | General Property Type: | Multifamily |
| Cut-off Date Balance: | $31,563,000 | | Detailed Property Type: | Garden |
| % of Initial Pool Balance: | 3.1% | | Title Vesting: | Fee |
| Loan Purpose: | Acquisition | | Year Built/Renovated: | 2018/ NAP |
| Borrower Sponsors: | Johnny D. Webb; Gregory L. Powell | | Size: | 252 Units |
| Guarantors: | Johnny D. Webb; Gregory L. Powell | | Cut-off Date Balance per Unit: | $125,250 |
| Mortgage Rate: | 3.4450% | | Maturity Date Balance per Unit: | $112,801 |
| Note Date: | 4/19/2021 | | Property Manager: | Hawthorne Residential Partners, LLC |
| First Payment Date: | 6/11/2021 | | | |
| Maturity Date: | 5/11/2031 | | Underwriting and Financial Information(1) |
| Original Term to Maturity: | 120 months | | UW NOI: | $2,945,206 |
| Original Amortization Term: | 360 months | | UW NOI Debt Yield: | 9.3% |
| IO Period: | 60 months | | UW NOI Debt Yield at Maturity: | 10.4% |
| Seasoning: | 0 months | | UW NCF DSCR: | 1.70x (P&I) / 2.61x (IO) |
| Prepayment Provisions: | L(24),D(92),O(4) | | Most Recent NOI: | $2,538,735 (3/31/2021) |
| Lockbox/Cash Mgmt Status: | Soft/Springing | | 2nd Most Recent NOI: | $2,361,547 (12/31/2020) |
| Additional Debt Type: | No | | 3rd Most Recent NOI: | $2,486,588 (12/31/2019) |
| Additional Debt Balance: | NAP | | Most Recent Occupancy: | 96.4% (4/5/2021) |
| Future Debt Permitted (Type): | No (NAP) | | 2nd Most Recent Occupancy: | 97.2% (12/31/2020) |
| Reserves | | 3rd Most Recent Occupancy: | 93.7% (12/31/2019) |
| Type | Initial | Monthly | Cap | | Appraised Value (as of): | $44,160,000 (3/18/2021) |
| RE Taxes: | $54,060 | $18,020 | NAP | | Appraised Value per Unit: | $175,238 |
| Insurance: | $11,551 | $11,548 | NAP | | Cut-off Date LTV Ratio: | 71.5% |
| Replacement Reserve: | $0 | $5,468 | NAP | | Maturity Date LTV Ratio: | 64.4% |
| | | | | | | | | |
| Sources and Uses |
| Sources | Proceeds | % of Total | | Uses | Proceeds | % of Total |
| Loan Amount: | $31,563,000 | 73.5% | | Purchase Price: | $42,084,000 | 98.0% |
| Borrower Equity: | $11,387,617 | 26.5% | | Closing Costs: | $801,006 | 1.9% |
| | | | | Upfront Reserves: | $65,611 | 0.1% |
| Total Sources: | $42,950,617 | 100.0% | | Total Uses: | $42,950,617 | 100.00% |
| (1) | All NOI, NCF and occupancy information, as well as the appraised value, were determined prior to the emergence of the novel coronavirus, and the economic disruption resulting from measures to combat the coronavirus, and all DSCR, LTV and Debt Yield metrics were calculated, and the Springs at Country Club Mortgage Loan (as defined below) was underwritten, based on such prior information. See ” Risk Factors—Risks Related to Market Conditions and Other External Factors—Coronavirus Pandemic Has Adversely Affected the Global Economy and Will Likely Adversely Affect the Performance of the Mortgage Loans” in the Preliminary Prospectus. |
The Mortgage Loan. The twelfth largest mortgage loan (the “Springs at Country Club Mortgage Loan”) is evidenced by a single promissory note in the original principal amount of $31,563,000 secured by a first mortgage encumbering the fee interest of a 252 unit multifamily property in Lake Charles, Louisiana (the “Springs at Country Club Property”).
The Borrower and the Borrower Sponsors. The borrower is Lake Charles CC, LLC, is a Delaware limited liability company and single purpose entity with one independent director (“Springs at Country Club Borrower”). Legal counsel to the Springs at Country Club Borrower delivered a non-consolidation opinion in connection with the origination of the Springs at Country Club Mortgage Loan. The borrower sponsors and non-recourse carveout guarantors are Johnny D. Webb and Gregory L. Powell.
Gregory L. Powell is the founder and CEO of The Legacy Companies, a vertically integrated real estate services company focused solely on the multifamily industry. Legacy partners currently owns 4,070 multifamily units in four states. The Legacy Companies also includes Legacy Financial Partners LLC, which is a commercial mortgage advisory firm that focuses on arranging debt for multifamily partners. Since its formation in 2006, Legacy Financial Partners LLC has completed over $1 billion of HUD, Fannie Mae, Freddie Mac and Conventional transactions.
The Property. The Springs at Country Club Property is a Class A 252-unit garden style apartment complex located in Lake Charles, Louisiana. The complex has 12 apartment buildings and one leasing office/clubhouse building. Constructed in 2018, the Springs at Country Club Property comprises 30 studio, 96 1-bedroom, 102 2-bedroom and 24 3-bedroom units, with an average square footage of 1,007. Leases representing 33.3% of total leases have a lease term of less than 12 months and the average lease term at the Springs at Country Club is 11 months. The units have stainless steel appliances, full-sized washers and dryers, steam showers, oversized walk-in closets, and a private patio or balcony. Property amenities include a business center, fitness center, swimming pool and resident lounge. The Springs at Country Club Property is situated on a 14.02-acre site and includes 542 parking spaces, resulting in a parking ratio of 2.15 per unit.
This is not a research report and was not prepared by any Underwriter’s research department. Please see additional important information and qualifications at the end of this Term Sheet.
T-142
| Multifamily - Garden | Loan #12 | Cut-off Date Balance: | | $31,563,000 |
| 2130 Country Club Road | Springs at Country Club | Cut-off Date LTV: | | 71.5% |
| Lake Charles, LA 70605 | | UW NCF DSCR: | | 1.70x (P&I) |
| | | UW NOI Debt Yield: | | 9.3% |
COVID 19 Update. As of April 27, 2021, the Springs at Country Club Property is open and operating and the Springs at Country Club Mortgage Loan is not subject to any forbearance, modification or debt service relief requests. The first payment date is June 11, 2021. As of April 27, 2021, there were no tenants with rent more than 30 days delinquent.
The Market.
The Springs at Country Club Property is located in Lake Charles, Louisiana, the sixth largest city in the state. The area is considered suburban in nature with surrounding land uses comprised primarily of multifamily, retail and office. The Springs at Country Club Property is located adjacent to a Kroger anchored shopping center and is within 1.5 miles of Prien Lake Elementary and A.M. Barbe High School, which are rated the #1 public schools in Calcasieu Parish by niche.com. Additionally, McNesse State University, with over 7,000 students, is located approximately 2.2 miles away. The Springs at Country Club Property is located 2.1 miles from the I-210 loop which provides access to the central Lake Charles neighborhood, and approximately 8.2 miles from I-10, connecting Lake Charles to cities to the east and west. Lake Charles’ largest employers include Calcasieu Parish School Board, Coushatta, Lake Charles Memorial Health System and Westlake Chemical Corporation.
According to a third party market research provider, the estimated 2020 population within a 1-, 3- and 5-mile radius of the Springs at Country Club Property was approximately 10,651, 44,140, and 77,627, respectively; and the estimated 2020 average household income within the same radii was approximately $98,701, $89,982 and $75,614, respectively.
According to the appraisal, the Springs at Country Club Property is located within the City of Lake Charles multifamily submarket in the larger Lake Charles metropolitan statistical area. As of the fourth quarter of 2020, the submarket includes 11,289 units, a vacancy rate of 13.3% and an average rent per unit of $965. There have been 628 units delivered over the last four quarters, and the market has recorded net absorption of 454. The appraisal identifies 5 competitive properties that range from 87-99% occupied.
The following table presents certain information relating to certain comparable multifamily properties provided in the appraisal for the Springs at Country Club Property:
| Comparable Property Summary | |
| Property Name | Distance From Subject | Year Built | Total Units | Average Unit Size | Occupancy | |
| Legacy at Lake Charles, 5225 Elliot Road, Lake Charles, LA | 2.6 miles | 2018 | 268 | 940 SF | 99% | |
| Evergreen at River Oaks, 4650 Nelson Road, Lake Charles, LA | 0.5 miles | 1999 | 312 | 922 SF | 95% | |
| Country Club Pointe, 2845 Country Club Road, Lake Charles, LA | 2.4 miles | 2008 | 256 | 939 SF | 93% | |
| Advenir at Lake Charles, 1531 Country Club Road, Lake Charles, LA | 0.5 miles | 2002 | 224 | 885 SF | 87% | |
| Belle Savanne Apartments, 1000 Carlyss Blvd, Sulphur, LA | 11.5 miles | 2017 | 208 | 980 SF | 97% | |
Source: Appraisal.
This is not a research report and was not prepared by any Underwriter’s research department. Please see additional important information and qualifications at the end of this Term Sheet.
T-143
| Multifamily - Garden | Loan #12 | Cut-off Date Balance: | | $31,563,000 |
| 2130 Country Club Road | Springs at Country Club | Cut-off Date LTV: | | 71.5% |
| Lake Charles, LA 70605 | | UW NCF DSCR: | | 1.70x (P&I) |
| | | UW NOI Debt Yield: | | 9.3% |
The following table presents certain information relating to certain comparable multifamily sales for the Springs at Country Club Property:
| Comparable Property Sale Summary |
| Property Name/Location | Sale Date | Year Built/ Renovated | Total Units | Occupancy | Sale Price | Adjusted Sale Price(1) | Sale Price Per Unit | Appraiser’s Adjusted Sale Price Per Unit |
Springs at Country Club 2130 Country Club Road Lake Charles, LA | Apr-2021 | 2018/NAP | 252 | 96.4%(2) | $42,084,000 | $42,084,000 | $167,000 | $167,000 |
Millennium Towne Center 6810 Jefferson Hwy Baton Rouge, LA | Apr-2019 | 2007/NAP | 276 | 94% | $49,704,000 | $49,704,000 | $180,087 | $180,087 |
La Veranda Polly Lane 210 Polly Lane Lafayette, LA | Jul-2019 | 2017/NAP | 220 | 92% | $31,100,000 | $37,319,920 | $141,364 | $169,636 |
The Preserve at Old Dowlen 5350 Old Dowlen Road Beaumont, TX | Apr-2020 | 2008/NAP | 304 | 94% | $44,000,000 | $52,799,936 | $144,737 | $173,684 |
Indigo Park 11959 Nocholson Dr. Baton Rouge, LA | Nov-2020 | 2008/NAP | 330 | 100% | $46,400,000 | $55,100,100 | $133,576 | $166,970 |
Citiscape at Essen 5010 Mancuso Lane Baton Rouge, LA | Nov-2020 | 2003/NAP | 299 | 96% | $47,500,000 | $54,150,096 | $150,920 | $181,104 |
Source: Appraisal.
| (1) | Adjusted sale price was adjusted for location, size, age/condition, features/amenities and economic characteristics (as applicable). |
| (2) | Information is based on the underwritten rent roll. |
Operating History and Underwritten Net Cash Flow. The following table presents certain information relating to the historic operating performance and Underwritten Net Cash Flow at the Springs at Country Club Property:
| Cash Flow Analysis(1) |
| | 2019 | 2020 | TTM 3/31/2021(2) | UW(2) | UW Unit(1) |
| Gross Potential Rent | $3,820,114 | $3,632,573 | $3,762,113 | $4,103,676 | $16,284 |
| Parking | $19,195 | $22,084 | $23,131 | $21,470 | $85 |
| Other Income(3) | $573,259 | $549,147 | $524,192 | $548,866 | $2,178 |
| Bad Debt/Concessions | ($382,881) | ($306,920) | ($227,429) | ($82,074) | ($326) |
| Vacancy | ($285,458) | ($245,459) | ($187,303) | ($205,184) | ($814) |
| Effective Gross Income | $3,744,229 | $3,651,425 | $3,894,704 | $4,386,754 | $17,408 |
| | | | | | |
| Real Estate Taxes | $236,192 | $247,716 | $196,632 | $304,173 | $1,207 |
| Insurance | $74,231 | $92,983 | $97,250 | $125,636 | $499 |
| Management Fee | $113,390 | $110,006 | $154,894 | $131,603 | $522 |
| Other Operating Expenses | $833,828 | $839,173 | $907,193 | $880,136 | $3,493 |
| Total Expenses | $1,257,641 | $1,289,878 | $1,355,969 | $1,441,548 | $5,720 |
| | | | | | |
| Net Operating Income | $2,486,588 | $2,361,547 | $2,538,735 | $2,945,206 | $11,687 |
| Capital Expenditures | $0 | $0 | $0 | $65,621 | $260 |
| TI/LC | $0 | $0 | $0 | $0 | $0.00 |
| Net Cash Flow | $2,486,588 | $2,361,547 | $2,538,735 | $2,879,585 | $11,427 |
| | | | | | |
| Occupancy %(4) | 93.7% | 97.2% | 99.2% | 96.4% | |
| NOI DSCR (IO) | 2.26x | 2.14x | 2.30x | 2.67x | |
| NOI DSCR (P&I) | 1.47x | 1.40x | 1.50x | 1.74x | |
| NCF DSCR (IO) | 2.26x | 2.14x | 2.30x | 2.61x | |
| NCF DSCR (P&I) | 1.47x | 1.40x | 1.50x | 1.70x | |
| NOI Debt Yield | 7.9% | 7.5% | 8.0% | 9.3% | |
| NCF Debt Yield | 7.9% | 7.5% | 8.0% | 9.1% | |
| (1) | For the avoidance of doubt, no COVID-19 specific adjustments have been incorporated in the lender underwriting. |
| (2) | The increase from TTM 3/31/2021 to UW is driven by an increase in rents and lower bad debt/concession expenses. |
| (3) | Other Income includes termination fees, late charges, cleaning damage charges and pass through trash and water expenses. |
| (4) | Represents occupancy as of year-end 2019 and 2020 and as of March 8, 2021. The underwritten occupancy is as of April 5, 2021. |
This is not a research report and was not prepared by any Underwriter’s research department. Please see additional important information and qualifications at the end of this Term Sheet.
T-144
(THIS PAGE INTENTIONALLY LEFT BLANK)
This is not a research report and was not prepared by any Underwriter’s research department. Please see additional important information and qualifications at the end of this Term Sheet.
T-145
| Mortgage Loan No. 13 – Detroit Office Portfolio |
| Mortgage Loan Information | | Property Information |
| Mortgage Loan Seller: | BANA | | Single Asset/Portfolio: | Portfolio |
| Credit Assessment (Moody’s/Fitch/KBRA) | NR/NR/NR | | Location: | Various, MI |
| Original Balance: | $27,000,000 | | General Property Type: | Office |
| Cut-off Date Balance: | $27,000,000 | | Detailed Property Type: | Suburban |
| % of Initial Pool Balance: | 2.7% | | Title Vesting: | Fee |
| Loan Purpose: | Acquisition | | Year Built/Renovated: | Various/Various |
| Borrower Sponsor: | Group RMC Partners Inc. | | Size: | 477,677 SF |
| Guarantor: | Hungry Asset Monster, Inc. | Cut-off Date Balance PSF: | $57 |
| Mortgage Rate: | 3.500% | Maturity Date Balance PSF: | $46 |
| Note Date: | 3/25/2021 | | Property Manager: | CBRE, Inc. |
| First Payment Date: | 5/1/2021 | | | |
| Maturity Date: | 4/1/2031 | | | |
| Original Term to Maturity: | 120 months | | | |
| Original Amortization Term: | 360 months | | | |
| IO Period: | 12 months | | | |
| Seasoning: | 1 month | | Underwriting and Financial Information(3) |
| Prepayment Provisions: | L(25),D(91),O(4) | | UW NOI: | $3,574,061 |
| Lockbox/Cash Mgmt Status: | Hard/Springing | | UW NOI Debt Yield: | 13.2% |
| Additional Debt Type: | No | | UW NOI Debt Yield at Maturity: | 16.4% |
| Additional Debt Balance: | NAP | | UW NCF DSCR: | 2.04x |
| Future Debt Permitted (Type): | No (NAP) | | Most Recent NOI: | $3,692,216 (2/28/2021) |
| Reserves | | 2nd Most Recent NOI: | $3,668,792 (12/31/2020) |
| Type | Initial | Monthly | Cap | | 3rd Most Recent NOI: | $3,876,889 (12/31/2019) |
| RE Taxes: | $155,475 | $51,825 | NAP | | Most Recent Occupancy: | 80.5% (3/11/2021) |
| Insurance: | $0 | Springing(1) | NAP | | 2nd Most Recent Occupancy: | 84.9% (12/31/2020) |
| Deferred Maintenance: | $927,993 | $0 | NAP | | 3rd Most Recent Occupancy: | 85.0% (12/31/2019) |
| Recurring Replacements: | $238,839 | $9,952 | NAP | | Appraised Value (as of): | $38,300,000 (Various) |
| TI/LC Reserve: | $1,500,000 | Springing(2) | $1,500,000 | | Appraised Value PSF: | $80 |
| Environmental Reserve: | $25,000 | $0 | NAP | | Cut-off Date LTV Ratio: | 70.5% |
| Landlord Obligation Reserve: | $49,468 | $0 | NAP | | Maturity Date LTV Ratio: | 56.9% |
| | | | | | | | | |
| Sources and Uses |
| Sources | Proceeds | % of Total | | Uses | Proceeds | % of Total |
| Loan Amount: | $27,000,000 | 64.5% | | Purchase Price: | $38,250,000 | 91.3% |
| Borrower Equity: | $14,883,572 | 35.5% | | Reserves: | $2,896,775 | 6.9% |
| | | | | Closing Costs: | $736,797 | 1.8% |
| Total Sources: | $41,883,572 | 100.0% | | Total Uses: | $41,883,572 | 100.0% |
| (1) | The Detroit Office Portfolio Borrower (as defined below) is not required to make monthly insurance deposits as long as the Detroit Office Portfolio Properties (as defined below) are covered under a blanket policy acceptable to the lender (as currently). |
| (2) | The Detroit Office Portfolio Borrower is required to make monthly deposits of $60,805 if the balance falls below $1,000,000 until the cap of $1,500,000 is met. |
| (3) | The coronavirus pandemic is an evolving situation and could impact the Detroit Office Portfolio Mortgage Loan (as defined below) more severely than assumed in the underwriting of the Detroit Office Portfolio Mortgage Loan and could adversely affect the NOI, NCF and occupancy information, as well as the Appraised Value and the DSCR, LTV and Debt Yield metrics presented above and herein. See “Risk Factors—Risks Related to Market Conditions and Other External Factors—The Coronavirus Pandemic Has Adversely Affected the Global Economy and Will Likely Adversely Affect the Performance of the Mortgage Loans” in the Preliminary Prospectus. |
The Mortgage Loan. The thirteenth largest mortgage loan (the “Detroit Office Portfolio Mortgage Loan”) is evidenced by a promissory note in the original principal amount of $27,000,000 and secured by fee mortgages encumbering four office properties located in Michigan (the “Detroit Office Portfolio Properties”).
The Borrower and the Borrower Sponsor. The borrower is Detroit Suburb Portfolio Michigan Realty LP, Delaware limited partnership that is structured to be bankruptcy-remote with at least one independent director (the “Detroit Office Portfolio Borrower”).
The non-recourse carveout guarantor, Hungry Asset Monster, Inc., is wholly owned by Alexander Massa, who is also the owner of the borrower sponsor, Group RMC Partner Inc. (“RMC”). RMC is a commercial real estate investment management company based in New York City. RMC specializes in the acquisition and disposition of underutilized and undervalued office properties located in secondary and tertiary markets in the United States, principally in the Midwest and Southeast. RMC manages a portfolio of more than 19.4 million SF, representing over $2.0 billion in total asset value.
This is not a research report and was not prepared by any Underwriter’s research department. Please see additional important information and qualifications at the end of this Term Sheet.
T-146
| Office – Suburban | Loan #13 | Cut-off Date Balance: | | $27,000,000 |
| Property Addresses - Various | Detroit Office Portfolio | Cut-off Date LTV: | | 70.5% |
| | | UW NCF DSCR: | | 2.04x |
| | | UW NOI Debt Yield: | | 13.2% |
The Properties. The Detroit Office Portfolio Properties are comprised of four multi-tenant office buildings located in the suburbs of Detroit, Michigan. The Detroit Office Portfolio Properties were built between 1971 and 1986, with renovations done as recently as 2013. The Detroit Office Portfolio Properties have a diverse rent roll of 87 tenants with no tenant, after the top three tenants, representing over 5.6% of UW rent. The Detroit Office Portfolio Mortgage Loan documents do not permit property releases.
Laurel Office Park
The Laurel Office Park property is a midrise office building comprised of 129,041 NRA of office space. The Laurel Office Park property is located within the Laurel Park development in the northwest section of Livonia, Michigan. Built in 1985, the Laurel Office Park property consists of a single, four-story building situated on a 5.93-acre site featuring 446 on-site surface parking spaces. Over the past four years, approximately $1.16 million has been spent at the Laurel Office Park property on capital improvements. The Laurel Office Park property is currently 81.6% leased to 10 tenants.
Centrum Office Center
The Centrum Office Center property is a midrise office building comprised of 201,056 NRA of office space. The Centrum Office Center property is located in the southeast section of the city of Southfield, Michigan. Built in 1971, the Centrum Office Center property consists of a single, seven-story building situated on an 11.06-acre site featuring 939 on-site surface parking spaces. Over the past four years, approximately $1.34 million has been spent at the Centrum Office Center property on capital improvements. The Centrum Office Center property is currently 82.7% leased to 60 tenants.
Drake Pointe
The Drake Pointe property is a low-rise office building comprised of 68,528 NRA of office space. The Drake Pointe property is located in the northwest section of Farmington Hills, Oakland County, Michigan. Built in 1984, the Drake Pointe property contains two stories and is situated on a 3.85-acre site featuring 277 on-site surface parking spaces. Over the past five years, $852,637 has been spent at the Drake Pointe property on capital improvements. The Drake Pointe property is 96.9% leased to 9 tenants.
Oak Hollow Gateway
The Oak Hollow Gateway property is a low-rise office building comprised of 79,052 NRA of office space. The Oak Hollow Gateway property is located within the Oak Hollow Corporate Campus in the northwest section of Southfield, Michigan. Built in 1986, the Oak Hollow Gateway property consists of a single three-story building situated on a 5.00-acre site featuring 319 on-site surface parking spaces. Over the past four years, approximately $187,195 has been spent at the Oak Hollow Gateway property on capital improvements. The Oak Hollow Gateway property is currently 59.0% leased to 8 tenants.
| Portfolio Summary |
| Property Name | City, State | Year Built/ Renovated | Total SF | % of Total SF | Occ. % 3/11/2021 | Cut-off Date ALA | % of ALA | Appraised Value | 2/28/2021 NOI | % of NOI |
| Laurel Office Park | Livonia, MI | 1985/2013 | 129,041 | 27.0% | 81.6% | $9,657,963 | 35.8% | $13,700,000 | $1,702,794 | 46.1% |
| Centrum Office Center | Southfield, MI | 1971/2009 | 201,056 | 42.1% | 82.7% | $7,684,073 | 28.5% | $10,900,000 | $901,414 | 24.4% |
| Drake Pointe | Farmington Hills, MI | 1984/1996 | 68,528 | 14.3% | 96.9% | $5,357,702 | 19.8% | $7,600,000 | $702,341 | 19.0% |
| Oak Hollow Gateway | Southfield, MI | 1986/2009 | 79,052 | 16.5% | 59.0% | $4,300,262 | 15.9% | $6,100,000 | $385,667 | 10.4% |
| Total/Wtd. Avg. | | | 477,677 | 100.0% | 80.5% | $27,000,000 | 100.0% | $38,300,000 | $3,692,216 | 100.0% |
Major Tenants.
Orchards Children’s (42,451 SF, 8.9% of NRA, 9.5% of underwritten rent). Orchards Children’s is one of the largest child welfare agencies in the state of Michigan. The agency was founded in 1962 by the National Council of Jewish Women (NCJW) Greater Detroit Section. Orchards Children’s Services serves over 8,000 children throughout 15 counties in the state of Michigan. Orchards Children’s lease at the Centrum Office Center property commenced on January 7, 2014 and expires on July 6, 2024. The tenant has two, five-year renewal options.
The Mike Morse Law Firm (29,373 SF, 6.1% of NRA, 5.8% of underwritten rent). Mike Morse is the founder of The Mike Morse Law Firm, the largest personal injury law firm in Michigan. Since being founded in 1995, Mike Morse Law Firm has grown to 150 employees and has served 25,000 clients. The Mike Morse Law Firm has been a tenant at the Centrum Office Center property since 2013. The Mike Morse Law Firm’s lease expires on April 30, 2025 with one, five-year extension remaining. The Mike Morse Law Firm has the right to terminate the lease at any time during the term, upon 60 days’ prior written notice. If exercised, the tenant will be required to pay a termination fee of (i) the then remaining unamortized balance of leasing commissions plus (b) the then remaining unamortized costs incurred by the landlord in performing landlord’s work.
Morgan Stanley Smith Barney (28,008 SF, 5.9% of NRA, 8.8% of underwritten rent). Morgan Stanley Smith Barney is an American multinational investment bank and financial services company headquartered at New York City. With offices in 42 countries and more than 55,000 employees, the firm’s clients include corporations, governments, institutions, and individuals. Morgan Stanley Smith Barney has been a tenant at the Drake Pointe property since 1996. The lease was renewed in 2018, and has an expiration date of January 31, 2023. Morgan Stanley Smith Barney has one, five-year renewal option remaining.
This is not a research report and was not prepared by any Underwriter’s research department. Please see additional important information and qualifications at the end of this Term Sheet.
T-147
| Office – Suburban | Loan #13 | Cut-off Date Balance: | | $27,000,000 |
| Property Addresses - Various | Detroit Office Portfolio | Cut-off Date LTV: | | 70.5% |
| | | UW NCF DSCR: | | 2.04x |
| | | UW NOI Debt Yield: | | 13.2% |
The following table presents certain information relating to the tenants at the Detroit Office Portfolio Properties:
| | Tenant Summary |
| Tenant Name | Credit Ratings (Moody’s/S&P/ Fitch)(1) | Property Name | Tenant SF | Approx. % of Total SF | Annual UW Rent | % of Total Annual
UW Rent | Annual UW Rent PSF | Lease Exp. | Renewal Options | Term. Options |
| Major Tenants | | | | | | | | | | |
| Orchards Children’s | NR/NR/NR | Centrum | 42,451 | 8.9% | $615,540 | 9.5% | $14.50 | 7/6/2024 | 2 x 5 Yr | Y |
| The Mike Morse Law Firm | NR/NR/NR | Centrum | 29,373 | 6.1% | $374,506 | 5.8% | $12.75 | 4/30/2025 | 1 x 5 Yr | Y(2) |
| Morgan Stanley Smith Barney | A1/BBB+/A | Drake Pointe | 28,008 | 5.9% | $567,162 | 8.8% | $20.25 | 1/31/2023 | 1 x 5 Yr | N |
| Epitec, Inc. | NR/NR/NR | Oak Hollow | 18,011 | 3.8% | $351,216 | 5.4% | $19.50 | 9/30/2028 | 2 x 5 Yr | Y(3) |
| X by 2, Inc. | NR/NR/NR | Drake Pointe | 17,995 | 3.8% | $323,910 | 5.0% | $18.00 | 4/30/2026 | 1 x 5 Yr | N |
| Subtotal/Wtd. Avg. | | | 135,838 | 28.4% | $2,232,333 | 34.5% | $16.43 | | | |
| | | | | | | | | | | |
| Other Tenants | | | 248,755 | 52.1% | $4,238,902 | 65.5% | $17.04 | | | |
| Vacant Space | | | 93,084 | 19.5% | $0 | 0.0% | $0.00 | | | |
| Total/Wtd. Avg.(4) | | | 477,677 | 100.0% | $6,471,235 | 100.0% | $16.83 | | | |
| | | | | | | | | | | | |
Information is based on the underwritten rent roll.
| (1) | Certain ratings are those of the parent company whether or not the parent company guarantees the lease. |
| (2) | The Mike Morse Law Firm has the right to terminate the lease at any time during the term, upon 60 days’ prior written notice. If exercised, the tenant will be required to pay a termination fee of (i) the then remaining unamortized balance of leasing commissions plus (b) the then remaining unamortized costs incurred by the landlord in performing landlord’s work. |
| (3) | Epitec, Inc. has the right to terminate the lease on September 30, 2023, with a termination fee of $233,183, upon prior written notice to the landlord on or before February 28, 2023. |
| (4) | Total/Wtd. Avg. Annual UW Rent PSF excludes vacant space. |
The following table presents certain information relating to the lease rollover schedule at the Detroit Office Portfolio Properties:
| Lease Rollover Schedule(1) |
| Year | # of Leases Rolling | SF Rolling | UW Rent PSF Rolling | Approx. % of Total SF Rolling | Approx. Cumulative % of SF Rolling | Total UW Rent Rolling | Approx. % of Total Rent Rolling | Approx. Cumulative % of Total Rent Rolling |
| MTM(2) | 4 | 802 | $10.47 | 0.2% | 0.2% | $8,400 | 0.1% | 0.1% |
| 2021 | 22 | 40,466 | $15.96 | 8.5% | 8.6% | $645,711 | 10.0% | 10.1% |
| 2022(2) | 14 | 36,520 | $15.50 | 7.6% | 16.3% | $565,892 | 8.7% | 18.9% |
| 2023 | 19 | 88,899 | $18.46 | 18.6% | 34.9% | $1,640,638 | 25.4% | 44.2% |
| 2024 | 13 | 116,069 | $17.22 | 24.3% | 59.2% | $1,998,217 | 30.9% | 75.1% |
| 2025 | 7 | 48,686 | $13.31 | 10.2% | 69.4% | $648,029 | 10.0% | 85.1% |
| 2026 | 3 | 26,295 | $17.25 | 5.5% | 74.9% | $453,548 | 7.0% | 92.1% |
| 2027 | 1 | 2,205 | $15.89 | 0.5% | 75.4% | $35,032 | 0.5% | 92.6% |
| 2028 | 1 | 18,011 | $19.50 | 3.8% | 79.1% | $351,216 | 5.4% | 98.1% |
| 2029 | 1 | 1,613 | $12.00 | 0.3% | 79.5% | $19,356 | 0.3% | 98.4% |
| 2030 | 1 | 2,588 | $21.74 | 0.5% | 80.0% | $56,270 | 0.9% | 99.2% |
| 2031 | 1 | 2,439 | $20.06 | 0.5% | 80.5% | $48,926 | 0.8% | 100.0% |
| 2032 & Beyond | 0 | 0 | $0.00 | 0.0% | 80.5% | $0 | 0.0% | 100.0% |
| Vacant | 0 | 93,084 | $0.00 | 19.5% | 100.0% | $0 | 0.0% | 100.0% |
| Total/Wtd. Avg.(3) | 87 | 477,677 | $16.83 | 100.0% | | $6,471,235 | 100.0% | |
Information is based on the underwritten rent roll.
| (1) | Certain tenants may have lease termination options that were not taken into account in the Lease Rollover Schedule. |
| (2) | # of Leases Rolling and SF Rolling for MTM includes building storage, which has no associated rent. # of Leases Rolling and SF Rolling for 2022 includes The Weintraub Group, L.L.C., who has been delinquent and no rent was underwritten for the tenant. |
| (3) | Total/Wtd. Avg. UW Rent PSF Rolling excludes vacant space. |
COVID-19 Update. As of April 21, 2021, no loan modification or forbearance requests have been made on the Detroit Office Portfolio Mortgage Loan. The first payment date of the Flushing Plaza Mortgage Loan is May 1, 2021. As of April 21, 2021, the Detroit Office Portfolio Properties are open and operating with 100.0% of tenants having made full rent payments in March and April 2021.
The Market. The Detroit Office Portfolio Properties are located in the suburbs of Detroit, Michigan. The Detroit Office Portfolio Properties are all located within a short commute of the Detroit central business district and benefit from their close proximity to major Detroit highways, including M-10, I-275 and I-696. Detroit is the second largest regional economy within the Midwest and the largest incorporated area within the region. The Detroit region’s economy is driven by manufacturing, logistics and healthcare.
This is not a research report and was not prepared by any Underwriter’s research department. Please see additional important information and qualifications at the end of this Term Sheet.
T-148
| Office – Suburban | Loan #13 | Cut-off Date Balance: | | $27,000,000 |
| Property Addresses - Various | Detroit Office Portfolio | Cut-off Date LTV: | | 70.5% |
| | | UW NCF DSCR: | | 2.04x |
| | | UW NOI Debt Yield: | | 13.2% |
Laurel Office Park
The Laurel Office Park property is located in the city of Livonia in Wayne County, Michigan within the Livonia/Northville/Novi/Plymouth submarket. The Laurel Office Park property’s local area is comprised of a mixture of office and retail use along the principal thoroughfares, as well as single and multifamily residential use, off the main roadways. As of Q3 2020, submarket vacancy for the office market was 10.1% and average asking rents were $18.16 PSF. According to the appraisal, the estimated 2020 population within a one-, three- and five-mile radius of the Laurel Office Park property was 7,426, 68,618 and 204,157, respectively. The 2020 average household income within the same one-, three- and five-mile radius was $123,821, $117,960 and $109,579, respectively.
Centrum Office Center
The Centrum Office Center property is located in the city of Southfield in Oakland County, Michigan within the Southfield/Bingham Farms submarket. The Centrum Office Center property is situated along the southwest corner of Northwestern Highway and Evergreen Roads in the southeast section of the city. The Centrum Office Center property’s local area is comprised of a primarily residential community interspersed with retail and office uses. As of Q3 2020, submarket vacancy for the office market was 18.7% and average asking rents were $19.40 PSF. According to the appraisal, the estimated 2020 population within a one-, three- and five-mile radius of the Centrum Office Center property was 6,658, 102,715 and 313,007, respectively. The 2020 average household income within the same one-, three- and five-mile radius was $86,547, $73,803 and $82,653, respectively.
Drake Pointe
The Drake Pointe property is located in the city of Farmington Hills in Oakland County, Michigan within the Farmington/West Bloomfield submarket. The Drake Pointe property is located along I-595, which runs through the central section of Farmington Hills. As of Q3 2020, submarket vacancy for the office market was 12.5% and average asking rents were $23.16 PSF. According to the appraisal, the estimated 2020 population within a one-, three- and five-mile radius of the Drake Pointe property was 5,989, 67,279 and 183,747, respectively. The 2020 average household income within the same one-, three- and five-mile radius was $150,250, $118,298 and $116,884, respectively.
Oak Hollow Gateway
The Oak Hollow Gateway property is located in the city of Southfield in Oakland County, Michigan within the Southfield/Bingham Farms submarket. The Oak Hollow Gateway property is situated just west of Telegraph Road between Ten and Eleven Mile Roads. The Oak Hollow Gateway property’s local area is comprised of a primarily residential community interspersed with retail and office uses. As of Q3 2020, submarket vacancy for the office market was 18.7% and average asking rents were $19.40 PSF. According to the appraisal, the estimated 2020 population within a one-, three- and five-mile radius of the Oak Hollow Gateway property was 6,936, 68,812 and 234,735, respectively. The 2020 average household income within the same one-, three- and five-mile radius was $60,072, $84,895 and $84,971, respectively.
Operating History and Underwritten Net Cash Flow. The following table presents certain information relating to the historical operating performance and Underwritten Net Cash Flow at the Detroit Office Portfolio Properties:
| Cash Flow Analysis |
| | 2019 | 2020 | 2/28/2021 TTM | UW | | UW PSF |
| Gross Potential Income(1) | $7,472,583 | $7,227,773 | $7,112,428 | $8,870,966 | $18.57 |
| Other Income(2) | $25,632 | $22,477 | $23,235 | $25,000 | $0.05 |
| Vacancy | $0 | $0 | $0 | ($1,711,614) | ($3.58) |
| Effective Gross Income | $7,498,215 | $7,250,250 | $7,135,663 | $7,184,352 | $15.04 |
| | | | | | |
| Taxes | $806,891 | $820,583 | $825,492 | $836,925 | $1.75 |
| Insurance | $57,351 | $86,056 | $57,770 | $80,075 | $0.17 |
| Other Operating Expenses | $2,757,084 | $2,674,819 | $2,560,185 | $2,693,291 | $5.64 |
| Total Operating Expenses | $3,621,326 | $3,581,458 | $3,443,447 | $3,610,291 | $7.56 |
| | | | | | |
| Net Operating Income | $3,876,889 | $3,668,792 | $3,692,216 | $3,574,061 | $7.48 |
| TI/LC | $0 | $0 | $0 | $482,364 | $1.01 |
| Capital Expenditures | $0 | $0 | $0 | $121,610 | $0.25 |
| Net Cash Flow | $3,876,889 | $3,668,792 | $3,692,216 | $2,970,087 | $6.22 |
| | | | | | |
| Occupancy%(3) | 85.0% | 84.9% | 84.9% | 80.7% | |
| NOI DSCR | 2.66x | 2.52x | 2.54x | 2.46x | |
| NCF DSCR | 2.66x | 2.52x | 2.54x | 2.04x | |
| NOI Debt Yield | 14.4% | 13.6% | 13.7% | 13.2% | |
| NCF Debt Yield | 14.4% | 13.6% | 13.7% | 11.0% | |
| (1) | UW Gross Potential Income is comprised of (a) gross potential rent, which includes rent steps during the first 12 months of the loan term and (b) expense reimbursements. |
| (2) | Other Income includes storage rent, parking, work orders and other miscellaneous income. |
| (3) | UW Occupancy is based on in-place economic vacancy. |
This is not a research report and was not prepared by any Underwriter’s research department. Please see additional important information and qualifications at the end of this Term Sheet.
T-149
| Mortgage Loan No. 14 – SMG Portfolio |
| Mortgage Loan Information | | Property Information |
| Mortgage Loan Seller: | BANA | | Single Asset/Portfolio: | Portfolio |
| Credit Assessment (Moody’s/Fitch/KBRA): | NR/NR/NR | | Location: | Various |
| Original Balance: | $26,000,000 | | General Property Type: | Multifamily |
| Cut-off Date Balance: | $26,000,000 | | Detailed Property Type: | Garden |
| % of Initial Pool Balance: | 2.6% | | Title Vesting: | Fee |
| Loan Purpose: | Refinance | | Year Built/Renovated: | Various/Various |
| Borrower Sponsor: | SMG Property Management, Inc. | | Size: | 442 Units |
| Guarantor: | John S. Newsome | Cut-off Date Balance Per Unit: | $58,824 |
| Mortgage Rate: | 3.9280% | Maturity Date Balance Per Unit: | $58,824 |
| Note Date: | 4/9/2021 | | Property Manager: | SMG Property Management, Inc. |
| First Payment Date: | 6/1/2021 | | | (borrower-related) |
| Maturity Date: | 5/1/2031 | | | |
| Original Term to Maturity: | 120 months | | |
| Original Amortization Term: | 0 months | | Underwriting and Financial Information(2) |
| IO Period: | 120 months | | UW NOI: | $2,679,035 |
| Seasoning: | 0 months | | UW NOI Debt Yield: | 10.3% |
| Prepayment Provisions: | L(24),D(92),O(4) | | UW NOI Debt Yield at Maturity: | 10.3% |
| Lockbox/Cash Mgmt Status: | Springing/Springing | | UW NCF DSCR: | 2.48x |
| Additional Debt Type: | No | | Most Recent NOI: | $2,513,516 (2/28/2021) |
| Additional Debt Balance: | NAP | | 2nd Most Recent NOI: | $2,530,451 (12/31/2020) |
| Future Debt Permitted (Type): | No (NAP) | | 3rd Most Recent NOI: | $2,688,888 (12/31/2019) |
| Reserves | | Most Recent Occupancy: | 93.7% (2/17/2021) |
| Type | Initial | Monthly | Cap | | 2nd Most Recent Occupancy: | 90.2% (12/31/2020) |
| RE Taxes: | $191,791 | $31,068 | NAP | | 3rd Most Recent Occupancy: | 92.5% (12/31/2019) |
| Insurance: | $9,079 | $3,026 | NAP | | Appraised Value (as of): | $45,200,000 (Various) |
| Deferred Maintenance: | $22,500 | $0 | NAP | | Appraised Value Per Unit: | $102,262 |
| Replacement Reserve: | $0 | $9,208 | NAP | | Cut-off Date LTV Ratio: | 57.5% |
| Royal Glen Parking Reserve(1): | $31,405 | $0 | NAP | | Maturity Date LTV Ratio: | 57.5% |
| | | | | | | | |
| Sources and Uses |
| Sources | Proceeds | % of Total | | Uses | Proceeds | % of Total |
| Loan Amount: | $26,000,000 | 100.0% | | Loan Payoff: | $13,682,849 | 52.6% |
| | | | | Return of Equity: | $11,342,474 | 43.6% |
| | | | | Closing Costs: | $719,902 | 2.8% |
| | | | | Reserves: | $254,775 | 1.0% |
| Total Sources: | $26,000,000 | 100.0% | | Total Uses: | $26,000,000 | 100.0% |
| (1) | The SMG Portfolio Borrower (as defined below) deposited an amount of $31,405 into an upfront reserve to modify the parking lot to increase the number of parking spaces necessary to satisfy the applicable zoning ordinance at the Royal Glen property. |
| (2) | The coronavirus pandemic is an evolving situation and could impact the SMG Portfolio Mortgage Loan more severely than assumed in the underwriting of the SMG Portfolio Mortgage Loan and could adversely affect the NOI, NCF and occupancy information, as well as the Appraised Value and the DSCR, LTV and Debt Yield metrics presented above and herein. See “Risk Factors—Risks Related to Market Conditions and Other External Factors—The Coronavirus Pandemic Has Adversely Affected the Global Economy and Will Likely Adversely Affect the Performance of the Mortgage Loans” in the Preliminary Prospectus. |
The Mortgage Loan. The fourteenth largest mortgage loan (the “SMG Portfolio Mortgage Loan”) is evidenced by a promissory note in the original principal amount of $26,000,000 and secured by first priority fee mortgages encumbering three multifamily communities located in Henrico, Virginia, Glen Allen, Virginia, and Comstock Park, Michigan (together, the “SMG Portfolio Properties”).
The Borrowers and the Borrower Sponsor. The borrowers are Royal Glen Associates Limited Partnership, Amber Ridge Associates Limited Partnership and Oakbrook Associates Limited Partnership (together, the “SMG Portfolio Borrower”), each a single-purpose limited partnership with at least one independent director. The borrower sponsor, SMG Property Management, Inc. (“SMG”), was formed in 1988 for the purpose of managing multifamily and commercial properties acquired by the company’s founding principals, John S. Newsome, the non-recourse carveout guarantor, and Michael Doyle. SMG’s current portfolio spans six eastern US states, primarily focused in the southeast region (2,000 apartments in 23 communities).
The Properties. The SMG Portfolio Properties consist of three garden style multifamily properties that total 442 units. The SMG Portfolio Properties were built between 1987 and 1988. The borrower sponsor has owned, operated and managed the SMG Portfolio Properties for more than 30 years and has completed $2,489,027 in renovations over the past five years ($5,631.28 per unit), which modernized most of the apartment units and upgraded common area amenities. The SMG Portfolio Properties have exhibited stable occupancy, having averaged 95.5% occupancy since 2016. The SMG Portfolio Properties were 93.7% occupied as of February 17, 2021.
This is not a research report and was not prepared by any Underwriter’s research department. Please see additional important information and qualifications at the end of this Term Sheet.
T-150
| Multifamily – Garden | Loan #14 | Cut-off Date Balance: | | $26,000,000 |
| Property Addresses - Various | SMG Portfolio | Cut-off Date LTV: | | 57.5% |
| | | UW NCF DSCR: | | 2.48x |
| | | UW NOI Debt Yield: | | 10.3% |
| SMG Portfolio Properties Summary |
Property Address | Year Built/ Renovated | Units | % of Portfolio Units | 2/17/2021 Occupancy | Appraised Value | % of Portfolio Appraised Value | Allocated Loan Amount | UW NOI | UW NOI Per Unit | % of Total UW NOI |
Oakbrook 4140 Fairlake Lane Glen Allen, VA 23060 | 1988 / 2004 | 157 | 35.5% | 93.0% | $16,700,000 | 36.9% | $9,606,195 | $920,386 | $5,862 | 34.4% |
Royal Glen 4306 Royal Glen Drive Northeast Comstock Park, MI 49321 | 1987 / NAP | 170 | 38.5% | 95.3% | $16,300,000 | 36.1% | $9,376,106 | $1,110,876 | $6,535 | 41.5% |
Amber Ridge 5601 Goldthread Lane Henrico, VA 23228 | 1987 / 2004 | 115 | 26.0% | 92.2% | $12,200,000 | 27.0% | $7,017,699 | $647,773 | $5,633 | 24.2% |
| Total/Weighted Average: | | 442 | 100.0% | 93.7% | $45,200,000 | 100.0% | $26,000,000 | $2,679,035 | | 100.0% |
Oakbrook
The Oakbrook property is a 157-unit multifamily community located in Glen Allen, Virginia, just north of Richmond. The garden style community was developed in 1988, renovated in 2004 and is improved with a total of 22 buildings and 80,064 of NRA. The 157 units average 510 SF of NRA and are housed in 22 single-story apartment buildings, with of a unit mix as shown in table below. Unit amenities include private patios, granite countertops, hardwood floors, and a full appliance package including an electric range oven, microwave, refrigerator, garbage disposal and dishwasher. Over the past five years, the borrower sponsor has spent $1.28 million ($8,157.07/Unit) on capital improvements. The Oakbrook property was 93.0% occupied as of February 17, 2021.
| Oakbrook Unit Mix |
| Unit Mix / Type | | Units | | Occupied Units | | % Occupied | | Average SF per Unit | | Total SF | | Monthly Average Rent per Unit | | Monthly Avg. Market Rent per Unit |
| Studio | | 47 | | | 40 | | | 85.1 | % | | 288 | | | 13,536 | | | $862 | | | $908 | |
| Studio - L | | 2 | | | 2 | | | 100.0 | % | | 455 | | | 910 | | | $865 | | | $936 | |
| 1 BR 1 BA | | 95 | | | 94 | | | 98.9 | % | | 576 | | | 54,720 | | | $967 | | | $1,005 | |
| 2 BR 1 BA | | 2 | | | 2 | | | 100.0 | % | | 697 | | | 1,394 | | | $1,070 | | | $1,260 | |
| 2 BR 1 BA - L | | 4 | | | 3 | | | 75.0 | % | | 864 | | | 3,456 | | | $1,125 | | | $1,310 | |
| 2 BR 2 BA | | 7 | | | 7 | | | 100.0 | % | | 864 | | | 6,048 | | | $1,126 | | | $1,400 | |
| Total/Wtd. Avg. | | 157 | | | 148 | | | 94.3 | % | | 510 | | | 80,064 | | | $947 | | | $1,004 | |
Source: Borrower rent roll as of March 31, 2021.
Royal Glen
The Royal Glen property is a 170-unit multifamily community located in Comstock Park, Michigan, a suburb of Grand Rapids. The garden style community was developed in 1987 and is improved with 26 buildings and 122,879 SF of NRA. The 170 units average 723 SF of NRA and are housed in 26 single-story apartments, with a unit mix as shown in the table below. Unit amenities include private patio, laminate countertops, carpet and vinyl flooring, and a full appliance package including an electric range oven, microwave, refrigerator, garbage disposal and dishwasher. Over the past five years, the borrower sponsor has spent $562,327 ($3,307.81/Unit) on capital improvements. The Royal Glen property was 95.3% as of February 17, 2021.
| Royal Glen Unit Mix |
| Unit Mix / Type | | Units | | Occupied Units | | % Occupied | | Average SF per Unit | | Total SF | | Monthly Average Rent per Unit | | Monthly Avg. Market Rent per Unit |
| Studio | | 11 | | | 11 | | | 100.0 | % | | 455 | | | 5,005 | | | $732 | | | $845 | |
| 1 BR 1 BA | | 124 | | | 121 | | | 97.6 | % | | 696 | | | 86,304 | | | $805 | | | $951 | |
| 2 BR 1 BA | | 10 | | | 9 | | | 90.0 | % | | 697 | | | 6,970 | | | $911 | | | $1,035 | |
| 2 BR 1 BA - L | | 12 | | | 11 | | | 91.7 | % | | 984 | | | 11,808 | | | $977 | | | $1,111 | |
| 2 BR 2 BA | | 13 | | | 13 | | | 100.0 | % | | 984 | | | 12,792 | | | $962 | | | $1,067 | |
| Total/Wtd. Avg. | | 170 | | | 165 | | | 97.1 | % | | 723 | | | 122,879 | | | $831 | | | $969 | |
Source: Borrower rent roll as of March 31, 2021.
This is not a research report and was not prepared by any Underwriter’s research department. Please see additional important information and qualifications at the end of this Term Sheet.
T-151
| Multifamily – Garden | Loan #14 | Cut-off Date Balance: | | $26,000,000 |
| Property Addresses - Various | SMG Portfolio | Cut-off Date LTV: | | 57.5% |
| | | UW NCF DSCR: | | 2.48x |
| | | UW NOI Debt Yield: | | 10.3% |
Amber Ridge
The Amber Ridge property is a 115-unit multifamily community located in Henrico, Virginia, just north of Richmond. The garden style community was developed in 1987, renovated in 2004 and is improved with a total of 15 buildings and 59,040 of NRA. The 115 units average 513 SF of NRA and are housed in 15 single-story apartment buildings, with a unit mix as shown in the table below. Unit amenities include private patios, granite countertops, hardwood floors, and a full appliance package including an electric range oven, microwave, refrigerator, garbage disposal and dishwasher. Over the past five years, the borrower sponsor has spent $646,040 ($5,617.74/Unit) on capital improvements. The Amber Ridge property was 92.2% occupied as of February 17, 2021.
| Amber Ridge Unit Mix |
| Unit Mix / Type | | Units | | Occupied Units | | % Occupied | | Average SF per Unit | | Total SF | | Monthly Average Rent per Unit | | Monthly Avg. Market Rent per Unit |
| Studio | | 33 | | | 29 | | | 87.9 | % | | 288 | | | 9,504 | | | $849 | | | $894 | |
| 1 BR 1 BA | | 74 | | | 70 | | | 94.6 | % | | 576 | | | 42,624 | | | $799 | | | $982 | |
| 2 BR 1 BA | | 3 | | | 3 | | | 100.0 | % | | 864 | | | 2,592 | | | $1,062 | | | $1,100 | |
| 2 BR 2 BA | | 5 | | | 5 | | | 100.0 | % | | 864 | | | 4,320 | | | $1,107 | | | $1,220 | |
| Total/Wtd. Avg. | | 115 | | | 107 | | | 93.0 | % | | 513 | | | 59,040 | | | $833 | | | $970 | |
Source: Borrower rent roll as of March 31, 2021.
COVID-19 Update. As of May 3, 2021, the SMG Portfolio Properties are open and operating. The first debt service payment on the SMG Portfolio Mortgage Loan is due in June 2021 and, as of May 3, 2021 the SMG Portfolio Mortgage Loan is not subject to any forbearance, modification or debt service relief request. As of May 3, 2021, 98.8% of tenants by Units and 98.7% of tenants by base rent paid their full April 2021 rent payments.
The Markets.
Oakbrook
The Oakbrook property is located 13.0 miles northwest of Richmond in Henrico County in Glen Allen, Virginia. The Oakbrook property is located along a secondary north-south thoroughfare within Henrico County. Glen Allen has a strategic location near notable economic hubs, with convenient connections to well-traveled transportation networks. The immediate area surrounding the Oakbrook property consists of office and retail uses along major arterials that are interspersed with multi-family complexes and single-family residential developments removed from arterials.
The Oakbrook property is located in the Richmond Metro market and the Northwest Richmond submarket. As of the fourth quarter of 2020, the Richmond Metro market had an average occupancy of 96.1%, with an average market rent of $1,171 per month. The Northwest Richmond submarket had an average occupancy of 96.0%, with an average market rent of $1,182 per month.
According to the appraisal, the estimated 2020 population within a one-, three- and five-mile radius of the Oakbrook property was 15,200, 88,417 and 205,178, respectively. The 2020 average household income within the same radii was $89,437, $105,109 and $113,400 respectively.
The following table presents recent leasing data with respect to comparable properties to the Oakbrook property:
| Comparable Properties - Oakbrook |
| Property/Location | Distance | Year Built/Reno. | Occupancy | Total Units | Avg Unit Size (SF) | Avg Monthly Rent Per Unit |
Oakbrook(1) 4140 Fairlake Lane Glen Allen, VA | NAP | 1988/2004 | 94.3% | 157 | 510 | Studio - $862 1BR - $967 2BR - $1,117 |
Springfield Apartments 9500 Brightway Court Richmond, VA | 0.3 miles | 1974 | 99.1% | 432 | 948 | 1BR - $1,074 2BR - $1,373 |
Westbury Apartments 9522 Shepton Drive Richmond, VA | 0.2 miles | 1978 | 100.0% | 158 | 893 | 1BR - $910 2BR - $1,156 |
Colonial Village at Hampton Glen 4118 Whitford Circle Glen Allen, VA | 0.2 miles | 1986 | 95.7% | 232 | 766 | 1BR - $1,213 2BR - $1,545 |
Breckenridge Apartments 9951 Racquet Club Lane Glen Allen, VA | 0.4 miles | 1987 | 94.0% | 300 | 817 | 1BR - $1,090 2BR - $1,312 |
Colonial Village at West End 4008 Gaelic Lane Glen Allen, VA | 0.9 miles | 1987 | 98.2% | 224 | 694 | 1BR - $1,051 2BR - $1,196 |
Champions Club Apartments 4200 Harw in Place Glen Allen, VA | 0.2 miles | 1987 | 93.4% | 212 | 776 | 1BR - $993 2BR - $1,194 |
Source: Appraisal.
| (1) | Per borrower rent roll dated March 31, 2021. |
This is not a research report and was not prepared by any Underwriter’s research department. Please see additional important information and qualifications at the end of this Term Sheet.
T-152
| Multifamily – Garden | Loan #14 | Cut-off Date Balance: | | $26,000,000 |
| Property Addresses - Various | SMG Portfolio | Cut-off Date LTV: | | 57.5% |
| | | UW NCF DSCR: | | 2.48x |
| | | UW NOI Debt Yield: | | 10.3% |
Royal Glen
The Royal Glen property is located in Comstock Park, Michigan, within Kent County and approximately 7.1 miles north of downtown Grand Rapids. The Royal Glen property has frontage along two arterials within Comstock Park. Grand Rapids is home to five of the world’s leading office furniture manufacturers. The city and surrounding communities are economically diverse, and contribute to the healthcare, information technology, automotive, aviation and manufacturing industries.
The Royal Glen property is located in the Grand Rapids market and the North Grand Rapids submarket. As of the second quarter of 2020, the Grand Rapids market had an average occupancy of 95.3%, with an average asking rent of $908 per month. The North Grand Rapids submarket had an average occupancy of 97.3%, with an average asking rent of $965 per month.
According to the appraisal, the estimated 2020 population within a one-, three- and five-mile radius of the Royal Glen property was 5,361, 45,212 and 129,754, respectively. The 2020 average household income within the same radii was $75,038, $70,488 and $74,769 respectively.
The following table presents recent leasing data with respect to comparable properties to the Royal Glen property:
| Comparable Properties – Royal Glen |
| Property/Location | Distance | Year Built/Reno. | Occupancy | Total Units | Avg Unit Size (SF) | Avg Monthly Rent Per Unit |
Royal Glen(1) 4306 Royal Glen Drive Northeast Comstock Park, MI | NAP | 1987/NAP | 97.1% | 170 | 723 | Studio - $732 1BR - $805 2BR - $962 |
Greenfield Apartments 1310 Ball Avenue Northeast Grand Rapids, MI | 4.2 miles | 1987 | 97.6% | 168 | 701 | 1BR - $841 2BR - $888 |
York Creek Apartments 650 York Creek Drive Northwest Comstock Park, MI | 1.1 miles | 1998 | 98.6% | 1,764 | 895 | 1BR - $937 2BR - $1,018 |
Autumn Ridge 3902 Mayfield Avenue Grand Rapids, MI | 1.8 miles | 1970 | 97.3% | 328 | 594 | Studio - $584 1BR - $848 2BR - $938 |
Marcell Ridge Apartments 200 Marcell Drive Rockford, MI | 7.8 miles | 2001 | 100.0% | 100 | 989 | 1BR - $1,000 2BR - $1,150 |
Northview Harbor 2625 Northvale Drive Plainfield Township, MI | 3.1 miles | 1979 | 98.1% | 360 | 721 | Studio - $829 1BR - $1,042 2BR - $1,138 |
Central Park Place Apartments 2875 Central Park Way Northeast Grand Rapids, MI | 2.6 miles | 1988 | 97.7% | 216 | 874 | 1BR - $1,062 2BR - $1,137 |
Source: Appraisal.
| (1) | Per borrower rent roll dated March 31, 2021. |
Amber Ridge
The Amber Ridge property is located 9.7 miles northwest of Richmond in Henrico, Virginia. The Amber Ridge property is located along Hungary Spring Road, a north-south secondary arterial within Henrico. Henrico has a strategic location near notable economic hubs, with convenient connections to well-traveled transportation networks. Richmond is the state capital and the headquarters of the Fifth Federal Reserve Bank, an institution that oversees monetary policies and banks for the region. There are seven Fortune 500 companies and 11 Fortune 1000 headquartered in the area.
The Amber Ridge property is located in the Richmond Metro market and the Northwest Richmond submarket. As of the fourth quarter of 2020, the Richmond Metro market had an average occupancy of 96.1%, with an average market rent of $1,171 per month. The Northwest Richmond submarket had an average occupancy of 96.0%, with an average market rent of $1,182 per month.
According to the appraisal, the estimated 2020 population within a one-, three- and five-mile radius of the Amber Ridge property was 11,781, 92,797 and 202,173, respectively. The 2020 average household income within the same radii was $66,232, $81,436 and $101,264 respectively.
This is not a research report and was not prepared by any Underwriter’s research department. Please see additional important information and qualifications at the end of this Term Sheet.
T-153
| Multifamily – Garden | Loan #14 | Cut-off Date Balance: | | $26,000,000 |
| Property Addresses - Various | SMG Portfolio | Cut-off Date LTV: | | 57.5% |
| | | UW NCF DSCR: | | 2.48x |
| | | UW NOI Debt Yield: | | 10.3% |
The following table presents recent leasing data with respect to comparable properties to the Amber Ridge property:
| Comparable Properties – Amber Ridge |
| Property/Location | Distance | Year Built/Reno. | Occupancy | Total Units | Avg Unit Size (SF) | Avg Monthly Rent Per Unit |
Amber Ridge(1) 5601 Goldthread Lane Henrico, VA | NAP | 1987/2004 | 93.0% | 115 | 513 | Studio - $849 1BR - $799 2BR - $1,090 |
Maple Springs Apartment Homes 5624 Maple Run Lane Richmond, VA | 0.1 miles | 1985 | 95.1% | 268 | 587 | Studio - $1,028 1BR - $965 2BR - $1,210 |
Courthouse Green West Apartments 7518 Hudgins Road Henrico, VA | 0.1 miles | 1974 | 99.4% | 180 | 1,085 | 1BR - $852 2BR - $1,169 |
Villages at West Laurel 5541 Olde West Court Richmond, VA | 0.3 miles | 1982 | 93.6% | 503 | 975 | 1BR - $1,132 2BR - $1,122 |
Millspring Commons 9318 Tarheel Terrace Richmond, VA | 0.6 miles | 1972 | 93.7% | 159 | 1,038 | 1BR - $1,159 2BR - $1,279 |
Colonial Village at West End 4008 Gaelic Lane Glen Allen, VA | 3.3 miles | 1987 | 98.2% | 224 | 694 | 1BR - $1,051 2BR - $1,196 |
Source: Appraisal.
| (1) | Per borrower rent roll dated March 31, 2021. |
The following table presents certain information relating to the appraisal’s market rent conclusions for the SMG Portfolio Properties:
| Market Rent Summary |
| | Oakbrook | Royal Glen | Amber Ridge |
| Market Rent (Monthly Per Unit) - Studio | $884 | $742 | $886 |
| Market Rent (Monthly Per Unit) - 1 BR | $964 | $841 | $982 |
| Market Rent (Monthly Per Unit) - 2 BR | $1,191 | $986 | $1,118 |
Operating History and Underwritten Net Cash Flow. The following table presents certain information relating to the historical operating performance and Underwritten Net Cash Flow at the SMG Portfolio Properties:
| Cash Flow Analysis(1) |
| | 2019 | 2020 | 2/28/2021 TTM | UW | | UW Per Unit |
| Gross Potential Rent | $4,481,226 | $4,638,759 | $4,717,067 | $4,709,361 | $10,655 |
| Concessions | ($123,600) | ($131,818) | ($192,650) | ($141,516) | ($320) |
| Other Income(1) | $328,710 | $304,150 | $303,979 | $321,655 | $728 |
| Vacancy and Credit Loss | ($366,958) | ($503,525) | ($479,014) | ($437,518) | ($990) |
| Effective Gross Income | $4,319,378 | $4,307,566 | $4,349,382 | $4,451,982 | $10,072 |
| | | | | | |
| Taxes | $319,852 | $358,176 | $372,594 | $372,594 | $843 |
| Insurance | $127,169 | $138,072 | $134,184 | $112,050 | $254 |
| Other Operating Expenses | $1,183,469 | $1,280,867 | $1,329,088 | $1,288,303 | $2,915 |
| Total Operating Expenses | $1,630,490 | $1,777,115 | $1,835,866 | $1,772,947 | $4,011 |
| | | | | | |
| Net Operating Income | $2,688,888 | $2,530,451 | $2,513,516 | $2,679,035 | $6,061 |
| Capital Expenditures | $0 | $0 | $0 | $110,500 | $250 |
| Net Cash Flow | $2,688,888 | $2,530,451 | $2,513,516 | $2,568,535 | $5,811 |
| | | | | | |
| Occupancy%(2) | 92.5% | 90.2% | 90.3% | 90.4% | |
| NOI DSCR | 2.60x | 2.44x | 2.43x | 2.59x | |
| NCF DSCR | 2.60x | 2.44x | 2.43x | 2.48x | |
| NOI Debt Yield | 10.3% | 9.7% | 9.7% | 10.3% | |
| NCF Debt Yield | 10.3% | 9.7% | 9.7% | 9.9% | |
| (1) | Other Income includes parking, pet fees, late fees, application fees, termination fees, damage and cleaning fees and miscellaneous other income. |
| (2) | Economic occupancy is shown. Physical occupancy as of February 17, 2021 was 93.7%. |
This is not a research report and was not prepared by any Underwriter’s research department. Please see additional important information and qualifications at the end of this Term Sheet.
T-154
| Multifamily – Garden | Loan #14 | Cut-off Date Balance: | | $26,000,000 |
| Property Addresses - Various | SMG Portfolio | Cut-off Date LTV: | | 57.5% |
| | | UW NCF DSCR: | | 2.48x |
| | | UW NOI Debt Yield: | | 10.3% |
Release of Property. At any time following the first two years after the Closing Date the SMG Portfolio Borrower is permitted to release one or more individual properties in connection with a sale to a purchaser that is not affiliated with the SMB Portfolio Borrower, subject to the following conditions, among others: (i) no event of default is continuing, (ii) the SMG Portfolio Mortgage Loan is defeased by an amount equal to 125% of the allocated loan amount for each property being released, (iii) if required by the lender, rating agency confirmation has been obtained, and (iii) after giving effect to the release, the remaining property or properties meet (a) a minimum debt yield of the greater of 9.88% and the debt yield immediately prior to the release based on the trailing six month period and (b) a minimum amortizing debt service coverage ratio of the greater of 1.74x and the amortizing debt service coverage ratio immediately prior to the release based on the trailing six month period, and (v) customary REMIC requirements are satisfied.
This is not a research report and was not prepared by any Underwriter’s research department. Please see additional important information and qualifications at the end of this Term Sheet.
T-155
| Mortgage Loan No. 15 – Century Plaza Albuquerque |
| Mortgage Loan Information | | Property Information |
| Mortgage Loan Seller: | BANA | | Single Asset/Portfolio: | Single Asset |
| Credit Assessment (Moody’/KBRA/Fitch): | NR/NR/NR | | Location: | Albuquerque, NM 87102 |
| Original Balance: | $25,700,000 | | General Property Type: | Office |
| Cut-off Date Balance: | $25,700,000 | | Detailed Property Type: | CBD |
| % of Initial Pool Balance: | 2.6% | | Title Vesting: | Fee |
| Loan Purpose: | Refinance | | Year Built/Renovated: | 1980/2014 |
| Borrower Sponsor: | Omninet Capital, LLC | | Size: | 410,561 SF |
| Guarantors: | Neil Kadisha; Benjamin Nazarian | Cut-off Date Balance PSF: | $63 |
| Mortgage Rate: | 3.2920% | Maturity Date Balance PSF: | $63 |
| Note Date: | 4/26/2021 | | Property Manager: | Omninet Property Management, Inc. |
| First Payment Date: | 6/1/2021 | | | (borrower-related) |
| Maturity Date: | 5/1/2031 | | | |
| Original Term to Maturity: | 120 months | | Underwriting and Financial Information(2) |
| Original Amortization Term: | 0 months | | UW NOI: | $3,207,679 |
| IO Period: | 120 months | | UW NOI Debt Yield: | 12.5% |
| Seasoning: | 0 months | | UW NOI Debt Yield at Maturity: | 12.5% |
| Prepayment Provisions: | L(24),D(89),O(7) | | UW NCF DSCR: | 3.20x |
| Lockbox/Cash Mgmt Status: | Hard/Springing | | Most Recent NOI: | $4,216,555 (12/31/2020) |
| Additional Debt Type: | No | | 2nd Most Recent NOI: | $4,046,084 (12/31/2019) |
| Additional Debt Balance: | NAP | | 3rd Most Recent NOI: | $3,875,118 (12/31/2018) |
| Future Debt Permitted (Type): | No (NAP) | | Most Recent Occupancy: | 73.6% (4/1/2021) |
| Reserves | | 2nd Most Recent Occupancy: | 77.0% (12/31/2020) |
| Type | Initial | Monthly | Cap | | 3rd Most Recent Occupancy: | 83.0% (12/31/2019) |
| RE Taxes: | $0 | $21,406 | NAP | | Appraised Value (as of): | $44,700,000 (1/21/2021) |
| Insurance: | $0 | Springing(1) | NAP | | Appraised Value PSF: | $109 |
| Replacement Reserve: | $0 | $8,553 | NAP | | Cut-off Date LTV Ratio: | 57.5% |
| TI/LC Reserve: | $0 | $34,213 | $1,642,244 | | Maturity Date LTV Ratio: | 57.5% |
| | | | | | | | |
| Sources and Uses |
| Sources | Proceeds | % of Total | | Uses | Proceeds | % of Total |
| Loan Amount: | $25,700,000 | 100.0% | | Loan Payoff: | $16,196,780 | 63.0% |
| | | | | Return of Equity: | $9,185,014 | 35.7% |
| | | | | Closing Costs: | $318,206 | 1.2% |
| Total Sources: | $25,700,000 | 100.0% | | Total Uses: | $25,700,000 | 100.0% |
| (1) | The Century Plaza Albuquerque Borrower (as defined below) is not required to make monthly insurance deposits as long as no event of default is continuing and the Century Plaza Albuquerque Property (as defined below) is covered under a blanket policy acceptable to the lender (as currently). |
| (2) | The coronavirus pandemic is an evolving situation and could impact the Century Plaza Albuquerque Mortgage Loan (as defined below) more severely than assumed in the underwriting of the Century Plaza Albuquerque Mortgage Loan and could adversely affect the NOI, NCF and occupancy information, as well as the Appraised Value and the DSCR, LTV and Debt Yield metrics presented above. See “Risk Factors—Risks Related to Market Conditions and Other External Factors—The Coronavirus Pandemic Has Adversely Affected the Global Economy and Will Likely Adversely Affect the Performance of the Mortgage Loans” in the Preliminary Prospectus. |
The Mortgage Loan. The fifteenth largest mortgage loan (the “Century Plaza Albuquerque Mortgage Loan”) is evidenced by a promissory note in the original principal amount of $25,700,000 and secured by a first priority fee mortgage encumbering a 410,561 SF office complex located in Albuquerque, New Mexico (the “Century Plaza Albuquerque Property”).
The Borrower and the Borrower Sponsor. The borrower is Omninet Tijeras, LLC (the “Century Plaza Albuquerque Borrower”), a single-purpose Delaware limited liability company with one independent director. Omninet Capital, LLC (“Omninet”) is the borrower sponsor and its CEO and Managing Partner, Neil Kadisha and Benjamin Nazarian, respectively, are the non-recourse carveout guarantors for the Century Plaza Albuquerque Mortgage Loan. Omninet is a diversified real estate investment and operating firm that develops, operates and manages residential and commercial real estate. Omninet’s current portfolio consists of over 13,000 residential units and over 7 million SF of commercial space.
The Property. The Century Plaza Albuquerque Property consists of one, seven-story office building containing a total of 410,561 SF, located in Albuquerque, New Mexico. The Century Plaza Albuquerque Property was constructed in 1980 on a 1.84-acre site and was most recently renovated in 2014. The Century Plaza Albuquerque Property is improved with a subterranean parking garage with 53 parking spaces and an exterior loading dock. The Century Plaza Albuquerque Property offers a wide range of suite configurations and is comprised of two building sections that are connected via hallways. The Century Plaza Albuquerque Property was 73.6% occupied as of April 1, 2021 by three office tenants.
This is not a research report and was not prepared by any Underwriter’s research department. Please see additional important information and qualifications at the end of this Term Sheet.
T-156
| Office – CBD | Loan #15 | Cut-off Date Balance: | | $25,700,000 |
| 400 Tijeras Avenue Northwest | Century Plaza Albuquerque | Cut-off Date LTV: | | 57.5% |
| Albuquerque, NM 87102 | | UW NCF DSCR: | | 3.20x |
| | | UW NOI Debt Yield: | | 12.5% |
Major Tenants.
Molina Healthcare (181,912 SF, 44.3% of NRA, 69.3% of underwritten rent). Molina Healthcare provides health insurance to individuals through government programs such as Medicaid and Medicare. Molina Healthcare contracts with state governments and serves as a health plan, providing a wide range of health care services to families and individuals who qualify for government-sponsored programs, including Medicaid and the State Children’s Health Insurance Program. Molina Healthcare currently serves approximately 3.6 million individuals in 13 states and Puerto Rico. Molina Healthcare’s lease commenced on May 18, 2015 and the tenant leases multiple suites within the building, including Suites 200, 220, 300, 350, 550 and 700 (123,658 SF). Additionally, the tenant subleases Suites 400, 430 and 450 (39,995 SF) to The Regents of the University of New Mexico and Suite 750 (18,259 SF) to Lending Solutions, Inc. Both subtenant leases are coterminous with Molina Healthcare’s lease at discounted rental rates below Molina Healthcare’s contract rate. Molina Healthcare’s rental income is underwritten based on sublease rents for Suites 400, 430, 450 and 750. The lease does not contain any termination or contraction options. The Century Plaza Albuquerque Mortgage Loan is structured with a cash sweep should Molina Healthcare vacate or terminate its lease, fail to renew its lease, default in payment, or should the tenant or its lease guarantor become subject to bankruptcy.
CenturyLink Communications (114,709 SF, 27.9% of NRA, 28.2% of underwritten rent). CenturyLink Communications (“CenturyLink”) is a telecommunications company that offers high-speed internet, fiber, voice, phone and TV services for both residential and small business customers. CenturyLink’s lease commenced on December 19, 2014 and expires on December 31, 2029 with two 5-year renewal options with 6 months’ notice at market rent. CenturyLink leases multiple suites in the building, including Suites 130A, 210, 310, 320, 420 and BMT2. CenturyLink subleases 86,235 SF to an affiliate, Cyxtera Communications, LLC. Cyxtera Communications, LLC operates a data center at the site. The sublease is coterminous with the CenturyLink lease and requires the same rent as the CenturyLink lease. CenturyLink has provided notice that it is exercising its option to contract its space by 10,368 SF (Suite 500) effective on December 31, 2021. The lender has underwritten CenturyLink’s leased space assuming such contraction. The lease does not contain any additional termination or contraction options. The Century Plaza Albuquerque Mortgage Loan is structured with a cash sweep should CenturyLink vacate or terminate its lease, fail to renew its lease, default in payment, or should the tenant or its lease guarantor become subject to bankruptcy.
The following table presents certain information relating to the major tenants at the Century Plaza Albuquerque Property:
| Tenant Summary(1) |
| Tenant Name | Credit Rating (Fitch/Moody’s/S&P) | Tenant SF | Approx % of SF | Annual UW Rent | % of Total Annual
UW Rent | Annual UW Rent PSF | Lease Expiration | Renewal Options | Term. Options (Y/N) |
| Molina Healthcare | NR/NR/NR | 181,912 | 44.3% | $3,299,670 | 69.3% | $18.14 | Various(2) | NAP | N |
| CenturyLink Communications | NR/NR/NR | 114,709 | 27.9% | $1,342,326 | 28.2% | $11.70 | 12/31/2029 | 2 x 5 Yr | N |
| Greater Chamber of Commerce | NR/NR/NR | 5,747 | 1.4% | $112,066 | 2.4% | $19.50 | 1/31/2030 | NAP | N |
| Zayo Group LLC (Antenna) | NR/NR/NR | 0 | 0.0% | $4,017 | 0.1% | $0.00 | 4/30/2024 | NAP | N |
| Subtotal/Wtd. Avg. | | 302,368 | 73.6% | $4,758,079 | 100.0% | $15.74 | | | |
| | | | | | | | | | |
| Vacant Space | | 108,193 | 26.4% | $0 | 0.0% | $0.00 | | | |
| Total/Wtd. Avg.(3) | | 410,561 | 100.0% | 4,758,079 | 100.0% | $15.74 | | | |
| | | | | | | | | | |
| (1) | Information based on the underwritten rent roll. |
| (2) | Molina Healthcare occupies 123,658 SF ($19.10 annual UW Rent PSF) of leased space through May 31, 2025 and leases another 39,995 SF ($16.60 annual UW Rent PSF) through April 30, 2025 and 18,259 SF ($15.00 annual UW Rent PSF) through May 31, 2025, which it has subleased as described above. |
| (3) | Wtd. Avg. Annual UW Rent PSF excludes vacant space. |
This is not a research report and was not prepared by any Underwriter’s research department. Please see additional important information and qualifications at the end of this Term Sheet.
T-157
| Office – CBD | Loan #15 | Cut-off Date Balance: | | $25,700,000 |
| 400 Tijeras Avenue Northwest | Century Plaza Albuquerque | Cut-off Date LTV: | | 57.5% |
| Albuquerque, NM 87102 | | UW NCF DSCR: | | 3.20x |
| | | UW NOI Debt Yield: | | 12.5% |
The following table presents certain information relating to the lease rollover schedule at the Century Plaza Albuquerque Property:
| Lease Rollover Schedule(1) |
| Year | # of Leases Rolling | SF Rolling | UW Rent PSF Rolling | Approx. % of Total SF Rolling | Approx. Cumulative % of SF Rolling | Total UW Rent Rolling | Approx. % of Total Rent Rolling | Approx. Cumulative % of Total Rent Rolling |
| 2021 | 0 | 0 | $0.00 | 0.0% | 0.0% | $0 | 0.0% | 0.0% |
| 2022 | 0 | 0 | $0.00 | 0.0% | 0.0% | $0 | 0.0% | 0.0% |
| 2023 | 0 | 0 | $0.00 | 0.0% | 0.0% | $0 | 0.0% | 0.0% |
| 2024(2) | 1 | 0 | $0.00 | 0.0% | 0.0% | $4,017 | 0.1% | 0.1% |
| 2025 | 3 | 181,912 | $18.14 | 44.3% | 44.3% | $3,299,670 | 69.3% | 69.4% |
| 2026 | 0 | 0 | $0.00 | 0.0% | 44.3% | $0 | 0.0% | 69.4% |
| 2027 | 0 | 0 | $0.00 | 0.0% | 44.3% | $0 | 0.0% | 69.4% |
| 2028 | 0 | 0 | $0.00 | 0.0% | 44.3% | $0 | 0.0% | 69.4% |
| 2029 | 1 | 114,709 | $11.70 | 27.9% | 72.2% | $1,342,326 | 28.2% | 97.6% |
| 2030 | 1 | 5,747 | $19.50 | 1.4% | 73.6% | $112,066 | 2.4% | 100.0% |
| 2031 & Beyond | 0 | 0 | $0.00 | 0.0% | 73.6% | $0 | 0.0% | 100.0% |
| Vacant | 0 | 108,193 | $0.00 | 26.4% | 100.0% | $0 | 0.0% | 100.0% |
| Total/Wtd. Avg.(3) | 6 | 410,561 | $15.74 | 100.0% | | $4,758,079 | 100.0% | |
| (1) | Information is based on the underwritten rent roll. |
| (2) | # of Leases Rolling includes the antenna tenant, which does not have any SF associated. |
| (3) | Wtd. Avg. UW Rent PSF Rolling excludes vacant space. |
COVID-19 Update. As of April 22, 2021, the Century Plaza Albuquerque Property is open and operating. 100.0% of the tenants by NRA and 100.0% by underwritten rent have paid full rental payments in March and April 2021. Throughout the COVID-19 pandemic, only one tenant (Greater Chamber of Commerce, 1.4% of NRA) has requested rent relief, which was for November and December 2020. Such tenant is required to pay the deferred rent in six installments starting in May 2021. The first debt service payment on the Century Plaza Albuquerque Mortgage Loan is due in June 2021 and, as of April 22, 2021, the Century Plaza Albuquerque Mortgage Loan is not subject to any forbearance, modification or debt service relief request.
The Market. The Century Plaza Albuquerque Property is part of the Albuquerque Office market and the Downtown Office submarket. The Century Plaza Albuquerque Property is located on the south side of Tijeras Avenue Northwest between 4th and 5th Street Northwest and is approximately one mile west of Interstate 25, which is the region’s main north-south highway connecting Santa Fe to the north and Las Cruces to the south. The Century Plaza Albuquerque Property is located in downtown Albuquerque in the Central Business District where a significant number of the city’s high-rise buildings are located. The Central Business District is the center of government and business for the metropolitan statistical area (“MSA”). The Albuquerque MSA economy is largely focused on the public sector, while the agriculture, tourism and manufacturing segments also have a substantial foothold.
According to a third party market report, in the second quarter of 2021, the Downtown submarket has an inventory of 7.5 million SF and is currently operating at a total vacancy of 5.9%. The Century Plaza Albuquerque Property is one of only five buildings that are classified as Class A in the Downtown submarket, with a total of 1.6 million SF and a current vacancy of 12.3%. The Downtown submarket has only received two new additions to supply in the past 10 years, totaling 9,700 SF, with the last delivery in 2014.
According to the appraisal, the estimated 2020 population within a one- and three- radius of the Century Plaza Albuquerque Property was 14,283 and 92,352, respectively. The 2020 average household income within the same radii was $56,107 and $61,287, respectively. The estimated 2020 population of the Albuquerque MSA is 919,935 and has grown at a compound annual rate of 0.4% since 2010. Population is expected to continue to grow 0.3% annually through 2025.
This is not a research report and was not prepared by any Underwriter’s research department. Please see additional important information and qualifications at the end of this Term Sheet.
T-158
| Office – CBD | Loan #15 | Cut-off Date Balance: | | $25,700,000 |
| 400 Tijeras Avenue Northwest | Century Plaza Albuquerque | Cut-off Date LTV: | | 57.5% |
| Albuquerque, NM 87102 | | UW NCF DSCR: | | 3.20x |
| | | UW NOI Debt Yield: | | 12.5% |
The following table presents recent leasing data with respect to comparable office properties to the Century Plaza Albuquerque Property:
| Comparable Office Lease Summary |
| Property/Location | Year Built/Reno. | Stories | Size (NRA) | Occupancy | Rent PSF | Comments |
Century Plaza Albuquerque 400 Tijeras Avenue Northwest | 1980/2014 | 7 | 410,561(1) | 73.6%(1) | $15.74(1) | Molina Healthcare – 181,912 SF |
| Signed Leases |
First Plaza Gallery 200 3rd St. NW | 1985/1992 | 7 | 316,505 | 40% | $16.00 | ACVB signed an extension for 14,048 SF |
Bank of the West Center 303 Roma Ave. | 1974 | 10 | 218,151 | 91% | $16.50 | CareNet signed a 10-year term for 23,452 SF |
Compass Bank 505 Marquette Ave. NW | 1970/2007 | 10 | 270,000 | 100% | $19.50 | 8,000 SF 10-year renewal to BBVA |
| Available Large Spaces |
| 505 Marquette Ave. NW | 1970/2007 | 18 | 270,000 | 100% | $14.50 | 15,054 SF available |
| 111 Lomas Blvd. NW | 1970/1989 | 5 | 102,000 | 58% | $16.50 | 22,424 SF available |
500 Marquette 500 Marquette Ave, NW | 1985 | 15 | 231,135 | 60% | $17.50 | 27,097 SF available |
Source: Appraisal.
| (1) | Based on the underwritten rent roll. |
The following table presents certain information relating to the appraisal’s market rent conclusion for the Century Plaza Albuquerque Property:
| Market Rent Summary |
| | Office |
| Market Rent (PSF) | $18.50 |
| Lease Term (Yrs.) | 8 |
| Rent Increase Projection | 3.0% per annum |
Operating History and Underwritten Net Cash Flow. The following table presents certain information relating to the historical operating performance and Underwritten Net Cash Flow at the Century Plaza Albuquerque Property:
| Cash Flow Analysis |
| | 2018 | 2019 | 2020 | UW | | UW PSF |
| Gross Potential Rent(1) | $5,229,031 | $5,383,300 | $5,533,274 | $6,765,646 | $16.48 |
| Expense Reimbursement | $1,351,357 | $1,252,855 | $1,348,917 | $1,249,966 | $3.04 |
| Other Income(2) | $27,360 | $26,920 | $35,848 | $25,200 | $0.06 |
| Concessions | $0 | ($26,580) | ($17,720) | $0 | $0.00 |
| Vacancy | $0 | $0 | $0 | ($2,007,567) | ($4.89) |
| Effective Gross Income | $6,607,748 | $6,636,495 | $6,900,319 | $6,033,246 | $14.70 |
| | | | | | |
| Taxes | $247,028 | $247,018 | $246,996 | $259,345 | $0.63 |
| Insurance | $77,605 | $86,963 | $101,287 | $108,174 | $0.26 |
| Other Operating Expenses | $2,407,997 | $2,256,430 | $2,335,481 | $2,458,048 | $5.99 |
| Total Operating Expenses | 2,732,630 | 2,590,411 | 2,683,764 | 2,825,567 | $6.88 |
| | | | | | |
| Net Operating Income | $3,875,118 | $4,046,084 | $4,216,555 | $3,207,679 | $7.81 |
| TI/LC | $0 | $0 | $0 | $364,303 | $0.89 |
| Capital Expenditures | $0 | $0 | $0 | $102,640 | $0.25 |
| Net Cash Flow | $3,875,118 | $4,046,084 | $4,216,555 | $2,740,736 | $6.68 |
| | | | | | |
| Occupancy%(3) | 83.0% | 83.0% | 77.0% | 75.0% | |
| NOI DSCR | 4.52x | 4.72x | 4.92x | 3.74x | |
| NCF DSCR | 4.52x | 4.72x | 4.92x | 3.20x | |
| NOI Debt Yield | 15.1% | 15.7% | 16.4% | 12.5% | |
| NCF Debt Yield | 15.1% | 15.7% | 16.4% | 10.7% | |
| (1) | UW Gross Potential Rent includes contractual rent steps through March 1, 2022 and grossed up vacant space. Molina Healthcare’s income is underwritten based on sublease rents for Suites 400-450 and Suite 750. |
| (2) | UW Other Income primarily consists of parking income. Historical Other Income includes one-time termination fees. |
| (3) | The Century Plaza Albuquerque Property is 73.6% occupied as of April 1, 2021. |
This is not a research report and was not prepared by any Underwriter’s research department. Please see additional important information and qualifications at the end of this Term Sheet.
T-159
This material was prepared by sales, trading, banking or other non-research personnel of one of the following: BofA Securities, Inc. (together with its affiliates, “BofA Securities”), Wells Fargo Securities, LLC (together with its affiliates, “Wells Fargo”), Morgan Stanley & Co. LLC, Morgan Stanley & Co. International Limited, Morgan Stanley Japan Limited and/or Morgan Stanley Dean Witter Asia Limited (together with their affiliates, hereinafter “Morgan Stanley”), Academy Securities, Inc. (together with its affiliates, “Academy”) and Drexel Hamilton, LLC (together with its affiliates, “Drexel” and, collectively with , BofA Securities, Wells Fargo, Morgan Stanley and Academy, the “Underwriters”). This material was not produced by an Underwriter’s research analyst, although it may refer to an Underwriter’s research analyst or research report. Unless otherwise indicated, these views (if any) are the author’s and may differ from those of the fixed income or equity research departments of the Underwriters or others in those firms.
This material may have been prepared by or in conjunction with the respective trading desks of the Underwriters that may deal as principal in or own or act as market maker or liquidity provider for the securities/instruments (or related derivatives) mentioned herein. The trading desk may have accumulated a position in the subject securities/instruments based on the information contained herein. Trading desk materials are not independent of the proprietary interests of the Underwriters, which may conflict with your interests. Each of the Underwriters may also perform or seek to perform investment banking services for the issuers of the securities and instruments mentioned herein.
The information contained in this material is preliminary as of the date hereof. This material is subject to change, completion or amendment from time to time. The information in this material supersedes information in any other communication relating to the securities referred to in this material; provided, that the information in this material will be superseded by similar information delivered to you as part of a preliminary prospectus. This material is not a solicitation to participate in any trading strategy, and is not an offer to sell any security or instrument or a solicitation of an offer to buy or sell any security or instrument in any jurisdiction where an offer, solicitation or sale is not permitted. Unless otherwise set forth in this material, any securities referred to in this material may not have been registered under the U.S. Securities Act of 1933, as amended, and, if not, may not be offered or sold absent an exemption therefrom. Recipients are required to comply with any legal or contractual restrictions on their purchase, holding, sale, exercise of rights or performance of obligations under any securities/instruments transaction.
The securities/instruments discussed in this material may not be suitable for all investors. This material has been prepared and issued by the Underwriters for intended distribution to market professionals and institutional investor clients. Other recipients should seek independent investment advice prior to making any investment decision based on this material. This material does not provide individually tailored investment advice or offer tax, regulatory, accounting or legal advice. Prior to entering into any proposed transaction, recipients should determine, in consultation with their own investment, legal, tax, regulatory and accounting advisors, the economic risks and merits, as well as the legal, tax, regulatory and accounting characteristics and consequences, of the transaction. You should consider this material as only a single factor in making an investment decision.
The value of and income from investments may vary because of changes in interest rates, foreign exchange rates, default rates, prepayment rates, securities/instruments prices, market indexes, operational or financial conditions of companies or other factors. There may be time limitations on the exercise of options or other rights in securities/instruments transactions. Past performance is not necessarily a guide to future performance. Estimates of future performance are based on assumptions that may not be realized. Actual events may differ from those assumed and changes to any assumptions may have a material impact on any projections or estimates. Other events not taken into account may occur and may significantly affect the projections or estimates. Certain assumptions may have been made for modeling purposes only to simplify the presentation and/or calculation of any projections or estimates, and the Underwriters do not represent that any such assumptions will reflect actual future events. Accordingly, there can be no assurance that estimated returns or projections will be realized or that actual returns or performance results will not materially differ from those estimated herein. Some of the information contained in this document may be aggregated data of transactions in securities or other financial instruments executed by an Underwriter that has been compiled so as not to identify the underlying transactions of any particular customer.
Notwithstanding anything herein to the contrary, the Underwriters and each recipient hereof (and their employees, representatives, and other agents) may disclose to any and all persons, without limitation of any kind from the commencement of discussions, the U.S. federal and state income tax treatment and tax structure of the transaction and all materials of any kind (including opinions or other tax analyses) that are provided to it relating to the tax treatment and tax structure (as such terms are defined in Treasury Regulation 1.6011-4). For this purpose, “tax structure” is limited to facts relevant to the U.S. federal and state income tax treatment of the transaction and does not include information relating to the identity of the parties, their affiliates, agents or advisors. This authorization of tax disclosure is retroactively effective to the commencement of discussions with prospective investors regarding the transactions contemplated herein.
THE DISTRIBUTION OF THIS MATERIAL (A) IF MADE BY A PERSON WHO IS NOT AN AUTHORIZED PERSON UNDER THE FINANCIAL SERVICES AND MARKETS ACT 2000 (“FSMA”), IS BEING MADE ONLY TO, OR DIRECTED ONLY AT, PERSONS WHO (I) ARE OUTSIDE THE UNITED KINGDOM, OR (II) HAVE PROFESSIONAL EXPERIENCE IN MATTERS RELATING TO INVESTMENTS AND QUALIFY AS INVESTMENT PROFESSIONALS IN ACCORDANCE WITH ARTICLE 19(5) OF THE FINANCIAL SERVICES AND MARKETS ACT 2000 (FINANCIAL PROMOTION) ORDER 2005 (AS AMENDED, THE “FINANCIAL PROMOTION ORDER”), OR (III) ARE PERSONS FALLING WITHIN ARTICLE 49(2)(A) THROUGH (D) (“HIGH NET WORTH COMPANIES, UNINCORPORATED ASSOCIATIONS, ETC.”) OF THE FINANCIAL PROMOTION ORDER OR, (IV) ARE PERSONS TO WHOM THIS MATERIAL MAY OTHERWISE LAWFULLY BE COMMUNICATED OR DIRECTED; AND (B) IF MADE BY A PERSON WHO IS AN AUTHORIZED PERSON UNDER THE FSMA, IS BEING MADE ONLY TO, OR DIRECTED ONLY AT, PERSONS WHO (I) ARE OUTSIDE THE UNITED KINGDOM, OR (II) HAVE PROFESSIONAL EXPERIENCE OF PARTICIPATING IN UNREGULATED SCHEMES (AS DEFINED FOR PURPOSES OF THE FINANCIAL SERVICES AND MARKETS ACT 2000 (PROMOTION OF COLLECTIVE INVESTMENT SCHEMES) (EXEMPTIONS) ORDER 2001 (AS AMENDED, THE “PROMOTION OF COLLECTIVE INVESTMENT SCHEMES EXEMPTIONS ORDER”)) AND QUALIFY AS INVESTMENT PROFESSIONALS IN ACCORDANCE WITH ARTICLE 14(5) OF THE PROMOTION OF COLLECTIVE INVESTMENT SCHEMES EXEMPTIONS ORDER, OR (III) ARE PERSONS FALLING WITHIN ARTICLE 22(2)(A) THROUGH (D) (HIGH NET WORTH COMPANIES, UNINCORPORATED ASSOCIATIONS, ETC.) OF THE PROMOTION OF COLLECTIVE INVESTMENT SCHEMES EXEMPTIONS ORDER, OR (IV) ARE PERSONS TO WHOM THE ISSUING ENTITY MAY LAWFULLY BE PROMOTED IN ACCORDANCE WITH SECTION 4.12 OF THE FCA HANDBOOK CONDUCT OF BUSINESS SOURCEBOOK.
THE OFFERED CERTIFICATES HAVE NOT BEEN AND WILL NOT BE REGISTERED UNDER THE FINANCIAL INSTRUMENTS AND EXCHANGE LAW OF JAPAN, AS AMENDED (THE “FIEL”), AND DISCLOSURE UNDER THE FIEL HAS NOT BEEN AND WILL NOT BE MADE WITH RESPECT TO THE OFFERED CERTIFICATES. ACCORDINGLY, EACH OF BOFA SECURITIES, INC., WELLS FARGO SECURITIES, LLC, MORGAN STANLEY & CO. LLC, ACADEMY SECURITIES, INC. AND DREXEL HAMILTON, LLC HAS REPRESENTED AND AGREED THAT IT HAS NOT, DIRECTLY OR INDIRECTLY, OFFERED OR SOLD AND WILL NOT, DIRECTLY OR INDIRECTLY, OFFER OR SELL ANY OFFERED CERTIFICATES IN JAPAN OR TO, OR FOR THE BENEFIT OF, ANY RESIDENT OF JAPAN (WHICH TERM AS USED IN THIS MATERIAL MEANS ANY PERSON RESIDENT IN JAPAN, INCLUDING ANY CORPORATION OR OTHER ENTITY ORGANIZED UNDER THE LAWS OF JAPAN) OR TO OTHERS FOR REOFFERING OR RE SALE, DIRECTLY OR INDIRECTLY, IN JAPAN OR TO, OR FOR THE BENEFIT OF, ANY RESIDENT OF JAPAN EXCEPT PURSUANT TO AN EXEMPTION FROM THE REGISTRATION REQUIREMENTS OF, AND OTHERWISE IN COMPLIANCE WITH, THE FIEL AND OTHER RELEVANT LAWS, REGULATIONS AND MINISTERIAL GUIDELINES OF JAPAN. AS PART OF THIS OFFERING OF THE OFFERED CERTIFICATES, THE UNDERWRITERS MAY OFFER THE OFFERED CERTIFICATES IN JAPAN TO UP TO 49 OFFEREES IN ACCORDANCE WITH THE ABOVE PROVISIONS.