UNITED STATES
SECURITIES AND EXCHANGE COMMISSION
Washington, D.C. 20549
FORM N-CSR
CERTIFIED SHAREHOLDER REPORT OF REGISTERED
MANAGEMENT INVESTMENT COMPANIES
Investment Company Act file number 811-07455
Virtus Opportunities Trust
(Exact name of registrant as specified in charter)
101 Munson Street
Greenfield, MA 01301-9668
(Address of principal executive offices) (Zip code)
Jennifer Fromm, Esq.
Vice President, Chief Legal Officer, Counsel and Secretary for Registrant
One Financial Plaza
Hartford, CT 06103-2608
(Name and address of agent for service)
Registrant’s telephone number, including area code: (800) 243-1574
Date of fiscal year end: May 31
Date of reporting period: May 31, 2023
Form N-CSR is to be used by management investment companies to file reports with the Commission not later than 10 days after the transmission to stockholders of any report that is required to be transmitted to stockholders under Rule 30e-1 under the Investment Company Act of 1940 (17 CFR 270.30e-1). The Commission may use the information provided on Form N-CSR in its regulatory, disclosure review, inspection, and policymaking roles.
A registrant is required to disclose the information specified by Form N-CSR, and the Commission will make this information public. A registrant is not required to respond to the collection of information contained in Form N-CSR unless the Form displays a currently valid Office of Management and Budget (“OMB”) control number. Please direct comments concerning the accuracy of the information collection burden estimate and any suggestions for reducing the burden to Secretary, Securities and Exchange Commission, 450 Fifth Street, NW, Washington, DC 20549-0609. The OMB has reviewed this collection of information under the clearance requirements of 44 U.S.C. § 3507.
Item 1. Reports to Stockholders.
| (a) | The Report to Shareholders is attached herewith. |
| (b) | Not applicable. |

| Virtus Stone Harbor Emerging Markets Bond Fund (f/k/a Virtus Stone Harbor Emerging Markets Corporate Debt Fund) |
| Virtus Stone Harbor Emerging Markets Debt Allocation Fund* |
| Virtus Stone Harbor Emerging Markets Debt Income Fund (f/k/a Virtus Stone Harbor Emerging Markets Debt Fund) |
| Virtus Stone Harbor High Yield Bond Fund |
| Virtus Stone Harbor Local Markets Fund |
| Virtus Stone Harbor Strategic Income Fund* |
| 1 | ||
| 2 | ||
| 4 | ||
| Fund | Fund Summary | Schedule of Investments |
| 7 | 25 | |
| 10 | 29 | |
| 13 | 30 | |
| 16 | 39 | |
| 19 | 43 | |
| 22 | 47 | |
| 53 | ||
| 57 | ||
| 59 | ||
| 62 | ||
| 65 | ||
| 85 | ||
| 86 | ||
| 87 | ||
| 88 | ||


President, Virtus Opportunities Trust
July 2023
sales charges on purchases of Class A shares and (2) ongoing costs, including investment advisory fees, distribution and service fees, and other expenses.
Class I shares are sold without sales charges and do not incur distribution and service fees. For further information regarding applicable sales charges, see
Note 1 in the Notes to Financial Statements. These examples are intended to help you understand your ongoing costs (in dollars) of investing in a Fund and to compare these costs with the ongoing costs of investing in other mutual funds. These examples are based on an investment of $1,000 invested at the beginning of the period and held for the entire six-month period. The Annualized Expense Ratios may be different from the expense ratios in the Financial Highlights which are for the fiscal year ended May 31, 2023.
| Beginning Account Value December 1, 2022 | Ending Account Value May 31, 2023 | Annualized Expense Ratio | Expenses Paid During Period* | |||||
Stone Harbor Emerging Markets Bond Fund | ||||||||
| Class A | $ 1,000.00 | $ 1,032.60 | 1.24 % | $ 6.28 | ||||
| Class I | 1,000.00 | 1,033.30 | 0.99 | 5.02 | ||||
Stone Harbor Emerging Markets Debt Allocation Fund | ||||||||
| Class A | 1,000.00 | 1,030.20 | 0.27 | 1.37 | ||||
| Class I | 1,000.00 | 1,029.90 | 0.01 | 0.05 | ||||
Stone Harbor Emerging Markets Debt Income Fund | ||||||||
| Class A | 1,000.00 | 1,015.20 | 1.00 | 5.02 | ||||
| Class I | 1,000.00 | 1,017.30 | 0.72 | 3.62 | ||||
Stone Harbor High Yield Bond Fund | ||||||||
| Class A | 1,000.00 | 1,025.50 | 0.89 | 4.49 | ||||
| Class I | 1,000.00 | 1,026.30 | 0.64 | 3.23 | ||||
Stone Harbor Local Markets Fund | ||||||||
| Class A | 1,000.00 | 1,044.80 | 1.12 | 5.71 | ||||
| Class I | 1,000.00 | 1,046.10 | 0.87 | 4.44 | ||||
Stone Harbor Strategic Income Fund | ||||||||
| Class A | 1,000.00 | 1,025.60 | 0.56 | 2.83 | ||||
| Class I | 1,000.00 | 1,025.70 | 0.31 | 1.57 |
| * | Expenses are equal to the relevant Fund’s annualized expense ratio, which is net of waived fees and reimbursed expenses, if applicable, multiplied by the average account value over the period, multiplied by the number of days (182) expenses were accrued in the most recent fiscal half-year, then divided by 365 to reflect the one-half year period. |
| Beginning Account Value December 1, 2022 | Ending Account Value May 31, 2023 | Annualized Expense Ratio | Expenses Paid During Period* | |||||
Stone Harbor Emerging Markets Bond Fund | ||||||||
| Class A | $ 1,000.00 | $ 1,018.75 | 1.24 % | $ 6.24 | ||||
| Class I | 1,000.00 | 1,020.00 | 0.99 | 4.99 | ||||
Stone Harbor Emerging Markets Debt Allocation Fund | ||||||||
| Class A | 1,000.00 | 1,023.59 | 0.27 | 1.36 | ||||
| Class I | 1,000.00 | 1,024.88 | 0.01 | 0.05 | ||||
Stone Harbor Emerging Markets Debt Income Fund | ||||||||
| Class A | 1,000.00 | 1,019.95 | 1.00 | 5.04 | ||||
| Class I | 1,000.00 | 1,021.34 | 0.72 | 3.63 | ||||
Stone Harbor High Yield Bond Fund | ||||||||
| Class A | 1,000.00 | 1,020.49 | 0.89 | 4.48 | ||||
| Class I | 1,000.00 | 1,021.74 | 0.64 | 3.23 | ||||
Stone Harbor Local Markets Fund | ||||||||
| Class A | 1,000.00 | 1,019.35 | 1.12 | 5.64 | ||||
| Class I | 1,000.00 | 1,020.59 | 0.87 | 4.38 | ||||
Stone Harbor Strategic Income Fund | ||||||||
| Class A | 1,000.00 | 1,022.14 | 0.56 | 2.82 | ||||
| Class I | 1,000.00 | 1,023.39 | 0.31 | 1.56 |
| * | Expenses are equal to the relevant Fund’s annualized expense ratio, which is net of waived fees and reimbursed expenses, if applicable, multiplied by the average account value over the period, multiplied by the number of days (182) expenses were accrued in the most recent fiscal half-year, then divided by 365 to reflect the one-half year period. |
| Ticker Symbols: | |
| Class A: VSHAX | |
| Class I: SHCDX |
Stone Harbor Investment Partners
| ■ | The Fund is diversified and has an investment objective of seeking to maximize total return, which consists of income on its investments and capital appreciation There is no guarantee that the Fund will meet its objective. |
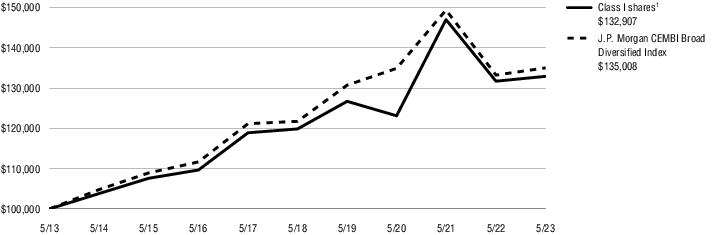
| ■ | For the fiscal year ended May 31, 2023, the Fund’s Class A shares at NAV returned 0.71% and Class I shares at NAV returned 0.91%. For the same period, the J.P. Morgan CEMBI Broad Diversified Index, the Fund’s broad-based and style-specific index appropriate for comparison, returned 1.34%. |
| Corporate Bonds and Notes | 98% | |
| Electric | 17% | |
| Financial & Lease | 15 | |
| Exploration & Production | 13 | |
| Wireless | 10 | |
| Gaming | 9 | |
| Metals, Mining & Steel | 7 | |
| Midstream | 7 | |
| Chemicals | 4 | |
| Media Cable | 2 | |
| Industrial Other | 2 | |
| All other Corporate Bonds and Notes | 12 | |
| Short-Term Investment | 2 | |
| Total | 100% | |
| 1 Year | 5 Years | 10 Years | Since inception | Inception date | ||
| Class A shares at NAV2 | 0.71 % | — % | — % | -1.23 % | 4/11/22 | |
| Class A shares at POP3,4 | -3.07 | — | — | -4.50 | 4/11/22 | |
| Class I shares at NAV2 | 0.91 | 2.09 | 2.89 | — | — | |
| J.P. Morgan CEMBI Broad Diversified Index | 1.34 | 2.09 | 3.05 | -0.40 5 | — | |
| Fund Expense Ratios6: Class A shares: Gross 3.47%; Net: 1.26%; Class I shares: Gross 3.15%; Net: 1.01%. | ||||||
| All returns represent past performance which is no guarantee of future results. Current performance may be higher or lower than the performance shown. The investment return and principal value of an investment will fluctuate so that an investor’s shares, when redeemed, may be worth more or less than their original cost. The above table and graph below do not reflect the deduction of taxes that a shareholder would pay on fund distributions or the redemption of shares. Please visit Virtus.com for performance data current to the most recent month-end. |
| 1 | Total returns are historical and include changes in share price and the reinvestment of both dividends and capital gain distributions. |
| 2 | “NAV” (Net Asset Value) total returns do not include the effect of any sales charge. |
| 3 | “POP” (Public Offering Price) total returns include the effect of the maximum front-end 3.75% sales charge. |
| 4 | “CDSC” (contingent deferred sales charge) is applied to redemptions of certain classes of shares that do not have a sales charge applied at the time of purchase. CDSC for certain redemptions of Class A shares made within 18 months of a finder’s fee being paid are 0.50%. |
| 5 | The since inception index return is from the inception date of Class A shares. |
| 6 | The expense ratios of the Fund are set forth according to the prospectus for the Fund effective April 5, 2022, as supplemented and revised, and may differ from the expense ratios disclosed in the Financial Highlights tables in this report. See the Financial Highlights for more current expense ratios. Net Expense: Expenses reduced by a contractual expense limitation in effect through April 7, 2024. Gross Expense: Does not reflect the effect of the expense limitation. Expense ratios include fees and expenses associated with any underlying funds. |
| Ticker Symbols: | |
| Class A: VSHBX | |
| Class I: SHADX |
Stone Harbor Investment Partners
| ■ | The Fund is diversified and has an investment objective of seeking to maximize total return, which consists of income on its investments and capital appreciation. There is no guarantee that the Fund will meet its objective. |
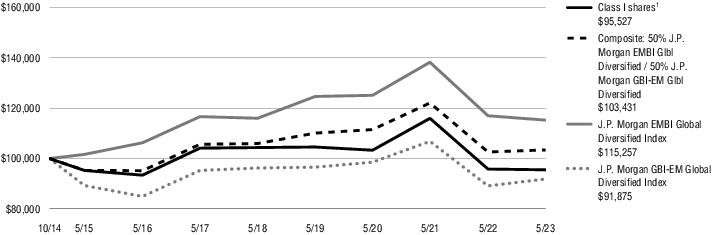
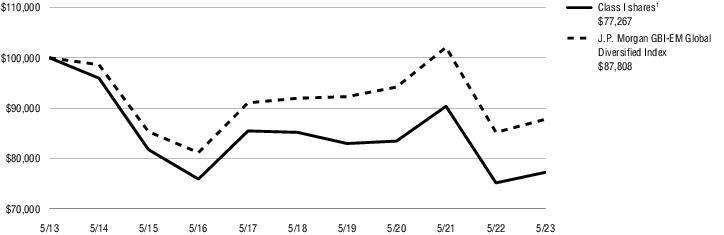
| ■ | For the fiscal year ended, May 31, 2023, the Fund’s Class A shares at NAV returned -0.41 and Class I shares at NAV returned -0.30%. For the same period, the J.P. Morgan EMBI Global Diversified Index, the Fund’s broad-based index appropriate for comparison, returned -1.48% and the J.P. Morgan GBI-EM Global Diversified Index; a broad-based index, returned 3.06%. The Fund’s style-specific composite index returned 0.80%. |
| Affiliated Mutual Funds | 100% | |
| Total | 100% | |
| 1 Year | 5 Years | Since inception | Inception date | ||
| Class A shares at NAV2 | -0.41 % | — % | -3.19 % | 4/11/22 | |
| Class A shares at POP3,4 | -4.14 | — | -6.39 | 4/11/22 | |
| Class I shares at NAV2 | -0.30 | -1.75 | -0.53 | 10/20/14 | |
| Composite Index: 50% J.P. Morgan EMBI Global Diversified / 50% J.P. Morgan GBI-EM Global Diversified Index | 0.80 | -0.48 | — 5 | — | |
| J.P. Morgan EMBI Global Diversified Index | -1.48 | -0.13 | — 6 | — | |
| J.P. Morgan GBI-EM Global Diversified Index | 3.06 | -0.92 | — 7 | — | |
| Fund Expense Ratios8: Class A shares: Gross 3.39%, Net 1.10%; Class I shares: Gross 3.07%, Net 0.85%. | |||||
| All returns represent past performance which is no guarantee of future results. Current performance may be higher or lower than the performance shown. The investment return and principal value of an investment will fluctuate so that an investor’s shares, when redeemed, may be worth more or less than their original cost. The above table and graph below do not reflect the deduction of taxes that a shareholder would pay on fund distributions or the redemption of shares. Please visit Virtus.com for performance data current to the most recent month-end. |
| 1 | Total returns are historical and include changes in share price and the reinvestment of both dividends and capital gain distributions. |
| 2 | “NAV” (Net Asset Value) total returns do not include the effect of any sales charge. |
| 3 | “POP” (Public Offering Price) total returns include the effect of the maximum front-end 3.75% sales charge. |
| 4 | “CDSC” (contingent deferred sales charge) is applied to redemptions of certain classes of shares that do not have a sales charge applied at the time of purchase. CDSC for certain redemptions of Class A shares made within 18 months of a finder’s fee being paid are 0.50%. |
| 5 | The since inception index returned -1.67% from the inception date of Class A shares and 0.39% from the inception date of Class I shares. |
| 6 | The since inception index returned -3.76% from the inception date of Class A shares and 1.66% from the inception date of Class I shares. |
| 7 | The since inception index returned 0.39% from the inception date of Class A shares and -0.98% from the inception date of Class I shares. |
| 8 | The expense ratios of the Fund are set forth according to the prospectus for the Fund effective April 5, 2022, as supplemented and revised, and may differ from the expense ratios disclosed in the Financial Highlights tables in this report. See the Financial Highlights for more current expense ratios. Net Expense: Expenses reduced by a contractual expense limitation in effect through April 7, 2024. Gross Expense: Does not reflect the effect of the expense limitation. Expense ratios include fees and expenses associated with any underlying funds. |
| Ticker Symbols: | |
| Class A: VSHCX | |
| Class I: SHMDX |
Stone Harbor Investment Partners
| ■ | The Fund is diversified and has an investment objective of seeking to maximize total return, which consists of income on its investments and capital appreciation. There is no guarantee that the Fund will meet its objective. |
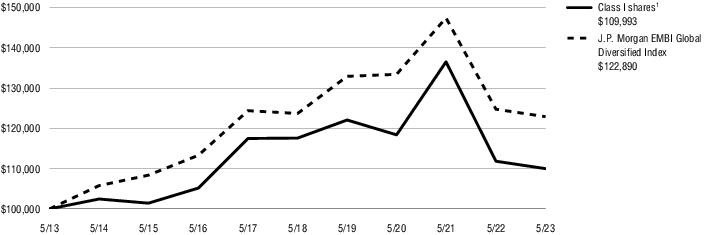
| ■ | For the fiscal year ended May 31, 2023, the Fund’s Class A shares at NAV returned -1.96% and Class I shares at NAV returned -1.64%. For the same period, the J.P. Morgan EMBI Global Diversified Index, the Fund’s broad-based and style-specific index appropriate for comparison, returned -1.48%. |
| Foreign Government Securities | 64% | |
| Corporate Bonds and Notes | 32 | |
| Exploration & Production | 14% | |
| Electric | 4 | |
| Financial & Lease | 3 | |
| Metals, Mining & Steel | 2 | |
| Financials | 2 | |
| Wireless | 2 | |
| Refining | 2 | |
| All other Corporate Bonds and Notes | 3 | |
| Affiliated Mutual Funds | 3 | |
| Credit Linked Notes | 1 | |
| Total | 100% | |
| 1 Year | 5 Years | 10 Years | Since inception | Inception date | ||
| Class A shares at NAV2 | -1.96 % | — % | — % | -5.13 % | 4/11/22 | |
| Class A shares at POP3,4 | -5.63 | — | — | -8.27 | 4/11/22 | |
| Class I shares at NAV2 | -1.64 | -1.32 | 0.96 | — | — | |
| J.P. Morgan EMBI Global Diversified Index | -1.48 | -0.13 | 2.08 | -3.76 5 | — | |
| Fund Expense Ratios6: Class A shares: Gross 1.12%; Net: 1.01%; Class I shares: Gross 0.80%; Net: 0.73%. | ||||||
| All returns represent past performance which is no guarantee of future results. Current performance may be higher or lower than the performance shown. The investment return and principal value of an investment will fluctuate so that an investor’s shares, when redeemed, may be worth more or less than their original cost. The above table and graph below do not reflect the deduction of taxes that a shareholder would pay on fund distributions or the redemption of shares. Please visit Virtus.com for performance data current to the most recent month-end. |
| 1 | Total returns are historical and include changes in share price and the reinvestment of both dividends and capital gain distributions. |
| 2 | “NAV” (Net Asset Value) total returns do not include the effect of any sales charge. |
| 3 | “POP” (Public Offering Price) total returns include the effect of the maximum front-end 3.75% sales charge. |
| 4 | “CDSC” (contingent deferred sales charge) is applied to redemptions of certain classes of shares that do not have a sales charge applied at the time of purchase. CDSC for certain redemptions of Class A shares made within 18 months of a finder’s fee being paid are 0.50%. |
| 5 | The since inception index return is from the inception date of Class A shares. |
| 6 | The expense ratios of the Fund are set forth according to the prospectus for the Fund effective April 5, 2022, as supplemented and revised, and may differ from the expense ratios disclosed in the Financial Highlights tables in this report. See the Financial Highlights for more current expense ratios. Net Expense: Expenses reduced by a contractual expense limitation in effect through April 7, 2024. Gross Expense: Does not reflect the effect of the expense limitation. Expense ratios include fees and expenses associated with any underlying funds. |
| Ticker Symbols: | |
| Class A: VSHDX | |
| Class I: SHHYX |
Stone Harbor Investment Partners
| ■ | The Fund is diversified and has an investment objective of seeking to maximize total return, which consists of income on its investments and capital appreciation. There is no guarantee that the Fund will meet its objective. |
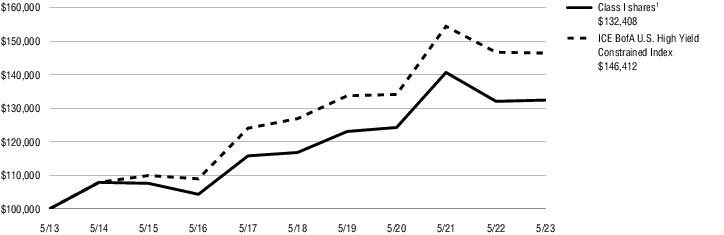
| ■ | For the fiscal year ended May 31, 2023, the Fund’s Class A shares at NAV returned -0.04% and Class I shares at NAV returned 0.27%. For the same period, the ICE BofA U.S. High Yield Constrained Index, the Fund’s broad-based and style-specific index appropriate for comparison, returned -0.17%. |
| Corporate Bonds and Notes | 100% | |
| Exploration & Production | 9% | |
| Media Cable | 8 | |
| Financial & Lease | 7 | |
| Health Care | 7 | |
| Midstream | 5 | |
| Gaming | 5 | |
| Building Products | 5 | |
| Leisure | 5 | |
| Retail Non Food & Drug | 5 | |
| Industrial Other | 4 | |
| All other Corporate Bonds and Notes | 40 | |
| Total | 100% | |
| 1 Year | 5 Years | 10 Years | Since inception | Inception date | ||
| Class A shares at NAV2 | -0.04 % | — % | — % | -1.25 % | 4/11/22 | |
| Class A shares at POP3,4 | -3.79 | — | — | -4.51 | 4/11/22 | |
| Class I shares at NAV2 | 0.27 | 2.54 | 2.85 | — | — | |
| ICE BofA U.S. High Yield Constrained Index | -0.17 | 2.90 | 3.89 | -1.15 5 | — | |
| Fund Expense Ratios6: Class A shares: Gross 1.14%, Net: 0.91%; Class I shares: Gross 0.83%, Net: 0.66%. | ||||||
| All returns represent past performance which is no guarantee of future results. Current performance may be higher or lower than the performance shown. The investment return and principal value of an investment will fluctuate so that an investor’s shares, when redeemed, may be worth more or less than their original cost. The above table and graph below do not reflect the deduction of taxes that a shareholder would pay on fund distributions or the redemption of shares. Please visit Virtus.com for performance data current to the most recent month-end. |
| 1 | Total returns are historical and include changes in share price and the reinvestment of both dividends and capital gain distributions. |
| 2 | “NAV” (Net Asset Value) total returns do not include the effect of any sales charge. |
| 3 | “POP” (Public Offering Price) total returns include the effect of the maximum front-end 3.75% sales charge. |
| 4 | “CDSC” (contingent deferred sales charge) is applied to redemptions of certain classes of shares that do not have a sales charge applied at the time of purchase. CDSC for certain redemptions of Class A shares made within 18 months of a finder’s fee being paid are 0.50%. |
| 5 | The since inception index return is from the inception date of Class A shares. |
| 6 | The expense ratios of the Fund are set forth according to the prospectus for the Fund effective April 5, 2022, as supplemented and revised, and may differ from the expense ratios disclosed in the Financial Highlights tables in this report. See the Financial Highlights for more current expense ratios. Net Expense: Expenses reduced by a contractual expense limitation in effect through April 7, 2024. Gross Expense: Does not reflect the effect of the expense limitation. Expense ratios include fees and expenses associated with any underlying funds. |
| Ticker Symbols: | |
| Class A: VSHEX | |
| Class I: SHLMX |
Stone Harbor Investment Partners
| ■ | The Fund is non-diversified and has an investment objective of seeking to maximize total return, which consists of income on its investments and capital appreciation. There is no guarantee that the Fund will meet its objective. |
| ■ | For the fiscal year ended May 31, 2023, the Fund’s Class A shares at NAV returned 2.40% and Class I shares at NAV returned 2.80%. For the same period, the J.P. Morgan GBI-EM Global Diversified Index, the Fund’s broad-based and style-specific index appropriate for comparison, returned 3.06%. |
| Foreign Government Securities | 96% | |
| Corporate Bonds and Notes | 4 | |
| Financial & Lease | 4% | |
| Total | 100% | |
| 1 Year | 5 Years | 10 Years | Since inception | Inception date | ||
| Class A shares at NAV2 | 2.40 % | — % | — % | -0.23 % | 4/11/22 | |
| Class A shares at POP3,4 | -1.44 | — | — | -3.53 | 4/11/22 | |
| Class I shares at NAV2 | 2.80 | -1.94 | -2.55 | — | — | |
| J.P. Morgan GBI-EM Global Diversified Index | 3.06 | -0.92 | -1.29 | 0.39 5 | — | |
| Fund Expense Ratios6: Class A shares: Gross 1.54%, Net 1.26%; Class I shares: Gross 1.23%, Net 1.01%. | ||||||
| All returns represent past performance which is no guarantee of future results. Current performance may be higher or lower than the performance shown. The investment return and principal value of an investment will fluctuate so that an investor’s shares, when redeemed, may be worth more or less than their original cost. The above table and graph below do not reflect the deduction of taxes that a shareholder would pay on fund distributions or the redemption of shares. Please visit Virtus.com for performance data current to the most recent month-end. |
| 1 | Total returns are historical and include changes in share price and the reinvestment of both dividends and capital gain distributions. |
| 2 | “NAV” (Net Asset Value) total returns do not include the effect of any sales charge. |
| 3 | “POP” (Public Offering Price) total returns include the effect of the maximum front-end 3.75% sales charge. |
| 4 | “CDSC” (contingent deferred sales charge) is applied to redemptions of certain classes of shares that do not have a sales charge applied at the time of purchase. CDSC for certain redemptions of Class A shares made within 18 months of a finder’s fee being paid are 0.50%. |
| 5 | The since inception index return is from the inception date of Class A shares. |
| 6 | The expense ratios of the Fund are set forth according to the prospectus for the Fund effective April 5, 2022, as supplemented and revised, and may differ from the expense ratios disclosed in the Financial Highlights tables in this report. See the Financial Highlights for more current expense ratios. Net Expense: Expenses reduced by a contractual expense limitation in effect through April 7, 2024. Gross Expense: Does not reflect the effect of the expense limitation. Expense ratios include fees and expenses associated with any underlying funds. |
| Ticker Symbols: | |
| Class A: VSHFX | |
| Class I: SHSIX |
Stone Harbor Investment Partners
| ■ | The Fund is diversified and has an investment objective of seeking to maximize total return, which consists of income on its investments and capital appreciation. There is no guarantee that the Fund will meet its objective. |
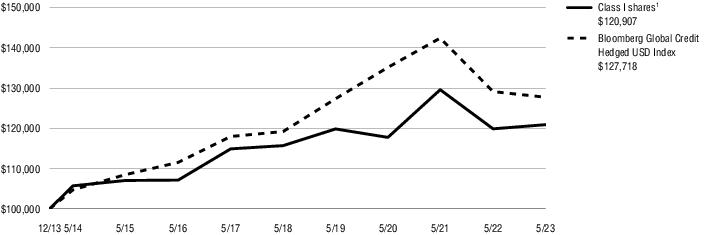
| ■ | For the fiscal year ended May 31, 2023, the Fund’s Class A shares at NAV returned 0.71% and Class I shares at NAV returned 0.86%. For the same period, the Bloomberg Global Credit Hedged USD Index, the Fund’s broad-based and style-specific index appropriate for comparison, returned -1.08%. |
| Affiliated Mutual Funds | 67% | |
| Corporate Bonds and Notes | 17 | |
| Financial & Lease | 6% | |
| Health Care | 2 | |
| Electric | 2 | |
| All other Corporate Bonds and Notes | 7 | |
| Mortgage-Backed Securities | 9 | |
| Agency | 7 | |
| Non-Agency | 2 | |
| U.S. Government Securities | 7 | |
| Total | 100% | |
| 1 Year | 5 Years | Since inception | Inception date | ||
| Class A shares at NAV2 | 0.71 % | — % | -1.13 % | 4/11/22 | |
| Class A shares at POP3,4 | -3.07 | — | -4.40 | 4/11/22 | |
| Class I shares at NAV2 | 0.86 | 0.88 | 2.03 | 12/18/13 | |
| Bloomberg Global Credit Hedged USD Index | -1.08 | 1.39 | — 5 | — | |
| Fund Expense Ratios6: Class A shares: Gross 1.79%, Net 0.95%; Class I shares: Gross 1.47%, Net 0.70%. | |||||
| All returns represent past performance which is no guarantee of future results. Current performance may be higher or lower than the performance shown. The investment return and principal value of an investment will fluctuate so that an investor’s shares, when redeemed, may be worth more or less than their original cost. The above table and graph below do not reflect the deduction of taxes that a shareholder would pay on fund distributions or the redemption of shares. Please visit Virtus.com for performance data current to the most recent month-end. |
| 1 | Total returns are historical and include changes in share price and the reinvestment of both dividends and capital gain distributions. |
| 2 | “NAV” (Net Asset Value) total returns do not include the effect of any sales charge. |
| 3 | “POP” (Public Offering Price) total returns include the effect of the maximum front-end 3.75% sales charge. |
| 4 | “CDSC” (contingent deferred sales charge) is applied to redemptions of certain classes of shares that do not have a sales charge applied at the time of purchase. CDSC for certain redemptions of Class A shares made within 18 months of a finder’s fee being paid are 0.50%. |
| 5 | The since inception index returned -2.44% from the inception date of Class A shares and 2.62% from the inception date of Class I shares. |
| 6 | The expense ratios of the Fund are set forth according to the prospectus for the Fund effective April 5, 2022, as supplemented and revised, and may differ from the expense ratios disclosed in the Financial Highlights tables in this report. See the Financial Highlights for more current expense ratios. Net Expense: Expenses reduced by a contractual expense limitation in effect through April 7, 2024. Gross Expense: Does not reflect the effect of the expense limitation. Expense ratios include fees and expenses associated with any underlying funds. |
| Par Value | Value | ||
| Corporate Bonds and Notes—93.8% | |||
| Argentina—1.9% | |||
| MSU Energy S.A. 144A 6.875%, 2/1/25(1) | $ 80 | $ 56 | |
| YPF S.A. | |||
| 144A 8.500%, 7/28/25(1) | 16 | 14 | |
| RegS 8.500%, 7/28/25(2) | 19 | 16 | |
| RegS 6.950%, 7/21/27(2) | 82 | 62 | |
| 148 | |||
| Brazil—5.9% | |||
| Banco do Brasil S.A. | |||
| 144A 6.250%(1)(3) | 40 | 34 | |
| 144A 9.000%(1)(3) | 19 | 19 | |
| Braskem Netherlands Finance B.V. 144A 5.875%, 1/31/50(1) | 13 | 10 | |
| BRF S.A. 144A 4.875%, 1/24/30(1) | 32 | 26 | |
| Guara Norte S.a.r.l. 144A 5.198%, 6/15/34(1) | 10 | 8 | |
| Iochpe-Maxion Austria GmbH 144A 5.000%, 5/7/28(1) | 37 | 30 | |
| JBS USA LUX S.A. 144A 4.375%, 2/2/52(1) | 62 | 41 | |
| MC Brazil Downstream Trading S.a.r.l. 144A 7.250%, 6/30/31(1) | 47 | 34 | |
| Minerva Luxembourg S.A. 144A 4.375%, 3/18/31(1) | 44 | 34 | |
| MV24 Capital B.V. 144A 6.748%, 6/1/34(1) | 4 | 4 | |
| Petrobras Global Finance B.V. 6.900%, 3/19/49 | 35 | 32 | |
| Rumo Luxembourg S.a.r.l. 144A 4.200%, 1/18/32(1) | 58 | 46 | |
| Simpar Europe S.A. 144A 5.200%, 1/26/31(1) | 45 | 34 | |
| Suzano Austria GmbH 3.750%, 1/15/31 | 38 | 32 | |
| Usiminas International S.a.r.l. 144A 5.875%, 7/18/26(1) | 76 | 74 | |
| 458 | |||
| Chile—2.8% | |||
| ATP Tower Holdings LLC 144A 4.050%, 4/27/26(1) | 116 | 99 | |
| Banco de Chile RegS 2.990%, 12/9/31(2) | 61 | 52 | |
| Celulosa Arauco y Constitucion S.A. 144A 5.500%, 4/30/49(1) | 68 | 57 | |
| Cencosud S.A. 144A 4.375%, 7/17/27(1) | 14 | 14 | |
| 222 | |||
| China—4.4% | |||
| Bank of China Ltd. RegS 5.000%, 11/13/24(2) | 46 | 46 | |
| ENN Clean Energy International Investment Ltd. 144A 3.375%, 5/12/26(1) | 156 | 142 | |
| Par Value | Value | ||
| China—continued | |||
| Tencent Holdings Ltd. | |||
| 144A 2.390%, 6/3/30(1) | $ 14 | $ 12 | |
| 144A 3.240%, 6/3/50(1) | 14 | 9 | |
| RegS 3.975%, 4/11/29(2) | 25 | 23 | |
| Wanda Properties International Co., Ltd. RegS 7.250%, 1/29/24(2) | 200 | 111 | |
| 343 | |||
| Colombia—4.2% | |||
| AI Candelaria Spain S.A. | |||
| 144A 7.500%, 12/15/28(1) | 29 | 27 | |
| 144A 5.750%, 6/15/33(1) | 66 | 46 | |
| Ecopetrol S.A. | |||
| 5.375%, 6/26/26 | 29 | 28 | |
| 7.375%, 9/18/43 | 73 | 58 | |
| Geopark Ltd. 144A 5.500%, 1/17/27(1) | 61 | 49 | |
| Gran Tierra Energy International Holdings Ltd. 144A 6.250%, 2/15/25(1) | 65 | 54 | |
| Grupo Aval Ltd. 144A 4.375%, 2/4/30(1) | 30 | 22 | |
| SierraCol Energy Andina LLC 144A 6.000%, 6/15/28(1) | 61 | 44 | |
| 328 | |||
| Ghana—1.0% | |||
| Kosmos Energy Ltd. RegS 7.750%, 5/1/27(2) | 60 | 51 | |
| Tullow Oil plc 144A 7.000%, 3/1/25(1) | 45 | 24 | |
| 75 | |||
| Guatemala—1.9% | |||
| CT Trust 144A 5.125%, 2/3/32(1) | 57 | 45 | |
| Investment Energy Resources Ltd. 144A 6.250%, 4/26/29(1) | 58 | 54 | |
| Millicom International Cellular S.A. 144A 5.125%, 1/15/28(1) | 54 | 46 | |
| 145 | |||
| Hong Kong—4.4% | |||
| CK Hutchison International 17 II Ltd. RegS 3.250%, 9/29/27(2) | 50 | 47 | |
| Standard Chartered plc | |||
| 144A 6.301%, 1/9/29(1) | 80 | 81 | |
| 144A 2.678%, 6/29/32(1) | 25 | 20 | |
| Towngas Finance Ltd. RegS 4.750% (2)(3) | 200 | 197 | |
| 345 | |||
| India—7.1% | |||
| Adani Electricity Mumbai Ltd. 144A 3.949%, 2/12/30(1) | 100 | 75 | |
| Adani Transmission Ltd. 144A 4.000%, 8/3/26(1) | 23 | 20 | |
| Par Value | Value | ||
| India—continued | |||
| Bharti Airtel Ltd. | |||
| 144A 3.250%, 6/3/31(1) | $ 33 | $ 29 | |
| RegS 4.375%, 6/10/25(2) | 15 | 15 | |
| Greenko Dutch B.V. 144A 3.850%, 3/29/26(1) | 60 | 53 | |
| Greenko Power II Ltd. 144A 4.300%, 12/13/28(1) | 26 | 22 | |
| JSW Hydro Energy Ltd. RegS 4.125%, 5/18/31(2) | 70 | 59 | |
| Network i2i Ltd. 144A 5.650% (1)(3) | 170 | 164 | |
| Reliance Industries Ltd. RegS 3.625%, 1/12/52(2) | 43 | 30 | |
| Summit Digitel Infrastructure Ltd. RegS 2.875%, 8/12/31(2) | 60 | 48 | |
| Vedanta Resources Finance II plc | |||
| 144A 13.875%, 1/21/24(1) | 17 | 16 | |
| 144A 8.950%, 3/11/25(1) | 31 | 23 | |
| 554 | |||
| Indonesia—5.4% | |||
| Freeport Indonesia PT | |||
| 144A 4.763%, 4/14/27(1) | 68 | 66 | |
| RegS 5.315%, 4/14/32(2) | 30 | 28 | |
| Indika Energy Capital IV Pte Ltd. | |||
| 144A 8.250%, 10/22/25(1) | 6 | 6 | |
| RegS 8.250%, 10/22/25(2) | 136 | 134 | |
| Indonesia Asahan Aluminium PT 144A 5.450%, 5/15/30(1) | 40 | 39 | |
| Minejesa Capital B.V. 144A 4.625%, 8/10/30(1) | 165 | 147 | |
| Star Energy Geothermal Darajat II 144A 4.850%, 10/14/38(1) | 5 | 5 | |
| 425 | |||
| Israel—4.4% | |||
| Altice Financing S.A. 144A 5.000%, 1/15/28(1) | 94 | 73 | |
| Leviathan Bond Ltd. RegS, 144A 6.750%, 6/30/30(1)(2) | 134 | 123 | |
| Teva Pharmaceutical Finance Netherlands III B.V. 3.150%, 10/1/26 | 164 | 146 | |
| 342 | |||
| Jamaica—0.2% | |||
| Digicel International Finance Ltd. 144A 8.750%, 5/25/24(1) | 16 | 14 | |
| Digicel Ltd. RegS 6.750%, 3/1/23(2)(4) | 15 | 3 | |
| 17 | |||
| Kazakhstan—1.9% | |||
| KazMunayGas National Co. JSC RegS 3.500%, 4/14/33(2) | 200 | 150 | |
| Par Value | Value | ||
| Macau—6.1% | |||
| Melco Resorts Finance Ltd. | |||
| 144A 5.750%, 7/21/28(1) | $ 32 | $ 27 | |
| RegS 5.625%, 7/17/27(2) | 37 | 32 | |
| RegS 5.750%, 7/21/28(2) | 50 | 42 | |
| RegS 5.375%, 12/4/29(2) | 30 | 24 | |
| MGM China Holdings Ltd. RegS 5.875%, 5/15/26(2) | 53 | 50 | |
| Sands China Ltd. 3.750%, 8/8/31 | 100 | 80 | |
| Studio City Co., Ltd. 144A 7.000%, 2/15/27(1) | 54 | 50 | |
| Studio City Finance Ltd. | |||
| 144A 6.000%, 7/15/25(1) | 79 | 72 | |
| 144A 5.000%, 1/15/29(1) | 138 | 100 | |
| 477 | |||
| Malaysia—2.9% | |||
| Gohl Capital Ltd. RegS 4.250%, 1/24/27(2) | 200 | 187 | |
| Resorts World Las Vegas LLC RegS 4.625%, 4/6/31(2) | 50 | 38 | |
| 225 | |||
| Mexico—8.1% | |||
| Banco Mercantil del Norte S.A. | |||
| 144A 6.750%(1)(3) | 53 | 50 | |
| 144A 7.500%(1)(3) | 43 | 37 | |
| BBVA Bancomer S.A. | |||
| 144A 5.125%, 1/18/33(1) | 19 | 17 | |
| RegS 5.350%, 11/12/29(2) | 32 | 30 | |
| Braskem Idesa SAPI 144A 6.990%, 2/20/32(1) | 62 | 42 | |
| Cemex SAB de C.V. | |||
| 144A 5.125%(1)(3) | 57 | 50 | |
| 144A 9.125%(1)(3) | 38 | 38 | |
| 144A 3.875%, 7/11/31(1) | 54 | 45 | |
| Cometa Energia S.A. de C.V. 144A 6.375%, 4/24/35(1) | 46 | 45 | |
| Mexico Generadora de Energia S de rl 144A 5.500%, 12/6/32(1) | 22 | 22 | |
| Petroleos Mexicanos | |||
| 6.625%, 6/15/35 | 33 | 22 | |
| 7.690%, 1/23/50 | 48 | 31 | |
| Poinsettia Finance Ltd. RegS 6.625%, 6/17/31(2) | 56 | 46 | |
| Sitios Latinoamerica SAB de C.V. 144A 5.375%, 4/4/32(1) | 33 | 29 | |
| Sixsigma Networks Mexico S.A. de C.V. 144A 7.500%, 5/2/25(1) | 47 | 41 | |
| Southern Copper Corp. 6.750%, 4/16/40 | 34 | 37 | |
| Tierra Mojada Luxembourg II S.a.r.l. 144A 5.750%, 12/1/40(1) | 54 | 46 | |
| 628 | |||
| Morocco—0.6% | |||
| OCP S.A. 144A 3.750%, 6/23/31(1) | 55 | 45 | |
| Par Value | Value | ||
| Nigeria—1.8% | |||
| Access Bank plc 144A 6.125%, 9/21/26(1) | $ 28 | $ 22 | |
| Africa Finance Corp. 144A 2.875%, 4/28/28(1) | 63 | 51 | |
| IHS Holding Ltd. 144A 6.250%, 11/29/28(1) | 41 | 33 | |
| IHS Netherlands Holdco B.V. 144A 8.000%, 9/18/27(1) | 36 | 32 | |
| 138 | |||
| Oman —0.3% | |||
| Oryx Funding Ltd. 144A 5.800%, 2/3/31(1) | 28 | 27 | |
| Peru—2.7% | |||
| Banco de Credito del Peru S.A. 144A 3.125%, 7/1/30(1) | 28 | 26 | |
| Inkia Energy Ltd. 144A 5.875%, 11/9/27(1) | 112 | 105 | |
| Kallpa Generacion S.A. 144A 4.125%, 8/16/27(1) | 53 | 49 | |
| Nexa Resources S.A. 144A 6.500%, 1/18/28(1) | 30 | 28 | |
| 208 | |||
| Saudi Arabia—3.8% | |||
| Acwa Power Management & Investments One Ltd. 144A 5.950%, 12/15/39(1) | 103 | 99 | |
| EIG Pearl Holdings S.a.r.l. 144A 3.545%, 8/31/36(1) | 35 | 30 | |
| Saudi Arabian Oil Co. 144A 4.375%, 4/16/49(1) | 65 | 55 | |
| Saudi Government International Bond 144A 3.500%, 4/16/29(1) | 40 | 37 | |
| TMS Issuer S.a.r.l. 144A 5.780%, 8/23/32(1) | 75 | 78 | |
| 299 | |||
| Singapore—2.6% | |||
| BOC Aviation Ltd. (3 month LIBOR + 1.300%) RegS 6.679%, 5/21/25(2)(5) | 200 | 199 | |
| South Africa—4.3% | |||
| Anglo American Capital plc | |||
| 144A 2.625%, 9/10/30(1) | 10 | 8 | |
| RegS 2.625%, 9/10/30(2) | 8 | 7 | |
| Eskom Holdings SOC Ltd. | |||
| 144A 6.750%, 8/6/23(1) | 64 | 63 | |
| 144A 7.125%, 2/11/25(1) | 67 | 64 | |
| Prosus N.V. | |||
| 144A 3.680%, 1/21/30(1) | 33 | 27 | |
| 144A 3.832%, 2/8/51(1) | 19 | 11 | |
| RegS 3.680%, 1/21/30(2) | 37 | 31 | |
| RegS 3.061%, 7/13/31(2) | 47 | 36 | |
| Par Value | Value | ||
| South Africa—continued | |||
| Sasol Financing USA LLC | |||
| 4.375%, 9/18/26 | $ 80 | $ 70 | |
| 144A 8.750%, 5/3/29(1) | 20 | 19 | |
| 336 | |||
| South Korea—2.5% | |||
| LG Chem Ltd. | |||
| RegS 1.375%, 7/7/26(2) | 50 | 44 | |
| RegS 2.375%, 7/7/31(2) | 40 | 33 | |
| Shinhan Bank Co., Ltd. RegS 3.875%, 3/24/26(2) | 60 | 57 | |
| Woori Bank RegS 4.750%, 4/30/24(2) | 60 | 59 | |
| 193 | |||
| Taiwan—0.8% | |||
| TSMC Arizona Corp. | |||
| 3.875%, 4/22/27 | 14 | 14 | |
| 4.125%, 4/22/29 | 23 | 22 | |
| TSMC Global Ltd. RegS 1.375%, 9/28/30(2) | 35 | 28 | |
| 64 | |||
| Tanzania—1.2% | |||
| HTA Group Ltd. 144A 7.000%, 12/18/25(1) | 104 | 96 | |
| Thailand—1.5% | |||
| Bangkok Bank PCL 144A 3.733%, 9/25/34(1) | 50 | 42 | |
| PTT Treasury Center Co., Ltd. 144A 4.500%, 10/25/42(1) | 52 | 44 | |
| Thaioil Treasury Center Co., Ltd. RegS 4.875%, 1/23/43(2) | 40 | 32 | |
| 118 | |||
| Turkey—2.5% | |||
| Akbank TAS 144A 5.125%, 3/31/25(1) | 15 | 14 | |
| Aydem Yenilenebilir Enerji AS 144A 7.750%, 2/2/27(1) | 62 | 50 | |
| Turkcell Iletisim Hizmetleri AS 144A 5.750%, 10/15/25(1) | 85 | 78 | |
| Turkiye Garanti Bankasi AS 144A 7.177%, 5/24/27(1) | 60 | 53 | |
| 195 | |||
| Ukraine—1.0% | |||
| Metinvest B.V. 144A 7.750%, 10/17/29(1) | 75 | 43 | |
| VF Ukraine PAT via VFU Funding plc 144A 6.200%, 2/11/25(1) | 55 | 36 | |
| 79 | |||
| United Arab Emirates—4.0% | |||
| Abu Dhabi National Energy Co. PJSC 144A 4.696%, 4/24/33(1) | 129 | 128 | |
| Par Value | Value | ||
| United Arab Emirates—continued | |||
| DP World Ltd. 144A 4.700%, 9/30/49(1) | $ 149 | $ 124 | |
| Galaxy Pipeline Assets Bidco Ltd. 144A 1.750%, 9/30/27(1) | 61 | 57 | |
| 309 | |||
| Vietnam—1.2% | |||
| Mong Duong Finance Holdings B.V. 144A 5.125%, 5/7/29(1) | 111 | ��� 96 | |
| Zambia—0.4% | |||
| First Quantum Minerals Ltd. 144A 8.625%, 6/1/31(1) | 33 | 33 | |
| Total Corporate Bonds and Notes (Identified Cost $8,024) | 7,317 | ||
| Total Long-Term Investments—93.8% (Identified Cost $8,024) | 7,317 | ||
| Shares | ||
| Short-Term Investment—1.9% | ||
| Money Market Mutual Fund—1.9% | ||
| Dreyfus Government Cash Management Fund - Institutional Shares (seven-day effective yield 4.993%)(6) | 145,820 | 146 |
| Total Short-Term Investment (Identified Cost $146) | 146 | |
| TOTAL INVESTMENTS—95.7% (Identified Cost $8,170) | $7,463 | |
| Other assets and liabilities, net—4.3% | 339 | |
| NET ASSETS—100.0% | $7,802 | |
| Abbreviations: | |
| JSC | Joint Stock Company |
| LIBOR | London Interbank Offered Rate |
| LLC | Limited Liability Company |
| PJSC | Public Joint Stock Company |
| Footnote Legend: | |
| (1) | Security exempt from registration under Rule 144A of the Securities Act of 1933. These securities may be resold in transactions exempt from registration, normally to qualified institutional buyers. At May 31, 2023, these securities amounted to a value of $4,698 or 60.2% of net assets. |
| (2) | Regulation S security. Security is offered and sold outside of the United States; therefore, it is exempt from registration with the SEC under Rules 903 and 904 of the Securities Act of 1933. |
| (3) | No contractual maturity date. |
| (4) | Security in default, interest payments are being received during the bankruptcy proceedings. |
| (5) | Variable rate security. Rate disclosed is as of May 31, 2023. Information in parenthesis represents benchmark and reference rate for each security. Certain variable rate securities are not based on a published reference rate and spread but are determined by the issuer or agent and are based on current market conditions, or, for mortgage-backed securities, are impacted by the individual mortgages which are paying off over time. These securities do not indicate a reference rate and spread in their descriptions. |
| (6) | Shares of this fund are publicly offered, and its prospectus and annual report are publicly available. |
| Country Weightings (Unaudited)† | |
| Mexico | 8% |
| India | 7 |
| Macau | 6 |
| Brazil | 6 |
| Indonesia | 6 |
| Hong Kong | 5 |
| China | 5 |
| Other | 57 |
| Total | 100% |
| † % of total investments as of May 31, 2023. | |
| Total Value at May 31, 2023 | Level 1 Quoted Prices | Level 2 Significant Observable Inputs | |||
| Assets: | |||||
| Debt Instruments: | |||||
| Corporate Bonds and Notes | $7,317 | $ — | $7,317 | ||
| Money Market Mutual Fund | 146 | 146 | — | ||
| Total Investments | $7,463 | $146 | $7,317 |
| Shares | Value | ||
| Affiliated Mutual Funds—97.7% | |||
| Fixed Income Funds—97.7% | |||
| Virtus Stone Harbor Emerging Markets Debt Income Fund Class I(1)(2) | 163,738 | $ 1,131 | |
| Virtus Stone Harbor Local Markets Fund Class I(1)(2)(3) | 156,350 | 1,207 | |
| Total Affiliated Mutual Funds (Identified Cost $2,285) | 2,338 | ||
| Total Long-Term Investments—97.7% (Identified Cost $2,285) | 2,338 | ||
| TOTAL INVESTMENTS—97.7% (Identified Cost $2,285) | $2,338 | ||
| Other assets and liabilities, net—2.3% | 54 | ||
| NET ASSETS—100.0% | $2,392 | ||
| Footnote Legend: | |
| (1) | Affiliated investment. See Note 4I in Notes to Financial Statements. |
| (2) | Shares of this fund are publicly offered, and its prospectus and annual report are publicly available. |
| (3) | Non-income producing. |
| Total Value at May 31, 2023 | Level 1 Quoted Prices | ||
| Assets: | |||
| Affiliated Mutual Funds | $2,338 | $2,338 | |
| Total Investments | $2,338 | $2,338 |
| Par Value(1) | Value | ||
| Foreign Government Securities—61.3% | |||
| Angola —3.7% | |||
| Republic of Angola | |||
| 144A 8.000%, 11/26/29(2) | $ 3,965 | $ 3,368 | |
| 144A 9.125%, 11/26/49(2) | 2,270 | 1,689 | |
| Republic of Angola Via Avenir II B.V. | |||
| (6 month LIBOR + 4.500%) RegS 9.687%, 12/7/23(3)(4)(5) | 890 | 886 | |
| (6 month LIBOR + 7.500%) RegS 12.772%, 7/3/23(3)(4)(5) | 5,708 | 5,680 | |
| Republic of Angola Via Avenir Issuer II Ireland DAC RegS 6.927%, 2/19/27(3)(4) | 4,109 | 3,821 | |
| 15,444 | |||
| Argentina—1.2% | |||
| Provincia De Buenos Aires RegS 5.250%, 9/1/37(4)(5) | 5,515 | 1,751 | |
| Republic of Argentina | |||
| 1.000%, 7/9/29 | 865 | 220 | |
| 0.500%, 7/9/30(5) | 3,198 | 837 | |
| 1.500%, 7/9/35(5) | 9,215 | 2,142 | |
| 4,950 | |||
| Benin—0.3% | |||
| Benin Intl Gov Bond RegS 4.875%, 1/19/32(4) | 1,400 EUR | 1,111 | |
| Brazil—2.5% | |||
| Federative Republic of Brazil | |||
| 5.000%, 1/27/45 | 1,987 | 1,532 | |
| 5.625%, 2/21/47 | 61 | 51 | |
| 4.750%, 1/14/50 | 12,129 | 8,778 | |
| 10,361 | |||
| Chile—0.6% | |||
| Republic of Chile | |||
| 3.860%, 6/21/47 | 670 | 537 | |
| 3.500%, 1/25/50 | 1,562 | 1,153 | |
| 3.250%, 9/21/71 | 1,300 | 827 | |
| 2,517 | |||
| Colombia—2.6% | |||
| Republic of Colombia | |||
| 3.000%, 1/30/30 | 1,141 | 876 | |
| 3.125%, 4/15/31 | 616 | 457 | |
| 8.000%, 4/20/33 | 2 | 2 | |
| 6.125%, 1/18/41 | 3,708 | 2,893 | |
| 4.125%, 2/22/42 | 158 | 97 | |
| 5.000%, 6/15/45 | 4,208 | 2,793 | |
| 5.200%, 5/15/49 | 3,641 | 2,420 | |
| 3.875%, 2/15/61 | 2,401 | 1,303 | |
| 10,841 | |||
| Costa Rica—0.5% | |||
| Costa Rica Government 144A 6.550%, 4/3/34(2) | 1,884 | 1,900 | |
| Par Value(1) | Value | ||
| Dominican Republic—2.9% | |||
| Dominican Republic | |||
| 144A 4.875%, 9/23/32(2) | $ 1,999 | $ 1,674 | |
| 144A 6.000%, 2/22/33(2) | 495 | 451 | |
| RegS 5.300%, 1/21/41(4) | 7,105 | 5,497 | |
| RegS 7.450%, 4/30/44(4) | 2,218 | 2,115 | |
| RegS 6.500%, 2/15/48(4) | 429 | 358 | |
| RegS 5.875%, 1/30/60(4) | 2,586 | 1,914 | |
| 12,009 | |||
| Ecuador—1.5% | |||
| Republic of Ecuador | |||
| 144A 0.000%, 7/31/30(2) | 4,037 | 1,176 | |
| 144A 5.500%, 7/31/30(2)(5) | 4,446 | 2,140 | |
| RegS 5.500%, 7/31/30(4)(5) | 5,674 | 2,730 | |
| 6,046 | |||
| Egypt—2.6% | |||
| Arab Republic of Egypt | |||
| 144A 4.750%, 4/16/26(2) | 952 EUR | 672 | |
| 144A 5.800%, 9/30/27(2) | 5,073 | 3,175 | |
| 144A 6.375%, 4/11/31(2) | 5,204 EUR | 2,934 | |
| 144A 7.053%, 1/15/32(2) | 903 | 493 | |
| 144A 7.625%, 5/29/32(2) | 331 | 183 | |
| 144A 8.875%, 5/29/50(2) | 365 | 188 | |
| 144A 8.750%, 9/30/51(2) | 1,033 | 527 | |
| RegS 5.750%, 5/29/24(4) | 271 | 244 | |
| RegS 4.750%, 4/16/26(4) | 3,091 EUR | 2,183 | |
| 10,599 | |||
| El Salvador—0.8% | |||
| Republic of El Salvador | |||
| RegS 6.375%, 1/18/27(4) | 500 | 317 | |
| RegS 8.625%, 2/28/29(4) | 2,649 | 1,573 | |
| RegS 7.650%, 6/15/35(4) | 400 | 210 | |
| RegS 9.500%, 7/15/52(4) | 2,225 | 1,241 | |
| 3,341 | |||
| Par Value(1) | Value | ||
| Ethiopia—0.5% | |||
| Federal Republic of Ethiopia 144A 6.625%, 12/11/24(2) | $ 3,217 | $ 2,174 | |
| Gabon—1.1% | |||
| Republic of Gabon | |||
| 144A 6.950%, 6/16/25(2) | 1,191 | 1,134 | |
| 144A 6.625%, 2/6/31(2) | 2,474 | 1,932 | |
| 144A 7.000%, 11/24/31(2) | 1,559 | 1,217 | |
| RegS 6.625%, 2/6/31(4) | 201 | 157 | |
| 4,440 | |||
| Ghana—1.2% | |||
| Republic of Ghana | |||
| 144A 6.375%, 2/11/27(2)(6) | 514 | 206 | |
| 144A 10.750%, 10/14/30(2) | 1,001 | 679 | |
| 144A 8.875%, 5/7/42(2)(6) | 343 | 130 | |
| 144A 8.950%, 3/26/51(2)(6) | 5,583 | 2,114 | |
| RegS 10.750%, 10/14/30(4) | 2,842 | 1,928 | |
| 5,057 | |||
| Guatemala—0.7% | |||
| Republic of Guatemala | |||
| 144A 3.700%, 10/7/33(2) | 1,039 | 833 | |
| 144A 4.650%, 10/7/41(2) | 1,697 | 1,330 | |
| RegS 4.900%, 6/1/30(4) | 987 | 913 | |
| 3,076 | |||
| Honduras—0.1% | |||
| Honduras Government RegS 5.625%, 6/24/30(4) | 302 | 241 | |
| Hungary—2.5% | |||
| Hungary Government International Bond | |||
| 144A 6.125%, 5/22/28(2) | 332 | 338 | |
| 144A 2.125%, 9/22/31(2) | 1,225 | 931 | |
| 144A 6.250%, 9/22/32(2) | 931 | 947 | |
| 144A 6.750%, 9/25/52(2) | 3,416 | 3,444 | |
| RegS 4.250%, 6/16/31(4) | 1,065 EUR | 1,047 | |
| RegS 1.750%, 6/5/35(4) | 2,371 EUR | 1,725 | |
| RegS 1.500%, 11/17/50(4) | 1,207 EUR | 635 | |
| Par Value(1) | Value | ||
| Hungary—continued | |||
| RegS 3.125%, 9/21/51(4) | $ 1,850 | $ 1,100 | |
| 10,167 | |||
| Indonesia—2.1% | |||
| Republic of Indonesia | |||
| 4.150%, 9/20/27 | 661 | 647 | |
| 4.850%, 1/11/33 | 3,737 | 3,779 | |
| 4.300%, 3/31/52 | 1,048 | 896 | |
| 144A 5.250%, 1/8/47(2) | 439 | 436 | |
| RegS 6.750%, 1/15/44(4) | 927 | 1,084 | |
| RegS 5.125%, 1/15/45(4) | 1,727 | 1,706 | |
| 8,548 | |||
| Ivory Coast—0.7% | |||
| Ivory Coast Government International Bond | |||
| 144A 6.625%, 3/22/48(2) | 1,055 EUR | 763 | |
| RegS 5.250%, 3/22/30(4) | 373 EUR | 325 | |
| RegS 5.875%, 10/17/31(4) | 345 EUR | 300 | |
| RegS 4.875%, 1/30/32(4) | 1,038 EUR | 839 | |
| RegS 6.625%, 3/22/48(4) | 1,000 EUR | 724 | |
| 2,951 | |||
| Jordan—0.9% | |||
| Kingdom of Jordan | |||
| 144A 7.500%, 1/13/29(2) | 1,800 | 1,775 | |
| 144A 7.375%, 10/10/47(2) | 1,015 | 846 | |
| RegS 7.375%, 10/10/47(4) | 1,394 | 1,162 | |
| 3,783 | |||
| Kazakhstan—0.3% | |||
| Republic of Kazakhstan RegS 1.500%, 9/30/34(4) | 1,582 EUR | 1,196 | |
| Kenya—1.6% | |||
| Republic of Kenya | |||
| RegS 6.875%, 6/24/24(4) | 975 | 896 | |
| 144A 6.875%, 6/24/24(2) | 4,757 | 4,371 | |
| 144A 8.000%, 5/22/32(2) | 1,410 | 1,133 | |
| RegS 7.250%, 2/28/28(4) | 471 | 392 | |
| 6,792 | |||
| Par Value(1) | Value | ||
| Lebanon—0.9% | |||
| Lebanese Republic | |||
| 6.375%, 3/9/20(6) | $ 2,089 | $ 118 | |
| 6.150%, 6/19/20(6) | 7,173 | 405 | |
| 6.250%, 5/27/22(6) | 6,726 | 380 | |
| 6.400%, 5/26/23(6) | 1,368 | 77 | |
| 6.850%, 5/25/29(6) | 5,626 | 310 | |
| 8.200%, 5/17/33(6) | 9,360 | 528 | |
| RegS 5.800%, 4/14/20(4)(6) | 1,612 | 91 | |
| RegS 8.250%, 4/12/21(4)(6) | 17,726 | 1,023 | |
| RegS 6.000%, 1/27/23(4)(6) | 3,105 | 178 | |
| RegS 6.650%, 4/22/24(4)(6) | 4,594 | 264 | |
| RegS 6.600%, 11/27/26(4)(6) | 4,423 | 254 | |
| RegS 6.850%, 3/23/27(4)(6) | 2,417 | 139 | |
| 3,767 | |||
| Mexico—1.0% | |||
| United Mexican States | |||
| 2.250%, 8/12/36 | 1,839 EUR | 1,421 | |
| 5.000%, 4/27/51 | 708 | 603 | |
| 3.771%, 5/24/61 | 2,297 | 1,527 | |
| 3.750%, 4/19/71 | 700 | 459 | |
| 4,010 | |||
| Mongolia—0.1% | |||
| Mongolia Government International Bond 144A 8.650%, 1/19/28(2) | 474 | 467 | |
| Morocco—0.4% | |||
| Kingdom of Morocco 144A 6.500%, 9/8/33(2) | 1,835 | 1,871 | |
| Mozambique—0.4% | |||
| Republic of Mozambique 144A 5.000%, 9/15/31(2)(5) | 2,160 | 1,511 | |
| Nigeria—2.1% | |||
| Republic of Nigeria | |||
| 144A 6.500%, 11/28/27(2) | 1,476 | 1,245 | |
| 144A 6.125%, 9/28/28(2) | 3,256 | 2,621 | |
| 144A 8.375%, 3/24/29(2) | 2,020 | 1,746 | |
| 144A 7.375%, 9/28/33(2) | 1,747 | 1,283 | |
| RegS 8.747%, 1/21/31(4) | 1,145 | 956 | |
| RegS 7.375%, 9/28/33(4) | 1,129 | 829 | |
| 8,680 | |||
| Par Value(1) | Value | ||
| Oman —3.0% | |||
| Oman Government International Bond | |||
| 144A 6.750%, 10/28/27(2) | $ 1,118 | $ 1,158 | |
| 144A 5.625%, 1/17/28(2) | 1,016 | 1,006 | |
| 144A 6.000%, 8/1/29(2) | 2,782 | 2,788 | |
| 144A 7.375%, 10/28/32(2) | 1,122 | 1,223 | |
| 144A 6.500%, 3/8/47(2) | 1,565 | 1,426 | |
| 144A 6.750%, 1/17/48(2) | 5,040 | 4,735 | |
| 12,336 | |||
| Pakistan—0.5% | |||
| Islamic Republic of Pakistan | |||
| 144A 6.000%, 4/8/26(2) | 4,708 | 1,766 | |
| 144A 6.875%, 12/5/27(2) | 1,411 | 525 | |
| 2,291 | |||
| Panama—3.0% | |||
| Panama Bonos del Tesoro 3.362%, 6/30/31 | 2,659 | 2,262 | |
| Republic of Panama | |||
| 6.400%, 2/14/35 | 1,955 | 2,041 | |
| 6.700%, 1/26/36 | 746 | 795 | |
| 6.853%, 3/28/54 | 1,581 | 1,619 | |
| 4.500%, 4/1/56 | 7,689 | 5,672 | |
| 12,389 | |||
| Papua New Guinea —0.1% | |||
| Papua New Guinea Government International Bond 144A 8.375%, 10/4/28(2) | 449 | 405 | |
| Peru—0.2% | |||
| Republic of Peru 2.783%, 1/23/31 | 1,167 | 993 | |
| Philippines—2.1% | |||
| Republic of Philippines | |||
| 5.000%, 7/17/33 | 4,679 | 4,774 | |
| 2.650%, 12/10/45 | 2,125 | 1,432 | |
| 5.500%, 1/17/48 | 2,317 | 2,400 | |
| 8,606 | |||
| Poland—0.7% | |||
| Republic of Poland 4.875%, 10/4/33 | 2,881 | 2,871 | |
| Qatar—2.5% | |||
| State of Qatar | |||
| 144A 4.817%, 3/14/49(2) | 6,693 | 6,361 | |
| Par Value(1) | Value | ||
| Qatar—continued | |||
| 144A 4.400%, 4/16/50(2) | $ 3,966 | $ 3,584 | |
| RegS 4.400%, 4/16/50(4) | 687 | 621 | |
| 10,566 | |||
| Romania—2.2% | |||
| Romania Government International Bond | |||
| 144A 3.750%, 2/7/34(2) | 946 EUR | 796 | |
| 144A 3.375%, 2/8/38(2) | 1,007 EUR | 754 | |
| 144A 2.750%, 4/14/41(2) | 3,070 EUR | 1,940 | |
| 144A 2.875%, 4/13/42(2) | 1,969 EUR | 1,244 | |
| 144A 3.375%, 1/28/50(2) | 1,435 EUR | 912 | |
| RegS 3.624%, 5/26/30(4) | 1,110 EUR | 1,021 | |
| RegS 4.125%, 3/11/39(4) | 1,422 EUR | 1,140 | |
| RegS 2.875%, 4/13/42(4) | 1,012 EUR | 639 | |
| RegS 5.125%, 6/15/48(4) | 668 | 546 | |
| RegS 4.000%, 2/14/51(4) | 460 | 313 | |
| 9,305 | |||
| Russia—0.0% | |||
| Russian Federation - Eurobond RegS 5.100%, 3/28/35(4)(6)(7)(8) | 100 | 5 | |
| Saudi Arabia—2.7% | |||
| Saudi Government International Bond | |||
| 144A 5.500%, 10/25/32(2) | 3,034 | 3,200 | |
| 144A 2.250%, 2/2/33(2) | 2,490 | 2,023 | |
| 144A 4.500%, 10/26/46(2) | 1,449 | 1,263 | |
| 144A 5.000%, 4/17/49(2) | 1,520 | 1,405 | |
| RegS 4.500%, 10/26/46(4) | 1,804 | 1,572 | |
| RegS 3.750%, 1/21/55(4) | 2,341 | 1,747 | |
| 11,210 | |||
| Senegal—0.5% | |||
| Republic of Senegal | |||
| 144A 5.375%, 6/8/37(2) | 2,765 EUR | 1,830 | |
| RegS 4.750%, 3/13/28(4) | 452 EUR | 395 | |
| 2,225 | |||
| Par Value(1) | Value | ||
| South Africa—0.5% | |||
| Republic of South Africa | |||
| 4.300%, 10/12/28 | $ 378 | $ 325 | |
| 5.875%, 4/20/32 | 1,200 | 1,034 | |
| 7.300%, 4/20/52 | 921 | 739 | |
| 2,098 | |||
| Sri Lanka—0.8% | |||
| Republic of Sri Lanka | |||
| 144A 6.750%, 4/18/28(2)(6) | 4,561 | 1,644 | |
| RegS 6.350%, 6/28/24(4)(6) | 1,194 | 433 | |
| RegS 6.200%, 5/11/27(4)(6) | 3,068 | 1,106 | |
| 3,183 | |||
| Tunisia—1.6% | |||
| Tunisian Republic | |||
| 144A 6.750%, 10/31/23(2) | 1,511 EUR | 1,514 | |
| RegS 5.625%, 2/17/24(4) | 5,732 EUR | 4,914 | |
| RegS 6.375%, 7/15/26(4) | 684 EUR | 391 | |
| 6,819 | |||
| Turkey—1.8% | |||
| Hazine Mustesarligi Varl RegS 9.758%, 11/13/25(4) | 1,160 | 1,165 | |
| Republic of Turkey | |||
| 6.375%, 10/14/25 | 5,932 | 5,521 | |
| 9.125%, 7/13/30 | 671 | 643 | |
| 7,329 | |||
| Ukraine—0.4% | |||
| Ukraine Government Bond | |||
| 144A 7.750%, 9/1/27(2)(6) | 437 | 82 | |
| 144A 9.750%, 11/1/30(2)(6) | 2,206 | 440 | |
| 144A 6.876%, 5/21/31(2)(6) | 1,198 | 213 | |
| RegS 7.750%, 9/1/28(4)(6) | 734 | 140 | |
| RegS 7.750%, 9/1/29(4)(6) | 3,258 | 622 | |
| RegS 9.750%, 11/1/30(4)(6) | 272 | 54 | |
| 1,551 | |||
| United Arab Emirates—1.6% | |||
| Finance Department Government of Sharjah 144A 4.000%, 7/28/50(2) | 9,189 | 5,636 | |
| Uae Int’L Govt Bond 144A 4.951%, 7/7/52(2) | 1,214 | 1,198 | |
| 6,834 | |||
| Par Value(1) | Value | ||
| Uruguay—0.1% | |||
| Republica Orient Uruguay 5.100%, 6/18/50 | $ 406 | $ 398 | |
| Venezuela—0.4% | |||
| Republic of Venezuela RegS 7.750%, 10/13/19(4)(6) | 25,087 | 1,593 | |
| Zambia—0.8% | |||
| Republic of Zambia | |||
| 5.375%, 9/23/23(6) | 5,095 | 2,278 | |
| 144A 5.375%, 9/20/23(2)(6) | 1,359 | 608 | |
| RegS 8.500%, 4/14/24(4)(6) | 509 | 248 | |
| 3,134 | |||
| Total Foreign Government Securities (Identified Cost $295,460) | 253,991 | ||
| Corporate Bonds and Notes—30.4% | |||
| Argentina—0.2% | |||
| MSU Energy S.A. 144A 6.875%, 2/1/25(2) | 501 | 349 | |
| YPF S.A. 144A 8.750%, 4/4/24(2) | 441 | 415 | |
| 764 | |||
| Azerbaijan—0.4% | |||
| State Oil Co. of the Azerbaijan Republic RegS 6.950%, 3/18/30(4) | 1,574 | 1,619 | |
| Brazil—0.9% | |||
| Braskem Netherlands Finance B.V. 144A 5.875%, 1/31/50(2) | 1,000 | 775 | |
| Guara Norte S.a.r.l. 144A 5.198%, 6/15/34(2) | 601 | 502 | |
| MC Brazil Downstream Trading S.a.r.l. 144A 7.250%, 6/30/31(2) | 1,297 | 946 | |
| Minerva Luxembourg S.A. 144A 4.375%, 3/18/31(2) | 293 | 226 | |
| MV24 Capital B.V. 144A 6.748%, 6/1/34(2) | 1,255 | 1,107 | |
| 3,556 | |||
| Chile—1.3% | |||
| ATP Tower Holdings LLC 144A 4.050%, 4/27/26(2) | 2,030 | 1,739 | |
| Corp. Nacional del Cobre de Chile RegS 5.125%, 2/2/33(4) | 2,450 | 2,424 | |
| Empresa Nacional del Petroleo RegS 5.250%, 11/6/29(4) | 1,491 | 1,448 | |
| 5,611 | |||
| China—0.6% | |||
| Country Garden Holdings Co., Ltd. RegS 4.800%, 8/6/30(4) | 350 | 109 | |
| Par Value(1) | Value | ||
| China—continued | |||
| Huarong Finance II Co., Ltd. RegS 4.875%, 11/22/26(4) | $ 400 | $ 339 | |
| Longfor Group Holdings Ltd. RegS 3.950%, 9/16/29(4) | 500 | 331 | |
| Wanda Properties International Co., Ltd. RegS 7.250%, 1/29/24(4) | 1,070 | 596 | |
| Wanda Properties Overseas Ltd. RegS 6.875%, 7/23/23(4) | 1,103 | 1,009 | |
| 2,384 | |||
| Colombia—1.3% | |||
| AI Candelaria Spain S.A. RegS 5.750%, 6/15/33(4) | 1,746 | 1,220 | |
| Geopark Ltd. 144A 5.500%, 1/17/27(2) | 1,357 | 1,092 | |
| Gran Tierra Energy International Holdings Ltd. 144A 6.250%, 2/15/25(2) | 1,284 | 1,069 | |
| Gran Tierra Energy, Inc. 144A 7.750%, 5/23/27(2) | 333 | 241 | |
| Grupo Aval Ltd. 144A 4.375%, 2/4/30(2) | 454 | 335 | |
| SierraCol Energy Andina LLC 144A 6.000%, 6/15/28(2) | 1,927 | 1,401 | |
| 5,358 | |||
| Georgia—0.1% | |||
| Georgian Railway JSC 144A 4.000%, 6/17/28(2) | 514 | 437 | |
| Ghana—0.5% | |||
| Kosmos Energy Ltd. RegS 7.750%, 5/1/27(4) | 500 | 426 | |
| Tullow Oil plc RegS 7.000%, 3/1/25(4) | 3,271 | 1,751 | |
| 2,177 | |||
| Guatemala—0.3% | |||
| CT Trust 144A 5.125%, 2/3/32(2) | 1,836 | 1,435 | |
| India—0.8% | |||
| Adani Electricity Mumbai Ltd. RegS 3.949%, 2/12/30(4) | 537 | 405 | |
| Adani Green Energy Ltd. RegS 4.375%, 9/8/24(4) | 500 | 459 | |
| Adani Renewable Energy RJ Ltd. 144A 4.625%, 10/15/39(2) | 534 | 387 | |
| Adani Transmission Ltd. 144A 4.000%, 8/3/26(2) | 465 | 408 | |
| Greenko Dutch B.V. | |||
| 144A 3.850%, 3/29/26(2) | 299 | 263 | |
| RegS 3.850%, 3/29/26(4) | 218 | 192 | |
| Network i2i Ltd. 144A 5.650% (2)(9) | 897 | 865 | |
| Vedanta Resources Finance II plc 144A 8.950%, 3/11/25(2) | 536 | 399 | |
| 3,378 | |||
| Par Value(1) | Value | ||
| Indonesia—2.4% | |||
| Freeport Indonesia PT 144A 6.200%, 4/14/52(2) | $ 1,775 | $ 1,578 | |
| Indika Energy Capital III Pte Ltd. RegS 5.875%, 11/9/24(4) | 353 | 342 | |
| Indonesia Asahan Aluminium PT 144A 5.800%, 5/15/50(2) | 3,499 | 3,090 | |
| Minejesa Capital B.V. 144A 5.625%, 8/10/37(2) | 2,235 | 1,763 | |
| Pertamina Persero PT RegS 6.000%, 5/3/42(4) | 1,879 | 1,854 | |
| Perusahaan Perseroan Persero PT Perusahaan Listrik Negara | |||
| RegS 5.250%, 10/24/42(4) | 808 | 711 | |
| RegS 4.875%, 7/17/49(4) | 1,048 | 844 | |
| 10,182 | |||
| Israel—0.1% | |||
| Leviathan Bond Ltd. Regs, 144A 6.125%, 6/30/25(2)(4) | 345 | 335 | |
| Jamaica—0.1% | |||
| Digicel International Finance Ltd. | |||
| 144A 8.750%, 5/25/24(2) | 159 | 145 | |
| 144A 8.750%, 5/25/24(2) | 374 | 341 | |
| 486 | |||
| Kazakhstan—1.7% | |||
| KazMunayGas National Co. JSC | |||
| 144A 6.375%, 10/24/48(2) | 4,064 | 3,313 | |
| RegS 3.500%, 4/14/33(4) | 985 | 737 | |
| QazaqGaz NC JSC 144A 4.375%, 9/26/27(2) | 3,319 | 3,078 | |
| 7,128 | |||
| Macau—0.4% | |||
| Sands China Ltd. | |||
| 4.875%, 6/18/30 | 10 | 9 | |
| 3.750%, 8/8/31 | 220 | 176 | |
| Studio City Finance Ltd. | |||
| 144A 6.000%, 7/15/25(2) | 296 | 268 | |
| 144A 6.500%, 1/15/28(2) | 1,387 | 1,137 | |
| 1,590 | |||
| Mexico—9.3% | |||
| Banco Mercantil del Norte S.A. | |||
| 144A 5.875%(2)(9) | 1,419 | 1,206 | |
| 144A 6.750%(2)(9) | 1,772 | 1,659 | |
| BBVA Bancomer S.A. 144A 5.125%, 1/18/33(2) | 175 | 154 | |
| Braskem Idesa SAPI 144A 6.990%, 2/20/32(2) | 1,014 | 689 | |
| Cemex SAB de C.V. 144A 9.125% (2)(9) | 1,152 | 1,148 | |
| Comision Federal de Electricidad 144A 4.688%, 5/15/29(2) | 2,904 | 2,591 | |
| Par Value(1) | Value | ||
| Mexico—continued | |||
| Petroleos Mexicanos | |||
| 6.490%, 1/23/27 | $ 1,301 | $ 1,120 | |
| 6.500%, 3/13/27 | 3,430 | 2,959 | |
| 6.840%, 1/23/30 | 650 | 505 | |
| 6.700%, 2/16/32 | 5,244 | 3,911 | |
| 6.500%, 6/2/41 | 1,655 | 1,012 | |
| 6.750%, 9/21/47 | 2,620 | 1,576 | |
| 144A 10.000%, 2/7/33(2) | 1,100 | 981 | |
| Poinsettia Finance Ltd. RegS 6.625%, 6/17/31(4) | 22,182 | 18,362 | |
| Sixsigma Networks Mexico S.A. de C.V. 144A 7.500%, 5/2/25(2) | 774 | 676 | |
| 38,549 | |||
| Nigeria—0.8% | |||
| Africa Finance Corp. 144A 2.875%, 4/28/28(2) | 3,136 | 2,556 | |
| IHS Netherlands Holdco B.V. 144A 8.000%, 9/18/27(2) | 883 | 785 | |
| 3,341 | |||
| Panama—0.1% | |||
| AES Panama Generation Holdings Srl 144A 4.375%, 5/31/30(2) | 476 | 412 | |
| Peru—1.9% | |||
| Kallpa Generacion S.A. 144A 4.875%, 5/24/26(2) | 1,461 | 1,396 | |
| Peru Payroll Deduction Finance Ltd. RegS 0.000%, 11/1/29(4) | 1,604 | 1,329 | |
| Petroleos del Peru S.A. | |||
| 144A 5.625%, 6/19/47(2) | 2,226 | 1,351 | |
| RegS 5.625%, 6/19/47(4) | 6,032 | 3,661 | |
| 7,737 | |||
| Saudi Arabia—2.1% | |||
| Gaci First Investment Co. | |||
| RegS 5.250%, 10/13/32(4) | 6,182 | 6,355 | |
| RegS 4.875%, 2/14/35(4) | 854 | 826 | |
| Saudi Government International Bond 144A 3.500%, 4/16/29(2) | 1,653 | 1,538 | |
| 8,719 | |||
| Singapore—0.1% | |||
| LMIRT Capital Pte Ltd. RegS 7.250%, 6/19/24(4) | 790 | 513 | |
| South Africa—1.1% | |||
| Eskom Holdings SOC Ltd. | |||
| 144A 6.750%, 8/6/23(2) | 439 | 434 | |
| 144A 7.125%, 2/11/25(2) | 1,522 | 1,454 | |
| 144A 8.450%, 8/10/28(2) | 1,509 | 1,378 | |
| RegS 7.125%, 2/11/25(4) | 200 | 191 | |
| Prosus N.V. 144A 3.061%, 7/13/31(2) | 832 | 632 | |
| Par Value(1) | Value | ||
| South Africa—continued | |||
| Sasol Financing USA LLC 144A 8.750%, 5/3/29(2) | $ 350 | $ 335 | |
| 4,424 | |||
| Tanzania—0.2% | |||
| HTA Group Ltd. 144A 7.000%, 12/18/25(2) | 833 | 773 | |
| Turkey—0.2% | |||
| Aydem Yenilenebilir Enerji AS 144A 7.750%, 2/2/27(2) | 1,165 | 947 | |
| Ukraine—0.2% | |||
| NPC Ukrenergo 144A 6.875%, 11/9/28(2)(10) | 3,633 | 618 | |
| State Savings Bank of Ukraine Via SSB #1 plc RegS 9.625%, 3/20/25(3)(4)(5) | 140 | 115 | |
| 733 | |||
| United Arab Emirates—1.6% | |||
| DAE Funding LLC 144A 3.375%, 3/20/28(2) | 612 | 555 | |
| DP World Ltd. | |||
| 144A 6.850%, 7/2/37(2) | 511 | 553 | |
| 144A 4.700%, 9/30/49(2) | 450 | 375 | |
| RegS 4.700%, 9/30/49(4) | 500 | 417 | |
| DP World Salaam RegS 6.000% (4)(9) | 4,145 | 4,108 | |
| MAF Global Securities Ltd. RegS 6.375% (4)(9) | 717 | 697 | |
| 6,705 | |||
| Uzbekistan—1.0% | |||
| Uzauto Motors AJ | |||
| 144A 4.850%, 5/4/26(2) | 3,974 | 3,386 | |
| RegS 4.850%, 5/4/26(4) | 697 | 594 | |
| 3,980 | |||
| Venezuela—0.5% | |||
| Petroleos de Venezuela S.A. | |||
| RegS 6.000%, 5/16/24(4)(10) | 60,490 | 1,724 | |
| RegS 6.000%, 11/15/26(4)(10) | 3,307 | 66 | |
| RegS 5.375%, 4/12/27(4)(7)(10) | 600 | 12 | |
| RegS 9.750%, 5/17/35(4)(10) | 4,592 | 115 | |
| 1,917 | |||
| Vietnam—0.2% | |||
| Mong Duong Finance Holdings B.V. 144A 5.125%, 5/7/29(2) | 1,106 | 959 | |
| Total Corporate Bonds and Notes (Identified Cost $168,591) | 126,149 | ||
| Shares | Value | ||
| Affiliated Mutual Funds—2.6% | |||
| Fixed Income Funds—2.6% | |||
| Virtus Stone Harbor Emerging Markets Bond Fund Class I(11)(12) | 586,841 | $ 4,478 | |
| Virtus Stone Harbor Local Markets Fund Class I(11)(12)(13) | 788,382 | 6,086 | |
| Total Affiliated Mutual Funds (Identified Cost $11,049) | 10,564 | ||
| Par Value(1) | ||
| Credit Linked Notes—1.2% | ||
| Iraq—1.2% | ||
| Republic of Iraq | ||
| (Counterparty: BOA) 2.536%, 1/1/28(5)(7) | 323,859 JPY | 2,070 |
| (Counterparty: BOA) 3.154%, 1/1/28(5)(7) | 147,636 JPY | 941 |
| (Counterparty: BOA) 3.227%, 1/6/28(5)(7) | 318,005 JPY | 2,031 |
| Total Credit Linked Notes (Identified Cost $7,490) | 5,042 | |
| Total Long-Term Investments—95.5% (Identified Cost $482,590) | 395,746 | |
| TOTAL INVESTMENTS—95.5% (Identified Cost $482,590) | $395,746 | |
| Other assets and liabilities, net—4.5% | 18,779 | |
| NET ASSETS—100.0% | $414,525 | |
| Abbreviations: | |
| CDS | Credit Default Swap |
| DAC | Designated Activity Company |
| JSC | Joint Stock Company |
| LIBOR | London Interbank Offered Rate |
| LLC | Limited Liability Company |
| Footnote Legend: | |
| (1) | Par Value disclosed in foreign currency is reported in thousands. |
| (2) | Security exempt from registration under Rule 144A of the Securities Act of 1933. These securities may be resold in transactions exempt from registration, normally to qualified institutional buyers. At May 31, 2023, these securities amounted to a value of $168,706 or 40.7% of net assets. |
| (3) | This Note was issued for the sole purpose of funding a leveraged loan between the issuer and the borrower. As the credit risk for this security lies solely with the borrower, the name represented here is that of the borrower. |
| (4) | Regulation S security. Security is offered and sold outside of the United States; therefore, it is exempt from registration with the SEC under Rules 903 and 904 of the Securities Act of 1933. |
| (5) | Variable rate security. Rate disclosed is as of May 31, 2023. Information in parenthesis represents benchmark and reference rate for each security. Certain variable rate securities are not based on a published reference rate and spread but are determined by the issuer or agent and are based on current market conditions, or, for mortgage-backed securities, are impacted by the individual mortgages which are paying off over time. These securities do not indicate a reference rate and spread in their descriptions. |
| (6) | Security in default; no interest payments are being received. |
| (7) | The value of this security was determined using significant unobservable inputs and is reported as a Level 3 security in the Fair Value Hierarchy table located after the Schedule of Investments. |
| (8) | The Fund is unable to receive and repatriate proceeds due to U.S. sanctions related to the Russia/Ukraine war. |
| (9) | No contractual maturity date. |
| (10) | Security in default; no interest payments are being received during the bankruptcy proceedings. |
| (11) | Affiliated investment. See Note 4I in Notes to Financial Statements. |
| (12) | Shares of this fund are publicly offered, and its prospectus and annual report are publicly available. |
| (13) | Non-income producing. |
| Counterparties: | |
| BCLY | Barclays |
| BOA | Bank of America |
| CITI | Citigroup Global Markets |
| JPM | JPMorgan Chase Bank N.A. |
| Foreign Currencies: | |
| EUR | Euro |
| JPY | Japanese Yen |
| USD | United States Dollar |
| Country Weightings (Unaudited)† | |
| Mexico | 11% |
| Saudi Arabia | 5 |
| Indonesia | 5 |
| Colombia | 4 |
| Angola | 4 |
| Brazil | 3 |
| United Arab Emirates | 3 |
| Other | 65 |
| Total | 100% |
| † % of total investments as of May 31, 2023. | |
| Forward foreign currency exchange contracts as of May 31, 2023 were as follows: | ||||||||
| Currency Purchased | Currency Amount Purchased | Currency Sold | Currency Amount Sold | Counterparty | Settlement Date | Unrealized Appreciation | Unrealized Depreciation | |
| EUR | 1,328 | USD | 1,442 | JPM | 07/21/23 | $ — | $ (18) | |
| USD | 1,717 | EUR | 1,571 | CITI | 07/21/23 | 32 | — | |
| USD | 34,571 | EUR | 31,375 | JPM | 07/21/23 | 936 | — | |
| Total | $968 | $ (18) | ||||||
| Over-the-counter credit default swaps - sell protection(1) outstanding as of May 31, 2023 were as follows: | |||||||||||||
| Reference Entity | Payment Frequency | Counterparty | Fixed Rate | Expiration Date | Notional Amount(2) | Value | Premiums Paid (Received) | Unrealized Appreciation | Unrealized Depreciation | ||||
| Republic of Turkey CDS AA-/Aa3 | Quarterly | BCLY | 1.000% | 06/20/27 | $12,002 | $(1,915) | $(2,285) | $370 | $— | ||||
| Total | $(1,915) | $(2,285) | $370 | $— | |||||||||
| Footnote Legend: | |
| (1) | If the Fund is a seller of protection and a credit event occurs, as defined under the terms of that particular swap agreement, the Fund will either (i) pay to the buyer of protection an amount equal to the notional amount of the swap and take delivery of the referenced obligation or underlying investments comprising the referenced index or (ii) pay a net settlement amount in the form of cash or investments equal to the notional amount of the swap less the recovery value of the referenced obligation or underlying investments comprising the referenced index. |
| (2) | The maximum potential amount the Fund could be required to pay as a seller of credit protection or receive as a buyer of credit protection if a credit event occurs as defined under the terms of that particular swap agreement. |
| Total Value at May 31, 2023 | Level 1 Quoted Prices | Level 2 Significant Observable Inputs | Level 3 Significant Unobservable Inputs | ||||
| Assets: | |||||||
| Debt Instruments: | |||||||
| Corporate Bonds and Notes | $126,149 | $ — | $126,137 | $ 12 | |||
| Foreign Government Securities | 253,991 | — | 253,986 | 5 | |||
| Credit Linked Notes | 5,042 | — | — | 5,042 | |||
| Affiliated Mutual Funds | 10,564 | 10,564 | — | — | |||
| Other Financial Instruments: | |||||||
| Forward Foreign Currency Exchange Contracts | 968 | — | 968 | — | |||
| Total Assets | 396,714 | 10,564 | 381,091 | 5,059 | |||
| Liabilities: | |||||||
| Other Financial Instruments: | |||||||
| Forward Foreign Currency Exchange Contracts | (18) | — | (18) | — | |||
| Over-the-Counter Credit Default Swap | (1,915) | — | (1,915) | — | |||
| Total Liabilities | (1,933) | — | (1,933) | — | |||
| Total Investments | $394,781 | $10,564 | $379,158 | $5,059 |
| Total | Corporate Bonds And Notes | Credit Linked Notes | Foreign Government Securities | ||||
| Investments in Securities | |||||||
| Balance as of May 31, 2022: | $ 7,752 | $ —(a) | $ 6,438 | $ 1,314 | |||
| Accrued discount/(premium) | 134 | — | 128 | 6 | |||
| Net realized gain (loss) | (5,231) | 48 | (309) | (4,970) | |||
| Net change in unrealized appreciation (depreciation)(c) | 6,487 | — | (40) | 6,527 | |||
| Purchases | — (b) | — (b) | — | — | |||
| Sales (d) | (4,095) | (48) | (1,175) | (2,872) | |||
| Transfers into Level 3(e) | 12 | 12 | — | — | |||
| Balance as of May 31, 2023 | $ 5,059 | $ 12 | $ 5,042 | $ 5 |
| Par Value | Value | ||
| Corporate Bonds and Notes—97.8% | |||
| Airlines—3.2% | |||
| Air Canada 144A 3.875%, 8/15/26(1) | $ 800 | $ 742 | |
| United Airlines, Inc. 144A 4.375%, 4/15/26(1) | 795 | 752 | |
| VistaJet Malta Finance plc | |||
| 144A 7.875%, 5/1/27(1) | 1,345 | 1,214 | |
| 144A 9.500%, 6/1/28(1) | 26 | 24 | |
| 2,732 | |||
| Automotive—3.9% | |||
| Ford Motor Credit Co. LLC | |||
| 6.950%, 3/6/26 | 81 | 81 | |
| 7.350%, 11/4/27 | 471 | 475 | |
| 6.800%, 5/12/28 | 294 | 291 | |
| 5.113%, 5/3/29 | 2,721 | 2,491 | |
| 3,338 | |||
| Building Products—4.9% | |||
| Griffon Corp. 5.750%, 3/1/28 | 899 | 829 | |
| Knife River Holding Co. 144A 7.750%, 5/1/31(1) | 88 | 88 | |
| LBM Acquisition LLC 144A 6.250%, 1/15/29(1) | 1,349 | 1,068 | |
| Park River Holdings, Inc. 144A 6.750%, 8/1/29(1) | 361 | 269 | |
| Specialty Building Products Holdings LLC 144A 6.375%, 9/30/26(1) | 1,356 | 1,224 | |
| White Cap Buyer LLC 144A 6.875%, 10/15/28(1) | 816 | 706 | |
| 4,184 | |||
| Chemicals—3.5% | |||
| Illuminate Buyer LLC 144A 9.000%, 7/1/28(1) | 1,380 | 1,205 | |
| INEOS Quattro Finance 2 plc 144A 3.375%, 1/15/26(1) | 358 | 328 | |
| LSB Industries, Inc. 144A 6.250%, 10/15/28(1) | 951 | 861 | |
| WR Grace Holdings LLC 144A 5.625%, 8/15/29(1) | 739 | 614 | |
| 3,008 | |||
| Consumer Discretionary—1.0% | |||
| Newell Brands, Inc. 6.625%, 9/15/29 | 896 | 846 | |
| Consumer Products—1.0% | |||
| Kronos Acquisition Holdings, Inc. 144A 7.000%, 12/31/27(1) | 971 | 834 | |
| Containers & Packaging—2.1% | |||
| Graham Packaging Co., Inc. 144A 7.125%, 8/15/28(1) | 871 | 739 | |
| Mauser Packaging Solutions Holding Co. 144A 7.875%, 8/15/26(1) | 195 | 193 | |
| Par Value | Value | ||
| Containers & Packaging—continued | |||
| Trivium Packaging Finance B.V. 144A 8.500%, 8/15/27(1) | $ 935 | $ 880 | |
| 1,812 | |||
| Drillers & Services—2.2% | |||
| Enerflex Ltd. 144A 9.000%, 10/15/27(1) | 872 | 848 | |
| Precision Drilling Corp. 144A 6.875%, 1/15/29(1) | 1,103 | 988 | |
| 1,836 | |||
| Electric—1.0% | |||
| Vistra Operations Co. LLC | |||
| 144A 5.625%, 2/15/27(1) | 335 | 322 | |
| 144A 5.000%, 7/31/27(1) | 599 | 563 | |
| 885 | |||
| Exploration & Production—9.2% | |||
| Antero Resources Corp. | |||
| 144A 7.625%, 2/1/29(1) | 667 | 679 | |
| 144A 5.375%, 3/1/30(1) | 198 | 182 | |
| Ascent Resources Utica Holdings LLC 144A 5.875%, 6/30/29(1) | 947 | 831 | |
| Chesapeake Energy Corp. 144A 5.875%, 2/1/29(1) | 473 | 445 | |
| CrownRock LP 144A 5.000%, 5/1/29(1) | 290 | 272 | |
| Hilcorp Energy I LP | |||
| 144A 6.250%, 11/1/28(1) | 988 | 923 | |
| 144A 5.750%, 2/1/29(1) | 100 | 91 | |
| 144A 6.000%, 4/15/30(1) | 102 | 92 | |
| Murphy Oil Corp. 5.875%, 12/1/27 | 492 | 478 | |
| Occidental Petroleum Corp. | |||
| 8.875%, 7/15/30 | 1,943 | 2,239 | |
| 7.500%, 5/1/31 | 327 | 355 | |
| SM Energy Co. | |||
| 5.625%, 6/1/25 | 481 | 464 | |
| 6.500%, 7/15/28 | 843 | 790 | |
| 7,841 | |||
| Financial & Lease—7.2% | |||
| Acrisure LLC | |||
| 144A 7.000%, 11/15/25(1) | 930 | 881 | |
| 144A 6.000%, 8/1/29(1) | 783 | 655 | |
| Alliant Holdings Intermediate LLC | |||
| 144A 6.750%, 10/15/27(1) | 999 | 931 | |
| 144A 5.875%, 11/1/29(1) | 505 | 433 | |
| Discover Financial Services 6.700%, 11/29/32 | 385 | 399 | |
| Nationstar Mortgage Holdings, Inc. 144A 5.750%, 11/15/31(1) | 1,423 | 1,156 | |
| OneMain Finance Corp. | |||
| 7.125%, 3/15/26 | 945 | 904 | |
| 3.500%, 1/15/27 | 505 | 420 | |
| 6.625%, 1/15/28 | 369 | 334 | |
| 6,113 | |||
| Par Value | Value | ||
| Food, Beverages & Tobacco—2.9% | |||
| Pilgrim’s Pride Corp. 3.500%, 3/1/32 | $ 1,584 | $ 1,266 | |
| Triton Water Holdings, Inc. 144A 6.250%, 4/1/29(1) | 1,434 | 1,196 | |
| 2,462 | |||
| Gaming—5.0% | |||
| Caesars Entertainment, Inc. 144A 7.000%, 2/15/30(1) | 80 | 80 | |
| International Game Technology plc 144A 5.250%, 1/15/29(1) | 664 | 628 | |
| MGM Growth Properties Operating Partnership LP 5.750%, 2/1/27 | 282 | 275 | |
| Penn Entertainment, Inc. 144A 4.125%, 7/1/29(1) | 1,088 | 877 | |
| Raptor Acquisition Corp. 144A 4.875%, 11/1/26(1) | 982 | 921 | |
| Scientific Games International, Inc. 144A 7.250%, 11/15/29(1) | 1,031 | 1,025 | |
| VICI Properties LP 144A 4.125%, 8/15/30(1) | 457 | 401 | |
| 4,207 | |||
| Health Care—6.5% | |||
| AdaptHealth LLC | |||
| 144A 4.625%, 8/1/29(1) | 903 | 695 | |
| 144A 5.125%, 3/1/30(1) | 343 | 267 | |
| Catalent Pharma Solutions, Inc. 144A 3.500%, 4/1/30(1) | 1,321 | 1,065 | |
| Community Health Systems, Inc. 144A 5.250%, 5/15/30(1) | 1,455 | 1,093 | |
| Endo Luxembourg Finance Co. I S.a.r.l. 144A 6.125%, 4/1/29(1)(2) | 1,462 | 1,066 | |
| Teva Pharmaceutical Finance Netherlands III B.V. 8.125%, 9/15/31 | 250 | 258 | |
| US Acute Care Solutions LLC 144A 6.375%, 3/1/26(1) | 1,267 | 1,074 | |
| 5,518 | |||
| Home Builders—2.5% | |||
| Ashton Woods USA LLC 144A 4.625%, 4/1/30(1) | 86 | 71 | |
| KB Home | |||
| 4.800%, 11/15/29 | 350 | 320 | |
| 7.250%, 7/15/30 | 402 | 406 | |
| Mattamy Group Corp. 144A 4.625%, 3/1/30(1) | 794 | 682 | |
| Weekley Homes LLC 144A 4.875%, 9/15/28(1) | 756 | 663 | |
| 2,142 | |||
| Industrial Other—4.1% | |||
| Chart Industries, Inc. | |||
| 144A 7.500%, 1/1/30(1) | 178 | 180 | |
| 144A 9.500%, 1/1/31(1) | 178 | 186 | |
| Madison IAQ LLC 144A 5.875%, 6/30/29(1) | 1,429 | 1,088 | |
| United Rentals North America, Inc. 3.750%, 1/15/32 | 1,166 | 976 | |
| Par Value | Value | ||
| Industrial Other—continued | |||
| WESCO Distribution, Inc. 144A 7.250%, 6/15/28(1) | $ 1,005 | $ 1,027 | |
| 3,457 | |||
| Leisure—4.7% | |||
| Carnival Corp. | |||
| 144A 7.625%, 3/1/26(1) | 1,140 | 1,081 | |
| 144A 6.000%, 5/1/29(1) | 304 | 253 | |
| NCL Corp., Ltd. | |||
| 144A 5.875%, 3/15/26(1) | 412 | 374 | |
| 144A 7.750%, 2/15/29(1) | 368 | 333 | |
| NCL Finance Ltd. 144A 6.125%, 3/15/28(1) | 723 | 616 | |
| Royal Caribbean Cruises Ltd. | |||
| 144A 5.500%, 8/31/26(1) | 366 | 344 | |
| 144A 11.625%, 8/15/27(1) | 678 | 737 | |
| 144A 5.500%, 4/1/28(1) | 241 | 221 | |
| 3,959 | |||
| Materials—1.1% | |||
| ASP Unifrax Holdings, Inc. 144A 5.250%, 9/30/28(1) | 1,182 | 890 | |
| Media Cable—7.5% | |||
| Altice France Holding S.A. 144A 6.000%, 2/15/28(1) | 637 | 315 | |
| Altice France S.A. | |||
| 144A 5.125%, 1/15/29(1) | 102 | 73 | |
| 144A 5.125%, 7/15/29(1) | 1,072 | 763 | |
| CCO Holdings LLC | |||
| 144A 5.375%, 6/1/29(1) | 416 | 375 | |
| 144A 4.500%, 8/15/30(1) | 1,854 | 1,526 | |
| CSC Holdings LLC | |||
| 144A 7.500%, 4/1/28(1) | 1,476 | 800 | |
| 144A 4.125%, 12/1/30(1) | 1,167 | 810 | |
| DISH DBS Corp. | |||
| 5.875%, 11/15/24 | 345 | 296 | |
| 7.750%, 7/1/26 | 122 | 70 | |
| 7.375%, 7/1/28 | 493 | 252 | |
| 5.125%, 6/1/29 | 626 | 284 | |
| 144A 5.250%, 12/1/26(1) | 617 | 487 | |
| 144A 5.750%, 12/1/28(1) | 444 | 322 | |
| 6,373 | |||
| Media Other—3.9% | |||
| CMG Media Corp. 144A 8.875%, 12/15/27(1) | 1,465 | 949 | |
| Gray Escrow II, Inc. 144A 5.375%, 11/15/31(1) | 1,849 | 1,176 | |
| Univision Communications, Inc. 144A 6.625%, 6/1/27(1) | 1,220 | 1,155 | |
| 3,280 | |||
| Midstream—5.0% | |||
| Antero Midstream Partners LP | |||
| 144A 7.875%, 5/15/26(1) | 232 | 235 | |
| 144A 5.750%, 3/1/27(1) | 465 | 446 | |
| 144A 5.750%, 1/15/28(1) | 557 | 531 | |
| Par Value | Value | ||
| Midstream—continued | |||
| CNX Midstream Partners LP 144A 4.750%, 4/15/30(1) | $ 43 | $ 36 | |
| DT Midstream, Inc. 144A 4.375%, 6/15/31(1) | 729 | 613 | |
| Genesis Energy LP | |||
| 8.000%, 1/15/27 | 572 | 557 | |
| 7.750%, 2/1/28 | 915 | 879 | |
| Hess Midstream Operations LP | |||
| 144A 4.250%, 2/15/30(1) | 161 | 140 | |
| 144A 5.500%, 10/15/30(1) | 682 | 618 | |
| Holly Energy Partners LP 144A 6.375%, 4/15/27(1) | 171 | 169 | |
| 4,224 | |||
| Paper & Forest Products—1.1% | |||
| Mercer International, Inc. 5.125%, 2/1/29 | 1,158 | 916 | |
| Refining—1.1% | |||
| Parkland Corp. 144A 4.625%, 5/1/30(1) | 519 | 449 | |
| Sunoco LP 4.500%, 4/30/30 | 517 | 453 | |
| 902 | |||
| Retail Food & Drug—1.5% | |||
| Albertsons Cos., Inc. | |||
| 144A 4.625%, 1/15/27(1) | 283 | 269 | |
| 144A 5.875%, 2/15/28(1) | 514 | 502 | |
| 144A 4.875%, 2/15/30(1) | 533 | 488 | |
| 1,259 | |||
| Retail Non Food & Drug—4.5% | |||
| eG Global Finance plc | |||
| 144A 6.750%, 2/7/25(1) | 627 | 603 | |
| 144A 8.500%, 10/30/25(1) | 175 | 169 | |
| LCM Investments Holdings II LLC 144A 4.875%, 5/1/29(1) | 916 | 764 | |
| Michaels Cos., Inc. (The) | |||
| 144A 5.250%, 5/1/28(1) | 659 | 507 | |
| 144A 7.875%, 5/1/29(1) | 580 | 356 | |
| PetSmart, Inc. | |||
| 144A 4.750%, 2/15/28(1) | 474 | 438 | |
| 144A 7.750%, 2/15/29(1) | 966 | 938 | |
| 3,775 | |||
| Satellite—2.0% | |||
| Hughes Satellite Systems Corp. 6.625%, 8/1/26 | 906 | 837 | |
| Intelsat Jackson Holdings S.A. Escrow 5.500%, 8/1/23(3) | 464 | — | |
| Viasat, Inc. 144A 5.625%, 9/15/25(1) | 910 | 874 | |
| 1,711 | |||
| Services Other—3.5% | |||
| ADT Security Corp. (The) 144A 4.125%, 8/1/29(1) | 713 | 622 | |
| Par Value | Value | ||
| Services Other—continued | |||
| GFL Environmental, Inc. | |||
| 144A 4.750%, 6/15/29(1) | $ 446 | $ 405 | |
| 144A 4.375%, 8/15/29(1) | 1,107 | 983 | |
| Prime Security Services Borrower LLC 144A 6.250%, 1/15/28(1) | 1,038 | 953 | |
| 2,963 | |||
| Technology—0.5% | |||
| Ciena Corp. 144A 4.000%, 1/31/30(1) | 86 | 74 | |
| Rackspace Technology Global, Inc. 144A 3.500%, 2/15/28(1) | 922 | 367 | |
| 441 | |||
| Transport Other—1.2% | |||
| Hertz Corp. (The) | |||
| 144A 4.625%, 12/1/26(1) | 607 | 541 | |
| 144A 5.000%, 12/1/29(1) | 541 | 435 | |
| 976 | |||
| Total Corporate Bonds and Notes (Identified Cost $92,522) | 82,884 | ||
| Leveraged Loans—0.0% | |||
| Health Care—0.0% | |||
| Envision Healthcare Corp. (3 month LIBOR + 3.750%) 8.909%, 10/10/25(2)(3) | 278 | 2 | |
| Total Leveraged Loans (Identified Cost $278) | 2 | ||
| Shares | ||
| Common Stocks—0.1% | ||
| Exploration & Production—0.0% | ||
| Alta Mesa Holdings LP Escrow(3)(4) | 400,000 | — |
| Satellite—0.1% | ||
| Intelsat Emergence S.A.(3)(4) | 4,338 | 106 |
| Total Common Stocks (Identified Cost $157) | 106 | |
| Rights—0.0% | ||
| Satellite—0.0% | ||
| Intelsat Jackson Holdings S.A. Series A, 12/05/25(3)(4) | 454 | 2 |
| Shares | Value | ||
| Satellite—continued | |||
| Intelsat Jackson Holdings S.A. Series B, 12/05/25(3)(4) | 454 | $ 3 | |
| Total Rights (Identified Cost $—) | 5 | ||
| Total Long-Term Investments—97.9% (Identified Cost $92,957) | 82,997 | ||
| TOTAL INVESTMENTS—97.9% (Identified Cost $92,957) | $82,997 | ||
| Other assets and liabilities, net—2.1% | 1,798 | ||
| NET ASSETS—100.0% | $84,795 | ||
| Abbreviations: | |
| LIBOR | London Interbank Offered Rate |
| LLC | Limited Liability Company |
| LP | Limited Partnership |
| Footnote Legend: | |
| (1) | Security exempt from registration under Rule 144A of the Securities Act of 1933. These securities may be resold in transactions exempt from registration, normally to qualified institutional buyers. At May 31, 2023, these securities amounted to a value of $63,443 or 74.8% of net assets. |
| (2) | Security in default; no interest payments are being received during the bankruptcy proceedings. |
| (3) | The value of this security was determined using significant unobservable inputs and is reported as a Level 3 security in the Fair Value Hierarchy table located after the Schedule of Investments. |
| (4) | Non-income producing. |
| Country Weightings (Unaudited)† | |
| United States | 86% |
| Canada | 8 |
| Switzerland | 2 |
| France | 2 |
| United Kingdom | 1 |
| Netherlands | 1 |
| Total | 100% |
| † % of total investments as of May 31, 2023. | |
| Total Value at May 31, 2023 | Level 2 Significant Observable Inputs | Level 3 Significant Unobservable Inputs | |||
| Assets: | |||||
| Debt Instruments: | |||||
| Corporate Bonds and Notes | $82,884 | $82,884 | $ —(1) | ||
| Leveraged Loans | 2 | — | 2 | ||
| Equity Securities: | |||||
| Common Stocks | 106 | — | 106 (1) | ||
| Rights | 5 | — | 5 | ||
| Total Investments | $82,997 | $82,884 | $113 |
| (1) | Includes internally fair valued securities currently priced at zero ($0). |
| Par Value(1) | Value | ||
| Foreign Government Securities—80.8% | |||
| Brazil—11.5% | |||
| Brazil Notas do Tesouro Nacional | |||
| Series F 10.000%, 1/1/25 | 2,700 BRL | $ 520 | |
| Series F 10.000%, 1/1/27 | 2,850 BRL | 547 | |
| Series F 10.000%, 1/1/31 | 3,890 BRL | 715 | |
| 1,782 | |||
| Chile—2.4% | |||
| Bonos Tesoreria Pesos | |||
| 5.000%, 3/1/35 | 90,000 CLP | 108 | |
| 144A, RegS 7.000%, 5/1/34(2) | 30,000 CLP | 42 | |
| RegS, 144A 5.000%, 10/1/28(2)(3) | 140,000 CLP | 167 | |
| RegS, 144A 4.700%, 9/1/30(2)(3) | 45,000 CLP | 53 | |
| 370 | |||
| China—4.8% | |||
| China Government Bond | |||
| 3.130%, 11/21/29 | 2,020 CNY | 292 | |
| 2.890%, 11/18/31 | 2,040 CNY | 290 | |
| 3.720%, 4/12/51 | 1,070 CNY | 166 | |
| 748 | |||
| Colombia—6.1% | |||
| Bogota Distrio Capital RegS 9.750%, 7/26/28(3) | 1,891,000 COP | 384 | |
| Colombian Titulos De Tesoreria | |||
| 7.250%, 10/18/34 | 268,000 COP | 45 | |
| 7.250%, 10/26/50 | 2,025,000 COP | 298 | |
| Titulos De Tesoreria 7.500%, 8/26/26 | 1,030,000 COP | 212 | |
| 939 | |||
| Czech Republic—4.8% | |||
| Czech Republic | |||
| 2.750%, 7/23/29 | 2,230 CZK | 90 | |
| RegS 2.400%, 9/17/25(3) | 7,250 CZK | 306 | |
| RegS 0.950%, 5/15/30(3) | 2,330 CZK | 83 | |
| RegS 4.200%, 12/4/36(3) | 5,960 CZK | 258 | |
| 737 | |||
| Hungary—1.8% | |||
| Hungary Government Bond | |||
| 4.750%, 11/24/32 | 99,700 HUF | 228 | |
| 3.000%, 10/27/38 | 30,000 HUF | 52 | |
| 280 | |||
| Par Value(1) | Value | ||
| Indonesia—9.0% | |||
| Indonesia Government Bond | |||
| 8.375%, 3/15/24 | 5,480,000 IDR | $ 373 | |
| 9.000%, 3/15/29 | 1,000,000 IDR | 75 | |
| 8.375%, 3/15/34 | 2,478,000 IDR | 189 | |
| 8.250%, 5/15/36 | 3,500,000 IDR | 266 | |
| 7.500%, 5/15/38 | 6,808,000 IDR | 489 | |
| 1,392 | |||
| Malaysia—9.6% | |||
| Malaysia Government Bond | |||
| 3.906%, 7/15/26 | 2,536 MYR | 557 | |
| 3.885%, 8/15/29 | 325 MYR | 71 | |
| 2.632%, 4/15/31 | 1,735 MYR | 348 | |
| 3.582%, 7/15/32 | 2,090 MYR | 448 | |
| 4.893%, 6/8/38 | 220 MYR | 52 | |
| 1,476 | |||
| Mexico—8.8% | |||
| Mex Bonos Desarr | |||
| 5.500%, 3/4/27 | 5,290 MXN | 264 | |
| 7.750%, 11/23/34 | 6,360 MXN | 332 | |
| 7.750%, 11/13/42 | 15,240 MXN | 757 | |
| 1,353 | |||
| Peru—1.7% | |||
| Bonos De Tesoreria | |||
| 6.150%, 8/12/32 | 400 PEN | 102 | |
| 5.400%, 8/12/34 | 230 PEN | 55 | |
| 5.350%, 8/12/40 | 490 PEN | 109 | |
| 266 | |||
| Poland—3.3% | |||
| Poland Government Bond | |||
| 0.250%, 10/25/26 | 250 PLN | 49 | |
| 7.500%, 7/25/28 | 255 PLN | 64 | |
| 1.250%, 10/25/30 | 2,255 PLN | 388 | |
| 501 | |||
| Romania—2.3% | |||
| Romania Government Bond | |||
| 5.000%, 2/12/29 | 1,145 RON | 226 | |
| 4.750%, 10/11/34 | 750 RON | 133 | |
| 359 | |||
| Russia—0.5% | |||
| Russia Government Bond - OFZ 7.600%, 7/20/22(4)(5)(6) | 126,870 RUB | 78 | |
| South Africa—9.2% | |||
| Republic of South Africa | |||
| 10.500%, 12/21/26 | 4,560 ZAR | ��235 | |
| 7.000%, 2/28/31 | 2,000 ZAR | 78 | |
| 8.875%, 2/28/35 | 7,100 ZAR | 282 | |
| 8.500%, 1/31/37 | 6,650 ZAR | 247 | |
| 6.500%, 2/28/41 | 17,030 ZAR | 491 | |
| Par Value(1) | Value | ||
| South Africa—continued | |||
| 8.750%, 1/31/44 | 2,580 ZAR | $ 93 | |
| 1,426 | |||
| Thailand—4.1% | |||
| Thailand Government Bond | |||
| 2.875%, 12/17/28 | 1,140 THB | 34 | |
| 3.775%, 6/25/32 | 2,940 THB | 93 | |
| 1.585%, 12/17/35 | 11,550 THB | 291 | |
| 4.675%, 6/29/44 | 5,980 THB | 213 | |
| 631 | |||
| Turkey—0.3% | |||
| European Bank for Reconstruction & Development 30.000%, 9/1/23 | 1,070 TRY | 42 | |
| Uruguay—0.6% | |||
| Republica Orient Uruguay | |||
| 8.250%, 5/21/31 | 3,200 UYU | 75 | |
| 144A 8.500%, 3/15/28(2) | 1,000 UYU | 24 | |
| 99 | |||
| Total Foreign Government Securities (Identified Cost $14,459) | 12,479 | ||
| Corporate Bonds and Notes—3.4% | |||
| Poland—3.4% | |||
| Kreditanstalt fuer Wiederaufbau 0.625%, 7/25/25 | 2,500 PLN | 523 | |
| Total Corporate Bonds and Notes (Identified Cost $620) | 523 | ||
| Total Long-Term Investments—84.2% (Identified Cost $15,079) | 13,002 | ||
| TOTAL INVESTMENTS—84.2% (Identified Cost $15,079) | $13,002 | ||
| Other assets and liabilities, net—15.8% | 2,437 | ||
| NET ASSETS—100.0% | $15,439 | ||
| Footnote Legend: | |
| (1) | Par Value disclosed in foreign currency is reported in thousands. |
| (2) | Security exempt from registration under Rule 144A of the Securities Act of 1933. These securities may be resold in transactions exempt from registration, normally to qualified institutional buyers. At May 31, 2023, these securities amounted to a value of $286 or 1.9% of net assets. |
| (3) | Regulation S security. Security is offered and sold outside of the United States; therefore, it is exempt from registration with the SEC under Rules 903 and 904 of the Securities Act of 1933. |
| (4) | Security in default; no interest payments are being received. |
| (5) | The value of this security was determined using significant unobservable inputs and is reported as a Level 3 security in the Fair Value Hierarchy table located after the Schedule of Investments. |
| (6) | The Fund is unable to receive and repatriate proceeds due to U.S. sanctions related to the Russia/Ukraine war. |
| Counterparties: | |
| CITI | Citigroup Global Markets |
| GS | Goldman Sachs & Co. |
| JPM | JPMorgan Chase Bank N.A. |
| Foreign Currencies: | |
| BRL | Brazilian Real |
| CLP | Chilean Peso |
| CNY | Chinese Yuan |
| COP | Colombian Peso |
| CZK | Czech Koruna |
| HUF | Hungarian Forint |
| IDR | Indonesian Rupiah |
| MXN | Mexican Peso |
| MYR | Malaysian Ringgit |
| PEN | Peruvian Nuevo Sol |
| PLN | Polish Zloty |
| RON | Romania New Leu |
| RUB | Russian Ruble |
| THB | Thailand Baht |
| TRY | Turkish Lira |
| USD | United States Dollar |
| UYU | Uruguayan Peso |
| ZAR | South African Rand |
| Country Weightings (Unaudited)† | |
| Brazil | 14% |
| Malaysia | 11 |
| South Africa | 11 |
| Indonesia | 11 |
| Mexico | 10 |
| Poland | 8 |
| Colombia | 7 |
| Other | 28 |
| Total | 100% |
| † % of total investments as of May 31, 2023. | |
| Forward foreign currency exchange contracts as of May 31, 2023 were as follows: | ||||||||
| Currency Purchased | Currency Amount Purchased | Currency Sold | Currency Amount Sold | Counterparty | Settlement Date | Unrealized Appreciation | Unrealized Depreciation | |
| CNY | 4,455 | USD | 639 | JPM | 06/13/23 | $— | $ (12) | |
| CZK | 8,560 | USD | 387 | JPM | 06/06/23 | — | (3) | |
| HUF | 78,900 | USD | 224 | GS | 06/08/23 | 3 | — | |
| HUF | 65,400 | USD | 186 | GS | 08/08/23 | — | (1) | |
| IDR | 6,610,000 | USD | 443 | JPM | 06/12/23 | — | (2) | |
| MXN | 27,850 | USD | 1,555 | JPM | 07/12/23 | 5 | — | |
| PEN | 290 | USD | 79 | JPM | 07/17/23 | — | — (1) | |
| PLN | 135 | USD | 32 | JPM | 06/09/23 | — | — (1) | |
| PLN | 135 | USD | 32 | JPM | 08/09/23 | — (1) | — | |
| RON | 495 | USD | 110 | JPM | 06/26/23 | — | (3) | |
| THB | 33,540 | USD | 1,004 | GS | 08/11/23 | — | (33) | |
| THB | 6,400 | USD | 192 | JPM | 08/11/23 | — | (6) | |
| TRY | 2,630 | USD | 122 | JPM | 06/20/23 | — | (5) | |
| USD | 389 | CZK | 8,560 | JPM | 06/06/23 | 3 | — | |
| USD | 228 | HUF | 78,900 | GS | 06/08/23 | 1 | — | |
| USD | 31 | PLN | 135 | JPM | 06/09/23 | — | — (1) | |
| USD | 40 | IDR | 580,000 | JPM | 06/12/23 | 1 | — | |
| USD | 80 | CNY | 550 | JPM | 06/13/23 | 2 | — | |
| USD | 147 | BRL | 745 | JPM | 07/05/23 | 1 | — | |
| USD | 78 | CLP | 63,000 | CITI | 07/10/23 | 1 | — | |
| USD | 1,218 | MXN | 22,160 | JPM | 07/12/23 | — | (24) | |
| USD | 92 | PEN | 340 | JPM | 07/17/23 | — | — (1) | |
| USD | 157 | COP | 727,000 | CITI | 07/18/23 | — | (4) | |
| USD | 227 | ZAR | 4,160 | JPM | 07/19/23 | 17 | — | |
| USD | 44 | CZK | 980 | JPM | 08/08/23 | — (1) | — | |
| USD | 102 | THB | 3,520 | GS | 08/11/23 | 1 | — | |
| ZAR | 230 | USD | 12 | JPM | 07/19/23 | — | (1) | |
| Total | $35 | $ (94) | ||||||
| Footnote Legend: | |
| (1) | Amount is less than $500 (not in thousands). |
| Total Value at May 31, 2023 | Level 2 Significant Observable Inputs | Level 3 Significant Unobservable Inputs | |||
| Assets: | |||||
| Debt Instruments: | |||||
| Corporate Bonds and Notes | $ 523 | $ 523 | $— | ||
| Foreign Government Securities | 12,479 | 12,401 | 78 | ||
| Other Financial Instruments: | |||||
| Forward Foreign Currency Exchange Contracts | 35 | 35 | — | ||
| Total Assets | 13,037 | 12,959 | 78 | ||
| Liabilities: | |||||
| Other Financial Instruments: | |||||
| Forward Foreign Currency Exchange Contracts | (94) | (94) | — | ||
| Total Liabilities | (94) | (94) | — | ||
| Total Investments | $12,943 | $12,865 | $78 |
| Total | Foreign Government Securities | ||
| Investments in Securities | |||
| Balance as of May 31, 2022: | $ 640 | $ 640 | |
| Net realized gain (loss) | (6,520) | (6,520) | |
| Net change in unrealized appreciation (depreciation)(a) | 7,937 | 7,937 | |
| Sales (b) | (1,979) | (1,979) | |
| Balance as of May 31, 2023 | $ 78 | $ 78 |
| Par Value(1) | Value | ||
| U.S. Government Securities—6.6% | |||
| U.S. Treasury Bonds | |||
| 2.500%, 2/15/46 | $ 225 | $ 174 | |
| 3.625%, 2/15/53 | 200 | 192 | |
| U.S. Treasury Notes | |||
| 2.125%, 5/15/25 | 325 | 311 | |
| 2.000%, 8/15/25 | 550 | 524 | |
| 2.750%, 4/30/27 | 500 | 479 | |
| 2.750%, 2/15/28 | 300 | 286 | |
| 1.250%, 8/15/31 | 450 | 374 | |
| 2.875%, 5/15/32 | 500 | 470 | |
| Total U.S. Government Securities (Identified Cost $3,055) | 2,810 | ||
| Mortgage-Backed Securities—8.0% | |||
| Agency—6.1% | |||
| Federal National Mortgage Association | |||
| Pool #AR8557 3.000%, 7/1/27 | 17 | 16 | |
| TBA 2.500%(2) | 3,000 | 2,564 | |
| 2,580 | |||
| Non-Agency—1.9% | |||
| BBCMS Mortgage Trust 2018-TALL, A (1 month LIBOR + 0.872%, Cap N/A, Floor 0.872%) 144A 5.980%, 3/15/37(3)(4) | 75 | 67 | |
| BB-UBS Trust 2012-TFT, A 144A 2.892%, 6/5/30(3) | 10 | 9 | |
| BX Commercial Mortgage Trust 2019-IMC, B (1 month LIBOR + 1.300%, Cap N/A, Floor 1.300%) 144A 6.407%, 4/15/34(3)(4) | 100 | 98 | |
| CLNY Trust 2019-IKPR, A (1 month Term SOFR + 1.243%, Cap N/A, Floor 1.243%) 144A 6.302%, 11/15/38(3)(4) | 50 | 48 | |
| Commercial Mortgage Pass Through Certificates 2012-LTRT, A2 144A 3.400%, 10/5/30(3) | 65 | 57 | |
| HMH Trust 2017-NSS, A 144A 3.062%, 7/5/31(3) | 50 | 47 | |
| Hudsons Bay Simon JV Trust 2015-HB10, A10 144A 4.155%, 8/5/34(3) | 125 | 108 | |
| JP Morgan Chase Commercial Mortgage Securities Trust | |||
| 2006-LDP9, AMS 5.337%, 5/15/47 | 80 | 76 | |
| 2014-DSTY, A 144A 3.429%, 6/10/27(3) | 120 | 44 | |
| MBRT 2019-MBR, A (1 month LIBOR + 1.200%, Cap N/A, Floor 0.850%) 144A 6.307%, 11/15/36(3)(4) | 75 | 75 | |
| Morgan Stanley Capital I Trust 2019-BPR, D (1 month LIBOR + 4.250%, Cap N/A, Floor 4.000%) 144A 9.607%, 5/15/36(3)(4) | 75 | 69 | |
| Palisades Center Trust 2016-PLSD, A 144A 2.713%, 4/13/33(3) | 100 | 56 | |
| Par Value(1) | Value | ||
| Non-Agency—continued | |||
| Verus Securitization Trust 2021-3, A1 144A 1.046%, 6/25/66(3)(4) | $ 67 | $ 56 | |
| 810 | |||
| Total Mortgage-Backed Securities (Identified Cost $3,483) | 3,390 | ||
| Asset-Backed Securities—0.4% | |||
| Automobiles—0.3% | |||
| Santander Drive Auto Receivables Trust 2021-2, D 1.350%, 7/15/27 | 125 | 118 | |
| Credit Card—0.0% | |||
| Citibank Credit Card Issuance Trust 2017-A5, A5 (1 month LIBOR + 0.620%) 5.768%, 4/22/26(4) | 25 | 25 | |
| Other—0.1% | |||
| New Residential Advance Receivables Trust Advance Receivables Backed 2020-T1, AT1 144A 1.426%, 8/15/53(3) | 50 | 49 | |
| Total Asset-Backed Securities (Identified Cost $194) | 192 | ||
| Corporate Bonds and Notes—15.6% | |||
| Aerospace & Defense—0.2% | |||
| Boeing Co. (The) 3.600%, 5/1/34 | 75 | 64 | |
| Automotive—0.4% | |||
| General Motors Financial Co., Inc. 3.600%, 6/21/30 | 75 | 65 | |
| Hyundai Capital America | |||
| 144A 3.000%, 2/10/27(3) | 50 | 46 | |
| 144A 2.100%, 9/15/28(3) | 25 | 21 | |
| Mercedes-Benz Finance North America LLC 144A 5.375%, 11/26/25(3) | 50 | 50 | |
| 182 | |||
| Chemicals—0.2% | |||
| FMC Corp. 5.150%, 5/18/26 | 35 | 35 | |
| Huntsman International LLC 2.950%, 6/15/31 | 75 | 60 | |
| 95 | |||
| Electric—1.5% | |||
| AES Corp. (The) 5.450%, 6/1/28 | 75 | 74 | |
| Duke Energy Corp. 3.500%, 6/15/51 | 75 | 53 | |
| Electricite de France S.A. 144A 4.500%, 9/21/28(3) | 75 | 72 | |
| Enel Finance International N.V. 144A 5.500%, 6/15/52(3) | 75 | 66 | |
| Par Value(1) | Value | ||
| Electric—continued | |||
| Exelon Corp. 2.750%, 3/15/27 | $ 100 | $ 92 | |
| NSTAR Electric Co. 4.550%, 6/1/52 | 50 | 45 | |
| PacifiCorp. 5.350%, 12/1/53 | 100 | 99 | |
| San Diego Gas & Electric Co. 5.350%, 4/1/53 | 65 | 64 | |
| Vistra Operations Co. LLC 144A 3.550%, 7/15/24(3) | 75 | 73 | |
| 638 | |||
| Exploration & Production—0.7% | |||
| BP Capital Markets America, Inc. 4.893%, 9/11/33 | 25 | 25 | |
| BP Capital Markets plc 4.375% (2) | 50 | 48 | |
| Continental Resources, Inc. 4.375%, 1/15/28 | 75 | 70 | |
| Diamondback Energy, Inc. 6.250%, 3/15/33 | 125 | 130 | |
| 273 | |||
| Financial & Lease—5.8% | |||
| Air Lease Corp. | |||
| 5.850%, 12/15/27 | 75 | 75 | |
| 3.000%, 2/1/30 | 25 | 21 | |
| Bank of America Corp. | |||
| 2.496%, 2/13/31 | 75 | 63 | |
| 2.482%, 9/21/36 | 75 | 57 | |
| Barclays plc | |||
| 2.852%, 5/7/26 | 55 | 52 | |
| 2.279%, 11/24/27 | 75 | 67 | |
| Boston Properties LP 3.400%, 6/21/29 | 75 | 62 | |
| BPCE S.A. 144A 5.975%, 1/18/27(3) | 75 | 75 | |
| Capital One Financial Corp. 2.618%, 11/2/32 | 75 | 58 | |
| Citigroup, Inc. | |||
| 4.400%, 6/10/25 | 25 | 24 | |
| 4.450%, 9/29/27 | 100 | 96 | |
| CubeSmart LP 3.000%, 2/15/30 | 75 | 65 | |
| Deutsche Bank AG 2.129%, 11/24/26 | 75 | 66 | |
| Discover Financial Services 6.700%, 11/29/32 | 50 | 52 | |
| DNB Bank ASA 144A 1.605%, 3/30/28(3) | 75 | 65 | |
| Fifth Third Bancorp. 1.707%, 11/1/27 | 75 | 64 | |
| Goldman Sachs Group, Inc. (The) | |||
| 0.855%, 2/12/26 | 25 | 23 | |
| 4.223%, 5/1/29 | 75 | 71 | |
| HSBC Holdings plc | |||
| 1.589%, 5/24/27 | 25 | 22 | |
| 6.254%, 3/9/34 | 100 | 103 | |
| JPMorgan Chase & Co. | |||
| 2.595%, 2/24/26 | 50 | 48 | |
| Par Value(1) | Value | ||
| Financial & Lease—continued | |||
| Subordinate Notes 3.625%, 12/1/27 | $ 50 | $ 47 | |
| Kemper Corp. 2.400%, 9/30/30 | 75 | 59 | |
| KeyBank NA 4.900%, 8/8/32 | 100 | 80 | |
| Kimco Realty OP LLC 4.600%, 2/1/33 | 50 | 46 | |
| Mizuho Financial Group, Inc. 2.564%, 9/13/31 | 75 | 59 | |
| Morgan Stanley | |||
| 5.164%, 4/20/29 | 50 | 50 | |
| 2.484%, 9/16/36 | 125 | 94 | |
| Nomura Holdings, Inc. 2.172%, 7/14/28 | 150 | 127 | |
| Office Properties Income Trust 2.400%, 2/1/27 | 75 | 47 | |
| Societe Generale S.A. 144A 1.488%, 12/14/26(3) | 100 | 88 | |
| Standard Chartered plc | |||
| 144A 1.456%, 1/14/27(3) | 25 | 22 | |
| 144A 3.265%, 2/18/36(3) | 25 | 20 | |
| Sumitomo Mitsui Financial Group, Inc. 2.142%, 9/23/30 | 25 | 20 | |
| Synchrony Financial | |||
| 3.700%, 8/4/26 | 50 | 44 | |
| 2.875%, 10/28/31 | 100 | 71 | |
| UBS Group AG 144A 2.746%, 2/11/33(3) | 150 | 119 | |
| US Bancorp 4.967%, 7/22/33 | 100 | 91 | |
| WEA Finance LLC 144A 2.875%, 1/15/27(3) | 50 | 43 | |
| Wells Fargo & Co. 3.350%, 3/2/33 | 125 | 107 | |
| 2,463 | |||
| Food, Beverages & Tobacco—0.4% | |||
| Conagra Brands, Inc. 1.375%, 11/1/27 | 75 | 64 | |
| Constellation Brands, Inc. 5.000%, 2/2/26 | 50 | 50 | |
| PepsiCo, Inc. 2.750%, 3/19/30 | 75 | 68 | |
| 182 | |||
| Health Care—1.5% | |||
| Amgen, Inc. | |||
| 5.150%, 3/2/28 | 50 | 50 | |
| 5.650%, 3/2/53 | 50 | 50 | |
| Baxter International, Inc. 2.272%, 12/1/28 | 75 | 65 | |
| CSL Finance plc 144A 4.750%, 4/27/52(3) | 75 | 69 | |
| Elevance Health, Inc. 4.900%, 2/8/26 | 100 | 99 | |
| HCA, Inc. 5.200%, 6/1/28 | 50 | 50 | |
| Kenvue, Inc. 144A 5.000%, 3/22/30(3) | 75 | 76 | |
| Par Value(1) | Value | ||
| Health Care—continued | |||
| Pfizer Investment Enterprises Pte Ltd. 5.110%, 5/19/43 | $ 145 | $ 144 | |
| Pfizer, Inc. 4.000%, 12/15/36 | 50 | 47 | |
| 650 | |||
| Home Builders—0.1% | |||
| MDC Holdings, Inc. 2.500%, 1/15/31 | 50 | 39 | |
| Industrial Other—0.5% | |||
| Ashtead Capital, Inc. 144A 4.000%, 5/1/28(3) | 75 | 69 | |
| Flowserve Corp. 3.500%, 10/1/30 | 50 | 44 | |
| Regal Rexnord Corp. 144A 6.050%, 4/15/28(3) | 100 | 99 | |
| 212 | |||
| Lodging—0.2% | |||
| Marriott International, Inc. Series HH 2.850%, 4/15/31 | 75 | 63 | |
| Media Cable—0.2% | |||
| Charter Communications Operating LLC 6.484%, 10/23/45 | 75 | 68 | |
| Media Other—0.1% | |||
| Warnermedia Holdings, Inc. 5.050%, 3/15/42 | 75 | 61 | |
| Metals, Mining & Steel—0.2% | |||
| Glencore Funding LLC 144A 2.500%, 9/1/30(3) | 75 | 62 | |
| Rio Tinto Finance USA Ltd. 2.750%, 11/2/51 | 50 | 33 | |
| 95 | |||
| Midstream—0.9% | |||
| Boardwalk Pipelines LP 4.800%, 5/3/29 | 50 | 48 | |
| Enbridge, Inc. 2.500%, 2/14/25 | 75 | 72 | |
| Energy Transfer LP 6.000%, 6/15/48 | 75 | 69 | |
| KeySpan Gas East Corp. 144A 5.994%, 3/6/33(3) | 105 | 107 | |
| Sabine Pass Liquefaction LLC 4.200%, 3/15/28 | 75 | 71 | |
| 367 | |||
| Refining—0.1% | |||
| Phillips 66 2.150%, 12/15/30 | 75 | 61 | |
| Restaurants—0.1% | |||
| McDonald’s Corp. 3.600%, 7/1/30 | 50 | 47 | |
| Par Value(1) | Value | ||
| Retail Non Food & Drug—0.3% | |||
| O’Reilly Automotive, Inc. 4.700%, 6/15/32 | $ 75 | $ 73 | |
| Tapestry, Inc. 3.050%, 3/15/32 | 75 | 60 | |
| 133 | |||
| Services Other—0.4% | |||
| Equifax, Inc. 2.350%, 9/15/31 | 75 | 60 | |
| Waste Management, Inc. 2.950%, 6/1/41 | 75 | 55 | |
| Western Union Co. (The) 2.750%, 3/15/31 | 75 | 60 | |
| 175 | |||
| Technology—1.1% | |||
| Arrow Electronics, Inc. 6.125%, 3/1/26 | 50 | 50 | |
| Broadcom, Inc. 144A 3.187%, 11/15/36(3) | 100 | 75 | |
| Leidos, Inc. 5.750%, 3/15/33 | 75 | 74 | |
| Oracle Corp. 5.550%, 2/6/53 | 75 | 70 | |
| Texas Instruments, Inc. 5.000%, 3/14/53 | 75 | 75 | |
| TSMC Arizona Corp. 3.125%, 10/25/41 | 100 | 79 | |
| TSMC Global Ltd. 144A 1.000%, 9/28/27(3) | 50 | 43 | |
| 466 | |||
| Transport Other—0.2% | |||
| FedEx Corp. 4.400%, 1/15/47 | 75 | 62 | |
| Wireless—0.4% | |||
| Sprint Capital Corp. 6.875%, 11/15/28 | 50 | 53 | |
| T-Mobile USA, Inc. 3.875%, 4/15/30 | 100 | 93 | |
| 146 | |||
| Wirelines—0.1% | |||
| AT&T, Inc. 2.250%, 2/1/32 | 50 | 40 | |
| Total Corporate Bonds and Notes (Identified Cost $7,143) | 6,582 | ||
| Shares | ||
| Affiliated Mutual Funds—61.7% | ||
| Fixed Income Funds—61.7% | ||
| Virtus Stone Harbor Emerging Markets Bond Fund Class I(5)(6) | 274,049 | 2,091 |
| Virtus Stone Harbor Emerging Markets Debt Income Fund Class I(5)(6) | 1,477,616 | 10,211 |
| Virtus Stone Harbor High Yield Bond Fund Class I(5)(6) | 1,825,010 | 12,702 |
| Shares | Value | ||
| Fixed Income Funds—continued | |||
| Virtus Stone Harbor Local Markets Fund Class I(5)(6)(7) | 142,118 | $ 1,097 | |
| Total Affiliated Mutual Funds (Identified Cost $30,300) | 26,101 | ||
| Total Long-Term Investments—92.3% (Identified Cost $44,175) | 39,075 | ||
| TOTAL INVESTMENTS—92.3% (Identified Cost $44,175) | $39,075 | ||
| Other assets and liabilities, net—7.7% | 3,239 | ||
| NET ASSETS—100.0% | $42,314 | ||
| Abbreviations: | |
| BTP | Italian Buonie |
| CDX.EM | Markit CDX® Emerging Markets Index |
| CDX.NA.HY | Markit’s North American High Yield CDX Index |
| HSBC | Hong Kong & Shanghai Bank |
| LIBOR | London Interbank Offered Rate |
| LLC | Limited Liability Company |
| LP | Limited Partnership |
| NA | National Association |
| Nomura | Nomura Global Financial Products, Inc. |
| SOFR | Secured Overnight Financing Rate |
| TBA | To-be-announced |
| Footnote Legend: | |
| (1) | Par Value disclosed in foreign currency is reported in thousands. |
| (2) | No contractual maturity date. |
| (3) | Security exempt from registration under Rule 144A of the Securities Act of 1933. These securities may be resold in transactions exempt from registration, normally to qualified institutional buyers. At May 31, 2023, these securities amounted to a value of $2,143 or 5.1% of net assets. |
| (4) | Variable rate security. Rate disclosed is as of May 31, 2023. Information in parenthesis represents benchmark and reference rate for each security. Certain variable rate securities are not based on a published reference rate and spread but are determined by the issuer or agent and are based on current market conditions, or, for mortgage-backed securities, are impacted by the individual mortgages which are paying off over time. These securities do not indicate a reference rate and spread in their descriptions. |
| (5) | Affiliated investment. See Note 4I in Notes to Financial Statements. |
| (6) | Shares of this fund are publicly offered, and its prospectus and annual report are publicly available. |
| (7) | Non-income producing. |
| Counterparties: | |
| CITI | Citigroup Global Markets |
| GS | Goldman Sachs & Co. |
| JPM | JPMorgan Chase Bank N.A. |
| Foreign Currencies: | |
| AUD | Australian Dollar |
| CAD | Canadian Dollar |
| EUR | Euro |
| GBP | United Kingdom Pound Sterling |
| JPY | Japanese Yen |
| MXN | Mexican Peso |
| SGD | Singapore Dollar |
| USD | United States Dollar |
| Exchange-traded futures contracts as of May 31, 2023 were as follows: | ||||||
| Issue | Expiration | Contracts Purchased/(Sold) | Notional Value | Value / Unrealized Appreciation | Value / Unrealized Depreciation | |
| Long Contracts: | ||||||
| 10 Year Euro-Bund Future | June 2023 | 8 | $ 1,164 | $22 | $ — | |
| 10 Year U.K. Gilt Future | September 2023 | 7 | 843 | 6 | — | |
| $28 | $ — | |||||
| Short Contracts: | ||||||
| Euro-BTP Future | June 2023 | (5) | (620) | — | (19) | |
| Exchange-traded futures contracts as of May 31, 2023 were as follows (continued): | ||||||
| Issue | Expiration | Contracts Purchased/(Sold) | Notional Value | Value / Unrealized Appreciation | Value / Unrealized Depreciation | |
| 10 Year U.S. Treasury Note Future | September 2023 | (119) | $(13,622) | $ 5 | $ — | |
| 10 Year U.S. Ultra Bond Future | September 2023 | (1) | (137) | — | (1) | |
| 5 | (20) | |||||
| Total | $33 | $ (20) | ||||
| Forward foreign currency exchange contracts as of May 31, 2023 were as follows: | ||||||||
| Currency Purchased | Currency Amount Purchased | Currency Sold | Currency Amount Sold | Counterparty | Settlement Date | Unrealized Appreciation | Unrealized Depreciation | |
| AUD | 410 | USD | 271 | JPM | 06/05/23 | $— | $ (4) | |
| AUD | 410 | USD | 268 | JPM | 07/05/23 | — | (1) | |
| CAD | 280 | USD | 206 | GS | 06/12/23 | 1 | — | |
| EUR | 190 | USD | 204 | GS | 06/12/23 | — | (1) | |
| EUR | 200 | GBP | 174 | CITI | 06/22/23 | — | (3) | |
| JPY | 28,630 | USD | 208 | CITI | 06/05/23 | — | (2) | |
| JPY | 28,930 | USD | 211 | CITI | 06/23/23 | — | (2) | |
| JPY | 44,310 | USD | 317 | JPM | 06/30/23 | 2 | — | |
| SGD | 290 | USD | 214 | CITI | 06/30/23 | — (1) | — | |
| USD | 268 | AUD | 410 | JPM | 06/05/23 | 1 | — | |
| USD | 106 | JPY | 14,310 | CITI | 06/05/23 | 4 | — | |
| USD | 107 | JPY | 14,320 | JPM | 06/05/23 | 4 | — | |
| USD | 209 | CAD | 280 | GS | 06/12/23 | 2 | — | |
| USD | 209 | EUR | 190 | GS | 06/12/23 | 6 | — | |
| USD | 214 | JPY | 28,930 | CITI | 06/23/23 | 5 | — | |
| USD | 218 | MXN | 3,860 | CITI | 06/23/23 | 1 | — | |
| USD | 105 | MXN | 1,860 | CITI | 06/26/23 | 1 | — | |
| USD | 106 | MXN | 1,900 | GS | 06/30/23 | — | (1) | |
| USD | 231 | EUR | 210 | JPM | 07/21/23 | 6 | — | |
| USD | 23 | GBP | 18 | CITI | 07/21/23 | — | — (1) | |
| Total | $33 | $(14) | ||||||
| Footnote Legend: | |
| (1) | Amount is less than $500 (not in thousands). |
| Centrally cleared credit default swaps - buy protection(1) outstanding as of May 31, 2023 were as follows: | |||||||||||||
| Reference Entity | Payment Frequency | Fixed Rate | Expiration Date | Notional Amount(2) | Value | Premiums Paid (Received) | Unrealized Appreciation | Unrealized Depreciation | |||||
| CDX.EM.S39 | Quarterly | 1.000% | 06/20/28 | $(4,400) | $ 267 | $ 269 | $— | $ (2) | |||||
| CDX.NA.HY.S40 | Quarterly | 5.000% | 06/20/28 | (6,350) | (132) | (64) | — | (68) | |||||
| Total | $ 135 | $ 205 | $— | $ (70) | |||||||||
| Footnote Legend: | |
| (1) | If the Fund is a buyer of protection and a credit event occurs, as defined under the terms of that particular swap agreement, the Fund will either: (i) receive from the seller of protection an amount equal to the notional amount of the swap and deliver the referenced obligation or underlying investments comprising the referenced index; or (ii) receive a net settlement amount in the form of cash or investments equal to the notional amount of the swap less the recovery value of the referenced obligation or underlying investments comprising the referenced index. |
| (2) | The maximum potential amount the Fund could be required to pay as a seller of credit protection or receive as a buyer of credit protection if a credit event occurs as defined under the terms of that particular swap agreement. |
| Total Value at May 31, 2023 | Level 1 Quoted Prices | Level 2 Significant Observable Inputs | |||
| Assets: | |||||
| Debt Instruments: | |||||
| Asset-Backed Securities | $ 192 | $ — | $ 192 | ||
| Corporate Bonds and Notes | 6,582 | — | 6,582 | ||
| Mortgage-Backed Securities | 3,390 | — | 3,390 | ||
| U.S. Government Securities | 2,810 | — | 2,810 | ||
| Affiliated Mutual Funds | 26,101 | 26,101 | — | ||
| Other Financial Instruments: | |||||
| Futures Contracts | 33 | 33 | — | ||
| Forward Foreign Currency Exchange Contracts | 33 | — | 33 | ||
| Centrally Cleared Credit Default Swaps | 135 | — | 135 | ||
| Total Assets | 39,276 | 26,134 | 13,142 | ||
| Liabilities: | |||||
| Other Financial Instruments: | |||||
| Futures Contracts | (20) | (20) | — | ||
| Forward Foreign Currency Exchange Contracts | (14) | — | (14) | ||
| Total Liabilities | (34) | (20) | (14) | ||
| Total Investments | $39,242 | $26,114 | $13,128 |
| Stone Harbor Emerging Markets Bond Fund | Stone Harbor Emerging Markets Debt Allocation Fund | Stone Harbor Emerging Markets Debt Income Fund | |||
| Assets | |||||
Investment in securities at value(1) | $ 7,463 | $ — | $ 385,182 | ||
Investment in affiliates at value(2) | — | 2,338 | 10,564 | ||
Foreign currency at value(3) | — | — | 43 | ||
Cash | 301 | 84 | 16,116 | ||
Cash pledged as collateral for swap contracts | — | — | 2,070 | ||
Unrealized appreciation on forward foreign currency exchange contracts | — | — | 968 | ||
| Receivables | |||||
Investment securities sold | — | — | 5,944 | ||
Fund shares sold | — | — | 1,026 | ||
Dividends and interest | 112 | — (a) | 6,531 | ||
Receivable from adviser | 2 | — | — | ||
Tax reclaims | — (a) | — | 19 | ||
Prepaid Trustees’ retainer | — (a) | — (a) | 7 | ||
Prepaid expenses | 6 | 10 | 15 | ||
Other assets | 1 | — (a) | 48 | ||
Total assets | 7,885 | 2,432 | 428,533 | ||
| Liabilities | |||||
Over-the-counter swaps at value(4) | — | — | 1,915 | ||
Unrealized depreciation on forward foreign currency exchange contracts | — | — | 18 | ||
| Payables | |||||
Investment securities purchased | 41 | — | 11,652 | ||
Investment advisory fees | — | 19 | 229 | ||
Distribution and service fees | — (a) | — (a) | — (a) | ||
Administration and accounting fees | 1 | 1 | 36 | ||
Transfer agent and sub-transfer agent fees and expenses | — | — | 18 | ||
Professional fees | 34 | 20 | 38 | ||
Trustee deferred compensation plan | 1 | — (a) | 48 | ||
Interest expense and/or commitment fees | — | — | — (a) | ||
Other accrued expenses | 6 | — | 54 | ||
Total liabilities | 83 | 40 | 14,008 | ||
Net Assets | $ 7,802 | $ 2,392 | $ 414,525 | ||
| Net Assets Consist of: | |||||
Capital paid in on shares of beneficial interest | $ 13,216 | $ 11,028 | $ 939,636 | ||
Accumulated earnings (loss) | (5,414) | (8,636) | (525,111) | ||
Net Assets | $ 7,802 | $ 2,392 | $ 414,525 | ||
| Net Assets: | |||||
Class A | $ 96 | $ 85 | $ 88 | ||
Class I | $ 7,706 | $ 2,307 | $ 414,437 | ||
| Shares Outstanding (unlimited number of shares authorized, no par value): | |||||
Class A | 12,584 | 12,887 | 12,768 | ||
Class I | 1,010,494 | 349,390 | 59,934,165 | ||
| Net Asset Value and Redemption Price Per Share:* | |||||
Class A | $ 7.61 | $ 6.60 | $ 6.90 | ||
Class I | $ 7.63 | $ 6.60 | $ 6.91 |
| Stone Harbor Emerging Markets Bond Fund | Stone Harbor Emerging Markets Debt Allocation Fund | Stone Harbor Emerging Markets Debt Income Fund | |||
| Maximum Offering Price Per Share (NAV/(1-Maximum Sales Charge)): | |||||
Class A | $ 7.91 | $ 6.86 | $ 7.17 | ||
Maximum Sales Charge - Class A | 3.75% | 3.75% | 3.75% | ||
(1) Investment in securities at cost | $ 8,170 | $ — | $ 471,541 | ||
(2) Investment in affiliates at cost | $ — | $ 2,285 | $ 11,049 | ||
(3) Foreign currency at cost | $ — | $ — | $ 43 | ||
(4) Includes premiums paid (received) on swaps | $ — | $ — | $ (2,285) |
| (a) | Amount is less than $500 (not in thousands). |
| * | Net Asset Value and Redemption Price Per Share are calculated using unrounded net assets. |
| Stone Harbor High Yield Bond Fund | Stone Harbor Local Markets Fund | Stone Harbor Strategic Income Fund | |||
| Assets | |||||
Investment in securities at value(1) | $ 82,997 | $ 13,002 | $ 12,974 | ||
Investment in affiliates at value(2) | — | — | 26,101 | ||
Foreign currency at value(3) | — | 244 | 385 | ||
Cash | 395 | 79 | 4,493 | ||
Due from broker | — | — | 23 | ||
Cash pledged as collateral for futures contracts | — | — | 342 | ||
Cash pledged as collateral for swap contracts | — | — | 530 | ||
Variation margin receivable on cleared swaps | — | — | 16 | ||
Unrealized appreciation on forward foreign currency exchange contracts | — | 35 | 33 | ||
| Receivables | |||||
Investment securities sold | — | 2,599 | — | ||
Dividends and interest | 1,487 | 343 | 101 | ||
Receivable from adviser | — | — | 3 | ||
Tax reclaims | — | 17 | 1 | ||
Prepaid Trustees’ retainer | 1 | — (a) | 1 | ||
Prepaid expenses | 8 | 6 | 11 | ||
Other assets | 10 | 2 | 5 | ||
Total assets | 84,898 | 16,327 | 45,019 | ||
| Liabilities | |||||
Variation margin payable on futures contracts | — | — | 43 | ||
Unrealized depreciation on forward foreign currency exchange contracts | — | 94 | 14 | ||
| Payables | |||||
Investment securities purchased | — | 711 | 2,592 | ||
Investment advisory fees | 28 | 30 | — | ||
Distribution and service fees | — (a) | — (a) | — (a) | ||
Administration and accounting fees | 8 | 2 | 4 | ||
Transfer agent and sub-transfer agent fees and expenses | 2 | — | 1 | ||
Professional fees | 39 | 36 | 34 | ||
Trustee deferred compensation plan | 10 | 2 | 5 | ||
Other accrued expenses | 16 | 13 | 12 | ||
Total liabilities | 103 | 888 | 2,705 | ||
Net Assets | $ 84,795 | $ 15,439 | $ 42,314 | ||
| Net Assets Consist of: | |||||
Capital paid in on shares of beneficial interest | $ 122,989 | $ 215,879 | $ 48,967 | ||
Accumulated earnings (loss) | (38,194) | (200,440) | (6,653) | ||
Net Assets | $ 84,795 | $ 15,439 | $ 42,314 | ||
| Net Assets: | |||||
Class A | $ 155 | $ 100 | $ 99 | ||
Class I | $ 84,640 | $ 15,339 | $ 42,215 | ||
| Shares Outstanding (unlimited number of shares authorized, no par value): | |||||
Class A | 22,365 | 12,970 | 11,979 | ||
Class I | 12,155,604 | 1,986,590 | 5,097,102 | ||
| Net Asset Value and Redemption Price Per Share:* | |||||
Class A | $ 6.95 | $ 7.69 | $ 8.29 | ||
Class I | $ 6.96 | $ 7.72 | $ 8.28 |
| Stone Harbor High Yield Bond Fund | Stone Harbor Local Markets Fund | Stone Harbor Strategic Income Fund | |||
| Maximum Offering Price Per Share (NAV/(1-Maximum Sales Charge)): | |||||
Class A | $ 7.22 | $ 7.99 | $ 8.61 | ||
Maximum Sales Charge - Class A | 3.75% | 3.75% | 3.75% | ||
(1) Investment in securities at cost | $ 92,957 | $ 15,079 | $ 13,875 | ||
(2) Investment in affiliates at cost | $ — | $ — | $ 30,300 | ||
(3) Foreign currency at cost | $ — | $ 243 | $ 387 |
| (a) | Amount is less than $500 (not in thousands). |
| * | Net Asset Value and Redemption Price Per Share are calculated using unrounded net assets. |
| Stone Harbor Emerging Markets Bond Fund | Stone Harbor Emerging Markets Debt Allocation Fund | Stone Harbor Emerging Markets Debt Income Fund | |||
| Investment Income | |||||
Dividends | $ 11 | $ 3 | $ 770 | ||
Dividends from affiliates | — | 132 | 195 | ||
Interest | 474 | — | 39,177 | ||
Foreign taxes withheld | (5) | — | (149) | ||
Total investment income | 480 | 135 | 39,993 | ||
| Expenses | |||||
Investment advisory fees | 61 | 31 | 2,998 | ||
Distribution and service fees, Class A | — (1) | — (1) | — (1) | ||
Administration and accounting fees | 6 | 12 | 461 | ||
Transfer agent fees and expenses | 2 | — (1) | 199 | ||
Sub-transfer agent fees and expenses, Class I | 19 | 2 | 94 | ||
Custodian fees | 1 | 4 | — | ||
Printing fees and expenses | — | — | 68 | ||
Professional fees | 18 | 5 | 90 | ||
Interest expense and/or commitment fees | — | — (1) | — | ||
Registration fees | 31 | 27 | 34 | ||
Trustees’ fees and expenses | — (1) | — | 38 | ||
Miscellaneous expenses | 19 | 7 | 133 | ||
Total expenses | 157 | 88 | 4,115 | ||
Less net expenses reimbursed and/or waived by investment adviser(2) | (86) | (87) | (456) | ||
Net expenses | 71 | 1 | 3,659 | ||
Net investment income (loss) | 409 | 134 | 36,334 | ||
| Net Realized and Unrealized Gain (Loss) on Investments | |||||
| Net realized gain (loss) from: | |||||
Investments | (282) | (2) | (155,554) | ||
Investments in affiliates | — | (1,000) | — | ||
Foreign currency transactions | — | — | (4,122) | ||
Foreign capital gains tax | — | — | — (1) | ||
Forward foreign currency exchange contracts | — | (1) | 940 | ||
Swaps | — | — | 1,731 | ||
| Net change in unrealized appreciation (depreciation) on: | |||||
Investments | (59) | — | 97,046 | ||
Investments in affiliates | — | 223 | 232 | ||
Foreign currency transactions | — | — | 36 | ||
Forward foreign currency exchange contracts | — | (4) | 1,182 | ||
Swaps | — | — | 226 | ||
Net realized and unrealized gain (loss) on investments | (341) | (784) | (58,283) | ||
Net increase (decrease) in net assets resulting from operations | $ 68 | $ (650) | $ (21,949) |
| (1) | Amount is less than $500 (not in thousands). |
| (2) | See Note 4D in Notes to Financial Statements. |
| Stone Harbor High Yield Bond Fund | Stone Harbor Local Markets Fund | Stone Harbor Strategic Income Fund | |||
| Investment Income | |||||
Dividends | $ 49 | $ 28 | $ 151 | ||
Dividends from affiliates | — | — | 1,435 | ||
Interest | 6,513 | 2,242 | 374 | ||
Foreign taxes withheld | — | (27) | (1) | ||
Total investment income | 6,562 | 2,243 | 1,959 | ||
| Expenses | |||||
Investment advisory fees | 490 | 229 | 219 | ||
Distribution and service fees, Class A | — (1) | — (1) | — (1) | ||
Administration and accounting fees | 98 | 26 | 35 | ||
Transfer agent fees and expenses | 38 | 10 | 14 | ||
Sub-transfer agent fees and expenses, Class I | 5 | 21 | 2 | ||
Custodian fees | 3 | (32) | — | ||
Printing fees and expenses | 12 | 2 | 3 | ||
Professional fees | 31 | 29 | 20 | ||
Interest expense and/or commitment fees | — | 3 | — (1) | ||
Registration fees | 29 | 29 | 33 | ||
Trustees’ fees and expenses | 6 | 3 | 2 | ||
Miscellaneous expenses | 30 | 8 | 34 | ||
Total expenses | 742 | 328 | 362 | ||
Less net expenses reimbursed and/or waived by investment adviser(2) | (100) | (27) | (247) | ||
Net expenses | 642 | 301 | 115 | ||
Net investment income (loss) | 5,920 | 1,942 | 1,844 | ||
| Net Realized and Unrealized Gain (Loss) on Investments | |||||
| Net realized gain (loss) from: | |||||
Investments | (4,391) | (10,570) | (471) | ||
Investments in affiliates | — | — | (213) | ||
Foreign currency transactions | — | (11,058) | 17 | ||
Foreign capital gains tax | — | (51) | — | ||
Forward foreign currency exchange contracts | — | (354) | 67 | ||
Futures | — | — | 868 | ||
Swaps | — | — | (91) | ||
Payment by affiliates(3) | 1 | — | — | ||
| Net change in unrealized appreciation (depreciation) on: | |||||
Investments | (1,189) | 16,628 | (254) | ||
Investments in affiliates | — | — | (1,206) | ||
Foreign currency transactions | — | (12) | (2) | ||
Forward foreign currency exchange contracts | — | (43) | (1) | ||
Futures | — | — | (1) | ||
Swaps | — | — | (101) | ||
Net realized and unrealized gain (loss) on investments | (5,579) | (5,460) | (1,388) | ||
Net increase (decrease) in net assets resulting from operations | $ 341 | $ (3,518) | $ 456 |
| (1) | Amount is less than $500 (not in thousands). |
| (2) | See Note 4D in Notes to Financial Statements. |
| (3) | See Note 4G in Notes to Financial Statements. |
| Stone Harbor Emerging Markets Bond Fund | Stone Harbor Emerging Markets Debt Allocation Fund | ||||||
| Year Ended May 31, 2023 | Year Ended May 31, 2022 | Year Ended May 31, 2023 | Year Ended May 31, 2022 | ||||
| Increase (Decrease) in Net Assets Resulting from Operations | |||||||
Net investment income (loss) | $ 409 | $ 308 | $ 134 | $ 390 | |||
Net realized gain (loss) | (282) | (135) | (1,003) | (269) | |||
Net change in unrealized appreciation (depreciation) | (59) | (922) | 219 | (3,138) | |||
Increase (decrease) in net assets resulting from operations | 68 | (749) | (650) | (3,017) | |||
| Dividends and Distributions to Shareholders | |||||||
| Net Investment Income and Net Realized Gains: | |||||||
Class A* | (4) | (1) | (11) | — | |||
Class I | (312) | (317) | (219) | (433) | |||
Total dividends and distributions to shareholders | (316) | (318) | (230) | (433) | |||
| Change in Net Assets from Capital Transactions (See Note 6): | |||||||
Class A* | 3 | 100 | — | 100 | |||
Class I | 989 | 1,331 | (4,976) | (7,209) | |||
Increase (decrease) in net assets from capital transactions | 992 | 1,431 | (4,976) | (7,109) | |||
Net increase (decrease) in net assets | 744 | 364 | (5,856) | (10,559) | |||
| Net Assets | |||||||
Beginning of period | 7,058 | 6,694 | 8,248 | 18,807 | |||
End of Period | $ 7,802 | $ 7,058 | $ 2,392 | $ 8,248 | |||
| * | Inception date April 11, 2022. |
| Stone Harbor Emerging Markets Debt Income Fund | Stone Harbor High Yield Bond Fund | ||||||
| Year Ended May 31, 2023 | Year Ended May 31, 2022 | Year Ended May 31, 2023 | Year Ended May 31, 2022 | ||||
| Increase (Decrease) in Net Assets Resulting from Operations | |||||||
Net investment income (loss) | $ 36,334 | $ 59,896 | $ 5,920 | $ 4,753 | |||
Net realized gain (loss) | (157,005) | (78,244) | (4,391) | (585) | |||
Payment by affiliates(1) | — | — | 1 | — | |||
Net change in unrealized appreciation (depreciation) | 98,722 | (176,170) | (1,189) | (10,600) | |||
Increase (decrease) in net assets resulting from operations | (21,949) | (194,518) | 341 | (6,432) | |||
| Dividends and Distributions to Shareholders | |||||||
| Net Investment Income and Net Realized Gains: | |||||||
Class A* | (7) | (1) | (6) | (1) | |||
Class I | (40,443) | (60,380) | (4,729) | (4,960) | |||
Total dividends and distributions to shareholders | (40,450) | (60,381) | (4,735) | (4,961) | |||
| Change in Net Assets from Capital Transactions (See Note 6): | |||||||
Class A* | 2 | 100 | 61 | 100 | |||
Class I | (254,202) | (410,972) | (12,657) | 15,153 | |||
Increase (decrease) in net assets from capital transactions | (254,200) | (410,872) | (12,596) | 15,253 | |||
Net increase (decrease) in net assets | (316,599) | (665,771) | (16,990) | 3,860 | |||
| Net Assets | |||||||
Beginning of period | 731,124 | 1,396,895 | 101,785 | 97,925 | |||
End of Period | $ 414,525 | $ 731,124 | $ 84,795 | $ 101,785 | |||
| * | Inception date April 11, 2022. |
| (1) | See Note 4G in Notes to Financial Statements. |
| Stone Harbor Local Markets Fund | Stone Harbor Strategic Income Fund | ||||||
| Year Ended May 31, 2023 | Year Ended May 31, 2022 | Year Ended May 31, 2023 | Year Ended May 31, 2022 | ||||
| Increase (Decrease) in Net Assets Resulting from Operations | |||||||
Net investment income (loss) | $ 1,942 | $ 5,572 | $ 1,844 | $ 945 | |||
Net realized gain (loss) | (22,033) | (6,926) | 177 | 398 | |||
Net change in unrealized appreciation (depreciation) | 16,573 | (17,252) | (1,565) | (3,500) | |||
Increase (decrease) in net assets resulting from operations | (3,518) | (18,606) | 456 | (2,157) | |||
| Dividends and Distributions to Shareholders | |||||||
| Net Investment Income and Net Realized Gains: | |||||||
Class A* | — | — | (5) | (—) (1) | |||
Class I | — | — | (2,245) | (800) | |||
Total dividends and distributions to shareholders | — | — | (2,250) | (800) | |||
| Change in Net Assets from Capital Transactions (See Note 6): | |||||||
Class A* | — | 100 | 6 | 100 | |||
Class I | (58,145) | (65,384) | 5,495 | 9,914 | |||
Increase (decrease) in net assets from capital transactions | (58,145) | (65,284) | 5,501 | 10,014 | |||
Net increase (decrease) in net assets | (61,663) | (83,890) | 3,707 | 7,057 | |||
| Net Assets | |||||||
Beginning of period | 77,102 | 160,992 | 38,607 | 31,550 | |||
End of Period | $ 15,439 | $ 77,102 | $ 42,314 | $ 38,607 | |||
| * | Inception date April 11, 2022. |
| (1) | Amount is less than $500 (not in thousands). |
THROUGHOUT EACH PERIOD
| Net Asset Value, Beginning of Period | Net Investment Income (Loss)(1) | Net Realized and Unrealized Gain (Loss) | Total from Investment Operations | Dividends from Net Investment Income | Total Distributions | Payments from Affiliates | Change in Net Asset Value | Net Asset Value, End of Period | Total Return(2)(3) | Net Assets, End of Period (in thousands) | Ratio of Net Expenses to Average Net Assets(4)(5) | Ratio of Gross Expenses to Average Net Assets(4)(5) | Ratio of Net Investment Income (Loss) to Average Net Assets(4) | Portfolio Turnover Rate(2) | ||
| Stone Harbor Emerging Markets Bond Fund | ||||||||||||||||
| Class A | ||||||||||||||||
| 6/1/22 to 5/31/23 | $7.89 | 0.41 | (0.36) | 0.05 | (0.33) | (0.33) | — | (0.28) | $7.61 | 0.71 % | $ 96 | 1.25 % (6) | 2.25 % | 5.49 % | 31 % | |
| 4/11/22 (7) to 5/31/22 | 8.16 | 0.05 | (0.22) | (0.17) | (0.10) | (0.10) | — | (0.27) | 7.89 | (2.10) | 97 | 1.27 (8) | 3.15 | 4.50 | 14 (9) | |
| Class I | ||||||||||||||||
| 6/1/22 to 5/31/23 | $7.91 | 0.43 | (0.37) | 0.06 | (0.34) | (0.34) | — | (0.28) | $7.63 | 0.91 % | $ 7,706 | 1.00 % (6) | 2.21 % | 5.75 % | 31 % | |
| 6/1/21 to 5/31/22 | 9.25 | 0.40 | (1.33) | (0.93) | (0.41) | (0.41) | — | (1.34) | 7.91 | (10.40) | 6,961 | 1.02 (8) | 3.21 | 4.49 | 14 | |
| 6/1/20 to 5/31/21 | 8.17 | 0.45 | 1.10 | 1.55 | (0.47) | (0.47) | — | 1.08 | 9.25 | 19.25 | 6,694 | 1.01 (10) | 3.46 | 4.99 | 55 | |
| 6/1/19 to 5/31/20 | 8.82 | 0.42 | (0.64) | (0.22) | (0.43) | (0.43) | — | (0.65) | 8.17 | (2.71) | 5,666 | 1.01 (10) | 1.95 | 4.68 | 168 | |
| 6/1/18 to 5/31/19 | 8.80 | 0.45 | 0.03 | 0.48 | (0.46) | (0.46) | — | 0.02 | 8.82 | 5.71 | 13,078 | 1.01 (10) | 2.15 | 5.21 | 63 | |
| Stone Harbor Emerging Markets Debt Allocation Fund | ||||||||||||||||
| Class A | ||||||||||||||||
| 6/1/22 to 5/31/23 | $7.51 | 0.27 | (0.32) | (0.05) | (0.86) | (0.86) | — | (0.91) | $6.60 | (0.41) % | $ 85 | 0.25 % (6) | 2.30 % | 3.95 % | 48 % | |
| 4/11/22 (7) to 5/31/22 | 7.76 | 0.02 | (0.27) | (0.25) | — | — | — | (0.25) | 7.51 | (3.22) | 97 | 0.26 | 2.14 | 2.12 | 12 (9) | |
| Class I | ||||||||||||||||
| 6/1/22 to 5/31/23 | $7.51 | 0.21 | (0.25) | (0.04) | (0.87) | (0.87) | — | (0.91) | $6.60 | (0.30) % | $ 2,307 | 0.02 % (6) | 2.00 % | 3.03 % | 48 % | |
| 6/1/21 to 5/31/22 | 9.32 | 0.21 | (1.80) | (1.59) | (0.22) | (0.22) | — | (1.81) | 7.51 | (17.38) | 8,151 | — | 1.48 | 2.37 | 12 | |
| 6/1/20 to 5/31/21 | 8.61 | 0.20 | 0.86 | 1.06 | (0.35) | (0.35) | — | 0.71 | 9.32 | 12.26 | 18,807 | 0.02 | 1.32 | 2.13 | 29 | |
| 6/1/19 to 5/31/20 | 8.95 | 0.27 | (0.36) | (0.09) | (0.25) | (0.25) | — | (0.34) | 8.61 | (1.21) | 31,267 | 0.03 | 1.22 | 2.98 | 21 | |
| 6/1/18 to 5/31/19 | 9.25 | 0.33 | (0.33) | — | (0.30) | (0.30) | — | (0.30) | 8.95 | 0.20 | 28,213 | 0.05 | 1.21 | 3.70 | 38 | |
| Stone Harbor Emerging Markets Debt Income Fund | ||||||||||||||||
| Class A | ||||||||||||||||
| 6/1/22 to 5/31/23 | $7.63 | 0.49 | (0.65) | (0.16) | (0.57) | (0.57) | — | (0.73) | $6.90 | (1.96) % | $ 88 | 1.01 % (6) | 1.10 % | 7.04 % | 131 % | |
| 4/11/22 (7) to 5/31/22 | 8.06 | 0.06 | (0.38) | (0.32) | (0.11) | (0.11) | — | (0.43) | 7.63 | (3.93) | 95 | 1.02 (10) | 1.10 | 6.09 | 104 (9) | |
| Class I | ||||||||||||||||
| 6/1/22 to 5/31/23 | $7.63 | 0.51 | (0.65) | (0.14) | (0.58) | (0.58) | — | (0.72) | $6.91 | (1.64) % | $ 414,437 | 0.73 % (6) | 0.82 % | 7.27 % | 131 % | |
| 6/1/21 to 5/31/22 | 9.82 | 0.46 | (2.18) | (1.72) | (0.47) | (0.47) | — | (2.19) | 7.63 | (18.08) | 731,029 | 0.74 (10) | 0.75 | 4.96 | 104 | |
| 6/1/20 to 5/31/21 | 8.92 | 0.51 | 0.85 | 1.36 | (0.46) | (0.46) | — | 0.90 | 9.82 | 15.31 | 1,396,895 | 0.73 (10) | 0.73 | 5.18 | 106 | |
| 6/1/19 to 5/31/20 | 9.73 | 0.47 | (0.74) | (0.27) | (0.54) | (0.54) | — | (0.81) | 8.92 | (3.02) | 1,094,713 | 0.72 (10) | 0.72 | 4.89 | 118 | |
| 6/1/18 to 5/31/19 | 9.99 | 0.56 | (0.21) | 0.35 | (0.61) | (0.61) | — | (0.26) | 9.73 | 3.82 | 1,212,774 | 0.71 (10) | 0.71 | 5.81 | 104 | |
| Stone Harbor High Yield Bond Fund | ||||||||||||||||
| Class A | ||||||||||||||||
| 6/1/22 to 5/31/23 | $7.28 | 0.41 | (0.42) | (0.01) | (0.32) | (0.32) | — (11)(12) | (0.33) | $6.95 | (0.04) % | $ 155 | 0.90 % | 1.04 % | 5.85 % | 37 % | |
| 4/11/22 (7) to 5/31/22 | 7.48 | 0.04 | (0.15) | (0.11) | (0.09) | (0.09) | — | (0.20) | 7.28 | (1.38) | 97 | 0.92 (10) | 1.12 | 4.12 | 55 (9) |
| Net Asset Value, Beginning of Period | Net Investment Income (Loss)(1) | Net Realized and Unrealized Gain (Loss) | Total from Investment Operations | Dividends from Net Investment Income | Total Distributions | Payments from Affiliates | Change in Net Asset Value | Net Asset Value, End of Period | Total Return(2)(3) | Net Assets, End of Period (in thousands) | Ratio of Net Expenses to Average Net Assets(4)(5) | Ratio of Gross Expenses to Average Net Assets(4)(5) | Ratio of Net Investment Income (Loss) to Average Net Assets(4) | Portfolio Turnover Rate(2) | ||
| Stone Harbor High Yield Bond Fund (Continued) | ||||||||||||||||
| Class I | ||||||||||||||||
| 6/1/22 to 5/31/23 | $7.28 | 0.42 | (0.41) | 0.01 | (0.33) | (0.33) | — (11)(12) | (0.32) | $6.96 | 0.27 % | $ 84,640 | 0.65 % (6) | 0.76 % | 6.04 % | 37 % | |
| 6/1/21 to 5/31/22 | 8.14 | 0.37 | (0.85) | (0.48) | (0.38) | (0.38) | — | (0.86) | 7.28 | (6.11) | 101,688 | 0.67 (10) | 0.80 | 4.61 | 55 | |
| 6/1/20 to 5/31/21 | 7.53 | 0.38 | 0.60 | 0.98 | (0.37) | (0.37) | — | 0.61 | 8.14 | 13.19 | 97,925 | 0.66 (10) | 0.88 | 4.76 | 94 | |
| 6/1/19 to 5/31/20 | 7.88 | 0.42 | (0.34) | 0.08 | (0.43) | (0.43) | — | (0.35) | 7.53 | 0.96 | 65,454 | 0.66 (10) | 0.88 | 5.36 | 57 | |
| 6/1/18 to 5/31/19 | 7.91 | 0.43 | (0.02) | 0.41 | (0.44) | (0.44) | — | (0.03) | 7.88 | 5.36 | 88,562 | 0.66 (10) | 0.84 | 5.51 | 54 | |
| Stone Harbor Local Markets Fund | ||||||||||||||||
| Class A | ||||||||||||||||
| 6/1/22 to 5/31/23 | $7.51 | 0.47 | (0.29) | 0.18 | — | — | — | 0.18 | $7.69 | 2.40 % | $ 100 | 1.19 % (6)(10) | 1.26 % | 6.35 % | 112 % | |
| 4/11/22 (7) to 5/31/22 | 7.71 | 0.05 | (0.25) | (0.20) | — | — | — | (0.20) | 7.51 | (2.59) | 97 | 1.27 (10) | 1.53 | 5.24 | 67 (9) | |
| Class I | ||||||||||||||||
| 6/1/22 to 5/31/23 | $7.51 | 0.47 | (0.26) | 0.21 | — | — | — | 0.21 | $7.72 | 2.80 % | $ 15,339 | 0.99 % (6)(10) | 1.08 % | 6.35 % | 112 % | |
| 6/1/21 to 5/31/22 | 9.03 | 0.41 | (1.93) | (1.52) | — | — | — | (1.52) | 7.51 | (16.83) | 77,005 | 1.01 (10) | 1.14 | 4.87 | 67 | |
| 6/1/20 to 5/31/21 | 8.34 | 0.40 | 0.29 | 0.69 | — | — | — | 0.69 | 9.03 | 8.27 | 160,992 | 1.01 (10) | 1.04 | 4.60 | 95 | |
| 6/1/19 to 5/31/20 | 8.30 | 0.47 | (0.42) | 0.05 | (0.01) | (0.01) | — | 0.04 | 8.34 | 0.59 | 329,596 | 0.96 (10) | 0.96 | 5.53 | 103 | |
| 6/1/18 to 5/31/19 | 8.64 | 0.51 | (0.74) | (0.23) | (0.11) | (0.11) | — | (0.34) | 8.30 | (2.60) | 719,558 | 0.90 (10) | 0.90 | 6.28 | 101 | |
| Stone Harbor Strategic Income Fund | ||||||||||||||||
| Class A | ||||||||||||||||
| 6/1/22 to 5/31/23 | $8.68 | 0.36 | (0.31) | 0.05 | (0.44) | (0.44) | — | (0.39) | $8.29 | 0.71 % | $ 99 | 0.54 % | 1.21 % | 4.33 % | 99 % | |
| 4/11/22 (7) to 5/31/22 | 8.89 | 0.06 | (0.24) | (0.18) | (0.03) | (0.03) | — | (0.21) | 8.68 | (1.98) | 98 | 0.51 | 1.35 | 5.04 | 120 (9) | |
| Class I | ||||||||||||||||
| 6/1/22 to 5/31/23 | $8.69 | 0.39 | (0.33) | 0.06 | (0.47) | (0.47) | — | (0.41) | $8.28 | 0.86 % | $ 42,215 | 0.29 % (6) | 0.91 % | 4.64 % | 99 % | |
| 6/1/21 to 5/31/22 | 9.64 | 0.28 | (0.99) | (0.71) | (0.24) | (0.24) | — | (0.95) | 8.69 | (7.49) | 38,509 | 0.24 | 1.13 | 3.01 | 120 | |
| 6/1/20 to 5/31/21 | 9.13 | 0.37 | 0.54 | 0.91 | (0.40) | (0.40) | — | 0.51 | 9.64 | 10.05 | 31,550 | 0.07 | 1.13 | 3.84 | 13 | |
| 6/1/19 to 5/31/20 | 9.58 | 0.38 | (0.54) | (0.16) | (0.29) | (0.29) | — | (0.45) | 9.13 | (1.75) | 30,622 | 0.08 | 1.12 | 3.99 | 7 | |
| 6/1/18 to 5/31/19 | 9.64 | 0.37 | (0.04) | 0.33 | (0.39) | (0.39) | — | (0.06) | 9.58 | 3.58 | 32,489 | 0.06 | 1.09 | 3.94 | 8 |
| Footnote Legend: | |
| (1) | Calculated using average shares outstanding. |
| (2) | Not annualized for periods less than one year. |
| (3) | Total returns would have been lower had various fees and expenses not been waived and reimbursed during the period. The total returns in the table represent the rate that an investor would have earned (or lost) on an investment in a Fund (assuming reinvestment of all dividends and distributions). |
| (4) | Annualized for periods less than one year. |
| (5) | The Funds will also indirectly bear their prorated share of expenses of any underlying funds in which they invest. Such expenses are not included in the calculation of this ratio. |
| (6) | Net expense ratio includes extraordinary proxy expenses. |
| (7) | Inception date. |
| (8) | Includes borrowing costs of 0.02% to average net assets. |
| (9) | Portfolio turnover is representative of the Fund for the entire period. |
| (10) | Includes borrowing costs of 0.01% to average net assets. |
| (11) | See Note 4G in Notes to Financial Statements. |
| (12) | Amount is less than $0.005 per share. |
| Predecessor Fund | Fund | |
| Stone Harbor Emerging Markets Corporate Debt Fund | Virtus Stone Harbor Emerging Markets Bond Fund | |
| Stone Harbor Emerging Markets Debt Allocation Fund | Virtus Stone Harbor Emerging Markets Debt Allocation Fund | |
| Stone Harbor Emerging Markets Debt Fund | Virtus Stone Harbor Emerging Markets Debt Income Fund | |
| Stone Harbor High Yield Bond Fund | Virtus Stone Harbor High Yield Bond Fund | |
| Stone Harbor Local Markets Fund | Virtus Stone Harbor Local Markets Fund | |
| Stone Harbor Strategic Income Fund | Virtus Stone Harbor Strategic Income Fund |
| A. | Security Valuation |
| Trustees have designated the Investment Adviser as the valuation designee to perform fair valuations pursuant to Rule 2a-5 under the Investment Company Act of 1940. Each Fund utilizes a fair value hierarchy which prioritizes the inputs to valuation techniques used to measure fair value into three broad levels. The Funds’ policy is to recognize transfers into or out of Level 3 at the end of the reporting period. | |
| • Level 1 – quoted prices in active markets for identical securities (security types generally include listed equities). |
actively quoted markets including but not limited to: underlying reference entity details, indices, spreads, interest rates, yield curves, dividend and
exchange rates. These instruments are generally categorized as Level 2 in the hierarchy. Centrally cleared swaps listed or traded on a bilateral or
trade facility platform, such as a registered exchange, are valued at the last posted settlement price determined by the respective exchange. These
securities are generally categorized as Level 2 within the hierarchy.
| B. | Security Transactions and Investment Income |
| Security transactions are recorded on the trade date. Realized gains and losses from the sale of securities are determined on the identified cost basis. Dividend income and capital gain distributions are recognized on the ex-dividend date or, in the case of certain foreign securities, as soon as a Fund is notified. Interest income is recorded on the accrual basis. Each Fund amortizes premiums and accretes discounts using the effective interest method. Premiums on callable debt instruments are amortized to interest income to the earliest call date using the effective interest method. Any distributions from underlying funds are recorded in accordance with the character of the distributions as designated by the underlying funds. | |
| Dividend income from REITs is recorded using management’s estimate of the percentage of income included in distributions received from such investments based on historical information and other industry sources. The return of capital portion of the estimate is a reduction to investment income and a reduction in the cost basis of each investment which increases net realized gain (loss) and net change in unrealized appreciation |
| (depreciation). If the return of capital distributions exceed their cost basis, the distributions are treated as realized gains. The actual amounts of income, return of capital, and capital gains are only determined by each REIT after its fiscal year-end, and may differ from the estimated amounts. | |
| C. | Income Taxes |
| Each Fund is treated as a separate taxable entity. It is the intention of each Fund to comply with the requirements of Subchapter M of the Internal Revenue Code of 1986, as amended (the “Code”) and to distribute substantially all of its taxable income to its shareholders. Therefore, no provision for federal income taxes or excise taxes has been made. | |
| Certain Funds may be subject to foreign taxes on income, gains on investments or currency repatriation, a portion of which may be recoverable. Each Fund will accrue such taxes and recoveries as applicable based upon current interpretations of the tax rules and regulations that exist in the markets in which it invests. | |
| Management of the Funds has concluded that there are no significant uncertain tax positions that would require recognition in the financial statements. Each Fund’s U.S. federal income tax return is generally subject to examination by the Internal Revenue Service for a period of three years after it is filed. State, local and/or non-U.S. tax returns and/or other filings may be subject to examination for different periods, depending upon the tax rules of each applicable jurisdiction. | |
| D. | Distributions to Shareholders |
| Distributions are recorded by each Fund on the ex-dividend date. Income and capital gain distributions are determined in accordance with income tax regulations which may differ from U.S. GAAP. | |
| E. | Expenses |
| Expenses incurred together by a Fund and other affiliated mutual funds are allocated in proportion to the net assets of each such fund, except where allocation of direct expenses to each Fund and each such other fund, or an alternative allocation method, can be more appropriately used. | |
| In addition to the net annual operating expenses that a Fund bears directly, the shareholders of a Fund indirectly bear the pro-rata expenses of any underlying mutual funds in which the Fund invests. | |
| F. | Convertible Securities |
| Certain Funds may invest a portion of their assets in convertible securities. Although convertible securities derive part of their value from that of the securities into which they are convertible, they are not considered derivative financial instruments. However, certain of the Funds’ investments in convertible securities include features which render them sensitive to price changes in their underlying securities. The value of structured/synthetic convertible securities can be affected by interest rate changes and credit risks of the issuer. Such securities may be structured in ways that limit their potential for capital appreciation, and the entire value of the security may be at risk of loss depending on the performance of the underlying equity security. Consequently, the Funds are exposed to greater downside risk than traditional convertible securities, but typically still less than that of the underlying stock. | |
| G. | Foreign Currency Transactions |
| Non-U.S. investment securities and other assets and liabilities denominated in foreign currencies are translated into U.S. dollar amounts at the foreign currency exchange rate effective at the end of the reporting period. Cost of investments is translated at the currency exchange rate effective at the trade date. The gain or loss resulting from a change in currency exchange rates between the trade and settlement date of a portfolio transaction is treated as a gain or loss on foreign currency. Likewise, the gain or loss resulting from a change in currency exchange rates between the date income is accrued and the date it is paid is treated as a gain or loss on foreign currency. For fixed income instruments, the Funds bifurcate that portion of the results of operations arising from changes in foreign exchange rates on investments from the fluctuations arising from changes in the market prices of securities held and such fluctuations are included with the net realized and unrealized gain or loss on foreign currency transactions. For equity securities, the Funds do not isolate that portion of the results of operations arising from changes in foreign exchange rates on investments from the fluctuations arising from changes in the market prices of securities held and such fluctuations are included with the net realized and unrealized gain or loss on investments. | |
| H. | Payment-In-Kind Securities |
| Certain Funds may invest in payment-in-kind securities, which are debt or preferred stock securities that require or permit payment of interest in the form of additional securities. Payment-in-kind securities allow the issuer to avoid or delay the need to generate cash to meet current interest payments and, as a result, may involve greater risk than securities that pay interest currently or in cash. | |
| I. | Inflation-Indexed Bonds |
| Certain Funds may invest in inflation-indexed bonds. Inflation-indexed bonds are fixed-income securities whose principal value is periodically adjusted to the rate of inflation. The interest rate on these bonds is generally fixed at issuance at a rate lower than typical bonds. Over the life of an inflation-indexed bond, however, interest will be paid based on a principal value which is adjusted for inflation. Any increase or decrease in the principal amount of an inflation-indexed bond will be included as interest income on the Statements of Operations, even though investors do not receive their principal until maturity. | |
| J. | Mortgage-Related and Other Asset-Backed Securities |
| Certain Funds may invest in mortgage-related and other asset-backed securities. These securities include mortgage pass-through securities, collateralized mortgage obligations, commercial mortgage-backed securities, stripped mortgage-backed securities, asset-backed securities, collateralized debt obligations and other securities that directly or indirectly represent a participation in, or are secured by and payable from, mortgage loans on real property. Mortgage-related and other asset-backed securities are interests in pools of loans or other receivables. |
| Mortgage-related securities are created from pools of residential or commercial mortgage loans, including mortgage loans made by savings and loan institutions, mortgage bankers, commercial banks and others. Asset-backed securities are created from many types of assets, including auto loans, credit card receivables, home equity loans, and student loans. These securities provide a monthly payment which consists of both interest and principal payments. Interest payments may be determined by fixed or adjustable rates. The rate of prepayments on underlying mortgages will affect the price and volatility of a mortgage-related security, and may have the effect of shortening or extending the effective duration of the security relative to what was anticipated at the time of purchase. The timely payment of principal and interest of certain mortgage-related securities is guaranteed with the full faith and credit of the U.S. Government. Pools created and guaranteed by non-governmental issuers, including government sponsored corporations, may be supported by various forms of insurance or guarantees, but there can be no assurance that the private insurers or guarantors can meet their obligations under the insurance policies or guarantee arrangements. | |
| K. | U.S. Government Agencies or Government-Sponsored Enterprises |
| Certain Funds may invest in securities of U.S. Government agencies or government-sponsored enterprises. U.S. Government securities are obligations of and, in certain cases, guaranteed by, the U.S. Government, its agencies or instrumentalities. Some U.S. Government securities, such as Treasury bills, notes and bonds, and securities guaranteed by the Government National Mortgage Association (“GNMA” or “Ginnie Mae”), are supported by the full faith and credit of the U.S. Government; others, such as those of the Federal Home Loan Banks, are supported by the right of the issuer to borrow from the U.S. Department of the Treasury (the “U.S. Treasury”); others, such as those of the Federal National Mortgage Association (“FNMA” or “Fannie Mae”), are supported by the discretionary authority of the U.S. Government to purchase the agency’s obligations. U.S. Government securities may include zero coupon securities, which do not distribute interest on a current basis and tend to be subject to greater risk than interest-paying securities of similar maturities. | |
| Government-related guarantors (i.e., not backed by the full faith and credit of the U.S. Government) include FNMA and the Federal Home Loan Mortgage Corporation (“FHLMC” or “Freddie Mac”). FNMA is a government-sponsored corporation. FNMA purchases conventional (i.e., not insured or guaranteed by any government agency) residential mortgages from a list of approved seller/servicers which include state and federally chartered savings and loan associations, mutual savings banks, commercial banks and credit unions and mortgage bankers. Pass-through securities issued by FNMA are guaranteed as to timely payment of principal and interest by FNMA, but are not backed by the full faith and credit of the U.S. Government. FHLMC issues Participation Certificates (“PCs”), which are pass-through securities, each representing an undivided interest in a pool of residential mortgages. FHLMC guarantees the timely payment of interest and ultimate collection of principal, but PCs are not backed by the full faith and credit of the U.S. Government. | |
| L. | Securities Traded on a To-Be-Announced Basis |
| Certain Funds may trade securities on a to-be-announced (“TBA”) basis. In a TBA transaction, a Fund commits to purchasing or selling securities which have not yet been issued by the issuer and for which specific information, such as the face amount, maturity date and underlying pool of investments in U.S. government agency mortgage pass-through securities, is not announced. Securities purchased on a TBA basis are not settled until they are delivered to the Fund. Beginning on the date a Fund enters into a TBA transaction, cash, U.S. government securities or other liquid high-grade debt obligations are segregated in an amount equal in value to the purchase price of the TBA security. These securities are subject to market fluctuations and their current value is determined in the same manner as for other securities. | |
| M. | When-issued Purchases and Forward Commitments (Delayed Delivery) |
| Certain Funds may engage in when-issued or forward commitment transactions. Securities purchased on a when-issued or forward commitment basis are also known as delayed delivery transactions. Delayed delivery transactions involve a commitment by a Fund to purchase or sell a security at a future date (ordinarily up to 90 days later). When-issued or forward commitments enable the Funds to lock in what is believed to be an attractive price or yield on a particular security for a period of time, regardless of future changes in interest rates. Each Fund records when-issued and forward commitment securities on the trade date. Each Fund maintains collateral for the securities purchased. Securities purchased on a when-issued or forward commitment basis begin earning interest on the settlement date. | |
| N. | Leveraged Loans |
| Certain Funds may invest in direct debt instruments which are interests in amounts owed by a corporate, governmental, or other borrower to lenders or lending syndicates. Leveraged loans are generally non-investment grade and often involve borrowers that are highly leveraged. The Funds may invest in obligations of borrowers who are in bankruptcy proceedings. Leveraged loans are typically senior in the corporate capital structure of the borrower. A loan is often administered by a bank or other financial institution (the “lender”) that acts as agent for all holders. The agent administers the terms of the loan, as specified in the leveraged loan. A Fund’s investments in loans may be in the form of participations in loans or assignments of all or a portion of loans from third parties. When investing in loan participations, a Fund has the right to receive payments of principal, interest and any fees to which it is entitled only from the lender selling the loan participation and only upon receipt by the lender of payments from the borrower. A Fund generally has no right to enforce compliance with the terms of the leveraged loan with the borrower. As a result, a Fund may be subject to the credit risk of both the borrower and the lender that is selling the leveraged loan. When a Fund purchases assignments from lenders it acquires direct rights against the borrower on the loan. | |
| A Fund may invest in multiple series or tranches of a loan, which may have varying terms and carry different associated risks. Leveraged loans may involve foreign borrowers and investments may be denominated in foreign currencies. Direct indebtedness of emerging countries involves a risk that the government entities responsible for the repayment of the debt may be unable, or unwilling, to pay the principal and interest when due. | |
| The leveraged loans have floating rate loan interests which generally pay interest at rates that are periodically determined by reference to a base lending rate plus a premium. The base lending rates are generally LIBOR, SOFR, the prime rate offered by one or more U.S. banks or the certificate of deposit rate. When a leveraged loan is purchased a Fund may pay an assignment fee. On an ongoing basis, a Fund may receive a commitment |
| fee based on the undrawn portion of the underlying line of credit portion of a leveraged loan. Prepayment penalty fees are received upon the prepayment of a leveraged loan by a borrower. Prepayment penalty, facility, commitment, consent and amendment fees are recorded to income as earned or paid. | |
| A Fund may invest in both secured loans and “covenant lite” loans which have few or no financial maintenance covenants that would require a borrower to maintain certain financial metrics. The lack of financial maintenance covenants in covenant lite loans increases the risk that the applicable Fund will experience difficulty or delays in enforcing its rights on its holdings of such loans, which may result in losses, especially during a downturn in the credit cycle. | |
| O. | Credit Linked Notes |
| The Funds may invest in credit linked notes to obtain economic exposure to high yield, emerging markets or other securities. Investments in a credit linked note typically provide the holder with a return based on the return of an underlying reference instrument, such as an emerging market bond. Like an investment in a bond, investments in credit-linked securities represent the right to receive periodic income payments (in the form of distributions) and payment of principal at the end of the term of the security. In addition to the risks associated with the underlying reference instrument, an investment in a credit linked note is also subject to liquidity risk, market risk, interest rate risk and the risk that the counterparty will be unwilling or unable to meet its obligations under the note. |
| A. | Futures Contracts |
| A futures contract is an agreement between two parties to purchase (long) or sell (short) a security at a set price for delivery on a future date. Upon entering into a futures contract, a Fund is required to pledge to the broker an amount of cash and/or securities equal to the “initial margin” requirements of the futures exchange on which the contract is traded. Pursuant to the contract, the Fund agrees to receive from or pay to the broker an amount of cash equal to the daily fluctuation in value of the contract. Such receipts or payments are known as variation margin and are recorded by a Fund for financial statement purposes on a daily basis as unrealized appreciation or depreciation. When the contract expires or is closed, gain or loss equal to the difference between the value of the contract at the time it was opened and the value at the time it was closed is realized. This is presented in the Statement of Operations as net realized gain (loss) from future contracts. | |
| During the year ended May 31, 2023, the Stone Harbor Strategic Income Fund utilized futures to optimize performance by gaining exposure to broad markets or to hedge the risk of securities within the portfolios. The potential risks of doing so are that 1) the use of futures may result in larger losses or smaller gains than the use of more traditional investments, 2) the prices of futures and the price movements of the securities that the future is intended to simulate may not correlate well, 3) the Fund’s success in using futures will be dependent upon the subadviser’s ability to correctly predict such price movements, 4) liquidity of futures can be adversely affected by market factors, and the prices of such securities may move in unexpected ways, and 5) if the Fund cannot close out a futures position, it may be compelled to continue to make daily cash payments to the broker to meet margin requirements, thus increasing transaction costs. Futures contracts outstanding at period end, if any, are listed after the Fund’s Schedule of Investments. Cash deposited as margin is recorded on the Statements of Assets and Liabilities as “Cash pledged as collateral for futures contracts.” | |
| B. | Forward Foreign Currency Exchange Contracts |
| A forward foreign currency exchange contract is an agreement between two parties to buy and sell a currency at a set exchange rate on a future date. Forward foreign currency exchange contracts, when used by a Fund, help to manage the overall exposure to the currencies in which some of the investments held by the Fund are denominated. The contract is marked-to-market daily and the change in market value is recorded by the Fund as an unrealized appreciation or depreciation. When the contract is closed, the Fund records a realized gain or loss equal to the difference between the value at the time it was opened and the value at the time it was closed. The use of forward foreign currency exchange contracts involves the risk that the value of the contract changes unfavorably due to movements in the value of the referenced foreign currencies. Non-deliverable forward foreign currency exchange contracts are settled with the counterparty in U.S. dollars without the delivery of foreign currency. Cash deposited is recorded on the Statements of Assets and Liabilities as “Cash pledged as collateral for forward foreign currency contracts.” | |
| During the year ended May 31, 2023, the Stone Harbor Emerging Markets Debt Allocation Fund, Stone Harbor Emerging Markets Debt Income Fund, Stone Harbor Local Markets Fund and Stone Harbor Strategic Income Fund entered into forward foreign currency exchange contracts as an economic hedge against either specific transactions or portfolio instruments or to obtain exposure to, or hedge exposure away from, foreign currencies (foreign currency exchange rate risk). | |
| Forward foreign currency contracts outstanding at period end, if any, are listed after each Fund’s Schedule of Investments. | |
| C. | Swaps |
| Certain Funds enter into swap agreements, in which the Fund and a counterparty agree either to make periodic net payments on a specified notional amount or a net payment upon termination. Swap agreements are negotiated in the OTC market and may be entered into as a bilateral contract “OTC swaps at value” for OTC swaps and as “Variation margin receivable on cleared swaps”. The value of the swap is reflected on the Statements of Assets and Liabilities as “Over-the-counter swaps at value” and as “Variation margin receivable/payable on cleared swaps” for |
| centrally cleared swaps. Swaps are marked-to-market daily and changes are recorded as “Net Change in unrealized appreciation (depreciation) on swaps” in the Statement of Operations. Swaps are marked-to-market daily and changes in value are recorded as “Net change in unrealized appreciation (depreciation) on swaps” in the Statements of Operations. | |
| Any upfront premiums paid are recorded as assets and any upfront fees received are recorded as liabilities and are shown under “Over-the-counter swaps at value” in the Statements of Assets and Liabilities and are amortized over the term of the swap for OTC swaps. When a swap is terminated, the Fund records a realized gain or loss equal to the difference between the proceeds from (or cost of) the closing transaction and the Fund’s basis in the contract, if any. Generally, the basis of the contracts is the unamortized premium received or paid. Cash settlements between the Fund and the counterparty are recognized as “Net realized gain (loss) on swaps” in the Statements of Operations. Swap contracts outstanding at period end, if any, are listed after each Fund’s Schedule of Investments. | |
| In a centrally cleared swap, immediately following execution of the swap agreement, the swap agreement is submitted to a central counterparty (the “CCP”) and the Fund’s counterparty on the swap agreement becomes the CCP. The Fund is required to interface with the CCP through a clearing broker. Upon entering into a centrally cleared swap, a Fund is required to deposit initial margin with the clearing broker in the form of cash or securities in an amount that varies depending on the size and risk profile of the particular swap. | |
| Securities deposited as margin are designated on the Schedule of Investments and cash deposited is recorded on the Statements of Assets and Liabilities as “Cash pledged as collateral for swaps.” | |
| Swap transactions involve, to varying degrees, elements of interest rate, credit and market risk in excess of the amounts recognized in the Statements of Assets and Liabilities. Such risks involve the possibility that there will be no liquid market for these agreements, that the counterparty to the agreements may default on its obligation to perform or disagree as to the meaning of the contractual terms in the agreements, and that there may be unfavorable changes in interest rates and/or market values associated with these transactions. | |
| Credit default swaps – A Fund may either buy or sell (write) credit default swaps on single-name issuers (corporate or sovereign), a combination or basket of single-name issuers or traded indexes. Credit default swaps on single-name issuers are agreements in which the buyer pays fixed periodic payments to the seller in consideration for a guarantee from the protection seller to make specific payment should a negative credit event take place with respect to the referenced entity (e.g., bankruptcy, failure to pay, obligation accelerators, repudiation, moratorium or restructuring). Credit default swaps on a combination or basket of single-name issuers are agreements in which the buyer pays fixed periodic payments to the seller in consideration for a guarantee from the protection seller to make specific payment should a negative credit event take place with respect to any of the referenced entities (e.g., bankruptcy, failure to pay, obligation accelerators, repudiation, moratorium or restructuring). Credit default swaps on traded indexes are agreements in which the buyer pays fixed periodic payments to the seller in consideration for a guarantee from the seller to make a specific payment should a write-down, principal or interest shortfall or default of all or individual underlying securities included in the index occurs. As a buyer, if an underlying credit event occurs, the Fund will either receive from the seller an amount equal to the notional amount of the swap and deliver the referenced security or underlying securities comprising the index or receive a net settlement of cash equal to the notional amount of the swap less the recovery value of the security or underlying securities comprising the index. As a seller (writer), if an underlying credit event occurs, the Fund will either pay the buyer an amount equal to the notional amount of the swap and take delivery of the referenced security or underlying securities comprising the index or pay a net settlement of cash equal to the notional amount of the swap less the recovery value of the security or underlying securities comprising the index. The Funds may enter into credit default swaps to manage their exposure to the market or certain sectors of the market, to reduce their risk exposure to defaults of corporate and/or sovereign issuers or to create exposure to corporate and/or sovereign issuers to which they are not otherwise exposed (credit risk). | |
| During the year ended May 31, 2023, the Stone Harbor Emerging Markets Debt Income Fund and Stone Harbor Strategic Income Fund utilized both single name credit default swaps and credit index swaps to gain exposure to short individual securities or to gain exposure to a credit or asset-backed index. | |
| The following is a summary of derivative instruments categorized by primary risk exposure, and location as presented in the Statements of Assets and Liabilities at May 31, 2023: |
| Statement Line Description | Primary Risk | Stone Harbor Emerging Markets Debt Income Fund | Stone Harbor Local Markets Fund | |
| Asset Derivatives | ||||
| Over-the-counter swaps at value(1) | Credit contracts | $ 370 | $ — | |
| Unrealized appreciation on forward foreign currency exchange contracts | Foreign currency contracts | 968 | 35 | |
| Total | $1,338 | $ 35 | ||
| Liability Derivatives | ||||
| Unrealized depreciation on forward foreign currency exchange contracts | Foreign currency contracts | $ (18) | $(94) | |
| Total | $ (18) | $(94) | ||
| Statement Line Description | Primary Risk | Stone Harbor Strategic Income Fund | |
| Asset Derivatives | |||
| Unrealized appreciation on forward foreign currency exchange contracts | Foreign currency contracts | $ 33 | |
| Variation margin payable on futures contracts(1) | Interest rate contracts | 33 | |
| Total | $ 66 | ||
| Liability Derivatives | |||
| Variation margin receivable on cleared swaps(1) | Credit contracts | $ (70) | |
| Unrealized depreciation on forward foreign currency exchange contracts | Foreign currency contracts | (14) | |
| Variation margin payable on futures contracts(1) | Interest rate contracts | (20) | |
| Total | $(104) | ||
| (1) | Represents cumulative appreciation (depreciation) on futures contracts and swap contracts as reported in the Schedule of Investments. Only current day’s variation margin is shown in the Statements of Assets and Liabilities for exchange-traded futures contracts and centrally cleared swap contracts. For OTC swap contracts, the value (including premiums) at May 31, 2023 is shown in the Statements of Assets and Liabilities. |
| Statement Line Description | Primary Risk | Stone Harbor Emerging Markets Debt Allocation Fund | Stone Harbor Emerging Markets Debt Income Fund | ||
| Net Realized Gain (Loss) from | |||||
| Swaps | Credit contracts | $ — | $1,731 | ||
| Forward foreign currency exchange contracts | Foreign currency contracts | (1) | 940 | ||
| Total | $ (1) | $2,671 | |||
| Net Change in Unrealized Appreciation (Depreciation) on | |||||
| Swaps | Credit contracts | $ — | $ 226 | ||
| Forward foreign currency exchange contracts | Foreign currency contracts | (4) | 1,182 | ||
| Total | $ (4) | $1,408 | |||
| Statement Line Description | Primary Risk | Stone Harbor Local Markets Fund | Stone Harbor Strategic Income Fund | ||
| Net Realized Gain (Loss) from | |||||
| Swaps | Credit contracts | $ — | $ (91) | ||
| Forward foreign currency exchange contracts | Foreign currency contracts | (354) | 67 | ||
| Futures | Interest rate contracts | — | 868 | ||
| Total | $ (354) | $ 844 | |||
| Net Change in Unrealized Appreciation (Depreciation) on | |||||
| Swaps | Credit contracts | $ — | $ (101) | ||
| Forward foreign currency exchange contracts | Foreign currency contracts | (43) | (1) | ||
| Futures | Interest rate contracts | — | (1) | ||
| Total | $ (43) | $ (103) | |||
| Stone Harbor Emerging Markets Debt Allocation Fund | Stone Harbor Emerging Markets Debt Income Fund | ||
Futures Contracts - Long Positions | $ — | $ — | |
Futures Contracts - Short Positions | — | — | |
Forward Foreign Currency Exchange Purchase Contracts(2) | 57 | 8,112 | |
Forward Foreign Currency Exchange Sale Contracts(2) | 22 | 50,126 | |
Credit Default Swap Contracts - Buy Protection(2) | — | — | |
Credit Default Swap Contracts - Sell Protection(2) | — | 21,102 |
| Stone Harbor Local Markets Fund | Stone Harbor Strategic Income Fund | ||
Futures Contracts - Long Positions(1) | $ — | $ 4 | |
Futures Contracts - Short Positions(1) | — | 17 | |
Forward Foreign Currency Exchange Purchase Contracts(2) | 9,162 | 1,875 | |
Forward Foreign Currency Exchange Sale Contracts(2) | 6,126 | 1,635 | |
Credit Default Swap Contracts - Buy Protection(2) | — | 6,236 | |
Credit Default Swap Contracts - Sell Protection(2) | — | 1,203 |
| (1) Average unrealized for the period. |
| (2) Average notional amount. |
| D. | Derivative Risks |
| A derivative contract may suffer a mark-to-market loss if the value of the contract decreases due to an unfavorable change in the market rates or values of the underlying instrument. Losses can also occur if the counterparty does not perform under the contract. | |
| A Fund’s risk of loss from counterparty credit risk on derivatives bought or sold OTC rather than traded on a securities exchange, is generally limited to the aggregate unrealized gain netted against any collateral held by such Fund. For OTC purchased options, each Fund bears the risk of loss of the amount of the premiums paid plus the positive change in market values net of any collateral held by such Fund should the counterparty fail to perform under the contracts. Options written by a Fund do not typically give rise to counterparty credit risk, as options written generally obligate the Fund, and not the counterparty to perform. | |
| With exchange traded purchased options and futures and centrally cleared swaps generally speaking, there is less counterparty credit risk to the Fund since the exchange or clearinghouse, as counterparty to such instruments, guarantees against a possible default. The clearinghouse stands between the buyer and the seller of the contract; therefore, credit risk is limited to failure of the clearinghouse. While offset rights may exist under applicable law, a Fund does not have a contractual right of offset against a clearing broker or clearinghouse in the event of a default (including the bankruptcy or insolvency) of the clearing broker or clearinghouse. Additionally, credit risk exists in exchange traded futures and centrally cleared swaps with respect to initial and variation margin that is held in a clearing broker’s customer accounts. While clearing brokers are required to segregate customer margin from their own assets, in the event that a clearing broker becomes insolvent or goes into bankruptcy and at that time there is a shortfall in the aggregate amount of margin held by the clearing broker for all its clients, typically the shortfall would be allocated on a pro-rata basis across all the clearing broker’s customers, potentially resulting in losses to the Fund. | |
| In order to better define its contractual rights and to secure rights that will help a Fund mitigate its counterparty risk, each Fund may enter into an International Swaps and Derivatives Association, Inc. Master Agreement (“ISDA Master Agreement”) or similar agreement with its derivative contract counterparties. An ISDA Master Agreement is a bilateral agreement between a Fund and a counterparty that governs certain OTC derivatives and typically contains, among other things, collateral posting terms and netting provisions in the event of a default and/or termination event. Under an ISDA Master Agreement, a Fund may, under certain circumstances, offset with the counterparty certain derivative financial instruments’ payables and/or receivables with collateral held and/or posted and create one single net payment. The provisions of the ISDA Master Agreement typically permit a single net payment in the event of default including the bankruptcy or insolvency of the counterparty. However, bankruptcy or insolvency laws of a particular jurisdiction may impose restrictions on or prohibitions against the right of offset in bankruptcy, insolvency or other events. In addition, certain ISDA Master Agreements allow counterparties to OTC derivatives to terminate derivative contracts |
| prior to maturity in the event a Fund’s net assets decline by a stated percentage or the Fund fails to meet the terms of its ISDA Master Agreements, which would cause the Fund to accelerate payment of any net liability owed to the counterparty. | |
| E. | Collateral Requirements and Master Netting Agreements (“MNA”) |
| For derivatives traded under an ISDA Master Agreement, the collateral requirements are typically calculated by netting the mark-to-market amount for each transaction under such agreement and comparing that amount to the value of any collateral currently pledged by the Funds and the counterparty. | |
| Cash collateral that has been pledged to cover obligations of a Fund and cash collateral received from the counterparty, if any, is reported separately on the Statements of Assets and Liabilities as cash pledged as collateral and cash received as collateral, respectively. Non-cash collateral pledged by a Fund, if any, is noted in the Schedules of Investments. Typically, the Funds and counterparties are not permitted to sell, re-pledge or use the collateral they receive. To the extent amounts due to a Fund from its counterparties are not fully collateralized, contractually or otherwise, the Fund bears the risk of loss from counterparty non-performance. The Funds attempt to mitigate counterparty risk by only entering into agreements with counterparties that they believe have the financial resources to honor their obligations and by monitoring the financial stability of those counterparties. | |
| For financial reporting purposes, the Funds do not offset derivative assets and derivative liabilities that are subject to netting arrangements in the Statements of Assets and Liabilities. | |
| The following tables present the Funds’ derivative assets and liabilities by counterparty net of amounts available for offset under a MNA and net of the related collateral received/pledged by the Funds as of May 31, 2023: |
| At May 31, 2023, the Funds’ derivative assets and liabilities (by type) are as follows: | |||||||||||||||||
| Stone Harbor Emerging Markets Debt Income Fund | Stone Harbor Local Markets Fund | Stone Harbor Strategic Income Fund | |||||||||||||||
| Assets | Liabilities | Assets | Liabilities | Assets | Liabilities | ||||||||||||
| Derivative Financial Instruments: | |||||||||||||||||
| Futures contracts | $ — | $ — | $ — | $ — | $ 33 | $ 20 | |||||||||||
| Forward foreign currency exchange contracts | 968 | 18 | 35 | 94 | 33 | 14 | |||||||||||
| Centrally cleared swaps | — | — | — | — | — | 70 | |||||||||||
| OTC swaps | — | 1,915 | — | — | — | — | |||||||||||
| Total derivative assets and liabilities in the Statements of Assets and Liabilities | $968 | $1,933 | $35 | $94 | $ 66 | $104 | |||||||||||
| Derivatives not subject to a MNA or similar agreement | — | — | — | — | (33) | (90) | |||||||||||
| Total assets and liabilities subject to a MNA | $968 | $1,933 | $35 | $94 | $ 33 | $ 14 | |||||||||||
| Stone Harbor Emerging Markets Debt Income Fund | ||||||||||
| Counterparty | Gross Derivative Assets Subject to a MNA by Counterparty | Derivatives Available for Offset | Non-cash Collateral Received(1) | Cash Collateral Received(1) | Net Amount of Derivative Assets(1) | |||||
Citigroup Global Markets | $ 32 | $ — | $— | $— | $ 32 | |||||
JPMorgan Chase Bank N.A | 936 | (18) | — | — | 918 | |||||
Total | $968 | $(18) | $— | $— | $950 | |||||
| Counterparty | Gross Derivative Liabilities Subject to a MNA by Counterparty | Derivatives Available for Offset | Non-cash Collateral Pledged(1) | Cash Collateral Pledged(1) | Net Amount of Derivative Liabilities(1) | |||||
Barclays Bank | $1,915 | $ — | $— | $(1,915) | $— | |||||
JPMorgan Chase Bank N.A | 18 | (18) | — | — | — | |||||
Total | $1,933 | $(18) | $— | $(1,915) | $— |
| Stone Harbor Local Markets Fund | ||||||||||
| Counterparty | Gross Derivative Assets Subject to a MNA by Counterparty | Derivatives Available for Offset | Non-cash Collateral Received(1) | Cash Collateral Received(1) | Net Amount of Derivative Assets(1) | |||||
Citigroup Global Markets | $ 1 | $ (1) | $— | $— | $— | |||||
Goldman Sachs & Co. | 5 | (5) | — | — | — | |||||
JPMorgan Chase Bank N.A | 29 | (29) | — | — | — | |||||
Total | $35 | $(35) | $— | $— | $— | |||||
| Counterparty | Gross Derivative Liabilities Subject to a MNA by Counterparty | Derivatives Available for Offset | Non-cash Collateral Pledged(1) | Cash Collateral Pledged(1) | Net Amount of Derivative Liabilities(1) | |||||
Citigroup Global Markets | $ 4 | $ (1) | $— | $— | $ 3 | |||||
Goldman Sachs & Co. | 34 | (5) | — | — | 29 | |||||
JPMorgan Chase Bank N.A | 56 | (29) | — | — | 27 | |||||
Total | $94 | $(35) | $— | $— | $59 |
| Stone Harbor Strategic Income Fund | ||||||||||
| Counterparty | Gross Derivative Assets Subject to a MNA by Counterparty | Derivatives Available for Offset | Non-cash Collateral Received(1) | Cash Collateral Received(1) | Net Amount of Derivative Assets(1) | |||||
Citigroup Global Markets | $11 | $ (7) | $— | $— | $ 4 | |||||
Goldman Sachs & Co. | 9 | (2) | — | — | 7 | |||||
JPMorgan Chase Bank N.A. | 13 | (5) | — | — | 8 | |||||
Total | $33 | $(14) | $— | $— | $19 | |||||
| Counterparty | Gross Derivative Liabilities Subject to a MNA by Counterparty | Derivatives Available for Offset | Non-cash Collateral Pledged(1) | Cash Collateral Pledged(1) | Net Amount of Derivative Liabilities(1) | |||||
Citigroup Global Markets | $ 7 | $ (7) | $— | $— | $— | |||||
Goldman Sachs & Co. | 2 | (2) | — | — | — | |||||
JPMorgan Chase Bank N.A. | 5 | (5) | — | — | — | |||||
Total | $14 | $(14) | $— | $— | $— |
| A. | Investment Adviser |
| Virtus Alternative Investment Advisers, Inc. (the “Adviser”), an indirect, wholly-owned subsidiary of Virtus Investment Partners, Inc. (“Virtus”), is the investment adviser to the Funds. The Adviser manages the Funds’ investment programs and general operations of the Funds, including oversight of the Funds’ subadviser. | |
| As compensation for its services to the Funds, the Adviser is entitled to a fee, which is calculated daily and paid monthly based upon the following annual rates as a percentage of the average daily net assets of each Fund: |
| Fund | Advisory Fee | |
Stone Harbor Emerging Markets Bond Fund | 0.85% | |
Stone Harbor Emerging Markets Debt Allocation Fund | 0.70 | |
Stone Harbor Emerging Markets Debt Income Fund | 0.60 | |
Stone Harbor High Yield Bond Fund | 0.50 | |
Stone Harbor Local Markets Fund | 0.75 | |
Stone Harbor Strategic Income Fund | 0.55 |
| B. | Subadviser |
| Stone Harbor Investment Partners (the “Subadviser”), a division of Virtus Fixed Income Advisers LLC (“VFIA”), an indirect, wholly-owned subsidiary of Virtus, is the subadviser to the Funds. The Subadviser manages the investments of the Funds, for which it is paid a fee by the Adviser. | |
| C. | Expense Limitations |
| The Adviser has contractually agreed to limit each Fund’s annual total operating expenses, subject to the exceptions listed below, so that such expenses do not exceed, on an annualized basis, the following respective percentages of average daily net assets through April 7, 2024. Following the contractual period, the Adviser may discontinue these expense limitation arrangements at any time. The waivers and reimbursements are accrued daily and received monthly. |
| Fund | Class A | Institutional Class | ||
Stone Harbor Emerging Markets Bond Fund | 1.25% | 1.00 % | ||
Stone Harbor Emerging Markets Debt Allocation Fund | 1.10 | 0.85 | ||
Stone Harbor Emerging Markets Debt Income Fund | 1.00 | 0.72 | ||
Stone Harbor High Yield Bond Fund | 0.90 | 0.65 | ||
Stone Harbor Local Markets Fund | 1.25 | 1.00 | ||
Stone Harbor Strategic Income Fund | 0.95 | 0.70 |
| D. | Expense Recapture |
| Under certain conditions, the Adviser may recapture operating expenses reimbursed or fees waived under these arrangements within three years after the date on which such amounts were incurred or waived. A Fund must pay its ordinary operating expenses before the Adviser is entitled to any reimbursement and must remain in compliance with any applicable expense limitations or, if none, the expense limitation in effect at the time of the waiver or reimbursement. All or a portion of the following Adviser reimbursed expenses may be recaptured by the year ending May 31: |
| Expiration | ||||||||
| Fund | 2024 | 2025 | 2026 | Total | ||||
| Stone Harbor Emerging Markets Bond Fund | ||||||||
Class A | $ — | $ — (1) | $ 1 | $ 1 | ||||
Class I | 148 | 150 | 85 | 383 | ||||
| Stone Harbor Emerging Markets Debt Allocation Fund | ||||||||
Class A | — | — (1) | 1 | 1 | ||||
Class I | 352 | 239 | 51 | 642 | ||||
| Stone Harbor Emerging Markets Debt Income Fund | ||||||||
Class A | — | — | — (1) | — (1) | ||||
Class I | — | 94 | 438 | 532 | ||||
| Stone Harbor High Yield Bond Fund | ||||||||
Class A | — | — (1) | — (1) | — (1) | ||||
Class I | 175 | 136 | 100 | 411 | ||||
| Stone Harbor Local Markets Fund | ||||||||
Class A | — | — | — (1) | — (1) | ||||
Class I | 38 | 147 | 59 | 244 | ||||
| Stone Harbor Strategic Income Fund | ||||||||
Class A | — | — (1) | — (1) | — (1) | ||||
Class I | 325 | 258 | 69 | 652 | ||||
| (1) | Amount is less than $500 (not in thousands). |
| Fund | Class A | Class I | Total | |||
Stone Harbor Emerging Markets Bond Fund | $— (1) | $ — | $ —(1) | |||
Stone Harbor Emerging Markets Debt Allocation Fund | — (1) | 2 | 2 | |||
Stone Harbor Emerging Markets Debt Income Fund | — (1) | 27 | 27 | |||
Stone Harbor High Yield Bond Fund | — (1) | — | — (1) | |||
Stone Harbor Local Markets Fund | — (1) | 32 | 32 | |||
Stone Harbor Strategic Income Fund | — (1) | — | — (1) |
| (1) | Amount is less than $500 (not in thousands). |
| E. | Distributor |
| VP Distributors, LLC (“VP Distributors”), an indirect, wholly-owned subsidiary of Virtus, serves as the distributor of each Fund’s shares. VP Distributors has advised the Funds that for the year ended May 31, 2023, it retained net commissions of $—(1) for Class A shares. | |
| In addition, each Fund pays VP Distributors 12b-1 fees under a 12b-1 Plan, at the annual rate of 0.25% of the average daily net assets of such Fund’s Class A shares. Class I shares are not subject to a 12b-1 plan. | |
| Under certain circumstances, shares of certain Virtus Funds may be exchanged for shares of the same class of certain other Virtus Funds on the basis of the relative NAV per share at the time of the exchange. On exchanges with share classes that carry a CDSC, the CDSC schedule of the |
| original shares purchased continues to apply. | |
| (1)Amount is less than $500 (not in thousands). | |
| F. | Administrator and Transfer Agent |
| Virtus Fund Services, LLC, an indirect, wholly-owned subsidiary of Virtus, serves as the administrator and transfer agent to the Funds. | |
| For the year ended May 31, 2023, the Funds incurred administration fees totaling $640 which are included in the Statements of Operations within the line item “Administration and accounting fees.” The fees are calculated daily and paid monthly. | |
| For the year ended May 31, 2023, the Funds incurred transfer agent fees totaling $287 which are included in the Statements of Operations within the line item “Transfer agent fees and expenses.” The fees are calculated daily and paid monthly. | |
| G. | Payment from Affiliates |
| The Stone Harbor High Yield Bond Fund was reimbursed $1 by the Adviser for losses incurred due to a trade error during the year ended May 31, 2023. | |
| H. | Affiliated Shareholders |
| At May 31, 2023, Virtus and its affiliates held shares of the following Funds, which may be redeemed at any time, that aggregated to the following: |
| Shares | Aggregate Net Asset Value | ||
| Stone Harbor Emerging Markets Bond Fund | |||
Class A | 12,255 | $ 93 | |
Class I | 885,204 | 6,754 | |
| Stone Harbor Local Markets Fund | |||
Class A | 12,970 | 100 | |
Class I | 1,140,455 | 8,804 |
| I. | Investments with Affiliates |
| The Funds are permitted to purchase assets from or sell assets to certain related affiliates under specified conditions outlined in procedures adopted by the Board. The procedures have been designed to ensure that any purchase or sale of assets by the Funds from or to another fund or portfolio that are, or could be, considered an affiliate by virtue of having a common investment adviser (or affiliated investment advisers), common Trustees and/or common officers comply with Rule 17a-7 under the 1940 Act. Further, as defined under the procedures, each transaction is effected at the current market price. During the year ended May 31, 2023, the Funds did not engage in any transactions pursuant to Rule 17a-7 under the 1940 Act. | |
| Outside of Rule 17a-7 transactions, other investments with affiliated issuers are separately reported in this Note. An affiliated issuer includes any company in which the Fund held 5% or more of a company’s outstanding voting shares at any point during the period, as well as other circumstances where an investment adviser or subadviser to the Fund is deemed to exercise, directly or indirectly, a certain level of control over the company. | |
| A summary of the Funds’ total long-term and short-term purchases and sales of the respective shares of the affiliated investments during the year ended May 31, 2023, is as follows: |
| Value, beginning of period | Purchases (1) | Sales proceeds | Net realized gain (loss) on affiliated securities | Net change in unrealized appreciation (depreciation) on affiliated securities | Value, end of period | Shares | Dividend income | Distributions of realized gains | |||||||||
| Stone Harbor Emerging Markets Debt Allocation Fund | |||||||||||||||||
| Affiliated Mutual Funds—97.7%(2) | |||||||||||||||||
Virtus Stone Harbor Emerging Markets Debt Income Fund Class I(3) | $3,976 | $1,417 | $3,694 | $ (918) | $ 350 | $1,131 | 163,738 | $132 | $— | ||||||||
Virtus Stone Harbor Local Markets Fund Class I(3),(4) | 3,980 | 764 | 3,328 | (82) | (127) | 1,207 | 156,350 | — | — | ||||||||
| Total | $7,956 | $2,181 | $7,022 | $(1,000) | $ 223 | $2,338 | $132 | $— | |||||||||
| Value, beginning of period | Purchases (1) | Sales proceeds | Net realized gain (loss) on affiliated securities | Net change in unrealized appreciation (depreciation) on affiliated securities | Value, end of period | Shares | Dividend income | Distributions of realized gains | |||||||||
| Stone Harbor Emerging Markets Debt Income Fund | |||||||||||||||||
| Affiliated Mutual Funds—2.5%(5) | |||||||||||||||||
Virtus Stone Harbor Emerging Markets Bond Fund Class I(3) | $4,437 | $ 195 | $— | $— | $(154) | $ 4,478 | 586,841 | $195 | $— | ||||||||
Virtus Stone Harbor Local Markets Fund Class I(3),(4) | — | 5,700 | — | — | 386 | 6,086 | 788,382 | — | — | ||||||||
| Total | $4,437 | $5,895 | $— | $— | $ 232 | $10,564 | $195 | $— | |||||||||
| Value, beginning of period | Purchases (1) | Sales proceeds | Net realized gain (loss) on affiliated securities | Net change in unrealized appreciation (depreciation) on affiliated securities | Value, end of period | Shares | Dividend income | Distributions of realized gains | |||||||||
| Stone Harbor Strategic Income Fund | |||||||||||||||||
| Affiliated Mutual Funds—61.7%(6) | |||||||||||||||||
Virtus Stone Harbor Emerging Markets Bond Fund Class I(3) | $ 1,902 | $ 250 | $ 1 | $ (—)(7) | $ (60) | $ 2,091 | 274,049 | $ 87 | $— | ||||||||
Virtus Stone Harbor Emerging Markets Debt Income Fund Class I(3) | 8,606 | 2,461 | 6 | (3) | (847) | 10,211 | 1,477,616 | 782 | — | ||||||||
Virtus Stone Harbor High Yield Bond Fund Class I(3) | 11,666 | 1,550 | 7 | (3) | (504) | 12,702 | 1,825,010 | 566 | — | ||||||||
Virtus Stone Harbor Local Markets Fund Class I(3),(4) | 1,876 | 83 | 860 | (207) | 205 | 1,097 | 142,118 | — | — | ||||||||
| Total | $24,050 | $4,344 | $874 | $(213) | $(1,206) | $26,101 | $1,435 | $— | |||||||||
| Footnote Legend: | |
| (1) | Includes reinvested dividends from income and capital gain distributions. |
| (2) | The Stone Harbor Emerging Markets Debt Allocation Fund does not invest in the underlying funds for the purpose of exercising management or control; however, investments made by the Fund within each of its principal investment strategies may represent a significant portion of an underlying fund’s net assets. At May 31, 2023, the Fund was the owner of record of less than 10% of all affiliated underlying funds. |
| (3) | Shares of this fund are publicly offered, and its prospectus and annual report are publicly available. |
| (4) | Non-income producing. |
| (5) | The Stone Harbor Emerging Markets Debt Income Fund does not invest in the underlying funds for the purpose of exercising management or control; however, investments made by the Fund within each of its principal investment strategies may represent a significant portion of an underlying fund’s net assets. At May 31, 2023, the Fund was the owner of record of 57% of the Virtus Stone Harbor Emerging Markets Bond Fund Class I and the owner of record of 39% of the Virtus Stone Harbor Local Markets Fund Class I. |
| (6) | The Stone Harbor Strategic Income Fund does not invest in the underlying funds for the purpose of exercising management or control; however, investments made by the Fund within each of its principal investment strategies may represent a significant portion of an underlying fund’s net assets. At May 31, 2023, the Fund was the owner of record of 27% of the Virtus Stone Harbor Emerging Markets Bond Fund, the owner of record of 15% of the Virtus Stone Harbor High Yield Bond Fund Class I and the owner of record of less than 10% of all other affiliated underlying funds. |
| (7) | Amount is less than $500 (not in thousands). |
| J. | Trustee Deferred Compensation Plan |
| The Trust provides a deferred compensation plan for its Trustees who receive compensation from the Trust. Under the deferred compensation plan, Trustees may elect to defer all or a portion of their compensation. Amounts deferred are retained by the Trust, and then, to the extent permitted by |
| the 1940 Act, in turn, may be invested in the shares of affiliated or unaffiliated mutual funds selected by the participating Trustees. Investments in such instruments are included in “Other assets” in the Statements of Assets and Liabilities at May 31, 2023. |
| Purchases | Sales | ||
Stone Harbor Emerging Markets Bond Fund | $ 2,977 | $ 2,067 | |
Stone Harbor Emerging Markets Debt Allocation Fund | 2,181 | 7,021 | |
Stone Harbor Emerging Markets Debt Income Fund | 600,072 | 847,693 | |
Stone Harbor High Yield Bond Fund | 35,558 | 45,539 | |
Stone Harbor Local Markets Fund | 31,218 | 84,205 | |
Stone Harbor Strategic Income Fund | 9,284 | 4,488 |
| Purchases | Sales | ||
Stone Harbor Emerging Markets Debt Income Fund | $20,996 | $20,187 | |
Stone Harbor Strategic Income Fund | 31,984 | 31,843 |
| Stone Harbor Emerging Markets Bond Fund | Stone Harbor Emerging Markets Debt Allocation Fund | ||||||||||||||
| Year Ended May 31, 2023 | Year Ended May 31, 2022 | Year Ended May 31, 2023 | Year Ended May 31, 2022 | ||||||||||||
| SHARES | AMOUNT | SHARES | AMOUNT | SHARES | AMOUNT | SHARES | AMOUNT | ||||||||
| Class A* | |||||||||||||||
| Shares sold and cross class conversions | — (1) | $ 3 | 12 | $ 100 | — | $ — | 13 | $ 100 | |||||||
| Reinvestment of distributions | — (1) | — (2) | — | — | — | — | — | — | |||||||
| Net Increase / (Decrease) | — (1) | $ 3 | 12 | $ 100 | — | $ — | 13 | $ 100 | |||||||
| Class I | |||||||||||||||
| Shares sold and cross class conversions | 89 | $ 681 | 614 | $ 5,564 | 225 | $ 1,557 | 108 | $ 922 | |||||||
| Reinvestment of distributions | 41 | 312 | 36 | 317 | 24 | 158 | 50 | 433 | |||||||
| Shares repurchased and cross class conversions | (—) (1) | (4) | (494) | (4,550) | (986) | (6,691) | (1,090) | (8,564) | |||||||
| Net Increase / (Decrease) | 130 | $ 989 | 156 | $ 1,331 | (737) | $ (4,976) | (932) | $ (7,209) | |||||||
| Stone Harbor Emerging Markets Debt Income Fund | Stone Harbor High Yield Bond Fund | ||||||||||||||
| Year Ended May 31, 2023 | Year Ended May 31, 2022 | Year Ended May 31, 2023 | Year Ended May 31, 2022 | ||||||||||||
| SHARES | AMOUNT | SHARES | AMOUNT | SHARES | AMOUNT | SHARES | AMOUNT | ||||||||
| Class A* | |||||||||||||||
| Shares sold and cross class conversions | — (1) | $ 2 | 12 | $ 100 | 10 | $ 67 | 13 | $ 100 | |||||||
| Reinvestment of distributions | — (1) | — (2) | — | — | — (1) | 2 | — | — | |||||||
| Shares repurchased and cross class conversions | — | — | — | — | (1) | (8) | — | — | |||||||
| Net Increase / (Decrease) | — (1) | $ 2 | 12 | $ 100 | 9 | $ 61 | 13 | $ 100 | |||||||
| Class I | |||||||||||||||
| Shares sold and cross class conversions | 16,016 | $ 113,172 | 34,545 | $ 322,559 | 165 | $ 1,144 | 1,568 | $ 12,265 | |||||||
| Reinvestment of distributions | 4,966 | 34,660 | 6,078 | 55,072 | 680 | 4,729 | 638 | 4,960 | |||||||
| Shares repurchased and cross class conversions | (56,826) | (402,034) | (87,070) | (788,603) | (2,654) | (18,530) | (264) | (2,072) | |||||||
| Net Increase / (Decrease) | (35,844) | $ (254,202) | (46,447) | $ (410,972) | (1,809) | $ (12,657) | 1,942 | $ 15,153 | |||||||
| Stone Harbor Local Markets Fund | Stone Harbor Strategic Income Fund | ||||||||||||||
| Year Ended May 31, 2023 | Year Ended May 31, 2022 | Year Ended May 31, 2023 | Year Ended May 31, 2022 | ||||||||||||
| SHARES | AMOUNT | SHARES | AMOUNT | SHARES | AMOUNT | SHARES | AMOUNT | ||||||||
| Class A* | |||||||||||||||
| Shares sold and cross class conversions | — | $ — | 13 | $ 100 | 4 | $ 30 | 11 | $ 100 | |||||||
| Reinvestment of distributions | — | — | — | — | — (1) | — (2) | — | — | |||||||
| Shares repurchased and cross class conversions | — | — | — | — | (3) | (24) | — | — | |||||||
| Net Increase / (Decrease) | — | $ — | 13 | $ 100 | 1 | $ 6 | 11 | $ 100 | |||||||
| Class I | |||||||||||||||
| Shares sold and cross class conversions | 956 | $ 6,962 | 220 | $ 1,778 | 393 | $ 3,251 | 1,075 | $ 9,115 | |||||||
| Reinvestment of distributions | — | — | — | — | 272 | 2,245 | 86 | 799 | |||||||
| Shares repurchased and cross class conversions | (9,220) | (65,107) | (7,801) | (67,162) | (—) (1) | (1) | — | — | |||||||
| Net Increase / (Decrease) | (8,264) | $ (58,145) | (7,581) | $ (65,384) | 665 | $ 5,495 | 1,161 | $ 9,914 | |||||||
| * | Inception date April 11, 2022. |
| (1) | Amount is less than 500 shares (not in thousands). |
| (2) | Amount is less than $500 (not in thousands). |
| % of Shares Outstanding | Number of Accounts | ||
Stone Harbor Emerging Markets Bond Fund | 84 % | 2 * | |
Stone Harbor Emerging Markets Debt Allocation Fund | 93 | 3 * | |
Stone Harbor Emerging Markets Debt Income Fund | 28 | 2 | |
Stone Harbor High Yield Bond Fund | 89 | 3 * | |
Stone Harbor Local Markets Fund | 75 | 3 * |
| % of Shares Outstanding | Number of Accounts | ||
Stone Harbor Strategic Income Fund | 82% | 1 |
| * | Includes affiliated shareholder account(s). |
| Fund | Interest Incurred on Borrowing | Average Borrowing | Weighted Average Interest Rate | Days Outstanding | ||||
Stone Harbor Local Markets Fund | $3 | $1,250 | 3.36% | 24 |
| Fund | Federal Tax Cost | Unrealized Appreciation | Unrealized (Depreciation) | Net Unrealized Appreciation (Depreciation) | ||||
Stone Harbor Emerging Markets Bond Fund | $ 8,180 | $ 40 | $ (757) | $ (717) | ||||
Stone Harbor Emerging Markets Debt Allocation Fund | 2,441 | 76 | (179) | (103) | ||||
Stone Harbor Emerging Markets Debt Income Fund | 501,247 | 4,872 | (109,052) | (104,180) | ||||
Stone Harbor High Yield Bond Fund | 93,350 | 440 | (10,793) | (10,353) | ||||
Stone Harbor Local Markets Fund | 15,756 | 482 | (3,296) | (2,814) | ||||
Stone Harbor Strategic Income Fund | 44,584 | 27 | (5,574) | (5,547) |
| Fund | Short-Term | Long-Term | ||
Stone Harbor Emerging Markets Bond Fund | $ 1,721 | $ 2,959 | ||
Stone Harbor Emerging Markets Debt Allocation Fund | 612 | 7,104 | ||
Stone Harbor Emerging Markets Debt Income Fund | 186,618 | 194,399 |
| Fund | Short-Term | Long-Term | ||
Stone Harbor High Yield Bond Fund | $ 1,354 | $ 26,065 | ||
Stone Harbor Local Markets Fund | 120,699 | 73,868 | ||
Stone Harbor Strategic Income Fund | 336 | 774 |
| Fund | Undistributed Ordinary Income | Late Year Ordinary Losses Deferred | Post-October Capital Loss Deferred | Capital Loss Deferred | ||||
Stone Harbor Emerging Markets Bond Fund | $ 116 | $ — | $ 132 | $ 4,680 | ||||
Stone Harbor Emerging Markets Debt Allocation Fund | — | — | 816 | 7,716 | ||||
Stone Harbor Emerging Markets Debt Income Fund | 12,094 | — | 51,949 | 381,017 | ||||
Stone Harbor High Yield Bond Fund | 1,524 | — | 1,935 | 27,419 | ||||
Stone Harbor Local Markets Fund | — | 2,360 | 697 | 194,567 | ||||
Stone Harbor Strategic Income Fund | 175 | — | 166 | 1,110 |
| Ordinary Income | Total | ||
Stone Harbor Emerging Markets Bond Fund | |||
5/31/23 | $ 316 | $ 316 | |
5/31/22 | 318 | 318 | |
Stone Harbor Emerging Markets Debt Allocation Fund | |||
5/31/23 | 230 | 230 | |
5/31/22 | 433 | 433 | |
Stone Harbor Emerging Markets Debt Income Fund | |||
5/31/23 | 40,450 | 40,450 | |
5/31/22 | 60,381 | 60,381 | |
Stone Harbor High Yield Bond Fund | |||
5/31/23 | 4,735 | 4,735 | |
5/31/22 | 4,961 | 4,961 | |
Stone Harbor Strategic Income Fund | |||
5/31/23 | 2,250 | 2,250 | |
5/31/22 | 800 | 800 |

Philadelphia, PA
July 24, 2023
| Fund | Qualified Dividend Income % (non-corporate shareholder) | Dividend Received Deduction % (corporate shareholders) | Long-Term Capital Gain Distributions ($) | |||
Stone Harbor Emerging Markets Bond Fund | 0.00 % | 0.00 % | $ 0 | |||
Stone Harbor Emerging Markets Debt Allocation Fund | 0.00 | 0.00 | 0 | |||
Stone Harbor Emerging Markets Debt Income Fund | 0.00 | 0.00 | 0 | |||
Stone Harbor High Yield Bond Fund | 0.00 | 0.00 | 0 | |||
Stone Harbor Local Markets Fund | 0.00 | 0.00 | 0 | |||
Stone Harbor Strategic Income Fund | 0.00 | 0.00 | 0 |
| Name, Year of Birth, Length of Time Served and Number of Portfolios in Fund Complex Overseen by Trustee | Principal Occupation(s) During Past 5 Years | Other Directorships Held by Trustee During Past 5 Years |
| Burke, Donald C. YOB: 1960 Served Since: 2016 108 Portfolios | Private investor (since 2009). Formerly, President and Chief Executive Officer, BlackRock U.S. Funds (2007 to 2009); Managing Director, BlackRock, Inc. (2006 to 2009); and Managing Director, Merrill Lynch Investment Managers (1990 to 2006). | Trustee (since May 2023) and Advisory Board Member (May 2023), Virtus Artificial Intelligence & Technology Opportunities Fund, Virtus Dividend, Interest & Premium Strategy Fund and Virtus Equity & Convertible Income Fund; Advisory Board Member (since May 2023), Virtus Convertible & Income 2024 Target Term Fund, Virtus Convertible & Income Fund, Virtus Convertible & Income Fund II and Virtus Diversified Income & Convertible Fund; Trustee (since 2022), Virtus Stone Harbor Emerging Markets Income Fund and Virtus Stone Harbor Emerging Markets Total Income Fund; Trustee (since 2021), The Merger Fund®, The Merger Fund® VL, Virtus Event Opportunities Trust (2 portfolios), Virtus Investment Trust (13 portfolios) and Virtus Strategy Trust (8 portfolios); Director (2020 to 2021), Duff & Phelps Select MLP and Midstream Energy Fund Inc.; Director (since 2020), Virtus Total Return Fund Inc.; Trustee (since 2020), Virtus Global Multi-Sector Income Fund; Trustee (since 2016), Virtus Mutual Fund Family (57 portfolios), Virtus Variable Insurance Trust (8 portfolios) and Virtus Alternative Solutions Trust (4 portfolios); Director (since 2014), closed-end funds managed by Duff & Phelps Investment Management Co. (3 funds); Director, Avista Corp. (energy company) (since 2011); Trustee, Goldman Sachs Fund Complex (2010 to 2014); and Director, BlackRock Luxembourg and Cayman Funds (2006 to 2010). |
| Cogan, Sarah E. YOB: 1956 Served Since: 2022 105 Portfolios | Retired Partner, Simpson Thacher & Bartlett LLP (“STB”) (law firm) (since 2019); Director, Girl Scouts of Greater New York (since 2016); Trustee, Natural Resources Defense Council, Inc. (since 2013); and formerly, Partner, STB (1989 to 2018). | Trustee (since 2022) and Advisory Board Member (2021 to 2022), Virtus Alternative Solutions Trust (4 portfolios), Virtus Mutual Fund Family (57 portfolios) and Virtus Variable Insurance Trust (8 portfolios); Trustee (since 2022), Virtus Stone Harbor Emerging Markets Income Fund and Virtus Stone Harbor Emerging Markets Total Income Fund; Trustee (since 2022), PIMCO Access Income Fund and PIMCO California Flexible Municipal Income Fund; Trustee (since 2021), PIMCO Flexible Emerging Markets Income Fund; Trustee (since 2021), The Merger Fund®, The Merger Fund® VL, Virtus Event Opportunities Trust (2 portfolios), and Virtus Global Multi-Sector Income Fund; Advisory Board Member (February 2021 to June 2021), Duff & Phelps Select MLP and Midstream Energy Fund Inc.; Director (since 2021), Virtus Total Return Fund Inc.; Trustee (since 2019), Virtus Investment Trust (13 portfolios) and Virtus Strategy Trust (8 portfolios); Trustee (since 2019), Virtus Artificial Intelligence & Technology Opportunities Fund, Virtus Convertible & Income 2024 Target Term Fund, Virtus Convertible & Income Fund, Virtus Convertible & Income Fund II, Virtus Diversified Income & Convertible Fund, Virtus Equity & Convertible Income Fund, and Virtus Dividend, Interest & Premium Strategy Fund; Trustee (since 2019), PIMCO California Municipal Income Fund, PIMCO California Municipal Income Fund II, PIMCO California Municipal Income Fund III, PIMCO Municipal Income Fund, PIMCO Municipal Income Fund II, PIMCO Municipal Income Fund III, PIMCO New York Municipal Income Fund, PIMCO New York Municipal Income Fund II, PIMCO New York Municipal Income Fund III, PIMCO Energy and Tactical Credit Opportunities Fund, PCM Fund, Inc, PIMCO Corporate & Income Strategy Fund, PIMCO Corporate & Income Opportunity Fund, PIMCO Dynamic Income Fund, PIMCO Global StocksPLUS® & Income Fund, PIMCO High Income Fund, PIMCO Income Strategy Fund, PIMCO Income Strategy Fund II, PIMCO Strategic Income Fund, Inc., PIMCO Flexible Credit Income Fund and PIMCO Flexible Municipal Income Fund; Trustee (since 2019), PIMCO Managed Accounts Trust (5 portfolios); and Trustee (2019 to 2021), PIMCO Dynamic Credit and Mortgage Income Fund and PIMCO Income Opportunity Fund. |
| Name, Year of Birth, Length of Time Served and Number of Portfolios in Fund Complex Overseen by Trustee | Principal Occupation(s) During Past 5 Years | Other Directorships Held by Trustee During Past 5 Years |
| DeCotis, Deborah A. YOB: 1952 Served Since: 2022 105 Portfolios | Director, Cadre Holdings Inc. (since 2022); Advisory Director, Morgan Stanley & Co., Inc. (since 1996); Member, Circle Financial Group (since 2009); Member, Council on Foreign Relations (since 2013); and Trustee, Smith College (since 2017). Formerly, Director, Watford Re (2017 to 2021); Co-Chair Special Projects Committee, Memorial Sloan Kettering (2005 to 2015); and Trustee, Stanford University (2010 to 2015). | Trustee (since 2022) and Advisory Board Member (2021 to 2022), Virtus Alternative Solutions Trust (4 portfolios), Virtus Mutual Fund Family (57 portfolios) and Virtus Variable Insurance Trust (8 portfolios); Trustee (since 2022), Virtus Stone Harbor Emerging Markets Income Fund and Virtus Stone Harbor Emerging Markets Total Income Fund; Trustee (since 2022), PIMCO Access Income Fund and PIMCO California Flexible Municipal Income Fund; Trustee (since 2021), PIMCO Flexible Emerging Markets Income Fund; Trustee (since 2021), The Merger Fund®, The Merger Fund® VL, Virtus Event Opportunities Trust (2 portfolios), and Virtus Global Multi-Sector Income Fund; Advisory Board Member (February 2021 to June 2021), Duff & Phelps Select MLP and Midstream Energy Fund Inc.; Director (since 2021), Virtus Total Return Fund Inc.; Trustee (since 2020), PIMCO Dynamic Income Opportunities Fund; Trustee (since 2019), PIMCO Energy and Tactical Credit Opportunities Fund and Virtus Artificial Intelligence & Technology Opportunities Fund; Trustee (since 2018), PIMCO Flexible Municipal Income Fund; Trustee (since 2017), PIMCO Flexible Credit Income Fund and Virtus Convertible & Income 2024 Target Term Fund; Trustee (since 2015), Virtus Diversified Income & Convertible Fund; Trustee (since 2014), Virtus Investment Trust (13 portfolios); Trustee (2013 to 2021), PIMCO Dynamic Credit and Mortgage Income Fund; Trustee (since 2012), PIMCO Dynamic Income Fund; Trustee (since 2011), Virtus Strategy Trust (8 portfolios); Trustee (since 2011), PIMCO California Municipal Income Fund II, PIMCO California Municipal Income Fund III, PIMCO Municipal Income Fund, PIMCO Municipal Income Fund II, PIMCO Municipal Income Fund III, PIMCO New York Municipal Income Fund, PIMCO New York Municipal Income Fund II, PIMCO New York Municipal Income Fund III, PCM Fund, Inc., PIMCO Corporate & Income Strategy Fund, PIMCO Corporate & Income Opportunity Fund, PIMCO Global StocksPLUS® & Income Fund, PIMCO High Income Fund, PIMCO Income Strategy Fund, PIMCO Income Strategy Fund II, PIMCO Strategic Income Fund, Inc., and PIMCO Managed Accounts Trust (5 portfolios); Trustee (since 2011), Virtus Convertible & Income Fund, Virtus Convertible & Income Fund II, Virtus Equity & Convertible Income Fund, and Virtus Dividend, Interest & Premium Strategy Fund; and Trustee (2011 to 2021), PIMCO Income Opportunity Fund. |
| Drummond, F. Ford YOB: 1962 Served Since: 2022 105 Portfolios | President (since 1998), F.G. Drummond Ranches, Inc.; and Director (since 2015), Texas and Southwestern Cattle Raisers Association. Formerly Chairman, Oklahoma Nature Conservancy (2019 to 2020); Board Member (2006 to 2020) and Chairman (2016 to 2018), Oklahoma Water Resources Board; Trustee (since 2014), Frank Phillips Foundation; Director (1998 to 2008), The Cleveland Bank; and General Counsel (1998 to 2008), BMIHealth Plans (benefits administration). | Trustee (since 2022) and Advisory Board Member (2021 to 2022), Virtus Alternative Solutions Trust (4 portfolios), Virtus Mutual Fund Family (57 portfolios), and Virtus Variable Insurance Trust (8 portfolios); Trustee (since 2022), Virtus Stone Harbor Emerging Markets Income Fund and Virtus Stone Harbor Emerging Markets Total Income Fund; Trustee (since 2021), The Merger Fund®, The Merger Fund® VL, and Virtus Event Opportunities Trust (2 portfolios); Advisory Board Member (February 2021 to June 2021), Duff & Phelps Select MLP and Midstream Energy Fund Inc.; Trustee (since 2021), Virtus Global Multi-Sector Income Fund; Director (since 2021), Virtus Total Return Fund Inc.; Trustee (since 2019), Virtus Artificial Intelligence & Technology Opportunities Fund; Trustee (since 2017), Virtus Convertible & Income 2024 Target Term Fund; Trustee (since 2015), Virtus Convertible & Income Fund, Virtus Convertible & Income Fund II, Virtus Diversified Income & Convertible Fund, Virtus Dividend, Interest & Premium Strategy Fund and Virtus Equity & Convertible Income Fund; Trustee (since 2014), Virtus Strategy Trust (8 portfolios); Director (since 2011), Bancfirst Corporation; and Trustee (since 2006), Virtus Investment Trust (13 portfolios). |
| Name, Year of Birth, Length of Time Served and Number of Portfolios in Fund Complex Overseen by Trustee | Principal Occupation(s) During Past 5 Years | Other Directorships Held by Trustee During Past 5 Years |
| Harris, Sidney E. YOB: 1949 Served Since: 2017 98 Portfolios | Private Investor (since 2021); Dean Emeritus (since 2015), Professor (2015 to 2021 and 1997 to 2014), and Dean (1997 to 2004), J. Mack Robinson College of Business, Georgia State University. | Trustee (since 2022), Virtus Stone Harbor Emerging Markets Income Fund and Virtus Stone Harbor Emerging Markets Total Income Fund; Trustee (since 2021), The Merger Fund®, The Merger Fund® VL, Virtus Event Opportunities Trust (2 portfolios), Virtus Investment Trust (13 portfolios) and Virtus Strategy Trust (8 portfolios); Director (2020 to 2021), Duff & Phelps Select MLP and Midstream Energy Fund Inc.; Director (since 2020), Virtus Total Return Fund Inc.; Trustee (since 2020), Virtus Global Multi-Sector Income Fund; Trustee (since 2019), Mutual Fund Directors Forum; Trustee (since 2017), Virtus Mutual Fund Family (57 portfolios), Virtus Variable Insurance Trust (8 portfolios), and Virtus Alternative Solutions Trust (4 portfolios); Trustee (2013 to 2020) and Honorary Trustee (since 2020), KIPP Metro Atlanta; Director (1999 to 2019), Total System Services, Inc.; Trustee (2004 to 2017), RidgeWorth Funds; Chairman (2012 to 2017), International University of the Grand Bassam Foundation; Trustee (since 2012), International University of the Grand Bassam Foundation; and Trustee (2011 to 2015), Genspring Family Offices, LLC. |
| Mallin, John R. YOB: 1950 Served Since: 2016 98 Portfolios | Partner/Attorney (since 2003), McCarter & English LLP (law firm) Real Property Practice Group; and Member (2014 to 2022), Counselors of Real Estate. | Trustee (since 2022), Virtus Stone Harbor Emerging Markets Income Fund and Virtus Stone Harbor Emerging Markets Total Income Fund; Trustee (since 2021), The Merger Fund®, The Merger Fund® VL, Virtus Event Opportunities Trust (2 portfolios), Virtus Investment Trust (13 portfolios) and Virtus Strategy Trust (8 portfolios); Director (2020 to 2021), Duff & Phelps Select MLP and Midstream Energy Fund Inc.; Director (since 2020), Virtus Total Return Fund Inc.; Trustee (since 2020), Virtus Global Multi-Sector Income Fund; Trustee (since 2016), Virtus Mutual Fund Family (57 portfolios) and Virtus Alternative Solutions Trust (4 portfolios); Director (since 2019), 1892 Club, Inc. (non-profit); Director (2013 to 2020), Horizons, Inc. (non-profit); and Trustee (since 1999), Virtus Variable Insurance Trust (8 portfolios). |
| McDaniel, Connie D. YOB: 1958 Served Since: 2017 105 Portfolios | Retired (since 2013). Vice President, Chief of Internal Audit, Corporate Audit Department (2009 to 2013); Vice President, Global Finance Transformation (2007 to 2009); and Vice President and Controller (1999 to 2007), The Coca-Cola Company. | Trustee (since May 2023) and Advisory Board Member (May 2023), Virtus Artificial Intelligence & Technology Opportunities Fund, Virtus Convertible & Income 2024 Target Term Fund, Virtus Convertible & Income Fund, Virtus Convertible & Income Fund II, Virtus Diversified Income & Convertible Fund, Virtus Dividend, Interest & Premium Strategy Fund and Virtus Equity & Convertible Income Fund; Trustee (since 2022), Virtus Stone Harbor Emerging Markets Income Fund and Virtus Stone Harbor Emerging Markets Total Income Fund; Trustee (since 2021), The Merger Fund®, The Merger Fund® VL, Virtus Event Opportunities Trust (2 portfolios), Virtus Investment Trust (13 portfolios) and Virtus Strategy Trust (8 portfolios); Director (2020 to 2021), Duff & Phelps Select MLP and Midstream Energy Fund Inc.; Director (since 2020), Virtus Total Return Fund Inc.; Trustee (since 2020), Virtus Global Multi-Sector Income Fund; Director (since 2019), Global Payments Inc.; Chairperson (since 2021), Governance & Nominating Committee, Global Payments Inc; Trustee (since 2017), Virtus Mutual Fund Family (57 portfolios), Virtus Variable Insurance Trust (8 portfolios), and Virtus Alternative Solutions Trust (4 portfolios); Director (since 2021), North Florida Land Trust; Director (2014 to 2019), Total System Services, Inc.; Member (2011 to 2022) and Chair (2014 to 2016), Georgia State University, Robinson College of Business Board of Advisors; and Trustee (2005 to 2017), RidgeWorth Funds. |
| Name, Year of Birth, Length of Time Served and Number of Portfolios in Fund Complex Overseen by Trustee | Principal Occupation(s) During Past 5 Years | Other Directorships Held by Trustee During Past 5 Years |
| McLoughlin, Philip YOB: 1946 Served Since: 1999 108 Portfolios | Private investor since 2010. | Trustee and Chairman (since 2022), Virtus Stone Harbor Emerging Markets Income Fund and Virtus Stone Harbor Emerging Markets Total Income Fund; Trustee (since 2021), The Merger Fund®, The Merger Fund® VL, Virtus Event Opportunities Trust (2 portfolios), Virtus Investment Trust (13 portfolios) and Virtus Strategy Trust (8 portfolios); Chairman (since 2023) and Trustee (since 2021), Virtus Artificial Intelligence & Technology Opportunities Fund, Virtus Convertible & Income Fund II, Virtus Diversified Income & Convertible Fund, Virtus Equity & Convertible Income Fund and Virtus Dividend, Interest & Premium Strategy Fund; Chairman (since 2023), Trustee (since 2022) and Advisory Board Member (2021), Virtus Convertible & Income 2024 Target Term Fund and Virtus Convertible & Income Fund; Director and Chairman (since 2016), Virtus Total Return Fund Inc.; Director and Chairman (2016 to 2019), the former Virtus Total Return Fund Inc.; Director and Chairman (2014 to 2021), Duff & Phelps Select MLP and Midstream Energy Fund Inc.; Trustee and Chairman (since 2013), Virtus Alternative Solutions Trust (4 portfolios); Trustee and Chairman (since 2011), Virtus Global Multi-Sector Income Fund; Chairman and Trustee (since 2003), Virtus Variable Insurance Trust (8 portfolios); Director (since 1995), closed-end funds managed by Duff & Phelps Investment Management Co. (3 funds); Director (1991 to 2019) and Chairman (2010 to 2019), Lazard World Trust Fund (closed-end investment firm in Luxembourg); and Trustee (since 1989) and Chairman (since 2002), Virtus Mutual Fund Family (57 portfolios). |
| McNamara, Geraldine M. YOB: 1951 Served Since: 2001 108 Portfolios | Private investor (since 2006); and Managing Director, U.S. Trust Company of New York (1982 to 2006). | Trustee (since May 2023) and Advisory Board Member (January 2023 to May 2023), Virtus Convertible & Income Fund, Virtus Convertible & Income Fund II, Virtus Diversified Income & Convertible Fund and Virtus Dividend, Interest & Premium Strategy Fund; Trustee (since 2023), Virtus Artificial Intelligence & Technology Opportunities Fund and Virtus Equity & Convertible Income Fund; Advisory Board Member (since 2023), Virtus Convertible & Income 2024 Target Term Fund; Trustee (since 2022), Virtus Stone Harbor Emerging Markets Income Fund and Virtus Stone Harbor Emerging Markets Total Income Fund; Trustee (since 2021), The Merger Fund®, The Merger Fund® VL, Virtus Event Opportunities Trust (2 portfolios), Virtus Investment Trust (13 portfolios) and Virtus Strategy Trust (8 portfolios); Director (2020 to 2021), Duff & Phelps Select MLP and Midstream Energy Fund Inc.; Director (since 2020), Virtus Total Return Fund Inc.; Trustee (since 2020), Virtus Global Multi-Sector Income Fund; Trustee (since 2016) Virtus Alternative Solutions Trust (4 portfolios); Trustee (since 2015), Virtus Variable Insurance Trust (8 portfolios); Director (since 2003), closed-end funds managed by Duff & Phelps Investment Management Co. (3 funds); and Trustee (since 2001), Virtus Mutual Fund Family (57 portfolios). |
| Walton, R. Keith YOB: 1964 Served Since: 2020 105 Portfolios | Senior Adviser (since 2022), Brightwood Capital LLC; Venture and Operating Partner (since 2020), Plexo Capital, LLC; Venture Partner (since 2019) and Senior Adviser (2018 to 2019), Plexo, LLC; and Partner (since 2006), Global Infrastructure Partners. Formerly, Managing Director (2020 to 2021), Lafayette Square Holding Company LLC; Senior Adviser (2018 to 2019), Vatic Labs, LLC; Executive Vice President, Strategy (2017 to 2019), Zero Mass Water, LLC; and Vice President, Strategy (2013 to 2017), Arizona State University. | Trustee (since May 2023) and Advisory Board Member (2022 to May 2023), Virtus Convertible & Income Fund II and Virtus Dividend, Interest & Premium Strategy Fund; Trustee (since 2022) and Advisory Board Member (January 2022 to July 2022), Virtus Artificial Intelligence & Technology Opportunities Fund, Virtus Convertible & Income Fund and Virtus Equity & Convertible Income Fund; Trustee (since 2022), Virtus Stone Harbor Emerging Markets Income Fund and Virtus Stone Harbor Emerging Markets Total Income Fund; Trustee (since 2022), Virtus Diversified Income & Convertible Fund; Advisory Board Member (since 2022), Virtus Convertible & Income 2024 Target Term Fund; Trustee (since 2021), The Merger Fund®, The Merger Fund® VL, Virtus Event Opportunities Trust (2 portfolios), Virtus Investment Trust (13 portfolios) and Virtus Strategy Trust (8 portfolios); Trustee (since 2020) Virtus Alternative Solutions Trust (4 portfolios), Virtus Variable Insurance Trust (8 portfolios) and Virtus Mutual Fund Family (57 portfolios); Director (since 2017), certain funds advised by Bessemer Investment Management LLC; Director (2016 to 2021), Duff & Phelps Select MLP and Midstream Energy Fund Inc.; Trustee (since 2016), Virtus Global Multi-Sector Income Fund; Director (2006 to 2019), Systematica Investments Limited Funds; Director (2006 to 2017), BlueCrest Capital Management Funds; Trustee (2014 to 2017), AZ Service; Director (since 2004), Virtus Total Return Fund Inc.; and Director (2004 to 2019), the former Virtus Total Return Fund Inc. |
| Name, Year of Birth, Length of Time Served and Number of Portfolios in Fund Complex Overseen by Trustee | Principal Occupation(s) During Past 5 Years | Other Directorships Held by Trustee During Past 5 Years |
| Zion, Brian T. YOB: 1952 Served Since: 2020 105 Portfolios | Retired. Various roles (1982 to 2009), J. & W. Seligman & Co. Incorporated, including President (1994 to 2009). | Trustee (since 2022), Virtus Stone Harbor Emerging Markets Income Fund and Virtus Stone Harbor Emerging Markets Total Income Fund; Trustee (since 2021), The Merger Fund®, The Merger Fund® VL, Virtus Event Opportunities Trust (2 portfolios), Virtus Investment Trust (13 portfolios) and Virtus Strategy Trust (8 portfolios); Trustee (since 2022) and Advisory Board Member (2021), Virtus Artificial Intelligence & Technology Opportunities Fund, Virtus Convertible & Income 2024 Target Term Fund, Virtus Convertible & Income Fund, Virtus Convertible & Income Fund II, Virtus Diversified Income & Convertible Fund, Virtus Equity & Convertible Income Fund, and Virtus Dividend, Interest & Premium Strategy Fund; Trustee (since 2020) Virtus Alternative Solutions Trust (4 portfolios), Virtus Variable Insurance Trust (8 portfolios) and Virtus Mutual Fund Family (57 portfolios); Director (2016 to 2021), Duff & Phelps Select MLP and Midstream Energy Fund Inc.; Trustee (since 2016), Virtus Global Multi-Sector Income Fund; Director (since 2014), Virtus Total Return Fund Inc.; Director (2014 to 2019), the former Virtus Total Return Fund Inc.; Trustee (since 2011), Bentley University; Director (1986 to 2009) and President (1994 to 2009), J&W Seligman Co. Inc.; Director (1998 to 2009), Chairman (2002 to 2004) and Vice Chairman (2000 to 2002), ICI Mutual Insurance Company; Member, Board of Governors of ICI (1998 to 2008). |
| Name, Year of Birth, Length of Time Served and Number of Funds Overseen | Principal Occupation(s) During Past 5 Years | Principal Occupation(s) During Past 5 Years and Other Directorships Held by Trustee |
| Aylward, George R.* Trustee and President YOB: 1964 Served Since: 2006 111 Portfolios | Director, President and Chief Executive Officer (since 2008), Virtus Investment Partners, Inc. and/or certain of its subsidiaries, and various senior officer positions with Virtus affiliates (since 2005). | Trustee, President and Chief Executive Officer (since 2022), Virtus Stone Harbor Emerging Markets Income Fund and Virtus Stone Harbor Emerging Markets Total Income Fund; Member, Board of Governors of the Investment Company Institute (since 2021); Trustee and President (since 2021), The Merger Fund®, The Merger Fund® VL, Virtus Event Opportunities Trust (2 portfolios), Virtus Investment Trust (13 portfolios) and Virtus Strategy Trust (8 portfolios); Trustee, President and Chief Executive Officer (since 2021), Virtus Artificial Intelligence & Technology Opportunities Fund, Virtus Convertible & Income 2024 Target Term Fund, Virtus Convertible & Income Fund, Virtus Convertible & Income Fund II, Virtus Diversified Income & Convertible Fund, Virtus Equity & Convertible Income Fund, and Virtus Dividend, Interest & Premium Strategy Fund; Chairman and Trustee (since 2015), Virtus ETF Trust II (6 portfolios); Director, President and Chief Executive Officer (2014 to 2021), Duff & Phelps Select MLP and Midstream Energy Fund Inc.; Trustee and President (since 2013), Virtus Alternative Solutions Trust (4 portfolios); Director (since 2013), Virtus Global Funds, PLC (5 portfolios); Trustee (since 2012) and President (since 2010), Virtus Variable Insurance Trust (8 portfolios); Trustee, President and Chief Executive Officer (since 2011), Virtus Global Multi-Sector Income Fund; Trustee and President (since 2006) and Executive Vice President (2004 to 2006), Virtus Mutual Fund Family (57 portfolios); Director, President and Chief Executive Officer (since 2006), Virtus Total Return Fund Inc.; and Director, President and Chief Executive Officer (2006 to 2019), the former Virtus Total Return Fund Inc. |
| Name, Address and Year of Birth | Position(s) Held with Trust and Length of Time Served | Principal Occupation(s) During Past 5 Years |
| Batchelar, Peter J. YOB: 1970 | Senior Vice President (since 2017), and Vice President (2008 to 2016). | Senior Vice President, Product Development (since 2017), Vice President, Product Development (2008 to 2017), and various officer positions (since 2008), Virtus Investment Partners, Inc. and/or certain of its subsidiaries; various officer positions (since 2008) of various registered funds advised by subsidiaries of Virtus Investment Partners, Inc. |
| Bradley, W. Patrick YOB: 1972 | Executive Vice President (since 2016); Senior Vice President (2013 to 2016); Vice President (2011 to 2013); Chief Financial Officer and Treasurer (since 2006). | Executive Vice President, Fund Services (since 2016), Senior Vice President, Fund Services (2010 to 2016) and various officer positions (since 2004), Virtus Investment Partners, Inc. and/or certain of its subsidiaries; various officer positions (since 2006) of various registered funds advised by subsidiaries of Virtus Investment Partners, Inc.; Member (since 2022), BNY Mellon Asset Servicing Client Advisory Board. |
| Branigan, Timothy YOB: 1976 | Vice President and Fund Chief Compliance Officer (since 2022); Assistant Vice President and Deputy Fund Chief Compliance Officer (March to May 2022); and Assistant Vice President and Assistant Chief Compliance Officer (2021 to 2022). | Various officer positions (since 2019) of various registered funds advised by subsidiaries of Virtus Investment Partners, Inc. |
| Chisolm, Daphne YOB: 1969 | Vice President, Counsel and Assistant Secretary (since 2023). | Vice President and Senior Counsel (since 2023), Virtus Investment Partners, Inc.; Attorney at Law engaged in private practice as a solo practitioner (2018 to 2023); and various officers positions (since 2023) of various registered funds advised by subsidiaries of Virtus Investment Partners, Inc. |
| Fromm Jennifer YOB: 1973 | Chief Legal Officer, Counsel and Secretary (since 2023); Vice President (since 2017); and Assistant Secretary (2008 to 2022). | Vice President (since 2016) and Senior Counsel, Legal (since 2007) and various officer positions (since 2008), Virtus Investment Partners, Inc. and/or certain of its subsidiaries; various officer positions (since 2008) of various registered funds advised by subsidiaries of Virtus Investment Partners, Inc. |
| Name, Address and Year of Birth | Position(s) Held with Trust and Length of Time Served | Principal Occupation(s) During Past 5 Years |
| Griswold, Heidi YOB: 1973 | Vice President (since 2016). | Vice President, Head of Transfer Agent & Servicing, Mutual Fund Services (since 2018), Virtus Investment Partners, Inc. and/or certain of its subsidiaries; and Vice President (since 2016) of various registered funds advised by subsidiaries of Virtus Investment Partners, Inc. |
| Hackett, Amy YOB: 1968 | Vice President and Assistant Treasurer (since 2013); Assistant Treasurer (2009 to 2013). | Vice President, Fund Services (since 2010) and Assistant Vice President, Fund Services (2007 to 2010), Virtus Investment Partners, Inc. and/or certain of its subsidiaries; and various officer positions (since 2007) of various registered funds advised by subsidiaries of Virtus Investment Partners, Inc. |
| Krishnan, Suneeta YOB: 1965 | Vice President and Assistant Treasurer (since 2018); and Assistant Treasurer (2009 to 2018). | Vice President, Mutual Fund Administration (since 2017), and Assistant Treasurer, Mutual Fund Administration (since 2007), Virtus Investment Partners, Inc. and/or certain of its subsidiaries; and various officer positions (since 2009) of various registered funds advised by subsidiaries of Virtus Investment Partners, Inc. |
| Lowe, Benjamin YOB: 1978 | Vice President, Controller and Assistant Treasurer (since 2021); and Vice President and Assistant Treasurer (2018 to 2021). | Vice President, Fund Services (since 2017), Virtus Investment Partners, Inc. and/or certain of its subsidiaries; and various officer positions (since 2018) of various registered funds advised by subsidiaries of Virtus Investment Partners, Inc. |
| Martin, David YOB: 1959 | Anti-Money Laundering Compliance Officer (since 2016). | Vice President, Compliance – Broker/Dealer (since 2009), Virtus Investment Partners, Inc.; and Vice President and Chief Compliance Officer of certain Virtus subsidiaries (since 2004). |
| Rahman, Mahmood YOB: 1967 | Assistant Vice President (since 2021). | Assistant Vice President and Tax Director, Fund Administration (since 2020), Virtus Investment Partners, Inc.; Assistant Vice President (since 2021) of various registered funds advised by subsidiaries of Virtus Investment Partners, Inc.; and Assistant Treasurer and Tax Director, Grantham, Mayo, Van Otterloo & Co. LLC (2007 to 2019). |
| Short, Julia R. YOB: 1972 | Senior Vice President (since 2017). | Senior Vice President, Product Development (since 2017), Virtus Investment Partners, Inc. and/or certain of its subsidiaries; Senior Vice President (since 2017) of various registered funds advised by subsidiaries of Virtus Investment Partners, Inc.; and Managing Director, Product Manager, RidgeWorth Investments (2004 to 2017). |
| Smirl, Richard W. YOB: 1967 | Executive Vice President (since 2021). | Chief Operating Officer (since 2021), Virtus Investment Partners, Inc.; Executive Vice President (since 2021), Virtus Investment Partners, Inc. and/or certain of its subsidiaries; Executive Vice President (since 2021) of various registered funds advised by subsidiaries of Virtus Investment Partners, Inc.; Chief Operating Officer (2018 to 2021), Russell Investments; Executive Director (Jan. to July 2018), State of Wisconsin Investment Board; and Partner and Chief Operating Officer (2004 to 2018), William Blair Investment Management. |
| Suss, Amanda YOB: 1969 | Vice President, Controller and Assistant Treasurer (since 2022). | Vice President and Controller (since 2022), Mutual Fund Administration and Financial Reporting, Virtus Investment Partners, Inc.; Vice President, Controller and Assistant Treasurer (since 2022) of various registered funds advised by subsidiaries of Virtus Investment Partners, Inc.; and Senior Finance Associate (2011 to 2022), Stone Harbor Investment Partners LP. |
Accounting Firm
| Mutual Fund Services | 1-800-243-1574 |
| Adviser Consulting Group | 1-800-243-4361 |
| Website | Virtus.com |
The Securities and Exchange Commission has modified mailing regulations for semiannual and annual shareholder fund reports to allow mutual fund companies to send a single copy of these reports to shareholders who share the same mailing address. If you would like additional copies, please call Mutual Fund Services at 1-800-243-1574.

please contact us at 1-800-243-1574, or visit Virtus.com.
| 8457 | 07-23 |
Item 2. Code of Ethics.
| (a) | The registrant, as of the end of the period covered by this report, has adopted a code of ethics that applies to the registrant’s principal executive officer, principal financial officer, principal accounting officer or controller, or persons performing similar functions, regardless of whether these individuals are employed by the registrant or a third party. |
| (c) | Other than certain non-substantive changes, there have been no amendments during the period covered by this report, to a provision of the code of ethics that applies to the registrant’s principal executive officer, principal financial officer, principal accounting officer or controller, or persons performing similar functions, regardless of whether these individuals are employed by the registrant or a third party, and that relates to any element of the code of ethics described in Item 2(b) of the instructions for completion of Form N-CSR. A copy of the currently applicable code is included as an exhibit. |
| (d) | The registrant has not granted any waivers, during the period covered by this report, including an implicit waiver, from a provision of the code of ethics that applies to the registrant’s principal executive officer, principal financial officer, principal accounting officer or controller, or persons performing similar functions, regardless of whether these individuals are employed by the registrant or a third party, that relates to one or more of the items set forth in paragraph (b) of the instructions for completion of this Item. |
| (e) | Not applicable. |
Item 3. Audit Committee Financial Expert.
| (a)(1) | The Registrant’s Board of Trustees has determined that the Registrant has an “audit committee financial expert” serving on its Audit Committee. |
| (a)(2) | The Registrant’s Board of Trustees has determined that each of Donald C. Burke, Connie D. McDaniel and Brian T. Zino possesses the technical attributes identified in Instruction 2(b) of Item 3 to Form N-CSR to qualify as an “audit committee financial expert.” Each such individual is an “independent” trustee pursuant to paragraph (a)(2) of Item 3 to Form N-CSR. |
| (a)(3) | Not applicable. |
Item 4. Principal Accountant Fees and Services.
Audit Fees
| (a) | The aggregate fees billed for each of the last two fiscal years for professional services rendered by the principal accountant for the audit of the registrant’s annual financial statements or services that are normally provided by the accountant in connection with statutory and regulatory filings or engagements for those fiscal years are $229,900 for 2022 and $234,900 for 2023. |
Audit-Related Fees
| (b) | The aggregate fees billed in each of the last two fiscal years for assurance and related services by the principal accountant that are reasonably related to the performance of the audit of the registrant’s financial statements and are not reported under paragraph (a) of this Item are $7,000 for 2022 and $ 0 for 2023. Such audit-related fees include the out of pocket expenses. |
Tax Fees
| (c) | The aggregate fees billed in each of the last two fiscal years for professional services rendered by the principal accountant for tax compliance, tax advice, and tax planning are $30,000 for 2022 and $67,595 for 2023. |
“Tax Fees” are those primarily associated with review of the Trust’s tax provision and qualification as a regulated investment company (RIC) in connection with audits of the Trust’s financial statement, review of year-end distributions by the Fund to avoid excise tax for the Trust, periodic discussion with management on tax issues affecting the Trust, and reviewing and signing the Fund’s federal income returns.
All Other Fees
| (d) | The aggregate fees billed in each of the last two fiscal years for products and services provided by the principal accountant, other than the services reported in paragraphs (a) through (c) of this Item are $0 for 2022 and $0 for 2023. |
| (e)(1) | Disclose the audit committee’s pre-approval policies and procedures described in paragraph (c)(7) of Rule 2-01 of Regulation S-X. |
The Board of Trustees of Virtus Opportunities Trust (the “Fund”) has adopted policies and procedures with regard to the pre-approval of services provided by its independent auditors. Audit, audit-related and tax compliance services provided to the Fund on an annual basis require specific pre-approval by the Audit Committee. The Audit Committee must also approve other non-audit services provided to the Fund and those non-audit services provided to the Fund’s Affiliated Service Providers that relate directly to the operations and financial reporting of the Fund. Certain of these non-audit services that the Audit Committee believes are a) consistent with the SEC’s auditor independence rules and b) routine and recurring services that will not impair the independence of the independent auditors may be approved by the Audit Committee without consideration on a specific case-by-case basis (“general pre-approval”).
The Audit Committee has determined that the Chair of the Audit Committee, may provide pre-approval for such services that meet the above requirements but are not included in the general pre-approval in the event such approval is sought between regularly scheduled meetings. In any event, the Audit Committee is informed of, and ratifies, each service approved at the next regularly scheduled in-person Audit Committee meeting.
| (e)(2) | The percentage of services described in each of paragraphs (b) through (d) of this Item that were approved by the audit committee pursuant to paragraph (c)(7)(i)(C) of Rule 2-01 of Regulation S-X are as follows: |
(b) 0%
(c) 0%
(d) N/A
| (f) | The percentage of hours expended on the principal accountant’s engagement to audit the registrant’s financial statements for the most recent fiscal year that were attributed to work performed by persons other than the principal accountant’s full-time, permanent employees was less than fifty percent. |
| (g) | The aggregate non-audit fees billed by the registrant’s accountant for services rendered to the registrant, and rendered to the registrant’s investment adviser (not including any sub-adviser whose role is primarily portfolio management and is subcontracted with or overseen by another investment adviser), and any entity controlling, controlled by, or under common control with the adviser that provides ongoing services to the registrant for each of the last two fiscal years of the registrant was $37,000 for 2022 and $67,595 for 2023. |
| (h) | The registrant’s audit committee of the board of directors has considered whether the provision of non-audit services that were rendered to the registrant’s investment adviser (not including any sub-adviser whose role is primarily portfolio management and is subcontracted with or overseen by another investment adviser), and any entity controlling, controlled by, or under common control with the investment adviser that provides ongoing services to the registrant that were not pre-approved pursuant to paragraph (c)(7)(ii) of Rule 2-01 of Regulation S-X is compatible with maintaining the principal accountant’s independence. |
| (i) | Not applicable. |
| (j) | Not applicable. |
Item 5. Audit Committee of Listed Registrants.
Not applicable.
Item 6. Investments.
| (a) | Schedule of Investments in securities of unaffiliated issuers as of the close of the reporting period is included as part of the report to shareholders filed under Item 1(a) of this form. |
| (b) | Not applicable. |
Item 7. Disclosure of Proxy Voting Policies and Procedures for Closed-End Management Investment Companies.
Not applicable.
Item 8. Portfolio Managers of Closed-End Management Investment Companies.
Not applicable.
Item 9. Purchases of Equity Securities by Closed-End Management Investment Company and Affiliated Purchasers.
Not applicable.
Item 10. Submission of Matters to a Vote of Security Holders.
There have been no material changes to the procedures by which the shareholders may recommend nominees to the registrant’s board of trustees, where those changes were implemented after the registrant last provided disclosure in response to the requirements of Item 407(c)(2)(iv) of Regulation S-K (17 CFR 229.407) (as required by Item 22(b)(15) of Schedule 14A (17 CFR 240.14a-101)), or this Item.
Item 11. Controls and Procedures.
| (a) | The registrant’s principal executive and principal financial officers, or persons performing similar functions, have concluded that the registrant’s disclosure controls and procedures (as defined in Rule 30a-3(c) under the Investment Company Act of 1940, as amended (the “1940 Act”) (17 CFR 270.30a-3(c))) are effective, as of a date within 90 days of the filing date of the report that includes the disclosure required by this paragraph, based on their evaluation of these controls and procedures required by Rule 30a-3(b) under the 1940 Act (17 CFR 270.30a-3(b)) and Rules 13a-15(b) or 15d-15(b) under the Securities Exchange Act of 1934, as amended (17 CFR 240.13a-15(b) or 240.15d-15(b)). |
| (b) | There were no changes in the registrant’s internal control over financial reporting (as defined in Rule 30a-3(d) under the 1940 Act (17 CFR 270.30a-3(d))) that occurred during the period covered by this report that has materially affected, or is reasonably likely to materially affect, the registrant’s internal control over financial reporting. |
Item 12. Disclosure of Securities Lending Activities for Closed-End Management Investment Companies.
Not applicable.
Item 13. Exhibits.
| (a)(1) |
| (a)(2) |
| (a)(2)(1) | Not applicable. |
| (a)(2)(2) | Not applicable. |
| (b) |
SIGNATURES
Pursuant to the requirements of the Securities Exchange Act of 1934 and the Investment Company Act of 1940, the registrant has duly caused this report to be signed on its behalf by the undersigned, thereunto duly authorized.
| (Registrant) | Virtus Opportunities Trust | |||
| By (Signature and Title)* | /s/ George R. Aylward | |||
| George R. Aylward, President | ||||
| (principal executive officer) | ||||
| Date 7/27/2023 | ||
Pursuant to the requirements of the Securities Exchange Act of 1934 and the Investment Company Act of 1940, this report has been signed below by the following persons on behalf of the registrant and in the capacities and on the dates indicated.
| By (Signature and Title)* | /s/ George R. Aylward | |||
| George R. Aylward, President | ||||
| (principal executive officer) |
| Date 7/27/2023 | ||
| By (Signature and Title)* | /s/ W. Patrick Bradley | |||
| W. Patrick Bradley, Executive Vice President, Chief Financial Officer, and Treasurer | ||||
| (principal financial officer) |
| Date 7/26/2023 | ||
| * | Print the name and title of each signing officer under his or her signature. |