UNITED STATES
SECURITIES AND EXCHANGE COMMISSION
Washington, D.C. 20549
FORM N-CSR
CERTIFIED SHAREHOLDER REPORT OF REGISTERED
MANAGEMENT INVESTMENT COMPANIES
Investment Company Act file number 811-07455
Virtus Opportunities Trust
(Exact name of registrant as specified in charter)
101 Munson Street
Greenfield, MA 01301-9668
(Address of principal executive offices) (Zip code)
Jennifer Fromm, Esq.
Vice President, Chief Legal Officer, Counsel and Secretary for Registrant
One Financial Plaza
Hartford, CT 06103-2608
(Name and address of agent for service)
Registrant’s telephone number, including area code: (800) 243-1574
Date of fiscal year end: September 30
Date of reporting period: September 30, 2023
Form N-CSR is to be used by management investment companies to file reports with the Commission not later than 10 days after the transmission to stockholders of any report that is required to be transmitted to stockholders under Rule 30e-1 under the Investment Company Act of 1940 (17 CFR 270.30e-1). The Commission may use the information provided on Form N-CSR in its regulatory, disclosure review, inspection, and policymaking roles.
A registrant is required to disclose the information specified by Form N-CSR, and the Commission will make this information public. A registrant is not required to respond to the collection of information contained in Form N-CSR unless the Form displays a currently valid Office of Management and Budget (“OMB”) control number. Please direct comments concerning the accuracy of the information collection burden estimate and any suggestions for reducing the burden to Secretary, Securities and Exchange Commission, 450 Fifth Street, NW, Washington, DC 20549-0609. The OMB has reviewed this collection of information under the clearance requirements of 44 U.S.C. § 3507.
| Item 1. | Reports to Stockholders. |
| | (a) | The Report to Shareholders is attached herewith. |
ANNUAL REPORT
VIRTUS OPPORTUNITIES TRUST
| Virtus Newfleet Core Plus Bond Fund |
| Virtus Newfleet High Yield Fund* |
| Virtus Newfleet Low Duration Core Plus Bond Fund |
| Virtus Newfleet Multi-Sector Intermediate Bond Fund |
| Virtus Newfleet Multi-Sector Short Term Bond Fund |
| Virtus Newfleet Senior Floating Rate Fund |
| Virtus Seix Tax-Exempt Bond Fund* |
*Prospectus supplement applicable to this fund appears at the back of this annual report.
Not FDIC Insured • No Bank Guarantee • May Lose Value
Table of Contents
| 1 |
| 2 |
| 5 |
| Fund | Fund
Summary | Schedule
of
Investments |
| 8 | 35 |
| 12 | 45 |
| 16 | 49 |
| 20 | 58 |
| 24 | 71 |
| 28 | 85 |
| 32 | 92 |
| 96 |
| 100 |
| 102 |
| 106 |
| 111 |
| 125 |
| 126 |
| 127 |
| 128 |
Proxy Voting Procedures and Voting Record (Form N-PX)
The subadvisers vote proxies, if any, relating to portfolio securities in accordance with procedures that have been approved by the Board of Trustees of the Trust (“Trustees”, or the “Board”). You may obtain a description of these procedures, along with information regarding how the Funds voted proxies during the most recent 12-month period ended June 30, free of charge, by calling toll-free 1-800-243-1574. This information is also available through the Securities and Exchange Commission’s (the “SEC”) website at https://www.sec.gov.
PORTFOLIO HOLDINGS INFORMATION
The Trust files a complete schedule of portfolio holdings for each Fund with the SEC for the first and third quarters of each fiscal year as an exhibit to its reports on Form N-PORT-P. Form N-PORT-P is available on the SEC’s website at https://www.sec.gov.
This report is not authorized for distribution to prospective investors in the Funds presented in this book unless preceded or accompanied by an effective prospectus which includes information concerning the sales charge, each Fund’s record and other pertinent information.
To my fellow shareholders of Virtus Funds:
I am pleased to present this annual report, which reviews the performance of your Fund for the 12 months ended September 30, 2023.
After a challenging 2022, markets showed strength in 2023. Inflation began to slow while the U.S. economy demonstrated continued resilience. The efforts of the Federal Reserve (Fed) and other central banks to manage inflation appeared more likely to generate an economic “soft landing.” A brief banking crisis in March of 2023 was quickly resolved without impacting economic growth, and investors were optimistic about the possibilities for artificial intelligence (AI). As the fiscal year came to a close, however, concerns that interest rates might remain higher for longer began to weigh on markets.
Domestic equity indexes posted strong returns for the 12 months ended September 30, 2023. U.S. large-capitalization stocks led the way with a return of 21.62%, as measured by the S&P 500® Index, while small-cap stocks returned 8.93%, as measured by the Russell 2000® Index. International equities also performed well, with developed markets, as measured by the MSCI EAFE® Index (net), returning 25.65%, while emerging markets, as measured by the MSCI Emerging Markets Index (net), returned 11.70%.
In fixed income markets, the yield on the 10-year Treasury rose to 4.59% on September 30, 2023, from 3.83% on September 30, 2022. The broader U.S. fixed income market, as represented by the Bloomberg U.S. Aggregate Bond Index, returned 0.64% for the 12-month period, while non-investment grade bonds, as measured by the Bloomberg U.S. Corporate High Yield Bond Index, were up 10.28%.
Thank you for entrusting the Virtus Funds with your assets. Please call our customer service team at 800-243-1574 if you have questions about your account or require assistance. We appreciate your business and remain committed to your long-term financial success.
Sincerely,
George R. Aylward
President and Trustee, Virtus Funds
November 2023
Refer to the Fund Summary section for your Fund’s performance. Performance data quoted represents past results. Past performance is no guarantee of future results, and current performance may be higher or lower than the performance shown above. Investing involves risk, including the risk of loss of principal invested.
VIRTUS OPPORTUNITIES TRUST
DISCLOSURE OF FUND EXPENSES (Unaudited)
FOR THE SIX-MONTH PERIOD OF April 1, 2023 TO September 30, 2023
We believe it is important for you to understand the impact of costs on your investment. All mutual funds have operating expenses. As a shareholder of a Virtus Opportunities Trust Fund discussed in this shareholder report (each, a “Fund”), you may incur two types of costs: (1) transaction costs, including sales charges on purchases of Class A shares and contingent deferred sales charges on Class C shares (except for Newfleet Multi-Sector Short Term Bond Fund), and C1 shares; and (2) ongoing costs, including investment advisory fees, distribution and service fees, and other expenses. Class C shares for Newfleet Multi-Sector Short Term Bond Fund are sold without a sales charge. Class I shares and Class R6 shares are sold without sales charges and do not incur distribution and service fees. Class R6 shares also do not incur shareholder servicing fees. For further information regarding applicable sales charges, see Note 1 in the Notes to Financial Statements. These examples are intended to help you understand your ongoing costs (in dollars) of investing in a Fund and to compare these costs with the ongoing costs of investing in other mutual funds. These examples are based on an investment of $1,000 invested at the beginning of the period and held for the entire six-month period. The Annualized Expense Ratios may be different from the expense ratios in the Financial Highlights which are for the fiscal year ended September 30, 2023.
Please note that the expenses shown in the accompanying tables are meant to highlight your ongoing costs only and do not reflect any transactional costs, such as sales charges or contingent deferred sales charges. Therefore, the accompanying tables are useful in comparing ongoing costs only, and will not help you determine the relative total costs of owning different funds. In addition, if these transactional costs were included, your costs would have been higher. The calculations assume no shares were bought or sold during the period. Your actual costs may have been higher or lower, depending on the amount of your investment and the timing of any purchases or redemptions.
Actual Expenses
The table below provides information about actual account values and actual expenses. You may use the information below, together with the amount you invested, to estimate the expenses that you paid over the period. Simply divide your account value by $1,000 (for example, an $8,600 account value divided by $1,000 = 8.6), then multiply the result by the number in the table under the heading entitled “Expenses Paid During Period” to estimate the expenses you paid on your account during this period.
| | | Beginning
Account Value
April 1, 2023 | | Ending
Account Value
September 30, 2023 | | Annualized
Expense
Ratio | | Expenses
Paid
During
Period* |
Newfleet Core Plus Bond Fund
| | | | | | | | |
| | Class A | $ 1,000.00 | | $ 974.30 | | 0.77 % | | $ 3.81 |
| | Class C | 1,000.00 | | 969.50 | | 1.52 | | 7.50 |
| | Class I | 1,000.00 | | 975.20 | | 0.52 | | 2.57 |
| | Class R6 | 1,000.00 | | 975.90 | | 0.40 | | 1.98 |
Newfleet High Yield Fund
| | | | | | | | |
| | Class A | 1,000.00 | | 1,028.50 | | 0.98 | | 4.98 |
| | Class C | 1,000.00 | | 1,027.40 | | 1.74 | | 8.84 |
| | Class I | 1,000.00 | | 1,032.50 | | 0.74 | | 3.77 |
| | Class R6 | 1,000.00 | | 1,030.60 | | 0.58 | | 2.95 |
Newfleet Low Duration Core Plus Bond Fund
| | | | | | | | |
| | Class A | 1,000.00 | | 1,015.40 | | 0.74 | | 3.74 |
| | Class C | 1,000.00 | | 1,011.60 | | 1.49 | | 7.51 |
| | Class I | 1,000.00 | | 1,015.60 | | 0.49 | | 2.48 |
| | Class R6 | 1,000.00 | | 1,016.00 | | 0.42 | | 2.12 |
Newfleet Multi-Sector Intermediate Bond Fund
| | | | | | | | |
| | Class A | 1,000.00 | | 999.90 | | 0.98 | | 4.91 |
| | Class C | 1,000.00 | | 997.40 | | 1.73 | | 8.66 |
| | Class I | 1,000.00 | | 1,001.60 | | 0.74 | | 3.71 |
| | Class R6 | 1,000.00 | | 1,002.70 | | 0.60 | | 3.01 |
Newfleet Multi-Sector Short Term Bond Fund
| | | | | | | | |
| | Class A | 1,000.00 | | 1,016.40 | | 0.89 | | 4.50 |
| | Class C | 1,000.00 | | 1,012.50 | | 1.15 | | 5.80 |
| | Class C1 | 1,000.00 | | 1,010.10 | | 1.65 | | 8.31 |
| | Class I | 1,000.00 | | 1,015.30 | | 0.64 | | 3.23 |
| | Class R6 | 1,000.00 | | 1,017.90 | | 0.51 | | 2.58 |
Newfleet Senior Floating Rate Fund
| | | | | | | | |
| | Class A | 1,000.00 | | 1,053.90 | | 1.02 | | 5.25 |
| | Class C | 1,000.00 | | 1,050.00 | | 1.77 | | 9.10 |
| | Class I | 1,000.00 | | 1,055.20 | | 0.77 | | 3.97 |
| | Class R6 | 1,000.00 | | 1,055.90 | | 0.63 | | 3.25 |
VIRTUS OPPORTUNITIES TRUST
DISCLOSURE OF FUND EXPENSES (Unaudited) (Continued)
FOR THE SIX-MONTH PERIOD OF April 1, 2023 TO September 30, 2023
| | | Beginning
Account Value
April 1, 2023 | | Ending
Account Value
September 30, 2023 | | Annualized
Expense
Ratio | | Expenses
Paid
During
Period* |
Seix Tax-Exempt Bond Fund
| | | | | | | | |
| | Class A | $1,000.00 | | $ 969.10 | | 0.83% | | $4.10 |
| | Class C | 1,000.00 | | 965.50 | | 1.58 | | 7.78 |
| | Class I | 1,000.00 | | 970.40 | | 0.58 | | 2.86 |
| * | Expenses are equal to the relevant Fund’s annualized expense ratio, which is net of waived fees and reimbursed expenses, if applicable, multiplied by the average account value over the period, multiplied by the number of days (183) expenses were accrued in the most recent fiscal half-year, then divided by 365 to reflect the one-half year period. |
For Funds which may invest in other funds, the annualized expense ratios noted above do not reflect fees and expenses associated with any underlying funds. If such fees and expenses had been included, the expenses would have been higher.
You can find more information about a Fund’s expenses in the Financial Statements section that follows. For additional information on operating expenses and other shareholder costs, refer to that Fund’s prospectus.
Hypothetical Example for Comparison Purposes
The table below provides information about hypothetical account values and hypothetical expenses based on a Fund’s actual expense ratio and an assumed rate of return of 5% per year before expenses, which is not your Fund’s actual return. The hypothetical account values and expenses may not be used to estimate the actual ending account balance or expenses you paid for the period. You may use this information to compare the ongoing costs of investing in your Fund and other funds. To do so, compare these 5% hypothetical examples with the 5% hypothetical examples that appear in the shareholder reports of other mutual funds.
| | | Beginning
Account Value
April 1, 2023 | | Ending
Account Value
September 30, 2023 | | Annualized
Expense
Ratio | | Expenses
Paid
During
Period* |
Newfleet Core Plus Bond Fund
| | | | | | | | |
| | Class A | $ 1,000.00 | | $ 1,021.21 | | 0.77 % | | $ 3.90 |
| | Class C | 1,000.00 | | 1,017.45 | | 1.52 | | 7.69 |
| | Class I | 1,000.00 | | 1,022.46 | | 0.52 | | 2.64 |
| | Class R6 | 1,000.00 | | 1,023.06 | | 0.40 | | 2.03 |
Newfleet High Yield Fund
| | | | | | | | |
| | Class A | 1,000.00 | | 1,020.16 | | 0.98 | | 4.96 |
| | Class C | 1,000.00 | | 1,016.34 | | 1.74 | | 8.80 |
| | Class I | 1,000.00 | | 1,021.36 | | 0.74 | | 3.75 |
| | Class R6 | 1,000.00 | | 1,022.16 | | 0.58 | | 2.94 |
Newfleet Low Duration Core Plus Bond Fund
| | | | | | | | |
| | Class A | 1,000.00 | | 1,021.36 | | 0.74 | | 3.75 |
| | Class C | 1,000.00 | | 1,017.60 | | 1.49 | | 7.54 |
| | Class I | 1,000.00 | | 1,022.61 | | 0.49 | | 2.48 |
| | Class R6 | 1,000.00 | | 1,022.96 | | 0.42 | | 2.13 |
Newfleet Multi-Sector Intermediate Bond Fund
| | | | | | | | |
| | Class A | 1,000.00 | | 1,020.16 | | 0.98 | | 4.96 |
| | Class C | 1,000.00 | | 1,016.39 | | 1.73 | | 8.74 |
| | Class I | 1,000.00 | | 1,021.36 | | 0.74 | | 3.75 |
| | Class R6 | 1,000.00 | | 1,022.06 | | 0.60 | | 3.04 |
Newfleet Multi-Sector Short Term Bond Fund
| | | | | | | | |
| | Class A | 1,000.00 | | 1,020.61 | | 0.89 | | 4.51 |
| | Class C | 1,000.00 | | 1,019.30 | | 1.15 | | 5.82 |
| | Class C1 | 1,000.00 | | 1,016.80 | | 1.65 | | 8.34 |
| | Class I | 1,000.00 | | 1,021.86 | | 0.64 | | 3.24 |
| | Class R6 | 1,000.00 | | 1,022.51 | | 0.51 | | 2.59 |
Newfleet Senior Floating Rate Fund
| | | | | | | | |
| | Class A | 1,000.00 | | 1,019.95 | | 1.02 | | 5.17 |
| | Class C | 1,000.00 | | 1,016.19 | | 1.77 | | 8.95 |
| | Class I | 1,000.00 | | 1,021.21 | | 0.77 | | 3.90 |
| | Class R6 | 1,000.00 | | 1,021.91 | | 0.63 | | 3.19 |
VIRTUS OPPORTUNITIES TRUST
DISCLOSURE OF FUND EXPENSES (Unaudited) (Continued)
FOR THE SIX-MONTH PERIOD OF April 1, 2023 TO September 30, 2023
| | | Beginning
Account Value
April 1, 2023 | | Ending
Account Value
September 30, 2023 | | Annualized
Expense
Ratio | | Expenses
Paid
During
Period* |
Seix Tax-Exempt Bond Fund
| | | | | | | | |
| | Class A | $1,000.00 | | $1,020.91 | | 0.83% | | $4.20 |
| | Class C | 1,000.00 | | 1,017.15 | | 1.58 | | 7.99 |
| | Class I | 1,000.00 | | 1,022.16 | | 0.58 | | 2.94 |
| * | Expenses are equal to the relevant Fund’s annualized expense ratio, which is net of waived fees and reimbursed expenses, if applicable, multiplied by the average account value over the period, multiplied by the number of days (183) expenses were accrued in the most recent fiscal half-year, then divided by 365 to reflect the one-half year period. |
For Funds which may invest in other funds, the annualized expense ratios noted above do not reflect fees and expenses associated with any underlying funds. If such fees and expenses had been included, the expenses would have been higher.
You can find more information about a Fund’s expenses in the Financial Statements section that follows. For additional information on operating expenses and other shareholder costs, refer to that Fund’s prospectus.
VIRTUS OPPORTUNITIES TRUST
KEY INVESTMENT TERMS (Unaudited)
September 30, 2023
American Depositary Receipt (“ADR”)
Represents shares of foreign companies traded in U.S. dollars on U.S. exchanges that are held by a U.S. bank or a trust. Foreign companies use ADRs in order to make it easier for Americans to buy their shares.
Asset-Backed Securities (“ABS”)
Asset-backed securities represent interests in pools of underlying assets such as motor vehicle installment sales or installment loan contracts, leases of various types of real and personal property, and receivables from credit card arrangements.
Bank of England (“BOE”)
The Central Bank of the United Kingdom, responsible for controlling the money supply, interest rates, credit, and regulation of U.K. Banks with the goal of keeping the U.K. financial system stable.
Bloomberg U.S. Aggregate Bond Index
The Bloomberg U.S. Aggregate Bond Index measures the U.S. investment-grade fixed-rate bond market. The index is calculated on a total return basis. The index is unmanaged, its returns do not reflect any fees, expenses, or sales charges, and it is not available for direct investment.
Bloomberg U.S. Corporate High Yield Bond Index
The Bloomberg U.S. Corporate High Yield Bond Index measures the U.S. dollar-denominated, high yield, fixed-rate corporate bond market. The index is calculated on a total return basis. The index is unmanaged, its returns do not reflect any fees, expenses, or sales charges, and it is not available for direct investment.
Bloomberg U.S. High-Yield 2% Issuer Capped Bond Index
The Bloomberg High-Yield 2% Issuer Capped Bond Index is a market capitalization-weighted index that measures fixed rate non-investment grade debt securities of U.S. and non-U.S. corporations. No single issuer accounts for more than 2% of market cap. The index is calculated on a total return basis. The index is unmanaged, its returns do not reflect any fees, expenses, or sales charges, and it is not available for direct investment.
Build America Municipal Insured (“BAM”)
Build America Municipal Insured Bonds are municipal bonds insured against default by Build America Mutual, a Financial Guaranty insurance company.
Collateralized Loan Obligation (“CLO”)
A collateralized loan obligation is a type of security backed by a pool of debt, typically low-rated corporate loans, structured so that there are several classes of bondholders with varying maturities, called tranches.
Credit Suisse Leveraged Loan Index
The Credit Suisse Leveraged Loan Index is a market-weighted index that tracks the investable universe of the U.S. dollar denominated leveraged loans. The index is calculated on a total return basis, is unmanaged and not available for direct investment. The unmanaged index returns do not reflect any fees, expenses, or sales charges.
European Central Bank (“ECB”)
The ECB is responsible for conducting monetary policy for the euro area. The ECB was established as the core of the Euro-system and the European System of Central Banks (“ESCB”). The ESCB comprises the ECB and the National Central Banks (“NCBs”) of all 17 EU Member States whether they have adopted the Euro or not.
Exchange-Traded Fund (“ETF”)
An open-end fund that is traded on a stock exchange. Most ETFs have a portfolio of stocks or bonds that track a specific market index.
Federal Home Loan Mortgage Corporation (“Freddie Mac”)
A government-owned corporation that buys mortgages and packages them into mortgage-backed securities.
Federal National Mortgage Association (“Fannie Mae”)
A government-sponsored, publicly traded enterprise that makes mortgages available to low- and moderate-income borrowers. It does not provide loans but backs or guarantees them in the secondary mortgage market.
Federal Reserve (the “Fed”)
The central bank of the U.S., responsible for controlling money supply, interest rates, and credit with the goal of keeping the U.S. economy and currency stable. Governed by a seven-member board, the system includes 12 regional Federal Reserve Banks, 25 branches, and all national and state banks that are part of the system.
VIRTUS OPPORTUNITIES TRUST
KEY INVESTMENT TERMS (Unaudited) (Continued)
September 30, 2023
Government National Mortgage Association (“Ginnie Mae”)
A U.S. government corporation that guarantees the timely payment of principal and interest on mortgage-backed securities (MBSs) issued by approved Ginnie Mae lenders, with the goal of expanding the pool of homeowners by mostly aiding lending to homeowners who are traditionally underserved in the mortgage marketplace such as first-time home buyers and low-income borrowers.
Gross Domestic Product (“GDP”)
The market value of all officially recognized final goods and services produced within a country in a given period.
Headline Inflation
Headline inflation is the total inflation in an economy, as measured by inflation in the prices of a basket of goods that includes commodities like food and energy.
ICE BofA 1-3 Year A-BBB U.S. Corporate Index
The ICE BofA 1-3 Year A-BBB U.S. Corporate Index measures performance of U.S. corporate bond issues rated A1 through BBB3, inclusive (based on an average of Moody’s, S&P and Fitch), with a remaining term to final maturity less than 3 years. The index is calculated on a total return basis. The index is unmanaged, its returns do not reflect any fees, expenses, or sales charges, and it is not available for direct investment.
ICE BofA 1-5 Year Corporate & Government Bond Index
The ICE BofA 1-5 Year U.S. Corporate & Government Bond Index tracks the performance of U.S. dollar denominated investment grade debt publicly issued in the U.S. domestic market, including U.S. Treasury, U.S. agency, foreign government, supranational and corporate securities, with a remaining term to final maturity less than 5 years, calculated on a total return basis. The index is unmanaged, its returns do not reflect any fees, expenses, or sales charges, and is not available for direct investment.
ICE BofA 1–22 Year U.S. Municipal Securities Index
The ICE BofA 1–22 Year U.S. Municipal Securities Index is a subset of the ICE BofA U.S. Municipal Securities Index including all securities with a remaining term to final maturity less than 22 years, calculated on a total return basis. The index is unmanaged, its returns do not reflect any fees, expenses, or sales charges, and is not available for direct investment.
Joint Stock Company (“JSC”)
A joint stock company is a business entity in which shares of the company’s stock can be bought and sold by shareholders. Each shareholder owns company stock in proportion, evidenced by their shares (certificates of ownership). Shareholders are able to transfer their shares to others without any effects to the continued existence of the company.
Leveraged Loan
Leveraged loans (also known as bank, senior or floating-rate loans) consists of below investment-grade credit quality loans that are arranged by banks and other financial institutions to help companies finance acquisitions, recapitalizations, or other highly leveraged transactions. Such loans may be especially vulnerable to adverse changes in economic or market conditions, although they are senior in the capital structure which typically provides investors/lenders a degree of potential credit risk protection.
London Interbank Offered Rate (“LIBOR”)
A benchmark rate that some of the world’s leading banks charge each other for short-term loans and that serves as the first step to calculating interest rates on various loans throughout the world.
Mortgage-Backed Securities (“MBS”)
Mortgage-backed securities represent interests in pools of mortgage loans purchased from individual lenders by a federal agency or originated and issued by private lenders.
MSCI EAFE® Index (net)
The MSCI EAFE® (Europe, Australasia, Far East) Index (net) is a free float-adjusted market capitalization-weighted index that measures developed foreign market equity performance, excluding the U.S. and Canada. The index is calculated on a total return basis with net dividends reinvested. The index is unmanaged, its returns do not reflect any fees, expenses, or sales charges, and it is not available for direct investment.
MSCI Emerging Markets Index (net)
The MSCI Emerging Markets Index (net) is a free float-adjusted market capitalization-weighted index designed to measure equity market performance in the global emerging markets. The index is calculated on a total return basis with net dividends reinvested. The index is unmanaged, its returns do not reflect any fees, expenses, or sales charges, and it is not available for direct investment.
Permanent School Fund Guarantee Program (“PSF GTD”)
A program by which the bonds issued by certain public school districts and/or charter schools are guaranteed using a pool of assets held by a state for the purpose of ensuring the availability of public education.
VIRTUS OPPORTUNITIES TRUST
KEY INVESTMENT TERMS (Unaudited) (Continued)
September 30, 2023
Prime Rate
The federal funds rate commercial banks charge their most creditworthy corporate customers.
Risk Assets
Risk assets are those that tend to demonstrate price volatility, such as equities, high yield bonds, currencies, and commodities.
Russell 2000® Index
The Russell 2000® Index is a market capitalization-weighted index of the 2,000 smallest companies in the Russell Universe, which comprises the 3,000 largest U.S. companies. The index is calculated on a total return basis with dividends reinvested. The index is unmanaged, its returns do not reflect any fees, expenses, or sales charges, and it is not available for direct investment.
School Bond Guaranty (“SCH BD GTY”)
A program by which the bonds issued by certain public school districts and/or charter schools are guaranteed using a pool of assets held by a state for the purpose of ensuring the availability of public education.
Secured Overnight Financing Rate (“SOFR”)
The Secured Overnight Financing Rate is a benchmark interest rate for dollar-denominated derivatives and loans that is replacing the LIBOR.
S&P 500® Index
The S&P 500® Index is a free-float market capitalization-weighted index of 500 of the largest U.S. companies. The index is calculated on a total return basis with dividends reinvested. The index is unmanaged, its returns do not reflect any fees, expenses, or sales charges, and it is not available for direct investment.
Yield Curve
A yield curve is a line on a graph plotting the interest rates, at a set point in time, of bonds having equal credit quality but different maturity dates.
| | Ticker Symbols: |
| | Class A: SAVAX |
| | Class C: SAVCX |
| | Class I: SAVYX |
| | Class R6: VBFRX |
Newfleet Core Plus Bond Fund
Fund Summary (Unaudited)
Portfolio Manager Commentary by
Newfleet Asset Management
| ■ | The Fund is diversified and has an investment objective of high total return from both current income and capital appreciation. There is no guarantee that the Fund will meet its objective. |
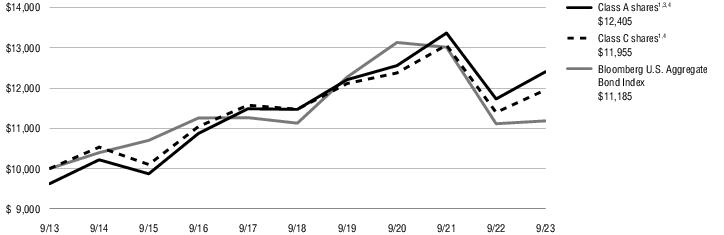
| ■ | For the fiscal year ended September 30, 2023, the Fund’s Class A shares at NAV returned 2.06%, Class C shares at NAV returned 1.25%, Class I shares at NAV returned 2.33%, and Class R6 shares at NAV returned 2.47%. For the same period, the Bloomberg U.S. Aggregate Bond Index, which serves as both the Fund’s broad-based and style-specific benchmark index appropriate for comparison, returned 0.64%. |
All performance figures assume reinvestment of distributions and exclude the effect of sales charges. Performance data quoted represents past results. Past performance is no guarantee of future results, and current performance may be higher or lower than the performance shown above. Investment return and principal value will fluctuate so your shares, when redeemed, may be worth more or less than their original cost. Please visit Virtus.com for performance data current to the most recent month-end.
How did the markets perform during the Fund’s fiscal year ended September 30, 2023?
As the third quarter of 2023 came to an end, economic transitions were proceeding across the globe. China was struggling with a slowing economy amid calls for more stimulus, despite having ended its strict zero-COVID policies earlier in the year. Europe, too, was wrestling with a slowing economy and inflation that remained above official targets. In the meantime, the U.S. economy proved remarkably resilient – unlike other major world economies, it defied expectations of a slowdown, leading to a growing consensus that the Federal Reserve (the Fed) might be able to pull off the often-elusive soft landing. The main risk to this scenario remained the unpredictable cumulative effect of 18 months of monetary tightening on the economy. Because monetary policy works on the economy with a lag, it presents a challenge to central bankers who are trying to return inflation to target without the associated economic pain of higher interest rates.
During the 12 months ended September 30, 2023, the Fed raised its main policy interest rate by 2.25% in its continuing fight to tame inflation. This resulted in significant progress on headline inflation readings as supply chains healed, demand shifted from goods to services, and energy prices rebalanced. Core readings of inflation, however, remained stubbornly above targets at the end of the period. That said, market expectations held that that most major global central banks were approaching the end of their interest rate increases. Evidence of this could be found in the Fed’s most recent summary of economic projections, which indicated one more rate increase. The Bank of England (BOE) paused its rate hikes during the period, while the European Central Bank (ECB) signaled a pause. However, market expectations of a quick reversal of tighter policy moderated, and the higher-for-longer narrative was taking hold by the end of the fiscal year. The Fed tamped down expectations of rapid rate cuts in 2024 and 2025, and the ECB and BOE remained committed to the inflation fight, which could lead to their rates staying elevated for longer as well. As the fiscal year came to an end, it was clear that there was still work to be done on the inflation front.
Despite the volatility during the fiscal year, financial market performance was resilient, with most risk assets outperforming U.S. Treasuries. The U.S. Treasury yield curve shifted higher during the period and remained inverted as of September 30, 2023. The 2-year Treasury yield increased 0.77%, the 5-year Treasury yield increased by 0.52%, the 10-year Treasury yield increased by 0.74%, and the 30-year Treasury yield moved 0.92% higher.
What factors affected the Fund’s performance during its fiscal year?
The Fund’s underweight to U.S. Treasuries contributed to performance for the 12 months ended September 30, 2023. Selection within investment grade corporate bonds, and the allocations to corporate high yield bonds and bank loans had a positive impact on performance for the period.
The Fund’s duration, or sensitivity to changes in interest rates, and yield curve positioning within U.S. Treasuries detracted from performance.
Longer duration municipal bonds detracted from performance, however, issue selection within the sector had a positive impact on performance during the 12-month period.
The preceding information is the opinion of portfolio management only through the end of the period stated on the cover. Any such opinions are subject to change at any time based upon market or other conditions and should not be relied upon as investment advice. Past performance is no guarantee of future results, and there is no guarantee that market forecasts will be realized.
Credit & Interest: Debt instruments are subject to various risks, including credit and interest rate risk. The issuer of a debt security may fail to make interest and/or principal payments. Values of debt instruments may rise or fall in response to changes in interest rates, and this risk may be enhanced with longer-term maturities.
ABS/MBS: Changes in interest rates can cause both extension and prepayment risks for asset- and mortgage-backed securities. These securities are also subject to risks associated with the non-repayment of underlying collateral, including losses to the Fund.
High Yield Fixed Income Securities: There is a greater risk of issuer default, less liquidity, and increased price volatility related to high yield securities than investment grade securities.
Bank Loans: Bank loans may be unsecured or not fully collateralized, may be subject to restrictions on resale, may be less liquid and may trade infrequently on the secondary market. Bank loans settle on a delayed basis; thus, sale proceeds may not be available to meet redemptions for a substantial period of time after the sale of the loan.
Foreign & Emerging Markets: Investing in foreign securities, especially in emerging markets, subjects the portfolio to additional risks such as increased volatility, currency fluctuations, less liquidity, and political, regulatory, economic, and market risk.
Market Volatility: The value of the securities in the Fund may go up or down in response to the prospects of individual companies and/or general economic conditions. Local, regional, or global events such as war or military conflict, terrorism, pandemic, or recession could impact the Fund, including hampering the ability of the Fund’s manager(s) to invest its assets as intended.
Prospectus: For additional information on risks, please see the Fund’s prospectus.
For information regarding the indexes and certain investment terms, see the Key Investment Terms starting on page 5.
Newfleet Core Plus Bond Fund (Continued)
Asset Allocation
The following table presents asset allocation within certain sectors as a percentage of total investments as of September 30, 2023.
| Corporate Bonds and Notes | | 32% |
| Financials | 11% | |
| Industrials | 4 | |
| Health Care | 3 | |
| All other Corporate Bonds and Notes | 14 | |
| Mortgage-Backed Securities | | 28 |
| U.S. Government Securities | | 18 |
| Asset-Backed Securities | | 12 |
| Leveraged Loans | | 6 |
| Municipal Bonds | | 2 |
| Foreign Government Securities | | 1 |
| Other (includes short-term investment and securities lending collateral) | | 1 |
| Total | | 100% |
| | |
For information regarding the indexes and certain investment terms, see the Key Investment Terms starting on page 5.
Newfleet Core Plus Bond Fund (Continued)
Average Annual Total Returns1 for periods ended 9/30/23
| | | 1 Year | 5 Years | 10 Years | Since
inception | Inception
date |
| Class A shares at NAV2 | | 2.06 % | 0.83 % | 1.79 % | — % | — |
| Class A shares at POP3,4 | | -1.77 | 0.07 | 1.40 | — | — |
| Class C shares at NAV2 and with CDSC4 | | 1.25 | 0.07 | 1.02 | — | — |
| Class I shares at NAV2 | | 2.33 | 1.08 | 2.04 | — | — |
| Class R6 shares at NAV2 | | 2.47 | 1.20 | — | 1.32 | 11/3/16 |
| Bloomberg U.S. Aggregate Bond Index | | 0.64 | 0.10 | 1.13 | 0.01 5 | — |
| Fund Expense Ratios6: Class A shares: Gross 1.03 %; Net: 0.80%; Class C shares: Gross 1.82%; Net: 1.55 %; Class I shares: Gross 0.78%; Net: 0.55%; Class R6 shares: Gross 0.71%, Net 0.43%. |
| All returns represent past performance which is no guarantee of future results. Current performance may be higher or lower than the performance shown. The investment return and principal value of an investment will fluctuate so that an investor’s shares, when redeemed, may be worth more or less than their original cost. The above table and graph below do not reflect the deduction of taxes that a shareholder would pay on fund distributions or the redemption of shares. Please visit Virtus.com for performance data current to the most recent month-end. |
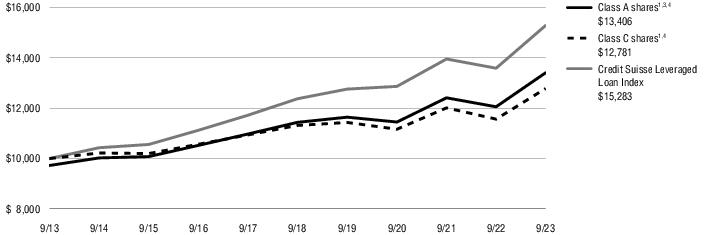
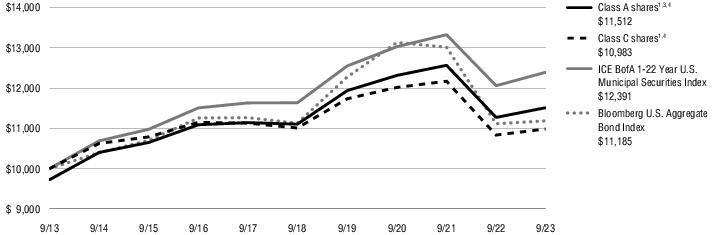
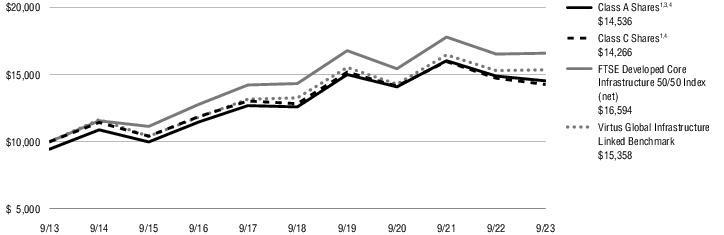
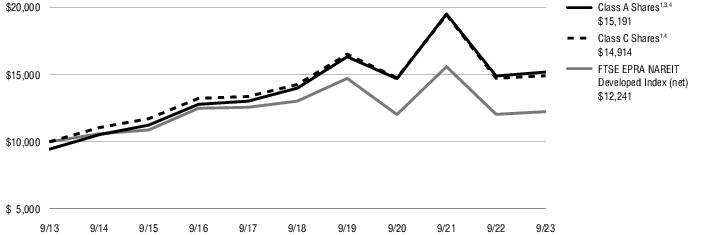
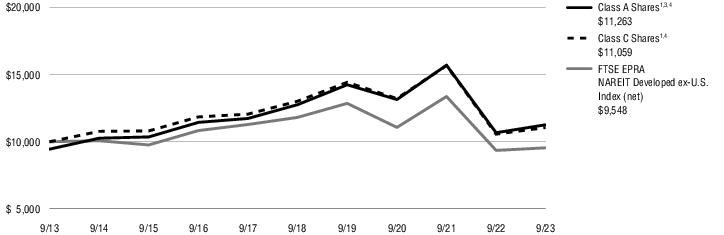
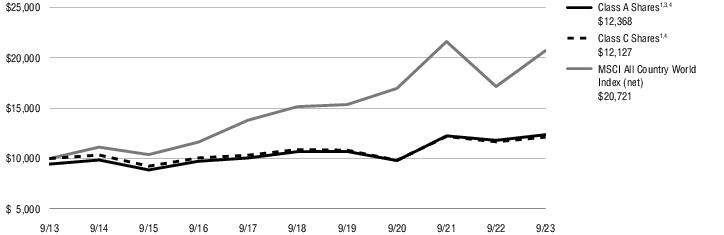
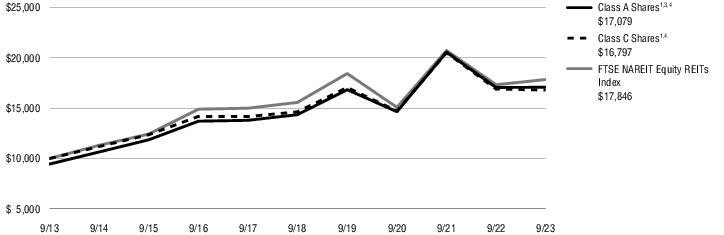
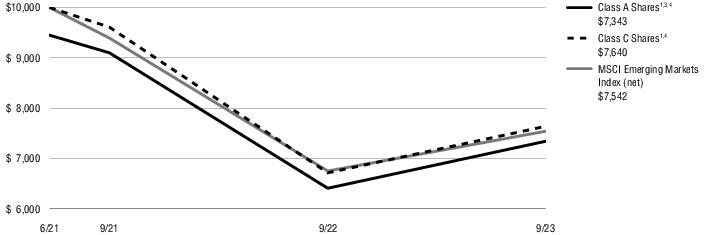
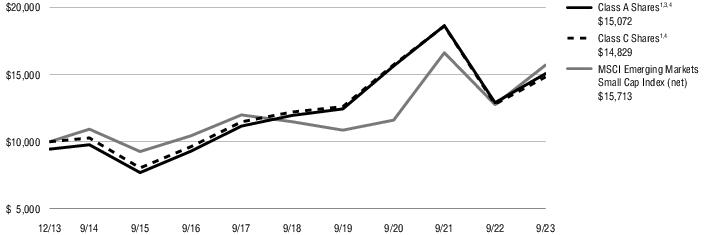
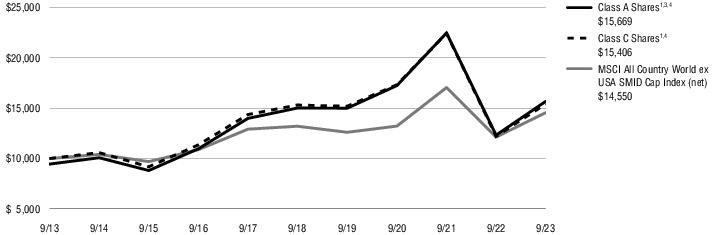
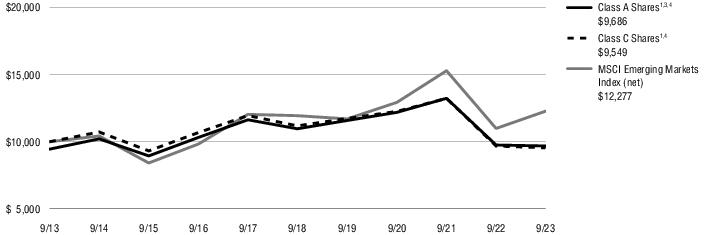
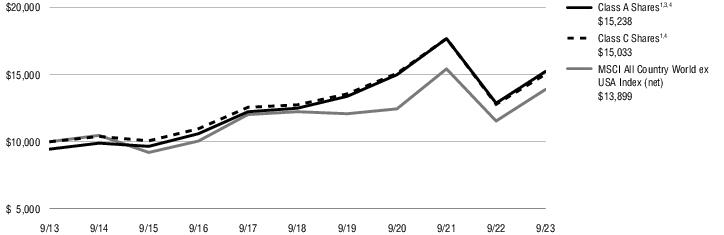
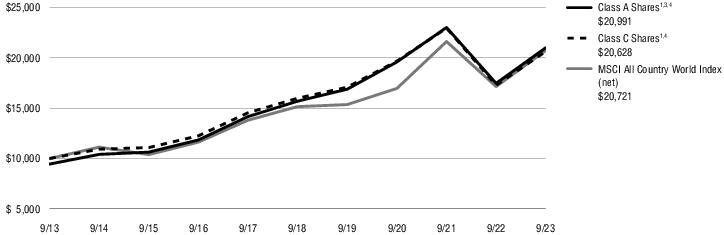
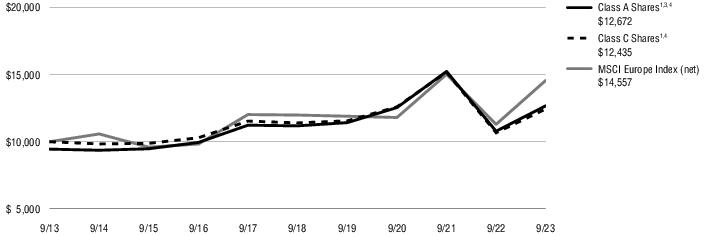
Growth of $10,000 for periods ended 9/30
This chart assumes an initial investment of $10,000 made on September 30, 2013, for Class A shares and Class C shares including any applicable sales charges or fees. The performance of the other share class may be greater or less than that shown based on differences in inception dates, fees, and sales charges. Performance assumes reinvestment of dividends and capital gain distributions.
For information regarding the indexes and certain investment terms, see the Key Investment Terms starting on page 5.
Newfleet Core Plus Bond Fund (Continued)
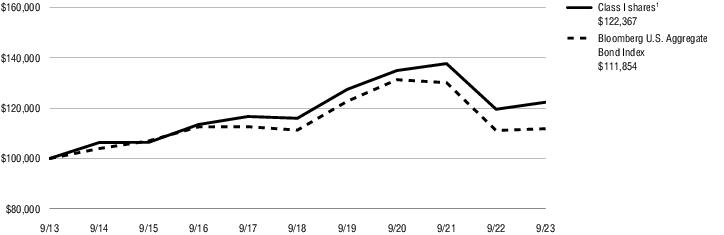
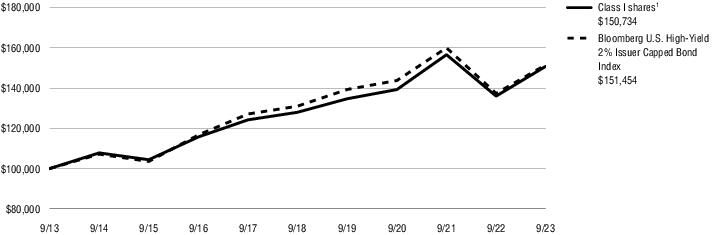
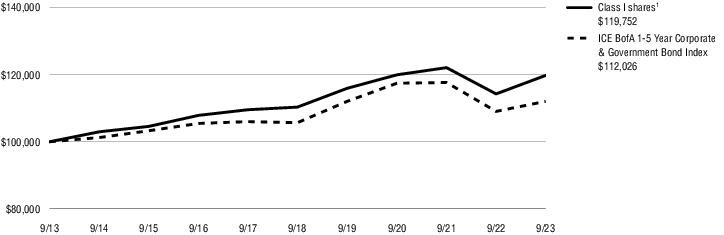
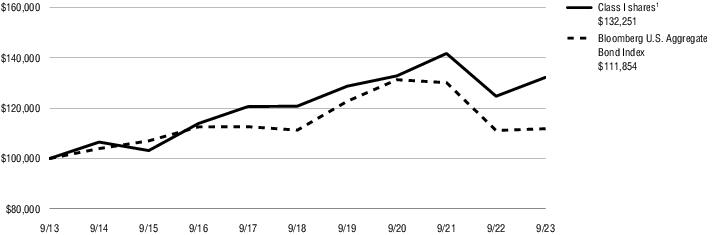
Growth of $100,000 for periods ended 9/30
This chart assumes an initial investment of $100,000 made on September 30, 2013, for Class I shares. The performance of the other share class may be greater or less than that shown based on differences in inception dates, fees, and sales charges. Performance assumes reinvestment of dividends and capital gain distributions.
| 1 | Total returns are historical and include changes in share price and the reinvestment of both dividends and capital gain distributions. |
| 2 | “NAV” (Net Asset Value) total returns do not include the effect of any sales charge. |
| 3 | “POP” (Public Offering Price) total returns include the effect of the maximum front-end 3.75% sales charge. |
| 4 | “CDSC” (contingent deferred sales charge) is applied to redemptions of certain classes of shares that do not have a sales charge applied at the time of purchase. CDSC for certain redemptions of Class A shares made within 18 months of a finder’s fee being paid and all Class C shares are 1% within the first year and 0% thereafter. |
| 5 | The since inception index return is from the inception date of Class R6 shares. |
| 6 | The expense ratios of the Fund are set forth according to the prospectus for the Fund effective January 27, 2023, as supplemented and revised, and may differ from the expense ratios disclosed in the Financial Highlights tables in this report. See the Financial Highlights for more current expense ratios. Net Expense: Expenses reduced by a contractual expense limitation in effect through January 31, 2024. Gross Expense: Does not reflect the effect of the expense limitation. Expense ratios include fees and expenses associated with any underlying funds. |
The index is unmanaged and not available for direct investment; therefore, its performance does not reflect the expenses associated with active management of an actual portfolio.
For information regarding the indexes and certain investment terms, see the Key Investment Terms starting on page 5.
| | Ticker Symbols: |
| | Class A: PHCHX |
| | Class C: PGHCX |
| | Class I: PHCIX |
| | Class R6: VRHYX |
Newfleet High Yield Fund
Fund Summary (Unaudited)
Portfolio Manager Commentary by
Newfleet Asset Management
| ■ | The Fund is diversified and has a primary investment objective of high current income and a secondary objective of capital growth. There is no guarantee that the Fund will meet its objectives. |
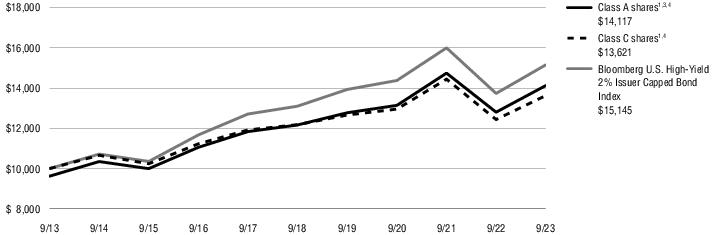
| ■ | For the fiscal year ended September 30, 2023, the Fund’s Class A shares at NAV returned 10.27%, Class C shares at NAV returned 9.51%, Class I shares at NAV returned 10.84%, and Class R6 shares at NAV returned 10.71%. For the same period, the Bloomberg U.S. High-Yield 2% Issuer Capped Bond Index, which serves as both the Fund’s broad-based and style-specific index appropriate for comparison, returned 10.28%. |
All performance figures assume reinvestment of distributions and exclude the effect of sales charges. Performance data quoted represents past results. Past performance is no guarantee of future results, and current performance may be higher or lower than the performance shown above. Investment return and principal value will fluctuate so your shares, when redeemed, may be worth more or less than their original cost. Please visit Virtus.com for performance data current to the most recent month-end.
How did the markets perform during the Fund’s fiscal year ended September 30, 2023?
The Bloomberg U.S. High Yield 2% Issuer Capped Bond Index posted a strong result in fiscal year 2023 with a total return of more than 10%. Investors entered the 12-month period cautiously positioned, as the high inflation coming out of Covid combined with the impact of the war in Ukraine led the Federal Reserve (the Fed) to begin increasing interest rates. Equity markets were weak and the Fed’s hiking campaign had many economic forecasters predicting a recession in 2023. But markets outperformed expectations as economic data and corporate earnings came in stronger than expected throughout the year. U.S. gross domestic product (GDP) forecasts for 2023 were repeatedly raised despite the Fed continuing to raise interest rates.
This strong economic growth combined with the fact that consumers were still benefiting from government stimulus programs created a favorable climate for the high yield market. Consequently, credit spreads, or the additional yield the market
demands from lower-rated bonds versus higher quality bonds, ended the fiscal year more than 1.50% tighter than they were at the start, although there were bouts of volatility during the 12 months. The most notable was the spike in spreads in March 2023, driven by the volatility in bank stocks related to the collapses of Silicon Valley Bank and Credit Suisse. The rise in Treasury rates hurt overall returns and appeared likely to impact credit metrics, but in a delayed fashion, as many companies had significant amounts of their debt locked in at fixed rates and slowed their refinancing activity in order to avoid the step-up in interest costs. CCC-rated bonds, the lowest credit quality tier, were the best-performing tier, which has historically been typical in an environment of tightening credit spreads and rising rates.
The high yield market also benefited from certain industry trends. High oil prices and a continued focus by energy management teams on reducing debt levels and generating free cash flows were supportive, as energy-related issuers comprise the largest industry exposure in the high yield market. The trend of consumers preferring experiences over goods following the lockdowns in 2020 continued, leading to strong results by cruise lines and airlines. The housing market remained robust despite the rise in mortgage rates, contributing to favorable results by homebuilders and building products suppliers. Lastly, defaults increased throughout the year and appeared likely to continue to rise as the full impact of higher interest rates flows through the economy. Investors continued to weigh the probabilities of the Fed engineering a soft landing or pushing the economy into a recession as it works to bring down inflation.
What factors affected the Fund’s performance during its fiscal year?
The Fund outperformed its benchmark due to a variety of factors. The Fund maintained an overweight position to CCC-rated securities and an underweight to BB-rated securities, which helped relative performance as CCC-rated securities outperformed. The Fund also maintained an allocation to bank loans, which are floating rate, and thus remained insulated from the rise in Treasury yields and outperformed the benchmark. The Fund’s industry exposures contributed to the outperformance, as well. The Fund avoided many poorly performing media-related credits, and had
strong selection within the health care and packaging space. The Fund’s underweight to leisure, specifically cruise line bonds, was the largest detractor from an industry perspective.
On an individual bond basis, the top contributors were bonds issued by New Enterprise Stone & Lime, Taseko Mines, and Medline. New Enterprise Stone & Lime is a provider of building products that benefited from the continued growth in highway construction. Taseko Mines, a copper producer, rallied in the fourth quarter of 2022 as copper prices rebounded. Lastly, Medline is a manufacturer and distributor of health care supplies to hospitals, and its strong organic growth over the fiscal year led to its bonds performing well.
The primary detractors included the bonds of Hearthside Foods, Level 3 Communications, and Unifrax. Hearthside Foods is a contract manufacturer for packaged foods that was recovering from Covid-related supply chain disruptions while also being implicated in child labor investigations across the food industry. The company’s high level of debt, continued weak earnings, and legal overhang led the bonds to underperform. The bonds of Level 3 Communications, a telecommunications company owned by Lumen Technologies, underperformed on weaker operational results due to increased competition while also adding debt to its balance sheet to fund bonds of its parent company that were maturing. Bonds of Unifrax, a manufacturer of fiber-based industrial products, declined in price as credit metrics weakened due to a slower-than-expected recovery in its end markets as customers destocked during the period.
The preceding information is the opinion of portfolio management only through the end of the period stated on the cover. Any such opinions are subject to change at any time based upon market or other conditions and should not be relied upon as investment advice. Past performance is no guarantee of future results, and there is no guarantee that market forecasts will be realized.
Credit & Interest: Debt instruments are subject to various risks, including credit and interest rate risk. The issuer of a debt security may fail to make interest and/or principal payments. Values of debt instruments may rise or fall in response to changes in interest rates, and this risk may be enhanced with longer-term maturities.
For information regarding the indexes and certain investment terms, see the Key Investment Terms starting on page 5.
Newfleet High Yield Fund (Continued)
High Yield Fixed Income Securities: There is a greater risk of issuer default, less liquidity, and increased price volatility related to high yield securities than investment grade securities.
Industry/Sector Concentration: A fund that focuses its investments in a particular industry or sector will be more sensitive to conditions that affect that industry or sector than a non-concentrated fund.
Foreign Investing: Investing in foreign securities subjects the Fund to additional risks such as increased volatility; currency fluctuations; less liquidity; less publicly available information about the foreign investment; and political, regulatory, economic, and market risk.
Market Volatility: The value of the securities in the Fund may go up or down in response to the prospects of individual companies and/or general economic conditions. Local, regional, or global events such as war or military conflict, terrorism, pandemic, or recession could impact the Fund, including hampering the ability of the Fund’s manager(s) to invest its assets as intended.
Prospectus: For additional information on risks, please see the Fund’s prospectus.
Asset Allocation
The following table presents asset allocation within certain sectors as a percentage of total investments as of September 30, 2023.
| Corporate Bonds and Notes | | 91% |
| Energy | 19% | |
| Consumer Discretionary | 15 | |
| Industrials | 11 | |
| All other Corporate Bonds and Notes | 46 | |
| Leveraged Loans | | 4 |
| Securities Lending Collateral | | 4 |
| Other | | 1 |
| Total | | 100% |
| | |
For information regarding the indexes and certain investment terms, see the Key Investment Terms starting on page 5.
Newfleet High Yield Fund (Continued)
Average Annual Total Returns1 for periods ended 9/30/23
| | | 1 Year | 5 Years | 10 Years | Since
inception | Inception
date |
| Class A shares at NAV2 | | 10.27 % | 3.02 % | 3.90 % | — % | — |
| Class A shares at POP3,4 | | 6.14 | 2.24 | 3.51 | — | — |
| Class C shares at NAV2 and with CDSC4 | | 9.51 | 2.26 | 3.14 | — | — |
| Class I shares at NAV2 | | 10.84 | 3.33 | 4.19 | — | — |
| Class R6 shares at NAV2 | | 10.71 | 3.39 | — | 4.04 | 11/3/16 |
| Bloomberg U.S. High-Yield 2% Issuer Capped Bond Index | | 10.28 | 2.95 | 4.24 | 3.89 5 | — |
| Fund Expense Ratios6: Class A shares: Gross 1.26%, Net 1.00%; Class C shares: Gross 2.06%, Net 1.75%; Class I shares: Gross 1.08%, Net 0.75%; Class R6 shares: Gross 0.95%, Net 0.59%. |
| All returns represent past performance which is no guarantee of future results. Current performance may be higher or lower than the performance shown. The investment return and principal value of an investment will fluctuate so that an investor’s shares, when redeemed, may be worth more or less than their original cost. The above table and graph below do not reflect the deduction of taxes that a shareholder would pay on fund distributions or the redemption of shares. Please visit Virtus.com for performance data current to the most recent month-end. |
Growth of $10,000 for periods ended 9/30
This chart assumes an initial investment of $10,000 made on September 30, 2013, for Class A shares and Class C shares including any applicable sales charges or fees. The performance of the other share class may be greater or less than that shown based on differences in inception dates, fees, and sales charges. Performance assumes reinvestment of dividends and capital gain distributions.
For information regarding the indexes and certain investment terms, see the Key Investment Terms starting on page 5.
Newfleet High Yield Fund (Continued)
Growth of $100,000 for periods ended 9/30
This chart assumes an initial investment of $100,000 made on September 30, 2013, for Class I shares. The performance of the other share class may be greater or less than that shown based on differences in inception dates, fees, and sales charges. Performance assumes reinvestment of dividends and capital gain distributions.
| 1 | Total returns are historical and include changes in share price and the reinvestment of both dividends and capital gain distributions. |
| 2 | “NAV” (Net Asset Value) total returns do not include the effect of any sales charge. |
| 3 | “POP” (Public Offering Price) total returns include the effect of the maximum front-end 3.75% sales charge. |
| 4 | “CDSC” (contingent deferred sales charge) is applied to redemptions of certain classes of shares that do not have a sales charge applied at the time of purchase. CDSC for certain redemptions of Class A shares made within 18 months of a finder’s fee being paid and all Class C shares are 1% within the first year and 0% thereafter. |
| 5 | The since inception index return is from the inception date of Class R6 shares. |
| 6 | The expense ratios of the Fund are set forth according to the prospectus for the Fund effective January 27, 2023, as supplemented and revised, and may differ from the expense ratios disclosed in the Financial Highlights tables in this report. See the Financial Highlights for more current expense ratios. Net Expense: Expenses reduced by a contractual expense limitation in effect through January 31, 2024. Gross Expense: Does not reflect the effect of the expense limitation. Expense ratios include fees and expenses associated with any underlying funds. |
The index is unmanaged and not available for direct investment; therefore, its performance does not reflect the expenses associated with active management of an actual portfolio.
For information regarding the indexes and certain investment terms, see the Key Investment Terms starting on page 5.
| | Ticker Symbols: |
| | Class A: HIMZX |
| | Class C: PCMZX |
| | Class I: HIBIX |
| | Class R6: VLDRX |
Newfleet Low Duration Core Plus Bond Fund
Fund Summary (Unaudited)
Portfolio Manager Commentary by
Newfleet Asset Management
| ■ | The Fund is diversified and has an investment objective to provide a high level of total return, including a competitive level of current income, while limiting fluctuations in net asset value due to changes in interest rates. There is no guarantee that the Fund will meet its objective. |
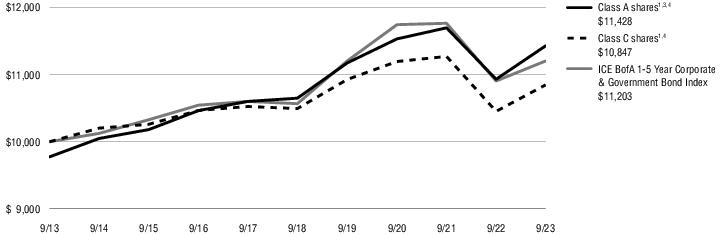
| ■ | For the fiscal year ended September 30, 2023, the Fund’s Class A shares at NAV returned 4.55%, Class C shares at NAV returned 3.78%, Class I shares at NAV returned 4.81%, and Class R6 shares at NAV returned 4.89%. For the same period, the ICE BofA 1-5 Year Corporate & Government Bond Index returned 2.73%. |
All performance figures assume reinvestment of distributions and exclude the effect of sales charges. Performance data quoted represents past results. Past performance is no guarantee of future results, and current performance may be higher or lower than the performance shown above. Investment return and principal value will fluctuate so your shares, when redeemed, may be worth more or less than their original cost. Please visit Virtus.com for performance data current to the most recent month-end.
How did the markets perform during the Fund’s fiscal year ended September 30, 2023?
As the third quarter of 2023 came to an end, economic transitions were proceeding across the globe. China was struggling with a slowing economy amid calls for more stimulus, despite having ended its strict zero-COVID policies earlier in the year. Europe, too, was wrestling with a slowing economy and inflation that remained above official targets. In the meantime, the U.S. economy proved remarkably resilient – unlike other major world economies, it defied expectations of a slowdown, leading to a growing consensus that the Federal Reserve (the Fed) might be able to pull off the often-elusive soft landing. The main risk to this scenario remained the unpredictable cumulative effect of 18 months of monetary tightening on the economy. Because monetary policy works on the economy with a lag, it presents a challenge to central bankers who are trying to return inflation to target without the associated economic pain of higher interest rates.
During the 12 months ended September 30, 2023, the Fed raised its main policy interest rate by 2.25% in its continuing fight to tame inflation. This resulted in significant progress on headline inflation readings as supply chains healed, demand shifted from goods to services, and energy prices rebalanced. Core readings of inflation, however, remained stubbornly above targets at the end of the period. That said, market expectations held that that most major global
central banks were approaching the end of their interest rate increases. Evidence of this could be found in the Fed’s most recent summary of economic projections, which indicated one more rate increase. The Bank of England (BOE) paused its rate hikes during the period, while the European Central Bank (ECB) signaled a pause. However, market expectations of a quick reversal of tighter policy moderated, and the higher-for-longer narrative was taking hold by the end of the fiscal year. The Fed tamped down expectations of rapid rate cuts in 2024 and 2025, and the ECB and BOE remained committed to the inflation fight, which could lead to their rates staying elevated for longer as well. As the fiscal year came to an end, it was clear that there was still work to be done on the inflation front.
Despite the volatility during the fiscal year, financial market performance was resilient, with most risk assets outperforming U.S. Treasuries. The U.S. Treasury yield curve shifted higher during the period and remained inverted as of September 30, 2023. The 2-year Treasury yield increased 0.77%, the 5-year Treasury yield increased by 0.52%, the 10-year Treasury yield increased by 0.74%, and the 30-year Treasury yield moved 0.92% higher.
What factors affected the Fund’s performance during its fiscal year?
The Fund outperformed its benchmark. The Fund’s underweight to U.S. Treasuries positively contributed to performance for the 12 months ended September 30, 2023. Allocation and positioning within asset-backed securities, and the allocation to corporate high yield bonds and bank loans had a positive impact on performance for the period. In addition, issue selection within investment grade corporate bonds helped performance.
The Fund’s selection within high yield corporate bonds detracted from performance. The higher quality bias within bank loans was a slight detractor from performance during the 12-month period.
The preceding information is the opinion of portfolio management only through the end of the period stated on the cover. Any such opinions are subject to change at any time based upon market or other conditions and should not be relied upon as investment advice. Past performance is no guarantee of future results, and there is no guarantee that market forecasts will be realized.
Credit & Interest: Debt instruments are subject to various risks, including credit and interest rate risk. The issuer of a debt security may fail to make interest and/or principal payments. Values of debt instruments may rise or fall in response to changes in interest rates, and this risk may be enhanced with longer-term maturities.
Foreign & Emerging Markets: Investing in foreign securities, especially in emerging markets, subjects the portfolio to additional risks such as increased volatility, currency fluctuations, less liquidity, and political, regulatory, economic, and market risk.
ABS/MBS: Changes in interest rates can cause both extension and prepayment risks for asset- and mortgage-backed securities. These securities are also subject to risks associated with the non-repayment of underlying collateral, including losses to the Fund.
High Yield Fixed Income Securities: There is a greater risk of issuer default, less liquidity, and increased price volatility related to high yield securities than investment grade securities.
Bank Loans: Bank loans may be unsecured or not fully collateralized, may be subject to restrictions on resale, may be less liquid and may trade infrequently on the secondary market. Bank loans settle on a delayed basis; thus, sale proceeds may not be available to meet redemptions for a substantial period of time after the sale of the loan.
Market Volatility: The value of the securities in the Fund may go up or down in response to the prospects of individual companies and/or general economic conditions. Local, regional, or global events such as war or military conflict, terrorism, pandemic, or recession could impact the Fund, including hampering the ability of the Fund’s manager(s) to invest its assets as intended.
Prospectus: For additional information on risks, please see the Fund’s prospectus.
For information regarding the indexes and certain investment terms, see the Key Investment Terms starting on page 5.
Newfleet Low Duration Core Plus Bond Fund (Continued)
Asset Allocation
The following table presents asset allocation within certain sectors as a percentage of total investments as of September 30, 2023.
| Asset-Backed Securities | | 35% |
| Mortgage-Backed Securities | | 28 |
| Corporate Bonds and Notes | | 22 |
| Financials | 9% | |
| Utilities | 2 | |
| Industrials | 2 | |
| All other Corporate Bonds and Notes | 9 | |
| U.S. Government Securities | | 7 |
| Leveraged Loans | | 6 |
| Other (includes securities lending collateral) | | 2 |
| Total | | 100% |
| | |
For information regarding the indexes and certain investment terms, see the Key Investment Terms starting on page 5.
Newfleet Low Duration Core Plus Bond Fund (Continued)
Average Annual Total Returns1 for periods ended 9/30/23
| | | 1 Year | 5 Years | 10 Years | Since
inception | Inception
date |
| Class A shares at NAV2 | | 4.55 % | 1.42 % | 1.58 % | — % | — |
| Class A shares at POP3,4 | | 2.20 | 0.96 | 1.34 | — | — |
| Class C shares at NAV2 and with CDSC4 | | 3.78 | 0.66 | 0.82 | — | — |
| Class I shares at NAV2 | | 4.81 | 1.65 | 1.82 | — | — |
| Class R6 shares at NAV2 | | 4.89 | — | — | 1.79 | 12/19/18 |
| ICE BofA 1-5 Year Corporate & Government Bond Index | | 2.73 | 1.17 | 1.14 | 1.01 5 | — |
| Fund Expense Ratios6: Class A shares: Gross 0.88 %; Net: 0.75%; Class C shares: Gross 1.68%; Net: 1.50 %; Class I shares: Gross 0.64%; Net: 0.50%; Class R6 shares: Gross 0.58%, Net 0.43%. |
| All returns represent past performance which is no guarantee of future results. Current performance may be higher or lower than the performance shown. The investment return and principal value of an investment will fluctuate so that an investor’s shares, when redeemed, may be worth more or less than their original cost. The above table and graph below do not reflect the deduction of taxes that a shareholder would pay on fund distributions or the redemption of shares. Please visit Virtus.com for performance data current to the most recent month-end. |
Growth of $10,000 for periods ended 9/30
This chart assumes an initial investment of $10,000 made on September 30, 2013, for Class A shares and Class C shares including any applicable sales charges or fees. The performance of the other share class may be greater or less than that shown based on differences in inception dates, fees, and sales charges. Performance assumes reinvestment of dividends and capital gain distributions.
For information regarding the indexes and certain investment terms, see the Key Investment Terms starting on page 5.
Newfleet Low Duration Core Plus Bond Fund (Continued)
Growth of $100,000 for periods ended 9/30
This chart assumes an initial investment of $100,000 made on September 30, 2013, for Class I shares. The performance of the other share class may be greater or less than that shown based on differences in inception dates, fees, and sales charges. Performance assumes reinvestment of dividends and capital gain distributions.
| 1 | Total returns are historical and include changes in share price and the reinvestment of both dividends and capital gain distributions. |
| 2 | “NAV” (Net Asset Value) total returns do not include the effect of any sales charge. |
| 3 | “POP” (Public Offering Price) total returns include the effect of the maximum front-end 2.25% sales charge. |
| 4 | “CDSC” (contingent deferred sales charge) is applied to redemptions of certain classes of shares that do not have a sales charge applied at the time of purchase. CDSC for certain redemptions of Class A shares made within 18 months of a finder’s fee being paid and all Class C shares are 1% within the first year and 0% thereafter. |
| 5 | The since inception index return is from the inception date of Class R6 shares. |
| 6 | The expense ratios of the Fund are set forth according to the prospectus for the Fund effective January 27, 2023, as supplemented and revised, and may differ from the expense ratios disclosed in the Financial Highlights tables in this report. See the Financial Highlights for more current expense ratios. Net Expense: Expenses reduced by a contractual expense limitation in effect through January 31, 2024. Gross Expense: Does not reflect the effect of the expense limitation. Expense ratios include fees and expenses associated with any underlying funds. |
The index is unmanaged and not available for direct investment; therefore, its performance does not reflect the expenses associated with active management of an actual portfolio.
For information regarding the indexes and certain investment terms, see the Key Investment Terms starting on page 5.
| | Ticker Symbols: |
| | Class A: NAMFX |
| | Class C: NCMFX |
| | Class I: VMFIX |
| | Class R6: VMFRX |
Newfleet Multi-Sector Intermediate Bond Fund
Fund Summary (Unaudited)
Portfolio Manager Commentary by
Newfleet Asset Management
| ■ | The Fund is diversified and has an investment objective of maximizing current income while preserving capital. There is no guarantee that the Fund will meet its objective. |
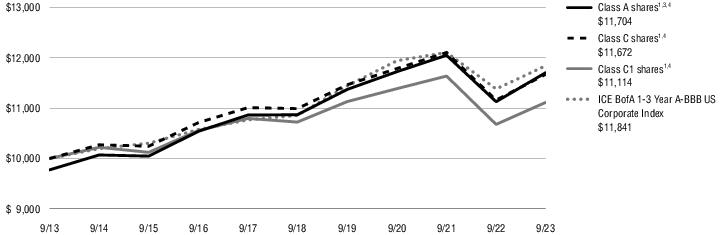
| ■ | For the fiscal year ended September 30, 2023, the Fund’s Class A shares at NAV returned 5.76%†, Class C shares at NAV returned 4.91%, Class I shares at NAV returned 6.01%, and Class R6 shares at NAV returned 6.21%. For the same period, the Bloomberg U.S. Aggregate Bond Index, which serves as both the Fund’s broad-based and style-specific fixed income index, returned 0.64%. |
† See footnote 3 on page 23.
All performance figures assume reinvestment of distributions and exclude the effect of sales charges. Performance data quoted represents past results. Past performance is no guarantee of future results, and current performance may be higher or lower than the performance shown above. Investment return and principal value will fluctuate so your shares, when redeemed, may be worth more or less than their original cost. Please visit Virtus.com for performance data current to the most recent month-end.
How did the markets perform during the Fund’s fiscal year ended September 30, 2023?
As the third quarter of 2023 came to an end, economic transitions were proceeding across the globe. China was struggling with a slowing economy amid calls for more stimulus, despite having ended its strict zero-COVID policies earlier in the year. Europe, too, was wrestling with a slowing economy and inflation that remained above official targets. In the meantime, the U.S. economy proved remarkably resilient – unlike other major world economies, it defied expectations of a slowdown, leading to a growing consensus that the Federal Reserve (the Fed) might be able to pull off the often-elusive soft landing. The main risk to this scenario remained the unpredictable cumulative effect of 18 months of monetary tightening on the economy. Because monetary policy works on the economy with a lag, it presents a challenge to central bankers who are trying to return inflation to target without the associated economic pain of higher interest rates.
During the 12 months ended September 30, 2023, the Fed raised its main policy interest rate by 2.25% in its continuing fight to tame inflation. This resulted in significant progress on headline inflation readings as supply chains healed, demand shifted from goods to services, and energy prices rebalanced. Core readings of inflation, however, remained stubbornly above targets at the end of the period. That said, market expectations held that that most major global central banks were approaching the end of their interest rate increases. Evidence of this could be found in the Fed’s most recent summary of economic projections, which indicated one more rate increase. The Bank of England (BOE) paused its rate hikes during the period, while the European Central Bank (ECB) signaled a pause. However, market expectations of a quick reversal of tighter policy moderated, and the higher-for-longer narrative was taking hold by the end of the fiscal year. The Fed tamped down expectations of rapid rate cuts in 2024 and 2025, and the ECB and BOE remained committed to the inflation fight, which could lead to their rates staying elevated for longer as well. As the fiscal year came to an end, it was clear that there was still work to be done on the inflation front.
Despite the volatility during the fiscal year, financial market performance was resilient, with most risk assets outperforming U.S. Treasuries. The U.S. Treasury yield curve shifted higher during the period and remained inverted as of September 30, 2023. The 2-year Treasury yield increased 0.77%, the 5-year Treasury yield increased by 0.52%, the 10-year Treasury yield increased by 0.74%, and the 30-year Treasury yield moved 0.92% higher.
What factors affected the Fund’s performance during its fiscal year?
The Fund outperformed its benchmark. The Fund’s underweight to U.S. Treasuries contributed to performance for the 12 months ended September 30, 2023. Allocation and positioning within corporate high yield and high yield bank loans had a positive impact on performance for the period. The allocation to emerging markets high yield, and issue selection within investment grade corporate bonds contributed to performance.
The Fund’s duration, or sensitivity to changes in interest rates, and yield curve positioning within U.S. Treasuries detracted from performance. The overweight to asset-backed securities and the
underweight to investment grade corporate bonds detracted during the period, however selection within both sectors was positive. Selection within emerging market securities also had a negative impact on performance during the 12-month period.
The preceding information is the opinion of portfolio management only through the end of the period stated on the cover. Any such opinions are subject to change at any time based upon market or other conditions and should not be relied upon as investment advice. Past performance is no guarantee of future results, and there is no guarantee that market forecasts will be realized.
Credit & Interest: Debt instruments are subject to various risks, including credit and interest rate risk. The issuer of a debt security may fail to make interest and/or principal payments. Values of debt instruments may rise or fall in response to changes in interest rates, and this risk may be enhanced with longer-term maturities.
High Yield Fixed Income Securities: There is a greater risk of issuer default, less liquidity, and increased price volatility related to high yield securities than investment grade securities.
Bank Loans: Bank loans may be unsecured or not fully collateralized, may be subject to restrictions on resale, may be less liquid and may trade infrequently on the secondary market. Bank loans settle on a delayed basis; thus, sale proceeds may not be available to meet redemptions for a substantial period of time after the sale of the loan.
Foreign & Emerging Markets: Investing in foreign securities, especially in emerging markets, subjects the portfolio to additional risks such as increased volatility, currency fluctuations, less liquidity, and political, regulatory, economic, and market risk.
ABS/MBS: Changes in interest rates can cause both extension and prepayment risks for asset- and mortgage-backed securities. These securities are also subject to risks associated with the non-repayment of underlying collateral, including losses to the Fund.
Market Volatility: The value of the securities in the Fund may go up or down in response to the prospects of individual companies and/or general economic conditions. Local, regional, or global events such as war or military conflict, terrorism,
For information regarding the indexes and certain investment terms, see the Key Investment Terms starting on page 5.
Newfleet Multi-Sector Intermediate Bond Fund (Continued)
pandemic, or recession could impact the Fund, including hampering the ability of the Fund’s manager(s) to invest its assets as intended.
Prospectus: For additional information on risks, please see the fund’s prospectus.
Asset Allocation
The following table presents asset allocation within certain sectors as a percentage of total investments as of September 30, 2023.
| Corporate Bonds and Notes | | 37% |
| Financials | 10% | |
| Energy | 7 | |
| Health Care | 4 | |
| All other Corporate Bonds and Notes | 16 | |
| Mortgage-Backed Securities | | 18 |
| Asset-Backed Securities | | 14 |
| Leveraged Loans | | 13 |
| U.S. Government Securities | | 9 |
| Foreign Government Securities | | 6 |
| Securities Lending Collateral | | 1 |
| Other (includes short-term investment) | | 2 |
| Total | | 100% |
| | |
For information regarding the indexes and certain investment terms, see the Key Investment Terms starting on page 5.
Newfleet Multi-Sector Intermediate Bond Fund (Continued)
Average Annual Total Returns1 for periods ended 9/30/23
| | | 1 Year | 5 Years | 10 Years | Since
inception | Inception
date |
| Class A shares at NAV2 | | 5.76 % 3 | 1.58 % | 2.57 % | — % | — |
| Class A shares at POP4,5 | | 1.80 | 0.81 | 2.18 | — | — |
| Class C shares at NAV2 and with CDSC5 | | 4.91 | 0.82 | 1.80 | — | — |
| Class I shares at NAV2 | | 6.01 | 1.83 | 2.83 | — | — |
| Class R6 shares at NAV2 | | 6.21 | 1.99 | — | 2.56 | 11/12/14 |
| Bloomberg U.S. Aggregate Bond Index | | 0.64 | 0.10 | 1.13 | 0.73 6 | — |
| Fund Expense Ratios7: Class A shares: Gross 1.08%, Net 0.99%; Class C shares: Gross 1.84%, Net 1.74%; Class I shares: Gross 0.84%, Net 0.74%; Class R6 shares: Gross 0.76%; Net 0.60%. |
| All returns represent past performance which is no guarantee of future results. Current performance may be higher or lower than the performance shown. The investment return and principal value of an investment will fluctuate so that an investor’s shares, when redeemed, may be worth more or less than their original cost. The above table and graph below do not reflect the deduction of taxes that a shareholder would pay on fund distributions or the redemption of shares. Please visit Virtus.com for performance data current to the most recent month-end. |
Growth of $10,000 for periods ended 9/30
This chart assumes an initial investment of $10,000 made on September 30, 2013, for Class A shares and Class C shares including any applicable sales charges or fees. The performance of the other share class may be greater or less than that shown based on differences in inception dates, fees, and sales charges. Performance assumes reinvestment of dividends and capital gain distributions.
For information regarding the indexes and certain investment terms, see the Key Investment Terms starting on page 5.
Newfleet Multi-Sector Intermediate Bond Fund (Continued)
Growth of $100,000 for periods ended 9/30
This chart assumes an initial investment of $100,000 made on September 30, 2013, for Class I shares. The performance of the other share class may be greater or less than that shown based on differences in inception dates, fees, and sales charges. Performance assumes reinvestment of dividends and capital gain distributions.
| 1 | Total returns are historical and include changes in share price and the reinvestment of both dividends and capital gain distributions. |
| 2 | “NAV” (Net Asset Value) total returns do not include the effect of any sales charge. |
| 3 | Total Return for the report period presented in the table differs from the return in the Financial Highlights. The total return presented in the above table is calculated based on the NAV at which shareholder transactions were processed. The total return presented in the Financial Highlights section of the report is calculated in the same manner, but also takes into account certain adjustments that are necessary under generally accepted accounting principles required in the annual report and semiannual report. |
| 4 | “POP” (Public Offering Price) total returns include the effect of the maximum front-end 3.75% sales charge. |
| 5 | “CDSC” (contingent deferred sales charge) is applied to redemptions of certain classes of shares that do not have a sales charge applied at the time of purchase. CDSC for certain redemptions of Class A shares made within 18 months of a finder’s fee being paid and all Class C shares are 1% within the first year and 0% thereafter. |
| 6 | The since inception index return is from the inception date of Class R6 shares. |
| 7 | The expense ratios of the Fund are set forth according to the prospectus for the Fund effective January 27, 2023, as supplemented and revised, and may differ from the expense ratios disclosed in the Financial Highlights tables in this report. See the Financial Highlights for more current expense ratios. Net Expense: Expenses reduced by a contractual expense limitation in effect through January 31, 2024. Gross Expense: Does not reflect the effect of the expense limitation. Expense ratios include fees and expenses associated with any underlying funds. |
The index is unmanaged and not available for direct investment; therefore, its performance does not reflect the expenses associated with active management of an actual portfolio.
For information regarding the indexes and certain investment terms, see the Key Investment Terms starting on page 5.
| | Ticker Symbols: |
| | Class A: NARAX |
| | Class C: PSTCX |
| | Class C1: PMSTX |
| | Class I: PIMSX |
| | Class R6: VMSSX |
Newfleet Multi-Sector Short Term Bond Fund
Fund Summary (Unaudited)
Portfolio Manager Commentary by
Newfleet Asset Management
| ■ | The Fund is diversified and has an investment objective of providing high current income while attempting to limit changes in the Fund’s net asset value per share caused by interest rate changes. There is no guarantee that the Fund will meet its objective. |
| ■ | For the fiscal year ended September 30, 2023, the Fund’s Class A shares at NAV returned 5.17%, Class C shares at NAV returned 4.58%, Class C1 shares at NAV returned 4.09%, Class I shares at NAV returned 5.18%, and Class R6 shares at NAV returned 5.48%. For the same period, the ICE BofA 1–3 Year A–BBB U.S. Corporate Index, which serves as both the Fund’s broad-based and style-specific index appropriate for comparison, returned 4.03%. |
All performance figures assume reinvestment of distributions and exclude the effect of sales charges. Performance data quoted represents past results. Past performance is no guarantee of future results, and current performance may be higher or lower than the performance shown above. Investment return and principal value will fluctuate so your shares, when redeemed, may be worth more or less than their original cost. Please visit Virtus.com for performance data current to the most recent month-end.
How did the markets perform during the Fund’s fiscal year ended September 30, 2023?
As the third quarter of 2023 came to an end, economic transitions were proceeding across the globe. China was struggling with a slowing economy amid calls for more stimulus, despite having ended its strict zero-COVID policies earlier in the year. Europe, too, was wrestling with a slowing economy and inflation that remained above official targets. In the meantime, the U.S. economy proved remarkably resilient – unlike other major world economies, it defied expectations of a slowdown, leading to a growing consensus that the Federal Reserve (the Fed) might be able to pull off the often-elusive soft landing. The main risk to this scenario remained the unpredictable cumulative effect of 18 months of monetary tightening on the economy. Because monetary policy works on the economy with a lag, it presents a challenge to central bankers who are
trying to return inflation to target without the associated economic pain of higher interest rates.
During the 12 months ended September 30, 2023, the Fed raised its main policy interest rate by 2.25% in its continuing fight to tame inflation. This resulted in significant progress on headline inflation readings as supply chains healed, demand shifted from goods to services, and energy prices rebalanced. Core readings of inflation, however, remained stubbornly above targets at the end of the period. That said, market expectations held that that most major global central banks were approaching the end of their interest rate increases. Evidence of this could be found in the Fed’s most recent summary of economic projections, which indicated one more rate increase. The Bank of England (BOE) paused its rate hikes during the period, while the European Central Bank (ECB) signaled a pause. However, market expectations of a quick reversal of tighter policy moderated, and the higher-for-longer narrative was taking hold by the end of the fiscal year. The Fed tamped down expectations of rapid rate cuts in 2024 and 2025, and the ECB and BOE remained committed to the inflation fight, which could lead to their rates staying elevated for longer as well. As the fiscal year came to an end, it was clear that there was still work to be done on the inflation front.
Despite the volatility during the fiscal year, financial market performance was resilient, with most risk assets outperforming U.S. Treasuries. The U.S. Treasury yield curve shifted higher during the period and remained inverted as of September 30, 2023. The 2-year Treasury yield increased 0.77%, the 5-year Treasury yield increased by 0.52%, the 10-year Treasury yield increased by 0.74%, and the 30-year Treasury yield moved 0.92% higher.
What factors affected the Fund’s performance during its fiscal year?
The Fund outperformed its benchmark. The Fund’s underweight to U.S. Treasuries contributed to performance for the 12 months ended September 30, 2023. Allocation and positioning within high yield bank loans, and the allocation to corporate high yield bonds had a positive impact on performance for the period. Issue selection within investment grade corporate bonds also contributed to performance.
The Fund’s duration, or sensitivity to changes in interest rates, and yield curve positioning within U.S. Treasuries detracted from performance. The
overweight to the asset-backed security sector was also a detractor during the period, however selection within the sector was positive. Selection within emerging markets high yield and commercial mortgage-backed securities also had a negative impact on performance during the 12-month period.
The preceding information is the opinion of portfolio management only through the end of the period stated on the cover. Any such opinions are subject to change at any time based upon market or other conditions and should not be relied upon as investment advice. Past performance is no guarantee of future results, and there is no guarantee that market forecasts will be realized.
Credit & Interest: instruments are subject to various risks, including credit and interest rate risk. The issuer of a debt security may fail to make interest and/or principal payments. Values of debt instruments may rise or fall in response to changes in interest rates, and this risk may be enhanced with longer-term maturities.
High Yield Fixed Income Securities: There is a greater risk of issuer default, less liquidity, and increased price volatility related to high yield securities than investment grade securities.
Bank Loans: Bank loans may be unsecured or not fully collateralized, may be subject to restrictions on resale, may be less liquid and may trade infrequently on the secondary market. Bank loans settle on a delayed basis; thus, sale proceeds may not be available to meet redemptions for a substantial period of time after the sale of the loan.
Foreign & Emerging Markets: Investing in foreign securities, especially in emerging markets, subjects the portfolio to additional risks such as increased volatility, currency fluctuations, less liquidity, and political, regulatory, economic, and market risk.
ABS/MBS: Changes in interest rates can cause both extension and prepayment risks for asset- and mortgage-backed securities. These securities are also subject to risks associated with the non-repayment of underlying collateral, including losses to the Fund.
Market Volatility: The value of the securities in the Fund may go up or down in response to the prospects of individual companies and/or general economic conditions. Local, regional, or global
For information regarding the indexes and certain investment terms, see the Key Investment Terms starting on page 5.
Newfleet Multi-Sector Short Term Bond Fund (Continued)
events such as war or military conflict, terrorism, pandemic, or recession could impact the Fund, including hampering the ability of the Fund’s manager(s) to invest its assets as intended.
Prospectus: For additional information on risks, please see the Fund’s prospectus.
Asset Allocation
The following table presents asset allocation within certain sectors as a percentage of total investments as of September 30, 2023.
| Corporate Bonds and Notes | | 27% |
| Financials | 9% | |
| Energy | 4 | |
| Industrials | 3 | |
| All other Corporate Bonds and Notes | 11 | |
| Mortgage-Backed Securities | | 26 |
| Asset-Backed Securities | | 26 |
| Leveraged Loans | | 9 |
| U.S. Government Securities | | 9 |
| Other (includes short-term investment and securities lending collateral) | | 3 |
| Total | | 100% |
| | |
For information regarding the indexes and certain investment terms, see the Key Investment Terms starting on page 5.
Newfleet Multi-Sector Short Term Bond Fund (Continued)
Average Annual Total Returns1 for periods ended 9/30/23
| | | 1 Year | 5 Years | 10 Years | Since
inception | Inception
date |
| Class A shares at NAV2 | | 5.17 % | 1.49 % | 1.82 % | — % | — |
| Class A shares at POP3,4 | | 2.80 | 1.03 | 1.59 | — | — |
| Class C shares at NAV2 and with CDSC4 | | 4.58 | 1.21 | 1.56 | — | — |
| Class C1 shares at NAV2 and with CDSC4 | | 4.09 | 0.72 | 1.06 | — | — |
| Class I shares at NAV2 | | 5.18 | 1.70 | 2.07 | — | — |
| Class R6 shares at NAV2 | | 5.48 | 1.90 | — | 1.94 | 11/3/16 |
ICE BofA 1-3 Year A-BBB
U.S. Corporate Index | | 4.03 | 1.75 | 1.70 | 1.63 5 | — |
| Fund Expense Ratios: Class A shares: Gross 0.96%, Net 0.90%; Class C shares: Gross 1.23%, Net 1.16%; Class C1 shares: Gross 1.71%, Net 1.66%; Class I shares: Gross 0.71%, Net 0.65%; Class R6 shares: Gross 0.67%, Net 0.52%. |
| All returns represent past performance which is no guarantee of future results. Current performance may be higher or lower than the performance shown. The investment return and principal value of an investment will fluctuate so that an investor’s shares, when redeemed, may be worth more or less than their original cost. The above table and graph below do not reflect the deduction of taxes that a shareholder would pay on fund distributions or the redemption of shares. Please visit Virtus.com for performance data current to the most recent month-end. |
Growth of $10,000 for periods ended 9/30
This chart assumes an initial investment of $10,000 made on September 30, 2013, for Class A shares, Class C shares and Class C1 shares including any applicable sales charges or fees. The performance of the other share class may be greater or less than that shown based on differences in inception dates, fees, and sales charges. Performance assumes reinvestment of dividends and capital gain distributions.
For information regarding the indexes and certain investment terms, see the Key Investment Terms starting on page 5.
Newfleet Multi-Sector Short Term Bond Fund (Continued)
Growth of $100,000 for periods ended 9/30
This chart assumes an initial investment of $100,000 made on September 30, 2013, for Class I shares. The performance of the other share class may be greater or less than that shown based on differences in inception dates, fees, and sales charges. Performance assumes reinvestment of dividends and capital gain distributions.
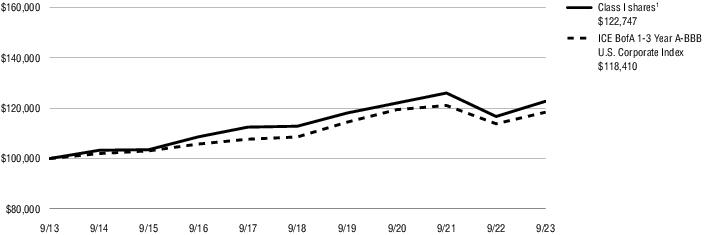
| 1 | Total returns are historical and include changes in share price and the reinvestment of both dividends and capital gain distributions. |
| 2 | “NAV” (Net Asset Value) total returns do not include the effect of any sales charge. |
| 3 | “POP” (Public Offering Price) total returns include the effect of the maximum front-end 2.25% sales charge. |
| 4 | “CDSC” (contingent deferred sales charge) is applied to redemptions of certain classes of shares that do not have a sales charge applied at the time of purchase. CDSC for certain redemptions of Class A shares made within 18 months of a finder’s fee being paid and all Class C1 shares are 1% within the first year and 0% thereafter. |
| 5 | The since inception index return is from the inception date of Class R6 shares. |
The index is unmanaged and not available for direct investment; therefore, its performance does not reflect the expenses associated with active management of an actual portfolio.
For information regarding the indexes and certain investment terms, see the Key Investment Terms starting on page 5.
| | Ticker Symbols: |
| | Class A: PSFRX |
| | Class C: PFSRX |
| | Class I: PSFIX |
| | Class R6: VRSFX |
Newfleet Senior Floating Rate Fund
Fund Summary (Unaudited)
Portfolio Manager Commentary by
Newfleet Asset Management
| ■ | The Fund is diversified and has an investment objective of high total return from both current income and capital appreciation. There is no guarantee that the Fund will meet its objective. |
| ■ | For the fiscal year ended September 30, 2023, the Fund’s Class A shares at NAV returned 11.20%, Class C shares at NAV returned 10.50%, Class I shares at NAV returned 11.61%, and Class R6 shares at NAV returned 11.77%. For the same period, the Credit Suisse Leveraged Loan Index, which serves as both the Fund’s broad-based and style-specific index, returned 12.47%. |
All performance figures assume reinvestment of distributions and exclude the effect of sales charges. Performance data quoted represents past results. Past performance is no guarantee of future results, and current performance may be higher or lower than the performance shown above. Investment return and principal value will fluctuate so your shares, when redeemed, may be worth more or less than their original cost. Please visit Virtus.com for performance data current to the most recent month-end.
How did the markets perform during the Fund’s fiscal year ended September 30, 2023?
Leveraged bank loans had a strong showing for the 12-month period, up 12.47%, as measured by the Credit Suisse Leveraged Loan Index. Bank loans outperformed other fixed income assets as concerns about rising interest rates negatively impacted longer-duration investments, or those that are more sensitive to changes in interest rates. The fiscal year started on a cautiously optimistic note: though the market consensus had forecast a growth slowdown, positive economic data started to indicate a possible soft landing – a scenario in which a central bank successfully raises interest rates to slow down an economy while avoiding a recession – or a mild slowdown at worst. This was soon upended by the release of higher-than-expected inflation data and disappointing fourth quarter corporate earnings results, which renewed concerns about the Federal Reserve’s (the Fed’s) interest rate path. This was followed by the failures of several regional banks in March, which led to market volatility.
Subsequent interventions from the Fed and the European Central Bank (ECB) successfully calmed the markets, and this, coupled with encouraging inflation data, sparked hopes that the Fed might start cutting rates sooner than anticipated. This seemed to be supported by the Fed’s pause on rate hikes in June. However, hopes that the Fed would suspend rate hikes or even cut rates began to fall away as a string of stronger-than-expected economic data and elevated inflation data fueled a growing narrative that interest rates might stay higher for longer. Since leveraged loans have historically performed well in rising rate environments, the asset class ended the fiscal year with a strong finish against this supportive macroeconomic backdrop.
As inflation stayed stubbornly high throughout the 12-month period, the Fed continued its campaign of rate increases, starting with a 0.75% increase in November 2022, a 0.50% increase in December 2022, and, subsequently, a string of 0.25% hikes at each Fed meeting during the period except June 2023 and September 2023. This sharp increase in the Fed’s target interest rate had a favorable effect on leveraged loan performance: in the first half of 2023 alone, loans saw their highest six-month gain since 2009.
The end of the fiscal year also left the loan market with spreads (the additional yield an investor receives above the Secured Overnight Financing Rate (SOFR) for the same duration) tighter than historical long-term averages, reflecting the stronger-than-expected economic data pointing toward a possible soft landing. The weighted average market price of the Credit Suisse Leveraged Loan Index also increased over the 12-month period, to $94.80 as of September 30, 2023.
Fundamentals in the loan market stayed mostly resilient, though there were signs toward period-end that they might be starting to weaken. At 1.27%, the default rate – the percentage of loans in the market that have been marked down as unpaid after a prolonged period of missed payments – was below both the 10-year average of 1.6% and the historical average of 2.7%. That said, though the sharp rise in the cost of borrowing benefited loan performance, it also presented some risk, as it puts more stress on borrowers. At the end of the period, concerns included the lagged impact of higher Fed interest rates on corporate borrowers and consumers, which could take time to flow through the economy.
Consumers were also concerned about the upcoming expiration of pandemic-era stimulus and the resumption of student loan debt payments. As of September 30, 2023, higher rates on housing, auto, and consumer-related loans were beginning to result in slower demand and even some delinquencies in lower-rated loans.
Collateralized loan obligation (CLO) issuance – the largest source of demand in the loan market – saw a slowdown, with issuance of $83.9 billion for the period, which was 21% behind last fiscal year’s issuance. However, this was more than offset by a sharp decrease in new issue supply driven by a drop in leveraged buyout (LBO) and mergers & acquisitions (M&A) activity. Most months subsequently posted a supply shortage, with retail fund flows also finally turning positive toward the end of the period after a 15-month streak of outflows, which contributed to loan outperformance.
What factors affected the Fund’s performance during its fiscal year?
For the 12 months ended September 30, 2023, the Fund lagged its benchmark, the Credit Suisse Leveraged Loan Index. At the start of the fiscal year, the Fund’s higher-quality defensive positioning contributed to its underperformance versus the Index as the anticipated growth slowdown kept being delayed by news pointing to the economy’s resilience. As the odds of a recession started to give way to the increased odds of a soft landing, we pivoted the Fund’s holdings to take into account a stronger-than-anticipated economy.
Overall security selection – particularly within the health care, consumer non-durables, diversified media, manufacturing, and food/tobacco sectors – had a positive impact on performance. Conversely, the Fund’s cash holdings and its equity holdings left over from previously reorganized issuers both hurt performance, as did weak security selection within retail.
The preceding information is the opinion of portfolio management only through the end of the period stated on the cover. Any such opinions are subject to change at any time based upon market or other conditions and should not be relied upon as investment advice. Past performance is no guarantee of future results, and there is no guarantee that market forecasts will be realized.
For information regarding the indexes and certain investment terms, see the Key Investment Terms starting on page 5.
Newfleet Senior Floating Rate Fund (Continued)
Credit & Interest: Debt instruments are subject to various risks, including credit and interest rate risk. The issuer of a debt security may fail to make interest and/or principal payments. Values of debt instruments may rise or fall in response to changes in interest rates, and this risk may be enhanced with longer-term maturities.
Bank Loans: Bank loans may be unsecured or not fully collateralized, may be subject to restrictions on resale, may be less liquid and may trade infrequently on the secondary market. Bank loans settle on a delayed basis; thus, sale proceeds may not be available to meet redemptions for a substantial period of time after the sale of the loan.
High Yield Fixed Income Securities: There is a greater risk of issuer default, less liquidity, and increased price volatility related to high yield securities than investment grade securities.
Liquidity: Certain instruments may be difficult or impossible to sell at a time and price beneficial to the Fund.
Leverage: When the Fund leverages its portfolio, the Fund may be less liquid and/or may liquidate positions at an unfavorable time, and the value of the Fund’s shares will be more volatile and sensitive to market movements.
Market Volatility: The value of the securities in the Fund may go up or down in response to the prospects of individual companies and/or general economic conditions. Local, regional, or global
events such as war or military conflict, terrorism, pandemic, or recession could impact the Fund, including hampering the ability of the Fund’s manager(s) to invest its assets as intended.
Prospectus: For additional information on risks, please see the Fund’s prospectus.
Asset Allocation
The following table presents asset allocation within certain sectors as a percentage of total investments as of September 30, 2023.
| Leveraged Loans | | 91% |
| Health Care | 12% | |
| Information Technology | 11 | |
| Service | 11 | |
| Manufacturing | 7 | |
| Food / Tobacco | 6 | |
| Gaming / Leisure | 6 | |
| Financials | 4 | |
| All other Leveraged Loans | 34 | |
| Corporate Bonds and Notes | | 4 |
| Exchange-Traded Funds | | 2 |
| Other (includes short-term investment) | | 3 |
| Total | | 100% |
| | |
For information regarding the indexes and certain investment terms, see the Key Investment Terms starting on page 5.
Newfleet Senior Floating Rate Fund (Continued)
Average Annual Total Returns1 for periods ended 9/30/23
| | | 1 Year | 5 Years | 10 Years | Since
inception | Inception
date |
| Class A shares at NAV2 | | 11.20 % | 3.23 % | 3.26 % | — % | — |
| Class A shares at POP3,4 | | 8.14 | 2.65 | 2.97 | — | — |
| Class C shares at NAV2 and with CDSC4 | | 10.50 | 2.47 | 2.48 | — | — |
| Class I shares at NAV2 | | 11.61 | 3.49 | 3.51 | — | — |
| Class R6 shares at NAV2 | | 11.77 | 3.64 | — | 3.93 | 11/3/16 |
| Credit Suisse Leveraged Loan Index | | 12.47 | 4.31 | 4.33 | 4.63 5 | — |
| Fund Expense Ratios6: Class A shares: Gross 1.09%, Net: 1.04%; Class C shares: Gross 1.85%, Net: 1.79%; Class I shares: Gross 0.84% Net: 0.79%; Class R6 shares: Gross 0.78%, Net: 0.65%. |
| All returns represent past performance which is no guarantee of future results. Current performance may be higher or lower than the performance shown. The investment return and principal value of an investment will fluctuate so that an investor’s shares, when redeemed, may be worth more or less than their original cost. The above table and graph below do not reflect the deduction of taxes that a shareholder would pay on fund distributions or the redemption of shares. Please visit Virtus.com for performance data current to the most recent month-end. |
Growth of $10,000 for periods ended 9/30
This chart assumes an initial investment of $10,000 made on September 30, 2013, for Class A shares and Class C shares including any applicable sales charges or fees. The performance of the other share class may be greater or less than that shown based on differences in inception dates, fees, and sales charges. Performance assumes reinvestment of dividends and capital gain distributions.
For information regarding the indexes and certain investment terms, see the Key Investment Terms starting on page 5.
Newfleet Senior Floating Rate Fund (Continued)
Growth of $100,000 for periods ended 9/30
This chart assumes an initial investment of $100,000 made on September 30, 2013, for Class I shares. The performance of the other share class may be greater or less than that shown based on differences in inception dates, fees, and sales charges. Performance assumes reinvestment of dividends and capital gain distributions.
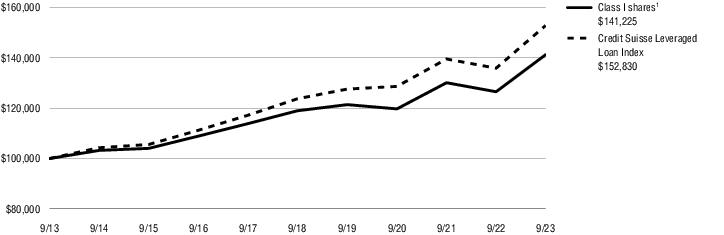
| 1 | Total returns are historical and include changes in share price and the reinvestment of both dividends and capital gain distributions. |
| 2 | “NAV” (Net Asset Value) total returns do not include the effect of any sales charge. |
| 3 | “POP” (Public Offering Price) total returns include the effect of the maximum front-end 2.75% sales charge. |
| 4 | “CDSC” (contingent deferred sales charge) is applied to redemptions of certain classes of shares that do not have a sales charge applied at the time of purchase. CDSC for certain redemptions of Class A shares made within 18 months of a finder’s fee being paid and all Class C shares are 1% within the first year and 0% thereafter. |
| 5 | The since inception index return is from the inception date of Class R6 shares. |
| 6 | The expense ratios of the Fund are set forth according to the prospectus for the Fund effective January 27, 2023, as supplemented and revised, and may differ from the expense ratios disclosed in the Financial Highlights tables in this report. See the Financial Highlights for more current expense ratios. Net Expense: Expenses reduced by a contractual expense limitation in effect through January 31, 2024. Gross Expense: Does not reflect the effect of the expense limitation. Expense ratios include fees and expenses associated with any underlying funds. |
The index is unmanaged and not available for direct investment; therefore, its performance does not reflect the expenses associated with active management of an actual portfolio.
For information regarding the indexes and certain investment terms, see the Key Investment Terms starting on page 5.
| | Ticker Symbols: |
| | Class A: HXBZX |
| | Class C: PXCZX |
| | Class I: HXBIX |
Seix Tax-Exempt Bond Fund
Fund Summary (Unaudited)
Portfolio Manager Commentary by
Seix Investment Advisors
| ■ | The Fund is diversified and has an investment objective of providing a high level of current income that is exempt from federal income tax. There is no guarantee that the Fund will meet its objective. |
| ■ | For the fiscal year ended September 30, 2023, the Fund’s Class A shares at NAV returned 2.14%, Class C shares at NAV returned 1.37%, and Class I shares at NAV returned 2.39%. For the same period, the Bloomberg U.S. Aggregate Bond Index, a broad-based fixed income index, returned 0.64%, and the ICE BofA 1-22 Year U.S. Municipal Securities Index, which is the Fund’s style-specific benchmark appropriate for comparison, returned 2.76%. |
All performance figures assume reinvestment of distributions and exclude the effect of sales charges. Performance data quoted represents past results. Past performance is no guarantee of future results, and current performance may be higher or lower than the performance shown above. Investment return and principal value will fluctuate so your shares, when redeemed, may be worth more or less than their original cost. Please visit Virtus.com for performance data current to the most recent month-end.
How did the markets perform during the Fund’s fiscal year ended September 30, 2023?
The municipal bond market experienced positive performance for the fiscal year ended September 30, 2023, despite a dramatic rise in interest rates and continued concerns about both inflation and recession. For the fiscal year, yields in the 10-year area of the yield curve rose the least, while the very short end and the long end of the curve saw the largest increases in yields. Credit spreads, or the additional yield the market demands from
lower-rated bonds versus higher quality bonds, tightened.
Municipal bonds outperformed the broader fixed income market, except for corporate bonds, during the fiscal year. However, the market’s shifting views about whether the Federal Reserve (the Fed) would be able to negotiate a soft landing for the economy in the face of soaring inflation resulted in lopsided market moves and extreme volatility.
What factors affected the Fund’s performance during its fiscal year?
The Fund underperformed its benchmark. For the 12 months ended September 30, 2023, performance relative to the benchmark benefited from exposure to intermediate maturities (6 to 10 years) and lesser credit quality. Relative performance versus the benchmark was negatively impacted by the Fund’s exposure to bonds with maturities greater than 22 years, lower coupon structures, and, to some extent, exposure to very high quality bonds.
The Fund’s investment strategy focuses on higher quality municipalities that we believe show value for the long term. The credit profile of the municipal market was stable during the reporting period. The resilience of consumer spending and the impact of residual COVID relief funds, particularly in the tax-backed sectors, helped to steady balance sheets. However, investors were concerned about a potential recession on the horizon, as well as moderating consumer spending, and how both could impact budgets.
The preceding information is the opinion of portfolio management only through the end of the period stated on the cover. Any such opinions are subject to change at any time based upon market or other conditions and should not be relied upon as investment advice. Past performance is no guarantee of future results, and there is no guarantee that market forecasts will be realized.
Credit & Interest: Debt instruments are subject to various risks, including credit and interest rate risk. The issuer of a debt security may fail to make interest and/or principal payments. Values of debt instruments may rise or fall in response to changes in interest rates, and this risk may be enhanced with longer-term maturities.
Municipal Market: Events negatively impacting a municipality, municipal security, or the municipal bond market in general, may cause the portfolio to decrease in value.
High Yield Fixed Income Securities: There is a greater risk of issuer default, less liquidity, and increased price volatility related to high yield securities than investment grade securities.
State & AMT Tax: A portion of income may be subject to some state and/or local taxes and, for certain investors, a portion may be subject to the federal alternative minimum tax.
Market Volatility: value of the securities in the Fund may go up or down in response to the prospects of individual companies and/or general economic conditions. Local, regional, or global events such as war or military conflict, terrorism, pandemic, or recession could impact the Fund, including hampering the ability of the Fund’s manager(s) to invest its assets as intended.
Prospectus: For additional information on risks, please see the Fund’s prospectus.
Asset Allocation
The following table presents asset allocation within certain sectors as a percentage of total investments as of September 30, 2023.
| Municipal Bonds | | 100% |
| Total | | 100% |
| | |
For information regarding the indexes and certain investment terms, see the Key Investment Terms starting on page 5.
Seix Tax-Exempt Bond Fund (Continued)
Average Annual Total Returns1 for periods ended 9/30/23
| | | 1 Year | 5 Years | 10 Years |
| Class A shares at NAV2 | 2.14 % | 0.73% | 1.70% |
| Class A shares at POP3,4 | -0.67 | 0.17 | 1.42 |
| Class C shares at NAV2 and with CDSC4 | 1.37 | -0.04 | 0.94 |
| Class I shares at NAV2 | 2.39 | 0.98 | 1.96 |
| Bloomberg U.S. Aggregate Bond Index | 0.64 | 0.10 | 1.13 |
| ICE BofA 1-22 Year U.S. Municipal Securities Index | 2.76 | 1.27 | 2.17 |
| Fund Expense Ratios5: Class A shares: Gross 1.01%, Net 0.83%; Class C shares: Gross 1.76%, Net 1.58%; Class I shares: Gross 0.77%, Net 0.58%. |
| All returns represent past performance which is no guarantee of future results. Current performance may be higher or lower than the performance shown. The investment return and principal value of an investment will fluctuate so that an investor’s shares, when redeemed, may be worth more or less than their original cost. The above table and graph below do not reflect the deduction of taxes that a shareholder would pay on fund distributions or the redemption of shares. Please visit Virtus.com for performance data current to the most recent month-end. |
Growth of $10,000 for periods ended 9/30
This chart assumes an initial investment of $10,000 made on September 30, 2013, for Class A shares and Class C shares including any applicable sales charges or fees. The performance of the other share class may be greater or less than that shown based on differences in inception dates, fees, and sales charges. Performance assumes reinvestment of dividends and capital gain distributions.
For information regarding the indexes and certain investment terms, see the Key Investment Terms starting on page 5.
Seix Tax-Exempt Bond Fund (Continued)
Growth of $100,000 for periods ended 9/30
This chart assumes an initial investment of $100,000 made on September 30, 2013, for Class I shares. The performance of the other share class may be greater or less than that shown based on differences in inception dates, fees, and sales charges. Performance assumes reinvestment of dividends and capital gain distributions.
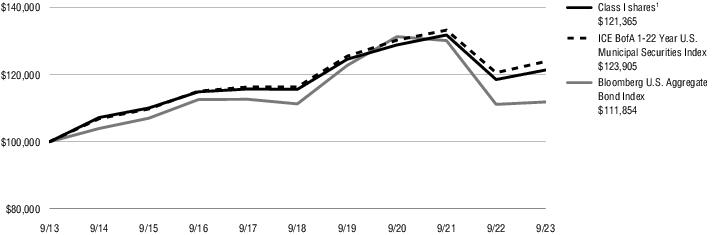
| 1 | Total returns are historical and include changes in share price and the reinvestment of both dividends and capital gain distributions. |
| 2 | “NAV” (Net Asset Value) total returns do not include the effect of any sales charge. |
| 3 | “POP” (Public Offering Price) total returns include the effect of the maximum front-end 2.75% sales charge. |
| 4 | “CDSC” (contingent deferred sales charge) is applied to redemptions of certain classes of shares that do not have a sales charge applied at the time of purchase. CDSC for certain redemptions of Class A shares made within 18 months of a finder’s fee being paid and all Class C shares are 1% within the first year and 0% thereafter. |
| 5 | The expense ratios of the Fund are set forth according to the prospectus for the Fund effective January 27, 2023, as supplemented and revised, and may differ from the expense ratios disclosed in the Financial Highlights tables in this report. See the Financial Highlights for more current expense ratios. Net Expense: Expenses reduced by a contractual expense limitation in effect through January 31, 2024. Gross Expense: Does not reflect the effect of the expense limitation. Expense ratios include fees and expenses associated with any underlying funds. |
The index is unmanaged and not available for direct investment; therefore, its performance does not reflect the expenses associated with active management of an actual portfolio.
For information regarding the indexes and certain investment terms, see the Key Investment Terms starting on page 5.
Newfleet Core Plus Bond Fund
SCHEDULE OF INVESTMENTS
September 30, 2023
($ reported in thousands)
| | Par Value | | Value |
| U.S. Government Securities—17.3% |
| U.S. Treasury Bonds | | | |
| 2.375%, 2/15/42 | $ 720 | | $ 498 |
| 3.875%, 5/15/43 | 1,440 | | 1,252 |
| 3.000%, 8/15/48 | 3,115 | | 2,277 |
| 1.375%, 8/15/50 | 1,320 | | 644 |
| 1.875%, 2/15/51 | 1,335 | | 748 |
| 1.875%, 11/15/51 | 940 | | 524 |
| 2.250%, 2/15/52 | 950 | | 583 |
| 2.875%, 5/15/52 | 985 | | 698 |
| 4.000%, 11/15/52 | 2,800 | | 2,482 |
| 3.625%, 2/15/53 | 1,420 | | 1,174 |
| 3.625%, 5/15/53 | 7,550 | | 6,251 |
| 4.125%, 8/15/53 | 2,330 | | 2,115 |
| U.S. Treasury Notes | | | |
| 5.125%, 9/30/25 | 825 | | 824 |
| 0.625%, 12/31/27 | 990 | | 837 |
| 4.500%, 9/30/28 | 825 | | 826 |
| 1.500%, 2/15/30 | 1,265 | | 1,049 |
| 1.375%, 11/15/31 | 630 | | 494 |
| 4.125%, 11/15/32 | 1,170 | | 1,128 |
| 3.500%, 2/15/33 | 625 | | 574 |
| 3.375%, 5/15/33 | 3,990 | | 3,618 |
Total U.S. Government Securities
(Identified Cost $34,039) | | 28,596 |
| | | | |
| |
| | | | |
| |
| Municipal Bonds—2.0% |
| California—0.1% | | |
Santa Clara Valley Water District Series B, Taxable
2.967%, 6/1/50 | 250 | | 159 |
| Florida—0.6% | | |
Broward County, Water & Sewer Utility Revenue Series A
4.000%, 10/1/47 | 1,065 | | 946 |
| Idaho—0.1% | | |
Idaho Health Facilities Authority St. Luke’s Health System Revenue Taxable Series B
5.020%, 3/1/48 | 170 | | 146 |
| Illinois—0.0% | | |
Sales Tax Securitization Corp. Series B, Second Lien, Taxable (BAM Insured)
3.411%, 1/1/43 | 30 | | 22 |
| New York—0.8% | | |
Metropolitan Transportation Authority Revenue Taxable Series A
5.000%, 11/15/45 | 1,290 | | 1,329 |
| Texas—0.3% | | |
City of San Antonio, General Obligation Taxable
1.963%, 2/1/33 | 255 | | 193 |
| | Par Value | | Value |
| | | | |
| Texas—continued | | |
State of Texas, General Obligation Taxable
3.211%, 4/1/44 | $ 80 | | $ 60 |
Texas Public Finance Authority Revenue Taxable
2.140%, 2/1/35 | 205 | | 149 |
Texas Transportation Commission State Highway Fund Revenue Taxable
4.000%, 10/1/33 | 80 | | 73 |
| | | | 475 |
| | | | |
| |
| Virginia—0.1% | | |
City of Bristol, General Obligation Taxable (State AID Withholding Insured)
4.210%, 1/1/42 | 285 | | 231 |
Total Municipal Bonds
(Identified Cost $4,014) | | 3,308 |
| | | | |
| |
| | | | |
| |
| Foreign Government Securities—0.9% |
Dominican Republic 144A
4.875%, 9/23/32(1) | 420 | | 341 |
Federative Republic of Brazil
6.000%, 10/20/33 | 200 | | 189 |
Republic of Serbia 144A
6.500%, 9/26/33(1) | 200 | | 190 |
| United Mexican States | | | |
| 2.659%, 5/24/31 | 425 | | 335 |
| 6.350%, 2/9/35 | 400 | | 391 |
Total Foreign Government Securities
(Identified Cost $1,564) | | 1,446 |
| | | | |
| |
| | | | |
| |
| Mortgage-Backed Securities—27.1% |
| Agency—5.7% | | |
| Federal Home Loan Mortgage Corporation | | | |
Pool #SD2026
5.000%, 11/1/52 | 1,592 | | 1,503 |
Pool #SD3238
5.500%, 12/1/52 | 152 | | 147 |
Pool #SD8309
6.000%, 3/1/53 | 3,078 | | 3,039 |
Pool #SD8317
6.000%, 4/1/53 | 424 | | 419 |
| Federal National Mortgage Association | | | |
Pool #323702
6.000%, 5/1/29 | 5 | | 5 |
Pool #535371
6.500%, 5/1/30 | — (2) | | — (2) |
Pool #590108
7.000%, 7/1/31 | 3 | | 3 |
Pool #880117
5.500%, 4/1/36 | 20 | | 20 |
Pool #909092
6.000%, 9/1/37 | 8 | | 8 |
| | Par Value | | Value |
| | | | |
| Agency—continued | | |
Pool #909220
6.000%, 8/1/38 | $ 103 | | $ 104 |
Pool #938574
5.500%, 9/1/36 | 39 | | 39 |
Pool #986067
6.000%, 8/1/38 | 1 | | 2 |
Pool #FS4438
5.000%, 11/1/52 | 147 | | 138 |
Pool #MA4785
5.000%, 10/1/52 | 346 | | 326 |
Pool #MA4805
4.500%, 11/1/52 | 508 | | 466 |
Pool #MA4980
6.000%, 4/1/53 | 2,338 | | 2,308 |
Pool #MA5072
5.500%, 7/1/53 | 910 | | 880 |
Government National Mortgage Association I Pool #443000
6.500%, 9/15/28 | 7 | | 7 |
| | | | 9,414 |
| | | | |
| |
| Non-Agency—21.4% | | |
A&D Mortgage Trust 2023-NQM3, A1 144A
6.733%, 7/25/68(1)(3) | 828 | | 827 |
| Ajax Mortgage Loan Trust | | | |
2019-D, A1 144A
2.956%, 9/25/65(1)(3) | 138 | | 126 |
2021-A, A1 144A
1.065%, 9/25/65(1)(3) | 164 | | 139 |
2022-B, A1 144A
3.500%, 3/27/62(1)(3) | 917 | | 841 |
| American Homes 4 Rent Trust | | | |
2015-SFR1, A 144A
3.467%, 4/17/52(1) | 189 | | 182 |
2015-SFR2, C 144A
4.691%, 10/17/52(1) | 125 | | 121 |
| AMSR Trust | | | |
2020-SFR1, B 144A
2.120%, 4/17/37(1) | 255 | | 239 |
2020-SFR2, C 144A
2.533%, 7/17/37(1) | 100 | | 93 |
2020-SFR2, D 144A
3.282%, 7/17/37(1) | 250 | | 235 |
2021-SFR2, C 144A
1.877%, 8/17/38(1) | 460 | | 402 |
2022-SFR1, C 144A
3.740%, 3/17/39(1) | 515 | | 464 |
| Angel Oak Mortgage Trust | | | |
2021-8, A1 144A
1.820%, 11/25/66(1)(3) | 230 | | 189 |
2022-5, A1 144A
4.500%, 5/25/67(1)(3) | 810 | | 760 |
2023-1, A1 144A
4.750%, 9/26/67(1)(3) | 1,240 | | 1,181 |
Angel Oak SB Commercial Mortgage Trust 2020-SBC1, A1 144A
2.068%, 5/25/50(1)(3) | 504 | | 460 |
See Notes to Financial Statements
Newfleet Core Plus Bond Fund
SCHEDULE OF INVESTMENTS (Continued)
September 30, 2023
($ reported in thousands)
| | Par Value | | Value |
| | | | |
| Non-Agency—continued | | |
| Arroyo Mortgage Trust | | | |
2019-1, A1 144A
3.805%, 1/25/49(1)(3) | $ 72 | | $ 66 |
2019-2, A1 144A
3.347%, 4/25/49(1)(3) | 28 | | 26 |
2021-1R, A1 144A
1.175%, 10/25/48(1)(3) | 83 | | 64 |
2022-1, A1B 144A
3.269%, 12/25/56(1)(3) | 270 | | 225 |
BBCMS Mortgage Trust 2018-TALL, A (1 month Term SOFR + 0.919%, Cap N/A, Floor 0.872%) 144A
6.252%, 3/15/37(1)(3) | 425 | | 393 |
Benchmark Mortgage Trust 2023-B38, A2
5.626%, 4/15/56 | 235 | | 228 |
| BPR Trust | | | |
2021-KEN, A (1 month Term SOFR + 1.364%, Cap N/A, Floor 1.250%) 144A
6.696%, 2/15/29(1)(3) | 360 | | 356 |
2022-OANA, A (1 month Term SOFR + 1.898%, Cap N/A, Floor 1.898%) 144A
7.230%, 4/15/37(1)(3) | 670 | | 658 |
| BX Commercial Mortgage Trust | | | |
2019-XL, C (1 month Term SOFR + 1.364%, Cap N/A, Floor 1.250%) 144A
6.697%, 10/15/36(1)(3) | 145 | | 143 |
2022-LP2, D (1 month Term SOFR + 1.961%, Cap N/A, Floor 1.961%) 144A
7.293%, 2/15/39(1)(3) | 263 | | 252 |
BX Trust 2019-OC11, D 144A
4.075%, 12/9/41(1)(3) | 815 | | 670 |
Cascade MH Asset Trust 2021-MH1, A1 144A
1.753%, 2/25/46(1) | 388 | | 326 |
CENT Trust 2023-CITY, A (1 month Term SOFR + 2.620%, Cap N/A, Floor 2.620%) 144A
7.952%, 9/15/28(1)(3) | 635 | | 635 |
| Chase Mortgage Finance Corp. | | | |
2016-SH1, M2 144A
3.750%, 4/25/45(1)(3) | 78 | | 69 |
2016-SH2, M2 144A
3.750%, 12/25/45(1)(3) | 161 | | 141 |
CHL Mortgage Pass-Through Trust 2004-6, 1A2
4.892%, 5/25/34(3) | 55 | | 49 |
CIM Trust 2022-R2, A1 144A
3.750%, 12/25/61(1)(3) | 609 | | 548 |
Citigroup Mortgage Loan Trust, Inc. 2019-RP1, A1 144A
3.500%, 1/25/66(1)(3) | 313 | | 293 |
| | Par Value | | Value |
| | | | |
| Non-Agency—continued | | |
| COLT Mortgage Loan Trust | | | |
2022-4, A1 144A
4.301%, 3/25/67(1)(3) | $ 287 | | $ 269 |
2022-5, A1 144A
4.550%, 4/25/67(1)(3) | 228 | | 215 |
COLT Mortgage Pass-Through Certificates 2021-1R, A1 144A
0.857%, 5/25/65(1)(3) | 42 | | 35 |
| COMM Mortgage Trust | | | |
2013-300P, A1 144A
4.353%, 8/10/30(1) | 390 | | 356 |
2020-CBM, B 144A
3.099%, 2/10/37(1) | 210 | | 196 |
| CoreVest American Finance Trust | | | |
2019-3, C 144A
3.265%, 10/15/52(1) | 220 | | 183 |
2020-1, A1 144A
1.832%, 3/15/50(1) | 255 | | 243 |
2020-3, A 144A
1.358%, 8/15/53(1) | 148 | | 135 |
2020-4, A 144A
1.174%, 12/15/52(1) | 242 | | 219 |
2022-1, A 144A
4.744%, 6/17/55(1)(3) | 749 | | 725 |
Credit Suisse Mortgage Capital Certificates 2019-ICE4, A (1 month Term SOFR + 1.027%, Cap N/A, Floor 0.980%) 144A
6.360%, 5/15/36(1)(3) | 369 | | 369 |
| Credit Suisse Mortgage Capital Trust | | | |
2020-NQM1, A1 144A
1.208%, 5/25/65(1)(3) | 36 | | 32 |
2020-RPL4, A1 144A
2.000%, 1/25/60(1)(3) | 270 | | 229 |
Deephaven Residential Mortgage Trust 2022-1, A1 144A
2.205%, 1/25/67(1)(3) | 438 | | 379 |
| Ellington Financial Mortgage Trust | | | |
2019-2, A3 144A
3.046%, 11/25/59(1)(3) | 37 | | 33 |
2022-1, A1 144A
2.206%, 1/25/67(1)(3) | 863 | | 701 |
Extended Stay America Trust 2021-ESH, C (1 month Term SOFR + 1.814%, Cap N/A, Floor 1.700%) 144A
7.146%, 7/15/38(1)(3) | 480 | | 473 |
FirstKey Homes Trust 2021-SFR1, D 144A
2.189%, 8/17/38(1) | 335 | | 292 |
Flagstar Mortgage Trust 2017-1, 1A3 144A
3.500%, 3/25/47(1)(3) | 40 | | 34 |
Galton Funding Mortgage Trust 2018-1, A23 144A
3.500%, 11/25/57(1)(3) | 404 | | 353 |
| | Par Value | | Value |
| | | | |
| Non-Agency—continued | | |
GCAT Trust 2020-NQM1, A1 144A
2.247%, 1/25/60(1)(3) | $ 10 | | $ 9 |
GCT Commercial Mortgage Trust 2021-GCT, A (1 month Term SOFR + 0.914%, Cap N/A, Floor 0.800%) 144A
6.247%, 2/15/38(1)(3) | 395 | | 310 |
Homes Trust 2023-NQM2, A1 144A
6.456%, 2/25/68(1)(3) | 191 | | 191 |
INTOWN Mortgage Trust 2022-STAY, A (1 month Term SOFR + 2.489%, Cap N/A, Floor 2.489%) 144A
7.821%, 8/15/39(1)(3) | 305 | | 305 |
JPMBB Commercial Mortgage Securities Trust 2014-C18, AS
4.439%, 2/15/47(3) | 307 | | 300 |
JPMorgan Chase Commercial Mortgage Securities Trust 2013-C13, E 144A
3.986%, 1/15/46(1)(3) | 540 | | 457 |
| JPMorgan Chase Mortgage Trust | | | |
2017-3, 2A2 144A
2.500%, 8/25/47(1)(3) | 526 | | 440 |
2017-5, A1 144A
3.542%, 10/26/48(1)(3) | 21 | | 20 |
KNDL Mortgage Trust 2019-KNSQ, A (1 month Term SOFR + 0.996%, Cap N/A, Floor 0.800%) 144A
6.328%, 5/15/36(1)(3) | 399 | | 397 |
| LHOME Mortgage Trust | | | |
2021-RTL1, A1 144A
2.090%, 2/25/26(1)(3) | 63 | | 62 |
2021-RTL2, A1 144A
2.090%, 6/25/26(1)(3) | 84 | | 83 |
MetLife Securitization Trust 2017-1A, M1 144A
3.451%, 4/25/55(1)(3) | 305 | | 251 |
| MFA Trust | | | |
2022-NQM2, A1 144A
4.000%, 5/25/67(1)(3) | 868 | | 790 |
2020-NQM3, A1 144A
1.014%, 1/26/65(1)(3) | 215 | | 190 |
| Mill City Mortgage Loan Trust | | | |
2017-3, B1 144A
3.250%, 1/25/61(1)(3) | 574 | | 454 |
2019-1, M2 144A
3.500%, 10/25/69(1)(3) | 155 | | 129 |
2021-NMR1, A1 144A
1.125%, 11/25/60(1)(3) | 98 | | 89 |
MIRA Trust 2023-MILE, A 144A
6.755%, 6/10/38(1) | 400 | | 392 |
Morgan Stanley Bank of America Merrill Lynch Trust 2013-C13, AS
4.266%, 11/15/46 | 360 | | 358 |
See Notes to Financial Statements
Newfleet Core Plus Bond Fund
SCHEDULE OF INVESTMENTS (Continued)
September 30, 2023
($ reported in thousands)
| | Par Value | | Value |
| | | | |
| Non-Agency—continued | | |
| New Residential Mortgage Loan Trust | | | |
2014-1A, A 144A
3.750%, 1/25/54(1)(3) | $ 52 | | $ 48 |
2015-2A, A1 144A
3.750%, 8/25/55(1)(3) | 36 | | 33 |
2016-1A, A1 144A
3.750%, 3/25/56(1)(3) | 28 | | 26 |
2016-3A, B1 144A
4.000%, 9/25/56(1)(3) | 176 | | 161 |
2016-4A, B1A 144A
4.500%, 11/25/56(1)(3) | 200 | | 185 |
2017-2A, A3 144A
4.000%, 3/25/57(1)(3) | 838 | | 771 |
2018-2A, A1 144A
4.500%, 2/25/58(1)(3) | 102 | | 96 |
2019-RPL2, M2 144A
3.750%, 2/25/59(1)(3) | 650 | | 526 |
2021-NQ2R, A1 144A
0.941%, 10/25/58(1)(3) | 1,051 | | 926 |
2022-NQM2, A1 144A
3.079%, 3/27/62(1)(3) | 430 | | 376 |
2022-RTL1, A1F 144A
4.336%, 12/25/26(1) | 255 | | 245 |
2018-1A, A1A 144A
4.000%, 12/25/57(1)(3) | 436 | | 405 |
NLT Trust 2021-INV2, A1 144A
1.162%, 8/25/56(1)(3) | 153 | | 122 |
| Preston Ridge Partners Mortgage LLC | | | |
2021-2, A1 144A
2.115%, 3/25/26(1)(3) | 265 | | 255 |
2021-RPL1, A1 144A
1.319%, 7/25/51(1)(3) | 335 | | 294 |
PRET LLC 2021-RN3, A1 144A
1.843%, 9/25/51(1)(3) | 364 | | 329 |
Pretium Mortgage Credit Partners I LLC 2021-NPL1, A1 144A
2.240%, 9/27/60(1)(3) | 125 | | 121 |
Progress Residential Trust 2019-SFR3, B 144A
2.571%, 9/17/36(1) | 365 | | 351 |
Provident Funding Mortgage Trust 2019-1, A2 144A
3.000%, 12/25/49(1)(3) | 360 | | 295 |
| RCKT Mortgage Trust | | | |
2020-1, A1 144A
3.000%, 2/25/50(1)(3) | 116 | | 94 |
2023-CES1, A1A 144A
6.515%, 6/25/43(1)(3) | 167 | | 165 |
2023-CES2, A1A 144A
6.808%, 9/25/43(1)(3) | 400 | | 399 |
Residential Mortgage Loan Trust 2019-2, A1 144A
2.913%, 5/25/59(1)(3) | 9 | | 9 |
Sequoia Mortgage Trust 2013-8, B1
3.481%, 6/25/43(3) | 22 | | 21 |
SG Residential Mortgage Trust 2021-1, A3 144A
1.560%, 7/25/61(1)(3) | 177 | | 135 |
| | Par Value | | Value |
| | | | |
| Non-Agency—continued | | |
Starwood Mortgage Residential Trust 2021-3, A3 144A
1.518%, 6/25/56(1)(3) | $ 57 | | $ 45 |
| Towd Point Mortgage Trust | | | |
2016-4, B1 144A
3.969%, 7/25/56(1)(3) | 310 | | 280 |
2017-1, M1 144A
3.750%, 10/25/56(1)(3) | 340 | | 316 |
2017-4, A2 144A
3.000%, 6/25/57(1)(3) | 570 | | 499 |
2018-2, A2 144A
3.500%, 3/25/58(1)(3) | 670 | | 609 |
2018-6, A2 144A
3.750%, 3/25/58(1)(3) | 600 | | 502 |
2019-1, A1 144A
3.750%, 3/25/58(1)(3) | 116 | | 108 |
2019-2, A2 144A
3.750%, 12/25/58(1)(3) | 190 | | 160 |
2019-4, A2 144A
3.250%, 10/25/59(1)(3) | 240 | | 198 |
2019-HY2, M1 (1 month Term SOFR + 1.714%, Cap N/A, Floor 1.600%) 144A
7.034%, 5/25/58(1)(3) | 100 | | 100 |
2020-MH1, A2 144A
2.500%, 2/25/60(1)(3) | 405 | | 354 |
2021-1, A2 144A
2.750%, 11/25/61(1)(3) | 355 | | 269 |
2023-1, A1 144A
3.750%, 1/25/63(1) | 459 | | 420 |
| Tricon American Homes Trust | | | |
2019-SFR1, C 144A
3.149%, 3/17/38(1) | 190 | | 176 |
2020-SFR2, D 144A
2.281%, 11/17/39(1) | 310 | | 262 |
VCAT LLC 2021-NPL2, A1 144A
2.115%, 3/27/51(1)(3) | 172 | | 164 |
| Verus Securitization Trust | | | |
2019-4, M1 144A
3.207%, 11/25/59(1)(3) | 100 | | 87 |
2019-INV2, A1 144A
3.913%, 7/25/59(1)(3) | 604 | | 582 |
2022-4, A1 144A
4.474%, 4/25/67(1)(3) | 924 | | 864 |
2022-6, A1 144A
4.910%, 6/25/67(1)(3) | 395 | | 382 |
| Visio Trust | | | |
2020-1R, A2 144A
1.567%, 11/25/55(1) | 66 | | 58 |
2021-1R, A1 144A
1.280%, 5/25/56(1) | 198 | | 179 |
| | Par Value | | Value |
| | | | |
| Non-Agency—continued | | |
Wells Fargo Commercial Mortgage Trust 2014-C24, AS
3.931%, 11/15/47 | $ 361 | | $ 325 |
| | | | 35,426 |
| | | | |
| |
Total Mortgage-Backed Securities
(Identified Cost $47,573) | | 44,840 |
| | | | |
| |
| | | | |
| |
| Asset-Backed Securities—11.8% |
| Automobiles—5.1% | | |
American Credit Acceptance Receivables Trust 2022-1, D 144A
2.460%, 3/13/28(1) | 270 | | 256 |
| Avis Budget Rental Car Funding LLC | | | |
(AESOP) 2020-2A, A 144A
2.020%, 2/20/27(1) | 381 | | 348 |
(AESOP) 2023-3A, A 144A
5.440%, 2/22/28(1) | 237 | | 233 |
CarNow Auto Receivables Trust 2023-1A, C 144A
7.240%, 9/15/26(1) | 288 | | 285 |
| Carvana Auto Receivables Trust | | | |
2019-3A, D 144A
3.040%, 4/15/25(1) | 24 | | 24 |
2021-N3, D
1.580%, 6/12/28 | 202 | | 191 |
2023-N1, C 144A
5.920%, 7/10/29(1) | 250 | | 244 |
CPS Auto Receivables Trust 2019-D, E 144A
3.860%, 10/15/25(1) | 260 | | 257 |
Credit Acceptance Auto Loan Trust 2020-3A, B 144A
1.770%, 12/17/29(1) | 265 | | 262 |
| DT Auto Owner Trust | | | |
2023-1A, B 144A
5.190%, 10/16/28(1) | 384 | | 378 |
2023-3A, C 144A
6.400%, 5/15/29(1) | 200 | | 199 |
Exeter Automobile Receivables Trust 2023-2A, B
5.610%, 9/15/27 | 315 | | 312 |
FHF Trust 2023-1A, A2 144A
6.570%, 6/15/28(1) | 248 | | 245 |
| First Investors Auto Owner Trust | | | |
2021-1A, C 144A
1.170%, 3/15/27(1) | 300 | | 288 |
2022-1A, C 144A
3.130%, 5/15/28(1) | 270 | | 253 |
| Foursight Capital Automobile Receivables Trust | | | |
2022-1, B 144A
2.150%, 5/17/27(1) | 215 | | 203 |
See Notes to Financial Statements
Newfleet Core Plus Bond Fund
SCHEDULE OF INVESTMENTS (Continued)
September 30, 2023
($ reported in thousands)
| | Par Value | | Value |
| | | | |
| Automobiles—continued | | |
2023-2, A2 144A
5.990%, 5/15/28(1) | $ 355 | | $ 354 |
GLS Auto Select Receivables Trust 2023-1A, B 144A
6.090%, 3/15/29(1) | 385 | | 379 |
| LAD Auto Receivables Trust | | | |
2021-1A, D 144A
3.990%, 11/15/29(1) | 270 | | 252 |
2022-1A, A 144A
5.210%, 6/15/27(1) | 596 | | 592 |
2023-2A, D 144A
6.300%, 2/15/31(1) | 265 | | 259 |
Lendbuzz Securitization Trust 2022-1A, A 144A
4.220%, 5/17/27(1) | 168 | | 163 |
Santander Drive Auto Receivables Trust 2023-1, B
4.980%, 2/15/28 | 627 | | 616 |
Tesla Auto Lease Trust 2023-A, B 144A
6.410%, 7/20/27(1) | 340 | | 338 |
Tricolor Auto Securitization Trust 2023-1A, B 144A
6.840%, 11/16/26(1) | 459 | | 457 |
United Auto Credit Securitization Trust 2023-1, B 144A
5.910%, 7/10/28(1) | 287 | | 285 |
Veridian Auto Receivables Trust 2023-1A, A4 144A
5.590%, 12/15/28(1) | 315 | | 310 |
| Westlake Automobile Receivables Trust | | | |
2021-3A, D 144A
2.120%, 1/15/27(1) | 265 | | 247 |
2023-1A, C 144A
5.740%, 8/15/28(1) | 265 | | 262 |
| | | | 8,492 |
| | | | |
| |
| Consumer Loans—1.1% | | |
| ACHV ABS Trust | | | |
2023-1PL, A 144A
6.420%, 3/18/30(1) | 31 | | 31 |
2023-1PL, B 144A
6.800%, 3/18/30(1) | 369 | | 369 |
2023-3PL, B 144A
7.170%, 8/19/30(1) | 355 | | 357 |
Marlette Funding Trust 2023-2A, B 144A
6.540%, 6/15/33(1) | 249 | | 248 |
OneMain Financial Issuance Trust 2022-3A, A 144A
5.940%, 5/15/34(1) | 256 | | 254 |
Oportun Issuance Trust 2021-C, A 144A
2.180%, 10/8/31(1) | 270 | | 246 |
Reach ABS Trust 2023-1A, B 144A
7.330%, 2/18/31(1) | 310 | | 309 |
| | | | 1,814 |
| | | | |
| |
| | Par Value | | Value |
| | | | |
| Credit Card—0.3% | | |
Avant Credit Card Master Trust 2021-1A, A 144A
1.370%, 4/15/27(1) | $ 280 | | $ 260 |
Genesis Sales Finance Master Trust 2021-AA, A 144A
1.200%, 12/21/26(1) | 280 | | 266 |
| | | | 526 |
| | | | |
| |
| Equipment—0.2% | | |
NMEF Funding LLC 2021-A, B 144A
1.850%, 12/15/27(1) | 324 | | 319 |
| Other—5.1% | | |
Adams Outdoor Advertising LP 2023-1, A2 144A
6.967%, 7/15/53(1) | 340 | | 334 |
Aligned Data Centers Issuer LLC 2021-1A, A2 144A
1.937%, 8/15/46(1) | 444 | | 388 |
Amur Equipment Finance Receivables XII LLC 2023-1A, A2 144A
6.090%, 12/20/29(1) | 325 | | 325 |
Applebee’s Funding LLC 2023-1A, A2 144A
7.824%, 3/5/53(1) | 434 | | 428 |
| Aqua Finance Trust | | | |
2017-A, A 144A
3.720%, 11/15/35(1) | 10 | | 10 |
2019-A, A 144A
3.140%, 7/16/40(1) | 51 | | 47 |
2019-A, C 144A
4.010%, 7/16/40(1) | 216 | | 195 |
2020-AA, B 144A
2.790%, 7/17/46(1) | 270 | | 235 |
Arby’s Funding LLC 2020-1A, A2 144A
3.237%, 7/30/50(1) | 426 | | 377 |
BHG Securitization Trust 2021-A, A 144A
1.420%, 11/17/33(1) | 180 | | 168 |
BXG Receivables Note Trust 2023-A, A 144A
5.770%, 11/15/38(1) | 354 | | 347 |
Cajun Global LLC 2021-1, A2 144A
3.931%, 11/20/51(1) | 161 | | 140 |
CCG Receivables Trust 2021-1, C 144A
0.840%, 6/14/27(1) | 285 | | 271 |
Dext ABS LLC 2023-1, A2 144A
5.990%, 3/15/32(1) | 187 | | 184 |
Diamond Resorts Owner Trust 2021-1A, A 144A
1.510%, 11/21/33(1) | 66 | | 61 |
| Foundation Finance Trust | | | |
2019-1A, A 144A
3.860%, 11/15/34(1) | 17 | | 17 |
| | Par Value | | Value |
| | | | |
| Other—continued | | |
2021-1A, A 144A
1.270%, 5/15/41(1) | $ 105 | | $ 93 |
2023-2A, A 144A
6.530%, 6/15/49(1) | 402 | | 402 |
Hardee’s Funding LLC 2020-1A, A2 144A
3.981%, 12/20/50(1) | 415 | | 349 |
Jack in the Box Funding LLC 2022-1A, A2I 144A
3.445%, 2/26/52(1) | 393 | | 352 |
Jersey Mike’s Funding 2019-1A, A2 144A
4.433%, 2/15/50(1) | 193 | | 178 |
MAPS Trust 2021-1A, A 144A
2.521%, 6/15/46(1) | 153 | | 132 |
MVW LLC 2020-1A, A 144A
1.740%, 10/20/37(1) | 182 | | 168 |
MVW Owner Trust 2019-1A, A 144A
2.890%, 11/20/36(1) | 50 | | 48 |
Navient Private Education Refi Loan Trust 2021-EA, A 144A
0.970%, 12/16/69(1) | 187 | | 157 |
NBC Funding LLC 2021-1, A2 144A
2.989%, 7/30/51(1) | 223 | | 194 |
NMEF Funding LLC 2022-A, B 144A
3.350%, 10/16/28(1) | 260 | | 247 |
Octane Receivables Trust 2023-1A, C 144A
6.370%, 9/20/29(1) | 285 | | 280 |
Orange Lake Timeshare Trust 2019-A, B 144A
3.360%, 4/9/38(1) | 202 | | 193 |
Pawneee Equipment Receivables LLC 2022-1, B 144A
5.400%, 7/17/28(1) | 300 | | 286 |
Progress Residential Trust 2021-SFR6, D 144A
2.225%, 7/17/38(1) | 205 | | 178 |
Purchasing Power Funding LLC 2021-A, A 144A
1.570%, 10/15/25(1) | 39 | | 38 |
Sierra Timeshare Receivables Funding LLC 2023-2A, B 144A
6.280%, 4/20/40(1) | 299 | | 297 |
Taco Bell Funding LLC 2016-1A, A23 144A
4.970%, 5/25/46(1) | 319 | | 307 |
TRP LLC 2021-1, A 144A
2.070%, 6/19/51(1) | 138 | | 119 |
| VFI ABS LLC | | | |
2022-1A, A 144A
2.230%, 3/24/28(1) | 65 | | 64 |
2022-1A, B 144A
3.040%, 7/24/28(1) | 425 | | 404 |
See Notes to Financial Statements
Newfleet Core Plus Bond Fund
SCHEDULE OF INVESTMENTS (Continued)
September 30, 2023
($ reported in thousands)
| | Par Value | | Value |
| | | | |
| Other—continued | | |
ZAXBY’S Funding LLC 2021-1A, A2 144A
3.238%, 7/30/51(1) | $ 387 | | $ 321 |
| | | | 8,334 |
| | | | |
| |
Total Asset-Backed Securities
(Identified Cost $20,166) | | 19,485 |
| | | | |
| |
| | | | |
| |
| Corporate Bonds and Notes—30.7% |
| Communication Services—1.1% | | |
AT&T, Inc.
5.400%, 2/15/34 | 545 | | 510 |
| CCO Holdings LLC | | | |
| 144A 6.375%, 9/1/29(1) | 23 | | 21 |
| 144A 4.750%, 3/1/30(1) | 180 | | 151 |
Level 3 Financing, Inc. 144A
3.625%, 1/15/29(1) | 245 | | 137 |
Sprint Capital Corp.
8.750%, 3/15/32 | 265 | | 307 |
Telecomunicaciones Digitales S.A. 144A
4.500%, 1/30/30(1) | 200 | | 162 |
T-Mobile USA, Inc.
5.050%, 7/15/33 | 246 | | 228 |
Vodafone Group plc
5.625%, 2/10/53 | 320 | | 284 |
| | | | 1,800 |
| | | | |
| |
| Consumer Discretionary—1.5% | | |
| Ashtead Capital, Inc. | | | |
| 144A 4.375%, 8/15/27(1) | 305 | | 283 |
| 144A 5.500%, 8/11/32(1) | 200 | | 185 |
Churchill Downs, Inc. 144A
6.750%, 5/1/31(1) | 115 | | 109 |
Clarios Global LP 144A
6.750%, 5/15/28(1) | 20 | | 19 |
Ford Motor Co.
4.750%, 1/15/43 | 110 | | 80 |
Ford Motor Credit Co. LLC
6.800%, 5/12/28(4) | 200 | | 200 |
MDC Holdings, Inc.
3.966%, 8/6/61 | 550 | | 303 |
Newell Brands, Inc.
6.375%, 9/15/27(4) | 321 | | 306 |
Nissan Motor Acceptance Co. LLC 144A
7.050%, 9/15/28(1) | 295 | | 295 |
Ontario Gaming GTA LP 144A
8.000%, 8/1/30(1) | 250 | | 250 |
PulteGroup, Inc.
6.375%, 5/15/33(4) | 355 | | 357 |
Station Casinos LLC 144A
4.500%, 2/15/28(1) | 70 | | 61 |
| | | | 2,448 |
| | | | |
| |
| Consumer Staples—1.3% | | |
Anheuser-Busch Cos. LLC
4.900%, 2/1/46 | 240 | | 209 |
| | Par Value | | Value |
| | | | |
| Consumer Staples—continued | | |
Anheuser-Busch InBev Worldwide, Inc.
5.550%, 1/23/49 | $ 270 | | $ 258 |
Bacardi Ltd. 144A
5.400%, 6/15/33(1) | 275 | | 258 |
| BAT Capital Corp. | | | |
| 7.750%, 10/19/32 | 193 | | 204 |
| 4.758%, 9/6/49 | 245 | | 172 |
Central American Bottling Corp. 144A
5.250%, 4/27/29(1) | 90 | | 81 |
Church & Dwight Co., Inc.
5.000%, 6/15/52 | 295 | | 262 |
Coty, Inc. 144A
6.625%, 7/15/30(1) | 330 | | 322 |
Pilgrim’s Pride Corp.
6.250%, 7/1/33 | 352 | | 331 |
| | | | 2,097 |
| | | | |
| |
| Energy—2.9% | | |
Alliance Resource Operating Partners LP 144A
7.500%, 5/1/25(1) | 157 | | 157 |
BP Capital Markets plc
4.875% (5) | 635 | | 567 |
Civitas Resources, Inc. 144A
8.750%, 7/1/31(1) | 135 | | 138 |
| Columbia Pipelines Operating Co. LLC | | | |
| 144A 6.036%, 11/15/33(1) | 160 | | 156 |
| 144A 6.544%, 11/15/53(1) | 140 | | 137 |
| 144A 6.714%, 8/15/63(1) | 40 | | 39 |
CrownRock LP 144A
5.000%, 5/1/29(1) | 135 | | 127 |
DT Midstream, Inc. 144A
4.125%, 6/15/29(1) | 170 | | 147 |
Ecopetrol S.A.
8.875%, 1/13/33 | 175 | | 170 |
| Enbridge, Inc. | | | |
| 7.625%, 1/15/83 | 320 | | 306 |
| 8.500%, 1/15/84 | 94 | | 93 |
Enerflex Ltd. 144A
9.000%, 10/15/27(1) | 220 | | 217 |
Energy Transfer LP Series H
6.500% (5) | 230 | | 211 |
Flex Intermediate Holdco LLC 144A
3.363%, 6/30/31(1) | 520 | | 404 |
Genesis Energy LP
8.875%, 4/15/30 | 100 | | 98 |
| Kinder Morgan Energy Partners LP | | | |
| 6.950%, 1/15/38 | 110 | | 113 |
| 7.500%, 11/15/40 | 215 | | 226 |
Kinder Morgan, Inc.
7.750%, 1/15/32 | 40 | | 43 |
Occidental Petroleum Corp.
6.125%, 1/1/31 | 305 | | 301 |
Pertamina Persero PT 144A
6.450%, 5/30/44(1) | 500 | | 476 |
Petroleos Mexicanos
7.690%, 1/23/50 | 275 | | 176 |
| | Par Value | | Value |
| | | | |
| Energy—continued | | |
Reliance Industries Ltd. 144A
2.875%, 1/12/32(1)(4) | $ 250 | | $ 199 |
USA Compression Partners LP
6.875%, 4/1/26 | 125 | | 122 |
Venture Global Calcasieu Pass LLC 144A
3.875%, 8/15/29(1) | 125 | | 105 |
| | | | 4,728 |
| | | | |
| |
| Financials—10.6% | | |
Allianz SE 144A
6.350%, 9/6/53(1) | 400 | | 386 |
Allstate Corp. (The) Series B (3 month Term SOFR + 3.200%)
8.564%, 8/15/53(3) | 310 | | 306 |
American Express Co.
5.625%, 7/28/34 | 485 | | 458 |
Ares Finance Co. LLC 144A
4.000%, 10/8/24(1) | 270 | | 261 |
Ascot Group Ltd. 144A
4.250%, 12/15/30(1) | 270 | | 199 |
Banco Mercantil del Norte S.A. 144A
6.625% (1)(5) | 235 | | 184 |
| Bank of America Corp. | | | |
| 2.687%, 4/22/32 | 975 | | 766 |
| 5.288%, 4/25/34 | 105 | | 98 |
| 2.482%, 9/21/36 | 635 | | 462 |
| Bank of New York Mellon Corp. (The) | | | |
| 5.834%, 10/25/33 | 200 | | 197 |
Series G
4.700%(5) | 430 | | 414 |
Barclays plc
7.437%, 11/2/33 | 400 | | 411 |
BBVA Bancomer S.A. 144A
5.125%, 1/18/33(1) | 200 | | 172 |
Blackstone Private Credit Fund
2.625%, 12/15/26 | 144 | | 124 |
Blue Owl Credit Income Corp.
4.700%, 2/8/27 | 185 | | 168 |
Blue Owl Finance LLC 144A
3.125%, 6/10/31(1) | 355 | | 265 |
Brookfield Capital Finance LLC
6.087%, 6/14/33 | 140 | | 136 |
Brookfield Finance, Inc.
2.724%, 4/15/31 | 440 | | 349 |
Capital One Financial Corp.
2.359%, 7/29/32 | 422 | | 289 |
| Charles Schwab Corp. (The) | | | |
| 6.136%, 8/24/34 | 240 | | 233 |
Series H
4.000%(5) | 240 | | 169 |
Citadel LP 144A
4.875%, 1/15/27(1) | 255 | | 242 |
| Citigroup, Inc. | | | |
| 3.980%, 3/20/30 | 275 | | 247 |
| 6.270%, 11/17/33 | 255 | | 254 |
| 6.174%, 5/25/34 | 273 | | 261 |
Citizens Bank N.A.
2.250%, 4/28/25 | 500 | | 463 |
See Notes to Financial Statements
Newfleet Core Plus Bond Fund
SCHEDULE OF INVESTMENTS (Continued)
September 30, 2023
($ reported in thousands)
| | Par Value | | Value |
| | | | |
| Financials—continued | | |
Corebridge Financial, Inc.
6.875%, 12/15/52 | $ 405 | | $ 388 |
Discover Financial Services
6.700%, 11/29/32 | 126 | | 122 |
Drawbridge Special Opportunities Fund LP 144A
3.875%, 2/15/26(1) | 280 | | 249 |
Fifth Third Bancorp
4.337%, 4/25/33 | 265 | | 224 |
First American Financial Corp.
4.000%, 5/15/30 | 405 | | 343 |
Global Atlantic Fin Co. 144A
7.950%, 6/15/33(1) | 121 | | 116 |
| Goldman Sachs Group, Inc. (The) | | | |
| 1.992%, 1/27/32 | 505 | | 379 |
| 3.102%, 2/24/33 | 145 | | 116 |
| 6.450%, 5/1/36 | 145 | | 144 |
Huntington Bancshares, Inc.
2.550%, 2/4/30 | 180 | | 142 |
| JPMorgan Chase & Co. | | | |
| 5.717%, 9/14/33 | 435 | | 418 |
| 5.350%, 6/1/34 | 185 | | 175 |
| 1.953%, 2/4/32 | 685 | | 519 |
KeyCorp
4.789%, 6/1/33 | 270 | | 225 |
Ladder Capital Finance Holdings LLLP 144A
4.250%, 2/1/27(1) | 155 | | 136 |
Liberty Mutual Group, Inc. 144A
4.125%, 12/15/51(1) | 305 | | 251 |
Lincoln National Corp. (3 month LIBOR + 2.040%)
7.628%, 4/20/67(3) | 315 | | 209 |
MetLife, Inc. Series G
3.850% (4)(5) | 325 | | 301 |
| Morgan Stanley | | | |
| 5.250%, 4/21/34 | 375 | | 348 |
| 5.424%, 7/21/34 | 140 | | 132 |
| 5.948%, 1/19/38 | 123 | | 115 |
| 6.375%, 7/24/42 | 260 | | 269 |
MSCI, Inc. 144A
3.625%, 9/1/30(1) | 376 | | 315 |
National Rural Utilities Cooperative Finance Corp. (3 month Term SOFR + 3.172%)
8.541%, 4/30/43(3) | 150 | | 147 |
Nippon Life Insurance Co. 144A
6.250%, 9/13/53(1) | 225 | | 223 |
| Northern Trust Corp. | | | |
| 3.375%, 5/8/32 | 315 | | 278 |
| 6.125%, 11/2/32 | 150 | | 148 |
OneMain Finance Corp.
6.875%, 3/15/25 | 285 | | 283 |
| Prudential Financial, Inc. | | | |
| 5.125%, 3/1/52 | 88 | | 76 |
| 6.000%, 9/1/52 | 44 | | 40 |
| 6.750%, 3/1/53 | 185 | | 179 |
| | Par Value | | Value |
| | | | |
| Financials—continued | | |
| State Street Corp. | | | |
| 4.164%, 8/4/33 | $ 295 | | $ 258 |
| 4.821%, 1/26/34 | 83 | | 76 |
| Synchrony Financial | | | |
| 4.875%, 6/13/25 | 80 | | 77 |
| 3.700%, 8/4/26 | 132 | | 119 |
Texas Capital Bancshares, Inc.
4.000%, 5/6/31 | 330 | | 274 |
Toronto-Dominion Bank (The)
8.125%, 10/31/82 | 435 | | 433 |
UBS Group AG 144A
6.301%, 9/22/34(1) | 480 | | 469 |
| Wells Fargo & Co. | | | |
| 5.389%, 4/24/34 | 480 | | 449 |
Series BB
3.900%(5) | 245 | | 214 |
Series U
5.875%(3)(5) | 360 | | 353 |
Zions Bancorp NA
3.250%, 10/29/29 | 250 | | 194 |
| | | | 17,440 |
| | | | |
| |
| Health Care—3.2% | | |
AdaptHealth LLC 144A
5.125%, 3/1/30(1) | 180 | | 139 |
| Amgen, Inc. | | | |
| 5.250%, 3/2/33 | 334 | | 319 |
| 5.650%, 3/2/53 | 83 | | 78 |
Bio-Rad Laboratories, Inc.
3.700%, 3/15/32 | 505 | | 425 |
Catalent Pharma Solutions, Inc. 144A
3.500%, 4/1/30(1)(4) | 345 | | 284 |
CVS Health Corp.
5.875%, 6/1/53 | 320 | | 296 |
DENTSPLY SIRONA, Inc.
3.250%, 6/1/30 | 660 | | 552 |
Fortrea Holdings, Inc. 144A
7.500%, 7/1/30(1) | 64 | | 62 |
GE HealthCare Technologies, Inc.
5.857%, 3/15/30 | 360 | | 357 |
| HCA, Inc. | | | |
| 5.500%, 6/1/33 | 250 | | 236 |
| 5.250%, 6/15/49 | 170 | | 140 |
Illumina, Inc.
2.550%, 3/23/31 | 553 | | 429 |
IQVIA, Inc. 144A
5.700%, 5/15/28(1) | 194 | | 189 |
Par Pharmaceutical, Inc. 144A
7.500%, 4/1/27(1)(6) | 70 | | 50 |
| Royalty Pharma plc | | | |
| 2.150%, 9/2/31(4) | 200 | | 150 |
| 3.350%, 9/2/51 | 350 | | 203 |
Teva Pharmaceutical Finance Netherlands III B.V.
3.150%, 10/1/26 | 175 | | 156 |
Universal Health Services, Inc.
2.650%, 1/15/32 | 655 | | 491 |
Utah Acquisition Sub, Inc.
3.950%, 6/15/26 | 107 | | 100 |
| | Par Value | | Value |
| | | | |
| Health Care—continued | | |
| Viatris, Inc. | | | |
| 2.300%, 6/22/27 | $ 226 | | $ 195 |
| 144A 2.300%, 6/22/27(1) | 2 | | 1 |
Zimmer Biomet Holdings, Inc.
3.550%, 3/20/30 | 500 | | 427 |
| | | | 5,279 |
| | | | |
| |
| Industrials—3.6% | | |
Alaska Airlines Pass-Through Trust 2020-1, A 144A
4.800%, 2/15/29(1) | 371 | | 356 |
Aviation Capital Group LLC 144A
3.500%, 11/1/27(1) | 245 | | 216 |
Avolon Holdings Funding Ltd. 144A
4.375%, 5/1/26(1) | 260 | | 244 |
Beacon Roofing Supply, Inc. 144A
6.500%, 8/1/30(1) | 85 | | 82 |
BlueLinx Holdings, Inc. 144A
6.000%, 11/15/29(1) | 225 | | 198 |
| Boeing Co. (The) | | | |
| 5.805%, 5/1/50 | 130 | | 118 |
| 5.930%, 5/1/60 | 509 | | 457 |
British Airways Pass-Through Trust 2021-1, A 144A
2.900%, 9/15/36(1) | 268 | | 222 |
Concentrix Corp.
6.650%, 8/2/26 | 165 | | 164 |
CoStar Group, Inc. 144A
2.800%, 7/15/30(1) | 465 | | 375 |
Delta Air Lines Pass-Through Trust 2015-1, AA
3.625%, 1/30/29 | 186 | | 174 |
Ferguson Finance plc 144A
4.650%, 4/20/32(1) | 370 | | 332 |
Flowserve Corp.
3.500%, 10/1/30 | 84 | | 70 |
Fortune Brands Innovations, Inc.
5.875%, 6/1/33 | 385 | | 371 |
Global Infrastructure Solutions, Inc. 144A
7.500%, 4/15/32(1) | 215 | | 184 |
Huntington Ingalls Industries, Inc.
2.043%, 8/16/28 | 439 | | 369 |
Icahn Enterprises LP
5.250%, 5/15/27 | 200 | | 176 |
Regal Rexnord Corp. 144A
6.400%, 4/15/33(1) | 435 | | 419 |
Science Applications International Corp. 144A
4.875%, 4/1/28(1) | 285 | | 259 |
Sempra Global 144A
3.250%, 1/15/32(1) | 339 | | 265 |
TransDigm, Inc.
5.500%, 11/15/27 | 100 | | 93 |
United Airlines Pass-Through Trust 2023-1, A
5.800%, 7/15/37 | 253 | | 246 |
See Notes to Financial Statements
Newfleet Core Plus Bond Fund
SCHEDULE OF INVESTMENTS (Continued)
September 30, 2023
($ reported in thousands)
| | Par Value | | Value |
| | | | |
| Industrials—continued | | |
Veralto Corp. 144A
5.450%, 9/18/33(1) | $ 625 | | $ 605 |
| | | | 5,995 |
| | | | |
| |
| Information Technology—1.6% | | |
| Booz Allen Hamilton, Inc. | | | |
| 5.950%, 8/4/33 | 140 | | 137 |
| 144A 3.875%, 9/1/28(1) | 260 | | 233 |
| 144A 4.000%, 7/1/29(1) | 275 | | 243 |
Broadcom, Inc.
4.150%, 11/15/30 | 255 | | 226 |
CDW LLC
3.569%, 12/1/31 | 287 | | 236 |
Consensus Cloud Solutions, Inc. 144A
6.500%, 10/15/28(1) | 125 | | 107 |
Dell International LLC
8.100%, 7/15/36 | 272 | | 304 |
Kyndryl Holdings, Inc.
2.700%, 10/15/28 | 198 | | 163 |
Leidos, Inc.
2.300%, 2/15/31 | 475 | | 365 |
Motorola Solutions, Inc.
4.600%, 5/23/29 | 180 | | 170 |
| Oracle Corp. | | | |
| 6.250%, 11/9/32 | 170 | | 172 |
| 5.550%, 2/6/53 | 240 | | 210 |
| 3.850%, 4/1/60 | 60 | | 38 |
| | | | 2,604 |
| | | | |
| |
| Materials—0.8% | | |
ArcelorMittal S.A.
6.800%, 11/29/32 | 200 | | 199 |
Bayport Polymers LLC 144A
5.140%, 4/14/32(1) | 300 | | 259 |
Corp. Nacional del Cobre de Chile 144A
5.950%, 1/8/34(1) | 310 | | 300 |
FMG Resources August 2006 Pty Ltd. 144A
5.875%, 4/15/30(1) | 215 | | 197 |
Glencore Funding LLC 144A
2.850%, 4/27/31(1) | 225 | | 178 |
Teck Resources Ltd.
6.125%, 10/1/35 | 265 | | 253 |
| | | | 1,386 |
| | | | |
| |
| Real Estate—1.4% | | |
EPR Properties
4.750%, 12/15/26(4) | 350 | | 320 |
| GLP Capital LP | | | |
| 5.750%, 6/1/28 | 206 | | 198 |
| 4.000%, 1/15/30 | 75 | | 64 |
| 3.250%, 1/15/32 | 298 | | 231 |
Kite Realty Group Trust
4.750%, 9/15/30 | 325 | | 289 |
MPT Operating Partnership LP
3.500%, 3/15/31 | 190 | | 119 |
| | Par Value | | Value |
| | | | |
| Real Estate—continued | | |
Ontario Teachers’ Cadillac Fairview Properties Trust 144A
2.500%, 10/15/31(1) | $ 330 | | $ 249 |
Phillips Edison Grocery Center Operating Partnership I LP
2.625%, 11/15/31 | 420 | | 309 |
| VICI Properties LP | | | |
| 4.950%, 2/15/30 | 175 | | 160 |
| 5.125%, 5/15/32 | 340 | | 304 |
| 144A 4.125%, 8/15/30(1) | 145 | | 123 |
| | | | 2,366 |
| | | | |
| |
| Utilities—2.7% | | |
Black Hills Corp.
6.150%, 5/15/34 | 460 | | 448 |
Brooklyn Union Gas Co. (The) 144A
4.866%, 8/5/32(1) | 190 | | 169 |
CMS Energy Corp.
4.750%, 6/1/50 | 540 | | 461 |
| Electricite de France S.A. | | | |
| 144A 6.250%, 5/23/33(1) | 200 | | 200 |
| 144A 6.900%, 5/23/53(1) | 215 | | 213 |
Enel Finance International N.V. 144A
7.500%, 10/14/32(1) | 400 | | 427 |
Entergy Texas, Inc.
5.800%, 9/1/53 | 455 | | 435 |
Exelon Corp.
5.600%, 3/15/53 | 495 | | 450 |
KeySpan Gas East Corp. 144A
5.994%, 3/6/33(1) | �� 240 | | 232 |
New York State Electric & Gas Corp. 144A
5.850%, 8/15/33(1) | 370 | | 365 |
NRG Energy, Inc. 144A
7.000%, 3/15/33(1) | 365 | | 353 |
| Puget Energy, Inc. | | | |
| 2.379%, 6/15/28 | 204 | | 175 |
| 4.224%, 3/15/32 | 158 | | 135 |
Southern Co. (The) Series 21-A
3.750%, 9/15/51 | 429 | | 374 |
Vistra Corp. 144A
8.000% (1)(5) | 100 | | 95 |
| | | | 4,532 |
| | | | |
| |
Total Corporate Bonds and Notes
(Identified Cost $55,121) | | 50,675 |
| | | | |
| |
| | | | |
| |
| Leveraged Loans—5.7% |
| Aerospace—0.3% | | |
Brown Group Holding LLC (1 month Term SOFR + 2.850%)
8.166%, 6/7/28(3) | 219 | | 217 |
Delta Air Lines, Inc. (3 month Term SOFR + 3.750%)
9.076%, 10/20/27(3) | 102 | | 106 |
| | Par Value | | Value |
| | | | |
| Aerospace—continued | | |
Mileage Plus Holdings LLC (3 month Term SOFR + 5.400%)
10.798%, 6/21/27(3) | $ 90 | | $ 93 |
TransDigm, Inc. Tranche I (3 month Term SOFR + 3.250%)
8.640%, 8/24/28(3) | 143 | | 143 |
| | | | 559 |
| | | | |
| |
| Chemicals—0.5% | | |
Ineos Finance plc 2027 (1 month Term SOFR + 3.850%)
9.166%, 11/8/27(3) | 278 | | 277 |
Innophos Holdings, Inc. (1 month Term SOFR + 3.364%)
8.681%, 2/5/27(3) | 159 | | 159 |
LSF11 A5 Holdco LLC (1 month Term SOFR + 4.350%)
9.666%, 10/15/28(3) | 145 | | 142 |
Nouryon Finance B.V. (3 month LIBOR + 3.250%)
0.000%, 4/3/28(3)(7) | 155 | | 152 |
Windsor Holdings III LLC Tranche B (1 month Term SOFR + 4.500%)
9.830%, 8/1/30(3) | 170 | | 169 |
| | | | 899 |
| | | | |
| |
| Consumer Durables—0.0% | | |
Resideo Funding, Inc. Tranche B (1 month Term SOFR + 2.364%)
7.693% - 7.698%, 2/11/28(3) | — (2) | | — (2) |
| Consumer Non-Durables—0.1% | | |
Kronos Acquisition Holdings, Inc. Tranche B-1 (3 month Term SOFR + 4.012%)
9.402%, 12/22/26(3) | 209 | | 208 |
| Energy—0.2% | | |
Freeport LNG Investments LLP Tranche B (3 month Term SOFR + 3.762%)
9.088%, 12/21/28(3) | 123 | | 122 |
Oryx Midstream Services Permian Basin LLC 2023 (1 month Term SOFR + 3.364%)
8.692%, 10/5/28(3) | 122 | | 121 |
| | | | 243 |
| | | | |
| |
See Notes to Financial Statements
Newfleet Core Plus Bond Fund
SCHEDULE OF INVESTMENTS (Continued)
September 30, 2023
($ reported in thousands)
| | Par Value | | Value |
| | | | |
| Financials—0.4% | | |
Blackhawk Network Holdings, Inc. First Lien (3 month Term SOFR + 2.750%)
8.172%, 6/15/25(3) | $ 87 | | $ 87 |
Citadel Securities LP Tranche B (1 month Term SOFR + 2.614%)
7.931%, 7/29/30(3) | 101 | | 100 |
Finco I LLC 2023 (3 month Term SOFR + 3.000%)
8.369%, 6/27/29(3) | 254 | | 254 |
GIP Pilot Acquisition Partners LP (1 month Term SOFR + 3.250%)
0.000%, 9/18/30(3)(7) | 45 | | 45 |
GTCR W Merger Sub LLC Tranche B (3 month LIBOR + 3.250%)
0.000%, 9/20/30(3)(7) | 95 | | 95 |
| | | | 581 |
| | | | |
| |
| Food / Tobacco—0.4% | | |
Del Monte Foods, Inc. (1 month Term SOFR + 4.350% - 3 month PRIME + 3.250%)
9.668% - 11.750%, 5/16/29(3) | 210 | | 204 |
Froneri U.S., Inc. Tranche B-2 (1 month Term SOFR + 2.350%)
7.666%, 1/29/27(3) | 252 | | 250 |
Hostess Brands LLC Tranche B (3 month Term SOFR + 2.500%)
7.890%, 6/21/30(3) | 223 | | 223 |
| | | | 677 |
| | | | |
| |
| Gaming / Leisure—0.4% | | |
Caesars Entertainment, Inc. Tranche B (1 month Term SOFR + 3.350%)
8.666%, 2/6/30(3) | 50 | | 50 |
Carnival Corp. (1 month Term SOFR + 3.000%)
8.327%, 8/9/27(3) | 140 | | 139 |
Entain plc Tranche B-2 (3 month Term SOFR + 3.600%)
8.990%, 10/31/29(3) | 20 | | 20 |
Ontario Gaming GTA Ltd. Partnership Tranche B (3 month Term SOFR + 4.250%)
9.640%, 8/1/30(3) | 40 | | 40 |
Scientific Games International, Inc. Tranche B (1 month Term SOFR + 3.100%)
8.434%, 4/13/29(3) | 64 | | 64 |
| | Par Value | | Value |
| | | | |
| Gaming / Leisure—continued | | |
Station Casinos LLC Tranche B-1 (1 month Term SOFR + 2.350%)
7.666%, 2/8/27(3) | $ 121 | | $ 121 |
UFC Holdings LLC Tranche B-3 (3 month Term SOFR + 3.012%)
8.369%, 4/29/26(3) | 269 | | 269 |
| | | | 703 |
| | | | |
| |
| Health Care—0.6% | | |
Agiliti Health, Inc. 2023, Tranche B (3 month Term SOFR + 3.000%)
8.247%, 5/1/30(3) | 109 | | 108 |
CHG Healthcare Services, Inc. First Lien (1 month Term SOFR + 3.364%)
8.681%, 9/29/28(3) | 234 | | 233 |
LifePoint Health, Inc. Tranche B, First Lien (3 month Term SOFR + 4.012%)
9.377%, 11/16/25(3) | 97 | | 97 |
Medline Borrower LP (1 month Term SOFR + 3.364%)
8.681%, 10/23/28(3) | 179 | | 178 |
Perrigo Investments LLC Tranche B (1 month Term SOFR + 2.350%)
7.666%, 4/20/29(3) | 93 | | 93 |
Select Medical Corp. Tranche B-1 (1 month Term SOFR + 3.000%)
8.316%, 3/8/27(3) | 105 | | 104 |
Sunshine Luxembourg VII S.a.r.l. Tranche B-3 (3 month Term SOFR + 3.850%)
9.240%, 10/1/26(3) | 190 | | 190 |
| | | | 1,003 |
| | | | |
| |
| Housing—0.2% | | |
SRS Distribution, Inc. 2021 (1 month Term SOFR + 3.500%)
0.000%, 6/2/28(3)(7) | 160 | | 158 |
Standard Industries, Inc. (1 month Term SOFR + 2.614%)
7.938%, 9/22/28(3) | 122 | | 123 |
| | | | 281 |
| | | | |
| |
| Information Technology—0.7% | | |
Applied Systems, Inc. 2026 (3 month Term SOFR + 4.500%)
9.890%, 9/18/26(3) | 222 | | 222 |
| | Par Value | | Value |
| | | | |
| Information Technology—continued | | |
CCC Intelligent Solutions, Inc. Tranche B (1 month Term SOFR + 2.364%)
7.681%, 9/21/28(3) | $ 123 | | $ 122 |
CDK Global, Inc. (1 month Term SOFR + 4.250%)
9.640%, 7/6/29(3) | 189 | | 189 |
Epicor Software Corp. First Lien (3 month LIBOR + 1.750%)
9.069%, 7/30/27(3) | 20 | | 20 |
Open Text Corp. Tranche B (1 month Term SOFR + 2.850%)
8.166%, 1/31/30(3) | 80 | | 79 |
Sophia LP Tranche B (1 month Term SOFR + 3.600%)
8.916%, 10/7/27(3) | 121 | | 121 |
Uber Technologies, Inc. 2023 (3 month Term SOFR + 2.750%)
8.159%, 3/3/30(3) | 293 | | 293 |
UKG, Inc. 2021-2, First Lien (3 month Term SOFR + 3.350%)
8.618%, 5/4/26(3) | 121 | | 121 |
| | | | 1,167 |
| | | | |
| |
| Manufacturing—0.2% | | |
Alliance Laundry Systems LLC Tranche B (3 month Term SOFR + 3.600%)
8.901%, 10/8/27(3) | 82 | | 82 |
Filtration Group Corp. 2021 (1 month Term SOFR + 3.614%)
8.931%, 10/21/28(3) | 125 | | 125 |
NCR Corp. (1 month Term SOFR + 2.614%)
7.931%, 8/28/26(3) | 108 | | 107 |
| | | | 314 |
| | | | |
| |
| Media / Telecom - Broadcasting—0.2% | | |
Univision Communications, Inc. 2021 (1 month Term SOFR + 3.364%)
8.681%, 3/15/26(3) | 259 | | 258 |
Media / Telecom - Cable/Wireless
Video—0.4% | | |
Cogeco Communications Finance USA LP Tranche B-1 (3 month LIBOR + 3.250%)
0.000%, 9/18/30(3)(7) | 265 | | 260 |
DIRECTV Financing LLC (1 month Term SOFR + 5.000%)
10.431%, 8/2/27(3) | 228 | | 223 |
See Notes to Financial Statements
Newfleet Core Plus Bond Fund
SCHEDULE OF INVESTMENTS (Continued)
September 30, 2023
($ reported in thousands)
| | Par Value | | Value |
| | | | |
Media / Telecom - Cable/Wireless
Video—continued | | |
Eagle Broadband Investments LLC (3 month Term SOFR + 3.262%)
8.652%, 11/12/27(3) | $ 145 | | $ 141 |
| | | | 624 |
| | | | |
| |
Media / Telecom - Diversified
Media—0.0% | | |
Simon & Schuster, Inc. Tranche B (3 month LIBOR + 3.250%)
0.000%, 9/27/30(3)(7) | 25 | | 25 |
| Metals / Minerals—0.0% | | |
Arsenal Aic Parent LLC Tranche B (1 month Term SOFR + 4.500%)
9.879%, 8/19/30(3) | 40 | | 40 |
| Retail—0.1% | | |
PetsMart LLC (1 month Term SOFR + 3.850%)
9.166%, 2/11/28(3) | 189 | | 188 |
| Service—0.7% | | |
AlixPartners LLP (1 month Term SOFR + 2.864%)
8.181%, 2/4/28(3) | 35 | | 35 |
BrightView Landscapes LLC Tranche B (3 month Term SOFR + 3.250%)
8.619%, 4/20/29(3) | 161 | | 161 |
Dun & Bradstreet Corp. (The) Tranche B (1 month Term SOFR + 2.850%)
8.167%, 2/6/26(3) | 120 | | 120 |
NAB Holdings LLC First Lien (3 month Term SOFR + 3.150%)
8.540%, 11/23/28(3) | 122 | | 122 |
Peraton Corp. Tranche B, First Lien (1 month Term SOFR + 3.850%)
9.166%, 2/1/28(3) | 213 | | 212 |
Pike Corp. 2028 (1 month Term SOFR + 3.114%)
8.431%, 1/21/28(3) | 250 | | 249 |
Titan Acquisition Ltd. (3 month LIBOR + 3.000%)
8.731%, 3/28/25(3) | 224 | | 222 |
| | | | 1,121 |
| | | | |
| |
| Transportation - Automotive—0.1% | | |
Clarios Global LP 2023 (1 month Term SOFR + 3.750%)
9.066%, 5/6/30(3) | 170 | | 169 |
| | Par Value | | Value |
| | | | |
| Utilities—0.2% | | |
Brookfield WEC Holdings, Inc. (1 month Term SOFR + 2.864%)
8.181%, 8/1/25(3) | $ 251 | | $ 250 |
Generation Bridge Northeast LLC Tranche B (1 month Term SOFR + 4.250%)
9.566%, 8/7/29(3) | 70 | | 70 |
| | | | 320 |
| | | | |
| |
Total Leveraged Loans
(Identified Cost $9,338) | | 9,380 |
| | Shares | |
| Preferred Stocks—0.3% |
| Financials—0.3% | |
| JPMorgan Chase & Co. Series HH, 4.600% | 171 (8) | 160 |
| MetLife, Inc. Series D, 5.875% | 108 (8) | 101 |
| Truist Financial Corp. Series Q, 5.100% | 330 (8) | 282 |
| | | 543 |
| | | |
| |
Total Preferred Stocks
(Identified Cost $584) | 543 |
| | | |
| |
| | | |
| |
Total Long-Term Investments—95.8%
(Identified Cost $172,399) | 158,273 |
| | | |
| |
| | | |
| |
| Short-Term Investment—0.3% |
| Money Market Mutual Fund—0.3% |
| Dreyfus Government Cash Management Fund - Institutional Shares (seven-day effective yield 5.222%)(9) | 432,680 | 433 |
Total Short-Term Investment
(Identified Cost $433) | 433 |
| | | |
| |
| | | |
| |
| Securities Lending Collateral—0.5% |
| Dreyfus Government Cash Management Fund - Institutional Shares (seven-day effective yield 5.222%)(9)(10) | 922,536 | 923 |
Total Securities Lending Collateral
(Identified Cost $923) | 923 |
| | | |
| |
| | | |
| |
TOTAL INVESTMENTS—96.6%
(Identified Cost $173,755) | $159,629 |
| Other assets and liabilities, net—3.4% | 5,572 |
| NET ASSETS—100.0% | $165,201 |
| Abbreviations: |
| ABS | Asset-Backed Securities |
| BAM | Build America Municipal Insured |
| LIBOR | London Interbank Offered Rate |
| LLC | Limited Liability Company |
| LLLP | Limited Liability Limited Partnership |
| LLP | Limited Liability Partnership |
| LP | Limited Partnership |
| MSCI | Morgan Stanley Capital International |
| NA | National Association |
| SOFR | Secured Overnight Financing Rate |
| Footnote Legend: |
| (1) | Security exempt from registration under Rule 144A of the Securities Act of 1933. These securities may be resold in transactions exempt from registration, normally to qualified institutional buyers. At September 30, 2023, these securities amounted to a value of $69,571 or 42.1% of net assets. |
| (2) | Amount is less than $500 (not in thousands). |
| (3) | Variable rate security. Rate disclosed is as of September 30, 2023. Information in parenthesis represents benchmark and reference rate for each security. Certain variable rate securities are not based on a published reference rate and spread but are determined by the issuer or agent and are based on current market conditions, or, for mortgage-backed securities, are impacted by the individual mortgages which are paying off over time. These securities do not indicate a reference rate and spread in their descriptions. |
| (4) | All or a portion of security is on loan. |
| (5) | No contractual maturity date. |
| (6) | Security in default; interest payments are being received. |
| (7) | This loan will settle after September 30, 2023, at which time the interest rate, calculated on the base lending rate and the agreed upon spread on trade date, will be reflected. |
| (8) | Value shown as par value. |
| (9) | Shares of this fund are publicly offered, and its prospectus and annual report are publicly available. |
| (10) | Represents security purchased with cash collateral received for securities on loan. |
| Country Weightings (Unaudited)† |
| United States | 93% |
| Canada | 2 |
| United Kingdom | 1 |
| Mexico | 1 |
| Netherlands | 1 |
| Indonesia | 1 |
| Switzerland | 1 |
| Total | 100% |
| † % of total investments as of September 30, 2023. |
For information regarding the abbreviations, see the Key Investment Terms starting on page 5.
See Notes to Financial Statements
Newfleet Core Plus Bond Fund
SCHEDULE OF INVESTMENTS (Continued)
September 30, 2023
($ reported in thousands)
The following table summarizes the value of the Fund’s investments as of September 30, 2023, based on the inputs used to value them (See Security Valuation Note 2A in the Notes to Financial Statements):
| | Total
Value at
September 30, 2023 | | Level 1
Quoted Prices | | Level 2
Significant
Observable
Inputs |
| Assets: | | | | | |
| Debt Instruments: | | | | | |
| Asset-Backed Securities | $ 19,485 | | $ — | | $ 19,485 |
| Corporate Bonds and Notes | 50,675 | | — | | 50,675 |
| Foreign Government Securities | 1,446 | | — | | 1,446 |
| Leveraged Loans | 9,380 | | — | | 9,380 |
| Mortgage-Backed Securities | 44,840 | | — | | 44,840 |
| Municipal Bonds | 3,308 | | — | | 3,308 |
| U.S. Government Securities | 28,596 | | — | | 28,596 |
| Equity Securities: | | | | | |
| Preferred Stocks | 543 | | — | | 543 |
| Money Market Mutual Fund | 433 | | 433 | | — |
| Securities Lending Collateral | 923 | | 923 | | — |
| Total Investments | $159,629 | | $1,356 | | $158,273 |
There were no securities valued using significant unobservable inputs (Level 3) at September 30, 2023.
Security held by the Fund with an end of period value of $353 was transferred from Level 3 to Level 2 due to an increase in trading activities during the period.
See Notes to Financial Statements
Newfleet High Yield Fund
SCHEDULE OF INVESTMENTS
September 30, 2023
($ reported in thousands)
| | Par Value | | Value |
| Corporate Bonds and Notes—92.4% |
| Communication Services—9.4% | | |
Altice France Holding S.A. 144A
6.000%, 2/15/28(1) | $ 200 | | $ 99 |
Altice France S.A. 144A
5.125%, 7/15/29(1) | 400 | | 284 |
| CCO Holdings LLC | | | |
| 144A 6.375%, 9/1/29(1) | 17 | | 16 |
| 144A 4.750%, 3/1/30(1) | 1,015 | | 852 |
| CSC Holdings LLC | | | |
| 5.250%, 6/1/24 | 280 | | 266 |
| 144A 7.500%, 4/1/28(1) | 410 | | 266 |
| DISH DBS Corp. | | | |
| 5.875%, 11/15/24 | 380 | | 354 |
| 7.750%, 7/1/26 | 465 | | 349 |
Gray Television, Inc. 144A
7.000%, 5/15/27(1) | 490 | | 421 |
Level 3 Financing, Inc. 144A
3.625%, 1/15/29(1) | 465 | | 260 |
McGraw-Hill Education, Inc. 144A
5.750%, 8/1/28(1) | 150 | | 130 |
Millennium Escrow Corp. 144A
6.625%, 8/1/26(1) | 365 | | 291 |
Rackspace Technology Global, Inc. 144A
5.375%, 12/1/28(1) | 365 | | 122 |
Telesat Canada 144A
6.500%, 10/15/27(1) | 175 | | 89 |
TripAdvisor, Inc. 144A
7.000%, 7/15/25(1) | 280 | | 280 |
VZ Secured Financing B.V. 144A
5.000%, 1/15/32(1) | 290 | | 228 |
| | | | 4,307 |
| | | | |
| |
| Consumer Discretionary—15.2% | | |
Caesars Entertainment, Inc. 144A
8.125%, 7/1/27(1) | 175 | | 176 |
| Carnival Corp. | | | |
| 144A 7.625%, 3/1/26(1)(2) | 400 | | 389 |
| 144A 7.000%, 8/15/29(1) | 35 | | 35 |
Carriage Services, Inc. 144A
4.250%, 5/15/29(1) | 175 | | 150 |
Churchill Downs, Inc. 144A
6.750%, 5/1/31(1) | 290 | | 274 |
| Clarios Global LP | | | |
| 144A 8.500%, 5/15/27(1) | 300 | | 299 |
| 144A 6.750%, 5/15/28(1) | 30 | | 29 |
| eG Global Finance plc | | | |
| 144A 6.750%, 2/7/25(1) | 200 | | 196 |
| 144A 8.500%, 10/30/25(1) | 205 | | 202 |
| Ford Motor Co. | | | |
| 3.250%, 2/12/32 | 581 | | 448 |
| 4.750%, 1/15/43 | 225 | | 164 |
| Ford Motor Credit Co. LLC | | | |
| 4.125%, 8/17/27 | 200 | | 182 |
| 7.350%, 3/6/30 | 200 | | 203 |
Gates Global LLC 144A
6.250%, 1/15/26(1) | 315 | | 307 |
| | Par Value | | Value |
| | | | |
| Consumer Discretionary—continued | | |
Hilton Domestic Operating Co., Inc. 144A
3.625%, 2/15/32(1) | $ 300 | | $ 242 |
Jacobs Entertainment, Inc. 144A
6.750%, 2/15/29(1) | 327 | | 290 |
Legends Hospitality Holding Co. LLC 144A
5.000%, 2/1/26(1) | 310 | | 304 |
Light & Wonder International, Inc. 144A
7.000%, 5/15/28(1) | 410 | | 403 |
Newell Brands, Inc.
6.625%, 9/15/29(2) | 375 | | 357 |
NMG Holding Co., Inc. 144A
7.125%, 4/1/26(1) | 405 | | 380 |
Nordstrom, Inc.
4.250%, 8/1/31 | 495 | | 359 |
Ontario Gaming GTA LP 144A
8.000%, 8/1/30(1) | 305 | | 305 |
Premier Entertainment Sub LLC 144A
5.625%, 9/1/29(1)(2) | 365 | | 281 |
Raptor Acquisition Corp. 144A
4.875%, 11/1/26(1) | 315 | | 295 |
Royal Caribbean Cruises Ltd. 144A
9.250%, 1/15/29(1) | 15 | | 16 |
Station Casinos LLC 144A
4.500%, 2/15/28(1) | 335 | | 292 |
Weekley Homes LLC 144A
4.875%, 9/15/28(1) | 460 | | 399 |
| | | | 6,977 |
| | | | |
| |
| Consumer Staples—3.5% | | |
Albertsons Cos., Inc. 144A
4.625%, 1/15/27(1) | 285 | | 269 |
BAT Capital Corp.
7.750%, 10/19/32 | 215 | | 227 |
Coty, Inc. 144A
6.625%, 7/15/30(1) | 330 | | 322 |
H-Food Holdings LLC 144A
8.500%, 6/1/26(1) | 270 | | 68 |
HLF Financing S.a.r.l. LLC 144A
4.875%, 6/1/29(1) | 400 | | 284 |
Pilgrim’s Pride Corp.
6.250%, 7/1/33 | 300 | | 282 |
Sigma Holdco B.V. 144A
7.875%, 5/15/26(1) | 215 | | 180 |
| | | | 1,632 |
| | | | |
| |
| Energy—19.7% | | |
Alliance Resource Operating Partners LP 144A
7.500%, 5/1/25(1) | 350 | | 350 |
Antero Midstream Partners LP 144A
5.750%, 1/15/28(1) | 340 | | 321 |
| | Par Value | | Value |
| | | | |
| Energy—continued | | |
Ascent Resources Utica Holdings LLC 144A
8.250%, 12/31/28(1) | $ 360 | | $ 356 |
BP Capital Markets plc
4.875% (3) | 415 | | 371 |
| Chesapeake Energy Corp. | | | |
| 144A 5.500%, 2/1/26(1) | 160 | | 155 |
| 144A 5.875%, 2/1/29(1) | 165 | | 155 |
CITGO Petroleum Corp. 144A
7.000%, 6/15/25(1) | 440 | | 434 |
Civitas Resources, Inc. 144A
8.750%, 7/1/31(1) | 255 | | 261 |
Coronado Finance Pty Ltd. 144A
10.750%, 5/15/26(1) | 367 | | 380 |
| CrownRock LP | | | |
| 144A 5.625%, 10/15/25(1) | 260 | | 256 |
| 144A 5.000%, 5/1/29(1) | 230 | | 216 |
DT Midstream, Inc. 144A
4.125%, 6/15/29(1) | 420 | | 363 |
Enbridge, Inc.
8.500%, 1/15/84 | 350 | | 347 |
Enerflex Ltd. 144A
9.000%, 10/15/27(1) | 286 | | 282 |
Energy Transfer LP Series H
6.500% (3) | 495 | | 455 |
Genesis Energy LP
8.875%, 4/15/30 | 295 | | 288 |
| Hilcorp Energy I LP | | | |
| 144A 5.750%, 2/1/29(1) | 280 | | 253 |
| 144A 6.000%, 2/1/31(1) | 245 | | 216 |
| International Petroleum Corp. | | | |
| 144A, RegS 7.250%, 2/1/27(1)(4) | 300 | | 280 |
| 144A, RegS 7.250%, 2/1/27(1)(4) | 200 | | 186 |
Magnolia Oil & Gas Operating LLC 144A
6.000%, 8/1/26(1) | 335 | | 323 |
Mesquite Energy, Inc. 144A
7.250%, 2/15/23(1)(5) | 115 | | 10 |
Nabors Industries Ltd. 144A
7.250%, 1/15/26(1) | 355 | | 343 |
Northriver Midstream Finance LP 144A
5.625%, 2/15/26(1) | 335 | | 319 |
Occidental Petroleum Corp.
6.125%, 1/1/31 | 460 | | 453 |
Southwestern Energy Co.
5.375%, 2/1/29 | 300 | | 276 |
Teine Energy Ltd. 144A
6.875%, 4/15/29(1) | 380 | | 349 |
| Transocean, Inc. | | | |
| 144A 11.500%, 1/30/27(1) | 143 | | 150 |
| 144A 8.750%, 2/15/30(1) | 233 | | 238 |
USA Compression Partners LP
6.875%, 4/1/26 | 250 | | 245 |
See Notes to Financial Statements
Newfleet High Yield Fund
SCHEDULE OF INVESTMENTS (Continued)
September 30, 2023
($ reported in thousands)
| | Par Value | | Value |
| | | | |
| Energy—continued | | |
| Venture Global Calcasieu Pass LLC | | | |
| 144A 3.875%, 8/15/29(1) | $ 30 | | $ 25 |
| 144A 4.125%, 8/15/31(1) | 500 | | 410 |
| | | | 9,066 |
| | | | |
| |
| Financials—7.5% | | |
Acrisure LLC 144A
7.000%, 11/15/25(1) | 675 | | 656 |
Block, Inc.
3.500%, 6/1/31(2) | 335 | | 263 |
BroadStreet Partners, Inc. 144A
5.875%, 4/15/29(1) | 375 | | 331 |
Cobra AcquisitionCo. LLC 144A
6.375%, 11/1/29(1) | 280 | | 207 |
Global Atlantic Fin Co. 144A
7.950%, 6/15/33(1) | 268 | | 258 |
Ladder Capital Finance Holdings LLLP 144A
4.250%, 2/1/27(1) | 485 | | 424 |
Midcap Financial Issuer Trust 144A
6.500%, 5/1/28(1) | 600 | | 518 |
Navient Corp.
5.875%, 10/25/24 | 185 | | 182 |
NCR Atleos Escrow Corp. 144A
9.500%, 4/1/29(1) | 300 | | 290 |
OneMain Finance Corp.
6.875%, 3/15/25 | 330 | | 327 |
| | | | 3,456 |
| | | | |
| |
| Health Care—8.7% | | |
AdaptHealth LLC 144A
5.125%, 3/1/30(1) | 445 | | 345 |
Akumin, Inc. 144A
7.000%, 11/1/25(1) | 320 | | 240 |
| Bausch Health Cos., Inc. | | | |
| 144A 6.125%, 2/1/27(1) | 45 | | 28 |
| 144A 11.000%, 9/30/28(1) | 52 | | 35 |
| 144A 14.000%, 10/15/30(1) | 10 | | 6 |
Catalent Pharma Solutions, Inc. 144A
3.500%, 4/1/30(1)(2) | 335 | | 276 |
Cheplapharm Arzneimittel GmbH 144A
5.500%, 1/15/28(1) | 385 | | 349 |
| Community Health Systems, Inc. | | | |
| 144A 6.875%, 4/15/29(1) | 25 | | 13 |
| 144A 6.125%, 4/1/30(1) | 215 | | 109 |
| 144A 5.250%, 5/15/30(1) | 285 | | 217 |
| 144A 4.750%, 2/15/31(1) | 160 | | 113 |
Endo Dac 144A
9.500%, 7/31/27(1)(6) | 50 | | 3 |
Fortrea Holdings, Inc. 144A
7.500%, 7/1/30(1) | 117 | | 114 |
Lannett Co., Inc. 144A
7.750%, 4/15/26(1)(5) | 105 | | 6 |
| | Par Value | | Value |
| | | | |
| Health Care—continued | | |
Legacy LifePoint Health LLC 144A
4.375%, 2/15/27(1) | $ 285 | | $ 245 |
LifePoint Health, Inc. 144A
9.875%, 8/15/30(1) | 260 | | 252 |
Medline Borrower LP 144A
5.250%, 10/1/29(1) | 640 | | 553 |
Par Pharmaceutical, Inc. 144A
7.500%, 4/1/27(1)(7) | 256 | | 182 |
Star Parent, Inc. 144A
9.000%, 10/1/30(1) | 105 | | 106 |
| Surgery Center Holdings, Inc. | | | |
| 144A 6.750%, 7/1/25(1) | 90 | | 89 |
| 144A 10.000%, 4/15/27(1) | 76 | | 77 |
Team Health Holdings, Inc. 144A
6.375%, 2/1/25(1) | 310 | | 239 |
| Teva Pharmaceutical Finance Netherlands III B.V. | | | |
| 3.150%, 10/1/26 | 245 | | 218 |
| 5.125%, 5/9/29 | 200 | | 181 |
| | | | 3,996 |
| | | | |
| |
| Industrials—11.1% | | |
Allied Universal Holdco LLC 144A
6.625%, 7/15/26(1) | 380 | | 360 |
Beacon Roofing Supply, Inc. 144A
6.500%, 8/1/30(1) | 125 | | 121 |
BlueLinx Holdings, Inc. 144A
6.000%, 11/15/29(1) | 350 | | 308 |
Boeing Co. (The)
5.930%, 5/1/60 | 381 | | 342 |
Chart Industries, Inc. 144A
9.500%, 1/1/31(1) | 275 | | 292 |
| Fortress Transportation & Infrastructure Investors LLC | | | |
| 144A 6.500%, 10/1/25(1) | 231 | | 227 |
| 144A 9.750%, 8/1/27(1) | 40 | | 42 |
Global Infrastructure Solutions, Inc. 144A
7.500%, 4/15/32(1) | 430 | | 368 |
Hertz Corp. (The) 144A
5.000%, 12/1/29(1) | 290 | | 227 |
| Icahn Enterprises LP | | | |
| 6.250%, 5/15/26 | 90 | | 84 |
| 5.250%, 5/15/27 | 280 | | 246 |
Neptune Bidco U.S., Inc. 144A
9.290%, 4/15/29(1) | 310 | | 281 |
| Regal Rexnord Corp. | | | |
| 144A 6.300%, 2/15/30(1) | 465 | | 449 |
| 144A 6.400%, 4/15/33(1) | 146 | | 141 |
Science Applications International Corp. 144A
4.875%, 4/1/28(1) | 435 | | 395 |
| | Par Value | | Value |
| | | | |
| Industrials—continued | | |
SRS Distribution, Inc. 144A
6.125%, 7/1/29(1) | $ 370 | | $ 315 |
| TransDigm, Inc. | | | |
| 144A 6.875%, 12/15/30(1) | 140 | | 137 |
| 5.500%, 11/15/27 | 310 | | 290 |
United Rentals North America, Inc.
3.750%, 1/15/32 | 404 | | 326 |
VistaJet Malta Finance plc 144A
9.500%, 6/1/28(1) | 155 | | 136 |
| | | | 5,087 |
| | | | |
| |
| Information Technology—4.5% | | |
ams-OSRAM AG 144A
7.000%, 7/31/25(1) | 285 | | 281 |
CDW LLC
3.569%, 12/1/31 | 290 | | 239 |
CommScope Technologies LLC 144A
6.000%, 6/15/25(1) | 250 | | 238 |
| Consensus Cloud Solutions, Inc. | | | |
| 144A 6.000%, 10/15/26(1)(2) | 130 | | 120 |
| 144A 6.500%, 10/15/28(1) | 340 | | 290 |
GTCR W-2 Merger Sub LLC 144A
7.500%, 1/15/31(1) | 237 | | 237 |
ION Trading Technologies S.a.r.l. 144A
5.750%, 5/15/28(1) | 200 | | 174 |
Viasat, Inc. 144A
5.625%, 9/15/25(1) | 535 | | 494 |
| | | | 2,073 |
| | | | |
| |
| Materials—7.8% | | |
ArcelorMittal S.A.
6.800%, 11/29/32 | 340 | | 338 |
ASP Unifrax Holdings, Inc. 144A
5.250%, 9/30/28(1) | 568 | | 404 |
| Cleveland-Cliffs, Inc. | | | |
| 7.000%, 3/15/27 | 170 | | 165 |
| 144A 6.750%, 3/15/26(1) | 115 | | 115 |
FMG Resources August 2006 Pty Ltd. 144A
5.875%, 4/15/30(1) | 485 | | 443 |
Graham Packaging Co., Inc. 144A
7.125%, 8/15/28(1) | 400 | | 335 |
LSB Industries, Inc. 144A
6.250%, 10/15/28(1) | 475 | | 430 |
Mauser Packaging Solutions Holding Co. 144A
9.250%, 4/15/27(1) | 245 | | 214 |
Mercer International, Inc.
5.125%, 2/1/29 | 55 | | 43 |
New Enterprise Stone & Lime Co., Inc. 144A
9.750%, 7/15/28(1) | 390 | | 385 |
See Notes to Financial Statements
Newfleet High Yield Fund
SCHEDULE OF INVESTMENTS (Continued)
September 30, 2023
($ reported in thousands)
| | Par Value | | Value |
| | | | |
| Materials—continued | | |
Taseko Mines Ltd. 144A
7.000%, 2/15/26(1) | $ 265 | | $ 248 |
Windsor Holdings III LLC 144A
8.500%, 6/15/30(1) | 234 | | 231 |
WR Grace Holdings LLC 144A
5.625%, 8/15/29(1) | 263 | | 213 |
| | | | 3,564 |
| | | | |
| |
| Real Estate—1.4% | | |
MPT Operating Partnership LP
3.500%, 3/15/31 | 465 | | 291 |
VICI Properties LP
5.125%, 5/15/32 | 370 | | 331 |
| | | | 622 |
| | | | |
| |
| Utilities—3.6% | | |
Alexander Funding Trust II 144A
7.467%, 7/31/28(1) | 285 | | 285 |
| Ferrellgas LP | | | |
| 144A 5.375%, 4/1/26(1) | 305 | | 286 |
| 144A 5.875%, 4/1/29(1) | 175 | | 157 |
NRG Energy, Inc. 144A
7.000%, 3/15/33(1) | 235 | | 227 |
Sunnova Energy Corp. 144A
5.875%, 9/1/26(1)(2) | 305 | | 261 |
TerraForm Power Operating LLC 144A
5.000%, 1/31/28(1) | 240 | | 218 |
Vistra Corp. 144A
8.000% (1)(3) | 220 | | 210 |
| | | | 1,644 |
| | | | |
| |
Total Corporate Bonds and Notes
(Identified Cost $46,456) | | 42,424 |
| | | | |
| |
| | | | |
| |
| Leveraged Loans—4.4% |
| Aerospace—0.7% | | |
Kestrel Bidco, Inc. (1 month Term SOFR + 3.100%)
8.420%, 12/11/26(8) | 303 | | 296 |
| Forest Prod / Containers—0.6% | | |
Klockner Pentaplast of America, Inc. Tranche B (6 month Term SOFR + 4.975%)
10.476%, 2/12/26(8) | 304 | | 292 |
| Health Care—0.6% | | |
| Envision Healthcare Corp. | | | |
(3 month Term SOFR + 3.750%)
9.140%, 3/31/27(5)(6)(8) | 87 | | — (9) |
(3 month Term SOFR + 4.250%)
9.640%, 3/31/27(6) | 36 | | 8 |
| | Par Value | | Value |
| | | | |
| Health Care—continued | | |
(3 month Term SOFR + 8.025%)
13.415%, 3/31/27(6) | $ 10 | | $ 12 |
Sotera Health Holdings LLC (1 month Term SOFR + 3.750%)
9.073%, 12/11/26(8) | 249 | | 249 |
| | | | 269 |
| | | | |
| |
| Information Technology—0.3% | | |
Infinite Bidco LLC Second Lien (1 month Term SOFR + 7.000%)
12.431%, 3/2/29(8) | 175 | | 152 |
| Manufacturing—0.7% | | |
| Arcline FM Holdings LLC | | | |
First Lien (3 month Term SOFR + 5.012%)
10.402%, 6/23/28(8) | 147 | | 146 |
Second Lien (3 month Term SOFR + 8.250%)
13.902%, 6/25/29(8) | 190 | | 182 |
| | | | 328 |
| | | | |
| |
| Metals / Minerals—0.8% | | |
Covia Holdings Corp. (3 month Term SOFR + 4.262%)
9.530%, 7/31/26(8) | 360 | | 357 |
| Service—0.7% | | |
Carlisle Foodservice Products, Inc. First Lien (3 month PRIME + 2.000%)
10.500%, 3/20/25 | 77 | | 74 |
Sweetwater Borrower LLC (1 month Term SOFR + 4.364%)
9.681%, 8/7/28(8) | 259 | | 251 |
| | | | 325 |
| | | | |
| |
Total Leveraged Loans
(Identified Cost $2,162) | | 2,019 |
| | Shares | |
| Preferred Stocks—1.1% |
| Financials—1.1% | |
| Capital Farm Credit ACA Series 1 144A, 5.000%(1) | 250 (10) | 223 |
| Citigroup, Inc. Series T, 6.250% | 315 (10) | 303 |
| | | 526 |
| | | |
| |
Total Preferred Stocks
(Identified Cost $564) | 526 |
| | | |
| |
| | | |
| |
| | Shares | | Value |
| | | | |
| | | | |
| Common Stocks—0.4% |
| Consumer Discretionary—0.1% | | |
| MYT Holding LLC Class B(5)(11) | 33,144 | | $ 10 |
| NMG Parent LLC(5)(11) | 116 | | 14 |
| | | | 24 |
| | | | |
| |
| Energy—0.3% | | |
| QuarterNorth Energy Holding, Inc.(11) | 1,072 | | 140 |
Total Common Stocks
(Identified Cost $329) | | 164 |
| | | | |
| |
| | | | |
| |
| Rights—0.0% |
| Utilities—0.0% | | |
| Vistra Energy Corp., 12/29/49(5)(11) | 8,563 | | 10 |
Total Rights
(Identified Cost $7) | | 10 |
| | | | |
| |
| | | | |
| |
Total Long-Term Investments—98.3%
(Identified Cost $49,518) | | 45,143 |
| | | | |
| |
| | | | |
| |
| Securities Lending Collateral—3.6% |
| Dreyfus Government Cash Management Fund - Institutional Shares (seven-day effective yield 5.222%)(12)(13) | 1,641,367 | | 1,641 |
Total Securities Lending Collateral
(Identified Cost $1,641) | | 1,641 |
| | | | |
| |
| | | | |
| |
TOTAL INVESTMENTS—101.9%
(Identified Cost $51,159) | | $46,784 |
| Other assets and liabilities, net—(1.9)% | | (862) |
| NET ASSETS—100.0% | | $45,922 |
| Abbreviations: |
| ACA | American Capital Access Financial Guarantee Corp. |
| LLC | Limited Liability Company |
| LLLP | Limited Liability Limited Partnership |
| LP | Limited Partnership |
| SOFR | Secured Overnight Financing Rate |
| Footnote Legend: |
| (1) | Security exempt from registration under Rule 144A of the Securities Act of 1933. These securities may be resold in transactions exempt from registration, normally to qualified institutional buyers. At September 30, 2023, these securities amounted to a value of $33,155 or 72.2% of net assets. |
| (2) | All or a portion of security is on loan. |
For information regarding the abbreviations, see the Key Investment Terms starting on page 5.
See Notes to Financial Statements
Newfleet High Yield Fund
SCHEDULE OF INVESTMENTS (Continued)
September 30, 2023
($ reported in thousands)
| (3) | No contractual maturity date. |
| (4) | Regulation S security. Security is offered and sold outside of the United States; therefore, it is exempt from registration with the SEC under Rules 903 and 904 of the Securities Act of 1933. |
| (5) | The value of this security was determined using significant unobservable inputs and is reported as a Level 3 security in the Fair Value Hierarchy table located after the Schedule of Investments. |
| (6) | Security in default; no interest payments are being received. |
| (7) | Security in default; interest payments are being received. |
| (8) | Variable rate security. Rate disclosed is as of September 30, 2023. Information in parenthesis represents benchmark and reference rate for each security. Certain variable rate securities are not based on a published reference rate and spread but are determined by the issuer or agent and are based on current market conditions, or, for mortgage-backed securities, are impacted by the individual mortgages which are paying off over time. These securities do not indicate a reference rate and spread in their descriptions. |
| (9) | Amount is less than $500 (not in thousands). |
| (10) | Value shown as par value. |
| (11) | Non-income producing. |
| (12) | Shares of this fund are publicly offered, and its prospectus and annual report are publicly available. |
| (13) | Represents security purchased with cash collateral received for securities on loan. |
| Country Weightings (Unaudited)† |
| United States | 83% |
| Canada | 6 |
| Australia | 2 |
| Netherlands | 2 |
| United Kingdom | 2 |
| Luxembourg | 1 |
| Panama | 1 |
| Other | 3 |
| Total | 100% |
| † % of total investments as of September 30, 2023. |
The following table summarizes the value of the Fund’s investments as of September 30, 2023, based on the inputs used to value them (See Security Valuation Note 2A in the Notes to Financial Statements):
| | Total
Value at
September 30, 2023 | | Level 1
Quoted Prices | | Level 2
Significant
Observable
Inputs | | Level 3
Significant
Unobservable
Inputs |
| Assets: | | | | | | | |
| Debt Instruments: | | | | | | | |
| Corporate Bonds and Notes | $42,424 | | $ — | | $42,408 | | $16 |
| Leveraged Loans | 2,019 | | — | | 2,019 | | — |
| Equity Securities: | | | | | | | |
| Preferred Stocks | 526 | | — | | 526 | | — |
| Rights | 10 | | — | | — | | 10 |
| Common Stocks | 164 | | — | | 140 | | 24 |
| Securities Lending Collateral | 1,641 | | 1,641 | | — | | — |
| Total Investments | $46,784 | | $1,641 | | $45,093 | | $50 |
Securities held by the Fund with an end of period value of $—(1) were transferred from Level 2 to Level 3 due to a decrease in trading activities at period end.
Some of the Fund’s investments that were categorized as Level 3 may have been valued utilizing third party pricing information without adjustment. If applicable, such valuations are based on unobservable inputs. A significant change in third party information could result in a significantly lower or higher value of Level 3 investments.
Management has determined that the amount of Level 3 securities compared to total net assets is not material; therefore, the roll-forward of Level 3 securities and assumptions are not shown for the period ended September 30, 2023.
(1) Amount is less than $500 (not in thousands).
See Notes to Financial Statements
Newfleet Low Duration Core Plus Bond Fund
SCHEDULE OF INVESTMENTS
September 30, 2023
($ reported in thousands)
| | Par Value | | Value |
| U.S. Government Securities—6.7% |
| U.S. Treasury Notes | | | |
| 2.500%, 4/30/24 | $ 1,145 | | $ 1,126 |
| 4.125%, 1/31/25 | 8,145 | | 8,019 |
| 0.250%, 5/31/25 | 2,405 | | 2,218 |
| 5.000%, 8/31/25(1) | 6,390 | | 6,377 |
| 4.375%, 8/15/26 | 8,590 | | 8,483 |
Total U.S. Government Securities
(Identified Cost $26,413) | | 26,223 |
| | | | |
| |
| | | | |
| |
| Foreign Government Securities—0.3% |
Dominican Republic 144A
5.500%, 2/22/29(2) | 1,090 | | 997 |
Republic of South Africa
5.875%, 9/16/25 | 265 | | 261 |
Total Foreign Government Securities
(Identified Cost $1,365) | | 1,258 |
| | | | |
| |
| | | | |
| |
| Mortgage-Backed Securities—28.1% |
| Agency—3.8% | | |
| Federal Home Loan Mortgage Corporation | | | |
Pool #SB8269
6.000%, 10/1/38 | 3,000 | | 3,007 |
Pool #SD3238
5.500%, 12/1/52 | 1,275 | | 1,233 |
Pool #SD8309
6.000%, 3/1/53 | 3,924 | | 3,874 |
| Federal National Mortgage Association | | | |
Pool #AC3654
5.000%, 10/1/39 | 62 | | 61 |
Pool #AD3841
4.500%, 4/1/40 | 19 | | 18 |
Pool #AD6058
4.000%, 8/1/25 | 4 | | 4 |
Pool #AL7532
3.000%, 11/1/27 | 114 | | 109 |
Pool #AO5149
3.000%, 6/1/27 | 31 | | 30 |
Pool #AS5730
3.000%, 9/1/30 | 312 | | 291 |
Pool #FS4438
5.000%, 11/1/52 | 2,248 | | 2,123 |
Pool #MA0908
4.000%, 11/1/31 | 86 | | 80 |
Pool #MA3663
3.500%, 5/1/49 | 171 | | 149 |
Pool #MA4805
4.500%, 11/1/52 | 2,231 | | 2,049 |
Pool #MA5072
5.500%, 7/1/53 | 2,137 | | 2,066 |
Government National Mortgage Association Pool #780023
7.000%, 9/15/24 | — (3) | | — (3) |
| | | | 15,094 |
| | | | |
| |
| | Par Value | | Value |
| | | | |
| Non-Agency—24.3% | | |
Ajax Mortgage Loan Trust 2019-D, A1 144A
2.956%, 9/25/65(2)(4) | $ 420 | | $ 384 |
American Homes 4 Rent Trust 2015-SFR1, A 144A
3.467%, 4/17/52(2) | 168 | | 162 |
| AMSR Trust | | | |
2020-SFR1, B 144A
2.120%, 4/17/37(2) | 940 | | 881 |
2020-SFR3, B 144A
1.806%, 9/17/37(2) | 2,400 | | 2,200 |
2021-SFR2, C 144A
1.877%, 8/17/38(2) | 1,010 | | 883 |
| Angel Oak Mortgage Trust | | | |
2020-4, A1 144A
1.469%, 6/25/65(2)(4) | 784 | | 724 |
2020-R1, A2 144A
1.247%, 4/25/53(2)(4) | 632 | | 568 |
2021-8, A1 144A
1.820%, 11/25/66(2)(4) | 2,288 | | 1,880 |
Angel Oak SB Commercial Mortgage Trust 2020-SBC1, A1 144A
2.068%, 5/25/50(2)(4) | 75 | | 68 |
| Arroyo Mortgage Trust | | | |
2019-1, A1 144A
3.805%, 1/25/49(2)(4) | 939 | | 864 |
2020-1, A1B 144A
2.100%, 3/25/55(2) | 871 | | 794 |
BBCMS Mortgage Trust 2018-TALL, A (1 month Term SOFR + 0.919%, Cap N/A, Floor 0.872%) 144A
6.252%, 3/15/37(2)(4) | 770 | | 712 |
| BPR Trust | | | |
2021-KEN, A (1 month Term SOFR + 1.364%, Cap N/A, Floor 1.250%) 144A
6.696%, 2/15/29(2)(4) | 755 | | 746 |
2022-OANA, A (1 month Term SOFR + 1.898%, Cap N/A, Floor 1.898%) 144A
7.230%, 4/15/37(2)(4) | 1,525 | | 1,498 |
Bunker Hill Loan Depositary Trust 2019-2, A1 144A
2.879%, 7/25/49(2)(4) | 394 | | 364 |
BX Commercial Mortgage Trust 2019-XL, C (1 month Term SOFR + 1.364%, Cap N/A, Floor 1.250%) 144A
6.697%, 10/15/36(2)(4) | 880 | | 873 |
| BX Trust | | | |
2018-GW, B (1 month Term SOFR + 1.317%, Cap N/A, Floor 1.270%) 144A
6.650%, 5/15/35(2)(4) | 1,265 | | 1,243 |
| | Par Value | | Value |
| | | | |
| Non-Agency—continued | | |
2019-OC11, B 144A
3.605%, 12/9/41(2) | $ 811 | | $ 684 |
2022-CLS, A 144A
5.760%, 10/13/27(2) | 2,212 | | 2,134 |
Cascade MH Asset Trust 2021-MH1, A1 144A
1.753%, 2/25/46(2) | 2,096 | | 1,763 |
CENT Trust 2023-CITY, A (1 month Term SOFR + 2.620%, Cap N/A, Floor 2.620%) 144A
7.952%, 9/15/28(2)(4) | 425 | | 425 |
| Chase Mortgage Finance Corp. | | | |
2016-SH1, M2 144A
3.750%, 4/25/45(2)(4) | 197 | | 173 |
2016-SH2, M2 144A
3.750%, 12/25/45(2)(4) | 359 | | 313 |
Citigroup Mortgage Loan Trust, Inc. 2019-RP1, A1 144A
3.500%, 1/25/66(2)(4) | 954 | | 894 |
COLT Funding LLC 2021-3R, A1 144A
1.051%, 12/25/64(2)(4) | 899 | | 770 |
| COLT Mortgage Loan Trust | | | |
2022-3, A1 144A
3.901%, 2/25/67(2)(4) | 1,875 | | 1,686 |
2022-4, A1 144A
4.301%, 3/25/67(2)(4) | 609 | | 571 |
2021-2R, A1 144A
0.798%, 7/27/54(2) | 314 | | 268 |
COMM Mortgage Trust 2020-CBM, B 144A
3.099%, 2/10/37(2) | 1,035 | | 967 |
CoreVest American Finance Issuer LLC 2021-RTL1, A1 144A
2.239%, 3/28/29(2)(4) | 950 | | 878 |
| CoreVest American Finance Trust | | | |
2020-1, A1 144A
1.832%, 3/15/50(2) | 1,444 | | 1,374 |
2020-4, A 144A
1.174%, 12/15/52(2) | 1,182 | | 1,073 |
Credit Suisse Mortgage Capital Certificates 2019-ICE4, A (1 month Term SOFR + 1.027%, Cap N/A, Floor 0.980%) 144A
6.360%, 5/15/36(2)(4) | 1,451 | | 1,450 |
| Credit Suisse Mortgage Capital Trust | | | |
2017-RPL1, A1 144A
2.750%, 7/25/57(2)(4) | 608 | | 572 |
2020-RPL4, A1 144A
2.000%, 1/25/60(2)(4) | 2,413 | | 2,047 |
Deephaven Residential Mortgage Trust 2022-1, A1 144A
2.205%, 1/25/67(2)(4) | 99 | | 86 |
See Notes to Financial Statements
Newfleet Low Duration Core Plus Bond Fund
SCHEDULE OF INVESTMENTS (Continued)
September 30, 2023
($ reported in thousands)
| | Par Value | | Value |
| | | | |
| Non-Agency—continued | | |
| Ellington Financial Mortgage Trust | | | |
2019-2, A3 144A
3.046%, 11/25/59(2)(4) | $ 218 | | $ 198 |
2020-1, A1 144A
2.006%, 5/25/65(2)(4) | 325 | | 310 |
2020-2, A1 144A
1.178%, 10/25/65(2)(4) | 1,339 | | 1,193 |
2021-1, A2 144A
1.003%, 2/25/66(2)(4) | 440 | | 360 |
Extended Stay America Trust 2021-ESH, C (1 month Term SOFR + 1.814%, Cap N/A, Floor 1.700%) 144A
7.146%, 7/15/38(2)(4) | 1,026 | | 1,011 |
| FirstKey Homes Trust | | | |
2020-SFR1, B 144A
1.740%, 8/17/37(2) | 440 | | 403 |
2020-SFR2, B 144A
1.567%, 10/19/37(2) | 2,045 | | 1,857 |
2021-SFR1, D 144A
2.189%, 8/17/38(2) | 1,050 | | 915 |
| Galton Funding Mortgage Trust | | | |
2018-1, A23 144A
3.500%, 11/25/57(2)(4) | 42 | | 37 |
2019-2, A52 144A
3.500%, 6/25/59(2)(4) | 397 | | 343 |
GCAT Trust 2020-NQM1, A1 144A
2.247%, 1/25/60(2)(4) | 88 | | 82 |
GCT Commercial Mortgage Trust 2021-GCT, A (1 month Term SOFR + 0.914%, Cap N/A, Floor 0.800%) 144A
6.247%, 2/15/38(2)(4) | 2,085 | | 1,637 |
Goldman Sachs Mortgage Securities Trust 2020-GC45, AS
3.173%, 2/13/53(4) | 1,426 | | 1,144 |
Homes Trust 2023-NQM2, A1 144A
6.456%, 2/25/68(2)(4) | 1,146 | | 1,144 |
INTOWN Mortgage Trust 2022-STAY, A (1 month Term SOFR + 2.489%, Cap N/A, Floor 2.489%) 144A
7.821%, 8/15/39(2)(4) | 1,765 | | 1,767 |
| JPMBB Commercial Mortgage Securities Trust | | | |
2014-C18, AS
4.439%, 2/15/47(4) | 1,395 | | 1,365 |
2015-C32, AS
3.984%, 11/15/48 | 2,200 | | 2,029 |
| JPMorgan Chase Mortgage Trust | | | |
2014-1, 2A12 144A
3.500%, 1/25/44(2)(4) | 97 | | 86 |
| | Par Value | | Value |
| | | | |
| Non-Agency—continued | | |
2015-1, AM1 144A
6.565%, 12/25/44(2)(4) | $ 35 | | $ 34 |
2015-5, A2 144A
6.651%, 5/25/45(2)(4) | 204 | | 200 |
2017-3, 2A2 144A
2.500%, 8/25/47(2)(4) | 192 | | 160 |
2017-5, A1 144A
3.542%, 10/26/48(2)(4) | 257 | | 252 |
KNDL Mortgage Trust 2019-KNSQ, A (1 month Term SOFR + 0.996%, Cap N/A, Floor 0.800%) 144A
6.328%, 5/15/36(2)(4) | 1,040 | | 1,035 |
LHOME Mortgage Trust 2021-RTL1, A1 144A
2.090%, 2/25/26(2)(4) | 232 | | 231 |
| MetLife Securitization Trust | | | |
2018-1A, A 144A
3.750%, 3/25/57(2)(4) | 1,351 | | 1,241 |
2019-1A, A1A 144A
3.750%, 4/25/58(2)(4) | 1,728 | | 1,646 |
| MFA Trust | | | |
2020-NQM3, A1 144A
1.014%, 1/26/65(2)(4) | 700 | | 618 |
2021-INV1, A1 144A
0.852%, 1/25/56(2)(4) | 116 | | 103 |
Mill City Mortgage Loan Trust 2021-NMR1, A1 144A
1.125%, 11/25/60(2)(4) | 576 | | 527 |
Morgan Stanley Residential Mortgage Loan Trust 2014-1A, B2 144A
6.815%, 6/25/44(2)(4) | 207 | | 207 |
| New Residential Mortgage Loan Trust | | | |
2014-1A, A 144A
3.750%, 1/25/54(2)(4) | 450 | | 415 |
2015-2A, A1 144A
3.750%, 8/25/55(2)(4) | 480 | | 437 |
2016-1A, A1 144A
3.750%, 3/25/56(2)(4) | 267 | | 243 |
2016-3A, A1 144A
3.750%, 9/25/56(2)(4) | 281 | | 256 |
2016-4A, A1 144A
3.750%, 11/25/56(2)(4) | 1,223 | | 1,113 |
2017-2A, A3 144A
4.000%, 3/25/57(2)(4) | 773 | | 711 |
2014-3A, AFX3 144A
3.750%, 11/25/54(2)(4) | 1,067 | | 955 |
2016-2A, A1 144A
3.750%, 11/26/35(2)(4) | 616 | | 568 |
2018-1A, A1A 144A
4.000%, 12/25/57(2)(4) | 1,881 | | 1,747 |
NYMT Loan Trust 2022-CP1, A1 144A
2.042%, 7/25/61(2) | 2,106 | | 1,864 |
OBX Trust 2018-1, A2 (1 month Term SOFR + 0.764%) 144A
6.084%, 6/25/57(2)(4) | 96 | | 91 |
| | Par Value | | Value |
| | | | |
| Non-Agency—continued | | |
PRET LLC 2021-RN3, A1 144A
1.843%, 9/25/51(2)(4) | $ 1,091 | | $ 987 |
| Progress Residential Trust | | | |
2019-SFR3, B 144A
2.571%, 9/17/36(2) | 850 | | 818 |
2021-SFR3, C 144A
2.088%, 5/17/26(2) | 500 | | 443 |
2021-SFR3, D 144A
2.288%, 5/17/26(2) | 1,010 | | 891 |
2020-SFR3, A 144A
1.294%, 10/17/27(2) | 342 | | 311 |
2021-SFR1, C 144A
1.555%, 4/17/38(2) | 1,050 | | 926 |
Provident Funding Mortgage Trust 2019-1, A2 144A
3.000%, 12/25/49(2)(4) | 98 | | 80 |
| Residential Mortgage Loan Trust | | | |
2019-2, A1 144A
2.913%, 5/25/59(2)(4) | 85 | | 84 |
2020-1, A1 144A
2.376%, 1/26/60(2)(4) | 1,932 | | 1,826 |
SG Residential Mortgage Trust 2021-1, A3 144A
1.560%, 7/25/61(2)(4) | 395 | | 302 |
| Starwood Mortgage Residential Trust | | | |
2020-1, A1 144A
2.275%, 2/25/50(2)(4) | 65 | | 60 |
2020-3, A1 144A
1.486%, 4/25/65(2)(4) | 209 | | 193 |
2021-3, A3 144A
1.518%, 6/25/56(2)(4) | 285 | | 222 |
| Towd Point Mortgage Trust | | | |
2016-1, M1 144A
3.500%, 2/25/55(2)(4) | 718 | | 705 |
2016-2, M2 144A
3.000%, 8/25/55(2)(4) | 3,370 | | 2,998 |
2017-1, A2 144A
3.500%, 10/25/56(2)(4) | 2,355 | | 2,266 |
2018-2, A2 144A
3.500%, 3/25/58(2)(4) | 1,565 | | 1,422 |
2018-3, A1 144A
3.750%, 5/25/58(2)(4) | 678 | | 642 |
2018-6, A1A 144A
3.750%, 3/25/58(2)(4) | 809 | | 783 |
2019-1, A1 144A
3.750%, 3/25/58(2)(4) | 274 | | 255 |
2019-HY2, M1 (1 month Term SOFR + 1.714%, Cap N/A, Floor 1.600%) 144A
7.034%, 5/25/58(2)(4) | 1,450 | | 1,450 |
2017-6, A2 144A
3.000%, 10/25/57(2)(4) | 1,170 | | 1,040 |
| VCAT LLC | | | |
2021-NPL2, A1 144A
2.115%, 3/27/51(2)(4) | 580 | | 552 |
2021-NPL6, A1 144A
1.917%, 9/25/51(2)(4) | 1,016 | | 934 |
See Notes to Financial Statements
Newfleet Low Duration Core Plus Bond Fund
SCHEDULE OF INVESTMENTS (Continued)
September 30, 2023
($ reported in thousands)
| | Par Value | | Value |
| | | | |
| Non-Agency—continued | | |
| Verus Securitization Trust | | | |
2019-INV2, A1 144A
3.913%, 7/25/59(2)(4) | $ 477 | | $ 460 |
2021-3, A1 144A
1.046%, 6/25/66(2)(4) | 1,511 | | 1,253 |
2022-7, A1 144A
5.152%, 7/25/67(2)(4) | 2,889 | | 2,811 |
2020-1, A1 144A
2.417%, 1/25/60(2)(4) | 478 | | 451 |
2021-R1, A1 144A
0.820%, 10/25/63(2)(4) | 831 | | 738 |
2021-R2, A1 144A
0.918%, 2/25/64(2)(4) | 250 | | 212 |
| Visio Trust | | | |
2019-2, A1 144A
2.722%, 11/25/54(2)(4) | 1,966 | | 1,843 |
2021-1R, A1 144A
1.280%, 5/25/56(2) | 1,504 | | 1,359 |
| Wells Fargo Commercial Mortgage Trust | | | |
2014-C24, AS
3.931%, 11/15/47 | 1,140 | | 1,028 |
2015-P2, A3
3.541%, 12/15/48 | 1,382 | | 1,309 |
Wells Fargo Mortgage Backed Securities Trust 2020-4, A1 144A
3.000%, 7/25/50(2)(4) | 258 | | 206 |
| | | | 95,367 |
| | | | |
| |
Total Mortgage-Backed Securities
(Identified Cost $119,656) | | 110,461 |
| | | | |
| |
| | | | |
| |
| Asset-Backed Securities—34.5% |
| Automobiles—18.5% | | |
ACC Trust 2021-1, C 144A
2.080%, 12/20/24(2) | 899 | | 883 |
| American Credit Acceptance Receivables Trust | | | |
2021-1, C 144A
0.830%, 3/15/27(2) | 294 | | 292 |
2021-3, C 144A
0.980%, 11/15/27(2) | 801 | | 791 |
Arivo Acceptance Auto Loan Receivables Trust 2022-2A, A 144A
6.900%, 1/16/29(2) | 552 | | 549 |
| Avid Automobile Receivables Trust | | | |
2021-1, D 144A
1.990%, 4/17/28(2) | 400 | | 376 |
2023-1, A 144A
6.630%, 7/15/26(2) | 807 | | 806 |
| Avis Budget Rental Car Funding LLC | | | |
(AESOP) 2020-1A, A 144A
2.330%, 8/20/26(2) | 1,475 | | 1,382 |
| | Par Value | | Value |
| | | | |
| Automobiles—continued | | |
(AESOP) 2020-2A, A 144A
2.020%, 2/20/27(2) | $ 400 | | $ 365 |
(AESOP) 2021-1A, A 144A
1.380%, 8/20/27(2) | 1,750 | | 1,544 |
(AESOP) 2023-3A, A 144A
5.440%, 2/22/28(2) | 1,181 | | 1,160 |
| Carvana Auto Receivables Trust | | | |
2019-3A, D 144A
3.040%, 4/15/25(2) | 142 | | 141 |
2019-3A, E 144A
4.600%, 7/15/26(2) | 1,445 | | 1,429 |
2020-N1A, D 144A
3.430%, 1/15/26(2) | 544 | | 540 |
2020-P1, B
0.920%, 11/9/26 | 1,340 | | 1,227 |
2021-N1, C
1.300%, 1/10/28 | 439 | | 410 |
2021-N2, C
1.070%, 3/10/28 | 552 | | 511 |
2021-N3, D
1.580%, 6/12/28 | 1,367 | | 1,295 |
2022-N1, C 144A
3.320%, 12/11/28(2) | 1,297 | | 1,260 |
2023-N1, C 144A
5.920%, 7/10/29(2) | 1,109 | | 1,082 |
CIG Auto Receivables Trust 2021-1A, D 144A
2.110%, 4/12/27(2) | 1,985 | | 1,853 |
| CPS Auto Receivables Trust | | | |
2019-D, E 144A
3.860%, 10/15/25(2) | 1,864 | | 1,841 |
2022-D, D 144A
8.730%, 1/16/29(2) | 1,335 | | 1,383 |
Credit Acceptance Auto Loan Trust 2023-2A, A 144A
5.920%, 5/16/33(2) | 920 | | 910 |
| DT Auto Owner Trust | | | |
2020-2A, C 144A
3.280%, 3/16/26(2) | 287 | | 286 |
2021-2A, C 144A
1.100%, 2/16/27(2) | 2,015 | | 1,970 |
2023-1A, B 144A
5.190%, 10/16/28(2) | 1,534 | | 1,511 |
2023-3A, C 144A
6.400%, 5/15/29(2) | 650 | | 647 |
| Exeter Automobile Receivables Trust | | | |
2019-2A, E 144A
4.680%, 5/15/26(2) | 1,605 | | 1,595 |
2020-1A, D 144A
2.730%, 12/15/25(2) | 633 | | 621 |
2020-3A, E 144A
3.440%, 8/17/26(2) | 1,985 | | 1,908 |
2022-3A, C
5.300%, 9/15/27 | 895 | | 882 |
2023-2A, B
5.610%, 9/15/27 | 1,150 | | 1,137 |
| | Par Value | | Value |
| | | | |
| Automobiles—continued | | |
FHF Trust 2023-1A, A2 144A
6.570%, 6/15/28(2) | $ 1,188 | | $ 1,176 |
| First Investors Auto Owner Trust | | | |
2021-1A, B 144A
0.890%, 3/15/27(2) | 1,597 | | 1,579 |
2021-1A, C 144A
1.170%, 3/15/27(2) | 1,895 | | 1,819 |
2021-2A, C 144A
1.470%, 11/15/27(2) | 1,845 | | 1,687 |
| Foursight Capital Automobile Receivables Trust | | | |
2022-1, B 144A
2.150%, 5/17/27(2) | 1,610 | | 1,521 |
2023-1, A3 144A
5.390%, 12/15/27(2) | 1,435 | | 1,409 |
2023-2, A2 144A
5.990%, 5/15/28(2) | 875 | | 873 |
| GLS Auto Receivables Issuer Trust | | | |
2019-4A, D 144A
4.090%, 8/17/26(2) | 801 | | 786 |
2020-4A, C 144A
1.140%, 11/17/25(2) | 353 | | 350 |
2021-3A, C 144A
1.110%, 9/15/26(2) | 1,055 | | 1,018 |
2022-2A, C 144A
5.300%, 4/17/28(2) | 1,825 | | 1,785 |
2022-2A, D 144A
6.150%, 4/17/28(2) | 1,775 | | 1,744 |
GLS Auto Select Receivables Trust 2023-1A, B 144A
6.090%, 3/15/29(2) | 1,315 | | 1,296 |
Hertz Vehicle Financing III LLC 2022-1A, C 144A
2.630%, 6/25/26(2) | 1,000 | | 932 |
| LAD Auto Receivables Trust | | | |
2021-1A, D 144A
3.990%, 11/15/29(2) | 2,000 | | 1,870 |
2022-1A, A 144A
5.210%, 6/15/27(2) | 1,199 | | 1,190 |
2023-2A, D 144A
6.300%, 2/15/31(2) | 825 | | 806 |
Lobel Automobile Receivables Trust 2023-1, A 144A
6.970%, 7/15/26(2) | 876 | | 876 |
OCCU Auto Receivables Trust 2023-1A, A2 144A
6.230%, 4/15/27(2) | 1,181 | | 1,181 |
OneMain Direct Auto Receivables Trust 2022-1A, C 144A
5.310%, 6/14/29(2) | 1,210 | | 1,162 |
Oscar U.S. Funding XV LLC 2023-1A, A3 144A
5.810%, 12/10/27(2) | 1,100 | | 1,093 |
Santander Consumer Auto Receivables Trust 2021-AA, C 144A
1.030%, 11/16/26(2) | 590 | | 549 |
See Notes to Financial Statements
Newfleet Low Duration Core Plus Bond Fund
SCHEDULE OF INVESTMENTS (Continued)
September 30, 2023
($ reported in thousands)
| | Par Value | | Value |
| | | | |
| Automobiles—continued | | |
| Santander Drive Auto Receivables Trust | | | |
2022-5, C
4.740%, 10/16/28 | $ 1,155 | | $ 1,123 |
2022-7, A2
5.810%, 1/15/26 | 587 | | 587 |
Tesla Auto Lease Trust 2023-A, B 144A
6.410%, 7/20/27(2) | 1,090 | | 1,085 |
Tidewater Auto Receivables Trust 2020-AA, C 144A
1.910%, 9/15/26(2) | 45 | | 45 |
| Tricolor Auto Securitization Trust | | | |
2022-1A, C 144A
4.710%, 8/15/25(2) | 1,725 | | 1,702 |
2023-1A, B 144A
6.840%, 11/16/26(2) | 1,455 | | 1,448 |
| United Auto Credit Securitization Trust | | | |
2021-1, D 144A
1.140%, 6/10/26(2) | 730 | | 725 |
2023-1, B 144A
5.910%, 7/10/28(2) | 1,434 | | 1,424 |
| Westlake Automobile Receivables Trust | | | |
2020-3A, C 144A
1.240%, 11/17/25(2) | 404 | | 401 |
2021-3A, D 144A
2.120%, 1/15/27(2) | 2,015 | | 1,878 |
2022-1A, B 144A
2.750%, 3/15/27(2) | 1,825 | | 1,785 |
2023-1A, C 144A
5.740%, 8/15/28(2) | 1,100 | | 1,087 |
| | | | 72,579 |
| | | | |
| |
| Collateralized Loan Obligations—0.5% | | |
GoldenTree Loan Management US CLO 1 Ltd. 2021-9A, A (3 month Term SOFR + 1.332%, Cap N/A, Floor 1.070%) 144A
6.658%, 1/20/33(2)(4) | 1,435 | | 1,428 |
Palmer Square Loan Funding Ltd. 2021-1A, A1 (3 month Term SOFR + 1.162%, Cap N/A, Floor 1.162%) 144A
6.488%, 4/20/29(2)(4) | 612 | | 610 |
| | | | 2,038 |
| | | | |
| |
| Consumer Loans—2.7% | | |
ACHV ABS Trust 2023-3PL, B 144A
7.170%, 8/19/30(2) | 1,090 | | 1,095 |
Affirm Asset Securitization Trust 2022-A, 1A 144A
4.300%, 5/17/27(2) | 1,113 | | 1,089 |
| | Par Value | | Value |
| | | | |
| Consumer Loans—continued | | |
Lendingpoint Asset Securitization Trust 2022-A, B 144A
2.410%, 6/15/29(2) | $ 803 | | $ 800 |
Marlette Funding Trust 2023-2A, B 144A
6.540%, 6/15/33(2) | 1,154 | | 1,150 |
Oportun Issuance Trust 2021-C, A 144A
2.180%, 10/8/31(2) | 1,970 | | 1,791 |
Reach ABS Trust 2023-1A, B 144A
7.330%, 2/18/31(2) | 1,025 | | 1,023 |
Regional Management Issuance Trust 2021-1, A 144A
1.680%, 3/17/31(2) | 1,815 | | 1,708 |
Republic Finance Issuance Trust 2020-A, A 144A
2.470%, 11/20/30(2) | 1,020 | | 992 |
Upstart Securitization Trust 2021-2, B 144A
1.750%, 6/20/31(2) | 1,146 | | 1,132 |
| | | | 10,780 |
| | | | |
| |
| Credit Card—1.3% | | |
Avant Credit Card Master Trust 2021-1A, A 144A
1.370%, 4/15/27(2) | 1,875 | | 1,741 |
Discover Card Execution Note Trust 2023-A2, A
4.930%, 6/15/28 | 1,300 | | 1,284 |
Genesis Sales Finance Master Trust 2021-AA, A 144A
1.200%, 12/21/26(2) | 700 | | 665 |
Mercury Financial Credit Card Master Trust 2023-1A, A 144A
8.040%, 9/20/27(2) | 1,452 | | 1,457 |
| | | | 5,147 |
| | | | |
| |
| Equipment—1.3% | | |
CLI Funding VI LLC 2020-1A, A 144A
2.080%, 9/18/45(2) | 1,626 | | 1,404 |
NMEF Funding LLC 2021-A, B 144A
1.850%, 12/15/27(2) | 2,659 | | 2,618 |
Post Road Equipment Finance 2022-1A, B 144A
5.150%, 1/16/29(2) | 1,210 | | 1,171 |
| | | | 5,193 |
| | | | |
| |
| Other—10.2% | | |
Amur Equipment Finance Receivables XII LLC 2023-1A, A2 144A
6.090%, 12/20/29(2) | 1,300 | | 1,301 |
| | Par Value | | Value |
| | | | |
| Other—continued | | |
| Aqua Finance Trust | | | |
2017-A, A 144A
3.720%, 11/15/35(2) | $ 293 | | $ 290 |
2019-A, A 144A
3.140%, 7/16/40(2) | 301 | | 279 |
2019-A, C 144A
4.010%, 7/16/40(2) | 1,765 | | 1,596 |
Arby’s Funding LLC 2020-1A, A2 144A
3.237%, 7/30/50(2) | 1,787 | | 1,582 |
BHG Securitization Trust 2021-B, B 144A
1.670%, 10/17/34(2) | 1,495 | | 1,331 |
BXG Receivables Note Trust 2020-A, B 144A
2.490%, 2/28/36(2) | 551 | | 499 |
| CCG Receivables Trust | | | |
2021-1, C 144A
0.840%, 6/14/27(2) | 1,510 | | 1,435 |
2023-1, A2 144A
5.820%, 9/16/30(2) | 500 | | 499 |
Commercial Equipment Finance LLC 2021-A, A 144A
2.050%, 2/16/27(2) | 350 | | 340 |
Dext ABS LLC 2023-1, A2 144A
5.990%, 3/15/32(2) | 695 | | 684 |
| Diamond Resorts Owner Trust | | | |
2019-1A, B 144A
3.530%, 2/20/32(2) | 345 | | 345 |
2021-1A, A 144A
1.510%, 11/21/33(2) | 607 | | 557 |
Elara HGV Timeshare Issuer LLC 2023-A, A 144A
6.160%, 2/25/38(2) | 943 | | 944 |
| Foundation Finance Trust | | | |
2019-1A, A 144A
3.860%, 11/15/34(2) | 224 | | 221 |
2023-2A, A 144A
6.530%, 6/15/49(2) | 983 | | 983 |
FREED ABS Trust 2022-1FP, C 144A
2.510%, 3/19/29(2) | 1,205 | | 1,180 |
GCI Funding I LLC 2021-1, A 144A
2.380%, 6/18/46(2) | 1,114 | | 941 |
Hardee’s Funding LLC 2020-1A, A2 144A
3.981%, 12/20/50(2) | 1,906 | | 1,604 |
| Hilton Grand Vacations Trust | | | |
2017-AA, A 144A
2.660%, 12/26/28(2) | 69 | | 69 |
2018-AA, A 144A
3.540%, 2/25/32(2) | 225 | | 218 |
HIN Timeshare Trust 2020-A, C 144A
3.420%, 10/9/39(2) | 859 | | 790 |
See Notes to Financial Statements
Newfleet Low Duration Core Plus Bond Fund
SCHEDULE OF INVESTMENTS (Continued)
September 30, 2023
($ reported in thousands)
| | Par Value | | Value |
| | | | |
| Other—continued | | |
Jersey Mike’s Funding 2019-1A, A2 144A
4.433%, 2/15/50(2) | $ 2,193 | | $ 2,014 |
LL ABS Trust 2021-1A, A 144A
1.070%, 5/15/29(2) | 239 | | 236 |
Mariner Finance Issuance Trust 2020-AA, A 144A
2.190%, 8/21/34(2) | 967 | | 938 |
| MVW LLC | | | |
2020-1A, A 144A
1.740%, 10/20/37(2) | 1,111 | | 1,023 |
2021-1WA, B 144A
1.440%, 1/22/41(2) | 575 | | 518 |
MVW Owner Trust 2019-1A, A 144A
2.890%, 11/20/36(2) | 241 | | 231 |
NBC Funding LLC 2021-1, A2 144A
2.989%, 7/30/51(2) | 1,925 | | 1,670 |
| NMEF Funding LLC | | | |
2022-A, B 144A
3.350%, 10/16/28(2) | 1,480 | | 1,406 |
2023-A, B 144A
6.830%, 6/17/30(2) | 1,000 | | 996 |
Oasis Securitization Funding LLC 2021-2A, A 144A
2.143%, 10/15/33(2) | 377 | | 375 |
| Octane Receivables Trust | | | |
2020-1A, B 144A
1.980%, 6/20/25(2) | 1,474 | | 1,463 |
2021-1A, A 144A
0.930%, 3/22/27(2) | 351 | | 344 |
2023-1A, C 144A
6.370%, 9/20/29(2) | 1,450 | | 1,425 |
2023-3A, B 144A
6.480%, 7/20/29(2) | 1,179 | | 1,179 |
Orange Lake Timeshare Trust 2019-A, B 144A
3.360%, 4/9/38(2) | 260 | | 249 |
Purchasing Power Funding LLC 2021-A, A 144A
1.570%, 10/15/25(2) | 232 | | 231 |
| Sierra Timeshare Receivables Funding LLC | | | |
2019-1A, B 144A
3.420%, 1/20/36(2) | 138 | | 134 |
2019-2A, B 144A
2.820%, 5/20/36(2) | 143 | | 139 |
2020-2A, B 144A
2.320%, 7/20/37(2) | 505 | | 477 |
2023-2A, B 144A
6.280%, 4/20/40(2) | 826 | | 819 |
Taco Bell Funding LLC 2016-1A, A23 144A
4.970%, 5/25/46(2) | 652 | | 628 |
TRP LLC 2021-1, A 144A
2.070%, 6/19/51(2) | 519 | | 447 |
| | Par Value | | Value |
| | | | |
| Other—continued | | |
VFI ABS LLC 2022-1A, B 144A
3.040%, 7/24/28(2) | $ 2,443 | | $ 2,320 |
| Westgate Resorts LLC | | | |
2020-1A, A 144A
2.713%, 3/20/34(2) | 267 | | 262 |
2022-1A, B 144A
2.288%, 8/20/36(2) | 901 | | 853 |
ZAXBY’S Funding LLC 2021-1A, A2 144A
3.238%, 7/30/51(2) | 2,347 | | 1,948 |
| | | | 40,013 |
| | | | |
| |
| Student Loan—0.0% | | |
Commonbond Student Loan Trust 2017-AGS, A1 144A
2.550%, 5/25/41(2) | 90 | | 83 |
Navient Private Education Loan Trust 2017-A, A2A 144A
2.880%, 12/16/58(2) | 41 | | 40 |
| | | | 123 |
| | | | |
| |
Total Asset-Backed Securities
(Identified Cost $141,852) | | 135,873 |
| | | | |
| |
| | | | |
| |
| Corporate Bonds and Notes—21.8% |
| Communication Services—0.6% | | |
CCO Holdings LLC 144A
6.375%, 9/1/29(2) | 216 | | 201 |
Level 3 Financing, Inc. 144A
4.625%, 9/15/27(2) | 595 | | 428 |
Sprint Capital Corp.
6.875%, 11/15/28 | 665 | | 687 |
Sprint Spectrum Co. LLC 144A
4.738%, 9/20/29(2) | 90 | | 89 |
TripAdvisor, Inc. 144A
7.000%, 7/15/25(2) | 900 | | 898 |
| | | | 2,303 |
| | | | |
| |
| Consumer Discretionary—0.8% | | |
Ashtead Capital, Inc. 144A
4.375%, 8/15/27(2) | 1,600 | | 1,487 |
Clarios Global LP 144A
6.750%, 5/15/28(2) | 95 | | 93 |
Ford Motor Credit Co. LLC
7.350%, 11/4/27 | 525 | | 535 |
MDC Holdings, Inc.
2.500%, 1/15/31 | 840 | | 627 |
| Nissan Motor Acceptance Co. LLC | | | |
| 144A 6.950%, 9/15/26(2) | 195 | | 197 |
| 144A 7.050%, 9/15/28(2) | 315 | | 315 |
| | | | 3,254 |
| | | | |
| |
| Consumer Staples—0.5% | | |
BAT Capital Corp.
2.259%, 3/25/28 | 970 | | 820 |
| | Par Value | | Value |
| | | | |
| Consumer Staples—continued | | |
Central American Bottling Corp. 144A
5.250%, 4/27/29(2) | $ 495 | | $ 445 |
Coty, Inc. 144A
6.625%, 7/15/30(2) | 615 | | 600 |
| | | | 1,865 |
| | | | |
| |
| Energy—1.7% | | |
Boardwalk Pipelines LP
4.950%, 12/15/24 | 955 | | 941 |
BP Capital Markets plc
4.875% (5) | 1,115 | | 996 |
Civitas Resources, Inc. 144A
8.375%, 7/1/28(2) | 325 | | 331 |
Enbridge, Inc.
7.375%, 1/15/83 | 1,155 | | 1,098 |
Energy Transfer LP
4.200%, 4/15/27 | 690 | | 650 |
| EQM Midstream Partners LP | | | |
| 144A 6.000%, 7/1/25(2) | 403 | | 397 |
| 144A 7.500%, 6/1/27(2) | 5 | | 5 |
Korea National Oil Corp. 144A
4.875%, 4/3/28(2) | 200 | | 195 |
NGPL PipeCo LLC 144A
4.875%, 8/15/27(2) | 954 | | 901 |
Petroleos Mexicanos
6.500%, 3/13/27 | 1,215 | | 1,065 |
| | | | 6,579 |
| | | | |
| |
| Financials—9.5% | | |
| AerCap Ireland Capital DAC | | | |
| 2.450%, 10/29/26 | 760 | | 681 |
| 3.000%, 10/29/28 | 150 | | 129 |
Series 3NC1
1.750%, 10/29/24 | 266 | | 254 |
Banco Santander Chile 144A
2.700%, 1/10/25(2) | 950 | | 908 |
| Bank of America Corp. | | | |
| 1.734%, 7/22/27 | 1,615 | | 1,431 |
| 2.551%, 2/4/28 | 719 | | 641 |
(3 month Term SOFR + 1.032%)
6.401%, 2/5/26(4) | 840 | | 841 |
| Barclays plc | | | |
| 7.325%, 11/2/26 | 370 | | 376 |
| 7.385%, 11/2/28 | 360 | | 369 |
| Blackstone Private Credit Fund | | | |
| 2.625%, 12/15/26 | 349 | | 300 |
| 4.000%, 1/15/29 | 415 | | 353 |
Blue Owl Credit Income Corp.
5.500%, 3/21/25 | 500 | | 484 |
BPCE S.A. 144A
5.975%, 1/18/27(2) | 610 | | 603 |
Brookfield Finance, Inc.
3.900%, 1/25/28 | 1,125 | | 1,036 |
Capital One Financial Corp.
6.312%, 6/8/29 | 672 | | 657 |
See Notes to Financial Statements
Newfleet Low Duration Core Plus Bond Fund
SCHEDULE OF INVESTMENTS (Continued)
September 30, 2023
($ reported in thousands)
| | Par Value | | Value |
| | | | |
| Financials—continued | | |
| Charles Schwab Corp. (The) | | | |
Series G
5.375%(5) | $ 275 | | $ 264 |
Series H
4.000%(5) | 830 | | 586 |
Citadel Finance LLC 144A
3.375%, 3/9/26(2) | 1,190 | | 1,073 |
| Citigroup, Inc. | | | |
| 3.200%, 10/21/26 | 410 | | 378 |
(3 month Term SOFR + 1.512%)
6.906%, 7/1/26(4) | 1,080 | | 1,099 |
(SOFR + 1.280%)
6.623%, 2/24/28(1)(4) | 962 | | 960 |
Citizens Bank N.A.
2.250%, 4/28/25 | 810 | | 750 |
Corebridge Financial, Inc.
6.875%, 12/15/52 | 939 | | 900 |
Credit Suisse AG
7.950%, 1/9/25 | 465 | | 473 |
| Danske Bank A/S | | | |
| 144A 3.773%, 3/28/25(2) | 500 | | 493 |
| 144A 1.621%, 9/11/26(2) | 673 | | 613 |
Drawbridge Special Opportunities Fund LP 144A
3.875%, 2/15/26(2) | 1,430 | | 1,272 |
Fifth Third Bancorp
4.055%, 4/25/28 | 255 | | 235 |
Fifth Third Bank N.A.
5.852%, 10/27/25 | 470 | | 462 |
| Goldman Sachs Group, Inc. (The) | | | |
(3 month Term SOFR + 1.432%)
6.796%, 5/15/26(4) | 475 | | 478 |
(3 month Term SOFR + 2.012%)
7.377%, 10/28/27(4) | 1,750 | | 1,794 |
Huntington Bancshares, Inc.
6.208%, 8/21/29 | 370 | | 362 |
Huntington National Bank (The)
5.699%, 11/18/25 | 292 | | 285 |
| JPMorgan Chase & Co. | | | |
| 1.578%, 4/22/27 | 970 | | 866 |
(SOFR + 1.180%)
6.523%, 2/24/28(1)(4) | 1,500 | | 1,498 |
Ladder Capital Finance Holdings LLLP 144A
4.250%, 2/1/27(2) | 1,135 | | 993 |
Liberty Mutual Group, Inc. 144A
4.125%, 12/15/51(2) | 1,385 | | 1,139 |
Lincoln National Corp. (3 month LIBOR + 2.040%)
7.628%, 4/20/67(4) | 1,394 | | 923 |
| Morgan Stanley | | | |
| 2.475%, 1/21/28 | 1,016 | | 906 |
| 6.296%, 10/18/28 | 339 | | 342 |
| 5.123%, 2/1/29 | 1,185 | | 1,141 |
| | Par Value | | Value |
| | | | |
| Financials—continued | | |
MSCI, Inc. 144A
3.625%, 9/1/30(2) | $ 612 | | $ 513 |
Navient Corp.
5.875%, 10/25/24 | 1,130 | | 1,112 |
Prudential Financial, Inc.
6.000%, 9/1/52 | 260 | | 238 |
| State Street Corp. | | | |
| 5.751%, 11/4/26 | 633 | | 631 |
| 5.820%, 11/4/28 | 495 | | 496 |
| Synchrony Financial | | | |
| 4.875%, 6/13/25 | 200 | | 192 |
| 3.700%, 8/4/26 | 304 | | 274 |
Texas Capital Bancshares, Inc.
4.000%, 5/6/31 | 1,020 | | 847 |
Toronto-Dominion Bank (The)
8.125%, 10/31/82 | 1,070 | | 1,064 |
Truist Bank
3.625%, 9/16/25 | 965 | | 912 |
UBS AG
5.650%, 9/11/28 | 600 | | 590 |
| Wells Fargo & Co. | | | |
| 3.526%, 3/24/28 | 700 | | 643 |
Series U
5.875%(4)(5) | 435 | | 427 |
| | | | 37,287 |
| | | | |
| |
| Health Care—1.6% | | |
DENTSPLY SIRONA, Inc.
3.250%, 6/1/30 | 1,060 | | 887 |
HCA, Inc.
5.200%, 6/1/28 | 627 | | 606 |
| Illumina, Inc. | | | |
| 5.800%, 12/12/25 | 420 | | 417 |
| 5.750%, 12/13/27 | 510 | | 501 |
IQVIA, Inc. 144A
5.700%, 5/15/28(2) | 835 | | 811 |
| Royalty Pharma plc | | | |
| 1.200%, 9/2/25 | 190 | | 173 |
| 1.750%, 9/2/27 | 1,155 | | 986 |
Universal Health Services, Inc.
1.650%, 9/1/26 | 1,205 | | 1,062 |
Utah Acquisition Sub, Inc.
3.950%, 6/15/26 | 273 | | 256 |
| Viatris, Inc. | | | |
| 2.300%, 6/22/27 | 716 | | 616 |
| 144A 2.300%, 6/22/27(2) | — (3) | | — (3) |
| | | | 6,315 |
| | | | |
| |
| Industrials—1.9% | | |
Alaska Airlines Pass-Through Trust 2020-1, A 144A
4.800%, 2/15/29(2) | 1,273 | | 1,221 |
Beacon Roofing Supply, Inc. 144A
6.500%, 8/1/30(2) | 220 | | 213 |
Boeing Co. (The)
4.875%, 5/1/25 | 335 | | 329 |
| | Par Value | | Value |
| | | | |
| Industrials—continued | | |
British Airways Pass-Through Trust 2021-1, A 144A
2.900%, 9/15/36(2) | $ 940 | | $ 778 |
Concentrix Corp.
6.650%, 8/2/26 | 525 | | 522 |
CoStar Group, Inc. 144A
2.800%, 7/15/30(2) | 843 | | 679 |
Hexcel Corp.
4.200%, 2/15/27 | 985 | | 912 |
Huntington Ingalls Industries, Inc.
2.043%, 8/16/28 | 973 | | 818 |
| Regal Rexnord Corp. | | | |
| 144A 6.050%, 2/15/26(2) | 256 | | 253 |
| 144A 6.050%, 4/15/28(2) | 391 | | 380 |
| 144A 6.300%, 2/15/30(2) | 450 | | 435 |
Veralto Corp. 144A
5.350%, 9/18/28(2) | 845 | | 836 |
| | | | 7,376 |
| | | | |
| |
| Information Technology—0.8% | | |
| Booz Allen Hamilton, Inc. | | | |
| 144A 3.875%, 9/1/28(2) | 184 | | 165 |
| 144A 4.000%, 7/1/29(2) | 861 | | 759 |
CDW LLC
3.276%, 12/1/28 | 527 | | 454 |
Kyndryl Holdings, Inc.
2.700%, 10/15/28 | 547 | | 450 |
Open Text Corp. 144A
3.875%, 2/15/28(2) | 900 | | 786 |
SK Hynix, Inc. 144A
1.500%, 1/19/26(2) | 510 | | 458 |
| | | | 3,072 |
| | | | |
| |
| Materials—1.0% | | |
Ardagh Packaging Finance plc 144A
4.125%, 8/15/26(2) | 1,125 | | 1,028 |
Bayport Polymers LLC 144A
4.743%, 4/14/27(2) | 1,185 | | 1,094 |
FMG Resources August 2006 Pty Ltd. 144A
5.875%, 4/15/30(2) | 1,280 | | 1,170 |
Silgan Holdings, Inc. 144A
1.400%, 4/1/26(2) | 1,038 | | 921 |
| | | | 4,213 |
| | | | |
| |
| Real Estate—1.4% | | |
EPR Properties
4.950%, 4/15/28 | 735 | | 651 |
GLP Capital LP
5.250%, 6/1/25 | 955 | | 935 |
Office Properties Income Trust
2.650%, 6/15/26 | 373 | | 254 |
Retail Opportunity Investments Partnership LP
5.000%, 12/15/23 | 1,645 | | 1,641 |
See Notes to Financial Statements
Newfleet Low Duration Core Plus Bond Fund
SCHEDULE OF INVESTMENTS (Continued)
September 30, 2023
($ reported in thousands)
| | Par Value | | Value |
| | | | |
| Real Estate—continued | | |
| Service Properties Trust | | | |
| 4.650%, 3/15/24 | $ 520 | | $ 513 |
| 4.350%, 10/1/24 | 550 | | 527 |
| VICI Properties LP | | | |
| 144A 4.625%, 6/15/25(2) | 170 | | 164 |
| 144A 4.500%, 1/15/28(2) | 265 | | 242 |
| 144A 4.625%, 12/1/29(2) | 720 | | 639 |
| | | | 5,566 |
| | | | |
| |
| Utilities—2.0% | | |
American Electric Power Co., Inc.
5.699%, 8/15/25 | 964 | | 959 |
DPL, Inc.
4.125%, 7/1/25 | 147 | | 139 |
Electricite de France S.A. 144A
5.700%, 5/23/28(2) | 690 | | 683 |
Enel Finance America LLC 144A
7.100%, 10/14/27(2) | 570 | | 590 |
Enel Finance International N.V. 144A
6.800%, 10/14/25(2) | 200 | | 202 |
Exelon Corp.
5.150%, 3/15/28 | 640 | | 628 |
FirstEnergy Transmission LLC 144A
2.866%, 9/15/28(2) | 837 | | 726 |
National Grid plc
5.602%, 6/12/28 | 422 | | 418 |
NRG Energy, Inc. 144A
3.750%, 6/15/24(2) | 1,161 | | 1,137 |
Puget Energy, Inc.
2.379%, 6/15/28 | 1,068 | | 914 |
Southern Co. (The) Series 21-A
3.750%, 9/15/51 | 1,640 | | 1,430 |
| | | | 7,826 |
| | | | |
| |
Total Corporate Bonds and Notes
(Identified Cost $91,738) | | 85,656 |
| | | | |
| |
| | | | |
| |
| Leveraged Loans—6.2% |
| Aerospace—0.7% | | |
Brown Group Holding LLC (1 month Term SOFR + 2.850%)
8.166%, 6/7/28(4) | 739 | | 731 |
Delta Air Lines, Inc. (3 month Term SOFR + 3.750%)
9.076%, 10/20/27(4) | 514 | | 532 |
Mileage Plus Holdings LLC (3 month Term SOFR + 5.400%)
10.798%, 6/21/27(4) | 454 | | 471 |
| | Par Value | | Value |
| | | | |
| Aerospace—continued | | |
TransDigm, Inc. Tranche I (3 month Term SOFR + 3.250%)
8.640%, 8/24/28(4) | $ 1,124 | | $ 1,124 |
| | | | 2,858 |
| | | | |
| |
| Chemicals—0.3% | | |
Ineos Finance plc 2027 (1 month Term SOFR + 3.850%)
9.166%, 11/8/27(4) | 1,027 | | 1,022 |
| Consumer Durables—0.2% | | |
Zodiac Pool Solutions LLC (1 month Term SOFR + 2.025%)
7.341%, 1/29/29(4) | 763 | | 757 |
| Energy—0.3% | | |
Freeport LNG Investments LLP Tranche B (3 month Term SOFR + 3.762%)
9.088%, 12/21/28(4) | 625 | | 618 |
Oryx Midstream Services Permian Basin LLC 2023 (1 month Term SOFR + 3.364%)
8.692%, 10/5/28(4) | 745 | | 745 |
Paragon Offshore Finance Co. (3 month LIBOR + 1.750%)
3.750%, 7/16/21(6)(7) | 1 | | — |
| | | | 1,363 |
| | | | |
| |
| Financials—0.4% | | |
Avolon TLB Borrower 1 U.S. LLC Tranche B-5 (1 month Term SOFR + 2.350%)
7.675%, 12/1/27(4) | 514 | | 514 |
Citadel Securities LP Tranche B (1 month Term SOFR + 2.614%)
7.931%, 7/29/30(4) | 910 | | 907 |
Finco I LLC 2023 (3 month Term SOFR + 3.000%)
8.369%, 6/27/29(4) | 125 | | 124 |
| | | | 1,545 |
| | | | |
| |
| Food / Tobacco—0.4% | | |
Aramark Services, Inc. Tranche B-5 (1 month Term SOFR + 2.614%)
7.931%, 4/6/28(4) | 583 | | 582 |
Hostess Brands LLC Tranche B (3 month Term SOFR + 2.500%)
7.890%, 6/21/30(4) | 889 | | 890 |
| | | | 1,472 |
| | | | |
| |
| | Par Value | | Value |
| | | | |
| Forest Prod / Containers—0.2% | | |
Berry Global, Inc. Tranche Z (3 month Term SOFR + 2.012%)
7.293%, 7/1/26(4) | $ 734 | | $ 733 |
| Gaming / Leisure—0.5% | | |
Caesars Entertainment, Inc. Tranche B (1 month Term SOFR + 3.350%)
8.666%, 2/6/30(4) | 259 | | 258 |
Scientific Games International, Inc. Tranche B (1 month Term SOFR + 3.100%)
8.434%, 4/13/29(4) | 365 | | 365 |
Stars Group Holdings B.V. 2021 (3 month Term SOFR + 2.512%)
7.902%, 7/21/26(4) | 621 | | 620 |
UFC Holdings LLC Tranche B-3 (3 month Term SOFR + 3.012%)
8.369%, 4/29/26(4) | 835 | | 834 |
| | | | 2,077 |
| | | | |
| |
| Health Care—0.3% | | |
Agiliti Health, Inc. 2023, Tranche B (3 month Term SOFR + 3.000%)
8.247%, 5/1/30(4) | 643 | | 640 |
CHG Healthcare Services, Inc. 2023 (1 month Term SOFR + 3.000%)
0.000%, 9/29/28(4)(8) | 50 | | 50 |
Select Medical Corp. Tranche B-1 (1 month Term SOFR + 3.000%)
8.316%, 3/8/27(4) | 644 | | 641 |
| | | | 1,331 |
| | | | |
| |
| Housing—0.3% | | |
Quikrete Holdings, Inc. Tranche B-1 (1 month Term SOFR + 2.864%)
8.181%, 3/18/29(4) | 630 | | 630 |
Standard Industries, Inc. (1 month Term SOFR + 2.614%)
7.938%, 9/22/28(4) | 612 | | 612 |
| | | | 1,242 |
| | | | |
| |
| Information Technology—0.7% | | |
CCC Intelligent Solutions, Inc. Tranche B (1 month Term SOFR + 2.364%)
7.681%, 9/21/28(4) | 624 | | 621 |
Go Daddy Operating Co. LLC Tranche B-5 (1 month Term SOFR + 2.500%)
7.816%, 11/9/29(4) | 1,363 | | 1,364 |
See Notes to Financial Statements
Newfleet Low Duration Core Plus Bond Fund
SCHEDULE OF INVESTMENTS (Continued)
September 30, 2023
($ reported in thousands)
| | Par Value | | Value |
| | | | |
| Information Technology—continued | | |
Uber Technologies, Inc. 2023 (3 month Term SOFR + 2.750%)
8.159%, 3/3/30(4) | $ 357 | | $ 357 |
UKG, Inc. 2021-2, First Lien (3 month Term SOFR + 3.350%)
8.618%, 5/4/26(4) | 503 | | 501 |
| | | | 2,843 |
| | | | |
| |
| Manufacturing—0.4% | | |
Gates Global LLC Tranche B-3 (1 month Term SOFR + 2.600%)
7.916%, 3/31/27(4) | 523 | | 521 |
NCR Corp. (1 month Term SOFR + 2.614%)
7.931%, 8/28/26(4) | 938 | | 936 |
| | | | 1,457 |
| | | | |
| |
| Media / Telecom - Broadcasting—0.1% | | |
Nexstar Media, Inc. Tranche B-4 (1 month Term SOFR + 2.614%)
7.931%, 9/18/26(4) | 371 | | 370 |
Media / Telecom - Cable/Wireless
Video—0.5% | | |
Charter Communications Operating LLC Tranche B-2 (3 month Term SOFR + 1.750%)
7.116%, 2/1/27(4) | 632 | | 631 |
Cogeco Communications Finance USA LP Tranche B-1 (1 month Term SOFR + 3.250%)
0.000%, 9/18/30(4)(8) | 715 | | 703 |
DIRECTV Financing LLC (1 month Term SOFR + 5.000%)
10.431%, 8/2/27(4) | 604 | | 590 |
| | | | 1,924 |
| | | | |
| |
| Service—0.5% | | |
Dun & Bradstreet Corp. (The) Tranche B (1 month Term SOFR + 2.850%)
8.167%, 2/6/26(4) | 598 | | 597 |
NAB Holdings LLC First Lien (3 month Term SOFR + 3.150%)
8.540%, 11/23/28(4) | 628 | | 626 |
| Pike Corp. | | | |
2028 (1 month Term SOFR + 3.114%)
8.431%, 1/21/28(4) | 657 | | 655 |
| | Par Value | | Value |
| | | | |
| Service—continued | | |
2028, Tranche B (1 month Term SOFR + 3.500%)
8.816%, 1/21/28(4) | $ 109 | | $ 109 |
| | | | 1,987 |
| | | | |
| |
| Utilities—0.4% | | |
Brookfield WEC Holdings, Inc. (1 month Term SOFR + 2.864%)
8.181%, 8/1/25(4) | 458 | | 457 |
Generation Bridge Northeast LLC Tranche B (1 month Term SOFR + 4.250%)
9.566%, 8/7/29(4) | 155 | | 155 |
Vistra Operations Co. LLC 2018 (1 month Term SOFR + 1.864%)
7.181%, 12/31/25(4) | 909 | | 909 |
| | | | 1,521 |
| | | | |
| |
Total Leveraged Loans
(Identified Cost $24,415) | | 24,502 |
| | Shares | |
| Preferred Stocks—0.6% |
| Financials—0.6% | |
| Citigroup, Inc. Series T, 6.250% | 1,235 (9) | 1,188 |
| JPMorgan Chase & Co. Series HH, 4.600% | 1,106 (9) | 1,035 |
| | | 2,223 |
| | | |
| |
Total Preferred Stocks
(Identified Cost $2,363) | 2,223 |
| | | |
| |
| | | |
| |
Total Long-Term Investments—98.2%
(Identified Cost $407,802) | 386,196 |
| | | |
| |
| | | |
| |
| Securities Lending Collateral—0.9% |
| Dreyfus Government Cash Management Fund - Institutional Shares (seven-day effective yield 5.222%)(10)(11) | 3,448,896 | 3,449 |
Total Securities Lending Collateral
(Identified Cost $3,449) | 3,449 |
| | | |
| |
| | | |
| |
TOTAL INVESTMENTS—99.1%
(Identified Cost $411,251) | $389,645 |
| Other assets and liabilities, net—0.9% | 3,625 |
| NET ASSETS—100.0% | $393,270 |
| Abbreviations: |
| ABS | Asset-Backed Securities |
| CLO | Collateralized Loan Obligation |
| DAC | Designated Activity Company |
| LIBOR | London Interbank Offered Rate |
| LLC | Limited Liability Company |
| LLLP | Limited Liability Limited Partnership |
| LLP | Limited Liability Partnership |
| LP | Limited Partnership |
| MSCI | Morgan Stanley Capital International |
| SOFR | Secured Overnight Financing Rate |
| Footnote Legend: |
| (1) | All or a portion of security is on loan. |
| (2) | Security exempt from registration under Rule 144A of the Securities Act of 1933. These securities may be resold in transactions exempt from registration, normally to qualified institutional buyers. At September 30, 2023, these securities amounted to a value of $247,465 or 62.9% of net assets. |
| (3) | Amount is less than $500 (not in thousands). |
| (4) | Variable rate security. Rate disclosed is as of September 30, 2023. Information in parenthesis represents benchmark and reference rate for each security. Certain variable rate securities are not based on a published reference rate and spread but are determined by the issuer or agent and are based on current market conditions, or, for mortgage-backed securities, are impacted by the individual mortgages which are paying off over time. These securities do not indicate a reference rate and spread in their descriptions. |
| (5) | No contractual maturity date. |
| (6) | The value of this security was determined using significant unobservable inputs and is reported as a Level 3 security in the Fair Value Hierarchy table located after the Schedule of Investments. |
| (7) | Security in default; no interest payments are being received. |
| (8) | This loan will settle after September 30, 2023, at which time the interest rate, calculated on the base lending rate and the agreed upon spread on trade date, will be reflected. |
| (9) | Value shown as par value. |
| (10) | Shares of this fund are publicly offered, and its prospectus and annual report are publicly available. |
| (11) | Represents security purchased with cash collateral received for securities on loan. |
For information regarding the abbreviations, see the Key Investment Terms starting on page 5.
See Notes to Financial Statements
Newfleet Low Duration Core Plus Bond Fund
SCHEDULE OF INVESTMENTS (Continued)
September 30, 2023
($ reported in thousands)
| Country Weightings (Unaudited)† |
| United States | 94% |
| Canada | 1 |
| United Kingdom | 1 |
| Cayman Islands | 1 |
| France | 1 |
| Australia | 1 |
| Denmark | 1 |
| Total | 100% |
| † % of total investments as of September 30, 2023. |
The following table summarizes the value of the Fund’s investments as of September 30, 2023, based on the inputs used to value them (See Security Valuation Note 2A in the Notes to Financial Statements):
| | Total
Value at
September 30, 2023 | | Level 1
Quoted Prices | | Level 2
Significant
Observable
Inputs | | Level 3
Significant
Unobservable
Inputs |
| Assets: | | | | | | | |
| Debt Instruments: | | | | | | | |
| Asset-Backed Securities | $135,873 | | $ — | | $135,873 | | $— |
| Corporate Bonds and Notes | 85,656 | | — | | 85,656 | | — |
| Foreign Government Securities | 1,258 | | — | | 1,258 | | — |
| Leveraged Loans | 24,502 | | — | | 24,502 | | — (1) |
| Mortgage-Backed Securities | 110,461 | | — | | 110,461 | | — |
| U.S. Government Securities | 26,223 | | — | | 26,223 | | — |
| Equity Securities: | | | | | | | |
| Preferred Stocks | 2,223 | | — | | 2,223 | | — |
| Securities Lending Collateral | 3,449 | | 3,449 | | — | | — |
| Total Investments | $389,645 | | $3,449 | | $386,196 | | $— |
| (1) | Includes internally fair valued securities currently priced at zero ($0). |
There were no transfers into or out of Level 3 related to securities held at September 30, 2023.
Some of the Fund’s investments that were categorized as Level 3 may have been valued utilizing third party pricing information without adjustment. If applicable, such valuations are based on unobservable inputs. A significant change in third party information could result in a significantly lower or higher value of Level 3 investments.
Management has determined that the amount of Level 3 securities compared to total net assets is not material; therefore, the roll-forward of Level 3 securities and assumptions are not shown for the period ended September 30, 2023.
See Notes to Financial Statements
Newfleet Multi-Sector Intermediate Bond Fund
SCHEDULE OF INVESTMENTS
September 30, 2023
($ reported in thousands)
| | Par Value | | Value |
| U.S. Government Securities—9.0% |
| U.S. Treasury Bonds | | | |
| 3.875%, 5/15/43 | $ 1,410 | | $ 1,226 |
| 1.875%, 11/15/51 | 4,265 | | 2,377 |
| 4.000%, 11/15/52 | 13,215 | | 11,713 |
| U.S. Treasury Notes | | | |
| 2.500%, 4/30/24 | 670 | | 659 |
| 0.250%, 5/31/25 | 1,375 | | 1,268 |
| 1.875%, 2/15/32 | 10,440 | | 8,480 |
| 4.125%, 11/15/32 | 9,475 | | 9,138 |
| 3.375%, 5/15/33 | 1,020 | | 925 |
Total U.S. Government Securities
(Identified Cost $40,573) | | 35,786 |
| | | | |
| |
| | | | |
| |
| Municipal Bonds—0.3% |
| Florida—0.1% | | |
Broward County, Water & Sewer Utility Revenue Series A
4.000%, 10/1/47 | 470 | | 417 |
| Illinois—0.0% | | |
Sales Tax Securitization Corp. Series B, Second Lien, Taxable (BAM Insured)
3.411%, 1/1/43 | 100 | | 72 |
| New York—0.2% | | |
Metropolitan Transportation Authority Revenue Taxable Series A
5.000%, 11/15/45 | 665 | | 685 |
| Virginia—0.0% | | |
Tobacco Settlement Financing Corp. Revenue Taxable Series A-1, Taxable
6.706%, 6/1/46 | 285 | | 236 |
Total Municipal Bonds
(Identified Cost $1,660) | | 1,410 |
| | | | |
| |
| | | | |
| |
| Foreign Government Securities—5.7% |
| Arab Republic of Egypt | | | |
144A
7.600%, 3/1/29(1) | 445 | | 285 |
144A
5.875%, 2/16/31(1) | 850 | | 467 |
| Bolivarian Republic of Venezuela | | | |
| 9.375%, 1/13/34(2) | 920 | | 87 |
RegS
7.650%, 4/21/25(2)(3) | 1,500 | | 143 |
Dominican Republic 144A
4.875%, 9/23/32(1) | 1,995 | | 1,619 |
Emirate of Dubai Government International Bonds RegS
5.250%, 1/30/43(3) | 1,175 | | 1,045 |
| | Par Value | | Value |
| | | | |
| Foreign Government Securities—continued |
Federative Republic of Brazil
6.000%, 10/20/33 | $ 1,405 | | $ 1,325 |
Hungary Government International Bond 144A
6.250%, 9/22/32(1) | 610 | | 595 |
Kingdom of Jordan 144A
5.850%, 7/7/30(1) | 780 | | 690 |
| Kingdom of Morocco | | | |
144A
3.000%, 12/15/32(1) | 460 | | 350 |
144A
5.500%, 12/11/42(1) | 410 | | 331 |
Republic of Angola 144A
8.250%, 5/9/28(1) | 865 | | 747 |
Republic of Argentina
3.500%, 7/9/41(4) | 3,350 | | 862 |
Republic of Cote d’Ivoire 144A
6.375%, 3/3/28(1) | 445 | | 415 |
Republic of Ecuador 144A
6.000%, 7/31/30(1)(4) | 1,040 | | 529 |
| Republic of Guatemala | | | |
144A
5.250%, 8/10/29(1) | 460 | | 423 |
144A
7.050%, 10/4/32(1) | 300 | | 301 |
Republic of Indonesia
2.850%, 2/14/30 | 790 | | 671 |
Republic of Nigeria 144A
7.375%, 9/28/33(1) | 610 | | 450 |
Republic of Panama
3.298%, 1/19/33 | 495 | | 386 |
Republic of Philippines
3.700%, 3/1/41 | 965 | | 725 |
Republic of Poland
4.875%, 10/4/33 | 710 | | 658 |
Republic of Serbia 144A
6.500%, 9/26/33(1) | 770 | | 732 |
Republic of South Africa
5.875%, 4/20/32 | 830 | | 705 |
| Republic of Turkey | | | |
| 9.375%, 3/14/29 | 270 | | 277 |
| 7.625%, 4/26/29 | 1,025 | | 980 |
| 9.125%, 7/13/30 | 1,305 | | 1,309 |
Romania Government International Bond 144A
7.125%, 1/17/33(1) | 605 | | 618 |
| Saudi International Bond | | | |
144A
5.500%, 10/25/32(1) | 670 | | 669 |
144A
4.500%, 10/26/46(1) | 770 | | 606 |
State of Qatar 144A
3.750%, 4/16/30(1) | 620 | | 577 |
| Ukraine Government | | | |
144A
7.750%, 9/1/26(1)(2) | 825 | | 243 |
RegS
7.750%, 9/1/26(2)(3) | 680 | | 201 |
RegS
7.750%, 9/1/28(2)(3) | 475 | | 135 |
| United Mexican States | | | |
| 3.500%, 2/12/34 | 450 | | 351 |
| | Par Value | | Value |
| | | | |
| Foreign Government Securities—continued |
| 6.350%, 2/9/35 | $ 915 | | $ 893 |
| 6.338%, 5/4/53 | 1,230 | | 1,116 |
Total Foreign Government Securities
(Identified Cost $26,590) | | 22,516 |
| | | | |
| |
| | | | |
| |
| Mortgage-Backed Securities—18.6% |
| Agency—3.9% | | |
| Federal Home Loan Mortgage Corporation | | | |
Pool #SD3238
5.500%, 12/1/52 | 309 | | 299 |
Pool #SD8309
6.000%, 3/1/53 | 3,998 | | 3,946 |
Pool #SD8317
6.000%, 4/1/53 | 1,273 | | 1,257 |
| Federal National Mortgage Association | | | |
Pool #FS4438
5.000%, 11/1/52 | 1,026 | | 969 |
Pool #MA4785
5.000%, 10/1/52 | 1,912 | | 1,805 |
Pool #MA4805
4.500%, 11/1/52 | 1,519 | | 1,395 |
Pool #MA4980
6.000%, 4/1/53 | 4,582 | | 4,523 |
Pool #MA5072
5.500%, 7/1/53 | 1,434 | | 1,387 |
| | | | 15,581 |
| | | | |
| |
| Non-Agency—14.7% | | |
A&D Mortgage Trust 2023-NQM3, A1 144A
6.733%, 7/25/68(1)(4) | 1,676 | | 1,674 |
Ajax Mortgage Loan Trust 2022-B, A1 144A
3.500%, 3/27/62(1)(4) | 1,638 | | 1,503 |
| American Homes 4 Rent Trust | | | |
2014-SFR2, C 144A
4.705%, 10/17/36(1) | 1,320 | | 1,293 |
2015-SFR2, C 144A
4.691%, 10/17/52(1) | 1,011 | | 980 |
| AMSR Trust | | | |
2020-SFR2, D 144A
3.282%, 7/17/37(1) | 660 | | 619 |
2020-SFR3, B 144A
1.806%, 9/17/37(1) | 2,000 | | 1,833 |
2021-SFR2, C 144A
1.877%, 8/17/38(1) | 510 | | 446 |
2021-SFR3, D 144A
2.177%, 10/17/38(1) | 540 | | 466 |
| Angel Oak Mortgage Trust | | | |
2022-5, A1 144A
4.500%, 5/25/67(1)(4) | 2,381 | | 2,233 |
2023-1, A1 144A
4.750%, 9/26/67(1)(4) | 2,900 | | 2,762 |
| Arroyo Mortgage Trust | | | |
2019-1, A1 144A
3.805%, 1/25/49(1)(4) | 109 | | 101 |
See Notes to Financial Statements
Newfleet Multi-Sector Intermediate Bond Fund
SCHEDULE OF INVESTMENTS (Continued)
September 30, 2023
($ reported in thousands)
| | Par Value | | Value |
| | | | |
| Non-Agency—continued | | |
2019-2, A1 144A
3.347%, 4/25/49(1)(4) | $ 243 | | $ 223 |
2021-1R, A1 144A
1.175%, 10/25/48(1)(4) | 306 | | 239 |
BBCMS Mortgage Trust 2018-TALL, A (1 month Term SOFR + 0.919%, Cap N/A, Floor 0.872%) 144A
6.252%, 3/15/37(1)(4) | 590 | | 546 |
Benchmark Mortgage Trust 2023-B38, A2
5.626%, 4/15/56 | 700 | | 679 |
BPR Trust 2022-OANA, A (1 month Term SOFR + 1.898%, Cap N/A, Floor 1.898%) 144A
7.230%, 4/15/37(1)(4) | 675 | | 663 |
Bunker Hill Loan Depositary Trust 2019-2, A1 144A
2.879%, 7/25/49(1)(4) | 258 | | 238 |
BX Commercial Mortgage Trust 2019-XL, C (1 month Term SOFR + 1.364%, Cap N/A, Floor 1.250%) 144A
6.697%, 10/15/36(1)(4) | 1,054 | | 1,046 |
| BX Trust | | | |
2019-OC11, D 144A
4.075%, 12/9/41(1)(4) | 1,412 | | 1,161 |
2022-CLS, A 144A
5.760%, 10/13/27(1) | 603 | | 582 |
CENT Trust 2023-CITY, A (1 month Term SOFR + 2.620%, Cap N/A, Floor 2.620%) 144A
7.952%, 9/15/28(1)(4) | 770 | | 770 |
| Chase Mortgage Finance Corp. | | | |
2016-SH1, M2 144A
3.750%, 4/25/45(1)(4) | 193 | | 169 |
2016-SH2, M2 144A
3.750%, 12/25/45(1)(4) | 405 | | 352 |
CIM Trust 2022-R2, A1 144A
3.750%, 12/25/61(1)(4) | 978 | | 880 |
Citigroup Mortgage Loan Trust, Inc. 2018-RP1, A1 144A
3.000%, 9/25/64(1)(4) | 795 | | 756 |
| COLT Mortgage Loan Trust | | | |
2022-4, A1 144A
4.301%, 3/25/67(1)(4) | 1,196 | | 1,121 |
2022-5, A1 144A
4.550%, 4/25/67(1)(4) | 685 | | 645 |
COMM Mortgage Trust 2013-300P, A1 144A
4.353%, 8/10/30(1) | 985 | | 899 |
CoreVest American Finance Trust 2019-3, C 144A
3.265%, 10/15/52(1) | 250 | | 208 |
| | Par Value | | Value |
| | | | |
| Non-Agency—continued | | |
Credit Suisse Mortgage Capital Certificates 2019-ICE4, A (1 month Term SOFR + 1.027%, Cap N/A, Floor 0.980%) 144A
6.360%, 5/15/36(1)(4) | $ 1,272 | | $ 1,270 |
Credit Suisse Mortgage Capital Trust 2020-RPL4, A1 144A
2.000%, 1/25/60(1)(4) | 801 | | 679 |
Deephaven Residential Mortgage Trust 2022-1, A1 144A
2.205%, 1/25/67(1)(4) | 331 | | 286 |
| Ellington Financial Mortgage Trust | | | |
2019-2, A3 144A
3.046%, 11/25/59(1)(4) | 34 | | 31 |
2022-1, A1 144A
2.206%, 1/25/67(1)(4) | 283 | | 230 |
| FirstKey Homes Trust | | | |
2020-SFR1, B 144A
1.740%, 8/17/37(1) | 770 | | 706 |
2020-SFR2, B 144A
1.567%, 10/19/37(1) | 1,245 | | 1,131 |
2021-SFR1, D 144A
2.189%, 8/17/38(1) | 1,010 | | 880 |
Galton Funding Mortgage Trust 2018-1, A23 144A
3.500%, 11/25/57(1)(4) | 37 | | 32 |
Homes Trust 2023-NQM2, A1 144A
6.456%, 2/25/68(1)(4) | 430 | | 429 |
INTOWN Mortgage Trust 2022-STAY, A (1 month Term SOFR + 2.489%, Cap N/A, Floor 2.489%) 144A
7.821%, 8/15/39(1)(4) | 836 | | 837 |
JPMBB Commercial Mortgage Securities Trust 2014-C18, AS
4.439%, 2/15/47(4) | 885 | | 866 |
JPMorgan Chase Commercial Mortgage Securities Trust 2013-C13, E 144A
3.986%, 1/15/46(1)(4) | 1,331 | | 1,127 |
JPMorgan Chase Mortgage Trust 2014-5, B2 144A
2.758%, 10/25/29(1)(4) | 237 | | 206 |
KNDL Mortgage Trust 2019-KNSQ, A (1 month Term SOFR + 0.996%, Cap N/A, Floor 0.800%) 144A
6.328%, 5/15/36(1)(4) | 975 | | 971 |
LHOME Mortgage Trust 2021-RTL1, A1 144A
2.090%, 2/25/26(1)(4) | 104 | | 104 |
| | Par Value | | Value |
| | | | |
| Non-Agency—continued | | |
MetLife Securitization Trust 2017-1A, M1 144A
3.451%, 4/25/55(1)(4) | $ 425 | | $ 350 |
| MFA Trust | | | |
2022-NQM2, A1 144A
4.000%, 5/25/67(1)(4) | 1,303 | | 1,184 |
2021-INV1, A1 144A
0.852%, 1/25/56(1)(4) | 132 | | 118 |
| Mill City Mortgage Loan Trust | | | |
2017-1, M2 144A
3.250%, 11/25/58(1)(4) | 375 | | 351 |
2017-3, B1 144A
3.250%, 1/25/61(1)(4) | 677 | | 536 |
2019-1, M2 144A
3.500%, 10/25/69(1)(4) | 779 | | 647 |
MIRA Trust 2023-MILE, A 144A
6.755%, 6/10/38(1) | 640 | | 627 |
| New Residential Mortgage Loan Trust | | | |
2016-3A, B1 144A
4.000%, 9/25/56(1)(4) | 473 | | 431 |
2016-4A, B1A 144A
4.500%, 11/25/56(1)(4) | 383 | | 354 |
2017-2A, A3 144A
4.000%, 3/25/57(1)(4) | 1,467 | | 1,349 |
2018-2A, A1 144A
4.500%, 2/25/58(1)(4) | 31 | | 29 |
2021-NQ2R, A1 144A
0.941%, 10/25/58(1)(4) | 586 | | 516 |
2022-NQM2, A1 144A
3.079%, 3/27/62(1)(4) | 1,020 | | 890 |
Palisades Mortgage Loan Trust 2021-RTL1, A1 144A
2.857%, 6/25/26(1)(4) | 385 | | 373 |
Preston Ridge Partners Mortgage LLC 2021-RPL1, A1 144A
1.319%, 7/25/51(1)(4) | 161 | | 141 |
Pretium Mortgage Credit Partners I LLC 2021-NPL1, A1 144A
2.240%, 9/27/60(1)(4) | 303 | | 293 |
Progress Residential Trust 2019-SFR3, B 144A
2.571%, 9/17/36(1) | 1,000 | | 963 |
RCKT Mortgage Trust 2023-CES1, A1A 144A
6.515%, 6/25/43(1)(4) | 1,159 | | 1,148 |
Residential Mortgage Loan Trust 2019-2, A1 144A
2.913%, 5/25/59(1)(4) | 27 | | 27 |
Sequoia Mortgage Trust 2013-8, B1
3.481%, 6/25/43(4) | 151 | | 141 |
Starwood Mortgage Residential Trust 2021-3, A3 144A
1.518%, 6/25/56(1)(4) | 175 | | 136 |
See Notes to Financial Statements
Newfleet Multi-Sector Intermediate Bond Fund
SCHEDULE OF INVESTMENTS (Continued)
September 30, 2023
($ reported in thousands)
| | Par Value | | Value |
| | | | |
| Non-Agency—continued | | |
| Towd Point Mortgage Trust | | | |
2016-1, M1 144A
3.500%, 2/25/55(1)(4) | $ 199 | | $ 195 |
2016-4, B1 144A
3.969%, 7/25/56(1)(4) | 485 | | 438 |
2017-1, M1 144A
3.750%, 10/25/56(1)(4) | 550 | | 511 |
2017-4, A2 144A
3.000%, 6/25/57(1)(4) | 850 | | 743 |
2018-6, A1A 144A
3.750%, 3/25/58(1)(4) | 71 | | 69 |
2018-6, A2 144A
3.750%, 3/25/58(1)(4) | 1,925 | | 1,612 |
2019-2, A2 144A
3.750%, 12/25/58(1)(4) | 1,198 | | 1,009 |
2020-1, M1 144A
3.500%, 1/25/60(1)(4) | 305 | | 239 |
2023-1, A1 144A
3.750%, 1/25/63(1) | 643 | | 588 |
2017-6, A2 144A
3.000%, 10/25/57(1)(4) | 665 | | 591 |
| Tricon American Homes Trust | | | |
2019-SFR1, C 144A
3.149%, 3/17/38(1) | 610 | | 565 |
2020-SFR2, D 144A
2.281%, 11/17/39(1) | 840 | | 710 |
TVC Mortgage Trust 2020-RTL1, M 144A
5.193%, 9/25/24(1)(4) | 1,405 | | 1,401 |
| VCAT LLC | | | |
2021-NPL3, A1 144A
1.743%, 5/25/51(1)(4) | 382 | | 355 |
2021-NPL4, A1 144A
1.868%, 8/25/51(1)(4) | 520 | | 485 |
| Verus Securitization Trust | | | |
2019-4, M1 144A
3.207%, 11/25/59(1)(4) | 310 | | 269 |
2021-3, A1 144A
1.046%, 6/25/66(1)(4) | 121 | | 101 |
2022-5, A1 144A
3.800%, 4/25/67(1)(4) | 828 | | 746 |
2022-6, A1 144A
4.910%, 6/25/67(1)(4) | 938 | | 906 |
2022-7, A1 144A
5.152%, 7/25/67(1)(4) | 464 | | 452 |
Visio Trust 2020-1R, A2 144A
1.567%, 11/25/55(1) | 112 | | 98 |
Wells Fargo Commercial Mortgage Trust 2014-C24, AS
3.931%, 11/15/47 | 716 | | 646 |
| | | | 58,205 |
| | | | |
| |
Total Mortgage-Backed Securities
(Identified Cost $77,847) | | 73,786 |
| | | | |
| |
| | | | |
| |
| | Par Value | | Value |
| | | | |
| | | | |
| Asset-Backed Securities—14.0% |
| Automobiles—6.0% | | |
ACC Trust 2021-1, C 144A
2.080%, 12/20/24(1) | $ 415 | | $ 408 |
ACM Auto Trust 2023-2A, A 144A
7.970%, 6/20/30(1) | 789 | | 790 |
Avid Automobile Receivables Trust 2023-1, A 144A
6.630%, 7/15/26(1) | 451 | | 450 |
| Avis Budget Rental Car Funding LLC | | | |
(AESOP) 2019-2A, D 144A
3.040%, 9/22/25(1) | 1,129 | | 1,075 |
(AESOP) 2023-3A, A 144A
5.440%, 2/22/28(1) | 841 | | 826 |
| Carvana Auto Receivables Trust | | | |
2019-3A, E 144A
4.600%, 7/15/26(1) | 690 | | 682 |
2022-N1, D 144A
4.130%, 12/11/28(1) | 685 | | 655 |
2023-N1, C 144A
5.920%, 7/10/29(1) | 805 | | 785 |
| DT Auto Owner Trust | | | |
2023-1A, D 144A
6.440%, 11/15/28(1) | 777 | | 766 |
2023-3A, C 144A
6.400%, 5/15/29(1) | 485 | | 483 |
| Exeter Automobile Receivables Trust | | | |
2023-2A, B
5.610%, 9/15/27 | 745 | | 737 |
2023-3A, D
6.680%, 4/16/29 | 920 | | 917 |
FHF Trust 2023-1A, A2 144A
6.570%, 6/15/28(1) | 743 | | 735 |
| GLS Auto Receivables Issuer Trust | | | |
2019-4A, D 144A
4.090%, 8/17/26(1) | 991 | | 972 |
2020-3A, E 144A
4.310%, 7/15/27(1) | 940 | | 913 |
2022-2A, D 144A
6.150%, 4/17/28(1) | 800 | | 786 |
2023-1A, B 144A
6.190%, 6/15/27(1) | 983 | | 979 |
Hertz Vehicle Financing LLC 2022-4A, D 144A
6.560%, 9/25/26(1) | 530 | | 506 |
| LAD Auto Receivables Trust | | | |
2022-1A, A 144A
5.210%, 6/15/27(1) | 1,067 | | 1,059 |
2023-1A, D 144A
7.300%, 6/17/30(1) | 780 | | 782 |
2023-2A, D 144A
6.300%, 2/15/31(1) | 750 | | 733 |
Lendbuzz Securitization Trust 2023-2A, A2 144A
7.090%, 10/16/28(1) | 747 | | 745 |
| | Par Value | | Value |
| | | | |
| Automobiles—continued | | |
Lobel Automobile Receivables Trust 2023-1, B 144A
7.050%, 9/15/28(1) | $ 895 | | $ 881 |
OneMain Direct Auto Receivables Trust 2022-1A, C 144A
5.310%, 6/14/29(1) | 520 | | 499 |
Tesla Auto Lease Trust 2023-A, B 144A
6.410%, 7/20/27(1) | 855 | | 851 |
| Tricolor Auto Securitization Trust | | | |
2023-1A, B 144A
6.840%, 11/16/26(1) | 1,088 | | 1,083 |
2023-1A, C 144A
7.240%, 2/16/27(1) | 780 | | 778 |
| United Auto Credit Securitization Trust | | | |
2023-1, C 144A
6.280%, 7/10/28(1) | 784 | | 775 |
2023-1, D 144A
8.000%, 7/10/28(1) | 1,102 | | 1,109 |
USASF Receivables LLC 2020-1A, C 144A
5.940%, 8/15/24(1) | 232 | | 232 |
Westlake Automobile Receivables Trust 2022-1A, B 144A
2.750%, 3/15/27(1) | 760 | | 743 |
| | | | 23,735 |
| | | | |
| |
| Consumer Loans—1.6% | | |
| ACHV ABS Trust | | | |
2023-1PL, B 144A
6.800%, 3/18/30(1) | 1,140 | | 1,140 |
2023-3PL, B 144A
7.170%, 8/19/30(1) | 865 | | 869 |
BHG Securitization Trust 2021-B, D 144A
3.170%, 10/17/34(1) | 875 | | 709 |
Marlette Funding Trust 2023-2A, B 144A
6.540%, 6/15/33(1) | 746 | | 743 |
OneMain Financial Issuance Trust 2022-3A, A 144A
5.940%, 5/15/34(1) | 743 | | 738 |
Reach ABS Trust 2023-1A, B 144A
7.330%, 2/18/31(1) | 767 | | 765 |
Republic Finance Issuance Trust 2020-A, A 144A
2.470%, 11/20/30(1) | 835 | | 812 |
Upstart Pass-Through Trust Series 2021-ST2, A 144A
2.500%, 4/20/27(1) | 229 | | 222 |
Upstart Securitization Trust 2022-2, A 144A
4.370%, 5/20/32(1) | 185 | | 183 |
| | | | 6,181 |
| | | | |
| |
See Notes to Financial Statements
Newfleet Multi-Sector Intermediate Bond Fund
SCHEDULE OF INVESTMENTS (Continued)
September 30, 2023
($ reported in thousands)
| | Par Value | | Value |
| | | | |
| Credit Card—0.6% | | |
| Mercury Financial Credit Card Master Trust | | | |
2022-1A, A 144A
2.500%, 9/21/26(1) | $ 735 | | $ 703 |
2023-1A, A 144A
8.040%, 9/20/27(1) | 777 | | 780 |
| Mission Lane Credit Card Master Trust | | | |
2023-A, A 144A
7.230%, 7/17/28(1) | 746 | | 740 |
2023-B, A 144A
7.790%, 11/15/28(1) | 280 | | 280 |
| | | | 2,503 |
| | | | |
| |
| Other—5.8% | | |
Adams Outdoor Advertising LP 2023-1, A2 144A
6.967%, 7/15/53(1) | 855 | | 841 |
Applebee’s Funding LLC 2023-1A, A2 144A
7.824%, 3/5/53(1) | 1,146 | | 1,130 |
| Aqua Finance Trust | | | |
2017-A, A 144A
3.720%, 11/15/35(1) | 51 | | 51 |
2019-A, C 144A
4.010%, 7/16/40(1) | 746 | | 675 |
2020-AA, D 144A
7.150%, 7/17/46(1) | 815 | | 697 |
Arby’s Funding LLC 2020-1A, A2 144A
3.237%, 7/30/50(1) | 912 | | 807 |
CCG Receivables Trust 2023-1, A2 144A
5.820%, 9/16/30(1) | 825 | | 824 |
| Conn’s Receivables Funding LLC | | | |
2022-A, B 144A
9.520%, 12/15/26(1) | 478 | | 480 |
2023-A, B 144A
10.000%, 1/17/28(1) | 1,500 | | 1,503 |
| Dext ABS LLC | | | |
2020-1, D 144A
7.210%, 2/15/28(1) | 840 | | 810 |
2023-1, A2 144A
5.990%, 3/15/32(1) | 845 | | 832 |
Elara HGV Timeshare Issuer LLC 2023-A, A 144A
6.160%, 2/25/38(1) | 946 | | 947 |
FAT Brands Royalty LLC 2021-1A, A2 144A
4.750%, 4/25/51(1) | 830 | | 757 |
Foundation Finance Trust 2023-2A, A 144A
6.530%, 6/15/49(1) | 991 | | 991 |
Hardee’s Funding LLC 2020-1A, A2 144A
3.981%, 12/20/50(1) | 1,031 | | 867 |
HIN Timeshare Trust 2020-A, C 144A
3.420%, 10/9/39(1) | 450 | | 414 |
| | Par Value | | Value |
| | | | |
| Other—continued | | |
Hotwire Funding LLC 2021-1, C 144A
4.459%, 11/20/51(1) | $ 960 | | $ 799 |
Jack in the Box Funding LLC 2022-1A, A2I 144A
3.445%, 2/26/52(1) | 1,169 | | 1,046 |
Jersey Mike’s Funding 2019-1A, A2 144A
4.433%, 2/15/50(1) | 613 | | 563 |
Mariner Finance Issuance Trust 2020-AA, A 144A
2.190%, 8/21/34(1) | 896 | | 870 |
NBC Funding LLC 2021-1, A2 144A
2.989%, 7/30/51(1) | 665 | | 577 |
| Octane Receivables Trust | | | |
2020-1A, B 144A
1.980%, 6/20/25(1) | 520 | | 516 |
2023-3A, C 144A
6.740%, 8/20/29(1) | 991 | | 991 |
Pawneee Equipment Receivables LLC 2022-1, B 144A
5.400%, 7/17/28(1) | 635 | | 606 |
Planet Fitness Master Issuer LLC 2018-1A, A2II 144A
4.666%, 9/5/48(1) | 969 | | 929 |
Progress Residential Trust 2021-SFR6, D 144A
2.225%, 7/17/38(1) | 505 | | 439 |
Purchasing Power Funding LLC 2021-A, B 144A
1.920%, 10/15/25(1) | 1,000 | | 989 |
Sierra Timeshare Receivables Funding LLC 2023-2A, B 144A
6.280%, 4/20/40(1) | 726 | | 720 |
Taco Bell Funding LLC 2016-1A, A23 144A
4.970%, 5/25/46(1) | 881 | | 849 |
ZAXBY’S Funding LLC 2021-1A, A2 144A
3.238%, 7/30/51(1) | 877 | | 728 |
| | | | 23,248 |
| | | | |
| |
Total Asset-Backed Securities
(Identified Cost $57,173) | | 55,667 |
| | | | |
| |
| | | | |
| |
| Corporate Bonds and Notes—36.7% |
| Communication Services—2.1% | | |
Altice France Holding S.A. 144A
6.000%, 2/15/28(1) | 660 | | 326 |
Altice France S.A. 144A
5.125%, 7/15/29(1) | 730 | | 519 |
AT&T, Inc.
5.400%, 2/15/34 | 1,040 | | 973 |
CCO Holdings LLC 144A
4.750%, 3/1/30(1) | 970 | | 814 |
| | Par Value | | Value |
| | | | |
| Communication Services—continued | | |
| CSC Holdings LLC | | | |
| 5.250%, 6/1/24 | $ 450 | | $ 428 |
| 144A 7.500%, 4/1/28(1) | 710 | | 461 |
CT Trust 144A
5.125%, 2/3/32(1) | 610 | | 472 |
| DISH DBS Corp. | | | |
| 5.875%, 11/15/24 | 590 | | 549 |
| 7.750%, 7/1/26 | 440 | | 330 |
Gray Television, Inc. 144A
7.000%, 5/15/27(1) | 725 | | 624 |
Level 3 Financing, Inc. 144A
3.625%, 1/15/29(1) | 530 | | 297 |
Millennium Escrow Corp. 144A
6.625%, 8/1/26(1) | 475 | | 379 |
Rackspace Technology Global, Inc. 144A
5.375%, 12/1/28(1) | 555 | | 186 |
Sprint Capital Corp.
8.750%, 3/15/32 | 470 | | 544 |
Telecomunicaciones Digitales S.A. 144A
4.500%, 1/30/30(1) | 790 | | 640 |
Telesat Canada 144A
6.500%, 10/15/27(1) | 365 | | 186 |
T-Mobile USA, Inc.
5.050%, 7/15/33 | 301 | | 279 |
VZ Secured Financing B.V. 144A
5.000%, 1/15/32(1) | 455 | | 358 |
| | | | 8,365 |
| | | | |
| |
| Consumer Discretionary—2.8% | | |
| Ashtead Capital, Inc. | | | |
| 144A 4.375%, 8/15/27(1) | 870 | | 809 |
| 144A 5.500%, 8/11/32(1) | 285 | | 263 |
Carnival Corp. 144A
7.000%, 8/15/29(1) | 115 | | 113 |
Carriage Services, Inc. 144A
4.250%, 5/15/29(1) | 480 | | 411 |
Churchill Downs, Inc. 144A
6.750%, 5/1/31(1) | 515 | | 487 |
| Clarios Global LP | | | |
| 144A 8.500%, 5/15/27(1) | 450 | | 449 |
| 144A 6.750%, 5/15/28(1) | 65 | | 63 |
eG Global Finance plc 144A
8.500%, 10/30/25(1) | 495 | | 487 |
Ford Motor Co.
4.750%, 1/15/43 | 475 | | 347 |
| Ford Motor Credit Co. LLC | | | |
| 4.125%, 8/17/27 | 455 | | 414 |
| 7.350%, 3/6/30 | 450 | | 456 |
Jacobs Entertainment, Inc. 144A
6.750%, 2/15/29(1) | 700 | | 621 |
Light & Wonder International, Inc. 144A
7.000%, 5/15/28(1) | 575 | | 565 |
MDC Holdings, Inc.
3.966%, 8/6/61 | 1,295 | | 713 |
See Notes to Financial Statements
Newfleet Multi-Sector Intermediate Bond Fund
SCHEDULE OF INVESTMENTS (Continued)
September 30, 2023
($ reported in thousands)
| | Par Value | | Value |
| | | | |
| Consumer Discretionary—continued | | |
Newell Brands, Inc.
6.625%, 9/15/29(5) | $ 622 | | $ 592 |
Nissan Motor Acceptance Co. LLC 144A
7.050%, 9/15/28(1) | 695 | | 695 |
NMG Holding Co., Inc. 144A
7.125%, 4/1/26(1) | 725 | | 680 |
Nordstrom, Inc.
4.250%, 8/1/31 | 720 | | 522 |
Ontario Gaming GTA LP 144A
8.000%, 8/1/30(1) | 630 | | 630 |
Premier Entertainment Sub LLC 144A
5.625%, 9/1/29(1)(5) | 715 | | 551 |
| PulteGroup, Inc. | | | |
| 7.875%, 6/15/32(5) | 525 | | 580 |
| 6.375%, 5/15/33 | 230 | | 231 |
Royal Caribbean Cruises Ltd. 144A
9.250%, 1/15/29(1) | 24 | | 25 |
Weekley Homes LLC 144A
4.875%, 9/15/28(1) | 505 | | 438 |
| | | | 11,142 |
| | | | |
| |
| Consumer Staples—1.2% | | |
| Albertsons Cos., Inc. | | | |
| 144A 3.250%, 3/15/26(1) | 285 | | 264 |
| 144A 6.500%, 2/15/28(1) | 272 | | 269 |
BAT Capital Corp.
7.750%, 10/19/32 | 859 | | 907 |
Central American Bottling Corp. 144A
5.250%, 4/27/29(1) | 315 | | 283 |
Coty, Inc. 144A
6.625%, 7/15/30(1) | 720 | | 703 |
HLF Financing S.a.r.l. LLC 144A
4.875%, 6/1/29(1) | 465 | | 330 |
Minerva Luxembourg S.A. 144A
8.875%, 9/13/33(1) | 945 | | 938 |
Pilgrim’s Pride Corp.
6.250%, 7/1/33 | 695 | | 653 |
Sigma Holdco B.V. 144A
7.875%, 5/15/26(1) | 390 | | 327 |
| | | | 4,674 |
| | | | |
| |
| Energy—7.0% | | |
Alliance Resource Operating Partners LP 144A
7.500%, 5/1/25(1) | 716 | | 715 |
Antero Midstream Partners LP 144A
5.750%, 1/15/28(1) | 685 | | 646 |
Ascent Resources Utica Holdings LLC 144A
8.250%, 12/31/28(1) | 580 | | 574 |
BP Capital Markets plc
4.875% (6) | 1,530 | | 1,367 |
| | Par Value | | Value |
| | | | |
| Energy—continued | | |
Chesapeake Energy Corp. 144A
5.875%, 2/1/29(1) | $ 455 | | $ 428 |
CITGO Petroleum Corp. 144A
7.000%, 6/15/25(1) | 640 | | 630 |
Civitas Resources, Inc. 144A
8.750%, 7/1/31(1) | 385 | | 393 |
| Columbia Pipelines Operating Co. LLC | | | |
| 144A 6.036%, 11/15/33(1) | 820 | | 800 |
| 144A 6.714%, 8/15/63(1) | 100 | | 98 |
Coronado Finance Pty Ltd. 144A
10.750%, 5/15/26(1) | 679 | | 703 |
| CrownRock LP | | | |
| 144A 5.625%, 10/15/25(1) | 415 | | 408 |
| 144A 5.000%, 5/1/29(1) | 460 | | 431 |
DT Midstream, Inc. 144A
4.125%, 6/15/29(1) | 845 | | 731 |
| Ecopetrol S.A. | | | |
| 4.625%, 11/2/31 | 770 | | 588 |
| 8.875%, 1/13/33 | 1,020 | | 994 |
| Enbridge, Inc. | | | |
| 7.625%, 1/15/83 | 685 | | 654 |
| 8.500%, 1/15/84 | 416 | | 413 |
Enerflex Ltd. 144A
9.000%, 10/15/27(1) | 695 | | 686 |
Energy Transfer LP Series H
6.500% (6) | 660 | | 606 |
Flex Intermediate Holdco LLC 144A
3.363%, 6/30/31(1) | 1,010 | | 785 |
Genesis Energy LP
8.875%, 4/15/30 | 580 | | 566 |
Greensaif Pipelines Bidco S.a.r.l. 144A
6.129%, 2/23/38(1) | 375 | | 367 |
| Hilcorp Energy I LP | | | |
| 144A 5.750%, 2/1/29(1) | 485 | | 438 |
| 144A 6.000%, 2/1/31(1) | 485 | | 427 |
| International Petroleum Corp. | | | |
| 144A, RegS 7.250%, 2/1/27(1)(3) | 200 | | 187 |
| 144A, RegS 7.250%, 2/1/27(1)(3) | 1,000 | | 931 |
KazMunayGas National Co. JSC 144A
6.375%, 10/24/48(1)(5) | 915 | | 744 |
Kinder Morgan, Inc.
7.750%, 1/15/32 | 640 | | 694 |
Korea National Oil Corp. 144A
4.875%, 4/3/28(1) | 200 | | 195 |
Magnolia Oil & Gas Operating LLC 144A
6.000%, 8/1/26(1) | 660 | | 637 |
Mesquite Energy, Inc. 144A
7.250%, 2/15/23(1)(7) | 375 | | 33 |
Nabors Industries Ltd. 144A
7.250%, 1/15/26(1) | 700 | | 676 |
| | Par Value | | Value |
| | | | |
| Energy—continued | | |
Northriver Midstream Finance LP 144A
5.625%, 2/15/26(1) | $ 735 | | $ 700 |
Occidental Petroleum Corp.
6.125%, 1/1/31 | 840 | | 828 |
Odebrecht Oil & Gas Finance Ltd. 144A
0.000% (1)(6)(8) | 124 | | 3 |
Pertamina Persero PT 144A
2.300%, 2/9/31(1) | 1,465 | | 1,135 |
Petroleos de Venezuela S.A. 144A
6.000%, 5/16/24(1)(2) | 1,580 | | 86 |
| Petroleos Mexicanos | | | |
| 6.500%, 3/13/27 | 740 | | 649 |
| 6.700%, 2/16/32 | 1,250 | | 926 |
| 7.690%, 1/23/50 | 735 | | 470 |
Petronas Capital Ltd. 144A
3.500%, 4/21/30(1) | 565 | | 499 |
Reliance Industries Ltd. 144A
2.875%, 1/12/32(1)(5) | 780 | | 620 |
Southwestern Energy Co.
5.375%, 2/1/29 | 615 | | 566 |
State Oil Co. of the Azerbaijan Republic RegS
6.950%, 3/18/30(3) | 685 | | 690 |
Teine Energy Ltd. 144A
6.875%, 4/15/29(1) | 415 | | 381 |
| Transocean, Inc. | | | |
| 144A 11.500%, 1/30/27(1) | 471 | | 494 |
| 144A 8.750%, 2/15/30(1) | 380 | | 389 |
USA Compression Partners LP
6.875%, 4/1/26 | 410 | | 402 |
| Venture Global Calcasieu Pass LLC | | | |
| 144A 3.875%, 8/15/29(1) | 55 | | 46 |
| 144A 4.125%, 8/15/31(1) | 485 | | 398 |
| | | | 27,827 |
| | | | |
| |
| Financials—10.0% | | |
Acrisure LLC 144A
7.000%, 11/15/25(1) | 1,175 | | 1,141 |
Allianz SE 144A
6.350%, 9/6/53(1) | 800 | | 772 |
Allstate Corp. (The) Series B (3 month Term SOFR + 3.200%)
8.564%, 8/15/53(4) | 720 | | 711 |
American Express Co.
5.625%, 7/28/34 | 905 | | 854 |
Ascot Group Ltd. 144A
4.250%, 12/15/30(1) | 735 | | 542 |
Banco Mercantil del Norte S.A. 144A
6.625% (1)(6) | 855 | | 670 |
Banco Santander Chile 144A
3.177%, 10/26/31(1) | 935 | | 779 |
| Bank of America Corp. | | | |
| 5.015%, 7/22/33 | 910 | | 837 |
| 5.288%, 4/25/34 | 300 | | 279 |
See Notes to Financial Statements
Newfleet Multi-Sector Intermediate Bond Fund
SCHEDULE OF INVESTMENTS (Continued)
September 30, 2023
($ reported in thousands)
| | Par Value | | Value |
| | | | |
| Financials—continued | | |
| 2.482%, 9/21/36 | $ 840 | | $ 611 |
| Bank of New York Mellon Corp. (The) | | | |
| 5.834%, 10/25/33 | 515 | | 506 |
Series G
4.700%(6) | 795 | | 765 |
Barclays plc
7.437%, 11/2/33 | 580 | | 596 |
BBVA Bancomer S.A. 144A
5.125%, 1/18/33(1) | 890 | | 764 |
Blackstone Private Credit Fund
2.625%, 12/15/26 | 430 | | 370 |
Block, Inc.
3.500%, 6/1/31(5) | 565 | | 444 |
Blue Owl Credit Income Corp.
4.700%, 2/8/27 | 422 | | 384 |
Blue Owl Finance LLC 144A
3.125%, 6/10/31(1) | 815 | | 610 |
BroadStreet Partners, Inc. 144A
5.875%, 4/15/29(1) | 665 | | 587 |
Brookfield Capital Finance LLC
6.087%, 6/14/33 | 705 | | 685 |
Capital One Financial Corp.
2.359%, 7/29/32 | 865 | | 593 |
| Charles Schwab Corp. (The) | | | |
| 6.136%, 8/24/34 | 365 | | 355 |
Series H
4.000%(6) | 720 | | 508 |
Citadel LP 144A
4.875%, 1/15/27(1) | 605 | | 575 |
| Citigroup, Inc. | | | |
| 6.270%, 11/17/33 | 985 | | 982 |
| 6.174%, 5/25/34 | 544 | | 520 |
Citizens Bank N.A.
2.250%, 4/28/25 | 490 | | 454 |
Cobra AcquisitionCo. LLC 144A
6.375%, 11/1/29(1) | 470 | | 348 |
Corebridge Financial, Inc.
6.875%, 12/15/52 | 1,053 | | 1,009 |
Discover Financial Services
6.700%, 11/29/32 | 428 | | 414 |
Drawbridge Special Opportunities Fund LP 144A
3.875%, 2/15/26(1) | 970 | | 863 |
Export-Import Bank Korea
5.125%, 1/11/33 | 625 | | 610 |
Fifth Third Bancorp
4.337%, 4/25/33 | 645 | | 546 |
First American Financial Corp.
4.000%, 5/15/30 | 820 | | 695 |
Global Atlantic Fin Co. 144A
7.950%, 6/15/33(1) | 282 | | 271 |
| Goldman Sachs Group, Inc. (The) | | | |
| 3.102%, 2/24/33 | 790 | | 632 |
| | Par Value | | Value |
| | | | |
| Financials—continued | | |
| 6.450%, 5/1/36 | $ 355 | | $ 353 |
Huntington Bancshares, Inc.
2.550%, 2/4/30 | 540 | | 427 |
| JPMorgan Chase & Co. | | | |
| 5.717%, 9/14/33 | 570 | | 548 |
| 5.350%, 6/1/34 | 325 | | 308 |
| 1.953%, 2/4/32 | 795 | | 603 |
KeyCorp
4.789%, 6/1/33 | 680 | | 567 |
Ladder Capital Finance Holdings LLLP 144A
4.250%, 2/1/27(1) | 430 | | 376 |
Liberty Mutual Group, Inc. 144A
4.125%, 12/15/51(1) | 740 | | 608 |
Lincoln National Corp. (3 month LIBOR + 2.040%)
7.628%, 4/20/67(4) | 666 | | 441 |
MetLife, Inc. Series G
3.850% (6) | 715 | | 661 |
Midcap Financial Issuer Trust 144A
6.500%, 5/1/28(1) | 1,080 | | 932 |
| Morgan Stanley | | | |
| 6.342%, 10/18/33 | 710 | | 714 |
| 5.250%, 4/21/34 | 570 | | 529 |
| 5.424%, 7/21/34 | 345 | | 325 |
| 5.948%, 1/19/38 | 352 | | 329 |
MSCI, Inc. 144A
3.625%, 9/1/30(1) | 931 | | 780 |
National Rural Utilities Cooperative Finance Corp. (3 month Term SOFR + 3.172%)
8.541%, 4/30/43(4) | 450 | | 442 |
NCR Atleos Escrow Corp. 144A
9.500%, 4/1/29(1) | 510 | | 493 |
Nippon Life Insurance Co. 144A
6.250%, 9/13/53(1) | 375 | | 371 |
| Northern Trust Corp. | | | |
| 3.375%, 5/8/32 | 600 | | 529 |
| 6.125%, 11/2/32 | 365 | | 360 |
OneMain Finance Corp.
6.875%, 3/15/25 | 605 | | 600 |
| Prudential Financial, Inc. | | | |
| 5.125%, 3/1/52 | 192 | | 165 |
| 6.000%, 9/1/52 | 117 | | 107 |
| 6.750%, 3/1/53 | 560 | | 542 |
State Street Corp.
4.821%, 1/26/34 | 838 | | 764 |
| Synchrony Financial | | | |
| 4.875%, 6/13/25 | 310 | | 297 |
| 3.700%, 8/4/26 | 180 | | 163 |
Texas Capital Bancshares, Inc.
4.000%, 5/6/31 | �� 945 | | 785 |
Toronto-Dominion Bank (The)
8.125%, 10/31/82 | 600 | | 597 |
| | Par Value | | Value |
| | | | |
| Financials—continued | | |
UBS Group AG 144A
6.301%, 9/22/34(1) | $ 995 | | $ 972 |
| Wells Fargo & Co. | | | |
| 5.389%, 4/24/34 | 425 | | 397 |
Series BB
3.900%(6) | 950 | | 830 |
Series U
5.875%(4)(6) | 505 | | 495 |
| | | | 39,692 |
| | | | |
| |
| Health Care—3.6% | | |
AdaptHealth LLC 144A
5.125%, 3/1/30(1) | 900 | | 697 |
Akumin, Inc. 144A
7.000%, 11/1/25(1) | 665 | | 499 |
| Amgen, Inc. | | | |
| 5.250%, 3/2/33 | 359 | | 343 |
| 5.650%, 3/2/53 | 143 | | 134 |
| Bausch Health Cos., Inc. | | | |
| 144A 6.125%, 2/1/27(1) | 45 | | 28 |
| 144A 11.000%, 9/30/28(1) | 133 | | 90 |
| 144A 14.000%, 10/15/30(1) | 26 | | 15 |
Bio-Rad Laboratories, Inc.
3.700%, 3/15/32 | 556 | | 468 |
Catalent Pharma Solutions, Inc. 144A
3.500%, 4/1/30(1)(5) | 940 | | 774 |
Cheplapharm Arzneimittel GmbH 144A
5.500%, 1/15/28(1) | 800 | | 726 |
| Community Health Systems, Inc. | | | |
| 144A 6.875%, 4/15/29(1) | 70 | | 37 |
| 144A 6.125%, 4/1/30(1) | 645 | | 328 |
| 144A 4.750%, 2/15/31(1) | 650 | | 460 |
DENTSPLY SIRONA, Inc.
3.250%, 6/1/30 | 1,190 | | 996 |
Fortrea Holdings, Inc. 144A
7.500%, 7/1/30(1) | 111 | | 108 |
GE HealthCare Technologies, Inc.
5.857%, 3/15/30 | 605 | | 600 |
HCA, Inc.
5.500%, 6/1/33 | 740 | | 700 |
Illumina, Inc.
2.550%, 3/23/31 | 1,145 | | 889 |
IQVIA, Inc. 144A
5.700%, 5/15/28(1) | 581 | | 565 |
Lannett Co., Inc. 144A
7.750%, 4/15/26(1)(7) | 165 | | 9 |
LifePoint Health, Inc. 144A
9.875%, 8/15/30(1) | 1,115 | | 1,080 |
Medline Borrower LP 144A
5.250%, 10/1/29(1) | 670 | | 579 |
Par Pharmaceutical, Inc. 144A
7.500%, 4/1/27(1)(9) | 345 | | 245 |
Star Parent, Inc. 144A
9.000%, 10/1/30(1) | 135 | | 136 |
See Notes to Financial Statements
Newfleet Multi-Sector Intermediate Bond Fund
SCHEDULE OF INVESTMENTS (Continued)
September 30, 2023
($ reported in thousands)
| | Par Value | | Value |
| | | | |
| Health Care—continued | | |
| Surgery Center Holdings, Inc. | | | |
| 144A 6.750%, 7/1/25(1) | $ 340 | | $ 337 |
| 144A 10.000%, 4/15/27(1) | 173 | | 175 |
Team Health Holdings, Inc. 144A
6.375%, 2/1/25(1) | 510 | | 393 |
Teva Pharmaceutical Finance Netherlands III B.V.
3.150%, 10/1/26 | 540 | | 480 |
Universal Health Services, Inc.
2.650%, 1/15/32 | 1,550 | | 1,162 |
Viatris, Inc.
2.700%, 6/22/30 | 915 | | 715 |
Zimmer Biomet Holdings, Inc.
3.550%, 3/20/30 | 830 | | 709 |
| | | | 14,477 |
| | | | |
| |
| Industrials—3.2% | | |
Alaska Airlines Pass-Through Trust 2020-1, A 144A
4.800%, 2/15/29(1) | 878 | | 842 |
Aviation Capital Group LLC 144A
3.500%, 11/1/27(1) | 705 | | 622 |
Avolon Holdings Funding Ltd. 144A
4.375%, 5/1/26(1) | 597 | | 561 |
Beacon Roofing Supply, Inc. 144A
6.500%, 8/1/30(1) | 250 | | 242 |
BlueLinx Holdings, Inc. 144A
6.000%, 11/15/29(1) | 685 | | 603 |
| Boeing Co. (The) | | | |
| 5.150%, 5/1/30 | 295 | | 282 |
| 3.750%, 2/1/50 | 450 | | 306 |
| 5.805%, 5/1/50 | 155 | | 140 |
| 5.930%, 5/1/60 | 220 | | 198 |
| Chart Industries, Inc. | | | |
| 144A 7.500%, 1/1/30(1) | 10 | | 10 |
| 144A 9.500%, 1/1/31(1) | 550 | | 585 |
Concentrix Corp.
6.650%, 8/2/26 | 495 | | 492 |
CoStar Group, Inc. 144A
2.800%, 7/15/30(1) | 1,015 | | 818 |
Flowserve Corp.
3.500%, 10/1/30 | 260 | | 217 |
Fortress Transportation & Infrastructure Investors LLC 144A
6.500%, 10/1/25(1) | 280 | | 275 |
Global Infrastructure Solutions, Inc. 144A
7.500%, 4/15/32(1) | 580 | | 496 |
Hertz Corp. (The) 144A
5.000%, 12/1/29(1) | 765 | | 599 |
| Icahn Enterprises LP | | | |
| 6.250%, 5/15/26 | 175 | | ���163 |
| | Par Value | | Value |
| | | | |
| Industrials—continued | | |
| 5.250%, 5/15/27 | $ 365 | | $ 321 |
Neptune Bidco U.S., Inc. 144A
9.290%, 4/15/29(1) | 325 | | 294 |
Regal Rexnord Corp. 144A
6.400%, 4/15/33(1) | 893 | | 860 |
Science Applications International Corp. 144A
4.875%, 4/1/28(1) | 650 | | 590 |
Sempra Global 144A
3.250%, 1/15/32(1) | 814 | | 637 |
| TransDigm, Inc. | | | |
| 144A 6.875%, 12/15/30(1) | 460 | | 451 |
| 5.500%, 11/15/27 | 310 | | 290 |
United Airlines Pass-Through Trust 2023-1, A
5.800%, 7/15/37 | 589 | | 573 |
United Rentals North America, Inc.
3.750%, 1/15/32 | 540 | | 436 |
Veralto Corp. 144A
5.450%, 9/18/33(1) | 450 | | 435 |
VistaJet Malta Finance plc 144A
9.500%, 6/1/28(1) | 340 | | 298 |
| | | | 12,636 |
| | | | |
| |
| Information Technology—1.6% | | |
| Booz Allen Hamilton, Inc. | | | |
| 5.950%, 8/4/33 | 485 | | 473 |
| 144A 3.875%, 9/1/28(1) | 365 | | 327 |
| 144A 4.000%, 7/1/29(1) | 600 | | 529 |
CDW LLC
3.569%, 12/1/31 | 682 | | 562 |
CommScope Technologies LLC 144A
6.000%, 6/15/25(1) | 645 | | 614 |
| Consensus Cloud Solutions, Inc. | | | |
| 144A 6.000%, 10/15/26(1)(5) | 110 | | 101 |
| 144A 6.500%, 10/15/28(1) | 635 | | 541 |
Dell International LLC
8.100%, 7/15/36 | 575 | | 643 |
GTCR W-2 Merger Sub LLC 144A
7.500%, 1/15/31(1) | 566 | | 567 |
Kyndryl Holdings, Inc.
3.150%, 10/15/31 | 610 | | 462 |
Leidos, Inc.
2.300%, 2/15/31 | 1,135 | | 873 |
Viasat, Inc. 144A
5.625%, 9/15/25(1) | 845 | | 781 |
| | | | 6,473 |
| | | | |
| |
| Materials—2.1% | | |
ArcelorMittal S.A.
6.800%, 11/29/32 | 595 | | 591 |
ASP Unifrax Holdings, Inc. 144A
5.250%, 9/30/28(1) | 1,235 | | 879 |
| | Par Value | | Value |
| | | | |
| Materials—continued | | |
Bayport Polymers LLC 144A
5.140%, 4/14/32(1) | $ 710 | | $ 613 |
Cleveland-Cliffs, Inc. 144A
6.750%, 3/15/26(1) | 750 | | 748 |
Corp. Nacional del Cobre de Chile 144A
5.950%, 1/8/34(1) | 850 | | 822 |
FMG Resources August 2006 Pty Ltd. 144A
5.875%, 4/15/30(1) | 935 | | 855 |
Graham Packaging Co., Inc. 144A
7.125%, 8/15/28(1) | 988 | | 828 |
LSB Industries, Inc. 144A
6.250%, 10/15/28(1) | 930 | | 843 |
Mauser Packaging Solutions Holding Co. 144A
7.875%, 8/15/26(1) | 510 | | 492 |
Mercer International, Inc.
5.125%, 2/1/29 | 125 | | 98 |
New Enterprise Stone & Lime Co., Inc. 144A
9.750%, 7/15/28(1) | 591 | | 584 |
Taseko Mines Ltd. 144A
7.000%, 2/15/26(1) | 460 | | 430 |
Teck Resources Ltd.
6.125%, 10/1/35 | 510 | | 488 |
WR Grace Holdings LLC 144A
5.625%, 8/15/29(1) | 167 | | 135 |
| | | | 8,406 |
| | | | |
| |
| Real Estate—1.4% | | |
| EPR Properties | | | |
| 4.750%, 12/15/26 | 205 | | 187 |
| 3.600%, 11/15/31 | 475 | | 352 |
| GLP Capital LP | | | |
| 5.750%, 6/1/28 | 579 | | 555 |
| 4.000%, 1/15/30 | 245 | | 208 |
| 3.250%, 1/15/32 | 436 | | 338 |
Kite Realty Group Trust
4.750%, 9/15/30 | 840 | | 748 |
MPT Operating Partnership LP
3.500%, 3/15/31 | 510 | | 319 |
Office Properties Income Trust
4.500%, 2/1/25 | 900 | | 736 |
Phillips Edison Grocery Center Operating Partnership I LP
2.625%, 11/15/31 | 845 | | 621 |
Service Properties Trust
4.950%, 2/15/27 | 455 | | 384 |
| VICI Properties LP | | | |
| 4.950%, 2/15/30 | 375 | | 343 |
| 5.125%, 5/15/32 | 725 | | 649 |
| 144A 4.125%, 8/15/30(1) | 180 | | 153 |
| | | | 5,593 |
| | | | |
| |
See Notes to Financial Statements
Newfleet Multi-Sector Intermediate Bond Fund
SCHEDULE OF INVESTMENTS (Continued)
September 30, 2023
($ reported in thousands)
| | Par Value | | Value |
| | | | |
| Utilities—1.7% | | |
CMS Energy Corp.
4.750%, 6/1/50 | $ 1,130 | | $ 964 |
| Electricite de France S.A. | | | |
| 144A 6.250%, 5/23/33(1) | 200 | | 200 |
| 144A 6.900%, 5/23/53(1) | 605 | | 600 |
Enel Finance International N.V. 144A
7.500%, 10/14/32(1) | 585 | | 625 |
| Eskom Holdings SOC Ltd. | | | |
| 144A 7.125%, 2/11/25(1) | 465 | | 452 |
| 144A 8.450%, 8/10/28(1) | 285 | | 270 |
| RegS 6.350%, 8/10/28(3) | 215 | | 196 |
| Ferrellgas LP | | | |
| 144A 5.375%, 4/1/26(1) | 305 | | 286 |
| 144A 5.875%, 4/1/29(1) | 175 | | 157 |
KeySpan Gas East Corp. 144A
5.994%, 3/6/33(1) | 775 | | 748 |
NRG Energy, Inc. 144A
7.000%, 3/15/33(1) | 712 | | 688 |
Southern Co. (The) Series 21-A
3.750%, 9/15/51 | 877 | | 765 |
Sunnova Energy Corp. 144A
5.875%, 9/1/26(1)(5) | 555 | | 476 |
Vistra Corp. 144A
8.000% (1)(6) | 295 | | 281 |
| | | | 6,708 |
| | | | |
| |
Total Corporate Bonds and Notes
(Identified Cost $160,309) | | 145,993 |
| | | | |
| |
| | | | |
| |
| Leveraged Loans—12.6% |
| Aerospace—0.6% | | |
Amentum Government Services Holdings LLC (1 month Term SOFR + 4.000%)
9.331%, 2/15/29(4) | 217 | | 214 |
Brown Group Holding LLC (1 month Term SOFR + 2.850%)
8.166%, 6/7/28(4) | 638 | | 632 |
| Dynasty Acquisition Co., Inc. | | | |
2023, Tranche B-1 (1 month Term SOFR + 4.000%)
9.316%, 8/24/28(4) | 337 | | 336 |
2023, Tranche B-2 (1 month Term SOFR + 4.000%)
9.316%, 8/24/28(4) | 145 | | 144 |
Kestrel Bidco, Inc. (1 month Term SOFR + 3.100%)
8.420%, 12/11/26(4) | 288 | | 281 |
Mileage Plus Holdings LLC (3 month Term SOFR + 5.400%)
10.798%, 6/21/27(4) | 289 | | 300 |
| | Par Value | | Value |
| | | | |
| Aerospace—continued | | |
TransDigm, Inc. Tranche I (3 month Term SOFR + 3.250%)
8.640%, 8/24/28(4) | $ 458 | | $ 458 |
| | | | 2,365 |
| | | | |
| |
| Chemicals—0.4% | | |
Ineos Finance plc 2027 (1 month Term SOFR + 3.850%)
9.166%, 11/8/27(4) | 407 | | 405 |
LSF11 A5 Holdco LLC (1 month Term SOFR + 4.350%)
9.666%, 10/15/28(4) | 404 | | 398 |
Nouryon Finance B.V. (3 month LIBOR + 3.250%)
0.000%, 4/3/28(4)(10) | 579 | | 571 |
Windsor Holdings III LLC Tranche B (1 month Term SOFR + 4.500%)
9.830%, 8/1/30(4) | 405 | | 403 |
| | | | 1,777 |
| | | | |
| |
| Consumer Non-Durables—0.2% | | |
DS Parent, Inc. Tranche B (6 month Term SOFR + 5.750%)
11.337%, 12/8/28(4) | 288 | | 283 |
Kronos Acquisition Holdings, Inc. Tranche B-1 (3 month Term SOFR + 4.012%)
9.402%, 12/22/26(4) | 572 | | 569 |
| | | | 852 |
| | | | |
| |
| Energy—0.7% | | |
Freeport LNG Investments LLP Tranche B (3 month Term SOFR + 3.762%)
9.088%, 12/21/28(4) | 575 | | 569 |
Hamilton Projects Acquiror LLC (1 month Term SOFR + 4.614%)
9.931%, 6/17/27(4) | 389 | | 387 |
Medallion Midland Acquisition LLC (3 month Term SOFR + 4.012%)
9.402%, 10/18/28(4) | 620 | | 620 |
Oryx Midstream Services Permian Basin LLC 2023 (1 month Term SOFR + 3.364%)
8.692%, 10/5/28(4) | 488 | | 487 |
| | Par Value | | Value |
| | | | |
| Energy—continued | | |
Traverse Midstream Partners LLC 2023, Tranche B (3 month Term SOFR + 3.850%)
9.216%, 2/16/28(4) | $ 520 | | $ 519 |
| | | | 2,582 |
| | | | |
| |
| Financials—0.3% | | |
Asurion LLC Tranche B-8 (1 month Term SOFR + 3.364%)
8.681%, 12/23/26(4) | 379 | | 370 |
Blackhawk Network Holdings, Inc. First Lien (3 month Term SOFR + 2.750%)
8.172%, 6/15/25(4) | 269 | | 268 |
Castlelake Aviation One Designated Activity Co. 2023 (3 month Term SOFR + 3.012%)
8.421%, 10/22/27(4) | 362 | | 361 |
GIP Pilot Acquisition Partners LP (1 month Term SOFR + 3.250%)
0.000%, 9/18/30(4)(10) | 120 | | 120 |
GTCR W Merger Sub LLC Tranche B (3 month LIBOR + 3.250%)
0.000%, 9/20/30(4)(10) | 235 | | 235 |
| | | | 1,354 |
| | | | |
| |
| Food / Tobacco—0.9% | | |
Del Monte Foods, Inc. (1 month Term SOFR + 4.350% - 3 month PRIME + 3.250%)
9.668% - 11.750%, 5/16/29(4) | 672 | | 652 |
Froneri U.S., Inc. Tranche B-2 (1 month Term SOFR + 2.350%)
7.666%, 1/29/27(4) | 556 | | 551 |
Naked Juice LLC (3 month Term SOFR + 3.350%)
8.740%, 1/24/29(4) | 551 | | 522 |
Pegasus Bidco B.V. Tranche B-2 (3 month Term SOFR + 4.250%)
9.615%, 7/12/29(4) | 547 | | 545 |
Shearer’s Foods LLC First Lien (1 month Term SOFR + 3.614%)
8.931%, 9/23/27(4) | 391 | | 390 |
Sigma Bidco B.V. Tranche B-7 (3 month LIBOR + 3.250%)
0.000%, 1/2/28(4)(10) | 384 | | 374 |
See Notes to Financial Statements
Newfleet Multi-Sector Intermediate Bond Fund
SCHEDULE OF INVESTMENTS (Continued)
September 30, 2023
($ reported in thousands)
| | Par Value | | Value |
| | | | |
| Food / Tobacco—continued | | |
Triton Water Holdings, Inc. First Lien (3 month Term SOFR + 3.512%)
8.902%, 3/31/28(4) | $ 636 | | $ 620 |
| | | | 3,654 |
| | | | |
| |
| Forest Prod / Containers—0.4% | | |
Clydesdale Acquisition Holdings, Inc. Tranche B (1 month Term SOFR + 4.275%)
9.591%, 4/13/29(4) | 384 | | 379 |
Klockner Pentaplast of America, Inc. Tranche B (6 month Term SOFR + 4.975%)
10.476%, 2/12/26(4) | 483 | | 463 |
Mauser Packaging Solutions Holding Co. (1 month Term SOFR + 4.000%)
9.319% - 9.330%, 8/14/26(4) | 209 | | 209 |
TricorBraun, Inc. (1 month Term SOFR + 3.364%)
8.681%, 3/3/28(4) | 563 | | 551 |
| | | | 1,602 |
| | | | |
| |
| Gaming / Leisure—1.0% | | |
Caesars Entertainment, Inc. Tranche B (1 month Term SOFR + 3.350%)
8.666%, 2/6/30(4) | 144 | | 144 |
Carnival Corp. (1 month Term SOFR + 3.000%)
8.327%, 8/9/27(4) | 359 | | 358 |
ECL Entertainment LLC Tranche B (3 month Term SOFR + 4.750%)
10.140%, 9/3/30(4) | 405 | | 404 |
Entain Holdings Gibraltar Ltd. Tranche B (3 month Term SOFR + 2.600%)
7.990%, 3/29/27(4) | 319 | | 318 |
Entain plc Tranche B-2 (3 month Term SOFR + 3.600%)
8.990%, 10/31/29(4) | 50 | | 50 |
| J&J Ventures Gaming LLC | | | |
(3 month Term SOFR + 4.262%)
9.652%, 4/26/28(4) | 333 | | 317 |
2023 (1 month Term SOFR + 3.250%)
0.000%, 4/26/28(4)(10) | 415 | | 396 |
2023 (1 month Term SOFR + 4.364%)
9.693%, 4/26/28(4) | 230 | | 220 |
Ontario Gaming GTA Ltd. Partnership Tranche B (3 month Term SOFR + 4.250%)
9.640%, 8/1/30(4) | 140 | | 140 |
| | Par Value | | Value |
| | | | |
| Gaming / Leisure—continued | | |
Playa Hotels & Resorts B.V. (1 month Term SOFR + 4.250%)
9.581%, 1/5/29(4) | $ 301 | | $ 301 |
Raptor Acquisition Corp. Tranche B (3 month Term SOFR + 4.262%)
9.658%, 11/1/26(4) | 128 | | 128 |
Scientific Games Holdings LP (3 month Term SOFR + 3.500%)
8.768%, 4/4/29(4) | 463 | | 460 |
UFC Holdings LLC Tranche B-3 (3 month Term SOFR + 3.012%)
8.369%, 4/29/26(4) | 558 | | 556 |
| | | | 3,792 |
| | | | |
| |
| Health Care—1.6% | | |
Agiliti Health, Inc. 2023, Tranche B (3 month Term SOFR + 3.000%)
8.247%, 5/1/30(4) | 455 | | 453 |
Bausch & Lomb Corp. (3 month LIBOR + 3.000%)
0.000%, 9/14/28(4)(10) | 280 | | 276 |
CHG Healthcare Services, Inc. First Lien (1 month Term SOFR + 3.364%)
8.681%, 9/29/28(4) | 553 | | 550 |
Gainwell Acquisition Corp. Tranche B (3 month Term SOFR + 4.100%)
9.490%, 10/1/27(4) | 238 | | 232 |
Hunter Holdco 3 Ltd. First Lien (3 month Term SOFR + 4.350%)
9.740%, 8/19/28(4) | 265 | | 264 |
LifePoint Health, Inc. Tranche B, First Lien (3 month Term SOFR + 4.012%)
9.377%, 11/16/25(4) | 244 | | 243 |
Medline Borrower LP (1 month Term SOFR + 3.364%)
8.681%, 10/23/28(4) | 556 | | 554 |
Packaging Coordinators Midco, Inc. Tranche B, First Lien (3 month Term SOFR + 3.762%)
9.152%, 11/30/27(4) | 265 | | 264 |
| Phoenix Guarantor, Inc. | | | |
Tranche B-1 (1 month Term SOFR + 3.364%)
8.681%, 3/5/26(4) | 312 | | 309 |
Tranche B-3 (1 month Term SOFR + 3.614%)
8.931%, 3/5/26(4) | 100 | | 100 |
| | Par Value | | Value |
| | | | |
| Health Care—continued | | |
Phoenix Newco, Inc. First Lien (1 month Term SOFR + 3.364%)
8.681%, 11/15/28(4) | $ 516 | | $ 512 |
Sotera Health Holdings LLC (1 month Term SOFR + 3.750%)
9.073%, 12/11/26(4) | 155 | | 155 |
Star Parent, Inc. Tranche B (1 month Term SOFR + 3.250%)
0.000%, 9/19/30(4)(10) | 860 | | 840 |
Sunshine Luxembourg VII S.a.r.l. Tranche B-3 (3 month Term SOFR + 3.850%)
9.240%, 10/1/26(4) | 576 | | 575 |
Upstream Newco, Inc. 2021 (1 month Term SOFR + 4.364%)
9.681%, 11/20/26(4) | 347 | | 332 |
Viant Medical Holdings, Inc. First Lien (1 month Term SOFR + 3.864%)
9.181%, 7/2/25(4) | 552 | | 540 |
| | | | 6,199 |
| | | | |
| |
| Housing—0.4% | | |
Chariot Buyer LLC (1 month Term SOFR + 3.350%)
8.666%, 11/3/28(4) | 455 | | 447 |
Quikrete Holdings, Inc. Tranche B-1 (1 month Term SOFR + 2.864%)
8.181%, 3/18/29(4) | 340 | | 340 |
| SRS Distribution, Inc. | | | |
2021 (1 month Term SOFR + 3.614%)
8.931%, 6/2/28(4) | 556 | | 550 |
2022 (1 month Term SOFR + 3.600%)
8.916%, 6/2/28(4) | 49 | | 49 |
| | | | 1,386 |
| | | | |
| |
| Information Technology—1.2% | | |
| Applied Systems, Inc. | | | |
2026 (3 month Term SOFR + 4.500%)
9.890%, 9/18/26(4) | 264 | | 264 |
Second Lien (3 month Term SOFR + 6.750%)
12.140%, 9/17/27(4) | 366 | | 367 |
Barracuda Parent LLC First Lien (3 month Term SOFR + 4.500%)
9.869%, 8/15/29(4) | 499 | | 493 |
CDK Global, Inc. (1 month Term SOFR + 4.250%)
9.640%, 7/6/29(4) | 746 | | 745 |
ConnectWise LLC (1 month Term SOFR + 3.614%)
8.931%, 9/29/28(4) | 136 | | 134 |
See Notes to Financial Statements
Newfleet Multi-Sector Intermediate Bond Fund
SCHEDULE OF INVESTMENTS (Continued)
September 30, 2023
($ reported in thousands)
| | Par Value | | Value |
| | | | |
| Information Technology—continued | | |
| Epicor Software Corp. | | | |
First Lien (3 month LIBOR + 1.750%)
9.069%, 7/30/27(4) | $ 35 | | $ 35 |
Tranche C (1 month Term SOFR + 3.364%)
8.681%, 7/30/27(4) | 264 | | 264 |
Indicor LLC (3 month Term SOFR + 4.500%)
9.890%, 11/22/29(4) | 502 | | 503 |
Mosel Bidco SE Tranche B (1 month Term SOFR + 5.000%)
0.000%, 9/16/30(4)(7)(10) | 223 | | 223 |
Polaris Newco LLC First Lien (1 month Term SOFR + 4.114%)
9.431%, 6/2/28(4) | 579 | | 553 |
Project Ruby Ultimate Parent Corp. First Lien (1 month Term SOFR + 3.364%)
8.681%, 3/10/28(4) | 398 | | 393 |
Proofpoint, Inc. (1 month Term SOFR + 3.364%)
8.681%, 8/31/28(4) | 136 | | 135 |
RealPage, Inc. First Lien (1 month Term SOFR + 3.114%)
8.431%, 4/24/28(4) | 253 | | 249 |
Sophia LP Tranche B (1 month Term SOFR + 3.600%)
8.916%, 10/7/27(4) | 337 | | 336 |
| UKG, Inc. | | | |
2021, Second Lien (3 month Term SOFR + 5.350%)
10.618%, 5/3/27(4) | 25 | | 25 |
2021-2, First Lien (3 month Term SOFR + 3.350%)
8.618%, 5/4/26(4) | 132 | | 131 |
| | | | 4,850 |
| | | | |
| |
| Manufacturing—1.0% | | |
Alliance Laundry Systems LLC Tranche B (3 month Term SOFR + 3.600%)
8.901%, 10/8/27(4) | 222 | | 221 |
| Arcline FM Holdings LLC | | | |
First Lien (3 month Term SOFR + 5.012%)
10.402%, 6/23/28(4) | 337 | | 335 |
Second Lien (3 month Term SOFR + 8.250%)
13.902%, 6/25/29(4) | 140 | | 134 |
Chart Industries, Inc. (1 month Term SOFR + 3.850%)
9.174%, 3/15/30(4) | 239 | | 239 |
| | Par Value | | Value |
| | | | |
| Manufacturing—continued | | |
CPM Holdings, Inc. (1 month Term SOFR + 3.500%)
0.000%, 9/22/28(4)(10) | $ 458 | | $ 457 |
Filtration Group Corp. 2021 (1 month Term SOFR + 3.614%)
8.931%, 10/21/28(4) | 622 | | 619 |
Madison IAQ LLC (1 month Term SOFR + 3.364%)
8.689%, 6/21/28(4) | 482 | | 474 |
NCR Atleos LLC Tranche B (3 month LIBOR + 3.250%)
0.000%, 3/27/29(4)(10) | 835 | | 804 |
Safe Fleet Holdings LLC 2022 (1 month Term SOFR + 3.850%)
9.170%, 2/23/29(4) | 397 | | 397 |
Star U.S. Bidco LLC (1 month Term SOFR + 4.350%)
9.666%, 3/17/27(4) | 296 | | 295 |
| | | | 3,975 |
| | | | |
| |
| Media / Telecom - Broadcasting—0.2% | | |
Terrier Media Buyer, Inc. 2021, Tranche B (3 month Term SOFR + 3.600%)
8.990%, 12/17/26(4) | 404 | | 368 |
Univision Communications, Inc. 2021 (1 month Term SOFR + 3.364%)
8.681%, 3/15/26(4) | 617 | | 615 |
| | | | 983 |
| | | | |
| |
Media / Telecom - Cable/Wireless
Video—0.3% | | |
DIRECTV Financing LLC (1 month Term SOFR + 5.000%)
10.431%, 8/2/27(4) | 637 | | 622 |
Eagle Broadband Investments LLC (3 month Term SOFR + 3.262%)
8.652%, 11/12/27(4) | 379 | | 369 |
| | | | 991 |
| | | | |
| |
Media / Telecom - Diversified
Media—0.2% | | |
AssuredPartners, Inc. (3 month LIBOR + 3.000%)
0.000%, 2/12/27(4)(10) | 60 | | 60 |
McGraw-Hill Education, Inc. (1 month Term SOFR + 4.864%)
10.181%, 7/28/28(4) | 272 | | 267 |
| | Par Value | | Value |
| | | | |
Media / Telecom - Diversified
Media—continued | | |
Neptune Bidco U.S., Inc. Tranche B (3 month Term SOFR + 5.100%)
10.398%, 4/11/29(4) | $ 284 | | $ 255 |
Simon & Schuster, Inc. Tranche B (3 month LIBOR + 3.250%)
0.000%, 9/27/30(4)(10) | 80 | | 79 |
William Morris Endeavor Entertainment LLC Tranche B-1 (1 month Term SOFR + 2.864%)
8.181%, 5/18/25(4) | 263 | | 262 |
| | | | 923 |
| | | | |
| |
Media / Telecom -
Telecommunications—0.1% | | |
Cincinnati Bell, Inc. Tranche B-2 (1 month Term SOFR + 3.350%)
8.666%, 11/22/28(4) | 328 | | 322 |
| Metals / Minerals—0.2% | | |
Arsenal Aic Parent LLC Tranche B (1 month Term SOFR + 4.500%)
9.879%, 8/19/30(4) | 185 | | 185 |
Covia Holdings Corp. (3 month Term SOFR + 4.262%)
9.530%, 7/31/26(4) | 530 | | 526 |
| | | | 711 |
| | | | |
| |
| Retail—0.4% | | |
CNT Holdings I Corp. First Lien (3 month Term SOFR + 3.500%)
8.800%, 11/8/27(4) | 365 | | 363 |
EG America LLC (1 month Term SOFR + 4.114%)
9.414%, 2/7/25(4) | 486 | | 478 |
Great Outdoors Group LLC Tranche B-2 (3 month Term SOFR + 4.012%)
9.402%, 3/6/28(4) | 348 | | 347 |
PetsMart LLC (1 month Term SOFR + 3.850%)
9.166%, 2/11/28(4) | 521 | | 519 |
| | | | 1,707 |
| | | | |
| |
| Service—2.0% | | |
AlixPartners LLP (1 month Term SOFR + 2.864%)
8.181%, 2/4/28(4) | 617 | | 616 |
Ascend Learning LLC (1 month Term SOFR + 3.600%)
8.916%, 12/11/28(4) | 402 | | 383 |
See Notes to Financial Statements
Newfleet Multi-Sector Intermediate Bond Fund
SCHEDULE OF INVESTMENTS (Continued)
September 30, 2023
($ reported in thousands)
| | Par Value | | Value |
| | | | |
| Service—continued | | |
BrightView Landscapes LLC Tranche B (3 month Term SOFR + 3.250%)
8.619%, 4/20/29(4) | $ 346 | | $ 346 |
Carlisle Foodservice Products, Inc. First Lien (3 month PRIME + 2.000%)
10.500%, 3/20/25 | 734 | | 705 |
DG Investment Intermediate Holdings 2, Inc. 2022 (1 month Term SOFR + 4.750%)
10.066%, 3/31/28(4) | 424 | | 420 |
DXP Enterprises, Inc. (3 month Term SOFR + 5.250%)
10.444%, 12/23/27(4) | 336 | | 334 |
Garda World Security Corp. Tranche B-2 (3 month Term SOFR + 4.350%)
9.746%, 10/30/26(4) | 115 | | 115 |
Grab Holdings, Inc. (1 month Term SOFR + 4.614%)
9.931%, 1/29/26(4) | 130 | | 130 |
Kuehg Corp. (3 month Term SOFR + 5.000%)
10.390%, 6/12/30(4) | 460 | | 460 |
NAB Holdings LLC First Lien (3 month Term SOFR + 3.150%)
8.540%, 11/23/28(4) | 544 | | 542 |
Omnia Partners LLC (3 month Term SOFR + 4.250%)
9.601%, 7/19/30(4) | 539 | | 539 |
Peraton Corp. Tranche B, First Lien (1 month Term SOFR + 3.850%)
9.166%, 2/1/28(4) | 662 | | 660 |
PODS LLC (1 month Term SOFR + 3.114%)
8.431%, 3/31/28(4) | 184 | | 178 |
Sedgwick Claims Management Services, Inc. 2023 (1 month Term SOFR + 3.750%)
9.066%, 2/24/28(4) | 407 | | 406 |
St. George’s University Scholastic Services LLC (1 month Term SOFR + 3.350%)
8.666%, 2/10/29(4) | 262 | | 259 |
Sweetwater Borrower LLC (1 month Term SOFR + 4.364%)
9.681%, 8/7/28(4) | 381 | | 369 |
Titan Acquisition Ltd. (3 month LIBOR + 3.000%)
8.731%, 3/28/25(4) | 768 | | 761 |
| | Par Value | | Value |
| | | | |
| Service—continued | | |
TMF Sapphire Bidco B.V. Tranche B-2 (2 month Term SOFR + 5.000%)
10.370%, 5/3/28(4) | $ 215 | | $ 214 |
Weld North Education LLC 2021 (1 month Term SOFR + 3.864%)
9.181%, 12/21/27(4) | 335 | | 328 |
| | | | 7,765 |
| | | | |
| |
| Transportation - Automotive—0.3% | | |
American Axle & Manufacturing, Inc. Tranche B, First Lien (1-6 month Term SOFR + 3.600%)
8.436% - 8.929%, 12/13/29(4) | 389 | | 387 |
Clarios Global LP 2023 (1 month Term SOFR + 3.750%)
9.066%, 5/6/30(4) | 525 | | 524 |
PAI Holdco, Inc. Tranche B (3 month Term SOFR + 4.012%)
9.381%, 10/28/27(4) | 439 | | 415 |
| | | | 1,326 |
| | | | |
| |
| Utilities—0.2% | | |
Brookfield WEC Holdings, Inc. (1 month Term SOFR + 2.864%)
8.181%, 8/1/25(4) | 732 | | 730 |
Generation Bridge Northeast LLC Tranche B (1 month Term SOFR + 4.250%)
9.566%, 8/7/29(4) | 180 | | 180 |
| | | | 910 |
| | | | |
| |
Total Leveraged Loans
(Identified Cost $49,864) | | 50,026 |
| | Shares | |
| Preferred Stocks—0.7% |
| Financials—0.7% | |
| Capital Farm Credit ACA Series 1 144A, 5.000%(1) | 525 (11) | 467 |
| JPMorgan Chase & Co. Series HH, 4.600% | 300 (11) | 281 |
| MetLife, Inc. Series D, 5.875% | 478 (11) | 449 |
| Truist Financial Corp. Series Q, 5.100% | 725 (11) | 620 |
| | Shares | | Value |
| Financials—continued | | |
| Zions Bancorp NA, 9.561% | 38,525 | | $ 963 |
| | | | 2,780 |
| | | | |
| |
Total Preferred Stocks
(Identified Cost $2,954) | | 2,780 |
| | | | |
| |
| | | | |
| |
| Common Stocks—0.0% |
| Consumer Discretionary—0.0% | | |
| MYT Holding LLC Class B(7)(12) | 42,729 | | 13 |
| NMG Parent LLC(7)(12) | 836 | | 96 |
| West Marine(7)(12) | 650 | | 2 |
| | | | 111 |
| | | | |
| |
Total Common Stocks
(Identified Cost $308) | | 111 |
| | | | |
| |
| | | | |
| |
| Rights—0.0% |
| Utilities—0.0% | | |
| Vistra Energy Corp., 12/29/49(7)(12) | 6,252 | | 7 |
Total Rights
(Identified Cost $5) | | 7 |
| | | | |
| |
| | | | |
| |
Total Long-Term Investments—97.6%
(Identified Cost $417,283) | | 388,082 |
| | | | |
| |
| | | | |
| |
| Short-Term Investment—1.0% |
| Money Market Mutual Fund—1.0% |
| Dreyfus Government Cash Management Fund - Institutional Shares (seven-day effective yield 5.222%)(13) | 4,069,518 | | 4,070 |
Total Short-Term Investment
(Identified Cost $4,070) | | 4,070 |
| | | | |
| |
| | | | |
| |
| Securities Lending Collateral—1.1% |
| Dreyfus Government Cash Management Fund - Institutional Shares (seven-day effective yield 5.222%)(13)(14) | 4,427,184 | | 4,427 |
Total Securities Lending Collateral
(Identified Cost $4,427) | | 4,427 |
| | | | |
| |
| | | | |
| |
TOTAL INVESTMENTS—99.7%
(Identified Cost $425,780) | | $396,579 |
| Other assets and liabilities, net—0.3% | | 1,007 |
| NET ASSETS—100.0% | | $397,586 |
See Notes to Financial Statements
Newfleet Multi-Sector Intermediate Bond Fund
SCHEDULE OF INVESTMENTS (Continued)
September 30, 2023
($ reported in thousands)
| Abbreviations: |
| ABS | Asset-Backed Securities |
| ACA | American Capital Access Financial Guarantee Corp. |
| BAM | Build America Municipal Insured |
| JSC | Joint Stock Company |
| LIBOR | London Interbank Offered Rate |
| LLC | Limited Liability Company |
| LLLP | Limited Liability Limited Partnership |
| LLP | Limited Liability Partnership |
| LP | Limited Partnership |
| MSCI | Morgan Stanley Capital International |
| NA | National Association |
| SOFR | Secured Overnight Financing Rate |
| Footnote Legend: |
| (1) | Security exempt from registration under Rule 144A of the Securities Act of 1933. These securities may be resold in transactions exempt from registration, normally to qualified institutional buyers. At September 30, 2023, these securities amounted to a value of $198,655 or 50.0% of net assets. |
| (2) | Security in default; no interest payments are being received. |
| (3) | Regulation S security. Security is offered and sold outside of the United States; therefore, it is exempt from registration with the SEC under Rules 903 and 904 of the Securities Act of 1933. |
| (4) | Variable rate security. Rate disclosed is as of September 30, 2023. Information in parenthesis represents benchmark and reference rate for each security. Certain variable rate securities are not based on a published reference rate and spread but are determined by the issuer or agent and are based on current market conditions, or, for mortgage-backed securities, are impacted by the individual mortgages which are paying off over time. These securities do not indicate a reference rate and spread in their descriptions. |
| (5) | All or a portion of security is on loan. |
| (6) | No contractual maturity date. |
| (7) | The value of this security was determined using significant unobservable inputs and is reported as a Level 3 security in the Fair Value Hierarchy table located after the Schedule of Investments. |
| (8) | Issued with a zero coupon. Income is recognized through the accretion of discount. |
| (9) | Security in default; interest payments are being received. |
| (10) | This loan will settle after September 30, 2023, at which time the interest rate, calculated on the base lending rate and the agreed upon spread on trade date, will be reflected. |
| (11) | Value shown as par value. |
| (12) | Non-income producing. |
| (13) | Shares of this fund are publicly offered, and its prospectus and annual report are publicly available. |
| (14) | Represents security purchased with cash collateral received for securities on loan. |
| Country Weightings (Unaudited)† |
| United States | 84% |
| Canada | 2 |
| Mexico | 2 |
| Netherlands | 1 |
| United Kingdom | 1 |
| Luxembourg | 1 |
| Turkey | 1 |
| Other | 8 |
| Total | 100% |
| † % of total investments as of September 30, 2023. |
As of September 30, 2023, the Fund had the following unfunded loan commitments:
| Borrower | | Par Value | | Commitment | | Value | | Unrealized
Appreciation
(Depreciation) |
| Omnia Partners LLC, (3 month LIBOR + 4.250%) 0.000%, 7/19/30 | | $51 | | $50 | | $51 | | $1 |
For information regarding the abbreviations, see the Key Investment Terms starting on page 5.
See Notes to Financial Statements
Newfleet Multi-Sector Intermediate Bond Fund
SCHEDULE OF INVESTMENTS (Continued)
September 30, 2023
($ reported in thousands)
The following table summarizes the value of the Fund’s investments as of September 30, 2023, based on the inputs used to value them (See Security Valuation Note 2A in the Notes to Financial Statements):
| | Total
Value at
September 30, 2023 | | Level 1
Quoted Prices | | Level 2
Significant
Observable
Inputs | | Level 3
Significant
Unobservable
Inputs |
| Assets: | | | | | | | |
| Debt Instruments: | | | | | | | |
| Asset-Backed Securities | $ 55,667 | | $ — | | $ 55,667 | | $ — |
| Corporate Bonds and Notes | 145,993 | | — | | 145,951 | | 42 |
| Foreign Government Securities | 22,516 | | — | | 22,516 | | — |
| Leveraged Loans | 50,026 | | — | | 49,803 | | 223 |
| Mortgage-Backed Securities | 73,786 | | — | | 73,786 | | — |
| Municipal Bonds | 1,410 | | — | | 1,410 | | — |
| U.S. Government Securities | 35,786 | | — | | 35,786 | | — |
| Equity Securities: | | | | | | | |
| Preferred Stocks | 2,780 | | 963 | | 1,817 | | — |
| Rights | 7 | | — | | — | | 7 |
| Common Stocks | 111 | | — | | — | | 111 |
| Money Market Mutual Fund | 4,070 | | 4,070 | | — | | — |
| Securities Lending Collateral | 4,427 | | 4,427 | | — | | — |
| Total Investments | $396,579 | | $9,460 | | $386,736 | | $383 |
There were no transfers into or out of Level 3 related to securities held at September 30, 2023.
Some of the Fund’s investments that were categorized as Level 3 may have been valued utilizing third party pricing information without adjustment. If applicable, such valuations are based on unobservable inputs. A significant change in third party information could result in a significantly lower or higher value of Level 3 investments.
Management has determined that the amount of Level 3 securities compared to total net assets is not material; therefore, the roll-forward of Level 3 securities and assumptions are not shown for the period ended September 30, 2023.
See Notes to Financial Statements
Newfleet Multi-Sector Short Term Bond Fund
SCHEDULE OF INVESTMENTS
September 30, 2023
($ reported in thousands)
| | Par Value | | Value |
| U.S. Government Securities—7.9% |
| U.S. Treasury Notes | | | |
| 0.375%, 10/31/23 | $ 48,400 | | $ 48,210 |
| 2.500%, 4/30/24 | 196,160 | | 192,827 |
| 0.250%, 5/31/25 | 17,850 | | 16,460 |
| 1.625%, 2/15/26 | 68,160 | | 63,138 |
| 4.375%, 8/15/26 | 33,880 | | 33,459 |
Total U.S. Government Securities
(Identified Cost $356,039) | | 354,094 |
| | | | |
| |
| | | | |
| |
| Municipal Bond—0.1% |
| Virginia—0.1% | | |
Tobacco Settlement Financing Corp. Revenue Taxable Series A-1, Taxable
6.706%, 6/1/46 | 4,120 | | 3,410 |
Total Municipal Bond
(Identified Cost $3,871) | | 3,410 |
| | | | |
| |
| | | | |
| |
| Foreign Government Securities—2.2% |
| Arab Republic of Egypt | | | |
144A
5.800%, 9/30/27(1) | 2,910 | | 1,910 |
144A
7.600%, 3/1/29(1) | 4,075 | | 2,613 |
| Bolivarian Republic of Venezuela | | | |
RegS
7.000%, 12/1/18(2)(3) | 20,999 | | 1,470 |
RegS
7.750%, 10/13/19(2)(3) | 9,851 | | 690 |
| Dominican Republic | | | |
144A
5.500%, 2/22/29(1) | 8,710 | | 7,965 |
144A
7.050%, 2/3/31(1) | 2,200 | | 2,122 |
Hungary Government International Bond 144A
6.125%, 5/22/28(1) | 9,800 | | 9,760 |
Kingdom of Jordan 144A
7.500%, 1/13/29(1) | 5,500 | | 5,371 |
Kingdom of Morocco 144A
5.950%, 3/8/28(1) | 3,000 | | 2,951 |
Republic of Cote d’Ivoire 144A
6.375%, 3/3/28(1) | 13,575 | | 12,671 |
Republic of Panama
3.875%, 3/17/28 | 13,590 | | 12,478 |
Republic of Serbia 144A
6.250%, 5/26/28(1) | 6,800 | | 6,659 |
| Republic of Turkey | | | |
| 9.375%, 3/14/29 | 3,230 | | 3,308 |
| 9.125%, 7/13/30 | 7,490 | | 7,511 |
Saudi International Bond 144A
4.750%, 1/18/28(1) | 6,500 | | 6,338 |
| United Mexican States | | | |
| 3.750%, 1/11/28 | 8,700 | | 8,045 |
| | Par Value | | Value |
| | | | |
| Foreign Government Securities—continued |
| 5.400%, 2/9/28 | $ 5,300 | | $ 5,219 |
Total Foreign Government Securities
(Identified Cost $126,097) | | 97,081 |
| | | | |
| |
| | | | |
| |
| Mortgage-Backed Securities—26.2% |
| Agency—2.7% | | |
| Federal Home Loan Mortgage Corporation | | | |
Pool #SB8269
6.000%, 10/1/38 | 34,137 | | 34,221 |
Pool #SD3238
5.500%, 12/1/52 | 2,951 | | 2,853 |
| Federal National Mortgage Association | | | |
Pool #254549
6.000%, 12/1/32 | 8 | | 8 |
Pool #725762
6.000%, 8/1/34 | 47 | | 47 |
Pool #773385
5.500%, 5/1/34 | 55 | | 55 |
Pool #800267
5.500%, 12/1/34 | 13 | | 13 |
Pool #806318
5.500%, 11/1/34 | 108 | | 104 |
Pool #806328
5.500%, 11/1/34 | 92 | | 89 |
Pool #808018
5.500%, 1/1/35 | 67 | | 67 |
Pool #889578
6.000%, 4/1/38 | 33 | | 34 |
Pool #890710
3.000%, 2/1/31 | 2,401 | | 2,237 |
Pool #941322
6.000%, 7/1/37 | 5 | | 5 |
Pool #AC6992
5.000%, 12/1/39 | 934 | | 914 |
Pool #AD3841
4.500%, 4/1/40 | 989 | | 933 |
Pool #AD4224
5.000%, 8/1/40 | 1,106 | | 1,082 |
Pool #AD6058
4.000%, 8/1/25 | 366 | | 350 |
Pool #AE4799
4.000%, 10/1/40 | 11 | | 10 |
Pool #AH4009
4.000%, 3/1/41 | 1,348 | | 1,235 |
Pool #AI2472
4.500%, 5/1/41 | 816 | | 771 |
Pool #AO5149
3.000%, 6/1/27 | 103 | | 99 |
Pool #AS6515
4.000%, 1/1/46 | 1,792 | | 1,633 |
Pool #FS4438
5.000%, 11/1/52 | 12,677 | | 11,971 |
Pool #MA4785
5.000%, 10/1/52 | 11,563 | | 10,918 |
Pool #MA4805
4.500%, 11/1/52 | 23,208 | | 21,317 |
Pool #MA5072
5.500%, 7/1/53 | 30,250 | | 29,245 |
| | Par Value | | Value |
| | | | |
| Agency—continued | | |
Government National Mortgage Association Pool #563381
6.500%, 11/15/31 | $ 5 | | $ 5 |
| | | | 120,216 |
| | | | |
| |
| Non-Agency—23.5% | | |
A&D Mortgage Trust 2023-NQM3, A1 144A
6.733%, 7/25/68(1)(4) | 10,616 | | 10,603 |
| Ajax Mortgage Loan Trust | | | |
2019-D, A1 144A
2.956%, 9/25/65(1)(4) | 3,111 | | 2,843 |
2021-A, A1 144A
1.065%, 9/25/65(1)(4) | 7,837 | | 6,636 |
2022-B, A1 144A
3.500%, 3/27/62(1)(4) | 16,865 | | 15,473 |
| American Homes 4 Rent Trust | | | |
2014-SFR3, A 144A
3.678%, 12/17/36(1) | 18,909 | | 18,399 |
2015-SFR1, A 144A
3.467%, 4/17/52(1) | 10,253 | | 9,864 |
| AMSR Trust | | | |
2020-SFR1, A 144A
1.819%, 4/17/37(1) | 8,627 | | 8,072 |
2020-SFR1, B 144A
2.120%, 4/17/37(1) | 6,739 | | 6,319 |
2020-SFR2, D 144A
3.282%, 7/17/37(1) | 1,680 | | 1,576 |
2020-SFR3, B 144A
1.806%, 9/17/37(1) | 4,362 | | 3,998 |
2021-SFR2, C 144A
1.877%, 8/17/38(1) | 4,535 | | 3,966 |
2021-SFR3, D 144A
2.177%, 10/17/38(1) | 6,675 | | 5,758 |
2021-SFR4, B 144A
2.417%, 12/17/38(1) | 4,106 | | 3,622 |
2022-SFR1, C 144A
3.740%, 3/17/39(1) | 1,985 | | 1,790 |
2022-SFR3, C 144A
4.000%, 10/17/39(1) | 2,000 | | 1,793 |
| Angel Oak Mortgage Trust | | | |
2020-4, A1 144A
1.469%, 6/25/65(1)(4) | 3,282 | | 3,032 |
2021-3, A2 144A
1.305%, 5/25/66(1)(4) | 1,802 | | 1,482 |
2021-5, A1 144A
0.951%, 7/25/66(1)(4) | 6,864 | | 5,567 |
2021-8, A1 144A
1.820%, 11/25/66(1)(4) | 10,250 | | 8,423 |
2022-5, A1 144A
4.500%, 5/25/67(1)(4) | 5,156 | | 4,835 |
| Arroyo Mortgage Trust | | | |
2019-1, A1 144A
3.805%, 1/25/49(1)(4) | 3,265 | | 3,005 |
2019-2, A1 144A
3.347%, 4/25/49(1)(4) | 2,991 | | 2,739 |
2021-1R, A1 144A
1.175%, 10/25/48(1)(4) | 4,885 | | 3,816 |
See Notes to Financial Statements
Newfleet Multi-Sector Short Term Bond Fund
SCHEDULE OF INVESTMENTS (Continued)
September 30, 2023
($ reported in thousands)
| | Par Value | | Value |
| | | | |
| Non-Agency—continued | | |
2022-1, A1B 144A
3.269%, 12/25/56(1)(4) | $ 4,252 | | $ 3,541 |
Banc of America Funding Trust 2004-D, 5A1
3.941%, 1/25/35(4) | 824 | | 797 |
BBCMS Mortgage Trust 2018-TALL, A (1 month Term SOFR + 0.919%, Cap N/A, Floor 0.872%) 144A
6.252%, 3/15/37(1)(4) | 10,490 | | 9,704 |
Benchmark Mortgage Trust 2023-B38, A2
5.626%, 4/15/56 | 12,132 | | 11,770 |
| BPR Trust | | | |
2021-KEN, A (1 month Term SOFR + 1.364%, Cap N/A, Floor 1.250%) 144A
6.696%, 2/15/29(1)(4) | 1,975 | | 1,953 |
2022-OANA, A (1 month Term SOFR + 1.898%, Cap N/A, Floor 1.898%) 144A
7.230%, 4/15/37(1)(4) | 18,900 | | 18,559 |
BRAVO Residential Funding Trust 2021-A, A1 144A
1.991%, 10/25/59(1)(4) | 4,485 | | 4,283 |
Bunker Hill Loan Depositary Trust 2019-2, A1 144A
2.879%, 7/25/49(1)(4) | 1,696 | | 1,564 |
| BX Commercial Mortgage Trust | | | |
2019-XL, C (1 month Term SOFR + 1.364%, Cap N/A, Floor 1.250%) 144A
6.697%, 10/15/36(1)(4) | 6,626 | | 6,575 |
2022-LP2, D (1 month Term SOFR + 1.961%, Cap N/A, Floor 1.961%) 144A
7.293%, 2/15/39(1)(4) | 9,243 | | 8,846 |
| BX Trust | | | |
2018-GW, B (1 month Term SOFR + 1.317%, Cap N/A, Floor 1.270%) 144A
6.650%, 5/15/35(1)(4) | 19,910 | | 19,559 |
2019-OC11, B 144A
3.605%, 12/9/41(1) | 5,000 | | 4,219 |
2019-OC11, D 144A
4.075%, 12/9/41(1)(4) | 7,699 | | 6,329 |
2022-CLS, A 144A
5.760%, 10/13/27(1) | 15,725 | | 15,168 |
CENT Trust 2023-CITY, A (1 month Term SOFR + 2.620%, Cap N/A, Floor 2.620%) 144A
7.952%, 9/15/28(1)(4) | 4,505 | | 4,503 |
| | Par Value | | Value |
| | | | |
| Non-Agency—continued | | |
| Chase Mortgage Finance Corp. | | | |
2016-SH1, M2 144A
3.750%, 4/25/45(1)(4) | $ 4,039 | | $ 3,542 |
2016-SH2, M2 144A
3.750%, 12/25/45(1)(4) | 6,067 | | 5,285 |
CHL Mortgage Pass-Through Trust 2004-6, 1A2
4.892%, 5/25/34(4) | 290 | | 259 |
CIM Trust 2022-R2, A1 144A
3.750%, 12/25/61(1)(4) | 5,003 | | 4,503 |
| Citigroup Mortgage Loan Trust, Inc. | | | |
2013-A, A 144A
3.000%, 5/25/42(1)(4) | 2,390 | | 2,274 |
2018-RP1, A1 144A
3.000%, 9/25/64(1)(4) | 3,245 | | 3,084 |
2019-RP1, A1 144A
3.500%, 1/25/66(1)(4) | 4,037 | | 3,782 |
2020-EXP1, A1B 144A
1.804%, 5/25/60(1)(4) | 1,517 | | 1,355 |
| COLT Funding LLC | | | |
2021-3R, A1 144A
1.051%, 12/25/64(1)(4) | 2,799 | | 2,399 |
2021-3R, A2 144A
1.257%, 12/25/64(1)(4) | 656 | | 559 |
| COLT Mortgage Loan Trust | | | |
2021-2, A2 144A
1.130%, 8/25/66(1)(4) | 5,148 | | 3,907 |
2022-3, A1 144A
3.901%, 2/25/67(1)(4) | 14,992 | | 13,484 |
2022-4, A1 144A
4.301%, 3/25/67(1)(4) | 7,374 | | 6,907 |
2022-5, A1 144A
4.550%, 4/25/67(1)(4) | 14,633 | | 13,778 |
2021-2R, A1 144A
0.798%, 7/27/54(1) | 1,796 | | 1,536 |
COLT Mortgage Pass-Through Certificates 2021-1R, A1 144A
0.857%, 5/25/65(1)(4) | 5,516 | | 4,586 |
COMM Mortgage Trust 2013-300P, A1 144A
4.353%, 8/10/30(1) | 10,795 | | 9,850 |
CoreVest American Finance Issuer LLC 2021-RTL1, A1 144A
2.239%, 3/28/29(1)(4) | 9,555 | | 8,831 |
| CoreVest American Finance Trust | | | |
2020-1, A1 144A
1.832%, 3/15/50(1) | 7,911 | | 7,530 |
2020-3, A 144A
1.358%, 8/15/53(1) | 3,500 | | 3,187 |
2020-4, A 144A
1.174%, 12/15/52(1) | 12,343 | | 11,203 |
2022-1, A 144A
4.744%, 6/17/55(1)(4) | 7,502 | | 7,267 |
| | Par Value | | Value |
| | | | |
| Non-Agency—continued | | |
Credit Suisse Mortgage Capital Certificates 2019-ICE4, A (1 month Term SOFR + 1.027%, Cap N/A, Floor 0.980%) 144A
6.360%, 5/15/36(1)(4) | $ 22,728 | | $ 22,704 |
| Credit Suisse Mortgage Capital Trust | | | |
2017-RPL1, A1 144A
2.750%, 7/25/57(1)(4) | 6,794 | | 6,390 |
2020-NQM1, A1 144A
1.208%, 5/25/65(1)(4) | 2,800 | | 2,496 |
2020-RPL4, A1 144A
2.000%, 1/25/60(1)(4) | 11,291 | | 9,578 |
Deephaven Residential Mortgage Trust 2022-1, A1 144A
2.205%, 1/25/67(1)(4) | 6,321 | | 5,466 |
| Ellington Financial Mortgage Trust | | | |
2019-2, A3 144A
3.046%, 11/25/59(1)(4) | 1,323 | | 1,200 |
2020-1, A1 144A
2.006%, 5/25/65(1)(4) | 1,165 | | 1,112 |
2020-2, A1 144A
1.178%, 10/25/65(1)(4) | 4,896 | | 4,361 |
2021-1, A2 144A
1.003%, 2/25/66(1)(4) | 929 | | 760 |
2022-1, A1 144A
2.206%, 1/25/67(1)(4) | 6,694 | | 5,434 |
Extended Stay America Trust 2021-ESH, C (1 month Term SOFR + 1.814%, Cap N/A, Floor 1.700%) 144A
7.146%, 7/15/38(1)(4) | 5,266 | | 5,187 |
| FirstKey Homes Trust | | | |
2020-SFR1, B 144A
1.740%, 8/17/37(1) | 7,020 | | 6,433 |
2020-SFR2, A 144A
1.266%, 10/19/37(1) | 4,614 | | 4,186 |
2020-SFR2, B 144A
1.567%, 10/19/37(1) | 21,440 | | 19,470 |
2021-SFR1, D 144A
2.189%, 8/17/38(1) | 13,785 | | 12,015 |
| Galton Funding Mortgage Trust | | | |
2018-1, A23 144A
3.500%, 11/25/57(1)(4) | 707 | | 618 |
2019-2, A52 144A
3.500%, 6/25/59(1)(4) | 4,049 | | 3,503 |
GCAT Trust 2020-NQM1, A1 144A
2.247%, 1/25/60(1)(4) | 1,049 | | 977 |
GCT Commercial Mortgage Trust 2021-GCT, A (1 month Term SOFR + 0.914%, Cap N/A, Floor 0.800%) 144A
6.247%, 2/15/38(1)(4) | 5,700 | | 4,474 |
See Notes to Financial Statements
Newfleet Multi-Sector Short Term Bond Fund
SCHEDULE OF INVESTMENTS (Continued)
September 30, 2023
($ reported in thousands)
| | Par Value | | Value |
| | | | |
| Non-Agency—continued | | |
Goldman Sachs Mortgage Securities Trust 2020-GC45, AS
3.173%, 2/13/53(4) | $ 2,630 | | $ 2,109 |
Homes Trust 2023-NQM2, A1 144A
6.456%, 2/25/68(1)(4) | 9,395 | | 9,384 |
Imperial Fund Mortgage Trust 2022-NQM3, A1 144A
4.380%, 5/25/67(1)(4) | 8,866 | | 8,348 |
INTOWN Mortgage Trust 2022-STAY, A (1 month Term SOFR + 2.489%, Cap N/A, Floor 2.489%) 144A
7.821%, 8/15/39(1)(4) | 10,161 | | 10,174 |
| JPMBB Commercial Mortgage Securities Trust | | | |
2014-C18, AS
4.439%, 2/15/47(4) | 6,407 | | 6,270 |
2015-C32, AS
3.984%, 11/15/48 | 2,495 | | 2,301 |
| JPMorgan Chase Mortgage Trust | | | |
2006-A6, 3A3L
4.407%, 10/25/36(4) | 243 | | 175 |
2014-1, 2A12 144A
3.500%, 1/25/44(1)(4) | 589 | | 521 |
2014-5, B1 144A
2.758%, 10/25/29(1)(4) | 1,882 | | 1,638 |
2014-5, B2 144A
2.758%, 10/25/29(1)(4) | 886 | | 767 |
2015-1, AM1 144A
6.565%, 12/25/44(1)(4) | 717 | | 690 |
2015-5, A2 144A
6.651%, 5/25/45(1)(4) | 957 | | 940 |
2017-3, 2A2 144A
2.500%, 8/25/47(1)(4) | 1,816 | | 1,519 |
2017-5, A1 144A
3.542%, 10/26/48(1)(4) | 2,657 | | 2,600 |
2018-7FRB, A2 (1 month Term SOFR + 0.864%) 144A
6.184%, 4/25/46(1)(4) | 4,528 | | 4,350 |
KNDL Mortgage Trust 2019-KNSQ, A (1 month Term SOFR + 0.996%, Cap N/A, Floor 0.800%) 144A
6.328%, 5/15/36(1)(4) | 14,572 | | 14,507 |
| LHOME Mortgage Trust | | | |
2021-RTL1, A1 144A
2.090%, 2/25/26(1)(4) | 2,567 | | 2,554 |
2021-RTL2, A1 144A
2.090%, 6/25/26(1)(4) | 6,825 | | 6,714 |
| MetLife Securitization Trust | | | |
2017-1A, M1 144A
3.451%, 4/25/55(1)(4) | 7,930 | | 6,533 |
2018-1A, A 144A
3.750%, 3/25/57(1)(4) | 14,657 | | 13,464 |
| | Par Value | | Value |
| | | | |
| Non-Agency—continued | | |
2019-1A, A1A 144A
3.750%, 4/25/58(1)(4) | $ 5,123 | | $ 4,882 |
| MFA Trust | | | |
2022-INV1, A1 144A
3.907%, 4/25/66(1)(4) | 10,604 | | 9,869 |
2022-NQM2, A1 144A
4.000%, 5/25/67(1)(4) | 617 | | 561 |
2020-NQM3, A1 144A
1.014%, 1/26/65(1)(4) | 1,789 | | 1,578 |
2021-INV1, A1 144A
0.852%, 1/25/56(1)(4) | 1,205 | | 1,074 |
| Mill City Mortgage Loan Trust | | | |
2017-1, M2 144A
3.250%, 11/25/58(1)(4) | 1,983 | | 1,854 |
2017-3, M2 144A
3.250%, 1/25/61(1)(4) | 8,987 | | 8,000 |
2019-1, M2 144A
3.500%, 10/25/69(1)(4) | 12,131 | | 10,083 |
2021-NMR1, A1 144A
1.125%, 11/25/60(1)(4) | 3,956 | | 3,617 |
MIRA Trust 2023-MILE, A 144A
6.755%, 6/10/38(1) | 12,180 | | 11,929 |
Morgan Stanley Bank of America Merrill Lynch Trust 2013-C13, AS
4.266%, 11/15/46 | 1,735 | | 1,726 |
Morgan Stanley Mortgage Loan Trust 2004-2AR, 3A
6.352%, 2/25/34(4) | 349 | | 330 |
Morgan Stanley Residential Mortgage Loan Trust 2014-1A, B2 144A
6.815%, 6/25/44(1)(4) | 2,432 | | 2,425 |
| New Residential Mortgage Loan Trust | | | |
2014-1A, A 144A
3.750%, 1/25/54(1)(4) | 3,412 | | 3,146 |
2015-2A, A1 144A
3.750%, 8/25/55(1)(4) | 2,939 | | 2,678 |
2016-1A, A1 144A
3.750%, 3/25/56(1)(4) | 1,583 | | 1,443 |
2016-3A, A1 144A
3.750%, 9/25/56(1)(4) | 1,891 | | 1,719 |
2016-4A, A1 144A
3.750%, 11/25/56(1)(4) | 2,450 | | 2,231 |
2017-2A, A3 144A
4.000%, 3/25/57(1)(4) | 9,621 | | 8,852 |
2018-2A, A1 144A
4.500%, 2/25/58(1)(4) | 5,483 | | 5,165 |
2019-RPL2, M2 144A
3.750%, 2/25/59(1)(4) | 595 | | 482 |
2021-NQ2R, A1 144A
0.941%, 10/25/58(1)(4) | 3,464 | | 3,053 |
2022-RTL1, A1F 144A
4.336%, 12/25/26(1) | 8,710 | | 8,369 |
2014-3A, AFX3 144A
3.750%, 11/25/54(1)(4) | 2,804 | | 2,511 |
2016-2A, A1 144A
3.750%, 11/26/35(1)(4) | 3,567 | | 3,291 |
| | Par Value | | Value |
| | | | |
| Non-Agency—continued | | |
2018-1A, A1A 144A
4.000%, 12/25/57(1)(4) | $ 6,766 | | $ 6,283 |
NewRez Warehouse Securitization Trust 2021-1, C (1 month Term SOFR + 1.164%, Cap N/A, Floor 1.050%) 144A
6.484%, 5/25/55(1)(4) | 11,999 | | 11,935 |
NLT Trust 2021-INV2, A1 144A
1.162%, 8/25/56(1)(4) | 10,110 | | 8,074 |
NYMT Loan Trust 2022-CP1, A1 144A
2.042%, 7/25/61(1) | 4,285 | | 3,793 |
OBX Trust 2018-1, A2 (1 month Term SOFR + 0.764%) 144A
6.084%, 6/25/57(1)(4) | 2,020 | | 1,915 |
Palisades Mortgage Loan Trust 2021-RTL1, A1 144A
2.857%, 6/25/26(1)(4) | 7,890 | | 7,654 |
| Preston Ridge Partners Mortgage LLC | | | |
2021-2, A1 144A
2.115%, 3/25/26(1)(4) | 2,045 | | 1,962 |
2021-RPL2, A1 144A
1.455%, 10/25/51(1)(4) | 19,940 | | 17,283 |
PRET LLC 2021-RN3, A1 144A
1.843%, 9/25/51(1)(4) | 9,577 | | 8,662 |
Pretium Mortgage Credit Partners I LLC 2021-NPL1, A1 144A
2.240%, 9/27/60(1)(4) | 11,509 | | 11,106 |
| Progress Residential Trust | | | |
2019-SFR3, B 144A
2.571%, 9/17/36(1) | 10,340 | | 9,955 |
2020-SFR2, E 144A
5.115%, 6/17/37(1) | 6,890 | | 6,658 |
2021-SFR3, D 144A
2.288%, 5/17/26(1) | 11,130 | | 9,819 |
2021-SFR5, D 144A
2.109%, 7/17/38(1) | 2,500 | | 2,184 |
2021-SFR6, D 144A
2.225%, 7/17/38(1) | 3,750 | | 3,264 |
2020-SFR3, A 144A
1.294%, 10/17/27(1) | 3,625 | | 3,298 |
2021-SFR1, C 144A
1.555%, 4/17/38(1) | 1,430 | | 1,262 |
Provident Funding Mortgage Trust 2019-1, A2 144A
3.000%, 12/25/49(1)(4) | 1,952 | | 1,598 |
| RCKT Mortgage Trust | | | |
2020-1, A1 144A
3.000%, 2/25/50(1)(4) | 3,691 | | 3,009 |
2023-CES1, A1A 144A
6.515%, 6/25/43(1)(4) | 6,394 | | 6,331 |
2023-CES2, A1A 144A
6.808%, 9/25/43(1)(4) | 8,600 | | 8,588 |
See Notes to Financial Statements
Newfleet Multi-Sector Short Term Bond Fund
SCHEDULE OF INVESTMENTS (Continued)
September 30, 2023
($ reported in thousands)
| | Par Value | | Value |
| | | | |
| Non-Agency—continued | | |
| Residential Mortgage Loan Trust | | | |
2019-2, A1 144A
2.913%, 5/25/59(1)(4) | $ 347 | | $ 342 |
2020-1, A1 144A
2.376%, 1/26/60(1)(4) | 1,303 | | 1,232 |
Sequoia Mortgage Trust 2013-8, B1
3.481%, 6/25/43(4) | 1,363 | | 1,274 |
SG Residential Mortgage Trust 2021-1, A3 144A
1.560%, 7/25/61(1)(4) | 5,935 | | 4,536 |
STAR Trust 2021-1, A1 144A
1.219%, 5/25/65(1)(4) | 4,922 | | 4,253 |
| Starwood Mortgage Residential Trust | | | |
2020-1, A1 144A
2.275%, 2/25/50(1)(4) | 447 | | 413 |
2020-3, A1 144A
1.486%, 4/25/65(1)(4) | 2,066 | | 1,904 |
2021-3, A3 144A
1.518%, 6/25/56(1)(4) | 2,070 | | 1,613 |
| Towd Point Mortgage Trust | | | |
2016-4, B1 144A
3.969%, 7/25/56(1)(4) | 8,095 | | 7,308 |
2017-1, M1 144A
3.750%, 10/25/56(1)(4) | 4,374 | | 4,067 |
2018-2, A2 144A
3.500%, 3/25/58(1)(4) | 12,525 | | 11,383 |
2018-6, A1A 144A
3.750%, 3/25/58(1)(4) | 2,974 | | 2,878 |
2018-6, A1B 144A
3.750%, 3/25/58(1)(4) | 1,705 | | 1,550 |
2019-2, A2 144A
3.750%, 12/25/58(1)(4) | 925 | | 779 |
2019-HY2, M1 (1 month Term SOFR + 1.714%, Cap N/A, Floor 1.600%) 144A
7.034%, 5/25/58(1)(4) | 4,045 | | 4,045 |
2020-1, M1 144A
3.500%, 1/25/60(1)(4) | 4,820 | | 3,776 |
2020-MH1, A2 144A
2.500%, 2/25/60(1)(4) | 12,111 | | 10,570 |
2021-1, A2 144A
2.750%, 11/25/61(1)(4) | 12,970 | | 9,824 |
2017-6, A2 144A
3.000%, 10/25/57(1)(4) | 11,390 | | 10,122 |
Tricon American Homes Trust 2020-SFR2, D 144A
2.281%, 11/17/39(1) | 5,243 | | 4,432 |
Tricon Residential Trust 2021-SFR1, B 144A
2.244%, 7/17/38(1) | 6,490 | | 5,791 |
| VCAT LLC | | | |
2021-NPL2, A1 144A
2.115%, 3/27/51(1)(4) | 5,767 | | 5,489 |
2021-NPL3, A1 144A
1.743%, 5/25/51(1)(4) | 9,089 | | 8,443 |
| | Par Value | | Value |
| | | | |
| Non-Agency—continued | | |
2021-NPL4, A1 144A
1.868%, 8/25/51(1)(4) | $ 12,669 | | $ 11,819 |
2021-NPL6, A1 144A
1.917%, 9/25/51(1)(4) | 8,148 | | 7,492 |
Velocity Commercial Capital Loan Trust 2020-1, AFX 144A
2.610%, 2/25/50(1)(4) | 5,521 | | 4,671 |
| Verus Securitization Trust | | | |
2019-4, M1 144A
3.207%, 11/25/59(1)(4) | 6,070 | | 5,274 |
2019-INV2, A1 144A
3.913%, 7/25/59(1)(4) | 3,932 | | 3,789 |
2021-2, A1 144A
1.031%, 2/25/66(1)(4) | 6,122 | | 5,102 |
2021-3, A1 144A
1.046%, 6/25/66(1)(4) | 9,618 | | 7,974 |
2021-R3, A1 144A
1.020%, 4/25/64(1)(4) | 4,400 | | 3,847 |
2022-4, A1 144A
4.474%, 4/25/67(1)(4) | 12,435 | | 11,630 |
2022-5, A1 144A
3.800%, 4/25/67(1)(4) | 20,406 | | 18,398 |
2022-7, A1 144A
5.152%, 7/25/67(1)(4) | 7,706 | | 7,499 |
2020-1, A1 144A
2.417%, 1/25/60(1)(4) | 1,480 | | 1,394 |
2020-4, A1 144A
1.502%, 5/25/65(1)(4) | 5,070 | | 4,604 |
2021-R1, A1 144A
0.820%, 10/25/63(1)(4) | 3,553 | | 3,154 |
2021-R2, A1 144A
0.918%, 2/25/64(1)(4) | 3,388 | | 2,874 |
| Visio Trust | | | |
2019-2, A1 144A
2.722%, 11/25/54(1)(4) | 2,573 | | 2,413 |
2021-1R, A1 144A
1.280%, 5/25/56(1) | 7,194 | | 6,499 |
VM Master Issuer LLC 2022-1, A1 144A
5.163%, 5/24/25(1)(4)(5) | 11,785 | | 11,629 |
WaMu Mortgage Pass-Through Certificates Series Trust 2004-CB1, 2A
5.000%, 6/25/34 | 222 | | 210 |
Wells Fargo Commercial Mortgage Trust 2014-C24, AS
3.931%, 11/15/47 | 6,689 | | 6,034 |
Wells Fargo Mortgage Backed Securities Trust 2020-4, A1 144A
3.000%, 7/25/50(1)(4) | 2,327 | | 1,854 |
| | | | 1,051,696 |
| | | | |
| |
Total Mortgage-Backed Securities
(Identified Cost $1,271,156) | | 1,171,912 |
| | | | |
| |
| | | | |
| |
| | Par Value | | Value |
| | | | |
| | | | |
| Asset-Backed Securities—25.8% |
| Automobiles—11.9% | | |
ACC Auto Trust 2021-A, C 144A
3.790%, 4/15/27(1) | $ 6,948 | | $ 6,793 |
| ACC Trust | | | |
2021-1, C 144A
2.080%, 12/20/24(1) | 1,524 | | 1,496 |
2022-1, C 144A
3.240%, 10/20/25(1) | 6,580 | | 4,696 |
ACM Auto Trust 2023-2A, A 144A
7.970%, 6/20/30(1) | 10,312 | | 10,321 |
| American Credit Acceptance Receivables Trust | | | |
2021-1, C 144A
0.830%, 3/15/27(1) | 1,946 | | 1,933 |
2021-3, C 144A
0.980%, 11/15/27(1) | 1,038 | | 1,026 |
2022-1, E 144A
3.640%, 3/13/28(1) | 11,425 | | 10,423 |
Arivo Acceptance Auto Loan Receivables Trust 2022-2A, A 144A
6.900%, 1/16/29(1) | 6,582 | | 6,555 |
| Avid Automobile Receivables Trust | | | |
2019-1, D 144A
4.030%, 7/15/26(1) | 1,615 | | 1,606 |
2021-1, D 144A
1.990%, 4/17/28(1) | 3,200 | | 3,006 |
2021-1, E 144A
3.390%, 4/17/28(1) | 1,590 | | 1,466 |
Avis Budget Rental Car Funding AESOP LLC (AESOP) 2022-5A, A 144A
6.120%, 4/20/27(1) | 3,393 | | 3,383 |
| Avis Budget Rental Car Funding LLC | | | |
(AESOP) 2019-2A, D 144A
3.040%, 9/22/25(1) | 15,919 | | 15,157 |
(AESOP) 2020-1A, A 144A
2.330%, 8/20/26(1) | 8,025 | | 7,520 |
(AESOP) 2020-2A, A 144A
2.020%, 2/20/27(1) | 9,205 | | 8,400 |
(AESOP) 2021-1A, A 144A
1.380%, 8/20/27(1) | 1,870 | | 1,650 |
(AESOP) 2021-1A, D 144A
3.710%, 8/20/27(1) | 11,500 | | 9,968 |
BOF URSA VI Funding Trust I 2023-CAR2, A2 144A
5.542%, 10/27/31(1) | 2,009 | | 1,981 |
| CarNow Auto Receivables Trust | | | |
2021-1A, C 144A
2.160%, 2/17/26(1) | 2,094 | | 2,078 |
See Notes to Financial Statements
Newfleet Multi-Sector Short Term Bond Fund
SCHEDULE OF INVESTMENTS (Continued)
September 30, 2023
($ reported in thousands)
| | Par Value | | Value |
| | | | |
| Automobiles—continued | | |
2022-1A, B 144A
4.890%, 3/16/26(1) | $ 3,128 | | $ 3,110 |
2023-1A, C 144A
7.240%, 9/15/26(1) | 12,824 | | 12,700 |
| Carvana Auto Receivables Trust | | | |
2019-3A, D 144A
3.040%, 4/15/25(1) | 426 | | 425 |
2019-3A, E 144A
4.600%, 7/15/26(1) | 4,399 | | 4,350 |
2020-N1A, D 144A
3.430%, 1/15/26(1) | 5,024 | | 4,989 |
2020-P1, C
1.320%, 11/9/26 | 2,250 | | 2,020 |
2021-N2, C
1.070%, 3/10/28 | 1,915 | | 1,772 |
2021-N3, D
1.580%, 6/12/28 | 11,641 | | 11,027 |
2021-P3, B
1.420%, 8/10/27 | 4,590 | | 3,976 |
2022-N1, C 144A
3.320%, 12/11/28(1) | 3,152 | | 3,063 |
2022-N1, D 144A
4.130%, 12/11/28(1) | 7,315 | | 6,998 |
2023-N1, C 144A
5.920%, 7/10/29(1) | 3,044 | | 2,969 |
CIG Auto Receivables Trust 2021-1A, D 144A
2.110%, 4/12/27(1) | 4,015 | | 3,749 |
CPS Auto Receivables Trust 2022-D, D 144A
8.730%, 1/16/29(1) | 7,170 | | 7,426 |
| Credit Acceptance Auto Loan Trust | | | |
2020-3A, B 144A
1.770%, 12/17/29(1) | 11,195 | | 11,078 |
2022-1A, A 144A
4.600%, 6/15/32(1) | 7,275 | | 7,112 |
2023-2A, A 144A
5.920%, 5/16/33(1) | 2,080 | | 2,057 |
| DT Auto Owner Trust | | | |
2021-1A, D 144A
1.160%, 11/16/26(1) | 3,930 | | 3,684 |
2021-1A, E 144A
2.380%, 1/18/28(1) | 2,000 | | 1,866 |
2021-2A, C 144A
1.100%, 2/16/27(1) | 5,985 | | 5,853 |
2021-2A, D 144A
1.500%, 2/16/27(1) | 4,350 | | 4,066 |
2022-2A, D 144A
5.460%, 3/15/28(1) | 7,500 | | 7,259 |
2023-1A, D 144A
6.440%, 11/15/28(1) | 1,741 | | 1,717 |
| Exeter Automobile Receivables Trust | | | |
2020-1A, D 144A
2.730%, 12/15/25(1) | 4,532 | | 4,450 |
2020-3A, E 144A
3.440%, 8/17/26(1) | 3,015 | | 2,898 |
2021-1A, C
0.740%, 1/15/26 | 930 | | 923 |
| | Par Value | | Value |
| | | | |
| Automobiles—continued | | |
2022-3A, C
5.300%, 9/15/27 | $ 8,423 | | $ 8,298 |
2023-2A, B
5.610%, 9/15/27 | 12,333 | | 12,197 |
2023-3A, D
6.680%, 4/16/29 | 3,723 | | 3,712 |
| FHF Trust | | | |
2022-2A, B 144A
6.570%, 1/16/29(1) | 8,847 | | 8,656 |
2023-1A, A2 144A
6.570%, 6/15/28(1) | 2,896 | | 2,866 |
| First Investors Auto Owner Trust | | | |
2021-1A, C 144A
1.170%, 3/15/27(1) | 2,915 | | 2,798 |
2021-2A, C 144A
1.470%, 11/15/27(1) | 6,395 | | 5,848 |
2022-1A, C 144A
3.130%, 5/15/28(1) | 5,745 | | 5,387 |
| Flagship Credit Auto Trust | | | |
2020-1, C 144A
2.240%, 1/15/26(1) | 3,013 | | 2,999 |
2020-3, C 144A
1.730%, 9/15/26(1) | 3,344 | | 3,255 |
2020-4, C 144A
1.280%, 2/16/27(1) | 5,016 | | 4,879 |
| Foursight Capital Automobile Receivables Trust | | | |
2021-2, C 144A
1.570%, 7/15/27(1) | 2,110 | | 1,990 |
2022-1, B 144A
2.150%, 5/17/27(1) | 2,140 | | 2,022 |
2023-2, A2 144A
5.990%, 5/15/28(1) | 6,170 | | 6,158 |
| GLS Auto Receivables Issuer Trust | | | |
2019-4A, D 144A
4.090%, 8/17/26(1) | 8,821 | | 8,655 |
2020-3A, D 144A
2.270%, 5/15/26(1) | 10,527 | | 10,346 |
2020-3A, E 144A
4.310%, 7/15/27(1) | 4,410 | | 4,285 |
2020-4A, C 144A
1.140%, 11/17/25(1) | 1,520 | | 1,509 |
2022-2A, C 144A
5.300%, 4/17/28(1) | 3,075 | | 3,008 |
2022-2A, D 144A
6.150%, 4/17/28(1) | 4,565 | | 4,485 |
2023-1A, B 144A
6.190%, 6/15/27(1) | 4,105 | | 4,086 |
GLS Auto Receivables Trust 2022-1A, C 144A
3.190%, 2/16/27(1) | 6,000 | | 5,771 |
GLS Auto Select Receivables Trust 2023-1A, B 144A
6.090%, 3/15/29(1) | 4,400 | | 4,336 |
Hertz Vehicle Financing III LLC 2022-1A, C 144A
2.630%, 6/25/26(1) | 5,894 | | 5,494 |
| | Par Value | | Value |
| | | | |
| Automobiles—continued | | |
Hertz Vehicle Financing LLC 2022-4A, D 144A
6.560%, 9/25/26(1) | $ 5,995 | | $ 5,718 |
| LAD Auto Receivables Trust | | | |
2021-1A, D 144A
3.990%, 11/15/29(1) | 2,705 | | 2,529 |
2022-1A, A 144A
5.210%, 6/15/27(1) | 4,780 | | 4,744 |
2023-1A, D 144A
7.300%, 6/17/30(1) | 2,570 | | 2,576 |
Lendbuzz Securitization Trust 2023-2A, A2 144A
7.090%, 10/16/28(1) | 6,613 | | 6,596 |
| Lobel Automobile Receivables Trust | | | |
2023-1, A 144A
6.970%, 7/15/26(1) | 2,170 | | 2,170 |
2023-1, B 144A
7.050%, 9/15/28(1) | 8,568 | | 8,432 |
OCCU Auto Receivables Trust 2023-1A, A2 144A
6.230%, 4/15/27(1) | 6,019 | | 6,021 |
| OneMain Direct Auto Receivables Trust | | | |
2021-1A, B 144A
1.260%, 7/14/28(1) | 17,610 | | 15,889 |
2022-1A, C 144A
5.310%, 6/14/29(1) | 7,485 | | 7,185 |
Oscar U.S. Funding XIII LLC 2021-2A, A4 144A
1.270%, 9/11/28(1) | 6,000 | | 5,556 |
Oscar U.S. Funding XV LLC 2023-1A, A3 144A
5.810%, 12/10/27(1) | 5,680 | | 5,643 |
| Santander Drive Auto Receivables Trust | | | |
2021-3, C
0.950%, 9/15/27 | 9,277 | | 9,136 |
2022-7, A2
5.810%, 1/15/26 | 1,827 | | 1,826 |
2023-1, B
4.980%, 2/15/28 | 4,101 | | 4,030 |
Tesla Auto Lease Trust 2023-A, B 144A
6.410%, 7/20/27(1) | 5,155 | | 5,131 |
Tidewater Auto Receivables Trust 2020-AA, C 144A
1.910%, 9/15/26(1) | 307 | | 306 |
| Tricolor Auto Securitization Trust | | | |
2022-1A, C 144A
4.710%, 8/15/25(1) | 3,040 | | 3,000 |
2022-1A, D 144A
5.380%, 1/15/26(1) | 4,640 | | 4,517 |
2023-1A, B 144A
6.840%, 11/16/26(1) | 995 | | 990 |
2023-1A, C 144A
7.240%, 2/16/27(1) | 5,547 | | 5,532 |
See Notes to Financial Statements
Newfleet Multi-Sector Short Term Bond Fund
SCHEDULE OF INVESTMENTS (Continued)
September 30, 2023
($ reported in thousands)
| | Par Value | | Value |
| | | | |
| Automobiles—continued | | |
U.S. Auto Funding 2021-1A, B 144A
1.490%, 3/17/25(1) | $ 1,788 | | $ 1,773 |
| United Auto Credit Securitization Trust | | | |
2021-1, D 144A
1.140%, 6/10/26(1) | 4,033 | | 4,002 |
2022-1, C 144A
2.610%, 6/10/27(1) | 2,394 | | 2,375 |
2023-1, B 144A
5.910%, 7/10/28(1) | 5,206 | | 5,169 |
2023-1, C 144A
6.280%, 7/10/28(1) | 4,655 | | 4,602 |
2023-1, D 144A
8.000%, 7/10/28(1) | 7,750 | | 7,799 |
USASF Receivables LLC 2020-1A, C 144A
5.940%, 8/15/24(1) | 1,471 | | 1,470 |
Veridian Auto Receivables Trust 2023-1A, A4 144A
5.590%, 12/15/28(1) | 9,585 | | 9,430 |
| Veros Auto Receivables Trust | | | |
2021-1, B 144A
1.490%, 10/15/26(1) | 4,115 | | 4,036 |
2022-1, B 144A
4.390%, 8/16/27(1) | 16,900 | | 16,522 |
2023-1, B 144A
7.170%, 11/15/28(1) | 10,000 | | 9,897 |
| Westlake Automobile Receivables Trust | | | |
2020-3A, C 144A
1.240%, 11/17/25(1) | 3,599 | | 3,576 |
2021-3A, D 144A
2.120%, 1/15/27(1) | 4,720 | | 4,399 |
2022-1A, B 144A
2.750%, 3/15/27(1) | 6,090 | | 5,957 |
2023-1A, C 144A
5.740%, 8/15/28(1) | 1,415 | | 1,398 |
| | | | 533,967 |
| | | | |
| |
| Collateralized Loan Obligations—0.4% | | |
GoldenTree Loan Management US CLO 1 Ltd. 2021-9A, A (3 month Term SOFR + 1.332%, Cap N/A, Floor 1.070%) 144A
6.658%, 1/20/33(1)(4) | 18,315 | | 18,229 |
Palmer Square Loan Funding Ltd. 2021-1A, A1 (3 month Term SOFR + 1.162%, Cap N/A, Floor 1.162%) 144A
6.488%, 4/20/29(1)(4) | 1,480 | | 1,473 |
| | | | 19,702 |
| | | | |
| |
| Consumer Loans—1.6% | | |
ACHV ABS Trust 2023-3PL, B 144A
7.170%, 8/19/30(1) | 2,190 | | 2,200 |
| | Par Value | | Value |
| | | | |
| Consumer Loans—continued | | |
| Affirm Asset Securitization Trust | | | |
2022-A, 1A 144A
4.300%, 5/17/27(1) | $ 4,930 | | $ 4,825 |
2022-A, A 144A
4.300%, 5/17/27(1) | 4,765 | | 4,663 |
2023-B, A 144A
6.820%, 9/15/28(1) | 7,678 | | 7,688 |
| Lendingpoint Asset Securitization Trust | | | |
2022-A, B 144A
2.410%, 6/15/29(1) | 3,095 | | 3,083 |
2022-B, A 144A
4.770%, 10/15/29(1) | 2,229 | | 2,202 |
Marlette Funding Trust 2023-2A, B 144A
6.540%, 6/15/33(1) | 1,753 | | 1,746 |
OneMain Financial Issuance Trust 2022-3A, A 144A
5.940%, 5/15/34(1) | 7,261 | | 7,213 |
| Oportun Funding XIV LLC | | | |
2021-A, A 144A
1.210%, 3/8/28(1) | 5,839 | | 5,612 |
2021-A, B 144A
1.760%, 3/8/28(1) | 4,935 | | 4,725 |
Oportun Issuance Trust 2021-C, A 144A
2.180%, 10/8/31(1) | 11,210 | | 10,195 |
Regional Management Issuance Trust 2021-1, A 144A
1.680%, 3/17/31(1) | 2,610 | | 2,456 |
Republic Finance Issuance Trust 2020-A, A 144A
2.470%, 11/20/30(1) | 7,335 | | 7,133 |
| Upstart Securitization Trust | | | |
2021-2, B 144A
1.750%, 6/20/31(1) | 4,729 | | 4,671 |
2022-2, A 144A
4.370%, 5/20/32(1) | 1,273 | | 1,263 |
2023-1, A 144A
6.590%, 2/20/33(1) | 2,497 | | 2,492 |
| | | | 72,167 |
| | | | |
| |
| Credit Card—1.1% | | |
Avant Credit Card Master Trust 2021-1A, A 144A
1.370%, 4/15/27(1) | 4,030 | | 3,743 |
Genesis Sales Finance Master Trust 2021-AA, A 144A
1.200%, 12/21/26(1) | 9,020 | | 8,565 |
| Mercury Financial Credit Card Master Trust | | | |
2022-1A, A 144A
2.500%, 9/21/26(1) | 9,265 | | 8,869 |
2023-1A, A 144A
8.040%, 9/20/27(1) | 14,709 | | 14,762 |
| | Par Value | | Value |
| | | | |
| Credit Card—continued | | |
| Mission Lane Credit Card Master Trust | | | |
2023-A, A 144A
7.230%, 7/17/28(1) | $ 4,804 | | $ 4,764 |
2023-B, A 144A
7.790%, 11/15/28(1) | 7,720 | | 7,719 |
| | | | 48,422 |
| | | | |
| |
| Equipment—0.6% | | |
Amur Equipment Finance Receivables VIII LLC 2020-1A, C 144A
3.060%, 4/20/26(1) | 435 | | 434 |
CCG Receivables Trust 2022-1, C 144A
4.670%, 7/16/29(1) | 3,750 | | 3,562 |
CLI Funding VI LLC 2020-1A, A 144A
2.080%, 9/18/45(1) | 13,536 | | 11,691 |
Post Road Equipment Finance 2022-1A, B 144A
5.150%, 1/16/29(1) | 9,548 | | 9,237 |
| | | | 24,924 |
| | | | |
| |
| Other—10.2% | | |
ACHV ABS Trust 2023-1PL, A 144A
6.420%, 3/18/30(1) | 220 | | 220 |
Adams Outdoor Advertising LP 2023-1, A2 144A
6.967%, 7/15/53(1) | 12,166 | | 11,961 |
Aligned Data Centers Issuer LLC 2021-1A, A2 144A
1.937%, 8/15/46(1) | 13,750 | | 12,028 |
| Amur Equipment Finance Receivables IX LLC | | | |
2021-1A, B 144A
1.380%, 2/22/27(1) | 1,830 | | 1,752 |
2021-1A, C 144A
1.750%, 6/21/27(1) | 5,388 | | 5,086 |
Amur Equipment Finance Receivables XII LLC 2023-1A, A2 144A
6.090%, 12/20/29(1) | 2,465 | | 2,466 |
Applebee’s Funding LLC 2023-1A, A2 144A
7.824%, 3/5/53(1) | 11,197 | | 11,038 |
| Aqua Finance Trust | | | |
2017-A, A 144A
3.720%, 11/15/35(1) | 665 | | 659 |
2019-A, A 144A
3.140%, 7/16/40(1) | 1,854 | | 1,716 |
2019-A, C 144A
4.010%, 7/16/40(1) | 16,859 | | 15,247 |
2020-AA, B 144A
2.790%, 7/17/46(1) | 2,160 | | 1,882 |
2020-AA, D 144A
7.150%, 7/17/46(1) | 7,435 | | 6,357 |
See Notes to Financial Statements
Newfleet Multi-Sector Short Term Bond Fund
SCHEDULE OF INVESTMENTS (Continued)
September 30, 2023
($ reported in thousands)
| | Par Value | | Value |
| | | | |
| Other—continued | | |
Arby’s Funding LLC 2020-1A, A2 144A
3.237%, 7/30/50(1) | $ 16,501 | | $ 14,614 |
Arm Master Trust LLC 2023-T1, A 144A
6.562%, 2/17/25(1) | 3,630 | | 3,624 |
| BHG Securitization Trust | | | |
2021-A, A 144A
1.420%, 11/17/33(1) | 4,771 | | 4,450 |
2021-B, B 144A
1.670%, 10/17/34(1) | 8,195 | | 7,294 |
Business Jet Securities LLC 2021-1A, A 144A
2.162%, 4/15/36(1) | 2,522 | | 2,293 |
| BXG Receivables Note Trust | | | |
2017-A, A 144A
2.950%, 10/4/32(1) | 2,477 | | 2,425 |
2020-A, B 144A
2.490%, 2/28/36(1) | 3,064 | | 2,776 |
2022-A, B 144A
4.610%, 9/28/37(1) | 2,251 | | 2,089 |
2023-A, A 144A
5.770%, 11/15/38(1) | 7,181 | | 7,045 |
Cajun Global LLC 2021-1, A2 144A
3.931%, 11/20/51(1) | 13,214 | | 11,548 |
| CCG Receivables Trust | | | |
2021-1, C 144A
0.840%, 6/14/27(1) | 1,415 | | 1,345 |
2023-1, A2 144A
5.820%, 9/16/30(1) | 1,140 | | 1,138 |
CF Hippolyta Issuer LLC 2020-1, A1 144A
1.690%, 7/15/60(1) | 8,095 | | 7,353 |
Commercial Equipment Finance LLC 2021-A, A 144A
2.050%, 2/16/27(1) | 1,109 | | 1,077 |
| Conn’s Receivables Funding LLC | | | |
2022-A, B 144A
9.520%, 12/15/26(1) | 8,629 | | 8,664 |
2023-A, B 144A
10.000%, 1/17/28(1) | 3,050 | | 3,056 |
| Dext ABS LLC | | | |
2020-1, D 144A
7.210%, 2/15/28(1) | 6,258 | | 6,037 |
2023-1, A2 144A
5.990%, 3/15/32(1) | 12,036 | | 11,851 |
| Diamond Resorts Owner Trust | | | |
2019-1A, B 144A
3.530%, 2/20/32(1) | 1,210 | | 1,209 |
2021-1A, A 144A
1.510%, 11/21/33(1) | 1,101 | | 1,009 |
2021-1A, B 144A
2.050%, 11/21/33(1) | 493 | | 454 |
| | Par Value | | Value |
| | | | |
| Other—continued | | |
Elara HGV Timeshare Issuer LLC 2023-A, A 144A
6.160%, 2/25/38(1) | $ 10,790 | | $ 10,800 |
FAT Brands Royalty LLC 2021-1A, A2 144A
4.750%, 4/25/51(1) | 11,870 | | 10,825 |
| Foundation Finance Trust | | | |
2019-1A, A 144A
3.860%, 11/15/34(1) | 578 | | 572 |
2021-1A, A 144A
1.270%, 5/15/41(1) | 7,914 | | 6,978 |
2023-1A, A 144A
5.670%, 12/15/43(1) | 3,547 | | 3,457 |
2023-2A, A 144A
6.530%, 6/15/49(1) | 10,588 | | 10,587 |
FREED ABS Trust 2022-1FP, C 144A
2.510%, 3/19/29(1) | 4,650 | | 4,553 |
GCI Funding I LLC 2021-1, A 144A
2.380%, 6/18/46(1) | 4,258 | | 3,597 |
Global SC Finance VII Srl 2020-1A, A 144A
2.170%, 10/17/40(1) | 9,778 | | 8,705 |
Hardee’s Funding LLC 2020-1A, A2 144A
3.981%, 12/20/50(1) | 19,280 | | 16,221 |
| Hilton Grand Vacations Trust | | | |
2017-AA, A 144A
2.660%, 12/26/28(1) | 566 | | 564 |
2018-AA, A 144A
3.540%, 2/25/32(1) | 1,447 | | 1,400 |
2022-1D, B 144A
4.100%, 6/20/34(1) | 2,982 | | 2,816 |
2022-2A, C 144A
5.570%, 1/25/37(1) | 835 | | 801 |
HIN Timeshare Trust 2020-A, C 144A
3.420%, 10/9/39(1) | 1,440 | | 1,324 |
| Hotwire Funding LLC | | | |
2021-1, C 144A
4.459%, 11/20/51(1) | 6,405 | | 5,328 |
2023-1A, A2 144A
5.687%, 5/20/53(1) | 5,500 | | 5,288 |
Jack in the Box Funding LLC 2022-1A, A2I 144A
3.445%, 2/26/52(1) | 8,066 | | 7,219 |
Jersey Mike’s Funding 2019-1A, A2 144A
4.433%, 2/15/50(1) | 19,017 | | 17,459 |
Lendingpoint Asset Securitization Trust 2022-C, A 144A
6.560%, 2/15/30(1) | 1,760 | | 1,757 |
Lendmark Funding Trust 2021-1A, A 144A
1.900%, 11/20/31(1) | 10,385 | | 8,967 |
| | Par Value | | Value |
| | | | |
| Other—continued | | |
| Libra Solutions LLC | | | |
2022-1A, A 144A
4.750%, 5/15/34(1) | $ 1,260 | | $ 1,247 |
2023-1A, A 144A
7.000%, 2/15/35(1) | 3,658 | | 3,640 |
MAPS Trust 2021-1A, A 144A
2.521%, 6/15/46(1) | 9,376 | | 8,086 |
Mariner Finance Issuance Trust 2020-AA, A 144A
2.190%, 8/21/34(1) | 1,733 | | 1,682 |
| MVW LLC | | | |
2021-1WA, B 144A
1.440%, 1/22/41(1) | 1,572 | | 1,417 |
2023-1A, B 144A
5.420%, 10/20/40(1) | 6,812 | | 6,606 |
MVW Owner Trust 2019-1A, A 144A
2.890%, 11/20/36(1) | 1,571 | | 1,505 |
Navient Private Education Refi Loan Trust 2021-EA, A 144A
0.970%, 12/16/69(1) | 4,001 | | 3,349 |
NBC Funding LLC 2021-1, A2 144A
2.989%, 7/30/51(1) | 9,320 | | 8,084 |
| NMEF Funding LLC | | | |
2022-A, B 144A
3.350%, 10/16/28(1) | 5,495 | | 5,222 |
2023-A, B 144A
6.830%, 6/17/30(1) | 7,120 | | 7,092 |
Oasis Securitization Funding LLC 2021-2A, A 144A
2.143%, 10/15/33(1) | 1,236 | | 1,232 |
| Octane Receivables Trust | | | |
2020-1A, B 144A
1.980%, 6/20/25(1) | 899 | | 893 |
2021-1A, A 144A
0.930%, 3/22/27(1) | 1,941 | | 1,901 |
2021-1A, B 144A
1.530%, 4/20/27(1) | 3,700 | | 3,488 |
2023-1A, C 144A
6.370%, 9/20/29(1) | 2,000 | | 1,965 |
2023-3A, B 144A
6.480%, 7/20/29(1) | 3,759 | | 3,758 |
2023-3A, C 144A
6.740%, 8/20/29(1) | 3,834 | | 3,836 |
Oportun Funding LLC 2022-1, A 144A
3.250%, 6/15/29(1) | 1,191 | | 1,180 |
Orange Lake Timeshare Trust 2019-A, B 144A
3.360%, 4/9/38(1) | 3,732 | | 3,567 |
Pawneee Equipment Receivables LLC 2022-1, B 144A
5.400%, 7/17/28(1) | 10,570 | | 10,091 |
Planet Fitness Master Issuer LLC 2018-1A, A2II 144A
4.666%, 9/5/48(1) | 13,138 | | 12,593 |
See Notes to Financial Statements
Newfleet Multi-Sector Short Term Bond Fund
SCHEDULE OF INVESTMENTS (Continued)
September 30, 2023
($ reported in thousands)
| | Par Value | | Value |
| | | | |
| Other—continued | | |
| Purchasing Power Funding LLC | | | |
2021-A, A 144A
1.570%, 10/15/25(1) | $ 1,432 | | $ 1,427 |
2021-A, B 144A
1.920%, 10/15/25(1) | 5,465 | | 5,403 |
Regional Management Issuance Trust 2022-1, A 144A
3.070%, 3/15/32(1) | 6,500 | | 6,060 |
| Sierra Timeshare Receivables Funding LLC | | | |
2019-1A, B 144A
3.420%, 1/20/36(1) | 606 | | 590 |
2019-2A, B 144A
2.820%, 5/20/36(1) | 2,150 | | 2,084 |
2020-2A, B 144A
2.320%, 7/20/37(1) | 1,642 | | 1,552 |
Trinity Rail Leasing LLC 2019-1A, A 144A
3.820%, 4/17/49(1) | 13,665 | | 12,802 |
TRP LLC 2021-1, A 144A
2.070%, 6/19/51(1) | 5,757 | | 4,961 |
| VFI ABS LLC | | | |
2022-1A, A 144A
2.230%, 3/24/28(1) | 3,493 | | 3,407 |
2022-1A, D 144A
6.680%, 11/26/29(1) | 2,794 | | 2,627 |
Welk Resorts LLC 2019-AA, B 144A
2.990%, 6/15/38(1) | 2,994 | | 2,806 |
| Westgate Resorts LLC | | | |
2020-1A, A 144A
2.713%, 3/20/34(1) | 778 | | 763 |
2022-1A, B 144A
2.288%, 8/20/36(1) | 2,896 | | 2,740 |
ZAXBY’S Funding LLC 2021-1A, A2 144A
3.238%, 7/30/51(1) | 20,144 | | 16,723 |
| | | | 457,360 |
| | | | |
| |
| Student Loan—0.0% | | |
Navient Private Education Loan Trust 2017-A, A2A 144A
2.880%, 12/16/58(1) | 139 | | 138 |
Total Asset-Backed Securities
(Identified Cost $1,216,699) | | 1,156,680 |
| | | | |
| |
| | | | |
| |
| Corporate Bonds and Notes—26.3% |
| Communication Services—0.7% | | |
| Altice France S.A. | | | |
| 144A 5.125%, 7/15/29(1) | 4,885 | | 3,473 |
| 144A 5.500%, 10/15/29(1) | 3,970 | | 2,855 |
CCO Holdings LLC 144A
6.375%, 9/1/29(1) | 1,585 | | 1,478 |
CSC Holdings LLC
5.250%, 6/1/24 | 4,800 | | 4,566 |
| | Par Value | | Value |
| | | | |
| Communication Services—continued | | |
Level 3 Financing, Inc. 144A
4.625%, 9/15/27(1) | $ 5,040 | | $ 3,625 |
Sprint Capital Corp.
6.875%, 11/15/28 | 6,685 | | 6,902 |
Sprint Spectrum Co. LLC 144A
4.738%, 9/20/29(1) | 2,479 | | 2,452 |
Telesat Canada 144A
6.500%, 10/15/27(1) | 2,485 | | 1,267 |
TripAdvisor, Inc. 144A
7.000%, 7/15/25(1) | 4,755 | | 4,746 |
VTR Comunicaciones SpA 144A
5.125%, 1/15/28(1) | 3 | | 2 |
| | | | 31,366 |
| | | | |
| |
| Consumer Discretionary—1.3% | | |
Ashtead Capital, Inc. 144A
4.250%, 11/1/29(1) | 8,000 | | 7,084 |
Carriage Services, Inc. 144A
4.250%, 5/15/29(1) | 2,880 | | 2,463 |
Churchill Downs, Inc. 144A
6.750%, 5/1/31(1) | 5,770 | | 5,453 |
Clarios Global LP 144A
6.750%, 5/15/28(1) | 590 | | 576 |
eG Global Finance plc 144A
8.500%, 10/30/25(1) | 4,943 | | 4,865 |
| Ford Motor Credit Co. LLC | | | |
| 7.350%, 11/4/27 | 5,165 | | 5,267 |
| 6.800%, 5/12/28(6) | 2,130 | | 2,128 |
Legends Hospitality Holding Co. LLC 144A
5.000%, 2/1/26(1) | 5,345 | | 5,238 |
MDC Holdings, Inc.
2.500%, 1/15/31 | 8,930 | | 6,668 |
Newell Brands, Inc.
6.375%, 9/15/27(6) | 5,000 | | 4,770 |
| Nissan Motor Acceptance Co. LLC | | | |
| 144A 6.950%, 9/15/26(1) | 1,775 | | 1,788 |
| 144A 7.050%, 9/15/28(1) | 4,225 | | 4,224 |
Ontario Gaming GTA LP 144A
8.000%, 8/1/30(1) | 4,765 | | 4,765 |
Royal Caribbean Cruises Ltd. 144A
9.250%, 1/15/29(1) | 183 | | 193 |
Weekley Homes LLC 144A
4.875%, 9/15/28(1) | 2,895 | | 2,512 |
| | | | 57,994 |
| | | | |
| |
| Consumer Staples—0.6% | | |
Albertsons Cos., Inc. 144A
6.500%, 2/15/28(1) | 4,341 | | 4,291 |
| BAT Capital Corp. | | | |
| 4.700%, 4/2/27 | 7,700 | | 7,372 |
| 2.259%, 3/25/28 | 2,195 | | 1,856 |
| | Par Value | | Value |
| | | | |
| Consumer Staples—continued | | |
Central American Bottling Corp. 144A
5.250%, 4/27/29(1) | $ 6,625 | | $ 5,950 |
Coty, Inc. 144A
6.625%, 7/15/30(1) | 6,940 | | 6,776 |
HLF Financing S.a.r.l. LLC 144A
4.875%, 6/1/29(1) | 2,990 | | 2,123 |
| | | | 28,368 |
| | | | |
| |
| Energy—4.2% | | |
Aker BP ASA 144A
2.000%, 7/15/26(1) | 1,890 | | 1,687 |
Ascent Resources Utica Holdings LLC 144A
8.250%, 12/31/28(1) | 5,740 | | 5,680 |
Boardwalk Pipelines LP
4.950%, 12/15/24 | 12,645 | | 12,459 |
BP Capital Markets plc
4.875% (7) | 10,210 | | 9,122 |
CITGO Petroleum Corp. 144A
7.000%, 6/15/25(1) | 9,020 | | 8,886 |
| Civitas Resources, Inc. | | | |
| 144A 8.375%, 7/1/28(1) | 2,340 | | 2,381 |
| 144A 8.750%, 7/1/31(1) | 2,275 | | 2,324 |
| CrownRock LP | | | |
| 144A 5.625%, 10/15/25(1) | 5,045 | | 4,964 |
| 144A 5.000%, 5/1/29(1) | 5,695 | | 5,336 |
Ecopetrol S.A.
8.625%, 1/19/29 | 9,875 | | 9,886 |
Enbridge, Inc.
7.375%, 1/15/83 | 11,650 | | 11,079 |
Energy Transfer LP
4.200%, 4/15/27 | 8,610 | | 8,113 |
EQM Midstream Partners LP 144A
7.500%, 6/1/27(1) | 90 | | 90 |
Genesis Energy LP
8.875%, 4/15/30 | 6,290 | | 6,141 |
Hilcorp Energy I LP 144A
6.000%, 4/15/30(1) | 4,315 | | 3,891 |
| KazMunayGas National Co. JSC | | | |
| 144A 5.375%, 4/24/30(1) | 4,490 | | 4,074 |
| RegS 5.375%, 4/24/30(3) | 3,550 | | 3,221 |
Kinder Morgan, Inc. 144A
5.625%, 11/15/23(1) | 9,880 | | 9,873 |
Korea National Oil Corp. 144A
4.875%, 4/3/28(1) | 7,000 | | 6,815 |
NGPL PipeCo LLC 144A
4.875%, 8/15/27(1) | 7,945 | | 7,500 |
Petroleos de Venezuela S.A. 144A
6.000%, 5/16/24(1)(2) | 9,545 | | 520 |
Petroleos Mexicanos
6.500%, 3/13/27 | 33,165 | | 29,083 |
Saudi Arabian Oil Co. 144A
2.875%, 4/16/24(1) | 17,260 | | 16,912 |
See Notes to Financial Statements
Newfleet Multi-Sector Short Term Bond Fund
SCHEDULE OF INVESTMENTS (Continued)
September 30, 2023
($ reported in thousands)
| | Par Value | | Value |
| | | | |
| Energy—continued | | |
Southwestern Energy Co.
5.375%, 2/1/29 | $ 4,090 | | $ 3,767 |
Transocean, Inc. 144A
11.500%, 1/30/27(1) | 5,045 | | 5,291 |
USA Compression Partners LP
6.875%, 4/1/26 | 5,955 | | 5,833 |
Venture Global Calcasieu Pass LLC 144A
3.875%, 8/15/29(1) | 6,175 | | 5,196 |
| | | | 190,124 |
| | | | |
| |
| Financials—9.2% | | |
| AerCap Ireland Capital DAC | | | |
| 2.450%, 10/29/26 | 6,290 | | 5,634 |
| 3.000%, 10/29/28 | 695 | | 596 |
Series 3NC1
1.750%, 10/29/24 | 2,584 | | 2,463 |
Allstate Corp. (The) Series B (3 month Term SOFR + 3.200%)
8.564%, 8/15/53(4) | 10,625 | | 10,485 |
Banco Mercantil del Norte S.A. 144A
5.875% (1)(7) | 15,295 | | 13,039 |
Banco Santander Chile 144A
2.700%, 1/10/25(1) | 7,545 | | 7,211 |
| Bank of America Corp. | | | |
| 3.841%, 4/25/25 | 4,915 | | 4,845 |
| 1.734%, 7/22/27 | 13,290 | | 11,777 |
| 2.551%, 2/4/28 | 6,080 | | 5,421 |
(3 month Term SOFR + 1.032%)
6.401%, 2/5/26(4) | 11,312 | | 11,331 |
| Barclays plc | | | |
| 7.325%, 11/2/26 | 3,430 | | 3,482 |
| 7.385%, 11/2/28 | 3,215 | | 3,299 |
| Blackstone Private Credit Fund | | | |
| 2.625%, 12/15/26 | 5,165 | | 4,446 |
| 4.000%, 1/15/29 | 3,345 | | 2,844 |
Block, Inc.
2.750%, 6/1/26 | 7,535 | | 6,777 |
Blue Owl Credit Income Corp.
5.500%, 3/21/25 | 4,304 | | 4,163 |
BPCE S.A. 144A
5.975%, 1/18/27(1) | 6,390 | | 6,321 |
Brookfield Finance, Inc.
3.900%, 1/25/28 | 9,490 | | 8,741 |
Capital One Financial Corp.
6.312%, 6/8/29 | 7,118 | | 6,956 |
| Charles Schwab Corp. (The) | | | |
Series G
5.375%(7) | 4,332 | | 4,162 |
Series H
4.000%(7) | 6,721 | | 4,742 |
Citadel Finance LLC 144A
3.375%, 3/9/26(1) | 5,660 | | 5,105 |
| | Par Value | | Value |
| | | | |
| Financials—continued | | |
Citadel LP 144A
4.875%, 1/15/27(1) | $ 1,055 | | $ 1,003 |
| Citigroup, Inc. | | | |
| 5.610%, 9/29/26 | 9,000 | | 8,909 |
| 3.200%, 10/21/26 | 9,162 | | 8,459 |
(SOFR + 1.280%)
6.623%, 2/24/28(4)(6) | 8,147 | | 8,132 |
Citizens Bank N.A.
2.250%, 4/28/25 | 9,235 | | 8,551 |
Corebridge Financial, Inc.
6.875%, 12/15/52 | 8,938 | | 8,563 |
Credit Suisse AG
7.950%, 1/9/25 | 4,910 | | 4,997 |
| Danske Bank A/S | | | |
| 144A 3.773%, 3/28/25(1) | 6,075 | | 5,985 |
| 144A 1.621%, 9/11/26(1) | 1,935 | | 1,762 |
Drawbridge Special Opportunities Fund LP 144A
3.875%, 2/15/26(1) | 15,930 | | 14,173 |
Export-Import Bank Korea
3.250%, 8/12/26 | 7,800 | | 7,322 |
Fifth Third Bancorp
4.055%, 4/25/28 | 2,565 | | 2,361 |
Fifth Third Bank N.A.
5.852%, 10/27/25 | 4,530 | | 4,457 |
| Goldman Sachs Group, Inc. (The) | | | |
| 4.250%, 10/21/25 | 24,315 | | 23,432 |
| 3.850%, 1/26/27 | 6,630 | | 6,218 |
Huntington Bancshares, Inc.
6.208%, 8/21/29 | 3,920 | | 3,835 |
Huntington National Bank (The)
5.699%, 11/18/25 | 2,708 | | 2,647 |
| JPMorgan Chase & Co. | | | |
| 1.578%, 4/22/27 | 16,600 | | 14,814 |
| 4.323%, 4/26/28 | 5,930 | | 5,626 |
(SOFR + 1.180%)
6.523%, 2/24/28(4) | 13,015 | | 12,998 |
Ladder Capital Finance Holdings LLLP 144A
4.250%, 2/1/27(1) | 8,085 | | 7,071 |
Liberty Mutual Group, Inc. 144A
4.125%, 12/15/51(1) | 8,415 | | 6,918 |
Lincoln National Corp. (3 month LIBOR + 2.040%)
7.628%, 4/20/67(4) | 10,579 | | 7,009 |
| Morgan Stanley | | | |
| 2.188%, 4/28/26 | 6,000 | | 5,636 |
| 2.475%, 1/21/28 | 10,911 | | 9,729 |
| 6.296%, 10/18/28 | 1,604 | | 1,616 |
| 3.772%, 1/24/29 | 6,000 | | 5,471 |
MSCI, Inc. 144A
3.625%, 9/1/30(1) | 6,679 | | 5,598 |
Navient Corp.
5.875%, 10/25/24 | 7,452 | | 7,334 |
OneMain Finance Corp.
6.875%, 3/15/25 | 7,400 | | 7,341 |
| | Par Value | | Value |
| | | | |
| Financials—continued | | |
| State Street Corp. | | | |
| 5.751%, 11/4/26 | $ 6,169 | | $ 6,147 |
| 5.820%, 11/4/28 | 2,518 | | 2,521 |
| Synchrony Financial | | | |
| 4.875%, 6/13/25 | 3,194 | | 3,062 |
| 3.700%, 8/4/26 | 3,062 | | 2,764 |
Texas Capital Bancshares, Inc.
4.000%, 5/6/31 | 5,470 | | 4,541 |
Toronto-Dominion Bank (The)
8.125%, 10/31/82 | 10,895 | | 10,839 |
Truist Bank
3.625%, 9/16/25 | 8,785 | | 8,298 |
UBS AG
5.650%, 9/11/28 | 6,700 | | 6,588 |
| Wells Fargo & Co. | | | |
| 3.526%, 3/24/28 | 9,000 | | 8,265 |
Series U
5.875%(4)(7) | 6,935 | | 6,800 |
| | | | 411,632 |
| | | | |
| |
| Health Care—1.9% | | |
Cheplapharm Arzneimittel GmbH 144A
5.500%, 1/15/28(1) | 7,120 | | 6,460 |
| Community Health Systems, Inc. | | | |
| 144A 6.125%, 4/1/30(1) | 4,935 | | 2,511 |
| 144A 5.250%, 5/15/30(1) | 3,065 | | 2,330 |
DENTSPLY SIRONA, Inc.
3.250%, 6/1/30 | 13,108 | | 10,971 |
Fortrea Holdings, Inc. 144A
7.500%, 7/1/30(1) | 2,373 | | 2,309 |
HCA, Inc.
5.200%, 6/1/28 | 4,461 | | 4,311 |
| Illumina, Inc. | | | |
| 5.800%, 12/12/25 | 4,445 | | 4,416 |
| 5.750%, 12/13/27 | 5,005 | | 4,921 |
IQVIA, Inc. 144A
5.700%, 5/15/28(1) | 8,587 | | 8,343 |
| Royalty Pharma plc | | | |
| 1.200%, 9/2/25 | 2,749 | | 2,498 |
| 1.750%, 9/2/27 | 7,234 | | 6,172 |
| Teva Pharmaceutical Finance Netherlands III B.V. | | | |
| 6.000%, 4/15/24 | 516 | | 512 |
| 3.150%, 10/1/26 | 5,430 | | 4,828 |
| 4.750%, 5/9/27 | 1,280 | | 1,172 |
| 7.875%, 9/15/29 | 975 | | 987 |
Universal Health Services, Inc.
1.650%, 9/1/26 | 12,600 | | 11,107 |
Utah Acquisition Sub, Inc.
3.950%, 6/15/26 | 1,804 | | 1,690 |
| Viatris, Inc. | | | |
| 2.300%, 6/22/27 | 8,330 | | 7,168 |
| 144A 2.300%, 6/22/27(1) | — (8) | | — (8) |
| | | | 82,706 |
| | | | |
| |
See Notes to Financial Statements
Newfleet Multi-Sector Short Term Bond Fund
SCHEDULE OF INVESTMENTS (Continued)
September 30, 2023
($ reported in thousands)
| | Par Value | | Value |
| | | | |
| Industrials—2.4% | | |
Alaska Airlines Pass-Through Trust 2020-1, A 144A
4.800%, 2/15/29(1) | $ 11,144 | | $ 10,686 |
Allied Universal Holdco LLC 144A
6.625%, 7/15/26(1) | 6,885 | | 6,524 |
Beacon Roofing Supply, Inc. 144A
6.500%, 8/1/30(1) | 2,940 | | 2,849 |
BlueLinx Holdings, Inc. 144A
6.000%, 11/15/29(1) | 6,086 | | 5,362 |
Boeing Co. (The)
4.875%, 5/1/25 | 4,191 | | 4,119 |
British Airways Pass-Through Trust 2021-1, A 144A
2.900%, 9/15/36(1) | 9,216 | | 7,630 |
Chart Industries, Inc. 144A
9.500%, 1/1/31(1) | 2,890 | | 3,072 |
Concentrix Corp.
6.650%, 8/2/26 | 5,425 | | 5,392 |
CoStar Group, Inc. 144A
2.800%, 7/15/30(1) | 8,984 | | 7,239 |
Hexcel Corp.
4.200%, 2/15/27 | 10,050 | | 9,306 |
Huntington Ingalls Industries, Inc.
2.043%, 8/16/28 | 11,255 | | 9,454 |
| Icahn Enterprises LP | | | |
| 4.750%, 9/15/24 | 10,690 | | 10,296 |
| 6.250%, 5/15/26 | 2,110 | | 1,960 |
Neptune Bidco U.S., Inc. 144A
9.290%, 4/15/29(1) | 3,805 | | 3,445 |
| Regal Rexnord Corp. | | | |
| 144A 6.050%, 2/15/26(1) | 2,680 | | 2,650 |
| 144A 6.050%, 4/15/28(1) | 4,590 | | 4,465 |
| 144A 6.300%, 2/15/30(1) | 4,698 | | 4,538 |
Veralto Corp. 144A
5.350%, 9/18/28(1) | 8,890 | | 8,789 |
| | | | 107,776 |
| | | | |
| |
| Information Technology—1.0% | | |
| Booz Allen Hamilton, Inc. | | | |
| 144A 3.875%, 9/1/28(1) | 1,950 | | 1,747 |
| 144A 4.000%, 7/1/29(1) | 9,207 | | 8,121 |
CDW LLC
3.276%, 12/1/28 | 5,341 | | 4,603 |
| Consensus Cloud Solutions, Inc. | | | |
| 144A 6.000%, 10/15/26(1)(6) | 1,440 | | 1,326 |
| 144A 6.500%, 10/15/28(1) | 2,165 | | 1,845 |
ION Trading Technologies S.a.r.l. 144A
5.750%, 5/15/28(1) | 920 | | 802 |
| Kyndryl Holdings, Inc. | | | |
| 2.050%, 10/15/26 | 5,026 | | 4,387 |
| 2.700%, 10/15/28 | 4,835 | | 3,975 |
| | Par Value | | Value |
| | | | |
| Information Technology—continued | | |
Leidos, Inc.
3.625%, 5/15/25 | $ 7,850 | | $ 7,547 |
SK Hynix, Inc. 144A
1.500%, 1/19/26(1) | 4,710 | | 4,225 |
Viasat, Inc. 144A
5.625%, 9/15/25(1) | 7,025 | | 6,489 |
| | | | 45,067 |
| | | | |
| |
| Materials—1.6% | | |
Bayport Polymers LLC 144A
4.743%, 4/14/27(1) | 12,755 | | 11,774 |
Celanese U.S. Holdings LLC
3.500%, 5/8/24 | 8,694 | | 8,550 |
Cleveland-Cliffs, Inc. 144A
6.750%, 3/15/26(1) | 2,230 | | 2,223 |
FMG Resources August 2006 Pty Ltd. 144A
5.875%, 4/15/30(1) | 8,105 | | 7,410 |
Glencore Funding LLC 144A
1.625%, 9/1/25(1) | 7,650 | | 7,055 |
International Flavors & Fragrances, Inc. 144A
1.230%, 10/1/25(1) | 7,666 | | 6,872 |
Mauser Packaging Solutions Holding Co. 144A
9.250%, 4/15/27(1) | 3,120 | | 2,727 |
NOVA Chemicals Corp. 144A
5.000%, 5/1/25(1) | 6,740 | | 6,349 |
Silgan Holdings, Inc. 144A
1.400%, 4/1/26(1) | 11,513 | | 10,212 |
Suzano Austria GmbH
2.500%, 9/15/28 | 8,725 | | 7,242 |
| | | | 70,414 |
| | | | |
| |
| Real Estate—1.2% | | |
EPR Properties
4.950%, 4/15/28 | 9,545 | | 8,458 |
| GLP Capital LP | | | |
| 5.250%, 6/1/25 | 7,340 | | 7,189 |
| 5.750%, 6/1/28 | 1,863 | | 1,786 |
| 5.300%, 1/15/29 | 2,731 | | 2,532 |
Office Properties Income Trust
2.650%, 6/15/26 | 5,087 | | 3,460 |
Retail Opportunity Investments Partnership LP
5.000%, 12/15/23 | 10,874 | | 10,846 |
Service Properties Trust
4.350%, 10/1/24 | 8,270 | | 7,933 |
| VICI Properties LP | | | |
| 144A 4.625%, 6/15/25(1) | 1,305 | | 1,260 |
| 144A 5.750%, 2/1/27(1) | 6,370 | | 6,167 |
| 144A 4.500%, 1/15/28(1) | 1,710 | | 1,560 |
| 144A 4.625%, 12/1/29(1) | 3,420 | | 3,034 |
| | Par Value | | Value |
| | | | |
| Real Estate—continued | | |
| 144A 4.125%, 8/15/30(1) | $ 1,780 | | $ 1,514 |
| | | | 55,739 |
| | | | |
| |
| Utilities—2.2% | | |
American Electric Power Co., Inc.
5.699%, 8/15/25 | 10,255 | | 10,203 |
Dominion Energy, Inc. Series A
1.450%, 4/15/26 | 7,155 | | 6,437 |
DPL, Inc.
4.125%, 7/1/25 | 1,596 | | 1,512 |
Electricite de France S.A. 144A
5.700%, 5/23/28(1) | 7,110 | | 7,041 |
Enel Finance America LLC 144A
7.100%, 10/14/27(1) | 5,430 | | 5,617 |
Enel Finance International N.V. 144A
6.800%, 10/14/25(1) | 2,600 | | 2,630 |
Eskom Holdings SOC Ltd. 144A
7.125%, 2/11/25(1) | 7,425 | | 7,225 |
Exelon Corp.
5.150%, 3/15/28 | 6,585 | | 6,462 |
Ferrellgas LP 144A
5.375%, 4/1/26(1) | 5,670 | | 5,315 |
National Grid plc
5.602%, 6/12/28 | 4,481 | | 4,432 |
NextEra Energy Capital Holdings, Inc.
6.051%, 3/1/25 | 4,792 | | 4,799 |
NRG Energy, Inc. 144A
3.750%, 6/15/24(1) | 14,667 | | 14,362 |
Puget Energy, Inc.
2.379%, 6/15/28 | 9,794 | | 8,378 |
Southern Co. (The) Series 21-A
3.750%, 9/15/51 | 13,578 | | 11,843 |
| | | | 96,256 |
| | | | |
| |
Total Corporate Bonds and Notes
(Identified Cost $1,259,006) | | 1,177,442 |
| | | | |
| |
| | | | |
| |
| Leveraged Loans—9.2% |
| Aerospace—0.7% | | |
Amentum Government Services Holdings LLC (1 month Term SOFR + 4.000%)
9.331%, 2/15/29(4) | 2,627 | | 2,586 |
Brown Group Holding LLC (1 month Term SOFR + 2.850%)
8.166%, 6/7/28(4) | 6,980 | | 6,909 |
Delta Air Lines, Inc. (3 month Term SOFR + 3.750%)
9.076%, 10/20/27(4) | 4,599 | | 4,758 |
See Notes to Financial Statements
Newfleet Multi-Sector Short Term Bond Fund
SCHEDULE OF INVESTMENTS (Continued)
September 30, 2023
($ reported in thousands)
| | Par Value | | Value |
| | | | |
| Aerospace—continued | | |
Mileage Plus Holdings LLC (3 month Term SOFR + 5.400%)
10.798%, 6/21/27(4) | $ 3,919 | | $ 4,066 |
TransDigm, Inc. Tranche I (3 month Term SOFR + 3.250%)
8.640%, 8/24/28(4) | 12,948 | | 12,946 |
| | | | 31,265 |
| | | | |
| |
| Chemicals—0.3% | | |
Ineos Finance plc 2027 (1 month Term SOFR + 3.850%)
9.166%, 11/8/27(4) | 8,322 | | 8,279 |
LSF11 A5 Holdco LLC (1 month Term SOFR + 4.350%)
9.666%, 10/15/28(4) | 4,170 | | 4,107 |
| | | | 12,386 |
| | | | |
| |
| Consumer Non-Durables—0.1% | | |
Kronos Acquisition Holdings, Inc. Tranche B-1 (3 month Term SOFR + 4.012%)
9.402%, 12/22/26(4) | 6,347 | | 6,308 |
| Energy—0.3% | | |
AL GCX Holdings LLC (3 month Term SOFR + 3.650%)
8.931%, 5/17/29(4) | 1,674 | | 1,674 |
Freeport LNG Investments LLP Tranche B (3 month Term SOFR + 3.762%)
9.088%, 12/21/28(4) | 5,980 | | 5,918 |
Oryx Midstream Services Permian Basin LLC 2023 (1 month Term SOFR + 3.364%)
8.692%, 10/5/28(4) | 7,269 | | 7,258 |
Paragon Offshore Finance Co. (3 month LIBOR + 1.750%)
3.750%, 7/16/21(2)(5) | 66 | | — |
| | | | 14,850 |
| | | | |
| |
| Financials—0.6% | | |
Avolon TLB Borrower 1 U.S. LLC Tranche B-5 (1 month Term SOFR + 2.350%)
7.675%, 12/1/27(4) | 5,973 | | 5,967 |
Blackhawk Network Holdings, Inc. First Lien (3 month Term SOFR + 2.750%)
8.172%, 6/15/25(4) | 6,003 | | 5,978 |
| | Par Value | | Value |
| | | | |
| Financials—continued | | |
Citadel Securities LP Tranche B (1 month Term SOFR + 2.614%)
7.931%, 7/29/30(4) | $ 8,623 | | $ 8,596 |
Finco I LLC 2023 (3 month Term SOFR + 3.000%)
8.369%, 6/27/29(4) | 1,307 | | 1,306 |
GIP Pilot Acquisition Partners LP (3 month LIBOR + 3.250%)
0.000%, 9/18/30(4)(9) | 1,325 | | 1,320 |
GTCR W Merger Sub LLC Tranche B (3 month LIBOR + 3.250%)
0.000%, 9/20/30(4)(9) | 2,635 | | 2,633 |
| | | | 25,800 |
| | | | |
| |
| Food / Tobacco—0.8% | | |
Aramark Services, Inc. Tranche B-5 (1 month Term SOFR + 2.614%)
7.931%, 4/6/28(4) | 4,656 | | 4,649 |
Del Monte Foods, Inc. (1 month Term SOFR + 4.350% - 3 month PRIME + 3.250%)
9.668% - 11.750%, 5/16/29(4) | 7,325 | | 7,112 |
Froneri U.S., Inc. Tranche B-2 (1 month Term SOFR + 2.350%)
7.666%, 1/29/27(4) | 8,971 | | 8,896 |
Hostess Brands LLC Tranche B (3 month Term SOFR + 2.500%)
7.890%, 6/21/30(4) | 8,322 | | 8,331 |
Pegasus Bidco B.V. Tranche B-2 (3 month Term SOFR + 4.250%)
9.615%, 7/12/29(4) | 2,273 | | 2,267 |
Triton Water Holdings, Inc. First Lien (3 month Term SOFR + 3.512%)
8.902%, 3/31/28(4) | 6,341 | | 6,173 |
| | | | 37,428 |
| | | | |
| |
| Forest Prod / Containers—0.3% | | |
Berry Global, Inc. Tranche Z (3 month Term SOFR + 2.012%)
7.293%, 7/1/26(4) | 5,404 | | 5,401 |
Mauser Packaging Solutions Holding Co. (1 month Term SOFR + 4.000%)
9.330%, 8/14/26(4) | 3,631 | | 3,627 |
TricorBraun, Inc. (1 month Term SOFR + 3.364%)
8.681%, 3/3/28(4) | 4,994 | | 4,893 |
| | | | 13,921 |
| | | | |
| |
| | Par Value | | Value |
| | | | |
| Gaming / Leisure—0.9% | | |
Caesars Entertainment, Inc. Tranche B (1 month Term SOFR + 3.350%)
8.666%, 2/6/30(4) | $ 3,338 | | $ 3,336 |
Carnival Corp. (1 month Term SOFR + 3.000%)
8.327%, 8/9/27(4) | 4,489 | | 4,472 |
Ontario Gaming GTA Ltd. Partnership Tranche B (3 month Term SOFR + 4.250%)
9.640%, 8/1/30(4) | 1,490 | | 1,490 |
Playa Hotels & Resorts B.V. (1 month Term SOFR + 4.250%)
9.581%, 1/5/29(4) | 4,720 | | 4,719 |
Playtika Holding Corp. Tranche B-1 (1 month Term SOFR + 2.864%)
8.181%, 3/13/28(4) | 5,989 | | 5,977 |
Raptor Acquisition Corp. Tranche B (3 month Term SOFR + 4.262%)
9.658%, 11/1/26(4) | 2,518 | | 2,520 |
Scientific Games International, Inc. Tranche B (1 month Term SOFR + 3.100%)
8.434%, 4/13/29(4) | 3,199 | | 3,196 |
Stars Group Holdings B.V. 2021 (3 month Term SOFR + 2.512%)
7.902%, 7/21/26(4) | 5,770 | | 5,762 |
UFC Holdings LLC Tranche B-3 (3 month Term SOFR + 3.012%)
8.369%, 4/29/26(4) | 6,231 | | 6,221 |
| | | | 37,693 |
| | | | |
| |
| Health Care—0.6% | | |
Agiliti Health, Inc. 2023, Tranche B (3 month Term SOFR + 3.000%)
8.247%, 5/1/30(4) | 6,087 | | 6,057 |
| CHG Healthcare Services, Inc. | | | |
2023 (1 month Term SOFR + 3.000%)
0.000%, 9/29/28(4)(9) | 780 | | 778 |
First Lien (1 month Term SOFR + 3.364%)
8.681%, 9/29/28(4) | 2,343 | | 2,330 |
Perrigo Investments LLC Tranche B (1 month Term SOFR + 2.350%)
7.666%, 4/20/29(4) | 2,548 | | 2,536 |
Phoenix Guarantor, Inc. Tranche B-3 (1 month Term SOFR + 3.614%)
8.931%, 3/5/26(4) | 5,958 | | 5,925 |
See Notes to Financial Statements
Newfleet Multi-Sector Short Term Bond Fund
SCHEDULE OF INVESTMENTS (Continued)
September 30, 2023
($ reported in thousands)
| | Par Value | | Value |
| | | | |
| Health Care—continued | | |
Phoenix Newco, Inc. First Lien (1 month Term SOFR + 3.364%)
8.681%, 11/15/28(4) | $ 2,118 | | $ 2,101 |
Select Medical Corp. Tranche B-1 (1 month Term SOFR + 3.000%)
8.316%, 3/8/27(4) | 6,548 | | 6,524 |
Sunshine Luxembourg VII S.a.r.l. Tranche B-3 (3 month Term SOFR + 3.850%)
9.240%, 10/1/26(4) | 2,363 | | 2,358 |
| | | | 28,609 |
| | | | |
| |
| Housing—0.4% | | |
Quikrete Holdings, Inc. Tranche B-1 (1 month Term SOFR + 2.864%)
8.181%, 3/18/29(4) | 5,501 | | 5,498 |
| SRS Distribution, Inc. | | | |
2021 (1 month Term SOFR + 3.614%)
8.931%, 6/2/28(4) | 3,322 | | 3,285 |
2022 (1 month Term SOFR + 3.600%)
8.916%, 6/2/28(4) | 739 | | 731 |
Standard Industries, Inc. (1 month Term SOFR + 2.614%)
7.938%, 9/22/28(4) | 5,857 | | 5,852 |
| | | | 15,366 |
| | | | |
| |
| Information Technology—0.8% | | |
Applied Systems, Inc. 2026 (3 month Term SOFR + 4.500%)
9.890%, 9/18/26(4) | 14,246 | | 14,275 |
CCC Intelligent Solutions, Inc. Tranche B (1 month Term SOFR + 2.364%)
7.681%, 9/21/28(4) | 4,066 | | 4,052 |
Epicor Software Corp. First Lien (3 month LIBOR + 1.750%)
9.069%, 7/30/27(4) | 635 | | 635 |
Uber Technologies, Inc. 2023 (3 month Term SOFR + 2.750%)
8.159%, 3/3/30(4) | 8,080 | | 8,073 |
| UKG, Inc. | | | |
2021, Second Lien (3 month Term SOFR + 5.350%)
10.618%, 5/3/27(4) | 355 | | 354 |
2021-2, First Lien (3 month Term SOFR + 3.350%)
8.618%, 5/4/26(4) | 8,800 | | 8,768 |
| | | | 36,157 |
| | | | |
| |
| | Par Value | | Value |
| | | | |
| Manufacturing—0.6% | | |
Alliance Laundry Systems LLC Tranche B (3 month Term SOFR + 3.600%)
8.901%, 10/8/27(4) | $ 5,876 | | $ 5,869 |
Chart Industries, Inc. (1 month Term SOFR + 3.850%)
9.174%, 3/15/30(4) | 4,692 | | 4,691 |
Filtration Group Corp. 2021 (1 month Term SOFR + 3.614%)
8.931%, 10/21/28(4) | 6,049 | | 6,020 |
Gates Global LLC Tranche B-3 (1 month Term SOFR + 2.600%)
7.916%, 3/31/27(4) | 4,834 | | 4,817 |
NCR Corp. (1 month Term SOFR + 2.614%)
7.931%, 8/28/26(4) | 5,377 | | 5,364 |
Safe Fleet Holdings LLC 2022 (1 month Term SOFR + 3.850%)
9.170%, 2/23/29(4) | 1,394 | | 1,393 |
| | | | 28,154 |
| | | | |
| |
| Media / Telecom - Broadcasting—0.3% | | |
Nexstar Media, Inc. Tranche B-4 (1 month Term SOFR + 2.614%)
7.931%, 9/18/26(4) | 4,264 | | 4,257 |
Univision Communications, Inc. 2021 (1 month Term SOFR + 3.364%)
8.681%, 3/15/26(4) | 7,143 | | 7,120 |
| | | | 11,377 |
| | | | |
| |
Media / Telecom - Cable/Wireless
Video—0.6% | | |
Charter Communications Operating LLC Tranche B-2 (3 month Term SOFR + 1.750%)
7.116%, 2/1/27(4) | 5,368 | | 5,359 |
Cogeco Communications Finance USA LP Tranche B-1 (3 month LIBOR + 3.250%)
0.000%, 9/18/30(4)(9) | 7,715 | | 7,586 |
CSC Holdings LLC 2022 (1 month Term SOFR + 4.500%)
9.832%, 1/18/28(4) | 8,107 | | 7,668 |
DIRECTV Financing LLC (1 month Term SOFR + 5.000%)
10.431%, 8/2/27(4) | 5,997 | | 5,854 |
| | | | 26,467 |
| | | | |
| |
| | Par Value | | Value |
| | | | |
Media / Telecom - Diversified
Media—0.1% | | |
Neptune Bidco U.S., Inc. Tranche B (3 month Term SOFR + 5.100%)
10.398%, 4/11/29(4) | $ 6,264 | | $ 5,625 |
Simon & Schuster, Inc. Tranche B (3 month LIBOR + 3.250%)
0.000%, 9/27/30(4)(9) | 721 | | 715 |
| | | | 6,340 |
| | | | |
| |
| Metals / Minerals—0.0% | | |
Arsenal Aic Parent LLC Tranche B (1 month Term SOFR + 4.500%)
9.879%, 8/19/30(4) | 1,230 | | 1,226 |
| Retail—0.1% | | |
PetsMart LLC (1 month Term SOFR + 3.850%)
9.166%, 2/11/28(4) | 4,767 | | 4,747 |
| Service—1.1% | | |
AlixPartners LLP (1 month Term SOFR + 2.864%)
8.181%, 2/4/28(4) | 5,285 | | 5,277 |
BrightView Landscapes LLC Tranche B (3 month Term SOFR + 3.250%)
8.619%, 4/20/29(4) | 2,911 | | 2,909 |
Dun & Bradstreet Corp. (The) Tranche B (1 month Term SOFR + 2.850%)
8.167%, 2/6/26(4) | 5,654 | | 5,642 |
NAB Holdings LLC First Lien (3 month Term SOFR + 3.150%)
8.540%, 11/23/28(4) | 5,883 | | 5,860 |
Peraton Corp. Tranche B, First Lien (1 month Term SOFR + 3.850%)
9.166%, 2/1/28(4) | 6,185 | | 6,166 |
| Pike Corp. | | | |
2028 (1 month Term SOFR + 3.114%)
8.431%, 1/21/28(4) | 8,226 | | 8,208 |
2028, Tranche B (1 month Term SOFR + 3.500%)
8.816%, 1/21/28(4) | 1,069 | | 1,069 |
PODS LLC (1 month Term SOFR + 3.114%)
8.431%, 3/31/28(4) | 3,253 | | 3,147 |
St. George’s University Scholastic Services LLC (1 month Term SOFR + 3.350%)
8.666%, 2/10/29(4) | 3,482 | | 3,445 |
See Notes to Financial Statements
Newfleet Multi-Sector Short Term Bond Fund
SCHEDULE OF INVESTMENTS (Continued)
September 30, 2023
($ reported in thousands)
| | Par Value | | Value |
| | | | |
| Service—continued | | |
Titan Acquisition Ltd. (3 month LIBOR + 3.000%)
8.731%, 3/28/25(4) | $ 6,304 | | $ 6,246 |
| | | | 47,969 |
| | | | |
| |
| Transportation - Automotive—0.2% | | |
Clarios Global LP 2023 (1 month Term SOFR + 3.750%)
9.066%, 5/6/30(4) | 5,085 | | 5,069 |
PAI Holdco, Inc. Tranche B (3 month Term SOFR + 4.012%)
9.381%, 10/28/27(4) | 3,270 | | 3,089 |
| | | | 8,158 |
| | | | |
| |
| Utilities—0.4% | | |
Brookfield WEC Holdings, Inc. (1 month Term SOFR + 2.864%)
8.181%, 8/1/25(4) | 8,741 | | 8,731 |
Generation Bridge Northeast LLC Tranche B (1 month Term SOFR + 4.250%)
9.566%, 8/7/29(4) | 1,685 | | 1,683 |
Vistra Operations Co. LLC 2018 (1 month Term SOFR + 1.864%)
7.181%, 12/31/25(4) | 8,643 | | 8,639 |
| | | | 19,053 |
| | | | |
| |
Total Leveraged Loans
(Identified Cost $413,233) | | 413,274 |
| | Shares | |
| Preferred Stock—0.1% |
| Financials—0.1% | |
| JPMorgan Chase & Co. Series HH, 4.600% | 4,159 (10) | 3,891 |
Total Preferred Stock
(Identified Cost $4,159) | 3,891 |
| | | |
| |
| | | |
| |
| Rights—0.0% |
| Utilities—0.0% | |
| Vistra Energy Corp., 12/29/49(5)(11) | 98,789 | 115 |
Total Rights
(Identified Cost $83) | 115 |
| | | |
| |
| | | |
| |
Total Long-Term Investments—97.8%
(Identified Cost $4,650,343) | 4,377,899 |
| | | |
| |
| | | |
| |
| | Shares | | Value |
| | | | |
| | | | |
| Short-Term Investments—1.4% |
| Money Market Mutual Fund—0.9% |
| Dreyfus Government Cash Management Fund - Institutional Shares (seven-day effective yield 5.222%)(12) | 40,449,967 | | $ 40,450 |
Total Money Market Mutual Fund
(Identified Cost $40,450) | | 40,450 |
| | Par Value | |
| U.S. Government Security—0.5% |
U.S. Treasury Bill
0.000%, 2/29/24(13) | $ 23,165 | 22,653 |
Total U.S. Government Security
(Identified Cost $22,651) | 22,653 |
| | | |
| |
| | | |
| |
Total Short-Term Investments
(Identified Cost $63,101) | 63,103 |
| | Shares | |
| Securities Lending Collateral—0.2% |
| Dreyfus Government Cash Management Fund - Institutional Shares (seven-day effective yield 5.222%)(12)(14) | 10,236,580 | 10,237 |
Total Securities Lending Collateral
(Identified Cost $10,237) | 10,237 |
| | | |
| |
| | | |
| |
TOTAL INVESTMENTS—99.4%
(Identified Cost $4,723,681) | $4,451,239 |
| Other assets and liabilities, net—0.6% | 25,620 |
| NET ASSETS—100.0% | $4,476,859 |
| Abbreviations: |
| ABS | Asset-Backed Securities |
| CLO | Collateralized Loan Obligation |
| DAC | Designated Activity Company |
| JSC | Joint Stock Company |
| LIBOR | London Interbank Offered Rate |
| LLC | Limited Liability Company |
| LLLP | Limited Liability Limited Partnership |
| LLP | Limited Liability Partnership |
| LP | Limited Partnership |
| MSCI | Morgan Stanley Capital International |
| SOFR | Secured Overnight Financing Rate |
| WaMu | Washington Mutual |
| Footnote Legend: |
| (1) | Security exempt from registration under Rule 144A of the Securities Act of 1933. These securities may be resold in transactions exempt from registration, normally to qualified institutional buyers. At September 30, 2023, these securities amounted to a value of $2,642,473 or 59.0% of net assets. |
| (2) | Security in default; no interest payments are being received. |
| (3) | Regulation S security. Security is offered and sold outside of the United States; therefore, it is exempt from registration with the SEC under Rules 903 and 904 of the Securities Act of 1933. |
| (4) | Variable rate security. Rate disclosed is as of September 30, 2023. Information in parenthesis represents benchmark and reference rate for each security. Certain variable rate securities are not based on a published reference rate and spread but are determined by the issuer or agent and are based on current market conditions, or, for mortgage-backed securities, are impacted by the individual mortgages which are paying off over time. These securities do not indicate a reference rate and spread in their descriptions. |
| (5) | The value of this security was determined using significant unobservable inputs and is reported as a Level 3 security in the Fair Value Hierarchy table located after the Schedule of Investments. |
| (6) | All or a portion of security is on loan. |
| (7) | No contractual maturity date. |
| (8) | Amount is less than $500 (not in thousands). |
| (9) | This loan will settle after September 30, 2023, at which time the interest rate, calculated on the base lending rate and the agreed upon spread on trade date, will be reflected. |
| (10) | Value shown as par value. |
| (11) | Non-income producing. |
| (12) | Shares of this fund are publicly offered, and its prospectus and annual report are publicly available. |
| (13) | Issued with a zero coupon. Income is recognized through the accretion of discount. |
| (14) | Represents security purchased with cash collateral received for securities on loan. |
| Country Weightings (Unaudited)† |
| United States | 90% |
| Canada | 1 |
| Mexico | 1 |
| United Kingdom | 1 |
| Cayman Islands | 1 |
| Saudi Arabia | 1 |
| Netherlands | 1 |
| Other | 4 |
| Total | 100% |
| † % of total investments as of September 30, 2023. |
For information regarding the abbreviations, see the Key Investment Terms starting on page 5.
See Notes to Financial Statements
Newfleet Multi-Sector Short Term Bond Fund
SCHEDULE OF INVESTMENTS (Continued)
September 30, 2023
($ reported in thousands)
The following table summarizes the value of the Fund’s investments as of September 30, 2023, based on the inputs used to value them (See Security Valuation Note 2A in the Notes to Financial Statements):
| | Total
Value at
September 30, 2023 | | Level 1
Quoted Prices | | Level 2
Significant
Observable
Inputs | | Level 3
Significant
Unobservable
Inputs |
| Assets: | | | | | | | |
| Debt Instruments: | | | | | | | |
| Asset-Backed Securities | $1,156,680 | | $ — | | $1,156,680 | | $ — |
| Corporate Bonds and Notes | 1,177,442 | | — | | 1,177,442 | | — |
| Foreign Government Securities | 97,081 | | — | | 97,081 | | — |
| Leveraged Loans | 413,274 | | — | | 413,274 | | — (1) |
| Mortgage-Backed Securities | 1,171,912 | | — | | 1,160,283 | | 11,629 |
| Municipal Bond | 3,410 | | — | | 3,410 | | — |
| U.S. Government Securities | 376,747 | | — | | 376,747 | | — |
| Equity Securities: | | | | | | | |
| Rights | 115 | | — | | — | | 115 |
| Preferred Stock | 3,891 | | — | | 3,891 | | — |
| Money Market Mutual Fund | 40,450 | | 40,450 | | — | | — |
| Securities Lending Collateral | 10,237 | | 10,237 | | — | | — |
| Total Investments | $4,451,239 | | $50,687 | | $4,388,808 | | $11,744 |
| (1) | Includes internally fair valued securities currently priced at zero ($0). |
Securities held by the Fund with an end of period value of $10,570 were transferred from Level 3 to Level 2 due to an increase in trading activities at period end.
Securities held by the Fund with an end of period value of $11,629 were transferred from Level 2 to Level 3 due to a decrease in trading activities at period end.
Some of the Fund’s investments that were categorized as Level 3 may have been valued utilizing third party pricing information without adjustment. If applicable, such valuations are based on unobservable inputs. A significant change in third party information could result in a significantly lower or higher value of Level 3 investments.
Management has determined that the amount of Level 3 securities compared to total net assets is not material; therefore, the roll-forward of Level 3 securities and assumptions are not shown for the period ended September 30, 2023.
See Notes to Financial Statements
Newfleet Senior Floating Rate Fund
SCHEDULE OF INVESTMENTS
September 30, 2023
($ reported in thousands)
| | Par Value | | Value |
| Corporate Bonds and Notes—4.2% |
| Communication Services—0.6% | | |
CSC Holdings LLC 144A
7.500%, 4/1/28(1) | $ 200 | | $ 130 |
Gray Television, Inc. 144A
7.000%, 5/15/27(1) | 320 | | 275 |
iHeartCommunications, Inc.
6.375%, 5/1/26 | 258 | | 222 |
Level 3 Financing, Inc. 144A
4.250%, 7/1/28(1) | 55 | | 34 |
McGraw-Hill Education, Inc. 144A
5.750%, 8/1/28(1) | 565 | | 488 |
| | | | 1,149 |
| | | | |
| |
| Consumer Discretionary—0.7% | | |
Carnival Corp. 144A
7.000%, 8/15/29(1) | 70 | | 69 |
CCM Merger, Inc. 144A
6.375%, 5/1/26(1) | 350 | | 335 |
Clarios Global LP 144A
6.750%, 5/15/28(1) | 35 | | 34 |
eG Global Finance plc 144A
6.750%, 2/7/25(1) | 314 | | 308 |
Ontario Gaming GTA LP 144A
8.000%, 8/1/30(1) | 195 | | 195 |
PetSmart, Inc. 144A
4.750%, 2/15/28(1) | 500 | | 438 |
| | | | 1,379 |
| | | | |
| |
| Consumer Staples—0.5% | | |
Albertsons Cos., Inc. 144A
6.500%, 2/15/28(1) | 265 | | 262 |
Coty, Inc. 144A
6.625%, 7/15/30(1) | 190 | | 185 |
Kronos Acquisition Holdings, Inc. 144A
5.000%, 12/31/26(1) | 5 | | 5 |
Sigma Holdco B.V. 144A
7.875%, 5/15/26(1) | 380 | | 318 |
Triton Water Holdings, Inc. 144A
6.250%, 4/1/29(1) | 225 | | 184 |
| | | | 954 |
| | | | |
| |
| Financials—0.4% | | |
Acrisure LLC 144A
4.250%, 2/15/29(1) | 240 | | 202 |
Ladder Capital Finance Holdings LLLP 144A
4.250%, 2/1/27(1) | 225 | | 197 |
NCR Atleos Escrow Corp. 144A
9.500%, 4/1/29(1) | 334 | | 323 |
| | | | 722 |
| | | | |
| |
| Health Care—0.5% | | |
Community Health Systems, Inc. 144A
6.125%, 4/1/30(1) | 75 | | 38 |
| | Par Value | | Value |
| | | | |
| Health Care—continued | | |
Legacy LifePoint Health LLC 144A
4.375%, 2/15/27(1) | $ 260 | | $ 224 |
LifePoint Health, Inc. 144A
9.875%, 8/15/30(1) | 550 | | 532 |
Medline Borrower LP 144A
3.875%, 4/1/29(1) | 150 | | 127 |
| | | | 921 |
| | | | |
| |
| Industrials—0.8% | | |
Beacon Roofing Supply, Inc. 144A
6.500%, 8/1/30(1) | 135 | | 131 |
Icahn Enterprises LP
4.750%, 9/15/24 | 550 | | 530 |
| Regal Rexnord Corp. | | | |
| 144A 6.050%, 4/15/28(1) | 195 | | 190 |
| 144A 6.300%, 2/15/30(1) | 270 | | 261 |
TransDigm, Inc. 144A
6.875%, 12/15/30(1) | 330 | | 323 |
Vertiv Group Corp. 144A
4.125%, 11/15/28(1) | 295 | | 259 |
| | | | 1,694 |
| | | | |
| |
| Information Technology—0.2% | | |
Central Parent LLC 144A
8.000%, 6/15/29(1) | 50 | | 50 |
GTCR W-2 Merger Sub LLC 144A
7.500%, 1/15/31(1) | 123 | | 123 |
ION Trading Technologies S.a.r.l. 144A
5.750%, 5/15/28(1) | 215 | | 187 |
| | | | 360 |
| | | | |
| |
| Materials—0.3% | | |
Ardagh Packaging Finance plc 144A
4.125%, 8/15/26(1) | 590 | | 539 |
Mauser Packaging Solutions Holding Co. 144A
7.875%, 8/15/26(1) | 130 | | 126 |
| | | | 665 |
| | | | |
| |
| Real Estate—0.2% | | |
| VICI Properties LP | | | |
| 4.950%, 2/15/30 | 300 | | 274 |
| 144A 4.625%, 6/15/25(1) | 70 | | 68 |
| | | | 342 |
| | | | |
| |
Total Corporate Bonds and Notes
(Identified Cost $8,785) | | 8,186 |
| | | | |
| |
| | | | |
| |
| Leveraged Loans—91.7% |
| Aerospace—3.9% | | |
Amentum Government Services Holdings LLC (1 month Term SOFR + 4.000%)
9.331%, 2/15/29(2) | 652 | | 641 |
| | Par Value | | Value |
| | | | |
| Aerospace—continued | | |
American Airlines, Inc. (3 month Term SOFR + 5.012%)
10.338%, 4/20/28(2) | $ 370 | | $ 381 |
Brown Group Holding LLC (1 month Term SOFR + 2.850%)
8.166%, 6/7/28(2) | 1,287 | | 1,274 |
| Dynasty Acquisition Co., Inc. | | | |
2023, Tranche B-1 (1 month Term SOFR + 4.000%)
9.316%, 8/24/28(2) | 529 | | 527 |
2023, Tranche B-2 (1 month Term SOFR + 4.000%)
9.316%, 8/24/28(2) | 227 | | 226 |
Kestrel Bidco, Inc. (1 month Term SOFR + 3.100%)
8.420%, 12/11/26(2) | 911 | | 891 |
Mileage Plus Holdings LLC (3 month Term SOFR + 5.400%)
10.798%, 6/21/27(2) | 806 | | 837 |
TransDigm, Inc. Tranche I (3 month Term SOFR + 3.250%)
8.640%, 8/24/28(2) | 2,205 | | 2,205 |
United AirLines, Inc. Tranche B (1 month Term SOFR + 3.864%)
9.182%, 4/21/28(2) | 644 | | 644 |
| | | | 7,626 |
| | | | |
| |
| Chemicals—3.5% | | |
Ineos Finance plc 2027 (1 month Term SOFR + 3.850%)
9.166%, 11/8/27(2) | 2,156 | | 2,145 |
Innophos Holdings, Inc. (1 month Term SOFR + 3.364%)
8.681%, 2/5/27(2) | 1,323 | | 1,316 |
LSF11 A5 Holdco LLC (1 month Term SOFR + 4.350%)
9.666%, 10/15/28(2) | 883 | | 869 |
Nouryon Finance B.V. (3 month LIBOR + 3.250%)
0.000%, 4/3/28(2)(3) | 525 | | 518 |
Starfruit Finco B.V. (1 month Term SOFR + 3.100%)
8.427%, 10/1/25(2) | 1,012 | | 1,010 |
Windsor Holdings III LLC Tranche B (1 month Term SOFR + 4.500%)
9.830%, 8/1/30(2) | 890 | | 885 |
| | | | 6,743 |
| | | | |
| |
See Notes to Financial Statements
Newfleet Senior Floating Rate Fund
SCHEDULE OF INVESTMENTS (Continued)
September 30, 2023
($ reported in thousands)
| | Par Value | | Value |
| | | | |
| Consumer Durables—0.5% | | |
Zodiac Pool Solutions LLC (1 month Term SOFR + 2.025%)
7.341%, 1/29/29(2) | $ 1,041 | | $ 1,034 |
| Consumer Non-Durables—1.1% | | |
DS Parent, Inc. Tranche B (6 month Term SOFR + 5.750%)
11.337%, 12/8/28(2) | 675 | | 665 |
Kronos Acquisition Holdings, Inc. Tranche B-1 (3 month Term SOFR + 4.012%)
9.402%, 12/22/26(2) | 1,531 | | 1,522 |
| | | | 2,187 |
| | | | |
| |
| Energy—2.7% | | |
AL GCX Holdings LLC (3 month Term SOFR + 3.650%)
8.931%, 5/17/29(2) | 593 | | 593 |
Freeport LNG Investments LLP Tranche B (3 month Term SOFR + 3.762%)
9.088%, 12/21/28(2) | 1,060 | | 1,049 |
Hamilton Projects Acquiror LLC (1 month Term SOFR + 4.614%)
9.931%, 6/17/27(2) | 675 | | 671 |
Medallion Midland Acquisition LLC (3 month Term SOFR + 4.012%)
9.402%, 10/18/28(2) | 1,210 | | 1,210 |
Oryx Midstream Services Permian Basin LLC 2023 (1 month Term SOFR + 3.364%)
8.692%, 10/5/28(2) | 765 | | 764 |
Paragon Offshore Finance Co. (3 month LIBOR + 1.750%)
3.750%, 7/16/21(4)(5) | 11 | | — |
Traverse Midstream Partners LLC 2023, Tranche B (3 month Term SOFR + 3.850%)
9.216%, 2/16/28(2) | 1,014 | | 1,011 |
| | | | 5,298 |
| | | | |
| |
| Financials—4.1% | | |
Acrisure LLC 2020, Tranche B (1 month LIBOR + 3.500%)
8.931%, 2/15/27(2) | 1,224 | | 1,205 |
Asurion LLC Tranche B-8 (1 month Term SOFR + 3.364%)
8.681%, 12/23/26(2) | 1,117 | | 1,092 |
| | Par Value | | Value |
| | | | |
| Financials—continued | | |
Avolon TLB Borrower 1 (US) LLC Tranche B-6 (1 month Term SOFR + 2.500%)
7.825%, 6/22/28(2) | $ 651 | | $ 651 |
Blackhawk Network Holdings, Inc. First Lien (3 month Term SOFR + 2.750%)
8.172%, 6/15/25(2) | 1,136 | | 1,131 |
Castlelake Aviation One Designated Activity Co. 2023 (3 month Term SOFR + 3.012%)
8.421%, 10/22/27(2) | 680 | | 678 |
Citadel Securities LP Tranche B (1 month Term SOFR + 2.614%)
7.931%, 7/29/30(2) | 1,501 | | 1,496 |
Finco I LLC 2023 (3 month Term SOFR + 3.000%)
8.369%, 6/27/29(2) | 977 | | 977 |
GIP Pilot Acquisition Partners LP (1 month Term SOFR + 3.250%)
0.000%, 9/18/30(2)(3) | 290 | | 289 |
GTCR W Merger Sub LLC Tranche B (3 month LIBOR + 3.250%)
0.000%, 9/20/30(2)(3) | 580 | | 580 |
| | | | 8,099 |
| | | | |
| |
| Food / Tobacco—5.9% | | |
Aramark Services, Inc. Tranche B-5 (1 month Term SOFR + 2.614%)
7.931%, 4/6/28(2) | 960 | | 959 |
Del Monte Foods, Inc. (1 month Term SOFR + 4.350% - 3 month PRIME + 3.250%)
9.668% - 11.750%, 5/16/29(2) | 1,151 | | 1,117 |
Froneri U.S., Inc. Tranche B-2 (1 month Term SOFR + 2.350%)
7.666%, 1/29/27(2) | 1,774 | | 1,760 |
H-Food Holdings LLC (3 month LIBOR + 3.688%)
9.268%, 5/23/25(2) | 1,348 | | 1,171 |
Hostess Brands LLC Tranche B (3 month Term SOFR + 2.500%)
7.890%, 6/21/30(2) | 459 | | 459 |
Naked Juice LLC (3 month Term SOFR + 3.350%)
8.740%, 1/24/29(2) | 1,013 | | 960 |
Pegasus Bidco B.V. Tranche B-2 (3 month Term SOFR + 4.250%)
9.615%, 7/12/29(2) | 1,067 | | 1,064 |
| | Par Value | | Value |
| | | | |
| Food / Tobacco—continued | | |
Shearer’s Foods LLC First Lien (1 month Term SOFR + 3.614%)
8.931%, 9/23/27(2) | $ 1,051 | | $ 1,049 |
Sigma Bidco B.V. Tranche B-7 (3 month Term SOFR + 4.910%)
4.910%, 1/2/28(2) | 2,008 | | 1,953 |
Triton Water Holdings, Inc. First Lien (3 month Term SOFR + 3.512%)
8.902%, 3/31/28(2) | 959 | | 933 |
| | | | 11,425 |
| | | | |
| |
| Forest Prod / Containers—3.3% | | |
Anchor Glass Container Corp. 2023, First Lien (3-6 month Term SOFR + 5.428%)
10.628% - 10.896%, 12/7/25(2) | 746 | | 613 |
Clydesdale Acquisition Holdings, Inc. Tranche B (1 month Term SOFR + 4.275%)
9.591%, 4/13/29(2) | 993 | | 978 |
Klockner Pentaplast of America, Inc. Tranche B (6 month Term SOFR + 4.975%)
10.476%, 2/12/26(2) | 1,499 | | 1,439 |
Mauser Packaging Solutions Holding Co. (1 month Term SOFR + 4.000%)
9.330%, 8/14/26(2) | 788 | | 787 |
TricorBraun, Inc. (1 month Term SOFR + 3.364%)
8.681%, 3/3/28(2) | 1,215 | | 1,190 |
| Trident TPI Holdings, Inc. | | | |
Tranche B-3, First Lien (3 month Term SOFR + 4.262%)
9.652%, 9/15/28(2) | 397 | | 395 |
Tranche B-5 (3 month Term SOFR + 4.500%)
9.890%, 9/15/28(2) | 1,021 | | 1,018 |
| | | | 6,420 |
| | | | |
| |
| Gaming / Leisure—5.8% | | |
Caesars Entertainment, Inc. Tranche B (1 month Term SOFR + 3.350%)
8.666%, 2/6/30(2) | 702 | | 701 |
| Carnival Corp. | | | |
(1 month Term SOFR + 3.000%)
8.327%, 8/9/27(2) | 668 | | 666 |
2021, Tranche B (1 month Term SOFR + 3.364%)
8.681%, 10/18/28(2) | 466 | | 463 |
See Notes to Financial Statements
Newfleet Senior Floating Rate Fund
SCHEDULE OF INVESTMENTS (Continued)
September 30, 2023
($ reported in thousands)
| | Par Value | | Value |
| | | | |
| Gaming / Leisure—continued | | |
ECL Entertainment LLC Tranche B (3 month Term SOFR + 4.750%)
10.140%, 9/3/30(2) | $ 685 | | $ 683 |
Entain Holdings Gibraltar Ltd. Tranche B (3 month Term SOFR + 2.600%)
7.990%, 3/29/27(2) | 708 | | 706 |
Entain plc Tranche B-2 (3 month Term SOFR + 3.600%)
8.990%, 10/31/29(2) | 85 | | 84 |
Fertitta Entertainment LLC Tranche B (1 month Term SOFR + 4.000%)
9.316%, 1/26/29(2) | 998 | | 986 |
| J&J Ventures Gaming LLC | | | |
(3 month Term SOFR + 4.262%)
9.652%, 4/26/28(2) | 872 | | 831 |
2023 (1 month Term SOFR + 3.250%)
0.000%, 4/26/28(2)(3) | 273 | | 261 |
2023 (1 month Term SOFR + 4.364%)
9.693%, 4/26/28(2) | 152 | | 145 |
Ontario Gaming GTA Ltd. Partnership Tranche B (3 month Term SOFR + 4.250%)
9.640%, 8/1/30(2) | 380 | | 380 |
Playa Hotels & Resorts B.V. (1 month Term SOFR + 4.250%)
9.581%, 1/5/29(2) | 1,174 | | 1,173 |
Raptor Acquisition Corp. Tranche B (3 month Term SOFR + 4.262%)
9.658%, 11/1/26(2) | 262 | | 262 |
Scientific Games Holdings LP (3 month Term SOFR + 3.500%)
8.768%, 4/4/29(2) | 1,246 | | 1,238 |
Scientific Games International, Inc. Tranche B (1 month Term SOFR + 3.100%)
8.434%, 4/13/29(2) | 1,314 | | 1,313 |
UFC Holdings LLC Tranche B-3 (3 month Term SOFR + 3.012%)
8.369%, 4/29/26(2) | 1,382 | | 1,380 |
| | | | 11,272 |
| | | | |
| |
| Health Care—12.6% | | |
Agiliti Health, Inc. 2023, Tranche B (3 month Term SOFR + 3.000%)
8.247%, 5/1/30(2) | 832 | | 827 |
Bausch & Lomb Corp. (3 month LIBOR + 3.000%)
0.000%, 9/14/28(2)(3) | 385 | | 380 |
| | Par Value | | Value |
| | | | |
| Health Care—continued | | |
Catalent Pharma Solutions, Inc. Tranche B-3 (1 month Term SOFR + 2.114%)
7.438%, 2/22/28(2) | $ 948 | | $ 925 |
CHG Healthcare Services, Inc. First Lien (1 month Term SOFR + 3.364%)
8.681%, 9/29/28(2) | 1,671 | | 1,662 |
Endo Luxembourg Finance Co. I S.a.r.l. 2021 (3 month PRIME + 6.250%)
14.500%, 3/27/28(6) | 530 | | 378 |
| Envision Healthcare Corp. | | | |
(3 month Term SOFR + 3.750%)
9.140%, 3/31/27(2)(4)(5) | 772 | | 1 |
(3 month Term SOFR + 4.250%)
9.640%, 3/31/27(5) | 316 | | 71 |
(3 month Term SOFR + 8.025%)
13.415%, 3/31/27(5) | 91 | | 106 |
eResearch Technology, Inc. First Lien (1 month Term SOFR + 4.614%)
9.931%, 2/4/27(2) | 618 | | 606 |
Gainwell Acquisition Corp. Tranche B (3 month Term SOFR + 4.100%)
9.490%, 10/1/27(2) | 1,378 | | 1,342 |
Hunter Holdco 3 Ltd. First Lien (3 month Term SOFR + 4.350%)
9.740%, 8/19/28(2) | 512 | | 510 |
LifePoint Health, Inc. Tranche B, First Lien (3 month Term SOFR + 4.012%)
9.377%, 11/16/25(2) | 1,249 | | 1,245 |
Medline Borrower LP (1 month Term SOFR + 3.364%)
8.681%, 10/23/28(2) | 2,032 | | 2,025 |
One Call Corp. Tranche B, First Lien (3 month Term SOFR + 5.762%)
11.113%, 4/22/27(2) | 674 | | 540 |
Packaging Coordinators Midco, Inc. Tranche B, First Lien (3 month Term SOFR + 3.762%)
9.152%, 11/30/27(2) | 1,104 | | 1,098 |
Pearl Intermediate Parent LLC First Lien (1 month Term SOFR + 2.850%)
8.166%, 2/14/25(2) | 1,049 | | 1,042 |
Perrigo Investments LLC Tranche B (1 month Term SOFR + 2.350%)
7.666%, 4/20/29(2) | 1,032 | | 1,027 |
| | Par Value | | Value |
| | | | |
| Health Care—continued | | |
| Phoenix Guarantor, Inc. | | | |
Tranche B-1 (1 month Term SOFR + 3.364%)
8.681%, 3/5/26(2) | $ 297 | | $ 295 |
Tranche B-3 (1 month Term SOFR + 3.614%)
8.931%, 3/5/26(2) | 803 | | 799 |
Phoenix Newco, Inc. First Lien (1 month Term SOFR + 3.364%)
8.681%, 11/15/28(2) | 879 | | 872 |
Pluto Acquisition I, Inc. 2021, First Lien (3 month Term SOFR + 4.262%)
9.684%, 6/22/26(2) | 635 | | 553 |
Select Medical Corp. Tranche B-1 (1 month Term SOFR + 3.000%)
8.316%, 3/8/27(2) | 1,125 | | 1,121 |
Sotera Health Holdings LLC (1 month Term SOFR + 3.750%)
9.073%, 12/11/26(2) | 289 | | 289 |
Southern Veterinary Partners LLC First Lien (1 month Term SOFR + 4.114%)
9.431%, 10/5/27(2) | 871 | | 865 |
Star Parent, Inc. Tranche B (1 month Term SOFR + 3.250%)
0.000%, 9/19/30(2)(3) | 1,625 | | 1,587 |
Sunshine Luxembourg VII S.a.r.l. Tranche B-3 (3 month Term SOFR + 3.850%)
9.240%, 10/1/26(2) | 1,287 | | 1,284 |
Surgery Center Holdings, Inc. 2021 (1 month Term SOFR + 3.864%)
9.189%, 8/31/26(2) | 1,152 | | 1,153 |
Team Health Holdings, Inc. (1 month Term SOFR + 5.250%)
10.566%, 3/2/27(2) | 395 | | 298 |
Upstream Newco, Inc. 2021 (1 month Term SOFR + 4.364%)
9.681%, 11/20/26(2) | 260 | | 249 |
Viant Medical Holdings, Inc. First Lien (1 month Term SOFR + 3.864%)
9.181%, 7/2/25(2) | 1,386 | | 1,359 |
| | | | 24,509 |
| | | | |
| |
| Housing—2.3% | | |
Chariot Buyer LLC (1 month Term SOFR + 3.350%)
8.666%, 11/3/28(2) | 880 | | 865 |
See Notes to Financial Statements
Newfleet Senior Floating Rate Fund
SCHEDULE OF INVESTMENTS (Continued)
September 30, 2023
($ reported in thousands)
| | Par Value | | Value |
| | | | |
| Housing—continued | | |
CPG International LLC (1 month Term SOFR + 2.600%)
7.916%, 4/28/29(2) | $ 900 | | $ 899 |
Quikrete Holdings, Inc. Tranche B-1 (1 month Term SOFR + 2.864%)
8.181%, 3/18/29(2) | 1,216 | | 1,216 |
| SRS Distribution, Inc. | | | |
2021 (1 month Term SOFR + 3.614%)
8.931%, 6/2/28(2) | 1,511 | | 1,494 |
2022 (1 month Term SOFR + 3.600%)
8.916%, 6/2/28(2) | 74 | | 73 |
| | | | 4,547 |
| | | | |
| |
| Information Technology—11.0% | | |
| Applied Systems, Inc. | | | |
2026 (3 month Term SOFR + 4.500%)
9.890%, 9/18/26(2) | 1,797 | | 1,801 |
Second Lien (3 month Term SOFR + 6.750%)
12.140%, 9/17/27(2) | 747 | | 748 |
Barracuda Parent LLC First Lien (3 month Term SOFR + 4.500%)
9.869%, 8/15/29(2) | 1,172 | | 1,159 |
CCC Intelligent Solutions, Inc. Tranche B (1 month Term SOFR + 2.364%)
7.681%, 9/21/28(2) | 1,297 | | 1,293 |
CDK Global, Inc. (1 month Term SOFR + 4.250%)
9.640%, 7/6/29(2) | 842 | | 841 |
ConnectWise LLC (1 month Term SOFR + 3.614%)
8.931%, 9/29/28(2) | 830 | | 816 |
| Epicor Software Corp. | | | |
First Lien (3 month LIBOR + 1.750%)
0.000%, 7/30/27(2)(3) | 55 | | 55 |
Tranche C (1 month Term SOFR + 3.364%)
8.681%, 7/30/27(2) | 960 | | 958 |
Go Daddy Operating Co. LLC Tranche B-5 (1 month Term SOFR + 2.500%)
7.816%, 11/9/29(2) | 1,577 | | 1,577 |
Indicor LLC (3 month Term SOFR + 4.500%)
9.890%, 11/22/29(2) | 915 | | 917 |
Infinite Bidco LLC Second Lien (1 month Term SOFR + 7.000%)
12.431%, 3/2/29(2) | 290 | | 251 |
Mosel Bidco SE Tranche B (1 month Term SOFR + 5.000%)
0.000%, 9/16/30(2)(3)(4) | 235 | | 235 |
| | Par Value | | Value |
| | | | |
| Information Technology—continued | | |
Open Text Corp. Tranche B (1 month Term SOFR + 2.850%)
8.166%, 1/31/30(2) | $ 948 | | $ 947 |
Polaris Newco LLC First Lien (1 month Term SOFR + 4.114%)
9.431%, 6/2/28(2) | 988 | | 944 |
Project Ruby Ultimate Parent Corp. First Lien (1 month Term SOFR + 3.364%)
8.681%, 3/10/28(2) | 590 | | 581 |
Proofpoint, Inc. (1 month Term SOFR + 3.364%)
8.681%, 8/31/28(2) | 1,154 | | 1,144 |
RealPage, Inc. First Lien (1 month Term SOFR + 3.114%)
8.431%, 4/24/28(2) | 1,232 | | 1,217 |
Sophia LP Tranche B (1 month Term SOFR + 3.600%)
8.916%, 10/7/27(2) | 789 | | 787 |
SS&C Technologies Holdings, Inc. Tranche B-5 (1 month Term SOFR + 1.864%)
7.181%, 4/16/25(2) | 1,408 | | 1,407 |
Uber Technologies, Inc. 2023 (3 month Term SOFR + 2.750%)
8.159%, 3/3/30(2) | 845 | | 844 |
| UKG, Inc. | | | |
2021, Second Lien (3 month Term SOFR + 5.350%)
10.618%, 5/3/27(2) | 55 | | 55 |
2021-2, First Lien (3 month Term SOFR + 3.350%)
8.618%, 5/4/26(2) | 1,921 | | 1,913 |
Vertiv Group Corp. Tranche B (1 month Term SOFR + 2.864%)
8.192%, 3/2/27(2) | 1,023 | | 1,021 |
| | | | 21,511 |
| | | | |
| |
| Manufacturing—7.0% | | |
Alliance Laundry Systems LLC Tranche B (3 month Term SOFR + 3.600%)
8.901%, 10/8/27(2) | 944 | | 943 |
| Arcline FM Holdings LLC | | | |
First Lien (3 month Term SOFR + 5.012%)
10.402%, 6/23/28(2) | 1,115 | | 1,106 |
Second Lien (3 month Term SOFR + 8.250%)
13.902%, 6/25/29(2) | 400 | | 384 |
| | Par Value | | Value |
| | | | |
| Manufacturing—continued | | |
Chart Industries, Inc. (1 month Term SOFR + 3.850%)
9.174%, 3/15/30(2) | $ 966 | | $ 966 |
Circor International, Inc. (1 month Term SOFR + 5.600%)
10.916%, 12/20/28(2) | 957 | | 957 |
CPM Holdings, Inc. (1 month Term SOFR + 3.500%)
0.000%, 9/22/28(2)(3) | 703 | | 701 |
Filtration Group Corp. 2021 (1 month Term SOFR + 3.614%)
8.931%, 10/21/28(2) | 1,615 | | 1,607 |
Gates Global LLC Tranche B-3 (1 month Term SOFR + 2.600%)
7.916%, 3/31/27(2) | 1,529 | | 1,524 |
Madison IAQ LLC (1 month Term SOFR + 3.364%)
8.689%, 6/21/28(2) | 1,011 | | 993 |
NCR Atleos LLC Tranche B (3 month LIBOR + 3.250%)
0.000%, 3/27/29(2)(3) | 1,325 | | 1,276 |
NCR Corp. (1 month Term SOFR + 2.614%)
7.931%, 8/28/26(2) | 1,363 | | 1,359 |
Safe Fleet Holdings LLC 2022 (1 month Term SOFR + 3.850%)
9.170%, 2/23/29(2) | 907 | | 906 |
Star U.S. Bidco LLC (1 month Term SOFR + 4.350%)
9.666%, 3/17/27(2) | 926 | | 923 |
| | | | 13,645 |
| | | | |
| |
| Media / Telecom - Broadcasting—2.1% | | |
Gray Television, Inc. (1 month Term SOFR + 3.114%)
8.444%, 12/1/28(2) | 364 | | 355 |
iHeartCommunications, Inc. (1 month Term SOFR + 3.114%)
8.431%, 5/1/26(2) | 894 | | 801 |
Nexstar Media, Inc. Tranche B-4 (1 month Term SOFR + 2.614%)
7.931%, 9/18/26(2) | 660 | | 659 |
Terrier Media Buyer, Inc. 2021, Tranche B (3 month Term SOFR + 3.600%)
8.990%, 12/17/26(2) | 1,167 | | 1,065 |
See Notes to Financial Statements
Newfleet Senior Floating Rate Fund
SCHEDULE OF INVESTMENTS (Continued)
September 30, 2023
($ reported in thousands)
| | Par Value | | Value |
| | | | |
Media / Telecom -
Broadcasting—continued | | |
Univision Communications, Inc. 2021 (1 month Term SOFR + 3.364%)
8.681%, 3/15/26(2) | $ 1,240 | | $ 1,236 |
| | | | 4,116 |
| | | | |
| |
Media / Telecom - Cable/Wireless
Video—3.2% | | |
Cogeco Communications Finance USA LP Tranche B-1 (3 month LIBOR + 3.250%)
0.000%, 9/18/30(2)(3) | 1,230 | | 1,209 |
| CSC Holdings LLC | | | |
2017 (1 month LIBOR + 2.250%)
7.697%, 7/17/25(2) | 549 | | 531 |
2022 (1 month Term SOFR + 4.500%)
9.832%, 1/18/28(2) | 1,048 | | 992 |
DIRECTV Financing LLC (1 month Term SOFR + 5.000%)
10.431%, 8/2/27(2) | 1,470 | | 1,434 |
Eagle Broadband Investments LLC (3 month Term SOFR + 3.262%)
8.652%, 11/12/27(2) | 853 | | 830 |
Virgin Media Bristol LLC Tranche N (1 month Term SOFR + 2.614%)
7.947%, 1/31/28(2) | 1,215 | | 1,179 |
| | | | 6,175 |
| | | | |
| |
Media / Telecom - Diversified
Media—2.4% | | |
AssuredPartners, Inc. (3 month LIBOR + 3.000%)
0.000%, 2/12/27(2)(3) | 95 | | 95 |
Clear Channel Outdoor Holdings, Inc. Tranche B (1-3 month Term SOFR + 3.762%)
8.931% - 9.131%, 8/21/26(2) | 686 | | 665 |
Dotdash Meredith, Inc. Tranche B (1 month Term SOFR + 4.100%)
9.430%, 12/1/28(2) | 741 | | 712 |
McGraw-Hill Education, Inc. (1 month Term SOFR + 4.864%)
10.181%, 7/28/28(2) | 830 | | 812 |
Neptune Bidco U.S., Inc. Tranche B (3 month Term SOFR + 5.100%)
10.398%, 4/11/29(2) | 1,093 | | 982 |
| | Par Value | | Value |
| | | | |
Media / Telecom - Diversified
Media—continued | | |
Simon & Schuster, Inc. Tranche B (3 month LIBOR + 3.250%)
0.000%, 9/27/30(2)(3) | $ 150 | | $ 149 |
William Morris Endeavor Entertainment LLC Tranche B-1 (1 month Term SOFR + 2.864%)
8.181%, 5/18/25(2) | 1,311 | | 1,307 |
| | | | 4,722 |
| | | | |
| |
Media / Telecom -
Telecommunications—2.1% | | |
Cincinnati Bell, Inc. Tranche B-2 (1 month Term SOFR + 3.350%)
8.666%, 11/22/28(2) | 959 | | 940 |
Level 3 Financing, Inc. 2027, Tranche B (1 month Term SOFR + 1.864%)
7.181%, 3/1/27(2) | 1,541 | | 1,453 |
| Numericable U.S. LLC | | | |
Tranche B-11 (3 month LIBOR + 2.750%)
8.381%, 7/31/25(2) | 1,323 | | 1,277 |
Tranche B-12 (3 month LIBOR + 3.688%)
9.257%, 1/31/26(2) | 521 | | 490 |
| | | | 4,160 |
| | | | |
| |
| Metals / Minerals—0.8% | | |
Arsenal Aic Parent LLC Tranche B (1 month Term SOFR + 4.500%)
9.879%, 8/19/30(2) | 590 | | 588 |
Covia Holdings Corp. (3 month Term SOFR + 4.262%)
9.530%, 7/31/26(2) | 951 | | 944 |
| | | | 1,532 |
| | | | |
| |
| Retail—1.8% | | |
CNT Holdings I Corp. First Lien (3 month Term SOFR + 3.500%)
8.800%, 11/8/27(2) | 842 | | 838 |
EG America LLC (1 month Term SOFR + 4.114%)
9.414%, 2/7/25(2) | 954 | | 937 |
Great Outdoors Group LLC Tranche B-2 (3 month Term SOFR + 4.012%)
9.402%, 3/6/28(2) | 819 | | 817 |
PetsMart LLC (1 month Term SOFR + 3.850%)
9.166%, 2/11/28(2) | 874 | | 871 |
| | | | 3,463 |
| | | | |
| |
| | Par Value | | Value |
| | | | |
| Service—10.8% | | |
AlixPartners LLP (1 month Term SOFR + 2.864%)
8.181%, 2/4/28(2) | $ 1,172 | | $ 1,170 |
Allied Universal Holdco LLC (1 month Term SOFR + 3.850%)
9.166%, 5/12/28(2) | 559 | | 539 |
Ascend Learning LLC (1 month Term SOFR + 3.600%)
8.916%, 12/11/28(2) | 605 | | 576 |
BrightView Landscapes LLC Tranche B (3 month Term SOFR + 3.250%)
8.619%, 4/20/29(2) | 923 | | 923 |
Carlisle Foodservice Products, Inc. First Lien (3 month PRIME + 2.000%)
10.500%, 3/20/25 | 1,221 | | 1,173 |
DG Investment Intermediate Holdings 2, Inc. 2022 (1 month Term SOFR + 4.750%)
10.066%, 3/31/28(2) | 633 | | 627 |
Dun & Bradstreet Corp. (The) Tranche B (1 month Term SOFR + 2.850%)
8.167%, 2/6/26(2) | 1,012 | | 1,010 |
DXP Enterprises, Inc. (3 month Term SOFR + 5.250%)
10.444%, 12/23/27(2) | 741 | | 739 |
Garda World Security Corp. Tranche B-2 (3 month Term SOFR + 4.350%)
9.746%, 10/30/26(2) | 915 | | 913 |
Grab Holdings, Inc. (1 month Term SOFR + 4.614%)
9.931%, 1/29/26(2) | 368 | | 370 |
Kuehg Corp. (3 month Term SOFR + 5.000%)
10.390%, 6/12/30(2) | 680 | | 680 |
NAB Holdings LLC First Lien (3 month Term SOFR + 3.150%)
8.540%, 11/23/28(2) | 1,181 | | 1,176 |
Omnia Partners LLC (3 month Term SOFR + 4.250%)
9.601%, 7/19/30(2) | 1,042 | | 1,042 |
| Peraton Corp. | | | |
Tranche B, First Lien (1 month Term SOFR + 3.850%)
9.166%, 2/1/28(2) | 1,697 | | 1,692 |
Tranche B-1, Second Lien (3 month Term SOFR + 7.850%)
13.233%, 2/1/29(2) | 259 | | 253 |
See Notes to Financial Statements
Newfleet Senior Floating Rate Fund
SCHEDULE OF INVESTMENTS (Continued)
September 30, 2023
($ reported in thousands)
| | Par Value | | Value |
| | | | |
| Service—continued | | |
| Pike Corp. | | | |
2028 (1 month Term SOFR + 3.114%)
8.431%, 1/21/28(2) | $ 1,141 | | $ 1,138 |
2028, Tranche B (1 month Term SOFR + 3.500%)
8.816%, 1/21/28(2) | 144 | | 144 |
PODS LLC (1 month Term SOFR + 3.114%)
8.431%, 3/31/28(2) | 630 | | 609 |
Sedgwick Claims Management Services, Inc. 2023 (1 month Term SOFR + 3.750%)
9.066%, 2/24/28(2) | 1,310 | | 1,306 |
St. George’s University Scholastic Services LLC (1 month Term SOFR + 3.350%)
8.666%, 2/10/29(2) | 1,153 | | 1,141 |
Sweetwater Borrower LLC (1 month Term SOFR + 4.364%)
9.681%, 8/7/28(2) | 1,078 | | 1,043 |
Titan Acquisition Ltd. (3 month LIBOR + 3.000%)
8.731%, 3/28/25(2) | 1,250 | | 1,238 |
TMF Sapphire Bidco B.V. Tranche B-2 (2 month Term SOFR + 5.000%)
10.370%, 5/3/28(2) | 320 | | 319 |
Weld North Education LLC 2021 (1 month Term SOFR + 3.864%)
9.181%, 12/21/27(2) | 1,212 | | 1,187 |
| | | | 21,008 |
| | | | |
| |
| Transportation - Automotive—2.0% | | |
American Axle & Manufacturing, Inc. Tranche B, First Lien (1-6 month Term SOFR + 3.600%)
8.436% - 8.929%, 12/13/29(2) | 872 | | 868 |
Clarios Global LP 2023 (1 month Term SOFR + 3.750%)
9.066%, 5/6/30(2) | 885 | | 882 |
Mavis Tire Express Services Topco Corp. First Lien (1 month Term SOFR + 4.114%)
9.431%, 5/4/28(2) | 972 | | 969 |
PAI Holdco, Inc. Tranche B (3 month Term SOFR + 4.012%)
9.381%, 10/28/27(2) | 1,287 | | 1,216 |
| | | | 3,935 |
| | | | |
| |
| | Par Value | | Value |
| | | | |
| Utilities—2.8% | | |
Astoria Energy LLC Tranche B (1 month Term SOFR + 3.614%)
8.931%, 12/10/27(2) | $ 987 | | $ 986 |
Brookfield WEC Holdings, Inc. (1 month Term SOFR + 2.864%)
8.181%, 8/1/25(2) | 2,367 | | 2,364 |
Calpine Construction Finance Co. L P (1 month Term SOFR + 2.250%)
7.566%, 7/31/30(2) | 1,028 | | 1,022 |
Generation Bridge Northeast LLC Tranche B (1 month Term SOFR + 4.250%)
9.566%, 8/7/29(2) | 310 | | 310 |
| Lightstone HoldCo LLC | | | |
Tranche B (1 month Term SOFR + 5.750%)
11.066%, 1/29/27(2) | 804 | | 747 |
Tranche C (1 month Term SOFR + 5.750%)
11.066%, 1/29/27(2) | 45 | | 42 |
| | | | 5,471 |
| | | | |
| |
Total Leveraged Loans
(Identified Cost $180,571) | | 178,898 |
| | Shares | |
| Common Stocks—0.2% |
| Consumer Discretionary—0.2% | |
| NMG Parent LLC(4)(7) | 3,033 | 349 |
| West Marine(4)(7) | 1,450 | 3 |
| | | 352 |
| | | |
| |
Total Common Stocks
(Identified Cost $170) | 352 |
| | | |
| |
| | | |
| |
| Exchange-Traded Funds—1.3% |
| iShares iBoxx High Yield Corporate Bond ETF(8) | 17,020 | 1,255 |
| Janus Henderson AAA CLO ETF(8) | 26,645 | 1,341 |
Total Exchange-Traded Funds
(Identified Cost $2,586) | 2,596 |
| | | |
| |
| | | |
| |
| | Shares | | Value |
| | | | |
| | | | |
| Rights—0.1% |
| Utilities—0.1% | | |
| Vistra Energy Corp., 12/29/49(4)(7) | 152,810 | | $ 178 |
Total Rights
(Identified Cost $129) | | 178 |
| | | | |
| |
| | | | |
| |
Total Long-Term Investments—97.5%
(Identified Cost $192,241) | | 190,210 |
| | | | |
| |
| | | | |
| |
| Short-Term Investment—3.2% |
| Money Market Mutual Fund—3.2% |
| Dreyfus Government Cash Management Fund - Institutional Shares (seven-day effective yield 5.222%)(8) | 6,336,804 | | 6,337 |
Total Short-Term Investment
(Identified Cost $6,337) | | 6,337 |
| | | | |
| |
| | | | |
| |
TOTAL INVESTMENTS—100.7%
(Identified Cost $198,578) | | $196,547 |
| Other assets and liabilities, net—(0.7)% | | (1,452) |
| NET ASSETS—100.0% | | $195,095 |
| Abbreviations: |
| CLO | Collateralized Loan Obligation |
| ETF | Exchange-Traded Fund |
| LIBOR | London Interbank Offered Rate |
| LLC | Limited Liability Company |
| LLLP | Limited Liability Limited Partnership |
| LLP | Limited Liability Partnership |
| LP | Limited Partnership |
| SOFR | Secured Overnight Financing Rate |
| Footnote Legend: |
| (1) | Security exempt from registration under Rule 144A of the Securities Act of 1933. These securities may be resold in transactions exempt from registration, normally to qualified institutional buyers. At September 30, 2023, these securities amounted to a value of $7,160 or 3.7% of net assets. |
| (2) | Variable rate security. Rate disclosed is as of September 30, 2023. Information in parenthesis represents benchmark and reference rate for each security. Certain variable rate securities are not based on a published reference rate and spread but are determined by the issuer or agent and are based on current market conditions, or, for mortgage-backed securities, are impacted by the individual mortgages which are paying off over time. These securities do not indicate a reference rate and spread in their descriptions. |
For information regarding the abbreviations, see the Key Investment Terms starting on page 5.
See Notes to Financial Statements
Newfleet Senior Floating Rate Fund
SCHEDULE OF INVESTMENTS (Continued)
September 30, 2023
($ reported in thousands)
| (3) | This loan will settle after September 30, 2023, at which time the interest rate, calculated on the base lending rate and the agreed upon spread on trade date, will be reflected. |
| (4) | The value of this security was determined using significant unobservable inputs and is reported as a Level 3 security in the Fair Value Hierarchy table located after the Schedule of Investments. |
| (5) | Security in default; no interest payments are being received. |
| (6) | Security in default; interest payments are being received. |
| (7) | Non-income producing. |
| (8) | Shares of this fund are publicly offered, and its prospectus and annual report are publicly available. |
| Country Weightings (Unaudited)† |
| United States | 91% |
| Canada | 3 |
| Netherlands | 1 |
| Luxembourg | 1 |
| France | 1 |
| Panama | 1 |
| United Kingdom | 1 |
| Other | 1 |
| Total | 100% |
| † % of total investments as of September 30, 2023. |
As of September 30, 2023, the Fund had the following unfunded loan commitments:
| Borrower | | Par Value | | Commitment | | Value | | Unrealized
Appreciation
(Depreciation) |
| Omnia Partners LLC, (3 month LIBOR + 4.250%) 0.000%, 7/19/30 | | $98 | | $97 | | $98 | | $1 |
The following table summarizes the value of the Fund’s investments as of September 30, 2023, based on the inputs used to value them (See Security Valuation Note 2A in the Notes to Financial Statements):
| | Total
Value at
September 30, 2023 | | Level 1
Quoted Prices | | Level 2
Significant
Observable
Inputs | | Level 3
Significant
Unobservable
Inputs |
| Assets: | | | | | | | |
| Debt Instruments: | | | | | | | |
| Corporate Bonds and Notes | $ 8,186 | | $ — | | $ 8,186 | | $ — |
| Leveraged Loans | 178,898 | | — | | 178,662 | | 236 (1) |
| Equity Securities: | | | | | | | |
| Rights | 178 | | — | | — | | 178 |
| Common Stocks | 352 | | — | | — | | 352 |
| Exchange-Traded Funds | 2,596 | | 2,596 | | — | | — |
| Money Market Mutual Fund | 6,337 | | 6,337 | | — | | — |
| Total Investments | $196,547 | | $8,933 | | $186,848 | | $766 |
| (1) | Includes internally fair valued securities currently priced at zero ($0). |
Securities held by the Fund with an end of period value of $1 were transferred from Level 2 to Level 3 due to a decrease in trading activities at period end.
Some of the Fund’s investments that were categorized as Level 3 may have been valued utilizing third party pricing information without adjustment. If applicable, such valuations are based on unobservable inputs. A significant change in third party information could result in a significantly lower or higher value of Level 3 investments.
Management has determined that the amount of Level 3 securities compared to total net assets is not material; therefore, the roll-forward of Level 3 securities and assumptions are not shown for the period ended September 30, 2023.
See Notes to Financial Statements
Seix Tax-Exempt Bond Fund
SCHEDULE OF INVESTMENTS
September 30, 2023
($ reported in thousands)
| | Par Value | | Value |
| Municipal Bonds(1)—96.7% |
| Alabama—1.4% | | |
Black Belt Energy Gas District, Natural Gas Purchase Revenue, Mandatory Put, Series A, 12/1/23,
4.000%, 12/1/48(2) | $ 910 | | $ 910 |
| Arizona—3.7% | | |
Arizona Board of Regents, Arizona State University System Revenue, Green Bond, Series B
5.000%, 7/1/37 | 360 | | 365 |
Arizona Board of Regents, Arizona State University System Revenue, Green Bond, Series C
5.000%, 7/1/36 | 1,000 | | 1,015 |
Arizona Department of Transportation, State Highway Fund Revenue,
5.000%, 7/1/36 | 500 | | 512 |
Arizona State Health Facilities Authority, Scottsdale Lincoln Hospital Revenue,
5.000%, 12/1/24 | 565 | | 571 |
| | | | 2,463 |
| | | | |
| |
| California—3.1% | | |
California Municipal Finance Authority, Bowles Hall Foundation Revenue, Series A
4.500%, 6/1/24 | 150 | | 150 |
California State Health Facilities Financing Authority, Providence St. Joseph Health, Series A
4.000%, 10/1/36 | 275 | | 257 |
California, State of, General Obligation
4.000%, 9/1/43 | 525 | | 502 |
Inglewood Redevelopment Agency Successor Agency, Subordinate Lien Merged Redevelopment Project, Tax Allocation Revenue, Series A (BAM Insured)
5.000%, 5/1/32 | 545 | | 566 |
Santa Clarita Community College District, General Obligation,
3.000%, 8/1/44 | 500 | | 363 |
Temecula Valley Unified School District Financing Authority, Special Tax Revenue, (BAM Insured)
5.000%, 9/1/25 | 175 | | 178 |
| | | | 2,016 |
| | | | |
| |
| | Par Value | | Value |
| | | | |
| Colorado—8.5% | | |
City & County of Denver Co. Airport System Revenue, Series D (AMT)
5.500%, 11/15/30 | $1,000 | | $ 1,080 |
Denver Convention Center Hotel Authority Revenue, Senior Lien,
5.000%, 12/1/27 | 400 | | 403 |
| Public Authority For Colorado Energy, Natural Gas Purchase Revenue, | | | |
| 6.125%, 11/15/23 | 510 | | 511 |
| 6.250%, 11/15/28 | 2,250 | | 2,354 |
Regional Transportation District, Sales Tax Revenue, Fastracks Project, Series A
5.000%, 11/1/32 | 1,195 | | 1,238 |
| | | | 5,586 |
| | | | |
| |
| Connecticut—1.9% | | |
Connecticut Housing Finance Authority, Mortgage Revenue, Series F1 (GNMA / FNMA / FHLMC Insured)
3.200%, 11/15/33 | 325 | | 293 |
Connecticut State Higher Education Supplement Loan Authority, Chesla Loan Program Revenue, Series D (Pre-Refunded 11/15/26 @ 100)
3.000%, 11/15/35 | 200 | | 196 |
State of Connecticut, Series E General Obligation,
5.000%, 9/15/34 | 750 | | 788 |
| | | | 1,277 |
| | | | |
| |
| District of Columbia—4.9% | | |
Metropolitan Washington Airports Authority, Dulles Toll Road Revenue, Convertible Capital Appreciation Series C Second Lien, (AGC Insured) (Pre-Refunded 10/1/26 @ 100)
6.500%, 10/1/41 | 3,000 | | 3,241 |
| Florida—16.8% | | |
Brevard County School Board, Certificates of Participation, Series A
5.000%, 7/1/32 | 1,000 | | 1,044 |
Broward County School Board, Certificates of Participation, Series A
5.000%, 7/1/32 | 300 | | 304 |
Central Florida Expressway Authority, Senior Lien Toll Revenue, Series B
4.000%, 7/1/30 | 230 | | 228 |
| | Par Value | | Value |
| | | | |
| Florida—continued | | |
City of Tallahassee, Health Facilities Revenue, Tallahassee Memorial Healthcare, Series A
5.000%, 12/1/36 | $ 500 | | $ 475 |
| Miami Beach Redevelopment Agency, | | | |
Tax Increment Revenue,
5.000%, 2/1/32 | 320 | | 321 |
Tax Increment Revenue, (AGM Insured)
5.000%, 2/1/31 | 40 | | 40 |
Miami-Dade County Educational Facilities Authority, University of Miami Revenue, Series A
5.000%, 4/1/30 | 200 | | 202 |
Miami-Dade County School Board, Certificates of Participation, Series D
5.000%, 2/1/34 | 1,700 | | 1,726 |
Miami-Dade Seaport Department County Revenue, Senior Bonds Series A
5.250%, 10/1/52 | 500 | | 497 |
Seminole County School Board, Certificates of Participation, Series C
5.000%, 7/1/29 | 1,935 | | 1,988 |
South Florida Water Management District, Certificates of Participation,
5.000%, 10/1/35 | 750 | | 764 |
State of Florida, Department of Transportation Right of Way General Obligation, Series B
5.000%, 7/1/31 | 3,000 | | 3,197 |
Wildwood Utility Dependent District, South Sumter Utility Project Revenue, (BAM Insured)
5.000%, 10/1/37 | 250 | | 260 |
| | | | 11,046 |
| | | | |
| |
| Georgia—0.8% | | |
Atlanta Water & Wastewater Revenue,
5.000%, 11/1/31 | 550 | | 558 |
| Illinois—7.2% | | |
| City of Chicago | | | |
Second Lien, (AGM Insured)
5.250%, 11/1/32 | 350 | | 365 |
Second Lien, Series 2017-2 (AGM Insured)
5.000%, 11/1/31 | 500 | | 513 |
Waterworks Revenue, Second Lien,
5.000%, 11/1/30 | 500 | | 505 |
See Notes to Financial Statements
Seix Tax-Exempt Bond Fund
SCHEDULE OF INVESTMENTS (Continued)
September 30, 2023
($ reported in thousands)
| | Par Value | | Value |
| | | | |
| Illinois—continued | | |
Cook County School District No. 78 Rosemont, General Obligation, (AGM Insured)
5.000%, 12/1/38 | $1,000 | | $ 1,038 |
Illinois State Toll Highway Authority, Toll Highway Revenue, Senior Lien, Series B
5.000%, 1/1/32 | 1,000 | | 1,017 |
State of Illinois, General Obligation,
5.000%, 2/1/27 | 1,250 | | 1,285 |
| | | | 4,723 |
| | | | |
| |
| Indiana—3.4% | | |
Indiana Finance Authority, Parkview Health System, Series A
5.000%, 11/1/43 | 1,700 | | 1,703 |
Indianapolis Local Public Improvement Bond Bank Revenue, (AMT)
5.000%, 1/1/34 | 500 | | 521 |
| | | | 2,224 |
| | | | |
| |
| Maryland—4.0% | | |
Maryland Community Development Administration, Revenue, Series A
1.250%, 3/1/30 | 200 | | 161 |
Maryland Health & Higher Educational Facilities Authority, Medstar Health System Revenue,
5.000%, 8/15/26 | 800 | | 808 |
Maryland Health & Higher Educational Facilities Authority, Medstar Health System Revenue, Series A
5.000%, 5/15/42 | 600 | | 597 |
Maryland Stadium Authority, Series A
5.000%, 3/1/37 | 1,000 | | 1,069 |
| | | | 2,635 |
| | | | |
| |
| Massachusetts—1.3% | | |
Massachusetts Housing Finance Agency,
2.300%, 12/1/40 | 500 | | 323 |
Massachusetts Port Authority, Transportation Revenue, Series A (AMT)
5.000%, 7/1/31 | 500 | | 512 |
| | | | 835 |
| | | | |
| |
| | Par Value | | Value |
| | | | |
| Michigan—1.5% | | |
| Michigan State Building Authority, Facilities Program Lease Revenue, Series I | | | |
| 5.000%, 4/15/25 | $ 500 | | $ 509 |
| 4.000%, 10/15/36 | 500 | | 486 |
| | | | 995 |
| | | | |
| |
| Minnesota—3.6% | | |
| Minneapolis Special School District No. 1 | | | |
Series B General Obligation, (SD CRED PROG Insured)
5.000%, 2/1/39 | 1,085 | | 1,152 |
Series B General Obligation, (SD CRED PROG Insured)
5.000%, 2/1/40 | 1,140 | | 1,206 |
| | | | 2,358 |
| | | | |
| |
| New Jersey—1.6% | | |
| Tobacco Settlement Financing Corp., Tobacco Settlement Revenue, Series A | | | |
| 5.000%, 6/1/31 | 250 | | 258 |
| 5.000%, 6/1/32 | 250 | | 258 |
| 5.000%, 6/1/33 | 250 | | 258 |
| 5.000%, 6/1/34 | 250 | | 258 |
| | | | 1,032 |
| | | | |
| |
| New York—3.1% | | |
City of New York, General Obligation, Series A
5.000%, 8/1/51 | 590 | | 599 |
Dutchess County Local Development Corp., The Culinary Institute of America Revenue,
5.000%, 7/1/33 | 180 | | 182 |
| New York City Industrial Development Agency, Queens Baseball Stadium Project Revenue, | | | |
Series A (AGM Insured)
3.000%, 1/1/36 | 250 | | 202 |
Series A (AGM Insured)
3.000%, 1/1/37 | 100 | | 78 |
Series A (AGM Insured)
3.000%, 1/1/46 | 750 | | 517 |
| New York State Dormitory Authority, | | | |
New York University Hospitals Center Revenue,
5.000%, 7/1/33 | 150 | | 153 |
Orange Regional Medical Center Revenue,
144A 5.000%, 12/1/23(3) | 300 | | 299 |
| | | | 2,030 |
| | | | |
| |
| | Par Value | | Value |
| | | | |
| Ohio—0.9% | | |
Buckeye Tobacco Settlement Financing Authority, Tobacco Settlement Senior Series A-2 Class 1 Revenue,
4.000%, 6/1/48 | $ 500 | | $ 422 |
Hamilton County, Life Enriching Communities Pro Revenue, Series A
5.500%, 1/1/43 | 160 | | 155 |
| | | | 577 |
| | | | |
| |
| Oregon—3.0% | | |
State of Oregon, Article XI-Q Series F General Obligation,
5.000%, 5/1/33 | 1,095 | | 1,123 |
Washington & Multnomah Counties, Beaverton School District No. 48J, Capital Appreciation Bond, General Obligation, Series D (SCH BD GTY Insured)
5.000%, 6/15/36 | 800 | | 826 |
| | | | 1,949 |
| | | | |
| |
| Pennsylvania—5.3% | | |
City of Philadelphia, Water & Wastewater Revenue, Series A
5.000%, 10/1/42 | 300 | | 305 |
Delaware River Joint Toll Bridge Commission, Bridge System Revenue,
5.000%, 7/1/34 | 250 | | 259 |
Pennsylvania Economic Development Financing Authority Revenue, PENNDOT Major Bridges (AMT)
5.500%, 6/30/39 | 485 | | 507 |
Pennsylvania Turnpike Commission Revenue, First Subordinate Series
5.000%, 12/1/38 | 2,325 | | 2,423 |
| | | | 3,494 |
| | | | |
| |
| South Carolina—0.4% | | |
South Carolina Association of Governmental Organizations Educational Facilities Corp., for Pickens School District Lease Revenue,
5.000%, 12/1/24 | 290 | | 293 |
| Tennessee—5.8% | | |
Chattanooga-Hamilton County Hospital Authority, Erlanger Health System Revenue, Series A
5.000%, 10/1/26 | 1,000 | | 1,004 |
See Notes to Financial Statements
Seix Tax-Exempt Bond Fund
SCHEDULE OF INVESTMENTS (Continued)
September 30, 2023
($ reported in thousands)
| | Par Value | | Value |
| | | | |
| Tennessee—continued | | |
| Metropolitan Nashville Airport Authority (The) | | | |
Revenue, Series A
5.250%, 7/1/47 | $ 250 | | $ 260 |
Revenue, Series A
5.000%, 7/1/52 | 250 | | 251 |
Revenue, Series B (AMT)
5.500%, 7/1/40 | 500 | | 525 |
Revenue, Series B (AMT)
5.500%, 7/1/41 | 250 | | 262 |
Revenue, Series B (AMT)
5.500%, 7/1/52 | 500 | | 513 |
Tennessee State School Bond Authority, Higher Education Program Revenue, Series B (State Higher Education Intercept Program Insured)
5.000%, 11/1/34 | 1,000 | | 1,039 |
| | | | 3,854 |
| | | | |
| |
| Texas—11.7% | | |
Arlington Higher Education Finance Corp., Trinity Basin Preparatory Revenue, (PSF-GTD Insured)
4.500%, 8/15/53 | 190 | | 179 |
Central Texas Regional Mobility Authority, Senior Lien Toll Revenue, Series D
4.000%, 1/1/38 | 750 | | 688 |
Denton Independent School District, General Obligation, (PSF-GTD Insured)
5.000%, 8/15/48 | 520 | | 545 |
Georgetown Independent School District General Obligation, (PSF-GTD Insured)
3.750%, 8/15/41 | 500 | | 431 |
Lamar Consolidated Independent School District, General Obligation, (PSF-GTD Insured)
5.000%, 2/15/34 | 1,000 | | 1,030 |
Northwest Independent School District, Series A General Obligation, (PSF-GTD Insured)
5.000%, 2/15/39 | 1,370 | | 1,445 |
Texas Municipal Gas Acquisition and Supply Corp. I, Gas Supply Revenue, Senior Lien, Series D
6.250%, 12/15/26 | 895 | | 914 |
| | Par Value | | Value |
| | | | |
| Texas—continued | | |
Texas Municipal Gas Acquisition and Supply Corp. II, Gas Supply Revenue, LIBOR Index Series C
4.433%, 9/15/27(2) | $1,600 | | $ 1,561 |
Texas Public Finance Authority, Texas Southern University Revenue, (BAM Insured)
5.250%, 5/1/37 | 300 | | 312 |
Wharton Independent School District, General Obligation, (PSF-GTD Insured)
3.000%, 2/15/32 | 645 | | 575 |
| | | | 7,680 |
| | | | |
| |
| Vermont—0.4% | | |
Vermont Educational & Health Buildings Financing Agency, University of Vermont Health Network Revenue, Series A
5.000%, 12/1/35 | 300 | | 303 |
| Washington—0.5% | | |
Grant County Public Hospital District No. 1, General Obligation
5.500%, 12/1/43 | 305 | | 306 |
| Wisconsin—1.9% | | |
| Public Finance Authority, | | | |
Renown Regional Medical Center Revenue, Series A
5.000%, 6/1/33 | 1,000 | | 1,008 |
Waste Management, Inc. Project Revenue, (AMT)
2.875%, 5/1/27 | 250 | | 232 |
| | | | 1,240 |
| | | | |
| |
Total Municipal Bonds
(Identified Cost $66,317) | | 63,625 |
| | | | |
| |
| | | | |
| |
Total Long-Term Investments—96.7%
(Identified Cost $66,317) | | 63,625 |
| | | | |
| |
| | | | |
| |
TOTAL INVESTMENTS—96.7%
(Identified Cost $66,317) | | $63,625 |
| Other assets and liabilities, net—3.3% | | 2,187 |
| NET ASSETS—100.0% | | $65,812 |
| Abbreviations: |
| AGC | Assured Guaranty Corp. |
| AGM | Assured Guaranty Municipal Corp. |
| AMT | Alternative Minimum Tax |
| BAM | Build America Municipal Insured |
| FHLMC | Federal Home Loan Mortgage Corporation (“Freddie Mac”) |
| FNMA | Federal National Mortgage Association (“Fannie Mae”) |
| GNMA | Government National Mortgage Association (“Ginnie Mae”) |
| LIBOR | London Interbank Offered Rate |
| PSF-GTD | Permanent School Fund Guarantee Program |
| SCH BD GTY | School Bond Guaranty |
| SD CRED PROG | State Credit Enhancement Program |
| Footnote Legend: |
| (1) | At September 30, 2023, 25.2% of the securities in the portfolio are backed by insurance of financial institutions and financial guaranty assurance agencies. None of the insurers concentration exceeds 10% of the Fund’s net assets. |
| (2) | Variable or step coupon security; interest rate shown reflects the rate in effect at September 30, 2023. For securities based on a published reference rate and spread, the reference rate and spread are indicated in the description above. Certain variable rate securities are not based on a published reference rate and spread but are determined by the issuer or agent and are based on current market conditions. These securities do not indicate a reference rate and spread in their description above. |
| (3) | Security exempt from registration under Rule 144A of the Securities Act of 1933. These securities may be resold in transactions exempt from registration, normally to qualified institutional buyers. At September 30, 2023, these securities amounted to a value of $299 or 0.5% of net assets. |
For information regarding the abbreviations, see the Key Investment Terms starting on page 5.
See Notes to Financial Statements
Seix Tax-Exempt Bond Fund
SCHEDULE OF INVESTMENTS (Continued)
September 30, 2023
($ reported in thousands)
The following table summarizes the value of the Fund’s investments as of September 30, 2023, based on the inputs used to value them (See Security Valuation Note 2A in the Notes to Financial Statements):
| | Total
Value at
September 30, 2023 | | Level 2
Significant
Observable
Inputs |
| Assets: | | | |
| Debt Instruments: | | | |
| Municipal Bonds | $63,625 | | $63,625 |
| Total Investments | $63,625 | | $63,625 |
There were no securities valued using quoted prices (Level 1) or significant unobservable inputs (Level 3) at September 30, 2023.
There were no transfers into or out of Level 3 related to securities held at September 30, 2023.
See Notes to Financial Statements
VIRTUS OPPORTUNITIES TRUST
STATEMENTS OF ASSETS AND LIABILITIES
September 30, 2023
(Reported in thousands except shares and per share amounts)
| | Newfleet
Core Plus Bond Fund | | Newfleet
High Yield
Fund | | Newfleet
Low Duration
Core Plus
Bond Fund | | Newfleet
Multi-Sector
Intermediate
Bond Fund |
| Assets | | | | | | | |
Investment in securities at value(1)(2)
| $ 159,629 | | $ 46,784 | | $ 389,645 | | $ 396,579 |
Cash
| 4,290 | | 284 | | 5,967 | | 9,584 |
| Receivables | | | | | | | |
Investment securities sold
| 310 | | — | | 1,307 | | 526 |
Fund shares sold
| 3,659 | | 3 | | 811 | | 741 |
Dividends and interest
| 1,350 | | 852 | | 1,884 | | 3,754 |
Unrealized appreciation on unfunded loan commitment(a)
| — | | — | | — | | 1 |
Securities lending income
| 1 | | 4 | | 2 | | 7 |
Prepaid Trustees’ retainer
| 3 | | 1 | | 8 | | 7 |
Prepaid expenses
| 25 | | 19 | | 28 | | 43 |
Other assets
| 20 | | 6 | | 52 | | 49 |
Total assets
| 169,287 | | 47,953 | | 399,704 | | 411,291 |
| Liabilities | | | | | | | |
| Payables | | | | | | | |
Fund shares repurchased
| 254 | | 52 | | 872 | | 742 |
Investment securities purchased
| 2,769 | | 238 | | 1,700 | | 7,978 |
Collateral on securities loaned
| 923 | | 1,641 | | 3,449 | | 4,427 |
Dividend distributions
| — | | 18 | | 96 | | 166 |
Investment advisory fees
| 15 | | 4 | | 67 | | 166 |
Distribution and service fees
| 7 | | 9 | | 20 | | 22 |
Administration and accounting fees
| 14 | | 5 | | 34 | | 34 |
Transfer agent and sub-transfer agent fees and expenses
| 31 | | 13 | | 70 | | 51 |
Professional fees
| 36 | | 36 | | 36 | | 42 |
Trustee deferred compensation plan
| 20 | | 6 | | 52 | | 49 |
Interest expense and/or commitment fees
| — (b) | | — (b) | | 1 | | 1 |
Other accrued expenses
| 17 | | 9 | | 37 | | 27 |
Total liabilities
| 4,086 | | 2,031 | | 6,434 | | 13,705 |
Net Assets
| $ 165,201 | | $ 45,922 | | $ 393,270 | | $ 397,586 |
| Net Assets Consist of: | | | | | | | |
Common stock $0.001 par value
| $ — | | $ — | | $ 38 | | $ — |
Capital paid in on shares of beneficial interest
| 186,680 | | 56,396 | | 439,684 | | 452,079 |
Accumulated earnings (loss)
| (21,479) | | (10,474) | | (46,452) | | (54,493) |
Net Assets
| $ 165,201 | | $ 45,922 | | $ 393,270 | | $ 397,586 |
| Net Assets: | | | | | | | |
Class A
| $ 28,811 | | $ 35,738 | | $ 62,424 | | $ 67,280 |
Class C
| $ 1,553 | | $ 1,098 | | $ 8,845 | | $ 9,131 |
Class I
| $ 132,866 | | $ 7,225 | | $ 314,549 | | $ 303,103 |
Class R6
| $ 1,971 | | $ 1,861 | | $ 7,452 | | $ 18,072 |
| Shares Outstanding (unlimited number of shares authorized, no par value):(3) | | | | | | | |
Class A
| 2,981,377 | | 9,789,278 | | 6,104,161 | | 7,650,618 |
Class C
| 164,606 | | 306,162 | | 864,946 | | 1,025,841 |
Class I
| 13,524,423 | | 1,974,686 | | 30,767,171 | | 34,595,004 |
Class R6
| 200,520 | | 509,360 | | 728,125 | | 2,044,665 |
| Net Asset Value and Redemption Price Per Share:* | | | | | | | |
Class A
| $ 9.66 | | $ 3.65 | | $ 10.23 | | $ 8.79 |
Class C
| $ 9.43 | | $ 3.59 | | $ 10.23 | | $ 8.90 |
Class I
| $ 9.82 | | $ 3.66 | | $ 10.22 | | $ 8.76 |
Class R6
| $ 9.83 | | $ 3.65 | | $ 10.23 | | $ 8.84 |
See Notes to Financial Statements
VIRTUS OPPORTUNITIES TRUST
STATEMENTS OF ASSETS AND LIABILITIES (Continued)
September 30, 2023
(Reported in thousands except shares and per share amounts)
| | Newfleet
Core Plus Bond Fund | | Newfleet
High Yield
Fund | | Newfleet
Low Duration
Core Plus
Bond Fund | | Newfleet
Multi-Sector
Intermediate
Bond Fund |
| Maximum Offering Price Per Share (NAV/(1-Maximum Sales Charge)): | | | | | | | |
Class A
| $ 10.04 | | $ 3.79 | | $ 10.47 | | $ 9.13 |
Maximum Sales Charge - Class A
| 3.75% | | 3.75% | | 2.25% | | 3.75% |
(1) Investment in securities at cost
| $ 173,755 | | $ 51,159 | | $ 411,251 | | $ 425,780 |
(2) Market value of securities on loan
| $ 888 | | $ 1,586 | | $ 3,362 | | $ 4,262 |
| (3) Newfleet Core Plus Bond Fund and Newfleet Low Duration Core Plus Bond Fund have a par value of $1.00, and all other funds on this page have no par value. | | | | | | | |
| (a) | See Schedule of Investments for schedule of unfunded loan commitments. |
| (b) | Amount is less than $500 (not in thousands). |
| * | Net Asset Value and Redemption Price Per Share are calculated using unrounded net assets. |
See Notes to Financial Statements
VIRTUS OPPORTUNITIES TRUST
STATEMENTS OF ASSETS AND LIABILITIES (Continued)
September 30, 2023
(Reported in thousands except shares and per share amounts)
| | Newfleet Multi-Sector Short Term Bond Fund | | Newfleet
Senior Floating
Rate Fund | | Seix
Tax-Exempt
Bond Fund |
| Assets | | | | | |
Investment in securities at value(1)(2)
| $ 4,451,239 | | $ 196,547 | | $ 63,625 |
Cash
| 51,051 | | 5,902 | | 1,451 |
| Receivables | | | | | |
Investment securities sold
| 5,173 | | 3,139 | | — |
Fund shares sold
| 4,927 | | 353 | | 44 |
Dividends and interest
| 27,676 | | 869 | | 927 |
Unrealized appreciation on unfunded loan commitment(a)
| — | | 1 | | — |
Securities lending income
| 5 | | — | | — |
Prepaid Trustees’ retainer
| 87 | | 4 | | 1 |
Prepaid expenses
| 65 | | 24 | | 13 |
Other assets
| 569 | | 25 | | 9 |
Total assets
| 4,540,792 | | 206,864 | | 66,070 |
| Liabilities | | | | | |
| Payables | | | | | |
Fund shares repurchased
| 9,919 | | 702 | | 165 |
Investment securities purchased
| 38,767 | | 10,640 | | — |
Collateral on securities loaned
| 10,237 | | — | | — |
Dividend distributions
| 1,114 | | 196 | | 11 |
Investment advisory fees
| 1,706 | | 66 | | 7 |
Distribution and service fees
| 220 | | 18 | | 7 |
Administration and accounting fees
| 374 | | 17 | | 6 |
Transfer agent and sub-transfer agent fees and expenses
| 706 | | 26 | | 13 |
Professional fees
| 87 | | 41 | | 31 |
Trustee deferred compensation plan
| 569 | | 25 | | 9 |
Interest expense and/or commitment fees
| 9 | | 22 | | — (b) |
Other accrued expenses
| 225 | | 16 | | 9 |
Total liabilities
| 63,933 | | 11,769 | | 258 |
Net Assets
| $ 4,476,859 | | $ 195,095 | | $ 65,812 |
| Net Assets Consist of: | | | | | |
Common stock $0.001 par value
| $ — | | $ — | | $ 7 |
Capital paid in on shares of beneficial interest
| 5,099,675 | | 270,340 | | 69,099 |
Accumulated earnings (loss)
| (622,816) | | (75,245) | | (3,294) |
Net Assets
| $ 4,476,859 | | $ 195,095 | | $ 65,812 |
| Net Assets: | | | | | |
Class A
| $ 660,114 | | $ 61,100 | | $ 27,621 |
Class C
| $ 132,559 | | $ 6,311 | | $ 1,370 |
Class C1
| $ 33,679 | | $ — | | $ — |
Class I
| $ 3,639,516 | | $ 126,422 | | $ 36,821 |
Class R6
| $ 10,991 | | $ 1,262 | | $ — |
| Shares Outstanding (unlimited number of shares authorized, no par value):(3) | | | | | |
Class A
| 151,199,484 | | 7,019,672 | | 2,791,593 |
Class C
| 29,902,003 | | 724,464 | | 138,517 |
Class C1
| 7,619,048 | | — | | — |
Class I
| 832,234,551 | | 14,545,337 | | 3,721,679 |
Class R6
| 2,505,778 | | 145,193 | | — |
See Notes to Financial Statements
VIRTUS OPPORTUNITIES TRUST
STATEMENTS OF ASSETS AND LIABILITIES (Continued)
September 30, 2023
(Reported in thousands except shares and per share amounts)
| | Newfleet Multi-Sector Short Term Bond Fund | | Newfleet
Senior Floating
Rate Fund | | Seix
Tax-Exempt
Bond Fund |
| Net Asset Value and Redemption Price Per Share:* | | | | | |
Class A
| $ 4.37 | | $ 8.70 | | $ 9.89 |
Class C
| $ 4.43 | | $ 8.71 | | $ 9.89 |
Class C1
| $ 4.42 | | $ — | | $ — |
Class I
| $ 4.37 | | $ 8.69 | | $ 9.89 |
Class R6
| $ 4.39 | | $ 8.69 | | $ — |
| Maximum Offering Price Per Share (NAV/(1-Maximum Sales Charge)): | | | | | |
Class A
| $ 4.47 | | $ 8.95 | | $ 10.17 |
Maximum Sales Charge - Class A
| 2.25% | | 2.75% | | 2.75% |
(1) Investment in securities at cost
| $ 4,723,681 | | $ 198,578 | | $ 66,317 |
(2) Market value of securities on loan
| $ 9,886 | | $ — | | $ — |
| (3) Seix Tax-Exempt Bond Fund has a par value of $0.001, and all other funds on this page have no par value. | | | | | |
| (a) | See Schedule of Investments for schedule of unfunded loan commitments. |
| (b) | Amount is less than $500 (not in thousands). |
| * | Net Asset Value and Redemption Price Per Share are calculated using unrounded net assets. |
See Notes to Financial Statements
VIRTUS OPPORTUNITIES TRUST
STATEMENTS OF OPERATIONS YEAR ENDED
September 30, 2023
($ reported in thousands)
| | Newfleet
Core Plus Bond
Fund | | Newfleet
High Yield
Fund | | Newfleet
Low Duration
Core Plus
Bond Fund | | Newfleet
Multi-Sector
Intermediate
Bond Fund |
| Investment Income | | | | | | | |
Dividends
| $ 174 | | $ 77 | | $ 348 | | $ 476 |
Interest
| 5,002 | | 3,417 | | 17,248 | | 16,920 |
Securities lending, net of fees
| 4 | | 23 | | 11 | | 41 |
Foreign taxes withheld
| — | | — (1) | | — | | (1) |
Total investment income
| 5,180 | | 3,517 | | 17,607 | | 17,436 |
| Expenses | | | | | | | |
Investment advisory fees
| 488 | | 257 | | 1,860 | | 1,609 |
Distribution and service fees, Class A
| 72 | | 91 | | 170 | | 170 |
Distribution and service fees, Class C
| 14 | | 11 | | 104 | | 107 |
Administration and accounting fees
| 118 | | 55 | | 480 | | 306 |
Transfer agent fees and expenses
| 58 | | 40 | | 209 | | 132 |
Sub-transfer agent fees and expenses, Class A
| 19 | | 17 | | 44 | | 48 |
Sub-transfer agent fees and expenses, Class C
| 1 | | 1 | | 5 | | 8 |
Sub-transfer agent fees and expenses, Class I
| 82 | | 11 | | 275 | | 120 |
Custodian fees
| 9 | | 5 | | 12 | | 11 |
Printing fees and expenses
| 11 | | 6 | | 36 | | 25 |
Professional fees
| 33 | | 42 | | 5 | | 31 |
Interest expense and/or commitment fees
| 6 | | — (1) | | 9 | | 2 |
Registration fees
| 44 | | 39 | | 73 | | 69 |
Trustees’ fees and expenses
| 8 | | 4 | | 38 | | 20 |
Miscellaneous expenses
| 37 | | 30 | | 81 | | 42 |
Total expenses
| 1,000 | | 609 | | 3,401 | | 2,700 |
Less net expenses reimbursed and/or waived by investment adviser(2)
| (318) | | (155) | | (859) | | (280) |
Less low balance account fees
| (1) | | (2) | | — (1) | | — (1) |
Net expenses
| 681 | | 452 | | 2,542 | | 2,420 |
Net investment income (loss)
| 4,499 | | 3,065 | | 15,065 | | 15,016 |
| Net Realized and Unrealized Gain (Loss) on Investments | | | | | | | |
| Net realized gain (loss) from: | | | | | | | |
Investments
| (4,987) | | (1,240) | | (15,402) | | (6,767) |
| Net change in unrealized appreciation (depreciation) on: | | | | | | | |
Investments
| 588 | | 2,749 | | 21,836 | | 5,009 |
Net realized and unrealized gain (loss) on investments
| (4,399) | | 1,509 | | 6,434 | | (1,758) |
Net increase (decrease) in net assets resulting from operations
| $ 100 | | $ 4,574 | | $ 21,499 | | $13,258 |
| (1) | Amount is less than $500 (not in thousands). |
| (2) | See Note 3D in Notes to Financial Statements. |
See Notes to Financial Statements
VIRTUS OPPORTUNITIES TRUST
STATEMENTS OF OPERATIONS (Continued)
YEAR ENDED September 30, 2023
($ reported in thousands)
| | Newfleet
Multi-Sector Short
Term Bond Fund | | Newfleet
Senior Floating
Rate Fund | | Seix
Tax-Exempt
Bond Fund |
| Investment Income | | | | | |
Dividends
| $ 2,150 | | $ 566 | | $ 79 |
Interest
| 205,973 | | 14,968 | | 2,454 |
Securities lending, net of fees
| 39 | | — | | — |
Foreign taxes withheld
| (30) | | — | | — |
Total investment income
| 208,132 | | 15,534 | | 2,533 |
| Expenses | | | | | |
Investment advisory fees
| 22,981 | | 822 | | 324 |
Distribution and service fees, Class A
| 1,778 | | 140 | | 73 |
Distribution and service fees, Class C
| 770 | | 67 | | 17 |
Distribution and service fees, Class C1
| 395 | | — | | — |
Administration and accounting fees
| 4,860 | | 193 | | 81 |
Transfer agent fees and expenses
| 2,047 | | 81 | | 34 |
Sub-transfer agent fees and expenses, Class A
| 527 | | 38 | | 18 |
Sub-transfer agent fees and expenses, Class C
| 126 | | 5 | | 1 |
Sub-transfer agent fees and expenses, Class C1
| 26 | | — | | — |
Sub-transfer agent fees and expenses, Class I
| 2,790 | | 89 | | 34 |
Custodian fees
| 23 | | 4 | | 1 |
Printing fees and expenses
| 144 | | 16 | | 8 |
Professional fees
| 40 | | 56 | | 32 |
Interest expense and/or commitment fees
| 51 | | 174 | | — (1) |
Registration fees
| 139 | | 66 | | 32 |
Trustees’ fees and expenses
| 377 | | 14 | | 6 |
Miscellaneous expenses
| 275 | | 32 | | 27 |
Total expenses
| 37,349 | | 1,797 | | 688 |
Less net expenses reimbursed and/or waived by investment adviser(2)
| (3,711) | | (146) | | (180) |
Less low balance account fees
| (1) | | — (1) | | — (1) |
Net expenses
| 33,637 | | 1,651 | | 508 |
Net investment income (loss)
| 174,495 | | 13,883 | | 2,025 |
| Net Realized and Unrealized Gain (Loss) on Investments | | | | | |
| Net realized gain (loss) from: | | | | | |
Investments
| (118,530) | | (2,804) | | (421) |
| Net change in unrealized appreciation (depreciation) on: | | | | | |
Investments
| 188,100 | | 8,757 | | 319 |
Net realized and unrealized gain (loss) on investments
| 69,570 | | 5,953 | | (102) |
Net increase (decrease) in net assets resulting from operations
| $ 244,065 | | $19,836 | | $1,923 |
| (1) | Amount is less than $500 (not in thousands). |
| (2) | See Note 3D in Notes to Financial Statements. |
See Notes to Financial Statements
VIRTUS OPPORTUNITIES TRUST
STATEMENTS OF CHANGES IN NET ASSETS
($ reported in thousands)
| | Newfleet Core Plus Bond Fund | | Newfleet High Yield Fund |
| | Year Ended
September 30,
2023 | | Year Ended
September 30,
2022 | | Year Ended
September 30,
2023 | | Year Ended
September 30,
2022 |
| Increase (Decrease) in Net Assets Resulting from Operations | | | | | | | |
Net investment income (loss)
| $ 4,499 | | $ 2,939 | | $ 3,065 | | $ 2,692 |
Net realized gain (loss)
| (4,987) | | (2,104) | | (1,240) | | (1,153) |
Net change in unrealized appreciation (depreciation)
| 588 | | (17,663) | | 2,749 | | (8,805) |
Increase (decrease) in net assets resulting from operations
| 100 | | (16,828) | | 4,574 | | (7,266) |
| Dividends and Distributions to Shareholders | | | | | | | |
| Net Investment Income and Net Realized Gains: | | | | | | | |
Class A
| (1,120) | | (1,220) | | (2,350) | | (2,131) |
Class C
| (44) | | (70) | | (61) | | (54) |
Class I
| (3,274) | | (3,141) | | (501) | | (380) |
Class R6
| (63) | | (56) | | (128) | | (112) |
Total dividends and distributions to shareholders
| (4,501) | | (4,487) | | (3,040) | | (2,677) |
| Change in Net Assets from Capital Transactions (See Note 5): | | | | | | | |
Class A
| 2,328 | | (2,007) | | (1,768) | | (2,932) |
Class C
| 307 | | (984) | | 51 | | (212) |
Class I
| 73,094 | | 8,112 | | 836 | | (757) |
Class R6
| 680 | | 384 | | 42 | | 224 |
Increase (decrease) in net assets from capital transactions
| 76,409 | | 5,505 | | (839) | | (3,677) |
Net increase (decrease) in net assets
| 72,008 | | (15,810) | | 695 | | (13,620) |
| Net Assets | | | | | | | |
Beginning of period
| 93,193 | | 109,003 | | 45,227 | | 58,847 |
End of Period
| $ 165,201 | | $ 93,193 | | $ 45,922 | | $ 45,227 |
See Notes to Financial Statements
VIRTUS OPPORTUNITIES TRUST
STATEMENTS OF CHANGES IN NET ASSETS (Continued)
($ reported in thousands)
| | Newfleet Low Duration Core Plus
Bond Fund | | Newfleet Multi-Sector Intermediate
Bond Fund |
| | Year Ended
September 30,
2023 | | Year Ended
September 30,
2022 | | Year Ended
September 30,
2023 | | Year Ended
September 30,
2022 |
| Increase (Decrease) in Net Assets Resulting from Operations | | | | | | | |
Net investment income (loss)
| $ 15,065 | | $ 11,395 | | $ 15,016 | | $ 10,888 |
Net realized gain (loss)
| (15,402) | | (8,110) | | (6,767) | | (7,239) |
Net change in unrealized appreciation (depreciation)
| 21,836 | | (48,638) | | 5,009 | | (38,130) |
Increase (decrease) in net assets resulting from operations
| 21,499 | | (45,353) | | 13,258 | | (34,481) |
| Dividends and Distributions to Shareholders | | | | | | | |
| Net Investment Income and Net Realized Gains: | | | | | | | |
Class A
| (2,081) | | (1,330) | | (3,278) | | (2,724) |
Class C
| (239) | | (108) | | (429) | | (487) |
Class I
| (11,461) | | (9,384) | | (10,816) | | (7,635) |
Class R6
| (1,285) | | (554) | | (300) | | (234) |
| Return of Capital: | | | | | | | |
Class A
| — | | — | | — | | (153) |
Class C
| — | | — | | — | | (35) |
Class I
| — | | — | | — | | (396) |
Class R6
| — | | — | | — | | (12) |
Total dividends and distributions to shareholders
| (15,066) | | (11,376) | | (14,823) | | (11,676) |
| Change in Net Assets from Capital Transactions (See Note 5): | | | | | | | |
Class A
| (15,835) | | (16,540) | | 2,294 | | (6,219) |
Class C
| (3,095) | | (4,355) | | (3,010) | | (5,331) |
Class I
| (115,578) | | (163,556) | | 145,801 | | (22,746) |
Class R6
| (32,510) | | 14,785 | | 13,062 | | (222) |
Increase (decrease) in net assets from capital transactions
| (167,018) | | (169,666) | | 158,147 | | (34,518) |
Net increase (decrease) in net assets
| (160,585) | | (226,395) | | 156,582 | | (80,675) |
| Net Assets | | | | | | | |
Beginning of period
| 553,855 | | 780,250 | | 241,004 | | 321,679 |
End of Period
| $ 393,270 | | $ 553,855 | | $ 397,586 | | $ 241,004 |
See Notes to Financial Statements
VIRTUS OPPORTUNITIES TRUST
STATEMENTS OF CHANGES IN NET ASSETS (Continued)
($ reported in thousands)
| | Newfleet Multi-Sector Short Term
Bond Fund | | Newfleet Senior Floating Rate Fund |
| | Year Ended
September 30,
2023 | | Year Ended
September 30,
2022 | | Year Ended
September 30,
2023 | | Year Ended
September 30,
2022 |
| Increase (Decrease) in Net Assets Resulting from Operations | | | | | | | |
Net investment income (loss)
| $ 174,495 | | $ 134,967 | | $ 13,883 | | $ 7,621 |
Net realized gain (loss)
| (118,530) | | (82,760) | | (2,804) | | (2,643) |
Net change in unrealized appreciation (depreciation)
| 188,100 | | (511,840) | | 8,757 | | (10,866) |
Increase (decrease) in net assets resulting from operations
| 244,065 | | (459,633) | | 19,836 | | (5,888) |
| Dividends and Distributions to Shareholders | | | | | | | |
| Net Investment Income and Net Realized Gains: | | | | | | | |
Class A
| (24,311) | | (17,877) | | (4,200) | | (2,381) |
Class C
| (4,756) | | (3,892) | | (447) | | (241) |
Class C1
| (1,035) | | (735) | | — | | — |
Class I
| (141,108) | | (111,213) | | (9,164) | | (4,942) |
Class R6
| (530) | | (677) | | (94) | | (56) |
| Return of Capital: | | | | | | | |
Class A
| — | | (1,085) | | — | | — |
Class C
| — | | (280) | | — | | — |
Class C1
| — | | (73) | | — | | — |
Class I
| — | | (6,029) | | — | | — |
Class R6
| — | | (36) | | — | | — |
Total dividends and distributions to shareholders
| (171,740) | | (141,897) | | (13,905) | | (7,620) |
| Change in Net Assets from Capital Transactions (See Note 5): | | | | | | | |
Class A
| (121,688) | | (98,535) | | 2,708 | | (11,478) |
Class C
| (51,256) | | (64,648) | | (1,119) | | (1,865) |
Class C1
| (11,806) | | (19,482) | | — | | — |
Class I
| (673,115) | | (482,484) | | 3,335 | | (8,832) |
Class R6
| (15,195) | | (1,409) | | (125) | | (179) |
Increase (decrease) in net assets from capital transactions
| (873,060) | | (666,558) | | 4,799 | | (22,354) |
Net increase (decrease) in net assets
| (800,735) | | (1,268,088) | | 10,730 | | (35,862) |
| Net Assets | | | | | | | |
Beginning of period
| 5,277,594 | | 6,545,682 | | 184,365 | | 220,227 |
End of Period
| $ 4,476,859 | | $ 5,277,594 | | $ 195,095 | | $ 184,365 |
See Notes to Financial Statements
VIRTUS OPPORTUNITIES TRUST
STATEMENTS OF CHANGES IN NET ASSETS (Continued)
($ reported in thousands)
| | Seix Tax-Exempt Bond Fund |
| | Year Ended
September 30,
2023 | | Year Ended
September 30,
2022 |
| Increase (Decrease) in Net Assets Resulting from Operations | | | |
Net investment income (loss)
| $ 2,025 | | $ 2,040 |
Net realized gain (loss)
| (421) | | (124) |
Net change in unrealized appreciation (depreciation)
| 319 | | (11,461) |
Increase (decrease) in net assets resulting from operations
| 1,923 | | (9,545) |
| Dividends and Distributions to Shareholders | | | |
| Net Investment Income and Net Realized Gains: | | | |
Class A
| (765) | | (846) |
Class C
| (33) | | (51) |
Class I
| (1,178) | | (1,469) |
Total dividends and distributions to shareholders
| (1,976) | | (2,366) |
| Change in Net Assets from Capital Transactions (See Note 5): | | | |
Class A
| (1,885) | | (3,838) |
Class C
| (705) | | (1,127) |
Class I
| (6,990) | | (11,580) |
Increase (decrease) in net assets from capital transactions
| (9,580) | | (16,545) |
Net increase (decrease) in net assets
| (9,633) | | (28,456) |
| Net Assets | | | |
Beginning of period
| 75,445 | | 103,901 |
End of Period
| $ 65,812 | | $ 75,445 |
See Notes to Financial Statements
VIRTUS OPPORTUNITIES TRUST
FINANCIAL HIGHLIGHTS
SELECTED PER SHARE DATA AND RATIOS FOR A SHARE OUTSTANDING
THROUGHOUT EACH PERIOD
| | | Net Asset Value,
Beginning of Period | Net Investment Income (Loss)(1) | Net Realized and
Unrealized Gain (Loss) | Total from Investment Operations | Dividends from
Net Investment Income | Return of Capital | Distributions from
Net Realized Gains | Total Distributions | Payment from Affiliate(1) | Change in Net Asset Value | Net Asset Value, End of Period | Total Return(2)(3) | Net Assets, End of Period
(in thousands) | Ratio of Net Expenses to
Average Net Assets(4)(5) | Ratio of Gross Expenses
to Average Net Assets(4)(5) | Ratio of Net Investment Income (Loss)
to Average Net Assets(4) | Portfolio Turnover Rate(3) |
| | | | | | | | | | | | | | | | | | | |
| Newfleet Core Plus Bond Fund | | | | | | | | | | | | | | | | | | |
| Class A | | | | | | | | | | | | | | | | | | |
| 10/1/22 to 9/30/23 | | $ 9.84 | 0.39 | (0.18) | 0.21 | (0.39) | — | — | (0.39) | — | (0.18) | $ 9.66 | 2.06 % | $ 28,811 | 0.80 % (6) | 1.10 % | 3.90 % | 49 % |
| 10/1/21 to 9/30/22 | | 11.81 | 0.26 | (1.80) | (1.54) | (0.27) | — | (0.16) | (0.43) | — | (1.97) | 9.84 | (13.38) | 27,013 | 0.81 (7) | 1.05 | 2.34 | 52 |
| 10/1/20 to 9/30/21 | | 11.85 | 0.25 | (0.04) | 0.21 | (0.25) | — | — | (0.25) | — | (0.04) | 11.81 | 1.79 | 34,538 | 0.80 | 1.05 | 2.12 | 59 |
| 10/1/19 to 9/30/20 | | 11.51 | 0.30 | 0.34 | 0.64 | (0.30) | — | — | (0.30) | — | 0.34 | 11.85 | 5.66 | 37,507 | 0.81 (8) | 1.07 | 2.61 | 65 |
| 10/1/18 to 9/30/19 | | 10.84 | 0.35 | 0.67 | 1.02 | (0.35) | — | — | (0.35) | — | 0.67 | 11.51 | 9.64 | 36,248 | 0.85 | 1.11 | 3.21 | 59 |
| Class C | | | | | | | | | | | | | | | | | | |
| 10/1/22 to 9/30/23 | | $ 9.61 | 0.31 | (0.18) | 0.13 | (0.31) | — | — | (0.31) | — | (0.18) | $ 9.43 | 1.25 % | $ 1,553 | 1.55 % (6) | 1.87 % | 3.16 % | 49 % |
| 10/1/21 to 9/30/22 | | 11.54 | 0.17 | (1.75) | (1.58) | (0.19) | — | (0.16) | (0.35) | — | (1.93) | 9.61 | (14.05) | 1,283 | 1.56 (7) | 1.84 | 1.55 | 52 |
| 10/1/20 to 9/30/21 | | 11.57 | 0.16 | (0.03) | 0.13 | (0.16) | — | — | (0.16) | — | (0.03) | 11.54 | 1.11 | 2,621 | 1.55 | 1.81 | 1.39 | 59 |
| 10/1/19 to 9/30/20 | | 11.24 | 0.21 | 0.33 | 0.54 | (0.21) | — | — | (0.21) | — | 0.33 | 11.57 | 4.85 | 4,676 | 1.56 (8) | 1.82 | 1.84 | 65 |
| 10/1/18 to 9/30/19 | | 10.59 | 0.27 | 0.65 | 0.92 | (0.27) | — | — | (0.27) | — | 0.65 | 11.24 | 8.78 | 3,725 | 1.59 | 1.85 | 2.49 | 59 |
| Class I | | | | | | | | | | | | | | | | | | |
| 10/1/22 to 9/30/23 | | $10.00 | 0.43 | (0.19) | 0.24 | (0.42) | — | — | (0.42) | — | (0.18) | $ 9.82 | 2.33 % | $ 132,866 | 0.55 % | 0.84 % | 4.26 % | 49 % |
| 10/1/21 to 9/30/22 | | 12.00 | 0.29 | (1.82) | (1.53) | (0.31) | — | (0.16) | (0.47) | — | (2.00) | 10.00 | (13.17) | 63,559 | 0.57 (7) | 0.80 | 2.62 | 52 |
| 10/1/20 to 9/30/21 | | 12.04 | 0.28 | (0.04) | 0.24 | (0.28) | — | — | (0.28) | — | (0.04) | 12.00 | 2.04 | 70,630 | 0.55 | 0.79 | 2.36 | 59 |
| 10/1/19 to 9/30/20 | | 11.70 | 0.33 | 0.34 | 0.67 | (0.33) | — | — | (0.33) | — | 0.34 | 12.04 | 5.87 | 63,222 | 0.56 (8) | 0.80 | 2.85 | 65 |
| 10/1/18 to 9/30/19 | | 11.02 | 0.38 | 0.69 | 1.07 | (0.39) | — | — | (0.39) | — | 0.68 | 11.70 | 9.90 | 54,038 | 0.60 | 0.82 | 3.39 | 59 |
| Class R6 | | | | | | | | | | | | | | | | | | |
| 10/1/22 to 9/30/23 | | $10.01 | 0.44 | (0.19) | 0.25 | (0.43) | — | — | (0.43) | — | (0.18) | $ 9.83 | 2.47 % | $ 1,971 | 0.43 % | 0.74 % | 4.32 % | 49 % |
| 10/1/21 to 9/30/22 | | 12.01 | 0.30 | (1.82) | (1.52) | (0.32) | — | (0.16) | (0.48) | — | (2.00) | 10.01 | (13.05) | 1,338 | 0.45 (7) | 0.73 | 2.74 | 52 |
| 10/1/20 to 9/30/21 | | 12.05 | 0.30 | (0.04) | 0.26 | (0.30) | — | — | (0.30) | — | (0.04) | 12.01 | 2.17 | 1,214 | 0.43 | 0.72 | 2.48 | 59 |
| 10/1/19 to 9/30/20 | | 11.71 | 0.35 | 0.34 | 0.69 | (0.35) | — | — | (0.35) | — | 0.34 | 12.05 | 6.00 | 1,122 | 0.44 (8) | 0.74 | 2.99 | 65 |
| 10/1/18 to 9/30/19 | | 11.02 | 0.40 | 0.69 | 1.09 | (0.40) | — | — | (0.40) | — | 0.69 | 11.71 | 10.13 | 1,031 | 0.48 | 0.77 | 3.52 | 59 |
| | | | | | | | | | | | | | | | | | | |
| Newfleet High Yield Fund | | | | | | | | | | | | | | | | | | |
| Class A | | | | | | | | | | | | | | | | | | |
| 10/1/22 to 9/30/23 | | $ 3.53 | 0.24 | 0.12 | 0.36 | (0.24) | — | — | (0.24) | — | 0.12 | $ 3.65 | 10.27 % | $ 35,738 | 1.01 % (7) | 1.33 % | 6.53 % | 52 % |
| 10/1/21 to 9/30/22 | | 4.28 | 0.20 | (0.75) | (0.55) | (0.20) | — | — | (0.20) | — | (0.75) | 3.53 | (13.15) | 36,258 | 1.01 (7) | 1.27 | 5.10 | 47 |
| 10/1/20 to 9/30/21 | | 4.00 | 0.20 | 0.28 | 0.48 | (0.20) | — | — | (0.20) | — | 0.28 | 4.28 | 12.18 | 47,153 | 1.00 | 1.25 | 4.77 | 74 |
| 10/1/19 to 9/30/20 | | 4.10 | 0.21 | (0.10) | 0.11 | (0.21) | — | — | (0.21) | — | (0.10) | 4.00 | 2.88 | 45,234 | 1.00 | 1.37 | 5.31 | 88 |
| 10/1/18 to 9/30/19 | | 4.13 | 0.23 | (0.03) | 0.20 | (0.23) | — | — | (0.23) | — | (0.03) | 4.10 | 4.99 | 49,890 | 0.99 | 1.36 | 5.61 | 59 |
| Class C | | | | | | | | | | | | | | | | | | |
| 10/1/22 to 9/30/23 | | $ 3.47 | 0.21 | 0.12 | 0.33 | (0.21) | — | — | (0.21) | — | 0.12 | $ 3.59 | 9.51 % | $ 1,098 | 1.76 % (7) | 2.10 % | 5.77 % | 52 % |
| 10/1/21 to 9/30/22 | | 4.21 | 0.17 | (0.74) | (0.57) | (0.17) | — | — | (0.17) | — | (0.74) | 3.47 | (13.87) | 1,013 | 1.76 (7) | 2.08 | 4.34 | 47 |
| 10/1/20 to 9/30/21 | | 3.93 | 0.17 | 0.28 | 0.45 | (0.17) | — | — | (0.17) | — | 0.28 | 4.21 | 11.47 | 1,460 | 1.75 | 2.03 | 4.05 | 74 |
| 10/1/19 to 9/30/20 | | 4.02 | 0.18 | (0.09) | 0.09 | (0.18) | — | — | (0.18) | — | (0.09) | 3.93 | 2.33 | 2,542 | 1.75 | 2.11 | 4.55 | 88 |
| 10/1/18 to 9/30/19 | | 4.06 | 0.19 | (0.04) | 0.15 | (0.19) | — | — | (0.19) | — | (0.04) | 4.02 | 3.94 | 2,207 | 1.75 | 2.11 | 4.85 | 59 |
| Class I | | | | | | | | | | | | | | | | | | |
| 10/1/22 to 9/30/23 | | $ 3.53 | 0.25 | 0.13 | 0.38 | (0.25) | — | — | (0.25) | — | 0.13 | $ 3.66 | 10.84 % | $ 7,225 | 0.76 % (7) | 1.12 % | 6.77 % | 52 % |
| 10/1/21 to 9/30/22 | | 4.29 | 0.21 | (0.76) | (0.55) | (0.21) | — | — | (0.21) | — | (0.76) | 3.53 | (13.14) | 6,196 | 0.76 (7) | 1.10 | 5.34 | 47 |
| 10/1/20 to 9/30/21 | | 4.01 | 0.21 | 0.28 | 0.49 | (0.21) | — | — | (0.21) | — | 0.28 | 4.29 | 12.43 | 8,297 | 0.75 | 1.05 | 5.01 | 74 |
| 10/1/19 to 9/30/20 | | 4.10 | 0.22 | (0.09) | 0.13 | (0.22) | — | — | (0.22) | — | (0.09) | 4.01 | 3.40 | 9,319 | 0.75 | 1.17 | 5.54 | 88 |
| 10/1/18 to 9/30/19 | | 4.13 | 0.24 | (0.03) | 0.21 | (0.24) | — | — | (0.24) | — | (0.03) | 4.10 | 5.25 | 7,805 | 0.75 | 1.15 | 5.82 | 59 |
The footnote legend is at the end of the financial highlights.
See Notes to Financial Statements
VIRTUS OPPORTUNITIES TRUST
FINANCIAL HIGHLIGHTS (Continued)
SELECTED PER SHARE DATA AND RATIOS FOR A SHARE OUTSTANDING
THROUGHOUT EACH PERIOD
| | | Net Asset Value,
Beginning of Period | Net Investment Income (Loss)(1) | Net Realized and
Unrealized Gain (Loss) | Total from Investment Operations | Dividends from
Net Investment Income | Return of Capital | Distributions from
Net Realized Gains | Total Distributions | Payment from Affiliate(1) | Change in Net Asset Value | Net Asset Value, End of Period | Total Return(2)(3) | Net Assets, End of Period
(in thousands) | Ratio of Net Expenses to
Average Net Assets(4)(5) | Ratio of Gross Expenses
to Average Net Assets(4)(5) | Ratio of Net Investment Income (Loss)
to Average Net Assets(4) | Portfolio Turnover Rate(3) |
| Newfleet High Yield Fund (Continued) | | | | | | | | | | | | | | | | | | |
| Class R6 | | | | | | | | | | | | | | | | | | |
| 10/1/22 to 9/30/23 | | $ 3.53 | 0.25 | 0.12 | 0.37 | (0.25) | — | — | (0.25) | — | 0.12 | $ 3.65 | 10.71 % | $ 1,861 | 0.60 % (7) | 0.99 % | 6.93 % | 52 % |
| 10/1/21 to 9/30/22 | | 4.29 | 0.22 | (0.76) | (0.54) | (0.22) | — | — | (0.22) | — | (0.76) | 3.53 | (13.00) | 1,760 | 0.60 (7) | 0.96 | 5.50 | 47 |
| 10/1/20 to 9/30/21 | | 4.00 | 0.22 | 0.29 | 0.51 | (0.22) | — | — | (0.22) | — | 0.29 | 4.29 | 12.87 | 1,937 | 0.60 (8) | 0.93 | 5.12 | 74 |
| 10/1/19 to 9/30/20 | | 4.10 | 0.22 | (0.10) | 0.12 | (0.22) | — | — | (0.22) | — | (0.10) | 4.00 | 3.20 | 1,157 | 0.69 | 1.05 | 5.58 | 88 |
| 10/1/18 to 9/30/19 | | 4.13 | 0.23 | (0.02) | 0.21 | (0.24) | — | — | (0.24) | — | (0.03) | 4.10 | 5.30 | 829 | 0.69 | 1.04 | 5.77 | 59 |
| | | | | | | | | | | | | | | | | | | |
| Newfleet Low Duration Core Plus Bond Fund | | | | | | | | | | | | | | | | | | |
| Class A | | | | | | | | | | | | | | | | | | |
| 10/1/22 to 9/30/23 | | $10.09 | 0.31 | 0.14 | 0.45 | (0.31) | — | — | (0.31) | — | 0.14 | $10.23 | 4.55 % | $ 62,424 | 0.74 % | 0.93 % | 3.05 % | 38 % |
| 10/1/21 to 9/30/22 | | 10.96 | 0.15 | (0.86) | (0.71) | (0.16) | — | — | (0.16) | — | (0.87) | 10.09 | (6.55) | 77,244 | 0.77 (7) | 0.90 | 1.46 | 38 |
| 10/1/20 to 9/30/21 | | 10.96 | 0.16 | — (9) | 0.16 | (0.16) | — | — | (0.16) | — | — (9) | 10.96 | 1.44 | 101,271 | 0.75 | 0.89 | 1.42��� | 55 |
| 10/1/19 to 9/30/20 | | 10.86 | 0.24 | 0.10 | 0.34 | (0.24) | — | — | (0.24) | — | 0.10 | 10.96 | 3.21 | 87,690 | 0.75 | 0.91 | 2.24 | 57 |
| 10/1/18 to 9/30/19 | | 10.64 | 0.29 | 0.22 | 0.51 | (0.29) | — | — | (0.29) | — | 0.22 | 10.86 | 4.82 | 81,384 | 0.75 | 0.95 | 2.67 | 45 |
| Class C | | | | | | | | | | | | | | | | | | |
| 10/1/22 to 9/30/23 | | $10.09 | 0.23 | 0.15 | 0.38 | (0.24) | — | — | (0.24) | — | 0.14 | $10.23 | 3.78 % | $ 8,845 | 1.49 % | 1.66 % | 2.29 % | 38 % |
| 10/1/21 to 9/30/22 | | 10.96 | 0.07 | (0.86) | (0.79) | (0.08) | — | — | (0.08) | — | (0.87) | 10.09 | (7.26) | 11,773 | 1.51 (7) | 1.69 | 0.70 | 38 |
| 10/1/20 to 9/30/21 | | 10.96 | 0.08 | (0.01) | 0.07 | (0.07) | — | — | (0.07) | — | — (9) | 10.96 | 0.68 | 17,403 | 1.50 | 1.66 | 0.69 | 55 |
| 10/1/19 to 9/30/20 | | 10.86 | 0.16 | 0.10 | 0.26 | (0.16) | — | — | (0.16) | — | 0.10 | 10.96 | 2.44 | 20,105 | 1.50 | 1.67 | 1.50 | 57 |
| 10/1/18 to 9/30/19 | | 10.64 | 0.21 | 0.22 | 0.43 | (0.21) | — | — | (0.21) | — | 0.22 | 10.86 | 4.04 | 20,746 | 1.50 | 1.70 | 1.92 | 45 |
| Class I | | | | | | | | | | | | | | | | | | |
| 10/1/22 to 9/30/23 | | $10.08 | 0.34 | 0.14 | 0.48 | (0.34) | — | — | (0.34) | — | 0.14 | $10.22 | 4.81 % | $ 314,549 | 0.49 % | 0.68 % | 3.29 % | 38 % |
| 10/1/21 to 9/30/22 | | 10.96 | 0.18 | (0.88) | (0.70) | (0.18) | — | — | (0.18) | — | (0.88) | 10.08 | (6.41) | 425,501 | 0.52 (7) | 0.66 | 1.69 | 38 |
| 10/1/20 to 9/30/21 | | 10.95 | 0.18 | 0.01 | 0.19 | (0.18) | — | — | (0.18) | — | 0.01 | 10.96 | 1.78 | 634,354 | 0.50 | 0.65 | 1.64 | 55 |
| 10/1/19 to 9/30/20 | | 10.85 | 0.27 | 0.10 | 0.37 | (0.27) | — | — | (0.27) | — | 0.10 | 10.95 | 3.46 | 401,784 | 0.50 | 0.67 | 2.49 | 57 |
| 10/1/18 to 9/30/19 | | 10.63 | 0.31 | 0.22 | 0.53 | (0.31) | — | — | (0.31) | — | 0.22 | 10.85 | 5.09 | 352,583 | 0.50 | 0.70 | 2.91 | 45 |
| Class R6 | | | | | | | | | | | | | | | | | | |
| 10/1/22 to 9/30/23 | | $10.09 | 0.34 | 0.15 | 0.49 | (0.35) | — | — | (0.35) | — | 0.14 | $10.23 | 4.89 % | $ 7,452 | 0.42 % | 0.60 % | 3.37 % | 38 % |
| 10/1/21 to 9/30/22 | | 10.96 | 0.19 | (0.87) | (0.68) | (0.19) | — | — | (0.19) | — | (0.87) | 10.09 | (6.25) | 39,337 | 0.45 (7) | 0.60 | 1.81 | 38 |
| 10/1/20 to 9/30/21 | | 10.96 | 0.16 | 0.03 | 0.19 | (0.19) | — | — | (0.19) | — | — (9) | 10.96 | 1.76 | 27,222 | 0.43 | 0.57 | 1.46 | 55 |
| 10/1/19 to 9/30/20 | | 10.86 | 0.28 | 0.10 | 0.38 | (0.28) | — | — | (0.28) | — | 0.10 | 10.96 | 3.54 | 387 | 0.43 | 0.61 | 2.56 | 57 |
| 12/19/18 (10) to 9/30/19 | | 10.58 | 0.25 | 0.28 | 0.53 | (0.25) | — | — | (0.25) | — | 0.28 | 10.86 | 5.08 | 282 | 0.43 | 0.62 | 3.02 | 45 (11) |
| | | | | | | | | | | | | | | | | | | |
| Newfleet Multi-Sector Intermediate Bond Fund | | | | | | | | | | | | | | | | | | |
| Class A | | | | | | | | | | | | | | | | | | |
| 10/1/22 to 9/30/23 | | $ 8.73 | 0.44 | 0.05 | 0.49 | (0.43) | — | — | (0.43) | — | 0.06 | $ 8.79 | 5.64 % | $ 67,280 | 0.99 % | 1.10 % | 4.94 % | 48 % |
| 10/1/21 to 9/30/22 | | 10.35 | 0.36 | (1.59) | (1.23) | (0.37) | (0.02) | — | (0.39) | — | (1.62) | 8.73 | (12.15) | 64,515 | 1.00 (7) | 1.10 | 3.76 | 52 |
| 10/1/20 to 9/30/21 | | 10.06 | 0.37 | 0.27 | 0.64 | (0.35) | — | — | (0.35) | — (9) | 0.29 | 10.35 | 6.45 (12) | 82,697 | 0.99 | 1.07 | 3.56 | 77 |
| 10/1/19 to 9/30/20 | | 10.16 | 0.39 | (0.11) | 0.28 | (0.38) | — | — | (0.38) | — | (0.10) | 10.06 | 2.86 | 78,378 | 0.99 | 1.09 | 3.87 | 95 |
| 10/1/18 to 9/30/19 | | 9.97 | 0.43 | 0.19 | 0.62 | (0.38) | (0.05) | — | (0.43) | — (9) | 0.19 | 10.16 | 6.43 (12) | 86,034 | 0.98 | 1.10 | 4.34 | 81 |
The footnote legend is at the end of the financial highlights.
See Notes to Financial Statements
VIRTUS OPPORTUNITIES TRUST
FINANCIAL HIGHLIGHTS (Continued)
SELECTED PER SHARE DATA AND RATIOS FOR A SHARE OUTSTANDING
THROUGHOUT EACH PERIOD
| | | Net Asset Value,
Beginning of Period | Net Investment Income (Loss)(1) | Net Realized and
Unrealized Gain (Loss) | Total from Investment Operations | Dividends from
Net Investment Income | Return of Capital | Distributions from
Net Realized Gains | Total Distributions | Payment from Affiliate(1) | Change in Net Asset Value | Net Asset Value, End of Period | Total Return(2)(3) | Net Assets, End of Period
(in thousands) | Ratio of Net Expenses to
Average Net Assets(4)(5) | Ratio of Gross Expenses
to Average Net Assets(4)(5) | Ratio of Net Investment Income (Loss)
to Average Net Assets(4) | Portfolio Turnover Rate(3) |
| Newfleet Multi-Sector Intermediate Bond Fund (Continued) | | | | | | | | | | | | | | | | | | |
| Class C | | | | | | | | | | | | | | | | | | |
| 10/1/22 to 9/30/23 | | $ 8.83 | 0.38 | 0.05 | 0.43 | (0.36) | — | — | (0.36) | — | 0.07 | $ 8.90 | 4.91 % | $ 9,131 | 1.74 % | 1.85 % | 4.15 % | 48 % |
| 10/1/21 to 9/30/22 | | 10.46 | 0.30 | (1.62) | (1.32) | (0.29) | (0.02) | — | (0.31) | — | (1.63) | 8.83 | (12.78) | 12,014 | 1.75 (7) | 1.85 | 3.00 | 52 |
| 10/1/20 to 9/30/21 | | 10.17 | 0.29 | 0.27 | 0.56 | (0.27) | — | — | (0.27) | — (9) | 0.29 | 10.46 | 5.58 (12) | 20,004 | 1.74 | 1.82 | 2.81 | 77 |
| 10/1/19 to 9/30/20 | | 10.26 | 0.31 | (0.10) | 0.21 | (0.30) | — | — | (0.30) | — | (0.09) | 10.17 | 2.16 | 30,872 | 1.74 | 1.83 | 3.12 | 95 |
| 10/1/18 to 9/30/19 | | 10.07 | 0.36 | 0.19 | 0.55 | (0.31) | (0.05) | — | (0.36) | — (9) | 0.19 | 10.26 | 5.57 (12) | 39,778 | 1.73 | 1.85 | 3.63 | 81 |
| Class I | | | | | | | | | | | | | | | | | | |
| 10/1/22 to 9/30/23 | | $ 8.70 | 0.47 | 0.05 | 0.52 | (0.46) | — | — | (0.46) | — | 0.06 | $ 8.76 | 6.01 % | $ 303,103 | 0.74 % | 0.82 % | 5.24 % | 48 % |
| 10/1/21 to 9/30/22 | | 10.33 | 0.39 | (1.60) | (1.21) | (0.40) | (0.02) | — | (0.42) | — | (1.63) | 8.70 | (11.99) | 159,300 | 0.75 (7) | 0.86 | 4.00 | 52 |
| 10/1/20 to 9/30/21 | | 10.05 | 0.39 | 0.28 | 0.67 | (0.39) | — | — | (0.39) | — (9) | 0.28 | 10.33 | 6.70 (12) | 212,633 | 0.74 | 0.82 | 3.80 | 77 |
| 10/1/19 to 9/30/20 | | 10.15 | 0.41 | (0.10) | 0.31 | (0.41) | — | — | (0.41) | — | (0.10) | 10.05 | 3.19 | 299,784 | 0.74 | 0.83 | 4.09 | 95 |
| 10/1/18 to 9/30/19 | | 9.98 | 0.46 | 0.18 | 0.64 | (0.42) | (0.05) | — | (0.47) | — (9) | 0.17 | 10.15 | 6.57 (12) | 177,574 | 0.73 | 0.85 | 4.57 | 81 |
| Class R6 | | | | | | | | | | | | | | | | | | |
| 10/1/22 to 9/30/23 | | $ 8.76 | 0.48 | 0.06 | 0.54 | (0.46) | — | — | (0.46) | — | 0.08 | $ 8.84 | 6.21 % | $ 18,072 | 0.60 % | 0.77 % | 5.39 % | 48 % |
| 10/1/21 to 9/30/22 | | 10.38 | 0.40 | (1.60) | (1.20) | (0.40) | (0.02) | — | (0.42) | — | (1.62) | 8.76 | (11.83) | 5,175 | 0.61 (7) | 0.78 | 4.15 | 52 |
| 10/1/20 to 9/30/21 | | 10.08 | 0.41 | 0.28 | 0.69 | (0.39) | — | — | (0.39) | — (9) | 0.30 | 10.38 | 6.87 (12) | 6,345 | 0.60 | 0.75 | 3.94 | 77 |
| 10/1/19 to 9/30/20 | | 10.17 | 0.42 | (0.10) | 0.32 | (0.41) | — | — | (0.41) | — | (0.09) | 10.08 | 3.28 | 6,068 | 0.60 | 0.76 | 4.25 | 95 |
| 10/1/18 to 9/30/19 | | 9.98 | 0.46 | 0.20 | 0.66 | (0.42) | (0.05) | — | (0.47) | — (9) | 0.19 | 10.17 | 6.77 (12) | 4,903 | 0.59 | 0.78 | 4.65 | 81 |
| | | | | | | | | | | | | | | | | | | |
| Newfleet Multi-Sector Short Term Bond Fund | | | | | | | | | | | | | | | | | | |
| Class A | | | | | | | | | | | | | | | | | | |
| 10/1/22 to 9/30/23 | | $ 4.30 | 0.15 | 0.07 | 0.22 | (0.15) | — | — | (0.15) | — | 0.07 | $ 4.37 | 5.17 % | $ 660,114 | 0.89 % | 0.97 % | 3.47 % | 37 % |
| 10/1/21 to 9/30/22 | | 4.76 | 0.09 | (0.45) | (0.36) | (0.09) | (0.01) | — | (0.10) | — | (0.46) | 4.30 | (7.65) | 771,020 | 0.92 (7)(8) | 0.97 | 2.04 | 41 |
| 10/1/20 to 9/30/21 | | 4.73 | 0.10 | 0.03 | 0.13 | (0.10) | — | — | (0.10) | — | 0.03 | 4.76 | 2.78 | 956,384 | 0.96 (13) | 0.96 | 2.02 | 64 |
| 10/1/19 to 9/30/20 | | 4.72 | 0.12 | 0.02 | 0.14 | (0.12) | (0.01) | — | (0.13) | — | 0.01 | 4.73 | 3.10 | 857,107 | 0.98 (13) | 0.98 | 2.58 | 70 |
| 10/1/18 to 9/30/19 | | 4.65 | 0.14 | 0.07 | 0.21 | (0.12) | (0.02) | — | (0.14) | — | 0.07 | 4.72 | 4.62 | 898,392 | 0.97 (13) | 0.98 | 3.01 | 58 |
| Class C | | | | | | | | | | | | | | | | | | |
| 10/1/22 to 9/30/23 | | $ 4.37 | 0.14 | 0.06 | 0.20 | (0.14) | — | — | (0.14) | — | 0.06 | $ 4.43 | 4.58 % | $ 132,559 | 1.15 % | 1.23 % | 3.19 % | 37 % |
| 10/1/21 to 9/30/22 | | 4.83 | 0.08 | (0.45) | (0.37) | (0.08) | (0.01) | — | (0.09) | — | (0.46) | 4.37 | (7.79) | 181,221 | 1.18 (7)(8) | 1.24 | 1.77 | 41 |
| 10/1/20 to 9/30/21 | | 4.79 | 0.09 | 0.04 | 0.13 | (0.09) | — | — | (0.09) | — | 0.04 | 4.83 | 2.69 | 267,919 | 1.21 (13) | 1.21 | 1.82 | 64 |
| 10/1/19 to 9/30/20 | | 4.78 | 0.11 | 0.02 | 0.13 | (0.11) | (0.01) | — | (0.12) | — | 0.01 | 4.79 | 2.81 | 433,279 | 1.21 (13) | 1.21 | 2.35 | 70 |
| 10/1/18 to 9/30/19 | | 4.71 | 0.13 | 0.07 | 0.20 | (0.11) | (0.02) | — | (0.13) | — | 0.07 | 4.78 | 4.31 | 575,524 | 1.21 (13) | 1.21 | 2.78 | 58 |
| Class C1 | | | | | | | | | | | | | | | | | | |
| 10/1/22 to 9/30/23 | | $ 4.36 | 0.12 | 0.06 | 0.18 | (0.12) | — | — | (0.12) | — | 0.06 | $ 4.42 | 4.09 % | $ 33,679 | 1.65 % | 1.72 % | 2.70 % | 37 % |
| 10/1/21 to 9/30/22 | | 4.82 | 0.06 | (0.46) | (0.40) | (0.05) | (0.01) | — | (0.06) | — | (0.46) | 4.36 | (8.25) | 44,838 | 1.68 (7)(8) | 1.72 | 1.27 | 41 |
| 10/1/20 to 9/30/21 | | 4.78 | 0.06 | 0.04 | 0.10 | (0.06) | — | — | (0.06) | — | 0.04 | 4.82 | 2.19 | 70,114 | 1.71 (13) | 1.71 | 1.32 | 64 |
| 10/1/19 to 9/30/20 | | 4.77 | 0.09 | 0.02 | 0.11 | (0.09) | (0.01) | — | (0.10) | — | 0.01 | 4.78 | 2.31 | 114,699 | 1.71 (13) | 1.71 | 1.85 | 70 |
| 10/1/18 to 9/30/19 | | 4.70 | 0.11 | 0.07 | 0.18 | (0.09) | (0.02) | — | (0.11) | — | 0.07 | 4.77 | 3.80 | 195,185 | 1.71 (13) | 1.72 | 2.28 | 58 |
The footnote legend is at the end of the financial highlights.
See Notes to Financial Statements
VIRTUS OPPORTUNITIES TRUST
FINANCIAL HIGHLIGHTS (Continued)
SELECTED PER SHARE DATA AND RATIOS FOR A SHARE OUTSTANDING
THROUGHOUT EACH PERIOD
| | | Net Asset Value,
Beginning of Period | Net Investment Income (Loss)(1) | Net Realized and
Unrealized Gain (Loss) | Total from Investment Operations | Dividends from
Net Investment Income | Return of Capital | Distributions from
Net Realized Gains | Total Distributions | Payment from Affiliate(1) | Change in Net Asset Value | Net Asset Value, End of Period | Total Return(2)(3) | Net Assets, End of Period
(in thousands) | Ratio of Net Expenses to
Average Net Assets(4)(5) | Ratio of Gross Expenses
to Average Net Assets(4)(5) | Ratio of Net Investment Income (Loss)
to Average Net Assets(4) | Portfolio Turnover Rate(3) |
| Newfleet Multi-Sector Short Term Bond Fund (Continued) | | | | | | | | | | | | | | | | | | |
| Class I | | | | | | | | | | | | | | | | | | |
| 10/1/22 to 9/30/23 | | $ 4.31 | 0.16 | 0.06 | 0.22 | (0.16) | — | — | (0.16) | — | 0.06 | $ 4.37 | 5.18 % | $3,639,516 | 0.64 % | 0.72 % | 3.72 % | 37 % |
| 10/1/21 to 9/30/22 | | 4.77 | 0.10 | (0.45) | (0.35) | (0.10) | (0.01) | — | (0.11) | — | (0.46) | 4.31 | (7.40) | 4,254,653 | 0.67 (7)(8) | 0.72 | 2.29 | 41 |
| 10/1/20 to 9/30/21 | | 4.73 | 0.11 | 0.04 | 0.15 | (0.11) | — | — | (0.11) | — | 0.04 | 4.77 | 3.25 | 5,221,147 | 0.71 (13) | 0.71 | 2.28 | 64 |
| 10/1/19 to 9/30/20 | | 4.72 | 0.13 | 0.02 | 0.15 | (0.13) | (0.01) | — | (0.14) | — | 0.01 | 4.73 | 3.36 | 4,539,835 | 0.72 (13) | 0.72 | 2.83 | 70 |
| 10/1/18 to 9/30/19 | | 4.66 | 0.15 | 0.06 | 0.21 | (0.13) | (0.02) | — | (0.15) | — | 0.06 | 4.72 | 4.66 | 4,695,968 | 0.72 (13) | 0.72 | 3.26 | 58 |
| Class R6 | | | | | | | | | | | | | | | | | | |
| 10/1/22 to 9/30/23 | | $ 4.32 | 0.16 | 0.07 | 0.23 | (0.16) | — | — | (0.16) | — | 0.07 | $ 4.39 | 5.48 % | $ 10,991 | 0.51 % | 0.69 % | 3.75 % | 37 % |
| 10/1/21 to 9/30/22 | | 4.78 | 0.11 | (0.46) | (0.35) | (0.10) | (0.01) | — | (0.11) | — | (0.46) | 4.32 | (7.32) | 25,862 | 0.54 (7)(8) | 0.69 | 2.43 | 41 |
| 10/1/20 to 9/30/21 | | 4.74 | 0.12 | 0.04 | 0.16 | (0.12) | — | — | (0.12) | — | 0.04 | 4.78 | 3.31 | 30,118 | 0.55 | 0.67 | 2.42 | 64 |
| 10/1/19 to 9/30/20 | | 4.72 | 0.14 | 0.03 | 0.17 | (0.14) | (0.01) | — | (0.15) | — | 0.02 | 4.74 | 3.65 | 11,358 | 0.55 | 0.65 | 2.99 | 70 |
| 10/1/18 to 9/30/19 | | 4.65 | 0.16 | 0.07 | 0.23 | (0.14) | (0.02) | — | (0.16) | — | 0.07 | 4.72 | 4.96 | 6,408 | 0.55 | 0.65 | 3.42 | 58 |
| | | | | | | | | | | | | | | | | | | |
| Newfleet Senior Floating Rate Fund | | | | | | | | | | | | | | | | | | |
| Class A | | | | | | | | | | | | | | | | | | |
| 10/1/22 to 9/30/23 | | $ 8.43 | 0.64 | 0.28 | 0.92 | (0.65) | — | — | (0.65) | — | 0.27 | $ 8.70 | 11.20 % | $ 61,100 | 1.04 % (14) | 1.12 % | 7.48 % | 50 % |
| 10/1/21 to 9/30/22 | | 9.01 | 0.32 | (0.58) | (0.26) | (0.32) | — | — | (0.32) | — | (0.58) | 8.43 | (2.87) | 56,561 | 1.05 (7)(14) | 1.11 | 3.65 | 33 |
| 10/1/20 to 9/30/21 | | 8.58 | 0.28 | 0.43 | 0.71 | (0.28) | — | — | (0.28) | — | 0.43 | 9.01 | 8.40 | 72,274 | 1.04 (14) | 1.08 | 3.18 | 65 |
| 10/1/19 to 9/30/20 | | 9.11 | 0.38 | (0.54) | (0.16) | (0.37) | — | — | (0.37) | — | (0.53) | 8.58 | (1.66) | 57,743 | 1.12 (14) | 1.13 | 4.31 | 40 |
| 10/1/18 to 9/30/19 | | 9.41 | 0.46 | (0.30) | 0.16 | (0.46) | — | — | (0.46) | — | (0.30) | 9.11 | 1.80 | 167,595 | 1.10 (14) | 1.11 | 4.96 | 24 |
| Class C | | | | | | | | | | | | | | | | | | |
| 10/1/22 to 9/30/23 | | $ 8.43 | 0.58 | 0.28 | 0.86 | (0.58) | — | — | (0.58) | — | 0.28 | $ 8.71 | 10.50 % | $ 6,311 | 1.79 % (14) | 1.89 % | 6.69 % | 50 % |
| 10/1/21 to 9/30/22 | | 9.02 | 0.26 | (0.59) | (0.33) | (0.26) | — | — | (0.26) | — | (0.59) | 8.43 | (3.71) | 7,202 | 1.80 (7)(14) | 1.87 | 2.92 | 33 |
| 10/1/20 to 9/30/21 | | 8.59 | 0.22 | 0.43 | 0.65 | (0.22) | — | — | (0.22) | — | 0.43 | 9.02 | 7.59 | 9,595 | 1.78 (14) | 1.85 | 2.49 | 65 |
| 10/1/19 to 9/30/20 | | 9.12 | 0.30 | (0.52) | (0.22) | (0.31) | — | — | (0.31) | — | (0.53) | 8.59 | (2.36) | 27,287 | 1.86 (14) | 1.92 | 3.47 | 40 |
| 10/1/18 to 9/30/19 | | 9.42 | 0.39 | (0.30) | 0.09 | (0.39) | — | — | (0.39) | — | (0.30) | 9.12 | 1.05 | 47,050 | 1.86 (14) | 1.92 | 4.23 | 24 |
| Class I | | | | | | | | | | | | | | | | | | |
| 10/1/22 to 9/30/23 | | $ 8.41 | 0.66 | 0.29 | 0.95 | (0.67) | — | — | (0.67) | — | 0.28 | $ 8.69 | 11.61 % | $ 126,422 | 0.79 % (14) | 0.87 % | 7.70 % | 50 % |
| 10/1/21 to 9/30/22 | | 9.00 | 0.35 | (0.59) | (0.24) | (0.35) | — | — | (0.35) | — | (0.59) | 8.41 | (2.75) | 119,257 | 0.80 (7)(14) | 0.86 | 3.94 | 33 |
| 10/1/20 to 9/30/21 | | 8.57 | 0.30 | 0.44 | 0.74 | (0.31) | — | — | (0.31) | — | 0.43 | 9.00 | 8.68 | 136,742 | 0.79 (14) | 0.83 | 3.42 | 65 |
| 10/1/19 to 9/30/20 | | 9.10 | 0.39 | (0.52) | (0.13) | (0.40) | — | — | (0.40) | — | (0.53) | 8.57 | (1.39) | 110,156 | 0.86 (14) | 0.91 | 4.45 | 40 |
| 10/1/18 to 9/30/19 | | 9.40 | 0.48 | (0.30) | 0.18 | (0.48) | — | — | (0.48) | — | (0.30) | 9.10 | 2.05 | 158,703 | 0.86 (14) | 0.91 | 5.20 | 24 |
| Class R6 | | | | | | | | | | | | | | | | | | |
| 10/1/22 to 9/30/23 | | $ 8.41 | 0.67 | 0.29 | 0.96 | (0.68) | — | — | (0.68) | — | 0.28 | $ 8.69 | 11.77 % | $ 1,262 | 0.65 % (14) | 0.80 % | 7.84 % | 50 % |
| 10/1/21 to 9/30/22 | | 9.00 | 0.36 | (0.59) | (0.23) | (0.36) | — | — | (0.36) | — | (0.59) | 8.41 | (2.61) | 1,345 | 0.66 (7)(14) | 0.80 | 4.08 | 33 |
| 10/1/20 to 9/30/21 | | 8.57 | 0.32 | 0.43 | 0.75 | (0.32) | — | — | (0.32) | — | 0.43 | 9.00 | 8.83 | 1,616 | 0.65 (14) | 0.77 | 3.61 | 65 |
| 10/1/19 to 9/30/20 | | 9.11 | 0.37 | (0.50) | (0.13) | (0.41) | — | — | (0.41) | — | (0.54) | 8.57 | (1.33) | 2,746 | 0.70 (14) | 0.82 | 4.51 | 40 |
| 10/1/18 to 9/30/19 | | 9.40 | 0.49 | (0.28) | 0.21 | (0.50) | — | — | (0.50) | — | (0.29) | 9.11 | 2.31 | 219 | 0.71 (14) | 0.84 | 5.35 | 24 |
The footnote legend is at the end of the financial highlights.
See Notes to Financial Statements
VIRTUS OPPORTUNITIES TRUST
FINANCIAL HIGHLIGHTS (Continued)
SELECTED PER SHARE DATA AND RATIOS FOR A SHARE OUTSTANDING
THROUGHOUT EACH PERIOD
| | | Net Asset Value,
Beginning of Period | Net Investment Income (Loss)(1) | Net Realized and
Unrealized Gain (Loss) | Total from Investment Operations | Dividends from
Net Investment Income | Return of Capital | Distributions from
Net Realized Gains | Total Distributions | Payment from Affiliate(1) | Change in Net Asset Value | Net Asset Value, End of Period | Total Return(2)(3) | Net Assets, End of Period
(in thousands) | Ratio of Net Expenses to
Average Net Assets(4)(5) | Ratio of Gross Expenses
to Average Net Assets(4)(5) | Ratio of Net Investment Income (Loss)
to Average Net Assets(4) | Portfolio Turnover Rate(3) |
| | | | | | | | | | | | | | | | | | | |
| Seix Tax-Exempt Bond Fund | | | | | | | | | | | | | | | | | | |
| Class A | | | | | | | | | | | | | | | | | | |
| 10/1/22 to 9/30/23 | | $ 9.94 | 0.27 | (0.05) | 0.22 | (0.27) | — | — | (0.27) | — | (0.05) | $ 9.89 | 2.14 % | $ 27,621 | 0.83 % | 1.08 % | 2.69 % | 23 % |
| 10/1/21 to 9/30/22 | | 11.36 | 0.23 | (1.38) | (1.15) | (0.23) | — | (0.04) | (0.27) | — | (1.42) | 9.94 | (10.30) | 29,594 | 0.85 (7)(8) | 1.02 | 2.13 | 1 |
| 10/1/20 to 9/30/21 | | 11.45 | 0.23 | — (9) | 0.23 | (0.23) | — | (0.09) | (0.32) | — | (0.09) | 11.36 | 2.04 | 37,928 | 0.85 | 1.01 | 2.05 | 6 |
| 10/1/19 to 9/30/20 | | 11.34 | 0.25 | 0.11 | 0.36 | (0.25) | — | — | (0.25) | — | 0.11 | 11.45 | 3.17 | 37,078 | 0.85 | 1.01 | 2.21 | 6 |
| 10/1/18 to 9/30/19 | | 10.88 | 0.27 | 0.53 | 0.80 | (0.27) | — | (0.07) | (0.34) | — | 0.46 | 11.34 | 7.50 | 38,374 | 0.85 | 0.99 | 2.47 | 4 |
| Class C | | | | | | | | | | | | | | | | | | |
| 10/1/22 to 9/30/23 | | $ 9.94 | 0.20 | (0.06) | 0.14 | (0.19) | — | — | (0.19) | — | (0.05) | $ 9.89 | 1.37 % | $ 1,370 | 1.58 % | 1.81 % | 1.94 % | 23 % |
| 10/1/21 to 9/30/22 | | 11.36 | 0.15 | (1.38) | (1.23) | (0.15) | — | (0.04) | (0.19) | — | (1.42) | 9.94 | (10.97) | 2,058 | 1.60 (7)(8) | 1.77 | 1.37 | 1 |
| 10/1/20 to 9/30/21 | | 11.45 | 0.15 | — (9) | 0.15 | (0.15) | — | (0.09) | (0.24) | — | (0.09) | 11.36 | 1.28 | 3,561 | 1.60 | 1.75 | 1.31 | 6 |
| 10/1/19 to 9/30/20 | | 11.34 | 0.17 | 0.10 | 0.27 | (0.16) | — | — | (0.16) | — | 0.11 | 11.45 | 2.40 | 8,145 | 1.60 | 1.74 | 1.47 | 6 |
| 10/1/18 to 9/30/19 | | 10.89 | 0.19 | 0.52 | 0.71 | (0.19) | — | (0.07) | (0.26) | — | 0.45 | 11.34 | 6.60 | 11,194 | 1.60 | 1.73 | 1.73 | 4 |
| Class I | | | | | | | | | | | | | | | | | | |
| 10/1/22 to 9/30/23 | | $ 9.94 | 0.30 | (0.06) | 0.24 | (0.29) | — | — | (0.29) | — | (0.05) | $ 9.89 | 2.39 % | $ 36,821 | 0.58 % | 0.83 % | 2.94 % | 23 % |
| 10/1/21 to 9/30/22 | | 11.36 | 0.26 | (1.39) | (1.13) | (0.25) | — | (0.04) | (0.29) | — | (1.42) | 9.94 | (10.07) | 43,793 | 0.60 (7)(8) | 0.79 | 2.37 | 1 |
| 10/1/20 to 9/30/21 | | 11.45 | 0.26 | — (9) | 0.26 | (0.26) | — | (0.09) | (0.35) | — | (0.09) | 11.36 | 2.29 | 62,412 | 0.60 | 0.77 | 2.30 | 6 |
| 10/1/19 to 9/30/20 | | 11.34 | 0.28 | 0.10 | 0.38 | (0.27) | — | — | (0.27) | — | 0.11 | 11.45 | 3.43 | 67,924 | 0.60 | 0.78 | 2.46 | 6 |
| 10/1/18 to 9/30/19 | | 10.88 | 0.30 | 0.53 | 0.83 | (0.30) | — | (0.07) | (0.37) | — | 0.46 | 11.34 | 7.76 | 84,588 | 0.60 | 0.78 | 2.72 | 4 |
| Footnote Legend: |
| (1) | Calculated using average shares outstanding. |
| (2) | Sales charges, where applicable, are not reflected in the total return calculation. |
| (3) | Not annualized for periods less than one year. |
| (4) | Annualized for periods less than one year. |
| (5) | The Funds will also indirectly bear their prorated share of expenses of any underlying funds in which they invest. Such expenses are not included in the calculation of this ratio. |
| (6) | Includes interest expense on borrowings. |
| (7) | Net expense ratio includes extraordinary proxy expenses. |
| (8) | Due to a change in expense cap, the ratio shown is a blended expense ratio. |
| (9) | Amount is less than $0.005 per share. |
| (10) | Inception date. |
| (11) | Portfolio turnover is representative of the Fund for the entire period. |
| (12) | Payment from affiliate had no impact on total return. |
| (13) | The share class is currently under its expense limitation. |
| (14) | Ratios of total expenses excluding interest expense on borrowings for year ended September 30, 2023, 2022, 2021, 2020 and 2019, were 0.94% (Class A), 1.69% (Class C), 0.69% (Class I) and 0.55% (Class R6). |
See Notes to Financial Statements
VIRTUS OPPORTUNITIES TRUST
NOTES TO FINANCIAL STATEMENTS
September 30, 2023
Note 1. Organization
Virtus Opportunities Trust (the “Trust”) is organized as a Delaware statutory trust and is registered under the Investment Company Act of 1940, as amended (the “1940 Act”), as an open-end management investment company.
As of the date of this report, 25 funds of the Trust are offered for sale, of which 7 (each a “Fund” or collectively, the “Funds”) are reported in this annual report. Each Fund has a distinct investment objective and all of the Funds are diversified. Each Fund’s investment objective is outlined in its respective Fund Summary page. There is no guarantee that a Fund will achieve its objective(s).
All of the Funds offer Class A shares, Class C shares and Class I shares. All of the Funds with the exception of the Seix Tax-Exempt Bond Fund offer Class R6 shares. The Newfleet Multi-Sector Short Term Bond Fund offers Class C1 shares.
Class A shares of Newfleet Low Duration Core Plus Bond Fund and Newfleet Multi-Sector Short Term Bond Fund are sold with a front-end sales charge of 2.25% with some exceptions. Class A shares of the Newfleet Senior Floating Rate Fund and Seix Tax-Exempt Bond Fund are sold with a front-end sales charge of up to 2.75% with some exceptions. Class A shares of the Newfleet Core Plus Bond Fund, Newfleet High Yield Fund, and Newfleet Multi-Sector Intermediate Bond Fund are sold with a front-end sales charge of up to 3.75% with some exceptions. Generally, Class A shares are not subject to any charges by the Funds when redeemed; however, a 0.50% – 1% contingent deferred sales charge (“CDSC”) may be imposed on certain redemptions made within a certain period following purchases on which a finder’s fee has been paid. The period for which such CDSC applies for the Funds is 18 months. The CDSC period begins on the last day of the month preceding the month in which the purchase was made.
Class C shares are generally sold with a 1% CDSC (except the Newfleet Multi-Sector Short Term Bond Fund, which are sold without a sales charge), applicable if redeemed within one year of purchase. Class C shares and any reinvested dividends and other distributions paid on such shares, will be automatically converted to Class A shares of the same Fund following a required holding period, which as of March 1, 2021, was eight years. Effective January 1, 2019, to February 28, 2021, with certain exceptions, Class C shares for all Funds (except the Newfleet Multi-Sector Short Term Bond Fund) and Class C1 shares of the Newfleet Multi-Sector Short Term Bond Fund and any reinvested dividends and other distributions paid on such shares, were automatically converted to Class A shares of the same Fund ten years after the purchase date. If an investor intends to purchase greater than $999,999 of Class C shares of Newfleet Core Plus Bond Fund, Newfleet High Yield Fund, Newfleet Multi-Sector Intermediate Bond Fund, Newfleet Senior Floating Rate Fund and Seix Tax-Exempt Bond Fund, and purchase greater than $249,999 of Class C shares of Newfleet Low Duration Core Plus Bond Fund, and the purchase would qualify for Class A shares with no load, then the purchase will automatically be made into a purchase of Class A shares, thus reducing expenses. Effective April 30, 2019, Class C shares of the Newfleet Multi-Sector Short Term Bond Fund are no longer available for purchase by new or existing shareholders, except by existing shareholders through reinvestment transactions. Shareholders who own Class C shares of the Newfleet Multi-Sector Short Term Bond Fund may continue to hold such shares until they convert to Class A shares under the existing conversion schedule, as described in the Fund’s prospectus, or may exchange them for Class C shares of another Virtus Mutual Fund as permitted by existing exchange privileges. All other Class C share characteristics of the Newfleet Multi-Sector Short Term Bond Fund, including 12b-1 Plan fees, shareholder service fees, and conversion features are unchanged. Class I shares and Class R6 shares are sold without a front-end sales charge or CDSC.
Class I Shares are offered primarily to clients of financial intermediaries that (i) charge such clients an ongoing fee for advisory, investment, consulting, or similar services; or (ii) have entered into an agreement with the funds’ distributor to offer Class I Shares through a no-load network or platform. Such clients may include pension and profit sharing plans, other employee benefit trusts, endowments, foundations and corporations. Class I Shares are also offered to private and institutional clients of, or referred by, the adviser, a subadviser or their affiliates, and to Trustees of the funds and trustees/directors of affiliated open- and closed-end funds, and directors, officers and employees of Virtus and its affiliates. If you are eligible to purchase and do purchase Class I Shares, you will pay no sales charge at any time. There are no distribution and service fees applicable to Class I Shares.
Class R6 shares are offered without a minimum initial investment to the following investors in plan level or omnibus accounts only (provided that they do not require or receive any compensation, administrative payments, sub-transfer agency payments or service payments with respect to Class R6 shares): (i) qualified retirement plans, including, but not limited to, 401(k) plans, 457 plans, employer-sponsored 403(b) plans, and defined benefit plans; (ii) banks and trust companies; (iii) insurance companies; (iv) financial intermediaries utilizing such shares in fee-based investment advisory programs; (v) registered investment companies; and (vi) non-qualified deferred compensation plans. Other institutional investors may be permitted to purchase Class R6 shares subject to the applicable Fund’s determination of eligibility and may be subject to a $2,500,000 minimum initial investment requirement. In addition, without a minimum initial investment requirement, Class R6 shares are available to any Trustee of the Virtus Funds and trustees/directors of affiliated open- and closed-end funds, directors, officers and employees of Virtus and its affiliates, and a spouse or domestic partner, child or minor grandchild of any such qualifying individual (in each case either individually or jointly with other investors), provided in each case that those shares are held directly with the Transfer Agent or in an eligible account. Class R6 shares do not carry sales commissions or pay Rule 12b-1 fees. No compensation, administrative payments, sub-transfer agency payments or service payments are paid to brokers or other entities from Fund assets or the Funds’ distributor’s or an affiliate’s resources on sales of or investments in Class R6 shares.
The Funds may impose an annual fee on accounts having balances of less than $2,500. The small account fee may be waived in certain circumstances, as disclosed in the prospectuses and/or statement of additional information. The fees collected will be used to offset certain expenses of the Funds. These fees are reflected as “Less low balance account fees” in each Fund’s Statement of Operations for the period, as applicable.
Each class of shares has identical voting, dividend, liquidation and other rights and the same terms and conditions, except that each class bears any expenses attributable specifically to that class (“class-specific expenses”) and has exclusive voting rights with respect to any Rule 12b-1 and/or shareholder service plan (“12b-1 Plan”) approved by the Board. Class I shares and Class R6 shares are not subject to a 12b-1 Plan. Class-specific expenses may include shareholder servicing fees, sub-transfer agency fees, and fees under a 12b-1 Plan, as well as certain other expenses as
VIRTUS OPPORTUNITIES TRUST
NOTES TO FINANCIAL STATEMENTS (Continued)
September 30, 2023
designated by the Funds’ Treasurer and approved by the Board. Investment income, common operating expenses and realized and unrealized gains and losses of each Fund are borne pro-rata by the holders of each class of shares.
Note 2. Significant Accounting Policies
($ reported in thousands)
The Trust is an investment company that follows the accounting and reporting guidance of the Financial Accounting Standards Board (“FASB”) Accounting Standards Codification Topic 946 Financial Services – Investment Companies. The following is a summary of significant accounting policies consistently followed by the Funds in the preparation of their financial statements. The preparation of financial statements in conformity with U.S. generally accepted accounting principles (“U.S. GAAP”) requires management to make estimates and assumptions that affect the reported amounts of assets and liabilities, disclosure of contingent assets and liabilities at the date of the financial statements, and the reported amounts of increases and decreases in net assets from operations during the reporting period. Actual results could differ from those estimates and those differences could be significant.
| A. | Security Valuation |
| | The Funds’ Board of Trustees (the “Board”) has designated the Investment Adviser as the valuation designee to perform fair valuations pursuant to Rule 2a-5 under the Investment Company Act of 1940. Each Fund utilizes a fair value hierarchy which prioritizes the inputs to valuation techniques used to measure fair value into three broad levels. The Funds’ policy is to recognize transfers into or out of Level 3 at the end of the reporting period. |
| | • Level 1 – quoted prices in active markets for identical securities (security types generally include listed equities). |
| | • Level 2 – prices determined using other significant observable inputs (including quoted prices for similar securities, interest rates, prepayment speeds, credit risk, etc.). |
| | • Level 1 – prices determined using significant unobservable inputs (including the Investment Adviser’s Valuation Committee’s own assumptions in determining the fair value of investments). |
A description of the valuation techniques applied to a Fund’s major categories of assets and liabilities measured at fair value on a recurring basis is as follows:
Equity securities are valued at the official closing price (typically last sale) on the exchange on which the securities are primarily traded or, if no closing price is available, at the last bid price and are categorized as Level 1 in the hierarchy. Illiquid, restricted equity securities and illiquid private placements are internally fair valued by the Investment Adviser’s Valuation Committee, and are generally categorized as Level 3 in the hierarchy.
Certain non-U.S. securities may be fair valued in cases where closing prices are not readily available or are deemed not reflective of readily available market prices. For example, significant events (such as movement in the U.S. securities market, or other regional and local developments) may occur between the time that non-U.S. markets close (where the security is principally traded) and the time that a Fund calculates its net asset value (“NAV”) at the close of regular trading on the NYSE (generally 4 p.m. Eastern time) that may impact the value of securities traded in these non-U.S. markets. In such cases, the Funds fair value non-U.S. securities using an independent pricing service which considers the correlation of the trading patterns of the non-U.S. security to the intraday trading in the U.S. markets for investments such as ADRs, financial futures, ETFs, and certain indexes, as well as prices for similar securities. Such fair valuations are categorized as Level 2 in the hierarchy. Because the frequency of significant events is not predictable, fair valuation of certain non-U.S. common stocks may occur on a frequent basis.
Debt instruments, including convertible bonds, and restricted securities, are valued based on evaluated quotations received from independent pricing services or from dealers who make markets in such securities. For most bond types, the pricing service utilizes matrix pricing that considers one or more of the following factors: yield or price of bonds of comparable quality, coupon, maturity, current cash flows, type, activity of the underlying equities, and current day trade information, as well as dealer supplied prices. These valuations are generally categorized as Level 2 in the hierarchy. Structured debt instruments, such as mortgage-backed and asset-backed securities may also incorporate collateral analysis and utilize cash flow models for valuation and are generally categorized as Level 2 in the hierarchy. Pricing services do not provide pricing for all securities and therefore indicative bids from dealers are utilized which are based on pricing models used by market makers in the security and are generally categorized as Level 2 in the hierarchy. Debt instruments that are internally fair valued by the Investment Adviser’s Valuation Committee are generally categorized as Level 3 in the hierarchy.
Listed derivatives, such as options, that are actively traded are valued at the last posted settlement price from the exchange where they are principally traded and are categorized as Level 1 in the hierarchy. Over-the-counter (“OTC”) derivative contracts, which include forward currency contracts and equity-linked instruments, do not require material subjectivity as pricing inputs are observed from actively quoted markets and are categorized as Level 2 in the hierarchy.
Investments in open-end mutual funds are valued at NAV. Investments in closed-end funds and ETFs are valued as of the close of regular trading on the NYSE each business day. Each is categorized as Level 1 in the hierarchy.
A summary of the inputs used to value a Fund’s net assets by each major security type is disclosed at the end of the Schedule of Investments for each Fund. The inputs or methodologies used for valuing securities are not necessarily an indication of the risk associated with investing in those securities.
VIRTUS OPPORTUNITIES TRUST
NOTES TO FINANCIAL STATEMENTS (Continued)
September 30, 2023
| B. | Security Transactions and Investment Income |
| | Security transactions are recorded on the trade date. Realized gains and losses from the sale of securities are determined on the identified cost basis. Dividend income and capital gain distributions are recognized on the ex-dividend date or, in the case of certain foreign securities, as soon as a Fund is notified. Interest income is recorded on the accrual basis. Each Fund amortizes premiums and accretes discounts using the effective interest method. Premiums on callable debt instruments are amortized to interest income to the earliest call date using the effective interest method. Any distributions from underlying funds are recorded in accordance with the character of the distributions as designated by the underlying funds. |
| | Dividend income from REITs is recorded using management’s estimate of the percentage of income included in distributions received from such investments based on historical information and other industry sources. The return of capital portion of the estimate is a reduction to investment income and a reduction in the cost basis of each investment which increases net realized gain (loss) and net change in unrealized appreciation (depreciation). If the return of capital distributions exceed their cost basis, the distributions are treated as realized gains. The actual amounts of income, return of capital, and capital gains are only determined by each REIT after its fiscal year-end, and may differ from the estimated amounts. |
| C. | Income Taxes |
| | Each Fund is treated as a separate taxable entity. It is the intention of each Fund to comply with the requirements of Subchapter M of the Internal Revenue Code of 1986, as amended (the “Code”) and to distribute substantially all of its taxable income to its shareholders. Therefore, no provision for federal income taxes or excise taxes has been made. |
| | Certain Funds may be subject to foreign taxes on income, gains on investments or currency repatriation, a portion of which may be recoverable. Each Fund will accrue such taxes and recoveries as applicable based upon current interpretations of the tax rules and regulations that exist in the markets in which it invests. |
| | Management of the Funds has concluded that there are no significant uncertain tax positions that would require recognition in the financial statements. Each Fund’s U.S. federal income tax return is generally subject to examination by the Internal Revenue Service for a period of three years after it is filed. State, local and/or non-U.S. tax returns and/or other filings may be subject to examination for different periods, depending upon the tax rules of each applicable jurisdiction. |
| D. | Distributions to Shareholders |
| | Distributions are recorded by each Fund on the ex-dividend date. Income and capital gain distributions are determined in accordance with income tax regulations which may differ from U.S. GAAP. |
| E. | Expenses |
| | Expenses incurred together by a Fund and other affiliated mutual funds are allocated in proportion to the net assets of each such fund, except where allocation of direct expenses to each Fund and each such other fund, or an alternative allocation method, can be more appropriately used. |
| | In addition to the net annual operating expenses that a Fund bears directly, the shareholders of a Fund indirectly bear the pro-rata expenses of any underlying mutual funds in which the Fund invests. |
| F. | Foreign Currency Transactions |
| | Non-U.S. investment securities and other assets and liabilities denominated in foreign currencies are translated into U.S. dollar amounts at the
foreign currency exchange rate effective at the end of the reporting period. Cost of investments is translated at the currency exchange rate effective
at the trade date. The gain or loss resulting from a change in currency exchange rates between the trade and settlement date of a portfolio
transaction is treated as a gain or loss on foreign currency. Likewise, the gain or loss resulting from a change in currency exchange rates between
the date income is accrued and the date it is paid is treated as a gain or loss on foreign currency. For fixed income instruments, the Funds bifurcate that portion of the results of operations arising from changes in foreign exchange rates on investments from the fluctuations arising from changes in
the market prices of securities held and such fluctuations are included with the net realized and unrealized gain or loss on foreign currency
transactions. For equity securities, the Funds do not isolate that portion of the results of operations arising from changes in foreign exchange rates
on investments from the fluctuations arising from changes in the market prices of securities held and such fluctuations are included with the net
realized and unrealized gain or loss on investments. |
| G. | Payment-In-Kind Securities |
| | Certain Funds may invest in payment-in-kind securities, which are debt or preferred stock securities that require or permit payment of interest in the form of additional securities. Payment-in-kind securities allow the issuer to avoid or delay the need to generate cash to meet current interest payments and, as a result, may involve greater risk than securities that pay interest currently or in cash. |
| H. | When-Issued Purchases and Forward Commitments (Delayed Delivery) |
| | Certain Funds may engage in when-issued or forward commitment transactions. Securities purchased on a when-issued or forward commitment basis are also known as delayed delivery transactions. Delayed delivery transactions involve a commitment by a Fund to purchase or sell a security at a future date (ordinarily up to 90 days later). When-issued or forward commitments enable the Funds to lock in what is believed to be an attractive price or yield on a particular security for a period of time, regardless of future changes in interest rates. Each Fund records when-issued and forward commitment securities on the trade date. Each Fund maintains collateral for the securities purchased. Securities purchased on a when-issued or forward commitment basis begin earning interest on the settlement date. |
| I. | Interest-Only and Principal-Only Securities |
| | Certain Funds may invest in stripped mortgage-backed securities. Stripped mortgage-backed securities represent a participation in, or are secured by, or payable from, mortgage loans on real property, and may be structured in classes with rights to receive varying proportions of principal and |
VIRTUS OPPORTUNITIES TRUST
NOTES TO FINANCIAL STATEMENTS (Continued)
September 30, 2023
| | interest. Stripped mortgage-backed securities include interest-only securities (IOs) which receive all of the interest, and principal-only securities (POs) which receive all of the principal. The market value of these securities is highly sensitive to changes in interest rates and a rapid (slow) rate of principal payments may have an adverse (positive) effect on yield to maturity. Payments received for IOs are included in interest income. Because principal will not be received at the maturity of an IO, adjustments are made to the book value of the security on a daily basis until maturity and these adjustments are also included in interest income. Payments received for POs are treated as reductions to the cost and par value of the securities. Any paydown gains or losses associated with the payments received are included in interest income. If the underlying mortgage assets are greater than anticipated payments of principal, a Fund may fail to recoup some or all of its initial investment in these securities. |
| J. | Leveraged Loans |
| | Certain Funds may invest in direct debt instruments which are interests in amounts owed by a corporate, governmental, or other borrower to lenders or lending syndicates. Leveraged loans are generally non-investment grade and often involve borrowers that are highly leveraged. The Funds may invest in obligations of borrowers who are in bankruptcy proceedings. Leveraged loans are typically senior in the corporate capital structure of the borrower. A loan is often administered by a bank or other financial institution (the “lender”) that acts as agent for all holders. The agent administers the terms of the loan, as specified in the leveraged loan. A Fund’s investments in loans may be in the form of participations in loans or assignments of all or a portion of loans from third parties. When investing in loan participations, a Fund has the right to receive payments of principal, interest and any fees to which it is entitled only from the lender selling the loan participation and only upon receipt by the lender of payments from the borrower. A Fund generally has no right to enforce compliance with the terms of the leveraged loan with the borrower. As a result, a Fund may be subject to the credit risk of both the borrower and the lender that is selling the leveraged loan. When a Fund purchases assignments from lenders it acquires direct rights against the borrower on the loan. |
| | A Fund may invest in multiple series or tranches of a loan, which may have varying terms and carry different associated risks. Leveraged loans may involve foreign borrowers and investments may be denominated in foreign currencies. Direct indebtedness of emerging countries involves a risk that the government entities responsible for the repayment of the debt may be unable, or unwilling, to pay the principal and interest when due. |
| | The leveraged loans have floating rate loan interests which generally pay interest at rates that are periodically determined by reference to a base lending rate plus a premium. The base lending rates are generally LIBOR, SOFR, the prime rate offered by one or more U.S. banks or the certificate of deposit rate. When a leveraged loan is purchased a Fund may pay an assignment fee. On an ongoing basis, a Fund may receive a commitment fee based on the undrawn portion of the underlying line of credit portion of a leveraged loan. Prepayment penalty fees are received upon the prepayment of a leveraged loan by a borrower. Prepayment penalty, facility, commitment, consent and amendment fees are recorded to income as earned or paid. |
| | A Fund may invest in both secured loans and “covenant lite” loans which have few or no financial maintenance covenants that would require a borrower to maintain certain financial metrics. The lack of financial maintenance covenants in covenant lite loans increases the risk that the applicable Fund will experience difficulty or delays in enforcing its rights on its holdings of such loans, which may result in losses, especially during a downturn in the credit cycle. |
| K. | Securities Lending |
| | The Funds may loan securities to qualified brokers through a securities lending agency agreement with The Bank of New York Mellon (“BNYM”). Under the securities lending policy, when lending securities a Fund is required to maintain collateral with a market value not less than 100% of the market value of loaned securities. Collateral is adjusted daily in connection with changes in the market value of securities on loan bringing the collateral market value in line with the required percent. Due to timing of collateral adjustments, the market value of collateral held with respect to a loaned security, may be more or less than the value of the security on loan. |
| | Collateral may consist of cash and securities issued by the U.S. Government or its agencies. Cash collateral is invested in a short-term money market fund. Dividends earned on the collateral and premiums paid by the broker are recorded as income by the Fund net of fees and rebates charged/paid by BNYM for its services as securities lending agent and in connection with this securities lending program. Lending portfolio securities involves a risk of delay in the recovery of the loaned securities or in the declining value of the collateral. |
| | Securities lending transactions are entered into by each Fund under a Master Securities Lending Agreement (“MSLA”) which permits the Fund, under certain circumstances including an event of default (such as bankruptcy or insolvency), to offset amounts payable by the Fund to the same counterparty against amounts to be received and create one single net payment due to or from the Fund. |
| | At September 30, 2023, the securities loaned were subject to a MSLA on a net payment basis as follows: |
| Fund | | Value of
Securities
on Loan | | Cash
Collateral
Received(1) | | Net
Amount(2) |
Newfleet Core Plus Bond Fund
| | $ 888 | | $ 888 | | $ — |
Newfleet High Yield Fund
| | 1,586 | | 1,586 | | — |
Newfleet Low Duration Core Plus Bond Fund
| | 3,362 | | 3,362 | | — |
Newfleet Multi-Sector Intermediate Bond Fund
| | 4,262 | | 4,262 | | — |
Newfleet Multi-Sector Short Term Bond Fund
| | 9,886 | | 9,886 | | — |
| (1) | Collateral received in excess of the value of securities on loan is not presented in this table. The cash collateral received in connection with securities lending transactions has been used for the purchase of securities as disclosed in the Fund’s Schedule of Investments. |
VIRTUS OPPORTUNITIES TRUST
NOTES TO FINANCIAL STATEMENTS (Continued)
September 30, 2023
| (2) | Net amount represents the net amount receivable due from the counterparty in the event of default. |
The following table reflects a breakdown of investments made from cash collateral received from lending activities and the remaining contractual maturity of those transactions as of September 30, 2023 for the Funds:
| Fund | | Investment of Cash Collateral | | Overnight
and
Continuous |
Newfleet Core Plus Bond Fund
| | Money Market Mutual Fund | | $ 923 |
Newfleet High Yield Fund
| | Money Market Mutual Fund | | 1,641 |
Newfleet Low Duration Core Plus Bond Fund
| | Money Market Mutual Fund | | 3,449 |
Newfleet Multi-Sector Intermediate Bond Fund
| | Money Market Mutual Fund | | 4,427 |
Newfleet Multi-Sector Short Term Bond Fund
| | Money Market Mutual Fund | | 10,237 |
Note 3. Investment Advisory Fees and Related Party Transactions
($ reported in thousands)
| A. | Investment Adviser |
| | Virtus Investment Advisers, Inc. (the “Adviser”), an indirect, wholly-owned subsidiary of Virtus Investment Partners, Inc. (“Virtus”), is the investment adviser to the Funds. The Adviser manages the Funds’ investment programs and general operations of the Funds, including oversight of the Funds’ subadvisers. |
| | As compensation for its services to the Funds, the Adviser is entitled to a fee, which is calculated daily and paid monthly based upon the following annual rates as a percentage of the average daily net assets of each Fund: |
| | First $1 Billion | | $1+ Billion |
Newfleet Core Plus Bond Fund
| 0.45 % | | 0.40 % |
Seix Tax-Exempt Bond Fund
| 0.45 | | 0.40 |
| | First $2 Billion | | $2+ Billion |
Newfleet Low Duration Core Plus Bond Fund
| 0.40 % | | 0.375% |
| | First $1 Billion | | $1+ Billion through
$2 Billion | | $2+ Billion |
Newfleet High Yield Fund
| 0.55 % | | 0.50 % | | 0.45 % |
Newfleet Multi-Sector Intermediate Bond Fund
| 0.55 | | 0.50 | | 0.45 |
| | First $1 Billion | | $1+ Billion through
$2 Billion | | $2+ Billion through
$10 Billion | | $10+ Billion |
Newfleet Multi-Sector Short Term Bond Fund
| 0.55 % | | 0.50 % | | 0.45 % | | 0.425% |
| | First $2 Billion | | $2+ Billion through
$4 Billion | | $4+ Billion |
Newfleet Senior Floating Rate Fund
| 0.45 % | | 0.40 % | | 0.38 % |
VIRTUS OPPORTUNITIES TRUST
NOTES TO FINANCIAL STATEMENTS (Continued)
September 30, 2023
| B. | Subadvisers |
| | The subadvisers manage the investments of each Fund for which they are paid a fee by the Adviser. A list of the subadvisers and the Funds they serve as of the end of the period is as follows: |
| Fund | | Subadviser |
Newfleet Core Plus Bond Fund
| | Newfleet(1) |
Newfleet High Yield Fund
| | Newfleet(1) |
Newfleet Low Duration Core Plus Bond Fund
| | Newfleet(1) |
Newfleet Multi-Sector Intermediate Bond Fund
| | Newfleet(1) |
Newfleet Multi-Sector Short Term Bond Fund
| | Newfleet(1) |
Newfleet Senior Floating Rate Fund
| | Newfleet(1) |
Seix Tax-Exempt Bond Fund
| | Seix(2) |
| (1) | Newfleet Asset Management (“Newfleet”), a division of Virtus Fixed Income Advisers LLC (“VFIA”), an indirect wholly owned subsidiary of Virtus. |
| (2) | Seix Investment Advisors, LLC (“Seix”), a division of VFIA, an indirect, wholly-owned subsidiary of Virtus. |
| C. | Expense Limitations |
| | The Adviser has contractually agreed to limit each Fund’s annual total operating expenses, subject to the exceptions listed below, so that such expenses do not exceed, on an annualized basis, the following respective percentages of average daily net assets through January 31, 2024. Following the contractual period, the Adviser may discontinue these expense limitation arrangements at any time. The waivers and reimbursements are accrued daily and received monthly. |
| Fund | | Class A | | Class C | | Class C1 | | Class I | | Class R6 |
Newfleet Core Plus Bond Fund
| | 0.80% | | 1.55% | | N/A | | 0.55% | | 0.43% |
Newfleet High Yield Fund
| | 1.00 | | 1.75 | | N/A | | 0.75 | | 0.59 |
Newfleet Low Duration Core Plus Bond Fund
| | 0.75 | | 1.50 | | N/A | | 0.50 | | 0.43 |
Newfleet Multi-Sector Intermediate Bond Fund
| | 0.99 | | 1.74 | | N/A | | 0.74 | | 0.60 |
Newfleet Multi-Sector Short Term Bond Fund
| | 0.90 | | 1.16 | | 1.66% | | 0.65 | | 0.52 |
Newfleet Senior Floating Rate Fund
| | 0.94 | | 1.69 | | N/A | | 0.69 | | 0.55 |
Seix Tax-Exempt Bond Fund
| | 0.83 | | 1.58 | | N/A | | 0.58 | | N/A |
The exclusions include front-end or contingent deferred sales charges, taxes, leverage and borrowing expenses (such as commitment, amendment and renewal expenses on credit or redemption facilities), interest, brokerage commissions, expenses incurred in connection with any merger or reorganization, unusual or infrequently occurring expenses (such as litigation), acquired fund fees and expenses, and dividend expenses, if any.
| D. | Expense Recapture |
| | Under certain conditions, the Adviser may recapture operating expenses reimbursed or fees waived under these arrangements within three years after the date on which such amounts were incurred or waived. A Fund must pay its ordinary operating expenses before the Adviser is entitled to any reimbursement and must remain in compliance with any applicable expense limitations or, if none, the expense limitation in effect at the time of the waiver or reimbursement. All or a portion of the following Adviser reimbursed expenses may be recaptured by the year ending September 30: |
| | | Expiration | | |
| Fund | | 2024 | | 2025 | | 2026 | | Total |
| Newfleet Core Plus Bond Fund | | | | | | | | |
Class A
| | $ 90 | | $ 72 | | $ 85 | | $ 247 |
Class C
| | 9 | | 6 | | 4 | | 19 |
Class I
| | 165 | | 192 | | 224 | | 581 |
Class R6
| | 3 | | 4 | | 5 | | 12 |
| Newfleet High Yield Fund | | | | | | | | |
Class A
| | 118 | | 108 | | 117 | | 343 |
Class C
| | 5 | | 4 | | 4 | | 13 |
Class I
| | 26 | | 24 | | 27 | | 77 |
Class R6
| | 6 | | 7 | | 7 | | 20 |
| Newfleet Low Duration Core Plus Bond Fund | | | | | | | | |
Class A
| | 129 | | 119 | | 128 | | 376 |
Class C
| | 30 | | 28 | | 17 | | 75 |
Class I
| | 770 | | 805 | | 646 | | 2,221 |
Class R6
| | 1 | | 47 | | 68 | | 116 |
VIRTUS OPPORTUNITIES TRUST
NOTES TO FINANCIAL STATEMENTS (Continued)
September 30, 2023
| | | Expiration | | |
| Fund | | 2024 | | 2025 | | 2026 | | Total |
| Newfleet Multi-Sector Intermediate Bond Fund | | | | | | | | |
Class A
| | $ 69 | | $ 68 | | $ 78 | | $ 215 |
Class C
| | 20 | | 16 | | 12 | | 48 |
Class I
| | 206 | | 188 | | 180 | | 574 |
Class R6
| | 9 | | 9 | | 10 | | 28 |
| Newfleet Multi-Sector Short Term Bond Fund | | | | | | | | |
Class A
| | — | | 410 | | 577 | | 987 |
Class C
| | — | | 130 | | 123 | | 253 |
Class C1
| | — | | 22 | | 25 | | 47 |
Class I
| | — | | 2,267 | | 2,961 | | 5,228 |
Class R6
| | 32 | | 43 | | 26 | | 101 |
| Newfleet Senior Floating Rate Fund | | | | | | | | |
Class A
| | 29 | | 34 | | 44 | | 107 |
Class C
| | 13 | | 5 | | 6 | | 24 |
Class I
| | 55 | | 68 | | 94 | | 217 |
Class R6
| | 3 | | 2 | | 2 | | 7 |
| Seix Tax-Exempt Bond Fund | | | | | | | | |
Class A
| | 61 | | 60 | | 72 | | 193 |
Class C
| | 8 | | 5 | | 4 | | 17 |
Class I
| | 111 | | 102 | | 104 | | 317 |
During the year ended September 30, 2023, the Adviser recaptured expenses previously waived for the following Fund:
| Fund | | Class R6 |
Newfleet Multi-Sector Short Term Bond Fund
| | $1 |
| E. | Distributor |
| | VP Distributors, LLC (“VP Distributors”), an indirect, wholly-owned subsidiary of Virtus, serves as the distributor of each Fund’s shares. VP Distributors has advised the Funds that for the year ended September 30, 2023, it retained net commissions of $21 for Class A shares and CDSC of $10, $2 and $6 for Class A shares, Class C shares and Class C1 shares, respectively. |
| | In addition, each Fund pays VP Distributors 12b-1 fees under a 12b-1 Plan as a percentage of the average daily net assets of each respective class at the annual rates of 0.25% for Class A shares and 1.00% for Class C shares (0.50% for Newfleet Multi-Sector Short Term Bond Fund), and 1.00% for Class C1 shares. Class I shares and Class R6 shares are not subject to a 12b-1 Plan. |
| | Under certain circumstances, shares of certain Virtus Funds may be exchanged for shares of the same class of certain other Virtus Funds on the basis of the relative NAV per share at the time of the exchange. On exchanges with share classes that carry a CDSC, the CDSC schedule of the original shares purchased continues to apply. |
| F. | Administrator and Transfer Agent |
| | Virtus Fund Services, LLC, an indirect, wholly-owned subsidiary of Virtus, serves as the administrator and transfer agent to the Funds. |
| | For the year ended September 30, 2023, the Funds incurred administration fees totaling $5,613 which are included in the Statements of Operations within the line item “Administration and accounting fees.” The fees are calculated daily and paid monthly. |
| | For the year ended September 30, 2023, the Funds incurred transfer agent fees totaling $2,513 which are included in the Statements of Operations within the line item “Transfer agent fees and expenses.” The fees are calculated daily and paid monthly. |
| G. | Investments with Affiliates |
| | The Funds are permitted to purchase assets from or sell assets to certain related affiliates under specified conditions outlined in procedures adopted by the Board. The procedures have been designed to ensure that any purchase or sale of assets by the Funds from or to another fund or portfolio that are, or could be, considered an affiliate by virtue of having a common investment adviser (or affiliated investment advisers), common Trustees and/or common officers comply with Rule 17a-7 under the 1940 Act. Further, as defined under the procedures, each transaction is effected at the current market price. During the year ended September 30, 2023, the Funds did not engage in any transactions pursuant to Rule 17a-7 under the 1940 Act. |
| H. | Trustee Deferred Compensation Plan |
| | The Trust provides a deferred compensation plan for its Trustees who receive compensation from the Trust. Under the deferred compensation plan, Trustees may elect to defer all or a portion of their compensation. Amounts deferred are retained by the Trust, and then, to the extent permitted by the 1940 Act, in turn, may be invested in the shares of affiliated or unaffiliated mutual funds selected by the participating Trustees. Investments in such instruments are included in “Other assets” in the Statements of Assets and Liabilities at September 30, 2023. |
VIRTUS OPPORTUNITIES TRUST
NOTES TO FINANCIAL STATEMENTS (Continued)
September 30, 2023
Note 4. Purchases and Sales of Securities
($ reported in thousands)
Purchases and sales of securities (excluding U.S. government and agency securities and short-term securities) during the year ended September 30, 2023, were as follows:
| | Purchases | | Sales |
Newfleet Core Plus Bond Fund
| $ 80,703 | | $ 41,698 |
Newfleet High Yield Fund
| 22,845 | | 22,140 |
Newfleet Low Duration Core Plus Bond Fund
| 115,059 | | 276,426 |
Newfleet Multi-Sector Intermediate Bond Fund
| 225,616 | | 99,839 |
Newfleet Multi-Sector Short Term Bond Fund
| 1,431,007 | | 2,187,610 |
Newfleet Senior Floating Rate Fund
| 96,130 | | 87,261 |
Seix Tax-Exempt Bond Fund
| 15,815 | | 24,054 |
Purchases and sales of long-term U.S. government and agency securities during the year ended September 30, 2023, were as follows:
| | Purchases | | Sales |
Newfleet Core Plus Bond Fund
| $ 33,823 | | $ 10,577 |
Newfleet High Yield Fund
| 809 | | 818 |
Newfleet Low Duration Core Plus Bond Fund
| 55,740 | | 37,382 |
Newfleet Multi-Sector Intermediate Bond Fund
| 67,483 | | 38,691 |
Newfleet Multi-Sector Short Term Bond Fund
| 284,282 | | 454,762 |
Newfleet Senior Floating Rate Fund
| — | | 975 |
Note 5. Capital Share Transactions
(reported in thousands)
Transactions in shares of capital stock, during the years ended as indicated below, were as follows:
| | Newfleet Core Plus Bond Fund | | Newfleet High Yield Fund |
| | Year Ended
September 30, 2023 | | Year Ended
September 30, 2022 | | Year Ended
September 30, 2023 | | Year Ended
September 30, 2022 |
| | SHARES | | AMOUNT | | SHARES | | AMOUNT | | SHARES | | AMOUNT | | SHARES | | AMOUNT |
| Class A | | | | | | | | | | | | | | | |
Shares sold and cross class
conversions | 516 | | $ 5,129 | | 213 | | $ 2,304 | | 662 | | $ 2,422 | | 275 | | $ 1,107 |
| Reinvestment of distributions | 102 | | 1,012 | | 99 | | 1,100 | | 556 | | 2,037 | | 476 | | 1,869 |
Shares repurchased and cross
class conversions | (382) | | (3,813) | | (490) | | (5,411) | | (1,709) | | (6,227) | | (1,479) | | (5,908) |
| Net Increase / (Decrease) | 236 | | $ 2,328 | | (178) | | $ (2,007) | | (491) | | $ (1,768) | | (728) | | $ (2,932) |
| Class C | | | | | | | | | | | | | | | |
Shares sold and cross class
conversions | 121 | | $ 1,176 | | 25 | | $ 276 | | 84 | | $ 303 | | 32 | | $ 133 |
| Reinvestment of distributions | 4 | | 44 | | 6 | | 70 | | 17 | | 60 | | 14 | | 53 |
Shares repurchased and cross
class conversions | (94) | | (913) | | (125) | | (1,330) | | (87) | | (312) | | (101) | | (398) |
| Net Increase / (Decrease) | 31 | | $ 307 | | (94) | | $ (984) | | 14 | | $ 51 | | (55) | | $ (212) |
| Class I | | | | | | | | | | | | | | | |
Shares sold and cross class
conversions | 11,395 | | $ 115,739 | | 4,971 | | $ 56,063 | | 2,472 | | $ 9,067 | | 422 | | $ 1,660 |
| Reinvestment of distributions | 324 | | 3,277 | | 282 | | 3,155 | | 136 | | 500 | | 97 | | 382 |
Shares repurchased and cross
class conversions | (4,549) | | (45,922) | | (4,782) | | (51,106) | | (2,387) | | (8,731) | | (699) | | (2,799) |
| Net Increase / (Decrease) | 7,170 | | $ 73,094 | | 471 | | $ 8,112 | | 221 | | $ 836 | | (180) | | $ (757) |
VIRTUS OPPORTUNITIES TRUST
NOTES TO FINANCIAL STATEMENTS (Continued)
September 30, 2023
| | Newfleet Core Plus Bond Fund | | Newfleet High Yield Fund |
| | Year Ended
September 30, 2023 | | Year Ended
September 30, 2022 | | Year Ended
September 30, 2023 | | Year Ended
September 30, 2022 |
| | SHARES | | AMOUNT | | SHARES | | AMOUNT | | SHARES | | AMOUNT | | SHARES | | AMOUNT |
| Class R6 | | | | | | | | | | | | | | | |
Shares sold and cross class
conversions | 121 | | $ 1,228 | | 59 | | $ 678 | | 87 | | $ 318 | | 192 | | $ 797 |
| Reinvestment of distributions | 6 | | 58 | | 5 | | 52 | | 33 | | 121 | | 27 | | 107 |
Shares repurchased and cross
class conversions | (60) | | (606) | | (31) | | (346) | | (109) | | (397) | | (172) | | (680) |
| Net Increase / (Decrease) | 67 | | $ 680 | | 33 | | $ 384 | | 11 | | $ 42 | | 47 | | $ 224 |
| | Newfleet Low Duration Core Plus Bond Fund | | Newfleet Multi-Sector Intermediate Bond Fund |
| | Year Ended
September 30, 2023 | | Year Ended
September 30, 2022 | | Year Ended
September 30, 2023 | | Year Ended
September 30, 2022 |
| | SHARES | | AMOUNT | | SHARES | | AMOUNT | | SHARES | | AMOUNT | | SHARES | | AMOUNT |
| Class A | | | | | | | | | | | | | | | |
Shares sold and cross class
conversions | 1,078 | | $ 10,953 | | 2,275 | | $ 24,030 | | 1,500 | | $ 13,390 | | 1,108 | | $ 10,490 |
| Reinvestment of distributions | 168 | | 1,715 | | 98 | | 1,024 | | 301 | | 2,692 | | 248 | | 2,377 |
Shares repurchased and cross
class conversions | (2,800) | | (28,503) | | (3,957) | | (41,594) | | (1,544) | | (13,788) | | (1,954) | | (19,086) |
| Net Increase / (Decrease) | (1,554) | | $ (15,835) | | (1,584) | | $ (16,540) | | 257 | | $ 2,294 | | (598) | | $ (6,219) |
| Class C | | | | | | | | | | | | | | | |
Shares sold and cross class
conversions | 270 | | $ 2,746 | | 440 | | $ 4,714 | | 277 | | $ 2,505 | | 151 | | $ 1,478 |
| Reinvestment of distributions | 22 | | 219 | | 9 | | 99 | | 43 | | 386 | | 48 | | 470 |
Shares repurchased and cross
class conversions | (594) | | (6,060) | | (870) | | (9,168) | | (655) | | (5,901) | | (750) | | (7,279) |
| Net Increase / (Decrease) | (302) | | $ (3,095) | | (421) | | $ (4,355) | | (335) | | $ (3,010) | | (551) | | $ (5,331) |
| Class I | | | | | | | | | | | | | | | |
Shares sold and cross class
conversions | 11,502 | | $ 117,472 | | 17,323 | | $ 184,267 | | 25,553 | | $ 228,145 | | 7,134 | | $ 67,976 |
| Reinvestment of distributions | 1,032 | | 10,536 | | 821 | | 8,632 | | 1,007 | | 8,970 | | 648 | | 6,191 |
Shares repurchased and cross
class conversions | (23,961) | | (243,586) | | (33,854) | | (356,455) | | (10,272) | | (91,314) | | (10,063) | | (96,913) |
| Net Increase / (Decrease) | (11,427) | | $ (115,578) | | (15,710) | | $ (163,556) | | 16,288 | | $ 145,801 | | (2,281) | | $ (22,746) |
| Class R6 | | | | | | | | | | | | | | | |
Shares sold and cross class
conversions | 652 | | $ 6,667 | | 2,038 | | $ 21,359 | | 1,807 | | $ 16,234 | | 70 | | $ 674 |
| Reinvestment of distributions | 99 | | 1,015 | | 45 | | 469 | | 27 | | 241 | | 19 | | 181 |
Shares repurchased and cross
class conversions | (3,920) | | (40,192) | | (669) | | (7,043) | | (380) | | (3,413) | | (109) | | (1,077) |
| Net Increase / (Decrease) | (3,169) | | $ (32,510) | | 1,414 | | $ 14,785 | | 1,454 | | $ 13,062 | | (20) | | $ (222) |
VIRTUS OPPORTUNITIES TRUST
NOTES TO FINANCIAL STATEMENTS (Continued)
September 30, 2023
| | Newfleet Multi-Sector Short Term Bond Fund | | Newfleet Senior Floating Rate Fund |
| | Year Ended
September 30, 2023 | | Year Ended
September 30, 2022 | | Year Ended
September 30, 2023 | | Year Ended
September 30, 2022 |
| | SHARES | | AMOUNT | | SHARES | | AMOUNT | | SHARES | | AMOUNT | | SHARES | | AMOUNT |
| Class A | | | | | | | | | | | | | | | |
Shares sold and cross class
conversions | 16,083 | | $ 70,197 | | 28,778 | | $ 132,136 | | 1,549 | | $ 13,403 | | 2,640 | | $ 23,430 |
| Reinvestment of distributions | 4,870 | | 21,274 | | 3,692 | | 16,722 | | 417 | | 3,598 | | 228 | | 1,991 |
Shares repurchased and cross
class conversions | (48,904) | | (213,159) | | (54,254) | | (247,393) | | (1,660) | | (14,293) | | (4,176) | | (36,899) |
| Net Increase / (Decrease) | (27,951) | | $ (121,688) | | (21,784) | | $ (98,535) | | 306 | | $ 2,708 | | (1,308) | | $ (11,478) |
| Class C | | | | | | | | | | | | | | | |
Shares sold and cross class
conversions | — (1) | | $ 1 | | 3 | | $ 8 | | 199 | | $ 1,711 | | 428 | | $ 3,759 |
| Reinvestment of distributions | 1,068 | | 4,737 | | 909 | | 4,180 | | 48 | | 413 | | 26 | | 227 |
Shares repurchased and cross
class conversions | (12,658) | | (55,994) | | (14,912) | | (68,836) | | (377) | | (3,243) | | (664) | | (5,851) |
| Net Increase / (Decrease) | (11,590) | | $ (51,256) | | (14,000) | | $ (64,648) | | (130) | | $ (1,119) | | (210) | | $ (1,865) |
| Class C1 | | | | | | | | | | | | | | | |
Shares sold and cross class
conversions | 989 | | $ 4,354 | | 1,445 | | $ 6,764 | | — | | $ — | | — | | $ — |
| Reinvestment of distributions | 199 | | 882 | | 148 | | 677 | | — | | — | | — | | — |
Shares repurchased and cross
class conversions | (3,861) | | (17,042) | | (5,857) | | (26,923) | | — | | — | | — | | — |
| Net Increase / (Decrease) | (2,673) | | $ (11,806) | | (4,264) | | $ (19,482) | | — | | $ — | | — | | $ — |
| Class I | | | | | | | | | | | | | | | |
Shares sold and cross class
conversions | 201,373 | | $ 880,233 | | 252,671 | | $ 1,160,210 | | 9,153 | | $ 78,639 | | 9,393 | | $ 82,580 |
| Reinvestment of distributions | 29,093 | | 127,291 | | 22,911 | | 103,966 | | 853 | | 7,344 | | 421 | | 3,661 |
Shares repurchased and cross
class conversions | (385,197) | | (1,680,639) | | (383,808) | | (1,746,660) | | (9,637) | | (82,648) | | (10,834) | | (95,073) |
| Net Increase / (Decrease) | (154,731) | | $ (673,115) | | (108,226) | | $ (482,484) | | 369 | | $ 3,335 | | (1,020) | | $ (8,832) |
| Class R6 | | | | | | | | | | | | | | | |
Shares sold and cross class
conversions | 1,182 | | $ 5,180 | | 1,649 | | $ 7,583 | | 14 | | $ 119 | | 1 | | $ 13 |
| Reinvestment of distributions | 81 | | 353 | | 131 | | 593 | | 10 | | 87 | | 6 | | 53 |
Shares repurchased and cross
class conversions | (4,740) | | (20,728) | | (2,102) | | (9,585) | | (39) | | (331) | | (27) | | (245) |
| Net Increase / (Decrease) | (3,477) | | $ (15,195) | | (322) | | $ (1,409) | | (15) | | $ (125) | | (20) | | $ (179) |
| | Seix Tax-Exempt Bond Fund |
| | Year Ended
September 30, 2023 | | Year Ended
September 30, 2022 |
| | SHARES | | AMOUNT | | SHARES | | AMOUNT |
| Class A | | | | | | | |
Shares sold and cross class
conversions | 238 | | $ 2,427 | | 123 | | $ 1,342 |
| Reinvestment of distributions | 65 | | 662 | | 69 | | 741 |
Shares repurchased and cross
class conversions | (489) | | (4,974) | | (552) | | (5,921) |
| Net Increase / (Decrease) | (186) | | $ (1,885) | | (360) | | $ (3,838) |
VIRTUS OPPORTUNITIES TRUST
NOTES TO FINANCIAL STATEMENTS (Continued)
September 30, 2023
| | Seix Tax-Exempt Bond Fund |
| | Year Ended
September 30, 2023 | | Year Ended
September 30, 2022 |
| | SHARES | | AMOUNT | | SHARES | | AMOUNT |
| Class C | | | | | | | |
Shares sold and cross class
conversions | 37 | | $ 377 | | 12 | | $ 131 |
| Reinvestment of distributions | 3 | | 32 | | 5 | | 51 |
Shares repurchased and cross
class conversions | (109) | | (1,114) | | (123) | | (1,309) |
| Net Increase / (Decrease) | (69) | | $ (705) | | (106) | | $ (1,127) |
| Class I | | | | | | | |
Shares sold and cross class
conversions | 1,148 | | $ 11,647 | | 741 | | $ 7,806 |
| Reinvestment of distributions | 105 | | 1,068 | | 122 | | 1,320 |
Shares repurchased and cross
class conversions | (1,938) | | (19,705) | | (1,949) | | (20,706) |
| Net Increase / (Decrease) | (685) | | $ (6,990) | | (1,086) | | $ (11,580) |
| (1) | Amount is less than 500 shares (not in thousands). |
Note 6. 10% Shareholders
As of September 30, 2023, certain Funds had individual shareholder account(s) and/or omnibus shareholder account(s) (comprised of a group of individual shareholders), which individually amounted to more than 10% of the total shares outstanding of such Fund as detailed below:
| | % of Shares
Outstanding | | Number of
Accounts* |
Newfleet Core Plus Bond Fund
| 58 % | | 3 |
Newfleet Low Duration Core Plus Bond Fund
| 61 | | 4 |
Newfleet Multi-Sector Intermediate Bond Fund
| 42 | | 2 |
Newfleet Multi-Sector Short Term Bond Fund
| 35 | | 2 |
Newfleet Senior Floating Rate Fund
| 37 | | 3 |
Seix Tax-Exempt Bond Fund
| 13 | | 1 |
| * | None of the accounts are affiliated. |
Note 7. Credit and Market Risk and Asset Concentration
In July 2017, the head of the United Kingdom Financial Conduct Authority (“FCA”) announced the intention to phase out the use of LIBOR by the end of 2021. However, after subsequent announcements by the FCA, the LIBOR administrator and other regulators, certain of the most widely used LIBORs continued until June 30, 2023. The ICE Benchmark Administration Limited, which is regulated and authorized by FCA, and the administrator of LIBOR, ceased publishing certain LIBOR settings on December 31, 2021. On April 3, 2023, the FCA announced its decision to require LIBOR’s administrator to continue to publish the 1-month, 3-month, and 6-month U.S. dollar settings under an unrepresentative synthetic methodology until September 30, 2024. On March 15, 2022, the Adjustable Interest Act (LIBOR) Act (the “LIBOR Act”) was enacted into law which directs the Federal Reserve Board, as a fallback mechanism, to identify benchmark rates based on SOFR that will replace LIBOR in certain financial contracts after June 30, 2023. On December 16, 2022, the Federal Reserve adopted regulations implementing the LIBOR Act. The Funds may be exposed to financial instruments tied to LIBOR to determine payment obligations, financing terms, hedging strategies or investment value. The discontinuation of LIBOR could have a significant impact on the financial markets and may present a material risk for certain market participants, including the Funds. Abandonment of or modifications to LIBOR could lead to significant short- and long-term uncertainty and market instability. The risks associated with this discontinuation and transition may be exacerbated if the work necessary to effect an orderly transition to an alternative reference rate is not completed in a timely manner. It remains uncertain the effects such changes will have on the Funds, issuers of instruments in which the Funds invest, and the financial markets generally.
Local, regional or global events such as war or military conflict, acts of terrorism, the spread of infectious illness or other public health issue, recessions, or other events could have a significant impact on a Fund and its investments, including hampering the ability of each Fund’s portfolio manager(s) to invest each Fund’s assets as intended.
In countries with limited or developing markets, investments may present greater risks than in more developed markets and the prices of such investments may be volatile. The consequences of political, social, or economic changes in these markets may have disruptive effects on the market prices of these investments and the income they generate, as well as a Fund’s ability to repatriate such amounts.
VIRTUS OPPORTUNITIES TRUST
NOTES TO FINANCIAL STATEMENTS (Continued)
September 30, 2023
High-yield/high-risk securities typically entail greater price volatility and/or principal and interest rate risk. There is a greater chance that an issuer will not be able to make principal and interest payments on time. Analysis of the creditworthiness of issuers of high-yield/high-risk securities may be complex, and as a result, it may be more difficult for the Adviser and/or Subadviser to accurately predict risk.
Many municipalities insure repayment for their obligations. Although bond insurance reduces the risk of loss due to default by an issuer, such bonds remain subject to the risk that the market may fluctuate for other reasons, and there is no assurance that the insurance company will meet its obligations. Insured securities have been identified in the Schedule of Investments. A real or perceived decline in creditworthiness of a bond insurer can have an adverse impact on the value of insured bonds held in the Funds.
Certain Funds may invest a high percentage of their assets in specific sectors of the market in the pursuit of their investment objectives. Fluctuations in these sectors of concentration may have a greater impact on a Fund, positive or negative, than if the Fund did not concentrate its investments in such sectors.
Note 8. Indemnifications
Under the Trust’s organizational documents and in separate agreements between each Trustee and the Trust, its Trustees and officers are indemnified against certain liabilities arising out of the performance of their duties to the Trust and its funds. In addition, in the normal course of business, the Trust and the Funds enter into contracts that provide a variety of indemnifications to other parties. The Trust’s and/or the Funds’ maximum exposure under these arrangements is unknown, as this would involve future claims that may be made against the Trust or the Funds and that have not occurred. However, neither the Trust nor the Funds have had prior claims or losses pursuant to these arrangements, and they expect the risk of loss to be remote.
Note 9. Restricted Securities
Restricted securities are not registered under the Securities Act of 1933, as amended (the “1933 Act”). Generally, 144A securities are excluded from this category. Each Fund will bear any costs, including those involved in registration under the 1933 Act, in connection with the disposition of such securities. At September 30, 2023, the Funds did not hold any securities that were restricted.
Note 10. Redemption Facility
($ reported in thousands)
On September 18, 2017, the Funds (with the exception of the Newfleet Senior Floating Rate Fund) and certain other affiliated funds entered into a $150,000 unsecured line of credit (“Credit Agreement”). On June 14, 2021, the Credit Agreement was increased to $250,000. This Credit Agreement, as amended, is with a commercial bank that allows the Funds to borrow cash from the bank to manage large unexpected redemptions and trade fails, up to a limit of one third or one fifth, as applicable, of each Fund’s total net assets in accordance with the terms of the agreement. This Credit Agreement has a scheduled termination date of July 6, 2024, however, the Funds may request at any time and from time to time to extend the termination date by 364 days. Effective March 10, 2022, interest is charged at the higher of the SOFR or the Federal Funds rate plus an additional percentage rate on the amount borrowed. Commitment fees are charged on the undrawn balance. Total commitment fees paid for the year ended September 30, 2023, are included in the “Interest expense and/or commitment fees” line on the Statements of Operations. The Funds and other affiliated funds that are parties are individually, and not jointly, liable for their particular advances, if any, under the Credit Agreement. The lending bank has the ability to require repayment of outstanding borrowings under this Credit Agreement upon certain circumstances such as an event of default. At September 30, 2023, the Funds did not have outstanding borrowings.
The following Funds had outstanding loans during the year. The borrowings were valued at cost, which approximates fair value.
| Fund | | Interest
Incurred on
Borrowing | | Average
Borrowing | | Weighted Average
Interest Rate | | Days
Outstanding |
Newfleet Core Plus Bond Fund
| | $ 5 | | $ 3,200 | | 4.12% | | 13 |
Newfleet Low Duration Core Plus Bond Fund
| | 5 | | 4,900 | | 4.99 | | 8 |
Newfleet Multi-Sector Short Term Bond Fund
| | 15 | | 29,400 | | 6.17 | | 3 |
Note 11. Borrowings
($ reported in thousands)
Effective March 20, 2023, the Newfleet Senior Floating Rate Fund amended its Credit Agreement (the “Agreement”) with a commercial bank (the “Bank”) that allows the Fund to borrow cash from the Bank, up to a limit of $35,000. Prior to March 20, 2023, the Agreement allowed the Fund to borrow cash from the Bank up to a limit of $70,000. Borrowings under the Agreement are collateralized by investments of the Fund. The Agreement results in the Fund being subject to certain covenants including asset coverage and portfolio composition (among others). If the Fund fails to meet or maintain certain covenants as required under the Agreement, the Fund may be required to repay immediately, in part or in full, the loan balance outstanding under the Agreement, necessitating the sale of securities at potentially inopportune times. Effective March 10, 2022, interest is charged at the higher of the SOFR or the Federal Funds rate plus an additional percentage rate on the amount borrowed. Commitment fees are charged on the undrawn balance, if less than 75% of the commitment amount is outstanding as a loan to the Fund. Total commitment fees paid for the year ended September 30, 2023, were $128 and are included in the “Interest expense and/or commitment fees” line on the Statements of Operations. The Agreement has a term that extends until the 179th day after the date that the lender delivers a “notice of termination” to the Fund. The Bank has the ability to require repayment
VIRTUS OPPORTUNITIES TRUST
NOTES TO FINANCIAL STATEMENTS (Continued)
September 30, 2023
of outstanding borrowings under the Agreement upon certain circumstances such as an event of default. For the year ended September 30, 2023, the average daily borrowings under the Agreement and the weighted daily average interest rate were $6,375 and 5.62%, respectively. At September 30, 2023, the Fund did not have outstanding borrowings.
Note 12. Federal Income Tax Information
($ reported in thousands)
At September 30, 2023, the approximate aggregate cost basis and the unrealized appreciation (depreciation) of investments and other financial instruments for federal income tax purposes were as follows:
| Fund | | Federal
Tax Cost | | Unrealized
Appreciation | | Unrealized
(Depreciation) | | Net Unrealized
Appreciation
(Depreciation) |
Newfleet Core Plus Bond Fund
| | $ 173,797 | | $ 111 | | $ (14,279) | | $ (14,168) |
Newfleet High Yield Fund
| | 51,138 | | 169 | | (4,523) | | (4,354) |
Newfleet Low Duration Core Plus Bond Fund
| | 411,256 | | 345 | | (21,956) | | (21,611) |
Newfleet Multi-Sector Intermediate Bond Fund
| | 426,329 | | 839 | | (30,589) | | (29,750) |
Newfleet Multi-Sector Short Term Bond Fund
| | 4,725,271 | | 3,756 | | (277,788) | | (274,032) |
Newfleet Senior Floating Rate Fund
| | 198,622 | | 1,140 | | (3,215) | | (2,075) |
Seix Tax-Exempt Bond Fund
| | 66,389 | | 335 | | (3,099) | | (2,764) |
Certain Funds have capital loss carryforwards available to offset future realized capital gains, if any, to the extent permitted by the Code. Net capital losses are carried forward without expiration and generally retain their short-term and/or long-term tax character, as applicable. For the year ended September 30, 2023, the Funds’ capital loss carryovers were as follows:
| Fund | | Short-Term | | Long-Term |
Newfleet Core Plus Bond Fund
| | $ 2,551 | | $ 3,021 |
Newfleet High Yield Fund
| | 656 | | 4,608 |
Newfleet Low Duration Core Plus Bond Fund
| | 5,507 | | 5,324 |
Newfleet Multi-Sector Intermediate Bond Fund
| | 4,180 | | 16,192 |
Newfleet Multi-Sector Short Term Bond Fund
| | 103,881 | | 148,494 |
Newfleet Senior Floating Rate Fund
| | 7,485 | | 63,487 |
Seix Tax-Exempt Bond Fund
| | — | | 648 |
The components of distributable earnings on a tax basis and certain tax attributes for the Funds consist of the following:
| Fund | | Undistributed
Ordinary
Income | | Undistributed
Tax-Exempt
Income | | Post-October
Capital Loss
Deferred | | Capital Loss
Deferred |
Newfleet Core Plus Bond Fund
| | $ 5 | | $ — | | $ 1,724 | | $ 5,572 |
Newfleet High Yield Fund
| | 354 | | — | | 1,205 | | 5,264 |
Newfleet Low Duration Core Plus Bond Fund
| | 330 | | — | | 14,288 | | 10,831 |
Newfleet Multi-Sector Intermediate Bond Fund
| | 291 | | — | | 4,613 | | 20,372 |
Newfleet Multi-Sector Short Term Bond Fund
| | 2,835 | | — | | 98,675 | | 252,375 |
Newfleet Senior Floating Rate Fund
| | 27 | | — | | 2,202 | | 70,972 |
Seix Tax-Exempt Bond Fund
| | — | | 230 | | 104 | | 648 |
The differences between the book and tax basis of distributable earnings relate principally to the timing of recognition of income and gains for federal income tax purposes. Short-term gain distributions, if any, are reported as ordinary income for federal tax purposes. Distributions are determined on a tax basis and may differ from net investment income and realized capital gains for financial reporting purposes.
The tax character of dividends and distributions paid during the years ended September 30, 2023 and 2022, was as follows:
| | Ordinary
Income | | Long-Term
Capital Gains | | Tax-Exempt
Distributions | | Return of
Capital | | Total |
Newfleet Core Plus Bond Fund
| | | | | | | | | |
9/30/23
| $ 4,501 | | $ — | | $ — | | $ — | | $ 4,501 |
9/30/22
| 3,597 | | 890 | | — | | — | | 4,487 |
VIRTUS OPPORTUNITIES TRUST
NOTES TO FINANCIAL STATEMENTS (Continued)
September 30, 2023
| | Ordinary
Income | | Long-Term
Capital Gains | | Tax-Exempt
Distributions | | Return of
Capital | | Total |
Newfleet High Yield Fund
| | | | | | | | | |
9/30/23
| $ 3,040 | | $ — | | $ — | | $ — | | $ 3,040 |
9/30/22
| 2,677 | | — | | — | | — | | 2,677 |
Newfleet Low Duration Core Plus Bond Fund
| | | | | | | | | |
9/30/23
| 15,066 | | — | | — | | — | | 15,066 |
9/30/22
| 11,376 | | — | | — | | — | | 11,376 |
Newfleet Multi-Sector Intermediate Bond Fund
| | | | | | | | | |
9/30/23
| 14,823 | | — | | — | | — | | 14,823 |
9/30/22
| 11,080 | | — | | — | | 596 | | 11,676 |
Newfleet Multi-Sector Short Term Bond Fund
| | | | | | | | | |
9/30/23
| 171,740 | | — | | — | | — | | 171,740 |
9/30/22
| 134,394 | | — | | — | | 7,503 | | 141,897 |
Newfleet Senior Floating Rate Fund
| | | | | | | | | |
9/30/23
| 13,905 | | — | | — | | — | | 13,905 |
9/30/22
| 7,620 | | — | | — | | — | | 7,620 |
Seix Tax-Exempt Bond Fund
| | | | | | | | | |
9/30/23
| 1 | | — | | 1,975 | | — | | 1,976 |
9/30/22
| 1 | | 345 | | 2,020 | | — | | 2,366 |
Certain capital accounts in the financial statements are periodically adjusted for permanent differences in order to reflect their tax character. Permanent reclassifications can arise from differing treatment of certain income and gain transactions and nondeductible current year net operating losses. These adjustments have no impact on net assets or net asset value per share of the Funds. Temporary differences that arise from recognizing certain items of income, expense, gain or loss in different periods for financial statement and tax purposes will likely reverse at some time in the future.
Note 13. Regulatory Matters and Litigation
From time to time, the Trust, the Funds, the Adviser and/or subadvisers and/or their affiliates may be involved in litigation and arbitration as well as examinations and investigations by various regulatory bodies, including the SEC, involving compliance with, among other things, securities laws, client investment guidelines, laws governing the activities of broker-dealers and other laws and regulations affecting their activities. At this time, the Adviser believes that the outcomes of such matters are not likely, either individually or in aggregate, to be material to these financial statements.
Note 14. Recent Accounting Pronouncement
In March 2020, the FASB issued Accounting Standards Update (“ASU”) No. 2020-04 (“ASU 2020-04”), Reference Rate Reform (Topic 848) – Facilitation of the Effects of Reference Rate Reform on Financial Reporting. The amendments in ASU 2020-04 provide optional temporary financial reporting relief from the effect of certain types of contract modifications due to the planned discontinuation of the LIBOR and other interbank-offered reference rates as of the end of 2021. In March 2021, the administrator for LIBOR announced the extension of the publication of a majority of the USD LIBOR settings to June 30, 2023. On December 21, 2022, the FASB issued ASU 2022-06 to defer the sunset date of ASC 848 until December 31, 2024. ASU 2020-04 is effective for certain reference rate-related contract modifications that occur during the period March 12, 2020 through December 31, 2024. Management is currently evaluating ASU 2020-04 and ASU 2020-06, but does not believe there will be a material impact.
Note 15. New Regulatory Pronouncement
In October 2022, the SEC adopted a rule and form amendments relating to tailored shareholder reports for mutual funds and ETFs; and fee information in investment company advertisements. The rule and form amendments will require mutual funds and ETFs to transmit streamlined shareholder reports that highlight key information to investors. The rule amendments will require that certain more in-depth information be made available online and available for delivery free of charge to investors on request. The amendments became effective in January 2023 and there is an 18-month transition period after the effective date of the amendment with a compliance date of July 2024.
Note 16. Subsequent Events
Management has evaluated the impact of all subsequent events on the Funds through the date the financial statements were available for issuance, and has determined that there are no subsequent events requiring recognition or disclosure in these financial statements.
Report of Independent Registered Public Accounting Firm
To the Board of Trustees of Virtus Opportunities Trust and Shareholders of Virtus Newfleet Core Plus Bond Fund, Virtus Newfleet High Yield Fund, Virtus Newfleet Low Duration Core Plus Bond Fund, Virtus Newfleet Multi-Sector Intermediate Bond Fund, Virtus Newfleet Multi-Sector Short Term Bond Fund, Virtus Newfleet Senior Floating Rate Fund and Virtus Seix Tax-Exempt Bond Fund
Opinions on the Financial Statements
We have audited the accompanying statements of assets and liabilities, including the schedules of investments, of Virtus Newfleet Core Plus Bond Fund, Virtus Newfleet High Yield Fund, Virtus Newfleet Low Duration Core Plus Bond Fund, Virtus Newfleet Multi-Sector Intermediate Bond Fund, Virtus Newfleet Multi-Sector Short Term Bond Fund, Virtus Newfleet Senior Floating Rate Fund and Virtus Seix Tax-Exempt Bond Fund (seven of the Funds constituting Virtus Opportunities Trust, hereafter collectively referred to as the “Funds”) as of September 30, 2023, the related statements of operations for the year ended September 30, 2023, the statements of changes in net assets for each of the two years in the period ended September 30, 2023, including the related notes, and the financial highlights for each of the periods indicated therein (collectively referred to as the “financial statements”). In our opinion, the financial statements present fairly, in all material respects, the financial position of each of the Funds as of September 30, 2023, the results of each of their operations for the year then ended, the changes in each of their net assets for each of the two years in the period ended September 30, 2023 and the financial highlights for each of the periods indicated therein in conformity with accounting principles generally accepted in the United States of America.
Basis for Opinions
These financial statements are the responsibility of the Funds’ management. Our responsibility is to express an opinion on the Funds’ financial statements based on our audits. We are a public accounting firm registered with the Public Company Accounting Oversight Board (United States) (PCAOB) and are required to be independent with respect to the Funds in accordance with the U.S. federal securities laws and the applicable rules and regulations of the Securities and Exchange Commission and the PCAOB.
We conducted our audits of these financial statements in accordance with the standards of the PCAOB. Those standards require that we plan and perform the audit to obtain reasonable assurance about whether the financial statements are free of material misstatement, whether due to error or fraud.
Our audits included performing procedures to assess the risks of material misstatement of the financial statements, whether due to error or fraud, and performing procedures that respond to those risks. Such procedures included examining, on a test basis, evidence regarding the amounts and disclosures in the financial statements. Our audits also included evaluating the accounting principles used and significant estimates made by management, as well as evaluating the overall presentation of the financial statements. Our procedures included confirmation of securities owned as of September 30, 2023 by correspondence with the custodian, transfer agents, agent banks and brokers; when replies were not received from a transfer agent and brokers, we performed other auditing procedures. We believe that our audits provide a reasonable basis for our opinions.
/s/ PricewaterhouseCoopers LLP
Philadelphia, Pennsylvania
November 27, 2023
We have served as the auditor of one or more investment companies in Virtus Mutual Funds since at least 1977. We have not been able to determine the specific year we began serving as auditor.
VIRTUS OPPORTUNITIES TRUST
TAX INFORMATION NOTICE (Unaudited)
September 30, 2023
The following information ($ reported in thousands) is being provided in order to meet reporting requirements set forth by the Code and/or to meet state specific requirements. In early 2024, the Funds will notify applicable shareholders of amounts for use in preparing 2023 U.S. federal income tax forms. Shareholders should consult their tax advisors.
With respect to distributions paid during the fiscal year ended September 30, 2023, the Funds designate the following amounts (or, if subsequently determined to be different, the maximum amount allowable):
| Fund | | Federal
Tax Exempt
Interest Dividends % |
Seix Tax-Exempt Bond Fund
| | 100.00 % |
STATEMENT REGARDING LIQUIDITY RISK MANAGEMENT PROGRAM (UNAUDITED)
Pursuant to Rule 22e-4 under the 1940 Act, the Funds have adopted a liquidity risk management program (the “Program”) to govern the Funds’ approach to managing liquidity risk, which is the risk that a Fund would not be able to meet redemption requests without significant dilution of remaining investors’ interests in the Fund. The Program is overseen by the Adviser as the Funds’ Liquidity Risk Management Program Administrator (the “Program Administrator”), and the Program’s principal objectives include assessing, managing and periodically reviewing each Fund’s liquidity risk, based on factors specific to the circumstances of the Funds. Assessment and management of a Fund’s liquidity risk under the Program take into consideration certain factors, such as the Fund’s investment strategy and the liquidity of its portfolio investments during normal and reasonably foreseeable stressed conditions, its short- and long-term cash-flow projections during both normal and reasonably foreseeable stressed conditions, and its cash and cash-equivalent holdings and access to other funding sources. As required by the rule, the Program includes policies and procedures for classification of Fund portfolio holdings in four liquidity categories, maintaining certain levels of highly liquid investments, and limiting holdings of illiquid investments.
At a meeting of the Board held on May 22-24, 2023, the Board received a report from the Program Administrator addressing the operation and management of the Program for calendar year 2022 (the “Review Period”). The Program Administrator’s report noted that for the Review Period, the Program Administrator believed that the Program was implemented and operated effectively in all material respects and that existing procedures, controls and safeguards were appropriately designed to enable the Program Administrator to administer the Program in compliance with Rule 22e-4. The Program Administrator’s report noted that during the Review Period, there were no events that created liquidity related concerns for the Funds. The Program Administrator’s report further noted that while changes to the Program had been made during the Review Period and reported to the Board, no material changes were made to the Program as a result of the Program Administrator’s annual review.
There can be no assurance that the Program will achieve its objectives in the future. Please refer to a Fund’s prospectus for more information regarding the Fund’s exposure to liquidity risk and other principal risks to which an investment in that Fund may be subject.
FUND MANAGEMENT TABLES (Unaudited)
Information pertaining to the Trustees and officers of the Trust as of the date of issuance of this report, is set forth below. The statement of additional information (SAI) includes additional information about the Trustees and is available without charge, upon request, by calling (800) 243-4361.
The address of each individual, unless otherwise noted, is c/o Virtus Opportunities Trust, One Financial Plaza, Hartford, CT 06103. There is no stated term of office for Trustees or officers of the Trust.
Independent Trustees
Name, Year of Birth,
Length of Time Served
and Number of
Portfolios in Fund
Complex Overseen by
Trustee | Principal Occupation(s) During Past 5 Years | Other Directorships Held by Trustee During Past 5 Years |
Burke, Donald C.
YOB: 1960
Served Since: 2016
107 Portfolios | Private investor (since 2009). Formerly, President and Chief Executive Officer, BlackRock U.S. Funds (2007 to 2009); Managing Director, BlackRock, Inc. (2006 to 2009); and Managing Director, Merrill Lynch Investment Managers (1990 to 2006). | Trustee (since May 2023) and Advisory Board Member (May 2023), Virtus Artificial Intelligence & Technology Opportunities Fund, Virtus Dividend, Interest & Premium Strategy Fund and Virtus Equity & Convertible Income Fund; Advisory Board Member (since May 2023), Virtus Convertible & Income 2024 Target Term Fund, Virtus Convertible & Income Fund, Virtus Convertible & Income Fund II and Virtus Diversified Income & Convertible Fund; Trustee (since 2022), Virtus Stone Harbor Emerging Markets Income Fund and Virtus Stone Harbor Emerging Markets Total Income Fund; Trustee (since 2021), The Merger Fund®, The Merger Fund® VL, Virtus Event Opportunities Trust (2 portfolios), Virtus Investment Trust (13 portfolios) and Virtus Strategy Trust (8 portfolios); Director (2020 to 2021), Duff & Phelps Select MLP and Midstream Energy Fund Inc.; Director (since 2020), Virtus Total Return Fund Inc.; Trustee (since 2020), Virtus Global Multi-Sector Income Fund; Trustee (since 2016), Virtus Mutual Fund Family (56 portfolios), Virtus Variable Insurance Trust (8 portfolios) and Virtus Alternative Solutions Trust (4 portfolios); Director (since 2014), closed-end funds managed by Duff & Phelps Investment Management Co. (3 funds); Director, Avista Corp. (energy company) (since 2011); Trustee, Goldman Sachs Fund Complex (2010 to 2014); and Director, BlackRock Luxembourg and Cayman Funds (2006 to 2010). |
Cogan, Sarah E.
YOB: 1956
Served Since: 2022
104 Portfolios | Retired Partner, Simpson Thacher & Bartlett LLP (“STB”) (law firm) (since 2019); Director, Girl Scouts of Greater New York (since 2016); Trustee, Natural Resources Defense Council, Inc. (since 2013); and formerly, Partner, STB (1989 to 2018). | Trustee (since 2022) and Advisory Board Member (2021 to 2022), Virtus Alternative Solutions Trust (4 portfolios), Virtus Mutual Fund Family (56 portfolios) and Virtus Variable Insurance Trust (8 portfolios); Trustee (since 2022), Virtus Stone Harbor Emerging Markets Income Fund and Virtus Stone Harbor Emerging Markets Total Income Fund; Trustee (since 2022), PIMCO Access Income Fund and PIMCO California Flexible Municipal Income Fund; Trustee (since 2021), PIMCO Flexible Emerging Markets Income Fund; Trustee (since 2021), The Merger Fund®, The Merger Fund® VL, Virtus Event Opportunities Trust (2 portfolios), and Virtus Global Multi-Sector Income Fund; Advisory Board Member (February 2021 to June 2021), Duff & Phelps Select MLP and Midstream Energy Fund Inc.; Director (since 2021), Virtus Total Return Fund Inc.; Trustee (since 2019), Virtus Investment Trust (13 portfolios) and Virtus Strategy Trust (8 portfolios); Trustee (since 2019), Virtus Artificial Intelligence & Technology Opportunities Fund, Virtus Convertible & Income 2024 Target Term Fund, Virtus Convertible & Income Fund, Virtus Convertible & Income Fund II, Virtus Diversified Income & Convertible Fund, Virtus Equity & Convertible Income Fund, and Virtus Dividend, Interest & Premium Strategy Fund; Trustee (since 2019), PIMCO California Municipal Income Fund, PIMCO California Municipal Income Fund II, PIMCO California Municipal Income Fund III, PIMCO Municipal Income Fund, PIMCO Municipal Income Fund II, PIMCO Municipal Income Fund III, PIMCO New York Municipal Income Fund, PIMCO New York Municipal Income Fund II, PIMCO New York Municipal Income Fund III, PIMCO Energy and Tactical Credit Opportunities Fund, PCM Fund, Inc, PIMCO Corporate & Income Strategy Fund, PIMCO Corporate & Income Opportunity Fund, PIMCO Dynamic Income Fund, PIMCO Global StocksPLUS® & Income Fund, PIMCO High Income Fund, PIMCO Income Strategy Fund, PIMCO Income Strategy Fund II, PIMCO Strategic Income Fund, Inc., PIMCO Flexible Credit Income Fund and PIMCO Flexible Municipal Income Fund; Trustee (since 2019), PIMCO Managed Accounts Trust (5 portfolios); and Trustee (2019 to 2021), PIMCO Dynamic Credit and Mortgage Income Fund and PIMCO Income Opportunity Fund. |
FUND MANAGEMENT TABLES (Unaudited) (Continued)
Name, Year of Birth,
Length of Time Served
and Number of
Portfolios in Fund
Complex Overseen by
Trustee | Principal Occupation(s) During Past 5 Years | Other Directorships Held by Trustee During Past 5 Years |
DeCotis, Deborah A.
YOB: 1952
Served Since: 2022
104 Portfolios | Director, Cadre Holdings Inc. (since 2022); Advisory Director, Morgan Stanley & Co., Inc. (since 1996); Member, Circle Financial Group (since 2009); Member, Council on Foreign Relations (since 2013); and Trustee, Smith College (since 2017). Formerly, Director, Watford Re (2017 to 2021); Co-Chair Special Projects Committee, Memorial Sloan Kettering (2005 to 2015); and Trustee, Stanford University (2010 to 2015). | Trustee (since 2022) and Advisory Board Member (2021 to 2022), Virtus Alternative Solutions Trust (4 portfolios), Virtus Mutual Fund Family (56 portfolios) and Virtus Variable Insurance Trust (8 portfolios); Trustee (since 2022), Virtus Stone Harbor Emerging Markets Income Fund and Virtus Stone Harbor Emerging Markets Total Income Fund; Trustee (since 2022), PIMCO Access Income Fund and PIMCO California Flexible Municipal Income Fund; Trustee (since 2021), PIMCO Flexible Emerging Markets Income Fund; Trustee (since 2021), The Merger Fund®, The Merger Fund® VL, Virtus Event Opportunities Trust (2 portfolios), and Virtus Global Multi-Sector Income Fund; Advisory Board Member (February 2021 to June 2021), Duff & Phelps Select MLP and Midstream Energy Fund Inc.; Director (since 2021), Virtus Total Return Fund Inc.; Trustee (since 2020), PIMCO Dynamic Income Opportunities Fund; Trustee (since 2019), PIMCO Energy and Tactical Credit Opportunities Fund and Virtus Artificial Intelligence & Technology Opportunities Fund; Trustee (since 2018), PIMCO Flexible Municipal Income Fund; Trustee (since 2017), PIMCO Flexible Credit Income Fund and Virtus Convertible & Income 2024 Target Term Fund; Trustee (since 2015), Virtus Diversified Income & Convertible Fund; Trustee (since 2014), Virtus Investment Trust (13 portfolios); Trustee (2013 to 2021), PIMCO Dynamic Credit and Mortgage Income Fund; Trustee (since 2012), PIMCO Dynamic Income Fund; Trustee (since 2011), Virtus Strategy Trust (8 portfolios); Trustee (since 2011), PIMCO California Municipal Income Fund II, PIMCO California Municipal Income Fund III, PIMCO Municipal Income Fund, PIMCO Municipal Income Fund II, PIMCO Municipal Income Fund III, PIMCO New York Municipal Income Fund, PIMCO New York Municipal Income Fund II, PIMCO New York Municipal Income Fund III, PCM Fund, Inc., PIMCO Corporate & Income Strategy Fund, PIMCO Corporate & Income Opportunity Fund, PIMCO Global StocksPLUS® & Income Fund, PIMCO High Income Fund, PIMCO Income Strategy Fund, PIMCO Income Strategy Fund II, PIMCO Strategic Income Fund, Inc., and PIMCO Managed Accounts Trust (5 portfolios); Trustee (since 2011), Virtus Convertible & Income Fund, Virtus Convertible & Income Fund II, Virtus Equity & Convertible Income Fund, and Virtus Dividend, Interest & Premium Strategy Fund; and Trustee (2011 to 2021), PIMCO Income Opportunity Fund. |
Drummond, F. Ford
YOB: 1962
Served Since: 2022
104 Portfolios | President (since 1998), F.G. Drummond Ranches, Inc.; and Director (since 2015), Texas and Southwestern Cattle Raisers Association. Formerly Chairman, Oklahoma Nature Conservancy (2019 to 2020); Board Member (2006 to 2020) and Chairman (2016 to 2018), Oklahoma Water Resources Board; Trustee (since 2014), Frank Phillips Foundation; Director (1998 to 2008), The Cleveland Bank; and General Counsel (1998 to 2008), BMIHealth Plans (benefits administration). | Trustee (since 2022) and Advisory Board Member (2021 to 2022), Virtus Alternative Solutions Trust (4 portfolios), Virtus Mutual Fund Family (56 portfolios), and Virtus Variable Insurance Trust (8 portfolios); Trustee (since 2022), Virtus Stone Harbor Emerging Markets Income Fund and Virtus Stone Harbor Emerging Markets Total Income Fund; Trustee (since 2021), The Merger Fund®, The Merger Fund® VL, and Virtus Event Opportunities Trust (2 portfolios);Advisory Board Member (February 2021 to June 2021), Duff & Phelps Select MLP and Midstream Energy Fund Inc.; Trustee (since 2021), Virtus Global Multi-Sector Income Fund; Director (since 2021), Virtus Total Return Fund Inc.; Trustee (since 2019), Virtus Artificial Intelligence & Technology Opportunities Fund; Trustee (since 2017), Virtus Convertible & Income 2024 Target Term Fund; Trustee (since 2015), Virtus Convertible & Income Fund, Virtus Convertible & Income Fund II, Virtus Diversified Income & Convertible Fund, Virtus Dividend, Interest & Premium Strategy Fund and Virtus Equity & Convertible Income Fund; Trustee (since 2014), Virtus Strategy Trust (8 portfolios); Director (since 2011), Bancfirst Corporation; and Trustee (since 2006), Virtus Investment Trust (13 portfolios). |
FUND MANAGEMENT TABLES (Unaudited) (Continued)
Name, Year of Birth,
Length of Time Served
and Number of
Portfolios in Fund
Complex Overseen by
Trustee | Principal Occupation(s) During Past 5 Years | Other Directorships Held by Trustee During Past 5 Years |
Harris, Sidney E.
YOB: 1949
Served Since: 2017
97 Portfolios | Private Investor (since 2021); Dean Emeritus (since 2015), Professor (2015 to 2021 and 1997 to 2014), and Dean (1997 to 2004), J. Mack Robinson College of Business, Georgia State University. | Trustee (since 2022), Virtus Stone Harbor Emerging Markets Income Fund and Virtus Stone Harbor Emerging Markets Total Income Fund; Trustee (since 2021), The Merger Fund®, The Merger Fund® VL, Virtus Event Opportunities Trust (2 portfolios), Virtus Investment Trust (13 portfolios) and Virtus Strategy Trust (8 portfolios); Director (2020 to 2021), Duff & Phelps Select MLP and Midstream Energy Fund Inc.; Director (since 2020), Virtus Total Return Fund Inc.; Trustee (since 2020), Virtus Global Multi-Sector Income Fund; Trustee (since 2019), Mutual Fund Directors Forum; Trustee (since 2017), Virtus Mutual Fund Family (56 portfolios), Virtus Variable Insurance Trust (8 portfolios), and Virtus Alternative Solutions Trust (4 portfolios); Trustee (2013 to 2020) and Honorary Trustee (since 2020), KIPP Metro Atlanta; Director (1999 to 2019), Total System Services, Inc.; Trustee (2004 to 2017), RidgeWorth Funds; Chairman (2012 to 2017), International University of the Grand Bassam Foundation; Trustee (since 2012), International University of the Grand Bassam Foundation; and Trustee (2011 to 2015), Genspring Family Offices, LLC. |
Mallin, John R.
YOB: 1950
Served Since: 2016
97 Portfolios | Partner/Attorney (since 2003), McCarter & English LLP (law firm) Real Property Practice Group; and Member (2014 to 2022), Counselors of Real Estate. | Trustee (since 2022), Virtus Stone Harbor Emerging Markets Income Fund and Virtus Stone Harbor Emerging Markets Total Income Fund; Trustee (since 2021), The Merger Fund®, The Merger Fund® VL, Virtus Event Opportunities Trust (2 portfolios), Virtus Investment Trust (13 portfolios) and Virtus Strategy Trust (8 portfolios); Director (2020 to 2021), Duff & Phelps Select MLP and Midstream Energy Fund Inc.; Director (since 2020), Virtus Total Return Fund Inc.; Trustee (since 2020), Virtus Global Multi-Sector Income Fund; Trustee (since 2016), Virtus Mutual Fund Family (56 portfolios) and Virtus Alternative Solutions Trust (4 portfolios); Director (since 2019), 1892 Club, Inc. (non-profit); Director (2013 to 2020), Horizons, Inc. (non-profit); and Trustee (since 1999), Virtus Variable Insurance Trust (8 portfolios). |
McDaniel, Connie D.
YOB: 1958
Served Since: 2017
104 Portfolios | Retired (since 2013). Vice President, Chief of Internal Audit, Corporate Audit Department (2009 to 2013); Vice President, Global Finance Transformation (2007 to 2009); and Vice President and Controller (1999 to 2007), The Coca-Cola Company. | Trustee (since May 2023) and Advisory Board Member (May 2023), Virtus Artificial Intelligence & Technology Opportunities Fund, Virtus Convertible & Income 2024 Target Term Fund, Virtus Convertible & Income Fund, Virtus Convertible & Income Fund II, Virtus Diversified Income & Convertible Fund, Virtus Dividend, Interest & Premium Strategy Fund and Virtus Equity & Convertible Income Fund; Trustee (since 2022), Virtus Stone Harbor Emerging Markets Income Fund and Virtus Stone Harbor Emerging Markets Total Income Fund; Trustee (since 2021), The Merger Fund®, The Merger Fund® VL, Virtus Event Opportunities Trust (2 portfolios), Virtus Investment Trust (13 portfolios) and Virtus Strategy Trust (8 portfolios); Director (2020 to 2021), Duff & Phelps Select MLP and Midstream Energy Fund Inc.; Director (since 2020), Virtus Total Return Fund Inc.; Trustee (since 2020), Virtus Global Multi-Sector Income Fund; Director (since 2019), Global Payments Inc.; Chairperson (since 2021), Governance & Nominating Committee, Global Payments Inc; Trustee (since 2017), Virtus Mutual Fund Family (56 portfolios), Virtus Variable Insurance Trust (8 portfolios), and Virtus Alternative Solutions Trust (4 portfolios); Director (since 2021), North Florida Land Trust; Director (2014 to 2019), Total System Services, Inc.; Member (2011 to 2022) and Chair (2014 to 2016), Georgia State University, Robinson College of Business Board of Advisors; and Trustee (2005 to 2017), RidgeWorth Funds. |
FUND MANAGEMENT TABLES (Unaudited) (Continued)
Name, Year of Birth,
Length of Time Served
and Number of
Portfolios in Fund
Complex Overseen by
Trustee | Principal Occupation(s) During Past 5 Years | Other Directorships Held by Trustee During Past 5 Years |
McLoughlin, Philip.
YOB: 1946
Served Since: 1999
107 Portfolios | Private investor since 2010. | Trustee and Chairman (since 2022), Virtus Stone Harbor Emerging Markets Income Fund and Virtus Stone Harbor Emerging Markets Total Income Fund; Trustee (since 2021), The Merger Fund®, The Merger Fund® VL, Virtus Event Opportunities Trust (2 portfolios), Virtus Investment Trust (13 portfolios) and Virtus Strategy Trust (8 portfolios); Chairman (since 2023) and Trustee (since 2021), Virtus Artificial Intelligence & Technology Opportunities Fund, Virtus Convertible & Income Fund II, Virtus Diversified Income & Convertible Fund, Virtus Equity & Convertible Income Fund and Virtus Dividend, Interest & Premium Strategy Fund; Chairman (since 2023), Trustee (since 2022) and Advisory Board Member (2021), Virtus Convertible & Income 2024 Target Term Fund and Virtus Convertible & Income Fund; Director and Chairman (since 2016), Virtus Total Return Fund Inc.; Director and Chairman (2016 to 2019), the former Virtus Total Return Fund Inc.; Director and Chairman (2014 to 2021), Duff & Phelps Select MLP and Midstream Energy Fund Inc.; Trustee and Chairman (since 2013), Virtus Alternative Solutions Trust (4 portfolios); Trustee and Chairman (since 2011), Virtus Global Multi-Sector Income Fund; Chairman and Trustee (since 2003), Virtus Variable Insurance Trust (8 portfolios); Director (since 1995), closed-end funds managed by Duff & Phelps Investment Management Co. (3 funds); Director (1991 to 2019) and Chairman (2010 to 2019), Lazard World Trust Fund (closed-end investment firm in Luxembourg); and Trustee (since 1989) and Chairman (since 2002), Virtus Mutual Fund Family (56 portfolios). |
McNamara, Geraldine M.
YOB: 1951
Served Since: 2001
107 Portfolios | Private investor (since 2006); and Managing Director, U.S. Trust Company of New York (1982 to 2006). | Trustee (since May 2023) and Advisory Board Member (January 2023 to May 2023), Virtus Convertible & Income Fund, Virtus Convertible & Income Fund II, Virtus Diversified Income & Convertible Fund and Virtus Dividend, Interest & Premium Strategy Fund; Trustee (since 2023), Virtus Artificial Intelligence & Technology Opportunities Fund and Virtus Equity & Convertible Income Fund; Advisory Board Member (since 2023), Virtus Convertible & Income 2024 Target Term Fund; Trustee (since 2022), Virtus Stone Harbor Emerging Markets Income Fund and Virtus Stone Harbor Emerging Markets Total Income Fund; Trustee (since 2021), The Merger Fund®, The Merger Fund® VL, Virtus Event Opportunities Trust (2 portfolios), Virtus Investment Trust (13 portfolios) and Virtus Strategy Trust (8 portfolios); Director (2020 to 2021), Duff & Phelps Select MLP and Midstream Energy Fund Inc.; Director (since 2020), Virtus Total Return Fund Inc.; Trustee (since 2020), Virtus Global Multi-Sector Income Fund; Trustee (since 2016) Virtus Alternative Solutions Trust (4 portfolios); Trustee (since 2015), Virtus Variable Insurance Trust (8 portfolios); Director (since 2003), closed-end funds managed by Duff & Phelps Investment Management Co. (3 funds); and Trustee (since 2001), Virtus Mutual Fund Family (56 portfolios). |
Walton, R. Keith
YOB: 1964
Served Since: 2020
104 Portfolios | Senior Adviser (since 2022), Brightwood Capital LLC; Venture and Operating Partner (since 2020), Plexo Capital, LLC; Venture Partner (since 2019) and Senior Adviser (2018 to 2019), Plexo, LLC; and Partner (since 2006), Global Infrastructure Partners. Formerly, Managing Director (2020 to 2021), Lafayette Square Holding Company LLC; Senior Adviser (2018 to 2019), Vatic Labs, LLC; Executive Vice President, Strategy (2017 to 2019), Zero Mass Water, LLC; and Vice President, Strategy (2013 to 2017), Arizona State University. | Trustee (since 2023) and Advisory Board Member (2022 to 2023), Virtus Convertible & Income 2024 Target Term Fund; Trustee (since 2023) and Advisory Board Member (2022 to 2023), Virtus Convertible & Income Fund II and Virtus Dividend, Interest & Premium Strategy Fund; Trustee (since 2022) and Advisory Board Member (January 2022 to July 2022), Virtus Artificial Intelligence & Technology Opportunities Fund, Virtus Convertible & Income Fund and Virtus Equity & Convertible Income Fund; Trustee (since 2022), Virtus Stone Harbor Emerging Markets Income Fund and Virtus Stone Harbor Emerging Markets Total Income Fund; Trustee (since 2022), Virtus Diversified Income & Convertible Fund; Trustee (since 2021), The Merger Fund®, The Merger Fund®VL, Virtus Event Opportunities Trust (2 portfolios), Virtus Investment Trust (13 portfolios) and Virtus Strategy Trust (8 portfolios); Trustee (since 2020) Virtus Alternative Solutions Trust (4 portfolios), Virtus Variable Insurance Trust (8 portfolios) and Virtus Mutual Fund Family (56 portfolios); Director (since 2017), certain funds advised by Bessemer Investment Management LLC; Director (2016 to 2021), Duff & Phelps Select MLP and Midstream Energy Fund Inc.; Trustee (since 2016), Virtus Global Multi-Sector Income Fund; Director (2006 to 2019), Systematica Investments Limited Funds; Director (2006 to 2017), BlueCrest Capital Management Funds; Trustee (2014 to 2017), AZ Service; Director (since 2004), Virtus Total Return Fund Inc.; and Director (2004 to 2019), the former Virtus Total Return Fund Inc. |
FUND MANAGEMENT TABLES (Unaudited) (Continued)
Name, Year of Birth,
Length of Time Served
and Number of
Portfolios in Fund
Complex Overseen by
Trustee | Principal Occupation(s) During Past 5 Years | Other Directorships Held by Trustee During Past 5 Years |
Zino, Brian T.
YOB: 1952
Served Since: 2020
104 Portfolios | Retired. Various roles (1982 to 2009), J. & W. Seligman & Co. Incorporated, including President (1994 to 2009). | Trustee (since 2022), Virtus Stone Harbor Emerging Markets Income Fund and Virtus Stone Harbor Emerging Markets Total Income Fund; Trustee (since 2021), The Merger Fund®, The Merger Fund® VL, Virtus Event Opportunities Trust (2 portfolios), Virtus Investment Trust (13 portfolios) and Virtus Strategy Trust (8 portfolios); Trustee (since 2022) and Advisory Board Member (2021), Virtus Artificial Intelligence & Technology Opportunities Fund, Virtus Convertible & Income 2024 Target Term Fund, Virtus Convertible & Income Fund, Virtus Convertible & Income Fund II, Virtus Diversified Income & Convertible Fund, Virtus Equity & Convertible Income Fund, and Virtus Dividend, Interest & Premium Strategy Fund; Trustee (since 2020) Virtus Alternative Solutions Trust (4 portfolios), Virtus Variable Insurance Trust (8 portfolios) and Virtus Mutual Fund Family (56 portfolios); Director (2016 to 2021), Duff & Phelps Select MLP and Midstream Energy Fund Inc.; Trustee (since 2016), Virtus Global Multi-Sector Income Fund; Director (since 2014), Virtus Total Return Fund Inc.; Director (2014 to 2019), the former Virtus Total Return Fund Inc.; Trustee (since 2011), Bentley University; Director (1986 to 2009) and President (1994 to 2009), J&W Seligman Co. Inc.; Director (1998 to 2009), Chairman (2002 to 2004) and Vice Chairman (2000 to 2002), ICI Mutual Insurance Company; Member, Board of Governors of ICI (1998 to 2008). |
FUND MANAGEMENT TABLES (Unaudited) (Continued)
Interested Trustee
Name, Year of Birth,
Length of Time Served and
Number of Funds
Overseen | Principal Occupation(s) During Past
5 Years | Principal Occupation(s) During Past 5 Years and
Other Directorships Held by Trustee |
Aylward, George R.*
Trustee and President
YOB: 1964
Served Since: 2006
110 Portfolios | Director, President and Chief Executive Officer (since 2008), Virtus Investment Partners, Inc. and/or certain of its subsidiaries, and various senior officer positions with Virtus affiliates (since 2005). | Director (since 2023), Stone Harbor Investment Funds plc (21 sub-funds) and Stone Harbor Global Funds plc (27 sub-funds); Trustee, President and Chief Executive Officer (since 2022), Virtus Stone Harbor Emerging Markets Income Fund and Virtus Stone Harbor Emerging Markets Total Income Fund; Member, Board of Governors of the Investment Company Institute (since 2021); Trustee and President (since 2021), The Merger Fund®, The Merger Fund® VL, Virtus Event Opportunities Trust (2 portfolios), Virtus Investment Trust (13 portfolios) and Virtus Strategy Trust (8 portfolios); Trustee, President and Chief Executive Officer (since 2021), Virtus Artificial Intelligence & Technology Opportunities Fund, Virtus Convertible & Income 2024 Target Term Fund, Virtus Convertible & Income Fund, Virtus Convertible & Income Fund II, Virtus Diversified Income & Convertible Fund, Virtus Equity & Convertible Income Fund, and Virtus Dividend, Interest & Premium Strategy Fund; Chairman and Trustee (since 2015), Virtus ETF Trust II (6 portfolios); Director, President and Chief Executive Officer (2014 to 2021), Duff & Phelps Select MLP and Midstream Energy Fund Inc.; Trustee and President (since 2013), Virtus Alternative Solutions Trust (4 portfolios); Director (since 2013), Virtus Global Funds, plc (5 portfolios); Trustee (since 2012) and President (since 2010), Virtus Variable Insurance Trust (8 portfolios); Trustee, President and Chief Executive Officer (since 2011), Virtus Global Multi-Sector Income Fund; Trustee and President (since 2006) and Executive Vice President (2004 to 2006), Virtus Mutual Fund Family (56 portfolios); Director, President and Chief Executive Officer (since 2006), Virtus Total Return Fund Inc.; and Director, President and Chief Executive Officer (2006 to 2019), the former Virtus Total Return Fund Inc. |
*Mr. Aylward is an “interested person,” as defined in the 1940 Act, by reason of his position as President and Chief Executive Officer of Virtus Investment Partners, Inc. (“Virtus”), the ultimate parent company of the Adviser, and various positions with its affiliates, including the Adviser.
FUND MANAGEMENT TABLES (Unaudited) (Continued)
Officers of the Trust Who Are Not Trustees
Name, Address and
Year of Birth | Position(s) Held with Trust and
Length of Time Served | Principal Occupation(s) During Past 5 Years |
Batchelar, Peter J.
YOB: 1970 | Senior Vice President (since 2017), and Vice President (2008 to 2016). | Senior Vice President, Product Development (since 2017), Vice President, Product Development (2008 to 2017), and various officer positions (since 2008), Virtus Investment Partners, Inc. and/or certain of its subsidiaries; various officer positions (since 2008) of various registered funds advised by subsidiaries of Virtus Investment Partners, Inc. |
Bradley, W. Patrick
YOB: 1972 | Executive Vice President (since 2016); Senior Vice President (2013 to 2016); Vice President (2011 to 2013); Chief Financial Officer and Treasurer (since 2006). | Executive Vice President, Fund Services (since 2016), Director (since 2023), Stone Harbor Investment Funds plc and Stone Harbor Global Funds plc; Director (since 2019), Virtus Global Funds ICAV; Director (since 2013), Virtus Global Funds, plc; Senior Vice President, Fund Services (2010 to 2016) and various officer positions (since 2004), Virtus Investment Partners, Inc. and/or certain of its subsidiaries; various officer positions (since 2006) of various registered funds advised by subsidiaries of Virtus Investment Partners, Inc.; Member (since 2022), BNY Mellon Asset Servicing Client Advisory Board. |
Branigan, Timothy
YOB: 1976 | Vice President and Fund Chief Compliance Officer (since 2022); Assistant Vice President and Deputy Fund Chief Compliance Officer (March to May 2022); and Assistant Vice President and Assistant Chief Compliance Officer (2021 to 2022). | Various officer positions (since 2019) of various registered funds advised by subsidiaries of Virtus Investment Partners, Inc. |
Chisolm, Daphne
YOB: 1969 | Vice President, Counsel and Assistant Secretary (since 2023) | Vice President and Senior Counsel (since 2023), Virtus Investment Partners, Inc.; Attorney at Law engaged in private practice as a solo practitioner (2018 to 2023); and various officer positions (since 2023) of various registered funds advised by subsidiaries of Virtus Investment Partners, Inc. |
Fromm, Jennifer
YOB: 1973 | Chief Legal Officer, Counsel and Secretary (since 2023); Vice President (since 2017); and Assistant Secretary (2008 to 2022). | Vice President (since 2016) and Senior Counsel, Legal (since 2007) and various officer positions (since 2008), Virtus Investment Partners, Inc. and/or certain of its subsidiaries; various officer positions (since 2008) of various registered funds advised by subsidiaries of Virtus Investment Partners, Inc. |
Griswold, Heidi
YOB: 1973 | Vice President (since 2016). | Vice President, Head of Transfer Agent & Servicing, Mutual Fund Services (since 2018), Virtus Investment Partners, Inc. and/or certain of its subsidiaries; and Vice President (since 2016) of various registered funds advised by subsidiaries of Virtus Investment Partners, Inc. |
Hackett, Amy
YOB: 1968 | Vice President and Assistant Treasurer (since 2013); Assistant Treasurer (2009 to 2013). | Vice President (since 2010) and Assistant Vice President (2007 to 2010), Fund Services, Virtus Investment Partners, Inc. and/or certain of its subsidiaries; and various officer positions (since 2007) of various registered funds advised by subsidiaries of Virtus Investment Partners, Inc. |
Krishnan, Suneeta
YOB: 1965 | Vice President and Assistant Treasurer (since 2018); and Assistant Treasurer (2009 to 2018). | Vice President (since 2017) and Assistant Treasurer (since 2007), Mutual Fund Administration, Virtus Investment Partners, Inc. and/or certain of its subsidiaries; and various officer positions (since 2009) of various registered funds advised by subsidiaries of Virtus Investment Partners, Inc. |
Lowe, Benjamin
YOB: 1978 | Vice President, Controller and Assistant Treasurer (since 2021); and Vice President and Assistant Treasurer (2018 to 2021). | Vice President, Fund Services (since 2017), Virtus Investment Partners, Inc. and/or certain of its subsidiaries; and various officer positions (since 2018) of various registered funds advised by subsidiaries of Virtus Investment Partners, Inc. |
Martin, David
YOB: 1959 | Anti-Money Laundering Compliance Officer (since 2016). | Vice President, Compliance – Broker/Dealer (since 2009), Virtus Investment Partners, Inc.; and Vice President and Chief Compliance Officer of certain Virtus subsidiaries (since 2004). |
Rahman, Mahmood
YOB: 1967 | Assistant Vice President (since 2021). | Vice President (since 2023), Tax Director (since 2020) and Assistant Vice President (2020 to 2023), Fund Administration, Virtus Investment Partners, Inc.; Assistant Vice President (since 2021) of various registered funds advised by subsidiaries of Virtus Investment Partners, Inc.; and Assistant Treasurer and Tax Director, Grantham, Mayo, Van Otterloo & Co. LLC (2007 to 2019). |
Short, Julia R.
YOB: 1972 | Senior Vice President (since 2017). | Senior Vice President, Product Development (since 2017), Virtus Investment Partners, Inc. and/or certain of its subsidiaries; Senior Vice President (since 2017) of various registered funds advised by subsidiaries of Virtus Investment Partners, Inc.; and Managing Director, Product Manager, RidgeWorth Investments (2004 to 2017). |
FUND MANAGEMENT TABLES (Unaudited) (Continued)
Name, Address and
Year of Birth | Position(s) Held with Trust and
Length of Time Served | Principal Occupation(s) During Past 5 Years |
Smirl, Richard W.
YOB: 1967 | Executive Vice President (since 2021). | Chief Operating Officer (since 2021), Virtus Investment Partners, Inc.; Executive Vice President (since 2021), Virtus Investment Partners, Inc. and/or certain of its subsidiaries; Executive Vice President (since 2021) of various registered funds advised by subsidiaries of Virtus Investment Partners, Inc.; Chief Operating Officer (2018 to 2021), Russell Investments; Executive Director (Jan. to July 2018), State of Wisconsin Investment Board; and Partner and Chief Operating Officer (2004 to 2018), William Blair Investment Management. |
Suss, Amanda
YOB: 1969 | Vice President, Controller and Assistant Treasurer (since 2022). | Vice President and Controller (since 2022), Mutual Fund Administration and Financial Reporting, Virtus Investment Partners, Inc.; Vice President, Controller and Assistant Treasurer (since 2022) of various registered funds advised by subsidiaries of Virtus Investment Partners, Inc.; and Senior Finance Associate (2011 to 2022), Stone Harbor Investment Partners LP. |
Virtus Newfleet High Yield Fund (the “Fund”)
a series of Virtus Opportunities Trust
(Unaudited)
Supplement dated November 6, 2023, to the Summary Prospectus and the Virtus Opportunities Trust
Statutory Prospectus pertaining to the Fund, each dated January 27, 2023, as supplemented
IMPORTANT NOTICE TO INVESTORS
Effective November 6, 2023, Francesco Ossino and Kyle A. Jennings, CFA are no longer portfolio managers of the Fund. In addition, Matthew Kearns, CFA is hereby added as a portfolio manager of the Fund.
The disclosure under “Portfolio Management” in the Fund’s summary prospectus and in the summary section of Fund’s statutory prospectus is hereby replaced in its entirety with the following:
> David L. Albrycht, CFA, Newfleet Division President and Chief Investment Officer, and senior portfolio manager of Newfleet, has managed the fund since 2011.
> William J. Eastwood, CFA, senior managing director, portfolio manager and head of trading of Newfleet, has managed the fund since August 2019.
> Eric Hess, CFA, senior managing director, portfolio manager and high yield sector head of Newfleet, has managed the fund since August 2019.
> Matthew Kearns, CFA, portfolio manager of Newfleet, has managed the fund since November 2023.
In the section “Management of the Funds” in the subsection “Portfolio Management,” the row for the Fund in the table under “Newfleet” on page 118 of the Fund’s statutory prospectus is hereby replaced with the following:
| Virtus Newfleet High Yield Fund | David L. Albrycht, CFA (since 2011)
William J. Eastwood, CFA (since August 2019)
Eric Hess, CFA (since August 2019)
Matthew Kearns, CFA (since November 2023) |
The portfolio manager biographies under the referenced table are hereby amended by adding the following for Mr. Kearns.
Matthew Kearns, CFA. Mr. Kearns is a portfolio manager for U.S. and European high yield at Newfleet, an operating division of VFIA, joining in November 2023. Additionally, Mr. Kearns is a portfolio manager (since 2018) for U.S. and European high yield at Stone Harbor Investment Partners, an operating division of VFIA. Mr. Kearns joined the predecessor to Stone Harbor in 1997, where he became a credit analyst, evaluating corporate securities and was responsible for covering the broadcasting, entertainment/leisure, towers, publishing, chemicals, and utilities industries. He is a Chartered Financial Analyst® (CFA®) charterholder and a member of the CFA Institute and CFA Society New York. He began working in the investment industry in 1997.
All other disclosure concerning the Fund, including fees, expenses, investment objective, strategies and risks, remains unchanged.
Investors should retain this supplement with the Prospectuses for future reference.
VOT 8020 Newfleet HYB PM Change Supplement (11/2023)
Virtus Seix Tax-Exempt Bond Fund (the “Fund”),
a series of Virtus Opportunities Trust
(Unaudited)
Supplement dated November 9, 2023, to the Summary and Statutory Prospectuses for the Fund listed
above, each dated January 27, 2023, as supplemented
IMPORTANT NOTICE TO INVESTORS
The table showing Average Annual Total Returns and the paragraph immediately after the table in the “Performance Information” section of the Fund’s summary prospectus and the summary section of the statutory prospectus applicable to the Fund, are hereby replaced in their entirety with the following:
| | 1 Year | 5 Years | 10 Years |
| Class I Shares | | | |
| Return Before Taxes | -7.76% | 1.00% | 1.67% |
| Return After Taxes on Distributions | -7.76% | 0.91% | 1.61% |
| Return After Taxes on Distributions and Sale of Fund Shares | -3.64% | 1.38% | 1.92% |
| Class A Shares | | | |
| Return Before Taxes | -10.52% | 0.18% | 1.13% |
| Class C Shares | | | |
| Return Before Taxes | -8.68% | -0.01% | 0.65% |
| Bloomberg U.S. Aggregate Bond Index | -13.01% | 0.02% | 1.06% |
| ICE BofA 1-22 Year U.S. Municipal Securities Index (reflects no deduction for fees, expenses or taxes) | -6.74% | 1.39% | 2.05% |
Effective February 1, 2021, the ICE BofA 1-22 Year U.S. Municipal Securities Index is the Fund’s style-specific benchmark. The ICE BofA 1–22 Year U.S. Municipal Securities Index is a subset of the ICE BofA U.S. Municipal Securities Index including all securities with a remaining term to final maturity less than 22 years, calculated on a total return basis. The Bloomberg U.S. Aggregate Bond Index, which is the Fund’s broad-based benchmark, measures the U.S. investment grade fixed rate bond market. The indexes are calculated on a total return basis, are unmanaged, and are not available for direct investment.
Investors should retain this supplement with the Prospectuses and SAI for future reference.
VOT 8020/Seix TEB (11/2023)
THIS PAGE INTENTIONALLY BLANK.
THIS PAGE INTENTIONALLY BLANK.
THIS PAGE INTENTIONALLY BLANK.
VIRTUS OPPORTUNITIES TRUST
101 Munson Street
Greenfield, MA 01301-9668
Trustees
Philip R. McLoughlin, Chairman
George R. Aylward
Donald C. Burke
Sarah E. Cogan
Deborah A. DeCotis
F. Ford Drummond
Sidney E. Harris
John R. Mallin
Connie D. McDaniel
Geraldine M. McNamara
R. Keith Walton
Brian T. Zino
Officers
George R. Aylward, President
Peter Batchelar, Senior Vice President
W. Patrick Bradley, Executive Vice President, Chief Financial Officer and Treasurer
Timothy Branigan, Vice President and Fund Chief Compliance Officer
Jennifer Fromm, Vice President, Chief Legal Officer, Counsel and Secretary
Julia R. Short, Senior Vice President
Richard W. Smirl, Executive Vice President
Investment Adviser
Virtus Investment Advisers, Inc.
One Financial Plaza
Hartford, CT 06103-2608
Principal Underwriter
VP Distributors, LLC
One Financial Plaza
Hartford, CT 06103-2608
Administrator and Transfer Agent
Virtus Fund Services, LLC
One Financial Plaza
Hartford, CT 06103-2608
Custodian
The Bank of New York Mellon
240 Greenwich Street
New York, NY 10286-1048
Independent Registered Public
Accounting Firm
PricewaterhouseCoopers LLP
2001 Market Street
Philadelphia, PA 19103-7042
How to Contact Us
| Mutual Fund Services | 1-800-243-1574 |
| Adviser Consulting Group | 1-800-243-4361 |
Important Notice to Shareholders
The Securities and Exchange Commission has modified mailing regulations for semiannual and annual shareholder fund reports to allow mutual fund companies to send a single copy of these reports to shareholders who share the same mailing address. If you would like additional copies, please call Mutual Fund Services at 1-800-243-1574.
P.O. Box 534470
Pittsburgh, PA 15253-4470
For more information about Virtus Funds,
please contact us at 1-800-243-1574, or visit Virtus.com.
ANNUAL REPORT
VIRTUS OPPORTUNITIES TRUST
| Virtus Duff & Phelps Global Infrastructure Fund |
| Virtus Duff & Phelps Global Real Estate Securities Fund |
| Virtus Duff & Phelps International Real Estate Securities Fund |
| Virtus Duff & Phelps Real Asset Fund |
| Virtus Duff & Phelps Real Estate Securities Fund |
| Virtus KAR Developing Markets Fund |
| Virtus KAR Emerging Markets Small-Cap Fund |
| Virtus KAR International Small-Mid Cap Fund |
| Virtus Vontobel Emerging Markets Opportunities Fund* |
| Virtus Vontobel Foreign Opportunities Fund* |
| Virtus Vontobel Global Opportunities Fund* |
| Virtus Vontobel Greater European Opportunities Fund* |
*Prospectus supplement applicable to this fund appears at the back of this annual report.
Not FDIC Insured • No Bank Guarantee • May Lose Value
Table of Contents
| 1 |
| 2 |
| 6 |
| Fund | Fund
Summary | Schedule
of
Investments |
| 10 | 56 |
| 14 | 57 |
| 18 | 59 |
| 22 | 60 |
| 26 | 61 |
| 30 | 62 |
| 34 | 64 |
| 37 | 66 |
| 40 | 67 |
| 44 | 69 |
| 48 | 71 |
| 52 | 73 |
| 74 |
| 80 |
| 83 |
| 89 |
| 97 |
| 116 |
| 117 |
| 118 |
| 119 |
Proxy Voting Procedures and Voting Record (Form N-PX)
The subadvisers vote proxies, if any, relating to portfolio securities in accordance with procedures that have been approved by the Board of Trustees of the Trust (“Trustees”, or the “Board”). You may obtain a description of these procedures, along with information regarding how the Funds voted proxies during the most recent 12-month period ended June 30, free of charge, by calling toll-free 1-800-243-1574. This information is also available through the Securities and Exchange Commission’s (the “SEC”) website at https://www.sec.gov.
PORTFOLIO HOLDINGS INFORMATION
The Trust files a complete schedule of portfolio holdings for each Fund with the SEC for the first and third quarters of each fiscal year as an exhibit to its reports on Form N-PORT-P. Form N-PORT-P is available on the SEC’s website at https://www.sec.gov.
This report is not authorized for distribution to prospective investors in the Funds presented in this book unless preceded or accompanied by an effective prospectus which includes information concerning the sales charge, each Fund’s record and other pertinent information.
To my fellow shareholders of Virtus Funds:
I am pleased to present this annual report, which reviews the performance of your Fund for the 12 months ended September 30, 2023.
After a challenging 2022, markets showed strength in 2023. Inflation began to slow while the U.S. economy demonstrated continued resilience. The efforts of the Federal Reserve (Fed) and other central banks to manage inflation appeared more likely to generate an economic “soft landing.” A brief banking crisis in March of 2023 was quickly resolved without impacting economic growth, and investors were optimistic about the possibilities for artificial intelligence (AI). As the fiscal year came to a close, however, concerns that interest rates might remain higher for longer began to weigh on markets.
Domestic equity indexes posted strong returns for the 12 months ended September 30, 2023. U.S. large-capitalization stocks led the way with a return of 21.62%, as measured by the S&P 500® Index, while small-cap stocks returned 8.93%, as measured by the Russell 2000® Index. International equities also performed well, with developed markets, as measured by the MSCI EAFE® Index (net), returning 25.65%, while emerging markets, as measured by the MSCI Emerging Markets Index (net), returned 11.70%.
In fixed income markets, the yield on the 10-year Treasury rose to 4.59% on September 30, 2023, from 3.83% on September 30, 2022. The broader U.S. fixed income market, as represented by the Bloomberg U.S. Aggregate Bond Index, returned 0.64% for the 12-month period, while non-investment grade bonds, as measured by the Bloomberg U.S. Corporate High Yield Bond Index, were up 10.28%.
Thank you for entrusting the Virtus Funds with your assets. Please call our customer service team at 800-243-1574 if you have questions about your account or require assistance. We appreciate your business and remain committed to your long-term financial success.
Sincerely,
George R. Aylward
President and Trustee, Virtus Funds
November 2023
Refer to the Fund Summary section for your Fund’s performance. Performance data quoted represents past results. Past performance is no guarantee of future results, and current performance may be higher or lower than the performance shown above. Investing involves risk, including the risk of loss of principal invested.
VIRTUS OPPORTUNITIES TRUST
DISCLOSURE OF FUND EXPENSES (Unaudited)
FOR THE SIX-MONTH PERIOD OF April 1, 2023 TO September 30, 2023
We believe it is important for you to understand the impact of costs on your investment. All mutual funds have operating expenses. As a shareholder of a Virtus Opportunities Trust Fund discussed in this shareholder report (each, a “Fund”), you may incur two types of costs: (1) transaction costs, including sales charges on purchases of Class A shares and contingent deferred sales charges on Class C shares; and (2) ongoing costs, including investment advisory fees, distribution and service fees, and other expenses. Class I shares and Class R6 shares are sold without sales charges and do not incur distribution and service fees. Class R6 shares also do not incur shareholder servicing fees. For further information regarding applicable sales charges, see Note 1 in the Notes to Financial Statements. These examples are intended to help you understand your ongoing costs (in dollars) of investing in a Fund and to compare these costs with the ongoing costs of investing in other mutual funds. These examples are based on an investment of $1,000 invested at the beginning of the period and held for the entire six-month period. The Annualized Expense Ratios may be different from the expense ratios in the Financial Highlights which are for the fiscal year ended September 30, 2023.
Please note that the expenses shown in the accompanying tables are meant to highlight your ongoing costs only and do not reflect any transactional costs, such as sales charges or contingent deferred sales charges. Therefore, the accompanying tables are useful in comparing ongoing costs only, and will not help you determine the relative total costs of owning different funds. In addition, if these transactional costs were included, your costs would have been higher. The calculations assume no shares were bought or sold during the period. Your actual costs may have been higher or lower, depending on the amount of your investment and the timing of any purchases or redemptions.
Actual Expenses
The table below provides information about actual account values and actual expenses. You may use the information below, together with the amount you invested, to estimate the expenses that you paid over the period. Simply divide your account value by $1,000 (for example, an $8,600 account value divided by $1,000 = 8.6), then multiply the result by the number in the table under the heading entitled “Expenses Paid During Period” to estimate the expenses you paid on your account during this period.
| | | Beginning
Account Value
April 1, 2023 | | Ending
Account Value
September 30, 2023 | | Annualized
Expense
Ratio | | Expenses
Paid
During
Period* |
Duff & Phelps Global Infrastructure Fund
| | | | | | | | |
| | Class A | $ 1,000.00 | | $ 891.20 | | 1.31 % | | $ 6.21 |
| | Class C | 1,000.00 | | 887.90 | | 2.08 | | 9.84 |
| | Class I | 1,000.00 | | 892.20 | | 1.05 | | 4.98 |
| | Class R6 | 1,000.00 | | 892.90 | | 0.84 | | 3.99 |
Duff & Phelps Global Real Estate Securities Fund
| | | | | | | | |
| | Class A | 1,000.00 | | 940.40 | | 1.39 | | 6.76 |
| | Class C | 1,000.00 | | 936.90 | | 2.14 | | 10.39 |
| | Class I | 1,000.00 | | 941.70 | | 1.14 | | 5.55 |
| | Class R6 | 1,000.00 | | 942.80 | | 0.88 | | 4.29 |
Duff & Phelps International Real Estate Securities Fund
| | | | | | | | |
| | Class A | 1,000.00 | | 958.20 | | 1.49 | | 7.31 |
| | Class C | 1,000.00 | | 954.20 | | 2.24 | | 10.97 |
| | Class I | 1,000.00 | | 958.30 | | 1.24 | | 6.09 |
Duff & Phelps Real Asset Fund
| | | | | | | | |
| | Class A | 1,000.00 | | 971.10 | | 0.49 | | 2.42 |
| | Class C | 1,000.00 | | 967.40 | | 1.25 | | 6.16 |
| | Class I | 1,000.00 | | 971.90 | | 0.25 | | 1.24 |
| | Class R6 | 1,000.00 | | 971.80 | | 0.20 | | 0.99 |
Duff & Phelps Real Estate Securities Fund
| | | | | | | | |
| | Class A | 1,000.00 | | 934.60 | | 1.35 | | 6.55 |
| | Class C | 1,000.00 | | 930.90 | | 2.06 | | 9.97 |
| | Class I | 1,000.00 | | 935.60 | | 1.10 | | 5.34 |
| | Class R6 | 1,000.00 | | 936.80 | | 0.78 | | 3.79 |
KAR Developing Markets Fund
| | | | | | | | |
| | Class A | 1,000.00 | | 982.10 | | 1.49 | | 7.40 |
| | Class C | 1,000.00 | | 978.10 | | 2.24 | | 11.11 |
| | Class I | 1,000.00 | | 983.30 | | 1.24 | | 6.17 |
| | Class R6 | 1,000.00 | | 983.40 | | 1.19 | | 5.92 |
KAR Emerging Markets Small-Cap Fund
| | | | | | | | |
| | Class A | 1,000.00 | | 1,021.00 | | 1.78 | | 9.02 |
| | Class C | 1,000.00 | | 1,017.40 | | 2.52 | | 12.74 |
| | Class I | 1,000.00 | | 1,021.60 | | 1.49 | | 7.55 |
| | Class R6 | 1,000.00 | | 1,022.40 | | 1.39 | | 7.05 |
VIRTUS OPPORTUNITIES TRUST
DISCLOSURE OF FUND EXPENSES (Unaudited) (Continued)
FOR THE SIX-MONTH PERIOD OF April 1, 2023 TO September 30, 2023
| | | Beginning
Account Value
April 1, 2023 | | Ending
Account Value
September 30, 2023 | | Annualized
Expense
Ratio | | Expenses
Paid
During
Period* |
KAR International Small-Mid Cap Fund
| | | | | | | | |
| | Class A | $1,000.00 | | $ 990.10 | | 1.44% | | $ 7.18 |
| | Class C | 1,000.00 | | 986.60 | | 2.19 | | 10.91 |
| | Class I | 1,000.00 | | 991.30 | | 1.19 | | 5.94 |
| | Class R6 | 1,000.00 | | 992.00 | | 1.08 | | 5.39 |
Vontobel Emerging Markets Opportunities Fund
| | | | | | | | |
| | Class A | 1,000.00 | | 940.90 | | 1.53 | | 7.44 |
| | Class C | 1,000.00 | | 937.40 | | 2.21 | | 10.73 |
| | Class I | 1,000.00 | | 942.50 | | 1.17 | | 5.70 |
| | Class R6 | 1,000.00 | | 943.00 | | 0.97 | | 4.72 |
Vontobel Foreign Opportunities Fund
| | | | | | | | |
| | Class A | 1,000.00 | | 963.80 | | 1.38 | | 6.79 |
| | Class C | 1,000.00 | | 960.00 | | 2.04 | | 10.02 |
| | Class I | 1,000.00 | | 965.20 | | 1.06 | | 5.22 |
| | Class R6 | 1,000.00 | | 965.70 | | 0.94 | | 4.63 |
Vontobel Global Opportunities Fund
| | | | | | | | |
| | Class A | 1,000.00 | | 1,006.20 | | 1.35 | | 6.79 |
| | Class C | 1,000.00 | | 1,002.80 | | 2.10 | | 10.54 |
| | Class I | 1,000.00 | | 1,007.50 | | 1.08 | | 5.44 |
| | Class R6 | 1,000.00 | | 1,008.70 | | 0.89 | | 4.48 |
Vontobel Greater European Opportunities Fund
| | | | | | | | |
| | Class A | 1,000.00 | | 935.30 | | 1.30 | | 6.31 |
| | Class C | 1,000.00 | | 931.60 | | 2.05 | | 9.93 |
| | Class I | 1,000.00 | | 936.50 | | 1.05 | | 5.10 |
| * | Expenses are equal to the relevant Fund’s annualized expense ratio, which is net of waived fees and reimbursed expenses, if applicable, multiplied by the average account value over the period, multiplied by the number of days (183) expenses were accrued in the most recent fiscal half-year, then divided by 365 to reflect the one-half year period. |
For Funds which may invest in other funds, the annualized expense ratios noted above do not reflect fees and expenses associated with any underlying funds. If such fees and expenses had been included, the expenses would have been higher.
You can find more information about a Fund’s expenses in the Financial Statements section that follows. For additional information on operating expenses and other shareholder costs, refer to that Fund’s prospectus.
VIRTUS OPPORTUNITIES TRUST
DISCLOSURE OF FUND EXPENSES (Unaudited) (Continued)
FOR THE SIX-MONTH PERIOD OF April 1, 2023 TO September 30, 2023
Hypothetical Example for Comparison Purposes
The table below provides information about hypothetical account values and hypothetical expenses based on a Fund’s actual expense ratio and an assumed rate of return of 5% per year before expenses, which is not your Fund’s actual return. The hypothetical account values and expenses may not be used to estimate the actual ending account balance or expenses you paid for the period. You may use this information to compare the ongoing costs of investing in your Fund and other funds. To do so, compare these 5% hypothetical examples with the 5% hypothetical examples that appear in the shareholder reports of other mutual funds.
| | | Beginning
Account Value
April 1, 2023 | | Ending
Account Value
September 30, 2023 | | Annualized
Expense
Ratio | | Expenses
Paid
During
Period* |
Duff & Phelps Global Infrastructure Fund
| | | | | | | | |
| | Class A | $ 1,000.00 | | $ 1,018.50 | | 1.31 % | | $ 6.63 |
| | Class C | 1,000.00 | | 1,014.64 | | 2.08 | | 10.50 |
| | Class I | 1,000.00 | | 1,019.80 | | 1.05 | | 5.32 |
| | Class R6 | 1,000.00 | | 1,020.86 | | 0.84 | | 4.26 |
Duff & Phelps Global Real Estate Securities Fund
| | | | | | | | |
| | Class A | 1,000.00 | | 1,018.10 | | 1.39 | | 7.03 |
| | Class C | 1,000.00 | | 1,014.34 | | 2.14 | | 10.81 |
| | Class I | 1,000.00 | | 1,019.35 | | 1.14 | | 5.77 |
| | Class R6 | 1,000.00 | | 1,020.66 | | 0.88 | | 4.46 |
Duff & Phelps International Real Estate Securities Fund
| | | | | | | | |
| | Class A | 1,000.00 | | 1,017.60 | | 1.49 | | 7.54 |
| | Class C | 1,000.00 | | 1,013.84 | | 2.24 | | 11.31 |
| | Class I | 1,000.00 | | 1,018.85 | | 1.24 | | 6.28 |
Duff & Phelps Real Asset Fund
| | | | | | | | |
| | Class A | 1,000.00 | | 1,022.61 | | 0.49 | | 2.48 |
| | Class C | 1,000.00 | | 1,018.80 | | 1.25 | | 6.33 |
| | Class I | 1,000.00 | | 1,023.82 | | 0.25 | | 1.27 |
| | Class R6 | 1,000.00 | | 1,024.07 | | 0.20 | | 1.01 |
Duff & Phelps Real Estate Securities Fund
| | | | | | | | |
| | Class A | 1,000.00 | | 1,018.30 | | 1.35 | | 6.83 |
| | Class C | 1,000.00 | | 1,014.74 | | 2.06 | | 10.40 |
| | Class I | 1,000.00 | | 1,019.55 | | 1.10 | | 5.57 |
| | Class R6 | 1,000.00 | | 1,021.16 | | 0.78 | | 3.95 |
KAR Developing Markets Fund
| | | | | | | | |
| | Class A | 1,000.00 | | 1,017.60 | | 1.49 | | 7.54 |
| | Class C | 1,000.00 | | 1,013.84 | | 2.24 | | 11.31 |
| | Class I | 1,000.00 | | 1,018.85 | | 1.24 | | 6.28 |
| | Class R6 | 1,000.00 | | 1,019.10 | | 1.19 | | 6.02 |
KAR Emerging Markets Small-Cap Fund
| | | | | | | | |
| | Class A | 1,000.00 | | 1,016.14 | | 1.78 | | 9.00 |
| | Class C | 1,000.00 | | 1,012.43 | | 2.52 | | 12.71 |
| | Class I | 1,000.00 | | 1,017.60 | | 1.49 | | 7.54 |
| | Class R6 | 1,000.00 | | 1,018.10 | | 1.39 | | 7.03 |
KAR International Small-Mid Cap Fund
| | | | | | | | |
| | Class A | 1,000.00 | | 1,017.85 | | 1.44 | | 7.28 |
| | Class C | 1,000.00 | | 1,014.09 | | 2.19 | | 11.06 |
| | Class I | 1,000.00 | | 1,019.10 | | 1.19 | | 6.02 |
| | Class R6 | 1,000.00 | | 1,019.65 | | 1.08 | | 5.47 |
Vontobel Emerging Markets Opportunities Fund
| | | | | | | | |
| | Class A | 1,000.00 | | 1,017.40 | | 1.53 | | 7.74 |
| | Class C | 1,000.00 | | 1,013.99 | | 2.21 | | 11.16 |
| | Class I | 1,000.00 | | 1,019.20 | | 1.17 | | 5.92 |
| | Class R6 | 1,000.00 | | 1,020.21 | | 0.97 | | 4.91 |
Vontobel Foreign Opportunities Fund
| | | | | | | | |
| | Class A | 1,000.00 | | 1,018.15 | | 1.38 | | 6.98 |
| | Class C | 1,000.00 | | 1,014.84 | | 2.04 | | 10.30 |
| | Class I | 1,000.00 | | 1,019.75 | | 1.06 | | 5.37 |
| | Class R6 | 1,000.00 | | 1,020.36 | | 0.94 | | 4.76 |
VIRTUS OPPORTUNITIES TRUST
DISCLOSURE OF FUND EXPENSES (Unaudited) (Continued)
FOR THE SIX-MONTH PERIOD OF April 1, 2023 TO September 30, 2023
| | | Beginning
Account Value
April 1, 2023 | | Ending
Account Value
September 30, 2023 | | Annualized
Expense
Ratio | | Expenses
Paid
During
Period* |
Vontobel Global Opportunities Fund
| | | | | | | | |
| | Class A | $1,000.00 | | $1,018.30 | | 1.35% | | $ 6.83 |
| | Class C | 1,000.00 | | 1,014.54 | | 2.10 | | 10.61 |
| | Class I | 1,000.00 | | 1,019.65 | | 1.08 | | 5.47 |
| | Class R6 | 1,000.00 | | 1,020.61 | | 0.89 | | 4.51 |
Vontobel Greater European Opportunities Fund
| | | | | | | | |
| | Class A | 1,000.00 | | 1,018.55 | | 1.30 | | 6.58 |
| | Class C | 1,000.00 | | 1,014.79 | | 2.05 | | 10.35 |
| | Class I | 1,000.00 | | 1,019.80 | | 1.05 | | 5.32 |
| * | Expenses are equal to the relevant Fund’s annualized expense ratio, which is net of waived fees and reimbursed expenses, if applicable, multiplied by the average account value over the period, multiplied by the number of days (183) expenses were accrued in the most recent fiscal half-year, then divided by 365 to reflect the one-half year period. |
For Funds which may invest in other funds, the annualized expense ratios noted above do not reflect fees and expenses associated with any underlying funds. If such fees and expenses had been included, the expenses would have been higher.
You can find more information about a Fund’s expenses in the Financial Statements section that follows. For additional information on operating expenses and other shareholder costs, refer to that Fund’s prospectus.
VIRTUS OPPORTUNITIES TRUST
KEY INVESTMENT TERMS (Unaudited)
September 30, 2023
Alerian Midstream Energy Index
The Alerian Midstream Energy Index is a capped, float-adjusted, market capitalization-weighted index. The index is a broad-based composite of North American energy infrastructure companies that earn the majority of their cash flow from midstream activities involving energy commodities. The index is unmanaged and it is not available for direct investment.
American Depositary Receipt (“ADR”)
Represents shares of foreign companies traded in U.S. dollars on U.S. exchanges that are held by a U.S. bank or a trust. Foreign companies use ADRs in order to make it easier for Americans to buy their shares.
Bank of England (“BOE”)
The Central Bank of the United Kingdom, responsible for controlling the money supply, interest rates, credit, and regulation of U.K. Banks with the goal of keeping the U.K. financial system stable.
Bank of Japan (“BOJ”)
One of the world’s major central banks, the BOJ is responsible for issuing the country’s currency, managing monetary policy, and maintaining financial system stability.
Bloomberg Commodity Index
The Bloomberg Commodity Index tracks prices of futures contracts on physical commodities on the commodity markets. The index is designed to minimize concentration in any one commodity or sector. The index is unmanaged, its returns do not reflect any fees, expenses, or sales charges, and it is not available for direct investment.
Bloomberg U.S. Aggregate Bond Index
The Bloomberg U.S. Aggregate Bond Index measures the U.S. investment-grade fixed-rate bond market. The index is calculated on a total return basis. The index is unmanaged, its returns do not reflect any fees, expenses, or sales charges, and it is not available for direct investment.
Bloomberg U.S. Corporate High Yield Bond Index
The Bloomberg U.S. Corporate High Yield Bond Index measures the U.S. dollar-denominated, high yield, fixed-rate corporate bond market. The index is calculated on a total return basis. The index is unmanaged, its returns do not reflect any fees, expenses, or sales charges, and it is not available for direct investment.
Consumer Price Index (“CPI”)
The Consumer Price Index is the official measure of inflation of consumer prices of the United Kingdom. It is also called the Harmonised Index of Consumer Prices.
Core Inflation
Core inflation is the change in the costs of goods and services, not including food and energy prices. These items are excluded because their prices are much more volatile.
Deutsche Bundesbank
The Deutsche Bundesbank is the central bank of the Federal Republic of Germany and is the most influential member of the European System of Central Banks.
European Central Bank (“ECB”)
The ECB is responsible for conducting monetary policy for the euro area. The ECB was established as the core of the Euro-system and the European System of Central Banks (“ESCB”). The ESCB comprises the ECB and the National Central Banks (“NCBs”) of all 17 EU Member States whether they have adopted the Euro or not.
European Union (“EU”)
The EU is a unique economic and political union of 28 European countries. The EU was created in the aftermath of the Second World War and has developed an internal single market through a standardized system of laws that apply to all member states. A monetary union was established in 1999 and is composed of the 19 member states which use the Euro currency.
Exchange-Traded Fund (“ETF”)
An open-end fund that is traded on a stock exchange. Most ETFs have a portfolio of stocks or bonds that track a specific market index.
Federal Reserve (the “Fed”)
The Central Bank of the U.S., responsible for controlling money supply, interest rates, and credit with the goal of keeping the U.S. economy and currency stable. Governed by a seven-member board, the system includes 12 regional Federal Reserve Banks, 25 branches, and all national and state banks that are part of the system.
VIRTUS OPPORTUNITIES TRUST
KEY INVESTMENT TERMS (Unaudited) (Continued) September 30, 2023
FTSE Developed Core Infrastructure 50/50 Index (net)
The FTSE Developed Core Infrastructure 50/50 Index (net) is a free float-adjusted market capitalization-weighted index that gives participants an industry-defined interpretation of infrastructure and adjust the exposure to certain infrastructure sub-sectors. The constituent weights for the index are 50% utilities, 30% transportation including capping of 7.5% for railroads/railways, and a 20% mix of other sectors including pipelines, satellites, and telecommunication towers. The index is calculated on a total return basis with net dividends reinvested. The index is unmanaged, its returns do not reflect any fees, expenses, or sales charges, and it is not available for direct investment.
FTSE EPRA NAREIT Developed ex-U.S. Index (net)
The FTSE EPRA NAREIT Developed ex-US Index (net) is a free-float market capitalization-weighted index measuring publicly traded equity REITs and listed property companies from developed markets excluding the United States, which meet minimum size and liquidity requirements. The index is calculated on a total return basis with net dividends reinvested. The index is unmanaged, its returns do not reflect any fees, expenses, or sales charges, and it is not available for direct investment.
FTSE EPRA NAREIT Developed Index (net)
The FTSE EPRA NAREIT Developed Index (net) is a free-float market capitalization-weighted index measuring publicly traded equity REITs and listed property companies from developed markets, which meet minimum size and liquidity requirements. The index is calculated on a total return basis with net dividends reinvested. The index is unmanaged, its returns do not reflect any fees, expenses, or sales charges, and it is not available for direct investment.
FTSE NAREIT Equity REITs Index
The FTSE NAREIT Equity REITs Index is a free-float market capitalization index measuring equity tax-qualified real estate investment trusts, which meet minimum size and liquidity criteria, that are listed on the New York Stock Exchange, the American Stock Exchange and the NASDAQ National Market System. The index is calculated on a total return basis with dividends reinvested. The index is unmanaged, its returns do not reflect any fees, expenses, or sales charges, and it is not available for direct investment.
Global Depositary Receipt (“GDR”)
A certificate issued by a bank that represents shares in a foreign stock on two or more global markets.
Global Infrastructure Linked Benchmark
The Global Infrastructure Linked Benchmark consists of the FTSE Developed Core Infrastructure 50/50 Index (net), a free float-adjusted market capitalization-weighted index that gives participants an industry-defined interpretation of developed market infrastructure companies and adjusts the exposure to certain infrastructure subsectors. The constituent weights are 50% utilities, 30% transportation (including capping 7.5% for railroads/railways), and a 20% mix of other sectors including pipelines, satellites, and telecommunication towers. The index is calculated on a total return basis with net dividends reinvested. The index is unmanaged, its returns do not reflect any fees, expenses, or sales charges, and it is not available for direct investment. Performance of the Global Infrastructure Linked Benchmark between 9/1/2008 and 9/30/2016 represents a 100% allocation to the MSCI World Infrastructure Sector Capped Index. Prior to 9/1/2008 the allocation consisted of 65% MSCI USA Utilities Index, 20% MSCI World Telecom Services Index, and 15% MSCI All Country World ex USA Utilities Index.
Gross Domestic Product (“GDP”)
The GDP represents the market value of all goods and services produced by the economy during the period measured, including personal consumption, government purchases, private inventories, paid-in construction costs, and the foreign trade balance.
Joint Stock Company (“JSC”)
A joint-stock company is a business entity in which shares of the company’s stock can be bought and sold by shareholders. Each shareholder owns company stock in proportion, evidenced by their shares (certificates of ownership). Shareholders are able to transfer their shares to others without any effects to the continued existence of the company.
London Interbank Offered Rate (“LIBOR”)
A benchmark rate that some of the world’s leading banks charge each other for short-term loans and that serves as the first step to calculating interest rates on various loans throughout the world.
Master Limited Partnership (“MLP”)
A type of limited partnership that is publicly traded. The partnership must derive most of its cash flows from real estate, natural resources and commodities.
MSCI All Country World ex USA Index (net)
The MSCI All Country World ex USA Index (net) is a free float-adjusted market capitalization-weighted index that measures equity performance of developed and emerging markets, excluding the United States. The index is calculated on a total return basis with net dividends reinvested. The index is unmanaged, its returns do not reflect any fees, expenses, or sales charges, and is not available for direct investment.
VIRTUS OPPORTUNITIES TRUST
KEY INVESTMENT TERMS (Unaudited) (Continued) September 30, 2023
MSCI All Country World ex USA SMID Cap Index (net)
The MSCI ACWI ex USA SMID Cap Index (net) is a free float-adjusted market capitalization-weighted index that measures mid- and small-cap performance across 22 of 23 Developed Market countries (excluding the U.S.) and 24 Emerging Markets countries. The index is calculated on a total return basis with net dividends reinvested. The index is unmanaged, its returns do not reflect any fees, expenses, or sales charges, and is not available for direct investment.
MSCI All Country World ex USA Utilities Index
The MSCI All Country World ex USA Utilities Index includes large and mid-cap securities across 23 developed market countries and 26 emerging market countries. All securities in the index are classified in the Utilities as per the Global Industry Classification Standard (GICS®). The index is unmanaged, its returns do not reflect any fees, expenses, or sales charges, and it is not available for direct investment.
MSCI All Country World Index (net)
The MSCI All Country World Index (net) is a free float-adjusted market capitalization-weighted index that measures equity performance of developed and emerging markets. The index is calculated on a total return basis with net dividends reinvested. The index is unmanaged, its returns do not reflect any fees, expenses, or sales charges, and it is not available for direct investment.
MSCI EAFE® Index (net)
The MSCI EAFE® (Europe, Australasia, Far East) Index (net) is a free float-adjusted market capitalization-weighted index that measures developed foreign market equity performance, excluding the U.S. and Canada. The index is calculated on a total return basis with net dividends reinvested. The index is unmanaged, its returns do not reflect any fees, expenses, or sales charges, and it is not available for direct investment.
MSCI Emerging Markets Index (net)
The MSCI Emerging Markets Index (net) is a free float-adjusted market capitalization-weighted index designed to measure equity market performance in the global emerging markets. The index is calculated on a total return basis with net dividends reinvested. The index is unmanaged, its returns do not reflect any fees, expenses, or sales charges, and it is not available for direct investment.
MSCI Emerging Markets Small Cap Index (net)
The MSCI Emerging Markets Small Cap Index (net) is a free float-adjusted market capitalization-weighted index designed to measure small cap equity market performance in the global emerging markets. The index is calculated on a total return basis with net dividends reinvested. The index is unmanaged, its returns do not reflect any fees, expenses, or sales charges, and it is not available for direct investment.
MSCI Europe Index (net)
The MSCI Europe Index (net) is a free float-adjusted market capitalization weighted index that measures equity market performance of the developed markets in Europe. The index is calculated on a total return basis with net dividends reinvested. The index is unmanaged, its returns do not reflect any fees, expenses, or sales charges, and it is not available for direct investment.
MSCI USA Utilities Index
The MSCI USA Utilities Index is designed to capture the large and mid cap segments of the U.S. equity universe. All securities in the index are classified in the utilities sector as per the Global Industry Classification Standard (GICS®). The index is unmanaged, its returns do not reflect any fees, expenses, or sales charges, and it is not available for direct investment.
MSCI World Index (net)
The MSCI World Index (net) is a free float-adjusted market capitalization-weighted index that measures developed global market equity performance. The index is calculated on a total return basis with net dividends reinvested. The index is unmanaged, its returns do not reflect any fees, expenses, or sales charges, and it is not available for direct investment.
MSCI World Infrastructure Sector Capped Index (net)
The MSCI World Infrastructure Sector Capped Index (net) is a market capitalization-weighted index that measures performance of global infrastructure companies by capturing broad and diversified opportunities across telecommunication, utilities, energy, transportation, and social infrastructure sectors. The telecommunication, infrastructure, and utilities sectors each represent one-third of the index weight, while energy, transportation, and social infrastructure sectors have a combined weight of the remaining one-third of the index. The index is calculated on a total return basis with net dividends reinvested. The index is unmanaged, its returns do not reflect any fees, expenses, or sales charges, and it is not available for direct investment.
MSCI World Telecom Services Index
The MSCI World Telecom Services Index is designed to capture the large and midcap segments across 23 developed markets countries. All securities in the index are classified in the telecommunication services sector as per the Global Industry Classification Standard (GICS®). The index is unmanaged, its returns do not reflect any fees, expenses, or sales charges, and it is not available for direct investment.
VIRTUS OPPORTUNITIES TRUST
KEY INVESTMENT TERMS (Unaudited) (Continued) September 30, 2023
Organization of the Petroleum Exporting Countries (“OPEC”)
OPEC coordinates and unifies the petroleum policies of its Member Countries and ensures the stabilization of oil markets in order to secure an efficient, economic and regular supply of petroleum to consumers, a steady income to producers and a fair return on capital for those investing in the petroleum industry.
Organization of the Petroleum Exporting Countries+ (“OPEC+”)
OPEC+ refers to the 13 members of OPEC and 11 other non-OPEC members. These nations came to an accord to institutionalize a framework for cooperation between OPEC and non-OPEC producing countries on a regular and sustainable basis. These nations aim to work together on adjusting crude oil production to bring stability to the oil market.
People’s Bank of China
The People’s Bank of China is the central bank of the People’s Republic of China, responsible for carrying out monetary policy, and regulation of financial institutions in China, as determined by the People’s Bank Law and the Commercial Bank Law.
Real Estate Investment Trust (“REIT”)
A publicly traded company that owns, develops and operates income-producing real estate such as apartments, office buildings, hotels, shopping centers and other commercial properties.
Russell 2000® Index
The Russell 2000® Index is a market capitalization-weighted index of the 2,000 smallest companies in the Russell Universe, which comprises the 3,000 largest U.S. companies. The index is calculated on a total return basis with dividends reinvested. The index is unmanaged, its returns do not reflect any fees, expenses, or sales charges, and it is not available for direct investment.
S&P Global Natural Resources Index
The S&P Global Natural Resources Index includes 90 of the largest publicly-traded companies in natural resources and commodities businesses that meet specific investability requirements, offering investors diversified and investable equity exposure across 3 primary commodity-related sectors: agribusiness, energy, and metals & mining. The index is unmanaged, its returns do not reflect any fees, expenses, or sales charges, and it is not available for direct investments.
S&P 500® Index
The S&P 500® Index is a free-float market capitalization-weighted index of 500 of the largest U.S. companies. The index is calculated on a total return basis with dividends reinvested. The index is unmanaged, its returns do not reflect any fees, expenses, or sales charges, and it is not available for direct investment.
Standard & Poor’s Depositary Receipt (SPDR®)
A portfolio of stocks tracking an index, commonly held by ETFs that offer investors a manner in which to experience the investment performance of the index without owning each individual security.
Secured Overnight Financing Rate (“SOFR”)
A broad measure of the cost of borrowing cash overnight collateralized by U.S. Treasury securities.
Sponsored ADR
An ADR which is issued with the cooperation of the company whose stock will underlie the ADR. Sponsored ADRs generally carry the same rights normally given to stockholders, such as voting rights. ADRs must be sponsored to be able to trade on a major U.S. exchange such as the New York Stock Exchange.
U.S. Treasury Inflation-Protected Securities (“TIPS”)
A United States Treasury security that is indexed to inflation in order to protect investors from the negative effects of inflation.
| | Ticker Symbols: |
| | Class A: PGUAX |
| | Class C: PGUCX |
| | Class I: PGIUX |
| | Class R6: VGIRX |
Duff & Phelps Global Infrastructure Fund
Fund Summary (Unaudited)
Portfolio Manager Commentary by
Duff & Phelps Investment Management Co.
| ■ | The Fund is diversified and has investment objectives of both capital appreciation and current income. There is no guarantee that the Fund will meet its objectives. |
| ■ | For the fiscal year ended September 30, 2023, the Fund’s Class A shares at NAV returned -2.40%, Class C shares at NAV returned -3.17%, Class I shares at NAV returned -2.17%, and Class R6 shares at NAV returned -1.96%. For the same period, the FTSE Developed Core Infrastructure 50/50 Index (net), a broad-based equity index, returned 0.38%, and the Global Infrastructure Linked Benchmark, the Fund’s style-specific benchmark appropriate for comparison, returned 0.38%. |
All performance figures assume reinvestment of distributions and exclude the effect of sales charges. Performance data quoted represents past results. Past performance is no guarantee of future results, and current performance may be higher or lower than the performance shown above. Investment return and principal value will fluctuate so your shares, when redeemed, may be worth more or less than their original cost. Please visit Virtus.com for performance data current to the most recent month-end.
How did the markets perform during the Fund’s fiscal year ended September 30, 2023?
Global developed markets equities rose 21.95%, as measured by the MSCI World Index (net), for the 12 months ended September 30, 2023, driven by large-capitalization technology companies and enthusiasm for artificial intelligence (AI). Early in the year, investors were optimistic that central banks were near the peak of their rate hike cycles, and that China’s reopening would support global economic growth. Sentiment reversed as the year progressed, as stronger-than-expected economic data and sticky inflation suggested that a pause in interest rate increases might still be some way off. Equity markets slid lower in the final quarter of the fiscal year, as investors came to grips with the idea of interest rates remaining higher for longer. The European Central Bank (ECB) announced that it also planned to keep rates higher for longer, despite concerns about a recession. Meanwhile, economic data from China did
not improve to the extent anticipated, which caused a drag on global growth.
The Fund’s benchmark, the FTSE Developed Core Infrastructure 50/50 Index (net), posted a modest gain of 0.38% for the 12-month period, significantly underperforming the broader global equity markets as measured by the MSCI World Index (net). Transportation was the best-performing sector, with European airports experiencing strong passenger volumes that were close to pre-pandemic levels. Toll road traffic was solid, with lower fuel prices removing some headwinds for vehicle usage. North American railroads were the laggard of the sector, as economic concerns weighed on volume growth expectations and train derailments brought negative headlines.
The energy infrastructure sector also posted positive performance, driven higher by a sharp increase in energy prices. Oil market tightness bolstered prices and offset any concerns about economic growth risks in China. In June of 2023, OPEC+ agreed on a broad deal to limit oil supply into 2024. Global natural gas prices rose during the fourth quarter of the fiscal year, driven by strong demand in Europe and Asia as countries looked to replenish inventories ahead of winter. While midstream companies generally do not take on direct commodity price exposure, commodity price movements tend to influence investors, and higher prices have historically been supportive of midstream companies.
Utility stocks lagged as investors appeared to shun defensive sectors such as consumer staples, real estate, and utilities. U.S. utilities traded lower despite constructive earnings results and positive management commentary. The higher interest rate environment remained a headwind for the sector in the minds of investors. The communications sector was the worst-performing sector during the period. A mix of higher interest rates and a maturing of the independent tower business model contributed to the group’s underperformance.
What factors affected the Fund’s performance during its fiscal year?
The Fund underperformed its benchmark for the fiscal year ended September 30, 2023, due to negative sector allocation and stock selection. The Fund’s overweight of communications and underweight of transportation were the key detractors. The overweight in energy and
underweight in utilities had negligible impacts. Stock selection in the utility sector was the primary driver of the negative contribution, somewhat offset by positive selection in transportation and energy infrastructure. Stock selection in communications was modestly negative.
Focusing on the security-level impacts, the largest contributors to performance were AENA SME SA, Enel SpA, and National Grid PLC. Spanish airport operator AENA performed well as passenger traffic continued to recover to pre-pandemic levels on the back of a strong rebound in leisure travel. In addition, the company appeared poised to benefit from a new duty-free retail contract. Enel SpA performed well as the company demonstrated progress on a restructuring plan that was revealed before the end of the fiscal year. Management announced asset sales in Latin America and non-core European Union (EU) countries while maintaining their profit outlook and increasing the dividend. National Grid’s stock gained over the period as investor sentiment improved for European utilities due to the mild winter, and the U.K. government renewed its commitment to carbon emission reductions.
The largest detractors from performance were NextEra Energy, Dominion Energy, and Crown Castle. NextEra declined significantly in the fourth fiscal quarter as the rapid rise in interest rates made it more difficult to fund growth in the company’s renewable energy business. Historically, NextEra moved its renewable assets to a publicly traded subsidiary, NextEra Partners (NEP). This arrangement allowed NextEra to recycle capital and invest more to grow its renewables business. However, higher rates pushed up the cost to fund the acquisitions of renewable assets by NEP to unattractive levels, meaning NextEra lost a key avenue to finance its growth. Dominion Energy, a Virginia-based utility, traded lower after announcing a business review and potential restructuring in November of 2022. The announcement surprised investors and raised concerns that the outcome of the business review could be dilutive to earnings. The stock continued to languish in the following months as the strategic review took longer than expected. Crown Castle, a Houston-based communications infrastructure company, suffered from the unfavorable macroeconomic environment for wireless towers and a temporary slowdown in the 5G deployment by the wireless providers.
For information regarding the indexes and certain investment terms, see the Key Investment Terms starting on page 6.
Duff & Phelps Global Infrastructure Fund (Continued)
The preceding information is the opinion of portfolio management only through the end of the period stated on the cover. Any such opinions are subject to change at any time based upon market or other conditions and should not be relied upon as investment advice. Past performance is no guarantee of future results, and there is no guarantee that market forecasts will be realized.
Equity Securities: The market price of equity securities may be adversely affected by financial market, industry, or issuer-specific events. Focus on a particular style or on small, medium, or large-sized companies may enhance that risk.
Industry/Sector Concentration: A fund that focuses its investments in a particular industry or sector will be more sensitive to conditions that affect that industry or sector than a non-concentrated fund.
Foreign Investing: Investing in foreign securities subjects the fund to additional risks such as increased volatility; currency fluctuations; less liquidity; less publicly available information about the foreign investment; and political, regulatory, economic, and market risk.
Income: Income received from the Fund may vary widely over the short- and long-term and/or be less than anticipated if the proceeds from maturing securities in the Fund are reinvested in lower-yielding securities.
Market Volatility: The value of the securities in the Fund may go up or down in response to the prospects of individual companies and/or general economic conditions. Local, regional, or global events such as war or military conflict, terrorism, pandemic, or recession could impact the Fund,
including hampering the ability of the portfolio’s manager(s) to invest its assets as intended.
Prospectus: For additional information on risks, please see the Fund’s prospectus.
Asset Allocation
The following table presents asset allocation within certain sectors as a percentage of total investments as of September 30, 2023.
| Utilities | 49% |
| Industrials | 27 |
| Energy | 14 |
| Real Estate | 8 |
| Communication Services | 2 |
| Total | 100% |
For information regarding the indexes and certain investment terms, see the Key Investment Terms starting on page 6.
Duff & Phelps Global Infrastructure Fund (Continued)
Average Annual Total Returns1 for periods ended 9/30/23
| | | 1 Year | 5 Years | 10 Years | Since
inception | Inception
date |
| Class A shares at NAV2 | | -2.40 % | 2.91 % | 4.40 % | — % | — |
| Class A shares at POP3,4 | | -7.77 | 1.75 | 3.81 | — | — |
| Class C shares at NAV2 and with CDSC4 | | -3.17 | 2.14 | 3.62 | — | — |
| Class I shares at NAV2 | | -2.17 | 3.16 | 4.66 | — | — |
| Class R6 shares at NAV2 | | -1.96 | 3.33 | — | 2.63 | 1/30/18 |
| FTSE Developed Core Infrastructure 50/50 Index (net) | | 0.38 | 2.97 | 5.19 | 2.55 5 | — |
| Global Infrastructure Linked Benchmark | | 0.38 | 2.97 | 4.38 | 2.55 5 | — |
| Fund Expense Ratios6: Class A shares: Gross 1.25%, Net 1.25%; Class C shares: Gross 2.03%, Net 2.03%; Class I shares: Gross 1.01%, Net 1.01%; Class R6 shares: Gross 0.91%, Net 0.85%. |
| All returns represent past performance which is no guarantee of future results. Current performance may be higher or lower than the performance shown. The investment return and principal value of an investment will fluctuate so that an investor’s shares, when redeemed, may be worth more or less than their original cost. The above table and graph below do not reflect the deduction of taxes that a shareholder would pay on fund distributions or the redemption of shares. Please visit Virtus.com for performance data current to the most recent month-end. |
Growth of $10,000 for periods ended 9/30
This chart assumes an initial investment of $10,000 made on September 30, 2013, for Class A shares and Class C shares including any applicable sales charges or fees. The performance of the other share class may be greater or less than that shown based on differences in inception dates, fees, and sales charges. Performance assumes reinvestment of dividends and capital gain distributions.
For information regarding the indexes and certain investment terms, see the Key Investment Terms starting on page 6.
Duff & Phelps Global Infrastructure Fund (Continued)
Growth of $100,000 for periods ended 9/30
This chart assumes an initial investment of $100,000 made on September 30, 2013 for Class I shares. The performance of the other share class may be greater or less than that shown based on differences in inception dates, fees, and sales charges. Performance assumes reinvestment of dividends and capital gain distributions.
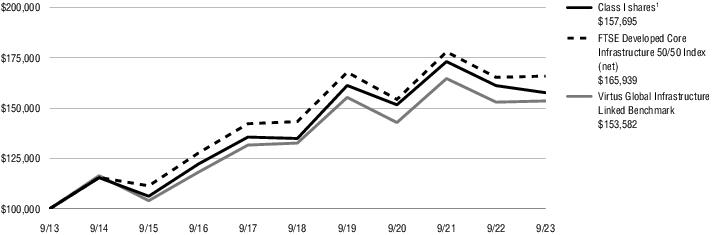
| 1 | Total returns are historical and include changes in share price and the reinvestment of both dividends and capital gain distributions. |
| 2 | “NAV” (Net Asset Value) total returns do not include the effect of any sales charge. |
| 3 | “POP” (Public Offering Price) total returns include the effect of the maximum front-end 5.50% sales charge. |
| 4 | “CDSC” (contingent deferred sales charge) is applied to redemptions of certain classes of shares that do not have a sales charge applied at the time of purchase. CDSC for certain redemptions of Class A shares made within 18 months of a finder’s fee being paid and all Class C shares are 1% within the first year and 0% thereafter. |
| 5 | The since inception index return is from the inception date of Class R6 shares. |
| 6 | The expense ratios of the Fund are set forth according to the prospectus for the Fund effective January 27, 2023, as supplemented and revised, and may differ from the expense ratios disclosed in the Financial Highlights tables in this report. See the Financial Highlights for more current expense ratios. Net Expense: Expenses reduced by a contractual expense limitation in effect through January 31, 2024. Gross Expense: Does not reflect the effect of the expense limitation. Expense ratios include fees and expenses associated with any underlying funds. |
The indexes are unmanaged and not available for direct investment; therefore, its performance does not reflect the expenses associated with active management of an actual portfolio.
For information regarding the indexes and certain investment terms, see the Key Investment Terms starting on page 6.
| | Ticker Symbols: |
| | Class A: VGSAX |
| | Class C: VGSCX |
| | Class I: VGISX |
| | Class R6: VRGEX |
Duff & Phelps Global Real Estate Securities Fund
Fund Summary (Unaudited)
Portfolio Manager Commentary by
Duff & Phelps Investment Management Co.
| ■ | The Fund is diversified and has a primary investment objective of long-term capital appreciation, with a secondary investment objective of income. There is no guarantee that the Fund will meet its objectives. |
| ■ | For the fiscal year ended September 30, 2023, the Fund’s Class A shares at NAV returned 1.97%, Class C shares at NAV returned 1.25%, Class I shares at NAV returned 2.26%, and Class R6 shares at NAV returned 2.50%. For the same period, the FTSE EPRA NAREIT Developed Index (net), which serves as both the Fund’s broad-based and style-specific index appropriate for comparison, returned 1.64%. |
All performance figures assume reinvestment of distributions and exclude the effect of sales charges. Performance data quoted represents past results. Past performance is no guarantee of future results, and current performance may be higher or lower than the performance shown above. Investment return and principal value will fluctuate so your shares, when redeemed, may be worth more or less than their original cost. Please visit Virtus.com for performance data current to the most recent month-end.
How did the markets perform during the Fund’s fiscal year ended September 30, 2023?
Uncertainty with regard to the persistence of core inflation, its impact on global growth, and signs that rapid interest rate increases could be problematic for global banks and liquidity were the dominant macroeconomic themes for the majority of the fiscal year ended September 30, 2023. During the fiscal year, the MSCI World Index (net) delivered a 22.0% return, while the FTSE EPRA NAREIT Developed Index (net), the Fund’s benchmark index, increased 2.7%.
The story of the fiscal year, however, was very different in each half of the year. In the first half of the period, there was a prevailing belief that central banks had surpassed the peak of their inflation-fighting efforts and that moderating Consumer Price Index (CPI) reports provided room for the central banks of England, Canada, and Australia to moderate interest rates, while the U.S. Federal Reserve (the Fed) began to reduce the
pace of its own hikes. Collectively, this contributed to easing global bond yields. When combined with signs that companies were dealing with profit margin pressures better than initially expected, along with new demand emerging from investments in artificial intelligence (AI) and other areas, equities responded positively. Near the end of the first half of the fiscal year, the collapse of two larger U.S. regional banks and the forced merger of the two largest Swiss banks created volatility and uncertainty in capital markets. This caused equity prices to adjust, with a decline in the benchmark return of 7.9% from the beginning of February through the end of March 2023. Despite the sharp pullback during this period, the benchmark return for the first half of the fiscal year remained positive at 8.2% in U.S. dollar terms.
While the second half of the year saw more discussion of the end of the rate hiking cycle, which would have been positive for the real estate sector, central banks repeatedly emphasized the message that rates would remain higher for longer. While many central banks had paused rate hikes, they were clear that more hikes could become necessary in the near term owing to continued robust levels of demand and persistent and elevated levels of core inflation. During the second half of the fiscal year, the yield on the 10-year U.S. Treasury bond increased by 1.10%, to its highest level since 2007, with the majority of that move being felt in August and September. To add to the pressures on global yields, the Bank of Japan (BOJ) loosened its policy of yield curve control (YCC), which impacted yields and necessitated increased BOJ bond purchases to maintain the new policy bounds. Yield curve control is a central bank policy tool in which the BOJ sets a target interest rate, and buys and sells bonds as needed to reach that target. With headwinds from rising global bond rates, the benchmark return in the second half of the fiscal year was -5.1% in U.S. dollar terms.
Taking a closer look at the performance of the individual countries that are represented within the FTSE EPRA NAREIT Developed Index, many major European economies delivered solid double-digit total returns, while most North American and Asia-Pacific countries posted more muted performance. The development of central banks’ monetary policies, stabilizing energy costs after the initial spike following Russia’s invasion of Ukraine, as well as the challenges in China’s
post-Covid-reopening growth, all contributed to the performance differences.
The five top-performing countries for the fiscal year, on a total return basis and measured in U.S. dollars, were all European countries – France, the Netherlands, Spain, Switzerland, and Austria. From a property sector perspective, data centers delivered by far the best return, propelled by optimism in secular AI-driven growth. The next-best sectors were industrial, based on solid growth prospects, and lodging/resorts and retail, based on the potential for further Covid-related recovery.
The five bottom-performing countries and regions during the fiscal year were Finland, Israel, South Korea, Hong Kong, and Ireland. From a property sector perspective, office and self storage lagged the most.
What factors affected the Fund’s performance during its fiscal year?
The Fund outperformed its benchmark for the 12 months ended September 30, 2023. Security selection and country allocation both aided performance.
Combining country allocation and security selection, the top relative contributors to performance for the fiscal year were the U.K. and France, with security selection the key driver for both, followed by Hong Kong due to an underweight allocation, and Australia and Sweden due to selection.
From a country/region allocation perspective, the overweight to Spain and underweight to Hong Kong were the largest contributors during the fiscal year.
At the security level, the Fund’s exposure to Equinix, a U.S.-based global data center real estate investment trust (REIT), was the largest contributor on an absolute basis. Equinix outperformed based on expected long-term data demand and the company’s market leadership in the interconnection segment, a business line that links two different entities within a data center. The Fund’s exposures to U.S. industrial REIT Prologis and U.S. healthcare REIT Welltower were the next largest contributors. Prologis outperformed as its earnings growth continued to reflect healthy fundamentals in the logistics market. Welltower outperformed on the potential for continued occupancy recovery and operating income growth in its largest segment, senior housing.
For information regarding the indexes and certain investment terms, see the Key Investment Terms starting on page 6.
Duff & Phelps Global Real Estate Securities Fund (Continued)
Combining country allocation and security selection, the top detractors were the U.S. due to security selection, Germany and Switzerland due to underweight allocations, China due to an overweight allocation, and the Netherlands due to an underweight allocation.
From a country allocation viewpoint, the Fund’s underweight exposures to Switzerland and Germany were the largest detractors for the fiscal year.
At the security level, the Fund’s exposure to Extra Space Storage, a U.S. self storage REIT, was the largest detractor on an absolute basis. The higher interest rate environment negatively affected tenant demand by lowering existing home sales volumes and affected Extra Space’s profitability due to its higher exposure to floating interest rates. The Fund’s exposures to U.S. freestanding REIT Realty Income and Link REIT from Hong Kong were the next largest detractors from performance. Realty Income was affected by concerns about lower potential to grow by acquisition in a higher interest rate environment, and Link REIT underperformed following management’s announcement of a discounted rights offering to reduce the company’s debt burden.
The preceding information is the opinion of portfolio management only through the end of the period stated on the cover. Any such opinions are subject to change at any time based upon market or other conditions and should not be relied upon as
investment advice. Past performance is no guarantee of future results, and there is no guarantee that market forecasts will be realized.
Equity Securities: The market price of equity securities may be adversely affected by financial market, industry, or issuer-specific events. Focus on a particular style or on small, medium, or large-sized companies may enhance that risk.
Real Estate: The Fund may be negatively affected by factors specific to the real estate market, including interest rates, leverage, property, and management.
Industry/Sector Concentration: A fund that focuses its investments in a particular industry or sector will be more sensitive to conditions that affect that industry or sector than a non-concentrated fund.
Foreign & Emerging Markets: Investing in foreign securities, especially in emerging markets, subjects the Fund to additional risks such as increased volatility, currency fluctuations, less liquidity, and political, regulatory, economic, and market risk.
Market Volatility: The value of the securities in the Fund may go up or down in response to the prospects of individual companies and/or general economic conditions. Local, regional, or global events such as war or military conflict, terrorism, pandemic, or recession could impact the Fund, including hampering the ability of the portfolio’s manager(s) to invest its assets as intended.
Prospectus: For additional information on risks, please see the Fund’s prospectus.
Asset Allocation
The following table presents asset allocation within certain sectors as a percentage of total investments as of September 30, 2023.
| Industrial/Office REITs | 22% |
| Residential REITs | 17 |
| Retail REITs | 13 |
| Health Care REITs | 9 |
| Data Centers REITs | 9 |
| Self Storage REITs | 9 |
| Real Estate Operating Companies | 7 |
| Other REITs | 14 |
| Total | 100% |
For information regarding the indexes and certain investment terms, see the Key Investment Terms starting on page 6.
Duff & Phelps Global Real Estate Securities Fund (Continued)
Average Annual Total Returns1 for periods ended 9/30/23
| | | 1 Year | 5 Years | 10 Years | Since
inception | Inception
date |
| Class A shares at NAV2 | | 1.97 % | 1.65 % | 4.86 % | — % | — |
| Class A shares at POP3,4 | | -3.64 | 0.51 | 4.27 | — | — |
| Class C shares at NAV2 and with CDSC4 | | 1.25 | 0.89 | 4.08 | — | — |
| Class I shares at NAV2 | | 2.26 | 1.91 | 5.12 | — | — |
| Class R6 shares at NAV2 | | 2.50 | 2.16 | — | 4.30 | 11/3/16 |
| FTSE EPRA NAREIT Developed Index (net) | | 1.64 | -1.24 | 2.04 | 0.88 5 | — |
| Fund Expense Ratios6: Class A shares: Gross 2.50%, Net 1.40%; Class C shares: Gross 2.13%, Net 2.15%; Class I shares: Gross 1.14%, Net 1.15%; Class R6 shares: Gross 1.03%, Net 0.89%. |
| All returns represent past performance which is no guarantee of future results. Current performance may be higher or lower than the performance shown. The investment return and principal value of an investment will fluctuate so that an investor’s shares, when redeemed, may be worth more or less than their original cost. The above table and graph below do not reflect the deduction of taxes that a shareholder would pay on fund distributions or the redemption of shares. Please visit Virtus.com for performance data current to the most recent month-end. |
Growth of $10,000 for periods ended 9/30
This chart assumes an initial investment of $10,000 made on September 30, 2013, for Class A shares and Class C shares including any applicable sales charges or fees. The performance of the other share class may be greater or less than that shown based on differences in inception dates, fees, and sales charges. Performance assumes reinvestment of dividends and capital gain distributions.
For information regarding the indexes and certain investment terms, see the Key Investment Terms starting on page 6.
Duff & Phelps Global Real Estate Securities Fund (Continued)
Growth of $100,000 for periods ended 9/30
This chart assumes an initial investment of $100,000 made on September 30, 2013 for Class I shares. The performance of the other share class may be greater or less than that shown based on differences in inception dates, fees, and sales charges. Performance assumes reinvestment of dividends and capital gain distributions.
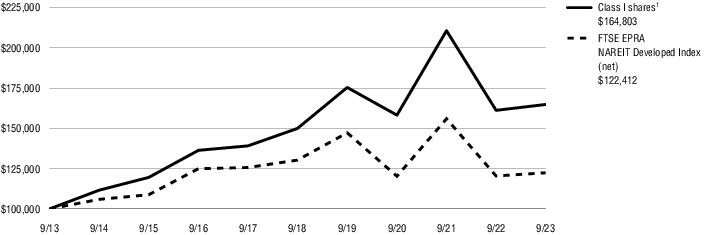
| 1 | Total returns are historical and include changes in share price and the reinvestment of both dividends and capital gain distributions. |
| 2 | “NAV” (Net Asset Value) total returns do not include the effect of any sales charge. |
| 3 | “POP” (Public Offering Price) total returns include the effect of the maximum front-end 5.50% sales charge. |
| 4 | “CDSC” (contingent deferred sales charge) is applied to redemptions of certain classes of shares that do not have a sales charge applied at the time of purchase. CDSC for certain redemptions of Class A shares made within 18 months of a finder’s fee being paid and all Class C shares are 1% within the first year and 0% thereafter. |
| 5 | The since inception index return is from the inception date of Class R6 shares. |
| 6 | The expense ratios of the Fund are set forth according to the prospectus for the Fund effective January 27, 2023, as supplemented and revised, and may differ from the expense ratios disclosed in the Financial Highlights tables in this report. See the Financial Highlights for more current expense ratios. Net Expense: Expenses reduced by a contractual expense limitation in effect through January 31, 2024. Gross Expense: Does not reflect the effect of the expense limitation. Expense ratios include fees and expenses associated with any underlying funds. |
The index is unmanaged and not available for direct investment; therefore, its performance does not reflect the expenses associated with active management of an actual portfolio.
For information regarding the indexes and certain investment terms, see the Key Investment Terms starting on page 6.
Duff & Phelps International Real Estate
Securities Fund
Fund Summary (Unaudited)
| | Ticker Symbols: |
| | Class A: PXRAX |
| | Class C: PXRCX |
| | Class I: PXRIX |
Portfolio Manager Commentary by
Duff & Phelps Investment Management Co.
| ■ | The Fund is diversified and has a primary investment objective of long-term capital appreciation, with a secondary investment objective of income. There is no guarantee that the Fund will meet its objectives. |
| ■ | For the fiscal year ended September 30, 2023, the Fund’s Class A shares at NAV returned 5.52%, Class C shares at NAV returned 4.65%, and Class I shares at NAV returned 5.70%. For the same period, the FTSE EPRA NAREIT Developed ex-U.S. Index (net), which serves as both the Fund’s broad-based and style-specific index appropriate for comparison, returned 2.06%. |
All performance figures assume reinvestment of distributions and exclude the effect of sales charges. Performance data quoted represents past results. Past performance is no guarantee of future results, and current performance may be higher or lower than the performance shown above. Investment return and principal value will fluctuate so your shares, when redeemed, may be worth more or less than their original cost. Please visit Virtus.com for performance data current to the most recent month-end.
How did the markets perform during the Fund’s fiscal year ended September 30, 2023?
Uncertainty with regard to the persistence of core inflation, its impact on global growth, and signs that rapid interest rate increases could be problematic for global banks and liquidity were the dominant macroeconomic themes for the majority of the fiscal year ended September 30, 2023. During the fiscal year, the MSCI EAFE® Index (net) delivered a 25.7% return, while the FTSE EPRA NAREIT Developed ex-U.S. Index (net), the Fund’s benchmark index, increased 2.8%.
The story of the fiscal year, however, was very different in each half of the year. In the first half of the period, there was a prevailing belief that central banks had surpassed the peak of their inflation-fighting efforts and that moderating Consumer Price Index (CPI) reports provided room for the central banks of England, Canada, and Australia to moderate interest rates, while the U.S. Federal Reserve (the Fed) began to reduce the pace of its own hikes. Collectively, this contributed to
easing global bond yields. When combined with signs that companies were dealing with profit margin pressures better than initially expected, along with new demand emerging from investments in artificial intelligence (AI) and other areas, equities responded positively. Near the end of the first half of the fiscal year, the collapse of two larger U.S. regional banks and the forced merger of the two largest Swiss banks created volatility and uncertainty in capital markets. This caused equity prices to adjust, with a decline in the benchmark return of 8.3% from the beginning of February through the end of March 2023. Despite the sharp pullback during this period, the benchmark return for the first half of the fiscal year remained positive at 8.8% in U.S. dollar terms.
While the second half of the year saw more discussion of the end of the rate hiking cycle, which would have been positive for the real estate sector, central banks repeatedly emphasized the message that rates would remain higher for longer. While many central banks had paused rate hikes, they were clear that more hikes could become necessary in the near term owing to continued robust levels of demand and persistent and elevated levels of core inflation. During the second half of the fiscal year, the yield on the 10-year U.S. Treasury bond increased by 1.10%, to its highest level since 2007, with the majority of that move being felt in August and September. To add to the pressures on global yields, the Bank of Japan (BOJ) loosened its policy of yield curve control (YCC), which impacted yields and necessitated increased BOJ bond purchases to maintain the new policy bounds. Yield curve control is a central bank policy tool in which the BOJ sets a target interest rate, and buys and sells bonds as needed to reach that target. With headwinds from rising global bond rates, the benchmark return in the second half of the fiscal year was -5.5% in U.S. dollar terms.
Taking a closer look at the performance of the individual countries that are represented within the FTSE EPRA NAREIT Developed ex-U.S. Index, many major European economies delivered solid double-digit total returns, while most Asia-Pacific countries posted more muted performance. The development of central banks’ monetary policies, stabilizing energy costs after the initial spike following Russia’s invasion of Ukraine, as well as the challenges in China’s post-Covid-reopening growth, all contributed to the performance differences.
The five top-performing countries for the fiscal year, on a total return basis and measured in U.S. dollars, were all European countries – France, the Netherlands, Spain, Switzerland, and Austria. From a property sector perspective, data centers delivered by far the best return, propelled by optimism in secular AI-driven growth. The next-best sectors were lodging/resorts, residential, and retail, based on the potential for further Covid-related recovery.
The five bottom-performing countries and regions during the fiscal year were Finland, Israel, South Korea, Hong Kong, and Italy. From a property sector perspective, health care and self storage lagged the most.
What factors affected the Fund’s performance during its fiscal year?
The Fund outperformed its benchmark for the 12 months ended September 30, 2023. Stock selection was the primary contributor to relative performance during the period.
Combining country allocation and security selection, the top relative contributors to performance for the fiscal year were the U.K., Canada, Singapore, and France, with security selection the key driver, followed by Hong Kong due to an underweight allocation, and Australia and Japan due to security selection.
From a country allocation perspective, the underweight to Hong Kong and overweight to Spain were the largest contributors during the fiscal year.
At the security level, the Fund’s exposure to NEXTDC Ltd., an Australian data center company, was the largest contributor to performance. The company delivered outsized leasing success driven by strong data center demand in Australia. The next two largest contributors to performance were the exposures to Workspace Group Plc., a U.K. real estate investment trust (REIT), and Swire Properties, a Hong Kong real estate company.
Combining country allocation and security selection, the top detractors were China due to an overweight allocation, Switzerland due to an underweight allocation, Germany due to an overweight allocation and security selection, and Ireland due to an underweight allocation.
From a country allocation viewpoint, the Fund’s overweight exposure to China and underweight
For information regarding the indexes and certain investment terms, see the Key Investment Terms starting on page 6.
Duff & Phelps International Real Estate Securities Fund (Continued)
exposure to Switzerland were the largest detractors during the fiscal year.
At the security level, the exposure to Allied Properties Real Estate, a Canadian office REIT, was the largest detractor. The Fund’s exposures to Hong Kong developer Sun Hung Kai Properties and Link REIT, a Hong Kong retail REIT, were the next largest detractors from performance.
The preceding information is the opinion of portfolio management only through the end of the period stated on the cover. Any such opinions are subject to change at any time based upon market or other conditions and should not be relied upon as investment advice. Past performance is no guarantee of future results, and there is no guarantee that market forecasts will be realized.
Equity Securities: The market price of equity securities may be adversely affected by financial market, industry, or issuer-specific events. Focus on a particular style or on small, medium, or large-sized companies may enhance that risk.
Real Estate: The Fund may be negatively affected by factors specific to the real estate market, including interest rates, leverage, property, and management.
Industry/Sector Concentration: A fund that focuses its investments in a particular industry or sector will be more sensitive to conditions that affect that industry or sector than a non-concentrated fund.
Foreign & Emerging Markets: Investing in foreign securities, especially in emerging markets, subjects the Fund to additional risks such as increased volatility, currency fluctuations, less liquidity, and political, regulatory, economic, and market risk.
Market Volatility: The value of the securities in the Fund may go up or down in response to the prospects of individual companies and/or general economic conditions. Local, regional, or global events such as war or military conflict, terrorism, pandemic, or recession could impact the Fund, including hampering the ability of the portfolio’s manager(s) to invest its assets as intended.
Prospectus: For additional information on risks, please see the Fund’s prospectus.
Asset Allocation
The following table presents asset allocation within certain sectors as a percentage of total investments as of September 30, 2023.
| Industrial/Office REITs | 20% |
| Retail REITs | 19 |
| Real Estate Operating Companies | 17 |
| Residential REITs | 10 |
| Diversified REITs | 10 |
| Real Estate Management & Development REITs | 9 |
| Lodging/Resorts REITs | 4 |
| Other REITs | 11 |
| Total | 100% |
For information regarding the indexes and certain investment terms, see the Key Investment Terms starting on page 6.
Duff & Phelps International Real Estate Securities Fund (Continued)
Average Annual Total Returns1 for periods ended 9/30/23
| | | 1 Year | 5 Years | 10 Years |
| Class A shares at NAV2 | 5.52 % | -2.46% | 1.77% |
| Class A shares at POP3,4 | -0.28 | -3.56 | 1.20 |
| Class C shares at NAV2 and with CDSC4 | 4.65 | -3.21 | 1.01 |
| Class I shares at NAV2 | 5.70 | -2.23 | 2.03 |
| FTSE EPRA NAREIT Developed ex-U.S. Index (net) | 2.06 | -4.17 | -0.46 |
| Fund Expense Ratios5: Class A shares: Gross 1.72%, Net 1.50%; Class C shares: Gross 2.55%, Net 2.25%; Class I shares: Gross 1.49%, Net 1.25%. |
| All returns represent past performance which is no guarantee of future results. Current performance may be higher or lower than the performance shown. The investment return and principal value of an investment will fluctuate so that an investor’s shares, when redeemed, may be worth more or less than their original cost. The above table and graph below do not reflect the deduction of taxes that a shareholder would pay on fund distributions or the redemption of shares. Please visit Virtus.com for performance data current to the most recent month-end. |
Growth of $10,000 for periods ended 9/30
This chart assumes an initial investment of $10,000 made on September 30, 2013, for Class A shares and Class C shares including any applicable sales charges or fees. The performance of the other share class may be greater or less than that shown based on differences in inception dates, fees, and sales charges. Performance assumes reinvestment of dividends and capital gain distributions.
For information regarding the indexes and certain investment terms, see the Key Investment Terms starting on page 6.
Duff & Phelps International Real Estate Securities Fund (Continued)
Growth of $100,000 for periods ended 9/30
This chart assumes an initial investment of $100,000 made on September 30, 2013 for Class I shares. The performance of the other share class may be greater or less than that shown based on differences in inception dates, fees, and sales charges. Performance assumes reinvestment of dividends and capital gain distributions.
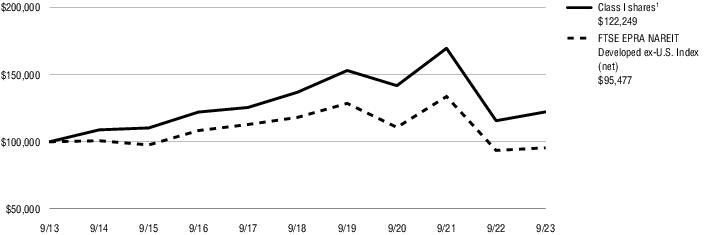
| 1 | Total returns are historical and include changes in share price and the reinvestment of both dividends and capital gain distributions. |
| 2 | “NAV” (Net Asset Value) total returns do not include the effect of any sales charge. |
| 3 | “POP” (Public Offering Price) total returns include the effect of the maximum front-end 5.50% sales charge. |
| 4 | “CDSC” (contingent deferred sales charge) is applied to redemptions of certain classes of shares that do not have a sales charge applied at the time of purchase. CDSC for certain redemptions of Class A shares made within 18 months of a finder’s fee being paid and all Class C shares are 1% within the first year and 0% thereafter. |
| 5 | The expense ratios of the Fund are set forth according to the prospectus for the Fund effective January 27, 2023, as supplemented and revised, and may differ from the expense ratios disclosed in the Financial Highlights tables in this report. See the Financial Highlights for more current expense ratios. Net Expense: Expenses reduced by a contractual expense limitation in effect through January 31, 2024. Gross Expense: Does not reflect the effect of the expense limitation. Expense ratios include fees and expenses associated with any underlying funds. |
The index is unmanaged and not available for direct investment; therefore, its performance does not reflect the expenses associated with active management of an actual portfolio.
For information regarding the indexes and certain investment terms, see the Key Investment Terms starting on page 6.
| | Ticker Symbols: |
| | Class A: PDPAX |
| | Class C: PDPCX |
| | Class I: VADIX |
| | Class R6: VAABX |
Duff & Phelps Real Asset Fund
Fund Summary (Unaudited)
Portfolio Manager Commentary by
Duff & Phelps Investment Management Co.
| ■ | The Fund is non-diversified and has an investment objective of long-term capital appreciation. There is no guarantee that the Fund will meet its objective. |
| ■ | For the fiscal year ended September 30, 2023, the Fund’s Class A shares at NAV returned 4.77%, Class C shares at NAV returned 3.95%, Class I shares at NAV returned 4.96%, and Class R6 shares at NAV returned 5.13%. For the fiscal year ended September 30, 2023, the MSCI All Country World Index (net) which serves as both the Fund’s broad-based and style-specific index appropriate for comparison, returned 20.80%. |
All performance figures assume reinvestment of distributions and exclude the effect of sales charges. Performance data quoted represents past results. Past performance is no guarantee of future results, and current performance may be higher or lower than the performance shown above. Investment return and principal value will fluctuate so your shares, when redeemed, may be worth more or less than their original cost. Please visit Virtus.com for performance data current to the most recent month-end.
How did the markets perform during the Fund’s fiscal year ended September 30, 2023?
After a difficult fiscal year in 2022, global markets bounced back strongly in the fiscal year ended September 30, 2023, with the MSCI All Country World Index (net) rising 20.8%. Mega-cap technology stocks were the clear market leaders as they regained momentum after a tough 2022 and then moved significantly higher around the emerging artificial intelligence (AI) theme. For the year, market leadership was concentrated in a very few areas, while many sectors significantly trailed the Index. Both large-cap stocks and growth stocks significantly outperformed their small-cap and value stock counterparts. A key driver for the market was the pullback in inflation after the rapid increases in prices following the Covid pandemic. As inflation slowed in the second half of fiscal 2023, the market grew more comfortable that key central banks would stop raising interest rates, which in turn spurred increases in stock prices.
Real assets significantly underperformed the broader market during the fiscal year. Real asset performance tends to be correlated with inflation. Thus, as inflation moderated, real assets struggled. While a
summer rally in crude prices pushed oil prices higher for the fiscal year, overall commodity prices, as measured by the Bloomberg Commodity Index, were down 6.0% for the year. Also hurting real assets was the poor performance, especially late in the fiscal year, of the more yield-driven equities, including utilities and real estate investment trusts (REITs). It appeared that much higher short-term interest rates crowded out traditional income equity buyers, as dividends for REITs and utilities went from trading at a premium to bond yields to trading at a discount.
For the year, global natural resources and midstream energy were the best performing real assets. The global natural resources sector, as measured by the S&P Global Natural Resources Index, was up 17.4%, while midstream energy stocks, as measured by the Alerian Midstream Energy Index, finished up 16.1%. The worst performing assets were gold and global listed infrastructure stocks.
What factors affected the Fund’s performance during its fiscal year?
The Fund posted positive returns for the fiscal year ended September 30, 2023, but significantly underperformed its benchmark index. The Fund performed well during the first quarter of the fiscal year, rising 7.80% as the overall market rallied and inflation fears remained front and center, but then struggled for the rest of the year.
The biggest contributors to Fund performance were midstream energy and global natural resources. Midstream energy contributed 2.6% as the sector benefitted from a rebounding economy, generally steady energy prices, and continued sustained capital discipline by midstream companies. Global natural resources, meanwhile, contributed 1.7%, driven by China’s re-opening at the end of 2022 and solid global economic growth.
The biggest detractors from Fund performance were global listed infrastructure, via the Virtus Duff & Phelps Global Infrastructure Fund (GI) and gold. GI, the Fund’s largest holding, contributed -0.67%, as both utilities and communication cell towers struggled due to significantly rising interest rates. The Fund’s two gold positions, the Invesco DB Gold Fund and the VanEck Gold Miners ETF, were also net negative contributors as gold prices fell meaningfully in the second half of the fiscal year, driven by lower inflation, rising interest rates, and a strengthening U.S. dollar.
The preceding information is the opinion of portfolio management only through the end of the period stated on the cover. Any such opinions are subject to
change at any time based upon market or other conditions and should not be relied upon as investment advice. Past performance is no guarantee of future results, and there is no guarantee that market forecasts will be realized.
Equity Securities: The market price of equity securities may be adversely affected by financial market, industry, or issuer-specific events. Focus on a particular style or on small, medium, or large-sized companies may enhance that risk.
Industry/Sector Concentration: A fund that focuses its investments in a particular industry or sector will be more sensitive to conditions that affect that industry or sector than a non-concentrated fund.
Real Estate: The Fund may be negatively affected by factors specific to the real estate market, including interest rates, leverage, property, and management.
Infrastructure: A fund that focuses its investments in infrastructure-related companies will be more sensitive to conditions affecting their business or operations such as local economic and political conditions, regulatory changes, and environmental issues.
Natural Resources: Investment in natural resources industries may be significantly affected by events relating to International political and economic developments, energy conservation, the success of exploration projects commodity prices, taxes and other governmental regulations.
Credit & Interest: Debt instruments are subject to various risks, including credit and interest rate risk. The issuer of a debt security may fail to make interest and/or principal payments. Values of debt instruments may rise or fall in response to changes in interest rates, and this risk may be enhanced with longer-term maturities.
Foreign Investing: Investing in foreign securities subjects the fund to additional risks such as increased volatility; currency fluctuations; less liquidity; less publicly available information about the foreign investment; and political, regulatory, economic, and market risk.
Allocation: The risk that the Fund’s exposure to equities and fixed income securities, or to different asset classes, may vary from the intended allocation or may not be optimal for market conditions at a given time.
Derivatives: Derivatives may include, among other things, futures, options, forwards and swap
For information regarding the indexes and certain investment terms, see the Key Investment Terms starting on page 6.
Duff & Phelps Real Asset Fund (Continued)
agreements and may be used in order to hedge portfolio risks, create leverage, or attempt to increase returns. Investments in derivatives may result in increased volatility and the Fund may incur a loss greater than its principal investment.
Bank Loans: Bank loans may be unsecured or not fully collateralized, may be subject to restrictions on resale, may be less liquid and may trade infrequently on the secondary market. Bank loans settle on a delayed basis; thus, sale proceeds may not be available to meet redemptions for a substantial period of time after the sale of the loan.
Inflation-Linked Investments: Inflation-linked investments may react differently than other fixed income securities to changes in interest rates. Generally, the value of an inflation linked security will fall when real interest rates rise and will rise when real interest rates fall.
Master Limited Partnerships: Investments in MLPs may be adversely impacted by interest rates, tax law changes, regulation, or factors affecting underlying assets.
Exchange-Traded Funds (ETF): The value of an ETF may be more volatile than the underlying portfolio of securities it is designed to track. The costs to the Fund of owning shares of an ETF may exceed the cost of investing directly in the underlying securities.
Fund of Funds: The risk that the Fund’s performance will be adversely affected by the assets owned by the other mutual funds and ETFs in which it invests, and that the layering of expenses associated with the Fund’s investment in such other funds will cost shareholders more than direct investments would have cost.
Affiliated Funds: The risk that the adviser’s authority to select and substitute underlying funds from a variety of affiliated mutual funds may create a conflict of interest.
Market Volatility: The value of the securities in the Fund may go up or down in response to the prospects of individual companies and/or general economic conditions. Local, regional, or global events such as war or military conflict, terrorism, pandemic, or recession could impact the Fund, including hampering the ability of the portfolio’s manager(s) to invest its assets as intended.
Prospectus: For additional information on risks, please see the Fund’s prospectus.
Asset Allocation
The following table presents asset allocation within certain sectors as a percentage of total investments as of September 30, 2023.
| Affiliated Mutual Funds | | 71% |
| Exchange-Traded Funds | | 29 |
| Total | | 100% |
For information regarding the indexes and certain investment terms, see the Key Investment Terms starting on page 6.
Duff & Phelps Real Asset Fund (Continued)
Average Annual Total Returns1 for periods ended 9/30/23
| | | 1 Year | 5 Years | 10 Years | Since
inception | Inception
date |
| Class A shares at NAV2 | | 4.77 % | 2.97 % | 2.73 % | — % | — |
| Class A shares at POP3,4 | | -1.00 | 1.81 | 2.15 | — | — |
| Class C shares at NAV2 and with CDSC4 | | 3.95 | 2.18 | 1.95 | — | — |
| Class I shares at NAV2 | | 4.96 | 3.23 | 2.99 | — | — |
| Class R6 shares at NAV2 | | 5.13 | — | — | -2.68 | 1/31/22 |
| MSCI All Country World Index (net) | | 20.80 | 6.46 | 7.56 | -3.36 5 | — |
| Fund Expense Ratios6: Class A shares: Gross 1.60%, Net 1.30%; Class C shares: Gross 2.35%, Net 2.05%; Class I shares: Gross 1.35%, Net 1.05%; Class R6 shares: Gross 1.32%, Net 1.00%. |
| All returns represent past performance which is no guarantee of future results. Current performance may be higher or lower than the performance shown. The investment return and principal value of an investment will fluctuate so that an investor’s shares, when redeemed, may be worth more or less than their original cost. The above table and graph below do not reflect the deduction of taxes that a shareholder would pay on fund distributions or the redemption of shares. Please visit Virtus.com for performance data current to the most recent month-end. |
Growth of $10,000 for periods ended 9/30
This chart assumes an initial investment of $10,000 made on September 30, 2013, for Class A shares and Class C shares including any applicable sales charges or fees. The performance of the other share class may be greater or less than that shown based on differences in inception dates, fees, and sales charges. Performance assumes reinvestment of dividends and capital gain distributions.
For information regarding the indexes and certain investment terms, see the Key Investment Terms starting on page 6.
Duff & Phelps Real Asset Fund (Continued)
Growth of $100,000 for periods ended 9/30
This chart assumes an initial investment of $100,000 made on September 30, 2013 for Class I shares. The performance of the other share class may be greater or less than that shown based on differences in inception dates, fees, and sales charges. Performance assumes reinvestment of dividends and capital gain distributions.
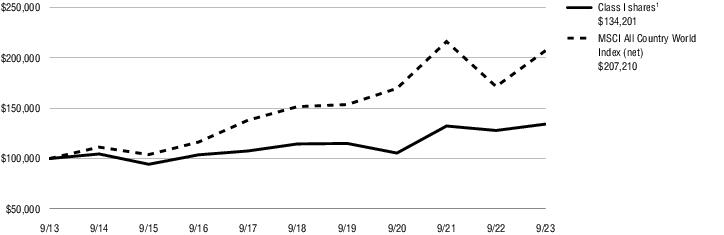
| 1 | Total returns are historical and include changes in share price and the reinvestment of both dividends and capital gain distributions. |
| 2 | “NAV” (Net Asset Value) total returns do not include the effect of any sales charge. |
| 3 | “POP” (Public Offering Price) total returns include the effect of the maximum front-end 5.50% sales charge. |
| 4 | “CDSC” (contingent deferred sales charge) is applied to redemptions of certain classes of shares that do not have a sales charge applied at the time of purchase. CDSC for certain redemptions of Class A shares made within 18 months of a finder’s fee being paid and all Class C shares are 1% within the first year and 0% thereafter. |
| 5 | The since inception index return is from the inception date of Class R6 shares. |
| 6 | The expense ratios of the Fund are set forth according to the prospectus for the Fund effective January 27, 2023, as supplemented and revised, and may differ from the expense ratios disclosed in the Financial Highlights tables in this report. See the Financial Highlights for more current expense ratios. Net Expense: Expenses reduced by a contractual expense limitation in effect through January 31, 2024. Gross Expense: Does not reflect the effect of the expense limitation. Expense ratios include fees and expenses associated with any underlying funds. |
The index is unmanaged and not available for direct investment; therefore, its performance does not reflect the expenses associated with active management of an actual portfolio.
For information regarding the indexes and certain investment terms, see the Key Investment Terms starting on page 6.
| | Ticker Symbols: |
| | Class A: PHRAX |
| | Class C: PHRCX |
| | Class I: PHRIX |
| | Class R6: VRREX |
Duff & Phelps Real Estate Securities Fund
Fund Summary (Unaudited)
Portfolio Manager Commentary by
Duff & Phelps Investment Management Co.
| ■ | The Fund is diversified and has investment objectives of capital appreciation and income with approximately equal emphasis. There is no guarantee that the Fund will meet its objectives. |
| ■ | For the fiscal year ended September 30, 2023, the Fund’s Class A shares at NAV returned 0.14%, Class C shares at NAV returned -0.59%, Class I shares at NAV returned 0.33%, and Class R6 shares at NAV returned 0.68%. For the same period, the FTSE NAREIT Equity REITs Index, the Fund’s style-specific index appropriate for comparison, returned 2.99%. |
All performance figures assume reinvestment of distributions and exclude the effect of sales charges. Performance data quoted represents past results. Past performance is no guarantee of future results, and current performance may be higher or lower than the performance shown above. Investment return and principal value will fluctuate so your shares, when redeemed, may be worth more or less than their original cost. Please visit Virtus.com for performance data current to the most recent month-end.
How did the markets perform during the Fund’s fiscal year ended September 30, 2023?
Uncertainty with regard to the persistence of core inflation, its impact on global growth, and signs that rapid interest rate increases could be problematic for global banks and liquidity were the dominant macroeconomic themes for the majority of the fiscal year ended September 30, 2023. During the fiscal year, the S&P 500® Index delivered a 21.6% return while the FTSE NAREIT Equity REITs Index, the Fund’s benchmark, increased 3.0%.
The story of the fiscal year, however, was very different in each half of the year. In the first half of the period, there was a prevailing belief that central banks had surpassed the peak of their inflation-fighting efforts and that moderating Consumer Price Index (CPI) reports provided room for the central banks of England, Canada, and Australia to moderate interest rates, while the U.S. Federal Reserve (the Fed) began to reduce the pace of its own hikes. Collectively, this contributed to easing global bond yields. When combined with signs that companies were dealing with profit margin
pressures better than initially expected, along with new demand emerging from investments in artificial intelligence (AI) and other areas, equities responded positively. Near the end of the first half of the fiscal year, the collapse of two larger U.S. regional banks and the forced merger of the two largest Swiss banks created volatility and uncertainty in capital markets. This caused equity prices to adjust, with a decline in the benchmark return of 7.7% from the beginning of February through the end of March 2023. Despite the sharp pullback during this period, the benchmark return for the first half of the fiscal year remained positive at 8.1% in U.S. dollar terms.
While the second half of the year saw more discussion of the end of the rate hiking cycle, which would have been positive for the real estate sector, central banks repeatedly emphasized the message that rates would remain higher for longer. While many central banks had paused rate hikes, they were clear that more hikes could become necessary in the near term owing to continued robust levels of demand and persistent and elevated levels of core inflation. During the second half of the fiscal year, the yield on the 10-year U.S. Treasury bond increased by 1.10%, to its highest level since 2007, with the majority of that move being felt in August and September. To add to the pressures on global yields, the Bank of Japan (BOJ) loosened its policy of yield curve control (YCC), which impacted yields and necessitated increased BOJ bond purchases to maintain the new policy bounds. Yield curve control is a central bank policy tool in which the BOJ sets a target interest rate, and buys and sells bonds as needed to reach that target. With headwinds from rising global bond rates, the benchmark return in the second half of the fiscal year was -4.7% in U.S. dollar terms.
From a property sector perspective, data centers delivered by far the best return for the fiscal year, propelled by optimism about long-term AI-driven growth. Regional malls and shopping centers performed well based on the potential for further Covid-related recovery. Among property sectors, office, diversified, and self storage lagged the most.
What factors affected the Fund’s performance during its fiscal year?
The Fund lagged its benchmark for the 12 months ended September 30, 2023. Security selection and sector allocation both detracted.
Combining property sector allocation and security selection, the strongest relative contributors to performance for the fiscal year were data centers, health care, diversified, lodging/resorts, and freestanding. Security selection was the larger driver of returns for data centers, health care, and lodging/resorts. Property sector allocation was the larger driver for diversified and freestanding.
From a property sector allocation perspective, the largest contributor was the Fund’s zero weight to diversified, followed by its underweight to office.
At the security level, the Fund’s exposure to Equinix, a U.S.-based global data center real estate investment trust (REIT), was the largest contributor on an absolute basis. Equinix outperformed based on expected long-term data demand and the company’s market leadership in the interconnection segment, a business line that links two different entities within a data center. The Fund’s exposures to U.S. industrial REIT Prologis and U.S. healthcare REIT Welltower were the next largest contributors. Prologis outperformed as its earnings growth continued to reflect healthy fundamentals in the logistics market. Welltower outperformed on the potential for continued occupancy recovery and operating income growth in its largest segment, senior housing.
Combining property sector allocation and security selection, the largest relative detractors from performance were specialty, apartments, manufactured homes, regional malls, and industrial. Security selection was a larger relative driver of underperformance for the specialty, manufactured home, and industrial sectors. An underweight allocation to regional malls detracted. In apartments, security selection and an overweight allocation both detracted, with allocation more detractive than security selection.
The largest property sector allocation detractors were overweight exposures to apartments and self storage.
At the security level, the Fund’s exposure to Extra Space Storage, a U.S. self storage REIT, was the largest detractor on an absolute basis. The higher interest rate environment negatively affected tenant demand by lowering existing home sales volumes, and affected Extra Space’s profitability due to its higher exposure to floating interest rates. The Fund’s exposures to U.S. freestanding REIT Realty Income
For information regarding the indexes and certain investment terms, see the Key Investment Terms starting on page 6.
Duff & Phelps Real Estate Securities Fund (Continued)
and cell tower REIT American Tower were the next largest detractors from performance. Realty Income was affected by concerns about lower potential to grow by acquisition in a higher interest rate environment, and American Tower underperformed due to worries about lower and slower capital expenditures by wireless carriers.
The preceding information is the opinion of portfolio management only through the end of the period stated on the cover. Any such opinions are subject to change at any time based upon market or other conditions and should not be relied upon as investment advice. Past performance is no guarantee of future results, and there is no guarantee that market forecasts will be realized.
Equity Securities: The market price of equity securities may be adversely affected by financial market, industry, or issuer-specific events. Focus on a particular style or on small, medium, or large-sized companies may enhance that risk.
Real Estate: The Fund may be negatively affected by factors specific to the real estate market, including interest rates, leverage, property, and management.
Industry/Sector Concentration: A fund that focuses its investments in a particular industry or sector will be more sensitive to conditions that affect that industry or sector than a non-concentrated fund.
Market Volatility: The value of the securities in the Fund may go up or down in response to the prospects of individual companies and/or general economic conditions. Local, regional, or global events such as war or military conflict, terrorism, pandemic, or recession could impact the Fund, including hampering the ability of the portfolio’s manager(s) to invest its assets as intended.
Prospectus: For additional information on risks, please see the Fund’s prospectus.
Asset Allocation
The following table presents asset allocation within certain sectors as a percentage of total investments as of September 30, 2023.
| Residential | 23% |
| Industrial/Office | 19 |
| Health Care | 13 |
| Data Centers | 13 |
| Retail | 12 |
| Self Storage | 10 |
| Gaming REITs | 4 |
| Other | 6 |
| Total | 100% |
For information regarding the indexes and certain investment terms, see the Key Investment Terms starting on page 6.
Duff & Phelps Real Estate Securities Fund (Continued)
Average Annual Total Returns1 for periods ended 9/30/23
| | | 1 Year | 5 Years | 10 Years | Since
inception | Inception
date |
| Class A shares at NAV2 | | 0.14 % | 3.54 % | 6.10 % | — % | — |
| Class A shares at POP3,4 | | -5.37 | 2.37 | 5.50 | — | — |
| Class C shares at NAV2 and with CDSC4 | | -0.59 | 2.79 | 5.32 | — | — |
| Class I shares at NAV2 | | 0.33 | 3.81 | 6.38 | — | — |
| Class R6 shares at NAV2 | | 0.68 | 4.11 | — | 4.84 | 11/12/14 |
| FTSE NAREIT Equity REITs Index | | 2.99 | 2.77 | 5.96 | 4.20 5 | — |
| Fund Expense Ratios6: Class A shares: Gross 1.33%, Net 1.33%; Class C shares: Gross 2.05%, Net 2.05%; Class I shares: Gross 1.08%, Net 1.08%; Class R6 shares: Gross 0.93%, Net 0.79%. |
| All returns represent past performance which is no guarantee of future results. Current performance may be higher or lower than the performance shown. The investment return and principal value of an investment will fluctuate so that an investor’s shares, when redeemed, may be worth more or less than their original cost. The above table and graph below do not reflect the deduction of taxes that a shareholder would pay on fund distributions or the redemption of shares. Please visit Virtus.com for performance data current to the most recent month-end. |
Growth of $10,000 for periods ended 9/30
This chart assumes an initial investment of $10,000 made on September 30, 2013, for Class A shares and Class C shares including any applicable sales charges or fees. The performance of the other share class may be greater or less than that shown based on differences in inception dates, fees, and sales charges. Performance assumes reinvestment of dividends and capital gain distributions.
For information regarding the indexes and certain investment terms, see the Key Investment Terms starting on page 6.
Duff & Phelps Real Estate Securities Fund (Continued)
Growth of $100,000 for periods ended 9/30
This chart assumes an initial investment of $100,000 made on September 30, 2013 for Class I shares. The performance of the other share class may be greater or less than that shown based on differences in inception dates, fees, and sales charges. Performance assumes reinvestment of dividends and capital gain distributions.
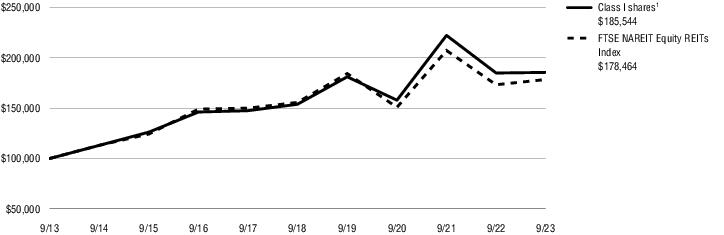
| 1 | Total returns are historical and include changes in share price and the reinvestment of both dividends and capital gain distributions. |
| 2 | “NAV” (Net Asset Value) total returns do not include the effect of any sales charge. |
| 3 | “POP” (Public Offering Price) total returns include the effect of the maximum front-end 5.50% sales charge. |
| 4 | “CDSC” (contingent deferred sales charge) is applied to redemptions of certain classes of shares that do not have a sales charge applied at the time of purchase. CDSC for certain redemptions of Class A shares made within 18 months of a finder’s fee being paid and all Class C shares are 1% within the first year and 0% thereafter. |
| 5 | The since inception index return is from the inception date of Class R6 shares. |
| 6 | The expense ratios of the Fund are set forth according to the prospectus for the Fund effective January 27, 2023, as supplemented and revised, and may differ from the expense ratios disclosed in the Financial Highlights tables in this report. See the Financial Highlights for more current expense ratios. Net Expense: Expenses reduced by a contractual expense limitation in effect through January 31, 2024. Gross Expense: Does not reflect the effect of the expense limitation. Expense ratios include fees and expenses associated with any underlying funds. |
The index is unmanaged and not available for direct investment; therefore, its performance does not reflect the expenses associated with active management of an actual portfolio.
For information regarding the indexes and certain investment terms, see the Key Investment Terms starting on page 6.
| | Ticker Symbols: |
| | Class A: VDMAX |
| | Class C: VDMCX |
| | Class I: VIDMX |
| | Class R6: VDMRX |
KAR Developing Markets Fund
Fund Summary (Unaudited)
Portfolio Manager Commentary by
Kayne Anderson Rudnick Investment Management, LLC
| ■ | The Fund is non-diversified and has an investment objective of capital appreciation. There is no guarantee that the Fund will meet its objective. |
| ■ | For the fiscal year ended September 30, 2023, the Fund’s Class A shares at NAV returned 14.56%, Class C shares at NAV returned 13.75%, Class I shares at NAV returned 14.76%, and Class R6 shares at NAV returned 14.97%. For the same period, the MSCI Emerging Markets Index (net), which serves as both the Fund’s broad-based and style-specific index appropriate for comparison, returned 11.70%. |
All performance figures assume reinvestment of distributions and exclude the effect of sales charges. Performance data quoted represents past results. Past performance is no guarantee of future results, and current performance may be higher or lower than the performance shown above. Investment return and principal value will fluctuate so your shares, when redeemed, may be worth more or less than their original cost. Please visit Virtus.com for performance data current to the most recent month-end.
How did the markets perform during the Fund’s fiscal year ended September 30, 2023?
Markets underperformed in 2022, driven largely by expectations of higher inflation and global central bank tightening in response to elevated inflation. Late in 2022, markets began to see some relief in terms of inflation expectations, which led to a rally in equities that started in early 2023. However, the rally slowed toward the end of the third quarter of 2023 on the realization that the Federal Reserve (the Fed) might have to hold interest rates higher for longer.
For the fiscal year ended September 30, 2023, non-U.S. developed markets, represented by the
MSCI EAFE® Index (net), returned 25.65%, outperforming U.S. stocks, represented by the S&P 500® Index, which returned 21.62%. Emerging markets, represented by the MSCI Emerging Markets Index (net), returned 11.70%, underperforming U.S. stocks. By comparison, U.S. small-capitalization stocks, as represented by the Russell 2000® Index, returned 8.93% for the 12-month period.
What factors affected the Fund’s performance during its fiscal year?
The Fund outperformed the MSCI Emerging Markets Index (net) for the fiscal year ended September 30, 2023. Positive stock selection and an underweight in financials, and positive stock selection and an overweight in industrials contributed to performance. Poor stock selection and an underweight in consumer discretionary, and poor stock selection and an overweight in consumer staples detracted from performance.
From a country perspective, positive stock selection and an overweight in Poland, and positive stock selection in the U.K. contributed to performance. Poor stock selection and underweight positions in South Korea and Taiwan detracted from performance.
The biggest contributors to performance from a stock selection perspective during the 12-month period were Tegma Gestao Logistica, Grupa Pracuj, Baltic Classifieds, Boa Vista Servicos, and Allergo.eu Societe.
The biggest detractors from performance during the period were Vasta Platforms, JD.com, PT Sarana Menara Nusantara, momo.com, and Saramin.
The preceding information is the opinion of portfolio management only through the end of the period stated on the cover. Any such opinions are subject to change at any time based upon market or other conditions and should not be relied upon as investment advice. Past performance is no guarantee
of future results, and there is no guarantee that market forecasts will be realized.
Equity Securities: The market price of equity securities may be adversely affected by financial market, industry, or issuer-specific events. Focus on a particular style or on small, medium, or large-sized companies may enhance that risk.
Foreign & Emerging Markets: Investing in foreign securities, especially in emerging markets, subjects the Fund to additional risks such as increased volatility, currency fluctuations, less liquidity, and political, regulatory, economic, and market risk.
Non-Diversified: The Fund is not diversified and may be more susceptible to factors negatively impacting its holdings to the extent the Fund invests more of its assets in the securities of fewer issuers than would a diversified fund.
Market Volatility: The value of the securities in the Fund may go up or down in response to the prospects of individual companies and/or general economic conditions. Local, regional, or global events such as war or military conflict, terrorism, pandemic, or recession could impact the Fund, including hampering the ability of the portfolio’s manager(s) to invest its assets as intended.
Prospectus: For additional information on risks, please see the Fund’s prospectus.
Asset Allocation
The following table presents asset allocation within certain sectors as a percentage of total investments as of September 30, 2023.
| Industrials | 27% |
| Consumer Staples | 17 |
| Communication Services | 15 |
| Financials | 15 |
| Consumer Discretionary | 15 |
| Information Technology | 9 |
| Health Care | 2 |
| Total | 100% |
For information regarding the indexes and certain investment terms, see the Key Investment Terms starting on page 6.
KAR Developing Markets Fund (Continued)
Average Annual Total Returns1 for periods ended 9/30/23
| | | 1 Year | Since
inception | Inception
date |
| Class A shares at NAV2 | | 14.56 % | -10.51 % | 6/22/21 |
| Class A shares at POP3,4 | | 8.26 | -12.71 | 6/22/21 |
| Class C shares at NAV2 and with CDSC2,4 | | 13.75 | -11.18 | 6/22/21 |
| Class I shares at NAV2 | | 14.76 | -10.30 | 6/22/21 |
| Class R6 shares at NAV2 | | 14.97 | -10.22 | 6/22/21 |
| MSCI Emerging Markets Index (net) | | 11.70 | -11.68 5 | — |
| Fund Expense Ratios6: Class A shares: Gross 4.81%, Net 1.50%; Class C shares: Gross 5.55%, Net 2.25%; Class I shares: Gross 4.51%, Net 1.25%; Class R6 shares: Gross 4.52%, Net 1.20%. |
| All returns represent past performance which is no guarantee of future results. Current performance may be higher or lower than the performance shown. The investment return and principal value of an investment will fluctuate so that an investor’s shares, when redeemed, may be worth more or less than their original cost. The above table and graph below do not reflect the deduction of taxes that a shareholder would pay on fund distributions or the redemption of shares. Please visit Virtus.com for performance data current to the most recent month-end. |
Growth of $10,000 for periods ended 9/30
This chart assumes an initial investment of $10,000 made on June 22, 2021 (inception date of the Fund), for Class A shares and Class C shares including any applicable sales charges or fees. The performance of the other share class may be greater or less than that shown based on differences in inception dates, fees, and sales charges. Performance assumes reinvestment of dividends and capital gain distributions.
For information regarding the indexes and certain investment terms, see the Key Investment Terms starting on page 6.
KAR Developing Markets Fund (Continued)
Growth of $100,000 for periods ended 9/30
This chart assumes an initial investment of $100,000 made on June 22, 2021 (inception date of the Fund), for Class I shares. The performance of the other share class may be greater or less than that shown based on differences in inception dates, fees, and sales charges. Performance assumes reinvestment of dividends and capital gain distributions.
For information regarding the indexes and certain investment terms, see the Key Investment Terms starting on page 6.
KAR Developing Markets Fund (Continued)
Growth of $2,500,000 for periods ended 9/30
This chart assumes an initial investment of $2,500,000 made on June 22, 2021 (inception date of the Fund), for Class I shares. The performance of the other share class may be greater or less than that shown based on differences in inception dates, fees, and sales charges. Performance assumes reinvestment of dividends and capital gain distributions.
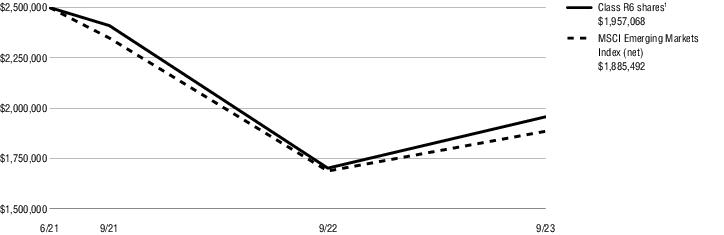
| 1 | Total returns are historical and include changes in share price and the reinvestment of both dividends and capital gain distributions. |
| 2 | “NAV” (Net Asset Value) total returns do not include the effect of any sales charge. |
| 3 | “POP” (Public Offering Price) total returns include the effect of the maximum front-end 5.50% sales charge. |
| 4 | “CDSC” (contingent deferred sales charge) is applied to redemptions of certain classes of shares that do not have a sales charge applied at the time of purchase. CDSC for certain redemptions of Class A shares made within 18 months of a finder’s fee being paid and all Class C shares are 1% within the first year and 0% thereafter. |
| 5 | The since inception index return is from the Fund’s inception date. |
| 6 | The expense ratios of the Fund are set forth according to the prospectus for the Fund effective January 27, 2023, as supplemented and revised, and may differ from the expense ratios disclosed in the Financial Highlights tables in this report. See the Financial Highlights for more current expense ratios. Net Expense: Expenses reduced by a contractual expense limitation in effect through January 31, 2024. Gross Expense: Does not reflect the effect of the expense limitation. Expense ratios include fees and expenses associated with any underlying funds. |
The index is unmanaged and not available for direct investment; therefore, its performance does not reflect the expenses associated with active management of an actual portfolio.
For information regarding the indexes and certain investment terms, see the Key Investment Terms starting on page 6.
| | Ticker Symbols: |
| | Class A: VAESX |
| | Class C: VCESX |
| | Class I: VIESX |
| | Class R6: VRESX |
KAR Emerging Markets Small-Cap Fund
Fund Summary (Unaudited)
Portfolio Manager Commentary by
Kayne Anderson Rudnick Investment Management, LLC
| ■ | The Fund is diversified and has an investment objective of capital appreciation. There is no guarantee that the Fund will meet its objective. |
| ■ | For the fiscal year ended September 30, 2023, the Fund’s Class A shares at NAV returned 16.73%, Class C shares at NAV returned 15.87%, Class I shares at NAV returned 16.98%, and Class R6 shares at NAV returned 17.08%. For the same period, the MSCI Emerging Markets Small Cap Index (net), which serves as both the Fund’s broad-based and style-specific index appropriate for comparison, returned 23.06%. |
All performance figures assume reinvestment of distributions and exclude the effect of sales charges. Performance data quoted represents past results. Past performance is no guarantee of future results, and current performance may be higher or lower than the performance shown above. Investment return and principal value will fluctuate so your shares, when redeemed, may be worth more or less than their original cost. Please visit Virtus.com for performance data current to the most recent month-end.
How did the markets perform during the Fund’s fiscal year ended September 30, 2023?
Markets underperformed in 2022, driven largely by expectations of higher inflation and global central bank tightening in response to elevated inflation. Late in 2022, markets began to see some relief in terms of inflation expectations, which led to a rally in equities that started in early 2023. However, the rally slowed toward the end of the third quarter of 2023 on the realization that the Federal Reserve (the Fed) might have to hold interest rates higher for longer.
For the fiscal year ended September 30, 2023, non-U.S. developed markets, represented by the MSCI EAFE® Index (net), returned 25.65%,
outperforming U.S. stocks, represented by the S&P 500® Index, which returned 21.62%. Emerging markets, represented by the MSCI Emerging Markets Index (net), returned 11.70%, underperforming U.S. stocks. By comparison, U.S. small-capitalization stocks, as represented by the Russell 2000® Index, returned 8.93% for the 12-month period.
What factors affected the Fund’s performance during its fiscal year?
The Fund underperformed the MSCI Emerging Markets Small Cap Index (net) for the fiscal year ended September 30, 2023. Poor stock selection and underweight positions in information technology and materials detracted from performance. Positive stock selection in financials and an underweight in real estate contributed to performance.
From a country perspective, poor stock selection in South Korea, and poor stock selection and an underweight in Taiwan detracted from performance. An overweight in Poland and positive stock selection in Brazil contributed to performance.
The biggest contributors to performance from a stock selection perspective during the 12-month period were Grupa Pracuj, Tegma Gestao Logistica, Baltic Classifieds, Boa Vista Servicos, and Qualitas Controladora.
The biggest detractors from performance during the period were Vasta Platform, PT Sarana Menara Nusantara, PT Avia Avian, Saramin, and NICE Information Service.
The preceding information is the opinion of portfolio management only through the end of the period stated on the cover. Any such opinions are subject to change at any time based upon market or other conditions and should not be relied upon as investment advice. Past performance is no guarantee of future results, and there is no guarantee that market forecasts will be realized.
Equity Securities: The market price of equity securities may be adversely affected by financial market, industry, or issuer-specific events. Focus on a particular style or on small, medium, or large-sized companies may enhance that risk.
Foreign & Emerging Markets: Investing in foreign securities, especially in emerging markets, subjects the Fund to additional risks such as increased volatility, currency fluctuations, less liquidity, and political, regulatory, economic, and market risk.
Industrial Concentration: Because the Fund is presently heavily weighted in the industrial sector, it will be impacted by that sector’s performance more than a fund with broader sector diversification.
Market Volatility: The value of the securities in the Fund may go up or down in response to the prospects of individual companies and/or general economic conditions. Local, regional, or global events such as war or military conflict, terrorism, pandemic, or recession could impact the Fund, including hampering the ability of the portfolio’s manager(s) to invest its assets as intended.
Prospectus: For additional information on risks, please see the Fund’s prospectus.
Asset Allocation
The following table presents asset allocation within certain sectors as a percentage of total investments as of September 30, 2023.
| Industrials | 31% |
| Communication Services | 19 |
| Information Technology | 14 |
| Consumer Discretionary | 11 |
| Consumer Staples | 9 |
| Financials | 8 |
| Materials | 4 |
| Other (includes short-term investment) | 4 |
| Total | 100% |
For information regarding the indexes and certain investment terms, see the Key Investment Terms starting on page 6.
KAR Emerging Markets Small-Cap Fund (Continued)
Average Annual Total Returns1 for periods ended 9/30/23
| | | 1 Year | 5 Years | Since
inception | Inception
date |
| Class A shares at NAV2 | | 16.73 % | 4.74 % | 4.88 % | 12/17/13 |
| Class A shares at POP3,4 | | 10.31 | 3.56 | 4.28 | 12/17/13 |
| Class C shares at NAV2 and with CDSC4 | | 15.87 | 3.95 | 4.11 | 12/17/13 |
| Class I shares at NAV2 | | 16.98 | 5.02 | 5.15 | 12/17/13 |
| Class R6 shares at NAV2 | | 17.08 | — | 4.68 | 8/1/19 |
| MSCI Emerging Markets Small Cap Index (net) | | 23.06 | 6.45 | — 5 | — |
| Fund Expense Ratios6: Class A shares: Gross 1.78%, Net 1.78%; Class C shares: Gross 2.60%, Net 2.53%; Class I shares: Gross 1.53%, Net 1.50%; Class R6 shares: Gross 1.43%, Net 1.40%. |
| All returns represent past performance which is no guarantee of future results. Current performance may be higher or lower than the performance shown. The investment return and principal value of an investment will fluctuate so that an investor’s shares, when redeemed, may be worth more or less than their original cost. The above table and graph below do not reflect the deduction of taxes that a shareholder would pay on fund distributions or the redemption of shares. Please visit Virtus.com for performance data current to the most recent month-end. |
Growth of $10,000 for periods ended 9/30
This chart assumes an initial investment of $10,000 made on December 17, 2013 (inception date of the Fund), for Class A shares and Class C shares including any applicable sales charges or fees. The performance of the other share class may be greater or less than that shown based on differences in inception dates, fees, and sales charges. Performance assumes reinvestment of dividends and capital gain distributions.
For information regarding the indexes and certain investment terms, see the Key Investment Terms starting on page 6.
KAR Emerging Markets Small-Cap Fund (Continued)
Growth of $100,000 for periods ended 9/30
This chart assumes an initial investment of $100,000 made on December 17, 2013 (inception date of the Fund), for Class I shares. The performance of the other share class may be greater or less than that shown based on differences in inception dates, fees, and sales charges. Performance assumes reinvestment of dividends and capital gain distributions.
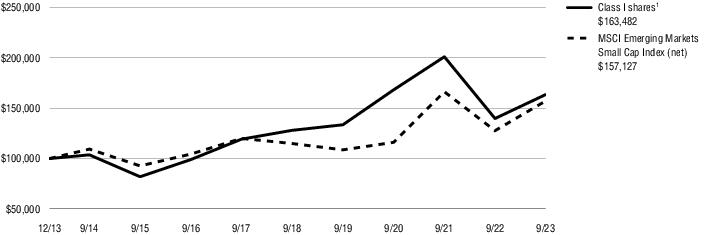
| 1 | Total returns are historical and include changes in share price and the reinvestment of both dividends and capital gain distributions. |
| 2 | “NAV” (Net Asset Value) total returns do not include the effect of any sales charge. |
| 3 | “POP” (Public Offering Price) total returns include the effect of the maximum front-end 5.50% sales charge. |
| 4 | “CDSC” (contingent deferred sales charge) is applied to redemptions of certain classes of shares that do not have a sales charge applied at the time of purchase. CDSC for certain redemptions of Class A shares made within 18 months of a finder’s fee being paid and all Class C shares are 1% within the first year and 0% thereafter. |
| 5 | The since inception index returned 8.71% from the inception date of Class R6 shares and 4.72% for the inception date of Class A shares, Class C shares, and Class I shares. |
| 6 | The expense ratios of the Fund are set forth according to the prospectus for the Fund effective January 27, 2023, as supplemented and revised, and may differ from the expense ratios disclosed in the Financial Highlights tables in this report. See the Financial Highlights for more current expense ratios. Net Expense: Expenses reduced by a contractual expense limitation in effect through January 31, 2024. Gross Expense: Does not reflect the effect of the expense limitation. Expense ratios include fees and expenses associated with any underlying funds. |
The index is unmanaged and not available for direct investment; therefore, its performance does not reflect the expenses associated with active management of an actual portfolio.
For information regarding the indexes and certain investment terms, see the Key Investment Terms starting on page 6.
| | Ticker Symbols: |
| | Class A: VISAX |
| | Class C: VCISX |
| | Class I: VIISX |
| | Class R6: VRISX |
KAR International Small-Mid Cap Fund
Fund Summary (Unaudited)
Portfolio Manager Commentary by
Kayne Anderson Rudnick Investment Management, LLC
| ■ | The Fund is diversified and has an investment objective of capital appreciation. There is no guarantee that the Fund will meet its objective. |
| ■ | For the fiscal year ended September 30, 2023, the Fund’s Class A shares at NAV returned 27.13%, Class C shares at NAV returned 26.18%, Institutional Class shares at NAV returned 27.50%, and Class R6 shares at NAV returned 27.62%. For the same period, the MSCI All Country World ex USA SMID Cap Index (net), the Fund’s broad-based and style-specific index appropriate for comparison, returned 19.95%. |
All performance figures assume reinvestment of distributions and exclude the effect of sales charges. Performance data quoted represents past results. Past performance is no guarantee of future results, and current performance may be higher or lower than the performance shown above. Investment return and principal value will fluctuate so your shares, when redeemed, may be worth more or less than their original cost. Please visit Virtus.com for performance data current to the most recent month-end.
How did the markets perform during the Fund’s fiscal year ended September 30, 2023?
Markets underperformed in 2022, driven largely by expectations of higher inflation and global central bank tightening in response to elevated inflation. Late in 2022, markets began to see some relief in terms of inflation expectations, which led to a rally in equities that started in early 2023. However, the rally slowed toward the end of the third quarter of 2023 on the realization that the Federal Reserve (the Fed) might have to hold interest rates higher for longer.
For the fiscal year ended September 30, 2023, non-U.S. developed markets, represented by the MSCI EAFE® Index (net), returned 25.65%, outperforming U.S. stocks, represented by the S&P 500® Index, which returned 21.62%. Emerging markets, represented by the MSCI Emerging Markets Index (net), returned 11.70%, underperforming U.S.
stocks. By comparison, U.S. small-capitalization stocks, as represented by the Russell 2000® Index, returned 8.93% for the 12-month period.
What factors affected the Fund’s performance during its fiscal year?
The Fund outperformed the MSCI All Country World ex USA SMID Cap Index (net) for the fiscal year ended September 30, 2023. Positive stock selection in communication services and consumer discretionary contributed to performance. Poor stock selection in financials and information technology detracted from performance.
From a country perspective, positive stock selection and an overweight in the U.K., and positive stock selection and an underweight in Canada contributed to performance. Poor stock selection in South Korea, and poor stock selection and an overweight in Singapore detracted from performance.
The biggest contributors to performance from a stock selection perspective during the 12-month period were Baltic Classifieds, Mercari, AutoTrader, Allegro.eu Societe, and Rightmove.
The biggest detractors from performance during the period were AJ Bell, Benefit One, PT Dayamitra Telekomunikasi, FDM Group, and CTS Eventim.
The preceding information is the opinion of portfolio management only through the end of the period stated on the cover. Any such opinions are subject to change at any time based upon market or other conditions and should not be relied upon as investment advice. Past performance is no guarantee of future results, and there is no guarantee that market forecasts will be realized.
Equity Securities: The market price of equity securities may be adversely affected by financial market, industry, or issuer-specific events. Focus on a particular style or on small, medium, or large-sized companies may enhance that risk.
Foreign & Emerging Markets: Investing in foreign securities, especially in emerging markets, subjects the Fund to additional risks such as increased volatility, currency fluctuations, less liquidity, and political, regulatory, economic, and market risk.
Industrial Concentration: Because the Fund is presently heavily weighted in the industrial sector, it will be impacted by that sector’s performance more than a fund with broader sector diversification.
Limited Number of Investments: Because the Fund has a limited number of securities, it may be more susceptible to factors adversely affecting its securities than a fund with a greater number of securities.
Market Volatility: The value of the securities in the Fund may go up or down in response to the prospects of individual companies and/or general economic conditions. Local, regional, or global events such as war or military conflict, terrorism, pandemic, or recession could impact the Fund, including hampering the ability of the portfolio’s manager(s) to invest its assets as intended.
Prospectus: For additional information on risks, please see the Fund’s prospectus.
Asset Allocation
The following table presents asset allocation within certain sectors as a percentage of total investments as of September 30, 2023.
| Communication Services | 28% |
| Industrials | 25 |
| Financials | 14 |
| Information Technology | 10 |
| Consumer Discretionary | 8 |
| Health Care | 5 |
| Consumer Staples | 5 |
| Other | 5 |
| Total | 100% |
For information regarding the indexes and certain investment terms, see the Key Investment Terms starting on page 6.
KAR International Small-Mid Cap Fund (Continued)
Average Annual Total Returns1 for periods ended 9/30/23
| | | 1 Year | 5 Years | 10 Years | Since
inception | Inception
date |
| Class A shares at NAV2 | | 27.13 % | 0.85 % | 5.19 % | — % | — |
| Class A shares at POP3,4 | | 20.14 | -0.28 | 4.59 | — | — |
| Class C shares at NAV2 and with CDSC4 | | 26.18 | 0.12 | 4.42 | — | — |
| Class I shares at NAV2 | | 27.50 | 1.13 | 5.46 | — | — |
| Class R6 shares at NAV2 | | 27.62 | 1.22 | — | 5.73 | 11/12/14 |
| MSCI All Country World ex USA SMID Cap Index (net) | | 19.95 | 1.95 | 3.82 | 4.08 5 | — |
| Fund Expense Ratios6: Class A shares: 1.42%; Class C shares: 2.18%; Class I shares: 1.17%; Class R6 shares: 1.08%. |
| All returns represent past performance which is no guarantee of future results. Current performance may be higher or lower than the performance shown. The investment return and principal value of an investment will fluctuate so that an investor’s shares, when redeemed, may be worth more or less than their original cost. The above table and graph below do not reflect the deduction of taxes that a shareholder would pay on fund distributions or the redemption of shares. Please visit Virtus.com for performance data current to the most recent month-end. |
Growth of $10,000 for periods ended 9/30
This chart assumes an initial investment of $10,000 made on September 30, 2013, for Class A shares and Class C shares including any applicable sales charges or fees. The performance of the other share class may be greater or less than that shown based on differences in inception dates, fees, and sales charges. Performance assumes reinvestment of dividends and capital gain distributions.
For information regarding the indexes and certain investment terms, see the Key Investment Terms starting on page 6.
KAR International Small-Mid Cap Fund (Continued)
Growth of $100,000 for periods ended 9/30
This chart assumes an initial investment of $100,000 made on September 30, 2013 for Class I shares. The performance of the other share class may be greater or less than that shown based on differences in inception dates, fees, and sales charges. Performance assumes reinvestment of dividends and capital gain distributions.
| 1 | Total returns are historical and include changes in share price and the reinvestment of both dividends and capital gain distributions. |
| 2 | “NAV” (Net Asset Value) total returns do not include the effect of any sales charge. |
| 3 | “POP” (Public Offering Price) total returns include the effect of the maximum front-end 5.50% sales charge. |
| 4 | “CDSC” (contingent deferred sales charge) is applied to redemptions of certain classes of shares that do not have a sales charge applied at the time of purchase. CDSC for certain redemptions of Class A shares made within 18 months of a finder’s fee being paid and all Class C shares are 1% within the first year and 0% thereafter. |
| 5 | The since inception index return is from the inception date of Class R6 shares. |
| 6 | The expense ratios of the Fund are set forth according to the prospectus for the Fund effective January 27, 2023, as supplemented and revised, and may differ from the expense ratios disclosed in the Financial Highlights tables in this report. See the Financial Highlights for more current expense ratios. Expense ratios include fees and expenses associated with any underlying funds. |
The index is unmanaged and not available for direct investment; therefore, its performance does not reflect the expenses associated with active management of an actual portfolio.
For information regarding the indexes and certain investment terms, see the Key Investment Terms starting on page 6.
| | Ticker Symbols: |
| | Class A: HEMZX |
| | Class C: PICEX |
| | Class I: HIEMX |
| | Class R6: VREMX |
Vontobel Emerging Markets Opportunities Fund
Fund Summary (Unaudited)
Portfolio Manager Commentary by
Vontobel Asset Management, Inc.
| ■ | The Fund is diversified and has an investment objective of capital appreciation. There is no guarantee that the Fund will meet its objective. |
| ■ | For the fiscal year ended September 30, 2023, the Fund’s Class A shares at NAV returned -0.71%, Class C shares at NAV returned -1.35%, Class I shares at NAV returned -0.41% and Class R6 shares at NAV returned -0.13%. For the same period, the MSCI Emerging Markets Index (net), which serves as both the broad-based and style-specific index appropriate for comparison, returned 11.70%. |
All performance figures assume reinvestment of distributions and exclude the effect of sales charges. Performance data quoted represents past results. Past performance is no guarantee of future results, and current performance may be higher or lower than the performance shown above. Investment return and principal value will fluctuate so your shares, when redeemed, may be worth more or less than their original cost. Please visit Virtus.com for performance data current to the most recent month-end.
How did the markets perform during the Fund’s fiscal year ended September 30, 2023?
The MSCI Emerging Markets Index (net) was positive in the first, second, and third fiscal quarters, and negative in the fourth fiscal quarter.
Emerging markets equities rallied in the fourth quarter of 2022 due to a reversal of China’s strict anti-Covid measures, although concerns about a slowdown in global demand and renewed supply chain challenges continued to weigh on stocks in December. China ended the year on a strong note with optimism for the economy. The country lifted the requirement for Covid sufferers to isolate and announced plans to end quarantine requirements for international arrivals, while also giving the green light to outbound travel. Chinese equity shares rallied, and pent-up demand for tourism was released. At the same time, Covid cases spiked sharply, leading some countries to introduce renewed checks on visitors from China. The rise in infections also prompted concerns about the impact on global supply chains. Asian countries exposed to China and international demand remained weak. Indian equities benefited
from the continued shift in supply chains away from China and the country’s expanding middle class. The World Bank upgraded its fiscal year 2023 gross domestic product (GDP) growth forecast for the country to 6.9%, expecting it to remain one of the fastest-growing major economies in the world. In Latin America, Brazilian markets were volatile following the presidential victory of Luiz Inacio Lula da Silva, with budget cap changes prompting concerns about looser fiscal discipline.
The trajectory of interest rates and reopening in China drove positive performance in emerging markets in the first quarter of 2023, although the specter of a new banking crisis and developed markets recession weighed on performance. China was the driver of the region’s strong start as a post-Covid reopening in time for the Lunar New Year holiday led to domestic consumption indicators above 2019 levels. The result was strong foreign investment inflows as international investors bought up $21 billion of Chinese stocks, pushing up share prices. After its relative outperformance in 2022, India’s markets cooled in the first quarter of 2023. In its last full budget before general elections next year, India’s government unveiled tax relief for the country’s middle class, as well as a boost for capital spending. The measures, which included a promise to reduce the fiscal deficit, helped underpin shares in February before global concerns weighed on performance for the quarter. In Brazil, after pushing through measures to boost welfare payments for the country’s poorest, the new president further ignited investor concerns by questioning the need for an independent central bank.
In the second quarter of 2023, the threat of slowing growth in China, combined with geopolitical tensions, created an uncertain backdrop for investors. Amid diverging performance across markets, EM equities finished the quarter in slightly positive territory. Tensions between the U.S. and China escalated. A visit to Beijing by U.S. Secretary of State Antony Blinken resulted in an agreement to stabilize strained relations between the two countries. Nonetheless, concerns impacted investor sentiment toward China’s tech industry and were exacerbated by worries about the pace of the country’s recovery. China’s manufacturing activity contracted for the third consecutive month in June, although services activity continued to grow. Retail sales increased in May, but slowed from significant
gains in April, prompting fears that consumer appetite was waning. India was a beneficiary of the increased tensions between the U.S. and China. India’s economy remained a bright spot for GDP growth globally, helping maintain the country’s stock market at record highs. Data from Brazil pointed to inflation coming back under control, fueling hopes that Brazil’s central bank could cut rates from their high level of 13.75%. Falling unemployment numbers provided another sign of improvement, helping underpin strong returns from Brazilian equity shares over the quarter.
Emerging markets stocks weakened in the third quarter of 2023 as China’s patchy recovery and ongoing tensions with the U.S. weighed on investor sentiment. The economic signals from China were mixed. Factory output declined for the fifth straight month in August, although new orders and producer prices improved. Retail sales also picked up, signaling improving consumer appetite. People’s Bank of China officials maintained that GDP should grow slightly more than 5% this year as it unleashed stimulus to boost the economy. Relations between the U.S. and China remained fractious. President Biden issued an executive order restricting U.S. investment in some Chinese technology. India’s economy continued to expand with growth of 7.8% in the quarter to June. Indian stocks recorded strong net international inflows before investors reduced holdings in September under pressure from rising oil prices. Indian Prime Minister Narendra Modi used G20 meetings to position the country as a trusted partner for international supply chains as businesses expand beyond China. Brazil kicked off its easing cycle with two successive 0.50% rate cuts, while the country’s central bank revised its 2023 growth forecast upward.
What factors affected the Fund’s performance during its fiscal year?
The Fund underperformed its benchmark for the 12 months ended September 30, 2023. The following discussion highlights specific stocks — those that provided the largest contribution to absolute performance and those that were the largest detractors for the fiscal year.
Stocks that helped absolute performance
Samsung Electronics is the top global player in memory semiconductors, smartphones, OLED display panels, and televisions, with 70% of the
For information regarding the indexes and certain investment terms, see the Key Investment Terms starting on page 6.
Vontobel Emerging Markets Opportunities
Fund (Continued)
world’s data being produced and saved using the company’s products. Samsung’s semiconductor business accounts for 60% of the company’s profits, as they play a critical role as enablers of the global digital economy and the advancements in 5G, artificial intelligence (AI), the internet of things (IoT), and cloud computing. Samsung is the only player in the market that can offer a comprehensive memory, manufacturing, and packaging solution to expand its presence to AI chip clients.
Housing Development Finance Corp., an Indian mortgage finance company, performed well during the period, delivering solid results. HDFC is the leader in mortgage lending in India, and demonstrates industry-leading low costs from both efficient operations and its solid credit history. HDFC, established in 1977, provides home loans, deposit products, and lease finance facilities to the corporate sector for plant, machinery, and property-related services nationwide.
Taiwan Semiconductor Manufacturing, Raia Drogasil SA, and Accton Technology Corp. also contributed to the Fund’s absolute performance.
Stocks that hurt absolute performance
A challenging period for Hapvida continued throughout 2022 and into 2023. Hapvida was formed from the merger of Hapvida and NotreDame Intermedica, which created the leading vertically integrated health plan in Brazil. While a surge of Covid-related demand began to dissipate, underlying cost inflation persisted. As a result, the company’s profit margins showed no signs of improvement despite price increases. Weak fourth quarter of 2022 results were compounded by a subsequent announcement that the company was investigating
measures to improve its balance sheet. Given the prospect of a more drawn-out recovery and the unexpected need for more capital, we sold out of the investment.
JD.com is the second largest business-to-consumer online platform in China. The company underperformed as it projected that revenue growth would be in the lower end of its guided range and that revenue would decline. The weakness was largely related to macroeconomic concerns about consumption, which we believe should stabilize going forward.
Lojas Renner SA, Wuxi Lead Intelligent Equipment Co., and HDFC Bank Ltd. also detracted from the Fund’s absolute performance.
The preceding information is the opinion of portfolio management only through the end of the period stated on the cover. Any such opinions are subject to change at any time based upon market or other conditions and should not be relied upon as investment advice. Past performance is no guarantee of future results, and there is no guarantee that market forecasts will be realized.
Equity Securities: The market price of equity securities may be adversely affected by financial market, industry, or issuer-specific events. Focus on a particular style or on small, medium, or large-sized companies may enhance that risk.
Geographic Concentration: A fund that focuses its investments in a particular geographic location will be sensitive to financial, economic, political, and other events negatively affecting that location.
Foreign & Emerging Markets: Investing in foreign securities, especially in emerging markets, subjects
the Fund to additional risks such as increased volatility, currency fluctuations, less liquidity, and political, regulatory, economic, and market risk.
Market Volatility: The value of the securities in the Fund may go up or down in response to the prospects of individual companies and/or general economic conditions. Local, regional, or global events such as war or military conflict, terrorism, pandemic, or recession could impact the Fund, including hampering the ability of the portfolio’s manager(s) to invest its assets as intended.
Prospectus: For additional information on risks, please see the Fund’s prospectus.
Asset Allocation
The following table presents asset allocation within certain sectors as a percentage of total investments as of September 30, 2023.
| Consumer Staples | 21% |
| Consumer Discretionary | 20 |
| Financials | 18 |
| Information Technology | 16 |
| Communication Services | 8 |
| Industrials | 8 |
| Health Care | 3 |
| Other | 6 |
| Total | 100% |
For information regarding the indexes and certain investment terms, see the Key Investment Terms starting on page 6.
Vontobel Emerging Markets Opportunities
Fund (Continued)
Average Annual Total Returns1 for periods ended 9/30/23
| | | 1 Year | 5 Years | 10 Years | Since
inception | Inception
date |
| Class A shares at NAV2 | | -0.71 % | -2.45 % | 0.25 % | — % | — |
| Class A shares at POP3,4 | | -6.17 | -3.55 | -0.32 | — | — |
| Class C shares at NAV2 and with CDSC4 | | -1.35 | -3.11 | -0.46 | — | — |
| Class I shares at NAV2 | | -0.41 | -2.14 | 0.55 | — | — |
| Class R6 shares at NAV2 | | -0.13 | -1.90 | — | -0.31 | 11/12/14 |
| MSCI Emerging Markets Index (net) | | 11.70 | 0.55 | 2.07 | 1.94 5 | — |
| Fund Expense Ratios6: Class A shares: Gross 1.56%, Net 1.56%; Class C shares: Gross 2.27%, Net 2.27%; Class I shares: Gross 1.23%, Net 1.23%; Class R6 shares: Gross 1.14%, Net 0.98%. |
| All returns represent past performance which is no guarantee of future results. Current performance may be higher or lower than the performance shown. The investment return and principal value of an investment will fluctuate so that an investor’s shares, when redeemed, may be worth more or less than their original cost. The above table and graph below do not reflect the deduction of taxes that a shareholder would pay on fund distributions or the redemption of shares. Please visit Virtus.com for performance data current to the most recent month-end. |
Growth of $10,000 for periods ended 9/30
This chart assumes an initial investment of $10,000 made on September 30, 2013, for Class A shares and Class C shares including any applicable sales charges or fees. The performance of the other share class may be greater or less than that shown based on differences in inception dates, fees, and sales charges. Performance assumes reinvestment of dividends and capital gain distributions.
For information regarding the indexes and certain investment terms, see the Key Investment Terms starting on page 6.
Vontobel Emerging Markets Opportunities
Fund (Continued)
Growth of $100,000 for periods ended 9/30
This chart assumes an initial investment of $100,000 made on September 30, 2013 for Class I shares. The performance of the other share class may be greater or less than that shown based on differences in inception dates, fees, and sales charges. Performance assumes reinvestment of dividends and capital gain distributions.
| 1 | Total returns are historical and include changes in share price and the reinvestment of both dividends and capital gain distributions. |
| 2 | “NAV” (Net Asset Value) total returns do not include the effect of any sales charge. |
| 3 | “POP” (Public Offering Price) total returns include the effect of the maximum front-end 5.50% sales charge. |
| 4 | “CDSC” (contingent deferred sales charge) is applied to redemptions of certain classes of shares that do not have a sales charge applied at the time of purchase. CDSC for certain redemptions of Class A shares made within 18 months of a finder’s fee being paid and all Class C shares are 1% within the first year and 0% thereafter. |
| 5 | The since inception index return is from the inception date of Class R6 shares. |
| 6 | The expense ratios of the Fund are set forth according to the prospectus for the Fund effective January 27, 2023, as supplemented and revised, and may differ from the expense ratios disclosed in the Financial Highlights tables in this report. See the Financial Highlights for more current expense ratios. Net Expense: Expenses reduced by a contractual expense limitation in effect through January 31, 2024. Gross Expense: Does not reflect the effect of the expense limitation. Expense ratios include fees and expenses associated with any underlying funds. |
The index is unmanaged and not available for direct investment; therefore, its performance does not reflect the expenses associated with active management of an actual portfolio.
For information regarding the indexes and certain investment terms, see the Key Investment Terms starting on page 6.
| | Ticker Symbols: |
| | Class A: JVIAX |
| | Class C: JVICX |
| | Class I: JVXIX |
| | Class R6: VFOPX |
Vontobel Foreign Opportunities Fund
Fund Summary (Unaudited)
Portfolio Manager Commentary by
Vontobel Asset Management, Inc.
| ■ | The Fund is diversified and has an investment objective of long-term capital appreciation. There is no guarantee that the Fund will meet its objective. |
| ■ | For the fiscal year ended September 30, 2023, the Fund’s Class A shares at NAV returned 18.36%, Class C shares at NAV returned 17.54%†, Class I shares at NAV returned 18.77%, and Class R6 shares at NAV returned 18.87%†. For the same period, the MSCI All Country World ex USA Index (net), which serves as both the Fund’s broad-based and style-specific index appropriate for comparison, returned 20.39%. |
† See footnote 5 on page 47.
All performance figures assume reinvestment of distributions and exclude the effect of sales charges. Performance data quoted represents past results. Past performance is no guarantee of future results, and current performance may be higher or lower than the performance shown above. Investment return and principal value will fluctuate so your shares, when redeemed, may be worth more or less than their original cost. Please visit Virtus.com for performance data current to the most recent month-end.
How did the markets perform during the Fund’s fiscal year ended September 30, 2023?
The MSCI All Country World ex USA Index (net) was positive in the first, second, and third fiscal quarters, and negative in the fourth fiscal quarter.
International equities advanced in the fourth quarter of 2022 due to optimism about the possibility of slowing interest rate rises and a reopening in China, although persistent inflation and recession fears led to many major markets weakening once more in December. The European Central Bank (ECB) cautioned that interest rates might need to be increased to levels that would restrict economic growth. There were some positive signals, including lower natural gas prices in Europe. Japanese inflation climbed to a four-decade high in November, yet the Bank of Japan (BOJ) remained out of step with most international central banks as it continued to pursue negative interest rates in the face of rising pressure. In December, policymakers surprised markets by adjusting yield curve control measures, which
prompted investors to speculate on an end to ultra-low interest rate conditions, sending the yen and bonds higher, and stocks sharply lower. Yield curve control is a central bank policy tool in which the BOJ sets a target interest rate, and buys and sells bonds as needed to reach that target. China ended the year on a strong note with optimism for the economy. In December, China abandoned many elements of its zero-Covid policy, releasing a rally in share prices and pent-up demand for tourism. At the same time, Covid cases spiked sharply, which prompted concerns about the impact on global supply chains. Indian equities benefited from the continued shift in supply chains away from China and the country’s expanding middle class.
The trajectory of interest rates continued to drive international markets in the first quarter of 2023, as expectations for the pace of hikes oscillated with inflation news and the threat of banking crises in the U.S. and Europe. The MSCI All Country World ex USA Index (net) finished the quarter in positive territory. The failures of Silicon Valley Bank and Signature Bank shook markets and prompted measures to guarantee the banks’ deposits. The collapse was followed by worries about Credit Suisse, which resulted in its merger with UBS. While developed market bank shares tumbled, leading to concerns about a new banking crisis, the fear dissipated on action from regulators and governments. The loss of confidence that hastened Credit Suisse’s fall did not lead to an easing of interest rate hikes in Europe. The ECB maintained a firm stance on inflation, arguing that there was no clear evidence of prices trending downward. Japanese stocks advanced, yet data showed that the economy stagnated in the final three months of 2022 as consumers reined in spending. The surprise appointment of Kazuo Ueda as BOJ governor fed speculation that he could oversee a slightly quicker move away from ultra-loose monetary policy and yield curve control measures. Emerging markets started the quarter strong, driven by China. The post-Covid reopening in time for the Lunar New Year holiday fueled domestic consumption. The market softened in February as investors then took a pause, although positive economic news continued.
In the second quarter of 2023, slow but steady progress in the fight against inflation, inconclusive economic data, and geopolitical tensions created a complex backdrop for investors. Despite the
uncertain outlook, markets continued to move upward, and international equities ended the quarter in positive territory. Japan was one of the best-performing countries as the BOJ indicated it would be slow to pull back from low interest rates and yield curve control measures, leading to expectations that the bank would be more accepting of higher inflation. European markets witnessed more modest yet still-positive gains despite stalling economic growth, as Eurozone gross domestic product (GDP) contracted by 0.1% in the first quarter and Germany entered recession. The ECB maintained its interest rate hiking program and guided to a further increase in July, with wage pressures prompting the bank to increase its inflation forecasts for 2023 and 2024. Geopolitical factors remained an undercurrent as tensions escalated between the U.S. and China. Concerns impacted investor sentiment toward China’s tech industry and were exacerbated by worries about the pace of the country’s recovery.
International equity markets declined in the third quarter of 2023 as concerns about an economic downturn and the possibility of higher for longer interest rates weighed on investor sentiment. Geopolitical risks remained elevated, and some companies showed signs of softening earnings. Fractious relations between the U.S. and China continued as President Biden issued an executive order restricting U.S. investment in some Chinese technology. The economic signals from China were mixed. People’s Bank of China officials maintained that GDP should grow slightly more than 5% this year as it unleashed stimulus to boost the economy. The pace of China’s recovery cast a shadow in Europe. Germany’s Bundesbank warned that the continent’s largest economy was likely to have shrunk in the third quarter, putting it on track to re-enter recession in 2023. Data pointed to worsening conditions across the entire Eurozone, with purchasing manager data indicating contraction in the second quarter. The European Commission trimmed its growth forecast for the year in the face of persistent inflation, and downgraded its 2024 predictions. Stalling economic growth prompted the ECB to signal the top for interest rates. In the U.K., a moderate reduction in inflation gave the Bank of England the room to freeze rates after 14 successive hikes. India’s economy continued to expand. Japan was an outlier on monetary policy, maintaining negative interest rates while making only minor alterations to yield curve control measures. In
For information regarding the indexes and certain investment terms, see the Key Investment Terms starting on page 6.
Vontobel Foreign Opportunities Fund (Continued)
September, Prime Minister Fumio Kishida unveiled a multi-pronged economic package designed to combat inflation and drive growth. The yen continued to track lower, helping Japanese stocks to outperform for the year.
What factors affected the Fund’s performance during its fiscal year?
The Fund underperformed its benchmark for the 12 months ended September 30, 2023. The following discussion highlights specific stocks — those that provided the largest contribution to absolute performance and those that were the largest detractors for the fiscal year.
Stocks that helped absolute performance
Constellation Software delivered strong earnings growth from value-added acquisitions and high single-digit organic growth. The Canada-based company specializes in back office and operational software for a wide range of industries including health care, law, and public transit. The company seeks to grow through acquisitions in a fragmented industry.
RELX (formerly Reed Elsevier) is a conglomerate of leading information services businesses, operating in the following segments: scientific, technical & medical (STM); risk & business analytics; legal; and exhibitions. The company reported a solid pick-up in organic growth as its STM segment was driven by the faster-growing database and tools segment. The company has demonstrated a high level of recurring subscription revenues, strong pricing power, operating leverage, and low capital requirements.
Hermes International NPV., Ferrari NV, and Air Liquide also contributed to the Fund’s absolute performance.
Stocks that hurt absolute performance
Hong Kong Exchanges is a volatile stock that declined as the Hong Kong market came under pressure from investor disappointment about the slow pace of recovery in China. The company owns and operates the only stock exchange in Hong Kong, as well as a futures exchange and related clearing houses. Hong Kong Exchanges provides trading platforms for a range of cash and derivatives products, as well as the facilities for processing trades.
Sartorius Stedim offers a comprehensive suite of services for the development and manufacturing of biopharmaceuticals. The company was a Covid beneficiary, but has since been dealing with a reduced demand for vaccines. Expectations continued to be weak, reflecting concerns about the inventory overhang in the industry and the pressure on the company’s order book. Given the difficult environment, we reallocated the position into other opportunities.
Diageo plc, Roche Holdings AG, and Taiwan Semiconductor Manufacturing also detracted from the Fund’s absolute performance.
The preceding information is the opinion of portfolio management only through the end of the period stated on the cover. Any such opinions are subject to change at any time based upon market or other conditions and should not be relied upon as investment advice. Past performance is no guarantee of future results, and there is no guarantee that market forecasts will be realized.
Equity Securities: The market price of equity securities may be adversely affected by financial market, industry, or issuer-specific events. Focus on a particular style or on small, medium, or large-sized companies may enhance that risk.
Foreign & Emerging Markets: Investing in foreign securities, especially in emerging markets, subjects the Fund to additional risks such as increased volatility, currency fluctuations, less liquidity, and political, regulatory, economic, and market risk.
Market Volatility: The value of the securities in the Fund may go up or down in response to the prospects of individual companies and/or general economic conditions. Local, regional, or global events such as war or military conflict, terrorism, pandemic, or recession could impact the Fund, including hampering the ability of the portfolio’s manager(s) to invest its assets as intended.
Prospectus: For additional information on risks, please see the Fund’s prospectus.
Asset Allocation
The following table presents asset allocation within certain sectors as a percentage of total investments as of September 30, 2023.
| Industrials | 25% |
| Information Technology | 19 |
| Financials | 17 |
| Consumer Discretionary | 13 |
| Health Care | 10 |
| Consumer Staples | 9 |
| Materials | 3 |
| Other (includes short-term investment) | 4 |
| Total | 100% |
For information regarding the indexes and certain investment terms, see the Key Investment Terms starting on page 6.
Vontobel Foreign Opportunities Fund (Continued)
Average Annual Total Returns1 for periods ended 9/30/23
| | | 1 Year | 5 Years | 10 Years | Since
inception | Inception
date |
| Class A shares at NAV2 | | 18.36 % | 4.04 % | 4.89 % | — % | — |
| Class A shares at POP3,4 | | 11.85 | 2.87 | 4.30 | — | — |
| Class C shares at NAV2 and with CDSC4 | | 17.54 5 | 3.35 | 4.16 | — | — |
| Class I shares at NAV2 | | 18.77 | 4.38 | 5.20 | — | — |
| Class R6 shares at NAV2 | | 18.87 5 | 4.49 | — | 5.19 | 11/12/14 |
| MSCI All Country World ex USA Index (net) | | 20.39 | 2.58 | 3.35 | 3.42 6 | — |
| Fund Expense Ratios7: Class A shares: Gross 1.39%, Net 1.39%; Class C shares: Gross 2.13%, Net 2.05%; Class I shares: Gross 1.13%, Net 1.07%; Class R6 shares: Gross 1.05%, Net 0.95%. |
| All returns represent past performance which is no guarantee of future results. Current performance may be higher or lower than the performance shown. The investment return and principal value of an investment will fluctuate so that an investor’s shares, when redeemed, may be worth more or less than their original cost. The above table and graph below do not reflect the deduction of taxes that a shareholder would pay on fund distributions or the redemption of shares. Please visit Virtus.com for performance data current to the most recent month-end. |
Growth of $10,000 for periods ended 9/30
This chart assumes an initial investment of $10,000 made on September 30, 2013, for Class A shares and Class C shares including any applicable sales charges or fees. The performance of the other share class may be greater or less than that shown based on differences in inception dates, fees, and sales charges. Performance assumes reinvestment of dividends and capital gain distributions.
For information regarding the indexes and certain investment terms, see the Key Investment Terms starting on page 6.
Vontobel Foreign Opportunities Fund (Continued)
Growth of $100,000 for periods ended 9/30
This chart assumes an initial investment of $100,000 made on September 30, 2013 for Class I shares. The performance of the other share class may be greater or less than that shown based on differences in inception dates, fees, and sales charges. Performance assumes reinvestment of dividends and capital gain distributions.
| 1 | Total returns are historical and include changes in share price and the reinvestment of both dividends and capital gain distributions. |
| 2 | “NAV” (Net Asset Value) total returns do not include the effect of any sales charge. |
| 3 | “POP” (Public Offering Price) total returns include the effect of the maximum front-end 5.50% sales charge. |
| 4 | “CDSC” (contingent deferred sales charge) is applied to redemptions of certain classes of shares that do not have a sales charge applied at the time of purchase. CDSC for certain redemptions of Class A shares made within 18 months of a finder’s fee being paid and all Class C shares are 1% within the first year and 0% thereafter. |
| 5 | Total Return for the report period presented in the table differs from the return in the Financial Highlights. The total return presented in the above table is calculated based on the NAV at which shareholder transactions were processed. The total return presented in the Financial Highlights section of the report is calculated in the same manner, but also takes into account certain adjustments that are necessary under generally accepted accounting principles required in the annual report and semiannual report. |
| 6 | The since inception index return is from the inception date of Class R6 shares. |
| 7 | The expense ratios of the Fund are set forth according to the prospectus for the Fund effective January 27, 2023, as supplemented and revised, and may differ from the expense ratios disclosed in the Financial Highlights tables in this report. See the Financial Highlights for more current expense ratios. Net Expense: Expenses reduced by a contractual expense limitation in effect through January 31, 2024. Gross Expense: Does not reflect the effect of the expense limitation. Expense ratios include fees and expenses associated with any underlying funds. |
The index is unmanaged and not available for direct investment; therefore, its performance does not reflect the expenses associated with active management of an actual portfolio.
For information regarding the indexes and certain investment terms, see the Key Investment Terms starting on page 6.
| | Ticker Symbols: |
| | Class A: NWWOX |
| | Class C: WWOCX |
| | Class I: WWOIX |
| | Class R6: VRGOX |
Vontobel Global Opportunities Fund
Fund Summary (Unaudited)
Portfolio Manager Commentary by
Vontobel Asset Management, Inc.
| ■ | The Fund is diversified and has an investment objective of capital appreciation. There is no guarantee that the Fund will meet its objective. |
| ■ | For the fiscal year ended September 30, 2023, the Fund’s Class A shares at NAV returned 20.16%, Class C shares at NAV returned 19.36%, Class I shares at NAV returned 20.55%, and Class R6 shares at NAV returned 20.81%. For the same period, the MSCI All Country World Index (net), which serves as both the Fund’s broad-based and style-specific index appropriate for comparison, returned 20.80%. |
All performance figures assume reinvestment of distributions and exclude the effect of sales charges. Performance data quoted represents past results. Past performance is no guarantee of future results, and current performance may be higher or lower than the performance shown above. Investment return and principal value will fluctuate so your shares, when redeemed, may be worth more or less than their original cost. Please visit Virtus.com for performance data current to the most recent month-end.
How did the markets perform during the Fund’s fiscal year ended September 30, 2023?
The MSCI All Country World Index (net) was positive in the first, second, and third fiscal quarters, and negative in the fourth fiscal quarter.
Global equities advanced in the fourth quarter of 2022 due to optimism about slowing interest rate rises, falling inflation, and a reopening in China, although the rekindling of recession fears saw most major markets decline in December. While hopes of an end to the Federal Reserve’s (the Fed’s) tightening cycle boosted U.S. equities early in the quarter the Fed chair warned that policymakers still had “more ground to cover” in the fight against inflation, dampening the mood and increasing recession fears in December. The European Central Bank (ECB) cautioned that interest rates might need to be increased to levels that would restrict economic growth. There were some positive signals, including lower natural gas prices in Europe. In December, China abandoned many elements of its zero-Covid policy, releasing a rally in share prices and pent-up demand for tourism. At the same time, Covid cases
spiked sharply and the rise in infections prompted concerns about the impact on global supply chains. Indian equities benefited from the continued shift in supply chains away from China and the country’s expanding middle class. In Latin America, Brazilian markets were volatile following the presidential victory of Luiz Inacio Lula da Silva, with budget cap changes prompting concerns about looser fiscal discipline.
The trajectory of interest rates continued to drive global markets in the first quarter of 2023, as expectations for the pace of hikes oscillated with inflation news and the threat of banking crises in the U.S. and Europe. Global equities finished the quarter in positive territory. Easing inflation and solid economic growth in the U.S. helped fuel a strong start to the year for the S&P 500® Index and other global indexes. However, the continuation of robust data on jobs and earnings fueled expectations that interest rates would move higher and remain elevated for longer than previously forecast, weighing on performance in February. The failures of Silicon Valley Bank and Signature Bank shook markets, along with the forced merger of Credit Suisse and UBS. But fears of a banking crisis dissipated after swift action from regulators and governments. Cooling energy prices through the quarter gave a boost to consumers, though the ECB maintained a firm stance on inflation. China was the driver of emerging market performance as the post-Covid reopening led to domestic consumption indicators above 2019 levels. After its relative outperformance in 2022, India’s markets cooled in the first quarter of 2023. In Brazil, after pushing through measures to boost welfare payments for the country’s poorest, the new president further ignited investor concerns by questioning the need for an independent central bank.
Inflationary pressures cooled in the second quarter of 2023, although stubborn core numbers continued to feed expectations of further interest rate hikes. Strong labor markets and consumer confidence helped drive company performance and markets, while exuberance about artificial intelligence (AI) also fueled large tech names. Global equities generated positive performance, particularly the S&P 500® Index. U.S. inflation continued to trend downward as the May 2023 core Consumer Price Index (CPI) report hit a two-year low of 4%. However, ongoing tightness in the job market fed strong wage
increases, which fueled concerns about consumer demand and further price increases. The Fed paused interest rate hikes in June but signaled that additional rate increases might be needed in 2023. Geopolitical factors remained an undercurrent as tensions escalated between the U.S. and China. Concerns were exacerbated by worries about the pace of China’s recovery, as manufacturing activity contracted for the third consecutive month in June, although services activity continued to grow. India was a beneficiary of the increased tensions between the U.S. and China. India’s economy remained a bright spot for gross domestic product (GDP) growth globally, helping maintain the country’s stock market at record highs. European markets witnessed gains despite stalling economic growth, as the Eurozone’s GDP contracted in the first quarter and Germany entered recession. The ECB maintained its interest rate hiking program and guided to a further increase in July.
Global equity markets declined in the third quarter of 2023 as concerns about an economic downturn and the potential of higher for longer interest rates weighed on investor sentiment. Geopolitical risks remained elevated, and some companies showed signs of softening earnings. While the Fed indicated that it was reaching the end of its hiking cycle, U.S. equities fell after the Fed noted that there could be fewer rate cuts in 2024 than investors had expected. Relations between the U.S. and China remained fractious as President Biden issued an executive order restricting U.S. investment in some Chinese technology. The economic signals from China were mixed. Factory output declined for the fifth straight month in August, although new orders and producer prices improved. Retail sales also picked up, signaling improving consumer appetite. China’s slow recovery cast a shadow on Europe. Germany’s Bundesbank warned that the economy was likely to have shrunk in the third quarter, while purchasing manager data pointed to worsening conditions across the Eurozone. Stalling economic performance prompted the ECB to signal the top for interest rates.
What factors affected the Fund’s performance during its fiscal year?
The Fund slightly lagged its benchmark for the 12 months ended September 30, 2023. The following discussion highlights specific stocks — those that provided the largest contribution to absolute
For information regarding the indexes and certain investment terms, see the Key Investment Terms starting on page 6.
Vontobel Global Opportunities Fund (Continued)
performance and those that were the largest detractors for the fiscal year.
Stocks that helped absolute performance
Microsoft’s stock performance was aided by optimism over the potential of generative AI, where the company has established itself as a leader through its partnership with OpenAI. The stock also benefited from the broader rally in mega-cap technology stocks. The company has built its Azure offering into a leading public cloud provider, and the shift to cloud computing has also driven growth in Microsoft’s traditional franchises.
During the fiscal year, Flutter Entertainment saw its U.S. business, which was previously the only division with a loss, break even and become profitable. After two major acquisitions in 2016 and 2019, Flutter became the largest global online gambling operator. The Flutter organization today houses a portfolio of brands that operate online sports betting and online gaming in legal markets around the world.
RELX plc, Adobe Systems, and Boston Scientific also contributed to the Fund’s absolute performance.
Stocks that hurt absolute performance
Teleperformance is the global leader in outsourced customer experience, providing solutions in customer care, technical support, interpretation services, and visa processing services, among
others. The company has been evaluating the use of AI for years, and has some capabilities already, but will need to scale these capabilities in order to stay competitive. During the 12-month period, Teleperformance cut its 2023 guidance for organic growth, and announced the acquisition of Majorel, which caused a negative market reaction.
JD.com is the second largest business-to-consumer online platform in China.The company underperformed as it projected that revenue growth would be in the lower end of its guided range and that revenue would decline. The weakness was largely related to macroeconomic concerns about consumption, which we believe should stabilize going forward.
HDFC Bank, Alibaba Group Holdings, and Yum China Holdings also detracted from the Fund’s absolute performance.
The preceding information is the opinion of portfolio management only through the end of the period stated on the cover. Any such opinions are subject to change at any time based upon market or other conditions and should not be relied upon as investment advice. Past performance is no guarantee of future results, and there is no guarantee that market forecasts will be realized.
Equity Securities: The market price of equity securities may be adversely affected by financial market, industry, or issuer-specific events. Focus on
a particular style or on small, medium, or large-sized companies may enhance that risk.
Foreign & Emerging Markets: Investing in foreign securities, especially in emerging markets, subjects the Fund to additional risks such as increased volatility, currency fluctuations, less liquidity, and political, regulatory, economic, and market risk.
Market Volatility: The value of the securities in the Fund may go up or down in response to the prospects of individual companies and/or general economic conditions. Local, regional, or global events such as war or military conflict, terrorism, pandemic, or recession could impact the Fund, including hampering the ability of the portfolio’s manager(s) to invest its assets as intended.
Prospectus: For additional information on risks, please see the Fund’s prospectus.
Asset Allocation
The following table presents asset allocation within certain sectors as a percentage of total investments as of September 30, 2023.
| Health Care | 20% |
| Financials | 18 |
| Consumer Staples | 17 |
| Information Technology | 16 |
| Consumer Discretionary | 12 |
| Industrials | 10 |
| Materials | 5 |
| Other | 2 |
| Total | 100% |
For information regarding the indexes and certain investment terms, see the Key Investment Terms starting on page 6.
Vontobel Global Opportunities Fund (Continued)
Average Annual Total Returns1 for periods ended 9/30/23
| | | 1 Year | 5 Years | 10 Years | Since
inception | Inception
date |
| Class A shares at NAV2 | | 20.16 % | 5.99 % | 8.31 % | — % | — |
| Class A shares at POP3,4 | | 13.56 | 4.80 | 7.70 | — | — |
| Class C shares at NAV2 and with CDSC4 | | 19.36 | 5.24 | 7.51 | — | — |
| Class I shares at NAV2 | | 20.55 | 6.30 | 8.60 | — | — |
| Class R6 shares at NAV2 | | 20.81 | 6.50 | — | 5.51 | 1/30/18 |
| MSCI All Country World Index (net) | | 20.80 | 6.46 | 7.56 | 5.36 5 | — |
| Fund Expense Ratios6: Class A shares: Gross 1.39%, Net 1.36%; Class C shares: Gross 2.14%, Net 2.11%; Class I shares: Gross 1.14%, Net 1.09%; Class R6 shares: Gross 1.05%, Net 0.90%. |
| All returns represent past performance which is no guarantee of future results. Current performance may be higher or lower than the performance shown. The investment return and principal value of an investment will fluctuate so that an investor’s shares, when redeemed, may be worth more or less than their original cost. The above table and graph below do not reflect the deduction of taxes that a shareholder would pay on fund distributions or the redemption of shares. Please visit Virtus.com for performance data current to the most recent month-end. |
Growth of $10,000 for periods ended 9/30
This chart assumes an initial investment of $10,000 made on September 30, 2013, for Class A shares and Class C shares including any applicable sales charges or fees. The performance of the other share class may be greater or less than that shown based on differences in inception dates, fees, and sales charges. Performance assumes reinvestment of dividends and capital gain distributions.
For information regarding the indexes and certain investment terms, see the Key Investment Terms starting on page 6.
Vontobel Global Opportunities Fund (Continued)
Growth of $100,000 for periods ended 9/30
This chart assumes an initial investment of $100,000 made on September 30, 2013 for Class I shares. The performance of the other share class may be greater or less than that shown based on differences in inception dates, fees, and sales charges. Performance assumes reinvestment of dividends and capital gain distributions.
| 1 | Total returns are historical and include changes in share price and the reinvestment of both dividends and capital gain distributions. |
| 2 | “NAV” (Net Asset Value) total returns do not include the effect of any sales charge. |
| 3 | “POP” (Public Offering Price) total returns include the effect of the maximum front-end 5.50% sales charge. |
| 4 | “CDSC” (contingent deferred sales charge) is applied to redemptions of certain classes of shares that do not have a sales charge applied at the time of purchase. CDSC for certain redemptions of Class A shares made within 18 months of a finder’s fee being paid and all Class C shares are 1% within the first year and 0% thereafter. |
| 5 | The since inception index return is from the inception date of Class R6 shares. |
| 6 | The expense ratios of the Fund are set forth according to the prospectus for the Fund effective January 27, 2023, as supplemented and revised, and may differ from the expense ratios disclosed in the Financial Highlights tables in this report. See the Financial Highlights for more current expense ratios. Net Expense: Expenses reduced by a contractual expense limitation in effect through January 31, 2024. Gross Expense: Does not reflect the effect of the expense limitation. Expense ratios include fees and expenses associated with any underlying funds. |
The index is unmanaged and not available for direct investment; therefore, its performance does not reflect the expenses associated with active management of an actual portfolio.
For information regarding the indexes and certain investment terms, see the Key Investment Terms starting on page 6.
Vontobel Greater European Opportunities Fund
Fund Summary (Unaudited)
| | Ticker Symbols: |
| | Class A: VGEAX |
| | Class C: VGECX |
| | Class I: VGEIX |
Portfolio Manager Commentary by
Vontobel Asset Management, Inc.
| ■ | The Fund is diversified and has an investment objective of long-term capital appreciation. There is no guarantee that the Fund will meet its objective. |
| ■ | For the fiscal year ended September 30, 2023, the Fund’s Class A shares at NAV returned 17.49%, Class C shares at NAV returned 16.53%, and Class I shares at NAV returned 17.77%. For the same period, the MSCI Europe Index (net), which serves as both the Fund’s broad-based and style-specific index appropriate for comparison, returned 28.85%. |
All performance figures assume reinvestment of distributions and exclude the effect of sales charges. Performance data quoted represents past results. Past performance is no guarantee of future results, and current performance may be higher or lower than the performance shown above. Investment return and principal value will fluctuate so your shares, when redeemed, may be worth more or less than their original cost. Please visit Virtus.com for performance data current to the most recent month-end.
How did the markets perform during the Fund’s fiscal year ended September 30, 2023?
The MSCI Europe Index (net) was positive in the first, second, and third fiscal quarters, and negative in the fourth fiscal quarter.
European equities advanced in the fourth quarter of 2022 due to optimism about the possibility of slowing interest rate rises and a reopening in China, although persistent inflation and recession fears saw markets decline in December. The European Central Bank (ECB) sought to tamp down inflation that remained stubbornly above 10%, with President Christine Lagarde cautioning that interest rates might need to be increased to levels that would restrict economic growth. There were some positive signals as a mild fall reduced the drain on European natural gas reserves through October and November, and forecasts for above-average temperatures in Northern Europe into the new year further relieved pressure on prices.
The trajectory of interest rates continued to drive European equity markets in the first quarter of 2023, as expectations for the pace of hikes oscillated with
inflation news and the threat of banking crises in the U.S. and Europe. Despite weakening in the latter stages of the quarter, the MSCI Europe Index (net) generated positive returns for the period. The failures of Silicon Valley Bank and Signature Bank shook markets. The collapse was followed by worries about Credit Suisse, which resulted in its merger with UBS. While developed market bank shares tumbled, leading to concerns about a new banking crisis, the fear dissipated on action from regulators and governments. The loss of confidence that hastened Credit Suisse’s fall did not lead to an easing of interest rate hikes in Europe. Cooling energy prices through the quarter gave a boost to consumers, and the ECB maintained a firm stance on inflation, arguing that there was no clear evidence of prices trending downward after the annual rate of inflation in the Eurozone fell just 0.1% in February to 8.5%. The annual rate of inflation then fell in March to 6.9%.
In the second quarter of 2023, slow but steady progress in the fight against inflation across much of Europe was tempered by a deteriorating macroeconomic environment, creating tough conditions for investors and monetary policymakers alike. Despite the uncertain outlook, European equities continued to move upward, and ended the quarter in positive territory. Economic growth showed signs of stalling as Eurozone gross domestic product (GDP) contracted in the first quarter and Germany entered recession. Nonetheless, the ECB maintained its interest rate hiking program and guided to a further increase in July, with wage pressures prompting the bank to increase its inflation forecasts for 2023 and 2024. Figures released at the end of June showed a deceleration in overall inflation levels, although the core reading that excludes food and energy ticked up modestly, cementing investor expectations for further rate rises.
European stocks fell in the third quarter of 2023 as economic headwinds combined with the threat of higher for longer interest rates to weigh on companies and markets. The MSCI Europe Index (net) posted negative returns. Germany’s Bundesbank warned that the continent’s largest economy was likely to have shrunk in the third quarter, putting it on track to re-enter recession in 2023, as the pace of China’s recovery cast a shadow in Europe. Data pointed to worsening conditions across the entire Eurozone, with purchasing manager data indicating contraction in the second quarter. The
European Commission trimmed its growth forecast for the year to 0.8% in the face of persistent inflation, and downgraded its 2024 predictions. Stalling economic performance prompted the ECB to signal the top for interest rates.
What factors affected the Fund’s performance during its fiscal year?
The Fund underperformed its benchmark for the 12 months ended September 30, 2023. The following discussion highlights specific stocks — those that provided the largest contribution to absolute performance and those that were the largest detractors for the fiscal year.
Stocks that helped absolute performance
RELX (formerly Reed Elsevier) is a conglomerate of leading information services businesses, operating in the following segments: scientific, technical & medical (STM); risk & business analytics; legal; and exhibitions. The company reported a solid pick-up in organic growth as its STM segment was driven by the faster-growing database and tools segment. The company has demonstrated a high level of recurring subscription revenues, strong pricing power, operating leverage, and low capital requirements.
Rentokil Initial, headquartered in the U.K., is a provider of pest control and other facilities management services including hygiene services. The stock performed well after worries about its acquisition of Terminix were assuaged with positive comments from the March earnings report highlighting favorable growth and trends from the acquisition. Most of the company’s business is contract-based, with high client retention, and driven by structural trends such as the growing global middle class, increasing regulation and higher standards, and changing pest threats.
Vinci, Flutter Entertainment plc, and Booking Holding Inc. also contributed to the Fund’s absolute performance.
Stocks that hurt absolute performance
Teleperformance is the global leader in outsourced customer experience, providing solutions in customer care, technical support, interpretation services, and visa processing services, among others. The company has been evaluating the use of AI for years, and has some capabilities already, but will need to scale these capabilities in order to stay
For information regarding the indexes and certain investment terms, see the Key Investment Terms starting on page 6.
Vontobel Greater European Opportunities Fund (Continued)
competitive. During the 12-month period, Teleperformance cut its 2023 guidance for organic growth, and announced the acquisition of Majorel, which caused a negative market reaction.
Compagnie Financière Richemont, along with other luxury goods stocks, moved lower during the period due to worries about demand being impacted by slower China reopening trends and macroeconomic conditions including rising rates and inflation. Richemont is a global leader in high-end hard luxury goods. The company sells watches and jewelry, as well as writing instruments, leather goods, and clothing, through brands including Cartier, Van Cleef & Arpels, and Montblanc.
Diageo plc, Roche Holdings AG, and Adyen NV also detracted from the Fund’s absolute performance.
The preceding information is the opinion of portfolio management only through the end of the period stated on the cover. Any such opinions are subject to change at any time based upon market or other conditions and should not be relied upon as
investment advice. Past performance is no guarantee of future results, and there is no guarantee that market forecasts will be realized.
Equity Securities: The market price of equity securities may be adversely affected by financial market, industry, or issuer-specific events. Focus on a particular style or on small, medium, or large-sized companies may enhance that risk.
Foreign & Emerging Markets: Investing in foreign securities, especially in emerging markets, subjects the Fund to additional risks such as increased volatility, currency fluctuations, less liquidity, and political, regulatory, economic, and market risk.
Geographic Concentration: A fund that focuses its investments in a particular geographic location will be sensitive to financial, economic, political, and other events negatively affecting that location.
Market Volatility: The value of the securities in the Fund may go up or down in response to the prospects of individual companies and/or general
economic conditions. Local, regional, or global events such as war or military conflict, terrorism, pandemic, or recession could impact the Fund, including hampering the ability of the portfolio’s manager(s) to invest its assets as intended.
Prospectus: For additional information on risks, please see the Fund’s prospectus.
Asset Allocation
The following table presents asset allocation within certain sectors as a percentage of total investments as of September 30, 2023.
| Industrials | 30% |
| Consumer Discretionary | 17 |
| Consumer Staples | 15 |
| Financials | 11 |
| Health Care | 10 |
| Information Technology | 7 |
| Materials | 5 |
| Other | 5 |
| Total | 100% |
For information regarding the indexes and certain investment terms, see the Key Investment Terms starting on page 6.
Vontobel Greater European Opportunities Fund (Continued)
Average Annual Total Returns1 for periods ended 9/30/23
| | | 1 Year | 5 Years | 10 Years |
| Class A shares at NAV2 | 17.49 % | 2.53% | 2.98% |
| Class A shares at POP3,4 | 11.03 | 1.37 | 2.40 |
| Class C shares at NAV2 and with CDSC4 | 16.53 | 1.75 | 2.20 |
| Class I shares at NAV2 | 17.77 | 2.78 | 3.23 |
| MSCI Europe Index (net) | 28.85 | 3.96 | 3.83 |
| Fund Expense Ratios5: Class A shares: Gross 2.21%, Net 1.38%; Class C shares: Gross 2.88%, Net 2.13%; Class I shares: Gross 1.93%, Net 1.13%. |
| All returns represent past performance which is no guarantee of future results. Current performance may be higher or lower than the performance shown. The investment return and principal value of an investment will fluctuate so that an investor’s shares, when redeemed, may be worth more or less than their original cost. The above table and graph below do not reflect the deduction of taxes that a shareholder would pay on fund distributions or the redemption of shares. Please visit Virtus.com for performance data current to the most recent month-end. |
Growth of $10,000 for periods ended 9/30
This chart assumes an initial investment of $10,000 made on September 30, 2013, for Class A shares and Class C shares including any applicable sales charges or fees. The performance of the other share class may be greater or less than that shown based on differences in inception dates, fees, and sales charges. Performance assumes reinvestment of dividends and capital gain distributions.
For information regarding the indexes and certain investment terms, see the Key Investment Terms starting on page 6.
Vontobel Greater European Opportunities Fund (Continued)
Growth of $100,000 for periods ended 9/30
This chart assumes an initial investment of $100,000 made on September 30, 2013 for Class I shares. The performance of the other share class may be greater or less than that shown based on differences in inception dates, fees, and sales charges. Performance assumes reinvestment of dividends and capital gain distributions.
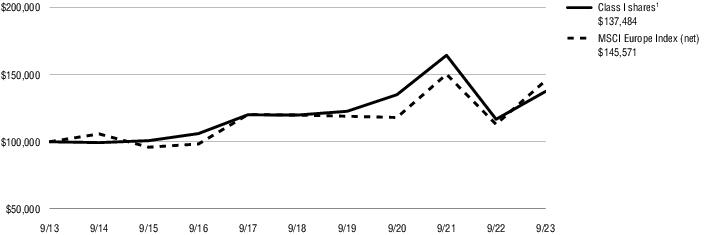
| 1 | Total returns are historical and include changes in share price and the reinvestment of both dividends and capital gain distributions. |
| 2 | “NAV” (Net Asset Value) total returns do not include the effect of any sales charge. |
| 3 | “POP” (Public Offering Price) total returns include the effect of the maximum front-end 5.50% sales charge. |
| 4 | “CDSC” (contingent deferred sales charge) is applied to redemptions of certain classes of shares that do not have a sales charge applied at the time of purchase. CDSC for certain redemptions of Class A shares made within 18 months of a finder’s fee being paid and all Class C shares are 1% within the first year and 0% thereafter. |
| 5 | The expense ratios of the Fund are set forth according to the prospectus for the Fund effective January 27, 2023, as supplemented and revised, and may differ from the expense ratios disclosed in the Financial Highlights tables in this report. See the Financial Highlights for more current expense ratios. Net Expense: Expenses reduced by a contractual expense limitation in effect through January 31, 2024. Gross Expense: Does not reflect the effect of the expense limitation. Expense ratios include fees and expenses associated with any underlying funds. |
The index is unmanaged and not available for direct investment; therefore, its performance does not reflect the expenses associated with active management of an actual portfolio.
For information regarding the indexes and certain investment terms, see the Key Investment Terms starting on page 6.
Duff & Phelps Global Infrastructure Fund
SCHEDULE OF INVESTMENTS
September 30, 2023
($ reported in thousands)
| | Shares | | Value |
| Common Stocks—98.9% |
| Communication Services—2.0% | | |
| Cellnex Telecom S.A. (Spain) | 37,016 | | $ 1,290 |
| Energy—13.5% | | |
| Cheniere Energy, Inc. (United States) | 18,028 | | 2,992 |
| DT Midstream, Inc. (United States) | 18,260 | | 967 |
| Enbridge, Inc. (Canada) | 76,019 | | 2,523 |
| Targa Resources Corp. (United States) | 16,567 | | 1,420 |
| Williams Cos., Inc. (The) (United States) | 20,723 | | 698 |
| | | | 8,600 |
| | | | |
| |
| Industrials—27.1% | | |
| Aena SME S.A. (Spain) | 17,518 | | 2,641 |
| Aeroports de Paris S.A. (France) | 6,797 | | 804 |
| Atlas Arteria Ltd. (Australia) | 459,234 | | 1,633 |
| Auckland International Airport Ltd. (New Zealand) | 341,651 | | 1,620 |
| Canadian Pacific Kansas City Ltd. (Canada) | 16,387 | | 1,219 |
| Ferrovial SE (Netherlands) | 33,856 | | 1,037 |
| Flughafen Zurich AG Registered Shares (Switzerland) | 6,829 | | 1,304 |
| Norfolk Southern Corp. (United States) | 7,458 | | 1,469 |
| Transurban Group (Australia) | 449,074 | | 3,664 |
| Union Pacific Corp. (United States) | 4,329 | | 881 |
| Vinci S.A. (France) | 9,419 | | 1,046 |
| | | | 17,318 |
| | | | |
| |
| | Shares | | Value |
| | | | |
| Real Estate—7.8% | | |
| American Tower Corp. (United States) | 19,011 | | $ 3,126 |
| Crown Castle, Inc. (United States) | 20,297 | | 1,868 |
| | | | 4,994 |
| | | | |
| |
| Utilities—48.5% | | |
| Ameren Corp. (United States) | 19,074 | | 1,427 |
| American Electric Power Co., Inc. (United States) | 23,214 | | 1,746 |
| APA Group (Australia) | 132,784 | | 709 |
| Atmos Energy Corp. (United States) | 9,986 | | 1,058 |
| CenterPoint Energy, Inc. (United States) | 71,985 | | 1,933 |
| CMS Energy Corp. (United States) | 22,586 | | 1,200 |
| Dominion Energy, Inc. (United States) | 33,607 | | 1,501 |
| DTE Energy Co. (United States) | 11,244 | | 1,116 |
| Edison International (United States) | 14,961 | | 947 |
| EDP - Energias de Portugal S.A. (Portugal) | 233,718 | | 973 |
| Emera, Inc. (Canada) | 33,506 | | 1,170 |
| Entergy Corp. (United States) | 10,183 | | 942 |
| Evergy, Inc. (United States) | 18,013 | | 913 |
| Iberdrola S.A. (Spain) | 95,528 | | 1,070 |
| National Grid plc (United Kingdom) | 172,965 | | 2,068 |
| NextEra Energy, Inc. (United States) | 52,913 | | 3,031 |
| NiSource, Inc. (United States) | 46,406 | | 1,145 |
| Public Service Enterprise Group, Inc. (United States) | 16,701 | | 951 |
| Sempra (United States) | 34,710 | | 2,361 |
| | Shares | | Value |
| | | | |
| Utilities—continued | | |
| Severn Trent plc (United Kingdom) | 34,549 | | $ 997 |
| Southern Co. (The) (United States) | 23,466 | | 1,519 |
| United Utilities Group plc (United Kingdom) | 55,678 | | 644 |
| Xcel Energy, Inc. (United States) | 27,315 | | 1,563 |
| | | | 30,984 |
| | | | |
| |
Total Common Stocks
(Identified Cost $67,480) | | 63,186 |
| | | | |
| |
| | | | |
| |
Total Long-Term Investments—98.9%
(Identified Cost $67,480) | | 63,186 |
| | | | |
| |
| | | | |
| |
TOTAL INVESTMENTS—98.9%
(Identified Cost $67,480) | | $63,186 |
| Other assets and liabilities, net—1.1% | | 688 |
| NET ASSETS—100.0% | | $63,874 |
| Country Weightings (Unaudited)† |
| United States | 58% |
| Australia | 9 |
| Spain | 8 |
| Canada | 8 |
| United Kingdom | 6 |
| France | 3 |
| New Zealand | 3 |
| Other | 5 |
| Total | 100% |
| † % of total investments as of September 30, 2023. |
The following table summarizes the value of the Fund’s investments as of September 30, 2023, based on the inputs used to value them (See Security Valuation Note 2A in the
Notes to Financial Statements):
| | Total
Value at
September 30, 2023 | | Level 1
Quoted Prices |
| Assets: | | | |
| Equity Securities: | | | |
| Common Stocks | $63,186 | | $63,186 |
| Total Investments | $63,186 | | $63,186 |
There were no securities valued using significant observable inputs (Level 2) or significant unobservable inputs (Level 3) at September 30, 2023.
There were no transfers into or out of Level 3 related to securities held at September 30, 2023.
See Notes to Financial Statements
Duff & Phelps Global Real Estate Securities Fund
SCHEDULE OF INVESTMENTS
September 30, 2023
($ reported in thousands)
| | Shares | | Value |
| Common Stocks—99.0% |
| Australia—4.1% | | |
| National Storage REIT | 2,908,962 | | $ 4,077 |
| NEXTDC Ltd.(1) | 395,598 | | 3,151 |
| Scentre Group | 3,429,100 | | 5,424 |
| | | | 12,652 |
| | | | |
| |
| Belgium—1.7% | | |
| Aedifica S.A. | 40,159 | | 2,286 |
| Warehouses De Pauw CVA | 122,141 | | 3,027 |
| | | | 5,313 |
| | | | |
| |
| Canada—3.0% | | |
| Allied Properties Real Estate Investment Trust | 142,350 | | 1,879 |
| Boardwalk Real Estate Investment Trust | 31,327 | | 1,541 |
| Chartwell Retirement Residences | 251,200 | | 1,901 |
| Granite Real Estate Investment Trust | 72,679 | | 3,857 |
| | | | 9,178 |
| | | | |
| |
| China—0.7% | | |
| Hang Lung Properties Ltd. | 1,479,700 | | 2,026 |
| France—1.2% | | |
| Klepierre S.A. | 150,294 | | 3,691 |
| Germany—1.2% | | |
| Vonovia SE | 153,678 | | 3,706 |
| Hong Kong—2.9% | | |
| Link REIT | 917,600 | | 4,500 |
| Swire Properties Ltd. | 2,172,000 | | 4,532 |
| | | | 9,032 |
| | | | |
| |
| India—1.2% | | |
| Capitaland India Trust | 4,626,783 | | 3,554 |
| Ireland—0.6% | | |
| Irish Residential Properties REIT plc | 1,859,468 | | 1,826 |
| Japan—7.6% | | |
| Japan Hotel REIT Investment Corp. | 6,436 | | 3,364 |
| Mitsubishi Estate Co., Ltd. | 533,800 | | 6,983 |
| Mitsui Fudosan Co., Ltd. | 171,700 | | 3,785 |
| Mitsui Fudosan Logistics Park, Inc. | 1,214 | | 3,826 |
| | Shares | | Value |
| | | | |
| Japan—continued | | |
| Orix JREIT, Inc. | 4,455 | | $ 5,348 |
| | | | 23,306 |
| | | | |
| |
| Singapore—2.6% | | |
| CapitaLand Ascendas REIT | 1,988,300 | | 4,000 |
| CapitaLand Integrated Commercial Trust | 2,925,000 | | 3,958 |
| | | | 7,958 |
| | | | |
| |
| Spain—1.0% | | |
| Merlin Properties Socimi S.A. | 380,200 | | 3,210 |
| Sweden—2.2% | | |
| Castellum AB | 406,966 | | 4,148 |
| Catena AB | 78,391 | | 2,726 |
| | | | 6,874 |
| | | | |
| |
| United Kingdom—5.3% | | |
| Derwent London plc | 98,210 | | 2,309 |
| Safestore Holdings plc | 321,947 | | 2,891 |
| Segro plc | 177,528 | | 1,558 |
| UNITE Group plc (The) | 630,699 | | 6,907 |
| Workspace Group plc | 414,826 | | 2,483 |
| | | | 16,148 |
| | | | |
| |
| United States—63.7% | | |
| Alexandria Real Estate Equities, Inc. | 35,429 | | 3,546 |
| American Homes 4 Rent Class A | 222,350 | | 7,491 |
| American Tower Corp. | 33,575 | | 5,521 |
| Apartment Income REIT Corp. | 146,778 | | 4,506 |
| AvalonBay Communities, Inc. | 35,665 | | 6,125 |
| Brixmor Property Group, Inc. | 292,833 | | 6,085 |
| Cousins Properties, Inc. | 70,200 | | 1,430 |
| CubeSmart | 184,275 | | 7,026 |
| Digital Realty Trust, Inc. | 103,300 | | 12,501 |
| Douglas Emmett, Inc. | 46,205 | | 590 |
| Equinix, Inc. | 19,975 | | 14,507 |
| Extra Space Storage, Inc. | 23,370 | | 2,841 |
| Healthpeak Properties, Inc. | 241,000 | | 4,425 |
| Host Hotels & Resorts, Inc. | 98,381 | | 1,581 |
| Mid-America Apartment Communities, Inc. | 54,300 | | 6,986 |
| Prologis, Inc. | 228,818 | | 25,676 |
| | Shares | | Value |
| | | | |
| United States—continued | | |
| Public Storage | 35,925 | | $ 9,467 |
| Realty Income Corp. | 167,450 | | 8,363 |
| Regency Centers Corp. | 86,150 | | 5,121 |
| Rexford Industrial Realty, Inc. | 127,800 | | 6,307 |
| Ryman Hospitality Properties, Inc. | 35,735 | | 2,976 |
| SBA Communications Corp. Class A | 19,350 | | 3,873 |
| Simon Property Group, Inc. | 14,996 | | 1,620 |
| Sun Communities, Inc. | 88,379 | | 10,459 |
| UDR, Inc. | 188,750 | | 6,733 |
| Ventas, Inc. | 208,350 | | 8,778 |
| VICI Properties, Inc. Class A | 327,450 | | 9,529 |
| Welltower, Inc. | 145,000 | | 11,878 |
| | | | 195,941 |
| | | | |
| |
Total Common Stocks
(Identified Cost $312,629) | | 304,415 |
| | | | |
| |
| | | | |
| |
Total Long-Term Investments—99.0%
(Identified Cost $312,629) | | 304,415 |
| | | | |
| |
| | | | |
| |
TOTAL INVESTMENTS—99.0%
(Identified Cost $312,629) | | $304,415 |
| Other assets and liabilities, net—1.0% | | 3,184 |
| NET ASSETS—100.0% | | $307,599 |
| Abbreviation: |
| REIT | Real Estate Investment Trust |
| Footnote Legend: |
| (1) | Non-income producing. |
| Country Weightings (Unaudited)† |
| United States | 64% |
| Japan | 8 |
| United Kingdom | 5 |
| Australia | 4 |
| Canada | 3 |
| Hong Kong | 3 |
| Singapore | 3 |
| Other | 10 |
| Total | 100% |
| † % of total investments as of September 30, 2023. |
For information regarding the abbreviations, see the Key Investment Terms starting on page 6.
See Notes to Financial Statements
Duff & Phelps Global Real Estate Securities Fund
SCHEDULE OF INVESTMENTS (Continued)
September 30, 2023
($ reported in thousands)
The following table summarizes the value of the Fund’s investments as of September 30, 2023, based on the inputs used to value them (See Security Valuation Note 2A in the
Notes to Financial Statements):
| | Total
Value at
September 30, 2023 | | Level 1
Quoted Prices |
| Assets: | | | |
| Equity Securities: | | | |
| Common Stocks | $304,415 | | $304,415 |
| Total Investments | $304,415 | | $304,415 |
There were no securities valued using significant observable inputs (Level 2) or significant unobservable inputs (Level 3) at September 30, 2023.
There were no transfers into or out of Level 3 related to securities held at September 30, 2023.
See Notes to Financial Statements
Duff & Phelps International Real Estate Securities Fund
SCHEDULE OF INVESTMENTS
September 30, 2023
($ reported in thousands)
| | Shares | | Value |
| Common Stocks—96.8% |
| Australia—10.3% | | |
| GPT Group (The) | 137,000 | | $ 344 |
| National Storage REIT | 478,154 | | 670 |
| NEXTDC Ltd.(1) | 73,024 | | 582 |
| Scentre Group | 537,600 | | 850 |
| | | | 2,446 |
| | | | |
| |
| Belgium—2.6% | | |
| Aedifica S.A. | 8,040 | | 458 |
| Warehouses De Pauw CVA | 6,716 | | 166 |
| | | | 624 |
| | | | |
| |
| Canada—7.1% | | |
| Allied Properties Real Estate Investment Trust | 23,400 | | 309 |
| Boardwalk Real Estate Investment Trust | 2,740 | | 135 |
| Chartwell Retirement Residences | 77,400 | | 586 |
| First Capital Real Estate Investment Trust | 43,200 | | 423 |
| Primaris Real Estate Investment Trust | 25,000 | | 248 |
| | | | 1,701 |
| | | | |
| |
| France—3.5% | | |
| Gecina S.A. | 2,500 | | 256 |
| Klepierre S.A. | 23,481 | | 576 |
| | | | 832 |
| | | | |
| |
| Germany—4.7% | | |
| Vonovia SE | 46,010 | | 1,110 |
| Hong Kong—8.8% | | |
| Fortune Real Estate Investment Trust | 392,000 | | 235 |
| Link REIT | 177,209 | | 869 |
| Swire Properties Ltd. | 277,600 | | 579 |
| Wharf Real Estate Investment Co., Ltd. | 105,000 | | 406 |
| | | | 2,089 |
| | | | |
| |
| India—1.7% | | |
| Capitaland India Trust | 528,279 | | 406 |
| | Shares | | Value |
| | | | |
| Ireland—1.9% | | |
| Irish Residential Properties REIT plc | 458,133 | | $ 450 |
| Japan—24.5% | | |
| Comforia Residential REIT, Inc. | 299 | | 663 |
| Hulic Co., Ltd. | 20,500 | | 184 |
| Japan Hotel REIT Investment Corp. | 1,785 | | 933 |
| Mitsubishi Estate Co., Ltd. | 71,640 | | 937 |
| Mitsui Fudosan Co., Ltd. | 52,800 | | 1,164 |
| Mitsui Fudosan Logistics Park, Inc. | 129 | | 406 |
| Nippon Accommodations Fund, Inc. | 111 | | 469 |
| Nippon Prologis REIT, Inc. | 62 | | 116 |
| Orix JREIT, Inc. | 538 | | 646 |
| United Urban Investment Corp. | 290 | | 302 |
| | | | 5,820 |
| | | | |
| |
| Mexico—1.2% | | |
| Prologis Property Mexico S.A. de C.V. | 87,100 | | 300 |
| Netherlands—1.1% | | |
| CTP N.V. | 18,000 | | 258 |
| Singapore—9.4% | | |
| CapitaLand Ascendas REIT | 542,000 | | 1,090 |
| CapitaLand Integrated Commercial Trust | 394,000 | | 533 |
| Frasers Centrepoint Trust | 377,000 | | 604 |
| | | | 2,227 |
| | | | |
| |
| Spain—3.0% | | |
| Merlin Properties Socimi S.A. | 85,200 | | 719 |
| Sweden—4.0% | | |
| Castellum AB | 69,914 | | 713 |
| Catena AB | 6,597 | | 229 |
| | | | 942 |
| | | | |
| |
| United Kingdom—13.0% | | |
| British Land Co. plc (The) | 97,000 | | 375 |
| Derwent London plc | 18,531 | | 436 |
| | Shares | | Value |
| | | | |
| United Kingdom—continued | | |
| Land Securities Group plc | 80,400 | | $ 579 |
| Safestore Holdings plc | 21,526 | | 193 |
| Segro plc | 27,168 | | 238 |
| UNITE Group plc (The) | 58,521 | | 641 |
| Workspace Group plc | 103,900 | | 622 |
| | | | 3,084 |
| | | | |
| |
Total Common Stocks
(Identified Cost $25,092) | | 23,008 |
| | | | |
| |
| | | | |
| |
Total Long-Term Investments—96.8%
(Identified Cost $25,092) | | 23,008 |
| | | | |
| |
| | | | |
| |
TOTAL INVESTMENTS—96.8%
(Identified Cost $25,092) | | $23,008 |
| Other assets and liabilities, net—3.2% | | 768 |
| NET ASSETS—100.0% | | $23,776 |
| Abbreviation: |
| REIT | Real Estate Investment Trust |
| Footnote Legend: |
| (1) | Non-income producing. |
| Country Weightings (Unaudited)† |
| Japan | 25% |
| United Kingdom | 13 |
| Australia | 11 |
| Singapore | 10 |
| Hong Kong | 9 |
| Canada | 7 |
| Germany | 5 |
| Other | 20 |
| Total | 100% |
| † % of total investments as of September 30, 2023. |
The following table summarizes the value of the Fund’s investments as of September 30, 2023, based on the inputs used to value them (See Security Valuation Note 2A in the
Notes to Financial Statements):
| | Total
Value at
September 30, 2023 | | Level 1
Quoted Prices |
| Assets: | | | |
| Equity Securities: | | | |
| Common Stocks | $23,008 | | $23,008 |
| Total Investments | $23,008 | | $23,008 |
There were no securities valued using significant observable inputs (Level 2) or significant unobservable inputs (Level 3) at September 30, 2023.
There were no transfers into or out of Level 3 related to securities held at September 30, 2023.
For information regarding the abbreviations, see the Key Investment Terms starting on page 6.
See Notes to Financial Statements
Duff & Phelps Real Asset Fund
SCHEDULE OF INVESTMENTS
September 30, 2023
($ reported in thousands)
| | Shares | | Value |
| Affiliated Mutual Funds(1)—71.2% |
| Equity Funds—65.7% | | |
| Virtus Duff & Phelps Global Infrastructure Fund Class R6(2) | 351,614 | | $ 4,357 |
| Virtus Duff & Phelps Global Real Estate Securities Fund Class R6(2) | 146,209 | | 4,193 |
| Virtus Duff & Phelps Select MLP and Energy Fund Class I(2) | 285,778 | | 3,375 |
| | | | 11,925 |
| | | | |
| |
| Fixed Income Fund—5.5% | | |
| Virtus Newfleet Senior Floating Rate Fund Class R6(2) | 114,104 | | 991 |
Total Affiliated Mutual Funds
(Identified Cost $9,511) | | 12,916 |
| | | | |
| |
| | | | |
| |
| | Shares | | Value |
| | | | |
| | | | |
| Exchange-Traded Funds(1)—29.0% |
| Invesco DB Agriculture Fund | 21,200 | | $ 454 |
| Invesco DB Commodity Index Tracking Fund | 73,774 | | 1,842 |
| Schwab U.S. TIPS ETF | 6,600 | | 333 |
| SPDR S&P Global Natural Resources ETF | 38,750 | | 2,159 |
| VanEck Gold Miners ETF | 17,800 | | 479 |
Total Exchange-Traded Funds
(Identified Cost $3,887) | | 5,267 |
| | | | |
| |
| | | | |
| |
Total Long-Term Investments—100.2%
(Identified Cost $13,398) | | 18,183 |
| | | | |
| |
| | | | |
| |
TOTAL INVESTMENTS—100.2%
(Identified Cost $13,398) | | $18,183 |
| Other assets and liabilities, net—(0.2)% | | (37) |
| NET ASSETS—100.0% | | $18,146 |
| Abbreviations: |
| DB | Deutsche Bank AG |
| ETF | Exchange-Traded Fund |
| MLP | Master Limited Partnership |
| S&P | Standard & Poor’s |
| SPDR | S&P Depositary Receipt |
| TIPS | Treasury-Inflation Protected Securities |
| Footnote Legend: |
| (1) | Shares of this fund are publicly offered, and its prospectus and annual report are publicly available. |
| (2) | Affiliated investment. See Note 3H in Notes to Financial Statements. |
The following table summarizes the value of the Fund’s investments as of September 30, 2023, based on the inputs used to value them (See Security Valuation Note 2A in the
Notes to Financial Statements):
| | Total
Value at
September 30, 2023 | | Level 1
Quoted Prices |
| Assets: | | | |
| Affiliated Mutual Funds | $12,916 | | $12,916 |
| Exchange-Traded Funds | 5,267 | | 5,267 |
| Total Investments | $18,183 | | $18,183 |
There were no securities valued using significant observable inputs (Level 2) or significant unobservable inputs (Level 3) at September 30, 2023.
There were no transfers into or out of Level 3 related to securities held at September 30, 2023.
For information regarding the abbreviations, see the Key Investment Terms starting on page 6.
See Notes to Financial Statements
Duff & Phelps Real Estate Securities Fund
SCHEDULE OF INVESTMENTS
September 30, 2023
($ reported in thousands)
| | Shares | | Value |
| Common Stocks—98.1% |
| Real Estate Investment Trusts—98.1% | | |
| Data Centers—12.4% | | |
| Digital Realty Trust, Inc. | 147,650 | | $ 17,869 |
| Equinix, Inc. | 36,351 | | 26,400 |
| | | | 44,269 |
| | | | |
| |
| Gaming REITs—4.5% | | |
| VICI Properties, Inc. Class A | 544,750 | | 15,852 |
| Health Care—12.5% | | |
| Healthpeak Properties, Inc. | 332,870 | | 6,112 |
| Sabra Health Care REIT, Inc. | 318,305 | | 4,437 |
| Ventas, Inc. | 393,450 | | 16,576 |
| Welltower, Inc. | 213,210 | | 17,466 |
| | | | 44,591 |
| | | | |
| |
| Industrial/Office—18.4% | | |
| Industrial—15.7% | | |
| Prologis, Inc. | 375,266 | | 42,108 |
| Rexford Industrial Realty, Inc. | 280,925 | | 13,864 |
| | | | 55,972 |
| | | | |
| |
| Office—2.7% | | |
| Alexandria Real Estate Equities, Inc. | 57,834 | | 5,789 |
| Cousins Properties, Inc. | 152,746 | | 3,112 |
| Douglas Emmett, Inc. | 54,968 | | 701 |
| | | | 9,602 |
| | | | |
| |
| Total Industrial/Office | | 65,574 |
| | | | |
| |
| | Shares | | Value |
| | | | |
| Lodging/Resorts—2.5% | | |
| Host Hotels & Resorts, Inc. | 205,844 | | $ 3,308 |
| Ryman Hospitality Properties, Inc. | 65,260 | | 5,435 |
| | | | 8,743 |
| | | | |
| |
| Residential—22.1% | | |
| Apartments—11.3% | | |
| Apartment Income REIT Corp. | 327,995 | | 10,069 |
| AvalonBay Communities, Inc. | 58,815 | | 10,101 |
| Mid-America Apartment Communities, Inc. | 74,140 | | 9,538 |
| UDR, Inc. | 292,670 | | 10,440 |
| | | | 40,148 |
| | | | |
| |
| Manufactured Homes—4.3% | | |
| Sun Communities, Inc. | 129,612 | | 15,338 |
| Single Family Homes—6.5% | | |
| American Homes 4 Rent Class A | 426,450 | | 14,367 |
| Invitation Homes, Inc. | 281,760 | | 8,929 |
| | | | 23,296 |
| | | | |
| |
| Total Residential | | 78,782 |
| | | | |
| |
| Retail—11.7% | | |
| Free Standing—4.3% | | |
| Realty Income Corp. | 302,174 | | 15,091 |
| Regional Malls—1.5% | | |
| Simon Property Group, Inc. | 48,746 | | 5,266 |
| Shopping Centers—5.9% | | |
| Brixmor Property Group, Inc. | 466,756 | | 9,699 |
| | Shares | | Value |
| | | | |
| Retail—continued | | |
| Shopping Centers—continued | | |
| Kimco Realty Corp. | 91,420 | | $ 1,608 |
| Regency Centers Corp. | 165,000 | | 9,808 |
| | | | 21,115 |
| | | | |
| |
| Total Retail | | | 41,472 |
| | | | |
| |
| Self Storage—10.1% | | |
| CubeSmart | 326,614 | | 12,454 |
| Extra Space Storage, Inc. | 51,814 | | 6,299 |
| Public Storage | 65,555 | | 17,275 |
| | | | 36,028 |
| | | | |
| |
| Specialty—3.9% | | |
| American Tower Corp. | 55,295 | | 9,094 |
| SBA Communications Corp. Class A | 24,600 | | 4,924 |
| | | | 14,018 |
| | | | |
| |
Total Common Stocks
(Identified Cost $271,530) | | 349,329 |
| | | | |
| |
| | | | |
| |
Total Long-Term Investments—98.1%
(Identified Cost $271,530) | | 349,329 |
| | | | |
| |
| | | | |
| |
TOTAL INVESTMENTS—98.1%
(Identified Cost $271,530) | | $349,329 |
| Other assets and liabilities, net—1.9% | | 6,697 |
| NET ASSETS—100.0% | | $356,026 |
| Abbreviation: |
| REIT | Real Estate Investment Trust |
The following table summarizes the value of the Fund’s investments as of September 30, 2023, based on the inputs used to value them (See Security Valuation Note 2A in the
Notes to Financial Statements):
| | Total
Value at
September 30, 2023 | | Level 1
Quoted Prices |
| Assets: | | | |
| Equity Securities: | | | |
| Common Stocks | $349,329 | | $349,329 |
| Total Investments | $349,329 | | $349,329 |
There were no securities valued using significant observable inputs (Level 2) or significant unobservable inputs (Level 3) at September 30, 2023.
There were no transfers into or out of Level 3 related to securities held at September 30, 2023.
For information regarding the abbreviations, see the Key Investment Terms starting on page 6.
See Notes to Financial Statements
KAR Developing Markets Fund
SCHEDULE OF INVESTMENTS
September 30, 2023
($ reported in thousands)
| | Shares | | Value |
| Common Stocks—97.7% |
| Communication Services—15.1% | | |
| Addcn Technology Co., Ltd. (Taiwan) | 6,305 | | $ 40 |
| Autohome, Inc. ADR (China) | 1,903 | | 58 |
| Baltic Classifieds Group plc (United Kingdom) | 67,832 | | 161 |
| Sarana Menara Nusantara Tbk PT (Indonesia) | 658,400 | | 41 |
| Tencent Holdings Ltd. (China) | 1,300 | | 51 |
| Tongdao Liepin Group (China)(1) | 10,336 | | 9 |
| Wirtualna Polska Holding S.A. (Poland) | 1,864 | | 43 |
| | | | 403 |
| | | | |
| |
| Consumer Discretionary—14.2% | | |
| Alibaba Group Holding Ltd. Sponsored ADR (China)(1) | 574 | | 50 |
| Allegro.eu S.A. (Poland)(1) | 11,270 | | 83 |
| JD.com, Inc. ADR (China) | 1,233 | | 36 |
| JD.com, Inc. Class A (China) | 1,447 | | 21 |
| momo.com, Inc. (Taiwan) | 2,057 | | 32 |
| Union Auction PCL Foreign Shares (Thailand) | 179,200 | | 51 |
| Vasta Platform Ltd. Class A (Brazil)(1) | 25,571 | | 106 |
| | | | 379 |
| | | | |
| |
| Consumer Staples—16.7% | | |
| Anhui Gujing Distillery Co., Ltd. Class B (China) | 4,100 | | 69 |
| Carlsberg Brewery Malaysia Bhd (Malaysia) | 11,200 | | 48 |
| Heineken Malaysia Bhd (Malaysia) | 10,800 | | 56 |
| Multi Bintang Indonesia Tbk PT (Indonesia) | 99,000 | | 55 |
| Pernod Ricard S.A. (France) | 372 | | 62 |
| Thai Beverage PCL (Thailand) | 142,500 | | 60 |
| Wal-Mart de Mexico SAB de C.V. (Mexico) | 16,546 | | 62 |
| Wuliangye Yibin Co., Ltd. Class A (China) | 1,700 | | 36 |
| | | | 448 |
| | | | |
| |
| | Shares | | Value |
| | | | |
| Financials—15.0% | | |
| Bank Central Asia Tbk PT (Indonesia) | 100,000 | | $ 57 |
| Caixa Seguridade Participacoes S.A. (Brazil) | 27,268 | | 61 |
| HDFC Bank Ltd. ADR (India) | 799 | | 47 |
| Kaspi.KZ JSC GDR, 144A (Kazakhstan)(2) | 632 | | 61 |
| Kfin Technologies Ltd. (India)(1) | 11,157 | | 63 |
| Qualitas Controladora SAB de C.V. (Mexico) | 6,394 | | 48 |
| United Overseas Bank Ltd. (Singapore) | 3,100 | | 65 |
| | | | 402 |
| | | | |
| |
| Health Care—1.6% | | |
| Prodia Widyahusada Tbk PT (Indonesia) | 104,000 | | 43 |
| Industrials—26.7% | | |
| Credit Bureau Asia Ltd. (Singapore) | 136,900 | | 92 |
| GFC Ltd. (Taiwan) | 16,000 | | 39 |
| Grupa Pracuj S.A. (Poland) | 10,787 | | 141 |
| Haitian International Holdings Ltd. (China) | 27,166 | | 58 |
| Humanica PCL Foreign Shares (Thailand) | 69,700 | | 21 |
| NICE Information Service Co., Ltd. (South Korea) | 4,472 | | 33 |
| Precision Tsugami China Corp., Ltd. (China) | 53,000 | | 54 |
| S-1 Corp. (South Korea) | 955 | | 40 |
| Saramin Co., Ltd. (South Korea) | 1,814 | | 28 |
| Tegma Gestao Logistica S.A. (Brazil) | 29,366 | | 151 |
| Wizz Air Holdings plc (Hungary)(1) | 2,475 | | 58 |
| | | | 715 |
| | | | |
| |
| Information Technology—8.4% | | |
| Koh Young Technology, Inc. (South Korea) | 3,807 | | 35 |
| LEENO Industrial, Inc. (South Korea) | 408 | | 46 |
| | Shares | | Value |
| | | | |
| Information Technology—continued | | |
| Taiwan Semiconductor Manufacturing Co., Ltd. Sponsored ADR (Taiwan) | 1,645 | | $ 143 |
| | | | 224 |
| | | | |
| |
Total Common Stocks
(Identified Cost $2,919) | | 2,614 |
| | | | |
| |
| | | | |
| |
Total Long-Term Investments—97.7%
(Identified Cost $2,919) | | 2,614 |
| | | | |
| |
| | | | |
| |
TOTAL INVESTMENTS—97.7%
(Identified Cost $2,919) | | $2,614 |
| Other assets and liabilities, net—2.3% | | 61 |
| NET ASSETS—100.0% | | $2,675 |
| Abbreviations: |
| ADR | American Depositary Receipt |
| GDR | Global Depositary Receipt |
| JSC | Joint Stock Company |
| Footnote Legend: |
| (1) | Non-income producing. |
| (2) | Security exempt from registration under Rule 144A of the Securities Act of 1933. These securities may be resold in transactions exempt from registration, normally to qualified institutional buyers. At September 30, 2023, these securities amounted to a value of $61 or 2.3% of net assets. |
| Country Weightings (Unaudited)† |
| China | 17% |
| Brazil | 12 |
| Poland | 10 |
| Taiwan | 10 |
| Indonesia | 8 |
| South Korea | 7 |
| United Kingdom | 6 |
| Other | 30 |
| Total | 100% |
| † % of total investments as of September 30, 2023. |
For information regarding the abbreviations, see the Key Investment Terms starting on page 6.
See Notes to Financial Statements
KAR Developing Markets Fund
SCHEDULE OF INVESTMENTS (Continued)
September 30, 2023
($ reported in thousands)
The following table summarizes the value of the Fund’s investments as of September 30, 2023, based on the inputs used to value them (See Security Valuation Note 2A in the
Notes to Financial Statements):
| | Total
Value at
September 30, 2023 | | Level 1
Quoted Prices |
| Assets: | | | |
| Equity Securities: | | | |
| Common Stocks | $2,614 | | $2,614 |
| Total Investments | $2,614 | | $2,614 |
There were no securities valued using significant observable inputs (Level 2) or significant unobservable inputs (Level 3) at September 30, 2023.
There were no transfers into or out of Level 3 related to securities held at September 30, 2023.
See Notes to Financial Statements
KAR Emerging Markets Small-Cap Fund
SCHEDULE OF INVESTMENTS
September 30, 2023
($ reported in thousands)
| | Shares | | Value |
| Common Stocks—94.8% |
| Communication Services—18.2% | | |
| Addcn Technology Co., Ltd. (Taiwan) | 1,040,555 | | $ 6,560 |
| Autohome, Inc. ADR (China) | 180,362 | | 5,474 |
| Baltic Classifieds Group plc (United Kingdom) | 6,496,770 | | 15,457 |
| Dayamitra Telekomunikasi PT (Indonesia) | 84,982,000 | | 3,739 |
| Sarana Menara Nusantara Tbk PT (Indonesia) | 103,760,586 | | 6,445 |
| Tongdao Liepin Group (China)(1) | 2,176,257 | | 1,945 |
| Wirtualna Polska Holding S.A. (Poland) | 358,347 | | 8,236 |
| | | | 47,856 |
| | | | |
| |
| Consumer Discretionary—10.3% | | |
| Allegro.eu S.A. (Poland)(1) | 1,185,278 | | 8,746 |
| momo.com, Inc. (Taiwan) | 201,300 | | 3,130 |
| Union Auction PCL Foreign Shares (Thailand)(2) | 33,162,000 | | 9,472 |
| Vasta Platform Ltd. Class A (Brazil)(1)(2) | 1,391,515 | | 5,733 |
| | | | 27,081 |
| | | | |
| |
| Consumer Staples—8.4% | | |
| Anhui Gujing Distillery Co., Ltd. Class B (China) | 383,509 | | 6,415 |
| Carlsberg Brewery Malaysia Bhd (Malaysia) | 1,468,000 | | 6,253 |
| Clicks Group Ltd. (South Africa) | 219,376 | | 2,997 |
| Heineken Malaysia Bhd (Malaysia) | 1,234,600 | | 6,395 |
| | | | 22,060 |
| | | | |
| |
| Financials—8.3% | | |
| Caixa Seguridade Participacoes S.A. (Brazil) | 2,648,125 | | 5,880 |
| Kaspi.KZ JSC GDR, 144A (Kazakhstan)(3) | 61,759 | | 5,978 |
| Kfin Technologies Ltd. (India)(1) | 610,556 | | 3,452 |
| Qualitas Controladora SAB de C.V. (Mexico) | 861,988 | | 6,490 |
| | | | 21,800 |
| | | | |
| |
| Health Care—2.2% | | |
| Haw Par Corp., Ltd. (Singapore) | 794,374 | | 5,724 |
| | Shares | | Value |
| | | | |
| Industrials—30.2% | | |
| Computer Age Management Services Ltd. (India) | 221,707 | | $ 6,703 |
| Grupa Pracuj S.A. (Poland) | 1,005,421 | | 13,118 |
| Haitian International Holdings Ltd. (China) | 2,791,218 | | 5,917 |
| Humanica PCL Foreign Shares (Thailand) | 16,086,100 | | 4,771 |
| IndiaMart InterMesh Ltd. (India) | 123,067 | | 4,263 |
| Kerry TJ Logistics Co., Ltd. (Taiwan) | 2,791,000 | | 3,195 |
| NICE Information Service Co., Ltd. (South Korea) | 537,368 | | 3,934 |
| S-1 Corp. (South Korea) | 166,975 | | 7,004 |
| Saramin Co., Ltd. (South Korea) | 291,036 | | 4,551 |
| Sporton International, Inc. (Taiwan) | 903,268 | | 7,065 |
| Tegma Gestao Logistica S.A. (Brazil) | 2,936,385 | | 15,118 |
| Wizz Air Holdings plc (Hungary)(1) | 153,044 | | 3,585 |
| | | | 79,224 |
| | | | |
| |
| Information Technology—13.3% | | |
| Douzone Bizon Co., Ltd. (South Korea) | 176,409 | | 3,791 |
| Koh Young Technology, Inc. (South Korea) | 371,460 | | 3,408 |
| LEENO Industrial, Inc. (South Korea) | 53,055 | | 6,047 |
| Oracle Financial Services Software Ltd. (India) | 250,312 | | 12,391 |
| TOTVS S.A. (Brazil) | 1,018,860 | | 5,457 |
| Webcash Corp. (South Korea)(1) | 172,077 | | 1,530 |
| Younglimwon Soft Lab Co., Ltd. (South Korea) | 382,706 | | 2,411 |
| | | | 35,035 |
| | | | |
| |
| Materials—3.9% | | |
| Avia Avian Tbk PT (Indonesia) | 81,982,660 | | 2,971 |
| Corp. Moctezuma SAB de C.V. (Mexico) | 1,875,583 | | 7,221 |
| | | | 10,192 |
| | | | |
| |
Total Common Stocks
(Identified Cost $254,864) | | 248,972 |
| | | | |
| |
| | | | |
| |
Total Long-Term Investments—94.8%
(Identified Cost $254,864) | | 248,972 |
| | | | |
| |
| | | | |
| |
| | Shares | | Value |
| | | | |
| | | | |
| Short-Term Investment—2.2% |
| Money Market Mutual Fund—2.2% |
| Dreyfus Government Cash Management Fund - Institutional Shares (seven-day effective yield 5.222%)(4) | 5,819,105 | | $ 5,819 |
Total Short-Term Investment
(Identified Cost $5,819) | | 5,819 |
| | | | |
| |
| | | | |
| |
TOTAL INVESTMENTS—97.0%
(Identified Cost $260,683) | | $254,791 |
| Other assets and liabilities, net—3.0% | | 7,828 |
| NET ASSETS—100.0% | | $262,619 |
| Abbreviations: |
| ADR | American Depositary Receipt |
| GDR | Global Depositary Receipt |
| JSC | Joint Stock Company |
| Footnote Legend: |
| (1) | Non-income producing. |
| (2) | Affiliated investment. See Note 3H in Notes to Financial Statements. |
| (3) | Security exempt from registration under Rule 144A of the Securities Act of 1933. These securities may be resold in transactions exempt from registration, normally to qualified institutional buyers. At September 30, 2023, these securities amounted to a value of $5,978 or 2.3% of net assets. |
| (4) | Shares of this fund are publicly offered, and its prospectus and annual report are publicly available. |
| Country Weightings (Unaudited)† |
| South Korea | 13% |
| Brazil | 13 |
| Poland | 12 |
| India | 11 |
| Taiwan | 8 |
| China | 8 |
| United Kingdom | 6 |
| Other | 29 |
| Total | 100% |
| † % of total investments as of September 30, 2023. |
For information regarding the abbreviations, see the Key Investment Terms starting on page 6.
See Notes to Financial Statements
KAR Emerging Markets Small-Cap Fund
SCHEDULE OF INVESTMENTS (Continued)
September 30, 2023
($ reported in thousands)
The following table summarizes the value of the Fund’s investments as of September 30, 2023, based on the inputs used to value them (See Security Valuation Note 2A in the
Notes to Financial Statements):
| | Total
Value at
September 30, 2023 | | Level 1
Quoted Prices |
| Assets: | | | |
| Equity Securities: | | | |
| Common Stocks | $248,972 | | $248,972 |
| Money Market Mutual Fund | 5,819 | | 5,819 |
| Total Investments | $254,791 | | $254,791 |
There were no securities valued using significant observable inputs (Level 2) or significant unobservable inputs (Level 3) at September 30, 2023.
There were no transfers into or out of Level 3 related to securities held at September 30, 2023.
See Notes to Financial Statements
KAR International Small-Mid Cap Fund
SCHEDULE OF INVESTMENTS
September 30, 2023
($ reported in thousands)
| | Shares | | Value |
| Common Stocks—99.1% |
| Communication Services—27.5% | | |
| Adevinta ASA (Norway)(1) | 2,123,320 | | $ 21,021 |
| Auto Trader Group plc (United Kingdom) | 6,535,881 | | 49,250 |
| Baltic Classifieds Group plc (United Kingdom)(2) | 29,622,573 | | 70,478 |
| CTS Eventim AG & Co. KGaA (Germany) | 330,096 | | 18,793 |
| Dayamitra Telekomunikasi PT (Indonesia) | 680,125,800 | | 29,925 |
| Infrastrutture Wireless Italiane SpA (Italy) | 794,750 | | 9,465 |
| New Work SE (Germany) | 139,687 | | 14,621 |
| Rightmove plc (United Kingdom) | 6,760,767 | | 46,375 |
| | | | 259,928 |
| | | | |
| |
| Consumer Discretionary—7.6% | | |
| Allegro.eu S.A. (Poland)(1) | 3,506,621 | | 25,874 |
| Goldlion Holdings Ltd. (Hong Kong) | 20,707,882 | | 2,671 |
| Max Stock Ltd. (Israel) | 5,449,362 | | 10,242 |
| Mercari, Inc. (Japan)(1) | 988,300 | | 21,335 |
| Victorian Plumbing Group plc (United Kingdom) | 10,746,647 | | 11,538 |
| | | | 71,660 |
| | | | |
| |
| Consumer Staples—4.5% | | |
| Anhui Gujing Distillery Co., Ltd. Class B (China) | 779,436 | | 13,039 |
| Heineken Malaysia Bhd (Malaysia) | 5,757,700 | | 29,823 |
| | | | 42,862 |
| | | | |
| |
| Energy—1.3% | | |
| Pason Systems, Inc. (Canada) | 1,266,627 | | 12,571 |
| Financials—14.2% | | |
| AJ Bell plc (United Kingdom) | 9,017,192 | | 30,189 |
| | Shares | | Value |
| | | | |
| Financials—continued | | |
| FinecoBank Banca Fineco SpA (Italy) | 2,222,655 | | $ 27,059 |
| Gruppo MutuiOnline SpA (Italy) | 1,040,355 | | 27,443 |
| Hypoport SE (Germany)(1) | 106,181 | | 14,403 |
| Mortgage Advice Bureau Holdings Ltd. (United Kingdom)(2) | 3,565,010 | | 23,314 |
| Nordnet AB publ (Sweden) | 689,169 | | 9,109 |
| VNV Global AB (Sweden)(1) | 1,935,096 | | 2,954 |
| | | | 134,471 |
| | | | |
| |
| Health Care—4.8% | | |
| Haw Par Corp., Ltd. (Singapore) | 5,592,812 | | 40,299 |
| Nakanishi, Inc. (Japan) | 232,900 | | 5,447 |
| | | | 45,746 |
| | | | |
| |
| Industrials—25.1% | | |
| Benefit One, Inc. (Japan) | 2,593,200 | | 18,767 |
| CAE, Inc. (Canada)(1) | 1,265,973 | | 29,556 |
| Enento Group Oyj (Finland)(1) | 779,978 | | 17,482 |
| Haitian International Holdings Ltd. (China) | 11,116,072 | | 23,564 |
| Howden Joinery Group plc (United Kingdom) | 3,354,510 | | 30,140 |
| Knorr-Bremse AG (Germany) | 428,254 | | 27,248 |
| Lumax International Corp., Ltd. (Taiwan) | 2,974,333 | | 7,813 |
| MEITEC Group Holdings, Inc. (Japan) | 1,561,400 | | 28,252 |
| MTU Aero Engines AG (Germany) | 142,039 | | 25,792 |
| S-1 Corp. (South Korea) | 672,790 | | 28,220 |
| | | | 236,834 |
| | | | |
| |
| Information Technology—9.7% | | |
| Alten S.A. (France) | 189,642 | | 24,982 |
| Bouvet ASA (Norway) | 4,574,063 | | 24,246 |
| | Shares | | Value |
| | | | |
| Information Technology—continued | | |
| Brockhaus Technologies AG (Germany)(1)(2) | 568,948 | | $ 12,933 |
| FDM Group Holdings plc (United Kingdom) | 4,616,728 | | 29,291 |
| | | | 91,452 |
| | | | |
| |
| Materials—4.4% | | |
| Corp. Moctezuma SAB de C.V. (Mexico) | 10,875,224 | | 41,872 |
Total Common Stocks
(Identified Cost $1,014,797) | | 937,396 |
| | | | |
| |
| | | | |
| |
Total Long-Term Investments—99.1%
(Identified Cost $1,014,797) | | 937,396 |
| | | | |
| |
| | | | |
| |
TOTAL INVESTMENTS—99.1%
(Identified Cost $1,014,797) | | $937,396 |
| Other assets and liabilities, net—0.9% | | 8,501 |
| NET ASSETS—100.0% | | $945,897 |
| Footnote Legend: |
| (1) | Non-income producing. |
| (2) | Affiliated investment. See Note 3H in Notes to Financial Statements. |
| Country Weightings (Unaudited)† |
| United Kingdom | 31% |
| Germany | 12 |
| Japan | 8 |
| Italy | 7 |
| Norway | 5 |
| Canada | 5 |
| Mexico | 4 |
| Other | 28 |
| Total | 100% |
| † % of total investments as of September 30, 2023. |
The following table summarizes the value of the Fund’s investments as of September 30, 2023, based on the inputs used to value them (See Security Valuation Note 2A in the
Notes to Financial Statements):
| | Total
Value at
September 30, 2023 | | Level 1
Quoted Prices |
| Assets: | | | |
| Equity Securities: | | | |
| Common Stocks | $937,396 | | $937,396 |
| Total Investments | $937,396 | | $937,396 |
There were no securities valued using significant observable inputs (Level 2) or significant unobservable inputs (Level 3) at September 30, 2023.
There were no transfers into or out of Level 3 related to securities held at September 30, 2023.
See Notes to Financial Statements
Vontobel Emerging Markets Opportunities Fund
SCHEDULE OF INVESTMENTS
September 30, 2023
($ reported in thousands)
| | Shares | | Value |
| Common Stocks—99.5% |
| Communication Services—8.2% | | |
| NetEase, Inc. (China) | 324,562 | | $ 6,611 |
| NetEase, Inc. ADR (China) | 87,485 | | 8,762 |
| Telkom Indonesia Persero Tbk PT (Indonesia) | 66,518,107 | | 16,140 |
| Tencent Holdings Ltd. (China) | 1,621,787 | | 63,414 |
| | | | 94,927 |
| | | | |
| |
| Consumer Discretionary—19.7% | | |
| Alibaba Group Holding Ltd. (China)(1) | 1,840,922 | | 20,123 |
| Alibaba Group Holding Ltd. Sponsored ADR (China)(1) | 347,313 | | 30,126 |
| Americana Restaurants International plc (United Arab Emirates) | 17,157,781 | | 19,152 |
| China Tourism Group Duty Free Corp., Ltd. Class A (China) | 537,286 | | 7,795 |
| Eicher Motors Ltd. (India) | 636,391 | | 26,416 |
| Galaxy Entertainment Group Ltd. (Hong Kong) | 1,182,037 | | 7,117 |
| JD.com, Inc. Class A (China) | 785,272 | | 11,542 |
| Lojas Renner S.A. (Brazil) | 2,752,459 | | 7,338 |
| Meituan Class B (China)(1) | 636,613 | | 9,316 |
| MercadoLibre, Inc. (Brazil)(1) | 11,664 | | 14,789 |
| Midea Group Co., Ltd. Class A (China) | 918,391 | | 6,976 |
| Sands China Ltd. (China)(1) | 3,056,619 | | 9,368 |
| Shenzhou International Group Holdings Ltd. (China) | 953,607 | | 9,133 |
| Titan Co., Ltd. (India) | 388,050 | | 14,714 |
| Yum China Holdings, Inc. (China) | 359,156 | | 20,012 |
| Yum China Holdings, Inc. (China) | 252,526 | | 14,247 |
| | | | 228,164 |
| | | | |
| |
| Consumer Staples—20.7% | | |
| Chacha Food Co., Ltd. Class A (China) | 2,327,766 | | 10,418 |
| Clicks Group Ltd. (South Africa) | 1,427,361 | | 19,499 |
| Dino Polska S.A. (Poland)(1) | 207,894 | | 16,894 |
| Heineken N.V. (Netherlands) | 259,917 | | 22,935 |
| Hindustan Unilever Ltd. (India) | 498,108 | | 14,789 |
| Inner Mongolia Yili Industrial Group Co., Ltd. Class A (China) | 2,990,069 | | 10,861 |
| Kweichow Moutai Co., Ltd. Class A (China) | 52,803 | | 13,002 |
| | Shares | | Value |
| | | | |
| Consumer Staples—continued | | |
| Orion Corp. (South Korea) | 201,060 | | $ 19,117 |
| President Chain Store Corp. (Taiwan) | 3,701,034 | | 30,096 |
| Raia Drogasil S.A. (Brazil) | 7,262,821 | | 39,893 |
| Wal-Mart de Mexico SAB de C.V. (Mexico) | 11,219,484 | | 42,348 |
| | | | 239,852 |
| | | | |
| |
| Energy—2.5% | | |
| Reliance Industries Ltd. (India) | 1,019,588 | | 28,792 |
| Financials—18.1% | | |
| Banco BTG Pactual S.A. (Brazil) | 2,858,419 | | 17,646 |
| Bancolombia S.A. Sponsored ADR (Colombia) | 318,195 | | 8,489 |
| Bank Central Asia Tbk PT (Indonesia) | 35,082,790 | | 20,033 |
| Bank Rakyat Persero Tbk PT (Indonesia) | 102,900,439 | | 34,788 |
| HDFC Bank Ltd. (India) | 3,244,733 | | 59,638 |
| Hong Kong Exchanges & Clearing Ltd. (Hong Kong) | 738,079 | | 27,578 |
| Kotak Mahindra Bank Ltd. (India) | 884,733 | | 18,492 |
| Saudi Tadawul Group Holding Co. (Saudi Arabia) | 268,596 | | 13,822 |
| SCB X PCL Foreign Shares (Thailand) | 840,034 | | 2,365 |
| United Overseas Bank Ltd. (Singapore) | 317,525 | | 6,620 |
| | | | 209,471 |
| | | | |
| |
| Health Care—2.8% | | |
| Cipla Ltd. (India) | 1,292,372 | | 18,460 |
| Max Healthcare Institute Ltd. (India) | 1,986,985 | | 13,577 |
| | | | 32,037 |
| | | | |
| |
| Industrials—7.6% | | |
| Airtac International Group (Taiwan) | 319,086 | | 9,677 |
| Grupo Aeroportuario del Pacifico SAB de C.V. Class B (Mexico) | 635,665 | | 10,436 |
| Polycab India Ltd. (India) | 215,084 | | 13,839 |
| Shanghai M&G Stationery, Inc. Class A (China) | 2,090,287 | | 10,446 |
| Shenzhen Inovance Technology Co., Ltd. Class A (China) | 708,471 | | 6,449 |
| Techtronic Industries Co., Ltd. (Hong Kong) | 563,999 | | 5,474 |
| Voltas Ltd. (India) | 1,158,587 | | 12,045 |
| WEG S.A. (Brazil) | 1,244,022 | | 8,994 |
| | Shares | | Value |
| | | | |
| Industrials—continued | | |
| Wuxi Lead Intelligent Equipment Co., Ltd. Class A (China) | 2,878,588 | | $ 10,727 |
| | | | 88,087 |
| | | | |
| |
| Information Technology—16.2% | | |
| Accton Technology Corp. (Taiwan) | 799,161 | | 12,205 |
| Infosys Ltd. (India) | 950,402 | | 16,429 |
| Samsung Electronics Co., Ltd. (South Korea) | 1,111,258 | | 56,329 |
| Samsung SDI Co., Ltd. (South Korea) | 27,870 | | 10,575 |
| Taiwan Semiconductor Manufacturing Co., Ltd. (Taiwan) | 3,980,719 | | 64,494 |
| Tata Consultancy Services Ltd. (India) | 232,354 | | 9,873 |
| TOTVS S.A. (Brazil) | 3,282,621 | | 17,580 |
| | | | 187,485 |
| | | | |
| |
| Materials—1.9% | | |
| APL Apollo Tubes Ltd. (India) | 454,699 | | 8,898 |
| Avia Avian Tbk PT (Indonesia) | 372,599,168 | | 13,501 |
| | | | 22,399 |
| | | | |
| |
| Utilities—1.8% | | |
| ENN Energy Holdings Ltd. (China) | 1,009,998 | | 8,383 |
| Power Grid Corp. of India Ltd. (India) | 4,917,081 | | 11,828 |
| | | | 20,211 |
| | | | |
| |
Total Common Stocks
(Identified Cost $1,130,159) | | 1,151,425 |
| | | | |
| |
| | | | |
| |
Total Long-Term Investments—99.5%
(Identified Cost $1,130,159) | | 1,151,425 |
| | | | |
| |
| | | | |
| |
TOTAL INVESTMENTS—99.5%
(Identified Cost $1,130,159) | | $1,151,425 |
| Other assets and liabilities, net—0.5% | | 5,943 |
| NET ASSETS—100.0% | | $1,157,368 |
| Abbreviation: |
| ADR | American Depositary Receipt |
| Footnote Legend: |
| (1) | Non-income producing. |
For information regarding the abbreviations, see the Key Investment Terms starting on page 6.
See Notes to Financial Statements
Vontobel Emerging Markets Opportunities Fund
SCHEDULE OF INVESTMENTS (Continued)
September 30, 2023
($ reported in thousands)
| Country Weightings (Unaudited)† |
| China | 25% |
| India | 23 |
| Taiwan | 10 |
| Brazil | 9 |
| South Korea | 7 |
| Indonesia | 7 |
| Mexico | 5 |
| Other | 14 |
| Total | 100% |
| † % of total investments as of September 30, 2023. |
The following table summarizes the value of the Fund’s investments as of September 30, 2023, based on the inputs used to value them (See Security Valuation Note 2A in the Notes to Financial Statements):
| | Total
Value at
September 30, 2023 | | Level 1
Quoted Prices |
| Assets: | | | |
| Equity Securities: | | | |
| Common Stocks | $1,151,425 | | $1,151,425 |
| Total Investments | $1,151,425 | | $1,151,425 |
There were no securities valued using significant observable inputs (Level 2) or significant unobservable inputs (Level 3) at September 30, 2023.
There were no transfers into or out of Level 3 related to securities held at September 30, 2023.
See Notes to Financial Statements
Vontobel Foreign Opportunities Fund
SCHEDULE OF INVESTMENTS
September 30, 2023
($ reported in thousands)
| | Shares | | Value |
| Common Stocks—96.0% |
| Consumer Discretionary—13.2% | | |
| Amadeus IT Group S.A. (Spain) | 248,269 | | $ 15,035 |
| Ferrari N.V. (Italy) | 88,041 | | 26,035 |
| Flutter Entertainment plc (Ireland)(1) | 114,991 | | 18,832 |
| Hermes International SCA (France) | 4,952 | | 9,056 |
| Yum China Holdings, Inc. (China) | 267,677 | | 15,102 |
| | | | 84,060 |
| | | | |
| |
| Consumer Staples—8.5% | | |
| Alimentation Couche-Tard, Inc. (Canada) | 209,358 | | 10,632 |
| Diageo plc (United Kingdom) | 276,735 | | 10,244 |
| L’Oreal S.A. (France) | 30,634 | | 12,735 |
| Nestle S.A. Registered Shares (Switzerland) | 182,810 | | 20,719 |
| | | | 54,330 |
| | | | |
| |
| Energy—2.5% | | |
| Schlumberger N.V. (United States) | 277,955 | | 16,205 |
| Financials—16.4% | | |
| Aon plc Class A (United States) | 69,976 | | 22,688 |
| Intact Financial Corp. (Canada) | 93,682 | | 13,658 |
| London Stock Exchange Group plc (United Kingdom) | 310,316 | | 31,175 |
| Mastercard, Inc. Class A (United States) | 93,162 | | 36,884 |
| | | | 104,405 |
| | | | |
| |
| Health Care—9.5% | | |
| Alcon, Inc. (Switzerland) | 359,192 | | 27,837 |
| EssilorLuxottica S.A. (France) | 84,664 | | 14,784 |
| Hoya Corp. (Japan) | 89,408 | | 9,169 |
| Mettler-Toledo International, Inc. (United States)(1) | 7,923 | | 8,779 |
| | | | 60,569 |
| | | | |
| |
| | Shares | | Value |
| | | | |
| Industrials—24.2% | | |
| Ashtead Group plc (United Kingdom) | 295,718 | | $ 18,047 |
| Canadian National Railway Co. (Canada) | 72,201 | | 7,819 |
| Epiroc AB Class A (Sweden) | 859,105 | | 16,356 |
| Experian plc (Ireland) | 272,057 | | 8,932 |
| IMCD N.V. (Netherlands) | 47,943 | | 6,083 |
| RELX plc (United Kingdom) | 1,148,674 | | 38,892 |
| Rentokil Initial plc (United Kingdom) | 3,510,826 | | 26,138 |
| Spirax-Sarco Engineering plc (United Kingdom) | 53,419 | | 6,209 |
| Wolters Kluwer N.V. (Netherlands) | 212,396 | | 25,745 |
| | | | 154,221 |
| | | | |
| |
| Information Technology—18.7% | | |
| Constellation Software, Inc. (Canada) | 21,136 | | 43,635 |
| Halma plc (United Kingdom) | 377,329 | | 8,924 |
| Keyence Corp. (Japan) | 20,663 | | 7,674 |
| Obic Co., Ltd. (Japan) | 160,728 | | 24,398 |
| Taiwan Semiconductor Manufacturing Co., Ltd. Sponsored ADR (Taiwan) | 143,153 | | 12,440 |
| Tata Consultancy Services Ltd. (India) | 512,511 | | 21,778 |
| | | | 118,849 |
| | | | |
| |
| Materials—3.0% | | |
| Air Liquide S.A. (France) | 111,604 | | 18,860 |
Total Common Stocks
(Identified Cost $472,654) | | 611,499 |
| | | | |
| |
| | | | |
| |
| Warrant—0.0% | | |
Information
Technology—0.0% | | | |
| Constellation Software, Inc. (Canada), 03/31/40(1)(2) | 21,398 | | — |
Total Warrant
(Identified Cost $—) | | | — |
| | | | |
| |
| | | | |
| |
Total Long-Term Investments—96.0%
(Identified Cost $472,654) | | 611,499 |
| | | | |
| |
| | | | |
| |
| | Shares | | Value |
| | | | |
| | | | |
| Short-Term Investment—1.5% |
| Money Market Mutual Fund—1.5% |
| Dreyfus Government Cash Management Fund - Institutional Shares (seven-day effective yield 5.222%)(3) | 9,469,495 | | $ 9,469 |
Total Short-Term Investment
(Identified Cost $9,469) | | 9,469 |
| | | | |
| |
| | | | |
| |
TOTAL INVESTMENTS—97.5%
(Identified Cost $482,123) | | $620,968 |
| Other assets and liabilities, net—2.5% | | 15,803 |
| NET ASSETS—100.0% | | $636,771 |
| Abbreviation: |
| ADR | American Depositary Receipt |
| Footnote Legend: |
| (1) | Non-income producing. |
| (2) | The value of this security was determined using significant unobservable inputs and is reported as a Level 3 security in the Fair Value Hierarchy table located after the Schedule of Investments. |
| (3) | Shares of this fund are publicly offered, and its prospectus and annual report are publicly available. |
| Country Weightings (Unaudited)† |
| United Kingdom | 23% |
| United States | 15 |
| Canada | 12 |
| France | 9 |
| Switzerland | 8 |
| Japan | 7 |
| Netherlands | 5 |
| Other | 21 |
| Total | 100% |
| † % of total investments as of September 30, 2023. |
See Notes to Financial Statements
Vontobel Foreign Opportunities Fund
SCHEDULE OF INVESTMENTS (Continued)
September 30, 2023
($ reported in thousands)
The following table summarizes the value of the Fund’s investments as of September 30, 2023, based on the inputs used to value them (See Security Valuation Note 2A in the
Notes to Financial Statements):
| | Total
Value at
September 30, 2023 | | Level 1
Quoted Prices | | Level 3
Significant
Unobservable
Inputs |
| Assets: | | | | | |
| Equity Securities: | | | | | |
| Common Stocks | $611,499 | | $611,499 | | $— |
| Warrant | — | | — | | — (1) |
| Money Market Mutual Fund | 9,469 | | 9,469 | | — |
| Total Investments | $620,968 | | $620,968 | | $— (1) |
| (1) | Includes internally fair valued securities currently priced at zero ($0). |
There were no securities valued using significant observable inputs (Level 2) at September 30, 2023.
There were no transfers into or out of Level 3 related to securities held at September 30, 2023.
Some of the Fund’s investments that were categorized as Level 3 may have been valued utilizing third party pricing information without adjustment. If applicable, such valuations are based on unobservable inputs. A significant change in third party information could result in a significantly lower or higher value of Level 3 investments.
Management has determined that the amount of Level 3 securities compared to total net assets is not material; therefore, the roll-forward of Level 3 securities and assumptions are not shown for the period ended September 30, 2023.
See Notes to Financial Statements
Vontobel Global Opportunities Fund
SCHEDULE OF INVESTMENTS
September 30, 2023
($ reported in thousands)
| | Shares | | Value |
| Common Stocks—98.7% |
| Communication Services—2.3% | | |
| Alphabet, Inc. Class C (United States)(1) | 46,767 | | $ 6,166 |
| Consumer Discretionary—11.4% | | |
| Amazon.com, Inc. (United States)(1) | 87,546 | | 11,129 |
| Booking Holdings, Inc. (United States)(1) | 1,038 | | 3,201 |
| Flutter Entertainment plc (Ireland)(1) | 42,986 | | 7,040 |
| LVMH Moet Hennessy Louis Vuitton SE (France) | 3,919 | | 2,968 |
| NIKE, Inc. Class B (United States) | 19,087 | | 1,825 |
| Yum China Holdings, Inc. (China) | 67,226 | | 3,746 |
| | | | 29,909 |
| | | | |
| |
| Consumer Staples—16.6% | | |
| Coca-Cola Co. (The) (United States) | 200,445 | | 11,221 |
| Kobe Bussan Co., Ltd. (Japan) | 110,490 | | 2,592 |
| L’Oreal S.A. (France) | 9,680 | | 4,024 |
| Mondelez International, Inc. Class A (United States) | 112,592 | | 7,814 |
| Nestle S.A. Registered Shares (Switzerland) | 103,667 | | 11,749 |
| Wal-Mart de Mexico SAB de C.V. (Mexico) | 1,676,277 | | 6,327 |
| | | | 43,727 |
| | | | |
| |
| Financials—17.8% | | |
| CME Group, Inc. Class A (United States) | 52,968 | | 10,605 |
| HDFC Bank Ltd. (India) | 609,947 | | 11,211 |
| Hong Kong Exchanges & Clearing Ltd. (Hong Kong) | 51,925 | | 1,940 |
| London Stock Exchange Group plc (United Kingdom) | 86,033 | | 8,643 |
| Mastercard, Inc. Class A (United States) | 23,005 | | 9,108 |
| Visa, Inc. Class A (United States) | 22,784 | | 5,241 |
| | | | 46,748 |
| | | | |
| |
| Health Care—19.8% | | |
| Abbott Laboratories (United States) | 73,649 | | 7,133 |
| Alcon, Inc. (Switzerland) | 69,450 | | 5,383 |
| Becton Dickinson & Co. (United States) | 27,528 | | 7,117 |
| | Shares | | Value |
| | | | |
| Health Care—continued | | |
| Boston Scientific Corp. (United States)(1) | 139,075 | | $ 7,343 |
| EssilorLuxottica S.A. (France) | 37,215 | | 6,498 |
| Hoya Corp. (Japan) | 33,958 | | 3,482 |
| Intuitive Surgical, Inc. (United States)(1) | 2,446 | | 715 |
| Thermo Fisher Scientific, Inc. (United States) | 7,865 | | 3,981 |
| UnitedHealth Group, Inc. (United States) | 20,897 | | 10,536 |
| | | | 52,188 |
| | | | |
| |
| Industrials—10.0% | | |
| Ashtead Group plc (United Kingdom) | 104,219 | | 6,360 |
| RB Global, Inc. (Canada) | 10,620 | | 664 |
| RELX plc (United Kingdom) | 328,875 | | 11,135 |
| Rentokil Initial plc (United Kingdom) | 1,099,097 | | 8,183 |
| | | | 26,342 |
| | | | |
| |
| Information Technology—16.3% | | |
| Adobe, Inc. (United States)(1) | 7,236 | | 3,690 |
| Constellation Software, Inc. (Canada) | 3,277 | | 6,765 |
| Microsoft Corp. (United States) | 46,244 | | 14,602 |
| ServiceNow, Inc. (United States)(1) | 6,441 | | 3,600 |
| Synopsys, Inc. (United States)(1) | 6,856 | | 3,147 |
| Taiwan Semiconductor Manufacturing Co., Ltd. Sponsored ADR (Taiwan) | 67,963 | | 5,906 |
| Tata Consultancy Services Ltd. (India) | 119,392 | | 5,073 |
| | | | 42,783 |
| | | | |
| |
| Materials—4.5% | | |
| Air Liquide S.A. (France) | 23,587 | | 3,986 |
| Sherwin-Williams Co. (The) (United States) | 10,272 | | 2,620 |
| Vulcan Materials Co. (United States) | 25,364 | | 5,124 |
| | | | 11,730 |
| | | | |
| |
Total Common Stocks
(Identified Cost $183,810) | | 259,593 |
| | | | |
| |
| | | | |
| |
| | Shares | | Value |
| | | | |
| Warrant—0.0% | | |
Information
Technology—0.0% | | | |
| Constellation Software, Inc. (Canada), 03/31/40(1)(2) | 3,277 | | $ — |
Total Warrant
(Identified Cost $—) | | | — |
| | | | |
| |
| | | | |
| |
Total Long-Term Investments—98.7%
(Identified Cost $183,810) | | 259,593 |
| | | | |
| |
| | | | |
| |
TOTAL INVESTMENTS—98.7%
(Identified Cost $183,810) | | $259,593 |
| Other assets and liabilities, net—1.3% | | 3,339 |
| NET ASSETS—100.0% | | $262,932 |
| Abbreviation: |
| ADR | American Depositary Receipt |
| Footnote Legend: |
| (1) | Non-income producing. |
| (2) | The value of this security was determined using significant unobservable inputs and is reported as a Level 3 security in the Fair Value Hierarchy table located after the Schedule of Investments. |
| Country Weightings (Unaudited)† |
| United States | 52% |
| United Kingdom | 13 |
| France | 7 |
| Switzerland | 7 |
| India | 6 |
| Canada | 3 |
| Ireland | 3 |
| Other | 9 |
| Total | 100% |
| † % of total investments as of September 30, 2023. |
For information regarding the abbreviations, see the Key Investment Terms starting on page 6.
See Notes to Financial Statements
Vontobel Global Opportunities Fund
SCHEDULE OF INVESTMENTS (Continued)
September 30, 2023
($ reported in thousands)
The following table summarizes the value of the Fund’s investments as of September 30, 2023, based on the inputs used to value them (See Security Valuation Note 2A in the
Notes to Financial Statements):
| | Total
Value at
September 30, 2023 | | Level 1
Quoted Prices | | Level 3
Significant
Unobservable
Inputs |
| Assets: | | | | | |
| Equity Securities: | | | | | |
| Common Stocks | $259,593 | | $259,593 | | $— |
| Warrant | — | | — | | — (1) |
| Total Investments | $259,593 | | $259,593 | | $— (1) |
| (1) | Includes internally fair valued securities currently priced at zero ($0). |
There were no securities valued using significant observable inputs (Level 2) at September 30, 2023.
There were no transfers into or out of Level 3 related to securities held at September 30, 2023.
Some of the Fund’s investments that were categorized as Level 3 may have been valued utilizing third party pricing information without adjustment. If applicable, such valuations are based on unobservable inputs. A significant change in third party information could result in a significantly lower or higher value of Level 3 investments.
Management has determined that the amount of Level 3 securities compared to total net assets is not material; therefore, the roll-forward of Level 3 securities and assumptions are not shown for the period ended September 30, 2023.
See Notes to Financial Statements
Vontobel Greater European Opportunities Fund
SCHEDULE OF INVESTMENTS
September 30, 2023
($ reported in thousands)
| | Shares | | Value |
| Common Stocks—97.6% |
| Communication Services—3.3% | | |
| Infrastrutture Wireless Italiane SpA (Italy) | 17,340 | | $ 207 |
| Consumer Discretionary—16.3% | | |
| Amadeus IT Group S.A. (Spain) | 2,734 | | 166 |
| Booking Holdings, Inc. (United States)(1) | 38 | | 117 |
| Cie Financiere Richemont S.A. Registered Shares (Switzerland) | 1,044 | | 128 |
| Ferrari N.V. (Italy) | 668 | | 197 |
| Flutter Entertainment plc (Ireland)(1) | 1,245 | | 204 |
| Hermes International SCA (France) | 34 | | 62 |
| LVMH Moet Hennessy Louis Vuitton SE (France) | 197 | | 149 |
| | | | 1,023 |
| | | | |
| |
| Consumer Staples—14.9% | | |
| Diageo plc (United Kingdom) | 4,532 | | 168 |
| Heineken N.V. (Netherlands) | 1,932 | | 170 |
| L’Oreal S.A. (France) | 346 | | 144 |
| Nestle S.A. Registered Shares (Switzerland) | 2,931 | | 332 |
| Pernod Ricard S.A. (France) | 732 | | 122 |
| | | | 936 |
| | | | |
| |
| Financials—10.9% | | |
| Edenred SE (France) | 3,448 | | 216 |
| London Stock Exchange Group plc (United Kingdom) | 3,240 | | 326 |
| UBS Group AG Registered Shares (Switzerland) | 5,690 | | 141 |
| | | | 683 |
| | | | |
| |
| | Shares | | Value |
| | | | |
| Health Care—10.0% | | |
| Alcon, Inc. (Switzerland) | 4,107 | | $ 318 |
| Amplifon SpA (Italy) | 3,304 | | 98 |
| EssilorLuxottica S.A. (France) | 1,228 | | 215 |
| | | | 631 |
| | | | |
| |
| Industrials—29.3% | | |
| Ashtead Group plc (United Kingdom) | 2,768 | | 169 |
| Epiroc AB Class A (Sweden) | 5,998 | | 114 |
| Experian plc (Ireland) | 5,357 | | 176 |
| IMCD N.V. (Netherlands) | 499 | | 64 |
| RELX plc (United Kingdom) | 10,574 | | 358 |
| Rentokil Initial plc (United Kingdom) | 40,591 | | 302 |
| Spirax-Sarco Engineering plc (United Kingdom) | 670 | | 78 |
| Vinci S.A. (France) | 2,496 | | 277 |
| Wolters Kluwer N.V. (Netherlands) | 2,499 | | 303 |
| | | | 1,841 |
| | | | |
| |
| Information Technology—7.0% | | |
| Accenture plc Class A (United States) | 641 | | 197 |
| ASML Holding N.V. (Netherlands) | 230 | | 136 |
| Halma plc (United Kingdom) | 4,537 | | 107 |
| | | | 440 |
| | | | |
| |
| Materials—4.4% | | |
| Air Liquide S.A. (France) | 1,127 | | 191 |
| Sika AG Registered Shares (Switzerland) | 347 | | 88 |
| | | | 279 |
| | | | |
| |
| | Shares | | Value |
| | | | |
| Utilities—1.5% | | |
| EDP - Energias de Portugal S.A. (Portugal) | 22,373 | | $ 93 |
Total Common Stocks
(Identified Cost $4,752) | | 6,133 |
| | | | |
| |
| | | | |
| |
Total Long-Term Investments—97.6%
(Identified Cost $4,752) | | 6,133 |
| | | | |
| |
| | | | |
| |
TOTAL INVESTMENTS—97.6%
(Identified Cost $4,752) | | $6,133 |
| Other assets and liabilities, net—2.4% | | 150 |
| NET ASSETS—100.0% | | $6,283 |
| Footnote Legend: |
| (1) | Non-income producing. |
| Country Weightings (Unaudited)† |
| United Kingdom | 25% |
| France | 22 |
| Switzerland | 16 |
| Netherlands | 11 |
| Italy | 8 |
| Ireland | 6 |
| United States | 5 |
| Other | 7 |
| Total | 100% |
| † % of total investments as of September 30, 2023. |
The following table summarizes the value of the Fund’s investments as of September 30, 2023, based on the inputs used to value them (See Security Valuation Note 2A in the
Notes to Financial Statements):
| | Total
Value at
September 30, 2023 | | Level 1
Quoted Prices |
| Assets: | | | |
| Equity Securities: | | | |
| Common Stocks | $6,133 | | $6,133 |
| Total Investments | $6,133 | | $6,133 |
There were no securities valued using significant observable inputs (Level 2) or significant unobservable inputs (Level 3) at September 30, 2023.
There were no transfers into or out of Level 3 related to securities held at September 30, 2023.
See Notes to Financial Statements
VIRTUS OPPORTUNITIES TRUST
STATEMENTS OF ASSETS AND LIABILITIES
September 30, 2023
(Reported in thousands except shares and per share amounts)
| | Duff & Phelps
Global
Infrastructure
Fund | | Duff & Phelps
Global
Real Estate
Securities Fund | | Duff & Phelps
International
Real Estate
Securities Fund | | Duff & Phelps
Real Asset Fund |
| Assets | | | | | | | |
Investment in securities at value(1)
| $ 63,186 | | $ 304,415 | | $ 23,008 | | $ 5,267 |
Investment in affiliates at value(2)
| — | | — | | — | | 12,916 |
Foreign currency at value(3)
| 11 | | 23 | | — (a) | | — |
Cash
| 626 | | 2,477 | | 658 | | — |
| Receivables | | | | | | | |
Investment securities sold
| 317 | | — | | — | | — |
Fund shares sold
| 11 | | 375 | | — (a) | | — |
Dividends
| 131 | | 1,252 | | 103 | | 7 |
Receivable from adviser
| — | | — | | — | | 11 |
Tax reclaims
| 65 | | 277 | | 44 | | — |
Prepaid Trustees’ retainer
| 1 | | 6 | | — (a) | | — (a) |
Prepaid expenses
| 16 | | 22 | | 15 | | 21 |
Other assets
| 9 | | 41 | | 3 | | 2 |
Total assets
| 64,373 | | 308,888 | | 23,831 | | 18,224 |
| Liabilities | | | | | | | |
Due to custodian
| — | | — | | — | | 23 |
| Payables | | | | | | | |
Fund shares repurchased
| 71 | | 382 | | — (a) | | 16 |
Investment securities purchased
| 321 | | 497 | | — | | 7 |
Investment advisory fees
| 35 | | 171 | | 8 | | — |
Distribution and service fees
| 7 | | 7 | | — (a) | | 3 |
Administration and accounting fees
| 6 | | 27 | | 3 | | 2 |
Transfer agent and sub-transfer agent fees and expenses
| 14 | | 110 | | 6 | | 6 |
Professional fees
| 31 | | 33 | | 31 | | 18 |
Trustee deferred compensation plan
| 9 | | 41 | | 3 | | 2 |
Interest expense and/or commitment fees
| — (a) | | 2 | | — (a) | | — (a) |
Other accrued expenses
| 5 | | 19 | | 4 | | 1 |
Total liabilities
| 499 | | 1,289 | | 55 | | 78 |
Net Assets
| $ 63,874 | | $ 307,599 | | $ 23,776 | | $ 18,146 |
| Net Assets Consist of: | | | | | | | |
Capital paid in on shares of beneficial interest
| $ 67,132 | | $ 348,428 | | $ 32,726 | | $ 37,724 |
Accumulated earnings (loss)
| (3,258) | | (40,829) | | (8,950) | | (19,578) |
Net Assets
| $ 63,874 | | $ 307,599 | | $ 23,776 | | $ 18,146 |
| Net Assets: | | | | | | | |
Class A
| $ 24,716 | | $ 17,965 | | $ 1,719 | | $ 10,323 |
Class C
| $ 2,221 | | $ 3,588 | | $ 60 | | $ 358 |
Class I
| $ 28,472 | | $ 206,071 | | $ 21,997 | | $ 6,304 |
Class R6
| $ 8,465 | | $ 79,975 | | $ — | | $ 1,161 |
| Shares Outstanding (unlimited number of shares authorized, no par value): | | | | | | | |
Class A
| 1,998,425 | | 609,385 | | 300,179 | | 829,765 |
Class C
| 179,757 | | 129,909 | | 10,676 | | 28,670 |
Class I
| 2,301,343 | | 7,208,771 | | 3,824,447 | | 506,861 |
Class R6
| 683,138 | | 2,788,329 | | — | | 93,442 |
| Net Asset Value and Redemption Price Per Share:* | | | | | | | |
Class A
| $ 12.37 | | $ 29.48 | | $ 5.73 | | $ 12.44 |
Class C
| $ 12.36 | | $ 27.62 | | $ 5.63 | | $ 12.48 |
Class I
| $ 12.37 | | $ 28.59 | | $ 5.75 | | $ 12.44 |
Class R6
| $ 12.39 | | $ 28.68 | | $ — | | $ 12.42 |
See Notes to Financial Statements
VIRTUS OPPORTUNITIES TRUST
STATEMENTS OF ASSETS AND LIABILITIES (Continued)
September 30, 2023
(Reported in thousands except shares and per share amounts)
| | Duff & Phelps
Global
Infrastructure
Fund | | Duff & Phelps
Global
Real Estate
Securities Fund | | Duff & Phelps
International
Real Estate
Securities Fund | | Duff & Phelps
Real Asset Fund |
| Maximum Offering Price Per Share (NAV/(1-Maximum Sales Charge)): | | | | | | | |
Class A
| $ 13.09 | | $ 31.20 | | $ 6.06 | | $ 13.16 |
Maximum Sales Charge - Class A
| 5.50% | | 5.50% | | 5.50% | | 5.50% |
(1) Investment in securities at cost
| $ 67,480 | | $ 312,629 | | $ 25,092 | | $ 3,887 |
(2) Investment in affiliates at cost
| $ — | | $ — | | $ — | | $ 9,511 |
(3) Foreign currency at cost
| $ 11 | | $ 26 | | $ —(a) | | $ — |
| (a) | Amount is less than $500 (not in thousands). |
| * | Net Asset Value and Redemption Price Per Share are calculated using unrounded net assets. |
See Notes to Financial Statements
VIRTUS OPPORTUNITIES TRUST
STATEMENTS OF ASSETS AND LIABILITIES (Continued)
September 30, 2023
(Reported in thousands except shares and per share amounts)
| | Duff & Phelps
Real Estate
Securities Fund | | KAR Developing
Markets Fund | | KAR Emerging
Markets
Small-Cap Fund | | KAR
International
Small-Mid
Cap Fund |
| Assets | | | | | | | |
Investment in securities at value(1)
| $ 349,329 | | $ 2,614 | | $ 239,586 | | $ 830,671 |
Investment in affiliates at value(2)
| — | | — | | 15,205 | | 106,725 |
Foreign currency at value(3)
| — | | — | | — (a) | | 96 |
Cash
| 5,838 | | 66 | | 8,435 | | 5,363 |
| Receivables | | | | | | | |
Investment securities sold
| — | | — (a) | | 195 | | 10 |
Fund shares sold
| 733 | | — | | 250 | | 923 |
Dividends and interest
| 1,257 | | 3 | | 362 | | 2,279 |
Receivable from adviser
| — | | 8 | | — | | — |
Tax reclaims
| — | | — | | 52 | | 1,984 |
Prepaid Trustees’ retainer
| 7 | | — (a) | | 5 | | 20 |
Prepaid expenses
| 29 | | 9 | | 19 | | 38 |
Other assets
| 47 | | — (a) | | 34 | | 123 |
Total assets
| 357,240 | | 2,700 | | 264,143 | | 948,232 |
| Liabilities | | | | | | | |
| Payables | | | | | | | |
Fund shares repurchased
| 568 | | — | | 167 | | 878 |
Investment securities purchased
| 177 | | — (a) | | 62 | | — |
Foreign capital gains tax
| — | | — | | 837 | | — |
Investment advisory fees
| 217 | | — | | 260 | | 798 |
Distribution and service fees
| 23 | | — (a) | | 9 | | 24 |
Administration and accounting fees
| 31 | | 1 | | 23 | | 82 |
Transfer agent and sub-transfer agent fees and expenses
| 99 | | — (a) | | 57 | | 202 |
Professional fees
| 32 | | 22 | | 51 | | 152 |
Trustee deferred compensation plan
| 47 | | — (a) | | 34 | | 123 |
Interest expense and/or commitment fees
| 1 | | — (a) | | — (a) | | 2 |
Other accrued expenses
| 19 | | 2 | | 24 | | 74 |
Total liabilities
| 1,214 | | 25 | | 1,524 | | 2,335 |
Net Assets
| $ 356,026 | | $ 2,675 | | $ 262,619 | | $ 945,897 |
| Net Assets Consist of: | | | | | | | |
Capital paid in on shares of beneficial interest
| $ 249,780 | | $ 3,387 | | $ 287,709 | | $ 1,355,087 |
Accumulated earnings (loss)
| 106,246 | | (712) | | (25,090) | | (409,190) |
Net Assets
| $ 356,026 | | $ 2,675 | | $ 262,619 | | $ 945,897 |
| Net Assets: | | | | | | | |
Class A
| $ 94,402 | | $ 98 | | $ 29,963 | | $ 41,974 |
Class C
| $ 3,196 | | $ 76 | | $ 3,803 | | $ 17,814 |
Class I
| $ 159,616 | | $ 143 | | $ 227,178 | | $ 809,503 |
Class R6
| $ 98,812 | | $ 2,358 | | $ 1,675 | | $ 76,606 |
| Shares Outstanding (unlimited number of shares authorized, no par value): | | | | | | | |
Class A
| 5,310,535 | | 12,771 | | 2,283,894 | | 2,635,186 |
Class C
| 179,882 | | 10,000 | | 296,013 | | 1,151,791 |
Class I
| 9,019,092 | | 18,595 | | 17,167,443 | | 50,473,063 |
Class R6
| 5,554,383 | | 306,399 | | 126,544 | | 4,765,102 |
| Net Asset Value and Redemption Price Per Share:* | | | | | | | |
Class A
| $ 17.78 | | $ 7.67 | | $ 13.12 | | $ 15.93 |
Class C
| $ 17.77 | | $ 7.61 | | $ 12.85 | | $ 15.47 |
Class I
| $ 17.70 | | $ 7.67 | | $ 13.23 | | $ 16.04 |
Class R6
| $ 17.79 | | $ 7.70 | | $ 13.23 | | $ 16.08 |
See Notes to Financial Statements
VIRTUS OPPORTUNITIES TRUST
STATEMENTS OF ASSETS AND LIABILITIES (Continued)
September 30, 2023
(Reported in thousands except shares and per share amounts)
| | Duff & Phelps
Real Estate
Securities Fund | | KAR Developing
Markets Fund | | KAR Emerging
Markets
Small-Cap Fund | | KAR
International
Small-Mid
Cap Fund |
| Maximum Offering Price Per Share (NAV/(1-Maximum Sales Charge)): | | | | | | | |
Class A
| $ 18.81 | | $ 8.12 | | $ 13.88 | | $ 16.86 |
Maximum Sales Charge - Class A
| 5.50% | | 5.50% | | 5.50% | | 5.50% |
(1) Investment in securities at cost
| $ 271,530 | | $ 2,919 | | $ 241,730 | | $ 903,183 |
(2) Investment in affiliates at cost
| $ — | | $ — | | $ 18,953 | | $ 111,614 |
(3) Foreign currency at cost
| $ — | | $ — | | $ — | | $ 96 |
| (a) | Amount is less than $500 (not in thousands). |
| * | Net Asset Value and Redemption Price Per Share are calculated using unrounded net assets. |
See Notes to Financial Statements
VIRTUS OPPORTUNITIES TRUST
STATEMENTS OF ASSETS AND LIABILITIES (Continued)
September 30, 2023
(Reported in thousands except shares and per share amounts)
| | Vontobel
Emerging
Markets
Opportunities
Fund | | Vontobel
Foreign
Opportunities
Fund | | Vontobel
Global
Opportunities
Fund | | Vontobel
Greater
European
Opportunities Fund |
| Assets | | | | | | | |
Investment in securities at value(1)
| $ 1,151,425 | | $ 620,968 | | $ 259,593 | | $ 6,133 |
Foreign currency at value(2)
| 254 | | 3,993 | | — | | — (a) |
Cash
| 7,241 | | 21,161 | | 5,900 | | 183 |
| Receivables | | | | | | | |
Investment securities sold
| 5,231 | | 355 | | 2,426 | | — |
Fund shares sold
| 464 | | 422 | | 62 | | — |
Dividends
| 1,613 | | 491 | | 178 | | 3 |
Receivable from adviser
| — | | — | | — | | 6 |
Tax reclaims
| 620 | | 1,317 | | 349 | | 20 |
Foreign capital gains tax refund
| — | | 130 | | — | | — |
Prepaid Trustees’ retainer
| 29 | | 13 | | 5 | | — (a) |
Prepaid expenses
| 23 | | 39 | | 27 | | 5 |
Other assets
| 166 | | 84 | | 34 | | 1 |
Total assets
| 1,167,066 | | 648,973 | | 268,574 | | 6,351 |
| Liabilities | | | | | | | |
Due to custodian
| — | | — | | — (a) | | — |
| Payables | | | | | | | |
Fund shares repurchased
| 3,821 | | 393 | | 243 | | 29 |
Investment securities purchased
| 2,964 | | 10,904 | | 4,996 | | — |
Foreign capital gains tax
| 972 | | — | | 17 | | — |
Investment advisory fees
| 956 | | 492 | | 196 | | — |
Distribution and service fees
| 47 | | 34 | | 26 | | 1 |
Administration and accounting fees
| 108 | | 56 | | 24 | | 1 |
Transfer agent and sub-transfer agent fees and expenses
| 390 | | 136 | | 44 | | 2 |
Professional fees
| 101 | | 58 | | 40 | | 31 |
Trustee deferred compensation plan
| 166 | | 84 | | 34 | | 1 |
Interest expense and/or commitment fees
| 3 | | 1 | | 1 | | — (a) |
Other accrued expenses
| 170 | | 44 | | 21 | | 3 |
Total liabilities
| 9,698 | | 12,202 | | 5,642 | | 68 |
Net Assets
| $ 1,157,368 | | $ 636,771 | | $ 262,932 | | $ 6,283 |
| Net Assets Consist of: | | | | | | | |
Common stock $0.001 par value
| $ — | | $ 26 | | $ — | | $ — |
Capital paid in on shares of beneficial interest
| 1,623,171 | | 495,755 | | 184,250 | | 5,294 |
Accumulated earnings (loss)
| (465,803) | | 140,990 | | 78,682 | | 989 |
Net Assets
| $ 1,157,368 | | $ 636,771 | | $ 262,932 | | $ 6,283 |
| Net Assets: | | | | | | | |
Class A
| $ 152,257 | | $ 136,675 | | $ 92,451 | | $ 2,300 |
Class C
| $ 17,208 | | $ 5,396 | | $ 6,842 | | $ 162 |
Class I
| $ 942,601 | | $ 457,233 | | $ 84,092 | | $ 3,821 |
Class R6
| $ 45,302 | | $ 37,467 | | $ 79,547 | | $ — |
| Shares Outstanding (unlimited number of shares authorized, no par value): | | | | | | | |
Class A
| 21,755,012 | | 5,639,218 | | 6,296,567 | | 221,042 |
Class C
| 2,611,567 | | 238,903 | | 632,578 | | 16,530 |
Class I
| 127,896,105 | | 18,718,752 | | 5,662,986 | | 365,084 |
Class R6
| 6,090,631 | | 1,528,311 | | 5,307,126 | | — |
See Notes to Financial Statements
VIRTUS OPPORTUNITIES TRUST
STATEMENTS OF ASSETS AND LIABILITIES (Continued)
September 30, 2023
(Reported in thousands except shares and per share amounts)
| | Vontobel Emerging Markets Opportunities Fund | | Vontobel Foreign Opportunities Fund | | Vontobel
Global
Opportunities
Fund | | Vontobel
Greater
European
Opportunities Fund |
| Net Asset Value and Redemption Price Per Share:* | | | | | | | |
Class A
| $ 7.00 | | $ 24.24 | | $ 14.68 | | $ 10.41 |
Class C
| $ 6.59 | | $ 22.59 | | $ 10.82 | | $ 9.80 |
Class I
| $ 7.37 | | $ 24.43 | | $ 14.85 | | $ 10.47 |
Class R6
| $ 7.44 | | $ 24.52 | | $ 14.99 | | $ — |
| Maximum Offering Price Per Share (NAV/(1-Maximum Sales Charge)): | | | | | | | |
Class A
| $ 7.41 | | $ 25.65 | | $ 15.53 | | $ 11.02 |
Maximum Sales Charge - Class A
| 5.50% | | 5.50% | | 5.50% | | 5.50% |
(1) Investment in securities at cost
| $ 1,130,159 | | $ 482,123 | | $ 183,810 | | $ 4,752 |
(2) Foreign currency at cost
| $ 295 | | $ 4,060 | | $ — | | $ —(a) |
| (a) | Amount is less than $500 (not in thousands). |
| * | Net Asset Value and Redemption Price Per Share are calculated using unrounded net assets. |
See Notes to Financial Statements
VIRTUS OPPORTUNITIES TRUST
STATEMENTS OF OPERATIONS
YEAR ENDED September 30, 2023
($ reported in thousands)
| | Duff & Phelps
Global
Infrastructure
Fund | | Duff & Phelps
Global
Real Estate
Securities Fund | | Duff & Phelps
International
Real Estate
Securities Fund | | Duff & Phelps
Real Asset Fund |
| Investment Income | | | | | | | |
Dividends
| $ 2,651 | | $ 12,095 | | $ 1,045 | | $ 146 |
Dividends from affiliates
| — | | — | | — | | 253 |
Foreign taxes withheld
| (138) | | (444) | | (92) | | — |
Total investment income
| 2,513 | | 11,651 | | 953 | | 399 |
| Expenses | | | | | | | |
Investment advisory fees
| 507 | | 2,988 | | 257 | | — (1) |
Distribution and service fees, Class A
| 74 | | 52 | | 5 | | 29 |
Distribution and service fees, Class C
| 31 | | 44 | | 1 | | 6 |
Administration and accounting fees
| 87 | | 365 | | 34 | | 29 |
Transfer agent fees and expenses
| 36 | | 154 | | 12 | | 11 |
Sub-transfer agent fees and expenses, Class A
| 30 | | 383 | | 2 | | 12 |
Sub-transfer agent fees and expenses, Class C
| 4 | | 4 | | — (2) | | 1 |
Sub-transfer agent fees and expenses, Class I
| 38 | | 279 | | 25 | | 11 |
Custodian fees
| 2 | | 3 | | 1 | | — (2) |
Printing fees and expenses
| 8 | | 24 | | 4 | | 6 |
Professional fees
| 27 | | 6 | | 29 | | 17 |
Interest expense and/or commitment fees
| 1 | | 8 | | — (2) | | — (2) |
Registration fees
| 45 | | 70 | | 28 | | 45 |
Trustees’ fees and expenses
| 6 | | 29 | | 2 | | 2 |
Miscellaneous expenses
| 13 | | 39 | | 16 | | 6 |
Total expenses
| 909 | | 4,448 | | 416 | | 175 |
Less net expenses reimbursed and/or waived by investment adviser(3)
| (9) | | (542) | | (90) | | (68) |
Less low balance account fees
| — (2) | | — (2) | | — | | — (2) |
Net expenses
| 900 | | 3,906 | | 326 | | 107 |
Net investment income (loss)
| 1,613 | | 7,745 | | 627 | | 292 |
| Net Realized and Unrealized Gain (Loss) on Investments | | | | | | | |
| Net realized gain (loss) from: | | | | | | | |
Investments
| 1,381 | | (34,510) | | (2,649) | | 468 |
Investment in affiliates
| — | | — | | — | | 114 |
Foreign currency transactions
| 5 | | (53) | | (11) | | — |
Capital gains received from investments in affiliates
| — | | — | | — | | 428 |
| Net change in unrealized appreciation (depreciation) on: | | | | | | | |
Investments
| (3,696) | | 37,910 | | 3,463 | | (85) |
Investment in affiliates
| — | | — | | — | | (72) |
Foreign currency transactions
| 6 | | 33 | | 5 | | — |
Net realized and unrealized gain (loss) on investments
| (2,304) | | 3,380 | | 808 | | 853 |
Net increase (decrease) in net assets resulting from operations
| $ (691) | | $ 11,125 | | $ 1,435 | | $1,145 |
| (1) | The Adviser does not charge an advisory fee. |
| (2) | Amount is less than $500 (not in thousands). |
| (3) | See Note 3D in Notes to Financial Statements. |
See Notes to Financial Statements
VIRTUS OPPORTUNITIES TRUST
STATEMENTS OF OPERATIONS (Continued)
YEAR ENDED September 30, 2023
($ reported in thousands)
| | Duff & Phelps
Real Estate
Securities Fund | | KAR Developing
Markets Fund | | KAR Emerging
Markets
Small-Cap Fund | | KAR
International
Small-Mid
Cap Fund |
| Investment Income | | | | | | | |
Dividends
| $ 12,492 | | $ 86 | | $ 6,919 | | $ 25,211 |
Dividends from affiliates
| — | | — | | 1,605 | | 4,317 |
Foreign taxes withheld
| — | | (7) | | (942) | | (3,231) |
Total investment income
| 12,492 | | 79 | | 7,582 | | 26,297 |
| Expenses | | | | | | | |
Investment advisory fees
| 2,931 | | 27 | | 3,071 | | 9,466 |
Distribution and service fees, Class A
| 265 | | — (1) | | 77 | | 115 |
Distribution and service fees, Class C
| 39 | | 1 | | 35 | | 194 |
Administration and accounting fees
| 405 | | 11 | | 268 | | 1,078 |
Transfer agent fees and expenses
| 178 | | 1 | | 110 | | 452 |
Sub-transfer agent fees and expenses, Class A
| 156 | | — (1) | | 36 | | 48 |
Sub-transfer agent fees and expenses, Class C
| 4 | | — | | 3 | | 22 |
Sub-transfer agent fees and expenses, Class I
| 285 | | — (1) | | 212 | | 1,032 |
Custodian fees
| 1 | | 1 | | 14 | | 18 |
Printing fees and expenses
| 33 | | 2 | | 24 | | 79 |
Professional fees
| 12 | | 27 | | 31 | | 66 |
Interest expense and/or commitment fees
| 4 | | — (1) | | 2 | | 64 |
Registration fees
| 84 | | 26 | | 60 | | 100 |
Trustees’ fees and expenses
| 32 | | 1 | | 19 | | 88 |
Miscellaneous expenses
| 33 | | 11 | | 27 | | 60 |
Total expenses
| 4,462 | | 108 | | 3,989 | | 12,882 |
Less net expenses reimbursed and/or waived by investment adviser(2)
| (175) | | (74) | | (42) | | (77) |
Less low balance account fees
| — (1) | | — | | — | | — |
Net expenses
| 4,287 | | 34 | | 3,947 | | 12,805 |
Net investment income (loss)
| 8,205 | | 45 | | 3,635 | | 13,492 |
| Net Realized and Unrealized Gain (Loss) on Investments | | | | | | | |
| Net realized gain (loss) from: | | | | | | | |
Investments
| 33,738 | | (159) | | (10,003) | | (108,854) |
Investment in affiliates
| — | | — | | (231) | | (6,001) |
Foreign currency transactions
| — | | (1) | | (130) | | (198) |
Foreign capital gains tax
| — | | — | | (55) | | — |
| Net change in unrealized appreciation (depreciation) on: | | | | | | | |
Investments
| (38,013) | | 478 | | 45,953 | | 324,469 |
Investment in affiliates
| — | | — | | (317) | | 36,394 |
Foreign currency transactions
| — | | — (1) | | 5 | | 98 |
Foreign capital gains tax
| — | | — | | (837) | | — |
Net realized and unrealized gain (loss) on investments
| (4,275) | | 318 | | 34,385 | | 245,908 |
Net increase (decrease) in net assets resulting from operations
| $ 3,930 | | $ 363 | | $ 38,020 | | $ 259,400 |
| (1) | Amount is less than $500 (not in thousands). |
| (2) | See Note 3D in Notes to Financial Statements. |
See Notes to Financial Statements
VIRTUS OPPORTUNITIES TRUST
STATEMENTS OF OPERATIONS (Continued)
YEAR ENDED September 30, 2023
($ reported in thousands)
| | Vontobel
Emerging
Markets
Opportunities
Fund | | Vontobel
Foreign
Opportunities
Fund | | Vontobel
Global
Opportunities
Fund | | Vontobel
Greater
European
Opportunities Fund |
| Investment Income | | | | | | | |
Dividends
| $ 43,164 | | $ 10,503 | | $ 4,149 | | $ 134 |
Securities lending, net of fees
| 2 | | 5 | | 2 | | — (1) |
Foreign taxes withheld
| (4,837) | | (1,000) | | (272) | | (15) |
Total investment income
| 38,329 | | 9,508 | | 3,879 | | 119 |
| Expenses | | | | | | | |
Investment advisory fees
| 16,450 | | 5,751 | | 2,255 | | 58 |
Distribution and service fees, Class A
| 444 | | 363 | | 238 | | 6 |
Distribution and service fees, Class C
| 242 | | 65 | | 80 | | 2 |
Administration and accounting fees
| 1,685 | | 668 | | 250 | | 15 |
Transfer agent fees and expenses
| 736 | | 318 | | 133 | | 4 |
Sub-transfer agent fees and expenses, Class A
| 329 | | 144 | | 68 | | 3 |
Sub-transfer agent fees and expenses, Class C
| 30 | | 6 | | 7 | | — (1) |
Sub-transfer agent fees and expenses, Class I
| 1,289 | | 410 | | 90 | | 4 |
Custodian fees
| 116 | | 8 | | 7 | | 2 |
Printing fees and expenses
| 54 | | 46 | | 19 | | 3 |
Professional fees
| 63 | | 18 | | 29 | | 31 |
Interest expense and/or commitment fees
| 30 | | 5 | | 11 | | — (1) |
Registration fees
| 77 | | 72 | | 67 | | 23 |
Trustees’ fees and expenses
| 140 | | 53 | | 21 | | 1 |
Miscellaneous expenses
| 12 | | 63 | | 36 | | 11 |
Total expenses
| 21,697 | | 7,990 | | 3,311 | | 163 |
Less net expenses reimbursed and/or waived by investment adviser(2)
| (259) | | (316) | | (215) | | (79) |
Less low balance account fees
| — (1) | | (1) | | (2) | | — |
Net expenses
| 21,438 | | 7,673 | | 3,094 | | 84 |
Net investment income (loss)
| 16,891 | | 1,835 | | 785 | | 35 |
| Net Realized and Unrealized Gain (Loss) on Investments | | | | | | | |
| Net realized gain (loss) from: | | | | | | | |
Investments
| (182,890) | | 18,954 | | 15,824 | | 11 |
Foreign currency transactions
| (1,091) | | (198) | | (97) | | (1) |
Foreign capital gains tax
| (2,551) | | (168) | | (110) | | — |
| Net change in unrealized appreciation (depreciation) on: | | | | | | | |
Investments
| 186,712 | | 93,798 | | 32,357 | | 1,047 |
Foreign currency transactions
| 115 | | 105 | | 20 | | 1 |
Foreign capital gains tax
| (382) | | (220) | | (17) | | — |
Net realized and unrealized gain (loss) on investments
| (87) | | 112,271 | | 47,977 | | 1,058 |
Net increase (decrease) in net assets resulting from operations
| $ 16,804 | | $114,106 | | $48,762 | | $1,093 |
| (1) | Amount is less than $500 (not in thousands). |
| (2) | See Note 3D in Notes to Financial Statements. |
See Notes to Financial Statements
VIRTUS OPPORTUNITIES TRUST
STATEMENTS OF CHANGES IN NET ASSETS
($ reported in thousands)
| | Duff & Phelps Global Infrastructure
Fund | | Duff & Phelps Global Real Estate
Securities Fund |
| | Year Ended
September 30,
2023 | | Year Ended
September 30,
2022 | | Year Ended
September 30,
2023 | | Year Ended
September 30,
2022 |
| Increase (Decrease) in Net Assets Resulting from Operations | | | | | | | |
Net investment income (loss)
| $ 1,613 | | $ 1,116 | | $ 7,745 | | $ 7,361 |
Net realized gain (loss)
| 1,386 | | 7,775 | | (34,563) | | (2,038) |
Net change in unrealized appreciation (depreciation)
| (3,690) | | (14,545) | | 37,943 | | (124,677) |
Increase (decrease) in net assets resulting from operations
| (691) | | (5,654) | | 11,125 | | (119,354) |
| Dividends and Distributions to Shareholders | | | | | | | |
| Net Investment Income and Net Realized Gains: | | | | | | | |
Class A
| (3,249) | | (1,936) | | (132) | | (814) |
Class C
| (337) | | (273) | | — | | (132) |
Class I
| (3,941) | | (2,497) | | (2,017) | | (12,094) |
Class R6
| (1,080) | | (682) | | (1,101) | | (3,450) |
Total dividends and distributions to shareholders
| (8,607) | | (5,388) | | (3,250) | | (16,490) |
| Change in Net Assets from Capital Transactions (See Note 5): | | | | | | | |
Class A
| (1,045) | | 1,679 | | (3,655) | | 1,543 |
Class C
| (1,009) | | (1,501) | | (1,207) | | 918 |
Class I
| (2,152) | | (132) | | (69,564) | | 25,272 |
Class R6
| 12 | | 917 | | 3,665 | | 11,094 |
Increase (decrease) in net assets from capital transactions
| (4,194) | | 963 | | (70,761) | | 38,827 |
Net increase (decrease) in net assets
| (13,492) | | (10,079) | | (62,886) | | (97,017) |
| Net Assets | | | | | | | |
Beginning of period
| 77,366 | | 87,445 | | 370,485 | | 467,502 |
End of Period
| $ 63,874 | | $ 77,366 | | $ 307,599 | | $ 370,485 |
See Notes to Financial Statements
VIRTUS OPPORTUNITIES TRUST
STATEMENTS OF CHANGES IN NET ASSETS (Continued)
($ reported in thousands)
| | Duff & Phelps International Real
Estate Securities Fund | | Duff & Phelps
Real Asset Fund |
| | Year Ended
September 30,
2023 | | Year Ended
September 30,
2022 | | Year Ended
September 30,
2023 | | Year Ended
September 30,
2022 |
| Increase (Decrease) in Net Assets Resulting from Operations | | | | | | | |
Net investment income (loss)
| $ 627 | | $ 689 | | $ 292 | | $ 244 |
Net realized gain (loss)
| (2,660) | | 572 | | 1,010 | | 317 |
Net change in unrealized appreciation (depreciation)
| 3,468 | | (12,123) | | (157) | | (1,563) |
Increase (decrease) in net assets resulting from operations
| 1,435 | | (10,862) | | 1,145 | | (1,002) |
| Dividends and Distributions to Shareholders | | | | | | | |
| Net Investment Income and Net Realized Gains: | | | | | | | |
Class A
| — | | (54) | | (125) | | (95) |
Class C
| — | | — | | (1) | | (3) |
Class I
| — | | (516) | | (112) | | (84) |
Class R6
| — | | — | | (2) | | — |
Total dividends and distributions to shareholders
| — | | (570) | | (240) | | (182) |
| Change in Net Assets from Capital Transactions (See Note 5): | | | | | | | |
Class A
| (489) | | (473) | | (1,345) | | (910) |
Class C
| (44) | | (108) | | (491) | | 460 |
Class I
| (568) | | 949 | | (3,699) | | 497 |
Class R6
| — | | — | | 1,094 | | 100 |
Increase (decrease) in net assets from capital transactions
| (1,101) | | 368 | | (4,441) | | 147 |
Net increase (decrease) in net assets
| 334 | | (11,064) | | (3,536) | | (1,037) |
| Net Assets | | | | | | | |
Beginning of period
| 23,442 | | 34,506 | | 21,682 | | 22,719 |
End of Period
| $ 23,776 | | $ 23,442 | | $ 18,146 | | $ 21,682 |
See Notes to Financial Statements
VIRTUS OPPORTUNITIES TRUST
STATEMENTS OF CHANGES IN NET ASSETS (Continued)
($ reported in thousands)
| | Duff & Phelps Real Estate Securities Fund | | KAR Developing Markets Fund |
| | Year Ended
September 30,
2023 | | Year Ended
September 30,
2022 | | Year Ended
September 30,
2023 | | Year Ended
September 30,
2022 |
| Increase (Decrease) in Net Assets Resulting from Operations | | | | | | | |
Net investment income (loss)
| $ 8,205 | | $ 5,054 | | $ 45 | | $ 23 |
Net realized gain (loss)
| 33,738 | | 37,592 | | (160) | | (272) |
Net change in unrealized appreciation (depreciation)
| (38,013) | | (118,834) | | 478 | | (674) |
Increase (decrease) in net assets resulting from operations
| 3,930 | | (76,188) | | 363 | | (923) |
| Dividends and Distributions to Shareholders | | | | | | | |
| Net Investment Income and Net Realized Gains: | | | | | | | |
Class A
| (11,213) | | (6,201) | | (1) | | (—) (1) |
Class C
| (390) | | (231) | | — | | (—) (1) |
Class I
| (18,652) | | (11,149) | | (1) | | (1) |
Class R6
| (11,535) | | (7,479) | | (26) | | (15) |
Total dividends and distributions to shareholders
| (41,790) | | (25,060) | | (28) | | (16) |
| Change in Net Assets from Capital Transactions (See Note 5): | | | | | | | |
Class A
| (2,346) | | (9,319) | | 2 | | 19 |
Class C
| (624) | | (919) | | — | | — |
Class I
| (8,891) | | 518 | | 49 | | 16 |
Class R6
| 12,218 | | (31,411) | | (132) | | 433 |
Increase (decrease) in net assets from capital transactions
| 357 | | (41,131) | | (81) | | 468 |
Net increase (decrease) in net assets
| (37,503) | | (142,379) | | 254 | | (471) |
| Net Assets | | | | | | | |
Beginning of period
| 393,529 | | 535,908 | | 2,421 | | 2,892 |
End of Period
| $ 356,026 | | $ 393,529 | | $ 2,675 | | $ 2,421 |
| (1) | Amount is less than $500 (not in thousands). |
See Notes to Financial Statements
VIRTUS OPPORTUNITIES TRUST
STATEMENTS OF CHANGES IN NET ASSETS (Continued)
($ reported in thousands)
| | KAR Emerging Markets Small-Cap Fund | | KAR International Small-Mid Cap Fund |
| | Year Ended
September 30,
2023 | | Year Ended
September 30,
2022 | | Year Ended
September 30,
2023 | | Year Ended
September 30,
2022 |
| Increase (Decrease) in Net Assets Resulting from Operations | | | | | | | |
Net investment income (loss)
| $ 3,635 | | $ 1,844 | | $ 13,492 | | $ 16,884 |
Net realized gain (loss)
| (10,419) | | (5,045) | | (115,053) | | (158,578) |
Net change in unrealized appreciation (depreciation)
| 44,804 | | (115,998) | | 360,961 | | (1,084,164) |
Increase (decrease) in net assets resulting from operations
| 38,020 | | (119,199) | | 259,400 | | (1,225,858) |
| Dividends and Distributions to Shareholders | | | | | | | |
| Net Investment Income and Net Realized Gains: | | | | | | | |
Class A
| — | | (4,302) | | — | | (7,342) |
Class C
| — | | (175) | | — | | (2,873) |
Class I
| — | | (27,544) | | — | | (211,939) |
Class R6
| — | | (99) | | — | | (22,516) |
Total dividends and distributions to shareholders
| — | | (32,120) | | — | | (244,670) |
| Change in Net Assets from Capital Transactions (See Note 5): | | | | | | | |
Class A
| (6,379) | | (6,203) | | (11,929) | | (10,312) |
Class C
| 1,757 | | 18 | | (5,143) | | (3,254) |
Class I
| (1,689) | | (34,298) | | (342,246) | | (484,904) |
Class R6
| 392 | | 380 | | (23,664) | | (67,539) |
Increase (decrease) in net assets from capital transactions
| (5,919) | | (40,103) | | (382,982) | | (566,009) |
Net increase (decrease) in net assets
| 32,101 | | (191,422) | | (123,582) | | (2,036,537) |
| Net Assets | | | | | | | |
Beginning of period
| 230,518 | | 421,940 | | 1,069,479 | | 3,106,016 |
End of Period
| $ 262,619 | | $ 230,518 | | $ 945,897 | | $ 1,069,479 |
See Notes to Financial Statements
VIRTUS OPPORTUNITIES TRUST
STATEMENTS OF CHANGES IN NET ASSETS (Continued)
($ reported in thousands)
| | Vontobel Emerging Markets Opportunities Fund | | Vontobel Foreign Opportunities Fund |
| | Year Ended
September 30,
2023 | | Year Ended
September 30,
2022 | | Year Ended
September 30,
2023 | | Year Ended
September 30,
2022 |
| Increase (Decrease) in Net Assets Resulting from Operations | | | | | | | |
Net investment income (loss)
| $ 16,891 | | $ 13,585 | | $ 1,835 | | $ (1,998) |
Net realized gain (loss)
| (186,532) | | (112,762) | | 18,588 | | 13,830 |
Net change in unrealized appreciation (depreciation)
| 186,445 | | (724,063) | | 93,683 | | (270,395) |
Increase (decrease) in net assets resulting from operations
| 16,804 | | (823,240) | | 114,106 | | (258,563) |
| Dividends and Distributions to Shareholders | | | | | | | |
| Net Investment Income and Net Realized Gains: | | | | | | | |
Class A
| — | | (66,729) | | (70) | | (40,624) |
Class C
| — | | (13,137) | | (4) | | (3,281) |
Class I
| — | | (656,363) | | (221) | | (156,089) |
Class R6
| — | | (30,881) | | (24) | | (12,796) |
Total dividends and distributions to shareholders
| — | | (767,110) | | (319) | | (212,790) |
| Change in Net Assets from Capital Transactions (See Note 5): | | | | | | | |
Class A
| (41,226) | | (26,317) | | (19,637) | | 20,737 |
Class C
| (14,475) | | (13,973) | | (2,517) | | (4,652) |
Class I
| (643,258) | | (1,199,214) | | (61,880) | | (22,026) |
Class R6
| (57,081) | | (37,502) | | (21,484) | | 13,208 |
Increase (decrease) in net assets from capital transactions
| (756,040) | | (1,277,006) | | (105,518) | | 7,267 |
Net increase (decrease) in net assets
| (739,236) | | (2,867,356) | | 8,269 | | (464,086) |
| Net Assets | | | | | | | |
Beginning of period
| 1,896,604 | | 4,763,960 | | 628,502 | | 1,092,588 |
End of Period
| $ 1,157,368 | | $ 1,896,604 | | $ 636,771 | | $ 628,502 |
See Notes to Financial Statements
VIRTUS OPPORTUNITIES TRUST
STATEMENTS OF CHANGES IN NET ASSETS (Continued)
($ reported in thousands)
| | Vontobel Global Opportunities Fund | | Vontobel Greater European
Opportunities Fund |
| | Year Ended
September 30,
2023 | | Year Ended
September 30,
2022 | | Year Ended
September 30,
2023 | | Year Ended
September 30,
2022 |
| Increase (Decrease) in Net Assets Resulting from Operations | | | | | | | |
Net investment income (loss)
| $ 785 | | $ (538) | | $ 35 | | $ 1 |
Net realized gain (loss)
| 15,617 | | 23,074 | | 10 | | (301) |
Net change in unrealized appreciation (depreciation)
| 32,360 | | (103,468) | | 1,048 | | (2,358) |
Increase (decrease) in net assets resulting from operations
| 48,762 | | (80,932) | | 1,093 | | (2,658) |
| Dividends and Distributions to Shareholders | | | | | | | |
| Net Investment Income and Net Realized Gains: | | | | | | | |
Class A
| (9,087) | | (22,330) | | — | | (114) |
Class C
| (1,060) | | (3,698) | | — | | (15) |
Class I
| (7,961) | | (26,621) | | — | | (283) |
Class R6
| (6,263) | | (15,811) | | — | | — |
Total dividends and distributions to shareholders
| (24,371) | | (68,460) | | — | | (412) |
| Change in Net Assets from Capital Transactions (See Note 5): | | | | | | | |
Class A
| (2,570) | | 6,881 | | (88) | | 97 |
Class C
| (2,001) | | (4,445) | | (88) | | (66) |
Class I
| (22,834) | | (24,753) | | (796) | | (599) |
Class R6
| 17,836 | | 1,948 | | — | | — |
Increase (decrease) in net assets from capital transactions
| (9,569) | | (20,369) | | (972) | | (568) |
Net increase (decrease) in net assets
| 14,822 | | (169,761) | | 121 | | (3,638) |
| Net Assets | | | | | | | |
Beginning of period
| 248,110 | | 417,871 | | 6,162 | | 9,800 |
End of Period
| $ 262,932 | | $ 248,110 | | $ 6,283 | | $ 6,162 |
See Notes to Financial Statements
VIRTUS OPPORTUNITIES TRUST
FINANCIAL HIGHLIGHTS
SELECTED PER SHARE DATA AND RATIOS FOR A SHARE OUTSTANDING
THROUGHOUT EACH PERIOD
| | | Net Asset Value,
Beginning of Period | Net Investment Income (Loss)(1) | Capital Gains Distributions
Received from Underlying Funds(1) | Net Realized and
Unrealized Gain (Loss) | Total from Investment Operations | Dividends from
Net Investment Income | Distributions from
Net Realized Gains | Total Distributions | Payment from Affiliate(1) | Change in Net Asset Value | Net Asset Value, End of Period | Total Return(2)(3) | Net Assets, End of Period
(in thousands) | Ratio of Net Expenses to
Average Net Assets(4)(5) | Ratio of Gross Expenses
to Average Net Assets(4)(5) | Ratio of Net Investment Income (Loss)
to Average Net Assets(4) | Portfolio Turnover Rate(3) |
| | | | | | | | | | | | | | | | | | | |
| Duff & Phelps Global Infrastructure Fund | | | | | | | | | | | | | | | | | | |
| Class A | | | | | | | | | | | | | | | | | | |
| 10/1/22 to 9/30/23 | | $14.16 | 0.27 | — | (0.46) | (0.19) | (0.30) | (1.30) | (1.60) | — | (1.79) | $12.37 | (2.40) % | $ 24,716 | 1.29 % | 1.29 % | 1.93 % | 26 % |
| 10/1/21 to 9/30/22 | | 16.17 | 0.18 | — | (1.20) | (1.02) | (0.15) | (0.84) | (0.99) | — | (2.01) | 14.16 | (7.07) | 29,344 | 1.27 (6) | 1.27 | 1.12 | 37 |
| 10/1/20 to 9/30/21 | | 14.54 | 0.14 | — | 1.84 | 1.98 | (0.17) | (0.18) | (0.35) | — | 1.63 | 16.17 | 13.75 | 31,857 | 1.28 | 1.28 | 0.86 | 28 |
| 10/1/19 to 9/30/20 | | 16.26 | 0.20 | — | (1.17) | (0.97) | (0.23) | (0.52) | (0.75) | — | (1.72) | 14.54 | (6.11) | 30,172 | 1.27 | 1.27 | 1.35 | 31 |
| 10/1/18 to 9/30/19 | | 14.45 | 0.25 | — | 2.38 | 2.63 | (0.27) | (0.55) | (0.82) | — | 1.81 | 16.26 | 19.13 | 37,533 | 1.26 | 1.26 | 1.69 | 30 |
| Class C | | | | | | | | | | | | | | | | | | |
| 10/1/22 to 9/30/23 | | $14.14 | 0.16 | — | (0.46) | (0.30) | (0.18) | (1.30) | (1.48) | — | (1.78) | $12.36 | (3.17) % | $ 2,221 | 2.07 % | 2.07 % | 1.11 % | 26 % |
| 10/1/21 to 9/30/22 | | 16.14 | 0.05 | — | (1.20) | (1.15) | (0.01) | (0.84) | (0.85) | — | (2.00) | 14.14 | (7.78) | 3,544 | 2.04 (6) | 2.04 | 0.32 | 37 |
| 10/1/20 to 9/30/21 | | 14.50 | 0.02 | — | 1.84 | 1.86 | (0.04) | (0.18) | (0.22) | — | 1.64 | 16.14 | 12.92 | 5,525 | 2.02 | 2.02 | 0.11 | 28 |
| 10/1/19 to 9/30/20 | | 16.20 | 0.09 | — | (1.16) | (1.07) | (0.11) | (0.52) | (0.63) | — | (1.70) | 14.50 | (6.83) | 9,833 | 2.03 | 2.03 | 0.59 | 31 |
| 10/1/18 to 9/30/19 | | 14.39 | 0.14 | — | 2.37 | 2.51 | (0.15) | (0.55) | (0.70) | — | 1.81 | 16.20 | 18.32 | 15,046 | 2.01 | 2.01 | 0.97 | 30 |
| Class I | | | | | | | | | | | | | | | | | | |
| 10/1/22 to 9/30/23 | | $14.16 | 0.31 | — | (0.47) | (0.16) | (0.33) | (1.30) | (1.63) | — | (1.79) | $12.37 | (2.17) % | $ 28,472 | 1.04 % | 1.04 % | 2.19 % | 26 % |
| 10/1/21 to 9/30/22 | | 16.17 | 0.22 | — | (1.21) | (0.99) | (0.18) | (0.84) | (1.02) | — | (2.01) | 14.16 | (6.84) | 34,847 | 1.03 (6) | 1.03 | 1.36 | 37 |
| 10/1/20 to 9/30/21 | | 14.54 | 0.18 | — | 1.85 | 2.03 | (0.22) | (0.18) | (0.40) | — | 1.63 | 16.17 | 14.07 | 39,955 | 1.01 | 1.01 | 1.15 | 28 |
| 10/1/19 to 9/30/20 | | 16.27 | 0.24 | — | (1.19) | (0.95) | (0.26) | (0.52) | (0.78) | — | (1.73) | 14.54 | (5.94) | 33,326 | 1.04 | 1.04 | 1.61 | 31 |
| 10/1/18 to 9/30/19 | | 14.45 | 0.29 | — | 2.39 | 2.68 | (0.31) | (0.55) | (0.86) | — | 1.82 | 16.27 | 19.50 | 50,089 | 1.02 | 1.02 | 1.94 | 30 |
| Class R6 | | | | | | | | | | | | | | | | | | |
| 10/1/22 to 9/30/23 | | $14.18 | 0.34 | — | (0.47) | (0.13) | (0.36) | (1.30) | (1.66) | — | (1.79) | $12.39 | (1.96) % | $ 8,465 | 0.84 % | 0.94 % | 2.39 % | 26 % |
| 10/1/21 to 9/30/22 | | 16.20 | 0.25 | — | (1.22) | (0.97) | (0.21) | (0.84) | (1.05) | — | (2.02) | 14.18 | (6.74) | 9,631 | 0.87 (6) | 0.93 | 1.53 | 37 |
| 10/1/20 to 9/30/21 | | 14.55 | 0.21 | — | 1.85 | 2.06 | (0.23) | (0.18) | (0.41) | — | 1.65 | 16.20 | 14.30 | 10,108 | 0.85 | 0.92 | 1.31 | 28 |
| 10/1/19 to 9/30/20 | | 16.27 | 0.26 | — | (1.18) | (0.92) | (0.28) | (0.52) | (0.80) | — | (1.72) | 14.55 | (5.75) | 8,614 | 0.85 | 0.94 | 1.74 | 31 |
| 10/1/18 to 9/30/19 | | 14.45 | 0.30 | — | 2.39 | 2.69 | (0.32) | (0.55) | (0.87) | — | 1.82 | 16.27 | 19.60 | 9,436 | 0.91 (7) | 0.93 | 2.02 | 30 |
| | | | | | | | | | | | | | | | | | | |
| Duff & Phelps Global Real Estate Securities Fund | | | | | | | | | | | | | | | | | | |
| Class A | | | | | | | | | | | | | | | | | | |
| 10/1/22 to 9/30/23 | | $29.09 | 0.60 | — | (0.02) | 0.58 | (0.19) | — | (0.19) | — | 0.39 | $29.48 | 1.97 % | $ 17,965 | 1.39 % | 3.14 % | 1.93 % | 29 % |
| 10/1/21 to 9/30/22 | | 39.17 | 0.47 | — | (9.38) | (8.91) | (0.47) | (0.70) | (1.17) | — | (10.08) | 29.09 | (23.66) | 21,145 | 1.41 (6) | 2.51 | 1.23 | 17 |
| 10/1/20 to 9/30/21 | | 29.50 | 0.41 | — | 9.26 | 9.67 | — | — | — | — | 9.67 | 39.17 | 32.78 | 27,127 | 1.40 | 2.65 | 1.14 | 17 |
| 10/1/19 to 9/30/20 | | 34.82 | 0.41 | — | (3.66) | (3.25) | (1.29) | (0.78) | (2.07) | — | (5.32) | 29.50 | (10.01) | 18,740 | 1.40 | 2.59 | 1.34 | 32 |
| 10/1/18 to 9/30/19 | | 30.30 | 0.51 | — | 4.46 | 4.97 | (0.44) | (0.01) | (0.45) | — | 4.52 | 34.82 | 16.72 | 21,612 | 1.40 | 2.61 | 1.63 | 31 |
| Class C | | | | | | | | | | | | | | | | | | |
| 10/1/22 to 9/30/23 | | $27.28 | 0.34 | — | — | 0.34 | — | — | — | — | 0.34 | $27.62 | 1.25 % | $ 3,588 | 2.14 % | 2.17 % | 1.15 % | 29 % |
| 10/1/21 to 9/30/22 | | 36.81 | 0.20 | — | (8.86) | (8.66) | (0.17) | (0.70) | (0.87) | — | (9.53) | 27.28 | (24.25) | 4,671 | 2.16 (6)(8)(9) | 2.15 | 0.56 | 17 |
| 10/1/20 to 9/30/21 | | 27.93 | 0.23 | — | 8.65 | 8.88 | — | — | — | — | 8.88 | 36.81 | 31.79 | 5,531 | 2.15 | 2.16 | 0.70 | 17 |
| 10/1/19 to 9/30/20 | | 33.42 | 0.16 | — | (3.47) | (3.31) | (1.40) | (0.78) | (2.18) | — | (5.49) | 27.93 | (10.67) | 6,297 | 2.15 | 2.19 | 0.53 | 32 |
| 10/1/18 to 9/30/19 | | 29.50 | 0.25 | — | 4.29 | 4.54 | (0.61) | (0.01) | (0.62) | — | 3.92 | 33.42 | 15.84 | 9,399 | 2.15 | 2.20 | 0.84 | 31 |
The footnote legend is at the end of the financial highlights.
See Notes to Financial Statements
VIRTUS OPPORTUNITIES TRUST
FINANCIAL HIGHLIGHTS (Continued)
SELECTED PER SHARE DATA AND RATIOS FOR A SHARE OUTSTANDING
THROUGHOUT EACH PERIOD
| | | Net Asset Value,
Beginning of Period | Net Investment Income (Loss)(1) | Capital Gains Distributions
Received from Underlying Funds(1) | Net Realized and
Unrealized Gain (Loss) | Total from Investment Operations | Dividends from
Net Investment Income | Distributions from
Net Realized Gains | Total Distributions | Payment from Affiliate(1) | Change in Net Asset Value | Net Asset Value, End of Period | Total Return(2)(3) | Net Assets, End of Period
(in thousands) | Ratio of Net Expenses to
Average Net Assets(4)(5) | Ratio of Gross Expenses
to Average Net Assets(4)(5) | Ratio of Net Investment Income (Loss)
to Average Net Assets(4) | Portfolio Turnover Rate(3) |
| Duff & Phelps Global Real Estate Securities Fund (Continued) | | | | | | | | | | | | | | | | | | |
| Class I | | | | | | | | | | | | | | | | | | |
| 10/1/22 to 9/30/23 | | $28.19 | 0.65 | — | — | 0.65 | (0.25) | — | (0.25) | — | 0.40 | $28.59 | 2.26 % | $ 206,071 | 1.14 % | 1.16 % | 2.15 % | 29 % |
| 10/1/21 to 9/30/22 | | 38.04 | 0.55 | — | (9.09) | (8.54) | (0.61) | (0.70) | (1.31) | — | (9.85) | 28.19 | (23.48) | 269,095 | 1.16 (6)(8)(9) | 1.16 | 1.48 | 17 |
| 10/1/20 to 9/30/21 | | 28.73 | 0.46 | — | 9.02 | 9.48 | (0.17) | — | (0.17) | — | 9.31 | 38.04 | 33.13 | 344,063 | 1.15 (8)(9) | 1.14 | 1.29 | 17 |
| 10/1/19 to 9/30/20 | | 34.33 | 0.47 | — | (3.54) | (3.07) | (1.75) | (0.78) | (2.53) | — | (5.60) | 28.73 | (9.79) | 168,410 | 1.15 | 1.20 | 1.55 | 32 |
| 10/1/18 to 9/30/19 | | 30.33 | 0.59 | — | 4.35 | 4.94 | (0.93) | (0.01) | (0.94) | — | 4.00 | 34.33 | 17.01 | 206,723 | 1.15 | 1.19 | 1.90 | 31 |
| Class R6 | | | | | | | | | | | | | | | | | | |
| 10/1/22 to 9/30/23 | | $28.37 | 0.76 | — | (0.04) | 0.72 | (0.41) | — | (0.41) | — | 0.31 | $28.68 | 2.50 % | $ 79,975 | 0.88 % | 1.05 % | 2.49 % | 29 % |
| 10/1/21 to 9/30/22 | | 38.26 | 0.64 | — | (9.13) | (8.49) | (0.70) | (0.70) | (1.40) | — | (9.89) | 28.37 | (23.27) | 75,574 | 0.91 (6) | 1.05 | 1.74 | 17 |
| 10/1/20 to 9/30/21 | | 28.86 | 0.61 | — | 9.00 | 9.61 | (0.21) | — | (0.21) | — | 9.40 | 38.26 | 33.46 | 90,781 | 0.89 | 1.04 | 1.73 | 17 |
| 10/1/19 to 9/30/20 | | 34.41 | 0.65 | — | (3.64) | (2.99) | (1.78) | (0.78) | (2.56) | — | (5.55) | 28.86 | (9.52) | 54,992 | 0.89 | 1.09 | 2.29 | 32 |
| 10/1/18 to 9/30/19 | | 30.37 | 0.54 | — | 4.47 | 5.01 | (0.96) | (0.01) | (0.97) | — | 4.04 | 34.41 | 17.23 | 2,893 | 0.94 (7) | 1.08 | 1.75 | 31 |
| | | | | | | | | | | | | | | | | | | |
| Duff & Phelps International Real Estate Securities Fund | | | | | | | | | | | | | | | | | | |
| Class A | | | | | | | | | | | | | | | | | | |
| 10/1/22 to 9/30/23 | | $ 5.43 | 0.13 | — | 0.17 | 0.30 | — | — | — | — | 0.30 | $ 5.73 | 5.52 % | $ 1,719 | 1.49 % | 1.85 % | 2.14 % | 48 % |
| 10/1/21 to 9/30/22 | | 8.11 | 0.14 | — | (2.70) | (2.56) | (0.12) | — | (0.12) | — | (2.68) | 5.43 | (32.02) | 2,086 | 1.51 (6) | 1.73 | 1.90 | 24 |
| 10/1/20 to 9/30/21 | | 6.79 | 0.14 | — | 1.18 | 1.32 | — | — | — | — | 1.32 | 8.11 | 19.44 | 3,612 | 1.50 | 1.75 | 1.69 | 71 |
| 10/1/19 to 9/30/20 | | 7.96 | 0.09 | — | (0.63) | (0.54) | (0.63) | — | (0.63) | — | (1.17) | 6.79 | (7.72) | 1,843 | 1.50 | 1.75 | 1.32 | 34 |
| 10/1/18 to 9/30/19 | | 7.41 | 0.14 | — | 0.68 | 0.82 | (0.27) | — | (0.27) | — | 0.55 | 7.96 | 11.65 | 2,318 | 1.50 | 1.71 | 1.87 | 34 |
| Class C | | | | | | | | | | | | | | | | | | |
| 10/1/22 to 9/30/23 | | $ 5.38 | 0.08 | — | 0.17 | 0.25 | — | — | — | — | 0.25 | $ 5.63 | 4.65 % | $ 60 | 2.24 % | 2.78 % | 1.35 % | 48 % |
| 10/1/21 to 9/30/22 | | 7.98 | 0.09 | — | (2.69) | (2.60) | — | — | — | — | (2.60) | 5.38 | (32.58) | 98 | 2.26 (6) | 2.56 | 1.22 | 24 |
| 10/1/20 to 9/30/21 | | 6.73 | 0.06 | — | 1.19 | 1.25 | — | — | — | — | 1.25 | 7.98 | 18.57 | 273 | 2.25 | 2.57 | 0.74 | 71 |
| 10/1/19 to 9/30/20 | | 7.92 | 0.04 | — | (0.63) | (0.59) | (0.60) | — | (0.60) | — | (1.19) | 6.73 | (8.37) | 526 | 2.25 | 2.50 | 0.61 | 34 |
| 10/1/18 to 9/30/19 | | 7.38 | 0.08 | — | 0.68 | 0.76 | (0.22) | — | (0.22) | — | 0.54 | 7.92 | 10.84 | 736 | 2.25 | 2.44 | 1.06 | 34 |
| Class I | | | | | | | | | | | | | | | | | | |
| 10/1/22 to 9/30/23 | | $ 5.44 | 0.15 | — | 0.16 | 0.31 | — | — | — | — | 0.31 | $ 5.75 | 5.70 % | $ 21,997 | 1.24 % | 1.59 % | 2.46 % | 48 % |
| 10/1/21 to 9/30/22 | | 8.11 | 0.17 | — | (2.71) | (2.54) | (0.13) | — | (0.13) | — | (2.67) | 5.44 | (31.81) | 21,258 | 1.26 (6) | 1.51 | 2.23 | 24 |
| 10/1/20 to 9/30/21 | | 6.78 | 0.15 | — | 1.18 | 1.33 | — | — | — | — | 1.33 | 8.11 | 19.62 | 30,621 | 1.25 | 1.51 | 1.89 | 71 |
| 10/1/19 to 9/30/20 | | 7.93 | 0.11 | — | (0.62) | (0.51) | (0.64) | — | (0.64) | — | (1.15) | 6.78 | (7.37) | 25,530 | 1.25 | 1.49 | 1.50 | 34 |
| 10/1/18 to 9/30/19 | | 7.40 | 0.16 | — | 0.67 | 0.83 | (0.30) | — | (0.30) | — | 0.53 | 7.93 | 11.84 | 51,060 | 1.25 | 1.44 | 2.10 | 34 |
The footnote legend is at the end of the financial highlights.
See Notes to Financial Statements
VIRTUS OPPORTUNITIES TRUST
FINANCIAL HIGHLIGHTS (Continued)
SELECTED PER SHARE DATA AND RATIOS FOR A SHARE OUTSTANDING
THROUGHOUT EACH PERIOD
| | | Net Asset Value,
Beginning of Period | Net Investment Income (Loss)(1) | Capital Gains Distributions
Received from Underlying Funds(1) | Net Realized and
Unrealized Gain (Loss) | Total from Investment Operations | Dividends from
Net Investment Income | Distributions from
Net Realized Gains | Total Distributions | Payment from Affiliate(1) | Change in Net Asset Value | Net Asset Value, End of Period | Total Return(2)(3) | Net Assets, End of Period
(in thousands) | Ratio of Net Expenses to
Average Net Assets(4)(5) | Ratio of Gross Expenses
to Average Net Assets(4)(5) | Ratio of Net Investment Income (Loss)
to Average Net Assets(4) | Portfolio Turnover Rate(3) |
| | | | | | | | | | | | | | | | | | | |
| Duff & Phelps Real Asset Fund | | | | | | | | | | | | | | | | | | |
| Class A | | | | | | | | | | | | | | | | | | |
| 10/1/22 to 9/30/23 | | $12.00 | 0.16 | 0.26 | 0.16 | 0.58 | (0.14) | — | (0.14) | — | 0.44 | $12.44 | 4.77 % | $ 10,323 | 0.60 % (7) | 0.92 % | 1.28 % | 10 % |
| 10/1/21 to 9/30/22 | | 12.55 | 0.13 | 0.02 | (0.60) | (0.45) | (0.10) | — | (0.10) | — | (0.55) | 12.00 | (3.64) | 11,226 | 0.81 (6) | 0.81 | 0.99 | 17 |
| 10/1/20 to 9/30/21 | | 10.10 | 0.02 | 0.03 | 2.47 | 2.52 | (0.07) | — | (0.07) | — | 2.45 | 12.55 | 25.10 | 12,674 | 0.85 (6) | 0.85 | 0.19 | 14 |
| 10/1/19 to 9/30/20 | | 11.38 | 0.27 | 0.26 | (1.46) | (0.93) | (0.35) | — | (0.35) | — | (1.28) | 10.10 | (8.50) | 11,964 | 1.05 (6) | 1.05 | 2.57 | 75 |
| 10/1/18 to 9/30/19 | | 11.63 | 0.14 | 0.16 | (0.31) | (0.01) | (0.24) | — | (0.24) | — | (0.25) | 11.38 | 0.18 | 15,897 | 0.76 | 0.76 | 1.25 | 13 |
| Class C | | | | | | | | | | | | | | | | | | |
| 10/1/22 to 9/30/23 | | $12.03 | 0.16 | 0.27 | 0.05 | 0.48 | (0.03) | — | (0.03) | — | 0.45 | $12.48 | 3.95 % | $ 358 | 1.36 % (7) | 1.72 % | 1.24 % | 10 % |
| 10/1/21 to 9/30/22 | | 12.64 | (0.11) | 0.02 | (0.45) | (0.54) | (0.07) | — | (0.07) | — | (0.61) | 12.03 | (4.28) | 812 | 1.57 (6) | 1.57 | (0.82) | 17 |
| 10/1/20 to 9/30/21 | | 10.19 | (0.04) | 0.03 | 2.46 | 2.45 | — | — | — | — | 2.45 | 12.64 | 24.04 | 435 | 1.68 (6) | 1.68 | (0.33) | 14 |
| 10/1/19 to 9/30/20 | | 11.32 | 0.31 | 0.26 | (1.60) | (1.03) | (0.10) | — | (0.10) | — | (1.13) | 10.19 | (9.17) | 604 | 1.74 (6) | 1.74 | 2.85 | 75 |
| 10/1/18 to 9/30/19 | | 11.50 | 0.27 | 0.16 | (0.52) | (0.09) | (0.09) | — | (0.09) | — | (0.18) | 11.32 | (0.65) | 2,126 | 1.50 | 1.50 | 2.44 | 13 |
| Class I | | | | | | | | | | | | | | | | | | |
| 10/1/22 to 9/30/23 | | $12.00 | 0.21 | 0.26 | 0.13 | 0.60 | (0.16) | — | (0.16) | — | 0.44 | $12.44 | 4.96 % | $ 6,304 | 0.36 % (7) | 0.68 % | 1.62 % | 10 % |
| 10/1/21 to 9/30/22 | | 12.52 | 0.15 | 0.02 | (0.58) | (0.41) | (0.11) | — | (0.11) | — | (0.52) | 12.00 | (3.35) | 9,553 | 0.57 (6) | 0.57 | 1.12 | 17 |
| 10/1/20 to 9/30/21 | | 10.07 | 0.05 | 0.03 | 2.47 | 2.55 | (0.10) | — | (0.10) | — | 2.45 | 12.52 | 25.47 | 9,610 | 0.60 (6) | 0.60 | 0.46 | 14 |
| 10/1/19 to 9/30/20 | | 11.35 | 0.48 | 0.26 | (1.64) | (0.90) | (0.38) | — | (0.38) | — | (1.28) | 10.07 | (8.32) | 8,759 | 0.72 (6) | 0.72 | 4.52 | 75 |
| 10/1/18 to 9/30/19 | | 11.62 | 0.25 | 0.16 | (0.39) | 0.02 | (0.29) | — | (0.29) | — | (0.27) | 11.35 | 0.44 | 21,018 | 0.51 | 0.51 | 2.26 | 13 |
| Class R6 | | | | | | | | | | | | | | | | | | |
| 10/1/22 to 9/30/23 | | $12.02 | 0.16 | 0.26 | 0.20 | 0.62 | (0.22) | — | (0.22) | — | 0.40 | $12.42 | 5.13 % | $ 1,161 | 0.20 % | 0.56 % | 1.24 % | 10 % |
| 1/31/22 (10) to 9/30/22 | | 13.22 | (0.14) | 0.02 | (1.08) | (1.20) | — | — | — | — | (1.20) | 12.02 | (9.08) | 91 | 0.22 (6) | 0.54 | (1.57) | 17 |
| | | | | | | | | | | | | | | | | | | |
| Duff & Phelps Real Estate Securities Fund | | | | | | | | | | | | | | | | | | |
| Class A | | | | | | | | | | | | | | | | | | |
| 10/1/22 to 9/30/23 | | $19.83 | 0.36 | — | (0.26) | 0.10 | (0.33) | (1.82) | (2.15) | — | (2.05) | $17.78 | 0.14 % | $ 94,402 | 1.35 % | 1.35 % | 1.85 % | 29 % |
| 10/1/21 to 9/30/22 | | 24.94 | 0.18 | — | (4.16) | (3.98) | (0.24) | (0.89) | (1.13) | — | (5.11) | 19.83 | (17.05) | 107,081 | 1.34 (6) | 1.34 | 0.73 | 14 |
| 10/1/20 to 9/30/21 | | 18.82 | 0.22 | — | 7.10 | 7.32 | (0.46) | (0.74) | (1.20) | — | 6.12 | 24.94 | 40.33 | 143,841 | 1.36 | 1.36 | 0.98 | 14 |
| 10/1/19 to 9/30/20 | | 26.33 | 0.26 | — | (3.23) | (2.97) | (0.33) | (4.21) | (4.54) | — | (7.51) | 18.82 | (12.99) | 209,309 | 1.35 | 1.35 | 1.25 | 40 |
| 10/1/18 to 9/30/19 | | 26.76 | 0.37 | — | 3.34 | 3.71 | (0.42) | (3.72) | (4.14) | — | (0.43) | 26.33 | 17.33 | 175,112 | 1.38 | 1.38 | 1.50 | 30 |
| Class C | | | | | | | | | | | | | | | | | | |
| 10/1/22 to 9/30/23 | | $19.81 | 0.21 | — | (0.25) | (0.04) | (0.18) | (1.82) | (2.00) | — | (2.04) | $17.77 | (0.59) % | $ 3,196 | 2.07 % | 2.07 % | 1.09 % | 29 % |
| 10/1/21 to 9/30/22 | | 24.90 | (0.01) | — | (4.13) | (4.14) | (0.06) | (0.89) | (0.95) | — | (5.09) | 19.81 | (17.64) | 4,181 | 2.06 (6) | 2.06 | (0.03) | 14 |
| 10/1/20 to 9/30/21 | | 18.79 | 0.10 | — | 7.04 | 7.14 | (0.29) | (0.74) | (1.03) | — | 6.11 | 24.90 | 39.32 | 6,244 | 2.08 | 2.08 | 0.43 | 14 |
| 10/1/19 to 9/30/20 | | 26.26 | 0.08 | — | (3.18) | (3.10) | (0.16) | (4.21) | (4.37) | — | (7.47) | 18.79 | (13.65) | 7,280 | 2.11 | 2.11 | 0.38 | 40 |
| 10/1/18 to 9/30/19 | | 26.69 | 0.19 | — | 3.32 | 3.51 | (0.22) | (3.72) | (3.94) | — | (0.43) | 26.26 | 16.49 | 12,325 | 2.09 | 2.09 | 0.78 | 30 |
| Class I | | | | | | | | | | | | | | | | | | |
| 10/1/22 to 9/30/23 | | $19.76 | 0.40 | — | (0.27) | 0.13 | (0.37) | (1.82) | (2.19) | — | (2.06) | $17.70 | 0.33 % | $ 159,616 | 1.11 % | 1.11 % | 2.07 % | 29 % |
| 10/1/21 to 9/30/22 | | 24.85 | 0.25 | — | (4.14) | (3.89) | (0.31) | (0.89) | (1.20) | — | (5.09) | 19.76 | (16.80) | 184,709 | 1.09 (6) | 1.09 | 0.98 | 14 |
| 10/1/20 to 9/30/21 | | 18.76 | 0.20 | — | 7.16 | 7.36 | (0.53) | (0.74) | (1.27) | — | 6.09 | 24.85 | 40.73 | 234,084 | 1.09 | 1.09 | 0.92 | 14 |
| 10/1/19 to 9/30/20 | | 26.28 | 0.30 | — | (3.23) | (2.93) | (0.38) | (4.21) | (4.59) | — | (7.52) | 18.76 | (12.80) | 272,248 | 1.10 | 1.10 | 1.43 | 40 |
| 10/1/18 to 9/30/19 | | 26.71 | 0.44 | — | 3.34 | 3.78 | (0.49) | (3.72) | (4.21) | — | (0.43) | 26.28 | 17.73 | 373,801 | 1.09 | 1.09 | 1.81 | 30 |
The footnote legend is at the end of the financial highlights.
See Notes to Financial Statements
VIRTUS OPPORTUNITIES TRUST
FINANCIAL HIGHLIGHTS (Continued)
SELECTED PER SHARE DATA AND RATIOS FOR A SHARE OUTSTANDING
THROUGHOUT EACH PERIOD
| | | Net Asset Value,
Beginning of Period | Net Investment Income (Loss)(1) | Capital Gains Distributions
Received from Underlying Funds(1) | Net Realized and
Unrealized Gain (Loss) | Total from Investment Operations | Dividends from
Net Investment Income | Distributions from
Net Realized Gains | Total Distributions | Payment from Affiliate(1) | Change in Net Asset Value | Net Asset Value, End of Period | Total Return(2)(3) | Net Assets, End of Period
(in thousands) | Ratio of Net Expenses to
Average Net Assets(4)(5) | Ratio of Gross Expenses
to Average Net Assets(4)(5) | Ratio of Net Investment Income (Loss)
to Average Net Assets(4) | Portfolio Turnover Rate(3) |
| Duff & Phelps Real Estate Securities Fund (Continued) | | | | | | | | | | | | | | | | | | |
| Class R6 | | | | | | | | | | | | | | | | | | |
| 10/1/22 to 9/30/23 | | $19.85 | 0.47 | — | (0.27) | 0.20 | (0.44) | (1.82) | (2.26) | — | (2.06) | $17.79 | 0.68 % | $ 98,812 | 0.78 % | 0.95 % | 2.43 % | 29 % |
| 10/1/21 to 9/30/22 | | 24.96 | 0.31 | — | (4.16) | (3.85) | (0.37) | (0.89) | (1.26) | — | (5.11) | 19.85 | (16.57) | 97,558 | 0.80 (6) | 0.95 | 1.21 | 14 |
| 10/1/20 to 9/30/21 | | 18.81 | 0.20 | — | 7.26 | 7.46 | (0.57) | (0.74) | (1.31) | — | 6.15 | 24.96 | 41.15 | 151,739 | 0.79 | 0.94 | 0.89 | 14 |
| 10/1/19 to 9/30/20 | | 26.30 | 0.37 | — | (3.24) | (2.87) | (0.41) | (4.21) | (4.62) | — | (7.49) | 18.81 | (12.52) | 43,705 | 0.79 | 0.96 | 1.80 | 40 |
| 10/1/18 to 9/30/19 | | 26.72 | 0.51 | — | 3.32 | 3.83 | (0.53) | (3.72) | (4.25) | — | (0.42) | 26.30 | 17.94 | 38,915 | 0.87 (7) | 0.95 | 2.11 | 30 |
| | | | | | | | | | | | | | | | | | | |
| KAR Developing Markets Fund | | | | | | | | | | | | | | | | | | |
| Class A | | | | | | | | | | | | | | | | | | |
| 10/1/22 to 9/30/23 | | $ 6.75 | 0.11 | — | 0.87 | 0.98 | (0.06) | — | (0.06) | — | 0.92 | $ 7.67 | 14.56 % | $ 98 | 1.52 % (7) | 4.24 % | 1.38 % | 27 % |
| 10/1/21 to 9/30/22 | | 9.63 | 0.04 | — | (2.87) | (2.83) | (0.01) | (0.04) | (0.05) | — | (2.88) | 6.75 | (29.56) | 85 | 1.56 (6) | 4.83 | 0.53 | 16 |
| 6/22/21 (10) to 9/30/21 | | 10.00 | — (11) | — | (0.37) | (0.37) | — | — | — | — | (0.37) | 9.63 | (3.70) | 96 | 1.55 | 12.33 | 0.01 | 5 (12) |
| Class C | | | | | | | | | | | | | | | | | | |
| 10/1/22 to 9/30/23 | | $ 6.69 | 0.05 | — | 0.87 | 0.92 | — | — | — | — | 0.92 | $ 7.61 | 13.75 % | $ 76 | 2.27 % (7) | 4.95 % | 0.63 % | 27 % |
| 10/1/21 to 9/30/22 | | 9.61 | (0.02) | — | (2.86) | (2.88) | — | (0.04) | (0.04) | — | (2.92) | 6.69 | (30.11) | 67 | 2.31 (6) | 5.56 | (0.25) | 16 |
| 6/22/21 (10) to 9/30/21 | | 10.00 | (0.02) | — | (0.37) | (0.39) | — | — | — | — | (0.39) | 9.61 | (3.90) | 96 | 2.30 | 13.08 | (0.74) | 5 (12) |
| Class I | | | | | | | | | | | | | | | | | | |
| 10/1/22 to 9/30/23 | | $ 6.77 | 0.13 | — | 0.87 | 1.00 | (0.10) | — | (0.10) | — | 0.90 | $ 7.67 | 14.76 % | $ 143 | 1.26 % (7) | 4.00 % | 1.68 % | 27 % |
| 10/1/21 to 9/30/22 | | 9.64 | 0.07 | — | (2.88) | (2.81) | (0.02) | (0.04) | (0.06) | — | (2.87) | 6.77 | (29.38) | 80 | 1.31 (6) | 4.53 | 0.78 | 16 |
| 6/22/21 (10) to 9/30/21 | | 10.00 | 0.01 | — | (0.37) | (0.36) | — | — | — | — | (0.36) | 9.64 | (3.60) | 97 | 1.30 | 12.08 | 0.26 | 5 (12) |
| Class R6 | | | | | | | | | | | | | | | | | | |
| 10/1/22 to 9/30/23 | | $ 6.77 | 0.13 | — | 0.88 | 1.01 | (0.08) | — | (0.08) | — | 0.93 | $ 7.70 | 14.97 % | $ 2,358 | 1.21 % (7) | 3.92 % | 1.67 % | 27 % |
| 10/1/21 to 9/30/22 | | 9.64 | 0.07 | — | (2.88) | (2.81) | (0.02) | (0.04) | (0.06) | — | (2.87) | 6.77 | (29.37) | 2,189 | 1.23 (6) | 4.53 | 0.89 | 16 |
| 6/22/21 (10) to 9/30/21 | | 10.00 | 0.01 | — | (0.37) | (0.36) | — | — | — | — | (0.36) | 9.64 | (3.60) | 2,603 | 1.22 | 12.06 | 0.34 | 5 (12) |
| | | | | | | | | | | | | | | | | | | |
| KAR Emerging Markets Small-Cap Fund | | | | | | | | | | | | | | | | | | |
| Class A | | | | | | | | | | | | | | | | | | |
| 10/1/22 to 9/30/23 | | $11.24 | 0.15 | — | 1.73 | 1.88 | — | — | — | — | 1.88 | $13.12 | 16.73 % | $ 29,963 | 1.78 % | 1.79 % | 1.17 % | 17 % |
| 10/1/21 to 9/30/22 | | 17.61 | 0.05 | — | (5.10) | (5.05) | (0.33) | (0.99) | (1.32) | — | (6.37) | 11.24 | (30.74) | 31,637 | 1.81 (6)(7)(8)(9) | 1.80 | 0.32 | 24 |
| 10/1/20 to 9/30/21 | | 14.93 | (0.02) | — | 2.87 | 2.85 | (0.17) | — | (0.17) | — | 2.68 | 17.61 | 19.15 | 57,403 | 1.85 (8)(9) | 1.81 | (0.11) | 19 |
| 10/1/19 to 9/30/20 | | 12.10 | (0.02) | — | 3.08 | 3.06 | (0.23) | — | (0.23) | — | 2.83 | 14.93 | 25.70 | 39,799 | 1.85 | 1.90 | (0.17) | 47 |
| 10/1/18 to 9/30/19 | | 11.66 | 0.32 | — | 0.15 | 0.47 | (0.03) | — | (0.03) | — | 0.44 | 12.10 | 4.10 | 27,479 | 1.86 | 1.90 | 2.70 | 44 |
| Class C | | | | | | | | | | | | | | | | | | |
| 10/1/22 to 9/30/23 | | $11.09 | 0.07 | — | 1.69 | 1.76 | — | — | — | — | 1.76 | $12.85 | 15.87 % | $ 3,803 | 2.52 % | 2.51 % | 0.52 % | 17 % |
| 10/1/21 to 9/30/22 | | 17.41 | (0.05) | — | (5.06) | (5.11) | (0.22) | (0.99) | (1.21) | — | (6.32) | 11.09 | (31.27) | 1,589 | 2.56 (6)(7) | 2.62 | (0.34) | 24 |
| 10/1/20 to 9/30/21 | | 14.80 | (0.14) | — | 2.85 | 2.71 | (0.10) | — | (0.10) | — | 2.61 | 17.41 | 18.33 | 2,540 | 2.60 (8)(9) | 2.54 | (0.79) | 19 |
| 10/1/19 to 9/30/20 | | 12.03 | (0.11) | — | 3.05 | 2.94 | (0.17) | — | (0.17) | — | 2.77 | 14.80 | 24.75 | 1,208 | 2.60 | 2.61 | (0.87) | 47 |
| 10/1/18 to 9/30/19 | | 11.65 | 0.17 | — | 0.21 | 0.38 | — | — | — | — | 0.38 | 12.03 | 3.26 | 736 | 2.61 | 2.62 | 1.47 | 44 |
The footnote legend is at the end of the financial highlights.
See Notes to Financial Statements
VIRTUS OPPORTUNITIES TRUST
FINANCIAL HIGHLIGHTS (Continued)
SELECTED PER SHARE DATA AND RATIOS FOR A SHARE OUTSTANDING
THROUGHOUT EACH PERIOD
| | | Net Asset Value,
Beginning of Period | Net Investment Income (Loss)(1) | Capital Gains Distributions
Received from Underlying Funds(1) | Net Realized and
Unrealized Gain (Loss) | Total from Investment Operations | Dividends from
Net Investment Income | Distributions from
Net Realized Gains | Total Distributions | Payment from Affiliate(1) | Change in Net Asset Value | Net Asset Value, End of Period | Total Return(2)(3) | Net Assets, End of Period
(in thousands) | Ratio of Net Expenses to
Average Net Assets(4)(5) | Ratio of Gross Expenses
to Average Net Assets(4)(5) | Ratio of Net Investment Income (Loss)
to Average Net Assets(4) | Portfolio Turnover Rate(3) |
| KAR Emerging Markets Small-Cap Fund (Continued) | | | | | | | | | | | | | | | | | | |
| Class I | | | | | | | | | | | | | | | | | | |
| 10/1/22 to 9/30/23 | | $11.31 | 0.19 | — | 1.73 | 1.92 | — | — | — | — | 1.92 | $13.23 | 16.98 % | $ 227,178 | 1.49 % | 1.51 % | 1.47 % | 17 % |
| 10/1/21 to 9/30/22 | | 17.72 | 0.09 | — | (5.12) | (5.03) | (0.39) | (0.99) | (1.38) | — | (6.41) | 11.31 | (30.49) | 196,191 | 1.51 (6)(7) | 1.55 | 0.61 | 24 |
| 10/1/20 to 9/30/21 | | 15.01 | 0.05 | — | 2.86 | 2.91 | (0.20) | — | (0.20) | — | 2.71 | 17.72 | 19.49 | 360,774 | 1.55 (8)(9) | 1.51 | 0.26 | 19 |
| 10/1/19 to 9/30/20 | | 12.16 | 0.01 | — | 3.10 | 3.11 | (0.26) | — | (0.26) | — | 2.85 | 15.01 | 26.01 | 180,829 | 1.60 | 1.62 | 0.11 | 47 |
| 10/1/18 to 9/30/19 | | 11.70 | 0.34 | — | 0.16 | 0.50 | (0.04) | — | (0.04) | — | 0.46 | 12.16 | 4.33 | 85,699 | 1.61 | 1.67 | 2.85 | 44 |
| Class R6 | | | | | | | | | | | | | | | | | | |
| 10/1/22 to 9/30/23 | | $11.30 | 0.20 | — | 1.73 | 1.93 | — | — | — | — | 1.93 | $13.23 | 17.08 % | $ 1,675 | 1.39 % | 1.42 % | 1.58 % | 17 % |
| 10/1/21 to 9/30/22 | | 17.74 | 0.13 | — | (5.14) | (5.01) | (0.44) | (0.99) | (1.43) | — | (6.44) | 11.30 | (30.43) | 1,101 | 1.41 (6)(7) | 1.45 | 0.96 | 24 |
| 10/1/20 to 9/30/21 | | 15.01 | 0.13 | — | 2.82 | 2.95 | (0.22) | — | (0.22) | — | 2.73 | 17.74 | 19.71 | 1,223 | 1.41 (8)(9) | 1.41 | 0.72 | 19 |
| 10/1/19 to 9/30/20 | | 12.16 | 0.02 | — | 3.10 | 3.12 | (0.27) | — | (0.27) | — | 2.85 | 15.01 | 26.13 | 125 | 1.50 | 1.51 | 0.17 | 47 |
| 8/1/19 (10) to 9/30/19 | | 12.36 | 0.03 | — | (0.23) | (0.20) | — | — | — | — | (0.20) | 12.16 | (1.62) | 98 | 1.51 (6) | 1.62 | 1.44 | 44 (12) |
| | | | | | | | | | | | | | | | | | | |
| KAR International Small-Mid Cap Fund | | | | | | | | | | | | | | | | | | |
| Class A | | | | | | | | | | | | | | | | | | |
| 10/1/22 to 9/30/23 | | $12.53 | 0.16 | — | 3.24 | 3.40 | — | — | — | — | 3.40 | $15.93 | 27.13 % | $ 41,974 | 1.45 % | 1.45 % | 1.04 % | 16 % |
| 10/1/21 to 9/30/22 | | 24.72 | 0.11 | — | (10.47) | (10.36) | (0.44) | (1.39) | (1.83) | — | (12.19) | 12.53 | (45.16) | 42,670 | 1.44 (6)(8) | 1.44 | 0.55 | 21 |
| 10/1/20 to 9/30/21 | | 19.15 | 0.04 | — | 5.74 | 5.78 | (0.16) | (0.05) | (0.21) | — (11) | 5.57 | 24.72 | 30.29 (13) | 100,353 | 1.53 (7)(8) | 1.53 | 0.18 | 23 |
| 10/1/19 to 9/30/20 | | 16.95 | 0.02 | — | 2.51 | 2.53 | (0.33) | — | (0.33) | — | 2.20 | 19.15 | 14.98 | 78,101 | 1.56 (8) | 1.56 | 0.13 | 48 |
| 10/1/18 to 9/30/19 | | 17.15 | 0.44 | — | (0.47) | (0.03) | (0.06) | (0.11) | (0.17) | — (11) | (0.20) | 16.95 | (0.05) (13) | 70,958 | 1.55 (8) | 1.55 | 2.66 | 30 |
| Class C | | | | | | | | | | | | | | | | | | |
| 10/1/22 to 9/30/23 | | $12.26 | 0.05 | — | 3.16 | 3.21 | — | — | — | — | 3.21 | $15.47 | 26.18 % | $ 17,814 | 2.20 % | 2.21 % | 0.30 % | 16 % |
| 10/1/21 to 9/30/22 | | 24.23 | (0.03) | — | (10.28) | (10.31) | (0.27) | (1.39) | (1.66) | — | (11.97) | 12.26 | (45.57) | 18,430 | 2.20 (6)(8) | 2.20 | (0.18) | 21 |
| 10/1/20 to 9/30/21 | | 18.78 | (0.13) | — | 5.65 | 5.52 | (0.02) | (0.05) | (0.07) | — (11) | 5.45 | 24.23 | 29.43 (13) | 42,388 | 2.25 (7) | 2.25 | (0.55) | 23 |
| 10/1/19 to 9/30/20 | | 16.64 | (0.11) | — | 2.45 | 2.34 | (0.20) | — | (0.20) | — | 2.14 | 18.78 | 14.07 | 33,524 | 2.27 (8) | 2.27 | (0.65) | 48 |
| 10/1/18 to 9/30/19 | | 16.89 | 0.32 | — | (0.46) | (0.14) | — | (0.11) | (0.11) | — (11) | (0.25) | 16.64 | (0.78) (13) | 37,210 | 2.29 (8) | 2.29 | 1.93 | 30 |
| Class I | | | | | | | | | | | | | | | | | | |
| 10/1/22 to 9/30/23 | | $12.58 | 0.21 | — | 3.25 | 3.46 | — | — | — | — | 3.46 | $16.04 | 27.50 % | $ 809,503 | 1.20 % | 1.20 % | 1.31 % | 16 % |
| 10/1/21 to 9/30/22 | | 24.86 | 0.15 | — | (10.51) | (10.36) | (0.53) | (1.39) | (1.92) | — | (12.28) | 12.58 | (45.04) | 927,917 | 1.19 (6)(8) | 1.19 | 0.76 | 21 |
| 10/1/20 to 9/30/21 | | 19.25 | 0.12 | — | 5.76 | 5.88 | (0.22) | (0.05) | (0.27) | — (11) | 5.61 | 24.86 | 30.69 (13) | 2,685,996 | 1.24 (7)(8) | 1.24 | 0.49 | 23 |
| 10/1/19 to 9/30/20 | | 17.03 | 0.06 | — | 2.53 | 2.59 | (0.37) | — | (0.37) | — | 2.22 | 19.25 | 15.28 | 1,705,562 | 1.28 (8) | 1.28 | 0.35 | 48 |
| 10/1/18 to 9/30/19 | | 17.24 | 0.50 | — | (0.49) | 0.01 | (0.11) | (0.11) | (0.22) | — (11) | (0.21) | 17.03 | 0.18 (13) | 1,372,552 | 1.30 (8) | 1.30 | 2.96 | 30 |
| Class R6 | | | | | | | | | | | | | | | | | | |
| 10/1/22 to 9/30/23 | | $12.60 | 0.22 | — | 3.26 | 3.48 | — | — | — | — | 3.48 | $16.08 | 27.62 % | $ 76,606 | 1.09 % | 1.09 % | 1.38 % | 16 % |
| 10/1/21 to 9/30/22 | | 24.89 | 0.17 | — | (10.52) | (10.35) | (0.55) | (1.39) | (1.94) | — | (12.29) | 12.60 | (44.97) | 80,462 | 1.09 (6)(8) | 1.09 | 0.86 | 21 |
| 10/1/20 to 9/30/21 | | 19.27 | 0.16 | — | 5.75 | 5.91 | (0.24) | (0.05) | (0.29) | — (11) | 5.62 | 24.89 | 30.82 (13) | 277,279 | 1.15 (7)(8) | 1.15 | 0.65 | 23 |
| 10/1/19 to 9/30/20 | | 17.05 | 0.11 | — | 2.50 | 2.61 | (0.39) | — | (0.39) | — | 2.22 | 19.27 | 15.35 | 75,086 | 1.18 (8) | 1.18 | 0.65 | 48 |
| 10/1/18 to 9/30/19 | | 17.26 | 0.43 | — | (0.41) | 0.02 | (0.12) | (0.11) | (0.23) | — (11) | (0.21) | 17.05 | 0.24 (13) | 40,866 | 1.19 (8) | 1.19 | 2.60 | 30 |
The footnote legend is at the end of the financial highlights.
See Notes to Financial Statements
VIRTUS OPPORTUNITIES TRUST
FINANCIAL HIGHLIGHTS (Continued)
SELECTED PER SHARE DATA AND RATIOS FOR A SHARE OUTSTANDING
THROUGHOUT EACH PERIOD
| | | Net Asset Value,
Beginning of Period | Net Investment Income (Loss)(1) | Capital Gains Distributions
Received from Underlying Funds(1) | Net Realized and
Unrealized Gain (Loss) | Total from Investment Operations | Dividends from
Net Investment Income | Distributions from
Net Realized Gains | Total Distributions | Payment from Affiliate(1) | Change in Net Asset Value | Net Asset Value, End of Period | Total Return(2)(3) | Net Assets, End of Period
(in thousands) | Ratio of Net Expenses to
Average Net Assets(4)(5) | Ratio of Gross Expenses
to Average Net Assets(4)(5) | Ratio of Net Investment Income (Loss)
to Average Net Assets(4) | Portfolio Turnover Rate(3) |
| | | | | | | | | | | | | | | | | | | |
| Vontobel Emerging Markets Opportunities Fund | | | | | | | | | | | | | | | | | | |
| Class A | | | | | | | | | | | | | | | | | | |
| 10/1/22 to 9/30/23 | | $ 7.05 | 0.05 | — | (0.10) | (0.05) | — | — | — | — | (0.05) | $ 7.00 | (0.71) % | $ 152,257 | 1.58 % | 1.59 % | 0.72 % | 52 % |
| 10/1/21 to 9/30/22 | | 11.91 | 0.02 | — | (2.55) | (2.53) | (0.10) | (2.23) | (2.33) | — | (4.86) | 7.05 | (26.30) | 193,151 | 1.58 (6) | 1.58 | 0.18 | 54 |
| 10/1/20 to 9/30/21 | | 11.01 | (0.04) | — | 0.99 | 0.95 | (0.05) | — | (0.05) | — | 0.90 | 11.91 | 8.58 | 362,477 | 1.54 | 1.54 | (0.33) | 67 |
| 10/1/19 to 9/30/20 | | 10.65 | 0.01 | — | 0.55 | 0.56 | (0.16) | (0.04) | (0.20) | — | 0.36 | 11.01 | 5.22 | 369,053 | 1.57 | 1.57 | 0.07 | 55 |
| 10/1/18 to 9/30/19 | | 10.44 | 0.12 | — | 0.42 | 0.54 | (0.06) | (0.27) | (0.33) | — | 0.21 | 10.65 | 5.64 | 479,456 | 1.57 | 1.57 | 1.20 | 30 |
| Class C | | | | | | | | | | | | | | | | | | |
| 10/1/22 to 9/30/23 | | $ 6.68 | — (11) | — | (0.09) | (0.09) | — | — | — | — | (0.09) | $ 6.59 | (1.35) % | $ 17,208 | 2.27 % | 2.28 % | (0.03) % | 52 % |
| 10/1/21 to 9/30/22 | | 11.46 | (0.05) | — | (2.42) | (2.47) | (0.08) | (2.23) | (2.31) | — | (4.78) | 6.68 | (26.85) | 31,378 | 2.28 (6) | 2.28 | (0.55) | 54 |
| 10/1/20 to 9/30/21 | | 10.62 | (0.13) | — | 0.97 | 0.84 | — | — | — | — | 0.84 | 11.46 | 7.91 | 72,832 | 2.22 | 2.22 | (1.06) | 67 |
| 10/1/19 to 9/30/20 | | 10.27 | (0.06) | — | 0.52 | 0.46 | (0.07) | (0.04) | (0.11) | — | 0.35 | 10.62 | 4.49 | 99,139 | 2.25 | 2.25 | (0.61) | 55 |
| 10/1/18 to 9/30/19 | | 10.08 | 0.04 | — | 0.42 | 0.46 | — | (0.27) | (0.27) | — | 0.19 | 10.27 | 4.93 | 135,668 | 2.25 | 2.25 | 0.41 | 30 |
| Class I | | | | | | | | | | | | | | | | | | |
| 10/1/22 to 9/30/23 | | $ 7.40 | 0.08 | — | (0.11) | (0.03) | — | — | — | — | (0.03) | $ 7.37 | (0.41) % | $ 942,601 | 1.24 % | 1.25 % | 1.04 % | 52 % |
| 10/1/21 to 9/30/22 | | 12.35 | 0.04 | — | (2.65) | (2.61) | (0.11) | (2.23) | (2.34) | — | (4.95) | 7.40 | (26.00) | 1,572,456 | 1.24 (6) | 1.24 | 0.46 | 54 |
| 10/1/20 to 9/30/21 | | 11.41 | — (11) | — | 1.02 | 1.02 | (0.08) | — | (0.08) | — | 0.94 | 12.35 | 8.93 | 4,124,645 | 1.23 | 1.23 | (0.03) | 67 |
| 10/1/19 to 9/30/20 | | 11.03 | 0.04 | — | 0.58 | 0.62 | (0.20) | (0.04) | (0.24) | — | 0.38 | 11.41 | 5.57 | 5,178,655 | 1.26 | 1.26 | 0.38 | 55 |
| 10/1/18 to 9/30/19 | | 10.82 | 0.17 | — | 0.42 | 0.59 | (0.11) | (0.27) | (0.38) | — | 0.21 | 11.03 | 5.91 | 6,228,010 | 1.25 | 1.25 | 1.56 | 30 |
| Class R6 | | | | | | | | | | | | | | | | | | |
| 10/1/22 to 9/30/23 | | $ 7.45 | 0.10 | — | (0.11) | (0.01) | — | — | — | — | (0.01) | $ 7.44 | (0.13) % | $ 45,302 | 0.97 % | 1.16 % | 1.30 % | 52 % |
| 10/1/21 to 9/30/22 | | 12.40 | 0.07 | — | (2.67) | (2.60) | (0.12) | (2.23) | (2.35) | — | (4.95) | 7.45 | (25.82) | 99,619 | 1.00 (6) | 1.16 | 0.74 | 54 |
| 10/1/20 to 9/30/21 | | 11.44 | 0.03 | — | 1.03 | 1.06 | (0.10) | — | (0.10) | — | 0.96 | 12.40 | 9.21 | 204,006 | 0.98 | 1.13 | 0.23 | 67 |
| 10/1/19 to 9/30/20 | | 11.04 | 0.06 | — | 0.59 | 0.65 | (0.21) | (0.04) | (0.25) | — | 0.40 | 11.44 | 5.86 | 200,523 | 0.98 | 1.15 | 0.59 | 55 |
| 10/1/18 to 9/30/19 | | 10.82 | 0.19 | — | 0.42 | 0.61 | (0.12) | (0.27) | (0.39) | — | 0.22 | 11.04 | 6.11 | 119,946 | 1.03 (7) | 1.13 | 1.80 | 30 |
| | | | | | | | | | | | | | | | | | | |
| Vontobel Foreign Opportunities Fund | | | | | | | | | | | | | | | | | | |
| Class A | | | | | | | | | | | | | | | | | | |
| 10/1/22 to 9/30/23 | | $20.49 | 0.01 | — | 3.75 | 3.76 | — | (0.01) | (0.01) | — | 3.75 | $24.24 | 18.36 % | $ 136,675 | 1.38 % | 1.40 % | 0.02 % | 55 % |
| 10/1/21 to 9/30/22 | | 34.97 | (0.12) | — | (7.42) | (7.54) | — | (6.94) | (6.94) | — | (14.48) | 20.49 | (27.20) | 132,361 | 1.40 (6)(8)(9) | 1.40 | (0.46) | 57 |
| 10/1/20 to 9/30/21 | | 31.75 | (0.15) | — | 5.63 | 5.48 | — | (2.26) | (2.26) | — | 3.22 | 34.97 | 17.95 | 204,395 | 1.39 | 1.40 | (0.43) | 81 |
| 10/1/19 to 9/30/20 | | 30.44 | (0.10) | — | 3.64 | 3.54 | (0.09) | (2.14) | (2.23) | — | 1.31 | 31.75 | 12.02 | 176,146 | 1.39 | 1.43 | (0.35) | 63 |
| 10/1/18 to 9/30/19 | | 34.62 | 0.11 | — | 1.25 | 1.36 | (0.15) | (5.39) | (5.54) | — | (4.18) | 30.44 | 7.08 | 186,206 | 1.40 (7) | 1.44 | 0.38 | 64 |
| Class C | | | | | | | | | | | | | | | | | | |
| 10/1/22 to 9/30/23 | | $19.22 | (0.15) | — | 3.53 | 3.38 | — | (0.01) | (0.01) | — | 3.37 | $22.59 | 17.60 % | $ 5,396 | 2.04 % | 2.14 % | (0.66) % | 55 % |
| 10/1/21 to 9/30/22 | | 33.41 | (0.30) | — | (6.95) | (7.25) | — | (6.94) | (6.94) | — | (14.19) | 19.22 | (27.68) | 6,744 | 2.06 (6) | 2.14 | (1.18) | 57 |
| 10/1/20 to 9/30/21 | | 30.62 | (0.37) | — | 5.42 | 5.05 | — | (2.26) | (2.26) | — | 2.79 | 33.41 | 17.16 | 18,014 | 2.05 | 2.12 | (1.17) | 81 |
| 10/1/19 to 9/30/20 | | 29.54 | (0.29) | — | 3.51 | 3.22 | — | (2.14) | (2.14) | — | 1.08 | 30.62 | 11.26 | 30,294 | 2.05 | 2.12 | (1.01) | 63 |
| 10/1/18 to 9/30/19 | | 33.83 | (0.10) | — | 1.23 | 1.13 | (0.03) | (5.39) | (5.42) | — | (4.29) | 29.54 | 6.40 | 41,638 | 2.07 (7) | 2.13 | (0.34) | 64 |
The footnote legend is at the end of the financial highlights.
See Notes to Financial Statements
VIRTUS OPPORTUNITIES TRUST
FINANCIAL HIGHLIGHTS (Continued)
SELECTED PER SHARE DATA AND RATIOS FOR A SHARE OUTSTANDING
THROUGHOUT EACH PERIOD
| | | Net Asset Value,
Beginning of Period | Net Investment Income (Loss)(1) | Capital Gains Distributions
Received from Underlying Funds(1) | Net Realized and
Unrealized Gain (Loss) | Total from Investment Operations | Dividends from
Net Investment Income | Distributions from
Net Realized Gains | Total Distributions | Payment from Affiliate(1) | Change in Net Asset Value | Net Asset Value, End of Period | Total Return(2)(3) | Net Assets, End of Period
(in thousands) | Ratio of Net Expenses to
Average Net Assets(4)(5) | Ratio of Gross Expenses
to Average Net Assets(4)(5) | Ratio of Net Investment Income (Loss)
to Average Net Assets(4) | Portfolio Turnover Rate(3) |
| Vontobel Foreign Opportunities Fund (Continued) | | | | | | | | | | | | | | | | | | |
| Class I | | | | | | | | | | | | | | | | | | |
| 10/1/22 to 9/30/23 | | $20.58 | 0.08 | — | 3.78 | 3.86 | — | (0.01) | (0.01) | — | 3.85 | $24.43 | 18.77 % | $ 457,233 | 1.06 % | 1.12 % | 0.34 % | 55 % |
| 10/1/21 to 9/30/22 | | 35.00 | (0.04) | — | (7.44) | (7.48) | — | (6.94) | (6.94) | — | (14.42) | 20.58 | (26.97) | 440,340 | 1.08 (6) | 1.14 | (0.16) | 57 |
| 10/1/20 to 9/30/21 | | 31.74 | (0.04) | — | 5.62 | 5.58 | (0.06) | (2.26) | (2.32) | — | 3.26 | 35.00 | 18.32 | 803,474 | 1.07 | 1.11 | (0.12) | 81 |
| 10/1/19 to 9/30/20 | | 30.43 | — (11) | — | 3.63 | 3.63 | (0.18) | (2.14) | (2.32) | — | 1.31 | 31.74 | 12.37 | 784,711 | 1.07 | 1.13 | (0.02) | 63 |
| 10/1/18 to 9/30/19 | | 34.70 | 0.20 | — | 1.24 | 1.44 | (0.32) | (5.39) | (5.71) | — | (4.27) | 30.43 | 7.43 | 761,809 | 1.08 (7) | 1.13 | 0.68 | 64 |
| Class R6 | | | | | | | | | | | | | | | | | | |
| 10/1/22 to 9/30/23 | | $20.63 | 0.11 | — | 3.79 | 3.90 | — | (0.01) | (0.01) | — | 3.89 | $24.52 | 18.91 % | $ 37,467 | 0.94 % | 1.04 % | 0.46 % | 55 % |
| 10/1/21 to 9/30/22 | | 35.03 | — (11) | — | (7.46) | (7.46) | — | (6.94) | (6.94) | — | (14.40) | 20.63 | (26.88) | 49,057 | 0.97 (6) | 1.06 | — (14) | 57 |
| 10/1/20 to 9/30/21 | | 31.76 | (0.01) | — | 5.63 | 5.62 | (0.09) | (2.26) | (2.35) | — | 3.27 | 35.03 | 18.44 | 66,705 | 0.95 | 1.03 | (0.03) | 81 |
| 10/1/19 to 9/30/20 | | 30.44 | 0.03 | — | 3.64 | 3.67 | (0.21) | (2.14) | (2.35) | — | 1.32 | 31.76 | 12.49 | 84,764 | 0.95 | 1.04 | 0.11 | 63 |
| 10/1/18 to 9/30/19 | | 34.72 | 0.29 | — | 1.18 | 1.47 | (0.36) | (5.39) | (5.75) | — | (4.28) | 30.44 | 7.57 | 69,198 | 0.96 (7) | 1.04 | 0.97 | 64 |
| | | | | | | | | | | | | | | | | | | |
| Vontobel Global Opportunities Fund | | | | | | | | | | | | | | | | | | |
| Class A | | | | | | | | | | | | | | | | | | |
| 10/1/22 to 9/30/23 | | $13.53 | 0.02 | — | 2.59 | 2.61 | — | (1.46) | (1.46) | — | 1.15 | $14.68 | 20.16 % | $ 92,451 | 1.36 % | 1.40 % | 0.11 % | 43 % |
| 10/1/21 to 9/30/22 | | 21.43 | (0.06) | — | (4.06) | (4.12) | (0.28) | (3.50) | (3.78) | — | (7.90) | 13.53 | (24.10) | 87,009 | 1.37 (6) | 1.40 | (0.32) | 33 |
| 10/1/20 to 9/30/21 | | 18.63 | (0.09) | — | 3.31 | 3.22 | — | (0.42) | (0.42) | — | 2.80 | 21.43 | 17.47 | 130,814 | 1.36 | 1.39 | (0.43) | 49 |
| 10/1/19 to 9/30/20 | | 16.37 | (0.05) | — | 2.65 | 2.60 | — | (0.34) | (0.34) | — | 2.26 | 18.63 | 16.03 | 111,264 | 1.36 | 1.41 | (0.28) | 48 |
| 10/1/18 to 9/30/19 | | 17.02 | 0.02 | — | 0.97 | 0.99 | — (11) | (1.64) | (1.64) | — | (0.65) | 16.37 | 7.62 | 99,951 | 1.37 (7) | 1.40 | 0.11 | 35 |
| Class C | | | | | | | | | | | | | | | | | | |
| 10/1/22 to 9/30/23 | | $10.38 | (0.07) | — | 1.97 | 1.90 | — | (1.46) | (1.46) | — | 0.44 | $10.82 | 19.36 % | $ 6,842 | 2.11 % | 2.16 % | (0.67) % | 43 % |
| 10/1/21 to 9/30/22 | | 17.37 | (0.15) | — | (3.09) | (3.24) | (0.25) | (3.50) | (3.75) | — | (6.99) | 10.38 | (24.71) | 8,393 | 2.12 (6) | 2.15 | (1.10) | 33 |
| 10/1/20 to 9/30/21 | | 15.28 | (0.20) | — | 2.71 | 2.51 | — | (0.42) | (0.42) | — | 2.09 | 17.37 | 16.64 | 19,745 | 2.11 | 2.13 | (1.21) | 49 |
| 10/1/19 to 9/30/20 | | 13.58 | (0.14) | — | 2.18 | 2.04 | — | (0.34) | (0.34) | — | 1.70 | 15.28 | 15.19 | 25,626 | 2.11 | 2.13 | (1.03) | 48 |
| 10/1/18 to 9/30/19 | | 14.51 | (0.08) | — | 0.79 | 0.71 | — | (1.64) | (1.64) | — | (0.93) | 13.58 | 6.89 | 28,147 | 2.12 (7) | 2.16 | (0.64) | 35 |
| Class I | | | | | | | | | | | | | | | | | | |
| 10/1/22 to 9/30/23 | | $13.63 | 0.05 | — | 2.63 | 2.68 | — | (1.46) | (1.46) | — | 1.22 | $14.85 | 20.55 % | $ 84,092 | 1.09 % | 1.16 % | 0.36 % | 43 % |
| 10/1/21 to 9/30/22 | | 21.53 | (0.01) | — | (4.10) | (4.11) | (0.29) | (3.50) | (3.79) | — | (7.90) | 13.63 | (23.93) | 96,319 | 1.10 (6) | 1.16 | (0.07) | 33 |
| 10/1/20 to 9/30/21 | | 18.67 | (0.03) | — | 3.31 | 3.28 | — | (0.42) | (0.42) | — | 2.86 | 21.53 | 17.76 | 178,017 | 1.09 | 1.13 | (0.16) | 49 |
| 10/1/19 to 9/30/20 | | 16.39 | — (11) | — | 2.66 | 2.66 | (0.04) | (0.34) | (0.38) | — | 2.28 | 18.67 | 16.41 | 153,902 | 1.09 | 1.17 | (0.02) | 48 |
| 10/1/18 to 9/30/19 | | 17.02 | 0.06 | — | 0.99 | 1.05 | (0.04) | (1.64) | (1.68) | — | (0.63) | 16.39 | 7.98 | 124,340 | 1.10 (7) | 1.17 | 0.41 | 35 |
| Class R6 | | | | | | | | | | | | | | | | | | |
| 10/1/22 to 9/30/23 | | $13.72 | 0.09 | — | 2.64 | 2.73 | — | (1.46) | (1.46) | — | 1.27 | $14.99 | 20.81 % | $ 79,547 | 0.90 % | 1.06 % | 0.58 % | 43 % |
| 10/1/21 to 9/30/22 | | 21.63 | 0.02 | — | (4.12) | (4.10) | (0.31) | (3.50) | (3.81) | — | (7.91) | 13.72 | (23.80) | 56,389 | 0.91 (6) | 1.07 | 0.11 | 33 |
| 10/1/20 to 9/30/21 | | 18.72 | — (11) | — | 3.33 | 3.33 | — | (0.42) | (0.42) | — | 2.91 | 21.63 | 17.98 | 89,295 | 0.90 | 1.05 | 0.02 | 49 |
| 10/1/19 to 9/30/20 | | 16.42 | 0.03 | — | 2.66 | 2.69 | (0.05) | (0.34) | (0.39) | — | 2.30 | 18.72 | 16.59 | 89,980 | 0.90 | 1.08 | 0.18 | 48 |
| 10/1/18 to 9/30/19 | | 17.03 | 0.13 | — | 0.94 | 1.07 | (0.04) | (1.64) | (1.68) | — | (0.61) | 16.42 | 8.19 | 65,704 | 0.90 (7) | 1.08 | 0.80 | 35 |
The footnote legend is at the end of the financial highlights.
See Notes to Financial Statements
VIRTUS OPPORTUNITIES TRUST
FINANCIAL HIGHLIGHTS (Continued)
SELECTED PER SHARE DATA AND RATIOS FOR A SHARE OUTSTANDING
THROUGHOUT EACH PERIOD
| | | Net Asset Value,
Beginning of Period | Net Investment Income (Loss)(1) | Capital Gains Distributions
Received from Underlying Funds(1) | Net Realized and
Unrealized Gain (Loss) | Total from Investment Operations | Dividends from
Net Investment Income | Distributions from
Net Realized Gains | Total Distributions | Payment from Affiliate(1) | Change in Net Asset Value | Net Asset Value, End of Period | Total Return(2)(3) | Net Assets, End of Period
(in thousands) | Ratio of Net Expenses to
Average Net Assets(4)(5) | Ratio of Gross Expenses
to Average Net Assets(4)(5) | Ratio of Net Investment Income (Loss)
to Average Net Assets(4) | Portfolio Turnover Rate(3) |
| | | | | | | | | | | | | | | | | | | |
| Vontobel Greater European Opportunities Fund | | | | | | | | | | | | | | | | | | |
| Class A | | | | | | | | | | | | | | | | | | |
| 10/1/22 to 9/30/23 | | $ 8.86 | 0.05 | — | 1.50 | 1.55 | — | — | — | — | 1.55 | $10.41 | 17.49 % | $ 2,300 | 1.36 % (7) | 2.54 % | 0.42 % | 39 % |
| 10/1/21 to 9/30/22 | | 13.04 | (0.01) | — | (3.63) | (3.64) | (0.02) | (0.52) | (0.54) | — | (4.18) | 8.86 | (29.21) | 2,023 | 1.41 (6) | 2.19 | (0.12) | 29 |
| 10/1/20 to 9/30/21 | | 11.24 | (0.01) | — | 2.36 | 2.35 | — | (0.55) | (0.55) | — | 1.80 | 13.04 | 21.44 | 2,853 | 1.41 (7) | 2.34 | (0.11) | 33 |
| 10/1/19 to 9/30/20 | | 11.55 | (0.02) | — | 1.09 | 1.07 | (0.06) | (1.32) | (1.38) | — | (0.31) | 11.24 | 9.82 | 1,486 | 1.45 | 3.58 | (0.19) | 51 |
| 10/1/18 to 9/30/19 | | 15.62 | 0.07 | — | (0.38) | (0.31) | (0.14) | (3.62) | (3.76) | — | (4.07) | 11.55 | 2.14 | 1,378 | 1.45 | 2.99 | 0.62 | 16 |
| Class C | | | | | | | | | | | | | | | | | | |
| 10/1/22 to 9/30/23 | | $ 8.41 | (0.03) | — | 1.42 | 1.39 | — | — | — | — | 1.39 | $ 9.80 | 16.53 % | $ 162 | 2.12 % (7) | 3.23 % | (0.35) % | 39 % |
| 10/1/21 to 9/30/22 | | 12.47 | (0.10) | — | (3.44) | (3.54) | — | (0.52) | (0.52) | — | (4.06) | 8.41 | (29.72) | 207 | 2.16 (6) | 2.86 | (0.89) | 29 |
| 10/1/20 to 9/30/21 | | 10.85 | (0.11) | — | 2.28 | 2.17 | — | (0.55) | (0.55) | — | 1.62 | 12.47 | 20.52 | 386 | 2.16 (7) | 3.06 | (0.95) | 33 |
| 10/1/19 to 9/30/20 | | 11.21 | (0.09) | — | 1.05 | 0.96 | — | (1.32) | (1.32) | — | (0.36) | 10.85 | 9.01 | 430 | 2.20 | 4.31 | (0.91) | 51 |
| 10/1/18 to 9/30/19 | | 15.22 | (0.04) | — | (0.35) | (0.39) | — | (3.62) | (3.62) | — | (4.01) | 11.21 | 1.34 | 579 | 2.20 | 3.73 | (0.32) | 16 |
| Class I | | | | | | | | | | | | | | | | | | |
| 10/1/22 to 9/30/23 | | $ 8.89 | 0.07 | — | 1.51 | 1.58 | — | — | — | — | 1.58 | $10.47 | 17.77 % | $ 3,821 | 1.11 % (7) | 2.25 % | 0.63 % | 39 % |
| 10/1/21 to 9/30/22 | | 13.06 | 0.01 | — | (3.62) | (3.61) | (0.04) | (0.52) | (0.56) | — | (4.17) | 8.89 | (29.00) | 3,932 | 1.16 (6) | 1.92 | 0.12 | 29 |
| 10/1/20 to 9/30/21 | | 11.23 | 0.01 | — | 2.37 | 2.38 | — | (0.55) | (0.55) | — | 1.83 | 13.06 | 21.74 | 6,561 | 1.16 (7) | 2.05 | 0.12 | 33 |
| 10/1/19 to 9/30/20 | | 11.55 | 0.01 | — | 1.09 | 1.10 | (0.10) | (1.32) | (1.42) | — | (0.32) | 11.23 | 10.06 | 2,562 | 1.20 | 3.31 | 0.12 | 51 |
| 10/1/18 to 9/30/19 | | 15.65 | 0.12 | — | (0.41) | (0.29) | (0.19) | (3.62) | (3.81) | — | (4.10) | 11.55 | 2.36 | 2,280 | 1.20 | 2.72 | 1.00 | 16 |
| Footnote Legend: |
| (1) | Calculated using average shares outstanding. |
| (2) | Sales charges, where applicable, are not reflected in the total return calculation. |
| (3) | Not annualized for periods less than one year. |
| (4) | Annualized for periods less than one year. |
| (5) | The Funds will also indirectly bear their prorated share of expenses of any underlying funds in which they invest. Such expenses are not included in the calculation of this ratio. |
| (6) | Net expense ratio includes extraordinary proxy expenses. |
| (7) | Due to a change in expense cap, the ratio shown is a blended expense ratio. |
| (8) | The share class is currently under its expense limitation. |
| (9) | See 3D in the Notes to Financial statements for information on recapture of expenses previously reimbursed and/or waived. |
| (10) | Inception date. |
| (11) | Amount is less than $0.005 per share. |
| (12) | Portfolio turnover is representative of the Fund for the entire period. |
| (13) | Payment from affiliate had no impact on total return. |
| (14) | Amount is less than 0.005%. |
See Notes to Financial Statements
VIRTUS OPPORTUNITIES TRUST
NOTES TO FINANCIAL STATEMENTS
September 30, 2023
Note 1. Organization
Virtus Opportunities Trust (the “Trust”) is organized as a Delaware statutory trust and is registered under the Investment Company Act of 1940, as amended (the “1940 Act”), as an open-end management investment company.
As of the date of this report, 25 funds of the Trust are offered for sale, of which 12 (each a “Fund” or collectively, the “Funds”) are reported in this annual report. Each Fund has a distinct investment objective and all of the Funds except the Duff & Phelps Real Asset Fund and KAR Developing Markets Fund are diversified. Each Fund’s investment objective is outlined in its respective Fund Summary page. There is no guarantee that a Fund will achieve its objective(s).
The Duff & Phelps Real Asset Fund is a fund of funds whose primary investment strategy involves investing in other investment companies, such as ETFs and other mutual funds.
All of the Funds offer Class A shares, Class C shares, and Class I shares. All of the Funds with the exception of the Duff & Phelps International Real Estate Securities Fund and Vontobel Greater European Opportunities Fund also offer Class R6 shares.
Class A shares of the Funds are sold with a front-end sales charge of up to 5.50% with some exceptions. Generally, Class A shares are not subject to any charges by the Funds when redeemed; however, a 0.50% – 1% contingent deferred sales charge (“CDSC”) may be imposed on certain redemptions made within a certain period following purchases on which a finder’s fee has been paid. The period for which such CDSC applies for the Funds is 18 months. The CDSC period begins on the last day of the month preceding the month in which the purchase was made.
Class C shares are generally sold with a 1% CDSC, applicable if redeemed within one year of purchase. Class C shares and any reinvested dividends and other distributions paid on such shares, will be automatically converted to Class A shares of the same Fund following a required holding period, which as of March 1, 2021, was eight years. Effective January 1, 2019 to February 28, 2021, with certain exceptions, Class C shares and any reinvested dividends and other distributions paid on such shares, were automatically converted to Class A shares of the same Fund ten years after the purchase date. If an investor intends to purchase greater than $999,999 of Class C shares, and the purchase would qualify for Class A shares with no load, then the purchase will automatically be made into a purchase of Class A shares, thus reducing expenses. Class I shares and Class R6 shares are sold without a front-end sales charge or CDSC.
Class I Shares are offered primarily to clients of financial intermediaries that (i) charge such clients an ongoing fee for advisory, investment, consulting, or similar services; or (ii) have entered into an agreement with the funds’ distributor to offer Class I Shares through a no-load network or platform. Such clients may include pension and profit sharing plans, other employee benefit trusts, endowments, foundations and corporations. Class I Shares are also offered to private and institutional clients of, or referred by, the adviser, a subadviser or their affiliates, and to Trustees of the funds and trustees/directors of affiliated open- and closed-end funds, and directors, officers and employees of Virtus and its affiliates. If you are eligible to purchase and do purchase Class I Shares, you will pay no sales charge at any time. There are no distribution and service fees applicable to Class I Shares.
Class R6 shares are offered without a minimum initial investment to the following investors in plan level or omnibus accounts only (provided that they do not require or receive any compensation, administrative payments, sub-transfer agency payments or service payments with respect to Class R6 shares): (i) qualified retirement plans, including, but not limited to, 401(k) plans, 457 plans, employer-sponsored 403(b) plans, and defined benefit plans; (ii) banks and trust companies; (iii) insurance companies; (iv) financial intermediaries utilizing such shares in fee-based investment advisory programs; (v) registered investment companies; and (vi) non-qualified deferred compensation plans. Other institutional investors may be permitted to purchase Class R6 shares subject to the applicable Fund’s determination of eligibility and may be subject to a $2,500,000 minimum initial investment requirement. In addition, without a minimum initial investment requirement, Class R6 shares are available to any Trustee of the Virtus Funds and trustees/directors of affiliated open- and closed-end funds, directors, officers and employees of Virtus and its affiliates, and a spouse or domestic partner, child or minor grandchild of any such qualifying individual (in each case either individually or jointly with other investors), provided in each case that those shares are held directly with the Transfer Agent or in an eligible account. Class R6 shares do not carry sales commissions or pay Rule 12b-1 fees. No compensation, administrative payments, sub-transfer agency payments or service payments are paid to brokers or other entities from Fund assets or the Funds’ distributor’s or an affiliate’s resources on sales of or investments in Class R6 shares.
The Funds may impose an annual fee on accounts having balances of less than $2,500. The small account fee may be waived in certain circumstances, as disclosed in the prospectuses and/or statement of additional information. The fees collected will be used to offset certain expenses of the Funds. These fees are reflected as “Less low balance account fees” in each Fund’s Statement of Operations for the period, as applicable.
Each class of shares has identical voting, dividend, liquidation and other rights and the same terms and conditions, except that each class bears any expenses attributable specifically to that class (“class-specific expenses”) and has exclusive voting rights with respect to any Rule 12b-1 and/or shareholder service plan (“12b-1 Plan”) approved by the Board. Class I shares and Class R6 shares are not subject to a 12b-1 Plan. Class-specific expenses may include shareholder servicing fees, sub-transfer agency fees, and fees under a 12b-1 Plan, as well as certain other expenses as designated by the Funds’ Treasurer and approved by the Board. Investment income, common operating expenses and realized and unrealized gains and losses of each Fund are borne pro-rata by the holders of each class of shares.
Note 2. Significant Accounting Policies
($ reported in thousands)
The Trust is an investment company that follows the accounting and reporting guidance of the Financial Accounting Standards Board (“FASB”) Accounting Standards Codification Topic 946 Financial Services – Investment Companies. The following is a summary of significant accounting policies consistently followed by the Funds in the preparation of their financial statements and for derivatives, included in Note 3 below. The preparation of financial statements in conformity with U.S. generally accepted accounting principles (“U.S. GAAP”) requires management to make estimates and
VIRTUS OPPORTUNITIES TRUST
NOTES TO FINANCIAL STATEMENTS (Continued)
September 30, 2023
assumptions that affect the reported amounts of assets and liabilities, disclosure of contingent assets and liabilities at the date of the financial statements, and the reported amounts of increases and decreases in net assets from operations during the reporting period. Actual results could differ from those estimates and those differences could be significant.
| A. | Security Valuation |
| | The Funds’ Board of Trustees (the “Board”) has designated the Investment Adviser as the valuation designee to perform fair valuations pursuant to Rule 2a-5 under the Investment Company Act of 1940. Each Fund utilizes a fair value hierarchy which prioritizes the inputs to valuation techniques used to measure fair value into three broad levels. The Funds’ policy is to recognize transfers into or out of Level 3 at the end of the reporting period. |
| | • Level 1 – quoted prices in active markets for identical securities (security types generally include listed equities). |
• Level 2 – prices determined using other significant observable inputs (including quoted prices for similar securities, interest rates, prepayment speeds, credit risk, etc.).
• Level 3 – prices determined using significant unobservable inputs (including the Investment Adviser’s Valuation Committee’s own assumptions in determining the fair value of investments).
A description of the valuation techniques applied to a Fund’s major categories of assets and liabilities measured at fair value on a recurring basis is as follows:
Equity securities are valued at the official closing price (typically last sale) on the exchange on which the securities are primarily traded or, if no closing price is available, at the last bid price and are categorized as Level 1 in the hierarchy. Illiquid, restricted equity securities and illiquid private placements are internally fair valued by the Investment Adviser’s Valuation Committee, and are generally categorized as Level 3 in the hierarchy.
Certain non-U.S. securities may be fair valued in cases where closing prices are not readily available or are deemed not reflective of readily available market prices. For example, significant events (such as movement in the U.S. securities market, or other regional and local developments) may occur between the time that non-U.S. markets close (where the security is principally traded) and the time that a Fund calculates its net asset value (“NAV”) at the close of regular trading on the New York Stock Exchange (“NYSE”) (generally 4 p.m. Eastern time) that may impact the value of securities traded in these non-U.S. markets. In such cases, the Funds fair value non-U.S. securities using an independent pricing service which considers the correlation of the trading patterns of the non-U.S. security to the intraday trading in the U.S. markets for investments such as ADRs, financial futures, ETFs, and certain indexes, as well as prices for similar securities. Such fair valuations are categorized as Level 2 in the hierarchy. Because the frequency of significant events is not predictable, fair valuation of certain non-U.S. common stocks may occur on a frequent basis.
Debt instruments, including convertible bonds, and restricted securities, are valued based on evaluated quotations received from independent pricing services or from dealers who make markets in such securities. For most bond types, the pricing service utilizes matrix pricing that considers one or more of the following factors: yield or price of bonds of comparable quality, coupon, maturity, current cash flows, type, activity of the underlying equities, and current day trade information, as well as dealer supplied prices. These valuations are generally categorized as Level 2 in the hierarchy. Structured debt instruments, such as mortgage-backed and asset-backed securities may also incorporate collateral analysis and utilize cash flow models for valuation and are generally categorized as Level 2 in the hierarchy. Pricing services do not provide pricing for all securities and therefore indicative bids from dealers are utilized which are based on pricing models used by market makers in the security and are generally categorized as Level 2 in the hierarchy. Debt instruments that are internally fair valued by the Investment Adviser’s Valuation Committee are generally categorized as Level 3 in the hierarchy.
Listed derivatives, such as options and futures, that are actively traded are valued at the last posted settlement price from the exchange where they are principally traded and are categorized as Level 1 in the hierarchy. Over-the-counter (“OTC”) derivative contracts, which include forward currency contracts and equity-linked instruments, do not require material subjectivity as pricing inputs are observed from actively quoted markets and are categorized as Level 2 in the hierarchy.
Investments in open-end mutual funds are valued at NAV. Investments in closed-end funds and ETFs are valued as of the close of regular trading on the NYSE each business day. Each is categorized as Level 1 in the hierarchy.
A summary of the inputs used to value a Fund’s net assets by each major security type is disclosed at the end of the Schedule of Investments for each Fund. The inputs or methodologies used for valuing securities are not necessarily an indication of the risk associated with investing in those securities.
| B. | Security Transactions and Investment Income |
| | Security transactions are recorded on the trade date. Realized gains and losses from the sale of securities are determined on the identified cost basis. Dividend income and capital gain distributions are recognized on the ex-dividend date or, in the case of certain foreign securities, as soon as a Fund is notified. Interest income is recorded on the accrual basis. Each Fund amortizes premiums and accretes discounts using the effective interest method. Premiums on callable debt instruments are amortized to interest income to the earliest call date using the effective interest method. Any distributions from underlying funds are recorded in accordance with the character of the distributions as designated by the underlying funds. |
| | Dividend income from REITs is recorded using management’s estimate of the percentage of income included in distributions received from such investments based on historical information and other industry sources. The return of capital portion of the estimate is a reduction to investment income and a reduction in the cost basis of each investment which increases net realized gain (loss) and net change in unrealized appreciation (depreciation). If the return of capital distributions exceed their cost basis, the distributions are treated as realized gains. The actual amounts of income, return of capital, and capital gains are only determined by each REIT after its fiscal year-end, and may differ from the estimated amounts. |
VIRTUS OPPORTUNITIES TRUST
NOTES TO FINANCIAL STATEMENTS (Continued)
September 30, 2023
| C. | Income Taxes |
| | Each Fund is treated as a separate taxable entity. It is the intention of each Fund to comply with the requirements of Subchapter M of the Internal Revenue Code of 1986, as amended (the “Code”) and to distribute substantially all of its taxable income to its shareholders. Therefore, no provision for federal income taxes or excise taxes has been made. |
| | Certain Funds may be subject to foreign taxes on income, gains on investments or currency repatriation, a portion of which may be recoverable. Each Fund will accrue such taxes and recoveries as applicable based upon current interpretations of the tax rules and regulations that exist in the markets in which it invests. |
| | Management of the Funds has concluded that there are no significant uncertain tax positions that would require recognition in the financial statements. Each Fund’s U.S. federal income tax return is generally subject to examination by the Internal Revenue Service for a period of three years after it is filed. State, local and/or non-U.S. tax returns and/or other filings may be subject to examination for different periods, depending upon the tax rules of each applicable jurisdiction. |
| D. | Distributions to Shareholders |
| | Distributions are recorded by each Fund on the ex-dividend date. Income and capital gain distributions are determined in accordance with income tax regulations which may differ from U.S. GAAP. |
| E. | Expenses |
| | Expenses incurred together by a Fund and other affiliated mutual funds are allocated in proportion to the net assets of each such fund, except where allocation of direct expenses to each Fund and each such other fund, or an alternative allocation method, can be more appropriately used. |
| | In addition to the net annual operating expenses that a Fund bears directly, the shareholders of a Fund indirectly bear the pro-rata expenses of any underlying mutual funds in which the Fund invests. |
| F. | Foreign Currency Transactions |
| | Non-U.S. investment securities and other assets and liabilities denominated in foreign currencies are translated into U.S. dollar amounts at the foreign currency exchange rate effective at the end of the reporting period. Cost of investments is translated at the currency exchange rate effective at the trade date. The gain or loss resulting from a change in currency exchange rates between the trade and settlement date of a portfolio transaction is treated as a gain or loss on foreign currency. Likewise, the gain or loss resulting from a change in currency exchange rates between the date income is accrued and the date it is paid is treated as a gain or loss on foreign currency. For fixed income instruments, the Funds bifurcate that portion of the results of operations arising from changes in foreign exchange rates on investments from the fluctuations arising from changes in the market prices of securities held and such fluctuations are included with the net realized and unrealized gain or loss on foreign currency transactions. For equity securities, the Funds do not isolate that portion of the results of operations arising from changes in foreign exchange rates on investments from the fluctuations arising from changes in the market prices of securities held and such fluctuations are included with the net realized and unrealized gain or loss on investments. |
| G. | Securities Lending |
| | The Funds may loan securities to qualified brokers through a securities lending agency agreement with The Bank of New York Mellon (“BNYM”). Under the securities lending policy, when lending securities a Fund is required to maintain collateral with a market value not less than 100% of the market value of loaned securities. Collateral is adjusted daily in connection with changes in the market value of securities on loan bringing the collateral market value in line with the required percent. Due to timing of collateral adjustments, the market value of collateral held with respect to a loaned security, may be more or less than the value of the security on loan. |
| | Collateral may consist of cash and securities issued by the U.S. Government or its agencies. Cash collateral is invested in a short-term money market fund. Dividends earned on the collateral and premiums paid by the broker are recorded as income by the Fund net of fees and rebates charged/paid by BNYM for its services as securities lending agent and in connection with this securities lending program. Lending portfolio securities involves a risk of delay in the recovery of the loaned securities or in the declining value of the collateral. |
| | Securities lending transactions are entered into by each Fund under a Master Securities Lending Agreement (“MSLA”) which permits the Fund, under certain circumstances including an event of default (such as bankruptcy or insolvency), to offset amounts payable by the Fund to the same counterparty against amounts to be received and create one single net payment due to or from the Fund. |
| | As of September 30, 2023, none of the Funds were lending under the agreement with BNYM. |
Note 3. Investment Advisory Fees and Related Party Transactions
($ reported in thousands)
| A. | Investment Adviser |
| | Virtus Investment Advisers, Inc. (the “Adviser”), an indirect, wholly-owned subsidiary of Virtus Investment Partners, Inc. (“Virtus”), is the investment adviser to the Funds. The Adviser manages the Funds’ investment programs and general operations of the Funds, including oversight of the Funds’ subadvisers. |
| | As compensation for its services to the Funds, the applicable Adviser is entitled to a fee, which is calculated daily and paid monthly based upon the following annual rates as a percentage of the average daily net assets (except as otherwise noted) of each Fund: |
VIRTUS OPPORTUNITIES TRUST
NOTES TO FINANCIAL STATEMENTS (Continued)
September 30, 2023
| | First $1 Billion | | $1+ Billion |
KAR Developing Markets Fund
| 1.00 % | | 0.95 % |
KAR Emerging Markets Small-Cap Fund
| 1.20 | | 1.15 |
Vontobel Emerging Markets Opportunities Fund
| 1.00 | | 0.95 |
Vontobel Greater European Opportunities Fund
| 0.85 | | 0.80 |
| | First $1 Billion | | $1+ Billion through
$2 Billion | | $2+ Billion |
Duff & Phelps Global Infrastructure Fund
| 0.65 % | | 0.60 % | | 0.55 % |
Duff & Phelps Global Real Estate Securities Fund
| 0.85 | | 0.80 | | 0.75 |
Duff & Phelps International Real Estate Securities Fund
| 1.00 | | 0.95 | | 0.90 |
Duff & Phelps Real Estate Securities Fund
| 0.75 | | 0.70 | | 0.65 |
Vontobel Global Opportunities Fund
| 0.85 | | 0.80 | | 0.75 |
| | First $2 Billion | | $2+ Billion through
$4 Billion | | $4+ Billion |
Vontobel Foreign Opportunities Fund
| 0.85 % | | 0.80 % | | 0.75 % |
| | First $3 Billion | | $3+ Billion |
KAR International Small-Mid Cap Fund
| 0.90 % | | 0.85 % |
Duff & Phelps Real Asset Fund – the Adviser does not charge an advisory fee.
| B. | Subadvisers |
| | The subadvisers manage the investments of each Fund for which they are paid a fee by the applicable Adviser. A list of the subadvisers and the Funds they serve as of the end of the period is as follows: |
| Fund | | Subadviser |
Duff & Phelps Global Infrastructure Fund
| | DPIM(1) |
Duff & Phelps Global Real Estate Securities Fund
| | DPIM(1) |
Duff & Phelps International Real Estate Securities Fund
| | DPIM(1) |
Duff & Phelps Real Asset Fund
| | DPIM(1) |
Duff & Phelps Real Estate Securities Fund
| | DPIM(1) |
KAR Developing Markets Fund
| | KAR(2) |
KAR Emerging Markets Small-Cap Fund
| | KAR(2) |
KAR International Small-Mid Cap Fund
| | KAR(2) |
Vontobel Emerging Markets Opportunities Fund
| | Vontobel(3) |
Vontobel Foreign Opportunities Fund
| | Vontobel(3) |
Vontobel Global Opportunities Fund
| | Vontobel(3) |
Vontobel Greater European Opportunities Fund
| | Vontobel(3) |
| (1) | Duff & Phelps Investment Management Co. (“DPIM”), an indirect, wholly-owned subsidiary of Virtus. |
| (2) | Kayne Anderson Rudnick Investment Management, LLC (“KAR”), an indirect, wholly-owned subsidiary of Virtus. |
| (3) | Vontobel Asset Management, Inc. (“Vontobel”). |
| C. | Expense Limitations |
| | The Adviser has contractually agreed to limit each Fund’s annual total operating expenses, subject to the exceptions listed below, so that such expenses do not exceed, on an annualized basis, the following respective percentages of average daily net assets through January 31, 2024. Following the contractual period, the Adviser may discontinue these expense limitation arrangements at any time. The waivers and reimbursements are accrued daily and received monthly. |
VIRTUS OPPORTUNITIES TRUST
NOTES TO FINANCIAL STATEMENTS (Continued)
September 30, 2023
| Fund | | Class A | | Class C | | Class I | | Class R6 |
Duff & Phelps Global Infrastructure Fund
| | N/A | | N/A | | N/A | | 0.85% |
Duff & Phelps Global Real Estate Securities Fund
| | 1.40% | | 2.15% | | 1.15% | | 0.89 |
Duff & Phelps International Real Estate Securities Fund
| | 1.50 | | 2.25 | | 1.25 | | N/A |
Duff & Phelps Real Asset Fund
| | 0.50 (1) | | 1.25 (1) | | 0.25 (1) | | 0.20 |
Duff & Phelps Real Estate Securities Fund
| | N/A | | N/A | | N/A | | 0.79 |
KAR Developing Markets Fund
| | 1.50 (2) | | 2.25 (2) | | 1.25 (2) | | 1.20 (2) |
KAR Emerging Markets Small-Cap Fund
| | 1.79 | | 2.53 | | 1.50 | | 1.40 |
KAR International Small-Mid Cap Fund
| | 1.45 | | 2.20 | | 1.20 | | 1.10 |
Vontobel Emerging Markets Opportunities Fund
| | N/A | | N/A | | N/A | | 0.98 |
Vontobel Foreign Opportunities Fund
| | 1.39 | | 2.05 | | 1.07 | | 0.95 |
Vontobel Global Opportunities Fund
| | 1.36 | | 2.11 | | 1.09 | | 0.90 |
Vontobel Greater European Opportunities Fund
| | 1.35 (3) | | 2.10 (3) | | 1.10 (3) | | N/A |
| (1) | Effective January 1, 2023. |
| (2) | Effective January 1, 2023. For the period October 1, 2022 through December 31, 2022, the expense caps were as follows for Class A shares, Class C shares, Class I shares and Class R6 shares, respectively: 1.55%, 2.30%, 1.30% and 1.22%. |
| (3) | Effective January 1, 2023. For the period October 1, 2022 through December 31, 2022, the expense caps were as follows for Class A shares, Class C shares and Class I shares, respectively: 1.40%, 2.15%, and 1.15%. |
The exclusions include front-end or contingent deferred loads, taxes, leverage and borrowing expenses (such as commitment, amendment and
renewal expenses on credit or redemption facilities), interest, brokerage commissions, expenses incurred in connection with any merger or
reorganization, unusual or infrequently occurring expenses (such as litigation), acquired fund fees and expenses, and dividend expenses, if any.
| D. | Expense Recapture |
| | Under certain conditions, the Adviser may recapture operating expenses reimbursed or fees waived under these arrangements within three years after the date on which such amounts were incurred or waived. A Fund must pay its ordinary operating expenses before the Adviser is entitled to any reimbursement and must remain in compliance with any applicable expense limitations or, if none, the expense limitation in effect at the time of the waiver or reimbursement. All or a portion of the following Adviser reimbursed expenses may be recaptured by the year ending September 30: |
| | | Expiration | | |
| Fund | | 2024 | | 2025 | | 2026 | | Total |
| Duff & Phelps Global Infrastructure Fund | | | | | | | | |
Class R6
| | $ 6 | | $ 7 | | $ 9 | | $ 22 |
| Duff & Phelps Global Real Estate Securities Fund | | | | | | | | |
Class A
| | 296 | | 303 | | 366 | | 965 |
Class C
| | 2 | | — (1) | | 2 | | 4 |
Class I
| | 34 | | 58 | | 45 | | 137 |
Class R6
| | 100 | | 137 | | 131 | | 368 |
| Duff & Phelps International Real Estate Securities Fund | | | | | | | | |
Class A
| | 7 | | 7 | | 7 | | 21 |
Class C
| | 1 | | 1 | | — (1) | | 2 |
Class I
| | 72 | | 69 | | 83 | | 224 |
| Duff & Phelps Real Asset Fund | | | | | | | | |
Class A
| | — | | — | | 37 | | 37 |
Class C
| | — | | — | | 2 | | 2 |
Class I
| | — | | — | | 27 | | 27 |
Class R6
| | — | | — (1) | | 2 | | 2 |
| Duff & Phelps Real Estate Securities Fund | | | | | | | | |
Class R6
| | 193 | | 204 | | 175 | | 572 |
| KAR Developing Markets Fund | | | | | | | | |
Class A
| | 3 | | 3 | | 3 | | 9 |
Class C
| | 3 | | 3 | | 2 | | 8 |
Class I
| | 3 | | 3 | | 4 | | 10 |
Class R6
| | 80 | | 81 | | 65 | | 226 |
VIRTUS OPPORTUNITIES TRUST
NOTES TO FINANCIAL STATEMENTS (Continued)
September 30, 2023
| | | Expiration | | |
| Fund | | 2024 | | 2025 | | 2026 | | Total |
| KAR Emerging Markets Small-Cap Fund | | | | | | | | |
Class A
| | $ — | | $ — | | $ 2 | | $ 2 |
Class C
| | — | | — (1) | | 1 | | 1 |
Class I
| | — | | 106 | | 50 | | 156 |
Class R6
| | — | | — (1) | | — (1) | | — (1) |
| KAR International Small-Mid Cap Fund | | | | | | | | |
Class A
| | — | | — | | 1 | | 1 |
Class C
| | — | | — | | 2 | | 2 |
Class I
| | — | | — | | 74 | | 74 |
| Vontobel Emerging Markets Opportunities Fund | | | | | | | | |
Class A
| | — | | — | | 12 | | 12 |
Class C
| | — | | — | | 2 | | 2 |
Class I
| | — | | — | | 92 | | 92 |
Class R6
| | 343 | | 226 | | 153 | | 722 |
| Vontobel Foreign Opportunities Fund | | | | | | | | |
Class A
| | 19 | | 8 | | 27 | | 54 |
Class C
| | 18 | | 10 | | 6 | | 34 |
Class I
| | 330 | | 376 | | 321 | | 1,027 |
Class R6
| | 62 | | 60 | | 46 | | 168 |
| Vontobel Global Opportunities Fund | | | | | | | | |
Class A
| | 38 | | 29 | | 44 | | 111 |
Class C
| | 6 | | 4 | | 4 | | 14 |
Class I
| | 78 | | 71 | | 67 | | 216 |
Class R6
| | 136 | | 117 | | 109 | | 362 |
| Vontobel Greater European Opportunities Fund | | | | | | | | |
Class A
| | 20 | | 20 | | 29 | | 69 |
Class C
| | 4 | | 2 | | 2 | | 8 |
Class I
| | 50 | | 42 | | 48 | | 140 |
| (1) | Amount is less than $500 (not in thousands). |
During the year ended September 30, 2023, the Adviser recaptured expenses previously waived for the following Funds:
| Fund | | Class A | | Class C | | Class I | | Class R6 | | Total |
Duff & Phelps Global Real Estate
Securities Fund
| | $— | | $— (1) | | $ 2 | | $— | | $ 2 |
KAR Emerging Markets Small-Cap Fund
| | 2 | | 1 | | 8 | | — | | 11 |
Vontobel Foreign Opportunities Fund
| | 8 | | — (1) | | 76 | | — (1) | | 84 |
Vontobel Global Opportunities Fund
| | 4 | | 1 | | 4 | | — | | 9 |
| (1) | Amount is less than $500 (not in thousands). |
| E. | Distributor |
| | VP Distributors, LLC (“VP Distributors”), an indirect, wholly-owned subsidiary of Virtus, serves as the distributor of each Fund’s shares. VP Distributors has advised the Funds that for the year ended September 30, 2023, it retained net commissions of $19 for Class A shares and CDSC of $7 and $2 for Class A shares and Class C shares, respectively. |
| | In addition, each Fund pays VP Distributors 12b-1 fees under a 12b-1 Plan as a percentage of the average daily net assets of each respective class at the annual rates of 0.25%(1) for Class A shares and 1.00%(1)(2) for Class C shares. Class I shares and Class R6 shares are not subject to a 12b-1 Plan. |
| | Under certain circumstances, shares of certain Virtus Funds may be exchanged for shares of the same class of certain other Virtus Funds on the basis of the relative NAV per share at the time of the exchange. On exchanges with share classes that carry a CDSC, the CDSC schedule of the original shares purchased continues to apply. |
(1) Some of the Funds invest in ETFs. In addition to the fees listed, the Funds bear their proportionate shares of any distribution and shareholder servicing fees of the ETFs.
(2) The Funds’ distributor has contractually agreed to waive its 12b-1 fees applicable to Class C shares to the extent that the Funds’ investments in underlying ETFs with their own 12b-1 fees would otherwise cause the total 12b-1 fees paid directly or indirectly by the Fund to exceed the limits set forth in applicable law or regulation.
VIRTUS OPPORTUNITIES TRUST
NOTES TO FINANCIAL STATEMENTS (Continued)
September 30, 2023
| F. | Administrator and Transfer Agent |
| | Virtus Fund Services, LLC, an indirect, wholly-owned subsidiary of Virtus, serves as the administrator and transfer agent to the Funds. |
| | For the year ended September 30, 2023, the Funds incurred administration fees totaling $4,540 which are included in the Statements of Operations within the line item “Administration and accounting fees.” The fees are calculated daily and paid monthly. |
| | For the year ended September 30, 2023, the Funds incurred transfer agent fees totaling $2,033 which are included in the Statements of Operations within the line item “Transfer agent fees and expenses.” The fees are calculated daily and paid monthly. |
| G. | Affiliated Shareholders |
| | At September 30, 2023, Virtus and its affiliates held shares of the following Fund, which may be redeemed at any time, that aggregated to the following: |
| | Shares | | Aggregate Net
Asset Value |
| KAR Developing Markets Fund | | | |
Class A
| 10,000 | | $ 77 |
Class C
| 10,000 | | 76 |
Class I
| 10,000 | | 77 |
Class R6
| 305,906 | | 2,355 |
| H. | Investments with Affiliates |
| | The Funds are permitted to purchase assets from or sell assets to certain related affiliates under specified conditions outlined in procedures adopted by the Board. The procedures have been designed to ensure that any purchase or sale of assets by the Funds from or to another fund or portfolio that are, or could be, considered an affiliate by virtue of having a common investment adviser (or affiliated investment advisers), common Trustees and/or common officers comply with Rule 17a-7 under the 1940 Act. Further, as defined under the procedures, each transaction is effected at the current market price. During the year ended September 30, 2023, the Funds did not engage in any transactions pursuant to Rule 17a-7 under the 1940 Act. |
| | A summary of the Duff & Phelps Real Asset Fund’s total long-term and short-term purchases and sales of the respective shares of the affiliated underlying funds(1) during the year ended September 30, 2023, is as follows: |
| | Value,
beginning
of period | | Purchases (2) | | Sales
proceeds(3) | | Net
realized
gain (loss)
on
affiliated
funds | | Net change in
unrealized
appreciation
(depreciation)
on affiliated funds | | Value,
end of
period | | Shares | | Dividend
income | | Distributions
of realized
gains |
| Duff & Phelps Real Asset Fund |
| Affiliated Mutual Funds—71.2% | | | | | | | | | | |
| Equity Funds—65.7% | | | | | | | | | | | | |
Virtus Duff & Phelps Global Infrastructure Fund Class R6
| $ 4,782 | | $553 | | $ 370 | | $ (39) | | $(569) | | $ 4,357 | | 351,614 | | $125 | | $428 |
Virtus Duff & Phelps Global Real Estate Securities Fund Class R6
| 4,517 | | 65 | | 470 | | (118) | | 199 | | 4,193 | | 146,209 | | 65 | | — |
Virtus Duff & Phelps Select MLP and Energy Fund Class I
| 3,771 | | 115 | | 1,046 | | 262 | | 273 | | 3,375 | | 285,778 | | (12) (4) | | — |
| Fixed Income Fund—5.5% | | | | | | | | | | | | |
Virtus Newfleet Senior Floating Rate Fund Class R6
| 1,113 | | 169 | | 325 | | 9 | | 25 | | 991 | | 114,104 | | 75 | | — |
| Total | $14,183 | | $902 | | $2,211 | | $ 114 | | $ (72) | | $12,916 | | | | $253 | | $428 |
Outside of Rule 17a-7 transactions, other investments with affiliated issuers are separately reported in this note. An affiliated issuer includes any company in which the Fund held 5% or more of a company’s outstanding voting shares at any point during the period, as well as other circumstances where an investment adviser or subadviser to the Fund is deemed to exercise, directly or indirectly, a certain level of control over the company.
VIRTUS OPPORTUNITIES TRUST
NOTES TO FINANCIAL STATEMENTS (Continued)
September 30, 2023
A summary of the Funds’ total long-term and short-term purchases and sales of the securities of affiliated issuers during the year ended September 30, 2023, is as follows:
| | Value,
beginning
of period | | Purchases | | Sales
proceeds | | Net
realized
gain
(loss)
on
affiliated
securities | | Net
change in
unrealized
appreciation
(depreciation)
on affiliated
securities | | Value,
end of
period | | Shares | | Dividend
income | | Distributions
of realized
gains |
| KAR Emerging Markets Small-Cap Fund |
| Common Stocks—5.8% |
Tegma Gestao Logistica S.A.(5)
| $14,162 | | $— | | $4,080 | | $(141) | | $ 162 | | $ — | | — | | $1,063 | | $— |
Union Auction PCL
| 8,843 | | — | | 374 | | (90) | | 1,093 | | 9,472 | | 33,162,000 | | 542 | | — |
Vasta Platform Ltd.(6)
| 7,305 | | — | | — | | — | | (1,572) | | 5,733 | | 1,391,515 | | — | | — |
| Total | $30,310 | | $— | | $4,454 | | $(231) | | $ (317) | | $15,205 | | | | $1,605 | | $— |
| | Value,
beginning
of period | | Purchases | | Sales
proceeds | | Net
realized
gain
(loss)
on
affiliated
securities | | Net
change in
unrealized
appreciation
(depreciation)
on affiliated
securities | | Value,
end of
period | | Shares | | Dividend
income | | Distributions
of realized
gains |
| KAR International Small-Mid Cap Fund |
| Common Stocks—11.3% |
Baltic Classifieds Group plc
| $ 51,417 | | $— | | $ 7,301 | | $(2,728) | | $ 29,090 | | $ 70,478 | | 29,622,573 | | $ 813 | | $— |
Bouvet ASA(5)
| 32,964 | | — | | 11,131 | | 5,450 | | (18,040) | | — | | — | | 1,340 | | — |
Brockhaus Technologies AG(6)
| 11,694 | | — | | 4,641 | | (2,806) | | 8,686 | | 12,933 | | 568,948 | | — | | — |
Max Stock Ltd.(5)
| 12,788 | | — | | 5,747 | | (6,437) | | 18,478 | | — | | — | | 827 | | — |
Mortgage Advice Bureau Holdings Ltd.
| 28,962 | | — | | 4,348 | | 520 | | (1,820) | | 23,314 | | 3,565,010 | | 1,337 | | — |
| Total | $137,825 | | $— | | $33,168 | | $(6,001) | | $ 36,394 | | $106,725 | | | | $4,317 | | $— |
| Footnote Legend: |
| (1) | The Duff & Phelps Real Asset Fund does not invest in the underlying funds for the purpose of exercising management or control; however, investments made by the Fund within each of its principal investment strategies may represent a significant portion of an underlying fund’s net assets. At September 30, 2023, the Fund was the owner of record of 11% of the Virtus Duff & Phelps Select MLP and Energy Fund Class I and the owner of record of less than 10% of all other affiliated underlying funds. |
| (2) | Includes reinvested dividends from income and capital gain distributions. |
| (3) | Includes return of capital. |
| (4) | Includes return of capital dividend reclassification in the amount of $(115), relating to a prior year dividend which exceeded the aggregate of dividend income earned during the current year. |
| (5) | Issuer is not an affiliated investment of the Fund at September 30, 2023. |
| (6) | Non-income producing. |
| I. | Trustee Deferred Compensation Plan |
| | The Trust provides a deferred compensation plan for its Trustees who receive compensation from the Trust. Under the deferred compensation plan, Trustees may elect to defer all or a portion of their compensation. Amounts deferred are retained by the Trust, and then, to the extent permitted by the 1940 Act, in turn, may be invested in the shares of affiliated or unaffiliated mutual funds selected by the participating Trustees. Investments in such instruments are included in “Other assets” in the Statements of Assets and Liabilities at September 30, 2023. |
VIRTUS OPPORTUNITIES TRUST
NOTES TO FINANCIAL STATEMENTS (Continued)
September 30, 2023
Note 4. Purchases and Sales of Securities
($ reported in thousands)
Purchases and sales of securities (excluding U.S. government and agency securities and short-term securities) during the year ended September 30, 2023, were as follows:
| | Purchases | | Sales |
Duff & Phelps Global Infrastructure Fund
| $ 20,281 | | $ 31,780 |
Duff & Phelps Global Real Estate Securities Fund
| 99,419 | | 162,932 |
Duff & Phelps International Real Estate Securities Fund
| 12,046 | | 12,499 |
Duff & Phelps Real Asset Fund
| 2,079 | | 5,810 |
Duff & Phelps Real Estate Securities Fund
| 112,461 | | 145,899 |
KAR Developing Markets Fund
| 694 | | 703 |
KAR Emerging Markets Small-Cap Fund
| 41,653 | | 54,383 |
KAR International Small-Mid Cap Fund
| 160,156 | | 526,530 |
Vontobel Emerging Markets Opportunities Fund
| 855,178 | | 1,589,891 |
Vontobel Foreign Opportunities Fund
| 353,222 | | 443,768 |
Vontobel Global Opportunities Fund
| 112,619 | | 142,715 |
Vontobel Greater European Opportunities Fund
| 2,548 | | 3,350 |
There were no purchases or sales of long-term U.S. government and agency securities during the year ended September 30, 2023.
Note 5. Capital Share Transactions
(reported in thousands)
Transactions in shares of capital stock, during the years ended as indicated below, were as follows:
| | Duff & Phelps Global Infrastructure Fund | | Duff & Phelps Global Real Estate Securities Fund |
| | Year Ended
September 30, 2023 | | Year Ended
September 30, 2022 | | Year Ended
September 30, 2023 | | Year Ended
September 30, 2022 |
| | SHARES | | AMOUNT | | SHARES | | AMOUNT | | SHARES | | AMOUNT | | SHARES | | AMOUNT |
| Class A | | | | | | | | | | | | | | | |
Shares sold and cross class
conversions | 101 | | $ 1,440 | | 235 | | $ 3,873 | | 144 | | $ 4,484 | | 210 | | $ 8,141 |
| Reinvestment of distributions | 220 | | 3,038 | | 113 | | 1,828 | | 3 | | 101 | | 15 | | 653 |
Shares repurchased and cross
class conversions | (395) | | (5,523) | | (245) | | (4,022) | | (265) | | (8,240) | | (191) | | (7,251) |
| Net Increase / (Decrease) | (74) | | $ (1,045) | | 103 | | $ 1,679 | | (118) | | $ (3,655) | | 34 | | $ 1,543 |
| Class C | | | | | | | | | | | | | | | |
Shares sold and cross class
conversions | 5 | | $ 71 | | 31 | | $ 511 | | 19 | | $ 553 | | 79 | | $ 2,924 |
| Reinvestment of distributions | 24 | | 337 | | 16 | | 269 | | — | | — | | 4 | | 132 |
Shares repurchased and cross
class conversions | (100) | | (1,417) | | (139) | | (2,281) | | (60) | | (1,760) | | (62) | | (2,138) |
| Net Increase / (Decrease) | (71) | | $ (1,009) | | (92) | | $ (1,501) | | (41) | | $ (1,207) | | 21 | | $ 918 |
| Class I | | | | | | | | | | | | | | | |
Shares sold and cross class
conversions | 355 | | $ 5,052 | | 429 | | $ 7,026 | | 2,353 | | $ 71,017 | | 3,749 | | $ 137,771 |
| Reinvestment of distributions | 283 | | 3,900 | | 153 | | 2,472 | | 68 | | 2,014 | | 298 | | 11,968 |
Shares repurchased and cross
class conversions | (798) | | (11,104) | | (592) | | (9,630) | | (4,758) | | (142,595) | | (3,546) | | (124,467) |
| Net Increase / (Decrease) | (160) | | $ (2,152) | | (10) | | $ (132) | | (2,337) | | $ (69,564) | | 501 | | $ 25,272 |
VIRTUS OPPORTUNITIES TRUST
NOTES TO FINANCIAL STATEMENTS (Continued)
September 30, 2023
| | Duff & Phelps Global Infrastructure Fund | | Duff & Phelps Global Real Estate Securities Fund |
| | Year Ended
September 30, 2023 | | Year Ended
September 30, 2022 | | Year Ended
September 30, 2023 | | Year Ended
September 30, 2022 |
| | SHARES | | AMOUNT | | SHARES | | AMOUNT | | SHARES | | AMOUNT | | SHARES | | AMOUNT |
| Class R6 | | | | | | | | | | | | | | | |
Shares sold and cross class
conversions | 62 | | $ 869 | | 106 | | $ 1,756 | | 437 | | $ 13,299 | | 458 | | $ 16,994 |
| Reinvestment of distributions | 78 | | 1,080 | | 42 | | 675 | | 36 | | 1,091 | | 85 | | 3,414 |
Shares repurchased and cross
class conversions | (136) | | (1,937) | | (93) | | (1,514) | | (349) | | (10,725) | | (252) | | (9,314) |
| Net Increase / (Decrease) | 4 | | $ 12 | | 55 | | $ 917 | | 124 | | $ 3,665 | | 291 | | $ 11,094 |
| | Duff & Phelps International Real Estate Securities Fund | | Duff & Phelps Real Asset Fund |
| | Year Ended
September 30, 2023 | | Year Ended
September 30, 2022 | | Year Ended
September 30, 2023 | | Year Ended
September 30, 2022 |
| | SHARES | | AMOUNT | | SHARES | | AMOUNT | | SHARES | | AMOUNT | | SHARES | | AMOUNT |
| Class A | | | | | | | | | | | | | | | |
Shares sold and cross class
conversions | 13 | | $ 75 | | 18 | | $ 140 | | 31 | | $ 393 | | 133 | | $ 1,849 |
| Reinvestment of distributions | — | | — | | 7 | | 52 | | 9 | | 113 | | 6 | | 84 |
Shares repurchased and cross
class conversions | (97) | | (564) | | (86) | | (665) | | (145) | | (1,851) | | (214) | | (2,843) |
| Net Increase / (Decrease) | (84) | | $ (489) | | (61) | | $ (473) | | (105) | | $ (1,345) | | (75) | | $ (910) |
| Class C | | | | | | | | | | | | | | | |
Shares sold and cross class
conversions | — (1) | | $ 2 | | 2 | | $ 14 | | 9 | | $ 114 | | 76 | | $ 1,037 |
| Reinvestment of distributions | — | | — | | — | | — | | — (1) | | 1 | | — (1) | | 3 |
Shares repurchased and cross
class conversions | (8) | | (46) | | (18) | | (122) | | (48) | | (606) | | (43) | | (580) |
| Net Increase / (Decrease) | (8) | | $ (44) | | (16) | | $ (108) | | (39) | | $ (491) | | 33 | | $ 460 |
| Class I | | | | | | | | | | | | | | | |
Shares sold and cross class
conversions | 613 | | $ 3,671 | | 669 | | $ 4,921 | | 52 | | $ 676 | | 386 | | $ 5,218 |
| Reinvestment of distributions | — | | — | | 65 | | 516 | | 9 | | 110 | | 6 | | 83 |
Shares repurchased and cross
class conversions | (698) | | (4,239) | | (598) | | (4,488) | | (351) | | (4,485) | | (363) | | (4,804) |
| Net Increase / (Decrease) | (85) | | $ (568) | | 136 | | $ 949 | | (290) | | $ (3,699) | | 29 | | $ 497 |
| Class R6 | | | | | | | | | | | | | | | |
Shares sold and cross class
conversions | — | | $ — | | — | | $ — | | 87 | | $ 1,111 | | 8 | | $ 100 |
Shares repurchased and cross
class conversions | — | | — | | — | | — | | (1) | | (17) | | — | | — |
| Net Increase / (Decrease) | — | | $ — | | — | | $ — | | 86 | | $ 1,094 | | 8 | | $ 100 |
VIRTUS OPPORTUNITIES TRUST
NOTES TO FINANCIAL STATEMENTS (Continued)
September 30, 2023
| | Duff & Phelps Real Estate Securities Fund | | KAR Developing Markets Fund |
| | Year Ended
September 30, 2023 | | Year Ended
September 30, 2022 | | Year Ended
September 30, 2023 | | Year Ended
September 30, 2022 |
| | SHARES | | AMOUNT | | SHARES | | AMOUNT | | SHARES | | AMOUNT | | SHARES | | AMOUNT |
| Class A | | | | | | | | | | | | | | | |
Shares sold and cross class
conversions | 547 | | $ 10,587 | | 864 | | $ 22,100 | | — (1) | | $ 2 | | 3 | | $ 19 |
| Reinvestment of distributions | 583 | | 10,848 | | 228 | | 6,019 | | — (1) | | — (2) | | — | | — |
Shares repurchased and cross
class conversions | (1,218) | | (23,781) | | (1,461) | | (37,438) | | — | | — | | — | | — |
| Net Increase / (Decrease) | (88) | | $ (2,346) | | (369) | | $ (9,319) | | — (1) | | $ 2 | | 3 | | $ 19 |
| Class C | | | | | | | | | | | | | | | |
Shares sold and cross class
conversions | 22 | | $ 437 | | 43 | | $ 1,092 | | — | | $ — | | — | | $ — |
| Reinvestment of distributions | 21 | | 390 | | 8 | | 229 | | — | | — | | — | | — |
Shares repurchased and cross
class conversions | (74) | | (1,451) | | (91) | | (2,240) | | — | | — | | — | | — |
| Net Increase / (Decrease) | (31) | | $ (624) | | (40) | | $ (919) | | — | | $ — | | — | | $ — |
| Class I | | | | | | | | | | | | | | | |
Shares sold and cross class
conversions | 2,253 | | $ 43,360 | | 2,943 | | $ 73,762 | | 7 | | $ 50 | | 2 | | $ 16 |
| Reinvestment of distributions | 983 | | 18,212 | | 420 | | 10,979 | | — (1) | | 1 | | — (1) | | — (2) |
Shares repurchased and cross
class conversions | (3,567) | | (70,463) | | (3,434) | | (84,223) | | (—) (1) | | (2) | | — | | — |
| Net Increase / (Decrease) | (331) | | $ (8,891) | | (71) | | $ 518 | | 7 | | $ 49 | | 2 | | $ 16 |
| Class R6 | | | | | | | | | | | | | | | |
Shares sold and cross class
conversions | 1,614 | | $ 31,718 | | 1,723 | | $ 43,154 | | 1 | | $ 4 | | 53 | | $ 433 |
| Reinvestment of distributions | 618 | | 11,509 | | 283 | | 7,461 | | 1 | | 4 | | — | | — |
Shares repurchased and cross
class conversions | (1,591) | | (31,009) | | (3,171) | | (82,026) | | (19) | | (140) | | — | | — |
| Net Increase / (Decrease) | 641 | | $ 12,218 | | (1,165) | | $ (31,411) | | (17) | | $ (132) | | 53 | | $ 433 |
| | KAR Emerging Markets Small-Cap Fund | | KAR International Small-Mid Cap Fund |
| | Year Ended
September 30, 2023 | | Year Ended
September 30, 2022 | | Year Ended
September 30, 2023 | | Year Ended
September 30, 2022 |
| | SHARES | | AMOUNT | | SHARES | | AMOUNT | | SHARES | | AMOUNT | | SHARES | | AMOUNT |
| Class A | | | | | | | | | | | | | | | |
Shares sold and cross class
conversions | 869 | | $ 10,974 | | 1,023 | | $ 14,093 | | 479 | | $ 7,538 | | 841 | | $ 15,750 |
| Shares issued-merger (See Note 12) | — | | — | | — | | — | | — | | — | | 24 | | 607 |
| Reinvestment of distributions | — | | — | | 277 | | 4,301 | | — | | — | | 323 | | 7,192 |
Shares repurchased and cross
class conversions | (1,399) | | (17,353) | | (1,745) | | (24,597) | | (1,250) | | (19,467) | | (1,842) | | (33,861) |
| Net Increase / (Decrease) | (530) | | $ (6,379) | | (445) | | $ (6,203) | | (771) | | $ (11,929) | | (654) | | $ (10,312) |
VIRTUS OPPORTUNITIES TRUST
NOTES TO FINANCIAL STATEMENTS (Continued)
September 30, 2023
| | KAR Emerging Markets Small-Cap Fund | | KAR International Small-Mid Cap Fund |
| | Year Ended
September 30, 2023 | | Year Ended
September 30, 2022 | | Year Ended
September 30, 2023 | | Year Ended
September 30, 2022 |
| | SHARES | | AMOUNT | | SHARES | | AMOUNT | | SHARES | | AMOUNT | | SHARES | | AMOUNT |
| Class C | | | | | | | | | | | | | | | |
Shares sold and cross class
conversions | 211 | | $ 2,478 | | 34 | | $ 488 | | 46 | | $ 708 | | 62 | | $ 1,230 |
| Shares issued-merger (See Note 12) | — | | — | | — | | — | | — | | — | | 12 | | 311 |
| Reinvestment of distributions | — | | — | | 11 | | 175 | | — | | — | | 128 | | 2,793 |
Shares repurchased and cross
class conversions | (58) | | (721) | | (48) | | (645) | | (398) | | (5,851) | | (449) | | (7,588) |
| Net Increase / (Decrease) | 153 | | $ 1,757 | | (3) | | $ 18 | | (352) | | $ (5,143) | | (247) | | $ (3,254) |
| Class I | | | | | | | | | | | | | | | |
Shares sold and cross class
conversions | 5,896 | | $ 74,697 | | 8,664 | | $ 121,808 | | 14,579 | | $ 226,815 | | 32,974 | | $ 632,173 |
| Shares issued-merger (See Note 12) | — | | — | | — | | — | | — | | — | | 1,501 | | 38,692 |
| Reinvestment of distributions | — | | — | | 1,765 | | 27,465 | | — | | — | | 8,896 | | 198,465 |
Shares repurchased and cross
class conversions | (6,080) | | (76,386) | | (13,435) | | (183,571) | | (37,854) | | (569,061) | | (77,670) | | (1,354,234) |
| Net Increase / (Decrease) | (184) | | $ (1,689) | �� | (3,006) | | $ (34,298) | | (23,275) | | $ (342,246) | | (34,299) | | $ (484,904) |
| Class R6 | | | | | | | | | | | | | | | |
Shares sold and cross class
conversions | 32 | | $ 439 | | 28 | | $ 372 | | 1,046 | | $ 16,133 | | 2,374 | | $ 46,184 |
| Shares issued-merger (See Note 12) | — | | — | | — | | — | | — | | — | | 171 | | 4,417 |
| Reinvestment of distributions | — | | — | | 6 | | 87 | | — | | — | | 832 | | 18,561 |
Shares repurchased and cross
class conversions | (3) | | (47) | | (6) | | (79) | | (2,667) | | (39,797) | | (8,131) | | (136,701) |
| Net Increase / (Decrease) | 29 | | $ 392 | | 28 | | $ 380 | | (1,621) | | $ (23,664) | | (4,754) | | $ (67,539) |
| | Vontobel Emerging Markets Opportunities Fund | | Vontobel Foreign Opportunities Fund |
| | Year Ended
September 30, 2023 | | Year Ended
September 30, 2022 | | Year Ended
September 30, 2023 | | Year Ended
September 30, 2022 |
| | SHARES | | AMOUNT | | SHARES | | AMOUNT | | SHARES | | AMOUNT | | SHARES | | AMOUNT |
| Class A | | | | | | | | | | | | | | | |
Shares sold and cross class
conversions | 4,343 | | $ 32,034 | | 6,803 | | $ 64,459 | | 515 | | $ 12,712 | | 942 | | $ 25,901 |
| Reinvestment of distributions | — | | — | | 5,927 | | 56,364 | | 3 | | 65 | | 1,291 | | 36,977 |
Shares repurchased and cross
class conversions | (9,989) | | (73,260) | | (15,768) | | (147,140) | | (1,340) | | (32,414) | | (1,618) | | (42,141) |
| Net Increase / (Decrease) | (5,646) | | $ (41,226) | | (3,038) | | $ (26,317) | | (822) | | $ (19,637) | | 615 | | $ 20,737 |
| Class C | | | | | | | | | | | | | | | |
Shares sold and cross class
conversions | 123 | | $ 862 | | 150 | | $ 1,341 | | 43 | | $ 984 | | 17 | | $ 430 |
| Reinvestment of distributions | — | | — | | 1,419 | | 12,857 | | — (1) | | 4 | | 117 | | 3,149 |
Shares repurchased and cross
class conversions | (2,207) | | (15,337) | | (3,229) | | (28,171) | | (155) | | (3,505) | | (322) | | (8,231) |
| Net Increase / (Decrease) | (2,084) | | $ (14,475) | | (1,660) | | $ (13,973) | | (112) | | $ (2,517) | | (188) | | $ (4,652) |
VIRTUS OPPORTUNITIES TRUST
NOTES TO FINANCIAL STATEMENTS (Continued)
September 30, 2023
| | Vontobel Emerging Markets Opportunities Fund | | Vontobel Foreign Opportunities Fund |
| | Year Ended
September 30, 2023 | | Year Ended
September 30, 2022 | | Year Ended
September 30, 2023 | | Year Ended
September 30, 2022 |
| | SHARES | | AMOUNT | | SHARES | | AMOUNT | | SHARES | | AMOUNT | | SHARES | | AMOUNT |
| Class I | | | | | | | | | | | | | | | |
Shares sold and cross class
conversions | 46,301 | | $ 362,681 | | 71,371 | | $ 682,721 | | 3,905 | | $ 95,871 | | 5,863 | | $ 155,649 |
| Reinvestment of distributions | — | | — | | 58,424 | | 581,318 | | 9 | | 205 | | 5,212 | | 149,581 |
Shares repurchased and cross
class conversions | (130,971) | | (1,005,939) | | (251,117) | | (2,463,253) | | (6,590) | | (157,956) | | (12,635) | | (327,256) |
| Net Increase / (Decrease) | (84,670) | | $ (643,258) | | (121,322) | | $ (1,199,214) | | (2,676) | | $ (61,880) | | (1,560) | | $ (22,026) |
| Class R6 | | | | | | | | | | | | | | | |
Shares sold and cross class
conversions | 3,652 | | $ 27,923 | | 4,120 | | $ 39,018 | | 185 | | $ 4,593 | | 606 | | $ 15,854 |
| Reinvestment of distributions | — | | — | | 2,328 | | 23,279 | | 1 | | 23 | | 399 | | 11,478 |
Shares repurchased and cross
class conversions | (10,936) | | (85,004) | | (9,520) | | (99,799) | | (1,036) | | (26,100) | | (531) | | (14,124) |
| Net Increase / (Decrease) | (7,284) | | $ (57,081) | | (3,072) | | $ (37,502) | | (850) | | $ (21,484) | | 474 | | $ 13,208 |
| | Vontobel Global Opportunities Fund | | Vontobel Greater European Opportunities Fund |
| | Year Ended
September 30, 2023 | | Year Ended
September 30, 2022 | | Year Ended
September 30, 2023 | | Year Ended
September 30, 2022 |
| | SHARES | | AMOUNT | | SHARES | | AMOUNT | | SHARES | | AMOUNT | | SHARES | | AMOUNT |
| Class A | | | | | | | | | | | | | | | |
Shares sold and cross class
conversions | 208 | | $ 2,997 | | 384 | | $ 6,809 | | 61 | | $ 661 | | 60 | | $ 688 |
| Reinvestment of distributions | 614 | | 8,320 | | 1,077 | | 20,114 | | — | | — | | 9 | | 114 |
Shares repurchased and cross
class conversions | (959) | | (13,887) | | (1,132) | | (20,042) | | (68) | | (749) | | (59) | | (705) |
| Net Increase / (Decrease) | (137) | | $ (2,570) | | 329 | | $ 6,881 | | (7) | | $ (88) | | 10 | | $ 97 |
| Class C | | | | | | | | | | | | | | | |
Shares sold and cross class
conversions | 25 | | $ 268 | | 56 | | $ 760 | | — (1) | | $ 3 | | — (1) | | $ 3 |
| Reinvestment of distributions | 104 | | 1,046 | | 246 | | 3,551 | | — | | — | | 1 | | 15 |
Shares repurchased and cross
class conversions | (305) | | (3,315) | | (630) | | (8,756) | | (8) | | (91) | | (8) | | (84) |
| Net Increase / (Decrease) | (176) | | $ (2,001) | | (328) | | $ (4,445) | | (8) | | $ (88) | | (7) | | $ (66) |
| Class I | | | | | | | | | | | | | | | |
Shares sold and cross class
conversions | 2,831 | | $ 41,285 | | 1,794 | | $ 29,502 | | 38 | | $ 415 | | 43 | | $ 495 |
| Reinvestment of distributions | 568 | | 7,763 | | 1,363 | | 25,593 | | — | | — | | 21 | | 275 |
Shares repurchased and cross
class conversions | (4,803) | | (71,882) | | (4,358) | | (79,848) | | (115) | | (1,211) | | (124) | | (1,369) |
| Net Increase / (Decrease) | (1,404) | | $ (22,834) | | (1,201) | | $ (24,753) | | (77) | | $ (796) | | (60) | | $ (599) |
| Class R6 | | | | | | | | | | | | | | | |
Shares sold and cross class
conversions | 1,426 | | $ 21,607 | | 327 | | $ 5,964 | | — | | $ — | | — | | $ — |
| Reinvestment of distributions | 454 | | 6,261 | | 824 | | 15,552 | | — | | — | | — | | — |
Shares repurchased and cross
class conversions | (682) | | (10,032) | | (1,169) | | (19,568) | | — | | — | | — | | — |
| Net Increase / (Decrease) | 1,198 | | $ 17,836 | | (18) | | $ 1,948 | | — | | $ — | | — | | $ — |
VIRTUS OPPORTUNITIES TRUST
NOTES TO FINANCIAL STATEMENTS (Continued)
September 30, 2023
| (1) | Amount is less than 500 shares (not in thousands). |
| (2) | Amount is less than $500 (not in thousands). |
Note 6. 10% Shareholders
As of September 30, 2023, the Funds had individual shareholder account(s) and/or omnibus shareholder account(s) (comprised of a group of individual shareholders), which individually amounted to more than 10% of the total shares outstanding of such Fund as detailed below:
| | % of Shares
Outstanding | | Number of
Accounts |
Duff & Phelps Global Infrastructure Fund
| 12 % | | 1 |
Duff & Phelps Global Real Estate Securities Fund
| 39 | | 2 |
Duff & Phelps International Real Estate Securities Fund
| 78 | | 1 |
Duff & Phelps Real Asset Fund
| 17 | | 1 |
Duff & Phelps Real Estate Securities Fund
| 12 | | 1 |
KAR Developing Markets Fund
| 88 | | 2 * |
KAR Emerging Markets Small-Cap Fund
| 67 | | 4 |
KAR International Small-Mid Cap Fund
| 57 | | 4 |
Vontobel Emerging Markets Opportunities Fund
| 38 | | 1 |
Vontobel Foreign Opportunities Fund
| 28 | | 1 |
Vontobel Global Opportunities Fund
| 34 | | 2 |
Vontobel Greater European Opportunities Fund
| 57 | | 2 |
| * | Includes affiliated shareholder account(s). |
Note 7. Credit and Market Risk and Asset Concentration
In July 2017, the head of the United Kingdom Financial Conduct Authority (“FCA”) announced the intention to phase out the use of LIBOR by the end of 2021. However, after subsequent announcements by the FCA, the LIBOR administrator and other regulators, certain of the most widely used LIBORs continued until June 30, 2023. The ICE Benchmark Administration Limited, which is regulated and authorized by FCA, and the administrator of LIBOR, ceased publishing certain LIBOR settings on December 31, 2021. On April 3, 2023, the FCA announced its decision to require LIBOR’s administrator to continue to publish the 1-month, 3-month, and 6-month U.S. dollar settings under an unrepresentative synthetic methodology until September 30, 2024. On March 15, 2022, the Adjustable Interest Act (LIBOR) Act (the “LIBOR Act”) was enacted into law which directs the Federal Reserve Board, as a fallback mechanism, to identify benchmark rates based on SOFR that will replace LIBOR in certain financial contracts after June 30, 2023. On December 16, 2022, the Federal Reserve adopted regulations implementing the LIBOR Act. The Funds may be exposed to financial instruments tied to LIBOR to determine payment obligations, financing terms, hedging strategies or investment value. The discontinuation of LIBOR could have a significant impact on the financial markets and may present a material risk for certain market participants, including the Funds. Abandonment of or modifications to LIBOR could lead to significant short- and long-term uncertainty and market instability. The risks associated with this discontinuation and transition may be exacerbated if the work necessary to effect an orderly transition to an alternative reference rate is not completed in a timely manner. It remains uncertain the effects such changes will have on the Funds, issuers of instruments in which the Funds invest, and the financial markets generally.
Local, regional or global events such as war or military conflict, acts of terrorism, the spread of infectious illness or other public health issue, recessions, or other events could have a significant impact on a Fund and its investments, including hampering the ability of each Fund’s portfolio manager(s) to invest each Fund’s assets as intended.
Emerging market countries typically have economic and political systems that are less fully developed, and can be expected to be less stable than those of more developed countries. For example, the economies of such countries can be subject to rapid and unpredictable rates of inflation or deflation. Since these markets are often small, they may be more likely to suffer sharp and frequent price changes or long-term price depression because of adverse publicity, investor perceptions or the actions of a few large investors. They may also have policies that restrict investment by foreigners, or that prevent foreign investors from withdrawing their money at will.
Certain emerging markets may also face other significant internal or external risks, including the risk of war and civil unrest. Each of these factors can affect the value and liquidity of the assets of a Fund. Failure to generate adequate earnings from foreign trade would make it difficult for an emerging market country to service foreign debt. Disruptions resulting from social and political factors may cause the securities markets of emerging market countries to close. If this were to occur, the liquidity and value of a Fund’s assets invested in corporate debt obligations of emerging market companies would decline.
The imposition of sanctions, exchange controls (including repatriation restrictions), confiscation of assets and property, trade restrictions (including tariffs) and other government restrictions by the U.S. or other governments, or from problems in registration, settlement or custody, may also result in losses. The type and severity of sanctions and other similar measures, including counter sanctions and other retaliatory actions, that may be imposed could vary broadly in scope, and their impact is impossible to predict. For example, the imposition of sanctions and other similar measures could, among other things, cause a decline in the value and/or liquidity of securities issued by the sanctioned country or companies located in or economically tied to the sanctioned country and increase market volatility and disruption in the sanctioned country and throughout the world. Sanctions and other similar measures could limit or prevent a Fund from buying and selling securities (in the sanctioned country and other markets), significantly delay or prevent the settlement of securities transactions, and significantly impact a Fund’s liquidity and performance.
VIRTUS OPPORTUNITIES TRUST
NOTES TO FINANCIAL STATEMENTS (Continued)
September 30, 2023
Sanctions threatened or imposed may result in a decline in the value and liquidity of a Fund’s assets. The securities of a Fund may be deemed to have a zero value. A Fund may make investments that are illiquid or that may become less liquid in response to market developments or adverse investor perceptions. Illiquid investments may be more difficult to value. Liquidity risk may also refer to the risk that a Fund will not be able to pay redemption proceeds within the allowable time period or without significant dilution to remaining investors’ interests because of unusual market conditions, an unusually high volume of redemption requests, or other reasons. To meet redemption requests, a Fund may be forced to sell investments at an unfavorable time and/or under unfavorable conditions. If a Fund is forced to sell securities at an unfavorable time and/or under unfavorable conditions, such sales may adversely affect a Fund’s NAV and dilute remaining investors’ interests. Liquidity risk may be the result of, among other things, the reduced number and capacity of traditional market participants to make a market in fixed income securities or the lack of an active market. The potential for liquidity risk may be magnified by a rising interest rate environment or other circumstances where investor redemptions from fixed income funds may be higher than normal, potentially causing increased supply in the market due to selling activity. These risks may be more pronounced in connection with a Fund’s investments in securities of issuers located in emerging market countries. Redemptions by large shareholders may have a negative impact on a Fund’s liquidity.
For all these reasons, investments in emerging markets may be considered speculative. To the extent that a Fund invests a significant portion of its assets in a particular emerging market, the Fund will be more vulnerable to financial, economic, political and other developments in that country, and conditions that negatively impact that country will have a greater impact on the Fund as compared with a fund that does not have its holdings concentrated in a particular country.
Certain Funds may invest a high percentage of their assets in specific sectors of the market in the pursuit of their investment objectives. Fluctuations in these sectors of concentration may have a greater impact on a Fund, positive or negative, than if the Fund did not concentrate its investments in such sectors.
At September 30, 2023, the following Funds held securities issued by various companies in specific sectors as detailed below:
| | Sector | | Percentage of
Total Investments |
Duff & Phelps Global Infrastructure Fund
| Utilities | | 49% |
Duff & Phelps Global Infrastructure Fund
| Industrials | | 27 |
KAR Developing Markets Fund
| Industrials | | 27 |
KAR Emerging Markets Small-Cap Fund
| Industrials | | 31 |
KAR International Small-Mid Cap Fund
| Communication Services | | 28 |
KAR International Small-Mid Cap Fund
| Industrials | | 25 |
Vontobel Foreign Opportunities Fund
| Industrials | | 25 |
Vontobel Greater European Opportunities Fund
| Industrials | | 30 |
Note 8. Indemnifications
Under the Trust’s organizational documents and in separate agreements between each Trustee and the Trust, its Trustees and officers are indemnified against certain liabilities arising out of the performance of their duties to the Trust and its funds. In addition, in the normal course of business, the Trust and the Funds enter into contracts that provide a variety of indemnifications to other parties. The Trust’s and/or the Funds’ maximum exposure under these arrangements is unknown, as this would involve future claims that may be made against the Trust or the Funds and that have not occurred. However, neither the Trust nor the Funds have had prior claims or losses pursuant to these arrangements, and they expect the risk of loss to be remote.
Note 9. Restricted Securities
Restricted securities are not registered under the Securities Act of 1933, as amended (the “1933 Act”). Generally, 144A securities are excluded from this category. Each Fund will bear any costs, including those involved in registration under the 1933 Act, in connection with the disposition of such securities.
At September 30, 2023, the Funds did not hold any securities that were restricted.
Note 10. Redemption Facility
($ reported in thousands)
On September 18, 2017, the Funds and certain other affiliated funds entered into a $150,000 unsecured line of credit (“Credit Agreement”). On June 14, 2021, the Credit Agreement was increased to $250,000. This Credit Agreement, as amended, is with a commercial bank that allows the Funds to borrow cash from the bank to manage large unexpected redemptions and trade fails, up to a limit of one-third or one-fifth, as applicable, of each Fund’s total net assets in accordance with the terms of the agreement. This Credit Agreement has a scheduled termination date of July 6, 2024, however, the Funds may request at any time and from time to time to extend the termination date by 364 days. Effective March 10, 2022, interest is charged at the higher of the SOFR or the Federal Funds rate plus an additional percentage rate on the amount borrowed. Commitment fees are charged on the undrawn balance. Total commitment fees paid for the year ended September 30, 2023, are included in the “Interest expense and/or commitment fees” line on the Statements of Operations. The Funds and other affiliated funds that are parties are individually, and not jointly, liable for their particular advances, if any, under the Credit Agreement. The lending bank has the ability to require repayment of outstanding borrowings under this Credit Agreement upon certain circumstances such as an event of default. At September 30, 2023, the Funds did not have outstanding borrowings.
VIRTUS OPPORTUNITIES TRUST
NOTES TO FINANCIAL STATEMENTS (Continued)
September 30, 2023
The following Funds had outstanding loans during the year. The borrowings were valued at cost, which approximates fair value.
| Fund | | Interest
Incurred on
Borrowing | | Average
Borrowing | | Weighted Average
Interest Rate | | Days
Outstanding |
Duff & Phelps Global Real Estate Securities Fund
| | $ 4 | | $ 2,500 | | 5.14% | | 10 |
Duff & Phelps Real Estate Securities Fund
| | 1 | | 2,300 | | 4.14 | | 4 |
KAR International Small-Mid Cap Fund
| | 57 | | 10,921 | | 5.49 | | 34 |
Vontobel Emerging Markets Opportunities Fund
| | 18 | | 6,825 | | 6.08 | | 16 |
Vontobel Global Opportunities Fund
| | 9 | | 8,038 | | 5.02 | | 8 |
Note 11. Federal Income Tax Information
($ reported in thousands)
At September 30, 2023, the approximate aggregate cost basis and the unrealized appreciation (depreciation) of investments and other financial instruments for federal income tax purposes were as follows:
| Fund | | Federal
Tax Cost | | Unrealized
Appreciation | | Unrealized
(Depreciation) | | Net Unrealized
Appreciation
(Depreciation) |
Duff & Phelps Global Infrastructure Fund
| | $ 67,715 | | $ 3,308 | | $ (7,837) | | $ (4,529) |
Duff & Phelps Global Real Estate Securities Fund
| | 314,223 | | 37,035 | | (46,843) | | (9,808) |
Duff & Phelps International Real Estate Securities Fund
| | 26,074 | | 2,517 | | (5,583) | | (3,066) |
Duff & Phelps Real Asset Fund
| | 23,148 | | 4,955 | | (9,920) | | (4,965) |
Duff & Phelps Real Estate Securities Fund
| | 275,201 | | 100,880 | | (26,752) | | 74,128 |
KAR Developing Markets Fund
| | 2,921 | | 262 | | (569) | | (307) |
KAR Emerging Markets Small-Cap Fund
| | 261,041 | | 42,068 | | (48,318) | | (6,250) |
KAR International Small-Mid Cap Fund
| | 1,016,236 | | 152,380 | | (231,220) | | (78,840) |
Vontobel Emerging Markets Opportunities Fund
| | 1,174,625 | | 176,833 | | (200,033) | | (23,200) |
Vontobel Foreign Opportunities Fund
| | 487,049 | | 160,814 | | (26,895) | | 133,919 |
Vontobel Global Opportunities Fund
| | 185,642 | | 82,181 | | (8,230) | | 73,951 |
Vontobel Greater European Opportunities Fund
| | 4,835 | | 1,687 | | (389) | | 1,298 |
Certain Funds have capital loss carryforwards available to offset future realized capital gains, if any, to the extent permitted by the Code. Net capital losses are carried forward without expiration and generally retain their short-term and/or long-term tax character, as applicable. For the year ended September 30, 2023, the Funds’ capital loss carryovers were as follows:
| Fund | | Short-Term | | Long-Term |
Duff & Phelps Global Real Estate Securities Fund
| | $ 3,885 | | $ 3,627 |
Duff & Phelps International Real Estate Securities Fund
| | 1,654 | | 1,152 |
Duff & Phelps Real Asset Fund
| | 12,815 | | 1,922 |
KAR Developing Markets Fund
| | 204 | | 77 |
KAR Emerging Markets Small-Cap Fund
| | 7,676 | | — |
KAR International Small-Mid Cap Fund
| | 185,278 | | 70,346 |
Vontobel Emerging Markets Opportunities Fund
| | 209,667 | | 69,744 |
Vontobel Greater European Opportunities Fund
| | 295 | | — |
The components of distributable earnings on a tax basis and certain tax attributes for the Funds consist of the following:
| Fund | | Undistributed
Ordinary
Income | | Undistributed
Long-Term
Capital Gains | | Post-October
Capital Loss
Deferred | | Capital Loss
Deferred |
Duff & Phelps Global Infrastructure Fund
| | $ 141 | | $ 1,142 | | $ — | | $ — |
Duff & Phelps Global Real Estate Securities Fund
| | 6,494 | | — | | 29,944 | | 7,512 |
Duff & Phelps International Real Estate Securities Fund
| | 329 | | — | | 3,399 | | 2,806 |
Duff & Phelps Real Asset Fund
| | 126 | | — | | — | | 14,737 |
Duff & Phelps Real Estate Securities Fund
| | 756 | | 31,410 | | — | | — |
KAR Developing Markets Fund
| | 52 | | — | | 177 | | 281 |
VIRTUS OPPORTUNITIES TRUST
NOTES TO FINANCIAL STATEMENTS (Continued)
September 30, 2023
| Fund | | Undistributed
Ordinary
Income | | Undistributed
Long-Term
Capital Gains | | Post-October
Capital Loss
Deferred | | Capital Loss
Deferred |
KAR Emerging Markets Small-Cap Fund
| | $ — | | $ — | | $ 10,289 | | $ 7,676 |
KAR International Small-Mid Cap Fund
| | — | | — | | 74,378 | | 255,624 |
Vontobel Emerging Markets Opportunities Fund
| | — | | — | | 162,010 | | 279,411 |
Vontobel Foreign Opportunities Fund
| | 96 | | 7,307 | | — | | — |
Vontobel Global Opportunities Fund
| | — | | 4,781 | | — | | — |
Vontobel Greater European Opportunities Fund
| | 6 | | — | | 18 | | 295 |
The differences between the book and tax basis of distributable earnings relate principally to the timing of recognition of income and gains for federal income tax purposes. Short-term gain distributions, if any, are reported as ordinary income for federal tax purposes. Distributions are determined on a tax basis and may differ from net investment income and realized capital gains for financial reporting purposes.
The tax character of dividends and distributions paid during the years ended September 30, 2023 and 2022 was as follows:
| | Ordinary
Income | | Long-Term
Capital Gains | | Total |
Duff & Phelps Global Infrastructure Fund
| | | | | |
9/30/23
| $ 1,807 | | $ 6,800 | | $ 8,607 |
9/30/22
| 1,548 | | 3,840 | | 5,388 |
Duff & Phelps Global Real Estate Securities Fund
| | | | | |
9/30/23
| 3,250 | | — | | 3,250 |
9/30/22
| 8,176 | | 8,314 | | 16,490 |
Duff & Phelps International Real Estate Securities Fund
| | | | | |
9/30/22
| 570 | | — | | 570 |
Duff & Phelps Real Asset Fund
| | | | | |
9/30/23
| 240 | | — | | 240 |
9/30/22
| 182 | | — | | 182 |
Duff & Phelps Real Estate Securities Fund
| | | | | |
9/30/23
| 7,450 | | 34,340 | | 41,790 |
9/30/22
| 12,351 | | 12,709 | | 25,060 |
KAR Developing Markets Fund
| | | | | |
9/30/23
| 28 | | — | | 28 |
9/30/22
| 16 | | — | | 16 |
KAR Emerging Markets Small-Cap Fund
| | | | | |
9/30/22
| 21,603 | | 10,517 | | 32,120 |
KAR International Small-Mid Cap Fund
| | | | | |
9/30/22
| 97,265 | | 147,405 | | 244,670 |
Vontobel Emerging Markets Opportunities Fund
| | | | | |
9/30/22
| 243,800 | | 523,310 | | 767,110 |
Vontobel Foreign Opportunities Fund
| | | | | |
9/30/23
| — | | 319 | | 319 |
9/30/22
| 40,481 | | 172,309 | | 212,790 |
Vontobel Global Opportunities Fund
| | | | | |
9/30/23
| — | | 24,371 | | 24,371 |
9/30/22
| 14,780 | | 53,680 | | 68,460 |
Vontobel Greater European Opportunities Fund
| | | | | |
9/30/22
| 128 | | 284 | | 412 |
Certain capital accounts in the financial statements are periodically adjusted for permanent differences in order to reflect their tax character. Permanent reclassifications can arise from differing treatment of certain income and gain transactions and nondeductible current year net operating losses. These adjustments have no impact on net assets or net asset value per share of the Funds. Temporary differences that arise from recognizing certain items of income, expense, gain or loss in different periods for financial statement and tax purposes will likely reverse at some time in the future.
Note 12. Reorganization
($ reported in thousands)
On July 19, 2021, the Board of Trustees of the Trust approved an Agreement and Plan of Reorganization (the “Plan”) with respect to Virtus KAR International Small-Mid Cap Fund II (the “Merged Fund”), a series of the Trust, and KAR International Small-Mid Cap Fund (the “Acquiring Fund”), which provided for the transfer of all of the assets of the Merged Fund for shares of the Acquiring Fund and the assumption of the liabilities of the Merged
VIRTUS OPPORTUNITIES TRUST
NOTES TO FINANCIAL STATEMENTS (Continued)
September 30, 2023
Fund. The purpose of the transaction was to allow shareholders of both funds to own shares of a larger combined fund, to reduce redundancies associated with having two funds that were substantially identical operating as separate series, and to allow shareholders of the Merged Fund to own shares of a fund with a substantially identical investment objective and style as, and potentially lower expenses than, the Merged Fund. The reorganization was accomplished by a tax-free exchange of shares on October 22, 2021. For financial reporting purposes, assets received and shares issued by the Acquiring Fund were recorded at fair value; however, the cost basis of the investments received from the Merged Fund were carried forward to align ongoing reporting of the Acquiring Fund’s realized and unrealized gains and losses with amounts distributable to shareholders for tax purposes.
The share transactions associated with the merger are as follows:
| Merged Fund | | Shares
Outstanding | | Shares Converted | | Merged Fund Net
Asset Value of
Converted Shares |
| Class A Shares | | 40,674 | | 23,696 | | $ 607 |
| Class C Shares | | 20,936 | | 12,399 | | 311 |
| Class I Shares | | 2,583,429 | | 1,501,375 | | 38,692 |
| Class R6 Shares | | 294,773 | | 171,167 | | 4,417 |
The net assets and net unrealized appreciation (depreciation) before the acquisition were as follows:
Merged Fund
Net Assets | | Merged Fund Unrealized
Appreciation (Depreciation) | | Acquiring
Fund Net Assets |
| $44,027 | | $9,371 | | $3,237,294 |
The net assets of the Acquiring Fund immediately following the acquisition were $3,281,321.
Assuming the acquisition had been completed on October 1, 2021, the Acquiring Fund’s pro-forma results of operations for the year ended
September 30, 2022 would have been as follows:
Net investment income (loss)
| $16,838(a) |
Net realized and unrealized gain (loss) on investments
| (1,241,150) (b) |
Net increase (decrease) in net assets resulting from operations
| $(1,224,312) |
(a) $16,884, as reported in the Statements of Changes in Net Assets, plus $(46) net investment loss from the Merged Fund pre-merger.
(b) $(1,242,742), as reported in the Statements of Changes in Net Assets, plus $1,592 net realized and unrealized gain (loss) on investments from Merged Fund pre-merger.
Because the Merged Fund and the Acquiring Fund have been managed as an integrated single fund since the completion date it is not feasible to separate the income/(losses) and gains/(losses) of the Merged Fund that have been included in the Acquiring Fund’s Statements of Changes in Net Assets since October 22, 2021.
Note 13. Regulatory Matters and Litigation
From time to time, the Trust, the Funds, the Adviser and/or subadvisers and/or their affiliates may be involved in litigation and arbitration as well as examinations and investigations by various regulatory bodies, including the SEC, involving compliance with, among other things, securities laws, client investment guidelines, laws governing the activities of broker-dealers and other laws and regulations affecting their activities. At this time, the Adviser believes that the outcomes of such matters are not likely, either individually or in aggregate, to be material to these financial statements.
Note 14. New Regulatory Pronouncement
In October 2022, the SEC adopted a rule and form amendments relating to tailored shareholder reports for mutual funds and ETFs; and fee information in investment company advertisements. The rule and form amendments will require mutual funds and ETFs to transmit streamlined shareholder reports that highlight key information to investors. The rule amendments will require that certain more in-depth information be made available online and available for delivery free of charge to investors on request. The amendments became effective in January 2023 and there is an 18-month transition period after the effective date of the amendment with a compliance date of July 2024.
Note 15. Subsequent Events
Management has evaluated the impact of all subsequent events on the Funds through the date the financial statements were available for issuance, and has determined that the following are subsequent events requiring recognition or disclosure in these financial statements.
VIRTUS OPPORTUNITIES TRUST
NOTES TO FINANCIAL STATEMENTS (Continued)
September 30, 2023
On November 1, 2023, the Board of Trustees of the Trust voted to approve a Plan of Liquidation of the Virtus Duff & Phelps International Real Estate Securities Fund, pursuant to which the Fund will be liquidated on or about December 13, 2023.
On November 15, 2023, the Board voted to approve:
• Termination of the subadvisory agreement with Vontobel Asset Management, Inc., with respect to Virtus Vontobel Emerging Markets Opportunities Fund; appointment of Sustainable Growth Advisers, LP, which is an indirect majority-owned subsidiary of Virtus, as that Fund’s new subadviser; and corresponding changes to that Fund’s name and investment strategy. The change in subadviser and name will take effect on or about December 27, 2024, and changes to the Fund’s investment strategy will be effective on or about January 26, 2024. Effective December 27, 2023, the Fund’s investment adviser, Virtus Investment Advisers, Inc., will implement the following new expense limitation arrangement to further limit the Fund’s expenses: Class A: 1.48%; Class C: 2.23%; Class I: 1.23%; and Class R6: 0.98%. See Note 3 for information about the Funds’ expense limitation arrangements.
• A Plan of Liquidation for Virtus Vontobel Greater European Opportunities Fund, pursuant to which that Fund will be liquidated on or about December 28, 2023.
• An Agreement and Plan of Reorganization, pursuant to which Virtus Vontobel Global Opportunities Fund (an “Acquired Fund”), a series of the Trust, will reorganize with and into Virtus SGA Global Growth Fund (an “Acquiring Fund”), a series of Virtus Equity Trust, on or about March 8, 2024. Effective upon consummation of the reorganization, the Acquiring Fund’s investment adviser, Virtus Investment Advisers, Inc., will implement the following new expense limitation arrangement to further limit the Fund’s expenses: Class A: 1.25%; Class C: 2.00%; Class I: 1.00%; and Class R6: 0.90%. See Note 3 for information about the Funds’ expense limitation arrangements.
• An Agreement and Plan of Reorganization, pursuant to which Virtus Vontobel Foreign Opportunities Fund (an “Acquired Fund”), a series of the Trust, will merge with and into Virtus SGA International Growth Fund (an “Acquiring Fund”), a series of Virtus Asset Trust, on or about March 8, 2024. Effective upon consummation of the reorganization, the Acquiring Fund’s investment adviser, Virtus Fund Advisers, LLC, will implement the following new expense limitation arrangement to further limit the Fund’s expenses: Class A: 1.30%; Class C: 2.05%; Class I: 1.05%; and Class R6: 0.95%. See Note 3 for information about the Funds’ expense limitation arrangements.
Pursuant to each Agreement and Plan of Reorganization, the respective Acquired Fund will transfer all or substantially all of its assets to its respective Acquiring Fund in exchange for shares of the Acquiring Fund and the assumption by the Acquiring Fund of all liabilities of the Acquired Fund. Following the exchange, each Acquired Fund will distribute the shares of its respective Acquiring Fund to its shareholders pro rata, in liquidation of the Acquired Fund, and shareholders of the Acquired Fund will therefore become shareholders of the Acquiring Fund. Each reorganization meets the requirements of Rule 17a-8 under the 1940 Act for a merger of affiliated funds for which shareholder approval is not required.
Report of Independent Registered Public Accounting Firm
To the Board of Trustees of Virtus Opportunities Trust and Shareholders of Virtus Duff & Phelps Global Infrastructure Fund, Virtus Duff & Phelps Global Real Estate Securities Fund, Virtus Duff & Phelps International Real Estate Securities Fund, Virtus Duff & Phelps Real Asset Fund, Virtus Duff & Phelps Real Estate Securities Fund, Virtus KAR Developing Markets Fund, Virtus KAR Emerging Markets Small-Cap Fund, Virtus KAR International Small-Mid Cap Fund, Virtus Vontobel Emerging Markets Opportunities Fund, Virtus Vontobel Foreign Opportunities Fund, Virtus Vontobel Global Opportunities Fund and Virtus Vontobel Greater European Opportunities Fund
Opinions on the Financial Statements
We have audited the accompanying statements of assets and liabilities, including the schedules of investments, of Virtus Duff & Phelps Global Infrastructure Fund, Virtus Duff & Phelps Global Real Estate Securities Fund, Virtus Duff & Phelps International Real Estate Securities Fund, Virtus Duff & Phelps Real Asset Fund, Virtus Duff & Phelps Real Estate Securities Fund, Virtus KAR Developing Markets Fund, Virtus KAR Emerging Markets Small-Cap Fund, Virtus KAR International Small-Mid Cap Fund, Virtus Vontobel Emerging Markets Opportunities Fund, Virtus Vontobel Foreign Opportunities Fund, Virtus Vontobel Global Opportunities Fund and Virtus Vontobel Greater European Opportunities Fund (twelve of the funds constituting Virtus Opportunities Trust, hereafter collectively referred to as the “Funds”) as of September 30, 2023, the related statements of operations for the year ended September 30, 2023, and statements of changes in net assets for each of the two years in the period ended September 30, 2023, including the related notes, and the financial highlights for each of the periods indicated therein (collectively referred to as the “financial statements”). In our opinion, the financial statements present fairly, in all material respects, the financial position of each of the Funds as of September 30, 2023, the results of each of their operations for the year then ended, the changes in each of their net assets for each of the two years in the period ended September 30, 2023, and the financial highlights for each of the periods indicated therein in conformity with accounting principles generally accepted in the United States of America.
Basis for Opinions
These financial statements are the responsibility of the Funds’ management. Our responsibility is to express an opinion on the Funds’ financial statements based on our audits. We are a public accounting firm registered with the Public Company Accounting Oversight Board (United States) (PCAOB) and are required to be independent with respect to the Funds in accordance with the U.S. federal securities laws and the applicable rules and regulations of the Securities and Exchange Commission and the PCAOB.
We conducted our audits of these financial statements in accordance with the standards of the PCAOB. Those standards require that we plan and perform the audit to obtain reasonable assurance about whether the financial statements are free of material misstatement, whether due to error or fraud.
Our audits included performing procedures to assess the risks of material misstatement of the financial statements, whether due to error or fraud, and performing procedures that respond to those risks. Such procedures included examining, on a test basis, evidence regarding the amounts and disclosures in the financial statements. Our audits also included evaluating the accounting principles used and significant estimates made by management, as well as evaluating the overall presentation of the financial statements. Our procedures included confirmation of securities owned as of September 30, 2023 by correspondence with the custodian, transfer agent and brokers; when replies were not received from brokers, we performed other auditing procedures. We believe that our audits provide a reasonable basis for our opinions.
/s/ PricewaterhouseCoopers LLP
Philadelphia, Pennsylvania
November 27, 2023
We have served as the auditor of one or more investment companies in Virtus Mutual Funds since at least 1977. We have not been able to determine the specific year we began serving as auditor.
VIRTUS OPPORTUNITIES TRUST
TAX INFORMATION NOTICE (Unaudited)
September 30, 2023
The following information ($ reported in thousands) is being provided in order to meet reporting requirements set forth by the Code and/or to meet state specific requirements. In early 2024, the Funds will notify applicable shareholders of amounts for use in preparing 2023 U.S. federal income tax forms. Shareholders should consult their tax advisors.
With respect to distributions paid during the fiscal year ended September 30, 2023, the Funds designate the following amounts (or, if subsequently determined to be different, the maximum amount allowable):
| Fund | | Qualified REIT
Dividend
Income %
(non-corporate
shareholders) | | Qualified
Dividend
Income %
(non-corporate
shareholder) | | Dividend
Received
Deduction %
(corporate
shareholders) | | Long-Term
Capital Gain
Distributions ($) |
Duff & Phelps Global Infrastructure Fund
| | — % | | 100.00 % | | 62.78 % | | $ 1,150 |
Duff & Phelps Global Real Estate Securities Fund
| | 58.51 | | 36.59 | | — | | — |
Duff & Phelps International Real Estate Securities Fund
| | — | | 100.00 | | — | | — |
Duff & Phelps Real Asset Fund
| | — | | 89.99 | | 39.76 | | — |
Duff & Phelps Real Estate Securities Fund
| | 90.94 | | — | | — | | 31,693 |
KAR Developing Markets Fund
| | — | | 56.74 | | — | | — |
KAR Emerging Markets Small-Cap Fund
| | — | | — | | — | | — |
KAR International Small-Mid Cap Fund
| | — | | — | | — | | — |
Vontobel Emerging Markets Opportunities Fund
| | — | | — | | — | | — |
Vontobel Foreign Opportunities Fund
| | — | | 100.00 | | 39.54 | | 7,307 |
Vontobel Global Opportunities Fund
| | — | | — | | — | | 4,781 |
Vontobel Greater European Opportunities Fund
| | — | | 100.00 | | — | | — |
For the fiscal year ended September 30, 2023, certain Funds are disclosing the following information pursuant to notice requirements of Section 853(a) and 855(d) of the Code and the Treasury Regulations thereunder.
| | Foreign Source
Income
Recognized | | Foreign Taxes
Paid on
Foreign
Source
Income |
Duff & Phelps International Real Estate Securities Fund
| $ 1,018 | | $ 92 |
Duff & Phelps Real Asset Fund
| 75 | | 5 |
KAR Developing Markets Fund
| 78 | | 7 |
Vontobel Foreign Opportunities Fund
| 8,988 | | 1,113 |
Vontobel Greater European Opportunities Fund
| 123 | | 15 |
STATEMENT REGARDING LIQUIDITY RISK MANAGEMENT PROGRAM (UNAUDITED)
Pursuant to Rule 22e-4 under the 1940 Act, the Funds have adopted a liquidity risk management program (the “Program”) to govern the Funds’ approach to managing liquidity risk, which is the risk that a Fund would not be able to meet redemption requests without significant dilution of remaining investors’ interests in the Fund. The Program is overseen by the Adviser as the Funds’ Liquidity Risk Management Program Administrator (the “Program Administrator”), and the Program’s principal objectives include assessing, managing and periodically reviewing each Fund’s liquidity risk, based on factors specific to the circumstances of the Funds. Assessment and management of a Fund’s liquidity risk under the Program take into consideration certain factors, such as the Fund’s investment strategy and the liquidity of its portfolio investments during normal and reasonably foreseeable stressed conditions, its short- and long-term cash-flow projections during both normal and reasonably foreseeable stressed conditions, and its cash and cash-equivalent holdings and access to other funding sources. As required by the rule, the Program includes policies and procedures for classification of Fund portfolio holdings in four liquidity categories, maintaining certain levels of highly liquid investments, and limiting holdings of illiquid investments.
At a meeting of the Board held on May 22-24, 2023, the Board received a report from the Program Administrator addressing the operation and management of the Program for calendar year 2022 (the “Review Period”). The Program Administrator’s report noted that for the Review Period, the Program Administrator believed that the Program was implemented and operated effectively in all material respects and that existing procedures, controls and safeguards were appropriately designed to enable the Program Administrator to administer the Program in compliance with Rule 22e-4. The Program Administrator’s report noted that during the Review Period, there were no events that created liquidity related concerns for the Funds. The Program Administrator’s report further noted that while changes to the Program had been made during the Review Period and reported to the Board, no material changes were made to the Program as a result of the Program Administrator’s annual review.
There can be no assurance that the Program will achieve its objectives in the future. Please refer to a Fund’s prospectus for more information regarding the Fund’s exposure to liquidity risk and other principal risks to which an investment in that Fund may be subject.
FUND MANAGEMENT TABLES (Unaudited)
Information pertaining to the Trustees and officers of the Trust as of the date of issuance of this report, is set forth below. The statement of additional information (SAI) includes additional information about the Trustees and is available without charge, upon request, by calling (800) 243-4361.
The address of each individual, unless otherwise noted, is c/o Virtus Opportunities Trust, One Financial Plaza, Hartford, CT 06103. There is no stated term of office for Trustees or officers of the Trust.
Independent Trustees
Name, Year of Birth,
Length of Time Served
and Number of
Portfolios in Fund
Complex Overseen by
Trustee | Principal Occupation(s) During Past 5 Years | Other Directorships Held by Trustee During Past 5 Years |
Burke, Donald C.
YOB: 1960
Served Since: 2016
107 Portfolios | Private investor (since 2009). Formerly, President and Chief Executive Officer, BlackRock U.S. Funds (2007 to 2009); Managing Director, BlackRock, Inc. (2006 to 2009); and Managing Director, Merrill Lynch Investment Managers (1990 to 2006). | Trustee (since May 2023) and Advisory Board Member (May 2023), Virtus Artificial Intelligence & Technology Opportunities Fund, Virtus Dividend, Interest & Premium Strategy Fund and Virtus Equity & Convertible Income Fund; Advisory Board Member (since May 2023), Virtus Convertible & Income 2024 Target Term Fund, Virtus Convertible & Income Fund, Virtus Convertible & Income Fund II and Virtus Diversified Income & Convertible Fund; Trustee (since 2022), Virtus Stone Harbor Emerging Markets Income Fund and Virtus Stone Harbor Emerging Markets Total Income Fund; Trustee (since 2021), The Merger Fund®, The Merger Fund® VL, Virtus Event Opportunities Trust (2 portfolios), Virtus Investment Trust (13 portfolios) and Virtus Strategy Trust (8 portfolios); Director (2020 to 2021), Duff & Phelps Select MLP and Midstream Energy Fund Inc.; Director (since 2020), Virtus Total Return Fund Inc.; Trustee (since 2020), Virtus Global Multi-Sector Income Fund; Trustee (since 2016), Virtus Mutual Fund Family (56 portfolios), Virtus Variable Insurance Trust (8 portfolios) and Virtus Alternative Solutions Trust (4 portfolios); Director (since 2014), closed-end funds managed by Duff & Phelps Investment Management Co. (3 funds); Director, Avista Corp. (energy company) (since 2011); Trustee, Goldman Sachs Fund Complex (2010 to 2014); and Director, BlackRock Luxembourg and Cayman Funds (2006 to 2010). |
Cogan, Sarah E.
YOB: 1956
Served Since: 2022
104 Portfolios | Retired Partner, Simpson Thacher & Bartlett LLP (“STB”) (law firm) (since 2019); Director, Girl Scouts of Greater New York (since 2016); Trustee, Natural Resources Defense Council, Inc. (since 2013); and formerly, Partner, STB (1989 to 2018). | Trustee (since 2022) and Advisory Board Member (2021 to 2022), Virtus Alternative Solutions Trust (4 portfolios), Virtus Mutual Fund Family (56 portfolios) and Virtus Variable Insurance Trust (8 portfolios); Trustee (since 2022), Virtus Stone Harbor Emerging Markets Income Fund and Virtus Stone Harbor Emerging Markets Total Income Fund; Trustee (since 2022), PIMCO Access Income Fund and PIMCO California Flexible Municipal Income Fund; Trustee (since 2021), PIMCO Flexible Emerging Markets Income Fund; Trustee (since 2021), The Merger Fund®, The Merger Fund® VL, Virtus Event Opportunities Trust (2 portfolios), and Virtus Global Multi-Sector Income Fund; Advisory Board Member (February 2021 to June 2021), Duff & Phelps Select MLP and Midstream Energy Fund Inc.; Director (since 2021), Virtus Total Return Fund Inc.; Trustee (since 2019), Virtus Investment Trust (13 portfolios) and Virtus Strategy Trust (8 portfolios); Trustee (since 2019), Virtus Artificial Intelligence & Technology Opportunities Fund, Virtus Convertible & Income 2024 Target Term Fund, Virtus Convertible & Income Fund, Virtus Convertible & Income Fund II, Virtus Diversified Income & Convertible Fund, Virtus Equity & Convertible Income Fund, and Virtus Dividend, Interest & Premium Strategy Fund; Trustee (since 2019), PIMCO California Municipal Income Fund, PIMCO California Municipal Income Fund II, PIMCO California Municipal Income Fund III, PIMCO Municipal Income Fund, PIMCO Municipal Income Fund II, PIMCO Municipal Income Fund III, PIMCO New York Municipal Income Fund, PIMCO New York Municipal Income Fund II, PIMCO New York Municipal Income Fund III, PIMCO Energy and Tactical Credit Opportunities Fund, PCM Fund, Inc, PIMCO Corporate & Income Strategy Fund, PIMCO Corporate & Income Opportunity Fund, PIMCO Dynamic Income Fund, PIMCO Global StocksPLUS® & Income Fund, PIMCO High Income Fund, PIMCO Income Strategy Fund, PIMCO Income Strategy Fund II, PIMCO Strategic Income Fund, Inc., PIMCO Flexible Credit Income Fund and PIMCO Flexible Municipal Income Fund; Trustee (since 2019), PIMCO Managed Accounts Trust (5 portfolios); and Trustee (2019 to 2021), PIMCO Dynamic Credit and Mortgage Income Fund and PIMCO Income Opportunity Fund. |
FUND MANAGEMENT TABLES (Unaudited) (Continued)
Name, Year of Birth,
Length of Time Served
and Number of
Portfolios in Fund
Complex Overseen by
Trustee | Principal Occupation(s) During Past 5 Years | Other Directorships Held by Trustee During Past 5 Years |
DeCotis, Deborah A.
YOB: 1952
Served Since: 2022
104 Portfolios | Director, Cadre Holdings Inc. (since 2022); Advisory Director, Morgan Stanley & Co., Inc. (since 1996); Member, Circle Financial Group (since 2009); Member, Council on Foreign Relations (since 2013); and Trustee, Smith College (since 2017). Formerly, Director, Watford Re (2017 to 2021); Co-Chair Special Projects Committee, Memorial Sloan Kettering (2005 to 2015); and Trustee, Stanford University (2010 to 2015). | Trustee (since 2022) and Advisory Board Member (2021 to 2022), Virtus Alternative Solutions Trust (4 portfolios), Virtus Mutual Fund Family (56 portfolios) and Virtus Variable Insurance Trust (8 portfolios); Trustee (since 2022), Virtus Stone Harbor Emerging Markets Income Fund and Virtus Stone Harbor Emerging Markets Total Income Fund; Trustee (since 2022), PIMCO Access Income Fund and PIMCO California Flexible Municipal Income Fund; Trustee (since 2021), PIMCO Flexible Emerging Markets Income Fund; Trustee (since 2021), The Merger Fund®, The Merger Fund® VL, Virtus Event Opportunities Trust (2 portfolios), and Virtus Global Multi-Sector Income Fund; Advisory Board Member (February 2021 to June 2021), Duff & Phelps Select MLP and Midstream Energy Fund Inc.; Director (since 2021), Virtus Total Return Fund Inc.; Trustee (since 2020), PIMCO Dynamic Income Opportunities Fund; Trustee (since 2019), PIMCO Energy and Tactical Credit Opportunities Fund and Virtus Artificial Intelligence & Technology Opportunities Fund; Trustee (since 2018), PIMCO Flexible Municipal Income Fund; Trustee (since 2017), PIMCO Flexible Credit Income Fund and Virtus Convertible & Income 2024 Target Term Fund; Trustee (since 2015), Virtus Diversified Income & Convertible Fund; Trustee (since 2014), Virtus Investment Trust (13 portfolios); Trustee (2013 to 2021), PIMCO Dynamic Credit and Mortgage Income Fund; Trustee (since 2012), PIMCO Dynamic Income Fund; Trustee (since 2011), Virtus Strategy Trust (8 portfolios); Trustee (since 2011), PIMCO California Municipal Income Fund II, PIMCO California Municipal Income Fund III, PIMCO Municipal Income Fund, PIMCO Municipal Income Fund II, PIMCO Municipal Income Fund III, PIMCO New York Municipal Income Fund, PIMCO New York Municipal Income Fund II, PIMCO New York Municipal Income Fund III, PCM Fund, Inc., PIMCO Corporate & Income Strategy Fund, PIMCO Corporate & Income Opportunity Fund, PIMCO Global StocksPLUS® & Income Fund, PIMCO High Income Fund, PIMCO Income Strategy Fund, PIMCO Income Strategy Fund II, PIMCO Strategic Income Fund, Inc., and PIMCO Managed Accounts Trust (5 portfolios); Trustee (since 2011), Virtus Convertible & Income Fund, Virtus Convertible & Income Fund II, Virtus Equity & Convertible Income Fund, and Virtus Dividend, Interest & Premium Strategy Fund; and Trustee (2011 to 2021), PIMCO Income Opportunity Fund. |
Drummond, F. Ford
YOB: 1962
Served Since: 2022
104 Portfolios | President (since 1998), F.G. Drummond Ranches, Inc.; and Director (since 2015), Texas and Southwestern Cattle Raisers Association. Formerly Chairman, Oklahoma Nature Conservancy (2019 to 2020); Board Member (2006 to 2020) and Chairman (2016 to 2018), Oklahoma Water Resources Board; Trustee (since 2014), Frank Phillips Foundation; Director (1998 to 2008), The Cleveland Bank; and General Counsel (1998 to 2008), BMIHealth Plans (benefits administration). | Trustee (since 2022) and Advisory Board Member (2021 to 2022), Virtus Alternative Solutions Trust (4 portfolios), Virtus Mutual Fund Family (56 portfolios), and Virtus Variable Insurance Trust (8 portfolios); Trustee (since 2022), Virtus Stone Harbor Emerging Markets Income Fund and Virtus Stone Harbor Emerging Markets Total Income Fund; Trustee (since 2021), The Merger Fund®, The Merger Fund® VL, and Virtus Event Opportunities Trust (2 portfolios); Advisory Board Member (February 2021 to June 2021), Duff & Phelps Select MLP and Midstream Energy Fund Inc.; Trustee (since 2021), Virtus Global Multi-Sector Income Fund; Director (since 2021), Virtus Total Return Fund Inc.; Trustee (since 2019), Virtus Artificial Intelligence & Technology Opportunities Fund; Trustee (since 2017), Virtus Convertible & Income 2024 Target Term Fund; Trustee (since 2015), Virtus Convertible & Income Fund, Virtus Convertible & Income Fund II, Virtus Diversified Income & Convertible Fund, Virtus Dividend, Interest & Premium Strategy Fund and Virtus Equity & Convertible Income Fund; Trustee (since 2014), Virtus Strategy Trust (8 portfolios); Director (since 2011), Bancfirst Corporation; and Trustee (since 2006), Virtus Investment Trust (13 portfolios). |
FUND MANAGEMENT TABLES (Unaudited) (Continued)
Name, Year of Birth,
Length of Time Served
and Number of
Portfolios in Fund
Complex Overseen by
Trustee | Principal Occupation(s) During Past 5 Years | Other Directorships Held by Trustee During Past 5 Years |
Harris, Sidney E.
YOB: 1949
Served Since: 2017
97 Portfolios | Private Investor (since 2021); Dean Emeritus (since 2015), Professor (2015 to 2021 and 1997 to 2014), and Dean (1997 to 2004), J. Mack Robinson College of Business, Georgia State University. | Trustee (since 2022), Virtus Stone Harbor Emerging Markets Income Fund and Virtus Stone Harbor Emerging Markets Total Income Fund; Trustee (since 2021), The Merger Fund®, The Merger Fund® VL, Virtus Event Opportunities Trust (2 portfolios), Virtus Investment Trust (13 portfolios) and Virtus Strategy Trust (8 portfolios); Director (2020 to 2021), Duff & Phelps Select MLP and Midstream Energy Fund Inc.; Director (since 2020), Virtus Total Return Fund Inc.; Trustee (since 2020), Virtus Global Multi-Sector Income Fund; Trustee (since 2019), Mutual Fund Directors Forum; Trustee (since 2017), Virtus Mutual Fund Family (56 portfolios), Virtus Variable Insurance Trust (8 portfolios), and Virtus Alternative Solutions Trust (4 portfolios); Trustee (2013 to 2020) and Honorary Trustee (since 2020), KIPP Metro Atlanta; Director (1999 to 2019), Total System Services, Inc.; Trustee (2004 to 2017), RidgeWorth Funds; Chairman (2012 to 2017), International University of the Grand Bassam Foundation; Trustee (since 2012), International University of the Grand Bassam Foundation; and Trustee (2011 to 2015), Genspring Family Offices, LLC. |
Mallin, John R.
YOB: 1950
Served Since: 2016
97 Portfolios | Partner/Attorney (since 2003), McCarter & English LLP (law firm) Real Property Practice Group; and Member (2014 to 2022), Counselors of Real Estate. | Trustee (since 2022), Virtus Stone Harbor Emerging Markets Income Fund and Virtus Stone Harbor Emerging Markets Total Income Fund; Trustee (since 2021), The Merger Fund®, The Merger Fund® VL, Virtus Event Opportunities Trust (2 portfolios), Virtus Investment Trust (13 portfolios) and Virtus Strategy Trust (8 portfolios); Director (2020 to 2021), Duff & Phelps Select MLP and Midstream Energy Fund Inc.; Director (since 2020), Virtus Total Return Fund Inc.; Trustee (since 2020), Virtus Global Multi-Sector Income Fund; Trustee (since 2016), Virtus Mutual Fund Family (56 portfolios) and Virtus Alternative Solutions Trust (4 portfolios); Director (since 2019), 1892 Club, Inc. (non-profit); Director (2013 to 2020), Horizons, Inc. (non-profit); and Trustee (since 1999), Virtus Variable Insurance Trust (8 portfolios). |
McDaniel, Connie D.
YOB: 1958
Served Since: 2017
104 Portfolios | Retired (since 2013). Vice President, Chief of Internal Audit, Corporate Audit Department (2009 to 2013); Vice President, Global Finance Transformation (2007 to 2009); and Vice President and Controller (1999 to 2007), The Coca-Cola Company. | Trustee (since May 2023) and Advisory Board Member (May 2023), Virtus Artificial Intelligence & Technology Opportunities Fund, Virtus Convertible & Income 2024 Target Term Fund, Virtus Convertible & Income Fund, Virtus Convertible & Income Fund II, Virtus Diversified Income & Convertible Fund, Virtus Dividend, Interest & Premium Strategy Fund and Virtus Equity & Convertible Income Fund; Trustee (since 2022), Virtus Stone Harbor Emerging Markets Income Fund and Virtus Stone Harbor Emerging Markets Total Income Fund; Trustee (since 2021), The Merger Fund®, The Merger Fund® VL, Virtus Event Opportunities Trust (2 portfolios), Virtus Investment Trust (13 portfolios) and Virtus Strategy Trust (8 portfolios); Director (2020 to 2021), Duff & Phelps Select MLP and Midstream Energy Fund Inc.; Director (since 2020), Virtus Total Return Fund Inc.; Trustee (since 2020), Virtus Global Multi-Sector Income Fund; Director (since 2019), Global Payments Inc.; Chairperson (since 2021), Governance & Nominating Committee, Global Payments Inc; Trustee (since 2017), Virtus Mutual Fund Family (56 portfolios), Virtus Variable Insurance Trust (8 portfolios), and Virtus Alternative Solutions Trust (4 portfolios); Director (since 2021), North Florida Land Trust; Director (2014 to 2019), Total System Services, Inc.; Member (2011 to 2022) and Chair (2014 to 2016), Georgia State University, Robinson College of Business Board of Advisors; and Trustee (2005 to 2017), RidgeWorth Funds. |
FUND MANAGEMENT TABLES (Unaudited) (Continued)
Name, Year of Birth,
Length of Time Served
and Number of
Portfolios in Fund
Complex Overseen by
Trustee | Principal Occupation(s) During Past 5 Years | Other Directorships Held by Trustee During Past 5 Years |
McLoughlin, Philip
YOB: 1946
Served Since: 1999
107 Portfolios | Private investor since 2010. | Trustee and Chairman (since 2022), Virtus Stone Harbor Emerging Markets Income Fund and Virtus Stone Harbor Emerging Markets Total Income Fund; Trustee (since 2021), The Merger Fund®, The Merger Fund® VL, Virtus Event Opportunities Trust (2 portfolios), Virtus Investment Trust (13 portfolios) and Virtus Strategy Trust (8 portfolios); Chairman (since 2023) and Trustee (since 2021), Virtus Artificial Intelligence & Technology Opportunities Fund, Virtus Convertible & Income Fund II, Virtus Diversified Income & Convertible Fund, Virtus Equity & Convertible Income Fund and Virtus Dividend, Interest & Premium Strategy Fund; Chairman (since 2023), Trustee (since 2022) and Advisory Board Member (2021), Virtus Convertible & Income 2024 Target Term Fund and Virtus Convertible & Income Fund; Director and Chairman (since 2016), Virtus Total Return Fund Inc.; Director and Chairman (2016 to 2019), the former Virtus Total Return Fund Inc.; Director and Chairman (2014 to 2021), Duff & Phelps Select MLP and Midstream Energy Fund Inc.; Trustee and Chairman (since 2013), Virtus Alternative Solutions Trust (4 portfolios); Trustee and Chairman (since 2011), Virtus Global Multi-Sector Income Fund; Chairman and Trustee (since 2003), Virtus Variable Insurance Trust (8 portfolios); Director (since 1995), closed-end funds managed by Duff & Phelps Investment Management Co. (3 funds); Director (1991 to 2019) and Chairman (2010 to 2019), Lazard World Trust Fund (closed-end investment firm in Luxembourg); and Trustee (since 1989) and Chairman (since 2002), Virtus Mutual Fund Family (56 portfolios). |
McNamara, Geraldine M.
YOB: 1951
Served Since: 2001
107 Portfolios | Private investor (since 2006); and Managing Director, U.S. Trust Company of New York (1982 to 2006). | Trustee (since May 2023) and Advisory Board Member (January 2023 to May 2023), Virtus Convertible & Income Fund, Virtus Convertible & Income Fund II, Virtus Diversified Income & Convertible Fund and Virtus Dividend, Interest & Premium Strategy Fund; Trustee (since 2023), Virtus Artificial Intelligence & Technology Opportunities Fund and Virtus Equity & Convertible Income Fund; Advisory Board Member (since 2023), Virtus Convertible & Income 2024 Target Term Fund; Trustee (since 2022), Virtus Stone Harbor Emerging Markets Income Fund and Virtus Stone Harbor Emerging Markets Total Income Fund; Trustee (since 2021), The Merger Fund®, The Merger Fund® VL, Virtus Event Opportunities Trust (2 portfolios), Virtus Investment Trust (13 portfolios) and Virtus Strategy Trust (8 portfolios); Director (2020 to 2021), Duff & Phelps Select MLP and Midstream Energy Fund Inc.; Director (since 2020), Virtus Total Return Fund Inc.; Trustee (since 2020), Virtus Global Multi-Sector Income Fund; Trustee (since 2016) Virtus Alternative Solutions Trust (4 portfolios); Trustee (since 2015), Virtus Variable Insurance Trust (8 portfolios); Director (since 2003), closed-end funds managed by Duff & Phelps Investment Management Co. (3 funds); and Trustee (since 2001), Virtus Mutual Fund Family (56 portfolios). |
Walton, R. Keith
YOB: 1964
Served Since: 2020
104 Portfolios | Senior Adviser (since 2022), Brightwood Capital LLC; Venture and Operating Partner (since 2020), Plexo Capital, LLC; Venture Partner (since 2019) and Senior Adviser (2018 to 2019), Plexo, LLC; and Partner (since 2006), Global Infrastructure Partners. Formerly, Managing Director (2020 to 2021), Lafayette Square Holding Company LLC; Senior Adviser (2018 to 2019), Vatic Labs, LLC; Executive Vice President, Strategy (2017 to 2019), Zero Mass Water, LLC; and Vice President, Strategy (2013 to 2017), Arizona State University. | Trustee (since 2023) and Advisory Board Member (2022 to 2023), Virtus Convertible & Income 2024 Target Term Fund; Trustee (since 2023) and Advisory Board Member (2022 to 2023), Virtus Convertible & Income Fund II and Virtus Dividend, Interest & Premium Strategy Fund; Trustee (since 2022) and Advisory Board Member (January 2022 to July 2022), Virtus Artificial Intelligence & Technology Opportunities Fund, Virtus Convertible & Income Fund and Virtus Equity & Convertible Income Fund; Trustee (since 2022), Virtus Stone Harbor Emerging Markets Income Fund and Virtus Stone Harbor Emerging Markets Total Income Fund; Trustee (since 2022), Virtus Diversified Income & Convertible Fund; Trustee (since 2021), The Merger Fund®, The Merger Fund® VL, Virtus Event Opportunities Trust (2 portfolios), Virtus Investment Trust (13 portfolios) and Virtus Strategy Trust (8 portfolios); Trustee (since 2020) Virtus Alternative Solutions Trust (4 portfolios), Virtus Variable Insurance Trust (8 portfolios) and Virtus Mutual Fund Family (56 portfolios); Director (since 2017), certain funds advised by Bessemer Investment Management LLC; Director (2016 to 2021), Duff & Phelps Select MLP and Midstream Energy Fund Inc.; Trustee (since 2016), Virtus Global Multi-Sector Income Fund; Director (2006 to 2019), Systematica Investments Limited Funds; Director (2006 to 2017), BlueCrest Capital Management Funds; Trustee (2014 to 2017), AZ Service; Director (since 2004), Virtus Total Return Fund Inc.; and Director (2004 to 2019), the former Virtus Total Return Fund Inc. |
FUND MANAGEMENT TABLES (Unaudited) (Continued)
Name, Year of Birth,
Length of Time Served
and Number of
Portfolios in Fund
Complex Overseen by
Trustee | Principal Occupation(s) During Past 5 Years | Other Directorships Held by Trustee During Past 5 Years |
Zino, Brian T.
YOB: 1952
Served Since: 2020
104 Portfolios | Retired. Various roles (1982 to 2009), J. & W. Seligman & Co. Incorporated, including President (1994 to 2009). | Trustee (since 2022), Virtus Stone Harbor Emerging Markets Income Fund and Virtus Stone Harbor Emerging Markets Total Income Fund; Trustee (since 2021), The Merger Fund®, The Merger Fund® VL, Virtus Event Opportunities Trust (2 portfolios), Virtus Investment Trust (13 portfolios) and Virtus Strategy Trust (8 portfolios); Trustee (since 2022) and Advisory Board Member (2021), Virtus Artificial Intelligence & Technology Opportunities Fund, Virtus Convertible & Income 2024 Target Term Fund, Virtus Convertible & Income Fund, Virtus Convertible & Income Fund II, Virtus Diversified Income & Convertible Fund, Virtus Equity & Convertible Income Fund, and Virtus Dividend, Interest & Premium Strategy Fund; Trustee (since 2020) Virtus Alternative Solutions Trust (4 portfolios), Virtus Variable Insurance Trust (8 portfolios) and Virtus Mutual Fund Family (56 portfolios); Director (2016 to 2021), Duff & Phelps Select MLP and Midstream Energy Fund Inc.; Trustee (since 2016), Virtus Global Multi-Sector Income Fund; Director (since 2014), Virtus Total Return Fund Inc.; Director (2014 to 2019), the former Virtus Total Return Fund Inc.; Trustee (since 2011), Bentley University; Director (1986 to 2009) and President (1994 to 2009), J&W Seligman Co. Inc.; Director (1998 to 2009), Chairman (2002 to 2004) and Vice Chairman (2000 to 2002), ICI Mutual Insurance Company; Member, Board of Governors of ICI (1998 to 2008). |
FUND MANAGEMENT TABLES (Unaudited) (Continued)
Interested Trustee
Name, Year of Birth,
Length of Time Served
and Number of
Funds Overseen | Principal Occupation(s) During Past
5 Years | Principal Occupation(s) During Past 5 Years and
Other Directorships Held by Trustee |
Aylward, George R.*
Trustee and President
YOB: 1964
Served Since: 2006
110 Portfolios | Director, President and Chief Executive Officer (since 2008), Virtus Investment Partners, Inc. and/or certain of its subsidiaries, and various senior officer positions with Virtus affiliates (since 2005). | Director (since 2023), Stone Harbor Investment Funds plc (21 sub-funds) and Stone Harbor Global Funds plc (27 sub-funds); Trustee, President and Chief Executive Officer (since 2022), Virtus Stone Harbor Emerging Markets Income Fund and Virtus Stone Harbor Emerging Markets Total Income Fund; Member, Board of Governors of the Investment Company Institute (since 2021); Trustee and President (since 2021), The Merger Fund®, The Merger Fund® VL, Virtus Event Opportunities Trust (2 portfolios), Virtus Investment Trust (13 portfolios) and Virtus Strategy Trust (8 portfolios); Trustee, President and Chief Executive Officer (since 2021), Virtus Artificial Intelligence & Technology Opportunities Fund, Virtus Convertible & Income 2024 Target Term Fund, Virtus Convertible & Income Fund, Virtus Convertible & Income Fund II, Virtus Diversified Income & Convertible Fund, Virtus Equity & Convertible Income Fund, and Virtus Dividend, Interest & Premium Strategy Fund; Chairman and Trustee (since 2015), Virtus ETF Trust II (6 portfolios); Director, President and Chief Executive Officer (2014 to 2021), Duff & Phelps Select MLP and Midstream Energy Fund Inc.; Trustee and President (since 2013), Virtus Alternative Solutions Trust (4 portfolios); Director (since 2013), Virtus Global Funds, plc (5 portfolios); Trustee (since 2012) and President (since 2010), Virtus Variable Insurance Trust (8 portfolios); Trustee, President and Chief Executive Officer (since 2011), Virtus Global Multi-Sector Income Fund; Trustee and President (since 2006) and Executive Vice President (2004 to 2006), Virtus Mutual Fund Family (56 portfolios); Director, President and Chief Executive Officer (since 2006), Virtus Total Return Fund Inc.; and Director, President and Chief Executive Officer (2006 to 2019), the former Virtus Total Return Fund Inc. |
*Mr. Aylward is an “interested person,” as defined in the 1940 Act, by reason of his position as President and Chief Executive Officer of Virtus Investment Partners, Inc. (“Virtus”), the ultimate parent company of the Adviser, and various positions with its affiliates, including the Adviser.
FUND MANAGEMENT TABLES (Unaudited) (Continued)
Officers of the Trust Who Are Not Trustees
Name, Address and
Year of Birth | Position(s) Held
with Trust and
Length of
Time Served | Principal Occupation(s) During Past 5 Years |
Batchelar, Peter J.
YOB: 1970 | Senior Vice President (since 2017), and Vice President (2008 to 2016). | Senior Vice President, Product Development (since 2017), Vice President, Product Development (2008 to 2017), and various officer positions (since 2008), Virtus Investment Partners, Inc. and/or certain of its subsidiaries; various officer positions (since 2008) of various registered funds advised by subsidiaries of Virtus Investment Partners, Inc. |
Bradley, W. Patrick
YOB: 1972 | Executive Vice President (since 2016); Senior Vice President (2013 to 2016); Vice President (2011 to 2013); Chief Financial Officer and Treasurer (since 2006). | Executive Vice President, Fund Services (since 2016), Senior Vice President, Fund Services (2010 to 2016) and various officer positions (since 2004), Virtus Investment Partners, Inc. and/or certain of its subsidiaries; Director (since 2023), Stone Harbor Investment Funds plc and Stone Harbor Global Funds plc; Director (since 2019), Virtus Global Funds ICAV; Director (since 2013), Virtus Global Funds, plc; various officer positions (since 2006) of various registered funds advised by subsidiaries of Virtus Investment Partners, Inc.; Member (since 2022), BNY Mellon Asset Servicing Client Advisory Board. |
Branigan, Timothy
YOB: 1976 | Vice President and Fund Chief Compliance Officer (since 2022); Assistant Vice President and Deputy Fund Chief Compliance Officer (March to May 2022); and Assistant Vice President and Assistant Chief Compliance Officer (2021 to 2022). | Various officer positions (since 2019) of various registered funds advised by subsidiaries of Virtus Investment Partners, Inc. |
Chisolm, Daphne
YOB: 1969 | Vice President, Counsel and Assistant Secretary (since 2023) | Vice President and Senior Counsel (since 2023), Virtus Investment Partners, Inc.; Attorney at Law engaged in private practice as a solo practitioner (2018 to 2023); and various officer positions (since 2023) of various registered funds advised by subsidiaries of Virtus Investment Partners, Inc. |
Fromm Jennifer
YOB: 1973 | Chief Legal Officer, Counsel and Secretary (since 2023); Vice President (since 2017); and Assistant Secretary (2008 to 2022). | Vice President (since 2016) and Senior Counsel, Legal (since 2007) and various officer positions (since 2008), Virtus Investment Partners, Inc. and/or certain of its subsidiaries; various officer positions (since 2008) of various registered funds advised by subsidiaries of Virtus Investment Partners, Inc. |
Griswold, Heidi
YOB: 1973 | Vice President (since 2016). | Vice President, Head of Transfer Agent & Servicing, Mutual Fund Services (since 2018), Virtus Investment Partners, Inc. and/or certain of its subsidiaries; and Vice President (since 2016) of various registered funds advised by subsidiaries of Virtus Investment Partners, Inc. |
Hackett, Amy
YOB: 1968 | Vice President and Assistant Treasurer (since 2013); Assistant Treasurer (2009 to 2013). | Vice President (since 2010) and Assistant Vice President (2007 to 2010), Fund Services, Virtus Investment Partners, Inc. and/or certain of its subsidiaries; and various officer positions (since 2007) of various registered funds advised by subsidiaries of Virtus Investment Partners, Inc |
Krishnan, Suneeta
YOB: 1965 | Vice President and Assistant Treasurer (since 2018); and Assistant Treasurer (2009 to 2018). | Vice President (since 2017) and Assistant Treasurer (since 2007), Mutual Fund Administration, Virtus Investment Partners, Inc. and/or certain of its subsidiaries; and various officer positions (since 2009) of various registered funds advised by subsidiaries of Virtus Investment Partners, Inc. |
Lowe, Benjamin
YOB: 1978 | Vice President, Controller and Assistant Treasurer (since 2021); and Vice President and Assistant Treasurer (2018 to 2021). | Vice President, Fund Services (since 2017), Virtus Investment Partners, Inc. and/or certain of its subsidiaries; and various officer positions (since 2018) of various registered funds advised by subsidiaries of Virtus Investment Partners, Inc. |
Martin, David
YOB: 1959 | Anti-Money Laundering Compliance Officer (since 2016). | Vice President, Compliance – Broker/Dealer (since 2009), Virtus Investment Partners, Inc.; and Vice President and Chief Compliance Officer of certain Virtus subsidiaries (since 2004). |
Rahman, Mahmood
YOB: 1967 | Assistant Vice President (since 2021). | Vice President (since 2023), Tax Director (since 2020) and Assistant Vice President (2020 to 2023), Fund Administration, Virtus Investment Partners, Inc.; Assistant Vice President (since 2021) of various registered funds advised by subsidiaries of Virtus Investment Partners, Inc.; and Assistant Treasurer and Tax Director, Grantham, Mayo, Van Otterloo & Co. LLC (2007 to 2019). |
Short, Julia R.
YOB: 1972 | Senior Vice President (since 2017). | Senior Vice President, Product Development (since 2017), Virtus Investment Partners, Inc. and/or certain of its subsidiaries; Senior Vice President (since 2017) of various registered funds advised by subsidiaries of Virtus Investment Partners, Inc.; and Managing Director, Product Manager, RidgeWorth Investments (2004 to 2017). |
FUND MANAGEMENT TABLES (Unaudited) (Continued)
Name, Address and
Year of Birth | Position(s) Held
with Trust and
Length of
Time Served | Principal Occupation(s) During Past 5 Years |
Smirl, Richard W.
YOB: 1967 | Executive Vice President (since 2021). | Chief Operating Officer (since 2021), Virtus Investment Partners, Inc.; Executive Vice President (since 2021), Virtus Investment Partners, Inc. and/or certain of its subsidiaries; Executive Vice President (since 2021) of various registered funds advised by subsidiaries of Virtus Investment Partners, Inc.; Chief Operating Officer (2018 to 2021), Russell Investments; Executive Director (Jan. to July 2018), State of Wisconsin Investment Board; and Partner and Chief Operating Officer (2004 to 2018), William Blair Investment Management. |
Suss, Amanda
YOB: 1969 | Vice President, Controller and Assistant Treasurer (since 2022). | Vice President and Controller (since 2022), Mutual Fund Administration and Financial Reporting, Virtus Investment Partners, Inc.; Vice President, Controller and Assistant Treasurer (since 2022) of various registered funds advised by subsidiaries of Virtus Investment Partners, Inc.; and Senior Finance Associate (2011 to 2022), Stone Harbor Investment Partners LP. |
Virtus Vontobel Emerging Markets Opportunities Fund (the “Fund”),
a series of Virtus Opportunities Trust
(Unaudited)
Supplement dated November 13, 2023 to the Summary Prospectus, and the Virtus Opportunities Trust
Statutory Prospectus applicable to the Fund and Statement of Additional Information (“SAI”),
each dated January 27, 2023, as supplemented
IMPORTANT NOTICE TO INVESTORS
Effective November 10, 2023, Jin Zhang, CFA, is no longer a portfolio manager of the Fund and all references to Mr. Zhang are hereby removed from the Fund’s Summary Prospectus, Statutory Prospectus and SAI.
There will be no change to the investment process for the Fund, which is team oriented, or to the other disclosures concerning the Fund, including fees, expenses, investment objective, strategies and risks, as a result o f Mr. Zhang ceasing to serve as a portfolio manager of the Fund.
Investors should retain this supplement with the Prospectuses and SAI for future reference.
VOT 8020/Vontobel PM Announcement (11/2023)
Virtus Vontobel Emerging Markets Opportunities Fund (the “Fund”),
a series of Virtus Opportunities Trust
(Unaudited)
Supplement dated November 28, 2023 to the Summary Prospectus and the Virtus Opportunities Trust Statutory Prospectus pertaining to the Fund, dated January 27, 2023, as supplemented
IMPORTANT NOTICE TO INVESTORS
The following changes, as approved by the Board of Trustees of Virtus Opportunities Trust (the “Trust”) on November 15, 2023, for the Virtus Vontobel Emerging Markets Opportunities Fund will be effective December 27, 2023.
• Sustainable Growth Advisers, LP (“SGA”), an affiliate of Virtus Investment Advisers, Inc., will be managing the Fund as subadviser.
• Hrishikesh Gupta, Kishore Rao, and Robert L. Rohn will be added as portfolio managers of the Fund.
• The current subadviser, Vontobel Asset Management, Inc. (“Vontobel”) will be removed as subadviser of the Fund and all references to Vontobel as subadviser of the Fund, and to Matthew Benkendorf and Ramiz Chelat as portfolio managers of the Fund, will be removed from the Fund’s prospectuses.
• The Fund will be renamed Virtus SGA Emerging Markets Equity Fund.
Accordingly, the following changes to the prospectus disclosure will take effect on December 27, 2023:
Under “Fees and Expenses” in the Fund’s summary prospectus and the summary section of the statutory prospectus, the “Annual Fund Operating Expenses” table and associated footnotes will be replaced with the following:
| Annual Fund Operating Expenses (expenses that you pay each year as a percentage of the value of your investment) | Class A | Class C | Class I | Class R6 |
| Management Fees | 0.98% | 0.98% | 0.98% | 0.98% |
| Distribution and Shareholder Servicing (12b-1) Fees | 0.25% | 1.00% | None | None |
| Other Expenses | 0.36% | 0.30% | 0.27% | 0.18% |
| Total Annual Fund Operating Expenses | 1.59% | 2.28% | 1.25% | 1.16% |
| Less: Fee Waiver and/or Expense Reimbursement(b) | (0.11)% | (0.05)% | (0.02)% | (0.18)% |
Total Annual Fund Operating Expenses After Expense
Reimbursement(b) | 1.48% | 2.23% | 1.23% | 0.98% |
(b) The fund’s investment adviser has contractually agreed to limit the fund’s total operating expenses (excluding certain expenses, such as front-end or contingent deferred sales charges, taxes, leverage and borrowing expenses (such as commitment, amendment and renewal expenses on credit or redemption facilities), interest, brokerage commissions, expenses incurred in connection with any merger or reorganization, unusual or infrequently occurring expenses (such as litigation), acquired fund fees and expenses, and dividend expenses, if any) so that such expenses do not exceed 1.48% for Class A Shares, 2.23% for Class C Shares, 1.23% for Class I Shares and 0.98% for Class R6 Shares through January 31, 2025. Following the contractual period, the adviser may discontinue these expense reimbursement arrangements at any time. Under certain conditions, the adviser may recapture operating expenses reimbursed and/or fees waived under these arrangements for a period of three years following the date such waiver or reimbursement occurred, provided that the recapture does not cause the fund to exceed its expense limit in effect at the time of the waiver or reimbursement, and any in effect at the time of recapture, after repayment is taken into account.
Virtus Vontobel Emerging Markets Opportunities Fund (the “Fund”),
a series of Virtus Opportunities Trust (Continued)
Under “Fees and Expenses,” the “Example” table will be replaced with the following:
| | Share Status | 1 Year | 3 Years | 5 Years | 10 Years |
| Class A | Sold or Held | $692 | $1,014 | $1,359 | $2,328 |
| Class C | Sold | $326 | $708 | $1,216 | $2,613 |
| Held | $226 | $708 | $1,216 | $2,613 |
| Class I | Sold or Held | $125 | $395 | $684 | $1,510 |
| Class R6 | Sold or Held | $100 | $351 | $622 | $1,395 |
In the summary prospectus and in the summary section of the statutory prospectus, the “Management” section will be replaced in its entirety with the following:
The fund’s investment adviser is Virtus Investment Advisers, Inc. (“VIA”).
The fund’s subadviser is Sustainable Growth Advisers, LP (“SGA”), an affiliate of VIA.
Portfolio Management
> Hrishikesh Gupta, Analyst, Portfolio Manager, Principal and a member of the Investment Committee at SGA. Mr. Gupta has served as a Portfolio Manager of the fund since December 2023.
> Kishore Rao, Analyst, Portfolio Manager, Principal and a member of the Investment Committee at SGA. Mr. Rao has served as a Portfolio Manager of the fund since December 2023.
> Robert L. Rohn, Portfolio Manager and co-founder of SGA. Mr. Rohn has served as a Portfolio Manager of the fund since December 2023.
On page 75 of the statutory prospectus, in the table in the section “More Information About Fund Expenses,” the row corresponding to the Fund will be replaced with the following and a new footnote will be added after the table:
| | Class A
Shares | Class C
Shares | Class I
Shares | Class R6
Shares |
| Virtus SGA Emerging Markets Equity Fund* | 1.48% | 2.23% | 1.23% | 0.98% |
* Contractual through January 31, 2025.
On page 114 of the statutory prospectus, under “The Adviser”, the row referencing the Fund in the table listing subadvisers of the funds of the Trust will be replaced with the following:
| Virtus SGA Emerging Markets Equity Fund | SGA |
In the statutory prospectus under “The Subadvisers” beginning on page 115, the disclosure referencing Vontobel on page 116 of the statutory prospectus will be removed and the following disclosure will be added for SGA:
SGA, an affiliate of VIA, is located at 301 Tresser Boulevard, Suite 1310, Stamford, CT 06901. SGA was cofounded by George P. Fraise, Gordon M. Marchand, and Robert L. Rohn in 2003. SGA is a registered investment advisor and provides investment advice to institutional and individual clients, private investment companies and mutual funds. As of September 30, 2023, SGA managed approximately $23.0 billion, of which $20.7 billion was regulatory assets under management and $2.3 billion was model/emulation assets under contract.
Model/emulation assets refer to assets that SGA is under contract to deliver a model portfolio to and are not considered regulatory assets under management.
Additionally, the following replaces the row in the table referencing the Fund on page 116:
| Virtus SGA Emerging Markets Equity Fund | 50% of net investment management fee |
Virtus Vontobel Emerging Markets Opportunities Fund (the “Fund”),
a series of Virtus Opportunities Trust (Continued)
On page 119 of the statutory prospectus, in the section “Portfolio Management”, the disclosure regarding Vontobel will be deleted and a new subsection entitled “SGA” will be added with the following row referencing the Fund:
| Virtus SGA Emerging Markets Equity Fund | Hrishikesh Gupta (since December 2023)
Kishore Rao (since December 2023)
Robert L. Rohn (since December 2023) |
Additionally, the following disclosure will be added below the table showing portfolio managers at SGA:
Hrishikesh Gupta. Mr. Gupta is an Analyst, Portfolio Manager, Principal and a member of the Investment Committee at SGA. Prior to joining the firm in 2014, he was a Senior Analyst at MDR Capital Management and an Investment Banking Associate at Bank of America Merrill Lynch. Prior to that, Mr. Gupta spent three years in the industry as a Product and Program Manager at Amazon.com and, as part of their strategic executive division, led the launch of Amazon’s Japanese and German merchant platforms.
Kishore Rao. Mr. Rao is an Analyst, Portfolio Manager, Principal and a member of the Investment Committee at SGA. Prior to joining the firm in 2004, he was a member of the investment team at Trident Capital, an Investment Analyst at Tiger Management and an Analyst at Wellington Management. Mr. Rao was a Founder and General Manager of the Street Events division of Corporate Communications Broadcast Network.
Robert L. Rohn. Mr. Rohn is a Portfolio Manager and a member of the firm’s Investment Committee. Prior to cofounding SGA in 2003, Mr. Rohn was a portfolio manager and principal with W.P Stewart & Co, Ltd. (“W.P. Stewart”), an investment advisory firm noted for managing large-cap growth stock portfolios. During his twelveyear tenure with W.P. Stewart, he was CEO of the firm’s core U.S. investment business and served as Chairman of the firm’s Management Committee. From 1988 through 1991, he was a Vice President with Yeager, Wood & Marshall, Inc., where he was a member of the Investment Policy Committee with responsibilities in equity analysis and portfolio management.
Additionally, the following changes to the prospectus disclosure will take effect on January 29, 2024:
The disclosure regarding the Fund’s principal investment strategies in the summary prospectus and the summary section of the statutory prospectus will be replaced in its entirety as follows:
Under normal circumstances, the fund invests at least 80% of its assets in equity securities or equity-linked instruments of issuers located in emerging markets countries; such issuers may be of any capitalization. Equitylinked instruments are instruments issued by financial institutions or special purpose entities located in foreign countries to provide the synthetic economic performance of a referenced equity security; these securities are valued at market value for purposes of the fund’s requirement to invest 80% of its assets in emerging markets countries. SGA generally considers emerging markets countries to be those included in the MSCI Emerging Markets Index. As of the date of this prospectus, SGA considers issuers to be “located in” emerging markets if an issuer: (i) is organized in emerging markets, (ii) is headquartered in emerging markets, or (iii) has “significant exposure” to emerging markets. SGA considers an issuer as having “significant exposure” to emerging markets if it derives at least 50% of its revenue from emerging markets countries.
SGA uses an investment process to identify companies that it believes have a high degree of predictability, strong profitability and above average earnings and cash flow growth. SGA selects investments for the fund’s portfolio that it believes have superior long-term earnings prospects and attractive valuation. To the extent consistent with the fund’s investment objective and strategies, the subadviser will consider as an element of its investment research and decision-making processes for the fund any environmental, social and/or governance (“ESG”) factors that the subadviser believes may influence risks and opportunities of companies under consideration. However, the pursuit of ESG-related goals is not the fund’s investment objective, nor one of its investment strategies. Therefore, ESG factors by themselves are not expected to determine investment decisions for the fund. The fund’s equity investments may include common stocks, preferred stocks, securities convertible into or exchangeable for common stocks, and depositary receipts.
Virtus Vontobel Emerging Markets Opportunities Fund (the “Fund”),
a series of Virtus Opportunities Trust (Continued)
The fund may invest in companies of all market capitalizations. The fund will allocate its assets among various regions and countries (but no fewer than three countries). From time to time, the fund may have a significant portion of its assets invested in the securities of companies in only a few countries and one or a few regions. Although the fund seeks investments across a number of sectors, from time to time, the fund may have significant positions in particular sectors.
SGA will sell a portfolio holding when it believes the security’s fundamentals deteriorate, its valuation is no longer attractive, or a better investment opportunity arises.
The disclosure under “Principal Risks” in the summary prospectus and in the summary section of the statutory prospectus will be restated as follows:
> Equity Securities Risk. The value of the stocks held by the fund may be negatively affected by the financial market, industries in which the fund invests, or issuer-specific events. Focus on a particular style or in small or medium-sized companies may enhance that risk.
> Foreign Investing Risk. Investing in foreign securities subjects the fund to additional risks such as increased volatility; currency fluctuations; less liquidity; less publicly available information about the foreign investment; and political, regulatory, economic, and market risk.
> Emerging Market Risk. Emerging markets securities may be more volatile, or more greatly affected by negative conditions, than those of their counterparts in more established foreign markets.
> Geographic Concentration Risk. A fund that focuses its investments in a particular geographic location will be sensitive to financial, economic, political and other events negatively affecting that location and may cause the value of the fund to decrease, perhaps significantly.
> Sector Focused Investing Risk. Events negatively affecting a particular market sector in which the fund focuses its investments may cause the value of the fund’s shares to decrease, perhaps significantly.
> Convertible Securities Risk. The value of a convertible security may decline as interest rates rise and/or vary with fluctuations in the market value of the underlying securities. The security may be called for redemption at a time and/or price unfavorable to the fund.
> Currency Rate Risk. Fluctuations in the exchange rates between the U.S. dollar and foreign currencies may negatively affect the value of the fund’s shares.
> Depositary Receipts Risk. Investments in foreign companies through depositary receipts may expose the fund to the same risks as direct investments in securities of foreign issuers.
> ESG Risk. The fund’s consideration of ESG factors could cause the fund to perform differently from other funds. While the subadviser believes that the integration of ESG factors into the fund’s investment process has the potential to contribute to performance, ESG factors may not be considered for every investment decision and there is no guarantee that the integration of ESG factors will result in better performance.
> Growth Stocks Risk. The fund’s investments in growth stocks may be more volatile than investments in other types of stocks, or may perform differently from the market as a whole and from other types of stocks.
> Large Market Capitalization Companies Risk. The value of investments in larger companies may not rise as much as smaller companies, or larger companies may be unable to respond quickly to competitive challenges, such as changes in technology and consumer tastes.
> Market Volatility Risk. The value of the securities in the fund may go up or down in response to the prospects of individual companies and/or general economic conditions. Price changes may be short- or long-term. Local, regional or global events such as war or military conflict (e.g. Russia’s invasion of Ukraine), acts of terrorism, the spread of infectious illness or other public health issue, recessions, or other events could have a significant impact on the fund and its investments, including hampering the ability of the fund’s portfolio manager(s) to invest the fund’s assets as intended.
> Preferred Stocks Risk. Preferred stocks may decline in price, fail to pay dividends when expected, or be illiquid.
Virtus Vontobel Emerging Markets Opportunities Fund (the “Fund”),
a series of Virtus Opportunities Trust (Continued)
> Redemption Risk. One or more large shareholders or groups of shareholders may redeem their holdings in the fund, resulting in an adverse impact on remaining shareholders in the fund by causing the fund to take actions it would not otherwise have taken.
> Small and Medium Market Capitalization Companies Risk. The fund’s investments in small and medium market capitalization companies may increase the volatility and risk of loss to the fund, as compared with investments in larger, more established companies.
In the section “More Information about Risks Related to Principal Investment strategies” the disclosure relating to the fund under “Principal Investment Strategies” starting on page 97 of the statutory prospectus will be replaced with the following:
Under normal circumstances, the fund invests at least 80% of its assets in equity securities or equity-linked instruments of issuers located in emerging markets countries; such issuers may be of any capitalization. Equitylinked instruments are instruments issued by financial institutions or special purpose entities located in foreign countries to provide the synthetic economic performance of a referenced equity security; these securities are valued at market value for purposes of the fund’s requirement to invest 80% of its assets in emerging markets countries. SGA generally considers emerging markets countries to be those included in the MSCI Emerging Markets Index. As of the date of this prospectus, SGA considers issuers to be “located in” emerging markets if an issuer: (i) is organized in emerging markets, (ii) is headquartered in emerging markets, or (iii) has “significant exposure” to emerging markets. SGA considers an issuer as having “significant exposure” to emerging markets if it derives at least 50% of its revenue from emerging markets countries.
SGA uses an investment process to identify companies that it believes have a high degree of predictability, strong profitability and above average earnings and cash flow growth. SGA selects investments for the fund’s portfolio that it believes have superior long-term earnings prospects and attractive valuation. To the extent consistent with the fund’s investment objective and strategies, the subadviser will consider as an element of its investment research and decision-making processes for the fund any environmental, social and/or governance (“ESG”) factors that the subadviser believes may influence risks and opportunities of companies under consideration. However, the pursuit of ESG-related goals is not the fund’s investment objective, nor one of its investment strategies. Therefore, ESG factors by themselves are not expected to determine investment decisions for the fund. The fund’s equity investments may include common stocks, preferred stocks, securities convertible into or exchangeable for common stocks, and depositary receipts. The fund may invest in companies of all market capitalizations. The fund will allocate its assets among various regions and countries (but no fewer than three countries). From time to time, the fund may have a significant portion of its assets invested in the securities of companies in only a few countries and one or a few regions. Although the fund seeks investments across a number of sectors, from time to time, the fund may have significant positions in particular sectors.
SGA will sell a portfolio holding when it believes the security’s fundamentals deteriorate, its valuation is no longer attractive, or a better investment opportunity arises.
Temporary Defensive Strategy: During periods of adverse market conditions, the fund may take temporary defensive positions that are inconsistent with its principal investment strategies by holding all or part of its assets in cash or short-term money market instruments including obligations of the U.S. Government, high-quality commercial paper, certificates of deposit, bankers acceptances, bank interest-bearing demand accounts, and repurchase agreements secured by U.S. Government securities. When this allocation happens, the fund may not achieve its objective.
Please see “More Information About Risks Related to Principal Investment Strategies” for information about the risks of investing in the fund. Please refer to “Additional Risks Associated with Investment Techniques and Fund Operations” for other investment techniques of the fund.
In the section “More Information About Risks Related to Principal Investment Strategies” the table beginning on page 101 of the statutory prospectus will be amended by changing the entries for the fund to reflect an “X” in the row for each of Equity Securities, Foreign Investing, Emerging Market Investing, Geographic Concentration, Sector Focused Investing, Convertible Securities, Currency Rate, Depositary Receipts, ESG Consideration, Growth Stocks, Large Market Capitalization Companies Risk, Market Volatility Risk, Preferred Stocks Risk, Redemption Risk and Small and Medium Market Capitalization Companies Risk.
Virtus Vontobel Emerging Markets Opportunities Fund (the “Fund”),
a series of Virtus Opportunities Trust (Continued)
In the section “More Information About Risks Related to Principal Investment Strategies” the following is added after the table beginning on page 101 of the statutory prospectus:
Convertible Securities
Convertible securities are bonds, debentures, notes, preferred stock, rights, warrants or other securities that may be converted into or exchanged for a prescribed amount of common stock or other security of the same or a different issuer or into cash within a particular period of time at a specified price or formula. A convertible security generally entitles the holder to receive interest paid or accrued on debt instruments or the dividend paid on preferred stock until the convertible security matures or is redeemed, converted or exchanged. If a convertible security is called for redemption, the respective fund may have to redeem the security, convert it into common stock or sell it to a third party at a price and time that is not beneficial for the fund. The value of convertible securities tends to decline as interest rates rise and, because of the conversion feature, tends to vary with fluctuations in the market value of the underlying securities. Securities convertible into common stocks may have higher yields than common stocks but lower yields than comparable nonconvertible securities.
ESG Consideration
A fund’s consideration of ESG factors could cause it to perform differently compared to funds that do not use such considerations. The relevance and weightings of specific ESG factors may vary across asset classes, sectors and strategies and no one factor is determinative. ESG factors are qualitative and subjective by nature and there are significant differences in interpretations of what it means for a company to have positive or negative ESG factors. There is no guarantee that the factors utilized by a fund’s subadviser or any judgment exercised by the subadviser will reflect the opinions of any particular investor, and the factors analyzed by the subadviser may differ from the factors any particular investor considers relevant in evaluating ESG practices. When integrating ESG factors into the investment process, the subadviser may rely on third-party data that it believes to be reliable, but it does not guarantee the accuracy of such third-party data. ESG information from third-party data providers may be incomplete, inaccurate or unavailable, which may adversely impact the investment process. Moreover, the current lack of common standards may result in different approaches to integrating ESG factors. As a result, the funds may invest in companies that do not reflect the beliefs and values of any particular investor.
The ESG factors that may be evaluated as part of a fund’s investment process are anticipated to evolve over time and one or more characteristics may not be relevant with respect to all issuers that are eligible for investment. Further, the regulatory landscape with respect to ESG integration in the United States is still developing and future rules and regulations may require a fund to modify or alter its investment process with respect to ESG integration.
Sector Focused Investing
The value of the investments of a fund that focuses its investments in a particular market sector will be highly sensitive to financial, economic, political and other developments affecting that market sector, and conditions that negatively impact that market sector will have a greater impact on the fund as compared with a fund that does not have its holdings similarly focused. Events negatively affecting the market sectors in which a fund has invested are therefore likely to cause the value of the fund’s shares to decrease, perhaps significantly.
The following will be added as a sub-risk of Equity Securities:
Growth Stocks Risk. Growth stocks can react differently to issuer, political, market, and economic developments than the market as a whole and other types of stocks. Growth stocks also tend to be more expensive relative to their earnings or assets compared to other types of stocks, and as a result they tend to be sensitive to changes in their earnings and more volatile than other types of stocks.
All other disclosure concerning the Fund, including fees and expenses, will remain unchanged from the prospectuses dated January 27, 2023, as supplemented.
Investors should retain this supplement with the Prospectuses for future reference.
VOT 8020/EM Opps Sub Change (11/2023)
Virtus Vontobel Foreign Opportunities Fund,
a series of Virtus Opportunities Trust
(Unaudited)
Supplement dated November 28, 2023, to the Summary Prospectus and
the Virtus Opportunities Trust Statutory Prospectus and Statement of Additional Information (“SAI”)
pertaining to the fund named above, each dated January 27, 2023, as supplemented
IMPORTANT NOTICE TO INVESTORS
As approved by the Board of Trustees of Virtus Opportunities Trust on November 15, 2023, pursuant to an Agreement and Plan of Reorganization, Virtus Vontobel Foreign Opportunities Fund (the “Acquired Fund”) will merge with and into Virtus SGA International Growth Fund (the “Acquiring Fund”), a series of Virtus Asset Trust, on or about March 8, 2024. The Acquired Fund and the Acquiring Fund have the same Board of Trustees.
The Acquiring Fund’s investment objective is identical to the investment objective of the Acquired Fund; the Acquiring Fund’s investment mandate is similar to that of the Acquired Fund; the Acquiring Fund’s investment advisory fee rates are contractually identical to those of the Acquired Fund; and the Acquiring Fund’s expenses are contractually limited by the investment adviser to levels lower than or equal to those of the Acquired Fund. Further, the Acquiring Fund’s investment adviser has agreed to contractually limit the Acquiring Fund’s expenses after the reorganization to levels lower than the limits in place prior to the reorganization. The Principal Investment Strategies of the Acquired Fund and the non-fundamental investment policy of the Acquired Fund regarding the investment of at least 80% of its assets are substantially similar to those of the Acquiring Fund. Therefore, the combined fund after the merger is expected to be managed substantially similarly to the way that the Acquired Fund was managed before the merger, with higher assets and the potential for lower fees and expenses.
Pursuant to the Agreement and Plan of Reorganization, the Acquired Fund will transfer all or substantially all of its assets to the Acquiring Fund in exchange for shares of the Acquiring Fund and the assumption by the Acquiring Fund of all liabilities of the Acquired Fund. Following the exchange, the Acquired Fund will distribute the shares of the Acquiring Fund to its shareholders pro rata, in liquidation of the Acquired Fund, and shareholders of the Acquired Fund will therefore become shareholders of the Acquiring Fund in the same class of shares they owned of the Acquired Fund immediately prior to the reorganization. (Although the Acquiring Fund does not currently offer Class C shares, such shares will be added to its registration prior to the reorganization.)
The merger is expected to be carried out pursuant to Rule 17a-8 under the Investment Company Act of 1940, as amended, which means that shareholder approval is not required for the merger to be carried out.
Investors should retain this supplement with the Prospectuses and
Statement of Additional Information for future reference.
VOT 8020/Vontobel Foreign Ops Merger (11/23)
Virtus Vontobel Global Opportunities Fund,
a series of Virtus Opportunities Trust
(Unaudited)
Supplement dated November 28, 2023, to the Summary Prospectus and
the Virtus Opportunities Trust Statutory Prospectus and Statement of Additional Information (“SAI”)
pertaining to the fund named above, each dated January 27, 2023, as supplemented
IMPORTANT NOTICE TO INVESTORS
As approved by the Board of Trustees of Virtus Opportunities Trust on November 15, 2023, pursuant to an Agreement and Plan of Reorganization, Virtus Vontobel Global Opportunities Fund (the “Acquired Fund”) will merge with and into Virtus SGA Global Growth Fund (the “Acquiring Fund”), a series of Virtus Equity Trust, on or about March 8, 2024. The Acquired Fund and the Acquiring Fund have the same Board of Trustees and investment adviser.
The Acquiring Fund’s investment objective and investment mandate are similar to those of the Acquired Fund; the Acquiring Fund’s investment advisory fee rates are contractually lower than those of the Acquired Fund; and the Acquiring Fund’s expenses are contractually limited by the investment adviser to levels lower than or equal to those of the Acquired Fund. Further, the Acquiring Fund’s investment adviser has agreed to contractually limit the Acquiring Fund’s expenses after the reorganization to levels lower than the limits in place prior to the reorganization. Therefore, the combined fund after the merger is expected to be managed substantially similarly to the way that the Acquired Fund was managed before the merger, with higher assets and the potential for lower fees and expenses.
Pursuant to the Agreement and Plan of Reorganization, the Acquired Fund will transfer all or substantially all of its assets to the Acquiring Fund in exchange for shares of the Acquiring Fund and the assumption by the Acquiring Fund of all liabilities of the Acquired Fund. Following the exchange, the Acquired Fund will distribute the shares of the Acquiring Fund to its shareholders pro rata, in liquidation of the Acquired Fund, and shareholders of the Acquired Fund will therefore become shareholders of the Acquiring Fund in the same class of shares they owned of the Acquired Fund immediately prior to the reorganization.
The merger is expected to be carried out pursuant to Rule 17a-8 under the Investment Company Act of 1940, as amended, which means that shareholder approval is not required for the merger to be carried out.
Investors should retain this supplement with the Prospectuses and
Statement of Additional Information for future reference.
VOT 8020/Vontobel Global Ops Merger (11/23)
Virtus Vontobel Greater European Opportunities Fund (the “Fund”),
a series of Virtus Opportunities Trust
(Unaudited)
Supplement dated November 28, 2023, to the Summary Prospectus and the Virtus Opportunities Trust
Statutory Prospectus and Statement of Additional Information (“SAI”) pertaining to the Fund,
each dated January 27, 2023, as supplemented
IMPORTANT NOTICE TO INVESTORS
On November 15, 2023, the Board of Trustees of Virtus Opportunities Trust voted to approve a Plan of Liquidation for Virtus Vontobel Greater European Opportunities Fund, pursuant to which the Fund will be liquidated (the “Liquidation”) on or about December 28, 2023 (“Liquidation Date”).
Effective December 13, 2023, the Fund will be closed to new investors and additional investor deposits, except that purchases will continue to be accepted for defined contribution and defined benefit retirement plans, the Fund will continue to accept payroll contributions and other types of purchase transactions from both existing and new participants in such plans, and the Fund will allow reinvestment of distributions from existing shareholders. Investors should note that the Fund’s investments will be sold in anticipation of the Liquidation and may be sold in advance of December 13, 2023.
At any time prior to the Liquidation Date, shareholders may redeem or exchange their shares of the Fund for shares of the same class of any other Virtus Mutual Fund. There will be no fee or sales charges associated with exchange or redemption requests.
Prior to the Liquidation Date, the Fund will begin engaging in business and activities for the purposes of winding down the Fund’s business affairs and transitioning some or all of the Fund’s portfolio to cash and cash equivalents in preparation for the orderly liquidation and subsequent distribution of its assets on the Liquidation Date. During this transition period, the Fund will no longer pursue its investment objective or be managed in a manner consistent with its investment strategies, as stated in the Prospectuses. This is likely to impact the Fund’s performance. The impending Liquidation of the Fund may result in large redemptions, which could adversely affect the Fund’s expense ratios. Those shareholders who remain invested in the Fund during part or all of this transition period may bear increased brokerage and other transaction expenses relating to the sale of portfolio investments prior to the Liquidation Date.
On the Liquidation Date, any outstanding shares of the Fund will be automatically redeemed as of the close of business, except shares held in BNY Mellon IS Trust Company custodial accounts, which will be exchanged for the same class of shares of Virtus Seix U.S. Government Securities Ultra-Short Bond Fund, with the exception of Class C shares which will be exchanged for Class A shares of Virtus Seix U.S. Government Securities Ultra-Short Bond Fund, and any contingent deferred sales charges will be waived. Shareholders with BNY Mellon IS Trust Company custodial accounts should consult the prospectus for the Virtus Seix U.S. Government Securities Ultra- Short Bond Fund for information about that fund.
The proceeds of any redemption will be equal to the net asset value of such shares after the Fund has paid or provided for all charges, taxes, expenses and liabilities. The distribution to shareholders of these liquidation proceeds will occur as soon as practicable, and will be made to all Fund shareholders of record at the time of the Liquidation. Additionally, the Fund must declare and distribute to shareholders any undistributed realized capital gains and all net investment income no later than the final liquidation distribution. To the extent that the Fund has experienced redemptions prior to the date the Fund distributes any realized capital gains and net investment income, the remaining shareholders at the time of the distribution(s) may bear increased tax liability due to receiving a higher proportion of the distribution(s).
Although shareholders are expected to receive proceeds of the Liquidation in cash, proceeds distributed to shareholders may be paid in cash, cash equivalents, or portfolio investments equal to the shareholder’s proportionate interest in the net assets of the Fund (the latter payment method, “in kind”). Shareholders who receive proceeds in kind should expect (i) that the in-kind distribution will be subject to market and other risks, such as liquidity risk, before sale, and (ii) to incur transaction costs, including brokerage costs, when converting the investments to cash.
Virtus Vontobel Greater European Opportunities Fund (the “Fund”),
a series of Virtus Opportunities Trust (Continued)
Because the exchange or redemption of your shares could be a taxable event, we suggest you consult with your tax advisor prior to the Fund’s liquidation.
Investors should retain this supplement with the Prospectuses and SAI for future reference.
VOT 8020 Vontobel Greater Euro Liquidation Supplement (11/2023)
THIS PAGE INTENTIONALLY BLANK.
THIS PAGE INTENTIONALLY BLANK.
THIS PAGE INTENTIONALLY BLANK.
VIRTUS OPPORTUNITIES TRUST
101 Munson Street
Greenfield, MA 01301-9668
Trustees
Philip R. McLoughlin, Chairman
George R. Aylward
Donald C. Burke
Sarah E. Cogan
Deborah A. DeCotis
F. Ford Drummond
Sidney E. Harris
John R. Mallin
Connie D. McDaniel
Geraldine M. McNamara
R. Keith Walton
Brian T. Zino
Officers
George R. Aylward, President
Peter Batchelar, Senior Vice President
W. Patrick Bradley, Executive Vice President, Chief Financial Officer and Treasurer
Jennifer Fromm, Vice President, Chief Legal Officer, Counsel and Secretary
Julia R. Short, Senior Vice President
Richard W. Smirl, Executive Vice President
Investment Adviser
Virtus Investment Advisers, Inc.
One Financial Plaza
Hartford, CT 06103-2608
Principal Underwriter
VP Distributors, LLC
One Financial Plaza
Hartford, CT 06103-2608
Administrator and Transfer Agent
Virtus Fund Services, LLC
One Financial Plaza
Hartford, CT 06103-2608
Custodian
The Bank of New York Mellon
240 Greenwich Street
New York, NY 10286-1048
Independent Registered Public
Accounting Firm
PricewaterhouseCoopers LLP
2001 Market Street
Philadelphia, PA 19103-7042
How to Contact Us
| Mutual Fund Services | 1-800-243-1574 |
| Adviser Consulting Group | 1-800-243-4361 |
Important Notice to Shareholders
The Securities and Exchange Commission has modified mailing regulations for semiannual and annual shareholder fund reports to allow mutual fund companies to send a single copy of these reports to shareholders who share the same mailing address. If you would like additional copies, please call Mutual Fund Services at 1-800-243-1574.
P.O. Box 534470
Pittsburgh, PA 15253-4470
For more information about Virtus Funds,
please contact us at 1-800-243-1574, or visit Virtus.com.
| Item 1. | Reports to Stockholders (cont.). |
| | (a) | The registrant, as of the end of the period covered by this report, has adopted a code of ethics that applies to the registrant’s principal executive officer, principal financial officer, principal accounting officer or controller, or persons performing similar functions, regardless of whether these individuals are employed by the registrant or a third party. |
| | (c) | There have been no amendments during the period covered by this report, to a provision of the code of ethics that applies to the registrant’s principal executive officer, principal financial officer, principal accounting officer or controller, or persons performing similar functions, regardless of whether these individuals are employed by the registrant or a third party, and that relates to any element of the code of ethics described in Item 2(b) of the instructions for completion of Form N-CSR. A copy of the currently applicable code is included as an exhibit. |
| | (d) | The registrant has not granted any waivers, including an implicit waiver, from a provision of the code of ethics that applies to the registrant’s principal executive officer, principal financial officer, principal accounting officer or controller, or persons performing similar functions, regardless of whether these individuals are employed by the registrant or a third party, that relates to one or more of the items set forth in paragraph (b) of this item’s instructions. |
| Item 3. | Audit Committee Financial Expert. |
| (a)(1) | The Registrant’s Board of Trustees has determined that the Registrant has an “audit committee financial expert” serving on its Audit Committee. |
| (a)(2) | The Registrant’s Board of Trustees has determined that each of Donald C. Burke, Connie D. McDaniel and Brian T. Zino possesses the technical attributes identified in Instruction 2(b) of Item 3 to Form N-CSR to qualify as an “audit committee financial expert.” Each such individual is an “independent” trustee pursuant to paragraph (a)(2) of Item 3 to Form N-CSR. |
| Item 4. | Principal Accountant Fees and Services. |
Audit Fees
| | (a) | The aggregate fees billed for each of the last two fiscal years for professional services rendered by the principal accountant for the audit of the registrant’s annual financial statements or services that are normally provided by the accountant in connection with statutory and regulatory filings or engagements for those fiscal years are $488,653 for 2022 and $480,540 for 2023. |
Audit-Related Fees
| | (b) | The aggregate fees billed in each of the last two fiscal years for assurance and related services by the principal accountant that are reasonably related to the performance of the audit of the registrant’s financial statements and are not reported under paragraph (a) of this Item are $34,978 for 2022 and $23,460 for 2023. Such audit-related fees include the out of pocket expenses. |
Tax Fees
| | (c) | The aggregate fees billed in each of the last two fiscal years for professional services rendered by the principal accountant for tax compliance, tax advice, and tax planning are $123,721 for 2022 and $72,663 for 2023. |
“Tax Fees” are those primarily associated with review of the Trust’s tax provision and qualification as a regulated investment company (RIC) in connection with audits of the Trust’s financial statement, review of year-end distributions by the Fund to avoid excise tax for the Trust, periodic discussion with management on tax issues affecting the Trust, and reviewing and signing the Fund’s federal income returns.
All Other Fees
| | (d) | The aggregate fees billed in each of the last two fiscal years for products and services provided by the principal accountant, other than the services reported in paragraphs (a) through (c) of this Item are $0 for 2022 and $0 for 2023. |
| | (e)(1) | Disclose the audit committee’s pre-approval policies and procedures described in paragraph (c)(7) of Rule 2-01 of Regulation S-X. |
The Board of Trustees of Virtus Opportunities Trust (the “Fund”) has adopted policies and procedures with regard to the pre-approval of services provided by its independent auditors. Audit, audit-related and tax compliance services provided to the Fund on an annual basis require specific pre-approval by the Audit Committee. The Audit Committee must also approve other non-audit services provided to the Fund and those non-audit services provided to the Fund’s Affiliated Service Providers that relate directly to the operations and financial reporting of the Fund. Certain of these non-audit services that the Audit Committee believes are a) consistent with the SEC’s auditor independence rules and b) routine and recurring services that will not impair the independence of the independent auditors may be approved by the Audit Committee without consideration on a specific case-by-case basis (“general pre-approval”).
The Audit Committee has determined that the Chair of the Audit Committee, may provide pre-approval for such services that meet the above requirements but are not included in the general pre-approval in the event such approval is sought between regularly scheduled meetings. In any event, the Audit Committee is informed of, and ratifies, each service approved subject to general pre-approval at the next regularly scheduled in-person Audit Committee meeting.
| | (e)(2) | The percentage of services described in each of paragraphs (b) through (d) of this Item that were approved by the audit committee pursuant to paragraph (c)(7)(i)(C) of Rule 2-01 of Regulation S-X are as follows: |
(b) 0%
(c) 0%
(d) N/A
| | (f) | The percentage of hours expended on the principal accountant’s engagement to audit the registrant’s financial statements for the most recent fiscal year that were attributed to work performed by persons other than the principal accountant’s full-time, permanent employees was less than fifty percent. |
| | (g) | The aggregate non-audit fees billed by the registrant’s accountant for services rendered to the registrant, and rendered to the registrant’s investment adviser (not including any sub-adviser whose role is primarily portfolio management and is subcontracted with or overseen by another investment adviser), and any entity controlling, controlled by, or under common control with the adviser that provides ongoing services to the registrant for each of the last two fiscal years of the registrant was $158,699 for 2022 and $96,123 for 2023. |
| | (h) | The registrant’s audit committee of the board of directors has considered whether the provision of non-audit services that were rendered to the registrant’s investment adviser (not including any sub-adviser whose role is primarily portfolio management and is subcontracted with or overseen by another investment adviser), and any entity controlling, controlled by, or under common control with the investment adviser that provides ongoing services to the registrant that were not pre-approved pursuant to paragraph (c)(7)(ii) of Rule 2-01 of Regulation S-X is compatible with maintaining the principal accountant’s independence. |
| Item 5. | Audit Committee of Listed Registrants. |
Disclosure not required for open-end management investment companies.
| (a) | Schedule of Investments in securities of unaffiliated issuers as of the close of the reporting period is included as part of the report to shareholders filed under Item 1(a) of this form. |
| Item 7. | Disclosure of Proxy Voting Policies and Procedures for Closed-End Management Investment Companies. |
Disclosure not required for open-end management investment companies.
| Item 8. | Portfolio Managers of Closed-End Management Investment Companies. |
Disclosure not required for open-end management investment companies.
| Item 9. | Purchases of Equity Securities by Closed-End Management Investment Company and Affiliated Purchasers. |
Disclosure not required for open-end management investment companies.
| Item 10. | Submission of Matters to a Vote of Security Holders. |
There have been no material changes to the procedures by which the shareholders may recommend nominees to the registrant’s board of trustees, where those changes were implemented after the registrant last provided disclosure in response to the requirements of Item 407(c)(2)(iv) of Regulation S-K (17 CFR 229.407) (as required by Item 22(b)(15) of Schedule 14A (17 CFR 240.14a-101)), or this Item.
| Item 11. | Controls and Procedures. |
| | (a) | The registrant’s principal executive and principal financial officers, or persons performing similar functions, have concluded that the registrant’s disclosure controls and procedures (as defined in Rule 30a-3(c) under the Investment Company Act of 1940, as amended (the “1940 Act”) (17 CFR 270.30a-3(c))) are effective, as of a date within 90 days of the filing date of the report that includes the disclosure required by this paragraph, based on their evaluation of these controls and procedures required by Rule 30a-3(b) under the 1940 Act (17 CFR 270.30a-3(b)) and Rules 13a-15(b) or 15d-15(b) under the Securities Exchange Act of 1934, as amended (17 CFR 240.13a-15(b) or 240.15d-15(b)). |
| | (b) | There were no changes in the registrant’s internal control over financial reporting (as defined in Rule 30a-3(d) under the 1940 Act (17 CFR 270.30a-3(d))) that occurred during the period covered by this report that has materially affected, or is reasonably likely to materially affect, the registrant’s internal control over financial reporting. |
| Item 12. | Disclosure of Securities Lending Activities for Closed-End Management Investment Companies. |
Disclosure not required for open-end management investment companies.
| | (a)(2)(2) | There was no change in the Registrant’s independent public accountant during the period covered by the report. |
SIGNATURES
Pursuant to the requirements of the Securities Exchange Act of 1934 and the Investment Company Act of 1940, the registrant has duly caused this report to be signed on its behalf by the undersigned, thereunto duly authorized.
| | | | |
| (Registrant) Virtus Opportunities Trust | | |
| | |
| By (Signature and Title)* | | /s/ George R. Aylward | | |
| | George R. Aylward, President | | |
| | (principal executive officer) | | |
| |
| Date 12/6/23 | | |
Pursuant to the requirements of the Securities Exchange Act of 1934 and the Investment Company Act of 1940, this report has been signed below by the following persons on behalf of the registrant and in the capacities and on the dates indicated.
| | | | |
| By (Signature and Title)* | | /s/ George R. Aylward | | |
| | George R. Aylward, President | | |
| | (principal executive officer) | | |
| |
| Date 12/6/23 | | |
| | |
| By (Signature and Title)* | | /s/ W. Patrick Bradley | | |
| | W. Patrick Bradley, Executive Vice President, Chief Financial Officer, and Treasurer | | |
| | (principal financial officer) | | |
| |
| Date 12/5/23 | | |
| * | Print the name and title of each signing officer under his or her signature. |