UNITED STATES
SECURITIES AND EXCHANGE COMMISSION
Washington, D.C. 20549
FORM N-CSR
CERTIFIED SHAREHOLDER REPORT OF REGISTERED MANAGEMENT INVESTMENT COMPANIES
Investment Company Act file number
Virtus Opportunities Trust
(Exact name of registrant as specified in charter)
101 Munson Street
Greenfield, MA 01301-9668
Jennifer Fromm, Esq.
Vice President, Chief Legal Officer, Counsel and Secretary for Registrant
One Financial Plaza
Hartford, CT 06103-2608
(Name and address of agent for service)
Registrant's telephone number, including area code:
Date of reporting period:
Item 1. Report to Stockholders.
(a) The registrant’s annual report transmitted to shareholders pursuant to Rule 30e-1 under the Investment Company Act of 1940 is as follows:
Stone Harbor Emerging Markets Bond Fund
Class A / VSHAX
Annual SHAREHOLDER REPORT | May 31, 2024
This annual shareholder report contains important information about the Virtus Stone Harbor Emerging Markets Bond Fund (“Fund”) for the period of June 1, 2023 to May 31, 2024. You can find additional information about the Fund at https://www.virtus.com/investor-resources/mutual-fund-documents. You can also request this information by contacting us at 1‑800‑243‑1574.
What were the Fund costs for the last year?
(Based on a hypothetical $10,000 investment)
| Fund (Class) | Costs of a $10,000 investment | Costs paid as a percentage of a $10,000 investment |
Virtus Stone Harbor Emerging Markets Bond Fund
Class A / VSHAX | $132 | 1.25% |
Portfolio Manager Commentary by Stone Harbor Investment Partners
For the fiscal year ended May 31, 2024, the Fund’s Class A shares at NAV returned 10.93%. For the same period, the J.P. Morgan EMBI Global Diversified Index, a broad-based securities market index, returned 10.98% and the J.P. Morgan CEMBI Broad Diversified Index, which serves as the style-specific index, returned 9.46%.
The J.P. Morgan EMBI Global Diversified Index tracks total returns for U.S. dollar-denominated debt instruments issued by emerging markets sovereign and quasi-sovereign entities: Brady bonds, loans, and Eurobonds. The index limits the weights of those index countries with larger debt stocks by only including specified portions of these countries' eligible current face amounts outstanding. The index is calculated on a total return basis. The index is unmanaged, its returns do not reflect any fees, expenses, or sales charges, and is not available for direct investment.
The J.P. Morgan CEMBI Broad Diversified Index tracks total returns for U.S. dollar denominated debt instruments issued by corporate entities in emerging markets countries. The index limits the weights of those index countries with larger corporate debt stocks by only including a specified portion of these countries’ eligible current face amounts of debt outstanding. Qualifying corporate bonds have a face amount greater than USD 300 million and maturity greater than 2.5 years. The index is calculated on a total return basis. The index is unmanaged, its returns do not reflect any fees, expenses, or sales charges, and is not available for direct investment.
What impacted Fund performance over the reporting period?
Country exposures and issue selection contributed positively to Fund performance relative to its style-specific benchmark for the 12-month period ended May 31, 2024. Exposures in Latin America contributed most to relative performance. In other regions, overweight exposures in Ghana, Ukraine, and Macau, as well as underweight exposures in Qatar and China, enhanced performance. Issue selection in Brazil, Colombia, and Mexico were among the top positive contributors. In terms of industry attribution, overweight exposures and issue selection in exploration and production, electric, and gaming contributed positively, as did an underweight exposure and issue selection in financials. Issue selection in wireless was also a top contributor to performance. Underweight exposures in higher-rated credits and overweight exposures in lower-quality credits contributed to relative performance during the period. Some of the positive performance attribution was offset by issue selection decisions in the Philippines and Indonesia.
| FACTOR | IMPACT | SUMMARY |
| Mexico | Positive | Issue selection, particularly in Aeromexico and America Movil, enhanced relative returns. |
| Colombia | Positive | Overweight exposure and issue selection, particularly in Sierracol Energy and Gran Tierra Energy, enhanced relative returns. |
| The Philippines | Negative | Underweight exposure and issue selection, especially in SMC Global Power Holdings, detracted from relative performance. |
| Indonesia | Negative | Issue selection, particularly in Paiton Energy, detracted from relative performance. |
The preceding information is the opinion of portfolio management only through the end of the period stated. Any such opinions are subject to change at any time based upon market or other conditions and should not be relied upon as investment advice. Performance figures assume reinvestment of distributions and exclude the effect of sales charges. Performance data quoted represents past results. Past performance is no guarantee of future results, and there is no guarantee that market forecasts will be realized.
How has the Fund historically performed?
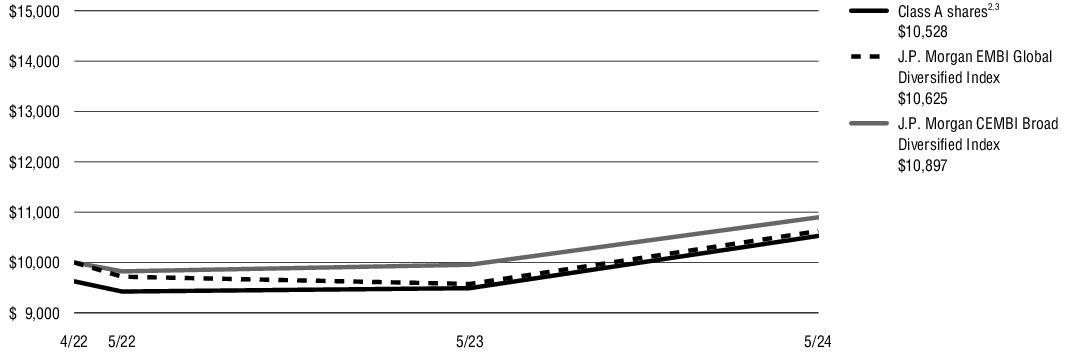
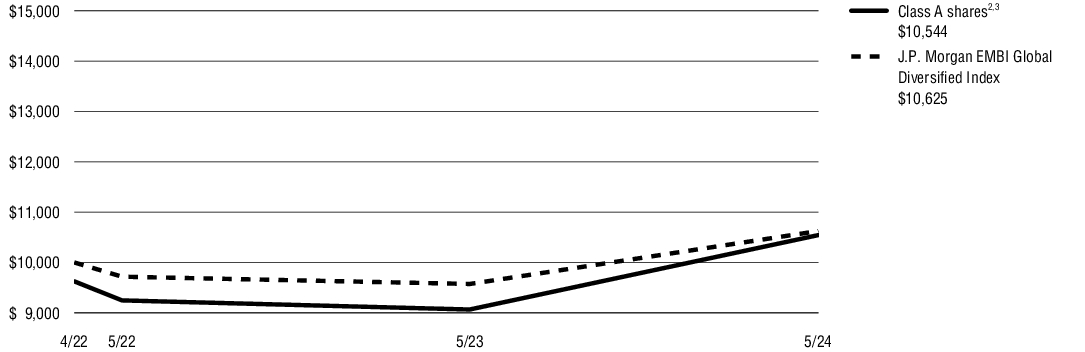
The following graph compares the initial and subsequent account values at the end of each of the most recently completed fiscal years of Class A shares from inception (April 11, 2022) including any applicable sales charges or fees. It assumes a $10,000 initial investment from inception, in an appropriate broad-based securities market index and style-specific index for the same period. Performance assumes reinvestment of dividends and capital gain distributions.
GROWTH OF $10,000
| AVERAGE ANNUAL TOTAL RETURNS for periods ended 5/31/24 | 1 Year | Since Inception |
| Virtus Stone Harbor Emerging Markets Bond Fund (Class A/VSHAX) at NAV(1) | 10.93% | 4.28% |
| Virtus Stone Harbor Emerging Markets Bond Fund (Class A/VSHAX) at POP(2),(3) | 6.77% | 2.43% |
| J.P. Morgan EMBI Global Diversified Index | 10.98% | 2.87% |
| J.P. Morgan CEMBI Broad Diversified Index | 9.46% | 4.10% |
| (1) | “NAV” (Net Asset Value) total returns do not include the effect of any sales charge. |
| (2) | “POP” (Public Offering Price) total returns include the effect of the maximum front-end 3.75% sales charge. |
| (3) | "CDSC" (contingent deferred sales charge) is applied to redemptions of certain classes of shares that do not have a sales charge applied at the time of purchase. CDSC for certain redemptions of Class A shares made within 18 months of a finder's fee being paid are 0.50%. |
Performance data quoted represents past performance. Past performance does not guarantee future results. Investment return and principal value will fluctuate so that shares, when redeemed, may be worth more or less than their original cost. The above table and graph do not reflect the deduction of taxes that a shareholder would pay on fund distributions or the redemption of shares. Current performance may be lower or higher than the performance data quoted. Please visit https://www.virtus.com/mutual-funds-monthly-performance for performance data current to the most recent month end. Average annual total return is the annual compound return for the indicated period and reflects the change in share price and the reinvestment of all dividends and capital gains.
KEY FUND STATISTICS (as of May 31, 2024)
| Fund net assets (‘000s) | $6,877% |
| Total number of portfolio holdings | $147% |
| Total advisory fee paid (‘000s) | $-% |
| Portfolio turnover rate as of the end of the reporting period | $69% |
| Corporate Bonds and Notes | | 100% |
| Financial & Lease | 21% | |
| Electric | 15% | |
| Exploration & Production | 15% | |
| Gaming | 8% | |
| Metals, Mining & Steel | 5% | |
| Midstream | 4% | |
| Chemicals | 4% | |
| Retail Food & Drug | 3% | |
| Services Other | 3% | |
| Technology | 3% | |
| All other Corporate Bonds and Notes | 19% | |
| Total | | 100% |
(1) | Percentage of total investments as of May 31, 2024. |
Where can I find more information?
For more information about the Fund including its Prospectus, Financial Information, Fund holdings, and proxy voting information, please contact us at 1-800-243-1574, or visit https://www.virtus.com/investor-resources/mutual-fund-documents.
Householding
Shareholders who have consented to receive a single annual or semi-annual shareholder report at a shared address may revoke this consent or request additional copies by calling Mutual Fund Services at 1-800-243-1574.
Stone Harbor Emerging Markets Bond Fund
Class I / SHCDX
Annual SHAREHOLDER REPORT | May 31, 2024
This annual shareholder report contains important information about the Virtus Stone Harbor Emerging Markets Bond Fund (“Fund”) for the period of June 1, 2023 to May 31, 2024. You can find additional information about the Fund at https://www.virtus.com/investor-resources/mutual-fund-documents. You can also request this information by contacting us at 1‑800‑243‑1574.
What were the Fund costs for the last year?
(Based on a hypothetical $10,000 investment)
| Fund (Class) | Costs of a $10,000 investment | Costs paid as a percentage of a $10,000 investment |
Virtus Stone Harbor Emerging Markets Bond Fund
Class I / SHCDX | $106 | 1.00% |
Portfolio Manager Commentary by Stone Harbor Investment Partners
For the fiscal year ended May 31, 2024, the Fund’s Class I shares at NAV returned 11.17%. For the same period, the J.P. Morgan EMBI Global Diversified Index, a broad-based securities market index, returned 10.98% and the J.P. Morgan CEMBI Broad Diversified Index, which serves as the style-specific index, returned 9.46%.
The J.P. Morgan EMBI Global Diversified Index tracks total returns for U.S. dollar-denominated debt instruments issued by emerging markets sovereign and quasi-sovereign entities: Brady bonds, loans, and Eurobonds. The index limits the weights of those index countries with larger debt stocks by only including specified portions of these countries' eligible current face amounts outstanding. The index is calculated on a total return basis. The index is unmanaged, its returns do not reflect any fees, expenses, or sales charges, and is not available for direct investment.
The J.P. Morgan CEMBI Broad Diversified Index tracks total returns for U.S. dollar denominated debt instruments issued by corporate entities in emerging markets countries. The index limits the weights of those index countries with larger corporate debt stocks by only including a specified portion of these countries’ eligible current face amounts of debt outstanding. Qualifying corporate bonds have a face amount greater than USD 300 million and maturity greater than 2.5 years. The index is calculated on a total return basis. The index is unmanaged, its returns do not reflect any fees, expenses, or sales charges, and is not available for direct investment.
What impacted Fund performance over the reporting period?
Country exposures and issue selection contributed positively to Fund performance relative to its style-specific benchmark for the 12-month period ended May 31, 2024. Exposures in Latin America contributed most to relative performance. In other regions, overweight exposures in Ghana, Ukraine, and Macau, as well as underweight exposures in Qatar and China, enhanced performance. Issue selection in Brazil, Colombia, and Mexico were among the top positive contributors. In terms of industry attribution, overweight exposures and issue selection in exploration and production, electric, and gaming contributed positively, as did an underweight exposure and issue selection in financials. Issue selection in wireless was also a top contributor to performance. Underweight exposures in higher-rated credits and overweight exposures in lower-quality credits contributed to relative performance during the period. Some of the positive performance attribution was offset by issue selection decisions in the Philippines and Indonesia.
| FACTOR | IMPACT | SUMMARY |
| Mexico | Positive | Issue selection, particularly in Aeromexico and America Movil, enhanced relative returns. |
| Colombia | Positive | Overweight exposure and issue selection, particularly in Sierracol Energy and Gran Tierra Energy, enhanced relative returns. |
| The Philippines | Negative | Underweight exposure and issue selection, especially in SMC Global Power Holdings, detracted from relative performance. |
| Indonesia | Negative | Issue selection, particularly in Paiton Energy, detracted from relative performance. |
The preceding information is the opinion of portfolio management only through the end of the period stated. Any such opinions are subject to change at any time based upon market or other conditions and should not be relied upon as investment advice. Performance figures assume reinvestment of distributions and exclude the effect of sales charges. Performance data quoted represents past results. Past performance is no guarantee of future results, and there is no guarantee that market forecasts will be realized.
How has the Fund historically performed?
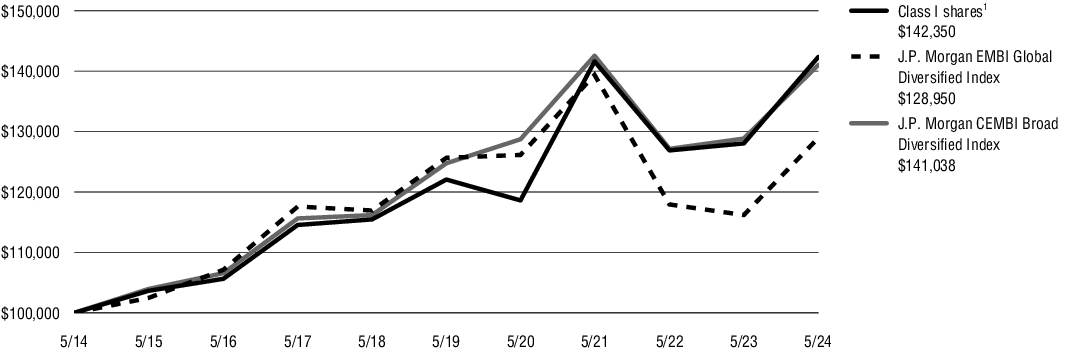
The following graph compares the initial and subsequent account values at the end of each of the most recently completed 10 fiscal years of Class I shares. It assumes a $100,000 initial investment at the beginning of the first fiscal year, in an appropriate broad-based securities market index and style-specific index for the same period. Performance assumes reinvestment of dividends and capital gain distributions.
GROWTH OF $100,000
| AVERAGE ANNUAL TOTAL RETURNS for periods ended 5/31/24 | 1 Year | 5 Years | 10 Years |
| Virtus Stone Harbor Emerging Markets Bond Fund (Class I/SHCDX) at NAV(1) | 11.17% | 3.12% | 3.59% |
| J.P. Morgan EMBI Global Diversified Index | 10.98% | 0.52% | 2.58% |
| J.P. Morgan CEMBI Broad Diversified Index | 9.46% | 2.48% | 3.50% |
| (1) | “NAV” (Net Asset Value) total returns do not include the effect of any sales charge. |
Performance data quoted represents past performance. Past performance does not guarantee future results. Investment return and principal value will fluctuate so that shares, when redeemed, may be worth more or less than their original cost. The above table and graph do not reflect the deduction of taxes that a shareholder would pay on fund distributions or the redemption of shares. Current performance may be lower or higher than the performance data quoted. Please visit https://www.virtus.com/mutual-funds-monthly-performance for performance data current to the most recent month end. Average annual total return is the annual compound return for the indicated period and reflects the change in share price and the reinvestment of all dividends and capital gains.
KEY FUND STATISTICS (as of May 31, 2024)
| Fund net assets (‘000s) | $6,877% |
| Total number of portfolio holdings | $147% |
| Total advisory fee paid (‘000s) | $-% |
| Portfolio turnover rate as of the end of the reporting period | $69% |
| Corporate Bonds and Notes | | 100% |
| Financial & Lease | 21% | |
| Electric | 15% | |
| Exploration & Production | 15% | |
| Gaming | 8% | |
| Metals, Mining & Steel | 5% | |
| Midstream | 4% | |
| Chemicals | 4% | |
| Retail Food & Drug | 3% | |
| Services Other | 3% | |
| Technology | 3% | |
| All other Corporate Bonds and Notes | 19% | |
| Total | | 100% |
(1) | Percentage of total investments as of May 31, 2024. |
Where can I find more information?
For more information about the Fund including its Prospectus, Financial Information, Fund holdings, and proxy voting information, please contact us at 1-800-243-1574, or visit https://www.virtus.com/investor-resources/mutual-fund-documents.
Householding
Shareholders who have consented to receive a single annual or semi-annual shareholder report at a shared address may revoke this consent or request additional copies by calling Mutual Fund Services at 1-800-243-1574.
Stone Harbor Emerging Markets Debt Income Fund
Class A / VSHCX
Annual SHAREHOLDER REPORT | May 31, 2024
This annual shareholder report contains important information about the Virtus Stone Harbor Emerging Markets Debt Income Fund (“Fund”) for the period of June 1, 2023 to May 31, 2024. You can find additional information about the Fund at https://www.virtus.com/investor-resources/mutual-fund-documents. You can also request this information by contacting us at 1‑800‑243‑1574.
What were the Fund costs for the last year?
(Based on a hypothetical $10,000 investment)
| Fund (Class) | Costs of a $10,000 investment | Costs paid as a percentage of a $10,000 investment |
Virtus Stone Harbor Emerging Markets Debt Income Fund
Class A / VSHCX | $108 | 1.00% |
Portfolio Manager Commentary by Stone Harbor Investment Partners
For the fiscal year ended May 31, 2024, the Fund’s Class A shares at NAV returned 16.31%. For the same period, the J.P. Morgan EMBI Global Diversified Index, a broad-based securities market index, returned 10.98%.
The J.P. Morgan EMBI Global Diversified Index tracks total returns for U.S. dollar-denominated debt instruments issued by emerging markets sovereign and quasi-sovereign entities: Brady bonds, loans, and Eurobonds. The index limits the weights of those index countries with larger debt stocks by only including specified portions of these countries' eligible current face amounts outstanding. The index is calculated on a total return basis. The index is unmanaged, its returns do not reflect any fees, expenses, or sales charges, and is not available for direct investment.
What impacted Fund performance over the reporting period?
Country selection decisions contributed positively to relative performance for the 12-month period ended May 31, 2024, as did issue selection. Out-of-benchmark exposures to hard currency corporate debt also enhanced performance. Some of the positive performance attribution was offset by exposure in local currency debt. Attribution from movements in U.S. Treasuries was negative during the period. In terms of regional performance, Latin America – particularly an overweight in Venezuela – was the top contributor to relative performance, while in Asia, underweights in several countries, including China, Indonesia, Malaysia, and the Philippines also contributed positively.
| FACTOR | IMPACT | SUMMARY |
| Venezuela | Positive | Overweight exposure in Venezuela enhanced relative performance during the period as U.S. sanctions were suspended as part of agreement for the Maduro administration to allow for free and fair elections. |
| China | Positive | Underweight exposure in China enhanced relative returns as the Chinese economy failed to sustain economic momentum and meaningfully ease the property market crisis. |
| Angola | Negative | Issue selection detracted from performance. |
| Indonesia | Negative | Exposures in local currency debt detracted from performance. |
The preceding information is the opinion of portfolio management only through the end of the period stated. Any such opinions are subject to change at any time based upon market or other conditions and should not be relied upon as investment advice. Performance figures assume reinvestment of distributions and exclude the effect of sales charges. Performance data quoted represents past results. Past performance is no guarantee of future results, and there is no guarantee that market forecasts will be realized.
How has the Fund historically performed?
The following graph compares the initial and subsequent account values at the end of each of the most recently completed fiscal years of Class A shares from inception (April 11, 2022) including any applicable sales charges or fees. It assumes a $10,000 initial investment from inception, in an appropriate broad-based securities market index for the same period. Performance assumes reinvestment of dividends and capital gain distributions.
GROWTH OF $10,000
| AVERAGE ANNUAL TOTAL RETURNS for periods ended 5/31/24 | 1 Year | Since Inception |
| Virtus Stone Harbor Emerging Markets Debt Income Fund (Class A/VSHCX) at NAV(1) | 16.31% | 4.35% |
| Virtus Stone Harbor Emerging Markets Debt Income Fund (Class A/VSHCX) at POP(2),(3) | 11.95% | 2.51% |
| J.P. Morgan EMBI Global Diversified Index | 10.98% | 2.87% |
| (1) | “NAV” (Net Asset Value) total returns do not include the effect of any sales charge. |
| (2) | “POP” (Public Offering Price) total returns include the effect of the maximum front-end 3.75% sales charge. |
| (3) | "CDSC" (contingent deferred sales charge) is applied to redemptions of certain classes of shares that do not have a sales charge applied at the time of purchase. CDSC for certain redemptions of Class A shares made within 18 months of a finder's fee being paid are 0.50%. |
Performance data quoted represents past performance. Past performance does not guarantee future results. Investment return and principal value will fluctuate so that shares, when redeemed, may be worth more or less than their original cost. The above table and graph do not reflect the deduction of taxes that a shareholder would pay on fund distributions or the redemption of shares. Current performance may be lower or higher than the performance data quoted. Please visit https://www.virtus.com/mutual-funds-monthly-performance for performance data current to the most recent month end. Average annual total return is the annual compound return for the indicated period and reflects the change in share price and the reinvestment of all dividends and capital gains.
KEY FUND STATISTICS (as of May 31, 2024)
| Fund net assets (‘000s) | $257,124% |
| Total number of portfolio holdings | $283% |
| Total advisory fee paid (‘000s) | $1,451% |
| Portfolio turnover rate as of the end of the reporting period | $123% |
| Foreign Government Securities | | 69% |
| Corporate Bonds and Notes | | 28% |
| Exploration & Production | 11% | |
| Electric | 4% | |
| Metals, Mining & Steel | 3% | |
| Financials | 2% | |
| Industrial Other | 2% | |
| Financial & Lease | 2% | |
| All other Corporate Bonds and Notes | 4% | |
| Affiliated Mutual Funds | | 2% |
| Credit Linked Note | | 1% |
| Total | | 100% |
(1) | Percentage of total investments as of May 31, 2024. |
Where can I find more information?
For more information about the Fund including its Prospectus, Financial Information, Fund holdings, and proxy voting information, please contact us at 1-800-243-1574, or visit https://www.virtus.com/investor-resources/mutual-fund-documents.
Householding
Shareholders who have consented to receive a single annual or semi-annual shareholder report at a shared address may revoke this consent or request additional copies by calling Mutual Fund Services at 1-800-243-1574.
Stone Harbor Emerging Markets Debt Income Fund
Class I / SHMDX
Annual SHAREHOLDER REPORT | May 31, 2024
This annual shareholder report contains important information about the Virtus Stone Harbor Emerging Markets Debt Income Fund (“Fund”) for the period of June 1, 2023 to May 31, 2024. You can find additional information about the Fund at https://www.virtus.com/investor-resources/mutual-fund-documents. You can also request this information by contacting us at 1‑800‑243‑1574.
What were the Fund costs for the last year?
(Based on a hypothetical $10,000 investment)
| Fund (Class) | Costs of a $10,000 investment | Costs paid as a percentage of a $10,000 investment |
Virtus Stone Harbor Emerging Markets Debt Income Fund
Class I / SHMDX | $78 | 0.72% |
Portfolio Manager Commentary by Stone Harbor Investment Partners
For the fiscal year ended May 31, 2024, the Fund’s Class I shares at NAV returned 16.57%. For the same period, the J.P. Morgan EMBI Global Diversified Index, a broad-based securities market index, returned 10.98%.
The J.P. Morgan EMBI Global Diversified Index tracks total returns for U.S. dollar-denominated debt instruments issued by emerging markets sovereign and quasi-sovereign entities: Brady bonds, loans, and Eurobonds. The index limits the weights of those index countries with larger debt stocks by only including specified portions of these countries' eligible current face amounts outstanding. The index is calculated on a total return basis. The index is unmanaged, its returns do not reflect any fees, expenses, or sales charges, and is not available for direct investment.
What impacted Fund performance over the reporting period?
Country selection decisions contributed positively to relative performance for the 12-month period ended May 31, 2024, as did issue selection. Out-of-benchmark exposures to hard currency corporate debt also enhanced performance. Some of the positive performance attribution was offset by exposure in local currency debt. Attribution from movements in U.S. Treasuries was negative during the period. In terms of regional performance, Latin America – particularly an overweight in Venezuela – was the top contributor to relative performance, while in Asia, underweights in several countries, including China, Indonesia, Malaysia, and the Philippines also contributed positively.
| FACTOR | IMPACT | SUMMARY |
| Venezuela | Positive | Overweight exposure in Venezuela enhanced relative performance during the period as U.S. sanctions were suspended as part of agreement for the Maduro administration to allow for free and fair elections. |
| China | Positive | Underweight exposure in China enhanced relative returns as the Chinese economy failed to sustain economic momentum and meaningfully ease the property market crisis. |
| Angola | Negative | Issue selection detracted from performance. |
| Indonesia | Negative | Exposures in local currency debt detracted from performance. |
The preceding information is the opinion of portfolio management only through the end of the period stated. Any such opinions are subject to change at any time based upon market or other conditions and should not be relied upon as investment advice. Performance figures assume reinvestment of distributions and exclude the effect of sales charges. Performance data quoted represents past results. Past performance is no guarantee of future results, and there is no guarantee that market forecasts will be realized.
How has the Fund historically performed?
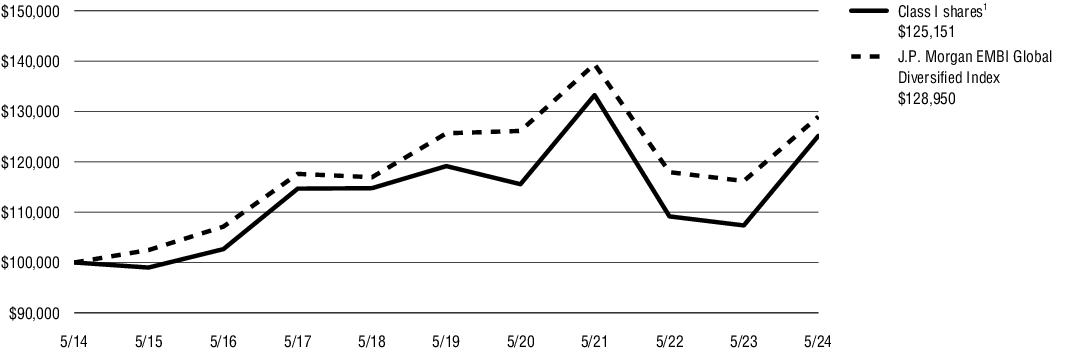
The following graph compares the initial and subsequent account values at the end of each of the most recently completed 10 fiscal years of Class I shares. It assumes a $100,000 initial investment at the beginning of the first fiscal year, in an appropriate broad-based securities market index for the same period. Performance assumes reinvestment of dividends and capital gain distributions.
GROWTH OF $100,000
| AVERAGE ANNUAL TOTAL RETURNS for periods ended 5/31/24 | 1 Year | 5 Years | 10 Years |
| Virtus Stone Harbor Emerging Markets Debt Income Fund (Class I/SHMDX) at NAV(1) | 16.57% | 0.99% | 2.27% |
| J.P. Morgan EMBI Global Diversified Index | 10.98% | 0.52% | 2.58% |
| (1) | “NAV” (Net Asset Value) total returns do not include the effect of any sales charge. |
Performance data quoted represents past performance. Past performance does not guarantee future results. Investment return and principal value will fluctuate so that shares, when redeemed, may be worth more or less than their original cost. The above table and graph do not reflect the deduction of taxes that a shareholder would pay on fund distributions or the redemption of shares. Current performance may be lower or higher than the performance data quoted. Please visit https://www.virtus.com/mutual-funds-monthly-performance for performance data current to the most recent month end. Average annual total return is the annual compound return for the indicated period and reflects the change in share price and the reinvestment of all dividends and capital gains.
KEY FUND STATISTICS (as of May 31, 2024)
| Fund net assets (‘000s) | $257,124% |
| Total number of portfolio holdings | $283% |
| Total advisory fee paid (‘000s) | $1,451% |
| Portfolio turnover rate as of the end of the reporting period | $123% |
| Foreign Government Securities | | 69% |
| Corporate Bonds and Notes | | 28% |
| Exploration & Production | 11% | |
| Electric | 4% | |
| Metals, Mining & Steel | 3% | |
| Financials | 2% | |
| Industrial Other | 2% | |
| Financial & Lease | 2% | |
| All other Corporate Bonds and Notes | 4% | |
| Affiliated Mutual Funds | | 2% |
| Credit Linked Note | | 1% |
| Total | | 100% |
(1) | Percentage of total investments as of May 31, 2024. |
Where can I find more information?
For more information about the Fund including its Prospectus, Financial Information, Fund holdings, and proxy voting information, please contact us at 1-800-243-1574, or visit https://www.virtus.com/investor-resources/mutual-fund-documents.
Householding
Shareholders who have consented to receive a single annual or semi-annual shareholder report at a shared address may revoke this consent or request additional copies by calling Mutual Fund Services at 1-800-243-1574.
Stone Harbor Local Markets Fund
Class A / VSHEX
Annual SHAREHOLDER REPORT | May 31, 2024
This annual shareholder report contains important information about the Virtus Stone Harbor Local Markets Fund (“Fund”) for the period of June 1, 2023 to May 31, 2024. You can find additional information about the Fund at https://www.virtus.com/investor-resources/mutual-fund-documents. You can also request this information by contacting us at 1‑800‑243‑1574.
What were the Fund costs for the last year?
(Based on a hypothetical $10,000 investment)
| Fund (Class) | Costs of a $10,000 investment | Costs paid as a percentage of a $10,000 investment |
Virtus Stone Harbor Local Markets Fund
Class A / VSHEX | $128 | 1.25% |
Portfolio Manager Commentary by Stone Harbor Investment Partners
For the fiscal year ended May 31, 2024, the Fund’s Class A shares at NAV returned 4.68%. For the same period, the J.P. Morgan EMBI Global Diversified Index, a broad-based securities market index, returned 10.98% and the J.P. Morgan GBI-EM Global Diversified Index, which serves as the style-specific index, returned 5.09%.
The J.P. Morgan EMBI Global Diversified Index tracks total returns for U.S. dollar-denominated debt instruments issued by emerging markets sovereign and quasi-sovereign entities: Brady bonds, loans, and Eurobonds. The index limits the weights of those index countries with larger debt stocks by only including specified portions of these countries' eligible current face amounts outstanding. The index is calculated on a total return basis. The index is unmanaged, its returns do not reflect any fees, expenses, or sales charges, and is not available for direct investment.
The J.P. Morgan GBI-EM Global Diversified Index consists of regularly traded, liquid fixed-rate, domestic currency government bonds to which international investors can gain exposure. The weightings among the countries are more evenly distributed within this index. The index is calculated on a total return basis. The index is unmanaged, its returns do not reflect any fees, expenses, or sales charges, and is not available for direct investment.
What impacted Fund performance over the reporting period?
Foreign exchange (FX) exposure and duration positioning contributed positively to relative performance for the 12 months ended May 31, 2024. Security selection and taxes also enhanced relative returns for the period. In FX, underweights in the Chilean peso and the Chinese yuan enhanced performance, while an underweight exposure in the Egyptian pound and an overweight exposure in the Indonesian rupiah detracted from performance. Within duration positioning, or adjusting the portfolio’s sensitivity to changes in interest rates, underweights to fixed income in countries where rates were rising, such as China, Thailand, and Turkey, enhanced performance, while overweights to fixed income in countries where rates were falling, such as Brazil, Mexico, and South Africa, detracted from relative returns. Allocations to Egypt, Mexico, and South Africa contributed most to relative performance, while some of the positive attribution was offset by allocations to China, Indonesia, and Thailand.
| FACTOR | IMPACT | SUMMARY |
| Egypt | Positive | Security selection and taxes contributed positively. |
| Turkey | Positive | Duration underweight, or reduced sensitivity to changes in interest rates, contributed as the central bank tightened monetary policy significantly. |
| Thailand | Negative | Security selection and taxes detracted from performance, although some of the negative attribution was offset by positive attribution from duration underweight. |
| China | Negative | Security selection and taxes detracted from relative returns, but some of the negative attribution was offset by underweights in FX exposure and duration positioning. |
The preceding information is the opinion of portfolio management only through the end of the period stated. Any such opinions are subject to change at any time based upon market or other conditions and should not be relied upon as investment advice. Performance figures assume reinvestment of distributions and exclude the effect of sales charges. Performance data quoted represents past results. Past performance is no guarantee of future results, and there is no guarantee that market forecasts will be realized.
How has the Fund historically performed?
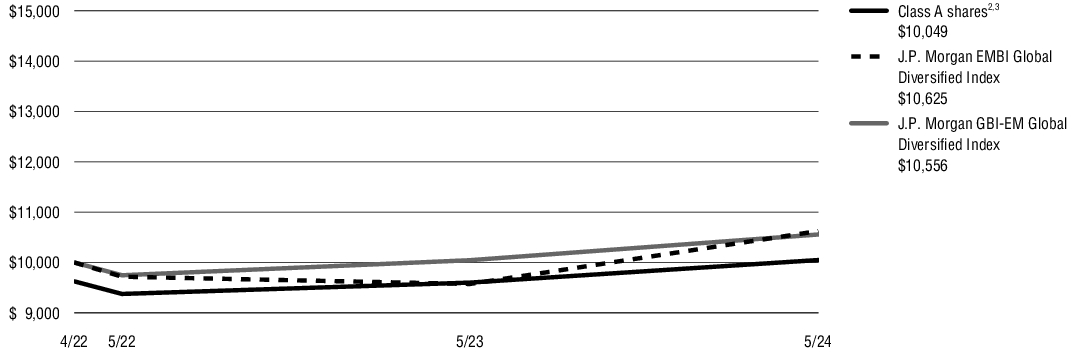
The following graph compares the initial and subsequent account values at the end of each of the most recently completed fiscal years of Class A shares from inception (April 11, 2022) including any applicable sales charges or fees. It assumes a $10,000 initial investment from inception, in an appropriate broad-based securities market index and style-specific index for the same period. Performance assumes reinvestment of dividends and capital gain distributions.
GROWTH OF $10,000
| AVERAGE ANNUAL TOTAL RETURNS for periods ended 5/31/24 | 1 Year | Since Inception |
| Virtus Stone Harbor Local Markets Fund (Class A/VSHEX) at NAV(1) | 4.68% | 2.04% |
| Virtus Stone Harbor Local Markets Fund (Class A/VSHEX) at POP(2),(3) | 0.76% | 0.23% |
| J.P. Morgan EMBI Global Diversified Index | 10.98% | 2.87% |
| J.P. Morgan GBI-EM Global Diversified Index | 5.09% | 2.56% |
| (1) | “NAV” (Net Asset Value) total returns do not include the effect of any sales charge. |
| (2) | “POP” (Public Offering Price) total returns include the effect of the maximum front-end 3.75% sales charge. |
| (3) | "CDSC" (contingent deferred sales charge) is applied to redemptions of certain classes of shares that do not have a sales charge applied at the time of purchase. CDSC for certain redemptions of Class A shares made within 18 months of a finder's fee being paid are 0.50%. |
Performance data quoted represents past performance. Past performance does not guarantee future results. Investment return and principal value will fluctuate so that shares, when redeemed, may be worth more or less than their original cost. The above table and graph do not reflect the deduction of taxes that a shareholder would pay on fund distributions or the redemption of shares. Current performance may be lower or higher than the performance data quoted. Please visit https://www.virtus.com/mutual-funds-monthly-performance for performance data current to the most recent month end. Average annual total return is the annual compound return for the indicated period and reflects the change in share price and the reinvestment of all dividends and capital gains.
KEY FUND STATISTICS (as of May 31, 2024)
| Fund net assets (‘000s) | $7,339% |
| Total number of portfolio holdings | $44% |
| Total advisory fee paid (‘000s) | $13% |
| Portfolio turnover rate as of the end of the reporting period | $133% |
| Foreign Government Securities | | 96% |
| Corporate Bonds and Notes | | 4% |
| Financial & Lease | 4% | |
| Total | | 100% |
(1) | Percentage of total investments as of May 31, 2024. |
Where can I find more information?
For more information about the Fund including its Prospectus, Financial Information, Fund holdings, and proxy voting information, please contact us at 1-800-243-1574, or visit https://www.virtus.com/investor-resources/mutual-fund-documents.
Householding
Shareholders who have consented to receive a single annual or semi-annual shareholder report at a shared address may revoke this consent or request additional copies by calling Mutual Fund Services at 1-800-243-1574.
Stone Harbor Local Markets Fund
Class I / SHLMX
Annual SHAREHOLDER REPORT | May 31, 2024
This annual shareholder report contains important information about the Virtus Stone Harbor Local Markets Fund (“Fund”) for the period of June 1, 2023 to May 31, 2024. You can find additional information about the Fund at https://www.virtus.com/investor-resources/mutual-fund-documents. You can also request this information by contacting us at 1‑800‑243‑1574.
What were the Fund costs for the last year?
(Based on a hypothetical $10,000 investment)
| Fund (Class) | Costs of a $10,000 investment | Costs paid as a percentage of a $10,000 investment |
Virtus Stone Harbor Local Markets Fund
Class I / SHLMX | $102 | 1.00% |
Portfolio Manager Commentary by Stone Harbor Investment Partners
For the fiscal year ended May 31, 2024, the Fund’s Class I shares at NAV returned 4.92%. For the same period, the J.P. Morgan EMBI Global Diversified Index, a broad-based securities market index, returned 10.98% and the J.P. Morgan GBI-EM Global Diversified Index, which serves as the style-specific index, returned 5.09%.
The J.P. Morgan EMBI Global Diversified Index tracks total returns for U.S. dollar-denominated debt instruments issued by emerging markets sovereign and quasi-sovereign entities: Brady bonds, loans, and Eurobonds. The index limits the weights of those index countries with larger debt stocks by only including specified portions of these countries' eligible current face amounts outstanding. The index is calculated on a total return basis. The index is unmanaged, its returns do not reflect any fees, expenses, or sales charges, and is not available for direct investment.
The J.P. Morgan GBI-EM Global Diversified Index consists of regularly traded, liquid fixed-rate, domestic currency government bonds to which international investors can gain exposure. The weightings among the countries are more evenly distributed within this index. The index is calculated on a total return basis. The index is unmanaged, its returns do not reflect any fees, expenses, or sales charges, and is not available for direct investment.
What impacted Fund performance over the reporting period?
Foreign exchange (FX) exposure and duration positioning contributed positively to relative performance for the 12 months ended May 31, 2024. Security selection and taxes also enhanced relative returns for the period. In FX, underweights in the Chilean peso and the Chinese yuan enhanced performance, while an underweight exposure in the Egyptian pound and an overweight exposure in the Indonesian rupiah detracted from performance. Within duration positioning, or adjusting the portfolio’s sensitivity to changes in interest rates, underweights to fixed income in countries where rates were rising, such as China, Thailand, and Turkey, enhanced performance, while overweights to fixed income in countries where rates were falling, such as Brazil, Mexico, and South Africa, detracted from relative returns. Allocations to Egypt, Mexico, and South Africa contributed most to relative performance, while some of the positive attribution was offset by allocations to China, Indonesia, and Thailand.
| FACTOR | IMPACT | SUMMARY |
| Egypt | Positive | Security selection and taxes contributed positively. |
| Turkey | Positive | Duration underweight, or reduced sensitivity to changes in interest rates, contributed as the central bank tightened monetary policy significantly. |
| Thailand | Negative | Security selection and taxes detracted from performance, although some of the negative attribution was offset by positive attribution from duration underweight. |
| China | Negative | Security selection and taxes detracted from relative returns, but some of the negative attribution was offset by underweights in FX exposure and duration positioning. |
The preceding information is the opinion of portfolio management only through the end of the period stated. Any such opinions are subject to change at any time based upon market or other conditions and should not be relied upon as investment advice. Performance figures assume reinvestment of distributions and exclude the effect of sales charges. Performance data quoted represents past results. Past performance is no guarantee of future results, and there is no guarantee that market forecasts will be realized.
How has the Fund historically performed?
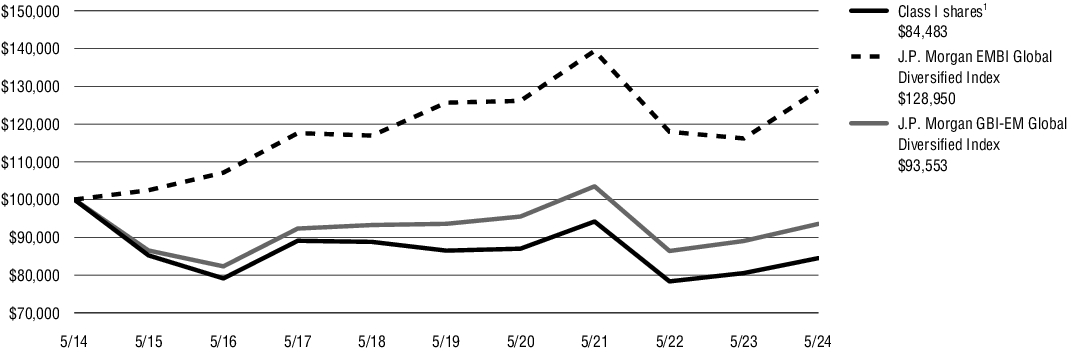
The following graph compares the initial and subsequent account values at the end of each of the most recently completed 10 fiscal years of Class I shares. It assumes a $100,000 initial investment at the beginning of the first fiscal year, in an appropriate broad-based securities market index and style-specific index for the same period. Performance assumes reinvestment of dividends and capital gain distributions.
GROWTH OF $100,000
| AVERAGE ANNUAL TOTAL RETURNS for periods ended 5/31/24 | 1 Year | 5 Years | 10 Years |
| Virtus Stone Harbor Local Markets Fund (Class I/SHLMX) at NAV(1) | 4.92% | (0.46)% | (1.67)% |
| J.P. Morgan EMBI Global Diversified Index | 10.98% | 0.52)% | 2.58)% |
| J.P. Morgan GBI-EM Global Diversified Index | 5.09% | -)% | (0.66)% |
| (1) | “NAV” (Net Asset Value) total returns do not include the effect of any sales charge. |
Performance data quoted represents past performance. Past performance does not guarantee future results. Investment return and principal value will fluctuate so that shares, when redeemed, may be worth more or less than their original cost. The above table and graph do not reflect the deduction of taxes that a shareholder would pay on fund distributions or the redemption of shares. Current performance may be lower or higher than the performance data quoted. Please visit https://www.virtus.com/mutual-funds-monthly-performance for performance data current to the most recent month end. Average annual total return is the annual compound return for the indicated period and reflects the change in share price and the reinvestment of all dividends and capital gains.
KEY FUND STATISTICS (as of May 31, 2024)
| Fund net assets (‘000s) | $7,339% |
| Total number of portfolio holdings | $44% |
| Total advisory fee paid (‘000s) | $13% |
| Portfolio turnover rate as of the end of the reporting period | $133% |
| Foreign Government Securities | | 96% |
| Corporate Bonds and Notes | | 4% |
| Financial & Lease | 4% | |
| Total | | 100% |
(1) | Percentage of total investments as of May 31, 2024. |
Where can I find more information?
For more information about the Fund including its Prospectus, Financial Information, Fund holdings, and proxy voting information, please contact us at 1-800-243-1574, or visit https://www.virtus.com/investor-resources/mutual-fund-documents.
Householding
Shareholders who have consented to receive a single annual or semi-annual shareholder report at a shared address may revoke this consent or request additional copies by calling Mutual Fund Services at 1-800-243-1574.
Item 2. Code of Ethics.
| | (a) | The registrant, as of the end of the period covered by this report, has adopted a code of ethics that applies to the registrant’s principal executive officer, principal financial officer, principal accounting officer or controller, or persons performing similar functions, regardless of whether these individuals are employed by the registrant or a third party. |
| | (c) | There have been no amendments during the period covered by this report, to a provision of the code of ethics that applies to the registrant’s principal executive officer, principal financial officer, principal accounting officer or controller, or persons performing similar functions, regardless of whether these individuals are employed by the registrant or a third party, and that relates to any element of the code of ethics described in Item 2(b) of the instructions for completion of Form N-CSR. A copy of the currently applicable code is included as an exhibit. |
| | (d) | The registrant has not granted any waivers, during the period covered by this report, including an implicit waiver, from a provision of the code of ethics that applies to the registrant’s principal executive officer, principal financial officer, principal accounting officer or controller, or persons performing similar functions, regardless of whether these individuals are employed by the registrant or a third party, that relates to one or more of the items set forth in paragraph (b) of this Item. |
| | (f) | A copy of the Code of Ethics is filed as an Exhibit. |
Item 3. Audit Committee Financial Expert.
| (a)(1) | The Registrant’s Board of Trustees has determined that the Registrant has an “audit committee financial expert” serving on its Audit Committee. |
| (a)(2) | The Registrant’s Board of Trustees has determined that each of Donald C. Burke and Brian T. Zino possesses the technical attributes identified in Instruction 2(b) of Item 3 to Form N-CSR to qualify as an “audit committee financial expert.” Each such individual is an “independent” trustee pursuant to paragraph (a)(2) of Item 3 to Form N-CSR. |
Item 4. Principal Accountant Fees and Services.
Audit Fees
| | (a) | The aggregate fees billed for each of the last two fiscal years for professional services rendered by the principal accountant for the audit of the registrant’s annual financial statements or services that are normally provided by the accountant in connection with statutory and regulatory filings or engagements for those fiscal years are $234,900 for 2023 and $77,738 for 2024. |
Audit-Related Fees
| | (b) | The aggregate fees billed in each of the last two fiscal years for assurance and related services by the principal accountant that are reasonably related to the performance of the audit of the registrant’s financial statements and are not reported under paragraph (a) of this Item are $0 for 2023 and $12,021 for 2024. Such audit-related fees include the out of pocket expenses. |
Tax Fees
| | (c) | The aggregate fees billed in each of the last two fiscal years for professional services rendered by the principal accountant for tax compliance, tax advice, and tax planning are $67,595 for 2023 and $34,221 for 2024. |
“Tax Fees” are those primarily associated with review of the Trust’s tax provision and qualification as a regulated investment company (RIC) in connection with audits of the Trust’s financial statement, review of year-end distributions by the Fund to avoid excise tax for the Trust, periodic discussion with management on tax issues affecting the Trust, and reviewing and signing the Fund’s federal income returns.
All Other Fees
| | (d) | The aggregate fees billed in each of the last two fiscal years for products and services provided by the principal accountant, other than the services reported in paragraphs (a) through (c) of this Item are $0 for 2023 and $0 for 2024. |
| | (e)(1) | Disclose the audit committee’s pre-approval policies and procedures described in paragraph (c)(7) of Rule 2-01 of Regulation S-X. |
The Board of Trustees of Virtus Opportunities Trust (the “Fund”) has adopted policies and procedures with regard to the pre-approval of services provided by its independent auditors. Audit, audit-related and tax compliance services provided to the Fund on an annual basis require specific pre-approval by the Audit Committee. The Audit Committee must also approve other non-audit services provided to the Fund and those non-audit services provided to the Fund’s Affiliated Service Providers that relate directly to the operations and financial reporting of the Fund. Certain of these non-audit services that the Audit Committee believes are a) consistent with the SEC’s auditor independence rules and b) routine and recurring services that will not impair the independence of the independent auditors may be approved by the Audit Committee without consideration on a specific case-by-case basis (“general pre-approval”).
The Audit Committee has determined that the Chair of the Audit Committee, may provide pre-approval for such services that meet the above requirements but are not included in the general pre-approval in the event such approval is sought between regularly scheduled meetings. In any event, the Audit Committee is informed of, and ratifies, each service approved at the next regularly scheduled in-person Audit Committee meeting.
| | (e)(2) | The percentage of services described in each of paragraphs (b) through (d) of this Item that were approved by the audit committee pursuant to paragraph (c)(7)(i)(C) of Rule 2-01 of Regulation S-X are as follows: |
(b) 0%
(c) 0%
(d) N/A
| | (f) | The percentage of hours expended on the principal accountant’s engagement to audit the registrant’s financial statements for the most recent fiscal year that were attributed to work performed by persons other than the principal accountant’s full-time, permanent employees was less than fifty percent. |
| | (g) | The aggregate non-audit fees billed by the registrant’s accountant for services rendered to the registrant, and rendered to the registrant’s investment adviser (not including any sub-adviser whose role is primarily portfolio management and is subcontracted with or overseen by another investment adviser), and any entity controlling, controlled by, or under common control with the adviser that provides ongoing services to the registrant for each of the last two fiscal years of the registrant was $67,595 for 2023 and $46,242 for 2024. |
| | (h) | The registrant’s audit committee of the board of directors has considered whether the provision of non-audit services that were rendered to the registrant’s investment adviser (not including any sub-adviser whose role is primarily portfolio management and is subcontracted with or overseen by another investment adviser), and any entity controlling, controlled by, or under common control with the investment adviser that provides ongoing services to the registrant that were not pre-approved pursuant to paragraph (c)(7)(ii) of Rule 2-01 of Regulation S-X is compatible with maintaining the principal accountant’s independence. |
Item 5. Audit Committee of Listed Registrants.
Disclosure not required for open-end management investment companies.
Item 6. Investments.
| (a) | Please refer to Item 7a. |
Item 7. Financial Statements and Financial Highlights for Open-End Management Investment Companies.
FINANCIALS
VIRTUS OPPORTUNITIES TRUST
| Virtus Stone Harbor Emerging Markets Bond Fund |
| Virtus Stone Harbor Emerging Markets Debt Income Fund |
| Virtus Stone Harbor Local Markets Fund |
Not FDIC Insured • No Bank Guarantee • May Lose Value
Table of Contents
| 1 |
| Fund | Schedule
of
Investments |
| 2 |
| 7 |
| 16 |
| 20 |
| 22 |
| 23 |
| 25 |
| 27 |
| 42 |
| 43 |
Proxy Voting Procedures and Voting Record (Form N-PX)
The subadviser votes proxies, if any, relating to portfolio securities in accordance with procedures that have been approved by the Board of Trustees of the Trust (“Trustees”, or the “Board”). You may obtain a description of these procedures, along with information regarding how the Funds voted proxies during the most recent 12-month period ended June 30, free of charge, by calling toll-free 1-800-243-1574. This information is also available through the Securities and Exchange Commission’s (the “SEC”) website at https://www.sec.gov.
PORTFOLIO HOLDINGS INFORMATION
The Trust files a complete schedule of portfolio holdings for each Fund with the SEC for the first and third quarters of each fiscal year as an exhibit to its reports on Form N-PORT-P. Form N-PORT-P is available on the SEC’s website at https://www.sec.gov.
This report is not authorized for distribution to prospective investors in the Funds presented in this book unless preceded or accompanied by an effective prospectus which includes information concerning the sales charge, each Fund’s record and other pertinent information.
VIRTUS OPPORTUNITIES TRUST
KEY INVESTMENT TERMS (Unaudited)
May 31, 2024
American Depositary Receipt (“ADR”)
Represents shares of foreign companies traded in U.S. dollars on U.S. exchanges that are held by a U.S. bank or a trust. Foreign companies use ADRs in order to make it easier for Americans to buy their shares.
Credit Default Swap (“CDS”)
A CDS is a financial derivative contract that shifts the credit risk of a fixed income product to a counterparty in exchange for a premium. The buyer of the CDS makes a series of payments (the CDS “fee” or “spread”) to the seller and, in exchange, may expect to receive a payoff if the asset defaults.
Exchange-Traded Fund (“ETF”)
An open-end fund that is traded on a stock exchange. Most ETFs have a portfolio of stocks or bonds that track a specific market index.
Federal Funds Rate
The target interest rate set by the Fed at which commercial banks borrow and lend their extra reserves to one another overnight.
London Interbank Offered Rate (“LIBOR”)
A benchmark rate that some of the world’s leading banks charge each other for short-term loans and that serves as the first step to calculating interest rates on various loans throughout the world. The one-, three-, and six- month LIBOR reference rates are published by ICE Benchmark Administration under a synthetic methodology.
Secured Overnight Financing Rate (“SOFR”)
The Secured Overnight Financing Rate is a benchmark interest rate for dollar-denominated derivatives and loans that is replacing the LIBOR.
Stone Harbor Emerging Markets Bond Fund
SCHEDULE OF INVESTMENTS
May 31, 2024
($ reported in thousands)
| | Par Value | | Value |
| Corporate Bonds and Notes—98.0% |
| Argentina—2.5% | | |
MSU Energy S.A. 144A
6.875%, 2/1/25(1) | $ 46 | | $ 38 |
| YPF S.A. | | | |
| 144A 9.500%, 1/17/31(1) | 75 | | 75 |
| RegS 6.950%, 7/21/27(2) | 67 | | 61 |
| | | | 174 |
| | | | |
| |
| Brazil—9.9% | | |
3R Lux S.a.r.l. 144A
9.750%, 2/5/31(1) | 58 | | 61 |
Banco do Brasil S.A. 144A
6.000%, 3/18/31(1) | 46 | | 45 |
| Braskem Netherlands Finance B.V. | | | |
| 144A 5.875%, 1/31/50(1) | 35 | | 26 |
| RegS 4.500%, 1/31/30(2) | 54 | | 45 |
BRF S.A. 144A
5.750%, 9/21/50(1) | 27 | | 21 |
FORESEA Holding S.A. 144A
7.500%, 6/15/30(1) | 55 | | 51 |
FS Luxembourg S.a.r.l. 144A
8.875%, 2/12/31(1) | 45 | | 44 |
Iochpe-Maxion Austria GmbH 144A
5.000%, 5/7/28(1) | 22 | | 20 |
JBS USA Holding Lux S.a.r.l.
4.375%, 2/2/52 | 51 | | 38 |
MC Brazil Downstream Trading S.a.r.l. 144A
7.250%, 6/30/31(1) | 37 | | 33 |
Minerva Luxembourg S.A. 144A
4.375%, 3/18/31(1) | 47 | | 39 |
Movida Europe S.A. 144A
7.850%, 4/11/29(1) | 66 | | 62 |
MV24 Capital B.V. 144A
6.748%, 6/1/34(1) | 30 | | 28 |
Samarco Mineracao S.A. PIK 144A
9.000%, 6/30/31(1)(3) | 55 | | 51 |
Simpar Europe S.A. 144A
5.200%, 1/26/31(1) | 67 | | 54 |
Suzano Austria GmbH
3.750%, 1/15/31 | 40 | | 34 |
Trident Energy Finance plc 144A
12.500%, 11/30/29(1) | 27 | | 28 |
| | | | 680 |
| | | | |
| |
| Chile—2.0% | | |
ATP Tower Holdings LLC 144A
4.050%, 4/27/26(1) | 63 | | 59 |
Banco de Chile RegS
2.990%, 12/9/31(2) | 28 | | 24 |
Banco de Credito e Inversiones S.A. 144A
8.750% (1)(4) | 24 | | 25 |
| Cencosud S.A. | | | |
| 144A 5.150%, 2/12/25(1) | 16 | | 16 |
| 144A 4.375%, 7/17/27(1) | 11 | | 10 |
| | | | 134 |
| | | | |
| |
| China—2.9% | | |
Bank of China Ltd. RegS
5.000%, 11/13/24(2) | 46 | | 46 |
| | Par Value | | Value |
| | | | |
| China—continued | | |
ENN Clean Energy International Investment Ltd. 144A
3.375%, 5/12/26(1) | $ 54 | | $ 51 |
| Tencent Holdings Ltd. | | | |
| 144A 2.390%, 6/3/30(1) | 11 | | 10 |
| 144A 3.240%, 6/3/50(1) | 11 | | 7 |
| RegS 3.975%, 4/11/29(2) | 93 | | 88 |
| | | | 202 |
| | | | |
| |
| Colombia—3.9% | | |
AI Candelaria Spain S.A. 144A
5.750%, 6/15/33(1) | 54 | | 43 |
Bancolombia S.A.
4.625%, 12/18/29 | 38 | | 37 |
Ecopetrol S.A.
7.375%, 9/18/43 | 60 | | 53 |
Geopark Ltd. 144A
5.500%, 1/17/27(1) | 28 | | 25 |
Gran Tierra Energy, Inc. 144A
9.500%, 10/15/29(1) | 61 | | 58 |
SierraCol Energy Andina LLC 144A
6.000%, 6/15/28(1) | 62 | | 55 |
| | | | 271 |
| | | | |
| |
| Ghana—2.0% | | |
Kosmos Energy Ltd. RegS
7.750%, 5/1/27(2) | 50 | | 48 |
Tullow Oil plc 144A
7.000%, 3/1/25(1) | 94 | | 91 |
| | | | 139 |
| | | | |
| |
| Guatemala—1.3% | | |
CT Trust 144A
5.125%, 2/3/32(1) | 30 | | 26 |
Investment Energy Resources Ltd. 144A
6.250%, 4/26/29(1) | 66 | | 64 |
| | | | 90 |
| | | | |
| |
| Hong Kong—4.5% | | |
Goodman HK Finance RegS
3.000%, 7/22/30(2) | 200 | | 169 |
| Standard Chartered plc | | | |
| 144A 6.301%, 1/9/29(1) | 65 | | 66 |
| 144A 2.678%, 6/29/32(1) | 20 | | 16 |
| 144A 6.097%, 1/11/35(1) | 46 | | 47 |
| RegS 6.000%(2)(4) | 13 | | 13 |
| | | | 311 |
| | | | |
| |
| India—6.8% | | |
Adani Electricity Mumbai Ltd. 144A
3.949%, 2/12/30(1) | 132 | | 111 |
Adani Green Energy UP Ltd. 144A
6.700%, 3/12/42(1) | 45 | | 42 |
Adani Ports & Special Economic Zone Ltd. RegS
3.375%, 7/24/24(2) | 22 | | 22 |
Adani Renewable Energy RJ Ltd. 144A
4.625%, 10/15/39(1) | 56 | | 45 |
Adani Transmission Step-One Ltd. 144A
4.000%, 8/3/26(1) | 19 | | 18 |
See Notes to Financial Statements
Stone Harbor Emerging Markets Bond Fund
SCHEDULE OF INVESTMENTS (Continued)
May 31, 2024
($ reported in thousands)
| | Par Value | | Value |
| | | | |
| India—continued | | |
Clean Renewable Power Mauritius Pte Ltd. 144A
4.250%, 3/25/27(1) | $ 37 | | $ 34 |
Greenko Dutch B.V. 144A
3.850%, 3/29/26(1) | 47 | | 44 |
JSW Hydro Energy Ltd. RegS
4.125%, 5/18/31(2) | 37 | | 32 |
| Reliance Industries Ltd. | | | |
| 144A 3.750%, 1/12/62(1) | 26 | | 18 |
| RegS 3.625%, 1/12/52(2) | 35 | | 24 |
ReNew Wind Energy AP2 RegS
4.500%, 7/14/28(2) | 24 | | 21 |
Summit Digitel Infrastructure Ltd. RegS
2.875%, 8/12/31(2) | 49 | | 40 |
Vedanta Resources Finance II plc 144A
13.875%, 12/9/28(1) | 14 | | 13 |
| | | | 464 |
| | | | |
| |
| Indonesia—4.7% | | |
| Freeport Indonesia PT | | | |
| RegS 5.315%, 4/14/32(2) | 90 | | 87 |
| RegS 6.200%, 4/14/52(2) | 19 | | 18 |
Indika Energy Capital IV Pte Ltd. 144A
8.250%, 10/22/25(1) | 5 | | 5 |
Indika Energy Tbk PT 144A
8.750%, 5/7/29(1) | 32 | | 32 |
Medco Maple Tree Pte Ltd. 144A
8.960%, 4/27/29(1) | 37 | | 38 |
| Minejesa Capital B.V. | | | |
| 144A 4.625%, 8/10/30(1) | 126 | | 119 |
| 144A 5.625%, 8/10/37(1) | 22 | | 20 |
Star Energy Geothermal Darajat II 144A
4.850%, 10/14/38(1) | 4 | | 4 |
| | | | 323 |
| | | | |
| |
| Israel—3.0% | | |
Altice Financing S.A. 144A
5.000%, 1/15/28(1) | 25 | | 20 |
| Energean Israel Finance Ltd. | | | |
| 144A, RegS 4.875%, 3/30/26(1)(2) | 33 | | 32 |
| 144A, RegS 5.375%, 3/30/28(1)(2) | 50 | | 45 |
Leviathan Bond Ltd. 144A, RegS
6.750%, 6/30/30(1)(2) | 35 | | 32 |
Teva Pharmaceutical Finance Netherlands III B.V.
3.150%, 10/1/26 | 84 | | 78 |
| | | | 207 |
| | | | |
| |
| Macau—7.3% | | |
| Melco Resorts Finance Ltd. | | | |
| 144A 5.750%, 7/21/28(1) | 26 | | 24 |
| 144A 7.625%, 4/17/32(1) | 40 | | 40 |
| RegS 5.625%, 7/17/27(2) | 30 | | 29 |
| RegS 5.750%, 7/21/28(2) | 91 | | 85 |
| RegS 5.375%, 12/4/29(2) | 24 | | 22 |
| Sands China Ltd. | | | |
| 5.400%, 8/8/28 | 33 | | 32 |
| 3.250%, 8/8/31 | 100 | | 84 |
Studio City Co., Ltd. 144A
7.000%, 2/15/27(1) | 23 | | 23 |
| | Par Value | | Value |
| | | | |
| Macau—continued | | |
| Studio City Finance Ltd. | | | |
| 144A 6.000%, 7/15/25(1) | $ 64 | | $ 63 |
| 144A 5.000%, 1/15/29(1) | 113 | | 98 |
| | | | 500 |
| | | | |
| |
| Malaysia—1.4% | | |
Resorts World Las Vegas LLC RegS
4.625%, 4/6/31(2) | 50 | | 43 |
Yinson Boronia Production B.V. 144A
8.947%, 7/31/42(1) | 52 | | 53 |
| | | | 96 |
| | | | |
| |
| Mexico—7.3% | | |
| Banco Mercantil del Norte S.A. | | | |
| 144A 6.750%(1)(4) | 23 | | 23 |
| 144A 7.500%(1)(4) | 35 | | 34 |
| BBVA Bancomer S.A. | | | |
| 144A 5.125%, 1/18/33(1) | 20 | | 18 |
| RegS 5.350%, 11/12/29(2) | 26 | | 26 |
Braskem Idesa SAPI 144A
6.990%, 2/20/32(1) | 20 | | 15 |
Buffalo Energy Mexico Holdings 144A
7.875%, 2/15/39(1) | 31 | | 33 |
| Cemex SAB de C.V. | | | |
| 144A 5.125%(1)(4) | 47 | | 45 |
| 144A 9.125%(1)(4) | 16 | | 17 |
Grupo Aeromexico SAB de C.V. 144A
8.500%, 3/17/27(1) | 56 | | 56 |
| Petroleos Mexicanos | | | |
| 6.625%, 6/15/35 | 74 | | 57 |
| 7.690%, 1/23/50 | 39 | | 28 |
Poinsettia Finance Ltd. RegS
6.625%, 6/17/31(2) | 52 | | 45 |
Sitios Latinoamerica SAB de C.V. 144A
5.375%, 4/4/32(1) | 19 | | 17 |
Sixsigma Networks Mexico S.A. de C.V. 144A
7.500%, 5/2/25(1) | 38 | | 36 |
Southern Copper Corp.
6.750%, 4/16/40 | 9 | | 10 |
Tierra Mojada Luxembourg II S.a.r.l. 144A
5.750%, 12/1/40(1) | 42 | | 39 |
| | | | 499 |
| | | | |
| |
| Morocco—1.2% | | |
| OCP S.A. | | | |
| 144A 3.750%, 6/23/31(1) | 45 | | 38 |
| 144A 6.875%, 4/25/44(1) | 23 | | 22 |
| 144A 7.500%, 5/2/54(1) | 24 | | 24 |
| | | | 84 |
| | | | |
| |
| Nigeria—1.4% | | |
Access Bank plc 144A
6.125%, 9/21/26(1) | 56 | | 53 |
IHS Holding Ltd. 144A
6.250%, 11/29/28(1) | 16 | | 15 |
See Notes to Financial Statements
Stone Harbor Emerging Markets Bond Fund
SCHEDULE OF INVESTMENTS (Continued)
May 31, 2024
($ reported in thousands)
| | Par Value | | Value |
| | | | |
| Nigeria—continued | | |
IHS Netherlands Holdco B.V. 144A
8.000%, 9/18/27(1) | $ 29 | | $ 28 |
| | | | 96 |
| | | | |
| |
| Peru—2.7% | | |
| Banco de Credito del Peru S.A. | | | |
| 144A 5.850%, 1/11/29(1) | 41 | | 41 |
| RegS 3.125%, 7/1/30(2) | 28 | | 27 |
Banco Internacional del Peru SAA Interbank RegS
4.000%, 7/8/30(2) | 35 | | 33 |
Inkia Energy Ltd. 144A
5.875%, 11/9/27(1) | 68 | | 66 |
Kallpa Generacion S.A. 144A
4.125%, 8/16/27(1) | 21 | | 20 |
| | | | 187 |
| | | | |
| |
| Philippines—2.9% | | |
Royal Capital B.V. RegS
5.000% (2)(4) | 200 | | 197 |
| Saudi Arabia—4.0% | | |
Acwa Power Management & Investments One Ltd. 144A
5.950%, 12/15/39(1) | 83 | | 80 |
EIG Pearl Holdings S.a.r.l. 144A
3.545%, 8/31/36(1) | 154 | | 131 |
Greensaif Pipelines Bidco S.a.r.l. 144A
6.129%, 2/23/38(1) | 21 | | 21 |
Saudi Arabian Oil Co. 144A
4.375%, 4/16/49(1) | 53 | | 43 |
| | | | 275 |
| | | | |
| |
| Singapore—2.9% | | |
BOC Aviation Ltd. (3 month LIBOR + 1.300%) RegS
6.887%, 5/21/25(2)(5)(6) | 200 | | 201 |
| South Africa—4.2% | | |
| Anglo American Capital plc | | | |
| 144A 2.625%, 9/10/30(1) | 8 | | 6 |
| RegS 2.625%, 9/10/30(2) | 7 | | 6 |
Eskom Holdings SOC Ltd. 144A
7.125%, 2/11/25(1) | 45 | | 45 |
| Prosus N.V. | | | |
| 144A 3.832%, 2/8/51(1) | 134 | | 84 |
| RegS 3.061%, 7/13/31(2) | 38 | | 31 |
Sasol Financing USA LLC
4.375%, 9/18/26 | 124 | | 116 |
| | | | 288 |
| | | | |
| |
| South Korea—3.2% | | |
Kookmin Bank 144A
5.375%, 5/8/27(1) | 60 | | 60 |
LG Chem Ltd. RegS
2.375%, 7/7/31(2) | 33 | | 27 |
Shinhan Bank Co., Ltd. RegS
3.875%, 3/24/26(2) | 49 | | 47 |
| | Par Value | | Value |
| | | | |
| South Korea—continued | | |
Woori Bank RegS
4.250% (2)(4) | $ 90 | | $ 89 |
| | | | 223 |
| | | | |
| |
| Taiwan—1.1% | | |
TSMC Arizona Corp.
3.875%, 4/22/27 | 17 | | 17 |
| TSMC Global Ltd. | | | |
| RegS 1.375%, 9/28/30(2) | 29 | | 23 |
| RegS 2.250%, 4/23/31(2) | 39 | | 33 |
| | | | 73 |
| | | | |
| |
| Tanzania—0.1% | | |
HTA Group Ltd. 144A
7.500%, 6/4/29(1) | 10 | | 10 |
| Thailand—2.1% | | |
Bangkok Bank PCL 144A
3.733%, 9/25/34(1) | 90 | | 79 |
PTT Treasury Center Co., Ltd. 144A
4.500%, 10/25/42(1) | 42 | | 36 |
Thaioil Treasury Center Co., Ltd. RegS
4.875%, 1/23/43(2) | 33 | | 29 |
| | | | 144 |
| | | | |
| |
| Turkey—4.4% | | |
Aydem Yenilenebilir Enerji AS 144A
7.750%, 2/2/27(1) | 51 | | 49 |
Sisecam UK plc 144A
8.250%, 5/2/29(1) | 60 | | 61 |
| Turkiye Garanti Bankasi AS | | | |
| 144A 7.177%, 5/24/27(1) | 24 | | 24 |
| 144A 8.375%, 2/28/34(1) | 67 | | 67 |
WE Soda Investments Holding plc 144A
9.500%, 10/6/28(1) | 96 | | 99 |
| | | | 300 |
| | | | |
| |
| Ukraine—1.2% | | |
Metinvest B.V. 144A
7.750%, 10/17/29(1) | 61 | | 39 |
VF Ukraine PAT via VFU Funding plc 144A
6.200%, 2/11/25(1) | 50 | | 43 |
| | | | 82 |
| | | | |
| |
| United Arab Emirates—5.0% | | |
Abu Dhabi Crude Oil Pipeline LLC 144A
3.650%, 11/2/29(1) | 24 | | 22 |
Abu Dhabi National Energy Co. PJSC 144A
4.696%, 4/24/33(1) | 26 | | 25 |
DP World Ltd. 144A
4.700%, 9/30/49(1) | 72 | | 59 |
Galaxy Pipeline Assets Bidco Ltd. 144A
1.750%, 9/30/27(1) | 39 | | 36 |
MAF Global Securities Ltd. RegS
7.875% (2)(4) | 200 | | 205 |
| | | | 347 |
| | | | |
| |
See Notes to Financial Statements
Stone Harbor Emerging Markets Bond Fund
SCHEDULE OF INVESTMENTS (Continued)
May 31, 2024
($ reported in thousands)
| | Par Value | | Value |
| | | | |
| Vietnam—1.2% | | |
Mong Duong Finance Holdings B.V. 144A
5.125%, 5/7/29(1) | $ 84 | | $ 80 |
| Zambia—0.9% | | |
First Quantum Minerals Ltd. 144A
8.625%, 6/1/31(1) | 65 | | 65 |
Total Corporate Bonds and Notes
(Identified Cost $6,743) | | 6,742 |
| | | | |
| |
| | | | |
| |
Total Long-Term Investments—98.0%
(Identified Cost $6,743) | | 6,742 |
| | | | |
| |
| | | | |
| |
TOTAL INVESTMENTS—98.0%
(Identified Cost $6,743) | | $6,742 |
| Other assets and liabilities, net—2.0% | | 135 |
| NET ASSETS—100.0% | | $6,877 |
| Abbreviations: |
| LIBOR | London Interbank Offered Rate |
| LLC | Limited Liability Company |
| PCL | Public Company Limited |
| PIK | Payment-in-Kind Security |
| PJSC | Public Joint Stock Company |
| Footnote Legend: |
| (1) | Security exempt from registration under Rule 144A of the Securities Act of 1933. These securities may be resold in transactions exempt from registration, normally to qualified institutional buyers. At May 31, 2024, these securities amounted to a value of $4,222 or 61.3% of net assets. |
| (2) | Regulation S security. Security is offered and sold outside of the United States; therefore, it is exempt from registration with the SEC under Rules 903 and 904 of the Securities Act of 1933. |
| (3) | 100% of the income received was in PIK. |
| (4) | No contractual maturity date. |
| (5) | At May 31, 2024, the one-, three-, and six-month reference rates are published by ICE Benchmark Administration under a synthetic methodology. See Note 9 in Notes to Financial Statements. |
| (6) | Variable rate security. Rate disclosed is as of May 31, 2024. Information in parenthesis represents benchmark and reference rate for each security. Certain variable rate securities are not based on a published reference rate and spread but are determined by the issuer or agent and are based on current market conditions, or, for mortgage-backed securities, are impacted by the individual mortgages which are paying off over time. These securities do not indicate a reference rate and spread in their descriptions. |
| Country Weightings (Unaudited)† |
| Brazil | 10% |
| Macau | 8 |
| Mexico | 7 |
| India | 7 |
| United Arab Emirates | 5 |
| Indonesia | 5 |
| Hong Kong | 5 |
| Other | 53 |
| Total | 100% |
| † % of total investments as of May 31, 2024. |
For information regarding the abbreviations, see the Key Investment Terms starting on page 1.
See Notes to Financial Statements
Stone Harbor Emerging Markets Bond Fund
SCHEDULE OF INVESTMENTS (Continued)
May 31, 2024
($ reported in thousands)
The following table summarizes the value of the Fund’s investments as of May 31, 2024, based on the inputs used to value them (See Security Valuation Note 2A in the Notes to Financial Statements):
| | Total
Value at
May 31, 2024 | | Level 2
Significant
Observable
Inputs |
| Assets: | | | |
| Debt Instruments: | | | |
| Corporate Bonds and Notes | $6,742 | | $6,742 |
| Total Investments | $6,742 | | $6,742 |
There were no securities valued using quoted prices (Level 1) or significant unobservable inputs (Level 3) at May 31, 2024.
There were no transfers into or out of Level 3 related to securities held at May 31, 2024.
See Notes to Financial Statements
Stone Harbor Emerging Markets Debt Income Fund
SCHEDULE OF INVESTMENTS
May 31, 2024
($ reported in thousands)
| | Par Value(1) | | Value |
| Foreign Government Securities—66.4% |
| Angola —2.4% | | |
| Republic of Angola | | | |
144A
8.000%, 11/26/29(2) | $ 109 | | $ 99 |
144A
8.750%, 4/14/32(2) | 2,388 | | 2,133 |
144A
9.375%, 5/8/48(2) | 1,147 | | 975 |
Republic of Angola Via Avenir Issuer II Ireland DAC RegS
6.927%, 2/19/27(3)(4) | 2,983 | | 2,861 |
| | | | 6,068 |
| | | | |
| |
| Argentina—2.4% | | |
Provincia De Buenos Aires RegS
6.375%, 9/1/37(4)(5) | 2,378 | | 1,046 |
| Republic of Argentina | | | |
| 1.000%, 7/9/29 | 1,016 | | 592 |
| 0.750%, 7/9/30(5) | 6,713 | | 3,820 |
| 3.625%, 7/9/35(5) | 1,366 | | 601 |
| | | | 6,059 |
| | | | |
| |
| Armenia—0.4% | | |
Republic of Armenia RegS
3.600%, 2/2/31(4) | 1,181 | | 964 |
| Bahrain—1.8% | | |
| Kingdom of Bahrain | | | |
144A
5.625%, 9/30/31(2) | 368 | | 347 |
144A
5.250%, 1/25/33(2) | 1,753 | | 1,569 |
144A
5.625%, 5/18/34(2) | 122 | | 110 |
144A
7.500%, 2/12/36(2) | 1,655 | | 1,688 |
RegS
5.625%, 9/30/31(4) | 1,000 | | 942 |
| | | | 4,656 |
| | | | |
| |
| Bermuda—0.2% | | |
Government of Bermuda 144A
4.750%, 2/15/29(2) | 661 | | 636 |
| Brazil—2.3% | | |
| Federative Republic of Brazil | | | |
| 6.250%, 3/18/31 | 349 | | 347 |
| 6.000%, 10/20/33 | 239 | | 231 |
| 5.000%, 1/27/45 | 2,619 | | 2,017 |
| 5.625%, 2/21/47 | 59 | | 49 |
| 4.750%, 1/14/50 | 3,396 | | 2,445 |
| 7.125%, 5/13/54 | 953 | | 930 |
| | | | 6,019 |
| | | | |
| |
| Chile—0.9% | | |
| Republic of Chile | | | |
| 4.950%, 1/5/36 | 1,925 | | 1,833 |
| | Par Value(1) | | Value |
| | | | |
| Chile—continued | | |
| 3.860%, 6/21/47 | $ 649 | | $ 500 |
| | | | 2,333 |
| | | | |
| |
| Colombia—2.6% | | |
| Republic of Colombia | | | |
| 4.500%, 3/15/29 | 1,065 | | 963 |
| 3.000%, 1/30/30 | 387 | | 314 |
| 3.250%, 4/22/32 | 3 | | 2 |
| 7.500%, 2/2/34 | 1,194 | | 1,183 |
| 8.000%, 11/14/35 | 637 | | 650 |
| 6.125%, 1/18/41 | 2,271 | | 1,888 |
| 4.125%, 2/22/42 | 153 | | 100 |
| 5.200%, 5/15/49 | 2,277 | | 1,592 |
| | | | 6,692 |
| | | | |
| |
| Costa Rica—1.1% | | |
| Costa Rica Government | | | |
144A
6.550%, 4/3/34(2) | 308 | | 315 |
144A
7.300%, 11/13/54(2) | 978 | | 1,024 |
RegS
6.550%, 4/3/34(4) | 804 | | 822 |
RegS
7.000%, 4/4/44(4) | 720 | | 731 |
| | | | 2,892 |
| | | | |
| |
| Dominican Republic—2.3% | | |
| Dominican Republic | | | |
144A
4.500%, 1/30/30(2) | 639 | | 579 |
144A
4.875%, 9/23/32(2) | 1,214 | | 1,083 |
RegS
5.950%, 1/25/27(4) | 1,327 | | 1,318 |
RegS
4.875%, 9/23/32(4) | 1,751 | | 1,562 |
RegS
5.300%, 1/21/41(4) | 1,336 | | 1,131 |
RegS
6.500%, 2/15/48(4) | 259 | | 244 |
| | | | 5,917 |
| | | | |
| |
| Ecuador—2.3% | | |
| Republic of Ecuador | | | |
144A
0.000%, 7/31/30(2)(6) | 1,341 | | 680 |
144A
6.000%, 7/31/30(2)(5) | 1,131 | | 757 |
RegS
6.000%, 7/31/30(4)(5) | 5,206 | | 3,483 |
RegS
3.500%, 7/31/35(4)(5) | 543 | | 278 |
RegS
2.500%, 7/31/40(4)(5) | 1,588 | | 740 |
| | | | 5,938 |
| | | | |
| |
See Notes to Financial Statements
Stone Harbor Emerging Markets Debt Income Fund
SCHEDULE OF INVESTMENTS (Continued)
May 31, 2024
($ reported in thousands)
| | Par Value(1) | | Value |
| | | | |
| Egypt—2.7% | | |
| Arab Republic of Egypt | | | |
144A
3.875%, 2/16/26(2) | $ 155 | | $ 144 |
144A
5.875%, 2/16/31(2) | 1 | | 1 |
144A
7.903%, 2/21/48(2) | 24 | | 18 |
144A
8.875%, 5/29/50(2) | 469 | | 379 |
144A
7.500%, 2/16/61(2) | 7,799 | | 5,479 |
RegS
4.750%, 4/16/26(4) | 257EUR | | 265 |
RegS
8.700%, 3/1/49(4) | 847 | | 673 |
| | | | 6,959 |
| | | | |
| |
| El Salvador—1.2% | | |
| Republic of El Salvador | | | |
RegS
6.375%, 1/18/27(4) | 483 | | 424 |
RegS
8.250%, 4/10/32(4) | 2,766 | | 2,144 |
RegS
7.650%, 6/15/35(4) | 824 | | 589 |
| | | | 3,157 |
| | | | |
| |
| Ethiopia—0.5% | | |
Federal Republic of Ethiopia 144A
6.625%, 12/11/24(2)(7) | 1,785 | | 1,258 |
| Gabon—0.3% | | |
| Republic of Gabon | | | |
144A
6.950%, 6/16/25(2) | 402 | | 379 |
144A
7.000%, 11/24/31(2) | 505 | | 402 |
| | | | 781 |
| | | | |
| |
| Ghana—0.9% | | |
| Republic of Ghana | | | |
144A
10.750%, 10/14/30(2) | 1,232 | | 840 |
RegS
10.750%, 10/14/30(4) | 1,481 | | 1,009 |
RegS
8.625%, 4/7/34(4)(7) | 1,032 | | 531 |
| | | | 2,380 |
| | | | |
| |
| Guatemala—1.0% | | |
| Republic of Guatemala | | | |
144A
3.700%, 10/7/33(2) | 1,890 | | 1,528 |
144A
6.600%, 6/13/36(2) | 1,040 | | 1,042 |
| | | | 2,570 |
| | | | |
| |
| | Par Value(1) | | Value |
| | | | |
| Honduras—0.2% | | |
| Honduras Government | | | |
RegS
6.250%, 1/19/27(4) | $ 305 | | $ 292 |
RegS
5.625%, 6/24/30(4) | 292 | | 252 |
| | | | 544 |
| | | | |
| |
| Hungary—2.7% | | |
| Hungary Government International Bond | | | |
144A
5.500%, 3/26/36(2) | 2,810 | | 2,676 |
RegS
2.125%, 9/22/31(4) | 1,409 | | 1,107 |
RegS
1.750%, 6/5/35(4) | 1,739EUR | | 1,453 |
RegS
1.500%, 11/17/50(4) | 1,169EUR | | 724 |
Magyar Export-Import Bank Zrt 144A
6.125%, 12/4/27(2) | 943 | | 948 |
| | | | 6,908 |
| | | | |
| |
| India—1.0% | | |
| Export-Import Bank India | | | |
RegS
2.250%, 1/13/31(4) | 1,569 | | 1,288 |
RegS
5.500%, 1/18/33(4) | 1,183 | | 1,186 |
| | | | 2,474 |
| | | | |
| |
| Indonesia—0.8% | | |
| Republic of Indonesia | | | |
| 4.850%, 1/11/33 | 301 | | 292 |
144A
5.250%, 1/8/47(2) | 425 | | 412 |
RegS
6.750%, 1/15/44(4) | 898 | | 1,028 |
RegS
5.125%, 1/15/45(4) | 332 | | 318 |
| | | | 2,050 |
| | | | |
| |
| Ivory Coast—1.1% | | |
| Republic of Ivory Coast | | | |
144A
6.125%, 6/15/33(2) | 669 | | 594 |
RegS
5.750%, 12/31/32(4)(5) | 184 | | 172 |
RegS
6.625%, 3/22/48(4) | 2,418EUR | | 2,080 |
| | | | 2,846 |
| | | | |
| |
| Jordan—1.2% | | |
| Kingdom of Jordan | | | |
144A
7.750%, 1/15/28(2) | 571 | | 577 |
144A
7.500%, 1/13/29(2) | 300 | | 299 |
144A
5.850%, 7/7/30(2) | 616 | | 567 |
See Notes to Financial Statements
Stone Harbor Emerging Markets Debt Income Fund
SCHEDULE OF INVESTMENTS (Continued)
May 31, 2024
($ reported in thousands)
| | Par Value(1) | | Value |
| | | | |
| Jordan—continued | | |
144A
7.375%, 10/10/47(2) | $ 1,202 | | $ 1,047 |
RegS
7.375%, 10/10/47(4) | 641 | | 558 |
| | | | 3,048 |
| | | | |
| |
| Kenya—0.8% | | |
| Republic of Kenya | | | |
144A
7.000%, 5/22/27(2) | 452 | | 436 |
144A
8.000%, 5/22/32(2) | 1,431 | | 1,304 |
RegS
7.250%, 2/28/28(4) | 471 | | 442 |
| | | | 2,182 |
| | | | |
| |
| Lebanon—0.2% | | |
| Lebanese Republic | | | |
RegS
5.800%, 4/14/20(4)(7) | 1,561 | | 107 |
RegS
8.250%, 4/12/21(4)(7) | 3,735 | | 256 |
RegS
6.400%, 5/26/23(4)(7) | 1,325 | | 91 |
| | | | 454 |
| | | | |
| |
| Mexico—1.4% | | |
| United Mexican States | | | |
| 3.500%, 2/12/34 | 750 | | 614 |
| 6.350%, 2/9/35 | 415 | | 419 |
| 6.000%, 5/7/36 | 793 | | 780 |
| 4.750%, 3/8/44 | 924 | | 747 |
| 5.000%, 4/27/51 | 686 | | 558 |
| 3.771%, 5/24/61 | 922 | | 573 |
| | | | 3,691 |
| | | | |
| |
| Morocco—0.3% | | |
Kingdom of Morocco 144A
4.000%, 12/15/50(2) | 1,233 | | 833 |
| Mozambique—0.2% | | |
Republic of Mozambique 144A
9.000%, 9/15/31(2)(5) | 490 | | 402 |
| Nigeria—1.9% | | |
| Republic of Nigeria | | | |
144A
6.500%, 11/28/27(2) | 779 | | 727 |
144A
6.125%, 9/28/28(2) | 1,272 | | 1,130 |
144A
8.375%, 3/24/29(2) | 654 | | 623 |
144A
7.875%, 2/16/32(2) | 734 | | 648 |
RegS
8.747%, 1/21/31(4) | 1,145 | | 1,079 |
| | Par Value(1) | | Value |
| | | | |
| Nigeria—continued | | |
RegS
7.375%, 9/28/33(4) | $ 794 | | $ 661 |
| | | | 4,868 |
| | | | |
| |
| Oman —2.0% | | |
| Oman Government International Bond | | | |
144A
5.625%, 1/17/28(2) | 1,146 | | 1,143 |
144A
6.000%, 8/1/29(2) | 1,133 | | 1,144 |
144A
7.375%, 10/28/32(2) | 1,222 | | 1,345 |
144A
6.500%, 3/8/47(2) | 1,516 | | 1,490 |
| | | | 5,122 |
| | | | |
| |
| Pakistan—1.0% | | |
| Islamic Republic of Pakistan | | | |
144A
6.000%, 4/8/26(2) | 2,545 | | 2,302 |
144A
6.875%, 12/5/27(2) | 258 | | 226 |
| | | | 2,528 |
| | | | |
| |
| Panama—1.7% | | |
Panama Bonos del Tesoro
3.362%, 6/30/31 | 2,575 | | 2,020 |
| Republic of Panama | | | |
| 3.875%, 3/17/28 | 198 | | 182 |
| 3.160%, 1/23/30 | 354 | | 295 |
| 6.700%, 1/26/36 | 263 | | 253 |
| 8.000%, 3/1/38 | 1,156 | | 1,212 |
| 6.853%, 3/28/54 | 422 | | 381 |
| | | | 4,343 |
| | | | |
| |
| Papua New Guinea —0.2% | | |
Papua New Guinea Government International Bond 144A
8.375%, 10/4/28(2) | 435 | | 413 |
| Paraguay—0.9% | | |
| Republic of Paraguay | | | |
RegS
2.739%, 1/29/33(4) | 1,805 | | 1,443 |
RegS
6.100%, 8/11/44(4) | 797 | | 757 |
| | | | 2,200 |
| | | | |
| |
| Peru—2.8% | | |
| Republic of Peru | | | |
| 2.844%, 6/20/30 | 340 | | 294 |
| 2.783%, 1/23/31 | 942 | | 795 |
| 8.750%, 11/21/33 | 710 | | 853 |
| 3.000%, 1/15/34 | 3,954 | | 3,169 |
| 2.780%, 12/1/60 | 3,726 | | 2,050 |
| | | | 7,161 |
| | | | |
| |
See Notes to Financial Statements
Stone Harbor Emerging Markets Debt Income Fund
SCHEDULE OF INVESTMENTS (Continued)
May 31, 2024
($ reported in thousands)
| | Par Value(1) | | Value |
| | | | |
| Philippines—0.3% | | |
Republic of Philippines
5.000%, 7/17/33 | $ 872 | | $ 853 |
| Poland—1.3% | | |
| Republic of Poland | | | |
| 4.875%, 10/4/33 | 212 | | 204 |
| 5.125%, 9/18/34 | 2,540 | | 2,478 |
| 5.500%, 4/4/53 | 669 | | 646 |
| | | | 3,328 |
| | | | |
| |
| Qatar—2.9% | | |
| State of Qatar | | | |
144A
3.750%, 4/16/30(2) | 1,859 | | 1,749 |
144A
5.750%, 1/20/42(2) | 1,530 | | 1,595 |
144A
5.103%, 4/23/48(2) | 1,089 | | 1,036 |
144A
4.400%, 4/16/50(2) | 2,965 | | 2,528 |
RegS
4.400%, 4/16/50(4) | 687 | | 586 |
| | | | 7,494 |
| | | | |
| |
| Romania—2.5% | | |
| Romania Government International Bond | | | |
144A
5.500%, 9/18/28(2) | 344EUR | | 384 |
144A
5.875%, 1/30/29(2) | 1,822 | | 1,808 |
144A
5.375%, 3/22/31(2) | 248EUR | | 268 |
144A
7.125%, 1/17/33(2) | 311 | | 326 |
144A
3.375%, 2/8/38(2) | 807EUR | | 677 |
144A
2.750%, 4/14/41(2) | 1,134EUR | | 822 |
144A
2.875%, 4/13/42(2) | 821EUR | | 594 |
RegS
4.125%, 3/11/39(4) | 627EUR | | 572 |
RegS
5.125%, 6/15/48(4) | 648 | | 544 |
RegS
4.000%, 2/14/51(4) | 446 | | 308 |
| | | | 6,303 |
| | | | |
| |
| Russia—0.0% | | |
Russian Federation - Eurobond RegS
5.100%, 3/28/35(4)(7)(8) | 100 | | 64 |
| Saudi Arabia—2.6% | | |
| Saudi International Bond | | | |
144A
4.375%, 4/16/29(2) | 1,118 | | 1,083 |
144A
4.500%, 4/17/30(2) | 1,237 | | 1,191 |
| | Par Value(1) | | Value |
| | | | |
| Saudi Arabia—continued | | |
144A
5.500%, 10/25/32(2) | $ 1,223 | | $ 1,242 |
144A
2.250%, 2/2/33(2) | 1,644 | | 1,303 |
144A
5.000%, 1/16/34(2) | 621 | | 604 |
144A
3.750%, 1/21/55(2) | 1,029 | | 720 |
RegS
3.750%, 1/21/55(4) | 902 | | 631 |
| | | | 6,774 |
| | | | |
| |
| Senegal—0.1% | | |
Republic of Senegal 144A
6.250%, 5/23/33(2) | 446 | | 377 |
| Serbia—0.4% | | |
Republic of Serbia RegS
2.050%, 9/23/36(4) | 1,496EUR | | 1,153 |
| South Africa—2.1% | | |
| Republic of South Africa | | | |
| 4.300%, 10/12/28 | 366 | | 327 |
| 5.875%, 4/20/32 | 3,677 | | 3,305 |
| 5.750%, 9/30/49 | 1,562 | | 1,123 |
| 7.300%, 4/20/52 | 771 | | 661 |
| | | | 5,416 |
| | | | |
| |
| Sri Lanka—1.0% | | |
| Republic of Sri Lanka | | | |
RegS
6.350%, 6/28/24(4)(7) | 1,156 | | 667 |
RegS
6.200%, 5/11/27(4)(7) | 2,475 | | 1,439 |
RegS
7.550%, 3/28/30(4)(7) | 640 | | 370 |
| | | | 2,476 |
| | | | |
| |
| Turkey—4.2% | | |
| Hazine Mustesarligi Varl | | | |
144A
8.509%, 1/14/29(2) | 1,387 | | 1,468 |
RegS
9.758%, 11/13/25(4) | 276 | | 290 |
| Republic of Turkiye | | | |
| 9.875%, 1/15/28 | 303 | | 332 |
| 9.375%, 3/14/29 | 4,003 | | 4,355 |
| 7.625%, 5/15/34 | 2,423 | | 2,429 |
| 5.750%, 5/11/47 | 2,550 | | 1,948 |
| | | | 10,822 |
| | | | |
| |
| Ukraine—0.9% | | |
| Ukraine Government Bond | | | |
144A
7.750%, 9/1/27(2)(7) | 423 | | 126 |
144A
7.750%, 9/1/28(2)(7) | 518 | | 152 |
See Notes to Financial Statements
Stone Harbor Emerging Markets Debt Income Fund
SCHEDULE OF INVESTMENTS (Continued)
May 31, 2024
($ reported in thousands)
| | Par Value(1) | | Value |
| | | | |
| Ukraine—continued | | |
144A
9.750%, 11/1/30(2)(7) | $ 2,137 | | $ 641 |
144A
6.876%, 5/21/31(2)(7) | 1,160 | | 313 |
RegS
7.750%, 9/1/29(4)(7) | 3,155 | | 915 |
RegS
9.750%, 11/1/30(4)(7) | 272 | | 81 |
| | | | 2,228 |
| | | | |
| |
| United Arab Emirates—0.7% | | |
Finance Department Government of Sharjah 144A
4.000%, 7/28/50(2) | 2,697 | | 1,723 |
| Uruguay—0.5% | | |
| Republica Orient Uruguay | | | |
| 5.750%, 10/28/34 | 713 | | 735 |
| 5.100%, 6/18/50 | 242 | | 226 |
| 4.975%, 4/20/55 | 375 | | 340 |
| | | | 1,301 |
| | | | |
| |
| Uzbekistan—0.2% | | |
Uzbekistan International Bond 144A
5.375%, 5/29/27(2) | 469EUR | | 507 |
| Venezuela—0.7% | | |
Bolivarian Republic of Venezuela RegS
7.750%, 10/13/19(4)(7) | 11,904 | | 1,726 |
| Zambia—0.3% | | |
| Republic of Zambia | | | |
| 8.500%, 4/14/25(7) | 509 | | 389 |
144A
5.375%, 9/20/24(2)(7) | 679 | | 463 |
| | | | 852 |
| | | | |
| |
Total Foreign Government Securities
(Identified Cost $174,604) | | 170,743 |
| | | | |
| |
| | | | |
| |
| Corporate Bonds and Notes—26.6% |
| Argentina—0.5% | | |
MSU Energy S.A. 144A
6.875%, 2/1/25(2) | 176 | | 145 |
YPF S.A. 144A
9.500%, 1/17/31(2) | 1,225 | | 1,228 |
| | | | 1,373 |
| | | | |
| |
| Azerbaijan—0.5% | | |
State Oil Co. of the Azerbaijan Republic RegS
6.950%, 3/18/30(4) | 1,146 | | 1,170 |
| Brazil—1.1% | | |
3R Lux S.a.r.l. 144A
9.750%, 2/5/31(2) | 321 | | 340 |
Braskem Netherlands Finance B.V. 144A
4.500%, 1/10/28(2) | 291 | | 259 |
| | Par Value(1) | | Value |
| | | | |
| Brazil—continued | | |
FORESEA Holding S.A. 144A
7.500%, 6/15/30(2) | $ 437 | | $ 407 |
Iochpe-Maxion Austria GmbH 144A
5.000%, 5/7/28(2) | 116 | | 104 |
MC Brazil Downstream Trading S.a.r.l. 144A
7.250%, 6/30/31(2) | 335 | | 301 |
Movida Europe S.A. 144A
7.850%, 4/11/29(2) | 498 | | 466 |
MV24 Capital B.V. 144A
6.748%, 6/1/34(2) | 517 | | 484 |
Samarco Mineracao S.A. PIK 144A
9.000%, 6/30/31(2)(9) | 320 | | 298 |
Trident Energy Finance plc 144A
12.500%, 11/30/29(2) | 205 | | 212 |
| | | | 2,871 |
| | | | |
| |
| Chile—1.7% | | |
ATP Tower Holdings LLC 144A
4.050%, 4/27/26(2) | 449 | | 418 |
| Corp. Nacional del Cobre de Chile | | | |
| 144A 5.950%, 1/8/34(2) | 1,974 | | 1,952 |
| 144A 6.440%, 1/26/36(2) | 956 | | 973 |
Empresa Nacional del Petroleo RegS
5.250%, 11/6/29(4) | 1,138 | | 1,107 |
| | | | 4,450 |
| | | | |
| |
| China—0.2% | | |
| Huarong Finance II Co., Ltd. | | | |
| RegS 4.625%, 6/3/26(4) | 200 | | 192 |
| RegS 4.875%, 11/22/26(4) | 200 | | 192 |
| | | | 384 |
| | | | |
| |
| Colombia—0.9% | | |
AI Candelaria Spain S.A. RegS
5.750%, 6/15/33(4) | 684 | | 540 |
| Banco Davivienda S.A. | | | |
| 144A 6.650%(2)(10) | 147 | | 102 |
| RegS 6.650%(4)(10) | 225 | | 156 |
Bancolombia S.A.
4.625%, 12/18/29 | 294 | | 287 |
Geopark Ltd. 144A
5.500%, 1/17/27(2) | 334 | | 301 |
Gran Tierra Energy, Inc. 144A
9.500%, 10/15/29(2) | 335 | | 318 |
SierraCol Energy Andina LLC 144A
6.000%, 6/15/28(2) | 620 | | 553 |
| | | | 2,257 |
| | | | |
| |
| Georgia—0.4% | | |
Georgian Railway JSC 144A
4.000%, 6/17/28(2) | 1,171 | | 1,037 |
| Ghana—0.7% | | |
Kosmos Energy Ltd. RegS
7.750%, 5/1/27(4) | 773 | | 753 |
See Notes to Financial Statements
Stone Harbor Emerging Markets Debt Income Fund
SCHEDULE OF INVESTMENTS (Continued)
May 31, 2024
($ reported in thousands)
| | Par Value(1) | | Value |
| | | | |
| Ghana—continued | | |
Tullow Oil plc RegS
7.000%, 3/1/25(4) | $ 1,103 | | $ 1,066 |
| | | | 1,819 |
| | | | |
| |
| India—0.6% | | |
Adani Electricity Mumbai Ltd. RegS
3.949%, 2/12/30(4) | 294 | | 246 |
Adani Renewable Energy RJ Ltd. 144A
4.625%, 10/15/39(2) | 280 | | 224 |
Adani Transmission Step-One Ltd. 144A
4.000%, 8/3/26(2) | 397 | | 372 |
Clean Renewable Power Mauritius Pte Ltd. 144A
4.250%, 3/25/27(2) | 141 | | 130 |
| Greenko Dutch B.V. | | | |
| 144A 3.850%, 3/29/26(2) | 192 | | 181 |
| RegS 3.850%, 3/29/26(4) | 205 | | 193 |
Network i2i Ltd. RegS
5.650% (4)(10) | 48 | | 47 |
Vedanta Resources Finance II plc RegS
13.875%, 12/9/28(4) | 139 | | 132 |
| | | | 1,525 |
| | | | |
| |
| Indonesia—2.7% | | |
Freeport Indonesia PT RegS
5.315%, 4/14/32(4) | 206 | | 198 |
Indonesia Asahan Aluminium PT 144A
5.800%, 5/15/50(2) | 3,389 | | 3,096 |
Medco Maple Tree Pte Ltd. 144A
8.960%, 4/27/29(2) | 433 | | 449 |
Minejesa Capital B.V. 144A
5.625%, 8/10/37(2) | 725 | | 646 |
Pertamina Persero PT RegS
6.000%, 5/3/42(4) | 815 | | 808 |
| Perusahaan Perseroan Persero PT Perusahaan Listrik Negara | | | |
| RegS 5.250%, 10/24/42(4) | 783 | | 700 |
| RegS 4.875%, 7/17/49(4) | 1,015 | | 833 |
Theta Capital Pte Ltd. RegS
8.125%, 1/22/25(4) | 200 | | 198 |
| | | | 6,928 |
| | | | |
| |
| Israel—0.3% | | |
Energean Israel Finance Ltd. 144A, RegS
4.875%, 3/30/26(2)(4) | 310 | | 294 |
Leviathan Bond Ltd. 144A, RegS
6.125%, 6/30/25(2)(4) | 333 | | 326 |
| | | | 620 |
| | | | |
| |
| Kazakhstan—1.1% | | |
| KazMunayGas National Co. JSC | | | |
| 144A 3.500%, 4/14/33(2) | 1,144 | | 930 |
| 144A 5.750%, 4/19/47(2) | 1,456 | | 1,240 |
QazaqGaz NC JSC 144A
4.375%, 9/26/27(2) | 802 | | 755 |
| | | | 2,925 |
| | | | |
| |
| | Par Value(1) | | Value |
| | | | |
| Macau—0.3% | | |
Studio City Finance Ltd. 144A
5.000%, 1/15/29(2) | $ 935 | | $ 814 |
| Malaysia—0.1% | | |
Yinson Boronia Production B.V. 144A
8.947%, 7/31/42(2) | 313 | | 316 |
| Mexico—5.9% | | |
Banco Mercantil del Norte S.A. 144A
5.875% (2)(10) | 794 | | 747 |
BBVA Bancomer S.A. 144A
5.125%, 1/18/33(2) | 380 | | 350 |
Comision Federal de Electricidad RegS
3.875%, 7/26/33(4) | 2,614 | | 2,112 |
Grupo Aeromexico SAB de C.V. 144A
8.500%, 3/17/27(2) | 515 | | 513 |
| Petroleos Mexicanos | | | |
| 6.500%, 1/23/29 | 852 | | 770 |
| 6.625%, 6/15/35 | 1,691 | | 1,298 |
| 6.750%, 9/21/47 | 2,084 | | 1,389 |
| 7.690%, 1/23/50 | 559 | | 406 |
| 6.950%, 1/28/60 | 1,560 | | 1,040 |
Poinsettia Finance Ltd. RegS
6.625%, 6/17/31(4) | 6,784 | | 5,911 |
Sixsigma Networks Mexico S.A. de C.V. 144A
7.500%, 5/2/25(2) | 661 | | 625 |
| | | | 15,161 |
| | | | |
| |
| Morocco—0.3% | | |
OCP S.A. 144A
7.500%, 5/2/54(2) | 869 | | 866 |
| Nigeria—0.3% | | |
Access Bank plc 144A
6.125%, 9/21/26(2) | 297 | | 283 |
IHS Netherlands Holdco B.V. 144A
8.000%, 9/18/27(2) | 387 | | 375 |
| | | | 658 |
| | | | |
| |
| Peru—0.6% | | |
Peru Payroll Deduction Finance Ltd. RegS
0.000%, 11/1/29(4)(6) | 1,249 | | 1,035 |
Petroleos del Peru S.A. RegS
5.625%, 6/19/47(4) | 968 | | 576 |
| | | | 1,611 |
| | | | |
| |
| Saudi Arabia—2.1% | | |
Gaci First Investment Co. RegS
4.875%, 2/14/35(4) | 5,691 | | 5,356 |
| South Africa—0.8% | | |
Eskom Holdings SOC Ltd. 144A
8.450%, 8/10/28(2) | 1,304 | | 1,297 |
Prosus N.V. 144A
3.832%, 2/8/51(2) | 150 | | 94 |
See Notes to Financial Statements
Stone Harbor Emerging Markets Debt Income Fund
SCHEDULE OF INVESTMENTS (Continued)
May 31, 2024
($ reported in thousands)
| | Par Value(1) | | Value |
| | | | |
| South Africa—continued | | |
Sasol Financing USA LLC
4.375%, 9/18/26 | $ 612 | | $ 573 |
| | | | 1,964 |
| | | | |
| |
| Tanzania—0.3% | | |
| HTA Group Ltd. | | | |
| 144A 7.000%, 12/18/25(2) | 360 | | 359 |
| 144A 7.500%, 6/4/29(2) | 350 | | 348 |
| | | | 707 |
| | | | |
| |
| Turkey—0.5% | | |
Aydem Yenilenebilir Enerji AS 144A
7.750%, 2/2/27(2) | 661 | | 640 |
Sisecam UK plc 144A
8.250%, 5/2/29(2) | 461 | | 470 |
WE Soda Investments Holding plc 144A
9.500%, 10/6/28(2) | 134 | | 138 |
| | | | 1,248 |
| | | | |
| |
| Ukraine—0.2% | | |
Metinvest B.V. 144A
8.500%, 4/23/26(2) | 200 | | 158 |
NPC Ukrenergo 144A
6.875%, 11/9/28(2)(7) | 502 | | 183 |
State Savings Bank of Ukraine Via SSB #1 plc RegS
9.625%, 3/20/25(3)(4)(5) | 70 | | 65 |
VF Ukraine PAT via VFU Funding plc 144A
6.200%, 2/11/25(2)(3) | 250 | | 213 |
| | | | 619 |
| | | | |
| |
| United Arab Emirates—2.1% | | |
Abu Dhabi Crude Oil Pipeline LLC 144A
4.600%, 11/2/47(2) | 200 | | 177 |
DAE Funding LLC 144A
3.375%, 3/20/28(2) | 593 | | 543 |
| DP World Ltd. | | | |
| 144A 6.850%, 7/2/37(2) | 491 | | 528 |
| 144A 4.700%, 9/30/49(2) | 436 | | 357 |
| RegS 4.700%, 9/30/49(4) | 500 | | 409 |
DP World Salaam RegS
6.000% (4)(10) | 2,145 | | 2,135 |
MAF Global Securities Ltd. RegS
6.375% (4)(10) | 517 | | 511 |
MDGH GMTN RSC Ltd. 144A
5.875%, 5/1/34(2) | 723 | | 756 |
| | | | 5,416 |
| | | | |
| |
| Uzbekistan—1.2% | | |
| Uzauto Motors AJ | | | |
| 144A 4.850%, 5/4/26(2) | 2,484 | | 2,329 |
| RegS 4.850%, 5/4/26(4) | 697 | | 653 |
| | | | 2,982 |
| | | | |
| |
| | Par Value(1) | | Value |
| | | | |
| Venezuela—1.0% | | |
| Petroleos de Venezuela S.A. | | | |
| RegS 6.000%, 5/16/24(4)(7) | $ 15,920 | | $ 1,879 |
| RegS 6.000%, 11/15/26(4)(7) | 6,345 | | 761 |
| | | | 2,640 |
| | | | |
| |
| Vietnam—0.2% | | |
Mong Duong Finance Holdings B.V. 144A
5.125%, 5/7/29(2) | 629 | | 595 |
Total Corporate Bonds and Notes
(Identified Cost $72,205) | | 68,312 |
| | Shares | |
| Affiliated Mutual Funds—1.9% |
| Fixed Income Funds—1.9% | |
| Virtus Stone Harbor Emerging Markets Bond Fund Class I(11)(12) | 321,341 | 2,529 |
| Virtus Stone Harbor Local Markets Fund Class I(11)(12)(13) | 306,586 | 2,483 |
Total Affiliated Mutual Funds
(Identified Cost $5,053) | 5,012 |
| | | |
| |
| | | |
| |
| Purchased Options—0.1% |
| (See open purchased options schedule) | |
Total Purchased Options
(Premiums paid $282) | 292 |
| | Par Value(1) | |
| Credit Linked Notes—1.5% |
| Iraq—1.5% | |
| Republic of Iraq | | |
(Counterparty: BOA)
2.536%, 1/1/28(5)(14) | 259,086JPY | 1,531 |
(Counterparty: BOA)
3.304%, 1/1/28(5)(14) | 118,068JPY | 696 |
(Counterparty: BOA)
3.399%, 1/6/28(5)(14) | 254,413JPY | 1,503 |
Total Credit Linked Notes
(Identified Cost $6,084) | 3,730 |
| | | |
| |
| | | |
| |
Total Long-Term Investments—96.5%
(Identified Cost $258,228) | 248,089 |
| | | |
| |
| | | |
| |
TOTAL INVESTMENTS—96.5%
(Identified Cost $258,228) | $248,089 |
| Other assets and liabilities, net—3.5% | 9,035 |
| NET ASSETS—100.0% | $257,124 |
| Abbreviations: |
| DAC | Designated Activity Company |
| GMTN | Global Medium Term Note |
| JSC | Joint Stock Company |
| LLC | Limited Liability Company |
| PIK | Payment-in-Kind Security |
For information regarding the abbreviations, see the Key Investment Terms starting on page 1.
See Notes to Financial Statements
Stone Harbor Emerging Markets Debt Income Fund
SCHEDULE OF INVESTMENTS (Continued)
May 31, 2024
($ reported in thousands)
| Footnote Legend: |
| (1) | Par Value disclosed in foreign currency is reported in thousands. |
| (2) | Security exempt from registration under Rule 144A of the Securities Act of 1933. These securities may be resold in transactions exempt from registration, normally to qualified institutional buyers. At May 31, 2024, these securities amounted to a value of $101,066 or 39.3% of net assets. |
| (3) | This Note was issued for the sole purpose of funding a leveraged loan between the issuer and the borrower. As the credit risk for this security lies solely with the borrower, the name represented here is that of the borrower. |
| (4) | Regulation S security. Security is offered and sold outside of the United States; therefore, it is exempt from registration with the SEC under Rules 903 and 904 of the Securities Act of 1933. |
| (5) | Variable rate security. Rate disclosed is as of May 31, 2024. Information in parenthesis represents benchmark and reference rate for each security. Certain variable rate securities are not based on a published reference rate and spread but are determined by the issuer or agent and are based on current market conditions, or, for mortgage-backed securities, are impacted by the individual mortgages which are paying off over time. These securities do not indicate a reference rate and spread in their descriptions. |
| (6) | Issued with a zero coupon. Income is recognized through the accretion of discount. |
| (7) | Security in default; no interest payments are being received. |
| (8) | The Fund is unable to trade and repatriate proceeds due to U.S. sanctions related to the Russia/Ukraine war. |
| (9) | 100% of the income received was in PIK. |
| (10) | No contractual maturity date. |
| (11) | Affiliated investment. See Note 4G in Notes to Financial Statements. |
| (12) | Shares of this fund are publicly offered, and its prospectus and annual report are publicly available. |
| (13) | Non-income producing. |
| (14) | The value of this security was determined using significant unobservable inputs and is reported as a Level 3 security in the Fair Value Hierarchy table located after the Schedule of Investments. |
| Counterparties: | |
| BOA | Bank of America |
| CITI | Citigroup Global Markets |
| GS | Goldman Sachs & Co. |
| JPM | JPMorgan Chase Bank N.A. |
| Foreign Currencies: |
| AUD | Australian Dollar |
| CNH | Chinese Yuan Offshore |
| EUR | Euro |
| JPY | Japanese Yen |
| MXN | Mexican Peso |
| USD | United States Dollar |
| Country Weightings (Unaudited)† |
| Mexico | 8% |
| Saudi Arabia | 5 |
| Turkey | 5 |
| Indonesia | 4 |
| Colombia | 4 |
| Brazil | 4 |
| Peru | 4 |
| Other | 66 |
| Total | 100% |
| † % of total investments as of May 31, 2024. |
| Open purchased option contracts as of May 31, 2024 were as follows:Shares |
| Description of Options | Counterparty | Number of
Contracts | Contract
Notional
Amount | Strike
Price(1) | Expiration
Date | Value |
| Call Options(2) | | | | | | |
| Call USD 2,208 versus Put CNH 16,284 | GS | 2,208,340 | $16,284 | 7.37 | 05/14/25 | $20 |
| Call USD 6,300 versus Put MXN 121,612 | GS | 6,300,000 | 121,612 | 19.30 | 05/20/25 | 143 |
| Call USD 3,811 versus Put CNH 28,097 | GS | 3,811,000 | 28,097 | 7.37 | 05/30/25 | 36 |
| Put Option(2) | | | | | | |
| Put AUD 9,565 versus Call USD 5,996 | GS | 9,565,000 | 5,996 | 0.63 | 05/30/25 | 93 |
| Total | | $292 |
| Footnote Legend: |
| (1) | Strike price not reported in thousands. |
| (2) | Over-the-counter options. |
| Forward foreign currency exchange contracts as of May 31, 2024 were as follows: |
Currency
Purchased | Currency
Amount
Purchased | Currency
Sold | Currency
Amount
Sold | Counterparty | Settlement
Date | Unrealized
Appreciation | Unrealized
Depreciation |
| EUR | 1,509 | USD | 1,630 | CITI | 07/19/24 | $12 | $— |
| EUR | 551 | USD | 592 | JPM | 07/19/24 | 7 | — |
| USD | 345 | EUR | 317 | CITI | 07/19/24 | —(1) | — |
See Notes to Financial Statements
Stone Harbor Emerging Markets Debt Income Fund
SCHEDULE OF INVESTMENTS (Continued)
May 31, 2024
($ reported in thousands)
| Forward foreign currency exchange contracts as of May 31, 2024 were as follows: |
Currency
Purchased | Currency
Amount
Purchased | Currency
Sold | Currency
Amount
Sold | Counterparty | Settlement
Date | Unrealized
Appreciation | | Unrealized
Depreciation |
| USD | 11,425 | EUR | 10,681 | JPM | 07/19/24 | $— | | $(191) |
| Total | | | | | | $19 | | $(191) |
| Footnote Legend: |
| (1) | Amount is less than $500 (not in thousands). |
The following table summarizes the value of the Fund’s investments as of May 31, 2024, based on the inputs used to value them (See Security Valuation Note 2A in the Notes to Financial Statements):
| | Total
Value at
May 31, 2024 | | Level 1
Quoted Prices | | Level 2
Significant
Observable
Inputs | | Level 3
Significant
Unobservable
Inputs |
| Assets: | | | | | | | |
| Debt Instruments: | | | | | | | |
| Foreign Government Securities | $170,743 | | $— | | $170,743 | | $— |
| Corporate Bonds and Notes | 68,312 | | — | | 68,312 | | — |
| Credit Linked Notes | 3,730 | | — | | — | | 3,730 |
| Affiliated Mutual Funds | 5,012 | | 5,012 | | — | | — |
| Other Financial Instruments: | | | | | | | |
| Purchased Options | 292 | | — | | 292 | | — |
| Forward Foreign Currency Exchange Contracts* | 19 | | — | | 19 | | — |
| Total Assets | 248,108 | | 5,012 | | 239,366 | | 3,730 |
| Liabilities: | | | | | | | |
| Other Financial Instruments: | | | | | | | |
| Forward Foreign Currency Exchange Contract* | (191) | | — | | (191) | | — |
| Total Liabilities | (191) | | — | | (191) | | — |
| Total Investments | $247,917 | | $5,012 | | $239,175 | | $3,730 |
| * | Forward Foreign Currency Exchange Contracts are valued at the net unrealized appreciation (depreciation) on the instrument by level and counterparty. |
Security held by the Fund with an end of period value of $64 was transferred from Level 3 to Level 2 due to an increase in trading activities during the period.
Some of the Fund’s investments that were categorized as Level 3 may have been valued utilizing third party pricing information without adjustment. If applicable, such valuations are based on unobservable inputs. A significant change in third party information could result in a significantly lower or higher value of Level 3 investments.
The following is a reconciliation of assets of the Fund for Level 3 investments for which significant unobservable inputs were used to determine fair value.
| | Total | | Corporate
Bonds
And Notes | | Credit Linked
Notes | | Foreign
Government
Securities |
| Investments in Securities | | | | | | | |
| Balance as of May 31, 2023: | $ 5,059 | | $ 12 | | $ 5,042 | | $ 5 |
| Accrued discount/(premium) | 101 | | — | | 101 | | — |
| Net realized gain (loss) | (425) | | (23) | | (402) | | — |
| Net change in unrealized appreciation (depreciation)(a) | 238 | | 86 | | 93 | | 59 |
| Sales(b) | (1,179) | | (75) | | (1,104) | | — |
| Transfers from Level 3(c) | (64) | | — | | — | | (64) |
| Balance as of May 31, 2024 | $ 3,730 | | $ — | | $ 3,730 | | $ — |
(a) The net change in unrealized appreciation (depreciation) on investments still held at May 31, 2024, was $93.
(b) Includes paydowns on securities.
(c) “Transfers into and/or from” represent the ending value as of May 31, 2024 for any investment security where a change in the pricing level occurred from the beginning to the end of the period.
See Notes to Financial Statements
Stone Harbor Local Markets Fund
SCHEDULE OF INVESTMENTS
May 31, 2024
($ reported in thousands)
| | Par Value(1) | | Value |
| Foreign Government Securities—81.0% |
| Brazil—11.0% | | |
| Brazil Notas do Tesouro Nacional | | | |
Series F
10.000%, 1/1/25 | 1,160BRL | | $ 220 |
Series F
10.000%, 1/1/31 | 3,320BRL | | 584 |
| | | | 804 |
| | | | |
| |
| Chile—0.8% | | |
| Bonos Tesoreria Pesos | | | |
| 5.000%, 3/1/35 | 20,000CLP | | 20 |
144A, RegS
5.000%, 10/1/28(2)(3) | 35,000CLP | | 37 |
| | | | 57 |
| | | | |
| |
| China—4.8% | | |
| China Government Bond | | | |
| 3.130%, 11/21/29 | 340CNY | | 49 |
| 2.890%, 11/18/31 | 1,550CNY | | 223 |
| 3.720%, 4/12/51 | 490CNY | | 82 |
| | | | 354 |
| | | | |
| |
| Colombia—6.3% | | |
Bogota Distrio Capital RegS
9.750%, 7/26/28(3) | 1,091,000COP | | 267 |
| Titulos De Tesoreria | | | |
| 9.250%, 5/28/42 | 533,000COP | | 112 |
| 7.250%, 10/26/50 | 480,000COP | | 80 |
| | | | 459 |
| | | | |
| |
| Czech Republic—4.7% | | |
| Czech Republic | | | |
| 2.750%, 7/23/29 | 2,070CZK | | 85 |
RegS
0.950%, 5/15/30(3) | 3,700CZK | | 134 |
RegS
4.200%, 12/4/36(3) | 2,980CZK | | 129 |
| | | | 348 |
| | | | |
| |
| Hungary—2.0% | | |
Hungary Government Bond
4.750%, 11/24/32 | 59,800HUF | | 144 |
| Indonesia—9.8% | | |
| Indonesia Government Bond | | | |
| 6.500%, 6/15/25 | 3,010,000IDR | | 185 |
| 9.000%, 3/15/29 | 1,860,000IDR | | 124 |
| 8.375%, 3/15/34 | 1,828,000IDR | | 124 |
| 7.500%, 5/15/38 | 3,278,000IDR | | 211 |
| 8.375%, 4/15/39 | 1,090,000IDR | | 75 |
| | | | 719 |
| | | | |
| |
| Malaysia—9.8% | | |
| Malaysia Government Bond | | | |
| 4.059%, 9/30/24 | 67MYR | | 14 |
| 3.906%, 7/15/26 | 851MYR | | 182 |
| 3.885%, 8/15/29 | 1,030MYR | | 221 |
| | Par Value(1) | | Value |
| | | | |
| Malaysia—continued | | |
| 3.582%, 7/15/32 | 640MYR | | $ 133 |
| 4.893%, 6/8/38 | 575MYR | | 133 |
| 4.696%, 10/15/42 | 145MYR | | 33 |
| | | | 716 |
| | | | |
| |
| Mexico—8.1% | | |
| Mex Bonos Desarr | | | |
| 7.750%, 11/13/42 | 5,110MXN | | 247 |
| 8.000%, 11/7/47 | 7,120MXN | | 349 |
| | | | 596 |
| | | | |
| |
| Peru—2.0% | | |
| Bonos De Tesoreria | | | |
| 6.150%, 8/12/32 | 400PEN | | 103 |
| 5.400%, 8/12/34 | 104PEN | | 24 |
| 5.350%, 8/12/40 | 90PEN | | 20 |
| | | | 147 |
| | | | |
| |
| Poland—4.5% | | |
Poland Government Bond
6.000%, 10/25/33 | 1,280PLN | | 332 |
| Romania—3.1% | | |
| Romania Government Bond | | | |
| 8.000%, 4/29/30 | 755RON | | 175 |
| 4.750%, 10/11/34 | 290RON | | 53 |
| | | | 228 |
| | | | |
| |
| South Africa—9.0% | | |
| Republic of South Africa | | | |
| 10.500%, 12/21/26 | 1,370ZAR | | 75 |
| 8.500%, 1/31/37 | 8,900ZAR | | 352 |
| 6.500%, 2/28/41 | 4,020ZAR | | 123 |
| 8.750%, 1/31/44 | 2,910ZAR | | 110 |
| | | | 660 |
| | | | |
| |
| Thailand—4.8% | | |
| Thailand Government Bond | | | |
| 2.875%, 12/17/28 | 870THB | | 24 |
| 3.775%, 6/25/32 | 4,550THB | | 132 |
| 1.585%, 12/17/35 | 1,110THB | | 26 |
| 3.300%, 6/17/38 | 3,610THB | | 101 |
| 4.675%, 6/29/44 | 2,180THB | | 71 |
| | | | 354 |
| | | | |
| |
| Uruguay—0.3% | | |
Republica Orient Uruguay
8.250%, 5/21/31 | 950UYU | | 24 |
Total Foreign Government Securities
(Identified Cost $6,034) | | 5,942 |
| | | | |
| |
| | | | |
| |
See Notes to Financial Statements
Stone Harbor Local Markets Fund
SCHEDULE OF INVESTMENTS (Continued)
May 31, 2024
($ reported in thousands)
| | Par Value(1) | | Value |
| | | | |
| | | | |
| Corporate Bonds and Notes—3.2% |
| Poland—3.2% | | |
Kreditanstalt fuer Wiederaufbau
0.625%, 7/25/25 | 1,000PLN | | $ 239 |
Total Corporate Bonds and Notes
(Identified Cost $250) | | 239 |
| | | | |
| |
| | | | |
| |
Total Long-Term Investments—84.2%
(Identified Cost $6,284) | | 6,181 |
| | | | |
| |
| | | | |
| |
TOTAL INVESTMENTS—84.2%
(Identified Cost $6,284) | | $6,181 |
| Other assets and liabilities, net—15.8% | | 1,158 |
| NET ASSETS—100.0% | | $7,339 |
| Footnote Legend: |
| (1) | Par Value disclosed in foreign currency is reported in thousands. |
| (2) | Security exempt from registration under Rule 144A of the Securities Act of 1933. These securities may be resold in transactions exempt from registration, normally to qualified institutional buyers. At May 31, 2024, these securities amounted to a value of $37 or 0.5% of net assets. |
| (3) | Regulation S security. Security is offered and sold outside of the United States; therefore, it is exempt from registration with the SEC under Rules 903 and 904 of the Securities Act of 1933. |
| Counterparties: | |
| CITI | Citigroup Global Markets |
| GS | Goldman Sachs & Co. |
| JPM | JPMorgan Chase Bank N.A. |
| Foreign Currencies: |
| BRL | Brazilian Real |
| CLP | Chilean Peso |
| CNH | Chinese Yuan Offshore |
| CNY | Chinese Yuan |
| COP | Colombian Peso |
| CZK | Czech Koruna |
| HUF | Hungarian Forint |
| IDR | Indonesian Rupiah |
| INR | Indian Rupee |
| MXN | Mexican Peso |
| MYR | Malaysian Ringgit |
| PEN | Peruvian Nuevo Sol |
| PLN | Polish Zloty |
| RON | Romania New Leu |
| RUB | Russian Ruble |
| THB | Thailand Baht |
| TRY | Turkish Lira |
| USD | United States Dollar |
| UYU | Uruguayan Peso |
| ZAR | South African Rand |
| Country Weightings (Unaudited)† |
| Brazil | 13% |
| Indonesia | 12 |
| Malaysia | 11 |
| South Africa | 11 |
| Mexico | 10 |
| Poland | 9 |
| Colombia | 7 |
| Other | 27 |
| Total | 100% |
| † % of total investments as of May 31, 2024. |
See Notes to Financial Statements
Stone Harbor Local Markets Fund
SCHEDULE OF INVESTMENTS (Continued)
May 31, 2024
($ reported in thousands)
| Forward foreign currency exchange contracts as of May 31, 2024 were as follows: |
Currency
Purchased | Currency
Amount
Purchased | Currency
Sold | Currency
Amount
Sold | Counterparty | Settlement
Date | Unrealized
Appreciation | | Unrealized
Depreciation |
| BRL | 360 | USD | 69 | JPM | 07/02/24 | $— | | $(1) |
| CLP | 109,000 | USD | 116 | JPM | 07/10/24 | 3 | | — |
| CNH | 2,970 | USD | 414 | JPM | 06/25/24 | — | | (4) |
| COP | 565,000 | USD | 144 | CITI | 06/27/24 | 2 | | — |
| CZK | 2,060 | USD | 89 | JPM | 06/04/24 | 1 | | — |
| CZK | 2,370 | USD | 104 | JPM | 07/30/24 | —(1) | | — |
| HUF | 76,200 | USD | 206 | GS | 06/04/24 | 6 | | — |
| HUF | 25,700 | USD | 72 | GS | 07/30/24 | — | | (1) |
| IDR | 870,000 | USD | 54 | JPM | 07/16/24 | — | | — (1) |
| INR | 19,000 | USD | 227 | JPM | 06/10/24 | —(1) | | — |
| INR | 12,300 | USD | 147 | JPM | 08/05/24 | — | | — (1) |
| MXN | 10,940 | USD | 640 | JPM | 07/09/24 | 1 | | — |
| MYR | 1,390 | USD | 293 | GS | 06/24/24 | 3 | | — |
| PLN | 160 | USD | 41 | JPM | 07/17/24 | — | | — (1) |
| RON | 100 | USD | 22 | JPM | 06/27/24 | —(1) | | — |
| THB | 21,840 | USD | 597 | GS | 06/05/24 | — | | (3) |
| THB | 7,000 | USD | 191 | GS | 07/25/24 | —(1) | | — |
| TRY | 5,070 | USD | 147 | JPM | 07/03/24 | 5 | | — |
| USD | 87 | CZK | 2,060 | JPM | 06/04/24 | — | | (3) |
| USD | 213 | HUF | 76,200 | GS | 06/04/24 | 1 | | — |
| USD | 593 | THB | 21,840 | GS | 06/05/24 | — | | (1) |
| USD | 228 | INR | 19,000 | JPM | 06/10/24 | —(1) | | — |
| USD | 219 | MYR | 1,040 | GS | 06/24/24 | — | | (2) |
| USD | 227 | CNH | 1,640 | JPM | 06/25/24 | 1 | | — |
| USD | 292 | COP | 1,165,000 | CITI | 06/27/24 | — | | (8) |
| USD | 56 | RON | 260 | JPM | 06/27/24 | — | | (1) |
| USD | 49 | BRL | 260 | JPM | 07/02/24 | —(1) | | — |
| USD | 28 | RUB | 2,700 | JPM | 07/02/24 | — | | (1) |
| USD | 39 | TRY | 1,320 | JPM | 07/03/24 | — | | (1) |
| USD | 488 | MXN | 8,300 | JPM | 07/09/24 | 2 | | — |
| USD | 42 | CLP | 39,000 | JPM | 07/10/24 | — | | (1) |
| USD | 255 | ZAR | 4,770 | JPM | 07/15/24 | 2 | | — |
| USD | 26 | THB | 950 | GS | 07/25/24 | — | | — (1) |
| USD | 40 | CZK | 910 | JPM | 07/30/24 | —(1) | | — |
| ZAR | 3,570 | USD | 191 | JPM | 07/15/24 | — | | (2) |
| Total | | | | | | $27 | | $(29) |
| Footnote Legend: |
| (1) | Amount is less than $500 (not in thousands). |
See Notes to Financial Statements
Stone Harbor Local Markets Fund
SCHEDULE OF INVESTMENTS (Continued)
May 31, 2024
($ reported in thousands)
The following table summarizes the value of the Fund’s investments as of May 31, 2024, based on the inputs used to value them (See Security Valuation Note 2A in the Notes to Financial Statements):
| | Total
Value at
May 31, 2024 | | Level 2
Significant
Observable
Inputs |
| Assets: | | | |
| Debt Instruments: | | | |
| Foreign Government Securities | $5,942 | | $5,942 |
| Corporate Bonds and Notes | 239 | | 239 |
| Other Financial Instruments: | | | |
| Forward Foreign Currency Exchange Contracts | 27 | | 27 |
| Total Assets | 6,208 | | 6,208 |
| Liabilities: | | | |
| Other Financial Instruments: | | | |
| Forward Foreign Currency Exchange Contracts | (29) | | (29) |
| Total Liabilities | (29) | | (29) |
| Total Investments | $6,179 | | $6,179 |
There were no securities valued using quoted prices (Level 1) or significant unobservable inputs (Level 3) at May 31, 2024.
There were no transfers into or out of Level 3 related to securities held at May 31, 2024.
The following is a reconciliation of assets of the Fund for Level 3 investments for which significant unobservable inputs were used to determine fair value.
| | Total | | Foreign
Government
Securities |
| Investments in Securities | | | |
| Balance as of May 31, 2023: | $ 78 | | $ 78 |
| Net realized gain (loss) | (371) | | (371) |
| Net change in unrealized appreciation (depreciation) | 1,640 | | 1,640 |
| Sales(a) | (1,347) | | (1,347) |
| Balance as of May 31, 2024 | $ — | | $ — |
(a) Includes paydowns on securities.
See Notes to Financial Statements
VIRTUS OPPORTUNITIES TRUST
STATEMENTS OF ASSETS AND LIABILITIES
May 31, 2024
(Reported in thousands except shares and per share amounts)
| | Stone Harbor Emerging Markets Bond Fund | | Stone Harbor Emerging Markets Debt Income Fund | | Stone Harbor Local Markets Fund |
| Assets | | | | | |
Investment in securities at value(1)
| $6,742 | | $243,077 | | $6,181 |
Investment in affiliates at value(2)
| — | | 5,012 | | — |
Foreign currency at value(3)
| — | | — | | 72 |
Cash
| 128 | | 5,880 | | 189 |
Unrealized appreciation on forward foreign currency exchange contracts
| — | | 19 | | 27 |
| Receivables | | | | | |
Investment securities sold
| — | | 123 | | 1,081 |
Fund shares sold
| — | | 2,511 | | — |
Dividends and interest
| 98 | | 3,689 | | 167 |
Receivable from adviser
| 4 | | — | | 1 |
Tax reclaims
| —(a) | | 9 | | 14 |
Prepaid Trustees’ retainer
| —(a) | | 6 | | —(a) |
Prepaid expenses
| 5 | | 18 | | 17 |
Other assets
| 1 | | 36 | | 83 |
Total assets
| 6,978 | | 260,380 | | 7,832 |
| Liabilities | | | | | |
Due to custodian
| — | | —(a) | | — |
Due to broker
| — | | 300 | | — |
Unrealized depreciation on forward foreign currency exchange contracts
| — | | 191 | | 29 |
| Payables | | | | | |
Fund shares repurchased
| — | | 8 | | — |
Investment securities purchased
| 62 | | 2,540 | | 424 |
Investment advisory fees
| — | | 68 | | — |
Distribution and service fees
| —(a) | | —(a) | | —(a) |
Administration and accounting fees
| 1 | | 23 | | 1 |
Transfer agent and sub-transfer agent fees and expenses
| —(a) | | 18 | | 1 |
Professional fees
| 31 | | 36 | | 37 |
Trustee deferred compensation plan
| 1 | | 36 | | 1 |
Interest expense and/or commitment fees
| —(a) | | 2 | | —(a) |
Other accrued expenses
| 6 | | 34 | | — |
Total liabilities
| 101 | | 3,256 | | 493 |
Net Assets
| $6,877 | | $257,124 | | $7,339 |
| Net Assets Consist of: | | | | | |
Capital paid in on shares of beneficial interest
| $11,872 | | $766,862 | | $204,831 |
Accumulated earnings (loss)
| (4,995) | | (509,738) | | (197,492) |
Net Assets
| $6,877 | | $257,124 | | $7,339 |
| Net Assets: | | | | | |
Class A
| $149 | | $93 | | $104 |
Class I
| $6,728 | | $257,031 | | $7,235 |
| Shares Outstanding (unlimited number of shares authorized, no par value): | | | | | |
Class A
| 18,953 | | 12,805 | | 12,970 |
Class I
| 854,789 | | 35,477,149 | | 893,084 |
| Net Asset Value and Redemption Price Per Share:* | | | | | |
Class A
| $7.85 | | $7.29 | | $8.05 |
Class I
| $7.87 | | $7.24 | | $8.10 |
See Notes to Financial Statements
VIRTUS OPPORTUNITIES TRUST
STATEMENTS OF ASSETS AND LIABILITIES (Continued)
May 31, 2024
(Reported in thousands except shares and per share amounts)
| | Stone Harbor Emerging Markets Bond Fund | | Stone Harbor Emerging Markets Debt Income Fund | | Stone Harbor Local Markets Fund |
| Maximum Offering Price Per Share (NAV/(1-Maximum Sales Charge)): | | | | | |
Class A
| $8.16 | | $7.57 | | $8.36 |
Maximum Sales Charge - Class A
| 3.75% | | 3.75% | | 3.75% |
(1) Investment in securities at cost
| $6,743 | | $253,175 | | $6,284 |
(2) Investment in affiliates at cost
| $— | | $5,053 | | $— |
(3) Foreign currency at cost
| $— | | $— | | $73 |
| (a) | Amount is less than $500 (not in thousands). |
| * | Net Asset Value and Redemption Price Per Share are calculated using unrounded net assets. |
See Notes to Financial Statements
VIRTUS OPPORTUNITIES TRUST
STATEMENTS OF OPERATIONS YEAR ENDED
May 31, 2024
($ reported in thousands)
| | Stone Harbor Emerging Markets Bond Fund | | Stone Harbor Emerging Markets Debt Income Fund | | Stone Harbor Local Markets Fund |
| Investment Income | | | | | |
Dividends
| $14 | | $328 | | $22 |
Dividends from affiliates
| — | | 333 | | — |
Interest
| 594 | | 24,247 | | 956 |
Foreign taxes withheld
| (2) | | (11) | | (11) |
Total investment income
| 606 | | 24,897 | | 967 |
| Expenses | | | | | |
Investment advisory fees
| 73 | | 1,959 | | 101 |
Distribution and service fees, Class A
| —(a) | | —(a) | | —(a) |
Administration and accounting fees
| 17 | | 340 | | 21 |
Transfer agent fees and expenses
| 4 | | 145 | | 7 |
Sub-transfer agent fees and expenses, Class A
| —(a) | | —(a) | | — |
Sub-transfer agent fees and expenses, Class I
| —(a) | | 186 | | 2 |
Custodian fees
| 6 | | 14 | | 4 |
Printing fees and expenses
| 4 | | 30 | | 5 |
Professional fees
| 36 | | 71 | | 45 |
Interest expense and/or commitment fees
| —(a) | | 12 | | —(a) |
Registration fees
| 22 | | 35 | | 25 |
Trustees’ fees and expenses
| 1 | | 31 | | 1 |
Miscellaneous expenses
| 20 | | 50 | | 12 |
Total expenses
| 183 | | 2,873 | | 223 |
Less net expenses reimbursed and/or waived by investment adviser(1)
| (97) | | (508) | | (88) |
Net expenses
| 86 | | 2,365 | | 135 |
Net investment income (loss)
| 520 | | 22,532 | | 832 |
| Net Realized and Unrealized Gain (Loss) on Investments | | | | | |
| Net realized gain (loss) from: | | | | | |
Investments
| (180) | | (46,959) | | (96) |
Investments in affiliates
| — | | 23 | | — |
Foreign currency transactions
| — | | (312) | | (482) |
Foreign capital gains tax
| — | | — | | (1) |
Forward foreign currency exchange contracts
| — | | 930 | | (254) |
Swaps
| — | | 874 | | — |
Redemption In kind
| (86) | | (622) | | — |
| Net change in unrealized appreciation (depreciation) on: | | | | | |
Investments
| 706 | | 76,267 | | 1,974 |
Investments in affiliates
| — | | 444 | | — |
Foreign currency transactions
| — | | 8 | | (1,264) |
Forward foreign currency exchange contracts
| — | | (1,123) | | 57 |
Swaps
| — | | (370) | | — |
Net realized and unrealized gain (loss) on investments
| 440 | | 29,160 | | (66) |
Net increase (decrease) in net assets resulting from operations
| $960 | | $51,692 | | $766 |
| (a) | Amount is less than $500 (not in thousands). |
| (1) | See Note 4D in Notes to Financial Statements. |
See Notes to Financial Statements
VIRTUS OPPORTUNITIES TRUST
STATEMENTS OF CHANGES IN NET ASSETS
($ reported in thousands)
| | Stone Harbor Emerging Markets Bond Fund | | Stone Harbor Emerging Markets Debt Income Fund |
| | Year Ended
May 31,
2024 | | Year Ended
May 31,
2023 | | Year Ended
May 31,
2024 | | Year Ended
May 31,
2023 |
| Increase (Decrease) in Net Assets Resulting from Operations | | | | | | | |
Net investment income (loss)
| $520 | | $409 | | $22,532 | | $36,334 |
Net realized gain (loss)
| (266) | | (282) | | (46,066) | | (157,005) |
Net change in unrealized appreciation (depreciation)
| 706 | | (59) | | 75,226 | | 98,722 |
Increase (decrease) in net assets resulting from operations
| 960 | | 68 | | 51,692 | | (21,949) |
| Dividends and Distributions to Shareholders | | | | | | | |
| Net Investment Income and Net Realized Gains: | | | | | | | |
Class A
| (8) | | (4) | | (9) | | (7) |
Class I
| (620) | | (312) | | (37,141) | | (40,443) |
Total dividends and distributions to shareholders
| (628) | | (316) | | (37,150) | | (40,450) |
| Change in Net Assets from Capital Transactions (See Note 6): | | | | | | | |
Class A
| 50 | | 3 | | —(a) | | 2 |
Class I
| (1,307) | | 989 | | (171,943) | | (254,202) |
Increase (decrease) in net assets from capital transactions
| (1,257) | | 992 | | (171,943) | | (254,200) |
Net increase (decrease) in net assets
| (925) | | 744 | | (157,401) | | (316,599) |
| Net Assets | | | | | | | |
Beginning of period
| 7,802 | | 7,058 | | 414,525 | | 731,124 |
End of Period
| $6,877 | | $7,802 | | $257,124 | | $414,525 |
| (a) | Amount is less than $500 (not in thousands). |
See Notes to Financial Statements
VIRTUS OPPORTUNITIES TRUST
STATEMENTS OF CHANGES IN NET ASSETS (Continued)
($ reported in thousands)
| | Stone Harbor Local Markets Fund |
| | Year Ended
May 31,
2024 | | Year Ended
May 31,
2023 |
| Increase (Decrease) in Net Assets Resulting from Operations | | | |
Net investment income (loss)
| $832 | | $1,942 |
Net realized gain (loss)
| (833) | | (22,033) |
Net change in unrealized appreciation (depreciation)
| 767 | | 16,573 |
Increase (decrease) in net assets resulting from operations
| 766 | | (3,518) |
| Change in Net Assets from Capital Transactions (See Note 6): | | | |
Class I
| (8,866) | | (58,145) |
Increase (decrease) in net assets from capital transactions
| (8,866) | | (58,145) |
Net increase (decrease) in net assets
| (8,100) | | (61,663) |
| Net Assets | | | |
Beginning of period
| 15,439 | | 77,102 |
End of Period
| $7,339 | | $15,439 |
See Notes to Financial Statements
VIRTUS OPPORTUNITIES TRUST
FINANCIAL HIGHLIGHTS
SELECTED PER SHARE DATA AND RATIOS FOR A SHARE OUTSTANDING
THROUGHOUT EACH PERIOD
| | | Net Asset Value,
Beginning of Period | Net Investment Income (Loss)(1) | Net Realized
and Unrealized Gain (Loss) | Total from Investment Operations | Dividends from
Net Investment Income | Total Distributions | Change in Net Asset Value | Net Asset Value, End of Period | Total Return(2)(3) | Net Assets, End of Period
(in thousands) | Ratio of Net Expenses to
Average Net Assets(4)(5) | Ratio of Gross Expenses to
Average Net Assets(4)(5) | Ratio of Net Investment Income (Loss)
to Average Net Assets(4) | Portfolio Turnover Rate(2) |
| | | | | | | | | | | | | | | | |
| Stone Harbor Emerging Markets Bond Fund | | | | | | | | | | | | | | | |
| Class A | | | | | | | | | | | | | | | |
| 6/1/23 to 5/31/24 | | $7.61 | 0.45 | 0.35 | 0.80 | (0.56) | (0.56) | 0.24 | $7.85 | 10.93 % | $149 | 1.25 % | 2.40 % | 5.79 % | 69 % |
| 6/1/22 to 5/31/23 | | 7.89 | 0.41 | (0.36) | 0.05 | (0.33) | (0.33) | (0.28) | 7.61 | 0.71 | 96 | 1.25 (6) | 2.25 | 5.49 | 31 |
| 4/11/22(7) to 5/31/22 | | 8.16 | 0.05 | (0.22) | (0.17) | (0.10) | (0.10) | (0.27) | 7.89 | (2.10) | 97 | 1.27 (8) | 3.15 | 4.50 | 14 (9) |
| Class I | | | | | | | | | | | | | | | |
| 6/1/23 to 5/31/24 | | $7.63 | 0.46 | 0.36 | 0.82 | (0.58) | (0.58) | 0.24 | $7.87 | 11.17 % | $6,728 | 1.00 % | 2.13 % | 6.01 % | 69 % |
| 6/1/22 to 5/31/23 | | 7.91 | 0.43 | (0.37) | 0.06 | (0.34) | (0.34) | (0.28) | 7.63 | 0.91 | 7,706 | 1.00 (6) | 2.21 | 5.75 | 31 |
| 6/1/21 to 5/31/22 | | 9.25 | 0.40 | (1.33) | (0.93) | (0.41) | (0.41) | (1.34) | 7.91 | (10.40) | 6,961 | 1.02 (8) | 3.21 | 4.49 | 14 |
| 6/1/20 to 5/31/21 | | 8.17 | 0.45 | 1.10 | 1.55 | (0.47) | (0.47) | 1.08 | 9.25 | 19.25 | 6,694 | 1.01 (10) | 3.46 | 4.99 | 55 |
| 6/1/19 to 5/31/20 | | 8.82 | 0.42 | (0.64) | (0.22) | (0.43) | (0.43) | (0.65) | 8.17 | (2.71) | 5,666 | 1.01 (10) | 1.95 | 4.68 | 168 |
| | | | | | | | | | | | | | | | |
| Stone Harbor Emerging Markets Debt Income Fund | | | | | | | | | | | | | | | |
| Class A | | | | | | | | | | | | | | | |
| 6/1/23 to 5/31/24 | | $6.90 | 0.46 | 0.61 | 1.07 | (0.68) | (0.68) | 0.39 | $7.29 | 16.31 % | $93 | 1.00 % | 1.10 % | 6.57 % | 123 % |
| 6/1/22 to 5/31/23 | | 7.63 | 0.49 | (0.65) | (0.16) | (0.57) | (0.57) | (0.73) | 6.90 | (1.96) | 88 | 1.01 (6) | 1.10 | 7.04 | 131 |
| 4/11/22(7) to 5/31/22 | | 8.06 | 0.06 | (0.38) | (0.32) | (0.11) | (0.11) | (0.43) | 7.63 | (3.93) | 95 | 1.02 (10) | 1.10 | 6.09 | 104 (9) |
| Class I | | | | | | | | | | | | | | | |
| 6/1/23 to 5/31/24 | | $6.91 | 0.48 | 0.60 | 1.08 | (0.75) | (0.75) | 0.33 | $7.24 | 16.57 % | $257,031 | 0.72 % | 0.88 % | 6.90 % | 123 % |
| 6/1/22 to 5/31/23 | | 7.63 | 0.51 | (0.65) | (0.14) | (0.58) | (0.58) | (0.72) | 6.91 | (1.64) | 414,437 | 0.73 (6) | 0.82 | 7.27 | 131 |
| 6/1/21 to 5/31/22 | | 9.82 | 0.46 | (2.18) | (1.72) | (0.47) | (0.47) | (2.19) | 7.63 | (18.08) | 731,029 | 0.74 (10) | 0.75 | 4.96 | 104 |
| 6/1/20 to 5/31/21 | | 8.92 | 0.51 | 0.85 | 1.36 | (0.46) | (0.46) | 0.90 | 9.82 | 15.31 | 1,396,895 | 0.73 (10) | 0.73 | 5.18 | 106 |
| 6/1/19 to 5/31/20 | | 9.73 | 0.47 | (0.74) | (0.27) | (0.54) | (0.54) | (0.81) | 8.92 | (3.02) | 1,094,713 | 0.72 (10) | 0.72 | 4.89 | 118 |
| | | | | | | | | | | | | | | | |
| Stone Harbor Local Markets Fund | | | | | | | | | | | | | | | |
| Class A | | | | | | | | | | | | | | | |
| 6/1/23 to 5/31/24 | | $7.69 | 0.47 | (0.11) | 0.36 | — | — | 0.36 | $8.05 | 4.68 % | $104 | 1.25 % | 1.90 % | 5.92 % | 133 % |
| 6/1/22 to 5/31/23 | | 7.51 | 0.47 | (0.29) | 0.18 | — | — | 0.18 | 7.69 | 2.40 | 100 | 1.19 (6)(10) | 1.26 | 6.35 | 112 |
| 4/11/22(7) to 5/31/22 | | 7.71 | 0.05 | (0.25) | (0.20) | — | — | (0.20) | 7.51 | (2.59) | 97 | 1.27 (10) | 1.53 | 5.24 | 67 (9) |
| Class I | | | | | | | | | | | | | | | |
| 6/1/23 to 5/31/24 | | $7.72 | 0.49 | (0.11) | 0.38 | — | — | 0.38 | $8.10 | 4.92 % | $7,235 | 1.00 % | 1.65 % | 6.16 % | 133 % |
| 6/1/22 to 5/31/23 | | 7.51 | 0.47 | (0.26) | 0.21 | — | — | 0.21 | 7.72 | 2.80 | 15,339 | 0.99 (6)(10) | 1.08 | 6.35 | 112 |
| 6/1/21 to 5/31/22 | | 9.03 | 0.41 | (1.93) | (1.52) | — | — | (1.52) | 7.51 | (16.83) | 77,005 | 1.01 (10) | 1.14 | 4.87 | 67 |
| 6/1/20 to 5/31/21 | | 8.34 | 0.40 | 0.29 | 0.69 | — | — | 0.69 | 9.03 | 8.27 | 160,992 | 1.01 (10) | 1.04 | 4.60 | 95 |
| 6/1/19 to 5/31/20 | | 8.30 | 0.47 | (0.42) | 0.05 | (0.01) | (0.01) | 0.04 | 8.34 | 0.59 | 329,596 | 0.96 (10) | 0.96 | 5.53 | 103 |
The footnote legend is at the end of the financial highlights.
See Notes to Financial Statements
VIRTUS OPPORTUNITIES TRUST
FINANCIAL HIGHLIGHTS (Continued)
SELECTED PER SHARE DATA AND RATIOS FOR A SHARE OUTSTANDING
THROUGHOUT EACH PERIOD
| Footnote Legend: |
| (1) | Calculated using average shares outstanding. |
| (2) | Not annualized for periods less than one year. |
| (3) | Total returns would have been lower had various fees and expenses not been waived and reimbursed during the period. The total returns in the table represent the rate that an investor would have earned (or lost) on an investment in a Fund (assuming reinvestment of all dividends and distributions). |
| (4) | Annualized for periods less than one year. |
| (5) | The Funds will also indirectly bear their prorated share of expenses of any underlying funds in which they invest. Such expenses are not included in the calculation of this ratio. |
| (6) | Net expense ratio includes extraordinary proxy expenses. |
| (7) | Inception date. |
| (8) | Includes borrowing costs of 0.02% to average net assets. |
| (9) | Portfolio turnover is representative of the Fund for the entire period. |
| (10) | Includes borrowing costs of 0.01% to average net assets. |
See Notes to Financial Statements
VIRTUS OPPORTUNITIES TRUST
NOTES TO FINANCIAL STATEMENTS
May 31, 2024
Note 1. Organization
Virtus Opportunities Trust (the “Trust”) is organized as a Delaware statutory trust and is registered under the Investment Company Act of 1940, as amended (the “1940 Act”), as an open-end management investment company.
As of the date of these financial statements, 18 funds of the Trust are offered for sale, of which three (each a “Fund” or collectively, the “Funds”) are reported in these financial statements. Each Fund has a distinct investment objective and is diversified, except Stone Harbor Local Markets Fund which is non-diversified.
All of the Funds offer Class A shares and Class I shares.
Class A shares of the Funds are sold with a front-end sales charge of up to 3.75% with some exceptions. Generally, Class A shares are not subject to any charges by the Funds when redeemed; however, a 0.50% contingent deferred sales charge (“CDSC”) may be imposed on certain redemptions made within a certain period following purchases on which a finder’s fee has been paid. The period for which such CDSC applies for the Funds is 18 months. No front-end sales load is applied to purchases of $1,000,000 or more. The CDSC period begins on the last day of the month preceding the month in which the purchase was made.
Class I Shares are offered primarily to clients of financial intermediaries that (i) charge such clients an ongoing fee for advisory, investment, consulting, or similar services; or (ii) have entered into an agreement with the funds’ distributor to offer Class I Shares through a no-load network or platform. Such clients may include pension and profit sharing plans, other employee benefit trusts, endowments, foundations and corporations. Class I Shares are also offered to private and institutional clients of, or referred by, the adviser, a subadviser or their affiliates, and to Trustees of the funds and trustees/directors of affiliated open- and closed-end funds, and directors, officers and employees of Virtus and its affiliates. If you are eligible to purchase and do purchase Class I Shares, you will pay no sales charge at any time. There are no distribution and service fees applicable to Class I Shares. Class I shares are sold without a front-end sales charge or CDSC.
The Funds may impose an annual fee on accounts having balances of less than $2,500. The small account fee may be waived in certain circumstances, as disclosed in the prospectuses and/or statement of additional information. The fees collected will be used to offset certain expenses of the Funds. These fees are reflected as “Less low balance account fees” in each Fund’s Statement of Operations for the period, as applicable.
Each class of shares has identical voting, dividend, liquidation and other rights and the same terms and conditions, except that each class bears any expenses attributable specifically to that class (“class-specific expenses”) and has exclusive voting rights with respect to any Rule 12b-1 and/or shareholder service plan (“12b-1 Plan”) approved by the Board. Class I shares are not subject to a 12b-1 Plan. Class-specific expenses may include shareholder servicing fees, sub-transfer agency fees, and fees under a 12b-1 Plan, as well as certain other expenses as designated by the Funds’ Treasurer and approved by the Board. Investment income, common operating expenses and realized and unrealized gains and losses of each Fund are borne pro-rata by the holders of each class of shares.
Note 2. Significant Accounting Policies
The Funds are investment companies that follow the accounting and reporting guidance of the Financial Accounting Standards Board (“FASB”) Accounting Standards Codification Topic 946 Financial Services – Investment Companies. The following is a summary of significant accounting policies consistently followed by the Funds in the preparation of their financial statements and for derivatives, included in Note 3 below. The preparation of financial statements in conformity with U.S. generally accepted accounting principles (“U.S. GAAP”) requires management to make estimates and assumptions that affect the reported amounts of assets and liabilities, disclosure of contingent assets and liabilities at the date of the financial statements, and the reported amounts of increases and decreases in net assets from operations during the reporting period. Actual results could differ from those estimates and those differences could be significant.
| A. | Security Valuation |
| | The Fund’s Board of Trustees has designated the investment adviser as the valuation designee to perform fair valuations pursuant to Rule 2a-5 under the Investment Company Act of 1940. Each Fund utilizes a fair value hierarchy which prioritizes the inputs to valuation techniques used to measure fair value into three broad levels. The Funds’ policy is to recognize transfers into or out of Level 3 at the end of the reporting period. |
| | |
• Level 1 – quoted prices in active markets for identical securities (security types generally include listed equities).
• Level 2 – prices determined using other significant observable inputs (including quoted prices for similar securities, interest rates, prepayment speeds, credit risk, etc.).
• Level 3 – prices determined using significant unobservable inputs (including the investment adviser’s Valuation Committee’s own assumptions in determining the fair value of investments).
A description of the valuation techniques applied to a Fund’s major categories of assets and liabilities measured at fair value on a recurring basis is as follows:
Equity securities are valued at the official closing price (typically last sale) on the exchange on which the securities are primarily traded or, if no closing price is available, at the last bid price and are categorized as Level 1 in the hierarchy. Illiquid, restricted equity securities and illiquid private placements are internally fair valued by the investment adviser’s Valuation Committee, and are generally categorized as Level 3 in the hierarchy.
Certain non-U.S. securities may be fair valued in cases where closing prices are not readily available or are deemed not reflective of readily available market prices. For example, significant events (such as movement in the U.S. securities market, or other regional and local developments) may occur between the time that non-U.S. markets close (where the security is principally traded) and the time that a Fund calculates its net asset
VIRTUS OPPORTUNITIES TRUST
NOTES TO FINANCIAL STATEMENTS (Continued)
May 31, 2024
value (“NAV”) at the close of regular trading on the New York Stock Exchange (“NYSE”) (generally 4 p.m. Eastern time) that may impact the value of securities traded in these non-U.S. markets. In such cases, the Funds fair value non-U.S. securities using an independent pricing service which considers the correlation of the trading patterns of the non-U.S. security to the intraday trading in the U.S. markets for investments such as ADRs, financial futures, ETFs, and certain indexes, as well as prices for similar securities. Such fair valuations are categorized as Level 2 in the hierarchy. Because the frequency of significant events is not predictable, fair valuation of certain non-U.S. common stocks may occur on a frequent basis.
Debt instruments, including convertible bonds, and restricted securities, are valued based on evaluated quotations received from independent pricing services or from dealers who make markets in such securities. For most bond types, the pricing service utilizes matrix pricing that considers one or more of the following factors: yield or price of bonds of comparable quality, coupon, maturity, current cash flows, type, activity of the underlying equities, and current day trade information, as well as dealer supplied prices. These valuations are generally categorized as Level 2 in the hierarchy. Structured debt instruments, such as mortgage-backed and asset-backed securities may also incorporate collateral analysis and utilize cash flow models for valuation and are generally categorized as Level 2 in the hierarchy. Pricing services do not provide pricing for all securities and therefore indicative bids from dealers are utilized which are based on pricing models used by market makers in the security and are generally categorized as Level 2 in the hierarchy. Debt instruments that are internally fair valued by the adviser’s Valuation Committee are generally categorized as Level 3 in the hierarchy.
Listed derivatives, such as options and futures, that are actively traded are valued at the last posted settlement price from the exchange where they are principally traded and are categorized as Level 1 in the hierarchy. Over-the-counter derivative contracts, which include forward currency contracts, swaps, swaptions, options and equity linked instruments, are valued based on model prices provided by independent pricing services or from dealer quotes. Depending on the derivative type and the specific terms of the transaction, these models vary and include observable inputs in
actively quoted markets including but not limited to: underlying reference entity details, indices, spreads, interest rates, yield curves, dividend and
exchange rates. These instruments are generally categorized as Level 2 in the hierarchy. Centrally cleared swaps listed or traded on a bilateral or
trade facility platform, such as a registered exchange, are valued at the last posted settlement price determined by the respective exchange. These
securities are generally categorized as Level 2 within the hierarchy.
Investments in open-end mutual funds are valued at NAV. Investments in closed-end funds and ETFs are valued as of the close of regular trading on the NYSE each business day. Each is categorized as Level 1 in the hierarchy.
A summary of the inputs used to value a Fund’s net assets by each major security type is disclosed at the end of the Schedule of Investments for each Fund. The inputs or methodologies used for valuing securities are not necessarily an indication of the risk associated with investing in those securities.
| B. | Security Transactions and Investment Income |
| | Security transactions are recorded on the trade date. Realized gains and losses from the sale of securities are determined on the identified cost basis. Dividend income and capital gain distributions are recognized on the ex-dividend date or, in the case of certain foreign securities, as soon as a Fund is notified. Interest income is recorded on the accrual basis. Each Fund amortizes premiums and accretes discounts using the effective interest method. Premiums on callable debt instruments are amortized to interest income to the earliest call date using the effective interest method. Any distributions from underlying funds are recorded in accordance with the character of the distributions as designated by the underlying funds. |
| | Dividend income from REITs is recorded using management’s estimate of the percentage of income included in distributions received from such investments based on historical information and other industry sources. The return of capital portion of the estimate is a reduction to investment income and a reduction in the cost basis of each investment which increases net realized gain (loss) and net change in unrealized appreciation (depreciation). If the return of capital distributions exceed their cost basis, the distributions are treated as realized gains. The actual amounts of income, return of capital, and capital gains are only determined by each REIT after its fiscal year-end, and may differ from the estimated amounts. |
| C. | Income Taxes |
| | Each Fund is treated as a separate taxable entity. It is the intention of each Fund to comply with the requirements of Subchapter M of the Internal Revenue Code of 1986, as amended (the “Code”) and to distribute substantially all of its taxable income to its shareholders. Therefore, no provision for federal income taxes or excise taxes has been made. |
| | Certain Funds may be subject to foreign taxes on income, gains on investments or currency repatriation, a portion of which may be recoverable. Each Fund will accrue such taxes and recoveries as applicable based upon current interpretations of the tax rules and regulations that exist in the markets in which it invests. |
| | Management of the Funds has concluded that there are no significant uncertain tax positions that would require recognition in the financial statements. Each Fund’s U.S. federal income tax return is generally subject to examination by the Internal Revenue Service for a period of three years after it is filed. State, local and/or non-U.S. tax returns and/or other filings may be subject to examination for different periods, depending upon the tax rules of each applicable jurisdiction. |
| D. | Distributions to Shareholders |
| | Distributions are recorded by each Fund on the ex-dividend date. Income and capital gain distributions are determined in accordance with income tax regulations which may differ from U.S. GAAP. |
| E. | Expenses |
| | Expenses incurred together by a Fund and other affiliated mutual funds are allocated in proportion to the net assets of each such fund, except where allocation of direct expenses to each Fund and each such other fund, or an alternative allocation method, can be more appropriately used. |
VIRTUS OPPORTUNITIES TRUST
NOTES TO FINANCIAL STATEMENTS (Continued)
May 31, 2024
| | In addition to the net annual operating expenses that a Fund bears directly, the shareholders of a Fund indirectly bear the pro-rata expenses of any underlying mutual funds in which the Fund invests. |
| F. | Convertible Securities |
| | Certain Funds may invest a portion of their assets in convertible securities. Although convertible securities derive part of their value from that of the securities into which they are convertible, they are not considered derivative financial instruments. However, certain of the Funds’ investments in convertible securities include features which render them sensitive to price changes in their underlying securities. The value of structured/synthetic convertible securities can be affected by interest rate changes and credit risks of the issuer. Such securities may be structured in ways that limit their potential for capital appreciation, and the entire value of the security may be at risk of loss depending on the performance of the underlying equity security. Consequently, the Funds are exposed to greater downside risk than traditional convertible securities, but typically still less than that of the underlying stock. |
| G. | Foreign Currency Transactions |
| | Non-U.S. investment securities and other assets and liabilities denominated in foreign currencies are translated into U.S. dollar amounts at the foreign currency exchange rate effective at the end of the reporting period. Cost of investments is translated at the currency exchange rate effective at the trade date. The gain or loss resulting from a change in currency exchange rates between the trade and settlement date of a portfolio transaction is treated as a gain or loss on foreign currency. Likewise, the gain or loss resulting from a change in currency exchange rates between the date income is accrued and the date it is paid is treated as a gain or loss on foreign currency. For fixed income instruments, the Funds bifurcate that portion of the results of operations arising from changes in foreign exchange rates on investments from the fluctuations arising from changes in the market prices of securities held and such fluctuations are included with the net realized and unrealized gain or loss on foreign currency transactions. For equity securities, the Funds do not isolate that portion of the results of operations arising from changes in foreign exchange rates on investments from the fluctuations arising from changes in the market prices of securities held and such fluctuations are included with the net realized and unrealized gain or loss on investments. |
| H. | Payment-In-Kind Securities |
| | Certain Funds may invest in payment-in-kind securities, which are debt or preferred stock securities that require or permit payment of interest in the form of additional securities. Payment-in-kind securities allow the issuer to avoid or delay the need to generate cash to meet current interest payments and, as a result, may involve greater risk than securities that pay interest currently or in cash. |
| I. | Inflation-Indexed Bonds |
| | Certain Funds may invest in inflation-indexed bonds. Inflation-indexed bonds are fixed-income securities whose principal value is periodically adjusted to the rate of inflation. The interest rate on these bonds is generally fixed at issuance at a rate lower than typical bonds. Over the life of an inflation-indexed bond, however, interest will be paid based on a principal value which is adjusted for inflation. Any increase or decrease in the principal amount of an inflation-indexed bond will be included as interest income on the Statements of Operations, even though investors do not receive their principal until maturity. |
| J. | When-Issued Purchases and Forward Commitments (Delayed Delivery) |
| | Certain Funds may engage in when-issued or forward commitment transactions. Securities purchased on a when-issued or forward commitment basis are also known as delayed delivery transactions. Delayed delivery transactions involve a commitment by a Fund to purchase or sell a security at a future date (ordinarily up to 90 days later). When-issued or forward commitments enable the Funds to lock in what is believed to be an attractive price or yield on a particular security for a period of time, regardless of future changes in interest rates. Each Fund records when-issued and forward commitment securities on the trade date. Each Fund maintains collateral for the securities purchased. Securities purchased on a when-issued or forward commitment basis begin earning interest on the settlement date. |
| K. | Leveraged Loans |
| | Certain Funds may invest in direct debt instruments which are interests in amounts owed by a corporate, governmental, or other borrower to lenders or lending syndicates. Leveraged loans are generally non-investment grade and often involve borrowers that are highly leveraged. The Funds may invest in obligations of borrowers who are in bankruptcy proceedings. Leveraged loans are typically senior in the corporate capital structure of the borrower. A loan is often administered by a bank or other financial institution (the “lender”) that acts as agent for all holders. The agent administers the terms of the loan, as specified in the leveraged loan. A Fund’s investments in loans may be in the form of participations in loans or assignments of all or a portion of loans from third parties. When investing in loan participations, a Fund has the right to receive payments of principal, interest and any fees to which it is entitled only from the lender selling the loan participation and only upon receipt by the lender of payments from the borrower. A Fund generally has no right to enforce compliance with the terms of the leveraged loan with the borrower. As a result, a Fund may be subject to the credit risk of both the borrower and the lender that is selling the leveraged loan. When a Fund purchases assignments from lenders it acquires direct rights against the borrower on the loan. |
| | A Fund may invest in multiple series or tranches of a loan, which may have varying terms and carry different associated risks. Leveraged loans may involve foreign borrowers and investments may be denominated in foreign currencies. Direct indebtedness of emerging countries involves a risk that the government entities responsible for the repayment of the debt may be unable, or unwilling, to pay the principal and interest when due. |
| | The leveraged loans have floating rate loan interests which generally pay interest at rates that are periodically determined by reference to a base lending rate plus a premium. The base lending rates are generally LIBOR, SOFR, the prime rate offered by one or more U.S. banks or the certificate of deposit rate. When a leveraged loan is purchased a Fund may pay an assignment fee. On an ongoing basis, a Fund may receive a commitment |
VIRTUS OPPORTUNITIES TRUST
NOTES TO FINANCIAL STATEMENTS (Continued)
May 31, 2024
| | fee based on the undrawn portion of the underlying line of credit portion of a leveraged loan. Prepayment penalty fees are received upon the prepayment of a leveraged loan by a borrower. Prepayment penalty, facility, commitment, consent and amendment fees are recorded to income as earned or paid. |
| | A Fund may invest in both secured loans and “covenant lite” loans which have few or no financial maintenance covenants that would require a borrower to maintain certain financial metrics. The lack of financial maintenance covenants in covenant lite loans increases the risk that the applicable Fund will experience difficulty or delays in enforcing its rights on its holdings of such loans, which may result in losses, especially during a downturn in the credit cycle. |
| L. | Credit Linked Notes |
| | The Funds may invest in credit linked notes to obtain economic exposure to high yield, emerging markets or other securities. Investments in a credit linked note typically provide the holder with a return based on the return of an underlying reference instrument, such as an emerging market bond. Like an investment in a bond, investments in credit-linked securities represent the right to receive periodic income payments (in the form of distributions) and payment of principal at the end of the term of the security. In addition to the risks associated with the underlying reference instrument, an investment in a credit linked note is also subject to liquidity risk, market risk, interest rate risk and the risk that the counterparty will be unwilling or unable to meet its obligations under the note. |
Note 3. Derivative Financial Instruments and Transactions
($ reported in thousands)
Disclosures about derivative instruments and hedging activities are intended to enable investors to understand how and why a Fund uses derivatives, how derivatives are accounted for, and how derivative instruments affect a Fund’s results of operations and financial position. Summarized below are such disclosures and accounting policies for each specific type of derivative instrument used by certain Funds.
| A. | Forward Foreign Currency Exchange Contracts |
| | A forward foreign currency exchange contract is an agreement between two parties to buy and sell a currency at a set exchange rate on a future date. Forward foreign currency exchange contracts, when used by a Fund, help to manage the overall exposure to the currencies in which some of the investments held by the Fund are denominated. The contract is marked-to-market daily and the change in market value is recorded by the Fund as an unrealized appreciation or depreciation. When the contract is closed, the Fund records a realized gain or loss equal to the difference between the value at the time it was opened and the value at the time it was closed. The use of forward foreign currency exchange contracts involves the risk that the value of the contract changes unfavorably due to movements in the value of the referenced foreign currencies. Non-deliverable forward foreign currency exchange contracts are settled with the counterparty in U.S. dollars without the delivery of foreign currency. Cash deposited is recorded on the Statements of Assets and Liabilities as “Cash pledged as collateral for forward foreign currency contracts.” |
| | During the year ended May 31, 2024, the Stone Harbor Emerging Markets Debt Income Fund and Stone Harbor Local Markets Fund entered into forward foreign currency exchange contracts as an economic hedge against either specific transactions or portfolio instruments or to obtain exposure to, or hedge exposure away from, foreign currencies (foreign currency exchange rate risk). |
| | Forward foreign currency contracts outstanding at period end, if any, are listed after each Fund’s Schedule of Investments. |
| B. | Options Contracts |
| | An options contract provides the purchaser with the right, but not the obligation, to buy (call option) or sell (put option) a financial instrument at an agreed upon price. The Funds may purchase or write both put and call options on portfolio securities. When doing so, the Fund is subject to equity price risk and/or foreign currency risk in the normal course of pursuing its investment objectives. |
| | When a Fund purchases an option, it pays a premium and an amount equal to that premium is recorded as an asset. When a Fund writes an option, it receives a premium and an amount equal to that premium is recorded as a liability. The asset or liability is adjusted daily to reflect the current market value of the option. Holdings of the Fund designated to cover outstanding written options are noted in the Schedules of Investments. Purchased options are reported as an asset within “Investment in securities at value” in the Statements of Assets and Liabilities. Written options are reported as a liability within “Written options at value.” Changes in value of the purchased option are included in “Net change in unrealized appreciation (depreciation) from investments” in the Statements of Operations. Changes in value of written options are included in “Net change in unrealized appreciation (depreciation) from written options” in the Statements of Operations. |
| | If an option expires unexercised, the Fund realizes a gain or loss to the extent of the premium received or paid. If an option is exercised, the premium received or paid is recorded as an adjustment to the proceeds from the sale or the cost basis of the purchase. The difference between the premium and the amount received or paid on effecting a closing purchase or sale transaction is also treated as a realized gain or loss. Gain or loss on purchased options is included in “Net realized gain (loss) on investments” in the Statements of Operations. Gain or loss on written options is presented separately as “Net realized gain (loss) from written options” in the Statements of Operations. |
| | The risk in writing call options is that the Fund gives up the opportunity for profit if the market price/foreign currency rate of the referenced security/currency increases and the option is exercised. The risk in writing put options is that the Fund may incur a loss if the market price/foreign currency rate of the referenced security/currency decreases and the option is exercised. The risk in buying options is that the Fund pays a premium whether or not the option is exercised. The use of such instruments may involve certain additional risks as a result of unanticipated movements in the market. Writers (sellers) of options are subject to unlimited risk of loss, as the seller will be obligated to deliver or take delivery of the security at a predetermined price which may, upon exercise of the option, be significantly different from the then-market value. As the writer of a covered call |
VIRTUS OPPORTUNITIES TRUST
NOTES TO FINANCIAL STATEMENTS (Continued)
May 31, 2024
| | option, the Fund forgoes, during the option’s life, the opportunity to profit from increases in the market value of the security covering the call option above the sum of the premium and the strike price of the call, but retains the risk of loss should the price of the underlying security decline. |
| | During the year ended May 31, 2024, Stone Harbor Emerging Markets Debt Income Fund invested in purchased call and put options contracts in an attempt to manage foreign currency risk and with the purpose of generating realized gains. |
| C. | Swaps |
| | Certain Funds enter into swap agreements, in which the Fund and a counterparty agree either to make periodic net payments on a specified notional amount or a net payment upon termination. Swap agreements are negotiated in the Over-the-Counter (“OTC”) market and may be entered into as a bilateral contract (“OTC swaps”) or centrally cleared (“centrally cleared swaps”). The value of the swap is reflected on the Statements of Assets and Liabilities as “Over-the-counter swaps at value” and as “Variation margin receivable/payable on cleared swaps” for centrally cleared swaps. Swaps are marked-to-market daily and changes in value are recorded as “Net Change in unrealized appreciation (depreciation) on swaps” in the Statement of Operations. |
| | Any upfront premiums paid are recorded as assets and any upfront fees received are recorded as liabilities and are shown under “Over-the-counter swaps at value” in the Statements of Assets and Liabilities and are amortized over the term of the swap for OTC swaps. When a swap is terminated, the Fund records a realized gain or loss equal to the difference between the proceeds from (or cost of) the closing transaction and the Fund’s basis in the contract, if any. Generally, the basis of the contracts is the unamortized premium received or paid. Cash settlements between the Fund and the counterparty are recognized as “Net realized gain (loss) on swaps” in the Statements of Operations. Swap contracts outstanding at period end, if any, are listed after each Fund’s Schedule of Investments. |
| | In a centrally cleared swap, immediately following execution of the swap agreement, the swap agreement is submitted to a central counterparty (the “CCP”) and the Fund’s counterparty on the swap agreement becomes the CCP. The Fund is required to interface with the CCP through a clearing broker. Upon entering into a centrally cleared swap, a Fund is required to deposit initial margin with the clearing broker in the form of cash or securities in an amount that varies depending on the size and risk profile of the particular swap. |
| | Securities deposited as margin are designated on the Schedule of Investments and cash deposited is recorded on the Statements of Assets and Liabilities as “Cash pledged as collateral for swaps.” |
| | Swap transactions involve, to varying degrees, elements of interest rate, credit and market risk in excess of the amounts recognized in the Statements of Assets and Liabilities. Such risks involve the possibility that there will be no liquid market for these agreements, that the counterparty to the agreements may default on its obligation to perform or disagree as to the meaning of the contractual terms in the agreements, and that there may be unfavorable changes in interest rates and/or market values associated with these transactions. |
| | Credit default swaps – A Fund may either buy or sell (write) credit default swaps on single-name issuers (corporate or sovereign), a combination or basket of single-name issuers or traded indexes. Credit default swaps on single-name issuers are agreements in which the buyer pays fixed periodic payments to the seller in consideration for a guarantee from the protection seller to make specific payment should a negative credit event take place with respect to the referenced entity (e.g., bankruptcy, failure to pay, obligation accelerators, repudiation, moratorium or restructuring). Credit default swaps on a combination or basket of single-name issuers are agreements in which the buyer pays fixed periodic payments to the seller in consideration for a guarantee from the protection seller to make specific payment should a negative credit event take place with respect to any of the referenced entities (e.g., bankruptcy, failure to pay, obligation accelerators, repudiation, moratorium or restructuring). Credit default swaps on traded indexes are agreements in which the buyer pays fixed periodic payments to the seller in consideration for a guarantee from the seller to make a specific payment should a write-down, principal or interest shortfall or default of all or individual underlying securities included in the index occurs. As a buyer, if an underlying credit event occurs, the Fund will either receive from the seller an amount equal to the notional amount of the swap and deliver the referenced security or underlying securities comprising the index or receive a net settlement of cash equal to the notional amount of the swap less the recovery value of the security or underlying securities comprising the index. As a seller (writer), if an underlying credit event occurs, the Fund will either pay the buyer an amount equal to the notional amount of the swap and take delivery of the referenced security or underlying securities comprising the index or pay a net settlement of cash equal to the notional amount of the swap less the recovery value of the security or underlying securities comprising the index. The Funds may enter into credit default swaps to manage their exposure to the market or certain sectors of the market, to reduce their risk exposure to defaults of corporate and/or sovereign issuers or to create exposure to corporate and/or sovereign issuers to which they are not otherwise exposed (credit risk). |
| | During the year ended May 31, 2024, Stone Harbor Emerging Markets Debt Income Fund utilized both single name credit default swaps and credit index swaps to gain exposure to short individual securities or to gain exposure to a credit or asset-backed index. |
| | The following is a summary of derivative instruments categorized by primary risk exposure, and location as presented in the Statements of Assets and Liabilities at May 31, 2024: |
VIRTUS OPPORTUNITIES TRUST
NOTES TO FINANCIAL STATEMENTS (Continued)
May 31, 2024
| Statement Line Description | | Primary Risk | Stone Harbor Emerging Markets Debt Income Fund | Stone Harbor Local Markets Fund |
| Asset Derivatives | |
| Unrealized appreciation on forward foreign currency exchange contracts | | Foreign currency contracts | $19 | $27 |
| Purchased options at value(1) | | Foreign currency contracts | 292 | — |
| Total Assets | | | $311 | $27 |
| Liability Derivatives | |
| Unrealized depreciation on forward foreign currency exchange contracts | | Foreign currency contracts | $(191) | $(29) |
| Total Liabilities | | | $(191) | $(29) |
| | |
| (1) | Amount included in Investment in securities at value. |
The following is a summary of derivative instruments categorized by primary risk exposure, and location as presented in the Statements of Operations for the year ended May 31, 2024:
| Statement Line Description | | Primary Risk | Stone Harbor Emerging Markets Debt Income Fund | Stone Harbor Local Markets Fund |
| Net Realized Gain (Loss) from |
| Forward foreign currency exchange contracts | | Foreign currency contracts | $930 | $(254) |
| Swaps | | Credit contracts | 874 | — |
| Total | | | $1,804 | $(254) |
| Net Change in Unrealized Appreciation (Depreciation) on |
| Purchased options(1) | | Foreign currency contracts | $10 | $— |
| Forward foreign currency exchange contracts | | Foreign currency contracts | (1,123) | 57 |
| Swaps | | Credit contracts | (370) | — |
| Total | | | $(1,483) | $57 |
| |
| (1) Amount included in Net change in unrealized appreciation (depreciation) on investments. |
The table below shows the quarterly average volume (unless otherwise specified) of the derivatives held by the applicable Fund for the year ended May 31, 2024:
| | Stone Harbor Emerging Markets Debt Income Fund(1) | | Stone Harbor Local Markets Fund |
Forward Foreign Currency Exchange Purchase Contracts(2)
| $2,822 | | $4,462 |
Forward Foreign Currency Exchange Sale Contracts(2)
| 20,904 | | 4,184 |
Credit Default Swap Contracts - Sell Protection(2)
| 2,400 | | — |
| (1) The purchased options outstanding as of period-end as disclosed in the Schedule of Investments serve as an indicator of the volume for the Fund. |
| (2) Average notional amount. |
| D. | Derivative Risks |
| | A derivative contract may suffer a mark-to-market loss if the value of the contract decreases due to an unfavorable change in the market rates or values of the underlying instrument. Losses can also occur if the counterparty does not perform under the contract. |
| | A Fund’s risk of loss from counterparty credit risk on derivatives bought or sold OTC rather than traded on a securities exchange, is generally limited to the aggregate unrealized gain netted against any collateral held by such Fund. For OTC purchased options, each Fund bears the risk of loss of the amount of the premiums paid plus the positive change in market values net of any collateral held by such Fund should the counterparty fail to perform under the contracts. Options written by a Fund do not typically give rise to counterparty credit risk, as options written generally obligate the Fund, and not the counterparty to perform. |
| | With exchange traded purchased options and futures and centrally cleared swaps generally speaking, there is less counterparty credit risk to the Fund since the exchange or clearinghouse, as counterparty to such instruments, guarantees against a possible default. The clearinghouse stands between the buyer and the seller of the contract; therefore, credit risk is limited to failure of the clearinghouse. While offset rights may exist under |
VIRTUS OPPORTUNITIES TRUST
NOTES TO FINANCIAL STATEMENTS (Continued)
May 31, 2024
| | applicable law, a Fund does not have a contractual right of offset against a clearing broker or clearinghouse in the event of a default (including the bankruptcy or insolvency) of the clearing broker or clearinghouse. Additionally, credit risk exists in exchange traded futures and centrally cleared swaps with respect to initial and variation margin that is held in a clearing broker’s customer accounts. While clearing brokers are required to segregate customer margin from their own assets, in the event that a clearing broker becomes insolvent or goes into bankruptcy and at that time there is a shortfall in the aggregate amount of margin held by the clearing broker for all its clients, typically the shortfall would be allocated on a pro-rata basis across all the clearing broker’s customers, potentially resulting in losses to the Fund. |
| | In order to better define its contractual rights and to secure rights that will help a Fund mitigate its counterparty risk, each Fund may enter into an International Swaps and Derivatives Association, Inc. Master Agreement (“ISDA Master Agreement”) or similar agreement with its derivative contract counterparties. An ISDA Master Agreement is a bilateral agreement between a Fund and a counterparty that governs certain OTC derivatives and typically contains, among other things, collateral posting terms and netting provisions in the event of a default and/or termination event. Under an ISDA Master Agreement, a Fund may, under certain circumstances, offset with the counterparty certain derivative financial instruments’ payables and/or receivables with collateral held and/or posted and create one single net payment. The provisions of the ISDA Master Agreement typically permit a single net payment in the event of default including the bankruptcy or insolvency of the counterparty. However, bankruptcy or insolvency laws of a particular jurisdiction may impose restrictions on or prohibitions against the right of offset in bankruptcy, insolvency or other events. In addition, certain ISDA Master Agreements allow counterparties to OTC derivatives to terminate derivative contracts prior to maturity in the event a Fund’s net assets decline by a stated percentage or the Fund fails to meet the terms of its ISDA Master Agreements, which would cause the Fund to accelerate payment of any net liability owed to the counterparty. |
| E. | Collateral Requirements and Master Netting Agreements (“MNA”) |
| | For derivatives traded under an ISDA Master Agreement, the collateral requirements are typically calculated by netting the mark-to-market amount for each transaction under such agreement and comparing that amount to the value of any collateral currently pledged by the Funds and the counterparty. |
| | Cash collateral that has been pledged to cover obligations of a Fund and cash collateral received from the counterparty, if any, is reported separately on the Statements of Assets and Liabilities as cash pledged as collateral and cash received as collateral, respectively. Non-cash collateral pledged by a Fund, if any, is noted in the Schedules of Investments. Typically, the Funds and counterparties are not permitted to sell, re-pledge or use the collateral they receive. To the extent amounts due to a Fund from its counterparties are not fully collateralized, contractually or otherwise, the Fund bears the risk of loss from counterparty non-performance. The Funds attempt to mitigate counterparty risk by only entering into agreements with counterparties that they believe have the financial resources to honor their obligations and by monitoring the financial stability of those counterparties. |
| | For financial reporting purposes, the Funds do not offset derivative assets and derivative liabilities that are subject to netting arrangements in the Statements of Assets and Liabilities. |
| | The following tables present the Funds’ derivative assets and liabilities by counterparty net of amounts available for offset under a MNA and net of the related collateral received/pledged by the Funds as of May 31, 2024: |
| At May 31, 2024, the Funds’ derivative assets and liabilities (by type) are as follows: | | | | |
| | Stone Harbor Emerging Markets Debt Income Fund | | Stone Harbor Local Markets Fund |
| | Assets | | Liabilities | | Assets | | Liabilities |
Derivative Financial
Instruments: | | | | | | | |
Forward foreign currency
exchange contracts | $19 | | $191 | | $27 | | $29 |
| Purchased options | 292 | | — | | — | | — |
| Total derivative assets and liabilities in the Statements of Assets and Liabilities | $311 | | $191 | | $27 | | $29 |
Derivatives not subject to a MNA
or similar agreement | — | | — | | — | | — |
Total assets and liabilities
subject to a MNA | $311 | | $191 | | $27 | | $29 |
VIRTUS OPPORTUNITIES TRUST
NOTES TO FINANCIAL STATEMENTS (Continued)
May 31, 2024
| Stone Harbor Emerging Markets Debt Income Fund |
| Counterparty | | Gross Derivative
Assets
Subject to
a MNA by
Counterparty | | Derivatives
Available
for Offset | | Non-cash
Collateral
Received(1) | | Cash
Collateral
Received(1) | | Net
Amount of
Derivative
Assets(1) |
Citigroup Global Markets
| | $12 | | $— | | $— | | $— | | $12 |
Goldman Sachs & Co.
| | 292 | | — | | — | | (292) | | — |
JPMorgan Chase Bank N.A.
| | 7 | | (7) | | — | | — | | — |
Total
| | $311 | | $(7) | | $— | | $(292) | | $12 |
| Counterparty | | Gross Derivative
Liabilities
Subject to
a MNA by
Counterparty | | Derivatives
Available
for Offset | | Non-cash
Collateral
Pledged(1) | | Cash
Collateral
Pledged(1) | | Net
Amount of
Derivative
Liabilities(1) |
JPMorgan Chase Bank N.A.
| | $191 | | $(7) | | $— | | $— | | $184 |
Total
| | $191 | | $(7) | | $— | | $— | | $184 |
| Stone Harbor Local Markets Fund |
| Counterparty | | Gross Derivative
Assets
Subject to
a MNA by
Counterparty | | Derivatives
Available
for Offset | | Non-cash
Collateral
Received(1) | | Cash
Collateral
Received(1) | | Net
Amount of
Derivative
Assets(1) |
Citigroup Global Markets
| | $2 | | $(2) | | $— | | $— | | $— |
Goldman Sachs & Co.
| | 10 | | (7) | | — | | — | | 3 |
JPMorgan Chase Bank N.A.
| | 15 | | (14) | | — | | — | | 1 |
Total
| | $27 | | $(23) | | $— | | $— | | $4 |
| Counterparty | | Gross Derivative
Liabilities
Subject to
a MNA by
Counterparty | | Derivatives
Available
for Offset | | Non-cash
Collateral
Pledged(1) | | Cash
Collateral
Pledged(1) | | Net
Amount of
Derivative
Liabilities(1) |
Citigroup Global Markets
| | $8 | | $(2) | | $— | | $— | | $6 |
Goldman Sachs & Co.
| | 7 | | (7) | | — | | — | | — |
JPMorgan Chase Bank N.A.
| | 14 | | (14) | | — | | — | | — |
Total
| | $29 | | $(23) | | $— | | $— | | $6 |
| | |
| (1) | These amounts are limited to the derivatives asset/liability balance and, accordingly, do not include excess collateral received/pledged. |
VIRTUS OPPORTUNITIES TRUST
NOTES TO FINANCIAL STATEMENTS (Continued)
May 31, 2024
Note 4. Investment Advisory Fees and Related Party Transactions
($ reported in thousands)
| A. | Investment Adviser |
| | Virtus Alternative Investment Advisers, Inc. (the “Adviser”), an indirect, wholly-owned subsidiary of Virtus Investment Partners, Inc. (“Virtus”), is the investment adviser to the Funds. The Adviser manages the Funds’ investment programs and general operations of the Funds, including oversight of the Funds’ subadviser. |
| | As compensation for its services to the Funds, the Adviser is entitled to a fee, which is calculated daily and paid monthly based upon the following annual rates as a percentage of the average daily net assets of each Fund: |
| Fund | | Advisory Fee |
Stone Harbor Emerging Markets Bond Fund
| | 0.85% |
Stone Harbor Emerging Markets Debt Income Fund
| | 0.60 |
Stone Harbor Local Markets Fund
| | 0.75 |
During the year ended May 31, 2024, the Stone Harbor Emerging Markets Debt Income Fund invested a portion of its assets in Stone Harbor Emerging Markets Bond Fund and Stone Harbor Local Markets Fund, each an affiliated mutual fund. In order to avoid any duplication of advisory fees, the Adviser voluntarily waived its advisory fees in an amount equal to that which would otherwise be paid by the Stone Harbor Emerging Markets Debt Income Fund on the assets invested in the Stone Harbor Emerging Markets Bond Fund and Stone Harbor Local Markets Fund. For the year ended May 31, 2024, the waiver amounted to $64 for Stone Harbor Emerging Markets Debt Income Fund. This waiver was in addition to the expense limitation and/or fee waiver covered elsewhere in these financial statements and is included in the Statements of Operations in “Less net expenses reimbursed and/or waived by investment adviser.”
| B. | Subadviser |
| | Stone Harbor Investment Partners (the “Subadviser”), a division of Virtus Fixed Income Advisers LLC (“VFIA”), an indirect, wholly-owned subsidiary of Virtus, is the subadviser to the Funds. The Subadviser manages the investments of the Funds, for which it is paid a fee by the Adviser. |
| C. | Expense Limitations |
| | The Adviser has contractually agreed to limit each Fund’s annual total operating expenses, subject to the exceptions listed below, so that such expenses do not exceed, on an annualized basis, the following respective percentages of average daily net assets through September 30, 2024. Following the contractual period, the Adviser may discontinue these expense limitation arrangements at any time. The waivers and reimbursements are accrued daily and received monthly. |
| Fund | | Class A | | Institutional Class |
Stone Harbor Emerging Markets Bond Fund
| | 1.25% | | 1.00 % |
Stone Harbor Emerging Markets Debt Income Fund
| | 1.00 | | 0.72 |
Stone Harbor Local Markets Fund
| | 1.25 | | 1.00 |
The exclusions include front-end or contingent deferred sales charges, taxes, leverage and borrowing expenses (such as commitment, amendment and renewal expenses on credit or redemption facilities), interest, brokerage commissions, expenses incurred in connection with any merger or reorganization, unusual or infrequently occurring expenses (such as litigation), acquired fund fees and expenses other than those of funds managed by the Funds’ subadviser, and dividend expenses, if any.
| D. | Expense Recapture |
| | Under certain conditions, the Adviser may recapture operating expenses reimbursed or fees waived under these arrangements within three years after the date on which such amounts were incurred or waived. A Fund must pay its ordinary operating expenses before the Adviser is entitled to any reimbursement and must remain in compliance with any applicable expense limitations or, if none, the expense limitation in effect at the time of the waiver or reimbursement. All or a portion of the following Adviser reimbursed expenses may be recaptured by the year ending May 31: |
| | | Expiration | | |
| Fund | | 2025 | | 2026 | | 2027 | | Total |
| Stone Harbor Emerging Markets Bond Fund | | | | | | | | |
Class A
| | $ — (1) | | $ 1 | | $ 1 | | $ 2 |
Class I
| | 150 | | 85 | | 96 | | 331 |
| Stone Harbor Emerging Markets Debt Income Fund | | | | | | | | |
Class A
| | — | | — (1) | | — (1) | | — (1) |
Class I
| | 94 | | 438 | | 444 | | 976 |
VIRTUS OPPORTUNITIES TRUST
NOTES TO FINANCIAL STATEMENTS (Continued)
May 31, 2024
| | | Expiration | | |
| Fund | | 2025 | | 2026 | | 2027 | | Total |
| Stone Harbor Local Markets Fund | | | | | | | | |
Class A
| | $— | | $— (1) | | $1 | | $1 |
Class I
| | 147 | | 59 | | 87 | | 293 |
| (1) | Amount is less than $500 (not in thousands). |
During the year ended May 31, 2024, the Adviser did not recapture any expenses previously waived.
| E. | Distributor |
| | VP Distributors, LLC (“VP Distributors”), an indirect, wholly-owned subsidiary of Virtus, serves as the distributor of each Fund’s shares. VP Distributors has advised the Funds that for the year ended May 31, 2024, it did not retain any net commissions for Class A shares. |
| | In addition, each Fund pays VP Distributors 12b-1 fees under a 12b-1 Plan, at the annual rate of 0.25% of the average daily net assets of such Fund’s Class A shares. Class I shares are not subject to a 12b-1 plan. |
| | Under certain circumstances, shares of certain Virtus Funds may be exchanged for shares of the same class of certain other Virtus Funds on the basis of the relative NAV per share at the time of the exchange. On exchanges with share classes that carry a CDSC, the CDSC schedule of the original shares purchased continues to apply. |
| F. | Administrator and Transfer Agent |
| | Virtus Fund Services, LLC, an indirect, wholly-owned subsidiary of Virtus, serves as the administrator and transfer agent to the Funds. |
| | For the year ended May 31, 2024, the Funds incurred administration fees totaling $330 which are included in the Statements of Operations within the line item “Administration and accounting fees.” The fees are calculated daily and paid monthly. |
| | For the year ended May 31, 2024, the Funds incurred transfer agent fees totaling $148 which are included in the Statements of Operations within the line item “Transfer agent fees and expenses.” The fees are calculated daily and paid monthly. |
| G. | Investments with Affiliates |
| | The Funds are permitted to purchase assets from or sell assets to certain related affiliates under specified conditions outlined in procedures adopted by the Board. The procedures have been designed to ensure that any purchase or sale of assets by the Funds from or to another fund or portfolio that are, or could be, considered an affiliate by virtue of having a common investment adviser (or affiliated investment advisers), common Trustees and/or common officers comply with Rule 17a-7 under the 1940 Act. Further, as defined under the procedures, each transaction is effected at the current market price. During the year ended May 31, 2024, the Funds did not engage in any transactions pursuant to Rule 17a-7 under the 1940 Act. |
| | Outside of Rule 17a-7 transactions, other investments with affiliated issuers are separately reported in this Note. An affiliated issuer includes any company in which the Fund held 5% or more of a company’s outstanding voting shares at any point during the period, as well as other circumstances where an investment adviser or subadviser to the Fund is deemed to exercise, directly or indirectly, a certain level of control over the company. |
| | A summary of the Funds’ total long-term and short-term purchases and sales of the respective shares of the affiliated investments during the year ended May 31, 2024, is as follows: |
| | Value,
beginning
of period | | Purchases(1) | | Sales
proceeds | | Net
realized
gain
(loss)
on
affiliated
securities | | Net
change in
unrealized
appreciation
(depreciation)
on affiliated
securities | | Value,
end of
period | | Shares | | Dividend
income | | Distributions
of realized
gains |
| Stone Harbor Emerging Markets Debt Income Fund |
| Affiliated Mutual Funds—1.9%(2) |
Virtus Stone Harbor Emerging Markets Bond Fund Class I(3)
| $4,478 | | $333 | | $2,435 | | $(411) | | $564 | | $2,529 | | 321,341 | | $333 | | $— |
Virtus Stone Harbor Local Markets Fund Class I(3),(4)
| 6,086 | | — | | 3,917 | | 434 | | (120) | | 2,483 | | 306,586 | | — | | — |
| Total | $10,564 | | $333 | | $6,352 | | $23 | | $444 | | $5,012 | | | | $333 | | $— |
| Footnote Legend: |
| (1) | Includes reinvested dividends from income and capital gain distributions. |
VIRTUS OPPORTUNITIES TRUST
NOTES TO FINANCIAL STATEMENTS (Continued)
May 31, 2024
| (2) | The Stone Harbor Emerging Markets Debt Income Fund does not invest in the underlying funds for the purpose of exercising management or control; however, investments made by the Fund within each of its principal investment strategies may represent a significant portion of an underlying fund’s net assets. At May 31, 2024, the Fund was the owner of record of 37% of the Virtus Stone Harbor Emerging Markets Bond Fund Class I shares and the owner of record of 34% of the Virtus Stone Harbor Local Markets Fund Class I shares. |
| (3) | Shares of this fund are publicly offered, and its prospectus and annual report are publicly available. |
| (4) | Non-income producing. |
| H. | Trustee Deferred Compensation Plan |
| | The Trust provides a deferred compensation plan for its Trustees who receive compensation from the Trust. Under the deferred compensation plan, Trustees may elect to defer all or a portion of their compensation. Amounts deferred are retained by the Trust, and then, to the extent permitted by the 1940 Act, in turn, may be invested in the shares of affiliated or unaffiliated mutual funds selected by the participating Trustees. Investments in such instruments are included in “Other assets” in the Statements of Assets and Liabilities at May 31, 2024. |
| I. | Trustee Fee |
| | For the year ended May 31, 2024, the Funds incurred independent Trustee’s fees totaling $31 which are included in the Statement of Operations within the line item “Trustees fees and expenses”. No remuneration was paid to the officers or affiliated trustee. |
Note 5. Purchases and Sales of Securities
($ reported in thousands)
Purchases and sales of securities (excluding U.S. government and agency securities, forward currency contracts, and short-term securities) during the year ended May 31, 2024, were as follows:
| | Purchases | | Sales |
Stone Harbor Emerging Markets Bond Fund
| $6,148 | | $5,701 |
Stone Harbor Emerging Markets Debt Income Fund
| 389,084 | | 556,840 |
Stone Harbor Local Markets Fund
| 16,226 | | 24,521 |
There were no purchases or sales of long-term U.S. government and agency securities during the year ended May 31, 2024.
Note 6. Capital Share Transactions
(reported in thousands)
Transactions in shares of capital stock, during the years ended as indicated below, were as follows:
| | Stone Harbor Emerging Markets Bond Fund | | Stone Harbor Emerging Markets Debt Income Fund |
| | Year Ended
May 31, 2024 | | Year Ended
May 31, 2023 | | Year Ended
May 31, 2024 | | Year Ended
May 31, 2023 |
| | SHARES | | AMOUNT | | SHARES | | AMOUNT | | SHARES | | AMOUNT | | SHARES | | AMOUNT |
| Class A | | | | | | | | | | | | | | | |
Shares sold and cross class
conversions | 7 | | $52 | | —(1) | | $3 | | — | | $— | | —(1) | | $2 |
| Reinvestment of distributions | —(1) | | 1 | | —(1) | | —(2) | | —(1) | | —(2) | | —(1) | | —(2) |
Shares repurchased and cross
class conversions | (—) (1) | | (3) | | — | | — | | — | | — | | — | | — |
| Net Increase / (Decrease) | 7 | | $50 | | —(1) | | $3 | | —(1) | | $—(2) | | —(1) | | $2 |
| Class I | | | | | | | | | | | | | | | |
Shares sold and cross class
conversions | 382 | | $2,903 | | 89 | | $681 | | 9,242 | | $64,978 | | 16,016 | | $113,172 |
| Reinvestment of distributions | 81 | | 620 | | 41 | | 312 | | 4,411 | | 30,569 | | 4,966 | | 34,660 |
Shares repurchased and cross
class conversions | (619) | | (4,830) | | (—) (1) | | (4) | | (38,110) | | (267,490) | | (56,826) | | (402,034) |
| Net Increase / (Decrease) | (156) | | $(1,307) | | 130 | | $989 | | (24,457) | | $(171,943) | | (35,844) | | $(254,202) |
VIRTUS OPPORTUNITIES TRUST
NOTES TO FINANCIAL STATEMENTS (Continued)
May 31, 2024
| | Stone Harbor Local Markets Fund |
| | Year Ended
May 31, 2024 | | Year Ended
May 31, 2023 |
| | SHARES | | AMOUNT | | SHARES | | AMOUNT |
| Class I | | | | | | | |
Shares sold and cross class
conversions | 30 | | $235 | | 956 | | $6,962 |
Shares repurchased and cross
class conversions | (1,123) | | (9,101) | | (9,220) | | (65,107) |
| Net Increase / (Decrease) | (1,093) | | $(8,866) | | (8,264) | | $(58,145) |
| (1) | Amount is less than 500 shares (not in thousands). |
| (2) | Amount is less than $500 (not in thousands). |
Note 7. Redemptions in-kind
Virtus Stone Harbor Strategic Income Fund was liquidated on January 30, 2024. Virtus Stone Harbor Strategic Income Fund held Class I shares of Virtus Stone Harbor Emerging Markets Bond Fund and Virtus Stone Harbor Emerging Markets Debt Income Fund. On January 23, 2024, the shares of these Funds were liquidated via redemption in-kinds. The value of the redemption in-kind (including cash) was $1,978, with a loss of $86 for Stone Harbor Emerging Markets Bond Fund. The value of the redemption in-kind (including cash) was $9,986, with a loss of $622 for Stone Harbor Emerging Markets Debt Income Fund.
Note 8. 10% Shareholders
As of May 31, 2024, each Fund had individual shareholder account(s) and/or omnibus shareholder account(s) (comprised of a group of individual shareholders), which individually amounted to more than 10% of the total shares outstanding of such Fund as detailed below:
| | % of Shares
Outstanding | | Number of
Accounts |
Stone Harbor Emerging Markets Bond Fund
| 87 % | | 3* |
Stone Harbor Emerging Markets Debt Income Fund
| 64 | | 4 |
Stone Harbor Local Markets Fund
| 72 | | 2* |
| * | Includes affiliated shareholder account(s). |
Note 9. Credit and Market Risk and Asset Concentration
In July 2017, the head of the United Kingdom Financial Conduct Authority (“FCA”) announced the intention to phase out the use of LIBOR by the end of 2021. However, after subsequent announcements by the FCA, the LIBOR administrator and other regulators, certain of the most widely used LIBORs continued until June 30, 2023. The ICE Benchmark Administration Limited, which is regulated and authorized by FCA, and the administrator of LIBOR, ceased publishing certain LIBOR settings on December 31, 2021. On April 3, 2023, the FCA announced its decision to require LIBOR’s administrator to continue to publish the 1-month, 3-month, and 6-month U.S. dollar settings under an unrepresentative synthetic methodology until September 30, 2024. On March 15, 2022, the Adjustable Interest Act (LIBOR) Act (the “LIBOR Act”) was enacted into law which directs the Federal Reserve Board, as a fallback mechanism, to identify benchmark rates based on SOFR that will replace LIBOR in certain financial contracts after June 30, 2023. On December 16, 2022, the Federal Reserve adopted regulations implementing the LIBOR Act. The Fund may be exposed to financial instruments tied to LIBOR to determine payment obligations, financing terms, hedging strategies or investment value. The discontinuation of LIBOR could have a significant impact on the financial markets and may present a material risk for certain market participants, including the Fund. Abandonment of or modifications to LIBOR could lead to significant short- and long-term uncertainty and market instability. The risks associated with this discontinuation and transition may be exacerbated if the work necessary to effect an orderly transition to an alternative reference rate is not completed in a timely manner. It remains uncertain the effects such changes will have on the Fund, issuers of instruments in which the Fund invests, and the financial markets generally.
Local, regional or global events such as war or military conflict, acts of terrorism, the spread of infectious illness or other public health issue, recessions, or other events could have a significant impact on a Fund and its investments, including hampering the ability of each Fund’s portfolio manager(s) to invest each Fund’s assets as intended.
Emerging market countries typically have economic and political systems that are less fully developed, and can be expected to be less stable than those of more developed countries. For example, the economies of such countries can be subject to rapid and unpredictable rates of inflation or deflation. Since these markets are often small, they may be more likely to suffer sharp and frequent price changes or long-term price depression because of adverse publicity, investor perceptions or the actions of a few large investors. They may also have policies that restrict investment by foreigners, or that prevent foreign investors from withdrawing their money at will.
Certain emerging markets may also face other significant internal or external risks, including the risk of war and civil unrest. Each of these factors can affect the value and liquidity of the assets of the Fund. Failure to generate adequate earnings from foreign trade would make it difficult for an emerging
VIRTUS OPPORTUNITIES TRUST
NOTES TO FINANCIAL STATEMENTS (Continued)
May 31, 2024
market country to service foreign debt. Disruptions resulting from social and political factors may cause the securities markets of emerging market countries to close. If this were to occur, the liquidity and value of the Fund’s assets invested in corporate debt obligations of emerging market companies would decline.
The imposition of sanctions, exchange controls (including repatriation restrictions), confiscation of assets and property, trade restrictions (including tariffs) and other government restrictions by the U.S. or other governments, or from problems in registration, settlement or custody, may also result in losses. The type and severity of sanctions and other similar measures, including counter sanctions and other retaliatory actions, that may be imposed could vary broadly in scope, and their impact is impossible to predict. For example, the imposition of sanctions and other similar measures could, among other things, cause a decline in the value and/or liquidity of securities issued by the sanctioned country or companies located in or economically tied to the sanctioned country and increase market volatility and disruption in the sanctioned country and throughout the world. Sanctions and other similar measures could limit or prevent the Fund from buying and selling securities (in the sanctioned country and other markets), significantly delay or prevent the settlement of securities transactions, and significantly impact the Fund’s liquidity and performance. The Fund is unable to receive and repatriate proceeds and/or interest payments due to U.S. and Russian sanctions related to the Russia/Ukraine war.
Sanctions threatened or imposed may result in a decline in the value and liquidity of the Fund’s assets. The securities of the Fund may be deemed to have a zero value. The Fund may make investments that are illiquid or that may become less liquid in response to market developments or adverse investor perceptions. Illiquid investments may be more difficult to value. If the Fund is forced to sell securities at an unfavorable time and/or under unfavorable conditions, such sales may adversely affect the Fund’s NAV and dilute investors’ interests. Liquidity risk may be the result of, among other things, the reduced number and capacity of traditional market participants to make a market in fixed income securities or the lack of an active market. The potential for liquidity risk may be magnified by a rising interest rate environment or other circumstances where investor redemptions from fixed income funds may be higher than normal, potentially causing increased supply in the market due to selling activity. These risks may be more pronounced in connection with the Fund’s investments in securities of issuers located in emerging market countries. Redemptions by large shareholders may have a negative impact on a Fund’s liquidity.
For all these reasons, investments in emerging markets may be considered speculative. To the extent that the Fund invests a significant portion of its assets in a particular emerging market, the Fund will be more vulnerable to financial, economic, political and other developments in that country, and conditions that negatively impact that country will have a greater impact on the Fund as compared with a fund that does not have its holdings concentrated in a particular country.
High-yield/high-risk securities typically entail greater price volatility and/or principal and interest rate risk. There is a greater chance that an issuer will not be able to make principal and interest payments on time. Analysis of the creditworthiness of issuers of high-yield/high-risk securities may be complex, and as a result, it may be more difficult for the Adviser and/or Subadviser to accurately predict risk.
Note 10. Indemnifications
Under the Trust’s organizational documents and in separate agreements between each Trustee and the Trust, its Trustees and officers are indemnified against certain liabilities arising out of the performance of their duties to the Trust and its funds. In addition, in the normal course of business, the Trust and the Funds enter into contracts that provide a variety of indemnifications to other parties. The Trust’s and/or the Funds’ maximum exposure under these arrangements is unknown, as this would involve future claims that may be made against the Trust or the Funds and that have not occurred. However, neither the Trust nor the Funds have had prior claims or losses pursuant to these arrangements, and they expect the risk of loss to be remote.
Note 11. Restricted Securities
Restricted securities are not registered under the Securities Act of 1933, as amended (the “1933 Act”). Generally, 144A securities are excluded from this category. Each Fund will bear any costs, including those involved in registration under the 1933 Act, in connection with the disposition of such securities. At May 31, 2024, the Funds did not hold any securities that were restricted.
Note 12. Redemption Facility
On April 11, 2022, the Funds were added to a $250,000 unsecured line of credit (“Credit Agreement”) with certain other affiliated funds. This Credit Agreement, as amended, is with a commercial bank that allows the Funds to borrow cash from the bank to manage large, unexpected redemptions and trade fails, up to a limit of one-third or one-fifth, as applicable, of each Fund’s total net assets in accordance with the terms of the agreement. This Credit Agreement has a term of 364 days and has been renewed for a period up to July 3, 2025, however, the Funds may request at any time and from time to time to extend the termination date by 364 days. Effective March 10, 2022, interest is charged at the higher of the SOFR or the Federal Funds Rate plus an additional percentage rate on the amount borrowed. Commitment fees are charged on the undrawn balance. Total commitment fees paid for the year ended May 31, 2024, are included in the “Interest expense and/or commitment fees” line on the Statements of Operations. The Funds and other affiliated funds that are parties are individually, and not jointly, liable for their particular advances, if any, under the Credit Agreement. The lending bank has the ability to require repayment of outstanding borrowings under this Credit Agreement upon certain circumstances such as an event of default.
The following Fund had an outstanding loan during the year ended May 31, 2024. The borrowings were valued at cost, which approximates fair value.
VIRTUS OPPORTUNITIES TRUST
NOTES TO FINANCIAL STATEMENTS (Continued)
May 31, 2024
| Fund | | Interest
Incurred on
Borrowing | | Average
Borrowing | | Weighted Average
Interest Rate | | Days
Outstanding |
Stone Harbor Emerging Markets Debt Income Fund
| | $9 | | $6,250 | | 6.25% | | 8 |
Note 13. Federal Income Tax Information
($ reported in thousands)
At May 31, 2024, the approximate aggregate cost basis and the unrealized appreciation (depreciation) of investments and other financial instruments for federal income tax purposes were as follows:
| Fund | | Federal
Tax Cost | | Unrealized
Appreciation | | Unrealized
(Depreciation) | | Net Unrealized
Appreciation
(Depreciation) |
Stone Harbor Emerging Markets Bond Fund
| | $ 6,748 | | $ 146 | | $ (152) | | $ (6) |
Stone Harbor Emerging Markets Debt Income Fund (including purchased options)
| | 263,446 | | 8,941 | | (24,470) | | (15,529) |
Stone Harbor Local Markets Fund
| | 6,570 | | 263 | | (654) | | (391) |
Certain Funds have capital loss carryforwards available to offset future realized capital gains, if any, to the extent permitted by the Code. Net capital losses are carried forward without expiration and generally retain their short-term and/or long-term tax character, as applicable. For the year ended May 31, 2024, the Funds’ capital loss carryovers were as follows:
| Fund | | Short-Term | | Long-Term |
Stone Harbor Emerging Markets Bond Fund
| | $1,756 | | $3,214 |
Stone Harbor Emerging Markets Debt Income Fund
| | 198,074 | | 285,003 |
Stone Harbor Local Markets Fund
| | 121,268 | | 74,163 |
The components of distributable earnings on a tax basis and certain tax attributes for the Funds consist of the following:
| Fund | | Undistributed
Ordinary
Income | | Late Year
Ordinary Losses
Deferred | | Post-October
Capital Loss
Deferred | | Capital Loss
Deferred |
Stone Harbor Emerging Markets Bond Fund
| | $7 | | $ — | | $ 26 | | $ 4,970 |
Stone Harbor Emerging Markets Debt Income Fund
| | 533 | | — | | 11,627 | | 483,077 |
Stone Harbor Local Markets Fund
| | — | | 145 | | 258 | | 195,431 |
The differences between the book and tax basis of distributable earnings relate principally to the timing of recognition of income and gains for federal income tax purposes. Short-term gain distributions, if any, are reported as ordinary income for federal tax purposes. Distributions are determined on a tax basis and may differ from net investment income and realized capital gains for financial reporting purposes.
The tax character of dividends and distributions paid during the years ended May 31, 2024 and 2023 was as follows:
| | Ordinary
Income | | Total |
Stone Harbor Emerging Markets Bond Fund
| | | |
5/31/24
| $ 628 | | $628 |
5/31/23
| 316 | | 316 |
Stone Harbor Emerging Markets Debt Income Fund
| | | |
5/31/24
| 37,150 | | 37,150 |
5/31/23
| 40,450 | | 40,450 |
Certain capital accounts in the financial statements are periodically adjusted for permanent differences in order to reflect their tax character. Permanent reclassifications can arise from differing treatment of certain income and gain transactions and nondeductible current year net operating losses. These adjustments have no impact on net assets or net asset value per share of the Funds. Temporary differences that arise from recognizing certain items of income, expense, gain or loss in different periods for financial statement and tax purposes will likely reverse at some time in the future.
VIRTUS OPPORTUNITIES TRUST
NOTES TO FINANCIAL STATEMENTS (Continued)
May 31, 2024
Note 14. Regulatory Matters and Litigation
From time to time, the Funds, the Adviser and/or Subadviser and/or their affiliates may be involved in litigation and arbitration as well as examinations and investigations by various regulatory bodies, including the SEC, involving compliance with, among other things, securities laws, client investment guidelines, laws governing the activities of broker-dealers and other laws and regulations affecting their activities. At this time, the Adviser believes that the outcomes of such matters are not likely, either individually or in aggregate, to be material to these financial statements.
Note 15. Recent Accounting Pronouncement
In March 2020, the FASB issued Accounting Standards Update (“ASU”) No. 2020-04 (“ASU 2020-04”), Reference Rate Reform (Topic 848) – Facilitation of the Effects of Reference Rate Reform on Financial Reporting. The amendments in ASU 2020-04 provide optional temporary financial reporting relief from the effect of certain types of contract modifications due to the planned discontinuation of the LIBOR and other interbank-offered reference rates as of the end of 2021. In March 2021, the administrator for LIBOR announced the extension of the publication of a majority of the USD LIBOR settings to June 30, 2023. On December 21, 2022, the FASB issued ASU 2022-06 to defer the sunset date of ASC 848 until December 31, 2024. ASU 2020-04 is effective for certain reference rate-related contract modifications that occur during the period March 12, 2020 through December 31, 2024. Management is currently evaluating ASU 2020-04 and ASU 2020-06, but does not believe there will be a material impact.
Note 16. Subsequent Events
Management has evaluated the impact of all subsequent events on the Funds through the date the financial statements were available for issuance, and has determined there are no subsequent events requiring recognition or disclosure in these financial statements.
Report of Independent Registered Public Accounting Firm
To the Board of Trustees of Virtus Opportunities Trust and Shareholders of Virtus Stone Harbor Emerging Markets Bond Fund, Virtus Stone Harbor Emerging Markets Debt Income Fund and Virtus Stone Harbor Local Markets Fund
Opinions on the Financial Statements
We have audited the accompanying statements of assets and liabilities, including the schedules of investments, of Virtus Stone Harbor Emerging Markets Bond Fund, Virtus Stone Harbor Emerging Markets Debt Income Fund and Virtus Stone Harbor Local Markets Fund (three of the funds constituting Virtus Opportunities Trust, hereafter collectively referred to as the “Funds”) as of May 31, 2024, the related statements of operations for the year ended May 31, 2024, the statements of changes in net assets for each of the two years in the period ended May 31, 2024, including the related notes, and the financial highlights for each of the two years in the period ended May 31, 2024 (collectively referred to as the “financial statements”). In our opinion, the financial statements present fairly, in all material respects, the financial position of each of the Funds as of May 31, 2024, the results of each of their operations for the year then ended, the changes in each of their net assets and each of their financial highlights for each of the two years in the period ended May 31, 2024, in conformity with accounting principles generally accepted in the United States of America.
The financial statements of the Funds, as of and for the year ended May 31, 2022, and the financial highlights for each of the periods ended on or prior to May 31, 2022 (not presented herein, other than the financial highlights) were audited by other auditors whose report dated July 26, 2022 expressed an unqualified opinion on those financial statements and financial highlights.
Basis for Opinions
These financial statements are the responsibility of the Funds’ management. Our responsibility is to express an opinion on the Funds’ financial statements based on our audits. We are a public accounting firm registered with the Public Company Accounting Oversight Board (United States) (PCAOB) and are required to be independent with respect to the Funds in accordance with the U.S. federal securities laws and the applicable rules and regulations of the Securities and Exchange Commission and the PCAOB.
We conducted our audits of these financial statements in accordance with the standards of the PCAOB. Those standards require that we plan and perform the audit to obtain reasonable assurance about whether the financial statements are free of material misstatement, whether due to error or fraud.
Our audits included performing procedures to assess the risks of material misstatement of the financial statements, whether due to error or fraud, and performing procedures that respond to those risks. Such procedures included examining, on a test basis, evidence regarding the amounts and disclosures in the financial statements. Our audits also included evaluating the accounting principles used and significant estimates made by management, as well as evaluating the overall presentation of the financial statements. Our procedures included confirmation of securities owned as of May 31, 2024 by correspondence with the custodian, and brokers; when replies were not received from brokers, we performed other auditing procedures. We believe that our audits provide a reasonable basis for our opinions.
/s/PricewaterhouseCoopers LLP
Philadelphia, PA
July 25, 2024
We have served as the auditor of one or more of the investment companies in the Virtus group of investment companies since at least 1977. We have not been able to determine the specific year we began serving as auditor.
VIRTUS OPPORTUNITIES TRUST
TAX INFORMATION NOTICE (Unaudited)
May 31, 2024
The following information ($ reported in thousands) is being provided in order to meet reporting requirements set forth by the Code and/or to meet state specific requirements. In early 2025, the Funds will notify applicable shareholders of amounts for use in preparing 2024 U.S. federal income tax forms. Shareholders should consult their tax advisors.
With respect to distributions paid during the year ended May 31, 2024, the Funds designate the following amounts (or, if subsequently determined to be different, the maximum amount allowable):
| Fund | | Qualified
Dividend
Income %
(non-corporate
shareholder) | | Dividend
Received
Deduction %
(corporate
shareholders) | | Long-Term
Capital Gain
Distributions ($) |
Stone Harbor Emerging Markets Bond Fund
| | 0.00% | | 0.00 % | | $ 0 |
Stone Harbor Emerging Markets Debt Income Fund
| | 0.00 | | 0.00 | | 0 |
Stone Harbor Local Markets Fund
| | 0.00 | | 0.00 | | 0 |
THIS PAGE INTENTIONALLY BLANK.
VIRTUS OPPORTUNITIES TRUST
101 Munson Street
Greenfield, MA 01301-9668
Trustees
Philip R. McLoughlin, Chairman
George R. Aylward
Donald C. Burke
Deborah A. DeCotis
F. Ford Drummond
Sidney E. Harris
John R. Mallin
Connie D. McDaniel
Geraldine M. McNamara
R. Keith Walton
Brian T. Zino
Principal Officers
George R. Aylward, President
Peter Batchelar, Senior Vice President
W. Patrick Bradley, Executive Vice President, Chief Financial Officer and Treasurer
Timothy Branigan, Vice President and Fund Chief Compliance Officer
Jennifer Fromm, Vice President, Chief Legal Officer, Counsel and Secretary
Julia R. Short, Senior Vice President
Richard W. Smirl, Executive Vice President
Investment Adviser
Virtus Alternative Investment Advisers, Inc.
One Financial Plaza
Hartford, CT 06103-2608
Principal Underwriter
VP Distributors, LLC
One Financial Plaza
Hartford, CT 06103-2608
Administrator and Transfer Agent
Virtus Fund Services, LLC
One Financial Plaza
Hartford, CT 06103-2608
Custodian
The Bank of New York Mellon
240 Greenwich Street
New York, NY 10286-1048
Independent Registered Public
Accounting Firm
PricewaterhouseCoopers LLP
2001 Market Street
Philadelphia, PA 19103-7042
How to Contact Us
| Mutual Fund Services | 1-800-243-1574 |
| Adviser Consulting Group | 1-800-243-4361 |
P.O. Box 534470
Pittsburgh, PA 15253-4470
For more information about Virtus Funds,
please contact us at 1-800-243-1574, or visit Virtus.com.
Item 8. Changes in and Disagreements with Accountants for Open-End Management Investment Companies.
None.
Item 9. Proxy Disclosures for Open-End Management Investment Companies.
None.
Item 10. Remuneration Paid to Directors, Officers, and Others of Open-End Management Investment Companies.
Please refer to Item 7a.
Item 11. Statement Regarding Basis for Approval of Investment Advisory Contract.
Not applicable.
Item 12. Disclosure of Proxy Voting Policies and Procedures for Closed-End Management Investment Companies.
Disclosure not required for open-end management investment companies.
Item 13. Portfolio Managers of Closed-End Management Investment Companies.
Disclosure not required for open-end management investment companies.
Item 14. Purchases of Equity Securities by Closed-End Management Investment Company and Affiliated Purchasers.
Disclosure not required for open-end management investment companies.
Item 15. Submission of Matters to a Vote of Security Holders.
There have been no material changes to the procedures by which shareholders may recommend nominees to the registrant’s board of trustees, where those changes were implemented after the registrant last provided disclosure in response to the requirements of Item 407(c)(2)(iv) of Regulation S-K (17 CFR 229.407) (as required by Item 22(b)(15) of Schedule 14A (17 CFR 240.14a-101)), or this Item.
Item 16. Controls and Procedures.
| | (a) | The registrant’s principal executive officer and principal financial officer have concluded, based on their evaluation of the effectiveness of the design and operation of the registrant’s disclosure controls and procedures (as defined in Rule 30a-3(c) under the Investment Company Act of 1940 (17 CFR 270.30a-3(c))) as of a date within 90 days of the filing date of this report, that the design and operation of such procedures are effective to provide reasonable assurance that information required to be disclosed by the registrant on Form N-CSR is recorded, processed, summarized and reported within the time periods specified in the Securities and Exchange Commission’s rules and forms, and that information required to be disclosed by the registrant in the reports that it files or submits on Form N-CSR is accumulated and communicated to the registrant’s management, including its principal executive and principal financial officers, as appropriate to allow timely decisions regarding required disclosure. |
| | (b) | There were no changes in the registrant’s internal control over financial reporting (as defined in Rule 30a-3(d) under the 1940 Act (17 CFR 270.30a-3(d))) that occurred during the period covered by this report that have materially affected, or are reasonably likely to materially affect, the registrant’s internal control over financial reporting. |
Item 17. Disclosure of Securities Lending Activities for Closed-End Management Investment Companies.
Disclosure not required for open-end management investment companies.
Item 18. Recovery of Erroneously Awarded Compensation.
Not applicable.
Item 19. Exhibits.
SIGNATURES
Pursuant to the requirements of the Securities Exchange Act of 1934 and the Investment Company Act of 1940, the registrant has duly caused this report to be signed on its behalf by the undersigned, thereunto duly authorized.
| | | | |
| (Registrant) Virtus Opportunities Trust | | |
| | |
| By (Signature and Title)* | | /s/ George R. Aylward | | |
| | George R. Aylward, President | | |
| | (principal executive officer) | | |
| |
| Date August 2, 2024 | | |
Pursuant to the requirements of the Securities Exchange Act of 1934 and the Investment Company Act of 1940, this report has been signed below by the following persons on behalf of the registrant and in the capacities and on the dates indicated.
| | | | |
| By (Signature and Title)* | | /s/ George R. Aylward | | |
| | George R. Aylward, President | | |
| | (principal executive officer) | | |
| |
| Date August 2, 2024 | | |
| | |
| By (Signature and Title)* | | /s/ W. Patrick Bradley | | |
| | W. Patrick Bradley, Executive Vice President, Chief Financial Officer, and Treasurer | | |
| | (principal financial officer) | | |
| |
| Date August 2, 2024 | | |
| * | Print the name and title of each signing officer under his or her signature. |