UNITED STATES
SECURITIES AND EXCHANGE COMMISSION
WASHINGTON, D.C. 20549
FORM N-CSR
CERTIFIED SHAREHOLDER REPORT OF REGISTERED
MANAGEMENT INVESTMENT COMPANIES
Investment Company Act file number 811-07489
Oppenheimer International Growth Fund
(Exact name of registrant as specified in charter)
6803 South Tucson Way, Centennial, Colorado 80112-3924
(Address of principal executive offices) (Zip code)
Arthur S. Gabinet
OFI Global Asset Management, Inc.
Two World Financial Center, New York, New York 10281-1008
(Name and address of agent for service)
Registrant’s telephone number, including area code: (303) 768-3200
Date of fiscal year end: November 30
Date of reporting period: 5/30/2014
Item 1. Reports to Stockholders.
Table of Contents
Class A Shares
AVERAGE ANNUAL TOTAL RETURNS AT 5/30/14*
| | | | | | | | |
| | | Class A Shares of the Fund | | |
| | | Without Sales Charge | | With Sales Charge | | | | MSCI AC World ex-U.S.
Index |
6-Month | | 5.91% | | -0.19% | | | | 4.73% |
1-Year | | 19.03 | | 12.19 | | | | 14.54 |
5-Year | | 15.02 | | 13.67 | | | | 10.49 |
10-Year | | 10.00 | | 9.35 | | | | 7.79 |
Performance data quoted represents past performance, which does not guarantee future results. The investment return and principal value of an investment in the Fund will fluctuate so that an investor’s shares, when redeemed, may be worth more or less than their original cost. Fund returns include changes in share price, reinvested distributions, and a 5.75% maximum applicable sales charge except where “without sales charge” is indicated. Returns do not consider capital gains or income taxes on an individual’s investment. Returns for periods of less than one year are cumulative and not annualized. For performance data current to the most recent month-end, visit oppenheimerfunds.com or call 1.800.CALL OPP (225.5677).
*May 30, 2014, was the last business day of the Fund’s semiannual period. See Note 1 of the accompanying Notes to Financial Statements. Index returns are calculated through May 31, 2014.
2 OPPENHEIMER INTERNATIONAL GROWTH FUND
Fund Performance Discussion
The Fund’s Class A shares (without sales charge) generated a cumulative total return of 5.91% during the reporting period. On a relative basis, the Fund outperformed the MSCI AC World ex-U.S. Index (the “Index”), which returned 4.73%. The Fund outperformed the Index in seven out of ten sectors, led by industrials, financials and consumer staples. The Fund underperformed the Index in the energy, utilities and health care sectors.
MARKET OVERVIEW
The global economy finished 2013 with slow and steady growth throughout the developed world. U.S. growth improved during the reporting period driven by continued strength in manufacturing, reasonable employment gains and strong activity in the housing market. At the end of May 2013, market volatility picked up measurably as remarks from former Federal Reserve (“Fed”) Chairman Ben Bernanke indicated a possible tapering of the Fed’s asset purchase program if the economy continued to show improvement. However, when the Fed actually announced in December that it would reduce its asset purchases, its decision was met with relative calm in financial markets. In Europe, economic growth picked up in its core countries, such as Germany, and long-awaited signs of recovery emerged in some of the region’s more troubled economies, including Spain and Italy. Investors responded particularly positively to a surprise reduction in short-term interest rates by the European Central Bank in November 2013. In the United Kingdom, investor sentiment improved when fears of economic stagnation failed to materialize. Emerging markets were the relative laggards in the global economy in
2013. Growth remained slow throughout the world’s emerging economies as inflation and persistent current account deficits restrained activity in certain countries. China’s economy grew, albeit at a much slower pace than prior years, as its leaders instituted several measures in an attempt to reorient the nation’s economy from an export-led model to a consumption-led one. We also began to see growing geopolitical tension (Russia and Ukraine) and political tension (Thailand, Turkey, Venezuela). However, over the second half of the reporting period, emerging markets posted a modest recovery.
FUND REVIEW
Top performing holdings for the Fund this reporting period included Aryzta AG, Bunzl plc and SES SA. Aryzta is the world’s biggest specialty bakery based in Switzerland. Aryzta provides a wide range of pre-baked bakery food products including bread, cookies and other pastries. Aryzta expanded its presence in North America by acquiring Canada-based Pineridge Bakery and U.S.-based Cloverhill Bakery, helping to drive its stock up. Aryzta has a healthy mergers and acquisitions (M&A) track record in a fragmented bakery industry.
3 OPPENHEIMER INTERNATIONAL GROWTH FUND
Bunzl is a U.K.-based distributor of a wide variety of non-food consumable products including everything from brown paper bags and plastic utensils to hard hats. The company allows customers to outsource the procurement, warehousing and distribution of such items, simplifying the process and freeing up working capital. No other company does what Bunzl does on their scale across international markets. Bunzl reported strong financial results during the reporting period and completed a number of acquisitions. We believe Bunzl has a strong competitive position and continues to benefit from value-added bolt-on acquisitions in a fragmented industry. SES is a world-leading satellite operator, providing reliable and secure satellite communications solutions to broadcast, telecom, corporate and government customers worldwide. The company is based in Luxembourg. SES has over 50 geostationary satellites covering 99% of the world’s population and is continuing to make good progress in investments in regions with high growth potential. They’ve launched several satellites since mid-2013.
Top detractors from performance this reporting period included YOOX SpA, Cairn Energy plc and APR Energy plc. YOOX, based in Italy, is a leading online retailer in the luxury goods space. The company’s business model includes a multi-brand business that sells discounted products from a variety of designers, as well as a mono-brand business that offers a shop-in-shop platform for a growing number of brands. Both consumers of luxury goods and luxury goods
manufacturers had been relatively slow to embrace e-commerce. As the shift to online sales accelerates, it presents a large growth opportunity for YOOX. Full year 2013 results were announced in March and while underlying metrics were solid, currency proved to be a headwind for the company. At period end, we continue to focus on the long-term structural growth opportunities for YOOX. Cairn Energy is an independent oil and gas exploration and development company in the U.K. Cairn’s share price declined during the period by news that it had been contacted by the Indian Income Tax Department to discuss tax assessments for year-end March 31, 2007. The inquiry is related to the initial public offering (IPO) of Cairn India. We sold out of our position during the reporting period. U.K.-based APR Energy provides cost-efficient reliable electricity, on a fast-track basis to customers worldwide. They leverage state-of-the art technology and industry-leading expertise to provide utility and industrial customers with fuel-efficient turnkey plants that are rapidly deployed, customizable and scalable. Despite a drop in share price during the reporting period, we believe APR remains well-positioned to benefit from the need for temporary power in emerging markets going forward.
STRATEGY & OUTLOOK
We continue to seek to invest in companies that may benefit from long-term secular growth trends, have significant and durable competitive advantages, and the financial flexibility to increase their relative market
4 OPPENHEIMER INTERNATIONAL GROWTH FUND
position against their competitors during downtrends in the business cycle. We are long-term investors with an average holding period of more than seven years.
We continue to see gradual improvement in the macroeconomic environment in the developed world. The U.S. economy is setting the pace and received a vote of confidence from the Fed to continue tapering its quantitative easing program. Europe appears to be turning the corner. The headwinds created by austerity and stressed financial markets are diminishing. While there is still some disparity in fundamentals across Euro area economies, we continue to get
positive signals on several fronts. Even the peripheral European economies have shown signs of stability and marginal improvement.
The emerging markets are likely to be a continued source of concern for investors as they weigh the impact of issues such as tightening global liquidity, slowing growth in China, and the events in the Ukraine. However, we believe that the rebound in emerging markets that occurred over the second half of the reporting period would suggest that investors realize some of these headwinds are more than reflected in the market valuation.
| | |
 | |  |
| | George R. Evans, CFA Portfolio Manager |
| | |

| |  |
| | Robert B. Dunphy, CFA Portfolio Manager |
5 OPPENHEIMER INTERNATIONAL GROWTH FUND
Top Holdings and Allocations*
TOP TEN COMMON STOCK HOLDINGS
| | |
BT Group plc | | 2 .0% |
SAP AG | | 1 .6 |
Roche Holding AG | | 1 .4 |
Syngenta AG | | 1 .4 |
Aalberts Industries NV | | 1 .4 |
Industria de Diseno Textil SA
(Inditex) | | 1 .4 |
Aryzta AG | | 1 .3 |
Unilever plc | | 1 .3 |
William Hill plc | | 1 .3 |
Grifols SA | | 1 .3 |
Portfolio holdings and allocations are subject to change. Percentages are as of May 30, 2014, and are based on net assets. For more current Fund holdings, please visit oppenheimerfunds.com.
TOP TEN GEOGRAPHICAL HOLDINGS
| | |
United Kingdom | | 26.5% |
Switzerland | | 14.4 |
France | | 12.1 |
Netherlands | | 7.2 |
Spain | | 5.2 |
Germany | | 5.1 |
United States | | 4.9 |
Japan | | 4.8 |
Italy | | 4.3 |
Sweden | | 2.9 |
Portfolio holdings and allocation are subject to change. Percentages are as of May 30, 2014, and are based on total market value of investments.
REGIONAL ALLOCATION
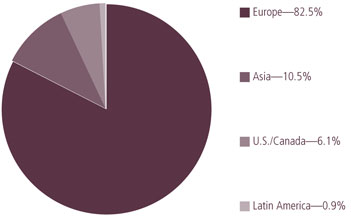
Portfolio holdings and allocations are subject to change. Percentages are as of May 30, 2014, and are based on the total market value of investments.
*May 30, 2014, was the last business day of the Fund’s semiannual period. See Note 1 of the accompanying Notes to Financial Statements.
6 OPPENHEIMER INTERNATIONAL GROWTH FUND
Share Class Performance
AVERAGE ANNUAL TOTAL RETURNS WITHOUT SALES CHARGE AS OF 5/30/14
| | | | | | | | | | | | |
| | | Inception
Date | | 6-Month | | 1-Year | | 5-Year | | 10-Year | | |
Class A (OIGAX) | | 3/25/96 | | 5.91% | | 19.03% | | 15.02% | | 10.00% | | |
Class B (IGRWX) | | 3/25/96 | | 5.50% | | 18.14% | | 14.13% | | 9.49% | | |
Class C (OIGCX) | | 3/25/96 | | 5.53% | | 18.17% | | 14.18% | | 9.19% | | |
Class I (OIGIX) | | 3/29/12 | | 6.14% | | 19.60% | | 16.95% * | | N/A | | |
Class N (OIGNX) | | 3/1/01 | | 5.78% | | 18.75% | | 14.74% | | 9.70% | | |
Class Y (OIGYX) | | 9/7/05 | | 6.02% | | 19.31% | | 15.50% | | 9.02% * | | |
AVERAGE ANNUAL TOTAL RETURNS WITH SALES CHARGE AS OF 5/30/14 |
| | | Inception
Date | | 6-Month | | 1-Year | | 5-Year | | 10-Year | | |
Class A (OIGAX) | | 3/25/96 | | -0.19% | | 12.19% | | 13.67% | | 9.35% | | |
Class B (IGRWX) | | 3/25/96 | | 0.50% | | 13.14% | | 13.89% | | 9.49% | | |
Class C (OIGCX) | | 3/25/96 | | 4.53% | | 17.17% | | 14.18% | | 9.19% | | |
Class I (OIGIX) | | 3/29/12 | | 6.14% | | 19.60% | | 16.95% * | | N/A | | |
Class N (OIGNX) | | 3/1/01 | | 4.78% | | 17.75% | | 14.74% | | 9.70% | | |
Class Y (OIGYX) | | 9/7/05 | | 6.02% | | 19.31% | | 15.50% | | 9.02% * | | |
| *Shows performance since inception. |
Performance data quoted represents past performance, which does not guarantee future results. The investment return and principal value of an investment in the Fund will fluctuate so that an investor’s shares, when redeemed, may be worth more or less than their original cost. Current performance may be lower or higher than the performance quoted. Returns do not consider capital gains or income taxes on an individual’s investment. For performance data current to the most recent month-end, visit oppenheimerfunds.com or call 1.800.CALL OPP (225.5677). Fund returns include changes in share price, reinvested distributions, and the applicable sales charge: for Class A shares, the current maximum initial sales charge of 5.75%; for Class B shares, the contingent deferred sales charge of 5% (1-year) and 2% (5-year); and for Class C and N shares, the contingent deferred sales charge (“CDSC”) of 1% for the 1-year period. As of July 1, 2014, Class N shares will be renamed Class R shares. Beginning July 1, 2014, new purchases of Class R shares will no longer be subject to a CDSC upon redemption (any CDSC will remain in effect for purchases prior to July 1, 2014). There is no sales charge for Class I and Class Y shares. Because Class B shares convert to Class A shares 72 months after purchase, the 10-year return for Class B shares uses Class A performance for the period after conversion. Returns for periods of less than one year are cumulative and not annualized.
The Fund’s performance is compared to the performance of the MSCI AC World ex-U.S. Index. The MSCI AC World ex-U.S. Index is designed to measure the equity market performance of developed and emerging markets and excludes the U.S. The Index is unmanaged and cannot be purchased directly by investors. While index comparisons may be useful to provide a benchmark for the Fund’s performance, it must be noted that the Fund’s investments are not limited to the investments comprising the Index. Index performance includes reinvestment of
7 OPPENHEIMER INTERNATIONAL GROWTH FUND
income, but does not reflect transaction costs, fees, expenses or taxes. Index performance is shown for illustrative purposes only as a benchmark for the Fund’s performance, and does not predict or depict performance of the Fund. The Fund’s performance reflects the effects of the Fund’s business and operating expenses.
The Fund’s investment strategy and focus can change over time. The mention of specific fund holdings does not constitute a recommendation by OppenheimerFunds, Inc. or its affiliates.
Before investing in any of the Oppenheimer funds, investors should carefully consider a fund’s investment objectives, risks, charges and expenses. Fund prospectuses and summary prospectuses contain this and other information about the funds, and may be obtained by asking your financial advisor, visiting oppenheimerfunds.com, or calling 1.800.CALL OPP (225.5677). Read prospectuses and summary prospectuses carefully before investing.
Shares of Oppenheimer funds are not deposits or obligations of any bank, are not guaranteed by any bank, are not insured by the FDIC or any other agency, and involve investment risks, including the possible loss of the principal amount invested.
8 OPPENHEIMER INTERNATIONAL GROWTH FUND
Fund Expenses
Fund Expenses. As a shareholder of the Fund, you incur two types of costs: (1) transaction costs, which may include sales charges (loads) on purchase payments, contingent deferred sales charges on redemptions; and (2) ongoing costs, including management fees; distribution and service fees; and other Fund expenses. These examples are intended to help you understand your ongoing costs (in dollars) of investing in the Fund and to compare these costs with the ongoing costs of investing in other mutual funds.
The examples are based on an investment of $1,000.00 invested at the beginning of the period and held for the entire 6-month period ended May 30, 2014.
Actual Expenses. The first section of the table provides information about actual account values and actual expenses. You may use the information in this section for the class of shares you hold, together with the amount you invested, to estimate the expense that you paid over the period. Simply divide your account value by $1,000.00 (for example, an $8,600.00 account value divided by $1,000.00 = 8.60), then multiply the result by the number in the first section under the heading entitled “Expenses Paid During Period” to estimate the expenses you paid on your account during this period.
Hypothetical Example for Comparison Purposes. The second section of the table provides information about hypothetical account values and hypothetical expenses based on the Fund’s actual expense ratio for each class of shares, and an assumed rate of return of 5% per year for each class before expenses, which is not the actual return. The hypothetical account values and expenses may not be used to estimate the actual ending account balance or expenses you paid for the period. You may use this information to compare the ongoing costs of investing in the Fund and other funds. To do so, compare this 5% hypothetical example for the class of shares you hold with the 5% hypothetical examples that appear in the shareholder reports of the other funds.
Please note that the expenses shown in the table are meant to highlight your ongoing costs only and do not reflect any transactional costs, such as front-end or contingent deferred sales charges (loads). Therefore, the “hypothetical” section of the table is useful in comparing ongoing costs only, and will not help you determine the relative total costs of owning different funds. In addition, if these transactional costs were included, your costs would have been higher.
9 OPPENHEIMER INTERNATIONAL GROWTH FUND
| | | | | | | | | | | | | | | | | | |
| Actual | | Beginning Account Value
December 1, 2013 | | Ending Account Value May 30, 2014 | | Expenses Paid During
6 Months Ended
May 30, 2014 |
Class A | | $ | 1,000.00 | | | | | $ | 1,059.10 | | | | | $ | 5.89 | | | |
Class B | | | 1,000.00 | | | | | | 1,055.00 | | | | | | 9.73 | | | |
Class C | | | 1,000.00 | | | | | | 1,055.30 | | | | | | 9.68 | | | |
Class I | | | 1,000.00 | | | | | | 1,061.40 | | | | | | 3.58 | | | |
Class N | | | 1,000.00 | | | | | | 1,057.80 | | | | | | 7.12 | | | |
Class Y | | | 1,000.00 | | | | | | 1,060.20 | | | | | | 4.56 | | | |
| | | | | | |
| Hypothetical | | | | | | | | | | | | | | | | | | |
(5% return before expenses) | | | | | | | | | | | | | | | | | | |
Class A | | | 1,000.00 | | | | | | 1,019.09 | | | | | | 5.77 | | | |
Class B | | | 1,000.00 | | | | | | 1,015.37 | | | | | | 9.54 | | | |
Class C | | | 1,000.00 | | | | | | 1,015.42 | | | | | | 9.49 | | | |
Class I | | | 1,000.00 | | | | | | 1,021.32 | | | | | | 3.51 | | | |
Class N | | | 1,000.00 | | | | | | 1,017.90 | | | | | | 6.98 | | | |
Class Y | | | 1,000.00 | | | | | | 1,020.38 | | | | | | 4.47 | | | |
Expenses are equal to the Fund’s annualized expense ratio for that class, multiplied by the average account value over the period, multiplied by 181/365 (to reflect the one-half year period). Those annualized expense ratios, excluding indirect expenses from affiliated funds, based on the 6-month period ended May 30, 2014 are as follows:
| | | | | | |
| Class | | Expense Ratios | | | |
Class A | | | 1.15 | % | | |
Class B | | | 1.90 | | | |
Class C | | | 1.89 | | | |
Class I | | | 0.70 | | | |
Class N | | | 1.39 | | | |
Class Y | | | 0.89 | | | |
The expense ratios reflect voluntary and/or contractual waivers and/or reimbursements of expenses by the Fund’s Manager. Some of these undertakings may be modified or terminated at any time, as indicated in the Fund’s prospectus. The “Financial Highlights” tables in the Fund’s financial statements, included in this report, also show the gross expense ratios, without such waivers or reimbursements and reduction to custodian expenses, if applicable.
10 OPPENHEIMER INTERNATIONAL GROWTH FUND
| | | | |
| |
| STATEMENT OF INVESTMENTS May 30, 2014* Unaudited | | |
| | | | | | | | |
| | | Shares | | | Value | |
| |
Common Stocks—96.1% | | | | | | | | |
| |
Consumer Discretionary—20.1% | | | | | | | | |
| |
Automobiles—1.1% | | | | | | | | |
Bayerische Motoren Werke (BMW) AG | | | 1,569,895 | | | $ | 197,107,698 | |
|
| |
Diversified Consumer Services—1.3% | | | | | | | | |
Benesse Holdings, Inc. | | | 2,814,882 | | | | 118,343,761 | |
|
| |
Dignity plc1 | | | 4,946,685 | | | | 117,103,533 | |
| | | | | | | | |
| | | | | | | 235,447,294 | |
|
| |
Hotels, Restaurants & Leisure—3.1% | | | | | | | | |
Carnival Corp. | | | 4,580,560 | | | | 183,359,817 | |
| |
Domino’s Pizza Group plc1 | | | 16,433,847 | | | | 155,110,359 | |
| |
William Hill plc | | | 40,177,947 | | | | 240,857,954 | |
| | | | | | | | |
| | | | | | | 579,328,130 | |
|
| |
Household Durables—0.9% | | | | | | | | |
SEB SA | | | 1,770,857 | | | | 159,795,311 | |
|
| |
Internet & Catalog Retail—1.4% | | | | | | | | |
Ctrip.com International Ltd., ADR2 | | | 2,298,100 | | | | 127,360,702 | |
| |
Yoox SpA1,2 | | | 4,433,043 | | | | 142,223,354 | |
| | | | | | | | |
| | | | | | | 269,584,056 | |
|
| |
Media—3.0% | | | | | | | | |
British Sky Broadcasting Group plc | | | 13,980,899 | | | | 207,361,455 | |
| |
Grupo Televisa SAB, Sponsored ADR | | | 1,017,630 | | | | 34,395,894 | |
| |
Liberty Global plc, Cl. A2 | | | 479,474 | | | | 21,585,920 | |
| |
Liberty Global plc, Series C2 | | | 1,195,528 | | | | 51,168,598 | |
| |
SES SA | | | 5,387,020 | | | | 195,683,722 | |
| |
Zee Entertainment Enterprises Ltd. | | | 8,197,109 | | | | 37,135,960 | |
| | | | | | | | |
| | | | | | | 547,331,549 | |
|
| |
Multiline Retail—1.2% | | | | | | | | |
Dollarama, Inc. | | | 2,565,436 | | | | 216,416,518 | |
|
| |
Specialty Retail—1.3% | | | | | | | | |
Industria de Diseno Textil SA (Inditex) | | | 1,711,102 | | | | 248,871,838 | |
|
| |
Textiles, Apparel & Luxury Goods—6.7% | | | | | | | | |
Burberry Group plc | | | 8,962,455 | | | | 230,472,125 | |
| |
Cie Financiere Richemont SA | | | 2,198,958 | | | | 232,115,757 | |
| |
Kering | | | 640,100 | | | | 141,669,721 | |
| |
Luxottica Group SpA | | | 1,478,431 | | | | 84,516,520 | |
| |
LVMH Moet Hennessy Louis Vuitton SA | | | 842,610 | | | | 167,900,745 | |
| |
Prada SpA | | | 24,582,200 | | | | 184,247,400 | |
| |
Swatch Group AG (The) | | | 343,748 | | | | 203,241,058 | |
| | | | | | | | |
| | | | | | | 1,244,163,326 | |
|
| |
Consumer Staples—10.9% | | | | | | | | |
| |
Beverages—3.1% | | | | | | | | |
Diageo plc | | | 7,193,204 | | | | 231,458,886 | |
| |
Heineken NV | | | 2,557,212 | | | | 180,389,371 | |
| |
Pernod-Ricard SA | | | 1,262,892 | | | | 154,991,620 | |
| | | | | | | | |
| | | | | | | 566,839,877 | |
|
| |
Food & Staples Retailing—1.2% | | | | | | | | |
CP ALL PCL | | | 164,254,700 | | | | 227,646,608 | |
|
| |
Food Products—4.6% | | | | | | | | |
Aryzta AG2 | | | 2,623,617 | | | | 244,820,504 | |
| |
Barry Callebaut AG2 | | | 142,738 | | | | 188,726,722 | |
| |
DANONE SA | | | 2,249,200 | | | | 167,623,044 | |
| |
Unilever plc | | | 5,416,632 | | | | 243,348,951 | |
| | | | | | | | |
| | | | | | | 844,519,221 | |
|
| |
Household Products—1.1% | | | | | | | | |
Reckitt Benckiser Group plc | | | 2,444,861 | | | | 209,126,230 | |
|
| |
Personal Products—0.2% | | | | | | | | |
L’Oreal SA | | | 188,483 | | | | 32,921,220 | |
|
| |
Tobacco—0.7% | | | | | | | | |
Swedish Match AB | | | 3,530,295 | | | | 123,313,474 | |
|
| |
Energy—3.4% | | | | | | | | |
| |
Energy Equipment & Services—2.4% | | | | | | | | |
Hunting plc | | | 805,759 | | | | 11,111,167 | |
| |
Saipem SpA2 | | | 6,311,339 | | | | 164,598,428 | |
| |
Schoeller-Bleckmann Oilfield Equipment AG1 | | | 843,412 | | | | 100,590,942 | |
| |
Technip SA | | | 1,522,122 | | | | 163,868,557 | |
| | | | | | | | |
| | | | | | | 440,169,094 | |
11 OPPENHEIMER INTERNATIONAL GROWTH FUND
| | | | |
| |
| STATEMENT OF INVESTMENTS Unaudited / Continued | | |
| | | | | | | | |
| | | Shares | | | Value | |
| |
Oil, Gas & Consumable Fuels—1.0% | | | | | | | | |
Koninklijke Vopak NV | | | 3,586,591 | | | $ | 182,863,160 | |
|
| |
Financials—4.1% | | | | | | | | |
| |
Capital Markets—2.2% | | | | | | | | |
ICAP plc | | | 27,854,854 | | | | 186,739,932 | |
| |
Tullett Prebon plc | | | 10,749,054 | | | | 52,258,611 | |
| |
UBS AG2 | | | 8,384,565 | | | | 168,304,118 | |
| | | | | | | | |
| | | | | | | 407,302,661 | |
|
| |
Commercial Banks—0.8% | | | | | | | | |
ICICI Bank Ltd., Sponsored ADR2 | | | 2,830,770 | | | | 140,604,346 | |
|
| |
Insurance—1.0% | | | | | | | | |
Prudential plc | | | 8,241,391 | | | | 191,519,647 | |
|
| |
Thrifts & Mortgage Finance—0.1% | | | | | | | | |
Housing Development Finance Corp. Ltd. | | | 772,602 | | | | 11,498,118 | |
|
| |
Health Care—10.4% | | | | | | | | |
| |
Biotechnology—2.4% | | | | | | | | |
CSL Ltd. | | | 3,158,000 | | | | 207,363,907 | |
| |
Grifols SA | | | 4,328,868 | | | | 235,268,065 | |
| | | | | | | | |
| | | | | | | 442,631,972 | |
|
| |
Health Care Equipment & Supplies—3.4% | | | | | | | | |
DiaSorin SpA1 | | | 3,121,503 | | | | 132,575,329 | |
| |
Essilor International SA | | | 1,494,676 | | | | 157,288,609 | |
| |
Sonova Holding AG2 | | | 1,328,637 | | | | 203,168,888 | |
| |
William Demant Holding2 | | | 1,543,656 | | | | 138,906,174 | |
| | | | | | | | |
| | | | | | | 631,939,000 | |
|
| |
Health Care Providers & Services—0.8% | | | | | | | | |
Sonic Healthcare Ltd. | | | 9,484,306 | | | | 156,194,420 | |
|
| |
Health Care Technology—0.3% | | | | | | | | |
CompuGroup Medical AG | | | 1,711,493 | | | | 46,168,838 | |
|
| |
Pharmaceuticals—3.5% | | | | | | | | |
Galenica AG | | | 157,010 | | | | 155,357,077 | |
| |
Novo Nordisk AS, Cl. B | | | 5,240,230 | | | | 221,646,099 | |
| |
Novogen Ltd.2 | | | 4,972,549 | | | | 724,934 | |
| |
Oxagen Ltd.2,3 | | | 214,287 | | | | 10,874 | |
| |
Roche Holding AG | | | 890,964 | | | | 262,867,365 | |
| | | | | | | | |
| | | | | | | 640,606,349 | |
|
| |
Industrials—23.5% | | | | | | | | |
| |
Aerospace & Defense—2.9% | | | | | | | | |
Airbus Group NV | | | 2,596,293 | | | | 186,386,882 | |
| |
Embraer SA | | | 13,896,746 | | | | 126,480,673 | |
| |
Rolls-Royce Holdings plc2 | | | 12,793,260 | | | | 223,211,821 | |
| | | | | | | | |
| | | | | | | 536,079,376 | |
|
| |
Air Freight & Couriers—0.6% | | | | | | | | |
Royal Mail plc2 | | | 13,589,060 | | | | 116,855,353 | |
|
| |
Commercial Services & Supplies—3.3% | | | | | | | | |
Aggreko plc | | | 7,077,067 | | | | 197,871,801 | |
| |
Edenred | | | 5,497,320 | | | | 172,439,494 | |
| |
Prosegur Compania de Seguridad SA1 | | | 32,003,236 | | | | 230,608,098 | |
| | | | | | | | |
| | | | | | | 600,919,393 | |
|
| |
Construction & Engineering—2.4% | | | | | | | | |
Koninklijke Boskalis Westminster NV | | | 3,942,812 | | | | 224,749,338 | |
| |
Leighton Holdings Ltd. | | | 6,662,390 | | | | 125,384,724 | |
| |
Trevi Finanziaria Industriale SpA1 | | | 8,996,150 | | | | 88,586,820 | |
| | | | | | | | |
| | | | | | | 438,720,882 | |
|
| |
Electrical Equipment—3.5% | | | | | | | | |
ABB Ltd.2 | | | 7,378,839 | | | | 175,464,432 | |
| |
Legrand SA | | | 3,176,430 | | | | 201,180,884 | |
| |
Nidec Corp. | | | 1,693,370 | | | | 99,018,155 | |
| |
Schneider Electric SA | | | 1,791,880 | | | | 169,285,809 | |
| | | | | | | | |
| | | | | | | 644,949,280 | |
|
| |
Machinery—4.0% | | | | | | | | |
Aalberts Industries NV1 | | | 7,706,645 | | | | 253,767,329 | |
| |
Atlas Copco AB, Cl. A | | | 7,339,963 | | | | 215,430,204 | |
| |
FANUC Corp. | | | 258,800 | | | | 44,281,823 | |
| |
Weir Group plc (The) | | | 5,223,413 | | | | 229,573,319 | |
| | | | | | | | |
| | | | | | | 743,052,675 | |
|
| |
Professional Services—3.4% | | | | | | | | |
Experian plc | | | 12,270,857 | | | | 213,455,444 | |
| |
Intertek Group plc | | | 4,156,880 | | | | 203,422,994 | |
| |
SGS SA | | | 81,611 | | | | 204,968,639 | |
| | | | | | | | |
| | | | | | | 621,847,077 | |
|
| |
Trading Companies & Distributors—3.4% | | | | | | | | |
Brenntag AG | | | 1,040,448 | | | | 194,445,192 | |
| |
Bunzl plc | | | 7,798,630 | | | | 219,433,474 | |
12 OPPENHEIMER INTERNATIONAL GROWTH FUND
| | | | | | | | |
| | | Shares | | | Value | |
| |
Trading Companies & Distributors (Continued) | | | | | | | | |
|
| |
Wolseley plc | | | 3,878,119 | | | $ | 216,334,093 | |
| | | | | | | | |
| | | | | | | 630,212,759 | |
|
| |
Information Technology—13.9% | | | | | | | | |
| |
Communications Equipment—1.1% | | | | | | | | |
Telefonaktiebolaget LM Ericsson, Cl. B | | | 15,863,858 | | | | 197,861,364 | |
| |
Electronic Equipment, Instruments, & Components—2.3% | | | | | | | | |
Hoya Corp. | | | 6,653,710 | | | | 206,931,607 | |
| |
Keyence Corp. | | | 435,321 | | | | 170,228,361 | |
| |
Omron Corp. | | | 1,302,218 | | | | 49,223,776 | |
| | | | | | | | |
| | | | | | | 426,383,744 | |
|
| |
Internet Software & Services—2.6% | | | | | | | | |
Telecity Group plc | | | 8,108,879 | | | | 96,725,767 | |
| |
United Internet AG | | | 4,425,238 | | | | 204,494,636 | |
| |
Yahoo Japan Corp. | | | 39,830,200 | | | | 183,213,265 | |
| | | | | | | | |
| | | | | | | 484,433,668 | |
|
| |
IT Services—1.4% | | | | | | | | |
Amadeus IT Holding SA, Cl. A | | | 5,317,945 | | | | 234,021,617 | |
| |
Infosys Ltd. | | | 360,672 | | | | 17,970,969 | |
| | | | | | | | |
| | | | | | | 251,992,586 | |
|
| |
Semiconductors & Semiconductor Equipment—1.2% | | | | | | | | |
ARM Holdings plc | | | 14,312,360 | | | | 221,018,694 | |
|
| |
Software—5.3% | | | | | | | | |
Aveva Group plc | | | 2,493,794 | | | | 93,669,689 | |
| |
Dassault Systemes SA | | | 1,402,940 | | | | 178,012,295 | |
| |
Gemalto NV | | | 1,543,706 | | | | 167,840,358 | |
| |
Sage Group plc (The) | | | 17,088,876 | | | | 117,463,042 | |
| |
SAP AG | | | 3,876,827 | | | | 296,757,401 | |
| |
Temenos Group AG2 | | | 3,515,715 | | | | 126,932,281 | |
| | | | | | | | |
| | | | | | | 980,675,066 | |
|
| |
Materials—4.9% | | | | | | | | |
| |
Chemicals—3.8% | | | | | | | | |
Essentra plc1 | | | 17,088,089 | | | | 226,300,409 | |
| |
Sika AG | | | 53,001 | | | | 210,450,381 | |
| |
Syngenta AG | | | 670,992 | | | | 258,334,634 | |
| | | | | | | | |
| | | | | | | 695,085,424 | |
|
| |
Construction Materials—1.1% | | | | | | | | |
James Hardie Industries plc | | | 15,535,900 | | | | 206,957,409 | |
| |
Telecommunication Services—4.5% | | | | | | | | |
| |
Diversified Telecommunication Services—4.5% | | | | | | | | |
BT Group plc | | | 54,320,251 | | | | 362,819,151 | |
| |
Iliad SA | | | 473,930 | | | | 151,646,421 | |
| |
Inmarsat plc | | | 15,522,567 | | | | 190,424,379 | |
| |
Ziggo NV | | | 2,434,907 | | | | 114,850,661 | |
| | | | | | | | |
| | | | | | | 819,740,612 | |
|
| |
Utilities—0.4% | | | | | | | | |
| |
Independent Power and Renewable Electricity Producers—0.4% | | | | | | | | |
APR Energy plc1 | | | 5,134,054 | | | | 68,669,442 | |
| | | | | | | | |
Total Common Stocks (Cost $13,342,839,358) | | | | | | | 17,679,364,759 | |
| |
Preferred Stock—0.0% | | | | | | | | |
Zee Entertainment Enterprises Ltd., 6% Cum. Non-Cv. (Cost $843,860) | | | 172,139,289 | | | | 2,214,010 | |
| | |
| | | Units | | | | |
| |
Rights, Warrants and Certificates—0.0% | | | | | | | | |
Ceres, Inc. Wts., Strike Price $19.50, Exp. 9/6/152,3 | | | 126,666 | | | | — | |
| |
MEI Pharma, Inc. Wts., Strike Price $1.19, Exp. 5/10/172 | | | 1,118,385 | | | | 415,480 | |
| | | | | | | | |
Total Rights, Warrants and Certificates (Cost $264,716) | | | | | | | 415,480 | |
| | |
| | | Shares | | | | |
| |
Investment Company—3.5% | | | | | | | | |
Oppenheimer Institutional Money Market Fund, Cl. E, 0.09%1,4 (Cost $643,383,813) | | | 643,383,813 | | | | 643,383,813 | |
| |
Total Investments, at Value (Cost $13,987,331,747) | | | 99.6 | % | | | 18,325,378,062 | |
| |
Assets in Excess of Other Liabilities | | | 0.4 | | | | 77,867,820 | |
| | | | |
Net Assets | | | 100.0 | % | | $ | 18,403,245,882 | |
| | | | |
13 OPPENHEIMER INTERNATIONAL GROWTH FUND
| | |
| |
| STATEMENTS OF INVESTMENTS Unaudited / Continued | | |
Footnotes to Statement of Investments
* May 30, 2014 represents the last business day of the Fund’s reporting period. See Note 1 of the accompanying Notes.
1. Is or was an affiliate, as defined in the Investment Company Act of 1940, at or during the period ended May 30, 2014, by virtue of the Fund owning at least 5% of the voting securities of the issuer or as a result of the Fund and the issuer having the same investment adviser. Transactions during the period in which the issuer was an affiliate are as follows:
| | | | | | | | | | | | | | | | |
| | | Shares
November 29,
2013 a | | | Gross Additions | | | Gross Reductions | | | Shares May 30, 2014 | |
| |
Aalberts Industries NV | | | 7,035,151 | | | | 671,494 | | | | — | | | | 7,706,645 | |
APR Energy plc | | | 5,134,054 | | | | — | | | | — | | | | 5,134,054 | |
DiaSorin SpA | | | 2,869,019 | | | | 252,484 | | | | — | | | | 3,121,503 | |
Dignity plc | | | 4,597,873 | | | | 348,812 | | | | — | | | | 4,946,685 | |
Domino’s Pizza Group plc | | | 13,699,467 | | | | 2,734,380 | | | | — | | | | 16,433,847 | |
Essentra plc | | | 13,080,031 | | | | 4,008,058 | | | | — | | | | 17,088,089 | |
Novogen Ltd.b | | | 8,330,223 | | | | — | | | | 3,357,674 | | | | 4,972,549 | |
| Oppenheimer Institutional Money Market Fund, Cl. E | | | 443,187,500 | | | | 2,394,024,325 | | | | 2,193,828,012 | | | | 643,383,813 | |
Prosegur Compania de Seguridad SA | | | 23,076,814 | | | | 8,926,422 | | | | — | | | | 32,003,236 | |
Schoeller-Bleckmann Oilfield Equipment AG | | | 804,134 | | | | 39,278 | | | | — | | | | 843,412 | |
Trevi Finanziaria Industriale SpA | | | 8,996,150 | | | | — | | | | — | | | | 8,996,150 | |
Tyrian Diagnostics Ltd. | | | 119,498,536 | | | | — | | | | 119,498,536 | | | | — | |
| Tyrian Diagnostics Ltd. Wts., Strike Price 0.012AUD, Exp. 12/20/13 | | | 11,949,853 | | | | — | | | | 11,949,853 | | | | — | |
Yoox SpA | | | 3,747,784 | | | | 685,259 | | | | — | | | | 4,433,043 | |
| | | | |
| | | | | | Value | | | Income | | | Realized
Loss | |
| |
Aalberts Industries NV | | | | | | $ | 253,767,329 | | | $ | 3,388,196 | | | $ | — | |
APR Energy plc | | | | | | | 68,669,442 | | | | 572,162 | | | | — | |
DiaSorin SpA | | | | | | | 132,575,329 | | | | 1,953,349 | | | | — | |
Dignity plc | | | | | | | 117,103,533 | | | | 987,688 | | | | — | |
Domino’s Pizza Group plc | | | | | | | 155,110,359 | | | | 2,401,379 | | | | — | |
Essentra plc | | | | | | | 226,300,409 | | | | 2,527,802 | c | | | — | |
Novogen Ltd.b | | | | | | | — | d | | | — | | | | 5,536,450 | |
| Oppenheimer Institutional Money Market Fund, Cl. E | | | | | | | 643,383,813 | | | | 253,700 | | | | — | |
Prosegur Compania de Seguridad SA | | | | | | | 230,608,098 | | | | 1,609,714 | | | | — | |
Schoeller-Bleckmann Oilfield Equipment AG | | | | | | | 100,590,942 | | | | 1,315,375 | | | | — | |
Trevi Finanziaria Industriale SpA | | | | | | | 88,586,820 | | | | — | | | | — | |
Tyrian Diagnostics Ltd. | | | | | | | — | | | | — | | | | 4,676,376 | |
| Tyrian Diagnostics Ltd. Wts., Strike Price 0.012AUD, Exp. 12/20/13 | | | | | | | — | | | | — | | | | — | |
Yoox SpA | | | | | | | 142,223,354 | | | | — | | | | — | |
| | | | | | | | |
Total | | | | | | $ | 2,158,919,428 | | | $ | 15,009,365 | | | $ | 10,212,826 | |
| | | | | | | | |
a. November 29, 2013 represents the last business day of the Fund’s reporting period. See Note 1 of the accompanying Notes.
b. No longer an affiliate as of May 30, 2014.
c. All or a portion of the transitions were the result of non-cash dividends.
d. The security is no longer an affiliate. Therefore, the value has been excluded from this table.
2. Non-income producing security.
14 OPPENHEIMER INTERNATIONAL GROWTH FUND
Footnotes to Statement of Investments (Continued)
3. Restricted security. The aggregate value of restricted securities as of May 30, 2014 was $10,874, which represents less than 0.005% of the Fund’s net assets. See Note 6 of the accompanying Notes. Information concerning restricted securities is as follows:
| | | | | | | | | | | | | | | | |
| Security | | Acquisition
Dates | | | Cost | | | Value | | | Unrealized
Depreciation | |
| |
Ceres, Inc. Wts., Strike Price
$19.50, Exp. 9/6/15 | | | 9/5/07 | | | $ | — | | | $ | — | | | $ | — | |
| Oxagen Ltd. | | | 12/20/00 | | | | 2,210,700 | | | | 10,874 | | | | 2,199,826 | |
| | | | | | | | |
| | | | | | $ | 2,210,700 | | | $ | 10,874 | | | $ | 2,199,826 | |
| | | | | | | | |
4. Rate shown is the 7-day yield as of May 30, 2014.
Distribution of investments representing geographic holdings, as a percentage of total investments at value, is as follows:
| | | | | | | | |
| Geographic Holdings | | Value | | | Percent | |
| |
United Kingdom | | $ | 4,860,273,150 | | | | 26.5 | % |
Switzerland | | | 2,634,751,857 | | | | 14.4 | |
France | | | 2,214,307,454 | | | | 12.1 | |
Netherlands | | | 1,310,847,098 | | | | 7.2 | |
Spain | | | 948,769,618 | | | | 5.2 | |
Germany | | | 938,973,765 | | | | 5.1 | |
United States | | | 899,913,628 | | | | 4.9 | |
Japan | | | 871,240,747 | | | | 4.8 | |
Italy | | | 796,747,849 | | | | 4.3 | |
Sweden | | | 536,605,042 | | | | 2.9 | |
Australia | | | 489,667,987 | | | | 2.7 | |
Denmark | | | 360,552,273 | | | | 2.0 | |
Thailand | | | 227,646,608 | | | | 1.2 | |
Canada | | | 216,416,518 | | | | 1.2 | |
Jersey, Channel Islands | | | 213,455,444 | | | | 1.2 | |
India | | | 209,423,404 | | | | 1.1 | |
Ireland | | | 206,957,409 | | | | 1.1 | |
China | | | 127,360,702 | | | | 0.7 | |
Brazil | | | 126,480,673 | | | | 0.7 | |
Austria | | | 100,590,942 | | | | 0.5 | |
Mexico | | | 34,395,894 | | | | 0.2 | |
| | | | |
Total | | $ | 18,325,378,062 | | | | 100.0 | % |
| | | | |
Glossary:
Strike price is reported in U.S. Dollars, except for those denoted in the following currency:
AUD Australian Dollar
See accompanying Notes to Financial Statements.
15 OPPENHEIMER INTERNATIONAL GROWTH FUND
| | | | |
| |
STATEMENT OF ASSETS AND LIABILITIES May 30, 20141 Unaudited | | |
| | | | |
| |
Assets | | | | |
Investments, at value—see accompanying statement of investments: | | | | |
Unaffiliated companies (cost $12,340,827,067) | | $ | 16,166,458,634 | |
Affiliated companies (cost $1,646,504,680) | | | 2,158,919,428 | |
| | | | |
| | | 18,325,378,062 | |
| |
Cash | | | 12,738,452 | |
| |
Cash—foreign currencies | | | 23,681 | |
| |
Receivables and other assets: | | | | |
Shares of beneficial interest sold | | | 89,280,938 | |
Dividends | | | 81,730,163 | |
Investments sold | | | 47,815 | |
Other | | | 707,602 | |
| | | | |
Total assets | | | 18,509,906,713 | |
|
| |
Liabilities | | | | |
Payables and other liabilities: | | | | |
Investments purchased | | | 87,513,328 | |
Shares of beneficial interest redeemed | | | 16,903,927 | |
Distribution and service plan fees | | | 1,356,386 | |
Trustees’ compensation | | | 537,738 | |
Foreign capital gains tax | | | 237,424 | |
Other | | | 112,028 | |
| | | | |
Total liabilities | | | 106,660,831 | |
|
| |
Net Assets | | $ | 18,403,245,882 | |
| | | | |
|
| |
Composition of Net Assets | | | | |
Additional paid-in capital | | $ | 14,115,863,177 | |
| |
Accumulated net investment income | | | 144,889,602 | |
| |
Accumulated net realized loss on investments and foreign currency transactions | | | (195,368,556 | ) |
| |
Net unrealized appreciation on investments and translation of assets and liabilities denominated in foreign currencies | | | 4,337,861,659 | |
| | | | |
Net Assets | | $ | 18,403,245,882 | |
| | | | |
16 OPPENHEIMER INTERNATIONAL GROWTH FUND
| | | | |
| |
Net Asset Value Per Share | | | | |
Class A Shares: | | | | |
| |
| Net asset value and redemption price per share (based on net assets of $5,436,298,305 and 138,070,479 shares of beneficial interest outstanding) | | $ | 39.37 | |
| |
| |
| Maximum offering price per share (net asset value plus sales charge of 5.75% of offering price) | | $ | 41.77 | |
| |
| Class B Shares: | | | | |
| |
| Net asset value, redemption price (excludes applicable contingent deferred sales charge) and offering price per share (based on net assets of $28,907,188 and 769,189 shares of beneficial interest outstanding) | | $ | 37.58 | |
| |
| |
| Class C Shares: | | | | |
| |
| Net asset value, redemption price (excludes applicable contingent deferred sales charge) and offering price per share (based on net assets of $509,128,930 and 13,614,657 shares of beneficial interest outstanding) | | $ | 37.40 | |
| |
| |
| Class I Shares: | | | | |
| |
| Net asset value, redemption price and offering price per share (based on net assets of $3,433,499,946 and 87,460,956 shares of beneficial interest outstanding) | | $ | 39.26 | |
| |
| |
| Class N Shares: | | | | |
| |
| Net asset value, redemption price (excludes applicable contingent deferred sales charge) and offering price per share (based on net assets of $368,034,244 and 9,505,292 shares of beneficial interest outstanding) | | $ | 38.72 | |
| |
| |
| Class Y Shares: | | | | |
| |
| Net asset value, redemption price and offering price per share (based on net assets of $8,627,377,269 and 219,961,359 shares of beneficial interest outstanding) | | $ | 39.22 | |
1. May 30, 2014 represents the last business day of the Fund’s reporting period. See Note 1 of the accompanying Notes.
See accompanying Notes to Financial Statements.
17 OPPENHEIMER INTERNATIONAL GROWTH FUND
| | | | |
| |
STATEMENT OF OPERATIONS For the Six Months Ended May 30, 20141 Unaudited | | |
| | | | |
| | | | |
Investment Income | | | | |
Dividends: | | | | |
Unaffiliated companies (net of foreign withholding taxes of $21,053,234) | | $ | 215,158,502 | |
Affiliated companies (net of foreign withholding taxes of $1,808,983) | | | 15,009,365 | |
Total investment income | | | 230,167,867 | |
Expenses | | | | |
Management fees | | | 51,019,590 | |
Distribution and service plan fees: | | | | |
Class A | | | 5,775,186 | |
Class B | | | 147,520 | |
Class C | | | 2,187,152 | |
Class N | | | 788,608 | |
Transfer and shareholder servicing agent fees: | | | | |
Class A | | | 5,086,096 | |
Class B | | | 32,521 | |
Class C | | | 481,540 | |
Class I | | | 378,200 | |
Class N | | | 347,757 | |
Class Y | | | 8,350,348 | |
Shareholder communications: | | | | |
Class A | | | 169,308 | |
Class B | | | 2,270 | |
Class C | | | 11,464 | |
Class I | | | 1,870 | |
Class N | | | 2,737 | |
Class Y | | | 158,295 | |
Custodian fees and expenses | | | 586,762 | |
Trustees’ compensation | | | 126,042 | |
Other | | | 285,662 | |
Total expenses | | | 75,938,928 | |
Less waivers and reimbursements of expenses | | | (327,285 | ) |
Net expenses | | | 75,611,643 | |
Net Investment Income | | | 154,556,224 | |
18 OPPENHEIMER INTERNATIONAL GROWTH FUND
| | | | |
Realized and Unrealized Gain (Loss) | | | | |
Net realized gain (loss) on: | | | | |
Investments from: | | | | |
Unaffiliated companies | | $ | (23,926,591 | ) |
Affiliated companies | | | (10,212,826 | ) |
Foreign currency transactions | | | 54,120 | |
Net realized loss | | | (34,085,297 | ) |
Net change in unrealized appreciation/depreciation on: | | | | |
Investments (net of foreign capital gains tax of $237,424) | | | 749,273,899 | |
Translation of assets and liabilities denominated in foreign currencies | | | 82,169,239 | |
Net change in unrealized appreciation/depreciation | | | 831,443,138 | |
Net Increase in Net Assets Resulting from Operations | | $ | 951,914,065 | |
| | | | |
| | | | |
1. May 30, 2014 represents the last business day of the Fund’s reporting period. See Note 1 of the accompanying Notes.
See accompanying Notes to Financial Statements.
19 OPPENHEIMER INTERNATIONAL GROWTH FUND
| | | | |
| |
STATEMENTS OF CHANGES IN NET ASSETS | | |
| | | | |
| | | | | | | | | | |
| | | Six Months Ended
May 30, 20141
(Unaudited) | | | | | Year Ended
November 29, 20131 | |
Operations | | | | | | | | | | |
Net investment income | | $ | 154,556,224 | | | | | $ | 122,440,596 | |
Net realized gain (loss) | | | (34,085,297 | ) | | | | | 190,221,124 | |
Net change in unrealized appreciation/depreciation | | | 831,443,138 | | | | | | 1,864,127,262 | |
Net increase in net assets resulting from operations | | | 951,914,065 | | | | | | 2,176,788,982 | |
Dividends and/or Distributions to Shareholders | | | | | | | | | | |
Dividends from net investment income: | | | | | | | | | | |
Class A | | | (29,041,497 | ) | | | | | (28,313,862 | ) |
Class B | | | — | | | | | | (70,269 | ) |
Class C | | | (1,063,893 | ) | | | | | (907,873 | ) |
Class I | | | (23,738,928 | ) | | | | | (1,742,830 | ) |
Class N | | | (1,548,447 | ) | | | | | (1,415,862 | ) |
Class Y | | | (63,514,324 | ) | | | | | (64,590,928 | ) |
| | | | (118,907,089 | ) | | | | | (97,041,624 | ) |
Beneficial Interest Transactions | | | | | | | | | | |
Net increase (decrease) in net assets resulting from beneficial interest transactions: | | | | | | | | | | |
Class A | | | 1,284,732,056 | | | | | | 880,597,437 | |
Class B | | | (3,969,444 | ) | | | | | (8,153,052 | ) |
Class C | | | 117,389,816 | | | | | | 107,231,802 | |
Class I | | | 1,421,534,414 | | | | | | 1,574,830,717 | |
Class N | | | 78,413,772 | | | | | | 69,894,875 | |
Class Y | | | 1,533,966,671 | | | | | | 1,158,187,341 | |
| | | | 4,432,067,285 | | | | | | 3,782,589,120 | |
Net Assets | | | | | | | | | | |
Total increase | | | 5,265,074,261 | | | | | | 5,862,336,478 | |
Beginning of period | | | 13,138,171,621 | | | | | | 7,275,835,143 | |
| | | |
| End of period (including accumulated net investment income of $144,889,602 and $109,240,467, respectively) | | $ | 18,403,245,882 | | | | | $ | 13,138,171,621 | |
| | | | | | | | | | |
| | | | | | | | | | |
1. May 30, 2014 and November 29, 2013 represent the last business days of the Fund’s reporting periods. See Note 1 of the accompanying Notes.
See accompanying Notes to Financial Statements.
20 OPPENHEIMER INTERNATIONAL GROWTH FUND
| | | | | | | | | | | | | | | | | | | | | | | | |
| Class A | | Six Months
Ended
May 30,
20141
(Unaudited) | | | Year Ended
November 29,
20131 | | | Year Ended
November 30,
2012 | | | Year Ended
November 30,
2011 | | | Year Ended
November 30,
2010 | | | Year Ended
November 30,
2009 | |
| |
| Per Share Operating Data | | | | | | | | | | | | | | | | | | | | | | | | |
Net asset value, beginning of period | | $ | 37.45 | | | $ | 30.43 | | | $ | 26.43 | | | $ | 25.75 | | | $ | 24.27 | | | $ | 17.02 | |
| |
Income (loss) from investment operations: | | | | | | | | | | | | | | | | | | | | | | | | |
Net investment income2 | | | 0.34 | | | | 0.36 | | | | 0.35 | | | | 0.23 | | | | 0.18 | | | | 0.18 | |
Net realized and unrealized gain | | | 1.85 | | | | 7.02 | | | | 3.85 | | | | 0.59 | | | | 1.45 | | | | 7.28 | |
| | | | |
Total from investment operations | | | 2.19 | | | | 7.38 | | | | 4.20 | | | | 0.82 | | | | 1.63 | | | | 7.46 | |
| |
Dividends and/or distributions to shareholders: | | | | | | | | | | | | | | | | | | | | | | | | |
Dividends from net investment income | | | (0.27 | ) | | | (0.36 | ) | | | (0.20 | ) | | | (0.14 | ) | | | (0.15 | ) | | | (0.21 | ) |
| |
Net asset value, end of period | | $ | 39.37 | | | $ | 37.45 | | | $ | 30.43 | | | $ | 26.43 | | | $ | 25.75 | | | $ | 24.27 | |
| | | | |
| | | | | | | | | | | | | | | | | | | |
| |
| Total Return, at Net Asset Value3 | | | 5.91% | | | | 24.52% | | | | 16.06% | | | | 3.16% | | | | 6.77% | | | | 44.32% | |
| |
| Ratios/Supplemental Data | | | | | | | | | | | | | | | | | | | | | | | | |
Net assets, end of period (in thousands) | | $ | 5,436,299 | | | $ | 3,903,102 | | | $ | 2,388,159 | | | $ | 1,663,354 | | | $ | 1,554,785 | | | $ | 1,266,608 | |
| |
Average net assets (in thousands) | | $ | 4,641,712 | | | $ | 3,048,384 | | | $ | 1,762,405 | | | $ | 1,730,811 | | | $ | 1,474,415 | | | $ | 960,876 | |
| |
Ratios to average net assets:4 | | | | | | | | | | | | | | | | | | | | | | | | |
Net investment income | | | 1.81% | | | | 1.05% | | | | 1.25% | | | | 0.83% | | | | 0.73% | | | | 0.91% | |
Total expenses5 | | | 1.15% | | | | 1.21% | | | | 1.45% | | | | 1.36% | | | | 1.39% | | | | 1.45% | |
Expenses after payments, waivers and/or reimbursements and reduction to custodian expenses | | | 1.15% | | | | 1.20% | | | | 1.28% | | | | 1.32% | | | | 1.34% | | | | 1.34% | |
| |
Portfolio turnover rate | | | 3% | | | | 12% | | | | 15% | | | | 19% | | | | 23% | | | | 13% | |
21 OPPENHEIMER INTERNATIONAL GROWTH FUND
| | |
| |
| FINANCIAL HIGHLIGHTS Continued | | |
1. May 30, 2014 and November 29, 2013 represent the last business days of the Fund’s reporting periods. See Note 1 of the accompanying Notes.
2. Per share amounts calculated based on the average shares outstanding during the period.
3. Assumes an initial investment on the business day before the first day of the fiscal period, with all dividends and distributions reinvested in additional shares on the reinvestment date, and redemption at the net asset value calculated on the last business day of the fiscal period. Sales charges are not reflected in the total returns. Total returns are not annualized for periods less than one full year. Returns do not reflect the deduction of taxes that a shareholder would pay on fund distributions or the redemption of fund shares.
4. Annualized for periods less than one full year.
5. Total expenses including indirect expenses from affiliated fund were as follows:
| | | | | | |
| | Six Months Ended May 30, 2014 | | | 1.15 | % |
| | Year Ended November 29, 2013 | | | 1.21 | % |
| | Year Ended November 30, 2012 | | | 1.45 | % |
| | Year Ended November 30, 2011 | | | 1.36 | % |
| | Year Ended November 30, 2010 | | | 1.39 | % |
| | Year Ended November 30, 2009 | | | 1.46 | % |
See accompanying Notes to Financial Statements.
22 OPPENHEIMER INTERNATIONAL GROWTH FUND
| | | | | | | | | | | | | | | | | | | | | | | | |
| Class B | | Six Months
Ended May 30,
20141
(Unaudited) | | | Year Ended
November 29,
20131 | | | Year Ended
November 30,
2012 | | | Year Ended
November 30,
2011 | | | Year Ended
November 30,
2010 | | | Year Ended
November 30,
2009 | |
| |
Per Share Operating Data | | | | | | | | | | | | | | | | | | | | | | | | |
| Net asset value, beginning of period | | $ | 35.62 | | | $ | 28.89 | | | $ | 25.09 | | | $ | 24.51 | | | $ | 23.14 | | | $ | 16.16 | |
| |
| Income (loss) from investment operations: | | | | | | | | | | | | | | | | | | | | | | | | |
| Net investment income (loss)2 | | | 0.14 | | | | 0.10 | | | | 0.14 | | | | 0.01 | | | | (0.02 | ) | | | 0.03 | |
| Net realized and unrealized gain | | | 1.82 | | | | 6.69 | | | | 3.66 | | | | 0.57 | | | | 1.39 | | | | 6.95 | |
| | | | |
| Total from investment operations | | | 1.96 | | | | 6.79 | | | | 3.80 | | | | 0.58 | | | | 1.37 | | | | 6.98 | |
| |
| Dividends and/or distributions to shareholders: | | | | | | | | | | | | | | | | | | | | | | | | |
| Dividends from net investment income | | | 0.00 | | | | (0.06 | ) | | | 0.00 | | | | 0.00 | | | | 0.00 | | | | 0.00 | |
| |
| Net asset value, end of period | | $ | 37.58 | | | $ | 35.62 | | | $ | 28.89 | | | $ | 25.09 | | | $ | 24.51 | | | $ | 23.14 | |
| | | | |
|
| |
Total Return, at Net Asset Value3 | | | 5.50% | | | | 23.56% | | | | 15.15% | | | | 2.37% | | | | 5.92% | | | | 43.19% | |
| |
Ratios/Supplemental Data | | | | | | | | | | | | | | | | | | | | | | | | |
| Net assets, end of period (in thousands) | | $ | 28,907 | | | $ | 31,300 | | | $ | 32,852 | | | $ | 39,319 | | | $ | 55,020 | | | $ | 77,565 | |
| |
| Average net assets (in thousands) | | $ | 29,720 | | | $ | 31,491 | | | $ | 35,472 | | | $ | 51,183 | | | $ | 67,453 | | | $ | 68,562 | |
| |
| Ratios to average net assets:4 | | | | | | | | | | | | | | | | | | | | | | | | |
| Net investment income (loss) | | | 0.79% | | | | 0.30% | | | | 0.53% | | | | 0.04% | | | | (0.07)% | | | | 0.16% | |
| Total expenses5 | | | 1.90% | | | | 2.04% | | | | 2.30% | | | | 2.35% | | | | 2.41% | | | | 2.51% | |
| Expenses after payments, waivers and/or reimbursements and reduction to custodian expenses | | | 1.90% | | | | 1.98% | | | | 2.07% | | | | 2.13% | | | | 2.13% | | | | 2.13% | |
| |
| Portfolio turnover rate | | | 3% | | | | 12% | | | | 15% | | | | 19% | | | | 23% | | | | 13% | |
1. May 30, 2014 and November 29, 2013 represent the last business days of the Fund’s reporting periods. See Note 1 of the accompanying Notes.
2. Per share amounts calculated based on the average shares outstanding during the period.
3. Assumes an initial investment on the business day before the first day of the fiscal period, with all dividends and distributions reinvested in additional shares on the reinvestment date, and redemption at the net asset value calculated on the last business day of the fiscal period. Sales charges are not reflected in the total returns. Total returns are not annualized for periods less than one full year. Returns do not reflect the deduction of taxes that a shareholder would pay on fund distributions or the redemption of fund shares.
4. Annualized for periods less than one full year.
5. Total expenses including indirect expenses from affiliated fund were as follows:
| | | | | | |
| | Six Months Ended May 30, 2014 | | | 1.90 | % |
| | Year Ended November 29, 2013 | | | 2.04 | % |
| | Year Ended November 30, 2012 | | | 2.30 | % |
| | Year Ended November 30, 2011 | | | 2.35 | % |
| | Year Ended November 30, 2010 | | | 2.41 | % |
| | Year Ended November 30, 2009 | | | 2.52 | % |
See accompanying Notes to Financial Statements.
23 OPPENHEIMER INTERNATIONAL GROWTH FUND
| | |
| |
| FINANCIAL HIGHLIGHTS Continued | | |
| | | | | | | | | | | | | | | | | | | | | | | | |
| Class C | | Six Months
Ended May 30,
20141
(Unaudited) | | | Year Ended
November 29,
20131 | | | Year Ended
November 30,
2012 | | | Year Ended
November 30,
2011 | | | Year Ended
November 30,
2010 | | | Year Ended
November 30,
2009 | |
| |
Per Share Operating Data | | | | | | | | | | | | | | | | | | | | | | | | |
| Net asset value, beginning of period | | $ | 35.54 | | | $ | 28.87 | | | $ | 25.07 | | | $ | 24.47 | | | $ | 23.10 | | | $ | 16.15 | |
| |
| Income (loss) from investment operations: | | | | | | | | | | | | | | | | | | | | | | | | |
| Net investment income (loss)2 | | | 0.19 | | | | 0.09 | | | | 0.14 | | | | 0.03 | | | | (0.01 | ) | | | 0.03 | |
| Net realized and unrealized gain | | | 1.77 | | | | 6.71 | | | | 3.66 | | | | 0.57 | | | | 1.38 | | | | 6.94 | |
| | | | |
| Total from investment operations | | | 1.96 | | | | 6.80 | | | | 3.80 | | | | 0.60 | | | | 1.37 | | | | 6.97 | |
| |
| Dividends and/or distributions to shareholders: | | | | | | | | | | | | | | | | | | | | | | | | |
| Dividends from net investment income | | | (0.10 | ) | | | (0.13 | ) | | | 0.00 | | | | 0.00 | | | | 0.00 | 3 | | | (0.02 | ) |
| |
| Net asset value, end of period | | $ | 37.40 | | | $ | 35.54 | | | $ | 28.87 | | | $ | 25.07 | | | $ | 24.47 | | | $ | 23.10 | |
| | | | |
|
| |
Total Return, at Net Asset Value4 | | | 5.53% | | | | 23.64% | | | | 15.16% | | | | 2.45% | | | | 5.94% | | | | 43.20% | |
| |
Ratios/Supplemental Data | | | | | | | | | | | | | | | | | | | | | | | | |
| Net assets, end of period (in thousands) | | $ | 509,129 | | | $ | 368,340 | | | $ | 206,019 | | | $ | 189,147 | | | $ | 196,001 | | | $ | 196,449 | |
| |
| Average net assets (in thousands) | | $ | 439,445 | | | $ | 267,686 | | | $ | 194,518 | | | $ | 210,320 | | | $ | 198,031 | | | $ | 163,758 | |
| |
| Ratios to average net assets:5 | | | | | | | | | | | | | | | | | | | | | | | | |
| Net investment income (loss) | | | 1.04% | | | | 0.29% | | | | 0.53% | | | | 0.12% | | | | (0.04)% | | | | 0.18% | |
| Total expenses6 | | | 1.89% | | | | 1.93% | | | | 2.05% | | | | 2.04% | | | | 2.10% | | | | 2.20% | |
| Expenses after payments, waivers and/or reimbursements and reduction to custodian expenses | | | 1.89% | | | | 1.93% | | | | 2.05% | | | | 2.04% | | | | 2.09% | | | | 2.10% | |
| |
| Portfolio turnover rate | | | 3% | | | | 12% | | | | 15% | | | | 19% | | | | 23% | | | | 13% | |
1. May 30, 2014 and November 29, 2013 represent the last business days of the Fund’s reporting periods. See Note 1 of the accompanying Notes.
2. Per share amounts calculated based on the average shares outstanding during the period.
3. Less than $0.005 per share.
4. Assumes an initial investment on the business day before the first day of the fiscal period, with all dividends and distributions reinvested in additional shares on the reinvestment date, and redemption at the net asset value calculated on the last business day of the fiscal period. Sales charges are not reflected in the total returns. Total returns are not annualized for periods less than one full year. Returns do not reflect the deduction of taxes that a shareholder would pay on fund distributions or the redemption of fund shares.
5. Annualized for periods less than one full year.
6. Total expenses including indirect expenses from affiliated fund were as follows:
| | | | | | |
| | Six Months Ended May 30, 2014 | | | 1.89 | % |
| | Year Ended November 29, 2013 | | | 1.93 | % |
| | Year Ended November 30, 2012 | | | 2.05 | % |
| | Year Ended November 30, 2011 | | | 2.04 | % |
| | Year Ended November 30, 2010 | | | 2.10 | % |
| | Year Ended November 30, 2009 | | | 2 .21 | % |
See accompanying Notes to Financial Statements.
24 OPPENHEIMER INTERNATIONAL GROWTH FUND
| | | | | | | | | | | | | | | | |
| Class I | | Six Months Ended May 30,
20141 (Unaudited) | | | Year Ended
November 29,
20131 | | | Period Ended
November
30, 20122 | | | | | |
| | | | | |
Per Share Operating Data | | | | | | | | | | | | | | | | |
| Net asset value, beginning of period | | $ | 37.41 | | | $ | 30.37 | | | $ | 28.71 | | | | | |
| | | | | |
| Income (loss) from investment operations: | | | | | | | | | | | | | | | | |
Net investment income3 | | | 0.47 | | | | 0.44 | | | | 0.21 | | | | | |
Net realized and unrealized gain | | | 1.80 | | | | 7.08 | | | | 1.45 | | | | | |
| | | | | | | | |
Total from investment operations | | | 2.27 | | | | 7.52 | | | | 1.66 | | | | | |
| | | | | |
Dividends and/or distributions to shareholders: | | | | | | | | | | | | | | | | |
Dividends from net investment income | | | (0.42 | ) | | | (0.48 | ) | | | 0.00 | | | | | |
| | | | | |
Net asset value, end of period | | $ | 39.26 | | | $ | 37.41 | | | $ | 30.37 | | | | | |
| | | | | | | | |
| | | | | |
| Total Return, at Net Asset Value4 | | | 6.14% | | | | 25.14% | | | | 5.78 | % | | | | |
| | | | | |
| Ratios/Supplemental Data | | | | | | | | | | | | | | | | |
Net assets, end of period (in thousands) | | $ | 3,433,500 | | | $ | 1,870,890 | | | $ | 108,917 | | | | | |
| | | | | |
| Average net assets (in thousands) | | $ | 2,528,703 | | | $ | 961,530 | | | $ | 61,111 | | | | | |
| | | | | |
| Ratios to average net assets:5 | | | | | | | | | | | | | | | | |
| Net investment income | | | 2.48% | | | | 1.28% | | | | 1.10 | % | | | | |
| Total expenses6 | | | 0.70% | | | | 0.72% | | | | 0.74 | % | | | | |
| Expenses after payments, waivers and/or reimbursements and reduction to custodian expenses | | | 0.70% | | | | 0.72% | | | | 0.74 | % | | | | |
| | | | | |
| Portfolio turnover rate | | | 3% | | | | 12% | | | | 15 | % | | | | |
1. May 30, 2014 and November 29, 2013 represent the last business days of the Fund’s reporting periods. See Note 1 of the accompanying Notes.
2. For the period from March 29, 2012 (inception of offering) to November 30, 2012.
3. Per share amounts calculated based on the average shares outstanding during the period.
4. Assumes an initial investment on the business day before the first day of the fiscal period, with all dividends and distributions reinvested in additional shares on the reinvestment date, and redemption at the net asset value calculated on the last business day of the fiscal period. Sales charges are not reflected in the total returns. Total returns are not annualized for periods less than one full year. Returns do not reflect the deduction of taxes that a shareholder would pay on fund distributions or the redemption of fund shares.
5. Annualized for periods less than one full year.
6. Total expenses including indirect expenses from affiliated fund were as follows:
| | | | | | |
| | Six Months Ended May 30, 2014 | | | 0.70 | % |
| | Year Ended November 29, 2013 | | | 0.72 | % |
| | Period Ended November 30, 2012 | | | 0.74 | % |
See accompanying Notes to Financial Statements.
25 OPPENHEIMER INTERNATIONAL GROWTH FUND
| | |
| |
| FINANCIAL HIGHLIGHTS Continued | | |
| | | | | | | | | | | | | | | | | | | | | | | | |
| Class N | | Six Months
Ended May 30,
20141
(Unaudited) | | | Year Ended
November 29,
20131 | | | Year Ended
November 30,
2012 | | | Year Ended
November 30,
2011 | | | Year Ended
November 30,
2010 | | | Year Ended
November 30,
2009 | |
| |
Per Share Operating Data | | | | | | | | | | | | | | | | | | | | | | | | |
Net asset value, beginning of period | | $ | 36.81 | | | $ | 29.89 | | | $ | 25.98 | | | $ | 25.33 | | | $ | 23.89 | | | $ | 16.74 | |
| |
Income (loss) from investment operations: | | | | | | | | | | | | | | | | | | | | | | | | |
Net investment income2 | | | 0.29 | | | | 0.26 | | | | 0.27 | | | | 0.17 | | | | 0.12 | | | | 0.14 | |
Net realized and unrealized gain | | | 1.82 | | | | 6.92 | | | | 3.78 | | | | 0.57 | | | | 1.43 | | | | 7.15 | |
| | | | |
Total from investment operations | | | 2.11 | | | | 7.18 | | | | 4.05 | | | | 0.74 | | | | 1.55 | | | | 7.29 | |
| |
Dividends and/or distributions to shareholders: | | | | | | | | | | | | | | | | | | | | | | | | |
Dividends from net investment income | | | (0.20 | ) | | | (0.26 | ) | | | (0.14 | ) | | | (0.09 | ) | | | (0.11 | ) | | | (0.14 | ) |
| |
Net asset value, end of period | | $ | 38.72 | | | $ | 36.81 | | | $ | 29.89 | | | $ | 25.98 | | | $ | 25.33 | | | $ | 23.89 | |
| | | | |
|
| |
Total Return, at Net Asset Value3 | | | 5.78% | | | | 24.23% | | | | 15.73% | | | | 2.90% | | | | 6.53% | | | | 43.90% | |
|
| |
Ratios/Supplemental Data | | | | | | | | | | | | | | | | | | | | | | | | |
Net assets, end of period (in thousands) | | $ | 368,034 | | | $ | 272,619 | | | $ | 158,362 | | | $ | 113,905 | | | $ | 100,249 | | | $ | 81,079 | |
| |
Average net assets (in thousands) | | $ | 317,184 | | | $ | 213,038 | | | $ | 137,418 | | | $ | 115,153 | | | $ | 92,184 | | | $ | 60,494 | |
| |
Ratios to average net assets:4 | | | | | | | | | | | | | | | | | | | | | | | | |
Net investment income | | | 1.53% | | | | 0.79% | | | | 0.97% | | | | 0.60% | | | | 0.48% | | | | 0.68% | |
Total expenses5 | | | 1.39% | | | | 1.45% | | | | 1.70% | | | | 1.65% | | | | 1.73% | | | | 1.82% | |
Expenses after payments, waivers and/or reimbursements and reduction to custodian expenses | | | 1.39% | | | | 1.44% | | | | 1.57% | | | | 1.56% | | | | 1.58% | | | | 1.58% | |
| |
Portfolio turnover rate | | | 3% | | | | 12% | | | | 15% | | | | 19% | | | | 23% | | | | 13% | |
1. May 30, 2014 and November 29, 2013 represent the last business days of the Fund’s reporting periods. See Note 1 of the accompanying Notes.
2. Per share amounts calculated based on the average shares outstanding during the period.
3. Assumes an initial investment on the business day before the first day of the fiscal period, with all dividends and distributions reinvested in additional shares on the reinvestment date, and redemption at the net asset value calculated on the last business day of the fiscal period. Sales charges are not reflected in the total returns. Total returns are not annualized for periods less than one full year. Returns do not reflect the deduction of taxes that a shareholder would pay on fund distributions or the redemption of fund shares.
4. Annualized for periods less than one full year.
5. Total expenses including indirect expenses from affiliated fund were as follows:
| | | | | | |
| | Six Months Ended May 30, 2014 | | | 1.39 | % |
| | Year Ended November 29, 2013 | | | 1.45 | % |
| | Year Ended November 30, 2012 | | | 1.70 | % |
| | Year Ended November 30, 2011 | | | 1.65 | % |
| | Year Ended November 30, 2010 | | | 1.73 | % |
| | Year Ended November 30, 2009 | | | 1.83 | % |
See accompanying Notes to Financial Statements.
26 OPPENHEIMER INTERNATIONAL GROWTH FUND
| | | | | | | | | | | | | | | | | | | | | | | | |
| Class Y | | Six Months
Ended May 30,
20141
(Unaudited) | | | Year Ended
November 29,
20131 | | | Year Ended
November 30, 2012 | | | Year Ended
November 30,
2011 | | | Year Ended
November 30,
2010 | | | Year Ended
November 30,
2009 | |
| |
Per Share Operating Data | | | | | | | | | | | | | | | | | | | | | | | | |
Net asset value, beginning of period | | $ | 37.35 | | | $ | 30.34 | | | $ | 26.38 | | | $ | 25.71 | | | $ | 24.20 | | | $ | 17.02 | |
| |
Income (loss) from investment operations: | | | | | | | | | | | | | | | | | | | | | | | | |
Net investment income2 | | | 0.38 | | | | 0.46 | | | | 0.48 | | | | 0.36 | | | | 0.30 | | | | 0.28 | |
Net realized and unrealized gain | | | 1.84 | | | | 6.99 | | | | 3.80 | | | | 0.58 | | | | 1.46 | | | | 7.24 | |
| | | | |
Total from investment operations | | | 2.22 | | | | 7.45 | | | | 4.28 | | | | 0.94 | | | | 1.76 | | | | 7.52 | |
| |
Dividends and/or distributions to shareholders: | | | | | | | | | | | | | | | | | | | | | | | | |
Dividends from net investment income | | | (0.35 | ) | | | (0.44 | ) | | | (0.32 | ) | | | (0.27 | ) | | | (0.25 | ) | | | (0.34 | ) |
| |
Net asset value, end of period | | $ | 39.22 | | | $ | 37.35 | | | $ | 30.34 | | | $ | 26.38 | | | $ | 25.71 | | | $ | 24.20 | |
| | | | |
|
| |
Total Return, at Net Asset Value3 | | | 6.02% | | | | 24.91% | | | | 16.54% | | | | 3.63% | | | | 7.34% | | | | 45.02% | |
| |
Ratios/Supplemental Data | | | | | | | | | | | | | | | | | | | | | | | | |
Net assets, end of period (in thousands) | | $ | 8,627,377 | | | $ | 6,691,921 | | | $ | 4,381,526 | | | $ | 2,996,792 | | | $ | 2,436,200 | | | $ | 1,645,882 | |
| |
Average net assets (in thousands) | | $ | 7,631,863 | | | $ | 5,487,802 | | | $ | 3,865,270 | | | $ | 2,934,647 | | | $ | 2,042,580 | | | $ | 1,155,662 | |
| |
Ratios to average net assets:4 | | | | | | | | | | | | | | | | | | | | | | | | |
Net investment income | | | 2.01% | | | | 1.38% | | | | 1.72% | | | | 1.30% | | | | 1.22% | | | | 1.42% | |
Total expenses5 | | | 0.89% | | | | 0.90% | | | | 0.87% | | | | 0.91% | | | | 0.81% | | | | 0.83% | |
Expenses after payments, waivers and/or reimbursements and reduction to custodian expenses | | | 0.89% | | | | 0.90% | | | | 0.87% | | | | 0.87% | | | | 0.81% | | | | 0.82% | |
| |
Portfolio turnover rate | | | 3% | | | | 12% | | | | 15% | | | | 19% | | | | 23% | | | | 13% | |
27 OPPENHEIMER INTERNATIONAL GROWTH FUND
| | | | |
| |
FINANCIAL HIGHLIGHTS Continued | | |
1. May 30, 2014 and November 29, 2013 represent the last business days of the Fund’s reporting periods. See Note 1 of the accompanying Notes.
2. Per share amounts calculated based on the average shares outstanding during the period.
3. Assumes an initial investment on the business day before the first day of the fiscal period, with all dividends and distributions reinvested in additional shares on the reinvestment date, and redemption at the net asset value calculated on the last business day of the fiscal period. Sales charges are not reflected in the total returns. Total returns are not annualized for periods less than one full year. Returns do not reflect the deduction of taxes that a shareholder would pay on fund distributions or the redemption of fund shares.
4. Annualized for periods less than one full year.
5. Total expenses including indirect expenses from affiliated fund were as follows:
| | | | | | |
| | Six Months Ended May 30, 2014 | | | 0.89 | % |
| | Year Ended November 29, 2013 | | | 0.90 | % |
| | Year Ended November 30, 2012 | | | 0.87 | % |
| | Year Ended November 30, 2011 | | | 0.91 | % |
| | Year Ended November 30, 2010 | | | 0.81 | % |
| | Year Ended November 30, 2009 | | | 0.84 | % |
See accompanying Notes to Financial Statements.
28 OPPENHEIMER INTERNATIONAL GROWTH FUND
| | | | |
| |
NOTES TO FINANCIAL STATEMENTS May 30, 2014 Unaudited | | |
|
1. Significant Accounting Policies
Oppenheimer International Growth Fund (the “Fund”) is registered under the Investment Company Act of 1940, as amended, as a diversified open-end management investment company. The Fund’s investment objective is to seek capital appreciation. The Fund’s investment adviser is OFI Global Asset Management, Inc. (“OFI Global” or the “Manager”), a wholly-owned subsidiary of OppenheimerFunds, Inc. (“OFI” or the “Sub-Adviser”). The Manager has entered into a sub-advisory agreement with OFI.
The Fund offers Class A, Class C, Class I, Class N and Class Y shares, and previously offered Class B shares for new purchase through June 29, 2012. Subsequent to that date, no new purchases of Class B shares are permitted, however reinvestment of dividend and/or capital gain distributions and exchanges of Class B shares into and from other Oppenheimer funds will be allowed. Class A shares are sold at their offering price, which is normally net asset value plus a front-end sales charge. Class C and Class N shares are sold, and Class B shares were sold, without a front-end sales charge but may be subject to a contingent deferred sales charge (“CDSC”). Class N shares are sold only through retirement plans. Retirement plans that offer Class N shares may impose charges on those accounts. As of July 1, 2014, Class N shares will be renamed Class R shares. Class N shares subject to a CDSC on July 1, 2014, will continue to be subject to a CDSC after the shares are renamed. Purchases of Class R shares occurring on or after July 1, 2014, will not be subject to a CDSC upon redemption. Class I and Class Y shares are sold to certain institutional investors or intermediaries without either a front-end sales charge or a CDSC, however, the intermediaries may impose charges on their accountholders who beneficially own Class I and Class Y shares. All classes of shares have identical rights and voting privileges with respect to the Fund in general and exclusive voting rights on matters that affect that class alone. Earnings, net assets and net asset value per share may differ due to each class having its own expenses, such as transfer and shareholder servicing agent fees and shareholder communications, directly attributable to that class. Class A, B, C and N shares have separate distribution and/or service plans under which they pay fees. Class I and Class Y shares do not pay such fees. Class B shares will automatically convert to Class A shares 72 months after the date of purchase.
The following is a summary of significant accounting policies consistently followed by the Fund.
Semiannual and Annual Periods. The last day of the Fund’s semiannual and annual periods was the last day the New York Stock Exchange was open for trading. The Fund’s financial statements have been presented through that date to maintain consistency with the Fund’s net asset value calculations used for shareholder transactions.
Investment in Oppenheimer Institutional Money Market Fund. The Fund is permitted to invest daily available cash balances in an affiliated money market fund. The Fund may invest the available cash in Class E shares of Oppenheimer Institutional Money Market Fund (“IMMF”) to seek current income while preserving liquidity. IMMF is a registered open-end
29 OPPENHEIMER INTERNATIONAL GROWTH FUND
| | | | |
| |
NOTES TO FINANCIAL STATEMENTS Unaudited / Continued | | |
|
| 1. Significant Accounting Policies (Continued) | | |
management investment company, regulated as a money market fund under the Investment Company Act of 1940, as amended. The Manager is the investment adviser of IMMF, and the Sub-Adviser provides investment and related advisory services to IMMF. When applicable, the Fund’s investment in IMMF is included in the Statement of Investments. Shares of IMMF are valued at their net asset value per share. As a shareholder, the Fund is subject to its proportional share of IMMF’s Class E expenses, including its management fee. The Manager will waive fees and/or reimburse Fund expenses in an amount equal to the indirect management fees incurred through the Fund’s investment in IMMF.
Foreign Currency Translation. The Fund’s accounting records are maintained in U.S. dollars. The values of securities denominated in foreign currencies and amounts related to the purchase and sale of foreign securities and foreign investment income are translated into U.S. dollars as of the close of the New York Stock Exchange (the “Exchange”), normally 4:00 P.M. Eastern time, on each day the Exchange is open for trading. Foreign exchange rates may be valued primarily using a reliable bank, dealer or service authorized by the Board of Trustees.
Reported net realized gains and losses from foreign currency transactions arise from sales of portfolio securities, sales and maturities of short-term securities, sales of foreign currencies, exchange rate fluctuations between the trade and settlement dates on securities transactions, and the difference between the amounts of dividends, interest, and foreign withholding taxes recorded on the Fund’s books and the U.S. dollar equivalent of the amounts actually received or paid. Net unrealized appreciation and depreciation on the translation of assets and liabilities denominated in foreign currencies arise from changes in the values of assets and liabilities, including investments in securities at fiscal period end, resulting from changes in exchange rates.
The effect of changes in foreign currency exchange rates on investments is separately identified from the fluctuations arising from changes in market values of securities held and reported with all other foreign currency gains and losses in the Fund’s Statement of Operations.
Allocation of Income, Expenses, Gains and Losses. Income, expenses (other than those attributable to a specific class), gains and losses are allocated on a daily basis to each class of shares based upon the relative proportion of net assets represented by such class. Operating expenses directly attributable to a specific class are charged against the operations of that class.
Federal Taxes. The Fund intends to comply with provisions of the Internal Revenue Code applicable to regulated investment companies and to distribute substantially all of its investment company taxable income to shareholders. Therefore, no federal income or excise tax provision is required. The Fund files income tax returns in U.S. federal and applicable state jurisdictions. The statute of limitations on the Fund’s tax return filings generally remain open for the three preceding fiscal reporting period ends.
30 OPPENHEIMER INTERNATIONAL GROWTH FUND
| | | | |
|
| 1. Significant Accounting Policies (Continued) | | |
During the fiscal year ended November 29, 2013, the Fund utilized $189,066,107 of capital loss carryforward to offset capital gains realized in that fiscal year. Details of the fiscal year ended November 29, 2013 capital loss carryforwards are included in the table below. Capital loss carryforwards with no expiration, if any, must be utilized prior to those with expiration dates. Capital losses with no expiration will be carried forward to future years if not offset by gains.
| | | | |
| Expiring | | | |
2015 | | $ | 658,603 | |
2016 | | | 11,117,617 | |
2017 | | | 115,960,740 | |
| | | | |
Total | | $ | 127,736,960 | |
| | | | |
Of these losses, $1,155,247 are subject to loss limitation rules resulting from merger activity. These limitations generally reduce the utilization of these losses to a maximum of $385,083 per year.
As of May 30, 2014, it is estimated that the capital loss carryforwards would be $127,736,960 expiring by 2017 and $34,085,297 which will not expire. The estimated capital loss carryforward represents the carryforward as of the end of the last fiscal year, increased or decreased by capital losses or gains realized in the first six months of the current fiscal year. During the six months ended May 30, 2014, it is estimated that the Fund will not utilize any capital loss carryforward to offset realized capital gains.
Net investment income (loss) and net realized gain (loss) may differ for financial statement and tax purposes. The character of dividends and distributions made during the fiscal year from net investment income or net realized gains may differ from their ultimate characterization for federal income tax purposes. Also, due to timing of dividends and distributions, the fiscal year in which amounts are distributed may differ from the fiscal year in which the income or net realized gain was recorded by the Fund.
The aggregate cost of securities and other investments and the composition of unrealized appreciation and depreciation of securities and other investments for federal income tax purposes as of May 30, 2014 are noted in the following table. The primary difference between book and tax appreciation or depreciation of securities and other investments, if applicable, is attributable to the tax deferral of losses or tax realization of financial statement unrealized gain or loss.
| | | | |
Federal tax cost of securities | | $ | 14,021,988,295 | |
| | | | |
Gross unrealized appreciation | | $ | 4,516,212,552 | |
Gross unrealized depreciation | | | (212,799,104) | |
| | | | |
Net unrealized appreciation | | $ | 4,303,413,448 | |
| | | | |
Trustees’ Compensation. The Fund has adopted an unfunded retirement plan (the “Plan”) for the Fund’s independent trustees. Benefits are based on years of service and fees paid to each trustee during their period of service. The Plan was frozen with respect to adding new participants effective December 31, 2006 (the “Freeze Date”) and existing Plan Participants as of the Freeze Date will continue to receive accrued benefits under the Plan. Active
31 OPPENHEIMER INTERNATIONAL GROWTH FUND
| | | | |
| |
NOTES TO FINANCIAL STATEMENTS Unaudited / Continued | | |
|
| 1. Significant Accounting Policies (Continued) | | |
independent trustees as of the Freeze Date have each elected a distribution method with respect to their benefits under the Plan. During the six months ended May 30, 2014, the Fund’s projected benefit obligations, payments to retired trustees and accumulated liability were as follows:
| | | | |
Projected Benefit Obligations Increased | | $ | 3,049 | |
Payments Made to Retired Trustees | | | 22,196 | |
Accumulated Liability as of May 30, 2014 | | | 174,820 | |
The Board of Trustees has adopted a compensation deferral plan for independent trustees that enables trustees to elect to defer receipt of all or a portion of the annual compensation they are entitled to receive from the Fund. For purposes of determining the amount owed to the Trustee under the plan, deferred amounts are treated as though equal dollar amounts had been invested in shares of the Fund or in other Oppenheimer funds selected by the Trustee. The Fund purchases shares of the funds selected for deferral by the Trustee in amounts equal to his or her deemed investment, resulting in a Fund asset equal to the deferred compensation liability. Such assets are included as a component of “Other” within the asset section of the Statement of Assets and Liabilities. Deferral of trustees’ fees under the plan will not affect the net assets of the Fund, and will not materially affect the Fund’s assets, liabilities or net investment income per share. Amounts will be deferred until distributed in accordance with the compensation deferral plan.
Dividends and Distributions to Shareholders. Dividends and distributions to shareholders, which are determined in accordance with income tax regulations and may differ from U.S. generally accepted accounting principles, are recorded on the ex-dividend date. Income and capital gain distributions, if any, are declared and paid annually or at other times as deemed necessary by the Manager.
The tax character of distributions is determined as of the Fund’s fiscal year end. Therefore, a portion of the Fund’s distributions made to shareholders prior to the Fund’s fiscal year end may ultimately be categorized as a tax return of capital.
Investment Income. Dividend income is recorded on the ex-dividend date or upon ex-dividend notification in the case of certain foreign dividends where the ex-dividend date may have passed. Non-cash dividends included in dividend income, if any, are recorded at the fair market value of the securities received. Interest income is recognized on an accrual basis. Discount and premium, which are included in interest income on the Statement of Operations, are amortized or accreted daily.
Custodian Fees. “Custodian fees and expenses” in the Statement of Operations may include interest expense incurred by the Fund on any cash overdrafts of its custodian account during the period. Such cash overdrafts may result from the effects of failed trades in portfolio securities and from cash outflows resulting from unanticipated shareholder redemption activity. The Fund pays interest to its custodian on such cash overdrafts, to the extent they are not offset by positive cash balances maintained by the Fund, at a rate equal to the Federal Funds Rate plus 0.50%. The “Reduction to custodian expenses” line item, if applicable,
32 OPPENHEIMER INTERNATIONAL GROWTH FUND
| | | | |
|
| 1. Significant Accounting Policies (Continued) | | |
represents earnings on cash balances maintained by the Fund during the period. Such interest expense and other custodian fees may be paid with these earnings.
Security Transactions. Security transactions are recorded on the trade date. Realized gains and losses on securities sold are determined on the basis of identified cost.
Indemnifications. The Fund’s organizational documents provide current and former trustees and officers with a limited indemnification against liabilities arising in connection with the performance of their duties to the Fund. In the normal course of business, the Fund may also enter into contracts that provide general indemnifications. The Fund’s maximum exposure under these arrangements is unknown as this would be dependent on future claims that may be made against the Fund. The risk of material loss from such claims is considered remote.
Other. The preparation of financial statements in conformity with accounting principles generally accepted in the United States of America requires management to make estimates and assumptions that affect the reported amounts of assets and liabilities and disclosure of contingent assets and liabilities at the date of the financial statements and the reported amounts of increases and decreases in net assets from operations during the reporting period. Actual results could differ from those estimates.
2. Securities Valuation
The Fund calculates the net asset value of its shares as of the close of the New York Stock Exchange (the “Exchange”), normally 4:00 P.M. Eastern time, on each day the Exchange is open for trading.
The Fund’s Board has adopted procedures for the valuation of the Fund’s securities and has delegated the day-to-day responsibility for valuation determinations under those procedures to the Manager. The Manager has established a Valuation Committee which is responsible for determining a “fair valuation” for any security for which market quotations are not “readily available.” The Valuation Committee’s fair valuation determinations are subject to review, approval and ratification by the Fund’s Board at its next regularly scheduled meeting covering the calendar quarter in which the fair valuation was determined.
Valuation Methods and Inputs
Securities are valued using unadjusted quoted market prices, when available, as supplied primarily by third party pricing services or dealers.
The following methodologies are used to determine the market value or the fair value of the types of securities described below:
Securities traded on a registered U.S. securities exchange (including exchange-traded derivatives other than futures and futures options) are valued based on the last sale price of the security reported on the principal exchange on which it is traded, prior to the time when the Fund’s assets are valued. In the absence of a sale, the security is valued at the last sale price on the prior trading day, if it is within the spread of the current day’s closing “bid” and “asked” prices, and if not, at the current day’s closing bid price. A security of a foreign issuer
33 OPPENHEIMER INTERNATIONAL GROWTH FUND
| | | | |
| |
NOTES TO FINANCIAL STATEMENTS Unaudited / Continued | | |
|
| 2. Securities Valuation (Continued) | | |
traded on a foreign exchange, but not listed on a registered U.S. securities exchange, is valued based on the last sale price on the principal exchange on which the security is traded, as identified by the third party pricing service used by the Manager, prior to the time when the Fund’s assets are valued. If the last sale price is unavailable, the security is valued at the most recent official closing price on the principal exchange on which it is traded. If the last sales price or official closing price for a foreign security is not available, the security is valued at the mean between the bid and asked price per the exchange or, if not available from the exchange, obtained from two dealers. If bid and asked prices are not available from either the exchange or two dealers, the security is valued by using one of the following methodologies (listed in order of priority): (1) using a bid from the exchange, (2) the mean between the bid and asked price as provided by a single dealer, or (3) a bid from a single dealer.
Shares of a registered investment company that are not traded on an exchange are valued at that investment company’s net asset value per share.
Corporate and government debt securities (of U.S. or foreign issuers) and municipal debt securities, event-linked bonds, loans, mortgage-backed securities, collateralized mortgage obligations, and asset-backed securities are valued at the mean between the “bid” and “asked” prices utilizing evaluated prices obtained from third party pricing services or broker-dealers who may use matrix pricing methods to determine the evaluated prices.
Short-term money market type debt securities with a remaining maturity of sixty days or less are valued at cost adjusted by the amortization of discount or premium to maturity (amortized cost), which approximates market value. Short-term debt securities with a remaining maturity in excess of sixty days are valued at the mean between the “bid” and “asked” prices utilizing evaluated prices obtained from third party pricing services or broker-dealers.
A description of the standard inputs that may generally be considered by the third party pricing vendors in determining their evaluated prices is provided below.
| | |
| Security Type | | Standard inputs generally considered by third-party pricing vendors |
| Corporate debt, government debt, municipal, mortgage-backed and asset-backed securities | | Reported trade data, broker-dealer price quotations, benchmark yields, issuer spreads on comparable securities, the credit quality, yield, maturity, and other appropriate factors. |
| Loans | | Information obtained from market participants regarding reported trade data and broker-dealer price quotations. |
| Event-linked bonds | | Information obtained from market participants regarding reported trade data and broker-dealer price quotations. |
If a market value or price cannot be determined for a security using the methodologies described above, or if, in the “good faith” opinion of the Manager, the market value or price obtained does not constitute a “readily available market quotation,” or a significant event has occurred that would materially affect the value of the security the security is fair valued either (i) by a standardized fair valuation methodology applicable to the security type or the significant event as previously approved by the Valuation Committee and the Fund’s Board or (ii) as determined in good faith by the Manager’s Valuation Committee. The Valuation
34 OPPENHEIMER INTERNATIONAL GROWTH FUND
| | | | |
|
| 2. Securities Valuation (Continued) |
Committee considers all relevant facts that are reasonably available, through either public information or information available to the Manager, when determining the fair value of a security. Fair value determinations by the Manager are subject to review, approval and ratification by the Fund’s Board at its next regularly scheduled meeting covering the calendar quarter in which the fair valuation was determined. Those fair valuation standardized methodologies include, but are not limited to, valuing securities at the last sale price or initially at cost and subsequently adjusting the value based on: changes in company specific fundamentals, changes in an appropriate securities index, or changes in the value of similar securities which may be further adjusted for any discounts related to security-specific resale restrictions. When possible, such methodologies use observable market inputs such as unadjusted quoted prices of similar securities, observable interest rates, currency rates and yield curves. The methodologies used for valuing securities are not necessarily an indication of the risks associated with investing in those securities nor can it be assured that the Fund can obtain the fair value assigned to a security if it were to sell the security.
To assess the continuing appropriateness of security valuations, the Manager, or its third party service provider who is subject to oversight by the Manager, regularly compares prior day prices, prices on comparable securities, and sale prices to the current day prices and challenges those prices exceeding certain tolerance levels with the third party pricing service or broker source. For those securities valued by fair valuations, whether through a standardized fair valuation methodology or a fair valuation determination, the Valuation Committee reviews and affirms the reasonableness of the valuations based on such methodologies and fair valuation determinations on a regular basis after considering all relevant information that is reasonably available.
Classifications
Each investment asset or liability of the Fund is assigned a level at measurement date based on the significance and source of the inputs to its valuation. Various data inputs are used in determining the value of each of the Fund’s investments as of the reporting period end. These data inputs are categorized in the following hierarchy under applicable financial accounting standards:
1) Level 1-unadjusted quoted prices in active markets for identical assets or liabilities (including securities actively traded on a securities exchange)
2) Level 2-inputs other than unadjusted quoted prices that are observable for the asset or liability (such as unadjusted quoted prices for similar assets and market corroborated inputs such as interest rates, prepayment speeds, credit risks, etc.)
3) Level 3-significant unobservable inputs (including the Manager’s own judgments about assumptions that market participants would use in pricing the asset or liability).
The inputs used for valuing securities are not necessarily an indication of the risks associated with investing in those securities.
35 OPPENHEIMER INTERNATIONAL GROWTH FUND
| | | | |
| |
NOTES TO FINANCIAL STATEMENTS Unaudited / Continued | | |
|
| 2. Securities Valuation (Continued) | | |
The table below categorizes amounts that are included in the Fund’s Statement of Assets and Liabilities as of May 30, 2014 based on valuation input level:
| | | | | | | | | | | | | | | | |
| | | Level 1—
Unadjusted
Quoted Prices | | | Level 2— Other Significant
Observable Inputs | | | Level 3— Significant
Unobservable
Inputs | | | Value | |
Assets Table | | | | | | | | | | | | | | | | |
Investments, at Value: | | | | | | | | | | | | | | | | |
Common Stocks | | | | | | | | | | | | | | | | |
Consumer Discretionary | | $ | 634,287,449 | | | $ | 3,063,758,271 | | | $ | — | | | $ | 3,698,045,720 | |
Consumer Staples | | | — | | | | 2,004,366,630 | | | | — | | | | 2,004,366,630 | |
Energy | | | — | | | | 623,032,254 | | | | — | | | | 623,032,254 | |
Financials | | | 140,604,346 | | | | 610,320,426 | | | | — | | | | 750,924,772 | |
Health Care | | | — | | | | 1,917,529,705 | | | | 10,874 | | | | 1,917,540,579 | |
Industrials | | | — | | | | 4,332,636,795 | | | | — | | | | 4,332,636,795 | |
Information Technology | | | — | | | | 2,562,365,122 | | | | — | | | | 2,562,365,122 | |
Materials | | | — | | | | 902,042,833 | | | | — | | | | 902,042,833 | |
Telecommunication Services | | | — | | | | 819,740,612 | | | | — | | | | 819,740,612 | |
Utilities | | | — | | | | 68,669,442 | | | | — | | | | 68,669,442 | |
Preferred Stock | | | 2,214,010 | | | | — | | | | — | | | | 2,214,010 | |
Rights, Warrants and Certificates | | | — | | | | 415,480 | | | | — | | | | 415,480 | |
Investment Company | | | 643,383,813 | | | | — | | | | — | | | | 643,383,813 | |
Total Assets | | $ | 1,420,489,618 | | | $ | 16,904,877,570 | | | $ | 10,874 | | | $ | 18,325,378,062 | |
Currency contracts and forwards, if any, are reported at their unrealized appreciation/ depreciation at measurement date, which represents the change in the contract’s value from trade date. Futures, if any, are reported at their variation margin at measurement date, which represents the amount due to/from the Fund at that date. All additional assets and liabilities included in the above table are reported at their market value at measurement date.
The table below shows the transfers between Level 2 and Level 3. The Fund’s policy is to recognize transfers in and transfers out as of the beginning of the reporting period.
| | | | | | | | |
| | | Transfers into
Level 2* | | | Transfers out of
Level 3* | |
Assets Table | | | | | | | | |
Investments, at Value: | | | | | | | | |
Rights, Warrants and Certificates | | $ | 11,400 | | | $ | (11,400 | ) |
Total Assets | | $ | 11,400 | | | $ | (11,400 | ) |
* Transferred from Level 3 to Level 2 due to the availability of market data for this security.
3. Shares of Beneficial Interest
The Fund has authorized an unlimited number of no par value shares of beneficial interest of each class. Transactions in shares of beneficial interest were as follows:
36 OPPENHEIMER INTERNATIONAL GROWTH FUND
| | | | |
|
| 3. Shares of Beneficial Interest (Continued) | | |
| | | | | | | | | | | | | | | | |
| | | Six Months Ended May 30, 2014 | | | Year Ended November 29, 20131 | |
| | | Shares | | | Amount | | | Shares | | | Amount | |
Class A | | | | | | | | | | | | | | | | |
Sold | | | 45,987,233 | | | $ | 1,745,124,097 | | | | 51,768,724 | | | $ | 1,769,356,234 | |
Dividends and/or distributions reinvested | | | 720,768 | | | | 26,567,499 | | | | 861,239 | | | | 26,284,999 | |
Redeemed | | | (12,852,695 | ) | | | (486,959,540 | ) | | | (26,901,188 | ) | | | (915,043,796 | ) |
| | | | |
Net increase | | | 33,855,306 | | | $ | 1,284,732,056 | | | | 25,728,775 | | | $ | 880,597,437 | |
| | | | |
| | | | |
| | | | | | | | | | | | | | | | | |
Class B | | | | | | | | | | | | | | | | |
Sold | | | 58,367 | | | $ | 2,100,021 | | | | 126,198 | | | $ | 4,071,308 | |
Dividends and/or distributions reinvested | | | — | | | | — | | | | 2,306 | | | | 67,418 | |
Redeemed | | | (167,930 | ) | | | (6,069,465 | ) | | | (387,003 | ) | | | (12,291,778 | ) |
| | | | |
Net decrease | | | (109,563 | ) | | $ | (3,969,444 | ) | | | (258,499 | ) | | $ | (8,153,052 | ) |
| | | | |
| | | | |
| | | | | | | | | | | | | | | | | |
Class C | | | | | | | | | | | | | | | | |
Sold | | | 4,239,467 | | | $ | 153,042,461 | | | | 4,857,424 | | | $ | 159,499,481 | |
Dividends and/or distributions reinvested | | | 24,999 | | | | 877,950 | | | | 25,887 | | | | 754,864 | |
Redeemed | | | (1,013,540 | ) | | | (36,530,595 | ) | | | (1,655,100 | ) | | | (53,022,543 | ) |
| | | | |
Net increase | | | 3,250,926 | | | $ | 117,389,816 | | | | 3,228,211 | | | $ | 107,231,802 | |
| | | | |
| | | | |
| | | | | | | | | | | | | | | | | |
Class I | | | | | | | | | | | | | | | | |
Sold | | | 43,445,199 | | | $ | 1,649,439,038 | | | | 50,523,796 | | | $ | 1,721,553,284 | |
Dividends and/or distributions reinvested | | | 638,347 | | | | 23,408,172 | | | | 57,457 | | | | 1,742,661 | |
Redeemed | | | (6,638,601 | ) | | | (251,312,796 | ) | | | (4,152,101 | ) | | | (148,465,228 | ) |
| | | | |
Net increase | | | 37,444,945 | | | $ | 1,421,534,414 | | | | 46,429,152 | | | $ | 1,574,830,717 | |
| | | | |
| | | | |
| | | | | | | | | | | | | | | | | |
Class N | | | | | | | | | | | | | | | | |
Sold | | | 2,873,406 | | | $ | 107,345,514 | | | | 3,967,959 | | | $ | 132,169,713 | |
Dividends and/or distributions reinvested | | | 39,246 | | | | 1,424,244 | | | | 43,745 | | | | 1,315,000 | |
Redeemed | | | (813,647 | ) | | | (30,355,986 | ) | | | (1,903,249 | ) | | | (63,589,838 | ) |
| | | | |
Net increase | | | 2,099,005 | | | $ | 78,413,772 | | | | 2,108,455 | | | $ | 69,894,875 | |
| | | | |
| | | | |
| | | | | | | | | | | | | | | | | |
Class Y | | | | | | | | | | | | | | | | |
Sold | | | 71,158,557 | | | $ | 2,686,080,703 | | | | 105,715,256 | | | $ | 3,565,424,574 | |
Dividends and/or distributions reinvested | | | 1,461,059 | | | | 53,577,048 | | | | 2,005,215 | | | | 60,838,229 | |
Redeemed | | | (31,850,092 | ) | | | (1,205,691,080 | ) | | | (72,965,971 | ) | | | (2,468,075,462 | ) |
| | | | |
Net increase | | | 40,769,524 | | | $ | 1,533,966,671 | | | | 34,754,500 | | | $ | 1,158,187,341 | |
| | | | |
1. For the year ended November 29, 2013 for Class A, Class B, Class C, Class N and Class Y shares, and for the period from March 28, 2013 (inception of offering) to November 29, 2013 for Class I shares.
37 OPPENHEIMER INTERNATIONAL GROWTH FUND
| | | | |
| |
NOTES TO FINANCIAL STATEMENTS Unaudited / Continued | | |
| | |
| 4. Purchases and Sales of Securities | | |
The aggregate cost of purchases and proceeds from sales of securities, other than short-term obligations and investments in IMMF, for the six months ended May 30, 2014 were as follows:
| | | | | | | | |
| | | Purchases | | | Sales | |
Investment securities | | $ | 4,617,668,946 | | | $ | 400,794,009 | |
5. Fees and Other Transactions with Affiliates
Management Fees. Under the investment advisory agreement, the Fund pays the Manager a management fee based on the daily net assets of the Fund at an annual rate as shown in the following table:
| | | | |
| Fee Schedule | | | |
Up to $250 million | | | 0.80 | % |
Next $250 million | | | 0.77 | |
Next $500 million | | | 0.75 | |
Next $1 billion | | | 0.69 | |
Next $3 billion | | | 0.67 | |
Next $5 billion | | | 0.65 | |
Over $10 billion | | | 0.63 | |
Over $20 billion | | | 0.61 | |
Sub-Adviser Fees. The Manager has retained the Sub-Adviser to provide the day-to-day portfolio management of the Fund. Under the Sub-Advisory Agreement, the Manager pays the Sub-Adviser an annual fee in monthly installments, equal to a percentage of the investment management fee collected by the Manager from the Fund, which shall be calculated after any investment management fee waivers. The fee paid to the Sub-Adviser is paid by the Manager, not by the Fund.
Transfer Agent Fees. OFI Global (the “Transfer Agent”) serves as the transfer and shareholder servicing agent for the Fund. The Fund pays the Transfer Agent a fee based on annual net assets. Fees incurred by the Fund with respect to these services are detailed in the Statement of Operations.
Sub-Transfer Agent Fees. The Transfer Agent has retained Shareholder Services, Inc., a wholly-owned subsidiary of OFI (the “Sub-Transfer Agent”), to provide the day-to-day transfer agent and shareholder servicing of the Fund. Under the Sub-Transfer Agency Agreement, the Transfer Agent pays the Sub-Transfer Agent an annual fee in monthly installments, equal to a percentage of the transfer agent fee collected by the Transfer Agent from the Fund, which shall be calculated after any applicable fee waivers. The fee paid to the Sub-Transfer Agent is paid by the Transfer Agent, not by the Fund.
38 OPPENHEIMER INTERNATIONAL GROWTH FUND
| | | | |
| | |
| 5. Fees and Other Transactions with Affiliates (Continued) | | |
Distribution and Service Plan (12b-1) Fees. Under its General Distributor’s Agreement with the Fund, OppenheimerFunds Distributor, Inc. (the “Distributor”) acts as the Fund’s principal underwriter in the continuous public offering of the Fund’s classes of shares.
Service Plan for Class A Shares. The Fund has adopted a Service Plan (the “Plan”) for Class A shares under Rule 12b-1 of the Investment Company Act of 1940. Under the Plan, the Fund reimburses the Distributor for a portion of its costs incurred for services provided to accounts that hold Class A shares. Reimbursement is made periodically at an annual rate of up to 0.25% of the daily net assets of Class A shares of the Fund. The Distributor currently uses all of those fees to pay dealers, brokers, banks and other financial institutions periodically for providing personal service and maintenance of accounts of their customers that hold Class A shares. Any unreimbursed expenses the Distributor incurs with respect to Class A shares in any fiscal year cannot be recovered in subsequent periods. Fees incurred by the Fund under the Plan are detailed in the Statement of Operations.
Distribution and Service Plans for Class B, Class C and Class N Shares. The Fund has adopted Distribution and Service Plans (the “Plans”) for Class B, Class C and Class N shares under Rule 12b-1 of the Investment Company Act of 1940 to compensate the Distributor for its services in connection with the distribution of those shares and servicing accounts. Under the Plans, the Fund pays the Distributor an annual asset-based sales charge of 0.75% on Class B and Class C shares daily net assets and 0.25% on Class N shares daily net assets. The Distributor also receives a service fee of 0.25% per year under each plan. If either the Class B, Class C or Class N plan is terminated by the Fund or by the shareholders of a class, the Board of Trustees and its independent trustees must determine whether the Distributor shall be entitled to payment from the Fund of all or a portion of the service fee and/or asset-based sales charge in respect to shares sold prior to the effective date of such termination. Fees incurred by the Fund under the Plans are detailed in the Statement of Operations. The Distributor determines its uncompensated expenses under the Plans at calendar quarter ends. The Distributor’s aggregate uncompensated expenses under the Plans at March 31, 2014 were as follows:
| | | | |
Class B | | $ | 43,582 | |
Class C | | | 8,756,964 | |
Class N | | | 3,165,642 | |
Sales Charges. Front-end sales charges and contingent deferred sales charges (“CDSC”) do not represent expenses of the Fund. They are deducted from the proceeds of sales of Fund shares prior to investment or from redemption proceeds prior to remittance, as applicable. The sales charges retained by the Distributor from the sale of shares and the CDSC retained by the Distributor on the redemption of shares is shown in the following table for the period indicated.
39 OPPENHEIMER INTERNATIONAL GROWTH FUND
| | | | |
| |
NOTES TO FINANCIAL STATEMENTS Unaudited / Continued | | |
| | |
| 5. Fees and Other Transactions with Affiliates (Continued) | | |
| | | | | | | | | | | | | | | | | | | | |
| | | | | | Class A | | | Class B | | | Class C | | | Class N | |
| | | Class A | | | Contingent | | | Contingent | | | Contingent | | | Contingent | |
| | | Front-End | | | Deferred Sales | | | Deferred Sales | | | Deferred Sales | | | Deferred Sales | |
| | | Sales Charges | | | Charges | | | Charges | | | Charges | | | Charges | |
| | | Retained by | | | Retained by | | | Retained by | | | Retained by | | | Retained by | |
| Six Months Ended | | Distributor | | | Distributor | | | Distributor | | | Distributor | | | Distributor | |
May 30, 2014 | | | $579,967 | | | | $4,508 | | | | $15,969 | | | | $30,903 | | | | $430 | |
Waivers and Reimbursements of Expenses. The Manager will waive fees and/or reimburse Fund expenses in an amount equal to the indirect management fees incurred through the Fund’s investment in IMMF. During the six months ended May 30, 2014, the Manager waived fees and/or reimbursed the Fund $327,285 for IMMF management fees.
Some of these undertakings may be modified or terminated at any time; some may not be modified or terminated until after one year from the date of the current prospectus, as indicated therein.
6. Restricted Securities
As of May 30, 2014, investments in securities included issues that are restricted. A restricted security may have a contractual restriction on its resale and is valued under methods approved by the Board of Trustees as reflecting fair value. Securities that are restricted are marked with an applicable footnote on the Statement of Investments. Restricted securities are reported on a schedule following the Statement of Investments.
7. Pending Litigation
Since 2009, seven class action lawsuits have been pending in the U.S. District Court for the District of Colorado against OppenheimerFunds, Inc. (“OFI”), OppenheimerFunds Distributor, Inc., the Fund’s principal underwriter and distributor (the “Distributor”), and certain funds (but not including the Fund) advised by OFI Global Asset Management, Inc. and distributed by the Distributor (the “Defendant Funds”). The lawsuits also name as defendants certain officers and current and former trustees of the respective Defendant Funds. The lawsuits raise claims under federal securities law and allege, among other things, that the disclosure documents of the respective Defendant Funds contained misrepresentations and omissions and that the respective Defendant Funds’ investment policies were not followed. The plaintiffs in these actions seek unspecified damages, equitable relief and awards of attorneys’ fees and litigation expenses. The Defendant Funds’ Boards of Trustees have also engaged counsel to represent the Funds and the present and former Independent Trustees named in those suits. On March 5, 2014, the parties in six of these lawsuits executed stipulations and agreements of settlement resolving those actions. The settlements are subject to a variety of contingencies, including approval by the court. The settlements do not resolve a seventh outstanding lawsuit relating to Oppenheimer Rochester California Municipal Fund.
40 OPPENHEIMER INTERNATIONAL GROWTH FUND
| | | | |
| | |
| 7. Pending Litigation (Continued) | | |
Other class action and individual lawsuits have been filed since 2008 in various state and federal courts against OFI and certain of its affiliates by investors seeking to recover investments they allegedly lost as a result of the “Ponzi” scheme run by Bernard L. Madoff and his firm, Bernard L. Madoff Investment Securities, LLC (“BLMIS”). Plaintiffs in these suits allege that they suffered losses as a result of their investments in several funds managed by an affiliate of OFI and assert a variety of claims, including breach of fiduciary duty, fraud, negligent misrepresentation, unjust enrichment, and violation of federal and state securities laws and regulations, among others. They seek unspecified damages, equitable relief and awards of attorneys’ fees and litigation expenses. Neither the Distributor, nor any of the Oppenheimer mutual funds, their independent trustees or directors are named as defendants in these lawsuits. None of the Oppenheimer mutual funds invested in any funds or accounts managed by Madoff or BLMIS. On February 28, 2011, a stipulation of partial settlement of three groups of consolidated putative class action lawsuits relating to these matters was filed in the U.S. District Court for the Southern District of New York. On August 19, 2011, the court entered an order and final judgment approving the settlement as fair, reasonable and adequate. In September 2011, certain parties filed notices of appeal from the court’s order approving the settlement. The settlement does not resolve other outstanding lawsuits against OFI and its affiliates relating to BLMIS.
In May 2014, certain current and/or former participants in 529 plans managed by OFI Private Investments, Inc. (“OFIPI”), an affiliate of OFI, filed a lawsuit in New Mexico state court against OFI, OFIPI and the Distributor. Plaintiffs in this suit allege that they are assignees of indemnification claims The Education Trust Board of New Mexico, The Education Plan Trust of New Mexico, and the State of New Mexico (collectively, the “State”) have or may have against defendants for losses the State incurred in connection with a class action lawsuit plaintiffs previously brought against the State. On the basis of the alleged assignment of the State’s indemnification claims, plaintiffs seek unspecified damages, equitable relief and an award of attorneys’ fees and litigation expenses.
OFI believes the lawsuits and appeals described above are without legal merit and, with the exception of actions it has settled, is defending against them vigorously. While it is premature to render any opinion as to the outcome in these lawsuits, or whether any costs that the Defendant Funds may bear in defending the suits might not be reimbursed by insurance, OFI believes that these suits should not impair the ability of OFI or the Distributor to perform their respective duties to the Fund, and that the outcome of all of the suits together should not have any material effect on the operations of any of the Oppenheimer mutual funds.
41 OPPENHEIMER INTERNATIONAL GROWTH FUND
| | | | |
| |
PORTFOLIO PROXY VOTING POLICIES AND PROCEDURES; UPDATES TO STATEMENTS OF INVESTMENTS Unaudited | | |
| | |
The Fund has adopted Portfolio Proxy Voting Policies and Procedures under which the Fund votes proxies relating to securities (“portfolio proxies”) held by the Fund. A description of the Fund’s Portfolio Proxy Voting Policies and Procedures is available (i) without charge, upon request, by calling the Fund toll-free at 1.800.CALL OPP (225.5677), (ii) on the Fund’s website at oppenheimerfunds.com, and (iii) on the SEC’s website at www.sec.gov. In addition, the Fund is required to file Form N-PX, with its complete proxy voting record for the 12 months ended June 30th, no later than August 31st of each year. The Fund’s voting record is available (i) without charge, upon request, by calling the Fund toll-free at 1.800.CALL OPP (225.5677), and (ii) in the Form N-PX filing on the SEC’s website at www.sec.gov.
The Fund files its complete schedule of portfolio holdings with the SEC for the first quarter and the third quarter of each fiscal year on Form N-Q. The Fund’s Form N-Q filings are available on the SEC’s website at www.sec.gov. Those forms may be reviewed and copied at the SEC’s Public Reference Room in Washington, D.C. Information on the operation of the Public Reference Room may be obtained by calling 1-800-SEC-0330.
Householding—Delivery of Shareholder Documents
This is to inform you about OppenheimerFunds’ “householding” policy. If more than one member of your household maintains an account in a particular fund, OppenheimerFunds will mail only one copy of the fund’s prospectus (or, if available, the fund’s summary prospectus), annual and semiannual report and privacy policy. The consolidation of these mailings, called householding, benefits your fund through reduced mailing expense, and benefits you by reducing the volume of mail you receive from OppenheimerFunds. Householding does not affect the delivery of your account statements.
Please note that we will continue to household these mailings for as long as you remain an OppenheimerFunds shareholder, unless you request otherwise. If you prefer to receive multiple copies of these materials, please call us at 1.800.CALL-OPP (225-5677). You may also notify us in writing or via email. We will begin sending you individual copies of the prospectus (or, if available, the summary prospectus), reports and privacy policy within 30 days of receiving your request to stop householding.
42 OPPENHEIMER INTERNATIONAL GROWTH FUND
| | | | |
| |
| OPPENHEIMER INTERNATIONAL GROWTH FUND | | |
| | |
| Trustees and Officers | | Brian F. Wruble, Chairman of the Board of Trustees and Trustee |
| | David K. Downes, Trustee |
| | Matthew P. Fink, Trustee |
| | Edmund P. Giambastiani, Jr., Trustee |
| | Mary F. Miller, Trustee |
| | Joel W. Motley, Trustee |
| | Joanne Pace, Trustee |
| | Joseph M. Wikler, Trustee |
| | Peter I. Wold, Trustee |
| | William F. Glavin, Jr., Trustee, President and Principal Executive Officer |
| | George R. Evans, Vice President |
| | Robert Dunphy, Vice President |
| | Arthur S. Gabinet, Secretary and Chief Legal Officer |
| | Christina M. Nasta, Vice President and Chief Business Officer |
| | Mary Ann Picciotto, Chief Compliance Officer and Chief Anti-Money |
| | Laundering Officer |
| | Brian W. Wixted, Treasurer and Principal Financial & Accounting Officer |
| |
| Manager | | OFI Global Asset Management, Inc. |
| |
| Sub-Adviser | | OppenheimerFunds, Inc. |
| |
| Distributor | | OppenheimerFunds Distributor, Inc. |
| |
| Transfer and Shareholder | | OFI Global Asset Management, Inc. |
| Servicing Agent | | |
| |
| Sub-Transfer Agent | | Shareholder Services, Inc. |
| | DBA OppenheimerFunds Services |
| |
| Independent Registered | | KPMGLLP |
| Public Accounting Firm | | |
| |
| Legal Counsel | | Kramer Levin Naftalis & Frankel LLP |
| |
| | The financial statements included herein have been taken from the records of the Fund without examination of those records by the independent registered public accounting firm. |
© 2014 OppenheimerFunds, Inc. All rights reserved.
43 OPPENHEIMER INTERNATIONAL GROWTH FUND
As an Oppenheimer fund shareholder, you are entitled to know how we protect your personal information and how we limit its disclosure.
Information Sources
We obtain nonpublic personal information about our shareholders from the following sources:
| — | | Applications or other forms |
| — | | When you create a user ID and password for online account access |
| — | | When you enroll in eDocs Direct, our electronic document delivery service |
| — | | Your transactions with us, our affiliates or others |
| — | | A software program on our website, often referred to as a “cookie,” which indicates which parts of our site you’ve visited |
| — | | When you set up challenge questions to reset your password online |
If you visit oppenheimerfunds.com and do not log on to the secure account information areas, we do not obtain any personal information about you. When you do log on to a secure area, we do obtain your user ID and password to identify you. We also use this information to provide you with products and services you have requested, to inform you about products and services that you may be interested in and assist you in other ways.
We do not collect personal information through our website unless you willingly provide it to us, either directly by email or in those areas of the website that request information. In order to update your personal information (including your mailing address, email address and phone number) you must first log on and visit your user profile.
If you have set your browser to warn you before accepting cookies, you will receive the warning message with each cookie. You can refuse cookies by turning them off in your browser. However, doing so may limit your access to certain sections of our website.
We use cookies to help us improve and manage our website. For example, cookies help us recognize new versus repeat visitors to the site, track the pages visited, and enable some special features on the website. This data helps us provide a better service for our website visitors.
Protection of Information
We do not disclose any non-public personal information (such as names on a customer list) about current or former customers to anyone, except as permitted by law.
Disclosure of Information
We send your financial advisor (as designated by you) copies of confirmations, account statements and other documents reporting activity in your fund accounts. We may also use details about you and your investments to help us, our financial service affiliates, or firms that jointly market their financial products and services with ours, to better serve your investment needs or suggest financial services or educational material that may be of interest to you. If this requires us to provide you with an opportunity to “opt in” or “opt out” of such information sharing with a firm not affiliated with us, you will receive notification on how to do so, before any such sharing takes place.
Right of Refusal
We will not disclose your personal information to unaffiliated third parties (except as permitted by law), unless we first offer you a reasonable opportunity to refuse or “opt out” of such disclosure.
44 OPPENHEIMER INTERNATIONAL GROWTH FUND
Internet Security and Encryption
In general, the email services provided by our website are encrypted and provide a secure and private means of communication with us. To protect your own privacy, confidential and/or personal information should only be communicated via email when you are advised that you are using a secure website. As a security measure, we do not include personal or account information in non-secure emails, and we advise you not to send such information to us in non-secure emails. Instead, you may take advantage of the secure features of our website to encrypt your email correspondence. To do this, you will need to use a browser that supports Secure Sockets Layer (SSL) protocol.
We do not guarantee or warrant that any part of our website, including files available for download, are free of viruses or other harmful code. It is your responsibility to take appropriate precautions, such as use of an anti-virus software package, to protect your computer hardware and software.
| — | | All transactions, including redemptions, exchanges and purchases, are secured by SSL and 128-bit encryption. SSL is used to establish a secure connection between your PC and OppenheimerFunds’ server. It transmits information in an encrypted and scrambled format. |
| — | | Encryption is achieved through an electronic scrambling technology that uses a “key” to code and then decode the data. Encryption acts like the cable converter box you may have on your television set. It scrambles data with a secret code so that no one can make sense of it while it is being transmitted. When the data reaches its destination, the same software unscrambles the data. |
| — | | You can exit the secure area by either closing your browser, or for added security, you can use the Log Out button before you close your browser. |
Other Security Measures
We maintain physical, electronic and procedural safeguards to protect your personal account information. Our employees and agents have access to that information only so that they may offer you products or provide services, for example, when responding to your account questions.
How You Can Help
You can also do your part to keep your account information private and to prevent unauthorized transactions. If you obtain a user ID and password for your account, do not allow it to be used by anyone else. Also, take special precautions when accessing your account on a computer used by others.
Who We Are
This joint notice describes the privacy policies of the Oppenheimer funds, OppenheimerFunds, Inc., and each of its investment adviser subsidiaries, OppenheimerFunds Distributor, Inc. and OFI Global Trust Co. It applies to all Oppenheimer fund accounts you presently have, or may open in the future, using your Social Security number—whether or not you remain a shareholder of our funds. This notice was last updated November 2013. In the event it is updated or changed, we will post an updated notice on our website at oppenheimerfunds.com. If you have any questions about these privacy policies, write to us at P.O. Box 5270, Denver, CO 80217-5270, email us by clicking on the Contact Us section of our website at oppenheimerfunds.com or call us at 1.800.CALL OPP (225.5677).
45 OPPENHEIMER INTERNATIONAL GROWTH FUND
THIS PAGE INTENTIONALLY LEFT BLANK.
46 OPPENHEIMER INTERNATIONAL GROWTH FUND
THIS PAGE INTENTIONALLY LEFT BLANK.
47 OPPENHEIMER INTERNATIONAL GROWTH FUND

Item 2. Code of Ethics.
Not applicable to semiannual reports.
Item 3. Audit Committee Financial Expert.
Not applicable to semiannual reports.
Item 4. Principal Accountant Fees and Services.
Not applicable to semiannual reports.
Item 5. Audit Committee of Listed Registrants
Not applicable.
Item 6. Schedule of Investments.
a) Not applicable. The complete schedule of investments is included in Item 1 of this Form N-CSR.
b) Not applicable.
Item 7. Disclosure of Proxy Voting Policies and Procedures for Closed-End Management Investment Companies.
Not applicable.
Item 8. Portfolio Managers of Closed-End Management Investment Companies.
Not applicable.
Item 9. Purchases of Equity Securities by Closed-End Management Investment Company and Affiliated Purchasers.
Not applicable.
Item 10. Submission of Matters to a Vote of Security Holders.
The Fund’s Governance Committee Provisions with Respect to Nominations of Directors/Trustees to the Respective Boards
None
Item 11. Controls and Procedures.
Based on their evaluation of the registrant’s disclosure controls and procedures (as defined in rule 30a-3(c) under the Investment Company Act of 1940 (17 CFR 270.30a-3(c)) as of 5/30/2014, the registrant’s principal executive officer and principal financial officer found the registrant’s disclosure controls and procedures to provide reasonable assurances that information required to be disclosed by the registrant in the reports that it files under the Securities Exchange Act of 1934 (a) is accumulated and communicated to registrant’s management, including its principal executive officer and principal financial officer, to allow timely decisions regarding required disclosure, and (b) is recorded, processed, summarized and reported, within the time periods specified in the rules and forms adopted by the U.S. Securities and Exchange Commission.
There have been no changes in the registrant’s internal controls over financial reporting that occurred during the registrant’s second fiscal quarter of the period covered by this report that have materially affected, or are reasonably likely to materially affect, the registrant’s internal control over financial reporting.
Item 12. Exhibits.
| (a) | (1) Not applicable to semiannual reports. |
(2) Exhibits attached hereto.
(3) Not applicable.
| (b) | Exhibit attached hereto. |
SIGNATURES
Pursuant to the requirements of the Securities Exchange Act of 1934 and the Investment Company Act of 1940, the registrant has duly caused this report to be signed on its behalf by the undersigned, thereunto duly authorized.
Oppenheimer International Growth Fund
| | |
| By: | | /s/ William F. Glavin, Jr. |
| | William F. Glavin, Jr. |
| | Principal Executive Officer |
| Date: | | 7/9/2014 |
Pursuant to the requirements of the Securities Exchange Act of 1934 and the Investment Company Act of 1940, this report has been signed below by the following persons on behalf of the registrant and in the capacities and on the dates indicated.
| | |
| By: | | /s/ William F. Glavin, Jr. |
| | William F. Glavin, Jr. |
| | Principal Executive Officer |
| Date: | | 7/9/2014 |
| |
| By: | | /s/ Brian W. Wixted |
| | Brian W. Wixted |
| | Principal Financial Officer |
| Date: | | 7/9/2014 |