| | |
| UNITED STATES
SECURITIES AND EXCHANGE COMMISSION |
| | |
| CERTIFIED SHAREHOLDER REPORT OF REGISTERED
MANAGEMENT INVESTMENT COMPANIES
|
| | |
| Investment Company Act file number: | (811-07513) |
| | |
| Exact name of registrant as specified in charter: | Putnam Funds Trust |
| | |
| Address of principal executive offices: | 100 Federal Street, Boston, Massachusetts 02110 |
| | |
| Name and address of agent for service: | Stephen Tate, Vice President
100 Federal Street
Boston, Massachusetts 02110 |
| | |
| Copy to: | Bryan Chegwidden, Esq.
Ropes & Gray LLP
1211 Avenue of the Americas
New York, New York 10036 |
| | |
| Registrant’s telephone number, including area code: | (617) 292-1000 |
| | |
| Date of fiscal year end: | November 30, 2022 |
| | |
| Date of reporting period: | December 1, 2021 – May 31, 2022 |
| | |
|
Item 1. Report to Stockholders: | |
| | |
| The following is a copy of the report transmitted to stockholders pursuant to Rule 30e-1 under the Investment Company Act of 1940: | |
Putnam
Short-Term Municipal
Income Fund
Semiannual report
5 | 31 | 22
Message from the Trustees
July 7, 2022
Dear Fellow Shareholder:
Financial markets in the first half of 2022 have tested the patience of investors. High inflation and rising interest rates have clouded the outlook for the U.S. economy. The Russia-Ukraine War has disrupted global energy markets, while pandemic-driven lockdowns in China have slowed global growth.
These issues, which are important to monitor and may persist for some time, are likely shorter term in nature than your long-term financial goals. History has shown that markets eventually recover from downturns. At Putnam, dedicated and experienced investors are working for you. They are evaluating risks while trying to achieve strong performance for your fund. Learn more in the interview with your fund manager(s) in the following pages.
Thank you for investing with Putnam.


Municipal bonds finance important public projects, such as schools, roads, and hospitals. The bonds are backed by the issuing city, town, or other government entity or by revenues collected from usage fees. However, unlike U.S. Treasuries and corporate bonds, the interest paid on municipal bonds is generally free from federal income taxes.
Putnam Short-Term Municipal Income Fund offers an additional advantage — the flexibility to invest in municipal bonds issued by any state or local government in the country. The fund invests mainly in bonds that have short-term maturities from three years or less and are investment grade in quality. Because an issuer’s fiscal health can affect the prices of its bonds, this flexibility is a distinct advantage.
Putnam Short-Term Municipal Income Fund offers an active, research-intensive investment approach.
|
| 2 Short-Term Municipal Income Fund |
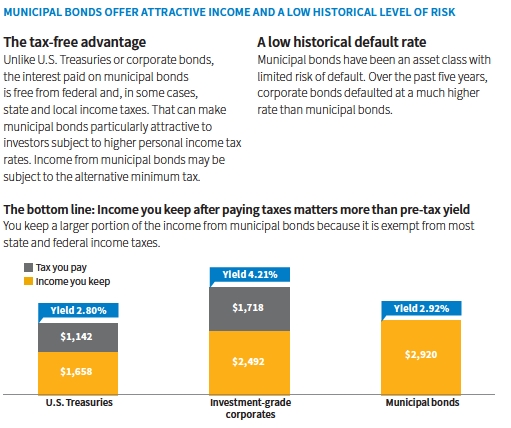
Sources: Putnam, Bloomberg Index Services Limited, as of 5/31/22. Past performance is no guarantee of future results. Yields for U.S. Treasuries, investment-grade corporates, and municipal bonds are represented by the average “yield to worst” — a calculation of the lowest possible yield generated without defaulting — of the Bloomberg U.S. Treasury Index, an unmanaged index of U.S. dollar-denominated, fixed-rate, nominal debt issued by the U.S. Treasury; the Bloomberg U.S. Corporate Bond Index, an unmanaged index of U.S. dollar-denominated, investment-grade, fixed-rate, taxable corporate bonds; and the Bloomberg Municipal Bond Index, an unmanaged index of long-term, fixed-rate, investment-grade tax-exempt bonds, respectively. You cannot invest directly in an index. Bond investments are subject to interest-rate risk (the risk of bond prices falling if interest rates rise) and credit risk (the risk of an issuer defaulting on interest or principal payments). Interest-rate risk is greater for longer-term bonds, and credit risk is greater for below-investment-grade bonds. Income from municipal bonds may be subject to the alternative minimum tax. Annual after-tax income is based on a 40.80% federal income tax rate. This rate reflects the Tax Cuts and Jobs Act of 2017 and includes the 3.80% Medicare surtax. The income data is based on a hypothetical $100,000 investment.

Source: Moody’s Investors Service, Annual U.S. Municipal Bond Defaults and Recoveries, Five-Year Average Cumulative Default Rates, 1970–2020 (July 2021). Most recent data available.
|
| Short-Term Municipal Income Fund 3 |
Current performance may be lower or higher than the quoted past performance, which cannot guarantee future results. Share price, principal value, and return will fluctuate, and you may have a gain or a loss when you sell your shares. Performance of class A shares assumes reinvestment of distributions and does not account for taxes. Fund returns in the bar chart do not reflect a sales charge of 2.25%; had they, returns would have been lower. See below and pages 9–11 for additional performance information. For a portion of the periods, the fund had expense limitations, without which returns would have been lower. To obtain the most recent month-end performance, visit putnam.com.
Returns for periods of less than one year are not annualized.
All Bloomberg indices are provided by Bloomberg Index Services Limited.
Lipper peer group average is provided by Lipper, a Refinitiv company.
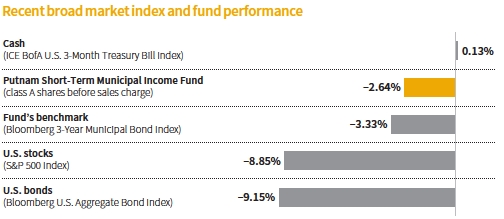
This comparison shows your fund’s performance in the context of broad market indexes for the six months ended 5/31/22. See above and pages 9–11 for additional fund performance information. Index descriptions can be found on pages 15–16.
All Bloomberg indices are provided by Bloomberg Index Services Limited.
|
| 4 Short-Term Municipal Income Fund |


Garrett, how was the market environment for short-term municipal bonds during the six-month period ended May 31, 2022?
Interest rates rose sharply due to an increasingly hawkish Federal Reserve. This was especially noteworthy for shorter-term rates, which tend to be more responsive to changes in the Fed’s benchmark rate than longer-term rates. Municipal bond prices fell, and their yields rose as the markets began pricing in a faster pace of monetary policy normalization. The entire yield curve flattened amid the bearish market sentiment.
Investors sought cash, which forced municipal bond funds to sell holdings to generate liquidity to meet redemptions. This exerted further downward pressure on prices, resulting in increasingly difficult market technicals [supply/demand dynamics] for the asset class.
For the six months ended May 31, 2022, the Bloomberg 3-Year Municipal Bond Index [the fund’s benchmark] returned –3.33%. Municipal bonds outperformed U.S. Treasuries and the broader U.S. fixed income markets. Short-term municipal bonds, which have a relatively short time to maturity, outperformed intermediate- and long-term cohorts. From
|
| Short-Term Municipal Income Fund 5 |

Allocations are shown as a percentage of the fund’s net assets as of 5/31/22. Cash and net other assets, if any, represent the market value weights of cash, derivatives, short-term securities, and other unclassified assets in the portfolio. Summary information may differ from the information in the portfolio schedule notes included in the financial statements due to the inclusion of derivative securities, any interest accruals, the timing of matured security transactions, the use of different classifications of securities for presentation purposes, and rounding. Holdings and allocations may vary over time.

Credit qualities are shown as a percentage of the fund’s net assets as of 5/31/22. A bond rated BBB or higher (SP-3 or higher, for short-term debt) is considered investment grade. This chart reflects the highest security rating provided by one or more of Standard & Poor’s, Moody’s, and Fitch. Ratings may vary over time.
Cash and net other assets, if any, represent the market value weights of cash, derivatives, and short-term securities in the portfolio. The fund itself has not been rated by an independent rating agency.
|
| 6 Short-Term Municipal Income Fund |
a credit perspective, investment-grade municipal bonds held up better than higher-yielding, lower-rated bonds in the risk-off environment. Within revenue-based bonds, the top-performing sectors for the period were electric, resource recovery, and water/sewer, while housing and hospital bonds were the biggest underperformers.
What is your current assessment of the health of the municipal bond market?
Municipal credit fundamentals continue to be strong, in our view. Higher employment, increasing wages, and rising property values have all served to bolster tax receipts. As a result, state and local tax collections were up 13.6% in 2021 compared with 2020. Unprecedented fiscal support and strong economic growth also put most state and local governments in their best fiscal shape in more than a decade. Finally, municipal defaults are running below long-term averages year to date through May 31, 2022, and remain isolated to the lowest-rated cohorts. As such, we believe the credit outlook remains favorable.
How did the fund perform during the period?
For the six months ended May 31, 2022, the fund outperformed its benchmark but underperformed the –2.34% average return of its Lipper peer group, Short Municipal Debt Funds. The fund outperformed the –2.85% return of the median fund ranked within its Lipper peer group. [Median is the midpoint in a series of values laid out in numerical order.]
What strategies or holdings influenced the fund’s performance?
The fund’s average maturity was slightly long relative to the Lipper peer average. This was due to our overweight positioning in bonds with maturities of two to five years and underweight positioning in bonds with maturities under one year. We managed the duration of the fund to be generally neutral relative to the average level of its Lipper peers over the period.

The portfolio held overweight positions in lower-investment-grade and select high-yield municipal bonds relative to its Lipper peer group. From a sector- or industry-positioning perspective, we favored local general obligation, hospital, and private higher education bonds relative to the fund’s Lipper peers.
Regarding our strategy for state debt, the fund held an overweight exposure to Illinois relative to its Lipper peer group. We believe Illinois’s financial profile continues to stabilize, and its flexibility and credit fundamentals have improved since the onset of the Covid-19 pandemic in the United States.
Regarding investments in Puerto Rico, we have become somewhat more optimistic about the U.S. territory’s credit fundamentals. In March 2022, Puerto Rico ended its nearly five-year bankruptcy with a plan to restructure its debt, resume payments to bondholders, and restore its public pension system. At period-end, the fund’s exposure to Puerto Rico municipal debt was neutral to slightly overweight relative to its Lipper peer group. We continue to monitor Puerto Rico debt for potential investment opportunities.
What is your outlook for the municipal bond market as we head into the second half of 2022?
The U.S. Treasury market has undergone a substantial adjustment during the last six months and is now more accurately pricing in the likely pace of Fed monetary tightening, in our view. While this adjustment has been painful for owners of interest-rate-sensitive assets, it has provided investors with
|
| Short-Term Municipal Income Fund 7 |
opportunities to invest at attractive yield levels that have rarely been seen in the past 10 years.
The risks around Fed tightening appear much more balanced for investors at this point compared with six months ago, in our view. We believe the increased income from higher yields and the fund’s limited duration provide a substantial cushion against losses from rising interest rates.
Thank you, Garrett, for your time and insights today.
The views expressed in this report are exclusively those of Putnam Management and are subject to change. They are not meant as investment advice.
Please note that the holdings discussed in this report may not have been held by the fund for the entire period. Portfolio composition is subject to review in accordance with the fund’s investment strategy and may vary in the future. Current and future portfolio holdings are subject to risk.
Statements in the Q&A concerning the fund’s performance or portfolio composition relative to those of the fund’s Lipper peer group may reference information produced by Lipper Inc. or through a third party.
|
| 8 Short-Term Municipal Income Fund |
Your fund’s performance
This section shows your fund’s performance, price, and distribution information for periods ended May 31, 2022, the end of the first half of its current fiscal year. In accordance with regulatory requirements for mutual funds, we also include performance information as of the most recent calendar quarter-end and expense information taken from the fund’s current prospectus. Performance should always be considered in light of a fund’s investment strategy. Data represent past performance. Past performance does not guarantee future results. More recent returns may be less or more than those shown. Investment return and principal value will fluctuate, and you may have a gain or a loss when you sell your shares. Performance information does not reflect any deduction for taxes a shareholder may owe on fund distributions or on the redemption of fund shares. For the most recent month-end performance, please visit the Individual Investors section at putnam.com or call Putnam at 1-800-225-1581. Class R6 and Y shares are not available to all investors. See the Terms and definitions section in this report for definitions of the share classes offered by your fund.
Annualized fund performance Total return for periods ended 5/31/22
| | | | | |
| | Life of fund | 5 years | 3 years | 1 year | 6 months |
| Class A (3/18/13) | | | | | |
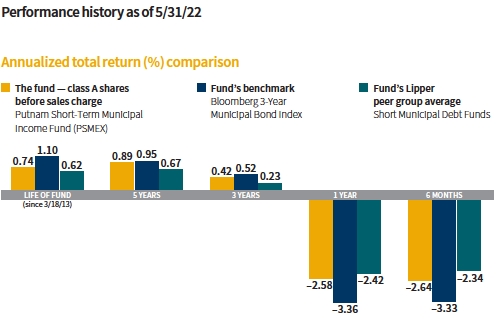
| Before sales charge | 0.74% | 0.89% | 0.42% | –2.58% | –2.64% |
| After sales charge | 0.49 | 0.43 | –0.34 | –4.77 | –4.83 |
| Class C (3/18/13) | | | | | |
| Before CDSC | 0.20 | 0.14 | –0.35 | –3.31 | –3.06 |
| After CDSC | 0.20 | 0.14 | –0.35 | –4.27 | –4.03 |
| Class R6 (5/22/18) | | | | | |
| Net asset value | 0.99 | 1.16 | 0.69 | –2.33 | –2.62 |
| Class Y (3/18/13) | | | | | |
| Net asset value | 0.99 | 1.16 | 0.67 | –2.34 | –2.53 |
Current performance may be lower or higher than the quoted past performance, which cannot guarantee future results. After-sales-charge returns for class A shares reflect the deduction of the maximum 2.25% sales charge levied at the time of purchase. Class C share returns after CDSC reflect a 1.00% CDSC for the first year that is eliminated thereafter. Class R6 and Y shares have no initial sales charge or CDSC. Performance for class R6 shares prior to their inception is derived from the historical performance of class Y shares and has not been adjusted for the lower investor servicing fees applicable to class R6 shares; had it, returns would have been higher.
Returns for periods of less than one year are not annualized.
For a portion of the periods, the fund had expense limitations, without which returns would have been lower.
Class C share performance reflects conversion to class A shares after eight years.
|
| Short-Term Municipal Income Fund 9 |
Comparative annualized index returns For periods ended 5/31/22
| | | | | |
| | Life of fund | 5 years | 3 years | 1 year | 6 months |
| Bloomberg 3-Year Municipal | | | | | |
| Bond Index | 1.10% | 0.95% | 0.52% | –3.36% | –3.33% |
| Lipper Short Municipal Debt | | | | | |
| Funds category average* | 0.62 | 0.67 | 0.23 | –2.42 | –2.34 |
Index and Lipper results should be compared with fund performance before sales charge, before CDSC, or at net asset value.
Returns for periods of less than one year are not annualized.
All Bloomberg indices are provided by Bloomberg Index Services Limited.
Lipper peer group average is provided by Lipper, a Refinitiv company.
* Over the 6-month, 1-year, 3-year, 5-year, and life-of-fund periods ended 5/31/22, there were 142, 140, 129, 106, and 82 funds, respectively, in this Lipper category.
Annualized fund performance as of most recent calendar quarter
Total return for periods ended 6/30/22
| | | | | |
| | Life of fund | 5 years | 3 years | 1 year | 6 months |
| Class A (3/18/13) | | | | | |
| Before sales charge | 0.70% | 0.84% | 0.24% | –2.93% | –2.93% |
| After sales charge | 0.45 | 0.39 | –0.52 | –5.12 | –5.12 |
| Class C (3/18/13) | | | | | |
| Before CDSC | 0.16 | 0.08 | –0.53 | –3.67 | –3.37 |
| After CDSC | 0.16 | 0.08 | –0.53 | –4.63 | –4.34 |
| Class R6 (5/22/18) | | | | | |
| Net asset value | 0.95 | 1.10 | 0.48 | –2.67 | –2.89 |
| Class Y (3/18/13) | | | | | |
| Net asset value | 0.95 | 1.10 | 0.49 | –2.70 | –2.81 |
See the discussion following the fund performance table on page 9 for information about the calculation of fund performance.
Returns for periods of less than one year are not annualized.
|
| 10 Short-Term Municipal Income Fund |
Fund price and distribution information For the six-month period ended 5/31/22
| | | | | |
| Distributions | Class A | Class C | Class R6 | Class Y |
| Number | 6 | 6 | 6 | 6 |
| Income1 | $0.028626 | $0.006444 | $0.040904 | $0.040334 |
| Capital gains2 | | | | | |
| Long-term gains | 0.005500 | 0.005500 | 0.005500 | 0.005500 |
| Short-term gains | 0.038600 | 0.038600 | 0.038600 | 0.038600 |
| Total | $0.072726 | $0.050544 | $0.085004 | $0.084434 |
| | Before | After | Net | Net | Net |
| | sales | sales | asset | asset | asset |
| Share value | charge | charge | value | value | value |
| 11/30/21 | $10.17 | $10.40 | $10.15 | $10.17 | $10.17 |
| 5/31/22 | 9.83 | 10.06 | 9.79 | 9.82 | 9.83 |
| | Before | After | Net | Net | Net |
| | sales | sales | asset | asset | asset |
| Current rate (end of period) | charge | charge | value | value | value |
| Current dividend rate3 | 0.99% | 0.97% | 0.27% | 1.27% | 1.24% |
| Taxable equivalent4 | 1.67 | 1.64 | 0.46 | 2.15 | 2.09 |
| Current 30-day SEC yield (with | | | | | |
| expense limitation)5,6 | N/A | 1.53 | 0.83 | 1.82 | 1.81 |
| Taxable equivalent4 | N/A | 2.58 | 1.40 | 3.07 | 3.06 |
| Current 30-day SEC yield | | | | | |
| (without expense limitation)6 | N/A | 1.24 | 0.53 | 1.53 | 1.52 |
The classification of distributions, if any, is an estimate. Before-sales-charge share value and current dividend rate for class A shares, if applicable, do not take into account any sales charge levied at the time of purchase. After-sales-charge share value, current dividend rate, and current 30-day SEC yield, if applicable, are calculated assuming that the maximum sales charge (2.25% for class A shares) was levied at the time of purchase. Final distribution information will appear on your year-end tax forms.
1 For some investors, investment income may be subject to the federal alternative minimum tax.
2 Capital gains, if any, are taxable for federal and, in most cases, state purposes.
3 Most recent distribution, including any return of capital and excluding capital gains, annualized and divided by share price before or after sales charge at period-end.
4 Assumes maximum 40.80% federal tax rate for 2022. Results for investors subject to lower tax rates would not be as advantageous.
5 For a portion of the period, the fund had expense limitations, without which yields would have been lower.
6 Based only on investment income and calculated using the maximum offering price for each share class, in accordance with SEC guidelines.
|
| Short-Term Municipal Income Fund 11 |
Your fund’s expenses
As a mutual fund investor, you pay ongoing expenses, such as management fees, distribution fees (12b-1 fees), and other expenses. In the most recent six-month period, your fund’s expenses were limited; had expenses not been limited, they would have been higher. Using the following information, you can estimate how these expenses affect your investment and compare them with the expenses of other funds. You may also pay one-time transaction expenses, including sales charges (loads) and redemption fees, which are not shown in this section and would have resulted in higher total expenses. For more information, see your fund’s prospectus or talk to your financial representative.
Expense ratios
| | | | |
| | Class A | Class C | Class R6 | Class Y |
| Net expenses for the fiscal year ended 11/30/21* | 0.59% | 1.34% | 0.33% | 0.34% |
| Total annual operating expenses for the fiscal year | | | | |
| ended 11/30/21 | 0.91% | 1.66% | 0.65% | 0.66% |
| Annualized expense ratio for the six-month period | | | | |
| ended 5/31/22 | 0.59% | 1.34% | 0.33% | 0.34% |
Fiscal year expense information in this table is taken from the most recent prospectus, is subject to change, and may differ from that shown for the annualized expense ratio and in the financial highlights of this report.
Expenses are shown as a percentage of average net assets.
* Reflects Putnam Management’s contractual obligation to limit certain fund expenses through 3/30/23.
Expenses per $1,000
The following table shows the expenses you would have paid on a $1,000 investment in each class of the fund from 12/1/21 to 5/31/22. It also shows how much a $1,000 investment would be worth at the close of the period, assuming actual returns and expenses.
| | | | |
| | Class A | Class C | Class R6 | Class Y |
| Expenses paid per $1,000*† | $2.90 | $6.58 | $1.62 | $1.67 |
| Ending value (after expenses) | $973.60 | $969.40 | $973.80 | $974.70 |
* Expenses for each share class are calculated using the fund’s annualized expense ratio for each class, which represents the ongoing expenses as a percentage of average net assets for the six months ended 5/31/22. The expense ratio may differ for each share class.
† Expenses are calculated by multiplying the expense ratio by the average account value for the period; then multiplying the result by the number of days in the period (182); and then dividing that result by the number of days in the year (365).
|
| 12 Short-Term Municipal Income Fund |
Estimate the expenses you paid
To estimate the ongoing expenses you paid for the six months ended 5/31/22, use the following calculation method. To find the value of your investment on 12/1/21, call Putnam at 1-800-225-1581.

Compare expenses using the SEC’s method
The Securities and Exchange Commission (SEC) has established guidelines to help investors assess fund expenses. Per these guidelines, the following table shows your fund’s expenses based on a $1,000 investment, assuming a hypothetical 5% annualized return. You can use this information to compare the ongoing expenses (but not transaction expenses or total costs) of investing in the fund with those of other funds. All mutual fund shareholder reports will provide this information to help you make this comparison. Please note that you cannot use this information to estimate your actual ending account balance and expenses paid during the period.
| | | | |
| | Class A | Class C | Class R6 | Class Y |
| Expenses paid per $1,000*† | $2.97 | $6.74 | $1.66 | $1.72 |
| Ending value (after expenses) | $1,021.99 | $1,018.25 | $1,023.29 | $1,023.24 |
* Expenses for each share class are calculated using the fund’s annualized expense ratio for each class, which represents the ongoing expenses as a percentage of average net assets for the six months ended 5/31/22. The expense ratio may differ for each share class.
† Expenses are calculated by multiplying the expense ratio by the average account value for the six-month period; then multiplying the result by the number of days in the six-month period (182); and then dividing that result by the number of days in the year (365).
|
| Short-Term Municipal Income Fund 13 |
Consider these risks before investing
The value of investments in the fund’s portfolio may fall or fail to rise over extended periods of time for a variety of reasons, including general economic, political, or financial market conditions; investor sentiment and market perceptions; government actions; geopolitical events or changes; and factors related to a specific issuer, geography, industry, or sector. These and other factors may lead to increased volatility and reduced liquidity in the fund’s portfolio holdings.
Bond investments are subject to interest-rate risk (the risk of bond prices falling if interest rates rise) and credit risk (the risk of an issuer defaulting on interest or principal payments). Bond investments may be more susceptible to downgrades or defaults during economic downturns or other periods of economic stress. Interest-rate risk is greater for longer-term bonds, and credit risk is greater for below-investment-grade bonds. Interest the fund receives might be taxable. Unlike bonds, funds that invest in bonds have fees and expenses. Tax-exempt bonds may be issued under the Internal Revenue Code only by limited types of issuers for limited types of projects. As a result, the fund’s investments may be focused in certain market segments and be more vulnerable to fluctuations in the values of the securities it holds than a more broadly invested fund. Capital gains, if any, are taxed at the federal and, in most cases, state levels. For some investors, investment income may be subject to the federal alternative minimum tax.
Our investment techniques, analyses, and judgments may not produce the outcome we intend. The investments we select for the fund may not perform as well as other securities that we do not select for the fund. We, or the fund’s other service providers, may experience disruptions or operating errors that could negatively impact the fund. You can lose money by investing in the fund.
|
| 14 Short-Term Municipal Income Fund |
Terms and definitions
Important terms
Total return shows how the value of the fund’s shares changed over time, assuming you held the shares through the entire period and reinvested all distributions in the fund.
Before sales charge, or net asset value, is the price, or value, of one share of a mutual fund, without a sales charge. Before-sales-charge figures fluctuate with market conditions. They are calculated by dividing the net assets of each class of shares by the number of outstanding shares in the class.
After sales charge is the price of a mutual fund share plus the maximum sales charge levied at the time of purchase. After-sales-charge performance figures shown here assume the 2.25% maximum sales charge for class A shares.
Contingent deferred sales charge (CDSC) is generally a charge applied at the time of the redemption of class C shares and assumes redemption at the end of the period. The CDSC for class C shares is 1% for one year after purchase.
Share classes
Class A shares are generally subject to an initial sales charge and no CDSC (except on certain redemptions of shares bought without an initial sales charge).
Class C shares are not subject to an initial sales charge and are subject to a CDSC only if the shares are redeemed during the first year.
Class R6 shares are not subject to an initial sales charge or CDSC and carry no 12b-1 fee. They are generally only available to employer-sponsored retirement plans, corporate and institutional clients, and clients in other approved programs.
Class Y shares are not subject to an initial sales charge or CDSC and carry no 12b-1 fee. They are generally only available to corporate and institutional clients and clients in other approved programs.
Fixed income terms
Current rate is the annual rate of return earned from dividends or interest of an investment. Current rate is expressed as a percentage of the price of a security, fund share, or principal investment.
Yield curve is a graph that plots the yields of bonds with equal credit quality against their differing maturity dates, ranging from shortest to longest. It is used as a benchmark for other debt, such as mortgage or bank lending rates.
Comparative indexes
Bloomberg 3-Year Municipal Bond Index is a subset of the Bloomberg Municipal Bond Index that measures the performance of investment-grade issues with remaining maturities of two to four years.
Bloomberg U.S. Aggregate Bond Index is an unmanaged index of U.S. investment-grade fixed income securities.
ICE BofA (Intercontinental Exchange Bank of America) U.S. 3-Month Treasury Bill Index is an unmanaged index that seeks to measure the performance of U.S. Treasury bills available in the marketplace.
S&P 500® Index is an unmanaged index of common stock performance.
Indexes assume reinvestment of all distributions and do not account for fees. Securities and performance of a fund and an index will differ. You cannot invest directly in an index.
BLOOMBERG® is a trademark and service mark of Bloomberg Finance L.P. and its affiliates (collectively “Bloomberg”). Bloomberg or Bloomberg’s licensors own all proprietary rights in the Bloomberg Indices. Neither Bloomberg nor Bloomberg’s licensors approve or endorse this material, or guarantee the accuracy or completeness of any information herein, or make any warranty, express or implied, as to the results to be obtained therefrom, and to the maximum extent allowed by law, neither shall have any liability or responsibility for injury or damages arising in connection therewith.
ICE Data Indices, LLC (“ICE BofA”), used with permission. ICE BofA permits use of the ICE BofA indices and related data on an “as is” basis; makes no warranties regarding same; does not guarantee the suitability,
|
| Short-Term Municipal Income Fund 15 |
quality, accuracy, timeliness, and/or completeness of the ICE BofA indices or any data included in, related to, or derived therefrom; assumes no liability in connection with the use of the foregoing; and does not sponsor, endorse, or recommend Putnam Investments, or any of its products or services.
Lipper, a Refinitiv company, is a third-party industry-ranking entity that ranks mutual funds. Its rankings do not reflect sales charges. Lipper rankings are based on total return at net asset value relative to other funds that have similar current investment styles or objectives as determined by Lipper. Lipper may change a fund’s category assignment at its discretion. Lipper category averages reflect performance trends for funds within a category.
|
| 16 Short-Term Municipal Income Fund |
Other information for shareholders
Important notice regarding delivery of shareholder documents
In accordance with Securities and Exchange Commission (SEC) regulations, Putnam sends a single notice of internet availability, or a single printed copy, of annual and semiannual shareholder reports, prospectuses, and proxy statements to Putnam shareholders who share the same address, unless a shareholder requests otherwise. If you prefer to receive your own copy of these documents, please call Putnam at 1-800-225-1581, and Putnam will begin sending individual copies within 30 days.
Proxy voting
Putnam is committed to managing our mutual funds in the best interests of our shareholders. The Putnam funds’ proxy voting guidelines and procedures, as well as information regarding how your fund voted proxies relating to portfolio securities during the 12-month period ended June 30, 2021, are available in the Individual Investors section of putnam.com and on the SEC’s website, www.sec.gov. If you have questions about finding forms on the SEC’s website, you may call the SEC at 1-800-SEC-0330. You may also obtain the Putnam funds’ proxy voting guidelines and procedures at no charge by calling Putnam’s Shareholder Services at 1-800-225-1581.
Fund portfolio holdings
The fund will file a complete schedule of its portfolio holdings with the SEC for the first and third quarters of each fiscal year on Form N-PORT within 60 days of the end of such fiscal quarter. Shareholders may obtain the fund’s Form N-PORT on the SEC’s website at www.sec.gov.
Prior to its use of Form N-PORT, the fund filed its complete schedule of its portfolio holdings with the SEC on Form N-Q, which is available online at www.sec.gov.
Trustee and employee fund ownership
Putnam employees and members of the Board of Trustees place their faith, confidence, and, most importantly, investment dollars in Putnam mutual funds. As of May 31, 2022, Putnam employees had approximately $488,000,000 and the Trustees had approximately $71,000,000 invested in Putnam mutual funds. These amounts include investments by the Trustees’ and employees’ immediate family members as well as investments through retirement and deferred compensation plans.
Liquidity risk management program
Putnam, as the administrator of the fund’s liquidity risk management program (appointed by the Board of Trustees), presented the most recent annual report on the program to the Trustees in April 2022. The report covered the structure of the program, including the program documents and related policies and procedures adopted to comply with Rule 22e-4 under the Investment Company Act of 1940, and reviewed the operation of the program from January 2021 through December 2021. The report included a description of the annual liquidity assessment of the fund that Putnam performed in November 2021. The report noted that there were no material compliance exceptions identified under Rule 22e-4 during the period. The report included a review of the governance of the program and the methodology for classification of the fund’s investments. The report also included a discussion of liquidity monitoring during the period, including during the market liquidity challenges caused by the Covid-19 pandemic, and the impact those challenges had on the liquidity of the fund’s investments. Putnam concluded that the program has been operating effectively and adequately to ensure compliance with Rule 22e-4.
|
| Short-Term Municipal Income Fund 17 |
Financial statements
These sections of the report, as well as the accompanying Notes, constitute the fund’s financial statements.
The fund’s portfolio lists all the fund’s investments and their values as of the last day of the reporting period. Holdings are organized by asset type and industry sector, country, or state to show areas of concentration and diversification.
Statement of assets and liabilities shows how the fund’s net assets and share price are determined. All investment and non-investment assets are added together. Any unpaid expenses and other liabilities are subtracted from this total. The result is divided by the number of shares to determine the net asset value per share, which is calculated separately for each class of shares. (For funds with preferred shares, the amount subtracted from total assets includes the liquidation preference of preferred shares.)
Statement of operations shows the fund’s net investment gain or loss. This is done by first adding up all the fund’s earnings — from dividends and interest income — and subtracting its operating expenses to determine net investment income (or loss). Then, any net gain or loss the fund realized on the sales of its holdings — as well as any unrealized gains or losses over the period — is added to or subtracted from the net investment result to determine the fund’s net gain or loss for the fiscal period.
Statement of changes in net assets shows how the fund’s net assets were affected by the fund’s net investment gain or loss, by distributions to shareholders, and by changes in the number of the fund’s shares. It lists distributions and their sources (net investment income or realized capital gains) over the current reporting period and the most recent fiscal year-end. The distributions listed here may not match the sources listed in the Statement of operations because the distributions are determined on a tax basis and may be paid in a different period from the one in which they were earned. Dividend sources are estimated at the time of declaration. Actual results may vary. Any non-taxable return of capital cannot be determined until final tax calculations are completed after the end of the fund’s fiscal period.
Financial highlights provide an overview of the fund’s investment results, per-share distributions, expense ratios, net investment income ratios, and portfolio turnover in one summary table, reflecting the five most recent reporting periods. In a semiannual report, the highlights table also includes the current reporting period.
|
| 18 Short-Term Municipal Income Fund |
| | |
| The fund’s portfolio 5/31/22 (Unaudited) | | |
|
Key to holding’s abbreviations
|
| AGM Assured Guaranty Municipal Corporation |
| COP Certificates of Participation |
| FHA Insd. Federal Housing Administration Insured |
| FNMA Coll. Federal National Mortgage Association Collateralized |
| FRB Floating Rate Bonds: The rate shown is the current interest rate at the close of the reporting period. Rates may be subject to a cap or floor. For certain securities, the rate may represent a fixed rate currently in place at the close of the reporting period. |
| FRN Floating Rate Notes: The rate shown is the current interest rate or yield at the close of the reporting period. Rates may be subject to a cap or floor. For certain securities, the rate may represent a fixed rate currently in place at the close of the reporting period. |
| G.O. Bonds General Obligation Bonds |
| PSFG Permanent School Fund Guaranteed |
| VRDN Variable Rate Demand Notes, which are floating-rate securities with long-term maturities that carry coupons that reset and are payable upon demand either daily, weekly or monthly. The rate shown is the current interest rate at the close of the reporting period. Rates are set by remarketing agents and may take into consideration market supply and demand, credit quality and the current SIFMA Municipal Swap Index rate, which was 0.79% as of the close of the reporting period. |
|
| | | | |
| MUNICIPAL BONDS AND NOTES (101.9%)* | Rating** | | Principal amount | Value |
| Alabama (1.2%) |
| AL State Special Care Fac. Fin. Auth. Mandatory Put Bonds (11/1/22), (Ascension Health Credit Group), Ser. 06C-1, 1.85%, 11/15/46 | AA+ | | $500,000 | $500,273 |
| Black Belt Energy Gas Dist., Gas Supply Mandatory Put Bonds (7/1/22), Ser. A, 4.00%, 8/1/47 | Aa1 | | 150,000 | 150,271 |
| | | | 650,544 |
| Arizona (—%) |
| Phoenix, Indl. Dev. Auth. Ed. Rev. Bonds, (Great Hearts Academies), 3.75%, 7/1/24 | BBB− | | 5,000 | 5,013 |
| | | | 5,013 |
| California (18.1%) |
| CA Hlth. Fac. Fin. Auth. Rev. Bonds, (Adventist Hlth. Syst./West Oblig. Group), Ser. A, 4.00%, 3/1/43 | A | | 230,000 | 229,956 |
| CA Muni. Fin. Auth. Rev. Bonds, (Channing House), Ser. A, 5.00%, 5/15/23 | AA− | | 650,000 | 670,228 |
| CA State Charter School Fin. Auth. 144A Rev. Bonds, (Summit Pub. Schools), 5.00%, 6/1/22 | Baa3 | | 105,000 | 105,000 |
| CA State Enterprise Dev. Auth. Student Hsg. Rev. Bonds, (Provident Group-SDSU Properties, LLC), Ser. A | | | | |
| 5.00%, 8/1/26 | Baa3 | | 100,000 | 105,959 |
| 5.00%, 8/1/24 | Baa3 | | 100,000 | 103,773 |
| 5.00%, 8/1/22 | Baa3 | | 50,000 | 50,194 |
| CA State Infrastructure & Econ. Dev. Bank Mandatory Put Bonds (8/1/24), (CA Academy of Sciences), 1.14%, 8/1/47 | A2 | | 1,000,000 | 991,096 |
| CA State Infrastructure & Econ. Dev. Bank Rev. Bonds, (Performing Arts Ctr. of Los Angeles Cnty.), 5.00%, 12/1/28 | A | | 640,000 | 708,315 |
| CA State Muni. Fin. Auth Mobile Home Park Rev. Bonds, (Caritas Affordable Housing, Inc.), Ser. A, 5.00%, 8/15/23 | A− | | 510,000 | 527,174 |
| |
Short-Term Municipal Income Fund 19 |
| | | | |
| MUNICIPAL BONDS AND NOTES (101.9%)* cont. | Rating** | | Principal amount | Value |
| California cont. |
| CA State Muni. Fin. Auth. Rev. Bonds, (HumanGood Oblig. Group), Ser. A, 4.00%, 10/1/30 | A−/F | | $165,000 | $166,836 |
| CA State Tobacco Securitization Agcy. Rev. Bonds, (Gold Country Settlement Funding Corp.), Ser. A, 5.00%, 6/1/23 | A | | 1,025,000 | 1,048,964 |
| Fontana, Special Tax Bonds, (Cmnty. Fac. Dist. No. 85), 3.00%, 9/1/23 | BB+/P | | 250,000 | 250,906 |
| Los Angeles Cnty., Regl. Fin. Auth. Rev. Bonds, (Vermont Manchester Social), 5.00%, 12/1/26 | AA+ | | 400,000 | 444,815 |
| Los Angeles, Dept. of Arpt. Rev. Bonds, 5.00%, 5/15/28 | Aa3 | | 500,000 | 555,562 |
| Port of Oakland Rev. Bonds, 1.181%, 5/1/25 | A1 | | 600,000 | 563,904 |
| San Bernardino Cnty., FRB, Ser. C, 1.03%, 8/1/23 | AA+ | | 250,000 | 248,569 |
| San Francisco, City & Cnty. Arpt. Comm. Intl. Arpt. VRDN, Ser. B, 0.72%, 5/1/58 | VMIG 1 | | 2,000,000 | 2,000,000 |
| Stockton, Unified School Dist. COP, 5.00%, 2/1/27 | A | | 550,000 | 612,458 |
| | | | 9,383,709 |
| Colorado (2.4%) |
| E-470 Pub. Hwy. Auth. Mandatory Put Bonds (9/1/24), Ser. B, 0.873%, 9/1/39 | A2 | | 1,000,000 | 984,096 |
| Regl. Trans. Dist. Rev. Bonds, (Denver Transit Partners, LLC) | | | | |
| 5.00%, 7/15/25 | Baa1 | | 160,000 | 168,249 |
| 5.00%, 7/15/24 | Baa1 | | 100,000 | 103,820 |
| | | | 1,256,165 |
| Connecticut (4.1%) |
| CT State G.O. Bonds, Ser. A, 5.00%, 4/15/30 | Aa3 | | 500,000 | 571,246 |
| CT State Hlth. & Edl. Fac. Auth. Rev. Bonds, (Stamford Hosp. Oblig. Group (The)) | | | | |
| Ser. M, 5.00%, 7/1/27 | BBB+ | | 250,000 | 274,611 |
| Ser. M, 5.00%, 7/1/25 | BBB+ | | 150,000 | 159,967 |
| Ser. L-1, 4.00%, 7/1/24 | BBB+ | | 500,000 | 512,167 |
| CT State Hsg. Fin. Auth. Rev. Bonds, Ser. D2, 3.00%, 5/15/24 | Aaa | | 600,000 | 604,473 |
| | | | 2,122,464 |
| District of Columbia (1.8%) |
| DC Rev. Bonds | | | | |
| (D.C. Intl. School), 5.00%, 7/1/27 | BBB | | 300,000 | 317,313 |
| (Plenary Infrastructure DC, LLC), 5.00%, 8/31/25 | A3 | | 500,000 | 532,858 |
| (KIPP DC), 5.00%, 7/1/23 | BBB+ | | 100,000 | 102,479 |
| | | | 952,650 |
| Florida (10.8%) |
| Alachua Cnty., Hlth. Fac. Auth. Rev. Bonds, (Oak Hammock U. of Florida), Ser. A, 8.00%, 10/1/42 (Prerefunded 10/1/22) | AAA/P | | 995,000 | 1,035,994 |
| FL State Dev. Fin. Corp. Ed. Fac. Rev. Bonds, (Nova Southeastern U., Inc.), 5.00%, 4/1/29 | A3 | | 150,000 | 168,184 |
| FL State Muni. Pwr. Agcy. Rev. Bonds, (St. Lucie), Ser. B, 5.00%, 10/1/27 ## | A2 | | 1,050,000 | 1,180,179 |
| Miami-Dade Cnty., Mandatory Put Bonds (7/1/24), (Waste Management, Inc.), Ser. B, 1.165%, 11/1/48 | A− | | 1,000,000 | 962,161 |
| |
20 Short-Term Municipal Income Fund |
| | | | |
| MUNICIPAL BONDS AND NOTES (101.9%)* cont. | Rating** | | Principal amount | Value |
| Florida cont. |
| Palm Beach Cnty., HFA Mandatory Put Bonds (2/1/24), (Christian Manor Restoration, LP), 1.25%, 2/15/25 | Aaa | | $1,985,000 | $1,906,630 |
| St. John’s Cnty., Indl. Dev. Auth. Rev. Bonds, (Life Care Ponte Vedra Oblig. Group), Ser. A | | | | |
| 4.00%, 12/15/28 | BB+/F | | 200,000 | 192,305 |
| 4.00%, 12/15/22 | BB+/F | | 110,000 | 110,143 |
| | | | 5,555,596 |
| Georgia (1.5%) |
| Main Street Natural Gas, Inc. Gas Supply Mandatory Put Bonds (9/1/23), Ser. B, 1.286%, 4/1/48 | Aa1 | | 800,000 | 795,218 |
| | | | 795,218 |
| Hawaii (0.5%) |
| HI State Harbor Syst. Rev. Bonds, Ser. B, 0.90%, 7/1/23 | Aa3 | | 250,000 | 244,951 |
| | | | 244,951 |
| Illinois (6.6%) |
| Chicago, Special Assmt., 1.99%, 12/1/23 | BBB/P | | 100,000 | 98,398 |
| Chicago, Waste Wtr. Transmission Rev. Bonds, 5.00%, 1/1/23 | A | | 200,000 | 201,117 |
| Cook Cnty., Cmnty. College G.O. Bonds, (Dist. No. 508), 5.25%, 12/1/30 | BBB | | 500,000 | 512,181 |
| IL State G.O. Bonds | | | | |
| Ser. A, 5.00%, 10/1/24 | Baa1 | | 500,000 | 527,300 |
| Ser. A, 5.00%, 3/1/24 | Baa1 | | 800,000 | 835,534 |
| 4.00%, 8/1/25 | Baa1 | | 225,000 | 225,660 |
| IL State Fin. Auth. Mandatory Put Bonds (11/15/24), (OSF Hlth. Care Syst. Oblig. Group), Ser. B-1, 5.00%, 5/15/50 | A | | 500,000 | 523,928 |
| IL State Fin. Auth. Rev. Bonds | | | | |
| (Presbyterian Homes Oblig. Group), Ser. A, 5.00%, 11/1/23 | A−/F | | 75,000 | 77,380 |
| (The Washington and Jane Smith Home), 4.00%, 10/15/24 | BBB−/F | | 215,000 | 216,055 |
| (The Washington and Jane Smith Home), 4.00%, 10/15/23 | BBB−/F | | 205,000 | 206,134 |
| | | | 3,423,687 |
| Iowa (0.6%) |
| IA State Fin. Auth. Solid Waste Fac. Mandatory Put Bonds (4/1/24), (Gevo NW Iowa RNG, LLC), 1.50%, 1/1/42 | Aa3 | | 300,000 | 298,421 |
| | | | 298,421 |
| Kentucky (0.3%) |
| KY Bond Dev. Corp. Edl. Fac. Rev. Bonds, (Transylvania U.), Ser. A, 5.00%, 3/1/27 | A− | | 160,000 | 176,469 |
| | | | 176,469 |
| |
Short-Term Municipal Income Fund 21 |
| | | | |
| MUNICIPAL BONDS AND NOTES (101.9%)* cont. | Rating** | | Principal amount | Value |
| Louisiana (2.9%) |
| LA Stadium & Exposition Dist. Rev. Bonds, 4.00%, 7/3/23 | BBB+/F | | $1,000,000 | $1,013,649 |
| LA State Offshore Term. Auth. Deepwater Port Mandatory Put Bonds (12/1/23), (Loop, LLC), Ser. A, 1.65%, 9/1/33 | A3 | | 400,000 | 397,693 |
| St. John The Baptist Parish Mandatory Put Bonds (7/1/24), (Marathon Oil Corp.), 2.125%, 6/1/37 | Baa3 | | 100,000 | 97,635 |
| | | | 1,508,977 |
| Maryland (0.8%) |
| Frederick Cnty., Special Tax Bonds, (Oakdale-Lake Linganore), 2.625%, 7/1/24 | BB/P | | 200,000 | 196,674 |
| MD State Hlth. & Higher Ed. Fac. Auth. Rev. Bonds, (Stevenson U.), 5.00%, 6/1/29 | BBB− | | 200,000 | 219,216 |
| | | | 415,890 |
| Massachusetts (0.1%) |
| Lowell, Collegiate Charter School Rev. Bonds, 4.00%, 6/15/24 | BB−/P | | 35,000 | 35,079 |
| MA State Hsg. Fin. Agcy. Rev. Bonds, Ser. SF-169, 4.00%, 12/1/44 | Aa1 | | 15,000 | 15,170 |
| | | | 50,249 |
| Michigan (5.1%) |
| Detroit, G.O. Bonds, 5.00%, 4/1/25 | Ba2 | | 600,000 | 631,442 |
| Flint, Hosp. Bldg. Auth. Rev. Bonds, (Hurley Med. Ctr.), Ser. B, 4.75%, 7/1/28 | Ba1 | | 560,000 | 567,933 |
| Great Lakes, Wtr. Auth. Wtr. Supply Syst. Rev. Bonds, Ser. D, 5.00%, 7/1/28 | A+ | | 1,000,000 | 1,088,242 |
| MI State Fin. Auth. Rev. Bonds, (Tobacco Settlement), Ser. A-1, 2.326%, 6/1/30 | A | | 382,036 | 358,900 |
| | | | 2,646,517 |
| Minnesota (1.6%) |
| Duluth, Econ. Dev. Auth. Rev. Bonds, (Benedictine Hlth. Syst. Oblig. Group), Ser. A, 3.00%, 7/1/24 | BB/P | | 200,000 | 199,797 |
| Duluth, Econ. Dev. Auth. Hlth. Care Fac. Rev. Bonds, (St. Luke’s Hosp. of Duluth Oblig. Group), 5.00%, 6/15/27 | BBB− | | 535,000 | 583,441 |
| MN State Res. Hsg. Fin. Agcy. Rev. Bonds, Ser. A, 4.00%, 7/1/38 | Aa1 | | 40,000 | 40,660 |
| | | | 823,898 |
| Missouri (3.4%) |
| Kansas City, Indl. Dev. Auth. Arpt. Special Oblig. Rev. Bonds | | | | |
| 5.00%, 3/1/27 | A2 | | 1,000,000 | 1,088,958 |
| 5.00%, 3/1/26 | A2 | | 500,000 | 539,350 |
| Plaza at Noah’s Ark Cmnty. Impt. Dist. Rev. Bonds, 3.00%, 5/1/23 | B+/P | | 150,000 | 149,235 |
| | | | 1,777,543 |
| Montana (—%) |
| MT State Board of Hsg. Rev. Bonds, Ser. A-2, FHA Insd., 3.00%, 12/1/43 | Aa1 | | 15,000 | 15,062 |
| | | | 15,062 |
| |
22 Short-Term Municipal Income Fund |
| | | | |
| MUNICIPAL BONDS AND NOTES (101.9%)* cont. | Rating** | | Principal amount | Value |
| Nevada (0.9%) |
| Clark Cnty., School Dist. G.O. Bonds, Ser. C, 5.00%, 6/15/28 | A1 | | $450,000 | $488,779 |
| | | | 488,779 |
| New Jersey (5.7%) |
| Newark, G.O. Bonds, Ser. C, 1.25%, 7/25/22 | BBB/P | | 1,200,000 | 1,198,740 |
| NJ State Econ. Dev. Auth. Mandatory Put Bonds (6/1/23), (NJ-American Water Co., Inc.), 1.20%, 11/1/34 | A1 | | 500,000 | 494,619 |
| NJ State Econ. Dev. Auth. Rev. Bonds | | | | |
| (NJ Transit Corp.), Ser. B, 5.00%, 11/1/24 | A3 | | 500,000 | 528,112 |
| (School Fac. Construction), 2.34%, 9/1/27 | A3 | | 100,000 | 100,726 |
| NJ State Trans. Trust Fund Auth. Rev. Bonds, Ser. AA, 5.25%, 6/15/30 | A3 | | 650,000 | 667,250 |
| | | | 2,989,447 |
| New Mexico (0.8%) |
| Farmington, Poll. Control Rev. Bonds, (Pub. Service Co. of NM), Ser. B, 2.15%, 4/1/33 | Baa2 | | 250,000 | 200,897 |
| NM State Hosp. Equip. Loan Council First Mtge. Rev. Bonds, (La Vida Expansion), Ser. C, 2.25%, 7/1/23 | BB+/F | | 200,000 | 199,363 |
| | | | 400,260 |
| New York (6.3%) |
| Long Island, Pwr. Auth. Elec. Syst. Mandatory Put Bonds | | | | |
| (9/1/26), Ser. B, 1.50%, 9/1/51 | A2 | | 200,000 | 190,402 |
| (9/1/25), Ser. B, 0.85%, 9/1/50 | A2 | | 500,000 | 471,054 |
| NY City, Hsg. Dev. Corp. Mandatory Put Bonds (7/3/23), Ser. B-2, 2.10%, 11/1/58 | AA+ | | 125,000 | 124,962 |
| NY City, Muni. Wtr. & Swr. Syst. Fin. Auth. VRDN, Ser. DD-1, 0.60%, 6/15/43 | VMIG 1 | | 1,000,000 | 1,000,000 |
| NY State Dorm. Auth. Rev. Bonds, (St. Joseph’s College) | | | | |
| 5.00%, 7/1/30 | BBB−/F | | 75,000 | 82,663 |
| 5.00%, 7/1/29 | BBB−/F | | 75,000 | 82,450 |
| 5.00%, 7/1/28 | BBB−/F | | 75,000 | 81,837 |
| 5.00%, 7/1/26 | BBB−/F | | 200,000 | 214,594 |
| 5.00%, 7/1/24 | BBB−/F | | 175,000 | 182,627 |
| 5.00%, 7/1/23 | BBB−/F | | 100,000 | 102,695 |
| NY State Hsg. Fin. Agcy. Rev. Bonds, (Climate Bond Certified), FNMA Coll., 1.625%, 5/1/23 | Aa2 | | 525,000 | 523,420 |
| NY State Trans. Special Fac. Dev. Corp. Rev. Bonds, (JFK Intl. Arpt. Term. 4, LLC), 5.00%, 12/1/25 | Baa1 | | 225,000 | 237,621 |
| | | | 3,294,325 |
| North Carolina (0.3%) |
| NC State Med. Care Comm. Hlth. Care Fac. Rev. Bonds, (Lutheran Svcs. for the Aging, Inc. Oblig. Group), 3.00%, 3/1/23 | BB/P | | 150,000 | 149,075 |
| | | | 149,075 |
| |
Short-Term Municipal Income Fund 23 |
| | | | |
| MUNICIPAL BONDS AND NOTES (101.9%)* cont. | Rating** | | Principal amount | Value |
| Ohio (3.9%) |
| Akron Bath Coply Joint Twp. Hosp. Dist. Rev. Bonds, (Summa Hlth. Syst. Oblig. Group) | | | | |
| 5.00%, 11/15/27 | BBB+/F | | $180,000 | $198,515 |
| 5.00%, 11/15/25 | BBB+/F | | 255,000 | 273,455 |
| OH State Higher Edl. Fac. Comm. Rev. Bonds | | | | |
| (Cleveland Inst. of Music (The)), 5.00%, 12/1/27 | BBB− | | 700,000 | 739,163 |
| (Ashtabula Cnty. Med. Ctr.), 5.00%, 1/1/26 | BBB+/F | | 100,000 | 106,307 |
| (Ashtabula Cnty. Med. Ctr.), 5.00%, 1/1/25 | BBB+/F | | 100,000 | 104,945 |
| (Ashtabula Cnty. Med. Ctr.), 5.00%, 1/1/24 | BBB+/F | | 90,000 | 93,165 |
| Ohio State Air Qlty. Dev. Auth. Mandatory Put Bonds (6/1/27), (Duke Energy Corp.), Ser. 22B, 4.00%, 9/1/30 | Baa2 | | 500,000 | 519,462 |
| | | | 2,035,012 |
| Pennsylvania (9.6%) |
| Monroeville, Fin. Auth. Rev. Bonds, (U. of Pittsburgh Med. Ctr.), Ser. B, 5.00%, 2/15/24 | A2 | | 715,000 | 749,577 |
| Philadelphia, Arpt. Rev. Bonds, Ser. C, 5.00%, 7/1/24 | A2 | | 750,000 | 787,501 |
| Philadelphia, Auth. for Indl. Dev. City Agreement Rev. Bonds, 5.00%, 12/1/27 | A2 | | 1,560,000 | 1,686,077 |
| Pittsburgh Wtr. & Swr. Auth. Mandatory Put Bonds (12/1/23), Ser. C, AGM, 1.44%, 9/1/40 | AA | | 625,000 | 625,604 |
| Scranton, School Dist. G.O. Bonds, Ser. 14-R, 1.394%, 4/1/31 | A1 | | 885,000 | 886,958 |
| Westmoreland Cnty. Indl. Dev. Auth. Hlth. Syst. Rev. Bonds, (Excela Hlth. Oblig. Group), Ser. A | | | | |
| 4.00%, 7/1/23 | Baa1 | | 150,000 | 152,614 |
| 4.00%, 7/1/22 | Baa1 | | 100,000 | 100,172 |
| | | | 4,988,503 |
| Puerto Rico (0.6%) |
| Cmnwlth. of PR, FRN, zero %, 11/1/51 | BB/P | | 14,000 | 6,458 |
| Cmnwlth. of PR, G.O. Bonds, Ser. A1, 5.25%, 7/1/23 | BB/P | | 250,000 | 253,349 |
| Cmnwlth. of PR, Hwy. & Trans. Auth. Rev. Bonds, Ser. CC, AGM, 5.50%, 7/1/29 | AA | | 55,000 | 58,998 |
| | | | 318,805 |
| South Carolina (0.2%) |
| SC State Pub. Svcs. Auth. Rev. Bonds, (Santee Cooper), Ser. D | | | | |
| 5.00%, 12/1/22 (Prerefunded 6/1/22) | AAA/P | | 50,000 | 50,000 |
| 5.00%, 12/1/22 (Prerefunded 6/1/22) | A2 | | 50,000 | 50,000 |
| | | | 100,000 |
| Texas (5.0%) |
| Dallas, Hotel Occupancy Tax Rev. Bonds, 4.00%, 8/15/33 | A | | 1,000,000 | 1,042,502 |
| Fort Bend, Indpt. School Dist. Mandatory Put Bonds (8/1/26), Ser. B, PSFG, 0.72%, 8/1/51 | AAA | | 1,000,000 | 922,584 |
| Houston, Indpt. School Dist. Mandatory Put Bonds (6/1/25), Ser. A-2, PSFG, 3.50%, 6/1/39 ## | Aaa | | 500,000 | 512,450 |
| SA Energy Acquisition Pub. Fac. Corp. Rev. Bonds, (Gas Supply), 5.50%, 8/1/25 | A2 | | 75,000 | 80,546 |
| TX State Affordable Hsg. Corp. Rev. Bonds, Ser. A, GNMA, 5.25%, 9/1/28 | Aaa | | 60,000 | 60,125 |
| | | | 2,618,207 |
| |
24 Short-Term Municipal Income Fund |
| | | | |
| MUNICIPAL BONDS AND NOTES (101.9%)* cont. | Rating** | | Principal amount | Value |
| Utah (1.0%) |
| UT Infrastructure Agcy. Rev. Bonds, Ser. A | | | | |
| 3.00%, 10/15/26 | BBB−/F | | $250,000 | $245,652 |
| 3.00%, 10/15/23 | BBB−/F | | 250,000 | 250,024 |
| | | | 495,676 |
| Virgin Islands (0.2%) |
| Matching Fund Special Purpose Securitization Corp. Rev. Bonds, Ser. A, 5.00%, 10/1/25 | BB/P | | 125,000 | 128,292 |
| | | | 128,292 |
| Virginia (0.8%) |
| VA State College Bldg. Auth. Edl. Fac. Rev. Bonds, Ser. B, 5.00%, 9/1/22 (Escrowed to Maturity) | AA+/P | | 160,000 | 161,488 |
| VA State Small Bus. Fin. Auth. Rev. Bonds, (National Sr. Campuses, Inc. Oblig. Group), 5.00%, 1/1/25 | A/F | | 250,000 | 265,175 |
| | | | 426,663 |
| Washington (4.8%) |
| Seattle, Muni. Lt. & Pwr. Mandatory Put Bonds (11/1/26), Ser. B, 1.04%, 5/1/45 | Aa2 | | 1,500,000 | 1,487,446 |
| WA State Hlth. Care Fac. Auth. Mandatory Put Bonds (7/3/23), (Fred Hutchinson Cancer Research Ctr.), 1.84%, 1/1/42 (Prerefunded (1/3/23)) | A+ | | 1,000,000 | 1,002,966 |
| | | | 2,490,412 |
| Total municipal bonds and notes (cost $53,840,965) | $53,026,479 |
|
| | | |
| SHORT-TERM INVESTMENTS (0.1%)* | Shares | Value |
| Putnam Short Term Investment Fund Class P 0.83% L | | 72,219 | $72,219 |
| Total short-term investments (cost $72,219) | $72,219 |
|
| |
| TOTAL INVESTMENTS |
| Total investments (cost $53,913,184) | $53,098,698 |
|
| | | |
| Notes to the fund’s portfolio |
| Unless noted otherwise, the notes to the fund’s portfolio are for the close of the fund’s reporting period, which ran from December 1, 2021 through May 31, 2022 (the reporting period). Within the following notes to the portfolio, references to “Putnam Management” represent Putnam Investment Management, LLC, the fund’s manager, an indirect wholly-owned subsidiary of Putnam Investments, LLC and references to “ASC 820” represent Accounting Standards Codification 820 Fair Value Measurements and Disclosures. |
| * | Percentages indicated are based on net assets of $52,048,119. |
| ** | The Moody’s, Standard & Poor’s or Fitch ratings indicated are believed to be the most recent ratings available at the close of the reporting period for the securities listed. Ratings are generally ascribed to securities at the time of issuance. While the agencies may from time to time revise such ratings, they undertake no obligation to do so, and the ratings do not necessarily represent what the agencies would ascribe to these securities at the close of the reporting period. Securities rated by Fitch are indicated by “/F.” Securities rated by Putnam are indicated by “/P.” The Putnam rating categories are comparable to the Standard & Poor’s classifications. If a security is insured, it will usually be rated by the ratings organizations based on the financial strength of the insurer. For further details regarding security ratings, please see the Statement of Additional Information. |
| ## | Forward commitment, in part or in entirety (Note 1). |
| L | Affiliated company (Note 5). The rate quoted in the security description is the annualized 7-day yield of the fund at the close of the reporting period. |
| |
Short-Term Municipal Income Fund 25 |
| | | |
| At the close of the reporting period, the fund maintained liquid assets totaling $2,485,673 to cover the settlement of certain securities. |
| 144A after the name of an issuer represents securities exempt from registration under Rule 144A of the Securities Act of 1933, as amended. These securities may be resold in transactions exempt from registration, normally to qualified institutional buyers. |
| On Mandatory Put Bonds, the rates shown are the current interest rates at the close of the reporting period and the dates shown represent the next mandatory put dates. Rates are set by remarketing agents and may take into consideration market supply and demand, credit quality and the current SIFMA Municipal Swap Index, 1 Month US LIBOR or 3 Month US LIBOR rates, which were 0.79%, 1.12% and 1.61%, respectively, as of the close of the reporting period. |
| The dates shown parenthetically on prerefunded bonds represent the next prerefunding dates. |
| The dates shown on debt obligations are the original maturity dates. |
| The fund had the following sector concentrations greater than 10% at the close of the reporting period (as a percentage of net assets): |
| Utilities | 15.3% |
| Local debt | 15.2 |
| Transportation | 14.1 |
| Health care | 13.3 |
|
| ASC 820 establishes a three-level hierarchy for disclosure of fair value measurements. The valuation hierarchy is based upon the transparency of inputs to the valuation of the fund’s investments. The three levels are defined as follows: |
Level 1: Valuations based on quoted prices for identical securities in active markets.
Level 2: Valuations based on quoted prices in markets that are not active or for which all significant inputs are observable, either directly or indirectly.
Level 3: Valuations based on inputs that are unobservable and significant to the fair value measurement.
| The following is a summary of the inputs used to value the fund’s net assets as of the close of the reporting period: |
|
| | | |
| | Valuation inputs |
| Investments in securities: | Level 1 | Level 2 | Level 3 |
| Municipal bonds and notes | $— | $53,026,479 | $— |
| Short-term investments | — | 72,219 | — |
| Totals by level | $— | $53,098,698 | $— |
The accompanying notes are an integral part of these financial statements.
| |
26 Short-Term Municipal Income Fund |
Statement of assets and liabilities 5/31/22 (Unaudited)
| |
| ASSETS | |
| Investment in securities, at value (Note 1): | |
| Unaffiliated issuers (identified cost $53,840,965) | $53,026,479 |
| Affiliated issuers (identified cost $72,219) (Note 5) | 72,219 |
| Interest and other receivables | 463,661 |
| Receivable for shares of the fund sold | 450 |
| Receivable for investments sold | 1,518,499 |
| Receivable from Manager (Note 2) | 27,305 |
| Prepaid assets | 50,907 |
| Total assets | 55,159,520 |
| |
| LIABILITIES | |
| Payable for investments purchased | 1,236,246 |
| Payable for purchases of delayed delivery securities (Note 1) | 1,755,112 |
| Payable for shares of the fund repurchased | 65,077 |
| Payable for custodian fees (Note 2) | 2,968 |
| Payable for investor servicing fees (Note 2) | 4,983 |
| Payable for Trustee compensation and expenses (Note 2) | 1,447 |
| Payable for administrative services (Note 2) | 158 |
| Payable for distribution fees (Note 2) | 11,095 |
| Distributions payable to shareholders | 313 |
| Other accrued expenses | 34,002 |
| Total liabilities | 3,111,401 |
| | |
| Net assets | $52,048,119 |
| |
| REPRESENTED BY | |
| Paid-in capital (Unlimited shares authorized) (Notes 1 and 4) | $53,135,411 |
| Total distributable earnings (Note 1) | (1,087,292) |
| Total — Representing net assets applicable to capital shares outstanding | $52,048,119 |
| |
| COMPUTATION OF NET ASSET VALUE AND OFFERING PRICE | |
| Net asset value and redemption price per class A share ($25,878,181 divided by 2,632,471 shares) | $9.83 |
| Offering price per class A share (100/97.75 of $9.83)* | $10.06 |
| Net asset value and offering price per class C share ($387,020 divided by 39,514 shares)** | $9.79 |
| Net asset value, offering price and redemption price per class R6 share | |
| ($4,445,539 divided by 452,483 shares) | $9.82 |
| Net asset value, offering price and redemption price per class Y share | |
| ($21,337,379 divided by 2,171,137 shares) | $9.83 |
* On single retail sales of less than $100,000. On sales of $100,000 or more the offering price is reduced.
** Redemption price per share is equal to net asset value less any applicable contingent deferred sales charge.
The accompanying notes are an integral part of these financial statements.
|
| Short-Term Municipal Income Fund 27 |
Statement of operations Six months ended 5/31/22 (Unaudited)
| |
| INVESTMENT INCOME | |
| Interest (including interest income of $2,214 from investments in affiliated issuers) (Note 5) | $307,764 |
| Total investment income | 307,764 |
| |
| EXPENSES | |
| Compensation of Manager (Note 2) | 69,643 |
| Investor servicing fees (Note 2) | 14,649 |
| Custodian fees (Note 2) | 3,521 |
| Trustee compensation and expenses (Note 2) | 985 |
| Distribution fees (Note 2) | 35,054 |
| Administrative services (Note 2) | 883 |
| Blue sky expenses | 41,940 |
| Auditing and tax fees | 20,446 |
| Other | 11,802 |
| Fees waived and reimbursed by Manager (Note 2) | (77,910) |
| Total expenses | 121,013 |
| Expense reduction (Note 2) | (57) |
| Net expenses | 120,956 |
| | |
| Net investment income | 186,808 |
| |
| REALIZED AND UNREALIZED LOSS | |
| Net realized loss on: | |
| Securities from unaffiliated issuers (Notes 1 and 3) | (287,614) |
| Total net realized loss | (287,614) |
| Change in net unrealized depreciation on: | |
| Securities from unaffiliated issuers | (1,198,324) |
| Total change in net unrealized depreciation | (1,198,324) |
| | |
| Net loss on investments | (1,485,938) |
| |
| Net decrease in net assets resulting from operations | $(1,299,130) |
The accompanying notes are an integral part of these financial statements.
|
| 28 Short-Term Municipal Income Fund |
Statement of changes in net assets
| | |
| INCREASE (DECREASE) IN NET ASSETS | Six months ended 5/31/22* | Year ended 11/30/21 |
| Operations | | |
| Net investment income | $186,808 | $377,353 |
| Net realized gain (loss) on investments | (287,614) | 235,311 |
| Change in net unrealized depreciation of investments | (1,198,324) | (134,748) |
| Net increase (decrease) in net assets resulting | | |
| from operations | (1,299,130) | 477,916 |
| Distributions to shareholders (Note 1): | | |
| From ordinary income | | |
| Taxable net investment income | | |
| Class A | — | (3,179) |
| Class B | — | (3) |
| Class C | — | (43) |
| Class R6 | — | (312) |
| Class Y | — | (2,491) |
| Net realized short-term gain on investments | | |
| Class A | (110,266) | (31,188) |
| Class B | (86) | (73) |
| Class C | (1,516) | (682) |
| Class R6 | (10,910) | (3,719) |
| Class Y | (81,071) | (33,501) |
| From net realized long-term gain on investments | | |
| Class A | (15,711) | — |
| Class B | (12) | — |
| Class C | (216) | — |
| Class R6 | (1,554) | — |
| Class Y | (11,552) | — |
| From tax-exempt net investment income | | |
| Class A | (76,077) | (157,907) |
| Class B | (5) | (190) |
| Class C | (258) | (195) |
| Class R6 | (14,741) | (23,260) |
| Class Y | (83,135) | (184,560) |
| Increase from capital share transactions (Note 4) | 1,315,587 | 5,840,307 |
| Total increase (decrease) in net assets | (390,653) | 5,876,920 |
| |
| NET ASSETS | | |
| Beginning of period | 52,438,772 | 46,561,852 |
| End of period | $52,048,119 | $52,438,772 |
* Unaudited.
The accompanying notes are an integral part of these financial statements.
|
| Short-Term Municipal Income Fund 29 |
Financial highlights
(For a common share outstanding throughout the period)
| | | | | | | | | | | | | |
| | INVESTMENT OPERATIONS | | | LESS DISTRIBUTIONS | | | | RATIOS AND SUPPLEMENTAL DATA | |
| | | | | | | | | | | | Ratio | Ratio of net | |
| | Net asset | | Net realized | | | | | | | | of expenses | investment | |
| | value, | | and unrealized | Total from | From net | From | | Net asset | Total return | Net assets, | to average | income (loss) | Portfolio |
| | beginning | Net investment | gain (loss) | investment | investment | net realized gain | Total | value, end | at net asset | end of period | net assets | to average | turnover |
| Period ended | of period | income (loss) | on investments | operations | income | on investments | distributions | of period | value (%)a | (in thousands) | (%)b,c | net assets (%)c | (%) |
| Class A | | | | | | | | | | | | | |
| May 31, 2022** | $10.17 | .03 | (.30) | (.27) | (.03) | (.04) | (.07) | $9.83 | (2.64)* | $25,878 | .29* | .31* | 30* |
| November 30, 2021 | 10.15 | .07 | .04 | .11 | (.07) | (.02) | (.09) | 10.17 | 1.00 | 27,661 | .59 | .63 | 54 |
| November 30, 2020 | 10.08 | .12 | .07 | .19 | (.12) | —d | (.12) | 10.15 | 1.95 | 20,955 | .59 | 1.19 | 51 |
| November 30, 2019 | 9.95 | .17 | .13 | .30 | (.17) | — | (.17) | 10.08 | 2.99 | 14,450 | .60 | 1.67 | 83 |
| November 30, 2018 | 9.97 | .14 | (.02) | .12 | (.14) | — | (.14) | 9.95 | 1.22 | 9,792 | .61 | 1.43 | 76 |
| November 30, 2017 | 9.92 | .09 | .05 | .14 | (.09) | — | (.09) | 9.97 | 1.45 | 8,067 | .60e | .93e | 156 |
| Class C | | | | | | | | | | | | | |
| May 31, 2022** | $10.15 | .01 | (.32) | (.31) | (.01) | (.04) | (.05) | $9.79 | (3.06)* | $387 | .67* | (.06)* | 30* |
| November 30, 2021 | 10.15 | .01 | .02 | .03 | (.01) | (.02) | (.03) | 10.15 | .21 | 374 | 1.34 | (.07) | 54 |
| November 30, 2020 | 10.08 | .04 | .08 | .12 | (.05) | —d | (.05) | 10.15 | 1.22 | 423 | 1.34 | .37 | 51 |
| November 30, 2019 | 9.94 | .09 | .14 | .23 | (.09) | — | (.09) | 10.08 | 2.32 | 311 | 1.35 | .93 | 83 |
| November 30, 2018 | 9.97 | .07 | (.03) | .04 | (.07) | — | (.07) | 9.94 | .36 | 280 | 1.36 | .68 | 76 |
| November 30, 2017 | 9.91 | .02 | .06 | .08 | (.02) | — | (.02) | 9.97 | .81 | 314 | 1.33e | .22e | 156 |
| Class R6 | | | | | | | | | | | | | |
| May 31, 2022** | $10.17 | .04 | (.31) | (.27) | (.04) | (.04) | (.08) | $9.82 | (2.62)* | $4,446 | .16* | .45* | 30* |
| November 30, 2021 | 10.15 | .09 | .04 | .13 | (.09) | (.02) | (.11) | 10.17 | 1.27 | 2,715 | .33 | .91 | 54 |
| November 30, 2020 | 10.08 | .14 | .08 | .22 | (.15) | —d | (.15) | 10.15 | 2.22 | 2,313 | .33 | 1.42 | 51 |
| November 30, 2019 | 9.94 | .20 | .13 | .33 | (.19) | — | (.19) | 10.08 | 3.37 | 1,347 | .33 | 1.95 | 83 |
| November 30, 2018† | 9.93 | .10 | .01 | .11 | (.10) | — | (.10) | 9.94 | 1.10* | 1,091 | .17* | 1.02* | 76 |
| Class Y | | | | | | | | | | | | | |
| May 31, 2022** | $10.17 | .04 | (.30) | (.26) | (.04) | (.04) | (.08) | $9.83 | (2.53)* | $21,337 | .17* | .43* | 30* |
| November 30, 2021 | 10.15 | .09 | .04 | .13 | (.09) | (.02) | (.11) | 10.17 | 1.26 | 21,666 | .34 | .91 | 54 |
| November 30, 2020 | 10.08 | .14 | .08 | .22 | (.15) | —d | (.15) | 10.15 | 2.21 | 22,819 | .34 | 1.38 | 51 |
| November 30, 2019 | 9.94 | .19 | .14 | .33 | (.19) | — | (.19) | 10.08 | 3.34 | 8,489 | .35 | 1.93 | 83 |
| November 30, 2018 | 9.97 | .17 | (.03) | .14 | (.17) | — | (.17) | 9.94 | 1.37 | 7,694 | .36 | 1.66 | 76 |
| November 30, 2017 | 9.91 | .12 | .06 | .18 | (.12) | — | (.12) | 9.97 | 1.81 | 7,223 | .35e | 1.18e | 156 |
See notes to financial highlights at the end of this section.
The accompanying notes are an integral part of these financial statements.
| |
| 30 Short-Term Municipal Income Fund | Short-Term Municipal Income Fund 31 |
Financial highlights cont.
* Not annualized.
** Unaudited.
† For the period May 22, 2018 (commencement of operations) to November 30, 2018.
a Total return assumes dividend reinvestment and does not reflect the effect of sales charges.
b Includes amounts paid through expense offset and brokerage/service arrangements, if any (Note 2). Also excludes acquired fund fees and expenses, if any.
c Reflects an involuntary contractual expense limitations in effect during the period. As a result of such limitations, the expenses of each class reflect a reduction of the following amount (Note 2):
| | | | | | |
| | | | | Percentage of average net assets |
| | 5/31/22 | 11/30/21 | 11/30/20 | 11/30/19 | 11/30/18 | 11/30/17 |
| Class A | 0.15% | 0.32% | 0.47% | 0.84% | 1.01% | 1.05% |
| Class C | 0.15 | 0.32 | 0.47 | 0.84 | 1.01 | 1.05 |
| Class R6 | 0.15 | 0.32 | 0.47 | 0.84 | 0.54 | N/A |
| Class Y | 0.15 | 0.32 | 0.47 | 0.84 | 1.01 | 1.05 |
d Amount represents less than $0.01 per share.
e Reflects a voluntary waiver of certain fund expenses in effect during the period relating to the enhancement of certain annualized net yields for the fund. As a result of such waivers, the expenses of each class reflect a reduction of the following amounts as a percentage of average net assets.
| |
| | 11/30/17 |
| Class A | N/A |
| Class C | 0.02% |
| Class Y | N/A |
The accompanying notes are an integral part of these financial statements.
|
| 32 Short-Term Municipal Income Fund |
Notes to financial statements 5/31/22 (Unaudited)
Within the following Notes to financial statements, references to “State Street” represent State Street Bank and Trust Company, references to “the SEC” represent the Securities and Exchange Commission, references to “Putnam Management” represent Putnam Investment Management, LLC, the fund’s manager, an indirect wholly-owned subsidiary of Putnam Investments, LLC and references to “OTC”, if any, represent over-the-counter. Unless otherwise noted, the “reporting period” represents the period from December 1, 2021 through May 31, 2022.
Putnam Short-Term Municipal Income Fund (the fund) is a diversified series of Putnam Funds Trust (the Trust), a Massachusetts business trust registered under the Investment Company Act of 1940, as amended, as an open-end management investment company. The goal of the fund is to seek as high a level of current income exempt from federal income tax as Putnam Management believes is consistent with preservation of capital. The fund invests mainly in bonds that pay interest that is exempt from federal income tax (but that may be subject to federal alternative minimum tax (AMT)) and that have short-term maturities (i.e., three years or less). The bonds the fund invests in are mainly investment-grade in quality. Under normal circumstances, Putnam Management invests at least 80% of the fund’s net assets in tax-exempt investments, which for purposes of this policy include investments paying interest subject to the federal AMT for individuals. This investment policy cannot be changed without the approval of the fund’s shareholders. Putnam Management may consider, among other factors, credit, interest rate and prepayment risks, as well as general market conditions, when deciding whether to buy or sell investments.
The fund offers class A, class C, class R6 and class Y shares. Effective January 6, 2022, class B shares were liquidated and are no longer offered for sale. Class A shares are sold with a maximum front-end sales charge of 2.25%. Class A shares generally are not subject to a contingent deferred sales charge and class R6 and class Y shares are not subject to a contingent deferred sales charge. Class C shares are subject to a one-year 1.00% contingent deferred sales charge and generally convert to class A shares after approximately eight years. Class R6 shares, which are not available to all investors, are sold at net asset value. The expenses for class A, class C and class R6 shares may differ based on the distribution fee of each class, which is identified in Note 2. Class Y shares, which are sold at net asset value, are generally subject to the same expenses as class A, class C and class R6 shares, but do not bear a distribution fee. Class Y shares are not available to all investors.
In the normal course of business, the fund enters into contracts that may include agreements to indemnify another party under given circumstances. The fund’s maximum exposure under these arrangements is unknown as this would involve future claims that may be, but have not yet been, made against the fund. However, the fund’s management team expects the risk of material loss to be remote.
The fund has entered into contractual arrangements with an investment adviser, administrator, distributor, shareholder servicing agent and custodian, who each provide services to the fund. Unless expressly stated otherwise, shareholders are not parties to, or intended beneficiaries of these contractual arrangements, and these contractual arrangements are not intended to create any shareholder right to enforce them against the service providers or to seek any remedy under them against the service providers, either directly or on behalf of the fund.
Under the fund’s Amended and Restated Agreement and Declaration of Trust, any claims asserted against or on behalf of the Putnam Funds, including claims against Trustees and Officers, must be brought in state and federal courts located within the Commonwealth of Massachusetts.
Note 1: Significant accounting policies
The following is a summary of significant accounting policies consistently followed by the fund in the preparation of its financial statements. The preparation of financial statements is in conformity with accounting principles generally accepted in the United States of America and requires management to make estimates and assumptions that affect the reported amounts of assets and liabilities in the financial statements and the reported amounts of increases and decreases in net assets from operations. Actual results could differ from those estimates. Subsequent events after the Statement of assets and liabilities date through the date that the financial statements were issued have been evaluated in the preparation of the financial statements.
Investment income, realized and unrealized gains and losses and expenses of the fund are borne pro-rata based on the relative net assets of each class to the total net assets of the fund, except that each class bears expenses unique to that class (including the distribution fees applicable to such classes). Each class votes as a class only with respect to its own distribution plan or other matters on which a class vote is required by law or determined by the Trustees. If the fund were liquidated, shares of each class would receive their pro-rata share of the net assets of the fund. In addition, the Trustees declare separate dividends on each class of shares.
|
| Short-Term Municipal Income Fund 33 |
Security valuation Portfolio securities and other investments are valued using policies and procedures adopted by the Board of Trustees. The Trustees have formed a Pricing Committee to oversee the implementation of these procedures and have delegated responsibility for valuing the fund’s assets in accordance with these procedures to Putnam Management. Putnam Management has established an internal Valuation Committee that is responsible for making fair value determinations, evaluating the effectiveness of the pricing policies of the fund and reporting to the Pricing Committee.
Tax-exempt bonds and notes are generally valued on the basis of valuations provided by an independent pricing service approved by the Trustees. Such services use information with respect to transactions in bonds, quotations from bond dealers, market transactions in comparable securities and various relationships between securities in determining value. These securities will generally be categorized as Level 2.
Investments in open-end investment companies (excluding exchange-traded funds), if any, which can be classified as Level 1 or Level 2 securities, are valued based on their net asset value. The net asset value of such investment companies equals the total value of their assets less their liabilities and divided by the number of their outstanding shares.
Certain investments, including certain restricted and illiquid securities and derivatives, are also valued at fair value following procedures approved by the Trustees. To assess the continuing appropriateness of fair valuations, the Valuation Committee reviews and affirms the reasonableness of such valuations on a regular basis after considering all relevant information that is reasonably available. Such valuations and procedures are reviewed periodically by the Trustees. These valuations consider such factors as significant market or specific security events such as interest rate or credit quality changes, various relationships with other securities, discount rates, U.S. Treasury, U.S. swap and credit yields, index levels, convexity exposures, recovery rates, sales and other multiples and resale restrictions. These securities are classified as Level 2 or as Level 3 depending on the priority of the significant inputs. The fair value of securities is generally determined as the amount that the fund could reasonably expect to realize from an orderly disposition of such securities over a reasonable period of time. By its nature, a fair value price is a good faith estimate of the value of a security in a current sale and does not reflect an actual market price, which may be different by a material amount.
Security transactions and related investment income Security transactions are recorded on the trade date (the date the order to buy or sell is executed). Gains or losses on securities sold are determined on the identified cost basis.
Interest income, net of any applicable withholding taxes, if any, and including amortization and accretion of premiums and discounts on debt securities, is recorded on the accrual basis.
Securities purchased or sold on a forward commitment or delayed delivery basis may be settled at a future date beyond customary settlement time; interest income is accrued based on the terms of the securities. Losses may arise due to changes in the fair value of the underlying securities or if the counterparty does not perform under the contract.
Interfund lending The fund, along with other Putnam funds, may participate in an interfund lending program pursuant to an exemptive order issued by the SEC. This program allows the fund to borrow from or lend to other Putnam funds that permit such transactions. Interfund lending transactions are subject to each fund’s investment policies and borrowing and lending limits. Interest earned or paid on the interfund lending transaction will be based on the average of certain current market rates. During the reporting period, the fund did not utilize the program.
Lines of credit The fund participates, along with other Putnam funds, in a $317.5 million unsecured committed line of credit and a $235.5 million unsecured uncommitted line of credit, both provided by State Street. Borrowings may be made for temporary or emergency purposes, including the funding of shareholder redemption requests and trade settlements. Interest is charged to the fund based on the fund’s borrowing at a rate equal to 1.25% plus the higher of (1) the Federal Funds rate and (2) the Overnight Bank Funding Rate for the committed line of credit and 1.30% plus the higher of (1) the Federal Funds rate and (2) the Overnight Bank Funding Rate for the uncommitted line of credit. A closing fee equal to 0.04% of the committed line of credit and 0.04% of the uncommitted line of credit has been paid by the participating funds. In addition, a commitment fee of 0.21% per annum on any unutilized portion of the committed line of credit is allocated to the participating funds based on their relative net assets and paid quarterly. During the reporting period, the fund had no borrowings against these arrangements.
|
| 34 Short-Term Municipal Income Fund |
Federal taxes It is the policy of the fund to distribute all of its income within the prescribed time period and otherwise comply with the provisions of the Internal Revenue Code of 1986, as amended (the Code), applicable to regulated investment companies. It is also the intention of the fund to distribute an amount sufficient to avoid imposition of any excise tax under Section 4982 of the Code.
The fund is subject to the provisions of Accounting Standards Codification 740 Income Taxes (ASC 740). ASC 740 sets forth a minimum threshold for financial statement recognition of the benefit of a tax position taken or expected to be taken in a tax return. The fund did not have a liability to record for any unrecognized tax benefits in the accompanying financial statements. No provision has been made for federal taxes on income, capital gains or unrealized appreciation on securities held nor for excise tax on income and capital gains. Each of the fund’s federal tax returns for the prior three fiscal years remains subject to examination by the Internal Revenue Service.
Tax cost of investments includes adjustments to net unrealized appreciation (depreciation) which may not necessarily be final tax cost basis adjustments, but closely approximate the tax basis unrealized gains and losses that may be realized and distributed to shareholders. The aggregate identified cost on a tax basis is $53,913,184, resulting in gross unrealized appreciation and depreciation of $236,962 and $1,051,448, respectively, or net unrealized depreciation of $814,486.
Distributions to shareholders Income dividends are recorded daily by the fund and are paid monthly. Distributions from capital gains, if any, are recorded on the ex-dividend date and paid at least annually. The amount and character of income and gains to be distributed are determined in accordance with income tax regulations which may differ from generally accepted accounting principles. Dividend sources are estimated at the time of declaration. Actual results may vary. Any non-taxable return of capital cannot be determined until final tax calculations are completed after the end of the fund’s fiscal year. Reclassifications are made to the fund’s capital accounts to reflect income and gains available for distribution (or available capital loss carryovers) under income tax regulations.
Expenses of the Trust Expenses directly charged or attributable to any fund will be paid from the assets of that fund. Generally, expenses of the Trust will be allocated among and charged to the assets of each fund on a basis that the Trustees deem fair and equitable, which may be based on the relative assets of each fund or the nature of the services performed and relative applicability to each fund.
Note 2: Management fee, administrative services and other transactions
The fund pays Putnam Management a management fee (based on the fund’s average net assets and computed and paid monthly) at annual rates that may vary based on the average of the aggregate net assets of all open-end mutual funds sponsored by Putnam Management (excluding net assets of funds that are invested in, or that are invested in by, other Putnam funds to the extent necessary to avoid “double counting” of those assets). Such annual rates may vary as follows:
| | | | |
| 0.440% | of the first $5 billion, | | 0.240% | of the next $50 billion, |
| 0.390% | of the next $5 billion, | | 0.220% | of the next $50 billion, |
| 0.340% | of the next $10 billion, | | 0.210% | of the next $100 billion and |
| 0.290% | of the next $10 billion, | | 0.205% | of any excess thereafter. |
For the reporting period, the management fee represented an effective rate (excluding the impact from any expense waivers in effect) of 0.137% of the fund’s average net assets.
Putnam Management has contractually agreed, through March 30, 2024, to waive fees and/or reimburse the fund’s expenses to the extent necessary to limit the cumulative expenses of the fund, exclusive of brokerage, interest, taxes, investment-related expenses, extraordinary expenses, acquired fund fees and expenses and payments under the fund’s investor servicing contract, investment management contract and distribution plans, on a fiscal year-to-date basis to an annual rate of 0.20% of the fund’s average net assets over such fiscal year-to-date period. During the reporting period, the fund’s expenses were reduced by $28,587 as a result of this limit.
Putnam Management has also contractually agreed to waive fees (and, to the extent necessary, bear other expenses) of the fund through March 30, 2024, to the extent that total expenses of the fund (excluding brokerage, interest, taxes, investment-related expenses, payments under distribution plans, extraordinary expenses, payments under the fund’s investor servicing contract and acquired fund fees and expenses, but including payments under the fund’s investment management contract) would exceed an annual rate of 0.28% of the
|
| Short-Term Municipal Income Fund 35 |
fund’s average net assets. During the reporting period, the fund’s expenses were reduced by $49,323 as a result of this limit.
Putnam Investments Limited (PIL), an affiliate of Putnam Management, is authorized by the Trustees to manage a separate portion of the assets of the fund as determined by Putnam Management from time to time. PIL did not manage any portion of the assets of the fund during the reporting period. If Putnam Management were to engage the services of PIL, Putnam Management would pay a quarterly sub-management fee to PIL for its services at an annual rate of 0.25% of the average net assets of the portion of the fund managed by PIL.
The fund reimburses Putnam Management an allocated amount for the compensation and related expenses of certain officers of the fund and their staff who provide administrative services to the fund. The aggregate amount of all such reimbursements is determined annually by the Trustees.
Custodial functions for the fund’s assets are provided by State Street. Custody fees are based on the fund’s asset level, the number of its security holdings and transaction volumes.
Putnam Investor Services, Inc., an affiliate of Putnam Management, provides investor servicing agent functions to the fund. Putnam Investor Services, Inc. received fees for investor servicing for class A, class B, class C and class Y shares that included (1) a per account fee for each direct and underlying non-defined contribution account (retail account) of the fund; (2) a specified rate of the fund’s assets attributable to defined contribution plan accounts; and (3) a specified rate based on the average net assets in retail accounts. Putnam Investor Services, Inc. has agreed that the aggregate investor servicing fees for each fund’s retail and defined contribution accounts for these share classes will not exceed an annual rate of 0.25% of the fund’s average assets attributable to such accounts.
Class R6 shares paid a monthly fee based on the average net assets of class R6 shares at an annual rate of 0.05%.
During the reporting period, the expenses for each class of shares related to investor servicing fees were as follows:
| | | | |
| Class A | $7,723 | | Class R6 | 860 |
| Class B* | 1 | | Class Y | 5,954 |
| Class C | 111 | | Total | $14,649 |
* Class B shares were liquidated on January 6, 2022.
The fund has entered into expense offset arrangements with Putnam Investor Services, Inc. and State Street whereby Putnam Investor Services, Inc.’s and State Street’s fees are reduced by credits allowed on cash balances. For the reporting period, the fund’s expenses were reduced by $57 under the expense offset arrangements.
Each Independent Trustee of the fund receives an annual Trustee fee, of which $36, as a quarterly retainer, has been allocated to the fund, and an additional fee for each Trustees meeting attended. Trustees also are reimbursed for expenses they incur relating to their services as Trustees.
The fund has adopted a Trustee Fee Deferral Plan (the Deferral Plan) which allows the Trustees to defer the receipt of all or a portion of Trustees fees payable on or after July 1, 1995. The deferred fees remain invested in certain Putnam funds until distribution in accordance with the Deferral Plan.
The fund has adopted an unfunded noncontributory defined benefit pension plan (the Pension Plan) covering all Trustees of the fund who have served as a Trustee for at least five years and were first elected prior to 2004. Benefits under the Pension Plan are equal to 50% of the Trustee’s average annual attendance and retainer fees for the three years ended December 31, 2005. The retirement benefit is payable during a Trustee’s lifetime, beginning the year following retirement, for the number of years of service through December 31, 2006. Pension expense for the fund is included in Trustee compensation and expenses in the Statement of operations. Accrued pension liability is included in Payable for Trustee compensation and expenses in the Statement of assets and liabilities. The Trustees have terminated the Pension Plan with respect to any Trustee first elected after 2003.
The fund has adopted distribution plans (the Plans) with respect to the following share classes pursuant to Rule 12b–1 under the Investment Company Act of 1940. The purpose of the Plans is to compensate Putnam Retail Management Limited Partnership, an indirect wholly-owned subsidiary of Putnam Investments, LLC, for services provided and expenses incurred in distributing shares of the fund. The Plans provide payments by the fund to
|
| 36 Short-Term Municipal Income Fund |
Putnam Retail Management Limited Partnership at an annual rate of up to the following amounts (Maximum %) of the average net assets attributable to each class. The Trustees have approved payment by the fund at the following annual rate (Approved %) of the average net assets attributable to each class. During the reporting period, the class-specific expenses related to distribution fees were as follows:
| | | |
| | Maximum % | Approved % | Amount |
| Class A | 0.35% | 0.25% | $33,131 |
| Class B* | 1.00% | 0.45% | 10 |
| Class C | 1.00% | 1.00% | 1,913 |
| Total | | | $35,054 |
* Class B shares were liquidated on January 6, 2022.
For the reporting period, Putnam Retail Management Limited Partnership, acting as underwriter, received net commissions of $511 from the sale of class A shares and received no monies in contingent deferred sales charges from redemptions of class B and class C shares.
A deferred sales charge of up to 1.00% is assessed on certain redemptions of class A shares. For the reporting period, Putnam Retail Management Limited Partnership, acting as underwriter, received no monies on class A redemptions.
Note 3: Purchases and sales of securities
During the reporting period, the cost of purchases and the proceeds from sales, excluding short-term investments, were as follows:
| | |
| | Cost of purchases | Proceeds from sales |
| Investments in securities (Long-term) | $19,286,566 | $13,861,894 |
| U.S. government securities (Long-term) | — | — |
| Total | $19,286,566 | $13,861,894 |
The fund may purchase or sell investments from or to other Putnam funds in the ordinary course of business, which can reduce the fund’s transaction costs, at prices determined in accordance with SEC requirements and policies approved by the Trustees. During the reporting period, purchases or sales of long-term securities from or to other Putnam funds, if any, did not represent more than 5% of the fund’s total cost of purchases and/or total proceeds from sales.
Note 4: Capital shares
At the close of the reporting period, there were an unlimited number of shares of beneficial interest authorized. Transactions, including, if applicable, direct exchanges pursuant to share conversions, in capital shares were as follows:
| | | | |
| | SIX MONTHS ENDED 5/31/22 | YEAR ENDED 11/30/21 |
| Class A | Shares | Amount | Shares | Amount |
| Shares sold | 1,115,824 | $11,110,131 | 2,390,302 | $24,344,936 |
| Shares issued in connection with | | | | |
| reinvestment of distributions | 19,986 | 200,598 | 18,795 | 191,229 |
| | 1,135,810 | 11,310,729 | 2,409,097 | 24,536,165 |
| Shares repurchased | (1,222,980) | (12,191,999) | (1,753,095) | (17,842,430) |
| Net increase (decrease) | (87,170) | $(881,270) | 656,002 | $6,693,735 |
|
| Short-Term Municipal Income Fund 37 |
| | | | |
| | PERIOD ENDED 5/31/22* | YEAR ENDED 11/30/21 |
| Class B | Shares | Amount | Shares | Amount |
| Shares sold | — | $— | — | $— |
| Shares issued in connection with | | | | |
| reinvestment of distributions | 10 | 103 | 26 | 266 |
| | 10 | 103 | 26 | 266 |
| Shares repurchased | (2,227) | (22,526) | (2,852) | (29,025) |
| Net decrease | (2,217) | $(22,423) | (2,826) | $(28,759) |
| |
| | SIX MONTHS ENDED 5/31/22 | YEAR ENDED 11/30/21 |
| Class C | Shares | Amount | Shares | Amount |
| Shares sold | 14,595 | $144,105 | 25,144 | $255,964 |
| Shares issued in connection with | | | | |
| reinvestment of distributions | 173 | 1,744 | 87 | 884 |
| | 14,768 | 145,849 | 25,231 | 256,848 |
| Shares repurchased | (12,058) | (118,653) | (30,132) | (306,601) |
| Net increase (decrease) | 2,710 | $27,196 | (4,901) | $(49,753) |
| |
| | SIX MONTHS ENDED 5/31/22 | YEAR ENDED 11/30/21 |
| Class R6 | Shares | Amount | Shares | Amount |
| Shares sold | 247,871 | $2,448,775 | 78,464 | $798,205 |
| Shares issued in connection with | | | | |
| reinvestment of distributions | 2,637 | 26,336 | 2,590 | 26,336 |
| | 250,508 | 2,475,111 | 81,054 | 824,541 |
| Shares repurchased | (65,148) | (638,670) | (41,796) | (424,838) |
| Net increase | 185,360 | $1,836,441 | 39,258 | $399,703 |
| |
| | SIX MONTHS ENDED 5/31/22 | YEAR ENDED 11/30/21 |
| Class Y | Shares | Amount | Shares | Amount |
| Shares sold | 1,125,235 | $11,049,730 | 1,745,256 | $17,764,360 |
| Shares issued in connection with | | | | |
| reinvestment of distributions | 17,547 | 175,758 | 21,566 | 219,384 |
| | 1,142,782 | 11,225,488 | 1,766,822 | 17,983,744 |
| Shares repurchased | (1,102,265) | (10,869,845) | (1,883,848) | (19,158,363) |
| Net increase (decrease) | 40,517 | $355,643 | (117,026) | $(1,174,619) |
* Class B shares were liquidated on January 6, 2022.
|
| 38 Short-Term Municipal Income Fund |
Note 5: Affiliated transactions
Transactions during the reporting period with any company which is under common ownership or control were as follows:
| | | | | |
| | | | | | Shares |
| | | | | | outstanding |
| | | | | | and fair |
| | Fair value as | Purchase | Sale | Investment | value as |
| Name of affiliate | of 11/30/21 | cost | proceeds | income | of 5/31/22 |
| Short-term investments | | | | | |
| Putnam Short Term | | | | | |
| Investment Fund* | $1,898,846 | $22,920,215 | $24,746,842 | $2,214 | $72,219 |
| Total Short-term | | | | | |
| investments | $1,898,846 | $22,920,215 | $24,746,842 | $2,214 | $72,219 |
* Management fees charged to Putnam Short Term Investment Fund have been waived by Putnam Management. There were no realized or unrealized gains or losses during the period.
Note 6: Market, credit and other risks
In the normal course of business, the fund trades financial instruments and enters into financial transactions where risk of potential loss exists due to changes in the market (market risk) or failure of the contracting party to the transaction to perform (credit risk). The fund may be exposed to additional credit risk that an institution or other entity with which the fund has unsettled or open transactions will default.
On July 27, 2017, the United Kingdom’s Financial Conduct Authority (“FCA”), which regulates LIBOR, announced its intention to cease compelling banks to provide the quotations needed to sustain LIBOR after 2021. ICE Benchmark Administration, the administrator of LIBOR, ceased publication of most LIBOR settings on a representative basis at the end of 2021 and is expected to cease publication of a majority of U.S. dollar LIBOR settings on a representative basis after June 30, 2023. In addition, global regulators have announced that, with limited exceptions, no new LIBOR-based contracts should be entered into after 2021.LIBOR has historically been a common benchmark interest rate index used to make adjustments to variable-rate loans. It is used throughout global banking and financial industries to determine interest rates for a variety of financial instruments and borrowing arrangements. Actions by regulators have resulted in the establishment of alternative reference rates to LIBOR in most major currencies. Various financial industry groups have been planning for the transition away from LIBOR, but there are obstacles to converting certain longer-term securities and transactions to new reference rates. Markets are developing slowly and questions around liquidity in these rates and how to appropriately adjust these rates to mitigate any economic value transfer at the time of transition remain a significant concern. Neither the effect of the transition process nor its ultimate success can yet be known. The transition process might lead to increased volatility and illiquidity in markets that rely on LIBOR to determine interest rates. It could also lead to a reduction in the value of some LIBOR-based investments and reduce the effectiveness of related transactions, such as hedges. While some LIBOR-based instruments may contemplate a scenario where LIBOR is no longer available by providing for an alternative rate-setting methodology, not all may have such provisions and there may be significant uncertainty regarding the effectiveness of any such alternative methodologies. Since the usefulness of LIBOR as a benchmark could deteriorate during the transition period, these effects could occur at any time.
Beginning in January 2020, global financial markets have experienced, and may continue to experience, significant volatility resulting from the spread of a virus known as Covid–19. The outbreak of Covid–19 has resulted in travel and border restrictions, quarantines, supply chain disruptions, lower consumer demand, and general market uncertainty. The effects of Covid–19 have adversely affected, and may continue to adversely affect, the global economy, the economies of certain nations, and individual issuers, all of which may negatively impact the fund’s performance.
Note 7: New accounting pronouncements
In March 2020, the Financial Accounting Standards Board (FASB) issued Accounting Standards Update (ASU) 2020–04, Reference Rate Reform (Topic 848) — Facilitation of the Effects of Reference Rate Reform on Financial Reporting. The amendments in ASU 2020–04 provide optional temporary financial reporting relief from the effect of certain types of contract modifications due to the planned discontinuation of LIBOR and other interbank-offered based reference rates as of the end of 2021. The discontinuation of LIBOR was subsequently extended to June 30, 2023.ASU 2020–04 is effective for certain reference rate-related contract modifications that occur during the period March 12, 2020 through December 31, 2022. Management expects that the adoption of the guidance will not have a material impact on the fund’s financial statements.
|
| Short-Term Municipal Income Fund 39 |
Services for shareholders
Investor services
Systematic investment plan Tell us how much you wish to invest regularly — weekly, semimonthly, or monthly — and the amount you choose will be transferred automatically from your checking or savings account. There’s no additional fee for this service, and you can suspend it at any time. This plan may be a great way to save for college expenses or to plan for your retirement.
Please note that regular investing does not guarantee a profit or protect against loss in a declining market. Before arranging a systematic investment plan, consider your financial ability to continue making purchases in periods when prices are low.
Systematic exchange You can make regular transfers from one Putnam fund to another Putnam fund. There are no additional fees for this service, and you can cancel or change your options at any time.
Dividends PLUS You can choose to have the dividend distributions from one of your Putnam funds automatically reinvested in another Putnam fund at no additional charge.
Free exchange privilege You can exchange money between Putnam funds free of charge, as long as they are the same class of shares. A signature guarantee is required if you are exchanging more than $500,000. The fund reserves the right to revise or terminate the exchange privilege.
Reinstatement privilege If you’ve sold Putnam shares or received a check for a dividend or capital gain, you may reinvest the proceeds with Putnam within 90 days of the transaction and they will be reinvested at the fund’s current net asset value — with no sales charge. However, reinstatement of class B shares may have special tax consequences. Ask your financial or tax representative for details.
Check-writing service You have ready access to many Putnam accounts. It’s as simple as writing a check, and there are no special fees or service charges. For more information about the check-writing service, call Putnam or visit our website.
Dollar cost averaging When you’re investing for long-term goals, it’s time, not timing, that counts. Investing on a systematic basis is a better strategy than trying to figure out when the markets will go up or down. This means investing the same amount of money regularly over a long period. This method of investing is called dollar cost averaging. When a fund’s share price declines, your investment dollars buy more shares at lower prices. When it increases, they buy fewer shares. Over time, you will pay a lower average price per share.
For more information
Visit the Individual Investors section at putnam.com A secure section of our website contains complete information on your account, including balances and transactions, updated daily. You may also conduct transactions, such as exchanges, additional investments, and address changes. Log on today to get your password.
Call us toll free at 1-800-225-1581 Ask a helpful Putnam representative or your financial advisor for details about any of these or other services, or see your prospectus.
|
| 40 Short-Term Municipal Income Fund |
Fund information
Founded over 80 years ago, Putnam Investments was built around the concept that a balance between risk and reward is the hallmark of a well-rounded financial program. We manage funds across income, value, blend, growth, sustainable, asset allocation, absolute return, and global sector categories.
| | |
| Investment Manager | Trustees | Richard T. Kircher |
| Putnam Investment | Kenneth R. Leibler, Chair | Vice President and |
| Management, LLC | Barbara M. Baumann, Vice Chair | BSA Compliance Officer |
| 100 Federal Street | Liaquat Ahamed | |
| Boston, MA 02110 | Katinka Domotorffy | Martin Lemaire |
| | Catharine Bond Hill | Vice President and |
| Investment Sub-Advisor | Jennifer Williams Murphy | Derivatives Risk Manager |
| Putnam Investments Limited | Marie Pillai | |
| 16 St James’s Street | George Putnam, III | Susan G. Malloy |
| London, England SW1A 1ER | Robert L. Reynolds | Vice President and |
| | Manoj P. Singh | Assistant Treasurer |
| Marketing Services | Mona K. Sutphen | |
| Putnam Retail Management | | Alan G. McCormack |
| Limited Partnership | Officers | Vice President and |
| 100 Federal Street | Robert L. Reynolds | Derivatives Risk Manager |
| Boston, MA 02110 | President | |
| | | Denere P. Poulack |
| Custodian | James F. Clark | Assistant Vice President, |
| State Street Bank | Vice President, Chief Compliance | Assistant Clerk, and |
| and Trust Company | Officer, and Chief Risk Officer | Assistant Treasurer |
| | | |
| Legal Counsel | Nancy E. Florek | Janet C. Smith |
| Ropes & Gray LLP | Vice President, Director of | Vice President, |
| | Proxy Voting and Corporate | Principal Financial Officer, |
| | Governance, Assistant Clerk, | Principal Accounting Officer, |
| | and Assistant Treasurer | and Assistant Treasurer |
| | | |
| | Michael J. Higgins | Stephen J. Tate |
| | Vice President, Treasurer, | Vice President and |
| | and Clerk | Chief Legal Officer |
| | | |
| | Jonathan S. Horwitz | Mark C. Trenchard |
| | Executive Vice President, | Vice President |
| | Principal Executive Officer, | |
| | and Compliance Liaison | |
This report is for the information of shareholders of Putnam Short-Term Municipal Income Fund. It may also be used as sales literature when preceded or accompanied by the current prospectus, the most recent copy of Putnam’s Quarterly Performance Summary, and Putnam’s Quarterly Ranking Summary. For more recent performance, please visit putnam.com. Investors should carefully consider the investment objectives, risks, charges, and expenses of a fund, which are described in its prospectus. For this and other information or to request a prospectus or summary prospectus, call 1-800-225-1581 toll free. Please read the prospectus carefully before investing. The fund’s Statement of Additional Information contains additional information about the fund’s Trustees and is available without charge upon request by calling 1-800-225-1581.

| |
| Item 3. Audit Committee Financial Expert: |
| |
| Item 4. Principal Accountant Fees and Services: |
| |
| Item 5. Audit Committee of Listed Registrants |
| |
| Item 6. Schedule of Investments: |
| |
| The registrant’s schedule of investments in unaffiliated issuers is included in the report to shareholders in Item 1 above. |
| |
| Item 7. Disclosure of Proxy Voting Policies and Procedures For Closed-End Management Investment Companies: |
| |
| Item 8. Portfolio Managers of Closed-End Investment Companies |
| |
| Item 9. Purchases of Equity Securities by Closed-End Management Investment Companies and Affiliated Purchasers: |
| |
| Item 10. Submission of Matters to a Vote of Security Holders: |
| |
| Item 11. Controls and Procedures: |
| |
| (a) The registrant’s principal executive officer and principal financial officer have concluded, based on their evaluation of the effectiveness of the design and operation of the registrant’s disclosure controls and procedures as of a date within 90 days of the filing date of this report, that the design and operation of such procedures are generally effective to provide reasonable assurance that information required to be disclosed by the registrant in this report is recorded, processed, summarized and reported within the time periods specified in the Commission’s rules and forms. |
| |
| (b) Changes in internal control over financial reporting: Not applicable |
| |
| Item 12. Disclosures of Securities Lending Activities for Closed-End Investment Companies: |
| |
| Pursuant to the requirements of the Securities Exchange Act of 1934 and the Investment Company Act of 1940, the registrant has duly caused this report to be signed on its behalf by the undersigned, thereunto duly authorized. |
| |
| By (Signature and Title): |
| |
| /s/ Janet C. Smith
Janet C. Smith
Principal Accounting Officer
|
| |
| Pursuant to the requirements of the Securities Exchange Act of 1934 and the Investment Company Act of 1940, this report has been signed below by the following persons on behalf of the registrant and in the capacities and on the dates indicated. |
| |
| By (Signature and Title): |
| |
| /s/ Jonathan S. Horwitz
Jonathan S. Horwitz
Principal Executive Officer
|
| |
| By (Signature and Title): |
| |
| /s/ Janet C. Smith
Janet C. Smith
Principal Financial Officer
|