| | |
| UNITED STATES
SECURITIES AND EXCHANGE COMMISSION |
| | |
| CERTIFIED SHAREHOLDER REPORT OF REGISTERED
MANAGEMENT INVESTMENT COMPANIES
|
| | |
| Investment Company Act file number: | (811-07513) |
| | |
| Exact name of registrant as specified in charter: | Putnam Funds Trust |
| | |
| Address of principal executive offices: | 100 Federal Street, Boston, Massachusetts 02110 |
| | |
| Name and address of agent for service: | Stephen Tate, Vice President
100 Federal Street
Boston, Massachusetts 02110 |
| | |
| Copy to: | Bryan Chegwidden, Esq.
Ropes & Gray LLP
1211 Avenue of the Americas
New York, New York 10036 |
| | |
| Registrant’s telephone number, including area code: | (617) 292-1000 |
| | |
| Date of fiscal year end: | February 28, 2023 |
| | |
| Date of reporting period: | March 1, 2022 – August 31, 2022 |
| | |
|
Item 1. Report to Stockholders: | |
| | |
| The following is a copy of the report transmitted to stockholders pursuant to Rule 30e-1 under the Investment Company Act of 1940: | |
Putnam
Floating Rate
Income Fund
Semiannual report
8 | 31 | 22
Message from the Trustees
October 6, 2022
Dear Fellow Shareholder:
Financial markets are reminding us that the journey to long-term returns often involves weathering periods of heightened volatility. This year, stocks and bonds have experienced declines, and U.S. gross domestic product decreased slightly in the first and second quarters. Consumers and businesses have grappled with multidecade-high inflation. In response, the U.S. Federal Reserve has been raising interest rates to contain price pressures, and certain economic indicators have begun to show improvement.
While this challenging environment may test investors’ patience, you can be confident that Putnam portfolio managers are actively working for you. They are assessing risks while researching new and attractive investment opportunities for your fund.
We also would like to announce changes to the Board of Trustees. In July 2022, we welcomed Jennifer Williams Murphy and Marie Pillai as new Trustees. Both have a wealth of investment advisory and executive management experience. We also want to thank our Trustees who retired from the Board on June 30, 2022: Paul Joskow served with us since 1997, and Ravi Akhoury joined the Board in 2009. We wish them well.
Thank you for investing with Putnam.


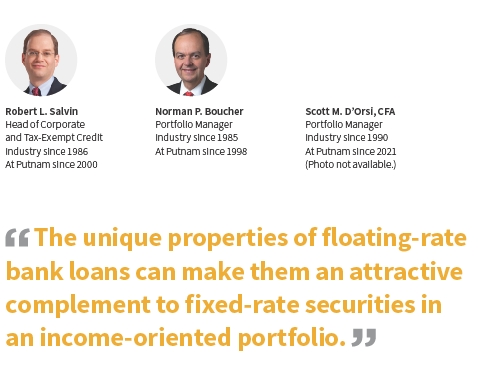
Putnam Floating Rate Income Fund focuses on a special class of bonds known as floating-rate bank loans. These are loans issued by banks to corporations. Interest rates on these loans “float” in that they periodically adjust to reflect changes in short-term rates. When rates rise, floating-rate loans pay a higher yield. With this feature, these loans can benefit from both rising interest rates and strong economic conditions — factors that pose risks to traditional bonds.
The fund’s managers each have more than 30 years of investment experience.
|
| 2 Floating Rate Income Fund |
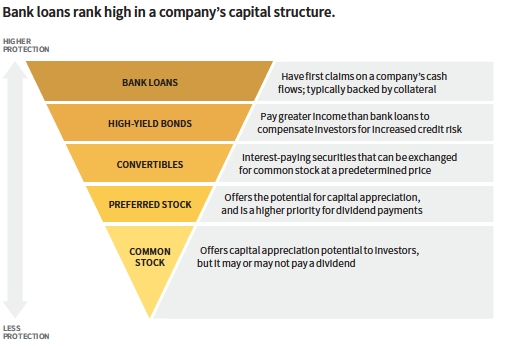
Most bank loans are senior-secured debt, meaning that lenders are generally paid before any unsecured debt holders in the event of a liquidation of a company’s assets due to bankruptcy.
Floating-rate loans are typically issued on behalf of companies that lack investment-grade credit ratings. Like high-yield corporate bonds, floating-rate loans are considered to have a greater chance of default and can be illiquid. The advantage for investors is the senior-secured status of the loans, which gives them a higher claim on the company’s assets.
|
| Floating Rate Income Fund 3 |
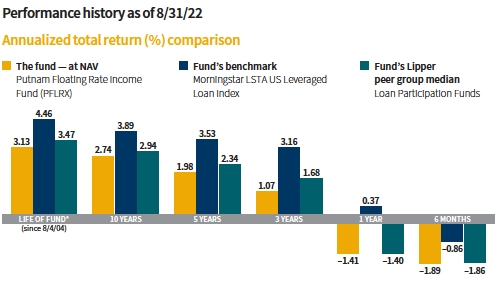
Current performance may be lower or higher than the quoted past performance, which cannot guarantee future results. Share price, principal value, and return will fluctuate, and you may have a gain or a loss when you sell your shares. Performance of class A shares assumes reinvestment of distributions and does not account for taxes. Fund returns in the bar chart do not reflect a sales charge of 2.25%; had they, returns would have been lower. See below and pages 9–11 for additional performance information. For a portion of the periods, the fund had expense limitations, without which returns would have been lower. To obtain the most recent month-end performance, visit putnam.com.
Returns for periods of less than one year are not annualized.
Lipper peer group median is provided by Lipper, a Refinitiv company.
* Benchmark life-of-fund return reflects performance from 8/31/04 to the current period as data is only available from the month-end following the fund’s inception (8/4/04).
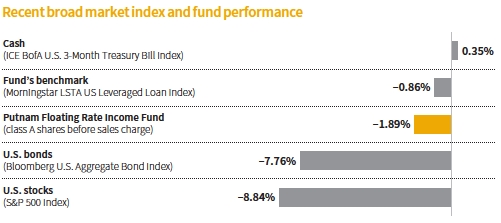
This comparison shows your fund’s performance in the context of broad market indexes for the six months ended 8/31/22. See above and pages 9–11 for additional fund performance information. Index descriptions can be found on pages 14–15.
All Bloomberg indices are provided by Bloomberg Index Services Limited.
|
| 4 Floating Rate Income Fund |

Rob, how would you summarize the high-yield bank loan market during the six-month reporting period ended August 31, 2022?
The period began on a positive note. While other asset classes remained in negative territory after a challenging first quarter, loans registered a slight gain in April. A shift to a more restrictive interest-rate policy by the U.S. Federal Reserve sparked demand for floating-rate debt.
The market context changed markedly in May. Loans declined sharply amid mounting concerns about the ability of corporations and consumers to withstand rising inflation, higher interest rates, and tighter monetary policy. Against this backdrop, loan funds [mutual funds and exchange-traded funds] experienced their first outflows in 18 months.
The asset class fell further in June. Investors shifted their focus to risks of slowing economic growth and possible recession as the Fed announced plans for larger rate increases at upcoming policy meetings. Heavy withdrawals from loan funds continued. Concerns about growth also fueled a moderate dispersion across industry groups, with sectors such
|
| Floating Rate Income Fund 5 |
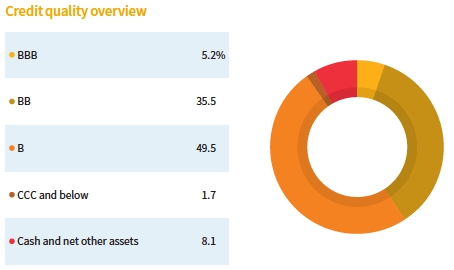
Credit qualities are shown as a percentage of the fund’s net assets as of 8/31/22. A bond rated BBB or higher (A-3 or higher, for short-term debt) is considered investment grade. This chart reflects the highest security rating provided by one or more of Standard & Poor’s, Moody’s, and Fitch. Ratings and portfolio credit quality will vary over time.
Cash and net other assets, if any, represent the market value weights of cash, derivatives, and short-term securities in the portfolio. The fund itself has not been rated by an independent rating agency. Data in the chart reflect a new calculation methodology put into effect on 6/30/22.
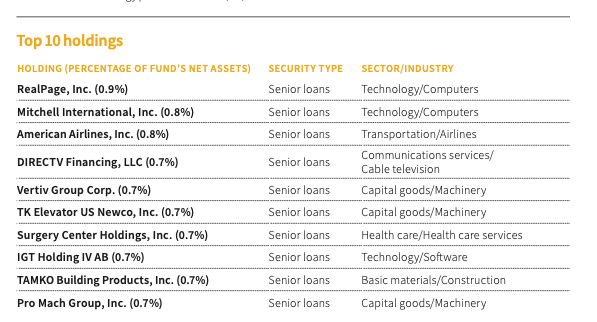
This table shows the fund’s top 10 individual holdings and the percentage of the fund’s net assets that each represented as of 8/31/22. Short-term investments and derivatives, if any, are excluded. Holdings may vary over time.
|
| 6 Floating Rate Income Fund |
as housing, consumer products, and telecommunications lagging.
Loans rallied sharply in July and continued to post gains in August. Expectations for a shallower Fed tightening cycle, better-than-expected corporate earnings growth, a decade low for supply, and steady demand from collateralized loan obligations [CLOs] boosted the market’s performance. [CLOs bundle corporate loans and sell slices of the debt to institutional investors.]
For the period as a whole, despite registering a negative return, loans handily outpaced high-yield corporate bonds and also topped investment-grade credit.
Within the fund’s benchmark during the period, consumer products, telecommunications, and health care were the biggest laggards, with each group declining by about 4%. Utilities [+2%] and energy [+1%] were the only gainers. From a credit-rating perspective, lower-quality loans were the poorest performers, reflecting investor risk aversion. Meanwhile, mid-tier and higher-quality credits outperformed the benchmark.
What factors had the biggest influence on the fund’s relative performance?
Security selection in broadcasting and consumer products hampered performance versus the benchmark, as did an overweight allocation in housing. Conversely, selection in technology notably contributed. Overall positioning in energy and underweight exposure to telecom also added value.
In terms of individual holdings, greater-than-benchmark positions in hospital-based physician group Envision Healthcare and Journey Personal Care, a provider of personal care products, worked against relative performance. An out-of-benchmark investment in hospital operator Quorum Health also detracted. We sold our position in Quorum before period-end.

On the plus side, avoiding several underperforming index components aided performance versus the benchmark. These included Bright Bidco, a designer of semiconductor devices for light-emitting diodes [LEDs]; MLN US Holdco, a maker of communications equipment; and Avaya, which specializes in cloud-based workplace collaboration solutions.
What is the team’s outlook for the bank loan market over the coming months?
We have a moderately positive outlook for the loan market. However, in light of tightening monetary policy, the ongoing war in Ukraine, and lingering supply chain disruptions due in part to Covid-19, we anticipate continued bouts of volatility.
As of period-end, we were continuing our efforts to assess the impact of these and other factors on the companies in our investment universe. In our view, the majority of loan issuers have sufficient capital to absorb the pressure that higher interest rates place on free cash flow.
Loan issuers are emphasizing that major supply chain glitches and inflationary costs are leading to higher working-capital investments. Companies are also grappling with when to pass these increased costs along to customers. Following record loan issuance in 2021, we believe companies generally have sufficient liquidity to fund these working-capital investments.
Including distressed exchanges, the U.S. leveraged loan default rate ended the period at 1.36%, still well below the long-term average of about 3%. Based on year-to-date corporate financial reports, along with a manageable amount of debt maturities over the next two to three years, we do not anticipate a spike in
|
| Floating Rate Income Fund 7 |
defaults. Rather, we expect a gradual increase toward the long-term average.
From a supply/demand standpoint, year-to-date net new loan issuance [net of issuance for refinancing purposes] was down 45% from the same period last year. Loan funds reported year-to-date inflows totaling $8.8 billion. Institutional demand from CLOs remained steady, albeit below last year’s levels.
How was the portfolio positioned as of August 31, 2022?
During the six-month reporting period, the fund remained well diversified across issuers and industries, with no single industry accounting for more than 20% of the fund. The fund’s largest industry exposure was technology, which was held at a roughly equal weight to the benchmark.
Our credit analysts are sector specialists and cover the full ratings spectrum, from investment-grade to lower-quality, more-speculative issuers. As of August 31, the corporate ratings distribution for the portfolio was 5.2% BBB, 35.5% BB, 49.5% B, and 1.7% CCC and below.
We continue to actively diversify the fund through security selection. At the same time, we remain cognizant of the lower liquidity profile of loans relative to corporate bonds. We manage portfolio liquidity by appropriately sizing positions and by maintaining a modest cash allocation. As of period-end, the fund’s cash position was about 8%.
Thanks for your time and for bringing us up to date, Rob.
The views expressed in this report are exclusively those of Putnam Management and are subject to change. They are not meant as investment advice.
Please note that the holdings discussed in this report may not have been held by the fund for the entire period. Portfolio composition is subject to review in accordance with the fund’s investment strategy and may vary in the future. Current and future portfolio holdings are subject to risk.
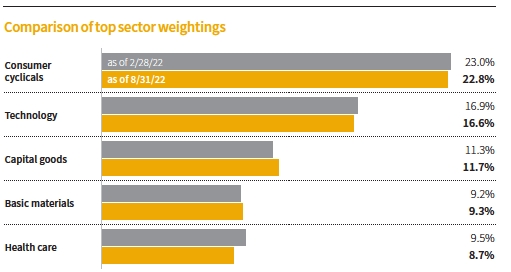
This chart shows how the fund’s top weightings have changed over the past six months. Allocations are shown as a percentage of the fund’s net assets. Current period summary information may differ from the portfolio schedule included in the financial statements due to the inclusion of derivative securities, any interest accruals, the use of different classifications of securities for presentation purposes, and rounding. Holdings and allocations may vary over time.
|
| 8 Floating Rate Income Fund |
Your fund’s performance
This section shows your fund’s performance, price, and distribution information for periods ended August 31, 2022, the end of the first half of its current fiscal year. In accordance with regulatory requirements for mutual funds, we also include performance information as of the most recent calendar quarter-end and expense information taken from the fund’s current prospectus. Performance should always be considered in light of a fund’s investment strategy. Data represent past performance. Past performance does not guarantee future results. More recent returns may be less or more than those shown. Investment return and principal value will fluctuate, and you may have a gain or a loss when you sell your shares. Performance information does not reflect any deduction for taxes a shareholder may owe on fund distributions or on the redemption of fund shares. For the most recent month-end performance, please visit the Individual Investors section at putnam.com or call Putnam at 1-800-225-1581. Class R, R6, and Y shares are not available to all investors. See the Terms and definitions section in this report for definitions of the share classes offered by your fund.
Annualized fund performance Total return for periods ended 8/31/22
| | | | | | |
| | Life of fund | 10 years | 5 years | 3 years | 1 year | 6 months |
| Class A (8/4/04) | | | | | | |
| Before sales charge | 3.13% | 2.74% | 1.98% | 1.07% | –1.41% | –1.89% |
| After sales charge | 3.00 | 2.50 | 1.52 | 0.31 | –3.63 | –4.10 |
| Class B (9/7/04) | | | | | | |
| Before CDSC | 2.90 | 2.56 | 1.78 | 0.91 | –1.61 | –1.87 |
| After CDSC | 2.90 | 2.56 | 1.78 | 0.91 | –2.56 | –2.83 |
| Class C (9/7/04) | | | | | | |
| Before CDSC | 2.78 | 2.12 | 1.19 | 0.31 | –2.15 | –2.27 |
| After CDSC | 2.78 | 2.12 | 1.19 | 0.31 | –3.10 | –3.23 |
| Class R (9/7/04) | | | | | | |
| Net asset value | 2.87 | 2.49 | 1.72 | 0.82 | –1.66 | –1.90 |
| Class R6 (5/22/18) | | | | | | |
| Net asset value | 3.39 | 3.04 | 2.30 | 1.41 | –1.09 | –1.61 |
| Class Y (10/4/05) | | | | | | |
| Net asset value | 3.37 | 3.01 | 2.24 | 1.33 | –1.15 | –1.76 |
Current performance may be lower or higher than the quoted past performance, which cannot guarantee future results. After-sales-charge returns for class A shares reflect the deduction of the maximum 2.25% sales charge levied at the time of purchase. Class B share returns after contingent deferred sales charge (CDSC) reflect the applicable CDSC, which, for class B shares, is 1% in the first year, declining to 0.5% in the second year, and is eliminated thereafter. Class C share returns after CDSC reflect a 1% CDSC for the first year that is eliminated thereafter. Class R, R6, and Y shares have no initial sales charge or CDSC. Performance for class B, C, R, and Y shares before their inception is derived from the historical performance of class A shares, adjusted for the applicable sales charge (or CDSC) and the higher operating expenses for such shares, except for class Y shares, for which 12b-1 fees are not applicable. Performance for class R6 shares prior to their inception is derived from the historical performance of class Y shares and has not been adjusted for the lower investor servicing fees applicable to class R6 shares; had it, returns would have been higher.
Returns for periods of less than one year are not annualized.
For a portion of the periods, the fund had expense limitations, without which returns would have been lower.
Class B and C share performance reflects conversion to class A shares after eight years.
|
| Floating Rate Income Fund 9 |
Comparative annualized index returns For periods ended 8/31/22
| | | | | | |
| | Life of fund | 10 years | 5 years | 3 years | 1 year | 6 months |
| Morningstar LSTA US | | | | | | |
| Leveraged Loan Index* | 4.46% | 3.89% | 3.53% | 3.16% | 0.37% | –0.86% |
| Lipper Loan Participation | | | | | | |
| Funds category median† | 3.47 | 2.94 | 2.34 | 1.68 | –1.40 | –1.86 |
Index and Lipper results should be compared with fund performance before sales charge, before CDSC, or at net asset value.
Returns for periods of less than one year are not annualized.
Lipper peer group median is provided by Lipper, a Refinitiv company.
* Benchmark life-of-fund return reflects performance from 8/31/04 to the current period as data is only available from the month-end following the fund’s inception (8/4/04).
† Over the 6-month, 1-year, 3-year, 5-year, 10-year, and life-of-fund periods ended 8/31/22, there were 240, 236, 227, 210, 140, and 26 funds, respectively, in this Lipper category.
Fund price and distribution information For the six-month period ended 8/31/22
| | | | | | | |
| Distributions | Class A | Class B | Class C | Class R | Class R6 | Class Y |
| Number | 6 | 6 | 6 | 6 | 6 | 6 |
| Income | $0.154106 | $0.146065 | $0.124128 | $0.144082 | $0.166629 | $0.164205 |
| Capital gains | — | — | — | — | — | — |
| Total | $0.154106 | $0.146065 | $0.124128 | $0.144082 | $0.166629 | $0.164205 |
| | Before | After | Net | Net | Net | Net | Net |
| | sales | sales | asset | asset | asset | asset | asset |
| Share value | charge | charge | value | value | value | value | value |
| 2/28/22 | $8.18 | $8.37 | $8.17 | $8.17 | $8.17 | $8.18 | $8.19 |
| 8/31/22 | 7.87 | 8.05 | 7.87 | 7.86 | 7.87 | 7.88 | 7.88 |
| | Before | After | Net | Net | Net | Net | Net |
| Current rate | sales | sales | asset | asset | asset | asset | asset |
| (end of period) | charge | charge | value | value | value | value | value |
| Current dividend rate1 | 4.86% | 4.75% | 4.66% | 4.13% | 4.61% | 5.16% | 5.10% |
| Current 30-day | | | | | | | |
| SEC yield2 | N/A | 5.02 | 4.93 | 4.38 | 4.89 | 5.47 | 5.39 |
The classification of distributions, if any, is an estimate. Before-sales-charge share value and current dividend rate for class A shares, if applicable, do not take into account any sales charge levied at the time of purchase. After-sales-charge share value, current dividend rate, and current 30-day SEC yield, if applicable, are calculated assuming that the maximum sales charge (2.25% for class A shares) was levied at the time of purchase. Final distribution information will appear on your year-end tax forms.
1 Most recent distribution, including any return of capital and excluding capital gains, annualized and divided by share price before or after sales charge at period-end.
2 Based only on investment income and calculated using the maximum offering price for each share class, in accordance with SEC guidelines.
|
| 10 Floating Rate Income Fund |
Annualized fund performance as of most recent calendar quarter
Total return for periods ended 9/30/22
| | | | | | |
| | Life of fund | 10 years | 5 years | 3 years | 1 year | 6 months |
| Class A (8/4/04) | | | | | | |
| Before sales charge | 2.98% | 2.39% | 1.41% | 0.15% | –4.27% | –4.09% |
| After sales charge | 2.85 | 2.16 | 0.95 | –0.61 | –6.43 | –6.25 |
| Class B (9/7/04) | | | | | | |
| Before CDSC | 2.76 | 2.23 | 1.18 | –0.06 | –4.48 | –4.19 |
| After CDSC | 2.76 | 2.23 | 1.18 | –0.06 | –5.40 | –5.13 |
| Class C (9/7/04) | | | | | | |
| Before CDSC | 2.63 | 1.77 | 0.62 | –0.61 | –5.00 | –4.46 |
| After CDSC | 2.63 | 1.77 | 0.62 | –0.61 | –5.92 | –5.40 |
| Class R (9/7/04) | | | | | | |
| Net asset value | 2.71 | 2.12 | 1.13 | –0.15 | –4.52 | –4.33 |
| Class R6 (5/22/18) | | | | | | |
| Net asset value | 3.24 | 2.67 | 1.71 | 0.44 | –3.97 | –4.05 |
| Class Y (10/4/05) | | | | | | |
| Net asset value | 3.22 | 2.64 | 1.64 | 0.36 | –4.03 | –4.08 |
See the discussion following the fund performance table on page 9 for information about the calculation of fund performance.
Returns for periods of less than one year are not annualized.
Your fund’s expenses
As a mutual fund investor, you pay ongoing expenses, such as management fees, distribution fees (12b-1 fees), and other expenses. Using the following information, you can estimate how these expenses affect your investment and compare them with the expenses of other funds. You may also pay one-time transaction expenses, including sales charges (loads) and redemption fees, which are not shown in this section and would have resulted in higher total expenses. For more information, see your fund’s prospectus or talk to your financial representative.
Expense ratios
| | | | | | |
| | Class A | Class B | Class C | Class R | Class R6 | Class Y |
| Total annual operating expenses for the | | | | | | |
| fiscal year ended 2/28/22 | 1.00% | 1.20% | 1.75% | 1.25% | 0.68% | 0.75% |
| Annualized expense ratio for the | | | | | | |
| six-month period ended 8/31/22* | 1.01% | 1.21% | 1.76% | 1.26% | 0.69% | 0.76% |
Fiscal year expense information in this table is taken from the most recent prospectus, is subject to change, and may differ from that shown for the annualized expense ratio and in the financial highlights of this report.
Expenses are shown as a percentage of average net assets.
* Includes one-time annualized proxy cost of 0.01%.
|
| Floating Rate Income Fund 11 |
Expenses per $1,000
The following table shows the expenses you would have paid on a $1,000 investment in each class of the fund from 3/1/22 to 8/31/22. It also shows how much a $1,000 investment would be worth at the close of the period, assuming actual returns and expenses.
| | | | | | |
| | Class A | Class B | Class C | Class R | Class R6 | Class Y |
| Expenses paid per $1,000*† | $5.04 | $6.04 | $8.77 | $6.29 | $3.45 | $3.80 |
| Ending value (after expenses) | $981.10 | $981.30 | $977.30 | $981.00 | $983.90 | $982.40 |
* Expenses for each share class are calculated using the fund’s annualized expense ratio for each class, which represents the ongoing expenses as a percentage of average net assets for the six months ended 8/31/22. The expense ratio may differ for each share class.
† Expenses are calculated by multiplying the expense ratio by the average account value for the period; then multiplying the result by the number of days in the period (184); and then dividing that result by the number of days in the year (365).
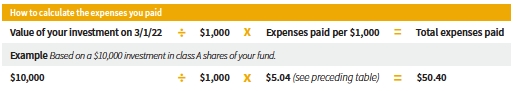
Estimate the expenses you paid
To estimate the ongoing expenses you paid for the six months ended 8/31/22, use the following calculation method. To find the value of your investment on 3/1/22, call Putnam at 1-800-225-1581.
Compare expenses using the SEC’s method
The Securities and Exchange Commission (SEC) has established guidelines to help investors assess fund expenses. Per these guidelines, the following table shows your fund’s expenses based on a $1,000 investment, assuming a hypothetical 5% annualized return. You can use this information to compare the ongoing expenses (but not transaction expenses or total costs) of investing in the fund with those of other funds. All mutual fund shareholder reports will provide this information to help you make this comparison. Please note that you cannot use this information to estimate your actual ending account balance and expenses paid during the period.
| | | | | | |
| | Class A | Class B | Class C | Class R | Class R6 | Class Y |
| Expenses paid per $1,000*† | $5.14 | $6.16 | $8.94 | $6.41 | $3.52 | $3.87 |
| Ending value (after expenses) | $1,020.11 | $1,019.11 | $1,016.33 | $1,018.85 | $1,021.73 | $1,021.37 |
* Expenses for each share class are calculated using the fund’s annualized expense ratio for each class, which represents the ongoing expenses as a percentage of average net assets for the six months ended 8/31/22. The expense ratio may differ for each share class.
† Expenses are calculated by multiplying the expense ratio by the average account value for the six-month period; then multiplying the result by the number of days in the six-month period (184); and then dividing that result by the number of days in the year (365).
|
| 12 Floating Rate Income Fund |
Consider these risks before investing
The value of investments in the fund’s portfolio may fall or fail to rise over extended periods of time for a variety of reasons, including general economic, political, or financial market conditions; investor sentiment and market perceptions; government actions; geopolitical events or changes; and factors related to a specific issuer, geography, industry, or sector. These and other factors may lead to increased volatility and reduced liquidity in the fund’s portfolio holdings.
Lower-rated bonds may offer higher yields in return for more risk. Bond investments are subject to interest-rate risk (the risk of bond prices falling if interest rates rise) and credit risk (the risk of an issuer defaulting on interest or principal payments). Interest-rate risk is generally greater for longer-term bonds, and credit risk is generally greater for below-investment-grade bonds. Unlike bonds, funds that invest in bonds have fees and expenses. Risks associated with derivatives include increased investment exposure (which may be considered leverage) and, in the case of over-the-counter instruments, the potential inability to terminate or sell derivatives positions and the potential failure of the other party to the instrument to meet its obligations. Floating-rate loans may reduce, but not eliminate, interest-rate risk. These loans are typically secured by specific collateral or assets of the issuer (so that holders of the loan, such as the fund, have a priority claim on those assets in the event of the issuer’s default or bankruptcy). The value of collateral may be insufficient to meet the issuer’s obligations, and the fund’s access to collateral may be limited by bankruptcy or other insolvency laws.
Our investment techniques, analyses, and judgments may not produce the outcome we intend. The investments we select for the fund may not perform as well as other securities that we do not select for the fund. We, or the fund’s other service providers, may experience disruptions or operating errors that could have a negative effect on the fund. You can lose money by investing in the fund.
|
| Floating Rate Income Fund 13 |
Terms and definitions
Important terms
Total return shows how the value of the fund’s shares changed over time, assuming you held the shares through the entire period and reinvested all distributions in the fund.
Before sales charge, or net asset value, is the price, or value, of one share of a mutual fund, without a sales charge. Before-sales-charge figures fluctuate with market conditions. They are calculated by dividing the net assets of each class of shares by the number of outstanding shares in the class.
After sales charge is the price of a mutual fund share plus the maximum sales charge levied at the time of purchase. After-sales-charge performance figures shown here assume the 2.25% maximum sales charge for class A shares.
Contingent deferred sales charge (CDSC) is generally a charge applied at the time of the redemption of class B or C shares and assumes redemption at the end of the period. Your fund’s class B CDSC declines over time from a 1% maximum during the first year to 0.5% during the second year. After the second year, the CDSC no longer applies. The CDSC for class C shares is 1% for one year after purchase.
Share classes
Class A shares are generally subject to an initial sales charge and no CDSC (except on certain redemptions of shares bought without an initial sales charge).
Class B shares are closed to new investments and are only available by exchange from class B shares of another Putnam fund or through dividend and/or capital gains reinvestment. They are not subject to an initial sales charge and may be subject to a CDSC.
Class C shares are not subject to an initial sales charge and are subject to a CDSC only if the shares are redeemed during the first year.
Class R shares are not subject to an initial sales charge or CDSC and are only available to employer-sponsored retirement plans.
Class R6 shares are not subject to an initial sales charge or CDSC and carry no 12b-1 fee. They are generally only available to employer-sponsored retirement plans, corporate and institutional clients, and clients in other approved programs.
Class Y shares are not subject to an initial sales charge or CDSC and carry no 12b-1 fee. They are generally only available to corporate and institutional clients and clients in other approved programs.
Fixed income terms
Current rate is the annual rate of return earned from dividends or interest of an investment. Current rate is expressed as a percentage of the price of a security, fund share, or principal investment.
Yield curve is a graph that plots the yields of bonds with equal credit quality against their differing maturity dates, ranging from shortest to longest. It is used as a benchmark for other debt, such as mortgage or bank lending rates.
Comparative indexes
Bloomberg U.S. Aggregate Bond Index is an unmanaged index of U.S. investment-grade fixed income securities.
ICE BofA (Intercontinental Exchange Bank of America) U.S. 3-Month Treasury Bill Index is an unmanaged index that seeks to measure the performance of U.S. Treasury bills available in the marketplace.
Morningstar® LSTA® US Leveraged Loan Index is an unmanaged index of U.S. leveraged loans.
S&P 500® Index is an unmanaged index of common stock performance.
|
| 14 Floating Rate Income Fund |
Indexes assume reinvestment of all distributions and do not account for fees. Securities and performance of a fund and an index will differ. You cannot invest directly in an index.
BLOOMBERG® is a trademark and service mark of Bloomberg Finance L.P. and its affiliates (collectively “Bloomberg”). Bloomberg or Bloomberg’s licensors own all proprietary rights in the Bloomberg Indices. Neither Bloomberg nor Bloomberg’s licensors approve or endorse this material, or guarantee the accuracy or completeness of any information herein, or make any warranty, express or implied, as to the results to be obtained therefrom, and to the maximum extent allowed by law, neither shall have any liability or responsibility for injury or damages arising in connection therewith.
ICE Data Indices, LLC (“ICE BofA”), used with permission. ICE BofA permits use of the ICE BofA indices and related data on an “as is” basis; makes no warranties regarding same; does not guarantee the suitability, quality, accuracy, timeliness, and/or completeness of the ICE BofA indices or any data included in, related to, or derived therefrom; assumes no liability in connection with the use of the foregoing; and does not sponsor, endorse, or recommend Putnam Investments, or any of its products or services.
Lipper, a Refinitiv company, is a third-party industry-ranking entity that ranks mutual funds. Its rankings do not reflect sales charges. Lipper rankings are based on total return at net asset value relative to other funds that have similar current investment styles or objectives as determined by Lipper. Lipper may change a fund’s category assignment at its discretion. Lipper category medians reflect performance trends for funds within a category.
|
| Floating Rate Income Fund 15 |
Other information for shareholders
Important notice regarding delivery of shareholder documents
In accordance with Securities and Exchange Commission (SEC) regulations, Putnam sends a single notice of internet availability, or a single printed copy, of annual and semiannual shareholder reports, prospectuses, and proxy statements to Putnam shareholders who share the same address, unless a shareholder requests otherwise. If you prefer to receive your own copy of these documents, please call Putnam at 1-800-225-1581, and Putnam will begin sending individual copies within 30 days.
Proxy voting
Putnam is committed to managing our mutual funds in the best interests of our shareholders. The Putnam funds’ proxy voting guidelines and procedures, as well as information regarding how your fund voted proxies relating to portfolio securities during the 12-month period ended June 30, 2022, are available in the Individual Investors section of putnam.com and on the SEC’s website, www.sec.gov. If you have questions about finding forms on the SEC’s website, you may call the SEC at 1-800-SEC-0330. You may also obtain the Putnam funds’ proxy voting guidelines and procedures at no charge by calling Putnam’s Shareholder Services at 1-800-225-1581.
Fund portfolio holdings
The fund will file a complete schedule of its portfolio holdings with the SEC for the first and third quarters of each fiscal year on Form N-PORT within 60 days of the end of such fiscal quarter. Shareholders may obtain the fund’s Form N-PORT on the SEC’s website at www.sec.gov.
Prior to its use of Form N-PORT, the fund filed its complete schedule of its portfolio holdings with the SEC on Form N-Q, which is available online at www.sec.gov.
Trustee and employee fund ownership
Putnam employees and members of the Board of Trustees place their faith, confidence, and, most importantly, investment dollars in Putnam mutual funds. As of August 31, 2022, Putnam employees had approximately $463,000,000 and the Trustees had approximately $63,000,000 invested in Putnam mutual funds. These amounts include investments by the Trustees’ and employees’ immediate family members as well as investments through retirement and deferred compensation plans.
Liquidity risk management program
Putnam, as the administrator of the fund’s liquidity risk management program (appointed by the Board of Trustees), presented the most recent annual report on the program to the Trustees in April 2022. The report covered the structure of the program, including the program documents and related policies and procedures adopted to comply with Rule 22e-4 under the Investment Company Act of 1940, and reviewed the operation of the program from January 2021 through December 2021. The report included a description of the annual liquidity assessment of the fund that Putnam performed in November 2021. The report noted that there were no material compliance exceptions identified under Rule 22e-4 during the period. The report included a review of the governance of the program and the methodology for classification of the fund’s investments. The report also included a discussion of liquidity monitoring during the period, including during the market liquidity challenges caused by the Covid-19 pandemic, and the impact those challenges had on the liquidity of the fund’s investments. Putnam concluded that the program has been operating effectively and adequately to ensure compliance with Rule 22e-4.
|
| 16 Floating Rate Income Fund |
Trustee approval of management contract
General conclusions
The Board of Trustees of The Putnam Funds oversees the management of each fund and, as required by law, determines annually whether to approve the continuance of your fund’s management contract with Putnam Investment Management, LLC (“Putnam Management”) and the sub-management contract with respect to your fund between Putnam Management and its affiliate, Putnam Investments Limited (“PIL”). The Board, with the assistance of its Contract Committee, requests and evaluates all information it deems reasonably necessary under the circumstances in connection with its annual contract review. The Contract Committee consists solely of Trustees who are not “interested persons” (as this term is defined in the Investment Company Act of 1940, as amended (the “1940 Act”)) of The Putnam Funds (“Independent Trustees”).
At the outset of the review process, members of the Board’s independent staff and independent legal counsel considered any possible changes to the annual contract review materials furnished to the Contract Committee during the course of the previous year’s review and, as applicable, identified those changes to Putnam Management. Following these discussions and in consultation with the Contract Committee, the Independent Trustees’ independent legal counsel requested that Putnam Management and its affiliates furnish specified information, together with any additional information that Putnam Management considered relevant, to the Contract Committee. Over the course of several months ending in June 2022, the Contract Committee met on a number of occasions with representatives of Putnam Management, and separately in executive session, to consider the information that Putnam Management provided. Throughout this process, the Contract Committee was assisted by the members of the Board’s independent staff and by independent legal counsel for The Putnam Funds and the Independent Trustees.
In May 2022, the Contract Committee met in executive session to discuss and consider its recommendations with respect to the continuance of the contracts. At the Trustees’ June 2022 meeting, the Contract Committee met in executive session with the other Independent Trustees to review a summary of the key financial, performance and other data that the Contract Committee considered in the course of its review. The Contract Committee then presented its written report, which summarized the key factors that the Committee had considered and set forth its recommendations. The Contract Committee recommended, and the Independent Trustees approved, the continuance of your fund’s management contract and the approval of your fund’s amended and restated sub-management contract, effective July 1, 2022. (Because PIL is an affiliate of Putnam Management and Putnam Management remains fully responsible for all services provided by PIL, the Trustees have not attempted to evaluate PIL as a separate entity, and all subsequent references to Putnam Management below should be deemed to include reference to PIL as necessary or appropriate in the context.)
The Independent Trustees’ approval was based on the following conclusions:
• That the fee schedule in effect for your fund represented reasonable compensation in light of the nature and quality of the services being provided to the fund, the fees paid by competitive funds, the costs incurred by Putnam Management in providing services to the fund and the application of certain reductions and waivers noted below; and
• That the fee schedule in effect for your fund represented an appropriate sharing between fund shareholders and Putnam Management of any economies of scale as may exist in the management of the fund at current asset levels.
These conclusions were based on a comprehensive consideration of all information provided to the Trustees and were not the result of any single factor. Some of the factors that figured particularly in the Trustees’ deliberations and how the Trustees considered these factors are described below, although individual Trustees may have evaluated the information presented differently, giving different weights to various factors. It is also important to recognize that the management arrangements for your fund and the other Putnam funds are the result of many years of review and discussion between the Independent Trustees and Putnam Management, that some aspects of the arrangements may receive greater scrutiny in some years than others and that the Trustees’ conclusions may be based, in part, on their consideration of fee arrangements in previous years. For example,
|
| Floating Rate Income Fund 17 |
with certain exceptions primarily involving newer or repositioned funds, the current fee arrangements under the vast majority of the funds’ management contracts were first implemented at the beginning of 2010 following extensive review by the Contract Committee and discussions with representatives of Putnam Management, as well as approval by shareholders.
Management fee schedules and total expenses
The Trustees reviewed the management fee schedules in effect for all Putnam funds, including fee levels and breakpoints. Under its management contract, your fund has the benefit of breakpoints in its management fee schedule that provide shareholders with reduced fee levels as assets under management in the Putnam family of funds increase. The Trustees also reviewed the total expenses of each Putnam fund, recognizing that in most cases management fees represented the major, but not the sole, determinant of total costs to fund shareholders. (Two funds have implemented so-called “all-in” management fees covering substantially all routine fund operating costs.) The Trustees considered that the proposed amended and restated sub-management contract would lower the sub-management fees paid by Putnam Management to PIL.
In reviewing fees and expenses, the Trustees generally focus their attention on material changes in circumstances — for example, changes in assets under management, changes in a fund’s investment strategy, changes in Putnam Management’s operating costs or profitability, or changes in competitive practices in the mutual fund industry — that suggest that consideration of fee changes might be warranted. The Trustees concluded that the circumstances did not indicate that changes to the management fee schedule for your fund would be appropriate at this time.
As in the past, the Trustees also focused on the competitiveness of each fund’s total expense ratio. The Trustees and Putnam Management and the funds’ investor servicing agent, Putnam Investor Services, Inc. (“PSERV”), have implemented expense limitations that were in effect during your fund’s fiscal year ending in 2021. These expense limitations were: (i) a contractual expense limitation applicable to specified open-end funds, including your fund, of 25 basis points on investor servicing fees and expenses and (ii) a contractual expense limitation applicable to specified open-end funds, including your fund, of 20 basis points on so-called “other expenses” (i.e., all expenses exclusive of management fees, distribution fees, investor servicing fees, investment-related expenses, interest, taxes, brokerage commissions, acquired fund fees and expenses and extraordinary expenses). These expense limitations attempt to maintain competitive expense levels for the funds. Most funds, including your fund, had sufficiently low expenses that these expense limitations were not operative during their fiscal years ending in 2021. PSERV has agreed to maintain the first expense limitation until at least August 31, 2023 and Putnam Management has agreed to maintain the second expense limitation until at least June 30, 2023. Putnam Management and PSERV’s commitment to these expense limitation arrangements, which were intended to support an effort to have fund expenses meet competitive standards, was an important factor in the Trustees’ decision to approve the continuance of your fund’s management contract and to approve your fund’s amended and restated sub-management contract.
The Trustees reviewed comparative fee and expense information for a custom group of competitive funds selected by Broadridge Financial Solutions, Inc. (“Broadridge”). This comparative information included your fund’s percentile ranking for effective management fees and total expenses (excluding any applicable 12b-1 fees), which provides a general indication of your fund’s relative standing. In the custom peer group, your fund ranked in the first quintile in effective management fees (determined for your fund and the other funds in the custom peer group based on fund asset size and the applicable contractual management fee schedule) and in the fourth quintile in total expenses (excluding any applicable 12b-1 fees) as of December 31, 2021. The first quintile represents the least expensive funds and the fifth quintile the most expensive funds. The fee and expense data reported by Broadridge as of December 31, 2021 reflected the most recent fiscal year-end data available in Broadridge’s database at that time.
In connection with their review of fund management fees and total expenses, the Trustees also reviewed the costs of the services provided and the profits realized by Putnam Management and its affiliates from their contractual relationships with the funds. This information included trends in revenues, expenses and profitability of Putnam Management and its affiliates relating to the
|
| 18 Floating Rate Income Fund |
investment management, investor servicing and distribution services provided to the funds. In this regard, the Trustees also reviewed an analysis of the revenues, expenses and profitability of Putnam Management and its affiliates, allocated on a fund-by-fund basis, with respect to the funds’ management, distribution and investor servicing contracts. For each fund, the analysis presented information about revenues, expenses and profitability for each of the agreements separately and for the agreements taken together on a combined basis. The Trustees concluded that, at current asset levels, the fee schedules in place for the Putnam funds, including the fee schedule for your fund, represented reasonable compensation for the services being provided and represented an appropriate sharing between fund shareholders and Putnam Management of any economies of scale as may exist in the management of the Putnam funds at that time.
The information examined by the Trustees in connection with their annual contract review for the Putnam funds included information regarding services provided and fees charged by Putnam Management and its affiliates to other clients, including collective investment trusts offered in the defined contribution and defined benefit retirement plan markets, sub-advised mutual funds, private funds sponsored by affiliates of Putnam Management, model-only separately managed accounts and Putnam Management’s exchange-traded funds. This information included, in cases where a product’s investment strategy corresponds with a fund’s strategy, comparisons of those fees with fees charged to the Putnam funds, as well as an assessment of the differences in the services provided to these clients as compared to the services provided to the Putnam funds. The Trustees observed that the differences in fee rates between these clients and the Putnam funds are by no means uniform when examined by individual asset sectors, suggesting that differences in the pricing of investment management services to these types of clients may reflect, among other things, historical competitive forces operating in separate marketplaces. The Trustees considered the fact that in many cases fee rates across different asset classes are higher on average for mutual funds than for other clients, and the Trustees also considered the differences between the services that Putnam Management provides to the Putnam funds and those that it provides to its other clients. The Trustees did not rely on these comparisons to any significant extent in concluding that the management fees paid by your fund are reasonable.
Investment performance
The quality of the investment process provided by Putnam Management represented a major factor in the Trustees’ evaluation of the quality of services provided by Putnam Management under your fund’s management contract. The Trustees were assisted in their review of Putnam Management’s investment process and performance by the work of the investment oversight committees of the Trustees and the full Board of Trustees, which meet on a regular basis with individual portfolio managers and with senior management of Putnam Management’s Investment Division throughout the year. The Trustees concluded that Putnam Management generally provides a high-quality investment process — based on the experience and skills of the individuals assigned to the management of fund portfolios, the resources made available to them and in general Putnam Management’s ability to attract and retain high-quality personnel — but also recognized that this does not guarantee favorable investment results for every fund in every time period.
The Trustees considered that, in the aggregate, the Putnam funds’ performance was generally solid in 2021 against a backdrop of strong U.S. economic and financial market growth. The Trustees considered Putnam Management’s observation that, despite an environment of generally strong growth, there had been various headwinds experienced in 2021. For the one-year period ended December 31, 2021, the Trustees noted that the Putnam funds, on an asset-weighted basis, ranked in the 52nd percentile of their peers as determined by Lipper Inc. (“Lipper”) and, on an asset-weighted-basis, delivered a gross return that trailed their benchmarks by 0.1%. Over the longer-term, the Committee noted that, on an asset-weighted basis, the Putnam funds delivered strong aggregate performance relative to their Lipper peers over the three-, five- and ten-year periods ended December 31, 2021, ranking in the 31st, 29th and 21st percentiles, respectively, and that the funds, in the aggregate, outperformed their benchmarks on a gross basis for each of those periods.
In addition to the performance of the individual Putnam funds, the Trustees considered, as they had in prior years, the performance of The Putnam Fund complex versus competitor fund complexes.
|
| Floating Rate Income Fund 19 |
In particular, the Trustees considered The Putnam Fund complex’s performance as reported in the Barron’s/Lipper Fund Families survey (the “Survey”), which ranks mutual fund companies based on their performance across a variety of asset types. The Trustees noted that The Putnam Fund complex continued to rank highly in the Survey, especially over the longer-term, with The Putnam Funds ranking as the 6th best performing mutual fund complex out of 45 complexes for the ten-year period and 13th out of 49 complexes for the five-year period. The Trustees noted that 2021 marked the fifth consecutive year that The Putnam Funds have ranked in the top ten fund complexes for the ten-year period. The Trustees also considered that The Putnam Fund complex’s Survey performance over the one-year period was solid, with The Putnam Funds ranking 27th out of 51 complexes. In addition to the Survey, the Trustees also considered the Putnam funds’ ratings assigned by Morningstar Inc., noting that 25 of the funds were four- or five-star rated at the end of 2021 (representing a decrease of one fund year-over-year) and that this included nine funds that had achieved a five-star rating (representing an increase of two funds year-over-year). They also noted, however, the disappointing investment performance of some Putnam funds for periods ended December 31, 2021 and considered information provided by Putnam Management regarding the factors contributing to the underperformance and actions being taken to improve the performance of these particular funds. The Trustees indicated their intention to continue to monitor closely the performance of those funds and evaluate whether additional actions to address areas of underperformance may be warranted.
For purposes of the Trustees’ evaluation of the Putnam funds’ investment performance, the Trustees generally focus on a competitive industry ranking of each fund’s total net return over a one-year, three-year and five-year period. For a number of Putnam funds with relatively unique investment mandates for which Putnam Management informed the Trustees that meaningful competitive performance rankings are not considered to be available, the Trustees evaluated performance based on their total gross and net returns and comparisons of those returns to the returns of selected investment benchmarks. In the case of your fund, the Trustees considered that its class A share cumulative total return performance at net asset value was in the following quartiles of its Lipper peer group (Lipper Loan Participation Funds) for the one-year, three-year and five-year periods ended December 31, 2021 (the first quartile representing the best-performing funds and the fourth quartile the worst-performing funds):
| |
| One-year period | 4th |
| Three-year period | 3rd |
| Five-year period | 3rd |
Over the one-year, three-year and five-year periods ended December 31, 2021, there were 241, 223 and 205 funds, respectively, in your fund’s Lipper peer group. (When considering performance information, shareholders should be mindful that past performance is not a guarantee of future results.)
The Trustees expressed concern about your fund’s fourth quartile performance over the one-year period ended December 31, 2021 and considered the circumstances that may have contributed to this disappointing performance. The Trustees considered Putnam Management’s observation that the fund’s underperformance over the one-year period was driven by the fund’s lower-risk approach as compared to its peers. The Trustees noted Putnam Management’s observation that this approach had benefitted the fund in early 2020 at the start of the COVID-19 pandemic but that the subsequent strong policy response aimed at certain areas of the fixed income markets resulted in the meaningful outperformance of corporate credit, leading to the fund’s significant peer-relative underperformance in 2021.
The Trustees noted that Putnam Management was considering whether to broaden the fund’s range of risks going forward. The Trustees also considered that a portfolio manager who retired in March 2022 had been replaced by another portfolio manager. The Trustees noted that Putnam Management remained confident in the fund’s portfolio managers. The Trustees also considered Putnam Management’s continued efforts to support fund performance through certain initiatives, including structuring compensation for portfolio managers to enhance accountability for fund performance, emphasizing accountability in the portfolio management process and affirming its commitment to a fundamental-driven approach to investing. The Trustees noted further that Putnam Management had made selective hires and internal promotions in 2021 to strengthen its investment team.
|
| 20 Floating Rate Income Fund |
As a general matter, the Trustees believe that cooperative efforts between the Trustees and Putnam Management represent the most effective way to address investment performance concerns that may arise from time to time. The Trustees noted that investors in the Putnam funds have, in effect, placed their trust in the Putnam organization, under the oversight of the funds’ Trustees, to make appropriate decisions regarding the management of the funds. The Trustees also considered that Putnam Management has made changes in light of subpar investment performance when warranted. Based on Putnam Management’s willingness to take appropriate measures to address fund performance issues, the Trustees concluded that it continued to be advisable to seek change within Putnam Management to address performance shortcomings. In the Trustees’ view, the alternative of engaging a new investment adviser for an underperforming fund, with all the attendant risks and disruptions, would not likely provide any greater assurance of improved investment performance.
Brokerage and soft-dollar allocations; investor servicing
The Trustees considered various potential benefits that Putnam Management may receive in connection with the services it provides under the management contract with your fund. These include benefits related to brokerage allocation and the use of soft dollars, whereby a portion of the commissions paid by a fund for brokerage may be used to acquire research services that are expected to be useful to Putnam Management in managing the assets of the fund and of other clients. Subject to policies established by the Trustees, soft dollars generated by these means are used predominantly to acquire brokerage and research services (including third-party research and market data) that enhance Putnam Management’s investment capabilities and supplement Putnam Management’s internal research efforts. The Trustees indicated their continued intent to monitor regulatory and industry developments in this area with the assistance of their Brokerage Committee. In addition, with the assistance of their Brokerage Committee, the Trustees indicated their continued intent to monitor the allocation of the Putnam funds’ brokerage in order to ensure that the principle of seeking best price and execution remains paramount in the portfolio trading process.
Putnam Management may also receive benefits from payments that the funds make to Putnam Management’s affiliates for investor or distribution services. In conjunction with the annual review of your fund’s management and sub-management contracts, the Trustees reviewed your fund’s investor servicing agreement with PSERV and its distributor’s contract and distribution plans with Putnam Retail Management Limited Partnership (“PRM”), both of which are affiliates of Putnam Management. The Trustees concluded that the fees payable by the funds to PSERV and PRM, as applicable, for such services are fair and reasonable in relation to the nature and quality of such services, the fees paid by competitive funds and the costs incurred by PSERV and PRM, as applicable, in providing such services. Furthermore, the Trustees were of the view that the investor services provided by PSERV were required for the operation of the funds, and that they were of a quality at least equal to those provided by other providers.
|
| Floating Rate Income Fund 21 |
Financial statements
These sections of the report, as well as the accompanying Notes, constitute the fund’s financial statements.
The fund’s portfolio lists all the fund’s investments and their values as of the last day of the reporting period. Holdings are organized by asset type and industry sector, country, or state to show areas of concentration and diversification.
Statement of assets and liabilities shows how the fund’s net assets and share price are determined. All investment and non-investment assets are added together. Any unpaid expenses and other liabilities are subtracted from this total. The result is divided by the number of shares to determine the net asset value per share, which is calculated separately for each class of shares. (For funds with preferred shares, the amount subtracted from total assets includes the liquidation preference of preferred shares.)
Statement of operations shows the fund’s net investment gain or loss. This is done by first adding up all the fund’s earnings — from dividends and interest income — and subtracting its operating expenses to determine net investment income (or loss). Then, any net gain or loss the fund realized on the sales of its holdings — as well as any unrealized gains or losses over the period — is added to or subtracted from the net investment result to determine the fund’s net gain or loss for the fiscal period.
Statement of changes in net assets shows how the fund’s net assets were affected by the fund’s net investment gain or loss, by distributions to shareholders, and by changes in the number of the fund’s shares. It lists distributions and their sources (net investment income or realized capital gains) over the current reporting period and the most recent fiscal year-end. The distributions listed here may not match the sources listed in the Statement of operations because the distributions are determined on a tax basis and may be paid in a different period from the one in which they were earned. Dividend sources are estimated at the time of declaration. Actual results may vary. Any non-taxable return of capital cannot be determined until final tax calculations are completed after the end of the fund’s fiscal period.
Financial highlights provide an overview of the fund’s investment results, per-share distributions, expense ratios, net investment income ratios, and portfolio turnover in one summary table, reflecting the five most recent reporting periods. In a semiannual report, the highlights table also includes the current reporting period.
|
| 22 Floating Rate Income Fund |
| | |
| The fund’s portfolio 8/31/22 (Unaudited) | | |
|
| | | |
| SENIOR LOANS (82.9%)*c | Principal
amount | Value |
| Advertising and marketing services (1.1%) |
| Clear Channel Outdoor Holdings, Inc. bank term loan FRN Ser. B, (ICE LIBOR USD 3 Month + 3.50%), 6.305%, 8/21/26 | | $2,385,037 | $2,203,846 |
| Terrier Media Buyer, Inc. bank term loan FRN (ICE LIBOR USD 3 Month + 3.50%), 6.024%, 12/17/26 | | 2,667,981 | 2,584,607 |
| | | 4,788,453 |
| Aerospace and defense (0.2%) |
| Epicor Software Corp. bank term loan FRN (ICE LIBOR USD 3 Month + 7.75%), 10.274%, 7/30/28 | | 855,000 | 850,366 |
| | | 850,366 |
| Automotive (0.4%) |
| Rough Country, LLC bank term loan FRN (ICE LIBOR USD 1 Month + 3.50%), 5.75%, 7/29/28 | | 1,975,000 | 1,875,263 |
| | | 1,875,263 |
| Basic materials (7.8%) |
| Avient Corp. bank term loan FRN Ser. B, (CME Term SOFR 1 Month + 3.25%), 5.577%, 7/27/29 | | 750,000 | 746,250 |
| Core & Main LP bank term loan FRN Ser. B, (ICE LIBOR USD 3 Month + 2.50%), 4.864%, 6/10/28 | | 1,483,759 | 1,445,271 |
| CP Atlas Buyer, Inc. bank term loan FRN Ser. B1, (ICE LIBOR USD 3 Month + 3.75%), 6.274%, 11/23/27 | | 2,120,408 | 1,959,384 |
| Diamond BC BV bank term loan FRN Ser. B, (ICE LIBOR USD 3 Month + 2.75%), 5.555%, 9/14/28 | | 1,990,000 | 1,914,539 |
GEON Performance Solutions, LLC bank term loan FRN Ser. B,
(ICE LIBOR USD 3 Month + 4.50%), 7.024%, 8/20/28 | | 992,500 | 975,131 |
| Herens US Holdco Corp. bank term loan FRN Ser. B, (ICE LIBOR USD 3 Month + 4.00%), 6.25%, 4/30/28 | | 3,152,034 | 2,897,255 |
Klockner-Pentaplast of America, Inc. bank term loan FRN
(ICE LIBOR USD 3 Month + 4.75%), 8.316%, 2/4/26 | | 1,500,856 | 1,374,529 |
| LSF11 A5 HoldCo, LLC bank term loan FRN Ser. B, (ICE LIBOR USD 3 Month + 3.61%), 5.77%, 9/30/28 | | 23,940 | 23,379 |
| Messer Industries USA, Inc. bank term loan FRN Ser. B, (ICE LIBOR USD 3 Month + 2.50%), 4.76%, 10/1/25 | | 2,468,708 | 2,418,717 |
Olympus Water US Holding Corp. bank term loan FRN Ser. B,
(ICE LIBOR USD 3 Month + 3.75%), 6.063%, 9/21/28 | | 1,486,253 | 1,427,502 |
| PMHC II, Inc. bank term loan FRN (CME TERM SOFR 3 Month + 4.25%), 6.977%, 2/2/29 | | 1,500,000 | 1,339,590 |
| Pregis TopCo, LLC bank term loan FRN (ICE LIBOR USD 3 Month + 4.00%), 6.805%, 8/1/26 | | 1,488,750 | 1,440,366 |
| Quikrete Holdings, Inc. bank term loan FRN Ser. B, (ICE LIBOR USD 3 Month + 3.00%), 5.524%, 6/11/28 | | 997,500 | 963,366 |
| Quikrete Holdings, Inc. bank term loan FRN Ser. B, (ICE LIBOR USD 3 Month + 2.63%), 5.149%, 2/1/27 | | 1,528,051 | 1,469,084 |
| SCIH Salt Holdings, Inc. bank term loan FRN Ser. B, (ICE LIBOR USD 3 Month + 4.00%), 6.806%, 3/16/27 | | 2,145,961 | 2,058,513 |
Smyrna Ready Mix Concrete, LLC bank term loan FRN Ser. B,
(ICE LIBOR USD 3 Month + 4.25%), 6.805%, 3/24/29 | | 1,000,000 | 972,500 |
| Starfruit US Holdco, LLC bank term loan FRN Ser. B, (ICE LIBOR USD 3 Month + 3.00%), 5.00%, 10/1/25 | | 1,145,029 | 1,114,400 |
| Sylvamo Corp. bank term loan FRN (ICE LIBOR USD 3 Month + 4.50%), 7.024%, 8/20/28 | | 1,083,333 | 1,048,125 |
| |
Floating Rate Income Fund 23 |
| | | |
| SENIOR LOANS (82.9%)*c cont. | Principal
amount | Value |
| Basic materials cont. |
TAMKO Building Products, Inc. bank term loan FRN Ser. B,
(ICE LIBOR USD 3 Month + 3.00%), 5.50%, 5/3/26 | | $3,044,245 | $2,926,281 |
| Tronox Finance, LLC bank term loan FRN Ser. B, (CME Term SOFR 3 Month Plus CSA + 3.25%), 5.304%, 3/3/29 | | 997,500 | 973,390 |
| W.R. Grace Holdings, LLC bank term loan FRN Ser. B, (ICE LIBOR USD 1 Month + 3.75%), 6.063%, 9/22/28 | | 1,000,000 | 979,170 |
| Watlow Electric Manufacturing, Co. bank term loan FRN (ICE LIBOR USD 3 Month + 3.75%), 6.274%, 3/2/28 | | 2,478,650 | 2,425,359 |
| | | 32,892,101 |
| Broadcasting (1.7%) |
Banijay Group US Holding, Inc. bank term loan FRN Ser. B,
(ICE LIBOR USD 3 Month + 3.75%), 6.112%, 3/4/25 | | 1,570,326 | 1,550,210 |
| Diamond Sports Group, LLC bank term loan FRN (ICE LIBOR USD 3 Month + 3.25%), 5.637%, 8/24/26 | | 1,436,702 | 260,661 |
| Entercom Media Corp. bank term loan FRN Ser. B1, (ICE LIBOR USD 3 Month + 2.50%), 4.993%, 11/17/24 | | 2,475,716 | 2,154,641 |
| iHeartCommunications, Inc. bank term loan FRN Ser. B, (ICE LIBOR USD 3 Month + 3.00%), 5.524%, 5/1/26 | | 1,472,582 | 1,421,306 |
| Univision Communications, Inc. bank term loan FRN (ICE LIBOR USD 3 Month + 3.25%), 5.274%, 3/24/26 | | 1,591,457 | 1,552,244 |
| | | 6,939,062 |
| Building materials (4.7%) |
| AppleCaramel Buyer, LLC bank term loan FRN (CME Term SOFR 3 Month Plus CSA + 0.00%), 6.205%, 10/19/27 | | 2,362,579 | 2,278,282 |
| Chariot Buyer, LLC bank term loan FRN (ICE LIBOR USD 1 Month + 3.50%), 6.024%, 10/22/28 | | 2,985,000 | 2,835,750 |
| Cornerstone Building Brands, Inc. bank term loan FRN (ICE LIBOR USD 3 Month + 3.25%), 5.641%, 4/12/28 | | 2,902,754 | 2,592,160 |
| CPG International, LLC bank term loan FRN Ser. B, (CME Term SOFR 1 Month + 2.50%), 4.092%, 4/28/29 | | 2,500,000 | 2,425,000 |
| LBM Acquisition, LLC bank term loan FRN Ser. B, (ICE LIBOR USD 3 Month + 3.75%), 7.121%, 12/17/27 | | 2,802,093 | 2,550,605 |
| MI Windows And Doors, Inc. bank term loan FRN Ser. B, (US SOFR Compounded Index + 3.60%), 6.055%, 12/18/27 | | 1,994,987 | 1,957,083 |
| Park River Holdings, Inc. bank term loan FRN (ICE LIBOR USD 3 Month + 3.25%), 5.527%, 12/28/27 | | 987,494 | 894,916 |
| Robertshaw Holdings Corp. bank term loan FRN (ICE LIBOR USD 3 Month + 8.00%), 10.563%, 2/28/26 | | 1,427,000 | 856,200 |
| SRS Distribution, Inc. bank term loan FRN Ser. B, (ICE LIBOR USD 3 Month + 3.50%), 6.306%, 5/20/28 | | 1,989,950 | 1,920,302 |
| Werner Finco LP bank term loan FRN Ser. B, (ICE LIBOR USD 3 Month + 4.00%), 6.524%, 7/24/24 | | 1,600,126 | 1,476,116 |
| | | 19,786,414 |
| Capital goods (9.3%) |
| Adient US, LLC bank term loan FRN Ser. B, (ICE LIBOR USD 3 Month + 3.25%), 5.774%, 4/1/28 | | 2,610,256 | 2,553,170 |
| American Trailer World Corp. bank term loan FRN (US SOFR Compounded Index + 3.50%), 6.305%, 3/3/28 | | 1,984,975 | 1,848,012 |
| BWAY Corp. bank term loan FRN Ser. B, (ICE LIBOR USD 3 Month + 3.25%), 5.623%, 4/3/24 | | 2,038,539 | 1,992,305 |
| Clarios Global LP bank term loan FRN Ser. B, (ICE LIBOR USD 3 Month + 3.25%), 5.774%, 4/30/26 | | 2,579,175 | 2,506,959 |
| |
24 Floating Rate Income Fund |
| | | |
| SENIOR LOANS (82.9%)*c cont. | Principal
amount | Value |
| Capital goods cont. |
| Filtration Group Corp. bank term loan FRN (ICE LIBOR USD 1 Month + 3.50%), 6.024%, 10/19/28 | | $2,488,731 | $2,419,047 |
| Filtration Group Corp. bank term loan FRN Ser. B, (ICE LIBOR USD 3 Month + 3.00%), 5.524%, 3/27/25 | | 1,397,551 | 1,372,004 |
| Graham Packaging Co., Inc. bank term loan FRN (ICE LIBOR USD 3 Month + 3.00%), 5.524%, 8/4/27 | | 1,644,606 | 1,603,491 |
| Granite US Holdings Corp. bank term loan FRN (ICE LIBOR USD 3 Month + 4.00%), 6.313%, 9/30/26 | | 1,419,437 | 1,380,402 |
| Harsco Corp. bank term loan FRN Ser. B, (ICE LIBOR USD 3 Month + 2.25%), 4.75%, 3/5/28 | | 1,980,000 | 1,857,893 |
| Madison IAQ, LLC bank term loan FRN (ICE LIBOR USD 3 Month + 3.25%), 4.524%, 6/15/28 | | 2,970,000 | 2,861,090 |
| MajorDrive Holdings IV, LLC bank term loan FRN (ICE LIBOR USD 3 Month + 4.00%), 5.625%, 6/1/28 | | 2,633,400 | 2,513,580 |
| OT Merger Corp. bank term loan FRN (ICE LIBOR USD 1 Month + 4.00%), 6.524%, 10/7/28 | | 990,599 | 922,674 |
| Patriot Container Corp. bank term loan FRN Ser. B, (ICE LIBOR USD 3 Month + 3.75%), 6.274%, 3/20/25 | | 487,277 | 419,059 |
| Pro Mach Group, Inc. bank term loan FRN Ser. B, (ICE LIBOR USD 3 Month + 4.00%), 6.524%, 8/13/28 | | 2,985,838 | 2,916,179 |
Reynolds Group Holdings, Inc. bank term loan FRN Ser. B,
(ICE LIBOR USD 3 Month + 3.50%), 6.024%, 9/20/28 | | 496,250 | 482,072 |
| Staples, Inc. bank term loan FRN (ICE LIBOR USD 3 Month + 5.00%), 7.782%, 4/9/26 | | 1,006,792 | 884,356 |
| Titan Acquisition, Ltd. (United Kingdom) bank term loan FRN Ser. B, (ICE LIBOR USD 3 Month + 3.00%), 5.877%, 3/28/25 | | 2,522,613 | 2,393,682 |
| TK Elevator US Newco, Inc. bank term loan FRN (ICE LIBOR USD 3 Month + 3.50%), 6.871%, 7/31/27 | | 3,159,130 | 3,062,397 |
| TransDigm, Inc. bank term loan FRN Ser. E, (ICE LIBOR USD 3 Month + 2.25%), 4.774%, 5/30/25 | | 1,560,341 | 1,521,489 |
| TransDigm, Inc. bank term loan FRN Ser. F, (ICE LIBOR USD 3 Month + 2.25%), 4.774%, 12/9/25 | | 468,309 | 455,492 |
| Vertiv Group Corp. bank term loan FRN Ser. B, (ICE LIBOR USD 3 Month + 2.75%), 5.112%, 3/2/27 | | 3,205,743 | 3,084,181 |
| | | 39,049,534 |
| Commercial and consumer services (3.1%) |
| Allied Universal Holdco, LLC bank term loan FRN Ser. B, (ICE LIBOR USD 3 Month + 3.75%), 6.274%, 5/5/28 | | 1,989,987 | 1,895,722 |
| API Group DE, Inc. bank term loan FRN (ICE LIBOR USD 1 Month + 2.75%), 5.274%, 10/7/28 | | 1,972,679 | 1,940,129 |
| Garda World Security Corp. bank term loan FRN Ser. B, (ICE LIBOR USD 3 Month + 4.25%), 7.24%, 10/30/26 | | 2,614,604 | 2,537,264 |
| Pitney Bowes, Inc. bank term loan FRN Ser. B, (ICE LIBOR USD 3 Month + 4.00%), 4.084%, 3/12/28 | | 1,975,000 | 1,826,875 |
| Prime Security Services Borrower, LLC bank term loan FRN Ser. B, (ICE LIBOR USD 3 Month + 2.75%), 5.107%, 9/23/26 | | 2,257,240 | 2,201,870 |
| Sabre GLBL, Inc. bank term loan FRN (CME Term SOFR 1 Month + 5.10%), 7.555%, 6/30/28 | | 1,000,000 | 962,500 |
| Signal Parent, Inc. bank term loan FRN Ser. B, (ICE LIBOR USD 3 Month + 3.50%), 6.024%, 4/3/28 | | 1,980,000 | 1,485,000 |
| | | 12,849,360 |
| |
Floating Rate Income Fund 25 |
| | | |
| SENIOR LOANS (82.9%)*c cont. | Principal
amount | Value |
| Communication services (3.3%) |
| Asurion, LLC bank term loan FRN (ICE LIBOR USD 3 Month + 5.25%), 7.774%, 1/30/29 | | $733,000 | $622,134 |
| Asurion, LLC bank term loan FRN Ser. B8, (ICE LIBOR USD 3 Month + 3.25%), 5.774%, 12/23/26 | | 2,416,456 | 2,209,341 |
| Cogeco Financing 2 LP bank term loan FRN (ICE LIBOR USD 3 Month + 2.50%), 5.024%, 7/28/28 | | 1,774,292 | 1,734,051 |
| DIRECTV Financing, LLC bank term loan FRN (ICE LIBOR USD 3 Month + 5.00%), 7.524%, 7/22/27 | | 3,263,750 | 3,116,065 |
| First Opportunity Fund, Ltd. bank term loan FRN (ICE LIBOR USD 1 Month + 3.50%), 6.21%, 7/20/28 | | 1,985,000 | 1,903,119 |
| Frontier Communications Corp. bank term loan FRN Ser. B, (ICE LIBOR USD 3 Month + 3.75%), 6.063%, 10/8/27 | | 2,277,701 | 2,201,967 |
| Level 3 Parent, LLC bank term loan FRN Ser. B, (ICE LIBOR USD 3 Month + 1.75%), 4.274%, 3/1/27 | | 748,167 | 713,295 |
| SFR Group SA bank term loan FRN Ser. B11, (ICE LIBOR USD 3 Month + 2.75%), 5.556%, 7/31/25 | | 1,565,401 | 1,511,097 |
| | | 14,011,069 |
| Communications equipment (0.3%) |
| CommScope, Inc. bank term loan FRN Ser. B2, (ICE LIBOR USD 3 Month + 3.25%), 5.774%, 2/7/26 | | 1,506,278 | 1,441,794 |
| | | 1,441,794 |
| Computers (5.4%) |
| Atlas CC Acquisition Corp. bank term loan FRN Ser. B, (ICE LIBOR USD 3 Month + 4.25%), 7.32%, 4/29/28 | | 1,645,352 | 1,551,435 |
| Atlas CC Acquisition Corp. bank term loan FRN Ser. C, (ICE LIBOR USD 3 Month + 4.25%), 7.32%, 4/29/28 | | 334,648 | 315,546 |
| Central Parent, Inc. bank term loan FRN Ser. B, (CME Term SOFR 1 Month + 0.00%), 6.61%, 6/9/29 | | 1,000,000 | 973,470 |
| Condor Merger Sub, Inc. bank term loan FRN Ser. B, (CME Term SOFR 3 Month Plus CSA + 3.75%), 6.157%, 2/2/29 | | 2,500,000 | 2,365,625 |
| ConnectWise, LLC bank term loan FRN Ser. B, (ICE LIBOR USD 3 Month + 3.50%), 5.75%, 9/30/28 | | 995,000 | 965,458 |
| Ivanti Software, Inc. bank term loan FRN (ICE LIBOR USD 1 Month + 4.25%), 5.848%, 12/1/27 | | 1,985,025 | 1,692,234 |
| Liftoff Mobile, Inc. bank term loan FRN Ser. B, (ICE LIBOR USD 3 Month + 3.75%), 6.274%, 9/30/28 | | 1,985,000 | 1,628,951 |
| Mitchell International, Inc. bank term loan FRN Ser. B, (ICE LIBOR USD 1 Month + 3.75%), 6.734%, 10/1/28 | | 3,421,425 | 3,259,968 |
| RealPage, Inc. bank term loan FRN Ser. B, (ICE LIBOR USD 1 Month + 3.00%), 5.524%, 4/22/28 | | 3,741,725 | 3,594,638 |
| Sovos Compliance, LLC bank term loan FRN (ICE LIBOR USD 1 Month + 4.50%), 7.024%, 8/12/28 | | 2,069,536 | 2,009,664 |
| Xperi Holding Corp. bank term loan FRN (ICE LIBOR USD 3 Month + 3.50%), 6.024%, 6/8/28 | | 1,900,000 | 1,858,447 |
| ZoomInfo, LLC bank term loan FRN (ICE LIBOR USD 3 Month + 3.00%), 5.524%, 2/2/26 | | 2,315,000 | 2,293,308 |
| | | 22,508,744 |
| Consumer (—%) |
| Reynolds Consumer Products, LLC bank term loan FRN (ICE LIBOR USD 3 Month + 1.75%), 4.274%, 2/4/27 | | 4,928 | 4,821 |
| | | 4,821 |
| |
26 Floating Rate Income Fund |
| | | |
| SENIOR LOANS (82.9%)*c cont. | Principal
amount | Value |
| Consumer staples (3.9%) |
| AG Group Holdings, Inc. bank term loan FRN Ser. B, (CME Term SOFR 3 Month Plus CSA + 4.00%), 6.775%, 12/29/28 | | $997,500 | $975,056 |
| Ascend Learning, LLC bank term loan FRN (ICE LIBOR USD 1 Month + 5.75%), 8.274%, 11/18/29 | | 1,220,000 | 1,093,120 |
| Ascend Learning, LLC bank term loan FRN (ICE LIBOR USD 1 Month + 3.50%), 6.024%, 11/18/28 | | 2,012,444 | 1,915,424 |
Bengal Debt Merger Sub, LLC bank term loan FRN Ser. B,
(CME Term SOFR 3 Month Plus CSA + 3.25%), 5.405%, 1/20/29 | | 2,000,000 | 1,914,280 |
| Brand Industrial Services, Inc. bank term loan FRN (ICE LIBOR USD 3 Month + 4.25%), 6.944%, 6/21/24 | | 2,366,695 | 2,156,414 |
| Hertz Corp. (The) bank term loan FRN Ser. B, (ICE LIBOR USD 3 Month + 3.25%), 5.78%, 6/30/28 | | 1,666,019 | 1,624,102 |
| Hertz Corp. (The) bank term loan FRN Ser. C, (ICE LIBOR USD 1 Month + 3.25%), 5.78%, 6/30/28 | | 317,152 | 309,173 |
| IRB Holding Corp. bank term loan FRN Ser. B, (ICE LIBOR USD 3 Month + 2.75%), 5.274%, 2/5/25 | | 2,122,144 | 2,075,287 |
| Journey Personal Care Corp. bank term loan FRN (ICE LIBOR USD 3 Month + 4.25%), 6.50%, 2/19/28 | | 1,980,000 | 1,351,350 |
| Naked Juice, LLC bank term loan FRN (CME Term SOFR 3 Month Plus CSA + 6.00%), 8.154%, 1/24/30 | | 500,000 | 456,665 |
| PECF USS Intermediate Holding III Corp. bank term loan FRN Ser. B, (ICE LIBOR USD 1 Month + 4.25%), 6.774%, 12/17/28 | | 2,669,081 | 2,480,244 |
| | | 16,351,115 |
| Electronics (0.5%) |
| Mirion Technologies US, Inc. bank term loan FRN (ICE LIBOR USD 1 Month + 2.75%), 5.627%, 10/20/28 | | 1,990,000 | 1,946,479 |
| | | 1,946,479 |
| Energy (4.5%) |
BCP Renaissance Parent, LLC bank term loan FRN Ser. B3,
(ICE LIBOR USD 3 Month + 3.50%), 5.53%, 10/31/26 | | 2,630,323 | 2,584,293 |
| ChampionX Corp. bank term loan FRN Ser. B, (CME Term SOFR 1 Month + 3.25%), 5.643%, 5/13/29 | | 1,000,000 | 995,000 |
| CQP Holdco LP bank term loan FRN (ICE LIBOR USD 3 Month + 3.75%), 6.00%, 5/27/28 | | 2,955,150 | 2,893,831 |
| GIP II Blue Holding LP bank term loan FRN Ser. B, (ICE LIBOR USD 3 Month + 4.50%), 6.75%, 9/22/28 | | 2,480,573 | 2,452,667 |
| M6 ETX Holdings II MidCo, LLC bank term loan FRN (CME Term SOFR 1 Month + 4.50%), 6.78%, 8/11/29 | | 1,500,000 | 1,476,570 |
| Medallion Midland Acquisition LP bank term loan FRN (ICE LIBOR USD 1 Month + 3.75%), 6.274%, 10/14/28 | | 1,994,987 | 1,962,569 |
| Oryx Midstream Services Permian Basin, LLC bank term loan FRN (ICE LIBOR USD 3 Month + 3.25%), 6.211%, 9/29/28 | | 2,487,500 | 2,440,859 |
| Prairie ECI Acquiror LP bank term loan FRN (ICE LIBOR USD 3 Month + 4.75%), 7.274%, 3/11/26 | | 2,000,000 | 1,902,180 |
| Southwestern Energy Co. bank term loan FRN Ser. B, (CME Term SOFR 3 Month Plus CSA + 2.50%), 4.704%, 6/8/27 | | 1,990,000 | 1,970,100 |
| | | 18,678,069 |
| |
Floating Rate Income Fund 27 |
| | | |
| SENIOR LOANS (82.9%)*c cont. | Principal
amount | Value |
| Entertainment (0.9%) |
| Allen Media, LLC bank term loan FRN Ser. B, (CME TERM SOFR 3 Month + 5.50%), 7.704%, 2/10/27 | | $1,484,830 | $1,295,886 |
AMC Entertainment Holdings, Inc. bank term loan FRN Ser. B,
(ICE LIBOR USD 3 Month + 3.00%), 5.38%, 4/22/26 | | 3,123,990 | 2,674,573 |
| | | 3,970,459 |
| Financials (5.4%) |
| Acrisure, LLC bank term loan FRN Ser. B, (ICE LIBOR USD 3 Month + 3.75%), 6.274%, 2/15/27 | | 992,500 | 952,800 |
| Acrisure, LLC bank term loan FRN Ser. B, (US SOFR Compounded Index + 3.50%), 6.024%, 2/15/27 | | 1,885,533 | 1,802,645 |
| Advisor Group Holdings, Inc. bank term loan FRN Ser. B, (ICE LIBOR USD 3 Month + 4.50%), 7.024%, 7/31/26 | | 2,705,316 | 2,633,463 |
| Alliant Holdings I, LLC bank term loan FRN Ser. B, (ICE LIBOR USD 3 Month + 3.00%), 5.774%, 4/27/25 | | 1,895,531 | 1,855,839 |
| AmWINS Group, Inc. bank term loan FRN Ser. B, (ICE LIBOR USD 3 Month + 2.25%), 4.774%, 2/19/28 | | 1,484,933 | 1,448,152 |
| Apollo Commercial Real Estate Finance, Inc. bank term loan FRN Ser. B, (ICE LIBOR USD 3 Month + 3.50%), 5.944%, 3/11/28 | | 1,431,875 | 1,374,600 |
| Aretec Group, Inc. bank term loan FRN (ICE LIBOR USD 3 Month + 4.25%), 6.805%, 10/1/25 | | 2,408,798 | 2,351,589 |
| BCPE Rover Merger Sub, Inc. bank term loan FRN Ser. B, (ICE LIBOR USD 3 Month + 4.25%), 6.774%, 11/28/25 | | 2,902,500 | 2,814,525 |
| Forest City Enterprises LP bank term loan FRN Ser. B, (ICE LIBOR USD 3 Month + 3.50%), 6.024%, 12/7/25 | | 1,776,228 | 1,734,789 |
| Greystone Select Financial, LLC bank term loan FRN (ICE LIBOR USD 3 Month + 5.00%), 7.738%, 5/6/28 | | 1,476,923 | 1,403,077 |
| HUB International, Ltd. bank term loan FRN Ser. B, (ICE LIBOR USD 3 Month + 3.00%), 5.766%, 4/25/25 | | 2,417,649 | 2,364,267 |
| USI, Inc./NY bank term loan FRN Ser. B, (ICE LIBOR USD 3 Month + 3.00%), 5.25%, 5/16/24 | | 1,913,278 | 1,888,960 |
| | | 22,624,706 |
| Gaming and lottery (3.1%) |
| Bally’s Corp. bank term loan FRN Ser. B, (ICE LIBOR USD 3 Month + 3.25%), 5.623%, 8/6/28 | | 2,487,500 | 2,366,856 |
Fertitta Entertainment, LLC/NV bank term loan FRN Ser. B,
(CME Term SOFR 3 Month Plus CSA + 4.00%), 6.455%, 1/12/29 | | 2,247,905 | 2,156,864 |
| Light & Wonder, Inc. bank term loan FRN (CME Term SOFR 1 Month + 3.00%), 5.407%, 4/7/29 | | 2,500,000 | 2,456,250 |
| Raptor Acquisition Corp. bank term loan FRN (ICE LIBOR USD 3 Month + 4.00%), 6.096%, 11/1/26 | | 1,500,000 | 1,467,750 |
Scientific Games Holdings LP bank term loan FRN Ser. B,
(CME Term SOFR 1 Month + 3.50%), 5.617%, 4/4/29 | | 3,000,000 | 2,885,430 |
| Stars Group Holdings BV bank term loan FRN Ser. B, (ICE LIBOR USD 1 Month + 2.25%), 4.50%, 7/21/26 | | 1,916,078 | 1,868,981 |
| | | 13,202,131 |
| Health care (8.4%) |
| athenahealth, Inc. bank term loan FRN Ser. B, (CME Term SOFR 3 Month Plus CSA + 3.50%), 5.80%, 1/27/29 | | 1,710,145 | 1,633,188 |
| athenahealth, Inc. bank term loan FRN Ser. DD, (CME Term SOFR 3 Month Plus CSA + 3.50%), 3.50%, 1/27/29 U | | 289,855 | 276,812 |
| |
28 Floating Rate Income Fund |
| | | |
| SENIOR LOANS (82.9%)*c cont. | Principal
amount | Value |
| Health care cont. |
| Azalea TopCo, Inc. bank term loan FRN Ser. B, (CME Term SOFR 3 Month Plus CSA + 3.75%), 6.205%, 7/25/26 | | $498,750 | $480,047 |
| Azalea TopCo, Inc. bank term loan FRN Ser. B, (ICE LIBOR USD 3 Month + 3.50%), 6.024%, 7/24/26 | | 1,492,327 | 1,427,411 |
| Bausch + Lomb Corp. bank term loan FRN Ser. B, (CME Term SOFR 1 Month + 3.25%), 5.653%, 5/5/27 | | 1,000,000 | 937,500 |
| Bausch Health Cos., Inc. bank term loan FRN Ser. B, (CME Term SOFR 1 Month + 5.25%), 7.662%, 1/27/27 | | 1,000,000 | 795,000 |
| Elanco Animal Health, Inc. bank term loan FRN Ser. B, (ICE LIBOR USD 3 Month + 1.75%), 4.123%, 2/4/27 | | 1,926,441 | 1,857,513 |
| Enterprise Merger Sub, Inc. bank term loan FRN (ICE LIBOR USD 3 Month + 3.75%), 6.122%, 10/10/25 | | — | — |
| Envision Healthcare Corp. bank term loan FRN (US SOFR + 4.25%), 6.825%, 3/31/27 | | 789,986 | 394,993 |
| Envision Healthcare Corp. bank term loan FRN (CME Term SOFR 1 Month + 3.75%), 6.325%, 3/31/27 | | 1,932,802 | 473,536 |
| Global Medical Response, Inc. bank term loan FRN (ICE LIBOR USD 1 Month + 4.25%), 6.623%, 10/2/25 | | 1,818,073 | 1,659,555 |
| Grifols Worldwide Operations USA, Inc. bank term loan FRN Ser. B, (ICE LIBOR USD 3 Month + 2.00%), 4.524%, 11/15/27 | | 2,300,151 | 2,220,934 |
| Icon Luxembourg SARL bank term loan FRN Ser. B, (ICE LIBOR USD 3 Month + 2.25%), 4.563%, 6/16/28 | | 1,202,221 | 1,182,084 |
| Indigo Merger Sub, Inc. bank term loan FRN Ser. B, (ICE LIBOR USD 3 Month + 2.25%), 4.563%, 6/16/28 | | 299,534 | 294,517 |
| Insulet Corp. bank term loan FRN Ser. B, (ICE LIBOR USD 3 Month + 3.25%), 5.774%, 5/4/28 | | 1,980,000 | 1,930,500 |
| Jazz Financing Lux SARL bank term loan FRN Ser. B, (ICE LIBOR USD 1 Month + 3.50%), 6.024%, 5/5/28 | | 2,821,500 | 2,764,054 |
| Mozart Borrower LP bank term loan FRN (ICE LIBOR USD 1 Month + 3.25%), 5.774%, 9/30/28 | | 2,992,500 | 2,849,818 |
| One Call Corp. bank term loan FRN Ser. B, (ICE LIBOR USD 1 Month + 5.50%), 7.752%, 4/22/27 | | 1,375,377 | 1,118,635 |
| Organon & Co. bank term loan FRN Ser. B, (ICE LIBOR USD 3 Month + 3.00%), 4.625%, 4/8/28 | | 2,792,500 | 2,757,594 |
| Pediatric Associates Holding Co., LLC bank term loan FRN Ser. B, (ICE LIBOR USD 1 Month + 3.25%), 5.076%, 2/8/29 | | 1,732,500 | 1,689,187 |
| Pediatric Associates Holding Co., LLC bank term loan FRN Ser. DD, (ICE LIBOR USD 3 Month + 3.25%), 4.255%, 2/8/29 U | | 262,829 | 256,258 |
| Perrigo Investments, LLC bank term loan FRN Ser. B, (CME Term SOFR 1 Month + 2.50%), 4.907%, 4/5/29 | | 1,000,000 | 990,000 |
| Phoenix Newco, Inc. bank term loan FRN (ICE LIBOR USD 3 Month + 3.25%), 5.774%, 8/11/28 | | 2,992,500 | 2,910,206 |
| Physician Partners, LLC bank term loan FRN (CME Term SOFR 3 Month Plus CSA + 0.00%), 6.559%, 2/1/29 | | 498,750 | 478,800 |
| Sotera Health Holdings, LLC bank term loan FRN Ser. B, (ICE LIBOR USD 3 Month + 2.75%), 5.274%, 12/13/26 | | 667,000 | 646,990 |
| Surgery Center Holdings, Inc. bank term loan FRN (ICE LIBOR USD 3 Month + 3.75%), 6.14%, 8/31/26 | | 3,152,367 | 3,054,423 |
| | | 35,079,555 |
| |
Floating Rate Income Fund 29 |
| | | |
| SENIOR LOANS (82.9%)*c cont. | Principal
amount | Value |
| Household furniture and appliances (1.1%) |
| Hunter Douglas, Inc. bank term loan FRN Ser. B, (CME Term SOFR 3 Month Plus CSA + 3.50%), 6.34%, 2/9/29 | | $3,000,000 | $2,614,500 |
| Osmosis Debt Merger Sub, Inc. bank term loan FRN (CME Term SOFR 1 Month + 3.75%), 6.037%, 7/30/28 | | 2,000,000 | 1,918,120 |
| | | 4,532,620 |
| Lodging/Tourism (1.1%) |
| Caesars Resort Collection, LLC bank term loan FRN (ICE LIBOR USD 3 Month + 2.75%), 5.274%, 9/28/24 | | 2,812,964 | 2,773,330 |
| Carnival Corp. bank term loan FRN (ICE LIBOR USD 1 Month + 3.25%), 6.127%, 10/8/28 | | 1,990,000 | 1,850,700 |
| | | 4,624,030 |
| Publishing (1.1%) |
| Cengage Learning, Inc. bank term loan FRN Ser. B, (ICE LIBOR USD 3 Month + 4.75%), 7.814%, 6/29/26 | | 2,211,075 | 2,085,508 |
| Mav Acquisition Corp. bank term loan FRN (ICE LIBOR USD 3 Month + 4.75%), 8.313%, 7/30/28 | | 2,478,756 | 2,392,000 |
| | | 4,477,508 |
| Retail (2.0%) |
| Crocs, Inc. bank term loan FRN Ser. B, (CME Term SOFR 3 Month Plus CSA + 3.50%), 4.45%, 1/27/29 | | 1,511,213 | 1,452,653 |
| Great Outdoors Group, LLC bank term loan FRN Ser. B1, (ICE LIBOR USD 1 Month + 3.75%), 6.274%, 3/5/28 | | 2,462,641 | 2,378,911 |
| Petco Health & Wellness Co., Inc. bank term loan FRN (ICE LIBOR USD 1 Month + 3.25%), 5.50%, 3/4/28 | | 1,975,000 | 1,912,057 |
| PetSmart, LLC bank term loan FRN Ser. B, (ICE LIBOR USD 3 Month + 3.75%), 6.27%, 1/29/28 | | 2,574,000 | 2,509,650 |
| | | 8,253,271 |
| Semiconductor (0.8%) |
| Altar Bidco, Inc. bank term loan FRN (US SOFR + 5.60%), 7.355%, 11/17/29 | | 1,500,000 | 1,361,250 |
| Altar Bidco, Inc. bank term loan FRN (US SOFR + 3.35%), 5.506%, 11/17/28 | | 2,000,000 | 1,917,920 |
| | | 3,279,170 |
| Software (5.0%) |
| AppLovin Corp. bank term loan FRN (ICE LIBOR USD 1 Month + 3.00%), 5.25%, 10/21/28 | | 2,294,250 | 2,226,868 |
| Boxer Parent Co., Inc. bank term loan FRN Ser. B, (ICE LIBOR USD 3 Month + 3.75%), 6.274%, 10/2/25 | | 2,412,628 | 2,323,771 |
| Epicor Software Corp. bank term loan FRN Ser. B, (ICE LIBOR USD 3 Month + 3.25%), 5.774%, 7/30/27 | | 1,850,695 | 1,793,250 |
| Greeneden US Holdings II, LLC bank term loan FRN (ICE LIBOR USD 3 Month + 4.00%), 6.524%, 12/1/27 | | 2,511,750 | 2,465,107 |
| IGT Holding IV AB bank term loan FRN Ser. B, (ICE LIBOR USD 3 Month + 3.40%), 5.65%, 3/22/28 | | 3,011,875 | 2,932,813 |
| NortonLifeLock, Inc. bank term loan FRN Ser. B, (CME Term SOFR 1 Month + 2.00%), 2.50%, 1/28/29 | | 2,000,000 | 1,937,500 |
| Polaris Newco, LLC bank term loan FRN Ser. B, (ICE LIBOR USD 3 Month + 4.00%), 6.524%, 6/3/28 | | 2,267,838 | 2,173,450 |
| Quasar Intermediate Holdings, Ltd. bank term loan FRN Ser. B, (CME Term SOFR 3 Month Plus CSA + 4.25%), 5.78%, 1/20/29 | | 1,000,000 | 906,390 |
| |
30 Floating Rate Income Fund |
| | | |
| SENIOR LOANS (82.9%)*c cont. | Principal
amount | Value |
| Software cont. |
| UKG, Inc. bank term loan FRN (ICE LIBOR USD 1 Month + 5.25%), 7.535%, 5/3/27 | | $995,000 | $966,861 |
| UKG, Inc. bank term loan FRN (ICE LIBOR USD 3 Month + 3.75%), 6.274%, 4/5/26 | | 1,945,000 | 1,891,765 |
| UKG, Inc. bank term loan FRN (ICE LIBOR USD 1 Month + 3.25%), 5.535%, 5/3/26 | | 1,354,469 | 1,310,205 |
| | | 20,927,980 |
| Technology services (4.5%) |
| Ahead DB Holdings, LLC bank term loan FRN Ser. B, (ICE LIBOR USD 3 Month + 3.75%), 6.03%, 10/16/27 | | 2,275,300 | 2,215,005 |
| Arches Buyer, Inc. bank term loan FRN (ICE LIBOR USD 3 Month + 3.25%), 5.774%, 12/6/27 | | 2,784,163 | 2,624,659 |
| GoDaddy Operating Co., LLC bank term loan FRN (ICE LIBOR USD 3 Month + 2.00%), 4.524%, 8/10/27 | | 1,994,911 | 1,957,087 |
| Ingram Micro, Inc. bank term loan FRN Ser. B, (ICE LIBOR USD 3 Month + 3.50%), 5.75%, 4/1/28 | | 1,980,000 | 1,900,800 |
| MH Sub I, LLC bank term loan FRN (ICE LIBOR USD 1 Month + 3.75%), 6.274%, 9/15/24 | | 2,084,051 | 2,030,220 |
| Proofpoint, Inc. bank term loan FRN Ser. B, (ICE LIBOR USD 3 Month + 6.25%), 9.32%, 8/31/29 | | 758,000 | 739,050 |
| Proofpoint, Inc. bank term loan FRN Ser. B, (ICE LIBOR USD 3 Month + 3.25%), 6.32%, 6/9/28 | | 2,693,445 | 2,587,727 |
| Star Merger Sub, Inc. bank term loan FRN Ser. B, (ICE LIBOR USD 3 Month + 3.25%), 5.743%, 2/1/26 | | 1,900,805 | 1,844,732 |
| Tempo Acquisition, LLC bank term loan FRN Ser. B, (CME Term SOFR 3 Month Plus CSA + 3.00%), 3.50%, 8/31/28 | | 2,575,402 | 2,531,620 |
| Tenable, Inc. bank term loan FRN (ICE LIBOR USD 3 Month + 2.75%), 5.556%, 7/7/28 | | 497,500 | 480,088 |
| | | 18,910,988 |
| Transportation (2.1%) |
| American Airlines, Inc. bank term loan FRN (ICE LIBOR USD 3 Month + 4.75%), 7.46%, 4/20/28 | | 3,295,000 | 3,238,721 |
| Einstein Merger Sub, Inc. bank term loan FRN (ICE LIBOR USD 1 Month + 3.50%), 6.024%, 11/4/28 | | 1,496,250 | 1,407,223 |
| KKR Apple Bidco, LLC bank term loan FRN (ICE LIBOR USD 3 Month + 5.75%), 8.274%, 7/13/29 | | 750,000 | 725,940 |
| Skymiles IP, Ltd. bank term loan FRN (ICE LIBOR USD 3 Month + 3.75%), 6.46%, 9/16/27 | | 1,000,000 | 1,011,960 |
| United Airlines, Inc. bank term loan FRN Ser. B, (ICE LIBOR USD 3 Month + 3.75%), 6.533%, 4/21/28 | | 2,325,513 | 2,257,050 |
| | | 8,640,894 |
| Utilities and power (1.2%) |
| Buckeye Partners LP bank term loan FRN (ICE LIBOR USD 3 Month + 2.25%), 4.623%, 11/1/26 | | 1,955,225 | 1,922,338 |
Calpine Construction Finance Co. LP bank term loan FRN
(ICE LIBOR USD 3 Month + 2.00%), 4.524%, 1/15/25 | | 1,540,511 | 1,508,745 |
| Pacific Gas & Electric Co. bank term loan FRN (ICE LIBOR USD 3 Month + 3.00%), 5.563%, 6/23/25 | | 1,470,000 | 1,439,689 |
| | | 4,870,772 |
| Total senior loans (cost $363,582,893) | $347,366,728 |
|
| |
Floating Rate Income Fund 31 |
| | | |
| CORPORATE BONDS AND NOTES (8.5%)* | Principal
amount | Value |
| Basic materials (1.4%) |
| Celanese US Holdings, LLC company guaranty sr. unsec. notes 6.05%, 3/15/25 (Germany) | | $1,000,000 | $1,002,543 |
| Cheever Escrow Issuer, LLC 144A sr. notes 7.125%, 10/1/27 | | 1,000,000 | 975,000 |
| First Quantum Minerals, Ltd. 144A company guaranty sr. unsec. notes 6.875%, 3/1/26 (Canada) | | 1,100,000 | 1,055,654 |
| Mauser Packaging Solutions Holding Co. 144A sr. notes 5.50%, 4/15/24 | | 730,000 | 706,697 |
| Novelis Corp. 144A company guaranty sr. unsec. notes 3.25%, 11/15/26 | | 1,000,000 | 890,000 |
| WR Grace Holdings, LLC 144A company guaranty sr. notes 5.625%, 10/1/24 | | 523,000 | 516,463 |
| WR Grace Holdings, LLC 144A company guaranty sr. notes 4.875%, 6/15/27 | | 785,000 | 726,031 |
| | | 5,872,388 |
| Capital goods (1.5%) |
| Berry Global, Inc. 144A company guaranty notes 5.625%, 7/15/27 | | 1,000,000 | 976,500 |
| Clarios Global LP 144A company guaranty sr. notes 6.75%, 5/15/25 | | 500,000 | 497,418 |
| Staples, Inc. 144A sr. notes 7.50%, 4/15/26 | | 1,266,000 | 1,069,846 |
| TransDigm, Inc. 144A company guaranty sr. notes 6.25%, 3/15/26 | | 1,745,000 | 1,714,463 |
| Trivium Packaging Finance BV 144A company guaranty sr. notes 5.50%, 8/15/26 (Netherlands) | | 1,000,000 | 959,120 |
| WESCO Distribution, Inc. 144A company guaranty sr. unsec. unsub. notes 7.125%, 6/15/25 | | 1,000,000 | 1,000,180 |
| | | 6,217,527 |
| Communication services (0.7%) |
| CCO Holdings, LLC/CCO Holdings Capital Corp. 144A company guaranty sr. unsec. bonds 5.50%, 5/1/26 | | 2,250,000 | 2,227,500 |
| DISH DBS Corp. company guaranty sr. unsec. notes 7.75%, 7/1/26 | | 660,000 | 520,357 |
| | | 2,747,857 |
| Conglomerates (0.2%) |
| General Electric Co. jr. unsec. sub. FRN (ICE LIBOR USD 3 Month + 3.33%), 5.159%, perpetual maturity | | 1,000,000 | 945,750 |
| | | 945,750 |
| Consumer cyclicals (2.3%) |
| Beasley Mezzanine Holdings, LLC 144A company guaranty sr. notes 8.625%, 2/1/26 | | 750,000 | 585,000 |
| Caesars Resort Collection, LLC/CRC Finco, Inc. 144A company guaranty sr. notes 5.75%, 7/1/25 | | 1,010,000 | 989,820 |
| Carnival Corp. 144A notes 10.50%, 2/1/26 | | 1,000,000 | 1,029,995 |
| Ford Motor Credit Co., LLC sr. unsec. unsub. notes 5.125%, 6/16/25 | | 1,000,000 | 976,840 |
| iHeartCommunications, Inc. company guaranty sr. notes 6.375%, 5/1/26 | | 1,000,000 | 944,480 |
| MGM Resorts International company guaranty sr. unsec. notes 6.00%, 3/15/23 | | 770,000 | 770,101 |
| Royal Caribbean Cruises, Ltd. 144A company guaranty sr. unsec. notes 9.125%, 6/15/23 | | 1,000,000 | 1,008,110 |
| Sabre GLBL, Inc. 144A company guaranty sr. notes 7.375%, 9/1/25 | | 1,000,000 | 947,400 |
| Spanish Broadcasting System, Inc. 144A sr. notes 9.75%, 3/1/26 | | 900,000 | 711,000 |
| |
32 Floating Rate Income Fund |
| | | |
| CORPORATE BONDS AND NOTES (8.5%)* cont. | Principal
amount | Value |
| Consumer cyclicals cont. |
| Standard Industries, Inc. 144A sr. unsec. notes 5.00%, 2/15/27 | | $1,000,000 | $914,540 |
| Univision Communications, Inc. 144A company guaranty sr. notes 6.625%, 6/1/27 | | 1,000,000 | 965,020 |
| | | 9,842,306 |
| Energy (1.1%) |
| Hess Midstream Operations LP 144A company guaranty sr. unsec. sub. notes 5.625%, 2/15/26 | | 1,000,000 | 975,070 |
| Occidental Petroleum Corp. sr. unsec. sub. notes 5.875%, 9/1/25 | | 1,500,000 | 1,537,530 |
| SM Energy Co. sr. unsec. unsub. notes 5.625%, 6/1/25 | | 1,300,000 | 1,264,250 |
| Southwestern Energy Co. company guaranty sr. unsec. sub. notes 5.70%, 1/23/25 | | 1,000,000 | 1,000,010 |
| | | 4,776,860 |
| Financials (0.5%) |
| iStar, Inc. sr. unsec. notes 5.50%, 2/15/26 R | | 1,200,000 | 1,224,000 |
| OneMain Finance Corp. company guaranty sr. unsec. sub. notes 7.125%, 3/15/26 | | 1,000,000 | 931,490 |
| | | 2,155,490 |
| Health care (0.3%) |
| Tenet Healthcare Corp. company guaranty sr. notes 4.625%, 7/15/24 | | 371,000 | 363,287 |
| Tenet Healthcare Corp. 144A company guaranty sr. notes 5.125%, 11/1/27 | | 1,000,000 | 926,500 |
| | | 1,289,787 |
| Utilities and power (0.5%) |
| Calpine Corp. 144A company guaranty sr. notes 5.25%, 6/1/26 | | 1,000,000 | 970,350 |
| Vistra Operations Co., LLC 144A company guaranty sr. notes 5.125%, 5/13/25 | | 1,000,000 | 994,641 |
| | | 1,964,991 |
| Total corporate bonds and notes (cost $37,045,211) | $35,812,956 |
|
| | |
| COMMON STOCKS (—%)* | Shares | Value |
| Texas Competitive Electric Holdings Co., LLC/TCEH Finance, Inc. (Rights) | 113,884 | $142,355 |
| Total common stocks (cost $142,355) | $142,355 |
|
| | | |
| SHORT-TERM INVESTMENTS (6.6%)* | Principal amount/
shares | Value |
| Putnam Short Term Investment Fund Class P 2.33% L | Shares | 26,763,596 | $26,763,596 |
| U.S. Treasury Bills 2.627%, 10/25/22 | | $100,000 | $99,607 |
| U.S. Treasury Bills 2.529%, 10/18/22 § | | 600,000 | 598,061 |
| U.S. Treasury Bills 2.451%, 10/11/22 § | | 300,000 | 299,206 |
| U.S. Treasury Bills 2.084%, 9/1/22 § | | 100,000 | 100,000 |
| Total short-term investments (cost $27,860,459) | $27,860,470 |
|
| |
| TOTAL INVESTMENTS |
| Total investments (cost $428,630,918) | $411,182,509 |
|
| |
Floating Rate Income Fund 33 |
| |
| Key to holding’s abbreviations |
| bp | Basis Points |
| FRN | Floating Rate Notes: The rate shown is the current interest rate or yield at the close of the reporting period. Rates may be subject to a cap or floor. For certain securities, the rate may represent a fixed rate currently in place at the close of the reporting period. |
| LIBOR | London Interbank Offered Rate |
| SOFR | Secured Overnight Financing Rate |
|
| | | |
| Notes to the fund’s portfolio |
| Unless noted otherwise, the notes to the fund’s portfolio are for the close of the fund’s reporting period, which ran from March 1, 2022 through August 31, 2022 (the reporting period). Within the following notes to the portfolio, references to “Putnam Management” represent Putnam Investment Management, LLC, the fund’s manager, an indirect wholly-owned subsidiary of Putnam Investments, LLC and references to “ASC 820” represent Accounting Standards Codification 820 Fair Value Measurements and Disclosures. |
| * | Percentages indicated are based on net assets of $419,151,431. |
| § | This security, in part or in entirety, was pledged and segregated with the custodian for collateral on the initial margin on certain centrally cleared derivative contracts at the close of the reporting period. Collateral at period end totaled $917,359 and is included in Investments in securities on the Statement of assets and liabilities (Notes 1 and 10). |
| c | Senior loans are exempt from registration under the Securities Act of 1933, as amended, but contain certain restrictions on resale and cannot be sold publicly. These loans pay interest at rates which adjust periodically. The interest rates shown for senior loans are the current interest rates at the close of the reporting period. Senior loans are also subject to mandatory and/or optional prepayment which cannot be predicted. As a result, the remaining maturity may be substantially less than the stated maturity shown (Notes 1 and 7). |
| L | Affiliated company (Note 5). The rate quoted in the security description is the annualized 7-day yield of the fund at the close of the reporting period. |
| R | Real Estate Investment Trust. |
| U | This security, in part or in entirety, represents an unfunded loan commitment (Note 8). |
| Unless otherwise noted, the rates quoted in Short-term investments security descriptions represent the weighted average yield to maturity. |
| Debt obligations are considered secured unless otherwise indicated. |
| 144A after the name of an issuer represents securities exempt from registration under Rule 144A of the Securities Act of 1933, as amended. These securities may be resold in transactions exempt from registration, normally to qualified institutional buyers. |
| The dates shown on debt obligations are the original maturity dates. |
|
| | | | | | | | |
CENTRALLY CLEARED CREDIT DEFAULT CONTRACTS OUTSTANDING — PROTECTION SOLD at 8/31/22
(Unaudited) |
| Referenced debt* | Rating*** | Upfront
premium
received
(paid)** | | Notional
amount | Value | Termi-
nation
date | Payments
received
by fund | Unrealized
appreciation/
(depreciation) |
| CDX NA HY Series 38 Index | B+/P | $(91,239) | | $8,910,000 | $115,830 | 6/20/27 | 500 bp — Quarterly | $(117,969) |
| Total | $(91,239) | $(117,969) |
| * Payments related to the referenced debt are made upon a credit default event. |
| ** Upfront premium is based on the difference between the original spread on issue and the market spread on day of execution. |
| *** Ratings for an underlying index represent the average of the ratings of all the securities included in that index. The Moody’s, Standard & Poor’s or Fitch ratings are believed to be the most recent ratings available at August 31, 2022. Securities rated by Fitch are indicated by “/F.” Securities rated by Putnam are indicated by “/P.” The Putnam rating categories are comparable to the Standard & Poor’s classifications. |
|
| |
34 Floating Rate Income Fund |
ASC 820 establishes a three-level hierarchy for disclosure of fair value measurements. The valuation hierarchy is based upon the transparency of inputs to the valuation of the fund’s investments. The three levels are defined as follows:
Level 1: Valuations based on quoted prices for identical securities in active markets.
Level 2: Valuations based on quoted prices in markets that are not active or for which all significant inputs are observable, either directly or indirectly.
Level 3: Valuations based on inputs that are unobservable and significant to the fair value measurement.
The following is a summary of the inputs used to value the fund’s net assets as of the close of the reporting period:
| | | |
| | Valuation inputs |
| Investments in securities: | Level 1 | Level 2 | Level 3 |
| Common stocks*: | | | |
| Utilities and power | $— | $142,355 | $— |
| Total common stocks | — | 142,355 | — |
| Corporate bonds and notes | — | 35,812,956 | — |
| Senior loans | — | 347,366,728 | — |
| Short-term investments | — | 27,860,470 | — |
| Totals by level | $— | $411,182,509 | $— |
|
| | | |
| | Valuation inputs |
| Other financial instruments: | Level 1 | Level 2 | Level 3 |
| Credit default contracts | $— | $(26,730) | $— |
| Totals by level | $— | $(26,730) | $— |
| * Common stock classifications are presented at the sector level, which may differ from the fund’s portfolio presentation. |
The accompanying notes are an integral part of these financial statements.
| |
Floating Rate Income Fund 35 |
Statement of assets and liabilities 8/31/22 (Unaudited)
| |
| ASSETS | |
| Investment in securities, at value (Note 1): | |
| Unaffiliated issuers (identified cost $401,867,322) | $384,418,913 |
| Affiliated issuers (identified cost $26,763,596) (Note 5) | 26,763,596 |
| Cash | 4,847,432 |
| Interest and other receivables | 2,303,476 |
| Receivable for shares of the fund sold | 151,050 |
| Receivable for investments sold | 7,637,493 |
| Prepaid assets | 81,547 |
| Total assets | 426,203,507 |
| |
| LIABILITIES | |
| Payable for investments purchased | 4,972,347 |
| Payable for purchases of delayed delivery securities (Notes 1 and 8) | 421,434 |
| Payable for shares of the fund repurchased | 897,313 |
| Payable for compensation of Manager (Note 2) | 200,735 |
| Payable for custodian fees (Note 2) | 6,864 |
| Payable for investor servicing fees (Note 2) | 88,759 |
| Payable for Trustee compensation and expenses (Note 2) | 107,916 |
| Payable for administrative services (Note 2) | 1,827 |
| Payable for distribution fees (Note 2) | 121,083 |
| Payable for variation margin on centrally cleared swap contracts (Note 1) | 15,992 |
| Distributions payable to shareholders | 141,440 |
| Other accrued expenses | 76,366 |
| Total liabilities | 7,052,076 |
| | |
| Net assets | $419,151,431 |
| |
| REPRESENTED BY | |
| Paid-in capital (Unlimited shares authorized) (Notes 1 and 4) | $509,469,258 |
| Total distributable earnings (Note 1) | (90,317,827) |
| Total — Representing net assets applicable to capital shares outstanding | $419,151,431 |
| |
| COMPUTATION OF NET ASSET VALUE AND OFFERING PRICE | |
| Net asset value and redemption price per class A share | |
| ($234,392,109 divided by 29,781,996 shares) | $7.87 |
| Offering price per class A share (100/97.75 of $7.87)* | $8.05 |
| Net asset value and offering price per class B share ($1,196,110 divided by 152,069 shares)** | $7.87 |
| Net asset value and offering price per class C share ($22,966,297 divided by 2,921,223 shares)** | $7.86 |
| Net asset value, offering price and redemption price per class R share | |
| ($869,475 divided by 110,528 shares) | $7.87 |
| Net asset value, offering price and redemption price per class R6 share | |
| ($7,619,562 divided by 967,308 shares) | $7.88 |
| Net asset value, offering price and redemption price per class Y share | |
| ($152,107,878 divided by 19,309,077 shares) | $7.88 |
* On single retail sales of less than $100,000. On sales of $100,000 or more the offering price is reduced.
** Redemption price per share is equal to net asset value less any applicable contingent deferred sales charge.
The accompanying notes are an integral part of these financial statements.
|
| 36 Floating Rate Income Fund |
Statement of operations Six months ended 8/31/22 (Unaudited)
| |
| INVESTMENT INCOME | |
| Interest (including interest income of $135,626 from investments in affiliated issuers) (Note 5) | $11,375,581 |
| Total investment income | 11,375,581 |
| |
| EXPENSES | |
| Compensation of Manager (Note 2) | 1,293,496 |
| Investor servicing fees (Note 2) | 274,842 |
| Custodian fees (Note 2) | 7,686 |
| Trustee compensation and expenses (Note 2) | 8,820 |
| Distribution fees (Note 2) | 444,025 |
| Administrative services (Note 2) | 5,754 |
| Other | 179,867 |
| Total expenses | 2,214,490 |
| Expense reduction (Note 2) | (780) |
| Net expenses | 2,213,710 |
| | |
| Net investment income | 9,161,871 |
| |
| REALIZED AND UNREALIZED GAIN (LOSS) | |
| Net realized gain (loss) on: | |
| Securities from unaffiliated issuers (Notes 1 and 3) | (6,756,563) |
| Swap contracts (Note 1) | (411,048) |
| Total net realized loss | (7,167,611) |
| Change in net unrealized appreciation (depreciation) on: | |
| Securities from unaffiliated issuers | (12,694,706) |
| Swap contracts | 350,254 |
| Total change in net unrealized depreciation | (12,344,452) |
| | |
| Net loss on investments | (19,512,063) |
| |
| Net decrease in net assets resulting from operations | $(10,350,192) |
The accompanying notes are an integral part of these financial statements.
|
| Floating Rate Income Fund 37 |
Statement of changes in net assets
| | |
| INCREASE (DECREASE) IN NET ASSETS | Six months ended 8/31/22* | Year ended 2/28/22 |
| Operations | | |
| Net investment income | $9,161,871 | $11,790,896 |
| Net realized loss on investments | (7,167,611) | (59,341) |
| Change in net unrealized depreciation of investments | (12,344,452) | (5,436,290) |
| Net increase (decrease) in net assets resulting | | |
| from operations | (10,350,192) | 6,295,265 |
| Distributions to shareholders (Note 1): | | |
| From ordinary income | | |
| Net investment income | | |
| Class A | (4,876,336) | (6,783,073) |
| Class B | (23,817) | (53,732) |
| Class C | (376,659) | (493,516) |
| Class R | (11,103) | (15,536) |
| Class R6 | (162,651) | (200,209) |
| Class Y | (3,549,209) | (4,367,311) |
| Increase (decrease) from capital share transactions (Note 4) | (57,253,483) | 146,947,708 |
| Total increase (decrease) in net assets | (76,603,450) | 141,329,596 |
| NET ASSETS | | |
| Beginning of period | 495,754,881 | 354,425,285 |
| End of period | $419,151,431 | $495,754,881 |
* Unaudited.
The accompanying notes are an integral part of these financial statements.
|
| 38 Floating Rate Income Fund |
|
| This page left blank intentionally. |
|
| Floating Rate Income Fund 39 |
Financial highlights
(For a common share outstanding throughout the period)
| | | | | | | | | | | | | |
| | INVESTMENT OPERATIONS | | | LESS DISTRIBUTIONS | | | | RATIOS AND SUPPLEMENTAL DATA | |
| | | | | | | | | | | | | Ratio of net | |
| | Net asset | | Net realized | | | | | | | | Ratio | investment | |
| | value, | | and unrealized | Total from | From net | | | Net asset | Total return | Net assets, | of expenses | income (loss) | Portfolio |
| | beginning | Net investment | gain (loss) | investment | investment | From return | Total | value, end | at net asset | end of period | to average | to average | turnover |
| Period ended | of period | income (loss)a | on investments | operations | income | of capital | distributions | of period | value (%)b | (in thousands) | net assets (%)c | net assets (%) | (%) |
| Class A | | | | | | | | | | | | | |
| August 31, 2022** | $8.18 | .16 | (.32) | (.16) | (.15) | — | (.15) | $7.87 | (1.89)* | $234,392 | .51* | 1.97* | 17* |
| February 28, 2022 | 8.27 | .22 | (.09) | .13 | (.22) | — | (.22) | 8.18 | 1.63 | 268,621 | 1.00 | 2.70 | 42 |
| February 28, 2021 | 8.28 | .24 | (.02) | .22 | (.23) | — | (.23) | 8.27 | 2.87 | 220,335 | 1.04 | 2.96 | 32 |
| February 29, 2020 | 8.46 | .36 | (.16) | .20 | (.37) | (.01) | (.38) | 8.28 | 2.31 | 226,047 | 1.03 | 4.28 | 33 |
| February 28, 2019 | 8.62 | .36 | (.14) | .22 | (.38) | — | (.38) | 8.46 | 2.60 | 281,109 | 1.03 | 4.22 | 40 |
| February 28, 2018 | 8.63 | .33 | (.02) | .31 | (.32) | — | (.32) | 8.62 | 3.71 | 356,807 | 1.02 | 3.79 | 60 |
| Class B | | | | | | | | | | | | | |
| August 31, 2022** | $8.17 | .15 | (.30) | (.15) | (.15) | — | (.15) | $7.87 | (1.87)* | $1,196 | .61* | 1.86* | 17* |
| February 28, 2022 | 8.27 | .20 | (.09) | .11 | (.21) | — | (.21) | 8.17 | 1.30 | 1,534 | 1.20 | 2.45 | 42 |
| February 28, 2021 | 8.27 | .22 | —d | .22 | (.22) | — | (.22) | 8.27 | 2.79 | 3,514 | 1.24 | 2.80 | 32 |
| February 29, 2020 | 8.46 | .35 | (.18) | .17 | (.35) | (.01) | (.36) | 8.27 | 1.98 | 6,429 | 1.23 | 4.10 | 33 |
| February 28, 2019 | 8.61 | .34 | (.13) | .21 | (.36) | — | (.36) | 8.46 | 2.51 | 9,318 | 1.23 | 4.03 | 40 |
| February 28, 2018 | 8.63 | .31 | (.02) | .29 | (.31) | — | (.31) | 8.61 | 3.39 | 12,666 | 1.22 | 3.60 | 60 |
| Class C | | | | | | | | | | | | | |
| August 31, 2022** | $8.17 | .13 | (.32) | (.19) | (.12) | — | (.12) | $7.86 | (2.27)* | $22,966 | .89* | 1.60* | 17* |
| February 28, 2022 | 8.27 | .16 | (.10) | .06 | (.16) | — | (.16) | 8.17 | .74 | 24,485 | 1.75 | 1.94 | 42 |
| February 28, 2021 | 8.27 | .18 | (.01) | .17 | (.17) | — | (.17) | 8.27 | 2.22 | 34,828 | 1.79 | 2.24 | 32 |
| February 29, 2020 | 8.46 | .30 | (.18) | .12 | (.30) | (.01) | (.31) | 8.27 | 1.42 | 51,058 | 1.78 | 3.54 | 33 |
| February 28, 2019 | 8.61 | .30 | (.14) | .16 | (.31) | — | (.31) | 8.46 | 1.95 | 71,231 | 1.78 | 3.46 | 40 |
| February 28, 2018 | 8.63 | .26 | (.02) | .24 | (.26) | — | (.26) | 8.61 | 2.82 | 90,475 | 1.77 | 3.05 | 60 |
| Class R | | | | | | | | | | | | | |
| August 31, 2022** | $8.17 | .15 | (.31) | (.16) | (.14) | — | (.14) | $7.87 | (1.90)* | $869 | .64* | 1.89* | 17* |
| February 28, 2022 | 8.27 | .20 | (.10) | .10 | (.20) | — | (.20) | 8.17 | 1.25 | 554 | 1.25 | 2.44 | 42 |
| February 28, 2021 | 8.28 | .22 | (.02) | .20 | (.21) | — | (.21) | 8.27 | 2.61 | 650 | 1.29 | 2.70 | 32 |
| February 29, 2020 | 8.46 | .34 | (.16) | .18 | (.35) | (.01) | (.36) | 8.28 | 2.05 | 687 | 1.28 | 3.99 | 33 |
| February 28, 2019 | 8.61 | .34 | (.13) | .21 | (.36) | — | (.36) | 8.46 | 2.46 | 713 | 1.28 | 3.97 | 40 |
| February 28, 2018 | 8.63 | .30 | (.02) | .28 | (.30) | — | (.30) | 8.61 | 3.33 | 510 | 1.27 | 3.55 | 60 |
| Class R6 | | | | | | | | | | | | | |
| August 31, 2022** | $8.18 | .17 | (.30) | (.13) | (.17) | — | (.17) | $7.88 | (1.61)* | $7,620 | .35* | 2.16* | 17* |
| February 28, 2022 | 8.28 | .25 | (.10) | .15 | (.25) | — | (.25) | 8.18 | 1.83 | 7,021 | .68 | 3.02 | 42 |
| February 28, 2021 | 8.29 | .26 | (.01) | .25 | (.26) | — | (.26) | 8.28 | 3.23 | 4,994 | .70 | 3.30 | 32 |
| February 29, 2020 | 8.47 | .39 | (.16) | .23 | (.40) | (.01) | (.41) | 8.29 | 2.66 | 5,700 | .70 | 4.61 | 33 |
| February 28, 2019 † | 8.62 | .31 | (.14) | .17 | (.32) | — | (.32) | 8.47 | 2.05* | 6,537 | .53* | 3.61* | 40 |
See notes to financial highlights at the end of this section.
The accompanying notes are an integral part of these financial statements.
| |
| 40 Floating Rate Income Fund | Floating Rate Income Fund 41 |
Financial highlights cont.
| | | | | | | | | | | | | |
| | INVESTMENT OPERATIONS | | | LESS DISTRIBUTIONS | | | | RATIOS AND SUPPLEMENTAL DATA | |
| | | | | | | | | | | | | Ratio of net | |
| | Net asset | | Net realized | | | | | | | | Ratio | investment | |
| | value, | | and unrealized | Total from | From net | | | Net asset | Total return | Net assets, | of expenses | income (loss) | Portfolio |
| | beginning | Net investment | gain (loss) | investment | investment | From return | Total | value, end | at net asset | end of period | to average | to average | turnover |
| Period ended | of period | income (loss)a | on investments | operations | income | of capital | distributions | of period | value (%)b | (in thousands) | net assets (%)c | net assets (%) | (%) |
| Class Y | | | | | | | | | | | | | |
| August 31, 2022** | $8.19 | .17 | (.32) | (.15) | (.16) | — | (.16) | $7.88 | (1.76)* | $152,108 | .39* | 2.07* | 17* |
| February 28, 2022 | 8.28 | .25 | (.10) | .15 | (.24) | — | (.24) | 8.19 | 1.88 | 193,541 | .75 | 2.97 | 42 |
| February 28, 2021 | 8.29 | .26 | (.02) | .24 | (.25) | — | (.25) | 8.28 | 3.13 | 90,104 | .79 | 3.23 | 32 |
| February 29, 2020 | 8.47 | .39 | (.17) | .22 | (.39) | (.01) | (.40) | 8.29 | 2.57 | 110,079 | .78 | 4.57 | 33 |
| February 28, 2019 | 8.63 | .39 | (.15) | .24 | (.40) | — | (.40) | 8.47 | 2.86 | 181,733 | .78 | 4.51 | 40 |
| February 28, 2018 | 8.64 | .35 | (.01) | .34 | (.35) | — | (.35) | 8.63 | 3.97 | 303,597 | .77 | 4.06 | 60 |
* Not annualized.
** Unaudited.
† For the period May 22, 2018 (commencement of operations) to February 28, 2019.
a Per share net investment income (loss) has been determined on the basis of the weighted average number of shares outstanding during the period.
b Total return assumes dividend reinvestment and does not reflect the effect of sales charges.
c Includes amounts paid through expense offset and/or brokerage service arrangements, if any (Note 2). Also excludes acquired fund fees and expenses, if any.
d Amount represents less than $0.01 per share.
The accompanying notes are an integral part of these financial statements.
| |
| 42 Floating Rate Income Fund | Floating Rate Income Fund 43 |
Notes to financial statements 8/31/22 (Unaudited)
Within the following Notes to financial statements, references to “State Street” represent State Street Bank and Trust Company, references to “the SEC” represent the Securities and Exchange Commission, references to “Putnam Management” represent Putnam Investment Management, LLC, the fund’s manager, an indirect wholly-owned subsidiary of Putnam Investments, LLC and references to “OTC”, if any, represent over-the-counter. Unless otherwise noted, the “reporting period” represents the period from March 1, 2022 through August 31, 2022.
Putnam Floating Rate Income Fund (the fund) is a diversified series of Putnam Funds Trust (the Trust), a Massachusetts business trust registered under the Investment Company Act of 1940, as amended, as an open-end management investment company. The goal of the fund is to seek high current income. Preservation of capital is a secondary goal. The fund invests mainly in corporate loans and debt securities that have floating rates of interest and other corporate debt securities. Under normal circumstances, the fund will invest at least 80% of its net assets in income-producing floating rate loans and other floating rate debt securities. This policy may be changed only after 60 days’ notice to shareholders. The fund invests mainly in obligations of U.S. issuers that are below- investment-grade in quality (having credit characteristics similar to “junk bonds”). Putnam Management may consider, among other factors, credit, interest rate and prepayment risks, as well as general market conditions, when deciding whether to buy or sell investments. Putnam Management may also use derivatives, such as futures, options, warrants and swap contracts, for both hedging and non-hedging purposes.
The fund offers the following share classes. The expenses for each class of shares may differ based on the distribution and investor servicing fees of each class, which are identified in Note 2.
| | | |
| Share class | Sales charge | Contingent deferred sales charge | Conversion feature |
| | | 1.00% on certain redemptions of shares | |
| Class A | Up to 2.25% | bought with no initial sales charge | None |
| | | | Converts to class A shares |
| ClassB * | None | 1.00% phased out over two years | after 8 years |
| | | | Converts to class A shares |
| Class C | None | 1.00% eliminated after one year | after 8 years |
| Class R † | None | None | None |
| ClassR 6† | None | None | None |
| Class Y† | None | None | None |
* Purchases of class B shares are closed to new and existing investors except by exchange from class B shares of another Putnam fund or through dividend and/or capital gains reinvestment.
† Not available to all investors.
In the normal course of business, the fund enters into contracts that may include agreements to indemnify another party under given circumstances. The fund’s maximum exposure under these arrangements is unknown as this would involve future claims that may be, but have not yet been, made against the fund. However, the fund’s management team expects the risk of material loss to be remote.
The fund has entered into contractual arrangements with an investment adviser, administrator, distributor, shareholder servicing agent and custodian, who each provide services to the fund. Unless expressly stated otherwise, shareholders are not parties to, or intended beneficiaries of these contractual arrangements, and these contractual arrangements are not intended to create any shareholder right to enforce them against the service providers or to seek any remedy under them against the service providers, either directly or on behalf of the fund.
Under the fund’s Amended and Restated Agreement and Declaration of Trust, any claims asserted against or on behalf of the Putnam Funds, including claims against Trustees and Officers, must be brought in state and federal courts located within the Commonwealth of Massachusetts.
Note 1: Significant accounting policies
The following is a summary of significant accounting policies consistently followed by the fund in the preparation of its financial statements. The preparation of financial statements is in conformity with accounting principles generally accepted in the United States of America and requires management to make estimates and assumptions that affect the reported amounts of assets and liabilities in the financial statements and the
|
| 44 Floating Rate Income Fund |
reported amounts of increases and decreases in net assets from operations. Actual results could differ from those estimates. Subsequent events after the Statement of assets and liabilities date through the date that the financial statements were issued have been evaluated in the preparation of the financial statements.
Investment income, realized and unrealized gains and losses and expenses of the fund are borne pro-rata based on the relative net assets of each class to the total net assets of the fund, except that each class bears expenses unique to that class (including the distribution fees applicable to such classes). Each class votes as a class only with respect to its own distribution plan or other matters on which a class vote is required by law or determined by the Trustees. If the fund were liquidated, shares of each class would receive their pro-rata share of the net assets of the fund. In addition, the Trustees declare separate dividends on each class of shares.
Security valuation Portfolio securities and other investments are valued using policies and procedures adopted by the Board of Trustees. The Trustees have formed a Pricing Committee to oversee the implementation of these procedures and have delegated responsibility for valuing the fund’s assets in accordance with these procedures to Putnam Management. Putnam Management has established an internal Valuation Committee that is responsible for making fair value determinations, evaluating the effectiveness of the pricing policies of the fund and reporting to the Pricing Committee.
Senior loans are valued at fair value on the basis of valuations provided by an independent pricing service, approved by the Trustees. Such services use information with respect to transactions in senior loans, quotations from senior loan dealers, market transactions in comparable securities and various relationships between securities in determining value. These securities will generally be categorized as Level 2.
Market quotations are not considered to be readily available for certain debt obligations (including short-term investments with remaining maturities of 60 days or less); such investments are valued on the basis of valuations furnished by an independent pricing service approved by the Trustees or dealers selected by Putnam Management. Such services or dealers determine valuations for normal institutional-size trading units of such securities using methods based on market transactions for comparable securities and various relationships, generally recognized by institutional traders, between securities (which consider such factors as security prices, yields, maturities and ratings). These securities will generally be categorized as Level 2.
Securities quoted in foreign currencies, if any, are translated into U.S. dollars at the current exchange rate. To the extent a pricing service or dealer is unable to value a security or provides a valuation that Putnam Management does not believe accurately reflects the security’s fair value, the security will be valued at fair value by Putnam Management in accordance with policies and procedures approved by the Trustees. Certain investments, including certain restricted and illiquid securities, are also valued at fair value following procedures approved by the Trustees. These valuations consider such factors as significant market or specific security events such as interest rate or credit quality changes, various relationships with other securities, discount rates, U.S. Treasury, U.S. swap and credit yields, index levels, convexity exposures, recovery rates, sales and other multiples and resale restrictions. These securities are classified as Level 2 or as Level 3 depending on the priority of the significant inputs.
To assess the continuing appropriateness of fair valuations, the Valuation Committee reviews and affirms the reasonableness of such valuations on a regular basis after considering all relevant information that is reasonably available. Such valuations and procedures are reviewed periodically by the Trustees. The fair value of securities is generally determined as the amount that the fund could reasonably expect to realize from an orderly disposition of such securities over a reasonable period of time. By its nature, a fair value price is a good faith estimate of the value of a security at a given point in time and does not reflect an actual market price, which may be different by a material amount.
Security transactions and related investment income Security transactions are recorded on the trade date (the date the order to buy or sell is executed). Gains or losses on securities sold are determined on the identified cost basis.
Interest income, net of any applicable withholding taxes, if any, and including amortization and accretion of premiums and discounts on debt securities, is recorded on the accrual basis.
The fund may have earned certain fees in connection with its senior loan purchasing activities. These fees, if any, are treated as market discount and are amortized into income in the Statement of operations.
Securities purchased or sold on a delayed delivery basis may be settled at a future date beyond customary settlement time; interest income is accrued based on the terms of the securities. Losses may arise due to changes in the fair value of the underlying securities or if the counterparty does not perform under the contract.
|
| Floating Rate Income Fund 45 |
Credit default contracts The fund entered into OTC and/or centrally cleared credit default contracts to hedge credit risk, to gain liquid exposure to individual names and to hedge market risk.
In OTC and centrally cleared credit default contracts, the protection buyer typically makes a periodic stream of payments to a counterparty, the protection seller, in exchange for the right to receive a contingent payment upon the occurrence of a credit event on the reference obligation or all other equally ranked obligations of the reference entity. Credit events are contract specific but may include bankruptcy, failure to pay, restructuring and obligation acceleration. For OTC credit default contracts, an upfront payment received by the fund is recorded as a liability on the fund’s books. An upfront payment made by the fund is recorded as an asset on the fund’s books. Centrally cleared credit default contracts provide the same rights to the protection buyer and seller except the payments between parties, including upfront premiums, are settled through a central clearing agent through variation margin payments. Upfront and periodic payments received or paid by the fund for OTC and centrally cleared credit default contracts are recorded as realized gains or losses at the reset date or close of the contract. The OTC and centrally cleared credit default contracts are marked to market daily based upon quotations from an independent pricing service or market makers. Any change in value of OTC credit default contracts is recorded as an unrealized gain or loss. Daily fluctuations in the value of centrally cleared credit default contracts are recorded in variation margin on the Statement of assets and liabilities and recorded as unrealized gain or loss. Upon the occurrence of a credit event, the difference between the par value and fair value of the reference obligation, net of any proportional amount of the upfront payment, is recorded as a realized gain or loss.
In addition to bearing the risk that the credit event will occur, the fund could be exposed to market risk due to unfavorable changes in interest rates or in the price of the underlying security or index or the possibility that the fund may be unable to close out its position at the same time or at the same price as if it had purchased the underlying reference obligations. In certain circumstances, the fund may enter into offsetting OTC and centrally cleared credit default contracts which would mitigate its risk of loss. Risks of loss may exceed amounts recognized on the Statement of assets and liabilities. The fund’s maximum risk of loss from counterparty risk, either as the protection seller or as the protection buyer, is the fair value of the contract. This risk may be mitigated for OTC credit default contracts by having a master netting arrangement between the fund and the counterparty and for centrally cleared credit default contracts through the daily exchange of variation margin. Counterparty risk is further mitigated with respect to centrally cleared credit default swap contracts due to the clearinghouse guarantee fund and other resources that are available in the event of a clearing member default. Where the fund is a seller of protection, the maximum potential amount of future payments the fund may be required to make is equal to the notional amount.
OTC and centrally cleared credit default contracts outstanding, including their respective notional amounts at period end, if any, are listed after the fund’s portfolio.
Interfund lending The fund, along with other Putnam funds, may participate in an interfund lending program pursuant to an exemptive order issued by the SEC. This program allows the fund to borrow from or lend to other Putnam funds that permit such transactions. Interfund lending transactions are subject to each fund’s investment policies and borrowing and lending limits. Interest earned or paid on the interfund lending transaction will be based on the average of certain current market rates. During the reporting period, the fund did not utilize the program.
Lines of credit The fund participates, along with other Putnam funds, in a $100 million ($317.5 million prior to October 14, 2022) unsecured committed line of credit and a $235.5 million unsecured uncommitted line of credit, both provided by State Street. Borrowings may be made for temporary or emergency purposes, including the funding of shareholder redemption requests and trade settlements. Interest is charged to the fund based on the fund’s borrowing at a rate equal to 1.25% plus the higher of (1) the Federal Funds rate and (2) the Overnight Bank Funding Rate for the committed line of credit and 1.30% plus the higher of (1) the Federal Funds rate and (2) the Overnight Bank Funding Rate for the uncommitted line of credit. A closing fee equal to 0.04% of the committed line of credit and 0.04% of the uncommitted line of credit has been paid by the participating funds. In addition, a commitment fee of 0.21% per annum on any unutilized portion of the committed line of credit is allocated to the participating funds based on their relative net assets and paid quarterly. During the reporting period, the fund had no borrowings against these arrangements.
Federal taxes It is the policy of the fund to distribute all of its taxable income within the prescribed time period and otherwise comply with the provisions of the Internal Revenue Code of 1986, as amended (the Code), applicable to regulated investment companies. It is also the intention of the fund to distribute an amount sufficient to avoid imposition of any excise tax under Section 4982 of the Code.
|
| 46 Floating Rate Income Fund |
The fund is subject to the provisions of Accounting Standards Codification 740 Income Taxes (ASC 740). ASC 740 sets forth a minimum threshold for financial statement recognition of the benefit of a tax position taken or expected to be taken in a tax return. The fund did not have a liability to record for any unrecognized tax benefits in the accompanying financial statements. No provision has been made for federal taxes on income, capital gains or unrealized appreciation on securities held nor for excise tax on income and capital gains. Each of the fund’s federal tax returns for the prior three fiscal years remains subject to examination by the Internal Revenue Service.
Under the Regulated Investment Company Modernization Act of 2010, the fund will be permitted to carry forward capital losses incurred for an unlimited period and the carry forwards will retain their character as either short-term or long-term capital losses. At February 28, 2022, the fund had the following capital loss carryovers available, to the extent allowed by the Code, to offset future net capital gain, if any:
| | |
| | Loss carryover | |
| Short-term | Long-term | Total |
| $9,134,048 | $56,929,183 | $66,063,231 |
Pursuant to federal income tax regulations applicable to regulated investment companies, the Fund has elected to defer $54,382 to its fiscal year ending February 28, 2023 late year ordinary losses ((i) ordinary losses recognized between January 1, 2022 and February 28, 2022, and (ii) specified ordinary and currency losses recognized between November 1 and February 28, 2022).
Tax cost of investments includes adjustments to net unrealized appreciation (depreciation) which may not necessarily be final tax cost basis adjustments, but closely approximate the tax basis unrealized gains and losses that may be realized and distributed to shareholders. The aggregate identified cost on a tax basis is $428,255,402, resulting in gross unrealized appreciation and depreciation of $609,520 and $17,709,143, respectively, or net unrealized depreciation of $17,099,623.
Distributions to shareholders The fund declares a distribution each day based upon the projected net investment income, for a specified period, calculated as if earned pro rata throughout the period on a daily basis. Such distributions are recorded daily and paid monthly. Distributions from capital gains, if any, are recorded on the ex-dividend date and paid at least annually. The amount and character of income and gains to be distributed are determined in accordance with income tax regulations, which may differ from generally accepted accounting principles. Dividend sources are estimated at the time of declaration. Actual results may vary. Any non-taxable return of capital cannot be determined until final tax calculations are completed after the end of the fund’s fiscal year. Reclassifications are made to the fund’s capital accounts to reflect income and gains available for distribution (or available capital loss carryovers) under income tax regulations.
Expenses of the Trust Expenses directly charged or attributable to any fund will be paid from the assets of that fund. Generally, expenses of the Trust will be allocated among and charged to the assets of each fund on a basis that the Trustees deem fair and equitable, which may be based on the relative assets of each fund or the nature of the services performed and relative applicability to each fund.
Note 2: Management fee, administrative services and other transactions
The fund pays Putnam Management a management fee (based on the fund’s average net assets and computed and paid monthly) at annual rates that may vary based on the average of the aggregate net assets of all open-end mutual funds sponsored by Putnam Management (excluding net assets of funds that are invested in, or that are invested in by, other Putnam funds to the extent necessary to avoid “double counting” of those assets). Such annual rates may vary as follows:
| | | | |
| 0.720% | of the first $5 billion, | | 0.520% | of the next $50 billion, |
| 0.670% | of the next $5 billion, | | 0.500% | of the next $50 billion, |
| 0.620% | of the next $10 billion, | | 0.490% | of the next $100 billion and |
| 0.570% | of the next $10 billion, | | 0.485% | of any excess thereafter. |
For the reporting period, the management fee represented an effective rate (excluding the impact from any expense waivers in effect) of 0.281% of the fund’s average net assets.
Putnam Management has contractually agreed, through June 30, 2023, to waive fees and/or reimburse the fund’s expenses to the extent necessary to limit the cumulative expenses of the fund, exclusive of brokerage, interest,
|
| Floating Rate Income Fund 47 |
taxes, investment-related expenses, extraordinary expenses, acquired fund fees and expenses and payments under the fund’s investor servicing contract, investment management contract and distribution plans, on a fiscal year-to-date basis to an annual rate of 0.20% of the fund’s average net assets over such fiscal year-to-date period. During the reporting period, the fund’s expenses were not reduced as a result of this limit.
Putnam Investments Limited (PIL), an affiliate of Putnam Management, is authorized by the Trustees to manage a separate portion of the assets of the fund as determined by Putnam Management from time to time. PIL did not manage any portion of the assets of the fund during the reporting period. If Putnam Management were to engage the services of PIL, Putnam Management would pay a quarterly sub-management fee to PIL for its services at an annual rate of 0.20% (prior to July 1, 2022, the annual rate was 0.40%) of the average net assets of the portion of the fund managed by PIL.
The fund reimburses Putnam Management an allocated amount for the compensation and related expenses of certain officers of the fund and their staff who provide administrative services to the fund. The aggregate amount of all such reimbursements is determined annually by the Trustees.
Custodial functions for the fund’s assets are provided by State Street. Custody fees are based on the fund’s asset level, the number of its security holdings and transaction volumes.
Putnam Investor Services, Inc., an affiliate of Putnam Management, provides investor servicing agent functions to the fund. Putnam Investor Services, Inc. received fees for investor servicing for class A, class B, class C, class R and class Y shares that included (1) a per account fee for each direct and underlying non-defined contribution account (retail account) of the fund; (2) a specified rate of the fund’s assets attributable to defined contribution plan accounts; and (3) a specified rate based on the average net assets in retail accounts. Putnam Investor Services, Inc. has agreed that the aggregate investor servicing fees for each fund’s retail and defined contribution accounts for these share classes will not exceed an annual rate of 0.25% of the fund’s average assets attributable to such accounts.
Class R6 shares paid a monthly fee based on the average net assets of class R6 shares at an annual rate of 0.05%.
During the reporting period, the expenses for each class of shares related to investor servicing fees were as follows:
| | | | |
| Class A | $152,483 | | Class R6 | 1,928 |
| Class B | 787 | | Class Y | 104,715 |
| Class C | 14,565 | | Total | $274,842 |
| Class R | 364 | | | |
The fund has entered into expense offset arrangements with Putnam Investor Services, Inc. and State Street whereby Putnam Investor Services, Inc.’s and State Street’s fees are reduced by credits allowed on cash balances. For the reporting period, the fund’s expenses were reduced by $780 under the expense offset arrangements.
Each Independent Trustee of the fund receives an annual Trustee fee, of which $359, as a quarterly retainer, has been allocated to the fund, and an additional fee for each Trustees meeting attended. Trustees also are reimbursed for expenses they incur relating to their services as Trustees.
The fund has adopted a Trustee Fee Deferral Plan (the Deferral Plan) which allows the Trustees to defer the receipt of all or a portion of Trustees fees payable on or after July 1, 1995. The deferred fees remain invested in certain Putnam funds until distribution in accordance with the Deferral Plan.
The fund has adopted an unfunded noncontributory defined benefit pension plan (the Pension Plan) covering all Trustees of the fund who have served as a Trustee for at least five years and were first elected prior to 2004. Benefits under the Pension Plan are equal to 50% of the Trustee’s average annual attendance and retainer fees for the three years ended December 31, 2005. The retirement benefit is payable during a Trustee’s lifetime, beginning the year following retirement, for the number of years of service through December 31, 2006. Pension expense for the fund is included in Trustee compensation and expenses in the Statement of operations. Accrued pension liability is included in Payable for Trustee compensation and expenses in the Statement of assets and liabilities. The Trustees have terminated the Pension Plan with respect to any Trustee first elected after 2003.
The fund has adopted distribution plans (the Plans) with respect to the following share classes pursuant to Rule 12b–1 under the Investment Company Act of 1940. The purpose of the Plans is to compensate Putnam Retail Management Limited Partnership, an indirect wholly-owned subsidiary of Putnam Investments, LLC, for services
|
| 48 Floating Rate Income Fund |
provided and expenses incurred in distributing shares of the fund. The Plans provide payments by the fund to Putnam Retail Management Limited Partnership at an annual rate of up to the following amounts (Maximum %) of the average net assets attributable to each class. The Trustees have approved payment by the fund at the following annual rate (Approved %) of the average net assets attributable to each class. During the reporting period, the class-specific expenses related to distribution fees were as follows:
| | | |
| | Maximum % | Approved % | Amount |
| Class A | 0.35% | 0.25% | $318,129 |
| Class B | 1.00% | 0.45% | 2,960 |
| Class C | 1.00% | 1.00% | 121,419 |
| Class R | 1.00% | 0.50% | 1,517 |
| Total | | | $444,025 |
For the reporting period, Putnam Retail Management Limited Partnership, acting as underwriter, received net commissions of $8,592 from the sale of class A shares and received no monies and $104 in contingent deferred sales charges from redemptions of class B and class C shares, respectively.
A deferred sales charge of up to 1.00% is assessed on certain redemptions of class A shares. For the reporting period, Putnam Retail Management Limited Partnership, acting as underwriter, received $909 on class A redemptions.
Note 3: Purchases and sales of securities
During the reporting period, the cost of purchases and the proceeds from sales, excluding short-term investments, were as follows:
| | |
| | Cost of purchases | Proceeds from sales |
| Investments in securities (Long-term) | $71,923,798 | $126,623,362 |
| U.S. government securities (Long-term) | — | — |
| Total | $71,923,798 | $126,623,362 |
The fund may purchase or sell investments from or to other Putnam funds in the ordinary course of business, which can reduce the fund’s transaction costs, at prices determined in accordance with SEC requirements and policies approved by the Trustees. During the reporting period, purchases or sales of long-term securities from or to other Putnam funds, if any, did not represent more than 5% of the fund’s total cost of purchases and/or total proceeds from sales.
Note 4: Capital shares
At the close of the reporting period, there were an unlimited number of shares of beneficial interest authorized. Transactions, including, if applicable, direct exchanges pursuant to share conversions, in capital shares were as follows:
| | | | |
| | SIX MONTHS ENDED 8/31/22 | YEAR ENDED 2/28/22 |
| Class A | Shares | Amount | Shares | Amount |
| Shares sold | 5,835,010 | $46,641,380 | 13,969,371 | $115,380,805 |
| Shares issued in connection with | | | | |
| reinvestment of distributions | 578,126 | 4,564,456 | 768,995 | 6,344,694 |
| | 6,413,136 | 51,205,836 | 14,738,366 | 121,725,499 |
| Shares repurchased | (9,477,392) | (75,027,696) | (8,520,684) | (70,365,497) |
| Net increase (decrease) | (3,064,256) | $(23,821,860) | 6,217,682 | $51,360,002 |
|
| Floating Rate Income Fund 49 |
| | | | |
| | SIX MONTHS ENDED 8/31/22 | YEAR ENDED 2/28/22 |
| Class B | Shares | Amount | Shares | Amount |
| Shares sold | 3,055 | $24,397 | 38,088 | $314,407 |
| Shares issued in connection with | | | | |
| reinvestment of distributions | 2,991 | 23,609 | 6,381 | 52,643 |
| | 6,046 | 48,006 | 44,469 | 367,050 |
| Shares repurchased | (41,680) | (333,770) | (281,650) | (2,326,026) |
| Net decrease | (35,634) | $(285,764) | (237,181) | $(1,958,976) |
| |
| | SIX MONTHS ENDED 8/31/22 | YEAR ENDED 2/28/22 |
| Class C | Shares | Amount | Shares | Amount |
| Shares sold | 577,812 | $4,613,633 | 917,438 | $7,569,422 |
| Shares issued in connection with | | | | |
| reinvestment of distributions | 44,649 | 351,654 | 55,933 | 460,981 |
| | 622,461 | 4,965,287 | 973,371 | 8,030,403 |
| Shares repurchased | (698,361) | (5,531,262) | (2,189,038) | (18,071,328) |
| Net decrease | (75,900) | $(565,975) | (1,215,667) | $(10,040,925) |
| |
| | SIX MONTHS ENDED 8/31/22 | YEAR ENDED 2/28/22 |
| Class R | Shares | Amount | Shares | Amount |
| Shares sold | 42,006 | $332,144 | 6,095 | $50,312 |
| Shares issued in connection with | | | | |
| reinvestment of distributions | 1,408 | 11,101 | 1,883 | 15,533 |
| | 43,414 | 343,245 | 7,978 | 65,845 |
| Shares repurchased | (601) | (4,784) | (18,882) | (155,916) |
| Net increase (decrease) | 42,813 | $338,461 | (10,904) | $(90,071) |
| |
| | SIX MONTHS ENDED 8/31/22 | YEAR ENDED 2/28/22 |
| Class R6 | Shares | Amount | Shares | Amount |
| Shares sold | 309,732 | $2,489,219 | 590,627 | $4,882,418 |
| Shares issued in connection with | | | | |
| reinvestment of distributions | 20,597 | 162,546 | 24,238 | 200,176 |
| | 330,329 | 2,651,765 | 614,865 | 5,082,594 |
| Shares repurchased | (220,825) | (1,734,736) | (360,157) | (2,966,146) |
| Net increase | 109,504 | $917,029 | 254,708 | $2,116,448 |
| |
| | SIX MONTHS ENDED 8/31/22 | YEAR ENDED 2/28/22 |
| Class Y | Shares | Amount | Shares | Amount |
| Shares sold | 4,784,943 | $38,364,552 | 17,296,599 | $143,036,859 |
| Shares issued in connection with | | | | |
| reinvestment of distributions | 403,385 | 3,190,739 | 462,325 | 3,817,355 |
| | 5,188,328 | 41,555,291 | 17,758,924 | 146,854,214 |
| Shares repurchased | (9,523,009) | (75,390,665) | (4,994,908) | (41,292,984) |
| Net increase (decrease) | (4,334,681) | $(33,835,374) | 12,764,016 | $105,561,230 |
|
| 50 Floating Rate Income Fund |
Note 5: Affiliated transactions
Transactions during the reporting period with any company which is under common ownership or control were as follows:
| | | | | |
| | | | | | Shares |
| | | | | | outstanding |
| | | | | | and fair |
| | Fair value as | Purchase | Sale | Investment | value as |
| Name of affiliate | of 2/28/22 | cost | proceeds | income | of 8/31/22 |
| Short-term investments | | | | | |
| Putnam Short Term | | | | | |
| Investment Fund* | $52,367,133 | $99,188,235 | $124,791,772 | $135,626 | $26,763,596 |
| Total Short-term | | | | | |
| investments | $52,367,133 | $99,188,235 | $124,791,772 | $135,626 | $26,763,596 |
* Management fees charged to Putnam Short Term Investment Fund have been waived by Putnam Management. There were no realized or unrealized gains or losses during the period.
Note 6: Market, credit and other risks
In the normal course of business, the fund trades financial instruments and enters into financial transactions where risk of potential loss exists due to changes in the market (market risk) or failure of the contracting party to the transaction to perform (credit risk). The fund may be exposed to additional credit risk that an institution or other entity with which the fund has unsettled or open transactions will default. Investments in foreign securities involve certain risks, including those related to economic instability, unfavorable political developments, and currency fluctuations. The fund may invest in higher-yielding, lower-rated bonds that may have a higher rate of default.
On July 27, 2017, the United Kingdom’s Financial Conduct Authority (“FCA”), which regulates LIBOR, announced its intention to cease compelling banks to provide the quotations needed to sustain LIBOR after 2021. ICE Benchmark Administration, the administrator of LIBOR, ceased publication of most LIBOR settings on a representative basis at the end of 2021 and is expected to cease publication of a majority of U.S. dollar LIBOR settings on a representative basis after June 30, 2023. In addition, global regulators have announced that, with limited exceptions, no new LIBOR-based contracts should be entered into after 2021. LIBOR has historically been a common benchmark interest rate index used to make adjustments to variable-rate loans. It is used throughout global banking and financial industries to determine interest rates for a variety of financial instruments and borrowing arrangements. Actions by regulators have resulted in the establishment of alternative reference rates to LIBOR in most major currencies. Various financial industry groups have been planning for the transition away from LIBOR, but there are obstacles to converting certain longer-term securities and transactions to new reference rates. Markets are developing slowly and questions around liquidity in these rates and how to appropriately adjust these rates to mitigate any economic value transfer at the time of transition remain a significant concern. Neither the effect of the transition process nor its ultimate success can yet be known. The transition process might lead to increased volatility and illiquidity in markets that rely on LIBOR to determine interest rates. It could also lead to a reduction in the value of some LIBOR-based investments and reduce the effectiveness of related transactions, such as hedges. While some LIBOR-based instruments may contemplate a scenario where LIBOR is no longer available by providing for an alternative rate-setting methodology, not all may have such provisions and there may be significant uncertainty regarding the effectiveness of any such alternative methodologies. Since the usefulness of LIBOR as a benchmark could deteriorate during the transition period, these effects could occur at any time.
Beginning in January 2020, global financial markets have experienced, and may continue to experience, significant volatility resulting from the spread of a virus known as Covid–19. The outbreak of Covid–19 has resulted in travel and border restrictions, quarantines, supply chain disruptions, lower consumer demand, and general market uncertainty. The effects of Covid–19 have adversely affected, and may continue to adversely affect, the global economy, the economies of certain nations, and individual issuers, all of which may negatively impact the fund’s performance.
|
| Floating Rate Income Fund 51 |
Note 7: Senior loan commitments
Senior loans are purchased or sold on a when-issued or delayed delivery basis and may be settled a month or more after the trade date, which from time to time can delay the actual investment of available cash balances; interest income is accrued based on the terms of the securities. Senior loans can be acquired through an agent, by assignment from another holder of the loan, or as a participation interest in another holder’s portion of the loan. When the fund invests in a loan or participation, the fund is subject to the risk that an intermediate participant between the fund and the borrower will fail to meet its obligations to the fund, in addition to the risk that the borrower under the loan may default on its obligations.
Note 8: Unfunded loan commitments
As of the close of the reporting period, the fund had unfunded loan commitments of $421,434, which could be extended at the option of the borrower, pursuant to the following loan agreements with the following borrowers:
| |
| Borrower | Unfunded Commitments |
| athenahealth, Inc. | $289,855 |
| Pediatric Associates Holding Co., LLC | 131,579 |
| Totals | $421,434 |
Note 9: Summary of derivative activity
The volume of activity for the reporting period for any derivative type that was held during the period is listed below and was based on an average of the holdings at the end of each fiscal quarter:
| |
| Centrally cleared credit default contracts (notional) | $10,300,000 |
The following is a summary of the fair value of derivative instruments as of the close of the reporting period:
| | | | |
| Fair value of derivative instruments as of the close of the reporting period | |
| | ASSET DERIVATIVES | LIABILITY DERIVATIVES |
| Derivatives not | | | | |
| accounted for as | Statement of | | Statement of | |
| hedging instruments | assets and | | assets and | |
| under ASC 815 | liabilities location | Fair value | liabilities location | Fair value |
| | | | Payables, Net assets — | |
| Credit contracts | Receivables | $— | Unrealized depreciation | $26,730* |
| Total | | $— | | $26,730 |
* Includes cumulative depreciation of centrally cleared swaps as reported in the fund’s portfolio. Only current day’s variation margin is reported within the Statement of assets and liabilities.
The following is a summary of realized and change in unrealized gains or losses of derivative instruments in the Statement of operations for the reporting period (Note 1):
| | |
| Amount of realized gain or (loss) on derivatives recognized in net gain or (loss) on investments | |
| Derivatives not accounted for as | | |
| hedging instruments under ASC 815 | Swaps | Total |
| Credit contracts | $(411,048) | $(411,048) |
| Total | $(411,048) | $(411,048) |
| | |
| Change in unrealized appreciation or (depreciation) on derivatives recognized in net gain or (loss) |
| on investments | | |
| Derivatives not accounted for as | | |
| hedging instruments under ASC 815 | Swaps | Total |
| Credit contracts | $350,254 | $350,254 |
| Total | $350,254 | $350,254 |
|
| 52 Floating Rate Income Fund |
Note 10: Offsetting of financial and derivative assets and liabilities
The following table summarizes any derivatives, repurchase agreements and reverse repurchase agreements, at the end of the reporting period, that are subject to an enforceable master netting agreement or similar agreement. For securities lending transactions or borrowing transactions associated with securities sold short, if any, see Note 1. For financial reporting purposes, the fund does not offset financial assets and financial liabilities that are subject to the master netting agreements in the Statement of assets and liabilities.
| | |
| | | Barclays Capital, Inc. | | |
| | | (clearing broker) | | Total |
| Assets: | | |
| Centrally cleared credit default contracts§ | $— | $— |
| Total Assets | $— | $— |
| Liabilities: | | |
| Centrally cleared credit default contracts§ | 15,992 | 15,992 |
| Total Liabilities | $15,992 | $15,992 |
| Total Financial and Derivative Net Assets | $(15,992) | $(15,992) |
| Total collateral received (pledged)†## | $— | |
| Net amount | $(15,992) | |
| Controlled collateral received (including | | |
| TBA commitments)** | $— | $— |
| Uncontrolled collateral received | $— | $— |
| Collateral (pledged) (including TBA commitments)** | $— | $— |
** Included with Investments in securities on the Statement of assets and liabilities.
† Additional collateral may be required from certain brokers based on individual agreements.
## Any over-collateralization of total financial and derivative net assets is not shown. Collateral may include amounts related to unsettled agreements.
§ Includes current day’s variation margin only as reported on the Statement of assets and liabilities, which is not collateralized. Cumulative appreciation/(depreciation) for centrally cleared swap contracts is represented in the table listed after the fund’s portfolio. Collateral pledged for initial margin on centrally cleared swap contracts, which is not included in the table above, amounted to $917,359.
|
| Floating Rate Income Fund 53 |
Shareholder meeting results (Unaudited)
June 29, 2022 special meeting
At the meeting, each of the nominees for Trustees was elected, with all funds of the Trust voting together as a single class, as follows:
| | |
| | Votes for | Votes withheld |
| Liaquat Ahamed | 3,583,882,479 | 32,417,735 |
| Barbara M. Baumann | 3,584,377,892 | 31,922,322 |
| Katinka Domotorffy | 3,584,956,517 | 31,343,697 |
| Catharine Bond Hill | 3,586,682,827 | 29,617,387 |
| Kenneth R. Leibler | 3,569,431,371 | 46,868,843 |
| Jennifer Williams Murphy | 3,581,263,937 | 35,036,277 |
| Marie Pillai | 3,578,125,932 | 38,174,282 |
| George Putnam, III | 3,576,315,198 | 39,985,016 |
| Robert L. Reynolds | 3,579,411,077 | 36,889,137 |
| Manoj P. Singh | 3,582,573,738 | 33,726,476 |
| Mona K. Sutphen | 3,588,302,923 | 27,997,291 |
All tabulations are rounded to the nearest whole number.
|
| 54 Floating Rate Income Fund |
Putnam family of funds
The following is a list of Putnam’s open-end mutual funds offered to the public. Investors should carefully consider the investment objective, risks, charges, and expenses of a fund before investing. For a prospectus, or a summary prospectus if available, containing this and other information for any Putnam fund or product, contact your financial advisor or call Putnam Investor Services at 1-800-225-1581. Please read the prospectus carefully before investing.
| |
| Blend | Income |
| Emerging Markets Equity Fund | Convertible Securities Fund |
| Focused Equity Fund | Diversified Income Trust |
| Focused International Equity Fund | Floating Rate Income Fund |
| International Capital Opportunities Fund | Global Income Trust |
| International Equity Fund | Government Money Market Fund* |
| Multi-Cap Core Fund | High Yield Fund |
| Research Fund | Income Fund |
| | Money Market Fund† |
| Global Sector | Mortgage Opportunities Fund |
| Global Health Care Fund | Mortgage Securities Fund |
| Global Technology Fund | Short Duration Bond Fund |
| | Ultra Short Duration Income Fund |
| Growth | |
| Growth Opportunities Fund | Tax-free Income |
| Small Cap Growth Fund | Intermediate-Term Municipal Income Fund |
| Sustainable Future Fund | Short-Term Municipal Income Fund |
| Sustainable Leaders Fund | Strategic Intermediate Municipal Fund |
| | Tax Exempt Income Fund |
| Value | Tax-Free High Yield Fund |
| International Value Fund | |
| Large Cap Value Fund | State tax-free income funds:‡ |
| Small Cap Value Fund | California, Massachusetts, Minnesota, |
| | New Jersey, New York, Ohio, and Pennsylvania |
|
| Floating Rate Income Fund 55 |
| |
| Absolute Return | Asset Allocation (cont.) |
| Fixed Income Absolute Return Fund | Putnam Retirement Advantage Maturity Fund |
| Multi-Asset Absolute Return Fund | Putnam Retirement Advantage 2065 Fund |
| | Putnam Retirement Advantage 2060 Fund |
| Putnam PanAgora§ | Putnam Retirement Advantage 2055 Fund |
| Putnam PanAgora Risk Parity Fund | Putnam Retirement Advantage 2050 Fund |
| | Putnam Retirement Advantage 2045 Fund |
| Asset Allocation | Putnam Retirement Advantage 2040 Fund |
| Dynamic Risk Allocation Fund | Putnam Retirement Advantage 2035 Fund |
| George Putnam Balanced Fund | Putnam Retirement Advantage 2030 Fund |
| | Putnam Retirement Advantage 2025 Fund |
| Dynamic Asset Allocation Balanced Fund | |
| Dynamic Asset Allocation Conservative Fund | RetirementReady® Maturity Fund |
| Dynamic Asset Allocation Growth Fund | RetirementReady® 2065 Fund |
| | RetirementReady® 2060 Fund |
| | RetirementReady® 2055 Fund |
| | RetirementReady® 2050 Fund |
| | RetirementReady® 2045 Fund |
| | RetirementReady® 2040 Fund |
| | RetirementReady® 2035 Fund |
| | RetirementReady® 2030 Fund |
| | RetirementReady® 2025 Fund |
* You could lose money by investing in the fund. Although the fund seeks to preserve the value of your investment at $1.00 per share, it cannot guarantee it will do so. An investment in the fund is not insured or guaranteed by the Federal Deposit Insurance Corporation or any other government agency. The fund’s sponsor has no legal obligation to provide financial support to the fund, and you should not expect that the sponsor will provide financial support to the fund at any time.
† You could lose money by investing in the fund. Although the fund seeks to preserve the value of your investment at $1.00 per share, it cannot guarantee it will do so. The fund may impose a fee upon sale of your shares or may temporarily suspend your ability to sell shares if the fund’s liquidity falls below required minimums because of market conditions or other factors. An investment in the fund is not insured or guaranteed by the Federal Deposit Insurance Corporation or any other government agency. The fund’s sponsor has no legal obligation to provide financial support to the fund, and you should not expect that the sponsor will provide financial support to the fund at any time.
‡ Not available in all states.
§ Sub-advised by PanAgora Asset Management.
Check your account balances and the most recent month-end performance in the Individual Investors section at putnam.com.
|
| 56 Floating Rate Income Fund |
Fund information
Founded over 80 years ago, Putnam Investments was built around the concept that a balance between risk and reward is the hallmark of a well-rounded financial program. We manage funds across income, value, blend, growth, sustainable, asset allocation, absolute return, and global sector categories.
| | |
| Investment Manager | Trustees | Richard T. Kircher |
| Putnam Investment | Kenneth R. Leibler, Chair | Vice President and |
| Management, LLC | Barbara M. Baumann, Vice Chair | BSA Compliance Officer |
| 100 Federal Street | Liaquat Ahamed | |
| Boston, MA 02110 | Katinka Domotorffy | Martin Lemaire |
| | Catharine Bond Hill | Vice President and |
| Investment Sub-Advisor | Jennifer Williams Murphy | Derivatives Risk Manager |
| Putnam Investments Limited | Marie Pillai | |
| 16 St James’s Street | George Putnam, III | Susan G. Malloy |
| London, England SW1A 1ER | Robert L. Reynolds | Vice President and |
| | Manoj P. Singh | Assistant Treasurer |
| Marketing Services | Mona K. Sutphen | |
| Putnam Retail Management | | Alan G. McCormack |
| Limited Partnership | Officers | Vice President and |
| 100 Federal Street | Robert L. Reynolds | Derivatives Risk Manager |
| Boston, MA 02110 | President | |
| | | Denere P. Poulack |
| Custodian | James F. Clark | Assistant Vice President, |
| State Street Bank | Vice President, Chief Compliance | Assistant Clerk, and |
| and Trust Company | Officer, and Chief Risk Officer | Assistant Treasurer |
| | | |
| Legal Counsel | Nancy E. Florek | Janet C. Smith |
| Ropes & Gray LLP | Vice President, Director of | Vice President, |
| | Proxy Voting and Corporate | Principal Financial Officer, |
| | Governance, Assistant Clerk, | Principal Accounting Officer, |
| | and Assistant Treasurer | and Assistant Treasurer |
| | | |
| | Michael J. Higgins | Stephen J. Tate |
| | Vice President, Treasurer, | Vice President and |
| | and Clerk | Chief Legal Officer |
| | | |
| | Jonathan S. Horwitz | Mark C. Trenchard |
| | Executive Vice President, | Vice President |
| Principal Executive Officer, | |
| | and Compliance Liaison | |
This report is for the information of shareholders of Putnam Floating Rate Income Fund. It may also be used as sales literature when preceded or accompanied by the current prospectus, the most recent copy of Putnam’s Quarterly Performance Summary, and Putnam’s Quarterly Ranking Summary. For more recent performance, please visit putnam.com. Investors should carefully consider the investment objectives, risks, charges, and expenses of a fund, which are described in its prospectus. For this and other information or to request a prospectus or summary prospectus, call 1-800-225-1581 toll free. Please read the prospectus carefully before investing. The fund’s Statement of Additional Information contains additional information about the fund’s Trustees and is available without charge upon request by calling 1-800-225-1581.

| |
| Item 3. Audit Committee Financial Expert: |
| |
| Item 4. Principal Accountant Fees and Services: |
| |
| Item 5. Audit Committee of Listed Registrants |
| |
| Item 6. Schedule of Investments: |
| |
| The registrant’s schedule of investments in unaffiliated issuers is included in the report to shareholders in Item 1 above. |
| |
| Item 7. Disclosure of Proxy Voting Policies and Procedures For Closed-End Management Investment Companies: |
| |
| Item 8. Portfolio Managers of Closed-End Investment Companies |
| |
| Item 9. Purchases of Equity Securities by Closed-End Management Investment Companies and Affiliated Purchasers: |
| |
| Item 10. Submission of Matters to a Vote of Security Holders: |
| |
| Item 11. Controls and Procedures: |
| |
| (a) The registrant’s principal executive officer and principal financial officer have concluded, based on their evaluation of the effectiveness of the design and operation of the registrant’s disclosure controls and procedures as of a date within 90 days of the filing date of this report, that the design and operation of such procedures are generally effective to provide reasonable assurance that information required to be disclosed by the registrant in this report is recorded, processed, summarized and reported within the time periods specified in the Commission’s rules and forms. |
| |
| (b) Changes in internal control over financial reporting: Not applicable |
| |
| Item 12. Disclosures of Securities Lending Activities for Closed-End Investment Companies: |
| |
| Pursuant to the requirements of the Securities Exchange Act of 1934 and the Investment Company Act of 1940, the registrant has duly caused this report to be signed on its behalf by the undersigned, thereunto duly authorized. |
| |
| By (Signature and Title): |
| |
| /s/ Janet C. Smith
Janet C. Smith
Principal Accounting Officer
|
| |
| Pursuant to the requirements of the Securities Exchange Act of 1934 and the Investment Company Act of 1940, this report has been signed below by the following persons on behalf of the registrant and in the capacities and on the dates indicated. |
| |
| By (Signature and Title): |
| |
| /s/ Jonathan S. Horwitz
Jonathan S. Horwitz
Principal Executive Officer
|
| |
| By (Signature and Title): |
| |
| /s/ Janet C. Smith
Janet C. Smith
Principal Financial Officer
|