UNITED STATES
SECURITIES AND EXCHANGE COMMISSION
WASHINGTON, D. C. 20549
FORM N-CSRS
Investment Company Act file number: 811-07507
DWS Investments VIT Funds
(Exact Name of Registrant as Specified in Charter)
345 Park Avenue
New York, NY 10154-0004
(Address of Principal Executive Offices) (Zip Code)
Registrant’s Telephone Number, including Area Code: (212) 250-3220
Paul Schubert
60 Wall Street
New York, NY 10005
(Name and Address of Agent for Service)
| Date of fiscal year end: | 12/31 |
| Date of reporting period: | 6/30/2012 |
| ITEM 1. | REPORT TO STOCKHOLDERS |
JUNE 30, 2012
SEMIANNUAL REPORT
DWS INVESTMENTS VIT FUNDS
| DWS Small Cap Index VIP |

Contents
3 Performance Summary 4 Portfolio Summary 6 Portfolio Management 7 Investment Portfolio 42 Statement of Assets and Liabilities 43 Statement of Operations 44 Statement of Changes in Net Assets 45 Financial Highlights 47 Notes to Financial Statements 52 Information About Your Fund's Expenses 53 Proxy Voting 54 Summary of Management Fee Evaluation by Independent Fee Consultant |
This report must be preceded or accompanied by a prospectus. To obtain an additional prospectus or summary prospectus, if available, call (800) 728-3337 or your financial representative. We advise you to consider the Fund's objectives, risks, charges and expenses carefully before investing. The summary prospectus and prospectus contain this and other important information about the Fund. Please read the prospectus carefully before you invest.
Investing in derivatives entails special risks relating to liquidity, leverage and credit that may reduce returns and/or increase volatility. Various factors, including costs, cash flows and security selection, may cause the Fund's performance to differ from that of the index. The Fund may lend securities to approved institutions. Stocks of smaller companies involve greater risk than securities of larger, more established companies. Stocks may decline in value. See prospectus for details.
DWS Investments is part of Deutsche Bank's Asset Management division and, within the U.S., represents the retail asset management activities of Deutsche Bank AG, Deutsche Bank Trust Company Americas, Deutsche Investment Management Americas Inc. and DWS Trust Company.
NOT FDIC/NCUA INSURED NO BANK GUARANTEE MAY LOSE VALUE NOT A DEPOSIT
NOT INSURED BY ANY FEDERAL GOVERNMENT AGENCY
Fund performance shown is historical, assumes reinvestment of all dividend and capital gain distributions, and does not guarantee future results. Investment return and principal value fluctuate with changing market conditions so that, when redeemed, shares may be worth more or less than their original cost. Current performance may be lower or higher than the performance data quoted. Please contact your participating insurance company for the Fund's most recent month-end performance. Performance figures for Classes A and B differ because each class maintains a distinct expense structure. Performance doesn't reflect charges and fees ("contract charges") associated with the separate account that invests in the Fund or any variable life insurance policy or variable annuity contract for which the Fund is an investment option. These charges and fees will reduce returns.
The gross expense ratios of the Fund, as stated in the fee table of the prospectus dated May 1, 2012 are 0.57% and 0.82% for Class A and Class B shares, respectively, and may differ from the expense ratios disclosed in the Financial Highlights tables in this report.
| Growth of an Assumed $10,000 Investment | ||
 | The Russell 2000® Index is an unmanaged, capitalization-weighted measure of approximately 2,000 of the smallest companies in the Russell 3000® Index. Index returns do not reflect any fees or expenses and it is not possible to invest directly into an index. | |
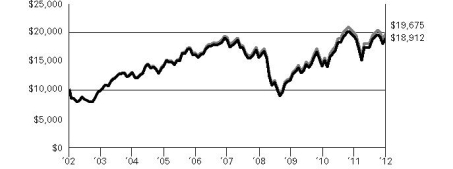 | ||
| Yearly periods ended June 30 | ||
| Comparative Results (as of June 30, 2012) | |||||||||||||||||||||
| DWS Small Cap Index VIP | 6-Month‡ | 1-Year | 3-Year | 5-Year | 10-Year | ||||||||||||||||
| Class A | Growth of $10,000 | $ | 10,845 | $ | 9,774 | $ | 16,214 | $ | 10,088 | $ | 18,912 | ||||||||||
| Average annual total return | 8.45 | % | -2.26 | % | 17.48 | % | 0.18 | % | 6.58 | % | |||||||||||
| Russell 2000 Index | Growth of $10,000 | $ | 10,853 | $ | 9,792 | $ | 16,346 | $ | 10,273 | $ | 19,675 | ||||||||||
| Average annual total return | 8.53 | % | -2.08 | % | 17.80 | % | 0.54 | % | 7.00 | % | |||||||||||
| DWS Small Cap Index VIP | 6-Month‡ | 1-Year | 3-Year | 5-Year | 10-Year | ||||||||||||||||
| Class B | Growth of $10,000 | $ | 10,827 | $ | 9,750 | $ | 16,086 | $ | 9,964 | $ | 18,453 | ||||||||||
| Average annual total return | 8.27 | % | -2.50 | % | 17.17 | % | -0.07 | % | 6.32 | % | |||||||||||
| Russell 2000 Index | Growth of $10,000 | $ | 10,853 | $ | 9,792 | $ | 16,346 | $ | 10,273 | $ | 19,675 | ||||||||||
| Average annual total return | 8.53 | % | -2.08 | % | 17.80 | % | 0.54 | % | 7.00 | % | |||||||||||
The growth of $10,000 is cumulative.
‡ Total returns shown for periods less than one year are not annualized.
Asset Allocation (As a % of Investment Portfolio excluding Securities Lending Collateral) | 6/30/12 | 12/31/11 |
| Common Stocks | 97% | 97% |
| Cash Equivalents* | 2% | 2% |
| Government & Agency Obligations | 1% | 1% |
| 100% | 100% |
Sector Diversification (As a % of Common Stocks and Warrants) | 6/30/12 | 12/31/11 |
| Financials | 21% | 22% |
| Information Technology | 17% | 17% |
| Industrials | 15% | 15% |
| Consumer Discretionary | 14% | 13% |
| Health Care | 13% | 13% |
| Energy | 6% | 7% |
| Materials | 5% | 4% |
| Consumer Staples | 4% | 4% |
| Utilities | 4% | 4% |
| Telecommunication Services | 1% | 1% |
| 100% | 100% |
Ten Largest Equity Holdings (2.4% of Net Assets) | |
1. Pharmacyclics, Inc. A pharmaceutical company | 0.3% |
2. Cepheid, Inc. Manufactures microfluidic systems | 0.3% |
3. HMS Holdings Corp. Provides proprietary information management and data processing products and services | 0.3% |
4. Questcor Pharmaceuticals, Inc. Develops and commercializes novel central-nervous-system-focused therapeutics that address significant unmet medical needs | 0.3% |
5. VIVUS, Inc. A biopharmaceutical company developing therapies for obesity, sleep apnea, diabeties and sexual health | 0.2% |
6. athenahealth, Inc. Provides Internet-based business services for physician practices | 0.2% |
7. Woodward, Inc. Manufacturer of engine fuel delivery and control systems | 0.2% |
8. United Natural Foods, Inc. Distributor of natural foods and related products | 0.2% |
9. Dril-Quip, Inc. Designer and manufacturer of offshore drilling and production equipment | 0.2% |
10. Hexcel Corp. Develops, manufactures and markets reinforcement products and engineered products | 0.2% |
* In order to keep cash on hand to meet shareholder redemptions or other needs while maintaining exposure to the market, the Fund invests in futures contracts.
Portfolio holdings and characteristics are subject to change.
For more complete details about the Fund's investment portfolio, see page 7.
Following the Fund's fiscal first and third quarter-end, a complete portfolio holdings listing is filed with the SEC on Form N-Q. The form will be available on the SEC's Web site at www.sec.gov, and it also may be reviewed and copied at the SEC's Public Reference Room in Washington, D.C. Information on the operation of the SEC's Public Reference Room may be obtained by calling (800) SEC-0330. The Fund's portfolio holdings are also posted on www.dws-investments.com from time to time. Please see the Fund's current prospectus for more information.
Brent Reeder
Portfolio Manager and Senior Vice President, Northern Trust Investments, Inc., Subadvisor to the Fund
| Shares | Value ($) | |||||||
| Common Stocks 97.1% | ||||||||
| Consumer Discretionary 13.4% | ||||||||
| Auto Components 0.8% | ||||||||
| American Axle & Manufacturing Holdings, Inc.* | 17,925 | 188,033 | ||||||
| Amerigon, Inc.* (a) | 7,786 | 89,461 | ||||||
| Cooper Tire & Rubber Co. | 16,689 | 292,725 | ||||||
| Dana Holding Corp. (a) | 39,551 | 506,648 | ||||||
| Dorman Products, Inc.* | 6,552 | 164,390 | ||||||
| Drew Industries, Inc.* | 5,151 | 143,455 | ||||||
| Exide Technologies* | 20,949 | 70,389 | ||||||
| Federal-Mogul Corp.* | 4,957 | 54,527 | ||||||
| Fuel Systems Solutions, Inc.* (a) | 3,939 | 65,742 | ||||||
| Modine Manufacturing Co.* | 12,773 | 88,517 | ||||||
| Shiloh Industries, Inc. | 1,452 | 16,698 | ||||||
| Spartan Motors, Inc. (a) | 9,110 | 47,736 | ||||||
| Standard Motor Products, Inc. (a) | 5,261 | 74,075 | ||||||
| Stoneridge, Inc.* | 7,745 | 52,743 | ||||||
| Superior Industries International, Inc. | 6,167 | 100,954 | ||||||
| Tenneco, Inc.* | 16,256 | 435,986 | ||||||
| Tower International, Inc.* | 1,701 | 17,861 | ||||||
| 2,409,940 | ||||||||
| Automobiles 0.0% | ||||||||
| Winnebago Industries, Inc.* (a) | 7,964 | 81,153 | ||||||
| Distributors 0.2% | ||||||||
| Core-Mark Holding Co., Inc. | 3,041 | 146,394 | ||||||
| Pool Corp. (a) | 12,700 | 513,842 | ||||||
| VOXX International Corp.* | 4,797 | 44,708 | ||||||
| Weyco Group, Inc. (a) | 1,795 | 41,608 | ||||||
| 746,552 | ||||||||
| Diversified Consumer Services 1.3% | ||||||||
| American Public Education, Inc.* (a) | 4,845 | 155,040 | ||||||
| Ascent Capital Group, Inc. "A"* | 3,823 | 197,840 | ||||||
| Bridgepoint Education, Inc.* (a) | 4,764 | 103,855 | ||||||
| Capella Education Co.* | 3,616 | 125,692 | ||||||
| Career Education Corp.* | 13,898 | 92,978 | ||||||
| Carriage Services, Inc. | 4,278 | 35,593 | ||||||
| Coinstar, Inc.* (a) | 8,388 | 575,920 | ||||||
| Collectors Universe, Inc. | 1,449 | 21,271 | ||||||
| Corinthian Colleges, Inc.* (a) | 20,624 | 59,603 | ||||||
| Education Management Corp.* (a) | 7,160 | 49,762 | ||||||
| Grand Canyon Education, Inc.* | 10,709 | 224,247 | ||||||
| Hillenbrand, Inc. (a) | 14,825 | 272,484 | ||||||
| K12, Inc.* (a) | 7,156 | 166,735 | ||||||
| Lincoln Educational Services Corp. | 5,887 | 38,266 | ||||||
| Mac-Gray Corp. | 3,169 | 44,651 | ||||||
| Matthews International Corp. "A" | 7,562 | 245,689 | ||||||
| National American University Holdings, Inc. | 2,172 | 9,340 | ||||||
| Regis Corp. (a) | 15,444 | 277,374 | ||||||
| Sotheby's | 18,165 | 605,985 | ||||||
| Steiner Leisure Ltd.* | 4,103 | 190,420 | ||||||
| Stewart Enterprises, Inc. "A" (a) | 19,787 | 141,279 | ||||||
| Strayer Education, Inc. (a) | 3,157 | 344,176 | ||||||
| Universal Technical Institute, Inc. | 5,638 | 76,169 | ||||||
| 4,054,369 | ||||||||
| Shares | Value ($) | |||||||
| Hotels, Restaurants & Leisure 3.2% | ||||||||
| AFC Enterprises, Inc.* | 6,465 | 149,600 | ||||||
| Ameristar Casinos, Inc. | 8,824 | 156,802 | ||||||
| Benihana, Inc. (a) | 2,824 | 45,495 | ||||||
| Biglari Holdings, Inc.* | 324 | 125,190 | ||||||
| BJ's Restaurants, Inc.* (a) | 6,567 | 249,546 | ||||||
| Bluegreen Corp.* | 3,840 | 19,046 | ||||||
| Bob Evans Farms, Inc. (a) | 7,797 | 313,439 | ||||||
| Boyd Gaming Corp.* (a) | 15,091 | 108,655 | ||||||
| Bravo Brio Restaurant Group, Inc.* (a) | 5,272 | 94,000 | ||||||
| Buffalo Wild Wings, Inc.* (a) | 4,973 | 430,861 | ||||||
| Caesars Entertainment Corp.* (a) | 9,684 | 110,398 | ||||||
| Caribou Coffee Co., Inc.* (a) | 5,657 | 73,032 | ||||||
| Carrols Restaurant Group, Inc.* | 4,342 | 25,791 | ||||||
| CEC Entertainment, Inc. | 4,944 | 179,813 | ||||||
| Churchill Downs, Inc. | 3,482 | 204,707 | ||||||
| Cracker Barrel Old Country Store, Inc. (a) | 5,133 | 322,352 | ||||||
| Denny's Corp.* | 26,161 | 116,155 | ||||||
| DineEquity, Inc.* | 4,141 | 184,854 | ||||||
| Domino's Pizza, Inc. (a) | 15,511 | 479,445 | ||||||
| Einstein Noah Restaurant Group, Inc. | 1,758 | 30,870 | ||||||
| Fiesta Restaurant Group, Inc.* | 4,324 | 57,207 | ||||||
| Frisch's Restaurants, Inc. | 838 | 23,749 | ||||||
| Gaylord Entertainment Co.* (a) | 8,320 | 320,819 | ||||||
| Ignite Restaurant Group, Inc.* | 1,775 | 32,145 | ||||||
| International Speedway Corp. "A" | 7,423 | 194,334 | ||||||
| Interval Leisure Group, Inc. | 10,451 | 198,674 | ||||||
| Isle of Capri Casinos, Inc.* (a) | 5,455 | 33,657 | ||||||
| Jack in the Box, Inc.* (a) | 11,835 | 329,960 | ||||||
| Jamba, Inc.* (a) | 18,987 | 37,215 | ||||||
| Krispy Kreme Doughnuts, Inc.* (a) | 15,920 | 101,729 | ||||||
| LIFE TIME FITNESS, Inc.* (a) | 11,483 | 534,074 | ||||||
| Luby's, Inc.* (a) | 5,004 | 33,527 | ||||||
| Marcus Corp. | 5,319 | 73,189 | ||||||
| Marriott Vacations Worldwide Corp.* | 7,125 | 220,733 | ||||||
| Monarch Casino & Resort, Inc.* | 2,265 | 20,702 | ||||||
| Morgans Hotel Group Co.* | 5,613 | 26,381 | ||||||
| MTR Gaming Group, Inc.* | 6,053 | 28,752 | ||||||
| Multimedia Games Holding Co., Inc.* | 7,177 | 100,478 | ||||||
| Nathan's Famous, Inc.* | 715 | 21,093 | ||||||
| Orient-Express Hotels Ltd. "A"* | 25,961 | 217,294 | ||||||
| P.F. Chang's China Bistro, Inc. (a) | 5,701 | 293,430 | ||||||
| Papa John's International, Inc.* (a) | 4,803 | 228,479 | ||||||
| Peet's Coffee & Tea, Inc.* (a) | 3,550 | 213,142 | ||||||
| Pinnacle Entertainment, Inc.* | 16,757 | 161,202 | ||||||
| Premier Exhibitions, Inc.* | 6,895 | 18,617 | ||||||
| Red Lion Hotels Corp.* | 3,771 | 32,619 | ||||||
| Red Robin Gourmet Burgers, Inc.* | 3,932 | 119,965 | ||||||
| Ruby Tuesday, Inc.* (a) | 17,232 | 117,350 | ||||||
| Ruth's Hospitality Group, Inc.* (a) | 9,324 | 61,538 | ||||||
| Scientific Games Corp. "A"* | 15,243 | 130,328 | ||||||
| Shuffle Master, Inc.* | 14,720 | 203,136 | ||||||
| Six Flags Entertainment Corp. (a) | 10,626 | 575,717 | ||||||
| Sonic Corp.* | 16,489 | 165,220 | ||||||
| Speedway Motorsports, Inc. (a) | 3,181 | 53,791 | ||||||
| Texas Roadhouse, Inc. (a) | 16,757 | 308,832 | ||||||
| Shares | Value ($) | |||||||
| The Cheesecake Factory, Inc.* (a) | 14,438 | 461,438 | ||||||
| Town Sports International Holdings, Inc.* | 6,220 | 82,664 | ||||||
| Vail Resorts, Inc. (a) | 9,649 | 483,222 | ||||||
| WMS Industries, Inc.* | 14,757 | 294,402 | ||||||
| 10,030,855 | ||||||||
| Household Durables 1.0% | ||||||||
| American Greetings Corp. "A" (a) | 9,420 | 137,720 | ||||||
| Bassett Furniture Industries, Inc. | 3,038 | 31,322 | ||||||
| Beazer Homes U.S.A., Inc.* (a) | 26,589 | 86,414 | ||||||
| Blyth, Inc. | 2,728 | 94,280 | ||||||
| Cavco Industries, Inc.* (a) | 1,834 | 94,047 | ||||||
| CSS Industries, Inc. | 2,632 | 54,088 | ||||||
| Ethan Allen Interiors, Inc. (a) | 6,521 | 129,964 | ||||||
| Flexsteel Industries, Inc. | 1,212 | 23,973 | ||||||
| Helen of Troy Ltd.* | 8,513 | 288,506 | ||||||
| Hooker Furniture Corp. | 2,904 | 34,238 | ||||||
| Hovnanian Enterprises, Inc. "A"* (a) | 26,772 | 77,639 | ||||||
| iRobot Corp.* (a) | 7,369 | 163,223 | ||||||
| KB HOME (a) | 20,690 | 202,762 | ||||||
| La-Z-Boy, Inc.* | 13,812 | 169,749 | ||||||
| Libbey, Inc.* (a) | 5,505 | 84,612 | ||||||
| Lifetime Brands, Inc. (a) | 2,536 | 31,624 | ||||||
| M.D.C. Holdings, Inc. | 10,259 | 335,161 | ||||||
| M/I Homes, Inc.* | 5,118 | 88,644 | ||||||
| Meritage Homes Corp.* | 7,588 | 257,537 | ||||||
| Ryland Group, Inc. (a) | 12,000 | 306,960 | ||||||
| Sealy Corp.* (a) | 13,302 | 24,609 | ||||||
| Skullcandy, Inc.* (a) | 4,347 | 61,510 | ||||||
| Standard Pacific Corp.* (a) | 29,105 | 180,160 | ||||||
| Universal Electronics, Inc.* | 3,966 | 52,232 | ||||||
| Zagg, Inc.* (a) | 6,833 | 74,548 | ||||||
| 3,085,522 | ||||||||
| Internet & Catalog Retail 0.3% | ||||||||
| 1-800 FLOWERS.COM, Inc. "A"* | 6,901 | 24,084 | ||||||
| Blue Nile, Inc.* (a) | 3,711 | 110,254 | ||||||
| CafePress, Inc.* | 1,242 | 18,481 | ||||||
| Geeknet, Inc.* (a) | 1,184 | 23,467 | ||||||
| HSN, Inc. | 10,173 | 410,481 | ||||||
| NutriSystem, Inc. (a) | 7,651 | 88,446 | ||||||
| Orbitz Worldwide, Inc.* | 5,489 | 20,035 | ||||||
| Overstock.com, Inc.* (a) | 2,996 | 20,702 | ||||||
| PetMed Express, Inc. (a) | 5,415 | 65,846 | ||||||
| Shutterfly, Inc.* (a) | 9,590 | 294,317 | ||||||
| U.S. Auto Parts Network, Inc.* | 4,076 | 17,038 | ||||||
| Vitacost.com, Inc.* (a) | 5,951 | 35,111 | ||||||
| 1,128,262 | ||||||||
| Leisure Equipment & Products 0.5% | ||||||||
| Arctic Cat, Inc.* | 3,393 | 124,048 | ||||||
| Black Diamond, Inc.* (a) | 5,636 | 53,260 | ||||||
| Brunswick Corp. | 23,925 | 531,614 | ||||||
| Callaway Golf Co. (a) | 17,117 | 101,161 | ||||||
| JAKKS Pacific, Inc. (a) | 6,860 | 109,829 | ||||||
| Johnson Outdoors, Inc. "A"* (a) | 1,520 | 31,312 | ||||||
| LeapFrog Enterprises, Inc.* | 13,517 | 138,684 | ||||||
| Marine Products Corp. | 3,050 | 18,544 | ||||||
| Smith & Wesson Holding Corp.* (a) | 17,384 | 144,461 | ||||||
| Steinway Musical Instruments, Inc.* | 1,951 | 47,800 | ||||||
| Sturm, Ruger & Co., Inc. (a) | 5,128 | 205,889 | ||||||
| 1,506,602 | ||||||||
| Shares | Value ($) | |||||||
| Media 1.2% | ||||||||
| Arbitron, Inc. | 7,125 | 249,375 | ||||||
| Beasley Broadcast Group, Inc. "A"* | 1,185 | 6,980 | ||||||
| Belo Corp. "A" | 25,286 | 162,842 | ||||||
| Carmike Cinemas, Inc.* | 4,747 | 69,543 | ||||||
| Central European Media Enterprises Ltd. "A"* (a) | 9,963 | 50,612 | ||||||
| Crown Media Holdings, Inc.* (a) | 7,874 | 13,779 | ||||||
| Cumulus Media, Inc. "A"* (a) | 15,081 | 45,394 | ||||||
| Daily Journal Corp.* | 263 | 22,560 | ||||||
| Dial Global, Inc.* (a) | 1,464 | 4,860 | ||||||
| Digital Domain Media Group, Inc.* (a) | 2,861 | 17,910 | ||||||
| Digital Generation, Inc.* (a) | 7,479 | 92,515 | ||||||
| Entercom Communications Corp. "A"* (a) | 6,479 | 39,004 | ||||||
| Entravision Communications Corp. "A" | 13,431 | 16,251 | ||||||
| Fisher Communications, Inc.* | 2,319 | 69,361 | ||||||
| Global Sources Ltd.* (a) | 5,067 | 33,442 | ||||||
| Harte-Hanks, Inc. | 12,163 | 111,170 | ||||||
| Journal Communications, Inc. "A"* | 11,334 | 58,483 | ||||||
| Knology, Inc.* | 8,340 | 164,048 | ||||||
| LIN TV Corp. "A"* | 7,600 | 22,952 | ||||||
| Lions Gate Entertainment Corp.* (a) | 22,730 | 335,040 | ||||||
| Live Nation Entertainment, Inc.* | 37,691 | 346,003 | ||||||
| Martha Stewart Living Omnimedia, Inc. "A" (a) | 7,657 | 26,034 | ||||||
| McClatchy Co. "A"* (a) | 14,716 | 32,375 | ||||||
| MDC Partners, Inc. "A" (a) | 6,735 | 76,375 | ||||||
| Meredith Corp. (a) | 9,708 | 310,073 | ||||||
| National CineMedia, Inc. | 15,027 | 227,960 | ||||||
| New York Times Co. "A"* (a) | 36,581 | 285,332 | ||||||
| Nexstar Broadcasting Group, Inc. "A"* (a) | 2,951 | 19,890 | ||||||
| Outdoor Channel Holdings, Inc. | 3,731 | 27,274 | ||||||
| ReachLocal, Inc.* | 2,611 | 28,721 | ||||||
| Reading International, Inc. "A"* (a) | 4,460 | 24,129 | ||||||
| Rentrak Corp.* | 2,404 | 49,643 | ||||||
| Saga Communications, Inc. "A"* | 945 | 35,069 | ||||||
| Salem Communications Corp. "A" | 2,719 | 14,873 | ||||||
| Scholastic Corp. (a) | 6,964 | 196,106 | ||||||
| Sinclair Broadcast Group, Inc. "A" | 13,480 | 122,129 | ||||||
| The E.W. Scripps Co. "A"* | 7,911 | 76,025 | ||||||
| Valassis Communications, Inc.* (a) | 11,460 | 249,255 | ||||||
| Value Line, Inc. (a) | 300 | 3,567 | ||||||
| World Wrestling Entertainment, Inc. "A" | 7,267 | 56,828 | ||||||
| 3,793,782 | ||||||||
| Multiline Retail 0.2% | ||||||||
| Fred's, Inc. "A" (a) | 9,866 | 150,851 | ||||||
| Gordmans Stores, Inc.* | 2,268 | 37,422 | ||||||
| Saks, Inc.* (a) | 29,488 | 314,047 | ||||||
| The Bon-Ton Stores, Inc. (a) | 3,254 | 25,414 | ||||||
| Tuesday Morning Corp.* | 11,226 | 48,160 | ||||||
| 575,894 | ||||||||
| Specialty Retail 3.4% | ||||||||
| Aeropostale, Inc.* | 21,770 | 388,159 | ||||||
| America's Car-Mart, Inc.* | 2,110 | 81,973 | ||||||
| ANN, Inc.* (a) | 13,069 | 333,129 | ||||||
| Asbury Automotive Group, Inc.* | 7,410 | 175,543 | ||||||
| Barnes & Noble, Inc.* (a) | 7,608 | 125,228 | ||||||
| Shares | Value ($) | |||||||
| bebe stores, inc. (a) | 10,068 | 59,099 | ||||||
| Big 5 Sporting Goods Corp. (a) | 4,473 | 33,816 | ||||||
| Body Central Corp.* | 4,334 | 39,006 | ||||||
| Brown Shoe Co., Inc. (a) | 11,485 | 148,271 | ||||||
| Cabela's, Inc.* (a) | 12,500 | 472,625 | ||||||
| Casual Male Retail Group, Inc.* | 11,533 | 41,865 | ||||||
| Cato Corp. "A" (a) | 7,375 | 224,642 | ||||||
| Children's Place Retail Stores, Inc.* (a) | 6,451 | 321,453 | ||||||
| Citi Trends, Inc.* (a) | 3,928 | 60,648 | ||||||
| Collective Brands, Inc.* (a) | 16,396 | 351,202 | ||||||
| Conn's, Inc.* (a) | 4,180 | 61,864 | ||||||
| Cost Plus, Inc.* (a) | 5,138 | 113,036 | ||||||
| Destination Maternity Corp. (a) | 3,589 | 77,522 | ||||||
| Express, Inc.* | 23,958 | 435,317 | ||||||
| Francesca's Holdings Corp.* (a) | 9,323 | 251,814 | ||||||
| Genesco, Inc.* (a) | 6,557 | 394,404 | ||||||
| Group 1 Automotive, Inc. (a) | 6,145 | 280,273 | ||||||
| Haverty Furniture Companies, Inc. | 5,054 | 56,453 | ||||||
| hhgregg, Inc.* (a) | 4,291 | 48,531 | ||||||
| Hibbett Sports, Inc.* (a) | 7,070 | 408,010 | ||||||
| Hot Topic, Inc. | 11,277 | 109,274 | ||||||
| Jos. A. Bank Clothiers, Inc.* (a) | 7,456 | 316,582 | ||||||
| Kirkland's, Inc.* (a) | 4,060 | 45,675 | ||||||
| Lithia Motors, Inc. "A" (a) | 5,825 | 134,266 | ||||||
| Lumber Liquidators Holdings, Inc.* (a) | 7,381 | 249,404 | ||||||
| MarineMax, Inc.* (a) | 5,482 | 52,134 | ||||||
| Mattress Firm Holding Corp.* (a) | 2,951 | 89,445 | ||||||
| Monro Muffler Brake, Inc. (a) | 8,278 | 275,161 | ||||||
| New York & Co., Inc.* | 6,834 | 23,782 | ||||||
| Office Depot, Inc.* | 76,147 | 164,478 | ||||||
| OfficeMax, Inc.* (a) | 23,743 | 120,140 | ||||||
| Orchard Supply Hardware Stores Corp. "A"* | 514 | 8,548 | ||||||
| Penske Automotive Group, Inc. | 11,376 | 241,626 | ||||||
| Perfumania Holdings, Inc.* (a) | 1,371 | 11,366 | ||||||
| Pier 1 Imports, Inc. (a) | 26,160 | 429,809 | ||||||
| RadioShack Corp. (a) | 26,658 | 102,367 | ||||||
| Rent-A-Center, Inc. | 15,924 | 537,276 | ||||||
| Rue21, Inc.* (a) | 4,149 | 104,721 | ||||||
| Select Comfort Corp.* | 15,194 | 317,858 | ||||||
| Shoe Carnival, Inc. | 3,833 | 82,371 | ||||||
| Sonic Automotive, Inc. "A" (a) | 10,694 | 146,187 | ||||||
| Stage Stores, Inc. (a) | 8,163 | 149,546 | ||||||
| Stein Mart, Inc.* | 7,238 | 57,542 | ||||||
| Systemax, Inc.* (a) | 2,979 | 35,212 | ||||||
| Talbots, Inc.* (a) | 18,603 | 46,880 | ||||||
| Teavana Holdings, Inc.* (a) | 2,356 | 31,877 | ||||||
| The Buckle, Inc. (a) | 7,435 | 294,203 | ||||||
| The Finish Line, Inc. "A" (a) | 13,642 | 285,254 | ||||||
| The Men's Wearhouse, Inc. | 13,565 | 381,719 | ||||||
| The Pep Boys — Manny, Moe & Jack (a) | 14,239 | 140,966 | ||||||
| The Wet Seal, Inc. "A"* | 23,786 | 75,164 | ||||||
| Tilly's, Inc. "A"* | 2,459 | 39,467 | ||||||
| Vitamin Shoppe, Inc.* (a) | 7,890 | 433,398 | ||||||
| West Marine, Inc.* (a) | 3,980 | 46,765 | ||||||
| Winmark Corp. (a) | 579 | 33,900 | ||||||
| Zumiez, Inc.* (a) | 5,869 | 232,412 | ||||||
| 10,830,658 | ||||||||
| Textiles, Apparel & Luxury Goods 1.3% | ||||||||
| Cherokee, Inc. (a) | 2,369 | 33,000 | ||||||
| Columbia Sportswear Co. (a) | 3,284 | 176,088 | ||||||
| Shares | Value ($) | |||||||
| Crocs, Inc.* | 24,091 | 389,070 | ||||||
| Culp, Inc. | 2,339 | 23,975 | ||||||
| Delta Apparel, Inc.* (a) | 1,898 | 25,927 | ||||||
| Fifth & Pacific Companies, Inc.* (a) | 29,129 | 312,554 | ||||||
| G-III Apparel Group Ltd.* (a) | 4,404 | 104,331 | ||||||
| Iconix Brand Group, Inc.* (a) | 18,875 | 329,746 | ||||||
| K-Swiss, Inc. "A"* (a) | 7,254 | 22,342 | ||||||
| Kenneth Cole Productions, Inc. "A"* | 2,090 | 31,455 | ||||||
| Maidenform Brands, Inc.* (a) | 6,419 | 127,866 | ||||||
| Movado Group, Inc. | 4,617 | 115,517 | ||||||
| Oxford Industries, Inc. (a) | 3,753 | 167,759 | ||||||
| Perry Ellis International, Inc.* (a) | 3,184 | 66,068 | ||||||
| Quiksilver, Inc.* | 34,635 | 80,700 | ||||||
| R.G. Barry Corp. | 2,256 | 30,659 | ||||||
| Skechers U.S.A., Inc. "A"* (a) | 10,254 | 208,874 | ||||||
| Steven Madden Ltd.* | 10,510 | 333,692 | ||||||
| The Jones Group, Inc. | 22,007 | 210,387 | ||||||
| The Warnaco Group, Inc.* (a) | 10,994 | 468,125 | ||||||
| True Religion Apparel, Inc. | 6,981 | 202,309 | ||||||
| Tumi Holdings, Inc.* (a) | 5,779 | 101,133 | ||||||
| Unifi, Inc.* | 3,776 | 42,782 | ||||||
| Vera Bradley, Inc.* (a) | 5,393 | 113,684 | ||||||
| Wolverine World Wide, Inc. | 13,055 | 506,273 | ||||||
| 4,224,316 | ||||||||
| Consumer Staples 3.6% | ||||||||
| Beverages 0.1% | ||||||||
| Boston Beer Co., Inc. "A"* (a) | 2,084 | 252,164 | ||||||
| Central European Distribution Corp.* (a) | 17,678 | 50,559 | ||||||
| Coca-Cola Bottling Co. Consolidated (a) | 1,253 | 80,543 | ||||||
| Craft Brewers Alliance, Inc.* (a) | 2,920 | 23,886 | ||||||
| National Beverage Corp.* (a) | 2,978 | 44,491 | ||||||
| 451,643 | ||||||||
| Food & Staples Retailing 1.2% | ||||||||
| Arden Group, Inc. "A" (a) | 314 | 27,384 | ||||||
| Casey's General Stores, Inc. | 10,200 | 601,698 | ||||||
| Harris Teeter Supermarkets, Inc. | 11,756 | 481,878 | ||||||
| Ingles Markets, Inc. "A" | 3,451 | 55,319 | ||||||
| Nash Finch Co. (a) | 3,191 | 68,543 | ||||||
| Pantry, Inc.* | 6,094 | 89,582 | ||||||
| PriceSmart, Inc. (a) | 4,872 | 328,909 | ||||||
| Rite Aid Corp.* | 176,787 | 247,502 | ||||||
| Roundy's, Inc. (a) | 5,548 | 56,645 | ||||||
| Spartan Stores, Inc. (a) | 5,864 | 106,314 | ||||||
| SUPERVALU, Inc. | 56,892 | 294,700 | ||||||
| Susser Holdings Corp.* | 2,995 | 111,324 | ||||||
| The Andersons, Inc. | 4,994 | 213,044 | ||||||
| The Chefs' Warehouse, Inc.* (a) | 2,952 | 53,284 | ||||||
| United Natural Foods, Inc.* | 13,088 | 718,008 | ||||||
| Village Super Market, Inc. "A" | 2,270 | 73,957 | ||||||
| Weis Markets, Inc. (a) | 2,951 | 131,378 | ||||||
| 3,659,469 | ||||||||
| Food Products 1.5% | ||||||||
| Alico, Inc. (a) | 948 | 28,952 | ||||||
| Annie's, Inc.* | 1,340 | 56,092 | ||||||
| B&G Foods, Inc. | 12,964 | 344,842 | ||||||
| Cal-Maine Foods, Inc. (a) | 3,881 | 151,747 | ||||||
| Calavo Growers, Inc. (a) | 3,141 | 80,347 | ||||||
| Chiquita Brands International, Inc.* | 11,975 | 59,875 | ||||||
| Darling International, Inc.* (a) | 31,525 | 519,847 | ||||||
| Diamond Foods, Inc. (a) | 6,049 | 107,914 | ||||||
| Shares | Value ($) | |||||||
| Dole Food Co., Inc.* (a) | 9,789 | 85,948 | ||||||
| Farmer Brothers Co.* (a) | 1,596 | 12,704 | ||||||
| Fresh Del Monte Produce, Inc. | 10,217 | 239,793 | ||||||
| Griffin Land & Nurseries, Inc. | 794 | 22,224 | ||||||
| Hain Celestial Group, Inc.* | 9,873 | 543,410 | ||||||
| Inventure Foods, Inc.* | 3,501 | 22,056 | ||||||
| J & J Snack Foods Corp. (a) | 3,971 | 234,686 | ||||||
| John B. Sanfilippo & Son, Inc.* | 2,132 | 38,056 | ||||||
| Lancaster Colony Corp. (a) | 4,927 | 350,852 | ||||||
| Lifeway Foods, Inc. | 1,483 | 15,379 | ||||||
| Limoneira Co. (a) | 2,308 | 37,436 | ||||||
| Omega Protein Corp.* | 5,139 | 37,823 | ||||||
| Pilgrim's Pride Corp.* (a) | 15,924 | 113,857 | ||||||
| Post Holdings, Inc.* | 7,404 | 227,673 | ||||||
| Sanderson Farms, Inc. (a) | 6,152 | 281,885 | ||||||
| Seneca Foods Corp. "A"* (a) | 2,383 | 64,103 | ||||||
| Smart Balance, Inc.* | 15,685 | 147,282 | ||||||
| Snyders-Lance, Inc. (a) | 11,821 | 298,244 | ||||||
| Tootsie Roll Industries, Inc. (a) | 6,399 | 152,680 | ||||||
| TreeHouse Foods, Inc.* | 9,632 | 599,977 | ||||||
| Westway Group, Inc. (a) | 3,271 | 19,593 | ||||||
| 4,895,277 | ||||||||
| Household Products 0.2% | ||||||||
| Central Garden & Pet Co. "A"* (a) | 10,357 | 112,788 | ||||||
| Harbinger Group, Inc.* | 11,049 | 86,072 | ||||||
| Oil-Dri Corp. of America (a) | 1,278 | 27,988 | ||||||
| Orchids Paper Products Co. (a) | 1,548 | 27,369 | ||||||
| Spectrum Brands Holdings, Inc.* | 6,154 | 200,436 | ||||||
| WD-40 Co. (a) | 4,276 | 212,987 | ||||||
| 667,640 | ||||||||
| Personal Products 0.3% | ||||||||
| Elizabeth Arden, Inc.* (a) | 6,753 | 262,084 | ||||||
| Female Health Co. (a) | 4,952 | 29,068 | ||||||
| Inter Parfums, Inc. (a) | 4,266 | 73,674 | ||||||
| Medifast, Inc.* (a) | 3,779 | 74,371 | ||||||
| Nature's Sunshine Products, Inc. (a) | 2,941 | 44,409 | ||||||
| Nutraceutical International Corp.* | 2,493 | 38,018 | ||||||
| Prestige Brands Holdings, Inc.* (a) | 13,523 | 213,799 | ||||||
| Revlon, Inc. "A"* (a) | 2,941 | 41,850 | ||||||
| Schiff Nutrition International, Inc.* (a) | 3,668 | 65,841 | ||||||
| Synutra International, Inc.* (a) | 4,155 | 22,437 | ||||||
| USANA Health Sciences, Inc.* (a) | 1,640 | 67,437 | ||||||
| 932,988 | ||||||||
| Tobacco 0.3% | ||||||||
| Alliance One International, Inc.* (a) | 23,966 | 82,922 | ||||||
| Star Scientific, Inc.* (a) | 39,069 | 178,155 | ||||||
| Universal Corp. (a) | 6,224 | 288,358 | ||||||
| Vector Group Ltd. (a) | 14,128 | 240,458 | ||||||
| 789,893 | ||||||||
| Energy 5.8% | ||||||||
| Energy Equipment & Services 1.8% | ||||||||
| Basic Energy Services, Inc.* | 8,261 | 85,254 | ||||||
| Bolt Technology Corp. | 2,294 | 34,433 | ||||||
| Bristow Group, Inc. | 9,578 | 389,537 | ||||||
| C&J Energy Services, Inc.* (a) | 11,937 | 220,835 | ||||||
| Cal Dive International, Inc.* (a) | 25,460 | 73,834 | ||||||
| Dawson Geophysical Co.* | 2,084 | 49,641 | ||||||
| Dril-Quip, Inc.* (a) | 10,762 | 705,880 | ||||||
| Exterran Holdings, Inc.* (a) | 17,379 | 221,582 | ||||||
| Forbes Energy Services Ltd.* | 3,953 | 18,579 | ||||||
| Shares | Value ($) | |||||||
| Forum Energy Technologies, Inc.* (a) | 5,932 | 116,801 | ||||||
| Global Geophysical Services, Inc.* | 5,486 | 33,574 | ||||||
| Gulf Island Fabrication, Inc. | 3,835 | 108,185 | ||||||
| GulfMark Offshore, Inc. "A"* | 7,187 | 244,645 | ||||||
| Heckmann Corp.* (a) | 35,829 | 121,102 | ||||||
| Helix Energy Solutions Group, Inc.* (a) | 28,296 | 464,337 | ||||||
| Hercules Offshore, Inc.* | 42,466 | 150,330 | ||||||
| Hornbeck Offshore Services, Inc.* | 9,456 | 366,704 | ||||||
| ION Geophysical Corp.* (a) | 35,361 | 233,029 | ||||||
| Key Energy Services, Inc.* | 40,460 | 307,496 | ||||||
| Lufkin Industries, Inc. (a) | 8,999 | 488,826 | ||||||
| Matrix Service Co.* (a) | 7,104 | 80,630 | ||||||
| Mitcham Industries, Inc.* | 3,405 | 57,783 | ||||||
| Natural Gas Services Group* | 3,396 | 50,329 | ||||||
| Newpark Resources, Inc.* (a) | 24,032 | 141,789 | ||||||
| OYO Geospace Corp.* | 1,707 | 153,613 | ||||||
| Parker Drilling Co.* | 31,513 | 142,124 | ||||||
| PHI, Inc. (Non Voting)* | 3,534 | 98,281 | ||||||
| Pioneer Drilling Co.* (a) | 16,484 | 131,377 | ||||||
| RigNet, Inc.* | 3,290 | 57,213 | ||||||
| Tesco Corp.* | 8,091 | 97,092 | ||||||
| TETRA Technologies, Inc.* | 20,801 | 148,311 | ||||||
| TGC Industries, Inc. | 3,902 | 37,888 | ||||||
| Union Drilling, Inc.* | 3,732 | 16,719 | ||||||
| Vantage Drilling Co.* (a) | 51,316 | 76,974 | ||||||
| Willbros Group, Inc.* (a) | 10,522 | 67,972 | ||||||
| 5,792,699 | ||||||||
| Oil, Gas & Consumable Fuels 4.0% | ||||||||
| Abraxas Petroleum Corp.* (a) | 21,828 | 69,631 | ||||||
| Adams Resources & Energy, Inc. | 564 | 23,643 | ||||||
| Alon U.S.A. Energy, Inc. (a) | 2,399 | 20,296 | ||||||
| Amyris, Inc.* (a) | 8,114 | 35,945 | ||||||
| Apco Oil & Gas International, Inc. (a) | 2,369 | 42,760 | ||||||
| Approach Resources, Inc.* (a) | 7,750 | 197,935 | ||||||
| Arch Coal, Inc. (a) | 56,882 | 391,917 | ||||||
| ATP Oil & Gas Corp.* (a) | 11,968 | 40,452 | ||||||
| Berry Petroleum Co. "A" (a) | 14,034 | 556,588 | ||||||
| Bill Barrett Corp.* | 12,890 | 276,104 | ||||||
| Bonanza Creek Energy, Inc.* | 2,652 | 44,103 | ||||||
| BPZ Resources, Inc.* (a) | 28,468 | 72,024 | ||||||
| Callon Petroleum Co.* | 11,130 | 47,414 | ||||||
| Carrizo Oil & Gas, Inc.* | 10,606 | 249,347 | ||||||
| Ceres, Inc.* | 1,513 | 13,693 | ||||||
| Clayton Williams Energy, Inc.* (a) | 1,623 | 78,521 | ||||||
| Clean Energy Fuels Corp.* (a) | 17,711 | 274,521 | ||||||
| Cloud Peak Energy, Inc.* | 16,352 | 276,512 | ||||||
| Comstock Resources, Inc.* (a) | 12,896 | 211,752 | ||||||
| Contango Oil & Gas Co.* (a) | 3,417 | 202,286 | ||||||
| CREDO Petroleum Corp.* | 1,838 | 26,596 | ||||||
| Crimson Exploration, Inc.* (a) | 5,588 | 25,649 | ||||||
| Crosstex Energy, Inc. | 10,926 | 152,964 | ||||||
| CVR Energy, Inc.* (a) | 4,375 | 116,288 | ||||||
| Delek U.S. Holdings, Inc. | 4,546 | 79,964 | ||||||
| Endeavour International Corp.* (a) | 10,365 | 87,066 | ||||||
| Energy Partners Ltd.* | 7,438 | 125,702 | ||||||
| Energy XXI (Bermuda) Ltd. (a) | 21,132 | 661,220 | ||||||
| Evolution Petroleum Corp.* (a) | 4,547 | 37,922 | ||||||
| Forest Oil Corp.* | 31,563 | 231,357 | ||||||
| Frontline Ltd. (a) | 13,711 | 62,522 | ||||||
| FX Energy, Inc.* (a) | 14,561 | 86,638 | ||||||
| GasLog Ltd.* (a) | 6,306 | 64,006 | ||||||
| Shares | Value ($) | |||||||
| Gastar Exploration Ltd.* (a) | 14,946 | 28,846 | ||||||
| GeoResources, Inc.* (a) | 5,673 | 207,689 | ||||||
| Gevo, Inc.* (a) | 5,584 | 27,752 | ||||||
| Goodrich Petroleum Corp.* (a) | 6,925 | 95,981 | ||||||
| Green Plains Renewable Energy, Inc.* (a) | 6,687 | 41,727 | ||||||
| Gulfport Energy Corp.* | 14,915 | 307,696 | ||||||
| Halcon Resources Corp.* (a) | 18,886 | 178,284 | ||||||
| Hallador Energy Co. (a) | 1,765 | 14,967 | ||||||
| Harvest Natural Resources, Inc.* (a) | 10,030 | 85,757 | ||||||
| Isramco, Inc.* (a) | 272 | 29,920 | ||||||
| KiOR, Inc.* (a) | 7,072 | 63,294 | ||||||
| Knightsbridge Tankers Ltd. (a) | 6,541 | 53,244 | ||||||
| Kodiak Oil & Gas Corp.* (a) | 70,616 | 579,757 | ||||||
| Magnum Hunter Resources Corp.* (a) | 39,941 | 166,953 | ||||||
| Matador Resources Co.* (a) | 3,688 | 39,609 | ||||||
| McMoRan Exploration Co.* (a) | 27,198 | 344,599 | ||||||
| Midstates Petroleum Co., Inc.* | 6,439 | 62,523 | ||||||
| Miller Energy Resources, Inc.* (a) | 8,307 | 41,535 | ||||||
| Nordic American Tankers Ltd. (a) | 14,187 | 192,518 | ||||||
| Northern Oil & Gas, Inc.* (a) | 17,016 | 271,235 | ||||||
| Oasis Petroleum, Inc.* | 21,406 | 517,597 | ||||||
| Overseas Shipholding Group, Inc. (a) | 6,617 | 73,515 | ||||||
| Panhandle Oil & Gas, Inc. (a) | 1,844 | 55,578 | ||||||
| Patriot Coal Corp.* (a) | 23,762 | 28,990 | ||||||
| PDC Energy, Inc.* (a) | 8,083 | 198,195 | ||||||
| Penn Virginia Corp. (a) | 12,253 | 89,937 | ||||||
| PetroQuest Energy, Inc.* (a) | 15,525 | 77,625 | ||||||
| Quicksilver Resources, Inc.* | 31,465 | 170,540 | ||||||
| Renewable Energy Group, Inc.* (a) | 1,932 | 14,355 | ||||||
| Rentech, Inc.* (a) | 59,802 | 123,192 | ||||||
| Resolute Energy Corp.* (a) | 12,946 | 123,893 | ||||||
| REX American Resources Corp.* | 1,571 | 30,666 | ||||||
| Rex Energy Corp.* | 11,569 | 129,688 | ||||||
| Rosetta Resources, Inc.* | 14,173 | 519,299 | ||||||
| Sanchez Energy Corp.* (a) | 3,103 | 64,542 | ||||||
| Saratoga Resources, Inc.* (a) | 4,876 | 28,671 | ||||||
| Scorpio Tankers, Inc.* (a) | 10,118 | 64,654 | ||||||
| SemGroup Corp. "A"* | 11,194 | 357,424 | ||||||
| Ship Finance International Ltd. (a) | 12,126 | 189,529 | ||||||
| Solazyme, Inc.* (a) | 8,770 | 121,903 | ||||||
| Stone Energy Corp.* | 13,258 | 335,958 | ||||||
| Swift Energy Co.* (a) | 11,485 | 213,736 | ||||||
| Synergy Resources Corp.* | 10,493 | 32,318 | ||||||
| Targa Resources Corp. (a) | 7,759 | 331,309 | ||||||
| Teekay Tankers Ltd. "A" (a) | 16,900 | 77,064 | ||||||
| Triangle Petroleum Corp.* (a) | 11,960 | 66,737 | ||||||
| Uranerz Energy Corp.* (a) | 16,739 | 24,272 | ||||||
| Uranium Energy Corp.* (a) | 22,731 | 52,054 | ||||||
| VAALCO Energy, Inc.* | 15,507 | 133,825 | ||||||
| Venoco, Inc.* | 7,676 | 76,837 | ||||||
| Voyager Oil & Gas, Inc.* (a) | 12,342 | 21,722 | ||||||
| W&T Offshore, Inc. (a) | 9,424 | 144,187 | ||||||
| Warren Resources, Inc.* | 19,323 | 46,375 | ||||||
| Western Refining, Inc. (a) | 15,351 | 341,867 | ||||||
| Westmoreland Coal Co.* (a) | 2,959 | 23,820 | ||||||
| ZaZa Energy Corp.* (a) | 6,661 | 30,108 | ||||||
| 12,649,206 | ||||||||
| Shares | Value ($) | |||||||
| Financials 20.7% | ||||||||
| Capital Markets 2.2% | ||||||||
| Apollo Investment Corp. (a) | 54,375 | 417,600 | ||||||
| Arlington Asset Investment Corp. "A" (a) | 2,308 | 50,107 | ||||||
| Artio Global Investors, Inc. "A" (a) | 8,152 | 28,532 | ||||||
| BGC Partners, Inc. "A" (a) | 26,397 | 154,950 | ||||||
| BlackRock Kelso Capital Corp. (a) | 19,735 | 192,614 | ||||||
| Calamos Asset Management, Inc. "A" (a) | 5,040 | 57,708 | ||||||
| Capital Southwest Corp. (a) | 783 | 80,524 | ||||||
| CIFC Corp.* (a) | 1,725 | 12,713 | ||||||
| Cohen & Steers, Inc. | 4,950 | 170,824 | ||||||
| Cowen Group, Inc. "A"* (a) | 23,536 | 62,606 | ||||||
| Diamond Hill Investment Group (a) | 700 | 54,803 | ||||||
| Duff & Phelps Corp. "A" (a) | 8,365 | 121,292 | ||||||
| Edelman Financial Group, Inc. (a) | 5,355 | 46,589 | ||||||
| Epoch Holding Corp. (a) | 4,276 | 97,407 | ||||||
| Evercore Partners, Inc. "A" | 7,673 | 179,471 | ||||||
| FBR & Co.* (a) | 10,243 | 28,373 | ||||||
| Fidus Investment Corp. (a) | 2,534 | 38,441 | ||||||
| Fifth Street Finance Corp. (a) | 22,093 | 220,488 | ||||||
| Financial Engines, Inc.* (a) | 12,415 | 266,302 | ||||||
| Firsthand Technology Value Fund, Inc.* (a) | 2,291 | 40,459 | ||||||
| FXCM, Inc. "A" | 5,534 | 65,080 | ||||||
| GAMCO Investors, Inc. "A" (a) | 1,742 | 77,327 | ||||||
| GFI Group, Inc. (a) | 18,300 | 65,148 | ||||||
| Gladstone Capital Corp. (a) | 5,787 | 45,659 | ||||||
| Gladstone Investment Corp. (a) | 5,926 | 43,793 | ||||||
| Golub Capital BDC LLC (a) | 3,819 | 57,629 | ||||||
| Greenhill & Co., Inc. | 7,793 | 277,820 | ||||||
| GSV Capital Corp.* (a) | 5,175 | 48,128 | ||||||
| Harris & Harris Group, Inc.* (a) | 8,500 | 32,300 | ||||||
| Hercules Technology Growth Capital, Inc. | 13,363 | 151,536 | ||||||
| HFF, Inc. "A"* | 8,747 | 121,933 | ||||||
| Horizon Technology Finance Corp. (a) | 1,683 | 27,753 | ||||||
| ICG Group, Inc.* | 9,722 | 89,929 | ||||||
| INTL FCStone, Inc.* (a) | 3,695 | 71,498 | ||||||
| Investment Technology Group, Inc.* | 10,305 | 94,806 | ||||||
| JMP Group, Inc. | 4,060 | 25,091 | ||||||
| KBW, Inc. (a) | 9,326 | 153,413 | ||||||
| Knight Capital Group, Inc. "A"* (a) | 26,409 | 315,323 | ||||||
| Kohlberg Capital Corp. (a) | 5,861 | 42,551 | ||||||
| Ladenburg Thalmann Financial Services, Inc.* (a) | 29,227 | 45,010 | ||||||
| Main Street Capital Corp. (a) | 6,423 | 155,437 | ||||||
| Manning & Napier, Inc. (a) | 3,649 | 51,925 | ||||||
| MCG Capital Corp. (a) | 20,923 | 96,246 | ||||||
| Medallion Financial Corp. | 4,784 | 50,806 | ||||||
| Medley Capital Corp. | 4,640 | 55,866 | ||||||
| MVC Capital, Inc. (a) | 6,391 | 82,763 | ||||||
| New Mountain Finance Corp. (a) | 2,278 | 32,325 | ||||||
| NGP Capital Resources Co. (a) | 5,775 | 40,887 | ||||||
| Oppenheimer Holdings, Inc. "A" (a) | 2,665 | 41,894 | ||||||
| PennantPark Investment Corp. (a) | 15,128 | 156,575 | ||||||
| Piper Jaffray Companies, Inc.* (a) | 4,411 | 103,350 | ||||||
| Prospect Capital Corp. (a) | 32,719 | 372,669 | ||||||
| Pzena Investment Management, Inc. "A" | 2,325 | 10,300 | ||||||
| Safeguard Scientifics, Inc.* | 5,681 | 87,942 | ||||||
| Shares | Value ($) | |||||||
| Solar Capital Ltd. (a) | 9,882 | 219,973 | ||||||
| Solar Senior Capital Ltd. (a) | 2,557 | 43,213 | ||||||
| Stifel Financial Corp.* (a) | 14,396 | 444,836 | ||||||
| SWS Group, Inc.* | 7,909 | 42,155 | ||||||
| TCP Capital Corp. (a) | 1,544 | 22,326 | ||||||
| THL Credit, Inc. (a) | 3,214 | 43,293 | ||||||
| TICC Capital Corp. (a) | 9,958 | 96,593 | ||||||
| Triangle Capital Corp. (a) | 7,207 | 164,175 | ||||||
| Virtus Investment Partners, Inc.* (a) | 1,621 | 131,301 | ||||||
| Walter Investment Management Corp. | 7,677 | 179,949 | ||||||
| Westwood Holdings Group, Inc. | 1,785 | 66,509 | ||||||
| WisdomTree Investments, Inc.* | 15,694 | 103,110 | ||||||
| 7,069,948 | ||||||||
| Commercial Banks 6.4% | ||||||||
| 1st Source Corp. | 3,964 | 89,586 | ||||||
| 1st United Bancorp., Inc.* | 8,043 | 49,947 | ||||||
| Access National Corp. (a) | 1,977 | 25,899 | ||||||
| Alliance Financial Corp. | 1,287 | 44,196 | ||||||
| American National Bankshares, Inc. | 2,097 | 49,405 | ||||||
| Ameris Bancorp.* (a) | 6,239 | 78,611 | ||||||
| Ames National Corp. (a) | 2,109 | 48,486 | ||||||
| Arrow Financial Corp. (a) | 2,735 | 66,105 | ||||||
| BancFirst Corp. (a) | 1,701 | 71,289 | ||||||
| Banco Latinoamericano de Comercio Exterior SA "E" | 7,569 | 162,204 | ||||||
| BancorpSouth, Inc. (a) | 25,304 | 367,414 | ||||||
| Bank of Kentucky Financial Corp. (a) | 1,566 | 41,718 | ||||||
| Bank of Marin Bancorp. (a) | 1,461 | 54,072 | ||||||
| Bank of the Ozarks, Inc. (a) | 7,793 | 234,413 | ||||||
| Banner Corp. (a) | 4,885 | 107,030 | ||||||
| Bar Harbor Bankshares | 1,037 | 37,332 | ||||||
| BBCN Bancorp., Inc.* | 20,900 | 227,601 | ||||||
| Berkshire Bancorp., Inc.* (a) | 1,142 | 10,050 | ||||||
| Boston Private Financial Holdings, Inc. | 20,925 | 186,860 | ||||||
| Bridge Bancorp., Inc. (a) | 2,317 | 54,658 | ||||||
| Bridge Capital Holdings* (a) | 2,572 | 41,538 | ||||||
| Bryn Mawr Bank Corp. (a) | 2,992 | 63,041 | ||||||
| BSB Bancorp., Inc.* | 2,189 | 27,910 | ||||||
| C&F Financial Corp. | 857 | 34,417 | ||||||
| Camden National Corp. | 2,123 | 77,744 | ||||||
| Capital Bank Corp.* (a) | 3,465 | 7,900 | ||||||
| Capital City Bank Group, Inc. (a) | 3,126 | 23,039 | ||||||
| Cardinal Financial Corp. | 7,865 | 96,582 | ||||||
| Cascade Bancorp.* | 1,700 | 10,081 | ||||||
| Cathay General Bancorp. (a) | 21,090 | 348,196 | ||||||
| Center Bancorp., Inc. (a) | 3,257 | 36,641 | ||||||
| Centerstate Banks, Inc. | 8,053 | 57,579 | ||||||
| Central Pacific Financial Corp.* (a) | 5,800 | 81,896 | ||||||
| Century Bancorp., Inc. "A" | 853 | 25,360 | ||||||
| Chemical Financial Corp. (a) | 7,464 | 160,476 | ||||||
| Citizens & Northern Corp. (a) | 3,236 | 61,646 | ||||||
| Citizens Republic Bancorp., Inc.* | 10,707 | 183,411 | ||||||
| City Holding Co. (a) | 3,873 | 130,481 | ||||||
| CNB Financial Corp. (a) | 3,426 | 55,878 | ||||||
| CoBiz Financial, Inc. (a) | 9,034 | 56,553 | ||||||
| Columbia Banking System, Inc. | 10,501 | 197,629 | ||||||
| Community Bank System, Inc. (a) | 10,550 | 286,116 | ||||||
| Community Trust Bancorp., Inc. (a) | 3,735 | 125,085 | ||||||
| Crescent Financial Bancshares, Inc.* | 835 | 3,774 | ||||||
| Shares | Value ($) | |||||||
| CVB Financial Corp. (a) | 23,504 | 273,822 | ||||||
| Eagle Bancorp., Inc.* (a) | 4,643 | 73,127 | ||||||
| Encore Bancshares, Inc.* (a) | 2,493 | 51,431 | ||||||
| Enterprise Bancorp., Inc. (a) | 1,668 | 27,339 | ||||||
| Enterprise Financial Services Corp. (a) | 4,778 | 52,367 | ||||||
| Farmers National Banc Corp. (a) | 5,030 | 31,337 | ||||||
| Fidelity Southern Corp. (a) | 2,515 | 21,730 | ||||||
| Financial Institutions, Inc. | 3,650 | 61,612 | ||||||
| First BanCorp.* (a) | 18,853 | 74,658 | ||||||
| First BanCorp. — North Carolina (a) | 4,128 | 36,698 | ||||||
| First Bancorp., Inc. (a) | 2,327 | 39,559 | ||||||
| First Busey Corp. (a) | 20,315 | 98,121 | ||||||
| First California Financial Group, Inc.* | 6,012 | 41,363 | ||||||
| First Commonwealth Financial Corp. (a) | 27,969 | 188,231 | ||||||
| First Community Bancshares, Inc. | 4,395 | 63,420 | ||||||
| First Connecticut Bancorp, Inc. (a) | 4,755 | 64,193 | ||||||
| First Financial Bancorp. | 15,761 | 251,861 | ||||||
| First Financial Bankshares, Inc. (a) | 8,442 | 291,756 | ||||||
| First Financial Corp. — Indiana (a) | 3,076 | 89,204 | ||||||
| First Interstate BancSystem, Inc. "A" (a) | 4,522 | 64,393 | ||||||
| First Merchants Corp. (a) | 7,661 | 95,456 | ||||||
| First Midwest Bancorp., Inc. | 20,300 | 222,894 | ||||||
| First of Long Island Corp. | 2,064 | 59,794 | ||||||
| FirstMerit Corp. (a) | 29,364 | 485,093 | ||||||
| FNB Corp. (a) | 37,376 | 406,277 | ||||||
| FNB United Corp.* (a) | 2,679 | 34,800 | ||||||
| German American Bancorp., Inc. (a) | 3,465 | 71,032 | ||||||
| Glacier Bancorp., Inc. (a) | 19,268 | 298,461 | ||||||
| Great Southern Bancorp., Inc. (a) | 2,688 | 74,135 | ||||||
| Greene Bancshares, Inc.* (a) | 3,308 | 5,491 | ||||||
| Guaranty Bancorp.* | 20,396 | 43,036 | ||||||
| Hampton Roads Bankshares, Inc. (Entitlement Shares)* | 4,972 | 3,807 | ||||||
| Hancock Holding Co. (a) | 20,441 | 622,224 | ||||||
| Hanmi Financial Corp.* (a) | 8,381 | 87,833 | ||||||
| Heartland Financial U.S.A., Inc. (a) | 3,900 | 93,600 | ||||||
| Heritage Commerce Corp.* (a) | 5,778 | 37,557 | ||||||
| Heritage Financial Corp. (a) | 4,301 | 63,010 | ||||||
| Heritage Oaks Bancorp.* (a) | 5,394 | 30,045 | ||||||
| Home Bancshares, Inc. | 5,843 | 178,679 | ||||||
| Horizon Bancorp. (a) | 1,002 | 26,353 | ||||||
| Hudson Valley Holding Corp. (a) | 4,259 | 77,088 | ||||||
| IBERIABANK Corp. (a) | 7,911 | 399,110 | ||||||
| Independent Bank Corp. (a) | 5,724 | 167,198 | ||||||
| International Bancshares Corp. | 14,278 | 278,707 | ||||||
| Investors Bancorp., Inc.* (a) | 11,753 | 177,353 | ||||||
| Lakeland Bancorp., Inc. (a) | 7,242 | 76,186 | ||||||
| Lakeland Financial Corp. | 4,409 | 118,293 | ||||||
| MainSource Financial Group, Inc. (a) | 5,589 | 66,118 | ||||||
| MB Financial, Inc. (a) | 14,661 | 315,798 | ||||||
| Mercantile Bank Corp.* | 2,300 | 42,435 | ||||||
| Merchants Bancshares, Inc. (a) | 1,284 | �� | 35,374 | |||||
| Metro Bancorp., Inc.* | 3,770 | 45,353 | ||||||
| MetroCorp Bancshares, Inc.* (a) | 4,236 | 45,198 | ||||||
| Middleburg Financial Corp. | 1,432 | 24,344 | ||||||
| MidSouth Bancorp., Inc. (a) | 2,182 | 30,723 | ||||||
| MidWestOne Financial Group, Inc. (a) | 1,818 | 39,087 | ||||||
| National Bankshares, Inc. (a) | 1,801 | 54,246 | ||||||
| National Penn Bancshares, Inc. | 33,035 | 316,145 | ||||||
| Shares | Value ($) | |||||||
| NBT Bancorp., Inc. (a) | 8,960 | 193,446 | ||||||
| Northrim BanCorp., Inc. | 1,725 | 37,070 | ||||||
| Old National Bancorp. (a) | 25,352 | 304,478 | ||||||
| OmniAmerican Bancorp., Inc.* (a) | 2,936 | 62,918 | ||||||
| Oriental Financial Group, Inc. | 10,860 | 120,329 | ||||||
| Pacific Capital Bancorp.* (a) | 1,133 | 51,812 | ||||||
| Pacific Continental Corp. (a) | 4,619 | 40,971 | ||||||
| Pacific Mercantile Bancorp.* (a) | 2,859 | 19,756 | ||||||
| PacWest Bancorp. (a) | 8,152 | 192,958 | ||||||
| Park National Corp. (a) | 3,036 | 211,761 | ||||||
| Park Sterling Corp.* | 8,459 | 39,842 | ||||||
| Peapack-Gladstone Financial Corp. | 2,369 | 36,743 | ||||||
| Penns Woods Bancorp., Inc. (a) | 1,059 | 42,159 | ||||||
| Peoples Bancorp., Inc. (a) | 2,888 | 63,478 | ||||||
| Pinnacle Financial Partners, Inc.* | 9,395 | 183,296 | ||||||
| Preferred Bank* | 3,142 | 41,977 | ||||||
| PrivateBancorp., Inc. | 16,182 | 238,846 | ||||||
| Prosperity Bancshares, Inc. | 12,711 | 534,243 | ||||||
| Renasant Corp. (a) | 6,723 | 105,618 | ||||||
| Republic Bancorp., Inc. "A" (a) | 2,649 | 58,940 | ||||||
| S&T Bancorp., Inc. (a) | 7,756 | 143,253 | ||||||
| S.Y. Bancorp., Inc. (a) | 3,285 | 78,676 | ||||||
| Sandy Spring Bancorp., Inc. (a) | 6,400 | 115,200 | ||||||
| SCBT Financial Corp. (a) | 4,041 | 142,445 | ||||||
| Seacoast Banking Corp. of Florida* | 18,143 | 27,396 | ||||||
| Sierra Bancorp. (a) | 3,235 | 32,027 | ||||||
| Simmons First National Corp. "A" (a) | 4,606 | 107,089 | ||||||
| Southside Bancshares, Inc. (a) | 4,731 | 106,353 | ||||||
| Southwest Bancorp., Inc.* | 5,448 | 51,266 | ||||||
| State Bank Financial Corp.* (a) | 8,376 | 126,980 | ||||||
| StellarOne Corp. | 6,044 | 75,429 | ||||||
| Sterling Bancorp. (a) | 8,060 | 80,439 | ||||||
| Sterling Financial Corp.* (a) | 7,153 | 135,120 | ||||||
| Suffolk Bancorp.* (a) | 2,554 | 33,125 | ||||||
| Sun Bancorp., Inc.* | 11,027 | 29,773 | ||||||
| Susquehanna Bancshares, Inc. | 50,335 | 518,452 | ||||||
| Taylor Capital Group, Inc.* (a) | 4,352 | 71,329 | ||||||
| Texas Capital Bancshares, Inc.* (a) | 10,155 | 410,160 | ||||||
| The Bancorp., Inc.* | 7,713 | 72,888 | ||||||
| Tompkins Financial Corp. (a) | 2,472 | 93,145 | ||||||
| TowneBank (a) | 7,073 | 99,022 | ||||||
| TriCo Bancshares (a) | 4,291 | 66,081 | ||||||
| Trustmark Corp. (a) | 17,347 | 424,655 | ||||||
| UMB Financial Corp. (a) | 8,645 | 442,883 | ||||||
| Umpqua Holdings Corp. | 30,159 | 396,892 | ||||||
| Union First Market Bankshares Corp. | 5,314 | 76,787 | ||||||
| United Bankshares, Inc. (a) | 13,460 | 348,345 | ||||||
| United Community Banks, Inc.* (a) | 11,087 | 95,016 | ||||||
| Univest Corp. of Pennsylvania | 4,634 | 76,600 | ||||||
| Virginia Commerce Bancorp., Inc.* | 7,178 | 60,511 | ||||||
| Washington Banking Co. (a) | 4,313 | 59,951 | ||||||
| Washington Trust Bancorp., Inc. (a) | 3,906 | 95,228 | ||||||
| Webster Financial Corp. | 19,327 | 418,623 | ||||||
| WesBanco, Inc. | 6,368 | 135,384 | ||||||
| West Bancorp. (a) | 4,052 | 38,535 | ||||||
| West Coast Bancorp.* (a) | 5,221 | 102,593 | ||||||
| Westamerica Bancorp. (a) | 7,452 | 351,660 | ||||||
| Western Alliance Bancorp.* | 18,743 | 175,434 | ||||||
| Wilshire Bancorp., Inc.* (a) | 16,309 | 89,373 | ||||||
| Wintrust Financial Corp. (a) | 9,726 | 345,273 | ||||||
| 20,274,436 | ||||||||
| Shares | Value ($) | |||||||
| Consumer Finance 0.6% | ||||||||
| Cash America International, Inc. | 7,871 | 346,639 | ||||||
| Credit Acceptance Corp.* (a) | 2,108 | 177,978 | ||||||
| DFC Global Corp.* | 11,783 | 217,161 | ||||||
| EZCORP, Inc. "A"* | 12,855 | 301,578 | ||||||
| First Cash Financial Services, Inc.* | 7,657 | 307,582 | ||||||
| Green Dot Corp. "A"* (a) | 6,431 | 142,254 | ||||||
| Nelnet, Inc. "A" | 6,400 | 147,200 | ||||||
| Netspend Holdings, Inc.* (a) | 8,332 | 76,571 | ||||||
| Nicholas Financial, Inc. (a) | 2,636 | 33,793 | ||||||
| Regional Management Corp.* (a) | 1,291 | 21,237 | ||||||
| The First Marblehead Corp.* (a) | 15,439 | 18,064 | ||||||
| World Acceptance Corp.* (a) | 2,948 | 193,978 | ||||||
| 1,984,035 | ||||||||
| Diversified Financial Services 0.3% | ||||||||
| California First National Bancorp. (a) | 762 | 11,956 | ||||||
| FX Alliance, Inc.* | 1,567 | 24,618 | ||||||
| Gain Capital Holdings, Inc. (a) | 3,999 | 19,955 | ||||||
| MarketAxess Holdings, Inc. | 9,778 | 260,486 | ||||||
| Marlin Business Services Corp. | 2,051 | 33,616 | ||||||
| MicroFinancial, Inc. | 2,275 | 18,427 | ||||||
| NewStar Financial, Inc.* (a) | 6,897 | 89,385 | ||||||
| PHH Corp.* (a) | 15,183 | 265,399 | ||||||
| PICO Holdings, Inc.* (a) | 6,072 | 136,074 | ||||||
| Resource America, Inc. "A" | 3,243 | 20,690 | ||||||
| 880,606 | ||||||||
| Insurance 2.3% | ||||||||
| Alterra Capital Holdings Ltd. (a) | 22,968 | 536,303 | ||||||
| American Equity Investment Life Holding Co. (a) | 16,223 | 178,615 | ||||||
| American Safety Insurance Holdings Ltd.* | 2,357 | 44,194 | ||||||
| AMERISAFE, Inc.* | 4,841 | 125,624 | ||||||
| AmTrust Financial Services, Inc. (a) | 6,537 | 194,214 | ||||||
| Argo Group International Holdings Ltd. | 6,909 | 202,226 | ||||||
| Baldwin & Lyons, Inc. (a) | 2,465 | 57,287 | ||||||
| Citizens, Inc.* (a) | 10,585 | 103,204 | ||||||
| CNO Financial Group, Inc. (a) | 56,840 | 443,352 | ||||||
| Crawford & Co. "B" (a) | 7,650 | 31,288 | ||||||
| Donegal Group, Inc. "A" | 2,074 | 27,543 | ||||||
| Eastern Insurance Holdings, Inc. | 1,773 | 30,141 | ||||||
| eHealth, Inc.* (a) | 5,375 | 86,591 | ||||||
| EMC Insurance Group, Inc. (a) | 1,245 | 25,149 | ||||||
| Employers Holdings, Inc. | 8,588 | 154,928 | ||||||
| Enstar Group Ltd.* | 2,263 | 223,901 | ||||||
| FBL Financial Group, Inc. "A" (a) | 2,720 | 76,187 | ||||||
| First American Financial Corp. | 28,446 | 482,444 | ||||||
| Flagstone Reinsurance Holdings SA (a) | 14,369 | 115,096 | ||||||
| Fortegra Financial Corp.* | 1,513 | 12,104 | ||||||
| Global Indemnity PLC* | 3,048 | 61,722 | ||||||
| Greenlight Capital Re Ltd. "A"* (a) | 7,522 | 191,209 | ||||||
| Hallmark Financial Services, Inc.* | 4,103 | 32,003 | ||||||
| Hilltop Holdings, Inc.* | 10,486 | 108,111 | ||||||
| Homeowners Choice, Inc. | 1,923 | 33,845 | ||||||
| Horace Mann Educators Corp. | 10,579 | 184,921 | ||||||
| Independence Holding Co. (a) | 2,109 | 20,774 | ||||||
| Infinity Property & Casualty Corp. | 3,149 | 181,603 | ||||||
| Investors Title Co. | 333 | 18,958 | ||||||
| Kansas City Life Insurance Co. (a) | 1,074 | 37,794 | ||||||
| Maiden Holdings Ltd. | 13,212 | 114,680 | ||||||
| Meadowbrook Insurance Group, Inc. (a) | 13,501 | 118,674 | ||||||
| Shares | Value ($) | |||||||
| Montpelier Re Holdings Ltd. | 13,411 | 285,520 | ||||||
| National Financial Partners Corp.* (a) | 11,079 | 148,459 | ||||||
| National Interstate Corp. | 1,647 | 43,794 | ||||||
| National Western Life Insurance Co. "A" | 577 | 81,888 | ||||||
| Navigators Group, Inc.* | 2,675 | 133,884 | ||||||
| OneBeacon Insurance Group Ltd. "A" | 6,186 | 80,542 | ||||||
| Phoenix Companies, Inc.* (a) | 31,041 | 57,426 | ||||||
| Platinum Underwriters Holdings Ltd. | 9,322 | 355,168 | ||||||
| Presidential Life Corp. | 5,610 | 55,146 | ||||||
| Primerica, Inc. | 12,594 | 336,638 | ||||||
| RLI Corp. (a) | 5,671 | 386,762 | ||||||
| Safety Insurance Group, Inc. | 3,403 | 138,298 | ||||||
| Seabright Holdings, Inc. | 5,256 | 46,726 | ||||||
| Selective Insurance Group, Inc. (a) | 14,674 | 255,474 | ||||||
| State Auto Financial Corp. (a) | 3,829 | 53,797 | ||||||
| Stewart Information Services Corp. (a) | 4,977 | 76,397 | ||||||
| Symetra Financial Corp. | 20,784 | 262,294 | ||||||
| Tower Group, Inc. (a) | 9,328 | 194,675 | ||||||
| United Fire Group, Inc. (a) | 5,395 | 115,075 | ||||||
| Universal Insurance Holdings, Inc. (a) | 5,335 | 18,192 | ||||||
| 7,380,840 | ||||||||
| Real Estate Investment Trusts 7.3% | ||||||||
| Acadia Realty Trust (REIT) | 11,721 | 271,693 | ||||||
| AG Mortgage Investment Trust, Inc. (a) | 4,206 | 90,387 | ||||||
| Agree Realty Corp. (REIT) (a) | 3,141 | 69,510 | ||||||
| Alexander's, Inc. (REIT) | 563 | 242,715 | ||||||
| American Assets Trust, Inc. (REIT) | 8,857 | 214,782 | ||||||
| American Capital Mortgage Investment Corp. (REIT) (a) | 9,691 | 231,421 | ||||||
| American Realty Capital Trust, Inc. (REIT) (a) | 42,445 | 463,499 | ||||||
| Anworth Mortgage Asset Corp. (REIT) (a) | 36,629 | 258,234 | ||||||
| Apollo Commercial Real Estate Finance, Inc. (REIT) (a) | 4,656 | 74,822 | ||||||
| Apollo Residential Mortgage, Inc. (REIT) (a) | 6,454 | 124,433 | ||||||
| Ares Commercial Real Estate Corp. (REIT) (a) | 2,063 | 36,061 | ||||||
| ARMOUR Residential REIT, Inc. (REIT) (a) | 47,582 | 338,308 | ||||||
| Ashford Hospitality Trust (REIT) | 14,308 | 120,616 | ||||||
| Associated Estates Realty Corp. (REIT) | 11,351 | 169,697 | ||||||
| Campus Crest Communities, Inc. (REIT) (a) | 8,383 | 87,099 | ||||||
| CapLease, Inc. (REIT) | 17,895 | 74,264 | ||||||
| Capstead Mortgage Corp. (REIT) | 24,971 | 347,347 | ||||||
| Cedar Realty Trust, Inc. (REIT) (a) | 16,227 | 81,946 | ||||||
| Chatham Lodging Trust (REIT) | 3,672 | 52,436 | ||||||
| Chesapeake Lodging Trust (REIT) (a) | 8,706 | 149,917 | ||||||
| Colonial Properties Trust (REIT) | 23,542 | 521,220 | ||||||
| Colony Financial, Inc. (REIT) | 8,763 | 151,600 | ||||||
| Coresite Realty Corp. (REIT) | 5,498 | 141,958 | ||||||
| Cousins Properties, Inc. (REIT) | 24,326 | 188,527 | ||||||
| CreXus Investment Corp. (REIT) (a) | 17,943 | 182,480 | ||||||
| CubeSmart (REIT) | 32,983 | 384,912 | ||||||
| CYS Investments, Inc. (REIT) (a) | 31,006 | 426,953 | ||||||
| Shares | Value ($) | |||||||
| DCT Industrial Trust, Inc. (REIT) (a) | 66,185 | 416,966 | ||||||
| DiamondRock Hospitality Co. (REIT) | 45,034 | 459,347 | ||||||
| DuPont Fabros Technology, Inc. (REIT) (a) | 16,433 | 469,327 | ||||||
| Dynex Capital, Inc. (REIT) | 14,752 | 153,126 | ||||||
| EastGroup Properties, Inc. (REIT) | 7,619 | 406,093 | ||||||
| Education Realty Trust, Inc. (REIT) | 25,341 | 280,778 | ||||||
| Entertainment Properties Trust (REIT) (a) | 12,549 | 515,889 | ||||||
| Equity One, Inc. (REIT) | 14,683 | 311,280 | ||||||
| Excel Trust, Inc. (REIT) (a) | 9,029 | 107,987 | ||||||
| FelCor Lodging Trust, Inc. (REIT)* | 33,050 | 155,335 | ||||||
| First Industrial Realty Trust, Inc. (REIT)* | 23,787 | 300,192 | ||||||
| First Potomac Realty Trust (REIT) | 13,660 | 160,778 | ||||||
| Franklin Street Properties Corp. (REIT) (a) | 19,454 | 205,823 | ||||||
| Getty Realty Corp. (REIT) (a) | 6,872 | 131,599 | ||||||
| Gladstone Commercial Corp. (REIT) (a) | 2,983 | 49,697 | ||||||
| Glimcher Realty Trust (REIT) | 37,371 | 381,932 | ||||||
| Government Properties Income Trust (REIT) | 9,926 | 224,526 | ||||||
| Gramercy Capital Corp. (REIT)* | 12,268 | 30,670 | ||||||
| Gyrodyne Co. of America, Inc. (REIT)* | 319 | 36,465 | ||||||
| Healthcare Realty Trust, Inc. (REIT) | 20,878 | 497,732 | ||||||
| Hersha Hospitality Trust (REIT) | 46,122 | 243,524 | ||||||
| Highwoods Properties, Inc. (REIT) | 19,773 | 665,361 | ||||||
| Hudson Pacific Properties, Inc. (REIT) | 9,608 | 167,275 | ||||||
| Inland Real Estate Corp. (REIT) | 20,513 | 171,899 | ||||||
| Invesco Mortgage Capital (REIT) | 30,911 | 566,908 | ||||||
| Investors Real Estate Trust (REIT) (a) | 22,910 | 180,989 | ||||||
| iStar Financial, Inc. (REIT)* (a) | 22,706 | 146,454 | ||||||
| Kite Realty Group Trust (REIT) | 14,993 | 74,815 | ||||||
| LaSalle Hotel Properties (REIT) (a) | 22,954 | 668,880 | ||||||
| Lexington Realty Trust (REIT) | 32,069 | 271,624 | ||||||
| LTC Properties, Inc. (REIT) (a) | 8,143 | 295,428 | ||||||
| Medical Properties Trust, Inc. (REIT) (a) | 36,321 | 349,408 | ||||||
| Mission West Properties, Inc. (REIT) | 4,993 | 43,040 | ||||||
| Monmouth Real Estate Investment Corp. "A" (REIT) | 10,922 | 128,006 | ||||||
| National Health Investors, Inc. (REIT) | 6,556 | 333,832 | ||||||
| New York Mortgage Trust, Inc. (REIT) | 4,614 | 32,575 | ||||||
| NorthStar Realty Finance Corp. (REIT) (a) | 36,080 | 188,338 | ||||||
| OMEGA Healthcare Investors, Inc. (REIT) (a) | 28,338 | 637,605 | ||||||
| One Liberty Properties, Inc. (REIT) (a) | 3,092 | 58,222 | ||||||
| Parkway Properties, Inc. (REIT) | 4,254 | 48,666 | ||||||
| Pebblebrook Hotel Trust (REIT) | 14,075 | 328,088 | ||||||
| Pennsylvania Real Estate Investment Trust (REIT) | 15,004 | 224,760 | ||||||
| PennyMac Mortgage Investment Trust (REIT) (a) | 11,078 | 218,569 | ||||||
| Potlatch Corp. (REIT) | 10,804 | 345,080 | ||||||
| PS Business Parks, Inc. (REIT) | 4,960 | 335,891 | ||||||
| RAIT Financial Trust (REIT) (a) | 13,036 | 60,226 | ||||||
| Shares | Value ($) | |||||||
| Ramco-Gershenson Properties Trust (REIT) | 12,478 | 156,849 | ||||||
| Redwood Trust, Inc. (REIT) (a) | 21,153 | 263,989 | ||||||
| Resource Capital Corp. (REIT) (a) | 22,692 | 120,948 | ||||||
| Retail Opportunity Investments Corp. (REIT) (a) | 13,569 | 163,642 | ||||||
| RLJ Lodging Trust (REIT) (a) | 28,596 | 518,446 | ||||||
| Rouse Properties, Inc. (REIT)* (a) | 5,935 | 80,419 | ||||||
| Sabra Health Care REIT, Inc. (REIT) | 9,832 | 168,226 | ||||||
| Saul Centers, Inc. (REIT) | 2,048 | 87,798 | ||||||
| Select Income REIT (REIT)* | 2,465 | 58,568 | ||||||
| Sovran Self Storage, Inc. (REIT) | 7,766 | 388,999 | ||||||
| STAG Industrial, Inc. (REIT) (a) | 6,387 | 93,123 | ||||||
| Starwood Property Trust, Inc. (REIT) | 31,174 | 664,318 | ||||||
| Strategic Hotels & Resorts, Inc. (REIT)* | 48,579 | 313,820 | ||||||
| Summit Hotel Properties, Inc. (REIT) | 8,201 | 68,642 | ||||||
| Sun Communities, Inc. (REIT) (a) | 7,081 | 313,263 | ||||||
| Sunstone Hotel Investors, Inc. (REIT)* | 31,923 | 350,834 | ||||||
| Terreno Realty Corp. (REIT) (a) | 3,539 | 53,474 | ||||||
| Two Harbors Investment Corp. (REIT) | 57,337 | 594,011 | ||||||
| UMH Properties, Inc. (REIT) | 3,540 | 37,984 | ||||||
| Universal Health Realty Income Trust (REIT) (a) | 3,136 | 130,238 | ||||||
| Urstadt Biddle Properties "A" (REIT) | 6,193 | 122,436 | ||||||
| Washington Real Estate Investment Trust (REIT) (a) | 17,744 | 504,817 | ||||||
| Western Asset Mortgage Capital Corp. (REIT)* (a) | 2,140 | 41,709 | ||||||
| Whitestone REIT "B" (REIT) (a) | 2,731 | 37,715 | ||||||
| Winthrop Realty Trust (REIT) (a) | 7,975 | 96,976 | ||||||
| 23,009,086 | ||||||||
| Real Estate Management & Development 0.2% | ||||||||
| AV Homes, Inc.* (a) | 2,668 | 38,899 | ||||||
| Consolidated-Tomoka Land Co. (a) | 1,100 | 31,658 | ||||||
| Forestar Group, Inc.* | 9,260 | 118,621 | ||||||
| Kennedy-Wilson Holdings, Inc. (a) | 9,425 | 132,044 | ||||||
| Tejon Ranch Co.* (a) | 3,547 | 101,515 | ||||||
| Thomas Properties Group, Inc. | 8,636 | 46,980 | ||||||
| 469,717 | ||||||||
| Thrifts & Mortgage Finance 1.4% | ||||||||
| Astoria Financial Corp. (a) | 23,354 | 228,869 | ||||||
| Bank Mutual Corp. (a) | 12,588 | 55,513 | ||||||
| BankFinancial Corp. (a) | 5,966 | 44,924 | ||||||
| Beneficial Mutual Bancorp., Inc.* | 8,922 | 76,997 | ||||||
| Berkshire Hills Bancorp., Inc. (a) | 5,949 | 130,878 | ||||||
| BofI Holding, Inc.* (a) | 2,572 | 50,823 | ||||||
| Brookline Bancorp., Inc. | 18,729 | 165,752 | ||||||
| Cape Bancorp., Inc.* (a) | 3,232 | 26,858 | ||||||
| Chartar Financial Corp. (a) | 1,490 | 14,453 | ||||||
| Clifton Savings Bancorp., Inc. | 2,359 | 24,557 | ||||||
| Dime Community Bancshares | 8,485 | 112,766 | ||||||
| Doral Financial Corp.* (a) | 35,758 | 53,637 | ||||||
| ESB Financial Corp. (a) | 2,803 | 37,000 | ||||||
| ESSA Bancorp., Inc. (a) | 2,280 | 24,624 | ||||||
| EverBank Financial Corp.* | 5,984 | 65,046 | ||||||
| Federal Agricultural Mortgage Corp. "C" (a) | 2,672 | 70,086 | ||||||
| First Defiance Financial Corp. | 2,601 | 44,529 | ||||||
| Shares | Value ($) | |||||||
| First Federal Bancshares of Arkansas, Inc.* (a) | 944 | 7,646 | ||||||
| First Financial Holdings, Inc. | 4,361 | 46,750 | ||||||
| First Financial Northwest, Inc.* | 4,297 | 34,892 | ||||||
| First PacTrust Bancorp, Inc. (a) | 2,857 | 33,884 | ||||||
| Flushing Financial Corp. | 8,390 | 114,356 | ||||||
| Fox Chase Bancorp. (a) | 3,253 | 46,973 | ||||||
| Franklin Financial Corp.* (a) | 3,775 | 62,099 | ||||||
| Heritage Financial Group, Inc. | 2,318 | 29,833 | ||||||
| Hingham Institution for Savings | 343 | 20,741 | ||||||
| Home Bancorp., Inc.* (a) | 1,831 | 31,365 | ||||||
| Home Federal Bancorp., Inc. (a) | 4,056 | 42,588 | ||||||
| Home Loan Servicing Solutions Ltd. (a) | 3,499 | 46,887 | ||||||
| HomeStreet, Inc.* (a) | 1,139 | 36,437 | ||||||
| Kaiser Federal Financial Group, Inc. | 2,404 | 35,531 | ||||||
| Kearny Financial Corp. (a) | 4,167 | 40,378 | ||||||
| Meridian Interstate Bancorp., Inc.* (a) | 2,448 | 34,076 | ||||||
| MGIC Investment Corp.* (a) | 50,782 | 146,252 | ||||||
| NASB Financial, Inc.* (a) | 1,126 | 22,351 | ||||||
| Nationstar Mortgage Holdings, Inc.* | 5,134 | 110,484 | ||||||
| Northfield Bancorp., Inc. (a) | 4,097 | 58,218 | ||||||
| Northwest Bancshares, Inc. | 26,088 | 305,490 | ||||||
| OceanFirst Financial Corp. | 3,998 | 57,411 | ||||||
| Ocwen Financial Corp.* (a) | 28,788 | 540,639 | ||||||
| Oritani Financial Corp. | 12,220 | 175,846 | ||||||
| Peoples Federal Bancshares, Inc.* | 1,623 | 27,104 | ||||||
| Provident Financial Holdings, Inc. | 2,597 | 29,943 | ||||||
| Provident Financial Services, Inc. (a) | 16,139 | 247,734 | ||||||
| Provident New York Bancorp. | 9,116 | 69,190 | ||||||
| Radian Group, Inc. (a) | 35,548 | 116,953 | ||||||
| Rockville Financial, Inc. (a) | 7,797 | 90,211 | ||||||
| Roma Financial Corp. (a) | 2,001 | 17,048 | ||||||
| SI Financial Group, Inc. | 2,826 | 32,499 | ||||||
| Territorial Bancorp., Inc. (a) | 2,875 | 65,464 | ||||||
| Tree.com, Inc.* | 1,621 | 18,544 | ||||||
| TrustCo Bank Corp. (a) | 24,678 | 134,742 | ||||||
| United Financial Bancorp., Inc. (a) | 4,217 | 60,640 | ||||||
| ViewPoint Financial Group | 9,016 | 141,010 | ||||||
| Walker & Dunlop, Inc.* | 2,987 | 38,383 | ||||||
| Waterstone Financial, Inc.* | 1,961 | 7,452 | ||||||
| Westfield Financial, Inc. (a) | 6,809 | 49,706 | ||||||
| WSFS Financial Corp. | 2,043 | 82,558 | ||||||
| 4,537,620 | ||||||||
| Health Care 13.1% | ||||||||
| Biotechnology 3.9% | ||||||||
| Achillion Pharmaceuticals, Inc.* | 14,261 | 88,418 | ||||||
| Acorda Therapeutics, Inc.* (a) | 10,756 | 253,411 | ||||||
| Aegerion Pharmaceuticals, Inc.* (a) | 5,788 | 85,894 | ||||||
| Affymax, Inc.* | 9,720 | 125,194 | ||||||
| Agenus, Inc.* (a) | 6,112 | 32,027 | ||||||
| Alkermes PLC* (a) | 32,820 | 556,955 | ||||||
| Allos Therapeutics, Inc.* (a) | 21,791 | 39,006 | ||||||
| Alnylam Pharmaceuticals, Inc.* (a) | 12,443 | 145,210 | ||||||
| AMAG Pharmaceuticals, Inc.* (a) | 5,672 | 87,349 | ||||||
| Amicus Therapeutics, Inc.* (a) | 8,102 | 44,561 | ||||||
| Anacor Pharmaceuticals, Inc.* (a) | 3,988 | 25,882 | ||||||
| Arena Pharmaceuticals, Inc.* (a) | 52,833 | 527,273 | ||||||
| ArQule, Inc.* (a) | 15,414 | 91,405 | ||||||
| Array BioPharma, Inc.* | 23,891 | 82,902 | ||||||
| Astex Pharmaceuticals, Inc.* | 25,057 | 52,369 | ||||||
| Shares | Value ($) | |||||||
| Aveo Pharmaceuticals, Inc.* (a) | 10,439 | 126,938 | ||||||
| BioCryst Pharmaceuticals, Inc.* (a) | 13,212 | 52,584 | ||||||
| BioSpecifics Technologies Corp.* (a) | 1,409 | 26,461 | ||||||
| BioTime, Inc.* (a) | 8,197 | 37,706 | ||||||
| Celldex Therapeutics, Inc.* (a) | 16,129 | 83,709 | ||||||
| Cepheid, Inc.* (a) | 17,585 | 786,929 | ||||||
| ChemoCentryx, Inc.* | 1,325 | 19,875 | ||||||
| Clovis Oncology, Inc.* (a) | 3,665 | 79,457 | ||||||
| Codexis, Inc.* (a) | 6,422 | 24,018 | ||||||
| Coronado Biosciences, Inc.* | 3,635 | 18,357 | ||||||
| Cubist Pharmaceuticals, Inc.* (a) | 16,977 | 643,598 | ||||||
| Curis, Inc.* (a) | 21,427 | 115,706 | ||||||
| Cytori Therapeutics, Inc.* (a) | 14,106 | 38,086 | ||||||
| Dendreon Corp.* (a) | 41,268 | 305,383 | ||||||
| Discovery Laboratories, Inc.* (a) | 11,653 | 27,035 | ||||||
| DUSA Pharmaceuticals, Inc.* (a) | 6,513 | 33,998 | ||||||
| Dyax Corp.* | 27,197 | 57,930 | ||||||
| Dynavax Technologies Corp.* (a) | 46,963 | 202,880 | ||||||
| Emergent Biosolutions, Inc.* | 6,952 | 105,323 | ||||||
| Enzon Pharmaceuticals, Inc.* (a) | 11,391 | 78,256 | ||||||
| Exact Sciences Corp.* (a) | 15,503 | 166,192 | ||||||
| Exelixis, Inc.* (a) | 39,496 | 218,413 | ||||||
| Genomic Health, Inc.* (a) | 4,303 | 143,720 | ||||||
| Geron Corp.* (a) | 34,552 | 59,429 | ||||||
| GTx, Inc.* (a) | 7,616 | 26,884 | ||||||
| Halozyme Therapeutics, Inc.* (a) | 24,058 | 213,154 | ||||||
| Horizon Pharma, Inc.* (a) | 5,672 | 40,441 | ||||||
| Idenix Pharmaceuticals, Inc.* (a) | 20,032 | 206,330 | ||||||
| ImmunoCellular Therapeutics Ltd.* | 10,706 | 40,147 | ||||||
| ImmunoGen, Inc.* (a) | 20,736 | 347,950 | ||||||
| Immunomedics, Inc.* (a) | 17,735 | 63,314 | ||||||
| Infinity Pharmaceuticals, Inc.* (a) | 5,233 | 70,959 | ||||||
| InterMune, Inc.* (a) | 17,534 | 209,531 | ||||||
| Ironwood Pharmaceuticals, Inc. "A"* (a) | 20,159 | 277,791 | ||||||
| Isis Pharmaceuticals, Inc.* (a) | 26,878 | 322,536 | ||||||
| Keryx Biopharmaceuticals, Inc.* (a) | 17,690 | 31,842 | ||||||
| Lexicon Pharmaceuticals, Inc.* (a) | 53,285 | 119,891 | ||||||
| Ligand Pharmaceuticals, Inc. "B"* (a) | 4,676 | 79,211 | ||||||
| MannKind Corp.* (a) | 30,261 | 69,298 | ||||||
| Maxygen, Inc.* (a) | 7,387 | 44,027 | ||||||
| Merrimack Pharmaceuticals, Inc.* (a) | 4,085 | 29,739 | ||||||
| Momenta Pharmaceuticals, Inc.* (a) | 12,555 | 169,744 | ||||||
| Neurocrine Biosciences, Inc.* | 17,780 | 140,640 | ||||||
| NewLink Genetics Corp.* (a) | 3,401 | 50,947 | ||||||
| Novavax, Inc.* (a) | 29,339 | 45,769 | ||||||
| NPS Pharmaceuticals, Inc.* (a) | 23,214 | 199,873 | ||||||
| OncoGenex Pharmaceutical, Inc.* (a) | 3,802 | 51,099 | ||||||
| Oncothyreon, Inc.* (a) | 15,364 | 71,904 | ||||||
| Opko Health, Inc.* (a) | 28,831 | 132,623 | ||||||
| Orexigen Therapeutics, Inc.* (a) | 16,183 | 89,654 | ||||||
| Osiris Therapeutics, Inc.* (a) | 4,179 | 45,844 | ||||||
| PDL BioPharma, Inc. (a) | 37,547 | 248,937 | ||||||
| Pharmacyclics, Inc.* (a) | 14,580 | 796,214 | ||||||
| Progenics Pharmaceuticals, Inc.* (a) | 7,920 | 77,458 | ||||||
| Raptor Pharmaceuticals Corp.* (a) | 13,432 | 75,085 | ||||||
| Repligen Corp.* | 8,285 | 35,625 | ||||||
| Rigel Pharmaceuticals, Inc.* (a) | 19,182 | 178,393 | ||||||
| Sangamo BioSciences, Inc.* (a) | 13,729 | 75,784 | ||||||
| Shares | Value ($) | |||||||
| SciClone Pharmaceuticals, Inc.* (a) | 15,227 | 106,741 | ||||||
| Seattle Genetics, Inc.* (a) | 25,391 | 644,677 | ||||||
| SIGA Technologies, Inc.* (a) | 9,355 | 26,849 | ||||||
| Spectrum Pharmaceuticals, Inc.* (a) | 15,953 | 248,229 | ||||||
| Sunesis Pharmaceuticals, Inc.* (a) | 7,416 | 21,284 | ||||||
| Synageva BioPharma Corp.* | 2,459 | 99,737 | ||||||
| Synergy Pharmaceuticals, Inc.* (a) | 11,017 | 52,331 | ||||||
| Synta Pharmaceuticals Corp.* (a) | 9,966 | 54,514 | ||||||
| Targacept, Inc.* | 7,283 | 31,317 | ||||||
| Theravance, Inc.* (a) | 16,260 | 361,297 | ||||||
| Threshold Pharmaceuticals, Inc.* (a) | 12,056 | 89,214 | ||||||
| Trius Therapeutics, Inc.* (a) | 6,705 | 38,621 | ||||||
| Vanda Pharmaceuticals, Inc.* | 7,331 | 32,256 | ||||||
| Verastem, Inc.* (a) | 1,606 | 16,381 | ||||||
| Vical, Inc.* (a) | 20,422 | 73,519 | ||||||
| XOMA Corp.* (a) | 18,281 | 54,843 | ||||||
| ZIOPHARM Oncology, Inc.* (a) | 17,876 | 106,362 | ||||||
| 12,426,649 | ||||||||
| Health Care Equipment & Supplies 3.3% | ||||||||
| Abaxis, Inc.* | 5,816 | 215,192 | ||||||
| ABIOMED, Inc.* (a) | 8,959 | 204,444 | ||||||
| Accuray, Inc.* (a) | 19,141 | 130,924 | ||||||
| Align Technology, Inc.* (a) | 19,256 | 644,306 | ||||||
| Alphatec Holdings, Inc.* (a) | 14,080 | 25,907 | ||||||
| Analogic Corp. | 3,293 | 204,166 | ||||||
| AngioDynamics, Inc.* | 6,425 | 77,164 | ||||||
| Anika Therapeutics, Inc.* | 3,160 | 42,944 | ||||||
| Antares Pharma, Inc.* (a) | 24,495 | 89,162 | ||||||
| ArthroCare Corp.* | 7,421 | 217,287 | ||||||
| AtriCure, Inc.* | 3,732 | 35,865 | ||||||
| Atrion Corp. | 417 | 85,477 | ||||||
| Biolase, Inc.* (a) | 1 | 2 | ||||||
| Cantel Medical Corp. (a) | 5,689 | 155,025 | ||||||
| Cardiovascular Systems, Inc.* (a) | 4,526 | 44,310 | ||||||
| Cerus Corp.* (a) | 14,245 | 47,293 | ||||||
| Conceptus, Inc.* (a) | 8,317 | 164,843 | ||||||
| CONMED Corp. | 7,605 | 210,430 | ||||||
| CryoLife, Inc.* | 7,011 | 36,668 | ||||||
| Cyberonics, Inc.* | 7,332 | 329,500 | ||||||
| Cynosure, Inc. "A"* | 2,700 | 57,105 | ||||||
| Derma Sciences, Inc.* (a) | 2,505 | 23,848 | ||||||
| Dexcom, Inc.* | 18,388 | 238,308 | ||||||
| Endologix, Inc.* (a) | 14,839 | 229,114 | ||||||
| EnteroMedics, Inc.* (a) | 6,833 | 23,574 | ||||||
| Exactech, Inc.* | 2,330 | 39,074 | ||||||
| Greatbatch, Inc.* | 6,359 | 144,413 | ||||||
| Haemonetics Corp.* | 6,783 | 502,688 | ||||||
| Hansen Medical, Inc.* (a) | 14,467 | 32,840 | ||||||
| HeartWare International, Inc.* (a) | 3,791 | 336,641 | ||||||
| ICU Medical, Inc.* (a) | 3,359 | 179,303 | ||||||
| Insulet Corp.* (a) | 12,825 | 274,070 | ||||||
| Integra LifeSciences Holdings* | 5,231 | 194,489 | ||||||
| Invacare Corp. | 8,566 | 132,173 | ||||||
| IRIS International, Inc.* | 4,126 | 46,624 | ||||||
| MAKO Surgical Corp.* (a) | 9,688 | 248,110 | ||||||
| Masimo Corp.* (a) | 13,395 | 299,780 | ||||||
| Meridian Bioscience, Inc. (a) | 11,170 | 228,538 | ||||||
| Merit Medical Systems, Inc.* | 11,180 | 154,396 | ||||||
| Natus Medical, Inc.* | 7,709 | 89,579 | ||||||
| Navidea Biopharmaceuticals, Inc.* (a) | 25,307 | 94,142 | ||||||
| Neogen Corp.* | 6,320 | 291,984 | ||||||
| Shares | Value ($) | |||||||
| NuVasive, Inc.* (a) | 11,575 | 293,542 | ||||||
| NxStage Medical, Inc.* (a) | 13,203 | 221,282 | ||||||
| OraSure Technologies, Inc.* | 12,938 | 145,423 | ||||||
| Orthofix International NV* (a) | 5,026 | 207,323 | ||||||
| Palomar Medical Technologies, Inc.* (a) | 5,096 | 43,316 | ||||||
| PhotoMedex, Inc.* (a) | 3,516 | 42,719 | ||||||
| Quidel Corp.* (a) | 7,476 | 117,224 | ||||||
| Rochester Medical Corp.* | 2,849 | 30,655 | ||||||
| Rockwell Medical Technologies, Inc.* (a) | 5,612 | 52,248 | ||||||
| RTI Biologics, Inc.* | 14,435 | 54,276 | ||||||
| Solta Medical, Inc.* (a) | 16,467 | 48,248 | ||||||
| Spectranetics Corp.* | 9,388 | 107,211 | ||||||
| STAAR Surgical Co.* (a) | 9,836 | 76,426 | ||||||
| STERIS Corp. | 15,454 | 484,792 | ||||||
| SurModics, Inc.* (a) | 4,240 | 73,352 | ||||||
| Symmetry Medical, Inc.* | 9,633 | 82,651 | ||||||
| Tornier NV* (a) | 4,059 | 91,003 | ||||||
| Unilife Corp.* (a) | 19,901 | 67,265 | ||||||
| Utah Medical Products, Inc. | 881 | 29,540 | ||||||
| Vascular Solutions, Inc.* | 4,436 | 55,716 | ||||||
| Volcano Corp.* | 14,287 | 409,323 | ||||||
| West Pharmaceutical Services, Inc. | 9,083 | 458,601 | ||||||
| Wright Medical Group, Inc.* (a) | 10,637 | 227,100 | ||||||
| Young Innovations, Inc. | 1,416 | 48,838 | ||||||
| Zeltiq Aesthetics, Inc.* (a) | 4,544 | 25,446 | ||||||
| 10,315,222 | ||||||||
| Health Care Providers & Services 2.8% | ||||||||
| Acadia Healthcare Co., Inc.* | 6,173 | 108,274 | ||||||
| Accretive Health, Inc.* (a) | 15,095 | 165,441 | ||||||
| Air Methods Corp.* | 3,436 | 337,587 | ||||||
| Almost Family, Inc.* (a) | 2,247 | 50,198 | ||||||
| Amedisys, Inc.* (a) | 8,256 | 102,787 | ||||||
| AMN Healthcare Services, Inc.* (a) | 10,673 | 63,291 | ||||||
| AmSurg Corp.* | 8,477 | 254,140 | ||||||
| Assisted Living Concepts, Inc. "A" (a) | 5,298 | 75,338 | ||||||
| Bio-Reference Laboratories, Inc.* (a) | 6,505 | 170,951 | ||||||
| BioScrip, Inc.* | 11,778 | 87,511 | ||||||
| Capital Senior Living Corp.* | 7,676 | 81,366 | ||||||
| Centene Corp.* | 13,789 | 415,876 | ||||||
| Chemed Corp. (a) | 5,142 | 310,783 | ||||||
| Chindex International, Inc.* (a) | 3,029 | 29,684 | ||||||
| CorVel Corp.* | 1,692 | 82,908 | ||||||
| Cross Country Healthcare, Inc.* | 6,856 | 29,961 | ||||||
| Emeritus Corp.* (a) | 8,331 | 140,211 | ||||||
| ExamWorks Group, Inc.* | 7,845 | 103,789 | ||||||
| Five Star Quality Care, Inc.* | 10,761 | 33,036 | ||||||
| Gentiva Health Services, Inc.* (a) | 8,193 | 56,778 | ||||||
| Hanger, Inc.* | 9,145 | 234,478 | ||||||
| HEALTHSOUTH Corp.* (a) | 25,628 | 596,107 | ||||||
| Healthways, Inc.* | 9,139 | 72,929 | ||||||
| HMS Holdings Corp.* | 23,034 | 767,263 | ||||||
| IntegraMed America, Inc.* | 2,343 | 32,451 | ||||||
| IPC The Hospitalist Co.* | 4,442 | 201,311 | ||||||
| Kindred Healthcare, Inc.* (a) | 14,062 | 138,229 | ||||||
| Landauer, Inc. | 2,510 | 143,898 | ||||||
| LHC Group, Inc.* | 4,193 | 71,113 | ||||||
| Magellan Health Services, Inc.* (a) | 7,316 | 331,634 | ||||||
| Metropolitan Health Networks, Inc.* | 11,883 | 113,720 | ||||||
| MModal, Inc.* (a) | 10,537 | 136,770 | ||||||
| Shares | Value ($) | |||||||
| Molina Healthcare, Inc.* | 8,023 | 188,220 | ||||||
| MWI Veterinary Supply, Inc.* | 3,411 | 350,548 | ||||||
| National Healthcare Corp. (a) | 2,832 | 128,091 | ||||||
| National Research Corp. | 675 | 35,336 | ||||||
| Owens & Minor, Inc. (a) | 17,012 | 521,078 | ||||||
| PDI, Inc.* | 2,687 | 22,141 | ||||||
| PharMerica Corp.* | 7,673 | 83,789 | ||||||
| Providence Service Corp.* | 3,628 | 49,740 | ||||||
| PSS World Medical, Inc.* (a) | 13,449 | 282,295 | ||||||
| Select Medical Holdings Corp.* (a) | 9,375 | 94,781 | ||||||
| Skilled Healthcare Group, Inc. "A"* | 5,253 | 32,989 | ||||||
| Sun Healthcare Group, Inc.* | 6,638 | 55,560 | ||||||
| Sunrise Senior Living, Inc.* (a) | 15,357 | 111,953 | ||||||
| Team Health Holdings, Inc.* | 7,610 | 183,325 | ||||||
| The Ensign Group, Inc. | 4,664 | 131,851 | ||||||
| Triple-S Management Corp. "B"* | 5,310 | 97,067 | ||||||
| U.S. Physical Therapy, Inc. | 3,095 | 78,706 | ||||||
| Universal American Corp.* | 10,073 | 106,069 | ||||||
| Vanguard Health Systems, Inc.* (a) | 8,722 | 77,539 | ||||||
| WellCare Health Plans, Inc.* | 11,543 | 611,779 | ||||||
| 8,782,670 | ||||||||
| Health Care Technology 0.7% | ||||||||
| athenahealth, Inc.* (a) | 9,606 | 760,507 | ||||||
| Computer Programs & Systems, Inc. | 2,965 | 169,657 | ||||||
| ePocrates, Inc.* | 5,010 | 40,180 | ||||||
| Greenway Medical Technologies, Inc.* (a) | 1,996 | 32,555 | ||||||
| HealthStream, Inc.* | 5,235 | 136,110 | ||||||
| MedAssets, Inc.* | 15,642 | 210,385 | ||||||
| Medidata Solutions, Inc.* | 5,954 | 194,517 | ||||||
| Mediware Information Systems, Inc.* | 963 | 14,060 | ||||||
| Merge Healthcare, Inc.* | 14,878 | 42,551 | ||||||
| Omnicell, Inc.* | 9,152 | 133,985 | ||||||
| Quality Systems, Inc. (a) | 10,600 | 291,606 | ||||||
| Vocera Communications, Inc.* | 1,805 | 48,356 | ||||||
| 2,074,469 | ||||||||
| Life Sciences Tools & Services 0.4% | ||||||||
| Affymetrix, Inc.* (a) | 19,138 | 89,757 | ||||||
| BG Medicine, Inc.* (a) | 2,890 | 20,172 | ||||||
| Cambrex Corp.* | 8,068 | 75,920 | ||||||
| eResearchTechnology, Inc.* | 13,511 | 107,953 | ||||||
| Fluidigm Corp.* (a) | 5,494 | 82,630 | ||||||
| Furiex Pharmaceuticals, Inc.* | 1,972 | 41,313 | ||||||
| Harvard Bioscience, Inc.* | 7,264 | 27,385 | ||||||
| Luminex Corp.* (a) | 11,156 | 273,210 | ||||||
| MEDTOX Scientific, Inc.* | 2,012 | 54,244 | ||||||
| Pacific Biosciences of California, Inc.* (a) | 9,016 | 19,565 | ||||||
| PAREXEL International Corp.* (a) | 16,039 | 452,781 | ||||||
| Sequenom, Inc.* (a) | 30,531 | 123,956 | ||||||
| 1,368,886 | ||||||||
| Pharmaceuticals 2.0% | ||||||||
| Acura Pharmaceuticals, Inc.* (a) | 3,929 | 12,337 | ||||||
| Akorn, Inc.* (a) | 15,229 | 240,161 | ||||||
| Ampio Pharmaceuticals, Inc.* (a) | 5,510 | 27,991 | ||||||
| Auxilium Pharmaceuticals, Inc.* | 12,966 | 348,656 | ||||||
| AVANIR Pharmaceuticals, Inc. "A"* (a) | 36,909 | 144,683 | ||||||
| BioDelivery Sciences International, Inc.* (a) | 5,688 | 25,482 | ||||||
| BioSante Pharmaceuticals, Inc.* | 1 | 3 | ||||||
| Shares | Value ($) | |||||||
| Cadence Pharmaceuticals, Inc.* (a) | 16,172 | 57,734 | ||||||
| Cempra, Inc.* | 1,039 | 9,725 | ||||||
| Corcept Therapeutics, Inc.* (a) | 11,753 | 52,771 | ||||||
| Cornerstone Therapeutics, Inc.* (a) | 2,025 | 12,818 | ||||||
| Cumberland Pharmaceuticals, Inc.* | 3,189 | 20,601 | ||||||
| DepoMed, Inc.* | 14,977 | 85,219 | ||||||
| Endocyte, Inc.* (a) | 7,940 | 65,267 | ||||||
| Hi-Tech Pharmacal Co., Inc.* (a) | 2,901 | 93,993 | ||||||
| Impax Laboratories, Inc.* | 17,959 | 364,029 | ||||||
| Jazz Pharmaceuticals PLC* | 11,127 | 500,826 | ||||||
| Lannett Co., Inc.* (a) | 4,143 | 17,566 | ||||||
| MAP Pharmaceuticals, Inc.* (a) | 6,680 | 100,067 | ||||||
| Medicines Co.* | 14,766 | 338,732 | ||||||
| Medicis Pharmaceutical Corp. "A" | 15,388 | 525,500 | ||||||
| Nektar Therapeutics* (a) | 30,729 | 247,983 | ||||||
| Obagi Medical Products, Inc.* | 5,131 | 78,351 | ||||||
| Omeros Corp.* (a) | 6,018 | 60,180 | ||||||
| Optimer Pharmaceuticals, Inc.* (a) | 12,612 | 195,738 | ||||||
| Pacira Pharmaceuticals, Inc.* (a) | 4,955 | 79,478 | ||||||
| Pain Therapeutics, Inc.* (a) | 10,693 | 50,150 | ||||||
| Par Pharmaceutical Companies, Inc.* (a) | 9,844 | 355,762 | ||||||
| Pernix Therapeutics Holdings, Inc.* | 2,453 | 17,882 | ||||||
| POZEN, Inc.* (a) | 6,813 | 42,513 | ||||||
| Questcor Pharmaceuticals, Inc.* (a) | 14,405 | 766,922 | ||||||
| Repros Therapeutics, Inc.* (a) | 3,978 | 36,120 | ||||||
| Sagent Pharmaceuticals, Inc.* (a) | 2,521 | 45,580 | ||||||
| Santarus, Inc.* (a) | 14,942 | 105,939 | ||||||
| Sucampo Pharmaceuticals, Inc. "A"* (a) | 2,707 | 19,030 | ||||||
| Supernus Pharmaceuticals, Inc.* (a) | 980 | 9,173 | ||||||
| Transcept Pharmaceuticals, Inc.* (a) | 3,386 | 20,993 | ||||||
| Ventrus Biosciences, Inc.* | 3,350 | 14,305 | ||||||
| ViroPharma, Inc.* | 18,629 | 441,507 | ||||||
| VIVUS, Inc.* (a) | 26,717 | 762,503 | ||||||
| XenoPort, Inc.* (a) | 9,635 | 58,196 | ||||||
| Zogenix, Inc.* (a) | 9,783 | 24,262 | ||||||
| 6,476,728 | ||||||||
| Industrials 14.8% | ||||||||
| Aerospace & Defense 1.6% | ||||||||
| AAR Corp. (a) | 10,801 | 145,597 | ||||||
| Aerovironment, Inc.* | 4,657 | 122,526 | ||||||
| American Science & Engineering, Inc. | 2,419 | 136,553 | ||||||
| API Technologies Corp.* (a) | 8,697 | 32,005 | ||||||
| Astronics Corp.* | 2,764 | 78,055 | ||||||
| Ceradyne, Inc. | 6,504 | 166,828 | ||||||
| CPI Aerostructures, Inc.* | 1,506 | 16,566 | ||||||
| Cubic Corp. | 4,272 | 205,398 | ||||||
| Curtiss-Wright Corp. | 12,579 | 390,578 | ||||||
| DigitalGlobe, Inc.* | 9,696 | 146,991 | ||||||
| Esterline Technologies Corp.* | 8,214 | 512,143 | ||||||
| GenCorp, Inc.* (a) | 16,183 | 105,351 | ||||||
| GeoEye, Inc.* (a) | 4,054 | 62,756 | ||||||
| HEICO Corp. (a) | 14,117 | 557,904 | ||||||
| Hexcel Corp.* (a) | 26,686 | 688,232 | ||||||
| Kratos Defense & Security Solutions, Inc.* (a) | 10,775 | 62,926 | ||||||
| LMI Aerospace, Inc.* (a) | 2,340 | 40,669 | ||||||
| Moog, Inc. "A"* | 12,139 | 501,948 | ||||||
| National Presto Industries, Inc. (a) | 1,279 | 89,236 | ||||||
| Orbital Sciences Corp.* (a) | 15,839 | 204,640 | ||||||
| SIFCO Industries, Inc. | 676 | 15,534 | ||||||
| Shares | Value ($) | |||||||
| Sypris Solutions, Inc. | 2,843 | 19,816 | ||||||
| Taser International, Inc.* (a) | 14,791 | 77,505 | ||||||
| Teledyne Technologies, Inc.* | 9,851 | 607,314 | ||||||
| The Keyw Holding Corp.* (a) | 4,886 | 49,055 | ||||||
| 5,036,126 | ||||||||
| Air Freight & Logistics 0.4% | ||||||||
| Air Transport Services Group, Inc.* | 14,420 | 74,984 | ||||||
| Atlas Air Worldwide Holdings, Inc.* (a) | 7,079 | 308,007 | ||||||
| Forward Air Corp. | 7,850 | 253,320 | ||||||
| Hub Group, Inc. "A"* | 9,920 | 359,104 | ||||||
| Pacer International, Inc.* | 9,352 | 50,688 | ||||||
| Park-Ohio Holdings Corp.* | 2,448 | 46,585 | ||||||
| XPO Logistics, Inc.* | 4,719 | 79,279 | ||||||
| 1,171,967 | ||||||||
| Airlines 0.8% | ||||||||
| Alaska Air Group, Inc.* | 19,070 | 684,613 | ||||||
| Allegiant Travel Co.* (a) | 4,011 | 279,487 | ||||||
| Hawaiian Holdings, Inc. "A"* (a) | 13,574 | 88,367 | ||||||
| JetBlue Airways Corp.* (a) | 62,688 | 332,246 | ||||||
| Republic Airways Holdings, Inc.* | 12,879 | 71,478 | ||||||
| SkyWest, Inc. (a) | 13,385 | 87,404 | ||||||
| Spirit Airlines, Inc.* | 11,164 | 217,251 | ||||||
| U.S. Airways Group, Inc.* (a) | 43,508 | 579,962 | ||||||
| 2,340,808 | ||||||||
| Building Products 0.8% | ||||||||
| A.O. Smith Corp. (a) | 10,459 | 511,340 | ||||||
| AAON, Inc. (a) | 5,014 | 94,514 | ||||||
| Ameresco, Inc. "A"* (a) | 5,435 | 64,840 | ||||||
| American Woodmark Corp.* (a) | 2,550 | 43,605 | ||||||
| Apogee Enterprises, Inc. | 7,527 | 120,959 | ||||||
| Builders FirstSource, Inc.* (a) | 11,657 | 55,254 | ||||||
| Gibraltar Industries, Inc.* | 8,113 | 84,213 | ||||||
| Griffon Corp. | 12,073 | 103,586 | ||||||
| Insteel Industries, Inc. | 4,711 | 52,528 | ||||||
| NCI Building Systems, Inc.* | 4,812 | 52,114 | ||||||
| Nortek, Inc.* (a) | 2,079 | 104,033 | ||||||
| Patrick Industries, Inc.* | 1,065 | 13,579 | ||||||
| PGT, Inc.* | 5,284 | 16,011 | ||||||
| Quanex Building Products Corp. | 9,805 | 175,313 | ||||||
| Simpson Manufacturing Co., Inc. | 10,722 | 316,406 | ||||||
| Trex Co., Inc.* (a) | 3,753 | 112,928 | ||||||
| Universal Forest Products, Inc. | 5,297 | 206,477 | ||||||
| USG Corp.* (a) | 19,876 | 378,638 | ||||||
| 2,506,338 | ||||||||
| Commercial Services & Supplies 2.3% | ||||||||
| A.T. Cross Co. "A"* | 2,529 | 24,961 | ||||||
| ABM Industries, Inc. | 14,393 | 281,527 | ||||||
| Acco Brands Corp.* | 30,287 | 313,168 | ||||||
| Acorn Energy, Inc. (a) | 4,794 | 39,886 | ||||||
| American Reprographics Co.* | 9,656 | 48,570 | ||||||
| Asset Acceptance Capital Corp.* | 4,246 | 28,873 | ||||||
| ASTA Funding, Inc. | 2,965 | 27,782 | ||||||
| Casella Waste Systems, Inc. "A"* (a) | 7,219 | 42,231 | ||||||
| CECO Environmental Corp. | 1,926 | 15,215 | ||||||
| Cenveo, Inc.* (a) | 15,166 | 29,270 | ||||||
| CompX International, Inc. | 452 | 5,695 | ||||||
| Consolidated Graphics, Inc.* | 2,075 | 60,279 | ||||||
| Courier Corp. | 2,933 | 38,862 | ||||||
| Deluxe Corp. (a) | 13,721 | 342,202 | ||||||
| Encore Capital Group, Inc.* | 5,871 | 173,899 | ||||||
| EnergySolutions, Inc.* | 21,222 | 35,865 | ||||||
| Shares | Value ($) | |||||||
| EnerNOC, Inc.* (a) | 6,765 | 48,979 | ||||||
| Ennis, Inc. | 6,979 | 107,337 | ||||||
| G & K Services, Inc. "A" | 5,103 | 159,163 | ||||||
| Gerber Scientific, Inc. | 6,939 | 0 | ||||||
| Healthcare Services Group, Inc. (a) | 17,990 | 348,646 | ||||||
| Heritage-Crystal Clean, Inc.* (a) | 2,060 | 33,681 | ||||||
| Herman Miller, Inc. | 15,625 | 289,375 | ||||||
| HNI Corp. (a) | 12,209 | 314,382 | ||||||
| Innerworkings, Inc.* (a) | 8,506 | 115,086 | ||||||
| Interface, Inc. (a) | 15,700 | 213,991 | ||||||
| Intersections, Inc. | 2,357 | 37,359 | ||||||
| Kimball International, Inc. "B" | 8,430 | 64,911 | ||||||
| Knoll, Inc. | 12,900 | 173,118 | ||||||
| McGrath RentCorp. | 6,638 | 175,907 | ||||||
| Metalico, Inc.* (a) | 10,662 | 23,456 | ||||||
| Mine Safety Appliances Co. (a) | 7,393 | 297,494 | ||||||
| Mobile Mini, Inc.* | 10,251 | 147,614 | ||||||
| Multi-Color Corp. | 3,623 | 80,576 | ||||||
| NL Industries, Inc. (a) | 1,832 | 22,845 | ||||||
| Portfolio Recovery Associates, Inc.* (a) | 4,584 | 418,336 | ||||||
| Quad Graphics, Inc. (a) | 6,909 | 99,352 | ||||||
| Schawk, Inc. | 2,999 | 38,087 | ||||||
| Standard Parking Corp.* (a) | 4,211 | 90,621 | ||||||
| Steelcase, Inc. "A" | 20,129 | 181,765 | ||||||
| Swisher Hygiene, Inc.* (a) | 30,213 | 76,439 | ||||||
| Sykes Enterprises, Inc.* | 10,575 | 168,777 | ||||||
| Team, Inc.* | 5,340 | 166,501 | ||||||
| Tetra Tech, Inc.* (a) | 16,992 | 443,151 | ||||||
| The Brink's Co. (a) | 12,665 | 293,575 | ||||||
| The Geo Group, Inc.* | 16,455 | 373,858 | ||||||
| TMS International Corp. "A"* (a) | 3,322 | 33,120 | ||||||
| TRC Companies, Inc.* | 3,842 | 23,359 | ||||||
| U.S. Ecology, Inc. | 5,010 | 88,877 | ||||||
| UniFirst Corp. | 3,876 | 247,095 | ||||||
| United Stationers, Inc. (a) | 10,901 | 293,782 | ||||||
| Viad Corp. | 5,482 | 109,640 | ||||||
| 7,308,540 | ||||||||
| Construction & Engineering 0.7% | ||||||||
| Aegion Corp.* | 10,453 | 187,004 | ||||||
| Argan, Inc. (a) | 2,655 | 37,117 | ||||||
| Comfort Systems U.S.A., Inc. | 10,105 | 101,252 | ||||||
| Dycom Industries, Inc.* | 8,984 | 167,192 | ||||||
| EMCOR Group, Inc. | 17,915 | 498,395 | ||||||
| Furmanite Corp.* (a) | 9,652 | 46,909 | ||||||
| Granite Construction, Inc. (a) | 10,388 | 271,231 | ||||||
| Great Lakes Dredge & Dock Co. | 15,595 | 111,036 | ||||||
| Layne Christensen Co.* | 5,247 | 108,561 | ||||||
| MasTec, Inc.* | 15,628 | 235,045 | ||||||
| Michael Baker Corp.* (a) | 2,280 | 59,485 | ||||||
| MYR Group, Inc.* | 5,612 | 95,741 | ||||||
| Northwest Pipe Co.* | 2,425 | 58,831 | ||||||
| Orion Marine Group, Inc.* | 7,515 | 52,304 | ||||||
| Pike Electric Corp.* | 4,276 | 33,011 | ||||||
| Primoris Services Corp. (a) | 8,043 | 96,516 | ||||||
| Sterling Construction Co., Inc.* | 4,300 | 43,946 | ||||||
| Tutor Perini Corp.* | 9,605 | 121,695 | ||||||
| 2,325,271 | ||||||||
| Electrical Equipment 1.1% | ||||||||
| A123 Systems, Inc.* (a) | 28,702 | 36,164 | ||||||
| Acuity Brands, Inc. (a) | 11,308 | 575,690 | ||||||
| American Superconductor Corp.* (a) | 10,494 | 49,322 | ||||||
| Shares | Value ($) | |||||||
| AZZ, Inc. (a) | 3,350 | 205,221 | ||||||
| Belden, Inc. | 12,194 | 406,670 | ||||||
| Brady Corp. "A" (a) | 13,143 | 361,564 | ||||||
| Capstone Turbine Corp.* (a) | 80,089 | 80,890 | ||||||
| Coleman Cable, Inc. | 2,288 | 19,883 | ||||||
| Encore Wire Corp. (a) | 5,099 | 136,551 | ||||||
| EnerSys* | 12,848 | 450,579 | ||||||
| Enphase Energy, Inc.* (a) | 2,125 | 13,217 | ||||||
| Franklin Electric Co., Inc. (a) | 6,281 | 321,147 | ||||||
| FuelCell Energy, Inc.* (a) | 42,275 | 42,698 | ||||||
| Generac Holdings, Inc.* | 6,667 | 160,408 | ||||||
| Global Power Equipment Group, Inc. (a) | 4,607 | 100,617 | ||||||
| II-VI, Inc.* | 14,089 | 234,864 | ||||||
| LSI Industries, Inc. | 4,939 | 35,166 | ||||||
| Powell Industries, Inc.* (a) | 2,345 | 87,609 | ||||||
| Preformed Line Products Co. (a) | 662 | 38,336 | ||||||
| Thermon Group Holdings, Inc.* (a) | 3,936 | 81,515 | ||||||
| Vicor Corp. | 5,406 | 37,518 | ||||||
| 3,475,629 | ||||||||
| Industrial Conglomerates 0.2% | ||||||||
| Raven Industries, Inc. | 4,858 | 338,068 | ||||||
| Seaboard Corp.* | 83 | 177,038 | ||||||
| Standex International Corp. | 3,386 | 144,142 | ||||||
| 659,248 | ||||||||
| Machinery 3.1% | ||||||||
| Accuride Corp.* (a) | 12,736 | 76,416 | ||||||
| Actuant Corp. "A" | 18,303 | 497,109 | ||||||
| Alamo Group, Inc. | 1,777 | 55,744 | ||||||
| Albany International Corp. "A" (a) | 7,354 | 137,593 | ||||||
| Altra Holdings, Inc. (a) | 7,106 | 112,133 | ||||||
| American Railcar Industries, Inc.* (a) | 2,611 | 70,758 | ||||||
| Ampco-Pittsburgh Corp. | 2,295 | 42,067 | ||||||
| Astec Industries, Inc.* | 5,384 | 165,181 | ||||||
| Barnes Group, Inc. (a) | 14,539 | 353,152 | ||||||
| Blount International, Inc.* (a) | 13,269 | 194,391 | ||||||
| Briggs & Stratton Corp. (a) | 13,155 | 230,081 | ||||||
| Cascade Corp. | 2,486 | 116,966 | ||||||
| Chart Industries, Inc.* | 8,014 | 551,043 | ||||||
| CIRCOR International, Inc. | 4,719 | 160,871 | ||||||
| CLARCOR, Inc. (a) | 13,454 | 647,945 | ||||||
| Columbus McKinnon Corp.* | 5,333 | 80,475 | ||||||
| Commercial Vehicle Group, Inc.* | 6,545 | 56,418 | ||||||
| Douglas Dynamics, Inc. (a) | 5,933 | 84,545 | ||||||
| Dynamic Materials Corp. (a) | 3,487 | 60,430 | ||||||
| Energy Recovery, Inc.* (a) | 10,991 | 26,378 | ||||||
| EnPro Industries, Inc.* | 5,490 | 205,161 | ||||||
| ESCO Technologies, Inc. (a) | 7,163 | 261,020 | ||||||
| Federal Signal Corp.* (a) | 16,764 | 97,902 | ||||||
| Flow International Corp.* | 12,996 | 40,937 | ||||||
| FreightCar America, Inc. | 3,136 | 72,034 | ||||||
| Gorman-Rupp Co. | 4,087 | 121,793 | ||||||
| Graham Corp. | 2,692 | 50,125 | ||||||
| Greenbrier Companies, Inc.* | 6,130 | 107,765 | ||||||
| Hardinge, Inc. | 3,137 | 28,547 | ||||||
| Hurco Companies, Inc.* | 1,628 | 33,358 | ||||||
| John Bean Technologies Corp. | 7,895 | 107,135 | ||||||
| Kadant, Inc.* | 3,049 | 71,499 | ||||||
| Kaydon Corp. (a) | 8,664 | 185,323 | ||||||
| L.B. Foster Co. "A" | 2,497 | 71,439 | ||||||
| Lindsay Corp. (a) | 3,411 | 221,374 | ||||||
| Lydall, Inc.* | 4,733 | 63,990 | ||||||
| Shares | Value ($) | |||||||
| Meritor, Inc.* | 25,871 | 135,047 | ||||||
| Met-Pro Corp. | 4,051 | 37,310 | ||||||
| Middleby Corp.* (a) | 5,017 | 499,743 | ||||||
| Miller Industries, Inc. | 2,809 | 44,747 | ||||||
| Mueller Industries, Inc. (a) | 7,267 | 309,502 | ||||||
| Mueller Water Products, Inc. "A" | 41,488 | 143,548 | ||||||
| NACCO Industries, Inc. "A" | 1,478 | 171,818 | ||||||
| NN, Inc.* | 4,544 | 46,394 | ||||||
| Omega Flex, Inc.* (a) | 800 | 9,528 | ||||||
| PMFG, Inc.* (a) | 5,418 | 42,315 | ||||||
| Proto Labs, Inc.* (a) | 1,291 | 37,129 | ||||||
| RBC Bearings, Inc.* (a) | 5,943 | 281,104 | ||||||
| Rexnord Corp.* (a) | 7,726 | 154,829 | ||||||
| Robbins & Myers, Inc. | 10,369 | 433,632 | ||||||
| Sauer-Danfoss, Inc. | 3,079 | 107,549 | ||||||
| Sun Hydraulics Corp. | 5,558 | 135,004 | ||||||
| Tennant Co. | 5,014 | 200,309 | ||||||
| The Eastern Co. (a) | 1,668 | 26,938 | ||||||
| Titan International, Inc. (a) | 11,325 | 277,802 | ||||||
| TriMas Corp.* | 8,629 | 173,443 | ||||||
| Twin Disc, Inc. (a) | 2,230 | 41,233 | ||||||
| Wabash National Corp.* (a) | 18,266 | 120,921 | ||||||
| Watts Water Technologies, Inc. "A" (a) | 7,905 | 263,553 | ||||||
| Woodward, Inc. | 18,531 | 730,863 | ||||||
| 9,883,359 | ||||||||
| Marine 0.0% | ||||||||
| Genco Shipping & Trading Ltd.* (a) | 7,928 | 24,180 | ||||||
| International Shipholding Corp. (a) | 1,425 | 26,876 | ||||||
| Rand Logistics, Inc.* | 4,745 | 40,332 | ||||||
| 91,388 | ||||||||
| Professional Services 1.5% | ||||||||
| Acacia Research Corp.* | 13,321 | 496,074 | ||||||
| Barrett Business Services, Inc. | 1,760 | 37,206 | ||||||
| CBIZ, Inc.* | 10,384 | 61,681 | ||||||
| CDI Corp. (a) | 3,675 | 60,270 | ||||||
| Corporate Executive Board Co. | 8,955 | 366,080 | ||||||
| CoStar Group, Inc.* (a) | 7,124 | 578,469 | ||||||
| CRA International, Inc.* | 2,764 | 40,603 | ||||||
| Dolan Co.* | 8,156 | 54,890 | ||||||
| Exponent, Inc.* | 3,616 | 191,033 | ||||||
| Franklin Covey Co.* | 3,515 | 35,994 | ||||||
| FTI Consulting, Inc.* (a) | 11,241 | 323,179 | ||||||
| GP Strategies Corp.* | 3,969 | 73,307 | ||||||
| Heidrick & Struggles International, Inc. (a) | 4,885 | 85,488 | ||||||
| Hill International, Inc.* | 6,325 | 20,240 | ||||||
| Hudson Global, Inc.* | 8,974 | 37,422 | ||||||
| Huron Consulting Group, Inc.* | 6,141 | 194,363 | ||||||
| ICF International, Inc.* | 5,266 | 125,541 | ||||||
| Insperity, Inc. (a) | 6,069 | 164,166 | ||||||
| Kelly Services, Inc. "A" | 7,368 | 95,121 | ||||||
| Kforce, Inc.* | 7,534 | 101,408 | ||||||
| Korn/Ferry International* | 12,887 | 184,929 | ||||||
| Mistras Group, Inc.* | 4,184 | 109,956 | ||||||
| Navigant Consulting, Inc.* | 13,923 | 175,987 | ||||||
| Odyssey Marine Exploration, Inc.* (a) | 19,399 | 72,552 | ||||||
| On Assignment, Inc.* | 11,509 | 183,684 | ||||||
| Pendrell Corp.* (a) | 40,128 | 44,943 | ||||||
| Resources Connection, Inc. | 11,311 | 139,125 | ||||||
| RPX Corp.* | 5,668 | 81,336 | ||||||
| The Advisory Board Co.* | 9,187 | 455,583 | ||||||
| Shares | Value ($) | |||||||
| TrueBlue, Inc.* | 10,659 | 165,001 | ||||||
| VSE Corp. (a) | 1,195 | 28,429 | ||||||
| WageWorks, Inc.* | 1,753 | 26,400 | ||||||
| 4,810,460 | ||||||||
| Road & Rail 1.3% | ||||||||
| AMERCO (a) | 2,324 | 209,090 | ||||||
| Arkansas Best Corp. (a) | 6,792 | 85,579 | ||||||
| Avis Budget Group, Inc.* (a) | 28,448 | 432,410 | ||||||
| Celadon Group, Inc. (a) | 5,515 | 90,336 | ||||||
| Dollar Thrifty Automotive Group, Inc.* (a) | 7,508 | 607,848 | ||||||
| Genesee & Wyoming, Inc. "A"* (a) | 10,863 | 574,001 | ||||||
| Heartland Express, Inc. (a) | 12,755 | 182,524 | ||||||
| Knight Transportation, Inc. | 15,507 | 247,957 | ||||||
| Marten Transport Ltd. (a) | 4,139 | 87,995 | ||||||
| Old Dominion Freight Line, Inc.* | 12,730 | 551,082 | ||||||
| Patriot Transportation Holding, Inc.* (a) | 1,628 | 38,307 | ||||||
| Quality Distribution, Inc.* | 5,736 | 63,612 | ||||||
| RailAmerica, Inc.* | 5,071 | 122,718 | ||||||
| Roadrunner Transportation Systems, Inc.* | 3,441 | 58,118 | ||||||
| Saia, Inc.* | 4,246 | 92,945 | ||||||
| Swift Transportation Co.* (a) | 21,182 | 200,170 | ||||||
| Universal Truckload Services, Inc. | 1,496 | 22,627 | ||||||
| Werner Enterprises, Inc. (a) | 11,861 | 283,359 | ||||||
| Zipcar, Inc.* (a) | 7,207 | 84,538 | ||||||
| 4,035,216 | ||||||||
| Trading Companies & Distributors 1.0% | ||||||||
| Aceto Corp. | 7,182 | 64,854 | ||||||
| Aircastle Ltd. | 15,714 | 189,354 | ||||||
| Applied Industrial Technologies, Inc. (a) | 11,293 | 416,147 | ||||||
| Beacon Roofing Supply, Inc.* (a) | 12,551 | 316,536 | ||||||
| BlueLinx Holdings, Inc.* | 6,467 | 15,197 | ||||||
| CAI International, Inc.* (a) | 3,454 | 68,666 | ||||||
| DXP Enterprises, Inc.* | 2,390 | 99,161 | ||||||
| Edgen Group, Inc.* | 4,012 | 30,170 | ||||||
| H&E Equipment Services, Inc.* (a) | 7,733 | 116,227 | ||||||
| Houston Wire & Cable Co. (a) | 4,946 | 54,060 | ||||||
| Interline Brands, Inc.* | 8,531 | 213,872 | ||||||
| Kaman Corp. | 7,147 | 221,128 | ||||||
| Rush Enterprises, Inc. "A"* | 8,900 | 145,515 | ||||||
| SeaCube Container Leasing Ltd. (a) | 2,950 | 50,357 | ||||||
| TAL International Group, Inc. (a) | 7,818 | 261,825 | ||||||
| Textainer Group Holdings Ltd. (a) | 3,284 | 121,180 | ||||||
| Titan Machinery, Inc.* (a) | 4,528 | 137,515 | ||||||
| Watsco, Inc. (a) | 7,869 | 580,732 | ||||||
| Willis Lease Finance Corp.* | 1,420 | 17,494 | ||||||
| 3,119,990 | ||||||||
| Transportation Infrastructure 0.0% | ||||||||
| Wesco Aircraft Holdings, Inc.* (a) | 4,725 | 60,149 | ||||||
| Information Technology 16.9% | ||||||||
| Communications Equipment 2.2% | ||||||||
| ADTRAN, Inc. (a) | 17,017 | 513,743 | ||||||
| Ambient Corp.* (a) | 726 | 3,971 | ||||||
| Anaren, Inc.* | 4,066 | 79,694 | ||||||
| Arris Group, Inc.* | 30,280 | 421,195 | ||||||
| Aruba Networks, Inc.* (a) | 29,968 | 451,018 | ||||||
| Aviat Networks, Inc.* | 15,896 | 44,509 | ||||||
| Aware, Inc. | 3,075 | 19,834 | ||||||
| Bel Fuse, Inc. "B" | 2,887 | 50,840 | ||||||
| Shares | Value ($) | |||||||
| Black Box Corp. | 4,636 | 133,053 | ||||||
| CalAmp Corp.* | 7,690 | 56,368 | ||||||
| Calix, Inc.* (a) | 10,651 | 87,551 | ||||||
| Ciena Corp.* | 26,577 | 435,066 | ||||||
| Comtech Telecommunications Corp. (a) | 5,011 | 143,214 | ||||||
| Comverse Technology, Inc.* | 58,684 | 341,541 | ||||||
| Digi International, Inc.* | 6,804 | 69,673 | ||||||
| Emulex Corp.* | 23,081 | 166,183 | ||||||
| Extreme Networks, Inc.* (a) | 24,634 | 84,741 | ||||||
| Finisar Corp.* (a) | 24,468 | 366,041 | ||||||
| Globecomm Systems, Inc.* | 6,407 | 64,967 | ||||||
| Harmonic, Inc.* | 31,591 | 134,578 | ||||||
| Infinera Corp.* | 29,425 | 201,267 | ||||||
| InterDigital, Inc. (a) | 11,937 | 352,261 | ||||||
| Ixia* (a) | 11,313 | 135,982 | ||||||
| KVH Industries, Inc.* (a) | 3,942 | 49,275 | ||||||
| Loral Space & Communications, Inc. (a) | 2,947 | 198,481 | ||||||
| NETGEAR, Inc.* | 10,179 | 351,277 | ||||||
| NumereX Corp. "A"* (a) | 2,509 | 23,334 | ||||||
| Oclaro, Inc.* (a) | 13,220 | 40,189 | ||||||
| Oplink Communications, Inc.* | 5,046 | 68,272 | ||||||
| ParkerVision, Inc.* (a) | 20,348 | 48,428 | ||||||
| PC-Tel, Inc. | 4,967 | 32,137 | ||||||
| Plantronics, Inc. | 11,307 | 377,654 | ||||||
| Procera Networks, Inc.* | 5,268 | 128,065 | ||||||
| ShoreTel, Inc.* (a) | 12,511 | 54,798 | ||||||
| Sonus Networks, Inc.* (a) | 55,953 | 120,299 | ||||||
| Sycamore Networks, Inc.* | 5,663 | 82,227 | ||||||
| Symmetricom, Inc.* | 11,136 | 66,705 | ||||||
| Tellabs, Inc. | 98,146 | 326,826 | ||||||
| Telular Corp. | 4,453 | 41,146 | ||||||
| TESSCO Technologies, Inc. | 1,444 | 31,840 | ||||||
| Ubiquiti Networks, Inc.* (a) | 2,809 | 40,028 | ||||||
| ViaSat, Inc.* (a) | 10,052 | 379,664 | ||||||
| Westell Technologies, Inc. "A"* | 13,638 | 32,458 | ||||||
| 6,850,393 | ||||||||
| Computers & Peripherals 0.8% | ||||||||
| 3D Systems Corp.* (a) | 11,572 | 395,068 | ||||||
| Avid Technology, Inc.* (a) | 8,000 | 59,440 | ||||||
| Cray, Inc.* | 10,093 | 121,924 | ||||||
| Datalink Corp.* | 4,072 | 38,888 | ||||||
| Electronics for Imaging, Inc.* | 12,481 | 202,816 | ||||||
| Imation Corp.* | 7,894 | 46,654 | ||||||
| Immersion Corp.* | 7,833 | 44,100 | ||||||
| Intermec, Inc.* | 15,837 | 98,189 | ||||||
| Intevac, Inc.* | 6,166 | 46,368 | ||||||
| OCZ Technology Group, Inc.* (a) | 18,409 | 97,568 | ||||||
| QLogic Corp.* | 26,080 | 357,035 | ||||||
| Quantum Corp.* (a) | 62,774 | 127,431 | ||||||
| Silicon Graphics International Corp.* (a) | 8,188 | 52,567 | ||||||
| STEC, Inc.* | 9,820 | 76,596 | ||||||
| Stratasys, Inc.* (a) | 5,704 | 282,633 | ||||||
| Super Micro Computer, Inc.* | 7,892 | 125,167 | ||||||
| Synaptics, Inc.* (a) | 9,017 | 258,157 | ||||||
| 2,430,601 | ||||||||
| Electronic Equipment, Instruments & Components 2.3% | ||||||||
| Aeroflex Holding Corp.* (a) | 5,160 | 31,218 | ||||||
| Agilysys, Inc.* (a) | 3,918 | 33,969 | ||||||
| Anixter International, Inc. (a) | 7,541 | 400,050 | ||||||
| Audience, Inc.* | 1,623 | 31,291 | ||||||
| Shares | Value ($) | |||||||
| Badger Meter, Inc. (a) | 3,909 | 146,783 | ||||||
| Benchmark Electronics, Inc.* | 15,450 | 215,527 | ||||||
| Brightpoint, Inc.* | 18,802 | 101,719 | ||||||
| Checkpoint Systems, Inc.* | 10,971 | 95,557 | ||||||
| Cognex Corp. (a) | 11,466 | 362,899 | ||||||
| Coherent, Inc.* | 6,339 | 274,479 | ||||||
| CTS Corp. | 9,191 | 86,579 | ||||||
| Daktronics, Inc. | 9,902 | 68,423 | ||||||
| DTS, Inc.* | 4,411 | 115,039 | ||||||
| Echelon Corp.* (a) | 10,727 | 37,330 | ||||||
| Electro Rent Corp. | 4,920 | 79,852 | ||||||
| Electro Scientific Industries, Inc. | 6,285 | 74,289 | ||||||
| Fabrinet* (a) | 5,922 | 74,321 | ||||||
| FARO Technologies, Inc.* | 4,530 | 190,622 | ||||||
| FEI Co.* (a) | 10,189 | 487,442 | ||||||
| GSI Group, Inc.* | 7,798 | 89,365 | ||||||
| Insight Enterprises, Inc.* | 11,897 | 200,227 | ||||||
| InvenSense, Inc.* (a) | 9,752 | 110,198 | ||||||
| KEMET Corp.* | 11,817 | 71,020 | ||||||
| Key Tronic Corp.* | 2,803 | 23,097 | ||||||
| LeCroy Corp.* | 4,586 | 65,396 | ||||||
| Littelfuse, Inc. (a) | 5,801 | 330,019 | ||||||
| Maxwell Technologies, Inc.* (a) | 8,041 | 52,749 | ||||||
| Measurement Specialties, Inc.* | 4,043 | 131,438 | ||||||
| Mercury Computer Systems, Inc.* | 8,464 | 109,440 | ||||||
| Mesa Laboratories, Inc. | 688 | 31,985 | ||||||
| Methode Electronics, Inc. | 10,097 | 85,925 | ||||||
| MTS Systems Corp. | 4,299 | 165,726 | ||||||
| Multi-Fineline Electronix, Inc.* | 2,319 | 57,140 | ||||||
| Neonode, Inc.* | 6,018 | 37,011 | ||||||
| NeoPhotonics Corp.* (a) | 5,249 | 25,930 | ||||||
| Newport Corp.* | 10,369 | 124,635 | ||||||
| OSI Systems, Inc.* | 5,314 | 336,589 | ||||||
| Park Electrochemical Corp. | 5,527 | 143,039 | ||||||
| PC Connection, Inc. | 2,400 | 25,488 | ||||||
| Plexus Corp.* (a) | 9,346 | 263,557 | ||||||
| Power-One, Inc.* (a) | 17,744 | 80,203 | ||||||
| RadiSys Corp.* | 6,137 | 38,540 | ||||||
| RealD, Inc.* (a) | 11,779 | 176,214 | ||||||
| Richardson Electronics Ltd. (a) | 3,583 | 44,178 | ||||||
| Rofin-Sinar Technologies, Inc.* | 7,763 | 146,954 | ||||||
| Rogers Corp.* (a) | 4,355 | 172,502 | ||||||
| Sanmina-SCI Corp.* | 21,832 | 178,804 | ||||||
| ScanSource, Inc.* | 7,375 | 225,970 | ||||||
| SYNNEX Corp.* (a) | 7,036 | 242,672 | ||||||
| TTM Technologies, Inc.* (a) | 14,423 | 135,720 | ||||||
| Universal Display Corp.* (a) | 10,644 | 382,545 | ||||||
| Viasystems Group, Inc.* (a) | 1,161 | 19,737 | ||||||
| Vishay Precision Group, Inc.* (a) | 3,234 | 45,114 | ||||||
| Zygo Corp.* | 4,438 | 79,263 | ||||||
| 7,355,779 | ||||||||
| Internet Software & Services 2.3% | ||||||||
| Ancestry.com, Inc.* (a) | 7,757 | 213,550 | ||||||
| Angie's List, Inc.* (a) | 9,537 | 151,066 | ||||||
| Bankrate, Inc.* (a) | 12,379 | 227,650 | ||||||
| Bazaarvoice, Inc.* (a) | 2,547 | 46,355 | ||||||
| Blucora, Inc.* (a) | 10,846 | 133,623 | ||||||
| Brightcove, Inc.* (a) | 1,519 | 23,165 | ||||||
| Carbonite, Inc.* (a) | 3,027 | 27,061 | ||||||
| comScore, Inc.* | 9,472 | 155,909 | ||||||
| Constant Contact, Inc.* (a) | 8,148 | 145,686 | ||||||
| Cornerstone OnDemand, Inc.* (a) | 9,023 | 214,838 | ||||||
| DealerTrack Holdings, Inc.* (a) | 11,375 | 342,501 | ||||||
| Shares | Value ($) | |||||||
| Demand Media, Inc.* (a) | 8,031 | 89,947 | ||||||
| Demandware, Inc.* (a) | 1,752 | 41,505 | ||||||
| Dice Holdings, Inc.* | 12,492 | 117,300 | ||||||
| Digital River, Inc.* | 10,050 | 167,031 | ||||||
| EarthLink, Inc. | 28,195 | 209,771 | ||||||
| Easylink Services International Corp. "A"* (a) | 8,473 | 61,345 | ||||||
| Envestnet, Inc.* | 5,632 | 67,584 | ||||||
| ExactTarget, Inc.* (a) | 2,617 | 57,208 | ||||||
| Internap Network Services Corp.* | 14,225 | 92,605 | ||||||
| Intralinks Holdings, Inc.* | 9,799 | 42,920 | ||||||
| iPass, Inc.* | 13,961 | 33,227 | ||||||
| j2 Global, Inc. (a) | 12,394 | 327,450 | ||||||
| Keynote Systems, Inc. (a) | 4,304 | 63,914 | ||||||
| KIT Digital, Inc.* (a) | 12,868 | 55,204 | ||||||
| Limelight Networks, Inc.* (a) | 16,309 | 47,785 | ||||||
| Liquidity Services, Inc.* | 6,312 | 323,111 | ||||||
| LivePerson, Inc.* (a) | 14,747 | 281,078 | ||||||
| LogMeIn, Inc.* (a) | 5,914 | 180,495 | ||||||
| Marchex, Inc. "B" (a) | 5,551 | 20,039 | ||||||
| Market Leader, Inc.* | 5,904 | 29,992 | ||||||
| MeetMe, Inc.* (a) | 4,972 | 11,684 | ||||||
| Millennial Media, Inc.* | 3,060 | 40,361 | ||||||
| Monster Worldwide, Inc.* | 32,497 | 276,225 | ||||||
| Move, Inc.* | 10,390 | 94,653 | ||||||
| NIC, Inc. (a) | 17,275 | 219,393 | ||||||
| OpenTable, Inc.* (a) | 6,047 | 272,175 | ||||||
| Perficient, Inc.* (a) | 8,565 | 96,185 | ||||||
| QuinStreet, Inc.* (a) | 8,765 | 81,164 | ||||||
| RealNetworks, Inc. | 6,119 | 52,868 | ||||||
| Responsys, Inc.* (a) | 9,593 | 116,267 | ||||||
| Saba Software, Inc.* | 7,972 | 73,980 | ||||||
| SciQuest, Inc.* | 4,790 | 86,028 | ||||||
| Spark Networks, Inc.* (a) | 3,089 | 15,939 | ||||||
| SPS Commerce, Inc.* (a) | 2,837 | 86,188 | ||||||
| Stamps.com, Inc.* (a) | 3,794 | 93,598 | ||||||
| Support.com, Inc.* | 12,427 | 39,642 | ||||||
| Synacor, Inc.* | 1,810 | 24,797 | ||||||
| TechTarget, Inc.* (a) | 3,701 | 18,653 | ||||||
| The Active Network, Inc.* | 10,418 | 160,333 | ||||||
| Travelzoo, Inc.* (a) | 1,909 | 43,373 | ||||||
| United Online, Inc. (a) | 24,539 | 103,555 | ||||||
| Unwired Planet, Inc.* | 22,941 | 52,764 | ||||||
| ValueClick, Inc.* (a) | 21,603 | 354,073 | ||||||
| VistaPrint NV* (a) | 9,914 | 320,222 | ||||||
| Vocus, Inc.* | 5,528 | 102,821 | ||||||
| Web.com Group, Inc.* (a) | 9,397 | 172,153 | ||||||
| WebMD Health Corp.* (a) | 13,572 | 278,362 | ||||||
| XO Group, Inc.* | 7,115 | 63,110 | ||||||
| Yelp, Inc.* | 2,261 | 51,393 | ||||||
| Zillow, Inc.* (a) | 826 | 31,908 | ||||||
| Zix Corp.* (a) | 15,785 | 41,041 | ||||||
| 7,465,823 | ||||||||
| IT Services 1.9% | ||||||||
| Acxiom Corp.* | 20,566 | 310,752 | ||||||
| CACI International, Inc. "A"* (a) | 7,136 | 392,623 | ||||||
| Cardtronics, Inc.* | 11,811 | 356,810 | ||||||
| Cass Information Systems, Inc. (a) | 2,535 | 102,034 | ||||||
| CIBER, Inc.* | 19,541 | 84,222 | ||||||
| Computer Task Group, Inc.* | 4,145 | 62,134 | ||||||
| Convergys Corp. | 31,244 | 461,474 | ||||||
| CSG Systems International, Inc.* | 9,068 | 156,695 | ||||||
| Echo Global Logistics, Inc.* (a) | 3,941 | 75,115 | ||||||
| Shares | Value ($) | |||||||
| EPAM Systems, Inc.* | 1,302 | 22,121 | ||||||
| Euronet Worldwide, Inc.* | 13,724 | 234,955 | ||||||
| Exlservice Holdings, Inc.* | 6,244 | 153,852 | ||||||
| Forrester Research, Inc. (a) | 3,732 | 126,365 | ||||||
| Global Cash Access Holdings, Inc.* | 17,620 | 127,040 | ||||||
| Heartland Payment Systems, Inc. | 10,376 | 312,110 | ||||||
| Higher One Holdings Inc.* (a) | 8,606 | 105,165 | ||||||
| iGATE Corp.* (a) | 8,605 | 146,457 | ||||||
| Innodata, Inc.* | 5,942 | 40,643 | ||||||
| Lionbridge Technologies, Inc.* | 15,386 | 48,466 | ||||||
| ManTech International Corp. "A" (a) | 6,297 | 147,791 | ||||||
| Mattersight Corp.* (a) | 2,722 | 21,722 | ||||||
| MAXIMUS, Inc. (a) | 9,132 | 472,581 | ||||||
| ModusLink Global Solutions, Inc.* | 10,185 | 30,453 | ||||||
| MoneyGram International, Inc.* | 5,760 | 84,096 | ||||||
| PRGX Global, Inc.* | 5,625 | 44,719 | ||||||
| Sapient Corp. | 33,007 | 332,380 | ||||||
| ServiceSource International, Inc.* (a) | 13,302 | 184,233 | ||||||
| Syntel, Inc. | 4,135 | 250,994 | ||||||
| TeleTech Holdings, Inc.* (a) | 6,151 | 98,416 | ||||||
| The Hackett Group, Inc.* (a) | 6,586 | 36,684 | ||||||
| TNS, Inc.* | 6,680 | 119,839 | ||||||
| Unisys Corp.* (a) | 11,741 | 229,537 | ||||||
| Virtusa Corp.* | 4,992 | 66,643 | ||||||
| Wright Express Corp.* (a) | 10,412 | 642,629 | ||||||
| 6,081,750 | ||||||||
| Semiconductors & Semiconductor Equipment 3.5% | ||||||||
| Advanced Energy Industries, Inc.* | 10,564 | 141,769 | ||||||
| Alpha & Omega Semiconductor Ltd.* (a) | 4,621 | 42,282 | ||||||
| Amkor Technology, Inc.* (a) | 21,376 | 104,315 | ||||||
| ANADIGICS, Inc.* (a) | 19,652 | 35,570 | ||||||
| Applied Micro Circuits Corp.* | 16,623 | 95,084 | ||||||
| ATMI, Inc.* | 8,555 | 175,976 | ||||||
| AuthenTec, Inc.* | 11,935 | 51,679 | ||||||
| Axcelis Technologies, Inc.* | 28,848 | 34,618 | ||||||
| AXT, Inc.* (a) | 8,503 | 33,587 | ||||||
| Brooks Automation, Inc. | 17,799 | 168,023 | ||||||
| Cabot Microelectronics Corp. | 6,310 | 184,315 | ||||||
| Cavium, Inc.* (a) | 13,326 | 373,128 | ||||||
| CEVA, Inc.* | 6,274 | 110,485 | ||||||
| Cirrus Logic, Inc.* (a) | 17,272 | 516,087 | ||||||
| Cohu, Inc. | 6,641 | 67,473 | ||||||
| Cymer, Inc.* (a) | 8,287 | 488,519 | ||||||
| Diodes, Inc.* (a) | 9,521 | 178,709 | ||||||
| DSP Group, Inc.* | 6,073 | 38,503 | ||||||
| Entegris, Inc.* | 36,791 | 314,195 | ||||||
| Entropic Communications, Inc.* (a) | 24,111 | 135,986 | ||||||
| Exar Corp.* | 9,974 | 81,388 | ||||||
| First Solar, Inc.* (a) | 16,141 | 243,083 | ||||||
| FormFactor, Inc.* (a) | 13,234 | 85,624 | ||||||
| FSI International, Inc.* (a) | 10,049 | 36,076 | ||||||
| GSI Technology, Inc.* (a) | 5,571 | 26,407 | ||||||
| GT Advanced Technologies, Inc.* (a) | 32,147 | 169,736 | ||||||
| Hittite Microwave Corp.* (a) | 8,441 | 431,504 | ||||||
| Inphi Corp.* (a) | 6,321 | 59,923 | ||||||
| Integrated Device Technology, Inc.* | 37,977 | 213,431 | ||||||
| Integrated Silicon Solution, Inc.* (a) | 7,155 | 72,194 | ||||||
| Intermolecular, Inc.* (a) | 3,716 | 28,799 | ||||||
| International Rectifier Corp.* (a) | 18,553 | 370,874 | ||||||
| Shares | Value ($) | |||||||
| Intersil Corp. "A" | 34,129 | 363,474 | ||||||
| IXYS Corp.* (a) | 6,745 | 75,342 | ||||||
| Kopin Corp.* | 18,334 | 63,069 | ||||||
| Lattice Semiconductor Corp.* | 31,184 | 117,564 | ||||||
| LTX-Credence Corp.* | 13,004 | 87,127 | ||||||
| MA-COM Technology Solutions Holdings, Inc.* | 1,630 | 30,155 | ||||||
| Mattson Technology, Inc.* (a) | 15,699 | 27,473 | ||||||
| MaxLinear, Inc. "A"* (a) | 5,951 | 29,517 | ||||||
| MEMC Electronic Materials, Inc.* | 61,886 | 134,293 | ||||||
| Micrel, Inc. (a) | 12,981 | 123,709 | ||||||
| Microsemi Corp.* | 23,817 | 440,376 | ||||||
| Mindspeed Technologies, Inc.* (a) | 8,832 | 21,727 | ||||||
| MIPS Technologies, Inc.* (a) | 12,820 | 85,509 | ||||||
| MKS Instruments, Inc. | 14,078 | 407,277 | ||||||
| Monolithic Power Systems, Inc.* | 8,190 | 162,735 | ||||||
| MoSys, Inc.* (a) | 8,668 | 28,084 | ||||||
| Nanometrics, Inc.* | 6,293 | 96,660 | ||||||
| NVE Corp.* (a) | 1,302 | 69,982 | ||||||
| OmniVision Technologies, Inc.* | 14,114 | 188,563 | ||||||
| PDF Solutions, Inc.* (a) | 6,254 | 61,727 | ||||||
| Pericom Semiconductor Corp.* | 6,165 | 55,485 | ||||||
| Photronics, Inc.* (a) | 16,513 | 100,729 | ||||||
| PLX Technology, Inc.* (a) | 11,988 | 76,124 | ||||||
| Power Integrations, Inc. | 7,562 | 282,063 | ||||||
| QuickLogic Corp.* | 10,392 | 26,084 | ||||||
| Rambus, Inc.* (a) | 29,606 | 169,938 | ||||||
| RF Micro Devices, Inc.* | 74,555 | 316,859 | ||||||
| Rubicon Technology, Inc.* (a) | 4,744 | 48,389 | ||||||
| Rudolph Technologies, Inc.* | 8,474 | 73,893 | ||||||
| Semtech Corp.* (a) | 17,544 | 426,670 | ||||||
| Sigma Designs, Inc.* | 8,869 | 56,584 | ||||||
| Silicon Image, Inc.* | 22,318 | 92,397 | ||||||
| Spansion, Inc. "A"* | 12,933 | 142,004 | ||||||
| Standard Microsystems Corp.* (a) | 6,138 | 226,431 | ||||||
| STR Holdings, Inc.* (a) | 8,021 | 36,576 | ||||||
| SunPower Corp.* (a) | 10,672 | 51,332 | ||||||
| Supertex, Inc.* (a) | 2,837 | 53,477 | ||||||
| Tessera Technologies, Inc. | 13,906 | 213,735 | ||||||
| TriQuint Semiconductor, Inc.* (a) | 45,175 | 248,462 | ||||||
| Ultra Clean Holdings* | 5,955 | 38,291 | ||||||
| Ultratech, Inc.* | 7,024 | 221,256 | ||||||
| Veeco Instruments, Inc.* (a) | 10,412 | 357,756 | ||||||
| Volterra Semiconductor Corp.* | 6,794 | 159,319 | ||||||
| 11,197,559 | ||||||||
| Software 3.9% | ||||||||
| Accelrys, Inc.* | 14,894 | 120,492 | ||||||
| ACI Worldwide, Inc.* (a) | 10,649 | 470,792 | ||||||
| Actuate Corp.* | 13,175 | 91,303 | ||||||
| Advent Software, Inc.* | 8,376 | 227,073 | ||||||
| American Software, Inc. "A" | 6,469 | 51,429 | ||||||
| Aspen Technology, Inc.* | 25,070 | 580,370 | ||||||
| AVG Technologies NV* (a) | 2,103 | 27,360 | ||||||
| Blackbaud, Inc. (a) | 12,089 | 310,325 | ||||||
| Bottomline Technologies, Inc.* | 9,265 | 167,233 | ||||||
| BroadSoft, Inc.* (a) | 7,363 | 213,232 | ||||||
| Callidus Software* (a) | 9,296 | 46,294 | ||||||
| CommVault Systems, Inc.* | 11,964 | 593,055 | ||||||
| Deltek, Inc.* (a) | 5,928 | 68,706 | ||||||
| Digimarc Corp. (a) | 1,901 | 48,780 | ||||||
| Ebix, Inc. (a) | 7,585 | 151,321 | ||||||
| Ellie Mae, Inc.* (a) | 5,788 | 104,184 | ||||||
| Envivio, Inc.* | 2,079 | 13,326 | ||||||
| Shares | Value ($) | |||||||
| EPIQ Systems, Inc. (a) | 8,592 | 105,252 | ||||||
| ePlus, Inc.* | 1,066 | 34,485 | ||||||
| Fair Isaac Corp. | 9,178 | 388,046 | ||||||
| FalconStor Software, Inc.* (a) | 8,242 | 21,512 | ||||||
| Glu Mobile, Inc.* (a) | 14,500 | 80,475 | ||||||
| Guidance Software, Inc.* | 3,841 | 36,528 | ||||||
| Guidewire Software, Inc.* (a) | 5,192 | 145,999 | ||||||
| Imperva, Inc.* (a) | 2,607 | 75,134 | ||||||
| Infoblox, Inc.* | 2,082 | 47,740 | ||||||
| Interactive Intelligence Group* (a) | 3,999 | 112,812 | ||||||
| JDA Software Group, Inc.* | 11,398 | 338,407 | ||||||
| Jive Software, Inc.* (a) | 4,337 | 91,034 | ||||||
| Kenexa Corp.* | 7,328 | 212,732 | ||||||
| Manhattan Associates, Inc.* | 5,463 | 249,714 | ||||||
| Mentor Graphics Corp.* | 24,945 | 374,175 | ||||||
| MicroStrategy, Inc. "A"* | 2,282 | 296,340 | ||||||
| Monotype Imaging Holdings, Inc.* (a) | 9,797 | 164,296 | ||||||
| Netscout Systems, Inc.* | 9,859 | 212,856 | ||||||
| OPNET Technologies, Inc. | 4,009 | 106,599 | ||||||
| Parametric Technology Corp.* (a) | 32,042 | 671,600 | ||||||
| Pegasystems, Inc. (a) | 4,607 | 151,939 | ||||||
| Pervasive Software, Inc.* | 3,542 | 26,530 | ||||||
| Progress Software Corp.* (a) | 16,845 | 351,555 | ||||||
| Proofpoint, Inc.* | 1,698 | 28,781 | ||||||
| PROS Holdings, Inc.* (a) | 5,988 | 100,718 | ||||||
| QAD, Inc. "A"* | 1,775 | 25,240 | ||||||
| QLIK Technologies, Inc.* (a) | 22,874 | 505,973 | ||||||
| Quest Software, Inc.* | 14,941 | 416,107 | ||||||
| RealPage, Inc.* (a) | 9,600 | 222,336 | ||||||
| Rosetta Stone, Inc.* (a) | 2,899 | 40,122 | ||||||
| Sapiens International Corp.* | 3,661 | 13,180 | ||||||
| SeaChange International, Inc.* | 7,652 | 62,976 | ||||||
| Sourcefire, Inc.* (a) | 7,918 | 406,985 | ||||||
| SRS Labs, Inc.* | 2,838 | 25,542 | ||||||
| SS&C Technologies Holdings, Inc.* | 9,063 | 226,575 | ||||||
| Synchronoss Technologies, Inc.* (a) | 7,407 | 136,807 | ||||||
| Take-Two Interactive Software, Inc.* (a) | 20,940 | 198,092 | ||||||
| Tangoe, Inc.* (a) | 7,992 | 170,310 | ||||||
| TeleNav, Inc.* | 4,248 | 26,040 | ||||||
| TiVo, Inc.* | 33,403 | 276,243 | ||||||
| Tyler Technologies, Inc.* (a) | 8,053 | 324,939 | ||||||
| Ultimate Software Group, Inc.* | 7,134 | 635,782 | ||||||
| VASCO Data Security International, Inc.* (a) | 7,836 | 64,098 | ||||||
| Verint Systems, Inc.* | 5,830 | 172,043 | ||||||
| Virnetx Holding Corp.* (a) | 11,244 | 396,351 | ||||||
| Websense, Inc.* | 9,942 | 186,214 | ||||||
| 12,242,489 | ||||||||
| Materials 4.5% | ||||||||
| Chemicals 1.9% | ||||||||
| A. Schulman, Inc. (a) | 7,797 | 154,770 | ||||||
| ADA-ES, Inc.* | 2,414 | 61,243 | ||||||
| American Vanguard Corp. (a) | 7,456 | 198,255 | ||||||
| Arabian American Development Co.* (a) | 5,349 | 51,832 | ||||||
| Balchem Corp. (a) | 7,840 | 255,662 | ||||||
| Calgon Carbon Corp.* | 15,258 | 216,969 | ||||||
| Chase Corp. (a) | 1,651 | 21,793 | ||||||
| Chemtura Corp.* | 26,445 | 383,453 | ||||||
| Ferro Corp.* | 23,011 | 110,453 | ||||||
| Flotek Industries, Inc.* | 13,086 | 122,223 | ||||||
| Shares | Value ($) | |||||||
| FutureFuel Corp. (a) | 5,237 | 55,041 | ||||||
| Georgia Gulf Corp. | 9,174 | 235,497 | ||||||
| GSE Holding, Inc.* (a) | 2,103 | 22,229 | ||||||
| H.B. Fuller Co. (a) | 13,361 | 410,183 | ||||||
| Hawkins, Inc. (a) | 2,459 | 93,885 | ||||||
| Innophos Holdings, Inc. | 5,838 | 329,613 | ||||||
| Innospec, Inc.* | 6,145 | 181,953 | ||||||
| KMG Chemicals, Inc. (a) | 1,977 | 38,117 | ||||||
| Koppers Holdings, Inc. (a) | 5,626 | 191,284 | ||||||
| Kraton Performance Polymers, Inc.* | 8,648 | 189,478 | ||||||
| Landec Corp.* | 6,891 | 58,987 | ||||||
| LSB Industries, Inc.* | 5,030 | 155,477 | ||||||
| Minerals Technologies, Inc. | 4,795 | 305,825 | ||||||
| Olin Corp. | 21,458 | 448,258 | ||||||
| OM Group, Inc.* | 8,692 | 165,148 | ||||||
| Omnova Solutions, Inc.* (a) | 12,586 | 94,898 | ||||||
| PolyOne Corp. | 24,013 | 328,498 | ||||||
| Quaker Chemical Corp. | 3,428 | 158,408 | ||||||
| Sensient Technologies Corp. (a) | 13,369 | 491,043 | ||||||
| Spartech Corp.* | 8,472 | 43,800 | ||||||
| Stepan Co. (a) | 2,249 | 211,811 | ||||||
| TPC Group, Inc.* (a) | 3,400 | 125,630 | ||||||
| Tredegar Corp. (a) | 6,527 | 95,033 | ||||||
| Zep, Inc. | 6,118 | 84,000 | ||||||
| Zoltek Companies, Inc.* (a) | 7,464 | 67,400 | ||||||
| 6,158,149 | ||||||||
| Construction Materials 0.3% | ||||||||
| Eagle Materials, Inc. | 12,125 | 452,747 | ||||||
| Headwaters, Inc.* (a) | 16,879 | 86,927 | ||||||
| Texas Industries, Inc. (a) | 6,086 | 237,415 | ||||||
| United States Lime & Minerals, Inc.* (a) | 464 | 21,655 | ||||||
| 798,744 | ||||||||
| Containers & Packaging 0.2% | ||||||||
| AEP Industries, Inc.* | 1,125 | 48,994 | ||||||
| Boise, Inc. (a) | 26,932 | 177,213 | ||||||
| Graphic Packaging Holding Co.* | 44,850 | 246,675 | ||||||
| Myers Industries, Inc. | 8,970 | 153,925 | ||||||
| UFP Technologies, Inc.* | 1,471 | 24,860 | ||||||
| 651,667 | ||||||||
| Metals & Mining 1.4% | ||||||||
| A.M. Castle & Co.* (a) | 4,420 | 46,940 | ||||||
| AK Steel Holding Corp. (a) | 29,636 | 173,963 | ||||||
| AMCOL International Corp. | 6,767 | 191,574 | ||||||
| Century Aluminum Co.* | 13,782 | 101,022 | ||||||
| Coeur d'Alene Mines Corp.* (a) | 24,095 | 423,108 | ||||||
| General Moly, Inc.* (a) | 18,078 | 56,765 | ||||||
| Globe Specialty Metals, Inc. | 16,496 | 221,541 | ||||||
| Gold Reserve, Inc.* (a) | 14,021 | 48,933 | ||||||
| Gold Resource Corp. (a) | 7,996 | 207,816 | ||||||
| Golden Minerals Co.* (a) | 7,446 | 33,582 | ||||||
| Golden Star Resources Ltd.* (a) | 69,293 | 80,380 | ||||||
| Handy & Harman Ltd.* | 1,316 | 17,740 | ||||||
| Haynes International, Inc. | 3,340 | 170,140 | ||||||
| Hecla Mining Co. (a) | 76,467 | 363,218 | ||||||
| Horsehead Holding Corp.* (a) | 11,645 | 115,984 | ||||||
| Kaiser Aluminum Corp. | 5,170 | 268,013 | ||||||
| Materion Corp. | 5,433 | 125,122 | ||||||
| McEwen Mining, Inc.* (a) | 52,872 | 159,145 | ||||||
| Metals U.S.A. Holdings Corp.* | 3,232 | 51,421 | ||||||
| Midway Gold Corp.* (a) | 30,687 | 42,655 | ||||||
| Noranda Aluminum Holding Corp. | 8,952 | 71,258 | ||||||
| Shares | Value ($) | |||||||
| Olympic Steel, Inc. (a) | 2,416 | 39,671 | ||||||
| Paramount Gold and Silver Corp.* (a) | 35,029 | 84,070 | ||||||
| Revett Minerals, Inc.* | 6,194 | 20,378 | ||||||
| RTI International Metals, Inc.* (a) | 8,129 | 183,959 | ||||||
| Schnitzer Steel Industries, Inc. "A" | 6,768 | 189,639 | ||||||
| Stillwater Mining Co.* (a) | 31,049 | 265,159 | ||||||
| SunCoke Energy, Inc.* (a) | 18,839 | 275,991 | ||||||
| U.S. Antimony Corp.* (a) | 14,417 | 58,245 | ||||||
| U.S. Silica Holdings, Inc.* (a) | 3,097 | 34,872 | ||||||
| Universal Stainless & Alloy Products, Inc.* | 1,831 | 75,254 | ||||||
| Vista Gold Corp.* (a) | 15,599 | 45,393 | ||||||
| Worthington Industries, Inc. | 14,106 | 288,750 | ||||||
| 4,531,701 | ||||||||
| Paper & Forest Products 0.7% | ||||||||
| Buckeye Technologies, Inc. | 10,473 | 298,376 | ||||||
| Clearwater Paper Corp.* | 6,271 | 213,966 | ||||||
| Deltic Timber Corp. (a) | 2,928 | 178,549 | ||||||
| KapStone Paper & Packaging Corp.* | 10,838 | 171,782 | ||||||
| Louisiana-Pacific Corp.* (a) | 36,869 | 401,135 | ||||||
| Neenah Paper, Inc. (a) | 4,158 | 110,977 | ||||||
| P.H. Glatfelter Co. (a) | 11,613 | 190,105 | ||||||
| Resolute Forest Products* (a) | 21,723 | 251,552 | ||||||
| Schweitzer-Mauduit International, Inc. (a) | 4,149 | 282,713 | ||||||
| Wausau Paper Corp. (a) | 11,857 | 115,369 | ||||||
| 2,214,524 | ||||||||
| Telecommunication Services 0.8% | ||||||||
| Diversified Telecommunication Services 0.7% | ||||||||
| 8x8, Inc.* (a) | 18,938 | 79,540 | ||||||
| AboveNet, Inc.* (a) | 6,295 | 528,780 | ||||||
| Atlantic Tele-Network, Inc. | 2,377 | 80,176 | ||||||
| Boingo Wireless, Inc.* (a) | 4,230 | 49,153 | ||||||
| Cbeyond, Inc.* | 7,416 | 50,206 | ||||||
| Cincinnati Bell, Inc.* (a) | 52,280 | 194,482 | ||||||
| Cogent Communications Group, Inc.* | 12,550 | 241,588 | ||||||
| Consolidated Communications Holdings, Inc. (a) | 8,014 | 118,607 | ||||||
| FairPoint Communications, Inc.* (a) | 5,540 | 34,071 | ||||||
| General Communication, Inc. "A"* | 9,696 | 80,574 | ||||||
| Hawaiian Telcom Holdco, Inc.* (a) | 2,746 | 53,574 | ||||||
| HickoryTech Corp. (a) | 3,849 | 42,762 | ||||||
| IDT Corp. "B" (a) | 4,295 | 42,134 | ||||||
| inContact, Inc.* (a) | 8,674 | 43,457 | ||||||
| Iridium Communications, Inc.* (a) | 13,317 | 119,320 | ||||||
| Lumos Networks Corp. | 3,931 | 37,148 | ||||||
| magicJack VocalTec Ltd.* | 4,045 | 76,855 | ||||||
| Neutral Tandem, Inc.* | 7,530 | 99,245 | ||||||
| Orbcomm, Inc.* | 8,994 | 29,320 | ||||||
| Premiere Global Services, Inc.* (a) | 13,558 | 113,752 | ||||||
| Primus Telecommunications Group, Inc. | 3,262 | 50,789 | ||||||
| SureWest Communications (a) | 3,811 | 80,298 | ||||||
| Towerstream Corp.* (a) | 12,745 | 52,892 | ||||||
| Vonage Holdings Corp.* | 42,724 | 85,875 | ||||||
| 2,384,598 | ||||||||
| Wireless Telecommunication Services 0.1% | ||||||||
| Leap Wireless International, Inc.* | 14,435 | 92,817 | ||||||
| NTELOS Holdings Corp. (a) | 3,931 | 74,099 | ||||||
| Shenandoah Telecommunications Co. (a) | 6,495 | 88,397 | ||||||
| Shares | Value ($) | |||||||
| U.S.A. Mobility, Inc. (a) | 6,031 | 77,559 | ||||||
| 332,872 | ||||||||
| Utilities 3.5% | ||||||||
| Electric Utilities 1.5% | ||||||||
| ALLETE, Inc. | 10,239 | 427,990 | ||||||
| Cleco Corp. (a) | 16,319 | 682,624 | ||||||
| El Paso Electric Co. | 10,726 | 355,674 | ||||||
| Empire District Electric Co. (a) | 11,320 | 238,852 | ||||||
| IDACORP, Inc. | 13,438 | 565,471 | ||||||
| MGE Energy, Inc. (a) | 6,206 | 293,544 | ||||||
| Otter Tail Corp. | 9,719 | 222,274 | ||||||
| PNM Resources, Inc. | 21,336 | 416,905 | ||||||
| Portland General Electric Co. | 20,240 | 539,598 | ||||||
| UIL Holdings Corp. (a) | 13,565 | 486,441 | ||||||
| Unitil Corp. (a) | 3,612 | 95,718 | ||||||
| UNS Energy Corp. | 10,759 | 413,253 | ||||||
| 4,738,344 | ||||||||
| Gas Utilities 1.0% | ||||||||
| Chesapeake Utilities Corp. | 2,603 | 113,803 | ||||||
| Delta Natural Gas Co., Inc. (a) | 1,824 | 39,636 | ||||||
| New Jersey Resources Corp. (a) | 11,126 | 485,205 | ||||||
| Northwest Natural Gas Co. (a) | 7,169 | 341,244 | ||||||
| Piedmont Natural Gas Co., Inc. (a) | 19,200 | 618,048 | ||||||
| South Jersey Industries, Inc. (a) | 8,139 | 414,845 | ||||||
| Southwest Gas Corp. | 12,333 | 538,335 | ||||||
| The Laclede Group, Inc. (a) | 6,012 | 239,338 | ||||||
| WGL Holdings, Inc. (a) | 13,790 | 548,153 | ||||||
| 3,338,607 | ||||||||
| Independent Power Producers & Energy Traders 0.3% | ||||||||
| American DG Energy, Inc.* (a) | 6,574 | 14,923 | ||||||
| Atlantic Power Corp.* (a) | 30,553 | 391,384 | ||||||
| Genie Energy Ltd. "B" | 3,759 | 29,208 | ||||||
| GenOn Energy, Inc.* | 207,202 | 354,315 | ||||||
| Ormat Technologies, Inc. (a) | 4,667 | 99,827 | ||||||
| 889,657 | ||||||||
| Multi-Utilities 0.4% | ||||||||
| Avista Corp. | 15,721 | 419,751 | ||||||
| Black Hills Corp. (a) | 11,813 | 380,024 | ||||||
| CH Energy Group, Inc. (a) | 3,994 | 262,366 | ||||||
| NorthWestern Corp. | 9,732 | 357,164 | ||||||
| 1,419,305 | ||||||||
| Water Utilities 0.3% | ||||||||
| American States Water Co. (a) | 5,011 | 198,335 | ||||||
| Artesian Resources Corp. "A" (a) | 2,051 | 44,179 | ||||||
| Shares | Value ($) | |||||||
| Cadiz, Inc.* (a) | 3,773 | 27,203 | ||||||
| California Water Service Group (a) | 11,292 | 208,563 | ||||||
| Connecticut Water Service, Inc. (a) | 2,343 | 67,900 | ||||||
| Consolidated Water Co., Ltd. (a) | 3,947 | 32,721 | ||||||
| Middlesex Water Co. | 4,173 | 79,287 | ||||||
| SJW Corp. (a) | 3,811 | 91,502 | ||||||
| York Water Co. (a) | 3,484 | 62,330 | ||||||
| 812,020 | ||||||||
Total Common Stocks (Cost $291,110,827) | 308,076,703 | |||||||
| Warrants 0.0% | ||||||||
| Energy | ||||||||
| Magnum Hunter Resources Corp., Expiration Date 10/14/2013* (Cost $0) | 2,943 | 687 | ||||||
Principal Amount ($) | Value ($) | |
| Government & Agency Obligation 0.4% | ||
| U.S. Treasury Obligation | ||
| U.S. Treasury Bill, 0.135%**, 11/1/2012 (b) (Cost $1,334,089) | 1,335,000 | 1,334,514 |
| Shares | Value ($) | |||||||
| Securities Lending Collateral 41.5% | ||||||||
| Daily Assets Fund Institutional, 0.24% (c) (d) (Cost $131,491,656) | 131,491,656 | 131,491,656 | ||||||
| Cash Equivalents 2.2% | ||||||||
| Central Cash Management Fund, 0.14% (c) (Cost $7,111,816) | 7,111,816 | 7,111,816 | ||||||
| % of Net Assets | Value ($) | |||||||
Total Investment Portfolio (Cost $431,048,388)+ | 141.2 | 448,015,376 | ||||||
| Other Assets and Liabilities, Net (a) | (41.2 | ) | (130,778,346 | ) | ||||
| Net Assets | 100.0 | 317,237,030 | ||||||
* Non-income producing security.
** Annualized yield at time of purchase; not a coupon rate.
+ The cost for federal income tax purposes was $435,083,639. At June 30, 2012, net unrealized appreciation for all securities based on tax cost was $12,931,737. This consisted of aggregate gross unrealized appreciation for all securities in which there was an excess of value over tax cost of $62,487,270 and aggregate gross unrealized depreciation for all securities in which there was an excess of tax cost over value of $49,555,533.
(a) All or a portion of these securities were on loan amounting to $131,652,654. In addition, included in other assets and liabilities, net are pending sales, amounting to $394,750, that are also on loan (see Notes to Financial Statements). The value of all securities loaned at June 30, 2012 amounted to $132,047,404, which is 41.6% of net assets.
(b) At June 30, 2012, this security has been pledged, in whole or in part, to cover initial margin requirements for open futures contracts.
(c) Affiliated fund managed by Deutsche Investment Management Americas Inc. The rate shown is the annualized seven-day yield at period end.
(d) Represents collateral held in connection with securities lending. Income earned by the Fund is net of borrower rebates.
REIT: Real Estate Investment Trust
At June 30, 2012, open futures contracts purchased were as follows:
| Futures | Currency | Expiration Date | Contracts | Notional Value ($) | Unrealized Appreciation ($) | |||||||||
| Russell E Mini 2000 Index | USD | 9/21/2012 | 124 | 9,862,960 | 519,152 | |||||||||
| Currency Abbreviation |
| USD United States Dollar |
For information on the Fund's policy and additional disclosures regarding futures contracts, please refer to Note B in the accompanying Notes to Financial Statements.
Fair Value Measurements
Various inputs are used in determining the value of the Fund's investments. These inputs are summarized in three broad levels. Level 1 includes quoted prices in active markets for identical securities. Level 2 includes other significant observable inputs (including quoted prices for similar securities, interest rates, prepayment speeds, and credit risk). Level 3 includes significant unobservable inputs (including the Fund's own assumptions in determining the fair value of investments). The inputs or methodology used for valuing securities are not necessarily an indication of the risk associated with investing in those securities.
The following is a summary of the inputs used as of June 30, 2012 in valuing the Fund's investments. For information on the Fund's policy regarding the valuation of investments, please refer to the Security Valuation section of Note A in the accompanying Notes to Financial Statements.
| Assets | Level 1 | Level 2 | Level 3 | Total | ||||||||||||
| Common Stocks and Warrants (e) | $ | 308,076,703 | $ | — | $ | 687 | $ | 308,077,390 | ||||||||
| Government & Agency Obligation | — | 1,334,514 | — | 1,334,514 | ||||||||||||
| Short-Term Investments (e) | 138,603,472 | — | — | 138,603,472 | ||||||||||||
| Derivatives (f) | 519,152 | — | — | 519,152 | ||||||||||||
| Total | $ | 447,199,327 | $ | 1,334,514 | $ | 687 | $ | 448,534,528 | ||||||||
There have been no transfers between Level 1 and Level 2 fair value measurements during the period ended June 30, 2012.
(e) See Investment Portfolio for additional detailed categorizations.
(f) Derivatives include unrealized appreciation (depreciation) on open futures contracts.
The accompanying notes are an integral part of the financial statements.
| as of June 30, 2012 (Unaudited) | ||||
| Assets | ||||
Investments: Investments in non-affiliated securities, at value (cost $292,444,916) — including $131,652,654 of securities loaned | $ | 309,411,904 | ||
| Investment in Daily Assets Fund Institutional (cost $131,491,656)* | 131,491,656 | |||
| Investment in Central Cash Management Fund (cost $7,111,816) | 7,111,816 | |||
| Total investments in securities, at value (cost $431,048,388) | 448,015,376 | |||
| Cash | 17,529 | |||
| Receivable for investments sold | 1,095,901 | |||
| Receivable for Fund shares sold | 26,882 | |||
| Dividends receivable | 322,437 | |||
| Interest receivable | 83,918 | |||
| Receivable for variation margin on futures contracts | 268,884 | |||
| Other assets | 4,217 | |||
| Total assets | 449,835,144 | |||
| Liabilities | ||||
| Payable upon return of securities loaned | 131,491,656 | |||
| Payable for investments purchased | 839,884 | |||
| Payable for Fund shares redeemed | 99,341 | |||
| Accrued management fee | 80,775 | |||
| Accrued Trustees' fees | 1,784 | |||
| Other accrued expenses and payables | 84,674 | |||
| Total liabilities | 132,598,114 | |||
| Net assets, at value | $ | 317,237,030 | ||
| Net Assets Consist of | ||||
| Undistributed net investment income | 2,181,492 | |||
Net unrealized appreciation (depreciation) on: Investments | 16,966,988 | |||
| Futures | 519,152 | |||
| Foreign currency | 35 | |||
| Accumulated net realized gain (loss) | 3,565,973 | |||
| Paid-in capital | 294,003,390 | |||
| Net assets, at value | $ | 317,237,030 | ||
Class A Net Asset Value, offering and redemption price per share ($275,268,935 ÷ 21,755,775 outstanding shares of beneficial interest, $.001 par value, unlimited number of shares authorized) | $ | 12.65 | ||
Class B Net Asset Value, offering and redemption price per share ($41,968,095 ÷ 3,315,089 outstanding shares of beneficial interest, $.001 par value, unlimited number of shares authorized) | $ | 12.66 | ||
* Represents collateral on securities loaned.
The accompanying notes are an integral part of the financial statements.
Statement of Operations
| for the six months ended June 30, 2012 (Unaudited) | ||||
| Investment Income | ||||
Income: Dividends (net of foreign taxes withheld of $2,505) | $ | 2,354,983 | ||
| Interest | 143 | |||
| Income distributions — Central Cash Management Fund | 5,100 | |||
| Securities lending income, including income from Daily Assets Fund Institutional, net of borrower rebates | 561,707 | |||
| Total income | 2,921,933 | |||
Expenses: Management fee | 557,508 | |||
| Administration fee | 158,576 | |||
| Services to shareholders | 3,312 | |||
| Distribution service fee (Class B) | 55,025 | |||
| Custodian fee | 15,396 | |||
| Professional fees | 34,078 | |||
| Reports to shareholders | 31,417 | |||
| Trustees' fees and expenses | 7,077 | |||
| Other | 26,689 | |||
| Total expenses before expense reductions | 889,078 | |||
| Expense reductions | (41,174 | ) | ||
| Total expenses after expense reductions | 847,904 | |||
| Net investment income (loss) | 2,074,029 | |||
| Realized and Unrealized Gain (Loss) | ||||
Net realized gain (loss) from: Investments | 8,159,136 | |||
| Futures | (90,033 | ) | ||
| Foreign currency | 1,571 | |||
| 8,070,674 | ||||
Change in net unrealized appreciation (depreciation) on: Investments | 14,094,262 | |||
| Futures | 523,973 | |||
| Foreign currency | 1 | |||
| 14,618,236 | ||||
| Net gain (loss) | 22,688,910 | |||
| Net increase (decrease) in net assets resulting from operations | $ | 24,762,939 | ||
The accompanying notes are an integral part of the financial statements.
| Increase (Decrease) in Net Assets | Six Months Ended June 30, 2012 (Unaudited) | Year Ended December 31, 2011 | ||||||
Operations: Net investment income (loss) | $ | 2,074,029 | $ | 2,891,402 | ||||
Operations: Net investment income (loss) | $ | 2,074,029 | $ | 2,891,402 | ||||
| Net realized gain (loss) | 8,070,674 | 16,289,359 | ||||||
| Change in net unrealized appreciation (depreciation) | 14,618,236 | (33,488,013 | ) | |||||
| Net increase (decrease) in net assets resulting from operations | 24,762,939 | (14,307,252 | ) | |||||
Distributions to shareholders from: Net investment income: Class A | (2,471,403 | ) | (2,352,452 | ) | ||||
| Class B | (283,947 | ) | (270,870 | ) | ||||
Net realized gains: Class A | (65,554 | ) | — | |||||
| Class B | (10,491 | ) | — | |||||
| Total distributions | (2,831,395 | ) | (2,623,322 | ) | ||||
Fund share transactions: Class A Proceeds from shares sold | 23,846,040 | 49,172,547 | ||||||
| Reinvestment of distributions | 2,536,957 | 2,352,452 | ||||||
| Payments for shares redeemed | (26,438,236 | ) | (65,044,297 | ) | ||||
| Net increase (decrease) in net assets from Class A share transactions | (55,239 | ) | (13,519,298 | ) | ||||
Class B Proceeds from shares sold | 3,320,684 | 3,566,544 | ||||||
| Reinvestment of distributions | 294,438 | 270,870 | ||||||
| Payments for shares redeemed | (5,892,399 | ) | (10,035,764 | ) | ||||
| Net increase (decrease) in net assets from Class B share transactions | (2,277,277 | ) | (6,198,350 | ) | ||||
| Increase (decrease) in net assets | 19,599,028 | (36,648,222 | ) | |||||
| Net assets at beginning of period | 297,638,002 | 334,286,224 | ||||||
| Net assets at end of period (including undistributed net investment income of $2,181,492 and $2,862,813, respectively) | $ | 317,237,030 | $ | 297,638,002 | ||||
| Other Information | ||||||||
Class A Shares outstanding at beginning of period | 21,776,446 | 22,942,780 | ||||||
| Shares sold | 1,886,003 | 4,067,878 | ||||||
| Shares issued to shareholders in reinvestment of distributions | 197,737 | 174,126 | ||||||
| Shares redeemed | (2,104,411 | ) | (5,408,338 | ) | ||||
| Net increase (decrease) in Class A shares | (20,671 | ) | (1,166,334 | ) | ||||
| Shares outstanding at end of period | 21,755,775 | 21,776,446 | ||||||
Class B Shares outstanding at beginning of period | 3,504,335 | 4,003,137 | ||||||
| Shares sold | 257,427 | 297,764 | ||||||
| Shares issued to shareholders in reinvestment of distributions | 22,931 | 20,035 | ||||||
| Shares redeemed | (469,604 | ) | (816,601 | ) | ||||
| Net increase (decrease) in Class B shares | (189,246 | ) | (498,802 | ) | ||||
| Shares outstanding at end of period | 3,315,089 | 3,504,335 | ||||||
The accompanying notes are an integral part of the financial statements.
| Years Ended December 31, | ||||||||||||||||||||||||
| Class A | Six Months Ended 6/30/12 (Unaudited) | 2011 | 2010 | 2009 | 2008 | 2007 | ||||||||||||||||||
| Selected Per Share Data | ||||||||||||||||||||||||
| Net asset value, beginning of period | $ | 11.77 | $ | 12.41 | $ | 9.90 | $ | 8.63 | $ | 14.71 | $ | 16.12 | ||||||||||||
Income (loss) from investment operations: Net investment income (loss)a | .08 | .12 | .10 | .10 | .18 | .17 | ||||||||||||||||||
| Net realized and unrealized gain (loss) | .91 | (.65 | ) | 2.51 | 1.93 | (4.77 | ) | (.40 | ) | |||||||||||||||
| Total from investment operations | .99 | (.53 | ) | 2.61 | 2.03 | (4.59 | ) | (.23 | ) | |||||||||||||||
Less distributions from: Net investment income | (.11 | ) | (.11 | ) | (.10 | ) | (.16 | ) | (.20 | ) | (.14 | ) | ||||||||||||
| Net realized gains | (.00 | )*** | — | — | (.60 | ) | (1.29 | ) | (1.04 | ) | ||||||||||||||
| Total distributions | (.11 | ) | (.11 | ) | (.10 | ) | (.76 | ) | (1.49 | ) | (1.18 | ) | ||||||||||||
| Net asset value, end of period | $ | 12.65 | $ | 11.77 | $ | 12.41 | $ | 9.90 | $ | 8.63 | $ | 14.71 | ||||||||||||
Total Return (%)b | 8.45 | ** | (4.41 | ) | 26.39 | 26.57 | (34.12 | ) | (1.90 | ) | ||||||||||||||
| Ratios to Average Net Assets and Supplemental Data | ||||||||||||||||||||||||
| Net assets, end of period ($ millions) | 275 | 256 | 285 | 258 | 198 | 305 | ||||||||||||||||||
| Ratio of expenses before expense reductions (%) | .53 | * | .52 | .52 | .56 | .54 | .53 | |||||||||||||||||
| Ratio of expenses after expense reductions (%) | .50 | * | .50 | .52 | .50 | .47 | .51 | |||||||||||||||||
| Ratio of net investment income (loss) (%) | 1.34 | * | .94 | .96 | 1.19 | 1.51 | 1.09 | |||||||||||||||||
| Portfolio turnover rate (%) | 12 | ** | 15 | 16 | 26 | 25 | 24 | c | ||||||||||||||||
a Based on average shares outstanding during the period. b Total return would have been lower had certain expenses not been reduced. c Excludes portfolio securities delivered as a result of processing redemption in-kind transactions. * Annualized ** Not annualized *** Amount is less than $.005. | ||||||||||||||||||||||||
| Years Ended December 31, | ||||||||||||||||||||||||
| Class B | Six Months Ended 6/30/12 (Unaudited) | 2011 | 2010 | 2009 | 2008 | 2007 | ||||||||||||||||||
| Selected Per Share Data | ||||||||||||||||||||||||
| Net asset value, beginning of period | $ | 11.77 | $ | 12.40 | $ | 9.89 | $ | 8.62 | $ | 14.70 | $ | 16.11 | ||||||||||||
Income (loss) from investment operations: Net investment income (loss)a | .07 | .08 | .08 | .08 | .15 | .13 | ||||||||||||||||||
| Net realized and unrealized gain (loss) | .90 | (.64 | ) | 2.50 | 1.93 | (4.77 | ) | (.40 | ) | |||||||||||||||
| Total from investment operations | .97 | (.56 | ) | 2.58 | 2.01 | (4.62 | ) | (.27 | ) | |||||||||||||||
Less distributions from: Net investment income | (.08 | ) | (.07 | ) | (.07 | ) | (.14 | ) | (.17 | ) | (.10 | ) | ||||||||||||
| Net realized gains | (.00 | )*** | — | — | (.60 | ) | (1.29 | ) | (1.04 | ) | ||||||||||||||
| Total distributions | (.08 | ) | (.07 | ) | (.07 | ) | (.74 | ) | (1.46 | ) | (1.14 | ) | ||||||||||||
| Net asset value, end of period | $ | 12.66 | $ | 11.77 | $ | 12.40 | $ | 9.89 | $ | 8.62 | $ | 14.70 | ||||||||||||
Total Return (%)b | 8.27 | ** | (4.58 | ) | 26.11 | 26.27 | (34.33 | ) | (2.16 | ) | ||||||||||||||
| Ratios to Average Net Assets and Supplemental Data | ||||||||||||||||||||||||
| Net assets, end of period ($ millions) | 42 | 41 | 50 | 45 | 42 | 73 | ||||||||||||||||||
| Ratio of expenses before expense reductions (%) | .78 | * | .77 | .77 | .81 | .79 | .78 | |||||||||||||||||
| Ratio of expenses after expense reductions (%) | .75 | * | .75 | .77 | .75 | .72 | .76 | |||||||||||||||||
| Ratio of net investment income (loss) (%) | 1.09 | * | .69 | .71 | .93 | 1.26 | .84 | |||||||||||||||||
| Portfolio turnover rate (%) | 12 | ** | 15 | 16 | 26 | 25 | 24 | c | ||||||||||||||||
a Based on average shares outstanding during the period. b Total return would have been lower had certain expenses not been reduced. c Excludes portfolio securities delivered as a result of processing redemption in-kind transactions. * Annualized ** Not annualized *** Amount is less than $.005. | ||||||||||||||||||||||||
A. Organization and Significant Accounting Policies
DWS Investments VIT Funds (the "Trust") is registered under the Investment Company Act of 1940, as amended (the "1940 Act"), as an open-end management investment company. The Trust is organized as a Massachusetts business trust. The Trust is comprised of two series. DWS Small Cap Index VIP (the "Fund") is a diversified series of the Trust offered to investors. The Fund is an underlying investment vehicle for variable annuity contracts and variable life insurance policies to be offered by the separate accounts of certain life insurance companies ("Participating Insurance Companies").
Multiple Classes of Shares of Beneficial Interest. The Fund offers two classes of shares to investors: Class A shares and Class B shares. Class B shares are subject to Rule 12b-1 distribution fees under the 1940 Act and record keeping fees equal to an annual rate up to 0.25% and 0.15%, respectively, of the Class B shares average daily net assets. Class A shares are not subject to such fees.
Investment income, realized and unrealized gains and losses, and certain fund-level expenses and expense reductions, if any, are borne pro rata on the basis of relative net assets by the holders of all classes of shares, except that each class bears certain expenses unique to that class (including the applicable Rule 12b-1 distribution fees). Differences in class-level expenses may result in payment of different per share dividends by class. All shares have equal rights with respect to voting subject to class-specific arrangements.
The Fund's financial statements are prepared in accordance with accounting principles generally accepted in the United States of America which require the use of management estimates. Actual results could differ from those estimates. The policies described below are followed consistently by the Fund in the preparation of its financial statements.
Security Valuation. Investments are stated at value determined as of the close of regular trading on the New York Stock Exchange on each day the exchange is open for trading.
Various inputs are used in determining the value of the Fund's investments. These inputs are summarized in three broad levels. Level 1 includes quoted prices in active markets for identical securities. Level 2 includes other significant observable inputs (including quoted prices for similar securities, interest rates, prepayment speeds, and credit risk). Level 3 includes significant unobservable inputs (including the Fund's own assumptions in determining the fair value of investments). The inputs or methodology used for valuing securities are not necessarily an indication of the risk associated with investing in those securities.
Equity securities are valued at the most recent sale price or official closing price reported on the exchange (U.S. or foreign) or over-the-counter market on which they trade and are categorized as Level 1 securities. Securities for which no sales are reported are valued at the calculated mean between the most recent bid and asked quotations on the relevant market or, if a mean cannot be determined, at the most recent bid quotation.
Debt securities are valued at prices supplied by independent pricing services approved by the Fund's Board. If the pricing services are unable to provide valuations, securities are valued at the most recent bid quotation or evaluated price, as applicable, obtained from one or more broker-dealers. Such services may use various pricing techniques which take into account appropriate factors such as yield, quality, coupon rate, maturity, type of issue, trading characteristics and other data, as well as broker quotes. These securities are generally categorized as Level 2.
Money market instruments purchased with an original or remaining maturity of sixty days or less, maturing at par, are valued at amortized cost, which approximates value, and are categorized as Level 2. Investments in open-end investment companies are valued at their net asset value each business day and are categorized as Level 1.
Futures contracts are generally valued at the settlement prices established each day on the exchange on which they are traded and are categorized as Level 1.
Securities and other assets for which market quotations are not readily available or for which the above valuation procedures are deemed not to reflect fair value are valued in a manner that is intended to reflect their fair value as determined in accordance with procedures approved by the Board and are generally categorized as Level 3. In accordance with the Fund's valuation procedures, factors used in determining value may include, but are not limited to, the type of the security; the size of the holding; the initial cost of the security; the existence of any contractual restrictions on the security's disposition; the price and extent of public trading in similar securities of the issuer or of comparable companies; quotations or evaluated prices from broker-dealers and/or pricing services; information obtained from the issuer, analysts, and/or the appropriate stock exchange (for exchange-traded securities); an analysis of the company's or issuer's financial statements; an evaluation of the forces that influence the issuer and the market(s) in which the security is purchased and sold and with respect to debt securities; the maturity, coupon, creditworthiness, currency denomination and the movement of the market in which the security is normally traded. The value determined under these procedures may differ from published values for the same securities.
Disclosure about the classification of fair value measurements is included in a table following the Fund's Investment Portfolio.
Securities Lending. The Fund lends securities to certain financial institutions. The Fund retains beneficial ownership of the securities it has loaned and continues to receive interest and dividends paid by the issuer of securities and to participate in any changes in their market value. The Fund requires the borrowers of the securities to maintain collateral with the Fund consisting of either cash or liquid, unencumbered assets having a value at least equal to the value of the securities loaned. When the collateral falls below specified amounts, the lending agent will use its best effort to obtain additional collateral on the next business day to meet required amounts under the security lending agreement. The Fund may invest the cash collateral into a joint trading account in an affiliated money market fund pursuant to Exemptive Orders issued by the SEC. The Fund receives compensation for lending its securities either in the form of fees or by earning interest on invested cash collateral net of borrower rebates and fees paid to a lending agent. Either the Fund or the borrower may terminate the loan. There may be risks of delay and costs in recovery of securities or even loss of rights in the collateral should the borrower of the securities fail financially. The Fund is also subject to all investment risks associated with the reinvestment of any cash collateral received, including, but not limited to, interest rate, credit and liquidity risk associated with such investments.
Federal Income Taxes. The Fund's policy is to comply with the requirements of the Internal Revenue Code, as amended, which are applicable to regulated investment companies, and to distribute all of its taxable income to its shareholders.
Under the Regulated Investment Company Modernization Act of 2010, net capital losses may be carried forward indefinitely, and their character is retained as short-term and/or long-term. Previously, net capital losses were carried forward for eight years and treated as short-term losses. As a transition rule, the Act requires that post-enactment net capital losses be used before pre-enactment net capital losses.
From November 1, 2011 to December 31, 2011, the Fund elects to defer qualified late year losses of approximately $256,000 of net long-term realized capital losses and $160,000 of net short-term realized capital losses and treat them as arising in the fiscal year ending December 31, 2012.
The Fund has reviewed the tax positions for the open tax years as of December 31, 2011 and has determined that no provision for income tax is required in the Fund's financial statements. The Fund's federal tax returns for the prior three fiscal years remain open subject to examination by the Internal Revenue Service.
Distribution of Income and Gains. Net investment income of the Fund, if any, is distributed to shareholders annually. Net realized gains from investment transactions, in excess of available capital loss carryforwards, would be taxable to the Fund if not distributed, and, therefore, will be distributed to shareholders at least annually. The Fund may also make additional distributions for tax purposes if necessary.
The timing and characterization of certain income and capital gain distributions are determined annually in accordance with federal tax regulations, which may differ from accounting principles generally accepted in the United States of America. These differences primarily relate to investments in futures contracts and certain securities sold at a loss. As a result, net investment income (loss) and net realized gain (loss) on investment transactions for a reporting period may differ significantly from distributions during such period. Accordingly, the Fund may periodically make reclassifications among certain of its capital accounts without impacting the net asset value of the Fund.
The tax character of current year distributions will be determined at the end of the current fiscal year.
Contingencies. In the normal course of business, the Fund may enter into contracts with service providers that contain general indemnification clauses. The Fund's maximum exposure under these arrangements is unknown as this would involve future claims that may be made against the Fund that have not yet been made. However, based on experience, the Fund expects the risk of loss to be remote.
Expenses. Expenses of the Trust arising in connection with a specific Fund are allocated to that Fund. Other Trust expenses which cannot be directly attributed to a fund are apportioned among the funds in the Trust.
Real Estate Investment Trusts. The Fund periodically recharacterizes distributions received from a Real Estate Investment Trust ("REIT") investment based on information provided by the REIT into the following categories: ordinary income, long-term and short-term capital gains, and return of capital. If information is not available timely from a REIT, the recharacterization will be estimated for financial statement purposes and a recharacterization will be made within the accounting records in the following year when such information becomes available. Distributions received from REITs in excess of income are recorded as either a reduction of cost of investments or realized gains. The Fund distinguishes between dividends on a tax basis and a financial reporting basis and only distributions in excess of tax basis earnings and profits are reported in the financial statements as a tax return of capital.
Other. Investment transactions are accounted for on a trade date plus one basis for daily net asset valuation calculations. However, for financial reporting purposes, investment transactions are reported on trade date. Interest income is recorded on the accrual basis. Dividend income is recorded on the ex-dividend date net of foreign withholding taxes. Realized gains and losses from investment transactions are recorded on an identified cost basis and may include proceeds from litigation.
B. Derivative Instruments
Futures Contracts. A futures contract is an agreement between a buyer or seller and an established futures exchange or its clearinghouse in which the buyer or seller agrees to take or make a delivery of a specific amount of a financial instrument at a specified price on a specific date (settlement date). For the six months ended June 30, 2012, the Fund invested in futures to keep cash on hand to meet shareholder redemptions or other needs while maintaining exposure to the stock market.
Upon entering into a futures contract, the Fund is required to deposit with a financial intermediary cash or securities ("initial margin") in an amount equal to a certain percentage of the face value indicated in the futures contract. Subsequent payments ("variation margin") are made or received by the Fund dependent upon the daily fluctuations in the value and are recorded for financial reporting purposes as unrealized gains or losses by the Fund. Gains or losses are realized when the contract expires or is closed. Since all futures contracts are exchange traded, counterparty risk is minimized as the exchange's clearinghouse acts as the counterparty, and guarantees the futures against default.
Certain risks may arise upon entering into futures contracts, including the risk that an illiquid market will limit the Fund's ability to close out a futures contract prior to the settlement date and the risk that the futures contract is not well correlated with the security, index or currency to which it relates. Risk of loss may exceed amounts disclosed in the Statement of Assets and Liabilities.
A summary of the open futures contracts as of June 30, 2012 is included in a table following the Fund's Investment Portfolio. For the six months ended June 30, 2012, the investment in futures contracts purchased had a total notional value generally indicative of a range from approximately $8,422,000 to $9,863,000.
The following tables summarize the value of the Fund's derivative instruments held as of June 30, 2012 and the related location in the accompanying Statement of Assets and Liabilities, presented by primary underlying risk exposure:
| Asset Derivative | Futures Contracts | |||
Equity Contracts (a) | $ | 519,152 | ||
The above derivative is located in the following Statement of Assets and Liabilities account:
(a) Includes cumulative appreciation of futures contracts as disclosed in the Investment Portfolio. Unsettled variation margin is disclosed separately within the Statement of Assets and Liabilities.
Additionally, the amount of unrealized and realized gains and losses on derivative instruments recognized in Fund earnings during the six months ended June 30, 2012 and the related location in the accompanying Statement of Operations is summarized in the following tables by primary underlying risk exposure:
| Realized Gain (Loss) | Futures Contracts | |||
Equity Contracts (a) | $ | (90,033 | ) | |
The above derivative is located in the following Statement of Operations account:
(a) Net realized gain (loss) from futures
| Change in Net Unrealized Appreciation (Depreciation) | Futures Contracts | |||
Equity Contracts (a) | $ | 523,973 | ||
The above derivative is located in the following Statement of Operations account:
(a) Change in net unrealized appreciation (depreciation) on futures
C. Purchases and Sales of Securities
During the six months ended June 30, 2012, purchases and sales of investment securities (excluding short-term investments) aggregated $42,542,858 and $36,863,052, respectively.
D. Related Parties
Investment Management Agreement. Under the Investment Management Agreement with Deutsche Investment Management Americas Inc. ("DIMA" or the "Advisor"), an indirect, wholly owned subsidiary of Deutsche Bank AG, the Advisor determines the securities, instruments and other contracts relating to investments to be purchased, sold, or entered into by the Fund or delegates such responsibility to the Fund's sub-advisor. Pursuant to the Investment Management Agreement with the Advisor, the Fund pays the Advisor an annual fee based on its average daily net assets, computed and accrued daily and payable monthly at the annual rate of 0.35%.
Northern Trust Investments, Inc. ("NTI") serves as subadvisor. As a sub-advisor to the Fund, NTI makes investment decisions and buys and sells securities for the Fund. NTI is paid by the Advisor for the services NTI provides to the Fund.
For the period from January 1, 2012 through April 30, 2013, the Advisor has contractually agreed to waive all or a portion of its fees and/or reimburse certain operating expenses of the Fund to the extent necessary to maintain the operating expenses (excluding certain expenses such as extraordinary expenses, taxes, brokerage and interest) of each class as follows:
| Class A | .50% |
| Class B | .75% |
Accordingly, for the six months ended June 30, 2012, the Advisor waived a portion of its management fee aggregating $40,472, and the amount charged aggregated $517,036, which was equivalent to an annualized effective rate of 0.33% of the Fund's average daily net assets.
Administration Fee. Pursuant to the Administrative Services Agreement, DIMA provides most administrative services to the Fund. For all services provided under the Administrative Services Agreement, the Fund pays DIMA an annual fee ("Administration Fee") of 0.10% of the Fund's average daily net assets, computed and accrued daily and payable monthly. For the six months ended June 30, 2012, the Administration Fee was $158,576, of which $24,913 is unpaid.
Distribution Service Agreement. DWS Investments Distributors, Inc. ("DIDI"), an affiliate of the Advisor, is the Fund's distributor. In accordance with the Distribution Plan, DIDI receives 12b-1 fees of up to 0.25% of average daily net assets of Class B shares. For the six months ended June 30, 2012, the Distribution Service Fee was as follows:
| Distribution Service Fee | Total Aggregated | Unpaid at June 30, 2012 | ||||||
| Class B | $ | 55,025 | $ | 8,499 | ||||
Service Provider Fees. DWS Investments Service Company ("DISC"), an affiliate of the Advisor, is the transfer agent, dividend-paying agent and shareholder service agent of the Fund. Pursuant to a sub-transfer agency agreement among DISC and DST Systems, Inc. ("DST"), DISC has delegated certain transfer agent, dividend-paying agent and shareholder service agent functions to DST. DISC compensates DST out of the shareholder servicing fee they receive from the Fund. For the six months ended June 30, 2012, the amounts charged to the Fund by DISC were as follows:
| Services to Shareholders | Total Aggregated | Waived | Unpaid at June 30, 2012 | |||||||||
| Class A | $ | 569 | $ | 569 | $ | — | ||||||
| Class B | 166 | 133 | 27 | |||||||||
| $ | 735 | $ | 702 | $ | 27 | |||||||
Typesetting and Filing Service Fees. Under an agreement with DIMA, DIMA is compensated for providing typesetting and certain regulatory filing services to the Fund. For the six months ended June 30, 2012, the amount charged to the Fund by DIMA included in the Statement of Operations under "reports to shareholders" aggregated $13,352, of which $5,788 is unpaid.
Trustees' Fees and Expenses. The Fund paid retainer fees to each Trustee not affiliated with the Advisor, plus specified amounts to the Board Chairperson and to each committee Chairperson.
Affiliated Cash Management Vehicle. The Fund may invest uninvested cash balances in Central Cash Management Fund, which is managed by the Advisor. The Fund indirectly bears its proportionate share of the expenses of Central Cash Management Fund. Central Cash Management Fund does not pay the Advisor an investment management fee. Central Cash Management Fund seeks a high level of current income consistent with liquidity and the preservation of capital.
E. Line of Credit
The Fund and other affiliated funds (the "Participants") share in a $375 million revolving credit facility provided by a syndication of banks. The Fund may borrow for temporary or emergency purposes, including the meeting of redemption requests that otherwise might require the untimely disposition of securities. The Participants are charged an annual commitment fee which is allocated based on net assets, among each of the Participants. Interest is calculated at a rate per annum equal to the sum of the Federal Funds Rate plus 1.25 percent plus if LIBOR exceeds the Federal Funds Rate the amount of such excess. The Fund may borrow up to a maximum of 33 percent of its net assets under the agreement. The Fund had no outstanding loans at June 30, 2012.
F. Ownership of the Fund
At June 30, 2012, two participating insurance companies were beneficial owners of record of 10% or more of the total outstanding Class A shares of the Fund, owning 56% and 10%. At June 30, 2012, two participating insurance companies were beneficial owners of record of 10% or more of the outstanding Class B shares of the Fund, each owning 43% and 28%, respectively.
As an investor of the Fund, you incur two types of costs: ongoing expenses and transaction costs. Ongoing expenses include management fees, distribution and service (12b-1) fees and other Fund expenses. Examples of transaction costs include contract charges, redemption fees and account maintenance fees, which are not shown in this section. The following tables are intended to help you understand your ongoing expenses (in dollars) of investing in the Fund and to help you compare these expenses with the ongoing expenses of investing in other mutual funds. In the most recent six-month period, the Fund limited these expenses; had it not done so, expenses would have been higher. The example in the table is based on an investment of $1,000 invested at the beginning of the six-month period and held for the entire period (January 1, 2012 to June 30, 2012).
The tables illustrate your Fund's expenses in two ways:
•Actual Fund Return. This helps you estimate the actual dollar amount of ongoing expenses (but not transaction costs) paid on a $1,000 investment in the Fund using the Fund's actual return during the period. To estimate the expenses you paid over the period, simply divide your account value by $1,000 (for example, an $8,600 account value divided by $1,000 = 8.6), then multiply the result by the number in the "Expenses Paid per $1,000" line under the share class you hold.
• Hypothetical 5% Fund Return. This helps you to compare your Fund's ongoing expenses (but not transaction costs) with those of other mutual funds using the Fund's actual expense ratio and a hypothetical rate of return of 5% per year before expenses. Examples using a 5% hypothetical Fund return may be found in the shareholder reports of other mutual funds. The hypothetical account values and expenses may not be used to estimate the actual ending account balance or expenses you paid for the period.
Please note that the expenses shown in these tables are meant to highlight your ongoing expenses only and do not reflect any transaction costs. The "Expenses Paid per $1,000" line of the tables is useful in comparing ongoing expenses only and will not help you determine the relative total expense of owning different funds. If these transaction costs had been included, your costs would have been higher.
Expenses and Value of a $1,000 Investment for the six months ended June 30, 2012 | ||||||||
| Actual Fund Return | Class A | Class B | ||||||
| Beginning Account Value 1/1/12 | $ | 1,000.00 | $ | 1,000.00 | ||||
| Ending Account Value 6/30/12 | $ | 1.084.50 | $ | 1,082.70 | ||||
| Expenses Paid per $1,000* | $ | 2.59 | $ | 3.88 | ||||
| Hypothetical 5% Fund Return | Class A | Class B | ||||||
| Beginning Account Value 1/1/12 | $ | 1,000.00 | $ | 1,000.00 | ||||
| Ending Account Value 6/30/12 | $ | 1,022.38 | $ | 1,021.13 | ||||
| Expenses Paid per $1,000* | $ | 2.51 | $ | 3.77 | ||||
* Expenses are equal to the Fund's annualized expense ratio for each share class, multiplied by the average account value over the period, multiplied by 182 (the number of days in the most recent six-month period), then divided by 366.
| Annualized Expense Ratios | Class A | Class B | ||
| DWS Small Cap Index VIP | .50% | .75% |
For more information, please refer to the Fund's prospectus.
These tables do not reflect charges and fees ("contract charges") associated with the separate account that invests in the Fund or any variable life insurance policy or variable annuity contract for which the Fund is an investment option.
The Fund's policies and procedures for voting proxies for portfolio securities and information about how the Fund voted proxies related to its portfolio securities during the 12-month period ended June 30 are available on our Web site — www.dws-investments.com (click on "proxy voting" at the bottom of the page) — or on the SEC's Web site — www.sec.gov. To obtain a written copy of the Fund's policies and procedures without charge, upon request, call us toll free at (800) 728-3337.
September 26, 2011
Pursuant to an Order entered into by Deutsche Investment Management Americas and affiliates (collectively, "DeAM") with the Attorney General of New York, I, Thomas H. Mack, have been appointed the Independent Fee Consultant for the DWS Funds (formerly the DWS Scudder Funds). My duties include preparing an annual written evaluation of the management fees DeAM charges the Funds, considering among other factors the management fees charged by other mutual fund companies for like services, management fees DeAM charges other clients for like services, DeAM's costs of supplying services under the management agreements and related profit margins, possible economies of scale if a Fund grows larger, and the nature and quality of DeAM's services, including fund performance. This report summarizes my evaluation for 2011, including my qualifications, the evaluation process for each of the DWS Funds, consideration of certain complex-level factors, and my conclusions. I served in substantially the same capacity in 2007, 2008, 2009 and 2010.
Qualifications
For more than 35 years I have served in various professional capacities within the investment management business. I have held investment analysis and advisory positions, including securities analyst, portfolio strategist and director of investment policy with a large investment firm. I have also performed business management functions, including business development, financial management and marketing research and analysis.
Since 1991, I have been an independent consultant within the asset management industry. I have provided services to over 125 client organizations, including investment managers, mutual fund boards, product distributors and related organizations. Over the past ten years I have completed a number of assignments for mutual fund boards, specifically including assisting boards with management contract renewal.
I hold a Master of Business Administration degree, with highest honors, from Harvard University and Master of Science and Bachelor of Science (highest honors) degrees from the University of California at Berkeley. I am an independent director and audit committee financial expert for two closed-end mutual funds and have served in various leadership and financial oversight capacities with non-profit organizations.
Evaluation of Fees for each DWS Fund
My work focused primarily on evaluating, fund-by-fund, the fees charged to each of the 109 mutual fund portfolios in the DWS Fund family. For each Fund, I considered each of the key factors mentioned above, as well as any other relevant information. In doing so I worked closely with the Funds' Independent Directors in their annual contract renewal process, as well as in their approval of contracts for several new funds (documented separately).
In evaluating each Fund's fees, I reviewed comprehensive materials provided by or on behalf of DeAM, including expense information prepared by Lipper Analytical, comparative performance information, profitability data, manager histories, and other materials. I also accessed certain additional information from the Lipper and Morningstar databases and drew on my industry knowledge and experience.
To facilitate evaluating this considerable body of information, I prepared for each Fund a document summarizing the key data elements in each area as well as additional analytics discussed below. This made it possible to consider each key data element in the context of the others.
In the course of contract renewal, DeAM agreed to implement a number of fee and expense adjustments requested by the Independent Directors which will favorably impact future fees and expenses, and my evaluation includes the effects of these changes.
Fees and Expenses Compared with Other Funds
The competitive fee and expense evaluation for each fund focused on two primary comparisons:
The Fund's contractual management fee (the advisory fee plus the administration fee where applicable) compared with those of a group of typically 12-15 funds in the same Lipper investment category (e.g. Large Capitalization Growth) having similar distribution arrangements and being of similar size.
The Fund's total expenses compared with a broader universe of funds from the same Lipper investment category and having similar distribution arrangements.
These two comparisons provide a view of not only the level of the fee compared with funds of similar scale but also the total expense the Fund bears for all the services it receives, in comparison with the investment choices available in the Fund's investment category and distribution channel. The principal figure-of-merit used in these comparisons was the subject Fund's percentile ranking against peers.
DeAM's Fees for Similar Services to Others
DeAM provided management fee schedules for all of its US domiciled fund and non-fund investment management accounts in any of the investment categories where there is a DWS Fund. These similar products included the other DWS Funds, non-fund pooled accounts, institutional accounts and sub-advisory accounts. Using this information, I calculated for each Fund the fee that would be charged to each similar product, at the subject Fund's asset level.
Evaluating information regarding non-fund products is difficult because there are varying levels of services required for different types of accounts, with mutual funds generally requiring considerably more regulatory and administrative types of service as well as having more frequent cash flows than other types of accounts. Also, while mutual fund fees for similar fund products can be expected to be similar, there will be some differences due to different pricing conditions in different distribution channels (e.g. retail funds versus those used in variable insurance products), differences in underlying investment processes and other factors.
Costs and Profit Margins
DeAM provided a detailed profitability analysis for each Fund. After making some adjustments so that the presentation would be more comparable to the available industry figures, I reviewed profit margins from investment management alone, from investment management plus other fund services (excluding distribution) provided to the Funds by DeAM (principally shareholder services), and DeAM profits from all sources, including distribution. A later section comments on overall profitability.
Economies of Scale
Economies of scale — an expected decline in management cost per dollar of fund assets as fund assets grow — are very rarely quantified and documented because of inherent difficulties in collecting and analyzing relevant data. However, in virtually every investment category that I reviewed, larger funds tend to have lower fees and lower total expenses than smaller funds. To see how each DWS Fund compares with this industry observation, I reviewed:
The trend in Fund assets over the last five years and the accompanying trend in total expenses. This shows if the Fund has grown and, if so, whether total expense (management fees as well as other expenses) have declined as a percent of assets.
Whether the Fund has break-points in its management fee schedule, the extent of the fee reduction built into the schedule and the asset levels where the breaks take effect, and in the case of a sub-advised Fund how the Fund's break-points compare with those of the sub-advisory fee schedule.
How the Fund's contractual fee schedule compares with trends in the industry data. To accomplish this, I constructed a chart showing how actual latest-fiscal-year contractual fees of the Fund and of other similar funds relate to average fund assets, with the subject Fund's contractual fee schedule superimposed.
Quality of Service — Performance
The quality-of-service evaluation focused on investment performance, which is the principal result of the investment management service. Each Fund's performance was reviewed over the past 1, 3, 5 and 10 years, as applicable, and compared with that of other funds in the same investment category and with a suitable market index.
In addition, I calculated and reviewed risk-adjusted returns relative to an index of similar mutual funds' returns and a suitable market index. The risk-adjusted returns analysis provides a way of determining the extent to which the Fund's return comparisons are mainly the product of investment value-added (or lack thereof) or alternatively taking considerably more or less risk than is typical in its investment category.
I also received and considered the history of portfolio manager changes for each Fund, as this provided an important context for evaluating the performance results.
Complex-Level Considerations
While this evaluation was conducted mainly at the individual fund level, there are some issues relating to the reasonableness of fees that can alternatively be considered across the whole fund complex:
I reviewed DeAM's profitability analysis for all DWS Funds, with a view toward determining if the allocation procedures used were reasonable and how profit levels compared with public data for other investment managers.
I considered whether DeAM and affiliates receive any significant ancillary or "fall-out" benefits that should be considered in interpreting the direct profitability results. These would be situations where serving as the investment manager of the Funds is beneficial to another part of the Deutsche Bank organization.
I considered how aggregated DWS Fund expenses had varied over the years, by asset class and in the context of trends in asset levels.
I reviewed the structure of the DeAM organization, trends in staffing levels, and information on compensation of investment management and other professionals compared with industry data.
Findings
Based on the process and analysis discussed above, which included reviewing a wide range of information from management and external data sources and considering among other factors the fees DeAM charges other clients, the fees charged by other fund managers, DeAM's costs and profits associated with managing the Funds, economies of scale, possible fall-out benefits, and the nature and quality of services provided, in my opinion the management fees charged the DWS Funds are reasonable.

Thomas H. Mack
President, Thomas H. Mack & Co., Inc.
Notes
DWS Investments Distributors, Inc.
222 South Riverside Plaza
Chicago, IL 60606
(800) 621-1148
vit-scif-3 (R-028372-1 8/12)
| ITEM 2. | CODE OF ETHICS | |
| Not applicable. | ||
| ITEM 3. | AUDIT COMMITTEE FINANCIAL EXPERT | |
| Not applicable | ||
| ITEM 4. | PRINCIPAL ACCOUNTANT FEES AND SERVICES | |
| Not applicable | ||
| ITEM 5. | AUDIT COMMITTEE OF LISTED REGISTRANTS | |
| Not applicable | ||
| ITEM 6. | SCHEDULE OF INVESTMENTS | |
| Not applicable | ||
| ITEM 7. | DISCLOSURE OF PROXY VOTING POLICIES AND PROCEDURES FOR CLOSED-END MANAGEMENT INVESTMENT COMPANIES | |
| Not applicable | ||
| ITEM 8. | PORTFOLIO MANAGERS OF CLOSED-END MANAGEMENT INVESTMENT COMPANIES | |
| Not applicable | ||
| ITEM 9. | PURCHASES OF EQUITY SECURITIES BY CLOSED-END MANAGEMENT INVESTMENT COMPANY AND AFFILIATED PURCHASERS | |
| Not applicable | ||
| ITEM 10. | SUBMISSION OF MATTERS TO A VOTE OF SECURITY HOLDERS | |
| There were no material changes to the procedures by which shareholders may recommend nominees to the Fund’s Board. The primary function of the Nominating and Governance Committee is to identify and recommend individuals for membership on the Board and oversee the administration of the Board Governance Guidelines. Shareholders may recommend candidates for Board positions by forwarding their correspondence by U.S. mail or courier service to Paul K. Freeman, Independent Chairman, DWS Funds, P.O. Box 101833, Denver, CO 80250-1833. | ||
| ITEM 11. | CONTROLS AND PROCEDURES | |
| (a) | The Chief Executive and Financial Officers concluded that the Registrant’s Disclosure Controls and Procedures are effective based on the evaluation of the Disclosure Controls and Procedures as of a date within 90 days of the filing date of this report. | |
| (b) | There have been no changes in the registrant’s internal control over financial reporting that occurred during the second fiscal quarter of the period covered by this report that has materially affected, or is reasonably likely to materially affect, the registrant’s internal controls over financial reporting. | |
| ITEM 12. | EXHIBITS | |
| (a)(1) | Certification pursuant to Rule 30a-2(a) under the Investment Company Act of 1940 (17 CFR 270.30a-2(a)) is filed and attached hereto as Exhibit 99.CERT. | |
| (b) | Certification pursuant to Rule 30a-2(b) under the Investment Company Act of 1940 (17 CFR 270.30a-2(b)) is furnished and attached hereto as Exhibit 99.906CERT. | |
Form N-CSRS Item F
SIGNATURES
Pursuant to the requirements of the Securities Exchange Act of 1934 and the Investment Company Act of 1940, the registrant has duly caused this report to be signed on its behalf by the undersigned, thereunto duly authorized.
| Registrant: | DWS Small Cap Index VIP, a series of DWS Investments VIT Funds |
| By: | /s/W. Douglas Beck W. Douglas Beck President |
| Date: | August 20, 2012 |
Pursuant to the requirements of the Securities Exchange Act of 1934 and the Investment Company Act of 1940, this report has been signed below by the following persons on behalf of the registrant and in the capacities and on the dates indicated.
| By: | /s/W. Douglas Beck W. Douglas Beck President |
| Date: | August 20, 2012 |
| By: | /s/Paul Schubert Paul Schubert Chief Financial Officer and Treasurer |
| Date: | August 20, 2012 |