WASHINGTON, D. C. 20549
Stocks may decline in value. Various factors, including costs, cash flows and security selection, may cause the Fund’s performance to differ from that of the index. Smaller company stocks tend to be more volatile than medium-sized or large company stocks. The Fund may lend securities to approved institutions. Investing in derivatives entails special risks relating to liquidity, leverage and credit that may reduce returns and/or increase volatility. See the prospectus for details.
Deutsche Asset Management represents the asset management activities conducted by Deutsche Bank AG or any of its subsidiaries.
Deutsche AM Distributors, Inc., 222 South Riverside Plaza, Chicago, IL 60606, (800) 621-1148
Generally accepted accounting principles require adjustments to be made to the net assets of the Fund at period end for financial reporting purposes only, and as such, the total return based on the unadjusted net asset value per share may differ from the total return reported in the financial highlights.
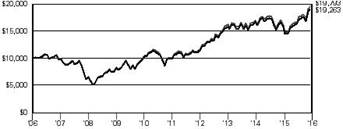
The growth of $10,000 is cumulative.
For the 12 months ended December 31, 2016, the Fund returned 21.03% (Class A shares, unadjusted for contract charges), compared with the 21.31% return of the Russell 2000® Index.1
The 12-month period began on a negative note, with China’s accelerated yuan depreciation rekindling worries regarding capital outflows and weaker growth there. Investor anxiety further dampened enthusiasm in January and February amid concerns regarding anemic fourth-quarter U.S. GDP growth, stemming from slower auto sales. However, the market staged a solid rally beginning on February 12 after China’s economic growth and currency outlook improved, oil prices rallied almost 50%, and enthusiasm built regarding an oil supply "freeze" proposal between several oil-producing countries. Equity markets then rallied through much of the spring and summer as better-than-expected economic data improved investor sentiment. In the fall of 2016, markets demonstrated anxiety leading up to the November presidential election, then rallied strongly post-election as investors were energized by the prospects for above-trend economic growth, lower corporate taxes and reduced regulation under a Republican-controlled federal government. In December, the U.S. Federal Reserve Board (the Fed) raised short-term interest rates as anticipated and projected additional rate increases in 2017 due to concerns that an acceleration in U.S. economic growth might lead to higher inflation.
To attempt to match the risk and return characteristics of the Russell 2000 Index as closely as possible, the Fund invests in a statistically selected sample of the securities found in the Russell 2000 Index, using a process known as "optimization." This process selects stocks for the Fund so that industry weightings, market capitalizations and fundamental characteristics closely match those of the securities in the Russell 2000 Index without purchasing all of the stocks in the index. Going forward, we will continue to seek returns that approximate those of the index.
The views expressed reflect those of the portfolio management team only through the end of the period of the report as stated on the cover. The management team's views are subject to change at any time based on market and other conditions and should not be construed as a recommendation. Past performance is no guarantee of future results. Current and future fund holdings are subject to risk.
Following the Fund's fiscal first and third quarter-end, a complete portfolio holdings listing is filed with the SEC on Form N-Q. The form will be available on the SEC's Web site at sec.gov, and it also may be reviewed and copied at the SEC's Public Reference Room in Washington, D.C. Information on the operation of the SEC's Public Reference Room may be obtained by calling (800) SEC-0330. The Fund's portfolio holdings are also posted on deutschefunds.com from time to time. Please see the Fund's current prospectus for more information.
| |
Shares | Value ($) |
| | | |
| Common Stocks 97.8% |
| Consumer Discretionary 12.3% |
| Auto Components 1.2% |
| American Axle & Manufacturing Holdings, Inc.* | 14,499 | 279,831 |
| Cooper Tire & Rubber Co. | 10,731 | 416,899 |
| Cooper-Standard Holdings, Inc.* | 2,880 | 297,734 |
| Dana, Inc. | 28,934 | 549,167 |
| Dorman Products, Inc.* | 5,141 | 375,601 |
| Federal-Mogul Holdings Corp.* | 6,321 | 65,170 |
| Fox Factory Holding Corp.* | 4,223 | 117,188 |
| Gentherm, Inc.* | 7,166 | 242,569 |
| Horizon Global Corp.* | 3,657 | 87,768 |
| LCI Industries | 4,604 | 496,081 |
| Metaldyne Performance Group, Inc. | 2,829 | 64,926 |
| Modine Manufacturing Co.* | 9,305 | 138,645 |
| Motorcar Parts of America, Inc.* | 3,426 | 92,228 |
| Spartan Motors, Inc. | 6,267 | 57,970 |
| Standard Motor Products, Inc. | 4,074 | 216,818 |
| Stoneridge, Inc.* | 5,309 | 93,916 |
| Strattec Security Corp. | 682 | 27,485 |
| Superior Industries International, Inc. | 5,023 | 132,356 |
| Tenneco, Inc.* | 10,936 | 683,172 |
| Tower International, Inc. | 3,896 | 110,452 |
| Unique Fabricating, Inc. | 1,234 | 18,016 |
| Workhorse Group, Inc.* (a) | 2,167 | 15,299 |
| | 4,579,291 |
| Automobiles 0.1% |
| Winnebago Industries, Inc. | 5,130 | 162,364 |
| Distributors 0.1% |
| Core-Mark Holding Co., Inc. | 8,880 | 382,462 |
| Weyco Group, Inc. | 1,254 | 39,250 |
| | 421,712 |
| Diversified Consumer Services 1.0% |
| American Public Education, Inc.* | 2,869 | 70,434 |
| Apollo Education Group, Inc.* | 16,202 | 160,400 |
| Ascent Capital Group, Inc. "A"* | 1,939 | 31,528 |
| Bridgepoint Education, Inc.* | 3,215 | 32,568 |
| Bright Horizons Family Solutions, Inc.* | 8,397 | 587,958 |
| Cambium Learning Group, Inc.* | 2,305 | 11,502 |
| Capella Education Co. | 2,166 | 190,175 |
| Career Education Corp.* | 12,609 | 127,225 |
| Carriage Services, Inc. | 2,890 | 82,770 |
| Chegg, Inc.* | 15,391 | 113,585 |
| Collectors Universe, Inc. | 1,342 | 28,491 |
| DeVry Education Group, Inc. | 12,177 | 379,922 |
| Grand Canyon Education, Inc.* | 8,639 | 504,949 |
| Houghton Mifflin Harcourt Co.* | 24,173 | 262,277 |
| K12, Inc.* | 6,857 | 117,666 |
| Liberty Tax, Inc. | 1,055 | 14,137 |
| LifeLock, Inc.* | 16,464 | 393,819 |
| Regis Corp.* | 7,073 | 102,700 |
| Sotheby's | 9,582 | 381,938 |
| Strayer Education, Inc.* | 2,095 | 168,920 |
| Weight Watchers International, Inc.* (a) | 5,062 | 57,960 |
| | 3,820,924 |
| |
Shares | Value ($) |
| | | |
| Hotels, Restaurants & Leisure 3.0% |
| Belmond Ltd. "A"* | 15,911 | 212,412 |
| Biglari Holdings, Inc.* | 196 | 92,747 |
| BJ's Restaurants, Inc.* | 4,544 | 178,579 |
| Bloomin' Brands, Inc. | 19,766 | 356,381 |
| Bob Evans Farms, Inc. | 3,763 | 200,229 |
| Bojangles', Inc.* | 1,870 | 34,876 |
| Boyd Gaming Corp.* | 16,006 | 322,841 |
| Buffalo Wild Wings, Inc.* | 3,678 | 567,883 |
| Caesars Acquisition Co. "A"* | 9,023 | 121,811 |
| Caesars Entertainment Corp.* | 10,770 | 91,545 |
| Carrols Restaurant Group, Inc.* | 6,649 | 101,397 |
| Century Casinos, Inc.* | 4,055 | 33,373 |
| Churchill Downs, Inc. | 2,620 | 394,179 |
| Chuy's Holdings, Inc.* | 3,064 | 99,427 |
| ClubCorp Holdings, Inc. | 12,716 | 182,475 |
| Cracker Barrel Old Country Store, Inc. (a) | 3,725 | 622,000 |
| Dave & Buster's Entertainment, Inc.* | 7,361 | 414,424 |
| Del Frisco's Restaurant Group, Inc.* | 4,618 | 78,506 |
| Del Taco Restaurants, Inc.* | 4,391 | 62,001 |
| Denny's Corp.* | 14,809 | 189,999 |
| DineEquity, Inc. | 3,391 | 261,107 |
| El Pollo Loco Holdings, Inc.* | 3,848 | 47,330 |
| Eldorado Resorts, Inc.* | 5,428 | 92,005 |
| Empire Resorts, Inc.* (a) | 587 | 13,354 |
| Fiesta Restaurant Group, Inc.* | 5,272 | 157,369 |
| Fogo De Chao, Inc.* | 867 | 12,441 |
| Golden Entertainment, Inc. | 1,959 | 23,723 |
| ILG, Inc. | 21,964 | 399,086 |
| International Speedway Corp. "A" | 5,202 | 191,434 |
| Intrawest Resorts Holdings, Inc.* | 3,334 | 59,512 |
| Isle of Capri Casinos, Inc.* | 4,746 | 117,179 |
| J. Alexander's Holdings, Inc.* | 2,340 | 25,155 |
| Jack in the Box, Inc. | 6,259 | 698,755 |
| Jamba, Inc.* (a) | 2,526 | 26,018 |
| Kona Grill, Inc.* (a) | 1,504 | 18,875 |
| La Quinta Holdings, Inc.* | 16,618 | 236,142 |
| Lindblad Expeditions Holdings, Inc.* | 2,797 | 26,432 |
| Luby's, Inc.* | 3,683 | 15,763 |
| Marcus Corp. | 3,504 | 110,376 |
| Marriott Vacations Worldwide Corp. | 4,355 | 369,522 |
| Monarch Casino & Resort, Inc.* | 2,125 | 54,783 |
| Nathan's Famous, Inc.* | 579 | 37,577 |
| Noodles & Co.* | 2,106 | 8,635 |
| Papa John's International, Inc. | 5,278 | 451,691 |
| Penn National Gaming, Inc.* | 13,974 | 192,701 |
| Pinnacle Entertainment, Inc.* | 10,636 | 154,222 |
| Planet Fitness, Inc. "A" | 4,879 | 98,068 |
| Popeyes Louisiana Kitchen, Inc.* | 3,933 | 237,868 |
| Potbelly Corp.* | 4,513 | 58,218 |
| Red Lion Hotels Corp.* | 2,685 | 22,420 |
| Red Robin Gourmet Burgers, Inc.* | 2,433 | 137,221 |
| Red Rock Resorts, Inc. "A" | 5,702 | 132,229 |
| Ruby Tuesday, Inc.* | 11,518 | 37,203 |
| Ruth's Hospitality Group, Inc. | 6,029 | 110,331 |
| Scientific Games Corp. "A"* | 9,958 | 139,412 |
| SeaWorld Entertainment, Inc. | 12,736 | 241,092 |
| Shake Shack, Inc. "A"* | 2,978 | 106,583 |
| Sonic Corp. | 8,424 | 223,320 |
| |
Shares | Value ($) |
| | | |
| Speedway Motorsports, Inc. | 2,192 | 47,501 |
| Texas Roadhouse, Inc. | 12,875 | 621,090 |
| The Cheesecake Factory, Inc. | 8,807 | 527,363 |
| The Habit Restaurants, Inc. "A"* | 2,560 | 44,160 |
| Wingstop, Inc. | 2,989 | 88,445 |
| Zoe's Kitchen, Inc.* (a) | 3,851 | 92,385 |
| | 11,123,181 |
| Household Durables 1.2% |
| Bassett Furniture Industries, Inc. | 1,910 | 58,064 |
| Beazer Homes U.S.A., Inc.* | 5,966 | 79,348 |
| Cavco Industries, Inc.* | 1,602 | 159,960 |
| Century Communities, Inc.* | 3,134 | 65,814 |
| CSS Industries, Inc. | 1,699 | 45,992 |
| Ethan Allen Interiors, Inc. | 4,910 | 180,933 |
| Flexsteel Industries, Inc. | 1,230 | 75,854 |
| GoPro, Inc. "A"* (a) | 19,713 | 171,700 |
| Green Brick Partners, Inc.* | 4,496 | 45,185 |
| Helen of Troy Ltd.* | 5,446 | 459,915 |
| Hooker Furniture Corp. | 2,186 | 82,959 |
| Hovnanian Enterprises, Inc. "A"* | 22,782 | 62,195 |
| Installed Building Products, Inc.* | 3,814 | 157,518 |
| iRobot Corp.* | 5,131 | 299,907 |
| KB HOME | 16,157 | 255,442 |
| La-Z-Boy, Inc. | 9,540 | 296,217 |
| LGI Homes, Inc.* (a) | 2,929 | 84,150 |
| Libbey, Inc. | 4,384 | 85,313 |
| Lifetime Brands, Inc. | 2,058 | 36,529 |
| M.D.C. Holdings, Inc. | 8,132 | 208,667 |
| M/I Homes, Inc.* | 4,467 | 112,479 |
| Meritage Homes Corp.* | 7,451 | 259,295 |
| NACCO Industries, Inc. "A" | 709 | 64,200 |
| New Home Co., Inc.* | 2,265 | 26,523 |
| Taylor Morrison Home Corp. "A"* | 5,811 | 111,920 |
| TopBuild Corp.* | 7,500 | 267,000 |
| TRI Pointe Group, Inc.* | 28,889 | 331,646 |
| UCP, Inc. "A"* | 1,541 | 18,569 |
| Universal Electronics, Inc.* | 2,767 | 178,610 |
| WCI Communities, Inc.* | 4,103 | 96,215 |
| William Lyon Homes "A"* | 4,529 | 86,187 |
| ZAGG, Inc.* | 5,246 | 37,246 |
| | 4,501,552 |
| Internet & Direct Marketing Retail 0.5% |
| 1-800 FLOWERS.COM, Inc. "A"* | 5,129 | 54,880 |
| Blue Nile, Inc. | 2,103 | 85,445 |
| Duluth Holdings, Inc. "B"* (a) | 1,818 | 46,177 |
| Etsy, Inc.* | 20,488 | 241,349 |
| FTD Companies, Inc.* | 3,169 | 75,549 |
| Gaia, Inc.* | 1,184 | 10,242 |
| HSN, Inc. | 6,072 | 208,270 |
| Lands' End, Inc.* (a) | 2,693 | 40,799 |
| Liberty TripAdvisor Holdings, Inc. "A"* | 14,079 | 211,889 |
| NutriSystem, Inc. | 5,521 | 191,303 |
| Overstock.com, Inc.* | 2,597 | 45,447 |
| PetMed Express, Inc. | 3,985 | 91,934 |
| Shutterfly, Inc.* | 6,692 | 335,804 |
| Wayfair, Inc. "A"* (a) | 6,172 | 216,328 |
| | 1,855,416 |
| Leisure Products 0.3% |
| Acushnet Holdings Corp.* | 4,230 | 83,373 |
| American Outdoor Brands Corp.* | 10,683 | 225,198 |
| Arctic Cat, Inc. | 2,372 | 35,627 |
| Callaway Golf Co. | 18,592 | 203,768 |
| |
Shares | Value ($) |
| | | |
| Escalade, Inc. | 1,919 | 25,331 |
| JAKKS Pacific, Inc.* | 2,688 | 13,843 |
| Johnson Outdoors, Inc. "A" | 976 | 38,738 |
| Malibu Boats, Inc. "A"* | 3,743 | 71,417 |
| Marine Products Corp. | 1,901 | 26,367 |
| MCBC Holdings, Inc. | 1,200 | 17,496 |
| Nautilus, Inc.* | 6,120 | 113,220 |
| Sturm, Ruger & Co., Inc. (a) | 3,622 | 190,879 |
| | 1,045,257 |
| Media 1.5% |
| AMC Entertainment Holdings, Inc. "A" | 5,671 | 190,829 |
| Central European Media Enterprises Ltd. "A"* | 13,726 | 35,001 |
| Daily Journal Corp.* | 204 | 49,327 |
| Entercom Communications Corp. "A" | 4,793 | 73,333 |
| Entravision Communications Corp. "A" | 12,382 | 86,674 |
| Eros International PLC* (a) | 5,608 | 73,184 |
| Gannett Co., Inc. | 22,890 | 222,262 |
| Global Eagle Entertainment, Inc.* | 9,108 | 58,838 |
| Gray Television, Inc.* | 12,814 | 139,032 |
| Hemisphere Media Group, Inc.* | 1,151 | 12,891 |
| IMAX Corp.* | 11,451 | 359,561 |
| Liberty Media Corp.-Liberty Braves "A"* | 1,744 | 35,735 |
| Liberty Media Corp.-Liberty Braves "C"* | 5,972 | 122,963 |
| Liberty Media Corp.-Liberty Media "A"* | 4,348 | 136,310 |
| Liberty Media Corp.-Liberty Media "C"* | 9,047 | 283,443 |
| Loral Space & Communications, Inc.* | 2,406 | 98,766 |
| MDC Partners, Inc. "A" | 9,720 | 63,666 |
| Media General, Inc.* | 21,095 | 397,219 |
| Meredith Corp. | 7,286 | 430,967 |
| MSG Networks, Inc. "A"* | 11,263 | 242,155 |
| National CineMedia, Inc. | 12,070 | 177,791 |
| New Media Investment Group, Inc. | 8,452 | 135,148 |
| New York Times Co. "A" | 24,204 | 321,913 |
| Nexstar Broadcasting Group, Inc. "A" (a) | 5,797 | 366,950 |
| Radio One, Inc. "D"* | 4,708 | 13,653 |
| Reading International, Inc. "A"* | 3,089 | 51,277 |
| Saga Communications, Inc. "A" | 704 | 35,411 |
| Salem Media Group, Inc. | 2,108 | 13,175 |
| Scholastic Corp. | 5,277 | 250,605 |
| Sinclair Broadcast Group, Inc. "A" | 12,850 | 428,548 |
| The E.W. Scripps Co. "A"* | 11,621 | 224,634 |
| Time, Inc. | 19,979 | 356,625 |
| Townsquare Media, Inc. "A"* | 1,342 | 13,970 |
| tronc, Inc. | 5,120 | 71,014 |
| World Wrestling Entertainment, Inc. "A" | 6,872 | 126,445 |
| | 5,699,315 |
| Multiline Retail 0.2% |
| Big Lots, Inc. | 8,659 | 434,768 |
| Fred's, Inc. "A" (a) | 6,514 | 120,900 |
| Ollie's Bargain Outlet Holdings, Inc.* | 3,822 | 108,736 |
| Sears Holdings Corp.* (a) | 2,132 | 19,806 |
| Tuesday Morning Corp.* | 8,091 | 43,692 |
| | 727,902 |
| |
Shares | Value ($) |
| | | |
| Specialty Retail 2.4% |
| Aaron's, Inc. | 12,784 | 408,960 |
| Abercrombie & Fitch Co. "A" | 13,369 | 160,428 |
| America's Car-Mart, Inc.* | 1,543 | 67,506 |
| American Eagle Outfitters, Inc. | 31,828 | 482,831 |
| Asbury Automotive Group, Inc.* | 3,947 | 243,530 |
| Ascena Retail Group, Inc.* | 33,088 | 204,815 |
| At Home Group, Inc.* | 1,619 | 23,686 |
| Barnes & Noble Education, Inc.* | 7,595 | 87,115 |
| Barnes & Noble, Inc. | 11,969 | 133,454 |
| Big 5 Sporting Goods Corp. | 3,337 | 57,897 |
| Boot Barn Holdings, Inc.* (a) | 2,366 | 29,622 |
| Build-A-Bear Workshop, Inc.* | 2,399 | 32,986 |
| Caleres, Inc. | 8,356 | 274,244 |
| Camping World Holdings, Inc. "A" | 2,280 | 74,305 |
| Cato Corp. "A" | 5,008 | 150,641 |
| Chico's FAS, Inc. | 25,346 | 364,729 |
| Citi Trends, Inc. | 2,773 | 52,243 |
| Conn's, Inc.* | 3,657 | 46,261 |
| Destination XL Group, Inc.* | 6,863 | 29,168 |
| DSW, Inc. "A" | 13,081 | 296,285 |
| Express, Inc.* | 14,101 | 151,727 |
| Five Below, Inc.* | 10,412 | 416,063 |
| Francesca's Holdings Corp.* | 7,330 | 132,160 |
| Genesco, Inc.* | 3,903 | 242,376 |
| GNC Holdings, Inc. "A" | 13,339 | 147,263 |
| Group 1 Automotive, Inc. | 3,963 | 308,876 |
| Guess?, Inc. | 11,908 | 144,087 |
| Haverty Furniture Companies, Inc. | 3,810 | 90,297 |
| Hibbett Sports, Inc.* | 4,544 | 169,491 |
| Kirkland's, Inc.* | 2,658 | 41,226 |
| Lithia Motors, Inc. "A" | 4,613 | 446,677 |
| Lumber Liquidators Holdings, Inc.* | 5,290 | 83,265 |
| MarineMax, Inc.* | 4,667 | 90,306 |
| Monro Muffler Brake, Inc. | 6,110 | 349,492 |
| Office Depot, Inc. | 107,597 | 486,338 |
| Party City Holdco, Inc.* | 5,105 | 72,491 |
| Pier 1 Imports, Inc. | 15,042 | 128,459 |
| Rent-A-Center, Inc. | 10,164 | 114,345 |
| RH* | 7,587 | 232,921 |
| Sears Hometown & Outlet Stores, Inc.* | 2,140 | 10,058 |
| Select Comfort Corp.* | 9,017 | 203,964 |
| Shoe Carnival, Inc. | 2,744 | 74,033 |
| Sonic Automotive, Inc. "A" | 5,544 | 126,958 |
| Sportsman's Warehouse Holdings, Inc.* | 4,900 | 46,011 |
| Stage Stores, Inc. | 4,531 | 19,800 |
| Stein Mart, Inc. | 5,972 | 32,727 |
| Tailored Brands, Inc. | 9,287 | 237,283 |
| The Buckle, Inc. (a) | 5,631 | 128,387 |
| The Children's Place, Inc. | 3,641 | 367,559 |
| The Container Store Group, Inc.* (a) | 2,885 | 18,320 |
| The Finish Line, Inc. "A" | 8,177 | 153,809 |
| Tile Shop Holdings, Inc.* | 6,176 | 120,741 |
| Tilly's, Inc. "A"* | 1,996 | 26,327 |
| Vitamin Shoppe, Inc.* | 4,811 | 114,261 |
| West Marine, Inc.* | 3,410 | 35,703 |
| Winmark Corp. | 449 | 56,641 |
| Zumiez, Inc.* | 3,648 | 79,709 |
| | 8,920,857 |
| |
Shares | Value ($) |
| | | |
| Textiles, Apparel & Luxury Goods 0.8% |
| Columbia Sportswear Co. | 5,254 | 306,308 |
| Crocs, Inc.* | 14,789 | 101,453 |
| Culp, Inc. | 2,036 | 75,637 |
| Deckers Outdoor Corp.* | 6,297 | 348,791 |
| Delta Apparel, Inc.* | 1,344 | 27,861 |
| Fossil Group, Inc.* | 7,920 | 204,811 |
| G-III Apparel Group Ltd.* | 8,356 | 247,003 |
| Iconix Brand Group, Inc.* | 8,004 | 74,757 |
| Movado Group, Inc. | 2,851 | 81,966 |
| Oxford Industries, Inc. | 2,851 | 171,431 |
| Perry Ellis International, Inc.* | 2,456 | 61,179 |
| Sequential Brands Group, Inc.* (a) | 7,443 | 34,833 |
| Steven Madden Ltd.* | 11,962 | 427,642 |
| Superior Uniform Group, Inc. | 1,638 | 32,138 |
| Unifi, Inc.* | 2,970 | 96,911 |
| Vera Bradley, Inc.* | 4,130 | 48,404 |
| Vince Holding Corp.* (a) | 3,621 | 14,665 |
| Wolverine World Wide, Inc. | 18,825 | 413,209 |
| | 2,768,999 |
| Consumer Staples 2.9% |
| Beverages 0.2% |
| Boston Beer Co., Inc. "A"* | 1,715 | 291,293 |
| Coca-Cola Bottling Co. Consolidated | 889 | 158,998 |
| Craft Brew Alliance, Inc.* | 2,560 | 43,264 |
| MGP Ingredients, Inc. | 2,378 | 118,852 |
| National Beverage Corp. | 2,204 | 112,580 |
| Primo Water Corp.* | 3,995 | 49,059 |
| | 774,046 |
| Food & Staples Retailing 0.6% |
| Ingles Markets, Inc. "A" | 2,813 | 135,305 |
| Natural Grocers by Vitamin Cottage, Inc.* | 1,700 | 20,213 |
| Performance Food Group Co.* | 7,039 | 168,936 |
| PriceSmart, Inc. | 3,901 | 325,734 |
| Smart & Final Stores, Inc.* | 4,309 | 60,757 |
| SpartanNash Co. | 7,252 | 286,744 |
| SUPERVALU, Inc.* | 51,705 | 241,462 |
| The Andersons, Inc. | 5,292 | 236,553 |
| The Chefs' Warehouse, Inc.* | 3,784 | 59,787 |
| United Natural Foods, Inc.* | 9,644 | 460,212 |
| Village Super Market, Inc. "A" | 1,478 | 45,670 |
| Weis Markets, Inc. | 1,813 | 121,181 |
| | 2,162,554 |
| Food Products 1.4% |
| AdvancePierre Foods Holdings, Inc. | 4,206 | 125,255 |
| Alico, Inc. | 689 | 18,706 |
| Amplify Snack Brands, Inc.* (a) | 5,541 | 48,816 |
| B&G Foods, Inc. | 12,773 | 559,457 |
| Cal-Maine Foods, Inc. (a) | 6,046 | 267,082 |
| Calavo Growers, Inc. | 3,057 | 187,700 |
| Darling Ingredients, Inc.* | 31,853 | 411,222 |
| Dean Foods Co. | 17,794 | 387,553 |
| Farmer Brothers Co.* | 1,669 | 61,252 |
| Fresh Del Monte Produce, Inc. | 6,264 | 379,786 |
| Freshpet, Inc.* (a) | 4,347 | 44,122 |
| Inventure Foods, Inc.* | 4,145 | 40,828 |
| J & J Snack Foods Corp. | 2,894 | 386,146 |
| John B. Sanfilippo & Son, Inc. | 1,695 | 119,311 |
| Lancaster Colony Corp. | 3,640 | 514,660 |
| Landec Corp.* | 5,479 | 75,610 |
| Lifeway Foods, Inc.* | 911 | 10,486 |
| |
Shares | Value ($) |
| | | |
| Limoneira Co. | 2,309 | 49,667 |
| Omega Protein Corp.* | 4,212 | 105,511 |
| Sanderson Farms, Inc. | 3,882 | 365,840 |
| Seaboard Corp.* | 52 | 205,504 |
| Seneca Foods Corp. "A"* | 1,199 | 48,020 |
| Snyder's-Lance, Inc. | 15,274 | 585,605 |
| Tootsie Roll Industries, Inc. (a) | 3,249 | 129,148 |
| | 5,127,287 |
| Household Products 0.3% |
| Central Garden & Pet Co.* | 1,917 | 63,434 |
| Central Garden & Pet Co. "A"* | 6,335 | 195,751 |
| HRG Group, Inc.* | 23,066 | 358,907 |
| Oil-Dri Corp. of America | 930 | 35,535 |
| Orchids Paper Products Co. (a) | 1,743 | 45,632 |
| WD-40 Co. | 2,727 | 318,786 |
| | 1,018,045 |
| Personal Products 0.2% |
| Avon Products, Inc. | 85,641 | 431,631 |
| elf Beauty, Inc.* | 1,771 | 51,253 |
| Inter Parfums, Inc. | 3,507 | 114,854 |
| Lifevantage Corp.* | 2,599 | 21,182 |
| Medifast, Inc. | 1,882 | 78,348 |
| Natural Health Trends Corp. | 1,400 | 34,790 |
| Nature's Sunshine Products, Inc. | 1,450 | 21,750 |
| Nutraceutical International Corp. | 1,508 | 52,704 |
| Revlon, Inc. "A"* | 2,276 | 66,345 |
| Synutra International, Inc.* (a) | 3,372 | 18,040 |
| USANA Health Sciences, Inc.* | 2,040 | 124,848 |
| | 1,015,745 |
| Tobacco 0.2% |
| Alliance One International, Inc.* | 1,581 | 30,355 |
| Turning Point Brands, Inc.* | 1,127 | 13,806 |
| Universal Corp. | 4,326 | 275,782 |
| Vector Group Ltd. (a) | 17,932 | 407,774 |
| | 727,717 |
| Energy 3.7% |
| Energy Equipment & Services 1.3% |
| Archrock, Inc. | 13,278 | 175,269 |
| Atwood Oceanics, Inc. | 11,616 | 152,518 |
| Bristow Group, Inc. | 6,436 | 131,809 |
| CARBO Ceramics, Inc.* (a) | 4,518 | 47,258 |
| Dawson Geophysical Co.* | 3,836 | 30,841 |
| Era Group, Inc.* | 3,545 | 60,159 |
| Exterran Corp.* | 6,355 | 151,884 |
| Fairmount Santrol Holdings, Inc.* | 17,300 | 203,967 |
| Forum Energy Technologies, Inc.* | 11,723 | 257,906 |
| Geospace Technologies Corp.* | 2,477 | 50,432 |
| Helix Energy Solutions Group, Inc.* | 21,936 | 193,475 |
| Hornbeck Offshore Services, Inc.* | 6,291 | 45,421 |
| Independence Contract Drilling, Inc.* | 5,722 | 38,337 |
| Mammoth Energy Services, Inc.* | 1,403 | 21,326 |
| Matrix Service Co.* | 5,300 | 120,310 |
| McDermott International, Inc.* | 46,982 | 347,197 |
| Natural Gas Services Group* | 2,293 | 73,720 |
| Newpark Resources, Inc.* | 16,624 | 124,680 |
| Oil States International, Inc.* | 9,981 | 389,259 |
| Parker Drilling Co.* | 22,098 | 57,455 |
| PHI, Inc. (Non Voting)* | 2,151 | 38,761 |
| Pioneer Energy Services Corp.* | 14,307 | 98,003 |
| RigNet, Inc.* | 2,305 | 53,361 |
| SEACOR Holdings, Inc.* | 3,043 | 216,905 |
| |
Shares | Value ($) |
| | | |
| Seadrill Ltd.* (a) | 72,697 | 247,897 |
| Smart Sand, Inc.* | 2,194 | 36,311 |
| Tesco Corp. | 8,651 | 71,371 |
| TETRA Technologies, Inc.* | 18,384 | 92,288 |
| Tidewater, Inc. (a) | 8,960 | 30,554 |
| U.S. Silica Holdings, Inc. | 14,355 | 813,641 |
| Unit Corp.* | 9,984 | 268,270 |
| Willbros Group, Inc.* | 8,232 | 26,672 |
| | 4,667,257 |
| Oil, Gas & Consumable Fuels 2.4% |
| Abraxas Petroleum Corp.* | 23,549 | 60,521 |
| Adams Resources & Energy, Inc. | 426 | 16,891 |
| Alon U.S.A. Energy, Inc. | 5,782 | 65,799 |
| Ardmore Shipping Corp. (a) | 5,580 | 41,292 |
| Bill Barrett Corp.* | 9,623 | 67,265 |
| California Resources Corp.* | 6,010 | 127,953 |
| Callon Petroleum Co.* | 28,245 | 434,126 |
| Carrizo Oil & Gas, Inc.* | 11,836 | 442,075 |
| Clayton Williams Energy, Inc.* | 1,164 | 138,819 |
| Clean Energy Fuels Corp.* | 17,216 | 49,238 |
| Cobalt International Energy, Inc.* | 77,446 | 94,484 |
| Contango Oil & Gas Co.* | 4,447 | 41,535 |
| CVR Energy, Inc. (a) | 3,024 | 76,779 |
| Delek U.S. Holdings, Inc. | 11,804 | 284,122 |
| Denbury Resources, Inc.* | 67,276 | 247,576 |
| DHT Holdings, Inc. | 19,040 | 78,826 |
| Dorian LPG Ltd.* | 4,452 | 36,551 |
| Earthstone Energy, Inc.* | 367 | 5,043 |
| Eclipse Resources Corp.* | 11,183 | 29,859 |
| EP Energy Corp. "A"* (a) | 7,346 | 48,116 |
| Erin Energy Corp.* (a) | 2,469 | 7,530 |
| Evolution Petroleum Corp. | 4,661 | 46,610 |
| EXCO Resources, Inc.* (a) | 24,978 | 21,823 |
| Frontline Ltd. (a) | 12,355 | 87,844 |
| GasLog Ltd. | 7,670 | 123,487 |
| Gener8 Maritime, Inc.* | 7,478 | 33,501 |
| Golar LNG Ltd. | 18,382 | 421,683 |
| Green Plains, Inc. | 6,883 | 191,692 |
| International Seaways, Inc.* | 3,197 | 44,886 |
| Isramco, Inc.* | 166 | 20,634 |
| Jones Energy, Inc. "A"* (a) | 11,073 | 55,365 |
| Matador Resources Co.* | 16,157 | 416,204 |
| Navios Maritime Acquisition Corp. | 15,053 | 25,590 |
| Nordic American Tankers Ltd. (a) | 19,172 | 161,045 |
| Northern Oil & Gas, Inc.* (a) | 8,912 | 24,508 |
| Oasis Petroleum, Inc.* | 45,316 | 686,084 |
| Overseas Shipholding Group, Inc. "A" | 7,618 | 29,177 |
| Pacific Ethanol, Inc.* | 5,209 | 49,485 |
| Panhandle Oil & Gas, Inc. "A" | 3,085 | 72,652 |
| Par Pacific Holdings, Inc.* | 5,860 | 85,204 |
| PDC Energy, Inc.* | 10,882 | 789,816 |
| Renewable Energy Group, Inc.* | 7,073 | 68,608 |
| REX American Resources Corp.* | 1,055 | 104,181 |
| Ring Energy, Inc.* | 7,887 | 102,452 |
| RSP Permian, Inc.* | 19,094 | 851,974 |
| Sanchez Energy Corp.* | 10,615 | 95,853 |
| Scorpio Tankers, Inc. | 31,071 | 140,752 |
| SemGroup Corp. "A" | 12,857 | 536,780 |
| Ship Finance International Ltd. | 11,752 | 174,517 |
| Synergy Resources Corp.* | 36,193 | 322,480 |
| Teekay Corp. | 9,506 | 76,333 |
| Teekay Tankers Ltd. "A" | 22,175 | 50,115 |
| |
Shares | Value ($) |
| | | |
| W&T Offshore, Inc.* (a) | 5,618 | 15,562 |
| Western Refining, Inc. | 15,678 | 593,412 |
| Westmoreland Coal Co.* | 3,686 | 65,132 |
| | 8,979,841 |
| Financials 19.4% |
| Banks 11.6% |
| 1st Source Corp. | 2,950 | 131,747 |
| Access National Corp. (a) | 1,597 | 44,333 |
| ACNB Corp. | 1,136 | 35,500 |
| Allegiance Bancshares, Inc.* | 2,080 | 75,192 |
| American National Bankshares, Inc. | 1,484 | 51,643 |
| Ameris Bancorp. | 6,675 | 291,030 |
| Ames National Corp. | 1,604 | 52,932 |
| Arrow Financial Corp. | 2,222 | 89,991 |
| Atlantic Capital Bancshares, Inc.* | 3,285 | 62,415 |
| Banc of California, Inc. (a) | 9,723 | 168,694 |
| BancFirst Corp. | 1,488 | 138,458 |
| Banco Latinoamericano de Comercio Exterior SA "E" | 5,732 | 168,750 |
| BancorpSouth, Inc. | 16,826 | 522,447 |
| Bank of Marin Bancorp. | 1,221 | 85,165 |
| Bank of NT Butterfield & Son Ltd. | 2,440 | 76,714 |
| Bank of the Ozarks, Inc. | 17,016 | 894,871 |
| Bankwell Financial Group, Inc. | 1,086 | 35,295 |
| Banner Corp. | 5,881 | 328,219 |
| Bar Harbor Bankshares | 1,063 | 50,312 |
| Berkshire Hills Bancorp., Inc. | 6,507 | 239,783 |
| Blue Hills Bancorp., Inc. | 4,561 | 85,519 |
| BNC Bancorp. | 7,952 | 253,669 |
| Boston Private Financial Holdings, Inc. | 16,064 | 265,859 |
| Bridge Bancorp., Inc. | 3,764 | 142,656 |
| Brookline Bancorp., Inc. | 13,222 | 216,841 |
| Bryn Mawr Bank Corp. | 3,166 | 133,447 |
| C&F Financial Corp. | 613 | 30,558 |
| California First National Bancorp. | 451 | 7,058 |
| Camden National Corp. | 2,895 | 128,683 |
| Capital Bank Financial Corp. "A" | 4,794 | 188,164 |
| Capital City Bank Group, Inc. | 2,067 | 42,332 |
| Capstar Financial Holdings, Inc.* | 687 | 15,087 |
| Cardinal Financial Corp. | 6,148 | 201,593 |
| Carolina Financial Corp. | 1,938 | 59,671 |
| Cascade Bancorp.* | 5,898 | 47,892 |
| Cathay General Bancorp. | 14,433 | 548,887 |
| Centerstate Banks, Inc. | 9,171 | 230,834 |
| Central Pacific Financial Corp. | 5,792 | 181,985 |
| Central Valley Community Bancorp. | 1,655 | 33,034 |
| Century Bancorp., Inc. "A" | 543 | 32,580 |
| Chemical Financial Corp. | 12,754 | 690,884 |
| Chemung Financial Corp. | 597 | 21,701 |
| Citizens & Northern Corp. | 2,448 | 64,138 |
| City Holding Co. | 2,776 | 187,658 |
| CNB Financial Corp. | 2,623 | 70,139 |
| CoBiz Financial, Inc. | 7,096 | 119,851 |
| Codorus Valley Bancorp., Inc. | 1,539 | 44,015 |
| Columbia Banking System, Inc. | 11,296 | 504,705 |
| Community Bank System, Inc. | 8,279 | 511,559 |
| Community Trust Bancorp., Inc. | 3,148 | 156,141 |
| ConnectOne Bancorp., Inc. | 5,403 | 140,208 |
| County Bancorp., Inc. | 914 | 24,651 |
| CU Bancorp.* | 3,061 | 109,584 |
| Customers Bancorp., Inc.* | 4,611 | 165,166 |
| CVB Financial Corp. | 19,722 | 452,225 |
| |
Shares | Value ($) |
| | | |
| Eagle Bancorp., Inc.* | 5,976 | 364,237 |
| Enterprise Bancorp., Inc. | 1,828 | 68,660 |
| Enterprise Financial Services Corp. | 3,819 | 164,217 |
| Equity Bancshares, Inc. "A"* | 968 | 32,564 |
| Farmers Capital Bank Corp. | 1,334 | 56,095 |
| Farmers National Banc Corp. | 4,719 | 67,010 |
| FB Financial Corp.* | 1,337 | 34,695 |
| FCB Financial Holdings, Inc. "A"* | 5,891 | 281,001 |
| Fidelity Southern Corp. | 4,172 | 98,751 |
| Financial Institutions, Inc. | 2,744 | 93,845 |
| First BanCorp.* | 22,522 | 148,870 |
| First BanCorp. — North Carolina | 3,815 | 103,539 |
| First Bancorp., Inc. | 1,889 | 62,526 |
| First Busey Corp. | 5,934 | 182,649 |
| First Business Financial Services, Inc. | 1,532 | 36,339 |
| First Citizens BancShares, Inc. "A" | 1,456 | 516,880 |
| First Commonwealth Financial Corp. | 17,122 | 242,790 |
| First Community Bancshares, Inc. | 3,056 | 92,108 |
| First Community Financial Partners, Inc.* | 2,567 | 30,034 |
| First Connecticut Bancorp, Inc. | 2,586 | 58,573 |
| First Financial Bancorp. | 11,759 | 334,544 |
| First Financial Bankshares, Inc. | 12,186 | 550,807 |
| First Financial Corp. — Indiana | 1,873 | 98,894 |
| First Financial Northwest, Inc. | 1,207 | 23,826 |
| First Foundation, Inc.* | 2,506 | 71,421 |
| First Internet Bancorp. | 985 | 31,520 |
| First Interstate BancSystem, Inc. "A" | 3,743 | 159,265 |
| First Merchants Corp. | 7,988 | 300,748 |
| First Mid-Illinois Bancshares, Inc. | 1,605 | 54,570 |
| First Midwest Bancorp., Inc. | 15,651 | 394,875 |
| First NBC Bank Holding Co.* (a) | 2,842 | 20,747 |
| First Northwest Bancorp.* | 2,109 | 32,900 |
| First of Long Island Corp. | 4,096 | 116,941 |
| Flushing Financial Corp. | 5,275 | 155,032 |
| FNB Corp. | 40,766 | 653,479 |
| Franklin Financial Network, Inc.* | 2,199 | 92,028 |
| Fulton Financial Corp. | 33,380 | 627,544 |
| German American Bancorp., Inc. | 2,709 | 142,520 |
| Glacier Bancorp., Inc. | 14,645 | 530,588 |
| Great Southern Bancorp., Inc. | 2,035 | 111,213 |
| Great Western Bancorp., Inc. | 11,498 | 501,198 |
| Green Bancorp., Inc.* | 3,938 | 59,858 |
| Guaranty Bancorp. | 3,450 | 83,490 |
| Hancock Holding Co. | 15,038 | 648,138 |
| Hanmi Financial Corp. | 6,174 | 215,473 |
| HarborOne Bancorp., Inc.* | 2,842 | 54,964 |
| Heartland Financial U.S.A., Inc. | 4,601 | 220,848 |
| Heritage Commerce Corp. | 4,931 | 71,154 |
| Heritage Financial Corp. | 5,975 | 153,856 |
| Heritage Oaks Bancorp. | 5,048 | 62,242 |
| Hilltop Holdings, Inc. | 14,633 | 436,063 |
| Home Bancshares, Inc. | 23,183 | 643,792 |
| HomeTrust Bancshares, Inc.* | 3,166 | 81,999 |
| Hope Bancorp., Inc. | 24,573 | 537,903 |
| Horizon Bancorp. | 3,948 | 110,544 |
| IBERIABANK Corp. | 8,519 | 713,466 |
| Independent Bank Corp. | 3,777 | 81,961 |
| Independent Bank Corp. | 4,953 | 348,939 |
| Independent Bank Group, Inc. | 2,109 | 131,602 |
| International Bancshares Corp. | 10,668 | 435,254 |
| |
Shares | Value ($) |
| | | |
| Investors Bancorp., Inc. | 57,401 | 800,744 |
| Lakeland Bancorp., Inc. | 7,330 | 142,935 |
| Lakeland Financial Corp. | 4,599 | 217,809 |
| LCNB Corp. | 1,677 | 38,990 |
| LegacyTexas Financial Group, Inc. | 8,623 | 371,306 |
| Live Oak Bancshares, Inc. | 3,705 | 68,542 |
| Macatawa Bank Corp. | 4,982 | 51,863 |
| MainSource Financial Group, Inc. | 4,453 | 153,183 |
| MB Financial, Inc. | 14,535 | 686,488 |
| MBT Financial Corp. | 3,340 | 37,909 |
| Mercantile Bank Corp. | 2,998 | 113,025 |
| Merchants Bancshares, Inc. | 1,102 | 59,728 |
| Middleburg Financial Corp. | 884 | 30,719 |
| Midland States Bancorp., Inc. | 700 | 25,326 |
| MidWestOne Financial Group, Inc. | 1,611 | 60,574 |
| MutualFirst Financial, Inc. | 1,032 | 34,159 |
| National Bank Holdings Corp. "A" | 4,550 | 145,099 |
| National Bankshares, Inc. | 1,314 | 57,093 |
| National Commerce Corp.* | 1,608 | 59,737 |
| NBT Bancorp., Inc. | 8,241 | 345,133 |
| Nicolet Bankshares, Inc.* | 1,466 | 69,914 |
| Northrim BanCorp., Inc. | 1,276 | 40,322 |
| OFG Bancorp. | 8,090 | 105,979 |
| Old Line Bancshares, Inc. | 1,592 | 38,176 |
| Old National Bancorp. | 25,579 | 464,259 |
| Old Second Bancorp., Inc. | 5,261 | 58,134 |
| Opus Bank | 3,253 | 97,753 |
| Orrstown Financial Services, Inc. | 1,404 | 31,450 |
| Pacific Continental Corp. | 4,009 | 87,597 |
| Pacific Mercantile Bancorp.* | 2,922 | 21,331 |
| Pacific Premier Bancorp., Inc.* | 5,339 | 188,734 |
| Paragon Commercial Corp.* | 238 | 10,405 |
| Park National Corp. | 2,610 | 312,313 |
| Park Sterling Corp. | 9,638 | 103,994 |
| Peapack-Gladstone Financial Corp. | 2,985 | 92,177 |
| Penns Woods Bancorp., Inc. | 859 | 43,379 |
| People's Utah Bancorp. | 2,466 | 66,212 |
| Peoples Bancorp., Inc. | 2,989 | 97,023 |
| Peoples Financial Services Corp. | 1,347 | 65,599 |
| Pinnacle Financial Partners, Inc. | 8,375 | 580,387 |
| Preferred Bank | 2,442 | 128,010 |
| Premier Financial Bancorp., Inc. | 1,768 | 35,537 |
| PrivateBancorp., Inc. | 15,074 | 816,860 |
| Prosperity Bancshares, Inc. | 12,774 | 916,918 |
| QCR Holdings, Inc. | 2,317 | 100,326 |
| Renasant Corp. | 7,979 | 336,873 |
| Republic Bancorp., Inc. "A" | 1,886 | 74,572 |
| Republic First Bancorp., Inc.* | 9,781 | 81,671 |
| S&T Bancorp., Inc. | 6,533 | 255,048 |
| Sandy Spring Bancorp., Inc. | 4,705 | 188,153 |
| Seacoast Banking Corp. of Florida* | 5,606 | 123,668 |
| ServisFirst Bancshares, Inc. | 8,788 | 329,023 |
| Shore Bancshares, Inc. | 2,371 | 36,158 |
| Sierra Bancorp. | 2,278 | 60,572 |
| Simmons First National Corp. "A" | 5,751 | 357,425 |
| South State Corp. | 4,621 | 403,875 |
| Southern First Bancshares, Inc.* | 1,082 | 38,952 |
| Southern National Bancorp. of Virginia, Inc. | 2,142 | 35,000 |
| Southside Bancshares, Inc. | 5,158 | 194,302 |
| Southwest Bancorp., Inc. | 3,401 | 98,629 |
| State Bank Financial Corp. | 6,687 | 179,613 |
| Sterling Bancorp. | 24,456 | 572,270 |
| |
Shares | Value ($) |
| | | |
| Stock Yards Bancorp., Inc. | 4,083 | 191,697 |
| Stonegate Bank | 2,516 | 104,993 |
| Suffolk Bancorp. | 2,130 | 91,207 |
| Summit Financial Group, Inc. (a) | 1,567 | 43,139 |
| Sun Bancorp, Inc. | 2,044 | 53,144 |
| Texas Capital Bancshares, Inc.* | 9,517 | 746,133 |
| The Bancorp., Inc.* | 9,761 | 76,721 |
| Tompkins Financial Corp. | 2,773 | 262,159 |
| TowneBank | 10,926 | 363,289 |
| TriCo Bancshares | 3,845 | 131,422 |
| TriState Capital Holdings, Inc.* | 4,308 | 95,207 |
| Triumph Bancorp., Inc.* | 3,020 | 78,973 |
| Trustmark Corp. | 13,081 | 466,338 |
| UMB Financial Corp. | 8,704 | 671,252 |
| Umpqua Holdings Corp. | 42,839 | 804,516 |
| Union Bankshares Corp. | 8,500 | 303,790 |
| Union Bankshares, Inc. (a) | 740 | 33,633 |
| United Bankshares, Inc. | 12,694 | 587,097 |
| United Community Banks, Inc. | 13,711 | 406,120 |
| Univest Corp. of Pennsylvania | 4,961 | 153,295 |
| Valley National Bancorp. | 47,946 | 558,091 |
| Veritex Holdings, Inc.* | 1,566 | 41,828 |
| Washington Trust Bancorp., Inc. | 2,840 | 159,182 |
| WashingtonFirst Bankshares, Inc. | 1,601 | 46,413 |
| Webster Financial Corp. | 17,585 | 954,514 |
| WesBanco, Inc. | 7,890 | 339,743 |
| West Bancorp. | 3,159 | 78,027 |
| Westamerica Bancorp. | 4,839 | 304,518 |
| Wintrust Financial Corp. | 9,970 | 723,523 |
| Xenith Bankshares, Inc.* | 1,523 | 42,949 |
| Yadkin Financial Corp. | 9,687 | 331,877 |
| | 43,167,799 |
| Capital Markets 1.4% |
| Arlington Asset Investment Corp. "A" | 4,146 | 61,444 |
| Associated Capital Group, Inc. "A" | 852 | 27,988 |
| B. Riley Financial, Inc. | 1,765 | 32,564 |
| BGC Partners, Inc. "A" | 42,190 | 431,604 |
| Calamos Asset Management, Inc. "A" | 3,223 | 27,557 |
| Cohen & Steers, Inc. | 4,156 | 139,642 |
| Cowen Group, Inc. "A"* (a) | 4,963 | 76,927 |
| Diamond Hill Investment Group | 576 | 121,179 |
| Evercore Partners, Inc. "A" | 7,573 | 520,265 |
| FBR & Co. | 1,180 | 15,340 |
| Fifth Street Asset Management, Inc. | 1,129 | 7,564 |
| Financial Engines, Inc. | 10,410 | 382,567 |
| Gain Capital Holdings, Inc. | 7,086 | 46,626 |
| GAMCO Investors, Inc. "A" | 830 | 25,639 |
| Greenhill & Co., Inc. | 5,339 | 147,890 |
| Hennessy Advisors, Inc. | 544 | 17,272 |
| Houlihan Lokey, Inc. | 2,287 | 71,171 |
| INTL. FCStone, Inc.* | 2,959 | 117,176 |
| Investment Technology Group, Inc. | 6,140 | 121,204 |
| Janus Capital Group, Inc. | 27,902 | 370,260 |
| KCG Holdings, Inc. "A"* | 9,945 | 131,771 |
| Ladenburg Thalmann Financial Services, Inc.* (a) | 18,811 | 45,899 |
| Manning & Napier, Inc. | 2,817 | 21,268 |
| Medley Management, Inc. "A" | 1,036 | 10,256 |
| Moelis & Co. "A" | 3,514 | 119,125 |
| OM Asset Management PLC | 7,597 | 110,157 |
| Oppenheimer Holdings, Inc. "A" | 1,955 | 36,363 |
| |
Shares | Value ($) |
| | | |
| Piper Jaffray Companies, Inc.* | 2,770 | 200,825 |
| PJT Partners, Inc. "A" | 3,359 | 103,726 |
| Pzena Investment Management, Inc. "A" | 2,886 | 32,063 |
| Safeguard Scientifics, Inc.* | 3,689 | 49,617 |
| Silvercrest Asset Management Group, Inc. "A" | 1,334 | 17,542 |
| Stifel Financial Corp.* | 12,460 | 622,377 |
| Value Line, Inc. | 416 | 8,112 |
| Virtu Financial, Inc. "A" | 4,784 | 76,305 |
| Virtus Investment Partners, Inc. | 827 | 97,627 |
| Waddell & Reed Financial, Inc. "A" | 15,522 | 302,834 |
| Westwood Holdings Group, Inc. | 1,511 | 90,645 |
| Wins Finance Holdings, Inc.* | 289 | 52,020 |
| WisdomTree Investments, Inc. (a) | 22,343 | 248,901 |
| | 5,139,312 |
| Consumer Finance 0.5% |
| Encore Capital Group, Inc.* (a) | 4,511 | 129,240 |
| Enova International, Inc.* | 5,470 | 68,649 |
| EZCORP, Inc. "A"* | 10,100 | 107,565 |
| FirstCash, Inc. | 9,270 | 435,690 |
| Green Dot Corp. "A"* | 8,345 | 196,525 |
| LendingClub Corp.* | 63,955 | 335,764 |
| Nelnet, Inc. "A" | 3,855 | 195,641 |
| PRA Group, Inc.* | 8,983 | 351,235 |
| Regional Management Corp.* | 1,955 | 51,377 |
| World Acceptance Corp.* | 1,120 | 71,994 |
| | 1,943,680 |
| Diversified Financial Services 0.1% |
| FNFV Group* | 12,438 | 170,400 |
| Marlin Business Services Corp. | 1,665 | 34,798 |
| NewStar Financial, Inc.* | 4,395 | 40,654 |
| On Deck Capital, Inc.* | 9,094 | 42,105 |
| PICO Holdings, Inc.* | 4,104 | 62,176 |
| Tiptree Financial, Inc. "A", | 3,945 | 24,262 |
| | 374,395 |
| Insurance 2.4% |
| Ambac Financial Group, Inc.* | 8,616 | 193,860 |
| American Equity Investment Life Holding Co. | 16,646 | 375,201 |
| AMERISAFE, Inc. | 3,591 | 223,899 |
| Argo Group International Holdings Ltd. | 5,578 | 367,590 |
| Atlas Financial Holdings, Inc.* | 1,891 | 34,132 |
| Baldwin & Lyons, Inc. "B" | 1,582 | 39,866 |
| Blue Capital Reinsurance Holdings Ltd. | 1,162 | 21,439 |
| Citizens, Inc.* | 8,810 | 86,514 |
| CNO Financial Group, Inc. | 34,772 | 665,884 |
| Crawford & Co. "B" | 2,268 | 28,486 |
| Donegal Group, Inc. "A" | 1,585 | 27,706 |
| eHealth, Inc.* | 3,363 | 35,816 |
| EMC Insurance Group, Inc. | 1,473 | 44,205 |
| Employers Holdings, Inc. | 6,252 | 247,579 |
| Enstar Group Ltd.* | 2,214 | 437,708 |
| FBL Financial Group, Inc. "A" | 1,965 | 153,565 |
| Federated National Holding Co. | 2,309 | 43,155 |
| Fidelity & Guaranty Life | 2,307 | 54,676 |
| Genworth Financial, Inc. "A"* | 97,812 | 372,664 |
| Global Indemnity Ltd.* | 1,546 | 59,073 |
| Greenlight Capital Re Ltd. "A"* | 5,550 | 126,540 |
| Hallmark Financial Services, Inc.* | 2,633 | 30,622 |
| HCI Group, Inc. | 1,579 | 62,339 |
| |
Shares | Value ($) |
| | | |
| Heritage Insurance Holdings, Inc. | 5,048 | 79,102 |
| Horace Mann Educators Corp. | 7,848 | 335,894 |
| Independence Holding Co. | 1,493 | 29,188 |
| Infinity Property & Casualty Corp. | 2,123 | 186,612 |
| Investors Title Co. | 271 | 42,867 |
| James River Group Holdings Ltd. | 2,708 | 112,517 |
| Kemper Corp. | 7,743 | 343,015 |
| Kinsale Capital Group, Inc. | 1,298 | 44,145 |
| Maiden Holdings Ltd. | 13,087 | 228,368 |
| MBIA, Inc.* | 25,201 | 269,651 |
| National General Holdings Corp. | 9,194 | 229,758 |
| National Western Life Group, Inc. "A" | 445 | 138,306 |
| Navigators Group, Inc. | 2,182 | 256,930 |
| OneBeacon Insurance Group Ltd. "A" | 4,117 | 66,078 |
| Patriot National, Inc.* | 2,264 | 10,528 |
| Primerica, Inc. | 9,125 | 630,994 |
| RLI Corp. | 7,338 | 463,248 |
| Safety Insurance Group, Inc. | 2,790 | 205,623 |
| Selective Insurance Group, Inc. | 11,010 | 473,980 |
| State Auto Financial Corp. | 2,960 | 79,358 |
| State National Companies, Inc. | 5,660 | 78,448 |
| Stewart Information Services Corp. | 4,516 | 208,097 |
| Third Point Reinsurance Ltd.* | 12,562 | 145,091 |
| Trupanion, Inc.* (a) | 2,904 | 45,070 |
| United Fire Group, Inc. | 4,289 | 210,890 |
| United Insurance Holdings Corp. | 3,186 | 48,236 |
| Universal Insurance Holdings, Inc. | 6,158 | 174,887 |
| WMIH Corp.* | 38,548 | 59,749 |
| | 8,929,149 |
| Mortgage Real Estate Investment Trusts (REITs) 1.1% |
| AG Mortgage Investment Trust, Inc. | 5,628 | 96,295 |
| Altisource Residential Corp. | 9,914 | 109,451 |
| Anworth Mortgage Asset Corp. | 18,565 | 95,981 |
| Apollo Commercial Real Estate Finance, Inc. | 14,026 | 233,112 |
| Ares Commercial Real Estate Corp. | 5,435 | 74,622 |
| ARMOUR Residential REIT, Inc. | 6,972 | 151,223 |
| Capstead Mortgage Corp. | 18,178 | 185,234 |
| Colony Capital, Inc. "A", | 21,817 | 441,794 |
| CYS Investments, Inc. | 29,319 | 226,636 |
| Dynex Capital, Inc. | 8,496 | 57,943 |
| Great Ajax Corp. | 3,063 | 40,646 |
| Hannon Armstrong Sustainable Infrastructure Capital, Inc. | 8,444 | 160,351 |
| Invesco Mortgage Capital, Inc. | 21,838 | 318,835 |
| Ladder Capital Corp. | 7,261 | 99,621 |
| MTGE Investment Corp. | 9,114 | 143,090 |
| New Residential Investment Corp. | 46,528 | 731,420 |
| New York Mortgage Trust, Inc. (a) | 20,847 | 137,590 |
| Orchid Island Capital, Inc. (a) | 4,930 | 53,392 |
| Owens Realty Mortgage, Inc. | 1,889 | 34,984 |
| PennyMac Mortgage Investment Trust | 13,382 | 219,063 |
| Redwood Trust, Inc. | 14,827 | 225,519 |
| Resource Capital Corp. | 5,725 | 47,689 |
| Western Asset Mortgage Capital Corp. | 8,323 | 83,813 |
| | 3,968,304 |
| Thrifts & Mortgage Finance 2.3% |
| Astoria Financial Corp. | 17,936 | 334,506 |
| Bank Mutual Corp. | 7,515 | 71,017 |
| |
Shares | Value ($) |
| | | |
| BankFinancial Corp. | 2,859 | 42,370 |
| Bear State Financial, Inc. | 3,400 | 34,510 |
| Beneficial Bancorp., Inc. | 13,835 | 254,564 |
| BofI Holding, Inc.* (a) | 11,668 | 333,121 |
| BSB Bancorp., Inc.* | 1,447 | 41,891 |
| Capitol Federal Financial, Inc. | 24,851 | 409,047 |
| Charter Financial Corp. | 2,568 | 42,809 |
| Clifton Bancorp., Inc. | 4,139 | 70,032 |
| Dime Community Bancshares | 5,942 | 119,434 |
| ESSA Bancorp., Inc. | 1,563 | 24,570 |
| Essent Group Ltd.* | 14,530 | 470,336 |
| EverBank Financial Corp. | 19,518 | 379,625 |
| Federal Agricultural Mortgage Corp. "C" | 1,626 | 93,121 |
| First Defiance Financial Corp. | 1,647 | 83,569 |
| Flagstar Bancorp., Inc.* | 4,138 | 111,478 |
| Greene County Bancorp., Inc. (a) | 571 | 13,076 |
| Hingham Institution for Savings | 235 | 46,243 |
| Home Bancorp., Inc. | 1,083 | 41,815 |
| HomeStreet, Inc.* | 4,634 | 146,434 |
| Impac Mortgage Holdings, Inc.* | 2,173 | 30,465 |
| Kearny Financial Corp. | 16,804 | 261,302 |
| Lake Sunapee Bank Group | 1,496 | 35,291 |
| LendingTree, Inc.* | 1,185 | 120,100 |
| Meridian Bancorp., Inc. | 9,128 | 172,519 |
| Meta Financial Group, Inc. | 1,559 | 160,421 |
| MGIC Investment Corp.* | 65,411 | 666,538 |
| Nationstar Mortgage Holdings, Inc.* (a) | 6,442 | 116,343 |
| NMI Holdings, Inc. "A"* | 10,010 | 106,606 |
| Northfield Bancorp., Inc. | 7,945 | 158,662 |
| Northwest Bancshares, Inc. | 18,705 | 337,251 |
| OceanFirst Financial Corp. | 5,002 | 150,210 |
| Ocwen Financial Corp.* | 19,223 | 103,612 |
| Oritani Financial Corp. | 7,302 | 136,912 |
| PennyMac Financial Services, Inc. "A"* | 2,471 | 41,142 |
| PHH Corp.* | 9,997 | 151,555 |
| Provident Bancorp., Inc.* | 835 | 14,946 |
| Provident Financial Holdings, Inc. | 1,251 | 25,295 |
| Provident Financial Services, Inc. | 12,012 | 339,940 |
| Radian Group, Inc. | 41,307 | 742,700 |
| SI Financial Group, Inc. | 2,097 | 32,294 |
| Southern Missouri Bancorp., Inc. | 1,091 | 38,600 |
| Territorial Bancorp., Inc. | 1,340 | 44,006 |
| TrustCo Bank Corp. | 18,381 | 160,834 |
| United Community Financial Corp. | 9,151 | 81,810 |
| United Financial Bancorp., Inc. | 9,518 | 172,847 |
| Walker & Dunlop, Inc.* | 5,250 | 163,800 |
| Walter Investment Management Corp.* | 3,540 | 16,815 |
| Washington Federal, Inc. | 17,645 | 606,106 |
| Waterstone Financial, Inc. | 4,904 | 90,234 |
| Western New England Bancorp, Inc. | 4,871 | 45,544 |
| WSFS Financial Corp. | 5,644 | 261,599 |
| | 8,749,867 |
| Health Care 11.9% |
| Biotechnology 4.2% |
| Acceleron Pharma, Inc.* | 5,365 | 136,915 |
| Achillion Pharmaceuticals, Inc.* | 22,969 | 94,862 |
| Acorda Therapeutics, Inc.* | 8,459 | 159,029 |
| Adamas Pharmaceuticals, Inc.* (a) | 3,166 | 53,505 |
| Aduro Biotech, Inc.* (a) | 6,721 | 76,619 |
| |
Shares | Value ($) |
| | | |
| Advaxis, Inc.* (a) | 7,096 | 50,807 |
| Adverum Biotechnologies, Inc.* | 5,537 | 16,057 |
| Aevi Genomic Medicine, Inc.* | 5,663 | 29,334 |
| Agenus, Inc.* (a) | 14,043 | 57,857 |
| Aimmune Therapeutics, Inc.* | 4,978 | 101,800 |
| Akebia Therapeutics, Inc.* | 6,796 | 70,746 |
| Alder Biopharmaceuticals, Inc.* | 9,131 | 189,925 |
| AMAG Pharmaceuticals, Inc.* | 6,842 | 238,102 |
| Amicus Therapeutics, Inc.* (a) | 27,813 | 138,231 |
| Anavex Life Sciences Corp.* (a) | 6,186 | 24,497 |
| Anthera Pharmaceuticals, Inc.* (a) | 7,316 | 4,749 |
| Applied Genetic Technologies Corp.* | 2,397 | 22,412 |
| Aptevo Therapeutics, Inc.* | 3,072 | 7,496 |
| Ardelyx, Inc.* | 5,842 | 82,956 |
| Arena Pharmaceuticals, Inc.* | 47,040 | 66,797 |
| Argos Therapeutics, Inc.* | 2,022 | 9,908 |
| ARIAD Pharmaceuticals, Inc.* | 34,424 | 428,235 |
| Array BioPharma, Inc.* | 32,515 | 285,807 |
| Arrowhead Pharmaceuticals, Inc.* (a) | 12,160 | 18,848 |
| Asterias Biotherapeutics, Inc.* (a) | 4,293 | 19,748 |
| Atara Biotherapeutics, Inc.* (a) | 4,402 | 62,508 |
| Athersys, Inc.* (a) | 14,404 | 22,038 |
| Audentes Therapeutics, Inc.* (a) | 1,116 | 20,389 |
| Avexis, Inc.* | 1,195 | 57,037 |
| Axovant Sciences Ltd.* (a) | 4,630 | 57,505 |
| Bellicum Pharmaceuticals, Inc.* (a) | 3,972 | 54,099 |
| BioCryst Pharmaceuticals, Inc.* | 14,928 | 94,494 |
| BioSpecifics Technologies Corp.* | 1,041 | 57,984 |
| BioTime, Inc.* (a) | 12,665 | 45,721 |
| Bluebird Bio, Inc.* | 7,794 | 480,890 |
| Blueprint Medicines Corp.* | 3,789 | 106,281 |
| Cara Therapeutics, Inc.* (a) | 3,745 | 34,791 |
| Celldex Therapeutics, Inc.* | 17,942 | 63,515 |
| Cellular Biomedicine Group, Inc.* | 2,303 | 30,169 |
| ChemoCentryx, Inc.* | 5,074 | 37,548 |
| Chimerix, Inc.* | 8,328 | 38,309 |
| Cidara Therapeutics, Inc.* (a) | 2,924 | 30,410 |
| Clovis Oncology, Inc.* (a) | 6,257 | 277,936 |
| Coherus Biosciences, Inc.* | 5,862 | 165,015 |
| Concert Pharmaceuticals, Inc.* | 3,312 | 34,080 |
| Corvus Pharmaceuticals, Inc.* | 626 | 8,952 |
| Curis, Inc.* | 23,326 | 71,844 |
| Cytokinetics, Inc.* | 6,204 | 75,379 |
| CytomX Therapeutics, Inc.* | 3,864 | 42,465 |
| CytRx Corp.* | 12,477 | 4,644 |
| Dimension Therapeutics, Inc.* | 2,312 | 10,057 |
| Dynavax Technologies Corp.* (a) | 7,361 | 29,076 |
| Eagle Pharmaceuticals, Inc.* (a) | 1,693 | 134,323 |
| Edge Therapeutics, Inc.* | 3,076 | 38,450 |
| Editas Medicine, Inc.* | 1,230 | 19,963 |
| Eiger BioPharmaceuticals, Inc.* | 657 | 7,654 |
| Emergent Biosolutions, Inc.* | 6,126 | 201,178 |
| Enanta Pharmaceuticals, Inc.* | 2,961 | 99,193 |
| Epizyme, Inc.* | 8,125 | 98,312 |
| Esperion Therapeutics, Inc.* (a) | 2,714 | 33,979 |
| Exact Sciences Corp.* (a) | 20,562 | 274,708 |
| Exelixis, Inc.* | 44,219 | 659,305 |
| FibroGen, Inc.* | 10,301 | 220,441 |
| Five Prime Therapeutics, Inc.* | 5,271 | 264,130 |
| Flexion Therapeutics, Inc.* | 4,824 | 91,752 |
| Fortress Biotech, Inc.* | 6,467 | 17,461 |
| Foundation Medicine, Inc.* (a) | 2,548 | 45,100 |
| |
Shares | Value ($) |
| | | |
| Galena Biopharma, Inc.* | 1,699 | 3,296 |
| Genomic Health, Inc.* | 3,540 | 104,041 |
| Geron Corp.* (a) | 28,914 | 59,852 |
| Global Blood Therapeutics, Inc.* (a) | 3,236 | 46,760 |
| GlycoMimetics, Inc.* | 1,936 | 11,810 |
| Halozyme Therapeutics, Inc.* | 21,320 | 210,642 |
| Heron Therapeutics, Inc.* (a) | 6,019 | 78,849 |
| Idera Pharmaceuticals, Inc.* (a) | 18,194 | 27,291 |
| Ignyta, Inc.* | 5,572 | 29,532 |
| Immune Design Corp.* | 3,312 | 18,216 |
| ImmunoGen, Inc.* (a) | 16,609 | 33,882 |
| Immunomedics, Inc.* (a) | 19,584 | 71,873 |
| Infinity Pharmaceuticals, Inc.* | 8,997 | 12,146 |
| Inotek Pharmaceuticals Corp.* (a) | 3,302 | 20,142 |
| Inovio Pharmaceuticals, Inc.* (a) | 12,567 | 87,215 |
| Insmed, Inc.* | 12,171 | 161,022 |
| Insys Therapeutics, Inc.* (a) | 4,843 | 44,556 |
| Intellia Therapeutics, Inc.* (a) | 1,321 | 17,318 |
| Invitae Corp.* (a) | 5,539 | 43,980 |
| Ironwood Pharmaceuticals, Inc.* | 25,260 | 386,225 |
| Kadmon Holdings, Inc.* (a) | 1,577 | 8,437 |
| Karyopharm Therapeutics, Inc.* (a) | 4,982 | 46,831 |
| Keryx Biopharmaceuticals, Inc.* (a) | 14,951 | 87,613 |
| Kite Pharma, Inc.* (a) | 7,637 | 342,443 |
| La Jolla Pharmaceutical Co.* (a) | 2,864 | 50,206 |
| Lexicon Pharmaceuticals, Inc.* | 8,404 | 116,227 |
| Ligand Pharmaceuticals, Inc.* | 3,716 | 377,583 |
| Lion Biotechnologies, Inc.* | 10,962 | 76,186 |
| Loxo Oncology, Inc.* | 2,522 | 80,994 |
| MacroGenics, Inc.* | 6,309 | 128,956 |
| MannKind Corp.* (a) | 61,455 | 39,128 |
| MediciNova, Inc.* | 5,623 | 33,907 |
| Merrimack Pharmaceuticals, Inc.* (a) | 23,120 | 94,330 |
| MiMedx Group, Inc.* (a) | 20,280 | 179,681 |
| Minerva Neurosciences, Inc.* | 3,730 | 43,827 |
| Mirati Therapeutics, Inc.* | 2,114 | 10,042 |
| Momenta Pharmaceuticals, Inc.* | 11,971 | 180,164 |
| Myovant Sciences Ltd.* | 1,717 | 21,359 |
| Myriad Genetics, Inc.* | 13,157 | 219,327 |
| NantKwest, Inc.* (a) | 3,156 | 18,052 |
| Natera, Inc.* | 4,942 | 57,871 |
| NewLink Genetics Corp.* (a) | 4,301 | 44,214 |
| Novavax, Inc.* (a) | 54,701 | 68,923 |
| OncoMed Pharmaceuticals, Inc.* | 4,217 | 32,513 |
| Ophthotech Corp.* | 5,949 | 28,734 |
| Organovo Holdings, Inc.* (a) | 19,047 | 64,569 |
| Osiris Therapeutics, Inc.* (a) | 3,347 | 16,434 |
| Otonomy, Inc.* | 4,554 | 72,409 |
| OvaScience, Inc.* | 5,946 | 9,097 |
| PDL BioPharma, Inc. | 31,644 | 67,085 |
| Pfenex, Inc.* | 3,672 | 33,305 |
| PharmAthene, Inc.* | 11,812 | 38,389 |
| Portola Pharmaceuticals, Inc.* | 9,604 | 215,514 |
| Progenics Pharmaceuticals, Inc.* | 13,781 | 119,068 |
| Protagonist Therapeutics, Inc.* (a) | 1,475 | 32,435 |
| Proteostasis Therapeutics, Inc.* (a) | 1,202 | 14,737 |
| Prothena Corp. PLC* (a) | 6,767 | 332,869 |
| PTC Therapeutics, Inc.* | 6,126 | 66,835 |
| Puma Biotechnology, Inc.* | 5,434 | 166,824 |
| Ra Pharmaceuticals, Inc.* | 993 | 15,084 |
| Radius Health, Inc.* (a) | 6,147 | 233,770 |
| REGENXBIO, Inc.* (a) | 3,833 | 71,102 |
| |
Shares | Value ($) |
| | | |
| Regulus Therapeutics, Inc.* (a) | 7,348 | 16,533 |
| Repligen Corp.* | 6,609 | 203,689 |
| Retrophin, Inc.* | 7,129 | 134,952 |
| Rigel Pharmaceuticals, Inc.* | 18,077 | 43,023 |
| Sage Therapeutics, Inc.* | 5,857 | 299,058 |
| Sangamo BioSciences, Inc.* | 14,381 | 43,862 |
| Sarepta Therapeutics, Inc.* | 9,743 | 267,250 |
| Selecta Biosciences, Inc.* | 991 | 16,996 |
| Seres Therapeutics, Inc.* | 3,376 | 33,422 |
| Sorrento Therapeutics, Inc.* (a) | 5,039 | 24,691 |
| Spark Therapeutics, Inc.* | 3,724 | 185,828 |
| Spectrum Pharmaceuticals, Inc.* | 14,498 | 64,226 |
| Stemline Therapeutics, Inc.* | 3,618 | 38,713 |
| Syndax Pharmaceuticals, Inc.* | 892 | 6,396 |
| Synergy Pharmaceuticals, Inc.* (a) | 35,875 | 218,479 |
| Synthetic Biologics, Inc.* | 14,334 | 10,931 |
| Syros Pharmaceuticals, Inc.* (a) | 905 | 11,005 |
| T2 Biosystems, Inc.* (a) | 3,125 | 16,437 |
| TESARO, Inc.* | 5,485 | 737,623 |
| TG Therapeutics, Inc.* (a) | 7,408 | 34,447 |
| Tokai Pharmaceuticals, Inc.* (a) | 1,692 | 1,655 |
| Trevena, Inc.* | 8,476 | 49,839 |
| Trovagene, Inc.* (a) | 5,536 | 11,626 |
| Ultragenyx Pharmaceutical, Inc.* | 7,018 | 493,436 |
| Vanda Pharmaceuticals, Inc.* | 6,915 | 110,294 |
| Versartis, Inc.* | 6,089 | 90,726 |
| Vital Therapies, Inc.* (a) | 3,993 | 17,370 |
| Voyager Therapeutics, Inc.* (a) | 2,225 | 28,346 |
| vTv Therapeutics, Inc. "A"* | 1,054 | 5,091 |
| XBiotech, Inc.* (a) | 3,315 | 33,548 |
| Xencor, Inc.* | 6,788 | 178,660 |
| Zafgen, Inc.* | 4,325 | 13,753 |
| ZIOPHARM Oncology, Inc.* (a) | 23,023 | 123,173 |
| | 15,595,127 |
| Health Care Equipment & Supplies 3.0% |
| Abaxis, Inc. | 4,287 | 226,225 |
| Accuray, Inc.* | 15,816 | 72,754 |
| Analogic Corp. | 2,306 | 191,283 |
| AngioDynamics, Inc.* | 5,204 | 87,791 |
| Anika Therapeutics, Inc.* | 2,683 | 131,360 |
| AtriCure, Inc.* | 5,966 | 116,755 |
| Atrion Corp. | 259 | 131,365 |
| Avinger, Inc.* | 3,900 | 14,430 |
| AxoGen, Inc.* | 5,647 | 50,823 |
| Cantel Medical Corp. | 6,762 | 532,507 |
| Cardiovascular Systems, Inc.* | 6,212 | 150,392 |
| Cerus Corp.* | 19,212 | 83,572 |
| ConforMIS, Inc.* (a) | 6,779 | 54,910 |
| CONMED Corp. | 5,380 | 237,635 |
| Corindus Vascular Robotics, Inc.* | 10,458 | 7,304 |
| CryoLife, Inc. | 5,978 | 114,479 |
| Cutera, Inc.* | 2,544 | 44,138 |
| Cynosure, Inc. "A"* | 4,620 | 210,672 |
| Endologix, Inc.* | 16,005 | 91,549 |
| Entellus Medical, Inc.* | 1,426 | 27,051 |
| Exactech, Inc.* | 1,915 | 52,279 |
| GenMark Diagnostics, Inc.* | 8,175 | 100,062 |
| Glaukos Corp.* | 3,171 | 108,765 |
| Globus Medical, Inc. "A"* | 13,633 | 338,235 |
| Haemonetics Corp.* | 9,958 | 400,312 |
| Halyard Health, Inc.* | 9,111 | 336,925 |
| ICU Medical, Inc.* | 2,862 | 421,716 |
| Inogen, Inc.* | 3,183 | 213,802 |
| |
Shares | Value ($) |
| | | |
| Insulet Corp.* | 11,218 | 422,694 |
| Integer Holdings Corp.* | 5,798 | 170,751 |
| Integra LifeSciences Holdings Corp.* | 5,655 | 485,142 |
| Invacare Corp. | 5,966 | 77,856 |
| InVivo Therapeutics Holdings Corp.* (a) | 5,989 | 25,154 |
| iRadimed Corp.* (a) | 793 | 8,802 |
| iRhythm Technologies, Inc.* | 1,285 | 38,550 |
| IRIDEX Corp.* | 1,426 | 20,050 |
| K2M Group Holdings, Inc.* | 4,883 | 97,855 |
| LeMaitre Vascular, Inc. | 2,556 | 64,769 |
| Masimo Corp.* | 7,750 | 522,350 |
| Meridian Bioscience, Inc. | 8,321 | 147,282 |
| Merit Medical Systems, Inc.* | 8,431 | 223,421 |
| Natus Medical, Inc.* | 6,330 | 220,284 |
| Neogen Corp.* | 7,102 | 468,732 |
| Nevro Corp.* | 4,669 | 339,249 |
| Novocure Ltd.* (a) | 9,602 | 75,376 |
| NuVasive, Inc.* | 9,624 | 648,273 |
| NxStage Medical, Inc.* | 12,406 | 325,161 |
| Obalon Therapeutics, Inc.* | 947 | 8,381 |
| OraSure Technologies, Inc.* | 10,054 | 88,274 |
| Orthofix International NV* | 3,516 | 127,209 |
| Oxford Immunotec Global PLC* | 4,283 | 64,031 |
| Penumbra, Inc.* | 4,950 | 315,810 |
| Quidel Corp.* | 5,151 | 110,334 |
| Rockwell Medical, Inc.* (a) | 8,999 | 58,943 |
| RTI Surgical, Inc.* | 10,252 | 33,319 |
| Second Sight Medical Products, Inc.* | 2,450 | 4,826 |
| Senseonics Holdings, Inc.* | 5,285 | 14,111 |
| Spectranetics Corp.* | 8,440 | 206,780 |
| STAAR Surgical Co.* | 7,958 | 86,344 |
| SurModics, Inc.* | 2,464 | 62,586 |
| Tactile Systems Technology, Inc.* | 810 | 13,292 |
| Tandem Diabetes Care, Inc.* | 4,207 | 9,045 |
| TransEnterix, Inc.* (a) | 13,196 | 17,155 |
| Utah Medical Products, Inc. | 736 | 53,544 |
| Vascular Solutions, Inc.* | 3,309 | 185,635 |
| Veracyte, Inc.* | 3,643 | 28,197 |
| ViewRay, Inc.* | 1,322 | 4,138 |
| Wright Medical Group NV* | 20,067 | 461,140 |
| Zeltiq Aesthetics, Inc.* | 6,934 | 301,768 |
| | 11,185,704 |
| Health Care Providers & Services 2.0% |
| AAC Holdings, Inc.* | 1,879 | 13,604 |
| Aceto Corp. | 5,536 | 121,626 |
| Addus HomeCare Corp.* | 1,329 | 46,581 |
| Adeptus Health, Inc. "A"* (a) | 2,786 | 21,285 |
| Air Methods Corp.* | 6,430 | 204,796 |
| Almost Family, Inc.* | 1,535 | 67,694 |
| Amedisys, Inc.* | 5,448 | 232,248 |
| American Renal Associates Holdings, Inc.* (a) | 1,653 | 35,176 |
| AMN Healthcare Services, Inc.* | 9,210 | 354,124 |
| BioScrip, Inc.* | 21,040 | 21,882 |
| BioTelemetry, Inc.* | 5,042 | 112,689 |
| Capital Senior Living Corp.* | 5,327 | 85,498 |
| Chemed Corp. | 3,142 | 504,008 |
| Civitas Solutions, Inc.* | 2,856 | 56,834 |
| Community Health Systems, Inc.* | 21,471 | 120,023 |
| CorVel Corp.* | 1,868 | 68,369 |
| |
Shares | Value ($) |
| | | |
| Cross Country Healthcare, Inc.* | 5,952 | 92,911 |
| Diplomat Pharmacy, Inc.* | 8,904 | 112,190 |
| Fulgent Genetics, Inc.* | 972 | 11,246 |
| Genesis Healthcare, Inc.* | 6,503 | 27,638 |
| Healthequity, Inc.* | 8,391 | 340,003 |
| HealthSouth Corp. | 16,928 | 698,111 |
| Healthways, Inc.* | 6,048 | 137,592 |
| Kindred Healthcare, Inc. | 16,814 | 131,990 |
| Landauer, Inc. | 1,851 | 89,033 |
| LHC Group, Inc.* | 2,836 | 129,605 |
| Magellan Health, Inc.* | 4,480 | 337,120 |
| Molina Healthcare, Inc.* | 8,406 | 456,110 |
| National Healthcare Corp. | 2,120 | 160,675 |
| National Research Corp. "A" | 1,489 | 28,291 |
| Nobilis Health Corp.* (a) | 10,486 | 22,021 |
| Owens & Minor, Inc. | 12,121 | 427,750 |
| PharMerica Corp.* | 5,903 | 148,460 |
| Providence Service Corp.* | 2,623 | 99,805 |
| Quorum Health Corp.* | 5,617 | 40,836 |
| RadNet, Inc.* | 7,589 | 48,949 |
| Select Medical Holdings Corp.* | 20,798 | 275,574 |
| Surgery Partners, Inc.* | 3,532 | 55,982 |
| Surgical Care Affiliates, Inc.* | 5,236 | 242,270 |
| Team Health Holdings, Inc.* | 13,195 | 573,323 |
| Teladoc, Inc.* (a) | 3,934 | 64,911 |
| The Ensign Group, Inc. | 9,310 | 206,775 |
| Triple-S Management Corp. "B"* | 4,446 | 92,032 |
| U.S. Physical Therapy, Inc. | 2,407 | 168,971 |
| Universal American Corp.* | 7,672 | 76,336 |
| | 7,362,947 |
| Health Care Technology 0.4% |
| Castlight Health, Inc. "B"* (a) | 7,643 | 37,833 |
| Computer Programs & Systems, Inc. | 2,091 | 49,348 |
| Cotiviti Holdings, Inc.* | 2,396 | 82,422 |
| Evolent Health, Inc. "A"* | 2,885 | 42,698 |
| HealthStream, Inc.* | 4,831 | 121,017 |
| HMS Holdings Corp.* | 16,391 | 297,661 |
| Medidata Solutions, Inc.* | 10,686 | 530,774 |
| NantHealth, Inc.* | 1,287 | 12,793 |
| Omnicell, Inc.* | 6,936 | 235,130 |
| Quality Systems, Inc. | 9,475 | 124,596 |
| Tabula Rasa HealthCare, Inc.* | 875 | 13,107 |
| Vocera Communications, Inc.* | 4,905 | 90,693 |
| | 1,638,072 |
| Life Sciences Tools & Services 0.7% |
| Accelerate Diagnostics, Inc.* (a) | 4,467 | 92,690 |
| Albany Molecular Research, Inc.* | 4,940 | 92,674 |
| Cambrex Corp.* | 6,188 | 333,843 |
| ChromaDex Corp.* | 5,445 | 18,023 |
| Enzo Biochem, Inc.* | 7,495 | 52,015 |
| Fluidigm Corp.* | 6,205 | 45,172 |
| INC Research Holdings, Inc. "A"* | 8,033 | 422,536 |
| Luminex Corp.* | 7,170 | 145,049 |
| Medpace Holdings, Inc.* | 1,583 | 57,099 |
| NanoString Technologies, Inc.* | 2,844 | 63,421 |
| NeoGenomics, Inc.* | 9,735 | 83,429 |
| Pacific Biosciences of California, Inc.* | 15,627 | 59,383 |
| PAREXEL International Corp.* | 10,191 | 669,753 |
| PRA Health Sciences, Inc.* | 4,733 | 260,883 |
| | 2,395,970 |
| |
Shares | Value ($) |
| | | |
| Pharmaceuticals 1.6% |
| AcelRx Pharmaceuticals, Inc.* (a) | 6,717 | 17,464 |
| Aclaris Therapeutics, Inc.* | 2,057 | 55,827 |
| Aerie Pharmaceuticals, Inc.* | 5,486 | 207,645 |
| Agile Therapeutics, Inc.* | 2,158 | 12,301 |
| Amphastar Pharmaceuticals, Inc.* | 6,754 | 124,409 |
| Ampio Pharmaceuticals, Inc.* | 8,304 | 7,475 |
| ANI Pharmaceuticals, Inc.* | 1,612 | 97,719 |
| Aratana Therapeutics, Inc.* | 6,321 | 45,385 |
| Axsome Therapeutics, Inc.* | 2,107 | 14,222 |
| Bio-Path Holdings, Inc.* | 15,702 | 21,198 |
| Catalent, Inc.* | 19,365 | 522,080 |
| Cempra, Inc.* (a) | 8,694 | 24,343 |
| Clearside Biomedical, Inc.* (a) | 1,602 | 14,322 |
| Collegium Pharmaceutical, Inc.* (a) | 3,149 | 49,030 |
| Corcept Therapeutics, Inc.* (a) | 14,180 | 102,947 |
| DepoMed, Inc.* | 11,877 | 214,024 |
| Dermira, Inc.* | 4,847 | 147,010 |
| Durect Corp.* | 25,179 | 33,740 |
| Egalet Corp.* (a) | 4,216 | 32,252 |
| Endocyte, Inc.* | 7,143 | 18,215 |
| Flex Pharma, Inc.* | 2,021 | 10,671 |
| Heska Corp.* | 1,196 | 85,634 |
| Horizon Pharma PLC* | 31,369 | 507,550 |
| Impax Laboratories, Inc.* | 14,245 | 188,746 |
| Innoviva, Inc.* (a) | 16,019 | 171,403 |
| Intersect ENT, Inc.* | 4,843 | 58,600 |
| Intra-Cellular Therapies, Inc.* | 6,685 | 100,877 |
| Lannett Co., Inc.* (a) | 5,521 | 121,738 |
| Lipocine, Inc.* (a) | 3,145 | 11,574 |
| Medicines Co.* | 13,103 | 444,716 |
| MyoKardia, Inc.* | 2,814 | 36,441 |
| Nektar Therapeutics* | 27,647 | 339,229 |
| Neos Therapeutics, Inc.* (a) | 2,607 | 15,251 |
| Novan, Inc.* (a) | 829 | 22,400 |
| Ocular Therapeutix, Inc.* | 3,855 | 32,266 |
| Omeros Corp.* (a) | 7,923 | 78,596 |
| Pacira Pharmaceuticals, Inc.* | 7,099 | 229,298 |
| Paratek Pharmaceuticals, Inc.* | 3,631 | 55,917 |
| Phibro Animal Health Corp. "A" | 3,714 | 108,820 |
| Prestige Brands Holdings, Inc.* | 9,897 | 515,634 |
| Reata Pharmaceuticals, Inc. "A"* (a) | 1,082 | 23,620 |
| Revance Therapeutics, Inc.* (a) | 3,885 | 80,419 |
| Sciclone Pharmaceuticals, Inc.* | 9,526 | 102,881 |
| Sucampo Pharmaceuticals, Inc. "A"* | 4,384 | 59,403 |
| Supernus Pharmaceuticals, Inc.* | 9,214 | 232,653 |
| Teligent, Inc.* | 8,427 | 55,702 |
| Tetraphase Pharmaceuticals, Inc.* | 6,769 | 27,279 |
| TherapeuticsMD, Inc.* (a) | 29,350 | 169,349 |
| Theravance Biopharma, Inc.* (a) | 7,662 | 244,265 |
| Titan Pharmaceuticals, Inc.* | 3,560 | 14,240 |
| WaVe Life Sciences Ltd.* | 1,404 | 36,715 |
| Zogenix, Inc.* | 4,591 | 55,781 |
| | 5,999,276 |
| Industrials 14.3% |
| Aerospace & Defense 1.5% |
| AAR Corp. | 6,303 | 208,314 |
| Aerojet Rocketdyne Holdings, Inc.* | 11,562 | 207,538 |
| Aerovironment, Inc.* | 4,120 | 110,540 |
| Astronics Corp.* | 3,752 | 126,968 |
| Cubic Corp. | 4,949 | 237,304 |
| |
Shares | Value ($) |
| | | |
| Curtiss-Wright Corp. | 8,552 | 841,175 |
| DigitalGlobe, Inc.* | 12,276 | 351,707 |
| Ducommun, Inc.* | 2,027 | 51,810 |
| Engility Holdings, Inc.* | 3,485 | 117,444 |
| Esterline Technologies Corp.* | 5,740 | 512,008 |
| KLX, Inc.* | 10,253 | 462,513 |
| Kratos Defense & Security Solutions, Inc.* | 10,845 | 80,253 |
| Mercury Systems, Inc.* | 7,582 | 229,128 |
| Moog, Inc. "A"* | 6,212 | 408,004 |
| National Presto Industries, Inc. | 1,003 | 106,719 |
| Sparton Corp.* | 1,968 | 46,937 |
| Taser International, Inc.* | 10,128 | 245,503 |
| Teledyne Technologies, Inc.* | 6,613 | 813,399 |
| The Keyw Holding Corp.* | 6,811 | 80,302 |
| Triumph Group, Inc. | 9,584 | 253,976 |
| Vectrus, Inc.* | 2,198 | 52,422 |
| Wesco Aircraft Holdings, Inc.* | 10,549 | 157,708 |
| | 5,701,672 |
| Air Freight & Logistics 0.6% |
| Air Transport Services Group, Inc.* | 9,147 | 145,986 |
| Atlas Air Worldwide Holdings, Inc.* | 4,816 | 251,154 |
| Echo Global Logistics, Inc.* | 5,686 | 142,434 |
| Forward Air Corp. | 5,777 | 273,714 |
| Hub Group, Inc. "A"* | 6,488 | 283,850 |
| Park-Ohio Holdings Corp. | 1,557 | 66,328 |
| Radiant Logistics, Inc.* | 7,884 | 30,748 |
| XPO Logistics, Inc.* | 18,840 | 813,135 |
| | 2,007,349 |
| Airlines 0.4% |
| Allegiant Travel Co. | 2,560 | 425,984 |
| Hawaiian Holdings, Inc.* | 10,223 | 582,711 |
| SkyWest, Inc. | 9,813 | 357,684 |
| | 1,366,379 |
| Building Products 1.1% |
| AAON, Inc. | 7,847 | 259,343 |
| Advanced Drainage Systems, Inc. | 6,936 | 142,882 |
| American Woodmark Corp.* | 2,719 | 204,605 |
| Apogee Enterprises, Inc. | 5,549 | 297,204 |
| Armstrong Flooring, Inc.* | 4,428 | 88,161 |
| Builders FirstSource, Inc.* | 16,588 | 181,970 |
| Caesarstone Ltd.* | 4,727 | 135,429 |
| Continental Building Products, Inc.* | 6,556 | 151,444 |
| CSW Industrials, Inc.* | 2,729 | 100,564 |
| Gibraltar Industries, Inc.* | 6,127 | 255,189 |
| Griffon Corp. | 5,720 | 149,864 |
| Insteel Industries, Inc. | 3,479 | 123,992 |
| Masonite International Corp.* | 5,886 | 387,299 |
| NCI Building Systems, Inc.* | 5,255 | 82,241 |
| Patrick Industries, Inc.* | 2,747 | 209,596 |
| PGT Innovations, Inc.* | 9,587 | 109,771 |
| Ply Gem Holdings, Inc.* | 4,258 | 69,192 |
| Quanex Building Products Corp. | 6,480 | 131,544 |
| Simpson Manufacturing Co., Inc. | 7,965 | 348,469 |
| Trex Co., Inc.* | 5,724 | 368,626 |
| Universal Forest Products, Inc. | 3,844 | 392,780 |
| | 4,190,165 |
| Commercial Services & Supplies 2.4% |
| ABM Industries, Inc. | 10,818 | 441,807 |
| Acco Brands Corp.* | 20,209 | 263,727 |
| Advanced Disposal Services, Inc.* | 4,223 | 93,835 |
| Aqua Metals, Inc.* (a) | 2,028 | 26,587 |
| |
Shares | Value ($) |
| | | |
| ARC Document Solutions, Inc.* | 8,849 | 44,953 |
| Brady Corp. "A" | 8,877 | 333,331 |
| Casella Waste Systems, Inc. "A"* | 7,335 | 91,027 |
| CECO Environmental Corp. | 5,717 | 79,752 |
| CompX International, Inc. | 545 | 8,775 |
| Deluxe Corp. | 9,431 | 675,354 |
| Ennis, Inc. | 5,144 | 89,248 |
| Essendant, Inc. | 7,007 | 146,446 |
| G&K Services, Inc. "A" | 3,790 | 365,546 |
| Healthcare Services Group, Inc. | 13,668 | 535,376 |
| Heritage-Crystal Clean, Inc.* | 2,282 | 35,827 |
| Herman Miller, Inc. | 11,625 | 397,575 |
| HNI Corp. | 8,809 | 492,599 |
| Innerworkings, Inc.* | 7,455 | 73,432 |
| Interface, Inc. | 12,657 | 234,787 |
| Kimball International, Inc. "B" | 6,985 | 122,657 |
| Knoll, Inc. | 9,349 | 261,118 |
| Matthews International Corp. "A" | 6,189 | 475,625 |
| McGrath RentCorp. | 4,585 | 179,686 |
| Mobile Mini, Inc. | 8,624 | 260,876 |
| MSA Safety, Inc. | 6,055 | 419,793 |
| Multi-Color Corp. | 2,578 | 200,053 |
| NL Industries, Inc.* | 1,487 | 12,119 |
| Quad Graphics, Inc. | 5,718 | 153,700 |
| SP Plus Corp.* | 3,274 | 92,163 |
| Steelcase, Inc. "A" | 16,356 | 292,772 |
| Team, Inc.* | 5,470 | 214,698 |
| Tetra Tech, Inc. | 11,197 | 483,151 |
| The Brink's Co. | 8,760 | 361,350 |
| TRC Companies, Inc.* | 3,963 | 42,008 |
| U.S. Ecology, Inc. | 4,329 | 212,770 |
| UniFirst Corp. | 2,920 | 419,458 |
| Viad Corp. | 3,858 | 170,138 |
| VSE Corp. | 1,662 | 64,552 |
| West Corp. | 8,198 | 202,982 |
| | 9,071,653 |
| Construction & Engineering 1.0% |
| Aegion Corp.* | 6,528 | 154,714 |
| Ameresco, Inc. "A"* | 4,913 | 27,021 |
| Argan, Inc. | 2,569 | 181,243 |
| Comfort Systems U.S.A., Inc. | 7,307 | 243,323 |
| Dycom Industries, Inc.* | 5,940 | 476,923 |
| EMCOR Group, Inc. | 11,602 | 820,957 |
| Granite Construction, Inc. | 7,710 | 424,050 |
| Great Lakes Dredge & Dock Co.* | 12,467 | 52,361 |
| HC2 Holdings, Inc.* | 7,419 | 43,995 |
| IES Holdings, Inc.* | 1,464 | 28,036 |
| Layne Christensen Co.* | 3,399 | 36,947 |
| MasTec, Inc.* | 12,881 | 492,698 |
| MYR Group, Inc.* | 2,801 | 105,542 |
| NV5 Holdings, Inc.* | 1,384 | 46,226 |
| Orion Group Holdings, Inc.* | 4,962 | 49,372 |
| Primoris Services Corp. | 7,662 | 174,540 |
| Tutor Perini Corp.* | 7,165 | 200,620 |
| | 3,558,568 |
| Electrical Equipment 0.7% |
| Allied Motion Technologies, Inc. | 1,111 | 23,764 |
| American Superconductor Corp.* (a) | 2,217 | 16,339 |
| Atkore International Group, Inc.* | 2,360 | 56,428 |
| AZZ, Inc. | 5,011 | 320,203 |
| Babcock & Wilcox Enterprises, Inc.* | 8,649 | 143,487 |
| Encore Wire Corp. | 4,006 | 173,660 |
| Energous Corp.* (a) | 2,806 | 47,281 |
| |
Shares | Value ($) |
| | | |
| EnerSys | 8,452 | 660,101 |
| FuelCell Energy, Inc.* (a) | 6,229 | 10,901 |
| Generac Holdings, Inc.* | 12,693 | 517,113 |
| General Cable Corp. | 9,556 | 182,042 |
| LSI Industries, Inc. | 4,485 | 43,684 |
| Plug Power, Inc.* (a) | 36,975 | 44,370 |
| Powell Industries, Inc. | 1,624 | 63,336 |
| Power Solutions International, Inc.* | 777 | 5,827 |
| Preformed Line Products Co. | 538 | 31,268 |
| Sunrun, Inc.* (a) | 11,977 | 63,598 |
| Thermon Group Holdings, Inc.* | 6,398 | 122,138 |
| TPI Composites, Inc.* | 1,167 | 18,719 |
| Vicor Corp.* | 3,238 | 48,894 |
| | 2,593,153 |
| Industrial Conglomerates 0.1% |
| Raven Industries, Inc. | 7,056 | 177,811 |
| Machinery 3.5% |
| Actuant Corp. "A" | 11,391 | 295,596 |
| Alamo Group, Inc. | 1,890 | 143,829 |
| Albany International Corp. "A" | 5,617 | 260,067 |
| Altra Industrial Motion Corp. | 4,791 | 176,788 |
| American Railcar Industries, Inc. (a) | 1,462 | 66,214 |
| Astec Industries, Inc. | 3,805 | 256,685 |
| Barnes Group, Inc. | 9,753 | 462,487 |
| Blue Bird Corp.* | 913 | 14,106 |
| Briggs & Stratton Corp. | 8,043 | 179,037 |
| Chart Industries, Inc.* | 5,811 | 209,312 |
| CIRCOR International, Inc. | 3,129 | 203,010 |
| CLARCOR, Inc. | 9,171 | 756,332 |
| Columbus McKinnon Corp. | 3,663 | 99,048 |
| DMC Global, Inc. | 2,645 | 41,923 |
| Douglas Dynamics, Inc. | 4,349 | 146,344 |
| Energy Recovery, Inc.* | 6,508 | 67,358 |
| EnPro Industries, Inc. | 4,209 | 283,518 |
| ESCO Technologies, Inc. | 4,875 | 276,169 |
| Federal Signal Corp. | 11,651 | 181,872 |
| Franklin Electric Co., Inc. | 8,947 | 348,038 |
| FreightCar America, Inc. | 2,340 | 34,936 |
| Gencor Industries, Inc.* | 1,422 | 22,325 |
| Global Brass & Copper Holdings, Inc. | 4,011 | 137,577 |
| Gorman-Rupp Co. | 3,509 | 108,604 |
| Graham Corp. | 1,917 | 42,462 |
| Greenbrier Companies, Inc. (a) | 5,266 | 218,802 |
| Hardinge, Inc. | 2,186 | 24,221 |
| Harsco Corp. | 15,677 | 213,207 |
| Hillenbrand, Inc. | 11,405 | 437,382 |
| Hurco Companies, Inc. | 1,216 | 40,250 |
| Hyster-Yale Materials Handling, Inc. | 1,808 | 115,296 |
| John Bean Technologies Corp. | 5,657 | 486,219 |
| Joy Global, Inc. | 18,821 | 526,988 |
| Kadant, Inc. | 2,123 | 129,928 |
| Kennametal, Inc. | 15,328 | 479,153 |
| Lindsay Corp. (a) | 2,017 | 150,488 |
| Lydall, Inc.* | 3,140 | 194,209 |
| Manitowoc Co., Inc.* | 24,040 | 143,759 |
| Meritor, Inc.* | 16,168 | 200,807 |
| Milacron Holdings Corp.* | 2,904 | 54,102 |
| Miller Industries, Inc. | 2,077 | 54,937 |
| Mueller Industries, Inc. | 10,983 | 438,881 |
| Mueller Water Products, Inc. "A" | 30,175 | 401,629 |
| Navistar International Corp.* | 9,473 | 297,168 |
| NN, Inc. | 4,876 | 92,888 |
| |
Shares | Value ($) |
| | | |
| Omega Flex, Inc. | 496 | 27,657 |
| Proto Labs, Inc.* | 4,818 | 247,404 |
| RBC Bearings, Inc.* | 4,388 | 407,250 |
| Rexnord Corp.* | 16,020 | 313,832 |
| SPX Corp.* | 7,903 | 187,459 |
| SPX FLOW, Inc.* | 6,969 | 223,426 |
| Standex International Corp. | 2,461 | 216,199 |
| Sun Hydraulics Corp. | 4,414 | 176,428 |
| Supreme Industries, Inc. "A" | 2,455 | 38,543 |
| Tennant Co. | 3,399 | 242,009 |
| The ExOne Co.* | 1,931 | 18,036 |
| Titan International, Inc. | 8,353 | 93,637 |
| TriMas Corp.* | 8,555 | 201,042 |
| Wabash National Corp.* | 12,195 | 192,925 |
| Watts Water Technologies, Inc. "A" | 5,360 | 349,472 |
| Woodward, Inc. | 10,231 | 706,451 |
| | 13,155,721 |
| Marine 0.1% |
| Costamare, Inc. | 4,971 | 27,838 |
| Matson, Inc. | 8,403 | 297,382 |
| Scorpio Bulkers, Inc.* (a) | 10,931 | 55,201 |
| | 380,421 |
| Professional Services 1.3% |
| Acacia Research Corp. | 9,463 | 61,509 |
| Barrett Business Services, Inc. | 1,313 | 84,163 |
| CBIZ, Inc.* | 9,546 | 130,780 |
| CEB, Inc. | 6,236 | 377,902 |
| Cogint, Inc.* (a) | 2,876 | 9,922 |
| CRA International, Inc. | 1,670 | 61,122 |
| Exponent, Inc. | 4,959 | 299,028 |
| Franklin Covey Co.* | 1,857 | 37,419 |
| FTI Consulting, Inc.* | 8,057 | 363,210 |
| GP Strategies Corp.* | 2,455 | 70,213 |
| Heidrick & Struggles International, Inc. | 3,698 | 89,307 |
| Hill International, Inc.* | 6,498 | 28,266 |
| Huron Consulting Group, Inc.* | 4,193 | 212,375 |
| ICF International, Inc.* | 3,436 | 189,667 |
| Insperity, Inc. | 3,087 | 219,023 |
| Kelly Services, Inc. "A" | 5,793 | 132,776 |
| Kforce, Inc. | 4,882 | 112,774 |
| Korn/Ferry International | 10,926 | 321,552 |
| Mistras Group, Inc.* | 3,298 | 84,693 |
| Navigant Consulting, Inc.* | 9,228 | 241,589 |
| On Assignment, Inc.* | 9,876 | 436,124 |
| Resources Connection, Inc. | 6,803 | 130,958 |
| RPX Corp.* | 9,951 | 107,471 |
| The Advisory Board Co.* | 7,954 | 264,470 |
| TriNet Group, Inc.* | 7,886 | 202,039 |
| TrueBlue, Inc.* | 8,205 | 202,253 |
| WageWorks, Inc.* | 7,078 | 513,155 |
| | 4,983,760 |
| Road & Rail 0.5% |
| ArcBest Corp. | 4,658 | 128,794 |
| Celadon Group, Inc. | 4,889 | 34,956 |
| Covenant Transportation Group, Inc. "A"* | 2,368 | 45,797 |
| Heartland Express, Inc. | 8,673 | 176,582 |
| Knight Transportation, Inc. | 12,916 | 426,874 |
| Marten Transport Ltd. | 4,313 | 100,493 |
| P.A.M. Transportation Services, Inc.* | 585 | 15,198 |
| |
Shares | Value ($) |
| | | |
| Roadrunner Transportation Systems, Inc.* | 5,795 | 60,210 |
| Saia, Inc.* | 4,798 | 211,832 |
| Swift Transportation Co.* | 14,483 | 352,806 |
| Universal Logistics Holdings, Inc. | 1,559 | 25,490 |
| USA Truck, Inc.* | 1,751 | 15,251 |
| Werner Enterprises, Inc. | 8,502 | 229,129 |
| YRC Worldwide, Inc.* | 6,093 | 80,915 |
| | 1,904,327 |
| Trading Companies & Distributors 1.1% |
| Aircastle Ltd. | 9,443 | 196,887 |
| Applied Industrial Technologies, Inc. | 7,016 | 416,750 |
| Beacon Roofing Supply, Inc.* | 11,605 | 534,642 |
| BMC Stock Holdings, Inc.* | 10,883 | 212,219 |
| CAI International, Inc.* | 3,112 | 26,981 |
| DXP Enterprises, Inc.* | 2,977 | 103,421 |
| GATX Corp. (a) | 7,941 | 489,007 |
| GMS, Inc.* | 1,333 | 39,030 |
| H&E Equipment Services, Inc. | 6,037 | 140,360 |
| Kaman Corp. | 5,125 | 250,766 |
| Lawson Products, Inc.* | 1,323 | 31,487 |
| MRC Global, Inc.* | 17,892 | 362,492 |
| Neff Corp. "A"* | 2,041 | 28,778 |
| NOW, Inc.* | 20,807 | 425,919 |
| Rush Enterprises, Inc. "A"* | 5,621 | 179,310 |
| Rush Enterprises, Inc. "B"* | 1,226 | 37,847 |
| SiteOne Landscape Supply, Inc.* | 2,194 | 76,198 |
| Textainer Group Holdings Ltd. | 3,974 | 29,606 |
| Titan Machinery, Inc.* | 3,745 | 54,565 |
| Triton International Ltd. | 7,969 | 125,910 |
| Univar, Inc.* | 8,049 | 228,350 |
| Veritiv Corp.* | 1,624 | 87,290 |
| Willis Lease Finance Corp.* | 789 | 20,183 |
| | 4,097,998 |
| Information Technology 16.6% |
| Communications Equipment 1.8% |
| ADTRAN, Inc. | 9,709 | 216,996 |
| Aerohive Networks, Inc.* | 4,136 | 23,575 |
| Applied Optoelectronics, Inc.* | 3,073 | 72,031 |
| Bel Fuse, Inc. "B" | 1,956 | 60,440 |
| Black Box Corp. | 2,889 | 44,057 |
| CalAmp Corp.* | 7,096 | 102,892 |
| Calix, Inc.* | 8,087 | 62,270 |
| Ciena Corp.* | 26,670 | 651,015 |
| Clearfield, Inc.* | 2,150 | 44,505 |
| Comtech Telecommunications Corp. | 4,224 | 50,054 |
| Digi International, Inc.* | 4,724 | 64,955 |
| EMCORE Corp. | 4,947 | 43,039 |
| Extreme Networks, Inc.* | 19,988 | 100,540 |
| Finisar Corp.* | 20,888 | 632,280 |
| Harmonic, Inc.* | 15,538 | 77,690 |
| Infinera Corp.* | 27,279 | 231,599 |
| InterDigital, Inc. | 6,706 | 612,593 |
| Ixia* | 12,138 | 195,422 |
| KVH Industries, Inc.* | 3,080 | 36,344 |
| Lumentum Holdings, Inc.* | 9,818 | 379,466 |
| NETGEAR, Inc.* | 6,279 | 341,264 |
| NetScout Systems, Inc.* | 17,392 | 547,848 |
| Oclaro, Inc.* | 21,742 | 194,591 |
| Plantronics, Inc. | 6,445 | 352,928 |
| Quantenna Communications, Inc.* | 1,166 | 21,139 |
| ShoreTel, Inc.* | 12,733 | 91,041 |
| |
Shares | Value ($) |
| | | |
| Silicom Ltd. | 1,062 | 43,637 |
| Sonus Networks, Inc.* | 9,856 | 62,093 |
| Ubiquiti Networks, Inc.* | 5,067 | 292,873 |
| ViaSat, Inc.* | 9,882 | 654,386 |
| Viavi Solutions, Inc.* | 45,446 | 371,748 |
| | 6,675,311 |
| Electronic Equipment, Instruments & Components 2.8% |
| Agilysys, Inc.* | 2,773 | 28,728 |
| Anixter International, Inc.* | 5,635 | 456,717 |
| AVX Corp. | 8,814 | 137,763 |
| Badger Meter, Inc. | 5,237 | 193,507 |
| Belden, Inc. | 7,995 | 597,786 |
| Benchmark Electronics, Inc.* | 9,594 | 292,617 |
| Coherent, Inc.* | 4,700 | 645,709 |
| Control4 Corp.* | 3,702 | 37,760 |
| CTS Corp. | 5,912 | 132,429 |
| Daktronics, Inc. | 7,095 | 75,917 |
| Electro Scientific Industries, Inc.* | 5,165 | 30,577 |
| ePlus, Inc.* | 1,196 | 137,779 |
| Fabrinet* | 6,780 | 273,234 |
| FARO Technologies, Inc.* | 3,126 | 112,536 |
| II-VI, Inc.* | 11,623 | 344,622 |
| Insight Enterprises, Inc.* | 7,143 | 288,863 |
| InvenSense, Inc.* | 15,764 | 201,622 |
| Itron, Inc.* | 6,490 | 407,896 |
| Kimball Electronics, Inc.* | 5,310 | 96,642 |
| Knowles Corp.* | 17,328 | 289,551 |
| Littelfuse, Inc. | 4,297 | 652,156 |
| Maxwell Technologies, Inc.* | 5,955 | 30,490 |
| Mesa Laboratories, Inc. | 609 | 74,755 |
| Methode Electronics, Inc. | 7,087 | 293,047 |
| MTS Systems Corp. | 3,317 | 188,074 |
| Novanta, Inc.* | 5,823 | 122,283 |
| OSI Systems, Inc.* | 3,322 | 252,871 |
| Park Electrochemical Corp. | 3,659 | 68,240 |
| PC Connection, Inc. | 2,233 | 62,725 |
| Plexus Corp.* | 6,475 | 349,909 |
| Radisys Corp.* | 6,733 | 29,827 |
| Rogers Corp.* | 3,502 | 268,989 |
| Sanmina Corp.* | 14,256 | 522,482 |
| ScanSource, Inc.* | 4,754 | 191,824 |
| SYNNEX Corp. | 5,672 | 686,425 |
| Systemax, Inc. | 2,113 | 18,531 |
| Tech Data Corp.* | 6,795 | 575,401 |
| TTM Technologies, Inc.* | 13,731 | 187,154 |
| Universal Display Corp.* | 8,061 | 453,834 |
| Vishay Intertechnology, Inc. | 26,436 | 428,263 |
| Vishay Precision Group, Inc.* | 2,383 | 45,039 |
| | 10,284,574 |
| Internet Software & Services 2.2% |
| 2U, Inc.* | 7,184 | 216,598 |
| Actua Corp.* | 6,768 | 94,752 |
| Alarm.com Holdings, Inc.* | 1,956 | 54,435 |
| Amber Road, Inc.* | 3,143 | 28,538 |
| Angie's List, Inc.* | 8,152 | 67,091 |
| Appfolio, Inc. "A"* (a) | 1,444 | 34,439 |
| Apptio, Inc. "A"* | 1,161 | 21,513 |
| Autobytel, Inc.* | 1,651 | 22,206 |
| Bankrate, Inc.* | 8,963 | 99,041 |
| Bazaarvoice, Inc.* | 15,611 | 75,713 |
| Benefitfocus, Inc.* (a) | 2,442 | 72,527 |
| Blucora, Inc.* | 7,841 | 115,655 |
| |
Shares | Value ($) |
| | | |
| Box, Inc. "A"* (a) | 9,260 | 128,344 |
| Brightcove, Inc.* | 6,173 | 49,693 |
| Carbonite, Inc.* | 3,452 | 56,613 |
| Care.com, Inc.* | 2,705 | 23,182 |
| ChannelAdvisor Corp.* | 4,430 | 63,570 |
| Cimpress NV* | 4,869 | 446,049 |
| comScore, Inc.* | 9,280 | 293,062 |
| Cornerstone OnDemand, Inc.* | 9,786 | 414,046 |
| Coupa Software, Inc.* (a) | 1,557 | 38,941 |
| DHI Group, Inc.* | 9,532 | 59,575 |
| EarthLink Holdings Corp. | 19,970 | 112,631 |
| Endurance International Group Holdings, Inc.* | 12,141 | 112,911 |
| Envestnet, Inc.* | 8,057 | 284,009 |
| Five9, Inc.* | 6,259 | 88,815 |
| Global Sources Ltd.* | 1,557 | 13,779 |
| Gogo, Inc.* (a) | 11,008 | 101,494 |
| GrubHub, Inc.* | 15,694 | 590,408 |
| GTT Communications, Inc.* | 5,225 | 150,219 |
| Hortonworks, Inc.* (a) | 8,702 | 72,314 |
| Instructure, Inc.* (a) | 1,993 | 38,963 |
| Intralinks Holdings, Inc.* | 8,033 | 108,606 |
| j2 Global, Inc. | 9,123 | 746,261 |
| Limelight Networks, Inc.* | 11,982 | 30,195 |
| Liquidity Services, Inc.* | 4,921 | 47,980 |
| LivePerson, Inc.* | 10,747 | 81,140 |
| LogMeIn, Inc. | 4,893 | 472,419 |
| Marchex, Inc. "B"* | 6,255 | 16,576 |
| MeetMe, Inc.* | 7,833 | 38,617 |
| MINDBODY, Inc. "A"* (a) | 2,735 | 58,256 |
| New Relic, Inc.* | 4,386 | 123,904 |
| NIC, Inc. | 12,356 | 295,308 |
| Numerex Corp. "A"* | 2,646 | 19,580 |
| Q2 Holdings, Inc.* | 4,849 | 139,894 |
| QuinStreet, Inc.* | 6,773 | 25,466 |
| Quotient Technology, Inc.* | 12,773 | 137,310 |
| RealNetworks, Inc.* | 4,458 | 21,666 |
| Reis, Inc. | 1,694 | 37,692 |
| RetailMeNot, Inc.* | 7,742 | 72,001 |
| Rightside Group Ltd.* | 2,204 | 18,227 |
| Shutterstock, Inc.* | 3,704 | 176,014 |
| SPS Commerce, Inc.* | 3,258 | 227,702 |
| Stamps.com, Inc.* | 3,160 | 362,294 |
| TechTarget, Inc.* | 2,507 | 21,385 |
| Trade Desk, Inc. "A"* (a) | 971 | 26,868 |
| TrueCar, Inc.* | 10,303 | 128,787 |
| Web.com Group, Inc.* | 8,017 | 169,560 |
| WebMD Health Corp.* | 7,251 | 359,432 |
| Xactly Corp.* | 4,335 | 47,685 |
| XO Group, Inc.* | 5,167 | 100,498 |
| | 8,152,449 |
| IT Services 2.0% |
| Acxiom Corp.* | 15,051 | 403,367 |
| ALJ Regional Holdings, Inc.* | 3,517 | 15,440 |
| Blackhawk Network Holdings, Inc.* | 10,671 | 402,030 |
| CACI International, Inc. "A"* | 4,724 | 587,193 |
| Cardtronics PLC "A"* | 8,743 | 477,106 |
| Cass Information Systems, Inc. | 2,093 | 153,982 |
| Convergys Corp. | 17,249 | 423,635 |
| CSG Systems International, Inc. | 6,229 | 301,484 |
| Datalink Corp.* | 3,701 | 41,673 |
| EPAM Systems, Inc.* | 9,186 | 590,752 |
| EVERTEC, Inc. | 12,021 | 213,373 |
| |
Shares | Value ($) |
| | | |
| Exlservice Holdings, Inc.* | 6,322 | 318,882 |
| Forrester Research, Inc. | 2,014 | 86,501 |
| Information Services Group, Inc.* | 5,870 | 21,367 |
| Lionbridge Technologies, Inc.* | 11,340 | 65,772 |
| ManTech International Corp. "A" | 4,633 | 195,744 |
| MAXIMUS, Inc. | 12,454 | 694,809 |
| MoneyGram International, Inc.* | 5,584 | 65,947 |
| NCI, Inc. "A" | 1,135 | 15,833 |
| NeuStar, Inc. "A"* | 10,505 | 350,867 |
| Perficient, Inc.* | 6,907 | 120,803 |
| PFSweb, Inc.* | 2,777 | 23,604 |
| Planet Payment, Inc.* | 8,000 | 32,640 |
| Science Applications International Corp. | 8,211 | 696,293 |
| ServiceSource International, Inc.* | 12,018 | 68,262 |
| Sykes Enterprises, Inc.* | 7,475 | 215,728 |
| Syntel, Inc. | 6,278 | 124,242 |
| TeleTech Holdings, Inc. | 3,169 | 96,654 |
| The Hackett Group, Inc. | 4,281 | 75,602 |
| Travelport Worldwide Ltd. | 22,399 | 315,826 |
| Unisys Corp.* (a) | 9,908 | 148,125 |
| Virtusa Corp.* | 5,230 | 131,378 |
| | 7,474,914 |
| Semiconductors & Semiconductor Equipment 3.8% |
| Acacia Communications, Inc.* | 992 | 61,256 |
| Advanced Energy Industries, Inc.* | 7,675 | 420,206 |
| Advanced Micro Devices, Inc.* | 145,231 | 1,646,920 |
| Alpha & Omega Semiconductor Ltd.* | 3,700 | 78,699 |
| Ambarella, Inc.* (a) | 6,222 | 336,797 |
| Amkor Technology, Inc.* | 19,496 | 205,683 |
| Applied Micro Circuits Corp.* | 14,341 | 118,313 |
| Axcelis Technologies, Inc.* | 5,633 | 81,960 |
| Brooks Automation, Inc. | 12,391 | 211,514 |
| Cabot Microelectronics Corp. | 4,466 | 282,117 |
| Cavium, Inc.* | 12,355 | 771,446 |
| CEVA, Inc.* | 3,725 | 124,974 |
| Cirrus Logic, Inc.* | 12,175 | 688,375 |
| Cohu, Inc. | 5,440 | 75,616 |
| Diodes, Inc.* | 7,473 | 191,832 |
| DSP Group, Inc.* | 4,147 | 54,118 |
| Entegris, Inc.* | 27,517 | 492,554 |
| Exar Corp.* | 8,267 | 89,118 |
| FormFactor, Inc.* | 13,091 | 146,619 |
| GigPeak, Inc.* | 12,352 | 31,127 |
| Impinj, Inc.* (a) | 1,085 | 38,344 |
| Inphi Corp.* | 7,803 | 348,170 |
| Integrated Device Technology, Inc.* | 26,193 | 617,107 |
| Intersil Corp. "A" | 25,676 | 572,575 |
| IXYS Corp. | 4,649 | 55,323 |
| Kopin Corp.* | 12,506 | 35,517 |
| Lattice Semiconductor Corp.* | 22,710 | 167,146 |
| MACOM Technology Solutions Holdings, Inc.* | 4,580 | 211,962 |
| MaxLinear, Inc. "A"* | 10,858 | 236,704 |
| Microsemi Corp.* | 21,909 | 1,182,429 |
| MKS Instruments, Inc. | 10,041 | 596,435 |
| Monolithic Power Systems, Inc. | 7,521 | 616,196 |
| Nanometrics, Inc.* | 4,448 | 111,467 |
| NeoPhotonics Corp.* | 6,046 | 65,357 |
| NVE Corp. | 923 | 65,930 |
| PDF Solutions, Inc.* | 5,232 | 117,982 |
| Photronics, Inc.* | 12,730 | 143,849 |
| |
Shares | Value ($) |
| | | |
| Power Integrations, Inc. | 5,333 | 361,844 |
| Rambus, Inc.* | 21,234 | 292,392 |
| Rudolph Technologies, Inc.* | 5,643 | 131,764 |
| Semtech Corp.* | 12,562 | 396,331 |
| Sigma Designs, Inc.* | 7,394 | 44,364 |
| Silicon Laboratories, Inc.* | 8,016 | 521,040 |
| Synaptics, Inc.* | 6,817 | 365,255 |
| Tessera Holding Corp. | 9,564 | 422,729 |
| Ultra Clean Holdings, Inc.* | 6,673 | 64,728 |
| Ultratech, Inc.* | 4,078 | 97,790 |
| Veeco Instruments, Inc.* | 7,798 | 227,312 |
| Xcerra Corp.* | 9,732 | 74,353 |
| | 14,291,639 |
| Software 3.5% |
| 8x8, Inc.* | 17,182 | 245,703 |
| A10 Networks, Inc.* | 8,347 | 69,364 |
| ACI Worldwide, Inc.* | 22,404 | 406,633 |
| American Software, Inc. "A" | 5,360 | 55,369 |
| Aspen Technology, Inc.* | 14,806 | 809,592 |
| Barracuda Networks, Inc.* | 4,161 | 89,170 |
| Blackbaud, Inc. | 8,907 | 570,048 |
| Blackline, Inc.* | 1,789 | 49,430 |
| Bottomline Technologies de, Inc.* | 7,811 | 195,431 |
| BroadSoft, Inc.* | 5,750 | 237,188 |
| Callidus Software* | 11,846 | 199,013 |
| CommVault Systems, Inc.* | 7,510 | 386,014 |
| Digimarc Corp.* (a) | 1,901 | 57,030 |
| Ebix, Inc. (a) | 4,901 | 279,602 |
| Ellie Mae, Inc.* | 6,365 | 532,623 |
| EnerNOC, Inc.* | 4,775 | 28,650 |
| Everbridge, Inc.* | 1,563 | 28,837 |
| Exa Corp.* | 2,626 | 40,335 |
| Fair Isaac Corp. | 5,906 | 704,113 |
| Gigamon, Inc.* | 6,317 | 287,739 |
| Globant SA* | 5,069 | 169,051 |
| Glu Mobile, Inc.* (a) | 19,020 | 36,899 |
| Guidance Software, Inc.* | 4,370 | 30,940 |
| HubSpot, Inc.* | 5,612 | 263,764 |
| Imperva, Inc.* | 5,573 | 214,003 |
| Jive Software, Inc.* | 10,920 | 47,502 |
| Majesco* | 1,211 | 7,363 |
| Mentor Graphics Corp. | 20,773 | 766,316 |
| MicroStrategy, Inc. "A"* | 1,840 | 363,216 |
| Mitek Systems, Inc.* | 5,567 | 34,237 |
| MobileIron, Inc.* | 8,870 | 33,263 |
| Model N, Inc.* | 4,214 | 37,294 |
| Monotype Imaging Holdings, Inc. | 7,900 | 156,815 |
| Park City Group, Inc.* (a) | 2,531 | 32,144 |
| Paycom Software, Inc.* | 8,552 | 389,030 |
| Paylocity Holding Corp.* | 4,277 | 128,353 |
| Pegasystems, Inc. | 7,020 | 252,720 |
| Progress Software Corp. | 9,732 | 310,743 |
| Proofpoint, Inc.* | 7,932 | 560,396 |
| PROS Holdings, Inc.* | 4,775 | 102,758 |
| QAD, Inc. "A" | 1,815 | 55,176 |
| Qualys, Inc.* | 5,379 | 170,245 |
| Rapid7, Inc.* (a) | 3,771 | 45,893 |
| RealPage, Inc.* | 10,508 | 315,240 |
| RingCentral, Inc. "A"* | 11,459 | 236,055 |
| Rosetta Stone, Inc.* | 3,654 | 32,557 |
| Rubicon Project, Inc.* | 7,044 | 52,266 |
| Sapiens International Corp. | 4,335 | 62,164 |
| SecureWorks Corp. "A"* | 1,142 | 12,094 |
| |
Shares | Value ($) |
| | | |
| Silver Spring Networks, Inc.* | 7,206 | 95,912 |
| Synchronoss Technologies, Inc.* | 8,024 | 307,319 |
| Take-Two Interactive Software, Inc.* | 16,148 | 795,935 |
| Tangoe, Inc.* | 5,240 | 41,291 |
| TeleNav, Inc.* | 6,674 | 47,052 |
| TiVo Corp.* | 22,759 | 475,663 |
| Varonis Systems, Inc.* | 2,022 | 54,190 |
| VASCO Data Security International, Inc.* | 5,717 | 78,037 |
| Verint Systems, Inc.* | 12,058 | 425,044 |
| Virnetx Holding Corp.* (a) | 9,773 | 21,501 |
| Workiva, Inc.* | 4,162 | 56,811 |
| Zendesk, Inc.* | 15,777 | 334,472 |
| Zix Corp.* | 10,252 | 50,645 |
| | 12,974,253 |
| Technology Hardware, Storage & Peripherals 0.5% |
| 3D Systems Corp.* | 20,832 | 276,857 |
| Avid Technology, Inc.* | 6,823 | 30,021 |
| CPI Card Group, Inc. | 4,412 | 18,310 |
| Cray, Inc.* | 7,978 | 165,145 |
| Diebold Nixdorf, Inc. | 13,255 | 333,363 |
| Eastman Kodak Co.* | 3,132 | 48,546 |
| Electronics for Imaging, Inc.* | 9,091 | 398,731 |
| Immersion Corp.* | 5,251 | 55,818 |
| Nimble Storage, Inc.* | 11,930 | 94,486 |
| Pure Storage, Inc. "A"* (a) | 13,371 | 151,226 |
| Stratasys Ltd.* | 9,673 | 159,992 |
| Super Micro Computer, Inc.* | 7,305 | 204,905 |
| U.S.A. Technologies, Inc.* (a) | 6,764 | 29,085 |
| | 1,966,485 |
| Materials 4.8% |
| Chemicals 2.4% |
| A. Schulman, Inc. | 5,699 | 190,632 |
| AgroFresh Solutions, Inc.* (a) | 4,179 | 11,074 |
| American Vanguard Corp. | 5,713 | 109,404 |
| Balchem Corp. | 6,110 | 512,751 |
| Calgon Carbon Corp. | 9,540 | 162,180 |
| Chase Corp. | 1,342 | 112,124 |
| Chemours Co. | 35,263 | 778,960 |
| Chemtura Corp.* | 12,366 | 410,551 |
| Codexis, Inc.* | 6,369 | 29,297 |
| Ferro Corp.* | 15,812 | 226,586 |
| Flotek Industries, Inc.* | 10,660 | 100,097 |
| FutureFuel Corp. | 4,551 | 63,259 |
| GCP Applied Technologies, Inc.* | 13,782 | 368,669 |
| H.B. Fuller Co. | 9,662 | 466,771 |
| Hawkins, Inc. | 1,775 | 95,761 |
| Ingevity Corp.* | 8,278 | 454,131 |
| Innophos Holdings, Inc. | 3,691 | 192,892 |
| Innospec, Inc. | 4,607 | 315,580 |
| KMG Chemicals, Inc. | 1,890 | 73,502 |
| Koppers Holdings, Inc.* | 3,860 | 155,558 |
| Kraton Corp.* | 5,834 | 166,152 |
| Kronos Worldwide, Inc. | 3,931 | 46,936 |
| LSB Industries, Inc.* | 3,974 | 33,461 |
| Minerals Technologies, Inc. | 6,730 | 519,893 |
| Olin Corp. | 31,812 | 814,705 |
| Omnova Solutions, Inc.* | 8,561 | 85,610 |
| PolyOne Corp. | 16,289 | 521,900 |
| Quaker Chemical Corp. | 2,530 | 323,688 |
| Rayonier Advanced Materials, Inc. | 8,104 | 125,288 |
| |
Shares | Value ($) |
| | | |
| Sensient Technologies Corp. | 8,514 | 669,030 |
| Stepan Co. | 3,810 | 310,439 |
| TerraVia Holdings, Inc.* (a) | 15,124 | 17,393 |
| Trecora Resources* | 3,644 | 50,469 |
| Tredegar Corp. | 4,853 | 116,472 |
| Trinseo SA | 5,224 | 309,783 |
| Tronox Ltd. "A" | 12,203 | 125,813 |
| Valhi, Inc. | 6,518 | 22,552 |
| | 9,089,363 |
| Construction Materials 0.3% |
| Forterra, Inc.* | 3,384 | 73,297 |
| Headwaters, Inc.* | 14,075 | 331,044 |
| Summit Materials, Inc. "A"* | 14,890 | 354,223 |
| U.S. Concrete, Inc.* | 2,817 | 184,513 |
| United States Lime & Minerals, Inc. | 377 | 28,558 |
| | 971,635 |
| Containers & Packaging 0.2% |
| AEP Industries, Inc. | 787 | 91,371 |
| Greif, Inc. "A" | 4,854 | 249,059 |
| Greif, Inc. "B" | 1,083 | 73,156 |
| Multi Packaging Solutions International Ltd.* | 4,013 | 57,225 |
| Myers Industries, Inc. | 4,549 | 65,051 |
| UFP Technologies, Inc.* | 1,205 | 30,667 |
| | 566,529 |
| Metals & Mining 1.3% |
| AK Steel Holding Corp.* | 60,090 | 613,519 |
| Allegheny Technologies, Inc. (a) | 21,083 | 335,852 |
| Ampco-Pittsburgh Corp. | 1,572 | 26,331 |
| Carpenter Technology Corp. | 8,967 | 324,336 |
| Century Aluminum Co.* | 9,708 | 83,100 |
| Cliffs Natural Resources, Inc.* | 42,854 | 360,402 |
| Coeur Mining, Inc.* | 34,637 | 314,850 |
| Commercial Metals Co. | 22,204 | 483,603 |
| Ferroglobe PLC | 12,466 | 135,007 |
| Ferroglobe Representation & Warranty Insurance Trust | 12,466 | 0 |
| Gold Resource Corp. | 9,413 | 40,947 |
| Handy & Harman Ltd.* | 541 | 13,823 |
| Haynes International, Inc. | 2,517 | 108,206 |
| Hecla Mining Co. | 74,175 | 388,677 |
| Kaiser Aluminum Corp. | 3,421 | 265,777 |
| Materion Corp. | 3,824 | 151,430 |
| Olympic Steel, Inc. | 1,750 | 42,403 |
| Real Industry, Inc.* | 5,114 | 31,195 |
| Ryerson Holding Corp.* | 2,757 | 36,806 |
| Schnitzer Steel Industries, Inc. "A" | 4,891 | 125,699 |
| Stillwater Mining Co.* | 23,752 | 382,645 |
| SunCoke Energy, Inc. | 12,267 | 139,108 |
| TimkenSteel Corp.* | 7,462 | 115,512 |
| Worthington Industries, Inc. | 8,724 | 413,867 |
| | 4,933,095 |
| Paper & Forest Products 0.6% |
| Boise Cascade Co.* | 7,618 | 171,405 |
| Clearwater Paper Corp.* | 3,214 | 210,678 |
| Deltic Timber Corp. | 2,057 | 158,533 |
| KapStone Paper & Packaging Corp. | 16,759 | 369,536 |
| Louisiana-Pacific Corp.* | 27,906 | 528,261 |
| Neenah Paper, Inc. | 3,167 | 269,828 |
| P.H. Glatfelter Co. | 8,500 | 203,065 |
| Schweitzer-Mauduit International, Inc. | 5,921 | 269,583 |
| | 2,180,889 |
| |
Shares | Value ($) |
| | | |
| Real Estate 7.7% |
| Equity Real Estate Investment Trusts (REITs) 7.2% |
| Acadia Realty Trust | 15,369 | 502,259 |
| Agree Realty Corp. | 4,825 | 222,191 |
| Alexander's, Inc. | 403 | 172,029 |
| American Assets Trust, Inc. | 7,585 | 326,762 |
| Armada Hoffler Properties, Inc. | 6,588 | 95,987 |
| Ashford Hospitality Prime, Inc. | 4,275 | 58,354 |
| Ashford Hospitality Trust | 15,762 | 122,313 |
| Bluerock Residential Growth REIT, Inc. | 3,336 | 45,770 |
| CareTrust REIT, Inc. | 12,171 | 186,460 |
| CatchMark Timber Trust, Inc. "A", | 7,447 | 83,853 |
| CBL & Associates Properties, Inc. | 32,803 | 377,234 |
| Cedar Realty Trust, Inc. | 15,560 | 101,607 |
| Chatham Lodging Trust | 7,404 | 152,152 |
| Chesapeake Lodging Trust | 11,548 | 298,631 |
| City Office REIT, Inc. | 4,283 | 56,407 |
| Colony Starwood Homes | 12,600 | 363,006 |
| Community Healthcare Trust, Inc. | 2,390 | 55,042 |
| CorEnergy Infrastructure Trust, Inc. | 2,209 | 77,050 |
| CoreSite Realty Corp. | 6,395 | 507,571 |
| Cousins Properties, Inc. | 64,525 | 549,108 |
| DiamondRock Hospitality Co. | 38,984 | 449,486 |
| DuPont Fabros Technology, Inc. | 14,281 | 627,364 |
| Easterly Government Properties, Inc. | 6,062 | 121,361 |
| EastGroup Properties, Inc. | 6,097 | 450,202 |
| Education Realty Trust, Inc. | 14,218 | 601,421 |
| Farmland Partners, Inc. | 3,070 | 34,261 |
| FelCor Lodging Trust, Inc. | 26,550 | 212,665 |
| First Industrial Realty Trust, Inc. | 22,485 | 630,704 |
| First Potomac Realty Trust | 11,435 | 125,442 |
| Four Corners Property Trust, Inc. | 11,830 | 242,752 |
| Franklin Street Properties Corp. | 20,390 | 264,254 |
| Getty Realty Corp. | 4,947 | 126,099 |
| Gladstone Commercial Corp. | 4,741 | 95,294 |
| Global Medical REIT, Inc. | 2,950 | 26,314 |
| Global Net Lease, Inc. (a) | 33,358 | 261,193 |
| Government Properties Income Trust | 13,649 | 260,218 |
| Gramercy Property Trust | 80,835 | 742,065 |
| Healthcare Realty Trust, Inc. | 21,791 | 660,703 |
| Hersha Hospitality Trust | 7,850 | 168,775 |
| Hudson Pacific Properties, Inc. | 20,499 | 712,955 |
| Independence Realty Trust, Inc. | 11,844 | 105,648 |
| InfraREIT, Inc.* | 7,551 | 135,238 |
| Investors Real Estate Trust | 23,966 | 170,878 |
| iStar, Inc.* | 12,886 | 159,400 |
| Kite Realty Group Trust | 16,054 | 376,948 |
| LaSalle Hotel Properties | 20,412 | 621,954 |
| Lexington Realty Trust | 44,656 | 482,285 |
| LTC Properties, Inc. | 7,323 | 344,035 |
| Mack-Cali Realty Corp. | 17,334 | 503,033 |
| MedEquities Realty Trust, Inc. | 4,069 | 45,166 |
| Medical Properties Trust, Inc. | 56,340 | 692,982 |
| Monmouth Real Estate Investment Corp. | 13,181 | 200,878 |
| Monogram Residential Trust, Inc. | 32,594 | 352,667 |
| National Health Investors, Inc. | 7,209 | 534,692 |
| National Storage Affiliates Trust | 6,982 | 154,093 |
| New Senior Investment Group, Inc. | 15,213 | 148,935 |
| New York REIT, Inc. | 32,039 | 324,235 |
| NexPoint Residential Trust, Inc. | 3,367 | 75,219 |
| |
Shares | Value ($) |
| | | |
| NorthStar Realty Europe Corp. | 10,565 | 132,802 |
| One Liberty Properties, Inc. | 2,600 | 65,312 |
| Parkway, Inc.* | 8,206 | 182,584 |
| Pebblebrook Hotel Trust | 13,881 | 412,960 |
| Pennsylvania Real Estate Investment Trust | 13,272 | 251,637 |
| Physicians Realty Trust | 25,752 | 488,258 |
| Potlatch Corp. | 7,908 | 329,368 |
| Preferred Apartment Communities, Inc. "A", | 5,051 | 75,310 |
| PS Business Parks, Inc. | 3,836 | 446,971 |
| QTS Realty Trust, Inc. "A", | 9,086 | 451,120 |
| RAIT Financial Trust | 18,928 | 63,598 |
| Ramco-Gershenson Properties Trust | 15,220 | 252,348 |
| Retail Opportunity Investments Corp. | 20,765 | 438,764 |
| Rexford Industrial Realty, Inc. | 12,782 | 296,415 |
| RLJ Lodging Trust | 23,273 | 569,956 |
| Ryman Hospitality Properties, Inc. | 8,284 | 521,975 |
| Sabra Health Care REIT, Inc. | 12,582 | 307,252 |
| Saul Centers, Inc. | 1,807 | 120,364 |
| Select Income REIT | 12,369 | 311,699 |
| Seritage Growth Properties "A", (a) | 4,901 | 209,322 |
| Silver Bay Realty Trust Corp. | 6,577 | 112,730 |
| STAG Industrial, Inc. | 14,379 | 343,227 |
| Summit Hotel Properties, Inc. | 16,840 | 269,945 |
| Sunstone Hotel Investors, Inc. | 41,618 | 634,674 |
| Terreno Realty Corp. | 8,795 | 250,570 |
| The Geo Group, Inc. | 14,433 | 518,578 |
| Tier REIT, Inc. | 9,021 | 156,875 |
| UMH Properties, Inc. | 5,016 | 75,491 |
| Universal Health Realty Income Trust | 2,465 | 161,679 |
| Urban Edge Properties | 17,376 | 478,014 |
| Urstadt Biddle Properties "A", | 5,850 | 141,044 |
| Washington Prime Group, Inc. | 36,107 | 375,874 |
| Washington Real Estate Investment Trust | 14,189 | 463,838 |
| Whitestone REIT | 5,488 | 78,917 |
| Xenia Hotels & Resorts, Inc. | 20,012 | 388,633 |
| | 26,973,704 |
| Real Estate Management & Development 0.5% |
| Alexander & Baldwin, Inc. | 8,889 | 398,849 |
| Altisource Portfolio Solutions SA* | 2,152 | 57,222 |
| AV Homes, Inc.* | 2,197 | 34,713 |
| Consolidated-Tomoka Land Co. | 799 | 42,683 |
| Forestar Group, Inc.* | 6,521 | 86,729 |
| FRP Holdings, Inc.* | 1,245 | 46,937 |
| Griffin Land & Nurseries, Inc. | 211 | 6,695 |
| HFF, Inc. "A" | 7,017 | 212,264 |
| Kennedy-Wilson Holdings, Inc. | 16,046 | 328,943 |
| Marcus & Millichap, Inc.* | 2,752 | 73,533 |
| RE/MAX Holdings, Inc. "A" | 3,362 | 188,272 |
| Stratus Properties, Inc.* | 1,172 | 38,383 |
| Tejon Ranch Co.* | 2,693 | 68,483 |
| The RMR Group, Inc. "A", | 1,261 | 49,810 |
| The St. Joe Co.* | 9,881 | 187,739 |
| Trinity Place Holdings, Inc.* | 3,657 | 33,900 |
| | 1,855,155 |
| Telecommunication Services 0.7% |
| Diversified Telecommunication Services 0.6% |
| ATN International, Inc. | 1,999 | 160,180 |
| Cincinnati Bell, Inc.* | 8,238 | 184,119 |
| |
Shares | Value ($) |
| | | |
| Cogent Communications Holdings, Inc. | 8,086 | 334,356 |
| Consolidated Communications Holdings, Inc. | 9,708 | 260,660 |
| FairPoint Communications, Inc.* | 4,125 | 77,137 |
| General Communication, Inc. "A"* | 4,983 | 96,919 |
| Globalstar, Inc.* (a) | 70,671 | 111,660 |
| Hawaiian Telcom Holdco, Inc.* | 1,137 | 28,175 |
| IDT Corp. "B" | 3,157 | 58,531 |
| Inteliquent, Inc. | 6,226 | 142,700 |
| Intelsat SA* (a) | 5,077 | 13,556 |
| Iridium Communications, Inc.* (a) | 16,239 | 155,894 |
| Lumos Networks Corp.* | 3,576 | 55,857 |
| Orbcomm, Inc.* | 12,240 | 101,225 |
| pdvWireless, Inc.* (a) | 1,849 | 41,695 |
| Straight Path Communications, Inc. "B"* (a) | 1,867 | 63,310 |
| Vonage Holdings Corp.* | 37,506 | 256,916 |
| Windstream Holdings, Inc. (a) | 18,232 | 133,641 |
| | 2,276,531 |
| Wireless Telecommunication Services 0.1% |
| Boingo Wireless, Inc.* | 6,605 | 80,515 |
| NII Holdings, Inc.* | 10,807 | 23,235 |
| Shenandoah Telecommunications Co. | 8,979 | 245,127 |
| Spok Holdings, Inc. | 4,176 | 86,652 |
| | 435,529 |
| Utilities 3.5% |
| Electric Utilities 1.1% |
| ALLETE, Inc. | 9,633 | 618,342 |
| El Paso Electric Co. | 7,893 | 367,024 |
| Empire District Electric Co. | 8,520 | 290,447 |
| Genie Energy Ltd. "B" | 2,225 | 12,794 |
| IDACORP, Inc. | 9,788 | 788,423 |
| MGE Energy, Inc. | 6,739 | 440,057 |
| Otter Tail Corp. | 7,446 | 303,797 |
| PNM Resources, Inc. | 15,028 | 515,460 |
| Portland General Electric Co. | 17,327 | 750,779 |
| Spark Energy, Inc. "A" (a) | 925 | 28,028 |
| | 4,115,151 |
| Gas Utilities 1.1% |
| Chesapeake Utilities Corp. | 3,034 | 203,126 |
| Delta Natural Gas Co., Inc. | 1,291 | 37,865 |
| New Jersey Resources Corp. | 16,364 | 580,922 |
| Northwest Natural Gas Co. | 5,321 | 318,196 |
| ONE Gas, Inc. | 10,140 | 648,554 |
| South Jersey Industries, Inc. | 15,522 | 522,936 |
| Southwest Gas Corp. | 8,993 | 689,044 |
| Spire, Inc. | 8,647 | 558,164 |
| WGL Holdings, Inc. | 9,676 | 738,085 |
| | 4,296,892 |
| Independent Power & Renewable Electricity Producers 0.5% |
| Atlantic Power Corp. | 21,382 | 53,455 |
| Atlantica Yield PLC | 11,623 | 224,905 |
| Dynegy, Inc.* | 22,705 | 192,084 |
| NRG Yield, Inc. "A" | 6,653 | 102,190 |
| NRG Yield, Inc. "C" | 12,548 | 198,259 |
| Ormat Technologies, Inc. | 7,523 | 403,383 |
| Pattern Energy Group, Inc. | 12,803 | 243,129 |
| TerraForm Global, Inc. "A" | 17,330 | 68,454 |
| TerraForm Power, Inc. "A" (a) | 17,183 | 220,114 |
| Vivint Solar, Inc.* | 3,705 | 9,448 |
| | 1,715,421 |
| |
Shares | Value ($) |
| | | |
| Multi-Utilities 0.5% |
| Avista Corp. | 12,236 | 489,317 |
| Black Hills Corp. | 10,023 | 614,811 |
| NorthWestern Corp. | 9,433 | 536,455 |
| Unitil Corp. | 2,796 | 126,771 |
| | 1,767,354 |
| Water Utilities 0.3% |
| American States Water Co. | 7,083 | 322,702 |
| AquaVenture Holdings Ltd.* | 1,427 | 35,004 |
| Artesian Resources Corp. "A" | 1,483 | 47,367 |
| California Water Service Group | 9,398 | 318,592 |
| Connecticut Water Service, Inc. | 2,022 | 112,929 |
| Consolidated Water Co., Ltd. | 2,624 | 28,470 |
| Global Water Resources, Inc. (a) | 1,555 | 14,151 |
| Middlesex Water Co. | 3,202 | 137,494 |
| SJW Group | 3,190 | 178,576 |
| York Water Co. | 2,631 | 100,504 |
| | 1,295,789 |
| Total Common Stocks (Cost $272,122,216) | 364,030,503 |
| |
| Rights 0.0% |
| Health Care 0.0% |
| Dyax Corp.* | 26,416 | 105,664 |
| Omthera Pharmaceutical, Inc.* | 1,167 | 700 |
| Tobira Therapeutics, Inc.* | 1,687 | 23,179 |
| | 129,543 |
| Industrials 0.0% |
| Gerber Scientific, Inc.* | 6,939 | 0 |
| |
| Telecommunication Services 0.0% |
| Leap Wireless International, Inc.* | 10,664 | 26,020 |
| Total Rights (Cost $79,374) | 155,563 |
| |
| Warrant 0.0% |
| Health Care |
| Asterias Biotherapeutics, Expiration Date 2/15/2017* (Cost $212) | 372 | 203 |
* Non-income producing security.
** Annualized yield at time of purchase; not a coupon rate.
(a) All or a portion of these securities were on loan. In addition, "Other Assets and Liabilities, Net" may include pending sales that are also on loan. The value of securities loaned at December 31, 2016 amounted to $15,369,592, which is 4.1% of net assets.
(b) At December 31, 2016, this security has been pledged, in whole or in part, to cover initial margin requirements for open futures contracts.
(c) Affiliated fund managed by Deutsche Investment Management Americas Inc. The rate shown is the annualized seven-day yield at period end.
(d) Represents collateral held in connection with securities lending. Income earned by the Fund is net of borrower rebates.
For information on the Fund's policy and additional disclosures regarding futures contracts, please refer to Note B in the accompanying Notes to Financial Statements.
Various inputs are used in determining the value of the Fund's investments. These inputs are summarized in three broad levels. Level 1 includes quoted prices in active markets for identical securities. Level 2 includes other significant observable inputs (including quoted prices for similar securities, interest rates, prepayment speeds and credit risk). Level 3 includes significant unobservable inputs (including the Fund's own assumptions in determining the fair value of investments). The level assigned to the securities valuations may not be an indication of the risk or liquidity associated with investing in those securities.
The following is a summary of the inputs used as of December 31, 2016 in valuing the Fund's investments. For information on the Fund's policy regarding the valuation of investments, please refer to the Security Valuation section of Note A in the accompanying Notes to Financial Statements.
There have been no transfers between fair value measurement levels during the year ended December 31, 2016.
(e) See Investment Portfolio for additional detailed categorizations.
(f) Derivatives include unrealized appreciation (depreciation) on futures contracts.
The accompanying notes are an integral part of the financial statements.
* Represents collateral on securities loaned.
The accompanying notes are an integral part of the financial statements.
The accompanying notes are an integral part of the financial statements.
The accompanying notes are an integral part of the financial statements.
Deutsche Investments VIT Funds (the "Trust") is registered under the Investment Company Act of 1940, as amended (the "1940 Act"), as an open-end management investment company. The Trust is organized as a Massachusetts business trust. Deutsche Small Cap Index VIP (the "Fund") is a diversified series of the Trust offered to investors. The Fund is an underlying investment vehicle for variable annuity contracts and variable life insurance policies to be offered by the separate accounts of certain life insurance companies ("Participating Insurance Companies").
Investment income, realized and unrealized gains and losses, and certain fund-level expenses and expense reductions, if any, are borne pro rata on the basis of relative net assets by the holders of all classes of shares, except that each class bears certain expenses unique to that class (including the applicable Rule 12b-1 distribution fees). Differences in class-level expenses may result in payment of different per share dividends by class. All shares have equal rights with respect to voting subject to class-specific arrangements.
The Fund's financial statements are prepared in accordance with accounting principles generally accepted in the United States of America ("U.S. GAAP") which require the use of management estimates. Actual results could differ from those estimates. The Fund qualifies as an investment company under Topic 946 of Accounting Standards Codification of U.S. GAAP. The policies described below are followed consistently by the Fund in the preparation of its financial statements.
Various inputs are used in determining the value of the Fund's investments. These inputs are summarized in three broad levels. Level 1 includes quoted prices in active markets for identical securities. Level 2 includes other significant observable inputs (including quoted prices for similar securities, interest rates, prepayment speeds and credit risk). Level 3 includes significant unobservable inputs (including the Fund's own assumptions in determining the fair value of investments). The level assigned to the securities valuations may not be an indication of the risk or liquidity associated with investing in those securities.
Equity securities are valued at the most recent sale price or official closing price reported on the exchange (U.S. or foreign) or over-the-counter market on which they trade. Securities for which no sales are reported are valued at the calculated mean between the most recent bid and asked quotations on the relevant market or, if a mean cannot be determined, at the most recent bid quotation. Equity securities are generally categorized as Level 1.
Debt securities are valued at prices supplied by independent pricing services approved by the Fund's Board. If the pricing services are unable to provide valuations, securities are valued at the most recent bid quotation or evaluated price, as applicable, obtained from one or more broker-dealers. Such services may use various pricing techniques which take into account appropriate factors such as yield, quality, coupon rate, maturity, type of issue, trading characteristics and other data, as well as broker quotes. These securities are generally categorized as Level 2.
Investments in open-end investment companies are valued at their net asset value each business day and are categorized as Level 1.
Futures contracts are generally valued at the settlement prices established each day on the exchange on which they are traded and are categorized as Level 1.
Securities and other assets for which market quotations are not readily available or for which the above valuation procedures are deemed not to reflect fair value are valued in a manner that is intended to reflect their fair value as determined in accordance with procedures approved by the Board and are generally categorized as Level 3. In accordance with the Fund's valuation procedures, factors considered in determining value may include, but are not limited to, the type of the security; the size of the holding; the initial cost of the security; the existence of any contractual restrictions on the security's disposition; the price and extent of public trading in similar securities of the issuer or of comparable companies; quotations or evaluated prices from broker-dealers and/or pricing services; information obtained from the issuer, analysts, and/or the appropriate stock exchange (for exchange-traded securities); an analysis of the company's or issuer's financial statements; an evaluation of the forces that influence the issuer and the market(s) in which the security is purchased and sold; and with respect to debt securities, the maturity, coupon, creditworthiness, currency denomination and the movement of the market in which the security is normally traded. The value determined under these procedures may differ from published values for the same securities.
Disclosure about the classification of fair value measurements is included in a table following the Fund's Investment Portfolio.
As of December 31, 2016, the Fund had securities on loan, which were classified as common stock in the Investment Portfolio. The value of the related collateral exceeded the value of the securities loaned at period end. As of period end, the remaining contractual maturity of the collateral agreements were overnight and continuous.
The Fund has reviewed the tax positions for the open tax years as of December 31, 2016 and has determined that no provision for income tax and/or uncertain tax provisions is required in the Fund's financial statements. The Fund's federal tax returns for the prior three fiscal years remain open subject to examination by the Internal Revenue Service.
The timing and characterization of certain income and capital gain distributions are determined annually in accordance with federal tax regulations, which may differ from accounting principles generally accepted in the United States of America. These differences primarily relate to investments in futures contracts and certain securities sold at a loss. As a result, net investment income (loss) and net realized gain (loss) on investment transactions for a reporting period may differ significantly from distributions during such period. Accordingly, the Fund may periodically make reclassifications among certain of its capital accounts without impacting the net asset value of the Fund.
At December 31, 2016, the Fund's components of distributable earnings (accumulated gains) on a tax basis were as follows:
In addition, the tax character of distributions paid to shareholders by the Fund is summarized as follows:
* For tax purposes, short-term capital gain distributions are considered ordinary income distributions.
A futures contract is an agreement between a buyer or seller and an established futures exchange or its clearinghouse in which the buyer or seller agrees to take or make a delivery of a specific amount of a financial instrument at a specified price on a specific date (settlement date). For the year ended December 31, 2016, the Fund invested in futures to keep cash on hand to meet shareholder redemptions or other needs while maintaining exposure to the stock market.
Upon entering into a futures contract, the Fund is required to deposit with a financial intermediary cash or securities ("initial margin") in an amount equal to a certain percentage of the face value indicated in the futures contract. Subsequent payments ("variation margin") are made or received by the Fund dependent upon the daily fluctuations in the value and are recorded for financial reporting purposes as unrealized gains or losses by the Fund. Gains or losses are realized when the contract expires or is closed. Since all futures contracts are exchange traded, counterparty risk is minimized as the exchange's clearinghouse acts as the counterparty, and guarantees the futures against default.
Certain risks may arise upon entering into futures contracts, including the risk that an illiquid market will limit the Fund's ability to close out a futures contract prior to the settlement date and the risk that the futures contract is not well correlated with the security, index or currency to which it relates. Risk of loss may exceed amounts disclosed in the Statement of Assets and Liabilities.
A summary of the open futures contracts as of December 31, 2016 is included in a table following the Fund's Investment Portfolio. For the year ended December 31, 2016, the investment in futures contracts purchased had a total notional value generally indicative of a range from approximately $4,868,000 to $12,760,000.
The following tables summarize the value of the Fund's derivative instruments held as of December 31, 2016 and the related location in the accompanying Statement of Assets and Liabilities, presented by primary underlying risk exposure:
Additionally, the amount of unrealized and realized gains and losses on derivative instruments recognized in Fund earnings during the year ended December 31, 2016 and the related location in the accompanying Statement of Operations is summarized in the following tables by primary underlying risk exposure:
During the year ended December 31, 2016, purchases and sales of investment securities (excluding short-term investments) aggregated $61,053,405 and $58,131,470, respectively.
Pursuant to the Investment Management Agreement with the Advisor, the Fund pays the Advisor an annual fee based on its average daily net assets, computed and accrued daily and payable monthly at the annual rate (exclusive of any applicable waivers/reimbursements) of 0.35%.
For the period from January 1, 2016 through April 30, 2017, the Advisor has contractually agreed to waive all or a portion of its fees and/or reimburse certain operating expenses of the Fund to the extent necessary to maintain the total annual operating expenses (excluding certain expenses such as extraordinary expenses, taxes, brokerage and interest) of each class as follows:
For the year ended December 31, 2016, fees waived and/or expenses reimbursed for each class are as follows:
The Fund and other affiliated funds (the "Participants") share in a $400 million revolving credit facility provided by a syndication of banks. The Fund may borrow for temporary or emergency purposes, including the meeting of redemption requests that otherwise might require the untimely disposition of securities. The Participants are charged an annual commitment fee which is allocated based on net assets, among each of the Participants. Interest is calculated at a rate per annum equal to the sum of the Federal Funds Rate plus 1.25 percent plus if the one-month LIBOR exceeds the Federal Funds Rate, the amount of such excess. The Fund may borrow up to a maximum of 33 percent of its net assets under the agreement. The Fund had no outstanding loans at December 31, 2016.
At December 31, 2016, three participating insurance companies were beneficial owners of record of 10% or more of the total outstanding Class A shares of the Fund, each owning 40%, 15% and 14%, respectively. At December 31, 2016, two participating insurance companies were beneficial owners of record of 10% or more of the outstanding Class B shares of the Fund, each owning 45% and 18%, respectively.
In our opinion, the accompanying statement of assets and liabilities, including the investment portfolio, and the related statements of operations and of changes in net assets and the financial highlights present fairly, in all material respects, the financial position of Deutsche Small Cap Index VIP (the "Fund") at December 31, 2016, and the results of its operations, the changes in its net assets and the financial highlights for each of the periods indicated therein, in conformity with accounting principles generally accepted in the United States of America. These financial statements and financial highlights (hereafter referred to as "financial statements") are the responsibility of the Fund's management. Our responsibility is to express an opinion on these financial statements based on our audits. We conducted our audits of these financial statements in accordance with the standards of the Public Company Accounting Oversight Board (United States). Those standards require that we plan and perform the audit to obtain reasonable assurance about whether the financial statements are free of material misstatement. An audit includes examining, on a test basis, evidence supporting the amounts and disclosures in the financial statements, assessing the accounting principles used and significant estimates made by management, and evaluating the overall financial statement presentation. We believe that our audits, which included confirmation of securities at December 31, 2016 by correspondence with the custodian, brokers and transfer agent, and the application of alternative auditing procedures where such confirmations had not been received, provide a reasonable basis for our opinion.
As an investor of the Fund, you incur two types of costs: ongoing expenses and transaction costs. Ongoing expenses include management fees, distribution and service (12b-1) fees and other Fund expenses. Examples of transaction costs include contract charges, which are not shown in this section. The following tables are intended to help you understand your ongoing expenses (in dollars) of investing in the Fund and to help you compare these expenses with the ongoing expenses of investing in other mutual funds. In the most recent six-month period, the Fund limited these expenses; had it not done so, expenses would have been higher. The example in the table is based on an investment of $1,000 invested at the beginning of the six-month period and held for the entire period (July 1, 2016 to December 31, 2016).
Please note that the expenses shown in these tables are meant to highlight your ongoing expenses only and do not reflect any transaction costs. The "Expenses Paid per $1,000" line of the tables is useful in comparing ongoing expenses only and will not help you determine the relative total expense of owning different funds. If these transaction costs had been included, your costs would have been higher.
* Expenses are equal to the Fund's annualized expense ratio for each share class, multiplied by the average account value over the period, multiplied by 184 (the number of days in the most recent six-month period), then divided by 366.
For more information, please refer to the Fund's prospectus.
These tables do not reflect charges and fees ("contract charges") associated with the separate account that invests in the Fund or any variable life insurance policy or variable annuity contract for which the Fund is an investment option.
For an analysis of the fees associated with an investment in the fund or similar funds, please refer to the current and hypothetical expense calculators for Variable Insurance Products which can be found at deutschefunds.com/EN/resources/calculators.jsp.
The Fund paid distributions of $1.11 per share from net long-term capital gains during its year ended December 31, 2016.
Pursuant to Section 852 of the Internal Revenue Code, the Fund designates $15,599,000 as capital gain dividends for its year ended December 31, 2016.
For corporate shareholders, 48% of the ordinary dividends (i.e., income dividends plus short-term capital gains) paid during the Fund's fiscal year ended December 31, 2016 qualified for the dividends received deduction.
Please consult a tax advisor if you have questions about federal or state income tax laws, or on how to prepare your tax returns. If you have specific questions about your account, contact your insurance provider.
The Fund's policies and procedures for voting proxies for portfolio securities and information about how the Fund voted proxies related to its portfolio securities during the most recent 12-month period ended June 30 are available on our Web site — deutschefunds.com (click on "proxy voting" at the bottom of the page) — or on the SEC's Web site — sec.gov. To obtain a written copy of the Fund's policies and procedures without charge, upon request, call us toll free at (800) 728-3337.
The Board of Trustees (hereinafter referred to as the "Board" or "Trustees") approved the renewal of Deutsche Small Cap Index VIP’s (the "Fund") investment management agreement (the "Agreement") with Deutsche Investment Management Americas Inc. ("DIMA") and sub-advisory agreement (the "Sub-Advisory Agreement" and together with the Agreement, the "Agreements") between DIMA and Northern Trust Investments, Inc. ("NTI") in September 2016.
In terms of the process that the Board followed prior to approving the Agreements, shareholders should know that:
In connection with the contract review process, the Contract Committee and the Board considered the factors discussed below, among others. The Board also considered that DIMA and its predecessors have managed the Fund since its inception, and the Board believes that a long-term relationship with a capable, conscientious advisor is in the best interests of the Fund. The Board considered, generally, that shareholders chose to invest or remain invested in the Fund knowing that DIMA managed the Fund, and that the Agreement was approved by the Fund’s shareholders. DIMA is part of Deutsche Bank AG’s ("Deutsche Bank") Asset Management ("Deutsche AM") division. Deutsche AM is a global asset management business that offers a wide range of investing expertise and resources, including research capabilities in many countries throughout the world. Deutsche Bank has advised the Board that the U.S. asset management business continues to be a critical and integral part of Deutsche Bank, and that Deutsche Bank will continue to invest in Deutsche AM and seek to enhance Deutsche AM’s investment platform. Deutsche Bank also has confirmed its commitment to maintaining strong legal and compliance groups within the Deutsche AM division.
As part of the contract review process, the Board carefully considered the fees and expenses of each Deutsche fund overseen by the Board in light of the fund’s performance. In many cases, this led to the negotiation and implementation of expense caps. As part of these negotiations, the Board indicated that it would consider relaxing these caps in future years following sustained improvements in performance, among other considerations.
While shareholders may focus primarily on fund performance and fees, the Fund’s Board considers these and many other factors, including the quality and integrity of DIMA’s and NTI’s personnel and such other issues as back-office operations, fund valuations, and compliance policies and procedures.
On the basis of the information provided, the Board concluded that management fees were reasonable and appropriate in light of the nature, quality and extent of services provided by DIMA and NTI.
Based on all of the information considered and the conclusions reached, the Board unanimously determined that the continuation of the Agreements is in the best interests of the Fund. In making this determination, the Board did not give particular weight to any single factor identified above. The Board considered these factors over the course of numerous meetings, certain of which were in executive session with only the Independent Trustees and counsel present. It is possible that individual Independent Trustees may have weighed these factors differently in reaching their individual decisions to approve the continuation of the Agreements.
The following table presents certain information regarding the Board Members and Officers of the fund. Each Board Member's year of birth is set forth in parentheses after his or her name. Unless otherwise noted, (i) each Board Member has engaged in the principal occupation(s) noted in the table for at least the most recent five years, although not necessarily in the same capacity; and (ii) the address of each Independent Board Member is c/o Keith R. Fox, Deutsche Funds Board Chair, c/o Thomas R. Hiller, Ropes & Gray LLP, Prudential Tower, 800 Boylston Street, Boston, MA 02199-3600. Except as otherwise noted below, the term of office for each Board Member is until the election and qualification of a successor, or until such Board Member sooner dies, resigns, is removed or as otherwise provided in the governing documents of the fund. Because the fund does not hold an annual meeting of shareholders, each Board Member will hold office for an indeterminate period. The Board Members may also serve in similar capacities with other funds in the fund complex.
The fund's Statement of Additional Information ("SAI") includes additional information about the Board Members. The SAI is available, without charge, upon request. If you would like to request a copy of the SAI, you may do so by calling the following toll-free number: (800) 728-3337.
The following table shows the amount of fees that PricewaterhouseCoopers, LLP (“PWC”), the Fund’s independent registered public accounting firm, billed to the Fund during the Fund’s last two fiscal years. The Audit Committee approved in advance all audit services and non-audit services that PWC provided to the Fund.
Services that the Fund’s Independent Registered Public Accounting Firm Billed to the Fund
The following table shows the amount of fees billed by PWC to Deutsche Investment Management Americas Inc. (“DIMA” or the “Adviser”), and any entity controlling, controlled by or under common control with DIMA (“Control Affiliate”) that provides ongoing services to the Fund (“Affiliated Fund Service Provider”), for engagements directly related to the Fund’s operations and financial reporting, during the Fund’s last two fiscal years.
The “Tax Fees Billed to the Advisor” were billed for services associated with foreign tax filings.
The following table shows the amount of fees that PWC billed during the Fund’s last two fiscal years for non-audit services. The Audit Committee pre-approved all non-audit services that PWC provided to the Adviser and any Affiliated Fund Service Provider that related directly to the Fund’s operations and financial reporting. The Audit Committee requested and received information from PWC about any non-audit services that PWC rendered during the Fund’s last fiscal year to the Adviser and any Affiliated Fund Service Provider. The Committee considered this information in evaluating PWC’s independence.
Audit Committee Pre-Approval Policies and Procedures. Generally, each Fund’s Audit Committee must pre approve (i) all services to be performed for a Fund by a Fund’s Independent Registered Public Accounting Firm and (ii) all non-audit services to be performed by a Fund’s Independent Registered Public Accounting Firm for the DIMA Entities with respect to operations and financial reporting of the Fund, except that the Chairperson or Vice Chairperson of each Fund’s Audit Committee may grant the pre-approval for non-audit services described in items (i) and (ii) above for non-prohibited services for engagements of less than $100,000. All such delegated pre approvals shall be presented to each Fund’s Audit Committee no later than the next Audit Committee meeting.
There were no amounts that were approved by the Audit Committee pursuant to the de minimis exception under Rule 2-01 of Regulation S-X.
According to the registrant’s principal Independent Registered Public Accounting Firm, substantially all of the principal Independent Registered Public Accounting Firm's hours spent on auditing the registrant's financial statements were attributed to work performed by full-time permanent employees of the principal Independent Registered Public Accounting Firm.
In connection with the audit of the 2015 and 2016 financial statements, the Fund entered into an engagement letter with PwC. The terms of the engagement letter required by PwC, and agreed to by the Fund’s Audit Committee, include a provision mandating the use of mediation and arbitration to resolve any controversy or claim between the parties arising out of or relating to the engagement letter or the services provided there-under.
In a letter provided to the Audit Committee pursuant to PCAOB Rule 3526 and dated July 19, 2016, PwC informed the Audit Committee that PwC had identified circumstances where PwC maintains lending relationships with owners of greater than 10% of the shares of certain investment companies within the “investment company complex” as defined under Rule 2-01(f)(14) of Regulation S-X. PwC informed the Audit Committee that these lending relationships are inconsistent with the SEC Staff’s interpretation of Rule 2-01(c)(l)(ii)(A) of Regulation S-X (referred to as the “Loan Rule”).
The Loan Rule specifically provides that an accounting firm would not be independent if it receives a loan from a lender that is a record or beneficial owner of more than ten percent of an audit client’s equity securities. For purposes of the Loan Rule, audit clients include the Fund as well as all registered investment companies advised by Deutsche Investment Management Americas Inc. (the “Adviser”), the Fund’s investment adviser, and its affiliates, including other subsidiaries of the Adviser’s parent company, Deutsche Bank AG (collectively, the “Deutsche Funds Complex”). PwC’s lending relationships effect PwC’s independence under the SEC Staff’s interpretation of the Loan Rule with respect to all investment companies in the Deutsche Funds Complex.
In its July 19, 2016 letter, PwC affirmed to the Audit Committee that, as of the date of the letter, PwC is an independent accountant with respect to the Fund, within the meaning of PCAOB Rule 3520. In its letter, PwC also informed the Audit Committee that, after evaluating the facts and circumstances and the applicable independence rules, PwC has concluded that with regard to its compliance with the independence criteria set forth in the rules and regulations of the SEC related to the Loan Rule, it believes that it remains objective and impartial despite matters that may ultimately be determined to be inconsistent with these criteria and therefore it can continue to serve as the Fund’s registered public accounting firm. PwC informed the Audit Committee that its conclusion was based on a number of factors, including, among others, PwC’s belief that the lenders are not able to impact the impartiality of PwC or assert any influence over the investment companies in the Deutsche Funds Complex whose shares the lenders own or the applicable investment company’s investment adviser; and the lenders receive no direct benefit from their ownership of the investment companies in the Deutsche Funds Complex in separate accounts maintained on behalf of their insurance contract holders. In addition, the individuals at PwC who arranged PwC’s lending relationships have no oversight of, or ability to influence, the individuals at PwC who conducted the audits of the Fund’s financial statements.
On June 20, 2016, the SEC Staff issued a “no-action” letter to another mutual fund complex (see Fidelity Management & Research Company et al., No-Action Letter) related to similar Loan Rule issues as those described above. In that letter, the SEC Staff confirmed that it would not recommend enforcement action against an investment company that relied on the audit services performed by an audit firm that was not in compliance with the Loan Rule in certain specified circumstances. The circumstances described in the no-action letter appear to be substantially similar to the circumstances that effected PwC’s independence under the Loan Rule with respect to the Fund. PwC confirmed to the Audit Committee that it meets the conditions of the no-action letter. In the no-action letter, the SEC Staff stated that the relief under the letter is temporary and will expire 18 months after the issuance of the letter.
Pursuant to the requirements of the Securities Exchange Act of 1934 and the Investment Company Act of 1940, the registrant has duly caused this report to be signed on its behalf by the undersigned, thereunto duly authorized.
Pursuant to the requirements of the Securities Exchange Act of 1934 and the Investment Company Act of 1940, this report has been signed below by the following persons on behalf of the registrant and in the capacities and on the dates indicated.