UNITED STATES
SECURITIES AND EXCHANGE COMMISSION
WASHINGTON, D. C. 20549
FORM N-CSR
Investment Company Act file number: 811-07507
Deutsche DWS Investments VIT Funds
(Exact Name of Registrant as Specified in Charter)
875 Third Avenue
New York, NY 10022-6225
(Address of Principal Executive Offices) (Zip Code)
Registrant’s Telephone Number, including Area Code:(212) 454-4500
Diane Kenneally
One International Place
Boston, MA 02110
(Name and Address of Agent for Service)
| Date of fiscal year end: | 12/31 |
| | |
| Date of reporting period: | 12/31/2019 |
| ITEM 1. | REPORT TO STOCKHOLDERS |
December 31, 2019
Annual Report
Deutsche DWS Investments VIT Funds
DWS Small Cap Index VIP
Beginning on January 1, 2021, as permitted by regulations adopted by the Securities and Exchange Commission, you may not be receiving paper copies of the Fund’s shareholder reports from the insurance company that offers your contract unless you specifically request paper copies from your insurance company or from your financial intermediary. Instead, the shareholder reports will be made available on a Web site, and your insurance company will notify you by mail each time a report is posted and provide you with a Web site link to access the report. Instructions for requesting paper copies will be provided by your insurance company.
If you already elected to receive shareholder reports electronically, you will not be affected by this change and you need not take any action. You may elect to receive shareholder reports and other communications from your insurance company electronically by following the instructions provided by your insurance company.
You may elect to receive all future reports in paper free of charge from your insurance company. If your insurance company informs you that future reports will be delivered via Web access, you can inform your insurance company that you wish to continue receiving paper copies of your shareholder reports by following the instructions provided by your insurance company.

Contents
This report must be preceded or accompanied by a prospectus. To obtain an additional prospectus or summary prospectus, if available, call (800) 728-3337 or your financial representative. We advise you to consider the Fund’s objectives, risks, charges and expenses carefully before investing. The summary prospectus and prospectus contain this and other important information about the Fund. Please read the prospectus carefully before you invest.
Stocks may decline in value. Various factors, including costs, cash flows and security selection, may cause the Fund’s performance to differ from that of the index. Smaller company stocks tend to be more volatile than medium-sized or large company stocks. The Fund may lend securities to approved institutions. Investing in derivatives entails special risks relating to liquidity, leverage and credit that may reduce returns and/or increase volatility. Please read the prospectus for details.
The brand DWS represents DWS Group GmbH & Co. KGaA and any of its subsidiaries such as DWS Distributors, Inc. which offers investment products or DWS Investment Management Americas, Inc. and RREEF America L.L.C. which offer advisory services.
DWS Distributors, Inc., 222 South Riverside Plaza, Chicago, IL 60606, (800) 621-1148
NOT FDIC/NCUA INSURED NO BANK GUARANTEE MAY LOSE VALUE NOT A DEPOSIT NOT INSURED BY ANY FEDERAL GOVERNMENT AGENCY
| | | | | | |
| | 2 | | | | | | DWS Small Cap Index VIP |
| | |
| Performance Summary | | December 31, 2019 (Unaudited) |
Fund performance shown is historical, assumes reinvestment of all dividend and capital gain distributions, and does not guarantee future results. Investment return and principal value fluctuate with changing market conditions so that, when redeemed, shares may be worth more or less than their original cost. Current performance may be lower or higher than the performance data quoted. Please contact your participating insurance company for the Fund’s most recent month-end performance. Performance figures for Classes A and B differ because each class maintains a distinct expense structure. Performance does not reflect charges and fees (“contract charges”) associated with the separate account that invests in the Fund or any variable life insurance policy or variable annuity contract for which the Fund is an investment option. These charges and fees will reduce returns.
The gross expense ratios of the Fund, as stated in the fee table of the prospectus dated May 1, 2019 are 0.51% and 0.80% for Class A and Class B shares, respectively, and may differ from the expense ratios disclosed in the Financial Highlights tables in this report.
Generally accepted accounting principles require adjustments to be made to the net assets of the Fund at period end for financial reporting purposes only, and as such, the total return based on the unadjusted net asset value per share may differ from the total return reported in the financial highlights.
Growth of an Assumed $10,000 Investment
| | |
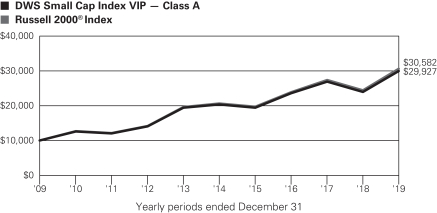
| | Russell 2000® Index is an unmanaged, capitalization-weighted measure of approximately 2,000 of the smallest companies in the Russell 3000® Index. The Russell 3000® Index is an unmanaged index that measures the performance of the 3,000 largest U.S. companies based on total market capitalization, which represents approximately 98% of the investable U.S. equity market. Index returns do not reflect any fees or expenses and it is not possible to invest directly into an index. |
| | | | | | | | | | |
| Comparative Results | | | | |
| | | | | |
| DWS Small Cap Index VIP | | | | 1-Year | | 3-Year | | 5-Year | | 10-Year |
| Class A | | Growth of $10,000 | | $12,522 | | $12,709 | | $14,674 | | $29,927 |
| | | Average annual total return | | 25.22% | | 8.32% | | 7.97% | | 11.59% |
| Russell 2000 Index | | Growth of $10,000 | | $12,552 | | $12,806 | | $14,849 | | $30,582 |
| | | Average annual total return | | 25.52% | | 8.59% | | 8.23% | | 11.83% |
| | | | | |
| DWS Small Cap Index VIP | | | | 1-Year | | 3-Year | | 5-Year | | 10-Year |
| Class B | | Growth of $10,000 | | $12,487 | | $12,613 | | $14,486 | | $29,187 |
| | | Average annual total return | | 24.87% | | 8.05% | | 7.69% | | 11.31% |
| Russell 2000 Index | | Growth of $10,000 | | $12,552 | | $12,806 | | $14,849 | | $30,582 |
| | Average annual total return | | 25.52% | | 8.59% | | 8.23% | | 11.83% |
The growth of $10,000 is cumulative.
| | | | |
| DWS Small Cap Index VIP | | | | | 3 |
| | |
| Management Summary | | December 31, 2019 (Unaudited) |
For the 12 months ended December 31, 2019, the Fund returned 25.22% (Class A shares, unadjusted for contract charges), compared with the 25.52% return of the Russell 2000® Index.
Risk assets including small-cap stocks exhibited mixed performance over the first nine months of 2019, amid signs of weakening global growth. Trade tensions exacerbated a slowdown that was already underway as market watchers struggled to predict the longer-term effect that the ongoing series of tariff increases would have on worldwide growth. The U.S. Federal Reserve (the Fed) halted its increases of the federal funds rate following its December rate hike, cut rates three times and ended the reduction of its balance sheet. Global manufacturing PMI figures fell into negative territory, and the Chinese and European economies weakened considerably. The overall heightened sense of uncertainty led many investors to pivot from traditional growth stocks to more defensive stocks viewed as being better positioned to withstand economic disruptions stemming from the trade war. However, U.S. equities surged in the fourth quarter, closing out what turned into an impressive year for the markets. Investors began to see evidence of improving economic growth both in United States and overseas, as well as progress in the U.S.-China trade talks. Although the Fed indicated that it was unlikely to enact any further rate cuts after its three quarter-point reductions at mid-year, its sizable injections of liquidity into the financial system boosted investor sentiment. For the 12-month period, small-cap growth stocks as represented by the Russell 2000 Growth Index outperformed small-cap value stocks as represented by the Russell 2000 Value Index.
To attempt to match the risk and return characteristics of the Russell 2000 Index as closely as possible, the Fund invests in a statistically selected sample of the securities found in the Russell 2000 Index, using a process known as “optimization.” This process selects stocks for the Fund so that industry weightings, market capitalizations and fundamental characteristics closely match those of the securities in the Russell 2000 Index without purchasing all of the stocks in the index. Going forward, we will continue to seek returns that approximate those of the index.
Brent Reeder
Senior Vice President, Northern Trust Investments, Inc., Subadvisor to the Fund
Portfolio Manager
The views expressed reflect those of the portfolio management team only through the end of the period of the report as stated on the cover. The management team’s views are subject to change at any time based on market and other conditions and should not be construed as a recommendation. Past performance is no guarantee of future results. Current and future fund holdings are subject to risk.
Terms to Know
TheRussell 2000 Indexis an unmanaged, capitalization-weighted measure of approximately 2,000 of the smallest companies in the Russell 3000® Index. TheRussell 2000 Growth Index tracks the performance of those Russell 2000 Index stocks with higher price-to-book ratios and higher forecasted growth values. TheRussell 2000 Value Index tracks the performance of those Russell 2000 Index stocks with lower price-to-book ratios and lower forecasted growth values. Index returns assume reinvestment of dividends and, unlike portfolio returns, do not reflect any fees or expenses. It is not possible to invest directly into an index.
Thefederal funds rateis the interest rate a borrowing bank pays to a lending bank, with the rate determined by members of the Federal Open Market Committee (FOMC) at their regular meetings. The federal funds rate sets the standard for short-term U.S. interest rates.
Maintained by the Institute for Supply Management (ISM), thePMI is a composite of information extracted from responses to surveys from more than 400 purchasing managers selected for their geographic and industry diversification. The survey measures responses to topics such as production levels, new orders from customers, supplier deliveries, inventories and employment levels.
| | | | | | |
| | 4 | | | | | | DWS Small Cap Index VIP |
| | | | |
| Portfolio Summary | | (Unaudited) |
| | | | | | | | |
| Asset Allocation (As a % of Investment Portfolio excluding Securities Lending Collateral) | | 12/31/19 | | | 12/31/18 | |
| Common Stocks | | | 98% | | | | 98% | |
| Cash Equivalents | | | 2% | | | | 1% | |
| Government & Agency Obligations | | | 0% | | | | 1% | |
| Rights | | | 0% | | | | 0% | |
| | | | 100% | | | | 100% | |
| | |
| Sector Diversification(As a % of Common Stocks and Rights) | | 12/31/19 | | | 12/31/18 | |
Health Care | | | 18% | | | | 16% | |
Financials | | | 18% | | | | 18% | |
Industrials | | | 16% | | | | 15% | |
Information Technology | | | 13% | | | | 15% | |
Consumer Discretionary | | | 11% | | | | 12% | |
Real Estate | | | 8% | | | | 7% | |
Materials | | | 4% | | | | 4% | |
Utilities | | | 4% | | | | 4% | |
Energy | | | 3% | | | | 3% | |
Consumer Staples | | | 3% | | | | 3% | |
Communication Services | | | 2% | | | | 3% | |
| | | | 100% | | | | 100% | |
| | | | | | |
| | Ten Largest Equity Holdings (2.8% of Net Assets) | | Percent |
| | 1 | | | Novocure Ltd. | | |
| | | | | Researches and develops novel technologies for the treatment of cancer | | 0.3% |
| | 2 | | | Medicines Co. | | |
| | | | | Developer of biopharmaceutical products in the late stages | | 0.3% |
| | 3 | | | Generac Holdings, Inc. | | |
| | | | | Manufactures automatic, stationary standby and portable generators | | 0.3% |
| | 4 | | | Lumentum Holdings, Inc. | | |
| | | | | Provider of optical and photonic products | | 0.3% |
| | 5 | | | Teladoc Health, Inc. | | |
| | | | | Provider of healthcare services | | 0.3% |
| | 6 | | | Arrowhead Pharmaceuticals, Inc. | | |
| | | | | Operates as a biotechnology company | | 0.3% |
| | 7 | | | Haemonetics Corp. | | |
| | | | | Manufactures and markets automated blood processing systems | | 0.3% |
| | 8 | | | Marriott Vacations Worldwide Corp. | | |
| | | | | Seller and manager of vacation ownership resorts and vacation club | | 0.3% |
| | 9 | | | Performance Food Group Co. | | |
| | | | | Markets and distributes food and food-related products | | 0.2% |
| | 10 | | | Trex Co., Inc. | | |
| | | | | Manufacturer of non-wood decking alternative products | | 0.2% |
Portfolio holdings and characteristics are subject to change.
For more complete details about the Fund’s investment portfolio, see page 6.
Following the Fund’s fiscal first and third quarter-end, a complete portfolio holdings listing is filed with the SEC on Form N-PORT. The Fund’s Form N-PORT will be available on the SEC’s Web site at sec.gov. The Fund’s portfolio holdings are also posted on dws.com from time to time. Please read the Fund’s current prospectus for more information.
| | | | |
| DWS Small Cap Index VIP | | | | | 5 |
| | |
| Investment Portfolio | | as of December 31, 2019 |
| | | | | | | | |
| | | Shares | | | Value ($) | |
| Common Stocks 98.1% | | | | | | | | |
| Communication Services 2.2% | |
Diversified Telecommunication Services 0.5% | |
| | |
Anterix, Inc.* | | | 1,891 | | | | 81,710 | |
| | |
ATN International, Inc. | | | 1,968 | | | | 109,008 | |
| | |
Bandwidth, Inc. “A”* | | | 2,905 | | | | 186,065 | |
| | |
Cincinnati Bell, Inc.* | | | 9,221 | | | | 96,544 | |
| | |
Cogent Communications Holdings, Inc. | | | 7,664 | | | | 504,368 | |
| | |
Consolidated Communications Holdings, Inc. | | | 13,133 | | | | 50,956 | |
| | |
Frontier Communications Corp.* (a) | | | 18,655 | | | | 16,595 | |
| | |
IDT Corp. “B”* | | | 3,076 | | | | 22,178 | |
| | |
Intelsat SA* (a) | | | 12,138 | | | | 85,330 | |
| | |
Iridium Communications, Inc.* | | | 17,908 | | | | 441,253 | |
| | |
Ooma, Inc.* | | | 3,425 | | | | 45,313 | |
| | |
Orbcomm, Inc.* | | | 14,001 | | | | 58,944 | |
| | |
Pareteum Corp.* | | | 19,839 | | | | 8,676 | |
| | |
Vonage Holdings Corp.* | | | 40,370 | | | | 298,334 | |
| | | | | | | | |
| | | | 2,005,274 | |
|
Entertainment 0.2% | |
| | |
AMC Entertainment Holdings, Inc. “A” (a) | | | 9,555 | | | | 69,178 | |
| | |
Eros International PLC* (a) | | | 12,889 | | | | 43,694 | |
| | |
Gaia, Inc.* | | | 2,099 | | | | 16,771 | |
| | |
Glu Mobile, Inc.* | | | 20,803 | | | | 125,858 | |
| | |
IMAX Corp.* | | | 9,512 | | | | 194,330 | |
| | |
Liberty Media Corp.-Liberty Braves “A”* | | | 1,868 | | | | 55,386 | |
| | |
Liberty Media Corp.-Liberty Braves “C”* | | | 6,423 | | | | 189,736 | |
| | |
LiveXLive Media, Inc.* | | | 5,338 | | | | 8,247 | |
| | |
Marcus Corp. | | | 4,000 | | | | 127,080 | |
| | |
Reading International, Inc. “A”* | | | 2,637 | | | | 29,508 | |
| | | | | | | | |
| | | | 859,788 | |
|
Interactive Media & Services 0.4% | |
| | |
Care.com, Inc.* | | | 4,045 | | | | 60,796 | |
| | |
Cargurus, Inc.* | | | 13,543 | | | | 476,443 | |
| | |
Cars.com, Inc.* | | | 11,892 | | | | 145,320 | |
| | |
DHI Group, Inc.* | | | 9,464 | | | | 28,487 | |
| | |
Eventbrite, Inc. “A”* (a) | | | 6,476 | | | | 130,621 | |
| | |
EverQuote, Inc. “A”* | | | 1,566 | | | | 53,792 | |
| | |
Liberty TripAdvisor Holdings, Inc. “A”* | | | 13,010 | | | | 95,623 | |
| | |
Meet Group, Inc.* | | | 11,821 | | | | 59,223 | |
| | |
QuinStreet, Inc.* | | | 8,092 | | | | 123,889 | |
| | |
Travelzoo* | | | 892 | | | | 9,544 | |
| | |
TrueCar, Inc.* | | | 18,330 | | | | 87,068 | |
| | |
Yelp, Inc.* | | | 12,230 | | | | 425,971 | |
| | | | | | | | |
| | | | 1,696,777 | |
|
Media 0.9% | |
| | |
Boston Omaha Corp. “A”* | | | 1,860 | | | | 39,134 | |
| | |
Cardlytics, Inc.* | | | 2,514 | | | | 158,030 | |
| | |
Central European Media Enterprises
Ltd. “A”* | | | 15,555 | | | | 70,464 | |
| | |
Clear Channel Outdoor Holdings, Inc.* | | | 8,193 | | | | 23,432 | |
| | |
comScore, Inc.* | | | 9,045 | | | | 44,682 | |
| | |
Cumulus Media, Inc. “A”* | | | 2,638 | | | | 46,350 | |
| | | | | | | | |
| | | Shares | | | Value ($) | |
| | |
Daily Journal Corp.* (a) | | | 205 | | | | 59,536 | |
| | |
Emerald Expositions Events, Inc. | | | 4,554 | | | | 48,045 | |
| | |
Entercom Communications Corp. “A” | | | 22,065 | | | | 102,382 | |
| | |
Entravision Communications Corp. “A” | | | 11,617 | | | | 30,437 | |
| | |
Fluent, Inc.* | | | 7,895 | | | | 19,737 | |
| | |
Gannett Co., Inc. | | | 21,275 | | | | 135,734 | |
| | |
Gray Television, Inc.* | | | 16,347 | | | | 350,480 | |
| | |
Hemisphere Media Group, Inc.* | | | 3,256 | | | | 48,352 | |
| | |
Lee Enterprises, Inc.* | | | 9,951 | | | | 14,130 | |
| | |
Liberty Latin America Ltd. “A”* | | | 8,288 | | | | 159,958 | |
| | |
Liberty Latin America Ltd. “C”* | | | 20,496 | | | | 398,852 | |
| | |
Loral Space & Communications, Inc.* | | | 2,231 | | | | 72,106 | |
| | |
Marchex, Inc. “B”* | | | 6,430 | | | | 24,305 | |
| | |
MDC Partners, Inc. “A”* | | | 10,611 | | | | 29,499 | |
| | |
Meredith Corp. | | | 7,100 | | | | 230,537 | |
| | |
MSG Networks, Inc. “A”* | | | 7,665 | | | | 133,371 | |
| | |
National CineMedia, Inc. | | | 11,569 | | | | 84,338 | |
| | |
Saga Communications, Inc. “A” | | | 704 | | | | 21,402 | |
| | |
Scholastic Corp. | | | 5,264 | | | | 202,401 | |
| | |
TechTarget, Inc.* | | | 4,011 | | | | 104,687 | |
| | |
TEGNA, Inc. | | | 39,129 | | | | 653,063 | |
| | |
The E.W. Scripps Co. “A” | | | 9,849 | | | | 154,728 | |
| | |
Tribune Publishing Co. | | | 3,218 | | | | 42,349 | |
| | |
WideOpenWest, Inc.* | | | 4,517 | | | | 33,516 | |
| | | | | | | | |
| | | | 3,536,037 | |
|
Wireless Telecommunication Services 0.2% | |
| | |
Boingo Wireless, Inc.* | | | 7,774 | | | | 85,126 | |
| | |
Gogo, Inc.* (a) | | | 10,268 | | | | 65,715 | |
| | |
Shenandoah Telecommunications Co. | | | 8,626 | | | | 358,928 | |
| | |
Spok Holdings, Inc. | | | 3,174 | | | | 38,818 | |
| | | | | | | | |
| | | | 548,587 | |
|
| Consumer Discretionary 10.7% | |
Auto Components 1.0% | |
| | |
Adient PLC* | | | 15,795 | | | | 335,644 | |
| | |
American Axle & Manufacturing Holdings, Inc.* | | | 20,378 | | | | 219,267 | |
| | |
Cooper Tire & Rubber Co. | | | 8,961 | | | | 257,629 | |
| | |
Cooper-Standard Holdings, Inc.* | | | 3,051 | | | | 101,171 | |
| | |
Dana, Inc. | | | 25,883 | | | | 471,071 | |
| | |
Dorman Products, Inc.* | | | 4,862 | | | | 368,151 | |
| | |
Fox Factory Holding Corp.* | | | 6,773 | | | | 471,198 | |
| | |
Gentherm, Inc.* | | | 5,943 | | | | 263,810 | |
| | |
LCI Industries | | | 4,373 | | | | 468,479 | |
| | |
Modine Manufacturing Co.* | | | 8,565 | | | | 65,950 | |
| | |
Motorcar Parts of America, Inc.* | | | 3,448 | | | | 75,959 | |
| | |
Standard Motor Products, Inc. | | | 3,799 | | | | 202,183 | |
| | |
Stoneridge, Inc.* | | | 4,670 | | | | 136,924 | |
| | |
Tenneco, Inc. “A” | | | 9,329 | | | | 122,210 | |
| | |
Visteon Corp.* | | | 5,009 | | | | 433,729 | |
| | | | | | | | |
| | | | 3,993,375 | |
|
Automobiles 0.1% | |
Winnebago Industries, Inc. | | | 5,559 | | | | 294,516 | |
|
Distributors 0.1% | |
| | |
Core-Mark Holding Co., Inc. | | | 8,089 | | | | 219,940 | |
| | |
Funko, Inc. “A”* | | | 3,893 | | | | 66,804 | |
The accompanying notes are an integral part of the financial statements.
| | | | | | |
| | 6 | | | | | | DWS Small Cap Index VIP |
| | | | | | | | |
| | | Shares | | | Value ($) | |
| | |
Greenlane Holdings, Inc. “A”* | | | 1,164 | | | | 3,789 | |
| | |
Weyco Group, Inc. | | | 1,183 | | | | 31,290 | |
| | | | | | | | |
| | | | 321,823 | |
|
Diversified Consumer Services 0.9% | |
| | |
Adtalem Global Education, Inc.* | | | 9,656 | | | | 337,670 | |
| | |
American Public Education, Inc.* | | | 2,711 | | | | 74,254 | |
| | |
Carriage Services, Inc. | | | 3,049 | | | | 78,054 | |
| | |
Chegg, Inc.* | | | 21,305 | | | | 807,673 | |
| | |
Collectors Universe, Inc. | | | 1,484 | | | | 34,206 | |
| | |
Houghton Mifflin Harcourt Co.* | | | 18,628 | | | | 116,425 | |
| | |
K12, Inc.* | | | 7,046 | | | | 143,386 | |
| | |
Laureate Education, Inc. “A”* | | | 21,152 | | | | 372,487 | |
| | |
OneSpaWorld Holdings Ltd.* | | | 8,097 | | | | 136,354 | |
| | |
Perdoceo Education Corp.* | | | 12,297 | | | | 226,142 | |
| | |
Regis Corp.* | | | 4,169 | | | | 74,500 | |
| | |
Select Interior Concepts, Inc. “A”* | | | 3,956 | | | | 35,565 | |
| | |
Strategic Education, Inc. | | | 3,836 | | | | 609,540 | |
| | |
WW International, Inc.* | | | 8,452 | | | | 322,951 | |
| | | | | | | | |
| | | | 3,369,207 | |
|
Hotels, Restaurants & Leisure 2.6% | |
| | |
BBX Capital Corp. | | | 12,037 | | | | 57,416 | |
| | |
Biglari Holdings, Inc. “B”* | | | 164 | | | | 18,765 | |
| | |
BJ’s Restaurants, Inc. | | | 3,402 | | | | 129,140 | |
| | |
Bloomin’ Brands, Inc. | | | 15,628 | | | | 344,910 | |
| | |
Bluegreen Vacations Corp. | | | 1,381 | | | | 14,280 | |
| | |
Boyd Gaming Corp. | | | 14,561 | | | | 435,956 | |
| | |
Brinker International, Inc. | | | 6,675 | | | | 280,350 | |
| | |
Carrols Restaurant Group, Inc.* | | | 6,069 | | | | 42,786 | |
| | |
Century Casinos, Inc.* | | | 4,779 | | | | 37,850 | |
| | |
Churchill Downs, Inc. | | | 6,318 | | | | 866,830 | |
| | |
Chuy’s Holdings, Inc.* | | | 2,979 | | | | 77,216 | |
| | |
Cracker Barrel Old Country Store, Inc. (a) | | | 4,322 | | | | 664,464 | |
| | |
Dave & Buster’s Entertainment, Inc. | | | 5,526 | | | | 221,979 | |
| | |
Del Taco Restaurants, Inc.* | | | 4,880 | | | | 38,576 | |
| | |
Denny’s Corp.* | | | 10,330 | | | | 205,360 | |
| | |
Dine Brands Global, Inc. | | | 2,850 | | | | 238,032 | |
| | |
Drive Shack, Inc.* | | | 11,610 | | | | 42,493 | |
| | |
El Pollo Loco Holdings, Inc.* | | | 3,501 | | | | 53,005 | |
| | |
Eldorado Resorts, Inc.* | | | 11,857 | | | | 707,151 | |
| | |
Everi Holdings, Inc.* | | | 12,155 | | | | 163,242 | |
| | |
Fiesta Restaurant Group, Inc.* | | | 4,413 | | | | 43,645 | |
| | |
Golden Entertainment, Inc.* | | | 3,233 | | | | 62,138 | |
| | |
Inspired Entertainment, Inc.* | | | 1,634 | | | | 11,029 | |
| | |
J. Alexander’s Holdings, Inc.* | | | 2,340 | | | | 22,370 | |
| | |
Jack in the Box, Inc. | | | 4,661 | | | | 363,698 | |
| | |
Kura Sushi USA, Inc.* | | | 598 | | | | 15,219 | |
| | |
Lindblad Expeditions Holdings, Inc.* | | | 3,991 | | | | 65,253 | |
| | |
Marriott Vacations Worldwide Corp. | | | 7,438 | | | | 957,717 | |
| | |
Monarch Casino & Resort, Inc.* | | | 1,978 | | | | 96,032 | |
| | |
Nathan’s Famous, Inc. | | | 536 | | | | 37,992 | |
| | |
Noodles & Co.* | | | 5,278 | | | | 29,240 | |
| | |
Papa John’s International, Inc. | | | 3,995 | | | | 252,284 | |
| | |
Penn National Gaming, Inc.* | | | 19,789 | | | | 505,807 | |
| | |
PlayAGS, Inc.* | | | 4,708 | | | | 57,108 | |
| | |
Potbelly Corp.* | | | 4,143 | | | | 17,483 | |
| | |
RCI Hospitality Holdings, Inc. | | | 1,715 | | | | 35,157 | |
| | |
Red Lion Hotels Corp.* | | | 4,390 | | | | 16,375 | |
| | |
Red Robin Gourmet Burgers, Inc.* | | | 2,426 | | | | 80,107 | |
| | | | | | | | |
| | | Shares | | | Value ($) | |
| | |
Red Rock Resorts, Inc. “A” | | | 12,455 | | | | 298,297 | |
| | |
Ruth’s Hospitality Group, Inc. | | | 5,002 | | | | 108,869 | |
| | |
Scientific Games Corp. “A”* | | | 9,983 | | | | 267,345 | |
| | |
SeaWorld Entertainment, Inc.* | | | 8,452 | | | | 268,013 | |
| | |
Shake Shack, Inc. “A”* | | | 5,194 | | | | 309,407 | |
| | |
Target Hospitality Corp.* | | | 6,100 | | | | 30,500 | |
| | |
Texas Roadhouse, Inc. | | | 11,887 | | | | 669,476 | |
| | |
The Cheesecake Factory, Inc. (a) | | | 7,532 | | | | 292,693 | |
| | |
The Habit Restaurants, Inc. “A”* | | | 3,818 | | | | 39,822 | |
| | |
Twin River Worldwide Holdings, Inc. | | | 3,067 | | | | 78,669 | |
| | |
Wingstop, Inc. | | | 5,271 | | | | 454,518 | |
| | | | | | | | |
| | | | 10,126,064 | |
|
Household Durables 1.7% | |
| | |
Bassett Furniture Industries, Inc. | | | 1,824 | | | | 30,424 | |
| | |
Beazer Homes U.S.A., Inc.* | | | 5,078 | | | | 71,752 | |
| | |
Cavco Industries, Inc.* | | | 1,562 | | | | 305,184 | |
| | |
Century Communities, Inc.* | | | 4,780 | | | | 130,733 | |
| | |
Ethan Allen Interiors, Inc. | | | 4,220 | | | | 80,433 | |
| | |
Flexsteel Industries, Inc. | | | 1,324 | | | | 26,374 | |
| | |
GoPro, Inc. “A”* (a) | | | 23,187 | | | | 100,632 | |
| | |
Green Brick Partners, Inc.* | | | 4,485 | | | | 51,488 | |
| | |
Hamilton Beach Brands Holding Co. “A” | | | 1,206 | | | | 23,035 | |
| | |
Helen of Troy Ltd.* | | | 4,524 | | | | 813,370 | |
| | |
Hooker Furniture Corp. | | | 2,130 | | | | 54,720 | |
| | |
Installed Building Products, Inc.* | | | 4,047 | | | | 278,717 | |
| | |
iRobot Corp.* (a) | | | 4,954 | | | | 250,821 | |
| | |
KB HOME | | | 15,436 | | | | 528,992 | |
| | |
La-Z-Boy, Inc. | | | 7,992 | | | | 251,588 | |
| | |
Legacy Housing Corp.* | | | 766 | | | | 12,746 | |
| | |
LGI Homes, Inc.* | | | 3,582 | | | | 253,068 | |
| | |
Lifetime Brands, Inc. | | | 2,187 | | | | 15,200 | |
| | |
Lovesac Co.* | | | 1,555 | | | | 24,958 | |
| | |
M.D.C. Holdings, Inc. | | | 9,145 | | | | 348,973 | |
| | |
M/I Homes, Inc.* | | | 4,793 | | | | 188,604 | |
| | |
Meritage Homes Corp.* | | | 6,544 | | | | 399,904 | |
| | |
Purple Innovation, Inc.* | | | 1,792 | | | | 15,608 | |
| | |
Skyline Champion Corp.* | | | 9,127 | | | | 289,326 | |
| | |
Sonos, Inc.* | | | 12,492 | | | | 195,125 | |
| | |
Taylor Morrison Home Corp. “A”* | | | 18,930 | | | | 413,810 | |
| | |
TopBuild Corp.* | | | 6,032 | | | | 621,778 | |
| | |
TRI Pointe Group, Inc.* | | | 24,758 | | | | 385,730 | |
| | |
Tupperware Brands Corp. | | | 8,754 | | | | 75,109 | |
| | |
Universal Electronics, Inc.* | | | 2,430 | | | | 126,992 | |
| | |
William Lyon Homes “A”* | | | 5,577 | | | | 111,428 | |
| | |
ZAGG, Inc.* | | | 5,408 | | | | 43,859 | |
| | | | | | | | |
| | | | 6,520,481 | |
|
Internet & Direct Marketing Retail 0.3% | |
| | |
1-800 FLOWERS.COM, Inc. “A”* | | | 4,713 | | | | 68,339 | |
| | |
Duluth Holdings, Inc. “B”* (a) | | | 1,991 | | | | 20,965 | |
| | |
Groupon, Inc.* | | | 80,843 | | | | 193,215 | |
| | |
Lands’ End, Inc.* | | | 1,999 | | | | 33,583 | |
| | |
Leaf Group Ltd.* | | | 3,048 | | | | 12,192 | |
| | |
Liquidity Services, Inc.* | | | 4,921 | | | | 29,329 | |
| | |
Overstock.com, Inc.* | | | 4,967 | | | | 35,017 | |
| | |
PetMed Express, Inc. (a) | | | 3,402 | | | | 80,015 | |
| | |
Quotient Technology, Inc.* | | | 13,757 | | | | 135,644 | |
| | |
RealReal, Inc.* (a) | | | 3,096 | | | | 58,360 | |
| | |
Rubicon Project, Inc.* | | | 8,858 | | | | 72,281 | |
| | |
Shutterstock, Inc.* | | | 3,419 | | | | 146,607 | |
| | |
Stamps.com, Inc.* | | | 2,985 | | | | 249,307 | |
| | |
Stitch Fix, Inc. “A”* (a) | | | 7,452 | | | | 191,218 | |
The accompanying notes are an integral part of the financial statements.
| | | | |
| DWS Small Cap Index VIP | | | | | 7 |
| | | | | | | | |
| | | Shares | | | Value ($) | |
| | |
Waitr Holdings, Inc.* (a) | | | 9,695 | | | | 3,122 | |
| | | | | | | | |
| | | | 1,329,194 | |
|
Leisure Products 0.4% | |
| | |
Acushnet Holdings Corp. | | | 6,357 | | | | 206,602 | |
| | |
American Outdoor Brands Corp.* | | | 9,408 | | | | 87,306 | |
| | |
Callaway Golf Co. | | | 16,747 | | | | 355,036 | |
| | |
Clarus Corp. | | | 4,339 | | | | 58,837 | |
| | |
Escalade, Inc. | | | 1,919 | | | | 18,864 | |
| | |
Johnson Outdoors, Inc. “A” | | | 910 | | | | 69,797 | |
| | |
Malibu Boats, Inc. “A”* | | | 3,712 | | | | 152,006 | |
| | |
Marine Products Corp. | | | 1,244 | | | | 17,914 | |
| | |
MasterCraft Boat Holdings, Inc.* | | | 3,214 | | | | 50,621 | |
| | |
Sturm, Ruger & Co., Inc. | | | 3,033 | | | | 142,642 | |
| | |
Vista Outdoor, Inc.* | | | 9,972 | | | | 74,591 | |
| | |
YETI Holdings, Inc.* (a) | | | 7,328 | | | | 254,868 | |
| | | | | | | | |
| | | | 1,489,084 | |
|
Multiline Retail 0.1% | |
| | |
Big Lots, Inc. | | | 7,065 | | | | 202,907 | |
| | |
Dillard’s, Inc. “A” (a) | | | 1,836 | | | | 134,909 | |
| | |
J.C. Penney Co., Inc.* (a) | | | 59,456 | | | | 66,591 | |
| | | | | | | | |
| | | | 404,407 | |
|
Specialty Retail 2.5% | |
| | |
Aaron’s, Inc. | | | 12,129 | | | | 692,687 | |
| | |
Abercrombie & Fitch Co. “A” | | | 11,232 | | | | 194,201 | |
| | |
America’sCar-Mart, Inc.* | | | 1,115 | | | | 122,271 | |
| | |
American Eagle Outfitters, Inc. | | | 28,533 | | | | 419,435 | |
| | |
Asbury Automotive Group, Inc.* | | | 3,477 | | | | 388,694 | |
| | |
Ascena Retail Group, Inc.* | | | 1,486 | | | | 11,390 | |
| | |
At Home Group, Inc.* | | | 8,850 | | | | 48,675 | |
| | |
Barnes & Noble Education, Inc.* | | | 7,057 | | | | 30,133 | |
| | |
Bed Bath & Beyond, Inc. (a) | | | 21,966 | | | | 380,012 | |
| | |
Boot Barn Holdings, Inc.* | | | 5,060 | | | | 225,322 | |
| | |
Caleres, Inc. | | | 7,202 | | | | 171,048 | |
| | |
Camping World Holdings, Inc. “A” (a) | | | 6,112 | | | | 90,091 | |
| | |
Cato Corp. “A” | | | 4,095 | | | | 71,253 | |
| | |
Chico’s FAS, Inc. | | | 21,424 | | | | 81,625 | |
| | |
Citi Trends, Inc. | | | 2,158 | | | | 49,893 | |
| | |
Conn’s, Inc.* (a) | | | 3,031 | | | | 37,554 | |
| | |
Designer Brands, Inc. “A” | | | 11,104 | | | | 174,777 | |
| | |
Express, Inc.* | | | 12,308 | | | | 59,940 | |
| | |
GameStop Corp. “A” (a) | | | 16,225 | | | | 98,648 | |
| | |
Genesco, Inc.* | | | 2,577 | | | | 123,490 | |
| | |
GNC Holdings, Inc. “A”* (a) | | | 15,167 | | | | 40,951 | |
| | |
Group 1 Automotive, Inc. | | | 3,193 | | | | 319,300 | |
| | |
Guess?, Inc. | | | 8,218 | | | | 183,919 | |
| | |
Haverty Furniture Companies, Inc. | | | 3,107 | | | | 62,637 | |
| | |
Hibbett Sports, Inc.* | | | 3,037 | | | | 85,157 | |
| | |
Hudson Ltd. “A”* | | | 6,892 | | | | 105,723 | |
| | |
J. Jill, Inc. (a) | | | 3,079 | | | | 3,479 | |
| | |
Lithia Motors, Inc. “A” | | | 4,034 | | | | 592,998 | |
| | |
Lumber Liquidators Holdings, Inc.* (a) | | | 5,184 | | | | 50,648 | |
| | |
MarineMax, Inc.* | | | 3,762 | | | | 62,788 | |
| | |
Monro, Inc. | | | 5,882 | | | | 459,972 | |
| | |
Murphy USA, Inc.* | | | 5,240 | | | | 613,080 | |
| | |
National Vision Holdings, Inc.* | | | 14,110 | | | | 457,587 | |
| | |
Office Depot, Inc. | | | 98,790 | | | | 270,685 | |
| | |
Party City Holdco, Inc.* (a) | | | 9,928 | | | | 23,232 | |
| | |
Rent-A-Center, Inc. | | | 8,810 | | | | 254,080 | |
| | |
RH* | | | 2,979 | | | | 636,016 | |
| | |
RTW RetailWinds, Inc.* | | | 5,437 | | | | 4,355 | |
| | | | | | | | |
| | | Shares | | | Value ($) | |
| | |
Sally Beauty Holdings, Inc.* | | | 21,634 | | | | 394,821 | |
| | |
Shoe Carnival, Inc. (a) | | | 1,661 | | | | 61,922 | |
| | |
Signet Jewelers Ltd. | | | 9,285 | | | | 201,856 | |
| | |
Sleep Number Corp.* | | | 5,010 | | | | 246,692 | |
| | |
Sonic Automotive, Inc. “A” | | | 4,272 | | | | 132,432 | |
| | |
Sportsman’s Warehouse Holdings, Inc.* | | | 7,441 | | | | 59,751 | |
| | |
Tailored Brands, Inc. (a) | | | 9,098 | | | | 37,666 | |
| | |
The Buckle, Inc. (a) | | | 5,139 | | | | 138,959 | |
| | |
The Children’s Place, Inc. (a) | | | 2,785 | | | | 174,118 | |
| | |
The Container Store Group, Inc.* | | | 2,885 | | | | 12,175 | |
| | |
The Michaels Companies, Inc.* | | | 15,360 | | | | 124,262 | |
| | |
Tilly’s, Inc. “A” | | | 3,823 | | | | 46,832 | |
| | |
Winmark Corp. | | | 425 | | | | 84,278 | |
| | |
Zumiez, Inc.* | | | 3,542 | | | | 122,341 | |
| | | | | | | | |
| | | | 9,535,851 | |
|
Textiles, Apparel & Luxury Goods 1.0% | |
| | |
Centric Brands, Inc.* | | | 3,062 | | | | 6,645 | |
| | |
Crocs, Inc.* | | | 12,397 | | | | 519,310 | |
| | |
Culp, Inc. | | | 2,036 | | | | 27,730 | |
| | |
Deckers Outdoor Corp.* | | | 5,051 | | | | 852,912 | |
| | |
Delta Apparel, Inc.* | | | 1,158 | | | | 36,014 | |
| | |
Fossil Group, Inc.* | | | 8,665 | | | | 68,280 | |
| | |
G-III Apparel Group Ltd.* | | | 7,866 | | | | 263,511 | |
| | |
Kontoor Brands, Inc.* | | | 8,011 | | | | 336,382 | |
| | |
Movado Group, Inc. | | | 2,679 | | | | 58,241 | |
| | |
Oxford Industries, Inc. | | | 3,006 | | | | 226,713 | |
| | |
Rocky Brands, Inc. | | | 1,302 | | | | 38,318 | |
| | |
Steven Madden Ltd. | | | 15,075 | | | | 648,376 | |
| | |
Superior Group of Company, Inc. | | | 1,996 | | | | 27,026 | |
| | |
Unifi, Inc.* | | | 2,631 | | | | 66,459 | |
| | |
Vera Bradley, Inc.* | | | 3,753 | | | | 44,285 | |
| | |
Vince Holding Corp.* | | | 581 | | | | 10,057 | |
| | |
Wolverine World Wide, Inc. | | | 14,257 | | | | 481,031 | |
| | | | | | | | |
| | | | 3,711,290 | |
|
| Consumer Staples 3.0% | |
Beverages 0.3% | |
| | |
Celsius Holdings, Inc.* | | | 4,260 | | | | 20,576 | |
| | |
Coca-Cola Bottling Co. Consolidated | | | 854 | | | | 242,579 | |
| | |
Craft Brew Alliance, Inc.* | | | 2,104 | | | | 34,716 | |
| | |
MGP Ingredients, Inc. (a) | | | 2,349 | | | | 113,809 | |
| | |
National Beverage Corp.* (a) | | | 2,161 | | | | 110,254 | |
| | |
New Age Beverages Corp.* (a) | | | 13,362 | | | | 24,319 | |
| | |
Primo Water Corp.* | | | 6,463 | | | | 72,547 | |
| | |
The Boston Beer Co., Inc. “A”* | | | 1,504 | | | | 568,286 | |
| | | | | | | | |
| | | | 1,187,086 | |
|
Food & Staples Retailing 0.7% | |
| | |
BJ’s Wholesale Club Holdings, Inc.* | | | 20,061 | | | | 456,187 | |
| | |
HF Foods Group, Inc.* | | | 1,393 | | | | 27,164 | |
| | |
Ingles Markets, Inc. “A” | | | 2,582 | | | | 122,671 | |
| | |
Natural Grocers by Vitamin Cottage, Inc. | | | 1,700 | | | | 16,779 | |
| | |
Performance Food Group Co.* | | | 18,533 | | | | 954,079 | |
| | |
PriceSmart, Inc. | | | 4,024 | | | | 285,784 | |
| | |
Rite Aid Corp.* (a) | | | 9,731 | | | | 150,539 | |
| | |
SpartanNash Co. | | | 6,455 | | | | 91,919 | |
| | |
The Andersons, Inc. | | | 5,604 | | | | 141,669 | |
| | |
The Chefs’ Warehouse, Inc.* | | | 4,343 | | | | 165,512 | |
| | |
United Natural Foods, Inc.* | | | 9,533 | | | | 83,509 | |
| | |
Village Super Market, Inc. “A” | | | 1,322 | | | | 30,670 | |
The accompanying notes are an integral part of the financial statements.
| | | | | | |
| | 8 | | | | | | DWS Small Cap Index VIP |
| | | | | | | | |
| | | Shares | | | Value ($) | |
| | |
Weis Markets, Inc. | | | 1,623 | | | | 65,715 | |
| | | | | | | | |
| | | | 2,592,197 | |
|
Food Products 1.3% | |
| | |
Alico, Inc. | | | 753 | | | | 26,980 | |
| | |
B&G Foods, Inc. (a) | | | 11,258 | | | | 201,856 | |
| | |
Bridgford Foods Corp.* | | | 322 | | | | 7,982 | |
| | |
Cal-Maine Foods, Inc. | | | 5,637 | | | | 240,982 | |
| | |
Calavo Growers, Inc. | | | 2,890 | | | | 261,805 | |
| | |
Darling Ingredients, Inc.* | | | 29,528 | | | | 829,146 | |
| | |
Farmer Brothers Co.* | | | 1,808 | | | | 27,229 | |
| | |
Fresh Del Monte Produce, Inc. | | | 5,587 | | | | 195,433 | |
| | |
Freshpet, Inc.* | | | 6,170 | | | | 364,585 | |
| | |
Hostess Brands, Inc.* | | | 21,583 | | | | 313,817 | |
| | |
J & J Snack Foods Corp. | | | 2,710 | | | | 499,372 | |
| | |
John B. Sanfilippo & Son, Inc. | | | 1,543 | | | | 140,845 | |
| | |
Lancaster Colony Corp. | | | 3,403 | | | | 544,820 | |
| | |
Landec Corp.* | | | 4,873 | | | | 55,114 | |
| | |
Limoneira Co. | | | 2,927 | | | | 56,286 | |
| | |
Sanderson Farms, Inc. | | | 3,583 | | | | 631,396 | |
| | |
Seneca Foods Corp. “A”* | | | 1,255 | | | | 51,192 | |
| | |
Simply Good Foods Co.* | | | 14,761 | | | | 421,279 | |
| | |
Tootsie Roll Industries, Inc. | | | 2,895 | | | | 98,835 | |
| | | | | | | | |
| | | | 4,968,954 | |
|
Household Products 0.2% | |
| | |
Central Garden & Pet Co.* | | | 1,894 | | | | 58,847 | |
| | |
Central Garden & Pet Co. “A”* | | | 7,559 | | | | 221,932 | |
| | |
Oil-Dri Corp. of America | | | 930 | | | | 33,713 | |
| | |
WD-40 Co. | | | 2,458 | | | | 477,196 | |
| | | | | | | | |
| | | | 791,688 | |
|
Personal Products 0.3% | |
| | |
Bellring Brands, Inc.* | | | 7,136 | | | | 151,925 | |
| | |
Edgewell Personal Care Co.* | | | 9,695 | | | | 300,157 | |
| | |
elf Beauty, Inc.* | | | 4,846 | | | | 78,166 | |
| | |
Inter Parfums, Inc. | | | 3,142 | | | | 228,455 | |
| | |
Lifevantage Corp.* | | | 2,581 | | | | 40,289 | |
| | |
Medifast, Inc. (a) | | | 1,977 | | | | 216,640 | |
| | |
Nature’s Sunshine Products, Inc.* | | | 1,427 | | | | 12,743 | |
| | |
Revlon, Inc. “A”* (a) | | | 1,271 | | | | 27,225 | |
| | |
USANA Health Sciences, Inc.* | | | 2,284 | | | | 179,408 | |
| | |
Youngevity International, Inc.* (a) | | | 1,522 | | | | 4,962 | |
| | | | | | | | |
| | | | 1,239,970 | |
|
Tobacco 0.2% | |
| | |
22nd Century Group, Inc.* | | | 22,026 | | | | 24,229 | |
| | |
Pyxus International, Inc.* | | | 1,641 | | | | 14,670 | |
| | |
Turning Point Brands, Inc. | | | 1,528 | | | | 43,701 | |
| | |
Universal Corp. | | | 4,361 | | | | 248,839 | |
| | |
Vector Group Ltd. | | | 20,011 | | | | 267,947 | |
| | | | | | | | |
| | | | 599,386 | |
|
| Energy 3.1% | |
Energy Equipment & Services 1.0% | |
| | |
Archrock, Inc. | | | 23,285 | | | | 233,781 | |
| | |
Cactus, Inc. “A” | | | 8,537 | | | | 292,990 | |
| | |
Covia Holdings Corp.* | | | 8,367 | | | | 17,069 | |
| | |
Diamond Offshore Drilling, Inc.* (a) | | | 11,403 | | | | 81,988 | |
| | |
DMC Global, Inc. | | | 2,500 | | | | 112,350 | |
| | |
Dril-Quip, Inc.* | | | 6,531 | | | | 306,369 | |
| | |
Era Group, Inc.* | | | 3,183 | | | | 32,371 | |
| | |
Exterran Corp.* | | | 5,668 | | | | 44,380 | |
| | |
Forum Energy Technologies, Inc.* | | | 14,836 | | | | 24,925 | |
| | | | | | | | |
| | | Shares | | | Value ($) | |
| | |
Frank’s International NV* | | | 18,955 | | | | 97,997 | |
| | |
FTS International, Inc.* | | | 6,849 | | | | 7,123 | |
| | |
Geospace Technologies Corp.* | | | 2,439 | | | | 40,902 | |
| | |
Helix Energy Solutions Group, Inc.* | | | 25,845 | | | | 248,887 | |
| | |
Independence Contract Drilling, Inc.* | | | 8,662 | | | | 8,634 | |
| | |
KLX Energy Services Holdings, Inc.* | | | 3,918 | | | | 25,232 | |
| | |
Liberty Oilfield Services, Inc. “A” | | | 9,499 | | | | 105,629 | |
| | |
Mammoth Energy Services, Inc. | | | 2,252 | | | | 4,954 | |
| | |
Matrix Service Co.* | | | 4,933 | | | | 112,867 | |
| | |
McDermott International, Inc.* (a) | | | 33,351 | | | | 22,565 | |
| | |
Nabors Industries Ltd. | | | 63,593 | | | | 183,148 | |
| | |
National Energy Services Reunited Corp.* | | | 4,379 | | | | 39,937 | |
| | |
Natural Gas Services Group* | | | 2,307 | | | | 28,284 | |
| | |
NCS Multistage Holdings, Inc.* | | | 1,648 | | | | 3,461 | |
| | |
Newpark Resources, Inc.* | | | 15,711 | | | | 98,508 | |
| | |
NexTier Oilfield Solutions, Inc.* | | | 28,879 | | | | 193,489 | |
| | |
Nine Energy Service, Inc.* | | | 2,961 | | | | 23,155 | |
| | |
Noble Corp. PLC* | | | 42,122 | | | | 51,389 | |
| | |
Oceaneering International, Inc.* | | | 18,012 | | | | 268,559 | |
| | |
Oil States International, Inc.* | | | 10,756 | | | | 175,430 | |
| | |
Pacific Drilling SA* | | | 5,514 | | | | 22,497 | |
| | |
Parker Drilling Co.* | | | 1,718 | | | | 38,655 | |
| | |
ProPetro Holding Corp.* | | | 14,174 | | | | 159,458 | |
| | |
RigNet, Inc.* | | | 2,512 | | | | 16,579 | |
| | |
RPC, Inc. | | | 10,105 | | | | 52,950 | |
| | |
SEACOR Holdings, Inc.* | | | 3,122 | | | | 134,714 | |
| | |
SEACOR Marine Holdings, Inc.* | | | 3,550 | | | | 48,955 | |
| | |
Seadrill Ltd.* (a) | | | 10,816 | | | | 27,473 | |
| | |
Select Energy Services, Inc. “A”* | | | 10,567 | | | | 98,062 | |
| | |
Smart Sand, Inc.* | | | 4,246 | | | | 10,700 | |
| | |
Solaris Oilfield Infrastructure, Inc. “A” | | | 5,366 | | | | 75,124 | |
| | |
TETRA Technologies, Inc.* | | | 22,865 | | | | 44,815 | |
| | |
Tidewater, Inc.* | | | 7,191 | | | | 138,643 | |
| | |
U.S. Silica Holdings, Inc. | | | 13,188 | | | | 81,106 | |
| | |
U.S. Well Services, Inc.* | | | 3,687 | | | | 6,968 | |
| | | | | | | | |
| | | | 3,843,072 | |
|
Oil, Gas & Consumable Fuels 2.1% | |
| | |
Abraxas Petroleum Corp.* | | | 28,532 | | | | 10,018 | |
| | |
Altus Midstream Co. “A”* (a) | | | 9,286 | | | | 26,558 | |
| | |
Amplify Energy Corp. | | | 2,781 | | | | 18,382 | |
| | |
Arch Coal, Inc. “A” | | | 2,640 | | | | 189,394 | |
| | |
Ardmore Shipping Corp.* | | | 5,527 | | | | 50,019 | |
| | |
Berry Petroleum Corp. | | | 11,283 | | | | 106,399 | |
| | |
Bonanza Creek Energy, Inc.* | | | 3,456 | | | | 80,663 | |
| | |
Brigham Minerals, Inc. “A” | | | 2,964 | | | | 63,548 | |
| | |
California Resources Corp.* (a) | | | 8,735 | | | | 78,877 | |
| | |
Callon Petroleum Co.* | | | 69,609 | | | | 336,211 | |
| | |
Chaparral Energy, Inc. “A”* | | | 5,732 | | | | 10,088 | |
| | |
Clean Energy Fuels Corp.* | | | 25,303 | | | | 59,209 | |
| | |
CNX Resources Corp.* | | | 33,323 | | | | 294,909 | |
| | |
Comstock Resources, Inc.* (a) | | | 2,778 | | | | 22,863 | |
| | |
CONSOL Energy, Inc.* | | | 4,093 | | | | 59,389 | |
| | |
Contura Energy, Inc.* | | | 3,427 | | | | 31,014 | |
| | |
CVR Energy, Inc. | | | 5,262 | | | | 212,743 | |
| | |
Delek U.S. Holdings, Inc. | | | 13,166 | | | | 441,456 | |
| | |
Denbury Resources, Inc.* | | | 86,203 | | | | 121,546 | |
| | |
DHT Holdings, Inc. | | | 16,332 | | | | 135,229 | |
| | |
Diamond S Shipping, Inc.* | | | 4,053 | | | | 67,847 | |
| | |
Dorian LPG Ltd.* | | | 5,169 | | | | 80,016 | |
The accompanying notes are an integral part of the financial statements.
| | | | |
| DWS Small Cap Index VIP | | | | | 9 |
| | | | | | | | |
| | | Shares | | | Value ($) | |
| | |
Earthstone Energy, Inc. “A”* | | | 3,413 | | | | 21,604 | |
| | |
Energy Fuels, Inc.* (a) | | | 17,075 | | | | 32,613 | |
| | |
Evolution Petroleum Corp. | | | 5,348 | | | | 29,254 | |
| | |
Extraction Oil & Gas, Inc.* (a) | | | 15,007 | | | | 31,815 | |
| | |
Falcon Minerals Corp. | | | 7,120 | | | | 50,267 | |
| | |
GasLog Ltd. | | | 7,038 | | | | 68,902 | |
| | |
Golar LNG Ltd. | | | 17,225 | | | | 244,939 | |
| | |
Goodrich Petroleum Corp.* | | | 1,605 | | | | 16,114 | |
| | |
Green Plains, Inc. | | | 5,906 | | | | 91,130 | |
| | |
Gulfport Energy Corp.* | | | 28,635 | | | | 87,050 | |
| | |
Hallador Energy Co. | | | 4,074 | | | | 12,100 | |
| | |
HighPoint Resources Corp.* | | | 20,079 | | | | 33,934 | |
| | |
International Seaways, Inc.* | | | 4,431 | | | | 131,867 | |
| | |
Jagged Peak Energy, Inc.* (a) | | | 11,591 | | | | 98,408 | |
| | |
Laredo Petroleum, Inc.* | | | 33,379 | | | | 95,798 | |
| | |
Magnolia Oil & Gas Corp. “A”* | | | 18,226 | | | | 229,283 | |
| | |
Matador Resources Co.* | | | 20,102 | | | | 361,233 | |
| | |
Montage Resources Corp.* | | | 3,954 | | | | 31,395 | |
| | |
NACCO Industries, Inc. “A” | | | 660 | | | | 30,908 | |
| | |
NextDecade Corp* | | | 2,234 | | | | 13,717 | |
| | |
Nordic American Tankers Ltd. | | | 25,289 | | | | 124,422 | |
| | |
Northern Oil & Gas, Inc.* | | | 53,138 | | | | 124,343 | |
| | |
Oasis Petroleum, Inc.* | | | 58,101 | | | | 189,409 | |
| | |
Overseas Shipholding Group, Inc. “A”* | | | 10,716 | | | | 24,647 | |
| | |
Panhandle Oil & Gas, Inc. “A” | | | 2,953 | | | | 33,103 | |
| | |
Par Pacific Holdings, Inc.* | | | 6,466 | | | | 150,270 | |
| | |
PDC Energy, Inc.* | | | 11,222 | | | | 293,680 | |
| | |
Peabody Energy Corp. | | | 11,159 | | | | 101,770 | |
| | |
Penn Virginia Corp.* | | | 2,508 | | | | 76,118 | |
| | |
PrimeEnergy Resources Corp.* | | | 96 | | | | 14,521 | |
| | |
QEP Resources, Inc. | | | 43,528 | | | | 195,876 | |
| | |
Renewable Energy Group, Inc.* | | | 6,701 | | | | 180,592 | |
| | |
REX American Resources Corp.* | | | 977 | | | | 80,075 | |
| | |
Ring Energy, Inc.* | | | 9,791 | | | | 25,848 | |
| | |
Rosehill Resources, Inc.* | | | 1,938 | | | | 2,481 | |
| | |
SandRidge Energy, Inc.* | | | 5,580 | | | | 23,659 | |
| | |
Scorpio Tankers, Inc. | | | 7,988 | | | | 314,248 | |
| | |
SFL Corp. Ltd. | | | 14,708 | | | | 213,854 | |
| | |
SilverBow Resources, Inc.* | | | 1,315 | | | | 13,018 | |
| | |
SM Energy Co. | | | 20,334 | | | | 228,554 | |
| | |
Southwestern Energy Co.* | | | 98,776 | | | | 239,038 | |
| | |
SRC Energy, Inc.* | | | 43,886 | | | | 180,810 | |
| | |
Talos Energy, Inc.* | | | 3,473 | | | | 104,711 | |
| | |
Teekay Corp. | | | 12,360 | | | | 65,755 | |
| | |
Teekay Tankers Ltd.* | | | 4,265 | | | | 102,232 | |
| | |
Tellurian, Inc.* (a) | | | 16,903 | | | | 123,054 | |
| | |
Unit Corp.* | | | 9,955 | | | | 6,925 | |
| | |
Uranium Energy Corp.* | | | 34,451 | | | | 31,667 | |
| | |
W&T Offshore, Inc.* | | | 16,444 | | | | 91,429 | |
| | |
Whiting Petroleum Corp.* (a) | | | 16,658 | | | | 122,270 | |
| | |
World Fuel Services Corp. | | | 11,582 | | | | 502,890 | |
| | | | | | | | |
| | | | 8,189,978 | |
|
| Financials 17.4% | |
Banks 9.6% | |
| | |
1st Constitution Bancorp. | | | 1,724 | | | | 38,152 | |
| | |
1st Source Corp. | | | 2,488 | | | | 129,077 | |
| | |
ACNB Corp. | | | 1,281 | | | | 48,447 | |
| | |
Allegiance Bancshares, Inc.* | | | 3,460 | | | | 130,096 | |
| | |
Amalgamated Bank “A” | | | 2,558 | | | | 49,753 | |
| | |
Amerant Bancorp, Inc.* | | | 3,574 | | | | 77,877 | |
| | |
American National Bankshares, Inc. | | | 1,852 | | | | 73,284 | |
| | | | | | | | |
| | | Shares | | | Value ($) | |
| | |
Ameris Bancorp. | | | 10,992 | | | | 467,600 | |
| | |
Ames National Corp. | | | 1,708 | | | | 47,926 | |
| | |
Arrow Financial Corp. | | | 2,305 | | | | 87,129 | |
| | |
Atlantic Capital Bancshares, Inc.* | | | 3,831 | | | | 70,299 | |
| | |
Atlantic Union Bankshares Corp. | | | 14,199 | | | | 533,172 | |
| | |
Banc of California, Inc. | | | 8,051 | | | | 138,316 | |
| | |
BancFirst Corp. | | | 3,357 | | | | 209,611 | |
| | |
BancorpSouth Bank | | | 17,574 | | | | 551,999 | |
| | |
Bank First Corp. (a) | | | 1,066 | | | | 74,631 | |
| | |
Bank of Commerce Holdings | | | 3,356 | | | | 38,829 | |
| | |
Bank of Marin Bancorp. | | | 2,360 | | | | 106,318 | |
| | |
Bank of NT Butterfield & Son Ltd. | | | 10,022 | | | | 371,014 | |
| | |
Bank of Princeton | | | 1,086 | | | | 34,198 | |
| | |
Bank7 Corp. | | | 588 | | | | 11,148 | |
| | |
BankFinancial Corp. | | | 2,098 | | | | 27,442 | |
| | |
Bankwell Financial Group, Inc. | | | 1,267 | | | | 36,540 | |
| | |
Banner Corp. | | | 6,236 | | | | 352,895 | |
| | |
Bar Harbor Bankshares | | | 2,785 | | | | 70,711 | |
| | |
Baycom Corp.* | | | 2,093 | | | | 47,595 | |
| | |
BCB Bancorp., Inc. | | | 2,455 | | | | 33,854 | |
| | |
Berkshire Hills Bancorp., Inc. | | | 7,897 | | | | 259,653 | |
| | |
Boston Private Financial Holdings, Inc. | | | 14,885 | | | | 179,067 | |
| | |
Bridge Bancorp., Inc. | | | 3,014 | | | | 101,059 | |
| | |
Brookline Bancorp., Inc. | | | 14,076 | | | | 231,691 | |
| | |
Bryn Mawr Bank Corp. | | | 3,613 | | | | 149,000 | |
| | |
Business First Bancshares, Inc. | | | 2,304 | | | | 57,439 | |
| | |
Byline Bancorp., Inc. | | | 4,066 | | | | 79,572 | |
| | |
C&F Financial Corp. | | | 613 | | | | 33,917 | |
| | |
Cadence BanCorp. | | | 22,461 | | | | 407,218 | |
| | |
Cambridge Bancorp. (a) | | | 792 | | | | 63,479 | |
| | |
Camden National Corp. | | | 2,720 | | | | 125,283 | |
| | |
Capital Bancorp. Inc* | | | 1,557 | | | | 23,184 | |
| | |
Capital City Bank Group, Inc. | | | 2,479 | | | | 75,610 | |
| | |
Capstar Financial Holdings, Inc. | | | 2,692 | | | | 44,822 | |
| | |
Carolina Financial Corp. | | | 4,202 | | | | 181,652 | |
| | |
Carter Bank & Trust* | | | 3,961 | | | | 93,955 | |
| | |
Cathay General Bancorp. | | | 13,728 | | | | 522,350 | |
| | |
CBTX, Inc. | | | 3,129 | | | | 97,374 | |
| | |
CenterState Bank Corp. | | | 21,399 | | | | 534,547 | |
| | |
Central Pacific Financial Corp. | | | 4,955 | | | | 146,569 | |
| | |
Central Valley Community Bancorp. | | | 1,861 | | | | 40,328 | |
| | |
Century Bancorp., Inc. “A” | | | 520 | | | | 46,779 | |
| | |
Chemung Financial Corp. | | | 703 | | | | 29,878 | |
| | |
Citizens & Northern Corp. | | | 2,289 | | | | 64,664 | |
| | |
City Holding Co. | | | 2,887 | | | | 236,590 | |
| | |
Civista Bancshares, Inc. | | | 2,832 | | | | 67,968 | |
| | |
CNB Financial Corp. | | | 2,480 | | | | 81,046 | |
| | |
Coastal Financial Corp.* | | | 1,496 | | | | 24,639 | |
| | |
Codorus Valley Bancorp., Inc. | | | 1,807 | | | | 41,615 | |
| | |
Colony Bankcorp, Inc. | | | 1,369 | | | | 22,589 | |
| | |
Columbia Banking System, Inc. | | | 12,775 | | | | 519,751 | |
| | |
Community Bank System, Inc. | | | 9,142 | | | | 648,533 | |
| | |
Community Bankers Trust Corp. | | | 3,937 | | | | 34,961 | |
| | |
Community Financial Corp. | | | 915 | | | | 32,547 | |
| | |
Community Trust Bancorp., Inc. | | | 2,840 | | | | 132,458 | |
| | |
ConnectOne Bancorp., Inc. | | | 5,904 | | | | 151,851 | |
| | |
CrossFirst Bankshares, Inc.* | | | 1,227 | | | | 17,693 | |
| | |
Customers Bancorp., Inc.* | | | 5,153 | | | | 122,693 | |
| | |
CVB Financial Corp. | | | 24,112 | | | | 520,337 | |
| | |
Dime Community Bancshares | | | 5,852 | | | | 122,248 | |
| | |
Eagle Bancorp., Inc. | | | 5,787 | | | | 281,422 | |
| | |
Enterprise Bancorp., Inc. | | | 1,681 | | | | 56,935 | |
The accompanying notes are an integral part of the financial statements.
| | | | | | |
| | 10 | | | | | | DWS Small Cap Index VIP |
| | | | | | | | |
| | | Shares | | | Value ($) | |
| | |
Enterprise Financial Services Corp. | | | 4,437 | | | | 213,908 | |
| | |
Equity Bancshares, Inc. “A”* | | | 2,788 | | | | 86,066 | |
| | |
Esquire Financial Holdings, Inc.* | | | 1,121 | | | | 29,224 | |
| | |
Evans Bancorp., Inc. | | | 846 | | | | 33,925 | |
| | |
Farmers & Merchants Bancorp., Inc. (a) | | | 1,862 | | | | 56,139 | |
| | |
Farmers National Banc Corp. | | | 4,606 | | | | 75,170 | |
| | |
FB Financial Corp. | | | 3,023 | | | | 119,681 | |
| | |
Fidelity D&D Bancorp, Inc. | | | 532 | | | | 33,096 | |
| | |
Financial Institutions, Inc. | | | 2,841 | | | | 91,196 | |
| | |
First BanCorp. | | | 38,578 | | | | 408,541 | |
| | |
First BanCorp. — North Carolina | | | 5,248 | | | | 209,448 | |
| | |
First Bancorp., Inc. | | | 1,840 | | | | 55,623 | |
| | |
First Bancshares, Inc. | | | 3,005 | | | | 106,738 | |
| | |
First Bank | | | 3,074 | | | | 33,968 | |
| | |
First Busey Corp. | | | 9,258 | | | | 254,595 | |
| | |
First Business Financial Services, Inc. | | | 1,532 | | | | 40,338 | |
| | |
First Capital, Inc. | | | 597 | | | | 43,581 | |
| | |
First Choice Bancorp. | | | 1,884 | | | | 50,793 | |
| | |
First Commonwealth Financial Corp. | | | 17,707 | | | | 256,929 | |
| | |
First Community Bancshares, Inc. | | | 2,818 | | | | 87,414 | |
| | |
First Financial Bancorp. | | | 17,602 | | | | 447,795 | |
| | |
First Financial Bankshares, Inc. | | | 23,361 | | | | 819,971 | |
| | |
First Financial Corp. — Indiana | | | 2,393 | | | | 109,408 | |
| | |
First Financial Northwest, Inc. | | | 1,554 | | | | 23,217 | |
| | |
First Foundation, Inc. | | | 7,094 | | | | 123,436 | |
| | |
First Guaranty Bancshares, Inc. | | | 928 | | | | 20,203 | |
| | |
First Internet Bancorp. | | | 1,792 | | | | 42,488 | |
| | |
First Interstate BancSystem, Inc. “A” | | | 6,851 | | | | 287,194 | |
| | |
First Merchants Corp. | | | 9,800 | | | | 407,582 | |
| | |
FirstMid-Illinois Bancshares, Inc. | | | 2,536 | | | | 89,394 | |
| | |
First Midwest Bancorp., Inc. | | | 19,227 | | | | 443,375 | |
| | |
First Northwest Bancorp. | | | 1,649 | | | | 29,896 | |
| | |
First of Long Island Corp. | | | 4,155 | | | | 104,207 | |
| | |
Flushing Financial Corp. | | | 4,698 | | | | 101,500 | |
| | |
FNCB Bancorp, Inc. | | | 3,161 | | | | 26,710 | |
| | |
Franklin Financial Network, Inc. | | | 2,430 | | | | 83,422 | |
| | |
Franklin Financial Services Corp. | | | 769 | | | | 29,753 | |
| | |
Fulton Financial Corp. | | | 28,343 | | | | 494,019 | |
| | |
FVCBankcorp, Inc.* | | | 2,234 | | | | 39,028 | |
| | |
German American Bancorp., Inc. | | | 4,397 | | | | 156,621 | |
| | |
Glacier Bancorp., Inc. | | | 15,617 | | | | 718,226 | |
| | |
Great Southern Bancorp., Inc. | | | 2,026 | | | | 128,286 | |
| | |
Great Western Bancorp., Inc. | | | 10,256 | | | | 356,293 | |
| | |
Guaranty Bancshares, Inc. | | | 1,517 | | | | 49,879 | |
| | |
Hancock Whitney Corp. | | | 15,440 | | | | 677,507 | |
| | |
Hanmi Financial Corp. | | | 5,511 | | | | 110,192 | |
| | |
Harborone Bancorp, Inc.* | | | 4,860 | | | | 53,411 | |
| | |
Hawthorn Bancshares, Inc. | | | 1,043 | | | | 26,597 | |
| | |
HBT Financial, Inc.* | | | 1,571 | | | | 29,833 | |
| | |
Heartland Financial U.S.A., Inc. | | | 6,270 | | | | 311,870 | |
| | |
Heritage Commerce Corp. | | | 9,540 | | | | 122,398 | |
| | |
Heritage Financial Corp. | | | 6,528 | | | | 184,742 | |
| | |
Hilltop Holdings, Inc. | | | 12,432 | | | | 309,930 | |
| | |
Home Bancshares, Inc. | | | 28,062 | | | | 551,699 | |
| | |
HomeTrust Bancshares, Inc. | | | 2,923 | | | | 78,424 | |
| | |
Hope Bancorp., Inc. | | | 21,842 | | | | 324,572 | |
| | |
Horizon Bancorp, Inc. | | | 6,491 | | | | 123,329 | |
| | |
Howard Bancorp., Inc.* | | | 2,459 | | | | 41,508 | |
| | |
IBERIABANK Corp. | | | 9,377 | | | | 701,681 | |
| | |
Independent Bank Corp. | | | 5,964 | | | | 496,503 | |
| | | | | | | | |
| | | Shares | | | Value ($) | |
| | |
Independent Bank Corp./Michigan | | | 3,769 | | | | 85,368 | |
| | |
Independent Bank Group, Inc. | | | 6,432 | | | | 356,590 | |
| | |
International Bancshares Corp. | | | 10,066 | | | | 433,543 | |
| | |
Investar Holding Corp. | | | 1,810 | | | | 43,440 | |
| | |
Investors Bancorp., Inc. | | | 40,601 | | | | 483,761 | |
| | |
Lakeland Bancorp., Inc. | | | 8,606 | | | | 149,572 | |
| | |
Lakeland Financial Corp. | | | 4,372 | | | | 213,922 | |
| | |
LCNB Corp. | | | 2,301 | | | | 44,409 | |
| | |
Level One Bancorp, Inc. | | | 921 | | | | 23,172 | |
| | |
Live Oak Bancshares, Inc. (a) | | | 4,693 | | | | 89,214 | |
| | |
Macatawa Bank Corp. | | | 4,809 | | | | 53,524 | |
| | |
Mackinac Financial Corp. | | | 1,700 | | | | 29,682 | |
| | |
MainStreet Bancshares, Inc.* | | | 1,307 | | | | 30,061 | |
| | |
Malvern Bancorp., Inc.* | | | 1,433 | | | | 33,088 | |
| | |
Mercantile Bank Corp. | | | 2,794 | | | | 101,897 | |
| | |
Metrocity Bankshares, Inc. | | | 2,790 | | | | 48,853 | |
| | |
Metropolitan Bank Holding Corp.* | | | 1,295 | | | | 62,458 | |
| | |
Mid Penn Bancorp, Inc. | | | 1,273 | | | | 36,662 | |
| | |
Midland States Bancorp., Inc. | | | 4,032 | | | | 116,767 | |
| | |
MidWestOne Financial Group, Inc. | | | 2,192 | | | | 79,416 | |
| | |
MutualFirst Financial, Inc. | | | 1,102 | | | | 43,716 | |
| | |
MVB Financial Corp. | | | 1,640 | | | | 40,869 | |
| | |
National Bank Holdings Corp. “A” | | | 5,326 | | | | 187,582 | |
| | |
National Bankshares, Inc. | | | 1,117 | | | | 50,187 | |
| | |
NBT Bancorp., Inc. | | | 7,735 | | | | 313,732 | |
| | |
Nicolet Bankshares, Inc.* | | | 1,641 | | | | 121,188 | |
| | |
Northeast Bank* | | | 1,409 | | | | 30,984 | |
| | |
Northrim BanCorp., Inc. | | | 1,251 | | | | 47,913 | |
| | |
Norwood Financial Corp. | | | 1,066 | | | | 41,467 | |
| | |
Oak Valley Bancorp. | | | 1,299 | | | | 25,279 | |
| | |
OFG Bancorp. | | | 9,006 | | | | 212,632 | |
| | |
Ohio Valley Banc Corp. | | | 758 | | | | 30,032 | |
| | |
Old National Bancorp. | | | 30,020 | | | | 549,066 | |
| | |
Old Second Bancorp., Inc. | | | 4,930 | | | | 66,407 | |
| | |
Opus Bank | | | 4,041 | | | | 104,541 | |
| | |
Origin Bancorp, Inc. | | | 3,439 | | | | 130,132 | |
| | |
Orrstown Financial Services, Inc. | | | 1,890 | | | | 42,752 | |
| | |
Pacific Mercantile Bancorp.* | | | 3,591 | | | | 29,159 | |
| | |
Pacific Premier Bancorp., Inc. | | | 10,331 | | | | 336,842 | |
| | |
Park National Corp. | | | 2,366 | | | | 242,231 | |
| | |
Parke Bancorp., Inc. | | | 1,664 | | | | 42,249 | |
| | |
PCB Bancorp. | | | 2,369 | | | | 40,936 | |
| | |
Peapack-Gladstone Financial Corp. | | | 3,300 | | | | 101,970 | |
| | |
Penns Woods Bancorp., Inc. | | | 1,300 | | | | 46,228 | |
| | |
People’s Utah Bancorp. | | | 2,909 | | | | 87,619 | |
| | |
Peoples Bancorp. of North Carolina, Inc. | | | 847 | | | | 27,824 | |
| | |
Peoples Bancorp., Inc. | | | 3,276 | | | | 113,546 | |
| | |
Peoples Financial Services Corp. | | | 1,172 | | | | 59,010 | |
| | |
Preferred Bank | | | 2,468 | | | | 148,302 | |
| | |
Premier Financial Bancorp., Inc. | | | 2,273 | | | | 41,232 | |
| | |
QCR Holdings, Inc. | | | 2,564 | | | | 112,457 | |
| | |
RBB Bancorp. | | | 3,002 | | | | 63,552 | |
| | |
Red River Bancshares, Inc.* | | | 826 | | | | 46,306 | |
| | |
Reliant Bancorp., Inc. | | | 1,919 | | | | 42,679 | |
| | |
Renasant Corp. | | | 9,800 | | | | 347,116 | |
| | |
Republic Bancorp., Inc. “A” | | | 1,820 | | | | 85,176 | |
| | |
Republic First Bancorp., Inc.* | | | 8,082 | | | | 33,783 | |
| | |
Richmond Mutual Bancorp., Inc.* | | | 2,366 | | | | 37,761 | |
| | |
S&T Bancorp., Inc. | | | 6,880 | | | | 277,195 | |
| | |
Sandy Spring Bancorp., Inc. | | | 6,370 | | | | 241,296 | |
| | |
SB One Bancorp. | | | 1,564 | | | | 38,975 | |
| | |
Seacoast Banking Corp. of Florida* | | | 9,160 | | | | 280,021 | |
The accompanying notes are an integral part of the financial statements.
| | | | |
| DWS Small Cap Index VIP | | | | | 11 |
| | | | | | | | |
| | | Shares | | | Value ($) | |
| | |
Select Bancorp, Inc.* | | | 2,366 | | | | 29,102 | |
| | |
ServisFirst Bancshares, Inc. | | | 8,568 | | | | 322,842 | |
| | |
Shore Bancshares, Inc. | | | 2,346 | | | | 40,727 | |
| | |
Sierra Bancorp. | | | 2,653 | | | | 77,255 | |
| | |
Silvergate Capital Corp.* | | | 516 | | | | 8,210 | |
| | |
Simmons First National Corp. “A” | | | 16,976 | | | | 454,787 | |
| | |
SmartFinancial, Inc. | | | 2,347 | | | | 55,507 | |
| | |
South Plains Financial, Inc. | | | 1,692 | | | | 35,312 | |
| | |
South State Corp. | | | 5,940 | | | | 515,295 | |
| | |
Southern First Bancshares, Inc.* | | | 1,305 | | | | 55,449 | |
| | |
Southern National Bancorp. of Virginia, Inc. | | | 3,587 | | | | 58,647 | |
| | |
Southside Bancshares, Inc. | | | 5,748 | | | | 213,481 | |
| | |
Spirit of Texas Bancshares, Inc.* | | | 2,479 | | | | 57,017 | |
| | |
Stock Yards Bancorp., Inc. | | | 3,605 | | | | 148,021 | |
| | |
Summit Financial Group, Inc. | | | 2,091 | | | | 56,645 | |
| | |
The Bancorp., Inc.* | | | 9,257 | | | | 120,063 | |
| | |
Tompkins Financial Corp. | | | 2,585 | | | | 236,528 | |
| | |
TowneBank | | | 12,018 | | | | 334,341 | |
| | |
TriCo Bancshares | | | 4,771 | | | | 194,705 | |
| | |
TriState Capital Holdings, Inc.* | | | 4,260 | | | | 111,271 | |
| | |
Triumph Bancorp., Inc.* | | | 4,273 | | | | 162,459 | |
| | |
Trustmark Corp. | | | 11,551 | | | | 398,625 | |
| | |
UMB Financial Corp. | | | 7,946 | | | | 545,413 | |
| | |
Union Bankshares, Inc. | | | 789 | | | | 28,609 | |
| | |
United Bankshares, Inc. | | | 17,547 | | | | 678,367 | |
| | |
United Community Banks, Inc. | | | 14,149 | | | | 436,921 | |
| | |
United Securities Bancshares | | | 2,548 | | | | 27,340 | |
| | |
Unity Bancorp., Inc. | | | 1,412 | | | | 31,869 | |
| | |
Univest Corp. of Pennsylvania | | | 5,250 | | | | 140,595 | |
| | |
Valley National Bancorp. | | | 69,699 | | | | 798,054 | |
| | |
Veritex Holdings, Inc. | | | 8,954 | | | | 260,830 | |
| | |
Washington Trust Bancorp., Inc. | | | 2,676 | | | | 143,942 | |
| | |
WesBanco, Inc. | | | 11,624 | | | | 439,271 | |
| | |
West Bancorp. | | | 2,677 | | | | 68,612 | |
| | |
Westamerica Bancorp. | | | 4,663 | | | | 316,012 | |
| | | | | | | | |
| | | | 37,204,818 | |
|
Capital Markets 1.4% | |
| | |
Ares Management Corp. “A” | | | 12,856 | | | | 458,831 | |
| | |
Artisan Partners Asset Management, Inc. “A” | | | 8,952 | | | | 289,329 | |
| | |
Assetmark Financial Holdings, Inc.* | | | 2,475 | | | | 71,824 | |
| | |
Associated Capital Group, Inc. “A” | | | 415 | | | | 16,268 | |
| | |
B. Riley Financial, Inc. | | | 3,654 | | | | 92,008 | |
| | |
Blucora, Inc.* | | | 8,576 | | | | 224,177 | |
| | |
Brightsphere Investment Group, Inc.* | | | 11,611 | | | | 118,664 | |
| | |
Cohen & Steers, Inc. | | | 4,135 | | | | 259,513 | |
| | |
Cowen, Inc.* | | | 5,315 | | | | 83,711 | |
| | |
Diamond Hill Investment Group | | | 564 | | | | 79,219 | |
| | |
Donnelley Financial Solution, Inc.* | | | 5,454 | | | | 57,103 | |
| | |
Federated Investors, Inc. “B” | | | 17,382 | | | | 566,479 | |
| | |
Focus Financial Partners, Inc. “A”* | | | 5,443 | | | | 160,405 | |
| | |
Gain Capital Holdings, Inc. | | | 3,505 | | | | 13,845 | |
| | |
GAMCO Investors, Inc. “A” | | | 957 | | | | 18,652 | |
| | |
Greenhill & Co., Inc. | | | 2,892 | | | | 49,395 | |
| | |
Hamilton Lane, Inc. “A” | | | 3,939 | | | | 234,764 | |
| | |
Houlihan Lokey, Inc. | | | 7,607 | | | | 371,754 | |
| | |
INTL. FCStone, Inc.* | | | 2,820 | | | | 137,701 | |
| | |
Ladenburg Thalmann Financial Services, Inc. | | | 21,943 | | | | 76,362 | |
| | | | | | | | |
| | | Shares | | | Value ($) | |
| | |
Moelis & Co. “A” | | | 8,489 | | | | 270,969 | |
| | |
Oppenheimer Holdings, Inc. “A” | | | 1,593 | | | | 43,776 | |
| | |
Piper Jaffray Companies, Inc. | | | 2,481 | | | | 198,331 | |
| | |
PJT Partners, Inc. “A” | | | 4,100 | | | | 185,033 | |
| | |
Pzena Investment Management, Inc. “A” | | | 3,077 | | | | 26,524 | |
| | |
Safeguard Scientifics, Inc. | | | 3,490 | | | | 38,320 | |
| | |
Sculptor Capital Management, Inc. | | | 3,112 | | | | 68,775 | |
| | |
Siebert Financial Corp.* | | | 1,389 | | | | 12,015 | |
| | |
Silvercrest Asset Management Group, Inc. “A” | | | 1,608 | | | | 20,229 | |
| | |
Stifel Financial Corp. | | | 11,910 | | | | 722,341 | |
| | |
Value Line, Inc. | | | 187 | | | | 5,406 | |
| | |
Virtus Investment Partners, Inc. | | | 1,158 | | | | 140,952 | |
| | |
Waddell & Reed Financial, Inc. “A” (a) | | | 12,308 | | | | 205,790 | |
| | |
Westwood Holdings Group, Inc. | | | 1,479 | | | | 43,808 | |
| | |
WisdomTree Investments, Inc. | | | 23,939 | | | | 115,865 | |
| | | | | | | | |
| | | | 5,478,138 | |
|
Consumer Finance 0.5% | |
| | |
Curo Group Holdings Corp.* | | | 2,645 | | | | 32,216 | |
| | |
Elevate Credit, Inc.* | | | 3,761 | | | | 16,736 | |
| | |
Encore Capital Group, Inc.* | | | 5,509 | | | | 194,798 | |
| | |
Enova International, Inc.* | | | 5,983 | | | | 143,951 | |
| | |
EZCORP, Inc. “A”* | | | 9,415 | | | | 64,210 | |
| | |
FirstCash, Inc. | | | 7,531 | | | | 607,225 | |
| | |
Green Dot Corp. “A”* | | | 8,672 | | | | 202,058 | |
| | |
Lendingclub Corp.* | | | 12,262 | | | | 154,746 | |
| | |
Medallion Financial Corp.* | | | 3,810 | | | | 27,699 | |
| | |
Nelnet, Inc. “A” | | | 3,268 | | | | 190,328 | |
| | |
Oportun Financial Corp.* | | | 1,243 | | | | 29,583 | |
| | |
PRA Group, Inc.* | | | 8,003 | | | | 290,509 | |
| | |
Regional Management Corp.* | | | 1,560 | | | | 46,847 | |
| | |
World Acceptance Corp.* | | | 969 | | | | 83,722 | |
| | | | | | | | |
| | | | 2,084,628 | |
|
Diversified Financial Services 0.3% | |
| | |
Alerus Financial Corp. | | | 450 | | | | 10,282 | |
| | |
Banco Latinoamericano de Comercio Exterior SA “E” | | | 5,636 | | | | 120,498 | |
| | |
Cannae Holdings, Inc.* | | | 12,119 | | | | 450,706 | |
| | |
FGL Holdings | | | 26,309 | | | | 280,191 | |
| | |
GWG Holdings, Inc.* (a) | | | 642 | | | | 6,304 | |
| | |
Marlin Business Services Corp. | | | 1,586 | | | | 34,860 | |
| | |
On Deck Capital, Inc.* | | | 10,457 | | | | 43,292 | |
| | | | | | | | |
| | | | 946,133 | |
|
Insurance 2.2% | |
| | |
Ambac Financial Group, Inc.* | | | 8,257 | | | | 178,104 | |
| | |
American Equity Investment Life Holding Co. | | | 16,180 | | | | 484,267 | |
| | |
AMERISAFE, Inc. | | | 3,418 | | | | 225,691 | |
| | |
Argo Group International Holdings Ltd. | | | 5,899 | | | | 387,859 | |
| | |
BRP Group, Inc.* | | | 2,669 | | | | 42,837 | |
| | |
Citizens, Inc.* (a) | | | 8,319 | | | | 56,153 | |
| | |
CNO Financial Group, Inc. | | | 26,830 | | | | 486,428 | |
| | |
Crawford & Co. “A” | | | 3,038 | | | | 34,846 | |
| | |
Donegal Group, Inc. “A” | | | 1,923 | | | | 28,499 | |
| | |
eHealth, Inc.* | | | 4,123 | | | | 396,138 | |
| | |
Employers Holdings, Inc. | | | 5,675 | | | | 236,931 | |
| | |
Enstar Group Ltd.* | | | 2,076 | | | | 429,441 | |
| | |
FBL Financial Group, Inc. “A” | | | 1,716 | | | | 101,124 | |
| | |
FedNat Holding, Co. | | | 2,019 | | | | 33,576 | |
The accompanying notes are an integral part of the financial statements.
| | | | | | |
| | 12 | | | | | | DWS Small Cap Index VIP |
| | | | | | | | |
| | | Shares | | | Value ($) | |
| | |
Genworth Financial, Inc. “A”* | | | 91,216 | | | | 401,350 | |
| | |
Global Indemnity Ltd. | | | 1,537 | | | | 45,541 | |
| | |
Goosehead Insurance, Inc. “A” (a) | | | 2,010 | | | | 85,224 | |
| | |
Greenlight Capital Re Ltd. “A”* | | | 5,111 | | | | 51,672 | |
| | |
Hallmark Financial Services, Inc.* | | | 2,522 | | | | 44,312 | |
| | |
HCI Group, Inc. | | | 1,086 | | | | 49,576 | |
| | |
Health Insurance Innovations, Inc. “A”* (a) | | | 1,801 | | | | 34,741 | |
| | |
Heritage Insurance Holdings, Inc. | | | 4,636 | | | | 61,427 | |
| | |
Horace Mann Educators Corp. | | | 7,425 | | | | 324,176 | |
| | |
Independence Holding Co. | | | 889 | | | | 37,409 | |
| | |
Investors Title Co. | | | 242 | | | | 38,526 | |
| | |
James River Group Holdings Ltd. | | | 5,385 | | | | 221,916 | |
| | |
Kinsale Capital Group, Inc. | | | 3,680 | | | | 374,109 | |
| | |
MBIA, Inc.* (a) | | | 13,058 | | | | 121,439 | |
| | |
National General Holdings Corp. | | | 12,100 | | | | 267,410 | |
| | |
National Western Life Group, Inc. “A” | | | 399 | | | | 116,061 | |
| | |
NI Holdings, Inc.* | | | 1,683 | | | | 28,948 | |
| | |
Palomar Holdings, Inc.* | | | 2,264 | | | | 114,309 | |
| | |
ProAssurance Corp. | | | 9,586 | | | | 346,438 | |
| | |
ProSight Global, Inc.* | | | 1,658 | | | | 26,744 | |
| | |
Protective Insurance Corp. “B” | | | 1,579 | | | | 25,406 | |
| | |
RLI Corp. | | | 7,179 | | | | 646,254 | |
| | |
Safety Insurance Group, Inc. | | | 2,673 | | | | 247,333 | |
| | |
Selective Insurance Group, Inc. | | | 10,523 | | | | 685,994 | |
| | |
State Auto Financial Corp. | | | 3,043 | | | | 94,394 | |
| | |
Stewart Information Services Corp. | | | 4,233 | | | | 172,664 | |
| | |
Third Point Reinsurance Ltd.* | | | 13,552 | | | | 142,567 | |
| | |
Tiptree, Inc. | | | 4,324 | | | | 35,197 | |
| | |
Trupanion, Inc.* (a) | | | 5,121 | | | | 191,833 | |
| | |
United Fire Group, Inc. | | | 3,843 | | | | 168,054 | |
| | |
United Insurance Holdings Corp. | | | 3,590 | | | | 45,270 | |
| | |
Universal Insurance Holdings, Inc. | | | 5,452 | | | | 152,602 | |
| | |
Watford Holdings Ltd.* | | | 3,575 | | | | 89,947 | |
| | | | | | | | |
| | | | 8,610,737 | |
|
Mortgage Real Estate Investment Trusts (REITs) 1.3% | |
| | |
AG Mortgage Investment Trust, Inc. | | | 6,022 | | | | 92,859 | |
| | |
Anworth Mortgage Asset Corp. | | | 18,024 | | | | 63,445 | |
| | |
Apollo Commercial Real Estate Finance, Inc. | | | 27,660 | | | | 505,901 | |
| | |
Ares Commercial Real Estate Corp. | | | 4,796 | | | | 75,969 | |
| | |
Arlington Asset Investment Corp. “A” | | | 6,671 | | | | 37,158 | |
| | |
ARMOUR Residential REIT, Inc. | | | 10,542 | | | | 188,386 | |
| | |
Blackstone Mortgage Trust, Inc. ,“A” | | | 22,675 | | | | 843,964 | |
| | |
Capstead Mortgage Corp. | | | 17,085 | | | | 135,313 | |
| | |
Cherry Hill Mortgage Investment Corp. | | | 2,793 | | | | 40,750 | |
| | |
Colony Credit Real Estate, Inc. | | | 14,495 | | | | 190,754 | |
| | |
Dynex Capital, Inc. | | | 3,692 | | | | 62,543 | |
| | |
Ellington Financial, Inc. | | | 5,297 | | | | 97,094 | |
| | |
Exantas Capital Corp. | | | 5,677 | | | | 67,045 | |
| | |
Granite Point Mortgage Trust, Inc. | | | 9,688 | | | | 178,065 | |
| | |
Great Ajax Corp. | | | 2,898 | | | | 42,919 | |
| | |
Invesco Mortgage Capital, Inc. | | | 25,855 | | | | 430,486 | |
| | |
KKR Real Estate Finance Trust, Inc. | | | 4,446 | | | | 90,787 | |
| | |
Ladder Capital Corp. | | | 18,421 | | | | 332,315 | |
| | |
New York Mortgage Trust, Inc. | | | 47,309 | | | | 294,735 | |
| | | | | | | | |
| | | Shares | | | Value ($) | |
| | |
Orchid Island Capital, Inc. | | | 11,280 | | | | 65,988 | |
| | |
PennyMac Mortgage Investment Trust | | | 16,258 | | | | 362,391 | |
| | |
Ready Capital Corp. | | | 5,862 | | | | 90,392 | |
| | |
Redwood Trust, Inc. | | | 20,108 | | | | 332,586 | |
| | |
TPG RE Finance Trust, Inc. | | | 8,986 | | | | 182,146 | |
| | |
Western Asset Mortgage Capital Corp. | | | 9,007 | | | | 93,042 | |
| | | | | | | | |
| | | | 4,897,033 | |
|
Thrifts & Mortgage Finance 2.1% | |
| | |
Axos Financial, Inc.* | | | 10,327 | | | | 312,702 | |
| | |
Bridgewater Bancshares, Inc.* | | | 3,819 | | | | 52,626 | |
| | |
Capitol Federal Financial, Inc. | | | 23,666 | | | | 324,934 | |
| | |
Columbia Financial, Inc.* | | | 9,475 | | | | 160,506 | |
| | |
Entegra Financial Corp.* | | | 1,222 | | | | 36,856 | |
| | |
ESSA Bancorp., Inc. | | | 1,656 | | | | 28,069 | |
| | |
Essent Group Ltd. | | | 17,347 | | | | 901,871 | |
| | |
Federal Agricultural Mortgage Corp. “C” | | | 1,612 | | | | 134,602 | |
| | |
First Defiance Financial Corp. | | | 3,390 | | | | 106,751 | |
| | |
Flagstar Bancorp., Inc. | | | 6,241 | | | | 238,718 | |
| | |
FS Bancorp, Inc. | | | 707 | | | | 45,100 | |
| | |
Greene County Bancorp., Inc. | | | 571 | | | | 16,439 | |
| | |
Hingham Institution for Savings | | | 261 | | | | 54,862 | |
| | |
Home Bancorp., Inc. | | | 1,408 | | | | 55,179 | |
| | |
HomeStreet, Inc.* | | | 4,037 | | | | 137,258 | |
| | |
Kearny Financial Corp. | | | 13,766 | | | | 190,384 | |
| | |
Luther Burbank Corp. | | | 3,695 | | | | 42,603 | |
| | |
Merchants Bancorp. | | | 1,599 | | | | 31,516 | |
| | |
Meridian Bancorp., Inc. | | | 8,641 | | | | 173,598 | |
| | |
Meta Financial Group, Inc. | | | 6,321 | | | | 230,780 | |
| | |
MMA Capital Holdings, Inc.* | | | 909 | | | | 28,906 | |
| | |
Mr Cooper Group, Inc.* | | | 13,533 | | | | 169,298 | |
| | |
NMI Holdings, Inc. “A”* | | | 11,694 | | | | 388,007 | |
| | |
Northfield Bancorp., Inc. | | | 7,852 | | | | 133,170 | |
| | |
Northwest Bancshares, Inc. | | | 18,203 | | | | 302,716 | |
| | |
OceanFirst Financial Corp. | | | 9,826 | | | | 250,956 | |
| | |
Ocwen Financial Corp.* | | | 24,854 | | | | 34,050 | |
| | |
OP Bancorp. | | | 2,318 | | | | 24,038 | |
| | |
PCSB Financial Corp. | | | 2,998 | | | | 60,709 | |
| | |
PennyMac Financial Services, Inc. | | | 4,428 | | | | 150,729 | |
| | |
Pioneer Bancorp. Inc.* | | | 2,013 | | | | 30,819 | |
| | |
Ponce de Leon Federal Bank* | | | 1,616 | | | | 23,755 | |
| | |
Provident Bancorp, Inc.* | | | 1,687 | | | | 21,003 | |
| | |
Provident Financial Holdings, Inc. | | | 1,084 | | | | 23,740 | |
| | |
Provident Financial Services, Inc. | | | 10,707 | | | | 263,928 | |
| | |
Prudential Bancorp., Inc. | | | 1,575 | | | | 29,185 | |
| | |
Radian Group, Inc. | | | 36,301 | | | | 913,333 | |
| | |
Riverview Bancorp., Inc. | | | 3,700 | | | | 30,377 | |
| | |
Southern Missouri Bancorp., Inc. | | | 1,457 | | | | 55,890 | |
| | |
Sterling Bancorp., Inc. | | | 3,148 | | | | 25,499 | |
| | |
Territorial Bancorp., Inc. | | | 1,518 | | | | 46,967 | |
| | |
Timberland Bancorp., Inc. | | | 1,398 | | | | 41,576 | |
| | |
TrustCo Bank Corp. | | | 16,944 | | | | 146,904 | |
| | |
United Community Financial Corp. | | | 8,554 | | | | 99,740 | |
| | |
Walker & Dunlop, Inc. | | | 5,023 | | | | 324,888 | |
| | |
Washington Federal, Inc. | | | 14,178 | | | | 519,624 | |
| | |
Waterstone Financial, Inc. | | | 4,267 | | | | 81,201 | |
| | |
Western New England Bancorp, Inc. | | | 4,291 | | | | 41,322 | |
| | |
WSFS Financial Corp. | | | 9,137 | | | | 401,937 | |
| | | | | | | | |
| | | | 7,939,621 | |
The accompanying notes are an integral part of the financial statements.
| | | | |
| DWS Small Cap Index VIP | | | | | 13 |
| | | | | | | | |
| | | Shares | | | Value ($) | |
|
| Health Care 17.8% | |
Biotechnology 8.0% | |
| | |
89bio, Inc.* | | | 547 | | | | 14,381 | |
| | |
Abeona Therapeutics, Inc.* | | | 5,806 | | | | 18,986 | |
| | |
ACADIA Pharmaceuticals, Inc.* | | | 20,272 | | | | 867,236 | |
| | |
Acceleron Pharma, Inc.* | | | 8,149 | | | | 432,060 | |
| | |
Achillion Pharmaceuticals, Inc.* | | | 24,569 | | | | 148,151 | |
| | |
Acorda Therapeutics, Inc.* | | | 8,544 | | | | 17,430 | |
| | |
Adamas Pharmaceuticals, Inc.* | | | 4,257 | | | | 16,134 | |
| | |
ADMA Biologics, Inc.* | | | 8,830 | | | | 35,320 | |
| | |
Aduro Biotech, Inc.* | | | 11,642 | | | | 13,738 | |
| | |
Adverum Biotechnologies, Inc.* | | | 9,683 | | | | 111,548 | |
| | |
Aeglea BioTherapeutics, Inc.* | | | 4,819 | | | | 36,817 | |
| | |
Affimed NV* | | | 13,800 | | | | 37,812 | |
| | |
Agenus, Inc.* (a) | | | 19,312 | | | | 78,600 | |
| | |
AgeX Therapeutics, Inc.* | | | 3,932 | | | | 7,156 | |
| | |
Aimmune Therapeutics, Inc.* (a) | | | 7,971 | | | | 266,789 | |
| | |
Akcea Therapeutics, Inc.* (a) | | | 2,318 | | | | 39,267 | |
| | |
Akebia Therapeutics, Inc.* | | | 20,782 | | | | 131,342 | |
| | |
Akero Therapeutics, Inc.* (a) | | | 803 | | | | 17,823 | |
| | |
Albireo Pharma, Inc.* | | | 1,907 | | | | 48,476 | |
| | |
Aldeyra Therapeutics, Inc.* | | | 4,070 | | | | 23,647 | |
| | |
Alector, Inc.* | | | 5,351 | | | | 92,198 | |
| | |
Allakos, Inc.* (a) | | | 3,485 | | | | 332,330 | |
| | |
Allogene Therapeutics, Inc.* (a) | | | 7,022 | | | | 182,432 | |
| | |
AMAG Pharmaceuticals, Inc.* (a) | | | 5,897 | | | | 71,766 | |
| | |
Amicus Therapeutics, Inc.* | | | 46,400 | | | | 451,936 | |
| | |
AnaptysBio, Inc.* | | | 4,467 | | | | 72,589 | |
| | |
Anavex Life Sciences Corp.* (a) | | | 7,924 | | | | 20,523 | |
| | |
Anika Therapeutics, Inc.* | | | 2,410 | | | | 124,958 | |
| | |
Apellis Pharmaceuticals, Inc.* | | | 8,762 | | | | 268,292 | |
| | |
Applied Therapeutics, Inc.* | | | 1,168 | | | | 31,863 | |
| | |
Aprea Therapeutics, Inc.* | | | 1,170 | | | | 53,691 | |
| | |
Arcus Biosciences, Inc.* | | | 6,084 | | | | 61,448 | |
| | |
Ardelyx, Inc.* | | | 8,100 | | | | 60,790 | |
| | |
Arena Pharmaceuticals, Inc.* | | | 9,147 | | | | 415,457 | |
| | |
ArQule, Inc.* | | | 20,005 | | | | 399,300 | |
| | |
Arrowhead Pharmaceuticals, Inc.* | | | 16,799 | | | | 1,065,561 | |
| | |
Assembly Biosciences, Inc.* | | | 4,004 | | | | 81,922 | |
| | |
Atara Biotherapeutics, Inc.* | | | 9,131 | | | | 150,388 | |
| | |
Athenex, Inc.* | | | 12,124 | | | | 185,133 | |
| | |
Athersys, Inc.* (a) | | | 23,640 | | | | 29,077 | |
| | |
Atreca, Inc.* | | | 1,090 | | | | 16,862 | |
| | |
Audentes Therapeutics, Inc.* | | | 8,082 | | | | 483,627 | |
| | |
Avid Bioservices, Inc.* | | | 10,374 | | | | 79,569 | |
| | |
Avrobio, Inc.* | | | 3,670 | | | | 73,877 | |
| | |
Axcella Health, Inc.* | | | 543 | | | | 2,177 | |
| | |
Baudax Bio, Inc.* | | | 1,421 | | | | 9,833 | |
| | |
Beyondspring, Inc.* | | | 2,485 | | | | 38,518 | |
| | |
BioCryst Pharmaceuticals, Inc.* | | | 26,622 | | | | 91,846 | |
| | |
Biohaven Pharmaceutical Holding Co., Ltd.* | | | 6,991 | | | | 380,590 | |
| | |
BioSpecifics Technologies Corp.* | | | 1,063 | | | | 60,527 | |
| | |
Bioxcel Therapeutics, Inc.* | | | 1,113 | | | | 16,261 | |
| | |
Blueprint Medicines Corp.* | | | 8,787 | | | | 703,927 | |
| | |
Bridgebio Pharma, Inc.* (a) | | | 4,010 | | | | 140,550 | |
| | |
Cabaletta Bio, Inc.* | | | 1,204 | | | | 16,820 | |
| | |
Calithera Biosciences, Inc.* | | | 8,443 | | | | 48,210 | |
| | |
Calyxt, Inc.* | | | 1,724 | | | | 12,085 | |
| | |
CareDx, Inc.* | | | 7,434 | | | | 160,351 | |
| | |
CASI Pharmaceuticals, Inc.* | | | 9,558 | | | | 29,534 | |
| | |
Castle Biosciences, Inc.* | | | 634 | | | | 21,791 | |
| | |
Catalyst Pharmaceuticals, Inc.* | | | 17,215 | | | | 64,556 | |
| | |
CEL-SCI Corp* | | | 4,869 | | | | 44,551 | |
| | | | | | | | |
| | | Shares | | | Value ($) | |
| | |
Celcuity, Inc.* | | | 1,097 | | | | 11,672 | |
| | |
Cellular Biomedicine Group, Inc.* | | | 2,118 | | | | 34,396 | |
| | |
Checkpoint Therapeutics, Inc.* | | | 4,256 | | | | 7,320 | |
| | |
ChemoCentryx, Inc.* | | | 7,333 | | | | 290,020 | |
| | |
Chimerix, Inc.* | | | 9,756 | | | | 19,805 | |
| | |
Clovis Oncology, Inc.* (a) | | | 8,699 | | | | 90,687 | |
| | |
Coherus Biosciences, Inc.* | | | 11,289 | | | | 203,258 | |
| | |
Concert Pharmaceuticals, Inc.* | | | 3,953 | | | | 36,466 | |
| | |
Constellation Pharmaceuticals, Inc.* | | | 2,696 | | | | 127,009 | |
| | |
Corbus Pharmaceuticals Holdings, Inc.* (a) | | | 10,962 | | | | 59,853 | |
| | |
Cortexyme, Inc.* (a) | | | 2,047 | | | | 114,919 | |
| | |
Crinetics Pharmaceuticals, Inc.* | | | 2,040 | | | | 51,184 | |
| | |
Cue Biopharma, Inc.* | | | 3,329 | | | | 52,848 | |
| | |
Cyclerion Therapeutics, Inc.* | | | 4,363 | | | | 11,867 | |
| | |
Cytokinetics, Inc.* | | | 9,748 | | | | 103,426 | |
| | |
CytomX Therapeutics, Inc.* | | | 7,829 | | | | 65,059 | |
| | |
Deciphera Pharmaceuticals, Inc.* | | | 3,563 | | | | 221,761 | |
| | |
Denali Therapeutics, Inc.* | | | 8,661 | | | | 150,875 | |
| | |
Dicerna Pharmaceuticals, Inc.* | | | 9,297 | | | | 204,813 | |
| | |
Dynavax Technologies Corp.* (a) | | | 14,608 | | | | 83,558 | |
| | |
Eagle Pharmaceuticals, Inc.* | | | 1,639 | | | | 98,471 | |
| | |
Editas Medicine, Inc.* | | | 9,339 | | | | 276,528 | |
| | |
Eidos Therapeutics, Inc.* | | | 2,078 | | | | 119,256 | |
| | |
Eiger BioPharmaceuticals, Inc.* | | | 4,323 | | | | 64,413 | |
| | |
Emergent BioSolutions, Inc.* | | | 8,213 | | | | 443,091 | |
| | |
Enanta Pharmaceuticals, Inc.* | | | 3,124 | | | | 193,001 | |
| | |
Enochian Biosciences, Inc.* (a) | | | 2,438 | | | | 12,239 | |
| | |
Epizyme, Inc.* | | | 14,058 | | | | 345,827 | |
| | |
Esperion Therapeutics, Inc.* | | | 4,542 | | | | 270,839 | |
| | |
Evelo Biosciences, Inc.* | | | 2,496 | | | | 10,134 | |
| | |
Fate Therapeutics, Inc.* | | | 10,936 | | | | 214,018 | |
| | |
FibroGen, Inc.* | | | 14,146 | | | | 606,722 | |
| | |
Five Prime Therapeutics, Inc.* | | | 6,656 | | | | 30,551 | |
| | |
Flexion Therapeutics, Inc.* (a) | | | 6,269 | | | | 129,768 | |
| | |
Forty Seven, Inc.* | | | 3,986 | | | | 156,929 | |
| | |
Frequency Therapeutics, Inc.* | | | 1,059 | | | | 18,564 | |
| | |
G1 Therapeutics, Inc.* | | | 6,088 | | | | 160,906 | |
| | |
Galectin Therapeutics, Inc.* | | | 7,728 | | | | 22,102 | |
| | |
Galera Therapeutics, Inc.* | | | 565 | | | | 7,435 | |
| | |
Geron Corp.* | | | 33,517 | | | | 45,583 | |
| | |
Global Blood Therapeutics, Inc.* | | | 10,425 | | | | 828,683 | |
| | |
GlycoMimetics, Inc.* | | | 5,874 | | | | 31,073 | |
| | |
Gossamer Bio, Inc.* | | | 7,638 | | | | 119,382 | |
| | |
Gritstone Oncology, Inc.* | | | 4,603 | | | | 41,289 | |
| | |
Halozyme Therapeutics, Inc.* | | | 25,913 | | | | 459,437 | |
| | |
Harpoon Therapeutics, Inc.* | | | 1,094 | | | | 16,180 | |
| | |
Heron Therapeutics, Inc.* | | | 15,157 | | | | 356,189 | |
| | |
Homology Medicines, Inc.* | | | 4,491 | | | | 92,964 | |
| | |
Hookipa Pharma, Inc.* | | | 1,786 | | | | 21,843 | |
| | |
IGM Biosciences, Inc.* | | | 898 | | | | 34,268 | |
| | |
ImmunoGen, Inc.* | | | 25,566 | | | | 130,514 | |
| | |
Immunomedics, Inc.* | | | 31,493 | | | | 666,392 | |
| | |
Inovio Pharmaceuticals, Inc.* (a) | | | 17,050 | | | | 56,265 | |
| | |
Insmed, Inc.* | | | 15,888 | | | | 379,405 | |
| | |
Intellia Therapeutics, Inc.* (a) | | | 6,870 | | | | 100,783 | |
| | |
Intercept Pharmaceuticals, Inc.* | | | 4,552 | | | | 564,084 | |
| | |
Intrexon Corp.* (a) | | | 12,708 | | | | 69,640 | |
| | |
Invitae Corp.* (a) | | | 15,645 | | | | 252,354 | |
| | |
Iovance Biotherapeutics, Inc.* | | | 21,104 | | | | 584,159 | |
| | |
Ironwood Pharmaceuticals, Inc.* | | | 27,585 | | | | 367,156 | |
| | |
Jounce Therapeutics, Inc.* | | | 2,760 | | | | 24,095 | |
| | |
Kadmon Holdings, Inc.* (a) | | | 28,210 | | | | 127,791 | |
The accompanying notes are an integral part of the financial statements.
| | | | | | |
| | 14 | | | | | | DWS Small Cap Index VIP |
| | | | | | | | |
| | | Shares | | | Value ($) | |
| | |
KalVista Pharmaceuticals, Inc.* | | | 2,157 | | | | 38,416 | |
| | |
Karuna Therapeutics, Inc.* | | | 764 | | | | 57,560 | |
| | |
Karyopharm Therapeutics, Inc.* | | | 10,577 | | | | 202,761 | |
| | |
Kezar Life Sciences, Inc.* | | | 2,871 | | | | 11,513 | |
| | |
Kindred Biosciences, Inc.* | | | 6,155 | | | | 52,194 | |
| | |
Kiniksa Pharmaceuticals Ltd. “A”* | | | 2,577 | | | | 28,502 | |
| | |
Kodiak Sciences, Inc.* | | | 4,187 | | | | 301,255 | |
| | |
Krystal Biotech, Inc.* | | | 1,871 | | | | 103,616 | |
| | |
Kura Oncology, Inc.* | | | 6,045 | | | | 83,119 | |
| | |
La Jolla Pharmaceutical Co.* | | | 4,075 | | | | 16,015 | |
| | |
Lexicon Pharmaceuticals, Inc.* | | | 7,485 | | | | 31,063 | |
| | |
Ligand Pharmaceuticals, Inc.* | | | 3,085 | | | | 321,735 | |
| | |
Lineage Cell Therapeutics, Inc.* | | | 19,721 | | | | 17,552 | |
| | |
LogicBio Therapeutics, Inc.* | | | 1,472 | | | | 10,598 | |
| | |
MacroGenics, Inc.* | | | 8,532 | | | | 92,828 | |
| | |
Madrigal Pharmaceuticals, Inc.* | | | 1,402 | | | | 127,736 | |
| | |
Magenta Therapeutics, Inc.* | | | 3,598 | | | | 54,546 | |
| | |
MannKind Corp.* (a) | | | 34,601 | | | | 44,635 | |
| | |
Marker Therapeutics, Inc.* | | | 5,003 | | | | 14,409 | |
| | |
Medicines Co.* (a) | | | 13,595 | | | | 1,154,759 | |
| | |
MediciNova, Inc.* | | | 7,646 | | | | 51,534 | |
| | |
MEI Pharma, Inc.* | | | 12,566 | | | | 31,164 | |
| | |
MeiraGTx Holdings PLC* | | | 2,883 | | | | 57,718 | |
| | |
Mersana Therapeutics, Inc.* | | | 6,635 | | | | 38,019 | |
| | |
Millendo Therapeutics, Inc.* | | | 1,731 | | | | 11,667 | |
| | |
Minerva Neurosciences, Inc.* | | | 5,484 | | | | 38,991 | |
| | |
Mirati Therapeutics, Inc.* | | | 4,903 | | | | 631,801 | |
| | |
Mirum Pharmaceuticals, Inc.* | | | 350 | | | | 8,582 | |
| | |
Molecular Templates, Inc.* | | | 3,153 | | | | 44,095 | |
| | |
Momenta Pharmaceuticals, Inc.* | | | 17,922 | | | | 353,601 | |
| | |
Morphic Holding, Inc.* | | | 825 | | | | 14,157 | |
| | |
Mustang Bio, Inc.* | | | 5,138 | | | | 20,963 | |
| | |
Myriad Genetics, Inc.* | | | 12,894 | | | | 351,104 | |
| | |
Natera, Inc.* | | | 11,240 | | | | 378,676 | |
| | |
Neon Therapeutics, Inc.* | | | 2,468 | | | | 2,912 | |
| | |
NextCure, Inc.* | | | 2,543 | | | | 143,247 | |
| | |
Novavax, Inc.* (a) | | | 4,328 | | | | 17,225 | |
| | |
Oncocyte Corp.* | | | 3,973 | | | | 8,939 | |
| | |
OPKO Health, Inc.* (a) | | | 70,524 | | | | 103,670 | |
| | |
Organogenesis Holdings, Inc.* | | | 1,949 | | | | 9,375 | |
| | |
Oyster Point Pharma, Inc.* | | | 1,036 | | | | 25,320 | |
| | |
Palatin Technologies, Inc.* (a) | | | 36,862 | | | | 28,833 | |
| | |
PDL BioPharma, Inc.* | | | 20,120 | | | | 65,289 | |
| | |
Pfenex, Inc.* | | | 5,552 | | | | 60,961 | |
| | |
PhaseBio Pharmaceuticals, Inc.* | | | 2,535 | | | | 15,489 | |
| | |
Pieris Pharmaceuticals, Inc.* | | | 8,549 | | | | 30,947 | |
| | |
PolarityTE, Inc.* (a) | | | 2,587 | | | | 6,726 | |
| | |
Portola Pharmaceuticals, Inc.* | | | 13,776 | | | | 328,971 | |
| | |
Precision BioSciences, Inc.* | | | 6,473 | | | | 89,910 | |
| | |
Prevail Therapeutics, Inc.* | | | 1,256 | | | | 19,882 | |
| | |
Principia Biopharma, Inc.* | | | 3,315 | | | | 181,596 | |
| | |
Progenics Pharmaceuticals, Inc.* | | | 16,249 | | | | 82,707 | |
| | |
Protagonist Therapeutics, Inc.* | | | 2,800 | | | | 19,740 | |
| | |
Prothena Corp. PLC* | | | 6,903 | | | | 109,274 | |
| | |
PTC Therapeutics, Inc.* | | | 10,897 | | | | 523,383 | |
| | |
Puma Biotechnology, Inc.* | | | 5,734 | | | | 50,173 | |
| | |
Ra Pharmaceuticals, Inc.* | | | 6,201 | | | | 291,013 | |
| | |
Radius Health, Inc.* | | | 8,158 | | | | 164,465 | |
| | |
RAPT Therapeutics, Inc.* | | | 307 | | | | 8,476 | |
| | |
REGENXBIO, Inc.* | | | 6,069 | | | | 248,647 | |
| | |
Replimune Group, Inc.* | | | 2,057 | | | | 29,518 | |
| | |
Retrophin, Inc.* | | | 7,465 | | | | 106,003 | |
| | |
Rhythm Pharmaceuticals, Inc.* | | | 5,288 | | | | 121,412 | |
| | |
Rigel Pharmaceuticals, Inc.* | | | 30,323 | | | | 64,891 | |
| | | | | | | | |
| | | Shares | | | Value ($) | |
| | |
Rocket Pharmaceuticals, Inc.* | | | 5,495 | | | | 125,066 | |
| | |
Rubius Therapeutics, Inc.* (a) | | | 6,158 | | | | 58,501 | |
| | |
Sangamo Therapeutics, Inc.* | | | 20,879 | | | | 174,757 | |
| | |
Savara, Inc.* (a) | | | 5,281 | | | | 23,659 | |
| | |
Scholar Rock Holding Corp.* | | | 2,886 | | | | 38,037 | |
| | |
Seres Therapeutics, Inc.* | | | 6,353 | | | | 21,918 | |
| | |
Solid Biosciences, Inc.* | | | 3,463 | | | | 15,410 | |
| | |
Sorrento Therapeutics, Inc.* (a) | | | 22,186 | | | | 74,989 | |
| | |
Spectrum Pharmaceuticals, Inc.* | | | 20,078 | | | | 73,084 | |
| | |
Spero Therapeutics, Inc.* | | | 1,891 | | | | 18,182 | |
| | |
SpringWorks Therapeutics* | | | 1,886 | | | | 72,592 | |
| | |
Stemline Therapeutics, Inc.* | | | 7,979 | | | | 84,817 | |
| | |
Stoke Therapeutics, Inc.* | | | 1,603 | | | | 45,397 | |
| | |
Sutro Biopharma, Inc.* | | | 2,010 | | | | 22,110 | |
| | |
Syndax Pharmaceuticals, Inc.* | | | 3,711 | | | | 32,583 | |
| | |
Synlogic, Inc.* | | | 2,897 | | | | 7,474 | |
| | |
Synthorx, Inc.* | | | 1,677 | | | | 117,206 | |
| | |
Syros Pharmaceuticals, Inc.* | | | 6,399 | | | | 44,217 | |
| | |
TCR2 Therapeutics, Inc.* | | | 2,057 | | | | 29,374 | |
| | |
TG Therapeutics, Inc.* | | | 15,544 | | | | 172,538 | |
| | |
Tocagen, Inc.* | | | 3,709 | | | | 1,978 | |
| | |
Translate Bio, Inc.* | | | 6,316 | | | | 51,412 | |
| | |
Turning Point Therapeutics, Inc.* | | | 4,993 | | | | 311,014 | |
| | |
Twist Bioscience Corp.* | | | 4,061 | | | | 85,281 | |
| | |
Tyme Technologies, Inc.* (a) | | | 10,890 | | | | 15,246 | |
| | |
Ultragenyx Pharmaceutical, Inc.* | | | 9,809 | | | | 418,942 | |
| | |
UNITY Biotechnology, Inc.* | | | 5,127 | | | | 36,966 | |
| | |
UroGen Pharma Ltd.* | | | 3,335 | | | | 111,289 | |
| | |
Vanda Pharmaceuticals, Inc.* | | | 9,322 | | | | 152,974 | |
| | |
VBI Vaccines, Inc.* | | | 15,486 | | | | 21,371 | |
| | |
Veracyte, Inc.* | | | 8,540 | | | | 238,437 | |
| | |
Vericel Corp.* | | | 7,909 | | | | 137,617 | |
| | |
Viela Bio, Inc.* | | | 990 | | | | 26,879 | |
| | |
Viking Therapeutics, Inc.* (a) | | | 11,483 | | | | 92,094 | |
| | |
Vir Biotechnology, Inc.* | | | 1,320 | | | | 16,599 | |
| | |
Voyager Therapeutics, Inc.* | | | 4,299 | | | | 59,971 | |
| | |
X4 Pharmaceuticals, Inc.* | | | 2,077 | | | | 22,224 | |
| | |
XBiotech, Inc.* (a) | | | 3,468 | | | | 64,730 | |
| | |
Xencor, Inc.* | | | 8,459 | | | | 290,905 | |
| | |
Y-mAbs Therapeutics, Inc.* | | | 4,272 | | | | 133,500 | |
| | |
ZIOPHARM Oncology, Inc.* (a) | | | 28,949 | | | | 136,639 | |
| | | | | | | | |
| | | | 30,935,405 | |
|
Health Care Equipment & Supplies 3.8% | |
| | |
Accuray, Inc.* | | | 16,213 | | | | 45,721 | |
| | |
Alphatec Holdings, Inc.* | | | 6,539 | | | | 46,394 | |
| | |
AngioDynamics, Inc.* | | | 6,550 | | | | 104,866 | |
| | |
Antares Pharma, Inc.* | | | 28,531 | | | | 134,096 | |
| | |
Apyx Medical Corp.* | | | 6,141 | | | | 51,953 | |
| | |
AtriCure, Inc.* | | | 6,858 | | | | 222,954 | |
| | |
Atrion Corp. | | | 255 | | | | 191,633 | |
| | |
Avanos Medical, Inc.* | | | 8,446 | | | | 284,630 | |
| | |
AxoGen, Inc.* | | | 6,054 | | | | 108,306 | |
| | |
Axonics Modulation Technologies, Inc.* (a) | | | 2,742 | | | | 75,981 | |
| | |
BioLife Solutions, Inc.* | | | 1,230 | | | | 19,901 | |
| | |
BioSig Technologies, Inc.* | | | 2,887 | | | | 17,091 | |
| | |
Cardiovascular Systems, Inc.* | | | 6,276 | | | | 304,951 | |
| | |
Cerus Corp.* | | | 24,337 | | | | 102,702 | |
| | |
ConforMIS, Inc.* | | | 11,793 | | | | 17,690 | |
| | |
CONMED Corp. | | | 4,904 | | | | 548,414 | |
| | |
CryoLife, Inc.* | | | 6,627 | | | | 179,525 | |
| | |
CryoPort, Inc.* | | | 5,605 | | | | 92,258 | |
| | |
Cutera, Inc.* | | | 2,534 | | | | 90,743 | |
The accompanying notes are an integral part of the financial statements.
| | | | |
| DWS Small Cap Index VIP | | | | | 15 |
| | | | | | | | |
| | | Shares | | | Value ($) | |
| | |
CytoSorbents Corp.* | | | 6,162 | | | | 23,724 | |
| | |
ElectroCore, Inc.* (a) | | | 2,066 | | | | 3,285 | |
| | |
GenMark Diagnostics, Inc.* | | | 10,167 | | | | 48,903 | |
| | |
Glaukos Corp.* | | | 6,989 | | | | 380,691 | |
| | |
Globus Medical, Inc. “A”* | | | 13,692 | | | | 806,185 | |
| | |
Haemonetics Corp.* | | | 9,220 | | | | 1,059,378 | |
| | |
Heska Corp.* | | | 1,229 | | | | 117,910 | |
| | |
Inogen, Inc.* | | | 3,318 | | | | 226,719 | |
| | |
Integer Holdings Corp.* | | | 5,873 | | | | 472,365 | |
| | |
IntriCon, Corp.* | | | 1,565 | | | | 28,170 | |
| | |
Invacare Corp. | | | 6,316 | | | | 56,970 | |
| | |
iRadimed Corp.* | | | 898 | | | | 20,995 | |
| | |
iRhythm Technologies, Inc.* | | | 4,756 | | | | 323,836 | |
| | |
Lantheus Holdings, Inc.* | | | 6,931 | | | | 142,155 | |
| | |
LeMaitre Vascular, Inc. | | | 2,840 | | | | 102,098 | |
| | |
LivaNova PLC* | | | 8,736 | | | | 658,957 | |
| | |
Meridian Bioscience, Inc. | | | 7,763 | | | | 75,845 | |
| | |
Merit Medical Systems, Inc.* | | | 9,667 | | | | 301,804 | |
| | |
Mesa Laboratories, Inc. | | | 719 | | | | 179,319 | |
| | |
Misonix, Inc.* | | | 1,354 | | | | 25,198 | |
| | |
Natus Medical, Inc.* | | | 6,057 | | | | 199,820 | |
| | |
Neogen Corp.* | | | 9,213 | | | | 601,240 | |
| | |
Neuronetics, Inc.* | | | 2,597 | | | | 11,661 | |
| | |
Nevro Corp.* | | | 5,377 | | | | 632,013 | |
| | |
Novocure Ltd.* | | | 15,633 | | | | 1,317,393 | |
| | |
NuVasive, Inc.* | | | 9,333 | | | | 721,814 | |
| | |
OraSure Technologies, Inc.* | | | 10,882 | | | | 87,383 | |
| | |
Orthofix Medical, Inc.* | | | 3,255 | | | | 150,316 | |
| | |
OrthoPediatrics Corp.* | | | 1,617 | | | | 75,983 | |
| | |
Pulse Biosciences, Inc.* | | | 2,158 | | | | 28,939 | |
| | |
Quidel Corp.* | | | 6,378 | | | | 478,541 | |
| | |
Rockwell Medical, Inc.* | | | 10,285 | | | | 25,095 | |
| | |
RTI Surgical, Inc.* | | | 10,287 | | | | 28,186 | |
| | |
SeaSpine Holdings Corp.* | | | 3,080 | | | | 36,991 | |
| | |
Senseonics Holdings, Inc.* (a) | | | 19,640 | | | | 17,990 | |
| | |
Shockwave Medical, Inc.* | | | 4,584 | | | | 201,329 | |
| | |
SI-BONE, Inc.* | | | 2,960 | | | | 63,640 | |
| | |
Sientra, Inc.* | | | 6,752 | | | | 60,363 | |
| | |
Silk Road Medical, Inc.* | | | 2,890 | | | | 116,698 | |
| | |
Soliton, Inc.* (a) | | | 1,120 | | | | 12,298 | |
| | |
STAAR Surgical Co.* | | | 7,934 | | | | 279,039 | |
| | |
SurModics, Inc.* | | | 2,401 | | | | 99,473 | |
| | |
Tactile Systems Technology, Inc.* | | | 3,285 | | | | 221,770 | |
| | |
Tandem Diabetes Care, Inc.* | | | 10,077 | | | | 600,690 | |
| | |
TransEnterix, Inc.* (a) | | | 2,615 | | | | 3,844 | |
| | |
TransMedics Group, Inc.* | | | 2,544 | | | | 48,361 | |
| | |
Utah Medical Products, Inc. | | | 612 | | | | 66,035 | |
| | |
Vapotherm, Inc.* | | | 2,521 | | | | 30,655 | |
| | |
Varex Imaging Corp.* | | | 6,837 | | | | 203,811 | |
| | |
ViewRay, Inc.* | | | 12,383 | | | | 52,256 | |
| | |
Wright Medical Group NV* | | | 22,702 | | | | 691,957 | |
| | |
Zynex, Inc.* (a) | | | 2,874 | | | | 22,618 | |
| | | | | | | | |
| | | | 14,882,518 | |
|
Health Care Providers & Services 2.2% | |
| | |
Addus HomeCare Corp.* | | | 2,250 | | | | 218,745 | |
| | |
Amedisys, Inc.* | | | 5,645 | | | | 942,263 | |
| | |
American Renal Associates Holdings, Inc.* | | | 3,389 | | | | 35,144 | |
| | |
AMN Healthcare Services, Inc.* | | | 8,326 | | | | 518,793 | |
| | |
Apollo Medical Holdings, Inc.* | | | 1,143 | | | | 21,043 | |
| | |
Avalon GloboCare Corp.* (a) | | | 4,006 | | | | 7,732 | |
| | |
BioTelemetry, Inc.* | | | 5,925 | | | | 274,327 | |
| | |
Brookdale Senior Living, Inc.* | | | 33,446 | | | | 243,152 | |
| | | | | | | | |
| | | Shares | | | Value ($) | |
| | |
Catasys, Inc.* | | | 1,304 | | | | 21,268 | |
| | |
Community Health Systems, Inc.* | | | 15,932 | | | | 46,203 | |
| | |
CorVel Corp.* | | | 1,607 | | | | 140,387 | |
| | |
Cross Country Healthcare, Inc.* | | | 6,558 | | | | 76,204 | |
| | |
Diplomat Pharmacy, Inc.* | | | 10,684 | | | | 42,736 | |
| | |
Enzo Biochem, Inc.* | | | 8,562 | | | | 22,518 | |
| | |
Exagen, Inc.* | | | 584 | | | | 14,834 | |
| | |
Genesis Healthcare, Inc.* | | | 14,991 | | | | 24,585 | |
| | |
Hanger, Inc.* | | | 6,455 | | | | 178,223 | |
| | |
HealthEquity, Inc.* | | | 12,459 | | | | 922,838 | |
| | |
LHC Group, Inc.* | | | 5,421 | | | | 746,797 | |
| | |
Magellan Health, Inc.* | | | 3,968 | | | | 310,496 | |
| | |
National Healthcare Corp. | | | 2,208 | | | | 190,837 | |
| | |
National Research Corp. “A” | | | 2,150 | | | | 141,771 | |
| | |
Option Care Health, Inc.* | | | 21,460 | | | | 80,046 | |
| | |
Owens & Minor, Inc. | | | 10,583 | | | | 54,714 | |
| | |
Patterson Companies, Inc. | | | 15,033 | | | | 307,876 | |
| | |
Pennant Group, Inc.* | | | 4,520 | | | | 149,476 | |
| | |
PetIQ, Inc.* | | | 3,405 | | | | 85,295 | |
| | |
Progyny, Inc.* (a) | | | 2,095 | | | | 57,508 | |
| | |
Providence Service Corp.* | | | 2,081 | | | | 123,154 | |
| | |
R1 RCM, Inc.* | | | 18,687 | | | | 242,557 | |
| | |
RadNet, Inc.* | | | 7,464 | | | | 151,519 | |
| | |
Select Medical Holdings Corp.* | | | 19,821 | | | | 462,622 | |
| | |
Surgery Partners, Inc.* | | | 4,424 | | | | 69,258 | |
| | |
Tenet Healthcare Corp.* | | | 18,495 | | | | 703,365 | |
| | |
The Ensign Group, Inc. | | | 9,088 | | | | 412,323 | |
| | |
The Joint Corp.* | | | 2,412 | | | | 38,930 | |
| | |
Tivity Health, Inc.* | | | 8,532 | | | | 173,584 | |
| | |
Triple-S Management Corp. “B”* | | | 4,056 | | | | 74,995 | |
| | |
U.S. Physical Therapy, Inc. | | | 2,246 | | | | 256,830 | |
| | | | | | | | |
| | | | 8,584,948 | |
|
Health Care Technology 1.0% | |
| | |
Allscripts Healthcare Solutions, Inc.* | | | 28,876 | | | | 283,418 | |
| | |
Castlight Health, Inc. “B”* | | | 18,589 | | | | 24,723 | |
| | |
Computer Programs & Systems, Inc. | | | 2,346 | | | | 61,934 | |
| | |
Evolent Health, Inc. “A”* | | | 13,379 | | | | 121,080 | |
| | |
Health Catalyst, Inc.* (a) | | | 1,446 | | | | 50,176 | |
| | |
HealthStream, Inc.* | | | 4,638 | | | | 126,154 | |
| | |
HMS Holdings Corp.* | | | 15,829 | | | | 468,538 | |
| | |
Inovalon Holdings, Inc. “A”* | | | 13,168 | | | | 247,822 | |
| | |
Inspire Medical Systems, Inc.* | | | 2,401 | | | | 178,178 | |
| | |
Livongo Health, Inc.* (a) | | | 2,589 | | | | 64,880 | |
| | |
NextGen Healthcare, Inc.* | | | 9,814 | | | | 157,711 | |
| | |
Omnicell, Inc.* | | | 7,427 | | | | 606,935 | |
| | |
OptimizeRx Corp.* | | | 2,214 | | | | 22,738 | |
| | |
Phreesia, Inc.* | | | 1,819 | | | | 48,458 | |
| | |
Simulations Plus, Inc. | | | 2,244 | | | | 65,233 | |
| | |
Tabula Rasa HealthCare, Inc.* (a) | | | 3,528 | | | | 171,743 | |
| | |
Teladoc Health, Inc.* (a) | | | 12,984 | | | | 1,087,021 | |
| | |
Vocera Communications, Inc.* | | | 5,542 | | | | 115,052 | |
| | | | | | | | |
| | | | 3,901,794 | |
|
Life Sciences Tools & Services 0.9% | |
| | |
Accelerate Diagnostics, Inc.* (a) | | | 4,770 | | | | 80,613 | |
| | |
ChromaDex Corp.* (a) | | | 7,218 | | | | 31,110 | |
| | |
Codexis, Inc.* | | | 9,540 | | | | 152,545 | |
| | |
Fluidigm Corp.* | | | 12,384 | | | | 43,096 | |
| | |
Luminex Corp. | | | 7,538 | | | | 174,580 | |
| | |
Medpace Holdings, Inc.* | | | 4,969 | | | | 417,694 | |
| | |
NanoString Technologies, Inc.* | | | 5,958 | | | | 165,752 | |
| | |
NeoGenomics, Inc.* | | | 17,181 | | | | 502,544 | |
The accompanying notes are an integral part of the financial statements.
| | | | | | |
| | 16 | | | | | | DWS Small Cap Index VIP |
| | | | | | | | |
| | | Shares | | | Value ($) | |
| | |
Pacific Biosciences of California, Inc.* | | | 25,526 | | | | 131,204 | |
| | |
Personalis, Inc.* | | | 1,565 | | | | 17,058 | |
| | |
Quanterix Corp.* | | | 2,289 | | | | 54,089 | |
| | |
Repligen Corp.* | | | 9,410 | | | | 870,425 | |
| | |
Syneos Health, Inc.* | | | 11,208 | | | | 666,596 | |
| | | | | | | | |
| | | | 3,307,306 | |
|
Pharmaceuticals 1.9% | |
| | |
AcelRx Pharmaceuticals, Inc.* | | | 14,440 | | | | 30,468 | |
| | |
Acer Therapeutics, Inc.* | | | 1,214 | | | | 4,868 | |
| | |
Aclaris Therapeutics, Inc.* | | | 5,273 | | | | 9,966 | |
| | |
Aerie Pharmaceuticals, Inc.* (a) | | | 7,649 | | | | 184,876 | |
| | |
Akorn, Inc.* | | | 17,243 | | | | 25,865 | |
| | |
Amneal Pharmaceuticals, Inc.* | | | 21,168 | | | | 102,030 | |
| | |
Amphastar Pharmaceuticals, Inc.* | | | 6,423 | | | | 123,900 | |
| | |
ANI Pharmaceuticals, Inc.* | | | 1,633 | | | | 100,707 | |
| | |
Arvinas Holding Co. LLC* | | | 3,821 | | | | 157,005 | |
| | |
Assertio Therapeutics, Inc.* | | | 12,185 | | | | 15,231 | |
| | |
Axsome Therapeutics, Inc.* (a) | | | 4,531 | | | | 468,324 | |
| | |
BioDelivery Sciences International, Inc.* | | | 15,041 | | | | 95,059 | |
| | |
Cara Therapeutics, Inc.* (a) | | | 7,069 | | | | 113,882 | |
| | |
cbdMD, Inc.* | | | 1,747 | | | | 3,948 | |
| | |
Cerecor, Inc.* | | | 3,952 | | | | 21,301 | |
| | |
Chiasma, Inc.* | | | 6,557 | | | | 32,523 | |
| | |
Collegium Pharmaceutical, Inc.* | | | 5,705 | | | | 117,409 | |
| | |
Corcept Therapeutics, Inc.* | | | 17,284 | | | | 209,136 | |
| | |
CorMedix, Inc.* (a) | | | 4,352 | | | | 31,683 | |
| | |
Cymabay Therapeutics, Inc.* | | | 12,712 | | | | 24,916 | |
| | |
Dermira, Inc.* (a) | | | 8,606 | | | | 130,467 | |
| | |
Eloxx Pharmaceuticals, Inc.* (a) | | | 4,043 | | | | 29,757 | |
| | |
Endo International PLC* | | | 40,939 | | | | 192,004 | |
| | |
Evofem Biosciences, Inc.* | | | 2,606 | | | | 16,079 | |
| | |
Evolus, Inc.* | | | 3,305 | | | | 40,222 | |
| | |
EyePoint Pharmaceuticals, Inc.* | | | 11,389 | | | | 17,653 | |
| | |
Fulcrum Therapeutics, Inc.* | | | 720 | | | | 11,981 | |
| | |
Innoviva, Inc.* | | | 11,506 | | | | 162,925 | |
| | |
Intersect ENT, Inc.* | | | 5,464 | | | | 136,054 | |
| | |
Intra-Cellular Therapies, Inc.* (a) | | | 8,143 | | | | 279,386 | |
| | |
Kala Pharmaceuticals, Inc.* | | | 4,016 | | | | 14,819 | |
| | |
Kaleido Biosciences, Inc.* (a) | | | 2,314 | | | | 11,616 | |
| | |
Lannett Co., Inc.* (a) | | | 5,971 | | | | 52,664 | |
| | |
Liquidia Technologies, Inc.* | | | 2,474 | | | | 10,576 | |
| | |
Mallinckrodt PLC* (a) | | | 15,017 | | | | 52,409 | |
| | |
Marinus Pharmaceuticals, Inc.* | | | 9,640 | | | | 20,822 | |
| | |
Menlo Therapeutics, Inc.* | | | 2,839 | | | | 13,173 | |
| | |
MyoKardia, Inc.* | | | 7,994 | | | | 582,643 | |
| | |
NGM Biopharmaceuticals, Inc.* (a) | | | 4,375 | | | | 80,894 | |
| | |
Ocular Therapeutix, Inc.* (a) | | | 7,234 | | | | 28,574 | |
| | |
Odonate Therapeutics, Inc.* | | | 2,080 | | | | 67,496 | |
| | |
Omeros Corp.* (a) | | | 8,327 | | | | 117,327 | |
| | |
Optinose, Inc.* | | | 4,592 | | | | 42,338 | |
| | |
Osmotica Pharmaceuticals PLC* (a) | | | 1,755 | | | | 12,267 | |
| | |
Pacira BioSciences, Inc.* | | | 7,298 | | | | 330,599 | |
| | |
Paratek Pharmaceuticals, Inc.* | | | 5,751 | | | | 23,177 | |
| | |
Phathom Pharmaceuticals, Inc.* | | | 1,920 | | | | 59,789 | |
| | |
Phibro Animal Health Corp. “A” | | | 3,626 | | | | 90,034 | |
| | |
Prestige Consumer Healthcare, Inc.* | | | 9,122 | | | | 369,441 | |
| | |
Reata Pharmaceuticals, Inc. “A”* | | | 4,023 | | | | 822,422 | |
| | |
Recro Pharma, Inc.* | | | 3,553 | | | | 65,127 | |
| | |
resTORbio, Inc.* | | | 2,759 | | | | 4,111 | |
| | | | | | | | |
| | | Shares | | | Value ($) | |
| | |
Revance Therapeutics, Inc.* | | | 8,210 | | | | 133,248 | |
| | |
Satsuma Pharmaceuticals, Inc.* | | | 776 | | | | 15,272 | |
| | |
SIGA Technologies, Inc.* | | | 10,568 | | | | 50,409 | |
| | |
Strongbridge Biopharma PLC* | | | 6,681 | | | | 13,963 | |
| | |
Supernus Pharmaceuticals, Inc.* | | | 8,972 | | | | 212,816 | |
| | |
TherapeuticsMD, Inc.* (a) | | | 39,716 | | | | 96,113 | |
| | |
Theravance Biopharma, Inc.* | | | 8,161 | | | | 211,288 | |
| | |
Tricida, Inc.* | | | 3,903 | | | | 147,299 | |
| | |
Verrica Pharmaceuticals, Inc.* | | | 2,378 | | | | 37,786 | |
| | |
WaVe Life Sciences Ltd.* | | | 3,991 | | | | 31,988 | |
| | |
Xeris Pharmaceuticals, Inc.* | | | 4,920 | | | | 34,686 | |
| | |
Zogenix, Inc.* | | | 7,679 | | | | 400,306 | |
| | |
Zynerba Pharmaceuticals, Inc.* | | | 3,839 | | | | 23,188 | |
| | | | | | | | |
| | | | 7,170,305 | |
|
| Industrials 15.5% | |
Aerospace & Defense 1.2% | |
| | |
AAR Corp. | | | 6,062 | | | | 273,396 | |
| | |
Aerojet Rocketdyne Holdings, Inc.* | | | 13,144 | | | | 600,155 | |
| | |
AeroVironment, Inc.* | | | 3,877 | | | | 239,366 | |
| | |
Astronics Corp.* | | | 4,025 | | | | 112,499 | |
| | |
Axon Enterprise, Inc.* | | | 10,493 | | | | 768,927 | |
| | |
Cubic Corp. | | | 5,625 | | | | 357,581 | |
| | |
Ducommun, Inc.* | | | 1,905 | | | | 96,260 | |
| | |
Kratos Defense & Security Solutions, Inc.* | | | 16,288 | | | | 293,347 | |
| | |
Maxar Technologies, Inc.* (a) | | | 10,633 | | | | 166,619 | |
| | |
Mercury Systems, Inc.* | | | 9,761 | | | | 674,583 | |
| | |
Moog, Inc. “A” | | | 5,815 | | | | 496,194 | |
| | |
National Presto Industries, Inc. | | | 857 | | | | 75,750 | |
| | |
Park Aerospace Corp. | | | 3,539 | | | | 57,580 | |
| | |
Parsons Corp.* | | | 3,466 | | | | 143,076 | |
| | |
Triumph Group, Inc. | | | 9,016 | | | | 227,834 | |
| | |
Vectrus, Inc.* | | | 1,973 | | | | 101,136 | |
| | |
Wesco Aircraft Holdings, Inc.* | | | 9,767 | | | | 107,632 | |
| | | | | | | | |
| | | | 4,791,935 | |
|
Air Freight & Logistics 0.3% | |
| | |
Air Transport Services Group, Inc.* | | | 10,604 | | | | 248,770 | |
| | |
Atlas Air Worldwide Holdings, Inc.* | | | 4,223 | | | | 116,428 | |
| | |
Echo Global Logistics, Inc.* | | | 4,696 | | | | 97,207 | |
| | |
Forward Air Corp. | | | 5,049 | | | | 353,178 | |
| | |
Hub Group, Inc. “A”* | | | 5,817 | | | | 298,354 | |
| | |
Radiant Logistics, Inc.* | | | 7,206 | | | | 40,137 | |
| | | | | | | | |
| | | | 1,154,074 | |
|
Airlines 0.5% | |
| | |
Allegiant Travel Co. | | | 2,343 | | | | 407,776 | |
| | |
Hawaiian Holdings, Inc. | | | 8,355 | | | | 244,718 | |
| | |
Mesa Air Group, Inc.* | | | 3,860 | | | | 34,508 | |
| | |
SkyWest, Inc. | | | 8,804 | | | | 569,003 | |
| | |
Spirit Airlines, Inc.* | | | 12,324 | | | | 496,780 | |
| | | | | | | | |
| | | | 1,752,785 | |
|
Building Products 1.5% | |
| | |
AAON, Inc. | | | 7,426 | | | | 366,919 | |
| | |
Advanced Drainage Systems, Inc. | | | 7,748 | | | | 300,932 | |
| | |
American Woodmark Corp.* | | | 3,027 | | | | 316,352 | |
| | |
Apogee Enterprises, Inc. | | | 4,781 | | | | 155,383 | |
| | |
Armstrong Flooring, Inc.* | | | 3,852 | | | | 16,448 | |
| | |
Builders FirstSource, Inc.* | | | 20,548 | | | | 522,125 | |
| | |
Caesarstone Ltd. | | | 4,164 | | | | 62,751 | |
The accompanying notes are an integral part of the financial statements.
| | | | |
| DWS Small Cap Index VIP | | | | | 17 |
| | | | | | | | |
| | | Shares | | | Value ($) | |
| | |
Continental Building Products, Inc.* | | | 6,242 | | | | 227,396 | |
| | |
Cornerstone Building Brands, Inc.* | | | 8,050 | | | | 68,506 | |
| | |
CSW Industrials, Inc. | | | 2,695 | | | | 207,515 | |
| | |
Gibraltar Industries, Inc.* | | | 5,784 | | | | 291,745 | |
| | |
Griffon Corp. | | | 6,467 | | | | 131,474 | |
| | |
Insteel Industries, Inc. | | | 3,409 | | | | 73,259 | |
| | |
JELD-WEN Holding, Inc.* | | | 12,235 | | | | 286,421 | |
| | |
Masonite International Corp.* | | | 4,381 | | | | 316,352 | |
| | |
Patrick Industries, Inc. | | | 4,100 | | | | 214,963 | |
| | |
PGT Innovations, Inc.* | | | 10,189 | | | | 151,918 | |
| | |
Quanex Building Products Corp. | | | 5,766 | | | | 98,483 | |
| | |
Simpson Manufacturing Co., Inc. | | | 8,070 | | | | 647,456 | |
| | |
Trex Co., Inc.* | | | 10,573 | | | | 950,301 | |
| | |
Universal Forest Products, Inc. | | | 10,715 | | | | 511,106 | |
| | | | | | | | |
| | | | 5,917,805 | |
|
Commercial Services & Supplies 2.7% | |
| | |
ABM Industries, Inc. | | | 12,016 | | | | 453,123 | |
| | |
Acco Brands Corp. | | | 16,969 | | | | 158,830 | |
| | |
Advanced Disposal Services, Inc.* | | | 13,097 | | | | 430,498 | |
| | |
Brady Corp. “A” | | | 8,562 | | | | 490,260 | |
| | |
BrightView Holdings, Inc.* | | | 5,527 | | | | 93,240 | |
| | |
Casella Waste Systems, Inc. “A”* | | | 8,219 | | | | 378,321 | |
| | |
CECO Environmental Corp.* | | | 5,409 | | | | 41,433 | |
| | |
Charah Solutions, Inc.* | | | 1,307 | | | | 3,189 | |
| | |
Cimpress PLC* | | | 3,570 | | | | 448,999 | |
| | |
CompX International, Inc. | | | 395 | | | | 5,763 | |
| | |
Covanta Holding Corp. | | | 21,091 | | | | 312,990 | |
| | |
Deluxe Corp. | | | 7,533 | | | | 376,047 | |
| | |
Ennis, Inc. | | | 4,687 | | | | 101,474 | |
| | |
Harsco Corp.* | | | 13,889 | | | | 319,586 | |
| | |
Healthcare Services Group, Inc. | | | 13,293 | | | | 323,286 | |
| | |
Heritage-Crystal Clean, Inc.* | | | 2,646 | | | | 83,005 | |
| | |
Herman Miller, Inc. | | | 10,611 | | | | 441,948 | |
| | |
HNI Corp. | | | 7,635 | | | | 286,007 | |
| | |
Interface, Inc. | | | 10,407 | | | | 172,652 | |
| | |
Kimball International, Inc. “B” | | | 6,298 | | | | 130,180 | |
| | |
Knoll, Inc. | | | 8,886 | | | | 224,460 | |
| | |
Matthews International Corp. “A” | | | 5,559 | | | | 212,187 | |
| | |
McGrath RentCorp. | | | 4,379 | | | | 335,169 | |
| | |
Mobile Mini, Inc. | | | 7,821 | | | | 296,494 | |
| | |
MSA Safety, Inc. | | | 6,363 | | | | 804,029 | |
| | |
NL Industries, Inc.* | | | 1,487 | | | | 5,814 | |
| | |
PICO Holdings, Inc.* | | | 2,794 | | | | 31,069 | |
| | |
Pitney Bowes, Inc. | | | 30,260 | | | | 121,948 | |
| | |
Quad Graphics, Inc. | | | 5,771 | | | | 26,951 | |
| | |
R.R. Donnelley & Sons Co. | | | 12,460 | | | | 49,217 | |
| | |
SP Plus Corp.* | | | 4,086 | | | | 173,369 | |
| | |
Steelcase, Inc. “A” | | | 15,792 | | | | 323,104 | |
| | |
Team, Inc.* | | | 5,479 | | | | 87,500 | |
| | |
Tetra Tech, Inc. | | | 9,802 | | | | 844,540 | |
| | |
The Brink’s Co. | | | 8,984 | | | | 814,669 | |
| | |
U.S. Ecology, Inc. | | | 4,342 | | | | 251,445 | |
| | |
UniFirst Corp. | | | 2,711 | | | | 547,568 | |
| | |
Viad Corp. | | | 3,655 | | | | 246,713 | |
| | |
VSE Corp. | | | 1,588 | | | | 60,408 | |
| | | | | | | | |
| | | | 10,507,485 | |
|
Construction & Engineering 1.1% | |
| | |
Aegion Corp.* | | | 5,437 | | | | 121,626 | |
| | |
Ameresco, Inc. “A”* | | | 4,055 | | | | 70,963 | |
| | |
Arcosa, Inc. | | | 8,780 | | | | 391,149 | |
| | |
Argan, Inc. | | | 2,686 | | | | 107,816 | |
| | | | | | | | |
| | | Shares | | | Value ($) | |
| | |
Comfort Systems U.S.A., Inc. | | | 6,586 | | | | 328,312 | |
| | |
Concrete Pumping Holdings, Inc.* | | | 3,502 | | | | 19,156 | |
| | |
Construction Partners, Inc. “A”* | | | 3,100 | | | | 52,297 | |
| | |
Dycom Industries, Inc.* | | | 5,446 | | | | 256,779 | |
| | |
EMCOR Group, Inc. | | | 10,046 | | | | 866,970 | |
| | |
Granite Construction, Inc. | | | 8,517 | | | | 235,665 | |
| | |
Great Lakes Dredge & Dock Corp.* | | | 10,871 | | | | 123,168 | |
| | |
IES Holdings, Inc.* | | | 1,464 | | | | 37,566 | |
| | |
MasTec, Inc.* | | | 10,805 | | | | 693,249 | |
| | |
MYR Group, Inc.* | | | 2,804 | | | | 91,382 | |
| | |
Northwest Pipe Co.* | | | 1,699 | | | | 56,594 | |
| | |
NV5 Holdings, Inc.* | | | 1,830 | | | | 92,323 | |
| | |
Primoris Services Corp. | | | 7,979 | | | | 177,453 | |
| | |
Sterling Construction Co., Inc.* | | | 4,636 | | | | 65,275 | |
| | |
Tutor Perini Corp.* | | | 7,088 | | | | 91,152 | |
| | |
Willscot Corp.* | | | 9,265 | | | | 171,310 | |
| | | | | | | | |
| | | | 4,050,205 | |
|
Electrical Equipment 0.9% | |
| | |
Allied Motion Technologies, Inc. | | | 1,304 | | | | 63,244 | |
| | |
American Superconductor Corp.* | | | 3,878 | | | | 30,442 | |
| | |
Atkore International Group, Inc.* | | | 8,403 | | | | 339,985 | |
| | |
AZZ, Inc. | | | 4,751 | | | | 218,309 | |
| | |
Bloom Energy Corp. “A”* | | | 9,854 | | | | 73,609 | |
| | |
Encore Wire Corp. | | | 3,636 | | | | 208,706 | |
| | |
Energous Corp.* | | | 5,624 | | | | 9,955 | |
| | |
EnerSys | | | 7,704 | | | | 576,490 | |
| | |
Generac Holdings, Inc.* | | | 11,014 | | | | 1,107,898 | |
| | |
Plug Power, Inc.* (a) | | | 44,574 | | | | 140,854 | |
| | |
Powell Industries, Inc. | | | 1,557 | | | | 76,277 | |
| | |
Preformed Line Products Co. | | | 538 | | | | 32,468 | |
| | |
Sunrun, Inc.* | | | 20,452 | | | | 282,442 | |
| | |
Thermon Group Holdings, Inc.* | | | 5,847 | | | | 156,700 | |
| | |
TPI Composites, Inc.* | | | 5,166 | | | | 95,623 | |
| | |
Vicor Corp.* | | | 3,162 | | | | 147,729 | |
| | |
Vivint Solar, Inc.* | | | 8,048 | | | | 58,429 | |
| | | | | | | | |
| | | | 3,619,160 | |
|
Industrial Conglomerates 0.1% | |
Raven Industries, Inc. | | | 6,480 | | | | 223,301 | |
|
Machinery 3.7% | |
| | |
Actuant Corp. “A” | | | 9,649 | | | | 251,164 | |
| | |
Alamo Group, Inc. | | | 1,755 | | | | 220,340 | |
| | |
Albany International Corp. “A” | | | 5,536 | | | | 420,293 | |
| | |
Altra Industrial Motion Corp. | | | 11,520 | | | | 417,139 | |
| | |
Astec Industries, Inc. | | | 4,105 | | | | 172,410 | |
| | |
Barnes Group, Inc. | | | 8,489 | | | | 525,978 | |
| | |
Blue Bird Corp.* | | | 2,537 | | | | 58,148 | |
| | |
Briggs & Stratton Corp. | | | 7,536 | | | | 50,190 | |
| | |
Chart Industries, Inc.* | | | 6,454 | | | | 435,580 | |
| | |
CIRCOR International, Inc.* | | | 3,510 | | | | 162,302 | |
| | |
Columbus McKinnon Corp. | | | 4,093 | | | | 163,843 | |
| | |
Commercial Vehicle Group, Inc.* | | | 5,504 | | | | 34,950 | |
| | |
Douglas Dynamics, Inc. | | | 4,025 | | | | 221,375 | |
| | |
Energy Recovery, Inc.* | | | 7,028 | | | | 68,804 | |
| | |
EnPro Industries, Inc. | | | 3,750 | | | | 250,800 | |
| | |
ESCO Technologies, Inc. | | | 4,610 | | | | 426,425 | |
| | |
Evoqua Water Technologies Corp.* | | | 13,506 | | | | 255,939 | |
| | |
Federal Signal Corp. | | | 10,733 | | | | 346,139 | |
| | |
Franklin Electric Co., Inc. | | | 8,297 | | | | 475,584 | |
| | |
Gencor Industries, Inc.* | | | 1,725 | | | | 20,131 | |
| | |
Gorman-Rupp Co. | | | 3,224 | | | | 120,900 | |
The accompanying notes are an integral part of the financial statements.
| | | | | | |
| | 18 | | | | | | DWS Small Cap Index VIP |
| | | | | | | | |
| | | Shares | | | Value ($) | |
| | |
Graham Corp. | | | 1,799 | | | | 39,362 | |
| | |
Greenbrier Companies, Inc. | | | 5,789 | | | | 187,737 | |
| | |
Helios Technologies, Inc. | | | 5,243 | | | | 242,384 | |
| | |
Hillenbrand, Inc. | | | 13,103 | | | | 436,461 | |
| | |
Hurco Companies, Inc. | | | 1,178 | | | | 45,188 | |
| | |
Hyster-Yale Materials Handling, Inc. | | | 1,785 | | | | 105,244 | |
| | |
John Bean Technologies Corp. | | | 5,617 | | | | 632,811 | |
| | |
Kadant, Inc. | | | 1,977 | | | | 208,257 | |
| | |
Kennametal, Inc. | | | 14,753 | | | | 544,238 | |
| | |
L.B. Foster Co. “A”* | | | 1,846 | | | | 35,776 | |
| | |
Lindsay Corp. | | | 1,944 | | | | 186,605 | |
| | |
Luxfer Holdings PLC | | | 4,835 | | | | 89,496 | |
| | |
Lydall, Inc.* | | | 3,147 | | | | 64,576 | |
| | |
Manitowoc Co., Inc.* | | | 6,384 | | | | 111,720 | |
| | |
Meritor, Inc.* | | | 13,363 | | | | 349,977 | |
| | |
Miller Industries, Inc. | | | 1,885 | | | | 69,990 | |
| | |
Mueller Industries, Inc. | | | 9,926 | | | | 315,151 | |
| | |
Mueller Water Products, Inc. “A” | | | 28,466 | | | | 341,023 | |
| | |
Navistar International Corp.* | | | 8,887 | | | | 257,190 | |
| | |
NN, Inc. | | | 7,172 | | | | 66,341 | |
| | |
Omega Flex, Inc. | | | 542 | | | | 58,151 | |
| | |
Park-Ohio Holdings Corp. | | | 1,505 | | | | 50,643 | |
| | |
Proto Labs, Inc.* | | | 4,873 | | | | 494,853 | |
| | |
RBC Bearings, Inc.* | | | 4,369 | | | | 691,787 | |
| | |
REV Group, Inc. | | | 4,650 | | | | 56,870 | |
| | |
Rexnord Corp.* | | | 19,185 | | | | 625,815 | |
| | |
Spartan Motors, Inc. | | | 5,864 | | | | 106,021 | |
| | |
SPX Corp.* | | | 7,914 | | | | 402,664 | |
| | |
SPX FLOW, Inc.* | | | 7,538 | | | | 368,382 | |
| | |
Standex International Corp. | | | 2,242 | | | | 177,903 | |
| | |
Tennant Co. | | | 3,262 | | | | 254,175 | |
| | |
Terex Corp. | | | 11,401 | | | | 339,522 | |
| | |
The Eastern Co. | | | 1,014 | | | | 30,957 | |
| | |
Titan International, Inc. | | | 9,043 | | | | 32,736 | |
| | |
TriMas Corp.* | | | 8,126 | | | | 255,238 | |
| | |
Twin Disc, Inc.* | | | 2,015 | | | | 22,205 | |
| | |
Wabash National Corp. | | | 9,550 | | | | 140,290 | |
| | |
Watts Water Technologies, Inc. “A” | | | 4,952 | | | | 494,012 | |
| | |
Welbilt, Inc.* | | | 23,399 | | | | 365,258 | |
| | | | | | | | |
| | | | 14,395,443 | |
|
Marine 0.1% | |
| | |
Costamare, Inc. | | | 9,549 | | | | 91,002 | |
| | |
Eagle Bulk Shipping, Inc.* | | | 7,643 | | | | 35,158 | |
| | |
Genco Shipping & Trading Ltd. | | | 2,821 | | | | 29,959 | |
| | |
Matson, Inc. | | | 7,622 | | | | 310,977 | |
| | |
Safe Bulkers, Inc.* | | | 9,520 | | | | 16,184 | |
| | |
Scorpio Bulkers, Inc. | | | 10,057 | | | | 64,063 | |
| | | | | | | | |
| | | | 547,343 | |
|
Professional Services 1.5% | |
| | |
Acacia Research Corp.* | | | 8,909 | | | | 23,698 | |
| | |
ASGN, Inc.* | | | 9,179 | | | | 651,434 | |
| | |
Barrett Business Services, Inc. | | | 1,308 | | | | 118,322 | |
| | |
BG Staffing, Inc. | | | 1,876 | | | | 41,066 | |
| | |
CBIZ, Inc.* | | | 9,256 | | | | 249,542 | |
| | |
CRA International, Inc. | | | 1,291 | | | | 70,321 | |
| | |
Exponent, Inc. | | | 9,317 | | | | 642,966 | |
| | |
Forrester Research, Inc. | | | 1,987 | | | | 82,858 | |
| | |
Franklin Covey Co.* | | | 1,793 | | | | 57,788 | |
| | |
FTI Consulting, Inc.* | | | 6,713 | | | | 742,861 | |
| | |
GP Strategies Corp.* | | | 2,366 | | | | 31,302 | |
| | | | | | | | |
| | | Shares | | | Value ($) | |
| | |
Heidrick & Struggles International, Inc. | | | 3,351 | | | | 108,907 | |
| | |
Huron Consulting Group, Inc.* | | | 4,004 | | | | 275,155 | |
| | |
ICF International, Inc. | | | 3,280 | | | | 300,514 | |
| | |
Innerworkings, Inc.* | | | 8,230 | | | | 45,347 | |
| | |
Insperity, Inc. | | | 6,738 | | | | 579,737 | |
| | |
Kelly Services, Inc. “A” | | | 5,961 | | | | 134,599 | |
| | |
Kforce, Inc. | | | 3,588 | | | | 142,444 | |
| | |
Korn/Ferry International | | | 10,126 | | | | 429,342 | |
| | |
Mistras Group, Inc.* | | | 2,950 | | | | 42,096 | |
| | |
Resources Connection, Inc. | | | 5,352 | | | | 87,398 | |
| | |
TriNet Group, Inc.* | | | 8,052 | | | | 455,824 | |
| | |
TrueBlue, Inc.* | | | 6,731 | | | | 161,948 | |
| | |
Upwork, Inc.* | | | 10,386 | | | | 110,819 | |
| | |
Willdan Group, Inc.* | | | 1,863 | | | | 59,206 | |
| | | | | | | | |
| | | | 5,645,494 | |
|
Road & Rail 0.5% | |
| | |
ArcBest Corp. | | | 4,670 | | | | 128,892 | |
| | |
Avis Budget Group, Inc.* | | | 10,283 | | | | 331,524 | |
| | |
Covenant Transportation Group, Inc. “A”* | | | 2,308 | | | | 29,831 | |
| | |
Daseke, Inc.* | | | 8,679 | | | | 27,426 | |
| | |
Heartland Express, Inc. | | | 8,153 | | | | 171,621 | |
| | |
Hertz Global Holdings, Inc.* | | | 18,201 | | | | 286,666 | |
| | |
Marten Transport Ltd. | | | 7,079 | | | | 152,128 | |
| | |
P.A.M. Transportation Services, Inc.* | | | 333 | | | | 19,217 | |
| | |
Roadrunner Transportation Systems, Inc.* | | | 653 | | | | 6,014 | |
| | |
Saia, Inc.* | | | 4,668 | | | | 434,684 | |
| | |
U.S. Xpress Enterprises, Inc. “A”* | | | 3,914 | | | | 19,687 | |
| | |
Universal Logistics Holdings, Inc. | | | 1,573 | | | | 29,824 | |
| | |
Werner Enterprises, Inc. | | | 8,083 | | | | 294,140 | |
| | |
YRC Worldwide, Inc.* | | | 6,102 | | | | 15,560 | |
| | | | | | | | |
| | | | 1,947,214 | |
|
Trading Companies & Distributors 1.4% | |
| | |
Aircastle Ltd. | | | 9,365 | | | | 299,774 | |
| | |
Applied Industrial Technologies, Inc. | | | 6,885 | | | | 459,161 | |
| | |
Beacon Roofing Supply, Inc.* | | | 12,303 | | | | 393,450 | |
| | |
BlueLinx Holdings, Inc.* (a) | | | 1,673 | | | | 23,840 | |
| | |
BMC Stock Holdings, Inc.* | | | 11,937 | | | | 342,473 | |
| | |
CAI International, Inc.* | | | 3,038 | | | | 88,041 | |
| | |
DXP Enterprises, Inc.* | | | 2,893 | | | | 115,170 | |
| | |
EVI Industries, Inc. (a) | | | 839 | | | | 22,687 | |
| | |
Foundation Building Materials, Inc.* | | | 3,640 | | | | 70,434 | |
| | |
GATX Corp. | | | 6,219 | | | | 515,244 | |
| | |
General Finance Corp.* | | | 1,969 | | | | 21,797 | |
| | |
GMS, Inc.* | | | 7,135 | | | | 193,216 | |
| | |
H&E Equipment Services, Inc. | | | 5,737 | | | | 191,788 | |
| | |
Herc Holdings, Inc.* | | | 4,348 | | | | 212,791 | |
| | |
Kaman Corp. | | | 4,934 | | | | 325,249 | |
| | |
Lawson Products, Inc.* | | | 770 | | | | 40,117 | |
| | |
MRC Global, Inc.* | | | 13,953 | | | | 190,319 | |
| | |
NOW, Inc.* | | | 19,300 | | | | 216,932 | |
| | |
Rush Enterprises, Inc. “A” | | | 4,962 | | | | 230,733 | |
| | |
Rush Enterprises, Inc. “B” | | | 817 | | | | 37,337 | |
| | |
SiteOne Landscape Supply, Inc.* | | | 7,330 | | | | 664,464 | |
| | |
Systemax, Inc. | | | 2,247 | | | | 56,534 | |
| | |
Textainer Group Holdings Ltd.* | | �� | 9,467 | | | | 101,392 | |
| | |
Titan Machinery, Inc.* | | | 3,231 | | | | 47,754 | |
| | |
Transcat, Inc.* | | | 1,257 | | | | 40,048 | |
The accompanying notes are an integral part of the financial statements.
| | | | |
| DWS Small Cap Index VIP | | | | | 19 |
| | | | | | | | |
| | | Shares | | | Value ($) | |
| | |
Triton International Ltd. | | | 9,590 | | | | 385,518 | |
| | |
Veritiv Corp.* | | | 2,394 | | | | 47,090 | |
| | |
Willis Lease Finance Corp.* | | | 491 | | | | 28,925 | |
| | | | | | | | |
| | | | 5,362,278 | |
|
| Information Technology 13.3% | |
Communications Equipment 1.1% | |
| | |
Acacia Communications, Inc.* | | | 6,823 | | | | 462,668 | |
| | |
ADTRAN, Inc. | | | 8,648 | | | | 85,529 | |
| | |
Applied Optoelectronics, Inc.* (a) | | | 3,437 | | | | 40,832 | |
| | |
CalAmp Corp.* | | | 5,697 | | | | 54,577 | |
| | |
Calix, Inc.* | | | 8,610 | | | | 68,880 | |
| | |
Cambium Networks Corp.* | | | 952 | | | | 8,320 | |
| | |
Casa Systems, Inc.* | | | 5,871 | | | | 24,012 | |
| | |
Clearfield, Inc.* | | | 2,171 | | | | 30,264 | |
| | |
Comtech Telecommunications Corp. | | | 4,201 | | | | 149,093 | |
| | |
DASAN Zhone Solutions, Inc.* | | | 1,081 | | | | 9,578 | |
| | |
Digi International, Inc.* | | | 5,146 | | | | 91,187 | |
| | |
Extreme Networks, Inc.* | | | 21,001 | | | | 154,777 | |
| | |
Harmonic, Inc.* | | | 15,702 | | | | 122,476 | |
| | |
Infinera Corp.* | | | 32,386 | | | | 257,145 | |
| | |
Inseego Corp.* (a) | | | 8,243 | | | | 60,421 | |
| | |
InterDigital, Inc. | | | 5,615 | | | | 305,961 | |
| | |
KVH Industries, Inc.* | | | 2,950 | | | | 32,834 | |
| | |
Lumentum Holdings, Inc.* | | | 13,895 | | | | 1,101,874 | |
| | |
NETGEAR, Inc.* | | | 5,281 | | | | 129,437 | |
| | |
NetScout Systems, Inc.* | | | 13,069 | | | | 314,571 | |
| | |
Plantronics, Inc. | | | 6,095 | | | | 166,637 | |
| | |
Ribbon Communications, Inc.* | | | 11,054 | | | | 34,267 | |
| | |
TESSCO Technologies, Inc. | | | 1,151 | | | | 12,914 | |
| | |
Viavi Solutions, Inc.* | | | 41,336 | | | | 620,040 | |
| | | | | | | | |
| | | | 4,338,294 | |
|
Electronic Equipment, Instruments & Components 2.6% | |
| | |
Airgain, Inc.* | | | 1,707 | | | | 18,248 | |
| | |
Akoustis Technologies, Inc.* | | | 4,631 | | | | 37,048 | |
| | |
Anixter International, Inc.* | | | 5,456 | | | | 502,498 | |
| | |
Arlo Technologies, Inc.* | | | 12,790 | | | | 53,846 | |
| | |
AVX Corp. | | | 8,432 | | | | 172,603 | |
| | |
Badger Meter, Inc. | | | 5,148 | | | | 334,260 | |
| | |
Bel Fuse, Inc. “B” | | | 1,744 | | | | 35,752 | |
| | |
Belden, Inc. | | | 7,050 | | | | 387,750 | |
| | |
Benchmark Electronics, Inc. | | | 6,524 | | | | 224,165 | |
| | |
Coda Octopus Group, Inc.* | | | 856 | | | | 7,165 | |
| | |
CTS Corp. | | | 5,816 | | | | 174,538 | |
| | |
Daktronics, Inc. | | | 6,822 | | | | 41,546 | |
| | |
ePlus, Inc.* | | | 2,398 | | | | 202,127 | |
| | |
Fabrinet* | | | 6,570 | | | | 425,999 | |
| | |
FARO Technologies, Inc.* | | | 3,093 | | | | 155,733 | |
| | |
Fitbit, Inc. “A”* | | | 39,911 | | | | 262,215 | |
| | |
II-VI, Inc.* | | | 16,146 | | | | 543,636 | |
| | |
Insight Enterprises, Inc.* | | | 6,245 | | | | 438,961 | |
| | |
Iteris, Inc.* | | | 7,226 | | | | 36,058 | |
| | |
Itron, Inc.* | | | 6,153 | | | | 516,544 | |
| | |
KEMET Corp. | | | 10,308 | | | | 278,831 | |
| | |
Kimball Electronics, Inc.* | | | 4,366 | | | | 76,623 | |
| | |
Knowles Corp.* | | | 14,580 | | | | 308,367 | |
| | |
Methode Electronics, Inc. | | | 6,610 | | | | 260,103 | |
| | |
MTS Systems Corp. | | | 3,251 | | | | 156,146 | |
| | |
Napco Security Technologies, Inc.* | | | 2,167 | | | | 63,688 | |
| | |
nLight, Inc.* | | | 6,084 | | | | 123,383 | |
| | |
Novanta, Inc.* | | | 6,045 | | | | 534,620 | |
| | |
OSI Systems, Inc.* | | | 3,002 | | | | 302,421 | |
| | | | | | | | |
| | | Shares | | | Value ($) | |
| | |
PAR Technology Corp.* (a) | | | 2,181 | | | | 67,044 | |
| | |
PC Connection, Inc. | | | 1,994 | | | | 99,022 | |
| | |
Plexus Corp.* | | | 5,185 | | | | 398,934 | |
| | |
Rogers Corp.* | | | 3,320 | | | | 414,104 | |
| | |
Sanmina Corp.* | | | 12,230 | | | | 418,755 | |
| | |
ScanSource, Inc.* | | | 4,634 | | | | 171,226 | |
| | |
Tech Data Corp.* | | | 6,375 | | | | 915,450 | |
| | |
TTM Technologies, Inc.* | | | 17,836 | | | | 268,432 | |
| | |
Vishay Intertechnology, Inc. | | | 23,852 | | | | 507,809 | |
| | |
Vishay Precision Group, Inc.* | | | 1,836 | | | | 62,424 | |
| | |
Wrap Technologies, Inc.* (a) | | | 1,399 | | | | 8,940 | |
| | | | | | | | |
| | | | 10,007,014 | |
|
IT Services 2.1% | |
| | |
Brightcove, Inc.* | | | 7,156 | | | | 62,186 | |
| | |
Cardtronics PLC “A”* | | | 6,698 | | | | 299,066 | |
| | |
Cass Information Systems, Inc. | | | 2,482 | | | | 143,311 | |
| | |
Conduent, Inc.* | | | 31,329 | | | | 194,240 | |
| | |
CSG Systems International, Inc. | | | 5,909 | | | | 305,968 | |
| | |
Endurance International Group Holdings, Inc.* | | | 12,326 | | | | 57,932 | |
| | |
EVERTEC, Inc. | | | 10,932 | | | | 372,125 | |
| | |
Evo Payments, Inc. “A”* | | | 6,374 | | | | 168,337 | |
| | |
Exela Technologies, Inc.* | | | 9,127 | | | | 3,721 | |
| | |
Exlservice Holdings, Inc.* | | | 6,046 | | | | 419,955 | |
| | |
GTT Communications, Inc.* (a) | | | 5,869 | | | | 66,613 | |
| | |
I3 Verticals, Inc. “A”* | | | 2,579 | | | | 72,857 | |
| | |
Information Services Group, Inc.* | | | 5,870 | | | | 14,851 | |
| | |
International Money Express, Inc.* | | | 3,207 | | | | 38,612 | |
| | |
KBR, Inc. | | | 25,536 | | | | 778,848 | |
| | |
Limelight Networks, Inc.* | | | 20,285 | | | | 82,763 | |
| | |
LiveRamp Holdings, Inc.* | | | 12,063 | | | | 579,868 | |
| | |
ManTech International Corp. “A” | | | 4,824 | | | | 385,341 | |
| | |
MAXIMUS, Inc. | | | 11,461 | | | | 852,584 | |
| | |
NIC, Inc. | | | 11,902 | | | | 266,010 | |
| | |
Paysign, Inc.* (a) | | | 5,502 | | | | 55,845 | |
| | |
Perficient, Inc.* | | | 5,677 | | | | 261,539 | |
| | |
Perspecta, Inc. | | | 25,117 | | | | 664,094 | |
| | |
PRGX Global, Inc.* | | | 3,855 | | | | 18,967 | |
| | |
Priority Technology Holdings, Inc.* | | | 1,214 | | | | 2,974 | |
| | |
Science Applications International Corp. | | | 10,400 | | | | 905,008 | |
| | |
StarTek, Inc.* | | | 2,999 | | | | 23,932 | |
| | |
Sykes Enterprises, Inc.* | | | 6,953 | | | | 257,192 | |
| | |
The Hackett Group, Inc. | | | 4,501 | | | | 72,646 | |
| | |
TTEC Holdings, Inc. | | | 2,622 | | | | 103,884 | |
| | |
Tucows, Inc. “A”* (a) | | | 1,662 | | | | 102,678 | |
| | |
Unisys Corp.* | | | 9,177 | | | | 108,839 | |
| | |
Verra Mobility Corp.* | | | 22,932 | | | | 320,819 | |
| | |
Virtusa Corp.* | | | 5,233 | | | | 237,212 | |
| | | | | | | | |
| | | | 8,300,817 | |
|
Semiconductors & Semiconductor Equipment 2.8% | |
| | |
Adesto Technologies Corp.* | | | 5,102 | | | | 43,367 | |
| | |
Advanced Energy Industries, Inc.* | | | 6,874 | | | | 489,429 | |
| | |
Alpha & Omega Semiconductor Ltd.* | | | 3,567 | | | | 48,583 | |
| | |
Ambarella, Inc.* | | | 5,661 | | | | 342,830 | |
| | |
Amkor Technology, Inc.* | | | 17,651 | | | | 229,463 | |
| | |
Axcelis Technologies, Inc.* | | | 5,891 | | | | 141,944 | |
| | |
AXT, Inc.* | | | 7,189 | | | | 31,272 | |
| | |
Brooks Automation, Inc. | | | 12,754 | | | | 535,158 | |
| | |
Cabot Microelectronics Corp. | | | 5,232 | | | | 755,082 | |
The accompanying notes are an integral part of the financial statements.
| | | | | | |
| | 20 | | | | | | DWS Small Cap Index VIP |
| | | | | | | | |
| | | Shares | | | Value ($) | |
| | |
CEVA, Inc.* | | | 3,841 | | | | 103,553 | |
| | |
Cirrus Logic, Inc.* | | | 10,501 | | | | 865,387 | |
| | |
Cohu, Inc. | | | 7,223 | | | | 165,046 | |
| | |
Diodes, Inc.* | | | 7,350 | | | | 414,319 | |
| | |
DSP Group, Inc.* | | | 4,006 | | | | 63,054 | |
| | |
Enphase Energy, Inc.* (a) | | | 16,588 | | | | 433,444 | |
| | |
FormFactor, Inc.* | | | 13,599 | | | | 353,166 | |
| | |
GSI Technology, Inc.* | | | 2,812 | | | | 19,937 | |
| | |
Ichor Holdings Ltd.* | | | 3,830 | | | | 127,424 | |
| | |
Impinj, Inc.* | | | 3,008 | | | | 77,787 | |
| | |
Inphi Corp.* | | | 8,093 | | | | 599,044 | |
| | |
Lattice Semiconductor Corp.* | | | 22,500 | | | | 430,650 | |
| | |
MACOM Technology Solutions Holdings, Inc.* | | | 8,228 | | | | 218,865 | |
| | |
MaxLinear, Inc.* | | | 11,853 | | | | 251,521 | |
| | |
NeoPhotonics Corp.* | | | 6,725 | | | | 59,315 | |
| | |
NVE Corp. | | | 878 | | | | 62,689 | |
| | |
Onto Innovation, Inc.* | | | 8,581 | | | | 313,550 | |
| | |
PDF Solutions, Inc.* | | | 5,267 | | | | 88,960 | |
| | |
Photronics, Inc.* | | | 11,567 | | | | 182,296 | |
| | |
Power Integrations, Inc. | | | 5,099 | | | | 504,342 | |
| | |
Rambus, Inc.* | | | 20,029 | | | | 275,899 | |
| | |
Semtech Corp.* | | | 11,874 | | | | 628,135 | |
| | |
Silicon Laboratories, Inc.* | | | 7,743 | | | | 898,033 | |
| | |
SMART Global Holdings, Inc.* | | | 2,523 | | | | 95,723 | |
| | |
SunPower Corp.* (a) | | | 11,279 | | | | 87,976 | |
| | |
Synaptics, Inc.* | | | 6,025 | | | | 396,264 | |
| | |
Ultra Clean Holdings, Inc.* | | | 7,031 | | | | 165,018 | |
| | |
Veeco Instruments, Inc.* | | | 8,814 | | | | 129,434 | |
| | |
Xperi Corp. | | | 8,901 | | | | 164,668 | |
| | | | | | | | |
| | | | 10,792,627 | |
|
Software 4.5% | |
| | |
8x8, Inc.* | | | 17,009 | | | | 311,265 | |
| | |
A10 Networks, Inc.* | | | 8,729 | | | | 59,968 | |
| | |
ACI Worldwide, Inc.* | | | 20,743 | | | | 785,849 | |
| | |
Agilysys, Inc.* | | | 3,656 | | | | 92,899 | |
| | |
Alarm.com Holdings, Inc.* | | | 6,589 | | | | 283,129 | |
| | |
Altair Engineering, Inc. “A”* | | | 7,102 | | | | 255,033 | |
| | |
American Software, Inc. “A” | | | 4,941 | | | | 73,522 | |
| | |
Appfolio, Inc. “A”* | | | 2,824 | | | | 310,499 | |
| | |
Appian Corp.* (a) | | | 6,131 | | | | 234,265 | |
| | |
Avaya Holdings Corp.* | | | 19,816 | | | | 267,516 | |
| | |
Benefitfocus, Inc.* | | | 5,313 | | | | 116,567 | |
| | |
Blackbaud, Inc. | | | 8,808 | | | | 701,117 | |
| | |
Blackline, Inc.* | | | 7,734 | | | | 398,765 | |
| | |
Bottomline Technologies de, Inc.* | | | 7,815 | | | | 418,884 | |
| | |
Box, Inc. “A”* | | | 25,829 | | | | 433,411 | |
| | |
ChannelAdvisor Corp.* | | | 4,344 | | | | 39,270 | |
| | |
Cision Ltd.* | | | 16,508 | | | | 164,585 | |
| | |
Cloudera, Inc.* (a) | | | 43,302 | | | | 503,602 | |
| | |
CommVault Systems, Inc.* | | | 7,287 | | | | 325,292 | |
| | |
Cornerstone OnDemand, Inc.* | | | 10,255 | | | | 600,430 | |
| | |
Digimarc Corp.* (a) | | | 2,043 | | | | 68,563 | |
| | |
Digital Turbine, Inc.* | | | 14,294 | | | | 101,916 | |
| | |
Domo, Inc. “B”* | | | 3,200 | | | | 69,504 | |
| | |
Ebix, Inc. | | | 4,232 | | | | 141,391 | |
| | |
eGain Corp.* | | | 3,408 | | | | 26,991 | |
| | |
Envestnet, Inc.* | | | 8,716 | | | | 606,895 | |
| | |
Everbridge, Inc.* | | | 5,969 | | | | 466,059 | |
| | |
Five9, Inc.* | | | 10,772 | | | | 706,428 | |
| | |
ForeScout Technologies, Inc.* | | | 7,666 | | | | 251,445 | |
| | |
GTY Technology Holdings, Inc.* | | | 7,061 | | | | 41,589 | |
| | |
Ideanomics, Inc.* | | | 9,455 | | | | 8,091 | |
| | | | | | | | |
| | | Shares | | | Value ($) | |
| | |
Instructure, Inc.* | | | 6,175 | | | | 297,697 | |
| | |
Intelligent Systems Corp.* (a) | | | 1,260 | | | | 50,324 | |
| | |
j2 Global, Inc. | | | 8,410 | | | | 788,101 | |
| | |
LivePerson, Inc.* | | | 11,240 | | | | 415,880 | |
| | |
Majesco* | | | 1,211 | | | | 9,991 | |
| | |
MicroStrategy, Inc. “A”* | | | 1,498 | | | | 213,660 | |
| | |
Mitek Systems, Inc.* | | | 6,808 | | | | 52,081 | |
| | |
MobileIron, Inc.* | | | 16,974 | | | | 82,494 | |
| | |
Model N, Inc.* | | | 5,994 | | | | 210,210 | |
| | |
OneSpan, Inc.* | | | 5,784 | | | | 99,022 | |
| | |
Phunware, Inc.* (a) | | | 7,206 | | | | 8,575 | |
| | |
Ping Identity Holding Corp.* (a) | | | 2,462 | | | | 59,827 | |
| | |
Progress Software Corp. | | | 7,978 | | | | 331,486 | |
| | |
PROS Holdings, Inc.* | | | 5,956 | | | | 356,883 | |
| | |
Q2 Holdings, Inc.* | | | 7,875 | | | | 638,505 | |
| | |
QAD, Inc. “A” | | | 2,085 | | | | 106,189 | |
| | |
Qualys, Inc.* | | | 6,015 | | | | 501,471 | |
| | |
Rapid7, Inc.* | | | 8,914 | | | | 499,362 | |
| | |
Rimini Street, Inc.* | | | 3,637 | | | | 14,112 | |
| | |
Rosetta Stone, Inc.* | | | 3,610 | | | | 65,485 | |
| | |
SailPoint Technologies Holding, Inc.* | | | 15,345 | | | | 362,142 | |
| | |
SecureWorks Corp. “A”* | | | 1,587 | | | | 26,439 | |
| | |
SharpSpring, Inc.* | | | 1,580 | | | | 18,123 | |
| | |
ShotSpotter, Inc.* | | | 1,482 | | | | 37,791 | |
| | |
SPS Commerce, Inc.* | | | 6,301 | | | | 349,201 | |
| | |
SVMK, Inc.* | | | 15,780 | | | | 281,989 | |
| | |
Synchronoss Technologies, Inc.* | | | 7,059 | | | | 33,530 | |
| | |
Telaria, Inc.* | | | 8,032 | | | | 70,762 | |
| | |
TeleNav, Inc.* | | | 6,158 | | | | 29,928 | |
| | |
Tenable Holdings, Inc.* | | | 6,709 | | | | 160,748 | |
| | |
TiVo Corp. | | | 22,136 | | | | 187,713 | |
| | |
Upland Software, Inc.* | | | 4,074 | | | | 145,483 | |
| | |
Varonis Systems, Inc.* | | | 5,327 | | | | 413,961 | |
| | |
Verint Systems, Inc.* | | | 11,931 | | | | 660,500 | |
| | |
Virnetx Holding Corp.* (a) | | | 11,475 | | | | 43,605 | |
| | |
Workiva, Inc.* | | | 6,591 | | | | 277,152 | |
| | |
Yext, Inc.* (a) | | | 17,132 | | | | 247,043 | |
| | |
Zix Corp.* | | | 9,484 | | | | 64,301 | |
| | |
Zuora, Inc. “A”* | | | 16,101 | | | | 230,727 | |
| | | | | | | | |
| | | | 17,307,233 | |
|
Technology Hardware, Storage & Peripherals 0.2% | |
| | |
3D Systems Corp.* | | | 20,529 | | | | 179,629 | |
| | |
AstroNova, Inc. | | | 1,262 | | | | 17,315 | |
| | |
Avid Technology, Inc.* | | | 5,253 | | | | 45,071 | |
| | |
Diebold Nixdorf, Inc.* | | | 13,734 | | | | 145,031 | |
| | |
Immersion Corp.* | | | 5,748 | | | | 42,707 | |
| | |
Sonim Technologies, Inc.* | | | 662 | | | | 2,403 | |
| | |
Stratasys Ltd.* (a) | | | 9,344 | | | | 188,982 | |
| | | | | | | | |
| | | | 621,138 | |
|
| Materials 3.8% | |
Chemicals 1.8% | |
| | |
Advanced Emissions Solutions, Inc. | | | 3,155 | | | | 33,128 | |
| | |
AdvanSix, Inc.* | | | 4,949 | | | | 98,782 | |
| | |
American Vanguard Corp. | | | 5,308 | | | | 103,347 | |
| | |
Amyris, Inc.* (a) | | | 10,641 | | | | 32,881 | |
| | |
Balchem Corp. | | | 5,774 | | | | 586,812 | |
| | |
Chase Corp. | | | 1,305 | | | | 154,616 | |
| | |
Ferro Corp.* | | | 14,540 | | | | 215,628 | |
| | |
Flotek Industries, Inc.* | | | 9,983 | | | | 19,966 | |
| | |
FutureFuel Corp. | | | 4,721 | | | | 58,493 | |
The accompanying notes are an integral part of the financial statements.
| | | | |
| DWS Small Cap Index VIP | | | | | 21 |
| | | | | | | | |
| | | Shares | | | Value ($) | |
| | |
GCP Applied Technologies, Inc.* | | | 9,632 | | | | 218,743 | |
| | |
H.B. Fuller Co. | | | 9,183 | | | | 473,567 | |
| | |
Hawkins, Inc. | | | 1,662 | | | | 76,136 | |
| | |
Ingevity Corp.* | | | 7,577 | | | | 662,078 | |
| | |
Innophos Holdings, Inc. | | | 3,606 | | | | 115,320 | |
| | |
Innospec, Inc. | | | 4,387 | | | | 453,791 | |
| | |
Intrepid Potash, Inc.* | | | 17,507 | | | | 47,444 | |
| | |
Koppers Holdings, Inc.* | | | 3,432 | | | | 131,171 | |
| | |
Kraton Corp.* | | | 5,678 | | | | 143,767 | |
| | |
Kronos Worldwide, Inc. (a) | | | 4,054 | | | | 54,324 | |
| | |
Livent Corp.* | | | 26,445 | | | | 226,105 | |
| | |
LSB Industries, Inc.* | | | 3,974 | | | | 16,691 | |
| | |
Marrone Bio Innovations, Inc.* | | | 10,223 | | | | 10,325 | |
| | |
Minerals Technologies, Inc. | | | 6,315 | | | | 363,933 | |
| | |
Omnova Solutions, Inc.* | | | 7,689 | | | | 77,736 | |
| | |
Orion Engineered Carbons SA | | | 10,844 | | | | 209,289 | |
| | |
PolyOne Corp. | | | 13,791 | | | | 507,371 | |
| | |
PQ Group Holdings, Inc.* | | | 6,707 | | | | 115,226 | |
| | |
Quaker Chemical Corp. | | | 2,365 | | | | 389,090 | |
| | |
Rayonier Advanced Materials, Inc. | | | 9,091 | | | | 34,909 | |
| | |
Sensient Technologies Corp. | | | 7,610 | | | | 502,945 | |
| | |
Stepan Co. | | | 3,678 | | | | 376,774 | |
| | |
Trecora Resources* | | | 4,191 | | | | 29,966 | |
| | |
Tredegar Corp. | | | 4,494 | | | | 100,441 | |
| | |
Trinseo SA | | | 6,967 | | | | 259,242 | |
| | |
Tronox Holdings PLC “A”* | | | 16,333 | | | | 186,523 | |
| | |
Valhi, Inc. | | | 4,843 | | | | 9,056 | |
| | | | | | | | |
| | | | 7,095,616 | |
|
Construction Materials 0.2% | |
| | |
Forterra, Inc.* | | | 3,226 | | | | 37,293 | |
| | |
Summit Materials, Inc. “A”* | | | 20,223 | | | | 483,330 | |
| | |
U.S. Concrete, Inc.* | | | 2,869 | | | | 119,522 | |
| | |
United States Lime & Minerals, Inc. | | | 377 | | | | 34,043 | |
| | | | | | | | |
| | | | 674,188 | |
|
Containers & Packaging 0.1% | |
| | |
Greif, Inc. “A” | | | 4,640 | | | | 205,088 | |
| | |
Greif, Inc. “B” | | | 1,062 | | | | 54,980 | |
| | |
Myers Industries, Inc. | | | 6,330 | | | | 105,584 | |
| | |
UFP Technologies, Inc.* | | | 1,266 | | | | 62,806 | |
| | | | | | | | |
| | | | 428,458 | |
|
Metals & Mining 1.3% | |
| | |
AK Steel Holding Corp.* | | | 56,320 | | | | 185,293 | |
| | |
Allegheny Technologies, Inc.* | | | 22,572 | | | | 466,337 | |
| | |
Carpenter Technology Corp. | | | 8,476 | | | | 421,935 | |
| | |
Century Aluminum Co.* | | | 9,381 | | | | 70,498 | |
| | |
Cleveland-Cliffs, Inc. (a) | | | 48,425 | | | | 406,770 | |
| | |
Coeur Mining, Inc.* | | | 42,753 | | | | 345,444 | |
| | |
Commercial Metals Co. | | | 21,228 | | | | 472,747 | |
| | |
Compass Minerals International, Inc. | | | 6,130 | | | | 373,685 | |
| | |
Ferroglobe Representation & Warranty Insurance Trust (Beneficial Units) (b) | | | 12,466 | | | | 0 | |
| | |
Gold Resource Corp. | | | 11,352 | | | | 62,890 | |
| | |
Haynes International, Inc. | | | 2,284 | | | | 81,721 | |
| | |
Hecla Mining Co. | | | 89,021 | | | | 301,781 | |
| | |
Kaiser Aluminum Corp. | | | 2,794 | | | | 309,827 | |
| | |
Materion Corp. | | | 3,628 | | | | 215,685 | |
| | |
Mayville Engineering Co., Inc.* | | | 1,165 | | | | 10,928 | |
| | |
Novagold Resources, Inc.* | | | 41,886 | | | | 375,299 | |
| | |
Olympic Steel, Inc. | | | 1,747 | | | | 31,306 | |
| | | | | | | | |
| | | Shares | | | Value ($) | |
| | |
Ramaco Resources, Inc.* | | | 1,195 | | | | 4,278 | |
| | |
Ryerson Holding Corp.* | | | 2,757 | | | | 32,615 | |
| | |
Schnitzer Steel Industries, Inc. “A” | | | 4,482 | | | | 97,170 | |
| | |
SunCoke Energy, Inc. | | | 12,551 | | | | 78,193 | |
| | |
Synalloy Corp. | | | 1,549 | | | | 19,998 | |
| | |
TimkenSteel Corp.* | | | 7,595 | | | | 59,697 | |
| | |
Warrior Met Coal, Inc. | | | 9,213 | | | | 194,671 | |
| | |
Worthington Industries, Inc. | | | 6,985 | | | | 294,627 | |
| | | | | | | | |
| | | | 4,913,395 | |
|
Paper & Forest Products 0.4% | |
| | |
Boise Cascade Co. | | | 7,007 | | | | 255,966 | |
| | |
Clearwater Paper Corp.* | | | 2,964 | | | | 63,311 | |
| | |
Louisiana-Pacific Corp. | | | 21,185 | | | | 628,559 | |
| | |
Neenah, Inc. | | | 3,033 | | | | 213,614 | |
| | |
P.H. Glatfelter Co. | | | 7,876 | | | | 144,131 | |
| | |
Schweitzer-Mauduit International, Inc. | | | 5,597 | | | | 235,018 | |
| | |
Verso Corp. “A”* | | | 6,228 | | | | 112,291 | |
| | | | | | | | |
| | | | 1,652,890 | |
|
| Real Estate 7.7% | |
Equity Real Estate Investment Trusts (REITs) 7.0% | |
| | |
Acadia Realty Trust | | | 15,216 | | | | 394,551 | |
| | |
Agree Realty Corp. | | | 7,502 | | | | 526,415 | |
| | |
Alexander & Baldwin, Inc. | | | 12,405 | | | | 260,009 | |
| | |
Alexander’s, Inc. | | | 383 | | | | 126,524 | |
| | |
American Assets Trust, Inc. | | | 8,671 | | | | 397,999 | |
| | |
American Finance Trust, Inc. | | | 19,149 | | | | 253,916 | |
| | |
Armada Hoffler Properties, Inc. | | | 9,775 | | | | 179,371 | |
| | |
Ashford Hospitality Trust | | | 15,552 | | | | 43,390 | |
| | |
Bluerock Residential Growth REIT, Inc. | | | 3,897 | | | | 46,959 | |
| | |
Braemar Hotels & Resorts, Inc. | | | 5,304 | | | | 47,365 | |
| | |
BRT Apartments Corp. | | | 1,928 | | | | 32,718 | |
| | |
CareTrust REIT, Inc. | | | 17,288 | | | | 356,651 | |
| | |
CatchMark Timber Trust, Inc. “A” | | | 8,978 | | | | 102,978 | |
| | |
CBL & Associates Properties, Inc. (a) | | | 29,680 | | | | 31,164 | |
| | |
Cedar Realty Trust, Inc. | | | 15,977 | | | | 47,132 | |
| | |
Chatham Lodging Trust | | | 8,213 | | | | 150,626 | |
| | |
CIM Commercial Trust Corp. | | | 253 | | | | 3,669 | |
| | |
City Office REIT, Inc. | | | 9,580 | | | | 129,522 | |
| | |
Clipper Realty, Inc. | | | 2,541 | | | | 26,935 | |
| | |
Community Healthcare Trust, Inc. | | | 3,369 | | | | 144,395 | |
| | |
CoreCivic, Inc. | | | 21,272 | | | | 369,707 | |
| | |
CorEnergy Infrastructure Trust, Inc. | | | 2,250 | | | | 100,598 | |
| | |
CorePoint Lodging, Inc. | | | 7,155 | | | | 76,415 | |
| | |
DiamondRock Hospitality Co. | | | 36,116 | | | | 400,165 | |
| | |
Easterly Government Properties, Inc. | | | 13,407 | | | | 318,148 | |
| | |
EastGroup Properties, Inc. | | | 6,843 | | | | 907,861 | |
| | |
Essential Properties Realty Trust, Inc. | | | 14,644 | | | | 363,318 | |
| | |
Farmland Partners, Inc. (a) | | | 5,124 | | | | 34,741 | |
| | |
First Industrial Realty Trust, Inc. | | | 22,744 | | | | 944,103 | |
| | |
Four Corners Property Trust, Inc. | | | 12,327 | | | | 347,498 | |
| | |
Franklin Street Properties Corp. | | | 18,684 | | | | 159,935 | |
| | |
Front Yard Residential Corp. | | | 9,039 | | | | 111,541 | |
| | |
Getty Realty Corp. | | | 5,923 | | | | 194,689 | |
| | |
Gladstone Commercial Corp. | | | 5,618 | | | | 122,809 | |
| | |
Gladstone Land Corp. | | | 3,001 | | | | 38,923 | |
| | |
Global Medical REIT, Inc. | | | 5,679 | | | | 75,133 | |
The accompanying notes are an integral part of the financial statements.
| | | | | | |
| | 22 | | | | | | DWS Small Cap Index VIP |
| | | | | | | | |
| | | Shares | | | Value ($) | |
| | |
Global Net Lease, Inc. | | | 16,050 | | | | 325,494 | |
| | |
Hannon Armstrong Sustainable Infrastructure Capital, Inc. | | | 11,391 | | | | 366,562 | |
| | |
Healthcare Realty Trust, Inc. | | | 23,756 | | | | 792,738 | |
| | |
Hersha Hospitality Trust | | | 6,188 | | | | 90,035 | |
| | |
Independence Realty Trust, Inc. | | | 16,558 | | | | 233,137 | |
| | |
Industrial Logistics Properties Trust | | | 11,627 | | | | 260,677 | |
| | |
Innovative Industrial Properties, Inc. (a) | | | 2,036 | | | | 154,471 | |
| | |
Investors Real Estate Trust | | | 2,097 | | | | 152,033 | |
| | |
iStar, Inc. | | | 10,615 | | | | 154,024 | |
| | |
Jernigan Capital, Inc. | | | 4,003 | | | | 76,617 | |
| | |
Kite Realty Group Trust | | | 14,826 | | | | 289,552 | |
| | |
Lexington Realty Trust | | | 43,397 | | | | 460,876 | |
| | |
LTC Properties, Inc. | | | 7,079 | | | | 316,927 | |
| | |
Mack-Cali Realty Corp. | | | 15,644 | | | | 361,846 | |
| | |
Monmouth Real Estate Investment Corp. | | | 16,791 | | | | 243,134 | |
| | |
National Health Investors, Inc. | | | 7,644 | | | | 622,833 | |
| | |
National Storage Affiliates Trust | | | 10,718 | | | | 360,339 | |
| | |
New Senior Investment Group, Inc. | | | 14,659 | | | | 112,141 | |
| | |
NexPoint Residential Trust, Inc. | | | 3,555 | | | | 159,975 | |
| | |
Office Properties Income Trust | | | 8,607 | | | | 276,629 | |
| | |
One Liberty Properties, Inc. | | | 2,909 | | | | 79,096 | |
| | |
Pebblebrook Hotel Trust | | | 23,347 | | | | 625,933 | |
| | |
Pennsylvania Real Estate Investment Trust (a) | | | 12,065 | | | | 64,306 | |
| | |
Physicians Realty Trust | | | 33,964 | | | | 643,278 | |
| | |
Piedmont Office Realty Trust, Inc. “A” | | | 22,568 | | | | 501,912 | |
| | |
PotlatchDeltic Corp. | | | 11,921 | | | | 515,822 | |
| | |
Preferred Apartment Communities, Inc. “A” | | | 8,280 | | | | 110,290 | |
| | |
PS Business Parks, Inc. | | | 3,602 | | | | 593,862 | |
| | |
QTS Realty Trust, Inc. “A” | | | 10,351 | | | | 561,749 | |
| | |
Retail Opportunity Investments Corp. | | | 20,651 | | | | 364,697 | |
| | |
Retail Value, Inc. | | | 2,641 | | | | 97,189 | |
| | |
Rexford Industrial Realty, Inc. | | | 19,981 | | | | 912,532 | |
| | |
RLJ Lodging Trust | | | 30,054 | | | | 532,557 | |
| | |
RPT Realty | | | 14,015 | | | | 210,786 | |
| | |
Ryman Hospitality Properties, Inc. | | | 8,267 | | | | 716,418 | |
| | |
Sabra Health Care REIT, Inc. | | | 34,752 | | | | 741,608 | |
| | |
Safehold, Inc. | | | 1,867 | | | | 75,240 | |
| | |
Saul Centers, Inc. | | | 2,125 | | | | 112,158 | |
| | |
Senior Housing Properties Trust | | | 42,242 | | | | 356,523 | |
| | |
Seritage Growth Properties “A” (a) | | | 6,087 | | | | 243,967 | |
| | |
STAG Industrial, Inc. | | | 24,132 | | | | 761,847 | |
| | |
Summit Hotel Properties, Inc. | | | 18,763 | | | | 231,535 | |
| | |
Sunstone Hotel Investors, Inc. | | | 40,343 | | | | 561,575 | |
| | |
Tanger Factory Outlet Centers, Inc. (a) | | | 16,089 | | | | 236,991 | |
| | |
Terreno Realty Corp. | | | 11,915 | | | | 645,078 | |
| | |
The Geo Group, Inc. | | | 21,533 | | | | 357,663 | |
| | |
UMH Properties, Inc. | | | 6,454 | | | | 101,521 | |
| | |
Uniti Group, Inc. (a) | | | 33,049 | | | | 271,332 | |
| | |
Universal Health Realty Income Trust | | | 2,331 | | | | 273,566 | |
| | |
Urban Edge Properties | | | 20,706 | | | | 397,141 | |
| | |
Urstadt Biddle Properties “A” | | | 5,412 | | | | 134,434 | |
| | |
Washington Prime Group, Inc. (a) | | | 33,511 | | | | 121,980 | |
| | |
Washington Real Estate Investment Trust | | | 14,435 | | | | 421,213 | |
| | | | | | | | |
| | | Shares | | | Value ($) | |
| | |
Whitestone REIT | | | 7,034 | | | | 95,803 | |
| | |
Xenia Hotels & Resorts, Inc. | | | 20,377 | | | | 440,347 | |
| | | | | | | | |
| | | | 26,789,862 | |
|
Real Estate Management & Development 0.7% | |
| | |
Altisource Portfolio Solutions SA* | | | 1,075 | | | | 20,780 | |
| | |
American Realty Investors, Inc.* | | | 447 | | | | 7,657 | |
| | |
Consolidated-Tomoka Land Co. | | | 917 | | | | 55,313 | |
| | |
Cushman & Wakefield PLC* | | | 20,172 | | | | 412,316 | |
| | |
EXP World Holdings, Inc.* (a) | | | 3,620 | | | | 41,015 | |
| | |
Forestar Group, Inc.* | | | 2,301 | | | | 47,976 | |
| | |
FRP Holdings, Inc.* | | | 1,235 | | | | 61,515 | |
| | |
Griffin Land & Nurseries, Inc. | | | 211 | | | | 8,345 | |
| | |
Kennedy-Wilson Holdings, Inc. | | | 21,982 | | | | 490,198 | |
| | |
Marcus & Millichap, Inc.* | | | 4,088 | | | | 152,278 | |
| | |
Maui Land & Pineapple Co., Inc.* | | | 1,307 | | | | 14,704 | |
| | |
Newmark Group, Inc. “A” | | | 25,972 | | | | 349,453 | |
| | |
Rafael Holdings, Inc. “B”* | | | 1,946 | | | | 34,717 | |
| | |
RE/MAX Holdings, Inc. “A” | | | 3,208 | | | | 123,476 | |
| | |
Realogy Holdings Corp. (a) | | | 20,422 | | | | 197,685 | |
| | |
Redfin Corp.* | | | 16,208 | | | | 342,637 | |
| | |
Stratus Properties, Inc.* | | | 1,152 | | | | 35,689 | |
| | |
Tejon Ranch Co.* | | | 3,627 | | | | 57,959 | |
| | |
The RMR Group, Inc. “A” | | | 2,719 | | | | 124,095 | |
| | |
The St. Joe Co.* | | | 6,049 | | | | 119,952 | |
| | |
Transcontinental Realty Investors, Inc.* | | | 152 | | | | 6,062 | |
| | | | | | | | |
| | | | 2,703,822 | |
|
| Utilities 3.6% | |
Electric Utilities 1.0% | |
| | |
ALLETE, Inc. | | | 9,320 | | | | 756,504 | |
| | |
El Paso Electric Co. | | | 7,279 | | | | 494,171 | |
| | |
Genie Energy Ltd. “B” | | | 2,658 | | | | 20,546 | |
| | |
MGE Energy, Inc. | | | 6,281 | | | | 495,068 | |
| | |
Otter Tail Corp. | | | 7,136 | | | | 366,006 | |
| | |
PNM Resources, Inc. | | | 14,342 | | | | 727,283 | |
| | |
Portland General Electric Co. | | | 16,150 | | | | 901,009 | |
| | |
Spark Energy, Inc. “A” | | | 2,257 | | | | 20,832 | |
| | | | | | | | |
| | | | 3,781,419 | |
|
Gas Utilities 1.1% | |
| | |
Chesapeake Utilities Corp. | | | 2,898 | | | | 277,715 | |
| | |
New Jersey Resources Corp. | | | 16,025 | | | | 714,234 | |
| | |
Northwest Natural Holding Co. | | | 5,412 | | | | 399,027 | |
| | |
ONE Gas, Inc. | | | 9,387 | | | | 878,341 | |
| | |
RGC Resources, Inc. | | | 1,479 | | | | 42,270 | |
| | |
South Jersey Industries, Inc. | | | 16,603 | | | | 547,567 | |
| | |
Southwest Gas Holdings, Inc. | | | 9,768 | | | | 742,075 | |
| | |
Spire, Inc. | | | 8,922 | | | | 743,292 | |
| | | | | | | | |
| | | | 4,344,521 | |
|
Independent Power & Renewable Electricity Producers 0.4% | |
| | |
Atlantic Power Corp.* | | | 17,412 | | | | 40,570 | |
| | |
Clearway Energy, Inc. “A” | | | 6,239 | | | | 119,290 | |
| | |
Clearway Energy, Inc. “C” | | | 13,235 | | | | 264,038 | |
| | |
Ormat Technologies, Inc. | | | 7,146 | | | | 532,520 | |
| | |
Pattern Energy Group, Inc. “A” | | | 15,808 | | | | 422,943 | |
| | |
Sunnova Energy International, Inc.* | | | 2,391 | | | | 26,683 | |
| | |
TerraForm Power, Inc. “A” | | | 14,207 | | | | 218,646 | |
| | | | | | | | |
| | | | 1,624,690 | |
The accompanying notes are an integral part of the financial statements.
| | | | |
| DWS Small Cap Index VIP | | | | | 23 |
| | | | | | | | |
| | | Shares | | | Value ($) | |
|
Multi-Utilities 0.6% | |
| | |
Avista Corp. | | | 11,920 | | | | 573,233 | |
| | |
Black Hills Corp. | | | 10,993 | | | | 863,390 | |
| | |
NorthWestern Corp. | | | 9,090 | | | | 651,480 | |
| | |
Unitil Corp. | | | 2,569 | | | | 158,816 | |
| | | | | | | | |
| | | | 2,246,919 | |
|
Water Utilities 0.5% | |
| | |
American States Water Co. | | | 6,617 | | | | 573,297 | |
| | |
AquaVenture Holdings Ltd.* | | | 2,474 | | | | 67,095 | |
| | |
Artesian Resources Corp. “A” | | | 1,335 | | | | 49,675 | |
| | |
Cadiz, Inc.* (a) | | | 2,333 | | | | 25,710 | |
| | |
California Water Service Group | | | 8,638 | | | | 445,375 | |
| | |
Consolidated Water Co., Ltd. | | | 2,624 | | | | 42,771 | |
| | |
Global Water Resources, Inc. | | | 2,048 | | | | 26,931 | |
| | |
Middlesex Water Co. | | | 2,917 | | | | 185,434 | |
| | |
Pure Cycle Corp.* | | | 3,157 | | | | 39,747 | |
| | |
SJW Group | | | 4,711 | | | | 334,764 | |
| | |
York Water Co. | | | 2,365 | | | | 109,050 | |
| | | | | | | | |
| | | | | | | | 1,899,849 | |
| Total Common Stocks(Cost $300,450,136) | | | | 378,534,744 | |
| | |
| Rights 0.0% | | | | | | | | |
Health Care 0.0% | | | | | | | | |
| | |
GTX, Inc.* (a) (b) | | | 123 | | | | 252 | |
| | |
Omthera Pharmaceutical, Inc.* (b) | | | 1,167 | | | | 700 | |
| | |
Tobira Therapeutics, Inc.* (b) | | | 1,687 | | | | 102 | |
| | | | | | | | |
| | | | | | | 1,054 | |
|
Materials 0.0% | |
Schulman A, Inc., “A”* (b) | | | 5,009 | | | | 2,169 | |
Total Rights (Cost $2,524) | | | | | | | 3,223 | |
| | | | | | | | |
| | |
| | | Principal
Amount ($) | | | Value ($) | |
| Government & Agency Obligations 0.4% | |
U.S. Treasury Obligation | |
U.S. Treasury Bill, 1.97% **, 1/9/2020 (c)
(Cost $1,519,335) | | | 1,520,000 | | | | 1,519,585 | |
| | |
| | | Shares | | | Value ($) | |
| Securities Lending Collateral 3.8% | |
DWS Government & Agency Securities Portfolio “DWS Government Cash Institutional Shares”, 1.50% (d) (e) (Cost $14,803,664) | | | 14,803,664 | | | | 14,803,664 | |
| | |
| Cash Equivalents 1.5% | | | | | | | | |
DWS Central Cash Management Government Fund, 1.62% (d)
(Cost $5,850,788) | | | 5,850,788 | | | | 5,850,788 | |
| | |
| | | % of Net
Assets | | | Value ($) | |
Total Investment Portfolio (Cost $322,626,447) | | | 103.8 | | | | 400,712,004 | |
| Other Assets and Liabilities, Net | | | (3.8 | ) | | | (14,654,951 | ) |
| Net Assets | | | 100.0 | | | | 386,057,053 | |
A summary of the Fund’s transactions with affiliated investments during the year ended December 31, 2019 are as follows:
| | | | | | | | | | | | | | | | | | | | | | | | | | | | | | | | |
Value ($) at
12/31/2018 | | Purchases Cost ($) | | | Sales Proceeds ($) | | | Net Realized
Gain/
(Loss) ($) | | | Net Change in
Unrealized Appreciation
(Depreciation) ($) | | | Income ($) | | | Capital Gain
Distributions ($) | | | Number
of Shares
at
12/31/2019 | | | Value ($)
at
12/31/2019 | |
Securities Lending Collateral 3.8% | | | | | | | | | | | | | | | | | |
DWS Government & Agency Securities Portfolio “DWS Government Cash Institutional Shares”, 1.50% (d) (e) | |
| 14,620,153 | | | 183,511 | (f) | | | — | | | | — | | | | — | | | | 401,473 | | | | — | | | | 14,803,664 | | | | 14,803,664 | |
Cash Equivalents 1.5% | | | | | | | | | | | | | | | | | |
DWS Central Cash Management Government Fund, 1.62% (d) | |
| 4,694,157 | | | 124,182,991 | | | | 123,026,360 | | | | — | | | | — | | | | 114,560 | | | | — | | | | 5,850,788 | | | | 5,850,788 | |
| 19,314,310 | | | 124,366,502 | | | | 123,026,360 | | | | — | | | | — | | | | 516,033 | | | | — | | | | 20,654,452 | | | | 20,654,452 | |
| * | Non-income producing security. |
| ** | Annualized yield at time of purchase; not a coupon rate. |
| (a) | All or a portion of these securities were on loan. In addition, “Other Assets and Liabilities, Net” may include pending sales that are also on loan. The value of securities loaned at December 31, 2019 amounted to $15,035,293, which is 3.9% of net assets. |
| (b) | Investment was valued using significant unobservable inputs. |
| (c) | At December 31, 2019, this security has been pledged, in whole or in part, to cover initial margin requirements for open futures contracts. |
| (d) | Affiliated fund managed by DWS Investment Management Americas, Inc. The rate shown is the annualizedseven-day yield at period end. |
| (e) | Represents cash collateral held in connection with securities lending. Income earned by the Fund is net of borrower rebates. In addition, the Fund heldnon-cash U.S. Treasury securities collateral having a value of $558,072. |
| (f) | Represents the net increase (purchase cost) or decrease (sales proceeds) in the amount invested in cash collateral for the year ended December 31, 2019. |
The accompanying notes are an integral part of the financial statements.
| | | | | | |
| | 24 | | | | | | DWS Small Cap Index VIP |
At December 31, 2019, open futures contracts purchased were as follows:
| | | | | | | | | | | | | | | | | | | | | | | | |
| Futures | | Currency | | | Expiration
Date | | | Contracts | | | Notional
Amount ($) | | | Notional
Value ($) | | | Unrealized
Appreciation ($) | |
| Russell E Mini 2000 Index | | | USD | | | | 3/20/2020 | | | | 93 | | | | 7,766,631 | | | | 7,768,290 | | | | 1,659 | |
Currency Abbreviation
For information on the Fund’s policy and additional disclosures regarding futures contracts, please refer to the Derivatives section of Note B in the accompanying Notes to Financial Statements
Fair Value Measurements
Various inputs are used in determining the value of the Fund’s investments. These inputs are summarized in three broad levels. Level 1 includes quoted prices in active markets for identical securities. Level 2 includes other significant observable inputs (including quoted prices for similar securities, interest rates, prepayment speeds and credit risk). Level 3 includes significant unobservable inputs (including the Fund’s own assumptions in determining the fair value of investments). The level assigned to the securities valuations may not be an indication of the risk or liquidity associated with investing in those securities.
The following is a summary of the inputs used as of December 31, 2019 in valuing the Fund’s investments. For information on the Fund’s policy regarding the valuation of investments, please refer to the Security Valuation section of Note A in the accompanying Notes to Financial Statements.
| | | | | | | | | | | | | | | | |
| Assets | | Level 1 | | | Level 2 | | | Level 3 | | | Total | |
| Common Stocks (g) | | $ | 378,534,744 | | | $ | — | | | $ | 0 | | | $ | 378,534,744 | |
| Rights (g) | | | — | | | | — | | | | 3,223 | | | | 3,223 | |
| Government & Agency Obligation | | | — | | | | 1,519,585 | | | | — | | | | 1,519,585 | |
| Short-Term Investments (g) | | | 20,654,452 | | | | — | | | | — | | | | 20,654,452 | |
| Derivatives (h) | | | | | | | | | | | | | | | | |
Futures Contracts | | | 1,659 | | | | — | | | | — | | | | 1,659 | |
| Total | | $ | 399,190,855 | | | $ | 1,519,585 | | | $ | 3,223 | | | $ | 400,713,663 | |
| (g) | See Investment Portfolio for additional detailed categorizations. |
| (h) | Derivatives include unrealized appreciation (depreciation) on open futures contracts. |
The accompanying notes are an integral part of the financial statements.
| | | | |
| DWS Small Cap Index VIP | | | | | 25 |
Statement of Assets and Liabilities
| | | | |
| as of December 31, 2019 | |
| |
| Assets | | | | |
| Investments innon-affiliated securities, at value (cost $301,971,995) — including $15,035,293 of securities loaned | | $ | 380,057,552 | |
| Investment in DWS Government & Agency Securities Portfolio (cost $14,803,664)* | | | 14,803,664 | |
| Investment in DWS Central Cash Management Government Fund (cost $5,850,788) | | | 5,850,788 | |
| Cash | | | 5,280 | |
| Receivable for investments sold | | | 8,893 | |
| Receivable for Fund shares sold | | | 96,882 | |
| Dividends receivable | | | 456,240 | |
| Interest receivable | | | 47,084 | |
| Receivable for variation margin on futures contracts | | | 10,515 | |
| Other assets | | | 22,485 | |
| Total assets | | | 401,359,383 | |
| |
| Liabilities | | | | |
| Payable upon return of securities loaned | | | 14,803,664 | |
| Payable for investments purchased | | | 46,193 | |
| Payable for Fund shares redeemed | | | 212,496 | |
| Accrued management fee | | | 67,164 | |
| Accrued Trustees’ fees | | | 5,115 | |
| Other accrued expenses and payables | | | 167,698 | |
| Total liabilities | | | 15,302,330 | |
| Net assets, at value | | $ | 386,057,053 | |
| |
| Net Assets Consist of | | | | |
| Distributable earnings (loss) | | | 113,505,169 | |
| Paid-in capital | | | 272,551,884 | |
| Net assets, at value | | $ | 386,057,053 | |
| |
| Net Asset Value | | | | |
Class A | | | | |
| |
| Net Asset Value and redemption price per share ($353,076,139 ÷ 20,802,116 outstanding shares of beneficial interest, $.001 par value, unlimited number of shares authorized) | | $ | 16.97 | |
Class B | | | | |
| |
| Net Asset Value offering and redemption price per share ($32,980,914 ÷ 1,943,200 outstanding shares of beneficial interest, $.001 par value, unlimited number of shares authorized) | | $ | 16.97 | |
| * | Represents collateral on securities loaned. In addition, the Fund held non-cash collateral having a value of $558,072. |
Statement of Operations
| | | | |
| for the year ended December 31, 2019 | |
| |
| Investment Income | | | | |
| Income: | | | | |
Dividends (net of foreign taxes withheld
of $1,548) | | $ | 4,686,422 | |
| Interest | | | 31,835 | |
| Income distributions — DWS Central Cash Management Government Fund | | | 114,560 | |
| Securities lending income, net of borrower rebates | | | 401,473 | |
| Total income | | | 5,234,290 | |
| Expenses: | | | | |
| Management fee | | | 1,279,759 | |
| Administration fee | | | 365,645 | |
| Services to Shareholders | | | 3,485 | |
| Recordkeeping fee (Class B) | | | 8,851 | |
| Distribution service fee (Class B) | | | 75,628 | |
| Custodian fee | | | 53,521 | |
| Professional fees | | | 65,777 | |
| Reports to shareholders | | | 63,770 | |
| Trustees’ fees and expenses | | | 19,829 | |
| Other | | | 76,083 | |
| Total expenses before expense reductions | | | 2,012,348 | |
| Expense reductions | | | (501,074 | ) |
| Total expenses after expense reductions | | | 1,511,274 | |
| Net investment income | | | 3,723,016 | |
| |
| Realized and Unrealized Gain (Loss) | | | | |
| Net realized gain (loss) from: | | | | |
| Investments | | | 32,933,859 | |
| Futures | | | 1,293,540 | |
| | | | 34,227,399 | |
| Change in net unrealized appreciation (depreciation) on: | | | | |
| Investments | | | 43,935,102 | |
| Futures | | | 294,756 | |
| Foreign currency | | | 55 | |
| | | | 44,229,913 | |
| Net gain (loss) | | | 78,457,312 | |
| Net increase (decrease) in net assets resulting from operations | | $ | 82,180,328 | |
The accompanying notes are an integral part of the financial statements.
| | | | | | |
| | 26 | | | | | | DWS Small Cap Index VIP |
| | |
| Statements of Changes in Net Assets | | |
| | | | | | | | |
| | | Years Ended December 31, | |
| Increase (Decrease) in Net Assets | | 2019 | | | 2018 | |
| Operations: | | | | | | | | |
| Net investment income (loss) | | $ | 3,723,016 | | | $ | 4,120,982 | |
| Net realized gain (loss) | | | 34,227,399 | | | | 32,583,952 | |
| Change in net unrealized appreciation (depreciation) | | | 44,229,913 | | | | (78,598,339 | ) |
| Net increase (decrease) in net assets resulting from operations | | | 82,180,328 | | | | (41,893,405 | ) |
| Distributions to shareholders: | | | | | | | | |
Class A | | | (33,194,342 | ) | | | (28,419,168 | ) |
Class B | | | (2,947,799 | ) | | | (2,572,476 | ) |
| Total distributions | | | (36,142,141 | ) | | | (30,991,644 | ) |
| Fund share transactions: | |
Class A | | | | | | | | |
| Proceeds from shares sold | | | 84,958,254 | | | | 41,172,754 | |
| Reinvestment of distributions | | | 33,194,342 | | | | 28,419,168 | |
| Payments for shares redeemed | | | (115,504,018 | ) | | | (54,633,970 | ) |
| Net increase (decrease) in net assets from Class A share transactions | | | 2,648,578 | | | | 14,957,952 | |
Class B | | | | | | | | |
| Proceeds from shares sold | | | 5,070,105 | | | | 18,227,770 | |
| Reinvestment of distributions | | | 2,947,799 | | | | 2,572,476 | |
| Payments for shares redeemed | | | (6,737,215 | ) | | | (21,601,323 | ) |
| Net increase (decrease) in net assets from Class B share transactions | | | 1,280,689 | | | | (801,077 | ) |
| Increase (decrease) in net assets | | | 49,967,454 | | | | (58,728,174 | ) |
| Net assets at beginning of period | | | 336,089,599 | | | | 394,817,773 | |
| | |
| Net assets at end of period | | $ | 386,057,053 | | | $ | 336,089,599 | |
| | |
| Other Information | | | | | | | | |
Class A | | | | | | | | |
| Shares outstanding at beginning of period | | | 20,590,649 | | | | 19,690,579 | |
| Shares sold | | | 5,220,842 | | | | 2,269,653 | |
| Shares issued to shareholders in reinvestment of distributions | | | 2,089,008 | | | | 1,663,885 | |
| Shares redeemed | | | (7,098,383 | ) | | | (3,033,468 | ) |
| Net increase (decrease) in Class A shares | | | 211,467 | | | | 900,070 | |
| | |
| Shares outstanding at end of period | | | 20,802,116 | | | | 20,590,649 | |
Class B | | | | | | | | |
| Shares outstanding at beginning of period | | | 1,861,335 | | | | 1,897,242 | |
| Shares sold | | | 317,699 | | | | 982,362 | |
| Shares issued to shareholders in reinvestment of distributions | | | 185,163 | | | | 150,437 | |
| Shares redeemed | | | (420,997 | ) | | | (1,168,706 | ) |
| Net increase (decrease) in Class B shares | | | 81,865 | | | | (35,907 | ) |
| | |
| Shares outstanding at end of period | | | 1,943,200 | | | | 1,861,335 | |
The accompanying notes are an integral part of the financial statements.
| | | | |
| DWS Small Cap Index VIP | | | | | 27 |
Financial Highlights
| | | | | | | | | | | | | | | | | | | | |
| | | Years Ended December 31, | |
| Class A | | 2019 | | | 2018 | | | 2017 | | | 2016 | | | 2015 | |
| | | | | |
| Selected Per Share Data | | | | | | | | | | | | | | | | | | | | |
| Net asset value, beginning of period | | $ | 14.97 | | | $ | 18.29 | | | $ | 16.78 | | | $ | 15.18 | | | $ | 17.33 | |
| Income (loss) from investment operations: | | | | | | | | | | | | | | | | | | | | |
| | | | | |
Net investment income (loss)a | | | .17 | | | | .19 | | | | .17 | | | | .18 | | | | .19 | |
Net realized and unrealized gain (loss) | | | 3.49 | | | | (2.06 | ) | | | 2.16 | | | | 2.76 | | | | (.87 | ) |
Total from investment operations | | | 3.66 | | | | (1.87 | ) | | | 2.33 | | | | 2.94 | | | | (.68 | ) |
| Less distributions from: | | | | | | | | | | | | | | | | | | | | |
| | | | | |
Net investment income | | | (.18 | ) | | | (.18 | ) | | | (.17 | ) | | | (.17 | ) | | | (.18 | ) |
Net realized gains | | | (1.48 | ) | | | (1.27 | ) | | | (.65 | ) | | | (1.17 | ) | | | (1.29 | ) |
Total distributions | | | (1.66 | ) | | | (1.45 | ) | | | (.82 | ) | | | (1.34 | ) | | | (1.47 | ) |
| Net asset value, end of period | | $ | 16.97 | | | $ | 14.97 | | | $ | 18.29 | | | $ | 16.78 | | | $ | 15.18 | |
| Total Return (%)b | | | 25.22 | | | | (11.23 | ) | | | 14.33 | | | | 21.03 | | | | (4.60 | ) |
| | | | | |
| Ratios to Average Net Assets and Supplemental Data | | | | | | | | | | | | | | | | | | | | |
| Net assets, end of period ($ millions) | | | 353 | | | | 308 | | | | 360 | | | | 343 | | | | 284 | |
| Ratio of expenses before expense reductions (%)c | | | .53 | | | | .51 | | | | .51 | | | | .53 | | | | .54 | |
| Ratio of expenses after expense reductions (%)c | | | .39 | | | | .41 | | | | .44 | | | | .45 | | | | .45 | |
| Ratio of net investment income (loss) (%) | | | 1.04 | | | | 1.03 | | | | 1.00 | | | | 1.25 | | | | 1.14 | |
| Portfolio turnover rate (%) | | | 22 | | | | 17 | | | | 15 | | | | 18 | | | | 21 | |
| a | Based on average shares outstanding during the period. |
| b | Total return would have been lower had certain expenses not been reduced. |
| c | Expense ratio does not reflect charges and fees associated with the separate account that invests in the Fund or any variable life insurance policy or variable annuity contract for which the Fund is an investment option. |
| | | | | | | | | | | | | | | | | | | | |
| | | Years Ended December 31, | |
| Class B | | 2019 | | | 2018 | | | 2017 | | | 2016 | | | 2015 | |
| | | | | |
| Selected Per Share Data | | | | | | | | | | | | | | | | | | | | |
| Net asset value, beginning of period | | $ | 14.97 | | | $ | 18.28 | | | $ | 16.77 | | | $ | 15.17 | | | $ | 17.31 | |
| Income (loss) from investment operations: | | | | | | | | | | | | | | | | | | | | |
| | | | | |
Net investment income (loss)a | | | .12 | | | | .14 | | | | .13 | | | | .15 | | | | .14 | |
Net realized and unrealized gain (loss) | | | 3.49 | | | | (2.05 | ) | | | 2.15 | | | | 2.75 | | | | (.86 | ) |
Total from investment operations | | | 3.61 | | | | (1.91 | ) | | | 2.28 | | | | 2.90 | | | | (.72 | ) |
| Less distributions from: | | | | | | | | | | | | | | | | | | | | |
| | | | | |
Net investment income | | | (.13 | ) | | | (.13 | ) | | | (.12 | ) | | | (.13 | ) | | | (.13 | ) |
Net realized gains | | | (1.48 | ) | | | (1.27 | ) | | | (.65 | ) | | | (1.17 | ) | | | (1.29 | ) |
Total distributions | | | (1.61 | ) | | | (1.40 | ) | | | (.77 | ) | | | (1.30 | ) | | | (1.42 | ) |
| Net asset value, end of period | | $ | 16.97 | | | $ | 14.97 | | | $ | 18.28 | | | $ | 16.77 | | | $ | 15.17 | |
| Total Return (%)b | | | 24.87 | | | | (11.42 | ) | | | 14.03 | | | | 20.71 | | | | (4.85 | ) |
| | | | | |
| Ratios to Average Net Assets and Supplemental Data | | | | | | | | | | | | | | | | | | | | |
| Net assets, end of period ($ millions) | | | 33 | | | | 28 | | | | 35 | | | | 30 | | | | 25 | |
| Ratio of expenses before expense reductions (%)c | | | .81 | | | | .80 | | | | .78 | | | | .78 | | | | .79 | |
| Ratio of expenses after expense reductions (%)c | | | .65 | | | | .67 | | | | .70 | | | | .71 | | | | .71 | |
| Ratio of net investment income (loss) (%) | | | .76 | | | | .77 | | | | .76 | | | | .99 | | | | .88 | |
| Portfolio turnover rate (%) | | | 22 | | | | 17 | | | | 15 | | | | 18 | | | | 21 | |
| a | Based on average shares outstanding during the period. |
| b | Total return would have been lower had certain expenses not been reduced. |
| c | Expense ratio does not reflect charges and fees associated with the separate account that invests in the Fund or any variable life insurance policy or variable annuity contract for which the Fund is an investment option. |
The accompanying notes are an integral part of the financial statements.
| | | | | | |
| | 28 | | | | | | DWS Small Cap Index VIP |
| | |
| Notes to Financial Statements | | |
A. Organization and Significant Accounting Policies
Deutsche DWS Investments VIT Funds (the “Trust”) is registered under the Investment Company Act of 1940, as amended (the “1940 Act”), as an open-end management investment company. The Trust is organized as a Massachusetts business trust. DWS Small Cap Index VIP (the “Fund”) is a diversified series of the Trust offered to investors. The Fund is an underlying investment vehicle for variable annuity contracts and variable life insurance policies to be offered by the separate accounts of certain life insurance companies (“Participating Insurance Companies”).
Multiple Classes of Shares of Beneficial Interest.The Fund offers two classes of shares to investors: Class A shares and Class B shares. Class B shares are subject to Rule 12b-1 distribution fees under the 1940 Act and recordkeeping fees equal to an annual rate of 0.25% and up to 0.15%, respectively, of the Class B shares average daily net assets. Class A shares are not subject to such fees.
Investment income, realized and unrealized gains and losses, and certain fund-level expenses and expense reductions, if any, are borne pro rata on the basis of relative net assets by the holders of all classes of shares, except that each class bears certain expenses unique to that class (including the applicable Rule 12b-1 distribution fees). Differences in class-level expenses may result in payment of different per share dividends by class. All shares have equal rights with respect to voting subject to class-specific arrangements.
The Fund’s financial statements are prepared in accordance with accounting principles generally accepted in the United States of America (“U.S. GAAP”) which require the use of management estimates. Actual results could differ from those estimates. The Fund qualifies as an investment company under Topic 946 of Accounting Standards Codification of U.S. GAAP. The policies described below are followed consistently by the Fund in the preparation of its financial statements.
Security Valuation.Investments are stated at value determined as of the close of regular trading on the New York Stock Exchange on each day the exchange is open for trading.
Various inputs are used in determining the value of the Fund’s investments. These inputs are summarized in three broad levels. Level 1 includes quoted prices in active markets for identical securities. Level 2 includes other significant observable inputs (including quoted prices for similar securities, interest rates, prepayment speeds and credit risk). Level 3 includes significant unobservable inputs (including the Fund’s own assumptions in determining the fair value of investments). The level assigned to the securities valuations may not be an indication of the risk or liquidity associated with investing in those securities.
Equity securities are valued at the most recent sale price or official closing price reported on the exchange (U.S. or foreign) or over-the-counter market on which they trade. Securities for which no sales are reported are valued at the calculated mean between the most recent bid and asked quotations on the relevant market or, if a mean cannot be determined, at the most recent bid quotation. Equity securities are generally categorized as Level 1.
Debt securities are valued at prices supplied by independent pricing services approved by the Fund’s Board. If the pricing services are unable to provide valuations, securities are valued at the most recent bid quotation or evaluated price, as applicable, obtained from one or more broker-dealers. Such services may use various pricing techniques which take into account appropriate factors such as yield, quality, coupon rate, maturity, type of issue, trading characteristics and other data, as well as broker quotes. These securities are generally categorized as Level 2.
Investments in open-end investment companies are valued at their net asset value each business day and are categorized as Level 1.
Futures contracts are generally valued at the settlement prices established each day on the exchange on which they are traded and are categorized as Level 1.
Securities and other assets for which market quotations are not readily available or for which the above valuation procedures are deemed not to reflect fair value are valued in a manner that is intended to reflect their fair value as determined in accordance with procedures approved by the Board and are generally categorized as Level 3. In accordance with the Fund’s valuation procedures, factors considered in determining value may include, but are not limited to, the type of the security; the size of the holding; the initial cost of the security; the existence of any contractual restrictions on the security’s disposition; the price and extent of public trading in similar securities of the issuer or of comparable companies; quotations or
| | | | |
| DWS Small Cap Index VIP | | | | | 29 |
evaluated prices from broker-dealers and/or pricing services; information obtained from the issuer, analysts, and/or the appropriate stock exchange (for exchange-traded securities); an analysis of the company’s or issuer’s financial statements; an evaluation of the forces that influence the issuer and the market(s) in which the security is purchased and sold; and with respect to debt securities, the maturity, coupon, creditworthiness, currency denomination and the movement of the market in which the security is normally traded. The value determined under these procedures may differ from published values for the same securities.
Disclosure about the classification of fair value measurements is included in a table following the Fund’s Investment Portfolio.
Securities Lending.Brown Brothers Harriman & Co. serves as securities lending agent for the Fund, lends securities of the Fund to certain financial institutions under the terms of its securities lending agreement. During the term of the loans, the Fund continues to receive interest and dividends generated by the securities and to participate in any changes in their market value. The Fund requires the borrowers of the securities to maintain collateral with the Fund consisting of either cash and/or U.S. Treasury Securities having a value at least equal to the value of the securities loaned. When the collateral falls below specified amounts, the lending agent will use its best effort to obtain additional collateral on the next business day to meet required amounts under the securities lending agreement. During the year ended December 31, 2019, the Fund invested the cash collateral into a joint trading account in DWS Government & Agency Securities Portfolio, an affiliated money market fund managed by DWS Investment Management Americas, Inc. DWS Investment Management Americas, Inc. receives a management/administration fee (0.12% annualized effective rate as of December 31, 2019) on the cash collateral invested in DWS Government & Agency Securities Portfolio. The Fund receives compensation for lending its securities either in the form of fees or by earning interest on invested cash collateral net of borrower rebates and fees paid to a lending agent. Either the Fund or the borrower may terminate the loan at any time, and the borrower, after notice, is required to return borrowed securities within a standard time period. There may be risks of delay and costs in recovery of securities or even loss of rights in the collateral should the borrower of the securities fail financially. If the Fund is not able to recover securities lent, the Fund may sell the collateral and purchase a replacement investment in the market, incurring the risk that the value of the replacement security is greater than the value of the collateral. The Fund is also subject to all investment risks associated with the reinvestment of any cash collateral received, including, but not limited to, interest rate, credit and liquidity risk associated with such investments.
As of December 31, 2019, the Fund had securities on loan, which were classified as common stock and rights in the Investment Portfolio. The value of the related collateral exceeded the value of the securities loaned at period end.
| | | | | | | | | | | | | | | | | | | | |
| Remaining Contractual Maturity of the Agreementsas of December 31, 2019 | |
| | | Overnight and Continuous | | | <30 days | | | Between 30 & 90 days | | | >90 days | | | Total | |
Securities Lending Transactions | | | | | | | | | | | | | | | | | | | | |
| Common Stocks | | $ | 14,803,620 | | | $ | — | | | $ | — | | | $ | 558,072 | | | $ | 15,361,692 | |
| Rights | | | 44 | | | | — | | | | — | | | | — | | | | 44 | |
| Total Borrowings | | $ | 14,803,664 | | | $ | — | | | $ | — | | | $ | 558,072 | | | $ | 15,361,736 | |
| | | |
Gross amount of recognized liabilities for securities lending transactions: | | | | | | | | | | | $ | 15,361,736 | |
Federal Income Taxes.The Fund’s policy is to comply with the requirements of the Internal Revenue Code, as amended, which are applicable to regulated investment companies, and to distribute all of its taxable income to its shareholders.
The Fund has reviewed the tax positions for the open tax years as of December 31, 2019 and has determined that no provision for income tax and/or uncertain tax positions is required in the Fund’s financial statements. The Fund’s federal tax returns for the prior three fiscal years remain open subject to examination by the Internal Revenue Service.
Distribution of Income and Gains.Net investment income of the Fund, if any, is distributed to shareholders annually. Net realized gains from investment transactions, in excess of available capital loss carryforwards, would be taxable to the Fund if not distributed, and, therefore, will be distributed to shareholders at least annually. The Fund may also make additional distributions for tax purposes if necessary.
| | | | | | |
| | 30 | | | | | | DWS Small Cap Index VIP |
The timing and characterization of certain income and capital gain distributions are determined annually in accordance with federal tax regulations, which may differ from accounting principles generally accepted in the United States of America. These differences primarily relate to investments in futures contracts and certain securities sold at a loss. As a result, net investment income (loss) and net realized gain (loss) on investment transactions for a reporting period may differ significantly from distributions during such period. Accordingly, the Fund may periodically make reclassifications among certain of its capital accounts without impacting the net asset value of the Fund.
At December 31, 2019, the Fund’s components of distributable earnings (accumulated gains) on a tax basis were as follows:
| | | | |
| Undistributed ordinary income* | | $ | 5,592,765 | |
| Undistributed long-term capital gains | | $ | 34,522,122 | |
| Net unrealized appreciation (depreciation) on investments | | $ | 73,267,514 | |
At December 31, 2019, the aggregate cost of investments for federal income tax purposes was $327,444,490. The net unrealized appreciation for all investments based on tax cost was $73,267,514. This consisted of aggregate gross unrealized appreciation for all investments in which there was an excess of value over tax cost of $118,968,449 and aggregate gross unrealized depreciation for all investments in which there was an excess of tax cost over value of $45,700,935.
In addition, the tax character of distributions paid to shareholders by the Fund is summarized as follows:
| | | | | | | | |
| | | Years Ended December 31, | |
| | | 2019 | | | 2018 | |
| Distributions from ordinary income* | | $ | 6,299,165 | | | $ | 6,449,285 | |
| Distributions from long-term capital gains | | $ | 29,842,976 | | | $ | 24,542,359 | |
| * | For tax purposes, short-term capital gain distributions are considered ordinary income distributions. |
Contingencies.In the normal course of business, the Fund may enter into contracts with service providers that contain general indemnification clauses. The Fund’s maximum exposure under these arrangements is unknown, as this would involve future claims that may be made against the Fund that have not yet been made. However, based on experience, the Fund expects the risk of loss to be remote.
Expenses.Expenses of the Trust arising in connection with a specific fund are allocated to that fund. Other Trust expenses which cannot be directly attributed to a fund are apportioned among the funds in the Trust based upon the relative net assets or other appropriate measures.
Real Estate Investment Trusts.The Fund at its fiscal year end recharacterizes distributions received from a Real Estate Investment Trust (“REIT”) investment based on information provided by the REIT into the following categories: ordinary income, long-term and short-term capital gains, and return of capital. If information is not available timely from a REIT, the recharacterization will be estimated for financial statement purposes and a recharacterization will be made within the accounting records in the following year when such information becomes available. Distributions received from REITs in excess of income are recorded as either a reduction of cost of investments or realized gains.
Other.Investment transactions are accounted for on a trade date plus one basis for daily net asset valuation calculations. However, for financial reporting purposes, investment transactions are reported on trade date. Interest income is recorded on the accrual basis. Dividend income is recorded on the ex-dividend date net of foreign withholding taxes. Realized gains and losses from investment transactions are recorded on an identified cost basis. Proceeds from litigation payments, if any, are included in net realized gain (loss) from investments.
B. Derivative Instruments
A futures contract is an agreement between a buyer or seller and an established futures exchange or its clearinghouse in which the buyer or seller agrees to take or make a delivery of a specific amount of a financial instrument at a specified price on a specific date (settlement date). For the year ended December 31, 2019, the Fund invested in futures to keep cash on hand to meet shareholder redemptions or other needs while maintaining exposure to the stock market.
Upon entering into a futures contract, the Fund is required to deposit with a financial intermediary cash or securities (“initial margin”) in an amount equal to a certain percentage of the face value indicated in the futures contract. Subsequent payments (“variation margin”) are made or received by the Fund dependent
| | | | |
| DWS Small Cap Index VIP | | | | | 31 |
upon the daily fluctuations in the value and are recorded for financial reporting purposes as unrealized gains or losses by the Fund. Gains or losses are realized when the contract expires or is closed. Since all futures contracts are exchange traded, counterparty risk is minimized as the exchange’s clearinghouse acts as the counterparty, and guarantees the futures against default.
Certain risks may arise upon entering into futures contracts, including the risk that an illiquid market will limit the Fund’s ability to close out a futures contract prior to the settlement date and the risk that the futures contract is not well correlated with the security, index or currency to which it relates. Risk of loss may exceed amounts disclosed in the Statement of Assets and Liabilities.
A summary of the open futures contracts as of December 31, 2019, is included in a table following the Fund’s Investment Portfolio. For the year ended December 31, 2019, the investment in futures contracts purchased had a total notional value generally indicative of a range from $4,388,000 to approximately $16,056,000.
The following tables summarize the value of the Fund’s derivative instruments held as of December 31, 2019 and the related location in the accompanying Statement of Assets and Liabilities, presented by primary underlying risk exposure:
| | | | |
| Asset Derivative | | Futures
Contracts | |
| Equity Contracts (a) | | $ | 1,659 | |
The above derivative is located in the following Statement of Assets and Liabilities account:
| (a) | Includes cumulative appreciation of futures contracts as disclosed in the Investment Portfolio. Unsettled variation margin is disclosed separately within the Statement of Assets and Liabilities. |
Additionally, the amount of unrealized and realized gains and losses on derivative instruments recognized in Fund earnings during the year ended December 31, 2019 and the related location in the accompanying Statement of Operations is summarized in the following tables by primary underlying risk exposure:
| | | | |
| Realized Gain (Loss) | | Futures Contracts | |
| Equity Contracts (b) | | $ | 1,293,540 | |
The above derivative is located in the following Statement of Operations account:
| (b) | Net realized gain (loss) from futures |
| | | | |
| Change in Net Unrealized Appreciation (Depreciation) | | Futures Contracts | |
| Equity Contracts (c) | | $ | 294,756 | |
The above derivative is located in the following Statement of Operations account:
| (c) | Change in net unrealized appreciation (depreciation) on futures |
C. Purchases and Sales of Securities
During the year ended December 31, 2019, purchases and sales of investment securities (excluding short-term investments) aggregated $78,566,280 and $105,097,480, respectively.
D. Related Parties
Investment Management Agreement. Under the Investment Management Agreement with DWS Investment Management Americas, Inc. (“DIMA” or the “Advisor”), an indirect, wholly owned subsidiary of DWS Group GmbH & Co. KGaA (“DWS Group”), the Advisor determines the securities, instruments and other contracts relating to investments to be purchased, sold, or entered into by the Fund or delegates such responsibility to the Fund’s subadvisor. Northern Trust Investments, Inc. (“NTI”) serves as subadvisor. As a subadvisor to the Fund, NTI makes investment decisions and buys and sells securities for the Fund. NTI is paid by the Advisor for the services NTI provides to the Fund.
Pursuant to the Investment Management Agreement with the Advisor, the Fund pays the Advisor an annual fee based on its average daily net assets, computed and accrued daily and payable monthly at the annual rate (exclusive of any applicable waivers/reimbursements) of 0.35%.
| | | | | | |
| | 32 | | | | | | DWS Small Cap Index VIP |
For the period from January 1, 2019 through September 30, 2020 (and through April 30, 2020 for Class B shares), the Advisor has contractually agreed to waive all or a portion of its fees and/or reimburse certain operating expenses of the Fund to the extent necessary to maintain the total annual operating expenses (excluding certain expenses such as extraordinary expenses, taxes, brokerage and interest) of each class as follows:
| | | | |
| Class A | | | .39 | % |
| Class B | | | .65 | % |
For the year ended December 31, 2019, fees waived and/or expenses reimbursed for each class are as follows:
| | | | |
| Class A | | $ | 454,157 | |
| Class B | | | 46,917 | |
| | | $ | 501,074 | |
Administration Fee.Pursuant to the Administrative Services Agreement, DIMA provides most administrative services to the Fund. For all services provided under the Administrative Services Agreement, the Fund pays DIMA an annual fee (“Administration Fee”) of 0.10% of the Fund’s average daily net assets, computed and accrued daily and payable monthly. For the year ended December 31, 2019, the Administration Fee was $365,645, of which $32,260 is unpaid.
Distribution Service Agreement.DWS Distributors, Inc. (“DDI”), an affiliate of the Advisor, is the Fund’s distributor. In accordance with the Distribution Plan, DDI receives 12b-1 fees of 0.25% of average daily net assets of Class B shares. For the year ended December 31, 2019, the Distribution Service Fee was as follows:
| | | | | | | | |
| Distribution Service Fee | | Total
Aggregated | | | Unpaid at
December 31, 2019 | |
| Class B | | $ | 75,628 | | | $ | 6,902 | |
Service Provider Fees.DWS Service Company (“DSC”), an affiliate of the Advisor, is the transfer agent, dividend-paying agent and shareholder service agent of the Fund. Pursuant to a sub-transfer agency agreement among DSC and DST Systems, Inc. (“DST”), DSC has delegated certain transfer agent, dividend-paying agent and shareholder service agent functions to DST. DSC compensates DST out of the shareholder servicing fee they receive from the Fund. For the year ended December 31, 2019, the amounts charged to the Fund by DSC were as follows:
| | | | | | | | |
| Services to Shareholders | | Total Aggregated | | | Unpaid at December 31, 2019 | |
| Class A | | $ | 1,062 | | | $ | 176 | |
| Class B | | | 223 | | | | 37 | |
| | | $ | 1,285 | | | $ | 213 | |
Typesetting and Filing Service Fees.Under an agreement with the Fund, DIMA is compensated for providing certain pre-press and regulatory filing services to the Fund. For the year ended December 31, 2019, the amount charged to the Fund by DIMA included in the Statement of Operations under “Reports to shareholders” aggregated $17,679, of which $5,455 is unpaid.
Trustees’ Fees and Expenses.The Fund paid retainer fees to each Trustee not affiliated with the Advisor, plus specified amounts to the Board Chairperson and to each committee Chairperson.
Affiliated Cash Management Vehicles. The Fund may invest uninvested cash balances in DWS Central Cash Management Government Fund and DWS ESG Liquidity Fund, affiliated money market funds which are managed by the Advisor. Each affiliated money market fund is managed in accordance with Rule 2a-7 under the 1940 Act, which governs the quality, maturity, diversity and liquidity of instruments in which a money market fund may invest. DWS Central Cash Management Government Fund seeks to maintain a stable net asset value, and DWS ESG Liquidity Fund maintains a floating net asset value. The Fund indirectly bears its proportionate share of the expenses of each affiliated money market fund in which it invests. DWS Central Cash Management Government Fund does not pay the Advisor an investment management fee. To the extent that DWS ESG Liquidity Fund pays an investment management fee to the Advisor, the Advisor will waive an amount of the investment management fee payable to the Advisor by the Fund equal to the amount of the investment management fee payable on the Fund’s assets invested in DWS ESG Liquidity Fund.
| | | | |
| DWS Small Cap Index VIP | | | | | 33 |
E. Line of Credit
The Fund and other affiliated funds (the “Participants”) share in a $400 million revolving credit facility provided by a syndication of banks. The Fund may borrow for temporary or emergency purposes, including the meeting of redemption requests that otherwise might require the untimely disposition of securities. The Participants are charged an annual commitment fee, which is allocated based on net assets, among each of the Participants. Interest is calculated at a rate per annum equal to the sum of the Federal Funds Rate plus 1.25 percent plus if the one-month LIBOR exceeds the Federal Funds Rate, the amount of such excess. The Fund may borrow up to a maximum of 33 percent of its net assets under the agreement. The Fund had no outstanding loans at December 31, 2019.
F. Ownership of the Fund
At December 31, 2019, four participating insurance companies were beneficial owners of record of 10% or more of the total outstanding Class A shares of the Fund, each owning 40%, 17%, 12% and 11%, respectively. At December 31, 2019, three participating insurance companies were beneficial owners of record of 10% or more of the outstanding Class B shares of the Fund, each owning 44%, 20% and 16%, respectively.
G. Change of Independent Registered Public Accounting Firm
On May 14, 2019, PricewaterhouseCoopers LLP (“PwC”) resigned as the independent registered public accounting firm to the Fund. PwC communicated its resignation to the Registrant’s Board of Trustees (the “Board of Trustees”).
PwC’s reports on the Fund’s financial statements for the fiscal years ended December 31, 2018 and December 31, 2017 contained no adverse opinion or disclaimer of opinion nor were they qualified or modified as to uncertainty, audit scope or accounting principle.
During the fiscal years ended December 31, 2018 and December 31, 2017 and during the subsequent interim period through May 14, 2019: (i) there were no disagreements with PwC on any matter of accounting principles or practices, financial statement disclosure or auditing scope or procedure, which disagreements, if not resolved to the satisfaction of PwC, would have caused PwC to make reference to the subject matter of the disagreements in connection with its reports on the Fund’s financial statements for such periods; and (ii) there were no “reportable events” of the kind described in Item 304(a)(1)(v) of Regulation S-K under the Securities Exchange Act of 1934, as amended.
On May 15, 2019, the Audit Committee of the Board of Trustees and the Board of Trustees approved the selection of Ernst & Young LLP (“EY”) as the Fund’s independent registered public accounting firm for the fiscal year ending December 31, 2019. During the Fund’s fiscal years ended December 31, 2018 and December 31, 2017, and the subsequent interim period through May 15, 2019, neither the Fund, nor anyone on their behalf, consulted with EY on items which: (i) concerned the application of accounting principles to a specified transaction, either completed or proposed, or the type of audit opinion that might be rendered on the Fund’s financial statements; or (ii) concerned the subject of a disagreement (as defined in paragraph (a)(1)(iv) of Item 304 of Regulation S-K) or reportable events (as described in paragraph (a)(1)(v) of said Item 304).
| | | | | | |
| | 34 | | | | | | DWS Small Cap Index VIP |
Report of Independent Registered Public Accounting Firm
To the Board of Trustees of Deutsche DWS Investments VIT Funds and Shareholders of DWS Small Cap Index VIP:
Opinion on the Financial Statements
We have audited the accompanying statement of assets and liabilities of DWS Small Cap Index VIP (the “Fund”) (one of the funds constituting Deutsche DWS Investments VIT Funds) (the “Trust”), including the investment portfolio, as of December 31, 2019, and the related statements of operations and changes in net assets and the financial highlights for the year then ended and the related notes (collectively referred to as the “financial statements”). In our opinion, the financial statements present fairly, in all material respects, the financial position of the Fund (one of the funds constituting Deutsche DWS Investments VIT Funds) at December 31, 2019, the results of its operations, the changes in its net assets and its financial highlights for the year then ended, in conformity with U.S. generally accepted accounting principles.
The statement of changes in net assets for the year ended December 31, 2018, and the financial highlights for the years ended December 31, 2015, December 31, 2016, December 31, 2017 and December 31, 2018, were audited by another independent registered public accounting firm whose report, dated February 14, 2019, expressed an unqualified opinion on that statement of changes in net assets and those financial highlights.
Basis for Opinion
These financial statements are the responsibility of the Trust’s management. Our responsibility is to express an opinion on the Fund’s financial statements based on our audit. We are a public accounting firm registered with the Public Company Accounting Oversight Board (United States) (“PCAOB”) and are required to be independent with respect to the Trust in accordance with the U.S. federal securities laws and the applicable rules and regulations of the Securities and Exchange Commission and the PCAOB.
We conducted our audit in accordance with the standards of the PCAOB. Those standards require that we plan and perform the audit to obtain reasonable assurance about whether the financial statements are free of material misstatement, whether due to error or fraud. The Trust is not required to have, nor were we engaged to perform, an audit of the Trust’s internal control over financial reporting. As part of our audit, we are required to obtain an understanding of internal control over financial reporting, but not for the purpose of expressing an opinion on the effectiveness of the Trust’s internal control over financial reporting. Accordingly, we express no such opinion.
Our audit included performing procedures to assess the risks of material misstatement of the financial statements, whether due to error or fraud, and performing procedures that respond to those risks. Such procedures included examining, on a test basis, evidence regarding the amounts and disclosures in the financial statements. Our procedures included confirmation of securities owned as of December 31, 2019, by correspondence with the custodian and others or by other appropriate auditing procedures where replies from others were not received. Our audit also included evaluating the accounting principles used and significant estimates made by management, as well as evaluating the overall presentation of the financial statements. We believe that our audit provides a reasonable basis for our opinion.

We have served as the auditor of one or more investment companies in the DWS family of funds since at least 1979, but we are unable to determine the specific year.
Boston, Massachusetts
February 14, 2020
| | | | |
| DWS Small Cap Index VIP | | | | | 35 |
| | |
| Information About Your Fund’s Expenses | | (Unaudited) |
As an investor of the Fund, you incur two types of costs: ongoing expenses and transaction costs. Ongoing expenses include management fees, distribution and service (12b-1) fees and other Fund expenses. Examples of transaction costs include contract charges, which are not shown in this section. The following tables are intended to help you understand your ongoing expenses (in dollars) of investing in the Fund and to help you compare these expenses with the ongoing expenses of investing in other mutual funds. In the most recent six-month period, the Fund limited these expenses; had it not done so, expenses would have been higher. The example in the table is based on an investment of $1,000 invested at the beginning of the six-month period and held for the entire period (July 1, 2019 to December 31, 2019).
The tables illustrate your Fund’s expenses in two ways:
| – | | Actual Fund Return. This helps you estimate the actual dollar amount of ongoing expenses (but not transaction costs) paid on a $1,000 investment in the Fund using the Fund’s actual return during the period. To estimate the expenses you paid over the period, simply divide your account value by $1,000 (for example, an $8,600 account value divided by $1,000 = 8.6), then multiply the result by the number in the “Expenses Paid per $1,000” line under the share class you hold. |
| – | | Hypothetical 5% Fund Return. This helps you to compare your Fund’s ongoing expenses (but not transaction costs) with those of other mutual funds using the Fund’s actual expense ratio and a hypothetical rate of return of 5% per year before expenses. Examples using a 5% hypothetical Fund return may be found in the shareholder reports of other mutual funds. The hypothetical account values and expenses may not be used to estimate the actual ending account balance or expenses you paid for the period. |
Please note that the expenses shown in these tables are meant to highlight your ongoing expenses only and do not reflect any transaction costs. The “Expenses Paid per $1,000” line of the tables is useful in comparing ongoing expenses only and will not help you determine the relative total expense of owning different funds. If these transaction costs had been included, your costs would have been higher.
| | | | | | | | |
| Expenses and Value of a $1,000 Investment for the six months ended December 31, 2019 | | | | |
| | |
| Actual Fund Return | | | Class A | | | | Class B | |
| Beginning Account Value 7/1/19 | | $ | 1,000.00 | | | $ | 1,000.00 | |
| Ending Account Value 12/31/19 | | $ | 1,071.30 | | | $ | 1,070.00 | |
| Expenses Paid per $1,000* | | $ | 2.04 | | | $ | 3.39 | |
| | |
| Hypothetical 5% Fund Return | | | Class A | | | | Class B | |
| Beginning Account Value 7/1/19 | | $ | 1,000.00 | | | $ | 1,000.00 | |
| Ending Account Value 12/31/19 | | $ | 1,023.24 | | | $ | 1,021.93 | |
| Expenses Paid per $1,000* | | $ | 1.99 | | | $ | 3.31 | |
| * | Expenses are equal to the Fund’s annualized expense ratio for each share class, multiplied by the average account value over the period, multiplied by 184 (the number of days in the most recent six-month period), then divided by 365. |
| | | | | | | | |
| Annualized Expense Ratios | | Class A | | | Class B | |
| DWS Small Cap Index VIP | | | .39 | % | | | .65 | % |
For more information, please refer to the Fund’s prospectus.
These tables do not reflect charges and fees (“contract charges”) associated with the separate account that invests in the Fund or any variable life insurance policy or variable annuity contract for which the Fund is an investment option.
For an analysis of the fees associated with an investment in the Fund or similar funds, please refer to the current and hypothetical expense calculators for Variable Insurance Products which can be found at dws.com/calculators.
| | | | | | |
| | 36 | | | | | | DWS Small Cap Index VIP |
| | |
| Tax Information | | (Unaudited) |
The Fund paid distributions of $1.37 per share from net long-term capital gains during its year ended
December 31, 2019.
Pursuant to Section 852 of the Internal Revenue Code, the Fund designates $38,583,000 as capital gain dividends for its year ended December 31, 2019.
For corporate shareholders, 52% of the ordinary dividends (i.e., income dividends plus short-term capital gains) paid during the Fund’s fiscal year ended December 31, 2019 qualified for the dividends received deduction.
Please consult a tax advisor if you have questions about federal or state income tax laws, or on how to prepare your tax returns. If you have specific questions about your account, contact your insurance provider.
Proxy Voting
The Fund’s policies and procedures for voting proxies for portfolio securities and information about how the Fund voted proxies related to its portfolio securities during the most recent 12-month period ended June 30 are available on our Web site — dws.com/en-us/resources/proxy-voting — or on the SEC’s Web site — sec.gov. To obtain a written copy of the Fund’s policies and procedures without charge, upon request, call us toll free at (800) 728-3337.
| | | | |
| DWS Small Cap Index VIP | | | | | 37 |
Advisory Agreement Board Considerations and Fee Evaluation
The Board of Trustees (hereinafter referred to as the “Board” or “Trustees”) approved the renewal of DWS Small Cap Index VIP’s (the “Fund”) investment management agreement (the “Agreement”) with DWS Investment Management Americas, Inc. (“DIMA”) andsub-advisory agreement (the“Sub-Advisory Agreement” and together with the Agreement, the “Agreements”) between DIMA and Northern Trust Investments, Inc. (“NTI”)in September 2019.
In terms of the process that the Board followed prior to approving the Agreements, shareholders should know that:
| – | | During the entire process, all of the Fund’s Trustees were independent of DIMA and its affiliates (the “Independent Trustees”). |
| – | | The Board met frequently during the past year to discuss fund matters and dedicated a substantial amount of time to contract review matters. Over the course of several months, the Board’s Contract Committee reviewed extensive materials received from DIMA, independent third parties and independent counsel. These materials included an analysis of the Fund’s performance, fees and expenses, and profitability from a fee consultant retained by the Fund’s Independent Trustees (the “Fee Consultant”). Based on its evaluation of the information provided, the Contract Committee presented its findings and recommendations to the Board. The Board then reviewed the Contract Committee’s findings and recommendations. |
| – | | The Board also received extensive information throughout the year regarding performance of the Fund. |
| – | | The Independent Trustees regularly met privately with counsel to discuss contract review and other matters. In addition, the Independent Trustees were advised by the Fee Consultant in the course of their review of the Fund’s contractual arrangements and considered a comprehensive report prepared by the Fee Consultant in connection with their deliberations. |
| – | | In connection with reviewing the Agreements, the Board also reviewed the terms of the Fund’s Rule12b-1 plan, distribution agreement, administrative services agreement, transfer agency agreement and other material service agreements. |
In connection with the contract review process, the Contract Committee and the Board considered the factors discussed below, among others. The Board also considered that DIMA and its predecessors have managed the Fund since its inception, and the Board believes that a long-term relationship with a capable, conscientious advisor is in the best interests of the Fund. The Board considered, generally, that shareholders chose to invest or remain invested in the Fund knowing that DIMA managed the Fund. DIMA is part of DWS Group GmbH & Co. KGaA (“DWS Group”). DWS Group is a global asset management business that offers a wide range of investing expertise and resources, including research capabilities in many countries throughout the world. In 2018, approximately 20% of DWS Group’s shares were sold in an initial public offering, with Deutsche Bank AG owning the remaining shares.
As part of the contract review process, the Board carefully considered the fees and expenses of each DWS fund overseen by the Board in light of the fund’s performance. In many cases, this led to the negotiation and implementation of expense caps. As part of these negotiations, the Board indicated that it would consider relaxing these caps in future years following sustained improvements in performance, among other considerations.
While shareholders may focus primarily on fund performance and fees, the Fund’s Board considers these and many other factors, including the quality and integrity of DIMA’s and NTI’s personnel and administrative support services provided by DIMA, such as back-office operations, fund valuations, and compliance policies and procedures.
Nature, Quality and Extent of Services. The Board considered the terms of the Agreements, including the scope of advisory services provided under the Agreements. The Board noted that, under the Agreements, DIMA and NTI provide portfolio management services to the Fund and that, pursuant to a separate administrative services agreement, DIMA provides administrative services to the Fund. The Board considered the experience and skills of senior management and investment personnel and the resources made available to such personnel. Throughout the course of the year, the Board also received information regarding DIMA’s oversight of fundsub-advisors, including NTI. The Board reviewed the Fund’s performance over short-term and long-term periods and compared those returns to various agreed-upon performance measures, including market index(es) and a peer universe compiled using information supplied by
| | | | | | |
| | 38 | | | | | | DWS Small Cap Index VIP |
Morningstar Direct (“Morningstar”), an independent fund data service. The Board also noted that it has put into place a process of identifying “Funds in Review” (e.g., funds performing poorly relative to a peer universe), and receives additional reporting from DIMA regarding such funds and, where appropriate, DIMA’s plans to address underperformance. The Board believes this process is an effective manner of identifying and addressing underperforming funds. Based on the information provided, the Board noted that, for theone-, three- and five-year periods ended December 31, 2018, the Fund’s performance (Class A shares) was in the 2nd quartile of the applicable Morningstar universe (the 1st quartile being the best performers and the 4th quartile being the worst performers).
Fees and Expenses. The Board considered the Fund’s investment management fee schedule,sub-advisory fee schedule, operating expenses and total expense ratios, and comparative information provided by Broadridge Financial Solutions, Inc. (“Broadridge”) and the Fee Consultant regarding investment management fee rates paid to other investment advisors by similar funds (1st quartile being the most favorable and 4th quartile being the least favorable). With respect to management fees paid to other investment advisors by similar funds, the Board noted that the contractual fee rates paid by the Fund, which include a 0.10% fee paid to DIMA under the Fund’s administrative services agreement, were higher than the median (4th quartile) of the applicable Broadridge peer group (based on Broadridge data provided as of December 31, 2018). With respect to thesub-advisory fee paid to NTI, the Board noted that the fee is paid by DIMA out of its fee and not directly by the Fund.The Board noted that the Fund’s Class A shares total (net) operating expenses were expected to be higher than the median (3rd quartile) of the applicable Broadridge expense universe (based on Broadridge data provided as of December 31, 2018, and analyzing Broadridge expense universe Class A (net) expenses less any applicable12b-1 fees) (“Broadridge Universe Expenses”). The Board also reviewed data comparing each other operational share class’s total (net) operating expenses to the applicable Broadridge Universe Expenses. The Board noted that the expense limitations agreed to by DIMA were expected to help the Fund’s total (net) operating expenses remain competitive. The Board considered the Fund’s management fee rate as compared to fees charged by DIMA to comparable DWS U.S. registered funds (“DWS Funds”) and considered differences between the Fund and the comparable DWS Funds. The information requested by the Board as part of its review of fees and expenses also included information about institutional accounts (including anysub-advised funds and accounts) and funds offered primarily to European investors (“DWS Europe Funds”) managed by DWS Group. The Board noted that DIMA indicated that DWS Group does not manage any institutional accounts or DWS Europe Funds comparable to the Fund.
On the basis of the information provided, the Board concluded that management fees were reasonable and appropriate in light of the nature, quality and extent of services provided by DIMA and NTI.
Profitability. The Board reviewed detailed information regarding revenues received by DIMA under the Agreement. The Board considered the estimated costs to DIMA, andpre-tax profits realized by DIMA, from advising the DWS Funds, as well as estimates of thepre-tax profits attributable to managing the Fund in particular. The Board also received information regarding the estimated enterprise-wide profitability of DIMA and its affiliates with respect to all fund services in totality and by fund. The Board and the Fee Consultant reviewed DIMA’s methodology in allocating its costs to the management of the Fund. Based on the information provided, the Board concluded that thepre-tax profits realized by DIMA in connection with the management of the Fund were not unreasonable. The Board also reviewed certain publicly available information regarding the profitability of certain similar investment management firms. The Board noted that, while information regarding the profitability of such firms is limited (and in some cases is not necessarily prepared on a comparable basis), DIMA and its affiliates’ overall profitability with respect to the DWS Funds (after taking into account distribution and other services provided to the funds by DIMA and its affiliates) was lower than the overall profitability levels of most comparable firms for which such data was available. The Board did not consider the profitability of NTI with respect to the Fund. The Board noted that DIMA pays NTI’s fee out of its management fee, and its understanding that the Fund’ssub-advisory fee schedule was the product of an arm’s length negotiation with DIMA.
Economies of Scale. The Board considered whether there are economies of scale with respect to the management of the Fund and whether the Fund benefits from any economies of scale. In this regard, the Board observed that while the Fund’s current investment management fee schedule does not include breakpoints, the Fund’s fee schedule represents an appropriate sharing between the Fund and DIMA of such economies of scale as may exist in the management of the Fund at current asset levels.
Other Benefits to DIMA and NTI and Their Affiliates. The Board also considered the character and amount of other incidental or“fall-out” benefits received by DIMA and NTI and their affiliates, including any fees
| | | | |
| DWS Small Cap Index VIP | | | | | 39 |
received by DIMA for administrative services provided to the Fund, any fees received by an affiliate of DIMA for transfer agency services provided to the Fund and any fees received by an affiliate of DIMA for distribution services. The Board also considered benefits to DIMA and NTI related to brokerage and soft-dollar allocations, including allocating brokerage to pay for research generated by parties other than the executing broker dealers, which pertain primarily to funds investing in equity securities. In addition, the Board considered the incidental public relations benefits to DIMA and NTI related to DWS Funds advertising and cross-selling opportunities among DIMA products and services. The Board considered these benefits in reaching its conclusion that the Fund’s management fees were reasonable.
Compliance. The Board considered the significant attention and resources dedicated by DIMA to its compliance processes in recent years. The Board noted in particular (i) the experience, seniority and time commitment of the individuals serving as DIMA’s and the Fund’s chief compliance officers and (ii) the substantial commitment of resources by DIMA and its affiliates to compliance matters, including the retention of compliance personnel. The Board also considered the attention and resources dedicated by DIMA to the oversight of the investmentsub-advisor’s compliance program and compliance with the applicable fund policies and procedures.
Based on all of the information considered and the conclusions reached, the Board determined that the continuation of the Agreements is in the best interests of the Fund. In making this determination, the Board did not give particular weight to any single factor identified above. The Board considered these factors over the course of numerous meetings, certain of which were in executive session with only the Independent Trustees and counsel present. It is possible that individual Independent Trustees may have weighed these factors differently in reaching their individual decisions to approve the continuation of the Agreements.
| | | | | | |
| | 40 | | | | | | DWS Small Cap Index VIP |
Board Members and Officers
The following table presents certain information regarding the Board Members and Officers of the Trust/Corporation. Each Board Member’s year of birth is set forth in parentheses after his or her name. Unless otherwise noted, (i) each Board Member has engaged in the principal occupation(s) noted in the table for at least the most recent five years, although not necessarily in the same capacity; and (ii) the address of each Independent Board Member is Keith R. Fox, DWS Funds Board Chair, c/o Thomas R. Hiller, Ropes & Gray LLP, Prudential Tower, 800 Boylston Street, Boston, MA02199-3600. Except as otherwise noted below, the term of office for each Board Member is until the election and qualification of a successor, or until such Board Member sooner dies, resigns, is removed or as otherwise provided in the governing documents of the Trust/Corporation. Because the Fund does not hold an annual meeting of shareholders, each Board Member will hold office for an indeterminate period.
The Board Members may also serve in similar capacities with other funds in the fund complex. The number of funds in DWS fund complex shown in the table below includes all registered open- and closed-end funds (including all of their portfolios) advised by the Advisor and any registered funds that have an investment advisor that is an affiliated person of the Advisor.
| | | | | | | | |
| Independent Board Members | | | | | |
Name, Year of Birth,
Position with the Trust/
Corporation and
Length of Time Served1 | | Business Experience and Directorships During the Past Five Years | | Number of
Funds in
DWS Fund
Complex
Overseen | | | Other
Directorships
Held by Board
Member
|
Keith R. Fox, CFA (1954) Chairperson since 2017, and Board Member since 1996 | | Managing General Partner, Exeter Capital Partners (a series of private investment funds) (since 1986). Directorships: ICI Mutual Insurance Company; Progressive International Corporation (kitchen goods importer and distributor); former Chairman, National Association of Small Business Investment Companies; former Directorships: The Kennel Shop (retailer); BoxTop Media Inc. (advertising); Sun Capital Advisers Trust (mutual funds) (2011–2012) | | | 77 | | | — |
John W. Ballantine (1946) Board Member since 1999 | | Retired; formerly, Executive Vice President and Chief Risk Management Officer, First Chicago NBD Corporation/The First National Bank of Chicago (1996–1998); Executive Vice President and Head of International Banking (1995–1996); former Directorships: Director and Chairman of the Board, Healthways, Inc.2 (population well-being and wellness services) (2003–2014); Stockwell Capital Investments PLC (private equity); Enron Corporation; FNB Corporation; Tokheim Corporation; First Oak Brook Bancshares, Inc.; Oak Brook Bank; and Prisma Energy International. Not-for-Profit Director/Trustee: Palm Beach Civic Association; Window to the World Communications (public media); Life Director of Harris Theater for Music and Dance (Chicago); Life Director of Hubbard Street Dance Chicago; former Not-for-Profit Directorships: Public Radio International | | | 77 | | | Portland
General
Electric2
(utility
company)
(2003–
present) |
Dawn-Marie Driscoll (1946) Board Member since 1987 | | Emeritus Executive Fellow, Center for Business Ethics, Bentley University; formerly: Partner, Palmer & Dodge (law firm) (1988–1990); Vice President of Corporate Affairs and General Counsel, Filene’s (retail) (1978–1988). Directorships: Advisory Board, Center for Business Ethics, Bentley University; Trustee and former Chairman of the Board, Southwest Florida Community Foundation (charitable organization); former Directorships: ICI Mutual Insurance Company (2007–2015); Sun Capital Advisers Trust (mutual funds) (2007–2012), Investment Company Institute (audit, executive, nominating committees) and Independent Directors Council (governance, executive committees) | | | 77 | | | — |
Richard J. Herring (1946) Board Member since 1990 | | Jacob Safra Professor of International Banking and Professor of Finance, The Wharton School, University of Pennsylvania (since July 1972); Director, The Wharton Financial Institutions Center (since 1994); formerly: Vice Dean and Director, Wharton Undergraduate Division (1995–2000) and Director, The Lauder Institute of International Management Studies (2000–2006); Member FDIC Systemic Risk Advisory Committee since 2011, member Systemic Risk Council since 2012 and member of the Advisory Board at the Yale Program on Financial Stability since 2013; Formerly Co-Chair of the Shadow Financial Regulatory Committee (2003–2015), Executive Director of The Financial Economists Roundtable (2008–2015), Director of The Thai Capital Fund (2007–2013), Director of The Aberdeen Singapore Fund (2007–2018), and Nonexecutive Director of Barclays Bank DE (2010–2018) | | | 77 | | | Director,
Aberdeen
Japan Fund
(since 2007) |
| | | | |
| DWS Small Cap Index VIP | | | | | 41 |
| | | | | | | | |
Name, Year of Birth,
Position with the Trust/
Corporation and
Length of Time Served1 | | Business Experience and Directorships During the Past Five Years | | Number of
Funds in
DWS Fund
Complex
Overseen | | | Other
Directorships
Held by Board
Member
|
William McClayton (1944) Board Member since 2004 | | Private equity investor (since October 2009); previously, Managing Director, Diamond Management & Technology Consultants, Inc. (global consulting firm) (2001–2009); Directorship: Board of Managers, YMCA of Metropolitan Chicago; formerly: Senior Partner, Arthur Andersen LLP (accounting) (1966–2001); Trustee, Ravinia Festival | | | 77 | | | — |
Rebecca W. Rimel (1951) Board Member since 1995 | | President, Chief Executive Officer and Director, The Pew Charitable Trusts (charitable organization) (1994–present); formerly: Executive Vice President, The Glenmede Trust Company (investment trust and wealth management) (1983–2004); Board Member, Investor Education (charitable organization) (2004–2005); Trustee, Executive Committee, Philadelphia Chamber of Commerce (2001–2007); Director, Viasys Health Care2 (January 2007–June 2007); Trustee, Thomas Jefferson Foundation (charitable organization) (1994–2012) | | | 77 | | | Director,
Becton
Dickinson
and
Company2
(medical
technology
company)
(2012–
present);
Director,
BioTelemetry
Inc.2(health
care) (2009–
present) |
William N. Searcy, Jr. (1946) Board Member since 1993 | | Private investor since October 2003; formerly: Pension & Savings Trust Officer, Sprint Corporation2(telecommunications) (November 1989–September 2003); Trustee, Sun Capital Advisers Trust (mutual funds) (1998–2012) | | | 77 | | | — |
| | |
| Officers4 | | |
Name, Year of Birth,
Position with the Trust/
Corporation and
Length of Time Served5 | | Business Experience and Directorships During the Past Five Years |
Hepsen Uzcan6(1974) President and Chief Executive Officer, 2017–present | | Managing Director,3 DWS; Secretary, DWS USA Corporation (2018–present); Assistant Secretary, DWS Distributors, Inc. (2018–present); Director and Vice President, DWS Service Company (2018–present); Assistant Secretary, DWS Investment Management Americas, Inc. (2018–present); and Director and President, DB Investment Managers, Inc. (2018–present); formerly: Vice President for the Deutsche funds (2016–2017); Assistant Secretary for the DWS funds (2013–2019) |
John Millette7(1962) Vice President and Secretary, 1999–present | | Director,3DWS; Chief Legal Officer, DWS Investment Management Americas, Inc. (2015–present); Director and Vice President, DWS Trust Company (2016–present); and Assistant Secretary, DBX ETF Trust (2019–present); formerly: Secretary, Deutsche Investment Management Americas Inc. (2015–2017) |
Diane Kenneally7(1966) Chief Financial Officer and Treasurer, 2018–present | | Director,3 DWS; and Treasurer, Chief Financial Officer and Controller, DBX ETF Trust (2019–present); formerly: Assistant Treasurer for the DWS funds (2007–2018) |
Paul Antosca7(1957) Assistant Treasurer, 2007–present | | Director,3DWS; and Assistant Treasurer, DBX ETF Trust (2019–present) |
Sheila Cadogan7(1966) Assistant Treasurer, 2017–present | | Director,3DWS; Director and Vice President, DWS Trust Company (2018–present); and Assistant Treasurer, DBX ETF Trust (2019–present) |
Scott D. Hogan7(1970) Chief Compliance Officer, 2016–present | | Director,3DWS |
Caroline Pearson7(1962) Chief Legal Officer, 2010–present | | Managing Director,3DWS; formerly: Secretary, Deutsche AM Distributors, Inc. (2002–2017); and Secretary, Deutsche AM Service Company (2010–2017) |
Wayne Salit6(1967) Anti-Money Laundering Compliance Officer, 2014–present | | Director,3 Deutsche Bank; and AML Officer, DWS Trust Company; formerly: Managing Director, AML Compliance Officer at BNY Mellon (2011–2014); and Director, AML Compliance Officer at Deutsche Bank (2004–2011) |
Ciara Crawford8 (1984) Assistant Secretary, (2019–present) | | Associate, DWS (since 2015); previously, Legal Assistant at Accelerated Tax Solutions. |
| | | | | | |
| | 42 | | | | | | DWS Small Cap Index VIP |
| 1 | The length of time served represents the year in which the Board Member joined the board of one or more DWS funds currently overseen by the Board. |
| 2 | A publicly held company with securities registered pursuant to Section 12 of the Securities Exchange Act of 1934. |
| 3 | Executive title, not a board directorship. |
| 4 | As a result of their respective positions held with the Advisor or its affiliates, these individuals are considered “interested persons” of the Advisor within the meaning of the 1940 Act. Interested persons receive no compensation from the Fund. |
| 5 | The length of time served represents the year in which the officer was first elected in such capacity for one or more DWS funds. |
| 6 | Address: 875 Third Avenue, New York, NY 10022. |
| 7 | Address: One International Place, Boston, MA 02110. |
| 8 | Address: 5022 Gate Parkway, Suite 400, Jacksonville, FL 32256. |
The Fund’s Statement of Additional Information (“SAI”) includes additional information about the Board Members. The SAI is available, without charge, upon request. If you would like to request a copy of the SAI, you may do so by calling the followingtoll-free number:(800) 728-3337.
| | | | |
| DWS Small Cap Index VIP | | | | | 43 |
| | |
| | |
vit-scif-2 (R-025818-9 2/20) | | |
| | |
| ITEM 2. | CODE OF ETHICS |
| | |
| | As of the end of the period covered by this report, the registrant has adopted a code of ethics, as defined in Item 2 of Form N-CSR that applies to its Principal Executive Officer and Principal Financial Officer. There have been no amendments to, or waivers from, a provision of the code of ethics during the period covered by this report that would require disclosure under Item 2. A copy of the code of ethics is filed as an exhibit to this Form N-CSR. |
| | |
| ITEM 3. | AUDIT COMMITTEE FINANCIAL EXPERT |
| | |
| | The fund’s audit committee is comprised solely of trustees who are "independent" (as such term has been defined by the Securities and Exchange Commission ("SEC") in regulations implementing Section 407 of the Sarbanes-Oxley Act (the "Regulations")). The fund’s Board of Trustees has determined that there are several "audit committee financial experts" (as such term has been defined by the Regulations) serving on the fund’s audit committee including Mr. William McClayton, the chair of the fund’s audit committee. An “audit committee financial expert” is not an “expert” for any purpose, including for purposes of Section 11 of the Securities Act of 1933 and the designation or identification of a person as an “audit committee financial expert” does not impose on such person any duties, obligations or liability that are greater than the duties, obligations and liability imposed on such person as a member of the audit committee and board of directors in the absence of such designation or identification. |
| | |
| ITEM 4. | PRINCIPAL ACCOUNTANT FEES AND SERVICES |
| | |
DWS Small Cap Index VIP
form n-csr disclosure re: AUDIT FEES
The following table shows the amount of fees that Ernst & Young LLP (“EY”), the Fund’s current Independent Registered Public Accounting Firm, billed to the Fund during the Fund’s fiscal year ended December 31, 2019 and the amount of fees that PricewaterhouseCoopers, LLP (“PwC”), the Fund’s prior Independent Registered Public Accounting Firm, billed to the Fund during the Fund’s fiscal year ended December 31, 2018. The Audit Committee approved in advance all audit services and non-audit services that EY or PwC provided to the Fund while serving as the Independent Registered Public Accounting Firm.
Services that the Fund’s Independent Registered Public Accounting Firm Billed to the Fund
Fiscal Year
Ended
December 31, | Audit Fees Billed to Fund | Audit-Related
Fees Billed to Fund | Tax Fees Billed to Fund | All
Other Fees Billed to Fund |
| 2019 | $38,433 | $0 | $9,039 | $0 |
| 2018 | $54,468 | $0 | $0 | $0 |
Services that the Fund’s Independent Registered Public Accounting Firm Billed to the Adviser and Affiliated Fund Service Providers
The following table shows the amount of fees billed by EY to DWS Investment Management Americas, Inc. (“DIMA” or the “Adviser”), and any entity controlling, controlled by or under common control with DIMA (“Control Affiliate”) that provides ongoing services to the Fund (“Affiliated Fund Service Provider”), for engagements directly related to the Fund’s operations and financial reporting, during the Fund’s fiscal year ended December 31, 2019 and the amount of fees billed by PwC to the Adviser and any Affiliated Fund Service provider for engagements directly related to the Fund’s operations and financial reporting, during the Fund’s fiscal year ended December 31, 2018.
Fiscal Year
Ended
December 31, | Audit-Related
Fees Billed to Adviser and Affiliated Fund Service Providers | Tax Fees Billed to Adviser and Affiliated Fund Service Providers | All
Other Fees Billed to Adviser and Affiliated Fund Service Providers |
| 2019 | $0 | $740,482 | $0 |
| 2018 | $0 | $0 | $0 |
The above “Tax Fees” were billed in connection with tax compliance services and agreed upon procedures. EY also billed $470,936 for tax services during the Fund’s fiscal year ended December 31, 2018.
Non-Audit Services
The following table shows the amount of fees that EY billed during the Fund’s fiscal year ended December 31, 2019 and the amount of fees that PwC billed during the Fund’s fiscal year ended December 31, 2018 for non-audit services. The Audit Committee pre-approved all non-audit services that EY or PwC, while serving as Independent Registered Public Accounting Firm, provided to the Adviser and any Affiliated Fund Service Provider that related directly to the Fund’s operations and financial reporting. The Audit Committee requested and received information from EY and PwC about any non-audit services that EY or PwC rendered to the Adviser and any Affiliated Fund Service Provider. The Committee considered this information in evaluating EY’s and PwC’s independence.
Fiscal Year
Ended
December 31, | Total
Non-Audit Fees Billed to Fund (A) | Total Non-Audit Fees billed to Adviser and Affiliated Fund Service Providers (engagements related directly to the operations and financial reporting of the Fund) (B) | Total Non-Audit Fees billed to Adviser and Affiliated Fund Service Providers (all other engagements) (C) | Total of (A), (B)
and (C) |
| 2019 | $9,039 | $740,482 | $0 | $749,521 |
| 2018 | $0 | $0 | $0 | $0 |
All other engagement fees were billed for services in connection with agreed upon procedures and tax compliance for DIMA and other related entities.EY also billed $984,066 for tax services during the Fund’s fiscal year ended December 31, 2018.
Audit Committee Pre-Approval Policies and Procedures. Generally, each Fund’s Audit Committee must pre approve (i) all services to be performed for a Fund by a Fund’s Independent Registered Public Accounting Firm and (ii) all non-audit services to be performed by a Fund’s Independent Registered Public Accounting Firm for the DIMA Entities with respect to operations and financial reporting of the Fund, except that the Chairperson or Vice Chairperson of each Fund’s Audit Committee may grant the pre-approval for non-audit services described in items (i) and (ii) above for non-prohibited services for engagements of less than $100,000. All such delegated pre approvals shall be presented to each Fund’s Audit Committee no later than the next Audit Committee meeting.
There were no amounts that were approved by the Audit Committee pursuant to the de minimis exception under Rule 2-01 of Regulation S-X.
According to each principal Independent Registered Public Accounting Firm, substantially all of the principal Independent Registered Public Accounting Firm's hours spent on auditing the registrant's financial statements were attributed to work performed by full-time permanent employees of the principal Independent Registered Public Accounting Firm.
***
In connection with the audit of the 2019 financial statements, the Fund entered into an engagement letter with EY. The terms of the engagement letter required by EY, and agreed to by the Audit Committee, include a provision mandating the use of mediation and arbitration to resolve any controversy or claim between the parties arising out of or relating to the engagement letter or services provided thereunder.
***
Pursuant to PCAOB Rule 3526, EY is required to describe in writing to the Fund’s Audit Committee, on at least an annual basis, all relationships between EY, or any of its affiliates, and the DWS Funds, including the Fund, or persons in financial reporting oversight roles at the DWS Funds that, as of the date of the communication, may reasonably be thought to bear on EY’s independence. Pursuant to PCAOB Rule 3526, EY has reported the matters set forth below that may reasonably be thought to bear on EY’s independence. With respect to each reported matter, individually and in the aggregate, EY advised the Audit Committee that, after careful consideration of the facts and circumstances and the applicable independence rules, it concluded that the matters do not and will not impair EY’s ability to exercise objective and impartial judgement in connection with the audits of the financial statements for the Fund and a reasonable investor with knowledge of all relevant facts and circumstances would conclude that EY has been and is capable of exercising objective and impartial judgment on all issues encompassed within EY’s audit engagements. EY also confirmed to the Audit Committee that it can continue act as the Independent Registered Public Accounting Firm for the Fund.
| · | EY advised the Fund’s Audit Committee of certain lending relationships of EY with owners of greater than 10% of the shares of certain investment companies within the DWS Funds Complex that EY had identified as inconsistent with Rule 2-01(c)(l)(ii)(A) of Regulation S-X (referred to as the “Loan Rule”). The Loan Rule specifically provides that an accounting firm would not be independent if it receives a loan from a lender that is a record or beneficial owner of more than ten percent of an audit client’s equity securities. For purposes of the Loan Rule, an audit client includes the Fund as well as all other investment companies in the DWS Funds Complex. EY’s lending relationships affect EY’s independence under the Loan Rule with respect to all investment companies in the DWS Funds Complex. |
EY stated its belief that, in each lending relationship, the lender is or was not able to impact the impartiality of EY or assert any influence over the investment companies in the DWS Funds Complex whose shares the lender owns or owned, or the applicable investment company’s investment adviser. In addition, on June 20, 2016, the SEC Staff issued a “no-action” letter to another mutual fund complex, Fidelity Management & Research Company et al., SEC Staff No-Action Letter (June 20, 2016) (the “Fidelity Letter”), related to similar Loan Rule issues as those described above. In the Fidelity Letter, the SEC Staff confirmed that it would not recommend enforcement action against an investment company that relied on the audit services performed by an audit firm that was not in compliance with the Loan Rule in certain specified circumstances. With respect to each lending relationship identified by EY, the circumstances described in the Fidelity Letter appear to be substantially similar to the circumstances that affected EY’s independence under the Loan Rule with respect to the Fund, and, in each case, EY confirmed to the Audit Committee that it meets the conditions of the Fidelity Letter.
| | |
| ITEM 5. | AUDIT COMMITTEE OF LISTED REGISTRANTS |
| | |
| | Not applicable |
| | |
| ITEM 6. | SCHEDULE OF INVESTMENTS |
| | |
| | Not applicable |
| | |
| ITEM 7. | DISCLOSURE OF PROXY VOTING POLICIES AND PROCEDURES FOR CLOSED-END MANAGEMENT INVESTMENT COMPANIES |
| | |
| | Not applicable |
| | |
| ITEM 8. | PORTFOLIO MANAGERS OF CLOSED-END MANAGEMENT INVESTMENT COMPANIES |
| | |
| | Not applicable |
| | |
| ITEM 9. | PURCHASES OF EQUITY SECURITIES BY CLOSED-END MANAGEMENT INVESTMENT COMPANY AND AFFILIATED PURCHASERS |
| | |
| | Not applicable |
| | |
| ITEM 10. | SUBMISSION OF MATTERS TO A VOTE OF SECURITY HOLDERS |
| | |
| | There were no material changes to the procedures by which shareholders may recommend nominees to the Fund’s Board. The primary function of the Nominating and Governance Committee is to identify and recommend individuals for membership on the Board and oversee the administration of the Board Governance Guidelines. Shareholders may recommend candidates for Board positions by forwarding their correspondence by U.S. mail or courier service to Keith R. Fox, DWS Funds Board Chair, c/o Thomas R. Hiller, Ropes & Gray LLP, Prudential Tower, 800 Boylston Street, Boston, MA 02199-3600. |
| | |
| ITEM 11. | CONTROLS AND PROCEDURES |
| | |
| | (a) | The Chief Executive and Financial Officers concluded that the Registrant’s Disclosure Controls and Procedures are effective based on the evaluation of the Disclosure Controls and Procedures as of a date within 90 days of the filing date of this report. |
| | |
| | (b) | There have been no changes in the registrant’s internal control over financial reporting that occurred during the period covered by this report that has materially affected, or is reasonably likely to materially affect, the registrant’s internal controls over financial reporting. |
| | |
| ITEM 12. | Disclosure of Securities Lending Activities for Closed-End Management Investment Companies |
| | |
| | Not applicable |
| | |
| ITEM 13. | EXHIBITS |
| | |
| | (a)(1) | Code of Ethics pursuant to Item 2 of Form N-CSR is filed and attached hereto as EX-99.CODE ETH. |
| | |
| | (a)(2) | Certification pursuant to Rule 30a-2(a) under the Investment Company Act of 1940 (17 CFR 270.30a-2(a)) is filed and attached hereto as Exhibit 99.CERT. |
| | |
| | (b) | Certification pursuant to Rule 30a-2(b) under the Investment Company Act of 1940 (17 CFR 270.30a-2(b)) is furnished and attached hereto as Exhibit 99.906CERT. |
SIGNATURES
Pursuant to the requirements of the Securities Exchange Act of 1934 and the Investment Company Act of 1940, the registrant has duly caused this report to be signed on its behalf by the undersigned, thereunto duly authorized.
| Registrant: | DWS Small Cap Index VIP, a series of Deutsche DWS Investments VIT Funds |
| | |
| | |
| By: | /s/Hepsen Uzcan Hepsen Uzcan President |
| | |
| Date: | 2/14/2020 |
Pursuant to the requirements of the Securities Exchange Act of 1934 and the Investment Company Act of 1940, this report has been signed below by the following persons on behalf of the registrant and in the capacities and on the dates indicated.
| By: | /s/Hepsen Uzcan Hepsen Uzcan President |
| | |
| Date: | 2/14/2020 |
| | |
| | |
| | |
| By: | /s/Diane Kenneally Diane Kenneally Chief Financial Officer and Treasurer |
| | |
| Date: | 2/14/2020 |
| | |