UNITED STATES
SECURITIES AND EXCHANGE COMMISSION
WASHINGTON, D. C. 20549
FORM N-CSR
Investment Company Act file number: 811-07507
Deutsche DWS Investments VIT Funds
(Exact Name of Registrant as Specified in Charter)
875 Third Avenue
New York, NY 10022-6225
(Address of Principal Executive Offices) (Zip Code)
Registrant’s Telephone Number, including Area Code:(212) 454-4500
Diane Kenneally
One International Place
Boston, MA 02110
(Name and Address of Agent for Service)
| Date of fiscal year end: | 12/31 |
| | |
| Date of reporting period: | 12/31/2019 |
| ITEM 1. | REPORT TO STOCKHOLDERS |
December 31, 2019
Annual Report
Deutsche DWS Investments VIT Funds
DWS Equity 500 Index VIP
Beginning on January 1, 2021, as permitted by regulations adopted by the Securities and Exchange Commission, you may not be receiving paper copies of the Fund’s shareholder reports from your insurance company that offers your contract unless you specifically request paper copies from the insurance company or from your financial intermediary. Instead, the shareholder reports will be made available on a Web site, and your insurance company will notify you by mail each time a report is posted and provide you with a Web site link to access the report. Instructions for requesting paper copies will be provided by your insurance company.
If you already elected to receive shareholder reports electronically, you will not be affected by this change and you need not take any action. You may elect to receive shareholder reports and other communications from your insurance company electronically by following the instructions provided by your insurance company.
You may elect to receive all future reports in paper free of charge from your insurance company. If your insurance company informs you that future reports will be delivered via Web access, you can inform your insurance company that you wish to continue receiving paper copies of your shareholder reports by following the instructions provided by your insurance company.

Contents
This report must be preceded or accompanied by a prospectus. To obtain an additional prospectus or summary prospectus, if available, call (800) 728-3337 or your financial representative. We advise you to consider the Fund’s objectives, risks, charges and expenses carefully before investing. The summary prospectus and prospectus contain this and other important information about the Fund. Please read the prospectus carefully before you invest.
Stocks may decline in value. Various factors, including costs, cash flows and security selection, may cause the Fund’s performance to differ from that of the index. Investing in derivatives entails special risks relating to liquidity, leverage and credit that may reduce returns and/or increase volatility. The Fund may lend securities to approved institutions. Please read the prospectus for details.
The brand DWS represents DWS Group GmbH & Co. KGaA and any of its subsidiaries such as DWS Distributors, Inc. which offers investment products or DWS Investment Management Americas, Inc. and RREEF America L.L.C. which offer advisory services.
DWS Distributors, Inc., 222 South Riverside Plaza, Chicago, IL 60606, (800) 621-1148
NOT FDIC/NCUA INSURED NO BANK GUARANTEE MAY LOSE VALUE NOT A DEPOSIT NOT INSURED BY ANY FEDERAL GOVERNMENT AGENCY
| | | | | | |
| | 2 | | | | | | DWS Equity 500 Index VIP |
| | |
| Performance Summary | | December 31, 2019 (Unaudited) |
Fund performance shown is historical, assumes reinvestment of all dividend and capital gain distributions, and does not guarantee future results. Investment return and principal value fluctuate with changing market conditions so that, when redeemed, shares may be worth more or less than their original cost. Current performance may be lower or higher than the performance data quoted. Please contact your participating insurance company for the Fund’s most recent month-end performance. Performance figures for Classes A, B and B2 differ because each class maintains a distinct expense structure. Performance does not reflect charges and fees (“contract charges”) associated with the separate account that invests in the Fund or any variable life insurance policy or variable annuity contract for which the Fund is an investment option. These charges and fees will reduce returns.
The gross expense ratios of the Fund, as stated in the fee table of the prospectus dated May 1, 2019 are 0.34%, 0.71% and 0.73% for Class A, Class B and Class B2 shares, respectively, and may differ from the expense ratios disclosed in the Financial Highlights tables in this report.
Generally accepted accounting principles require adjustments to be made to the net assets of the Fund at period end for financial reporting purposes only, and as such, the total return based on the unadjusted net asset value per share may differ from the total return reported in the financial highlights.
Growth of an Assumed $10,000 Investment
| | |
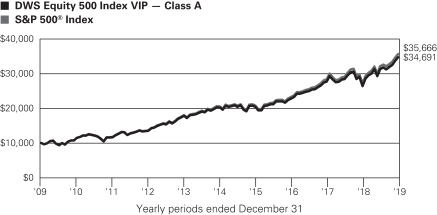
| | S&P 500® Index is an unmanaged, capitalization-weighted index of 500 stocks. The index is designed to measure performance of the broad domestic economy through changes in the aggregate market value of 500 stocks representing all major industries. Index returns do not reflect any fees or expenses and it is not possible to invest directly into an index. |
| | | | | | | | | | |
| Comparative Results |
| | | | | |
| DWS Equity 500 Index VIP | | | | 1-Year | | 3-Year | | 5-Year | | 10-Year |
| Class A | | Growth of $10,000 | | $13,119 | | $15,202 | | $17,160 | | $34,691 |
| | | Average annual total return | | 31.19% | | 14.98% | | 11.40% | | 13.25% |
| S&P 500 Index | | Growth of $10,000 | | $13,149 | | $15,317 | | $17,386 | | $35,666 |
| | | Average annual total return | | 31.49% | | 15.27% | | 11.70% | | 13.56% |
| | | | | |
| DWS Equity 500 Index VIP | | | | 1-Year | | 3-Year | | 5-Year | | 10-Year |
| Class B | | Growth of $10,000 | | $13,066 | | $15,038 | | $16,894 | | $33,736 |
| | | Average annual total return | | 30.66% | | 14.57% | | 11.06% | | 12.93% |
| S&P 500 Index | | Growth of $10,000 | | $13,149 | | $15,317 | | $17,386 | | $35,666 |
| | | Average annual total return | | 31.49% | | 15.27% | | 11.70% | | 13.56% |
| | | | | |
| DWS Equity 500 Index VIP | | | | 1-Year | | 3-Year | | 5-Year | | 10-Year |
| Class B2 | | Growth of $10,000 | | $13,064 | | $15,024 | | $16,833 | | $33,403 |
| | | Average annual total return | | 30.64% | | 14.53% | | 10.98% | | 12.82% |
| S&P 500 Index | | Growth of $10,000 | | $13,149 | | $15,317 | | $17,386 | | $35,666 |
| | | Average annual total return | | 31.49% | | 15.27% | | 11.70% | | 13.56% |
The growth of $10,000 is cumulative.
| | | | |
| DWS Equity 500 Index VIP | | | | | 3 |
| | |
| Management Summary | | December 31, 2019 (Unaudited) |
The Fund returned 31.19% in 2019 (Class A shares, unadjusted for contract charges). Since the Fund’s investment strategy is to replicate the performance of the S&P 500® Index, its return is normally close to that of the index. The index returned 31.49% in 2019. The difference in performance is typically driven by transaction costs and Fund expenses. The Fund periodically invested in equity index futures in order to keep the portfolio’s exposures in line with those of the index. This strategy had a neutral impact on performance.
Despite periodic volatility stemming from the ongoing U.S.-China trade dispute and concerns about slowing global growth, U.S. equities delivered a robust gain in 2019. The U.S. Federal Reserve’s (Fed’s) shift to an accommodative interest-rate policy was the key driver of the rally. The Fed cut rates by a quarter point on three occasions, bringing its benchmark fed funds rate to a range of 1.50% to 1.75%. Although the Fed indicated that it was unlikely to enact any more rate cuts barring a sharp slowdown in economic growth, it provided support to the markets through daily injections of liquidity frommid-September onward. The markets were further cheered by the fact that domestic growth remained in positive territory, calming the recession fears that pressured sentiment in late 2018. Corporate earnings provided little support to the market, however. As ofyear-end, it appeared that profits were set for only a very small increase versus 2018. Still, prices were buttressed by consensus expectations that earnings were on track to rise nearly 10% in 2020. (Source: Factset)
In a continuation of a longstanding trend, the growth style outperformed value. At a time of slowing economic conditions across the globe, investors continued to demonstrate a preference for faster-growing companies over those with attractive valuations and/or high dividends.
Technology stocks delivered the largest gains at the sector level. Themega-cap companies Apple, Inc. and Microsoft Corp. contributed to the sector’s rally, as did semiconductor companies such as Advanced Micro Devices, Inc. Financials also outperformed, reflecting improving profit expectations and the steepening of the yield curve in the final four months of the year. The gains were broad-based throughout the sector, with banks and insurance companies acting as the primary source of positive performance. Communication services was an additional area of strength for the index. As was the case with technology, the sector was propelled by investors’ continued gravitation tomega-cap growth stocks such as Alphabet, Inc. and Facebook, Inc. The sector was further aided by the strong performance of Walt Disney Co. and the telecommunications companies AT&T, Inc. and Verizon Communications, Inc.
Stocks poised to benefit from improving growth expectations generally performed well. Consumer discretionary stocks finished just behind the index, with strength in Amazon.com., Inc. and Home Depot, Inc. acting as the primary engine for the gains. Industrials also posted a healthy advance, with a rally in defense stocks outweighing uneven results for the transportation industry.
On the other hand, materials trailed the broader market by a notable margin amid uncertainty about the effect the prolonged U.S.-China trade dispute could have onraw-materials exports. China’s slowing economic growth further weighed on the sector given the country’s role as the largest source of world commodity demand.
After performing well through late August, defensive market segments started to lag as investors’ appetite for risk gradually expanded over the final four months of the year. As a result, utilities and real estate — while posting returns north of 20% — failed to keep pace with the index in 2019. Both sectors tend to have above-average interest-rate sensitivity, which was an additional headwind given the uptrend in U.S. Treasury yields in the latter part of the year. Consumer staples finished somewhat behind the index, as well.
Although energy generated a double-digit gain, it was nevertheless the year’s worst performer among the eleven major sectors. The category’s overall return was pressured by the weak showing of oil services stocks and smaller exploration and production companies.
Brent Reeder
Senior Vice President, Northern Trust Investments, Inc., Subadvisor to the Fund
Portfolio Manager
The views expressed reflect those of the portfolio management team only through the end of the period of the report as stated on the cover. The management team’s views are subject to change at any time based on market and other conditions and should not be construed as a recommendation. Past performance is no guarantee of future results. Current and future portfolio holdings are subject to risk.
| | | | | | |
| | 4 | | | | | | DWS Equity 500 Index VIP |
Terms to Know
TheS&P 500 Index is an unmanaged, capitalization weighted index of 500 stocks. The index is designed to measure performance of the broad domestic economy through changes in the aggregate market value of 500 stocks representing all major industries. Index returns do not reflect any fees or expenses and it is not possible to invest directly into an index.
Contributionanddetraction incorporate both a stock’s total return and its weighting in the index.
Theyield curve is a graph with a left to right line that shows how high or low yields are, from the shortest to the longest maturities. Typically the line rises from left to right as investors who are willing to tie up their money for a longer period of time are rewarded with higher yields.
Theconsumer discretionary sector represents industries that produce goods and services that are not necessities in everyday life.
Consumer staples are the industries that manufacture and sell products such as food and beverages, prescription drugs, and household products.
Futures contractsare contractual agreements to buy or sell a particular commodity or financial instrument at a predetermined price in the future.
| | | | |
| DWS Equity 500 Index VIP | | | | | 5 |
| | |
| Portfolio Summary | | (Unaudited) |
| | | | | | | | |
| Asset Allocation (As a % of Investment Portfolio excluding Securities Lending Collateral) | | 12/31/19 | | | 12/31/18 | |
| Common Stocks | | | 98% | | | | 99% | |
| Cash Equivalents | | | 2% | | | | 1% | |
| Government & Agency Obligations | | | 0% | | | | 0% | |
| | | | 100% | | | | 100% | |
| | |
| Sector Diversification (As a % of Common Stocks) | | 12/31/19 | | | 12/31/18 | |
| Information Technology | | | 23% | | | | 20% | |
| Health Care | | | 14% | | | | 16% | |
| Financials | | | 13% | | | | 14% | |
| Communication Services | | | 10% | | | | 10% | |
| Consumer Discretionary | | | 10% | | | | 10% | |
| Industrials | | | 9% | | | | 9% | |
| Consumer Staples | | | 7% | | | | 7% | |
| Energy | | | 5% | | | | 5% | |
| Utilities | | | 3% | | | | 3% | |
| Real Estate | | | 3% | | | | 3% | |
| Materials | | | 3% | | | | 3% | |
| | | | 100% | | | | 100% | |
| | | | | | |
| Ten Largest Equity Holdings (23.4% of Net Assets) | | |
| | 1. | | | Apple, Inc. | | 4.5% |
| | | | | Designs, manufactures and markets personal computers and related computing and mobile communication devices | | |
| | 2. | | | Microsoft Corp. | | 4.4% |
| | | | | Develops, manufactures, licenses, sells and supports software products | | |
| | 3. | | | Alphabet, Inc. | | 2.9% |
| | | | | Holding company with subsidiaries that provide web-based search, advertisements, maps, software applications, mobile operating systems and a variety of other products | | |
| | 4. | | | Amazon.com, Inc. | | 2.8% |
| | | | | Online retailer that offers a wide range of products, including books, music, videotapes, computers, electronics, home and garden, and numerous products | | |
| | 5. | | | Facebook, Inc. | | 1.8% |
| | | | | Operates a social networking web site | | |
| | 6. | | | Berkshire Hathaway, Inc. | | 1.6% |
| | | | | Holding company of insurance business and a variety of other businesses | | |
| | 7. | | | JPMorgan Chase & Co. | | 1.6% |
| | | | | Provider of global financial services | | |
| | 8. | | | Johnson & Johnson | | 1.4% |
| | | | | Provider of health care products | | |
| | 9. | | | Visa, Inc. | | 1.2% |
| | | | | Operates a retail electronic payments network and manages global financial services | | |
| | 10. | | | Procter & Gamble Co. | | 1.2% |
| | | | | Manufacturer of diversified consumer products | | |
Portfolio holdings and characteristics are subject to change.
For more complete details about the Fund’s investment portfolio, see page 7.
Following the Fund’s fiscal first and third quarter-end, a complete portfolio holdings listing is filed with the SEC onForm N-PORT. The Fund’sForm N-PORT will be available on the SEC’s Web site at sec.gov. The Fund’s portfolio holdings are also posted on dws.com from time to time. Please read the Fund’s current prospectus for more information.
| | | | | | |
| | 6 | | | | | | DWS Equity 500 Index VIP |
| | |
| Investment Portfolio | | as of December 31, 2019 |
| | | | | | | | |
| | | Shares | | | Value ($) | |
| Common Stocks 98.0% | | | | |
| Communication Services 10.2% | |
Diversified Telecommunication Services 2.0% | |
| | |
AT&T, Inc. | | | 163,567 | | | | 6,392,198 | |
| | |
CenturyLink, Inc. | | | 22,395 | | | | 295,838 | |
| | |
Verizon Communications, Inc. | | | 92,590 | | | | 5,685,026 | |
| | | | | | | | |
| | | | 12,373,062 | |
|
Entertainment 1.9% | |
| | |
Activision Blizzard, Inc. | | | 17,255 | | | | 1,025,292 | |
| | |
Electronic Arts, Inc.* | | | 6,517 | | | | 700,643 | |
| | |
Live Nation Entertainment, Inc.* | | | 3,146 | | | | 224,845 | |
| | |
Netflix, Inc.* | | | 9,811 | | | | 3,174,545 | |
| | |
Take-Two Interactive Software, Inc.* | | | 2,528 | | | | 309,503 | |
| | |
Walt Disney Co. | | | 40,355 | | | | 5,836,544 | |
| | | | | | | | |
| | | | 11,271,372 | |
|
Interactive Media & Services 4.8% | |
| | |
Alphabet, Inc. “A”* | | | 6,710 | | | | 8,987,307 | |
| | |
Alphabet, Inc. “C”* | | | 6,693 | | | | 8,948,675 | |
| | |
Facebook, Inc. “A”* | | | 53,887 | | | | 11,060,307 | |
| | |
Twitter, Inc.* | | | 17,292 | | | | 554,208 | |
| | | | | | | | |
| | | | 29,550,497 | |
|
Media 1.4% | |
| | |
Charter Communications, Inc. “A”* | | | 3,508 | | | | 1,701,661 | |
| | |
Comcast Corp. “A” | | | 101,628 | | | | 4,570,211 | |
| | |
Discovery, Inc. “C”* | | | 7,714 | | | | 235,200 | |
| | |
Discovery, Inc. “A”* (a) | | | 3,366 | | | | 110,203 | |
| | |
DISH Network Corp. “A”* | | | 5,793 | | | | 205,478 | |
| | |
Fox Corp. “A” | | | 8,025 | | | | 297,487 | |
| | |
Fox Corp. “B” | | | 3,504 | | | | 127,546 | |
| | |
Interpublic Group of Companies, Inc. | | | 8,573 | | | | 198,036 | |
| | |
News Corp. “A” | | | 8,780 | | | | 124,149 | |
| | |
News Corp. “B” | | | 3,121 | | | | 45,286 | |
| | |
Omnicom Group, Inc. | | | 4,869 | | | | 394,486 | |
| | |
ViacomCBS, Inc. “B” | | | 12,214 | | | | 512,621 | |
| | | | | | | | |
| | | | 8,522,364 | |
|
Wireless Telecommunication Services 0.1% | |
T-Mobile U.S., Inc.* | | | 7,077 | | | | 554,978 | |
|
| Consumer Discretionary 9.6% | |
Auto Components 0.1% | |
| | |
Aptiv PLC | | | 5,746 | | | | 545,698 | |
| | |
BorgWarner, Inc. | | | 4,743 | | | | 205,751 | |
| | | | | | | | |
| | | | 751,449 | |
|
Automobiles 0.3% | |
| | |
Ford Motor Co. | | | 86,756 | | | | 806,831 | |
| | |
General Motors Co. | | | 28,302 | | | | 1,035,853 | |
| | |
Harley-Davidson, Inc. | | | 3,393 | | | | 126,186 | |
| | | | | | | | |
| | | | 1,968,870 | |
|
Distributors 0.1% | |
| | |
Genuine Parts Co. | | | 3,295 | | | | 350,028 | |
| | |
LKQ Corp.* | | | 7,004 | | | | 250,043 | |
| | | | | | | | |
| | | | 600,071 | |
| | | | | | | | |
| | | Shares | | | Value ($) | |
|
Diversified Consumer Services 0.0% | |
H&R Block, Inc. | | | 4,591 | | | | 107,797 | |
|
Hotels, Restaurants & Leisure 1.9% | |
| | |
Carnival Corp. | | | 9,054 | | | | 460,215 | |
| | |
Chipotle Mexican Grill, Inc.* | | | 570 | | | | 477,153 | |
| | |
Darden Restaurants, Inc. | | | 2,766 | | | | 301,522 | |
| | |
Hilton Worldwide Holdings, Inc. | | | 6,300 | | | | 698,733 | |
| | |
Las Vegas Sands Corp. | | | 7,564 | | | | 522,218 | |
| | |
Marriott International, Inc. “A” | | | 6,055 | | | | 916,909 | |
| | |
McDonald’s Corp. | | | 16,867 | | | | 3,333,088 | |
| | |
MGM Resorts International | | | 11,404 | | | | 379,411 | |
| | |
Norwegian Cruise Line Holdings Ltd.* | | | 4,838 | | | | 282,587 | |
| | |
Royal Caribbean Cruises Ltd. | | | 3,886 | | | | 518,820 | |
| | |
Starbucks Corp. | | | 26,448 | | | | 2,325,308 | |
| | |
Wynn Resorts Ltd. | | | 2,155 | | | | 299,265 | |
| | |
Yum! Brands, Inc. | | | 6,735 | | | | 678,416 | |
| | | | | | | | |
| | | | 11,193,645 | |
|
Household Durables 0.4% | |
| | |
D.R. Horton, Inc. | | | 7,498 | | | | 395,519 | |
| | |
Garmin Ltd. | | | 3,201 | | | | 312,290 | |
| | |
Leggett & Platt, Inc. | | | 3,043 | | | | 154,676 | |
| | |
Lennar Corp. “A” | | | 6,254 | | | | 348,911 | |
| | |
Mohawk Industries, Inc.* | | | 1,325 | | | | 180,703 | |
| | |
Newell Brands, Inc. | | | 8,544 | | | | 164,216 | |
| | |
NVR, Inc.* | | | 78 | | | | 297,056 | |
| | |
PulteGroup, Inc. | | | 5,600 | | | | 217,280 | |
| | |
Whirlpool Corp. | | | 1,418 | | | | 209,197 | |
| | | | | | | | |
| | | | 2,279,848 | |
|
Internet & Direct Marketing Retail 3.3% | |
| | |
Amazon.com, Inc.* | | | 9,326 | | | | 17,232,956 | |
| | |
Booking Holdings, Inc.* | | | 937 | | | | 1,924,345 | |
| | |
eBay, Inc. | | | 17,143 | | | | 619,034 | |
| | |
Expedia Group, Inc. | | | 3,106 | | | | 335,883 | |
| | | | | | | | |
| | | | 20,112,218 | |
|
Leisure Products 0.1% | |
Hasbro, Inc. | | | 2,881 | | | | 304,262 | |
|
Multiline Retail 0.5% | |
| | |
Dollar General Corp. | | | 5,706 | | | | 890,022 | |
| | |
Dollar Tree, Inc.* | | | 5,298 | | | | 498,277 | |
| | |
Kohl’s Corp. | | | 3,536 | | | | 180,159 | |
| | |
Macy’s, Inc. | | | 6,782 | | | | 115,294 | |
| | |
Nordstrom, Inc. | | | 2,533 | | | | 103,675 | |
| | |
Target Corp. | | | 11,351 | | | | 1,455,312 | |
| | | | | | | | |
| | | | 3,242,739 | |
|
Specialty Retail 2.2% | |
| | |
Advance Auto Parts, Inc. | | | 1,523 | | | | 243,924 | |
| | |
AutoZone, Inc.* | | | 534 | | | | 636,160 | |
| | |
Best Buy Co., Inc. | | | 5,078 | | | | 445,848 | |
| | |
CarMax, Inc.* | | | 3,637 | | | | 318,856 | |
| | |
Home Depot, Inc. | | | 24,436 | | | | 5,336,334 | |
| | |
L Brands, Inc. | | | 5,340 | | | | 96,761 | |
| | |
Lowe’s Companies, Inc. | | | 17,173 | | | | 2,056,638 | |
| | |
O’Reilly Automotive, Inc.* | | | 1,693 | | | | 741,974 | |
| | |
Ross Stores, Inc. | | | 8,096 | | | | 942,536 | |
| | |
The Gap, Inc. | | | 4,429 | | | | 78,305 | |
| | |
Tiffany & Co. | | | 2,379 | | | | 317,953 | |
| | |
TJX Companies, Inc. | | | 27,182 | | | | 1,659,733 | |
The accompanying notes are an integral part of the financial statements.
| | | | |
| DWS Equity 500 Index VIP | | | | | 7 |
| | | | | | | | |
| | | Shares | | | Value ($) | |
| | |
Tractor Supply Co. | | | 2,673 | | | | 249,765 | |
| | |
Ulta Salon, Cosmetics & Fragrance, Inc.* | | | 1,281 | | | | 324,272 | |
| | | | | | | | |
| | | | 13,449,059 | |
|
Textiles, Apparel & Luxury Goods 0.7% | |
| | |
Capri Holdings Ltd.* | | | 3,303 | | | | 126,009 | |
| | |
Hanesbrands, Inc. | | | 7,905 | | | | 117,389 | |
| | |
NIKE, Inc. “B” | | | 27,939 | | | | 2,830,500 | |
| | |
PVH Corp. | | | 1,661 | | | | 174,654 | |
| | |
Ralph Lauren Corp. | | | 1,121 | | | | 131,404 | |
| | |
Tapestry, Inc. | | | 6,014 | | | | 162,197 | |
| | |
Under Armour, Inc. “A”* | | | 4,226 | | | | 91,282 | |
| | |
Under Armour, Inc. “C”* | | | 4,609 | | | | 88,401 | |
| | |
VF Corp. | | | 7,315 | | | | 729,013 | |
| | | | | | | | |
| | | | 4,450,849 | |
|
| Consumer Staples 7.0% | |
Beverages 1.8% | |
| | |
Brown-Forman Corp. “B” | | | 4,172 | | | | 282,027 | |
| | |
Coca-Cola Co. | | | 86,339 | | | | 4,778,864 | |
| | |
Constellation Brands, Inc. “A” | | | 3,756 | | | | 712,701 | |
| | |
Molson Coors Brewing Co. “B” | | | 4,206 | | | | 226,703 | |
| | |
Monster Beverage Corp.* | | | 8,513 | | | | 541,001 | |
| | |
PepsiCo, Inc. | | | 31,218 | | | | 4,266,564 | |
| | | | | | | | |
| | | | 10,807,860 | |
|
Food & Staples Retailing 1.5% | |
| | |
Costco Wholesale Corp. | | | 9,897 | | | | 2,908,926 | |
| | |
Kroger Co. | | | 17,769 | | | | 515,124 | |
| | |
Sysco Corp. | | | 11,417 | | | | 976,610 | |
| | |
Walgreens Boots Alliance, Inc. | | | 16,793 | | | | 990,115 | |
| | |
Walmart, Inc. | | | 31,771 | | | | 3,775,666 | |
| | | | | | | | |
| | | | 9,166,441 | |
|
Food Products 1.1% | |
| | |
Archer-Daniels-Midland Co. | | | 12,537 | | | | 581,090 | |
| | |
Campbell Soup Co. | | | 3,858 | | | | 190,662 | |
| | |
Conagra Brands, Inc. | | | 11,055 | | | | 378,523 | |
| | |
General Mills, Inc. | | | 13,590 | | | | 727,881 | |
| | |
Hormel Foods Corp. | | | 6,128 | | | | 276,434 | |
| | |
Kellogg Co. | | | 5,529 | | | | 382,386 | |
| | |
Kraft Heinz Co. | | | 13,851 | | | | 445,033 | |
| | |
Lamb Weston Holdings, Inc. | | | 3,338 | | | | 287,168 | |
| | |
McCormick & Co., Inc. | | | 2,769 | | | | 469,983 | |
| | |
Mondelez International, Inc. “A” | | | 32,192 | | | | 1,773,135 | |
| | |
The Hershey Co. | | | 3,334 | | | | 490,031 | |
| | |
The JM Smucker Co. | | | 2,579 | | | | 268,551 | |
| | |
Tyson Foods, Inc. “A” | | | 6,580 | | | | 599,043 | |
| | | | | | | | |
| | | | 6,869,920 | |
|
Household Products 1.6% | |
| | |
Church & Dwight Co., Inc. | | | 5,517 | | | | 388,066 | |
| | |
Clorox Co. | | | 2,825 | | | | 433,750 | |
| | |
Colgate-Palmolive Co. | | | 19,146 | | | | 1,318,011 | |
| | |
Kimberly-Clark Corp. | | | 7,661 | | | | 1,053,770 | |
| | |
Procter & Gamble Co. | | | 55,850 | | | | 6,975,665 | |
| | | | | | | | |
| | | | 10,169,262 | |
|
Personal Products 0.2% | |
| | |
Coty, Inc. “A” | | | 6,186 | | | | 69,593 | |
| | |
Estee Lauder Companies, Inc. “A” | | | 4,986 | | | | 1,029,808 | |
| | | | | | | | |
| | | | 1,099,401 | |
| | | | | | | | |
| | | Shares | | | Value ($) | |
|
Tobacco 0.8% | |
| | |
Altria Group, Inc. | | | 41,788 | | | | 2,085,639 | |
| | |
Philip Morris International, Inc. | | | 34,840 | | | | 2,964,536 | |
| | | | | | | | |
| | | | 5,050,175 | |
|
| Energy 4.3% | |
Energy Equipment & Services 0.4% | |
| | |
Baker Hughes Co. | | | 14,319 | | | | 366,996 | |
| | |
Halliburton Co. | | | 19,408 | | | | 474,914 | |
| | |
Helmerich & Payne, Inc. | | | 2,545 | | | | 115,619 | |
| | |
National Oilwell Varco, Inc. | | | 8,514 | | | | 213,276 | |
| | |
Schlumberger Ltd. | | | 31,100 | | | | 1,250,220 | |
| | |
TechnipFMC PLC | | | 9,118 | | | | 195,490 | |
| | | | | | | | |
| | | | 2,616,515 | |
|
Oil, Gas & Consumable Fuels 3.9% | |
| | |
Apache Corp. | | | 8,240 | | | | 210,862 | |
| | |
Cabot Oil & Gas Corp. | | | 9,388 | | | | 163,445 | |
| | |
Chevron Corp. | | | 42,332 | | | | 5,101,429 | |
| | |
Cimarex Energy Co. | | | 2,387 | | | | 125,294 | |
| | |
Concho Resources, Inc. | | | 4,524 | | | | 396,167 | |
| | |
ConocoPhillips | | | 24,551 | | | | 1,596,552 | |
| | |
Devon Energy Corp. | | | 8,848 | | | | 229,783 | |
| | |
Diamondback Energy, Inc. | | | 3,598 | | | | 334,110 | |
| | |
EOG Resources., Inc. | | | 13,046 | | | | 1,092,733 | |
| | |
Exxon Mobil Corp. | | | 94,728 | | | | 6,610,120 | |
| | |
Hess Corp. | | | 5,816 | | | | 388,567 | |
| | |
HollyFrontier Corp. | | | 3,210 | | | | 162,779 | |
| | |
Kinder Morgan, Inc. | | | 43,776 | | | | 926,738 | |
| | |
Marathon Oil Corp. | | | 17,578 | | | | 238,709 | |
| | |
Marathon Petroleum Corp. | | | 14,533 | | | | 875,613 | |
| | |
Noble Energy, Inc. | | | 10,955 | | | | 272,122 | |
| | |
Occidental Petroleum Corp. | | | 20,109 | | | | 828,692 | |
| | |
ONEOK, Inc. | | | 9,226 | | | | 698,131 | |
| | |
Phillips 66 | | | 9,942 | | | | 1,107,638 | |
| | |
Pioneer Natural Resources Co. | | | 3,731 | | | | 564,761 | |
| | |
Valero Energy Corp. | | | 9,190 | | | | 860,643 | |
| | |
Williams Companies, Inc. | | | 27,122 | | | | 643,334 | |
| | | | | | | | |
| | | | 23,428,222 | |
|
| Financials 12.7% | |
Banks 5.5% | |
| | |
Bank of America Corp. | | | 181,322 | | | | 6,386,161 | |
| | |
Citigroup, Inc. | | | 48,904 | | | | 3,906,941 | |
| | |
Citizens Financial Group, Inc. | | | 9,755 | | | | 396,151 | |
| | |
Comerica, Inc. | | | 3,205 | | | | 229,959 | |
| | |
Fifth Third Bancorp. | | | 15,918 | | | | 489,319 | |
| | |
First Republic Bank | | | 3,763 | | | | 441,964 | |
| | |
Huntington Bancshares, Inc. | | | 22,997 | | | | 346,795 | |
| | |
JPMorgan Chase & Co. | | | 70,249 | | | | 9,792,711 | |
| | |
KeyCorp | | | 21,814 | | | | 441,515 | |
| | |
M&T Bank Corp. | | | 2,957 | | | | 501,951 | |
| | |
People’s United Financial, Inc. | | | 10,148 | | | | 171,501 | |
| | |
PNC Financial Services Group, Inc. | | | 9,822 | | | | 1,567,886 | |
| | |
Regions Financial Corp. | | | 21,639 | | | | 371,325 | |
| | |
SVB Financial Group* | | | 1,132 | | | | 284,177 | |
| | |
Truist Financial Corp. | | | 29,943 | | | | 1,686,390 | |
| | |
U.S. Bancorp. | | | 31,853 | | | | 1,888,564 | |
| | |
Wells Fargo & Co. | | | 86,211 | | | | 4,638,152 | |
| | |
Zions Bancorp. NA | | | 3,932 | | | | 204,149 | |
| | | | | | | | |
| | | | 33,745,611 | |
The accompanying notes are an integral part of the financial statements.
| | | | | | |
| | 8 | | | | | | DWS Equity 500 Index VIP |
| | | | | | | | |
| | | Shares | | | Value ($) | |
|
Capital Markets 2.6% | |
| | |
Ameriprise Financial, Inc. | | | 2,841 | | | | 473,254 | |
| | |
Bank of New York Mellon Corp. | | | 18,802 | | | | 946,305 | |
| | |
BlackRock, Inc. | | | 2,645 | | | | 1,329,642 | |
| | |
Cboe Global Markets, Inc. | | | 2,474 | | | | 296,880 | |
| | |
Charles Schwab Corp. | | | 25,606 | | | | 1,217,821 | |
| | |
CME Group, Inc. | | | 7,995 | | | | 1,604,756 | |
| | |
E*TRADE Financial Corp. | | | 4,931 | | | | 223,719 | |
| | |
Franklin Resources., Inc. | | | 6,369 | | | | 165,467 | |
| | |
Intercontinental Exchange, Inc. | | | 12,475 | | | | 1,154,561 | |
| | |
Invesco Ltd. | | | 8,628 | | | | 155,131 | |
| | |
MarketAxess Holdings, Inc. | | | 846 | | | | 320,727 | |
| | |
Moody’s Corp. | | | 3,611 | | | | 857,288 | |
| | |
Morgan Stanley | | | 27,568 | | | | 1,409,276 | |
| | |
MSCI, Inc. | | | 1,885 | | | | 486,669 | |
| | |
Nasdaq, Inc. | | | 2,589 | | | | 277,282 | |
| | |
Northern Trust Corp. | | | 4,712 | | | | 500,603 | |
| | |
Raymond James Financial, Inc. | | | 2,825 | | | | 252,725 | |
| | |
S&P Global, Inc. | | | 5,475 | | | | 1,494,949 | |
| | |
State Street Corp. | | | 8,146 | | | | 644,349 | |
| | |
T. Rowe Price Group, Inc. | | | 5,210 | | | | 634,786 | |
| | |
The Goldman Sachs Group, Inc. | | | 7,139 | | | | 1,641,470 | |
| | | | | | | | |
| | | | 16,087,660 | |
|
Consumer Finance 0.7% | |
| | |
American Express Co. | | | 15,032 | | | | 1,871,334 | |
| | |
Capital One Financial Corp. | | | 10,430 | | | | 1,073,351 | |
| | |
Discover Financial Services | | | 6,992 | | | | 593,062 | |
| | |
Synchrony Financial | | | 13,322 | | | | 479,725 | |
| | | | | | | | |
| | | | 4,017,472 | |
|
Diversified Financial Services 1.6% | |
Berkshire Hathaway, Inc. “B”* | | | 43,802 | | | | 9,921,153 | |
|
Insurance 2.3% | |
| | |
Aflac, Inc. | | | 16,410 | | | | 868,089 | |
| | |
Allstate Corp. | | | 7,258 | | | | 816,162 | |
| | |
American International Group, Inc. | | | 19,563 | | | | 1,004,169 | |
| | |
Aon PLC | | | 5,246 | | | | 1,092,689 | |
| | |
Arthur J. Gallagher & Co. | | | 4,196 | | | | 399,585 | |
| | |
Assurant, Inc. | | | 1,360 | | | | 178,269 | |
| | |
Chubb Ltd. | | | 10,151 | | | | 1,580,105 | |
| | |
Cincinnati Financial Corp. | | | 3,346 | | | | 351,832 | |
| | |
Everest Re Group Ltd. | | | 917 | | | | 253,862 | |
| | |
Globe Life, Inc. | | | 2,234 | | | | 235,129 | |
| | |
Hartford Financial Services Group, Inc. | | | 8,078 | | | | 490,900 | |
| | |
Lincoln National Corp. | | | 4,500 | | | | 265,545 | |
| | |
Loews Corp. | | | 5,715 | | | | 299,980 | |
| | |
Marsh & McLennan Companies, Inc. | | | 11,284 | | | | 1,257,150 | |
| | |
MetLife, Inc. | | | 17,516 | | | | 892,791 | |
| | |
Principal Financial Group, Inc. | | | 5,692 | | | | 313,060 | |
| | |
Progressive Corp. | | | 13,146 | | | | 951,639 | |
| | |
Prudential Financial, Inc. | | | 9,037 | | | | 847,128 | |
| | |
The Travelers Companies, Inc. | | | 5,763 | | | | 789,243 | |
| | |
Unum Group | | | 4,432 | | | | 129,237 | |
| | |
W.R. Berkley Corp. | | | 3,253 | | | | 224,782 | |
| | |
Willis Towers Watson PLC | | | 2,885 | | | | 582,597 | |
| | | | | | | | |
| | | | 13,823,943 | |
|
| Health Care 13.9% | |
Biotechnology 2.0% | |
| | |
AbbVie, Inc. | | | 33,103 | | | | 2,930,940 | |
| | |
Alexion Pharmaceuticals, Inc.* | | | 5,008 | | | | 541,615 | |
| | | | | | | | |
| | | Shares | | | Value ($) | |
| | |
Amgen, Inc. | | | 13,299 | | | | 3,205,990 | |
| | |
Biogen., Inc.* | | | 4,036 | | | | 1,197,602 | |
| | |
Gilead Sciences, Inc. | | | 28,302 | | | | 1,839,064 | |
| | |
Incyte Corp.* | | | 4,056 | | | | 354,170 | |
| | |
Regeneron Pharmaceuticals, Inc.* | | | 1,796 | | | | 674,362 | |
| | |
Vertex Pharmaceuticals, Inc.* | | | 5,780 | | | | 1,265,531 | |
| | | | | | | | |
| | | | 12,009,274 | |
|
Health Care Equipment & Supplies 3.5% | |
| | |
Abbott Laboratories | | | 39,569 | | | | 3,436,963 | |
| | |
ABIOMED, Inc.* | | | 1,018 | | | | 173,661 | |
| | |
Align Technology, Inc.* | | | 1,602 | | | | 447,022 | |
| | |
Baxter International, Inc. | | | 11,479 | | | | 959,874 | |
| | |
Becton, Dickinson & Co. | | | 6,070 | | | | 1,650,858 | |
| | |
Boston Scientific Corp.* | | | 31,315 | | | | 1,416,064 | |
| | |
Danaher Corp. | | | 14,279 | | | | 2,191,541 | |
| | |
DENTSPLY SIRONA, Inc. | | | 4,921 | | | | 278,479 | |
| | |
Edwards Lifesciences Corp.* | | | 4,678 | | | | 1,091,331 | |
| | |
Hologic, Inc.* | | | 6,049 | | | | 315,818 | |
| | |
IDEXX Laboratories, Inc.* | | | 1,921 | | | | 501,631 | |
| | |
Intuitive Surgical, Inc.* | | | 2,592 | | | | 1,532,261 | |
| | |
Medtronic PLC | | | 30,011 | | | | 3,404,748 | |
| | |
ResMed, Inc. | | | 3,199 | | | | 495,749 | |
| | |
STERIS PLC | | | 1,894 | | | | 288,684 | |
| | |
Stryker Corp. | | | 7,216 | | | | 1,514,927 | |
| | |
Teleflex, Inc. | | | 1,045 | | | | 393,380 | |
| | |
The Cooper Companies, Inc. | | | 1,091 | | | | 350,527 | |
| | |
Varian Medical Systems, Inc.* | | | 2,039 | | | | 289,558 | |
| | |
Zimmer Biomet Holdings, Inc. | | | 4,615 | | | | 690,773 | |
| | | | | | | | |
| | | | 21,423,849 | |
|
Health Care Providers & Services 2.8% | |
| | |
AmerisourceBergen Corp. | | | 3,296 | | | | 280,226 | |
| | |
Anthem, Inc. | | | 5,683 | | | | 1,716,436 | |
| | |
Cardinal Health, Inc. | | | 6,548 | | | | 331,198 | |
| | |
Centene Corp.* | | | 9,169 | | | | 576,455 | |
| | |
Cigna Corp. | | | 8,368 | | | | 1,711,172 | |
| | |
CVS Health Corp. | | | 29,076 | | | | 2,160,056 | |
| | |
DaVita, Inc.* | | | 2,043 | | | | 153,286 | |
| | |
HCA Healthcare, Inc. | | | 5,893 | | | | 871,044 | |
| | |
Henry Schein, Inc.* | | | 3,311 | | | | 220,910 | |
| | |
Humana, Inc. | | | 2,969 | | | | 1,088,198 | |
| | |
Laboratory Corp. of America Holdings* | | | 2,146 | | | | 363,039 | |
| | |
McKesson Corp. | | | 4,041 | | | | 558,951 | |
| | |
Quest Diagnostics, Inc. | | | 3,019 | | | | 322,399 | |
| | |
UnitedHealth Group, Inc. | | | 21,222 | | | | 6,238,844 | |
| | |
Universal Health Services, Inc. “B” | | | 1,803 | | | | 258,658 | |
| | |
WellCare Health Plans, Inc.* | | | 1,141 | | | | 376,770 | |
| | | | | | | | |
| | | | 17,227,642 | |
|
Health Care Technology 0.1% | |
Cerner Corp. | | | 7,034 | | | | 516,225 | |
|
Life Sciences Tools & Services 1.0% | |
| | |
Agilent Technologies, Inc. | | | 6,867 | | | | 585,824 | |
| | |
Illumina, Inc.* | | | 3,306 | | | | 1,096,732 | |
| | |
IQVIA Holdings, Inc.* | | | 4,009 | | | | 619,431 | |
| | |
Mettler-Toledo International, Inc.* | | | 550 | | | | 436,304 | |
| | |
PerkinElmer, Inc. | | | 2,469 | | | | 239,740 | |
| | |
Thermo Fisher Scientific, Inc. | | | 8,969 | | | | 2,913,759 | |
| | |
Waters Corp.* | | | 1,443 | | | | 337,157 | |
| | | | | | | | |
| | | | 6,228,947 | |
The accompanying notes are an integral part of the financial statements.
| | | | |
| DWS Equity 500 Index VIP | | | | | 9 |
| | | | | | | | |
| | | Shares | | | Value ($) | |
|
Pharmaceuticals 4.5% | |
| | |
Allergan PLC | | | 7,377 | | | | 1,410,261 | |
| | |
Bristol-Myers Squibb Co. | | | 52,478 | | | | 3,368,563 | |
| | |
Eli Lilly & Co. | | | 18,907 | | | | 2,484,947 | |
| | |
Johnson & Johnson | | | 58,926 | | | | 8,595,536 | |
| | |
Merck & Co., Inc. | | | 56,994 | | | | 5,183,604 | |
| | |
Mylan NV* | | | 11,619 | | | | 233,542 | |
| | |
Perrigo Co. PLC | | | 3,108 | | | | 160,559 | |
| | |
Pfizer, Inc. | | | 123,895 | | | | 4,854,206 | |
| | |
Zoetis, Inc. | | | 10,650 | | | | 1,409,528 | |
| | | | | | | | |
| | | | 27,700,746 | |
|
| Industrials 8.9% | |
Aerospace & Defense 2.4% | |
| | |
Arconic, Inc. | | | 8,747 | | | | 269,145 | |
| | |
Boeing Co. | | | 11,973 | | | | 3,900,324 | |
| | |
General Dynamics Corp. | | | 5,267 | | | | 928,835 | |
| | |
Huntington Ingalls Industries, Inc. | | | 926 | | | | 232,315 | |
| | |
L3Harris Technologies, Inc. | | | 4,949 | | | | 979,259 | |
| | |
Lockheed Martin Corp. | | | 5,558 | | | | 2,164,174 | |
| | |
Northrop Grumman Corp. | | | 3,507 | | | | 1,206,303 | |
| | |
Raytheon Co. | | | 6,213 | | | | 1,365,245 | |
| | |
Textron, Inc. | | | 5,107 | | | | 227,772 | |
| | |
TransDigm Group, Inc. | | | 1,117 | | | | 625,520 | |
| | |
United Technologies Corp. | | | 18,168 | | | | 2,720,840 | |
| | | | | | | | |
| | | | 14,619,732 | |
|
Air Freight & Logistics 0.5% | |
| | |
C.H. Robinson Worldwide, Inc. | | | 2,979 | | | | 232,958 | |
| | |
Expeditors International of Washington, Inc. | | | 3,800 | | | | 296,476 | |
| | |
FedEx Corp. | | | 5,393 | | | | 815,475 | |
| | |
United Parcel Service, Inc. “B” | | | 15,732 | | | | 1,841,588 | |
| | | | | | | | |
| | | | 3,186,497 | |
|
Airlines 0.3% | |
| | |
Alaska Air Group, Inc. | | | 2,749 | | | | 186,245 | |
| | |
American Airlines Group, Inc. | | | 8,765 | | | | 251,380 | |
| | |
Delta Air Lines, Inc. | | | 12,834 | | | | 750,532 | |
| | |
Southwest Airlines Co. | | | 10,610 | | | | 572,728 | |
| | |
United Airlines Holdings, Inc.* | | | 4,928 | | | | 434,108 | |
| | | | | | | | |
| | | | 2,194,993 | |
|
Building Products 0.3% | |
| | |
A.O. Smith Corp. | | | 3,061 | | | | 145,826 | |
| | |
Allegion PLC | | | 2,056 | | | | 256,054 | |
| | |
Fortune Brands Home & Security, Inc. | | | 3,055 | | | | 199,614 | |
| | |
Johnson Controls International PLC | | | 17,304 | | | | 704,446 | |
| | |
Masco Corp. | | | 6,424 | | | | 308,288 | |
| | | | | | | | |
| | | | 1,614,228 | |
|
Commercial Services & Supplies 0.4% | |
| | |
Cintas Corp. | | | 1,885 | | | | 507,216 | |
| | |
Copart, Inc.* | | | 4,520 | | | | 411,049 | |
| | |
Republic Services, Inc. | | | 4,771 | | | | 427,625 | |
| | |
Rollins, Inc. | | | 3,089 | | | | 102,431 | |
| | |
Waste Management, Inc. | | | 8,686 | | | | 989,856 | |
| | | | | | | | |
| | | | 2,438,177 | |
|
Construction & Engineering 0.1% | |
| | |
Jacobs Engineering Group, Inc. | | | 2,962 | | | | 266,077 | |
| | |
Quanta Services, Inc. | | | 3,265 | | | | 132,918 | |
| | | | | | | | |
| | | | 398,995 | |
| | | | | | | | |
| | | Shares | | | Value ($) | |
|
Electrical Equipment 0.5% | |
| | |
AMETEK, Inc. | | | 5,140 | | | | 512,663 | |
| | |
Eaton Corp. PLC | | | 9,271 | | | | 878,149 | |
| | |
Emerson Electric Co. | | | 13,661 | | | | 1,041,788 | |
| | |
Rockwell Automation, Inc. | | | 2,576 | | | | 522,078 | |
| | | | | | | | |
| | | | 2,954,678 | |
|
Industrial Conglomerates 1.3% | |
| | |
3M Co. | | | 12,874 | | | | 2,271,231 | |
| | |
General Electric Co. | | | 195,243 | | | | 2,178,912 | |
| | |
Honeywell International, Inc. | | | 16,010 | | | | 2,833,770 | |
| | |
Roper Technologies, Inc. | | | 2,333 | | | | 826,419 | |
| | | | | | | | |
| | | | 8,110,332 | |
|
Machinery 1.6% | |
| | |
Caterpillar, Inc. | | | 12,389 | | | | 1,829,607 | |
| | |
Cummins, Inc. | | | 3,441 | | | | 615,801 | |
| | |
Deere & Co. | | | 7,018 | | | | 1,215,939 | |
| | |
Dover Corp. | | | 3,279 | | | | 377,938 | |
| | |
Flowserve Corp. | | | 2,969 | | | | 147,767 | |
| | |
Fortive Corp. | | | 6,645 | | | | 507,612 | |
| | |
IDEX Corp. | | | 1,725 | | | | 296,700 | |
| | |
Illinois Tool Works, Inc. | | | 6,566 | | | | 1,179,451 | |
| | |
Ingersoll-Rand PLC | | | 5,318 | | | | 706,869 | |
| | |
PACCAR, Inc. | | | 7,755 | | | | 613,420 | |
| | |
Parker-Hannifin Corp. | | | 2,859 | | | | 588,439 | |
| | |
Pentair PLC | | | 3,721 | | | | 170,682 | |
| | |
Snap-on, Inc. | | | 1,198 | | | | 202,941 | |
| | |
Stanley Black & Decker, Inc. | | | 3,381 | | | | 560,367 | |
| | |
Westinghouse Air Brake Technologies Corp. | | | 4,139 | | | | 322,014 | |
| | |
Xylem, Inc. | | | 4,096 | | | | 322,724 | |
| | | | | | | | |
| | | | 9,658,271 | |
|
Professional Services 0.3% | |
| | |
Equifax, Inc. | | | 2,705 | | | | 379,025 | |
| | |
IHS Markit Ltd.* | | | 9,038 | | | | 681,013 | |
| | |
Nielsen Holdings PLC | | | 7,923 | | | | 160,837 | |
| | |
Robert Half International, Inc. | | | 2,554 | | | | 161,285 | |
| | |
Verisk Analytics, Inc. | | | 3,642 | | | | 543,896 | |
| | | | | | | | |
| | | | 1,926,056 | |
|
Road & Rail 1.0% | |
| | |
CSX Corp. | | | 17,428 | | | | 1,261,090 | |
| | |
J.B. Hunt Transport Services, Inc. | | | 1,887 | | | | 220,364 | |
| | |
Kansas City Southern | | | 2,207 | | | | 338,024 | |
| | |
Norfolk Southern Corp. | | | 5,845 | | | | 1,134,690 | |
| | |
Old Dominion Freight Line, Inc. | | | 1,441 | | | | 273,473 | |
| | |
Union Pacific Corp. | | | 15,554 | | | | 2,812,008 | |
| | | | | | | | |
| | | | 6,039,649 | |
|
Trading Companies & Distributors 0.2% | |
| | |
Fastenal Co. | | | 12,963 | | | | 478,983 | |
| | |
United Rentals, Inc.* | | | 1,650 | | | | 275,170 | |
| | |
W.W. Grainger, Inc. | | | 979 | | | | 331,411 | |
| | | | | | | | |
| | | | 1,085,564 | |
|
| Information Technology 22.7% | |
Communications Equipment 0.9% | |
| | |
Arista Networks, Inc.* | | | 1,186 | | | | 241,232 | |
| | |
Cisco Systems, Inc. | | | 95,024 | | | | 4,557,351 | |
| | |
F5 Networks, Inc.* | | | 1,397 | | | | 195,091 | |
| | |
Juniper Networks, Inc. | | | 7,377 | | | | 181,696 | |
| | |
Motorola Solutions, Inc. | | | 3,840 | | | | 618,778 | |
| | | | | | | | |
| | | | 5,794,148 | |
The accompanying notes are an integral part of the financial statements.
| | | | | | |
| | 10 | | | | | | DWS Equity 500 Index VIP |
| | | | | | | | |
| | | Shares | | | Value ($) | |
|
Electronic Equipment, Instruments & Components 0.6% | |
| | |
Amphenol Corp. “A” | | | 6,687 | | | | 723,734 | |
| | |
CDW Corp. | | | 3,217 | | | | 459,516 | |
| | |
Corning, Inc. | | | 17,029 | | | | 495,714 | |
| | |
FLIR Systems, Inc. | | | 2,979 | | | | 155,117 | |
| | |
IPG Photonics Corp.* | | | 812 | | | | 117,675 | |
| | |
Keysight Technologies, Inc.* | | | 4,230 | | | | 434,125 | |
| | |
TE Connectivity Ltd. | | | 7,429 | | | | 711,995 | |
| | |
Zebra Technologies Corp. “A”* | | | 1,208 | | | | 308,572 | |
| | | | | | | | |
| | | | 3,406,448 | |
|
IT Services 5.3% | |
| | |
Accenture PLC “A” | | | 14,215 | | | | 2,993,253 | |
| | |
Akamai Technologies, Inc.* | | | 3,682 | | | | 318,051 | |
| | |
Alliance Data Systems Corp. | | | 903 | | | | 101,317 | |
| | |
Automatic Data Processing, Inc. | | | 9,685 | | | | 1,651,292 | |
| | |
Broadridge Financial Solutions, Inc. | | | 2,619 | | | | 323,551 | |
| | |
Cognizant Technology Solutions Corp. “A” | | | 12,231 | | | | 758,567 | |
| | |
DXC Technology Co. | | | 5,778 | | | | 217,195 | |
| | |
Fidelity National Information Services, Inc. | | | 13,801 | | | | 1,919,581 | |
| | |
Fiserv, Inc.* | | | 12,741 | | | | 1,473,242 | |
| | |
FleetCor Technologies, Inc.* | | | 1,929 | | | | 555,012 | |
| | |
Gartner, Inc.* | | | 2,004 | | | | 308,816 | |
| | |
Global Payments, Inc. | | | 6,754 | | | | 1,233,010 | |
| | |
International Business Machines Corp. | | | 19,834 | | | | 2,658,549 | |
| | |
Jack Henry & Associates, Inc. | | | 1,687 | | | | 245,745 | |
| | |
Leidos Holdings, Inc. | | | 2,959 | | | | 289,656 | |
| | |
Mastercard, Inc. “A” | | | 19,874 | | | | 5,934,178 | |
| | |
Paychex, Inc. | | | 7,160 | | | | 609,030 | |
| | |
PayPal Holdings, Inc.* | | | 26,288 | | | | 2,843,573 | |
| | |
VeriSign, Inc.* | | | 2,323 | | | | 447,596 | |
| | |
Visa, Inc. “A” | | | 38,324 | | | | 7,201,080 | |
| | |
Western Union Co. | | | 9,618 | | | | 257,570 | |
| | | | | | | | |
| | | | 32,339,864 | |
|
Semiconductors & Semiconductor Equipment 4.1% | |
| | |
Advanced Micro Devices, Inc.* | | | 24,931 | | | | 1,143,336 | |
| | |
Analog Devices, Inc. | | | 8,207 | | | | 975,320 | |
| | |
Applied Materials, Inc. | | | 20,783 | | | | 1,268,594 | |
| | |
Broadcom, Inc. | | | 8,881 | | | | 2,806,574 | |
| | |
Intel Corp. | | | 97,394 | | | | 5,829,031 | |
| | |
KLA Corp. | | | 3,529 | | | | 628,762 | |
| | |
Lam Research Corp. | | | 3,253 | | | | 951,177 | |
| | |
Maxim Integrated Products, Inc. | | | 6,008 | | | | 369,552 | |
| | |
Microchip Technology, Inc. | | | 5,355 | | | | 560,776 | |
| | |
Micron Technology, Inc.* | | | 24,826 | | | | 1,335,142 | |
| | |
NVIDIA Corp. | | | 13,698 | | | | 3,223,139 | |
| | |
Qorvo, Inc.* | | | 2,621 | | | | 304,639 | |
| | |
QUALCOMM., Inc. | | | 25,550 | | | | 2,254,276 | |
| | |
Skyworks Solutions, Inc. | | | 3,862 | | | | 466,839 | |
| | |
Texas Instruments, Inc. | | | 20,908 | | | | 2,682,287 | |
| | |
Xilinx, Inc. | | | 5,665 | | | | 553,867 | |
| | | | | | | | |
| | | | 25,353,311 | |
|
Software 6.9% | |
| | |
Adobe, Inc.* | | | 10,842 | | | | 3,575,800 | |
| | |
ANSYS, Inc.* | | | 1,919 | | | | 493,970 | |
| | |
Autodesk, Inc.* | | | 4,941 | | | | 906,476 | |
| | |
Cadence Design Systems, Inc.* | | | 6,247 | | | | 433,292 | |
| | |
Citrix Systems, Inc. | | | 2,713 | | | | 300,872 | |
| | |
Fortinet, Inc.* | | | 3,181 | | | | 339,603 | |
| | | | | | | | |
| | | Shares | | | Value ($) | |
| | |
Intuit, Inc. | | | 5,809 | | | | 1,521,551 | |
| | |
Microsoft Corp. | | | 170,841 | | | | 26,941,626 | |
| | |
NortonLifeLock, Inc. | | | 13,017 | | | | 332,194 | |
| | |
Oracle Corp. | | | 48,527 | | | | 2,570,960 | |
| | |
salesforce.com, Inc.* | | | 19,865 | | | | 3,230,843 | |
| | |
ServiceNow, Inc.* | | | 4,209 | | | | 1,188,285 | |
| | |
Synopsys, Inc.* | | | 3,344 | | | | 465,485 | |
| | | | | | | | |
| | | | 42,300,957 | |
|
Technology Hardware, Storage & Peripherals 4.9% | |
| | |
Apple, Inc. | | | 93,533 | | | | 27,465,966 | |
| | |
Hewlett Packard Enterprise Co. | | | 28,657 | | | | 454,500 | |
| | |
HP, Inc. | | | 33,177 | | | | 681,787 | |
| | |
NetApp, Inc. | | | 5,125 | | | | 319,031 | |
| | |
Seagate Technology PLC | | | 5,189 | | | | 308,746 | |
| | |
Western Digital Corp. | | | 6,615 | | | | 419,854 | |
| | |
Xerox Holding Corp. | | | 4,136 | | | | 152,494 | |
| | | | | | | | |
| | | | 29,802,378 | |
|
| Materials 2.6% | |
Chemicals 1.9% | |
| | |
Air Products & Chemicals, Inc. | | | 4,957 | | | | 1,164,845 | |
| | |
Albemarle Corp. | | | 2,352 | | | | 171,790 | |
| | |
Celanese Corp. | | | 2,699 | | | | 332,301 | |
| | |
CF Industries Holdings, Inc. | | | 4,749 | | | | 226,717 | |
| | |
Corteva, Inc.* | | | 16,840 | | | | 497,790 | |
| | |
Dow, Inc. | | | 16,502 | | | | 903,155 | |
| | |
DuPont de Nemours, Inc. | | | 16,582 | | | | 1,064,564 | |
| | |
Eastman Chemical Co. | | | 3,027 | | | | 239,920 | |
| | |
Ecolab, Inc. | | | 5,631 | | | | 1,086,727 | |
| | |
FMC Corp. | | | 2,951 | | | | 294,569 | |
| | |
International Flavors & Fragrances, Inc. (a) | | | 2,343 | | | | 302,294 | |
| | |
Linde PLC | | | 12,024 | | | | 2,559,910 | |
| | |
LyondellBasell Industries NV “A” | | | 5,779 | | | | 546,000 | |
| | |
PPG Industries, Inc. | | | 5,308 | | | | 708,565 | |
| | |
The Mosaic Co. | | | 7,979 | | | | 172,666 | |
| | |
The Sherwin-Williams Co. | | | 1,847 | | | | 1,077,798 | |
| | | | | | | | |
| | | | 11,349,611 | |
|
Construction Materials 0.1% | |
| | |
Martin Marietta Materials, Inc. | | | 1,384 | | | | 387,022 | |
| | |
Vulcan Materials Co. | | | 2,970 | | | | 427,650 | |
| | | | | | | | |
| | | | 814,672 | |
|
Containers & Packaging 0.3% | |
| | |
Amcor PLC | | | 36,382 | | | | 394,381 | |
| | |
Avery Dennison Corp. | | | 1,876 | | | | 245,418 | |
| | |
Ball Corp. | | | 7,285 | | | | 471,121 | |
| | |
International Paper Co. | | | 8,724 | | | | 401,740 | |
| | |
Packaging Corp. of America | | | 2,157 | | | | 241,563 | |
| | |
Sealed Air Corp. | | | 3,430 | | | | 136,617 | |
| | |
Westrock Co. | | | 5,741 | | | | 246,346 | |
| | | | | | | | |
| | | | 2,137,186 | |
|
Metals & Mining 0.3% | |
| | |
Freeport-McMoRan, Inc. | | | 32,349 | | | | 424,419 | |
| | |
Newmont Goldcorp Corp. | | | 18,379 | | | | 798,567 | |
| | |
Nucor Corp. | | | 6,739 | | | | 379,271 | |
| | | | | | | | |
| | | | 1,602,257 | |
|
| Real Estate 2.9% | |
Equity Real Estate Investment Trusts (REITs) 2.8% | |
| | |
Alexandria Real Estate Equities, Inc. | | | 2,556 | | | | 412,998 | |
The accompanying notes are an integral part of the financial statements.
| | | | |
| DWS Equity 500 Index VIP | | | | | 11 |
| | | | | | | | |
| | | Shares | | | Value ($) | |
| | |
American Tower Corp. | | | 9,908 | | | | 2,277,057 | |
| | |
Apartment Investment & Management Co. “A” | | | 3,294 | | | | 170,135 | |
| | |
AvalonBay Communities, Inc. | | | 3,133 | | | | 656,990 | |
| | |
Boston Properties, Inc. | | | 3,213 | | | | 442,944 | |
| | |
Crown Castle International Corp. | | | 9,271 | | | | 1,317,873 | |
| | |
Digital Realty Trust, Inc. | | | 4,655 | | | | 557,390 | |
| | |
Duke Realty Corp. | | | 8,144 | | | | 282,352 | |
| | |
Equinix, Inc. | | | 1,910 | | | | 1,114,867 | |
| | |
Equity Residential | | | 7,853 | | | | 635,465 | |
| | |
Essex Property Trust, Inc. | | | 1,486 | | | | 447,078 | |
| | |
Extra Space Storage, Inc. | | | 2,924 | | | | 308,833 | |
| | |
Federal Realty Investment Trust | | | 1,600 | | | | 205,968 | |
| | |
Healthpeak Properties, Inc. | | | 10,973 | | | | 378,239 | |
| | |
Host Hotels & Resorts, Inc. | | | 15,956 | | | | 295,984 | |
| | |
Iron Mountain, Inc. | | | 6,301 | | | | 200,813 | |
| | |
Kimco Realty Corp. | | | 9,433 | | | | 195,357 | |
| | |
Mid-America Apartment Communities, Inc. | | | 2,595 | | | | 342,177 | |
| | |
Prologis, Inc. | | | 14,218 | | | | 1,267,393 | |
| | |
Public Storage | | | 3,370 | | | | 717,675 | |
| | |
Realty Income Corp. | | | 7,349 | | | | 541,107 | |
| | |
Regency Centers Corp. | | | 3,780 | | | | 238,480 | |
| | |
SBA Communications Corp. | | | 2,535 | | | | 610,910 | |
| | |
Simon Property Group, Inc. | | | 6,852 | | | | 1,020,674 | |
| | |
SL Green Realty Corp. | | | 1,850 | | | | 169,978 | |
| | |
UDR, Inc. | | | 6,526 | | | | 304,764 | |
| | |
Ventas, Inc. | | | 8,379 | | | | 483,803 | |
| | |
Vornado Realty Trust | | | 3,463 | | | | 230,290 | |
| | |
Welltower, Inc. | | | 9,108 | | | | 744,852 | |
| | |
Weyerhaeuser Co. | | | 16,606 | | | | 501,501 | |
| | | | | | | | |
| | | | 17,073,947 | |
|
Real Estate Management & Development 0.1% | |
CBRE Group, Inc. “A”* | | | 7,494 | | | | 459,307 | |
|
| Utilities 3.2% | |
Electric Utilities 2.0% | |
| | |
Alliant Energy Corp. | | | 5,309 | | | | 290,508 | |
| | |
American Electric Power Co., Inc. | | | 11,113 | | | | 1,050,290 | |
| | |
Duke Energy Corp. | | | 16,249 | | | | 1,482,071 | |
| | |
Edison International | | | 8,057 | | | | 607,578 | |
| | |
Entergy Corp. | | | 4,457 | | | | 533,949 | |
| | |
Evergy, Inc. | | | 5,050 | | | | 328,705 | |
| | |
Eversource Energy | | | 7,286 | | | | 619,820 | |
| | |
Exelon Corp. | | | 21,837 | | | | 995,549 | |
| | |
FirstEnergy Corp. | | | 12,107 | | | | 588,400 | |
| | |
NextEra Energy, Inc. | | | 10,925 | | | | 2,645,598 | |
| | |
Pinnacle West Capital Corp. | | | 2,525 | | | | 227,073 | |
| | |
PPL Corp. | | | 16,252 | | | | 583,122 | |
| | |
Southern Co. | | | 23,523 | | | | 1,498,415 | |
| | |
Xcel Energy, Inc. | | | 11,801 | | | | 749,246 | |
| | | | | | | | |
| | | | 12,200,324 | |
|
Gas Utilities 0.0% | |
Atmos Energy Corp. | | | 2,661 | | | | 297,659 | |
|
Independent Power & Renewable Electricity Producers 0.1% | |
| | |
AES Corp. | | | 14,960 | | | | 297,704 | |
| | |
NRG Energy, Inc. | | | 5,770 | | | | 229,358 | |
| | | | | | | | |
| | | | 527,062 | |
|
Multi-Utilities 1.0% | |
| | |
Ameren Corp. | | | 5,444 | | | | 418,099 | |
| | |
CenterPoint Energy, Inc. | | | 11,427 | | | | 311,614 | |
| | |
CMS Energy Corp. | | | 6,362 | | | | 399,788 | |
| | | | | | | | |
| | | Shares | | | Value ($) | |
| | |
Consolidated Edison, Inc. | | | 7,466 | | | | 675,449 | |
| | |
Dominion Energy, Inc | | | 18,484 | | | | 1,530,845 | |
| | |
DTE Energy Co. | | | 4,249 | | | | 551,818 | |
| | |
NiSource, Inc. | | | 8,560 | | | | 238,310 | |
| | |
Public Service Enterprise Group, Inc. | | | 11,318 | | | | 668,328 | |
| | |
Sempra Energy | | | 6,295 | | | | 953,567 | |
| | |
WEC Energy Group, Inc. | | | 7,054 | | | | 650,590 | |
| | | | | | | | |
| | | | 6,398,408 | |
|
Water Utilities 0.1% | |
American Water Works Co., Inc. | | | 4,028 | | | | 494,840 | |
| Total Common Stocks(Cost $264,745,960) | | | | 599,222,949 | |
| | |
| | | Principal
Amount ($) | | | Value ($) | |
| Government & Agency Obligations 0.1% | |
| U.S. Treasury Obligation | |
U.S. Treasury Bill,
1.97%**, 1/9/2020 (b)
(Cost $659,711) | | | 660,000 | | | | 659,819 | |
| | |
| | | Shares | | | Value ($) | |
| Securities Lending Collateral 0.0% | |
DWS Government & Agency Securities Portfolio “DWS Government Cash Institutional Shares”, 1.50% (c) (d)
(Cost $251,422) | | | 251,422 | | | | 251,422 | |
| |
| Cash Equivalents 1.9% | | | | |
DWS Central Cash Management Government Fund, 1.62% (c)
(Cost $11,512,814) | | | 11,512,814 | | | | 11,512,814 | |
| | |
| | | % of Net
Assets | | | Value ($) | |
Total Investment Portfolio
(Cost $277,169,907) | | | 100.0 | | | | 611,647,004 | |
| Other Assets and Liabilities, Net | | | (0.0 | ) | | | (121,576 | ) |
| Net Assets | | | 100.0 | | | | 611,525,428 | |
The accompanying notes are an integral part of the financial statements.
| | | | | | |
| | 12 | | | | | | DWS Equity 500 Index VIP |
A summary of the Fund’s transactions with affiliated investments during the year ended December 31, 2019 are as follows:
| | | | | | | | | | | | | | | | | | | | | | | | | | | | | | | | |
Value ($) at
12/31/2018 | | Purchases
Cost ($) | | | Sales
Proceeds ($) | | | Net
Realized
Gain/
(Loss) ($) | | | Net Change in
Unrealized
Appreciation
(Depreciation) ($) | | | Income ($) | | | Capital Gain
Distributions ($) | | | Number
of Shares
at
12/31/2019 | | | Value ($)
at
12/31/2019 | |
Securities Lending Collateral 0.0% | |
DWS Government & Agency Securities Portfolio “DWS Government Cash Institutional Shares”, 1.50% (c) (d) | |
| 564,200 | | | — | | | | 312,778 | (e) | | | — | | | | — | | | | 1,379 | | | | — | | | | 251,422 | | | | 251,422 | |
Cash Equivalents 1.9% | |
DWS Central Cash Management Government Fund, 1.62% (c) | |
| 3,904,662 | | | 66,162,810 | | | | 58,554,658 | | | | — | | | | — | | | | 138,426 | | | | — | | | | 11,512,814 | | | | 11,512,814 | |
| 4,468,862 | | | 66,162,810 | | | | 58,867,436 | | | | — | | | | — | | | | 139,805 | | | | — | | | | 11,764,236 | | | | 11,764,236 | |
| * | Non-income producing security. |
| ** | Annualized yield at time of purchase; not a coupon rate. |
| (a) | All or a portion of these securities were on loan. In addition, “Other Assets and Liabilities, Net” may include pending sales that are also on loan. The value of securities loaned at December 31, 2019 amounted to $248,351, which is 0.04% of net assets. |
| (b) | At December 31, 2019, this security has been pledged, in whole or in part, to cover initial margin requirements for open futures contracts. |
| (c) | Affiliated fund managed by DWS Investment Management Americas, Inc. The rate shown is the annualizedseven-day yield at period end. |
| (d) | Represents cash collateral held in connection with securities lending. Income earned by the Fund is net of borrower rebates. |
| (e) | Represents the net increase (purchase cost) or decrease (sales proceeds) in the amount invested in cash collateral for the year ended December 31, 2019. |
S&P: Standard & Poor’s
At December 31, 2019, open futures contracts purchased were as follows:
| | | | | | | | | | | | | | | | | | | | | | | | |
| Futures | | Currency | | | Expiration
Date | | | Contracts | | | Notional
Amount ($) | | | Notional
Value ($) | | | Unrealized
Appreciation ($) | |
| S&P 500E-Mini Index | | | USD | | | | 3/20/2020 | | | | 79 | | | | 12,626,401 | | | | 12,762,845 | | | | 136,444 | |
Currency Abbreviation
For information on the Fund’s policy and additional disclosures regarding futures contracts, please refer to the Derivatives section of Note B in the accompanying Notes to Financial Statements.
Fair Value Measurements
Various inputs are used in determining the value of the Fund’s investments. These inputs are summarized in three broad levels. Level 1 includes quoted prices in active markets for identical securities. Level 2 includes other significant observable inputs (including quoted prices for similar securities, interest rates, prepayment speeds and credit risk). Level 3 includes significant unobservable inputs (including the Fund’s own assumptions in determining the fair value of investments). The level assigned to the securities valuations may not be an indication of the risk or liquidity associated with investing in those securities.
The following is a summary of the inputs used as of December 31, 2019 in valuing the Fund’s investments.
| | | | | | | | | | | | | | | | |
| Assets | | Level 1 | | | Level 2 | | | Level 3 | | | Total | |
| Common Stocks (f) | | $ | 599,222,949 | | | $ | — | | | $ | — | | | $ | 599,222,949 | |
| Government & Agency Obligations | | | — | | | | 659,819 | | | | — | | | | 659,819 | |
| Short-Term Investments (f) | | | 11,764,236 | | | | — | | | | — | | | | 11,764,236 | |
| Derivatives (g) | | | | | | | | | | | | | | | | |
Futures Contracts | | | 136,444 | | | | — | | | | — | | | | 136,444 | |
| Total | | $ | 611,123,629 | | | $ | 659,819 | | | $ | — | | | $ | 611,783,448 | |
| (f) | See Investment Portfolio for additional detailed categorizations. |
| (g) | Derivatives include unrealized appreciation (depreciation) on open futures contracts. |
The accompanying notes are an integral part of the financial statements.
| | | | |
| DWS Equity 500 Index VIP | | | | | 13 |
Statement of
Assets and Liabilities
| | | | |
| as of December 31, 2019 | | | | |
| |
| Assets | | | | |
Investments innon-affiliated securities, at value (cost $265,405,671) — including $248,351 of securities loaned | | $ | 599,882,768 | |
| Investment in DWS Government & Agency Securities Portfolio (cost $251,422)* | | | 251,422 | |
| Investment in DWS Central Cash Management Government Fund (cost $11,512,814) | | | 11,512,814 | |
| Receivable for Fund shares sold | | | 73,853 | |
| Dividends receivable | | | 610,390 | |
| Interest receivable | | | 9,813 | |
| Receivable for variation margin on futures contracts | | | 30,220 | |
| Other assets | | | 10,511 | |
| Total assets | | | 612,381,791 | |
| |
| Liabilities | | | | |
| Payable upon return of securities loaned | | | 251,422 | |
| Payable for Fund shares redeemed | | | 363,870 | |
| Accrued management fee | | | 54,450 | |
| Accrued Trustees’ fees | | | 7,405 | |
| Other accrued expenses and payables | | | 179,216 | |
| Total liabilities | | | 856,363 | |
| Net assets, at value | | $ | 611,525,428 | |
| |
| Net Assets Consist of | | | | |
| Distributable earnings (loss) | | | 371,021,567 | |
| Paid-in capital | | | 240,503,861 | |
| Net assets, at value | | $ | 611,525,428 | |
| |
| Net Asset Value | | | | |
Class A | | | | |
| |
Net Asset Value, offering and redemption
price per share ($561,352,376 ÷ 24,258,385
outstanding shares of beneficial interest,
$.001 par value, unlimited number of shares authorized) | | $ | 23.14 | |
Class B | | | | |
| |
Net Asset Value, offering and redemption
price per share ($32,987,529 ÷ 1,426,637
outstanding shares of beneficial interest,
$.001 par value, unlimited number of shares authorized) | | $ | 23.12 | |
Class B2 | | | | |
| |
Net Asset Value, offering and redemption
price per share ($17,185,523 ÷ 742,685
outstanding shares of beneficial interest,
$.001 par value, unlimited number of shares authorized) | | $ | 23.14 | |
| * | Represents collateral on securities loaned. |
Statement of Operations
| | | | |
| for the year ended December 31, 2019 | |
| |
| Investment Income | | | | |
| Income: | | | | |
| Dividends | | $ | 10,968,612 | |
| Interest | | | 11,458 | |
| Income distributions — DWS Central Cash Management Government Fund | | | 138,426 | |
| Securities lending income, net of borrower rebates | | | 1,379 | |
| Total income | | | 11,119,875 | |
| Expenses: | | | | |
| Management fee | | | 1,140,090 | |
| Administration fee | | | 570,045 | |
| Services to shareholders | | | 2,461 | |
| Recordkeeping fee (Class B andClass B-2) | | | 57,215 | |
| Distribution service fees (Class B andClass B-2) | | | 107,431 | |
| Custodian fee | | | 21,357 | |
| Professional fees | | | 78,395 | |
| Reports to shareholders | | | 77,846 | |
| Trustees’ fees and expenses | | | 29,228 | |
| Other | | | 47,913 | |
| Total expenses before expense reductions | | | 2,131,981 | |
| Expense reductions | | | (401,507 | ) |
| Total expenses after expense reductions | | | 1,730,474 | |
| Net investment income (loss) | | | 9,389,401 | |
| |
| Realized and Unrealized Gain (Loss) | | | | |
| Net realized gain (loss) from: | | | | |
| Investments | | | 34,377,679 | |
| Futures | | | 1,420,589 | |
| | | | 35,798,268 | |
| Change in net unrealized appreciation (depreciation) on: | | | | |
| Investments | | | 107,051,891 | |
| Futures | | | 249,385 | |
| | | | 107,301,276 | |
| Net gain (loss) | | | 143,099,544 | |
| Net increase (decrease) in net assets resulting from operations | | $ | 152,488,945 | |
The accompanying notes are an integral part of the financial statements.
| | | | | | |
| | 14 | | | | | | DWS Equity 500 Index VIP |
| | |
| Statements of Changes in Net Assets | | |
| | | | | | | | |
| Increase (Decrease) in | | Years Ended December 31, | |
| Net Assets | | 2019 | | | 2018 | |
| Operations: | | | | | | | | |
| Net investment income (loss) | | $ | 9,389,401 | | | $ | 9,800,551 | |
| Net realized gain (loss) | | | 35,798,268 | | | | 29,697,624 | |
| Change in net unrealized appreciation (depreciation) | | | 107,301,276 | | | | (62,661,892 | ) |
| Net increase (decrease) in net assets resulting from operations | | | 152,488,945 | | | | (23,163,717 | ) |
| Distributions to shareholders: | | | | | | | | |
Class A | | | (36,093,488 | ) | | | (55,569,580 | ) |
Class B | | | (1,569,495 | ) | | | (2,605,149 | ) |
Class B2 | | | (1,061,799 | ) | | | (1,716,159 | ) |
| Total distributions | | | (38,724,782 | ) | | | (59,890,888 | ) |
| Fund share transactions: | | | | | | | | |
Class A | | | | | | | | |
| Proceeds from shares sold | | | 15,867,889 | | | | 14,838,059 | |
| Reinvestment of distributions | | | 36,093,488 | | | | 55,569,580 | |
| Payments for shares redeemed | | | (67,585,767 | ) | | | (62,569,499 | ) |
| Net increase (decrease) in net assets from Class A share transactions | | | (15,624,390 | ) | | | 7,838,140 | |
Class B | | | | | | | | |
| Proceeds from shares sold | | | 10,003,444 | | | | 5,836,040 | |
| Reinvestment of distributions | | | 1,569,495 | | | | 2,605,149 | |
| Payments for shares redeemed | | | (4,895,248 | ) | | | (8,730,248 | ) |
| Net increase (decrease) in net assets from Class B share transactions | | | 6,677,691 | | | | (289,059 | ) |
Class B2 | | | | | | | | |
| Proceeds from shares sold | | | 373,269 | | | | 735,371 | |
| Reinvestment of distributions | | | 1,061,799 | | | | 1,716,159 | |
| Payments for shares redeemed | | | (2,353,334 | ) | | | (2,402,184 | ) |
| Net increase (decrease) in net assets from Class B2 share transaction | | | (918,266 | ) | | | 49,346 | |
| Increase (decrease) in net assets | | | 103,899,198 | | | | (75,456,178 | ) |
| Net assets at beginning of period | | | 507,626,230 | | | | 583,082,408 | |
| | |
| Net assets at end of period | | $ | 611,525,428 | | | $ | 507,626,230 | |
| | | | | | | | |
| | | Years Ended December 31, | |
| Other Information | | 2019 | | | 2018 | |
Class A | | | | | | | | |
| Shares outstanding at beginning of period | | | 24,962,490 | | | | 24,366,996 | |
| Shares sold | | | 755,485 | | | | 693,526 | |
| Shares issued to shareholders in reinvestment of distributions | | | 1,743,647 | | | | 2,826,530 | |
| Shares redeemed | | | (3,203,237 | ) | | | (2,924,562 | ) |
| Net increase (decrease) in Class A shares | | | (704,105 | ) | | | 595,494 | |
| | |
| Shares outstanding at end of period | | | 24,258,385 | | | | 24,962,490 | |
Class B | | | | | | | | |
| Shares outstanding at beginning of period | | | 1,109,669 | | | | 1,138,481 | |
| Shares sold | | | 475,525 | | | | 275,349 | |
| Shares issued to shareholders in reinvestment of distributions | | | 75,675 | | | | 132,308 | |
| Shares redeemed | | | (234,232 | ) | | | (436,469 | ) |
| Net increase (decrease) in Class B shares | | | 316,968 | | | | (28,812 | ) |
| | |
| Shares outstanding at end of period | | | 1,426,637 | | | | 1,109,669 | |
Class B2 | | | | | | | | |
| Shares outstanding at beginning of period | | | 784,684 | | | | 776,819 | |
| Shares sold | | | 18,043 | | | | 34,095 | |
| Shares issued to shareholders in reinvestment of distributions | | | 51,146 | | | | 87,115 | |
| Shares redeemed | | | (111,188 | ) | | | (113,345 | ) |
| Net increase (decrease) in Class B2 shares | | | (41,999 | ) | | | 7,865 | |
| | |
| Shares outstanding at end of period | | | 742,685 | | | | 784,684 | |
The accompanying notes are an integral part of the financial statements.
| | | | |
| DWS Equity 500 Index VIP | | | | | 15 |
Financial Highlights
| | | | | | | | | | | | | | | | | | | | |
| | | Years Ended December 31, | |
| Class A | | 2019 | | | 2018 | | | 2017 | | | 2016 | | | 2015 | |
| | | | | |
| Selected Per Share Data | | | | | | | | | | | | | | | | | | | | |
| Net asset value, beginning of period | | | $18.90 | | | $ | 22.19 | | | $ | 19.58 | | | $ | 19.40 | | | $ | 20.41 | |
| Income (loss) from investment operations: | | | | | | | | | | | | | | | | | | | | |
Net investment income (loss)a | | | .35 | | | | .37 | | | | .34 | | | | .35 | | | | .35 | |
Net realized and unrealized gain (loss) | | | 5.37 | | | | (1.31 | ) | | | 3.69 | | | | 1.74 | | | | (.10 | ) |
Total from investment operations | | | 5.72 | | | | (.94 | ) | | | 4.03 | | | | 2.09 | | | | .25 | |
| Less distributions from: | | | | | | | | | | | | | | | | | | | | |
Net investment income | | | (.43 | ) | | | (.38 | ) | | | (.37 | ) | | | (.40 | ) | | | (.33 | ) |
Net realized gains | | | (1.05 | ) | | | (1.97 | ) | | | (1.05 | ) | | | (1.51 | ) | | | (.93 | ) |
Total distributions | | | (1.48 | ) | | | (2.35 | ) | | | (1.42 | ) | | | (1.91 | ) | | | (1.26 | ) |
| Net asset value, end of period | | | $23.14 | | | $ | 18.90 | | | $ | 22.19 | | | $ | 19.58 | | | $ | 19.40 | |
| Total Return (%)b | | | 31.19 | | | | (4.65 | ) | | | 21.53 | | | | 11.61 | | | | 1.13 | |
| | | | | |
| Ratios to Average Net Assets and Supplemental Data | | | | | | | | | | | | | | | | | | | | |
| Net assets, end of period ($ millions) | | | 561 | | | | 472 | | | | 541 | | | | 519 | | | | 530 | |
| Ratio of expenses before expense reductions (%)c | | | .35 | | | | .34 | | | | .34 | | | | .34 | | | | .34 | |
| Ratio of expenses after expense reductions (%)c | | | .27 | | | | .30 | | | | .33 | | | | .33 | | | | .33 | |
| Ratio of net investment income (%) | | | 1.68 | | | | 1.73 | | | | 1.67 | | | | 1.88 | | | | 1.77 | |
| Portfolio turnover rate (%) | | | 3 | | | | 3 | | | | 3 | | | | 4 | | | | 3 | |
| a | Based on average shares outstanding during the period. |
| b | Total return would have been lower had certain expenses not been reduced. |
| c | Expense ratio does not reflect charges and fees associated with the separate account that invests in the Fund or any variable life insurance policy or variable annuity contract for which the Fund is an investment option. |
| | | | | | | | | | | | | | | | | | | | |
| | | Years Ended December 31, | |
| Class B | | 2019 | | | 2018 | | | 2017 | | | 2016 | | | 2015 | |
| | | | | |
| Selected Per Share Data | | | | | | | | | | | | | | | | | | | | |
| Net asset value, beginning of period | | | $18.89 | | | $ | 22.17 | | | $ | 19.58 | | | $ | 19.40 | | | $ | 20.40 | |
| Income (loss) from investment operations: | | | | | | | | | | | | | | | | | | | | |
Net investment income (loss)a | | | .28 | | | | .29 | | | | .28 | | | | .30 | | | | .30 | |
Net realized and unrealized gain (loss) | | | 5.35 | | | | (1.29 | ) | | | 3.67 | | | | 1.74 | | | | (.09 | ) |
Total from investment operations | | | 5.63 | | | | (1.00 | ) | | | 3.95 | | | | 2.04 | | | | .21 | |
| Less distributions from: | | | | | | | | | | | | | | | | | | | | |
Net investment income | | | (.35 | ) | | | (.31 | ) | | | (.31 | ) | | | (.35 | ) | | | (.28 | ) |
Net realized gains | | | (1.05 | ) | | | (1.97 | ) | | | (1.05 | ) | | | (1.51 | ) | | | (.93 | ) |
Total distributions | | | (1.40 | ) | | | (2.28 | ) | | | (1.36 | ) | | | (1.86 | ) | | | (1.21 | ) |
| Net asset value, end of period | | | $23.12 | | | $ | 18.89 | | | $ | 22.17 | | | $ | 19.58 | | | $ | 19.40 | |
| Total Return (%)b | | | 30.66 | | | | (4.94 | ) | | | 21.07 | | | | 11.32 | | | | .92 | |
| | | | | |
| Ratios to Average Net Assets and Supplemental Data | | | | | | | | | | | | | | | | | | | | |
| Net assets, end of period ($ millions) | | | 33 | | | | 21 | | | | 25 | | | | 18 | | | | 12 | |
| Ratio of expenses before expense reductions (%)c | | | .72 | | | | .71 | | | | .71 | | | | .69 | | | | .67 | |
| Ratio of expenses after expense reductions (%)c | | | .65 | | | | .65 | | | | .65 | | | | .61 | | | | .58 | |
| Ratio of net investment income (%) | | | 1.31 | | | | 1.38 | | | | 1.35 | | | | 1.61 | | | | 1.53 | |
| Portfolio turnover rate (%) | | | 3 | | | | 3 | | | | 3 | | | | 4 | | | | 3 | |
| a | Based on average shares outstanding during the period. |
| b | Total return would have been lower had certain expenses not been reduced. |
| c | Expense ratio does not reflect charges and fees associated with the separate account that invests in the Fund or any variable life insurance policy or variable annuity contract for which the Fund is an investment option. |
The accompanying notes are an integral part of the financial statements.
| | | | | | |
| | 16 | | | | | | DWS Equity 500 Index VIP |
| | | | | | | | | | | | | | | | | | | | |
| | | Years Ended December 31, | |
| Class B2 | | 2019 | | | 2018 | | | 2017 | | | 2016 | | | 2015 | |
| | | | | |
| Selected Per Share Data | | | | | | | | | | | | | | | | | | | | |
| Net asset value, beginning of period | | $ | 18.90 | | | $ | 22.18 | | | $ | 19.57 | | | $ | 19.39 | | | $ | 20.40 | |
| Income (loss) from investment operations: | | | | | | | | | | | | | | | | | | | | |
Net investment income (loss)a | | | .27 | | | | .28 | | | | .26 | | | | .28 | | | | .28 | |
Net realized and unrealized gain (loss) | | | 5.36 | | | | (1.30 | ) | | | 3.69 | | | | 1.74 | | | | (.10 | ) |
Total from investment operations | | | 5.63 | | | | (1.02 | ) | | | 3.95 | | | | 2.02 | | | | .18 | |
| Less distributions from: | | | | | | | | | | | | | | | | | | | | |
Net investment income | | | (.34 | ) | | | (.29 | ) | | | (.29 | ) | | | (.33 | ) | | | (.26 | ) |
Net realized gains | | | (1.05 | ) | | | (1.97 | ) | | | (1.05 | ) | | | (1.51 | ) | | | (.93 | ) |
Total distributions | | | (1.39 | ) | | | (2.26 | ) | | | (1.34 | ) | | | (1.84 | ) | | | (1.19 | ) |
| Net asset value, end of period | | $ | 23.14 | | | $ | 18.90 | | | $ | 22.18 | | | $ | 19.57 | | | $ | 19.39 | |
| Total Return (%)b | | | 30.64 | | | | (5.00 | ) | | | 21.06 | | | | 11.20 | | | | .76 | |
| | | | | |
| Ratios to Average Net Assets and Supplemental Data | | | | | | | | | | | | | | | | | | | | |
| Net assets, end of period ($ millions) | | | 17 | | | | 15 | | | | 17 | | | | 17 | | | | 17 | |
| Ratio of expenses before expense reductions (%)c | | | .74 | | | | .73 | | | | .74 | | | | .74 | | | | .74 | |
| Ratio of expenses after expense reductions (%)c | | | .67 | | | | .70 | | | | .72 | | | | .71 | | | | .68 | |
| Ratio of net investment income (%) | | | 1.28 | | | | 1.32 | | | | 1.27 | | | | 1.50 | | | | 1.42 | |
| Portfolio turnover rate (%) | | | 3 | | | | 3 | | | | 3 | | | | 4 | | | | 3 | |
| a | Based on average shares outstanding during the period. |
| b | Total return would have been lower had certain expenses not been reduced. |
| c | Expense ratio does not reflect charges and fees associated with the separate account that invests in the Fund or any variable life insurance policy or variable annuity contract for which the Fund is an investment option. |
The accompanying notes are an integral part of the financial statements.
| | | | |
| DWS Equity 500 Index VIP | | | | | 17 |
| | |
| Notes to Financial Statements | | |
A. Organization and Significant Accounting Policies
Deutsche DWS Investments VIT Funds (the “Trust”) is registered under the Investment Company Act of 1940, as amended (the “1940 Act”), as an open-end management investment company. The Trust is organized as a Massachusetts business trust. DWS Equity 500 Index VIP (the “Fund”) is a diversified series of the Trust offered to investors. The Fund is an underlying investment vehicle for variable annuity contracts and variable life insurance policies to be offered by the separate accounts of certain life insurance companies (“Participating Insurance Companies”).
Multiple Classes of Shares of Beneficial Interest. The Fund offers three classes of shares to investors: Class A shares, Class B shares and Class B2 shares. Class B and Class B2 shares are subject to Rule 12b-1 distribution fees under the 1940 Act equal to an annual rate of 0.25% of Class B and Class B2 shares average daily net assets. In addition, Class B and Class B2 shares are subject to recordkeeping fees equal to an annual rate up to 0.15% of average daily net assets. Class A shares are not subject to such fees.
Investment income, realized and unrealized gains and losses, and certain fund-level expenses and expense reductions, if any, are borne pro rata on the basis of relative net assets by the holders of all classes of shares, except that each class bears certain expenses unique to that class (including the applicable 12b-1 distribution fees and record keeping fees). Differences in class-level expenses may result in payment of different per share dividends by class. All shares have equal rights with respect to voting subject to class-specific arrangements.
The Fund’s financial statements are prepared in accordance with accounting principles generally accepted in the United States of America (“U.S. GAAP”) which require the use of management estimates. Actual results could differ from those estimates. The Fund qualifies as an investment company under Topic 946 of Accounting Standards Codification of U.S. GAAP. The policies described below are followed consistently by the Fund in the preparation of its financial statements.
Security Valuation. Investments are stated at value determined as of the close of regular trading on the New York Stock Exchange on each day the exchange is open for trading.
Various inputs are used in determining the value of the Fund’s investments. These inputs are summarized in three broad levels. Level 1 includes quoted prices in active markets for identical securities. Level 2 includes other significant observable inputs (including quoted prices for similar securities, interest rates, prepayment speeds and credit risk). Level 3 includes significant unobservable inputs (including the Fund’s own assumptions in determining the fair value of investments). The level assigned to the securities valuations may not be an indication of the risk or liquidity associated with investing in those securities.
Equity securities are valued at the most recent sale price or official closing price reported on the exchange (U.S. or foreign) or over-the-counter market on which they trade. Securities for which no sales are reported are valued at the calculated mean between the most recent bid and asked quotations on the relevant market or, if a mean cannot be determined, at the most recent bid quotation. Equity securities are generally categorized as Level 1.
Debt securities are valued at prices supplied by independent pricing services approved by the Fund’s Board. If the pricing services are unable to provide valuations, securities are valued at the most recent bid quotation or evaluated price, as applicable, obtained from one or more broker-dealers. Such services may use various pricing techniques which take into account appropriate factors such as yield, quality, coupon rate, maturity, type of issue, trading characteristics and other data, as well as broker quotes. These securities are generally categorized as Level 2.
Investments in open-end investment companies are valued at their net asset value each business day and are categorized as Level 1.
Futures contracts are generally valued at the settlement prices established each day on the exchange on which they are traded and are categorized as Level 1.
Securities and other assets for which market quotations are not readily available or for which the above valuation procedures are deemed not to reflect fair value are valued in a manner that is intended to reflect their fair value as determined in accordance with procedures approved by the Board and are generally categorized as Level 3. In accordance with the Fund’s valuation procedures, factors considered in determining value may include, but are not limited to, the type of the security; the size of the holding; the initial cost of the security; the existence of any contractual restrictions on the security’s disposition; the price
| | | | | | |
| | 18 | | | | | | DWS Equity 500 Index VIP |
and extent of public trading in similar securities of the issuer or of comparable companies; quotations or evaluated prices from broker-dealers and/or pricing services; information obtained from the issuer, analysts, and/or the appropriate stock exchange (for exchange-traded securities); an analysis of the company’s or issuer’s financial statements; an evaluation of the forces that influence the issuer and the market(s) in which the security is purchased and sold; and with respect to debt securities, the maturity, coupon, creditworthiness, currency denomination and the movement of the market in which the security is normally traded. The value determined under these procedures may differ from published values for the same securities.
Disclosure about the classification of fair value measurements is included in a table following the Fund’s Investment Portfolio.
Securities Lending. Deutsche Bank AG, as lending agent, lends securities of the Fund to certain financial institutions under the terms of its securities lending agreement. During the term of the loans, the Fund continues to receive interest and dividends generated by the securities and to participate in any changes in their market value. The Fund requires the borrowers of the securities to maintain collateral with the Fund consisting of either cash or liquid, unencumbered assets having a value at least equal to the value of the securities loaned. When the collateral falls below specified amounts, the lending agent will use its best effort to obtain additional collateral on the next business day to meet required amounts under the security lending agreement. As of period end, any securities on loan were collateralized by cash. During the year ended December 31, 2019, the Fund invested the cash collateral into a joint trading account in DWS Government & Agency Securities Portfolio, an affiliated money market fund managed by DWS Investment Management Americas, Inc. DWS Investment Management Americas, Inc. receives a management/administration fee (0.12% annualized effective rate as of December 31, 2019) on the cash collateral invested in DWS Government & Agency Securities Portfolio. The Fund receives compensation for lending its securities either in the form of fees or by earning interest on invested cash collateral net of borrower rebates and fees paid to a lending agent. Either the Fund or the borrower may terminate the loan at any time, and the borrower, after notice, is required to return borrowed securities within a standard time period. There may be risks of delay and costs in recovery of securities or even loss of rights in the collateral should the borrower of the securities fail financially. If the Fund is not able to recover securities lent, the Fund may sell the collateral and purchase a replacement investment in the market, incurring the risk that the value of the replacement security is greater than the value of the collateral. The Fund is also subject to all investment risks associated with the reinvestment of any cash collateral received, including, but not limited to, interest rate, credit and liquidity risk associated with such investments.
As of December 31, 2019, the Fund had securities on loan, which were classified as common stock in the Investment Portfolio. The value of the related collateral exceeded the value of the securities loaned at period end. As of period end, the remaining contractual maturity of the collateral agreements were overnight and continuous.
Federal Income Taxes. The Fund’s policy is to comply with the requirements of the Internal Revenue Code, as amended, which are applicable to regulated investment companies, and to distribute all of its taxable income to its shareholders.
The Fund has reviewed the tax positions for the open tax years as of December 31, 2019 and has determined that no provision for income tax and/or uncertain tax positions is required in the Fund’s financial statements. The Fund’s federal tax returns for the prior three fiscal years remain open subject to examination by the Internal Revenue Service.
Distribution of Income and Gains. Net investment income of the Fund, if any, is declared and distributed to shareholders annually. Net realized gains from investment transactions, in excess of available capital loss carryforwards, would be taxable to the Fund if not distributed, and, therefore, will be distributed to shareholders at least annually. The Fund may also make additional distributions for tax purposes if necessary.
The timing and characterization of certain income and capital gain distributions are determined annually in accordance with federal tax regulations, which may differ from accounting principles generally accepted in the United States of America. These differences primarily relate to investments in futures contracts and certain securities sold at a loss. As a result, net investment income (loss) and net realized gain (loss) on investment transactions for a reporting period may differ significantly from distributions during such period. Accordingly, the Fund may periodically make reclassifications among certain of its capital accounts without impacting the net asset value of the Fund.
| | | | |
| DWS Equity 500 Index VIP | | | | | 19 |
At December 31, 2019, the Fund’s components of distributable earnings (accumulated gains) on a tax basis were as follows:
| | | | |
| Undistributed ordinary income* | | $ | 10,388,381 | |
| Undistributed long-term capital gains | | $ | 33,643,502 | |
| Net unrealized appreciation (depreciation) on investments | | $ | 326,955,629 | |
At December 31, 2019, the aggregate cost of investments for federal income tax purposes was $284,688,849. The net unrealized appreciation for all investments based on tax cost was $326,955,629. This consisted of aggregate gross unrealized appreciation for all investments in which there was an excess of value over tax cost of $347,357,373 and aggregate gross unrealized depreciation for all investments in which was an excess of tax cost over value of $20,401,744.
In addition, the tax character of distributions paid to shareholders by the Fund is summarized as follows:
| | | | | | | | |
| | | Years Ended December 31, | |
| | | 2019 | | | 2018 | |
| Distributions from ordinary income* | | $ | 11,299,761 | | | $ | 10,441,101 | |
| Distributions from long-term capital gains | | $ | 27,425,021 | | | $ | 49,449,787 | |
| * | For tax purposes, short-term capital gain distributions are considered ordinary income distributions. |
Contingencies. In the normal course of business, the Fund may enter into contracts with service providers that contain general indemnification clauses. The Fund’s maximum exposure under these arrangements is unknown, as this would involve future claims that may be made against the Fund that have not yet been made. However, based on experience, the Fund expects the risk of loss to be remote.
Expenses. Expenses of the Trust arising in connection with a specific fund are allocated to that fund. Other Trust expenses which cannot be directly attributed to a fund are apportioned among the funds in the Trust based upon the relative net assets or other appropriate measures.
Real Estate Investment Trusts. The Fund at its fiscal year end recharacterizes distributions received from a Real Estate Investment Trust (“REIT”) investment based on information provided by the REIT into the following categories: ordinary income, long-term and short-term capital gains, and return of capital. If information is not available timely from a REIT, the recharacterization will be estimated for financial statement purposes and a recharacterization will be made within the accounting records in the following year when such information becomes available. Distributions received from REITs in excess of income are recorded as either a reduction of cost of investments or realized gains.
Other. Investment transactions are accounted for on a trade date plus one basis for daily net asset valuation calculations. However, for financial reporting purposes, investment transactions are reported on trade date. Interest income is recorded on the accrual basis. Dividend income is recorded on the ex-dividend date. Realized gains and losses from investment transactions are recorded on an identified cost basis. Proceeds from litigation payments, if any, are included in net realized gain (loss) from investments.
B. Derivative Instruments
A futures contract is an agreement between a buyer or seller and an established futures exchange or its clearinghouse in which the buyer or seller agrees to take or make a delivery of a specific amount of a financial instrument at a specified price on a specific date (settlement date). For the year ended December 31, 2019, the Fund invested in futures to keep cash on hand to meet shareholder redemptions or other needs while maintaining exposure to the stock market.
Upon entering into a futures contract, the Fund is required to deposit with a financial intermediary cash or securities (“initial margin”) in an amount equal to a certain percentage of the face value indicated in the futures contract. Subsequent payments (“variation margin”) are made or received by the Fund dependent upon the daily fluctuations in the value and are recorded for financial reporting purposes as unrealized gains or losses by the Fund. Gains or losses are realized when the contract expires or is closed. Since all futures contracts are exchange traded, counterparty risk is minimized as the exchange’s clearinghouse acts as the counterparty, and guarantees the futures against default. Upon a futures contract close out or expiration, realized gain or loss is recognized.
Certain risks may arise upon entering into futures contracts, including the risk that an illiquid market will limit the Fund’s ability to close out a futures contract prior to the settlement date and the risk that the futures
| | | | | | |
| | 20 | | | | | | DWS Equity 500 Index VIP |
contract is not well correlated with the security, index or currency to which it relates. Risk of loss may exceed amounts disclosed in the Statement of Assets and Liabilities.
A summary of the open futures contracts as of December 31, 2019, is included in a table following the Fund’s Investment Portfolio. For the year ended December 31, 2019, the investment in futures contracts purchased had a total notional value generally indicative of a range from approximately $4,885,000 to $13,543,000.
The following tables summarize the value of the Fund’s derivative instruments held as of December 31, 2019 and the related location in the accompanying Statement of Assets and Liabilities, presented by primary underlying risk exposure:
| | | | |
| Asset Derivative | | Futures
Contracts | |
| Equity Contracts (a) | | $
| 136,444
|
|
The above derivative is located in the following Statement of Assets and Liabilities account:
| (a) | Includes cumulative appreciation of futures contracts as disclosed in the Investment Portfolio. Unsettled variation margin is disclosed separately within the Statement of Assets and Liabilities. |
Additionally, the amount of unrealized and realized gains and losses on derivative instruments recognized in Fund earnings during the year ended December 31, 2019 and the related location in the accompanying Statement of Operations is summarized in the following tables by primary underlying risk exposure:
| | | | |
| Realized Gain (Loss) | | Futures
Contracts | |
| Equity Contracts (b) | | $ | 1,420,589 | |
The above derivative is located in the following Statement of Operations account:
| (b) | Net realized gain (loss) from futures |
| | | | |
| Change in Net Unrealized Appreciation (Depreciation) | | Futures
Contracts | |
| Equity Contracts (c) | | $ | 249,385 | |
The above derivative is located in the following Statement of Operations account:
| (c) | Change in net unrealized appreciation (depreciation) on futures |
C. Purchases and Sales of Securities
During the year ended December 31, 2019, purchases and sales of investment securities (excluding short-term investments) aggregated $17,587,825 and $61,464,039, respectively.
D. Related Parties
Management Agreement. Under the Investment Management Agreement with DWS Investment Management Americas, Inc. (“DIMA” or the “Advisor”), an indirect, wholly owned subsidiary of DWS Group GmbH & Co. KGaA (“DWS Group”), the Advisor determines the securities, instruments and other contracts relating to investments to be purchased, sold, or entered into by the Fund or delegates such responsibility to the Fund’s subadvisor. Northern Trust Investments, Inc. (“NTI”) serves as subadvisor. As a subadvisor to the Fund, NTI makes investment decisions and buys and sells securities for the Fund. NTI is paid by the Advisor for the services NTI provides to the Fund.
Pursuant to the Investment Management Agreement with the Advisor, the Fund pays the Advisor an annual fee based on its average daily net assets, computed and accrued daily and payable monthly, at the following annual rates:
| | | | |
| First $1 billion of the Fund’s average daily net assets | | | .200 | % |
| Next $1 billion of such net assets | | | .175 | % |
| Over $2 billion of such net assets | | | .150 | % |
Accordingly, for the year ended December 31, 2019, the fee pursuant to the Investment Management Agreement was equivalent to an annual rate (exclusive of any applicable waivers/reimbursements) of 0.20% of the Fund’s average daily net assets.
For the period from January 1, 2019 through September 30, 2019, the Advisor had contractually agreed to waive all or a portion of its fees and/or reimburse certain operating expenses of the Fund to the extent
| | | | |
| DWS Equity 500 Index VIP | | | | | 21 |
necessary to maintain the total annual operating expenses (excluding certain expenses such as extraordinary expenses, taxes, brokerage and interest) of each classes as follows:
| | | | |
| Class A | | | .28 | % |
| Class B | | | .65 | % |
| Class B2 | | | .75 | % |
Effective October 1, 2019 through September 30, 2020, the Advisor has contractually agreed to waive all
or a portion of its fees and/or reimburse certain operating expenses of the Fund to the extent necessary to maintain the total annual operating expenses (excluding certain expenses such as extraordinary expenses, taxes, brokerage and interest) of each classes as follows:
| | | | |
| Class A | | | .26 | % |
| Class B | | | .64 | % |
| Class B2 | | | .66 | % |
For the year ended December 31, 2019, fees waived and/or expenses reimbursed for each class are as follows:
| | | | |
| Class A | | $ | 369,577 | |
| Class B | | | 19,842 | |
| Class B2 | | | 12,088 | |
| | | $ | 401,507 | |
Administration Fee. Pursuant to the Administrative Services Agreement, DIMA provides most administrative services to the Fund. For all services provided under the Administrative Services Agreement, the Fund pays DIMA an annual fee (“Administration Fee”) of 0.10% of the Fund’s average daily net assets, computed and accrued daily and payable monthly. For the year ended December 31, 2019, the Administration Fee was $570,045, of which $51,029 is unpaid.
Distribution Service Agreement. DWS Distributors, Inc. (“DDI”), an affiliate of the Advisor, is the Fund’s distributor. In accordance with the Distribution Plan, DDI receives 12b-1 fees of 0.25% of average daily net assets of Class B and B2 shares. For the year ended December 31, 2019, the Distribution Service Fees were as follows:
| | | | | | | | |
| Distribution Service Fees | | Total
Aggregated | | | Unpaid at
December 31, 2019 | |
Class B | | $ | 66,458 | | | $ | 6,767 | |
| Class B2 | | | 40,973 | | | | 3,610 | |
| | | $ | 107,431 | | | $ | 10,377 | |
Service Provider Fees. DWS Service Company (“DSC”), an affiliate of the Advisor, is the transfer agent, dividend-paying agent and shareholder service agent of the Fund. Pursuant to a sub-transfer agency agreement among DSC and DST Systems, Inc. (“DST”), DSC has delegated certain transfer agent, dividend-paying agent and shareholder service agent functions to DST. DSC compensates DST out of the shareholder servicing fee they receive from the Fund. For the year ended December 31, 2019, the amounts charged to the Fund by DSC were as follows:
| | | | | | | | |
| Services to Shareholders | | Total
Aggregated | | | Unpaid at
December 31, 2019 | |
| Class A | | $ | 445 | | | $ | 74 | |
| Class B | | | 81 | | | | 14 | |
| Class B2 | | | 52 | | | | 8 | |
| | | $ | 578 | | | $ | 96 | |
Typesetting and Filing Service Fees. Under an agreement with the Fund, DIMA is compensated for providing certain pre-press and regulatory filing services to the Fund. For the year ended December 31, 2019, the amount charged to the Fund by DIMA included in the Statement of Operations under “Reports to shareholders” aggregated $14,999, of which $4,169 unpaid.
Trustees’ Fees and Expenses. The Fund paid retainer fees to each Trustee not affiliated with the Advisor, plus specified amounts to the Board Chairperson and to each committee Chairperson.
| | | | | | |
| | 22 | | | | | | DWS Equity 500 Index VIP |
Affiliated Cash Management Vehicles. The Fund may invest uninvested cash balances in DWS Central Cash Management Government Fund and DWS ESG Liquidity Fund, affiliated money market funds which are managed by the Advisor. Each affiliated money market fund is managed in accordance with Rule 2a-7 under the 1940 Act, which governs the quality, maturity, diversity and liquidity of instruments in which a money market fund may invest. DWS Central Cash Management Government Fund seeks to maintain a stable net asset value, and DWS ESG Liquidity Fund maintains a floating net asset value. The Fund indirectly bears its proportionate share of the expenses of each affiliated money market fund in which it invests. DWS Central Cash Management Government Fund does not pay the Advisor an investment management fee. To the extent that DWS ESG Liquidity Fund pays an investment management fee to the Advisor, the Advisor will waive an amount of the investment management fee payable to the Advisor by the Fund equal to the amount of the investment management fee payable on the Fund’s assets invested in DWS ESG Liquidity Fund.
Securities Lending Agent Fees. Deutsche Bank AG serves as securities lending agent for the Fund. For the year ended December 31, 2019, the Fund incurred securities lending agent fees to Deutsche Bank AG in the amount of $104.
E. Line of Credit
The Fund and other affiliated funds (the “Participants”) share in a $400 million revolving credit facility provided by a syndication of banks. The Fund may borrow for temporary or emergency purposes, including the meeting of redemption requests that otherwise might require the untimely disposition of securities. The Participants are charged an annual commitment fee, which is allocated based on net assets, among each of the Participants. Interest is calculated at a rate per annum equal to the sum of the Federal Funds Rate plus 1.25 percent plus if the one-month LIBOR exceeds the Federal Funds Rate, the amount of such excess. The Fund may borrow up to a maximum of 33 percent of its net assets under the agreement. The Fund had no outstanding loans at December 31, 2019.
F. Ownership of the Fund
At December 31, 2019, two participating insurance companies were beneficial owners of record of 10% or more of the total outstanding Class A shares of the Fund, each owning 53% and 14%, respectively. At December 31, 2019, one participating insurance company was beneficial owner of record of 10% or more of the total outstanding Class B shares of the Fund, owning 88%. At December 31, 2019, one participating insurance company was a beneficial owner of record of 86% of the total outstanding Class B2 shares of the Fund.
G. Change of Independent Registered Public Accounting Firm
On May 14, 2019, PricewaterhouseCoopers LLP (“PwC”) resigned as the independent registered public accounting firm to the Fund. PwC communicated its resignation to the Registrant’s Board of Trustees (the “Board of Trustees”).
PwC’s reports on the Fund’s financial statements for the fiscal years ended December 31, 2018 and December 31, 2017 contained no adverse opinion or disclaimer of opinion nor were they qualified or modified as to uncertainty, audit scope or accounting principle.
During the fiscal years ended December 31, 2018 and December 31, 2017 and during the subsequent interim period through May 14, 2019: (i) there were no disagreements with PwC on any matter of accounting principles or practices, financial statement disclosure or auditing scope or procedure, which disagreements, if not resolved to the satisfaction of PwC, would have caused PwC to make reference to the subject matter of the disagreements in connection with its reports on the Fund’s financial statements for such periods; and (ii) there were no “reportable events” of the kind described in Item 304(a)(1)(v) of Regulation S-K under the Securities Exchange Act of 1934, as amended.
On May 15, 2019, the Audit Committee of the Board of Trustees and the Board of Trustees approved the selection of Ernst & Young LLP (“EY”) as the Fund’s independent registered public accounting firm for the fiscal year ending December 31, 2019. During the Fund’s fiscal years ended December 31, 2018 and December 31, 2017, and the subsequent interim period through May 15, 2019, neither the Fund, nor anyone on their behalf, consulted with EY on items which: (i) concerned the application of accounting principles to a specified transaction, either completed or proposed, or the type of audit opinion that might be rendered on the Fund’s financial statements; or (ii) concerned the subject of a disagreement (as defined in paragraph (a)(1)(iv) of Item 304 of Regulation S-K) or reportable events (as described in paragraph (a)(1)(v) of said Item 304).
| | | | |
| DWS Equity 500 Index VIP | | | | | 23 |
Report of Independent Registered Public Accounting Firm
To the Board of Trustees of Deutsche DWS Investments VIT Funds and Shareholders of DWS Equity 500 Index VIP:
Opinion on the Financial Statements
We have audited the accompanying statement of assets and liabilities of DWS Equity 500 Index VIP (the “Fund”) (one of the funds constituting Deutsche DWS Investments VIT Funds) (the “Trust”), including the investment portfolio, as of December 31, 2019, and the related statements of operations and changes in net assets and the financial highlights for the year then ended and the related notes (collectively referred to as the “financial statements”). In our opinion, the financial statements present fairly, in all material respects, the financial position of the Fund (one of the funds constituting Deutsche DWS Investments VIT Funds) at December 31, 2019, the results of its operations, the changes in its net assets and its financial highlights for the year then ended, in conformity with U.S. generally accepted accounting principles.
The statement of changes in net assets for the year ended December 31, 2018, and the financial highlights for the years ended December 31, 2015, December 31, 2016, December 31, 2017 and December 31, 2018, were audited by another independent registered public accounting firm whose report, dated February 14, 2019, expressed an unqualified opinion on that statement of changes in net assets and those financial highlights.
Basis for Opinion
These financial statements are the responsibility of the Trust’s management. Our responsibility is to express an opinion on the Fund’s financial statements based on our audit. We are a public accounting firm registered with the Public Company Accounting Oversight Board (United States) (“PCAOB”) and are required to be independent with respect to the Trust in accordance with the U.S. federal securities laws and the applicable rules and regulations of the Securities and Exchange Commission and the PCAOB.
We conducted our audit in accordance with the standards of the PCAOB. Those standards require that we plan and perform the audit to obtain reasonable assurance about whether the financial statements are free of material misstatement, whether due to error or fraud. The Trust is not required to have, nor were we engaged to perform, an audit of the Trust’s internal control over financial reporting. As part of our audit, we are required to obtain an understanding of internal control over financial reporting, but not for the purpose of expressing an opinion on the effectiveness of the Trust’s internal control over financial reporting. Accordingly, we express no such opinion.
Our audit included performing procedures to assess the risks of material misstatement of the financial statements, whether due to error or fraud, and performing procedures that respond to those risks. Such procedures included examining, on a test basis, evidence regarding the amounts and disclosures in the financial statements. Our procedures included confirmation of securities owned as of December 31, 2019, by correspondence with the custodian and others. Our audit also included evaluating the accounting principles used and significant estimates made by management, as well as evaluating the overall presentation of the financial statements. We believe that our audit provides a reasonable basis for our opinion.

We have served as the auditor of one or more investment companies in the DWS family of funds since at least 1979, but we are unable to determine the specific year.
Boston, Massachusetts
February 14, 2020
| | | | | | |
| | 24 | | | | | | DWS Equity 500 Index VIP |
| | |
| Information About Your Fund’s Expenses | | (Unaudited) |
As an investor of the Fund, you incur two types of costs: ongoing expenses and transaction costs. Ongoing expenses include management fees, distribution and service (12b-1) fees and other Fund expenses. Examples of transaction costs include contract charges, which are not shown in this section. The following tables are intended to help you understand your ongoing expenses (in dollars) of investing in the Fund and to help you compare these expenses with the ongoing expenses of investing in other mutual funds. In the most recent six-month period, the Fund limited these expenses; had it not done so, expenses would have been higher. The example in the table is based on an investment of $1,000 invested at the beginning of the six-month period and held for the entire period (July 1, 2019 to December 31, 2019).
The tables illustrate your Fund’s expenses in two ways:
| – | | Actual Fund Return. This helps you estimate the actual dollar amount of ongoing expenses (but not transaction costs) paid on a $1,000 investment in the Fund using the Fund’s actual return during the period. To estimate the expenses you paid over the period, simply divide your account value by $1,000 (for example, an $8,600 account value divided by $1,000 = 8.6), then multiply the result by the number in the “Expenses Paid per $1,000” line under the share class you hold. |
| – | | Hypothetical 5% Fund Return. This helps you to compare your Fund’s ongoing expenses (but not transaction costs) with those of other mutual funds using the Fund’s actual expense ratio and a hypothetical rate of return of 5% per year before expenses. Examples using a 5% hypothetical Fund return may be found in the shareholder reports of other mutual funds. The hypothetical account values and expenses may not be used to estimate the actual ending account balance or expenses you paid for the period. |
Please note that the expenses shown in these tables are meant to highlight your ongoing expenses only and do not reflect any transaction costs. The “Expenses Paid per $1,000” line of the tables is useful in comparing ongoing expenses only and will not help you determine the relative total expense of owning different funds. If these transaction costs had been included, your costs would have been higher.
| | | | | | | | | | | | |
| Expenses and Value of a $1,000 Investment for the six months ended December 31, 2019 | |
| | | |
| Actual Fund Return | | Class A | | | Class B | | | Class B2 | |
| Beginning Account Value 7/1/19 | | $ | 1,000.00 | | | $ | 1,000.00 | | | $ | 1,000.00 | |
| Ending Account Value 12/31/19 | | $ | 1,107.70 | | | $ | 1,105.70 | | | $ | 1,105.60 | |
| Expenses Paid per $1,000* | | $ | 1.43 | | | $ | 3.45 | | | $ | 3.50 | |
| | | |
| Hypothetical 5% Fund Return | | Class A | | | Class B | | | Class B2 | |
| Beginning Account Value 7/1/19 | | $ | 1,000.00 | | | $ | 1,000.00 | | | $ | 1,000.00 | |
| Ending Account Value 12/31/19 | | $ | 1,023.84 | | | $ | 1,021.93 | | | $ | 1,021.88 | |
| Expenses Paid per $1,000* | | $ | 1.38 | | | $ | 3.31 | | | $ | 3.36 | |
| * | Expenses are equal to the Fund’s annualized expense ratio for each share class, multiplied by the average account value over the period, multiplied by 184 (the number of days in the most recent six-month period), then divided by 365. |
| | | | | | | | | | | | |
| Annualized Expense Ratios | | Class A | | | Class B | | | Class B2 | |
| DWS Equity 500 Index VIP | | | .27 | % | | | .65 | % | | | .66 | % |
For more information, please refer to the Fund’s prospectus.
These tables do not reflect charges and fees (“contract charges”) associated with the separate account that invests in the Fund or any variable life insurance policy or variable annuity contract for which the Fund is an investment option.
For an analysis of the fees associated with an investment in the Fund or similar funds, please refer to the current and hypothetical expense calculators for Variable Insurance Products which can be found at dws.com/calculators.
| | | | |
| DWS Equity 500 Index VIP | | | | | 25 |
| | |
| Tax Information | | (Unaudited) |
The Fund paid distributions of $1.04 per share from net long-term capital gains during its year ended December 31, 2019.
Pursuant to Section 852 of the Internal Revenue Code, the Fund designates $37,233,000 as capital gain dividends for its year ended December 31, 2019.
For corporate shareholders, 89% of the ordinary dividends (i.e., income dividends plus short-term capital gains) paid during the Fund’s fiscal year ended December 31, 2019 qualified for the dividends received deduction.
Please consult a tax advisor if you have questions about federal or state income tax laws, or on how to prepare your tax returns. If you have specific questions about your account, contact your insurance provider.
Proxy Voting
The Fund’s policies and procedures for voting proxies for portfolio securities and information about how the Fund voted proxies related to its portfolio securities during the most recent 12-month period ended June 30 are available on our Web site — dws.com/en-us/resources/proxy-voting — or on the SEC’s Web site — sec.gov. To obtain a written copy of the Fund’s policies and procedures without charge, upon request, call us toll free at (800) 728-3337.
| | | | | | |
| | 26 | | | | | | DWS Equity 500 Index VIP |
Advisory Agreement Board Considerations and Fee Evaluation
The Board of Trustees (hereinafter referred to as the “Board” or “Trustees”) approved the renewal of DWS Equity 500 Index VIP’s (the “Fund”) investment management agreement (the “Agreement”) with DWS Investment Management Americas, Inc. (“DIMA”) andsub-advisory agreement (the“Sub-Advisory Agreement” and together with the Agreement, the “Agreements”) between DIMA and Northern Trust Investments, Inc. (“NTI”)in September 2019.
In terms of the process that the Board followed prior to approving the Agreements, shareholders should know that:
| – | | During the entire process, all of the Fund’s Trustees were independent of DIMA and its affiliates (the “Independent Trustees”). |
| – | | The Board met frequently during the past year to discuss fund matters and dedicated a substantial amount of time to contract review matters. Over the course of several months, the Board’s Contract Committee reviewed extensive materials received from DIMA, independent third parties and independent counsel. These materials included an analysis of the Fund’s performance, fees and expenses, and profitability from a fee consultant retained by the Fund’s Independent Trustees (the “Fee Consultant”). Based on its evaluation of the information provided, the Contract Committee presented its findings and recommendations to the Board. The Board then reviewed the Contract Committee’s findings and recommendations. |
| – | | The Board also received extensive information throughout the year regarding performance of the Fund. |
| – | | The Independent Trustees regularly met privately with counsel to discuss contract review and other matters. In addition, the Independent Trustees were advised by the Fee Consultant in the course of their review of the Fund’s contractual arrangements and considered a comprehensive report prepared by the Fee Consultant in connection with their deliberations. |
| – | | In connection with reviewing the Agreements, the Board also reviewed the terms of the Fund’sRule 12b-1 plan, distribution agreement, administrative services agreement, transfer agency agreement and other material service agreements. |
In connection with the contract review process, the Contract Committee and the Board considered the factors discussed below, among others. The Board also considered that DIMA and its predecessors have managed the Fund since its inception, and the Board believes that a long-term relationship with a capable, conscientious advisor is in the best interests of the Fund. The Board considered, generally, that shareholders chose to invest or remain invested in the Fund knowing that DIMA managed the Fund. DIMA is part of DWS Group GmbH & Co. KGaA (“DWS Group”). DWS Group is a global asset management business that offers a wide range of investing expertise and resources, including research capabilities in many countries throughout the world. In 2018, approximately 20% of DWS Group’s shares were sold in an initial public offering, with Deutsche Bank AG owning the remaining shares.
As part of the contract review process, the Board carefully considered the fees and expenses of each DWS fund overseen by the Board in light of the fund’s performance. In many cases, this led to the negotiation and implementation of expense caps. As part of these negotiations, the Board indicated that it would consider relaxing these caps in future years following sustained improvements in performance, among other considerations.
While shareholders may focus primarily on fund performance and fees, the Fund’s Board considers these and many other factors, including the quality and integrity of DIMA’s and NTI’s personnel and administrative support services provided by DIMA, such as back-office operations, fund valuations, and compliance policies and procedures.
Nature, Quality and Extent of Services.The Board considered the terms of the Agreements, including the scope of advisory services provided under the Agreements. The Board noted that, under the Agreements, DIMA and NTI provide portfolio management services to the Fund and that, pursuant to a separate administrative services agreement, DIMA provides administrative services to the Fund. The Board considered the experience and skills of senior management and investment personnel and the resources made available to such personnel. Throughout the course of the year, the Board also received information regarding DIMA’s oversight of fundsub-advisors, including NTI. The Board reviewed the Fund’s performance over short-term and long-term periods and compared those returns to various agreed-upon performance measures, including market index(es) and a peer universe compiled using information supplied by
| | | | |
| DWS Equity 500 Index VIP | | | | | 27 |
Morningstar Direct (“Morningstar”), an independent fund data service. The Board also noted that it has put into place a process of identifying “Funds in Review” (e.g., funds performing poorly relative to a peer universe), and receives additional reporting from DIMA regarding such funds and, where appropriate, DIMA’s plans to address underperformance. The Board believes this process is an effective manner of identifying and addressing underperforming funds. Based on the information provided, the Board noted that, for theone-, three- and five-year periods ended December 31, 2018, the Fund’s performance (Class A shares) was in the 2nd quartile, 2nd quartile and 1st quartile, respectively, of the applicable Morningstar universe (the 1st quartile being the best performers and the 4th quartile being the worst performers).
Fees and Expenses. The Board considered the Fund’s investment management fee schedule,sub-advisory fee schedule, operating expenses and total expense ratios, and comparative information provided by Broadridge Financial Solutions, Inc. (“Broadridge”) and the Fee Consultant regarding investment management fee rates paid to other investment advisors by similar funds (1st quartile being the most favorable and 4th quartile being the least favorable). With respect to management fees paid to other investment advisors by similar funds, the Board noted that the contractual fee rates paid by the Fund, which include a 0.10% fee paid to DIMA under the Fund’s administrative services agreement, were higher than the median (3rd quartile) of the applicable Broadridge peer group (based on Broadridge data provided as of December 31, 2018). With respect to thesub-advisory fee paid to NTI, the Board noted that the fee is paid by DIMA out of its fee and not directly by the Fund.The Board noted that the Fund’s Class A shares total (net) operating expenses were expected to be higher than the median (3rd quartile) of the applicable Broadridge expense universe (based on Broadridge data provided as of December 31, 2018, and analyzing Broadridge expense universe Class A (net) expenses less any applicable12b-1 fees) (“Broadridge Universe Expenses”). The Board also reviewed data comparing each other operational share class’s total (net) operating expenses to the applicable Broadridge Universe Expenses. The Board noted that the expense limitations agreed to by DIMA were expected to help the Fund’s total (net) operating expenses remain competitive. The Board considered the Fund’s management fee rate as compared to fees charged by DIMA to comparable DWS U.S. registered funds (“DWS Funds”) and considered differences between the Fund and the comparable DWS Funds. The information requested by the Board as part of its review of fees and expenses also included information about institutional accounts (including anysub-advised funds and accounts) and funds offered primarily to European investors (“DWS Europe Funds”) managed by DWS Group. The Board noted that DIMA indicated that DWS Group does not manage any institutional accounts or DWS Europe Funds comparable to the Fund.
On the basis of the information provided, the Board concluded that management fees were reasonable and appropriate in light of the nature, quality and extent of services provided by DIMA and NTI.
Profitability. The Board reviewed detailed information regarding revenues received by DIMA under the Agreement. The Board considered the estimated costs to DIMA, andpre-tax profits realized by DIMA, from advising the DWS Funds, as well as estimates of thepre-tax profits attributable to managing the Fund in particular. The Board also received information regarding the estimated enterprise-wide profitability of DIMA and its affiliates with respect to all fund services in totality and by fund. The Board and the Fee Consultant reviewed DIMA’s methodology in allocating its costs to the management of the Fund. Based on the information provided, the Board concluded that thepre-tax profits realized by DIMA in connection with the management of the Fund were not unreasonable. The Board also reviewed certain publicly available information regarding the profitability of certain similar investment management firms. The Board noted that, while information regarding the profitability of such firms is limited (and in some cases is not necessarily prepared on a comparable basis), DIMA and its affiliates’ overall profitability with respect to the DWS Funds (after taking into account distribution and other services provided to the funds by DIMA and its affiliates) was lower than the overall profitability levels of most comparable firms for which such data was available. The Board did not consider the profitability of NTI with respect to the Fund. The Board noted that DIMA pays NTI’s fee out of its management fee, and its understanding that the Fund’ssub-advisory fee schedule was the product of an arm’s length negotiation with DIMA.
Economies of Scale. The Board considered whether there are economies of scale with respect to the management of the Fund and whether the Fund benefits from any economies of scale. The Board noted that the Fund’s investment management fee schedule includes fee breakpoints. The Board concluded that the Fund’s fee schedule represents an appropriate sharing between the Fund and DIMA of such economies of scale as may exist in the management of the Fund at current asset levels.
Other Benefits to DIMA and NTIand Their Affiliates. The Board also considered the character and amount of other incidental or“fall-out” benefits received by DIMA and NTI and their affiliates, including any fees
| | | | | | |
| | 28 | | | | | | DWS Equity 500 Index VIP |
received by DIMA for administrative services provided to the Fund, any fees received by an affiliate of DIMA for transfer agency services provided to the Fund and any fees received by an affiliate of DIMA for distribution services. The Board also considered benefits to DIMA and NTI related to brokerage and soft-dollar allocations, including allocating brokerage to pay for research generated by parties other than the executing broker dealers, which pertain primarily to funds investing in equity securities. In addition, the Board considered the incidental public relations benefits to DIMA and NTI related to DWS Funds advertising and cross-selling opportunities among DIMA products and services. The Board considered these benefits in reaching its conclusion that the Fund’s management fees were reasonable.
Compliance. The Board considered the significant attention and resources dedicated by DIMA to its compliance processes in recent years. The Board noted in particular (i) the experience, seniority and time commitment of the individuals serving as DIMA’s and the Fund’s chief compliance officers and (ii) the substantial commitment of resources by DIMA and its affiliates to compliance matters, including the retention of compliance personnel. The Board also considered the attention and resources dedicated by DIMA to the oversight of the investmentsub-advisor’s compliance program and compliance with the applicable fund policies and procedures.
Based on all of the information considered and the conclusions reached, the Board determined that the continuation of the Agreements is in the best interests of the Fund. In making this determination, the Board did not give particular weight to any single factor identified above. The Board considered these factors over the course of numerous meetings, certain of which were in executive session with only the Independent Trustees and counsel present. It is possible that individual Independent Trustees may have weighed these factors differently in reaching their individual decisions to approve the continuation of the Agreements.
| | | | |
| DWS Equity 500 Index VIP | | | | | 29 |
Board Members and Officers
The following table presents certain information regarding the Board Members and Officers of the Trust/Corporation. Each Board Member’s year of birth is set forth in parentheses after his or her name. Unless otherwise noted, (i) each Board Member has engaged in the principal occupation(s) noted in the table for at least the most recent five years, although not necessarily in the same capacity; and (ii) the address of each Independent Board Member is Keith R. Fox, DWS Funds Board Chair, c/o Thomas R. Hiller, Ropes & Gray LLP, Prudential Tower, 800 Boylston Street, Boston, MA02199-3600. Except as otherwise noted below, the term of office for each Board Member is until the election and qualification of a successor, or until such Board Member sooner dies, resigns, is removed or as otherwise provided in the governing documents of the Trust/Corporation. Because the Fund does not hold an annual meeting of shareholders, each Board Member will hold office for an indeterminate period.
The Board Members may also serve in similar capacities with other funds in the fund complex. The number of funds in DWS fund complex shown in the table below includes all registered open- and closed-end funds (including all of their portfolios) advised by the Advisor and any registered funds that have an investment advisor that is an affiliated person of the Advisor.
| | | | | | | | |
| Independent Board Members | | | | | |
Name, Year of Birth,
Position with the Trust/
Corporation and
Length of Time Served1 | | Business Experience and Directorships During the Past Five Years | | Number of
Funds in
DWS Fund
Complex
Overseen | | | Other
Directorships
Held by Board
Member
|
Keith R. Fox, CFA (1954) Chairperson since 2017, and Board Member since 1996 | | Managing General Partner, Exeter Capital Partners (a series of private investment funds) (since 1986). Directorships: ICI Mutual Insurance Company; Progressive International Corporation (kitchen goods importer and distributor); former Chairman, National Association of Small Business Investment Companies; former Directorships: The Kennel Shop (retailer); BoxTop Media Inc. (advertising); Sun Capital Advisers Trust (mutual funds) (2011–2012) | | | 77 | | | — |
John W. Ballantine (1946) Board Member since 1999 | | Retired; formerly, Executive Vice President and Chief Risk Management Officer, First Chicago NBD Corporation/The First National Bank of Chicago (1996–1998); Executive Vice President and Head of International Banking (1995–1996); former Directorships: Director and Chairman of the Board, Healthways, Inc.2 (population well-being and wellness services) (2003–2014); Stockwell Capital Investments PLC (private equity); Enron Corporation; FNB Corporation; Tokheim Corporation; First Oak Brook Bancshares, Inc.; Oak Brook Bank; and Prisma Energy International. Not-for-Profit Director/Trustee: Palm Beach Civic Association; Window to the World Communications (public media); Life Director of Harris Theater for Music and Dance (Chicago); Life Director of Hubbard Street Dance Chicago; former Not-for-Profit Directorships: Public Radio International | | | 77 | | | Portland
General
Electric2
(utility
company)
(2003–
present) |
Dawn-Marie Driscoll (1946) Board Member since 1987 | | Emeritus Executive Fellow, Center for Business Ethics, Bentley University; formerly: Partner, Palmer & Dodge (law firm) (1988–1990); Vice President of Corporate Affairs and General Counsel, Filene’s (retail) (1978–1988). Directorships: Advisory Board, Center for Business Ethics, Bentley University; Trustee and former Chairman of the Board, Southwest Florida Community Foundation (charitable organization); former Directorships: ICI Mutual Insurance Company (2007–2015); Sun Capital Advisers Trust (mutual funds) (2007–2012), Investment Company Institute (audit, executive, nominating committees) and Independent Directors Council (governance, executive committees) | | | 77 | | | — |
Richard J. Herring (1946) Board Member since 1990 | | Jacob Safra Professor of International Banking and Professor of Finance, The Wharton School, University of Pennsylvania (since July 1972); Director, The Wharton Financial Institutions Center (since 1994); formerly: Vice Dean and Director, Wharton Undergraduate Division (1995–2000) and Director, The Lauder Institute of International Management Studies (2000–2006); Member FDIC Systemic Risk Advisory Committee since 2011, member Systemic Risk Council since 2012 and member of the Advisory Board at the Yale Program on Financial Stability since 2013; Formerly Co-Chair of the Shadow Financial Regulatory Committee (2003–2015), Executive Director of The Financial Economists Roundtable (2008–2015), Director of The Thai Capital Fund (2007–2013), Director of The Aberdeen Singapore Fund (2007–2018), and Nonexecutive Director of Barclays Bank DE (2010–2018) | | | 77 | | | Director,
Aberdeen
Japan Fund
(since 2007) |
| | | | | | |
| | 30 | | | | | | DWS Equity 500 Index VIP |
| | | | | | | | |
Name, Year of Birth,
Position with the Trust/
Corporation and
Length of Time Served1 | | Business Experience and Directorships During the Past Five Years | | Number of
Funds in
DWS Fund
Complex
Overseen | | | Other
Directorships
Held by Board
Member
|
William McClayton (1944) Board Member since 2004 | | Private equity investor (since October 2009); previously, Managing Director, Diamond Management & Technology Consultants, Inc. (global consulting firm) (2001–2009); Directorship: Board of Managers, YMCA of Metropolitan Chicago; formerly: Senior Partner, Arthur Andersen LLP (accounting) (1966–2001); Trustee, Ravinia Festival | | | 77 | | | — |
Rebecca W. Rimel (1951) Board Member since 1995 | | President, Chief Executive Officer and Director, The Pew Charitable Trusts (charitable organization) (1994–present); formerly: Executive Vice President, The Glenmede Trust Company (investment trust and wealth management) (1983–2004); Board Member, Investor Education (charitable organization) (2004–2005); Trustee, Executive Committee, Philadelphia Chamber of Commerce (2001–2007); Director, Viasys Health Care2 (January 2007–June 2007); Trustee, Thomas Jefferson Foundation (charitable organization) (1994–2012) | | | 77 | | | Director,
Becton
Dickinson
and
Company2
(medical
technology
company)
(2012–
present);
Director,
BioTelemetry
Inc.2(health
care) (2009–
present) |
William N. Searcy, Jr. (1946) Board Member since 1993 | | Private investor since October 2003; formerly: Pension & Savings Trust Officer, Sprint Corporation2(telecommunications) (November 1989–September 2003); Trustee, Sun Capital Advisers Trust (mutual funds) (1998–2012) | | | 77 | | | — |
| | |
| Officers4 | | |
Name, Year of Birth,
Position with the Trust/
Corporation and
Length of Time Served5 | | Business Experience and Directorships During the Past Five Years |
Hepsen Uzcan6(1974) President and Chief Executive Officer, 2017–present | | Managing Director,3 DWS; Secretary, DWS USA Corporation (2018–present); Assistant Secretary, DWS Distributors, Inc. (2018–present); Director and Vice President, DWS Service Company (2018–present); Assistant Secretary, DWS Investment Management Americas, Inc. (2018–present); and Director and President, DB Investment Managers, Inc. (2018–present); formerly: Vice President for the Deutsche funds (2016–2017); Assistant Secretary for the DWS funds (2013–2019) |
John Millette7(1962) Vice President and Secretary, 1999–present | | Director,3DWS; Chief Legal Officer, DWS Investment Management Americas, Inc. (2015–present); Director and Vice President, DWS Trust Company (2016–present); and Assistant Secretary, DBX ETF Trust (2019–present); formerly: Secretary, Deutsche Investment Management Americas Inc. (2015–2017) |
Diane Kenneally7(1966) Chief Financial Officer and Treasurer, 2018–present | | Director,3 DWS; and Treasurer, Chief Financial Officer and Controller, DBX ETF Trust (2019–present); formerly: Assistant Treasurer for the DWS funds (2007–2018) |
Paul Antosca7(1957) Assistant Treasurer, 2007–present | | Director,3DWS; and Assistant Treasurer, DBX ETF Trust (2019–present) |
Sheila Cadogan7(1966) Assistant Treasurer, 2017–present | | Director,3DWS; Director and Vice President, DWS Trust Company (2018–present); and Assistant Treasurer, DBX ETF Trust (2019–present) |
Scott D. Hogan7(1970) Chief Compliance Officer, 2016–present | | Director,3DWS |
Caroline Pearson7(1962) Chief Legal Officer, 2010–present | | Managing Director,3DWS; formerly: Secretary, Deutsche AM Distributors, Inc. (2002–2017); and Secretary, Deutsche AM Service Company (2010–2017) |
Wayne Salit6(1967) Anti-Money Laundering Compliance Officer, 2014–present | | Director,3 Deutsche Bank; and AML Officer, DWS Trust Company; formerly: Managing Director, AML Compliance Officer at BNY Mellon (2011–2014); and Director, AML Compliance Officer at Deutsche Bank (2004–2011) |
Ciara Crawford8 (1984) Assistant Secretary, (2019–present) | | Associate, DWS (since 2015); previously, Legal Assistant at Accelerated Tax Solutions. |
| | | | |
| DWS Equity 500 Index VIP | | | | | 31 |
| 1 | The length of time served represents the year in which the Board Member joined the board of one or more DWS funds currently overseen by the Board. |
| 2 | A publicly held company with securities registered pursuant to Section 12 of the Securities Exchange Act of 1934. |
| 3 | Executive title, not a board directorship. |
| 4 | As a result of their respective positions held with the Advisor or its affiliates, these individuals are considered “interested persons” of the Advisor within the meaning of the 1940 Act. Interested persons receive no compensation from the Fund. |
| 5 | The length of time served represents the year in which the officer was first elected in such capacity for one or more DWS funds. |
| 6 | Address: 875 Third Avenue, New York, NY 10022. |
| 7 | Address: One International Place, Boston, MA 02110. |
| 8 | Address: 5022 Gate Parkway, Suite 400, Jacksonville, FL 32256. |
The Fund’s Statement of Additional Information (“SAI”) includes additional information about the Board Members. The SAI is available, without charge, upon request. If you would like to request a copy of the SAI, you may do so by calling the followingtoll-free number:(800) 728-3337.
| | | | | | |
| | 32 | | | | | | DWS Equity 500 Index VIP |
Notes
Notes
Notes
| | |
| | |
vit-equ500-2 (R-025817-9 2/20) | | |
| | |
| ITEM 2. | CODE OF ETHICS |
| | |
| | As of the end of the period covered by this report, the registrant has adopted a code of ethics, as defined in Item 2 of Form N-CSR that applies to its Principal Executive Officer and Principal Financial Officer. There have been no amendments to, or waivers from, a provision of the code of ethics during the period covered by this report that would require disclosure under Item 2. A copy of the code of ethics is filed as an exhibit to this Form N-CSR. |
| | |
| ITEM 3. | AUDIT COMMITTEE FINANCIAL EXPERT |
| | |
| | The fund’s audit committee is comprised solely of trustees who are "independent" (as such term has been defined by the Securities and Exchange Commission ("SEC") in regulations implementing Section 407 of the Sarbanes-Oxley Act (the "Regulations")). The fund’s Board of Trustees has determined that there are several "audit committee financial experts" (as such term has been defined by the Regulations) serving on the fund’s audit committee including Mr. William McClayton, the chair of the fund’s audit committee. An “audit committee financial expert” is not an “expert” for any purpose, including for purposes of Section 11 of the Securities Act of 1933 and the designation or identification of a person as an “audit committee financial expert” does not impose on such person any duties, obligations or liability that are greater than the duties, obligations and liability imposed on such person as a member of the audit committee and board of directors in the absence of such designation or identification. |
| | |
| ITEM 4. | PRINCIPAL ACCOUNTANT FEES AND SERVICES |
| | |
DWS Equity 500 INdex VIP
form n-csr disclosure re: AUDIT FEES
The following table shows the amount of fees that Ernst & Young LLP (“EY”), the Fund’s current Independent Registered Public Accounting Firm, billed to the Fund during the Fund’s fiscal year ended December 31, 2019 and the amount of fees that PricewaterhouseCoopers, LLP (“PwC”), the Fund’s prior Independent Registered Public Accounting Firm, billed to the Fund during the Fund’s fiscal year ended December 31, 2018. The Audit Committee approved in advance all audit services and non-audit services that EY or PwC provided to the Fund while serving as the Independent Registered Public Accounting Firm.
Services that the Fund’s Independent Registered Public Accounting Firm Billed to the Fund
Fiscal Year
Ended
December 31, | Audit Fees Billed to Fund | Audit-Related
Fees Billed to Fund | Tax Fees Billed to Fund | All
Other Fees Billed to Fund |
| 2019 | $41,433 | $0 | $7,833 | $0 |
| 2018 | $54,464 | $0 | $0 | $0 |
Services that the Fund’s Independent Registered Public Accounting Firm Billed to the Adviser and Affiliated Fund Service Providers
The following table shows the amount of fees billed by EY to DWS Investment Management Americas, Inc. (“DIMA” or the “Adviser”), and any entity controlling, controlled by or under common control with DIMA (“Control Affiliate”) that provides ongoing services to the Fund (“Affiliated Fund Service Provider”), for engagements directly related to the Fund’s operations and financial reporting, during the Fund’s fiscal year ended December 31, 2019 and the amount of fees billed by PwC to the Adviser and any Affiliated Fund Service provider for engagements directly related to the Fund’s operations and financial reporting, during the Fund’s fiscal year ended December 31, 2018.
Fiscal Year
Ended
December 31, | Audit-Related
Fees Billed to Adviser and Affiliated Fund Service Providers | Tax Fees Billed to Adviser and Affiliated Fund Service Providers | All
Other Fees Billed to Adviser and Affiliated Fund Service Providers |
| 2019 | $0 | $740,482 | $0 |
| 2018 | $0 | $0 | $0 |
The above “Tax Fees” were billed in connection with tax compliance services and agreed upon procedures. EY also billed $470,936 for tax services during the Fund’s fiscal year ended December 31, 2018.
Non-Audit Services
The following table shows the amount of fees that EY billed during the Fund’s fiscal year ended December 31, 2019 and the amount of fees that PwC billed during the Fund’s fiscal year ended December 31, 2018 for non-audit services. The Audit Committee pre-approved all non-audit services that EY or PwC, while serving as Independent Registered Public Accounting Firm, provided to the Adviser and any Affiliated Fund Service Provider that related directly to the Fund’s operations and financial reporting. The Audit Committee requested and received information from EY and PwC about any non-audit services that EY or PwC rendered to the Adviser and any Affiliated Fund Service Provider. The Committee considered this information in evaluating EY’s and PwC’s independence.
Fiscal Year
Ended
December 31, | Total
Non-Audit Fees Billed to Fund (A) | Total Non-Audit Fees billed to Adviser and Affiliated Fund Service Providers (engagements related directly to the operations and financial reporting of the Fund) (B) | Total Non-Audit Fees billed to Adviser and Affiliated Fund Service Providers (all other engagements) (C) | Total of (A), (B)
and (C) |
| 2019 | $7,833 | $740,482 | $0 | $748,315 |
| 2018 | $0 | $0 | $0 | $0 |
All other engagement fees were billed for services in connection with agreed upon procedures and tax compliance for DIMA and other related entities.EY also billed $984,066 for tax services during the Fund’s fiscal year ended December 31, 2018.
Audit Committee Pre-Approval Policies and Procedures. Generally, each Fund’s Audit Committee must pre approve (i) all services to be performed for a Fund by a Fund’s Independent Registered Public Accounting Firm and (ii) all non-audit services to be performed by a Fund’s Independent Registered Public Accounting Firm for the DIMA Entities with respect to operations and financial reporting of the Fund, except that the Chairperson or Vice Chairperson of each Fund’s Audit Committee may grant the pre-approval for non-audit services described in items (i) and (ii) above for non-prohibited services for engagements of less than $100,000. All such delegated pre approvals shall be presented to each Fund’s Audit Committee no later than the next Audit Committee meeting.
There were no amounts that were approved by the Audit Committee pursuant to the de minimis exception under Rule 2-01 of Regulation S-X.
According to each principal Independent Registered Public Accounting Firm, substantially all of the principal Independent Registered Public Accounting Firm's hours spent on auditing the registrant's financial statements were attributed to work performed by full-time permanent employees of the principal Independent Registered Public Accounting Firm.
***
In connection with the audit of the 2019 financial statements, the Fund entered into an engagement letter with EY. The terms of the engagement letter required by EY, and agreed to by the Audit Committee, include a provision mandating the use of mediation and arbitration to resolve any controversy or claim between the parties arising out of or relating to the engagement letter or services provided thereunder.
***
Pursuant to PCAOB Rule 3526, EY is required to describe in writing to the Fund’s Audit Committee, on at least an annual basis, all relationships between EY, or any of its affiliates, and the DWS Funds, including the Fund, or persons in financial reporting oversight roles at the DWS Funds that, as of the date of the communication, may reasonably be thought to bear on EY’s independence. Pursuant to PCAOB Rule 3526, EY has reported the matters set forth below that may reasonably be thought to bear on EY’s independence. With respect to each reported matter, individually and in the aggregate, EY advised the Audit Committee that, after careful consideration of the facts and circumstances and the applicable independence rules, it concluded that the matters do not and will not impair EY’s ability to exercise objective and impartial judgement in connection with the audits of the financial statements for the Fund and a reasonable investor with knowledge of all relevant facts and circumstances would conclude that EY has been and is capable of exercising objective and impartial judgment on all issues encompassed within EY’s audit engagements. EY also confirmed to the Audit Committee that it can continue act as the Independent Registered Public Accounting Firm for the Fund.
| · | EY advised the Fund’s Audit Committee of certain lending relationships of EY with owners of greater than 10% of the shares of certain investment companies within the DWS Funds Complex that EY had identified as inconsistent with Rule 2-01(c)(l)(ii)(A) of Regulation S-X (referred to as the “Loan Rule”). The Loan Rule specifically provides that an accounting firm would not be independent if it receives a loan from a lender that is a record or beneficial owner of more than ten percent of an audit client’s equity securities. For purposes of the Loan Rule, an audit client includes the Fund as well as all other investment companies in the DWS Funds Complex. EY’s lending relationships affect EY’s independence under the Loan Rule with respect to all investment companies in the DWS Funds Complex. |
EY stated its belief that, in each lending relationship, the lender is or was not able to impact the impartiality of EY or assert any influence over the investment companies in the DWS Funds Complex whose shares the lender owns or owned, or the applicable investment company’s investment adviser. In addition, on June 20, 2016, the SEC Staff issued a “no-action” letter to another mutual fund complex, Fidelity Management & Research Company et al., SEC Staff No-Action Letter (June 20, 2016) (the “Fidelity Letter”), related to similar Loan Rule issues as those described above. In the Fidelity Letter, the SEC Staff confirmed that it would not recommend enforcement action against an investment company that relied on the audit services performed by an audit firm that was not in compliance with the Loan Rule in certain specified circumstances. With respect to each lending relationship identified by EY, the circumstances described in the Fidelity Letter appear to be substantially similar to the circumstances that affected EY’s independence under the Loan Rule with respect to the Fund, and, in each case, EY confirmed to the Audit Committee that it meets the conditions of the Fidelity Letter.
| | |
| ITEM 5. | AUDIT COMMITTEE OF LISTED REGISTRANTS |
| | |
| | Not applicable |
| | |
| ITEM 6. | SCHEDULE OF INVESTMENTS |
| | |
| | Not applicable |
| | |
| ITEM 7. | DISCLOSURE OF PROXY VOTING POLICIES AND PROCEDURES FOR CLOSED-END MANAGEMENT INVESTMENT COMPANIES |
| | |
| | Not applicable |
| | |
| ITEM 8. | PORTFOLIO MANAGERS OF CLOSED-END MANAGEMENT INVESTMENT COMPANIES |
| | |
| | Not applicable |
| | |
| ITEM 9. | PURCHASES OF EQUITY SECURITIES BY CLOSED-END MANAGEMENT INVESTMENT COMPANY AND AFFILIATED PURCHASERS |
| | |
| | Not applicable |
| | |
| ITEM 10. | SUBMISSION OF MATTERS TO A VOTE OF SECURITY HOLDERS |
| | |
| | There were no material changes to the procedures by which shareholders may recommend nominees to the Fund’s Board. The primary function of the Nominating and Governance Committee is to identify and recommend individuals for membership on the Board and oversee the administration of the Board Governance Guidelines. Shareholders may recommend candidates for Board positions by forwarding their correspondence by U.S. mail or courier service to Keith R. Fox, DWS Funds Board Chair, c/o Thomas R. Hiller, Ropes & Gray LLP, Prudential Tower, 800 Boylston Street, Boston, MA 02199-3600. |
| | |
| ITEM 11. | CONTROLS AND PROCEDURES |
| | |
| | (a) | The Chief Executive and Financial Officers concluded that the Registrant’s Disclosure Controls and Procedures are effective based on the evaluation of the Disclosure Controls and Procedures as of a date within 90 days of the filing date of this report. |
| | |
| | (b) | There have been no changes in the registrant’s internal control over financial reporting that occurred during the period covered by this report that has materially affected, or is reasonably likely to materially affect, the registrant’s internal controls over financial reporting. |
| | |
| ITEM 12. | Disclosure of Securities Lending Activities for Closed-End Management Investment Companies |
| | |
| | Not applicable |
| | |
| ITEM 13. | EXHIBITS |
| | |
| | (a)(1) | Code of Ethics pursuant to Item 2 of Form N-CSR is filed and attached hereto as EX-99.CODE ETH. |
| | |
| | (a)(2) | Certification pursuant to Rule 30a-2(a) under the Investment Company Act of 1940 (17 CFR 270.30a-2(a)) is filed and attached hereto as Exhibit 99.CERT. |
| | |
| | (b) | Certification pursuant to Rule 30a-2(b) under the Investment Company Act of 1940 (17 CFR 270.30a-2(b)) is furnished and attached hereto as Exhibit 99.906CERT. |
SIGNATURES
Pursuant to the requirements of the Securities Exchange Act of 1934 and the Investment Company Act of 1940, the registrant has duly caused this report to be signed on its behalf by the undersigned, thereunto duly authorized.
| Registrant: | DWS Equity 500 Index VIP, a series of Deutsche DWS Investments VIT Funds |
| | |
| | |
| By: | /s/Hepsen Uzcan Hepsen Uzcan President |
| | |
| Date: | 2/14/2020 |
Pursuant to the requirements of the Securities Exchange Act of 1934 and the Investment Company Act of 1940, this report has been signed below by the following persons on behalf of the registrant and in the capacities and on the dates indicated.
| By: | /s/Hepsen Uzcan Hepsen Uzcan President |
| | |
| Date: | 2/14/2020 |
| | |
| | |
| | |
| By: | /s/Diane Kenneally Diane Kenneally Chief Financial Officer and Treasurer |
| | |
| Date: | 2/14/2020 |
| | |