UNITED STATES
SECURITIES AND EXCHANGE COMMISSION
Washington, D.C. 20549
FORM N-CSR
CERTIFIED SHAREHOLDER REPORT OF REGISTERED MANAGEMENT INVESTMENT COMPANIES
Investment Company Act file number: 811-07589
THE HARTFORD MUTUAL FUNDS, INC.
(Exact name of registrant as specified in charter)
690 Lee Road, Wayne, Pennsylvania 19087
(Address of Principal Executive Offices) (Zip Code)
Thomas R. Phillips, Esquire
Hartford Funds Management Company, LLC
690 Lee Road
Wayne, Pennsylvania 19087
(Name and Address of Agent for Service)
Copy to:
John V. O’Hanlon, Esquire
Dechert LLP
One International Place, 40th Floor
100 Oliver Street
Boston, Massachusetts 02110-2605
Registrant’s telephone number, including area code: (610) 386-4068
Date of fiscal year end: October 31
Date of reporting period: October 31, 2021
Form N-CSR is to be used by management investment companies to file reports with the Commission not later than 10 days after the transmission to stockholders of any report that is required to be transmitted to stockholders under Rule 30e-1 under the Investment Company Act of 1940 (17 CFR 270.30e-1). The Commission may use the information provided on Form N-CSR in its regulatory, disclosure review, inspection, and policymaking roles.
A registrant is required to disclose the information specified by Form N-CSR, and the Commission will make this information public. A registrant is not required to respond to the collection of information contained in Form N-CSR unless the Form displays a currently valid Office of Management and Budget (“OMB”) control number. Please direct comments concerning the accuracy of the information collection burden estimate and any suggestions for reducing the burden to Secretary, Securities and Exchange Commission, 100 F Street, NE, Washington, DC 20549. The OMB has reviewed this collection of information under the clearance requirements of 44 U.S.C. § 3507.
Item 1. Reports to Stockholders.

Hartford Domestic
Equity Funds
Annual Report
October 31, 2021
| ■ The Hartford Capital Appreciation Fund |
| ■ Hartford Core Equity Fund |
| ■ The Hartford Dividend and Growth Fund |
| ■ The Hartford Equity Income Fund |
| ■ The Hartford Growth Opportunities Fund |
| ■ The Hartford Healthcare Fund |
| ■ The Hartford MidCap Fund |
| ■ The Hartford MidCap Value Fund |
| ■ Hartford Quality Value Fund |
| ■ The Hartford Small Cap Growth Fund |
| ■ Hartford Small Cap Value Fund |
| ■ The Hartford Small Company Fund |
A MESSAGE FROM THE PRESIDENT
Dear Shareholders:
Thank you for investing in Hartford Mutual Funds. The following is the Funds’ Annual Report covering the period from November 1, 2020 through October 31, 2021.
Market Review
During the 12 months ended October 31, 2021, U.S. stocks, as measured by the S&P 500 Index,1 gained 42.9%, a number that reflects one of the most remarkable market rebounds in recent memory, particularly when measured against the March 2020 sell-off at the start of the coronavirus (COVID-19) pandemic.
That said, the market’s extraordinary performance occurred against a backdrop of uncertain and sometimes contradictory economic signals: inflation fears; global supply-chain bottlenecks; tightened labor markets; political gridlock; a stubbornly persistent pandemic and a U.S. Federal Reserve (Fed) methodically signaling its intention to cut back on the monetary stimulus that helped fuel the recovery.
A year ago, markets had already bounced back from their March 2020 lows, yet the economy still faced considerable turbulence from a fiercely divisive U.S. presidential election and a resurgence of COVID-19 infections. Once the election was settled in November 2020, the emergence of safe and effective vaccines provided a significant lift to equity markets, as did a major $900 billion economic relief package passed by the U.S. Congress in late December 2020.
In March 2021, the U.S. Congress fast-tracked approval of the Biden administration’s $1.9 trillion economic stimulus package. In August 2021, a $1.2 trillion proposal for an infrastructure spending package received U.S. Senate approval. However, by the period’s end, the outcome for the administration’s $1.75 trillion “Build Back Better” proposal, focused on social-safety-net improvements and climate-change mitigation, remained uncertain.
Inflation headlines dominated the spring and summer of 2021. In July 2021, the Fed’s preferred measure of inflation had risen to levels not seen since 1991.2 The supply-chain disruptions spawned in part by the economic recovery helped drive up prices for gasoline, used cars, airfare tickets, durable goods, and a host of other items toward the end of the period. The Fed's previous assurances that inflation would be mostly transitory were being sorely tested.
Throughout the period, the Fed continued to maintain its ongoing policy of near-zero interest rates in support of the recovery. However, in September 2021, Fed Chairman Jerome Powell rattled markets when he announced preparations for having the Fed gradually cut back the $120 billion in bonds it had been purchasing each month since the start of the pandemic. By period’s end, markets had recovered.
As of the end of the period, the economic recovery appears durable. Yet, inflation remains a wildcard and market volatility may persist. Nowadays, it’s more important than ever to maintain a strong relationship with your financial professional.
Thank you again for investing in Hartford Mutual Funds. For the most up-to-date information on our funds, please take advantage of all the resources available at hartfordfunds.com.
James Davey
President
Hartford Funds
| 1 | S&P 500 Index is a market capitalization-weighted price index composed of 500 widely held common stocks. The index is unmanaged and not available for direct investment. Past performance does not guarantee future results. |
| 2 | The Personal Consumption Expenditures Price Index, which excludes food and energy prices, rose 3.6% in July 2021. Source: U.S. Bureau of Economic Analysis and the St. Louis Fed, as of September 2021. |
Hartford Domestic Equity Funds
Table of Contents
The views expressed in each Fund’s Manager Discussion contained in the Fund Overview section are views of that Fund’s portfolio manager(s) through the end of the period and are subject to change based on market and other conditions, and we disclaim any responsibility to update the views contained herein. These views may contain statements that are “forward-looking” statements. Actual results may differ materially from those projected in the “forward-looking�� statements. Each Fund’s Manager Discussion is for informational purposes only and does not represent an offer, recommendation or solicitation to buy, hold or sell any security. The specific securities identified and described, if any, do not represent all of the securities purchased or sold and you should not assume that investments in the securities identified and discussed will be profitable. Holdings and characteristics are subject to change. Fund performance reflected in each Fund’s Manager Discussion reflects the returns of such Fund’s Class A shares, before sales charges. Returns for such Fund’s other classes differ only to the extent that the classes do not have the same expenses.
The Hartford Capital Appreciation Fund
Fund Overview
October 31, 2021 (Unaudited)
Inception 07/22/1996
Sub-advised by Wellington Management Company LLP | Investment objective – The Fund seeks growth of capital. |
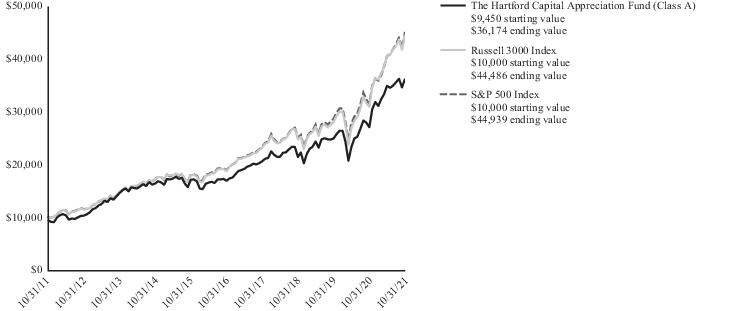
Comparison of Change in Value of $10,000 Investment (10/31/2011 - 10/31/2021)
The chart above represents the hypothetical growth of a $10,000 investment in Class A, which includes the maximum sales charge applicable to Class A shares. Returns for the Fund’s other classes will vary from what is seen above due to differences in the expenses charged to those share classes.
| Average Annual Total Returns |
| for the Periods Ending 10/31/2021 |
| | 1 Year | 5 Years | 10 Years |
| Class A1 | 33.83% | 16.44% | 14.37% |
| Class A2 | 26.47% | 15.13% | 13.72% |
| Class C1 | 32.78% | 15.56% | 13.54% |
| Class C3 | 31.78% | 15.56% | 13.54% |
| Class I1 | 34.18% | 16.76% | 14.71% |
| Class R31 | 33.32% | 16.03% | 14.01% |
| Class R41 | 33.72% | 16.39% | 14.36% |
| Class R51 | 34.13% | 16.74% | 14.70% |
| Class R61 | 34.27% | 16.86% | 14.81% |
| Class Y1 | 34.16% | 16.81% | 14.79% |
| Class F1 | 34.28% | 16.85% | 14.75% |
| Russell 3000 Index | 43.90% | 18.91% | 16.10% |
| S&P 500 Index | 42.91% | 18.93% | 16.21% |
| 1 | Without sales charge |
| 2 | Reflects maximum sales charge of 5.50% |
| 3 | Reflects a contingent deferred sales charge of 1.00% |
PERFORMANCE DATA QUOTED REPRESENTS PAST PERFORMANCE AND DOES NOT GUARANTEE FUTURE RESULTS. The investment return and principal value of the investment will fluctuate so that investors’ shares, when redeemed, may be worth more or less than their original cost. The chart and table do not reflect the deductions of taxes that a shareholder would pay on Fund distributions or the redemption of Fund shares. Current performance may be lower or higher than the performance data quoted. To obtain performance data current to the most recent month-end, please visit our website hartfordfunds.com.
Total returns presented above were calculated using the applicable class' net asset value available to shareholders for sale or redemption of Fund shares on 10/31/2021, which may exclude investment transactions as of this date. All share class returns assume the reinvestment of all distributions at net asset value and the deduction of all fund expenses. The total returns presented in the Financial Highlights section of the report are calculated in the same manner, but also take into account certain
adjustments that are necessary under generally accepted accounting principles. As a result, the total returns in the Financial Highlights section may differ from the total returns presented above.
Class R6 shares commenced operations on 11/07/2014. Performance prior to that date is that of the Fund’s Class Y shares. Class F shares commenced operations on 02/28/2017. Performance prior to that date is that of the Fund’s Class I shares.
To the extent a share class has adopted the prior performance of another share class that had different operating expenses, such performance has not been adjusted to reflect the different operating expenses. If the performance were adjusted, it may have been higher or lower.
You cannot invest directly in an index.
See “Benchmark Glossary” for benchmark descriptions.
Performance information may reflect expense waivers/reimbursements without which performance would have been lower.
| Operating Expenses* | Gross | Net |
| Class A | 1.07% | 1.07% |
| Class C | 1.84% | 1.84% |
| Class I | 0.78% | 0.78% |
| Class R3 | 1.41% | 1.41% |
| Class R4 | 1.10% | 1.10% |
| Class R5 | 0.80% | 0.80% |
| Class R6 | 0.70% | 0.70% |
| Class Y | 0.80% | 0.80% |
| Class F | 0.70% | 0.70% |
| * | Expenses as shown in the Fund’s most recent prospectus. Actual expenses may be higher or lower. Please see accompanying Financial Highlights for expense ratios for the period ended 10/31/2021. |
The Hartford Capital Appreciation Fund
Fund Overview – (continued)
October 31, 2021 (Unaudited)
Portfolio Managers
Gregg R. Thomas, CFA
Senior Managing Director and Director, Investment Strategy
Wellington Management Company LLP
Thomas S. Simon, CFA, FRM
Senior Managing Director and Portfolio Manager
Wellington Management Company LLP
Manager Discussion
How did the Fund perform during the period?
The Class A shares of The Hartford Capital Appreciation Fund returned 33.83%, before sales charges, for the twelve-month period ended October 31, 2021, underperforming the Fund’s benchmarks, the Russell 3000 Index, which returned 43.90% for the same period, and the S&P 500 Index, which returned 42.91% for the same period. For the same period, the Class A shares of the Fund, before sales charges, underperformed the 41.19% average return of the Lipper Multi-Cap Core Funds peer group, a group of funds with investment strategies similar to those of the Fund.
Why did the Fund perform this way?
United States (U.S.) equities, as measured by the S&P 500 Index, posted positive results over the trailing twelve-month period ending October 31, 2021. Towards the end of 2020, a sharp escalation in COVID-19 infections across the country and renewed restrictions to curb the spread of the virus were overshadowed by highly encouraging vaccine developments, despite the significant logistical challenges and uncertain timeline for distributing and administering vaccines on a broad scale. In December 2020, the government unveiled a long-awaited fifth stimulus package, worth approximately $900 billion.
Joe Biden was elected president in November 2020 after a closely contested election, removing a key element of uncertainty for the market. In the first quarter of 2021, U.S. equities rallied, bolstered by an accelerating vaccine rollout, substantial fiscal and monetary policy support, and upbeat forecasts for economic growth and earnings. Expectations for a strong rebound in the U.S. economy sparked inflationary fears, contributing to a pro-cyclical rotation. The Democrats secured slim majorities in both houses of Congress after winning control of the Senate, bolstering President Biden’s prospects of advancing his legislative agenda. In the second quarter of 2021, U.S. equities rallied for the fifth consecutive quarter amid a backdrop of improving vaccination rates, accelerating economic growth, and a broader reopening of the economy. Inflation rose sharply during the quarter, as robust demand for goods and services, along with significant global supply-chain disruptions, drove consumer and producer prices sharply higher. In the third quarter of 2021, U.S. equities rose against a backdrop of accommodative monetary policy, robust corporate earnings, and strong demand for goods and services. Growth equities outperformed their value counterparts for the quarter; however, surging U.S. Treasury yields sparked a sharp sell-off in shares of large technology companies at the end of September, triggering a powerful rotation into value equities. In the final month of
the period, U.S. equities registered their largest monthly gain of the year, as inflation anxiety was outweighed by improving coronavirus pandemic conditions, higher-than-expected corporate earnings, strong U.S. equity inflows, and improved prospects for additional fiscal stimulus. Markets were bolstered by a rapid decline in the number of U.S. COVID-19 cases, which fell nearly 60% from their latest peak in September 2021.
Returns varied by market cap during the period, as mid- and small-cap equities, as measured by the S&P MidCap 400 Index and Russell 2000 Index, respectively, both outperformed large-cap equities, as measured by the S&P 500 Index.
All eleven sectors in the Russell 3000 Index posted positive returns during the period. Strong performers included the Energy (+116.4%), Financials (+71.0%), and Real Estate (+47.6%) sectors. The Utilities (+12.0%), Consumer Staples (+19.6%), and Health Care (+31.6%) sectors posted the smallest gains for the period.
During the period, the Fund underperformed the Russell 3000 Index, primarily due to weak stock selection within the Consumer Discretionary, Information Technology, and Healthcare sectors. Conversely, stronger selection within the Energy, Consumer Staples, and Financials sectors contributed positively to relative returns during the period. Sector allocation, a result of bottom-up stock selection, detracted during the period primarily due to the Fund’s underweight exposure to the Energy sector and overweight exposure to the Consumer Staples sector. An underweight to the Utilities sector relative to the Russell 3000 Index contributed positively to performance.
Our decision to not own Tesla (Consumer Discretionary) within the Fund and the Fund’s underweight exposures, relative to the Russell 3000 Index, to Microsoft (Information Technology) and NVIDIA (Information Technology) were the top relative detractors from Fund performance during the period. Tesla, a constituent of the Russell 3000 Index, engages in the design, development, manufacture, and sale of fully electric vehicles, energy generation and storage systems. Shares of Tesla rose after the company reported third-quarter earnings that beat consensus estimates after Hertz announced it would be adding 100,000 Tesla vehicles to its rental-car fleet. The Fund did not hold the stock as of the end of the period. Microsoft develops and supports software, services, devices, and solutions. Shares of Microsoft rose after the company delivered strong first quarter fiscal year 2022 results with balanced performance across the product set and good margin expansion in all three reporting segments. We maintained the Fund’s underweight exposure to the
The Hartford Capital Appreciation Fund
Fund Overview – (continued)
October 31, 2021 (Unaudited)
stock as of the end of the period. NVIDIA is a leading producer of graphics processing units (GPUs). Shares of NVIDIA rose after Facebook (now named Meta) announced a significant increase in its capital spending plans for 2022. The majority of these investments will be aimed at developing the company's data center network and technology infrastructure, which is expected to benefit NVIDIA. We eliminated the Fund’s position earlier in the period on share-price strength.
ChemoCentryx (Health Care), Splunk (Information Technology), and Alibaba (Consumer Discretionary) were among the largest detractors from Fund performance on an absolute basis over the period.
Top contributors to the Fund’s performance relative to the Russell 3000 Index included the Fund’s out-of-benchmark exposure to Diamondback Energy (Energy), an overweight exposure to American Express (Financials), as well as an underweight exposure to Amazon (Consumer Discretionary). Diamondback Energy is an oil and gas exploration and production company. Shares rose over the period alongside surging global oil prices. The company also reported earnings for the first quarter that surprised to the upside, with investors focusing on strong free cash flow generation. The Fund maintained an overweight in the stock as of the end of the period. American Express is a credit card payments company. Shares rose during the period after the company announced better-than-expected first quarter earnings. Results were helped by a $1.1 billion release of reserves that were previously set aside to cover soured loans during the pandemic. Management also raised its outlook for fiscal year 2021. We trimmed the Fund’s position on share-price strength during the period. Amazon is a technology company with a focus on e-commerce and cloud computing. Shares of Amazon rose during the period but lagged the Russell 3000 Index. The company’s share price lost ground later in the period when management stated that sales growth was expected to slow over the next several quarters, as consumers continue to venture outside of their homes and away from their pandemic-induced online shopping habits. We increased the Fund’s underweight to Amazon during the period.
Alphabet (Communication Services), American Express (Financials), and TJX Companies (Consumer Discretionary) were among the largest contributors to the Fund’s performance on an absolute basis over the period.
Our investment process includes the use of factor-based strategies, which involve targeting certain company characteristics, or factors, that we believe impact returns across asset classes. Factor impact overall on the Fund was negative during the period. The Fund’s slight underweight exposure to higher-beta equities and overweight exposure to mid-cap equities detracted from performance, while the Fund’s slight underweight exposure to higher-volatility equities and slight overweight exposure to higher liquidity names contributed positively to performance.
During the period, the Fund, at times, used equity index futures to equitize cash or to seek to efficiently manage risks. During the period, the use of equity index futures contributed positively to relative performance.
What is the outlook as of the end of the period?
While company earnings have been improving relative to 2020 as of the end of the period, risks continue to evolve. This includes the potential economic ramifications following the spread of the COVID-19 Delta variant and the reemergence of pandemic-related restrictions in some regions, potential broad market disruption from political gridlock surrounding publicly listed equities in China and the government debt ceiling in the U.S., and the potential impact to company fundamentals as central banks begin to roll back stimulus programs. Against this backdrop, we expect continued volatility as investors balance long-term opportunities and nearer-term risks. As ever, we remain vigilant in managing risks in the Fund and seek to deliver performance that is driven by security selection.
Looking across markets, we are mindful of the ever-evolving risks of different equity factors and seek to create a fund that includes differentiated investment styles and philosophies. We maintain exposure to cyclical areas of the market through our allocations to mean-reversion (e.g. value and contrarian) underlying portfolio managers. These underlying portfolio managers look to invest in undervalued companies and use their security selection expertise to seek to identify companies with solid fundamentals and to avoid businesses that they believe are unlikely to mean-revert in the future. We look to our trend-following (e.g. growth and momentum) underlying portfolio managers to seek to provide capital appreciation by seeking attractive companies with favorable growth prospects. As with value equities, we look for the underlying portfolio managers' fundamental security selection processes to help differentiate companies with better long-term growth fundamentals versus those that are more speculative and driven by investor exuberance. We seek to balance these exposures with risk-aversion (e.g. quality and low volatility) allocations, which seek to provide a more defensive weight to the Fund by investing in companies with more stable businesses in our view. These characteristics are expected to add beneficial exposure to the Fund in the event of an unexpected shock to the economy or markets in our view. As of the end of the period, we also note that these equities continued to trade at attractive valuations relative to history in our view. To that end, we expect the market backdrop to benefit fundamental portfolio managers looking to differentiate between companies that can succeed in the current climate from those that cannot.
At the end of the period, the Fund’s largest overweights were to the Industrials and Consumer Staples sectors, while the Fund’s largest underweights were to the Information Technology and Utilities sectors, relative to the Russell 3000 Index.
Important Risks
Investing involves risk, including the possible loss of principal. Security prices fluctuate in value depending on general market and economic conditions and the prospects of individual companies. The Fund’s strategy for allocating assets among portfolio management teams may not work as intended. • Mid-cap securities can have greater risks and volatility than large-cap securities. • Foreign investments may be more volatile and less liquid than U.S. investments and are subject to the risk of currency fluctuations and adverse political, economic and regulatory developments. These risks are generally greater, and include additional risks, for investments in emerging markets. • To the
The Hartford Capital Appreciation Fund
Fund Overview – (continued)
October 31, 2021 (Unaudited)
extent the Fund focuses on one or more sectors, the Fund may be subject to increased volatility and risk of loss if adverse development occur.
| Composition by Sector(1) |
| as of 10/31/2021 |
| Sector | Percentage
of Net Assets |
| Equity Securities | |
| Communication Services | 7.7% |
| Consumer Discretionary | 14.9 |
| Consumer Staples | 7.5 |
| Energy | 1.0 |
| Financials | 11.5 |
| Health Care | 13.1 |
| Industrials | 12.2 |
| Information Technology | 22.3 |
| Materials | 3.1 |
| Real Estate | 4.1 |
| Utilities | 0.2 |
| Total | 97.6% |
| Short-Term Investments | 3.1 |
| Other Assets & Liabilities | (0.7) |
| Total | 100.0% |
| (1) | A sector may be comprised of several industries. For Fund compliance purposes, the Fund may not use the same classification system. These sector classifications are used for financial reporting purposes. |
Hartford Core Equity Fund
Fund Overview
October 31, 2021 (Unaudited)
Inception 04/30/1998
Sub-advised by Wellington Management Company LLP | Investment objective – The Fund seeks growth of capital. |
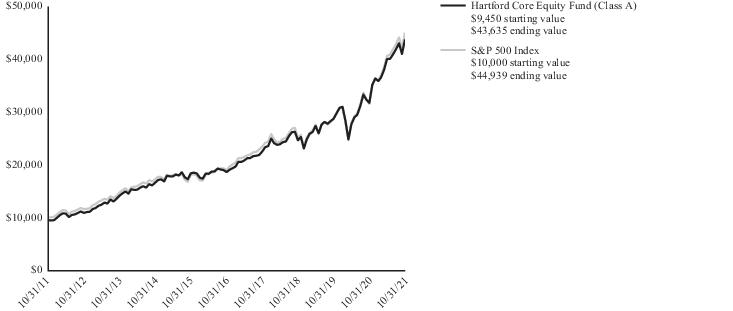
Comparison of Change in Value of $10,000 Investment (10/31/2011 - 10/31/2021)
The chart above represents the hypothetical growth of a $10,000 investment in Class A, which includes the maximum sales charge applicable to Class A shares. Returns for the Fund’s other classes will vary from what is seen above due to differences in the expenses charged to those share classes.
| Average Annual Total Returns |
| for the Periods Ending 10/31/2021 |
| | 1 Year | 5 Years | 10 Years |
| Class A1 | 37.85% | 18.68% | 16.53% |
| Class A2 | 30.27% | 17.34% | 15.87% |
| Class C1 | 36.86% | 17.81% | 15.69% |
| Class C3 | 35.86% | 17.81% | 15.69% |
| Class I1 | 38.19% | 18.99% | 16.73% |
| Class R31 | 37.38% | 18.27% | 16.20% |
| Class R41 | 37.82% | 18.66% | 16.57% |
| Class R51 | 38.17% | 18.98% | 16.90% |
| Class R61 | 38.31% | 19.10% | 16.97% |
| Class Y1 | 38.20% | 19.03% | 16.95% |
| Class F1 | 38.33% | 19.09% | 16.78% |
| S&P 500 Index | 42.91% | 18.93% | 16.21% |
| 1 | Without sales charge |
| 2 | Reflects maximum sales charge of 5.50% |
| 3 | Reflects a contingent deferred sales charge of 1.00% |
PERFORMANCE DATA QUOTED REPRESENTS PAST PERFORMANCE AND DOES NOT GUARANTEE FUTURE RESULTS. The investment return and principal value of the investment will fluctuate so that investors’ shares, when redeemed, may be worth more or less than their original cost. The chart and table do not reflect the deductions of taxes that a shareholder would pay on Fund distributions or the redemption of Fund shares. Current performance may be lower or higher than the performance data quoted. To obtain performance data current to the most recent month-end, please visit our website hartfordfunds.com.
Total returns presented above were calculated using the applicable class' net asset value available to shareholders for sale or redemption of Fund shares on 10/31/2021, which may exclude investment transactions as of this date. All share class returns assume the reinvestment of all distributions at net asset value and the deduction of all fund expenses. The total returns presented in the Financial Highlights section of the report are calculated in the same manner, but also take into account certain
adjustments that are necessary under generally accepted accounting principles. As a result, the total returns in the Financial Highlights section may differ from the total returns presented above.
Class I shares commenced operations on 03/31/2015. Performance prior to that date is that of the Fund’s Class A shares (excluding sales charges). Class R6 shares commenced operations on 03/31/2015 and performance prior to that date is that of the Fund’s Class Y shares. Class F shares commenced operations on 02/28/2017. Performance for Class F shares prior to 02/28/2017 reflects the performance of Class I shares from 03/31/2015 through 02/27/2017 and Class A shares (excluding sales charges) prior to 03/31/2015.
To the extent a share class has adopted the prior performance of another share class that had different operating expenses, such performance has not been adjusted to reflect the different operating expenses. If the performance were adjusted, it may have been higher or lower.
You cannot invest directly in an index.
See “Benchmark Glossary” for benchmark descriptions.
Performance information may reflect expense waivers/reimbursements without which performance would have been lower. For information on current expense waivers/reimbursements, please see the prospectus.
Hartford Core Equity Fund
Fund Overview – (continued)
October 31, 2021 (Unaudited)
| Operating Expenses* | Gross | Net |
| Class A | 0.73% | 0.73% |
| Class C | 1.47% | 1.47% |
| Class I | 0.46% | 0.46% |
| Class R3 | 1.07% | 1.07% |
| Class R4 | 0.78% | 0.78% |
| Class R5 | 0.48% | 0.48% |
| Class R6 | 0.38% | 0.38% |
| Class Y | 0.48% | 0.46% |
| Class F | 0.38% | 0.38% |
| * | Expenses as shown in the Fund’s most recent prospectus. Gross expenses do not reflect contractual fee waivers or expense reimbursement arrangements. Net expenses reflect such arrangements only with respect to Class Y. These arrangements remain in effect until 02/28/2022 unless the Fund’s Board of Directors approves an earlier termination. Actual expenses may be higher or lower. Please see accompanying Financial Highlights for expense ratios for the period ended 10/31/2021. |
Portfolio Managers
Mammen Chally, CFA
Senior Managing Director and Equity Portfolio Manager
Wellington Management Company LLP
David A. Siegle, CFA
Managing Director and Equity Research Analyst
Wellington Management Company LLP
Douglas W. McLane, CFA
Senior Managing Director and Equity Portfolio Manager
Wellington Management Company LLP
Manager Discussion
How did the Fund perform during the period?
The Class A shares of the Hartford Core Equity Fund returned 37.85%, before sales charges, for the twelve-month period ended October 31, 2021, underperforming the Fund’s benchmark, the S&P 500 Index, which returned 42.91% for the same period. For the same period, the Class A shares of the Fund, before sales charges, also underperformed the 41.18% average return of the Lipper Large-Cap Core Funds peer group, a group of funds with investment strategies similar to those of the Fund.
Why did the Fund perform this way?
United States (U.S.) equities, as measured by the S&P 500 Index, posted positive results over the trailing twelve-month period ending October 31, 2021. Towards the end of 2020, a sharp escalation in COVID-19 infections across the country and renewed restrictions to curb the spread of the virus were overshadowed by highly encouraging vaccine developments, despite the significant logistical challenges and uncertain timeline for distributing and administering vaccines on a broad scale. In December 2020, the government unveiled a long-awaited fifth stimulus package, worth approximately $900 billion.
Joe Biden was elected president in November 2020 after a closely contested election, removing a key element of uncertainty for the market. In the first quarter of 2021, U.S. equities rallied, bolstered by an accelerating vaccine rollout, substantial fiscal and monetary policy support, and upbeat forecasts for economic growth and earnings. Expectations for a strong rebound in the U.S. economy sparked inflationary fears, contributing to a pro-cyclical rotation. The Democrats secured slim majorities in both houses of Congress after winning control of the Senate, bolstering President Biden’s prospects of advancing his legislative agenda. In the second quarter of 2021, U.S. equities rallied for the fifth consecutive quarter amid a backdrop of improving vaccination rates, accelerating economic growth, and a broader reopening of the economy. Inflation rose sharply during the quarter, as robust demand for goods and services, along with significant global supply-chain disruptions, drove consumer and producer prices sharply higher. In the third quarter of 2021, U.S. equities rose against a backdrop of accommodative monetary policy, robust corporate earnings, and strong demand for goods and services. Growth equities outperformed their value counterparts for the quarter; however, surging U.S. Treasury yields sparked a sharp sell-off in shares of large technology companies at the end of September, triggering a powerful rotation into value equities. In the final month of the period, U.S. equities registered their largest monthly gain of the year, as inflation anxiety was outweighed by improving coronavirus pandemic conditions, higher-than-expected corporate earnings, strong
Hartford Core Equity Fund
Fund Overview – (continued)
October 31, 2021 (Unaudited)
U.S. equity inflows, and improved prospects for additional fiscal stimulus. Markets were bolstered by a rapid decline in the number of U.S. COVID-19 cases, which fell nearly 60% from their latest peak in September 2021.
Returns varied by market cap during the period, as large-cap equities, as measured by the S&P 500 Index, underperformed small-cap and mid-cap equities, as measured by the Russell 2000 Index and S&P MidCap 400 Index, respectively.
All eleven sectors in the S&P 500 Index rose during the period, with the Energy (+111%) and Financials (+72%) sectors performing best. Conversely, the Utilities (+11%) and Consumer Staples (+19%) sectors were the worst performers during the period.
Overall, the Fund’s underperformance relative to the S&P 500 Index during the period was driven by weak security selection, primarily within the Information Technology, Consumer Discretionary, and Consumer Staples sectors. This was partially offset by stronger stock selection within the Financials, Communication Services, and Energy sectors, which contributed positively to performance over the same period. Sector allocation, a result of the bottom-up stock selection process, also detracted from relative performance, primarily driven by the Fund’s underweight to the Energy sector and overweight allocation to the Consumer Staples sector. This was partially offset by the Fund’s underweight positions in the Consumer Discretionary and Utilities sectors, which contributed positively to performance over the period.
The top contributors to relative performance over the period were overweight positions in EOG Resources (Energy), Morgan Stanley (Financials) and Bank of America (Financials). Shares of oil and gas exploration and production company EOG Resources surged over the period after reporting both fourth quarter 2020 and calendar year 2020 earnings that beat consensus expectations. An unusually tight supply-demand balance in European gas heading into the winter added further price pressure to a market already at record highs while increased demand for crude oil continued to push prices higher, lifting share prices during the period. The Fund remained overweight in the stock at the end of period. Shares of Morgan Stanley rose over the period as well. This was driven by strong earnings throughout the period, where the company beat consensus earnings expectations each quarter. The Fund remained overweight in the stock at the end of period. Shares of Bank of America rose over the period. The company reported strong earnings during the same period, beating estimates, as the bank regained losses seen from the early onset of the pandemic. The Fund remained overweight the stock at the end of period. Top absolute contributors to Fund performance over the period included Alphabet (Communication Services) and Microsoft (Information Technology).
The top detractors from the Fund’s relative performance over the period included overweight positions in FedEx (Industrials) and American Electric Power (Utilities), as well as not owning NVIDIA (Information Technology). Shares of FedEx fell over the period after the company announced weak fiscal first quarter 2022 earnings, missing expectations in September 2021. High wage inflation and substantial inefficiencies from COVID-19 disruptions in the same quarter resulted in an estimated $450 million negative impact to operating results. The company also had mixed earnings in varying
quarters earlier in 2021. As of the end of the period, the Fund was overweight the stock, which performed poorly during the period. Shares of American Electric Power, a company that specializes in the provision of electricity, also fell during the period due to concerns stemming from President Biden’s continued remarks regarding the switch to clean energy. While the company has high exposures to coal currently, we believe the company is aligned with the energy transition since renewables are expected to be their dominant power source by 2030. As of the end of the period, the Fund was overweight the stock. Shares of NVIDIA, a leading producer of graphics processing units (GPUs), rose during the period. For the same period, Facebook (now renamed Meta) announced a significant increase in its capital spending plans for 2022. The majority of these investments will be aimed at developing the company's data center network and technology infrastructure, which is expected to benefit NVIDIA. Not owning the stock during the period was a detractor from the Fund’s relative performance due to the stock’s strong performance. The Fund’s absolute detractors for the period included American Electric Power (Utilities) and FedEx (Industrials).
Derivatives were not used in a significant manner in the Fund during the period and did not have a material impact on performance during the period.
What is the outlook as of the end of the period?
As of the end of the period, we believe several issues are emerging that will have near- and intermediate-term impacts. Infrastructure spending remains a key area of discussion and, while the negotiations around the large democratic bill and the Senate approved bipartisan bill remain stalled, our expectation remains that Congress will approve both bills with a total size of around $2.5 trillion. We also expect the U.S. debt ceiling will be extended. We believe this may provide some cushion for growth into 2022 with the caveat that a higher corporate tax rate may be included in the bills. Depending on the revenue required to offset the spending, we believe it could pose a challenge to future earnings growth.
In our opinion, the bigger question concerns expectations around inflation with companies struggling to offset higher input costs with higher pricing of their own goods and services, leading to margin compression. We believe that labor force participation rates may continue to increase as stimulus effects wane, and some supply chain disruptions may ease with the increased availability of vaccines globally, limiting the risk of runaway inflation. Still, we believe some of these higher costs are likely here to stay, and many companies have announced further price increases to offset cost pressures. Hence, we do expect some of the inflation to be sustained into the next year.
Lastly, we believe there are some lurking risks that are difficult to handicap, such as the deteriorating financial condition of Chinese real estate developers such as Evergrande and the high gas prices translating to increased power costs in Europe. Increased geopolitical tension is bringing increased attention to strategic industries such as semiconductors, electric vehicles, and robotics. We believe these industries are likely to see increased investment in local economies as each country tries to reduce reliance on imports. Given these factors, we believe it will be important to keep an eye on the U.S. Federal Reserve and other global central banks, as the manner in which the
Hartford Core Equity Fund
Fund Overview – (continued)
October 31, 2021 (Unaudited)
abundant liquidity is withdrawn from global economies will likely impact exchange rates and interest rates around the world and, in turn, affect prices of risk assets.
At the end of the period, the Fund’s largest overweights relative to the S&P 500 Index were to the Communication Services and Industrials sectors, while the Fund’s largest underweights were to the Information Technology and Energy sectors.
Important Risks
Investing involves risk, including the possible loss of principal. Security prices fluctuate in value depending on general market and economic conditions and the prospects of individual companies.
| Composition by Sector(1) |
| as of 10/31/2021 |
| Sector | Percentage
of Net Assets |
| Equity Securities | |
| Communication Services | 12.7% |
| Consumer Discretionary | 11.9 |
| Consumer Staples | 5.9 |
| Energy | 1.3 |
| Financials | 12.6 |
| Health Care | 14.4 |
| Industrials | 9.4 |
| Information Technology | 26.1 |
| Materials | 1.1 |
| Real Estate | 1.7 |
| Utilities | 2.0 |
| Total | 99.1% |
| Short-Term Investments | 0.6 |
| Other Assets & Liabilities | 0.3 |
| Total | 100.0% |
| (1) | A sector may be comprised of several industries. For Fund compliance purposes, the Fund may not use the same classification system. These sector classifications are used for financial reporting purposes. |
The Hartford Dividend and Growth Fund
Fund Overview
October 31, 2021 (Unaudited)
Inception 07/22/1996
Sub-advised by Wellington Management Company LLP | Investment objective – The Fund seeks a high level of current income consistent with growth of capital. |
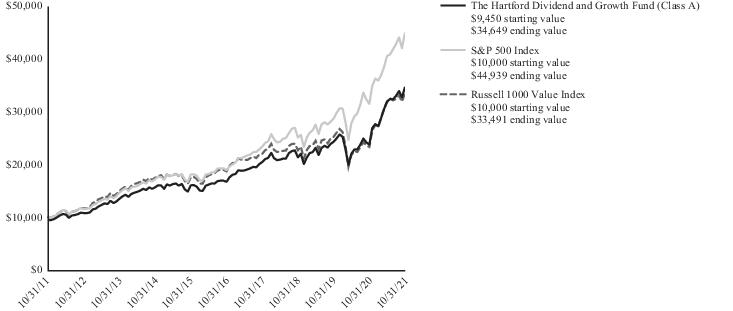
Comparison of Change in Value of $10,000 Investment (10/31/2011 - 10/31/2021)
The chart above represents the hypothetical growth of a $10,000 investment in Class A, which includes the maximum sales charge applicable to Class A shares. Returns for the Fund’s other classes will vary from what is seen above due to differences in the expenses charged to those share classes.
| Average Annual Total Returns |
| for the Periods Ending 10/31/2021 |
| | 1 Year | 5 Years | 10 Years |
| Class A1 | 46.01% | 15.72% | 13.87% |
| Class A2 | 37.98% | 14.42% | 13.23% |
| Class C1 | 44.92% | 14.85% | 13.02% |
| Class C3 | 43.92% | 14.85% | 13.02% |
| Class I1 | 46.39% | 16.02% | 14.14% |
| Class R31 | 45.43% | 15.31% | 13.49% |
| Class R41 | 45.92% | 15.66% | 13.84% |
| Class R51 | 46.35% | 16.01% | 14.18% |
| Class R61 | 46.52% | 16.13% | 14.29% |
| Class Y1 | 46.47% | 16.09% | 14.27% |
| Class F1 | 46.55% | 16.13% | 14.19% |
| S&P 500 Index | 42.91% | 18.93% | 16.21% |
| Russell 1000 Value Index | 43.76% | 12.39% | 12.85% |
| 1 | Without sales charge |
| 2 | Reflects maximum sales charge of 5.50% |
| 3 | Reflects a contingent deferred sales charge of 1.00% |
PERFORMANCE DATA QUOTED REPRESENTS PAST PERFORMANCE AND DOES NOT GUARANTEE FUTURE RESULTS. The investment return and principal value of the investment will fluctuate so that investors’ shares, when redeemed, may be worth more or less than their original cost. The chart and table do not reflect the deductions of taxes that a shareholder would pay on Fund distributions or the redemption of Fund shares. Current performance may be lower or higher than the performance data quoted. To obtain performance data current to the most recent month-end, please visit our website hartfordfunds.com.
Total returns presented above were calculated using the applicable class' net asset value available to shareholders for sale or redemption of Fund shares on 10/31/2021, which may exclude investment transactions as of this date. All share class returns assume the reinvestment of all distributions at net asset value and the deduction of all fund expenses. The total returns presented in the Financial Highlights section of the report are calculated in the same manner, but also take into account certain
adjustments that are necessary under generally accepted accounting principles. As a result, the total returns in the Financial Highlights section may differ from the total returns presented above.
Class R6 shares commenced operations on 11/07/2014. Performance prior to that date is that of the Fund’s Class Y shares. Class F shares commenced operations on 02/28/2017. Performance prior to that date is that of the Fund’s Class I shares.
To the extent a share class has adopted the prior performance of another share class that had different operating expenses, such performance has not been adjusted to reflect the different operating expenses. If the performance were adjusted, it may have been higher or lower.
You cannot invest directly in an index.
See “Benchmark Glossary” for benchmark descriptions.
Performance information may reflect expense waivers/reimbursements without which performance would have been lower. For information on current expense waivers/reimbursements, please see the prospectus.
The Hartford Dividend and Growth Fund
Fund Overview – (continued)
October 31, 2021 (Unaudited)
| Operating Expenses* | Gross | Net |
| Class A | 1.00% | 1.00% |
| Class C | 1.78% | 1.78% |
| Class I | 0.74% | 0.74% |
| Class R3 | 1.36% | 1.36% |
| Class R4 | 1.05% | 1.05% |
| Class R5 | 0.75% | 0.75% |
| Class R6 | 0.65% | 0.65% |
| Class Y | 0.74% | 0.69% |
| Class F | 0.65% | 0.65% |
| * | Expenses as shown in the Fund’s most recent prospectus. Gross expenses do not reflect contractual fee waivers or expense reimbursement arrangements. Net expenses reflect such arrangements only with respect to Class Y. These arrangements remain in effect until 02/28/2022 unless the Fund’s Board of Directors approves an earlier termination. Actual expenses may be higher or lower. Please see accompanying Financial Highlights for expense ratios for the period ended 10/31/2021. |
Portfolio Managers
Matthew G. Baker
Senior Managing Director and Equity Portfolio Manager
Wellington Management Company LLP
Nataliya Kofman
Managing Director and Equity Portfolio Manager
Wellington Management Company LLP
Manager Discussion
How did the Fund perform during the period?
The Class A shares of The Hartford Dividend and Growth Fund returned 46.01%, before sales charges, for the twelve-month period ended October 31, 2021, outperforming the Fund’s primary benchmark, the S&P 500 Index, which returned 42.91% for the same period, and also outperforming the Fund’s secondary benchmark, the Russell 1000 Value Index, which returned 43.76% for the same period. For the same period, the Class A shares of the Fund, before sales charges, outperformed the 39.88% average return of the Lipper Equity Income Funds peer group, a group of funds with investment strategies similar to those of the Fund.
Why did the Fund perform this way?
United States (U.S.) equities, as measured by the S&P 500 Index, posted positive results over the trailing twelve-month period ending October 31, 2021. Towards the end of 2020, a sharp escalation in COVID-19 infections across the country and renewed restrictions to curb the spread of the virus were overshadowed by highly encouraging vaccine developments, despite the significant logistical challenges and uncertain timeline for distributing and administering vaccines on a broad scale. In December 2020, the government unveiled a long-awaited fifth stimulus package, worth approximately $900 billion.
Joe Biden was elected president in November 2020 after a closely contested election, removing a key element of uncertainty for the market. In the first quarter of 2021, U.S. equities rallied, bolstered by an accelerating vaccine rollout, substantial fiscal and monetary policy support, and upbeat forecasts for economic growth and earnings. Expectations for a strong rebound in the U.S. economy sparked inflationary fears, contributing to a pro-cyclical rotation. The Democrats secured slim majorities in both houses of Congress after winning control of the Senate, bolstering President Biden’s prospects of advancing his legislative agenda. In the second quarter of 2021, U.S. equities rallied for the fifth consecutive quarter amid a backdrop of improving vaccination rates, accelerating economic growth, and a broader reopening of the economy. Inflation rose sharply during the quarter, as robust demand for goods and services, along with significant global supply-chain disruptions, drove consumer and producer prices sharply higher. In the third quarter of 2021, U.S. equities rose against a backdrop of accommodative monetary policy, robust corporate earnings, and strong demand for goods and services. Growth equities outperformed their value counterparts for the quarter; however, surging U.S. Treasury yields sparked a sharp sell-off in shares of large technology companies at the end of September, triggering a powerful rotation into value equities. In the final month of the period, U.S. equities registered their largest monthly gain of the year, as inflation anxiety was outweighed by improving coronavirus pandemic conditions, higher-than-expected corporate earnings, strong U.S. equity inflows, and improved prospects for additional fiscal stimulus. Markets were bolstered by a rapid decline in the number of U.S. COVID-19 cases, which fell nearly 60% from their latest peak in September 2021.
The Hartford Dividend and Growth Fund
Fund Overview – (continued)
October 31, 2021 (Unaudited)
Returns varied by market cap during the period, as mid- and small-cap equities, as measured by the S&P MidCap 400 Index and Russell 2000 Index, respectively, both outperformed large-cap equities, as measured by the S&P 500 Index.
All eleven sectors in the S&P 500 Index rose during the period, with the Energy (+111%), Financials (+72%), and Information Technology (+47%) sectors performing the best. The Utilities (+11%), Consumer Staples (+19%), and Healthcare (+34%) sectors were the worst performers during the period.
Security selection was the main driver of the Fund’s returns relative outperformance versus the S&P 500 Index over the period. Stock selection was strongest within the Financials, Industrials, and Healthcare sectors. This was partially offset by weaker selection within the Materials and Communication Services sectors, which detracted from relative performance over the same period. Sector allocation, a result of the bottom-up stock selection process, also contributed positively to the Fund’s performance relative to the S&P 500 Index over the period. An overweight to the Financials and Energy sectors added the most to returns relative to the S&P 500 Index during the period. This was partially offset by an underweight allocation to the Information Technology sector over the same period.
The Fund’s top positive contributors to performance relative to the S&P 500 Index during the period were not owning Amazon.com (Consumer Discretionary) and overweight positions in Bank of America (Financials) and ConocoPhilips (Energy). Not holding S&P 500 Index constituent Amazon.com was a top relative positive contributor to performance during the period as shares of the company rose yet underperformed the S&P 500 Index. The Fund did not hold a position in the company during the period as it did not align with our philosophy and process. Shares of Bank of America rose during the period as banking equities benefited from the vaccine-led rally and subsequent rotation towards value sectors. The U.S. Federal Reserve’s (Fed’s) decision in September 2021 to roll back its bond-buying program but leave short-term interest rates unchanged, sent share prices higher at the end of the period. We trimmed the Fund’s position on share-price strength during the period, but as of the end of the period, we continued to hold the stock. Shares of oil and gas conglomerate ConocoPhillips rose strongly over the period on news that the company had purchased the entirety of Royal Dutch Shell’s Permian Basin assets. The all-cash purchase has made ConocoPhillips one of the largest producers in the world’s top shale basin. The company continued to execute on acquisition opportunities after buying Concho Resources earlier in 2021. Rising global crude oil prices also buoyed share prices during the period. As of the end of the period, we continued to hold the stock.
The Fund’s top detractors from performance relative to the S&P 500 Index during the period included Verizon (Communication Services) and not owning Tesla (Consumer Discretionary) and NVIDIA (Information Technology). Shares of Verizon fell during the period. After releasing fourth-quarter 2020 results, investors were disappointed by weak subscriber growth that fell short of analyst estimates, sending share prices lower. As of the end of the period, we continued to hold Verizon in the Fund. Not owning Tesla also detracted from relative performance during the period. Shares of Telsa were
added to the S&P 500 Index in late 2020, which along with positive sentiment around electric vehicles led to a soaring share price. Since then, shares have reached all-time highs after the company reported third quarter 2021 earnings with increased revenue growth led by a 73% increase in vehicle deliveries. The Fund does not hold a position in the company as of the end of the period, as it does not align with our philosophy and process. Not owning NVIDIA also detracted from relative performance during the period. The company consecutively announced better-than expected results and continued to show strong growth across categories, particularly within gaming and datacenter categories over the period. In addition to strong growth in hardware, the company's software offerings also grew in importance during the same period, with management introducing the company's artificial intelligence (AI) as a service and its Omniverse platform as a foundation for the future metaverse. The Fund did not hold a position in the company during the period as it does not align with our philosophy and process.
Derivatives were not used in a significant manner in the Fund during the period and did not have a material impact on performance during the period.
What is the outlook as of the end of the period?
Despite high stock price correlations within industries, as of the end of the period we believe there is meaningful dissent in the market regarding the economic outlook and the path of the economic recovery from here. Our view is that inflation is likely to endure going forward due to the significant supply constraints (e.g., commodities, labor, etc.). We believe that persistent inflation, which we have not seen for years, will put downward pressure on margins and likely lead to higher interest rates. Given this outlook, we believe a market regime shift is likely and we are seeking to identify consistent compounders (high-quality businesses with strong recurring revenues) with strong competitive advantages and the ability to pass price inflation through to customers. We are also evaluating which end markets we believe are poised to benefit from continued supply tightness - such as metals and mining, for example.
We remain focused on seeking to limit downside risk in the Fund, so we are seeking to avoid companies that we would expect to struggle in an inflationary environment with rising interest rates. Such companies include those that we believe to have rich valuations amid increasing discount rates and companies with margins that we believe are vulnerable to inflation due to an inability to pass on price increases to their customers. We remain focused on seeking to identify quality companies with a positive risk/reward skew and a narrow range of outcomes.
At the end of the period, the Fund had its largest overweights in the Financials and Healthcare sectors, and the largest underweights in the Information Technology and Consumer Discretionary sectors, relative to the S&P 500 Index.
We continue to apply our valuation discipline within the Fund to seek to maintain a Fund of resilient businesses that in our opinion are reasonably valued and have favorable industry and competitive dynamics.
The Hartford Dividend and Growth Fund
Fund Overview – (continued)
October 31, 2021 (Unaudited)
Important Risks
Investing involves risk, including the possible loss of principal. Security prices fluctuate in value depending on general market and economic conditions and the prospects of individual companies. • For dividend-paying stocks, dividends are not guaranteed and may decrease without notice. • Foreign investments may be more volatile and less liquid than U.S. investments and are subject to the risk of currency fluctuations and adverse political, economic and regulatory developments. • To the extent the Fund focuses on one or more sectors, the Fund may be subject to increased volatility and risk of loss if adverse developments occur. • Integration of environmental, social, and/or governance (ESG) factors into the investment process may not work as intended.
| Composition by Sector(1) |
| as of 10/31/2021 |
| Sector | Percentage
of Net Assets |
| Equity Securities | |
| Communication Services | 8.2% |
| Consumer Discretionary | 6.2 |
| Consumer Staples | 5.8 |
| Energy | 4.2 |
| Financials | 20.0 |
| Health Care | 14.9 |
| Industrials | 8.1 |
| Information Technology | 19.0 |
| Materials | 3.4 |
| Real Estate | 3.2 |
| Utilities | 3.8 |
| Total | 96.8% |
| Short-Term Investments | 2.5 |
| Other Assets & Liabilities | 0.7 |
| Total | 100.0% |
| (1) | A sector may be comprised of several industries. For Fund compliance purposes, the Fund may not use the same classification system. These sector classifications are used for financial reporting purposes. |
The Hartford Equity Income Fund
Fund Overview
October 31, 2021 (Unaudited)
Inception 08/28/2003
Sub-advised by Wellington Management Company LLP | Investment objective – The Fund seeks a high level of current income consistent with growth of capital. |
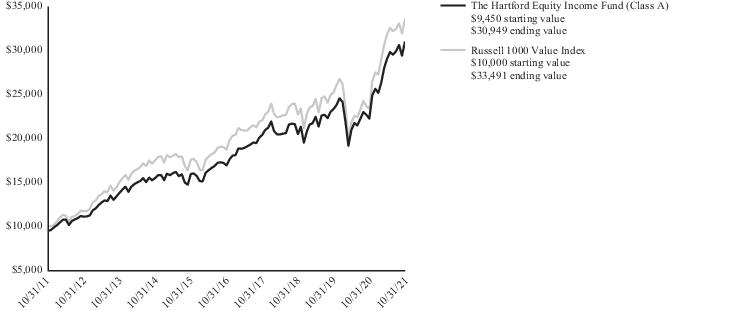
Comparison of Change in Value of $10,000 Investment (10/31/2011 - 10/31/2021)
The chart above represents the hypothetical growth of a $10,000 investment in Class A, which includes the maximum sales charge applicable to Class A shares. Returns for the Fund’s other classes will vary from what is seen above due to differences in the expenses charged to those share classes.
| Average Annual Total Returns |
| for the Periods Ending 10/31/2021 |
| | 1 Year | 5 Years | 10 Years |
| Class A1 | 39.45% | 12.89% | 12.60% |
| Class A2 | 31.78% | 11.62% | 11.96% |
| Class C1 | 38.31% | 12.02% | 11.76% |
| Class C3 | 37.31% | 12.02% | 11.76% |
| Class I1 | 39.69% | 13.15% | 12.88% |
| Class R31 | 38.83% | 12.47% | 12.20% |
| Class R41 | 39.25% | 12.80% | 12.54% |
| Class R51 | 39.75% | 13.15% | 12.89% |
| Class R61 | 39.82% | 13.26% | 13.00% |
| Class Y1 | 39.77% | 13.21% | 12.97% |
| Class F1 | 39.81% | 13.25% | 12.93% |
| Russell 1000 Value Index | 43.76% | 12.39% | 12.85% |
| 1 | Without sales charge |
| 2 | Reflects maximum sales charge of 5.50% |
| 3 | Reflects a contingent deferred sales charge of 1.00% |
PERFORMANCE DATA QUOTED REPRESENTS PAST PERFORMANCE AND DOES NOT GUARANTEE FUTURE RESULTS. The investment return and principal value of the investment will fluctuate so that investors’ shares, when redeemed, may be worth more or less than their original cost. The chart and table do not reflect the deductions of taxes that a shareholder would pay on Fund distributions or the redemption of Fund shares. Current performance may be lower or higher than the performance data quoted. To obtain performance data current to the most recent month-end, please visit our website hartfordfunds.com.
Total returns presented above were calculated using the applicable class' net asset value available to shareholders for sale or redemption of Fund shares on 10/31/2021, which may exclude investment transactions as of this date. All share class returns assume the reinvestment of all distributions at net asset value and the deduction of all fund expenses. The total returns presented in the Financial Highlights section of the report are calculated in the same manner, but also take into account certain
adjustments that are necessary under generally accepted accounting principles. As a result, the total returns in the Financial Highlights section may differ from the total returns presented above.
Class R6 shares commenced operations on 11/07/2014. Performance prior to that date is that of the Fund’s Class Y shares. Class F shares commenced operations on 02/28/2017. Performance prior to that date is that of the Fund’s Class I shares.
To the extent a share class has adopted the prior performance of another share class that had different operating expenses, such performance has not been adjusted to reflect the different operating expenses. If the performance were adjusted, it may have been higher or lower.
You cannot invest directly in an index.
See “Benchmark Glossary” for benchmark descriptions.
Performance information may reflect expense waivers/reimbursements without which performance would have been lower.
| Operating Expenses* | Gross | Net |
| Class A | 1.01% | 1.01% |
| Class C | 1.76% | 1.76% |
| Class I | 0.74% | 0.74% |
| Class R3 | 1.36% | 1.36% |
| Class R4 | 1.06% | 1.06% |
| Class R5 | 0.77% | 0.77% |
| Class R6 | 0.66% | 0.66% |
| Class Y | 0.76% | 0.76% |
| Class F | 0.66% | 0.66% |
| * | Expenses as shown in the Fund’s most recent prospectus. Actual expenses may be higher or lower. Please see accompanying Financial Highlights for expense ratios for the period ended 10/31/2021. |
The Hartford Equity Income Fund
Fund Overview – (continued)
October 31, 2021 (Unaudited)
Portfolio Managers
W. Michael Reckmeyer, III, CFA*
Senior Managing Director and Equity Portfolio Manager
Wellington Management Company LLP
Adam H. Illfelder, CFA
Senior Managing Director and Equity Portfolio Manager
Wellington Management Company LLP
Matthew C. Hand, CFA
Managing Director and Equity Portfolio Manager
Wellington Management Company LLP
| * | Michael Reckmeyer, III, CFA announced his plan to retire and withdraw from the partnership of Wellington Management Company LLP’s parent company, and effective June 30, 2022, he will no longer serve as a portfolio manager for the Fund. Mr. Reckmeyer’s portfolio management responsibilities will transition to Matthew C. Hand, CFA in the months leading up to his departure. |
Manager Discussion
How did the Fund perform during the period?
The Class A shares of The Hartford Equity Income Fund returned 39.45%, before sales charges, for the twelve-month period ended October 31, 2021, underperforming the Fund’s benchmark, the Russell 1000 Value Index, which returned 43.76% for the same period. For the same period, the Class A shares of the Fund, before sales charges, also underperformed the 39.88% average return of the Lipper Equity Income Funds peer group, a group of funds with investment strategies similar to that of the Fund.
Why did the Fund perform this way?
United States (U.S.) equities, as measured by the S&P 500 Index, posted positive results over the trailing twelve-month period ending October 31, 2021. In the first half of 2021, U.S. equities gained amid a backdrop of improving vaccination rates, accelerating economic growth, and a broader reopening of the economy. Inflation rose sharply, as robust demand for goods and services, along with significant global supply-chain disruptions, drove consumer and producer prices sharply higher. The U.S. Federal Reserve (Fed) maintained its view that elevated price pressures may prove transitory, but the Fed rattled markets by considerably raising its inflation forecast for 2021 and signaling the potential for two interest-rate increases in 2023. This shift in expectations toward tighter monetary policy triggered a rotation from value and cyclically sensitive equities to growth equities. U.S. equities continued to climb in the third quarter of 2021 against a backdrop of accommodative monetary policy, robust corporate earnings, and strong demand for goods and services, while risk sentiment was pressured by anxiety about rising inflation, imminent monetary tightening by the Fed, moderating economic growth, and uncertainty about fiscal stimulus and the federal debt ceiling. Growth equities outperformed their value counterparts for the quarter; however, surging U.S. Treasury yields sparked a sharp sell-off in shares of large technology companies at the end of September 2021, triggering a powerful rotation into value equities. COVID-19 cases fell sharply in September, although the proliferation of the Delta variant in July and August 2021 weighed on consumer confidence and
dampened momentum from businesses reopening. The Fed trimmed its 2021 gross domestic product (GDP) growth forecast to 5.9%, from 7%, and delivered a clearer signal that it would begin to taper asset purchases later this year if economic conditions remain stable.
During the period, all of the eleven sectors within the Russell 1000 Value Index posted positive absolute returns, with the Energy (+113%), Financials (+74%), and Real Estate (+53%) sectors performing the best. Conversely, the Utilities (+11%), Consumer Staples (+18%), and Communication Services (+26%) sectors lagged over the period.
The Fund’s underperformance relative to the Russell 1000 Value Index during the period was driven by sector allocation, a result of our bottom-up stock selection process, due primarily to overweight allocations to the Consumer Staples and Healthcare sectors (which are two sectors that are more defensively oriented and therefore did not benefit as materially from the re-opening economy), as well as an underweight allocation to the Energy sector (which experienced broad-based strength given the sharp rise in oil prices during the period). This was partially offset by underweight allocations to the Communication Services and Information Technology sectors. Security selection also detracted from relative results during the period. Selection within the Real Estate, Communication Services, and Energy sectors detracted the most from performance but was partially offset by positive selection within the Information Technology, Healthcare, and Industrials sectors.
Top detractors from relative results included Lockheed Martin (Industrials), Progressive (Financials), and not holding Exxon Mobil (Energy). Shares of Lockheed Martin, a United States (U.S.) based aerospace and defense company, declined after third-quarter 2021 sales missed estimates and management released 2022 guidance that was below expectations due to the withdrawal of the U.S. military presence in Afghanistan, re-basing of F-35 related revenue, and accelerated payments to suppliers to ensure supply-chain health.
The Hartford Equity Income Fund
Fund Overview – (continued)
October 31, 2021 (Unaudited)
Shares of insurance provider Progressive were pressured as catastrophe losses from Hurricane Ida eroded already lackluster underwriting results and growth slowed in the third quarter of 2021.
Top contributors to relative returns included an out-of-benchmark position in Blackstone (Financials), Morgan Stanley (Financials), and Bank of America (Financials). Shares of alternative investments manager Blackstone advanced over the period, driven by higher fee-related earnings and performance net revenues. Net accrued carried interest grew significantly over the prior year on the back of strong investment performance. Morgan Stanley, a diversified financial services company, reported third quarter earnings ahead of consensus estimates, benefiting from strong core performance as well as contributions from subsidiaries, E*TRADE and Eaton Vance. Finally, financial services provider Bank of America reported third-quarter 2021 results that beat consensus estimates on strong fees and rising net interest income.
Derivatives were not used in a significant manner in the Fund during the period and did not have a material impact on performance during the period.
What is the outlook as of the end of the period?
As of the end of the period, as the market’s concern shifts among inflation, stagnating growth, supply chain disruptions, the Delta variant of the coronavirus, and labor market tightness—to name several—we have continued to focus on high-quality businesses with strong balance sheets and sustainable dividends. While these issues are topical and worth monitoring, they have not been the driver of our decision-making. We stress-test the Fund’s portfolio across a number of scenarios and feel comfortable with the Fund’s balanced posturing relative to the Russell 1000 Value Index.
At the end of the period, the Consumer Staples, Healthcare, and Industrials sectors represented the Fund’s largest overweights relative to the Russell 1000 Value Index, while the Communication Services, Real Estate, and Financials sectors were the Fund’s largest underweights.
Important Risks
Investing involves risk, including the possible loss of principal. Security prices fluctuate in value depending on general market and economic conditions and the prospects of individual companies. • For dividend-paying stocks, dividends are not guaranteed and may decrease without notice. • Foreign investments may be more volatile and less liquid than U.S. investments and are subject to the risk of currency fluctuations and adverse political, economic and regulatory developments. • Different investment styles may go in and out favor, which may cause the Fund to underperform the broader stock market. • To the extent the Fund focuses on one or more sectors, the Fund may be subject to increased volatility and risk of loss if adverse developments occur.
| Composition by Sector(1) |
| as of 10/31/2021 |
| Sector | Percentage
of Net Assets |
| Equity Securities | |
| Communication Services | 3.6% |
| Consumer Discretionary | 4.6 |
| Consumer Staples | 11.7 |
| Energy | 5.3 |
| Financials | 20.6 |
| Health Care | 19.1 |
| Industrials | 12.7 |
| Information Technology | 9.3 |
| Materials | 4.3 |
| Real Estate | 2.0 |
| Utilities | 5.7 |
| Total | 98.9% |
| Short-Term Investments | 1.4 |
| Other Assets & Liabilities | (0.3) |
| Total | 100.0% |
| (1) | A sector may be comprised of several industries. For Fund compliance purposes, the Fund may not use the same classification system. These sector classifications are used for financial reporting purposes. |
The Hartford Growth Opportunities Fund
Fund Overview
October 31, 2021 (Unaudited)
Inception 03/31/1963
Sub-advised by Wellington Management Company LLP | Investment objective – The Fund seeks capital appreciation. |
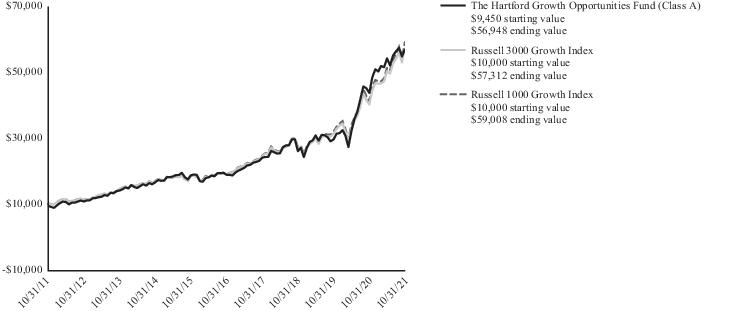
Comparison of Change in Value of $10,000 Investment (10/31/2011 - 10/31/2021)
The chart above represents the hypothetical growth of a $10,000 investment in Class A, which includes the maximum sales charge applicable to Class A shares. Returns for the Fund’s other classes will vary from what is seen above due to differences in the expenses charged to those share classes.
| Average Annual Total Returns |
| for the Periods Ending 10/31/2021 |
| | 1 Year | 5 Years | 10 Years |
| Class A1 | 30.45% | 24.75% | 19.68% |
| Class A2 | 23.28% | 23.34% | 19.00% |
| Class C1 | 29.47% | 23.82% | 18.80% |
| Class C3 | 28.47% | 23.82% | 18.80% |
| Class I1 | 30.75% | 25.07% | 19.97% |
| Class R31 | 29.96% | 24.31% | 19.29% |
| Class R41 | 30.36% | 24.69% | 19.65% |
| Class R51 | 30.74% | 25.07% | 20.01% |
| Class R61 | 30.87% | 25.19% | 20.12% |
| Class Y1 | 30.74% | 25.14% | 20.10% |
| Class F1 | 30.87% | 25.18% | 20.03% |
| Russell 3000 Growth Index | 42.81% | 24.96% | 19.08% |
| Russell 1000 Growth Index | 43.21% | 25.49% | 19.42% |
| 1 | Without sales charge |
| 2 | Reflects maximum sales charge of 5.50% |
| 3 | Reflects a contingent deferred sales charge of 1.00% |
PERFORMANCE DATA QUOTED REPRESENTS PAST PERFORMANCE AND DOES NOT GUARANTEE FUTURE RESULTS. The investment return and principal value of the investment will fluctuate so that investors’ shares, when redeemed, may be worth more or less than their original cost. The chart and table do not reflect the deductions of taxes that a shareholder would pay on Fund distributions or the redemption of Fund shares. Current performance may be lower or higher than the performance data quoted. To obtain performance data current to the most recent month-end, please visit our website hartfordfunds.com.
Total returns presented above were calculated using the applicable class' net asset value available to shareholders for sale or redemption of Fund shares on 10/31/2021, which may exclude investment transactions as of this date. All share class returns assume the reinvestment of all distributions at net asset value and the deduction of all fund expenses. The total returns presented in the Financial Highlights section of the
report are calculated in the same manner, but also take into account certain adjustments that are necessary under generally accepted accounting principles. As a result, the total returns in the Financial Highlights section may differ from the total returns presented above.
Class R6 shares commenced operations on 11/07/2014. Performance prior to that date is that of the Fund’s Class Y shares. Class F shares commenced operations on 02/28/2017. Performance prior to that date is that of the Fund’s Class I shares.
To the extent a share class has adopted the prior performance of another share class that had different operating expenses, such performance has not been adjusted to reflect the different operating expenses. If the performance were adjusted, it may have been higher or lower.
You cannot invest directly in an index.
See “Benchmark Glossary” for benchmark descriptions.
Performance information may reflect expense waivers/reimbursements without which performance would have been lower.
| Operating Expenses* | Gross | Net |
| Class A | 1.10% | 1.10% |
| Class C | 1.85% | 1.85% |
| Class I | 0.82% | 0.82% |
| Class R3 | 1.43% | 1.43% |
| Class R4 | 1.13% | 1.13% |
| Class R5 | 0.84% | 0.84% |
| Class R6 | 0.74% | 0.74% |
| Class Y | 0.82% | 0.82% |
| Class F | 0.74% | 0.74% |
| * | Expenses as shown in the Fund’s most recent prospectus. Actual expenses may be higher or lower. Please see accompanying Financial Highlights for expense ratios for the period ended 10/31/2021. |
The Hartford Growth Opportunities Fund
Fund Overview – (continued)
October 31, 2021 (Unaudited)
Portfolio Managers
Stephen Mortimer
Senior Managing Director and Equity Portfolio Manager
Wellington Management Company LLP
Mario E. Abularach, CFA, CMT
Senior Managing Director and Equity Research Analyst
Wellington Management Company LLP
Manager Discussion
How did the Fund perform during the period?
The Class A shares of The Hartford Growth Opportunities Fund returned 30.45%, before sales charges, for the twelve-month period ended October 31, 2021, underperforming the Fund’s primary benchmark, the Russell 3000 Growth Index, which returned 42.81% for the same period, and underperforming the Fund’s secondary benchmark, the Russell 1000 Growth Index, which returned 43.21% for the same period. For the same period, the Class A shares of the Fund, before sales charges, also underperformed the 39.88% average return of the Lipper Multi-Cap Growth Funds peer group, a group of funds with investment strategies similar to those of the Fund.
Why did the Fund perform this way?
United States (U.S.) equities, as measured by the S&P 500 Index, posted positive results over the trailing twelve-month period ending October 31, 2021. In the first half of 2021, U.S. equities gained amid a backdrop of improving vaccination rates, accelerating economic growth, and a broader reopening of the economy. Inflation rose sharply, as robust demand for goods and services, along with significant global supply-chain disruptions, drove consumer and producer prices sharply higher. The U.S. Federal Reserve (Fed) maintained its view that elevated price pressures may prove transitory, but the Fed rattled markets by considerably raising its inflation forecast for 2021 and signaling the potential for two interest-rate increases in 2023. This shift in expectations toward tighter monetary policy triggered a rotation from value and cyclically sensitive equities to growth equities. U.S. equities continued to climb in the third quarter of 2021 against a backdrop of accommodative monetary policy, robust corporate earnings, and strong demand for goods and services, while risk sentiment was pressured by anxiety about rising inflation, imminent monetary tightening by the Fed, moderating economic growth, and uncertainty about fiscal stimulus and the federal debt ceiling. Growth equities outperformed their value counterparts for the quarter; however, surging U.S. Treasury yields sparked a sharp sell-off in shares of large technology companies at the end of September 2021, triggering a powerful rotation into value equities. COVID-19 cases fell sharply in September, although the proliferation of the Delta variant in July and August 2021 weighed on consumer confidence and dampened momentum from businesses reopening. The Fed trimmed its 2021 gross domestic product (GDP) growth forecast to 5.9%, from 7%, and delivered a clearer signal that it would begin to taper asset purchases later this year if economic conditions remain stable.
All eleven sectors in the Russell 3000 Growth Index rose during the period, with the Energy (+105%), Financials (+52%), and Information Technology (+49%) sectors performing the best. Conversely, the Consumer Staples (+20%) and Materials (+23%) sectors lagged on a relative basis during the period.
Security selection detracted from Fund’s performance relative to the Russell 3000 Growth Index during the period, with weak selection in the Information Technology, Healthcare and Consumer Discretionary sectors, which was partially offset by strong selection within the Consumer Staples and Financials sectors. Sector allocation, a result of our bottom-up stock selection process, also detracted from relative performance during the period, due to an underweight to the Information Technology sector and an overweight to the Consumer Discretionary sector. This was partially offset by the positive impact of an overweight to the Communication Services sector and an underweight to the Consumer Staples sector, both of which contributed positively.
Top contributors to relative performance during the period included Coupang (Consumer Discretionary), Dexcom (Healthcare), and Apple (Information Technology). Coupang, a Korean e-commerce company, was a top relative contributor. The Fund had held Coupang as a private company, and shares rose ahead of the company’s initial public offering (IPO) in March 2021. The pandemic had been a major boost to the Korean e-commerce company’s rise as the population was forced to stay at home and order from online platforms. We eliminated the Fund’s position during the period. Shares of Dexcom, a glucose monitoring device company, rose during the period. The company has seen strong earnings for the last two quarters of the period, beating expectations. Management, in response to these strong results, raised fiscal-year guidance for revenue two quarters in a row. Shares of Apple, a technology company, rose over the period as the company experienced a massive benefit from the work-from-home environment with companies and individuals upgrading their technology. We eliminated the Fund’s position during the period. Alphabet (Communication Services) and Apple (Information Technology) were among the top absolute contributors to the Fund’s performance during the period.
Top relative detractors from performance during the period included Tesla (Consumer Discretionary), Microsoft (Information Technology), and Splunk (Information Technology). The Fund’s lack of exposure to Tesla detracted from relative performance. We did not invest in the company because we did not have a differentiated view on the stock.
The Hartford Growth Opportunities Fund
Fund Overview – (continued)
October 31, 2021 (Unaudited)
Shares of Tesla were added to the S&P 500 Index in late 2020 along with positive sentiment around electric vehicles leading to soaring share prices. Shares reached all-time highs after the company reported third-quarter 2021 earnings with topline growth led by a 73% increase in vehicle deliveries. The Fund’s lack of exposure to Microsoft also detracted from relative performance during the period. Shares of Microsoft rose over the period on continued strong earnings reports and strengthened core offerings. The company also announced plans to increase its commercial pricing for Microsoft 365 Business Basic from $5 to $6 and the premium package from $20 to $22, which investors expect to lead to a rise in revenue. Shares of Splunk fell sharply in the beginning of the period after the company released weak third-quarter 2020 results. Splunk experienced a sharp drop in its license revenue, which resulted in revenue dropping 11% year over year and a loss in adjusted profit per share of $1.26, falling far behind expectations of $0.09. Splunk (Information Technology) and Mastercard (Information Technology) were among the top absolute detractors from the Fund’s performance during the period.
Derivatives were not used in a significant manner in the Fund during the period and did not have a material impact on performance during the period.
What is the outlook as of the end of the period?
As of the end of the period, we believe that a lot of uncertainty remains in the market due to the evolving coronavirus pandemic, the implications of Fed tapering, and concerns about a global growth slowdown stemming from Chinese real estate company Evergrande and its financial difficulties. The Fund’s investment team is leveraging Wellington Management’s industry experts and macro analysts to provide additional insight into the path forward. Data suggests consumers have a greater willingness to revert to old habits and activities versus adapting to a “new normal” than may have been previously expected. However, it has not yet been determined what consumption will look like in 2022; on one hand, wage increases benefit consumers, but at the same time, many subsidies are expiring. Because of this lack of clarity, we are positioning the Fund as of the end of the period in equities that we believe have strong idiosyncratic growth drivers.
Important Risks
Investing involves risk, including the possible loss of principal. Security prices fluctuate in value depending on general market and economic conditions and the prospects of individual companies. • Mid-cap securities can have greater risks and volatility than large-cap securities. • Different investment styles may go in and out favor, which may cause the Fund to underperform the broader stock market. • To the extent the Fund focuses on one or more sectors, the Fund may be subject to increased volatility and risk of loss if adverse developments occur. • Foreign investments may be more volatile and less liquid than U.S. investments and are subject to the risk of currency fluctuations and adverse political, economic and regulatory developments. • The Fund may have high portfolio turnover, which could increase its transaction costs and an investor’s tax liability.
| Composition by Sector(1) |
| as of 10/31/2021 |
| Sector | Percentage
of Net Assets |
| Equity Securities | |
| Communication Services | 20.2% |
| Consumer Discretionary | 20.8 |
| Consumer Staples | 1.1 |
| Financials | 4.1 |
| Health Care | 14.3 |
| Industrials | 6.1 |
| Information Technology | 31.4 |
| Real Estate | 0.1 |
| Total | 98.1% |
| Short-Term Investments | 1.7 |
| Other Assets & Liabilities | 0.2 |
| Total | 100.0% |
| (1) | A sector may be comprised of several industries. For Fund compliance purposes, the Fund may not use the same classification system. These sector classifications are used for financial reporting purposes. |
The Hartford Healthcare Fund
Fund Overview
October 31, 2021 (Unaudited)
Inception 05/01/2000
Sub-advised by Wellington Management Company LLP | Investment objective – The Fund seeks long-term capital appreciation. |
Comparison of Change in Value of $10,000 Investment (10/31/2011 - 10/31/2021)
The chart above represents the hypothetical growth of a $10,000 investment in Class A, which includes the maximum sales charge applicable to Class A shares. Returns for the Fund’s other classes will vary from what is seen above due to differences in the expenses charged to those share classes.
| Average Annual Total Returns |
| for the Periods Ending 10/31/2021 |
| | 1 Year | 5 Years | 10 Years |
| Class A1 | 22.83% | 16.76% | 17.26% |
| Class A2 | 16.07% | 15.44% | 16.60% |
| Class C1 | 21.90% | 15.88% | 16.41% |
| Class C3 | 20.90% | 15.88% | 16.41% |
| Class I1 | 23.16% | 17.07% | 17.61% |
| Class R31 | 22.41% | 16.37% | 16.91% |
| Class R41 | 22.78% | 16.72% | 17.27% |
| Class R51 | 23.14% | 17.07% | 17.62% |
| Class R61 | 23.26% | 17.18% | 17.73% |
| Class Y1 | 23.17% | 17.14% | 17.71% |
| Class F1 | 23.28% | 17.18% | 17.66% |
| S&P Composite 1500 Health Care Index | 33.53% | 17.21% | 17.26% |
| S&P 500 Index | 42.91% | 18.93% | 16.21% |
| 1 | Without sales charge |
| 2 | Reflects maximum sales charge of 5.50% |
| 3 | Reflects a contingent deferred sales charge of 1.00% |
PERFORMANCE DATA QUOTED REPRESENTS PAST PERFORMANCE AND DOES NOT GUARANTEE FUTURE RESULTS. The investment return and principal value of the investment will fluctuate so that investors’ shares, when redeemed, may be worth more or less than their original cost. The chart and table do not reflect the deductions of taxes that a shareholder would pay on Fund distributions or the redemption of Fund shares. Current performance may be lower or higher than the performance data quoted. To obtain performance data current to the most recent month-end, please visit our website hartfordfunds.com.
Total returns presented above were calculated using the applicable class' net asset value available to shareholders for sale or redemption of Fund shares on 10/31/2021, which may exclude investment transactions as of this date. All share class returns assume the reinvestment of all distributions at net asset value and the deduction of all fund expenses. The total returns presented in the Financial Highlights section of the
report are calculated in the same manner, but also take into account certain adjustments that are necessary under generally accepted accounting principles. As a result, the total returns in the Financial Highlights section may differ from the total returns presented above.
Class F shares commenced operations on 02/28/2017. Performance prior to that date is that of the Fund’s Class I shares. Class R6 shares commenced operations on 02/28/2019. Performance prior to that date is that of the Fund’s Class Y shares.
To the extent a share class has adopted the prior performance of another share class that had different operating expenses, such performance has not been adjusted to reflect the different operating expenses. If the performance were adjusted, it may have been higher or lower.
You cannot invest directly in an index.
See “Benchmark Glossary” for benchmark descriptions.
Performance information may reflect expense waivers/reimbursements without which performance would have been lower.
| Operating Expenses* | Gross | Net |
| Class A | 1.27% | 1.27% |
| Class C | 2.04% | 2.04% |
| Class I | 0.99% | 0.99% |
| Class R3 | 1.60% | 1.60% |
| Class R4 | 1.30% | 1.30% |
| Class R5 | 1.00% | 1.00% |
| Class R6 | 0.90% | 0.90% |
| Class Y | 1.00% | 1.00% |
| Class F | 0.90% | 0.90% |
| * | Expenses as shown in the Fund’s most recent prospectus. Actual expenses may be higher or lower. Please see accompanying Financial Highlights for expense ratios for the period ended 10/31/2021. |
The Hartford Healthcare Fund
Fund Overview – (continued)
October 31, 2021 (Unaudited)
Portfolio Managers
Ann C. Gallo
Senior Managing Director and Global Industry Analyst
Wellington Management Company LLP
Robert L. Deresiewicz, MD*
Senior Managing Director and Global Industry Analyst
Wellington Management Company LLP
Rebecca D. Sykes, CFA
Senior Managing Director and Global Industry Analyst
Wellington Management Company LLP
Wen Shi, CFA, PhD**
Managing Director and Global Industry Analyst
Wellington Management Company LLP
| * | Robert L. Deresiewicz announced his plan to retire and withdraw from the partnership of Wellington Management Company LLP’s parent company, and effective June 30, 2022, he will no longer serve as a portfolio manager for the Fund. Robert Deresiewicz’s portfolio management responsibilities will transition to Wen Shi in the months leading up to his departure. |
** Wen Shi was added as a portfolio manager to the Fund effective July 22, 2021.
Manager Discussion
How did the Fund perform during the period?
The Class A shares of The Hartford Healthcare Fund returned 22.83%, before sales charges, for the twelve-month period ended October 31, 2021, underperforming the Fund’s benchmarks, the S&P Composite 1500 Health Care Index, which returned 33.53% for the same period, and the S&P 500 Index, which returned 42.91% for the same period. For the same period, the Class A shares of the Fund, before sales charges, also underperformed the 22.98% average return of the Lipper Global Health and Biotechnology peer group, a group of funds with investment strategies similar to those of the Fund.
Why did the Fund perform this way?
Healthcare equities (+33.8%) underperformed both the broader United States (U.S.) equity market (+42.9%) and the global equity market (+37.9%) during the period, as measured by the S&P 500 Healthcare Index, S&P 500 Index, and MSCI ACWI Index, respectively.
Within the S&P Composite 1500 Health Care Index, all five sub-sectors posted positive absolute returns during the period. Healthcare services (+47.2%), medical technology (+34.8%), small-cap biopharma (+27.9%), large-cap biopharma (+27.4%), and mid-cap biopharma (+2.9%) rose during the period.
Security selection was the primary detractor from the Fund’s performance relative to the S&P Composite 1500 Health Care Index during the period. Sector allocation also detracted from relative returns. Security selection was weakest in the medical technology and small-cap biopharma sub-sectors, while the mid-cap biopharma sub-sector was the strongest performer during the period. Within
sector allocation, which is a by-product of our bottom-up stock selection process, an overweight allocation to mid-cap biopharma detracted most from relative performance during the period.
Thermo Fisher Scientific (medical technology), Arena Pharmaceutical (mid-cap biopharma), and Madrigal Pharmaceuticals (small-cap biopharma) were the top detractors from performance relative to the S&P Composite 1500 Health Care Index over the period. Shares of Thermo Fisher Scientific rallied, and the Fund’s underweight position negatively affected relative performance. In February 2021, the company reported strong earnings, but expected fading COVID-19 testing volumes in the second quarter, which raised concerns around earnings growth potential. In April 2021, it was announced that Thermo Fisher intended to acquire contract research organization, PPD. After digesting the news of the acquisition, we grew concerned that such a large deal created additional integration risk, and in light of longer-term stock gains, decided it was most appropriate to trim back the Fund’s position. Since we pared back the position, the stock has rallied, and the Fund’s underweight position negatively affected relative performance. We eliminated the Fund’s position later in the period. Madrigal Pharmaceuticals was impacted in May and June 2021 after companies pursuing Nonalcoholic Steatohepatitis (NASH) treatments came under pressure after NGM Biopharmaceuticals announced the failure of a phase 2/3 study of its NASH treatment. During the period, the company continued to make clinical progress on a drug intended to treat NASH, a disease that causes liver inflammation due to the buildup of fat, and fibrosis, a lung disease that produces scarring, which can lead to shortness of breath and fatigue. Quidel, Arena Pharmaceutical, and Gracell Biotech were the top absolute detractors from the Fund’s performance.
The Hartford Healthcare Fund
Fund Overview – (continued)
October 31, 2021 (Unaudited)
Amgen (large-cap biopharma), Johnson & Johnson (large-cap biopharma), and Eli Lilly (large-cap biopharma) contributed positively to results relative to the S&P Composite 1500 Health Care Index over the period. Not owning Amgen, a constituent of the S&P Composite 1500 Health Care Index, also contributed positively to relative performance, as shares traded lower despite the company reporting better-than-expected second-quarter 2021 revenue due to pricing pressure broadly among the company’s commercial products. The Fund’s lack of exposure to Johnson & Johnson (J&J), a constituent of the S&P Composite 1500 Health Care Index, was a positive contributor to relative performance during the period, as shares of J&J underperformed the S&P Composite 1500 Health Care Index during the period. Regulators called for a pause in distribution of the company's COVID-19 vaccine after cases of people developing a rare blood clotting disorder were investigated. Distribution of the vaccine resumed with additional warnings, but no restrictions. Shares of Eli Lilly were driven by positive clinical developments, including solid phase 3 study results for the company’s injectable Type 2 diabetes drug, characterized by impressive weight loss and an acceptable tolerability profile. The company also announced during the period news of promising results from a phase 2 study of donanemab, an investigational antibody therapy for the treatment of Alzheimer’s disease. During the period, the company later received the U.S. Food and Drug Administration’s (FDA's) Breakthrough Drug Therapy designation for donanemab, an investigational antibody therapy for the treatment of Alzheimer’s disease, which will potentially provide an accelerated pathway for filing later this year and a few years earlier than expected. Top absolute contributors to the Fund’s performance during the period included UnitedHealth Group, Eli Lilly, and Pfizer.
Derivatives were not used in a significant manner in the Fund during the period and did not have a material impact on performance during the period.
What is the outlook as of the end of the period?
As of the end of the period, we expect the human and economic impact of COVID-19 to remain challenging, but we are optimistic as the rollout of effective vaccines is underway. As of September 30, 2021, roughly 55.9% of the U.S. population had been fully vaccinated against COVID-19, while vaccination progress in many other countries in the world has been slower due to lack of vaccine availability. Vaccines targeting the viral spike protein are expected to offer protection against the novel variants of the coronavirus, although the level of protection may vary depending on the variant. Questions remain around the exact role boosters will play in the fight against COVID-19, but we do anticipate the approval of a third coronavirus vaccine shot for a broad swath of the patient population.
We are also encouraged by the report of an efficacious oral antiviral drug, which may reduce the risk of hospitalization and death by half in patients with mild to moderate cases of COVID-19. The successful development of oral antiviral agents may serve as an important tool in reducing the societal burden of disease; these options may be especially useful in emerging markets where access to vaccines and antibody therapeutics may be limited.
Beyond vaccine development, the COVID-19 crisis highlighted the need for testing infrastructure in developed and emerging markets, which we believe may continue to drive demand within the diagnostics industry. While COVID-19 testing rates may moderate as vaccination rates rise, we believe we are likely to see healthcare providers and patients become more vigilant around respiratory testing for several years. Within procedure-oriented sub-sectors, outbreaks of the coronavirus Delta variant were causing some disruption to the pace of economic recovery as of the end of the period, but we have observed that medical device trends and hospital utilization are improving overall with stronger hospital safety processes in place.
In selecting equities for the Fund, we favor companies that develop innovative products designed to address important unmet medical needs. Over the long term, we believe that innovation, an aging population, and the globalization of demand for cutting-edge Western-style medicines are likely to continue to drive growth of the Healthcare sector.
Important Risks
Investing involves risk, including the possible loss of principal. Security prices fluctuate in value depending on general market and economic conditions and the prospects of individual companies. • Risks of focusing investments on the healthcare related sector include regulatory and legal developments, patent considerations, intense competitive pressures, rapid technological changes, potential product obsolescence, and liquidity risk. • Small- and mid-cap securities can have greater risks and volatility than large-cap securities. • Foreign investments may be more volatile and less liquid than U.S. investments and are subject to the risk of currency fluctuations and adverse political, economic and regulatory developments. These risks may be greater, and include additional risks, for investments in emerging markets.
| Composition by Subsector(1) |
| as of 10/31/2021 |
| Subsector | Percentage of
Net Assets |
| Equity Securities | |
| Biotechnology | 17.9% |
| Consumer Finance | 0.1 |
| Diversified Financial Services | 0.3 |
| Diversified Telecommunication Services | 0.2 |
| Health Care Equipment & Supplies | 25.8 |
| Health Care Providers & Services | 20.2 |
| Insurance | 0.2 |
| Life Sciences Tools & Services | 7.9 |
| Pharmaceuticals | 26.1 |
| Total | 98.7% |
| Short-Term Investments | 1.7 |
| Other Assets & Liabilities | (0.4) |
| Total | 100.0% |
| (1) | For Fund compliance purposes, the Fund may not use the same classification system. These subsector classifications are used for financial reporting purposes. |
Fund Overview
October 31, 2021 (Unaudited)
Inception 12/31/1997
Sub-advised by Wellington Management Company LLP | Investment objective – The Fund seeks long-term growth of capital. |
Comparison of Change in Value of $10,000 Investment (10/31/2011 - 10/31/2021)
The chart above represents the hypothetical growth of a $10,000 investment in Class A, which includes the maximum sales charge applicable to Class A shares. Returns for the Fund’s other classes will vary from what is seen above due to differences in the expenses charged to those share classes.
| Average Annual Total Returns |
| for the Periods Ending 10/31/2021 |
| | 1 Year | 5 Years | 10 Years |
| Class A1 | 35.51% | 17.26% | 15.30% |
| Class A2 | 28.06% | 15.94% | 14.65% |
| Class C1 | 34.49% | 16.38% | 14.45% |
| Class C3 | 33.49% | 16.38% | 14.45% |
| Class I1 | 35.79% | 17.55% | 15.58% |
| Class R31 | 35.03% | 16.85% | 14.92% |
| Class R41 | 35.45% | 17.21% | 15.28% |
| Class R51 | 35.84% | 17.56% | 15.62% |
| Class R61 | 36.00% | 17.68% | 15.75% |
| Class Y1 | 35.96% | 17.64% | 15.72% |
| Class F1 | 36.01% | 17.67% | 15.64% |
| S&P MidCap 400 Index | 48.90% | 14.89% | 13.90% |
| 1 | Without sales charge |
| 2 | Reflects maximum sales charge of 5.50% |
| 3 | Reflects a contingent deferred sales charge of 1.00% |
PERFORMANCE DATA QUOTED REPRESENTS PAST PERFORMANCE AND DOES NOT GUARANTEE FUTURE RESULTS. The investment return and principal value of the investment will fluctuate so that investors’ shares, when redeemed, may be worth more or less than their original cost. The chart and table do not reflect the deductions of taxes that a shareholder would pay on Fund distributions or the redemption of Fund shares. Current performance may be lower or higher than the performance data quoted. To obtain performance data current to the most recent month-end, please visit our website hartfordfunds.com.
Total returns presented above were calculated using the applicable class' net asset value available to shareholders for sale or redemption of Fund shares on 10/31/2021, which may exclude investment transactions as of this date. All share class returns assume the reinvestment of all distributions at net asset value and the deduction of all fund expenses. The total returns presented in the Financial Highlights section of the report are calculated in the same manner, but also take into account certain
adjustments that are necessary under generally accepted accounting principles. As a result, the total returns in the Financial Highlights section may differ from the total returns presented above.
Class R6 shares commenced operations on 11/07/2014. Performance prior to that date is that of the Fund’s Class Y shares. Class F shares commenced operations on 02/28/2017. Performance for Class F shares prior to 02/28/2017 reflects the performance of Class I shares.
To the extent a share class has adopted the prior performance of another share class that had different operating expenses, such performance has not been adjusted to reflect the different operating expenses. If the performance were adjusted, it may have been higher or lower.
You cannot invest directly in an index.
See “Benchmark Glossary” for benchmark descriptions.
Performance information may reflect expense waivers/reimbursements without which performance would have been lower. For information on current expense waivers/reimbursements, please see the prospectus.
Fund Overview – (continued)
October 31, 2021 (Unaudited)
| Operating Expenses* | Gross | Net |
| Class A | 1.11% | 1.11% |
| Class C | 1.87% | 1.87% |
| Class I | 0.88% | 0.87% |
| Class R3 | 1.47% | 1.47% |
| Class R4 | 1.17% | 1.17% |
| Class R5 | 0.85% | 0.85% |
| Class R6 | 0.75% | 0.75% |
| Class Y | 0.86% | 0.79% |
| Class F | 0.75% | 0.75% |
| * | Expenses as shown in the Fund’s most recent prospectus. Gross expenses do not reflect contractual fee waivers or expense reimbursement arrangements if any. Net expenses reflect such arrangements only with respect to Classes I and Y and in instances when they reduce gross expenses. These arrangements remain in effect until 02/28/2022 unless the Fund’s Board of Directors approves an earlier termination. Actual expenses may be higher or lower. Please see accompanying Financial Highlights for expense ratios for the period ended 10/31/2021. |
Portfolio Managers
Philip W. Ruedi, CFA
Senior Managing Director and Equity Portfolio Manager
Wellington Management Company LLP
Mark A. Whitaker, CFA
Senior Managing Director and Equity Portfolio Manager
Wellington Management Company LLP
Manager Discussion
How did the Fund perform during the period?
The Class A shares of The Hartford MidCap Fund returned 35.51%, before sales charges, for the twelve-month period ended October 31, 2021, underperforming the Fund’s benchmark, the S&P MidCap 400 Index, which returned 48.90% for the same period. For the same period, the Class A shares of the Fund, before sales charges, underperformed the 37.98% average return of the Morningstar Mid-Cap Growth Funds peer group, a group of funds with investment strategies similar to that of the Fund.
Why did the Fund perform this way?
United States (U.S.) equities, as measured by the S&P 500 Index, posted positive results over the trailing twelve-month period ending October 31, 2021. In the first half of 2021, U.S. equities gained amid a backdrop of improving vaccination rates, accelerating economic growth, and a broader reopening of the economy. Inflation rose sharply, as robust demand for goods and services, along with significant global supply-chain disruptions, drove consumer and producer prices sharply higher.
The U.S. Federal Reserve (Fed) maintained its view that elevated price pressures may prove transitory, but the Fed rattled markets by considerably raising its inflation forecast for 2021 and signaling the potential for two interest-rate increases in 2023. This shift in expectations toward tighter monetary policy triggered a rotation from value and cyclically sensitive equities to growth equities. U.S. equities
continued to climb in the third quarter of 2021 against a backdrop of accommodative monetary policy, robust corporate earnings, and strong demand for goods and services, while risk sentiment was pressured by anxiety about rising inflation, imminent monetary tightening by the Fed, moderating economic growth, and uncertainty about fiscal stimulus and the federal debt ceiling. Growth equities outperformed their value counterparts for the quarter; however, surging U.S. Treasury yields sparked a sharp sell-off in shares of large technology companies at the end of September 2021, triggering a powerful rotation into value equities. COVID-19 cases fell sharply in September, although the proliferation of the Delta variant in July and August 2021 weighed on consumer confidence and dampened momentum from businesses reopening. The Fed trimmed its 2021 gross domestic product (GDP) growth forecast from 7% to 5.9% and delivered a clearer signal that it would begin to taper asset purchases later this year if economic conditions remain stable.
Returns varied by market cap during the period, as mid- and small-cap equities, as measured by the S&P MidCap 400 Index and Russell 2000 Index, respectively, both outperformed large-cap equities, as measured by the S&P 500 Index. Within the S&P MidCap 400 Index, all eleven sectors posted positive returns during the period. The Energy (+125%), Financials (+61%), and Consumer Discretionary (+57%) sectors performed the best, while the Consumer Staples (+18%), Utilities (+21%) and Healthcare (+29%) sectors lagged.
The Fund underperformed the S& P MidCap 400 Index during the period primarily because of negative security selection. Selection effects were particularly weak within the Healthcare, Information
Fund Overview – (continued)
October 31, 2021 (Unaudited)
Technology, and Industrials sectors. This was partially offset by strong selection in the Consumer Discretionary, Materials, and Utilities sectors, which contributed positively to relative performance during the period. Sector allocation, a result of our bottom-up stock selection process, also detracted from the Fund’s performance relative to the S&P MidCap 400 Index during the period. This was primarily due to an overweight allocation to the Healthcare sector and an underweight to the Energy sector. This was partially offset by underweights to the Consumer Staples and Utilities sectors, which contributed positively to performance.
Top contributors to relative performance during the period included Teradata (Information Technology), Coherent (Information Technology), and Etsy (Consumer Discretionary). Shares of Teradata, a database and analytics software company, rose over the period. The company reported strong earnings during the period, including beating revenue expectations during the second quarter of 2021. The company expects total annual recurring revenue for fiscal-year 2021 to grow at a mid-to-high-single-digit percentage year-over-year. Shares of Coherent advanced during the period after receiving multiple acquisition offers. The laser equipment maker accepted a bid from II-VI (also held in the Fund) during the period, which will exchange each Coherent share for $220 in cash and 0.91 shares of II-VI. We eliminated the Fund’s position in Coherent during the period. Etsy's share price rose over the period as the handmade crafts e-commerce platform's sharp spike in customer acquisitions has increased brand awareness and opportunities for customer retention. The company made two notable acquisitions during the period: fashion resale marketplace, Depop, and handmade goods marketplace, Elo7.
Top relative detractors from the Fund’s relative performance included ChemoCentryx (Healthcare), Sage Therapeutics (Healthcare), and PTC Therapeutics (Healthcare). Shares of ChemoCentryx fell significantly during the period after a U.S. Food and Drug Administration (FDA) advisory panel was split on recommending approval of its vasculitis drug, Avacopan. We eliminated the Fund’s position during the period. Shares of Sage Therapeutics, a biopharmaceutical company, fell during the period as the efficacy of a major pipeline drug was lower than expected during the third quarter of 2021; however, we continue to believe that the drug will play a role in the treatment of depression moving forward and is attractive versus currently available treatments. PTC Therapeutics shares fell during the period. During the first quarter of 2021, Roche and Partner Ionis Pharmaceuticals (Healthcare) announced the discontinuation of their Phase 3 study of tominersen for Huntington's Disease (HD). This news created concern for feasibility of PTC’s trial of PTC518, an oral pill for the treatment of HD. PTC518 will likely now need to meet a higher bar of HTT gene mutation knockdown to demonstrate clinical efficacy.
Derivatives were not used in a significant manner in the Fund during the period and did not have a material impact on performance during the period.
What is the outlook as of the end of the period?
As of the end of the period, we believe the outlook for mid-cap equities remains positive, with signs of continued strength in consumer spending. We believe that high savings accumulated during
the economic shutdown are likely to be deployed into services with pent-up demand. However, our optimistic outlook is tempered by signs of persistent inflation and supply chain disruption. Additionally, valuations in certain areas of the market, based on our investment framework, continue to look expensive, particularly the software-as-a-service and medical technology industries.
As of the end of the period, we favored electrical equipment businesses that trade at attractive valuations, cyclical healthcare businesses that stand to bounce back as their markets begin to normalize, real estate businesses primed to take advantage of changing demographics, and solar businesses poised to benefit from the ongoing energy transition.
At the end of the period, the Fund’s largest overweights relative to the S&P MidCap 400 Index were to the Information Technology and Healthcare sector, with the largest underweights to the Real Estate, Materials, and Consumer Discretionary sectors.
Important Risks
Investing involves risk, including the possible loss of principal. Security prices fluctuate in value depending on general market and economic conditions and the prospects of individual companies. • Mid-cap securities can have greater risks and volatility than large-cap securities. • To the extent the Fund focuses on one or more sectors, the Fund may be subject to increased volatility and risk of loss if adverse developments occur. • Integration of environmental, social, and/or governance (ESG) factors into the investment process may not work as intended.
| Composition by Sector(1) |
| as of 10/31/2021 |
| Sector | Percentage
of Net Assets |
| Equity Securities | |
| Communication Services | 2.9% |
| Consumer Discretionary | 12.0 |
| Consumer Staples | 1.5 |
| Energy | 0.1 |
| Financials | 12.1 |
| Health Care | 18.2 |
| Industrials | 16.5 |
| Information Technology | 25.8 |
| Materials | 2.8 |
| Real Estate | 5.3 |
| Utilities | 2.5 |
| Total | 99.7% |
| Short-Term Investments | 2.2 |
| Other Assets & Liabilities | (1.9) |
| Total | 100.0% |
| (1) | A sector may be comprised of several industries. For Fund compliance purposes, the Fund may not use the same classification system. These sector classifications are used for financial reporting purposes. |
The Hartford MidCap Value Fund
Fund Overview
October 31, 2021 (Unaudited)
Inception 04/30/2001
Sub-advised by Wellington Management Company LLP | Investment objective – The Fund seeks long-term capital appreciation. |
Comparison of Change in Value of $10,000 Investment (10/31/2011 - 10/31/2021)
The chart above represents the hypothetical growth of a $10,000 investment in Class A, which includes the maximum sales charge applicable to Class A shares. Returns for the Fund’s other classes will vary from what is seen above due to differences in the expenses charged to those share classes.
| Average Annual Total Returns |
| for the Periods Ending 10/31/2021 |
| | 1 Year | 5 Years | 10 Years |
| Class A1 | 48.99% | 10.82% | 11.56% |
| Class A2 | 40.80% | 9.58% | 10.93% |
| Class C1 | 47.83% | 9.98% | 10.75% |
| Class C3 | 46.83% | 9.98% | 10.75% |
| Class I1 | 49.48% | 11.15% | 11.92% |
| Class R31 | 48.57% | 10.49% | 11.26% |
| Class R41 | 48.99% | 10.82% | 11.60% |
| Class R51 | 49.39% | 11.16% | 11.93% |
| Class Y1 | 49.49% | 11.23% | 12.03% |
| Class F1 | 49.64% | 11.28% | 11.98% |
| Russell Midcap Value Index | 48.60% | 12.30% | 13.18% |
| 1 | Without sales charge |
| 2 | Reflects maximum sales charge of 5.50% |
| 3 | Reflects a contingent deferred sales charge of 1.00% |
PERFORMANCE DATA QUOTED REPRESENTS PAST PERFORMANCE AND DOES NOT GUARANTEE FUTURE RESULTS. The investment return and principal value of the investment will fluctuate so that investors’ shares, when redeemed, may be worth more or less than their original cost. The chart and table do not reflect the deductions of taxes that a shareholder would pay on Fund distributions or the redemption of Fund shares. Current performance may be lower or higher than the performance data quoted. To obtain performance data current to the most recent month-end, please visit our website hartfordfunds.com.
Total returns presented above were calculated using the applicable class' net asset value available to shareholders for sale or redemption of Fund shares on 10/31/2021, which may exclude investment transactions as of this date. All share class returns assume the reinvestment of all distributions at net asset value and the deduction of all fund expenses. The total returns presented in the Financial Highlights section of the
report are calculated in the same manner, but also take into account certain adjustments that are necessary under generally accepted accounting principles. As a result, the total returns in the Financial Highlights section may differ from the total returns presented above.
Class F shares commenced operations on 02/28/2017. Performance for Class F shares prior to 02/28/2017 reflects the performance of Class I shares.
To the extent a share class has adopted the prior performance of another share class that had different operating expenses, such performance has not been adjusted to reflect the different operating expenses. If the performance were adjusted, it may have been higher or lower.
You cannot invest directly in an index.
See “Benchmark Glossary” for benchmark descriptions.
Performance information may reflect expense waivers/reimbursements without which performance would have been lower.
| Operating Expenses* | Gross | Net |
| Class A | 1.26% | 1.26% |
| Class C | 2.03% | 2.03% |
| Class I | 0.91% | 0.91% |
| Class R3 | 1.54% | 1.54% |
| Class R4 | 1.24% | 1.24% |
| Class R5 | 0.92% | 0.92% |
| Class Y | 0.92% | 0.92% |
| Class F | 0.82% | 0.82% |
| * | Expenses as shown in the Fund’s most recent prospectus. Actual expenses may be higher or lower. Please see accompanying Financial Highlights for expense ratios for the period ended 10/31/2021. |
The Hartford MidCap Value Fund
Fund Overview – (continued)
October 31, 2021 (Unaudited)
Portfolio Manager
Gregory J. Garabedian
Senior Managing Director and Equity Portfolio Manager
Wellington Management Company LLP
Manager Discussion
How did the Fund perform during the period?
The Class A shares of The Hartford MidCap Value Fund returned 48.99%, before sales charges, for the twelve-month period ended October 31, 2021, outperforming the Fund’s benchmark, the Russell Midcap Value Index, which returned 48.60% for the same period. For the same period, the Class A shares of the Fund, before sales charges, underperformed the 54.28% average return of the Lipper MidCap Value Fund peer group, a group of funds with investment strategies similar to those of the Fund.
Why did the Fund perform this way?
United States (U.S.) equities, as measured by the S&P 500 Index, posted positive results over the trailing twelve-month period ended October 31, 2021. Towards the end of 2020, a sharp escalation in COVID-19 infections across the country and renewed restrictions to curb the spread of the virus were overshadowed by highly encouraging vaccine developments, despite the significant logistical challenges and uncertain timeline for distributing and administering vaccines on a broad scale. In December 2020, the government unveiled a long-awaited fifth stimulus package, worth approximately $900 billion.
Joe Biden was elected president after a closely contested election, removing a key element of uncertainty for the market. In the first quarter of 2021, U.S. equities rallied, bolstered by an accelerating vaccine rollout, substantial fiscal and monetary policy support, and upbeat forecasts for economic growth and earnings. Expectations for a strong rebound in the U.S. economy sparked inflationary fears, contributing to a pro-cyclical rotation. The Democrats secured slim majorities in both houses of Congress after winning control of the Senate, bolstering President Biden’s prospects of advancing his legislative agenda. In the second quarter of 2021, U.S. equities rallied for the fifth consecutive quarter amid a backdrop of improving vaccination rates, accelerating economic growth, and a broader reopening of the economy. Inflation rose sharply during the quarter, as robust demand for goods and services, along with significant global supply-chain disruptions, drove consumer and producer prices sharply higher. In the third quarter of 2021, U.S. equities rose against a backdrop of accommodative monetary policy, robust corporate earnings, and strong demand for goods and services. Growth equities outperformed their value counterparts for the quarter; however, surging U.S. Treasury yields sparked a sharp sell-off in shares of large technology companies at the end of September, triggering a powerful rotation into value equities. In the final month of the period, U.S. equities registered their largest monthly gain of the year, as inflation anxiety was outweighed by improving coronavirus pandemic conditions, higher-than-expected corporate earnings, strong U.S.
equity inflows, and improved prospects for additional fiscal stimulus. Markets were bolstered by a rapid decline in the number of U.S. COVID-19 cases, which fell nearly 60% from their latest peak in September 2021.
Returns varied by market cap during the period, as mid- and small-cap equities, as measured by the S&P MidCap 400 Index and Russell 2000 Index, respectively, both outperformed large-cap equities, as measured by the S&P 500 Index. Returns within the mid-cap space varied by style, as the Russell Midcap Value Index outperformed the Russell Midcap Growth Index.
All eleven sectors in the Russell Midcap Value Index gained during the period, with the Energy (+128%), Financials (+73%), and Real Estate (+58%) sectors performing the best, while the Utilities (+10%), Consumer Staples (+20%), and Healthcare (+30%) sectors lagged during the period.
The Fund’s outperformance versus the Russell Midcap Value Index over the twelve-month period was driven primarily by sector allocation, a result of the bottom-up stock selection process. Specifically, relative positioning in the Utilities and Communication Services sectors (both underweights), and an overweight allocation to the Financials sector drove positive relative results. By contrast, an underweight allocation to the Energy sector and an overweight allocation to the Healthcare sector weighed on relative performance. Security selection also added to the Fund’s relative performance during the period. Strong selection within the Industrials, Energy, and Consumer Staples sectors contributed positively to relative performance, but this was partially offset by weaker selection in the Financials, Materials, and Real Estate sectors.
Top contributors to the Fund’s relative performance relative to the Russell Midcap Value Index over the period included overweights to Diamondback Energy (Energy), Western Alliance Bancorp (Financials), and Clean Harbors (Industrials). Shares of energy exploration and production company Diamondback Energy rose over the period, in line with surging global oil prices. The company also reported earnings for the first quarter of 2021 that surprised to the upside, with investors focusing on strong free cash flow generation and the sale of non-core Williston Basin and Permian Basin acreages. Shares of Western Alliance (Financial Services) rose after the company consecutively reported strong earnings. Loans and deposits have shown robust growth and net interest income beat consensus expectations on the back of improving credit trends. Additionally, the accretive acquisition of AmeriHome was well-received by the market. Shares of the environmental and industrial services provider Clean
The Hartford MidCap Value Fund
Fund Overview – (continued)
October 31, 2021 (Unaudited)
Harbors rose during the period after the company reported better-than-expected earnings as the benefits from a diverse customer base and improving operating efficiency.
Top detractors from the Fund’s relative performance during the period included overweight positions in Lumentum (Information Technology), Americold Realty Trust, (Real Estate), and Encompass Health (Healthcare). Shares of Lumentum declined after the maker of optical networking gear reported fiscal third-quarter profits that matched expectations but reported revenue that missed consensus expectations. Continued delays in 5G fronthaul deployments in China negatively impacted quarterly performance. Lumentum also posted fourth-quarter adjusted earnings and revenue outlook both below consensus. Americold Realty, a leader in cold storage warehouses, fell during the period after the real estate investment trust (REIT) cut its full year 2021 adjusted funds from operations guidance, citing market conditions primarily driven by unprecedented labor disruptions. Labor issues involved limiting food production, reducing its occupancy, and driving inflation in Americold's cost structure. Shares of Encompass Health detracted from relative performance during the period. The company reported lower-than-estimated third-quarter 2021 earnings driven by softer results in the home health and hospice segment, as the impact of COVID-19 weighed on both volumes and labor costs. The company also trimmed its guidance, citing the near-term challenges in home health and hospice.
Derivatives were not used in a significant manner in the Fund during the period and did not have a material impact on performance during the period.
What is the outlook as of the end of the period?
As of the end of the period, we continue to seek opportunities that offer a compelling combination of valuation, quality, and capital return. This remains our guiding focus when selecting securities for the Fund.
At the end of the period, the Fund’s largest overweights relative to the Russell Midcap Value Index were to the Industrials, Financials, and Healthcare sectors, with the largest underweights in the Communication Services, Materials, and Utilities sectors.
Important Risks
Investing involves risk, including the possible loss of principal. Security prices fluctuate in value depending on general market and economic conditions and the prospects of individual companies. • Mid-cap securities can have greater risks and volatility than large-cap securities. • Different investment styles may go in and out favor, which may cause the Fund to underperform the broader stock market. • Foreign investments may be more volatile and less liquid than U.S. investments and are subject to the risk of currency fluctuations and adverse political, economic and regulatory developments. • To the extent the Fund focuses on one or more sectors, the Fund may be subject to increased volatility and risk of loss if adverse developments occur.
| Composition by Sector(1) |
| as of 10/31/2021 |
| Sector | Percentage
of Net Assets |
| Equity Securities | |
| Communication Services | 1.8% |
| Consumer Discretionary | 10.0 |
| Consumer Staples | 2.8 |
| Energy | 3.9 |
| Financials | 19.1 |
| Health Care | 9.0 |
| Industrials | 22.3 |
| Information Technology | 8.5 |
| Materials | 5.6 |
| Real Estate | 11.5 |
| Utilities | 5.3 |
| Total | 99.8% |
| Short-Term Investments | 0.5 |
| Other Assets & Liabilities | (0.3) |
| Total | 100.0% |
| (1) | A sector may be comprised of several industries. For Fund compliance purposes, the Fund may not use the same classification system. These sector classifications are used for financial reporting purposes. |
Hartford Quality Value Fund
Fund Overview
October 31, 2021 (Unaudited)
Inception 01/02/1996
Sub-advised by Wellington Management Company LLP | Investment objective – The Fund seeks long-term capital appreciation. |
Comparison of Change in Value of $10,000 Investment (10/31/2011 - 10/31/2021)
The chart above represents the hypothetical growth of a $10,000 investment in Class A, which includes the maximum sales charge applicable to Class A shares. Returns for the Fund’s other classes will vary from what is seen above due to differences in the expenses charged to those share classes.
| Average Annual Total Returns |
| for the Periods Ending 10/31/2021 |
| | 1 Year | 5 Years | 10 Years |
| Class A1 | 44.08% | 12.34% | 11.87% |
| Class A2 | 36.16% | 11.08% | 11.24% |
| Class C1 | 42.97% | 11.49% | 11.04% |
| Class C3 | 41.97% | 11.49% | 11.04% |
| Class I1 | 44.56% | 12.71% | 12.24% |
| Class R31 | 43.73% | 12.04% | 11.59% |
| Class R41 | 44.20% | 12.38% | 11.94% |
| Class R51 | 44.59% | 12.70% | 12.26% |
| Class R61 | 44.79% | 12.84% | 12.35% |
| Class Y1 | 44.65% | 12.75% | 12.31% |
| Class F1 | 44.84% | 12.82% | 12.29% |
| Russell 1000 Value Index | 43.76% | 12.39% | 12.85% |
| 1 | Without sales charge |
| 2 | Reflects maximum sales charge of 5.50% |
| 3 | Reflects a contingent deferred sales charge of 1.00% |
PERFORMANCE DATA QUOTED REPRESENTS PAST PERFORMANCE AND DOES NOT GUARANTEE FUTURE RESULTS. The investment return and principal value of the investment will fluctuate so that investors’ shares, when redeemed, may be worth more or less than their original cost. The chart and table do not reflect the deductions of taxes that a shareholder would pay on Fund distributions or the redemption of Fund shares. Current performance may be lower or higher than the performance data quoted. To obtain performance data current to the most recent month-end, please visit our website hartfordfunds.com.
Total returns presented above were calculated using the applicable class' net asset value available to shareholders for sale or redemption of Fund shares on 10/31/2021, which may exclude investment transactions as of this date. All share class returns assume the reinvestment of all distributions at net asset value and the deduction of all fund expenses. The total returns presented in the Financial Highlights section of the report are calculated in the same manner, but also take into account certain
adjustments that are necessary under generally accepted accounting principles. As a result, the total returns in the Financial Highlights section may differ from the total returns presented above.
The returns include the Fund’s performance when the Fund pursued a different investment objective and principal investment strategy prior to 11/01/2017.
Class R6 shares commenced operations on 02/28/2018. Performance prior to that date is that of the Fund’s Class Y shares. Class F shares commenced operations on 02/28/2017. Performance prior to that date is that of the Fund’s Class I shares.
To the extent a share class has adopted the prior performance of another share class that had different operating expenses, such performance has not been adjusted to reflect the different operating expenses. If the performance were adjusted, it may have been higher or lower.
You cannot invest directly in an index.
See “Benchmark Glossary” for benchmark descriptions.
Performance information may reflect expense waivers/reimbursements without which performance would have been lower. For information on current expense waivers/reimbursements, please see the prospectus.
Hartford Quality Value Fund
Fund Overview – (continued)
October 31, 2021 (Unaudited)
| Operating Expenses* | Gross | Net |
| Class A | 1.03% | 0.96% |
| Class C | 1.82% | 1.71% |
| Class I | 0.67% | 0.66% |
| Class R3 | 1.29% | 1.18% |
| Class R4 | 0.98% | 0.88% |
| Class R5 | 0.69% | 0.63% |
| Class R6 | 0.58% | 0.46% |
| Class Y | 0.68% | 0.57% |
| Class F | 0.58% | 0.46% |
| * | Expenses as shown in the Fund’s most recent prospectus. Gross expenses do not reflect contractual fee waivers or expense reimbursement arrangements. Net expenses reflect such arrangements in instances when they reduce gross expenses. These arrangements remain in effect until 02/28/2022 unless the Fund’s Board of Directors approves an earlier termination. Actual expenses may be higher or lower. Please see accompanying Financial Highlights for expense ratios for the period ended 10/31/2021. |
Portfolio Managers
Matthew G. Baker
Senior Managing Director and Equity Portfolio Manager
Wellington Management Company LLP
Nataliya Kofman
Managing Director and Equity Portfolio Manager
Wellington Management Company LLP
Manager Discussion
How did the Fund perform during the period?
The Class A shares of the Hartford Quality Value Fund returned 44.08%, before sales charges, for the twelve-month period ended October 31, 2021, outperforming the Fund’s benchmark, the Russell 1000 Value Index, which returned 43.76% for the same period. For the same period, the Class A shares of the Fund, before sales charges, underperformed the 44.31% average return of the Lipper Large Cap Value Fund peer group, a group of funds with investment strategies similar to those of the Fund.
Why did the Fund perform this way?
United States (U.S.) equities, as measured by the S&P 500 Index, posted positive results over the trailing twelve-month period ending October 31, 2021. Towards the end of 2020, a sharp escalation in COVID-19 infections across the country and renewed restrictions to curb the spread of the virus were overshadowed by highly encouraging vaccine developments, despite the significant logistical challenges and uncertain timeline for distributing and administering vaccines on a broad scale. In December 2020, the government unveiled a long-awaited fifth stimulus package, worth approximately $900 billion.
Joe Biden was elected president in November 2020 after a closely contested election, removing a key element of uncertainty from the market. In the first quarter of 2021, U.S. equities rallied, bolstered by an accelerating vaccine rollout, substantial fiscal and monetary policy
accommodations, and upbeat forecasts for economic growth and earnings. Expectations for a strong rebound in the U.S. economy sparked inflationary fears, contributing to a pro-cyclical rotation. The Democrats secured slim majorities in both houses of Congress at the end of 2020 after winning control of the Senate, bolstering President Biden’s prospects of advancing his legislative agenda. In the second quarter of 2021, U.S. equities rallied higher for the fifth consecutive quarter amid a backdrop of improving vaccination rates, accelerating economic growth, and a broader reopening of the economy. Inflation rose sharply during the second quarter of 2021, as robust demand for goods and services, along with significant global supply-chain disruptions, drove consumer and producer prices sharply higher. In the third quarter of 2021, U.S. equities rose against a backdrop of accommodative monetary policy, robust corporate earnings, and strong demand for goods and services. Growth equities outperformed their value counterparts for the quarter; however, surging U.S. Treasury yields sparked a sharp sell-off in shares of large technology companies at the end of September 2021, triggering a powerful rotation into value equities. In the final month of the period, U.S. equities registered their largest monthly gain of 2021, as inflation anxiety was outweighed by improving coronavirus pandemic conditions, higher-than-expected corporate earnings, strong U.S. equity inflows, and improved prospects for additional fiscal stimulus. Markets were bolstered by a rapid decline in the number of U.S. coronavirus cases, which fell nearly 60% from their latest peak in September 2021.
Hartford Quality Value Fund
Fund Overview – (continued)
October 31, 2021 (Unaudited)
During the period, all eleven sectors within the Russell 1000 Value Index posted positive absolute returns, with the Energy (+113%), Financials (+74%), and Real Estate (+53%) sectors performing the best. Conversely, the Utilities (+11%), Consumer Staples (+18%), and Communication Services (+26%) sectors lagged over the period.
Security selection and sector allocation both contributed positively to the Fund’s performance relative to the Russell 1000 Value Index over the period. Strong stock selection within the Financials, Industrials, and Consumer Discretionary sectors were the top positive contributors to relative performance during the period. This was partially offset by weaker security selection within the Communication Services, Materials, and Utilities sectors, which detracted from relative performance over the same period. Sector allocation, a result of our bottom-up stock selection process, also contributed positively to relative performance during the period, due to an underweight allocation to the Communication Services sector and overweight allocations to the Financials and Energy sectors.
Top contributors to performance relative to the Russell 1000 Value Index over the period were Bank of America (Financials), EOG Resources (Energy), and PNC Financial Services (Financials). Shares of Bank of America rose during the period as banking equities benefited from the vaccine led rally and subsequent rotation towards value sectors. The U.S. Federal Reserve’s (Fed’s) decision in September 2021 to roll back its bond-buying program but leave short-term interest rates unchanged sent share prices higher at the end of the period. We trimmed the Fund’s position during the period on recent strength, but as of the end of the period, we continued to hold the stock. Shares of oil and gas exploration and production company, EOG Resources, rose over the period after reporting both fourth quarter and calendar year 2020 earnings that beat consensus expectations. The company highlighted that increasing prices for natural gas and crude oil during the fourth quarter of 2020 contributed positively to higher quarter-over-quarter earnings. As of the end of the period, we continued to hold the stock. Shares of PNC Financial Services rose during the period. The third quarter of 2021 was the first full quarter that the company benefited from the BBVA USA acquisition, which was completed on June 1, 2021. We trimmed the Fund’s position on share-price strength during the period but maintained a position in the stock as of the end of the period.
The largest detractors from the Fund’s performance relative to the Russell 1000 Value Index over the period were Verizon (Communication Services), FMC (Materials), and Lockheed Martin (Industrials). Shares of Verizon fell during the period. After releasing fourth-quarter 2020 results, investors were disappointed by weak subscriber growth that fell short of analyst estimates, sending share prices lower. As of the end of the period, we continued to hold Verizon in the Fund. Shares of FMC, a chemical manufacturing company, fell during the period. Despite reporting strong second-quarter 2021 results, FMC lowered its fiscal year 2021 earnings guidance. This was attributable to higher raw materials, packaging and logistics costs. Recent pullbacks in the share price gave us an opportunity to add to the Fund’s position in FMC during the period at an attractive valuation in our view. As of the end of the period, we continued to hold FMC in the Fund. Shares of Lockheed Martin underperformed during the period as well. In August 2021, the company reported lackluster
second-quarter 2021 earnings and revised full-year 2021 earnings downward. We added to the Fund’s position in Lockheed as we viewed the shares to be undervalued toward the end of the period.
Derivatives were not used in a significant manner in the Fund during the period and did not have a material impact on performance during the period.
What is the outlook as of the end of the period?
Despite high stock price correlations within industries as of the end of the period, we believe there is meaningful dissent in the market regarding the economic outlook and the path of the economic recovery from here. Our view is that inflation is likely to endure going forward due to the significant supply constraints (e.g., commodities, labor, etc.). We believe that persistent inflation, which we have not seen for years, will put downward pressure on margins and likely lead to higher interest rates. Given this outlook, we believe a market regime shift is likely and we are seeking to identify consistent compounders (high-quality businesses with strong recurring revenues) with strong competitive advantages and the ability to pass price inflation through to customers. We are also evaluating which end markets we believe are poised to benefit from continued supply tightness, such as metals and mining, for example.
We remain focused on mitigating downside risk in the Fund, so we are seeking to avoid companies that we would expect to struggle in an inflationary environment with rising interest rates. Such companies include those that we believe have rich valuations amid increasing discount rates and companies with margins that we believe are vulnerable to inflation due to an inability to pass on price increases to their customers. We remain focused on seeking to identify quality companies with a positive risk/reward skew and a narrow range of outcomes.
At the end of the period, the Fund’s largest overweights were to the Financials and Consumer Discretionary sectors, while the Fund’s largest underweight was to the Communication Services sector, relative to the Russell 1000 Value Index.
Important Risks
Investing involves risk, including the possible loss of principal. Security prices fluctuate in value depending on general market and economic conditions and the prospects of individual companies. • Different investment styles may go in and out favor, which may cause the Fund to underperform the broader stock market. • For dividend-paying stocks, dividends are not guaranteed and may decrease without notice. • To the extent the Fund focuses on one or more sectors, the Fund may be subject to increased volatility and risk of loss if adverse developments occur. • Integration of environmental, social, and/or governance (ESG) factors into the investment process may not work as intended.
Hartford Quality Value Fund
Fund Overview – (continued)
October 31, 2021 (Unaudited)
| Composition by Sector(1) |
| as of 10/31/2021 |
| Sector | Percentage
of Net Assets |
| Equity Securities | |
| Communication Services | 4.6% |
| Consumer Discretionary | 7.2 |
| Consumer Staples | 6.6 |
| Energy | 5.1 |
| Financials | 23.9 |
| Health Care | 17.1 |
| Industrials | 10.4 |
| Information Technology | 10.4 |
| Materials | 3.6 |
| Real Estate | 4.4 |
| Utilities | 4.6 |
| Total | 97.9% |
| Short-Term Investments | 2.0 |
| Other Assets & Liabilities | 0.1 |
| Total | 100.0% |
| (1) | A sector may be comprised of several industries. For Fund compliance purposes, the Fund may not use the same classification system. These sector classifications are used for financial reporting purposes. |
The Hartford Small Cap Growth Fund
Fund Overview
October 31, 2021 (Unaudited)
Inception 01/04/1988
Sub-advised by Wellington Management Company LLP | Investment objective – The Fund seeks long-term capital appreciation. |
Comparison of Change in Value of $10,000 Investment (10/31/2011 - 10/31/2021)
The chart above represents the hypothetical growth of a $10,000 investment in Class A, which includes the maximum sales charge applicable to Class A shares. Returns for the Fund’s other classes will vary from what is seen above due to differences in the expenses charged to those share classes.
| Average Annual Total Returns |
| for the Periods Ending 10/31/2021 |
| | 1 Year | 5 Years | 10 Years |
| Class A1 | 35.76% | 17.17% | 14.44% |
| Class A2 | 28.29% | 15.85% | 13.80% |
| Class C1 | 34.80% | 16.37% | 13.66% |
| Class C3 | 33.80% | 16.37% | 13.66% |
| Class I1 | 36.23% | 17.57% | 14.82% |
| Class R31 | 35.34% | 16.85% | 14.16% |
| Class R41 | 35.76% | 17.20% | 14.51% |
| Class R51 | 36.18% | 17.56% | 14.86% |
| Class R61 | 36.31% | 17.69% | 14.96% |
| Class Y1 | 36.24% | 17.64% | 14.95% |
| Class F1 | 36.32% | 17.68% | 14.87% |
| Russell 2000 Growth Index | 38.45% | 17.90% | 14.57% |
| 1 | Without sales charge |
| 2 | Reflects maximum sales charge of 5.50% |
| 3 | Reflects a contingent deferred sales charge of 1.00% |
PERFORMANCE DATA QUOTED REPRESENTS PAST PERFORMANCE AND DOES NOT GUARANTEE FUTURE RESULTS. The investment return and principal value of the investment will fluctuate so that investors’ shares, when redeemed, may be worth more or less than their original cost. The chart and table do not reflect the deductions of taxes that a shareholder would pay on Fund distributions or the redemption of Fund shares. Current performance may be lower or higher than the performance data quoted. To obtain performance data current to the most recent month-end, please visit our website hartfordfunds.com.
Total returns presented above were calculated using the applicable class' net asset value available to shareholders for sale or redemption of Fund shares on 10/31/2021, which may exclude investment transactions as of this date. All share class returns assume the reinvestment of all distributions at net asset value and the deduction of all fund expenses. The total returns presented in the Financial Highlights section of the report are calculated in the same manner, but also take into account certain
adjustments that are necessary under generally accepted accounting principles. As a result, the total returns in the Financial Highlights section may differ from the total returns presented above.
Class R6 shares commenced operations on 11/07/2014. Performance prior to that date is that of the Fund’s Class Y shares. Class F shares commenced operations on 02/28/2017. Performance prior to that date is that of the Fund’s Class I shares.
To the extent a share class has adopted the prior performance of another share class that had different operating expenses, such performance has not been adjusted to reflect the different operating expenses. If the performance were adjusted, it may have been higher or lower.
You cannot invest directly in an index.
See “Benchmark Glossary” for benchmark descriptions.
Performance information may reflect expense waivers/reimbursements without which performance would have been lower. For information on current expense waivers/reimbursements, please see the prospectus.
The Hartford Small Cap Growth Fund
Fund Overview – (continued)
October 31, 2021 (Unaudited)
| Operating Expenses* | Gross | Net |
| Class A | 1.26% | 1.26% |
| Class C | 1.90% | 1.90% |
| Class I | 0.85% | 0.85% |
| Class R3 | 1.49% | 1.49% |
| Class R4 | 1.19% | 1.19% |
| Class R5 | 0.89% | 0.89% |
| Class R6 | 0.77% | 0.77% |
| Class Y | 0.88% | 0.83% |
| Class F | 0.77% | 0.77% |
| * | Expenses as shown in the Fund’s most recent prospectus. Gross expenses do not reflect contractual fee waivers or expense reimbursement arrangements. Net expenses reflect such arrangements only with respect to Class Y. These arrangements remain in effect until 02/28/2022 unless the Fund’s Board of Directors approves an earlier termination. Actual expenses may be higher or lower. Please see accompanying Financial Highlights for expense ratios for the period ended 10/31/2021. |
Portfolio Managers
Mammen Chally, CFA
Senior Managing Director and Equity Portfolio Manager
Wellington Management Company LLP
David A. Siegle, CFA
Managing Director and Equity Research Analyst
Wellington Management Company LLP
Douglas W. McLane, CFA
Senior Managing Director and Equity Portfolio Manager
Wellington Management Company LLP
Manager Discussion
How did the Fund perform during the period?
The Class A shares of The Hartford Small Cap Growth Fund returned 35.76%, before sales charges, for the twelve-month period ended October 31, 2021, underperforming the Fund’s benchmark, the Russell 2000 Growth Index, which returned 38.45% for the same period. For the same period, the Class A shares of the Fund, before sales charges, underperformed the 45.31% average return of the Lipper Small-Cap Growth Funds peer group, a group of funds with investment strategies similar to those of the Fund.
Why did the Fund perform this way?
United States (U.S.) equities, as measured by the S&P 500 Index, posted positive results over the trailing twelve-month period ending October 31, 2021. Towards the end of 2020, a sharp escalation in COVID-19 infections across the country and renewed restrictions to curb the spread of the virus were overshadowed by highly encouraging vaccine developments, despite the significant logistical challenges and uncertain timeline for distributing and administering vaccines on a broad scale. In December 2020, the government unveiled a long-awaited fifth stimulus package, worth approximately $900 billion.
Joe Biden was elected president in November 2020 after a closely contested election, removing a key element of uncertainty for the market. In the first quarter of 2021, U.S. equities rallied, bolstered by an accelerating vaccine rollout, substantial fiscal and monetary policy accommodations, and upbeat forecasts for economic growth and earnings. Expectations for a strong rebound in the U.S. economy sparked inflationary fears, contributing to a pro-cyclical rotation. The second quarter of 2021 saw U.S. equities rally for the fifth consecutive quarter amid a backdrop of improving vaccination rates, accelerating economic growth, and a broader reopening of the economy. Inflation rose sharply during the quarter, as robust demand for goods and services, along with significant global supply-chain disruptions, drove consumer and producer prices sharply higher. In the third quarter of 2021, U.S. equities rose against a backdrop of accommodative monetary policy, robust corporate earnings, and strong demand for goods and services. Growth equities outperformed their value counterparts for the quarter; however, surging U.S. Treasury yields sparked a sharp sell-off in shares of large technology companies at the end of September, triggering a powerful rotation into value equities. In the final month of the period, U.S. equities registered their largest monthly gain of the year, as inflation anxiety was outweighed by improving coronavirus pandemic conditions, higher-than-expected corporate earnings, strong U.S. equity inflows, and improved
The Hartford Small Cap Growth Fund
Fund Overview – (continued)
October 31, 2021 (Unaudited)
prospects for additional fiscal stimulus. Markets were bolstered by a rapid decline in the number of U.S. COVID-19 cases, which fell nearly 60% from their latest peak in September 2021.
Returns varied by market cap during the period, as large-cap equities, as measured by the S&P 500 Index, underperformed small- and mid-cap equities, as measured by the Russell 2000 Index and S&P MidCap 400 Index, respectively.
All eleven sectors in the Russell 2000 Growth Index had positive returns during the period. The Energy (+183%), Industrials (+61%), and Information Technology (+55%) sectors increased the most during the period, while the Healthcare (+15%), Communication Services (+32%), and Consumer Staples (+32%) sectors lagged the broader index during the period.
Security selection was the primary driver of the Fund’s underperformance relative to the Russell 2000 Growth Index during the period. Weak selection within the Healthcare, Communication Services, and Industrials sectors detracted from relative performance. This was partially offset by stronger selection in the Financials, Information Technology, and Consumer Staples sectors, which contributed positively to relative performance. Sector allocation, a result of the bottom-up stock selection process, contributed positively to relative performance, primarily driven by the Fund’s underweight allocations to the Healthcare and Utilities sectors. An underweight allocation to the Energy sector and an overweight to the Financials sector detracted from performance during the period.
The top contributors to relative performance during the period were overweight positions in Perficient (Information Technology), Sprout Social (Information Technology), and Triumph Bancorp (Financials). Shares of Perficient, a digital consultancy firm, rose during the period after posting strong results throughout. Notably, second-quarter fiscal year 2021 (FY21) earnings grew quarter-over-quarter 26% to $184.1 million, beating consensus estimates, with earnings per share (EPS) of $0.84 also coming in higher than estimates. The Fund maintained an overweight position in the stock at the end of period. Shares of Sprout Social, an industry-leading provider of cloud-based social media management software, rose during the period. Notably first-quarter fiscal year 2021 results in May beat market consensus expectations with total revenue up 34% compared to the same period in 2020. The Fund remained overweight the stock at the end of period. Shares of Triumph Bancorp rose during the period as the company reported strong earnings throughout the period. Notably the company’s subsidiary, TriumphPay, announced it entered a definitive agreement in April to acquire HubTran, a cloud-based provider of automation software for the transportation industry's back-office. The Fund maintained an overweight position in the stock at the end of the period. Top absolute contributors for the period included Perficient (Information Technology), Omnicell (Healthcare), and Sprout Social (Information Technology).
The top detractors from relative performance during the period included underweight positions in Plug Power (Industrials) and Intellia Therapeutic (Healthcare), and an overweight position in Hydrofarm Holdings (Industrials). Shares of Plug Power, an alternative energy technology provider, rose during the period. The company announced they will be expanding their hydrogen and fuel cell solutions for
Walmart’s eCommerce applications in December 2020. The organization also entered a strategic partnership in January with SK Group to accelerate hydrogen as an alternative energy source in Asian Markets. Not owning the stock during the period was a detractor from the Fund’s relative performance due to the stock’s strong returns. An underweight to Intellia Therapeutics detracted from the Fund’s relative performance as shares soared higher after reporting strong earnings throughout the period. The company along with Regeneron Pharmaceuticals reported positive results from its first clinical trial using a new, Nobel Prize-winning Crispr technology to treat Transthyretin Amyloidosis at the end of June 2021. The study of six patients showed significant reductions in levels of a harmful liver protein associated with the genetic disease. During the period, we initiated a position in the company for the Fund. Shares of Hydrofarm Holdings, a manufacturer and distributor of agriculture equipment and supplies, fell during the period. Earnings guidance was updated in February 2021 and was seen as mixed by market participants. The organization’s management also sold off a large portion of shares in September 2021. During the period, we initiated a position in the company on behalf of the Fund. Top absolute detractors from Fund performance for the period included Hydrofarm Holdings (Industrials), LHC Group (Healthcare), and II-VI (Information Technology).
Derivatives were not used in a significant manner in the Fund during the period and did not have a material impact on performance during the period.
What is the outlook as of the end of the period?
As of the end of the period, we believe several issues are emerging that will have near- and intermediate-term impacts. Infrastructure spending remains a key area of discussion and, while the negotiations around the large democratic bill and the Senate approved bipartisan bill remain stalled, our expectation remains that Congress will approve both bills with a total size of around $2.5 trillion. We also expect the U.S. debt ceiling will be extended. We believe this may provide some cushion for growth into 2022 with the caveat that a higher corporate tax rate may be included in the bills. Depending on the revenue required to offset the spending, we believe it could pose a challenge to future earnings growth.
In our opinion, the bigger question concerns expectations around inflation with companies struggling to offset higher input costs with higher pricing of their own goods and services, leading to margin compression. We believe that labor force participation rates may continue to increase as stimulus effects wane, and some supply chain disruptions may ease with the increased availability of vaccines globally, limiting the risk of runaway inflation. Still, we believe some of these higher costs are likely here to stay, and many companies have announced further price increases to offset cost pressures. Hence, we do expect some of the inflation to be sustained into the next year.
Lastly, we believe there are some lurking risks that are difficult to handicap, such as the deteriorating financial condition of Chinese real estate developers such as Evergrande and the high gas prices translating to increased power costs in Europe. Increased geopolitical tension is bringing increased attention to strategic industries such as semiconductors, electric vehicles, and robotics. We believe these industries are likely to see increased investment in local economies as
The Hartford Small Cap Growth Fund
Fund Overview – (continued)
October 31, 2021 (Unaudited)
each country tries to reduce reliance on imports. Given these factors, we believe it will be important to keep an eye on the U.S. Federal Reserve and other global central banks, as the manner in which the abundant liquidity is withdrawn from global economies will likely impact exchange rates and interest rates around the world and, in turn, affect prices of risk assets.
At the end of the period, the Fund’s largest overweights were to the Industrials, Real Estate and Consumer Staples sectors, while the Fund’s largest underweights were to the Healthcare, Energy, and Materials sectors, relative to the Russell 2000 Growth Index.
Important Risks
Investing involves risk, including the possible loss of principal. Security prices fluctuate in value depending on general market and economic conditions and the prospects of individual companies. • Small-cap securities can have greater risks, including liquidity risk, and volatility than large-cap securities. • Different investment styles may go in and out favor, which may cause the Fund to underperform the broader stock market. • To the extent the Fund focuses on one or more sectors, the Fund may be subject to increased volatility and risk of loss if adverse developments occur.
| Composition by Sector(1) |
| as of 10/31/2021 |
| Sector | Percentage
of Net Assets |
| Equity Securities | |
| Communication Services | 2.4% |
| Consumer Discretionary | 14.7 |
| Consumer Staples | 4.6 |
| Energy | 0.5 |
| Financials | 5.1 |
| Health Care | 25.6 |
| Industrials | 16.6 |
| Information Technology | 23.0 |
| Materials | 2.1 |
| Real Estate | 4.5 |
| Total | 99.1% |
| Short-Term Investments | 0.8 |
| Other Assets & Liabilities | 0.1 |
| Total | 100.0% |
| (1) | A sector may be comprised of several industries. For Fund compliance purposes, the Fund may not use the same classification system. These sector classifications are used for financial reporting purposes. |
Hartford Small Cap Value Fund
Fund Overview
October 31, 2021 (Unaudited)
Inception 01/01/2005
Sub-advised by Wellington Management Company LLP | Investment objective – The Fund seeks long-term capital appreciation. |
Comparison of Change in Value of $10,000 Investment (10/31/2011 - 10/31/2021)
The chart above represents the hypothetical growth of a $10,000 investment in Class A, which includes the maximum sales charge applicable to Class A shares. Returns for the Fund’s other classes will vary from what is seen above due to differences in the expenses charged to those share classes.
| Average Annual Total Returns |
| for the Periods Ending 10/31/2021 |
| | 1 Year | 5 Years | 10 Years |
| Class A1 | 62.61% | 12.33% | 11.03% |
| Class A2 | 53.67% | 11.06% | 10.41% |
| Class C1 | 61.49% | 11.50% | 10.21% |
| Class C3 | 60.49% | 11.50% | 10.21% |
| Class I1 | 63.20% | 12.70% | 11.28% |
| Class R31 | 62.64% | 12.15% | 10.84% |
| Class R41 | 62.83% | 12.40% | 11.13% |
| Class R51 | 63.34% | 12.77% | 11.47% |
| Class R61 | 63.49% | 12.84% | 11.53% |
| Class Y1 | 63.37% | 12.80% | 11.51% |
| Class F1 | 63.53% | 12.83% | 11.34% |
| Russell 2000 Value Index | 64.30% | 12.61% | 12.12% |
| 1 | Without sales charge |
| 2 | Reflects maximum sales charge of 5.50% |
| 3 | Reflects a contingent deferred sales charge of 1.00% |
PERFORMANCE DATA QUOTED REPRESENTS PAST PERFORMANCE AND DOES NOT GUARANTEE FUTURE RESULTS. The investment return and principal value of the investment will fluctuate so that investors’ shares, when redeemed, may be worth more or less than their original cost. The chart and table do not reflect the deductions of taxes that a shareholder would pay on Fund distributions or the redemption of Fund shares. Current performance may be lower or higher than the performance data quoted. To obtain performance data current to the most recent month-end, please visit our website hartfordfunds.com.
Total returns presented above were calculated using the applicable class' net asset value available to shareholders for sale or redemption of Fund shares on 10/31/2021, which may exclude investment transactions as of this date. All share class returns assume the reinvestment of all distributions at net asset value and the deduction of all fund expenses. The total returns presented in the Financial Highlights section of the report are calculated in the same manner, but also take into account certain
adjustments that are necessary under generally accepted accounting principles. As a result, the total returns in the Financial Highlights section may differ from the total returns presented above.
Class I shares commenced operations on 03/31/2015. Performance prior to that date is that of the Fund’s Class A shares (excluding sales charges). Class F shares commenced operations on 02/28/2017. Performance for Class F shares prior to 02/28/2017 reflects the performance of Class I shares from 03/31/2015 through 02/27/2017 and Class A shares (excluding sales charges) prior to 03/31/2015. Class R6 shares commenced operations on 02/28/2018. Performance prior to that date is that of the Fund’s Class Y shares.
To the extent a share class has adopted the prior performance of another share class that had different operating expenses, such performance has not been adjusted to reflect the different operating expenses. If the performance were adjusted, it may have been higher or lower.
Performance prior to 11/01/2018 reflects when the Fund pursued different strategies.
Performance information includes performance under the Fund’s previous sub-adviser, Hartford Investment Management Company. As of 06/04/2012, Hartford Investment Management Company no longer served as the sub-adviser to the Fund.
You cannot invest directly in an index.
See “Benchmark Glossary” for benchmark descriptions.
Performance information may reflect expense waivers/reimbursements without which performance would have been lower. For information on current expense waivers/reimbursements, please see the prospectus.
Hartford Small Cap Value Fund
Fund Overview – (continued)
October 31, 2021 (Unaudited)
| Operating Expenses* | Gross | Net |
| Class A | 1.41% | 1.30% |
| Class C | 2.15% | 2.05% |
| Class I | 1.04% | 1.00% |
| Class R3 | 1.63% | 1.50% |
| Class R4 | 1.33% | 1.20% |
| Class R5 | 1.03% | 0.90% |
| Class R6 | 0.92% | 0.80% |
| Class Y | 1.02% | 0.85% |
| Class F | 0.91% | 0.80% |
| * | Expenses as shown in the Fund’s most recent prospectus. Gross expenses do not reflect contractual expense reimbursement arrangements. Net expenses reflect such arrangements in instances when they reduce gross expenses. These arrangements remain in effect until 02/28/2022 unless the Fund’s Board of Directors approves an earlier termination. Actual expenses may be higher or lower. Please see accompanying Financial Highlights for expense ratios for the period ended 10/31/2021. |
Portfolio Manager
Sean M. Kammann
Managing Director and Equity Portfolio Manager
Wellington Management Company LLP
Manager Discussion
How did the Fund perform during the period?
The Class A shares of the Hartford Small Cap Value Fund returned 62.61%, before sales charges, for the twelve-month period ended October 31, 2021, underperforming the Fund’s benchmark, the Russell 2000 Value Index, which returned 64.30% for the same period. For the same period, the Class A shares of the Fund, before sales charges, underperformed the 66.45% average return of the Lipper Small-Cap Value Funds peer group, a group of funds with investment strategies similar to those of the Fund.
Why did the Fund perform this way?
United States (U.S.) equities, as measured by the S&P 500 Index, posted positive results over the trailing twelve-month period ending October 31, 2021. In the first half of 2021, U.S. equities gained amid a backdrop of improving coronavirus vaccination rates, accelerating economic growth, and a broader reopening of the economy. Inflation rose sharply, as robust demand for goods and services, along with significant global supply-chain disruptions, drove consumer and producer prices sharply higher. The U.S. Federal Reserve (Fed) maintained its view that elevated price pressures should prove transitory, but the Fed rattled markets by considerably raising its inflation forecast for 2021 and signaling the potential for two interest-rate increases in 2023. This shift in expectations triggered a rotation from value and cyclically sensitive stocks to growth stocks.
U.S. equities continued to climb in the third quarter of 2021 against a backdrop of accommodative monetary policy, robust corporate earnings, and strong demand for goods and services, while risk sentiment was pressured by anxiety about rising inflation, imminent monetary tightening, moderating economic growth, and uncertainty about fiscal stimulus and the federal debt ceiling. Growth stocks
outperformed their value counterparts for the quarter; however, surging U.S. Treasury yields sparked a sharp sell-off in shares of large technology companies at the end of September 2021, triggering a powerful rotation into value stocks. COVID-19 cases fell sharply in September 2021, although the proliferation of the COVID-19 Delta variant in July and August 2021 weighed on consumer confidence and dampened reopening momentum. The Fed trimmed its 2021 gross domestic product (GDP) growth forecast from 7% to 5.9% and delivered a clearer signal that it expects to begin reducing asset purchases later this year should current economic conditions persist.
During the period, returns varied by market cap, as large-cap equities, as measured by the S&P 500 Index, underperformed mid- and small-cap equities, as measured by the S&P MidCap 400 Index and Russell 2000 Value Index, respectively.
All of the eleven sectors in the Russell 2000 Value Index rose during the period, with the Energy (+180%), Communication Services (+111%), and Consumer Discretionary (+78%) sectors performing best. Conversely, the Utilities (+20%), Healthcare (+38%), and Consumer Staples (+43%) sectors lagged over the period.
Sector allocation, a result of our bottom-up stock selection process, drove the Fund’s underperformance relative to the Russell 2000 Value Index during the period. Most notably, the underweight to the Energy sector (given our focus on quality in addition to valuation and capital return) presented a large challenge as a result of the extreme positive performance in that market segment. To a much lesser extent, the Fund’s overweight positioning in the Consumer Staples sector also detracted from relative performance. This was partially offset by underweights to the Utilities and Healthcare sectors and an overweight to the Information Technology sector. Strong security selection within the Consumer Discretionary, Financials, and Information Technology
Hartford Small Cap Value Fund
Fund Overview – (continued)
October 31, 2021 (Unaudited)
sectors contributed positively to relative results during the period, while weaker selection within the Materials, Consumer Staples, and Industrials sectors partially offset these results.
The largest contributors to relative performance over the period were The Children’s Place (Consumer Discretionary), Movado (Consumer Discretionary), and Michaels (Consumer Discretionary). Shares of The Children’s Place, a children’s apparel retailer, benefited at the end of 2020 from increasing digital sales penetration and fleet optimization. Earnings for the second quarter of 2021 came in ahead of consensus estimates, driven by significant margin expansion and continued e-commerce strength. American watchmaker Movado reported revenue upside due to e-commerce acceleration as sales and gross margins increased significantly compared to the prior year period, due to Movado.com, U.S. wholesale, and Movado Company Stores. At the beginning of this year, specialty arts and crafts retailer Michaels entered into a merger agreement with Apollo Global Management. Under the terms of the agreement, Apollo would acquire all outstanding shares of Michaels in a tender offer of $22.00 per share, a 47% premium to the current share price.
The largest detractors from relative performance during the period were out-of-benchmark positions in Lancashire (Financials) and Energizer (Consumer Staples), as well as not holding GameStop (Consumer Discretionary), a constituent of the Russell 2000 Value Index during part of the period. Insurance provider Lancashire faced challenges at the end of the period due to higher natural catastrophe losses from Hurricane Ida and floods in Northwestern Europe, as well as large losses driven by unrest in South Africa. Energizer, a battery manufacturer, faced inflationary challenges such as increased costs for transportation, commodities, and labor, along with higher tariffs associated with sourced products.
Derivatives were not used in a significant manner in the Fund during the period and did not have a material impact on performance during the period.
What is the outlook as of the end of the period?
As of the end of the period, we continue to believe that science will allow us to continue to transition from pandemic to endemic; specifically, we expect that COVID-19 cases will become less significant as increasing numbers of people are vaccinated. We remain of the view that economic growth and inflation will be persistently higher during this market cycle than it was in the prior decade. We see fiscal and monetary policies that are structurally more pro-growth at a time of low unemployment, low inventories, and overly flush deposit bases at banks. While we continue to expect some of the inflation to be transitory, we also expect inflation to be longer lasting in labor and finished goods prices, which has historically been a favorable backdrop for the higher quality businesses we seek to invest in as we believe they can leverage inflation and their pricing power to accelerate earnings growth.
At the end of the period, the Fund was most overweight to the Financials, Information Technology, and Industrials sectors, and most underweight to the Real Estate, Healthcare, and Energy sectors relative to the Russell 2000 Value Index.
Important Risks
Investing involves risk, including the possible loss of principal. Security prices fluctuate in value depending on general market and economic conditions and the prospects of individual companies. • Small-cap securities can have greater risks, including liquidity risk, and volatility than large-cap securities. • Different investment styles may go in and out favor, which may cause the Fund to underperform the broader stock market. • To the extent the Fund focuses on one or more sectors, the Fund may be subject to increased volatility and risk of loss if adverse developments occur. • Foreign investments may be more volatile and less liquid than U.S. investments and are subject to the risk of currency fluctuations and adverse political, economic and regulatory developments.
| Composition by Sector(1) |
| as of 10/31/2021 |
| Sector | Percentage
of Net Assets |
| Equity Securities | |
| Communication Services | 0.8% |
| Consumer Discretionary | 11.5 |
| Consumer Staples | 4.3 |
| Energy | 1.7 |
| Financials | 33.4 |
| Health Care | 4.8 |
| Industrials | 20.7 |
| Information Technology | 12.4 |
| Materials | 3.1 |
| Real Estate | 3.2 |
| Utilities | 3.3 |
| Total | 99.2% |
| Short-Term Investments | 0.4 |
| Other Assets & Liabilities | 0.4 |
| Total | 100.0% |
| (1) | A sector may be comprised of several industries. For Fund compliance purposes, the Fund may not use the same classification system. These sector classifications are used for financial reporting purposes. |
The Hartford Small Company Fund
Fund Overview
October 31, 2021 (Unaudited)
Inception 07/22/1996
Sub-advised by Wellington Management Company LLP | Investment objective – The Fund seeks growth of capital. |
Comparison of Change in Value of $10,000 Investment (10/31/2011 - 10/31/2021)
The chart above represents the hypothetical growth of a $10,000 investment in Class A, which includes the maximum sales charge applicable to Class A shares. Returns for the Fund’s other classes will vary from what is seen above due to differences in the expenses charged to those share classes.
| Average Annual Total Returns |
| for the Periods Ending 10/31/2021 |
| | 1 Year | 5 Years | 10 Years |
| Class A1 | 30.50% | 22.84% | 15.11% |
| Class A2 | 23.32% | 21.46% | 14.46% |
| Class C1 | 29.39% | 21.86% | 14.24% |
| Class C3 | 28.39% | 21.86% | 14.24% |
| Class I1 | 30.84% | 23.16% | 15.40% |
| Class R31 | 30.04% | 22.54% | 14.86% |
| Class R41 | 30.46% | 22.91% | 15.21% |
| Class R51 | 30.85% | 23.27% | 15.56% |
| Class R61 | 30.97% | 23.36% | 15.65% |
| Class Y1 | 30.92% | 23.31% | 15.63% |
| Class F1 | 30.98% | 23.32% | 15.48% |
| Russell 2000 Growth Index | 38.45% | 17.90% | 14.57% |
| 1 | Without sales charge |
| 2 | Reflects maximum sales charge of 5.50% |
| 3 | Reflects a contingent deferred sales charge of 1.00% |
PERFORMANCE DATA QUOTED REPRESENTS PAST PERFORMANCE AND DOES NOT GUARANTEE FUTURE RESULTS. The investment return and principal value of the investment will fluctuate so that investors’ shares, when redeemed, may be worth more or less than their original cost. The chart and table do not reflect the deductions of taxes that a shareholder would pay on Fund distributions or the redemption of Fund shares. Current performance may be lower or higher than the performance data quoted. To obtain performance data current to the most recent month-end, please visit our website hartfordfunds.com.
Total returns presented above were calculated using the applicable class' net asset value available to shareholders for sale or redemption of Fund shares on 10/31/2021, which may exclude investment transactions as of this date. All share class returns assume the reinvestment of all distributions at net asset value and the deduction of all fund expenses. The total returns presented in the Financial Highlights section of the report are calculated in the same manner, but also take into account certain
adjustments that are necessary under generally accepted accounting principles. As a result, the total returns in the Financial Highlights section may differ from the total returns presented above.
Class R6 shares commenced operations on 11/07/2014. Performance prior to that date is that of the Fund’s Class Y shares. Class F shares commenced operations on 02/28/2017. Performance prior to that date is that of the Fund’s Class I shares.
To the extent a share class has adopted the prior performance of another share class that had different operating expenses, such performance has not been adjusted to reflect the different operating expenses. If the performance were adjusted, it may have been higher or lower.
You cannot invest directly in an index.
See “Benchmark Glossary” for benchmark descriptions.
Performance information may reflect expense waivers/reimbursements without which performance would have been lower.
| Operating Expenses* | Gross | Net |
| Class A | 1.32% | 1.32% |
| Class C | 2.14% | 2.14% |
| Class I | 1.00% | 1.00% |
| Class R3 | 1.61% | 1.61% |
| Class R4 | 1.30% | 1.30% |
| Class R5 | 1.01% | 1.01% |
| Class R6 | 0.90% | 0.90% |
| Class Y | 0.96% | 0.96% |
| Class F | 0.90% | 0.90% |
| * | Expenses as shown in the Fund’s most recent prospectus. Actual expenses may be higher or lower. Please see accompanying Financial Highlights for expense ratios for the period ended 10/31/2021. |
The Hartford Small Company Fund
Fund Overview – (continued)
October 31, 2021 (Unaudited)
Portfolio Managers
Steven C. Angeli, CFA
Senior Managing Director and Equity Portfolio Manager
Wellington Management Company LLP
John V. Schneider, CFA
Managing Director and Equity Research Analyst
Wellington Management Company LLP
Ranjit Ramachandran, CFA
Managing Director and Equity Research Analyst
Wellington Management Company LLP
Manager Discussion
How did the Fund perform during the period?
The Class A shares of The Hartford Small Company Fund returned 30.50%, before sales charges, for the twelve-month period ended October 31, 2021, underperforming the Fund’s benchmark, the Russell 2000 Growth Index, which returned 38.45% for the same period. For the same period, the Class A shares of the Fund, before sales charges, underperformed the 45.31% average return of the Lipper Small-Cap Growth Funds peer group, a group of funds with investment strategies similar to those of the Fund.
Why did the Fund perform this way?
United States (U.S.) equities, as measured by the S&P 500 Index, posted positive results over the trailing twelve-month period ending October 31, 2021. Small-cap growth equities outperformed the broader market during this period. In the first half of 2021, U.S. equities gained amid a backdrop of improving vaccination rates, accelerating economic growth, and a broader reopening of the economy. Inflation rose sharply, as robust demand for goods and services, along with significant global supply-chain disruptions, drove consumer and producer prices sharply higher.
The U.S. Federal Reserve (Fed) maintained its view that elevated price pressures may prove transitory, but the Fed rattled markets by considerably raising its inflation forecast for 2021 and signaling the potential for two interest-rate increases in 2023. This shift in expectations toward tighter monetary policy triggered a rotation from value and cyclically sensitive equities to growth equities. U.S. equities continued to climb in the third quarter of 2021 against a backdrop of accommodative monetary policy, robust corporate earnings, and strong demand for goods and services, while risk sentiment was pressured by anxiety about rising inflation, imminent monetary tightening by the Fed, moderating economic growth, and uncertainty about fiscal stimulus and the federal debt ceiling. Growth equities outperformed their value counterparts for the quarter; however, surging U.S. Treasury yields sparked a sharp sell-off in shares of large technology companies at the end of September 2021, triggering a powerful rotation into value equities. COVID-19 cases fell sharply in September, although the proliferation of the Delta variant in July and August 2021 weighed on consumer confidence and dampened
momentum from businesses reopening. The Fed trimmed its 2021 gross domestic product (GDP) growth forecast to 5.9%, from 7%, and delivered a clearer signal that it would begin to taper asset purchases later this year if economic conditions remain stable.
Returns varied by market cap during the period. Small-cap equities, as measured by the Russell 2000 Index, outperformed large-cap equities, as measured by the Russell 1000 Index, and mid-cap equities, as measured by the Russell Midcap Index. Narrowing the focus to small caps, value led growth by over +2500 basis points (bps) over the trailing year, as measured by the Russell 2000 Value and Growth Indices, as cyclicals benefited from excitement around the reopening of the economy. To provide some context, the magnitude of value’s outperformance versus growth over the past year is something that has not been seen since the technology, media and telecommunications (TMT) bubble burst in the early 2000s.
All eleven sectors in the Russell 2000 Growth Index had positive returns during the period. The Energy (+183%), Industrials (+61%), and Information Technology (+55%) sectors increased the most, while the Healthcare (+15%), Communication Services (+32%), and Consumer Staples (+32%) sectors lagged the broader index.
During the period, security selection was the primary driver of the Fund’s underperformance relative to the Russell 2000 Growth Index. Selection in the Healthcare, Industrials, and Consumer Discretionary sectors detracted from relative performance, partially offset by stronger selection in the Information Technology and Financials sectors. Sector allocation, a result of our bottom-up stock selection process, contributed positively to relative performance, primarily driven by the Fund’s overweight allocation to the Information Technology and Consumer Discretionary sectors.
The top detractors from relative performance during the period included Ollie’s Bargain Outlet (Consumer Discretionary), Chegg (Consumer Discretionary), and Multiplan (Healthcare). Shares of Ollie’s Bargain Outlet fell during the period as investors reacted negatively to the discount retailer’s second-quarter earnings report. Results were weak against last year’s record results, when the company benefited from the initial retail backdrop stemming from the coronavirus pandemic by keeping its stores open. Additionally, Ollie’s
The Hartford Small Company Fund
Fund Overview – (continued)
October 31, 2021 (Unaudited)
cut its margin forecast for the full year, citing significantly higher supply chain costs in the second half. Shares of Chegg, an online education platform, lagged the Russell 2000 Growth Index over the period. In some ways, the market has viewed the stock as a beneficiary of the conditions surrounding the coronavirus pandemic, which allowed it to increase subscriptions and combat password sharing more effectively in a remote learning environment. The concern was that a return to a more normal education setting could mark a slowing of growth. We sold the Fund’s position at the end of the period on concerns around slowing subscriber additions. Shares of Multiplan, a digital cost management solutions provider to the healthcare industry, traded down after a key client was rumored to have plans to leave the provider. Top absolute detractors from the Fund’s performance for the period included The RealReal (Consumer Discretionary) and Bandwidth (Communication Services).
By contrast, some of the top contributors to relative performance included Perficient (Information Technology), Western Alliance Bancorp (Financials), and Skillz (Communication Services). The share price of Perficient, a digital consultancy firm, rose during the period after posting strong second-quarter fiscal year 2021 results and raising its outlook. The company won larger contracts with existing clients, reinforcing its ability to maintain competitive advantages and its “land and expand” model. We trimmed the Fund’s position to manage exposure but remained overweight at the end of the period. Shares of Western Alliance Bancorp, a bank holding company serving clients in Nevada, Arizona, and California, rose after management reported strong results over the period. Both loan and deposits showed robust growth and net interest income beat consensus expectations on the back of improving credit trends. Western Alliance’s acquisition of AmeriHome was viewed as accretive to projected 2022 earnings including cross-selling opportunities in the consumer direct channel. Finally, the share price of Skillz, a mobile game platform, rose following its trading debut in December 2020. The Fund exited the position in February after market exuberance caused valuations to become stretched. Top absolute contributors to the Fund’s performance for the period included Perficient (Information Technology) and Western Alliance Bancorp (Financials).
Derivatives were not used in a significant manner in the Fund during the period and did not have a material impact on performance during the period.
What is the outlook as of the end of the period?
Toward the end of the period, we began trimming or eliminating equities in the Fund that performed strongly and, in many cases, benefitted from the re-opening of the economy. This corresponds to the Fund’s reduced exposure in the Consumer Discretionary and Industrials sectors, using these segments as a source of funds to add to the Fund’s exposure within select areas of the Information Technology (payments, software, etc.) and Healthcare sectors where we are finding better opportunities in our up/down valuation framework in our view.
As of the end of the period, we believe the Fund maintained a good degree of balance with a nice mix of strong, secular growers as well as some cyclically oriented exposures more tied to a continued economic recovery. We avoid leaning too heavily on any one scenario, instead letting our upside/downside valuation framework to seek to guide us to the best opportunities at a given point in time.
At the end of the period, the Fund’s largest overweights were to the Information Technology, Consumer Discretionary, and Communication Services sectors, while the Fund’s largest underweights were to the Consumer Staples, Healthcare, and Materials sectors, relative to the Russell 2000 Growth Index.
Important Risks
Investing involves risk, including the possible loss of principal. Security prices fluctuate in value depending on general market and economic conditions and the prospects of individual companies. • Small-cap securities can have greater risks, including liquidity risk, and volatility than large-cap securities. • Different investment styles may go in and out favor, which may cause the Fund to underperform the broader stock market. • Foreign investments may be more volatile and less liquid than U.S. investments and are subject to the risk of currency fluctuations and adverse political, economic and regulatory developments. • To the extent the Fund focuses on one or more sectors, the Fund may be subject to increased volatility and risk of loss if adverse developments occur. • The Fund may have high portfolio turnover, which could increase its transaction costs and an investor’s tax liability.
| Composition by Sector(1) |
| as of 10/31/2021 |
| Sector | Percentage
of Net Assets |
| Equity Securities | |
| Communication Services | 4.1% |
| Consumer Discretionary | 16.3 |
| Energy | 2.3 |
| Financials | 6.5 |
| Health Care | 24.9 |
| Industrials | 12.8 |
| Information Technology | 28.6 |
| Materials | 0.7 |
| Real Estate | 2.6 |
| Total | 98.8% |
| Short-Term Investments | 3.2 |
| Other Assets & Liabilities | (2.0) |
| Total | 100.0% |
| (1) | A sector may be comprised of several industries. For Fund compliance purposes, the Fund may not use the same classification system. These sector classifications are used for financial reporting purposes. |
Hartford Domestic Equity Funds
Benchmark Glossary (Unaudited)
| Russell 1000 Growth Index (reflects no deduction for fees, expenses or taxes) is designed to measure the performance of those Russell 1000 Index companies with higher price-to-book ratios and higher forecasted growth values. The Russell 1000 Index is designed to measure the performance of the 1,000 largest companies in the Russell 3000 Index based on their market capitalization and current index membership. |
| Russell 1000 Value Index (reflects no deduction for fees, expenses or taxes) is designed to measure the performance of those Russell 1000 Index companies with lower price-to-book ratios and lower forecasted growth values. The Russell 1000 Index is designed to measure the performance of the 1,000 largest companies in the Russell 3000 Index based on their market capitalization and current index membership. |
| Russell 2000 Growth Index (reflects no deduction for fees, expenses or taxes) is designed to measure the performance of those Russell 2000 Index companies with higher price-to-book ratios and higher forecasted growth values. The Russell 2000 Index is an index comprised of 2,000 of the smallest U.S.-domiciled company common stocks based on a combination of their market capitalization and current index membership. |
| Russell 2000 Value Index (reflects no deduction for fees, expenses or taxes) is designed to measure the performance of those Russell 2000 Index companies with lower price-to-book ratios and lower forecasted growth values. The Russell 2000 Index is an index comprised of 2,000 of the smallest U.S.-domiciled company common stocks based on a combination of their market capitalization and current index membership. |
| Russell 3000 Growth Index (reflects no deduction for fees, expenses or taxes) is designed to measure the performance of those Russell 3000 Index companies with higher price-to-book ratios and higher forecasted growth values. The Russell 3000 Index is designed to measures the performance of the 3,000 largest U.S. companies based on total market capitalization. |
| Russell 3000 Index (reflects no deduction for fees, expenses or taxes) is designed to measure the performance of the 3,000 largest U.S. companies based on total market capitalization. |
| Russell Midcap Value Index (reflects no deduction for fees, expenses or taxes) is designed to measure the performance of the mid-cap value segment of the U.S. equity universe. It includes those Russell Midcap Index companies with lower price-to-book ratios and lower forecasted growth values. |
| S&P 500 Index (reflects no deduction for fees, expenses or taxes) is a float-adjusted market capitalization-weighted price index composed of 500 widely held common stocks. |
| S&P Composite 1500 Health Care Index (reflects no deduction for fees, expenses or taxes) is a float-adjusted market capitalization-weighted index comprised of those companies included in the S&P Composite 1500 that are classified as members of the Global Industry Classification Standard (GICS®) health care sector. |
| S&P MidCap 400 Index (reflects no deduction for fees, expenses or taxes) is a float-adjusted market capitalization-weighted index designed to measure the performance of the mid-cap segment of the market. The index is composed of 400 constituent companies. |
Hartford Domestic Equity Funds
Expense Examples (Unaudited)
Your Fund's Expenses
As a shareholder of a Fund, you incur two types of costs: (1) transaction costs, including sales charges (loads) on purchase payments, if any, and contingent deferred sales charges (CDSC), if any, and (2) ongoing costs, including investment management fees, distribution and/or service (12b-1) fees, if any, and other fund expenses. This example is intended to help you understand your ongoing costs (in dollars) of investing in a Fund and to compare these costs with the ongoing costs of investing in other mutual funds. The example is based on an investment of $1,000 invested at the beginning of the period and held for the entire period of May 1, 2021 through October 31, 2021. To the extent a Fund was subject to acquired fund fees and expenses during the period, acquired fund fees and expenses are not included in the annualized expense ratios below.
Actual Expenses
The first set of columns of the table below provides information about actual account values and actual expenses. You may use this information, together with the amount you invested, to estimate the expenses that you paid over the period. Simply divide your account value by $1,000 (for example, an $8,600 account value divided by $1,000 = 8.6), then multiply the result by the number in the line under the heading entitled “Expenses Paid During The Period” to estimate the expenses you paid on your account during this period.
Hypothetical Example for Comparison Purposes
The second set of columns of the table below provides information about hypothetical account values and hypothetical expenses based on a Fund’s actual expense ratio and an assumed rate of return of 5% per year before expenses, which is not the Fund’s actual return. The hypothetical account values and expenses may not be used to estimate the actual ending account balance or expenses you paid for the period. You may use this information to compare the ongoing costs of investing in a Fund and other funds. To do so, compare this 5% hypothetical example with the 5% hypothetical examples that appear in the shareholder reports of the other funds.
Please note that the expenses shown in the table are meant to highlight your ongoing costs only and do not reflect any transactional costs, such as sales charges (loads and CDSC). Therefore, the second set of columns of the table is useful in comparing ongoing costs only, and will not help you determine the relative total costs of owning different funds. In addition, if these transactional costs were included, your costs would be higher. Expenses for a class of a Fund are equal to the class' annualized expense ratio multiplied by average account value over the period, multiplied by 184/365 (to reflect the one-half year period).
| | Actual Return | | Hypothetical (5% return before expenses) |
| | Beginning
Account Value
May 1, 2021 | | Ending
Account Value
October 31, 2021 | | Expenses paid
during the period
May 1, 2021
through
October 31, 2021 | | Beginning
Account Value
May 1, 2021 | | Ending
Account Value
October 31, 2021 | | Expenses paid
during the period
May 1, 2021
through
October 31, 2021 | | Annualized
expense
ratio |
| The Hartford Capital Appreciation Fund |
| Class A | $ 1,000.00 | | $ 1,037.80 | | $ 5.29 | | $ 1,000.00 | | $ 1,020.01 | | $ 5.24 | | 1.03% |
| Class C | $ 1,000.00 | | $ 1,033.90 | | $ 9.33 | | $ 1,000.00 | | $ 1,016.03 | | $ 9.25 | | 1.82% |
| Class I | $ 1,000.00 | | $ 1,039.20 | | $ 3.96 | | $ 1,000.00 | | $ 1,021.32 | | $ 3.92 | | 0.77% |
| Class R3 | $ 1,000.00 | | $ 1,035.80 | | $ 7.24 | | $ 1,000.00 | | $ 1,018.10 | | $ 7.17 | | 1.41% |
| Class R4 | $ 1,000.00 | | $ 1,037.40 | | $ 5.65 | | $ 1,000.00 | | $ 1,019.66 | | $ 5.60 | | 1.10% |
| Class R5 | $ 1,000.00 | | $ 1,039.30 | | $ 4.11 | | $ 1,000.00 | | $ 1,021.17 | | $ 4.08 | | 0.80% |
| Class R6 | $ 1,000.00 | | $ 1,039.70 | | $ 3.55 | | $ 1,000.00 | | $ 1,021.73 | | $ 3.52 | | 0.69% |
| Class Y | $ 1,000.00 | | $ 1,039.20 | | $ 4.11 | | $ 1,000.00 | | $ 1,021.17 | | $ 4.08 | | 0.80% |
| Class F | $ 1,000.00 | | $ 1,039.70 | | $ 3.55 | | $ 1,000.00 | | $ 1,021.73 | | $ 3.52 | | 0.69% |
| Hartford Core Equity Fund |
| Class A | $ 1,000.00 | | $ 1,092.70 | | $ 3.69 | | $ 1,000.00 | | $ 1,021.68 | | $ 3.57 | | 0.70% |
| Class C | $ 1,000.00 | | $ 1,088.80 | | $ 7.63 | | $ 1,000.00 | | $ 1,017.90 | | $ 7.38 | | 1.45% |
| Class I | $ 1,000.00 | | $ 1,094.20 | | $ 2.43 | | $ 1,000.00 | | $ 1,022.89 | | $ 2.35 | | 0.46% |
| Class R3 | $ 1,000.00 | | $ 1,090.90 | | $ 5.64 | | $ 1,000.00 | | $ 1,019.81 | | $ 5.45 | | 1.07% |
| Class R4 | $ 1,000.00 | | $ 1,092.50 | | $ 3.85 | | $ 1,000.00 | | $ 1,021.53 | | $ 3.72 | | 0.73% |
| Class R5 | $ 1,000.00 | | $ 1,094.10 | | $ 2.48 | | $ 1,000.00 | | $ 1,022.84 | | $ 2.40 | | 0.47% |
| Class R6 | $ 1,000.00 | | $ 1,094.60 | | $ 1.90 | | $ 1,000.00 | | $ 1,023.39 | | $ 1.84 | | 0.36% |
| Class Y | $ 1,000.00 | | $ 1,094.20 | | $ 2.32 | | $ 1,000.00 | | $ 1,022.99 | | $ 2.24 | | 0.44% |
| Class F | $ 1,000.00 | | $ 1,094.80 | | $ 1.90 | | $ 1,000.00 | | $ 1,023.39 | | $ 1.84 | | 0.36% |
Hartford Domestic Equity Funds
Expense Examples (Unaudited) – (continued)
| | Actual Return | | Hypothetical (5% return before expenses) |
| | Beginning
Account Value
May 1, 2021 | | Ending
Account Value
October 31, 2021 | | Expenses paid
during the period
May 1, 2021
through
October 31, 2021 | | Beginning
Account Value
May 1, 2021 | | Ending
Account Value
October 31, 2021 | | Expenses paid
during the period
May 1, 2021
through
October 31, 2021 | | Annualized
expense
ratio |
| The Hartford Dividend and Growth Fund |
| Class A | $ 1,000.00 | | $ 1,086.00 | | $ 5.05 | | $ 1,000.00 | | $ 1,020.37 | | $ 4.89 | | 0.96% |
| Class C | $ 1,000.00 | | $ 1,081.60 | | $ 9.13 | | $ 1,000.00 | | $ 1,016.43 | | $ 8.84 | | 1.74% |
| Class I | $ 1,000.00 | | $ 1,087.20 | | $ 3.79 | | $ 1,000.00 | | $ 1,021.58 | | $ 3.67 | | 0.72% |
| Class R3 | $ 1,000.00 | | $ 1,083.70 | | $ 7.14 | | $ 1,000.00 | | $ 1,018.35 | | $ 6.92 | | 1.36% |
| Class R4 | $ 1,000.00 | | $ 1,085.40 | | $ 5.36 | | $ 1,000.00 | | $ 1,020.06 | | $ 5.19 | | 1.02% |
| Class R5 | $ 1,000.00 | | $ 1,087.20 | | $ 3.84 | | $ 1,000.00 | | $ 1,021.53 | | $ 3.72 | | 0.73% |
| Class R6 | $ 1,000.00 | | $ 1,088.00 | | $ 3.32 | | $ 1,000.00 | | $ 1,022.03 | | $ 3.21 | | 0.63% |
| Class Y | $ 1,000.00 | | $ 1,087.50 | | $ 3.53 | | $ 1,000.00 | | $ 1,021.83 | | $ 3.41 | | 0.67% |
| Class F | $ 1,000.00 | | $ 1,087.70 | | $ 3.32 | | $ 1,000.00 | | $ 1,022.03 | | $ 3.21 | | 0.63% |
| The Hartford Equity Income Fund |
| Class A | $ 1,000.00 | | $ 1,067.60 | | $ 5.11 | | $ 1,000.00 | | $ 1,020.27 | | $ 4.99 | | 0.98% |
| Class C | $ 1,000.00 | | $ 1,063.00 | | $ 9.05 | | $ 1,000.00 | | $ 1,016.43 | | $ 8.84 | | 1.74% |
| Class I | $ 1,000.00 | | $ 1,068.50 | | $ 3.86 | | $ 1,000.00 | | $ 1,021.48 | | $ 3.77 | | 0.74% |
| Class R3 | $ 1,000.00 | | $ 1,065.30 | | $ 7.08 | | $ 1,000.00 | | $ 1,018.35 | | $ 6.92 | | 1.36% |
| Class R4 | $ 1,000.00 | | $ 1,067.00 | | $ 5.42 | | $ 1,000.00 | | $ 1,019.96 | | $ 5.30 | | 1.04% |
| Class R5 | $ 1,000.00 | | $ 1,068.60 | | $ 3.96 | | $ 1,000.00 | | $ 1,021.37 | | $ 3.87 | | 0.76% |
| Class R6 | $ 1,000.00 | | $ 1,069.00 | | $ 3.39 | | $ 1,000.00 | | $ 1,021.93 | | $ 3.31 | | 0.65% |
| Class Y | $ 1,000.00 | | $ 1,068.40 | | $ 3.86 | | $ 1,000.00 | | $ 1,021.48 | | $ 3.77 | | 0.74% |
| Class F | $ 1,000.00 | | $ 1,068.90 | | $ 3.39 | | $ 1,000.00 | | $ 1,021.93 | | $ 3.31 | | 0.65% |
| The Hartford Growth Opportunities Fund |
| Class A | $ 1,000.00 | | $ 1,052.90 | | $ 5.48 | | $ 1,000.00 | | $ 1,019.86 | | $ 5.40 | | 1.06% |
| Class C | $ 1,000.00 | | $ 1,048.80 | | $ 9.45 | | $ 1,000.00 | | $ 1,015.98 | | $ 9.30 | | 1.83% |
| Class I | $ 1,000.00 | | $ 1,054.20 | | $ 4.30 | | $ 1,000.00 | | $ 1,021.02 | | $ 4.23 | | 0.83% |
| Class R3 | $ 1,000.00 | | $ 1,050.90 | | $ 7.50 | | $ 1,000.00 | | $ 1,017.90 | | $ 7.38 | | 1.45% |
| Class R4 | $ 1,000.00 | | $ 1,052.60 | | $ 5.90 | | $ 1,000.00 | | $ 1,019.46 | | $ 5.80 | | 1.14% |
| Class R5 | $ 1,000.00 | | $ 1,054.20 | | $ 4.35 | | $ 1,000.00 | | $ 1,020.97 | | $ 4.28 | | 0.84% |
| Class R6 | $ 1,000.00 | | $ 1,054.80 | | $ 3.83 | | $ 1,000.00 | | $ 1,021.48 | | $ 3.77 | | 0.74% |
| Class Y | $ 1,000.00 | | $ 1,054.00 | | $ 4.45 | | $ 1,000.00 | | $ 1,020.87 | | $ 4.38 | | 0.86% |
| Class F | $ 1,000.00 | | $ 1,054.70 | | $ 3.78 | | $ 1,000.00 | | $ 1,021.53 | | $ 3.72 | | 0.73% |
| The Hartford Healthcare Fund |
| Class A | $ 1,000.00 | | $ 1,045.80 | | $ 6.39 | | $ 1,000.00 | | $ 1,018.95 | | $ 6.31 | | 1.24% |
| Class C | $ 1,000.00 | | $ 1,041.50 | | $ 10.34 | | $ 1,000.00 | | $ 1,015.07 | | $ 10.21 | | 2.01% |
| Class I | $ 1,000.00 | | $ 1,047.00 | | $ 5.11 | | $ 1,000.00 | | $ 1,020.21 | | $ 5.04 | | 0.99% |
| Class R3 | $ 1,000.00 | | $ 1,043.70 | | $ 8.19 | | $ 1,000.00 | | $ 1,017.19 | | $ 8.08 | | 1.59% |
| Class R4 | $ 1,000.00 | | $ 1,045.30 | | $ 6.65 | | $ 1,000.00 | | $ 1,018.70 | | $ 6.56 | | 1.29% |
| Class R5 | $ 1,000.00 | | $ 1,046.90 | | $ 5.21 | | $ 1,000.00 | | $ 1,020.11 | | $ 5.14 | | 1.01% |
| Class R6 | $ 1,000.00 | | $ 1,047.40 | | $ 4.59 | | $ 1,000.00 | | $ 1,020.72 | | $ 4.53 | | 0.89% |
| Class Y | $ 1,000.00 | | $ 1,046.90 | | $ 5.11 | | $ 1,000.00 | | $ 1,020.21 | | $ 5.04 | | 0.99% |
| Class F | $ 1,000.00 | | $ 1,047.60 | | $ 4.59 | | $ 1,000.00 | | $ 1,020.72 | | $ 4.53 | | 0.89% |
| The Hartford MidCap Fund |
| Class A | $ 1,000.00 | | $ 1,000.30 | | $ 5.45 | | $ 1,000.00 | | $ 1,019.76 | | $ 5.50 | | 1.08% |
| Class C | $ 1,000.00 | | $ 996.10 | | $ 9.26 | | $ 1,000.00 | | $ 1,015.93 | | $ 9.35 | | 1.84% |
| Class I | $ 1,000.00 | | $ 1,001.00 | | $ 4.34 | | $ 1,000.00 | | $ 1,020.87 | | $ 4.38 | | 0.86% |
| Class R3 | $ 1,000.00 | | $ 998.30 | | $ 7.35 | | $ 1,000.00 | | $ 1,017.85 | | $ 7.43 | | 1.46% |
| Class R4 | $ 1,000.00 | | $ 999.80 | | $ 5.75 | | $ 1,000.00 | | $ 1,019.46 | | $ 5.80 | | 1.14% |
| Class R5 | $ 1,000.00 | | $ 1,001.30 | | $ 4.19 | | $ 1,000.00 | | $ 1,021.02 | | $ 4.23 | | 0.83% |
| Class R6 | $ 1,000.00 | | $ 1,001.90 | | $ 3.73 | | $ 1,000.00 | | $ 1,021.48 | | $ 3.77 | | 0.74% |
| Class Y | $ 1,000.00 | | $ 1,001.70 | | $ 3.88 | | $ 1,000.00 | | $ 1,021.32 | | $ 3.92 | | 0.77% |
| Class F | $ 1,000.00 | | $ 1,002.10 | | $ 3.68 | | $ 1,000.00 | | $ 1,021.53 | | $ 3.72 | | 0.73% |
Hartford Domestic Equity Funds
Expense Examples (Unaudited) – (continued)
| | Actual Return | | Hypothetical (5% return before expenses) |
| | Beginning
Account Value
May 1, 2021 | | Ending
Account Value
October 31, 2021 | | Expenses paid
during the period
May 1, 2021
through
October 31, 2021 | | Beginning
Account Value
May 1, 2021 | | Ending
Account Value
October 31, 2021 | | Expenses paid
during the period
May 1, 2021
through
October 31, 2021 | | Annualized
expense
ratio |
| The Hartford MidCap Value Fund |
| Class A | $ 1,000.00 | | $ 1,027.20 | | $ 5.98 | | $ 1,000.00 | | $ 1,019.31 | | $ 5.96 | | 1.17% |
| Class C | $ 1,000.00 | | $ 1,023.70 | | $ 9.84 | | $ 1,000.00 | | $ 1,015.48 | | $ 9.80 | | 1.93% |
| Class I | $ 1,000.00 | | $ 1,029.10 | | $ 4.30 | | $ 1,000.00 | | $ 1,020.97 | | $ 4.28 | | 0.84% |
| Class R3 | $ 1,000.00 | | $ 1,025.10 | | $ 7.66 | | $ 1,000.00 | | $ 1,017.64 | | $ 7.63 | | 1.50% |
| Class R4 | $ 1,000.00 | | $ 1,026.70 | | $ 6.08 | | $ 1,000.00 | | $ 1,019.21 | | $ 6.06 | | 1.19% |
| Class R5 | $ 1,000.00 | | $ 1,028.30 | | $ 4.60 | | $ 1,000.00 | | $ 1,020.67 | | $ 4.58 | | 0.90% |
| Class Y | $ 1,000.00 | | $ 1,028.80 | | $ 4.55 | | $ 1,000.00 | | $ 1,020.72 | | $ 4.53 | | 0.89% |
| Class F | $ 1,000.00 | | $ 1,029.10 | | $ 3.94 | | $ 1,000.00 | | $ 1,021.32 | | $ 3.92 | | 0.77% |
| Hartford Quality Value Fund |
| Class A | $ 1,000.00 | | $ 1,067.50 | | $ 5.00 | | $ 1,000.00 | | $ 1,020.37 | | $ 4.89 | | 0.96% |
| Class C | $ 1,000.00 | | $ 1,063.70 | | $ 8.89 | | $ 1,000.00 | | $ 1,016.59 | | $ 8.69 | | 1.71% |
| Class I | $ 1,000.00 | | $ 1,069.30 | | $ 3.34 | | $ 1,000.00 | | $ 1,021.98 | | $ 3.26 | | 0.64% |
| Class R3 | $ 1,000.00 | | $ 1,066.30 | | $ 6.15 | | $ 1,000.00 | | $ 1,019.26 | | $ 6.01 | | 1.18% |
| Class R4 | $ 1,000.00 | | $ 1,068.00 | | $ 4.59 | | $ 1,000.00 | | $ 1,020.77 | | $ 4.48 | | 0.88% |
| Class R5 | $ 1,000.00 | | $ 1,069.30 | | $ 3.29 | | $ 1,000.00 | | $ 1,022.03 | | $ 3.21 | | 0.63% |
| Class R6 | $ 1,000.00 | | $ 1,070.40 | | $ 2.40 | | $ 1,000.00 | | $ 1,022.89 | | $ 2.35 | | 0.46% |
| Class Y | $ 1,000.00 | | $ 1,070.10 | | $ 2.97 | | $ 1,000.00 | | $ 1,022.33 | | $ 2.91 | | 0.57% |
| Class F | $ 1,000.00 | | $ 1,070.40 | | $ 2.40 | | $ 1,000.00 | | $ 1,022.89 | | $ 2.35 | | 0.46% |
| The Hartford Small Cap Growth Fund |
| Class A | $ 1,000.00 | | $ 1,004.80 | | $ 5.91 | | $ 1,000.00 | | $ 1,019.31 | | $ 5.96 | | 1.17% |
| Class C | $ 1,000.00 | | $ 1,001.50 | | $ 9.33 | | $ 1,000.00 | | $ 1,015.88 | | $ 9.40 | | 1.85% |
| Class I | $ 1,000.00 | | $ 1,006.60 | | $ 4.25 | | $ 1,000.00 | | $ 1,020.97 | | $ 4.28 | | 0.84% |
| Class R3 | $ 1,000.00 | | $ 1,003.20 | | $ 7.52 | | $ 1,000.00 | | $ 1,017.69 | | $ 7.58 | | 1.49% |
| Class R4 | $ 1,000.00 | | $ 1,004.90 | | $ 5.86 | | $ 1,000.00 | | $ 1,019.36 | | $ 5.90 | | 1.16% |
| Class R5 | $ 1,000.00 | | $ 1,006.30 | | $ 4.45 | | $ 1,000.00 | | $ 1,020.77 | | $ 4.48 | | 0.88% |
| Class R6 | $ 1,000.00 | | $ 1,006.90 | | $ 3.84 | | $ 1,000.00 | | $ 1,021.37 | | $ 3.87 | | 0.76% |
| Class Y | $ 1,000.00 | | $ 1,006.60 | | $ 4.15 | | $ 1,000.00 | | $ 1,021.07 | | $ 4.18 | | 0.82% |
| Class F | $ 1,000.00 | | $ 1,007.00 | | $ 3.84 | | $ 1,000.00 | | $ 1,021.37 | | $ 3.87 | | 0.76% |
| Hartford Small Cap Value Fund |
| Class A | $ 1,000.00 | | $ 979.50 | | $ 6.44 | | $ 1,000.00 | | $ 1,018.70 | | $ 6.56 | | 1.29% |
| Class C | $ 1,000.00 | | $ 976.20 | | $ 10.21 | | $ 1,000.00 | | $ 1,014.87 | | $ 10.41 | | 2.05% |
| Class I | $ 1,000.00 | | $ 981.00 | | $ 4.89 | | $ 1,000.00 | | $ 1,020.27 | | $ 4.99 | | 0.98% |
| Class R3 | $ 1,000.00 | | $ 979.60 | | $ 7.19 | | $ 1,000.00 | | $ 1,017.95 | | $ 7.32 | | 1.44% |
| Class R4 | $ 1,000.00 | | $ 980.60 | | $ 5.99 | | $ 1,000.00 | | $ 1,019.16 | | $ 6.11 | | 1.20% |
| Class R5 | $ 1,000.00 | | $ 981.90 | | $ 4.50 | | $ 1,000.00 | | $ 1,020.67 | | $ 4.58 | | 0.90% |
| Class R6 | $ 1,000.00 | | $ 981.90 | | $ 4.00 | | $ 1,000.00 | | $ 1,021.17 | | $ 4.08 | | 0.80% |
| Class Y | $ 1,000.00 | | $ 982.60 | | $ 4.25 | | $ 1,000.00 | | $ 1,020.92 | | $ 4.33 | | 0.85% |
| Class F | $ 1,000.00 | | $ 982.40 | | $ 4.00 | | $ 1,000.00 | | $ 1,021.17 | | $ 4.08 | | 0.80% |
| The Hartford Small Company Fund |
| Class A | $ 1,000.00 | | $ 984.40 | | $ 6.15 | | $ 1,000.00 | | $ 1,019.00 | | $ 6.26 | | 1.23% |
| Class C | $ 1,000.00 | | $ 980.00 | | $ 10.18 | | $ 1,000.00 | | $ 1,014.92 | | $ 10.36 | | 2.04% |
| Class I | $ 1,000.00 | | $ 985.50 | | $ 4.85 | | $ 1,000.00 | | $ 1,020.32 | | $ 4.94 | | 0.97% |
| Class R3 | $ 1,000.00 | | $ 982.40 | | $ 7.94 | | $ 1,000.00 | | $ 1,017.19 | | $ 8.08 | | 1.59% |
| Class R4 | $ 1,000.00 | | $ 984.00 | | $ 6.35 | | $ 1,000.00 | | $ 1,018.80 | | $ 6.46 | | 1.27% |
| Class R5 | $ 1,000.00 | | $ 985.20 | | $ 4.95 | | $ 1,000.00 | | $ 1,020.21 | | $ 5.04 | | 0.99% |
| Class R6 | $ 1,000.00 | | $ 986.10 | | $ 4.31 | | $ 1,000.00 | | $ 1,020.87 | | $ 4.38 | | 0.86% |
| Class Y | $ 1,000.00 | | $ 985.80 | | $ 4.60 | | $ 1,000.00 | | $ 1,020.57 | | $ 4.69 | | 0.92% |
| Class F | $ 1,000.00 | | $ 985.90 | | $ 4.25 | | $ 1,000.00 | | $ 1,020.92 | | $ 4.33 | | 0.85% |
The Hartford Capital Appreciation Fund
Schedule of Investments
October 31, 2021
| Shares or Principal Amount | | Market Value† |
| COMMON STOCKS - 96.1% |
| | Automobiles & Components - 0.8% |
| 664,770 | Arrival S.A.*(1) | $ 10,988,648 |
| 2,017,201 | Ford Motor Co.* | 34,453,793 |
| 172,302 | Thor Industries, Inc. | 17,567,912 |
| | | | 63,010,353 |
| | Banks - 2.1% |
| 873,529 | Bank of America Corp. | 41,737,216 |
| 174,665 | JP Morgan Chase & Co. | 29,673,837 |
| 395,825 | Western Alliance Bancorp | 45,951,324 |
| 765,505 | Zions Bancorp NA | 48,219,160 |
| | | | 165,581,537 |
| | Capital Goods - 7.6% |
| 524,137 | AerCap Holdings N.V.* | 30,945,048 |
| 679,995 | Colfax Corp.* | 35,101,342 |
| 377,567 | Emerson Electric Co. | 36,627,775 |
| 258,433 | Fortive Corp. | 19,565,962 |
| 101,646 | General Dynamics Corp. | 20,608,727 |
| 806,800 | HF Global, Inc.*(2)(3)(4) | 16,039,184 |
| 498,263 | Ingersoll Rand, Inc.* | 26,786,619 |
| 890,488 | JELD-WEN Holding, Inc.* | 24,408,276 |
| 779,388 | Johnson Controls International plc | 57,183,698 |
| 572,018 | Kennametal, Inc. | 22,737,715 |
| 223,263 | Lockheed Martin Corp. | 74,194,760 |
| 267,220 | Middleby Corp.* | 48,751,617 |
| 208,954 | Northrop Grumman Corp. | 74,642,548 |
| 317,192 | Raytheon Technologies Corp. | 28,185,681 |
| 321,478 | SPX FLOW, Inc. | 24,017,621 |
| 546,415 | Westinghouse Air Brake Technologies Corp. | 49,576,233 |
| | | | 589,372,806 |
| | Commercial & Professional Services - 2.3% |
| 277,564 | Clean Harbors, Inc.* | 31,237,053 |
| 289,958 | Copart, Inc.* | 45,027,578 |
| 252,370 | CoStar Group, Inc.* | 21,716,438 |
| 486,303 | Leidos Holdings, Inc. | 48,620,574 |
| 211,674 | Waste Management, Inc. | 33,916,525 |
| | | | 180,518,168 |
| | Consumer Durables & Apparel - 3.3% |
| 140,936 | Garmin Ltd. | 20,238,409 |
| 179,331 | Lennar Corp. Class A | 17,920,547 |
| 102,361 | Lululemon Athletica, Inc.* | 47,701,250 |
| 472,484 | NIKE, Inc. Class B | 79,041,848 |
| 4,606 | NVR, Inc.* | 22,545,449 |
| 509,847 | Steven Madden Ltd. | 22,994,100 |
| 914,456 | Under Armour, Inc. Class A* | 20,081,454 |
| 828,040 | Under Armour, Inc. Class C* | 15,633,395 |
| 106,955 | VF Corp. | 7,794,880 |
| | | | 253,951,332 |
| | Consumer Services - 4.9% |
| 387,949 | Airbnb, Inc. Class A* | 66,207,376 |
| 24,566 | Booking Holdings, Inc.* | 59,468,882 |
| 1,472,422 | Denny's Corp.* | 23,411,510 |
| 604,928 | DraftKings, Inc. Class A* | 28,183,596 |
| 263,148 | Las Vegas Sands Corp.* | 10,212,774 |
| 383,161 | McDonald's Corp. | 94,085,184 |
| 402,209 | Penn National Gaming, Inc.* | 28,798,164 |
| 654,272 | Six Flags Entertainment Corp.* | 26,910,207 |
| 220,781 | Wyndham Hotels & Resorts, Inc. | 18,649,371 |
| 212,392 | Yum! Brands, Inc. | 26,536,256 |
| | | | 382,463,320 |
| | Diversified Financials - 3.1% |
| 475,100 | American Express Co. | 82,562,878 |
| Shares or Principal Amount | | Market Value† |
| COMMON STOCKS - 96.1% - (continued) |
| | Diversified Financials - 3.1% - (continued) |
| 629,593 | Bank of New York Mellon Corp. | $ 37,271,906 |
| 32,045 | BlackRock, Inc. | 30,233,176 |
| 406,987 | Charles Schwab Corp. | 33,385,144 |
| 436,147 | Synchrony Financial | 20,259,028 |
| 564,511 | Voya Financial, Inc. | 39,385,932 |
| | | | 243,098,064 |
| | Energy - 1.0% |
| 829,683 | Coterra Energy, Inc. | 17,688,841 |
| 533,020 | Diamondback Energy, Inc. | 57,134,414 |
| | | | 74,823,255 |
| | Food & Staples Retailing - 0.7% |
| 839,259 | U.S. Foods Holding Corp.* | 29,097,109 |
| 144,204 | Walmart, Inc. | 21,546,962 |
| | | | 50,644,071 |
| | Food, Beverage & Tobacco - 4.6% |
| 444,353 | Altria Group, Inc. | 19,600,411 |
| 1,156,311 | Coca-Cola Co. | 65,181,251 |
| 184,005 | Constellation Brands, Inc. Class A | 39,894,124 |
| 1,477,519 | Diageo plc | 73,509,066 |
| 459,484 | General Mills, Inc. | 28,396,111 |
| 531,044 | PepsiCo., Inc. | 85,816,710 |
| 442,451 | Philip Morris International, Inc. | 41,829,318 |
| 59,656 | Sovos Brands, Inc.* | 964,041 |
| | | | 355,191,032 |
| | Health Care Equipment & Services - 8.5% |
| 82,186 | ABIOMED, Inc.* | 27,289,039 |
| 345,312 | Acadia Healthcare Co., Inc.* | 21,409,344 |
| 40,617 | agilon health, Inc.* | 995,117 |
| 582,134 | Baxter International, Inc. | 45,965,301 |
| 47,430 | Becton Dickinson and Co. | 11,363,754 |
| 252,450 | Boston Scientific Corp.* | 10,888,168 |
| 202,292 | Cerner Corp. | 15,028,273 |
| 141,770 | Danaher Corp. | 44,199,633 |
| 62,373 | DexCom, Inc.* | 38,871,477 |
| 465,603 | Encompass Health Corp. | 29,593,727 |
| 430,793 | GoodRx Holdings, Inc. Class A*(1) | 19,213,368 |
| 148,363 | Insulet Corp.* | 45,995,497 |
| 392,973 | Integra LifeSciences Holdings Corp.* | 26,116,986 |
| 137,483 | Laboratory Corp. of America Holdings* | 39,460,371 |
| 663,304 | Medtronic plc | 79,503,617 |
| 120,296 | Molina Healthcare, Inc.* | 35,573,933 |
| 285,970 | Oak Street Health, Inc.* | 13,506,363 |
| 95,855 | Stryker Corp. | 25,504,140 |
| 61,817 | Teleflex, Inc. | 22,064,960 |
| 188,241 | UnitedHealth Group, Inc. | 86,679,333 |
| 53,345 | Veeva Systems, Inc. Class A* | 16,910,898 |
| | | | 656,133,299 |
| | Household & Personal Products - 2.2% |
| 1,160,082 | Colgate-Palmolive Co. | 88,386,648 |
| 90,304 | Kimberly-Clark Corp. | 11,693,465 |
| 486,459 | Procter & Gamble Co. | 69,558,772 |
| | | | 169,638,885 |
| | Insurance - 4.8% |
| 1,047,661 | Aflac, Inc. | 56,227,966 |
| 51,037 | Alleghany Corp.* | 33,244,481 |
| 199,305 | Assurant, Inc. | 32,149,890 |
| 460,827 | Chubb Ltd. | 90,036,379 |
| 823,580 | CNO Financial Group, Inc. | 19,881,221 |
| 132,676 | Globe Life, Inc. | 11,810,818 |
| 187,300 | Hanover Insurance Group, Inc. | 23,599,800 |
The accompanying notes are an integral part of these financial statements.
The Hartford Capital Appreciation Fund
Schedule of Investments – (continued)
October 31, 2021
| Shares or Principal Amount | | Market Value† |
| COMMON STOCKS - 96.1% - (continued) |
| | Insurance - 4.8% - (continued) |
| 356,874 | Kemper Corp. | $ 22,654,361 |
| 498,615 | Marsh & McLennan Cos., Inc. | 83,168,982 |
| | | | 372,773,898 |
| | Materials - 3.1% |
| 206,624 | Celanese Corp. | 33,371,842 |
| 321,890 | Ecolab, Inc. | 71,530,396 |
| 473,977 | FMC Corp. | 43,136,647 |
| 298,315 | Linde plc* | 95,222,148 |
| | | | 243,261,033 |
| | Media & Entertainment - 7.7% |
| 620,159 | Activision Blizzard, Inc. | 48,490,232 |
| 70,377 | Alphabet, Inc. Class A* | 208,380,667 |
| 12,627 | Charter Communications, Inc. Class A* | 8,521,836 |
| 287,084 | Facebook, Inc. Class A* | 92,891,770 |
| 148,050 | Match Group, Inc.* | 22,322,979 |
| 640,676 | Omnicom Group, Inc. | 43,617,222 |
| 273,367 | Pinterest, Inc. Class A* | 12,203,103 |
| 65,485 | Roku, Inc.* | 19,966,376 |
| 631,331 | Snap, Inc. Class A* | 33,195,384 |
| 167,956 | Spotify Technology S.A.* | 48,606,466 |
| 290,430 | Twitter, Inc.* | 15,549,622 |
| 144,393 | Walt Disney Co.* | 24,412,525 |
| 260,426 | ZoomInfo Technologies, Inc.* | 17,505,836 |
| | | | 595,664,018 |
| | Pharmaceuticals, Biotechnology & Life Sciences - 4.6% |
| 118,041 | Allakos, Inc.* | 11,872,564 |
| 436,529 | Elanco Animal Health, Inc.* | 14,353,073 |
| 74,928 | Eli Lilly & Co. | 19,088,657 |
| 282,818 | Exact Sciences Corp.* | 26,929,930 |
| 222,388 | Heron Therapeutics, Inc.* | 2,448,492 |
| 97,522 | Illumina, Inc.* | 40,477,481 |
| 534,026 | Johnson & Johnson | 86,982,155 |
| 169,398 | Kodiak Sciences, Inc.* | 19,834,812 |
| 1,879,297 | Pfizer, Inc. | 82,200,451 |
| 442,534 | PTC Therapeutics, Inc.* | 16,785,315 |
| 31,892 | Reata Pharmaceuticals, Inc. Class A* | 3,061,951 |
| 92,976 | Seagen, Inc.* | 16,394,458 |
| 89,982 | Vertex Pharmaceuticals, Inc.* | 16,640,371 |
| | | | 357,069,710 |
| | Real Estate - 4.1% |
| 147,020 | American Tower Corp. REIT | 41,455,229 |
| 336,254 | Americold Realty Trust REIT | 9,909,405 |
| 169,690 | Crown Castle International Corp. REIT | 30,595,107 |
| 720,840 | Gaming and Leisure Properties, Inc. REIT | 34,953,532 |
| 868,149 | Invitation Homes, Inc. REIT | 35,811,146 |
| 272,537 | Prologis, Inc. REIT | 39,506,964 |
| 277,765 | Redfin Corp.*(1) | 14,260,455 |
| 452,660 | Ryman Hospitality Properties, Inc. REIT* | 38,720,536 |
| 678,935 | STORE Capital Corp. REIT | 23,307,839 |
| 1,049,047 | VICI Properties, Inc. REIT | 30,789,530 |
| 186,393 | Welltower, Inc. REIT | 14,985,997 |
| 59,721 | WeWork, Inc.*(1) | 609,751 |
| | | | 314,905,491 |
| | Retailing - 5.9% |
| 18,984 | Amazon.com, Inc.* | 64,022,211 |
| 15,610 | AutoZone, Inc.* | 27,861,352 |
| 656,325 | Chewy, Inc. Class A*(1) | 49,749,435 |
| 135,953 | Dollar General Corp. | 30,116,309 |
| 107,894 | Etsy, Inc.* | 27,047,947 |
| 134,658 | Five Below, Inc.* | 26,568,023 |
| Shares or Principal Amount | | Market Value† |
| COMMON STOCKS - 96.1% - (continued) |
| | Retailing - 5.9% - (continued) |
| 647,301 | Honest Co., Inc.*(2)(5) | $ 5,919,568 |
| 90,616 | Lowe's Cos., Inc. | 21,187,833 |
| 12,011 | MercadoLibre, Inc.* | 17,788,531 |
| 124,289 | Ollie's Bargain Outlet Holdings, Inc.* | 8,409,394 |
| 282,959 | Ross Stores, Inc. | 32,030,959 |
| 1,480,520 | TJX Cos., Inc. | 96,959,255 |
| 316,327 | Tory Burch LLC*(2)(3)(4) | 16,730,518 |
| 86,737 | Ulta Salon Cosmetics & Fragrance, Inc.* | 31,863,704 |
| | | | 456,255,039 |
| | Semiconductors & Semiconductor Equipment - 3.9% |
| 690,461 | Advanced Micro Devices, Inc.* | 83,014,126 |
| 385,825 | First Solar, Inc.* | 46,140,812 |
| 484,917 | Marvell Technology, Inc. | 33,216,814 |
| 273,540 | MKS Instruments, Inc. | 41,044,677 |
| 66,129 | SolarEdge Technologies, Inc.* | 23,454,634 |
| 182,127 | Texas Instruments, Inc. | 34,145,170 |
| 768,733 | Tower Semiconductor Ltd.* | 24,499,521 |
| 72,200 | Universal Display Corp. | 13,227,040 |
| | | | 298,742,794 |
| | Software & Services - 14.1% |
| 103,958 | Accenture plc Class A | 37,299,091 |
| 239,743 | ANSYS, Inc.* | 91,001,648 |
| 194,005 | Avalara, Inc.* | 34,851,058 |
| 20,900 | Dynatrace, Inc.* | 1,567,500 |
| 61,824 | Fair Isaac Corp.* | 24,618,317 |
| 100,753 | Five9, Inc.* | 15,919,981 |
| 190,677 | FleetCor Technologies, Inc.* | 47,175,397 |
| 502,089 | Genpact Ltd. | 24,778,092 |
| 204,313 | Global Payments, Inc. | 29,214,716 |
| 203,233 | Guidewire Software, Inc.* | 25,552,485 |
| 511,777 | International Business Machines Corp. | 64,023,303 |
| 148,301 | Mastercard, Inc. Class A | 49,757,951 |
| 199,732 | Microsoft Corp. | 66,235,126 |
| 47,485 | MongoDB, Inc.* | 24,753,456 |
| 842,986 | Oracle Corp. | 80,876,077 |
| 81,619 | Paycom Software, Inc.* | 44,714,969 |
| 24,184 | Q2 Holdings, Inc.* | 1,897,477 |
| 192,836 | Rapid7, Inc.* | 24,827,635 |
| 84,843 | RingCentral, Inc. Class A* | 20,683,027 |
| 322,059 | salesforce.com, Inc.* | 96,517,862 |
| 3,273,121 | Sharecare, Inc.*(2)(5) | 23,887,237 |
| 12,640 | Sharecare, Inc. Earnout*(2)(5) | 37,515 |
| 163,673 | Square, Inc. Class A* | 41,654,778 |
| 428,848 | Tenable Holdings, Inc.* | 22,836,156 |
| 246,300 | Varonis Systems, Inc.* | 15,945,462 |
| 301,945 | Visa, Inc. Class A | 63,942,893 |
| 1,079,168 | Western Union Co. | 19,662,441 |
| 130,900 | WEX, Inc.* | 19,595,730 |
| 256,827 | Workday, Inc. Class A* | 74,474,693 |
| | | | 1,088,302,073 |
| | Technology Hardware & Equipment - 4.3% |
| 137,323 | Arista Networks, Inc.* | 56,259,860 |
| 94,514 | Arrow Electronics, Inc.* | 10,939,996 |
| 132,094 | CDW Corp. | 24,655,345 |
| 1,790,802 | Cisco Systems, Inc. | 100,231,188 |
| 160,458 | F5 Networks, Inc.* | 33,880,707 |
| 1,397,747 | Flex Ltd.* | 23,621,924 |
| 352,985 | II-VI, Inc.* | 21,359,122 |
The accompanying notes are an integral part of these financial statements.
The Hartford Capital Appreciation Fund
Schedule of Investments – (continued)
October 31, 2021
| Shares or Principal Amount | | Market Value† |
| COMMON STOCKS - 96.1% - (continued) |
| | Technology Hardware & Equipment - 4.3% - (continued) |
| 402,825 | Lumentum Holdings, Inc.* | $ 33,265,289 |
| 132,495 | Rogers Corp.* | 26,647,394 |
| | | | 330,860,825 |
| | Transportation - 2.3% |
| 130,064 | J.B. Hunt Transport Services, Inc. | 25,647,320 |
| 53,039 | Southwest Airlines Co.* | 2,507,684 |
| 625,957 | Uber Technologies, Inc.* | 27,429,436 |
| 271,858 | Union Pacific Corp. | 65,626,521 |
| 259,641 | United Parcel Service, Inc. Class B | 55,425,564 |
| | | | 176,636,525 |
| | Utilities - 0.2% |
| 391,711 | CenterPoint Energy, Inc. | 10,200,154 |
| 24,699 | Duke Energy Corp. | 2,519,545 |
| | | | 12,719,699 |
| | Total Common Stocks
(cost $5,480,324,260) | | $ 7,431,617,227 |
| CONVERTIBLE PREFERRED STOCKS - 0.0% |
| | Commercial & Professional Services - 0.0% |
| 33,739 | Rubicon Global Holdings LLC Series C*(2)(3)(4) | $ 689,861 |
| | Software & Services - 0.0% |
| 566,622 | Essence Group Holdings Corp. Series 3*(2)(3)(4) | 1,263,567 |
| 77,707 | Lookout, Inc. Series F*(2)(3)(4) | 707,911 |
| | | | 1,971,478 |
| | Total Convertible Preferred Stocks
(cost $2,457,101) | | $ 2,661,339 |
| EXCHANGE-TRADED FUNDS - 1.5% |
| | Other Investment Pools & Funds - 1.5% |
| 374,367 | iShares Russell 1000 Growth ETF | $ 111,561,366 |
| | Total Exchange-Traded Funds
(cost $104,105,756) | | $ 111,561,366 |
| | Total Long-Term Investments
(Cost $5,586,887,117) | | $ 7,545,839,932 |
| Shares or Principal Amount | | Market Value† |
| SHORT-TERM INVESTMENTS - 3.1% |
| | Repurchase Agreements - 2.2% |
| $ 168,581,979 | Fixed Income Clearing Corp. Repurchase Agreement dated 10/29/2021 at 0.010%, due on 11/01/2021 with a maturity value of $168,582,119; collateralized by U.S. Treasury Bond at 1.875%, maturing 02/15/2041, with a market value of $171,953,653 | $ 168,581,979 |
| | Securities Lending Collateral - 0.9% |
| 444,477 | Fidelity Investments Money Market Funds, Government Portfolio, Institutional Class, 0.01%(6) | 444,477 |
| 68,236,565 | Goldman Sachs Financial Square Funds, Government Fund, Institutional Class, 0.03%(6) | 68,236,565 |
| 4,898,882 | Invesco Government & Agency Portfolio, Institutional Class, 0.03%(6) | 4,898,882 |
| | | | 73,579,924 |
| | Total Short-Term Investments
(cost $242,161,903) | $ 242,161,903 |
| | Total Investments
(cost $5,829,049,020) | 100.7% | $ 7,788,001,835 |
| | Other Assets and Liabilities | (0.7)% | (52,815,623) |
| | Total Net Assets | 100.0% | $ 7,735,186,212 |
| Note: | Percentage of investments as shown is the ratio of the total market value to total net assets. |
| | For Fund compliance purposes, the Fund may not use the same classification system. These classifications are used for financial reporting purposes. |
| | See “Glossary” for abbreviation descriptions. |
| * | Non-income producing. |
| (1) | Represents entire or partial securities on loan. See Note 8 in the accompanying Notes to Financial Statements for securities lending information. |
| (2) | These securities are valued in good faith at fair value as determined under policies and procedures established by and under the supervision of the Board of Directors. At October 31, 2021, the aggregate fair value of these securities are $65,275,361, which represented 0.8% of total net assets. This amount excludes securities that are principally traded in certain foreign markets and whose prices are adjusted pursuant to a third party pricing service methodology approved by the Board of Directors. |
The accompanying notes are an integral part of these financial statements.
The Hartford Capital Appreciation Fund
Schedule of Investments – (continued)
October 31, 2021
| (3) | Investment in securities not registered under the Securities Act of 1933 (excluding securities acquired pursuant to Rule 144A and Regulation S). At the end of the period, the value of such restricted securities amounted to $35,431,041 or 0.5% of net assets. |
Period
Acquired | | Security Name | | Shares/
Par Value | | Total Cost | | Market Value |
| 05/2014 | | Essence Group Holdings Corp. Series 3 Convertible Preferred | | 566,622 | | $ 895,999 | | $ 1,263,567 |
| 06/2015 | | HF Global, Inc. | | 806,800 | | 10,846,942 | | 16,039,184 |
| 07/2014 | | Lookout, Inc. Series F Convertible Preferred | | 77,707 | | 887,655 | | 707,911 |
| 09/2015 | | Rubicon Global Holdings LLC Series C Convertible Preferred | | 33,739 | | 673,447 | | 689,861 |
| 11/2013 | | Tory Burch LLC | | 316,327 | | 24,792,580 | | 16,730,518 |
| | | | | | | $ 38,096,623 | | $ 35,431,041 |
| (4) | Investment valued using significant unobservable inputs. |
| (5) | As of October 31, 2021, investment is restricted from trading. The value of such restricted securities amounted to $29,844,320 or 0.4% of net assets. |
Period
Acquired | | Security Name | | Shares/
Par Value | | Total Cost | | Market Value |
| 08/2014 | | Honest Co., Inc. | | 647,301 | | $ 13,487,047 | | $ 5,919,568 |
| 03/2015 | | Sharecare, Inc. | | 3,273,121 | | 11,759,882 | | 23,887,237 |
| 07/2021 | | Sharecare, Inc. Earnout | | 12,640 | | — | | 37,515 |
| | | | | | | $ 25,246,929 | | $ 29,844,320 |
| (6) | Current yield as of period end. |
| Futures Contracts Outstanding at October 31, 2021 |
| Description | | Number of
Contracts | | Expiration
Date | | Current
Notional
Amount | | Value and
Unrealized
Appreciation/
(Depreciation) |
| Long position contracts: |
| Nasdaq 100 E-MINI | | 596 | | 12/17/2021 | | $ 188,794,920 | | $ 6,601,053 |
| Total futures contracts | | $ 6,601,053 |
† See Significant Accounting Policies of accompanying Notes to Financial Statements regarding valuation of investments.
The accompanying notes are an integral part of these financial statements.
The Hartford Capital Appreciation Fund
Schedule of Investments – (continued)
October 31, 2021
Fair Value Summary
The following is a summary of the fair valuations according to the inputs used as of October 31, 2021 in valuing the Fund’s investments.
| Description | | Total | | Level 1 | | Level 2 | | Level 3(1) |
| Assets | | | | | | | | |
| Common Stocks | | | | | | | | |
| Automobiles & Components | | $ 63,010,353 | | $ 63,010,353 | | $ — | | $ — |
| Banks | | 165,581,537 | | 165,581,537 | | — | | — |
| Capital Goods | | 589,372,806 | | 573,333,622 | | — | | 16,039,184 |
| Commercial & Professional Services | | 180,518,168 | | 180,518,168 | | — | | — |
| Consumer Durables & Apparel | | 253,951,332 | | 253,951,332 | | — | | — |
| Consumer Services | | 382,463,320 | | 382,463,320 | | — | | — |
| Diversified Financials | | 243,098,064 | | 243,098,064 | | — | | — |
| Energy | | 74,823,255 | | 74,823,255 | | — | | — |
| Food & Staples Retailing | | 50,644,071 | | 50,644,071 | | — | | — |
| Food, Beverage & Tobacco | | 355,191,032 | | 281,681,966 | | 73,509,066 | | — |
| Health Care Equipment & Services | | 656,133,299 | | 656,133,299 | | — | | — |
| Household & Personal Products | | 169,638,885 | | 169,638,885 | | — | | — |
| Insurance | | 372,773,898 | | 372,773,898 | | — | | — |
| Materials | | 243,261,033 | | 243,261,033 | | — | | — |
| Media & Entertainment | | 595,664,018 | | 595,664,018 | | — | | — |
| Pharmaceuticals, Biotechnology & Life Sciences | | 357,069,710 | | 357,069,710 | | — | | — |
| Real Estate | | 314,905,491 | | 314,905,491 | | — | | — |
| Retailing | | 456,255,039 | | 433,604,953 | | 5,919,568 | | 16,730,518 |
| Semiconductors & Semiconductor Equipment | | 298,742,794 | | 298,742,794 | | — | | — |
| Software & Services | | 1,088,302,073 | | 1,064,377,321 | | 23,924,752 | | — |
| Technology Hardware & Equipment | | 330,860,825 | | 330,860,825 | | — | | — |
| Transportation | | 176,636,525 | | 176,636,525 | | — | | — |
| Utilities | | 12,719,699 | | 12,719,699 | | — | | — |
| Convertible Preferred Stocks | | 2,661,339 | | — | | — | | 2,661,339 |
| Exchange-Traded Funds | | 111,561,366 | | 111,561,366 | | — | | — |
| Short-Term Investments | | 242,161,903 | | 73,579,924 | | 168,581,979 | | — |
| Futures Contracts(2) | | 6,601,053 | | 6,601,053 | | — | | — |
| Total | | $ 7,794,602,888 | | $ 7,487,236,482 | | $ 271,935,365 | | $ 35,431,041 |
| (1) | For the year ended October 31, 2021, investments valued at $24,616,180 were transferred out of Level 3 due to the initiation of a vendor providing prices that are based on market activity which has been determined to be significant observable input. There were no transfers into Level 3. |
| (2) | Derivative instruments (excluding purchased and written options, if applicable) are valued at the unrealized appreciation/(depreciation) on the investments. |
Level 3 investments at the beginning and/or end of the period in relation to net assets were not significant and accordingly, a reconciliation of Level 3 assets for the year ended October 31, 2021 is not presented.
The accompanying notes are an integral part of these financial statements.
Hartford Core Equity Fund
Schedule of Investments
October 31, 2021
| Shares or Principal Amount | | Market Value† |
| COMMON STOCKS - 99.1% |
| | Automobiles & Components - 1.7% |
| 4,216,780 | Ford Motor Co. | $ 72,022,602 |
| 130,186 | Tesla, Inc.* | 145,027,204 |
| | | | 217,049,806 |
| | Banks - 6.3% |
| 6,540,939 | Bank of America Corp. | 312,526,066 |
| 1,870,925 | JP Morgan Chase & Co. | 317,851,448 |
| 785,029 | PNC Financial Services Group, Inc. | 165,664,670 |
| | | | 796,042,184 |
| | Capital Goods - 5.8% |
| 920,873 | AMETEK, Inc. | 121,923,585 |
| 336,942 | Deere & Co. | 115,338,616 |
| 1,283,179 | Fortune Brands Home & Security, Inc. | 130,114,351 |
| 493,475 | IDEX Corp. | 109,832,731 |
| 469,622 | Illinois Tool Works, Inc. | 107,012,765 |
| 1,628,970 | Raytheon Technologies Corp. | 144,750,274 |
| | | | 728,972,322 |
| | Commercial & Professional Services - 2.6% |
| 509,244 | Equifax, Inc. | 141,279,563 |
| 1,213,493 | Leidos Holdings, Inc. | 121,325,030 |
| 530,571 | Republic Services, Inc. | 71,414,857 |
| | | | 334,019,450 |
| | Consumer Durables & Apparel - 2.3% |
| 1,007,926 | NIKE, Inc. Class B | 168,615,941 |
| 1,767,404 | VF Corp. | 128,808,403 |
| | | | 297,424,344 |
| | Consumer Services - 2.6% |
| 438,692 | Airbnb, Inc. Class A* | 74,867,177 |
| 38,316 | Booking Holdings, Inc.* | 92,754,606 |
| 639,955 | McDonald's Corp. | 157,140,950 |
| | | | 324,762,733 |
| | Diversified Financials - 5.3% |
| 1,043,602 | American Express Co. | 181,357,156 |
| 161,168 | BlackRock, Inc. | 152,055,561 |
| 1,544,009 | Charles Schwab Corp. | 126,655,058 |
| 2,112,381 | Morgan Stanley | 217,110,519 |
| | | | 677,178,294 |
| | Energy - 1.3% |
| 1,830,293 | EOG Resources, Inc. | 169,228,891 |
| | Food & Staples Retailing - 1.2% |
| 1,025,459 | Walmart, Inc. | 153,224,084 |
| | Food, Beverage & Tobacco - 1.9% |
| 667,944 | Constellation Brands, Inc. Class A | 144,816,939 |
| 1,194,897 | Monster Beverage Corp.* | 101,566,245 |
| | | | 246,383,184 |
| | Health Care Equipment & Services - 8.3% |
| 911,149 | Abbott Laboratories | 117,437,995 |
| 1,454,354 | Baxter International, Inc. | 114,835,792 |
| 482,675 | Becton Dickinson and Co. | 115,644,103 |
| 553,840 | Danaher Corp. | 172,670,697 |
| 1,478,019 | Hologic, Inc.* | 108,353,573 |
| 369,372 | Laboratory Corp. of America Holdings* | 106,017,151 |
| 678,234 | UnitedHealth Group, Inc. | 312,306,410 |
| | | | 1,047,265,721 |
| Shares or Principal Amount | | Market Value† |
| COMMON STOCKS - 99.1% - (continued) |
| | Household & Personal Products - 2.8% |
| 1,419,455 | Colgate-Palmolive Co. | $ 108,148,276 |
| 1,703,919 | Procter & Gamble Co. | 243,643,378 |
| | | | 351,791,654 |
| | Insurance - 1.0% |
| 631,912 | Chubb Ltd. | 123,462,967 |
| | Materials - 1.1% |
| 843,470 | PPG Industries, Inc. | 135,435,978 |
| | Media & Entertainment - 11.7% |
| 255,088 | Alphabet, Inc. Class A* | 755,295,161 |
| 909,359 | Facebook, Inc. Class A* | 294,241,292 |
| 296,130 | Netflix, Inc.* | 204,421,500 |
| 1,343,360 | Walt Disney Co.* | 227,121,875 |
| | | | 1,481,079,828 |
| | Pharmaceuticals, Biotechnology & Life Sciences - 6.1% |
| 764,948 | Eli Lilly & Co. | 194,878,152 |
| 2,459,852 | Merck & Co., Inc. | 216,589,969 |
| 227,712 | Regeneron Pharmaceuticals, Inc.* | 145,722,017 |
| 331,672 | Thermo Fisher Scientific, Inc. | 209,971,593 |
| | | | 767,161,731 |
| | Real Estate - 1.7% |
| 464,477 | American Tower Corp. REIT | 130,968,580 |
| 1,677,033 | Gaming and Leisure Properties, Inc. REIT | 81,319,330 |
| | | | 212,287,910 |
| | Retailing - 5.3% |
| 145,247 | Amazon.com, Inc.* | 489,835,340 |
| 2,813,031 | TJX Cos., Inc. | 184,225,400 |
| | | | 674,060,740 |
| | Semiconductors & Semiconductor Equipment - 4.8% |
| 1,031,633 | Advanced Micro Devices, Inc.* | 124,033,235 |
| 307,018 | KLA Corp. | 114,444,030 |
| 814,518 | QUALCOMM, Inc. | 108,363,475 |
| 559,651 | Teradyne, Inc. | 77,366,154 |
| 1,003,300 | Texas Instruments, Inc. | 188,098,684 |
| | | | 612,305,578 |
| | Software & Services - 11.7% |
| 869,108 | Fidelity National Information Services, Inc. | 96,245,020 |
| 575,418 | Global Payments, Inc. | 82,279,020 |
| 931,438 | GoDaddy, Inc. Class A* | 64,427,566 |
| 526,297 | Mastercard, Inc. Class A | 176,583,169 |
| 2,195,575 | Microsoft Corp. | 728,096,582 |
| 717,178 | salesforce.com, Inc.* | 214,931,075 |
| 395,406 | Workday, Inc. Class A* | 114,659,832 |
| | | | 1,477,222,264 |
| | Technology Hardware & Equipment - 9.6% |
| 3,997,148 | Apple, Inc. | 598,772,771 |
| 648,636 | CDW Corp. | 121,067,909 |
| 3,416,709 | Corning, Inc. | 121,532,339 |
| 424,001 | F5 Networks, Inc.* | 89,527,811 |
| 695,267 | Motorola Solutions, Inc. | 172,836,424 |
| 1,265,221 | NetApp, Inc. | 112,984,235 |
| | | | 1,216,721,489 |
| | Telecommunication Services - 1.0% |
| 2,382,342 | Verizon Communications, Inc. | 126,240,303 |
The accompanying notes are an integral part of these financial statements.
Hartford Core Equity Fund
Schedule of Investments – (continued)
October 31, 2021
| Shares or Principal Amount | | Market Value† |
| COMMON STOCKS - 99.1% - (continued) |
| | Transportation - 1.0% |
| 563,667 | FedEx Corp. | $ 132,760,488 |
| | Utilities - 2.0% |
| 1,535,596 | American Electric Power Co., Inc. | 130,080,337 |
| 1,145,031 | Duke Energy Corp. | 116,804,612 |
| | | | 246,884,949 |
| | Total Common Stocks
(cost $7,636,774,973) | | $ 12,548,966,892 |
| SHORT-TERM INVESTMENTS - 0.6% |
| | Repurchase Agreements - 0.6% |
| $ 72,985,489 | Fixed Income Clearing Corp. Repurchase Agreement dated 10/29/2021 at 0.010%, due on 11/01/2021 with a maturity value of $72,985,550; collateralized by U.S. Treasury Bond at 1.875%, maturing 02/15/2041, with a market value of $74,445,202 | $ 72,985,489 |
| | Total Short-Term Investments
(cost $72,985,489) | $ 72,985,489 |
| | Total Investments
(cost $7,709,760,462) | 99.7% | $ 12,621,952,381 |
| | Other Assets and Liabilities | 0.3% | 42,672,568 |
| | Total Net Assets | 100.0% | $ 12,664,624,949 |
| Note: | Percentage of investments as shown is the ratio of the total market value to total net assets. |
| | Equity industry classifications used in this report are the Global Industry Classification Standard, which was developed by and is the exclusive property and service mark of MSCI, Inc. and Standard & Poor’s. |
| | For Fund compliance purposes, the Fund may not use the same classification system. These classifications are used for financial reporting purposes. |
| | See “Glossary” for abbreviation descriptions. |
| * | Non-income producing. |
| † | See Significant Accounting Policies of accompanying Notes to Financial Statements regarding valuation of investments. |
Fair Value Summary
The following is a summary of the fair valuations according to the inputs used as of October 31, 2021 in valuing the Fund’s investments.
| Description | | Total | | Level 1 | | Level 2 | | Level 3(1) |
| Assets | | | | | | | | |
| Common Stocks | | | | | | | | |
| Automobiles & Components | | $ 217,049,806 | | $ 217,049,806 | | $ — | | $ — |
| Banks | | 796,042,184 | | 796,042,184 | | — | | — |
| Capital Goods | | 728,972,322 | | 728,972,322 | | — | | — |
| Commercial & Professional Services | | 334,019,450 | | 334,019,450 | | — | | — |
| Consumer Durables & Apparel | | 297,424,344 | | 297,424,344 | | — | | — |
| Consumer Services | | 324,762,733 | | 324,762,733 | | — | | — |
| Diversified Financials | | 677,178,294 | | 677,178,294 | | — | | — |
| Energy | | 169,228,891 | | 169,228,891 | | — | | — |
| Food & Staples Retailing | | 153,224,084 | | 153,224,084 | | — | | — |
| Food, Beverage & Tobacco | | 246,383,184 | | 246,383,184 | | — | | — |
| Health Care Equipment & Services | | 1,047,265,721 | | 1,047,265,721 | | — | | — |
| Household & Personal Products | | 351,791,654 | | 351,791,654 | | — | | — |
| Insurance | | 123,462,967 | | 123,462,967 | | — | | — |
| Materials | | 135,435,978 | | 135,435,978 | | — | | — |
| Media & Entertainment | | 1,481,079,828 | | 1,481,079,828 | | — | | — |
| Pharmaceuticals, Biotechnology & Life Sciences | | 767,161,731 | | 767,161,731 | | — | | — |
| Real Estate | | 212,287,910 | | 212,287,910 | | — | | — |
| Retailing | | 674,060,740 | | 674,060,740 | | — | | — |
| Semiconductors & Semiconductor Equipment | | 612,305,578 | | 612,305,578 | | — | | — |
| Software & Services | | 1,477,222,264 | | 1,477,222,264 | | — | | — |
| Technology Hardware & Equipment | | 1,216,721,489 | | 1,216,721,489 | | — | | — |
| Telecommunication Services | | 126,240,303 | | 126,240,303 | | — | | — |
| Transportation | | 132,760,488 | | 132,760,488 | | — | | — |
| Utilities | | 246,884,949 | | 246,884,949 | | — | | — |
| Short-Term Investments | | 72,985,489 | | — | | 72,985,489 | | — |
| Total | | $ 12,621,952,381 | | $ 12,548,966,892 | | $ 72,985,489 | | $ — |
| (1) | For the year ended October 31, 2021, there were no transfers in and out of Level 3. |
The accompanying notes are an integral part of these financial statements.
The Hartford Dividend and Growth Fund
Schedule of Investments
October 31, 2021
| Shares or Principal Amount | | Market Value† |
| COMMON STOCKS - 96.8% |
| | Banks - 7.2% |
| 7,836,529 | Bank of America Corp. | $ 374,429,355 |
| 2,711,967 | JP Morgan Chase & Co. | 460,736,074 |
| 1,068,329 | PNC Financial Services Group, Inc. | 225,449,469 |
| | | | 1,060,614,898 |
| | Capital Goods - 6.4% |
| 713,083 | General Dynamics Corp. | 144,577,578 |
| 2,247,469 | Ingersoll Rand, Inc.* | 120,823,933 |
| 1,638,652 | Johnson Controls International plc | 120,227,897 |
| 476,687 | Lockheed Martin Corp. | 158,412,624 |
| 2,121,335 | Otis Worldwide Corp. | 170,364,414 |
| 2,502,303 | Raytheon Technologies Corp. | 222,354,645 |
| | | | 936,761,091 |
| | Commercial & Professional Services - 1.1% |
| 1,010,769 | Waste Management, Inc. | 161,955,517 |
| | Consumer Services - 2.4% |
| 1,302,328 | Hilton Worldwide Holdings, Inc.* | 187,470,116 |
| 646,590 | McDonald's Corp. | 158,770,174 |
| | | | 346,240,290 |
| | Diversified Financials - 6.4% |
| 1,286,704 | American Express Co. | 223,603,421 |
| 177,313 | BlackRock, Inc. | 167,287,723 |
| 2,512,105 | Charles Schwab Corp. | 206,067,973 |
| 1,061,074 | Northern Trust Corp. | 130,554,545 |
| 445,150 | S&P Global, Inc. | 211,072,324 |
| | | | 938,585,986 |
| | Energy - 4.2% |
| 1,633,139 | Chevron Corp. | 186,978,084 |
| 2,567,884 | ConocoPhillips | 191,281,679 |
| 1,160,273 | Marathon Petroleum Corp. | 76,496,799 |
| 3,238,459 | TotalEnergies SE ADR | 162,279,181 |
| | | | 617,035,743 |
| | Food & Staples Retailing - 2.6% |
| 2,193,983 | Sysco Corp. | 168,717,293 |
| 1,469,305 | Walmart, Inc. | 219,543,553 |
| | | | 388,260,846 |
| | Food, Beverage & Tobacco - 2.6% |
| 3,442,168 | Coca-Cola Co. | 194,035,010 |
| 2,997,178 | Mondelez International, Inc. Class A | 182,048,592 |
| | | | 376,083,602 |
| | Health Care Equipment & Services - 7.4% |
| 445,493 | Anthem, Inc. | 193,847,369 |
| 744,198 | Becton Dickinson and Co. | 178,302,399 |
| 578,914 | HCA Healthcare, Inc. | 144,994,800 |
| 1,646,361 | Medtronic plc | 197,332,830 |
| 804,868 | UnitedHealth Group, Inc. | 370,617,568 |
| | | | 1,085,094,966 |
| | Household & Personal Products - 0.6% |
| 1,158,347 | Colgate-Palmolive Co. | 88,254,458 |
| | Insurance - 6.4% |
| 3,344,007 | American International Group, Inc. | 197,597,374 |
| 1,659,531 | Chubb Ltd. | 324,239,167 |
| 2,100,692 | MetLife, Inc. | 131,923,457 |
| 1,107,110 | Principal Financial Group, Inc. | 74,276,010 |
| 1,936,354 | Prudential Financial, Inc. | 213,095,758 |
| | | | 941,131,766 |
| Shares or Principal Amount | | Market Value† |
| COMMON STOCKS - 96.8% - (continued) |
| | Materials - 3.4% |
| 1,286,379 | Celanese Corp. | $ 207,763,072 |
| 1,869,862 | FMC Corp. | 170,176,141 |
| 726,769 | PPG Industries, Inc. | 116,697,298 |
| | | | 494,636,511 |
| | Media & Entertainment - 6.1% |
| 207,234 | Alphabet, Inc. Class A* | 613,603,295 |
| 5,420,503 | Comcast Corp. Class A | 278,776,470 |
| | | | 892,379,765 |
| | Pharmaceuticals, Biotechnology & Life Sciences - 7.5% |
| 890,131 | Agilent Technologies, Inc. | 140,186,731 |
| 2,567,638 | AstraZeneca plc ADR | 160,169,258 |
| 3,094,041 | Bristol-Myers Squibb Co. | 180,691,994 |
| 1,763,113 | Merck & Co., Inc. | 155,242,100 |
| 1,923,766 | Novartis AG ADR | 159,210,874 |
| 6,993,925 | Pfizer, Inc. | 305,914,280 |
| | | | 1,101,415,237 |
| | Real Estate - 3.2% |
| 587,108 | American Tower Corp. REIT | 165,546,842 |
| 7,154,513 | Host Hotels & Resorts, Inc. REIT* | 120,410,454 |
| 535,577 | Public Storage REIT | 177,907,968 |
| | | | 463,865,264 |
| | Retailing - 3.8% |
| 548,210 | Home Depot, Inc. | 203,791,586 |
| 841,033 | Lowe's Cos., Inc. | 196,650,336 |
| 2,369,531 | TJX Cos., Inc. | 155,180,585 |
| | | | 555,622,507 |
| | Semiconductors & Semiconductor Equipment - 3.3% |
| 422,332 | Broadcom, Inc. | 224,541,255 |
| 1,384,389 | Micron Technology, Inc. | 95,661,280 |
| 857,838 | Texas Instruments, Inc. | 160,827,468 |
| | | | 481,030,003 |
| | Software & Services - 8.7% |
| 442,948 | Accenture plc Class A | 158,925,313 |
| 2,582,253 | Cognizant Technology Solutions Corp. Class A | 201,648,137 |
| 1,587,342 | Fidelity National Information Services, Inc. | 175,782,253 |
| 2,245,315 | Microsoft Corp. | 744,591,360 |
| | | | 1,280,947,063 |
| | Technology Hardware & Equipment - 7.0% |
| 2,516,708 | Apple, Inc. | 377,002,858 |
| 4,577,565 | Cisco Systems, Inc. | 256,206,313 |
| 3,839,831 | Corning, Inc. | 136,582,789 |
| 5,659,075 | HP, Inc. | 171,639,745 |
| 353,673 | Motorola Solutions, Inc. | 87,919,571 |
| | | | 1,029,351,276 |
| | Telecommunication Services - 2.1% |
| 5,729,658 | Verizon Communications, Inc. | 303,614,577 |
| | Transportation - 0.6% |
| 384,170 | Union Pacific Corp. | 92,738,638 |
| | Utilities - 3.8% |
| 1,954,147 | Dominion Energy, Inc. | 148,378,382 |
| 1,305,770 | Duke Energy Corp. | 133,201,597 |
The accompanying notes are an integral part of these financial statements.
The Hartford Dividend and Growth Fund
Schedule of Investments – (continued)
October 31, 2021
| Shares or Principal Amount | | Market Value† |
| COMMON STOCKS - 96.8% - (continued) |
| | Utilities - 3.8% - (continued) |
| 2,824,728 | Exelon Corp. | $ 150,247,282 |
| 1,028,025 | Sempra Energy | 131,206,831 |
| | | | 563,034,092 |
| | Total Common Stocks
(cost $8,592,575,439) | | $ 14,198,654,096 |
| SHORT-TERM INVESTMENTS - 2.5% |
| | Repurchase Agreements - 2.5% |
| $ 369,098,764 | Fixed Income Clearing Corp. Repurchase Agreement dated 10/29/2021 at 0.01%, due on 11/01/2021 with a maturity value of $ 369,099,072 ; collateralized by U.S. Treasury Bond at 1.875%, maturing 02/15/2041, with a market value of $ 376,480,787 | $ 369,098,764 |
| | Total Short-Term Investments
(cost $369,098,764) | $ 369,098,764 |
| | Total Investments
(cost $8,961,674,203) | 99.3% | $ 14,567,752,860 |
| | Other Assets and Liabilities | 0.7% | 99,349,220 |
| | Total Net Assets | 100.0% | $ 14,667,102,080 |
| Note: | Percentage of investments as shown is the ratio of the total market value to total net assets. |
| | Equity industry classifications used in this report are the Global Industry Classification Standard, which was developed by and is the exclusive property and service mark of MSCI, Inc. and Standard & Poor’s. |
| | For Fund compliance purposes, the Fund may not use the same classification system. These classifications are used for financial reporting purposes. |
| | See “Glossary” for abbreviation descriptions. |
| * | Non-income producing. |
| † | See Significant Accounting Policies of accompanying Notes to Financial Statements regarding valuation of investments. |
Fair Value Summary
The following is a summary of the fair valuations according to the inputs used as of October 31, 2021 in valuing the Fund’s investments.
| Description | | Total | | Level 1 | | Level 2 | | Level 3(1) |
| Assets | | | | | | | | |
| Common Stocks | | | | | | | | |
| Banks | | $ 1,060,614,898 | | $ 1,060,614,898 | | $ — | | $ — |
| Capital Goods | | 936,761,091 | | 936,761,091 | | — | | — |
| Commercial & Professional Services | | 161,955,517 | | 161,955,517 | | — | | — |
| Consumer Services | | 346,240,290 | | 346,240,290 | | — | | — |
| Diversified Financials | | 938,585,986 | | 938,585,986 | | — | | — |
| Energy | | 617,035,743 | | 617,035,743 | | — | | — |
| Food & Staples Retailing | | 388,260,846 | | 388,260,846 | | — | | — |
| Food, Beverage & Tobacco | | 376,083,602 | | 376,083,602 | | — | | — |
| Health Care Equipment & Services | | 1,085,094,966 | | 1,085,094,966 | | — | | — |
| Household & Personal Products | | 88,254,458 | | 88,254,458 | | — | | — |
| Insurance | | 941,131,766 | | 941,131,766 | | — | | — |
| Materials | | 494,636,511 | | 494,636,511 | | — | | — |
| Media & Entertainment | | 892,379,765 | | 892,379,765 | | — | | — |
| Pharmaceuticals, Biotechnology & Life Sciences | | 1,101,415,237 | | 1,101,415,237 | | — | | — |
| Real Estate | | 463,865,264 | | 463,865,264 | | — | | — |
| Retailing | | 555,622,507 | | 555,622,507 | | — | | — |
| Semiconductors & Semiconductor Equipment | | 481,030,003 | | 481,030,003 | | — | | — |
| Software & Services | | 1,280,947,063 | | 1,280,947,063 | | — | | — |
| Technology Hardware & Equipment | | 1,029,351,276 | | 1,029,351,276 | | — | | — |
| Telecommunication Services | | 303,614,577 | | 303,614,577 | | — | | — |
| Transportation | | 92,738,638 | | 92,738,638 | | — | | — |
| Utilities | | 563,034,092 | | 563,034,092 | | — | | — |
| Short-Term Investments | | 369,098,764 | | — | | 369,098,764 | | — |
| Total | | $ 14,567,752,860 | | $ 14,198,654,096 | | $ 369,098,764 | | $ — |
| (1) | For the year ended October 31, 2021, there were no transfers in and out of Level 3. |
The accompanying notes are an integral part of these financial statements.
The Hartford Equity Income Fund
Schedule of Investments
October 31, 2021
| Shares or Principal Amount | | Market Value† |
| COMMON STOCKS - 98.9% |
| | Banks - 9.1% |
| 2,621,002 | Bank of America Corp. | $ 125,231,476 |
| 911,172 | JP Morgan Chase & Co. | 154,799,011 |
| 400,468 | PNC Financial Services Group, Inc. | 84,510,762 |
| 1,265,853 | Truist Financial Corp. | 80,343,690 |
| | | | 444,884,939 |
| | Capital Goods - 11.7% |
| 129,505 | Caterpillar, Inc. | 26,420,315 |
| 94,362 | Deere & Co. | 32,301,056 |
| 696,743 | Eaton Corp. plc | 114,795,377 |
| 372,159 | General Dynamics Corp. | 75,455,237 |
| 342,266 | Honeywell International, Inc. | 74,826,193 |
| 915,601 | Johnson Controls International plc | 67,177,646 |
| 208,200 | L3Harris Technologies, Inc. | 47,998,428 |
| 161,838 | Lockheed Martin Corp. | 53,782,004 |
| 897,315 | Raytheon Technologies Corp. | 79,735,411 |
| | | | 572,491,667 |
| | Consumer Services - 0.9% |
| 174,758 | McDonald's Corp. | 42,911,827 |
| | Diversified Financials - 5.5% |
| 635,846 | Ares Management Corp. Class A | 53,881,590 |
| 104,769 | BlackRock, Inc. | 98,845,361 |
| 1,155,103 | Morgan Stanley | 118,721,486 |
| | | | 271,448,437 |
| | Energy - 5.3% |
| 1,236,466 | ConocoPhillips | 92,104,352 |
| 247,066 | Phillips 66 | 18,475,596 |
| 506,657 | Pioneer Natural Resources Co. | 94,734,726 |
| 1,044,916 | TC Energy Corp. | 56,526,443 |
| | | | 261,841,117 |
| | Food, Beverage & Tobacco - 8.0% |
| 969,542 | Archer-Daniels-Midland Co. | 62,283,378 |
| 606,241 | Kellogg Co. | 37,162,573 |
| 1,671,319 | Mondelez International, Inc. Class A | 101,515,916 |
| 358,563 | Nestle S.A. ADR | 47,265,775 |
| 296,256 | PepsiCo., Inc. | 47,874,969 |
| 1,005,131 | Philip Morris International, Inc. | 95,025,085 |
| | | | 391,127,696 |
| | Health Care Equipment & Services - 9.1% |
| 154,078 | Anthem, Inc. | 67,043,960 |
| 705,979 | Baxter International, Inc. | 55,744,102 |
| 363,315 | Becton Dickinson and Co. | 87,046,641 |
| 504,783 | Medtronic plc | 60,503,290 |
| 379,518 | UnitedHealth Group, Inc. | 174,756,654 |
| | | | 445,094,647 |
| | Household & Personal Products - 3.7% |
| 352,507 | Kimberly-Clark Corp. | 45,646,131 |
| 652,839 | Procter & Gamble Co. | 93,349,449 |
| 842,571 | Unilever plc ADR | 45,144,954 |
| | | | 184,140,534 |
| | Insurance - 6.0% |
| 599,248 | Chubb Ltd. | 117,081,074 |
| Shares or Principal Amount | | Market Value† |
| COMMON STOCKS - 98.9% - (continued) |
| | Insurance - 6.0% - (continued) |
| 1,634,899 | MetLife, Inc. | $ 102,671,657 |
| 767,035 | Progressive Corp. | 72,776,281 |
| | | | 292,529,012 |
| | Materials - 4.3% |
| 459,445 | Celanese Corp. | 74,204,962 |
| 427,000 | LyondellBasell Industries N.V. Class A | 39,634,140 |
| 465,421 | PPG Industries, Inc. | 74,732,650 |
| 326,600 | Rio Tinto plc ADR(1) | 20,663,982 |
| | | | 209,235,734 |
| | Media & Entertainment - 2.6% |
| 2,438,968 | Comcast Corp. Class A | 125,436,124 |
| | Pharmaceuticals, Biotechnology & Life Sciences - 10.0% |
| 1,114,778 | AstraZeneca plc ADR | 69,539,852 |
| 247,631 | Eli Lilly & Co. | 63,086,474 |
| 838,868 | Johnson & Johnson | 136,634,820 |
| 903,191 | Merck & Co., Inc. | 79,525,967 |
| 2,019,373 | Pfizer, Inc. | 88,327,375 |
| 130,633 | Roche Holding AG | 50,606,435 |
| | | | 487,720,923 |
| | Real Estate - 2.0% |
| 537,436 | Crown Castle International Corp. REIT | 96,899,711 |
| | Retailing - 3.7% |
| 161,394 | Home Depot, Inc. | 59,996,605 |
| 340,213 | Lowe's Cos., Inc. | 79,548,604 |
| 653,772 | TJX Cos., Inc. | 42,815,528 |
| | | | 182,360,737 |
| | Semiconductors & Semiconductor Equipment - 2.5% |
| 431,375 | Analog Devices, Inc. | 74,839,249 |
| 260,200 | Texas Instruments, Inc. | 48,782,296 |
| | | | 123,621,545 |
| | Software & Services - 0.5% |
| 232,700 | Fidelity National Information Services, Inc. | 25,769,198 |
| | Technology Hardware & Equipment - 6.3% |
| 2,750,672 | Cisco Systems, Inc. | 153,955,112 |
| 1,642,408 | Corning, Inc. | 58,420,452 |
| 648,020 | TE Connectivity Ltd. | 94,610,920 |
| | | | 306,986,484 |
| | Telecommunication Services - 1.0% |
| 930,205 | Verizon Communications, Inc. | 49,291,563 |
| | Transportation - 1.0% |
| 205,438 | Union Pacific Corp. | 49,592,733 |
| | Utilities - 5.7% |
| 557,792 | American Electric Power Co., Inc. | 47,250,560 |
| 688,734 | Dominion Energy, Inc. | 52,295,573 |
| 412,001 | Duke Energy Corp. | 42,028,222 |
| 1,224,048 | Exelon Corp. | 65,107,113 |
The accompanying notes are an integral part of these financial statements.
The Hartford Equity Income Fund
Schedule of Investments – (continued)
October 31, 2021
| Shares or Principal Amount | | Market Value† |
| COMMON STOCKS - 98.9% - (continued) |
| | Utilities - 5.7% - (continued) |
| 391,665 | Sempra Energy | $ 49,988,204 |
| 485,429 | UGI Corp. | 21,072,473 |
| | | | 277,742,145 |
| | Total Common Stocks
(cost $3,254,434,435) | | $ 4,841,126,773 |
| SHORT-TERM INVESTMENTS - 1.4% |
| | Repurchase Agreements - 1.0% |
| $ 51,975,720 | Fixed Income Clearing Corp. Repurchase Agreement dated 10/29/2021 at 0.010%, due on 11/01/2021 with a maturity value of $51,975,763; collateralized by U.S. Treasury Bond at 1.375%, maturing 11/15/2040, with a market value of $53,015,261 | $ 51,975,720 |
| | Securities Lending Collateral - 0.4% |
| 110,306 | Fidelity Investments Money Market Funds, Government Portfolio, Institutional Class, 0.01%(2) | 110,306 |
| 16,934,307 | Goldman Sachs Financial Square Funds, Government Fund, Institutional Class, 0.03%(2) | 16,934,307 |
| 1,215,759 | Invesco Government & Agency Portfolio, Institutional Class, 0.03%(2) | 1,215,759 |
| | | | 18,260,372 |
| | Total Short-Term Investments
(cost $70,236,092) | $ 70,236,092 |
| | Total Investments
(cost $3,324,670,527) | 100.3% | $ 4,911,362,865 |
| | Other Assets and Liabilities | (0.3)% | (16,249,967) |
| | Total Net Assets | 100.0% | $ 4,895,112,898 |
| Note: | Percentage of investments as shown is the ratio of the total market value to total net assets. |
| | Prices of foreign equities that are principally traded on certain foreign markets will generally be adjusted daily pursuant to a fair value pricing service approved by the Board of Directors in order to reflect an adjustment for factors occurring after the close of certain foreign markets but before the close of the New York Stock Exchange. |
| | Equity industry classifications used in this report are the Global Industry Classification Standard, which was developed by and is the exclusive property and service mark of MSCI, Inc. and Standard & Poor’s. |
| | For Fund compliance purposes, the Fund may not use the same classification system. These classifications are used for financial reporting purposes. |
| | See “Glossary” for abbreviation descriptions. |
| (1) | Represents entire or partial securities on loan. See Note 8 in the accompanying Notes to Financial Statements for securities lending information. |
| (2) | Current yield as of period end. |
| † | See Significant Accounting Policies of accompanying Notes to Financial Statements regarding valuation of investments. |
The accompanying notes are an integral part of these financial statements.
The Hartford Equity Income Fund
Schedule of Investments – (continued)
October 31, 2021
Fair Value Summary
The following is a summary of the fair valuations according to the inputs used as of October 31, 2021 in valuing the Fund’s investments.
| Description | | Total | | Level 1 | | Level 2 | | Level 3(1) |
| Assets | | | | | | | | |
| Common Stocks | | | | | | | | |
| Banks | | $ 444,884,939 | | $ 444,884,939 | | $ — | | $ — |
| Capital Goods | | 572,491,667 | | 572,491,667 | | — | | — |
| Consumer Services | | 42,911,827 | | 42,911,827 | | — | | — |
| Diversified Financials | | 271,448,437 | | 271,448,437 | | — | | — |
| Energy | | 261,841,117 | | 261,841,117 | | — | | — |
| Food, Beverage & Tobacco | | 391,127,696 | | 391,127,696 | | — | | — |
| Health Care Equipment & Services | | 445,094,647 | | 445,094,647 | | — | | — |
| Household & Personal Products | | 184,140,534 | | 184,140,534 | | — | | — |
| Insurance | | 292,529,012 | | 292,529,012 | | — | | — |
| Materials | | 209,235,734 | | 209,235,734 | | — | | — |
| Media & Entertainment | | 125,436,124 | | 125,436,124 | | — | | — |
| Pharmaceuticals, Biotechnology & Life Sciences | | 487,720,923 | | 437,114,488 | | 50,606,435 | | — |
| Real Estate | | 96,899,711 | | 96,899,711 | | — | | — |
| Retailing | | 182,360,737 | | 182,360,737 | | — | | — |
| Semiconductors & Semiconductor Equipment | | 123,621,545 | | 123,621,545 | | — | | — |
| Software & Services | | 25,769,198 | | 25,769,198 | | — | | — |
| Technology Hardware & Equipment | | 306,986,484 | | 306,986,484 | | — | | — |
| Telecommunication Services | | 49,291,563 | | 49,291,563 | | — | | — |
| Transportation | | 49,592,733 | | 49,592,733 | | — | | — |
| Utilities | | 277,742,145 | | 277,742,145 | | — | | — |
| Short-Term Investments | | 70,236,092 | | 18,260,372 | | 51,975,720 | | — |
| Total | | $ 4,911,362,865 | | $ 4,808,780,710 | | $ 102,582,155 | | $ — |
| (1) | For the year ended October 31, 2021, there were no transfers in and out of Level 3. |
The accompanying notes are an integral part of these financial statements.
The Hartford Growth Opportunities Fund
Schedule of Investments
October 31, 2021
| Shares or Principal Amount | | Market Value† |
| COMMON STOCKS - 93.6% |
| | Automobiles & Components - 1.0% |
| 778,371 | Thor Industries, Inc. | $ 79,362,707 |
| | Capital Goods - 2.5% |
| 1,691,230 | Johnson Controls International plc | 124,085,545 |
| 450,322 | Middleby Corp.* | 82,156,746 |
| | | | 206,242,291 |
| | Commercial & Professional Services - 3.6% |
| 603,830 | Copart, Inc.* | 93,768,760 |
| 1,315,385 | CoStar Group, Inc.* | 113,188,879 |
| 875,064 | Leidos Holdings, Inc. | 87,488,899 |
| | | | 294,446,538 |
| | Consumer Durables & Apparel - 4.1% |
| 877,162 | Lennar Corp. Class A | 87,654,799 |
| 518,918 | Lululemon Athletica, Inc.* | 241,820,977 |
| | | | 329,475,776 |
| | Consumer Services - 6.5% |
| 1,206,879 | Airbnb, Inc. Class A* | 205,965,970 |
| 49,280 | Booking Holdings, Inc.* | 119,296,039 |
| 2,926,593 | DraftKings, Inc. Class A* | 136,349,968 |
| 916,314 | Penn National Gaming, Inc.* | 65,608,082 |
| | | | 527,220,059 |
| | Food, Beverage & Tobacco - 1.1% |
| 402,820 | Constellation Brands, Inc. Class A | 87,335,404 |
| | Health Care Equipment & Services - 8.7% |
| 365,287 | ABIOMED, Inc.* | 121,289,896 |
| 310,753 | Danaher Corp. | 96,883,463 |
| 293,514 | DexCom, Inc.* | 182,920,860 |
| 2,065,194 | GoodRx Holdings, Inc. Class A*(1) | 92,107,652 |
| 464,186 | Insulet Corp.* | 143,906,944 |
| 1,347,906 | Oak Street Health, Inc.* | 63,661,600 |
| | | | 700,770,415 |
| | Media & Entertainment - 20.2% |
| 206,035 | Alphabet, Inc. Class A* | 610,053,152 |
| 816,822 | Facebook, Inc. Class A* | 264,299,094 |
| 648,250 | Match Group, Inc.* | 97,743,135 |
| 2,865,570 | Snap, Inc. Class A* | 150,671,671 |
| 823,836 | Spotify Technology S.A.* | 238,418,138 |
| 1,409,809 | Twitter, Inc.* | 75,481,174 |
| 686,327 | Walt Disney Co.* | 116,037,306 |
| 1,237,948 | ZoomInfo Technologies, Inc.* | 83,214,865 |
| | | | 1,635,918,535 |
| | Pharmaceuticals, Biotechnology & Life Sciences - 5.6% |
| 209,083 | Ascendis Pharma A/S ADR* | 31,699,074 |
| 2,093,739 | Elanco Animal Health, Inc.* | 68,842,138 |
| 1,386,982 | Exact Sciences Corp.* | 132,068,426 |
| 455,111 | Illumina, Inc.* | 188,898,372 |
| 178,650 | Kodiak Sciences, Inc.* | 20,918,128 |
| 121,360 | Reata Pharmaceuticals, Inc. Class A*(1) | 11,651,774 |
| | | | 454,077,912 |
| | Real Estate - 0.1% |
| 448,214 | WeWork, Inc.*(1) | 4,576,265 |
| | Retailing - 9.2% |
| 89,268 | Amazon.com, Inc.* | 301,050,081 |
| 644,567 | Five Below, Inc.* | 127,173,069 |
| 575,034 | Honest Co., Inc.*(2)(3) | 5,258,686 |
| 1,293,870 | Ross Stores, Inc. | 146,466,084 |
| Shares or Principal Amount | | Market Value† |
| COMMON STOCKS - 93.6% - (continued) |
| | Retailing - 9.2% - (continued) |
| 171,581 | Tory Burch LLC*(2)(4)(5) | $ 9,074,918 |
| 411,626 | Ulta Salon Cosmetics & Fragrance, Inc.* | 151,214,927 |
| | | | 740,237,765 |
| | Semiconductors & Semiconductor Equipment - 7.3% |
| 2,162,009 | Advanced Micro Devices, Inc.* | 259,938,342 |
| 1,317,411 | Marvell Technology, Inc. | 90,242,653 |
| 475,971 | MKS Instruments, Inc. | 71,419,449 |
| 308,688 | SolarEdge Technologies, Inc.* | 109,485,460 |
| 345,750 | Universal Display Corp. | 63,341,400 |
| | | | 594,427,304 |
| | Software & Services - 21.2% |
| 303,467 | Fair Isaac Corp.* | 120,840,559 |
| 478,828 | Five9, Inc.* | 75,659,612 |
| 729,119 | Guidewire Software, Inc.* | 91,672,132 |
| 5,596,045 | ironSource Ltd.*(1) | 63,738,952 |
| 723,037 | Mastercard, Inc. Class A | 242,593,374 |
| 226,343 | MongoDB, Inc.* | 117,990,343 |
| 376,462 | Paycom Software, Inc.* | 206,244,707 |
| 685,800 | Payoneer Global, Inc.* | 5,177,790 |
| 413,817 | RingCentral, Inc. Class A* | 100,880,308 |
| 819,581 | salesforce.com, Inc.* | 245,620,230 |
| 778,540 | Square, Inc. Class A* | 198,138,430 |
| 1,165,278 | Varonis Systems, Inc.* | 75,440,098 |
| 578,541 | Workday, Inc. Class A* | 167,765,319 |
| | | | 1,711,761,854 |
| | Technology Hardware & Equipment - 2.5% |
| 492,886 | Arista Networks, Inc.* | 201,930,465 |
| | Total Common Stocks
(cost $5,737,128,894) | | $ 7,567,783,290 |
| CONVERTIBLE PREFERRED STOCKS - 0.4% |
| | Commercial & Professional Services - 0.1% |
| 470,535 | Rubicon Global Holdings LLC Series C*(2)(4)(5) | $ 9,621,029 |
| | Software & Services - 0.3% |
| 5,668,755 | Essence Group Holdings Corp. Series 3*(2)(4)(5) | 12,641,324 |
| 743,470 | Lookout, Inc. Series F*(2)(4)(5) | 6,773,012 |
| | | | 19,414,336 |
| | Total Convertible Preferred Stocks
(cost $26,848,848) | | $ 29,035,365 |
| EXCHANGE-TRADED FUNDS - 4.1% |
| | Other Investment Pools & Funds - 4.1% |
| 1,120,355 | iShares Russell 1000 Growth ETF (1) | $ 333,865,790 |
| | Total Exchange-Traded Funds
(cost $318,621,742) | | $ 333,865,790 |
| | Total Long-Term Investments
(Cost $6,082,599,484) | | $ 7,930,684,445 |
| SHORT-TERM INVESTMENTS - 1.7% |
| | Repurchase Agreements - 1.1% |
| $ 87,787,053 | Fixed Income Clearing Corp. Repurchase Agreement dated 10/29/2021 at 0.010%, due on 11/01/2021 with a maturity value of $87,787,126; collateralized by U.S. Treasury Bond at 1.875%, maturing 02/15/2041, with a market value of $89,542,843 | $ 87,787,053 |
The accompanying notes are an integral part of these financial statements.
The Hartford Growth Opportunities Fund
Schedule of Investments – (continued)
October 31, 2021
| Shares or Principal Amount | | Market Value† |
| SHORT-TERM INVESTMENTS - 1.7% - (continued) |
| | Securities Lending Collateral - 0.6% |
| 294,896 | Fidelity Investments Money Market Funds, Government Portfolio, Institutional Class, 0.01%(6) | $ 294,896 |
| 45,272,633 | Goldman Sachs Financial Square Funds, Government Fund, Institutional Class, 0.03%(6) | 45,272,633 |
| 3,250,241 | Invesco Government & Agency Portfolio, Institutional Class, 0.03%(6) | 3,250,241 |
| | | | 48,817,770 |
| | Total Short-Term Investments
(cost $136,604,823) | $ 136,604,823 |
| | Total Investments
(cost $6,219,204,307) | 99.8% | $ 8,067,289,268 |
| | Other Assets and Liabilities | 0.2% | 16,179,667 |
| | Total Net Assets | 100.0% | $ 8,083,468,935 |
| Note: | Percentage of investments as shown is the ratio of the total market value to total net assets. |
| | Prices of foreign equities that are principally traded on certain foreign markets will generally be adjusted daily pursuant to a fair value pricing service approved by the Board of Directors in order to reflect an adjustment for factors occurring after the close of certain foreign markets but before the close of the New York Stock Exchange. |
| | Equity industry classifications used in this report are the Global Industry Classification Standard, which was developed by and is the exclusive property and service mark of MSCI, Inc. and Standard & Poor’s. |
| | For Fund compliance purposes, the Fund may not use the same classification system. These classifications are used for financial reporting purposes. |
| | See “Glossary” for abbreviation descriptions. |
| * | Non-income producing. |
| (1) | Represents entire or partial securities on loan. See Note 8 in the accompanying Notes to Financial Statements for securities lending information. |
| (2) | These securities are valued in good faith at fair value as determined under policies and procedures established by and under the supervision of the Board of Directors. At October 31, 2021, the aggregate fair value of these securities are $43,368,969, which represented 0.5% of total net assets. This amount excludes securities that are principally traded in certain foreign markets and whose prices are adjusted pursuant to a third party pricing service methodology approved by the Board of Directors. |
| (3) | As of October 31, 2021, investment is restricted from trading. The value of such restricted securities amounted to $5,258,686 or 0.1% of net assets. |
Period
Acquired | | Security Name | | Shares/
Par Value | | Total Cost | | Market Value |
| 08/2014 | | Honest Co., Inc. | | 575,034 | | $ 7,360,452 | | $ 5,258,686 |
| (4) | Investment in securities not registered under the Securities Act of 1933 (excluding securities acquired pursuant to Rule 144A and Regulation S). At the end of the period, the value of such restricted securities amounted to $38,110,283 or 0.5% of net assets. |
Period
Acquired | | Security Name | | Shares/
Par Value | | Total Cost | | Market Value |
| 05/2014 | | Essence Group Holdings Corp. Series 3 Convertible Preferred | | 5,668,755 | | $ 8,964,002 | | $ 12,641,324 |
| 07/2014 | | Lookout, Inc. Series F Convertible Preferred | | 743,470 | | 8,492,732 | | 6,773,012 |
| 09/2015 | | Rubicon Global Holdings LLC Series C Convertible Preferred | | 470,535 | | 9,392,114 | | 9,621,029 |
| 11/2013 | | Tory Burch LLC | | 171,581 | | 13,447,917 | | 9,074,918 |
| | | | | | | $ 40,296,765 | | $ 38,110,283 |
| (5) | Investment valued using significant unobservable inputs. |
| (6) | Current yield as of period end. |
| † | See Significant Accounting Policies of accompanying Notes to Financial Statements regarding valuation of investments. |
The accompanying notes are an integral part of these financial statements.
The Hartford Growth Opportunities Fund
Schedule of Investments – (continued)
October 31, 2021
Fair Value Summary
The following is a summary of the fair valuations according to the inputs used as of October 31, 2021 in valuing the Fund’s investments.
| Description | | Total | | Level 1 | | Level 2 | | Level 3(1) |
| Assets | | | | | | | | |
| Common Stocks | | | | | | | | |
| Automobiles & Components | | $ 79,362,707 | | $ 79,362,707 | | $ — | | $ — |
| Capital Goods | | 206,242,291 | | 206,242,291 | | — | | — |
| Commercial & Professional Services | | 294,446,538 | | 294,446,538 | | — | | — |
| Consumer Durables & Apparel | | 329,475,776 | | 329,475,776 | | — | | — |
| Consumer Services | | 527,220,059 | | 527,220,059 | | — | | — |
| Food, Beverage & Tobacco | | 87,335,404 | | 87,335,404 | | — | | — |
| Health Care Equipment & Services | | 700,770,415 | | 700,770,415 | | — | | — |
| Media & Entertainment | | 1,635,918,535 | | 1,635,918,535 | | — | | — |
| Pharmaceuticals, Biotechnology & Life Sciences | | 454,077,912 | | 454,077,912 | | — | | — |
| Real Estate | | 4,576,265 | | 4,576,265 | | — | | — |
| Retailing | | 740,237,765 | | 725,904,161 | | 5,258,686 | | 9,074,918 |
| Semiconductors & Semiconductor Equipment | | 594,427,304 | | 594,427,304 | | — | | — |
| Software & Services | | 1,711,761,854 | | 1,711,761,854 | | — | | — |
| Technology Hardware & Equipment | | 201,930,465 | | 201,930,465 | | — | | — |
| Convertible Preferred Stocks | | 29,035,365 | | — | | — | | 29,035,365 |
| Exchange-Traded Funds | | 333,865,790 | | 333,865,790 | | — | | — |
| Short-Term Investments | | 136,604,823 | | 48,817,770 | | 87,787,053 | | — |
| Total | | $ 8,067,289,268 | | $ 7,936,133,246 | | $ 93,045,739 | | $ 38,110,283 |
| (1) | For the year ended October 31, 2021, investments valued at $13,101,364 were transferred out of Level 3 due to the initiation of a vendor providing prices that are based on market activity which has been determined to be significant observable input. There were no transfers into Level 3. |
Level 3 investments at the beginning and/or end of the period in relation to net assets were not significant and accordingly, a reconciliation of Level 3 assets for the year ended October 31, 2021 is not presented.
The accompanying notes are an integral part of these financial statements.
The Hartford Healthcare Fund
Schedule of Investments
October 31, 2021
| Shares or Principal Amount | | Market Value† |
| COMMON STOCKS - 98.7% |
| | Biotechnology - 17.9% |
| 636,147 | 89bio, Inc.* | $ 11,196,187 |
| 242,890 | Abcam plc* | 5,498,017 |
| 67,461 | Alnylam Pharmaceuticals, Inc.* | 10,764,077 |
| 157,714 | ALX Oncology Holdings, Inc.* | 8,838,293 |
| 1,280,964 | Amicus Therapeutics, Inc.* | 13,450,122 |
| 135,406 | Arena Pharmaceuticals, Inc.* | 7,770,950 |
| 22,901 | Argenx SE ADR* | 6,915,186 |
| 64,327 | Ascendis Pharma A/S ADR* | 9,752,617 |
| 179,608 | BioAtla, Inc.* | 5,249,942 |
| 101,689 | Blueprint Medicines Corp.* | 11,438,996 |
| 186,086 | Celldex Therapeutics, Inc.* | 7,916,099 |
| 259,682 | Connect Biopharma Holdings Ltd. ADR*(1) | 4,113,363 |
| 1,094,800 | Everest Medicines Ltd.*(1)(2) | 6,279,813 |
| 190,692 | Exact Sciences Corp.* | 18,157,692 |
| 15,195 | Genmab A/S* | 6,826,376 |
| 103,511 | Genus plc | 7,849,422 |
| 378,118 | Gracell Biotechnologies, Inc. ADR* | 4,045,863 |
| 1,095,843 | ImmunoGen, Inc.* | 6,607,933 |
| 2,443,000 | InnoCare Pharma Ltd.*(1)(2) | 5,858,408 |
| 871,000 | Innovent Biologics, Inc.*(2) | 7,795,755 |
| 325,840 | Invitae Corp.*(1) | 8,634,760 |
| 641,240 | Ironwood Pharmaceuticals, Inc.* | 8,188,635 |
| 16,756 | Karuna Therapeutics, Inc.* | 2,352,207 |
| 90,167 | Kodiak Sciences, Inc.* | 10,557,654 |
| 156,275 | Kymera Therapeutics, Inc.* | 9,201,472 |
| 93,379 | Madrigal Pharmaceuticals, Inc.* | 7,260,217 |
| 316,114 | Merus N.V.* | 8,866,998 |
| 52,367 | Mirati Therapeutics, Inc.* | 9,898,410 |
| 195,573 | Myovant Sciences Ltd.* | 4,279,137 |
| 252,578 | Nurix Therapeutics, Inc.* | 8,448,734 |
| 109,837 | Sage Therapeutics, Inc.* | 4,433,021 |
| 138,301 | Seagen, Inc.* | 24,386,615 |
| 230,374 | Veracyte, Inc.* | 11,030,307 |
| 122,075 | Verve Therapeutics, Inc.*(1) | 5,663,059 |
| 16,100 | Zai Lab Ltd.* | 1,670,230 |
| 153,427 | Zai Lab Ltd. ADR* | 16,017,779 |
| 58,545 | Zealand Pharma A/S ADR*(1) | 1,859,975 |
| | | | 309,074,321 |
| | Consumer Finance - 0.1% |
| 112,470 | Orion Acquisition Corp.* | 1,113,453 |
| | Health Care Distributors - 0.8% |
| 195,067 | AdaptHealth Corp.* | 5,315,576 |
| 220,464 | Owens & Minor, Inc. | 7,910,248 |
| | | | 13,225,824 |
| | Health Care Equipment - 23.5% |
| 272,548 | Baxter International, Inc. | 21,520,390 |
| 148,590 | Becton Dickinson and Co. | 35,600,678 |
| 1,221,571 | Boston Scientific Corp.* | 52,686,357 |
| 221,064 | Danaher Corp. | 68,921,123 |
| 64,009 | DiaSorin S.p.A. | 14,470,127 |
| 437,474 | Edwards Lifesciences Corp.* | 52,418,135 |
| 125,300 | Glaukos Corp.* | 5,727,463 |
| 199,927 | Hologic, Inc.* | 14,656,648 |
| 114,636 | Inari Medical, Inc.* | 10,376,851 |
| 44,369 | Insulet Corp.* | 13,755,277 |
| 111,528 | Integra LifeSciences Holdings Corp.* | 7,412,151 |
| 130,270 | iRhythm Technologies, Inc.* | 9,137,138 |
| 280,677 | Koninklijke Philips N.V. | 13,240,985 |
| 17,349 | Masimo Corp.* | 4,919,136 |
| 602,169 | Smith & Nephew plc | 10,399,499 |
| Shares or Principal Amount | | Market Value† |
| COMMON STOCKS - 98.7% - (continued) |
| | Health Care Equipment - 23.5% - (continued) |
| 171,346 | Stryker Corp. | $ 45,590,030 |
| 57,658 | Teleflex, Inc. | 20,580,447 |
| 1,112,000 | Venus MedTech Hangzhou, Inc. Class H*(1)(2) | 5,146,335 |
| | | | 406,558,770 |
| | Health Care Facilities - 2.7% |
| 460,563 | Cano Health, Inc.*(1) | 5,061,587 |
| 197,431 | Encompass Health Corp. | 12,548,714 |
| 115,493 | HCA Healthcare, Inc. | 28,926,377 |
| | | | 46,536,678 |
| | Health Care Services - 2.5% |
| 330,168 | agilon health, Inc.* | 8,089,116 |
| 53,248 | Amedisys, Inc.* | 9,017,016 |
| 411,170 | Aveanna Healthcare Holdings, Inc.* | 3,174,232 |
| 242,800 | Entrada Therapeutics, Inc. | 5,815,060 |
| 60,275 | Laboratory Corp. of America Holdings* | 17,300,131 |
| | | | 43,395,555 |
| | Health Care Supplies - 2.3% |
| 34,886 | Align Technology, Inc.* | 21,781,772 |
| 73,393 | Haemonetics Corp.* | 5,042,833 |
| 58,588 | Quidel Corp.* | 7,778,728 |
| 2,980,000 | Shandong Weigao Group Medical Polymer Co., Ltd. Class H | 5,075,924 |
| | | | 39,679,257 |
| | Integrated Telecommunication Services - 0.2% |
| 366,004 | MedTech Acquisition Corp.* | 3,740,561 |
| | Life & Health Insurance - 0.2% |
| 237,734 | Oscar Health, Inc. Class A* | 4,108,044 |
| | Life Sciences Tools & Services - 7.9% |
| 214,252 | Agilent Technologies, Inc. | 33,742,547 |
| 19,886 | Bio-Techne Corp. | 10,413,304 |
| 60,435 | Illumina, Inc.* | 25,084,151 |
| 167,320 | NanoString Technologies, Inc.* | 8,081,556 |
| 230,957 | NeoGenomics, Inc.* | 10,624,022 |
| 90,700 | Oxford Industries, Inc.* | 693,252 |
| 314,068 | Syneos Health, Inc.* | 29,315,107 |
| 15,660 | Tecan Group AG | 9,594,916 |
| 450,215 | WuXi AppTec Co., Ltd. Class H(2) | 9,612,614 |
| | | | 137,161,469 |
| | Managed Health Care - 14.2% |
| 321,445 | Centene Corp.* | 22,899,742 |
| 85,826 | Humana, Inc. | 39,751,170 |
| 53,748 | Molina Healthcare, Inc.* | 15,894,359 |
| 464,300 | Notre Dame Intermedica Participacoes S.A. | 5,279,913 |
| 349,594 | UnitedHealth Group, Inc. | 160,977,549 |
| | | | 244,802,733 |
| | Other Diversified Financial Services - 0.3% |
| 599,851 | DA32 Life Science Tech Acquisition Corp. Class A* | 5,878,540 |
| | Pharmaceuticals - 26.1% |
| 1,102,300 | Astellas Pharma, Inc. | 18,583,420 |
| 664,429 | AstraZeneca plc ADR | 41,447,081 |
| 993,748 | Bristol-Myers Squibb Co. | 58,034,883 |
| 2,436,000 | CSPC Pharmaceutical Group Ltd. | 2,541,965 |
| 755,625 | Daiichi Sankyo Co., Ltd. | 19,066,207 |
| 199,195 | Eisai Co., Ltd. | 14,114,188 |
| 182,112 | Elanco Animal Health, Inc.* | 5,987,843 |
| 356,242 | Eli Lilly & Co. | 90,756,212 |
The accompanying notes are an integral part of these financial statements.
The Hartford Healthcare Fund
Schedule of Investments – (continued)
October 31, 2021
| Shares or Principal Amount | | Market Value† |
| COMMON STOCKS - 98.7% - (continued) |
| | Pharmaceuticals - 26.1% - (continued) |
| 90,221 | Hikma Pharmaceuticals plc | $ 2,973,856 |
| 315,547 | Hutchmed China Ltd.* | 1,867,191 |
| 70,182 | Hutchmed China Ltd. ADR* | 2,064,755 |
| 1,386,600 | Hypera S.A. | 6,893,936 |
| 133,500 | Kyowa Kirin Co., Ltd. | 4,390,554 |
| 58,900 | Nippon Shinyaku Co., Ltd. | 4,718,854 |
| 95,995 | Novartis AG | 7,940,006 |
| 421,845 | Ono Pharmaceutical Co., Ltd. | 8,851,036 |
| 2,254,423 | Pfizer, Inc. | 98,608,462 |
| 35,517 | Roche Holding AG | 13,759,071 |
| 67,192 | UCB S.A. | 8,031,167 |
| 190,537 | Zoetis, Inc. | 41,194,099 |
| | | | 451,824,786 |
| | Total Common Stocks
(cost $1,268,187,086) | | $ 1,707,099,991 |
| SHORT-TERM INVESTMENTS - 1.7% |
| | Repurchase Agreements - 1.1% |
| $ 18,664,274 | Fixed Income Clearing Corp. Repurchase Agreement dated 10/29/2021 at 0.010%, due on 11/01/2021 with a maturity value of $18,664,290; collateralized by U.S. Treasury Bond at 1.875%, maturing 02/15/2041, with a market value of $19,037,631 | $ 18,664,274 |
| | Securities Lending Collateral - 0.6% |
| 61,744 | Fidelity Investments Money Market Funds, Government Portfolio, Institutional Class, 0.01%(3) | 61,744 |
| 9,479,008 | Goldman Sachs Financial Square Funds, Government Fund, Institutional Class, 0.03%(3) | 9,479,008 |
| 680,523 | Invesco Government & Agency Portfolio, Institutional Class, 0.03%(3) | 680,523 |
| | | | 10,221,275 |
| | Total Short-Term Investments
(cost $28,885,549) | $ 28,885,549 |
| | Total Investments
(cost $1,297,072,635) | 100.4% | $ 1,735,985,540 |
| | Other Assets and Liabilities | (0.4)% | (7,356,096) |
| | Total Net Assets | 100.0% | $ 1,728,629,444 |
| Note: | Percentage of investments as shown is the ratio of the total market value to total net assets. |
| | Prices of foreign equities that are principally traded on certain foreign markets will generally be adjusted daily pursuant to a fair value pricing service approved by the Board of Directors in order to reflect an adjustment for factors occurring after the close of certain foreign markets but before the close of the New York Stock Exchange. |
| | Equity industry classifications used in this report are the Global Industry Classification Standard, which was developed by and is the exclusive property and service mark of MSCI, Inc. and Standard & Poor’s. |
| | For Fund compliance purposes, the Fund may not use the same classification system. These classifications are used for financial reporting purposes. |
| | See “Glossary” for abbreviation descriptions. |
| * | Non-income producing. |
| (1) | Represents entire or partial securities on loan. See Note 8 in the accompanying Notes to Financial Statements for securities lending information. |
| (2) | Security was purchased pursuant to Rule 144A under the Securities Act of 1933 and may be sold in transactions that are exempt from registration (typically only to qualified institutional buyers) or in a public offering registered under the Securities Act of 1933. At October 31, 2021, the aggregate value of these securities was $34,692,925, representing 2.0% of net assets. |
| (3) | Current yield as of period end. |
| † | See Significant Accounting Policies of accompanying Notes to Financial Statements regarding valuation of investments. |
The accompanying notes are an integral part of these financial statements.
The Hartford Healthcare Fund
Schedule of Investments – (continued)
October 31, 2021
Fair Value Summary
The following is a summary of the fair valuations according to the inputs used as of October 31, 2021 in valuing the Fund’s investments.
| Description | | Total | | Level 1 | | Level 2 | | Level 3(1) |
| Assets | | | | | | | | |
| Common Stocks | | | | | | | | |
| Biotechnology | | $ 309,074,321 | | $ 272,794,317 | | $ 36,280,004 | | $ — |
| Consumer Finance | | 1,113,453 | | 1,113,453 | | — | | — |
| Health Care Distributors | | 13,225,824 | | 13,225,824 | | — | | — |
| Health Care Equipment | | 406,558,770 | | 363,301,824 | | 43,256,946 | | — |
| Health Care Facilities | | 46,536,678 | | 46,536,678 | | — | | — |
| Health Care Services | | 43,395,555 | | 43,395,555 | | — | | — |
| Health Care Supplies | | 39,679,257 | | 34,603,333 | | 5,075,924 | | — |
| Integrated Telecommunication Services | | 3,740,561 | | 3,740,561 | | — | | — |
| Life & Health Insurance | | 4,108,044 | | 4,108,044 | | — | | — |
| Life Sciences Tools & Services | | 137,161,469 | | 117,953,939 | | 19,207,530 | | — |
| Managed Health Care | | 244,802,733 | | 244,802,733 | | — | | — |
| Other Diversified Financial Services | | 5,878,540 | | 5,878,540 | | — | | — |
| Pharmaceuticals | | 451,824,786 | | 344,987,271 | | 106,837,515 | | — |
| Short-Term Investments | | 28,885,549 | | 10,221,275 | | 18,664,274 | | — |
| Total | | $ 1,735,985,540 | | $ 1,506,663,347 | | $ 229,322,193 | | $ — |
| (1) | For the year ended October 31, 2021, there were no transfers in and out of Level 3. |
The accompanying notes are an integral part of these financial statements.
Schedule of Investments
October 31, 2021
| Shares or Principal Amount | | Market Value† |
| COMMON STOCKS - 99.7% |
| | Automobiles & Components - 0.3% |
| 2,100,397 | Arrival S.A.*(1) | $ 34,719,562 |
| | Banks - 5.3% |
| 1,025,790 | Cullen/Frost Bankers, Inc. | 132,839,805 |
| 194,966 | First Citizens BancShares, Inc. Class A | 158,682,827 |
| 827,481 | First Republic Bank | 179,008,965 |
| 976,668 | M&T Bank Corp. | 143,687,396 |
| 1,577,763 | Prosperity Bancshares, Inc. | 118,821,332 |
| | | | 733,040,325 |
| | Capital Goods - 9.6% |
| 639,425 | Axon Enterprise, Inc.* | 115,070,923 |
| 1,355,232 | Builders FirstSource, Inc.* | 78,969,369 |
| 997,555 | Graco, Inc. | 74,996,185 |
| 990,618 | IDEX Corp. | 220,481,848 |
| 5,850,149 | Ingersoll Rand, Inc.* | 314,504,010 |
| 612,107 | Lennox International, Inc. | 183,191,383 |
| 1,095,952 | Lincoln Electric Holdings, Inc. | 156,063,565 |
| 471,679 | Middleby Corp.* | 86,053,117 |
| 350,026 | Watsco, Inc. | 101,360,529 |
| | | | 1,330,690,929 |
| | Commercial & Professional Services - 3.8% |
| 5,581,750 | Dun & Bradstreet Holdings, Inc.* | 105,160,170 |
| 4,500,933 | GFL Environmental, Inc. | 185,213,393 |
| 1,920,845 | IAA, Inc.* | 114,578,404 |
| 1,431,700 | Science Applications International Corp. | 128,538,026 |
| | | | 533,489,993 |
| | Consumer Durables & Apparel - 6.6% |
| 1,413,762 | Carter's, Inc. | 139,283,832 |
| 47,469 | NVR, Inc.* | 232,351,261 |
| 1,418,489 | PVH Corp.* | 155,083,403 |
| 6,705,234 | Under Armour, Inc. Class C* | 126,594,818 |
| 1,350,565 | Vizio Holding Corp.*(1) | 27,740,605 |
| 2,431,366 | YETI Holdings, Inc.* | 239,076,219 |
| | | | 920,130,138 |
| | Consumer Services - 2.1% |
| 1,576,391 | Choice Hotels International, Inc. | 221,672,102 |
| 821,868 | Hyatt Hotels Corp. Class A* | 70,023,154 |
| | | | 291,695,256 |
| | Diversified Financials - 2.4% |
| 436,396 | Credit Acceptance Corp.*(1) | 261,056,451 |
| 715,501 | Hamilton Lane, Inc. Class A | 74,777,010 |
| | | | 335,833,461 |
| | Energy - 0.1% |
| 765,797 | Coterra Energy, Inc. | 16,326,792 |
| | Food & Staples Retailing - 0.6% |
| 1,748,699 | Performance Food Group Co.* | 79,093,656 |
| | Food, Beverage & Tobacco - 0.9% |
| 2,268,536 | Lamb Weston Holdings, Inc. | 128,058,857 |
| | Health Care Equipment & Services - 5.6% |
| 1,789,941 | Encompass Health Corp. | 113,768,650 |
| 467,887 | Inari Medical, Inc.* | 42,353,131 |
| 3,010,499 | Integra LifeSciences Holdings Corp.* | 200,077,764 |
| 212,382 | LHC Group, Inc.* | 28,584,493 |
| 518,351 | Molina Healthcare, Inc.* | 153,286,758 |
| 358,161 | Nevro Corp.* | 40,737,232 |
| Shares or Principal Amount | | Market Value† |
| COMMON STOCKS - 99.7% - (continued) |
| | Health Care Equipment & Services - 5.6% - (continued) |
| 898,804 | NuVasive, Inc.* | $ 47,960,181 |
| 441,123 | Teleflex, Inc. | 157,454,444 |
| | | | 784,222,653 |
| | Insurance - 4.4% |
| 288,511 | Erie Indemnity Co. Class A | 59,378,449 |
| 2,181,404 | Fidelity National Financial, Inc. | 104,511,066 |
| 995,873 | Globe Life, Inc. | 88,652,614 |
| 144,120 | Markel Corp.* | 189,248,296 |
| 87,912 | White Mountains Insurance Group Ltd. | 92,746,281 |
| 990,037 | WR Berkley Corp. | 78,806,945 |
| | | | 613,343,651 |
| | Materials - 2.8% |
| 7,373,730 | Element Solutions, Inc. | 167,457,408 |
| 2,543,548 | Silgan Holdings, Inc. | 102,250,630 |
| 1,911,881 | Steel Dynamics, Inc. | 126,337,096 |
| | | | 396,045,134 |
| | Media & Entertainment - 2.9% |
| 112,736 | Cable One, Inc. | 192,914,971 |
| 3,243,974 | Cargurus, Inc.* | 108,802,888 |
| 14,737,745 | Zynga, Inc. Class A* | 108,764,558 |
| | | | 410,482,417 |
| | Pharmaceuticals, Biotechnology & Life Sciences - 12.6% |
| 1,224,567 | Allakos, Inc.* | 123,166,950 |
| 3,395,859 | Apellis Pharmaceuticals, Inc.* | 104,388,706 |
| 1,715,223 | Arena Pharmaceuticals, Inc.* | 98,436,648 |
| 735,922 | Exact Sciences Corp.* | 70,074,493 |
| 657,649 | ICON plc* | 188,594,004 |
| 5,071,958 | Iovance Biotherapeutics, Inc.* | 123,299,299 |
| 1,263,070 | Jazz Pharmaceuticals plc* | 168,038,833 |
| 1,190,403 | Kodiak Sciences, Inc.* | 139,384,287 |
| 682,899 | Mirati Therapeutics, Inc.* | 129,081,569 |
| 901,047 | NeoGenomics, Inc.* | 41,448,162 |
| 2,958,804 | PTC Therapeutics, Inc.* | 112,227,436 |
| 1,161,132 | Reata Pharmaceuticals, Inc. Class A* | 111,480,283 |
| 2,686,502 | Sage Therapeutics, Inc.* | 108,427,221 |
| 1,398,598 | Syneos Health, Inc.* | 130,545,137 |
| 1,324,292 | Ultragenyx Pharmaceutical, Inc.* | 111,134,584 |
| | | | 1,759,727,612 |
| | Real Estate - 5.3% |
| 1,647,136 | Life Storage, Inc. REIT | 220,403,268 |
| 339,934 | PS Business Parks, Inc. REIT | 60,406,272 |
| 1,878,364 | Redfin Corp.* | 96,435,207 |
| 2,741,859 | Rexford Industrial Realty, Inc. REIT | 184,252,925 |
| 5,287,457 | STORE Capital Corp. REIT | 181,518,399 |
| | | | 743,016,071 |
| | Retailing - 3.0% |
| 952,538 | CarMax, Inc.* | 130,421,503 |
| 1,161,263 | Etsy, Inc.* | 291,117,021 |
| | | | 421,538,524 |
| | Semiconductors & Semiconductor Equipment - 5.6% |
| 2,814,704 | First Solar, Inc.* | 336,610,451 |
| 1,356,592 | MKS Instruments, Inc. | 203,556,630 |
| 694,890 | Silicon Laboratories, Inc.* | 131,167,436 |
| 566,836 | Synaptics, Inc.* | 110,289,281 |
| | | | 781,623,798 |
| | Software & Services - 10.8% |
| 156,729 | Aspen Technology, Inc.* | 24,557,867 |
| 708,815 | Black Knight, Inc.* | 49,695,020 |
The accompanying notes are an integral part of these financial statements.
Schedule of Investments – (continued)
October 31, 2021
| Shares or Principal Amount | | Market Value† |
| COMMON STOCKS - 99.7% - (continued) |
| | Software & Services - 10.8% - (continued) |
| 1,823,731 | Digital Turbine, Inc.* | $ 156,950,290 |
| 6,274,649 | Genpact Ltd. | 309,653,928 |
| 1,237,778 | Guidewire Software, Inc.* | 155,625,828 |
| 1,333,753 | Informatica, Inc.* | 39,559,114 |
| 1,851,060 | LiveRamp Holdings, Inc.* | 99,050,220 |
| 1,030,751 | Olo, Inc.* | 28,057,042 |
| 1,341,592 | Q2 Holdings, Inc.* | 105,261,308 |
| 1,667,905 | Shift4 Payments, Inc. Class A* | 105,294,843 |
| 3,482,291 | Teradata Corp.* | 196,958,379 |
| 1,528,397 | WEX, Inc.* | 228,801,031 |
| | | | 1,499,464,870 |
| | Technology Hardware & Equipment - 9.4% |
| 777,784 | CDW Corp. | 145,173,384 |
| 10,220,711 | CommScope Holding Co., Inc.*(2) | 109,463,815 |
| 1,469,230 | F5 Networks, Inc.* | 310,227,914 |
| 11,718,531 | Flex Ltd.* | 198,043,174 |
| 4,321,301 | II-VI, Inc.* | 261,481,923 |
| 2,555,543 | Lumentum Holdings, Inc.* | 211,036,741 |
| 1,706,855 | National Instruments Corp. | 72,490,132 |
| | | | 1,307,917,083 |
| | Transportation - 3.1% |
| 234,604 | AMERCO | 172,900,802 |
| 4,443,074 | Knight-Swift Transportation Holdings, Inc. | 251,877,865 |
| | | | 424,778,667 |
| | Utilities - 2.5% |
| 1,310,358 | Black Hills Corp. | 86,981,564 |
| 2,085,993 | NiSource, Inc. | 51,461,447 |
| 4,765,883 | UGI Corp. | 206,886,981 |
| | | | 345,329,992 |
| | Total Common Stocks
(cost $9,383,481,835) | | $ 13,890,569,441 |
| SHORT-TERM INVESTMENTS - 2.2% |
| | Repurchase Agreements - 0.2% |
| $ 27,625,042 | Fixed Income Clearing Corp. Repurchase Agreement dated 10/29/2021 at 0.01%, due on 11/01/2021 with a maturity value of $27,625,065; collateralized by U.S. Treasury Bond at 1.875%, maturing 02/15/2041, with a market value of $28,177,640 | $ 27,625,042 |
| | Securities Lending Collateral - 2.0% |
| 1,679,805 | Fidelity Investments Money Market Funds, Government Portfolio, Institutional Class, 0.01%(3) | 1,679,805 |
| Shares or Principal Amount | | Market Value† |
| SHORT-TERM INVESTMENTS - 2.2% - (continued) |
| | Securities Lending Collateral - 2.0% - (continued) |
| 257,885,094 | Goldman Sachs Financial Square Funds, Government Fund, Institutional Class, 0.03%(3) | $ 257,885,094 |
| 18,514,248 | Invesco Government & Agency Portfolio, Institutional Class, 0.03%(3) | 18,514,248 |
| | | | 278,079,147 |
| | Total Short-Term Investments
(cost $305,704,189) | $ 305,704,189 |
| | Total Investments
(cost $9,689,186,024) | 101.9% | $ 14,196,273,630 |
| | Other Assets and Liabilities | (1.9)% | (269,981,623) |
| | Total Net Assets | 100.0% | $ 13,926,292,007 |
| Note: | Percentage of investments as shown is the ratio of the total market value to total net assets. |
| | Prices of foreign equities that are principally traded on certain foreign markets will generally be adjusted daily pursuant to a fair value pricing service approved by the Board of Directors in order to reflect an adjustment for factors occurring after the close of certain foreign markets but before the close of the New York Stock Exchange. |
| | Equity industry classifications used in this report are the Global Industry Classification Standard, which was developed by and is the exclusive property and service mark of MSCI, Inc. and Standard & Poor’s. |
| | For Fund compliance purposes, the Fund may not use the same classification system. These classifications are used for financial reporting purposes. |
| | See “Glossary” for abbreviation descriptions. |
| * | Non-income producing. |
| (1) | Represents entire or partial securities on loan. See Note 8 in the accompanying Notes to Financial Statements for securities lending information. |
| (2) | Affiliated company – The Fund owns greater than 5% of the outstanding voting securities of this issuer. |
| (3) | Current yield as of period end. |
| † | See Significant Accounting Policies of accompanying Notes to Financial Statements regarding valuation of investments. |
The accompanying notes are an integral part of these financial statements.
Schedule of Investments – (continued)
October 31, 2021
Fair Value Summary
The following is a summary of the fair valuations according to the inputs used as of October 31, 2021 in valuing the Fund’s investments.
| Description | | Total | | Level 1 | | Level 2 | | Level 3(1) |
| Assets | | | | | | | | |
| Common Stocks | | | | | | | | |
| Automobiles & Components | | $ 34,719,562 | | $ 34,719,562 | | $ — | | $ — |
| Banks | | 733,040,325 | | 733,040,325 | | — | | — |
| Capital Goods | | 1,330,690,929 | | 1,330,690,929 | | — | | — |
| Commercial & Professional Services | | 533,489,993 | | 533,489,993 | | — | | — |
| Consumer Durables & Apparel | | 920,130,138 | | 920,130,138 | | — | | — |
| Consumer Services | | 291,695,256 | | 291,695,256 | | — | | — |
| Diversified Financials | | 335,833,461 | | 335,833,461 | | — | | — |
| Energy | | 16,326,792 | | 16,326,792 | | — | | — |
| Food & Staples Retailing | | 79,093,656 | | 79,093,656 | | — | | — |
| Food, Beverage & Tobacco | | 128,058,857 | | 128,058,857 | | — | | — |
| Health Care Equipment & Services | | 784,222,653 | | 784,222,653 | | — | | — |
| Insurance | | 613,343,651 | | 613,343,651 | | — | | — |
| Materials | | 396,045,134 | | 396,045,134 | | — | | — |
| Media & Entertainment | | 410,482,417 | | 410,482,417 | | — | | — |
| Pharmaceuticals, Biotechnology & Life Sciences | | 1,759,727,612 | | 1,759,727,612 | | — | | — |
| Real Estate | | 743,016,071 | | 743,016,071 | | — | | — |
| Retailing | | 421,538,524 | | 421,538,524 | | — | | — |
| Semiconductors & Semiconductor Equipment | | 781,623,798 | | 781,623,798 | | — | | — |
| Software & Services | | 1,499,464,870 | | 1,499,464,870 | | — | | — |
| Technology Hardware & Equipment | | 1,307,917,083 | | 1,307,917,083 | | — | | — |
| Transportation | | 424,778,667 | | 424,778,667 | | — | | — |
| Utilities | | 345,329,992 | | 345,329,992 | | — | | — |
| Short-Term Investments | | 305,704,189 | | 278,079,147 | | 27,625,042 | | — |
| Total | | $ 14,196,273,630 | | $ 14,168,648,588 | | $ 27,625,042 | | $ — |
| (1) | For the year ended October 31, 2021, there were no transfers in and out of Level 3. |
The accompanying notes are an integral part of these financial statements.
The Hartford MidCap Value Fund
Schedule of Investments
October 31, 2021
| Shares or Principal Amount | | Market Value† |
| COMMON STOCKS - 99.8% |
| | Automobiles & Components - 2.0% |
| 600,328 | Ford Motor Co.* | $ 10,253,602 |
| 212,534 | Gentex Corp. | 7,521,578 |
| | | | 17,775,180 |
| | Banks - 9.5% |
| 359,179 | Cadence Bank* | 10,423,375 |
| 94,661 | M&T Bank Corp. | 13,926,526 |
| 587,012 | MGIC Investment Corp. | 9,486,114 |
| 155,626 | South State Corp. | 12,152,834 |
| 265,949 | Synovus Financial Corp. | 12,390,564 |
| 98,539 | Western Alliance Bancorp | 11,439,393 |
| 209,674 | Zions Bancorp NA | 13,207,365 |
| | | | 83,026,171 |
| | Capital Goods - 18.4% |
| 225,703 | AerCap Holdings N.V.* | 13,325,505 |
| 203,950 | Builders FirstSource, Inc.* | 11,884,167 |
| 235,043 | Colfax Corp.* | 12,132,920 |
| 313,706 | Howmet Aerospace, Inc. | 9,313,931 |
| 303,657 | Ingersoll Rand, Inc.* | 16,324,600 |
| 327,939 | JELD-WEN Holding, Inc.* | 8,988,808 |
| 155,448 | Johnson Controls International plc | 11,405,220 |
| 56,137 | L3Harris Technologies, Inc. | 12,941,824 |
| 72,328 | Middleby Corp.* | 13,195,520 |
| 43,785 | Regal-Beloit Corp. | 6,669,769 |
| 259,382 | Spirit AeroSystems Holdings, Inc. | 10,709,883 |
| 114,523 | SPX FLOW, Inc. | 8,556,013 |
| 202,396 | Westinghouse Air Brake Technologies Corp. | 18,363,389 |
| 196,380 | Zurn Water Solutios Corp. | 7,124,666 |
| | | | 160,936,215 |
| | Commercial & Professional Services - 3.0% |
| 101,773 | Clean Harbors, Inc.* | 11,453,534 |
| 146,645 | Leidos Holdings, Inc. | 14,661,567 |
| | | | 26,115,101 |
| | Consumer Durables & Apparel - 2.0% |
| 41,298 | Columbia Sportswear Co. | 4,288,384 |
| 121,582 | Leggett & Platt, Inc. | 5,696,117 |
| 157,153 | Steven Madden Ltd. | 7,087,600 |
| | | | 17,072,101 |
| | Consumer Services - 2.0% |
| 78,748 | Boyd Gaming Corp.* | 5,022,548 |
| 225,715 | Six Flags Entertainment Corp.* | 9,283,658 |
| 42,979 | Wyndham Hotels & Resorts, Inc. | 3,630,436 |
| | | | 17,936,642 |
| | Diversified Financials - 1.7% |
| 211,768 | Voya Financial, Inc. | 14,775,053 |
| | Energy - 3.9% |
| 604,445 | Coterra Energy, Inc. | 12,886,767 |
| 263,859 | Delek U.S. Holdings, Inc.* | 5,132,058 |
| 151,654 | Diamondback Energy, Inc. | 16,255,792 |
| | | | 34,274,617 |
| | Food & Staples Retailing - 1.5% |
| 369,285 | U.S. Foods Holding Corp.* | 12,803,111 |
| | Food, Beverage & Tobacco - 1.3% |
| 314,332 | Keurig Dr Pepper, Inc. | 11,344,242 |
| | Health Care Equipment & Services - 7.3% |
| 123,400 | Acadia Healthcare Co., Inc.* | 7,650,800 |
| Shares or Principal Amount | | Market Value† |
| COMMON STOCKS - 99.8% - (continued) |
| | Health Care Equipment & Services - 7.3% - (continued) |
| 340,058 | Centene Corp.* | $ 24,225,732 |
| 203,156 | Encompass Health Corp. | 12,912,595 |
| 89,149 | Haemonetics Corp.* | 6,125,428 |
| 201,630 | Integra LifeSciences Holdings Corp.* | 13,400,330 |
| | | | 64,314,885 |
| | Insurance - 7.9% |
| 22,430 | Alleghany Corp.* | 14,610,453 |
| 119,355 | Arthur J Gallagher & Co. | 20,012,253 |
| 84,802 | Assurant, Inc. | 13,679,411 |
| 88,992 | Hanover Insurance Group, Inc. | 11,212,992 |
| 153,462 | Kemper Corp. | 9,741,768 |
| | | | 69,256,877 |
| | Materials - 5.6% |
| 97,717 | Celanese Corp. | 15,782,273 |
| 104,554 | Crown Holdings, Inc. | 10,872,570 |
| 89,296 | FMC Corp. | 8,126,829 |
| 95,857 | Reliance Steel & Aluminum Co. | 14,010,459 |
| | | | 48,792,131 |
| | Media & Entertainment - 1.8% |
| 119,350 | Cargurus, Inc.* | 4,002,999 |
| 81,939 | Electronic Arts, Inc. | 11,491,945 |
| | | | 15,494,944 |
| | Pharmaceuticals, Biotechnology & Life Sciences - 1.7% |
| 163,895 | Syneos Health, Inc.* | 15,297,959 |
| | Real Estate - 11.5% |
| 188,907 | American Campus Communities, Inc. REIT | 10,148,084 |
| 323,306 | Americold Realty Trust REIT | 9,527,828 |
| 264,476 | Essential Properties Realty Trust, Inc. REIT | 7,878,740 |
| 163,539 | First Industrial Realty Trust, Inc. REIT | 9,522,876 |
| 295,395 | Gaming and Leisure Properties, Inc. REIT | 14,323,703 |
| 828,254 | Host Hotels & Resorts, Inc. REIT* | 13,939,515 |
| 54,643 | Life Storage, Inc. REIT | 7,311,780 |
| 178,333 | Ryman Hospitality Properties, Inc. REIT* | 15,254,605 |
| 154,878 | Welltower, Inc. REIT | 12,452,191 |
| | | | 100,359,322 |
| | Retailing - 4.0% |
| 87,017 | CarMax, Inc.* | 11,914,368 |
| 126,651 | Dollar Tree, Inc.* | 13,647,912 |
| 85,596 | Ross Stores, Inc. | 9,689,467 |
| | | | 35,251,747 |
| | Semiconductors & Semiconductor Equipment - 2.1% |
| 58,565 | MKS Instruments, Inc. | 8,787,678 |
| 57,356 | Qorvo, Inc.* | 9,649,000 |
| | | | 18,436,678 |
| | Technology Hardware & Equipment - 6.4% |
| 125,730 | Ciena Corp.* | 6,825,882 |
| 73,406 | F5 Networks, Inc.* | 15,499,677 |
| 139,971 | II-VI, Inc.* | 8,469,645 |
| 191,269 | Lumentum Holdings, Inc.* | 15,794,994 |
| 45,926 | Rogers Corp.* | 9,236,637 |
| | | | 55,826,835 |
| | Transportation - 0.9% |
| 541,218 | JetBlue Airways Corp.* | 7,593,289 |
| | Utilities - 5.3% |
| 209,593 | Alliant Energy Corp. | 11,856,676 |
The accompanying notes are an integral part of these financial statements.
The Hartford MidCap Value Fund
Schedule of Investments – (continued)
October 31, 2021
| Shares or Principal Amount | | Market Value† |
| COMMON STOCKS - 99.8% - (continued) |
| | Utilities - 5.3% - (continued) |
| 175,364 | Evergy, Inc. | $ 11,179,455 |
| 232,379 | Portland General Electric Co. | 11,458,609 |
| 96,142 | Sempra Energy | 12,270,603 |
| | | | 46,765,343 |
| | Total Common Stocks
(cost $668,280,112) | | $ 873,448,443 |
| SHORT-TERM INVESTMENTS - 0.5% |
| | Repurchase Agreements - 0.5% |
| $ 4,110,683 | Fixed Income Clearing Corp. Repurchase Agreement dated 10/29/2021 at 0.010%, due on 11/01/2021 with a maturity value of $4,110,686; collateralized by U.S. Treasury Bond at 1.875%, maturing 02/15/2041, with a market value of $4,192,923 | $ 4,110,683 |
| | Total Short-Term Investments
(cost $4,110,683) | $ 4,110,683 |
| | Total Investments
(cost $672,390,795) | 100.3% | $ 877,559,126 |
| | Other Assets and Liabilities | (0.3)% | (2,215,050) |
| | Total Net Assets | 100.0% | $ 875,344,076 |
| Note: | Percentage of investments as shown is the ratio of the total market value to total net assets. |
| | Prices of foreign equities that are principally traded on certain foreign markets will generally be adjusted daily pursuant to a fair value pricing service approved by the Board of Directors in order to reflect an adjustment for factors occurring after the close of certain foreign markets but before the close of the New York Stock Exchange. |
| | Equity industry classifications used in this report are the Global Industry Classification Standard, which was developed by and is the exclusive property and service mark of MSCI, Inc. and Standard & Poor’s. |
| | For Fund compliance purposes, the Fund may not use the same classification system. These classifications are used for financial reporting purposes. |
| | See “Glossary” for abbreviation descriptions. |
| * | Non-income producing. |
| † | See Significant Accounting Policies of accompanying Notes to Financial Statements regarding valuation of investments. |
Fair Value Summary
The following is a summary of the fair valuations according to the inputs used as of October 31, 2021 in valuing the Fund’s investments.
| Description | | Total | | Level 1 | | Level 2 | | Level 3(1) |
| Assets | | | | | | | | |
| Common Stocks | | | | | | | | |
| Automobiles & Components | | $ 17,775,180 | | $ 17,775,180 | | $ — | | $ — |
| Banks | | 83,026,171 | | 83,026,171 | | — | | — |
| Capital Goods | | 160,936,215 | | 160,936,215 | | — | | — |
| Commercial & Professional Services | | 26,115,101 | | 26,115,101 | | — | | — |
| Consumer Durables & Apparel | | 17,072,101 | | 17,072,101 | | — | | — |
| Consumer Services | | 17,936,642 | | 17,936,642 | | — | | — |
| Diversified Financials | | 14,775,053 | | 14,775,053 | | — | | — |
| Energy | | 34,274,617 | | 34,274,617 | | — | | — |
| Food & Staples Retailing | | 12,803,111 | | 12,803,111 | | — | | — |
| Food, Beverage & Tobacco | | 11,344,242 | | 11,344,242 | | — | | — |
| Health Care Equipment & Services | | 64,314,885 | | 64,314,885 | | — | | — |
| Insurance | | 69,256,877 | | 69,256,877 | | — | | — |
| Materials | | 48,792,131 | | 48,792,131 | | — | | — |
| Media & Entertainment | | 15,494,944 | | 15,494,944 | | — | | — |
| Pharmaceuticals, Biotechnology & Life Sciences | | 15,297,959 | | 15,297,959 | | — | | — |
| Real Estate | | 100,359,322 | | 100,359,322 | | — | | — |
| Retailing | | 35,251,747 | | 35,251,747 | | — | | — |
| Semiconductors & Semiconductor Equipment | | 18,436,678 | | 18,436,678 | | — | | — |
| Technology Hardware & Equipment | | 55,826,835 | | 55,826,835 | | — | | — |
| Transportation | | 7,593,289 | | 7,593,289 | | — | | — |
| Utilities | | 46,765,343 | | 46,765,343 | | — | | — |
| Short-Term Investments | | 4,110,683 | | — | | 4,110,683 | | — |
| Total | | $ 877,559,126 | | $ 873,448,443 | | $ 4,110,683 | | $ — |
| (1) | For the year ended October 31, 2021, there were no transfers in and out of Level 3. |
The accompanying notes are an integral part of these financial statements.
Hartford Quality Value Fund
Schedule of Investments
October 31, 2021
| Shares or Principal Amount | | Market Value† |
| COMMON STOCKS - 97.9% |
| | Banks - 11.9% |
| 196,066 | Bank of America Corp. | $ 9,368,033 |
| 30,617 | Bank of Nova Scotia | 2,007,251 |
| 63,765 | JP Morgan Chase & Co. | 10,833,036 |
| 25,897 | PNC Financial Services Group, Inc. | 5,465,044 |
| | | | 27,673,364 |
| | Capital Goods - 8.0% |
| 15,045 | Honeywell International, Inc. | 3,289,138 |
| 40,406 | Johnson Controls International plc | 2,964,588 |
| 8,052 | Lockheed Martin Corp. | 2,675,841 |
| 57,448 | Raytheon Technologies Corp. | 5,104,829 |
| 49,530 | Westinghouse Air Brake Technologies Corp. | 4,493,857 |
| | | | 18,528,253 |
| | Commercial & Professional Services - 1.3% |
| 18,488 | Waste Management, Inc. | 2,962,332 |
| | Consumer Services - 3.2% |
| 21,372 | Hilton Worldwide Holdings, Inc.* | 3,076,500 |
| 17,397 | McDonald's Corp. | 4,271,833 |
| | | | 7,348,333 |
| | Diversified Financials - 3.1% |
| 27,893 | American Express Co. | 4,847,245 |
| 1,026 | BlackRock, Inc. | 967,990 |
| 17,025 | Charles Schwab Corp. | 1,396,561 |
| | | | 7,211,796 |
| | Energy - 5.1% |
| 43,818 | Chevron Corp. | 5,016,723 |
| 37,600 | EOG Resources, Inc. | 3,476,496 |
| 65,997 | TotalEnergies SE ADR | 3,307,109 |
| | | | 11,800,328 |
| | Food & Staples Retailing - 1.2% |
| 36,960 | Sysco Corp. | 2,842,224 |
| | Food, Beverage & Tobacco - 4.0% |
| 31,316 | Coca-Cola Co. | 1,765,283 |
| 60,750 | Mondelez International, Inc. Class A | 3,689,955 |
| 40,280 | Philip Morris International, Inc. | 3,808,071 |
| | | | 9,263,309 |
| | Health Care Equipment & Services - 10.7% |
| 9,689 | Anthem, Inc. | 4,215,975 |
| 17,686 | Becton Dickinson and Co. | 4,237,389 |
| 14,551 | Hill-Rom Holdings, Inc. | 2,253,950 |
| 49,766 | Koninklijke Philips N.V. ADR | 2,351,443 |
| 38,315 | Medtronic plc | 4,592,436 |
| 15,785 | UnitedHealth Group, Inc. | 7,268,519 |
| | | | 24,919,712 |
| | Household & Personal Products - 1.4% |
| 43,315 | Colgate-Palmolive Co. | 3,300,170 |
| | Insurance - 8.9% |
| 60,044 | American International Group, Inc. | 3,548,000 |
| 29,903 | Chubb Ltd. | 5,842,448 |
| 20,149 | Marsh & McLennan Cos., Inc. | 3,360,853 |
| 38,903 | MetLife, Inc. | 2,443,109 |
| 37,593 | Principal Financial Group, Inc. | 2,522,114 |
| 26,151 | Prudential Financial, Inc. | 2,877,918 |
| | | | 20,594,442 |
| Shares or Principal Amount | | Market Value† |
| COMMON STOCKS - 97.9% - (continued) |
| | Materials - 3.6% |
| 21,023 | Celanese Corp. | $ 3,395,425 |
| 32,916 | FMC Corp. | 2,995,685 |
| 11,795 | PPG Industries, Inc. | 1,893,923 |
| | | | 8,285,033 |
| | Media & Entertainment - 2.2% |
| 87,579 | Comcast Corp. Class A | 4,504,188 |
| 7,932 | Omnicom Group, Inc. | 540,010 |
| | | | 5,044,198 |
| | Pharmaceuticals, Biotechnology & Life Sciences - 6.4% |
| 62,860 | AstraZeneca plc ADR | 3,921,207 |
| 29,767 | Merck & Co., Inc. | 2,620,984 |
| 30,825 | Novartis AG ADR | 2,551,077 |
| 132,196 | Pfizer, Inc. | 5,782,253 |
| | | | 14,875,521 |
| | Real Estate - 4.4% |
| 9,946 | American Tower Corp. REIT | 2,804,474 |
| 134,251 | Host Hotels & Resorts, Inc. REIT* | 2,259,444 |
| 8,109 | Public Storage REIT | 2,693,648 |
| 83,253 | VICI Properties, Inc. REIT | 2,443,475 |
| | | | 10,201,041 |
| | Retailing - 4.0% |
| 571,800 | Allstar Co.(1)(2)(3) | — |
| 15,824 | Lowe's Cos., Inc. | 3,699,968 |
| 11,900 | Target Corp. | 3,089,478 |
| 38,645 | TJX Cos., Inc. | 2,530,861 |
| | | | 9,320,307 |
| | Semiconductors & Semiconductor Equipment - 4.4% |
| 8,861 | Broadcom, Inc. | 4,711,128 |
| 45,063 | Intel Corp. | 2,208,087 |
| 17,449 | Texas Instruments, Inc. | 3,271,338 |
| | | | 10,190,553 |
| | Software & Services - 4.2% |
| 10,782 | Accenture plc Class A | 3,868,474 |
| 38,391 | Cognizant Technology Solutions Corp. Class A | 2,997,953 |
| 27,305 | Fidelity National Information Services, Inc. | 3,023,756 |
| | | | 9,890,183 |
| | Technology Hardware & Equipment - 1.8% |
| 74,461 | Cisco Systems, Inc. | 4,167,582 |
| | Telecommunication Services - 2.4% |
| 105,543 | Verizon Communications, Inc. | 5,592,724 |
| | Transportation - 1.1% |
| 8,851 | J.B. Hunt Transport Services, Inc. | 1,745,329 |
| 18,816 | Southwest Airlines Co.* | 889,620 |
| | | | 2,634,949 |
| | Utilities - 4.6% |
| 42,556 | Alliant Energy Corp. | 2,407,393 |
| 39,379 | Avangrid, Inc. | 2,075,273 |
| 27,400 | Dominion Energy, Inc. | 2,080,482 |
The accompanying notes are an integral part of these financial statements.
Hartford Quality Value Fund
Schedule of Investments – (continued)
October 31, 2021
| Shares or Principal Amount | | Market Value† |
| COMMON STOCKS - 97.9% - (continued) |
| | Utilities - 4.6% - (continued) |
| 25,906 | Eversource Energy | $ 2,199,419 |
| 16,134 | Sempra Energy | 2,059,183 |
| | | | 10,821,750 |
| | Total Common Stocks
(cost $166,440,224) | | $ 227,468,104 |
| SHORT-TERM INVESTMENTS - 2.0% |
| | Repurchase Agreements - 2.0% |
| $ 4,517,432 | Fixed Income Clearing Corp. Repurchase Agreement dated 10/29/2021 at 0.010%, due on 11/01/2021 with a maturity value of 4,517,436; collateralized by U.S. Treasury Bond at 1.875%, maturing 11/01/2021, with a market value of $4,607,836 | $ 4,517,432 |
| | Total Short-Term Investments
(cost $4,517,432) | $ 4,517,432 |
| | Total Investments
(cost $170,957,656) | 99.9% | $ 231,985,536 |
| | Other Assets and Liabilities | 0.1% | 293,678 |
| | Total Net Assets | 100.0% | $ 232,279,214 |
| Note: | Percentage of investments as shown is the ratio of the total market value to total net assets. |
| | Prices of foreign equities that are principally traded on certain foreign markets will generally be adjusted daily pursuant to a fair value pricing service approved by the Board of Directors in order to reflect an adjustment for factors occurring after the close of certain foreign markets but before the close of the New York Stock Exchange. |
Equity industry classifications used in this report are the Global Industry Classification Standard, which was developed by and is the exclusive property and service mark of MSCI, Inc. and Standard & Poor’s.
For Fund compliance purposes, the Fund may not use the same classification system. These classifications are used for financial reporting purposes.
See “Glossary” for abbreviation descriptions.
| * | Non-income producing. |
| (1) | This security is valued in good faith at fair value as determined under policies and procedures established by and under the supervision of the Board of Directors. At October 31, 2021, the aggregate fair value of this security was $0, which represented 0.0% of total net assets. This amount excludes securities that are principally traded in certain foreign markets and whose prices are adjusted pursuant to a third party pricing service methodology approved by the Board of Directors. |
| (2) | Investment in securities not registered under the Securities Act of 1933 (excluding securities acquired pursuant to Rule 144A and Regulation S). At the end of the period, the value of such restricted securities amounted to $0 or 0.0% of net assets. |
Period
Acquired | | Security Name | | Shares/
Par Value | | Total Cost | | Market Value |
| 08/2011 | | Allstar Co. | | 571,800 | | $ — | | $ — |
| (3) | Investment valued using significant unobservable inputs. |
| † | See Significant Accounting Policies of accompanying Notes to Financial Statements regarding valuation of investments. |
The accompanying notes are an integral part of these financial statements.
Hartford Quality Value Fund
Schedule of Investments – (continued)
October 31, 2021
Fair Value Summary
The following is a summary of the fair valuations according to the inputs used as of October 31, 2021 in valuing the Fund’s investments.
| Description | | Total | | Level 1 | | Level 2 | | Level 3(1) |
| Assets | | | | | | | | |
| Common Stocks | | | | | | | | |
| Banks | | $ 27,673,364 | | $ 27,673,364 | | $ — | | $ — |
| Capital Goods | | 18,528,253 | | 18,528,253 | | — | | — |
| Commercial & Professional Services | | 2,962,332 | | 2,962,332 | | — | | — |
| Consumer Services | | 7,348,333 | | 7,348,333 | | — | | — |
| Diversified Financials | | 7,211,796 | | 7,211,796 | | — | | — |
| Energy | | 11,800,328 | | 11,800,328 | | — | | — |
| Food & Staples Retailing | | 2,842,224 | | 2,842,224 | | — | | — |
| Food, Beverage & Tobacco | | 9,263,309 | | 9,263,309 | | — | | — |
| Health Care Equipment & Services | | 24,919,712 | | 24,919,712 | | — | | — |
| Household & Personal Products | | 3,300,170 | | 3,300,170 | | — | | — |
| Insurance | | 20,594,442 | | 20,594,442 | | — | | — |
| Materials | | 8,285,033 | | 8,285,033 | | — | | — |
| Media & Entertainment | | 5,044,198 | | 5,044,198 | | — | | — |
| Pharmaceuticals, Biotechnology & Life Sciences | | 14,875,521 | | 14,875,521 | | — | | — |
| Real Estate | | 10,201,041 | | 10,201,041 | | — | | — |
| Retailing | | 9,320,307 | | 9,320,307 | | — | | — |
| Semiconductors & Semiconductor Equipment | | 10,190,553 | | 10,190,553 | | — | | — |
| Software & Services | | 9,890,183 | | 9,890,183 | | — | | — |
| Technology Hardware & Equipment | | 4,167,582 | | 4,167,582 | | — | | — |
| Telecommunication Services | | 5,592,724 | | 5,592,724 | | — | | — |
| Transportation | | 2,634,949 | | 2,634,949 | | — | | — |
| Utilities | | 10,821,750 | | 10,821,750 | | — | | — |
| Short-Term Investments | | 4,517,432 | | — | | 4,517,432 | | — |
| Total | | $ 231,985,536 | | $ 227,468,104 | | $ 4,517,432 | | $ — |
| (1) | For the year ended October 31, 2021, investments valued at $480,312 were transferred into Level 3 due to the unavailability of active market pricing. There were no transfers out of Level 3. |
Level 3 investments at the beginning and/or end of the period in relation to net assets were not significant and accordingly, a reconciliation of Level 3 assets for the year ended October 31, 2021 is not presented.
The accompanying notes are an integral part of these financial statements.
The Hartford Small Cap Growth Fund
Schedule of Investments
October 31, 2021
| Shares or Principal Amount | | Market Value† |
| COMMON STOCKS - 99.1% |
| | Automobiles & Components - 2.7% |
| 67,336 | Fox Factory Holding Corp.* | $ 10,837,729 |
| 88,563 | Patrick Industries, Inc. | 6,899,943 |
| 64,533 | Thor Industries, Inc. | 6,579,785 |
| | | | 24,317,457 |
| | Banks - 2.8% |
| 394,794 | MGIC Investment Corp. | 6,379,871 |
| 113,785 | Synovus Financial Corp. | 5,301,243 |
| 69,234 | Triumph Bancorp, Inc.* | 8,121,148 |
| 46,267 | Western Alliance Bancorp | 5,371,136 |
| | | | 25,173,398 |
| | Capital Goods - 10.2% |
| 63,336 | Altra Industrial Motion Corp. | 3,302,972 |
| 70,126 | Applied Industrial Technologies, Inc. | 6,835,883 |
| 48,886 | Armstrong World Industries, Inc. | 5,164,806 |
| 55,462 | Boise Cascade Co. | 3,140,258 |
| 120,255 | Builders FirstSource, Inc.* | 7,007,259 |
| 34,547 | Chart Industries, Inc.* | 6,132,783 |
| 40,234 | Curtiss-Wright Corp. | 5,137,077 |
| 40,988 | EnerSys | 3,280,680 |
| 165,640 | Hydrofarm Holdings Group, Inc.* | 5,461,151 |
| 68,345 | ITT, Inc. | 6,429,214 |
| 63,179 | John Bean Technologies Corp. | 9,334,697 |
| 99,266 | SPX Corp.* | 5,766,362 |
| 75,646 | SPX FLOW, Inc. | 5,651,513 |
| 341,081 | WillScot Mobile Mini Holdings Corp.* | 11,852,565 |
| 172,740 | Zurn Water Solutios Corp. | 6,267,007 |
| | | | 90,764,227 |
| | Commercial & Professional Services - 6.4% |
| 93,252 | ASGN, Inc.* | 11,158,534 |
| 29,735 | CACI International, Inc. Class A* | 8,552,975 |
| 37,249 | Clean Harbors, Inc.* | 4,192,003 |
| 61,466 | Exponent, Inc. | 7,056,297 |
| 71,100 | Insperity, Inc. | 8,887,500 |
| 37,612 | Science Applications International Corp. | 3,376,805 |
| 56,314 | Tetra Tech, Inc. | 9,892,117 |
| 96,704 | Viad Corp.* | 4,290,757 |
| | | | 57,406,988 |
| | Consumer Durables & Apparel - 3.8% |
| 16,823 | Deckers Outdoor Corp.* | 6,650,300 |
| 59,236 | PVH Corp.* | 6,476,272 |
| 39,253 | TopBuild Corp.* | 10,086,843 |
| 132,428 | Traeger, Inc.*(1) | 2,501,565 |
| 208,370 | Under Armour, Inc. Class C* | 3,934,026 |
| 44,483 | YETI Holdings, Inc.* | 4,374,013 |
| | | | 34,023,019 |
| | Consumer Services - 5.5% |
| 158,373 | BJ's Restaurants, Inc.* | 5,276,988 |
| 33,277 | Churchill Downs, Inc. | 7,653,710 |
| 321,519 | GAN Ltd.* | 4,591,291 |
| 295,533 | Mister Car Wash, Inc.*(1) | 5,420,075 |
| 81,636 | Penn National Gaming, Inc.* | 5,845,138 |
| 101,195 | Texas Roadhouse, Inc. | 8,987,128 |
| 65,874 | Wingstop, Inc. | 11,361,289 |
| | | | 49,135,619 |
| | Diversified Financials - 1.5% |
| 125,093 | OneMain Holdings, Inc. | 6,606,161 |
| 86,238 | Stifel Financial Corp. | 6,284,163 |
| | | | 12,890,324 |
| Shares or Principal Amount | | Market Value† |
| COMMON STOCKS - 99.1% - (continued) |
| | Energy - 0.5% |
| 229,790 | Magnolia Oil & Gas Corp. Class A | $ 4,798,015 |
| | Food & Staples Retailing - 1.0% |
| 202,238 | Performance Food Group Co.* | 9,147,225 |
| | Food, Beverage & Tobacco - 3.2% |
| 42,752 | Celsius Holdings, Inc.* | 4,126,423 |
| 49,703 | Freshpet, Inc.* | 7,749,195 |
| 33,637 | Lancaster Colony Corp. | 5,718,290 |
| 146,561 | Simply Good Foods Co.* | 5,811,144 |
| 294,813 | Sovos Brands, Inc.* | 4,764,178 |
| | | | 28,169,230 |
| | Health Care Equipment & Services - 11.0% |
| 17,664 | Amedisys, Inc.* | 2,991,222 |
| 65,745 | AtriCure, Inc.* | 4,934,820 |
| 61,889 | Cardiovascular Systems, Inc.* | 2,171,066 |
| 181,726 | Covetrus, Inc.* | 3,669,048 |
| 66,050 | Glaukos Corp.* | 3,019,145 |
| 91,122 | Globus Medical, Inc. Class A* | 7,031,885 |
| 120,698 | Health Catalyst, Inc.* | 6,353,543 |
| 72,313 | Integer Holdings Corp.* | 6,509,616 |
| 106,793 | Integra LifeSciences Holdings Corp.* | 7,097,463 |
| 44,160 | LHC Group, Inc.* | 5,943,494 |
| 30,789 | ModivCare, Inc.* | 5,011,525 |
| 41,986 | Nevro Corp.* | 4,775,488 |
| 82,658 | Omnicell, Inc.* | 14,725,523 |
| 156,667 | Owens & Minor, Inc. | 5,621,212 |
| 473,748 | R1 RCM, Inc.* | 10,280,332 |
| 56,901 | Tandem Diabetes Care, Inc.* | 7,757,313 |
| | | | 97,892,695 |
| | Household & Personal Products - 0.4% |
| 144,264 | Beauty Health Co.* | 3,962,932 |
| | Insurance - 0.8% |
| 108,522 | James River Group Holdings Ltd. | 3,467,278 |
| 53,289 | Kemper Corp. | 3,382,786 |
| | | | 6,850,064 |
| | Materials - 2.1% |
| 247,214 | Axalta Coating Systems Ltd.* | 7,710,605 |
| 52,975 | Ingevity Corp.* | 4,127,282 |
| 80,860 | Louisiana-Pacific Corp. | 4,765,080 |
| 69,378 | Ranpak Holdings Corp.* | 2,390,766 |
| | | | 18,993,733 |
| | Media & Entertainment - 2.1% |
| 104,084 | Cardlytics, Inc.* | 8,187,247 |
| 80,117 | Ziff Davis, Inc.* | 10,276,608 |
| | | | 18,463,855 |
| | Pharmaceuticals, Biotechnology & Life Sciences - 14.6% |
| 202,253 | Aclaris Therapeutics, Inc.*(1) | 3,509,090 |
| 92,737 | Akero Therapeutics, Inc.* | 1,992,918 |
| 47,631 | Allakos, Inc.* | 4,790,726 |
| 65,565 | ALX Oncology Holdings, Inc.* | 3,674,263 |
| 88,276 | Apellis Pharmaceuticals, Inc.* | 2,713,604 |
| 51,949 | Arena Pharmaceuticals, Inc.* | 2,981,353 |
| 27,731 | Arrowhead Pharmaceuticals, Inc.* | 1,769,792 |
| 52,999 | Arvinas, Inc.* | 4,588,654 |
| 53,396 | BioAtla, Inc.* | 1,560,765 |
| 17,467 | Biohaven Pharmaceutical Holding Co., Ltd.* | 2,485,904 |
| 64,580 | Blueprint Medicines Corp.* | 7,264,604 |
| 98,002 | Celldex Therapeutics, Inc.* | 4,169,005 |
| 110,124 | Cytokinetics, Inc.* | 3,844,429 |
The accompanying notes are an integral part of these financial statements.
The Hartford Small Cap Growth Fund
Schedule of Investments – (continued)
October 31, 2021
| Shares or Principal Amount | | Market Value† |
| COMMON STOCKS - 99.1% - (continued) |
| | Pharmaceuticals, Biotechnology & Life Sciences - 14.6% -
(continued) |
| 126,609 | Dyne Therapeutics, Inc.*(1) | $ 1,837,097 |
| 30,333 | Fate Therapeutics, Inc.* | 1,631,915 |
| 226,798 | Heron Therapeutics, Inc.* | 2,497,046 |
| 524,517 | ImmunoGen, Inc.* | 3,162,838 |
| 37,916 | Intellia Therapeutics, Inc.* | 5,042,070 |
| 113,887 | KalVista Pharmaceuticals, Inc.* | 2,047,688 |
| 33,200 | Karuna Therapeutics, Inc.* | 4,660,616 |
| 43,813 | Kodiak Sciences, Inc.* | 5,130,064 |
| 73,756 | Kymera Therapeutics, Inc.* | 4,342,753 |
| 36,455 | Madrigal Pharmaceuticals, Inc.* | 2,834,376 |
| 252,225 | Mersana Therapeutics, Inc.* | 2,159,046 |
| 20,556 | Mirati Therapeutics, Inc.* | 3,885,495 |
| 101,240 | NanoString Technologies, Inc.* | 4,889,892 |
| 143,417 | NeoGenomics, Inc.* | 6,597,182 |
| 110,118 | PTC Therapeutics, Inc.* | 4,176,776 |
| 105,480 | RAPT Therapeutics, Inc.* | 3,331,058 |
| 32,194 | Reata Pharmaceuticals, Inc. Class A* | 3,090,946 |
| 140,810 | Revance Therapeutics, Inc.* | 1,936,138 |
| 85,273 | Revolution Medicines, Inc.* | 2,509,584 |
| 75,860 | Scholar Rock Holding Corp.* | 1,995,118 |
| 162,189 | Syndax Pharmaceuticals, Inc.* | 3,154,576 |
| 145,991 | TCR2 Therapeutics, Inc.* | 919,743 |
| 130,515 | TG Therapeutics, Inc.* | 4,074,678 |
| 50,897 | Turning Point Therapeutics, Inc.* | 2,116,297 |
| 76,271 | Veracyte, Inc.* | 3,651,856 |
| 109,120 | Y-mAbs Therapeutics, Inc.* | 2,679,987 |
| | | | 129,699,942 |
| | Real Estate - 4.5% |
| 233,353 | Essential Properties Realty Trust, Inc. REIT | 6,951,586 |
| 322,436 | Independence Realty Trust, Inc. REIT | 7,619,163 |
| 46,228 | PS Business Parks, Inc. REIT | 8,214,715 |
| 64,876 | Redfin Corp.* | 3,330,734 |
| 110,728 | Rexford Industrial Realty, Inc. REIT | 7,440,922 |
| 77,872 | Ryman Hospitality Properties, Inc. REIT* | 6,661,171 |
| | | | 40,218,291 |
| | Retailing - 2.7% |
| 11,209 | Floor & Decor Holdings, Inc. Class A* | 1,523,527 |
| 129,484 | Foot Locker, Inc. | 6,172,502 |
| 119,069 | Ollie's Bargain Outlet Holdings, Inc.* | 8,056,209 |
| 66,965 | Shutterstock, Inc. | 8,112,810 |
| | | | 23,865,048 |
| | Semiconductors & Semiconductor Equipment - 4.7% |
| 110,333 | Axcelis Technologies, Inc.* | 6,060,592 |
| 69,889 | Cirrus Logic, Inc.* | 5,647,730 |
| 151,093 | Lattice Semiconductor Corp.* | 10,491,898 |
| 94,430 | Power Integrations, Inc. | 9,746,120 |
| 50,099 | Synaptics, Inc.* | 9,747,762 |
| | | | 41,694,102 |
| | Software & Services - 16.1% |
| 79,250 | Alarm.com Holdings, Inc.* | 6,677,605 |
| 66,866 | Blackbaud, Inc.* | 4,748,155 |
| 57,018 | Concentrix Corp. | 10,130,958 |
| 25,652 | Consensus Cloud Solutions, Inc.* | 1,624,541 |
| 125,715 | Digital Turbine, Inc.* | 10,819,033 |
| 31,525 | Everbridge, Inc.* | 5,022,248 |
| 81,242 | ExlService Holdings, Inc.* | 9,962,706 |
| 263,526 | Kaltura, Inc.* | 2,487,685 |
| 88,222 | LiveRamp Holdings, Inc.* | 4,720,759 |
| 42,026 | Manhattan Associates, Inc.* | 7,629,400 |
| 91,165 | Mimecast Ltd.* | 6,877,488 |
| Shares or Principal Amount | | Market Value† |
| COMMON STOCKS - 99.1% - (continued) |
| | Software & Services - 16.1% - (continued) |
| 95,723 | Momentive Global, Inc.* | $ 2,193,971 |
| 94,693 | Perficient, Inc.* | 11,704,055 |
| 61,255 | Q2 Holdings, Inc.* | 4,806,067 |
| 84,031 | Rapid7, Inc.* | 10,818,991 |
| 273,264 | Repay Holdings Corp.* | 5,741,277 |
| 26,400 | Solo Brands, Inc.* | 484,704 |
| 113,772 | Sprinklr, Inc.*(1) | 2,195,800 |
| 70,592 | Sprout Social, Inc. Class A* | 9,013,186 |
| 178,348 | Telos Corp.* | 4,620,997 |
| 131,975 | Varonis Systems, Inc.* | 8,544,061 |
| 506,977 | Verra Mobility Corp.* | 7,543,818 |
| 34,683 | Workiva, Inc.* | 5,186,843 |
| | | | 143,554,348 |
| | Technology Hardware & Equipment - 2.2% |
| 128,632 | II-VI, Inc.* | 7,783,522 |
| 66,081 | Insight Enterprises, Inc.* | 6,257,871 |
| 67,418 | Lumentum Holdings, Inc.* | 5,567,379 |
| | | | 19,608,772 |
| | Telecommunication Services - 0.3% |
| 29,198 | Bandwidth, Inc. Class A* | 2,490,005 |
| | Total Common Stocks
(cost $603,199,663) | | $ 883,119,289 |
| SHORT-TERM INVESTMENTS - 0.8% |
| | Repurchase Agreements - 0.4% |
| $ 3,225,177 | Fixed Income Clearing Corp. Repurchase Agreement dated 10/29/2021 at 0.010%, due on 11/01/2021 with a maturity value of $3,225,180; collateralized by U.S. Treasury Bond at 1.875%, maturing 02/15/2041, with a market value of $3,289,705 | $ 3,225,177 |
| | Securities Lending Collateral - 0.4% |
| 22,865 | Fidelity Investments Money Market Funds, Government Portfolio, Institutional Class, 0.01%(2) | 22,865 |
| 3,510,319 | Goldman Sachs Financial Square Funds, Government Fund, Institutional Class, 0.03%(2) | 3,510,319 |
| 252,015 | Invesco Government & Agency Portfolio, Institutional Class, 0.03%(2) | 252,015 |
| | | | 3,785,199 |
| | Total Short-Term Investments
(cost $7,010,376) | $ 7,010,376 |
| | Total Investments
(cost $610,210,039) | 99.9% | $ 890,129,665 |
| | Other Assets and Liabilities | 0.1% | 454,020 |
| | Total Net Assets | 100.0% | $ 890,583,685 |
| Note: | Percentage of investments as shown is the ratio of the total market value to total net assets. |
| | For Fund compliance purposes, the Fund may not use the same classification system. These classifications are used for financial reporting purposes. |
| | See “Glossary” for abbreviation descriptions. |
The accompanying notes are an integral part of these financial statements.
The Hartford Small Cap Growth Fund
Schedule of Investments – (continued)
October 31, 2021
| * | Non-income producing. |
| (1) | Represents entire or partial securities on loan. See Note 8 in the accompanying Notes to Financial Statements for securities lending information. |
| (2) | Current yield as of period end. |
| † | See Significant Accounting Policies of accompanying Notes to Financial Statements regarding valuation of investments. |
Fair Value Summary
The following is a summary of the fair valuations according to the inputs used as of October 31, 2021 in valuing the Fund’s investments.
| Description | | Total | | Level 1 | | Level 2 | | Level 3(1) |
| Assets | | | | | | | | |
| Common Stocks | | | | | | | | |
| Automobiles & Components | | $ 24,317,457 | | $ 24,317,457 | | $ — | | $ — |
| Banks | | 25,173,398 | | 25,173,398 | | — | | — |
| Capital Goods | | 90,764,227 | | 90,764,227 | | — | | — |
| Commercial & Professional Services | | 57,406,988 | | 57,406,988 | | — | | — |
| Consumer Durables & Apparel | | 34,023,019 | | 34,023,019 | | — | | — |
| Consumer Services | | 49,135,619 | | 49,135,619 | | — | | — |
| Diversified Financials | | 12,890,324 | | 12,890,324 | | — | | — |
| Energy | | 4,798,015 | | 4,798,015 | | — | | — |
| Food & Staples Retailing | | 9,147,225 | | 9,147,225 | | — | | — |
| Food, Beverage & Tobacco | | 28,169,230 | | 28,169,230 | | — | | — |
| Health Care Equipment & Services | | 97,892,695 | | 97,892,695 | | — | | — |
| Household & Personal Products | | 3,962,932 | | 3,962,932 | | — | | — |
| Insurance | | 6,850,064 | | 6,850,064 | | — | | — |
| Materials | | 18,993,733 | | 18,993,733 | | — | | — |
| Media & Entertainment | | 18,463,855 | | 18,463,855 | | — | | — |
| Pharmaceuticals, Biotechnology & Life Sciences | | 129,699,942 | | 129,699,942 | | — | | — |
| Real Estate | | 40,218,291 | | 40,218,291 | | — | | — |
| Retailing | | 23,865,048 | | 23,865,048 | | — | | — |
| Semiconductors & Semiconductor Equipment | | 41,694,102 | | 41,694,102 | | — | | — |
| Software & Services | | 143,554,348 | | 143,554,348 | | — | | — |
| Technology Hardware & Equipment | | 19,608,772 | | 19,608,772 | | — | | — |
| Telecommunication Services | | 2,490,005 | | 2,490,005 | | — | | — |
| Short-Term Investments | | 7,010,376 | | 3,785,199 | | 3,225,177 | | — |
| Total | | $ 890,129,665 | | $ 886,904,488 | | $ 3,225,177 | | $ — |
| (1) | For the year ended October 31, 2021, there were no transfers in and out of Level 3. |
The accompanying notes are an integral part of these financial statements.
Hartford Small Cap Value Fund
Schedule of Investments
October 31, 2021
| Shares or Principal Amount | | Market Value† |
| COMMON STOCKS - 99.1% |
| | Banks - 22.3% |
| 74,819 | Bank OZK | $ 3,342,165 |
| 119,111 | Berkshire Hills Bancorp, Inc. | 3,233,864 |
| 104,728 | Cadence Bank* | 3,039,198 |
| 28,100 | Federal Agricultural Mortgage Corp. Class C | 3,543,129 |
| 86,313 | First Hawaiian, Inc. | 2,381,376 |
| 67,105 | First Interstate BancSystem, Inc. Class A | 2,789,555 |
| 207,226 | FNB Corp. | 2,414,183 |
| 89,172 | Great Western Bancorp, Inc. | 3,036,306 |
| 123,074 | Home BancShares, Inc. | 2,924,238 |
| 73,348 | Pacific Premier Bancorp, Inc. | 3,079,882 |
| 124,039 | Radian Group, Inc. | 2,960,811 |
| 73,458 | Sandy Spring Bancorp, Inc. | 3,486,317 |
| 155,210 | Umpqua Holdings Corp. | 3,174,044 |
| | | | 39,405,068 |
| | Capital Goods - 8.5% |
| 59,800 | Air Lease Corp. | 2,394,990 |
| 39,216 | EnerSys | 3,138,849 |
| 92,648 | Kennametal, Inc. | 3,682,758 |
| 90,919 | nVent Electric plc | 3,223,079 |
| 167,476 | REV Group, Inc. | 2,530,562 |
| | | | 14,970,238 |
| | Commercial & Professional Services - 12.2% |
| 150,208 | BrightView Holdings, Inc.* | 2,382,299 |
| 185,360 | CoreCivic, Inc. REIT* | 1,595,949 |
| 84,363 | Deluxe Corp. | 3,009,228 |
| 76,253 | Herman Miller, Inc. | 2,967,767 |
| 50,655 | Kforce, Inc. | 3,280,418 |
| 104,804 | Loomis AB | 2,830,001 |
| 32,541 | Science Applications International Corp. | 2,921,531 |
| 80,511 | US Ecology, Inc.* | 2,591,649 |
| | | | 21,578,842 |
| | Consumer Durables & Apparel - 8.2% |
| 30,270 | Carter's, Inc. | 2,982,200 |
| 50,269 | Kontoor Brands, Inc. | 2,664,257 |
| 79,638 | Movado Group, Inc. | 2,651,945 |
| 80,391 | Steven Madden Ltd. | 3,625,634 |
| 32,513 | Sturm Ruger & Co., Inc. | 2,564,626 |
| | | | 14,488,662 |
| | Consumer Services - 3.3% |
| 75,555 | Adtalem Global Education, Inc.* | 2,790,246 |
| 131,837 | H&R Block, Inc. | 3,041,480 |
| | | | 5,831,726 |
| | Diversified Financials - 6.4% |
| 160,139 | Greenhill & Co., Inc. | 2,517,385 |
| 140,544 | Navient Corp. | 2,768,717 |
| 72,741 | PRA Group, Inc.* | 3,119,134 |
| 71,353 | PROG Holdings, Inc.* | 2,886,229 |
| | | | 11,291,465 |
| | Energy - 1.7% |
| 71,886 | DMC Global, Inc.* | 3,003,397 |
| | Health Care Equipment & Services - 4.8% |
| 170,741 | NextGen Healthcare, Inc.* | 2,810,397 |
| Shares or Principal Amount | | Market Value† |
| COMMON STOCKS - 99.1% - (continued) |
| | Health Care Equipment & Services - 4.8% - (continued) |
| 45,156 | NuVasive, Inc.* | $ 2,409,524 |
| 82,506 | Premier, Inc. Class A | 3,213,609 |
| | | | 8,433,530 |
| | Household & Personal Products - 4.3% |
| 89,605 | Edgewell Personal Care Co. | 3,135,279 |
| 59,408 | Energizer Holdings, Inc. | 2,166,610 |
| 11,806 | Medifast, Inc. | 2,317,163 |
| | | | 7,619,052 |
| | Insurance - 4.6% |
| 392,884 | Lancashire Holdings Ltd. | 2,720,669 |
| 125,106 | ProAssurance Corp. | 2,866,179 |
| 273,641 | Siriuspoint Ltd.* | 2,572,225 |
| | | | 8,159,073 |
| | Materials - 3.1% |
| 41,120 | Compass Minerals International, Inc. | 2,697,472 |
| 78,653 | Schweitzer-Mauduit International, Inc. | 2,740,270 |
| | | | 5,437,742 |
| | Media & Entertainment - 0.8% |
| 72,041 | TEGNA, Inc. | 1,416,326 |
| | Real Estate - 3.2% |
| 125,511 | Pebblebrook Hotel Trust REIT | 2,818,977 |
| 161,426 | Piedmont Office Realty Trust, Inc. Class A, REIT | 2,866,926 |
| | | | 5,685,903 |
| | Semiconductors & Semiconductor Equipment - 6.5% |
| 44,283 | Ichor Holdings Ltd.* | 1,936,053 |
| 164,571 | Rambus, Inc.* | 3,829,567 |
| 35,980 | Silicon Motion Technology Corp. ADR | 2,569,332 |
| 95,765 | Tower Semiconductor Ltd.* | 3,052,030 |
| | | | 11,386,982 |
| | Software & Services - 4.3% |
| 49,239 | CSG Systems International, Inc. | 2,464,412 |
| 37,901 | InterDigital, Inc. | 2,537,472 |
| 149,215 | Xperi Holding Corp. | 2,673,933 |
| | | | 7,675,817 |
| | Technology Hardware & Equipment - 1.6% |
| 106,735 | Plantronics, Inc.* | 2,856,229 |
| | Utilities - 3.3% |
| 59,528 | Portland General Electric Co. | 2,935,326 |
| 125,060 | South Jersey Industries, Inc. | 2,846,365 |
| | | | 5,781,691 |
| | Total Common Stocks
(cost $148,724,517) | | $ 175,021,743 |
The accompanying notes are an integral part of these financial statements.
Hartford Small Cap Value Fund
Schedule of Investments – (continued)
October 31, 2021
| Shares or Principal Amount | | Market Value† |
| EXCHANGE-TRADED FUNDS - 0.1% |
| | Other Investment Pools & Funds - 0.1% |
| 1,357 | iShares Russell 2000 Value ETF | $ 225,778 |
| | Total Exchange-Traded Funds
(cost $205,314) | | $ 225,778 |
| | Total Long-Term Investments
(Cost $148,929,831) | | $ 175,247,521 |
| SHORT-TERM INVESTMENTS - 0.4% |
| | Repurchase Agreements - 0.4% |
| $ 732,030 | Fixed Income Clearing Corp. Repurchase Agreement dated 10/29/2021 at 0.010%, due on 11/01/2021 with a maturity value of $732,031; collateralized by U.S. Treasury Bond at 1.875%, maturing 02/15/2041, with a market value of $746,763 | $ 732,030 |
| | Total Short-Term Investments
(cost $732,030) | $ 732,030 |
| | Total Investments
(cost $149,661,861) | 99.6% | $ 175,979,551 |
| | Other Assets and Liabilities | 0.4% | 685,513 |
| | Total Net Assets | 100.0% | $ 176,665,064 |
| Note: | Percentage of investments as shown is the ratio of the total market value to total net assets. |
| | Equity industry classifications used in this report are the Global Industry Classification Standard, which was developed by and is the exclusive property and service mark of MSCI, Inc. and Standard & Poor’s. |
| | For Fund compliance purposes, the Fund may not use the same classification system. These classifications are used for financial reporting purposes. |
| | See “Glossary” for abbreviation descriptions. |
| * | Non-income producing. |
| † | See Significant Accounting Policies of accompanying Notes to Financial Statements regarding valuation of investments. |
Fair Value Summary
The following is a summary of the fair valuations according to the inputs used as of October 31, 2021 in valuing the Fund’s investments.
| Description | | Total | | Level 1 | | Level 2 | | Level 3(1) |
| Assets | | | | | | | | |
| Common Stocks | | | | | | | | |
| Banks | | $ 39,405,068 | | $ 39,405,068 | | $ — | | $ — |
| Capital Goods | | 14,970,238 | | 14,970,238 | | — | | — |
| Commercial & Professional Services | | 21,578,842 | | 21,578,842 | | — | | — |
| Consumer Durables & Apparel | | 14,488,662 | | 14,488,662 | | — | | — |
| Consumer Services | | 5,831,726 | | 5,831,726 | | — | | — |
| Diversified Financials | | 11,291,465 | | 11,291,465 | | — | | — |
| Energy | | 3,003,397 | | 3,003,397 | | — | | — |
| Health Care Equipment & Services | | 8,433,530 | | 8,433,530 | | — | | — |
| Household & Personal Products | | 7,619,052 | | 7,619,052 | | — | | — |
| Insurance | | 8,159,073 | | 8,159,073 | | — | | — |
| Materials | | 5,437,742 | | 5,437,742 | | — | | — |
| Media & Entertainment | | 1,416,326 | | 1,416,326 | | — | | — |
| Real Estate | | 5,685,903 | | 5,685,903 | | — | | — |
| Semiconductors & Semiconductor Equipment | | 11,386,982 | | 11,386,982 | | — | | — |
| Software & Services | | 7,675,817 | | 7,675,817 | | — | | — |
| Technology Hardware & Equipment | | 2,856,229 | | 2,856,229 | | — | | — |
| Utilities | | 5,781,691 | | 5,781,691 | | — | | — |
| Exchange-Traded Funds | | 225,778 | | 225,778 | | — | | — |
| Short-Term Investments | | 732,030 | | — | | 732,030 | | — |
| Total | | $ 175,979,551 | | $ 175,247,521 | | $ 732,030 | | $ — |
| (1) | For the year ended October 31, 2021, there were no transfers in and out of Level 3. |
The accompanying notes are an integral part of these financial statements.
The Hartford Small Company Fund
Schedule of Investments
October 31, 2021
| Shares or Principal Amount | | Market Value† |
| COMMON STOCKS - 97.5% |
| | Banks - 4.5% |
| 270,343 | Ameris Bancorp | $ 14,163,270 |
| 239,351 | Markforged, Inc. PIPE | 1,577,323 |
| 293,985 | Sterling Bancorp | 7,481,918 |
| 162,981 | Synovus Financial Corp. | 7,593,285 |
| 117,625 | Western Alliance Bancorp | 13,655,086 |
| | | | 44,470,882 |
| | Capital Goods - 12.0% |
| 36,754 | Acuity Brands, Inc. | 7,550,374 |
| 303,137 | Altra Industrial Motion Corp. | 15,808,594 |
| 201,070 | Applied Industrial Technologies, Inc. | 19,600,304 |
| 181,981 | Builders FirstSource, Inc.* | 10,604,033 |
| 299,118 | Colfax Corp.* | 15,440,471 |
| 79,285 | Curtiss-Wright Corp. | 10,123,109 |
| 447,954 | Fluor Corp.* | 8,708,226 |
| 114,457 | Gibraltar Industries, Inc.* | 7,458,018 |
| 109,800 | Hydrofarm Holdings Group, Inc.* | 3,620,106 |
| 35,950 | Kornit Digital Ltd.* | 6,013,716 |
| 77,543 | Middleby Corp.* | 14,146,945 |
| | | | 119,073,896 |
| | Consumer Durables & Apparel - 4.2% |
| 25,763 | Cavco Industries, Inc.* | 6,192,910 |
| 93,960 | Crocs, Inc.* | 15,169,842 |
| 223,176 | Skyline Champion Corp.* | 14,131,504 |
| 61,708 | YETI Holdings, Inc.* | 6,067,748 |
| | | | 41,562,004 |
| | Consumer Services - 3.9% |
| 96,754 | 2U, Inc.*(1) | 2,858,113 |
| 98,172 | Boyd Gaming Corp.* | 6,261,410 |
| 477,750 | Mister Car Wash, Inc.* | 8,761,935 |
| 130,609 | Planet Fitness, Inc. Class A* | 10,389,946 |
| 62,252 | Wingstop, Inc. | 10,736,603 |
| | | | 39,008,007 |
| | Diversified Financials - 0.7% |
| 117,424 | Hannon Armstrong Sustainable Infrastructure Capital, Inc. REIT | 7,092,410 |
| | Energy - 2.3% |
| 268,996 | Chesapeake Energy Corp. | 17,145,805 |
| 272,309 | Magnolia Oil & Gas Corp. Class A | 5,685,812 |
| | | | 22,831,617 |
| | Health Care Equipment & Services - 11.5% |
| 223,953 | Accolade, Inc.* | 8,911,090 |
| 564,774 | Cross Country Healthcare, Inc.* | 11,707,765 |
| 111,590 | Globus Medical, Inc. Class A* | 8,611,400 |
| 174,294 | Health Catalyst, Inc.* | 9,174,836 |
| 144,067 | HealthEquity, Inc.* | 9,534,354 |
| 55,106 | Inspire Medical Systems, Inc.* | 14,855,476 |
| 173,792 | Integra LifeSciences Holdings Corp.* | 11,550,216 |
| 58,582 | LHC Group, Inc.* | 7,884,551 |
| 59,353 | Oak Street Health, Inc.* | 2,803,242 |
| 60,641 | Omnicell, Inc.* | 10,803,194 |
| 487,311 | R1 RCM, Inc.* | 10,574,649 |
| 58,135 | Tandem Diabetes Care, Inc.* | 7,925,545 |
| | | | 114,336,318 |
| | Materials - 0.7% |
| 126,311 | Cabot Corp. | 6,738,692 |
| | Media & Entertainment - 3.5% |
| 79,357 | Cardlytics, Inc.* | 6,242,222 |
| Shares or Principal Amount | | Market Value† |
| COMMON STOCKS - 97.5% - (continued) |
| | Media & Entertainment - 3.5% - (continued) |
| 48,100 | Cargurus, Inc.* | $ 1,613,274 |
| 289,832 | Criteo S.A. ADR* | 9,576,049 |
| 268,662 | Genius Sports Ltd.* | 4,980,994 |
| 95,360 | Ziff Davis, Inc.* | 12,231,827 |
| | | | 34,644,366 |
| | Pharmaceuticals, Biotechnology & Life Sciences - 13.4% |
| 225,754 | Aclaris Therapeutics, Inc.* | 3,916,832 |
| 42,253 | Allakos, Inc.* | 4,249,807 |
| 36,824 | ALX Oncology Holdings, Inc.* | 2,063,617 |
| 358,529 | Amicus Therapeutics, Inc.* | 3,764,554 |
| 82,601 | Arena Pharmaceuticals, Inc.* | 4,740,471 |
| 42,428 | Ascendis Pharma A/S ADR* | 6,432,509 |
| 58,076 | BioAtla, Inc.* | 1,697,561 |
| 70,091 | Blueprint Medicines Corp.* | 7,884,537 |
| 56,775 | Celldex Therapeutics, Inc.* | 2,415,208 |
| 70,470 | Fate Therapeutics, Inc.* | 3,791,286 |
| 494,197 | ImmunoGen, Inc.* | 2,980,008 |
| 44,241 | Intellia Therapeutics, Inc.* | 5,883,168 |
| 156,741 | KalVista Pharmaceuticals, Inc.* | 2,818,203 |
| 28,309 | Karuna Therapeutics, Inc.* | 3,974,017 |
| 56,644 | Kodiak Sciences, Inc.* | 6,632,446 |
| 85,529 | Kymera Therapeutics, Inc.* | 5,035,948 |
| 33,591 | Madrigal Pharmaceuticals, Inc.* | 2,611,700 |
| 71,674 | Medpace Holdings, Inc.* | 16,237,745 |
| 270,051 | Mersana Therapeutics, Inc.* | 2,311,637 |
| 183,353 | Myovant Sciences Ltd.* | 4,011,764 |
| 113,097 | NanoString Technologies, Inc.* | 5,462,585 |
| 216,815 | NeoGenomics, Inc.* | 9,973,490 |
| 111,492 | RAPT Therapeutics, Inc.* | 3,520,917 |
| 30,874 | Reata Pharmaceuticals, Inc. Class A* | 2,964,213 |
| 105,157 | Revolution Medicines, Inc.* | 3,094,770 |
| 90,974 | Rocket Pharmaceuticals, Inc.* | 2,702,838 |
| 115,636 | Scholar Rock Holding Corp.* | 3,041,227 |
| 31,588 | Turning Point Therapeutics, Inc.* | 1,313,429 |
| 117,504 | Veracyte, Inc.* | 5,626,092 |
| 87,888 | Y-mAbs Therapeutics, Inc.* | 2,158,529 |
| | | | 133,311,108 |
| | Real Estate - 2.6% |
| 340,259 | Essential Properties Realty Trust, Inc. REIT | 10,136,315 |
| 103,548 | Ryman Hospitality Properties, Inc. REIT* | 8,857,496 |
| 382,020 | Xenia Hotels & Resorts, Inc. REIT* | 6,799,956 |
| | | | 25,793,767 |
| | Retailing - 8.2% |
| 3,136,600 | Allstar Co.(2)(3)(4)(5) | — |
| 104,431 | Five Below, Inc.* | 20,604,236 |
| 96,757 | Floor & Decor Holdings, Inc. Class A* | 13,151,212 |
| 100,384 | Honest Co., Inc.(3)(6) | 918,012 |
| 132,208 | National Vision Holdings, Inc.* | 8,149,301 |
| 36,008 | Ollie's Bargain Outlet Holdings, Inc.* | 2,436,301 |
| 427,738 | Porch Group, Inc.*(1) | 8,995,330 |
| 157,828 | Revolve Group, Inc.* | 11,843,413 |
| 120,290 | Shutterstock, Inc. | 14,573,134 |
| 26,907 | Tory Burch LLC(3)(4)(5) | 1,423,135 |
| | | | 82,094,074 |
| | Semiconductors & Semiconductor Equipment - 6.4% |
| 30,141 | Ambarella, Inc.* | 5,601,102 |
| 244,080 | Maxeon Solar Technologies Ltd.*(1) | 5,499,122 |
| 71,955 | MKS Instruments, Inc. | 10,796,848 |
The accompanying notes are an integral part of these financial statements.
The Hartford Small Company Fund
Schedule of Investments – (continued)
October 31, 2021
| Shares or Principal Amount | | Market Value† |
| COMMON STOCKS - 97.5% - (continued) |
| | Semiconductors & Semiconductor Equipment - 6.4% - (continued) |
| 109,456 | Synaptics, Inc.* | $ 21,296,854 |
| 630,560 | Tower Semiconductor Ltd.* | 20,095,947 |
| | | | 63,289,873 |
| | Software & Services - 18.2% |
| 52,067 | Concentrix Corp. | 9,251,265 |
| 31,786 | Consensus Cloud Solutions, Inc.* | 2,013,007 |
| 239,477 | Digital Turbine, Inc.* | 20,609,391 |
| 370,741 | Jamf Holding Corp.* | 17,665,809 |
| 759,295 | Kaltura, Inc.*(1) | 7,167,745 |
| 561,220 | Latch, Inc. | 4,989,246 |
| 194,027 | LiveRamp Holdings, Inc.* | 10,382,385 |
| 50,841 | Manhattan Associates, Inc.* | 9,229,675 |
| 97,227 | Marathon Digital Holdings, Inc.*(1) | 5,079,138 |
| 212,185 | Mimecast Ltd.* | 16,007,236 |
| 79,093 | New Relic, Inc.* | 6,419,188 |
| 561,926 | Payoneer Global, Inc.* | 4,242,541 |
| 93,156 | Perficient, Inc.* | 11,514,082 |
| 115,178 | Rapid7, Inc.* | 14,829,167 |
| 401,135 | Repay Holdings Corp.* | 8,427,846 |
| 175,693 | Telos Corp.* | 4,552,206 |
| 271,677 | Varonis Systems, Inc.* | 17,588,369 |
| 730,289 | Verra Mobility Corp.* | 10,866,700 |
| | | | 180,834,996 |
| | Technology Hardware & Equipment - 4.0% |
| 251,717 | Calix, Inc.* | 15,754,967 |
| 167,921 | II-VI, Inc.* | 10,160,900 |
| 51,719 | Novanta, Inc.* | 8,924,631 |
| 86,508 | PAR Technology Corp.*(1) | 5,434,432 |
| | | | 40,274,930 |
| | Telecommunication Services - 0.6% |
| 68,150 | Bandwidth, Inc. Class A* | 5,811,832 |
| | Transportation - 0.8% |
| 25,045 | Saia, Inc.* | 7,830,069 |
| | Total Common Stocks
(cost $793,907,592) | | $ 968,998,841 |
| EXCHANGE-TRADED FUNDS - 1.3% |
| | Other Investment Pools & Funds - 1.3% |
| 42,672 | iShares Russell 2000 Growth ETF (1) | $ 13,118,226 |
| | Total Exchange-Traded Funds
(cost $12,326,618) | | $ 13,118,226 |
| | Total Long-Term Investments
(Cost $806,234,210) | | $ 982,117,067 |
| SHORT-TERM INVESTMENTS - 3.2% |
| | Repurchase Agreements - 0.6% |
| $ 5,237,817 | Fixed Income Clearing Corp. Repurchase Agreement dated 10/29/2021 at 0.010%, due on 11/01/2021 with a maturity value of $5,237,821; collateralized by U.S. Treasury Bond at 1.875%, maturing 02/15/2041, with a market value of $5,342,663 | $ 5,237,817 |
| Shares or Principal Amount | | Market Value† |
| SHORT-TERM INVESTMENTS - 3.2% - (continued) |
| | Securities Lending Collateral - 2.6% |
| 156,697 | Fidelity Investments Money Market Funds, Government Portfolio, Institutional Class, 0.01%(7) | $ 156,697 |
| 24,056,190 | Goldman Sachs Financial Square Funds, Government Fund, Institutional Class, 0.03%(7) | 24,056,190 |
| 1,727,057 | Invesco Government & Agency Portfolio, Institutional Class, 0.03%(7) | 1,727,057 |
| | | | 25,939,944 |
| | Total Short-Term Investments
(cost $31,177,761) | $ 31,177,761 |
| | Total Investments
(cost $837,411,971) | 102.0% | $ 1,013,294,828 |
| | Other Assets and Liabilities | (2.0)% | (19,391,783) |
| | Total Net Assets | 100.0% | $ 993,903,045 |
| Note: | Percentage of investments as shown is the ratio of the total market value to total net assets. |
| | Prices of foreign equities that are principally traded on certain foreign markets will generally be adjusted daily pursuant to a fair value pricing service approved by the Board of Directors in order to reflect an adjustment for factors occurring after the close of certain foreign markets but before the close of the New York Stock Exchange. |
| | The Fund may refer to any one or more of the industry classifications used by one or more widely recognized market indices, ratings group and/or as defined by Fund management. Industry classifications may not be identical across all security types. |
| | Equity industry classifications used in this report are the Global Industry Classification Standard, which was developed by and is the exclusive property and service mark of MSCI, Inc. and Standard & Poor’s. |
| | For Fund compliance purposes, the Fund may not use the same classification system. These classifications are used for financial reporting purposes. |
| | See “Glossary” for abbreviation descriptions. |
| * | Non-income producing. |
| (1) | Represents entire or partial securities on loan. See Note 8 in the accompanying Notes to Financial Statements for securities lending information. |
| (2) | Affiliated company – The Fund owns greater than 5% of the outstanding voting securities of this issuer. |
| (3) | These securities are valued in good faith at fair value as determined under policies and procedures established by and under the supervision of the Board of Directors. At October 31, 2021, the aggregate fair value of these securities are $2,341,147, which represented 0.2% of total net assets. This amount excludes securities that are principally traded in certain foreign markets and whose prices are adjusted pursuant to a third party pricing service methodology approved by the Board of Directors. |
The accompanying notes are an integral part of these financial statements.
The Hartford Small Company Fund
Schedule of Investments – (continued)
October 31, 2021
| (4) | Investment in securities not registered under the Securities Act of 1933 (excluding securities acquired pursuant to Rule 144A and Regulation S). At the end of the period, the value of such restricted securities amounted to $1,423,135 or 0.1% of net assets. |
Period
Acquired | | Security Name | | Shares/
Par Value | | Total Cost | | Market Value |
| 08/2011 | | Allstar Co. | | 3,136,600 | | $ — | | $ — |
| 11/2013 | | Tory Burch LLC | | 26,907 | | 2,108,912 | | 1,423,135 |
| | | | | | | $ 2,108,912 | | $ 1,423,135 |
| (5) | Investment valued using significant unobservable inputs. |
| (6) | As of October 31, 2021, investment is restricted from trading. The value of such restricted securities amounted to $918,012 or 0.1% of net assets. |
Period
Acquired | | Security Name | | Shares/
Par Value | | Total Cost | | Market Value |
| 08/2014 | | Honest Co., Inc. | | 100,384 | | $ 2,172,859 | | $ 918,012 |
| (7) | Current yield as of period end. |
| † | See Significant Accounting Policies of accompanying Notes to Financial Statements regarding valuation of investments. |
Fair Value Summary
The following is a summary of the fair valuations according to the inputs used as of October 31, 2021 in valuing the Fund’s investments.
| Description | | Total | | Level 1 | | Level 2 | | Level 3(1) |
| Assets | | | | | | | | |
| Common Stocks | | | | | | | | |
| Banks | | $ 44,470,882 | | $ 44,470,882 | | $ — | | $ — |
| Capital Goods | | 119,073,896 | | 119,073,896 | | — | | — |
| Consumer Durables & Apparel | | 41,562,004 | | 41,562,004 | | — | | — |
| Consumer Services | | 39,008,007 | | 39,008,007 | | — | | — |
| Diversified Financials | | 7,092,410 | | 7,092,410 | | — | | — |
| Energy | | 22,831,617 | | 22,831,617 | | — | | — |
| Health Care Equipment & Services | | 114,336,318 | | 114,336,318 | | — | | — |
| Materials | | 6,738,692 | | 6,738,692 | | — | | — |
| Media & Entertainment | | 34,644,366 | | 34,644,366 | | — | | — |
| Pharmaceuticals, Biotechnology & Life Sciences | | 133,311,108 | | 133,311,108 | | — | | — |
| Real Estate | | 25,793,767 | | 25,793,767 | | — | | — |
| Retailing | | 82,094,074 | | 79,752,927 | | 918,012 | | 1,423,135 |
| Semiconductors & Semiconductor Equipment | | 63,289,873 | | 63,289,873 | | — | | — |
| Software & Services | | 180,834,996 | | 180,834,996 | | — | | — |
| Technology Hardware & Equipment | | 40,274,930 | | 40,274,930 | | — | | — |
| Telecommunication Services | | 5,811,832 | | 5,811,832 | | — | | — |
| Transportation | | 7,830,069 | | 7,830,069 | | — | | — |
| Exchange-Traded Funds | | 13,118,226 | | 13,118,226 | | — | | — |
| Short-Term Investments | | 31,177,761 | | 25,939,944 | | 5,237,817 | | — |
| Total | | $ 1,013,294,828 | | $ 1,005,715,864 | | $ 6,155,829 | | $ 1,423,135 |
| (1) | For the year ended October 31, 2021, investments valued at $2,634,744 were transferred into Level 3 due to the unavailability of active market pricing, and investments valued at $1,956,547 were transferred out of Level 3 due to the availability of significant observable inputs. |
Level 3 investments at the beginning and/or end of the period in relation to net assets were not significant and accordingly, a reconciliation of Level 3 assets for the year ended October 31, 2021 is not presented.
The accompanying notes are an integral part of these financial statements.
Hartford Domestic Equity Funds
GLOSSARY: (abbreviations used in preceding Schedules of Investments)
| Currency Abbreviations: |
| USD | United States Dollar |
| Index Abbreviations: |
| S&P | Standard & Poor's |
| Municipal Abbreviations: |
| Rev | Revenue |
| Other Abbreviations: |
| ADR | American Depositary Receipt |
| ETF | Exchange-Traded Fund |
| PIPE | Private Investment in Public Equity |
| REIT | Real Estate Investment Trust |
Hartford Domestic Equity Funds
Statements of Assets and Liabilities
October 31, 2021
| | The Hartford
Capital
Appreciation
Fund | | Hartford Core
Equity Fund | | The Hartford
Dividend and
Growth Fund | | The Hartford
Equity Income
Fund | | The Hartford
Growth
Opportunities
Fund | | The Hartford
Healthcare Fund |
| Assets: | | | | | | | | | | | |
| Investments in securities, at market value(1) | $ 7,619,419,856 | | $ 12,548,966,892 | | $ 14,198,654,096 | | $ 4,859,387,145 | | $ 7,979,502,215 | | $ 1,717,321,266 |
| Repurchase agreements | 168,581,979 | | 72,985,489 | | 369,098,764 | | 51,975,720 | | 87,787,053 | | 18,664,274 |
| Cash | 42,416,398 | | 18,364,607 | | 93,124,893 | | 13,076,951 | | 22,088,167 | | 4,696,074 |
| Cash collateral due from broker on futures contracts | 10,132,000 | | — | | — | | — | | — | | — |
| Cash collateral held for securities on loan | 3,872,628 | | — | | — | | 961,072 | | 2,569,356 | | 537,962 |
| Foreign currency | 1,240 | | — | | — | | 631,954 | | — | | 18 |
| Receivables: | | | | | | | | | | | |
| Investment securities sold | 47,500,257 | | 40,360,566 | | 81,980,066 | | 35,510,151 | | 116,917,314 | | 3,697,381 |
| Fund shares sold | 833,438 | | 19,953,368 | | 30,175,536 | | 3,172,146 | | 5,043,995 | | 908,176 |
| Dividends and interest | 2,982,664 | | 10,517,803 | | 15,155,928 | | 5,564,850 | | 652,909 | | 1,302,237 |
| Securities lending income | 52,775 | | — | | — | | 5,418 | | 26,392 | | 23,653 |
| Variation margin on futures contracts | 879,127 | | — | | — | | — | | — | | — |
| Tax reclaims | 579,346 | | — | | 2,257,630 | | 2,379,987 | | 407,735 | | 231,995 |
| Other assets | 99,317 | | 193,994 | | 216,115 | | 100,609 | | 132,255 | | 56,701 |
| Total assets | 7,897,351,025 | | 12,711,342,719 | | 14,790,663,028 | | 4,972,766,003 | | 8,215,127,391 | | 1,747,439,737 |
| Liabilities: | | | | | | | | | | | |
| Obligation to return securities lending collateral | 77,452,552 | | — | | — | | 19,221,444 | | 51,387,126 | | 10,759,237 |
| Payables: | | | | | | | | | | | |
| Investment securities purchased | 74,147,178 | | 31,418,407 | | 104,502,202 | | 51,457,804 | | 60,874,462 | | 5,184,372 |
| Fund shares redeemed | 4,510,609 | | 9,877,587 | | 9,679,332 | | 3,554,967 | | 13,051,353 | | 1,162,963 |
| Investment management fees | 4,292,486 | | 3,439,954 | | 7,239,243 | | 2,506,618 | | 4,745,963 | | 1,216,966 |
| Transfer agent fees | 1,097,362 | | 1,254,904 | | 1,268,977 | | 539,572 | | 1,016,050 | | 306,817 |
| Accounting services fees | 179,735 | | 280,232 | | 314,358 | | 114,417 | | 186,302 | | 45,306 |
| Board of Directors' fees | 21,835 | | 31,226 | | 33,293 | | 13,243 | | 20,789 | | 4,957 |
| Distribution fees | 260,079 | | 178,266 | | 230,577 | | 107,930 | | 207,133 | | 61,306 |
| Accrued expenses | 202,977 | | 237,194 | | 292,966 | | 137,110 | | 169,278 | | 68,369 |
| Total liabilities | 162,164,813 | | 46,717,770 | | 123,560,948 | | 77,653,105 | | 131,658,456 | | 18,810,293 |
| Net assets | $ 7,735,186,212 | | $ 12,664,624,949 | | $ 14,667,102,080 | | $ 4,895,112,898 | | $ 8,083,468,935 | | $ 1,728,629,444 |
| Summary of Net Assets: | | | | | | | | | | | |
| Capital stock and paid-in-capital | $ 4,736,174,336 | | $ 7,376,870,845 | | $ 8,354,194,715 | | $ 2,950,234,730 | | $ 4,679,255,005 | | $ 1,125,189,834 |
| Distributable earnings (loss) | 2,999,011,876 | | 5,287,754,104 | | 6,312,907,365 | | 1,944,878,168 | | 3,404,213,930 | | 603,439,610 |
| Net assets | $ 7,735,186,212 | | $ 12,664,624,949 | | $ 14,667,102,080 | | $ 4,895,112,898 | | $ 8,083,468,935 | | $ 1,728,629,444 |
| Shares authorized | 1,540,000,000 | | 825,000,000 | | 1,175,000,000 | | 675,000,000 | | 19,850,000,000 | | 485,000,000 |
| Par value | $ 0.0010 | | $ 0.0010 | | $ 0.0010 | | $ 0.0010 | | $ 0.0001 | | $ 0.0010 |
| Class A: Net asset value per share | $ 48.89 | | $ 49.41 | | $ 34.32 | | $ 23.85 | | $ 62.10 | | $ 44.57 |
| Maximum offering price per share | 51.74 | | 52.29 | | 36.32 | | 25.24 | | 65.71 | | 47.16 |
| Shares outstanding | 116,814,374 | | 34,023,739 | | 137,939,758 | | 78,188,182 | | 58,774,130 | | 19,826,710 |
| Net Assets | $ 5,710,869,050 | | $ 1,681,155,050 | | $ 4,733,857,918 | | $ 1,864,492,491 | | $ 3,650,083,238 | | $ 883,718,709 |
| Class C: Net asset value per share | $ 34.14 | | $ 44.63 | | $ 32.94 | | $ 23.72 | | $ 25.14 | | $ 32.92 |
| Shares outstanding | 4,359,759 | | 13,083,074 | | 5,148,348 | | 6,845,561 | | 12,772,504 | | 4,087,885 |
| Net Assets | $ 148,862,385 | | $ 583,876,103 | | $ 169,568,922 | | $ 162,393,278 | | $ 321,096,709 | | $ 134,574,473 |
| Class I: Net asset value per share | $ 49.25 | | $ 49.59 | | $ 34.12 | | $ 23.68 | | $ 67.29 | | $ 47.93 |
| Shares outstanding | 14,650,459 | | 94,791,907 | | 93,153,281 | | 57,436,382 | | 31,567,063 | | 9,673,890 |
| Net Assets | $ 721,608,044 | | $ 4,700,781,762 | | $ 3,178,644,677 | | $ 1,360,338,797 | | $ 2,124,159,902 | | $ 463,673,377 |
| Class R3: Net asset value per share | $ 55.21 | | $ 50.06 | | $ 34.88 | | $ 23.89 | | $ 61.55 | | $ 45.63 |
| Shares outstanding | 816,091 | | 1,430,690 | | 1,913,645 | | 1,401,611 | | 842,031 | | 713,286 |
| Net Assets | $ 45,054,324 | | $ 71,616,850 | | $ 66,751,455 | | $ 33,484,951 | | $ 51,823,521 | | $ 32,550,492 |
| Class R4: Net asset value per share | $ 57.63 | | $ 51.01 | | $ 35.17 | | $ 23.93 | | $ 67.45 | | $ 49.12 |
| Shares outstanding | 637,666 | | 4,689,079 | | 3,029,705 | | 2,086,152 | | 1,132,796 | | 525,566 |
| Net Assets | $ 36,749,920 | | $ 239,198,061 | | $ 106,561,016 | | $ 49,922,978 | | $ 76,404,459 | | $ 25,817,999 |
The accompanying notes are an integral part of these financial statements.
Hartford Domestic Equity Funds
Statements of Assets and Liabilities – (continued)
October 31, 2021
| | The Hartford
Capital
Appreciation
Fund | | Hartford Core
Equity Fund | | The Hartford
Dividend and
Growth Fund | | The Hartford
Equity Income
Fund | | The Hartford
Growth
Opportunities
Fund | | The Hartford
Healthcare Fund |
| Class R5: Net asset value per share | $ 59.02 | | $ 49.99 | | $ 35.33 | | $ 24.07 | | $ 72.75 | | $ 52.49 |
| Shares outstanding | 618,882 | | 4,501,062 | | 7,523,865 | | 3,365,253 | | 343,638 | | 246,408 |
| Net Assets | $ 36,529,281 | | $ 225,016,748 | | $ 265,832,265 | | $ 80,990,509 | | $ 25,000,217 | | $ 12,933,037 |
| Class R6: Net asset value per share | $ 59.48 | | $ 50.24 | | $ 35.34 | | $ 24.13 | | $ 74.55 | | $ 53.47 |
| Shares outstanding | 323,851 | | 20,812,277 | | 13,313,236 | | 3,382,927 | | 971,545 | | 113,909 |
| Net Assets | $ 19,261,274 | | $ 1,045,661,029 | | $ 470,425,300 | | $ 81,642,924 | | $ 72,428,272 | | $ 6,091,017 |
| Class Y: Net asset value per share | $ 59.41 | | $ 50.20 | | $ 35.34 | | $ 24.14 | | $ 74.41 | | $ 53.38 |
| Shares outstanding | 2,062,435 | | 18,005,370 | | 26,293,570 | | 4,991,997 | | 7,595,580 | | 2,300,490 |
| Net Assets | $ 122,539,204 | | $ 903,951,659 | | $ 929,282,966 | | $ 120,501,751 | | $ 565,204,403 | | $ 122,792,846 |
| Class F: Net asset value per share | $ 49.26 | | $ 49.65 | | $ 34.10 | | $ 23.68 | | $ 67.69 | | $ 48.18 |
| Shares outstanding | 18,141,549 | | 64,724,487 | | 139,201,458 | | 48,191,500 | | 17,687,464 | | 964,611 |
| Net Assets | $ 893,712,730 | | $ 3,213,367,687 | | $ 4,746,177,561 | | $ 1,141,345,219 | | $ 1,197,268,214 | | $ 46,477,494 |
| Cost of investments | $ 5,829,049,020 | | $ 7,709,760,462 | | $ 8,961,674,203 | | $ 3,324,670,527 | | $ 6,219,204,307 | | $ 1,297,072,635 |
| Cost of foreign currency | $ 1,233 | | $ — | | $ — | | $ 633,746 | | $ — | | $ 18 |
| (1) Includes Investment in securities on loan, at market value | $ 78,297,883 | | $ — | | $ — | | $ 18,426,375 | | $ 50,802,197 | | $ 12,432,635 |
The accompanying notes are an integral part of these financial statements.
Hartford Domestic Equity Funds
Statements of Assets and Liabilities – (continued)
October 31, 2021
| | The Hartford
MidCap Fund | | The Hartford
MidCap Value
Fund | | Hartford Quality
Value Fund | | The Hartford
Small Cap
Growth Fund | | Hartford
Small Cap
Value Fund | | The Hartford
Small Company
Fund |
| Assets: | | | | | | | | | | | |
| Investments in securities, at market value(1) | $ 14,059,184,773 | | $ 873,448,443 | | $ 227,468,104 | | $ 886,904,488 | | $ 175,247,521 | | $ 1,008,057,011 |
| Repurchase agreements | 27,625,042 | | 4,110,683 | | 4,517,432 | | 3,225,177 | | 732,030 | | 5,237,817 |
| Investments in affiliated investments, at market value | 109,463,815 | | — | | — | | — | | — | | — |
| Cash | 7,056,190 | | 1,034,123 | | 1,155,617 | | 5,539,188 | | 184,186 | | 465,012 |
| Cash collateral held for securities on loan | 14,635,744 | | — | | — | | 199,221 | | — | | 1,365,260 |
| Foreign currency | — | | — | | 7 | | — | | — | | — |
| Receivables: | | | | | | | | | | | |
| From affiliates | — | | — | | — | | — | | 5,146 | | — |
| Investment securities sold | 120,709,133 | | 3,516,641 | | 1,388,985 | | — | | 2,593,492 | | 12,302,508 |
| Fund shares sold | 9,770,736 | | 1,345,842 | | 11,967 | | 707,382 | | 458,933 | | 1,080,951 |
| Dividends and interest | 1,025,611 | | 150,812 | | 267,232 | | 40,922 | | 57,160 | | 38,378 |
| Securities lending income | 173,273 | | — | | — | | 1,559 | | 187 | | 28,213 |
| Tax reclaims | — | | — | | 56,850 | | — | | — | | — |
| Other assets | 161,724 | | 49,005 | | 24,822 | | 49,130 | | 51,486 | | 81,186 |
| Total assets | 14,349,806,041 | | 883,655,549 | | 234,891,016 | | 896,667,067 | | 179,330,141 | | 1,028,656,336 |
| Liabilities: | | | | | | | | | | | |
| Obligation to return securities lending collateral | 292,714,891 | | — | | — | | 3,984,420 | | — | | 27,305,204 |
| Payables: | | | | | | | | | | | |
| Investment securities purchased | 73,677,651 | | 6,590,316 | | 2,347,117 | | 448,800 | | 2,416,955 | | 5,765,448 |
| Fund shares redeemed | 45,952,899 | | 976,170 | | 79,555 | | 869,835 | | 76,455 | | 764,845 |
| Investment management fees | 8,282,139 | | 520,756 | | 87,439 | | 537,449 | | 104,988 | | 647,427 |
| Transfer agent fees | 1,759,865 | | 102,231 | | 51,130 | | 147,646 | | 26,700 | | 132,574 |
| Accounting services fees | 326,356 | | 24,463 | | 7,513 | | 25,628 | | 5,812 | | 27,231 |
| Board of Directors' fees | 48,328 | | 2,356 | | 624 | | 2,718 | | 480 | | 2,826 |
| Distribution fees | 219,229 | | 17,294 | | 8,455 | | 13,148 | | 2,774 | | 23,552 |
| Accrued expenses | 532,676 | | 77,887 | | 29,969 | | 53,738 | | 30,913 | | 84,184 |
| Total liabilities | 423,514,034 | | 8,311,473 | | 2,611,802 | | 6,083,382 | | 2,665,077 | | 34,753,291 |
| Net assets | $ 13,926,292,007 | | $ 875,344,076 | | $ 232,279,214 | | $ 890,583,685 | | $ 176,665,064 | | $ 993,903,045 |
| Summary of Net Assets: | | | | | | | | | | | |
| Capital stock and paid-in-capital | $ 7,969,271,648 | | $ 611,617,346 | | $ 157,414,123 | | $ 461,279,698 | | $ 141,214,034 | | $ 615,429,120 |
| Distributable earnings (loss) | 5,957,020,359 | | 263,726,730 | | 74,865,091 | | 429,303,987 | | 35,451,030 | | 378,473,925 |
| Net assets | $ 13,926,292,007 | | $ 875,344,076 | | $ 232,279,214 | | $ 890,583,685 | | $ 176,665,064 | | $ 993,903,045 |
| Shares authorized | 1,105,000,000 | | 475,000,000 | | 22,110,000,000 | | 22,100,000,000 | | 860,000,000 | | 525,000,000 |
| Par value | $ 0.0010 | | $ 0.0010 | | $ 0.0001 | | $ 0.0001 | | $ 0.0010 | | $ 0.0010 |
| Class A: Net asset value per share | $ 37.01 | | $ 18.14 | | $ 26.27 | | $ 64.88 | | $ 13.36 | | $ 30.24 |
| Maximum offering price per share | 39.16 | | 19.20 | | 27.80 | | 68.66 | | 14.14 | | 32.00 |
| Shares outstanding | 93,132,686 | | 20,066,591 | | 7,168,371 | | 3,946,506 | | 4,453,228 | | 16,633,361 |
| Net Assets | $ 3,446,674,196 | | $ 363,954,790 | | $ 188,343,780 | | $ 256,060,898 | | $ 59,496,447 | | $ 502,922,732 |
| Class C: Net asset value per share | $ 22.89 | | $ 14.28 | | $ 22.22 | | $ 41.34 | | $ 11.48 | | $ 17.65 |
| Shares outstanding | 16,668,511 | | 625,465 | | 152,850 | | 196,001 | | 269,928 | | 528,252 |
| Net Assets | $ 381,566,370 | | $ 8,930,558 | | $ 3,396,750 | | $ 8,102,065 | | $ 3,098,190 | | $ 9,324,284 |
| Class I: Net asset value per share | $ 38.77 | | $ 18.36 | | $ 25.93 | | $ 69.03 | | $ 13.40 | | $ 32.69 |
| Shares outstanding | 102,151,916 | | 1,378,009 | | 777,224 | | 1,740,371 | | 2,455,556 | | 1,817,737 |
| Net Assets | $ 3,960,712,874 | | $ 25,307,031 | | $ 20,153,140 | | $ 120,134,654 | | $ 32,905,244 | | $ 59,420,781 |
| Class R3: Net asset value per share | $ 41.94 | | $ 19.18 | | $ 26.71 | | $ 63.50 | | $ 13.91 | | $ 33.41 |
| Shares outstanding | 2,387,205 | | 363,519 | | 41,118 | | 136,011 | | 66,944 | | 464,762 |
| Net Assets | $ 100,112,898 | | $ 6,973,073 | | $ 1,098,399 | | $ 8,637,022 | | $ 931,035 | | $ 15,527,252 |
| Class R4: Net asset value per share | $ 44.51 | | $ 19.64 | | $ 27.02 | | $ 67.99 | | $ 14.13 | | $ 36.39 |
| Shares outstanding | 4,254,090 | | 534,644 | | 176,691 | | 310,290 | | 3,745 | | 421,042 |
| Net Assets | $ 189,348,282 | | $ 10,502,401 | | $ 4,774,827 | | $ 21,098,002 | | $ 52,909 | | $ 15,320,411 |
| Class R5: Net asset value per share | $ 46.54 | | $ 19.97 | | $ 27.30 | | $ 72.91 | | $ 14.10 | | $ 39.26 |
| Shares outstanding | 6,864,261 | | 107,248 | | 11,721 | | 1,190,292 | | 1,717 | | 172,754 |
| Net Assets | $ 319,470,199 | | $ 2,142,225 | | $ 320,014 | | $ 86,787,952 | | $ 24,204 | | $ 6,782,371 |
The accompanying notes are an integral part of these financial statements.
Hartford Domestic Equity Funds
Statements of Assets and Liabilities – (continued)
October 31, 2021
| | The Hartford
MidCap Fund | | The Hartford
MidCap Value
Fund | | Hartford Quality
Value Fund | | The Hartford
Small Cap
Growth Fund | | Hartford
Small Cap
Value Fund | | The Hartford
Small Company
Fund |
| Class R6: Net asset value per share | $ 47.29 | | $ — | | $ 27.38 | | $ 74.32 | | $ 14.10 | | $ 40.33 |
| Shares outstanding | 35,096,226 | | — | | 9,388 | | 1,142,459 | | 106,993 | | 147,632 |
| Net Assets | $ 1,659,581,715 | | $ — | | $ 257,072 | | $ 84,908,124 | | $ 1,508,417 | | $ 5,953,999 |
| Class Y: Net asset value per share | $ 47.18 | | $ 20.02 | | $ 27.34 | | $ 74.28 | | $ 14.07 | | $ 40.25 |
| Shares outstanding | 20,567,777 | | 764,775 | | 64,137 | | 3,613,498 | | 138,316 | | 1,132,719 |
| Net Assets | $ 970,296,215 | | $ 15,307,456 | | $ 1,753,297 | | $ 268,416,456 | | $ 1,946,741 | | $ 45,590,067 |
| Class F: Net asset value per share | $ 39.01 | | $ 18.37 | | $ 25.84 | | $ 69.43 | | $ 13.40 | | $ 32.96 |
| Shares outstanding | 74,310,824 | | 24,077,883 | | 471,493 | | 524,816 | | 5,724,378 | | 10,106,323 |
| Net Assets | $ 2,898,529,258 | | $ 442,226,542 | | $ 12,181,935 | | $ 36,438,512 | | $ 76,701,877 | | $ 333,061,148 |
| Cost of investments | $ 9,586,734,086 | | $ 672,390,795 | | $ 170,957,656 | | $ 610,210,039 | | $ 149,661,861 | | $ 837,411,971 |
| Cost of investments in affiliated investments | $ 102,451,938 | | $ — | | $ — | | $ — | | $ — | | $ — |
| Cost of foreign currency | $ — | | $ — | | $ 7 | | $ — | | $ — | | $ — |
| (1) Includes Investment in securities on loan, at market value | $ 285,537,889 | | $ — | | $ — | | $ 4,006,025 | | $ — | | $ 26,917,675 |
The accompanying notes are an integral part of these financial statements.
Hartford Domestic Equity Funds
Statements of Operations
For the Year Ended October 31, 2021
| | The Hartford
Capital
Appreciation
Fund | | Hartford Core
Equity Fund | | The Hartford
Dividend and
Growth Fund | | The Hartford
Equity Income
Fund | | The Hartford
Growth
Opportunities
Fund | | The Hartford
Healthcare Fund |
| Investment Income: | | | | | | | | | | | |
| Dividends | $ 86,490,916 | | $ 136,795,634 | | $ 252,552,716 | | $ 117,001,201 | | $ 19,108,988 | | $ 14,937,666 |
| Interest | 65,550 | | 87,235 | | 141,932 | | 36,912 | | 44,144 | | 15,034 |
| Securities lending | 202,085 | | 22,622 | | 121,350 | | 63,536 | | 352,094 | | 230,464 |
| Less: Foreign tax withheld | (72,342) | | — | | (1,936,818) | | (1,010,207) | | — | | (231,932) |
| Total investment income, net | 86,686,209 | | 136,905,491 | | 250,879,180 | | 116,091,442 | | 19,505,226 | | 14,951,232 |
| Expenses: | | | | | | | | | | | |
| Investment management fees | 49,676,683 | | 37,136,213 | | 74,151,966 | | 27,914,942 | | 53,553,149 | | 14,240,330 |
| Transfer agent fees | | | | | | | | | | | |
| Class A | 5,618,496 | | 1,337,171 | | 3,867,964 | | 1,420,724 | | 2,973,184 | | 972,857 |
| Class C | 233,282 | | 473,195 | | 197,771 | | 194,796 | | 336,435 | | 190,269 |
| Class I | 561,597 | | 3,641,597 | | 2,124,231 | | 1,118,898 | | 1,808,294 | | 437,635 |
| Class R3 | 102,666 | | 124,063 | | 142,586 | | 76,152 | | 116,044 | | 71,469 |
| Class R4 | 58,152 | | 309,598 | | 144,060 | | 71,423 | | 123,907 | | 41,440 |
| Class R5 | 41,188 | | 218,565 | | 232,793 | | 82,493 | | 26,392 | | 14,983 |
| Class R6 | 467 | | 21,916 | | 14,330 | | 2,935 | | 2,395 | | 225 |
| Class Y | 129,824 | | 810,008 | | 1,078,791 | | 103,232 | | 576,983 | | 129,123 |
| Class F | 6,368 | | 23,756 | | 25,744 | | 11,470 | | 7,437 | | 1,462 |
| Distribution fees | | | | | | | | | | | |
| Class A | 13,797,055 | | 3,691,312 | | 10,669,520 | | 4,259,988 | | 8,682,038 | | 2,141,127 |
| Class C | 1,723,108 | | 5,375,759 | | 1,591,467 | | 1,893,578 | | 3,387,379 | | 1,466,784 |
| Class R3 | 233,602 | | 299,348 | | 324,593 | | 180,149 | | 266,089 | | 171,257 |
| Class R4 | 90,159 | | 529,775 | | 239,606 | | 116,696 | | 195,851 | | 66,369 |
| Custodian fees | 15,440 | | 35,714 | | 32,206 | | 15,714 | | 31,974 | | 25,607 |
| Registration and filing fees | 159,815 | | 502,930 | | 408,671 | | 200,502 | | 269,303 | | 152,383 |
| Accounting services fees | 1,079,266 | | 1,601,426 | | 1,754,140 | | 659,987 | | 1,094,466 | | 255,936 |
| Board of Directors' fees | 192,690 | | 297,825 | | 322,741 | | 116,960 | | 200,727 | | 43,699 |
| Audit and tax fees | 39,415 | | 22,156 | | 22,376 | | 22,060 | | 38,555 | | 25,652 |
| Other expenses | 614,691 | | 813,780 | | 953,884 | | 412,099 | | 562,864 | | 167,975 |
| Total expenses (before waivers, reimbursements and fees paid indirectly) | 74,373,964 | | 57,266,107 | | 98,299,440 | | 38,874,798 | | 74,253,466 | | 20,616,582 |
| Transfer agent fee waivers | (17,901) | | (131,049) | | (682,575) | | (10,138) | | (48,828) | | (20,235) |
| Distribution fee reimbursements | (229,280) | | (101,307) | | (105,853) | | (16,158) | | (241,569) | | (28,670) |
| Commission recapture | (49,870) | | (9,920) | | (44,995) | | (11,719) | | (75,072) | | (5,949) |
| Total waivers, reimbursements and fees paid indirectly | (297,051) | | (242,276) | | (833,423) | | (38,015) | | (365,469) | | (54,854) |
| Total expenses | 74,076,913 | | 57,023,831 | | 97,466,017 | | 38,836,783 | | 73,887,997 | | 20,561,728 |
| Net Investment Income (Loss) | 12,609,296 | | 79,881,660 | | 153,413,163 | | 77,254,659 | | (54,382,771) | | (5,610,496) |
| Net Realized Gain (Loss) on Investments, Other Financial Instruments and Foreign Currency Transactions on: | | | | | | | | | | | |
| Investments | 1,086,100,955 | | 335,569,531 | | 700,954,383 | | 364,674,920 | | 1,724,290,896 | | 183,813,447 |
| Futures contracts | 31,660,302 | | 31,391,264 | | — | | — | | — | | — |
| Other foreign currency transactions | (17,591) | | — | | (2,510) | | 2,657 | | (10,450) | | 18,863 |
| Net Realized Gain (Loss) on Investments, Other Financial Instruments and Foreign Currency Transactions | 1,117,743,666 | | 366,960,795 | | 700,951,873 | | 364,677,577 | | 1,724,280,446 | | 183,832,310 |
| Net Changes in Unrealized Appreciation (Depreciation) of Investments, Other Financial Instruments and Foreign Currency Transactions of: | | | | | | | | | | | |
| Investments | 952,494,489 | | 2,961,617,485 | | 3,492,438,056 | | 993,084,121 | | 264,839,851 | | 154,309,751 |
| Futures contracts | 8,707,449 | | 2,034,977 | | — | | — | | — | | — |
| Translation of other assets and liabilities in foreign currencies | (5,142) | | — | | — | | 7,558 | | 521 | | (23,898) |
| Net Changes in Unrealized Appreciation (Depreciation) of Investments, Other Financial Instruments and Foreign Currency Transactions | 961,196,796 | | 2,963,652,462 | | 3,492,438,056 | | 993,091,679 | | 264,840,372 | | 154,285,853 |
The accompanying notes are an integral part of these financial statements.
Hartford Domestic Equity Funds
Statements of Operations – (continued)
For the Year Ended October 31, 2021
| | The Hartford
Capital
Appreciation
Fund | | Hartford Core
Equity Fund | | The Hartford
Dividend and
Growth Fund | | The Hartford
Equity Income
Fund | | The Hartford
Growth
Opportunities
Fund | | The Hartford
Healthcare Fund |
| Net Gain (Loss) on Investments, Other Financial Instruments and Foreign Currency Transactions | 2,078,940,462 | | 3,330,613,257 | | 4,193,389,929 | | 1,357,769,256 | | 1,989,120,818 | | 338,118,163 |
| Net Increase (Decrease) in Net Assets Resulting from Operations | $ 2,091,549,758 | | $ 3,410,494,917 | | $ 4,346,803,092 | | $ 1,435,023,915 | | $ 1,934,738,047 | | $ 332,507,667 |
The accompanying notes are an integral part of these financial statements.
Hartford Domestic Equity Funds
Statements of Operations – (continued)
For the Year Ended October 31, 2021
| | The Hartford
MidCap Fund | | The Hartford
MidCap Value
Fund | | Hartford Quality
Value Fund | | The Hartford
Small Cap
Growth Fund | | Hartford
Small Cap
Value Fund | | The Hartford
Small Company
Fund |
| Investment Income: | | | | | | | | | | | |
| Dividends | $ 201,741,540 | | $ 9,689,704 | | $ 5,142,877 | | $ 4,503,518 | | $ 2,918,048 | | $ 1,513,669 |
| Interest | 9,579 | | 3,064 | | 1,565 | | 1,721 | | 377 | | 7,668 |
| Securities lending | 702,498 | | — | | — | | 159,387 | | 2,639 | | 346,655 |
| Less: Foreign tax withheld | (34,024) | | (42,560) | | (63,015) | | — | | (11,114) | | — |
| Total investment income, net | 202,419,593 | | 9,650,208 | | 5,081,427 | | 4,664,626 | | 2,909,950 | | 1,867,992 |
| Expenses: | | | | | | | | | | | |
| Investment management fees | 105,484,421 | | 5,708,276 | | 960,238 | | 6,588,557 | | 988,172 | | 7,498,454 |
| Transfer agent fees | | | | | | | | | | | |
| Class A | 3,224,605 | | 525,217 | | 287,037 | | 434,824 | | 109,933 | | 633,628 |
| Class C | 466,043 | | 19,328 | | 9,424 | | 16,511 | | 7,053 | | 21,265 |
| Class I | 5,476,633 | | 18,055 | | 14,892 | | 85,250 | | 22,563 | | 55,197 |
| Class R3 | 232,025 | | 15,170 | | 2,299 | | 21,357 | | 1,603 | | 36,452 |
| Class R4 | 359,131 | | 17,280 | | 8,164 | | 42,331 | | 78 | | 25,118 |
| Class R5 | 398,704 | | 2,335 | | 344 | | 95,217 | | 37 | | 6,936 |
| Class R6 | 50,732 | | — | | 22 | | 2,254 | | 12 | | 147 |
| Class Y | 1,270,095 | | 19,048 | | 1,074 | | 305,889 | | 1,396 | | 27,139 |
| Class F | 39,723 | | 7,768 | | 213 | | 517 | | 234 | | 5,868 |
| Distribution fees | | | | | | | | | | | |
| Class A | 8,471,369 | | 828,375 | | 436,747 | | 625,134 | | 132,935 | | 1,232,988 |
| Class C | 4,218,510 | | 102,470 | | 37,720 | | 126,505 | | 28,540 | | 103,748 |
| Class R3 | 527,886 | | 34,514 | | 5,233 | | 48,579 | | 3,705 | | 82,922 |
| Class R4 | 534,779 | | 25,439 | | 12,163 | | 64,892 | | 117 | | 38,523 |
| Custodian fees | 164,146 | | 1,797 | | 2,214 | | 10,358 | | 4,304 | | 17,381 |
| Registration and filing fees | 305,049 | | 125,290 | | 116,885 | | 124,937 | | 117,008 | | 162,594 |
| Accounting services fees | 2,146,175 | | 129,561 | | 36,768 | | 146,956 | | 24,971 | | 150,619 |
| Board of Directors' fees | 387,370 | | 20,880 | | 5,478 | | 23,271 | | 3,942 | | 25,512 |
| Audit and tax fees | 22,535 | | 21,877 | | 22,026 | | 21,583 | | 21,903 | | 31,645 |
| Other expenses | 1,432,803 | | 174,542 | | 37,216 | | 88,724 | | 30,675 | | 177,502 |
| Total expenses (before waivers, reimbursements and fees paid indirectly) | 135,212,734 | | 7,797,222 | | 1,996,157 | | 8,873,646 | | 1,499,181 | | 10,333,638 |
| Expense waivers | — | | — | | (55,447) | | — | | (37,080) | | — |
| Transfer agent fee waivers | (857,805) | | (602) | | — | | (153,731) | | — | | — |
| Distribution fee reimbursements | (117,703) | | (7,915) | | (9,920) | | (20,310) | | (5,356) | | (23,248) |
| Commission recapture | (46,666) | | (13,118) | | (362) | | (10,002) | | (1,043) | | (20,274) |
| Total waivers, reimbursements and fees paid indirectly | (1,022,174) | | (21,635) | | (65,729) | | (184,043) | | (43,479) | | (43,522) |
| Total expenses | 134,190,560 | | 7,775,587 | | 1,930,428 | | 8,689,603 | | 1,455,702 | | 10,290,116 |
| Net Investment Income (Loss) | 68,229,033 | | 1,874,621 | | 3,150,999 | | (4,024,977) | | 1,454,248 | | (8,422,124) |
| Net Realized Gain (Loss) on Investments, Other Financial Instruments and Foreign Currency Transactions on: | | | | | | | | | | | |
| Investments | 1,762,635,518 | | 100,033,121 | | 13,598,690 | | 174,617,463 | | 17,238,965 | | 218,358,576 |
| Investments in affiliated investments | (55,422,395) | | — | | — | | — | | — | | 1,364,479 |
| Other foreign currency transactions | — | | 3,431 | | 215 | | — | | 4,312 | | 184 |
| Net Realized Gain (Loss) on Investments, Other Financial Instruments and Foreign Currency Transactions | 1,707,213,123 | | 100,036,552 | | 13,598,905 | | 174,617,463 | | 17,243,277 | | 219,723,239 |
| Net Changes in Unrealized Appreciation (Depreciation) of Investments, Other Financial Instruments and Foreign Currency Transactions of: | | | | | | | | | | | |
| Investments | 2,562,166,242 | | 189,407,923 | | 56,452,184 | | 106,905,409 | | 29,174,321 | | 8,069,059 |
| Investments in affiliated investments | 127,853,845 | | — | | — | | — | | — | | — |
| Net Changes in Unrealized Appreciation (Depreciation) of Investments, Other Financial Instruments and Foreign Currency Transactions | 2,690,020,087 | | 189,407,923 | | 56,452,184 | | 106,905,409 | | 29,174,321 | | 8,069,059 |
| Net Gain (Loss) on Investments, Other Financial Instruments and Foreign Currency Transactions | 4,397,233,210 | | 289,444,475 | | 70,051,089 | | 281,522,872 | | 46,417,598 | | 227,792,298 |
| Net Increase (Decrease) in Net Assets Resulting from Operations | $ 4,465,462,243 | | $ 291,319,096 | | $ 73,202,088 | | $ 277,497,895 | | $ 47,871,846 | | $ 219,370,174 |
The accompanying notes are an integral part of these financial statements.
Hartford Domestic Equity Funds
Statements of Changes in Net Assets
For the Year Ended October 31, 2021
| | The Hartford
Capital Appreciation Fund | | Hartford
Core Equity Fund |
| | For the
Year Ended
October 31,
2021 | | For the
Year Ended
October 31,
2020 | | For the
Year Ended
October 31,
2021 | | For the
Year Ended
October 31,
2020 |
| Operations: | | | | | | | |
| Net investment income (loss) | $ 12,609,296 | | $ 35,121,555 | | $ 79,881,660 | | $ 68,377,330 |
| Net realized gain (loss) on investments, other financial instruments and foreign currency transactions | 1,117,743,666 | | 321,998,365 | | 366,960,795 | | (54,681,104) |
| Net changes in unrealized appreciation (depreciation) of investments, other financial instruments and foreign currency transactions | 961,196,796 | | 174,640,236 | | 2,963,652,462 | | 762,997,999 |
| Net Increase (Decrease) in Net Assets Resulting from Operations | 2,091,549,758 | | 531,760,156 | | 3,410,494,917 | | 776,694,225 |
| Distributions to Shareholders: | | | | | | | |
| Class A | (256,624,217) | | (233,332,626) | | (7,166,565) | | (22,933,276) |
| Class C | (12,630,524) | | (16,172,531) | | — | | (8,130,633) |
| Class I | (33,651,291) | | (33,414,797) | | (26,510,048) | | (50,034,683) |
| Class R3 | (1,911,571) | | (1,922,241) | | (145,253) | | (766,121) |
| Class R4 | (1,459,215) | | (1,528,792) | | (972,045) | | (3,662,366) |
| Class R5 | (1,629,937) | | (1,654,005) | | (1,462,901) | | (6,433,518) |
| Class R6 | (638,212) | | (3,567,961) | | (6,940,312) | | (7,619,916) |
| Class Y | (4,992,537) | | (8,300,069) | | (5,937,551) | | (10,460,626) |
| Class F | (42,410,229) | | (40,192,877) | | (21,751,271) | | (48,473,881) |
| Total distributions | (355,947,733) | | (340,085,899) | | (70,885,946) | | (158,515,020) |
| Capital Share Transactions: | | | | | | | |
| Sold | 338,608,621 | | 393,860,254 | | 3,592,112,670 | | 4,431,360,869 |
| Issued on reinvestment of distributions | 343,956,936 | | 327,641,306 | | 67,490,064 | | 151,792,918 |
| Redeemed | (1,039,938,487) | | (1,497,856,000) | | (2,927,339,187) | | (2,300,491,319) |
| Net increase (decrease) from capital share transactions | (357,372,930) | | (776,354,440) | | 732,263,547 | | 2,282,662,468 |
| Net Increase (Decrease) in Net Assets | 1,378,229,095 | | (584,680,183) | | 4,071,872,518 | | 2,900,841,673 |
| Net Assets: | | | | | | | |
| Beginning of period | 6,356,957,117 | | 6,941,637,300 | | 8,592,752,431 | | 5,691,910,758 |
| End of period | $ 7,735,186,212 | | $ 6,356,957,117 | | $ 12,664,624,949 | | $ 8,592,752,431 |
The accompanying notes are an integral part of these financial statements.
Hartford Domestic Equity Funds
Statements of Changes in Net Assets – (continued)
For the Year Ended October 31, 2021
| | The Hartford
Dividend and Growth Fund | | The Hartford
Equity Income Fund |
| | For the
Year Ended
October 31,
2021 | | For the
Year Ended
October 31,
2020 | | For the
Year Ended
October 31,
2021 | | For the
Year Ended
October 31,
2020 |
| Operations: | | | | | | | |
| Net investment income (loss) | $ 153,413,163 | | $ 159,576,823 | | $ 77,254,659 | | $ 76,499,402 |
| Net realized gain (loss) on investments, other financial instruments and foreign currency transactions | 700,951,873 | | 194,550,105 | | 364,677,577 | | 41,190,676 |
| Net changes in unrealized appreciation (depreciation) of investments, other financial instruments and foreign currency transactions | 3,492,438,056 | | (496,987,234) | | 993,091,679 | | (294,473,186) |
| Net Increase (Decrease) in Net Assets Resulting from Operations | 4,346,803,092 | | (142,860,306) | | 1,435,023,915 | | (176,783,108) |
| Distributions to Shareholders: | | | | | | | |
| Class A | (124,272,767) | | (160,312,321) | | (41,652,685) | | (123,227,802) |
| Class C | (3,956,164) | | (7,036,533) | | (3,698,845) | | (20,643,364) |
| Class I | (71,985,276) | | (56,365,416) | | (33,459,498) | | (79,079,559) |
| Class R3 | (1,696,101) | | (2,526,370) | | (781,704) | | (3,167,178) |
| Class R4 | (2,690,217) | | (4,441,817) | | (1,147,861) | | (4,104,853) |
| Class R5 | (6,848,052) | | (8,627,986) | | (2,137,950) | | (6,408,419) |
| Class R6 | (9,408,231) | | (6,208,413) | | (2,007,112) | | (4,420,613) |
| Class Y | (30,895,801) | | (32,073,450) | | (2,882,683) | | (8,372,101) |
| Class F | (117,659,277) | | (133,641,614) | | (30,248,716) | | (77,653,805) |
| Total distributions | (369,411,886) | | (411,233,920) | | (118,017,054) | | (327,077,694) |
| Capital Share Transactions: | | | | | | | |
| Sold | 4,029,585,831 | | 2,466,834,298 | | 771,725,035 | | 870,782,771 |
| Issued on reinvestment of distributions | 354,750,045 | | 395,743,447 | | 113,763,031 | | 313,924,345 |
| Redeemed | (2,883,515,258) | | (2,162,912,714) | | (999,427,216) | | (1,064,410,832) |
| Net increase (decrease) from capital share transactions | 1,500,820,618 | | 699,665,031 | | (113,939,150) | | 120,296,284 |
| Net Increase (Decrease) in Net Assets | 5,478,211,824 | | 145,570,805 | | 1,203,067,711 | | (383,564,518) |
| Net Assets: | | | | | | | |
| Beginning of period | 9,188,890,256 | | 9,043,319,451 | | 3,692,045,187 | | 4,075,609,705 |
| End of period | $ 14,667,102,080 | | $ 9,188,890,256 | | $ 4,895,112,898 | | $ 3,692,045,187 |
The accompanying notes are an integral part of these financial statements.
Hartford Domestic Equity Funds
Statements of Changes in Net Assets – (continued)
For the Year Ended October 31, 2021
| | The Hartford
Growth Opportunities Fund | | The Hartford
Healthcare Fund |
| | For the
Year Ended
October 31,
2021 | | For the
Year Ended
October 31,
2020 | | For the
Year Ended
October 31,
2021 | | For the
Year Ended
October 31,
2020 |
| Operations: | | | | | | | |
| Net investment income (loss) | $ (54,382,771) | | $ (29,916,479) | | $ (5,610,496) | | $ (4,395,168) |
| Net realized gain (loss) on investments, other financial instruments and foreign currency transactions | 1,724,280,446 | | 1,058,626,660 | | 183,832,310 | | 203,398,936 |
| Net changes in unrealized appreciation (depreciation) of investments, other financial instruments and foreign currency transactions | 264,840,372 | | 1,003,071,867 | | 154,285,853 | | 73,940,755 |
| Net Increase (Decrease) in Net Assets Resulting from Operations | 1,934,738,047 | | 2,031,782,048 | | 332,507,667 | | 272,944,523 |
| Distributions to Shareholders: | | | | | | | |
| Class A | (423,673,541) | | (132,324,071) | | (93,880,300) | | (43,738,879) |
| Class C | (94,842,287) | | (33,402,683) | | (22,672,232) | | (11,289,417) |
| Class I | (234,064,363) | | (86,336,894) | | (44,908,247) | | (18,502,650) |
| Class R3 | (7,102,825) | | (2,788,128) | | (3,747,674) | | (2,132,500) |
| Class R4 | (9,398,654) | | (3,725,988) | | (2,881,694) | | (1,601,341) |
| Class R5 | (2,988,257) | | (1,419,176) | | (1,201,964) | | (362,224) |
| Class R6 | (5,296,402) | | (1,357,539) | | (438,736) | | (138,636) |
| Class Y | (53,966,607) | | (8,936,697) | | (10,597,239) | | (4,160,454) |
| Class F | (109,670,067) | | (31,543,831) | | (4,009,747) | | (1,805,276) |
| Total distributions | (941,003,003) | | (301,835,007) | | (184,337,833) | | (83,731,377) |
| Capital Share Transactions: | | | | | | | |
| Sold | 1,412,684,010 | | 1,236,652,514 | | 254,406,423 | | 225,456,081 |
| Issued on reinvestment of distributions | 867,858,722 | | 276,247,055 | | 175,117,607 | | 79,518,799 |
| Redeemed | (1,585,916,069) | | (1,570,077,091) | | (314,733,008) | | (300,020,713) |
| Net increase (decrease) from capital share transactions | 694,626,663 | | (57,177,522) | | 114,791,022 | | 4,954,167 |
| Net Increase (Decrease) in Net Assets | 1,688,361,707 | | 1,672,769,519 | | 262,960,856 | | 194,167,313 |
| Net Assets: | | | | | | | |
| Beginning of period | 6,395,107,228 | | 4,722,337,709 | | 1,465,668,588 | | 1,271,501,275 |
| End of period | $ 8,083,468,935 | | $ 6,395,107,228 | | $ 1,728,629,444 | | $ 1,465,668,588 |
The accompanying notes are an integral part of these financial statements.
Hartford Domestic Equity Funds
Statements of Changes in Net Assets – (continued)
For the Year Ended October 31, 2021
| | The Hartford
MidCap Fund | | The Hartford
MidCap Value Fund |
| | For the
Year Ended
October 31,
2021 | | For the
Year Ended
October 31,
2020 | | For the
Year Ended
October 31,
2021 | | For the
Year Ended
October 31,
2020 |
| Operations: | | | | | | | |
| Net investment income (loss) | $ 68,229,033 | | $ (10,215,371) | | $ 1,874,621 | | $ 4,875,802 |
| Net realized gain (loss) on investments, other financial instruments and foreign currency transactions | 1,707,213,123 | | 1,702,763,140 | | 100,036,552 | | (39,228,979) |
| Net changes in unrealized appreciation (depreciation) of investments, other financial instruments and foreign currency transactions | 2,690,020,087 | | (766,119,265) | | 189,407,923 | | (52,936,953) |
| Net Increase (Decrease) in Net Assets Resulting from Operations | 4,465,462,243 | | 926,428,504 | | 291,319,096 | | (87,290,130) |
| Distributions to Shareholders: | | | | | | | |
| Class A | (347,506,316) | | (150,147,304) | | (837,738) | | (9,305,290) |
| Class C | (72,065,078) | | (38,059,233) | | — | | (469,443) |
| Class I | (475,898,575) | | (215,894,776) | | (113,371) | | (986,601) |
| Class R3 | (10,341,121) | | (4,574,098) | | — | | (194,286) |
| Class R4 | (21,473,620) | | (11,938,522) | | (19,877) | | (330,164) |
| Class R5 | (36,606,303) | | (21,826,289) | | (9,446) | | (46,111) |
| Class R6 | (171,635,482) | | (75,768,819) | | — | | — |
| Class Y | (114,448,304) | | (67,701,427) | | (91,721) | | (388,031) |
| Class F | (294,576,639) | | (117,154,616) | | (2,424,869) | | (10,736,193) |
| Total distributions | (1,544,551,438) | | (703,065,084) | | (3,497,022) | | (22,456,119) |
| Capital Share Transactions: | | | | | | | |
| Sold | 2,014,553,894 | | 3,049,644,964 | | 146,817,585 | | 143,137,588 |
| Issued on reinvestment of distributions | 1,483,163,109 | | 674,235,988 | | 3,487,144 | | 22,332,350 |
| Redeemed | (5,460,496,113) | | (4,890,549,843) | | (162,560,509) | | (161,706,044) |
| Net increase (decrease) from capital share transactions | (1,962,779,110) | | (1,166,668,891) | | (12,255,780) | | 3,763,894 |
| Net Increase (Decrease) in Net Assets | 958,131,695 | | (943,305,471) | | 275,566,294 | | (105,982,355) |
| Net Assets: | | | | | | | |
| Beginning of period | 12,968,160,312 | | 13,911,465,783 | | 599,777,782 | | 705,760,137 |
| End of period | $ 13,926,292,007 | | $ 12,968,160,312 | | $ 875,344,076 | | $ 599,777,782 |
The accompanying notes are an integral part of these financial statements.
Hartford Domestic Equity Funds
Statements of Changes in Net Assets – (continued)
For the Year Ended October 31, 2021
| | Hartford
Quality Value Fund | | The Hartford
Small Cap Growth Fund |
| | For the
Year Ended
October 31,
2021 | | For the
Year Ended
October 31,
2020 | | For the
Year Ended
October 31,
2021 | | For the
Year Ended
October 31,
2020 |
| Operations: | | | | | | | |
| Net investment income (loss) | $ 3,150,999 | | $ 4,115,456 | | $ (4,024,977) | | $ (2,708,736) |
| Net realized gain (loss) on investments, other financial instruments and foreign currency transactions | 13,598,905 | | (2,408,260) | | 174,617,463 | | 76,991,681 |
| Net changes in unrealized appreciation (depreciation) of investments, other financial instruments and foreign currency transactions | 56,452,184 | | (16,678,797) | | 106,905,409 | | 50,280,658 |
| Net Increase (Decrease) in Net Assets Resulting from Operations | 73,202,088 | | (14,971,601) | | 277,497,895 | | 124,563,603 |
| Distributions to Shareholders: | | | | | | | |
| Class A | (3,241,327) | | (8,585,823) | | (16,552,797) | | (3,152,385) |
| Class C | (63,247) | | (334,835) | | (1,531,478) | | (371,513) |
| Class I | (300,872) | | (704,282) | | (7,507,522) | | (2,950,208) |
| Class R3 | (17,729) | | (57,990) | | (683,476) | | (162,662) |
| Class R4 | (91,734) | | (303,759) | | (2,012,020) | | (630,158) |
| Class R5 | (5,775) | | (12,405) | | (5,481,575) | | (1,205,841) |
| Class R6 | (13,682) | | (1,828) | | (6,037,686) | | (971,533) |
| Class Y | (10,318) | | (33,830) | | (17,719,809) | | (5,261,028) |
| Class F | (258,522) | | (650,547) | | (3,391,955) | | (693,277) |
| Total distributions | (4,003,206) | | (10,685,299) | | (60,918,318) | | (15,398,605) |
| Capital Share Transactions: | | | | | | | |
| Sold | 21,527,878 | | 14,502,495 | | 158,407,323 | | 261,523,570 |
| Issued on reinvestment of distributions | 3,936,286 | | 10,505,584 | | 58,369,869 | | 14,907,961 |
| Redeemed | (31,941,068) | | (38,374,320) | | (342,794,035) | | (601,709,062) |
| Net increase (decrease) from capital share transactions | (6,476,904) | | (13,366,241) | | (126,016,843) | | (325,277,531) |
| Net Increase (Decrease) in Net Assets | 62,721,978 | | (39,023,141) | | 90,562,734 | | (216,112,533) |
| Net Assets: | | | | | | | |
| Beginning of period | 169,557,236 | | 208,580,377 | | 800,020,951 | | 1,016,133,484 |
| End of period | $ 232,279,214 | | $ 169,557,236 | | $ 890,583,685 | | $ 800,020,951 |
The accompanying notes are an integral part of these financial statements.
Hartford Domestic Equity Funds
Statements of Changes in Net Assets – (continued)
For the Year Ended October 31, 2021
| | Hartford
Small Cap Value Fund | | The Hartford
Small Company Fund |
| | For the
Year Ended
October 31,
2021 | | For the
Year Ended
October 31,
2020 | | For the
Year Ended
October 31,
2021 | | For the
Year Ended
October 31,
2020 |
| Operations: | | | | | | | |
| Net investment income (loss) | $ 1,454,248 | | $ 1,079,397 | | $ (8,422,124) | | $ (3,224,456) |
| Net realized gain (loss) on investments, other financial instruments and foreign currency transactions | 17,243,277 | | (8,845,626) | | 219,723,239 | | 80,687,603 |
| Net changes in unrealized appreciation (depreciation) of investments, other financial instruments and foreign currency transactions | 29,174,321 | | (8,048,202) | | 8,069,059 | | 109,288,045 |
| Net Increase (Decrease) in Net Assets Resulting from Operations | 47,871,846 | | (15,814,431) | | 219,370,174 | | 186,751,192 |
| Distributions to Shareholders: | | | | | | | |
| Class A | (363,877) | | (2,971,162) | | (42,313,500) | | (19,581,596) |
| Class C | (3,950) | | (232,432) | | (1,604,568) | | (922,638) |
| Class I | (54,057) | | (419,421) | | (3,566,682) | | (1,641,458) |
| Class R3 | (3,498) | | (37,274) | | (1,394,856) | | (795,519) |
| Class R4 | (362) | | (4,174) | | (1,251,522) | | (754,352) |
| Class R5 | (148) | | (730) | | (377,954) | | (157,911) |
| Class R6 | (3,866) | | (7,037) | | (128,962) | | (5,772) |
| Class Y | (3,913) | | (28,438) | | (1,778,231) | | (1,571,493) |
| Class F | (666,330) | | (3,318,166) | | (24,289,826) | | (11,316,929) |
| Total distributions | (1,100,001) | | (7,018,834) | | (76,706,101) | | (36,747,668) |
| Capital Share Transactions: | | | | | | | |
| Sold | 82,135,100 | | 14,194,625 | | 307,799,887 | | 102,088,209 |
| Issued on reinvestment of distributions | 1,094,882 | | 6,977,511 | | 76,133,999 | | 36,543,865 |
| Redeemed | (32,701,037) | | (23,873,812) | | (262,911,327) | | (164,590,834) |
| Net increase (decrease) from capital share transactions | 50,528,945 | | (2,701,676) | | 121,022,559 | | (25,958,760) |
| Net Increase (Decrease) in Net Assets | 97,300,790 | | (25,534,941) | | 263,686,632 | | 124,044,764 |
| Net Assets: | | | | | | | |
| Beginning of period | 79,364,274 | | 104,899,215 | | 730,216,413 | | 606,171,649 |
| End of period | $ 176,665,064 | | $ 79,364,274 | | $ 993,903,045 | | $ 730,216,413 |
The accompanying notes are an integral part of these financial statements.
Hartford Domestic Equity Funds
| | | — Selected Per-Share Data(1) — | | — Ratios and Supplemental Data — |
| Class | | Net
Asset
Value at
Beginning
of Period | | Net
Investment
Income
(Loss) | | Net
Realized
and
Unrealized
Gain (Loss)
on
Investments | | Total from
Investment
Operations | | Dividends
from Net
Investment
Income | | Distributions
from
Capital
Gains | | Total
Dividends
and
Distributions | | Net
Asset
Value at
End of
Period | | Total
Return(2) | | Net
Assets
at End
of Period
(000s) | | Ratio of
Expenses
to
Average
Net
Assets
Before
Adjust-
ments(3) | | Ratio of
Expenses
to
Average
Net
Assets
After
Adjust-
ments(3) | | Ratio of
Net
Investment
Income
(Loss) to
Average
Net Assets | | Portfolio
Turnover |
| The Hartford Capital Appreciation Fund |
| For the Year Ended October 31, 2021 |
| A | | $ 38.39 | | $ 0.05 | | $ 12.59 | | $ 12.64 | | $ (0.15) | | $ (1.99) | | $ (2.14) | | $ 48.89 | | 33.83% | | $ 5,710,869 | | 1.04% | | 1.04% | | 0.12% | | 62% |
| C | | 27.45 | | (0.21) | | 8.89 | | 8.68 | | — | | (1.99) | | (1.99) | | 34.14 | | 32.74 | | 148,862 | | 1.83 | | 1.83 | | (0.66) | | 62 |
| I | | 38.66 | | 0.18 | | 12.65 | | 12.83 | | (0.26) | | (1.99) | | (2.25) | | 49.25 | | 34.15 | | 721,608 | | 0.77 | | 0.77 | | 0.38 | | 62 |
| R3 | | 43.14 | | (0.13) | | 14.19 | | 14.06 | | — | | (1.99) | | (1.99) | | 55.21 | | 33.32 | | 45,054 | | 1.41 | | 1.41 | | (0.25) | | 62 |
| R4 | | 44.91 | | 0.03 | | 14.77 | | 14.80 | | (0.10) | | (1.99) | | (2.09) | | 57.63 | | 33.72 | | 36,750 | | 1.10 | | 1.10 | | 0.06 | | 62 |
| R5 | | 45.94 | | 0.20 | | 15.10 | | 15.30 | | (0.24) | | (1.99) | | (2.23) | | 59.02 | | 34.11 | | 36,529 | | 0.80 | | 0.80 | | 0.36 | | 62 |
| R6 | | 46.27 | | 0.26 | | 15.22 | | 15.48 | | (0.28) | | (1.99) | | (2.27) | | 59.48 | | 34.27 | | 19,261 | | 0.69 | | 0.69 | | 0.46 | | 62 |
| Y | | 46.24 | | 0.21 | | 15.21 | | 15.42 | | (0.26) | | (1.99) | | (2.25) | | 59.41 | | 34.14 | | 122,539 | | 0.80 | | 0.79 | | 0.37 | | 62 |
| F | | 38.66 | | 0.21 | | 12.67 | | 12.88 | | (0.29) | | (1.99) | | (2.28) | | 49.26 | | 34.28 | | 893,713 | | 0.69 | | 0.69 | | 0.47 | | 62 |
| For the Year Ended October 31, 2020 |
| A | | $ 37.12 | | $ 0.18 | | $ 2.90 | | $ 3.08 | | $ (0.17) | | $ (1.64) | | $ (1.81) | | $ 38.39 | | 8.57% | | $ 4,645,677 | | 1.07% | | 1.07% | | 0.48% | | 84% |
| C | | 27.08 | | (0.07) | | 2.08 | | 2.01 | | — | | (1.64) | | (1.64) | | 27.45 | | 7.78 | | 177,309 | | 1.85 | | 1.85 | | (0.27) | | 84 |
| I | | 37.36 | | 0.28 | | 2.93 | | 3.21 | | (0.27) | | (1.64) | | (1.91) | | 38.66 | | 8.88 | | 584,048 | | 0.79 | | 0.79 | | 0.77 | | 84 |
| R3 | | 41.47 | | 0.06 | | 3.25 | | 3.31 | | — | | (1.64) | | (1.64) | | 43.14 | | 8.25 | | 42,449 | | 1.42 | | 1.42 | | 0.14 | | 84 |
| R4 | | 43.06 | | 0.20 | | 3.39 | | 3.59 | | (0.10) | | (1.64) | | (1.74) | | 44.91 | | 8.59 | | 32,732 | | 1.10 | | 1.10 | | 0.46 | | 84 |
| R5 | | 44.04 | | 0.33 | | 3.47 | | 3.80 | | (0.26) | | (1.64) | | (1.90) | | 45.94 | | 8.88 | | 34,188 | | 0.81 | | 0.81 | | 0.75 | | 84 |
| R6 | | 44.34 | | 0.43 | | 3.44 | | 3.87 | | (0.30) | | (1.64) | | (1.94) | | 46.27 | | 9.03 | | 12,531 | | 0.70 | | 0.70 | | 1.00 | | 84 |
| Y | | 44.32 | | 0.36 | | 3.49 | | 3.85 | | (0.29) | | (1.64) | | (1.93) | | 46.24 | | 8.97 | | 103,152 | | 0.80 | | 0.75 | | 0.83 | | 84 |
| F | | 37.36 | | 0.31 | | 2.93 | | 3.24 | | (0.30) | | (1.64) | | (1.94) | | 38.66 | | 9.00 | | 724,872 | | 0.70 | | 0.70 | | 0.85 | | 84 |
| For the Year Ended October 31, 2019 |
| A | | $ 37.88 | | $ 0.15 | | $ 4.81 | | $ 4.96 | | $ (0.11) | | $ (5.61) | | $ (5.72) | | $ 37.12 | | 16.32% | | $ 4,831,749 | | 1.07% | | 1.07% | | 0.42% | | 68% |
| C | | 29.30 | | (0.09) | | 3.48 | | 3.39 | | — | | (5.61) | | (5.61) | | 27.08 | | 15.45 | | 278,394 | | 1.83 | | 1.83 | | (0.33) | | 68 |
| I | | 38.08 | | 0.25 | | 4.84 | | 5.09 | | (0.20) | | (5.61) | | (5.81) | | 37.36 | | 16.66 | | 658,302 | | 0.79 | | 0.79 | | 0.70 | | 68 |
| R3 | | 41.62 | | 0.03 | | 5.43 | | 5.46 | | — | | (5.61) | | (5.61) | | 41.47 | | 15.91 | | 50,957 | | 1.42 | | 1.42 | | 0.07 | | 68 |
| R4 | | 42.94 | | 0.16 | | 5.63 | | 5.79 | | (0.06) | | (5.61) | | (5.67) | | 43.06 | | 16.27 | | 38,634 | | 1.11 | | 1.11 | | 0.39 | | 68 |
| R5 | | 43.80 | | 0.28 | | 5.75 | | 6.03 | | (0.18) | | (5.61) | | (5.79) | | 44.04 | | 16.64 | | 38,808 | | 0.80 | | 0.80 | | 0.68 | | 68 |
| R6 | | 44.07 | | 0.33 | | 5.78 | | 6.11 | | (0.23) | | (5.61) | | (5.84) | | 44.34 | | 16.74 | | 80,535 | | 0.70 | | 0.70 | | 0.78 | | 68 |
| Y | | 44.06 | | 0.32 | | 5.77 | | 6.09 | | (0.22) | | (5.61) | | (5.83) | | 44.32 | | 16.71 | | 187,754 | | 0.78 | | 0.74 | | 0.75 | | 68 |
| F | | 38.09 | | 0.28 | | 4.83 | | 5.11 | | (0.23) | | (5.61) | | (5.84) | | 37.36 | | 16.75 | | 776,505 | | 0.70 | | 0.70 | | 0.79 | | 68 |
| For the Year Ended October 31, 2018 |
| A | | $ 41.86 | | $ 0.15 | | $ 1.45 | | $ 1.60 | | $ (0.26) | | $ (5.32) | | $ (5.58) | | $ 37.88 | | 3.92% | | $ 4,742,846 | | 1.07% | | 1.06% | | 0.38% | | 108% |
| C | | 33.62 | | (0.11) | | 1.16 | | 1.05 | | (0.05) | | (5.32) | | (5.37) | | 29.30 | | 3.15 | | 426,256 | | 1.81 | | 1.81 | | (0.34) | | 108 |
| I | | 42.04 | | 0.26 | | 1.44 | | 1.70 | | (0.34) | | (5.32) | | (5.66) | | 38.08 | | 4.19 | | 734,580 | | 0.78 | | 0.78 | | 0.66 | | 108 |
| R3 | | 45.39 | | 0.02 | | 1.56 | | 1.58 | | (0.03) | | (5.32) | | (5.35) | | 41.62 | | 3.57 | | 61,882 | | 1.42 | | 1.41 | | 0.04 | | 108 |
| R4 | | 46.69 | | 0.15 | | 1.62 | | 1.77 | | (0.20) | | (5.32) | | (5.52) | | 42.94 | | 3.87 | | 51,635 | | 1.10 | | 1.10 | | 0.34 | | 108 |
| R5 | | 47.54 | | 0.30 | | 1.63 | | 1.93 | | (0.35) | | (5.32) | | (5.67) | | 43.80 | | 4.18 | | 34,288 | | 0.80 | | 0.80 | | 0.65 | | 108 |
| R6 | | 47.80 | | 0.35 | | 1.64 | | 1.99 | | (0.40) | | (5.32) | | (5.72) | | 44.07 | | 4.29 | | 70,935 | | 0.70 | | 0.70 | | 0.75 | | 108 |
| Y | | 47.78 | | 0.34 | | 1.64 | | 1.98 | | (0.38) | | (5.32) | | (5.70) | | 44.06 | | 4.28 | | 175,731 | | 0.71 | | 0.71 | | 0.74 | | 108 |
| F | | 42.06 | | 0.30 | | 1.45 | | 1.75 | | (0.40) | | (5.32) | | (5.72) | | 38.09 | | 4.28 | | 880,110 | | 0.70 | | 0.70 | | 0.75 | | 108 |
The accompanying notes are an integral part of these financial statements.
Hartford Domestic Equity Funds
Financial Highlights – (continued)
| | | — Selected Per-Share Data(1) — | | — Ratios and Supplemental Data — |
| Class | | Net
Asset
Value at
Beginning
of Period | | Net
Investment
Income
(Loss) | | Net
Realized
and
Unrealized
Gain (Loss)
on
Investments | | Total from
Investment
Operations | | Dividends
from Net
Investment
Income | | Distributions
from
Capital
Gains | | Total
Dividends
and
Distributions | | Net
Asset
Value at
End of
Period | | Total
Return(2) | | Net
Assets
at End
of Period
(000s) | | Ratio of
Expenses
to
Average
Net
Assets
Before
Adjust-
ments(3) | | Ratio of
Expenses
to
Average
Net
Assets
After
Adjust-
ments(3) | | Ratio of
Net
Investment
Income
(Loss) to
Average
Net Assets | | Portfolio
Turnover |
| The Hartford Capital Appreciation Fund – (continued) |
| For the Year Ended October 31, 2017 |
| A | | $ 34.49 | | $ 0.13 | | $ 7.39 | | $ 7.52 | | $ (0.15) | | $ — | | $ (0.15) | | $ 41.86 | | 21.86% | | $ 4,613,982 | | 1.09% (4) | | 1.08% (4) | | 0.34% | | 123% |
| C | | 27.80 | | (0.12) | | 5.94 | | 5.82 | | — | | — | | — | | 33.62 | | 20.97 | | 1,241,267 | | 1.82 (4) | | 1.82 (4) | | (0.39) | | 123 |
| I | | 34.65 | | 0.25 | | 7.40 | | 7.65 | | (0.26) | | — | | (0.26) | | 42.04 | | 22.20 | | 846,019 | | 0.81 (4) | | 0.81 (4) | | 0.63 | | 123 |
| R3 | | 37.38 | | 0.01 | | 8.01 | | 8.02 | | (0.01) | | — | | (0.01) | | 45.39 | | 21.47 | | 75,201 | | 1.42 (4) | | 1.40 (4) | | 0.03 | | 123 |
| R4 | | 38.39 | | 0.14 | | 8.23 | | 8.37 | | (0.07) | | — | | (0.07) | | 46.69 | | 21.82 | | 74,374 | | 1.11 (4) | | 1.11 (4) | | 0.33 | | 123 |
| R5 | | 39.15 | | 0.28 | | 8.37 | | 8.65 | | (0.26) | | — | | (0.26) | | 47.54 | | 22.20 | | 40,582 | | 0.81 (4) | | 0.80 (4) | | 0.63 | | 123 |
| R6 | | 39.36 | | 0.31 | | 8.42 | | 8.73 | | (0.29) | | — | | (0.29) | | 47.80 | | 22.33 | | 70,142 | | 0.71 (4) | | 0.71 (4) | | 0.71 | | 123 |
| Y | | 39.36 | | 0.30 | | 8.41 | | 8.71 | | (0.29) | | — | | (0.29) | | 47.78 | | 22.27 | | 184,502 | | 0.72 (4) | | 0.72 (4) | | 0.70 | | 123 |
| F (5) | | 38.15 | | 0.18 | | 3.73 | | 3.91 | | — | | — | | — | | 42.06 | | 10.28 (6) | | 1,103,972 | | 0.71 (4)(7) | | 0.71 (4)(7) | | 0.65 (7) | | 123 |
| Hartford Core Equity Fund |
| For the Year Ended October 31, 2021 |
| A | | $ 36.04 | | $ 0.23 | | $ 13.36 | | $ 13.59 | | $ (0.22) | | $ — | | $ (0.22) | | $ 49.41 | | 37.85% | | $ 1,681,155 | | 0.70% | | 0.70% | | 0.52% | | 13% |
| C | | 32.62 | | (0.09) | | 12.10 | | 12.01 | | — | | — | | — | | 44.63 | | 36.82 | | 583,876 | | 1.45 | | 1.45 | | (0.23) | | 13 |
| I | | 36.16 | | 0.34 | | 13.40 | | 13.74 | | (0.31) | | — | | (0.31) | | 49.59 | | 38.19 | | 4,700,782 | | 0.45 | | 0.45 | | 0.77 | | 13 |
| R3 | | 36.54 | | 0.07 | | 13.56 | | 13.63 | | (0.11) | | — | | (0.11) | | 50.06 | | 37.38 | | 71,617 | | 1.07 | | 1.06 | | 0.16 | | 13 |
| R4 | | 37.20 | | 0.23 | | 13.79 | | 14.02 | | (0.21) | | — | | (0.21) | | 51.01 | | 37.82 | | 239,198 | | 0.76 | | 0.72 | | 0.50 | | 13 |
| R5 | | 36.44 | | 0.34 | | 13.51 | | 13.85 | | (0.30) | | — | | (0.30) | | 49.99 | | 38.17 | | 225,017 | | 0.46 | | 0.46 | | 0.76 | | 13 |
| R6 | | 36.62 | | 0.39 | | 13.57 | | 13.96 | | (0.34) | | — | | (0.34) | | 50.24 | | 38.31 | | 1,045,661 | | 0.36 | | 0.36 | | 0.86 | | 13 |
| Y | | 36.60 | | 0.35 | | 13.56 | | 13.91 | | (0.31) | | — | | (0.31) | | 50.20 | | 38.20 | | 903,952 | | 0.46 | | 0.44 | | 0.78 | | 13 |
| F | | 36.19 | | 0.38 | | 13.42 | | 13.80 | | (0.34) | | — | | (0.34) | | 49.65 | | 38.33 | | 3,213,368 | | 0.36 | | 0.36 | | 0.86 | | 13 |
| For the Year Ended October 31, 2020 |
| A | | $ 33.40 | | $ 0.26 | | $ 3.23 | | $ 3.49 | | $ (0.23) | | $ (0.62) | | $ (0.85) | | $ 36.04 | | 10.58% | | $ 1,140,994 | | 0.73% | | 0.72% | | 0.77% | | 22% |
| C | | 30.35 | | 0.01 | | 2.92 | | 2.93 | | (0.04) | | (0.62) | | (0.66) | | 32.62 | | 9.74 | | 443,989 | | 1.47 | | 1.47 | | 0.03 | | 22 |
| I | | 33.50 | | 0.35 | | 3.24 | | 3.59 | | (0.31) | | (0.62) | | (0.93) | | 36.16 | | 10.87 | | 2,936,718 | | 0.46 | | 0.46 | | 1.03 | | 22 |
| R3 | | 33.86 | | 0.15 | | 3.26 | | 3.41 | | (0.11) | | (0.62) | | (0.73) | | 36.54 | | 10.17 | | 46,674 | | 1.07 | | 1.07 | | 0.43 | | 22 |
| R4 | | 34.44 | | 0.27 | | 3.33 | | 3.60 | | (0.22) | | (0.62) | | (0.84) | | 37.20 | | 10.58 | | 169,267 | | 0.78 | | 0.73 | | 0.77 | | 22 |
| R5 | | 33.75 | | 0.36 | | 3.25 | | 3.61 | | (0.30) | | (0.62) | | (0.92) | | 36.44 | | 10.85 | | 188,738 | | 0.47 | | 0.47 | | 1.04 | | 22 |
| R6 | | 33.91 | | 0.38 | | 3.29 | | 3.67 | | (0.34) | | (0.62) | | (0.96) | | 36.62 | | 10.96 | | 746,018 | | 0.38 | | 0.38 | | 1.10 | | 22 |
| Y | | 33.90 | | 0.36 | | 3.28 | | 3.64 | | (0.32) | | (0.62) | | (0.94) | | 36.60 | | 10.89 | | 668,655 | | 0.47 | | 0.45 | | 1.05 | | 22 |
| F | | 33.52 | | 0.38 | | 3.25 | | 3.63 | | (0.34) | | (0.62) | | (0.96) | | 36.19 | | 10.97 | | 2,251,700 | | 0.38 | | 0.38 | | 1.12 | | 22 |
| For the Year Ended October 31, 2019 |
| A | | $ 30.17 | | $ 0.27 | | $ 4.40 | | $ 4.67 | | $ (0.21) | | $ (1.23) | | $ (1.44) | | $ 33.40 | | 16.60% | | $ 881,587 | | 0.74% | | 0.73% | | 0.88% | | 15% |
| C | | 27.53 | | 0.04 | | 4.01 | | 4.05 | | — | | (1.23) | | (1.23) | | 30.35 | | 15.71 | | 366,553 | | 1.47 | | 1.47 | | 0.14 | | 15 |
| I | | 30.26 | | 0.35 | | 4.40 | | 4.75 | | (0.28) | | (1.23) | | (1.51) | | 33.50 | | 16.91 | | 1,740,669 | | 0.47 | | 0.47 | | 1.14 | | 15 |
| R3 | | 30.52 | | 0.16 | | 4.48 | | 4.64 | | (0.07) | | (1.23) | | (1.30) | | 33.86 | | 16.18 | | 34,158 | | 1.10 | | 1.10 | | 0.52 | | 15 |
| R4 | | 31.03 | | 0.28 | | 4.54 | | 4.82 | | (0.18) | | (1.23) | | (1.41) | | 34.44 | | 16.59 | | 150,159 | | 0.77 | | 0.74 | | 0.88 | | 15 |
| R5 | | 30.47 | | 0.35 | | 4.44 | | 4.79 | | (0.28) | | (1.23) | | (1.51) | | 33.75 | | 16.90 | | 231,879 | | 0.49 | | 0.49 | | 1.13 | | 15 |
| R6 | | 30.61 | | 0.38 | | 4.46 | | 4.84 | | (0.31) | | (1.23) | | (1.54) | | 33.91 | | 17.01 | | 259,706 | | 0.38 | | 0.38 | | 1.22 | | 15 |
| Y | | 30.61 | | 0.37 | | 4.45 | | 4.82 | | (0.30) | | (1.23) | | (1.53) | | 33.90 | | 16.94 | | 371,580 | | 0.46 | | 0.43 | | 1.18 | | 15 |
| F | | 30.28 | | 0.38 | | 4.40 | | 4.78 | | (0.31) | | (1.23) | | (1.54) | | 33.52 | | 17.00 | | 1,655,619 | | 0.38 | | 0.38 | | 1.21 | | 15 |
The accompanying notes are an integral part of these financial statements.
Hartford Domestic Equity Funds
Financial Highlights – (continued)
| | | — Selected Per-Share Data(1) — | | — Ratios and Supplemental Data — |
| Class | | Net
Asset
Value at
Beginning
of Period | | Net
Investment
Income
(Loss) | | Net
Realized
and
Unrealized
Gain (Loss)
on
Investments | | Total from
Investment
Operations | | Dividends
from Net
Investment
Income | | Distributions
from
Capital
Gains | | Total
Dividends
and
Distributions | | Net
Asset
Value at
End of
Period | | Total
Return(2) | | Net
Assets
at End
of Period
(000s) | | Ratio of
Expenses
to
Average
Net
Assets
Before
Adjust-
ments(3) | | Ratio of
Expenses
to
Average
Net
Assets
After
Adjust-
ments(3) | | Ratio of
Net
Investment
Income
(Loss) to
Average
Net Assets | | Portfolio
Turnover |
| Hartford Core Equity Fund – (continued) |
| For the Year Ended October 31, 2018 |
| A | | $ 28.53 | | $ 0.22 | | $ 2.42 | | $ 2.64 | | $ (0.25) | | $ (0.75) | | $ (1.00) | | $ 30.17 | | 9.41% | | $ 666,354 | | 0.74% | | 0.74% | | 0.73% | | 22% |
| C | | 26.13 | | — | | 2.22 | | 2.22 | | (0.07) | | (0.75) | | (0.82) | | 27.53 | | 8.61 | | 293,064 | | 1.48 | | 1.48 | | — | | 22 |
| I | | 28.60 | | 0.30 | | 2.43 | | 2.73 | | (0.32) | | (0.75) | | (1.07) | | 30.26 | | 9.72 | | 1,130,600 | | 0.47 | | 0.47 | | 1.00 | | 22 |
| R3 | | 28.85 | | 0.12 | | 2.44 | | 2.56 | | (0.14) | | (0.75) | | (0.89) | | 30.52 | | 9.02 | | 34,765 | | 1.10 | | 1.10 | | 0.38 | | 22 |
| R4 | | 29.32 | | 0.22 | | 2.48 | | 2.70 | | (0.24) | | (0.75) | | (0.99) | | 31.03 | | 9.37 | | 144,866 | | 0.79 | | 0.76 | | 0.72 | | 22 |
| R5 | | 28.81 | | 0.30 | | 2.44 | | 2.74 | | (0.33) | | (0.75) | | (1.08) | | 30.47 | | 9.69 | | 201,510 | | 0.49 | | 0.49 | | 0.99 | | 22 |
| R6 | | 28.93 | | 0.33 | | 2.45 | | 2.78 | | (0.35) | | (0.75) | | (1.10) | | 30.61 | | 9.80 | | 146,643 | | 0.39 | | 0.39 | | 1.08 | | 22 |
| Y | | 28.93 | | 0.32 | | 2.45 | | 2.77 | | (0.34) | | (0.75) | | (1.09) | | 30.61 | | 9.77 | | 216,788 | | 0.42 | | 0.42 | | 1.06 | | 22 |
| F | | 28.63 | | 0.33 | | 2.42 | | 2.75 | | (0.35) | | (0.75) | | (1.10) | | 30.28 | | 9.80 | | 635,245 | | 0.39 | | 0.39 | | 1.09 | | 22 |
| For the Year Ended October 31, 2017 |
| A | | $ 23.87 | | $ 0.27 | | $ 4.70 | | $ 4.97 | | $ (0.12) | | $ (0.19) | | $ (0.31) | | $ 28.53 | | 21.06% | | $ 631,817 | | 0.75% | | 0.75% | | 1.05% | | 39% |
| C | | 21.94 | | 0.07 | | 4.33 | | 4.40 | | (0.02) | | (0.19) | | (0.21) | | 26.13 | | 20.20 | | 316,886 | | 1.50 | | 1.50 | | 0.30 | | 39 |
| I | | 23.93 | | 0.34 | | 4.71 | | 5.05 | | (0.19) | | (0.19) | | (0.38) | | 28.60 | | 21.37 | | 982,686 | | 0.52 | | 0.52 | | 1.30 | | 39 |
| R3 | | 24.18 | | 0.19 | | 4.77 | | 4.96 | | (0.10) | | (0.19) | | (0.29) | | 28.85 | | 20.71 | | 43,004 | | 1.11 | | 1.09 | | 0.72 | | 39 |
| R4 | | 24.54 | | 0.27 | | 4.84 | | 5.11 | | (0.14) | | (0.19) | | (0.33) | | 29.32 | | 21.05 | | 172,584 | | 0.81 | | 0.79 | | 1.01 | | 39 |
| R5 | | 24.10 | | 0.35 | | 4.75 | | 5.10 | | (0.20) | | (0.19) | | (0.39) | | 28.81 | | 21.41 | | 192,359 | | 0.51 | | 0.49 | | 1.31 | | 39 |
| R6 | | 24.19 | | 0.37 | | 4.77 | | 5.14 | | (0.21) | | (0.19) | | (0.40) | | 28.93 | | 21.52 | | 118,527 | | 0.41 | | 0.41 | | 1.38 | | 39 |
| Y | | 24.20 | | 0.35 | | 4.78 | | 5.13 | | (0.21) | | (0.19) | | (0.40) | | 28.93 | | 21.47 | | 148,542 | | 0.42 | | 0.42 | | 1.33 | | 39 |
| F (5) | | 26.05 | | 0.26 | | 2.32 | | 2.58 | | — | | — | | — | | 28.63 | | 9.90 (6) | | 585,057 | | 0.41 (7) | | 0.41 (7) | | 1.39 (7) | | 39 |
| The Hartford Dividend and Growth Fund |
| For the Year Ended October 31, 2021 |
| A | | $ 24.26 | | $ 0.33 | | $ 10.63 | | $ 10.96 | | $ (0.33) | | $ (0.57) | | $ (0.90) | | $ 34.32 | | 46.01% | | $ 4,733,858 | | 0.97% | | 0.97% | | 1.07% | | 18% |
| C | | 23.31 | | 0.09 | | 10.22 | | 10.31 | | (0.11) | | (0.57) | | (0.68) | | 32.94 | | 44.92 | | 169,569 | | 1.75 | | 1.75 | | 0.30 | | 18 |
| I | | 24.12 | | 0.40 | | 10.58 | | 10.98 | | (0.41) | | (0.57) | | (0.98) | | 34.12 | | 46.39 | | 3,178,645 | | 0.71 | | 0.71 | | 1.30 | | 18 |
| R3 | | 24.65 | | 0.22 | | 10.80 | | 11.02 | | (0.22) | | (0.57) | | (0.79) | | 34.88 | | 45.43 | | 66,751 | | 1.35 | | 1.35 | | 0.70 | | 18 |
| R4 | | 24.84 | | 0.32 | | 10.89 | | 11.21 | | (0.31) | | (0.57) | | (0.88) | | 35.17 | | 45.92 | | 106,561 | | 1.03 | | 1.03 | | 1.01 | | 18 |
| R5 | | 24.95 | | 0.41 | | 10.95 | | 11.36 | | (0.41) | | (0.57) | | (0.98) | | 35.33 | | 46.35 | | 265,832 | | 0.73 | | 0.73 | | 1.30 | | 18 |
| R6 | | 24.95 | | 0.44 | | 10.96 | | 11.40 | | (0.44) | | (0.57) | | (1.01) | | 35.34 | | 46.52 | | 470,425 | | 0.63 | | 0.63 | | 1.37 | | 18 |
| Y | | 24.95 | | 0.44 | | 10.94 | | 11.38 | | (0.42) | | (0.57) | | (0.99) | | 35.34 | | 46.47 | | 929,283 | | 0.74 | | 0.67 | | 1.38 | | 18 |
| F | | 24.10 | | 0.43 | | 10.58 | | 11.01 | | (0.44) | | (0.57) | | (1.01) | | 34.10 | | 46.55 | | 4,746,178 | | 0.63 | | 0.63 | | 1.40 | | 18 |
| For the Year Ended October 31, 2020 |
| A | | $ 25.93 | | $ 0.39 | | $ (0.94) | | $ (0.55) | | $ (0.37) | | $ (0.75) | | $ (1.12) | | $ 24.26 | | (2.20)% | | $ 3,385,907 | | 1.00% | | 1.00% | | 1.61% | | 28% |
| C | | 24.96 | | 0.20 | | (0.92) | | (0.72) | | (0.18) | | (0.75) | | (0.93) | | 23.31 | | (3.01) | | 138,431 | | 1.78 | | 1.78 | | 0.84 | | 28 |
| I | | 25.80 | | 0.45 | | (0.94) | | (0.49) | | (0.44) | | (0.75) | | (1.19) | | 24.12 | | (1.97) | | 1,681,761 | | 0.73 | | 0.73 | | 1.86 | | 28 |
| R3 | | 26.32 | | 0.31 | | (0.95) | | (0.64) | | (0.28) | | (0.75) | | (1.03) | | 24.65 | | (2.54) | | 54,642 | | 1.35 | | 1.35 | | 1.26 | | 28 |
| R4 | | 26.52 | | 0.39 | | (0.97) | | (0.58) | | (0.35) | | (0.75) | | (1.10) | | 24.84 | | (2.26) | | 82,299 | | 1.05 | | 1.05 | | 1.56 | | 28 |
| R5 | | 26.64 | | 0.47 | | (0.98) | | (0.51) | | (0.43) | | (0.75) | | (1.18) | | 24.95 | | (1.97) | | 177,851 | | 0.74 | | 0.74 | | 1.86 | | 28 |
| R6 | | 26.64 | | 0.49 | | (0.97) | | (0.48) | | (0.46) | | (0.75) | | (1.21) | | 24.95 | | (1.87) | | 196,065 | | 0.65 | | 0.65 | | 1.94 | | 28 |
| Y | | 26.64 | | 0.48 | | (0.97) | | (0.49) | | (0.45) | | (0.75) | | (1.20) | | 24.95 | | (1.91) | | 735,618 | | 0.73 | | 0.68 | | 1.92 | | 28 |
| F | | 25.78 | | 0.48 | | (0.95) | | (0.47) | | (0.46) | | (0.75) | | (1.21) | | 24.10 | | (1.89) | | 2,736,317 | | 0.64 | | 0.64 | | 1.96 | | 28 |
The accompanying notes are an integral part of these financial statements.
Hartford Domestic Equity Funds
Financial Highlights – (continued)
| | | — Selected Per-Share Data(1) — | | — Ratios and Supplemental Data — |
| Class | | Net
Asset
Value at
Beginning
of Period | | Net
Investment
Income
(Loss) | | Net
Realized
and
Unrealized
Gain (Loss)
on
Investments | | Total from
Investment
Operations | | Dividends
from Net
Investment
Income | | Distributions
from
Capital
Gains | | Total
Dividends
and
Distributions | | Net
Asset
Value at
End of
Period | | Total
Return(2) | | Net
Assets
at End
of Period
(000s) | | Ratio of
Expenses
to
Average
Net
Assets
Before
Adjust-
ments(3) | | Ratio of
Expenses
to
Average
Net
Assets
After
Adjust-
ments(3) | | Ratio of
Net
Investment
Income
(Loss) to
Average
Net Assets | | Portfolio
Turnover |
| The Hartford Dividend and Growth Fund – (continued) |
| For the Year Ended October 31, 2019 |
| A | | $ 25.63 | | $ 0.40 | | $ 2.63 | | $ 3.03 | | $ (0.38) | | $ (2.35) | | $ (2.73) | | $ 25.93 | | 13.75% | | $ 3,739,696 | | 1.00% | | 0.99% | | 1.65% | | 22% |
| C | | 24.75 | | 0.21 | | 2.53 | | 2.74 | | (0.18) | | (2.35) | | (2.53) | | 24.96 | | 12.92 | | 192,715 | | 1.77 | | 1.77 | | 0.89 | | 22 |
| I | | 25.51 | | 0.46 | | 2.63 | | 3.09 | | (0.45) | | (2.35) | | (2.80) | | 25.80 | | 14.08 | | 1,079,962 | | 0.73 | | 0.73 | | 1.89 | | 22 |
| R3 | | 25.97 | | 0.32 | | 2.67 | | 2.99 | | (0.29) | | (2.35) | | (2.64) | | 26.32 | | 13.33 | | 66,115 | | 1.36 | | 1.35 | | 1.30 | | 22 |
| R4 | | 26.14 | | 0.40 | | 2.69 | | 3.09 | | (0.36) | | (2.35) | | (2.71) | | 26.52 | | 13.71 | | 111,451 | | 1.04 | | 1.04 | | 1.61 | | 22 |
| R5 | | 26.25 | | 0.47 | | 2.71 | | 3.18 | | (0.44) | | (2.35) | | (2.79) | | 26.64 | | 14.05 | | 193,707 | | 0.74 | | 0.74 | | 1.89 | | 22 |
| R6 | | 26.25 | | 0.50 | | 2.71 | | 3.21 | | (0.47) | | (2.35) | | (2.82) | | 26.64 | | 14.16 | | 119,159 | | 0.64 | | 0.64 | | 1.98 | | 22 |
| Y | | 26.25 | | 0.49 | | 2.70 | | 3.19 | | (0.45) | | (2.35) | | (2.80) | | 26.64 | | 14.10 | | 696,309 | | 0.71 | | 0.68 | | 1.96 | | 22 |
| F | | 25.50 | | 0.49 | | 2.61 | | 3.10 | | (0.47) | | (2.35) | | (2.82) | | 25.78 | | 14.15 | | 2,844,206 | | 0.64 | | 0.64 | | 2.00 | | 22 |
| For the Year Ended October 31, 2018 |
| A | | $ 27.46 | | $ 0.39 | | $ 0.80 | | $ 1.19 | | $ (0.38) | | $ (2.64) | | $ (3.02) | | $ 25.63 | | 4.38% | | $ 3,521,062 | | 0.99% | | 0.99% | | 1.49% | | 31% |
| C | | 26.62 | | 0.19 | | 0.77 | | 0.96 | | (0.19) | | (2.64) | | (2.83) | | 24.75 | | 3.58 | | 228,076 | | 1.76 | | 1.75 | | 0.76 | | 31 |
| I | | 27.35 | | 0.46 | | 0.79 | | 1.25 | | (0.45) | | (2.64) | | (3.09) | | 25.51 | | 4.68 | | 847,646 | | 0.73 | | 0.73 | | 1.75 | | 31 |
| R3 | | 27.78 | | 0.30 | | 0.81 | | 1.11 | | (0.28) | | (2.64) | | (2.92) | | 25.97 | | 4.03 | | 72,723 | | 1.35 | | 1.35 | | 1.13 | | 31 |
| R4 | | 27.95 | | 0.39 | | 0.80 | | 1.19 | | (0.36) | | (2.64) | | (3.00) | | 26.14 | | 4.32 | | 131,649 | | 1.04 | | 1.04 | | 1.44 | | 31 |
| R5 | | 28.05 | | 0.47 | | 0.82 | | 1.29 | | (0.45) | | (2.64) | | (3.09) | | 26.25 | | 4.65 | | 146,918 | | 0.74 | | 0.74 | | 1.74 | | 31 |
| R6 | | 28.05 | | 0.49 | | 0.82 | | 1.31 | | (0.47) | | (2.64) | | (3.11) | | 26.25 | | 4.76 | | 74,795 | | 0.64 | | 0.64 | | 1.84 | | 31 |
| Y | | 28.05 | | 0.49 | | 0.81 | | 1.30 | | (0.46) | | (2.64) | | (3.10) | | 26.25 | | 4.72 | | 616,454 | | 0.68 | | 0.68 | | 1.80 | | 31 |
| F | | 27.33 | | 0.48 | | 0.80 | | 1.28 | | (0.47) | | (2.64) | | (3.11) | | 25.50 | | 4.77 | | 2,591,584 | | 0.64 | | 0.64 | | 1.84 | | 31 |
| For the Year Ended October 31, 2017 |
| A | | $ 23.49 | | $ 0.39 | | $ 4.75 | | $ 5.14 | | $ (0.38) | | $ (0.79) | | $ (1.17) | | $ 27.46 | | 22.40% | | $ 3,619,123 | | 1.00% | | 1.00% | | 1.52% | | 26% |
| C | | 22.80 | | 0.19 | | 4.62 | | 4.81 | | (0.20) | | (0.79) | | (0.99) | | 26.62 | | 21.54 | | 449,961 | | 1.74 | | 1.74 | | 0.78 | | 26 |
| I | | 23.38 | | 0.44 | | 4.74 | | 5.18 | | (0.42) | | (0.79) | | (1.21) | | 27.35 | | 22.67 | | 775,427 | | 0.80 | | 0.80 | | 1.75 | | 26 |
| R3 | | 23.75 | | 0.30 | | 4.81 | | 5.11 | | (0.29) | | (0.79) | | (1.08) | | 27.78 | | 21.97 | | 77,175 | | 1.35 | | 1.35 | | 1.17 | | 26 |
| R4 | | 23.89 | | 0.38 | | 4.84 | | 5.22 | | (0.37) | | (0.79) | | (1.16) | | 27.95 | | 22.34 | | 142,563 | | 1.05 | | 1.05 | | 1.47 | | 26 |
| R5 | | 23.97 | | 0.46 | | 4.86 | | 5.32 | | (0.45) | | (0.79) | | (1.24) | | 28.05 | | 22.72 | | 132,739 | | 0.74 | | 0.74 | | 1.76 | | 26 |
| R6 | | 23.97 | | 0.46 | | 4.88 | | 5.34 | | (0.47) | | (0.79) | | (1.26) | | 28.05 | | 22.83 | | 10,957 | | 0.65 | | 0.64 | | 1.75 | | 26 |
| Y | | 23.97 | | 0.50 | | 4.84 | | 5.34 | | (0.47) | | (0.79) | | (1.26) | | 28.05 | | 22.81 | | 605,049 | | 0.66 | | 0.66 | | 1.94 | | 26 |
| F (5) | | 25.51 | | 0.29 | | 1.86 | | 2.15 | | (0.33) | | — | | (0.33) | | 27.33 | | 8.49 (6) | | 2,570,906 | | 0.64 (7) | | 0.64 (7) | | 1.66 (7) | | 26 |
| The Hartford Equity Income Fund |
| For the Year Ended October 31, 2021 |
| A | | $ 17.55 | | $ 0.34 | | $ 6.50 | | $ 6.84 | | $ (0.34) | | $ (0.20) | | $ (0.54) | | $ 23.85 | | 39.45% | | $ 1,864,492 | | 0.98% | | 0.98% | | 1.57% | | 24% |
| C | | 17.46 | | 0.18 | | 6.44 | | 6.62 | | (0.16) | | (0.20) | | (0.36) | | 23.72 | | 38.31 | | 162,393 | | 1.75 | | 1.75 | | 0.85 | | 24 |
| I | | 17.44 | | 0.39 | | 6.44 | | 6.83 | | (0.39) | | (0.20) | | (0.59) | | 23.68 | | 39.69 | | 1,360,339 | | 0.74 | | 0.74 | | 1.81 | | 24 |
| R3 | | 17.59 | | 0.26 | | 6.50 | | 6.76 | | (0.26) | | (0.20) | | (0.46) | | 23.89 | | 38.83 | | 33,485 | | 1.36 | | 1.35 | | 1.21 | | 24 |
| R4 | | 17.62 | | 0.33 | | 6.50 | | 6.83 | | (0.32) | | (0.20) | | (0.52) | | 23.93 | | 39.25 | | 49,923 | | 1.05 | | 1.05 | | 1.52 | | 24 |
| R5 | | 17.71 | | 0.40 | | 6.55 | | 6.95 | | (0.39) | | (0.20) | | (0.59) | | 24.07 | | 39.75 | | 80,991 | | 0.75 | | 0.75 | | 1.80 | | 24 |
| R6 | | 17.76 | | 0.42 | | 6.56 | | 6.98 | | (0.41) | | (0.20) | | (0.61) | | 24.13 | | 39.82 | | 81,643 | | 0.65 | | 0.65 | | 1.90 | | 24 |
| Y | | 17.76 | | 0.40 | | 6.57 | | 6.97 | | (0.39) | | (0.20) | | (0.59) | | 24.14 | | 39.77 | | 120,502 | | 0.74 | | 0.73 | | 1.81 | | 24 |
| F | | 17.44 | | 0.41 | | 6.44 | | 6.85 | | (0.41) | | (0.20) | | (0.61) | | 23.68 | | 39.81 | | 1,141,345 | | 0.65 | | 0.65 | | 1.92 | | 24 |
The accompanying notes are an integral part of these financial statements.
Hartford Domestic Equity Funds
Financial Highlights – (continued)
| | | — Selected Per-Share Data(1) — | | — Ratios and Supplemental Data — |
| Class | | Net
Asset
Value at
Beginning
of Period | | Net
Investment
Income
(Loss) | | Net
Realized
and
Unrealized
Gain (Loss)
on
Investments | | Total from
Investment
Operations | | Dividends
from Net
Investment
Income | | Distributions
from
Capital
Gains | | Total
Dividends
and
Distributions | | Net
Asset
Value at
End of
Period | | Total
Return(2) | | Net
Assets
at End
of Period
(000s) | | Ratio of
Expenses
to
Average
Net
Assets
Before
Adjust-
ments(3) | | Ratio of
Expenses
to
Average
Net
Assets
After
Adjust-
ments(3) | | Ratio of
Net
Investment
Income
(Loss) to
Average
Net Assets | | Portfolio
Turnover |
| The Hartford Equity Income Fund – (continued) |
| For the Year Ended October 31, 2020 |
| A | | $ 19.99 | | $ 0.34 | | $ (1.21) | | $ (0.87) | | $ (0.31) | | $ (1.26) | | $ (1.57) | | $ 17.55 | | (4.68)% | | $ 1,365,895 | | 1.00% | | 1.00% | | 1.89% | | 31% |
| C | | 19.88 | | 0.21 | | (1.20) | | (0.99) | | (0.17) | | (1.26) | | (1.43) | | 17.46 | | (5.38) | | 191,917 | | 1.76 | | 1.76 | | 1.15 | | 31 |
| I | | 19.88 | | 0.38 | | (1.20) | | (0.82) | | (0.36) | | (1.26) | | (1.62) | | 17.44 | | (4.44) | | 977,950 | | 0.74 | | 0.74 | | 2.13 | | 31 |
| R3 | | 20.02 | | 0.28 | | (1.20) | | (0.92) | | (0.25) | | (1.26) | | (1.51) | | 17.59 | | (4.97) | | 31,778 | | 1.36 | | 1.36 | | 1.55 | | 31 |
| R4 | | 20.06 | | 0.33 | | (1.21) | | (0.88) | | (0.30) | | (1.26) | | (1.56) | | 17.62 | | (4.72) | | 41,386 | | 1.05 | | 1.05 | | 1.85 | | 31 |
| R5 | | 20.16 | | 0.39 | | (1.22) | | (0.83) | | (0.36) | | (1.26) | | (1.62) | | 17.71 | | (4.46) | | 56,329 | | 0.77 | | 0.77 | | 2.14 | | 31 |
| R6 | | 20.21 | | 0.40 | | (1.21) | | (0.81) | | (0.38) | | (1.26) | | (1.64) | | 17.76 | | (4.34) | | 55,448 | | 0.66 | | 0.66 | | 2.22 | | 31 |
| Y | | 20.22 | | 0.40 | | (1.23) | | (0.83) | | (0.37) | | (1.26) | | (1.63) | | 17.76 | | (4.40) | | 81,615 | | 0.76 | | 0.71 | | 2.20 | | 31 |
| F | | 19.87 | | 0.40 | | (1.19) | | (0.79) | | (0.38) | | (1.26) | | (1.64) | | 17.44 | | (4.31) | | 889,727 | | 0.66 | | 0.66 | | 2.23 | | 31 |
| For the Year Ended October 31, 2019 |
| A | | $ 19.39 | | $ 0.38 | | $ 2.02 | | $ 2.40 | | $ (0.36) | | $ (1.44) | | $ (1.80) | | $ 19.99 | | 13.88% | | $ 1,565,663 | | 1.00% | | 1.00% | | 2.01% | | 21% |
| C | | 19.29 | | 0.24 | | 2.00 | | 2.24 | | (0.21) | | (1.44) | | (1.65) | | 19.88 | | 13.00 | | 292,388 | | 1.76 | | 1.76 | | 1.27 | | 21 |
| I | | 19.29 | | 0.43 | | 2.01 | | 2.44 | | (0.41) | | (1.44) | | (1.85) | | 19.88 | | 14.17 | | 959,142 | | 0.75 | | 0.75 | | 2.26 | | 21 |
| R3 | | 19.41 | | 0.32 | | 2.02 | | 2.34 | | (0.29) | | (1.44) | | (1.73) | | 20.02 | | 13.48 | | 43,474 | | 1.36 | | 1.36 | | 1.66 | | 21 |
| R4 | | 19.44 | | 0.37 | | 2.04 | | 2.41 | | (0.35) | | (1.44) | | (1.79) | | 20.06 | | 13.85 | | 53,957 | | 1.07 | | 1.07 | | 1.96 | | 21 |
| R5 | | 19.54 | | 0.43 | | 2.04 | | 2.47 | | (0.41) | | (1.44) | | (1.85) | | 20.16 | | 14.14 | | 81,758 | | 0.76 | | 0.76 | | 2.25 | | 21 |
| R6 | | 19.58 | | 0.45 | | 2.05 | | 2.50 | | (0.43) | | (1.44) | | (1.87) | | 20.21 | | 14.29 | | 52,201 | | 0.66 | | 0.66 | | 2.33 | | 21 |
| Y | | 19.58 | | 0.45 | | 2.05 | | 2.50 | | (0.42) | | (1.44) | | (1.86) | | 20.22 | | 14.21 | | 105,015 | | 0.73 | | 0.71 | | 2.34 | | 21 |
| F | | 19.29 | | 0.44 | | 2.01 | | 2.45 | | (0.43) | | (1.44) | | (1.87) | | 19.87 | | 14.24 | | 922,012 | | 0.66 | | 0.66 | | 2.34 | | 21 |
| For the Year Ended October 31, 2018 |
| A | | $ 20.64 | | $ 0.38 | | $ (0.24) | | $ 0.14 | | $ (0.35) | | $ (1.04) | | $ (1.39) | | $ 19.39 | | 0.49% | | $ 1,508,580 | | 1.00% | | 1.00% | | 1.90% | | 22% |
| C | | 20.53 | | 0.23 | | (0.23) | | — | | (0.20) | | (1.04) | | (1.24) | | 19.29 | | (0.22) | | 330,741 | | 1.75 | | 1.75 | | 1.16 | | 22 |
| I | | 20.54 | | 0.43 | | (0.24) | | 0.19 | | (0.40) | | (1.04) | | (1.44) | | 19.29 | | 0.77 | | 1,157,708 | | 0.74 | | 0.74 | | 2.14 | | 22 |
| R3 | | 20.66 | | 0.31 | | (0.25) | | 0.06 | | (0.27) | | (1.04) | | (1.31) | | 19.41 | | 0.12 | | 46,820 | | 1.36 | | 1.36 | | 1.53 | | 22 |
| R4 | | 20.69 | | 0.37 | | (0.24) | | 0.13 | | (0.34) | | (1.04) | | (1.38) | | 19.44 | | 0.43 | | 70,446 | | 1.06 | | 1.06 | | 1.83 | | 22 |
| R5 | | 20.78 | | 0.43 | | (0.23) | | 0.20 | | (0.40) | | (1.04) | | (1.44) | | 19.54 | | 0.78 | | 79,557 | | 0.76 | | 0.76 | | 2.13 | | 22 |
| R6 | | 20.83 | | 0.45 | | (0.24) | | 0.21 | | (0.42) | | (1.04) | | (1.46) | | 19.58 | | 0.83 | | 34,957 | | 0.66 | | 0.66 | | 2.22 | | 22 |
| Y | | 20.83 | | 0.45 | | (0.25) | | 0.20 | | (0.41) | | (1.04) | | (1.45) | | 19.58 | | 0.79 | | 140,057 | | 0.70 | | 0.70 | | 2.19 | | 22 |
| F | | 20.54 | | 0.45 | | (0.24) | | 0.21 | | (0.42) | | (1.04) | | (1.46) | | 19.29 | | 0.85 | | 774,529 | | 0.65 | | 0.65 | | 2.23 | | 22 |
| For the Year Ended October 31, 2017 |
| A | | $ 17.97 | | $ 0.35 | | $ 3.24 | | $ 3.59 | | $ (0.32) | | $ (0.60) | | $ (0.92) | | $ 20.64 | | 20.51% | | $ 1,685,398 | | 1.00% | | 1.00% | | 1.83% | | 16% |
| C | | 17.89 | | 0.21 | | 3.21 | | 3.42 | | (0.18) | | (0.60) | | (0.78) | | 20.53 | | 19.56 | | 449,104 | | 1.74 | | 1.74 | | 1.09 | | 16 |
| I | | 17.89 | | 0.39 | | 3.23 | | 3.62 | | (0.37) | | (0.60) | | (0.97) | | 20.54 | | 20.76 | | 1,111,235 | | 0.78 | | 0.78 | | 2.03 | | 16 |
| R3 | | 17.99 | | 0.28 | | 3.24 | | 3.52 | | (0.25) | | (0.60) | | (0.85) | | 20.66 | | 20.06 | | 57,341 | | 1.37 | | 1.37 | | 1.46 | | 16 |
| R4 | | 18.02 | | 0.34 | | 3.24 | | 3.58 | | (0.31) | | (0.60) | | (0.91) | | 20.69 | | 20.39 | | 79,632 | | 1.06 | | 1.06 | | 1.77 | | 16 |
| R5 | | 18.09 | | 0.40 | | 3.26 | | 3.66 | | (0.37) | | (0.60) | | (0.97) | | 20.78 | | 20.77 | | 83,048 | | 0.76 | | 0.76 | | 2.06 | | 16 |
| R6 | | 18.13 | | 0.41 | | 3.28 | | 3.69 | | (0.39) | | (0.60) | | (0.99) | | 20.83 | | 20.91 | | 29,284 | | 0.66 | | 0.66 | | 2.10 | | 16 |
| Y | | 18.13 | | 0.45 | | 3.23 | | 3.68 | | (0.38) | | (0.60) | | (0.98) | | 20.83 | | 20.88 | | 141,479 | | 0.67 | | 0.67 | | 2.35 | | 16 |
| F (5) | | 19.22 | | 0.24 | | 1.37 | | 1.61 | | (0.29) | | — | | (0.29) | | 20.54 | | 8.45 (6) | | 674,626 | | 0.66 (7) | | 0.66 (7) | | 1.84 (7) | | 16 |
The accompanying notes are an integral part of these financial statements.
Hartford Domestic Equity Funds
Financial Highlights – (continued)
| | | — Selected Per-Share Data(1) — | | — Ratios and Supplemental Data — |
| Class | | Net
Asset
Value at
Beginning
of Period | | Net
Investment
Income
(Loss) | | Net
Realized
and
Unrealized
Gain (Loss)
on
Investments | | Total from
Investment
Operations | | Dividends
from Net
Investment
Income | | Distributions
from
Capital
Gains | | Total
Dividends
and
Distributions | | Net
Asset
Value at
End of
Period | | Total
Return(2) | | Net
Assets
at End
of Period
(000s) | | Ratio of
Expenses
to
Average
Net
Assets
Before
Adjust-
ments(3) | | Ratio of
Expenses
to
Average
Net
Assets
After
Adjust-
ments(3) | | Ratio of
Net
Investment
Income
(Loss) to
Average
Net Assets | | Portfolio
Turnover |
| The Hartford Growth Opportunities Fund |
| For the Year Ended October 31, 2021 |
| A | | $ 54.65 | | $ (0.47) | | $ 15.83 | | $ 15.36 | | $ — | | $ (7.91) | | $ (7.91) | | $ 62.10 | | 30.45% | | $ 3,650,083 | | 1.07% | | 1.06% | | (0.80)% | | 87% |
| C | | 26.47 | | (0.38) | | 6.96 | | 6.58 | | — | | (7.91) | | (7.91) | | 25.14 | | 29.47 | | 321,097 | | 1.83 | | 1.83 | | (1.57) | | 87 |
| I | | 58.51 | | (0.36) | | 17.05 | | 16.69 | | — | | (7.91) | | (7.91) | | 67.29 | | 30.75 | | 2,124,160 | | 0.82 | | 0.82 | | (0.56) | | 87 |
| R3 | | 54.41 | | (0.68) | | 15.73 | | 15.05 | | — | | (7.91) | | (7.91) | | 61.55 | | 29.96 | | 51,824 | | 1.45 | | 1.44 | | (1.18) | | 87 |
| R4 | | 58.79 | | (0.56) | | 17.13 | | 16.57 | | — | | (7.91) | | (7.91) | | 67.45 | | 30.36 | | 76,404 | | 1.14 | | 1.14 | | (0.88) | | 87 |
| R5 | | 62.69 | | (0.39) | | 18.36 | | 17.97 | | — | | (7.91) | | (7.91) | | 72.75 | | 30.74 | | 25,000 | | 0.84 | | 0.84 | | (0.58) | | 87 |
| R6 | | 64.01 | | (0.34) | | 18.79 | | 18.45 | | — | | (7.91) | | (7.91) | | 74.55 | | 30.87 | | 72,428 | | 0.74 | | 0.74 | | (0.49) | | 87 |
| Y | | 63.96 | | (0.40) | | 18.76 | | 18.36 | | — | | (7.91) | | (7.91) | | 74.41 | | 30.74 | | 565,204 | | 0.84 | | 0.83 | | (0.57) | | 87 |
| F | | 58.77 | | (0.31) | | 17.14 | | 16.83 | | — | | (7.91) | | (7.91) | | 67.69 | | 30.87 | | 1,197,268 | | 0.73 | | 0.73 | | (0.48) | | 87 |
| For the Year Ended October 31, 2020 |
| A | | $ 39.45 | | $ (0.30) | | $ 18.03 | | $ 17.73 | | $ — | | $ (2.53) | | $ (2.53) | | $ 54.65 | | 47.69% | | $ 2,939,376 | | 1.10% | | 1.09% | | (0.66)% | | 118% |
| C | | 20.50 | | (0.31) | | 8.81 | | 8.50 | | — | | (2.53) | | (2.53) | | 26.47 | | 46.64 | | 322,226 | | 1.85 | | 1.85 | | (1.41) | | 118 |
| I | | 41.95 | | (0.19) | | 19.28 | | 19.09 | | — | | (2.53) | | (2.53) | | 58.51 | | 48.12 | | 1,722,100 | | 0.83 | | 0.83 | | (0.39) | | 118 |
| R3 | | 39.41 | | (0.44) | | 17.97 | | 17.53 | | — | | (2.53) | | (2.53) | | 54.41 | | 47.21 | | 47,880 | | 1.44 | | 1.43 | | (0.99) | | 118 |
| R4 | | 42.26 | | (0.33) | | 19.39 | | 19.06 | | — | | (2.53) | | (2.53) | | 58.79 | | 47.67 | | 70,918 | | 1.13 | | 1.13 | | (0.69) | | 118 |
| R5 | | 44.78 | | (0.20) | | 20.64 | | 20.44 | | — | | (2.53) | | (2.53) | | 62.69 | | 48.09 | | 23,170 | | 0.85 | | 0.85 | | (0.40) | | 118 |
| R6 | | 45.63 | | (0.17) | | 21.08 | | 20.91 | | — | | (2.53) | | (2.53) | | 64.01 | | 48.23 | | 40,559 | | 0.74 | | 0.74 | | (0.31) | | 118 |
| Y | | 45.62 | | (0.20) | | 21.07 | | 20.87 | | — | | (2.53) | | (2.53) | | 63.96 | | 48.15 | | 433,672 | | 0.83 | | 0.78 | | (0.38) | | 118 |
| F | | 42.09 | | (0.15) | | 19.36 | | 19.21 | | — | | (2.53) | | (2.53) | | 58.77 | | 48.25 | | 795,206 | | 0.74 | | 0.74 | | (0.31) | | 118 |
| For the Year Ended October 31, 2019 |
| A | | $ 45.89 | | $ (0.25) | | $ 4.35 | | $ 4.10 | | $ — | | $ (10.54) | | $ (10.54) | | $ 39.45 | | 13.64% | | $ 2,089,246 | | 1.12% | | 1.11% | | (0.64)% | | 66% |
| C | | 29.36 | | (0.29) | | 1.97 | | 1.68 | | — | | (10.54) | | (10.54) | | 20.50 | | 12.79 | | 281,545 | | 1.86 | | 1.86 | | (1.39) | | 66 |
| I | | 47.99 | | (0.16) | | 4.66 | | 4.50 | | — | | (10.54) | | (10.54) | | 41.95 | | 13.94 | | 1,500,756 | | 0.85 | | 0.85 | | (0.38) | | 66 |
| R3 | | 45.98 | | (0.39) | | 4.36 | | 3.97 | | — | | (10.54) | | (10.54) | | 39.41 | | 13.25 | | 44,757 | | 1.47 | | 1.46 | | (1.00) | | 66 |
| R4 | | 48.38 | | (0.29) | | 4.71 | | 4.42 | | — | | (10.54) | | (10.54) | | 42.26 | | 13.57 | | 67,104 | | 1.15 | | 1.15 | | (0.69) | | 66 |
| R5 | | 50.48 | | (0.17) | | 5.01 | | 4.84 | | — | | (10.54) | | (10.54) | | 44.78 | | 13.92 | | 25,396 | | 0.85 | | 0.85 | | (0.39) | | 66 |
| R6 | | 51.18 | | (0.13) | | 5.12 | | 4.99 | | — | | (10.54) | | (10.54) | | 45.63 | | 14.03 | | 22,765 | | 0.75 | | 0.75 | | (0.29) | | 66 |
| Y | | 51.18 | | (0.15) | | 5.13 | | 4.98 | | — | | (10.54) | | (10.54) | | 45.62 | | 14.00 | | 164,390 | | 0.83 | | 0.79 | | (0.33) | | 66 |
| F | | 48.07 | | (0.12) | | 4.68 | | 4.56 | | — | | (10.54) | | (10.54) | | 42.09 | | 14.07 | | 526,379 | | 0.74 | | 0.74 | | (0.28) | | 66 |
| For the Year Ended October 31, 2018 |
| A | | $ 46.20 | | $ (0.29) | | $ 3.86 | | $ 3.57 | | $ — | | $ (3.88) | | $ (3.88) | | $ 45.89 | | 8.31% | | $ 2,013,200 | | 1.11% | | 1.11% | | (0.61)% | | 122% |
| C | | 31.15 | | (0.41) | | 2.50 | | 2.09 | | — | | (3.88) | | (3.88) | | 29.36 | | 7.49 | | 321,653 | | 1.85 | | 1.85 | | (1.35) | | 122 |
| I | | 48.01 | | (0.17) | | 4.03 | | 3.86 | | — | | (3.88) | | (3.88) | | 47.99 | | 8.62 | | 1,674,141 | | 0.84 | | 0.84 | | (0.34) | | 122 |
| R3 | | 46.43 | | (0.45) | | 3.88 | | 3.43 | | — | | (3.88) | | (3.88) | | 45.98 | | 7.94 | | 47,707 | | 1.46 | | 1.45 | | (0.95) | | 122 |
| R4 | | 48.52 | | (0.32) | | 4.06 | | 3.74 | | — | | (3.88) | | (3.88) | | 48.38 | | 8.28 | | 79,229 | | 1.15 | | 1.15 | | (0.65) | | 122 |
| R5 | | 50.31 | | (0.18) | | 4.23 | | 4.05 | | — | | (3.88) | | (3.88) | | 50.48 | | 8.60 | | 19,708 | | 0.86 | | 0.86 | | (0.35) | | 122 |
| R6 | | 50.91 | | (0.14) | | 4.29 | | 4.15 | | — | | (3.88) | | (3.88) | | 51.18 | | 8.71 | | 12,061 | | 0.75 | | 0.75 | | (0.26) | | 122 |
| Y | | 50.92 | | (0.15) | | 4.29 | | 4.14 | | — | | (3.88) | | (3.88) | | 51.18 | | 8.68 | | 127,721 | | 0.78 | | 0.78 | | (0.28) | | 122 |
| F | | 48.05 | | (0.12) | | 4.02 | | 3.90 | | — | | (3.88) | | (3.88) | | 48.07 | | 8.71 | | 401,565 | | 0.75 | | 0.75 | | (0.25) | | 122 |
The accompanying notes are an integral part of these financial statements.
Hartford Domestic Equity Funds
Financial Highlights – (continued)
| | | — Selected Per-Share Data(1) — | | — Ratios and Supplemental Data — |
| Class | | Net
Asset
Value at
Beginning
of Period | | Net
Investment
Income
(Loss) | | Net
Realized
and
Unrealized
Gain (Loss)
on
Investments | | Total from
Investment
Operations | | Dividends
from Net
Investment
Income | | Distributions
from
Capital
Gains | | Total
Dividends
and
Distributions | | Net
Asset
Value at
End of
Period | | Total
Return(2) | | Net
Assets
at End
of Period
(000s) | | Ratio of
Expenses
to
Average
Net
Assets
Before
Adjust-
ments(3) | | Ratio of
Expenses
to
Average
Net
Assets
After
Adjust-
ments(3) | | Ratio of
Net
Investment
Income
(Loss) to
Average
Net Assets | | Portfolio
Turnover |
| The Hartford Growth Opportunities Fund – (continued) |
| For the Year Ended October 31, 2017 |
| A | | $ 37.66 | | $ (0.23) | | $ 10.17 | | $ 9.94 | | $ — | | $ (1.40) | | $ (1.40) | | $ 46.20 | | 27.40% | | $ 1,914,743 | | 1.11% | | 1.10% | | (0.57)% | | 119% |
| C | | 26.03 | | (0.36) | | 6.88 | | 6.52 | | — | | (1.40) | | (1.40) | | 31.15 | | 26.46 | | 412,184 | | 1.86 | | 1.86 | | (1.32) | | 119 |
| I | | 39.00 | | (0.15) | | 10.56 | | 10.41 | | — | | (1.40) | | (1.40) | | 48.01 | | 27.67 | | 1,546,058 | | 0.89 | | 0.89 | | (0.35) | | 119 |
| R3 | | 37.96 | | (0.37) | | 10.24 | | 9.87 | | — | | (1.40) | | (1.40) | | 46.43 | | 26.95 | | 48,315 | | 1.46 | | 1.45 | | (0.92) | | 119 |
| R4 | | 39.50 | | (0.26) | | 10.68 | | 10.42 | | — | | (1.40) | | (1.40) | | 48.52 | | 27.33 | | 81,413 | | 1.15 | | 1.15 | | (0.62) | | 119 |
| R5 | | 40.78 | | (0.14) | | 11.07 | | 10.93 | | — | | (1.40) | | (1.40) | | 50.31 | | 27.74 | | 16,530 | | 0.86 | | 0.85 | | (0.32) | | 119 |
| R6 | | 41.21 | | (0.12) | | 11.22 | | 11.10 | | — | | (1.40) | | (1.40) | | 50.91 | | 27.86 | | 4,554 | | 0.76 | | 0.75 | | (0.26) | | 119 |
| Y | | 41.23 | | (0.09) | | 11.18 | | 11.09 | | — | | (1.40) | | (1.40) | | 50.92 | | 27.83 | | 104,645 | | 0.77 | | 0.77 | | (0.22) | | 119 |
| F (5) | | 40.07 | | (0.10) | | 8.08 | | 7.98 | | — | | — | | — | | 48.05 | | 19.92 (6) | | 617,087 | | 0.75 (7) | | 0.75 (7) | | (0.34) (7) | | 119 |
| The Hartford Healthcare Fund |
| For the Year Ended October 31, 2021 |
| A | | $ 40.91 | | $ (0.15) | | $ 8.98 | | $ 8.83 | | $ — | | $ (5.17) | | $ (5.17) | | $ 44.57 | | 22.88% | | $ 883,719 | | 1.25% | | 1.24% | | (0.36)% | | 51% |
| C | | 31.63 | | (0.36) | | 6.82 | | 6.46 | | — | | (5.17) | | (5.17) | | 32.92 | | 21.98 | | 134,574 | | 2.01 | | 2.01 | | (1.12) | | 51 |
| I | | 43.53 | | (0.04) | | 9.61 | | 9.57 | | — | | (5.17) | | (5.17) | | 47.93 | | 23.23 | | 463,673 | | 0.98 | | 0.98 | | (0.10) | | 51 |
| R3 | | 41.90 | | (0.31) | | 9.21 | | 8.90 | | — | | (5.17) | | (5.17) | | 45.63 | | 22.46 | | 32,550 | | 1.59 | | 1.59 | | (0.70) | | 51 |
| R4 | | 44.63 | | (0.19) | | 9.85 | | 9.66 | | — | | (5.17) | | (5.17) | | 49.12 | | 22.83 | | 25,818 | | 1.29 | | 1.29 | | (0.40) | | 51 |
| R5 | | 47.24 | | (0.06) | | 10.48 | | 10.42 | | — | | (5.17) | | (5.17) | | 52.49 | | 23.21 | | 12,933 | | 1.00 | | 1.00 | | (0.11) | | 51 |
| R6 | | 47.99 | | — (8) | | 10.65 | | 10.65 | | — | | (5.17) | | (5.17) | | 53.47 | | 23.33 | | 6,091 | | 0.89 | | 0.89 | | — (9) | | 51 |
| Y | | 47.95 | | (0.05) | | 10.65 | | 10.60 | �� | — | | (5.17) | | (5.17) | | 53.38 | | 23.24 | | 122,793 | | 0.99 | | 0.98 | | (0.09) | | 51 |
| F | | 43.70 | | — (8) | | 9.65 | | 9.65 | | — | | (5.17) | | (5.17) | | 48.18 | | 23.34 | | 46,477 | | 0.89 | | 0.89 | | — (9) | | 51 |
| For the Year Ended October 31, 2020 |
| A | | $ 35.63 | | $ (0.13) | | $ 7.77 | | $ 7.64 | | $ — | | $ (2.36) | | $ (2.36) | | $ 40.91 | | 22.17% | | $ 746,242 | | 1.28% | | 1.28% | | (0.33)% | | 49% |
| C | | 28.24 | | (0.33) | | 6.08 | | 5.75 | | — | | (2.36) | | (2.36) | | 31.63 | | 21.21 | | 139,847 | | 2.04 | | 2.04 | | (1.09) | | 49 |
| I | | 37.68 | | (0.02) | | 8.23 | | 8.21 | | — | | (2.36) | | (2.36) | | 43.53 | | 22.49 | | 376,518 | | 0.99 | | 0.99 | | (0.05) | | 49 |
| R3 | | 36.56 | | (0.26) | | 7.96 | | 7.70 | | — | | (2.36) | | (2.36) | | 41.90 | | 21.74 | | 31,090 | | 1.61 | | 1.61 | | (0.65) | | 49 |
| R4 | | 38.69 | | (0.15) | | 8.45 | | 8.30 | | — | | (2.36) | | (2.36) | | 44.63 | | 22.12 | | 25,078 | | 1.30 | | 1.30 | | (0.35) | | 49 |
| R5 | | 40.71 | | (0.03) | | 8.92 | | 8.89 | | — | | (2.36) | | (2.36) | | 47.24 | | 22.48 | | 10,937 | | 1.01 | | 1.01 | | (0.07) | | 49 |
| R6 | | 41.28 | | 0.02 | | 9.05 | | 9.07 | | — | | (2.36) | | (2.36) | | 47.99 | | 22.61 | | 3,885 | | 0.90 | | 0.90 | | 0.04 | | 49 |
| Y | | 41.27 | | (0.01) | | 9.05 | | 9.04 | | — | | (2.36) | | (2.36) | | 47.95 | | 22.55 | | 97,263 | | 1.00 | | 0.95 | | (0.01) | | 49 |
| F | | 37.79 | | 0.02 | | 8.25 | | 8.27 | | — | | (2.36) | | (2.36) | | 43.70 | | 22.59 | | 34,808 | | 0.90 | | 0.90 | | 0.04 | | 49 |
| For the Year Ended October 31, 2019 |
| A | | $ 34.38 | | $ (0.10) | | $ 3.83 | | $ 3.73 | | $ — | | $ (2.48) | | $ (2.48) | | $ 35.63 | | 12.02% | | $ 666,181 | | 1.30% | | 1.30% | | (0.30)% | | 35% |
| C | | 27.98 | | (0.28) | | 3.02 | | 2.74 | | — | | (2.48) | | (2.48) | | 28.24 | | 11.17 | | 138,539 | | 2.05 | | 2.05 | | (1.06) | | 35 |
| I | | 36.11 | | — (8) | | 4.05 | | 4.05 | | — | | (2.48) | | (2.48) | | 37.68 | | 12.36 | | 297,000 | | 1.01 | | 1.01 | | (0.01) | | 35 |
| R3 | | 35.32 | | (0.21) | | 3.93 | | 3.72 | | — | | (2.48) | | (2.48) | | 36.56 | | 11.66 | | 33,948 | | 1.62 | | 1.62 | | (0.62) | | 35 |
| R4 | | 37.12 | | (0.12) | | 4.17 | | 4.05 | | — | | (2.48) | | (2.48) | | 38.69 | | 12.00 | | 26,699 | | 1.32 | | 1.32 | | (0.32) | | 35 |
| R5 | | 38.82 | | (0.01) | | 4.38 | | 4.37 | | — | | (2.48) | | (2.48) | | 40.71 | | 12.32 | | 6,170 | | 1.02 | | 1.02 | | (0.04) | | 35 |
| R6 (10) | | 39.22 | | 0.02 | | 2.04 | | 2.06 | | — | | — | | — | | 41.28 | | 5.25 (6) | | 1,341 | | 0.91 (7) | | 0.91 (7) | | 0.06 (7) | | 35 |
| Y | | 39.29 | | 0.01 | | 4.45 | | 4.46 | | — | | (2.48) | | (2.48) | | 41.27 | | 12.40 | | 72,515 | | 0.97 | | 0.96 | | 0.03 | | 35 |
| F | | 36.17 | | 0.02 | | 4.08 | | 4.10 | | — | | (2.48) | | (2.48) | | 37.79 | | 12.48 | | 29,108 | | 0.91 | | 0.91 | | 0.06 | | 35 |
The accompanying notes are an integral part of these financial statements.
Hartford Domestic Equity Funds
Financial Highlights – (continued)
| | | — Selected Per-Share Data(1) — | | — Ratios and Supplemental Data — |
| Class | | Net
Asset
Value at
Beginning
of Period | | Net
Investment
Income
(Loss) | | Net
Realized
and
Unrealized
Gain (Loss)
on
Investments | | Total from
Investment
Operations | | Dividends
from Net
Investment
Income | | Distributions
from
Capital
Gains | | Total
Dividends
and
Distributions | | Net
Asset
Value at
End of
Period | | Total
Return(2) | | Net
Assets
at End
of Period
(000s) | | Ratio of
Expenses
to
Average
Net
Assets
Before
Adjust-
ments(3) | | Ratio of
Expenses
to
Average
Net
Assets
After
Adjust-
ments(3) | | Ratio of
Net
Investment
Income
(Loss) to
Average
Net Assets | | Portfolio
Turnover |
| The Hartford Healthcare Fund – (continued) |
| For the Year Ended October 31, 2018 |
| A | | $ 34.86 | | $ (0.14) | | $ 1.45 | | $ 1.31 | | $ — | | $ (1.79) | | $ (1.79) | | $ 34.38 | | 3.86% | | $ 682,175 | | 1.28% | | 1.28% | | (0.40)% | | 27% |
| C | | 28.90 | | (0.33) | | 1.20 | | 0.87 | | — | | (1.79) | | (1.79) | | 27.98 | | 3.10 | | 160,084 | | 2.03 | | 2.02 | | (1.13) | | 27 |
| I | | 36.43 | | (0.04) | | 1.51 | | 1.47 | | — | | (1.79) | | (1.79) | | 36.11 | | 4.15 | | 379,392 | | 1.00 | | 1.00 | | (0.11) | | 27 |
| R3 | | 35.87 | | (0.26) | | 1.50 | | 1.24 | | — | | (1.79) | | (1.79) | | 35.32 | | 3.55 | | 38,412 | | 1.61 | | 1.61 | | (0.72) | | 27 |
| R4 | | 37.50 | | (0.16) | | 1.57 | | 1.41 | | — | | (1.79) | | (1.79) | | 37.12 | | 3.86 | | 32,373 | | 1.30 | | 1.30 | | (0.42) | | 27 |
| R5 | | 39.03 | | (0.05) | | 1.63 | | 1.58 | | — | | (1.79) | | (1.79) | | 38.82 | | 4.15 | | 7,757 | | 1.02 | | 1.02 | | (0.13) | | 27 |
| Y | | 39.45 | | (0.01) | | 1.64 | | 1.63 | | — | | (1.79) | | (1.79) | | 39.29 | | 4.24 | | 52,896 | | 0.92 | | 0.92 | | (0.03) | | 27 |
| F | | 36.45 | | — | | 1.51 | | 1.51 | | — | | (1.79) | | (1.79) | | 36.17 | | 4.26 | | 76,003 | | 0.90 | | 0.90 | | (0.01) | | 27 |
| For the Year Ended October 31, 2017 |
| A | | $ 30.96 | | $ (0.12) | | $ 7.04 | | $ 6.92 | | $ — | | $ (3.02) | | $ (3.02) | | $ 34.86 | | 24.28% | | $ 714,694 | | 1.29% | | 1.29% | | (0.36)% | | 23% |
| C | | 26.34 | | (0.30) | | 5.88 | | 5.58 | | — | | (3.02) | | (3.02) | | 28.90 | | 23.37 | | 242,421 | | 2.04 | | 2.03 | | (1.10) | | 23 |
| I | | 32.15 | | (0.04) | | 7.34 | | 7.30 | | — | | (3.02) | | (3.02) | | 36.43 | | 24.59 | | 351,686 | | 1.03 | | 1.03 | | (0.11) | | 23 |
| R3 | | 31.87 | | (0.23) | | 7.25 | | 7.02 | | — | | (3.02) | | (3.02) | | 35.87 | | 23.87 | | 45,673 | | 1.61 | | 1.61 | | (0.68) | | 23 |
| R4 | | 33.10 | | (0.13) | | 7.55 | | 7.42 | | — | | (3.02) | | (3.02) | | 37.50 | | 24.22 | | 35,927 | | 1.31 | | 1.31 | | (0.38) | | 23 |
| R5 | | 34.23 | | (0.03) | | 7.85 | | 7.82 | | — | | (3.02) | | (3.02) | | 39.03 | | 24.62 | | 6,888 | | 1.01 | | 1.01 | | (0.08) | | 23 |
| Y | | 34.54 | | (0.01) | | 7.94 | | 7.93 | | — | | (3.02) | | (3.02) | | 39.45 | | 24.72 | | 45,193 | | 0.93 | | 0.93 | | (0.02) | | 23 |
| F (5) | | 33.96 | | 0.01 | | 2.48 | | 2.49 | | — | | — | | — | | 36.45 | | 7.33 (6) | | 61,710 | | 0.90 (7) | | 0.90 (7) | | 0.04 (7) | | 23 |
| The Hartford MidCap Fund |
| For the Year Ended October 31, 2021 |
| A | | $ 30.63 | | $ 0.10 | | $ 10.24 | | $ 10.34 | | $ — | | $ (3.96) | | $ (3.96) | | $ 37.01 | | 35.51% | | $ 3,446,674 | | 1.08% | | 1.08% | | 0.28% | | 28% |
| C | | 20.34 | | (0.12) | | 6.63 | | 6.51 | | — | | (3.96) | | (3.96) | | 22.89 | | 34.49 | | 381,566 | | 1.84 | | 1.84 | | (0.52) | | 28 |
| I | | 31.87 | | 0.20 | | 10.66 | | 10.86 | | — | | (3.96) | | (3.96) | | 38.77 | | 35.79 | | 3,960,713 | | 0.86 | | 0.85 | | 0.53 | | 28 |
| R3 | | 34.38 | | (0.05) | | 11.57 | | 11.52 | | — | | (3.96) | | (3.96) | | 41.94 | | 35.03 | | 100,113 | | 1.45 | | 1.45 | | (0.12) | | 28 |
| R4 | | 36.18 | | 0.08 | | 12.21 | | 12.29 | | — | | (3.96) | | (3.96) | | 44.51 | | 35.45 | | 189,348 | | 1.15 | | 1.13 | | 0.18 | | 28 |
| R5 | | 37.58 | | 0.23 | | 12.69 | | 12.92 | | — | | (3.96) | | (3.96) | | 46.54 | | 35.84 | | 319,470 | | 0.83 | | 0.83 | | 0.52 | | 28 |
| R6 | | 38.09 | | 0.26 | | 12.90 | | 13.16 | | — | | (3.96) | | (3.96) | | 47.29 | | 36.00 | | 1,659,582 | | 0.74 | | 0.74 | | 0.57 | | 28 |
| Y | | 38.02 | | 0.24 | | 12.88 | | 13.12 | | — | | (3.96) | | (3.96) | | 47.18 | | 35.96 | | 970,296 | | 0.84 | | 0.77 | | 0.52 | | 28 |
| F | | 32.00 | | 0.23 | | 10.74 | | 10.97 | | — | | (3.96) | | (3.96) | | 39.01 | | 36.01 | | 2,898,529 | | 0.74 | | 0.74 | | 0.61 | | 28 |
| For the Year Ended October 31, 2020 |
| A | | $ 30.34 | | $ (0.08) | | $ 2.00 | | $ 1.92 | | $ — | | $ (1.63) | | $ (1.63) | | $ 30.63 | | 6.48% | | $ 2,724,316 | | 1.11% | | 1.11% | | (0.27)% | | 45% |
| C | | 20.83 | | (0.20) | | 1.34 | | 1.14 | | — | | (1.63) | | (1.63) | | 20.34 | | 5.63 | | 380,033 | | 1.87 | | 1.87 | | (1.02) | | 45 |
| I | | 31.43 | | (0.01) | | 2.08 | | 2.07 | | — | | (1.63) | | (1.63) | | 31.87 | | 6.74 | | 3,867,925 | | 0.88 | | 0.87 | | (0.04) | | 45 |
| R3 | | 33.98 | | (0.21) | | 2.24 | | 2.03 | | — | | (1.63) | | (1.63) | | 34.38 | | 6.09 | | 92,023 | | 1.47 | | 1.47 | | (0.63) | | 45 |
| R4 | | 35.57 | | (0.10) | | 2.34 | | 2.24 | | — | | (1.63) | | (1.63) | | 36.18 | | 6.42 | | 205,114 | | 1.16 | | 1.14 | | (0.30) | | 45 |
| R5 | | 36.77 | | 0.00 (8) | | 2.44 | | 2.44 | | — | | (1.63) | | (1.63) | | 37.58 | | 6.77 | | 371,791 | | 0.85 | | 0.85 | | 0.00 (9) | | 45 |
| R6 | | 37.22 | | 0.03 | | 2.47 | | 2.50 | | — | | (1.63) | | (1.63) | | 38.09 | | 6.85 | | 1,759,581 | | 0.75 | | 0.75 | | 0.08 | | 45 |
| Y | | 37.17 | | 0.02 | | 2.46 | | 2.48 | | — | | (1.63) | | (1.63) | | 38.02 | | 6.81 | | 1,144,624 | | 0.85 | | 0.79 | | 0.06 | | 45 |
| F | | 31.52 | | 0.03 | | 2.08 | | 2.11 | | — | | (1.63) | | (1.63) | | 32.00 | | 6.85 | | 2,422,752 | | 0.75 | | 0.75 | | 0.09 | | 45 |
| For the Year Ended October 31, 2019 |
| A | | $ 30.03 | | $ (0.09) | | $ 3.80 | | $ 3.71 | | $ — | | $ (3.40) | | $ (3.40) | | $ 30.34 | | 14.93% | | $ 2,820,971 | | 1.11% | | 1.10% | | (0.32)% | | 31% |
| C | | 21.90 | | (0.22) | | 2.55 | | 2.33 | | — | | (3.40) | | (3.40) | | 20.83 | | 14.10 | | 498,057 | | 1.86 | | 1.86 | | (1.08) | | 31 |
| I | | 30.91 | | (0.02) | | 3.94 | | 3.92 | | — | | (3.40) | | (3.40) | | 31.43 | | 15.25 | | 4,168,592 | | 0.85 | | 0.85 | | (0.06) | | 31 |
| R3 | | 33.31 | | (0.22) | | 4.29 | | 4.07 | | — | | (3.40) | | (3.40) | | 33.98 | | 14.54 | | 96,409 | | 1.45 | | 1.45 | | (0.67) | | 31 |
| R4 | | 34.59 | | (0.12) | | 4.50 | | 4.38 | | — | | (3.40) | | (3.40) | | 35.57 | | 14.89 | | 266,390 | | 1.16 | | 1.14 | | (0.36) | | 31 |
| R5 | | 35.55 | | (0.02) | | 4.64 | | 4.62 | | — | | (3.40) | | (3.40) | | 36.77 | | 15.23 | | 497,712 | | 0.84 | | 0.84 | | (0.07) | | 31 |
| R6 | | 35.90 | | 0.02 | | 4.70 | | 4.72 | | — | | (3.40) | | (3.40) | | 37.22 | | 15.37 | | 1,731,890 | | 0.74 | | 0.74 | | 0.04 | | 31 |
| Y | | 35.87 | | 0.00 (8) | | 4.70 | | 4.70 | | — | | (3.40) | | (3.40) | | 37.17 | | 15.32 | | 1,571,851 | | 0.82 | | 0.78 | | 0.01 | | 31 |
| F | | 30.96 | | 0.01 | | 3.95 | | 3.96 | | — | | (3.40) | | (3.40) | | 31.52 | | 15.36 | | 2,259,594 | | 0.74 | | 0.74 | | 0.04 | | 31 |
The accompanying notes are an integral part of these financial statements.
Hartford Domestic Equity Funds
Financial Highlights – (continued)
| | | — Selected Per-Share Data(1) — | | — Ratios and Supplemental Data — |
| Class | | Net
Asset
Value at
Beginning
of Period | | Net
Investment
Income
(Loss) | | Net
Realized
and
Unrealized
Gain (Loss)
on
Investments | | Total from
Investment
Operations | | Dividends
from Net
Investment
Income | | Distributions
from
Capital
Gains | | Total
Dividends
and
Distributions | | Net
Asset
Value at
End of
Period | | Total
Return(2) | | Net
Assets
at End
of Period
(000s) | | Ratio of
Expenses
to
Average
Net
Assets
Before
Adjust-
ments(3) | | Ratio of
Expenses
to
Average
Net
Assets
After
Adjust-
ments(3) | | Ratio of
Net
Investment
Income
(Loss) to
Average
Net Assets | | Portfolio
Turnover |
| The Hartford MidCap Fund – (continued) |
| For the Year Ended October 31, 2018 |
| A | | $ 30.36 | | $ (0.12) | | $ 1.20 | | $ 1.08 | | $ — | | $ (1.41) | | $ (1.41) | | $ 30.03 | | 3.63% | | $ 2,592,610 | | 1.11% | | 1.10% | | (0.39)% | | 37% |
| C | | 22.67 | | (0.27) | | 0.91 | | 0.64 | | — | | (1.41) | | (1.41) | | 21.90 | | 2.84 | | 580,708 | | 1.85 | | 1.85 | | (1.14) | | 37 |
| I | | 31.12 | | (0.03) | | 1.23 | | 1.20 | | — | | (1.41) | | (1.41) | | 30.91 | | 3.91 | | 3,666,464 | | 0.82 | | 0.82 | | (0.11) | | 37 |
| R3 | | 33.64 | | (0.26) | | 1.34 | | 1.08 | | — | | (1.41) | | (1.41) | | 33.31 | | 3.23 | | 102,632 | | 1.46 | | 1.46 | | (0.75) | | 37 |
| R4 | | 34.78 | | (0.16) | | 1.38 | | 1.22 | | — | | (1.41) | | (1.41) | | 34.59 | | 3.57 | | 289,049 | | 1.16 | | 1.15 | | (0.43) | | 37 |
| R5 | | 35.59 | | (0.05) | | 1.42 | | 1.37 | | — | | (1.41) | | (1.41) | | 35.55 | | 3.89 | | 468,146 | | 0.85 | | 0.85 | | (0.13) | | 37 |
| R6 | | 35.90 | | (0.01) | | 1.42 | | 1.41 | | — | | (1.41) | | (1.41) | | 35.90 | | 3.97 | | 1,014,518 | | 0.75 | | 0.75 | | (0.04) | | 37 |
| Y | | 35.88 | | (0.02) | | 1.42 | | 1.40 | | — | | (1.41) | | (1.41) | | 35.87 | | 3.95 | | 1,934,520 | | 0.78 | | 0.78 | | (0.06) | | 37 |
| F | | 31.15 | | (0.01) | | 1.23 | | 1.22 | | — | | (1.41) | | (1.41) | | 30.96 | | 3.97 | | 1,648,425 | | 0.75 | | 0.75 | | (0.03) | | 37 |
| For the Year Ended October 31, 2017 |
| A | | $ 24.25 | | $ (0.11) | | $ 7.00 | | $ 6.89 | | $ — | | $ (0.78) | | $ (0.78) | | $ 30.36 | | 29.02% | | $ 2,482,275 | | 1.13% | | 1.12% | | (0.38)% | | 30% |
| C | | 18.42 | | (0.23) | | 5.26 | | 5.03 | | — | | (0.78) | | (0.78) | | 22.67 | | 28.07 | | 717,521 | | 1.87 | | 1.87 | | (1.12) | | 30 |
| I | | 24.79 | | (0.05) | | 7.16 | | 7.11 | | — | | (0.78) | | (0.78) | | 31.12 | | 29.28 | | 2,996,705 | | 1.02 | | 0.89 | | (0.17) | | 30 |
| R3 | | 26.88 | | (0.22) | | 7.76 | | 7.54 | | — | | (0.78) | | (0.78) | | 33.64 | | 28.59 | | 90,582 | | 1.47 | | 1.47 | | (0.73) | | 30 |
| R4 | | 27.69 | | (0.14) | | 8.01 | | 7.87 | | — | | (0.78) | | (0.78) | | 34.78 | | 28.95 | | 263,236 | | 1.16 | | 1.16 | | (0.43) | | 30 |
| R5 | | 28.24 | | (0.04) | | 8.17 | | 8.13 | | — | | (0.78) | | (0.78) | | 35.59 | | 29.32 | | 356,166 | | 0.86 | | 0.86 | | (0.14) | | 30 |
| R6 | | 28.45 | | (0.05) | | 8.28 | | 8.23 | | — | | (0.78) | | (0.78) | | 35.90 | | 29.45 | | 431,183 | | 0.76 | | 0.76 | | (0.14) | | 30 |
| Y | | 28.44 | | (0.01) | | 8.23 | | 8.22 | | — | | (0.78) | | (0.78) | | 35.88 | | 29.43 | | 1,847,676 | | 0.78 | | 0.78 | | (0.04) | | 30 |
| F (5) | | 27.52 | | (0.03) | | 3.66 | | 3.63 | | — | | — | | — | | 31.15 | | 13.19 (6) | | 1,244,732 | | 0.76 (7) | | 0.76 (7) | | (0.15) (7) | | 30 |
| The Hartford MidCap Value Fund |
| For the Year Ended October 31, 2021 |
| A | | $ 12.21 | | $ —(8) | | $ 5.97 | | $ 5.97 | | $ (0.04) | | $ — | | $ (0.04) | | $ 18.14 | | 48.99% | | $ 363,955 | | 1.18% | | 1.18% | | 0.03% | | 57% |
| C | | 9.66 | | (0.09) | | 4.71 | | 4.62 | | — | | — | | — | | 14.28 | | 47.83 | | 8,931 | | 1.96 | | 1.96 | | (0.73) | | 57 |
| I | | 12.36 | | 0.06 | | 6.02 | | 6.08 | | (0.08) | | — | | (0.08) | | 18.36 | | 49.39 | | 25,307 | | 0.85 | | 0.85 | | 0.36 | | 57 |
| R3 | | 12.91 | | (0.05) | | 6.32 | | 6.27 | | — | | — | | — | | 19.18 | | 48.57 | | 6,973 | | 1.49 | | 1.49 | | (0.28) | | 57 |
| R4 | | 13.21 | | — (8) | | 6.46 | | 6.46 | | (0.03) | | — | | (0.03) | | 19.64 | | 48.99 | | 10,502 | | 1.19 | | 1.19 | | 0.02 | | 57 |
| R5 | | 13.44 | | 0.06 | | 6.56 | | 6.62 | | (0.09) | | — | | (0.09) | | 19.97 | | 49.39 | | 2,142 | | 0.89 | | 0.89 | | 0.31 | | 57 |
| Y | | 13.47 | | 0.06 | | 6.58 | | 6.64 | | (0.09) | | — | | (0.09) | | 20.02 | | 49.49 | | 15,307 | | 0.88 | | 0.88 | | 0.32 | | 57 |
| F | | 12.36 | | 0.07 | | 6.04 | | 6.11 | | (0.10) | | — | | (0.10) | | 18.37 | | 49.64 | | 442,227 | | 0.77 | | 0.77 | | 0.43 | | 57 |
| For the Year Ended October 31, 2020 |
| A | | $ 14.43 | | $ 0.07 | | $ (1.86) | | $ (1.79) | | $ (0.09) | | $ (0.34) | | $ (0.43) | | $ 12.21 | | (12.86)% | | $ 245,112 | | 1.25% | | 1.25% | | 0.56% | | 61% |
| C | | 11.51 | | (0.02) | | (1.49) | | (1.51) | | (0.00) (8) | | (0.34) | | (0.34) | | 9.66 | | (13.55) | | 9,533 | | 2.03 | | 2.03 | | (0.20) | | 61 |
| I | | 14.60 | | 0.12 | | (1.88) | | (1.76) | | (0.14) | | (0.34) | | (0.48) | | 12.36 | | (12.58) | | 19,722 | | 0.91 | | 0.91 | | 0.91 | | 61 |
| R3 | | 15.22 | | 0.04 | | (1.98) | | (1.94) | | (0.03) | | (0.34) | | (0.37) | | 12.91 | | (13.12) | | 5,317 | | 1.53 | | 1.53 | | 0.30 | | 61 |
| R4 | | 15.58 | | 0.08 | | (2.02) | | (1.94) | | (0.09) | | (0.34) | | (0.43) | | 13.21 | | (12.88) | | 8,857 | | 1.23 | | 1.23 | | 0.58 | | 61 |
| R5 | | 15.82 | | 0.12 | | (2.04) | | (1.92) | | (0.12) | | (0.34) | | (0.46) | | 13.44 | | (12.60) | | 1,423 | | 0.92 | | 0.92 | | 0.88 | | 61 |
| Y | | 15.87 | | 0.13 | | (2.05) | | (1.92) | | (0.14) | | (0.34) | | (0.48) | | 13.47 | | (12.55) | | 10,009 | | 0.92 | | 0.88 | | 0.93 | | 61 |
| F | | 14.60 | | 0.13 | | (1.88) | | (1.75) | | (0.15) | | (0.34) | | (0.49) | | 12.36 | | (12.51) | | 299,805 | | 0.82 | | 0.82 | | 0.98 | | 61 |
| For the Year Ended October 31, 2019 |
| A | | $ 14.54 | | $ 0.08 | | $ 1.44 | | $ 1.52 | | $ (0.04) | | $ (1.59) | | $ (1.63) | | $ 14.43 | | 12.74% | | $ 309,996 | | 1.23% | | 1.23% | | 0.61% | | 55% |
| C | | 11.97 | | (0.02) | | 1.15 | | 1.13 | | — | | (1.59) | | (1.59) | | 11.51 | | 11.99 | | 15,910 | | 1.99 | | 1.99 | | (0.14) | | 55 |
| I | | 14.68 | | 0.13 | | 1.46 | | 1.59 | | (0.08) | | (1.59) | | (1.67) | | 14.60 | | 13.20 | | 31,173 | | 0.89 | | 0.89 | | 0.95 | | 55 |
| R3 | | 15.23 | | 0.05 | | 1.53 | | 1.58 | | — | | (1.59) | | (1.59) | | 15.22 | | 12.42 | | 8,034 | | 1.52 | | 1.52 | | 0.33 | | 55 |
| R4 | | 15.55 | | 0.09 | | 1.57 | | 1.66 | | (0.04) | | (1.59) | | (1.63) | | 15.58 | | 12.77 | | 11,865 | | 1.21 | | 1.21 | | 0.64 | | 55 |
| R5 | | 15.76 | | 0.16 | | 1.57 | | 1.73 | | (0.08) | | (1.59) | | (1.67) | | 15.82 | | 13.14 | | 1,592 | | 0.92 | | 0.92 | | 1.06 | | 55 |
| Y | | 15.80 | | 0.15 | | 1.60 | | 1.75 | | (0.09) | | (1.59) | | (1.68) | | 15.87 | | 13.23 | | 12,624 | | 0.89 | | 0.85 | | 0.98 | | 55 |
| F | | 14.69 | | 0.14 | | 1.46 | | 1.60 | | (0.10) | | (1.59) | | (1.69) | | 14.60 | | 13.27 | | 314,566 | | 0.80 | | 0.80 | | 1.03 | | 55 |
The accompanying notes are an integral part of these financial statements.
Hartford Domestic Equity Funds
Financial Highlights – (continued)
| | | — Selected Per-Share Data(1) — | | — Ratios and Supplemental Data — |
| Class | | Net
Asset
Value at
Beginning
of Period | | Net
Investment
Income
(Loss) | | Net
Realized
and
Unrealized
Gain (Loss)
on
Investments | | Total from
Investment
Operations | | Dividends
from Net
Investment
Income | | Distributions
from
Capital
Gains | | Total
Dividends
and
Distributions | | Net
Asset
Value at
End of
Period | | Total
Return(2) | | Net
Assets
at End
of Period
(000s) | | Ratio of
Expenses
to
Average
Net
Assets
Before
Adjust-
ments(3) | | Ratio of
Expenses
to
Average
Net
Assets
After
Adjust-
ments(3) | | Ratio of
Net
Investment
Income
(Loss) to
Average
Net Assets | | Portfolio
Turnover |
| The Hartford MidCap Value Fund – (continued) |
| For the Year Ended October 31, 2018 |
| A | | $ 15.62 | | $ 0.03 | | $ (0.72) | | $ (0.69) | | $ — | | $ (0.39) | | $ (0.39) | | $ 14.54 | | (4.56)% | | $ 284,646 | | 1.22% | | 1.22% | | 0.18% | | 49% |
| C | | 13.03 | | (0.07) | | (0.60) | | (0.67) | | — | | (0.39) | | (0.39) | | 11.97 | | (5.26) | | 17,909 | | 1.98 | | 1.97 | | (0.57) | | 49 |
| I | | 15.72 | | 0.08 | | (0.73) | | (0.65) | | — | | (0.39) | | (0.39) | | 14.68 | | (4.27) | | 34,656 | | 0.90 | | 0.90 | | 0.50 | | 49 |
| R3 | | 16.39 | | (0.02) | | (0.75) | | (0.77) | | — | | (0.39) | | (0.39) | | 15.23 | | (4.84) | | 9,555 | | 1.52 | | 1.52 | | (0.13) | | 49 |
| R4 | | 16.68 | | 0.03 | | (0.77) | | (0.74) | | — | | (0.39) | | (0.39) | | 15.55 | | (4.52) | | 11,639 | | 1.22 | | 1.22 | | 0.18 | | 49 |
| R5 | | 16.88 | | 0.08 | | (0.78) | | (0.70) | | (0.03) | | (0.39) | | (0.42) | | 15.76 | | (4.32) | | 8,087 | | 0.91 | | 0.91 | | 0.48 | | 49 |
| Y | | 16.93 | | 0.09 | | (0.79) | | (0.70) | | (0.04) | | (0.39) | | (0.43) | | 15.80 | | (4.23) | | 11,371 | | 0.86 | | 0.86 | | 0.52 | | 49 |
| F | | 15.76 | | 0.10 | | (0.73) | | (0.63) | | (0.05) | | (0.39) | | (0.44) | | 14.69 | | (4.18) | | 252,917 | | 0.80 | | 0.80 | | 0.61 | | 49 |
| For the Year Ended October 31, 2017 |
| A | | $ 13.98 | | $ 0.01 | | $ 2.65 | | $ 2.66 | | $ — | | $ (1.02) | | $ (1.02) | | $ 15.62 | | 19.67% | | $ 291,082 | | 1.23% | | 1.23% | | 0.06% | | 40% |
| C | | 11.90 | | (0.08) | | 2.23 | | 2.15 | | — | | (1.02) | | (1.02) | | 13.03 | | 18.66 | | 35,520 | | 1.96 | | 1.96 | | (0.67) | | 40 |
| I | | 14.09 | | 0.03 | | 2.67 | | 2.70 | | (0.05) | | (1.02) | | (1.07) | | 15.72 | | 19.81 | | 43,342 | | 1.20 | | 1.10 | | 0.20 | | 40 |
| R3 | | 14.67 | | (0.04) | | 2.78 | | 2.74 | | — | | (1.02) | | (1.02) | | 16.39 | | 19.26 | | 11,923 | | 1.52 | | 1.52 | | (0.23) | | 40 |
| R4 | | 14.87 | | 0.01 | | 2.82 | | 2.83 | | — | | (1.02) | | (1.02) | | 16.68 | | 19.58 | | 12,637 | | 1.21 | | 1.21 | | 0.08 | | 40 |
| R5 | | 15.03 | | 0.06 | | 2.86 | | 2.92 | | (0.05) | | (1.02) | | (1.07) | | 16.88 | | 20.06 | | 11,445 | | 0.91 | | 0.91 | | 0.38 | | 40 |
| Y | | 15.07 | | 0.08 | | 2.86 | | 2.94 | | (0.06) | | (1.02) | | (1.08) | | 16.93 | | 20.10 | | 28,403 | | 0.82 | | 0.82 | | 0.48 | | 40 |
| F (5) | | 14.97 | | 0.05 | | 0.74 | | 0.79 | | — | | — | | — | | 15.76 | | 5.28 (6) | | 238,682 | | 0.81 (7) | | 0.81 (7) | | 0.46 (7) | | 40 |
| Hartford Quality Value Fund |
| For the Year Ended October 31, 2021 |
| A | | $ 18.61 | | $ 0.34 | | $ 7.76 | | $ 8.10 | | $ (0.44) | | $ — | | $ (0.44) | | $ 26.27 | | 44.08% | | $ 188,344 | | 0.97% | | 0.94% | | 1.44% | | 21% |
| C | | 15.78 | | 0.14 | | 6.57 | | 6.71 | | (0.27) | | — | | (0.27) | | 22.22 | | 42.97 | | 3,397 | | 1.80 | | 1.71 | | 0.71 | | 21 |
| I | | 18.37 | | 0.41 | | 7.65 | | 8.06 | | (0.50) | | — | | (0.50) | | 25.93 | | 44.56 | | 20,153 | | 0.65 | | 0.63 | | 1.73 | | 21 |
| R3 | | 18.92 | | 0.29 | | 7.89 | | 8.18 | | (0.39) | | — | | (0.39) | | 26.71 | | 43.73 | | 1,098 | | 1.27 | | 1.17 | | 1.22 | | 21 |
| R4 | | 19.13 | | 0.37 | | 7.97 | | 8.34 | | (0.45) | | — | | (0.45) | | 27.02 | | 44.20 | | 4,775 | | 0.97 | | 0.88 | | 1.50 | | 21 |
| R5 | | 19.32 | | 0.43 | | 8.06 | | 8.49 | | (0.51) | | — | | (0.51) | | 27.30 | | 44.59 | | 320 | | 0.67 | | 0.62 | | 1.76 | | 21 |
| R6 | | 19.38 | | 0.48 | | 8.06 | | 8.54 | | (0.54) | | — | | (0.54) | | 27.38 | | 44.79 | | 257 | | 0.56 | | 0.46 | | 1.95 | | 21 |
| Y | | 19.35 | | 0.44 | | 8.07 | | 8.51 | | (0.52) | | — | | (0.52) | | 27.34 | | 44.65 | | 1,753 | | 0.66 | | 0.57 | | 1.74 | | 21 |
| F | | 18.31 | | 0.45 | | 7.62 | | 8.07 | | (0.54) | | — | | (0.54) | | 25.84 | | 44.84 | | 12,182 | | 0.56 | | 0.46 | | 1.92 | | 21 |
| For the Year Ended October 31, 2020 |
| A | | $ 21.11 | | $ 0.42 | | $ (1.85) | | $ (1.43) | | $ (0.48) | | $ (0.59) | | $ (1.07) | | $ 18.61 | | (7.34)% | | $ 140,154 | | 1.03% | | 0.91% | | 2.19% | | 26% |
| C | | 18.05 | | 0.23 | | (1.59) | | (1.36) | | (0.32) | | (0.59) | | (0.91) | | 15.78 | | (8.09) | | 3,673 | | 1.82 | | 1.71 | | 1.38 | | 26 |
| I | | 20.85 | | 0.48 | | (1.82) | | (1.34) | | (0.55) | | (0.59) | | (1.14) | | 18.37 | | (7.02) | | 10,927 | | 0.67 | | 0.56 | | 2.53 | | 26 |
| R3 | | 21.45 | | 0.38 | | (1.89) | | (1.51) | | (0.43) | | (0.59) | | (1.02) | | 18.92 | | (7.56) | | 855 | | 1.29 | | 1.16 | | 1.91 | | 26 |
| R4 | | 21.68 | | 0.44 | | (1.91) | | (1.47) | | (0.49) | | (0.59) | | (1.08) | | 19.13 | | (7.34) | | 3,887 | | 0.98 | | 0.87 | | 2.21 | | 26 |
| R5 | | 21.87 | | 0.50 | | (1.92) | | (1.42) | | (0.54) | | (0.59) | | (1.13) | | 19.32 | | (7.05) | | 220 | | 0.69 | | 0.58 | | 2.53 | | 26 |
| R6 | | 21.93 | | 0.50 | | (1.89) | | (1.39) | | (0.57) | | (0.59) | | (1.16) | | 19.38 | | (6.92) | | 485 | | 0.58 | | 0.46 | | 2.53 | | 26 |
| Y | | 21.91 | | 0.51 | | (1.93) | | (1.42) | | (0.55) | | (0.59) | | (1.14) | | 19.35 | | (7.05) | | 382 | | 0.68 | | 0.57 | | 2.53 | | 26 |
| F | | 20.83 | | 0.50 | | (1.82) | | (1.32) | | (0.61) | | (0.59) | | (1.20) | | 18.31 | | (6.94) | | 8,975 | | 0.58 | | 0.46 | | 2.64 | | 26 |
| For the Year Ended October 31, 2019 |
| A | | $ 20.00 | | $ 0.38 | | $ 1.99 | | $ 2.37 | | $ (0.28) | | $ (0.98) | | $ (1.26) | | $ 21.11 | | 13.10% | | $ 169,771 | | 1.00% | | 0.90% | | 1.95% | | 23% |
| C | | 17.12 | | 0.20 | | 1.71 | | 1.91 | | — | | (0.98) | | (0.98) | | 18.05 | | 12.23 | | 6,834 | | 1.76 | | 1.67 | | 1.21 | | 23 |
| I | | 19.78 | | 0.45 | | 1.94 | | 2.39 | | (0.34) | | (0.98) | | (1.32) | | 20.85 | | 13.49 | | 12,796 | | 0.65 | | 0.56 | | 2.30 | | 23 |
| R3 | | 20.29 | | 0.34 | | 2.01 | | 2.35 | | (0.21) | | (0.98) | | (1.19) | | 21.45 | | 12.78 | | 1,240 | | 1.27 | | 1.16 | | 1.69 | | 23 |
| R4 | | 20.49 | | 0.40 | | 2.04 | | 2.44 | | (0.27) | | (0.98) | | (1.25) | | 21.68 | | 13.17 | | 6,014 | | 0.95 | | 0.86 | | 1.99 | | 23 |
| R5 | | 20.67 | | 0.47 | | 2.04 | | 2.51 | | (0.33) | | (0.98) | | (1.31) | | 21.87 | | 13.46 | | 230 | | 0.67 | | 0.58 | | 2.33 | | 23 |
| R6 | | 20.74 | | 0.47 | | 2.06 | | 2.53 | | (0.36) | | (0.98) | | (1.34) | | 21.93 | | 13.57 | | 34 | | 0.56 | | 0.46 | | 2.26 | | 23 |
| Y | | 20.72 | | 0.47 | | 2.05 | | 2.52 | | (0.35) | | (0.98) | | (1.33) | | 21.91 | | 13.50 | | 622 | | 0.64 | | 0.55 | | 2.29 | | 23 |
| F | | 19.77 | | 0.48 | | 1.92 | | 2.40 | | (0.36) | | (0.98) | | (1.34) | | 20.83 | | 13.58 | | 11,040 | | 0.55 | | 0.46 | | 2.52 | | 23 |
The accompanying notes are an integral part of these financial statements.
Hartford Domestic Equity Funds
Financial Highlights – (continued)
| | | — Selected Per-Share Data(1) — | | — Ratios and Supplemental Data — |
| Class | | Net
Asset
Value at
Beginning
of Period | | Net
Investment
Income
(Loss) | | Net
Realized
and
Unrealized
Gain (Loss)
on
Investments | | Total from
Investment
Operations | | Dividends
from Net
Investment
Income | | Distributions
from
Capital
Gains | | Total
Dividends
and
Distributions | | Net
Asset
Value at
End of
Period | | Total
Return(2) | | Net
Assets
at End
of Period
(000s) | | Ratio of
Expenses
to
Average
Net
Assets
Before
Adjust-
ments(3) | | Ratio of
Expenses
to
Average
Net
Assets
After
Adjust-
ments(3) | | Ratio of
Net
Investment
Income
(Loss) to
Average
Net Assets | | Portfolio
Turnover |
| Hartford Quality Value Fund – (continued) |
| For the Year Ended October 31, 2018 |
| A | | $ 20.49 | | $ 0.31 | | $ 0.16 | | $ 0.47 | | $ (0.20) | | $ (0.76) | | $ (0.96) | | $ 20.00 | | 2.25% | | $ 164,325 | | 1.06% | | 1.04% | | 1.52% | | 85% |
| C | | 17.67 | | 0.14 | | 0.15 | | 0.29 | | (0.08) | | (0.76) | | (0.84) | | 17.12 | | 1.53 | | 9,082 | | 1.81 | | 1.79 | | 0.80 | | 85 |
| I | | 20.25 | | 0.38 | | 0.16 | | 0.54 | | (0.25) | | (0.76) | | (1.01) | | 19.78 | | 2.60 | | 12,974 | | 0.71 | | 0.69 | | 1.87 | | 85 |
| R3 | | 20.70 | | 0.26 | | 0.17 | | 0.43 | | (0.08) | | (0.76) | | (0.84) | | 20.29 | | 2.03 | | 1,075 | | 1.34 | | 1.30 | | 1.26 | | 85 |
| R4 | | 20.95 | | 0.33 | | 0.16 | | 0.49 | | (0.19) | | (0.76) | | (0.95) | | 20.49 | | 2.29 | | 6,014 | | 1.04 | | 1.01 | | 1.55 | | 85 |
| R5 | | 21.13 | | 0.38 | | 0.17 | | 0.55 | | (0.25) | | (0.76) | | (1.01) | | 20.67 | | 2.57 | | 504 | | 0.74 | | 0.72 | | 1.76 | | 85 |
| R6 (11) | | 20.99 | | 0.28 | | (0.53) (12) | | (0.25) | | — | | — | | — | | 20.74 | | (1.19) (6) | | 10 | | 0.61 (7) | | 0.59 (7) | | 1.95 (7) | | 85 |
| Y | | 21.19 | | 0.40 | | 0.17 | | 0.57 | | (0.28) | | (0.76) | | (1.04) | | 20.72 | | 2.65 | | 601 | | 0.68 | | 0.66 | | 1.90 | | 85 |
| F | | 20.26 | | 0.39 | | 0.17 | | 0.56 | | (0.29) | | (0.76) | | (1.05) | | 19.77 | | 2.71 | | 88,336 | | 0.62 | | 0.60 | | 1.94 | | 85 |
| For the Year Ended October 31, 2017 |
| A | | $ 17.94 | | $ 0.19 | | $ 2.64 | | $ 2.83 | | $ (0.14) | | $ (0.14) | | $ (0.28) | | $ 20.49 | | 15.89% | | $ 180,059 | | 1.20% | | 1.20% | | 0.95% | | 39% |
| C | | 15.52 | | 0.04 | | 2.28 | | 2.32 | | (0.03) | | (0.14) | | (0.17) | | 17.67 | | 15.05 | | 20,312 | | 1.93 | | 1.93 | | 0.22 | | 39 |
| I | | 17.75 | | 0.24 | | 2.60 | | 2.84 | | (0.20) | | (0.14) | | (0.34) | | 20.25 | | 16.19 | | 15,561 | | 0.94 | | 0.94 | | 1.22 | | 39 |
| R3 | | 18.13 | | 0.13 | | 2.66 | | 2.79 | | (0.08) | | (0.14) | | (0.22) | | 20.70 | | 15.48 | | 1,448 | | 1.54 | | 1.53 | | 0.63 | | 39 |
| R4 | | 18.34 | | 0.19 | | 2.70 | | 2.89 | | (0.14) | | (0.14) | | (0.28) | | 20.95 | | 15.87 | | 7,550 | | 1.20 | | 1.20 | | 0.96 | | 39 |
| R5 | | 18.49 | | 0.23 | | 2.75 | | 2.98 | | (0.20) | | (0.14) | | (0.34) | | 21.13 | | 16.25 | | 480 | | 0.91 | | 0.91 | | 1.17 | | 39 |
| Y | | 18.55 | | 0.27 | | 2.73 | | 3.00 | | (0.22) | | (0.14) | | (0.36) | | 21.19 | | 16.32 | | 1,052 | | 0.83 | | 0.83 | | 1.31 | | 39 |
| F (5) | | 19.58 | | 0.16 | | 0.52 | | 0.68 | | — | | — | | — | | 20.26 | | 3.47 (6) | | 12,030 | | 0.80 (7) | | 0.80 (7) | | 1.17 (7) | | 39 |
| The Hartford Small Cap Growth Fund |
| For the Year Ended October 31, 2021 |
| A | | $ 51.35 | | $ (0.42) | | $ 18.27 | | $ 17.85 | | $ — | | $ (4.32) | | $ (4.32) | | $ 64.88 | | 35.73% | | $ 256,061 | | 1.18% | | 1.18% | | (0.67)% | | 48% |
| C | | 34.22 | | (0.55) | | 11.99 | | 11.44 | | — | | (4.32) | | (4.32) | | 41.34 | | 34.80 | | 8,102 | | 1.89 | | 1.89 | | (1.37) | | 48 |
| I | | 54.23 | | (0.22) | | 19.34 | | 19.12 | | — | | (4.32) | | (4.32) | | 69.03 | | 36.21 | | 120,135 | | 0.83 | | 0.83 | | (0.33) | | 48 |
| R3 | | 50.47 | | (0.59) | | 17.94 | | 17.35 | | — | | (4.32) | | (4.32) | | 63.50 | | 35.34 | | 8,637 | | 1.48 | | 1.47 | | (0.97) | | 48 |
| R4 | | 53.64 | | (0.42) | | 19.09 | | 18.67 | | — | | (4.32) | | (4.32) | | 67.99 | | 35.74 | | 21,098 | | 1.17 | | 1.17 | | (0.64) | | 48 |
| R5 | | 57.10 | | (0.25) | | 20.38 | | 20.13 | | — | | (4.32) | | (4.32) | | 72.91 | | 36.15 | | 86,788 | | 0.87 | | 0.87 | | (0.36) | | 48 |
| R6 | | 58.07 | | (0.18) | | 20.75 | | 20.57 | | — | | (4.32) | | (4.32) | | 74.32 | | 36.31 | | 84,908 | | 0.76 | | 0.76 | | (0.25) | | 48 |
| Y | | 58.07 | | (0.22) | | 20.75 | | 20.53 | | — | | (4.32) | | (4.32) | | 74.28 | | 36.24 | | 268,416 | | 0.87 | | 0.81 | | (0.31) | | 48 |
| F | | 54.48 | | (0.15) | | 19.42 | | 19.27 | | — | | (4.32) | | (4.32) | | 69.43 | | 36.32 | | 36,439 | | 0.76 | | 0.76 | | (0.23) | | 48 |
| For the Year Ended October 31, 2020 |
| A | | $ 45.71 | | $ (0.28) | | $ 6.67 | | $ 6.39 | | $ — | | $ (0.75) | | $ (0.75) | | $ 51.35 | | 14.06% | | $ 198,430 | | 1.26% | | 1.25% | | (0.60)% | | 58% |
| C | | 30.90 | | (0.39) | | 4.46 | | 4.07 | | — | | (0.75) | | (0.75) | | 34.22 | | 13.31 | | 12,323 | | 1.91 | | 1.91 | | (1.25) | | 58 |
| I | | 48.05 | | (0.09) | | 7.02 | | 6.93 | | — | | (0.75) | | (0.75) | | 54.23 | | 14.50 | | 98,673 | | 0.85 | | 0.85 | | (0.19) | | 58 |
| R3 | | 45.05 | | (0.38) | | 6.55 | | 6.17 | | — | | (0.75) | | (0.75) | | 50.47 | | 13.80 | | 7,485 | | 1.49 | | 1.49 | | (0.83) | | 58 |
| R4 | | 47.69 | | (0.26) | | 6.96 | | 6.70 | | — | | (0.75) | | (0.75) | | 53.64 | | 14.13 | | 31,169 | | 1.19 | | 1.19 | | (0.52) | | 58 |
| R5 | | 50.57 | | (0.12) | | 7.40 | | 7.28 | | — | | (0.75) | | (0.75) | | 57.10 | | 14.47 | | 71,754 | | 0.89 | | 0.89 | | (0.23) | | 58 |
| R6 | | 51.36 | | (0.06) | | 7.52 | | 7.46 | | — | | (0.75) | | (0.75) | | 58.07 | | 14.62 | | 80,327 | | 0.78 | | 0.78 | | (0.12) | | 58 |
| Y | | 51.39 | | (0.08) | | 7.51 | | 7.43 | | — | | (0.75) | | (0.75) | | 58.07 | | 14.58 | | 255,484 | | 0.88 | | 0.81 | | (0.16) | | 58 |
| F | | 48.23 | | (0.06) | | 7.06 | | 7.00 | | — | | (0.75) | | (0.75) | | 54.48 | | 14.62 | | 44,376 | | 0.78 | | 0.78 | | (0.13) | | 58 |
The accompanying notes are an integral part of these financial statements.
Hartford Domestic Equity Funds
Financial Highlights – (continued)
| | | — Selected Per-Share Data(1) — | | — Ratios and Supplemental Data — |
| Class | | Net
Asset
Value at
Beginning
of Period | | Net
Investment
Income
(Loss) | | Net
Realized
and
Unrealized
Gain (Loss)
on
Investments | | Total from
Investment
Operations | | Dividends
from Net
Investment
Income | | Distributions
from
Capital
Gains | | Total
Dividends
and
Distributions | | Net
Asset
Value at
End of
Period | | Total
Return(2) | | Net
Assets
at End
of Period
(000s) | | Ratio of
Expenses
to
Average
Net
Assets
Before
Adjust-
ments(3) | | Ratio of
Expenses
to
Average
Net
Assets
After
Adjust-
ments(3) | | Ratio of
Net
Investment
Income
(Loss) to
Average
Net Assets | | Portfolio
Turnover |
| The Hartford Small Cap Growth Fund – (continued) |
| For the Year Ended October 31, 2019 |
| A | | $ 55.20 | | $ (0.21) | | $ 2.62 | | $ 2.41 | | $ — | | $ (11.90) | | $ (11.90) | | $ 45.71 | | 8.99% | | $ 195,314 | | 1.24% | | 1.24% | | (0.46)% | | 48% |
| C | | 41.81 | | (0.34) | | 1.33 | | 0.99 | | — | | (11.90) | | (11.90) | | 30.90 | | 8.27 | | 15,722 | | 1.89 | | 1.89 | | (1.11) | | 48 |
| I | | 57.17 | | (0.02) | | 2.80 | | 2.78 | | — | | (11.90) | | (11.90) | | 48.05 | | 9.41 | | 191,482 | | 0.83 | | 0.83 | | (0.05) | | 48 |
| R3 | | 54.70 | | (0.31) | | 2.56 | | 2.25 | | — | | (11.90) | | (11.90) | | 45.05 | | 8.72 | | 10,036 | | 1.47 | | 1.47 | | (0.69) | | 48 |
| R4 | | 56.99 | | (0.18) | | 2.78 | | 2.60 | | — | | (11.90) | | (11.90) | | 47.69 | | 9.05 | | 42,296 | | 1.17 | | 1.17 | | (0.39) | | 48 |
| R5 | | 59.48 | | (0.03) | | 3.02 | | 2.99 | | — | | (11.90) | | (11.90) | | 50.57 | | 9.40 | | 82,624 | | 0.85 | | 0.85 | | (0.07) | | 48 |
| R6 | | 60.16 | | — (8) | | 3.10 | | 3.10 | | — | | (11.90) | | (11.90) | | 51.36 | | 9.49 | | 66,260 | | 0.76 | | 0.76 | | 0.01 | | 48 |
| Y | | 60.20 | | (0.01) | | 3.10 | | 3.09 | | — | | (11.90) | | (11.90) | | 51.39 | | 9.44 | | 365,867 | | 0.82 | | 0.80 | | (0.01) | | 48 |
| F | | 57.30 | | 0.01 | | 2.82 | | 2.83 | | — | | (11.90) | | (11.90) | | 48.23 | | 9.49 | | 46,533 | | 0.76 | | 0.76 | | 0.02 | | 48 |
| For the Year Ended October 31, 2018 |
| A | | $ 57.24 | | $ (0.33) | | $ 1.03 | | $ 0.70 | | $ — | | $ (2.74) | | $ (2.74) | | $ 55.20 | | 1.20% | | $ 203,297 | | 1.21% | | 1.20% | | (0.56)% | | 66% |
| C | | 44.29 | | (0.55) | | 0.81 | | 0.26 | | — | | (2.74) | | (2.74) | | 41.81 | | 0.53 | | 23,212 | | 1.88 | | 1.88 | | (1.22) | | 66 |
| I | | 58.97 | | (0.10) | | 1.04 | | 0.94 | | — | | (2.74) | | (2.74) | | 57.17 | | 1.59 | | 243,340 | | 0.82 | | 0.82 | | (0.16) | | 66 |
| R3 | | 56.89 | | (0.48) | | 1.03 | | 0.55 | | — | | (2.74) | | (2.74) | | 54.70 | | 0.94 | | 13,210 | | 1.47 | | 1.47 | | (0.82) | | 66 |
| R4 | | 58.98 | | (0.31) | | 1.06 | | 0.75 | | — | | (2.74) | | (2.74) | | 56.99 | | 1.26 | | 69,097 | | 1.15 | | 1.15 | | (0.50) | | 66 |
| R5 | | 61.26 | | (0.12) | | 1.08 | | 0.96 | | — | | (2.74) | | (2.74) | | 59.48 | | 1.56 | | 94,887 | | 0.85 | | 0.85 | | (0.20) | | 66 |
| R6 | | 61.87 | | (0.09) | | 1.12 | | 1.03 | | — | | (2.74) | | (2.74) | | 60.16 | | 1.66 | | 44,278 | | 0.75 | | 0.75 | | (0.14) | | 66 |
| Y | | 61.93 | | (0.09) | | 1.10 | | 1.01 | | — | | (2.74) | | (2.74) | | 60.20 | | 1.63 | | 358,049 | | 0.79 | | 0.79 | | (0.14) | | 66 |
| F | | 59.06 | | (0.06) | | 1.04 | | 0.98 | | — | | (2.74) | | (2.74) | | 57.30 | | 1.66 | | 47,999 | | 0.75 | | 0.75 | | (0.10) | | 66 |
| For the Year Ended October 31, 2017 |
| A | | $ 44.55 | | $ (0.25) | | $ 13.25 | | $ 13.00 | | $ — | | $ (0.31) | | $ (0.31) | | $ 57.24 | | 29.28% | | $ 215,743 | | 1.17% | | 1.16% | | (0.48)% | | 56% |
| C | | 34.78 | | (0.48) | | 10.30 | | 9.82 | | — | | (0.31) | | (0.31) | | 44.29 | | 28.36 | | 36,531 | | 1.89 | | 1.88 | | (1.19) | | 56 |
| I | | 45.79 | | (0.18) | | 13.67 | | 13.49 | | — | | (0.31) | | (0.31) | | 58.97 | | 29.56 | | 429,401 | | 1.03 | | 0.95 | | (0.33) | | 56 |
| R3 | | 44.42 | | (0.41) | | 13.19 | | 12.78 | | — | | (0.31) | | (0.31) | | 56.89 | | 28.87 | | 14,427 | | 1.48 | | 1.48 | | (0.79) | | 56 |
| R4 | | 45.90 | | (0.26) | | 13.65 | | 13.39 | | — | | (0.31) | | (0.31) | | 58.98 | | 29.27 | | 76,315 | | 1.16 | | 1.16 | | (0.48) | | 56 |
| R5 | | 47.52 | | (0.10) | | 14.15 | | 14.05 | | — | | (0.31) | | (0.31) | | 61.26 | | 29.67 | | 118,794 | | 0.86 | | 0.86 | | (0.17) | | 56 |
| R6 | | 47.94 | | (0.06) | | 14.30 | | 14.24 | | — | | (0.31) | | (0.31) | | 61.87 | | 29.80 | | 10,596 | | 0.76 | | 0.76 | | (0.11) | | 56 |
| Y | | 48.00 | | (0.05) | | 14.29 | | 14.24 | | — | | (0.31) | | (0.31) | | 61.93 | | 29.76 | | 370,006 | | 0.78 | | 0.78 | | (0.09) | | 56 |
| F | | 52.62 | | (0.09) | | 6.53 | | 6.44 | | — | | — | | — | | 59.06 | | 12.24 (6) | | 47,409 | | 0.75 (7) | | 0.75 (7) | | (0.24) (7) | | 56 |
| Hartford Small Cap Value Fund |
| For the Year Ended October 31, 2021 |
| A | | $ 8.29 | | $ 0.10 | | $ 5.06 | | $ 5.16 | | $ (0.09) | | $ — | | $ (0.09) | | $ 13.36 | | 62.61% | | $ 59,496 | | 1.30% | | 1.28% | | 0.78% | | 60% |
| C | | 7.12 | | — (8) | | 4.37 | | 4.37 | | (0.01) | | — | | (0.01) | | 11.48 | | 61.49 | | 3,098 | | 2.09 | | 2.04 | | 0.01 | | 60 |
| I | | 8.31 | | 0.15 | | 5.06 | | 5.21 | | (0.12) | | — | | (0.12) | | 13.40 | | 63.20 | | 32,905 | | 0.97 | | 0.96 | | 1.12 | | 60 |
| R3 | | 8.62 | | 0.09 | | 5.27 | | 5.36 | | (0.07) | | — | | (0.07) | | 13.91 | | 62.45 | | 931 | | 1.56 | | 1.39 | | 0.69 | | 60 |
| R4 | | 8.76 | | 0.12 | | 5.35 | | 5.47 | | (0.10) | | — | | (0.10) | | 14.13 | | 62.83 | | 53 | | 1.26 | | 1.20 | | 0.88 | | 60 |
| R5 | | 8.74 | | 0.15 | | 5.34 | | 5.49 | | (0.13) | | — | | (0.13) | | 14.10 | | 63.34 | | 24 | | 0.96 | | 0.90 | | 1.12 | | 60 |
| R6 | | 8.74 | | 0.16 | | 5.35 | | 5.51 | | (0.15) | | — | | (0.15) | | 14.10 | | 63.49 | | 1,508 | | 0.85 | | 0.80 | | 1.24 | | 60 |
| Y | | 8.73 | | 0.17 | | 5.31 | | 5.48 | | (0.14) | | — | | (0.14) | | 14.07 | | 63.26 | | 1,947 | | 0.95 | | 0.85 | | 1.22 | | 60 |
| F | | 8.31 | | 0.16 | | 5.08 | | 5.24 | | (0.15) | | — | | (0.15) | | 13.40 | | 63.53 | | 76,702 | | 0.84 | | 0.80 | | 1.26 | | 60 |
The accompanying notes are an integral part of these financial statements.
Hartford Domestic Equity Funds
Financial Highlights – (continued)
| | | — Selected Per-Share Data(1) — | | — Ratios and Supplemental Data — |
| Class | | Net
Asset
Value at
Beginning
of Period | | Net
Investment
Income
(Loss) | | Net
Realized
and
Unrealized
Gain (Loss)
on
Investments | | Total from
Investment
Operations | | Dividends
from Net
Investment
Income | | Distributions
from
Capital
Gains | | Total
Dividends
and
Distributions | | Net
Asset
Value at
End of
Period | | Total
Return(2) | | Net
Assets
at End
of Period
(000s) | | Ratio of
Expenses
to
Average
Net
Assets
Before
Adjust-
ments(3) | | Ratio of
Expenses
to
Average
Net
Assets
After
Adjust-
ments(3) | | Ratio of
Net
Investment
Income
(Loss) to
Average
Net Assets | | Portfolio
Turnover |
| Hartford Small Cap Value Fund – (continued) |
| For the Year Ended October 31, 2020 |
| A | | $ 10.35 | | $ 0.09 | | $ (1.49) | | $ (1.40) | | $ (0.08) | | $ (0.58) | | $ (0.66) | | $ 8.29 | | (14.57)% | | $ 32,996 | | 1.41% | | 1.29% | | 1.04% | | 62% |
| C | | 8.96 | | 0.02 | | (1.28) | | (1.26) | | (0.00) (8) | | (0.58) | | (0.58) | | 7.12 | | (15.15) | | 2,020 | | 2.15 | | 2.04 | | 0.29 | | 62 |
| I | | 10.37 | | 0.12 | | (1.48) | | (1.36) | | (0.12) | | (0.58) | | (0.70) | | 8.31 | | (14.22) | | 2,915 | | 1.04 | | 0.93 | | 1.43 | | 62 |
| R3 | | 10.73 | | 0.08 | | (1.54) | | (1.46) | | (0.07) | | (0.58) | | (0.65) | | 8.62 | | (14.62) | | 457 | | 1.63 | | 1.42 | | 0.92 | | 62 |
| R4 | | 10.89 | | 0.10 | | (1.56) | | (1.46) | | (0.09) | | (0.58) | | (0.67) | | 8.76 | | (14.46) | | 30 | | 1.33 | | 1.20 | | 1.10 | | 62 |
| R5 | | 10.87 | | 0.13 | | (1.56) | | (1.43) | | (0.12) | | (0.58) | | (0.70) | | 8.74 | | (14.21) | | 10 | | 1.03 | | 0.90 | | 1.51 | | 62 |
| R6 | | 10.87 | | 0.12 | | (1.54) | | (1.42) | | (0.13) | | (0.58) | | (0.71) | | 8.74 | | (14.17) | | 240 | | 0.92 | | 0.80 | | 1.42 | | 62 |
| Y | | 10.86 | | 0.13 | | (1.55) | | (1.42) | | (0.13) | | (0.58) | | (0.71) | | 8.73 | | (14.18) | | 250 | | 1.02 | | 0.85 | | 1.50 | | 62 |
| F | | 10.38 | | 0.13 | | (1.49) | | (1.36) | | (0.13) | | (0.58) | | (0.71) | | 8.31 | | (14.22) | | 40,447 | | 0.91 | | 0.80 | | 1.53 | | 62 |
| For the Year Ended October 31, 2019 |
| A | | $ 13.65 | | $ 0.10 | | $ (0.04) | | $ 0.06 | | $ (0.03) | | $ (3.33) | | $ (3.36) | | $ 10.35 | | 3.46% | | $ 47,037 | | 1.37% | | 1.27% | | 0.98% | | 140% |
| C | | 12.35 | | 0.02 | | (0.08) | | (0.06) | | — | | (3.33) | | (3.33) | | 8.96 | | 2.60 | | 3,719 | | 2.14 | | 2.04 | | 0.26 | | 140 |
| I | | 13.68 | | 0.14 | | (0.05) | | 0.09 | | (0.07) | | (3.33) | | (3.40) | | 10.37 | | 3.77 | | 4,354 | | 1.00 | | 0.90 | | 1.34 | | 140 |
| R3 | | 14.02 | | 0.09 | | (0.03) | | 0.06 | | (0.02) | | (3.33) | | (3.35) | | 10.73 | | 3.31 | | 609 | | 1.62 | | 1.42 | | 0.82 | | 140 |
| R4 | | 14.16 | | 0.11 | | (0.03) | | 0.08 | | (0.02) | | (3.33) | | (3.35) | | 10.89 | | 3.52 | | 69 | | 1.31 | | 1.20 | | 1.01 | | 140 |
| R5 | | 14.16 | | 0.16 | | (0.05) | | 0.11 | | (0.07) | | (3.33) | | (3.40) | | 10.87 | | 3.82 | | 11 | | 1.01 | | 0.90 | | 1.44 | | 140 |
| R6 | | 14.15 | | 0.15 | | (0.02) | | 0.13 | | (0.08) | | (3.33) | | (3.41) | | 10.87 | | 3.99 | | 103 | | 0.89 | | 0.80 | | 1.39 | | 140 |
| Y | | 14.15 | | 0.16 | | (0.04) | | 0.12 | | (0.08) | | (3.33) | | (3.41) | | 10.86 | | 3.94 | | 572 | | 0.97 | | 0.85 | | 1.43 | | 140 |
| F | | 13.68 | | 0.15 | | (0.04) | | 0.11 | | (0.08) | | (3.33) | | (3.41) | | 10.38 | | 3.99 | | 48,425 | | 0.89 | | 0.80 | | 1.43 | | 140 |
| For the Year Ended October 31, 2018 |
| A | | $ 14.13 | | $ 0.04 | | $ 0.10 | | $ 0.14 | | $ (0.02) | | $ (0.60) | | $ (0.62) | | $ 13.65 | | 1.00% | | $ 52,406 | | 1.35% | | 1.29% | | 0.28% | | 68% |
| C | | 12.91 | | (0.06) | | 0.10 | | 0.04 | | — | | (0.60) | | (0.60) | | 12.35 | | 0.27 | | 6,444 | | 2.13 | | 2.04 | | (0.44) | | 68 |
| I | | 14.15 | | 0.09 | | 0.10 | | 0.19 | | (0.06) | | (0.60) | | (0.66) | | 13.68 | | 1.33 | | 3,756 | | 1.02 | | 0.95 | | 0.62 | | 68 |
| R3 | | 14.50 | | 0.03 | | 0.09 | | 0.12 | | — | | (0.60) | | (0.60) | | 14.02 | | 0.82 | | 529 | | 1.62 | | 1.43 | | 0.18 | | 68 |
| R4 | | 14.61 | | 0.06 | | 0.10 | | 0.16 | | (0.01) | | (0.60) | | (0.61) | | 14.16 | | 1.07 | | 48 | | 1.32 | | 1.20 | | 0.41 | | 68 |
| R5 | | 14.63 | | 0.10 | | 0.10 | | 0.20 | | (0.07) | | (0.60) | | (0.67) | | 14.16 | | 1.39 | | 36 | | 1.02 | | 0.90 | | 0.71 | | 68 |
| R6 | | 13.99 | | 0.05 | | 0.11 | | 0.16 | | — | | — | | — | | 14.15 | | 1.14 (6) | | 10 | | 0.91 (7) | | 0.84 (7) | | 0.47 (7) | | 68 |
| Y | | 14.66 | | 0.11 | | 0.10 | | 0.21 | | (0.12) | | (0.60) | | (0.72) | | 14.15 | | 1.42 | | 646 | | 0.96 | | 0.85 | | 0.74 | | 68 |
| F | | 14.16 | | 0.11 | | 0.09 | | 0.20 | | (0.08) | | (0.60) | | (0.68) | | 13.68 | | 1.42 | | 38,087 | | 0.90 | | 0.84 | | 0.80 | | 68 |
| For the Year Ended October 31, 2017 |
| A | | $ 11.56 | | $ 0.04 | | $ 2.63 | | $ 2.67 | | $ (0.10) | | $ — | | $ (0.10) | | $ 14.13 | | 23.19% | | $ 53,057 | | 1.28% | | 1.27% | | 0.32% | | 83% |
| C | | 10.58 | | (0.05) | | 2.40 | | 2.35 | | (0.02) | | — | | (0.02) | | 12.91 | | 22.24 | | 11,081 | | 2.03 | | 2.01 | | (0.41) | | 83 |
| I | | 11.58 | | 0.08 | | 2.63 | | 2.71 | | (0.14) | | — | | (0.14) | | 14.15 | | 23.53 | | 3,225 | | 1.01 | | 1.00 | | 0.60 | | 83 |
| R3 | | 11.87 | | 0.01 | | 2.69 | | 2.70 | | (0.07) | | — | | (0.07) | | 14.50 | | 22.79 | | 723 | | 1.63 | | 1.50 | | 0.09 | | 83 |
| R4 | | 11.94 | | 0.05 | | 2.70 | | 2.75 | | (0.08) | | — | | (0.08) | | 14.61 | | 23.11 | | 113 | | 1.36 | | 1.20 | | 0.36 | | 83 |
| R5 | | 11.96 | | 0.10 | | 2.71 | | 2.81 | | (0.14) | | — | | (0.14) | | 14.63 | | 23.63 | | 44 | | 1.01 | | 0.90 | | 0.74 | | 83 |
| Y | | 12.00 | | 0.11 | | 2.71 | | 2.82 | | (0.16) | | — | | (0.16) | | 14.66 | | 23.58 | | 1,242 | | 0.86 | | 0.85 | | 0.78 | | 83 |
| F | | 13.22 | | 0.05 | | 0.89 | | 0.94 | | — | | — | | — | | 14.16 | | 7.11 (6) | | 86,675 | | 0.88 (7) | | 0.85 (7) | | 0.52 (7) | | 83 |
The accompanying notes are an integral part of these financial statements.
Hartford Domestic Equity Funds
Financial Highlights – (continued)
| | | — Selected Per-Share Data(1) — | | — Ratios and Supplemental Data — |
| Class | | Net
Asset
Value at
Beginning
of Period | | Net
Investment
Income
(Loss) | | Net
Realized
and
Unrealized
Gain (Loss)
on
Investments | | Total from
Investment
Operations | | Dividends
from Net
Investment
Income | | Distributions
from
Capital
Gains | | Total
Dividends
and
Distributions | | Net
Asset
Value at
End of
Period | | Total
Return(2) | | Net
Assets
at End
of Period
(000s) | | Ratio of
Expenses
to
Average
Net
Assets
Before
Adjust-
ments(3) | | Ratio of
Expenses
to
Average
Net
Assets
After
Adjust-
ments(3) | | Ratio of
Net
Investment
Income
(Loss) to
Average
Net Assets | | Portfolio
Turnover |
| The Hartford Small Company Fund |
| For the Year Ended October 31, 2021 |
| A | | $ 25.50 | | $ (0.30) | | $ 7.82 | | $ 7.52 | | $ — | | $ (2.78) | | $ (2.78) | | $ 30.24 | | 30.50% | | $ 502,923 | | 1.23% | | 1.22% | | (1.02)% | | 123% |
| C | | 15.97 | | (0.33) | | 4.79 | | 4.46 | | — | | (2.78) | | (2.78) | | 17.65 | | 29.39 | | 9,324 | | 2.05 | | 2.05 | | (1.85) | | 123 |
| I | | 27.31 | | (0.25) | | 8.41 | | 8.16 | | — | | (2.78) | | (2.78) | | 32.69 | | 30.84 | | 59,421 | | 0.95 | | 0.95 | | (0.77) | | 123 |
| R3 | | 28.02 | | (0.45) | | 8.62 | | 8.17 | | — | | (2.78) | | (2.78) | | 33.41 | | 30.04 | | 15,527 | | 1.57 | | 1.57 | | (1.37) | | 123 |
| R4 | | 30.22 | | (0.38) | | 9.33 | | 8.95 | | — | | (2.78) | | (2.78) | | 36.39 | | 30.46 | | 15,320 | | 1.26 | | 1.26 | | (1.06) | | 123 |
| R5 | | 32.33 | | (0.30) | | 10.01 | | 9.71 | | — | | (2.78) | | (2.78) | | 39.26 | | 30.85 | | 6,782 | | 0.97 | | 0.97 | | (0.78) | | 123 |
| R6 | | 33.12 | | (0.28) | | 10.27 | | 9.99 | | — | | (2.78) | | (2.78) | | 40.33 | | 30.97 | | 5,954 | | 0.85 | | 0.85 | | (0.69) | | 123 |
| Y | | 33.07 | | (0.29) | | 10.25 | | 9.96 | | — | | (2.78) | | (2.78) | | 40.25 | | 30.92 | | 45,590 | | 0.91 | | 0.91 | | (0.72) | | 123 |
| F | | 27.49 | | (0.21) | | 8.46 | | 8.25 | | — | | (2.78) | | (2.78) | | 32.96 | | 30.98 | | 333,061 | | 0.85 | | 0.85 | | (0.65) | | 123 |
| For the Year Ended October 31, 2020 |
| A | | $ 20.35 | | $ (0.14) | | $ 6.57 | | $ 6.43 | | $ — | | $ (1.28) | | $ (1.28) | | $ 25.50 | | 33.21% | | $ 389,496 | | 1.32% | | 1.31% | | (0.66)% | | 104% |
| C | | 13.30 | | (0.20) | | 4.15 | | 3.95 | | — | | (1.28) | | (1.28) | | 15.97 | | 32.08 | | 9,058 | | 2.14 | | 2.14 | | (1.50) | | 104 |
| I | | 21.65 | | (0.08) | | 7.02 | | 6.94 | | — | | (1.28) | | (1.28) | | 27.31 | | 33.59 | | 35,806 | | 1.00 | | 1.00 | | (0.35) | | 104 |
| R3 | | 22.29 | | (0.21) | | 7.22 | | 7.01 | | — | | (1.28) | | (1.28) | | 28.02 | | 32.91 | | 14,013 | | 1.61 | | 1.55 | | (0.90) | | 104 |
| R4 | | 23.88 | | (0.15) | | 7.77 | | 7.62 | | — | | (1.28) | | (1.28) | | 30.22 | | 33.29 | | 13,363 | | 1.30 | | 1.25 | | (0.60) | | 104 |
| R5 | | 25.40 | | (0.08) | | 8.29 | | 8.21 | | — | | (1.28) | | (1.28) | | 32.33 | | 33.64 | | 3,936 | | 1.01 | | 0.95 | | (0.30) | | 104 |
| R6 | | 25.97 | | (0.13) | | 8.56 | | 8.43 | | — | | (1.28) | | (1.28) | | 33.12 | | 33.75 | | 1,530 | | 0.90 | | 0.90 | | (0.42) | | 104 |
| Y | | 25.95 | | (0.08) | | 8.48 | | 8.40 | | — | | (1.28) | | (1.28) | | 33.07 | | 33.65 | | 19,956 | | 0.96 | | 0.95 | | (0.29) | | 104 |
| F | | 21.76 | | (0.06) | | 7.07 | | 7.01 | | — | | (1.28) | | (1.28) | | 27.49 | | 33.75 | | 243,057 | | 0.90 | | 0.90 | | (0.24) | | 104 |
| For the Year Ended October 31, 2019 |
| A | | $ 22.20 | | $ (0.13) | | $ 2.28 | | $ 2.15 | | $ — | | $ (4.00) | | $ (4.00) | | $ 20.35 | | 14.08% | | $ 311,742 | | 1.33% | | 1.32% | | (0.66)% | | 91% |
| C | | 16.11 | | (0.19) | | 1.38 | | 1.19 | | — | | (4.00) | | (4.00) | | 13.30 | | 13.24 | | 9,929 | | 2.14 | | 2.13 | | (1.46) | | 91 |
| I | | 23.28 | | (0.08) | | 2.45 | | 2.37 | | — | | (4.00) | | (4.00) | | 21.65 | | 14.48 | | 26,939 | | 1.04 | | 1.03 | | (0.37) | | 91 |
| R3 | | 23.95 | | (0.19) | | 2.53 | | 2.34 | | — | | (4.00) | | (4.00) | | 22.29 | | 13.84 | | 14,142 | | 1.62 | | 1.55 | | (0.89) | | 91 |
| R4 | | 25.28 | | (0.14) | | 2.74 | | 2.60 | | — | | (4.00) | | (4.00) | | 23.88 | | 14.20 | | 14,261 | | 1.32 | | 1.25 | | (0.59) | | 91 |
| R5 | | 26.53 | | (0.07) | | 2.94 | | 2.87 | | — | | (4.00) | | (4.00) | | 25.40 | | 14.56 | | 3,239 | | 1.02 | | 0.95 | | (0.29) | | 91 |
| R6 | | 27.02 | | (0.06) | | 3.01 | | 2.95 | | — | | (4.00) | | (4.00) | | 25.97 | | 14.60 | | 206 | | 0.90 | | 0.90 | | (0.23) | | 91 |
| Y | | 27.01 | | (0.06) | | 3.00 | | 2.94 | | — | | (4.00) | | (4.00) | | 25.95 | | 14.56 | | 32,472 | | 0.94 | | 0.93 | | (0.26) | | 91 |
| F | | 23.35 | | (0.05) | | 2.46 | | 2.41 | | — | | (4.00) | | (4.00) | | 21.76 | | 14.63 | | 193,242 | | 0.90 | | 0.90 | | (0.23) | | 91 |
| For the Year Ended October 31, 2018 |
| A | | $ 20.34 | | $ (0.20) | | $ 2.06 | | $ 1.86 | | $ — | | $ — | | $ — | | $ 22.20 | | 9.20% | | $ 283,912 | | 1.34% | | 1.33% | | (0.87)% | | 104% |
| C | | 14.87 | | (0.27) | | 1.51 | | 1.24 | | — | | — | | — | | 16.11 | | 8.34 | | 11,729 | | 2.12 | | 2.10 | | (1.64) | | 104 |
| I | | 21.27 | | (0.14) | | 2.15 | | 2.01 | | — | | — | | — | | 23.28 | | 9.45 | | 28,540 | | 1.07 | | 1.05 | | (0.60) | | 104 |
| R3 | | 21.98 | | (0.27) | | 2.24 | | 1.97 | | — | | — | | — | | 23.95 | | 8.92 | | 16,386 | | 1.63 | | 1.55 | | (1.09) | | 104 |
| R4 | | 23.14 | | (0.20) | | 2.34 | | 2.14 | | — | | — | | — | | 25.28 | | 9.25 | | 15,295 | | 1.32 | | 1.25 | | (0.79) | | 104 |
| R5 | | 24.21 | | (0.14) | | 2.46 | | 2.32 | | — | | — | | — | | 26.53 | | 9.58 | | 2,678 | | 1.03 | | 0.95 | | (0.51) | | 104 |
| R6 | | 24.64 | | (0.12) | | 2.50 | | 2.38 | | — | | — | | — | | 27.02 | | 9.66 | | 144 | | 0.91 | | 0.90 | | (0.42) | | 104 |
| Y | | 24.64 | | (0.12) | | 2.49 | | 2.37 | | — | | — | | — | | 27.01 | | 9.66 | | 35,351 | | 0.92 | | 0.90 | | (0.44) | | 104 |
| F | | 21.30 | | (0.11) | | 2.16 | | 2.05 | | — | | — | | — | | 23.35 | | 9.63 | | 115,365 | | 0.91 | | 0.90 | | (0.45) | | 104 |
The accompanying notes are an integral part of these financial statements.
Hartford Domestic Equity Funds
Financial Highlights – (continued)
| | | — Selected Per-Share Data(1) — | | — Ratios and Supplemental Data — |
| Class | | Net
Asset
Value at
Beginning
of Period | | Net
Investment
Income
(Loss) | | Net
Realized
and
Unrealized
Gain (Loss)
on
Investments | | Total from
Investment
Operations | | Dividends
from Net
Investment
Income | | Distributions
from
Capital
Gains | | Total
Dividends
and
Distributions | | Net
Asset
Value at
End of
Period | | Total
Return(2) | | Net
Assets
at End
of Period
(000s) | | Ratio of
Expenses
to
Average
Net
Assets
Before
Adjust-
ments(3) | | Ratio of
Expenses
to
Average
Net
Assets
After
Adjust-
ments(3) | | Ratio of
Net
Investment
Income
(Loss) to
Average
Net Assets | | Portfolio
Turnover |
| The Hartford Small Company Fund – (continued) |
| For the Year Ended October 31, 2017 |
| A | | $ 15.74 | | $ (0.12) | | $ 4.72 | | $ 4.60 | | $ — | | $ — | | $ — | | $ 20.34 | | 29.16% | | $ 252,187 | | 1.39% | | 1.37% | | (0.64)% | | 109% |
| C | | 11.60 | | (0.19) | | 3.46 | | 3.27 | | — | | — | | — | | 14.87 | | 28.19 | | 26,529 | | 2.12 | | 2.10 | | (1.40) | | 109 |
| I | | 16.43 | | (0.10) | | 4.94 | | 4.84 | | — | | — | | — | | 21.27 | | 29.40 | | 28,052 | | 1.49 | | 1.15 | | (0.51) | | 109 |
| R3 | | 17.05 | | (0.17) | | 5.10 | | 4.93 | | — | | — | | — | | 21.98 | | 28.91 | | 23,932 | | 1.63 | | 1.55 | | (0.84) | | 109 |
| R4 | | 17.89 | | (0.11) | | 5.36 | | 5.25 | | — | | — | | — | | 23.14 | | 29.29 | | 23,080 | | 1.32 | | 1.25 | | (0.53) | | 109 |
| R5 | | 18.67 | | (0.04) | | 5.58 | | 5.54 | | — | | — | | — | | 24.21 | | 29.67 | | 3,263 | | 1.06 | | 0.95 | | (0.20) | | 109 |
| R6 | | 18.99 | | (0.09) | | 5.74 | | 5.65 | | — | | — | | — | | 24.64 | | 29.75 | | 78 | | 1.07 | | 0.90 | | (0.38) | | 109 |
| Y | | 18.99 | | (0.02) | | 5.67 | | 5.65 | | — | | — | | — | | 24.64 | | 29.70 | | 33,040 | | 0.94 | | 0.90 | | (0.08) | | 109 |
| F (5) | | 18.76 | | (0.05) | | 2.59 | | 2.54 | | — | | — | | — | | 21.30 | | 13.49 (6) | | 81,831 | | 0.92 (7) | | 0.90 (7) | | (0.38) (7) | | 109 |
| FINANCIAL HIGHLIGHTS FOOTNOTES |
| (1) | Information presented relates to a share outstanding throughout the indicated period. Net investment income (loss) per share amounts are calculated based on average shares outstanding unless otherwise noted. |
| (2) | Assumes initial investment at net asset value at the beginning of each period, reinvestment of all distributions, the complete redemption of the investment at net asset value at the end of each period and no sales charge. Total return would be reduced if sales charges were taken into account. |
| (3) | Adjustments include waivers and reimbursements, if applicable. Ratios do not include fees paid indirectly (see Expenses in the accompanying Notes to Financial Statements). |
| (4) | Includes interest expense representing less than 0.005%. |
| (5) | Commenced operations on February 28, 2017. |
| (6) | Not annualized. |
| (7) | Annualized. |
| (8) | Amount is less than $0.01 per share. |
| (9) | Amount is less than 0.01%. |
| (10) | Commenced operations on February 28, 2019. |
| (11) | Commenced operations on February 28, 2018. |
| (12) | Per share amount was not in accord with the net realized and unrealized gain (loss) for the period because of the timing of transactions in shares of the Fund and the amount and timing of per-share net realized and unrealized gain (loss) on such shares. |
The accompanying notes are an integral part of these financial statements.
Hartford Domestic Equity Funds
Notes to Financial Statements
October 31, 2021
| 1. | Organization: |
| | The Hartford Mutual Funds, Inc. and The Hartford Mutual Funds II, Inc. (each, a "Company" and collectively, the "Companies") are each an open-end registered management investment company comprised of thirty-six and thirteen series, respectively, as of October 31, 2021. Financial statements for the series of each Company listed below (each, a “Fund” and collectively, the “Funds”) are included in this report. |
| | |
| The Hartford Mutual Funds, Inc.: |
| The Hartford Capital Appreciation Fund (the "Capital Appreciation Fund") |
| Hartford Core Equity Fund (the "Core Equity Fund") |
| The Hartford Dividend and Growth Fund (the "Dividend and Growth Fund") |
| The Hartford Equity Income Fund (the "Equity Income Fund") |
| The Hartford Healthcare Fund (the "Healthcare Fund") |
| The Hartford MidCap Fund (the "MidCap Fund") |
| The Hartford MidCap Value Fund (the "MidCap Value Fund") |
| Hartford Small Cap Value Fund (the "Small Cap Value Fund") |
| The Hartford Small Company Fund (the "Small Company Fund") |
| The Hartford Mutual Funds II, Inc.: |
| The Hartford Growth Opportunities Fund (the "Growth Opportunities Fund") |
| Hartford Quality Value Fund (the "Quality Value Fund") |
| The Hartford Small Cap Growth Fund (the "Small Cap Growth Fund") |
The assets of each Fund are separate, and a shareholder's interest is limited to the Fund in which shares are held. Each Company is organized under the laws of the State of Maryland and is registered with the Securities and Exchange Commission (the “SEC”) under the Investment Company Act of 1940, as amended (the “1940 Act”). Each Fund is a diversified open-end management investment company. Each Fund applies specialized accounting and reporting standards under Accounting Standards Codification Topic 946, "Financial Services – Investment Companies".
Each Fund has registered for sale Class A, Class C, Class I, Class R3, Class R4, Class R5, Class Y and Class F shares. Core Equity Fund has registered for sale Class T shares. As of October 31, 2021, Class T shares have not commenced operations. Each Fund, except the MidCap Value Fund, has registered for sale Class R6 shares. Class A shares of each Fund are sold with a front-end sales charge of up to 5.50%. Class T shares have a front-end sales charge of up to 2.50%. Class C shares of each Fund are sold with a contingent deferred sales charge of up to 1.00% on shares redeemed within twelve months of purchase. Effective April 1, 2021, Class C shares automatically convert to Class A shares of the same Fund after eight years provided that the Fund or the financial intermediary has records verifying that the Class C shares have been held for at least eight years. Classes I, R3, R4, R5, R6, Y and F shares do not have a sales charge.
| 2. | Significant Accounting Policies: |
| | The following is a summary of significant accounting policies of each Fund used in the preparation of its financial statements, which are in accordance with United States Generally Accepted Accounting Principles (“U.S. GAAP”). The preparation of financial statements in accordance with U.S. GAAP may require management to make estimates and assumptions that affect the reported amounts of assets and liabilities and disclosure of contingent assets and liabilities at the date of the financial statements and the reported amounts of increases and decreases in net assets from operations during the reporting period. Actual results could differ from those estimates. |
| a) | Determination of Net Asset Value – The net asset value ("NAV") of each class of each Fund’s shares is determined as of the close of regular trading on the New York Stock Exchange (the "Exchange") (normally 4:00 p.m. Eastern Time) (the “NYSE Close”) on each day that the Exchange is open ("Valuation Date"). If the Exchange is closed due to weather or other extraordinary circumstances on a day it would typically be open for business, each Fund may treat such day as a typical business day and accept purchase and redemption orders and calculate each Fund’s NAV in accordance with applicable law. The NAV of each class of each Fund's shares is determined by dividing the value of the Fund’s net assets attributable to the class of shares by the number of shares outstanding for that class. Information that becomes known to the Funds after the NAV has been calculated on a particular day will not generally be used to retroactively adjust the NAV determined earlier that day. |
| b) | Investment Valuation and Fair Value Measurements – For purposes of calculating the NAV of each class of each Fund, portfolio securities and other assets held in the Fund’s portfolio for which market prices are readily available are valued at market value. Market value is generally determined on the basis of official close price or last reported trade price. If no trades were reported, market value is based on prices obtained from a quotation reporting system, established market makers (including evaluated prices), or independent pricing services. Pricing vendors may use matrix pricing or valuation models that utilize certain inputs and assumptions to derive values, including transaction |
Hartford Domestic Equity Funds
Notes to Financial Statements – (continued)
October 31, 2021
| | data, credit quality information, general market conditions, news, and other factors and assumptions. |
| | If market prices are not readily available or are deemed unreliable, a Fund will use the fair value of the security or other instrument as determined in good faith under policies and procedures established by and under the supervision of the Board of Directors of the respective Company (the “Board of Directors”) (“Valuation Procedures”). Market prices are considered not readily available where there is an absence of current or reliable market-based data (e.g., trade information or broker quotes), including where events occur after the close of the relevant market, but prior to the NYSE Close, that materially affect the values of a Fund’s portfolio holdings or assets. In addition, market prices are considered not readily available when, due to extraordinary circumstances, the exchanges or markets on which the securities or other instruments trade do not open for trading for the entire day and no other market prices are available. Fair value pricing is subjective in nature and the use of fair value pricing by a Fund may cause the NAV of its shares to differ significantly from the NAV that would have been calculated using market prices at the close of the exchange on which a portfolio holding is primarily traded. There can be no assurance that a Fund could obtain the fair value assigned to an investment if the Fund were to sell the investment at approximately the time at which the Fund determines its NAV. |
| | Prices of foreign equities that are principally traded on certain foreign markets will generally be adjusted daily pursuant to a fair value pricing service in order to reflect an adjustment for the factors occurring after the close of certain foreign markets but before the NYSE Close. Securities and other instruments that are primarily traded on foreign markets may trade on days that are not business days of the Funds. The value of the foreign securities or other instruments in which a Fund invests may change on days when a shareholder will not be able to purchase, redeem or exchange shares of the Fund. |
| | Fixed income investments (other than short-term obligations) and non-exchange traded derivatives held by a Fund are normally valued at prices supplied by independent pricing services in accordance with the Valuation Procedures. Short-term investments maturing in 60 days or less are generally valued at amortized cost which approximates fair value. |
| | Exchange-traded derivatives, such as options, futures and options on futures, are valued at the last sale price determined by the exchange where such instruments principally trade as of the close of such exchange (“Exchange Close”). If a last sale price is not available, the value will be the mean of the most recently quoted bid and ask prices as of the Exchange Close. If a mean of the bid and ask prices cannot be calculated for the day, the value will be the most recently quoted bid price as of the Exchange Close. Over-the-counter derivatives are normally valued based on prices supplied by independent pricing services in accordance with the Valuation Procedures. |
| | Investments valued in currencies other than U.S. dollars are converted to U.S. dollars using the prevailing spot currency exchange rates obtained from independent pricing services for calculation of the NAV. As a result, the NAV of a Fund’s shares may be affected by changes in the value of currencies in relation to the U.S. dollar. The value of securities or other instruments traded in markets outside the United States or denominated in currencies other than the U.S. dollar may be affected significantly on a day that the Exchange is closed and the market value may change on days when an investor is not able to purchase, redeem or exchange shares of a Fund. |
| | Foreign currency contracts represent agreements to exchange currencies on specific future dates at predetermined rates. Foreign currency contracts are valued using foreign currency exchange rates and forward rates as provided by an independent pricing service on the Valuation Date. |
| | Investments in investment companies that are not listed or traded on an exchange ("Non-Traded Funds"), if any, are valued at the respective NAV of each Non-Traded Fund on the Valuation Date. Shares of investment companies listed and traded on an exchange are valued in the same manner as any exchange-listed equity security. Such Non-Traded Funds and listed investment companies may use fair value pricing as disclosed in their prospectuses. |
| | Financial instruments for which prices are not available from an independent pricing service may be valued using market quotations obtained from one or more dealers that make markets in the respective financial instrument in accordance with the Valuation Procedures. |
| | U.S. GAAP defines fair value as the price that a Fund would receive to sell an asset or pay to transfer a liability in an orderly transaction between market participants. The U.S. GAAP fair value measurement standards require disclosure of a fair value hierarchy for each major category of assets and liabilities. Various inputs are used in determining the fair value of each Fund’s investments. These inputs are summarized into three broad hierarchy levels. This hierarchy is based on whether the valuation inputs are observable or unobservable. These levels are: |
| • | Level 1 – Quoted prices in active markets for identical investments. Level 1 may include exchange traded instruments, such as domestic equities, some foreign equities, options, futures, mutual funds, exchange traded funds, rights and warrants. |
| • | Level 2 – Observable inputs other than Level 1 prices, such as quoted prices for similar investments; quoted prices in markets that are not active; or other inputs that are observable or can be corroborated by observable market data. Level 2 may include debt investments that are traded less frequently than exchange traded instruments and which are valued using independent pricing services; foreign equities, which are principally traded on certain foreign markets and are adjusted daily pursuant to a fair value pricing service in order |
Hartford Domestic Equity Funds
Notes to Financial Statements – (continued)
October 31, 2021
| | to reflect an adjustment for the factors occurring after the close of certain foreign markets but before the NYSE Close; senior floating rate interests, which are valued using an aggregate of dealer bids; short-term investments, which are valued at amortized cost; and swaps, which are valued based upon the terms of each swap contract. |
| • | Level 3 – Significant unobservable inputs that are supported by limited or no market activity. Level 3 may include financial instruments whose values are determined using indicative market quotes or require significant management judgment or estimation. These unobservable valuation inputs may include estimates for current yields, maturity/duration, prepayment speed, and indicative market quotes for comparable investments along with other assumptions relating to credit quality, collateral value, complexity of the investment structure, general market conditions and liquidity. This category may include investments where trading has been halted or there are certain restrictions on trading. While these investments are priced using unobservable inputs, the valuation of these investments reflects the best available data and management believes the prices are a reasonable representation of exit price. |
The Board of Directors has delegated the day-to-day responsibility for implementing the Valuation Procedures to the Valuation Committee. The Valuation Committee will consider all relevant factors in determining an investment’s fair value, and may seek the advice of such Fund’s sub-adviser(s), as applicable, knowledgeable brokers, and legal counsel in making such determination. The Valuation Committee reports to the Audit Committee of the Board of Directors.
Valuation levels are not necessarily indicative of the risk associated with investing in such investments. Individual investments within any of the above mentioned asset classes may be assigned a different hierarchical level than those presented above, as individual circumstances dictate.
For additional information, refer to the Fair Value Summary and the Level 3 roll-forward reconciliation, if applicable, which follows each Fund's Schedule of Investments.
| c) | Investment Transactions and Investment Income – Investment transactions are recorded as of the trade date (the date the order to buy or sell is executed) for financial reporting purposes. Investments purchased or sold on a when-issued or delayed-delivery basis may be settled a month or more after the trade date. Realized gains and losses are determined on the basis of identified cost. |
| | Dividend income from domestic securities is accrued on the ex-dividend date. In general, dividend income from foreign securities is recorded on the ex-date; however, dividend notifications in certain foreign jurisdictions may not be available in a timely manner and as a result, a Fund will record the dividend as soon as the relevant details (i.e., rate per share, payment date, shareholders of record, etc.) are publicly available. |
| | Interest income, including amortization of premium, accretion of discounts and additional principal received in-kind in lieu of cash, is accrued on a daily basis. |
Please refer to Note 8 for Securities Lending information.
| d) | Taxes – A Fund may be subject to taxes imposed on realized gains on securities of certain foreign countries in which such Fund invests. A Fund may also be subject to taxes withheld on foreign dividends and interest from securities in which a Fund invests. The amount of any foreign taxes withheld and foreign tax expense is included on the accompanying Statements of Operations as a reduction to net investment income or net realized or unrealized gain (loss) on investments in these securities, if applicable. |
| e) | Foreign Currency Transactions – Assets and liabilities denominated in currencies other than U.S. dollars are translated into U.S. dollars at the exchange rates in effect on the Valuation Date. Purchases and sales of investments, income and expenses are translated into U.S. dollars at the exchange rates on the dates of such transactions. |
| | A Fund does not isolate that portion of portfolio investment valuation resulting from fluctuations in the foreign currency exchange rates from the fluctuations arising from changes in the market prices of investments held. Exchange rate fluctuations are included with the net realized and unrealized gain or loss on investments in the accompanying financial statements. |
| | Net realized foreign exchange gains or losses arise from sales of foreign currencies and the difference between asset and liability amounts initially stated in foreign currencies and the U.S. dollar value of the amounts actually received or paid. Net unrealized foreign exchange gains or losses arise from changes in the value of other assets and liabilities at the end of the reporting period, resulting from changes in the exchange rates. |
| f) | Joint Trading Account – A Fund may invest cash balances into a joint trading account that may be invested in one or more repurchase agreements. |
| g) | Fund Share Valuation and Dividend Distributions to Shareholders – Orders for each class of each Fund’s shares are executed in accordance with the investment instructions of the shareholders. The NAV of each class of each Fund’s shares is determined as of the close of business on each business day of the Exchange (see Note 2(a)). The NAV is determined separately for each class of shares of a Fund by dividing the Fund's net assets attributable to that class by the number of shares of the class outstanding. Each class of shares offered by a Fund |
Hartford Domestic Equity Funds
Notes to Financial Statements – (continued)
October 31, 2021
| | has equal rights as to assets and voting privileges (except that shareholders of a class have exclusive voting rights regarding any matter relating solely to that class of shares). Income and non-class specific expenses are allocated daily to each class on the basis of the relative net assets of the class of the Fund. Realized and unrealized gains and losses are allocated daily based on the relative net assets of each class of shares of each Fund. |
| | Orders for the purchase of a Fund's shares received prior to the close of the Exchange on any day the Exchange is open for business are priced at the NAV determined as of the close of the Exchange. Orders received after the close of the Exchange, or on a day on which the Exchange and/or the Funds are not open for business, are priced at the next determined NAV. |
| | Dividends are declared pursuant to a policy adopted by the respective Company's Board of Directors. Dividends and/or distributions to shareholders are recorded on ex-date. The policy of each Fund, except Dividend and Growth Fund and Equity Income Fund, is to pay dividends from net investment income and realized gains, if any, at least once a year. The policy of Dividend and Growth Fund and Equity Income Fund is to pay dividends from net investment income, if any, quarterly and realized gains, if any, at least once a year. |
| | Income dividends and capital gains distributions are determined in accordance with federal income tax regulations, which may differ from U.S. GAAP with respect to character and timing (see Federal Income Taxes: Distributions and Components of Distributable Earnings and Reclassification of Capital Accounts notes). |
| 3. | Securities and Other Investments: |
| a) | Restricted Securities – Each Fund may invest in securities that are subject to legal or contractual restrictions on resale. These securities generally may be resold in transactions exempt from registration or to the public if the securities are registered. Disposal of these securities may involve time-consuming negotiations and expense, and prompt sale at an acceptable price may be difficult. Information regarding restricted securities, if applicable, is included at the end of each Fund's Schedule of Investments. |
| b) | Repurchase Agreements – A repurchase agreement is an agreement between two parties whereby one party sells the other a security at a specified price with a commitment to repurchase the security later at an agreed-upon price, date and interest payment. Each Fund is permitted to enter into fully collateralized repurchase agreements. Each Company's Board of Directors has delegated to the sub-adviser(s), as applicable, the responsibility of evaluating the creditworthiness of the banks and securities dealers with which the Funds will engage in repurchase agreements. The sub-adviser(s) will monitor such transactions to ensure that the value of underlying collateral will be at least equal to the total amount of the repurchase obligation as required by the valuation provision of the repurchase agreement, including the accrued interest. Repurchase agreements carry the risk that the market value of the securities declines below the repurchase price. A Fund could also lose money if it is unable to recover the securities and the value of any collateral held or assets segregated by the Fund to cover the transaction is less than the value of the securities. In the event the borrower commences bankruptcy proceedings, a court may characterize the transaction as a loan. If a Fund has not perfected a security interest in the underlying collateral, the Fund may be required to return the underlying collateral to the borrower’s estate and be treated as an unsecured creditor. As an unsecured creditor, the Fund could lose some or all of the principal and interest involved in the transaction. See each Fund's Schedule of Investments, if applicable, for repurchase agreements as of October 31, 2021. |
| c) | Special Purpose Acquisition Companies – A Fund may invest in special purpose acquisition companies (“SPACs”) or similar special purpose entities. SPACs are collective investment structures that pool funds in order to seek potential acquisition opportunities. SPACs and similar entities may be blank check companies with no operating history or ongoing business other than to seek a potential acquisition. Because SPACs and similar entities have no operating history or ongoing business other than seeking acquisitions, the value of their securities is particularly dependent on the ability of the entity’s management to identify and complete a profitable acquisition. Some SPACs may pursue acquisitions only within certain industries or regions, which may increase the volatility of their securities’ prices. In addition, these securities, which are typically traded in the OTC market, may be considered illiquid and/or be subject to restrictions on resale. A Fund may enter into a contingent commitment with a SPAC to purchase shares of private investments in public equity investments (“PIPE”) if and when the SPAC completes its merger or acquisition; however if the commitment expires, then no shares are purchased. Purchased PIPE shares will be restricted from trading until the registration statement for the shares is declared effective. Upon registration, the shares can be freely sold; however, in certain circumstances, the issuer may have the right to temporarily suspend trading of the shares in the first year after the merger. |
| 4. | Financial Derivative Instruments: |
| | The following disclosures contain information on how and why a Fund may use derivative instruments, the credit-risk-related contingent features in certain derivative instruments, and how derivative instruments affect a Fund’s financial position and results of operations. The location and fair value amounts of these instruments on the Statements of Assets and Liabilities and the realized gains and losses and changes in unrealized gains and losses on the Statements of Operations, each categorized by type of derivative contract, are included in the following Additional |
Hartford Domestic Equity Funds
Notes to Financial Statements – (continued)
October 31, 2021
Derivative Instrument Information footnote. The derivative instruments outstanding as of period-end are disclosed in the notes to the Schedules of Investments, if applicable. The amounts of realized gains and losses and changes in unrealized gains and losses on derivative instruments during the period are disclosed in the Statements of Operations.
| a) | Futures Contracts – A Fund may enter into futures contracts. A futures contract is an agreement between two parties to buy or sell an asset at a set price on a future date. A Fund may use futures contracts to manage risk or obtain exposure to the investment markets, commodities, or movements in interest rates and currency values. The primary risks associated with the use of futures contracts are the imperfect correlation between the change in market value of the investments held by a Fund and the prices of futures contracts and the possibility of an illiquid market. Upon entering into a futures contract, a Fund is required to deposit with a futures commission merchant (“FCM”) an amount of cash or U.S. Government or Agency Obligations in accordance with the initial margin requirements of the broker or exchange. Futures contracts are marked to market daily and an appropriate amount equal to the change in value (“variation margin”) is paid or received by a Fund. Gains or losses are recognized but not considered realized until the contracts expire or are closed. Futures contracts involve, to varying degrees, risk of loss in excess of the variation margin disclosed on the Statements of Assets and Liabilities. |
During the year ended October 31, 2021, each of Capital Appreciation Fund and Core Equity Fund had used futures contracts.
| b) | Additional Derivative Instrument Information: |
| | Capital Appreciation Fund |
| | |
| The Effect of Derivative Instruments on the Statement of Assets and Liabilities as of October 31, 2021: |
| | Risk Exposure Category |
| | Interest Rate
Contracts | | Foreign
Currency
Contracts | | Credit
Contracts | | Equity
Contracts | | Commodity
Contracts | | Total |
| Assets: | | | | | | | | | | | |
| Unrealized appreciation on futures contracts(1) | $ — | | $ — | | $ — | | $ 6,601,053 | | $ — | | $ 6,601,053 |
| Total | $ — | | $ — | | $ — | | $ 6,601,053 | | $ — | | $ 6,601,053 |
| (1) | Amount represents the cumulative appreciation and depreciation on futures contracts as disclosed within the Schedule of Investments under the open “Futures Contracts” section. Only current day’s variation margin, if any, is reported within the Statement of Assets and Liabilities. |
| The Effect of Derivative Instruments on the Statement of Operations for the year ended October 31, 2021: |
| | Risk Exposure Category |
| | Interest Rate
Contracts | | Foreign
Currency
Contracts | | Credit
Contracts | | Equity
Contracts | | Commodity
Contracts | | Total |
| Realized Gain (Loss) on Derivatives Recognized as a Result of Operations: | | | | | | | | | | | |
| Net realized gain (loss) on futures contracts | $ — | | $ — | | $ — | | $ 31,660,302 | | $ — | | $ 31,660,302 |
| Total | $ — | | $ — | | $ — | | $ 31,660,302 | | $ — | | $ 31,660,302 |
| Net Change in Unrealized Appreciation (Depreciation) on Derivatives Recognized as a Result of Operations: | | | | | | | | | | | |
| Net change in unrealized appreciation (depreciation) of futures contracts | $ — | | $ — | | $ — | | $ 8,707,449 | | $ — | | $ 8,707,449 |
| Total | $ — | | $ — | | $ — | | $ 8,707,449 | | $ — | | $ 8,707,449 |
For the year ended October 31, 2021, the average monthly amount or number per contract outstanding for each derivative type was as follows:
| Derivative Description | | Average Notional
Par, Contracts
or Face Amount |
| Futures Contracts Number of Long Contracts | | 471 |
Hartford Domestic Equity Funds
Notes to Financial Statements – (continued)
October 31, 2021
Core Equity Fund
| The Effect of Derivative Instruments on the Statement of Operations for the year ended October 31, 2021: |
| | Risk Exposure Category |
| | Interest Rate
Contracts | | Foreign
Currency
Contracts | | Credit
Contracts | | Equity
Contracts | | Commodity
Contracts | | Total |
| Realized Gain (Loss) on Derivatives Recognized as a Result of Operations: | | | | | | | | | | | |
| Net realized gain (loss) on futures contracts | $ — | | $ — | | $ — | | $ 31,391,264 | | $ — | | $ 31,391,264 |
| Total | $ — | | $ — | | $ — | | $ 31,391,264 | | $ — | | $ 31,391,264 |
| Net Change in Unrealized Appreciation (Depreciation) on Derivatives Recognized as a Result of Operations: | | | | | | | | | | | |
| Net change in unrealized appreciation (depreciation) of futures contracts | $ — | | $ — | | $ — | | $ 2,034,977 | | $ — | | $ 2,034,977 |
| Total | $ — | | $ — | | $ — | | $ 2,034,977 | | $ — | | $ 2,034,977 |
For the year ended October 31, 2021, the average monthly amount or number per contract outstanding for each derivative type was as follows:
| Derivative Description | | Average Notional
Par, Contracts
or Face Amount |
| Futures Contracts Number of Long Contracts | | 321 |
| c) | Balance Sheet Offsetting Information – Set forth below are tables which disclose both gross information and net information about instruments and transactions eligible for offset in the financial statements, and instruments and transactions that are subject to a master netting arrangement, as well as amounts related to margin, reflected as financial collateral (including cash collateral), held at clearing brokers, counterparties and a Fund's custodian. The master netting arrangements allow the clearing brokers to net any collateral held in or on behalf of a Fund, or liabilities or payment obligations of the clearing brokers to a Fund, against any liabilities or payment obligations of a Fund to the clearing brokers. A Fund is required to deposit financial collateral (including cash collateral) at the Fund's custodian on behalf of clearing brokers and counterparties to continually meet the original and maintenance requirements established by the clearing brokers and counterparties. Such requirements are specific to the respective clearing broker or counterparty. Certain master netting arrangements may not be enforceable in a bankruptcy. |
| | The following tables present a Fund's derivative assets and liabilities, presented on a gross basis as no amounts are netted within the Statements of Assets and Liabilities, by counterparty net of amounts available for offset under a master netting agreement or similar agreement ("MNA") and net of the related collateral received/pledged by a Fund as of October 31, 2021: |
| | |
| Capital Appreciation Fund | | | | |
| Derivative Financial Instruments: | | Assets | | Liabilities |
| Futures contracts | | $ 6,601,053 | | $ — |
| Total gross amount of derivative assets and liabilities in the Statement of Assets and Liabilities | | 6,601,053 | | — |
| Derivatives not subject to a MNA | | (6,601,053) | | — |
| Total gross amount of assets and liabilities subject to MNA or similar agreements | | $ — | | $ — |
| 5. | Principal Risks: |
| | A Fund’s investments expose it to various types of risks associated with financial instruments and the markets. A Fund may be exposed to the risks described below. Each Fund’s prospectus provides details of its principal risks. |
| | The market values of equity securities, such as common stocks and preferred stocks, or equity related derivative investments, such as futures and options, may decline due to general market conditions which are not specifically related to a particular company, such as real or perceived adverse economic conditions, changes in the general outlook for corporate earnings, changes in interest or currency rates or adverse investor sentiment generally. The market value of equity securities may also decline due to factors which affect a particular industry or industries, such as labor shortages or increased production costs and competitive conditions within an industry. Equity securities and equity related investments generally have greater market price volatility than fixed income securities. The extent of each Fund’s exposure to market risk is the market value of the investments held as shown in the Fund’s Schedule of Investments. |
Hartford Domestic Equity Funds
Notes to Financial Statements – (continued)
October 31, 2021
| | A widespread health crisis, such as a global pandemic, could cause substantial market volatility, exchange trading suspensions or restrictions and closures of securities exchanges and businesses, impact the ability to complete redemptions, and adversely impact Fund performance. The current ongoing outbreak of COVID-19, a respiratory disease caused by a novel coronavirus, has negatively affected the worldwide economy, created supply chain disruptions and labor shortages, and impacted the financial health of individual companies and the market in significant and unforeseen ways. The future impact of the ongoing COVID-19 pandemic remains unclear. The effects to public health, business and market conditions resulting from COVID-19 pandemic may have a significant negative impact on the performance of a Fund’s investments, including exacerbating other pre-existing political, social and economic risks. |
| | Investing in the securities of non-U.S. issuers, whether directly or indirectly, involves certain considerations and risks not typically associated with securities of U.S. issuers. Such risks include, but are not limited to: generally less liquid and less efficient securities markets; generally greater price volatility; exchange rate fluctuations; imposition of restrictions on the expatriation of funds or other protectionist measures; less publicly available information about issuers; the imposition of withholding or other taxes; higher transaction and custody costs; settlement delays and risk of loss attendant in settlement procedures; difficulties in enforcing contractual obligations; less regulation of securities markets; different accounting, disclosure and reporting requirements; more substantial governmental involvement in the economy; higher inflation rates; and greater social, economic and political uncertainties. Non-U.S. issuers may also be affected by political, social, economic or diplomatic developments in a foreign country or region or the U.S. (including the imposition of sanctions, tariffs, or other governmental restrictions). These risks are heightened for investments in issuers from countries with less developed markets. |
| | Securities lending involves the risk that a Fund may lose money because the borrower of the loaned securities fails to return the securities in a timely manner or at all. A Fund could also lose money in the event of a decline in the value of the collateral provided for the loaned securities or a decline in the value of any investments made with cash collateral. These events could also trigger adverse tax consequences for a Fund that lends its holdings. |
| a) | Each Fund intends to continue to qualify as a Regulated Investment Company ("RIC") under Subchapter M of the Internal Revenue Code (“IRC”) by distributing substantially all of its taxable net investment income and net realized capital gains to its shareholders each year. Each Fund has distributed substantially all of its income and capital gains in prior years, if applicable, and intends to distribute substantially all of its income and capital gains during the calendar year ending December 31, 2021. Accordingly, no provision for federal income or excise taxes has been made in the accompanying financial statements. Distributions from short-term capital gains are treated as ordinary income distributions for federal income tax purposes. |
| b) | Net Investment Income (Loss), Net Realized Gains (Losses) and Distributions – Net investment income (loss) and net realized gains (losses) may differ for financial statement and tax purposes primarily because of losses deferred due to wash sale adjustments, foreign currency gains and losses, adjustments related to Passive Foreign Investment Companies ("PFICs"), Real Estate Investment Trusts ("REITs"), RICs, certain derivatives and partnerships. The character of distributions made during the year from net investment income or net realized gains may differ from their ultimate characterization for federal income tax purposes. Also, due to the timing of dividend distributions, the fiscal year in which amounts are distributed may differ from the year that the income or realized gains (losses) were recorded by each Fund. |
| c) | Distributions and Components of Distributable Earnings – The tax character of distributions paid by each Fund for the years ended October 31, 2021 and October 31, 2020 are as follows: |
| | |
| | | For the Year Ended
October 31, 2021 | | For the Year Ended
October 31, 2020 |
| Fund | | Ordinary
Income | | Long-Term
Capital Gains(1) | | Ordinary
Income | | Long-Term
Capital Gains(1) |
| Capital Appreciation Fund | | $ 29,401,051 | | $ 326,546,682 | | $ 36,050,954 | | $ 304,034,945 |
| Core Equity Fund | | 70,885,946 | | — | | 60,527,093 | | 97,987,927 |
| Dividend and Growth Fund | | 154,554,069 | | 214,857,817 | | 150,668,454 | | 260,565,466 |
| Equity Income Fund | | 75,881,176 | | 42,135,878 | | 71,168,447 | | 255,909,247 |
| Growth Opportunities Fund | | 361,398,386 | | 579,604,617 | | — | | 301,835,007 |
| Healthcare Fund | | 27,136,342 | | 157,201,491 | | 6,049,810 | | 77,681,567 |
| MidCap Fund | | — | | 1,544,551,438 | | — | | 703,065,084 |
| MidCap Value Fund | | 3,497,022 | | — | | 5,747,295 | | 16,708,824 |
| Quality Value Fund | | 4,003,206 | | — | | 4,852,723 | | 5,832,576 |
| Small Cap Growth Fund | | 14,305,053 | | 46,613,265 | | — | | 15,398,605 |
| Small Cap Value Fund | | 1,100,001 | | — | | 1,006,381 | | 6,012,453 |
| Small Company Fund | | 37,854,022 | | 38,852,079 | | — | | 36,747,668 |
| (1) | The Funds designate these distributions as long-term capital gains dividends pursuant to IRC Sec 852(b)(3)(c) |
Hartford Domestic Equity Funds
Notes to Financial Statements – (continued)
October 31, 2021
As of October 31, 2021, the components of total accumulated earnings (deficit) for each Fund on a tax basis are as follows:
| Fund | | Undistributed
Ordinary
Income | | Undistributed
Long-Term
Capital Gains | | Unrealized
Appreciation
(Depreciation)
on Investments | | Total
Accumulated
Earnings
(Deficit) |
| Capital Appreciation Fund | | $ 275,556,677 | | $ 808,192,672 | | $ 1,915,262,527 | | $ 2,999,011,876 |
| Core Equity Fund | | 109,005,821 | | 276,779,779 | | 4,901,968,504 | | 5,287,754,104 |
| Dividend and Growth Fund | | 72,768,002 | | 650,563,089 | | 5,589,576,274 | | 6,312,907,365 |
| Equity Income Fund | | 23,718,521 | | 327,557,472 | | 1,593,602,175 | | 1,944,878,168 |
| Growth Opportunities Fund | | 625,300,617 | | 929,828,549 | | 1,849,084,764 | | 3,404,213,930 |
| Healthcare Fund | | 8,784,435 | | 157,636,285 | | 437,018,890 | | 603,439,610 |
| MidCap Fund | | 82,826,769 | | 1,452,195,245 | | 4,421,998,345 | | 5,957,020,359 |
| MidCap Value Fund | | 21,874,389 | | 40,778,782 | | 201,073,559 | | 263,726,730 |
| Quality Value Fund | | 3,297,860 | | 11,016,024 | | 60,551,207 | | 74,865,091 |
| Small Cap Growth Fund | | — | | 150,799,913 | | 278,504,074 | | 429,303,987 |
| Small Cap Value Fund | | 6,278,175 | | 5,362,817 | | 23,810,038 | | 35,451,030 |
| Small Company Fund | | 50,478,329 | | 153,794,458 | | 174,201,138 | | 378,473,925 |
| d) | Reclassification of Capital Accounts – The Funds may record reclassifications in their capital accounts. These reclassifications have no impact on the total net assets of the Funds. The reclassifications are a result of permanent differences between U.S. GAAP and tax accounting for such items as earnings and profits distributed to shareholders on the redemption of shares, and adjustments to prior year accumulated balances. Adjustments are made to reflect the impact these items have on current and future earnings distributions to shareholders. Therefore, the source of the Funds’ distributions may be shown in the accompanying Statements of Changes in Net Assets as from distributable earnings or from capital depending on the type of book and tax differences that exist. For the year ended October 31, 2021, the Funds recorded reclassifications to increase (decrease) the accounts listed below: |
| | |
| Fund | | Paid-in-Capital | | Distributable
Earnings (Loss) |
| Capital Appreciation Fund | | $ 36,737,981 | | $ (36,737,981) |
| Equity Income Fund | | 26,760,727 | | (26,760,727) |
| Growth Opportunities Fund | | 105,922,139 | | (105,922,139) |
| Healthcare Fund | | 9,171,665 | | (9,171,665) |
| MidCap Fund | | 202,946,801 | | (202,946,801) |
| Small Cap Growth Fund | | 17,201,525 | | (17,201,525) |
| Small Company Fund | | 6,096,797 | | (6,096,797) |
| e) | Capital Loss Carryforward – Under the Regulated Investment Company Modernization Act of 2010, funds are permitted to carry forward capital losses for an unlimited period. |
| | The Capital Appreciation Fund, Core Equity Fund, Dividend and Growth Fund, Equity Income Fund, Growth Opportunities Fund, Healthcare Fund, MidCap Fund, MidCap Value Fund, Quality Value Fund, Small Cap Growth Fund, Small Cap Value Fund and Small Company Fund had no capital loss carryforwards for U.S. federal tax purposes as of October 31, 2021. |
| | During the year ended October 31, 2021, Core Equity Fund utilized $46,847,127, MidCap Value Fund utilized $32,679,852, Quality Value Fund utilized $2,486,494, and Small Cap Value Fund utilized $5,504,390 of prior year capital loss carryforwards. |
| f) | Tax Basis of Investments – The aggregate cost of investments for federal income tax purposes at October 31, 2021 is different from book purposes primarily due to wash sale loss deferrals, passive foreign investment company (PFIC) mark-to-market adjustments, partnership adjustments and non-taxable distributions from underlying investments. The net unrealized appreciation/(depreciation) on investments for tax purposes, which consists of gross unrealized appreciation and depreciation, was also different from book purposes primarily due to wash sale loss deferrals and mark-to-market adjustments on futures, PFICs, partnership adjustments and non-taxable distributions from |
Hartford Domestic Equity Funds
Notes to Financial Statements – (continued)
October 31, 2021
| | underlying investments. Both the cost and unrealized appreciation and depreciation for federal income tax purposes are disclosed below: |
| | |
| Fund | | Tax Cost | | Gross Unrealized
Appreciation | | Gross Unrealized
(Depreciation) | | Net Unrealized
Appreciation
(Depreciation) |
| Capital Appreciation Fund | | $ 5,872,665,229 | | $ 2,009,304,658 | | $ (93,968,052) | | $ 1,915,336,606 |
| Core Equity Fund | | 7,719,983,877 | | 4,924,670,451 | | (22,701,947) | | 4,901,968,504 |
| Dividend and Growth Fund | | 8,978,176,586 | | 5,650,613,698 | | (61,037,424) | | 5,589,576,274 |
| Equity Income Fund | | 3,317,882,290 | | 1,622,736,076 | | (29,255,501) | | 1,593,480,575 |
| Growth Opportunities Fund | | 6,218,207,281 | | 2,015,361,057 | | (166,279,070) | | 1,849,081,987 |
| Healthcare Fund | | 1,298,957,148 | | 491,284,508 | | (54,256,116) | | 437,028,392 |
| MidCap Fund | | 9,774,275,285 | | 4,825,023,634 | | (403,025,289) | | 4,421,998,345 |
| MidCap Value Fund | | 676,485,567 | | 211,895,733 | | (10,822,174) | | 201,073,559 |
| Quality Value Fund | | 171,434,329 | | 61,682,308 | | (1,131,101) | | 60,551,207 |
| Small Cap Growth Fund | | 611,625,591 | | 322,908,546 | | (44,404,472) | | 278,504,074 |
| Small Cap Value Fund | | 152,169,513 | | 27,886,880 | | (4,076,842) | | 23,810,038 |
| Small Company Fund | | 839,093,690 | | 220,057,227 | | (45,856,089) | | 174,201,138 |
| g) | Accounting for Uncertainty in Income Taxes – Pursuant to provisions set forth by U.S. GAAP, Hartford Funds Management Company, LLC ("HFMC") reviews each Fund’s tax positions for all open tax years. As of October 31, 2021, HFMC had reviewed the open tax years and concluded that there was no reason to record a liability for net unrecognized tax obligations relating to uncertain income tax positions. Each Fund files U.S. tax returns. Although the statute of limitations for examining a Fund’s U.S. tax returns remains open for 3 years, no examination is currently in progress. The Funds recognize interest and penalties, if any, related to unrecognized tax benefits as income tax expense on the Statements of Operations. During the year ended October 31, 2021, the Funds did not incur any interest or penalties. HFMC is not aware of any tax positions for which it is reasonably possible that the total amounts of unrecognized tax obligations will significantly change in the next twelve months. |
| a) | Investment Management Agreement – HFMC serves as each Fund’s investment manager. Each Company, on behalf of its respective Funds, has entered into an Investment Management Agreement with HFMC. HFMC is an indirect subsidiary of The Hartford Financial Services Group, Inc. (“The Hartford”). HFMC has overall investment supervisory responsibility for each Fund. In addition, HFMC provides administrative personnel, services, equipment, facilities and office space for proper operation of each Fund. HFMC has contracted with Wellington Management Company LLP (“Wellington Management”) under a sub-advisory agreement and Wellington Management performs the daily investment of the assets of each Fund in accordance with the Fund’s investment objective and policies. Each Fund pays a fee to HFMC. HFMC pays a sub-advisory fee to Wellington Management out of its management fee. |
| | The schedule below reflects the rates of compensation paid to HFMC for investment management services rendered as of October 31, 2021; the rates are accrued daily and paid monthly based on each Fund’s average daily net assets, at the following annual rates: |
| | |
| Fund | | Management Fee Rates |
| Capital Appreciation Fund | | 0.8000% on first $500 million and; |
| | | 0.7000% on next $500 million and; |
| | | 0.6500% on next $4 billion and; |
| | | 0.6475% on next $5 billion and; |
| | | 0.6450% over $10 billion |
| Core Equity Fund | | 0.4500% on first $500 million and; |
| | | 0.3500% on next $500 million and; |
| | | 0.3300% on next $1.5 billion and; |
| | | 0.3250% on next $2.5 billion and; |
| | | 0.3225% over $5 billion |
| Dividend and Growth Fund | | 0.7500% on first $500 million and; |
| | | 0.6500% on next $500 million and; |
| | | 0.6000% on next $1.5 billion and; |
| | | 0.5950% on next $2.5 billion and; |
| | | 0.5900% on next $5 billion and; |
| | | 0.5850% over $10 billion |
Hartford Domestic Equity Funds
Notes to Financial Statements – (continued)
October 31, 2021
| Fund | | Management Fee Rates |
| Equity Income Fund | | 0.7500% on first $250 million and; |
| | | 0.7000% on next $250 million and; |
| | | 0.6500% on next $500 million and; |
| | | 0.6000% on next $1.5 billion and; |
| | | 0.5900% on next $2.5 billion and; |
| | | 0.5875% over $5 billion |
| Growth Opportunities Fund | | 0.8000% on first $250 million and; |
| | | 0.7000% on next $4.75 billion and; |
| | | 0.6975% on next $5 billion and; |
| | | 0.6950% over $10 billion |
| Healthcare Fund | | 0.9000% on first $500 million and; |
| | | 0.8500% on next $500 million and; |
| | | 0.8000% on next $4 billion and; |
| | | 0.7975% on next $5 billion and; |
| | | 0.7950% over $10 billion |
| MidCap Fund | | 0.8500% on first $500 million and; |
| | | 0.7500% on next $500 million and; |
| | | 0.7000% on next $4 billion and; |
| | | 0.6975% on next $5 billion and; |
| | | 0.6950% over $10 billion |
| MidCap Value Fund | | 0.7500% on first $500 million and; |
| | | 0.6500% on next $500 million and; |
| | | 0.6000% on next $1.5 billion and; |
| | | 0.5950% on next $2.5 billion and; |
| | | 0.5900% on next $5 billion and; |
| | | 0.5850% over $10 billion |
| Quality Value Fund | | 0.4500% on first $500 million and; |
| | | 0.3500% on next $500 million and; |
| | | 0.3300% on next $4 billion and; |
| | | 0.3250% on next $5 billion and; |
| | | 0.3225% over $10 billion |
| Small Cap Growth Fund | | 0.9000% on first $100 million and; |
| | | 0.8000% on next $150 million and; |
| | | 0.7000% on next $250 million and; |
| | | 0.6500% on next $4.5 billion and; |
| | | 0.6300% on next $5 billion and; |
| | | 0.6200% over $10 billion |
| Small Cap Value Fund | | 0.7000% on first $500 million and; |
| | | 0.6500% on next $500 million and; |
| | | 0.6000% on next $2 billion and; |
| | | 0.5900% on next $2 billion and; |
| | | 0.5800% on next $5 billion and; |
| | | 0.5700% over $10 billion |
| Small Company Fund | | 0.8500% on first $250 million and; |
| | | 0.8000% on next $250 million and; |
| | | 0.7500% on next $500 million and; |
| | | 0.7000% on next $500 million and; |
| | | 0.6500% on next $3.5 billion and; |
| | | 0.6300% on next $5 billion and; |
| | | 0.6200% over $10 billion |
| b) | Accounting Services Agreement – HFMC provides the Funds with accounting services pursuant to a fund accounting agreement by and between each Company, on behalf of its respective Funds, and HFMC. HFMC has delegated certain accounting and administrative service functions to State Street Bank and Trust Company (“State Street”). In consideration of services rendered and expenses assumed pursuant to the fund accounting agreement, each Fund pays HFMC a fee. Effective May 1, 2021, the fund accounting fee schedule as set forth in the fund accounting agreement by and between each Company, on behalf of its respective Funds, and HFMC, was revised. Effective May 1, 2021, the fund accounting fee for each Fund is equal to the greater of: (A) the sum of (i) the sub-accounting fee payable by HFMC with respect to the Fund; (ii) the fee payable for tax preparation services for the Fund; and (iii) the amount of expenses that HFMC allocates for providing the fund accounting services to the Fund; plus a target profit margin; or (B) $40,000 per year; provided, however, that to the extent the annual amount of the fund accounting fee exceeds 0.02% of the Fund’s average net assets (calculated during its current fiscal year), HFMC shall waive such portion of the fund accounting fee. For the period November 1, 2020 through April 30, 2021, HFMC received the |
Hartford Domestic Equity Funds
Notes to Financial Statements – (continued)
October 31, 2021
| | following fee with respect to each Fund: any sub-accounting fee payable by HFMC plus the amount of expenses that HFMC allocates for providing the fund accounting services. |
| c) | Operating Expenses – Allocable expenses incurred by each Company are allocated to each series within such Company, and allocated to classes within each such series, in proportion to the average daily net assets of such series and classes, except where allocation of certain expenses is more fairly made directly to a Fund or to specific classes within a Fund. As of October 31, 2021, HFMC contractually agreed to limit the total annual fund operating expenses (exclusive of taxes, interest expenses, brokerage commissions, acquired fund fees and expenses, and extraordinary expenses), through February 28, 2022 (unless the applicable Board of Directors approves its earlier termination) as follows for each of the following Funds: |
| | |
| | | Expense Limit as a Percentage of Average Daily Net Assets |
| Fund | | Class A | | Class C | | Class I | | Class R3 | | Class R4 | | Class R5 | | Class R6 | | Class Y | | Class F |
| Quality Value Fund | | 0.96% | | 1.71% | | 0.66% | | 1.18% | | 0.88% | | 0.63% | | 0.46% | | 0.57% | | 0.46% |
| Small Cap Value Fund | | 1.30% | | 2.05% | | 1.00% | | 1.50% | | 1.20% | | 0.90% | | 0.80% | | 0.85% | | 0.80% |
From November 1, 2020 through February 28, 2021, HFMC contractually limited the total operating expenses (exclusive of taxes, interest expenses, brokerage commissions, acquired fund fees and expenses and extraordinary expenses), as follows for the Small Company Fund:
| | | Expense Limit as a Percentage of Average Daily Net Assets |
| Fund | | Class A | | Class C | | Class I | | Class R3 | | Class R4 | | Class R5 | | Class R6 | | Class Y | | Class F |
| Small Company Fund | | 1.40% | | 2.15% | | 1.15% | | 1.55% | | 1.25% | | 0.95% | | 0.90% | | 0.95% | | 0.90% |
| d) | Fees Paid Indirectly – Certain Funds have entered into agreements with State Street Global Markets, LLC and Russell Implementation Services, Inc. to partially recapture non-discounted trade commissions. Such rebates are used to pay a portion of a Fund's expenses. For the year ended October 31, 2021, these amounts, if any, are included in the Statements of Operations. |
| | The ratio of expenses to average net assets in the accompanying financial highlights excludes the reduction in expenses related to fees paid indirectly. The annualized expense ratio after waivers reflecting the reduction for fees paid indirectly for the period is as follows: |
| | |
| Fund | | Class A | | Class C | | Class I | | Class R3 | | Class R4 | | Class R5 | | Class R6 | | Class Y | | Class F |
| Capital Appreciation Fund | | 1.04% | | 1.83% | | 0.77% | | 1.41% | | 1.10% | | 0.80% | | 0.69% | | 0.78% | | 0.69% |
| Core Equity Fund | | 0.70% | | 1.45% | | 0.45% | | 1.06% | | 0.72% | | 0.46% | | 0.36% | | 0.44% | | 0.36% |
| Dividend and Growth Fund | | 0.97% | | 1.75% | | 0.71% | | 1.35% | | 1.03% | | 0.73% | | 0.63% | | 0.67% | | 0.63% |
| Equity Income Fund | | 0.98% | | 1.75% | | 0.74% | | 1.35% | | 1.05% | | 0.75% | | 0.65% | | 0.73% | | 0.65% |
| Growth Opportunities Fund | | 1.06% | | 1.83% | | 0.82% | | 1.44% | | 1.14% | | 0.84% | | 0.73% | | 0.83% | | 0.73% |
| Healthcare Fund | | 1.24% | | 2.01% | | 0.98% | | 1.59% | | 1.29% | | 1.00% | | 0.89% | | 0.98% | | 0.89% |
| MidCap Fund | | 1.08% | | 1.84% | | 0.85% | | 1.45% | | 1.13% | | 0.83% | | 0.74% | | 0.77% | | 0.73% |
| MidCap Value Fund | | 1.18% | | 1.95% | | 0.85% | | 1.49% | | 1.19% | | 0.89% | | N/A | | 0.88% | | 0.77% |
| Quality Value Fund | | 0.94% | | 1.71% | | 0.63% | | 1.17% | | 0.88% | | 0.62% | | 0.46% | | 0.57% | | 0.46% |
| Small Cap Growth Fund | | 1.18% | | 1.89% | | 0.83% | | 1.47% | | 1.17% | | 0.86% | | 0.76% | | 0.81% | | 0.76% |
| Small Cap Value Fund | | 1.28% | | 2.04% | | 0.96% | | 1.39% | | 1.20% | | 0.90% | | 0.80% | | 0.85% | | 0.80% |
| Small Company Fund | | 1.22% | | 2.05% | | 0.95% | | 1.57% | | 1.26% | | 0.96% | | 0.85% | | 0.90% | | 0.85% |
| e) | Sales Charges and Distribution and Service Plan for Class A, T, C, R3 and R4 Shares – Hartford Funds Distributors, LLC (“HFD”), an indirect subsidiary of The Hartford, is the principal underwriter and distributor of each Fund. For the year ended October 31, 2021, HFD received front-end sales charges and contingent deferred sales charges for each Fund as follows: |
| | |
| Fund | | Front-End
Sales Charges | | Contingent Deferred
Sales Charges |
| Capital Appreciation Fund | | $ 1,636,733 | | $ 12,072 |
| Core Equity Fund | | 2,921,456 | | 43,366 |
| Dividend and Growth Fund | | 3,383,956 | | 24,796 |
| Equity Income Fund | | 1,125,483 | | 10,310 |
| Growth Opportunities Fund | | 3,114,928 | | 25,783 |
| Healthcare Fund | | 1,005,689 | | 6,572 |
| MidCap Fund | | 2,254,813 | | 19,506 |
| MidCap Value Fund | | 469,398 | | 428 |
| Quality Value Fund | | 97,745 | | 65 |
| Small Cap Growth Fund | | 100,663 | | 499 |
| Small Cap Value Fund | | 106,907 | | 860 |
| Small Company Fund | | 612,308 | | 2,894 |
Hartford Domestic Equity Funds
Notes to Financial Statements – (continued)
October 31, 2021
The Board of Directors of each Company has approved the adoption of a separate distribution plan (each a “Plan”) pursuant to Rule 12b-1 under the 1940 Act for each of Class A, T, C, R3 and R4 shares. Under a Plan, Class A, Class T, Class C, Class R3 and Class R4 shares of a Fund, as applicable, bear distribution and/or service fees paid to HFD, some or all of which may be paid to select broker-dealers. Pursuant to the Class A Plan, a Fund may pay HFD a fee of up to 0.25% of the average daily net assets attributable to Class A shares for distribution financing activities and shareholder account servicing activities. The entire amount of the fee may be used for shareholder servicing expenses and/or distribution expenses. Pursuant to the Class T Plan, a Fund may pay HFD a fee of up to 0.25% of the average daily net assets attributable to Class T shares for distribution financing activities and shareholder account servicing activities. The entire amount of the fee may be used for shareholder servicing expenses and/or distribution expenses. As of October 31, 2021, Class T shares have not commenced operations. Pursuant to the Class C Plan, a Fund may pay HFD a fee of up to 1.00% of the average daily net assets attributable to Class C shares for distribution financing activities, and up to 0.25% may be used for shareholder account servicing activities. The Class C Plan also provides that HFD will receive all contingent deferred sales charges attributable to Class C shares. Pursuant to the Class R3 Plan, a Fund may pay HFD a fee of up to 0.50% of the average daily net assets attributable to Class R3 shares for distribution financing activities, and up to 0.25% may be used for shareholder account servicing activities. Pursuant to the Class R4 Plan, a Fund may pay HFD a fee of up to 0.25% of the average daily net assets attributable to Class R4 shares for distribution financing activities. The entire amount of the fee may be used for shareholder account servicing activities. Each Fund’s 12b-1 fees are accrued daily and paid monthly or at such other intervals as the respective Company’s Board of Directors may determine. Any 12b-1 fees attributable to assets held in an account held directly with the Funds’ transfer agent for which there is not a third-party listed as the broker-dealer of record (or HFD does not otherwise have a payment obligation) are generally reimbursed to the applicable share class of the applicable Fund. Such amounts are reflected as “Distribution fee reimbursements” on the Statements of Operations.
| f) | Other Related Party Transactions – Certain officers of each Company are directors and/or officers of HFMC and/or The Hartford or its subsidiaries. For the year ended October 31, 2021, a portion of each Company’s Chief Compliance Officer’s (“CCO”) compensation was paid by all of the investment companies in the Hartford fund complex. The portion allocated to each Fund, as represented in other expenses on the Statements of Operations, is outlined in the table below. |
| | |
| Fund | | CCO Compensation
Paid by Fund |
| Capital Appreciation Fund | | $ 13,090 |
| Core Equity Fund | | 20,209 |
| Dividend and Growth Fund | | 22,565 |
| Equity Income Fund | | 8,109 |
| Growth Opportunities Fund | | 13,439 |
| Healthcare Fund | | 2,937 |
| MidCap Fund | | 24,786 |
| MidCap Value Fund | | 1,433 |
| Quality Value Fund | | 380 |
| Small Cap Growth Fund | | 1,545 |
| Small Cap Value Fund | | 280 |
| Small Company Fund | | 1,652 |
Hartford Administrative Services Company (“HASCO”), an indirect subsidiary of The Hartford, provides transfer agent services to each Fund. Each Fund pays HASCO a transfer agency fee payable monthly based on the lesser of (i) the costs of providing or overseeing transfer agency services provided to each share class of such Fund plus a target profit margin or (ii) a Specified Amount (as defined in the table below). Such fee is intended to compensate HASCO for: (i) fees payable by HASCO to DST Asset Manager Solutions, Inc. (“DST”) (and any other designated sub-agent) according to the agreed-upon fee schedule under the sub-transfer agency agreement between HASCO and DST (or between HASCO and any other designated sub-agent, as applicable); (ii) sub-transfer agency fees payable by HASCO to financial intermediaries, according to the agreed-upon terms between HASCO and the financial intermediaries, provided that such payments are
Hartford Domestic Equity Funds
Notes to Financial Statements – (continued)
October 31, 2021
within certain limits approved by the applicable Company’s Board of Directors; (iii) certain expenses that HASCO’s parent company, Hartford Funds Management Group, Inc., allocates to HASCO that relate to HASCO’s transfer agency services provided to the Fund; and (iv) a target profit margin.
| Share Class | | Specified Amount
(as a percentage
average daily
net assets) |
| Class A | | 0.25% |
| Class C | | 0.25% |
| Class I | | 0.20% |
| Class R3 | | 0.22% |
| Class R4 | | 0.17% |
| Class R5 | | 0.12% |
| Class R6 | | 0.004% |
| Class Y | | 0.11% |
| Class F | | 0.004% |
Effective March 1, 2021, HASCO has contractually agreed to waive its transfer agency fee and/or reimburse transfer agency-related expenses to the extent necessary to limit the transfer agency fee for the share classes of the Funds listed below through February 28, 2022, unless the Board of Directors approves its earlier termination.
| Fund | | Class I | | Class Y |
| Core Equity Fund | | N/A | | 0.08% |
| Dividend and Growth Fund | | N/A | | 0.04% |
| MidCap Fund | | 0.12% | | 0.04% |
| Small Cap Growth Fund | | N/A | | 0.06% |
From November 1, 2020 through February 28, 2021, HASCO contractually agreed to waive and/or reimburse a portion of the transfer agency fees for the share classes of the Funds listed below to the extent necessary to limit the transfer agency fees as follows:
| Fund | | Class I | | Class Y |
| Capital Appreciation Fund | | N/A | | 0.06% |
| Core Equity Fund | | N/A | | 0.08% |
| Dividend and Growth Fund | | N/A | | 0.04% |
| Equity Income Fund | | N/A | | 0.06% |
| Growth Opportunities Fund | | N/A | | 0.04% |
| Healthcare Fund | | N/A | | 0.05% |
| MidCap Fund | | 0.12% | | 0.04% |
| MidCap Value Fund | | N/A | | 0.07% |
| Small Cap Growth Fund | | N/A | | 0.04% |
Pursuant to a sub-transfer agency agreement between HASCO and DST, HASCO has delegated certain transfer agent, dividend disbursing agent and shareholder servicing agent functions to DST. Each Fund does not pay any fee directly to DST; rather, HASCO makes all such payments to DST. The accrued amount shown in the Statements of Operations reflects the amounts charged by HASCO. These fees are accrued daily and paid monthly.
For the year ended October 31, 2021, the effective rate of compensation paid to HASCO for transfer agency services as a percentage of each Class' average daily net assets is as follows:
| Fund | | Class A | | Class C | | Class I | | Class R3 | | Class R4 | | Class R5 | | Class R6 | | Class Y | | Class F |
| Capital Appreciation Fund | | 0.10% | | 0.14% | | 0.08% | | 0.22% | | 0.16% | | 0.11% | | 0.00% * | | 0.09% | | 0.00%* |
| Core Equity Fund | | 0.09% | | 0.09% | | 0.09% | | 0.21% | | 0.15% | | 0.10% | | 0.00% * | | 0.08% | | 0.00%* |
| Dividend and Growth Fund | | 0.09% | | 0.12% | | 0.09% | | 0.22% | | 0.15% | | 0.10% | | 0.00% * | | 0.04% | | 0.00%* |
| Equity Income Fund | | 0.08% | | 0.10% | | 0.09% | | 0.21% | | 0.15% | | 0.10% | | 0.00% * | | 0.09% | | 0.00%* |
| Growth Opportunities Fund | | 0.09% | | 0.10% | | 0.09% | | 0.22% | | 0.16% | | 0.11% | | 0.00% * | | 0.10% | | 0.00%* |
| Healthcare Fund | | 0.11% | | 0.13% | | 0.10% | | 0.21% | | 0.16% | | 0.12% | | 0.00% * | | 0.09% | | 0.00%* |
| MidCap Fund | | 0.10% | | 0.11% | | 0.12% | | 0.22% | | 0.17% | | 0.10% | | 0.00% * | | 0.04% | | 0.00%* |
| MidCap Value Fund | | 0.16% | | 0.19% | | 0.08% | | 0.22% | | 0.17% | | 0.12% | | N/A | | 0.11% | | 0.00%* |
| Quality Value Fund | | 0.16% | | 0.25% | | 0.09% | | 0.22% | | 0.17% | | 0.12% | | 0.00% * | | 0.11% | | 0.00%* |
| Small Cap Growth Fund | | 0.17% | | 0.13% | | 0.07% | | 0.22% | | 0.16% | | 0.11% | | 0.00% * | | 0.05% | | 0.00%* |
| Small Cap Value Fund | | 0.21% | | 0.25% | | 0.12% | | 0.22% | | 0.17% | | 0.12% | | 0.00% * | | 0.11% | | 0.00%* |
| Small Company Fund | | 0.13% | | 0.20% | | 0.11% | | 0.22% | | 0.16% | | 0.12% | | 0.00% * | | 0.06% | | 0.00%* |
Hartford Domestic Equity Funds
Notes to Financial Statements – (continued)
October 31, 2021
| 8. | Securities Lending: |
| | Each Company has entered into a securities lending agency agreement (“lending agreement”) with Citibank, N.A. (“Citibank”). A Fund may lend portfolio securities to certain borrowers in U.S. and non-U.S. markets in an amount not to exceed one-third (33 1/3%) of the value of its total assets. A Fund may lend portfolio securities, provided that the borrower provides collateral that is maintained in an amount at least equal to the current market value of the securities loaned. Cash collateral is invested for the benefit of a Fund by the Fund’s lending agent pursuant to collateral investment guidelines. The collateral is marked to market daily, in an amount at least equal to the current market value of the securities loaned. |
| | A Fund is subject to certain risks while its securities are on loan, including the following: (i) the risk that the borrower defaults on the loan and the collateral is inadequate to cover the Fund’s loss; (ii) the risk that the earnings on the collateral invested are not sufficient to pay fees incurred in connection with the loan; (iii) the Fund could lose money in the event of a decline in the value of the collateral provided for loaned securities or a decline in the value of any investments made with cash collateral; (iv) the risk that the borrower may use the loaned securities to cover a short sale, which may in turn place downward pressure on the market prices of the loaned securities; (v) the risk that return of loaned securities could be delayed and interfere with portfolio management decisions; and (vi) the risk that any efforts to restrict or recall the securities for purposes of voting may not be effective. These events could also trigger adverse tax consequences for the Fund. |
| | A Fund retains loan fees and the interest on cash collateral investments but is required to pay the borrower a rebate for the use of cash collateral. In cases where the lent security is of high value to borrowers, there may be a negative rebate (i.e., a net payment from the borrower to the applicable Fund). Upon termination of a loan, a Fund is required to return to the borrower an amount equal to the cash collateral, plus any rebate owed to the borrowers. |
| | The net income earned on the securities lending (after payment of rebates and Citibank’s fee) is included on the Statements of Operations as Investment Income from securities lending. A Fund also receives payments from the borrower during the period of the loan, equivalent to dividends and interest earned on the securities loaned, which are recorded as Investment Income from dividends or interest, respectively, on the Statements of Operations. |
| | The following table presents for each Fund that lends its portfolio securities the market value of the securities on loan; the collateral posted by the borrower; and the net amount, if any, due from the borrower in the event of default as of October 31, 2021. |
| | |
| Fund | | Investment Securities on Loan, at market value,
Presented on the Statements of Assets and Liabilities | | Collateral Posted by Borrower(1) | | Net Amount(2) |
| Capital Appreciation Fund | | $ 78,297,883 | | $ (78,297,883) | | $ — |
| Core Equity Fund | | — | | — | | — |
| Dividend and Growth Fund | | — | | — | | — |
| Equity Income Fund | | 18,426,375 | | (18,426,375) | | — |
| Growth Opportunities Fund | | 50,802,197 | | (50,802,197) | | — |
| Healthcare Fund | | 12,432,635 | | (12,432,635) (3) | | — |
| MidCap Fund | | 285,537,889 | | (285,537,889) | | — |
| MidCap Value Fund | | — | | — | | — |
| Quality Value Fund | | — | | — | | — |
| Small Cap Growth Fund | | 4,006,025 | | (4,006,025) | | — |
| Small Cap Value Fund | | — | | — | | — |
| Small Company Fund | | 26,917,675 | | (26,917,675) | | — |
| (1) | It is each Fund’s policy to obtain additional collateral from, or return excess collateral to, the borrower by the end of the next business day following the valuation date of the securities loaned. Therefore, the value of the collateral held may be temporarily less than that required under the lending contract due to timing. Pursuant to the lending agreement, the borrower will provide collateral in an amount at least equal to the current market value of securities loaned. Collateral received in excess or in deficit of the market value is not presented in this table. |
| (2) | Net amount represents the net amount receivable due from the borrower in the event of default. |
| (3) | Includes non-cash collateral of $2,493,877. |
| 9. | Secured Borrowings: |
| | The following tables reflect a breakdown of transactions accounted for as secured borrowings, the gross obligation by the type of collateral pledged, and the remaining contractual maturity of those transactions as of October 31, 2021. |
Hartford Domestic Equity Funds
Notes to Financial Statements – (continued)
October 31, 2021
| | Certain Transfers Accounted For As Secured Borrowings |
| | Remaining Contractual Maturity of the Agreements |
| | |
| | Overnight and
Continuous | | < 30 days | | Between
30 & 90 days | | > 90 days | | Total |
| Capital Appreciation Fund | | | | | | | | | |
| Securities Lending Transactions(1) | | | | | | | | | |
| Common Stocks | $ 77,452,552 | | $ — | | $ — | | $ — | | $ 77,452,552 |
| Total Borrowings | $ 77,452,552 | | $ — | | $ — | | $ — | | $ 77,452,552 |
| Gross amount of recognized liabilities for securities lending transactions | | $ 77,452,552 |
| Equity Income Fund | | | | | | | | | |
| Securities Lending Transactions(1) | | | | | | | | | |
| Common Stocks | $ 19,221,444 | | $ — | | $ — | | $ — | | $ 19,221,444 |
| Total Borrowings | $ 19,221,444 | | $ — | | $ — | | $ — | | $ 19,221,444 |
| Gross amount of recognized liabilities for securities lending transactions | | $ 19,221,444 |
| Growth Opportunities Fund | | | | | | | | | |
| Securities Lending Transactions(1) | | | | | | | | | |
| Common Stocks | $ 30,756,183 | | $ — | | $ — | | $ — | | $ 30,756,183 |
| Exchange-Traded Funds | 20,630,943 | | — | | — | | — | | 20,630,943 |
| Total Borrowings | $ 51,387,126 | | $ — | | $ — | | $ — | | $ 51,387,126 |
| Gross amount of recognized liabilities for securities lending transactions | | $ 51,387,126 |
| Healthcare Fund | | | | | | | | | |
| Securities Lending Transactions(1) | | | | | | | | | |
| Common Stocks | $ 10,759,237 | | $ — | | $ — | | $ — | | $ 10,759,237 |
| Total Borrowings | $ 10,759,237 | | $ — | | $ — | | $ — | | $ 10,759,237 |
| Gross amount of recognized liabilities for securities lending transactions | | $ 10,759,237 |
| MidCap Fund | | | | | | | | | |
| Securities Lending Transactions(1) | | | | | | | | | |
| Common Stocks | $ 292,714,891 | | $ — | | $ — | | $ — | | $ 292,714,891 |
| Total Borrowings | $ 292,714,891 | | $ — | | $ — | | $ — | | $ 292,714,891 |
| Gross amount of recognized liabilities for securities lending transactions | | $ 292,714,891 |
| Small Cap Growth Fund | | | | | | | | | |
| Securities Lending Transactions(1) | | | | | | | | | |
| Common Stocks | $ 3,984,420 | | $ — | | $ — | | $ — | | $ 3,984,420 |
| Total Borrowings | $ 3,984,420 | | $ — | | $ — | | $ — | | $ 3,984,420 |
| Gross amount of recognized liabilities for securities lending transactions | | $ 3,984,420 |
| Small Company Fund | | | | | | | | | |
| Securities Lending Transactions(1) | | | | | | | | | |
| Common Stocks | $ 3,373,971 | | $ — | | $ — | | $ — | | $ 3,373,971 |
| Exchange-Traded Funds | 23,931,233 | | — | | — | | — | | 23,931,233 |
| Total Borrowings | $ 27,305,204 | | $ — | | $ — | | $ — | | $ 27,305,204 |
| Gross amount of recognized liabilities for securities lending transactions | | $ 27,305,204 |
| (1) | Amount represents the payable for cash collateral received on securities on loan. This will generally be in the “Overnight and Continuous” column as the securities are typically callable on demand. |
Hartford Domestic Equity Funds
Notes to Financial Statements – (continued)
October 31, 2021
| 10. | Affiliated Security Transactions: |
| | If a Fund owns 5% or more of the outstanding voting securities, either directly or indirectly, of a particular issuer, the 1940 Act deems such an issuer to be an “affiliate” of the Fund. As of and during the year ended October 31, 2021, the MidCap Fund and Small Company Fund owned 5% or more of the outstanding voting securities of the issuers identified in the table below: |
| | A summary of affiliated security transactions for the year ended October 31, 2021 follows: |
| | |
| Affliated Investments | | Beginning
Value as of
November 1, 2020 | | Purchases
at Cost | | Proceeds
from Sales | | Net
Realized
Gain/(Loss)
on Sales | | Return of
Capital | | Change in
Unrealized
Appreciation/
(Depreciation) | | Ending
Value as of
October 31,
2021 | | Shares as of
October 31,
2021 | | Capital Gains
Distribution |
| MidCap Fund |
| Coherent, Inc.* | | $ 187,569,718 | | $ 18,058,381 | | $ 411,099,062 | | $ 188,312,226 | | $ — | | $ 17,158,737 | | $ — | | — | | $ — |
| CommScope Holding Co., Inc. | | 137,679,930 | | 36,110,935 | | 136,758,500 | | (55,422,395) | | — | | 127,853,845 | | 109,463,815 | | 10,220,711 | | — |
| II-VI, Inc.* | | 281,918,456 | | 51,442,698 | | 188,952,376 | | 65,146,804 | | — | | 51,926,342 | | 261,481,923 | | 4,321,301 | | — |
| KAR Auction Services, Inc.* | | 166,382,725 | | 2,968,202 | | 188,244,850 | | (21,888,071) | | — | | 40,781,994 | | — | | — | | — |
| NuVasive, Inc.* | | 122,529,543 | | 44,759,373 | | 145,995,683 | | (7,845,007) | | — | | 34,511,955 | | 47,960,181 | | 898,804 | | — |
| PTC Therapeutics, Inc.* | | 185,643,379 | | 19,931,856 | | 48,321,120 | | (6,267,817) | | — | | (38,758,862) | | 112,227,436 | | 2,958,804 | | — |
| Teradata Corp.* | | 158,390,567 | | 5,640,697 | | 221,630,337 | | 48,810,006 | | — | | 113,662,125 | | 196,958,379 | | 3,482,291 | | — |
| Total | | $ 1,240,114,318 | | $ 178,912,142 | | $ 1,341,001,928 | | $ 210,845,746 | | $ — | | $ 347,136,136 | | $728,091,734 | | 21,881,911 | | $ — |
| Small Company Fund |
| Allstar Co.(1) | | $ 2,634,744 | | $ — | | $ — | | $ — | | $ (1,364,479) | | $ (1,270,265) | | $ — | | 3,136,600 | | $ 5,465,767 |
| * | Not an affiliate as of October 31, 2021. |
| (1) | Allstar Co. is a Delaware limited liability company that was created for the purpose of investing in Academy Sports & Outdoors, Inc. As a result of the Fund's holdings in Allstar Co., the Fund previously had indirect exposure to Academy Sports & Outdoors, Inc.; however, the Fund does not have direct or indirect exposure to 5% or more of the outstanding voting securities of Academy Sports & Outdoors, Inc. |
| 11. | Affiliate Holdings: |
| | As of October 31, 2021, affiliates of The Hartford had ownership of shares in each Fund as follows: |
| | |
| Percentage of a Class: | | | | | | | | | | | | | | | | | | |
| Fund | | Class A | | Class C | | Class I | | Class R3 | | Class R4 | | Class R5 | | Class R6 | | Class Y | | Class F |
| Small Cap Value Fund | | — | | — | | — | | — | | — | | 65% | | — | | — | | — |
| Percentage of Fund by Class: | | | | | | | | | | | | | | | | | | |
| Fund | | Class A | | Class C | | Class I | | Class R3 | | Class R4 | | Class R5 | | Class R6 | | Class Y | | Class F |
| Small Cap Value Fund | | — | | — | | — | | — | | — | | 0%* | | — | | — | | — |
| * | Percentage rounds to zero. |
Hartford Domestic Equity Funds
Notes to Financial Statements – (continued)
October 31, 2021
As of October 31, 2021, affiliated funds of funds and the 529 plan for which HFMC serves as the program manager (the “529 plan”) in the aggregate owned a portion of the Funds identified below. Therefore, these Funds may experience relatively large purchases or redemptions of their shares as a result of purchase and sale activity from these affiliated funds of funds and the 529 plan. Affiliated funds of funds and the 529 plan owned shares in the Funds listed below as follows:
| Fund | | Percentage
of Fund* |
| Capital Appreciation Fund | | 8% |
| Core Equity Fund | | 3% |
| Dividend and Growth Fund | | 6% |
| Equity Income Fund | | 6% |
| Growth Opportunities Fund | | 3% |
| MidCap Fund | | 1% |
| MidCap Value Fund | | 2% |
| Small Cap Growth Fund | | 4% |
| Small Cap Value Fund | | 34% |
| Small Company Fund | | 8% |
| * | As of October 31, 2021, affiliated funds of funds and the 529 plan were invested in Class F shares. |
| 12. | Investment Transactions: |
| | For the year ended October 31, 2021, the cost of purchases and proceeds from sales of investment securities (excluding short-term investments) were as follows: |
| | |
| Fund | | Cost of Purchases
Excluding U.S.
Government
Obligations | | Sales Proceeds
Excluding U.S.
Government
Obligations | | Total Cost of
Purchases | | Total Sales
Proceeds |
| Capital Appreciation Fund | | $ 4,464,956,625 | | $ 5,206,803,039 | | $ 4,464,956,625 | | $ 5,206,803,039 |
| Core Equity Fund | | 2,350,534,922 | | 1,430,740,283 | | 2,350,534,922 | | 1,430,740,283 |
| Dividend and Growth Fund | | 3,190,240,893 | | 2,085,167,169 | | 3,190,240,893 | | 2,085,167,169 |
| Equity Income Fund | | 1,067,185,235 | | 1,216,065,330 | | 1,067,185,235 | | 1,216,065,330 |
| Growth Opportunities Fund | | 6,533,782,097 | | 6,816,019,926 | | 6,533,782,097 | | 6,816,019,926 |
| Healthcare Fund | | 824,641,192 | | 912,535,736 | | 824,641,192 | | 912,535,736 |
| MidCap Fund | | 4,121,031,940 | | 7,569,551,161 | | 4,121,031,940 | | 7,569,551,161 |
| MidCap Value Fund | | 441,899,041 | | 453,360,880 | | 441,899,041 | | 453,360,880 |
| Quality Value Fund | | 42,339,156 | | 51,449,852 | | 42,339,156 | | 51,449,852 |
| Small Cap Growth Fund | | 431,398,620 | | 625,517,479 | | 431,398,620 | | 625,517,479 |
| Small Cap Value Fund | | 132,253,465 | | 82,617,263 | | 132,253,465 | | 82,617,263 |
| Small Company Fund | | 1,185,210,655 | | 1,133,575,058 | | 1,185,210,655 | | 1,133,575,058 |
| 13. | Capital Share Transactions: |
| | The following information is for the years ended October 31, 2021 and October 31, 2020: |
| | |
| | For the Year Ended
October 31, 2021 | | For the Year Ended
October 31, 2020 |
| | Shares | | Amount | | Shares | | Amount |
| Capital Appreciation Fund | | | | | | | |
| Class A | | | | | | | |
| Shares Sold | 3,367,409 | | $ 153,139,085 | | 4,936,646 | | $ 174,349,729 |
| Shares Issued for Reinvested Dividends | 5,909,766 | | 249,118,669 | | 6,205,381 | | 227,070,199 |
| Shares Redeemed | (13,459,956) | | (610,878,988) | | (20,320,300) | | (726,270,861) |
| Net Increase (Decrease) | (4,182,781) | | (208,621,234) | | (9,178,273) | | (324,850,933) |
| Class C | | | | | | | |
| Shares Sold | 420,030 | | $ 13,300,659 | | 646,385 | | $ 16,546,122 |
| Shares Issued for Reinvested Dividends | 423,362 | | 12,493,414 | | 576,523 | | 15,076,069 |
| Shares Redeemed | (2,943,150) | | (94,205,765) | | (5,045,288) | | (130,502,671) |
| Net Increase (Decrease) | (2,099,758) | | (68,411,692) | | (3,822,380) | | (98,880,480) |
| Class I | | | | | | | |
| Shares Sold | 1,763,794 | | $ 80,348,270 | | 1,956,471 | | $ 70,731,684 |
| Shares Issued for Reinvested Dividends | 692,879 | | 29,440,161 | | 771,728 | | 28,460,949 |
| Shares Redeemed | (2,913,758) | | (132,549,967) | | (5,242,907) | | (186,790,433) |
| Net Increase (Decrease) | (457,085) | | (22,761,536) | | (2,514,708) | | (87,597,800) |
Hartford Domestic Equity Funds
Notes to Financial Statements – (continued)
October 31, 2021
| | For the Year Ended
October 31, 2021 | | For the Year Ended
October 31, 2020 |
| | Shares | | Amount | | Shares | | Amount |
| Class R3 | | | | | | | |
| Shares Sold | 81,697 | | $ 4,139,188 | | 116,903 | | $ 4,540,361 |
| Shares Issued for Reinvested Dividends | 40,201 | | 1,911,571 | | 46,694 | | 1,912,115 |
| Shares Redeemed | (289,780) | | (14,863,615) | | (408,486) | | (16,587,839) |
| Net Increase (Decrease) | (167,882) | | (8,812,856) | | (244,889) | | (10,135,363) |
| Class R4 | | | | | | | |
| Shares Sold | 75,708 | | $ 4,029,701 | | 102,404 | | $ 4,357,340 |
| Shares Issued for Reinvested Dividends | 28,656 | | 1,422,120 | | 34,702 | | 1,480,745 |
| Shares Redeemed | (195,566) | | (10,231,712) | | (305,424) | | (13,165,782) |
| Net Increase (Decrease) | (91,202) | | (4,779,891) | | (168,318) | | (7,327,697) |
| Class R5 | | | | | | | |
| Shares Sold | 38,655 | | $ 2,086,665 | | 73,396 | | $ 3,082,937 |
| Shares Issued for Reinvested Dividends | 31,983 | | 1,626,764 | | 37,234 | | 1,629,967 |
| Shares Redeemed | (196,018) | | (10,767,188) | | (247,588) | | (10,879,629) |
| Net Increase (Decrease) | (125,380) | | (7,053,759) | | (136,958) | | (6,166,725) |
| Class R6 | | | | | | | |
| Shares Sold | 101,705 | | $ 5,729,396 | | 154,746 | | $ 6,189,604 |
| Shares Issued for Reinvested Dividends | 11,975 | | 613,867 | | 80,778 | | 3,562,525 |
| Shares Redeemed | (60,680) | | (3,346,501) | | (1,780,995) | | (77,069,137) |
| Net Increase (Decrease) | 53,000 | | 2,996,762 | | (1,545,471) | | (67,317,008) |
| Class Y | | | | | | | |
| Shares Sold | 418,089 | | $ 23,154,624 | | 406,425 | | $ 17,905,774 |
| Shares Issued for Reinvested Dividends | 97,100 | | 4,973,187 | | 187,899 | | 8,281,321 |
| Shares Redeemed | (683,536) | | (37,544,012) | | (2,600,260) | | (116,860,535) |
| Net Increase (Decrease) | (168,347) | | (9,416,201) | | (2,005,936) | | (90,673,440) |
| Class F | | | | | | | |
| Shares Sold | 1,156,081 | | $ 52,681,033 | | 2,953,391 | | $ 96,156,703 |
| Shares Issued for Reinvested Dividends | 996,586 | | 42,357,183 | | 1,088,641 | | 40,167,416 |
| Shares Redeemed | (2,759,017) | | (125,550,739) | | (6,078,654) | | (219,729,113) |
| Net Increase (Decrease) | (606,350) | | (30,512,523) | | (2,036,622) | | (83,404,994) |
| Total Net Increase (Decrease) | (7,845,785) | | $ (357,372,930) | | (21,653,555) | | $ (776,354,440) |
| Core Equity Fund | | | | | | | |
| Class A | | | | | | | |
| Shares Sold | 8,048,194 | | $ 349,552,465 | | 12,000,329 | | $ 399,459,192 |
| Shares Issued for Reinvested Dividends | 170,767 | | 6,957,062 | | 652,243 | | 22,377,578 |
| Shares Redeemed | (5,854,509) | | (256,534,349) | | (7,386,228) | | (240,896,634) |
| Net Increase (Decrease) | 2,364,452 | | 99,975,178 | | 5,266,344 | | 180,940,136 |
| Class C | | | | | | | |
| Shares Sold | 2,433,951 | | $ 95,569,941 | | 4,551,296 | | $ 137,663,560 |
| Shares Issued for Reinvested Dividends | — | | — | | 247,606 | | 7,653,796 |
| Shares Redeemed | (2,963,058) | | (117,542,554) | | (3,263,520) | | (99,295,785) |
| Net Increase (Decrease) | (529,107) | | (21,972,613) | | 1,535,382 | | 46,021,571 |
| Class I | | | | | | | |
| Shares Sold | 38,606,478 | | $ 1,683,147,371 | | 55,251,441 | | $ 1,824,328,535 |
| Shares Issued for Reinvested Dividends | 587,802 | | 23,982,316 | | 1,340,855 | | 46,209,109 |
| Shares Redeemed | (25,621,499) | | (1,138,977,250) | | (27,336,937) | | (896,498,720) |
| Net Increase (Decrease) | 13,572,781 | | 568,152,437 | | 29,255,359 | | 974,038,924 |
| Class R3 | | | | | | | |
| Shares Sold | 430,551 | | $ 19,338,433 | | 599,499 | | $ 20,904,257 |
| Shares Issued for Reinvested Dividends | 3,454 | | 143,013 | | 21,100 | | 731,315 |
| Shares Redeemed | (280,505) | | (12,331,610) | | (352,314) | | (11,904,251) |
| Net Increase (Decrease) | 153,500 | | 7,149,836 | | 268,285 | | 9,731,321 |
| Class R4 | | | | | | | |
| Shares Sold | 1,346,774 | | $ 61,759,473 | | 1,581,637 | | $ 56,055,128 |
| Shares Issued for Reinvested Dividends | 22,870 | | 962,136 | | 100,713 | | 3,564,282 |
| Shares Redeemed | (1,230,844) | | (56,219,106) | | (1,491,613) | | (51,795,823) |
| Net Increase (Decrease) | 138,800 | | 6,502,503 | | 190,737 | | 7,823,587 |
Hartford Domestic Equity Funds
Notes to Financial Statements – (continued)
October 31, 2021
| | For the Year Ended
October 31, 2021 | | For the Year Ended
October 31, 2020 |
| | Shares | | Amount | | Shares | | Amount |
| Class R5 | | | | | | | |
| Shares Sold | 719,073 | | $ 31,981,033 | | 1,134,925 | | $ 38,804,050 |
| Shares Issued for Reinvested Dividends | 30,689 | | 1,262,537 | | 159,932 | | 5,552,692 |
| Shares Redeemed | (1,428,140) | | (63,174,300) | | (2,986,041) | | (101,176,396) |
| Net Increase (Decrease) | (678,378) | | (29,930,730) | | (1,691,184) | | (56,819,654) |
| Class R6 | | | | | | | |
| Shares Sold | 5,638,764 | | $ 249,691,246 | | 16,027,389 | | $ 553,894,759 |
| Shares Issued for Reinvested Dividends | 161,700 | | 6,679,826 | | 209,189 | | 7,302,091 |
| Shares Redeemed | (5,359,583) | | (240,460,323) | | (3,524,239) | | (123,476,087) |
| Net Increase (Decrease) | 440,881 | | 15,910,749 | | 12,712,339 | | 437,720,763 |
| Class Y | | | | | | | |
| Shares Sold | 4,083,890 | | $ 178,723,495 | | 11,888,408 | | $ 397,928,760 |
| Shares Issued for Reinvested Dividends | 139,865 | | 5,777,841 | | 285,662 | | 9,972,693 |
| Shares Redeemed | (4,487,602) | | (204,115,939) | | (4,866,025) | | (165,866,944) |
| Net Increase (Decrease) | (263,847) | | (19,614,603) | | 7,308,045 | | 242,034,509 |
| Class F | | | | | | | |
| Shares Sold | 20,968,799 | | $ 922,349,213 | | 29,798,828 | | $ 1,002,322,628 |
| Shares Issued for Reinvested Dividends | 532,223 | | 21,725,333 | | 1,403,840 | | 48,429,362 |
| Shares Redeemed | (18,994,470) | | (837,983,756) | | (18,375,875) | | (609,580,679) |
| Net Increase (Decrease) | 2,506,552 | | 106,090,790 | | 12,826,793 | | 441,171,311 |
| Total Net Increase (Decrease) | 17,705,634 | | $ 732,263,547 | | 67,672,100 | | $ 2,282,662,468 |
| Dividend and Growth Fund | | | | | | | |
| Class A | | | | | | | |
| Shares Sold | 11,151,010 | | $ 344,976,720 | | 12,878,095 | | $ 307,347,699 |
| Shares Issued for Reinvested Dividends | 4,336,771 | | 122,673,579 | | 6,355,646 | | 158,639,507 |
| Shares Redeemed | (17,131,999) | | (519,287,515) | | (23,863,951) | | (575,703,006) |
| Net Increase (Decrease) | (1,644,218) | | (51,637,216) | | (4,630,210) | | (109,715,800) |
| Class C | | | | | | | |
| Shares Sold | 1,419,508 | | $ 42,204,089 | | 1,341,581 | | $ 31,800,923 |
| Shares Issued for Reinvested Dividends | 145,715 | | 3,852,604 | | 277,274 | | 6,745,974 |
| Shares Redeemed | (2,354,366) | | (69,029,852) | | (3,403,410) | | (78,986,558) |
| Net Increase (Decrease) | (789,143) | | (22,973,159) | | (1,784,555) | | (40,439,661) |
| Class I | | | | | | | |
| Shares Sold | 36,793,322 | | $ 1,137,090,014 | | 44,546,101 | | $ 1,034,422,781 |
| Shares Issued for Reinvested Dividends | 2,425,264 | | 69,068,594 | | 2,167,389 | | 53,242,132 |
| Shares Redeemed | (15,783,459) | | (477,606,650) | | (18,862,040) | | (444,869,560) |
| Net Increase (Decrease) | 23,435,127 | | 728,551,958 | | 27,851,450 | | 642,795,353 |
| Class R3 | | | | | | | |
| Shares Sold | 324,177 | | $ 10,228,653 | | 319,957 | | $ 7,867,244 |
| Shares Issued for Reinvested Dividends | 59,719 | | 1,695,081 | | 98,410 | | 2,513,108 |
| Shares Redeemed | (687,387) | | (21,558,216) | | (713,282) | | (17,768,056) |
| Net Increase (Decrease) | (303,491) | | (9,634,482) | | (294,915) | | (7,387,704) |
| Class R4 | | | | | | | |
| Shares Sold | 676,475 | | $ 21,736,412 | | 646,555 | | $ 15,896,512 |
| Shares Issued for Reinvested Dividends | 75,716 | | 2,188,661 | | 137,823 | | 3,531,150 |
| Shares Redeemed | (1,035,619) | | (31,590,923) | | (1,673,250) | | (42,325,963) |
| Net Increase (Decrease) | (283,428) | | (7,665,850) | | (888,872) | | (22,898,301) |
| Class R5 | | | | | | | |
| Shares Sold | 2,526,093 | | $ 79,438,301 | | 2,555,808 | | $ 63,782,124 |
| Shares Issued for Reinvested Dividends | 96,696 | | 2,843,393 | | 142,472 | | 3,650,977 |
| Shares Redeemed | (2,227,663) | | (69,728,112) | | (2,841,394) | | (70,963,602) |
| Net Increase (Decrease) | 395,126 | | 12,553,582 | | (143,114) | | (3,530,501) |
| Class R6 | | | | | | | |
| Shares Sold | 7,406,904 | | $ 227,713,097 | | 4,880,872 | | $ 113,525,683 |
| Shares Issued for Reinvested Dividends | 297,938 | | 8,855,913 | | 237,877 | | 5,996,137 |
| Shares Redeemed | (2,250,013) | | (70,681,330) | | (1,733,037) | | (42,798,399) |
| Net Increase (Decrease) | 5,454,829 | | 165,887,680 | | 3,385,712 | | 76,723,421 |
Hartford Domestic Equity Funds
Notes to Financial Statements – (continued)
October 31, 2021
| | For the Year Ended
October 31, 2021 | | For the Year Ended
October 31, 2020 |
| | Shares | | Amount | | Shares | | Amount |
| Class Y | | | | | | | |
| Shares Sold | 20,130,737 | | $ 637,738,953 | | 9,848,904 | | $ 247,712,473 |
| Shares Issued for Reinvested Dividends | 944,058 | | 27,654,509 | | 1,131,629 | | 28,911,339 |
| Shares Redeemed | (24,259,929) | | (783,606,689) | | (7,635,109) | | (181,522,018) |
| Net Increase (Decrease) | (3,185,134) | | (118,213,227) | | 3,345,424 | | 95,101,794 |
| Class F | | | | | | | |
| Shares Sold | 49,096,886 | | $ 1,528,459,592 | | 27,526,744 | | $ 644,478,859 |
| Shares Issued for Reinvested Dividends | 4,082,716 | | 115,917,711 | | 5,376,050 | | 132,513,123 |
| Shares Redeemed | (27,500,734) | | (840,425,971) | | (29,713,611) | | (707,975,552) |
| Net Increase (Decrease) | 25,678,868 | | 803,951,332 | | 3,189,183 | | 69,016,430 |
| Total Net Increase (Decrease) | 48,758,536 | | $ 1,500,820,618 | | 30,030,103 | | $ 699,665,031 |
| Equity Income Fund | | | | | | | |
| Class A | | | | | | | |
| Shares Sold | 8,289,761 | | $ 180,610,904 | | 7,828,556 | | $ 136,913,278 |
| Shares Issued for Reinvested Dividends | 1,960,721 | | 40,766,669 | | 6,504,295 | | 121,363,438 |
| Shares Redeemed | (9,871,460) | | (212,979,569) | | (14,827,638) | | (260,683,783) |
| Net Increase (Decrease) | 379,022 | | 8,398,004 | | (494,787) | | (2,407,067) |
| Class C | | | | | | | |
| Shares Sold | 649,197 | | $ 14,115,367 | | 919,038 | | $ 16,271,303 |
| Shares Issued for Reinvested Dividends | 180,050 | | 3,621,924 | | 1,018,170 | | 19,066,339 |
| Shares Redeemed | (4,975,576) | | (107,730,675) | | (5,650,866) | | (99,286,782) |
| Net Increase (Decrease) | (4,146,329) | | (89,993,384) | | (3,713,658) | | (63,949,140) |
| Class I | | | | | | | |
| Shares Sold | 13,408,859 | | $ 286,986,093 | | 24,304,724 | | $ 412,538,522 |
| Shares Issued for Reinvested Dividends | 1,520,952 | | 31,538,766 | | 3,968,707 | | 73,365,491 |
| Shares Redeemed | (13,573,736) | | (290,903,554) | | (20,447,146) | | (354,091,319) |
| Net Increase (Decrease) | 1,356,075 | | 27,621,305 | | 7,826,285 | | 131,812,694 |
| Class R3 | | | | | | | |
| Shares Sold | 178,866 | | $ 3,905,700 | | 271,229 | | $ 4,760,437 |
| Shares Issued for Reinvested Dividends | 37,851 | | 778,951 | | 167,445 | | 3,145,148 |
| Shares Redeemed | (622,158) | | (13,765,852) | | (802,663) | | (14,461,635) |
| Net Increase (Decrease) | (405,441) | | (9,081,201) | | (363,989) | | (6,556,050) |
| Class R4 | | | | | | | |
| Shares Sold | 409,910 | | $ 8,975,208 | | 608,869 | | $ 10,607,139 |
| Shares Issued for Reinvested Dividends | 41,162 | | 854,303 | | 165,375 | | 3,099,772 |
| Shares Redeemed | (714,299) | | (15,093,697) | | (1,115,129) | | (20,177,582) |
| Net Increase (Decrease) | (263,227) | | (5,264,186) | | (340,885) | | (6,470,671) |
| Class R5 | | | | | | | |
| Shares Sold | 1,641,838 | | $ 34,220,609 | | 802,326 | | $ 14,635,220 |
| Shares Issued for Reinvested Dividends | 92,807 | | 1,954,636 | | 278,873 | | 5,250,372 |
| Shares Redeemed | (1,549,727) | | (34,015,363) | | (1,956,200) | | (36,004,334) |
| Net Increase (Decrease) | 184,918 | | 2,159,882 | | (875,001) | | (16,118,742) |
| Class R6 | | | | | | | |
| Shares Sold | 1,024,580 | | $ 22,209,707 | | 1,617,179 | | $ 29,511,931 |
| Shares Issued for Reinvested Dividends | 84,605 | | 1,790,192 | | 215,494 | | 4,044,046 |
| Shares Redeemed | (848,471) | | (18,624,173) | | (1,293,116) | | (23,556,776) |
| Net Increase (Decrease) | 260,714 | | 5,375,726 | | 539,557 | | 9,999,201 |
| Class Y | | | | | | | |
| Shares Sold | 1,290,931 | | $ 27,947,876 | | 2,226,330 | | $ 40,140,301 |
| Shares Issued for Reinvested Dividends | 115,344 | | 2,434,785 | | 392,940 | | 7,398,398 |
| Shares Redeemed | (1,008,753) | | (22,141,456) | | (3,219,621) | | (56,256,214) |
| Net Increase (Decrease) | 397,522 | | 8,241,205 | | (600,351) | | (8,717,515) |
| Class F | | | | | | | |
| Shares Sold | 8,946,727 | | $ 192,753,571 | | 11,762,717 | | $ 205,404,640 |
| Shares Issued for Reinvested Dividends | 1,449,703 | | 30,022,805 | | 4,181,434 | | 77,191,341 |
| Shares Redeemed | (13,229,490) | | (284,172,877) | | (11,310,899) | | (199,892,407) |
| Net Increase (Decrease) | (2,833,060) | | (61,396,501) | | 4,633,252 | | 82,703,574 |
| Total Net Increase (Decrease) | (5,069,806) | | $ (113,939,150) | | 6,610,423 | | $ 120,296,284 |
Hartford Domestic Equity Funds
Notes to Financial Statements – (continued)
October 31, 2021
| | For the Year Ended
October 31, 2021 | | For the Year Ended
October 31, 2020 |
| | Shares | | Amount | | Shares | | Amount |
| Growth Opportunities Fund | | | | | | | |
| Class A | | | | | | | |
| Shares Sold | 5,209,175 | | $ 302,551,393 | | 5,812,021 | | $ 259,824,535 |
| Shares Issued for Reinvested Dividends | 7,642,117 | | 408,394,711 | | 3,358,472 | | 128,192,872 |
| Shares Redeemed | (7,857,838) | | (457,256,332) | | (8,349,301) | | (364,377,295) |
| Net Increase (Decrease) | 4,993,454 | | 253,689,772 | | 821,192 | | 23,640,112 |
| Class C | | | | | | | |
| Shares Sold | 1,814,685 | | $ 42,859,385 | | 2,155,278 | | $ 46,083,147 |
| Shares Issued for Reinvested Dividends | 4,008,428 | | 87,303,560 | | 1,561,881 | | 29,066,389 |
| Shares Redeemed | (5,222,282) | | (124,561,047) | | (5,277,715) | | (112,869,127) |
| Net Increase (Decrease) | 600,831 | | 5,601,898 | | (1,560,556) | | (37,719,591) |
| Class I | | | | | | | |
| Shares Sold | 6,786,614 | | $ 423,546,619 | | 8,087,671 | | $ 380,046,455 |
| Shares Issued for Reinvested Dividends | 3,207,164 | | 185,309,937 | | 1,712,981 | | 69,821,119 |
| Shares Redeemed | (7,861,192) | | (491,248,063) | | (16,144,778) | | (718,420,627) |
| Net Increase (Decrease) | 2,132,586 | | 117,608,493 | | (6,344,126) | | (268,553,053) |
| Class R3 | | | | | | | |
| Shares Sold | 217,459 | | $ 12,458,353 | | 183,888 | | $ 8,139,758 |
| Shares Issued for Reinvested Dividends | 133,397 | | 7,088,738 | | 70,480 | | 2,685,999 |
| Shares Redeemed | (388,784) | | (22,241,704) | | (510,198) | | (22,155,084) |
| Net Increase (Decrease) | (37,928) | | (2,694,613) | | (255,830) | | (11,329,327) |
| Class R4 | | | | | | | |
| Shares Sold | 260,470 | | $ 16,275,076 | | 248,241 | | $ 12,098,571 |
| Shares Issued for Reinvested Dividends | 149,374 | | 8,675,642 | | 84,663 | | 3,477,115 |
| Shares Redeemed | (483,285) | | (30,586,387) | | (714,482) | | (33,779,284) |
| Net Increase (Decrease) | (73,441) | | (5,635,669) | | (381,578) | | (18,203,598) |
| Class R5 | | | | | | | |
| Shares Sold | 88,508 | | $ 5,974,431 | | 145,107 | | $ 7,246,281 |
| Shares Issued for Reinvested Dividends | 44,659 | | 2,790,306 | | 30,971 | | 1,353,114 |
| Shares Redeemed | (159,100) | | (10,438,793) | | (373,606) | | (18,780,243) |
| Net Increase (Decrease) | (25,933) | | (1,674,056) | | (197,528) | | (10,180,848) |
| Class R6 | | | | | | | |
| Shares Sold | 490,627 | | $ 33,816,735 | | 306,651 | | $ 16,060,946 |
| Shares Issued for Reinvested Dividends | 77,962 | | 4,986,464 | | 28,918 | | 1,288,564 |
| Shares Redeemed | (230,683) | | (16,066,034) | | (200,896) | | (10,416,531) |
| Net Increase (Decrease) | 337,906 | | 22,737,165 | | 134,673 | | 6,932,979 |
| Class Y | | | | | | | |
| Shares Sold | 2,179,222 | | $ 149,741,177 | | 4,986,167 | | $ 311,128,698 |
| Shares Issued for Reinvested Dividends | 841,194 | | 53,752,317 | | 199,027 | | 8,864,641 |
| Shares Redeemed | (2,205,530) | | (152,562,447) | | (2,009,071) | | (111,330,500) |
| Net Increase (Decrease) | 814,886 | | 50,931,047 | | 3,176,123 | | 208,662,839 |
| Class F | | | | | | | |
| Shares Sold | 6,728,193 | | $ 425,460,841 | | 3,945,706 | | $ 196,024,123 |
| Shares Issued for Reinvested Dividends | 1,886,638 | | 109,557,047 | | 769,915 | | 31,497,242 |
| Shares Redeemed | (4,459,130) | | (280,955,262) | | (3,691,002) | | (177,948,400) |
| Net Increase (Decrease) | 4,155,701 | | 254,062,626 | | 1,024,619 | | 49,572,965 |
| Total Net Increase (Decrease) | 12,898,062 | | $ 694,626,663 | | (3,583,011) | | $ (57,177,522) |
| Healthcare Fund | | | | | | | |
| Class A | | | | | | | |
| Shares Sold | 1,918,507 | | $ 82,032,094 | | 1,358,922 | | $ 51,528,734 |
| Shares Issued for Reinvested Dividends | 2,232,980 | | 90,190,081 | | 1,142,449 | | 42,179,219 |
| Shares Redeemed | (2,567,935) | | (109,917,953) | | (2,954,883) | | (111,468,464) |
| Net Increase (Decrease) | 1,583,552 | | 62,304,222 | | (453,512) | | (17,760,511) |
| Class C | | | | | | | |
| Shares Sold | 368,990 | | $ 11,716,851 | | 416,479 | | $ 12,224,079 |
| Shares Issued for Reinvested Dividends | 743,990 | | 22,349,458 | | 382,047 | | 10,983,839 |
| Shares Redeemed | (1,445,763) | | (46,040,790) | | (1,283,408) | | (37,962,383) |
| Net Increase (Decrease) | (332,783) | | (11,974,481) | | (484,882) | | (14,754,465) |
Hartford Domestic Equity Funds
Notes to Financial Statements – (continued)
October 31, 2021
| | For the Year Ended
October 31, 2021 | | For the Year Ended
October 31, 2020 |
| | Shares | | Amount | | Shares | | Amount |
| Class I | | | | | | | |
| Shares Sold | 2,309,673 | | $ 105,781,014 | | 2,595,432 | | $ 104,468,275 |
| Shares Issued for Reinvested Dividends | 924,714 | | 40,077,121 | | 416,322 | | 16,319,822 |
| Shares Redeemed | (2,209,353) | | (101,145,679) | | (2,244,715) | | (89,839,287) |
| Net Increase (Decrease) | 1,025,034 | | 44,712,456 | | 767,039 | | 30,948,810 |
| Class R3 | | | | | | | |
| Shares Sold | 151,226 | | $ 6,683,795 | | 197,480 | | $ 7,654,724 |
| Shares Issued for Reinvested Dividends | 90,203 | | 3,742,540 | | 55,830 | | 2,117,618 |
| Shares Redeemed | (270,146) | | (11,931,278) | | (439,877) | | (17,102,681) |
| Net Increase (Decrease) | (28,717) | | (1,504,943) | | (186,567) | | (7,330,339) |
| Class R4 | | | | | | | |
| Shares Sold | 134,157 | | $ 6,296,937 | | 200,061 | | $ 8,245,646 |
| Shares Issued for Reinvested Dividends | 58,738 | | 2,616,195 | | 36,845 | | 1,484,498 |
| Shares Redeemed | (229,273) | | (10,763,007) | | (365,083) | | (15,109,587) |
| Net Increase (Decrease) | (36,378) | | (1,849,875) | | (128,177) | | (5,379,443) |
| Class R5 | | | | | | | |
| Shares Sold | 79,162 | | $ 3,961,571 | | 209,035 | | $ 9,163,668 |
| Shares Issued for Reinvested Dividends | 25,326 | | 1,201,964 | | 8,515 | | 362,223 |
| Shares Redeemed | (89,603) | | (4,495,885) | | (137,584) | | (5,877,478) |
| Net Increase (Decrease) | 14,885 | | 667,650 | | 79,966 | | 3,648,413 |
| Class R6 | | | | | | | |
| Shares Sold | 55,913 | | $ 2,913,413 | | 54,266 | | $ 2,377,216 |
| Shares Issued for Reinvested Dividends | 9,082 | | 438,736 | | 3,211 | | 138,636 |
| Shares Redeemed | (32,048) | | (1,696,505) | | (9,001) | | (390,531) |
| Net Increase (Decrease) | 32,947 | | 1,655,644 | | 48,476 | | 2,125,321 |
| Class Y | | | | | | | |
| Shares Sold | 450,272 | | $ 22,884,351 | | 542,348 | | $ 23,900,470 |
| Shares Issued for Reinvested Dividends | 219,387 | | 10,587,619 | | 96,305 | | 4,156,525 |
| Shares Redeemed | (397,553) | | (20,324,517) | | (367,262) | | (16,122,522) |
| Net Increase (Decrease) | 272,106 | | 13,147,453 | | 271,391 | | 11,934,473 |
| Class F | | | | | | | |
| Shares Sold | 262,096 | | $ 12,136,397 | | 135,930 | | $ 5,893,269 |
| Shares Issued for Reinvested Dividends | 89,913 | | 3,913,893 | | 45,179 | | 1,776,419 |
| Shares Redeemed | (183,888) | | (8,417,394) | | (154,961) | | (6,147,780) |
| Net Increase (Decrease) | 168,121 | | 7,632,896 | | 26,148 | | 1,521,908 |
| Total Net Increase (Decrease) | 2,698,767 | | $ 114,791,022 | | (60,118) | | $ 4,954,167 |
| MidCap Fund | | | | | | | |
| Class A | | | | | | | |
| Shares Sold | 5,765,546 | | $ 206,608,439 | | 7,479,560 | | $ 213,627,977 |
| Shares Issued for Reinvested Dividends | 10,539,072 | | 343,679,112 | | 4,994,716 | | 148,592,803 |
| Shares Redeemed | (12,122,834) | | (430,915,073) | | (16,503,575) | | (468,979,095) |
| Net Increase (Decrease) | 4,181,784 | | 119,372,478 | | (4,029,299) | | (106,758,315) |
| Class C | | | | | | | |
| Shares Sold | 997,903 | | $ 22,218,396 | | 1,573,527 | | $ 30,282,962 |
| Shares Issued for Reinvested Dividends | 3,497,780 | | 71,039,908 | | 1,866,822 | | 37,149,763 |
| Shares Redeemed | (6,508,579) | | (145,602,161) | | (8,672,532) | | (165,685,884) |
| Net Increase (Decrease) | (2,012,896) | | (52,343,857) | | (5,232,183) | | (98,253,159) |
| Class I | | | | | | | |
| Shares Sold | 18,766,871 | | $ 702,875,370 | | 46,979,290 | | $ 1,323,608,186 |
| Shares Issued for Reinvested Dividends | 13,770,100 | | 469,422,719 | | 6,833,413 | | 211,084,130 |
| Shares Redeemed | (51,765,006) | | (1,948,483,150) | | (65,064,509) | | (1,964,863,323) |
| Net Increase (Decrease) | (19,228,035) | | (776,185,061) | | (11,251,806) | | (430,171,007) |
| Class R3 | | | | | | | |
| Shares Sold | 328,898 | | $ 13,349,542 | | 732,243 | | $ 22,709,563 |
| Shares Issued for Reinvested Dividends | 278,856 | | 10,337,182 | | 135,870 | | 4,553,016 |
| Shares Redeemed | (897,014) | | (36,300,678) | | (1,028,675) | | (33,458,482) |
| Net Increase (Decrease) | (289,260) | | (12,613,954) | | (160,562) | | (6,195,903) |
Hartford Domestic Equity Funds
Notes to Financial Statements – (continued)
October 31, 2021
| | For the Year Ended
October 31, 2021 | | For the Year Ended
October 31, 2020 |
| | Shares | | Amount | | Shares | | Amount |
| Class R4 | | | | | | | |
| Shares Sold | 616,644 | | $ 26,335,205 | | 1,188,661 | | $ 39,805,895 |
| Shares Issued for Reinvested Dividends | 530,397 | | 20,812,764 | | 324,499 | | 11,409,397 |
| Shares Redeemed | (2,562,147) | | (109,758,970) | | (3,333,796) | | (113,157,709) |
| Net Increase (Decrease) | (1,415,106) | | (62,611,001) | | (1,820,636) | | (61,942,417) |
| Class R5 | | | | | | | |
| Shares Sold | 1,925,411 | | $ 85,163,229 | | 2,214,020 | | $ 77,371,989 |
| Shares Issued for Reinvested Dividends | 805,971 | | 32,980,317 | | 534,352 | | 19,461,090 |
| Shares Redeemed | (5,761,404) | | (259,286,863) | | (6,388,662) | | (229,431,554) |
| Net Increase (Decrease) | (3,030,022) | | (141,143,317) | | (3,640,290) | | (132,598,475) |
| Class R6 | | | | | | | |
| Shares Sold | 7,264,767 | | $ 326,578,751 | | 13,129,081 | | $ 470,477,844 |
| Shares Issued for Reinvested Dividends | 3,932,733 | | 163,365,732 | | 1,978,533 | | 72,988,070 |
| Shares Redeemed | (22,294,027) | | (1,010,767,875) | | (15,444,055) | | (551,163,077) |
| Net Increase (Decrease) | (11,096,527) | | (520,823,392) | | (336,441) | | (7,697,163) |
| Class Y | | | | | | | |
| Shares Sold | 4,103,182 | | $ 185,837,048 | | 8,081,483 | | $ 279,248,651 |
| Shares Issued for Reinvested Dividends | 2,564,133 | | 106,283,299 | | 1,713,171 | | 63,096,079 |
| Shares Redeemed | (16,202,137) | | (733,248,509) | | (21,978,523) | | (783,693,402) |
| Net Increase (Decrease) | (9,534,822) | | (441,128,162) | | (12,183,869) | | (441,348,672) |
| Class F | | | | | | | |
| Shares Sold | 11,833,195 | | $ 445,587,914 | | 20,067,998 | | $ 592,511,897 |
| Shares Issued for Reinvested Dividends | 7,742,034 | | 265,242,076 | | 3,417,284 | | 105,901,640 |
| Shares Redeemed | (20,970,331) | | (786,132,834) | | (19,463,971) | | (580,117,317) |
| Net Increase (Decrease) | (1,395,102) | | (75,302,844) | | 4,021,311 | | 118,296,220 |
| Total Net Increase (Decrease) | (43,819,986) | | $ (1,962,779,110) | | (34,633,775) | | $ (1,166,668,891) |
| MidCap Value Fund | | | | | | | |
| Class A | | | | | | | |
| Shares Sold | 2,474,862 | | $ 41,495,746 | | 2,480,138 | | $ 30,751,925 |
| Shares Issued for Reinvested Dividends | 56,642 | | 831,510 | | 633,942 | | 9,248,149 |
| Shares Redeemed | (2,543,440) | | (41,457,915) | | (4,519,018) | | (55,158,666) |
| Net Increase (Decrease) | (11,936) | | 869,341 | | (1,404,938) | | (15,158,592) |
| Class C | | | | | | | |
| Shares Sold | 43,557 | | $ 579,493 | | 121,039 | | $ 1,113,875 |
| Shares Issued for Reinvested Dividends | — | | — | | 40,108 | | 460,945 |
| Shares Redeemed | (405,320) | | (5,295,304) | | (556,664) | | (5,538,552) |
| Net Increase (Decrease) | (361,763) | | (4,715,811) | | (395,517) | | (3,963,732) |
| Class I | | | | | | | |
| Shares Sold | 328,086 | | $ 5,572,562 | | 520,034 | | $ 6,756,443 |
| Shares Issued for Reinvested Dividends | 7,619 | | 112,984 | | 66,544 | | 983,484 |
| Shares Redeemed | (553,865) | | (8,619,992) | | (1,126,169) | | (13,885,918) |
| Net Increase (Decrease) | (218,160) | | (2,934,446) | | (539,591) | | (6,145,991) |
| Class R3 | | | | | | | |
| Shares Sold | 66,910 | | $ 1,193,206 | | 83,482 | | $ 1,027,547 |
| Shares Issued for Reinvested Dividends | — | | — | | 12,474 | | 191,545 |
| Shares Redeemed | (115,157) | | (2,047,635) | | (211,872) | | (2,849,232) |
| Net Increase (Decrease) | (48,247) | | (854,429) | | (115,916) | | (1,630,140) |
| Class R4 | | | | | | | |
| Shares Sold | 71,792 | | $ 1,296,064 | | 112,090 | | $ 1,454,297 |
| Shares Issued for Reinvested Dividends | 1,122 | | 17,850 | | 19,234 | | 303,476 |
| Shares Redeemed | (208,564) | | (3,543,019) | | (222,635) | | (3,007,462) |
| Net Increase (Decrease) | (135,650) | | (2,229,105) | | (91,311) | | (1,249,689) |
| Class R5 | | | | | | | |
| Shares Sold | 7,217 | | $ 128,610 | | 9,680 | | $ 139,991 |
| Shares Issued for Reinvested Dividends | 586 | | 9,446 | | 2,874 | | 46,111 |
| Shares Redeemed | (6,437) | | (116,999) | | (7,314) | | (94,084) |
| Net Increase (Decrease) | 1,366 | | 21,057 | | 5,240 | | 92,018 |
Hartford Domestic Equity Funds
Notes to Financial Statements – (continued)
October 31, 2021
| | For the Year Ended
October 31, 2021 | | For the Year Ended
October 31, 2020 |
| | Shares | | Amount | | Shares | | Amount |
| Class Y | | | | | | | |
| Shares Sold | 473,420 | | $ 8,111,667 | | 126,076 | | $ 1,744,448 |
| Shares Issued for Reinvested Dividends | 5,606 | | 90,649 | | 24,096 | | 388,031 |
| Shares Redeemed | (457,356) | | (8,763,398) | | (202,609) | | (2,806,695) |
| Net Increase (Decrease) | 21,670 | | (561,082) | | (52,437) | | (674,216) |
| Class F | | | | | | | |
| Shares Sold | 5,244,142 | | $ 88,440,237 | | 8,138,328 | | $ 100,149,062 |
| Shares Issued for Reinvested Dividends | 163,610 | | 2,424,705 | | 724,542 | | 10,710,609 |
| Shares Redeemed | (5,585,121) | | (92,716,247) | | (6,157,364) | | (78,365,435) |
| Net Increase (Decrease) | (177,369) | | (1,851,305) | | 2,705,506 | | 32,494,236 |
| Total Net Increase (Decrease) | (930,089) | | $ (12,255,780) | | 111,036 | | $ 3,763,894 |
| Quality Value Fund | | | | | | | |
| Class A | | | | | | | |
| Shares Sold | 434,273 | | $ 10,311,005 | | 439,196 | | $ 8,293,523 |
| Shares Issued for Reinvested Dividends | 151,354 | | 3,182,978 | | 399,950 | | 8,456,495 |
| Shares Redeemed | (947,815) | | (22,212,834) | | (1,349,336) | | (25,330,604) |
| Net Increase (Decrease) | (362,188) | | (8,718,851) | | (510,190) | | (8,580,586) |
| Class C | | | | | | | |
| Shares Sold | 29,926 | | $ 594,579 | | 27,218 | | $ 445,180 |
| Shares Issued for Reinvested Dividends | 3,530 | | 63,188 | | 16,808 | | 302,140 |
| Shares Redeemed | (113,368) | | (2,261,575) | | (189,929) | | (3,063,775) |
| Net Increase (Decrease) | (79,912) | | (1,603,808) | | (145,903) | | (2,316,455) |
| Class I | | | | | | | |
| Shares Sold | 278,233 | | $ 6,680,247 | | 116,192 | | $ 2,216,237 |
| Shares Issued for Reinvested Dividends | 14,220 | | 294,345 | | 32,925 | | 686,590 |
| Shares Redeemed | (110,028) | | (2,556,620) | | (167,957) | | (3,198,931) |
| Net Increase (Decrease) | 182,425 | | 4,417,972 | | (18,840) | | (296,104) |
| Class R3 | | | | | | | |
| Shares Sold | 4,235 | | $ 100,111 | | 5,088 | | $ 93,854 |
| Shares Issued for Reinvested Dividends | 828 | | 17,729 | | 2,697 | | 57,990 |
| Shares Redeemed | (9,137) | | (220,510) | | (20,388) | | (402,055) |
| Net Increase (Decrease) | (4,074) | | (102,670) | | (12,603) | | (250,211) |
| Class R4 | | | | | | | |
| Shares Sold | 44,905 | | $ 1,069,168 | | 42,840 | | $ 822,386 |
| Shares Issued for Reinvested Dividends | 4,243 | | 91,734 | | 13,979 | | 303,759 |
| Shares Redeemed | (75,589) | | (1,855,079) | | (131,128) | | (2,658,103) |
| Net Increase (Decrease) | (26,441) | | (694,177) | | (74,309) | | (1,531,958) |
| Class R5 | | | | | | | |
| Shares Sold | 123 | | $ 3,003 | | 510 | | $ 10,672 |
| Shares Issued for Reinvested Dividends | 265 | | 5,775 | | 566 | | 12,405 |
| Shares Redeemed | (64) | | (1,603) | | (173) | | (3,456) |
| Net Increase (Decrease) | 324 | | 7,175 | | 903 | | 19,621 |
| Class R6 | | | | | | | |
| Shares Sold | 5,718 | | $ 131,614 | | 25,758 | | $ 484,275 |
| Shares Issued for Reinvested Dividends | 536 | | 11,697 | | 83 | | 1,828 |
| Shares Redeemed | (21,890) | | (567,870) | | (2,382) | | (47,033) |
| Net Increase (Decrease) | (15,636) | | (424,559) | | 23,459 | | 439,070 |
| Class Y | | | | | | | |
| Shares Sold | 46,187 | | $ 1,183,352 | | 7,651 | | $ 158,274 |
| Shares Issued for Reinvested Dividends | 473 | | 10,318 | | 1,541 | | 33,830 |
| Shares Redeemed | (2,267) | | (57,102) | | (17,842) | | (304,447) |
| Net Increase (Decrease) | 44,393 | | 1,136,568 | | (8,650) | | (112,343) |
| Class F | | | | | | | |
| Shares Sold | 64,383 | | $ 1,454,799 | | 110,798 | | $ 1,978,094 |
| Shares Issued for Reinvested Dividends | 12,550 | | 258,522 | | 31,266 | | 650,547 |
| Shares Redeemed | (95,500) | | (2,207,875) | | (181,962) | | (3,365,916) |
| Net Increase (Decrease) | (18,567) | | (494,554) | | (39,898) | | (737,275) |
| Total Net Increase (Decrease) | (279,676) | | $ (6,476,904) | | (786,031) | | $ (13,366,241) |
Hartford Domestic Equity Funds
Notes to Financial Statements – (continued)
October 31, 2021
| | For the Year Ended
October 31, 2021 | | For the Year Ended
October 31, 2020 |
| | Shares | | Amount | | Shares | | Amount |
| Small Cap Growth Fund | | | | | | | |
| Class A | | | | | | | |
| Shares Sold | 242,684 | | $ 15,163,953 | | 129,404 | | $ 5,969,147 |
| Shares Issued for Reinvested Dividends | 280,755 | | 16,331,511 | | 64,625 | | 3,116,821 |
| Shares Redeemed | (441,435) | | (27,592,119) | | (602,309) | | (27,705,360) |
| Net Increase (Decrease) | 82,004 | | 3,903,345 | | (408,280) | | (18,619,392) |
| Class C | | | | | | | |
| Shares Sold | 18,046 | | $ 723,868 | | 4,911 | | $ 150,801 |
| Shares Issued for Reinvested Dividends | 40,883 | | 1,524,921 | | 10,908 | | 352,646 |
| Shares Redeemed | (223,022) | | (8,907,111) | | (164,584) | | (5,078,582) |
| Net Increase (Decrease) | (164,093) | | (6,658,322) | | (148,765) | | (4,575,135) |
| Class I | | | | | | | |
| Shares Sold | 356,881 | | $ 23,938,090 | | 1,191,528 | | $ 51,688,394 |
| Shares Issued for Reinvested Dividends | 118,956 | | 7,339,599 | | 57,456 | | 2,916,489 |
| Shares Redeemed | (555,069) | | (36,106,911) | | (3,414,260) | | (171,804,734) |
| Net Increase (Decrease) | (79,232) | | (4,829,222) | | (2,165,276) | | (117,199,851) |
| Class R3 | | | | | | | |
| Shares Sold | 34,992 | | $ 2,097,739 | | 41,973 | | $ 1,789,694 |
| Shares Issued for Reinvested Dividends | 11,592 | | 661,760 | | 3,087 | | 146,681 |
| Shares Redeemed | (58,869) | | (3,639,902) | | (119,534) | | (5,504,341) |
| Net Increase (Decrease) | (12,285) | | (880,403) | | (74,474) | | (3,567,966) |
| Class R4 | | | | | | | |
| Shares Sold | 89,389 | | $ 5,836,584 | | 138,690 | | $ 6,582,259 |
| Shares Issued for Reinvested Dividends | 32,051 | | 1,953,808 | | 12,210 | | 614,885 |
| Shares Redeemed | (392,229) | | (25,488,142) | | (456,656) | | (20,953,685) |
| Net Increase (Decrease) | (270,789) | | (17,697,750) | | (305,756) | | (13,756,541) |
| Class R5 | | | | | | | |
| Shares Sold | 262,369 | | $ 18,020,843 | | 720,572 | | $ 37,862,183 |
| Shares Issued for Reinvested Dividends | 80,046 | | 5,219,014 | | 21,655 | | 1,157,694 |
| Shares Redeemed | (408,838) | | (28,555,099) | | (1,119,362) | | (58,971,093) |
| Net Increase (Decrease) | (66,423) | | (5,315,242) | | (377,135) | | (19,951,216) |
| Class R6 | | | | | | | |
| Shares Sold | 334,847 | | $ 23,790,157 | | 1,797,542 | | $ 98,016,701 |
| Shares Issued for Reinvested Dividends | 90,910 | | 6,035,522 | | 17,777 | | 965,664 |
| Shares Redeemed | (666,499) | | (47,474,079) | | (1,722,133) | | (85,535,221) |
| Net Increase (Decrease) | (240,742) | | (17,648,400) | | 93,186 | | 13,447,144 |
| Class Y | | | | | | | |
| Shares Sold | 710,508 | | $ 50,782,835 | | 1,010,537 | | $ 51,567,246 |
| Shares Issued for Reinvested Dividends | 243,023 | | 16,134,292 | | 92,203 | | 5,010,332 |
| Shares Redeemed | (1,739,428) | | (123,651,652) | | (3,823,424) | | (209,045,933) |
| Net Increase (Decrease) | (785,897) | | (56,734,525) | | (2,720,684) | | (152,468,355) |
| Class F | | | | | | | |
| Shares Sold | 272,698 | | $ 18,053,254 | | 192,412 | | $ 7,897,145 |
| Shares Issued for Reinvested Dividends | 51,104 | | 3,169,442 | | 12,299 | | 626,749 |
| Shares Redeemed | (613,475) | | (41,379,020) | | (354,986) | | (17,110,113) |
| Net Increase (Decrease) | (289,673) | | (20,156,324) | | (150,275) | | (8,586,219) |
| Total Net Increase (Decrease) | (1,827,130) | | $ (126,016,843) | | (6,257,459) | | $ (325,277,531) |
| Small Cap Value Fund | | | | | | | |
| Class A | | | | | | | |
| Shares Sold | 1,188,590 | | $ 15,684,280 | | 431,215 | | $ 3,396,385 |
| Shares Issued for Reinvested Dividends | 34,939 | | 359,520 | | 292,505 | | 2,936,036 |
| Shares Redeemed | (750,779) | | (9,444,203) | | (1,289,036) | | (10,577,661) |
| Net Increase (Decrease) | 472,750 | | 6,599,597 | | (565,316) | | (4,245,240) |
| Class C | | | | | | | |
| Shares Sold | 108,329 | | $ 1,209,656 | | 31,607 | | $ 222,855 |
| Shares Issued for Reinvested Dividends | 441 | | 3,924 | | 26,761 | | 229,881 |
| Shares Redeemed | (122,556) | | (1,345,622) | | (189,586) | | (1,389,193) |
| Net Increase (Decrease) | (13,786) | | (132,042) | | (131,218) | | (936,457) |
Hartford Domestic Equity Funds
Notes to Financial Statements – (continued)
October 31, 2021
| | For the Year Ended
October 31, 2021 | | For the Year Ended
October 31, 2020 |
| | Shares | | Amount | | Shares | | Amount |
| Class I | | | | | | | |
| Shares Sold | 2,537,268 | | $ 33,866,723 | | 295,467 | | $ 2,831,571 |
| Shares Issued for Reinvested Dividends | 5,247 | | 53,996 | | 41,551 | | 418,405 |
| Shares Redeemed | (437,736) | | (5,819,619) | | (405,903) | | (3,187,749) |
| Net Increase (Decrease) | 2,104,779 | | 28,101,100 | | (68,885) | | 62,227 |
| Class R3 | | | | | | | |
| Shares Sold | 29,282 | | $ 397,377 | | 9,891 | | $ 82,868 |
| Shares Issued for Reinvested Dividends | 326 | | 3,498 | | 3,512 | | 36,622 |
| Shares Redeemed | (15,655) | | (197,530) | | (17,164) | | (139,499) |
| Net Increase (Decrease) | 13,953 | | 203,345 | | (3,761) | | (20,009) |
| Class R4 | | | | | | | |
| Shares Sold | 822 | | $ 11,178 | | 1,313 | | $ 11,330 |
| Shares Issued for Reinvested Dividends | 33 | | 362 | | 226 | | 2,398 |
| Shares Redeemed | (584) | | (8,365) | | (4,441) | | (42,520) |
| Net Increase (Decrease) | 271 | | 3,175 | | (2,902) | | (28,792) |
| Class R5 | | | | | | | |
| Shares Sold | 3,061 | | $ 44,058 | | 1,479 | | $ 10,000 |
| Shares Issued for Reinvested Dividends | 14 | | 148 | | 69 | | 730 |
| Shares Redeemed | (2,457) | | (34,282) | | (1,479) | | (11,716) |
| Net Increase (Decrease) | 618 | | 9,924 | | 69 | | (986) |
| Class R6 | | | | | | | |
| Shares Sold | 88,436 | | $ 1,245,447 | | 18,071 | | $ 163,710 |
| Shares Issued for Reinvested Dividends | 357 | | 3,866 | | 665 | | 7,036 |
| Shares Redeemed | (9,262) | | (115,115) | | (741) | | (7,349) |
| Net Increase (Decrease) | 79,531 | | 1,134,198 | | 17,995 | | 163,397 |
| Class Y | | | | | | | |
| Shares Sold | 124,042 | | $ 1,700,660 | | 842 | | $ 7,711 |
| Shares Issued for Reinvested Dividends | 342 | | 3,688 | | 2,671 | | 28,235 |
| Shares Redeemed | (14,694) | | (205,546) | | (27,529) | | (261,033) |
| Net Increase (Decrease) | 109,690 | | 1,498,802 | | (24,016) | | (225,087) |
| Class F | | | | | | | |
| Shares Sold | 2,116,114 | | $ 27,975,721 | | 906,600 | | $ 7,468,195 |
| Shares Issued for Reinvested Dividends | 64,774 | | 665,880 | | 329,545 | | 3,318,168 |
| Shares Redeemed | (1,320,995) | | (15,530,755) | | (1,038,699) | | (8,257,092) |
| Net Increase (Decrease) | 859,893 | | 13,110,846 | | 197,446 | | 2,529,271 |
| Total Net Increase (Decrease) | 3,627,699 | | $ 50,528,945 | | (580,588) | | $ (2,701,676) |
| Small Company Fund | | | | | | | |
| Class A | | | | | | | |
| Shares Sold | 1,809,812 | | $ 54,140,187 | | 1,886,865 | | $ 39,854,997 |
| Shares Issued for Reinvested Dividends | 1,517,800 | | 41,967,161 | | 956,824 | | 19,433,104 |
| Shares Redeemed | (1,970,509) | | (58,538,530) | | (2,885,202) | | (59,241,409) |
| Net Increase (Decrease) | 1,357,103 | | 37,568,818 | | (41,513) | | 46,692 |
| Class C | | | | | | | |
| Shares Sold | 105,496 | | $ 1,863,781 | | 116,822 | | $ 1,577,039 |
| Shares Issued for Reinvested Dividends | 98,681 | | 1,604,546 | | 70,385 | | 901,628 |
| Shares Redeemed | (243,229) | | (4,261,364) | | (366,573) | | (4,857,687) |
| Net Increase (Decrease) | (39,052) | | (793,037) | | (179,366) | | (2,379,020) |
| Class I | | | | | | | |
| Shares Sold | 722,263 | | $ 23,465,518 | | 296,143 | | $ 6,816,692 |
| Shares Issued for Reinvested Dividends | 113,755 | | 3,392,187 | | 75,333 | | 1,633,979 |
| Shares Redeemed | (329,416) | | (10,447,336) | | (304,758) | | (6,628,138) |
| Net Increase (Decrease) | 506,602 | | 16,410,369 | | 66,718 | | 1,822,533 |
| Class R3 | | | | | | | |
| Shares Sold | 136,144 | | $ 4,520,959 | | 89,211 | | $ 1,943,559 |
| Shares Issued for Reinvested Dividends | 45,509 | | 1,394,856 | | 35,475 | | 793,230 |
| Shares Redeemed | (217,034) | | (7,087,863) | | (258,886) | | (5,812,439) |
| Net Increase (Decrease) | (35,381) | | (1,172,048) | | (134,200) | | (3,075,650) |
Hartford Domestic Equity Funds
Notes to Financial Statements – (continued)
October 31, 2021
| | For the Year Ended
October 31, 2021 | | For the Year Ended
October 31, 2020 |
| | Shares | | Amount | | Shares | | Amount |
| Class R4 | | | | | | | |
| Shares Sold | 130,342 | | $ 4,726,037 | | 118,455 | | $ 2,883,625 |
| Shares Issued for Reinvested Dividends | 37,589 | | 1,251,351 | | 31,292 | | 752,892 |
| Shares Redeemed | (189,059) | | (6,753,577) | | (304,693) | | (7,836,433) |
| Net Increase (Decrease) | (21,128) | | (776,189) | | (154,946) | | (4,199,916) |
| Class R5 | | | | | | | |
| Shares Sold | 84,862 | | $ 3,272,537 | | 44,314 | | $ 1,187,403 |
| Shares Issued for Reinvested Dividends | 10,551 | | 377,953 | | 6,152 | | 157,911 |
| Shares Redeemed | (44,399) | | (1,705,756) | | (56,252) | | (1,506,697) |
| Net Increase (Decrease) | 51,014 | | 1,944,734 | | (5,786) | | (161,383) |
| Class R6 | | | | | | | |
| Shares Sold | 129,943 | | $ 5,123,929 | | 43,328 | | $ 1,379,271 |
| Shares Issued for Reinvested Dividends | 3,508 | | 128,962 | | 220 | | 5,772 |
| Shares Redeemed | (32,019) | | (1,254,201) | | (5,289) | | (151,909) |
| Net Increase (Decrease) | 101,432 | | 3,998,690 | | 38,259 | | 1,233,134 |
| Class Y | | | | | | | |
| Shares Sold | 2,592,104 | | $ 111,577,676 | | 236,078 | | $ 6,005,173 |
| Shares Issued for Reinvested Dividends | 47,078 | | 1,728,226 | | 58,965 | | 1,548,420 |
| Shares Redeemed | (2,109,893) | | (87,145,029) | | (943,050) | | (22,519,569) |
| Net Increase (Decrease) | 529,289 | | 26,160,873 | | (648,007) | | (14,965,976) |
| Class F | | | | | | | |
| Shares Sold | 3,078,986 | | $ 99,109,263 | | 1,838,858 | | $ 40,440,450 |
| Shares Issued for Reinvested Dividends | 808,547 | | 24,288,757 | | 518,887 | | 11,316,929 |
| Shares Redeemed | (2,624,084) | | (85,717,671) | | (2,396,511) | | (56,036,553) |
| Net Increase (Decrease) | 1,263,449 | | 37,680,349 | | (38,766) | | (4,279,174) |
| Total Net Increase (Decrease) | 3,713,328 | | $ 121,022,559 | | (1,097,607) | | $ (25,958,760) |
| 14. | Line of Credit: |
| | Each Fund participates in a committed line of credit pursuant to a credit agreement dated March 4, 2021. Each Fund may borrow under the line of credit for temporary or emergency purposes. The Funds (together with certain other Hartford Funds) may borrow up to $350 million in the aggregate, subject to asset coverage and other limitations specified in the credit agreement. The interest rate on borrowings varies depending on the nature of the loan. The facility also charges certain fees, such as an upfront fee and a commitment fee. From November 1, 2020 through March 4, 2021, the Funds (together with certain other Hartford Funds) had a similar agreement that enabled them to participate in a $350 million committed line of credit. The fees incurred by the Funds in connection with the committed lines of credit during the period appear in the Statements of Operations under “Other expenses.” During and as of the year ended October 31, 2021, none of the Funds had borrowings under this facility. |
| 15. | Indemnifications: |
| | Under each Company’s organizational documents, the Company shall indemnify its officers and directors to the full extent required or permitted under Maryland General Corporation Law and federal securities laws. In addition, each Company, on behalf of its respective Funds, may enter into contracts that contain a variety of indemnifications. Each Company’s maximum exposure under these arrangements is unknown. However, as of the date of these financial statements, each Company has not had prior claims or losses pursuant to these contracts and expects the risk of loss to be remote. |
| 16. | Change in Independent Registered Public Accounting Firm: |
| | On November 6, 2019, the Companies, on behalf of their respective Funds, dismissed Ernst & Young LLP (“EY”) as the Funds’ independent registered public accounting firm effective upon the issuance of EY’s report on the Funds’ financial statements as of and for the fiscal year ended October 31, 2019. EY’s report on the Funds’ financial statements for the fiscal years October 31, 2018 and October 31, 2019 contained no adverse opinion or disclaimer of opinion nor was EY’s report qualified or modified as to uncertainty, audit scope or accounting principles. During the Funds’ fiscal periods ended on October 31, 2018 and October 31, 2019 and through December 30, 2019 (the “Covered Period”), (i) there were no disagreements with EY on any matter of accounting principles or practices, financial statement disclosure or auditing scope or procedure, |
Hartford Domestic Equity Funds
Notes to Financial Statements – (continued)
October 31, 2021
| | which disagreements, if not resolved to the satisfaction of EY, would have caused it to make reference to the subject matter of the disagreements in connection with its reports on the Funds’ financial statements for the Covered Period, and (ii) there were no “reportable events” of the kind described in Item 304(a)(1)(v) of Regulation S-K under the Securities Exchange Act of 1934, as amended. |
| | On November 6, 2019, the Audit Committee of each Company’s Board of Directors participated in and approved the decision to engage PricewaterhouseCoopers LLP (“PwC”) as the independent registered public accounting firm for the Funds for the fiscal year ended October 31, 2020. The selection of PwC does not reflect any disagreements with or dissatisfaction by each Company or the Board of Directors with the performance of the Funds’ prior independent registered public accounting firm, EY. During the Covered Period, neither the Funds, nor anyone on their behalf, consulted with PwC on items which: (i) concerned the application of accounting principles to a specified transaction, either completed or proposed, or the type of audit opinion that might be rendered on the Funds’ financial statements; or (ii) concerned the subject of a disagreement (as defined in paragraph (a)(1)(iv) of Item 304 of Regulation S-K) or reportable events (as described in paragraph (a)(1)(v) of Item 304 of Regulation S-K). |
| 17. | Subsequent Events: |
| | Management has evaluated all subsequent transactions and events through the date on which these financial statements were issued and has determined that no additional items require disclosure in these financial statements. |
Report of Independent Registered Public Accounting Firm
To the Board of Directors of The Hartford Mutual Funds, Inc. and The Hartford Mutual Funds II, Inc. and Shareholders of The Hartford Capital Appreciation Fund, Hartford Core Equity Fund, The Hartford Dividend and Growth Fund, The Hartford Equity Income Fund, The Hartford Growth Opportunities Fund, The Hartford Healthcare Fund, The Hartford MidCap Fund, The Hartford MidCap Value Fund, Hartford Quality Value Fund, The Hartford Small Cap Growth Fund, Hartford Small Cap Value Fund and The Hartford Small Company Fund
Opinion on the Financial Statements
We have audited the accompanying statements of assets and liabilities, including the schedules of investments, of The Hartford Capital Appreciation Fund, Hartford Core Equity Fund, The Hartford Dividend and Growth Fund, The Hartford Equity Income Fund, The Hartford Healthcare Fund, The Hartford MidCap Fund, The Hartford MidCap Value Fund, Hartford Small Cap Value Fund and The Hartford Small Company Fund (nine of the funds constituting The Hartford Mutual Funds, Inc.) and The Hartford Growth Opportunities Fund, Hartford Quality Value Fund and The Hartford Small Cap Growth Fund (three of the funds constituting The Hartford Mutual Funds II, Inc.) (hereafter collectively referred to as the “Funds”) as of October 31, 2021, the related statements of operations for the year ended October 31, 2021, the statements of changes in net assets for each of the two years in the period ended October 31, 2021, including the related notes, and the financial highlights for each of the two years in the period ended October 31, 2021 (collectively referred to as the “financial statements”). In our opinion, the financial statements present fairly, in all material respects, the financial position of each of the Funds as of October 31, 2021, the results of each of their operations for the year then ended, the changes in each of their net assets for each of the two years in the period ended October 31, 2021 and each of the financial highlights for each of the two years in the period ended October 31, 2021 in conformity with accounting principles generally accepted in the United States of America.
The financial statements of the Funds as of and for the year ended October 31, 2019 and the financial highlights for each of the periods ended on or prior to October 31, 2019 (not presented herein, other than the financial highlights) were audited by other auditors whose report dated December 30, 2019 expressed an unqualified opinion on those financial statements and financial highlights.
Basis for Opinion
These financial statements are the responsibility of the Funds’ management. Our responsibility is to express an opinion on the Funds’ financial statements based on our audits. We are a public accounting firm registered with the Public Company Accounting Oversight Board (United States) (PCAOB) and are required to be independent with respect to the Funds in accordance with the U.S. federal securities laws and the applicable rules and regulations of the Securities and Exchange Commission and the PCAOB.
We conducted our audits of these financial statements in accordance with the standards of the PCAOB. Those standards require that we plan and perform the audit to obtain reasonable assurance about whether the financial statements are free of material misstatement, whether due to error or fraud.
Our audits included performing procedures to assess the risks of material misstatement of the financial statements, whether due to error or fraud, and performing procedures that respond to those risks. Such procedures included examining, on a test basis, evidence regarding the amounts and disclosures in the financial statements. Our audits also included evaluating the accounting principles used and significant estimates made by management, as well as evaluating the overall presentation of the financial statements. Our procedures included confirmation of securities owned as of October 31, 2021 by correspondence with the custodian, transfer agent and brokers; when replies were not received from brokers, we performed other auditing procedures. We believe that our audits provide a reasonable basis for our opinions.
/s/ PricewaterhouseCoopers LLP
Philadelphia, Pennsylvania
December 28, 2021
We have served as the auditor of one or more investment companies in the Hartford Funds group of investment companies since 2020.
Hartford Domestic Equity Funds
Operation of the Liquidity Risk Management Program (Unaudited)
This section describes the operation and effectiveness of the Liquidity Risk Management Program (“LRM Program”) established in accordance with Rule 22e-4 under the Investment Company Act of 1940, as amended (the “Liquidity Rule”). The LRM Program seeks to assess and manage each Fund’s liquidity risk. The Liquidity Rule generally defines liquidity risk as the risk that a Fund could not meet its obligation to redeem shares without significant dilution of the non-redeeming investors’ interests in the Fund. The Boards of Directors (“Board”) of The Hartford Mutual Funds, Inc. and The Hartford Mutual Funds II, Inc. have appointed Hartford Funds Management Company, LLC (“HFMC”) to serve as the administrator of the LRM Program with respect to each of the Funds, subject to the oversight of the Board. In order to efficiently and effectively administer the LRM Program, HFMC established a Liquidity Risk Oversight Committee.
The LRM Program is comprised of various components designed to support the assessment and/or management of liquidity risk, including: (1) the assessment and periodic review (no less frequently than annually) of certain factors that influence each Fund’s liquidity risk; (2) the classification and periodic review (no less frequently than monthly) of each Fund’s investments into one of four liquidity categories that reflect an estimate of their liquidity under current market conditions; (3) a 15% limit on the acquisition of “illiquid investments” (as defined under the Liquidity Rule); (4) the determination of a minimum percentage of each Fund’s assets that generally will be invested in highly liquid investments (“HLIM”); (5) the periodic review (no less frequently than annually) of the HLIM and the adoption and implementation of policies and procedures for responding to a shortfall of a Fund’s highly liquid investments below its HLIM; and (6) periodic reporting to the Board.
At a meeting of the Board held May 11-13, 2021, HFMC provided an annual written report to the Board covering the period from April 1, 2020 through March 31, 2021. The annual report addressed important aspects of the LRM Program, including, but not limited to:
| • | the operation of the LRM Program (and related policies and procedures utilized in connection with management of the Funds’ liquidity risk); |
| • | an assessment of the adequacy and effectiveness of the LRM Program’s (and related policies and procedures’) implementation; |
| • | the operation, and assessment of the adequacy and effectiveness, of each Fund’s HLIM; |
| • | whether the third-party liquidity vendor’s (“LRM Program Vendor”) processes for determining preliminary liquidity classifications, including the particular methodologies or factors used and metrics analyzed by the LRM Program Vendor, are sufficient under the Liquidity Rule and appropriate in light of each Fund’s specific circumstances; and |
| • | any material changes to the LRM Program. |
In addition, HFMC provides a quarterly report on the LRM Program at each quarterly meeting of the Board’s Compliance and Risk Oversight Committee. The quarterly report included information regarding the Funds’ liquidity as measured by established parameters, a summary of developments within the capital markets that may impact liquidity, and other factors that may impact liquidity. Among other things, HFMC reports any changes to a Fund’s HLIM.
From April 1, 2020 through March 31, 2021, HFMC did not increase or reduce the HLIM for any Fund.
Based on its review and assessment, HFMC has concluded that the LRM Program is operating effectively to assess and manage the liquidity risk of each Fund and that the LRM Program has been and continues to be adequately and effectively implemented with respect to each Fund. Because liquidity in the capital markets in which the Funds invest is beyond the control of the Funds, there can be no assurance that the LRM Program will ensure liquidity under all circumstances and does not protect against the risk of loss.
Hartford Domestic Equity Funds
Directors and Officers of each Company (Unaudited)
Each of The Hartford Mutual Funds, Inc. and The Hartford Mutual Funds II, Inc. (each, a “Company”) is governed by a Board of Directors (the “Directors”). The following tables present certain information regarding the Directors and officers of each Company as of October 31, 2021. For more information regarding the Directors and officers, please refer to the Statement of Additional Information, which is available, without charge, upon request by calling 1-888-843-7824.
NAME, YEAR OF BIRTH
AND ADDRESS(1) | | POSITION
HELD WITH
EACH COMPANY | | TERM OF
OFFICE(2) AND
LENGTH OF
TIME SERVED | | PRINCIPAL OCCUPATION(S)
DURING PAST 5 YEARS | | NUMBER OF
PORTFOLIOS
IN FUND
COMPLEX(3)
OVERSEEN
BY DIRECTOR | | OTHER DIRECTORSHIPS
FOR PUBLIC COMPANIES
AND OTHER REGISTERED
INVESTMENT COMPANIES
BY DIRECTOR |
| NON-INTERESTED DIRECTORS |
HILARY E. ACKERMANN
(1956) | | Director | | Since 2014 | | Ms. Ackermann served as Chief Risk Officer at Goldman Sachs Bank USA from October 2008 to November 2011. | | 75 | | Ms. Ackermann served as a Director of Dynegy, Inc. from October 2012 until its acquisition by Vistra Energy Corporation (“Vistra”) in 2018, and since that time she has served as a Director of Vistra. Ms. Ackermann serves as a Director of Credit Suisse Holdings (USA), Inc. from January 2017 to present. |
ROBIN C. BEERY
(1967) | | Director | | Since 2017 | | Ms. Beery has served as a consultant to ArrowMark Partners (an alternative asset manager) since March of 2015 and since November 2018 has been employed by ArrowMark Partners as a Senior Advisor. Previously, she was Executive Vice President, Head of Distribution, for Janus Capital Group, and Chief Executive Officer and President of the Janus Mutual Funds (a global asset manager) from September 2009 to August 2014. | | 75 | | Ms. Beery serves as an independent Director of UMB Financial Corporation (January 2015 to present), has chaired the Compensation Committee since April 2017, and serves on the Audit Committee and the Risk Committee. |
LYNN S. BIRDSONG(4), (5)
(1946) | | Director and Chair of the Board | | Director since 2003; Chair of the Board since 2019 | | From January 1981 through December 2013, Mr. Birdsong was a partner in Birdsong Company, an advertising specialty firm. From 1979 to 2002, Mr. Birdsong was a Managing Director of Zurich Scudder Investments, an investment management firm. | | 75 | | None |
DERRICK D. CEPHAS
(1952) | | Director | | Since 2020 | | Mr. Cephas currently serves as Of Counsel to Squire Patton Boggs LLP, an international law firm with 45 offices in 20 countries. Until his retirement in October 2020, Mr. Cephas was a Partner of Weil, Gotshal & Manges LLP, an international law firm headquartered in New York, where he served as the Head of the Financial Institutions Practice (April 2011 to October 2020). | | 75 | | Mr. Cephas currently serves as a Director of Signature Bank, a New York-based commercial bank, and is a member of the Credit Committee, Examining Committee and Risk Committee. Mr. Cephas currently serves as a Director of Claros Mortgage Trust, Inc., a real estate investment trust. |
CHRISTINE R. DETRICK(5)
(1958) | | Director | | Since 2016 | | Ms. Detrick served as a Senior Partner/Advisor at Bain & Company (a management consulting firm) from September 2002 to December 2012. | | 75 | | Ms. Detrick serves as a Director and Chair of the Nominating and Governance Committee of Reinsurance Group of America (from January 2014 to present). She also serves as a Director of Charles River Associates (May 2020 to present). |
Hartford Domestic Equity Funds
Directors and Officers of each Company (Unaudited) – (continued)
NAME, YEAR OF BIRTH
AND ADDRESS(1) | | POSITION
HELD WITH
EACH COMPANY | | TERM OF
OFFICE(2) AND
LENGTH OF
TIME SERVED | | PRINCIPAL OCCUPATION(S)
DURING PAST 5 YEARS | | NUMBER OF
PORTFOLIOS
IN FUND
COMPLEX(3)
OVERSEEN
BY DIRECTOR | | OTHER DIRECTORSHIPS
FOR PUBLIC COMPANIES
AND OTHER REGISTERED
INVESTMENT COMPANIES
BY DIRECTOR |
ANDREW A. JOHNSON
(1962) | | Director | | Since 2020 | | Mr. Johnson currently serves as a Diversity and Inclusion Advisor at Neuberger Berman, a private, global investment management firm. Prior to his current role, Mr. Johnson served as Chief Investment Officer and Head of Global Investment Grade Fixed Income at Neuberger Berman (January 2009 to December 2018). | | 75 | | Mr. Johnson currently serves as a Director of AGNC Investment Corp., a real estate investment trust. |
PAUL L. ROSENBERG
(1953) | | Director | | Since 2020 | | Mr. Rosenberg is a Partner of The Bridgespan Group, a global nonprofit consulting firm that is a social impact advisor to nonprofits, non-governmental organizations, philanthropists and institutional investors (October 2007 to present). | | 75 | | None |
LEMMA W. SENBET(4)
(1946) | | Director | | Since 2005 | | Dr. Senbet currently serves as the William E. Mayer Chair Professor of Finance in the Robert H. Smith School of Business at the University of Maryland, where he was chair of the Finance Department from 1998 to 2006. In June 2013, he began a sabbatical from the University to serve as Executive Director of the African Economic Research Consortium which focuses on economic policy research and training, which he completed in 2018. | | 75 | | None |
DAVID SUNG
(1953) | | Director | | Since 2017 | | Mr. Sung was a Partner at Ernst & Young LLP from October 1995 to July 2014. | | 75 | | Mr. Sung serves as a Trustee of Ironwood Institutional Multi-Strategy Fund, LLC and Ironwood Multi-Strategy Fund, LLC (October 2015 to present). |
| OFFICERS AND INTERESTED DIRECTORS |
JAMES E. DAVEY(6)
(1964) | | Director, President and Chief Executive Officer | | President and Chief Executive Officer since 2010; Director since 2012 | | Mr. Davey serves as Executive Vice President of The Hartford Financial Services Group, Inc. Mr. Davey has served in various positions within The Hartford and its subsidiaries and joined The Hartford in 2002. Additionally, Mr. Davey serves as Director, Chairman, President, and Senior Managing Director for Hartford Funds Management Group, Inc. ("HFMG"). Mr. Davey also serves as President, Manager, Chairman of the Board, and Senior Managing Director for Hartford Funds Management Company, LLC (“HFMC”); Manager, Chairman of the Board, and President of Lattice Strategies LLC (“Lattice”); Chairman of the Board, Manager, and Senior Managing Director of Hartford Funds Distributors, LLC (“HFD”); and Chairman of the Board, President and Senior Managing Director of Hartford Administrative Services Company (“HASCO”), each of which is an affiliate of HFMG. | | 75 | | None |
ANDREW S. DECKER
(1963) | | AML Compliance Officer | | Since 2015 | | Mr. Decker serves as Chief Compliance Officer and AML Compliance Officer of HASCO (since April 2015) and Vice President of HASCO (since April 2018). Mr. Decker serves as AML Officer of HFD (since May 2015). Mr. Decker also serves as Vice President of HFMG (since April 2018). Prior to joining The Hartford, Mr. Decker served as Vice President and AML Officer at Janney Montgomery Scott (a broker dealer) from April 2011 to January 2015. | | N/A | | N/A |
AMY N. FURLONG
(1979) | | Vice President | | Since 2018 | | Ms. Furlong serves as Vice President and Assistant Treasurer of HFMC (since September 2019). From 2018 through March 15, 2021, Ms. Furlong served as the Treasurer of each Company. Ms. Furlong has served in various positions within The Hartford and its subsidiaries in connection with the operation of the Hartford funds. Ms. Furlong joined The Hartford in 2004. | | N/A | | N/A |
Hartford Domestic Equity Funds
Directors and Officers of each Company (Unaudited) – (continued)
NAME, YEAR OF BIRTH
AND ADDRESS(1) | | POSITION
HELD WITH
EACH COMPANY | | TERM OF
OFFICE(2) AND
LENGTH OF
TIME SERVED | | PRINCIPAL OCCUPATION(S)
DURING PAST 5 YEARS | | NUMBER OF
PORTFOLIOS
IN FUND
COMPLEX(3)
OVERSEEN
BY DIRECTOR | | OTHER DIRECTORSHIPS
FOR PUBLIC COMPANIES
AND OTHER REGISTERED
INVESTMENT COMPANIES
BY DIRECTOR |
WALTER F. GARGER
(1965) | | Vice President and Chief Legal Officer | | Since 2016 | | Mr. Garger serves as Secretary, Managing Director and General Counsel of HFMG, HFMC, HFD, and HASCO (since 2013). Mr. Garger also serves as Secretary and General Counsel of Lattice (since July 2016). Mr. Garger has served in various positions within The Hartford and its subsidiaries in connection with the operation of the Hartford funds. Mr. Garger joined The Hartford in 1995. | | N/A | | N/A |
THEODORE J. LUCAS
(1966) | | Vice President | | Since 2017 | | Mr. Lucas serves as Executive Vice President of HFMG (since July 2016) and as Executive Vice President of Lattice (since June 2017). Previously, Mr. Lucas served as Managing Partner of Lattice (2003 to 2016). | | N/A | | N/A |
JOSEPH G. MELCHER
(1973) | | Vice President and Chief Compliance Officer | | Since 2013 | | Mr. Melcher serves as Executive Vice President of HFMG and HASCO (since December 2013). Mr. Melcher also serves as Executive Vice President (since December 2013) and Chief Compliance Officer (since December 2012) of HFMC, serves as Executive Vice President and Chief Compliance Officer of Lattice (since July 2016), serves as Executive Vice President of HFD (since December 2013), and served as President and Chief Executive Officer of HFD (from April 2018 to June 2019). | | N/A | | N/A |
VERNON J. MEYER
(1964) | | Vice President | | Since 2006 | | Mr. Meyer serves as Managing Director and Chief Investment Officer of HFMC and Managing Director of HFMG (since 2013). Mr. Meyer also serves as Senior Vice President-Investments of Lattice (since March 2019). Mr. Meyer has served in various positions within The Hartford and its subsidiaries in connection with the operation of the Hartford funds. Mr. Meyer joined The Hartford in 2004. | | N/A | | N/A |
DAVID A. NAAB
(1985) | | Vice President and Treasurer | | Since March 15, 2021 | | Mr. Naab serves as Vice President and Assistant Treasurer of HFMC (since June 2021). Prior to joining HFMC in 2021, Mr. Naab served in various positions as an associate, senior associate, manager, senior manager, and director within the investment management, financial services, and asset & wealth management practice groups of PricewaterhouseCoopers, LLP from 2007 to 2020. | | N/A | | N/A |
ALICE A. PELLEGRINO
(1960) | | Vice President and Assistant Secretary | | Since 2016 | | Ms. Pellegrino serves as Vice President of HFMG (since December 2013). Ms. Pellegrino also serves as Vice President and Assistant Secretary of Lattice (since June 2017). Ms. Pellegrino is a Senior Counsel and has served in various positions within The Hartford and its subsidiaries in connection with the operation of the Hartford funds. Ms. Pellegrino joined The Hartford in 2007. | | N/A | | N/A |
THOMAS R. PHILLIPS
(1960) | | Vice President and Secretary | | Since 2017 | | Mr. Phillips is Deputy General Counsel for HFMG and currently serves as a Senior Vice President (since June 2021) and Assistant Secretary (since June 2017) for HFMG. Mr. Phillips also serves as Vice President of HFMC (since June 2021). Prior to joining HFMG in 2017, Mr. Phillips was a Director and Chief Legal Officer of Saturna Capital Corporation from 2014–2016. Prior to that, Mr. Phillips was a Partner and Deputy General Counsel of Lord, Abbett & Co. LLC. | | N/A | | N/A |
Hartford Domestic Equity Funds
Directors and Officers of each Company (Unaudited) – (continued)
| (1) | The address for each officer and Director is c/o Hartford Funds 690 Lee Road, Wayne, Pennsylvania 19087. |
| (2) | Term of Office: Each Director holds an indefinite term until his or her retirement, resignation, removal, or death. Directors generally must retire no later than December 31 of the year in which the Director turns 75 years of age. Each Fund officer generally serves until his or her resignation, removal, or death. |
| (3) | The portfolios of the “Fund Complex” are operational series of The Hartford Mutual Funds, Inc., The Hartford Mutual Funds II, Inc., Hartford Series Fund, Inc., Hartford HLS Series Fund II, Inc., Lattice Strategies Trust, and Hartford Funds Exchange-Traded Trust. |
| (4) | Effective as of December 31, 2021, Messrs. Birdsong and Senbet will retire as Directors. |
| (5) | Mr. Birdsong will retire effective December 31, 2021. Anticipating Mr. Birdsong's retirement, the Board has elected Christine R. Detrick to serve as Chair of the Board effective November 4, 2021. Accordingly, effective November 4, 2021, Mr. Birdsong will no longer serve as Chair of the Board. Effective November 5, 2021, Ms. Detrick also will serve as a Director of Capital One Financial Corporation. |
| (6) | “Interested person,” as defined in the 1940 Act, of each Company because of the person’s affiliation with, or equity ownership of, HFMC, HFD or affiliated companies. |
Hartford Domestic Equity Funds
HOW TO OBTAIN A COPY OF EACH FUND’S PROXY VOTING POLICIES AND VOTING RECORDS (UNAUDITED)
A description of the policies and procedures that each Fund uses to determine how to vote proxies relating to portfolio securities and information about how each Fund voted proxies relating to portfolio securities during the most recent twelve-month period ended June 30 are available (1) without charge, upon request, by calling 888-843-7824 and (2) on the SEC’s website at http://www.sec.gov.
QUARTERLY PORTFOLIO HOLDINGS INFORMATION (UNAUDITED)
Each Fund files its complete schedule of portfolio holdings with the SEC for the first and third quarters of each fiscal year as an exhibit to its reports on Form N-PORT. Each Fund’s portfolio holdings filed as an exhibit to Form N-PORT for the most recent first and third quarter of the Fund’s fiscal year are available (1) without charge, upon request, by calling 888-843-7824, (2) on the Funds’ website, hartfordfunds.com, and (3) on the SEC’s website at http://www.sec.gov.
Hartford Domestic Equity Funds
Approval of Investment Management and Investment Sub-Advisory Agreements (Unaudited)
The Hartford Mutual Funds, Inc. and The Hartford Mutual Funds II, Inc.
The Hartford Capital Appreciation Fund
Hartford Core Equity Fund
The Hartford Dividend and Growth Fund
The Hartford Equity Income Fund
The Hartford Growth Opportunities Fund
The Hartford Healthcare Fund
The Hartford MidCap Fund
The Hartford MidCap Value Fund
Hartford Quality Value Fund
The Hartford Small Cap Growth Fund
Hartford Small Cap Value Fund
The Hartford Small Company Fund
(each, a “Fund” and collectively, the “Funds”)
Section 15(c) of the Investment Company Act of 1940, as amended (the “1940 Act”), requires that each mutual fund’s board of directors, including a majority of those directors who are not “interested persons” of the mutual fund, as defined in the 1940 Act (the “Independent Directors”), annually review and consider the continuation of the mutual fund’s investment advisory and sub-advisory agreements. At their meeting held on August 3-4, 2021, the Boards of Directors (collectively, the “Board”) of The Hartford Mutual Funds, Inc. (“HMF”) and The Hartford Mutual Funds II, Inc. (“HMF II”), including each of the Independent Directors, unanimously voted to approve (i) the continuation of an investment management agreement by and between Hartford Funds Management Company, LLC (“HFMC”) and each of HMF, on behalf of each of The Hartford Capital Appreciation Fund, Hartford Core Equity Fund, The Hartford Dividend and Growth Fund, The Hartford Equity Income Fund, The Hartford MidCap Fund, The Hartford MidCap Value Fund and Hartford Small Cap Value Fund, and HMF II, on behalf of each of The Hartford Growth Opportunities Fund, Hartford Quality Value Fund and The Hartford Small Cap Growth Fund (the “Management Agreement”); (ii) the continuation of a separate investment management agreement by and between HFMC and HMF, on behalf of each of The Hartford Healthcare Fund and The Hartford Small Company Fund (the “2013 Investment Management Agreement” and together with the Management Agreement, the “Management Agreements”); and (iii) the continuation of investment sub-advisory agreements (each, a “Sub-Advisory Agreement” and together with the Management Agreements, the “Agreements”) between HFMC and each Fund’s sub-adviser, Wellington Management Company LLP (the “Sub-adviser,” and together with HFMC, the “Advisers”), with respect to each Fund.
In the months preceding the August 3-4, 2021 meeting, the Board requested and reviewed written responses from the Advisers to questions posed to the Advisers on behalf of the Independent Directors and supporting materials relating to those questions and responses. In addition, the Board considered such additional information as it deemed reasonably necessary to evaluate the Agreements, as applicable, with respect to each Fund, which included information furnished to the Board and its committees at their meetings throughout the year and in between regularly scheduled meetings on particular matters as the need arose, as well as information specifically prepared in connection with the approval of the continuation of the Agreements that was presented at the Board’s meetings held on June 15-16, 2021 and August 3-4, 2021. Information provided to the Board and its committees at their meetings throughout the year included, among other things, reports on Fund performance, legal, compliance and risk management matters, sales and marketing activity, shareholder services, and the other services provided to each Fund by the Advisers and their affiliates. The members of the Board also considered the materials and presentations by Fund officers and representatives of HFMC received at the Board’s meetings on June 15-16, 2021 and August 3-4, 2021 concerning the Agreements and at the special meeting of the Board’s Investment Committee on May 18, 2021 concerning Fund performance and other investment-related matters.
The Independent Directors, advised by independent legal counsel throughout the evaluation process, engaged service providers to assist them with evaluating the Agreements with respect to each Fund, as applicable. Broadridge Financial Solutions, Inc. (“Broadridge”), an independent provider of investment company data, was retained to provide the Board with reports on how each Fund’s contractual management fees, actual management fees, total expense ratios and investment performance compared to those of comparable mutual funds with similar investment objectives. The Independent Directors also engaged an independent financial services consultant (the “Consultant”) to assist them in evaluating each Fund’s contractual management fees, actual management fees, total expense ratios and investment performance. In addition, the Consultant reviewed the profitability methodologies utilized by HFMC in connection with the continuation of the Management Agreements.
In determining whether to approve the continuation of the Agreements for a Fund, the members of the Board reviewed and evaluated information and factors they believed to be relevant and appropriate through the exercise of their reasonable business judgment. While individual members of the Board may have weighed certain factors differently, the Board’s determination to approve the continuation of the Agreements was based on a
Hartford Domestic Equity Funds
Approval of Investment Management and Investment Sub-Advisory Agreements (Unaudited) – (continued)
comprehensive consideration of all information provided to the Board throughout the year and specifically with respect to the continuation of the Agreements. The Board was also furnished with an analysis of its fiduciary obligations in connection with its evaluation of the Agreements. Throughout the evaluation process, the Board was assisted by counsel for the Funds and the Independent Directors were also separately assisted by independent legal counsel. In connection with their deliberations, the Independent Directors met separately with independent legal counsel and the Consultant on June 11, 2021 and in executive session on several occasions to consider their responsibilities under relevant laws and regulations and to discuss the materials presented and other matters deemed relevant to their consideration of the approval of the continuation of the Agreements. As a result of the discussions that occurred during the June 11, 2021 and June 15-16, 2021 meetings, the Independent Directors presented HFMC with requests for additional information on certain topics. HFMC responded to these requests with additional information in connection with the August 3-4, 2021 meeting. A more detailed summary of the important, but not necessarily all, factors the Board considered with respect to its approval of the continuation of the Agreements is provided below.
Nature, Extent and Quality of Services Provided by the Advisers
The Board requested and considered information concerning the nature, extent and quality of the services provided to each Fund by the Advisers. The Board considered, among other things, the terms of the Agreements and the range of services provided by the Advisers. The Board considered the Advisers’ professional personnel who provide services to the Funds, including each Adviser’s ability and experience in attracting and retaining qualified personnel to service the Funds. The Board considered each Adviser’s reputation and overall financial strength, as well as each Adviser’s willingness to consider and implement organizational and operational changes designed to enhance services to the funds managed by HFMC and its affiliates (the “Hartford funds”). In addition, the Board considered the quality of each Adviser’s communications with the Board and responsiveness to Board inquiries and requests made from time to time with respect to the Funds and other Hartford funds. In this regard, the Board took into account the Advisers’ communications with the Board in light of the coronavirus (“COVID-19”) pandemic.
The Board also requested and evaluated information concerning each Adviser’s regulatory and compliance environment. In this regard, the Board requested and reviewed information about each Adviser’s compliance policies and procedures and compliance history, and a report from the Funds’ Chief Compliance Officer about each Adviser’s compliance with applicable laws and regulations, including responses to regulatory developments and any compliance or other issues raised by regulators. The Board also noted the Advisers’ support of the Funds’ compliance control structure, as applicable, including the resources devoted by the Advisers in support of the Funds’ obligations pursuant to Rule 38a-1 under the 1940 Act and the Funds’ liquidity risk management program, as well as the efforts of the Advisers to combat cybersecurity risks. The Board also considered HFMC’s investments in business continuity planning designed to benefit the Funds, and the implementation of HFMC’s business continuity plans due to the COVID-19 pandemic. The Board also noted HFMC’s commitment to maintaining high quality systems and expending substantial resources to prepare for and respond to ongoing changes to the market, regulatory and control environments in which the Funds and their service providers operate, including changes associated with the COVID-19 pandemic.
With respect to HFMC, the Board noted that, under the Management Agreements, HFMC is responsible for the management of the Funds, including oversight of fund operations and service providers, and the provision of administrative and investment advisory services in connection with selecting, monitoring and supervising the Sub-adviser. In this regard, the Board evaluated information about the nature and extent of responsibilities retained and risks assumed by HFMC that were not delegated to or assumed by the Sub-adviser. The Board considered HFMC’s ongoing monitoring of people, process and performance, including its quarterly reviews of each of the Hartford funds, semi-annual meetings with the leaders of each Fund’s portfolio management team, and oversight of the Hartford funds’ portfolio managers. The Board noted that HFMC has demonstrated a record of initiating changes to the portfolio management and/or investment strategies of the Hartford funds when warranted. The Board considered HFMC’s periodic due diligence reviews of the Sub-adviser and ongoing oversight of the Sub-adviser’s investment approach and results, process for monitoring best execution of portfolio trades and other trading operations by the Sub-adviser, and approach to risk management with respect to the Funds and the service providers to the Funds. The Board considered HFMC’s oversight of the securities lending program for the Funds that engage in securities lending and noted the income earned by the Funds that participate in such program. The Board also considered HFMC’s day-to-day oversight of each Fund’s compliance with its investment objective and policies as well as with applicable laws and regulations, noting that regulatory and other developments had over time led to an increase in the scope of HFMC’s oversight in this regard. Moreover, the Board considered HFMC’s oversight of potential conflicts of interest between the Funds’ investments and those of other funds or accounts managed by the Funds’ portfolio management personnel.
In addition, the Board considered HFMC’s ongoing commitment to review and rationalize the Hartford funds product line-up. The Board also considered the expenses that HFMC had incurred, as well as the risks HFMC had assumed, in connection with the launch of new funds and changes to existing Hartford funds in recent years. The Board considered that HFMC is responsible for providing the Funds’ officers.
Hartford Domestic Equity Funds
Approval of Investment Management and Investment Sub-Advisory Agreements (Unaudited) – (continued)
With respect to the Sub-adviser, which provides certain day-to-day portfolio management services for the Funds, subject to oversight by HFMC, the Board considered, among other things, the Sub-adviser’s investment personnel, investment philosophy and process, investment research capabilities and resources, performance record, trade execution capabilities and experience, including with respect to sustainable investing and environmental, social and/or governance (ESG) criteria. The Board considered the experience of each Fund’s portfolio manager(s), the number of accounts managed by the portfolio manager(s), and the Sub-adviser’s method for compensating the portfolio manager(s). The Board also considered the Sub-adviser’s succession planning practices to ensure continuity of portfolio management services provided to the Funds.
The Board considered the benefits to shareholders of being part of the family of Hartford funds, including, with respect to certain share classes, the right to exchange investments between the same class of shares without a sales charge, the ability to reinvest Fund dividends into other Hartford funds (excluding the Hartford funds that are exchange-traded funds or an interval fund), and the ability to combine holdings in a Fund with holdings in other Hartford funds (excluding the Hartford funds that are exchange-traded funds or an interval fund) and 529 plans for which HFMC serves as the program manager to obtain a reduced sales charge. The Board considered HFMC’s efforts to provide investors in the Hartford funds with a broad range of investment styles and asset classes and the assumption of entrepreneurial and other risks by HFMC in sponsoring and providing ongoing services to new funds to expand these opportunities for shareholders. In addition, the Board observed that in the marketplace there are a range of investment options available to each Fund’s shareholders and such shareholders, having had the opportunity to consider other investment options, have chosen to invest in the Fund.
Based on these considerations, the Board concluded that it was satisfied with the nature, extent and quality of the services provided to each Fund by HFMC and the Sub-adviser.
Performance of each Fund and the Advisers
The Board considered the investment performance of each Fund. In this regard, the Board reviewed the performance of each Fund over different time periods presented in the materials and evaluated HFMC’s analysis of the Fund’s performance for these time periods. The Board considered information and materials provided to the Board by the Advisers concerning Fund performance, as well as information from Broadridge comparing the investment performance of each Fund to an appropriate universe of peer funds. The Board noted that while it found the comparative data provided by Broadridge generally useful in evaluating a Hartford fund’s investment performance, the Board recognized the limitations of such data, including that notable differences may exist between a Hartford fund and its peers. For details regarding each Fund’s performance, see the Fund-by-Fund synopsis below.
The Board considered the detailed investment analytics reports provided by HFMC’s Investment Advisory Group throughout the year, including in connection with the approval of the continuation of the Agreements. These reports included, among other things, information on each Fund’s gross returns and net returns, the Fund’s investment performance compared to one or more appropriate benchmarks and relevant groups or categories of peer funds, various statistics concerning the Fund’s portfolio, a narrative summary of various factors affecting Fund performance, and commentary on the effect of market conditions. The Board also noted that, for The Hartford Capital Appreciation Fund, the Fund utilizes a multiple sleeve structure whereby each sleeve uses a different investment style and considered the performance attributions of the underlying managers. The Board considered the Advisers’ work with the Investment Committee, which assists the Board in evaluating the performance of each Fund at periodic meetings throughout the year and specifically with respect to the approval of the continuation of the Agreements. The Board considered that the Investment Committee, in its evaluation of investment performance at meetings throughout the year, focused particular attention on information indicating less favorable performance of certain Hartford funds for specific time periods and discussed with the Advisers the reasons for such performance as well as any specific actions that the Advisers had taken, or had agreed to take, to seek to enhance Fund investment performance and the results of those actions. The Board also considered the analysis provided by the Consultant relating to each Fund’s performance track record.
Based on these considerations, the Board concluded that it had continued confidence in HFMC’s and the Sub-adviser’s overall capabilities to manage the Funds.
Costs of the Services and Profitability of the Advisers
The Board reviewed information regarding HFMC’s cost to provide investment management and related services to each Fund and HFMC’s profitability, both overall and for each Fund, on a pre-tax basis without regard to distribution expenses. The Board also requested and reviewed information about the profitability to HFMC and its affiliates from all services provided to each Fund and all aspects of their relationship with the Fund, including information regarding profitability trends over time and information provided by Broadridge analyzing the profitability of managers to other fund complexes. The Board also requested and received information relating to the operations and profitability of the Sub-adviser. The Board
Hartford Domestic Equity Funds
Approval of Investment Management and Investment Sub-Advisory Agreements (Unaudited) – (continued)
considered representations from HFMC and the Sub-adviser that the Sub-adviser’s fees were negotiated at arm’s length on a Fund-by-Fund basis and that the sub-advisory fees are paid by HFMC and not the Funds. Accordingly, the Board concluded that the profitability of the Sub-adviser is a less relevant factor with respect to the Board’s consideration of the Sub-Advisory Agreements.
The Board considered the Consultant’s review of the methodologies and estimates used by HFMC in calculating profitability in connection with the continuation of the Management Agreements, including a description of the methodology used to allocate certain expenses. The Board noted the Consultant’s view that HFMC’s process for calculating and reporting Fund profitability is reasonable and consistent with the process previously reviewed by the Consultant. The Board noted that the Consultant had previously performed a full review of this process and reported that such process is reasonable, sound and consistent with common industry practice.
Based on these considerations, the Board concluded that the profits realized by the Advisers and their affiliates from their relationships with each Fund were not excessive.
Comparison of Fees and Services Provided by the Advisers
The Board considered comparative information with respect to the services rendered to and the management fees to be paid by each Fund to HFMC and the total expense ratios of the Fund. The Board also considered comparative information with respect to the sub-advisory fees to be paid by HFMC to the Sub-adviser with respect to each Fund. In this regard, the Board requested and reviewed information from HFMC and the Sub-adviser relating to the management and sub-advisory fees, including the sub-advisory fee schedule for each Fund and the amount of the management fee retained by HFMC, and total operating expenses for each Fund. The Board also reviewed information from Broadridge comparing each Fund’s contractual management fees, actual management fees and total expense ratios relative to an appropriate group of funds selected by Broadridge. The Board considered such information from Broadridge in consultation with the Consultant. For details regarding each Fund’s expenses, see the Fund-by-Fund synopsis below.
The Board considered the methodology used by Broadridge to select the funds included in the expense groups. While the Board recognized that comparisons between a Fund and its peer funds may be imprecise given, among other differences, the different service levels and characteristics of mutual funds and the different business models and cost structures of the Advisers, the comparative information provided by Broadridge assisted the Board in evaluating the reasonableness of each Fund’s fees and total operating expenses. In addition, the Board considered the analysis and views of the Consultant relating to each Fund’s fees and total operating expenses and expense groups.
The Board also considered that HFMC provides nondiscretionary investment advisory services to model portfolios that pursue investment objectives and investment strategies similar to those of the Hartford Core Equity Fund and The Hartford Dividend and Growth Fund. The Board also received information regarding fees charged by the Sub-adviser to any other clients with investment strategies similar to those of the Funds, including institutional separate account clients and registered fund clients for which the Sub-adviser serves as either primary investment adviser or sub-adviser. The Board considered the explanations provided by the Sub-adviser about any differences between the Sub-adviser’s services to the Funds and the services the Sub-adviser provides to other types of clients. In this regard, the Board reviewed information about the generally broader scope of services and compliance, reporting and other legal burdens and risks of managing registered funds compared with those associated with managing assets of non-registered fund clients such as institutional separate accounts.
Based on these considerations, the Board concluded that each Fund’s fees and total operating expenses, in conjunction with the information about quality of services, profitability, economies of scale, and other matters considered, were reasonable in light of the services provided.
Economies of Scale
The Board considered information regarding economies of scale, including the extent to which economies of scale may be realized as a Fund grows and whether fee levels reflect these economies of scale for the benefit of shareholders of the Fund. The Board reviewed the breakpoints in the management fee schedule for each Fund, if any, which reduce fee rates as the Fund’s assets grow over time. The Board recognized that a Fund with assets beyond the highest breakpoint level will continue to benefit from economies of scale because additional assets are charged the lowest breakpoint fee resulting in lower effective management fee rates. The Board also recognized that a fee schedule that reaches a breakpoint at a lower asset level provides shareholders with the benefit of anticipated or potential economies of scale. The Board considered that expense limitations and fee waivers that reduce a Fund’s expenses at all asset levels can have the same effect as breakpoints in sharing economies of scale with shareholders and provide protection from an increase in expenses if the Fund’s assets decline. In addition, the Board considered that initially setting competitive fee rates, pricing a Fund to scale at inception and making additional investments intended to enhance services available to shareholders are other
Hartford Domestic Equity Funds
Approval of Investment Management and Investment Sub-Advisory Agreements (Unaudited) – (continued)
means of sharing anticipated or potential economies of scale with shareholders. The Board also considered that HFMC has been active in managing expenses, which has resulted in benefits being realized by shareholders. The Board also noted that, for the Hartford Small Cap Value Fund, the Fund’s current low asset levels have kept the Fund from fully realizing the benefits of anticipated or potential economies of scale.
The Board reviewed and evaluated materials from Broadridge and the Consultant showing how management fee schedules of peer funds reflect economies of scale for the benefit of shareholders as a peer fund’s assets hypothetically increase over time. Based on information provided by HFMC, Broadridge, and the Consultant, the Board recognized that there is no uniform methodology for establishing breakpoints or uniform pattern in asset levels that trigger breakpoints or the amounts of breakpoints triggered.
After considering all of the information available to it, the Board concluded that it was satisfied with the extent to which economies of scale would be shared for the benefit of each Fund’s shareholders based on currently available information and the effective management fees and total expense ratios for the Fund at its current and reasonably anticipated asset levels. The Board noted, however, that it would continue to monitor any future growth in each Fund’s assets and the appropriateness of additional management fee breakpoints or other methods to share benefits from economies of scale as part of its future review of the Agreements.
Other Benefits
The Board considered other benefits to the Advisers and their affiliates from their relationships with the Funds.
The Board noted that HFMC receives fees for fund accounting and related services from the Funds, and the Board considered information on the profitability to HFMC from providing such services to the Funds. The Board also considered that each Fund pays a transfer agency fee to Hartford Administrative Services Company (“HASCO”), an affiliate of HFMC, equal to the lesser of: (i) the actual costs incurred by HASCO in connection with the provisions of transfer agency services, including payments made to sub-transfer agents, plus a reasonable target profit margin; or (ii) a specified amount as set forth in the Transfer Agency and Service Agreement by and between HMF and HMF II, on behalf of their respective Funds, and HASCO. The Board reviewed information about the profitability to HASCO of the Funds’ transfer agency function. The Board considered information provided by HFMC indicating that the transfer agency fees charged by HASCO to the Funds were fair and reasonable based on available industry data about fees charged by transfer agents to other mutual funds. The Board also noted that HFMC and HASCO had delegated certain fund accounting services and transfer agency services, respectively, to external service providers.
The Board also considered that Hartford Funds Distributors, LLC (“HFD”), an affiliate of HFMC, serves as principal underwriter of the Funds. The Board noted that, as principal underwriter, HFD receives distribution and service fees from the Funds and receives all or a portion of the sales charges on sales or redemptions of certain classes of shares.
The Board considered the benefits, if any, to the Sub-adviser from any use of a Fund’s brokerage commissions to obtain soft dollar research.
Fund-by-Fund Factors
For purposes of the Fund-by-Fund discussion below, Fund performance is referred to as “in line with” a Fund’s benchmark where it was 0.5% above or below the benchmark return, and each Fund’s performance relative to its primary benchmark reflects the net performance of the Fund’s Class I shares as of March 31, 2021.
The Hartford Capital Appreciation Fund
| • | The Board noted that the Fund’s performance was in the 3rd quintile of its performance universe for the 1-year period, and the 2nd quintile for the 3- and 5-year periods. The Board also noted that the Fund’s performance was below its benchmark for the 1-, 3-, and 5-year periods. |
| • | The Board noted that the Fund’s contractual management fee and actual management fee were in the 4th quintile and its total expenses (less 12b-1 and shareholder service fees) were in the 3rd quintile. |
Hartford Core Equity Fund
| • | The Board noted that the Fund’s performance was in the 4th quintile of its performance universe for the 1-year period, the 2nd quintile for the 3-year period, and the 3rd quintile for the 5-year period. The Board also noted that the Fund’s performance was below its benchmark for the 1-year period and in line with its benchmark for the 3- and 5-year periods. |
Hartford Domestic Equity Funds
Approval of Investment Management and Investment Sub-Advisory Agreements (Unaudited) – (continued)
| • | The Board noted that the Fund’s contractual management fee, actual management fee, and total expenses (less 12b-1 and shareholder service fees) were in the 1st quintile of its expense group. The Board noted that Class Y shares of the Fund have a contractual transfer agency expense cap of 0.08% through February 28, 2022, which resulted in HFMC reimbursing the Fund for certain expenses. |
The Hartford Dividend and Growth Fund
| • | The Board noted that the Fund’s performance was in the 2nd quintile of its performance universe for the 1- and 3-year periods and the 1st quintile for the 5-year period. The Board also noted that the Fund’s performance was below its benchmark for the 1-, 3- , and 5-year periods. |
| • | The Board noted that the Fund’s contractual management fee was in the 4th quintile of its expense group, while its actual management fee and its total expenses (less 12b-1 and shareholder service fees) were in the 3rd quintile. The Board noted that Class Y shares of the Fund have a contractual transfer agency expense cap of 0.04% through February 28, 2022, which resulted in HFMC reimbursing the Fund for certain expenses. |
The Hartford Equity Income Fund
| • | The Board noted that the Fund’s performance was in the 4th quintile of its performance universe for the 1-year period and the 3rd quintile for the 3- and 5-year periods. The Board also noted that the Fund’s performance was below its benchmark for the 1-year period and in line with its benchmark for the 3- and 5-year periods. |
| • | The Board noted that the Fund’s contractual management fee was in the 4th quintile of its expense group, while its actual management fee and its total expenses (less 12b-1 and shareholder service fees) were in the 3rd quintile. |
The Hartford Growth Opportunities Fund
| • | The Board noted that the Fund’s performance was in the 1st quintile of its performance universe for the 1-, 3-, and 5-year periods. The Board also noted that the Fund’s performance was above its benchmark for the 1-, 3-, and 5-year periods. |
| • | The Board noted that the Fund’s contractual management fee and actual management fee were in the 4th quintile of its expense group, while its total expenses (less 12b-1 and shareholder service fees) were in the 3rd quintile. |
The Hartford Healthcare Fund
| • | The Board noted that the Fund’s performance was in the 2nd quintile of its performance universe for the 1-, 3-, and 5-year periods. The Board also noted that the Fund’s performance was above its benchmark for the 1-, 3-, and 5-year periods. The Board noted recent and upcoming changes to the Fund’s portfolio management team. |
| • | The Board noted that the Fund’s contractual management fee and actual management fee were in the 4th quintile of its expense group, while its total expenses (less 12b-1 and shareholder service fees) were in the 3rd quintile. |
The Hartford MidCap Fund
| • | The Board noted that the Fund’s performance was in the 3rd quintile of its performance universe for the 1-year period, the 5th quintile for the 3-year period, and the 4th quintile for the 5-year period. The Board also noted that the Fund’s performance was below its benchmark for the 1-year period and above its benchmark for the 3- and 5-year periods. |
| • | The Board noted that the Fund’s contractual management fee was in the 4th quintile of its expense group, while its actual management fee and its total expenses (less 12b-1 and shareholder service fees) were in the 3rd quintile. The Board noted that Class I and Y shares of the Fund have contractual transfer agency expense caps of 0.12% and 0.04%, respectively, through February 28, 2022. |
The Hartford MidCap Value Fund
| • | The Board noted that the Fund’s performance was in the 5th quintile of its performance universe for the 1-year period and the 3rd quintile for the 3- and 5-year periods. The Board also noted that the Fund’s performance was below its benchmark for the 1-, 3-, and 5-year periods. |
Hartford Domestic Equity Funds
Approval of Investment Management and Investment Sub-Advisory Agreements (Unaudited) – (continued)
| • | The Board noted that the Fund’s contractual management fee was in the 1st quintile of its expense group, while its actual management fee was in the 3rd quintile and its total expenses (less 12b-1 and shareholder service fees) were in the 5th quintile. |
Hartford Quality Value Fund
| • | The Board noted that the Fund’s performance was in the 4th quintile of its performance universe for the 1-year period and the 3rd quintile for the 3- and 5-year periods. The Board also noted that the Fund’s performance was below its benchmark for the 1-year period and in line with its benchmark for the 3- and 5-year periods. |
| • | The Board noted that the Fund’s contractual management fee and actual management fee were in the 1st quintile of its expense group, while its total expenses (less 12b-1 and shareholder service fees) were in the 2nd quintile. The Board noted that Class A shares of the Fund have a contractual expense cap of 0.96% through February 28, 2022, which resulted in HFMC reimbursing the Fund for certain expenses. |
The Hartford Small Cap Growth Fund
| • | The Board noted that the Fund’s performance was in the 4th quintile of its performance universe for the 1-, 3-, and 5-year periods. The Board also noted that the Fund’s performance was below its benchmark for the 1-, 3-, and 5-year periods. |
| • | The Board noted that the Fund’s contractual management fee was in the 2nd quintile of its expense group, while its actual management fee was in the 1st quintile of its expense group and its total expenses (less 12b-1 and shareholder service fees) were in the 3rd quintile. The Board noted that Class Y shares of the Fund have a contractual transfer agency expense cap of 0.06% through February 28, 2022, which resulted in HFMC reimbursing the Fund for certain expenses. |
Hartford Small Cap Value Fund
| • | The Board noted that the Fund’s performance was in the 2nd quintile of its performance universe for the 1-, 3-, and 5-year periods. The Board also noted that the Fund’s performance was above its benchmark for the 1- and 3-year periods and below its benchmark for the 5-year period. |
| • | The Board noted that the Fund’s contractual management fee and actual management fee were in the 1st quintile of its expense group, while its total expenses (less 12b-1 and shareholder service fees) were in the 3rd quintile. The Board noted that Class A shares of the Fund have a contractual expense cap of 1.30% through February 28, 2022, which resulted in HFMC reimbursing the Fund for certain expenses. |
The Hartford Small Company Fund
| • | The Board noted that the Fund’s performance was in the 1st quintile of its performance universe for the 1- and 3-year periods and the 2nd quintile for the 5-year period. The Board also noted that the Fund’s performance was above its benchmark for the 1-, 3-, and 5-year periods. |
| • | The Board noted that the Fund’s contractual management fee was in the 2nd quintile of its expense group, while its actual management fee was in the 3rd quintile and its total expenses (less 12b-1 and shareholder service fees) were in the 4th quintile. |
* * * *
Based upon the review of the factors summarized above, among others, the Board concluded that it is in the best interests of each Fund and its shareholders for the Board to approve the continuation of the Agreements for an additional year. In reaching this decision, the Board did not assign relative weights to the factors discussed above or deem any one or group of them to be controlling in and of themselves.
THIS PRIVACY POLICY IS NOT PART OF THIS REPORT
CUSTOMER PRIVACY NOTICE
The Hartford Financial Services Group, Inc. and Affiliates*
(herein called “we, our, and us”)
This Privacy Policy applies to our United States Operations
We value your trust. We are committed to the responsible:
| a) | management; |
| b) | use; and |
| c) | protection; |
of Personal Information.
This notice describes how we collect, disclose, and protect Personal Information.
We collect Personal Information to:
| a) | service your Transactions with us; and |
| b) | support our business functions. |
We may obtain Personal Information from:
| a) | You; |
| b) | your Transactions with us; and |
| c) | third parties such as a consumer-reporting agency. |
Based on the type of product or service You apply for or get from us, Personal Information such as:
| a) | your name; |
| b) | your address; |
| c) | your income; |
| d) | your payment; or |
| e) | your credit history; |
may be gathered from sources such as applications, Transactions, and consumer reports.
To serve You and service our business, we may share certain Personal Information. We will share Personal Information, only as allowed by law, with affiliates such as:
| a) | our insurance companies; |
| b) | our employee agents; |
| c) | our brokerage firms; and |
| d) | our administrators. |
As allowed by law, we may share Personal Financial Information with our affiliates to:
| a) | market our products; or |
| b) | market our services; |
to You without providing You with an option to prevent these disclosures.
We may also share Personal Information, only as allowed by law, with unaffiliated third parties including:
| a) | independent agents; |
| b) | brokerage firms; |
| c) | insurance companies; |
| d) | administrators; and |
| e) | service providers; |
who help us serve You and service our business.
When allowed by law, we may share certain Personal Financial Information with other unaffiliated third parties who assist us by performing services or functions such as:
| a) | taking surveys; |
| b) | marketing our products or services; or |
| c) | offering financial products or services under a joint agreement |
between us and one or more financial institutions.
We, and third parties we partner with, may track some of the pages You visit through the use of:
| a) | cookies; |
| b) | pixel tagging; or |
| c) | other technologies; |
and currently do not process or comply with any web browser’s “do not track” signal or other similar mechanism that indicates a request to disable online tracking of individual users who visit our websites or use our services.
For more information, our Online Privacy Policy, which governs information we collect on our website and our affiliate websites, is available at https://www.thehartford.com/online-privacy-policy.
We will not sell or share your Personal Financial Information with anyone for purposes unrelated to our business functions without offering You the opportunity to:
| a) | “opt-out;” or |
| b) | “opt-in;” |
as required by law.
We only disclose Personal Health Information with:
| a) | your authorization; or |
| b) | as otherwise allowed or required by law. |
Our employees have access to Personal Information in the course of doing their jobs, such as:
| a) | underwriting policies; |
| b) | paying claims; |
| c) | developing new products; or |
| d) | advising customers of our products and services. |
We use manual and electronic security procedures to maintain:
| a) | the confidentiality; and |
Personal Information that we have. We use these procedures to guard against unauthorized access.
Some techniques we use to protect Personal Information include:
| d) | firewall technology; and |
| e) | the use of detection software. |
We are responsible for and must:
| a) | identify information to be protected; |
| b) | provide an adequate level of protection for that data; and |
| c) | grant access to protected data only to those people who must use |
it in the performance of their job-related duties.
Employees who violate our privacy policies and procedures may be subject to discipline, which may include termination of their employment with us.
We will continue to follow our Privacy Policy regarding Personal Information even when a business relationship no longer exists between us.
As used in this Privacy Notice:
Application means your request for our product or service.
Personal Financial Information means financial information such as:
| d) | policy or claim information. |
Personal Financial Information may include Social Security Numbers, Driver’s license numbers, or other government-issued identification numbers, or credit, debit card, or bank account numbers.
Personal Health Information means health information such as:
| a) | your medical records; or |
| b) | information about your illness, disability or injury. |
Personal Information means information that identifies You personally and is not otherwise available to the public. It includes:
| a) | Personal Financial Information; and |
| b) | Personal Health Information. |
Transaction means your business dealings with us, such as:
| b) | your request for us to pay a claim; and |
| c) | your request for us to take an action on your account. |
You means an individual who has given us Personal Information in conjunction with:
a financial product or service from us if the product or service is used mainly for personal, family, or household purposes.
If you have any questions or comments about this privacy notice, please feel free to contact us at The Hartford – Consumer Rights and Privacy Compliance Unit, One Hartford Plaza, Mail Drop: T 04.180, Hartford, CT 06155, or at ConsumerPrivacyInquiriesMailbox@thehartford.com.
This Customer Privacy Notice is being provided on behalf of The Hartford Financial Services Group, Inc. and its affiliates (including the following as of February 2021), to the extent required by the Gramm-Leach-Bliley Act and implementing regulations:
1stAGChoice, Inc.; Access CoverageCorp, Inc.; Access CoverageCorp Technologies, Inc.; Assurances Continentales Continentale Verzekeringen N.V; Bracht, Deckers & Mackelbert N.V.; Business Management Group, Inc.; Canal Re S.A.; Cervus Claim Solutions, LLC; First State Insurance Company; FTC Resolution Company LLC; Hart Re Group L.L.C.; Hartford Accident and Indemnity Company; Hartford Administrative Services Company; Hartford Casualty General Agency, Inc.; Hartford Casualty Insurance Company; Hartford Fire General Agency, Inc.; Hartford Fire Insurance Company; Hartford Funds Distributors, LLC; Hartford Funds Management Company, LLC; Hartford Funds Management Group, Inc.; Hartford Holdings, Inc.; Hartford Insurance Company of Illinois; Hartford Insurance Company of the Midwest; Hartford Insurance Company of the Southeast; Hartford Insurance, Ltd.; Hartford Integrated Technologies, Inc.; Hartford Investment Management Company; Hartford Life and Accident Insurance Company; Hartford Lloyd’s Corporation; Hartford Lloyd’s Insurance Company; Hartford Management, Ltd.; Hartford Productivity Services LLC; Hartford of Texas General Agency, Inc.; Hartford Residual Market, L.C.C.; Hartford Specialty Insurance Services of Texas, LLC; Hartford STAG Ventures LLC; Hartford Strategic Investments, LLC; Hartford Underwriters General Agency, Inc.; Hartford Underwriters Insurance Company; Heritage Holdings, Inc.; Heritage Reinsurance Company, Ltd.; HLA LLC; HL Investment Advisors, LLC; Horizon Management Group, LLC; HRA Brokerage Services, Inc.; Lattice Strategies LLC; Maxum Casualty Insurance Company; Maxum Indemnity Company; Maxum Specialty Services Corporation; Millennium Underwriting Limited; MPC Resolution Company LLC; Navigators (Asia) Limited; Navigators Corporate Underwriters Limited; Navigators Holdings (Europe) N.V.; Navigators Holdings (UK) Limited; Navigators Insurance Company; Navigators International Insurance Company Ltd.; Navigators Management Company, Inc.; Navigators Management (UK) Limited; Navigators N.V.; Navigators Specialty Insurance Company; Navigators Underwriting Agency Limited; Navigators Underwriting Limited; New BDM NV; New England Insurance Company; New England Reinsurance Corporation; New Ocean Insurance Co., Ltd.; NIC Investments (Chile) SpA; Nutmeg Insurance Agency, Inc.; Nutmeg Insurance Company; Pacific Insurance Company, Limited; Property and Casualty Insurance Company of Hartford; Sentinel Insurance Company, Ltd; The Navigators Group, Inc.; Trumbull Flood Management, L.L.C.; Trumbull Insurance Company; Twin City Fire Insurance Company; Y-Risk, LLC.
Revised February 2021
[This page is intentionally left blank]
[This page is intentionally left blank]
[This page is intentionally left blank]
This report is submitted for the general information of the shareholders of the Funds referenced in this report. It is not authorized for distribution to persons who are not shareholders of one or more Funds referenced in this report unless preceded or accompanied by a current prospectus for the relevant Funds. Nothing herein contained is to be considered an offer of sale or a solicitation of an offer to buy shares of any Fund listed in this report.
The information cannot be used or relied upon for the purpose of avoiding IRS penalties. These materials are not intended to provide tax, accounting or legal advice. As with all matters of a tax or legal nature, you should consult your own tax or legal counsel for advice.
Investors should carefully consider a fund’s investment objectives, risks, charges and expenses. This and other important information is contained in the fund’s prospectus and summary prospectus, which can be obtained by visiting hartfordfunds.com. Please read it carefully before investing.
The Funds are distributed by Hartford Funds Distributors, LLC (HFD), Member FINRA. Hartford Funds Management Company, LLC (HFMC) is the Funds’ investment manager. The Funds referenced herein are sub-advised by Wellington Management Company LLP. HFD and HFMC are not affiliated with the Funds’ sub-adviser.
MFAR-DE21 12/21 226049 Printed in the U.S.A.

Hartford International/
Global Equity Funds
Annual Report
October 31, 2021
| ■ Hartford Climate Opportunities Fund |
| ■ Hartford Emerging Markets Equity Fund |
| ■ Hartford Global Impact Fund |
| ■ Hartford International Equity Fund |
| ■ The Hartford International Growth Fund |
| ■ The Hartford International Opportunities Fund |
| ■ The Hartford International Value Fund |
A MESSAGE FROM THE PRESIDENT
Dear Shareholders:
Thank you for investing in Hartford Mutual Funds. The following is the Funds’ Annual Report covering the period from November 1, 2020 through October 31, 2021.
Market Review
During the 12 months ended October 31, 2021, U.S. stocks, as measured by the S&P 500 Index,1 gained 42.9%, a number that reflects one of the most remarkable market rebounds in recent memory, particularly when measured against the March 2020 sell-off at the start of the coronavirus (COVID-19) pandemic.
That said, the market’s extraordinary performance occurred against a backdrop of uncertain and sometimes contradictory economic signals: inflation fears; global supply-chain bottlenecks; tightened labor markets; political gridlock; a stubbornly persistent pandemic and a U.S. Federal Reserve (Fed) methodically signaling its intention to cut back on the monetary stimulus that helped fuel the recovery.
A year ago, markets had already bounced back from their March 2020 lows, yet the economy still faced considerable turbulence from a fiercely divisive U.S. presidential election and a resurgence of COVID-19 infections. Once the election was settled in November 2020, the emergence of safe and effective vaccines provided a significant lift to equity markets, as did a major $900 billion economic relief package passed by the U.S. Congress in late December 2020.
In March 2021, the U.S. Congress fast-tracked approval of the Biden administration’s $1.9 trillion economic stimulus package. In August 2021, a $1.2 trillion proposal for an infrastructure spending package received U.S. Senate approval. However, by the period’s end, the outcome for the administration’s $1.75 trillion “Build Back Better” proposal, focused on social-safety-net improvements and climate-change mitigation, remained uncertain.
Inflation headlines dominated the spring and summer of 2021. In July 2021, the Fed’s preferred measure of inflation had risen to levels not seen since 1991.2 The supply-chain disruptions spawned in part by the economic recovery helped drive up prices for gasoline, used cars, airfare tickets, durable goods, and a host of other items toward the end of the period. The Fed's previous assurances that inflation would be mostly transitory were being sorely tested.
Throughout the period, the Fed continued to maintain its ongoing policy of near-zero interest rates in support of the recovery. However, in September 2021, Fed Chairman Jerome Powell rattled markets when he announced preparations for having the Fed gradually cut back the $120 billion in bonds it had been purchasing each month since the start of the pandemic. By period’s end, markets had recovered.
As of the end of the period, the economic recovery appears durable. Yet, inflation remains a wildcard and market volatility may persist. Nowadays, it’s more important than ever to maintain a strong relationship with your financial professional.
Thank you again for investing in Hartford Mutual Funds. For the most up-to-date information on our funds, please take advantage of all the resources available at hartfordfunds.com.
James Davey
President
Hartford Funds
| 1 | S&P 500 Index is a market capitalization-weighted price index composed of 500 widely held common stocks. The index is unmanaged and not available for direct investment. Past performance does not guarantee future results. |
| 2 | The Personal Consumption Expenditures Price Index, which excludes food and energy prices, rose 3.6% in July 2021. Source: U.S. Bureau of Economic Analysis and the St. Louis Fed, as of September 2021. |
Hartford International/Global Equity Funds
Table of Contents
The views expressed in each Fund’s Manager Discussion contained in the Fund Overview section are views of that Fund’s portfolio manager(s) through the end of the period and are subject to change based on market and other conditions, and we disclaim any responsibility to update the views contained herein. These views may contain statements that are “forward-looking” statements. Actual results may differ materially from those projected in the “forward-looking” statements. Each Fund’s Manager Discussion is for informational purposes only and does not represent an offer, recommendation or solicitation to buy, hold or sell any security. The specific securities identified and described, if any, do not represent all of the securities purchased or sold and you should not assume that investments in the securities identified and discussed will be profitable. Holdings and characteristics are subject to change. Fund performance reflected in each Fund’s Manager Discussion reflects the returns of such Fund’s Class A shares, before sales charges. Returns for such Fund’s other classes differ only to the extent that the classes do not have the same expenses.
Hartford Climate Opportunities Fund
Fund Overview
October 31, 2021 (Unaudited)
Inception 02/29/2016
Sub-advised by Wellington Management Company LLP (“Wellington Management”) and Schroder Investment Management North America Inc. (Schroder Investment Management North America Limited serves as a sub-sub-adviser) | Investment objective – The Fund seeks long-term capital appreciation. |
Comparison of Change in Value of $10,000 Investment (02/29/2016 - 10/31/2021)
The chart above represents the hypothetical growth of a $10,000 investment in Class A, which includes the maximum sales charge applicable to Class A shares. Returns for the Fund’s other classes will vary from what is seen above due to differences in the expenses charged to those share classes.
| Average Annual Total Returns |
| for the Periods Ending 10/31/2021 |
| | 1 Year | 5 Years | Since
Inception1 |
| Class A2 | 40.65% | 16.67% | 17.47% |
| Class A3 | 32.91% | 15.36% | 16.31% |
| Class C2 | 39.54% | 16.31% | 17.05% |
| Class C4 | 38.54% | 16.31% | 17.05% |
| Class I2 | 41.03% | 17.01% | 17.81% |
| Class R32 | 40.70% | 16.99% | 17.70% |
| Class R42 | 40.84% | 16.86% | 17.62% |
| Class R52 | 41.09% | 17.00% | 17.78% |
| Class R62 | 41.24% | 17.14% | 17.92% |
| Class Y2 | 41.08% | 17.07% | 17.86% |
| Class F2 | 41.32% | 17.11% | 17.90% |
| MSCI ACWI Index (Net) | 37.28% | 14.72% | 15.20% |
| 1 | Inception: 02/29/2016 |
| 2 | Without sales charge |
| 3 | Reflects maximum sales charge of 5.50% |
| 4 | Reflects a contingent deferred sales charge of 1.00% |
PERFORMANCE DATA QUOTED REPRESENTS PAST PERFORMANCE AND DOES NOT GUARANTEE FUTURE RESULTS. The investment return and principal value of the investment will fluctuate so that investors’ shares, when redeemed, may be worth more or less than their original cost. The chart and table do not reflect the deductions of taxes that a shareholder would pay on Fund distributions or the redemption of Fund shares. Current performance may be lower or higher than the performance data quoted. To obtain performance data current to the most recent month-end, please visit our website hartfordfunds.com.
Total returns presented above were calculated using the applicable class' net asset value available to shareholders for sale or redemption of Fund shares on 10/31/2021, which may exclude investment transactions as of this date. All share class returns assume the reinvestment of all distributions at net asset value and the deduction of all
fund expenses. The total returns presented in the Financial Highlights section of the report are calculated in the same manner, but also take into account certain adjustments that are necessary under generally accepted accounting principles. As a result, the total returns in the Financial Highlights section may differ from the total returns presented above.
Class F shares commenced operations on 02/28/2017. Performance prior to that date is that of the Fund’s Class I shares.
To the extent a share class has adopted the prior performance of another share class that had different operating expenses, such performance has not been adjusted to reflect the different operating expenses. If the performance were adjusted, it may have been higher or lower.
Prior to 11/08/2019, the Fund pursued a modified strategy and Wellington Management served as the Fund’s only sub-adviser.
You cannot invest directly in an index.
See “Benchmark Glossary” for benchmark descriptions.
Performance information may reflect expense waivers/reimbursements without which performance would have been lower. For information on current expense waivers/reimbursements, please see the prospectus.
Hartford Climate Opportunities Fund
Fund Overview – (continued)
October 31, 2021 (Unaudited)
| Operating Expenses* | Gross | Net |
| Class A | 1.49% | 1.19% |
| Class C | 2.33% | 1.94% |
| Class I | 1.21% | 0.89% |
| Class R3 | 1.80% | 1.41% |
| Class R4 | 1.50% | 1.11% |
| Class R5 | 1.20% | 0.81% |
| Class R6 | 1.08% | 0.69% |
| Class Y | 1.18% | 0.79% |
| Class F | 1.08% | 0.69% |
| * | Expenses as shown in the Fund’s most recent prospectus. Gross expenses do not reflect contractual expense reimbursement arrangements. Net expenses reflect such arrangements in instances when they reduce gross expenses. These arrangements remain in effect until 02/28/2022 unless the Fund’s Board of Directors approves an earlier termination. Actual expenses may be higher or lower. Please see accompanying Financial Highlights for expense ratios for the period ended 10/31/2021. |
Portfolio Managers
Wellington Management Company LLP (“Wellington Management”)
Alan T. Hsu
Managing Director, Global Industry Analyst, and Equity Portfolio Manager
G. Thomas Levering
Senior Managing Director and Global Industry Analyst
Schroder Investment Management North America Inc. and Schroder Investment Management North America Limited (collectively, “Schroders”)
Simon Webber, CFA
Portfolio Manager
Isabella Hervey-Bathurst
Portfolio Manager
Manager Discussion
How did the Fund perform during the period?
The Class A shares of the Hartford Climate Opportunities Fund returned 40.65%, before sales charges, for the twelve-month period ended October 31, 2021, outperforming the Fund’s benchmark, the MSCI ACWI Index (Net), which returned 37.28% for the same period. For the same period, the Class A shares of the Fund, before sales charges, outperformed the 38.78% average return of the Lipper Global Multi-Cap Value group, a group of funds with investment strategies similar to those of the Fund in terms of market cap distribution and value and growth style characteristics, but not necessarily similar in terms of investment focus.
Why did the Fund perform this way?
For the twelve-month period ended October 31, 2021, global equities rose as measured by the MSCI ACWI Index (Net). Towards the end of 2020, global equities rebounded sharply after two COVID-19 vaccines demonstrated high efficacy rates in Phase 3 trials, fueling optimism
that the pandemic could be alleviated in the near term. Despite this favorable development, the logistical challenges of distributing and administering the vaccines were significant, and high COVID-19 case counts threatened to undermine the global economic recovery.
In the first quarter of 2021, global markets continued to advance amid the accelerating global rollout of coronavirus vaccines, a favorable outlook for global economic growth, and substantial support from governments and central banks. Massive stimulus measures combined with pent-up savings and significant supply-chain disruptions throughout the global economy fueled expectations for higher inflation. As a result, there were increased concerns that central banks would have to tighten monetary policy to an extent that could potentially impair equity markets.
In the second quarter of 2021, global equities were bolstered by improving global economic data, fiscal and monetary stimulus, strong corporate earnings, and higher vaccination rates. A combination of surging commodity prices, pent-up demand, global supply-chain
Hartford Climate Opportunities Fund
Fund Overview – (continued)
October 31, 2021 (Unaudited)
disruptions, and stimulus-powered economic growth continued to drive inflation expectations higher, prompting some central banks to raise interest rates or consider tightening monetary policy.
In the third quarter of 2021, global markets contended with pandemic uncertainty, moderating economic growth, the imminent prospect of reduced quantitative easing and policy tightening, and persistent supply-chain dislocations that have amplified the risk of more sustained inflation. In Asia, the spread of the COVID-19 Delta variant shuttered factories and snarled traffic at several major ports, exacerbating supply-chain disruptions and driving shipping costs and goods prices even higher.
In the final month of the period, global equities rebounded strongly, as risk sentiment was bolstered by strong corporate earnings, robust global equity inflows, and improving COVID-19 trends and vaccine coverage. However, persistent supply-chain disruptions and uncertainty about the inflation outlook triggered anxiety about the global economic recovery.
From a climate change perspective, after an extraordinary performance in 2020 which resulted in high valuations across the renewable energy, hydrogen, storage and electric vehicles related sectors, there has been an inevitable retracement in 2021. The most notable factor behind this was the weakness of renewable energy stocks and renewable-focused utilities, as the market rotated away from higher multiple, longer duration “green growth” stocks into more cyclical stocks geared to the near-term reopening of the economy following the COVID-19 pandemic shutdowns. Inflationary pressures and logistical challenges continued to weigh on the renewables sector and other industries with global supply chains. Although these pressures are unlikely to abate over the near term, they do not undermine the fundamental competitiveness of renewables versus fossil fuel technologies, nor undermine what is expected to be a multi-decade transition to the low carbon economy. Corporate and government commitment to decarbonizing remains strong, led by the European Union with very ambitious targets to reduce emissions by 2030, and the EU Green Deal channeling at least a quarter of the €750 billion (US$847 billion) recovery package towards decarbonization initiatives.
All eleven sectors in the MSCI ACWI Index (Net) posted positive returns during the period. The Energy (+87%) and Financials (+60%) sectors had the largest gains, while the Utilities (+14%) and Consumer Staples (+19%) sectors had the smallest gains during the period.
Security selection was the primary driver of the Fund’s outperformance relative to the MSCI ACWI Index (Net) over the trailing twelve-month period ended October 31, 2021. Selection was strongest within the Utilities, Industrials, and Consumer Discretionary sectors, which was slightly offset by weaker selection within the Financials sector. On a regional basis, security selection in Europe and North America contributed most to relative performance. This was partially offset by selection in Japan, which detracted from performance. Sector allocation, a result of bottom-up stock selection of climate-related companies, also detracted from relative performance over the period. Due to the Fund��s focus on companies that address environmental challenges, relative to the MSCI ACWI Index (Net), the Fund has a natural overweight to the Industrials and Utilities sectors
and underweights to the Financials, Healthcare, and Communication Services sectors. During the period, the Fund’s overweight to the Utilities sector and an underweight to the Financials sector were the primary detractors from performance. Conversely, the Fund’s underweight to the Consumer Discretionary sector and an overweight to the Industrials sector was additive to performance during the period.
The top contributors to relative returns over the period included China Longyuan Power (Utilities), Sunnova Energy (Utilities), and Samsung SDI (Information Technology). Shares of China Longyuan Power, the largest renewable power producer in China, rose over the period after the company announced earnings for the first half of 2021 that beat consensus expectations, with net profit up 38% year-over-year versus expectations of a 15% increase. Increasing revenues from wind power and tariffs drove results. Management also announced the addition of 30 gigawatts (GW) of production capacity by 2025. Shares of renewable energy solutions company Sunnova Energy rose over the period. The company reported strong third-quarter revenue and customer growth with initial fiscal year 2023 (FY2023) guidance well above consensus expectations. Samsung SDI, which manufactures lithium-ion batteries, has seen orders for electric vehicle (EV) batteries hold up much better than expected despite the global supply chain issues amidst a strengthening of European environmental laws, which has helped to accelerate EV growth.
The top detractors from relative performance during the period included FMC (Materials), Eversource Energy (Utilities), and Alstom (Industrials). Shares of FMC, a chemical manufacturing company, fell sharply in August 2021. Despite reporting strong second-quarter results, FMC lowered its fiscal year 2021 guidance for earnings before interest, taxes, depreciation, and amortization (EBITDA) and for earnings per share (EPS). This was attributable to higher raw materials, packaging and logistics costs. Shares of Eversource Energy, a utility company that engages in the generation, transmission, and distribution of natural gas and electricity, were volatile over the period but ended the period lower. Shares were pressured by a rising interest rate and inflationary environment, as well as by the Biden administration discussing plans for reaching carbon-free power generation by 2035 and net-zero greenhouse gas emissions by 2050. French multinational rolling stock manufacturer Alstom detracted from the Fund’s performance as a diplomatic disagreement between Paris and Australia over a canceled submarine deal weakened investor sentiment towards the stock. Sentiment was further weakened by concerns about slowing global economic growth, fears about a potential spillover of the debt crisis at Chinese property company Evergrande, and the prospect of tighter monetary policy due to tapering of asset purchases by the U.S. Federal Reserve (Fed).
Derivatives were not used in a significant manner in the Fund during the period and did not have a material impact on performance during the period.
What is the outlook as of the end of the period?
As of the end of the period, Wellington Management believes that, given the backdrop of a potential Fed tightening cycle, year-over-year waning of fiscal stimulus globally, and optically rich valuations, their preferences remain to find inexpensive ways to find growth and upside surprise. In that order Wellington Management expects economic
Hartford Climate Opportunities Fund
Fund Overview – (continued)
October 31, 2021 (Unaudited)
growth to pick up, so future investments for this portion of the Fund may tilt in those areas. Thematically, sustainable transport remains attractive given reasonable valuations and a replacement cycle that has been delayed by the ongoing coronavirus pandemic, in the view of Wellington Management. Additionally, Wellington Management believes there will be an eventual end to current supply chain woes as well, although the timing is not yet clear. Wellington Management suspects it will be a 2022 event, and that the market will discount this well before it becomes obvious. If so, this is another argument in favor of transport and service-oriented investments at the relative expense of capital goods-oriented investments, in Wellington Management’s view.
As of the end of the period, Schroders expects rapid adoption of renewable energy practices worldwide, particularly in solar but also in wind, where technological gains are helping make installation more affordable. The build-out of a green hydrogen industry to decarbonize heavy industry and transport will also require very significant additional renewable energy capacity additions, in Schroders’ view. The portion of the Fund sub-advised by Schroders has significant exposure to higher-quality investments in these areas as of the end of the period, particularly the wind industry where consolidation has led to sufficient pricing power for companies to have good return potential, in Schroders’ view.
Important Risks
Investing involves risk, including the possible loss of principal. Security prices fluctuate in value depending on general market and economic conditions and the prospects of individual companies. • The Fund’s performance depends on the ability of the Investment Manager in selecting, overseeing, and allocating Fund assets to the sub-advisers. The sub-advisers’ investment styles may not be complementary. • Small- and mid-cap securities can have greater risks and volatility than large-cap securities. • Foreign investments may be more volatile and less liquid than U.S. investments and are subject to the risk of currency fluctuations and adverse political, economic and regulatory developments. These risks may be greater, and include additional risks, for investments in emerging markets or if the Fund focuses in a particular geographic region or country. • Focusing on investments that involve climate change opportunities or sustainable and environmental initiatives may result in foregoing certain investments and underperformance comparative to funds that do not have a similar focus. • The exclusion of certain issuers for reasons other than performance may negatively impact the Fund’s performance. • There are risks of focusing investments in securities of companies in the utilities and industrials sectors which may cause the Fund’s performance to be sensitive to developments in those sectors.
| Composition by Sector(1) |
| as of 10/31/2021 |
| Sector | Percentage
of Net Assets |
| Equity Securities | |
| Communication Services | 2.3% |
| Consumer Discretionary | 10.0 |
| Consumer Staples | 3.1 |
| Financials | 5.6 |
| Health Care | 1.3 |
| Industrials | 34.9 |
| Information Technology | 14.7 |
| Materials | 6.1 |
| Real Estate | 1.8 |
| Utilities | 15.8 |
| Total | 95.6% |
| Short-Term Investments | 3.7 |
| Other Assets & Liabilities | 0.7 |
| Total | 100.0% |
| (1) | A sector may be comprised of several industries. For Fund compliance purposes, the Fund may not use the same classification system. These sector classifications are used for financial reporting purposes. |
Hartford Emerging Markets Equity Fund
Fund Overview
October 31, 2021 (Unaudited)
Inception 05/31/2011
Sub-advised by Wellington Management Company LLP | Investment objective – The Fund seeks long-term capital appreciation. |
Comparison of Change in Value of $10,000 Investment (10/31/2011 - 10/31/2021)
The chart above represents the hypothetical growth of a $10,000 investment in Class A, which includes the maximum sales charge applicable to Class A shares. Returns for the Fund’s other classes will vary from what is seen above due to differences in the expenses charged to those share classes.
| Average Annual Total Returns |
| for the Periods Ending 10/31/2021 |
| | 1 Year | 5 Years | 10 Years |
| Class A1 | 21.18% | 8.86% | 4.99% |
| Class A2 | 14.51% | 7.63% | 4.40% |
| Class C1 | 20.23% | 8.01% | 4.20% |
| Class C3 | 19.23% | 8.01% | 4.20% |
| Class I1 | 21.64% | 9.19% | 5.35% |
| Class R31 | 20.99% | 8.56% | 4.72% |
| Class R41 | 21.22% | 8.88% | 5.02% |
| Class R51 | 21.24% | 9.14% | 5.25% |
| Class R61 | 21.75% | 9.33% | 5.46% |
| Class Y1 | 21.67% | 9.23% | 5.41% |
| Class F1 | 21.78% | 9.32% | 5.42% |
| MSCI Emerging Markets Index (Net) | 16.96% | 9.39% | 4.88% |
| 1 | Without sales charge |
| 2 | Reflects maximum sales charge of 5.50% |
| 3 | Reflects a contingent deferred sales charge of 1.00% |
PERFORMANCE DATA QUOTED REPRESENTS PAST PERFORMANCE AND DOES NOT GUARANTEE FUTURE RESULTS. The investment return and principal value of the investment will fluctuate so that investors’ shares, when redeemed, may be worth more or less than their original cost. The chart and table do not reflect the deductions of taxes that a shareholder would pay on Fund distributions or the redemption of Fund shares. Current performance may be lower or higher than the performance data quoted. To obtain performance data current to the most recent month-end, please visit our website hartfordfunds.com.
Total returns presented above were calculated using the applicable class' net asset value available to shareholders for sale or redemption of Fund shares on 10/31/2021, which may exclude investment transactions as of this date. All share class returns assume the reinvestment of all distributions at net asset value and the deduction of all fund expenses. The total returns presented in the Financial Highlights section of the report are calculated in the same manner, but also take into account certain
adjustments that are necessary under generally accepted accounting principles. As a result, the total returns in the Financial Highlights section may differ from the total returns presented above.
Class R6 shares commenced operations on 02/28/2018. Performance prior to that date is that of the Fund’s Class Y shares. Class F shares commenced operations on 02/28/2017. Performance prior to that date is that of the Fund’s Class I shares.
To the extent a share class has adopted the prior performance of another share class that had different operating expenses, such performance has not been adjusted to reflect the different operating expenses. If the performance were adjusted, it may have been higher or lower.
You cannot invest directly in an index.
See “Benchmark Glossary” for benchmark descriptions.
Performance information may reflect expense waivers/reimbursements without which performance would have been lower. For information on current expense waivers/reimbursements, please see the prospectus.
Performance information prior to 05/07/2015 reflects when the Fund pursued a modified investment strategy.
Hartford Emerging Markets Equity Fund
Fund Overview – (continued)
October 31, 2021 (Unaudited)
| Operating Expenses* | Gross | Net |
| Class A | 1.47% | 1.45% |
| Class C | 2.29% | 2.20% |
| Class I | 1.14% | 1.14% |
| Class R3 | 1.76% | 1.70% |
| Class R4 | 1.46% | 1.45% |
| Class R5 | 1.16% | 1.15% |
| Class R6 | 1.04% | 0.98% |
| Class Y | 1.14% | 1.10% |
| Class F | 1.04% | 0.98% |
| * | Expenses as shown in the Fund’s most recent prospectus. Gross expenses do not reflect contractual expense reimbursement arrangements. Net expenses reflect such arrangements in instances when they reduce gross expenses. These arrangements remain in effect until 02/28/2022 unless the Fund’s Board of Directors approves an earlier termination. Actual expenses may be higher or lower. Please see accompanying Financial Highlights for expense ratios for the period ended 10/31/2021. |
Portfolio Managers
David J. Elliott, CFA
Senior Managing Director, Co-Director of Quantitative Investments, and Director of Quantitative Portfolio Management
Wellington Management Company LLP
Mark A. Yarger, CFA
Managing Director and Quantitative Analyst
Wellington Management Company LLP
Manager Discussion
How did the Fund perform during the period?
The Class A shares of the Hartford Emerging Markets Equity Fund returned 21.18%, before sales charges, for the twelve-month period ended October 31, 2021, outperforming the Fund’s benchmark, the MSCI Emerging Markets Index (Net), which returned 16.96% for the same period. For the same period, the Class A shares of the Fund, before sales charges, underperformed the 22.66% average return of the Lipper Emerging Markets Equity Funds peer group, a group of funds with investment strategies similar to those of the Fund.
Why did the Fund perform this way?
Emerging market (EM) equities, as measured by the MSCI Emerging Markets Index (Net), performed strongly at the end of 2020 into 2021. Investor sentiment improved amid positive coronavirus vaccine news, higher commodity prices, and the potential for additional liquidity support globally. Despite a surge in coronavirus cases in emerging countries as well as in many other areas of the world, favorable vaccine developments strengthened the prospects for a faster global economic recovery.
In Asia, India and Taiwan led the region with higher returns within the MSCI Emerging Markets Index (Net). Markets focused on India’s favorable long-term growth potential and economic activity, which began to revive in June 2021 after a devastating wave of coronavirus cases. Taiwan and South Korea advanced amid ongoing strength in technology exports, while Thailand benefited from optimism about a
recovery in tourism. In China, the government’s regulatory crackdown on technology and gaming companies spooked investors, and a high-profile financial crisis at the country’s second-largest property developer, Evergrande, rippled through global markets, sparking widespread fears of a systemic crisis in China’s Real Estate sector.
Latin American equities produced positive results during the period, aided by a rebound in commodity prices and progress with the rollout of coronavirus vaccines. Despite Argentina’s severe coronavirus situation, markets gained comfort from indications that the International Monetary Fund (IMF) would continue to work with the country on a program that aims to provide economic stability and sustainable growth. Brazil and Mexico benefited from higher oil prices, with the rollout of coronavirus vaccines fueling prospects for stronger economic growth and greater demand for oil.
Within Europe, the Middle East, and Africa (EMEA), Central European countries such as the Czech Republic, Hungary, and Poland produced strong returns. Thanks to easing coronavirus restrictions, these countries benefited from a faster-than-expected rebound in Europe’s economic growth. Russia’s economic rebound was resilient despite a wave of coronavirus cases, as surging energy prices and higher oil output provided a boost for the economy.
Hartford Emerging Markets Equity Fund
Fund Overview – (continued)
October 31, 2021 (Unaudited)
Eight of eleven sectors within the MSCI Emerging Markets Index (Net) posted positive returns during the period. The Energy (+56%), Materials (+45%), and Financials (+36%) sectors rose the most, while the Consumer Discretionary (-15%), Real Estate (-11%), and Communication Services (-1%) sectors declined most during the period.
Within the Fund, security selection within the Consumer Discretionary, Financials, and Information Technology sectors were the largest contributors to returns relative to the MSCI Emerging Markets Index (Net). This was partially offset by weaker selection within the Energy and Healthcare sectors. Sector allocation, a result of our quantitative security selection process, also contributed positively to relative performance. An underweight to the Consumer Discretionary and Materials sectors contributed the most to relative performance, while an underweight to the Information Technology sector detracted from relative performance. From a country perspective, security selection within China, Taiwan, and Brazil contributed positively to relative performance, while security selection in Malaysia, Turkey, and Mexico detracted from returns. Allocation within countries detracted from relative performance, as the Fund’s underweights to Saudi Arabia, India, and no exposure to Kuwait detracted from relative performance, offsetting positive performance from the Fund’s overweights to the United Arab Emirates, Taiwan, and Poland.
Fubon Financial Holdings (Financials), Alibaba (Consumer Discretionary), and Sberbank Russia (Financials) were the largest contributors to relative performance during the period. The Fund’s overweight to Fubon Financial Holdings, a consumer insurance company in China, contributed positively to performance, as the company experienced strong growth on the back of increased demand for wealth and financial products domestically. Shares of Alibaba, China’s e-commerce leader and the holder of a 30% stake in Ant Financial, which operates the country’s largest digital payments platform, declined sharply for the period. The company has found itself in the crosshairs of local regulators, first with the forced postponement of the highly anticipated initial public offering (IPO) of Ant Financial, and more recently as the target of a government investigation into monopolistic behavior. The Fund’s overweight to Sberbank Russia, a commercial banking and financial services company, also contributed to relative performance during the period. Shares of Sberbank outperformed during the period as the bank consistently beat consensus earnings estimates and revised its full-year earnings guidance upward.
Gazprom (Energy), ANTA Sports Products (Consumer Discretionary), and Sinotruk Hong Kong (Industrials) were the top detractors from performance relative to the MSCI Emerging Markets Index (Net) during the period. An underweight to Gazprom, a Russian based gas exploration and production company, detracted from relative performance as shares surged on a rebound in commodity prices. Shares of ANTA Sports Products, a China-based sportswear designer, developer and manufacturer, declined as a rise in Delta variant cases and the country’s regulator crackdown created challenges for the company. Shares of Sinotruk, a heavy truck manufacturer in China, declined as year-over-year demand for trucks weakened due to lower than expected infrastructure and development spending.
Derivatives were not used in a significant manner in the Fund during the period and did not have a material impact on performance during the period.
What is the outlook as of the end of the period?
We plan to continue to seek to add value by utilizing proprietary quantitative research and investment tools in a highly disciplined framework. Stock selection is intended to be the key driver of the Fund’s returns.
At the end of the period, the Fund had the largest overweights to South Korea and Russia, and the largest underweights to Indonesia and India relative to the MSCI Emerging Markets Index (Net). On a sector basis, the Fund had its largest overweights to the Financials, Energy, and Healthcare sectors, and the largest underweights to the Materials, Communication Services, and Industrials sectors relative to the MSCI Emerging Markets Index (Net).
Important Risks
Investing involves risk, including the possible loss of principal. Security prices fluctuate in value depending on general market and economic conditions and the prospects of individual companies. • Foreign investments may be more volatile and less liquid than U.S. investments and are subject to the risk of currency fluctuations and adverse political, economic and regulatory developments. These risks may be greater, and include additional risks, for investments in emerging markets or if the Fund focuses in a particular geographic region or country, such as China. • Risks associated with investments in China include currency fluctuation, political, economic, social, environmental, regulatory and other risks, including risks associated with differing legal standards. • Small- and mid-cap securities can have greater risks and volatility than large-cap securities. • To the extent the Fund focuses on one or more sectors, the Fund may be subject to increased volatility and risk of loss if adverse developments occur. • The Fund may have high portfolio turnover, which could increase its transaction costs and an investor’s tax liability.
| Composition by Sector(1) |
| as of 10/31/2021 |
| Sector | Percentage
of Net Assets |
| Equity Securities | |
| Communication Services | 9.5% |
| Consumer Discretionary | 15.5 |
| Consumer Staples | 5.4 |
| Energy | 6.9 |
| Financials | 21.5 |
| Health Care | 4.7 |
| Industrials | 3.9 |
| Information Technology | 20.0 |
| Materials | 6.8 |
| Real Estate | 1.8 |
| Utilities | 1.9 |
| Total | 97.9% |
| Short-Term Investments | 1.7 |
| Other Assets & Liabilities | 0.4 |
| Total | 100.0% |
| (1) | A sector may be comprised of several industries. For Fund compliance purposes, the Fund may not use the same classification system. These sector classifications are used for financial reporting purposes. |
Hartford Global Impact Fund
Fund Overview
October 31, 2021 (Unaudited)
Inception 02/28/2017
Sub-advised by Wellington Management Company LLP | Investment objective – The Fund seeks long-term capital appreciation. |
Comparison of Change in Value of $10,000 Investment (02/28/2017 - 10/31/2021)
The chart above represents the hypothetical growth of a $10,000 investment in Class A, which includes the maximum sales charge applicable to Class A shares. Returns for the Fund’s other classes will vary from what is seen above due to differences in the expenses charged to those share classes.
| Average Annual Total Returns |
| for the Periods Ending 10/31/2021 |
| | 1 Year | Since
Inception1 |
| Class A2 | 35.64% | 16.90% |
| Class A3 | 28.18% | 15.49% |
| Class C2 | 34.52% | 16.16% |
| Class C4 | 33.52% | 16.16% |
| Class I2 | 36.03% | 17.33% |
| Class R32 | 35.24% | 16.83% |
| Class R42 | 35.65% | 17.04% |
| Class R52 | 36.10% | 17.30% |
| Class R62 | 36.32% | 17.43% |
| Class Y2 | 36.13% | 17.41% |
| Class F2 | 36.30% | 17.45% |
| MSCI ACWI Index (Net) | 37.28% | 13.78% |
| 1 | Inception: 02/28/2017 |
| 2 | Without sales charge |
| 3 | Reflects maximum sales charge of 5.50% |
| 4 | Reflects a contingent deferred sales charge of 1.00% |
PERFORMANCE DATA QUOTED REPRESENTS PAST PERFORMANCE AND DOES NOT GUARANTEE FUTURE RESULTS. The investment return and principal value of the investment will fluctuate so that investors’ shares, when redeemed, may be worth more or less than their original cost. The chart and table do not reflect the deductions of taxes that a shareholder would pay on Fund distributions or the redemption of Fund shares. Current performance may be lower or higher than the performance data quoted. To obtain performance data current to the most recent month-end, please visit our website hartfordfunds.com.
Total returns presented above were calculated using the applicable class' net asset value available to shareholders for sale or redemption of Fund shares on 10/31/2021, which may exclude investment transactions as of this date. All share class returns assume the reinvestment of all distributions at net asset value and the deduction of all
fund expenses. The total returns presented in the Financial Highlights section of the report are calculated in the same manner, but also take into account certain adjustments that are necessary under generally accepted accounting principles. As a result, the total returns in the Financial Highlights section may differ from the total returns presented above.
Performance information prior to 10/07/2019 reflects when the Fund operated as a feeder fund in a master feeder structure.
You cannot invest directly in an index.
See “Benchmark Glossary” for benchmark descriptions.
Performance information may reflect expense waivers/reimbursements without which performance would have been lower. For information on current expense waivers/reimbursements, please see the prospectus.
| Operating Expenses* | Gross | Net |
| Class A | 1.49% | 1.19% |
| Class C | 2.23% | 1.94% |
| Class I | 1.11% | 0.89% |
| Class R3 | 1.71% | 1.41% |
| Class R4 | 1.39% | 1.11% |
| Class R5 | 1.11% | 0.81% |
| Class R6 | 1.02% | 0.69% |
| Class Y | 1.12% | 0.79% |
| Class F | 1.02% | 0.69% |
| * | Expenses as shown in the Fund’s most recent prospectus. Gross expenses do not reflect contractual expense reimbursement arrangements. Net expenses reflect such arrangements in instances when they reduce gross expenses. These arrangements remain in effect until 02/28/2022 unless the Fund’s Board of Directors approves an earlier termination. Actual expenses may be higher or lower. Please see accompanying Financial Highlights for expense ratios for the period ended 10/31/2021. |
Hartford Global Impact Fund
Fund Overview – (continued)
October 31, 2021 (Unaudited)
Portfolio Manager
Tara C. Stilwell, CFA
Senior Managing Director and Equity Portfolio Manager
Wellington Management Company LLP
Manager Discussion
How did the Fund perform during the period?
The Class A shares of the Hartford Global Impact Fund returned 35.64%, before sales charge, for the twelve-month period ended October 31, 2021, underperforming the Fund’s benchmark, the MSCI ACWI Index (Net), which returned 37.28% for the same period. For the same period, the Class A shares of the Fund, before sales charges, also underperformed the 47.07% average return of the Lipper Global Small-/Mid-Cap Funds peer group, a group of funds with investment strategies similar to those of the Fund in terms of market cap distribution and global exposure, but not necessarily similar in terms of investment focus.
Why did the Fund perform this way?
For the twelve-month period ended October 31, 2021, global equities rose, as measured by the MSCI ACWI Index (Net). Towards the end of 2020, global equities rebounded sharply after two coronavirus vaccines demonstrated high efficacy rates in Phase 3 trials, fueling optimism that the pandemic could be alleviated in the near term. Despite this favorable development, the logistical challenges of distributing and administering the vaccines were significant, and high coronavirus case counts threatened to undermine the global economic recovery.
In the first quarter of 2021, global markets continued to advance amid the accelerating global rollout of coronavirus vaccines, a favorable outlook for global economic growth, and substantial support from governments and central banks. Massive stimulus measures combined with pent-up savings and significant supply-chain disruptions throughout the global economy fueled expectations for higher inflation. As a result, there were heightened concerns that central banks may have to tighten monetary policy to an extent that could impair equity markets.
In the second quarter of 2021, global equities were bolstered by improving global economic data, fiscal and monetary stimulus, strong corporate earnings, and higher vaccination rates. A combination of surging commodity prices, pent-up demand, global supply-chain disruptions, and stimulus-powered economic growth continued to drive inflation expectations higher, prompting some central banks to raise interest rates or consider tighter monetary policy.
In the third quarter of 2021, global markets contended with pandemic uncertainty, moderating economic growth, the imminent prospect of reduced quantitative easing and policy tightening, and persistent supply-chain dislocations that amplified the risk of more sustained inflation. In Asia, the spread of the coronavirus Delta variant shuttered
factories and snarled traffic at several major ports, exacerbating supply-chain disruptions and driving shipping costs and goods prices even higher.
In the final month of the period, global equities rebounded strongly, as risk sentiment was bolstered by strong corporate earnings, robust global equity inflows, and improving trends regarding the coronavirus pandemic and vaccine coverage. However, persistent supply-chain disruptions and uncertainty about the inflation outlook triggered anxiety about the global economic recovery.
All of the eleven sectors in the MSCI ACWI Index (Net) posted positive returns during the period. The Energy (+87%) and Financials (+60%) sectors rose the most, while the Utilities (+14%) and Consumer Staples (+19%) sectors rose the least during the period.
Sector allocation, a result of the bottom-up stock selection process, was the primary driver of the Fund’s underperformance relative to the MSCI ACWI Index (Net), primarily due to an underweight to the Financials sector and not holding equities in the Energy sector. On the other hand, underweights to the Consumer Staples and Consumer Discretionary sectors contributed positively to relative returns over the period.
Security selection also contributed positively to the Fund’s performance relative to the MSCI ACWI Index (Net). Strong selection in the Industrials, Consumer Discretionary, and Utilities sectors were the largest contributors to relative results. This was partially offset by weaker stock selection in the Healthcare and Financials sectors, which detracted from performance. On a regional basis, security selection in Emerging Markets was the primary contributor to relative performance, which was partially offset by weaker selection in Europe and the United Kingdom, which detracted from performance.
Top detractors from relative performance included Amedisys (Healthcare), StoneCo (Information Technology), and Tesla (Consumer Discretionary). Shares of Amedisys, a provider of home health and hospice care services, fell sharply in August 2021 on weakness within the hospice segment of the company’s business, as new patient development has been negatively affected by high turnover and labor shortages in their salesforce during the coronavirus pandemic. We added to the Fund’s position on the company’s stock-price weakness during the period, believing that the labor challenges would prove transient, management’s plans would address these staffing challenges, and that home health solutions would take market share from skilled nursing facilities. Shares of StoneCo, a Brazil-based payment solutions provider, declined during the period after the company reported weak second-quarter 2021 earnings impacted by its credit business. The Brazilian financial technology
Hartford Global Impact Fund
Fund Overview – (continued)
October 31, 2021 (Unaudited)
(fintech) company recognized more provisions for losses in light of problems related to collections in the new receivables system. Political instability and a higher inflation rate in Brazil also created additional challenges for the stock. Not owning Tesla, an electric vehicle and clean Energy company and constituent of the MSCI ACWI Index (Net), was also a top detractor from the Fund’s relative performance. The Fund did not own Tesla as of the end of the period due to expensive valuation and ongoing governance concerns in our view.
Top contributors to relative performance for the period included Upwork (Industrials), Etsy (Consumer Discretionary), and Mimecast (Information Technology). Shares of Upwork, a United States (U.S.)-based freelancing platform, rose in the first quarter of 2021 following sell-side upgrades which focused on Upwork’s better-than-expected results in multiple quarters and strategic changes brought about by the new management. We trimmed the Fund’s position during the period. Shares of Etsy, a U.S.-based company that helps drive critical connectivity for artisans and small businesses, rose in February 2021 following strong fourth-quarter results in 2020 that topped consensus revenue and earnings estimates, prompting several upgrades from sell-side coverage. Shares rose again in June 2021 following the announcement that the company would be acquiring Depop and Elo7. The Fund continued to hold the position as of the end of the period. Shares of Mimecast, a vendor of cloud-based email security solutions, rose over the period after the company reported several consecutive quarterly results that exceeded consensus expectations across the board, leading to a rising share price. During the period, the company saw accelerating revenue growth as well as increasing new customer additions and net retention rates for the first time since the start of the coronavirus pandemic. We trimmed the Fund’s position on the share price strength towards the end of the period.
Derivatives were not used in a significant manner in the Fund during the period and did not have a material impact on performance during the period.
What is the outlook as of the end of the period?
As of the end of the period, we are mindful that there are increased uncertainties on the horizon. We are monitoring progress on the U.S. infrastructure bill, which will have implications for growth and, depending on the size of the bill, could lend support to some of the Fund’s alternative energy holdings. In addition, it is likely that the U.S. Federal Reserve (Fed) will begin to taper its bond buying in the near term, which we believe may be positive for interest-rate-sensitive names and could have implications for market multiples overall. Finally, the progress of gross domestic product (GDP) growth in China, which has slowed recently, and the trajectory of current high energy prices will likely have implications for global growth. We remain mindful of the valuations of the companies held by the Fund and will look to adjust the Fund’s investments according to our assessment of shifting risk/rewards.
Due to the Fund’s focus on impact companies and sustainability, the Fund has natural underweights in certain sectors, such as the Financials, Consumer Discretionary, and Communication Services sectors, and overweights to the Industrials, Healthcare, and Real Estate sectors. Within our impact themes, the Fund’s largest absolute
weights at the end of the period were in health and resource efficiency. On a regional basis, the Fund ended the period with its largest overweight in Developed Europe ex United Kingdom and its largest underweight in Japan relative to the MSCI ACWI Index (Net).
Important Risks
Investing involves risk, including the possible loss of principal. Security prices fluctuate in value depending on general market and economic conditions and the prospects of individual companies. • Small- and mid-cap securities can have greater risks and volatility than large-cap securities. • Foreign investments may be more volatile and less liquid than U.S. investments and are subject to the risk of currency fluctuations and adverse political, economic and regulatory developments. These risks may be greater, and include additional risks, for investments in emerging markets. • Investing in companies that seek to address major social and environmental challenges may cause the Fund to forego certain investment opportunities and underperform funds that do not have a similar focus. The exclusion of certain issuers for reasons other than performance may negatively impact the Fund’s performance.
| Composition by Sector(1) |
| as of 10/31/2021 |
| Sector | Percentage
of Net Assets |
| Equity Securities | |
| Communication Services | 4.0% |
| Consumer Discretionary | 6.9 |
| Consumer Staples | 2.6 |
| Financials | 8.3 |
| Health Care | 19.8 |
| Industrials | 22.1 |
| Information Technology | 15.7 |
| Materials | 4.4 |
| Real Estate | 8.9 |
| Utilities | 3.6 |
| Total | 96.3% |
| Short-Term Investments | 4.5 |
| Other Assets & Liabilities | (0.8) |
| Total | 100.0% |
| (1) | A sector may be comprised of several industries. For Fund compliance purposes, the Fund may not use the same classification system. These sector classifications are used for financial reporting purposes. |
Hartford International Equity Fund
Fund Overview
October 31, 2021 (Unaudited)
Inception 06/30/2008
Sub-advised by Wellington Management Company LLP | Investment objective – The Fund seeks long-term capital appreciation. |
Comparison of Change in Value of $10,000 Investment (10/31/2011 - 10/31/2021)
The chart above represents the hypothetical growth of a $10,000 investment in Class A, which includes the maximum sales charge applicable to Class A shares. Returns for the Fund’s other classes will vary from what is seen above due to differences in the expenses charged to those share classes.
| Average Annual Total Returns |
| for the Periods Ending 10/31/2021 |
| | 1 Year | 5 Years | 10 Years |
| Class A1 | 26.93% | 8.40% | 6.82% |
| Class A2 | 19.95% | 7.18% | 6.22% |
| Class C1 | 26.06% | 7.60% | 6.03% |
| Class C3 | 25.06% | 7.60% | 6.03% |
| Class I1 | 27.45% | 8.77% | 7.20% |
| Class R31 | 26.71% | 8.09% | 6.54% |
| Class R41 | 27.00% | 8.40% | 6.85% |
| Class R51 | 27.35% | 8.81% | 7.15% |
| Class R61 | 27.52% | 8.99% | 7.34% |
| Class Y1 | 27.34% | 8.85% | 7.27% |
| Class F1 | 27.50% | 8.91% | 7.26% |
| MSCI ACWI ex USA Index (Net) | 29.66% | 9.77% | 6.66% |
| 1 | Without sales charge |
| 2 | Reflects maximum sales charge of 5.50% |
| 3 | Reflects a contingent deferred sales charge of 1.00% |
PERFORMANCE DATA QUOTED REPRESENTS PAST PERFORMANCE AND DOES NOT GUARANTEE FUTURE RESULTS. The investment return and principal value of the investment will fluctuate so that investors’ shares, when redeemed, may be worth more or less than their original cost. The chart and table do not reflect the deductions of taxes that a shareholder would pay on Fund distributions or the redemption of Fund shares. Current performance may be lower or higher than the performance data quoted. To obtain performance data current to the most recent month-end, please visit our website hartfordfunds.com.
Total returns presented above were calculated using the applicable class' net asset value available to shareholders for sale or redemption of Fund shares on 10/31/2021, which may exclude investment transactions as of this date. All share class returns assume the reinvestment of all distributions at net asset value and the deduction of all fund expenses. The total returns presented in the Financial Highlights section of the report are calculated in the same manner, but also take into account certain
adjustments that are necessary under generally accepted accounting principles. As a result, the total returns in the Financial Highlights section may differ from the total returns presented above.
Class R6 shares commenced operations on 02/28/2018. Performance prior to that date is that of the Fund’s Class Y shares. Class F shares commenced operations on 02/28/2017. Performance prior to that date is that of the Fund’s Class I shares.
To the extent a share class has adopted the prior performance of another share class that had different operating expenses, such performance has not been adjusted to reflect the different operating expenses. If the performance were adjusted, it may have been higher or lower.
You cannot invest directly in an index.
See “Benchmark Glossary” for benchmark descriptions.
Performance information may reflect expense waivers/reimbursements without which performance would have been lower.
Performance information prior to 08/13/2015 reflects when the Fund pursued a modified investment strategy.
Classes A, C, and I of the Fund are closed to new investors, subject to certain exceptions. For more information, please see the Fund’s prospectus.
Hartford International Equity Fund
Fund Overview – (continued)
October 31, 2021 (Unaudited)
| Operating Expenses* | Gross | Net |
| Class A | 0.99% | 0.99% |
| Class C | 1.76% | 1.76% |
| Class I | 0.63% | 0.63% |
| Class R3 | 1.24% | 1.24% |
| Class R4 | 0.95% | 0.95% |
| Class R5 | 0.66% | 0.66% |
| Class R6 | 0.55% | 0.55% |
| Class Y | 0.65% | 0.65% |
| Class F | 0.54% | 0.54% |
| * | Expenses as shown in the Fund’s most recent prospectus. Actual expenses may be higher or lower. Please see accompanying Financial Highlights for expense ratios for the period ended 10/31/2021. |
Portfolio Managers
Gregg R. Thomas, CFA
Senior Managing Director and Director, Investment Strategy
Wellington Management Company LLP
Thomas S. Simon, CFA, FRM
Senior Managing Director and Portfolio Manager
Wellington Management Company LLP
Manager Discussion
How did the Fund perform during the period?
The Class A shares of the Hartford International Equity Fund returned 26.93%, before sales charge, for the twelve-month period ended October 31, 2021, underperforming the Fund’s benchmark, the MSCI ACWI ex USA Index (Net), which returned 29.66% for the same period. For the same period, the Class A shares of the Fund, before sales charges, underperformed the 32.14% average return of the Lipper International Multi-Cap Core peer group, a group of funds with investment strategies similar to those of the Fund.
Why did the Fund perform this way?
For the twelve-month period ended October 31, 2021, international equities rose, as measured by the MSCI ACWI ex USA Index (Net). Early in the period, markets rebounded sharply after two coronavirus vaccines demonstrated high efficacy rates in Phase 3 trials. Markets continued to advance early in 2021 amid the accelerating global rollout of vaccines, a favorable outlook for global economic growth, and substantial support from governments and central banks. The combination of surging commodity prices, pent-up demand, global supply-chain disruptions, and stimulus-powered economic growth drove inflation expectations higher, prompting some central banks to raise interest rates or consider tighter monetary policy. The global decline in coronavirus cases came to a halt during the second quarter, as the rapid spread of the highly infectious Delta variant disrupted plans to lift lockdowns in many countries and reopen economies.
In the third quarter of 2021, international equities fell as markets contended with pandemic uncertainty, moderating economic growth, the imminent prospect of reduced quantitative easing and policy tightening, and persistent supply-chain dislocations that amplified the
risk of more sustained inflation. In Asia, the spread of the coronavirus Delta variant shuttered factories and snarled traffic at several major ports, exacerbating supply-chain disruptions and driving shipping costs and goods prices even higher. Then, a debt crisis at one of China’s largest real estate developers, Evergrande, destabilized financial markets and fueled concerns about lasting damage to China’s credit conditions and its economy. At the end of the period, international equities rebounded strongly, as risk sentiment was bolstered by strong corporate earnings, robust global equity inflows, and improving trends regarding the coronavirus pandemic and vaccine coverage. However, optimism was tempered by persistent supply chain disruptions and uncertainty about the inflation outlook.
All eleven sectors within the MSCI ACWI ex USA Index (Net) posted positive returns for the twelve months ending October 31, 2021. The Energy (+73.37%), Financials (+49.82%), and Information Technology (+43.07%) sectors posted the largest gains during the period, while the Communication Services (+5.98%), Consumer Discretionary (+13.34%), and Utilities (+17.12%) sectors posted the smallest gains for the period.
Sector allocation, a residual of the underlying portfolio managers’ bottom-up stock selection processes, detracted from the Fund’s returns relative to the MSCI ACWI ex USA Index (Net) over the period. Underweight exposure to the Financials sector was the largest detractor from relative performance during the period, while underweight exposure to the Utilities sector was the largest contributor.
Hartford International Equity Fund
Fund Overview – (continued)
October 31, 2021 (Unaudited)
Security selection contributed positively to the Fund’s relative performance during the period. Strong selection in the Communication Services, Industrials, and Financials sectors was only partially offset by weaker selection in the Healthcare, Consumer Staples, and Real Estate sectors, which detracted from performance.
Our investment process includes the use of factor-based strategies, which involve targeting certain company characteristics, or factors, that we believe impact returns across asset classes. Factor impact overall on the Fund was positive during the period. The Fund’s exposure to higher-beta names and its smaller cap footprint contributed positively to performance. The Fund’s slightly lower exposure to higher-leverage and higher-momentum names relative to the MSCI ACWI ex USA Index (Net) detracted from performance. From a top-down perspective, the Fund’s country and currency exposure detracted from relative results; Emerging Markets (Brazil, Russia) and North America (Canada) detracted most.
The largest detractors from the Fund’s relative performance were Vipshop (Consumer Discretionary), Sands China (Consumer Discretionary), and New Oriental Education (Consumer Discretionary). Vipshop is a Chinese e-commerce company. Shares fell over the period on weak second-quarter 2021 earnings. Management also announced lower-than-expected third-quarter 2021 guidance as a resurgence in coronavirus cases and seasonal weakness had impacted apparel demand. The Fund continued to hold this name as of the end of the period. Sands China is an operator of casinos in Macau. Shares ended the period lower after government officials announced plans to tighten gambling restrictions. The casino also released mixed earnings in the first half of 2021 as the company’s path to recovery continued to be challenged by coronavirus restrictions. We reduced the Fund’s position during the period. New Oriental Education is a provider of private education services in China. Shares plummeted after the Chinese regulator decided to convert after-school tutoring (AST) companies to non-profits. We increased the Fund’s position during the period.
Top contributors to the Fund’s relative performance during the period included Alibaba (Consumer Discretionary), Coupang (Consumer Discretionary), and Tencent (Communication Services). Alibaba is a Chinese technology conglomerate. Shares ended the period lower as Chinese tech companies faced challenges from new regulations proposed by Beijing aiming to stop unfair competition, particularly concerning companies’ use of data. The Fund’s underweight exposure to this stock contributed positively to performance. We reduced the Fund’s position during the period. The fair valuation of legacy private placement Coupang, a South Korea based e-commerce company, rose during the period following the company’s initial public offering (IPO). We eliminated the Fund’s position during the period following the company’s public listing. Shares of Chinese technology conglomerate Tencent, in which the Fund was underweight, fell during the period. China's sprawling crackdown on technology companies, including new regulation to limit online gaming by minors to three hours per week, weighed on shares.
At times during the period, the Fund used equity index futures to equitize cash or efficiently manage risks. During the period, the use of equity index futures had a slightly positive contribution to relative performance.
What is the outlook as of the end of the period?
As of the end of the period, we observed that while company earnings have been improving during 2021 relative to 2020, risks have continued to evolve. This includes the potential economic ramifications following the spread of the coronavirus Delta variant and the reemergence of pandemic-related restrictions in some regions, potential broad market disruption from political gridlock surrounding publicly listed equities in China and the government debt ceiling in the United States (U.S.), and the potential impact to company fundamentals as central banks begin to roll back stimulus programs. Against this backdrop, we expect continued volatility as investors balance long-term opportunities and near-term risks. As ever, we remain vigilant in managing risks in the Fund and seek to deliver performance that is driven by security selection.
Looking across markets, we are mindful of the ever-evolving risks of different equity factors and seek to create a portfolio of differentiated investment styles and philosophies. As of the end of the period, we are maintaining the Fund’s exposure to cyclical areas of the market through our allocations to mean-reversion (e.g. value and contrarian) underlying portfolio managers. These underlying portfolio managers look to invest in undervalued companies and use their security selection expertise to seek to identify companies with solid fundamentals and to avoid businesses that they believe are unlikely to mean-revert in the future. We look to our trend-following (e.g. growth and momentum) underlying portfolio managers to seek to provide capital appreciation by seeking attractive companies with favorable growth prospects. As with value equities, we look for the underlying portfolio managers' fundamental security selection processes to help identify companies with better long-term growth fundamentals versus those that are more speculative and driven by investor exuberance. We aim to balance these exposures with risk-aversion (e.g. quality and low volatility) allocations, which seek to provide a more defensive weight to the Fund by investing in companies with more stable businesses in our view. We believe these characteristics add beneficial exposure to the Fund in the event of an unexpected shock to the economy or markets. As of the end of the period, we believe these equities continue to trade at attractive valuations relative to history. To that end, we expect the market backdrop to benefit fundamental portfolio managers looking to differentiate between companies that can succeed in the current climate from those that cannot.
Important Risks
Investing involves risk, including the possible loss of principal. Security prices fluctuate in value depending on general market and economic conditions and the prospects of individual companies. • Foreign investments may be more volatile and less liquid than U.S. investments and are subject to the risk of currency fluctuations and adverse political, economic and regulatory developments. These risks may be greater, and include additional risks, for investments in emerging markets or if the Fund focuses in a particular geographic region or
Hartford International Equity Fund
Fund Overview – (continued)
October 31, 2021 (Unaudited)
country. • Small- and mid-cap securities can have greater risks and volatility than large-cap securities. • The Fund’s strategy for allocating assets among portfolio management teams may not work as intended.
| Composition by Sector(1) |
| as of 10/31/2021 |
| Sector | Percentage
of Net Assets |
| Equity Securities | |
| Communication Services | 8.3% |
| Consumer Discretionary | 12.7 |
| Consumer Staples | 9.7 |
| Energy | 4.8 |
| Financials | 16.7 |
| Health Care | 8.7 |
| Industrials | 14.0 |
| Information Technology | 12.9 |
| Materials | 5.1 |
| Real Estate | 1.9 |
| Utilities | 2.1 |
| Total | 96.9% |
| Short-Term Investments | 2.8 |
| Other Assets & Liabilities | 0.3 |
| Total | 100.0% |
| (1) | A sector may be comprised of several industries. For Fund compliance purposes, the Fund may not use the same classification system. These sector classifications are used for financial reporting purposes. |
The Hartford International Growth Fund
Fund Overview
October 31, 2021 (Unaudited)
Inception 04/30/2001
Sub-advised by Wellington Management Company LLP | Investment objective – The Fund seeks capital appreciation. |
Comparison of Change in Value of $10,000 Investment (10/31/2011 - 10/31/2021)
The chart above represents the hypothetical growth of a $10,000 investment in Class A, which includes the maximum sales charge applicable to Class A shares. Returns for the Fund’s other classes will vary from what is seen above due to differences in the expenses charged to those share classes.
| Average Annual Total Returns |
| for the Periods Ending 10/31/2021 |
| | 1 Year | 5 Years | 10 Years |
| Class A1 | 24.68% | 12.76% | 9.56% |
| Class A2 | 17.82% | 11.49% | 8.94% |
| Class C1 | 23.72% | 11.93% | 8.74% |
| Class C3 | 22.72% | 11.93% | 8.74% |
| Class I1 | 25.09% | 13.11% | 9.91% |
| Class R31 | 24.42% | 12.46% | 9.33% |
| Class R41 | 24.71% | 12.78% | 9.66% |
| Class R51 | 25.09% | 13.14% | 9.99% |
| Class R61 | 25.23% | 13.25% | 10.08% |
| Class Y1 | 25.13% | 13.16% | 10.04% |
| Class F1 | 25.29% | 13.24% | 9.97% |
| MSCI ACWI ex USA Growth Index (Net) | 22.73% | 12.67% | 8.50% |
| MSCI ACWI ex USA Index (Net) | 29.66% | 9.77% | 6.66% |
| 1 | Without sales charge |
| 2 | Reflects maximum sales charge of 5.50% |
| 3 | Reflects a contingent deferred sales charge of 1.00% |
PERFORMANCE DATA QUOTED REPRESENTS PAST PERFORMANCE AND DOES NOT GUARANTEE FUTURE RESULTS. The investment return and principal value of the investment will fluctuate so that investors’ shares, when redeemed, may be worth more or less than their original cost. The chart and table do not reflect the deductions of taxes that a shareholder would pay on Fund distributions or the redemption of Fund shares. Current performance may be lower or higher than the performance data quoted. To obtain performance data current to the most recent month-end, please visit our website hartfordfunds.com.
Total returns presented above were calculated using the applicable class' net asset value available to shareholders for sale or redemption of Fund shares on 10/31/2021, which may exclude investment transactions as of this date. All share class returns assume the reinvestment of all distributions at net asset value and the deduction of all fund expenses. The total returns presented in the Financial Highlights section of the
report are calculated in the same manner, but also take into account certain adjustments that are necessary under generally accepted accounting principles. As a result, the total returns in the Financial Highlights section may differ from the total returns presented above.
Class R6 shares commenced operations on 02/28/2018. Performance prior to that date is that of the Fund’s Class Y shares. Class F shares commenced on 02/28/2017. Performance prior to that date is that of the Fund’s Class I shares.
You cannot invest directly in an index.
See “Benchmark Glossary” for benchmark descriptions.
Performance information may reflect expense waivers/reimbursements without which performance would have been lower. For information on current expense waivers/reimbursements, please see the prospectus.
| Operating Expenses* | Gross | Net |
| Class A | 1.36% | 1.30% |
| Class C | 2.14% | 2.05% |
| Class I | 0.98% | 0.98% |
| Class R3 | 1.62% | 1.57% |
| Class R4 | 1.31% | 1.27% |
| Class R5 | 1.00% | 1.00% |
| Class R6 | 0.90% | 0.85% |
| Class Y | 1.01% | 0.95% |
| Class F | 0.90% | 0.85% |
| * | Expenses as shown in the Fund’s most recent prospectus. Gross expenses do not reflect contractual expense reimbursement arrangements. Net expenses reflect such arrangements in instances when they reduce gross expenses. These arrangements remain in effect until 02/28/2022 unless the Fund’s Board of Directors approves an earlier termination. Actual expenses may be higher or lower. Please see accompanying Financial Highlights for expense ratios for the period ended 10/31/2021. |
The Hartford International Growth Fund
Fund Overview – (continued)
October 31, 2021 (Unaudited)
Portfolio Manager
Matthew D. Hudson, CFA
Senior Managing Director and Equity Portfolio Manager
Wellington Management Company LLP
Manager Discussion
How did the Fund perform during the period?
The Class A shares of The Hartford International Growth Fund returned 24.68%, before sales charges, for the twelve-month period ended October 31, 2021, outperforming the Fund’s primary benchmark, the MSCI ACWI ex USA Growth Index (Net), which returned 22.73% for the same period, and underperforming the Fund’s secondary benchmark, the MSCI ACWI ex USA Index (Net), which returned 29.66% for the same period. For the same period, the Class A shares of the Fund, before sales charges, underperformed the 29.48% average return of the Lipper International Large-Cap Growth Funds peer group, a group of funds with investment strategies similar to those of the Fund.
Why did the Fund perform this way?
For the twelve-month period ended October 31, 2021, international equities rose as measured by the MSCI ACWI ex USA Index (Net). In the fourth quarter of 2020, markets rebounded sharply after two coronavirus vaccines demonstrated high efficacy rates in Phase 3 trials. Despite this favorable development, the logistical challenges of distributing and administering the vaccines were significant, and high coronavirus case counts threatened to undermine the global economic recovery.
International equities rose during the first quarter of 2021. Markets continued to advance amid the accelerating global rollout of coronavirus vaccines, a favorable outlook for global economic growth, and substantial support from governments and central banks. Massive stimulus measures combined with pent-up savings and significant supply chain disruptions throughout the global economy fueled investor expectations for higher inflation. As a result, there were heightened concerns that central banks may have to tighten monetary policy to an extent that could impair equity markets. Despite a broadening rollout of vaccines, global coronavirus pandemic trends remained volatile. Europe experienced a sharp rise in coronavirus infections, extended lockdowns, and a slow vaccine rollout. The European Parliament approved the Recovery and Resilience Facility, which will provide €672.5 billion in grants and loans to help European Union (EU) countries to alleviate the social and economic effects of the coronavirus pandemic.
In the second quarter of 2021, international equities rose as markets were bolstered by improving global economic data, fiscal and monetary stimulus, strong corporate earnings, and higher vaccination rates. A combination of surging commodity prices, pent-up demand, global supply-chain disruptions, and stimulus-powered economic growth continued to drive inflation expectations higher, prompting some central banks to raise interest rates or consider tighter monetary
policy. The global decline in coronavirus cases since mid-April 2021 came to a halt, and the rapid spread of the highly infectious Delta variant of the coronavirus disrupted plans to lift lockdowns in many countries and reopen economies.
In the third quarter of 2021, international equities fell as markets contended with pandemic uncertainty, moderating economic growth, the imminent prospect of reduced quantitative easing and policy tightening, and persistent supply-chain dislocations that amplified the risk of more sustained inflation. In Asia, the spread of the coronavirus Delta variant shuttered factories and snarled traffic at several major ports, exacerbating supply-chain disruptions and driving shipping costs and goods prices even higher. Mounting inflation forced many emerging-markets countries to raise interest rates, while other central banks assessed plans for curbing their accommodative policies. China’s regulatory crackdown on private education businesses and companies that handle large quantities of data pummeled the shares of Chinese technology stocks, sparking fears of more regulations for private companies. Then, a debt crisis at one of China’s largest real estate developers, Evergrande, destabilized financial markets and fueled concerns about lasting damage to China’s credit conditions and its economy.
At the end of the period, international equities rebounded strongly, as risk sentiment was bolstered by strong corporate earnings, robust global equity inflows, and improving trends regarding the coronavirus pandemic and vaccine coverage. However, persistent supply-chain disruptions and uncertainty about the inflation outlook triggered anxiety about the global economic recovery. A combination of strong demand and depleted supplies drove oil, gas, and coal prices sharply higher. In Europe, gas prices jumped by 60% in a week, before steadying after Russian President Vladimir Putin directed the country’s major gas producer to increase European supplies. China’s central bank governor indicated that the Chinese government could contain the risks that Evergrande’s debt woes posed to the country’s economy, as liabilities were spread across hundreds of entities in the financial system.
Ten out of the eleven sectors in the MSCI ACWI ex USA Growth Index (Net) rose during the period. Within the index, the Energy (+59%), Information Technology (+45%), and Financials (+45%) sectors performed best.
Security selection was a significant contributor to the Fund’s outperformance relative to the MSCI ACWI ex USA Index (Net). Strong selection in the Consumer Discretionary, Industrials, and Financials sectors contributed positively to the Fund’s outperformance. This was partially offset by weak selection within the Consumer Staples, Healthcare, and Communication Services sectors. Sector
The Hartford International Growth Fund
Fund Overview – (continued)
October 31, 2021 (Unaudited)
allocation, a residual of our bottom-up stock selection, detracted from relative performance. The Fund’s overweight to the Communication Services and Consumer Discretionary sectors detracted most from performance, while an overweight to the Information Technology sector and an underweight to the Consumer Staples sector contributed positively. On a regional basis, security selection in Europe ex U.K. and North America contributed positively to relative performance, while security selection in Emerging Markets and the U.K. detracted from performance.
Partners Group (Financials), Moncler (Consumer Discretionary), and Julius Baer (Financials) were the top contributors to the Fund’s performance relative to the MSCI ACWI ex USA Growth Index (Net) during the period. Partners Group, a Swiss-based private equity firm, outperformed during the period given continued investor demand for private assets resulting in a favorable fundraising environment. Moncler, an Italian luxury fashion brand, outperformed during the period. During the period, the company benefited from its international footprint, with strong demand in both Europe and China as the regions continue to recover from the coronavirus pandemic and resulting travel restrictions. Julius Baer, a Swiss-based private banking corporation, outperformed during the period. The company experienced a strong third quarter of 2021, and continued to excel through the end of the period, primarily due to accelerated growth of new assets under management. Additionally, as of the end of the period, efforts by management to reduce costs have begun to flow through to results.
Among the top detractors to relative performance during the period were Yatsen (Consumer Staples), Worldline (Information Technology), and Cellnex Telecom (Communication Services). Shares of Yatsen, a Chinese cosmetics company, fell over the period following weak earnings reports. Shares have also been pressured lower as regulatory uncertainty in China continues to intensify with plans to tighten rules for Chinese equities listed abroad. We eliminated the Fund’s position during the period. Shares of Worldline, a French payment and transactional service company, underperformed during the period after the company reported disappointing results during the first half of 2021. We eliminated the Fund’s position during the period. Shares of Cellnex Telecom, a Spain-based cell tower operator and consolidator, underperformed during the period. Shares of the company, which was largely viewed as a beneficiary of the conditions created by the coronavirus pandemic, lagged the broader markets as economies began to re-open. However, we continued to own the position within the Fund as of the end of the period.
Derivatives were not used in a significant manner in the Fund during the period and did not have a material impact on performance.
What is the outlook as of the end of the period?
As of the end of the period, macroeconomic considerations continue to dominate the investment landscape, while company fundamentals have been largely over-shadowed. In the U.S., the 10-year Treasury yield spiked given increasing expectations that the U.S. Federal Reserve (Fed) will begin to reduce its unprecedented levels of stimulus in order to combat rising inflation. Further, policy concerns over a potential government shutdown and uncertainty related to the outcome of the proposed infrastructure bill weighed on broader investor sentiment.
As of the end of the period, the Fund remained balanced between companies benefiting from structural growth opportunities and companies likely to benefit from continued re-opening of the economy and resumption of pre-pandemic activities. Given the multitude of macroeconomic factors that are currently impacting stock prices, we continued to maintain a dynamic balance in the Fund’s portfolio until we gain more clarity around the future environment. Lastly, we remained cognizant of potential supply chain issues and the possible near-term implications for companies’ inventory levels.
From a regional perspective, we have decreased our earnings and growth estimates for Chinese companies given an increasingly uncertain regulatory environment, and ultimately reduced the Fund’s exposure to China toward the end of the period. As of the end of the period, we continued to find what we consider to be attractive opportunities within our investable universe in Europe and North America.
Important Risks
Investing involves risk, including the possible loss of principal. Security prices fluctuate in value depending on general market and economic conditions and the prospects of individual companies. • Foreign investments may be more volatile and less liquid than U.S. investments and are subject to the risk of currency fluctuations and adverse political, economic and regulatory developments. These risks may be greater, and include additional risks, for investments in emerging markets. • Small- and mid-cap securities can have greater risks and volatility than large-cap securities. • The Fund may focus on investments in particular sectors, geographic regions or countries, so it may be more exposed to risks and volatility than a fund holding more geographically diverse investments. • Different investment styles may go in and out favor, which may cause the Fund to underperform the broader stock market. • The Fund may have high portfolio turnover, which could increase its transaction costs and an investor’s tax liability.
| Composition by Sector(1) |
| as of 10/31/2021 |
| Sector | Percentage
of Net Assets |
| Equity Securities | |
| Communication Services | 7.7% |
| Consumer Discretionary | 18.9 |
| Consumer Staples | 6.7 |
| Energy | 2.1 |
| Financials | 7.8 |
| Health Care | 6.5 |
| Industrials | 14.7 |
| Information Technology | 27.7 |
| Materials | 4.3 |
| Total | 96.4% |
| Short-Term Investments | 2.7 |
| Other Assets & Liabilities | 0.9 |
| Total | 100.0% |
| (1) | A sector may be comprised of several industries. For Fund compliance purposes, the Fund may not use the same classification system. These sector classifications are used for financial reporting purposes. |
The Hartford International Opportunities Fund
Fund Overview
October 31, 2021 (Unaudited)
Inception 07/22/1996
Sub-advised by Wellington Management Company LLP | Investment objective – The Fund seeks long-term growth of capital. |
Comparison of Change in Value of $10,000 Investment (10/31/2011 - 10/31/2021)
The chart above represents the hypothetical growth of a $10,000 investment in Class A, which includes the maximum sales charge applicable to Class A shares. Returns for the Fund’s other classes will vary from what is seen above due to differences in the expenses charged to those share classes.
| Average Annual Total Returns |
| for the Periods Ending 10/31/2021 |
| | 1 Year | 5 Years | 10 Years |
| Class A1 | 27.91% | 10.62% | 8.06% |
| Class A2 | 20.88% | 9.37% | 7.45% |
| Class C1 | 26.94% | 9.78% | 7.26% |
| Class C3 | 25.94% | 9.78% | 7.26% |
| Class I1 | 28.38% | 10.95% | 8.42% |
| Class R31 | 27.54% | 10.28% | 7.78% |
| Class R41 | 27.94% | 10.62% | 8.11% |
| Class R51 | 28.31% | 10.96% | 8.43% |
| Class R61 | 28.47% | 11.08% | 8.55% |
| Class Y1 | 28.34% | 11.01% | 8.52% |
| Class F1 | 28.51% | 11.07% | 8.48% |
| MSCI ACWI ex USA Index (Net) | 29.66% | 9.77% | 6.66% |
| 1 | Without sales charge |
| 2 | Reflects maximum sales charge of 5.50% |
| 3 | Reflects a contingent deferred sales charge of 1.00% |
PERFORMANCE DATA QUOTED REPRESENTS PAST PERFORMANCE AND DOES NOT GUARANTEE FUTURE RESULTS. The investment return and principal value of the investment will fluctuate so that investors’ shares, when redeemed, may be worth more or less than their original cost. The chart and table do not reflect the deductions of taxes that a shareholder would pay on Fund distributions or the redemption of Fund shares. Current performance may be lower or higher than the performance data quoted. To obtain performance data current to the most recent month-end, please visit our website hartfordfunds.com.
Total returns presented above were calculated using the applicable class' net asset value available to shareholders for sale or redemption of Fund shares on 10/31/2021, which may exclude investment transactions as of this date. All share class returns assume the reinvestment of all distributions at net asset value and the deduction of all fund expenses. The total returns presented in the Financial Highlights section of the report are calculated in the same manner, but also take into account certain
adjustments that are necessary under generally accepted accounting principles. As a result, the total returns in the Financial Highlights section may differ from the total returns presented above.
Class R6 shares commenced operations on 11/07/2014. Performance prior to that date is that of the Fund’s Class Y shares. Class F shares commenced operations on 02/28/2017. Performance for Class F shares prior to 02/28/2017 reflects the performance of Class I shares.
To the extent a share class has adopted the prior performance of another share class that had different operating expenses, such performance has not been adjusted to reflect the different operating expenses. If the performance were adjusted, it may have been higher or lower.
You cannot invest directly in an index.
See “Benchmark Glossary” for benchmark descriptions.
Performance information may reflect expense waivers/reimbursements without which performance would have been lower. For information on current expense waivers/reimbursements, please see the prospectus.
The Hartford International Opportunities Fund
Fund Overview – (continued)
October 31, 2021 (Unaudited)
| Operating Expenses* | Gross | Net |
| Class A | 1.13% | 1.13% |
| Class C | 1.90% | 1.90% |
| Class I | 0.79% | 0.79% |
| Class R3 | 1.42% | 1.42% |
| Class R4 | 1.11% | 1.11% |
| Class R5 | 0.81% | 0.81% |
| Class R6 | 0.71% | 0.71% |
| Class Y | 0.80% | 0.77% |
| Class F | 0.70% | 0.70% |
| * | Expenses as shown in the Fund’s most recent prospectus. Gross expenses do not reflect contractual fee waivers or expense reimbursement arrangements. Net expenses reflect such arrangements only with respect to Class Y. These arrangements remain in effect until 02/28/2022 unless the Fund’s Board of Directors approves an earlier termination. Actual expenses may be higher or lower. Please see accompanying Financial Highlights for expense ratios for the period ended 10/31/2021. |
Portfolio Managers
Nicolas M. Choumenkovitch
Senior Managing Director and Equity Portfolio Manager
Wellington Management Company LLP
Tara C. Stilwell, CFA
Senior Managing Director and Equity Portfolio Manager
Wellington Management Company LLP
Manager Discussion
How did the Fund perform during the period?
The Class A shares of The Hartford International Opportunities Fund returned 27.91%, before sales charges, for the twelve-month period ended October 31, 2021, underperforming the Fund’s benchmark, the MSCI ACWI ex USA Index (Net), which returned 29.66% for the same period. For the same period, the Class A shares of the Fund, before sales charges, underperformed the 29.48% average return of the Lipper International Large-Cap Growth Funds peer group, a group of funds with investment strategies similar to those of the Fund.
Why did the Fund perform this way?
For the twelve-month period ended October 31, 2021, international equities rose as measured by the MSCI ACWI ex USA Index (Net). In the fourth quarter of 2020, markets rebounded sharply after two COVID-19 vaccines demonstrated high efficacy rates in Phase 3 trials. Despite this favorable development, the logistical challenges of distributing and administering the vaccines were significant, and high coronavirus case counts threatened to undermine the global economic recovery.
International equities rose during the first quarter of 2021. Markets continued to advance amid the accelerating global rollout of coronavirus vaccines, a favorable outlook for global economic growth, and substantial support from governments and central banks. Massive stimulus measures combined with pent-up savings and significant supply chain disruptions throughout the global economy fueled
investor expectations for higher inflation. This led to increased concerns that central banks may have to tighten monetary policy to an extent that could impair equity markets. Despite a broadening rollout of vaccines, global coronavirus trends remained volatile. Europe experienced a sharp rise in COVID-19 infections, extended lockdowns, and a slow vaccine rollout. The European Parliament approved the Recovery and Resilience Facility, which will provide €672.5 billion in grants and loans to help European Union (EU) countries to alleviate the social and economic effects of the pandemic.
In the second quarter of 2021, international equities rose as markets were bolstered by improving global economic data, fiscal and monetary stimulus, strong corporate earnings, and higher vaccination rates. A combination of surging commodity prices, pent-up demand, global supply-chain disruptions, and stimulus-powered economic growth continued to drive inflation expectations higher, prompting some central banks to raise interest rates or consider tighter monetary policy. The global decline in COVID-19 cases since mid-April 2021 came to a halt. The rapid spread of the highly infectious Delta variant of the coronavirus disrupted plans to lift lockdowns and reopen economies in many countries.
In the third quarter of 2021, international equities fell as markets encountered pandemic uncertainty, moderating economic growth, the imminent prospect of reduced quantitative easing and policy tightening, and persistent supply-chain dislocations that amplified the risk of more sustained inflation. In Asia, the spread of the COVID-19 Delta variant shuttered factories and snarled traffic at several major ports, exacerbating supply-chain disruptions and driving shipping
The Hartford International Opportunities Fund
Fund Overview – (continued)
October 31, 2021 (Unaudited)
costs and goods prices even higher. Mounting inflation forced many emerging markets countries to raise interest rates, while other central banks assessed plans for curbing their accommodative policies. China’s regulatory crackdown on private education businesses and companies that handle large quantities of data pummeled share prices of Chinese technology equities, sparking fears of more regulations for private companies. Next, a debt crisis at one of China’s largest property developers, Evergrande, destabilized financial markets and fueled concerns about lasting damage to China’s credit conditions and its economy.
At the end of the period, international equities rebounded strongly, as risk sentiment was bolstered by strong corporate earnings, robust global equity inflows, improving coronavirus trends, and wider vaccine coverage. However, persistent supply-chain disruptions and an uncertain inflation outlook triggered anxiety about the global economic recovery. A combination of strong demand and depleted supplies drove oil, gas, and coal prices sharply higher. In Europe, gas prices jumped by 60% in a week, before steadying after Russian President Vladimir Putin directed the country’s major gas producer to increase European supplies. China’s central bank governor indicated that the Chinese government could contain the risks that Evergrande’s debt woes posed to the country’s economy, as liabilities were spread across hundreds of entities in the financial system.
Within the MSCI ACWI ex USA Index (Net), all eleven sectors posted positive returns for the twelve months ending October 31, 2021. The Energy (+73.37%), Financials (+49.82%), and Information Technology (+43.07%) sectors posted the largest gains over the period, while the Communication Services (+5.98%), Consumer Discretionary (+13.34%), and Utilities (+17.12%) sectors lagged.
Security selection detracted from the Fund’s relative performance over the period, led by weak selection within the Consumer Discretionary, Industrials, and Energy sectors. Conversely, strong selection within the Materials, Utilities, and Communication Services sectors contributed positively, partially offsetting the negative relative results. Sector allocation, a result of the bottom-up stock selection process, contributed positively to relative results. The Fund’s relative overweight to the Information Technology sector and underweights to the Consumer Staples and Communication Services sectors proved beneficial to performance, while a relative underweight to the Financials sector and a slight overweight to the Energy sector detracted from performance, partially offsetting results.
Top detractors from the Fund’s performance relative to the MSCI ACWI ex USA Index (Net) during the period included Alibaba Group (Consumer Discretionary), Iberdrola (Utilities), and Localiza (Industrials). Shares of Alibaba ended the period lower. Chinese tech companies faced challenges from new regulations proposed by Beijing aiming to stop unfair competition, particularly concerning companies’ use of data. Shares of Spanish multinational electric utility company Iberdrola fell during the period after the Spanish government announced a number of measures aimed at reducing electricity bills, including a tax on hydro and nuclear plants tied to European gas prices. The new tax will ultimately cost Iberdrola a large one-time expense in the first quarter of 2022 as gas prices continue to skyrocket in the region. Shares of Localiza, a Brazilian rental car
company, fell during the period, despite reporting positive second-quarter 2021 earnings led by higher used car prices. Net revenue increased 72% year-over-year. However, a second COVID-19 wave led to lower volumes, and the company held off on used car sales in an effort to support demand in the rent-a-car business segment. Koninklijke Philips (Healthcare) was a top absolute detractor from performance during the period.
Anglo American (Materials), BNP Paribas (Financials), and Suncor Energy (Energy) were among the top contributors to the Fund’s relative performance during the period. Shares of British mining company Anglo American rose during the period. The company delivered strong first-half 2021 results with earnings of $12.1 billion, signaling a rebound in consumer demand. Results were driven by the platinum group metals, copper, and premium quality iron ore. Shares of BNP Paribas increased during the period. Share price performance was particularly strong after the French international banking group reported its third-quarter results in February 2021. Earnings exceeded expectations, led by a rise in equity trading and lower provisions for pandemic-related loan losses. Shares of Suncor rose during the period after the Canadian integrated energy company reported upbeat third-quarter 2021 earnings. During the period, downstream demand returned to near 2019 levels and the board approved a 100% increase in the firm’s quarterly dividend. ASML (Information Technology) was a top absolute contributor to performance during the period.
Derivatives were not used in a significant manner in the Fund during the period and did not have a material impact on performance during the period.
What is the outlook as of the end of the period?
As of the end of the period, we have seen continued volatility driven by inflation and interest rate concerns, slowing growth and the regulatory cycle in China, and a non-linear and uneven economic recovery as regions experience resurgences in the coronavirus and face new variants. As the world adjusts to this new normal of rolling bouts of volatility across regions, industries, and end markets, we remain focused on seeking to identify compelling bottom-up opportunities where future returns on capital are mispriced. In addition, given the drastic stock price moves, we remain focused on maintaining a balanced Fund as markets remain very macro-driven and the range of global economic outcomes remains wide.
We continue to track economic data and the direction of fiscal and monetary policy globally, paying particular attention to the impact of China on the broader global economy and demand. We believe that economic activity should pick up over the next few quarters if the bottlenecks we have seen in the labor market subside. We believe the market is not pricing in this economic recovery and, as such, as of the end of the period, we continued to find what we consider to be compelling opportunities in parts of the market geared to economic recovery. We expect volatility to persist in the coming months driven by the continued ebb and flow of the uneven global recovery, the pace and magnitude of changes in interest rates, expectations around the outlook for inflation, and regulatory risk. We aim to take advantage of volatility and market dislocations where appropriate to invest in companies across sectors and geographies that we believe have an underappreciated ability to improve or sustain returns on capital.
The Hartford International Opportunities Fund
Fund Overview – (continued)
October 31, 2021 (Unaudited)
At the end of the period, the Fund’s largest overweight positions were in the Information Technology, Energy, and Healthcare sectors, while the Fund had the largest underweights to the Consumer Staples and Materials sectors, relative to the MSCI ACWI ex USA Index (Net). From a regional perspective, the Fund had the largest overweights to Developed Europe and Middle East ex-UK and the largest underweight to emerging markets, relative to the MSCI ACWI ex USA Index (Net), at the end of the period.
Important Risks
Investing involves risk, including the possible loss of principal. Security prices fluctuate in value depending on general market and economic conditions and the prospects of individual companies. • Foreign investments may be more volatile and less liquid than U.S. investments and are subject to the risk of currency fluctuations and adverse political, economic and regulatory developments. These risks may be greater, and include additional risks, for investments in emerging markets. • Mid-cap securities can have greater risks and volatility than large-cap securities. • To the extent the Fund focuses on one or more sectors, geographic regions or countries, the Fund may be subject to increased volatility and risk of loss if adverse developments occur. • Integration of environmental, social, and/or governance (ESG) factors into the investment process may not work as intended. • The Fund may have high portfolio turnover, which could increase its transaction costs and an investor’s tax liability.
| Composition by Sector(1) |
| as of 10/31/2021 |
| Sector | Percentage
of Net Assets |
| Equity Securities | |
| Communication Services | 5.4% |
| Consumer Discretionary | 12.0 |
| Consumer Staples | 5.5 |
| Energy | 5.9 |
| Financials | 21.1 |
| Health Care | 9.9 |
| Industrials | 10.8 |
| Information Technology | 15.8 |
| Materials | 6.5 |
| Real Estate | 2.5 |
| Utilities | 2.2 |
| Total | 97.6% |
| Short-Term Investments | 1.9 |
| Other Assets & Liabilities | 0.5 |
| Total | 100.0% |
| (1) | A sector may be comprised of several industries. For Fund compliance purposes, the Fund may not use the same classification system. These sector classifications are used for financial reporting purposes. |
The Hartford International Value Fund
Fund Overview
October 31, 2021 (Unaudited)
Inception 05/28/2010
Sub-advised by Wellington Management Company LLP | Investment objective – The Fund seeks long-term total return. |
Comparison of Change in Value of $10,000 Investment (10/31/2011 - 10/31/2021)
The chart above represents the hypothetical growth of a $10,000 investment in Class A, which includes the maximum sales charge applicable to Class A shares. Returns for the Fund’s other classes will vary from what is seen above due to differences in the expenses charged to those share classes.
| Average Annual Total Returns |
| for the Periods Ending 10/31/2021 |
| | 1 Year | 5 Years | 10 Years |
| Class A1 | 49.38% | 6.88% | 7.78% |
| Class A2 | 41.17% | 5.68% | 7.18% |
| Class C1 | 48.27% | 6.13% | 7.04% |
| Class C3 | 47.27% | 6.13% | 7.04% |
| Class I1 | 49.79% | 7.21% | 8.15% |
| Class R31 | 48.84% | 6.53% | 7.48% |
| Class R41 | 49.24% | 6.85% | 7.81% |
| Class R51 | 49.76% | 7.19% | 8.14% |
| Class R61 | 49.88% | 7.30% | 8.41% |
| Class Y1 | 49.84% | 7.25% | 8.39% |
| Class F1 | 49.94% | 7.31% | 8.20% |
| MSCI EAFE Value Index (Net) | 38.31% | 6.25% | 5.21% |
| MSCI EAFE Index (Net) | 34.18% | 9.79% | 7.37% |
| 1 | Without sales charge |
| 2 | Reflects maximum sales charge of 5.50% |
| 3 | Reflects a contingent deferred sales charge of 1.00% |
PERFORMANCE DATA QUOTED REPRESENTS PAST PERFORMANCE AND DOES NOT GUARANTEE FUTURE RESULTS. The investment return and principal value of the investment will fluctuate so that investors’ shares, when redeemed, may be worth more or less than their original cost. The chart and table do not reflect the deductions of taxes that a shareholder would pay on Fund distributions or the redemption of Fund shares. Current performance may be lower or higher than the performance data quoted. To obtain performance data current to the most recent month-end, please visit our website hartfordfunds.com.
Total returns presented above were calculated using the applicable class' net asset value available to shareholders for sale or redemption of Fund shares on 10/31/2021, which may exclude investment transactions as of this date. All share class returns assume the reinvestment of all distributions at net asset value and the deduction of all fund expenses. The total returns presented in the Financial Highlights section of the report are calculated in the same manner, but also take into account certain
adjustments that are necessary under generally accepted accounting principles. As a result, the total returns in the Financial Highlights section may differ from the total returns presented above.
Class R6 shares commenced operations on 02/28/2019. Performance prior to that date is that of the Fund’s Class Y shares. Class F shares commenced operations on 02/28/2017. Performance prior to that date is that of the Fund’s Class I shares.
To the extent a share class has adopted the prior performance of another share class that had different operating expenses, such performance has not been adjusted to reflect the different operating expenses. If the performance were adjusted, it may have been higher or lower.
You cannot invest directly in an index.
See “Benchmark Glossary” for benchmark descriptions.
Performance information may reflect expense waivers/reimbursements without which performance would have been lower. For information on current expense waivers/reimbursements, please see the prospectus.
The Hartford International Value Fund
Fund Overview – (continued)
October 31, 2021 (Unaudited)
| Operating Expenses* | Gross | Net |
| Class A | 1.23% | 1.23% |
| Class C | 1.99% | 1.99% |
| Class I | 0.93% | 0.93% |
| Class R3 | 1.58% | 1.58% |
| Class R4 | 1.28% | 1.28% |
| Class R5 | 0.95% | 0.95% |
| Class R6 | 0.86% | 0.86% |
| Class Y | 0.93% | 0.92% |
| Class F | 0.86% | 0.86% |
| * | Expenses as shown in the Fund’s most recent prospectus. Gross expenses do not reflect contractual fee waivers or expense reimbursement arrangements. Net expenses reflect such arrangements only with respect to Class Y. These arrangements remain in effect until 02/28/2022 unless the Fund’s Board of Directors approves an earlier termination. Actual expenses may be higher or lower. Please see accompanying Financial Highlights for expense ratios for the period ended 10/31/2021. |
Portfolio Managers
James H. Shakin, CFA
Senior Managing Director and Equity Portfolio Manager
Wellington Management Company LLP
Andrew M. Corry, CFA
Senior Managing Director and Equity Portfolio Manager
Wellington Management Company LLP
Manager Discussion
How did the Fund perform during the period?
The Class A shares of The Hartford International Value Fund returned 49.38%, before sales charge, for the twelve-month period ended October 31, 2021, outperforming the Fund’s benchmarks, the MSCI EAFE Value Index (Net), which returned 38.31% for the same period, and the MSCI EAFE Index (Net), which returned 34.18% for the same period. For the same period, the Class A shares of the Fund, before sales charges, also outperformed the 37.40% average return of the Lipper International Multi-Cap Value Funds peer group, a group of funds with investment strategies similar to those of the Fund.
Why did the Fund perform this way?
For the twelve-month period ended October 31, 2021, international equities rose, as measured by the MSCI ACWI ex USA Index (Net). In the fourth quarter of 2020, markets rebounded sharply after two COVID-19 vaccines demonstrated high efficacy rates in Phase 3 trials. Despite this favorable development, the logistical challenges of distributing and administering the vaccines were significant, and high coronavirus case counts threatened to undermine the global economic recovery.
International equities rose during the first quarter of 2021. Markets continued to advance amid the accelerating global rollout of coronavirus vaccines, a favorable outlook for global economic growth, and substantial support from governments and central banks. Massive stimulus measures combined with pent-up savings and significant
supply chain disruptions throughout the global economy fueled investor expectations for higher inflation. This led to increased concerns that central banks may have to tighten monetary policy to an extent that could impair equity markets. Despite a broadening rollout of vaccines, global coronavirus trends remained volatile. Europe experienced a sharp rise in COVID-19 infections, extended lockdowns, and a slow vaccine rollout. The European Parliament approved the Recovery and Resilience Facility, which will provide €672.5 billion in grants and loans to help European Union (EU) countries to alleviate the social and economic effects of the pandemic.
In the second quarter of 2021, international equities rose as markets were bolstered by improving global economic data, fiscal and monetary stimulus, strong corporate earnings, and higher vaccination rates. A combination of surging commodity prices, pent-up demand, global supply-chain disruptions, and stimulus-powered economic growth continued to drive inflation expectations higher, prompting some central banks to raise interest rates or consider tighter monetary policy. The global decline in COVID-19 cases since mid-April 2021 came to a halt. The rapid spread of the highly infectious coronavirus Delta variant disrupted plans to lift lockdowns and reopen economies in many countries.
In the third quarter of 2021, international equities fell as markets encountered pandemic uncertainty, moderating economic growth, the imminent prospect of reduced quantitative easing and policy tightening, and persistent supply-chain dislocations that amplified the risk of more sustained inflation. In Asia, the spread of the COVID-19 Delta variant shuttered factories and snarled traffic at several major
The Hartford International Value Fund
Fund Overview – (continued)
October 31, 2021 (Unaudited)
ports, exacerbating supply-chain disruptions and driving shipping costs and goods prices even higher. Mounting inflation forced many emerging markets countries to raise interest rates, while other central banks assessed plans for curbing their accommodative policies. China’s regulatory crackdown on private education businesses and companies that handle large quantities of data pummeled share prices of Chinese technology equities, sparking fears of more regulations for private companies. Next, a debt crisis at one of China’s largest property developers, Evergrande, destabilized financial markets and fueled concerns about lasting damage to China’s credit conditions and its economy.
At the end of the period, international equities rebounded strongly, as risk sentiment was bolstered by strong corporate earnings, robust global equity inflows, improving coronavirus trends, and wider vaccine coverage. However, persistent supply-chain disruptions and an uncertain inflation outlook triggered anxiety about the global economic recovery. A combination of strong demand and depleted supplies drove oil, gas, and coal prices sharply higher. In Europe, gas prices jumped by 60% in a week, before steadying after Russian President Vladimir Putin directed the country’s major gas producer to increase European supplies. China’s central bank governor indicated that the Chinese government could contain the risks that Evergrande’s debt woes posed to the country’s economy, as liabilities were spread across hundreds of entities in the financial system.
All eleven sectors in the MSCI EAFE Value Index (Net) posted positive returns for the twelve months ending October 31, 2021. The Energy (+85.3%), Financials (+59.6%), and Consumer Discretionary (+42.3%) sectors gained the most during the period.
The primary driver of the Fund’s outperformance relative to the MSCI EAFE Value Index (Net) over the period was strong security selection. Selection in the Industrials, Communication Services, and Financials sectors were the largest positive contributors. This was partially offset by selection in the Materials and Healthcare sectors. Sector allocation, a result of bottom-up stock selection decisions, also contributed positively to relative performance, driven by the Fund’s overweight to the Energy sector and underweights to the Utilities and Healthcare sectors. On a regional basis, security selection in Europe ex-U.K., the U.K., and North America contributed most to relative returns. The Fund’s overweight to North America and underweight to Japan detracted from relative returns during the period.
The largest contributors to performance relative to the MSCI EAFE Value Index (Net) over the period were Norsk Hydro (Materials), Novartis (Healthcare), and Pacific Basin Shipping (Industrials). Share prices of Norsk Hydro, a Norwegian alumina and aluminum producer, rose during the period after the company reported multiple strong earnings. Novartis is a Switzerland-based pharmaceuticals company. The Fund initiated a position at the end of the period after the shares were weighed down by the Biden administration’s plan to cut prescription drug prices for Medicare. The stock rebounded partially after the company released strong third-quarter earnings. Shares of Pacific Basin Shipping, a Hong Kong-based maritime transportation services company, benefited from strong grain trade and high United States (U.S.) soybean and corn exports. Near the end of the
period, the company’s confirmed third quarter 2021 profits continued to be supported by tighter capacity and a shortage of containers, which drove up shipping prices.
The largest detractors from performance relative to the MSCI EAFE Value Index (Net) over the period were Barrick Gold (Materials), Shimamura (Consumer Discretionary), and not owning Commonwealth Bank of Australia (Financials). Shares of Canada-based Barrick Gold, a large gold miner, declined during the period despite posting multiple strong earnings. Shares were weighed down by market sentiment as gold prices fell below $1800 per ounce during the period. Shares of Shimamura, a Japanese apparel and textile company, were weighed down from a slow vaccine rollout in Japan. Shares of Commonwealth Bank of Australia outperformed over the period; because the Fund did not have a position in the stock during the period, this detracted from relative performance.
Derivatives were not used in a significant manner in the Fund during the period and did not have a material impact on performance during the period.
What is the outlook as of the end of the period?
We continue to focus on opportunities which fit into our framework of looking for equities with low relative price, low expectations, and low valuations that generally feature strong balance sheets and significant potential upside.
At the end of the period, the Energy and Communication Services sectors were the Fund’s largest overweight exposures, while the Utilities and Consumer Staples sectors were the Fund’s largest underweight exposures relative to the MSCI EAFE Value Index (Net). On a regional basis, the Fund ended the period with the largest overweights to Emerging Markets and Japan and the largest underweights to Europe and Developed Asia ex Japan, relative to the MSCI EAFE Value Index (Net).
Important Risks
Investing involves risk, including the possible loss of principal. Security prices fluctuate in value depending on general market and economic conditions and the prospects of individual companies. • Foreign investments may be more volatile and less liquid than U.S. investments and are subject to the risk of currency fluctuations and adverse political, economic and regulatory developments. These risks may be greater, and include additional risks, for investments in emerging markets. These risks may also be greater, and there may be additional risks, if the Fund focuses in a particular geographic region or country, such as Japan. • Different investment styles may go in and out favor, which may cause the Fund to underperform the broader stock market. • Small- and mid-cap securities can have greater risks and volatility than large-cap securities. • To the extent the Fund focuses on one or more sectors, the Fund may be subject to increased volatility and risk of loss if adverse developments occur.
The Hartford International Value Fund
Fund Overview – (continued)
October 31, 2021 (Unaudited)
| Composition by Sector(1) |
| as of 10/31/2021 |
| Sector | Percentage
of Net Assets |
| Equity Securities | |
| Communication Services | 9.4% |
| Consumer Discretionary | 12.0 |
| Consumer Staples | 2.1 |
| Energy | 11.7 |
| Financials | 26.5 |
| Health Care | 4.6 |
| Industrials | 13.4 |
| Information Technology | 4.6 |
| Materials | 7.7 |
| Real Estate | 2.1 |
| Utilities | 1.7 |
| Total | 95.8% |
| Short-Term Investments | 3.2 |
| Other Assets & Liabilities | 1.0 |
| Total | 100.0% |
| (1) | A sector may be comprised of several industries. For Fund compliance purposes, the Fund may not use the same classification system. These sector classifications are used for financial reporting purposes. |
Hartford International/Global Equity Funds
Benchmark Glossary (Unaudited)
| MSCI ACWI (All Country World) ex USA Growth Index (Net) (reflects reinvested dividends net of withholding taxes but reflects no deduction for fees, expenses or other taxes) is designed to capture large and mid cap securities exhibiting overall growth style characteristics across developed market countries (excluding the United States) and emerging market countries. |
| MSCI ACWI (All Country World) ex USA Index (Net) (reflects reinvested dividends net of withholding taxes but reflects no deduction for fees, expenses or other taxes) is designed to capture large and mid cap representation across developed markets (excluding the United States) and emerging market countries. |
| MSCI ACWI (All Country World) Index (Net) (reflects reinvested dividends net of withholding taxes but reflects no deduction for fees, expenses or other taxes) is designed to capture large and mid cap representation across developed markets and emerging markets countries. |
| MSCI EAFE Index (Net) (reflects reinvested dividends net of withholding taxes but reflects no deduction for fees, expenses or other taxes) is designed to capture large and mid cap representation across developed market countries, excluding the U.S. and Canada. |
| MSCI EAFE Value Index (Net) (reflects reinvested dividends net of withholding taxes but reflects no deduction for fees, expenses or other taxes) is designed to capture large and mid cap securities exhibiting overall value style characteristics across developed market countries, excluding the U.S. and Canada. |
| MSCI Emerging Markets Index (Net) (reflects reinvested dividends net of withholding taxes but reflects no deduction for fees, expenses or other taxes) is designed to capture large and mid cap representation across emerging market countries. |
Hartford International/Global Equity Funds
Expense Examples (Unaudited)
Your Fund's Expenses
As a shareholder of a Fund, you incur two types of costs: (1) transaction costs, including sales charges (loads) on purchase payments, if any, and contingent deferred sales charges (CDSC), if any, and (2) ongoing costs, including investment management fees, distribution and/or service (12b-1) fees, if any, and other fund expenses. This example is intended to help you understand your ongoing costs (in dollars) of investing in a Fund and to compare these costs with the ongoing costs of investing in other mutual funds. The example is based on an investment of $1,000 invested at the beginning of the period and held for the entire period of May 1, 2021 through October 31, 2021. To the extent a Fund was subject to acquired fund fees and expenses during the period, acquired fund fees and expenses are not included in the annualized expense ratios below.
Actual Expenses
The first set of columns of the table below provides information about actual account values and actual expenses. You may use this information, together with the amount you invested, to estimate the expenses that you paid over the period. Simply divide your account value by $1,000 (for example, an $8,600 account value divided by $1,000 = 8.6), then multiply the result by the number in the line under the heading entitled “Expenses Paid During The Period” to estimate the expenses you paid on your account during this period.
Hypothetical Example for Comparison Purposes
The second set of columns of the table below provides information about hypothetical account values and hypothetical expenses based on a Fund’s actual expense ratio and an assumed rate of return of 5% per year before expenses, which is not the Fund’s actual return. The hypothetical account values and expenses may not be used to estimate the actual ending account balance or expenses you paid for the period. You may use this information to compare the ongoing costs of investing in a Fund and other funds. To do so, compare this 5% hypothetical example with the 5% hypothetical examples that appear in the shareholder reports of the other funds.
Please note that the expenses shown in the table are meant to highlight your ongoing costs only and do not reflect any transactional costs, such as sales charges (loads and CDSC). Therefore, the second set of columns of the table is useful in comparing ongoing costs only, and will not help you determine the relative total costs of owning different funds. In addition, if these transactional costs were included, your costs would be higher. Expenses for a class of a Fund are equal to the class' annualized expense ratio multiplied by average account value over the period, multiplied by 184/365 (to reflect the one-half year period).
| | Actual Return | | Hypothetical (5% return before expenses) |
| | Beginning
Account Value
May 1, 2021 | | Ending
Account Value
October 31, 2021 | | Expenses paid
during the period
May 1, 2021
through
October 31, 2021 | | Beginning
Account Value
May 1, 2021 | | Ending
Account Value
October 31, 2021 | | Expenses paid
during the period
May 1, 2021
through
October 31, 2021 | | Annualized
expense
ratio |
| Hartford Climate Opportunities Fund |
| Class A | $ 1,000.00 | | $ 1,060.40 | | $ 6.18 | | $ 1,000.00 | | $ 1,019.21 | | $ 6.06 | | 1.19% |
| Class C | $ 1,000.00 | | $ 1,056.00 | | $ 10.05 | | $ 1,000.00 | | $ 1,015.43 | | $ 9.86 | | 1.94% |
| Class I | $ 1,000.00 | | $ 1,061.90 | | $ 4.63 | | $ 1,000.00 | | $ 1,020.72 | | $ 4.53 | | 0.89% |
| Class R3 | $ 1,000.00 | | $ 1,060.20 | | $ 6.08 | | $ 1,000.00 | | $ 1,019.31 | | $ 5.96 | | 1.17% |
| Class R4 | $ 1,000.00 | | $ 1,060.80 | | $ 5.35 | | $ 1,000.00 | | $ 1,020.01 | | $ 5.24 | | 1.03% |
| Class R5 | $ 1,000.00 | | $ 1,061.80 | | $ 4.21 | | $ 1,000.00 | | $ 1,021.12 | | $ 4.13 | | 0.81% |
| Class R6 | $ 1,000.00 | | $ 1,062.60 | | $ 3.59 | | $ 1,000.00 | | $ 1,021.73 | | $ 3.52 | | 0.69% |
| Class Y | $ 1,000.00 | | $ 1,062.20 | | $ 4.11 | | $ 1,000.00 | | $ 1,021.22 | | $ 4.02 | | 0.79% |
| Class F | $ 1,000.00 | | $ 1,063.30 | | $ 3.59 | | $ 1,000.00 | | $ 1,021.73 | | $ 3.52 | | 0.69% |
| Hartford Emerging Markets Equity Fund |
| Class A | $ 1,000.00 | | $ 968.00 | | $ 7.29 | | $ 1,000.00 | | $ 1,017.80 | | $ 7.48 | | 1.47% (1) |
| Class C | $ 1,000.00 | | $ 963.80 | | $ 10.89 | | $ 1,000.00 | | $ 1,014.12 | | $ 11.17 | | 2.20% |
| Class I | $ 1,000.00 | | $ 968.80 | | $ 5.71 | | $ 1,000.00 | | $ 1,019.41 | | $ 5.85 | | 1.15% |
| Class R3 | $ 1,000.00 | | $ 967.00 | | $ 8.48 | | $ 1,000.00 | | $ 1,016.59 | | $ 8.69 | | 1.71% (1) |
| Class R4 | $ 1,000.00 | | $ 967.70 | | $ 7.24 | | $ 1,000.00 | | $ 1,017.85 | | $ 7.43 | | 1.46% (1) |
| Class R5 | $ 1,000.00 | | $ 966.80 | | $ 7.39 | | $ 1,000.00 | | $ 1,017.69 | | $ 7.58 | | 1.49% (1) |
| Class R6 | $ 1,000.00 | | $ 970.60 | | $ 4.87 | | $ 1,000.00 | | $ 1,020.27 | | $ 4.99 | | 0.98% |
| Class Y | $ 1,000.00 | | $ 969.60 | | $ 5.46 | | $ 1,000.00 | | $ 1,019.66 | | $ 5.60 | | 1.10% |
| Class F | $ 1,000.00 | | $ 969.50 | | $ 4.86 | | $ 1,000.00 | | $ 1,020.27 | | $ 4.99 | | 0.98% |
Hartford International/Global Equity Funds
Expense Examples (Unaudited) – (continued)
| | Actual Return | | Hypothetical (5% return before expenses) |
| | Beginning
Account Value
May 1, 2021 | | Ending
Account Value
October 31, 2021 | | Expenses paid
during the period
May 1, 2021
through
October 31, 2021 | | Beginning
Account Value
May 1, 2021 | | Ending
Account Value
October 31, 2021 | | Expenses paid
during the period
May 1, 2021
through
October 31, 2021 | | Annualized
expense
ratio |
| Hartford Global Impact Fund |
| Class A | $ 1,000.00 | | $ 1,065.40 | | $ 6.20 | | $ 1,000.00 | | $ 1,019.21 | | $ 6.06 | | 1.19% |
| Class C | $ 1,000.00 | | $ 1,061.40 | | $ 10.08 | | $ 1,000.00 | | $ 1,015.43 | | $ 9.86 | | 1.94% |
| Class I | $ 1,000.00 | | $ 1,066.80 | | $ 4.64 | | $ 1,000.00 | | $ 1,020.72 | | $ 4.53 | | 0.89% |
| Class R3 | $ 1,000.00 | | $ 1,064.00 | | $ 7.34 | | $ 1,000.00 | | $ 1,018.10 | | $ 7.17 | | 1.41% |
| Class R4 | $ 1,000.00 | | $ 1,065.60 | | $ 5.78 | | $ 1,000.00 | | $ 1,019.61 | | $ 5.65 | | 1.11% |
| Class R5 | $ 1,000.00 | | $ 1,067.40 | | $ 4.22 | | $ 1,000.00 | | $ 1,021.12 | | $ 4.13 | | 0.81% |
| Class R6 | $ 1,000.00 | | $ 1,068.00 | | $ 3.60 | | $ 1,000.00 | | $ 1,021.73 | | $ 3.52 | | 0.69% |
| Class Y | $ 1,000.00 | | $ 1,067.20 | | $ 4.12 | | $ 1,000.00 | | $ 1,021.22 | | $ 4.02 | | 0.79% |
| Class F | $ 1,000.00 | | $ 1,068.10 | | $ 3.60 | | $ 1,000.00 | | $ 1,021.73 | | $ 3.52 | | 0.69% |
| Hartford International Equity Fund |
| Class A | $ 1,000.00 | | $ 996.90 | | $ 4.68 | | $ 1,000.00 | | $ 1,020.52 | | $ 4.74 | | 0.93% |
| Class C | $ 1,000.00 | | $ 993.70 | | $ 8.59 | | $ 1,000.00 | | $ 1,016.59 | | $ 8.69 | | 1.71% |
| Class I | $ 1,000.00 | | $ 999.20 | | $ 3.12 | | $ 1,000.00 | | $ 1,022.08 | | $ 3.16 | | 0.62% |
| Class R3 | $ 1,000.00 | | $ 996.10 | | $ 6.29 | | $ 1,000.00 | | $ 1,018.90 | | $ 6.36 | | 1.25% |
| Class R4 | $ 1,000.00 | | $ 996.90 | | $ 4.78 | | $ 1,000.00 | | $ 1,020.42 | | $ 4.84 | | 0.95% |
| Class R5 | $ 1,000.00 | | $ 998.20 | | $ 3.17 | | $ 1,000.00 | | $ 1,022.03 | | $ 3.21 | | 0.63% |
| Class R6 | $ 1,000.00 | | $ 999.20 | | $ 2.67 | | $ 1,000.00 | | $ 1,022.53 | | $ 2.70 | | 0.53% |
| Class Y | $ 1,000.00 | | $ 998.50 | | $ 3.17 | | $ 1,000.00 | | $ 1,022.03 | | $ 3.21 | | 0.63% |
| Class F | $ 1,000.00 | | $ 999.20 | | $ 2.62 | | $ 1,000.00 | | $ 1,022.58 | | $ 2.65 | | 0.52% |
| The Hartford International Growth Fund |
| Class A | $ 1,000.00 | | $ 1,002.60 | | $ 6.36 | | $ 1,000.00 | | $ 1,018.85 | | $ 6.41 | | 1.26% |
| Class C | $ 1,000.00 | | $ 998.30 | | $ 10.33 | | $ 1,000.00 | | $ 1,014.87 | | $ 10.41 | | 2.05% |
| Class I | $ 1,000.00 | | $ 1,004.20 | | $ 5.05 | | $ 1,000.00 | | $ 1,020.16 | | $ 5.09 | | 1.00% |
| Class R3 | $ 1,000.00 | | $ 1,001.00 | | $ 7.97 | | $ 1,000.00 | | $ 1,017.24 | | $ 8.03 | | 1.58% |
| Class R4 | $ 1,000.00 | | $ 1,002.50 | | $ 6.41 | | $ 1,000.00 | | $ 1,018.80 | | $ 6.46 | | 1.27% |
| Class R5 | $ 1,000.00 | | $ 1,004.00 | | $ 4.85 | | $ 1,000.00 | | $ 1,020.37 | | $ 4.89 | | 0.96% |
| Class R6 | $ 1,000.00 | | $ 1,004.40 | | $ 4.29 | | $ 1,000.00 | | $ 1,020.92 | | $ 4.33 | | 0.85% |
| Class Y | $ 1,000.00 | | $ 1,004.00 | | $ 4.85 | | $ 1,000.00 | | $ 1,020.37 | | $ 4.89 | | 0.96% (1) |
| Class F | $ 1,000.00 | | $ 1,004.70 | | $ 4.30 | | $ 1,000.00 | | $ 1,020.92 | | $ 4.33 | | 0.85% |
| The Hartford International Opportunities Fund |
| Class A | $ 1,000.00 | | $ 1,037.60 | | $ 5.50 | | $ 1,000.00 | | $ 1,019.81 | | $ 5.45 | | 1.07% |
| Class C | $ 1,000.00 | | $ 1,033.80 | | $ 9.38 | | $ 1,000.00 | | $ 1,015.98 | | $ 9.30 | | 1.83% |
| Class I | $ 1,000.00 | | $ 1,039.40 | | $ 4.06 | | $ 1,000.00 | | $ 1,021.22 | | $ 4.02 | | 0.79% |
| Class R3 | $ 1,000.00 | | $ 1,036.00 | | $ 7.18 | | $ 1,000.00 | | $ 1,018.15 | | $ 7.12 | | 1.40% |
| Class R4 | $ 1,000.00 | | $ 1,037.70 | | $ 5.65 | | $ 1,000.00 | | $ 1,019.66 | | $ 5.60 | | 1.10% |
| Class R5 | $ 1,000.00 | | $ 1,039.30 | | $ 4.06 | | $ 1,000.00 | | $ 1,021.22 | | $ 4.02 | | 0.79% |
| Class R6 | $ 1,000.00 | | $ 1,039.90 | | $ 3.55 | | $ 1,000.00 | | $ 1,021.73 | | $ 3.52 | | 0.69% |
| Class Y | $ 1,000.00 | | $ 1,039.50 | | $ 3.86 | | $ 1,000.00 | | $ 1,021.42 | | $ 3.82 | | 0.75% |
| Class F | $ 1,000.00 | | $ 1,040.30 | | $ 3.50 | | $ 1,000.00 | | $ 1,021.78 | | $ 3.47 | | 0.68% |
Hartford International/Global Equity Funds
Expense Examples (Unaudited) – (continued)
| | Actual Return | | Hypothetical (5% return before expenses) |
| | Beginning
Account Value
May 1, 2021 | | Ending
Account Value
October 31, 2021 | | Expenses paid
during the period
May 1, 2021
through
October 31, 2021 | | Beginning
Account Value
May 1, 2021 | | Ending
Account Value
October 31, 2021 | | Expenses paid
during the period
May 1, 2021
through
October 31, 2021 | | Annualized
expense
ratio |
| The Hartford International Value Fund |
| Class A | $ 1,000.00 | | $ 1,055.20 | | $ 6.32 | | $ 1,000.00 | | $ 1,019.06 | | $ 6.21 | | 1.22% |
| Class C | $ 1,000.00 | | $ 1,052.10 | | $ 10.03 | | $ 1,000.00 | | $ 1,015.43 | | $ 9.86 | | 1.94% |
| Class I | $ 1,000.00 | | $ 1,056.90 | | $ 4.82 | | $ 1,000.00 | | $ 1,020.52 | | $ 4.74 | | 0.93% |
| Class R3 | $ 1,000.00 | | $ 1,053.10 | | $ 8.28 | | $ 1,000.00 | | $ 1,017.14 | | $ 8.13 | | 1.60% |
| Class R4 | $ 1,000.00 | | $ 1,055.30 | | $ 6.53 | | $ 1,000.00 | | $ 1,018.85 | | $ 6.41 | | 1.26% |
| Class R5 | $ 1,000.00 | | $ 1,057.30 | | $ 4.87 | | $ 1,000.00 | | $ 1,020.47 | | $ 4.79 | | 0.94% |
| Class R6 | $ 1,000.00 | | $ 1,057.40 | | $ 4.30 | | $ 1,000.00 | | $ 1,021.02 | | $ 4.23 | | 0.83% |
| Class Y | $ 1,000.00 | | $ 1,057.40 | | $ 4.62 | | $ 1,000.00 | | $ 1,020.72 | | $ 4.53 | | 0.89% |
| Class F | $ 1,000.00 | | $ 1,057.50 | | $ 4.30 | | $ 1,000.00 | | $ 1,021.02 | | $ 4.23 | | 0.83% |
| (1) | The annualized expense ratio is representative of the period from May 1, 2021 through October 31, 2021. The annualized expense ratio does not fully reflect the contractual expense limitation arrangement as this arrangement is based on the entire fiscal year and not the six-month period. As such, the annualized expense ratio exceeds the amount of the contractual expense limitation arrangement for this share class of the Fund for purposes of the hypothetical example. Please see the accompanying Financial Highlights for the expense ratio for the year ended October 31, 2021. |
Hartford Climate Opportunities Fund
Schedule of Investments
October 31, 2021
| Shares or Principal Amount | | Market Value† |
| COMMON STOCKS - 95.4% |
| | Austria - 0.5% |
| 6,135 | Lenzing AG* | $ 739,826 |
| | Belgium - 0.6% |
| 16,155 | Umicore S.A. | 926,271 |
| | Chile - 0.4% |
| 29,853 | Antofagasta plc | 582,290 |
| | China - 2.6% |
| 1,098,692 | China Longyuan Power Group Corp. Ltd. Class H | 2,569,880 |
| 5,400 | Contemporary Amperex Technology Co., Ltd. | 540,929 |
| 39,800 | LONGi Green Energy Technology Co., Ltd. Class A | 606,829 |
| 28,100 | Shenzhen Inovance Technology Co., Ltd. Class A | 286,306 |
| | | | 4,003,944 |
| | Denmark - 2.1% |
| 75,221 | Vestas Wind Systems A/S | 3,251,775 |
| | France - 5.1% |
| 17,643 | Alstom S.A. | 628,758 |
| 29,482 | Cie de Saint-Gobain | 2,034,627 |
| 12,697 | Legrand S.A. | 1,385,116 |
| 8,910 | Schneider Electric SE | 1,536,245 |
| 67,241 | Veolia Environnement S.A. | 2,196,022 |
| | | | 7,780,768 |
| | Germany - 5.4% |
| 16,269 | Bayerische Motoren Werke AG | 1,643,755 |
| 33,045 | Infineon Technologies AG | 1,547,541 |
| 8,005 | Knorr-Bremse AG | 844,864 |
| 6,147 | Muenchener Rueckversicherungs-Gesellschaft AG in Muenchen | 1,820,042 |
| 14,798 | Siemens AG | 2,405,887 |
| | | | 8,262,089 |
| | Ireland - 3.3% |
| 17,905 | Aptiv plc* | 3,095,596 |
| 9,611 | Kingspan Group plc | 1,106,466 |
| 4,528 | Trane Technologies plc | 819,251 |
| | | | 5,021,313 |
| | Israel - 0.6% |
| 2,615 | SolarEdge Technologies, Inc.* | 927,488 |
| | Italy - 1.5% |
| 161,238 | Enel S.p.A. | 1,349,850 |
| 26,823 | Prysmian S.p.A. | 1,014,152 |
| | | | 2,364,002 |
| | Japan - 8.4% |
| 8,200 | Daifuku Co., Ltd. | 754,887 |
| 10,000 | Daikin Industries Ltd. | 2,190,147 |
| 20,520 | East Japan Railway Co. | 1,278,118 |
| 38,891 | Hitachi Ltd. | 2,241,076 |
| 1,800 | Keyence Corp. | 1,086,506 |
| 106,955 | Kubota Corp. | 2,278,462 |
| 26,200 | Nabtesco Corp. | 850,284 |
| 4,300 | Nidec Corp. | 476,259 |
| 28,000 | Sekisui Chemical Co., Ltd. | 460,004 |
| 3,100 | Shimano, Inc. | 864,942 |
| 26,400 | Sumitomo Forestry Co., Ltd. | 504,265 |
| | | | 12,984,950 |
| Shares or Principal Amount | | Market Value† |
| COMMON STOCKS - 95.4% - (continued) |
| | Netherlands - 1.1% |
| 18,648 | Aalberts N.V. | $ 1,032,141 |
| 6,081 | Alfen Beheer B.V.*(1) | 685,013 |
| | | | 1,717,154 |
| | Norway - 1.9% |
| 17,548 | Borregaard ASA | 426,126 |
| 41,150 | Marine Harvest ASA | 1,193,234 |
| 102,564 | Norsk Hydro ASA | 753,380 |
| 9,599 | Tomra Systems ASA | 620,390 |
| | | | 2,993,130 |
| | South Korea - 1.2% |
| 2,555 | Samsung SDI Co., Ltd. | 1,612,021 |
| 1,273 | SK IE Technology Co., Ltd.*(1) | 181,159 |
| | | | 1,793,180 |
| | Spain - 3.3% |
| 9,023 | Acciona S.A. | 1,732,803 |
| 19,198 | Corp. Acciona Energias Renovables S.A.* | 670,891 |
| 124,037 | Iberdrola S.A. | 1,464,696 |
| 36,337 | Siemens Gamesa Renewable Energy S.A.* | 986,026 |
| 33,136 | Soltec Power Holdings S.A.* | 294,950 |
| | | | 5,149,366 |
| | Sweden - 2.0% |
| 133,133 | Hexagon AB Class B | 2,142,602 |
| 66,054 | Nibe Industrier AB Class B | 982,465 |
| | | | 3,125,067 |
| | Switzerland - 1.5% |
| 34,297 | ABB Ltd. | 1,134,655 |
| 11,529 | Swiss Re AG | 1,116,878 |
| | | | 2,251,533 |
| | Taiwan - 1.1% |
| 139,000 | Chroma ATE, Inc. | 907,721 |
| 63,000 | Giant Manufacturing Co., Ltd. | 731,699 |
| | | | 1,639,420 |
| | United Kingdom - 8.3% |
| 30,272 | Atlantica Sustainable Infrastructure plc | 1,191,203 |
| 12,226 | Croda International plc | 1,582,418 |
| 70,717 | ITM Power plc*(2) | 472,906 |
| 27,973 | Johnson Matthey plc | 1,045,506 |
| 226,142 | Kingfisher plc | 1,037,899 |
| 314,115 | National Grid plc | 4,021,791 |
| 52,480 | Persimmon plc | 1,955,315 |
| 19,590 | Spectris plc | 1,007,947 |
| 111,856 | Trainline plc*(1) | 484,959 |
| | | | 12,799,944 |
| | United States - 44.5% |
| 6,156 | Acuity Brands, Inc. | 1,264,627 |
| 22,994 | AECOM * | 1,572,100 |
| 1,173 | Alphabet, Inc. Class A* | 3,473,159 |
| 645 | Amazon.com, Inc.* | 2,175,217 |
| 14,615 | Array Technologies, Inc.* | 312,030 |
| 11,300 | Aspen Technology, Inc.* | 1,770,597 |
| 4,217 | Autodesk, Inc.* | 1,339,361 |
| 39,486 | Avangrid, Inc. | 2,080,912 |
| 8,351 | Ball Corp. | 763,950 |
| 3,365 | Beyond Meat, Inc.*(2) | 333,068 |
| 22,308 | Consolidated Edison, Inc. | 1,682,023 |
| 6,446 | Danaher Corp. | 2,009,669 |
| 27,664 | Darling Ingredients, Inc.* | 2,338,161 |
| 6,357 | Deere & Co. | 2,176,065 |
| 7,964 | Eaton Corp. plc | 1,312,149 |
The accompanying notes are an integral part of these financial statements.
Hartford Climate Opportunities Fund
Schedule of Investments – (continued)
October 31, 2021
| Shares or Principal Amount | | Market Value† |
| COMMON STOCKS - 95.4% - (continued) |
| | United States - 44.5% - (continued) |
| 4,318 | Ecolab, Inc. | $ 959,546 |
| 28,527 | Eversource Energy | 2,421,942 |
| 21,801 | First Solar, Inc.* | 2,607,182 |
| 7,763 | Fluence Energy, Inc.* | 276,130 |
| 15,229 | FMC Corp. | 1,385,991 |
| 33,180 | Hannon Armstrong Sustainable Infrastructure Capital, Inc. REIT | 2,004,072 |
| 5,388 | Hubbell, Inc. | 1,074,206 |
| 5,120 | IPG Photonics Corp.* | 814,131 |
| 23,725 | Johnson Controls International plc | 1,740,703 |
| 25,872 | Kroger Co. | 1,035,398 |
| 318 | Lindsay Corp. | 46,323 |
| 8,631 | Lowe's Cos., Inc. | 2,018,100 |
| 9,262 | Microsoft Corp. | 3,071,465 |
| 4,521 | Moody's Corp. | 1,827,162 |
| 17,067 | NextEra Energy, Inc. | 1,456,327 |
| 14,280 | Owens Corning | 1,333,895 |
| 3,721 | S&P Global, Inc. | 1,764,349 |
| 27,516 | Sunnova Energy International, Inc.* | 1,226,113 |
| 8,697 | Texas Instruments, Inc. | 1,630,514 |
| 11,183 | TPI Composites, Inc.* | 376,084 |
| 16,270 | Trimble, Inc.* | 1,421,510 |
| 5,678 | Union Pacific Corp. | 1,370,669 |
| 11,963 | Verisk Analytics, Inc. | 2,515,460 |
| 15,102 | Waste Management, Inc. | 2,419,794 |
| 30,563 | Westinghouse Air Brake Technologies Corp. | 2,772,981 |
| 76,931 | Weyerhaeuser Co., REIT | 2,747,975 |
| 11,104 | Xylem, Inc. | 1,450,071 |
| | | | 68,371,181 |
| | Total Common Stocks
(cost $115,636,052) | | $ 146,684,691 |
| WARRANTS - 0.2% |
| | Switzerland - 0.2% |
| 6,771 | Beijing Sinohytec Co., Ltd. Expires 03/17/2023* | $ 261,347 |
| | Total Warrants
(cost $303,256) | | $ 261,347 |
| | Total Long-Term Investments
(cost $115,939,308) | | $ 146,946,038 |
| SHORT-TERM INVESTMENTS - 3.7% |
| | Other Investment Pools & Funds - 1.7% |
| $ 2,504,538 | Morgan Stanley Institutional Liquidity Funds, Treasury Portfolio, Institutional Class, 0.01%(3) | $ 2,504,538 |
| | Repurchase Agreements - 1.7% |
| 2,624,278 | Fixed Income Clearing Corp. Repurchase Agreement dated 10/29/2021 at 0.010%, due on 11/01/2021 with a maturity value of $2,624,280; collateralized by U.S. Treasury Bond at 1.375%, maturing 11/15/2040, with a market value of $2,676,837 | 2,624,278 |
| Shares or Principal Amount | | Market Value† |
| SHORT-TERM INVESTMENTS - 3.7% - (continued) |
| | Securities Lending Collateral - 0.3% |
| 2,947 | Fidelity Investments Money Market Funds, Government Portfolio, Institutional Class, 0.01%(3) | $ 2,947 |
| 452,479 | Goldman Sachs Financial Square Funds, Government Fund, Institutional Class, 0.03%(3) | 452,479 |
| 32,485 | Invesco Government & Agency Portfolio, Institutional Class, 0.03%(3) | 32,485 |
| | | | 487,911 |
| | Total Short-Term Investments
(cost $5,616,727) | $ 5,616,727 |
| | Total Investments
(cost $121,556,035) | 99.3% | $ 152,562,765 |
| | Other Assets and Liabilities | 0.7% | 1,090,519 |
| | Total Net Assets | 100.0% | $ 153,653,284 |
| Note: | Percentage of investments as shown is the ratio of the total market value to total net assets. |
| | Prices of foreign equities that are principally traded on certain foreign markets will generally be adjusted daily pursuant to a fair value pricing service approved by the Board of Directors in order to reflect an adjustment for factors occurring after the close of certain foreign markets but before the close of the New York Stock Exchange. |
| | Equity industry classifications used in this report are the Global Industry Classification Standard, which was developed by and is the exclusive property and service mark of MSCI, Inc. and Standard & Poor’s. |
| | For Fund compliance purposes, the Fund may not use the same classification system. These classifications are used for financial reporting purposes. |
| | See “Glossary” for abbreviation descriptions. |
| * | Non-income producing. |
| (1) | Security was purchased pursuant to Rule 144A under the Securities Act of 1933 and may be sold in transactions that are exempt from registration (typically only to qualified institutional buyers) or in a public offering registered under the Securities Act of 1933. At October 31, 2021, the aggregate value of these securities was $1,351,131, representing 0.9% of net assets. |
| (2) | Represents entire or partial securities on loan. See Note 8 in the accompanying Notes to Financial Statements for securities lending information. |
| (3) | Current yield as of period end. |
| † | See Significant Accounting Policies of accompanying Notes to Financial Statements regarding valuation of investments. |
The accompanying notes are an integral part of these financial statements.
Hartford Climate Opportunities Fund
Schedule of Investments – (continued)
October 31, 2021
Fair Value Summary
The following is a summary of the fair valuations according to the inputs used as of October 31, 2021 in valuing the Fund’s investments.
| Description | | Total | | Level 1 | | Level 2 | | Level 3(1) |
| Assets | | | | | | | | |
| Common Stocks | | | | | | | | |
| Austria | | $ 739,826 | | $ — | | $ 739,826 | | $ — |
| Belgium | | 926,271 | | — | | 926,271 | | — |
| Chile | | 582,290 | | — | | 582,290 | | — |
| China | | 4,003,944 | | — | | 4,003,944 | | — |
| Denmark | | 3,251,775 | | — | | 3,251,775 | | — |
| France | | 7,780,768 | | — | | 7,780,768 | | — |
| Germany | | 8,262,089 | | — | | 8,262,089 | | — |
| Ireland | | 5,021,313 | | 3,914,847 | | 1,106,466 | | — |
| Israel | | 927,488 | | 927,488 | | — | | — |
| Italy | | 2,364,002 | | — | | 2,364,002 | | — |
| Japan | | 12,984,950 | | — | | 12,984,950 | | — |
| Netherlands | | 1,717,154 | | — | | 1,717,154 | | — |
| Norway | | 2,993,130 | | — | | 2,993,130 | | — |
| South Korea | | 1,793,180 | | — | | 1,793,180 | | — |
| Spain | | 5,149,366 | | 2,430,537 | | 2,718,829 | | — |
| Sweden | | 3,125,067 | | — | | 3,125,067 | | — |
| Switzerland | | 2,251,533 | | — | | 2,251,533 | | — |
| Taiwan | | 1,639,420 | | — | | 1,639,420 | | — |
| United Kingdom | | 12,799,944 | | 1,676,162 | | 11,123,782 | | — |
| United States | | 68,371,181 | | 68,371,181 | | — | | — |
| Warrants | | 261,347 | | 261,347 | | — | | — |
| Short-Term Investments | | 5,616,727 | | 2,992,449 | | 2,624,278 | | — |
| Total | | $ 152,562,765 | | $ 80,574,011 | | $ 71,988,754 | | $ — |
| (1) | For the year ended October 31, 2021, there were no transfers in and out of Level 3. |
The accompanying notes are an integral part of these financial statements.
Hartford Emerging Markets Equity Fund
Schedule of Investments
October 31, 2021
| Shares or Principal Amount | | Market Value† |
| COMMON STOCKS - 95.8% |
| | Brazil - 2.3% |
| 77,300 | Banco do Brasil S.A. | $ 390,349 |
| 113,500 | Cia Brasileira de Distribuicao | 513,423 |
| 540,021 | Cia Energetica de Minas Gerais | 1,232,409 |
| 197,500 | CPFL Energia S.A. | 920,696 |
| 112,100 | Embraer S.A.* | 435,585 |
| 164,400 | Even Construtora e Incorporadora S.A. | 181,184 |
| 427,624 | JBS S.A. | 2,958,772 |
| 566,100 | Lojas Americanas S.A. (Preference Shares) | 484,472 |
| 206,100 | Marfrig Global Foods S.A. | 967,726 |
| 121,000 | Sao Martinho S.A. | 821,131 |
| 60,400 | SLC Agricola S.A. | 466,393 |
| 163,200 | Vale S.A. | 2,070,724 |
| | | | 11,442,864 |
| | Cayman Islands - 0.3% |
| 97,000 | Wuxi Biologics Cayman, Inc.*(1) | 1,469,254 |
| | Chile - 0.5% |
| 673,872 | Cencosud S.A. | 985,750 |
| 447,564 | Falabella S.A. | 1,237,664 |
| | | | 2,223,414 |
| | China - 32.9% |
| 7,064,131 | Agricultural Bank of China Ltd. Class H | 2,400,443 |
| 242,800 | Alibaba Group Holding Ltd.* | 4,992,613 |
| 62,138 | Alibaba Group Holding Ltd. ADR* | 10,249,042 |
| 494,000 | Aluminum Corp. of China Ltd. Class H* | 297,284 |
| 683,321 | Anhui Conch Cement Co., Ltd. Class H | 3,378,958 |
| 202,600 | ANTA Sports Products Ltd. | 3,139,028 |
| 41,708 | Autodesk, Inc. | 1,641,210 |
| 3,709,000 | BAIC Motor Corp. Ltd. Class H(1) | 1,228,605 |
| 30,215 | Baidu, Inc. ADR* | 4,902,082 |
| 20,753,205 | Bank of China Ltd. Class H | 7,344,591 |
| 6,206,224 | Bank of Communications Co., Ltd. Class H | 3,691,975 |
| 1,476,513 | Baoshan Iron & Steel Co., Ltd. Class A | 1,643,405 |
| 70,000 | BYD Co., Ltd. Class H | 2,677,331 |
| 7,325,345 | China Cinda Asset Management Co., Ltd. Class H | 1,222,937 |
| 4,771,137 | China CITIC Bank Corp. Ltd. Class H | 2,092,857 |
| 6,031,102 | China Construction Bank Corp. Class H | 4,104,651 |
| 3,208,000 | China Energy Engineering Corp. Ltd.(2) | 474,160 |
| 1,081,000 | China Everbright Bank Co., Ltd. Class H | 380,145 |
| 583,000 | China Feihe Ltd.(1) | 967,951 |
| 3,620,895 | China Fortune Land Development Co., Ltd.* | 2,083,179 |
| 1,950,000 | China Galaxy Securities Co., Ltd. Class H | 1,085,713 |
| 794,000 | China Medical System Holdings Ltd. | 1,344,416 |
| 572,000 | China Mengniu Dairy Co., Ltd.* | 3,639,386 |
| 225,000 | China Merchants Bank Co., Ltd. Class H | 1,885,531 |
| 1,908,000 | China National Building Material Co., Ltd. Class H | 2,391,283 |
| 91,600 | China Northern Rare Earth Group High-Tech Co., Ltd. | 726,496 |
| 3,620,000 | China Petroleum & Chemical Corp. Class H | 1,763,782 |
| 2,119,500 | China Railway Group Ltd. Class A | 1,738,335 |
| 1,445,000 | China Resources Pharmaceutical Group Ltd.(1) | 695,113 |
| 534,000 | China Suntien Green Energy Corp. Ltd. Class H | 424,405 |
| 494,000 | China Yongda Automobiles Services Holdings Ltd. | 785,991 |
| 89,400 | Chongqing Brewery Co., Ltd. Class A* | 2,097,286 |
| 971,500 | CITIC Securities Co., Ltd. Class H | 2,466,597 |
| 6,200 | Contemporary Amperex Technology Co., Ltd. | 621,067 |
| 1,008,149 | COSCO Shipping Holdings Co., Ltd. Class H*(2) | 1,561,529 |
| 2,332,000 | CSPC Pharmaceutical Group Ltd. | 2,433,441 |
| 16,818 | Daqo New Energy Corp. ADR* | 1,308,272 |
| 2,312,000 | Dongfeng Motor Group Co., Ltd. Class H | 2,153,297 |
| 132,900 | East Money Information Co., Ltd. | 683,439 |
| 54,600 | Ecovacs Robotics Co., Ltd. | 1,463,916 |
| 977,200 | GF Securities Co., Ltd. | 1,657,444 |
| Shares or Principal Amount | | Market Value† |
| COMMON STOCKS - 95.8% - (continued) |
| | China - 32.9% - (continued) |
| 1,465,600 | Guangzhou R&F Properties Co., Ltd. Class H(2) | $ 916,812 |
| 19,800 | Guangzhou Tinci Materials Technology Co., Ltd. | 509,547 |
| 247,000 | Haier Smart Home Co., Ltd. Class H | 919,752 |
| 203,000 | Huatai Securities Co., Ltd.(1) | 301,883 |
| 129,769 | HUYA, Inc. ADR*(2) | 1,066,701 |
| 23,788 | Imeik Technology Development Co., Ltd. | 2,325,903 |
| 25,365 | JD.com, Inc. ADR* | 1,985,572 |
| 37,500 | JiuGui Liquor Co., Ltd. Class A | 1,254,866 |
| 3,350,000 | Lenovo Group Ltd. | 3,637,993 |
| 480,500 | Li Ning Co., Ltd. | 5,302,345 |
| 444,900 | Luxi Chemical Group Co., Ltd. | 1,141,639 |
| 103,200 | Meituan Class B*(1) | 3,511,753 |
| 39,747 | NetEase, Inc. ADR | 3,878,910 |
| 916,000 | Newborn Town, Inc.* | 515,565 |
| 32,255 | NIO, Inc. ADR* | 1,271,170 |
| 714,000 | Orient Securities Co., Ltd.(1) | 585,840 |
| 6,721,098 | People's Insurance Co., Group of China Ltd. Class H | 2,096,466 |
| 5,962,800 | PetroChina Co., Ltd. Class A | 5,103,244 |
| 18,926 | Pinduoduo, Inc. ADR* | 1,682,900 |
| 1,244,800 | Shaanxi Coal Industry Co., Ltd. Class A | 2,439,404 |
| 313,400 | Shanxi Lu'an Environmental Energy Development Co., Ltd. | 636,037 |
| 294,000 | Shanxi Xishan Coal & Electricity Power Co., Ltd. | 426,856 |
| 476,700 | Shenzhen Overseas Chinese Town Co., Ltd. | 466,609 |
| 10,000 | Silergy Corp. | 1,652,051 |
| 1,194,249 | Sinotruk Hong Kong Ltd. | 1,648,393 |
| 15,300 | Sunny Optical Technology Group Co., Ltd. | 410,552 |
| 273,380 | Tencent Holdings Ltd. | 16,629,649 |
| 289,000 | Topsports International Holdings Ltd.*(1) | 351,091 |
| 612,000 | Uni-President China Holdings Ltd. | 521,602 |
| 49,646 | Weibo Corp.* | 2,233,077 |
| 636,000 | Weichai Power Co., Ltd. Class H | 1,138,419 |
| 24,900 | Wuliangye Yibin Co., Ltd. Class A | 841,406 |
| 32,864 | Yum China Holdings, Inc. | 1,875,877 |
| 355,000 | Zhongsheng Group Holdings Ltd. | 3,200,803 |
| 105,800 | Zhuzhou Kibing Group Co., Ltd. | 262,572 |
| | | | 164,582,445 |
| | Hong Kong - 1.8% |
| 310,000 | China Resources Beer Holdings Co., Ltd. | 2,559,620 |
| 526,000 | CIMC Enric Holdings Ltd. | 676,387 |
| 225,060 | Hopson Development Holdings Ltd. | 610,715 |
| 402,500 | Kingboard Holdings Ltd. | 1,754,016 |
| 399,000 | Kingboard Laminates Holdings Ltd. | 625,476 |
| 1,918,000 | Sino Biopharmaceutical Ltd. | 1,414,303 |
| 4,660,000 | Truly International Holdings Ltd. | 1,519,280 |
| | | | 9,159,797 |
| | Hungary - 0.7% |
| 59,383 | OTP Bank Nyrt* | 3,568,171 |
| | India - 10.5% |
| 139,659 | Adani Enterprises Ltd. | 2,658,779 |
| 77,232 | Adani Power Ltd.* | 103,635 |
| 63,809 | Adani Total Gas Ltd. | 1,226,607 |
| 56,263 | Adani Transmission Ltd.* | 1,325,338 |
| 20,985 | Apollo Hospitals Enterprise Ltd. | 1,197,058 |
| 5,781 | Bajaj Finserv Ltd. | 1,380,151 |
| 81,930 | Balkrishna Industries Ltd. | 2,698,902 |
| 221,605 | Bharat Electronics Ltd. | 613,254 |
| 77,317 | Bharat Forge Ltd. | 794,925 |
| 164,127 | Crompton Greaves Consumer Electricals Ltd. | 1,021,778 |
| 13,939 | Deepak Nitrite Ltd. | 415,993 |
| 47,614 | Divi's Laboratories Ltd. | 3,276,242 |
| 25,930 | Dr Lal PathLabs Ltd.(1) | 1,217,943 |
The accompanying notes are an integral part of these financial statements.
Hartford Emerging Markets Equity Fund
Schedule of Investments – (continued)
October 31, 2021
| Shares or Principal Amount | | Market Value† |
| COMMON STOCKS - 95.8% - (continued) |
| | India - 10.5% - (continued) |
| 42,909 | Havells India Ltd. | $ 725,194 |
| 275,182 | ICICI Bank Ltd. | 2,962,914 |
| 110,232 | Indiabulls Housing Finance Ltd. | 320,367 |
| 87,118 | Infosys Ltd. | 1,949,598 |
| 102,194 | JSW Steel Ltd. | 915,301 |
| 5,592 | Jubilant Foodworks Ltd. | 276,378 |
| 23,424 | L&T Technology Services Ltd.(1) | 1,481,997 |
| 18,720 | Larsen & Toubro Infotech Ltd.(1) | 1,674,745 |
| 80,479 | Laurus Labs Ltd.*(1) | 555,847 |
| 55,528 | Mindtree Ltd. | 3,341,005 |
| 1,374 | MRF Ltd. | 1,420,717 |
| 13,562 | NIIT Technologies Ltd. | 884,376 |
| 793,808 | Power Finance Corp. Ltd. | 1,414,788 |
| 475,736 | Power Grid Corp. of India Ltd. | 1,178,413 |
| 712,835 | State Bank of India | 4,796,021 |
| 68,291 | Sun Pharmaceutical Industries Ltd. | 726,179 |
| 29,145 | Tata Elxsi Ltd. | 2,289,517 |
| 99,812 | Tata Steel Ltd. | 1,759,767 |
| 189,408 | Tech Mahindra Ltd. | 3,749,157 |
| 14,559 | UltraTech Cement Ltd. | 1,486,898 |
| 168,359 | Vedanta Ltd. | 685,136 |
| | | | 52,524,920 |
| | Indonesia - 0.1% |
| 14,584,400 | Multipolar Tbk PT* | 415,888 |
| | Malaysia - 1.7% |
| 1,336,400 | Hartalega Holdings Bhd | 1,891,162 |
| 2,093,300 | Inari Amertron Bhd | 1,960,972 |
| 1,347,600 | Kossan Rubber Industries | 768,012 |
| 2,409,100 | Supermax Corp. Bhd | 1,116,994 |
| 4,518,000 | Top Glove Corp. Bhd | 2,967,631 |
| | | | 8,704,771 |
| | Mexico - 1.6% |
| 422,709 | Cemex S.A.B. de C.V. ADR* | 2,718,019 |
| 37,534 | Controladora Vuela Cia de Aviacion S.A.B. de C.V.* | 679,365 |
| 332,400 | Grupo Bimbo S.A.B. de C.V. Series A | 988,094 |
| 176,300 | Grupo Financiero Banorte S.A.B. de C.V. Class O | 1,114,420 |
| 433,400 | Grupo Mexico S.A.B. de C.V. Series B | 1,899,230 |
| 149,900 | Orbia Advance Corp. S.A.B. de C.V. | 391,715 |
| | | | 7,790,843 |
| | Poland - 0.6% |
| 39,782 | Bank Polska Kasa Opieki S.A. | 1,314,401 |
| 120 | LPP S.A. | 431,015 |
| 219,597 | PGE Polska Grupa Energetyczna S.A.* | 540,379 |
| 529,781 | Polskie Gornictwo Naftowe i Gazownictwo S.A. | 798,815 |
| | | | 3,084,610 |
| | Qatar - 0.7% |
| 1,166,610 | Barwa Real Estate Co. | 1,011,466 |
| 418,550 | Industries Qatar QSC | 1,823,181 |
| 37,094 | Qatar Islamic Bank SAQ | 187,661 |
| 1,561,412 | United Development Co. | 667,537 |
| | | | 3,689,845 |
| | Russia - 5.0% |
| 722,940 | Gazprom PJSC ADR | 7,094,112 |
| 94,256 | Magnit PJSC GDR | 1,745,621 |
| 8,412 | Novatek PJSC | 2,132,442 |
| 66,793 | Novolipetsk Steel PJSC GDR | 2,110,871 |
| 70,154 | PhosAgro PJSC GDR | 1,678,084 |
| 363,200 | Sberbank of Russia PJSC ADR | 7,283,981 |
| Shares or Principal Amount | | Market Value† |
| COMMON STOCKS - 95.8% - (continued) |
| | Russia - 5.0% - (continued) |
| 38,991 | Severstal PAO GDR | $ 891,685 |
| 292,920 | Surgutneftegas PJSC ADR | 1,399,158 |
| 297,867 | VTB Bank PJSC GDR | 432,983 |
| | | | 24,768,937 |
| | Saudi Arabia - 3.0% |
| 190,586 | Al Rajhi Bank | 7,042,368 |
| 502,407 | Alinma Bank | 3,368,668 |
| 99,729 | Bank AlBilad* | 1,122,014 |
| 138,351 | Bank Al-Jazira | 708,187 |
| 121,784 | Riyad Bank | 959,428 |
| 38,656 | Saudi Ceramic Co. | 559,605 |
| 10,250 | Saudi Research & Media Group* | 461,823 |
| 29,838 | Saudi Telecom Co. | 930,722 |
| | | | 15,152,815 |
| | South Africa - 2.6% |
| 58,081 | Absa Group Ltd. | 531,303 |
| 57,729 | Bid Corp. Ltd. | 1,239,010 |
| 7,505 | Capitec Bank Holdings Ltd. | 838,585 |
| 133,326 | Exxaro Resources Ltd. | 1,459,821 |
| 45,986 | Foschini Group Ltd.* | 390,467 |
| 113,531 | Investec Ltd. | 520,273 |
| 9,740 | Kumba Iron Ore Ltd. | 296,390 |
| 57,820 | Mr. Price Group Ltd. | 756,903 |
| 410,367 | MTN Group Ltd.* | 3,679,813 |
| 240,667 | MultiChoice Group Ltd. | 1,913,834 |
| 94,167 | Sasol Ltd.* | 1,581,626 |
| | | | 13,208,025 |
| | South Korea - 14.1% |
| 137,511 | BNK Financial Group, Inc. | 1,036,700 |
| 1,434 | CJ CheilJedang Corp. | 466,055 |
| 82,169 | Daewoo Engineering & Construction Co., Ltd.* | 439,926 |
| 197,663 | DGB Financial Group, Inc. | 1,751,457 |
| 45,915 | Doosan Infracore Co., Ltd.* | 413,282 |
| 21,769 | E-Mart, Inc. | 3,133,693 |
| 33,057 | Hana Financial Group, Inc. | 1,274,672 |
| 12,886 | Hankook Tire & Technology Co., Ltd. | 456,568 |
| 16,708 | Hyundai Mobis Co., Ltd. | 3,611,752 |
| 25,400 | Hyundai Motor Co. | 4,542,928 |
| 186,726 | Industrial Bank of Korea | 1,767,292 |
| 45,953 | Kakao Corp. | 4,943,826 |
| 107,172 | KB Financial Group, Inc. | 5,187,541 |
| 81,671 | Kia Motors Corp. | 5,959,723 |
| 12,438 | Korea Gas Corp.* | 472,514 |
| 10,153 | Korea Investment Holdings Co., Ltd. | 759,356 |
| 65,000 | KT Corp. | 1,697,083 |
| 53,306 | KT Corp. ADR | 682,850 |
| 88,743 | LG Display Co., Ltd.* | 1,499,790 |
| 23,201 | LG Electronics, Inc. | 2,400,233 |
| 4,421 | LG Innotek Co., Ltd. | 794,704 |
| 4,187 | Lotte Chemical Corp. | 805,334 |
| 5,676 | POSCO | 1,439,613 |
| 4,486 | Samsung Electro-Mechanics Co., Ltd. | 610,934 |
| 305,806 | Samsung Electronics Co., Ltd. | 18,309,558 |
| 9,279 | Silicon Works Co., Ltd. | 872,492 |
| 2,165 | SK Bioscience Co., Ltd.* | 426,126 |
| 9,671 | SK Telecom Co., Ltd.(3)(4) | 2,560,752 |
| 13,816 | SM Entertainment Co., Ltd.* | 930,869 |
The accompanying notes are an integral part of these financial statements.
Hartford Emerging Markets Equity Fund
Schedule of Investments – (continued)
October 31, 2021
| Shares or Principal Amount | | Market Value† |
| COMMON STOCKS - 95.8% - (continued) |
| | South Korea - 14.1% - (continued) |
| 7,533 | S-Oil Corp. | $ 659,120 |
| 48,977 | Woori Financial Group, Inc. | 556,778 |
| | | | 70,463,521 |
| | Taiwan - 13.2% |
| 1,034,000 | Acer, Inc. | 967,805 |
| 146,000 | Ardentec Corp. | 312,843 |
| 3,310,000 | Cathay Financial Holding Co., Ltd. | 6,899,669 |
| 358,000 | Elan Microelectronics Corp. | 2,155,293 |
| 7,000 | eMemory Technology, Inc. | 581,458 |
| 435,000 | Evergreen Marine Corp. Taiwan Ltd. | 1,565,426 |
| 2,280,865 | Fubon Financial Holding Co., Ltd. | 6,029,290 |
| 21,667 | Himax Technologies, Inc. ADR(2) | 228,804 |
| 254,959 | MediaTek, Inc. | 8,391,385 |
| 17,000 | momo.com, Inc. | 1,095,484 |
| 15,000 | Nan Ya Printed Circuit Board Corp. | 265,414 |
| 142,000 | Novatek Microelectronics Corp. | 2,129,849 |
| 10,000 | Parade Technologies Ltd. | 644,195 |
| 78,000 | Realtek Semiconductor Corp. | 1,403,035 |
| 1,271,176 | Taiwan Semiconductor Manufacturing Co., Ltd. | 26,974,723 |
| 2,038,724 | United Microelectronics Corp. | 4,232,338 |
| 251,000 | Vanguard International Semiconductor Corp. | 1,307,904 |
| 636,000 | Yuanta Financial Holding Co., Ltd. | 565,330 |
| | | | 65,750,245 |
| | Thailand - 2.4% |
| 497,600 | Com7 PCL | 1,075,953 |
| 697,400 | Kasikornbank PCL | 2,942,394 |
| 485,300 | Kiatnakin Bank PCL | 877,511 |
| 635,900 | PTT Exploration & Production PCL | 2,251,737 |
| 1,117,100 | PTT Global Chemical PCL | 2,112,500 |
| 497,000 | PTT PCL | 576,644 |
| 224,200 | Siam Commercial Bank PCL | 851,328 |
| 755,000 | Thai Vegetable Oil PCL | 711,030 |
| 237,400 | Tisco Financial Group PCL | 659,991 |
| | | | 12,059,088 |
| | Turkey - 0.4% |
| 86,876 | Arcelik AS | 304,792 |
| 11,422 | Ford Otomotiv Sanayi AS | 220,504 |
| 322,392 | Turkiye Sise ve Cam Fabrikalari AS | 290,401 |
| 3,389,172 | Yapi ve Kredi Bankasi AS | 962,392 |
| | | | 1,778,089 |
| | United Arab Emirates - 1.4% |
| 55,961 | Abu Dhabi Commercial Bank PJSC | 126,452 |
| 559,945 | Abu Dhabi Islamic Bank PJSC | 891,538 |
| 3,583,547 | Aldar Properties PJSC | 3,942,946 |
| 521,137 | Emirates NBD Bank PJSC | 1,979,190 |
| | | | 6,940,126 |
| | Total Common Stocks
(cost $409,044,674) | | $ 478,777,668 |
| PREFERRED STOCKS - 2.1% |
| | Brazil - 2.1% |
| 273,300 | Cia de Transmissao de Energia Eletrica Paulista | $ 1,177,692 |
| Shares or Principal Amount | | Market Value† |
| PREFERRED STOCKS - 2.1% - (continued) |
| | Brazil - 2.1% - (continued) |
| 2,080,000 | Cia Paranaense de Energia | $ 2,181,792 |
| 1,505,900 | Petroleo Brasileiro S.A. | 7,270,948 |
| | | | 10,630,432 |
| | Total Preferred Stocks
(cost $11,277,027) | | $ 10,630,432 |
| | Total Long-Term Investments
(cost $420,321,701) | | $ 489,408,100 |
| SHORT-TERM INVESTMENTS - 1.7% |
| | Repurchase Agreements - 1.1% |
| 5,672,719 | Fixed Income Clearing Corp. Repurchase Agreement dated 10/29/2021 at 0.010%, due on 11/01/2021 with a maturity value of $5,672,724; collateralized by U.S. Treasury Bond at 1.875%, maturing 02/15/2041, with a market value of $5,786,183 | $ 5,672,719 |
| | Securities Lending Collateral - 0.6% |
| 16,737 | Fidelity Investments Money Market Funds, Government Portfolio, Institutional Class, 0.01%(5) | 16,737 |
| 2,569,486 | Goldman Sachs Financial Square Funds, Government Fund, Institutional Class, 0.03%(5) | 2,569,486 |
| 184,470 | Invesco Government & Agency Portfolio, Institutional Class, 0.03%(5) | 184,470 |
| | | | 2,770,693 |
| | Total Short-Term Investments
(cost $8,443,412) | $ 8,443,412 |
| | Total Investments
(cost $428,765,113) | 99.6% | $ 497,851,512 |
| | Other Assets and Liabilities | 0.4% | 1,987,934 |
| | Total Net Assets | 100.0% | $ 499,839,446 |
| Note: | Percentage of investments as shown is the ratio of the total market value to total net assets. |
| | Prices of foreign equities that are principally traded on certain foreign markets will generally be adjusted daily pursuant to a fair value pricing service approved by the Board of Directors in order to reflect an adjustment for factors occurring after the close of certain foreign markets but before the close of the New York Stock Exchange. |
| | The Fund may refer to any one or more of the industry classifications used by one or more widely recognized market indices, ratings group and/or as defined by Fund management. Industry classifications may not be identical across all security types. |
| | For Fund compliance purposes, the Fund may not use the same classification system. These classifications are used for financial reporting purposes. |
| | See “Glossary” for abbreviation descriptions. |
| * | Non-income producing. |
| (1) | Security was purchased pursuant to Rule 144A under the Securities Act of 1933 and may be sold in transactions that are exempt from registration (typically only to qualified institutional buyers) or in a public offering registered under the Securities Act of 1933. At October 31, 2021, the aggregate value of these securities was $14,042,022, representing 2.8% of net assets. |
The accompanying notes are an integral part of these financial statements.
Hartford Emerging Markets Equity Fund
Schedule of Investments – (continued)
October 31, 2021
| (2) | Represents entire or partial securities on loan. See Note 8 in the accompanying Notes to Financial Statements for securities lending information. |
| (3) | This security is valued in good faith at fair value as determined under policies and procedures established by and under the supervision of the Board of Directors. At October 31, 2021, the aggregate fair value of this security was $2,560,752, which represented 0.5% of total net assets. This amount excludes securities that are principally traded in certain foreign markets and whose prices are adjusted pursuant to a third party pricing service methodology approved by the Board of Directors. |
| (4) | Investment valued using significant unobservable inputs. |
| (5) | Current yield as of period end. |
| Futures Contracts Outstanding at October 31, 2021 |
| Description | | Number of
Contracts | | Expiration
Date | | Current
Notional
Amount | | Value and
Unrealized
Appreciation/
(Depreciation) |
| Long position contracts: |
| MSCI Emerging Market Index Future | | 109 | | 12/17/2021 | | $ 6,877,900 | | $ (159,649) |
| Total futures contracts | | $ (159,649) |
† See Significant Accounting Policies of accompanying Notes to Financial Statements regarding valuation of investments.
Fair Value Summary
The following is a summary of the fair valuations according to the inputs used as of October 31, 2021 in valuing the Fund’s investments.
| Description | | Total | | Level 1 | | Level 2 | | Level 3(1) |
| Assets | | | | | | | | |
| Common Stocks | | | | | | | | |
| Brazil | | $ 11,442,864 | | $ 11,442,864 | | $ — | | $ — |
| Cayman Islands | | 1,469,254 | | — | | 1,469,254 | | — |
| Chile | | 2,223,414 | | 2,223,414 | | — | | — |
| China | | 164,582,445 | | 34,894,876 | | 129,687,569 | | — |
| Hong Kong | | 9,159,797 | | — | | 9,159,797 | | — |
| Hungary | | 3,568,171 | | — | | 3,568,171 | | — |
| India | | 52,524,920 | | 1,226,607 | | 51,298,313 | | — |
| Indonesia | | 415,888 | | 415,888 | | — | | — |
| Malaysia | | 8,704,771 | | 6,743,799 | | 1,960,972 | | — |
| Mexico | | 7,790,843 | | 7,790,843 | | — | | — |
| Poland | | 3,084,610 | | 431,015 | | 2,653,595 | | — |
| Qatar | | 3,689,845 | | 2,010,842 | | 1,679,003 | | — |
| Russia | | 24,768,937 | | 5,556,147 | | 19,212,790 | | — |
| Saudi Arabia | | 15,152,815 | | 15,152,815 | | — | | — |
| South Africa | | 13,208,025 | | 7,118,893 | | 6,089,132 | | — |
| South Korea | | 70,463,521 | | 1,108,976 | | 66,793,793 | | 2,560,752 |
| Taiwan | | 65,750,245 | | 228,804 | | 65,521,441 | | — |
| Thailand | | 12,059,088 | | 12,059,088 | | — | | — |
| Turkey | | 1,778,089 | | 1,473,297 | | 304,792 | | — |
| United Arab Emirates | | 6,940,126 | | 2,105,642 | | 4,834,484 | | — |
| Preferred Stocks | | 10,630,432 | | 10,630,432 | | — | | — |
| Short-Term Investments | | 8,443,412 | | 2,770,693 | | 5,672,719 | | — |
| Total | | $ 497,851,512 | | $ 125,384,935 | | $ 369,905,825 | | $ 2,560,752 |
| Liabilities | | | | | | | | |
| Futures Contracts(2) | | $ (159,649) | | $ (159,649) | | $ — | | $ — |
| Total | | $ (159,649) | | $ (159,649) | | $ — | | $ — |
| (1) | For the year ended October 31, 2021, there were no transfers in and out of Level 3. |
| (2) | Derivative instruments (excluding purchased and written options, if applicable) are valued at the unrealized appreciation/(depreciation) on the investments. |
Level 3 investments at the beginning and/or end of the period in relation to net assets were not significant and accordingly, a reconciliation of Level 3 assets for the year ended October 31, 2021 is not presented.
The accompanying notes are an integral part of these financial statements.
Hartford Global Impact Fund
Schedule of Investments
October 31, 2021
| Shares or Principal Amount | | Market Value† |
| COMMON STOCKS - 96.3% |
| | Australia - 0.8% |
| 44,224 | SEEK Ltd. | $ 1,099,094 |
| | Bangladesh - 0.7% |
| 241,359 | GrameenPhone Ltd. | 1,001,118 |
| | Brazil - 1.3% |
| 24,174 | StoneCo Ltd. Class A* | 818,532 |
| 265,500 | YDUQS Participacoes S.A. | 981,312 |
| | | | 1,799,844 |
| | Canada - 2.7% |
| 56,820 | Brookfield Renewable Partners L.P. | 2,277,666 |
| 27,849 | Stantec, Inc. | 1,539,166 |
| | | | 3,816,832 |
| | China - 1.8% |
| 1,000 | Hangzhou Tigermed Consulting Co., Ltd. Class H(1) | 19,504 |
| 53,964 | Niu Technologies ADR*(2) | 1,412,778 |
| 18,900 | Shenzhen Mindray Bio-Medical Electronics Co., Ltd. Class A | 1,107,494 |
| | | | 2,539,776 |
| | Denmark - 0.8% |
| 25,735 | Vestas Wind Systems A/S | 1,112,514 |
| | France - 3.3% |
| 33,854 | Nexity S.A. | 1,547,710 |
| 18,279 | Schneider Electric SE | 3,151,630 |
| | | | 4,699,340 |
| | Germany - 0.7% |
| 16,754 | Vonovia SE | 1,016,344 |
| | India - 0.7% |
| 52,679 | Shriram Transport Finance Co., Ltd. | 1,014,713 |
| | Indonesia - 1.7% |
| 7,801,729 | Bank Rakyat Indonesia Persero Tbk PT | 2,341,951 |
| | Ireland - 2.0% |
| 15,426 | Trane Technologies plc | 2,791,026 |
| | Israel - 1.7% |
| 13,243 | CyberArk Software Ltd.* | 2,385,197 |
| | Japan - 2.1% |
| 13,000 | Eisai Co., Ltd. | 921,130 |
| 55,348 | Katitas Co., Ltd. | 2,020,963 |
| | | | 2,942,093 |
| | Kenya - 1.1% |
| 3,824,600 | Safaricom plc | 1,470,736 |
| | Netherlands - 6.3% |
| 15,954 | Koninklijke DSM N.V. | 3,485,601 |
| 65,601 | Koninklijke Philips N.V. | 3,094,738 |
| 47,681 | Signify N.V.(1) | 2,310,449 |
| | | | 8,890,788 |
| | Puerto Rico - 1.2% |
| 21,121 | Popular, Inc. | 1,720,094 |
| | South Africa - 2.7% |
| 1,845,663 | Old Mutual Ltd. | 1,883,724 |
| 217,799 | Vodacom Group Ltd. | 1,933,171 |
| | | | 3,816,895 |
| Shares or Principal Amount | | Market Value† |
| COMMON STOCKS - 96.3% - (continued) |
| | South Korea - 1.3% |
| 2,968 | Samsung SDI Co., Ltd. | $ 1,872,594 |
| | Spain - 2.0% |
| 14,711 | Acciona S.A. | 2,825,144 |
| | Sweden - 0.8% |
| 9,156 | MIPS AB | 1,105,586 |
| | Switzerland - 1.0% |
| 21,071 | Landis+Gyr Group AG | 1,448,581 |
| | Taiwan - 2.4% |
| 208,000 | Chroma ATE, Inc. | 1,358,317 |
| 58,891 | MediaTek, Inc. | 1,938,261 |
| | | | 3,296,578 |
| | United Kingdom - 4.3% |
| 24,017 | Genus plc | 1,821,251 |
| 62,794 | Hikma Pharmaceuticals plc | 2,069,810 |
| 77,097 | Nomad Foods Ltd.* | 2,099,351 |
| | | | 5,990,412 |
| | United States - 52.9% |
| 11,218 | Advanced Drainage Systems, Inc. | 1,265,390 |
| 19,206 | Agilent Technologies, Inc. | 3,024,753 |
| 61,251 | agilon health, Inc.* | 1,500,650 |
| 13,912 | Alexandria Real Estate Equities, Inc. REIT | 2,839,996 |
| 10,143 | Amedisys, Inc.* | 1,717,616 |
| 28,706 | Ball Corp. | 2,626,025 |
| 23,306 | Baxter International, Inc. | 1,840,242 |
| 19,092 | Boston Properties, Inc. REIT | 2,169,615 |
| 73,498 | Boston Scientific Corp.* | 3,169,969 |
| 86,173 | Covanta Holding Corp. | 1,738,971 |
| 11,306 | Danaher Corp. | 3,524,872 |
| 17,809 | Darling Ingredients, Inc.* | 1,505,217 |
| 8,460 | Etsy, Inc.* | 2,120,837 |
| 61,116 | Evoqua Water Technologies Corp.* | 2,556,482 |
| 16,319 | First Solar, Inc.* | 1,951,589 |
| 26,562 | Globe Life, Inc. | 2,364,549 |
| 26,706 | GoDaddy, Inc. Class A* | 1,847,254 |
| 16,533 | Health Catalyst, Inc.* | 870,297 |
| 11,598 | Hubbell, Inc. | 2,312,293 |
| 3,276 | Illumina, Inc.* | 1,359,737 |
| 5,073 | Insulet Corp.* | 1,572,731 |
| 12,866 | Itron, Inc.* | 1,000,589 |
| 115,300 | Laureate Education, Inc. Class A* | 1,996,996 |
| 37,737 | Mimecast Ltd.* | 2,846,879 |
| 23,810 | National Vision Holdings, Inc.* | 1,467,648 |
| 45,853 | OneMain Holdings, Inc. | 2,421,497 |
| 81,695 | PGT Innovations, Inc.* | 1,744,188 |
| 31,220 | PowerSchool Holdings, Inc.* | 721,494 |
| 17,235 | Rapid7, Inc.* | 2,219,006 |
| 7,706 | Square, Inc. Class A* | 1,961,177 |
| 15,706 | Sun Communities, Inc. REIT | 3,078,062 |
| 12,464 | Tetra Tech, Inc. | 2,189,426 |
| 15,955 | Udemy, Inc.* | 438,763 |
| 27,110 | Upwork, Inc.* | 1,277,423 |
| 11,073 | Watts Water Technologies, Inc. Class A | 2,104,091 |
The accompanying notes are an integral part of these financial statements.
Hartford Global Impact Fund
Schedule of Investments – (continued)
October 31, 2021
| Shares or Principal Amount | | Market Value† |
| COMMON STOCKS - 96.3% - (continued) |
| | United States - 52.9% - (continued) |
| 32,001 | Westinghouse Air Brake Technologies Corp. | $ 2,903,451 |
| 16,388 | Xylem, Inc. | 2,140,109 |
| | | | 74,389,884 |
| | Total Common Stocks
(cost $101,004,106) | | $ 135,387,134 |
| SHORT-TERM INVESTMENTS - 4.5% |
| | Repurchase Agreements - 4.1% |
| 5,763,539 | Fixed Income Clearing Corp. Repurchase Agreement dated 10/29/2021 at 0.010%, due on 11/01/2021 with a maturity value of $5,763,544; collateralized by U.S. Treasury Bond at 1.875%, maturing 02/15/2041, with a market value of $5,878,813 | $ 5,763,539 |
| | Securities Lending Collateral - 0.4% |
| 3,097 | Fidelity Investments Money Market Funds, Government Portfolio, Institutional Class, 0.01%(3) | 3,097 |
| 475,391 | Goldman Sachs Financial Square Funds, Government Fund, Institutional Class, 0.03%(3) | 475,391 |
| 34,129 | Invesco Government & Agency Portfolio, Institutional Class, 0.03%(3) | 34,129 |
| | | | 512,617 |
| | Total Short-Term Investments
(cost $6,276,156) | $ 6,276,156 |
| | Total Investments
(cost $107,280,262) | 100.8% | $ 141,663,290 |
| | Other Assets and Liabilities | (0.8)% | (1,063,152) |
| | Total Net Assets | 100.0% | $ 140,600,138 |
| Note: | Percentage of investments as shown is the ratio of the total market value to total net assets. |
| | Prices of foreign equities that are principally traded on certain foreign markets will generally be adjusted daily pursuant to a fair value pricing service approved by the Board of Directors in order to reflect an adjustment for factors occurring after the close of certain foreign markets but before the close of the New York Stock Exchange. |
| | For Fund compliance purposes, the Fund may not use the same classification system. These classifications are used for financial reporting purposes. |
| | See “Glossary” for abbreviation descriptions. |
| * | Non-income producing. |
| (1) | Security was purchased pursuant to Rule 144A under the Securities Act of 1933 and may be sold in transactions that are exempt from registration (typically only to qualified institutional buyers) or in a public offering registered under the Securities Act of 1933. At October 31, 2021, the aggregate value of these securities was $2,329,953, representing 1.7% of net assets. |
| (2) | Represents entire or partial securities on loan. See Note 8 in the accompanying Notes to Financial Statements for securities lending information. |
| (3) | Current yield as of period end. |
| † | See Significant Accounting Policies of accompanying Notes to Financial Statements regarding valuation of investments. |
The accompanying notes are an integral part of these financial statements.
Hartford Global Impact Fund
Schedule of Investments – (continued)
October 31, 2021
Fair Value Summary
The following is a summary of the fair valuations according to the inputs used as of October 31, 2021 in valuing the Fund’s investments.
| Description | | Total | | Level 1 | | Level 2 | | Level 3(1) |
| Assets | | | | | | | | |
| Common Stocks | | | | | | | | |
| Australia | | $ 1,099,094 | | $ — | | $ 1,099,094 | | $ — |
| Bangladesh | | 1,001,118 | | 1,001,118 | | — | | — |
| Brazil | | 1,799,844 | | 1,799,844 | | — | | — |
| Canada | | 3,816,832 | | 3,816,832 | | — | | — |
| China | | 2,539,776 | | 1,412,778 | | 1,126,998 | | — |
| Denmark | | 1,112,514 | | — | | 1,112,514 | | — |
| France | | 4,699,340 | | — | | 4,699,340 | | — |
| Germany | | 1,016,344 | | — | | 1,016,344 | | — |
| India | | 1,014,713 | | — | | 1,014,713 | | — |
| Indonesia | | 2,341,951 | | — | | 2,341,951 | | — |
| Ireland | | 2,791,026 | | 2,791,026 | | — | | — |
| Israel | | 2,385,197 | | 2,385,197 | | — | | — |
| Japan | | 2,942,093 | | — | | 2,942,093 | | — |
| Kenya | | 1,470,736 | | 1,470,736 | | — | | — |
| Netherlands | | 8,890,788 | | — | | 8,890,788 | | — |
| Puerto Rico | | 1,720,094 | | 1,720,094 | | — | | — |
| South Africa | | 3,816,895 | | 3,816,895 | | — | | — |
| South Korea | | 1,872,594 | | — | | 1,872,594 | | — |
| Spain | | 2,825,144 | | — | | 2,825,144 | | — |
| Sweden | | 1,105,586 | | 1,105,586 | | — | | — |
| Switzerland | | 1,448,581 | | — | | 1,448,581 | | — |
| Taiwan | | 3,296,578 | | — | | 3,296,578 | | — |
| United Kingdom | | 5,990,412 | | 2,099,351 | | 3,891,061 | | — |
| United States | | 74,389,884 | | 74,389,884 | | — | | — |
| Short-Term Investments | | 6,276,156 | | 512,617 | | 5,763,539 | | — |
| Total | | $ 141,663,290 | | $ 98,321,958 | | $ 43,341,332 | | $ — |
| (1) | For the year ended October 31, 2021, there were no transfers in and out of Level 3. |
The accompanying notes are an integral part of these financial statements.
Hartford International Equity Fund
Schedule of Investments
October 31, 2021
| Shares or Principal Amount | | Market Value† |
| COMMON STOCKS - 96.2% |
| | Argentina - 0.0% |
| 46,725 | YPF S.A. ADR* | $ 196,245 |
| | Australia - 0.7% |
| 138,416 | Austal Ltd. | 196,729 |
| 9,047 | CSL Ltd. | 2,058,557 |
| 245,555 | OceanaGold Corp.* | 458,332 |
| 402,296 | Resolute Mining Ltd.* | 126,431 |
| 73,304 | Wesfarmers Ltd. | 3,171,550 |
| 138,155 | Western Areas Ltd.* | 330,806 |
| | | | 6,342,405 |
| | Austria - 0.1% |
| 24,124 | Erste Group Bank AG | 1,034,575 |
| 28,791 | Zumtobel Group AG | 296,213 |
| | | | 1,330,788 |
| | Belgium - 0.4% |
| 23,348 | Ageas S.A. | 1,135,826 |
| 85,670 | AGFA-Gevaert N.V.* | 372,370 |
| 33,998 | Anheuser-Busch InBev S.A. | 2,079,562 |
| 31,255 | bpost S.A.* | 267,772 |
| | | | 3,855,530 |
| | Brazil - 1.2% |
| 241,600 | B3 S.A. - Brasil Bolsa Balcao | 509,844 |
| 222,071 | Caixa Seguridade Participacoes S/A* | 344,293 |
| 137,022 | Cia de Saneamento Basico do Estado de Sao Paulo | 854,597 |
| 129,200 | Localiza Rent a Car S.A. | 1,037,025 |
| 607,888 | Magazine Luiza S.A. | 1,164,334 |
| 80,337 | Pagseguro Digital Ltd. Class A* | 2,908,199 |
| 89,960 | Petroleo Brasileiro S.A. ADR | 883,407 |
| 78,091 | Telefonica Brasil S.A. | 629,842 |
| 217,522 | Vale S.A. ADR | 2,769,055 |
| 5,198 | XP, Inc.* | 170,387 |
| | | | 11,270,983 |
| | Canada - 6.1% |
| 54,482 | ARC Resources Ltd. | 522,545 |
| 36,442 | Bank of Montreal(1) | 3,956,619 |
| 39,379 | Bank of Nova Scotia | 2,581,781 |
| 54,303 | Barrick Gold Corp. | 996,462 |
| 40,644 | Cameco Corp. | 987,528 |
| 35,108 | Canadian National Railway Co. | 4,665,937 |
| 70,469 | Centerra Gold, Inc. | 528,404 |
| 42,330 | Eldorado Gold Corp.* | 379,277 |
| 75,804 | Fortis, Inc. | 3,374,307 |
| 28,065 | Intact Financial Corp. | 3,762,334 |
| 96,203 | Kinross Gold Corp. | 578,180 |
| 15,092 | Lululemon Athletica, Inc.* | 7,033,023 |
| 14,915 | National Bank of Canada | 1,234,802 |
| 28,082 | Nuvei Corp.*(2) | 3,375,013 |
| 45,923 | Pembina Pipeline Corp.(1) | 1,520,253 |
| 82,961 | Royal Bank of Canada | 8,635,291 |
| 3,299 | Shopify, Inc. Class A* | 4,838,742 |
| 76,582 | Toronto-Dominion Bank | 5,559,249 |
| 16,984 | Tourmaline Oil Corp. | 613,845 |
| 184,943 | Trican Well Service Ltd.* | 518,546 |
| | | | 55,662,138 |
| | Chile - 0.1% |
| 264,204 | Embotelladora Andina S.A. Class B | 545,621 |
| | China - 7.3% |
| 18,713 | Alibaba Group Holding Ltd. ADR* | 3,086,522 |
| 334,000 | Anhui Conch Cement Co., Ltd. Class H | 1,651,598 |
| 8,611 | Baidu, Inc. ADR* | 1,397,049 |
| Shares or Principal Amount | | Market Value† |
| COMMON STOCKS - 96.2% - (continued) |
| | China - 7.3% - (continued) |
| 1,488,977 | China BlueChemical Ltd. Class H | $ 497,885 |
| 6,306,540 | China Construction Bank Corp. Class H | 4,292,109 |
| 1,155,485 | China Longyuan Power Group Corp. Ltd. Class H | 2,702,721 |
| 559,083 | China Merchants Bank Co., Ltd. Class H | 4,685,193 |
| 7,783,405 | China Reinsurance Group Corp. Class H | 809,416 |
| 461,955 | China Resources Sanjiu Medical & Pharmaceutical Co., Ltd. | 1,741,562 |
| 16,104,593 | China Tower Corp. Ltd. Class H(2) | 2,087,135 |
| 861,263 | China Vanke Co., Ltd. Class H | 2,012,280 |
| 2,573,545 | CSPC Pharmaceutical Group Ltd. | 2,685,493 |
| 3,339,798 | Dongfeng Motor Group Co., Ltd. Class H | 3,110,544 |
| 517,000 | Haidilao International Holding Ltd.(1)(2) | 1,441,566 |
| 261,027 | Haier Smart Home Co., Ltd. | 1,109,156 |
| 202,014 | Jiangsu Hengrui Medicine Co., Ltd. Class A | 1,551,871 |
| 526,700 | Jinyu Bio-Technology Co., Ltd. Class A | 1,310,858 |
| 22,419 | JOYY, Inc. | 1,129,693 |
| 203,500 | Livzon Pharmaceutical Group, Inc. Class A | 1,116,797 |
| 38,900 | Meituan Class B*(2) | 1,323,713 |
| 113,600 | Midea Group Co., Ltd. Class A | 1,218,543 |
| 205,724 | New Oriental Education & Technology Group, Inc. ADR* | 421,734 |
| 179,500 | Ping An Insurance Group Co. of China Ltd. Class H | 1,285,710 |
| 1,062,374 | Shanghai Pharmaceuticals Holding Co., Ltd. Class H | 1,944,385 |
| 126,066 | Shenzhou International Group Holdings Ltd. | 2,715,991 |
| 4,712,000 | Sinopec Engineering Group Co., Ltd. Class H | 2,483,569 |
| 198,024 | Tencent Holdings Ltd. | 12,045,759 |
| 31,605 | Trip.com Group Ltd. ADR* | 902,639 |
| 194,032 | Vipshop Holdings Ltd. ADR* | 2,165,397 |
| 723,400 | Yintai Gold Co., Ltd. | 993,440 |
| | | | 65,920,328 |
| | Cyprus - 0.1% |
| 25,873 | Ozon Holdings plc ADR* | 1,164,285 |
| | Denmark - 1.1% |
| 21,968 | Carlsberg A/S Class B | 3,627,264 |
| 31,043 | D/S Norden A/S | 749,181 |
| 2,506 | Drilling Co.* | 89,828 |
| 24,676 | DSV Panalpina A/S | 5,735,127 |
| | | | 10,201,400 |
| | Finland - 0.6% |
| 29,615 | Kone Oyj Class B | 2,019,715 |
| 332,833 | Nokia Oyj* | 1,910,296 |
| 28,250 | Orion Oyj Class B | 1,223,327 |
| | | | 5,153,338 |
| | France - 9.0% |
| 123,193 | Accor S.A.* | 4,408,635 |
| 44,397 | Airbus SE* | 5,695,337 |
| 184,938 | AXA S.A. | 5,380,398 |
| 39,245 | BNP Paribas S.A. | 2,626,951 |
| 88,914 | Bureau Veritas S.A. | 2,826,134 |
| 12,455 | Capgemini SE | 2,904,043 |
| 38,656 | Cie de Saint-Gobain | 2,667,748 |
| 20,443 | Criteo S.A. ADR* | 675,437 |
| 52,174 | Danone S.A. | 3,401,000 |
| 7,671 | Dassault Aviation S.A. | 801,649 |
| 33,581 | Eiffage S.A. | 3,456,330 |
| 165,640 | Engie S.A. | 2,356,253 |
| 154,529 | Groupe Eurotunnel SE | 2,378,375 |
| 15,647 | Imerys S.A. | 678,224 |
| 11,666 | L'Oreal S.A. | 5,336,667 |
| 1,813 | LVMH Moet Hennessy Louis Vuitton SE | 1,421,612 |
| 42,935 | Metropole Television S.A. | 946,002 |
The accompanying notes are an integral part of these financial statements.
Hartford International Equity Fund
Schedule of Investments – (continued)
October 31, 2021
| Shares or Principal Amount | | Market Value† |
| COMMON STOCKS - 96.2% - (continued) |
| | France - 9.0% - (continued) |
| 116,925 | Orange S.A. | $ 1,275,061 |
| 33,153 | Quadient S.A. | 792,584 |
| 22,057 | Renault S.A.* | 794,804 |
| 40,338 | Rexel S.A.* | 801,766 |
| 49,210 | Schneider Electric SE | 8,484,693 |
| 32,353 | SCOR SE | 1,089,168 |
| 56,726 | Societe Generale S.A. | 1,894,871 |
| 30,693 | Sodexo S.A.* | 2,986,099 |
| 1,602 | Sopra Steria Group | 314,982 |
| 112,698 | Television Francaise | 1,206,528 |
| 120,547 | TotalEnergies SE | 6,036,385 |
| 13,941 | Vicat S.A. | 594,984 |
| 42,240 | Vinci S.A. | 4,515,887 |
| 44,212 | Worldline S.A.*(2) | 2,578,274 |
| | | | 81,326,881 |
| | Germany - 5.0% |
| 39,618 | Brenntag SE | 3,769,188 |
| 114,064 | CECONOMY AG* | 556,511 |
| 10,080 | Continental AG* | 1,185,120 |
| 22,293 | Daimler AG | 2,212,857 |
| 22,326 | Deutsche Boerse AG | 3,706,274 |
| 226,591 | Deutsche Telekom AG | 4,213,947 |
| 37,572 | Fresenius Medical Care AG & Co. KGaA | 2,495,873 |
| 39,672 | Fresenius SE & Co. KGaA | 1,803,241 |
| 29,306 | FUCHS PETROLUB SE | 1,403,893 |
| 121,059 | Infineon Technologies AG | 5,669,354 |
| 6,346 | Merck KGaA | 1,499,717 |
| 23,475 | Metro AG | 296,751 |
| 33,189 | SAP SE | 4,806,135 |
| 25,665 | Scout24 AG(2) | 1,787,465 |
| 22,227 | Volkswagen AG | 4,988,437 |
| 49,532 | Zalando SE*(2) | 4,679,811 |
| | | | 45,074,574 |
| | Greece - 0.0% |
| 19,951 | Hellenic Telecommunications Organization S.A. | 354,206 |
| | Hong Kong - 3.3% |
| 435,455 | AIA Group Ltd. | 4,880,148 |
| 1,318,000 | China Merchants Port Holdings Co., Ltd. | 2,197,343 |
| 1,224,178 | China Overseas Land & Investment Ltd. | 2,699,993 |
| 515,201 | China Resources Gas Group Ltd. | 2,767,869 |
| 199,915 | CK Asset Holdings Ltd. | 1,234,886 |
| 134,304 | Dah Sing Financial Holdings Ltd. | 416,310 |
| 211,255 | G-Resources Group Ltd.* | 79,826 |
| 96,218 | Hong Kong Exchanges & Clearing Ltd. | 5,796,336 |
| 118,847 | iClick Interactive Asia Group Ltd. ADR*(1) | 818,856 |
| 1,927,095 | Pacific Basin Shipping Ltd. | 889,367 |
| 730,013 | PAX Global Technology Ltd. | 505,879 |
| 1,892,745 | Sino Biopharmaceutical Ltd. | 1,395,681 |
| 129,695 | Swire Pacific Ltd. Class A | 815,339 |
| 249,000 | Techtronic Industries Co., Ltd. | 5,115,768 |
| 284,069 | Yue Yuen Industrial Holdings Ltd.* | 602,996 |
| | | | 30,216,597 |
| | Hungary - 0.1% |
| 397,103 | Magyar Telekom Telecommunications plc | 547,287 |
| | India - 2.4% |
| 32,671 | Asian Paints Ltd. | 1,353,994 |
| 248,952 | Bharti Airtel Ltd.* | 2,283,722 |
| 195,242 | Canara Bank* | 561,337 |
| 130,132 | ICICI Bank Ltd. ADR | 2,752,292 |
| 162,309 | Infosys Ltd. | 3,632,283 |
| Shares or Principal Amount | | Market Value† |
| COMMON STOCKS - 96.2% - (continued) |
| | India - 2.4% - (continued) |
| 360,069 | Manappuram Finance Ltd. | $ 1,002,172 |
| 411,108 | Oil & Natural Gas Corp. Ltd. | 818,078 |
| 50,204 | Reliance Industries Ltd. | 1,703,681 |
| 66,452 | Reliance Industries Ltd. GDR(2) | 4,518,736 |
| 62,957 | Tata Consultancy Services Ltd. | 2,861,678 |
| 110,312 | Zee Entertainment Enterprises Ltd. | 444,530 |
| | | | 21,932,503 |
| | Indonesia - 0.7% |
| 1,354,200 | Astra International Tbk PT | 576,771 |
| 6,359,635 | Bank Central Asia Tbk PT | 3,362,831 |
| 2,428,415 | Bank Mandiri Persero Tbk PT | 1,227,738 |
| 3,970,900 | Bank Rakyat Indonesia Persero Tbk PT | 1,191,999 |
| 1,183,356 | Perusahaan Perkebunan London Sumatra Indonesia Tbk PT | 116,569 |
| | | | 6,475,908 |
| | Ireland - 1.9% |
| 434,733 | AIB Group plc* | 1,176,595 |
| 197,767 | Bank of Ireland Group plc* | 1,178,135 |
| 72,155 | Experian plc | 3,308,393 |
| 29,293 | Flutter Entertainment plc* | 5,527,794 |
| 17,543 | Linde plc* | 5,644,221 |
| | | | 16,835,138 |
| | Italy - 2.4% |
| 79,936 | Assicurazioni Generali S.p.A. | 1,740,622 |
| 329,029 | BPER Banca | 721,418 |
| 324,141 | Davide Campari-Milano N.V. | 4,604,148 |
| 170,492 | Eni S.p.A. | 2,443,566 |
| 19,606 | Ferrari N.V. | 4,652,246 |
| 66,153 | Moncler S.p.A. | 4,760,660 |
| 189,721 | Saipem S.p.A.* | 415,674 |
| 157,021 | UniCredit S.p.A. | 2,075,730 |
| | | | 21,414,064 |
| | Japan - 13.4% |
| 24,790 | Aeon Delight Co., Ltd. | 761,348 |
| 52,660 | Alfresa Holdings Corp. | 742,347 |
| 66,450 | Alps Electric Co., Ltd. | 649,287 |
| 66,966 | Asahi Group Holdings Ltd. | 3,038,933 |
| 306,740 | Astellas Pharma, Inc. | 5,171,259 |
| 4,620 | Benesse Holdings, Inc. | 105,697 |
| 75,220 | Chiyoda Corp.* | 274,966 |
| 15,435 | Chubu Steel Plate Co., Ltd. | 111,319 |
| 45,580 | Chugai Pharmaceutical Co., Ltd. | 1,704,207 |
| 189,240 | Citizen Watch Co., Ltd. | 825,287 |
| 16,260 | CMIC Holdings Co., Ltd. | 211,751 |
| 50,690 | Cosel Co., Ltd. | 412,729 |
| 72,260 | Dai-ichi Life Holdings, Inc. | 1,520,246 |
| 53,140 | DeNA Co., Ltd. | 981,611 |
| 42,988 | Eisai Co., Ltd. | 3,045,964 |
| 4,170 | Enplas Corp. | 110,585 |
| 30,230 | Exedy Corp. | 450,299 |
| 35,565 | Fuji Media Holdings, Inc. | 368,649 |
| 9,435 | Gendai Agency, Inc. | 28,147 |
| 100,700 | Gree, Inc. | 849,289 |
| 135,140 | Hino Motors Ltd. | 1,278,381 |
| 32,170 | Hisaka Works Ltd. | 238,693 |
| 98,400 | Honda Motor Co., Ltd. | 2,910,462 |
| 48,650 | Ichiyoshi Securities Co., Ltd. | 277,608 |
| 152,240 | Inpex Corp. | 1,269,578 |
| 119,572 | Isuzu Motors Ltd. | 1,608,578 |
| 56,480 | Japan Airlines Co., Ltd.* | 1,215,529 |
| 24,410 | Japan Petroleum Exploration Co., Ltd. | 444,206 |
The accompanying notes are an integral part of these financial statements.
Hartford International Equity Fund
Schedule of Investments – (continued)
October 31, 2021
| Shares or Principal Amount | | Market Value† |
| COMMON STOCKS - 96.2% - (continued) |
| | Japan - 13.4% - (continued) |
| 22,220 | Japan Steel Works Ltd. | $ 652,763 |
| 44,896 | Japan Tobacco, Inc. | 881,361 |
| 120,920 | JGC Holdings Corp. | 1,136,322 |
| 40,020 | Kamigumi Co., Ltd. | 805,801 |
| 77,535 | Kao Corp. | 4,386,002 |
| 152,290 | KDDI Corp. | 4,657,026 |
| 6,200 | Keyence Corp. | 3,742,411 |
| 118,610 | Kirin Holdings Co., Ltd. | 2,064,507 |
| 21,230 | Kissei Pharmaceutical Co., Ltd. | 424,670 |
| 47,320 | Kyoei Steel Ltd. | 583,878 |
| 36,680 | Maruichi Steel Tube Ltd. | 833,433 |
| 39,450 | Maxell Holdings Ltd. | 474,712 |
| 24,310 | Miraial Co., Ltd. | 337,107 |
| 89,380 | Mitsubishi Estate Co., Ltd. | 1,358,307 |
| 18,691 | Mitsubishi Heavy Industries Ltd. | 477,982 |
| 104,690 | Mitsubishi Motors Corp.* | 335,063 |
| 427,730 | Mitsubishi UFJ Financial Group, Inc. | 2,345,455 |
| 62,150 | Nakayama Steel Works Ltd. | 236,074 |
| 46,290 | Neturen Co., Ltd. | 247,365 |
| 26,865 | Nichicon Corp. | 254,236 |
| 72,050 | Nikon Corp. | 794,405 |
| 429 | Nippon Building Fund, Inc. | 2,787,189 |
| 39,240 | Nippon Chemi-Con Corp.* | 737,408 |
| 67,074 | Nippon Television Holdings, Inc. | 722,631 |
| 220,130 | Nissan Motor Co., Ltd.* | 1,120,431 |
| 36,510 | Nitori Holdings Co., Ltd. | 6,707,269 |
| 72,710 | NOK Corp. | 844,000 |
| 111,825 | Nomura Holdings, Inc. | 532,568 |
| 12,030 | Obic Co., Ltd. | 2,224,631 |
| 10,690 | OKUMA Corp. | 509,363 |
| 60,410 | Ono Pharmaceutical Co., Ltd. | 1,267,506 |
| 18,350 | Pacific Metals Co., Ltd. | 332,610 |
| 20,890 | Paramount Bed Holdings Co., Ltd. | 389,789 |
| 396,290 | Resona Holdings, Inc. | 1,488,703 |
| 22,250 | Sanyo Shokai Ltd.* | 176,622 |
| 31,048 | Secom Co., Ltd. | 2,116,618 |
| 86,392 | Seven & i Holdings Co., Ltd. | 3,627,148 |
| 46,498 | SG Holdings Co., Ltd. | 1,167,615 |
| 5,146 | Shibaura Machine Co., Ltd. | 119,959 |
| 11,690 | Shimamura Co., Ltd. | 989,820 |
| 23,867 | Shin-Etsu Chemical Co., Ltd. | 4,256,275 |
| 49,990 | Shiseido Co., Ltd. | 3,335,679 |
| 256,848 | Softbank Corp. | 3,505,892 |
| 51,680 | Subaru Corp. | 1,013,692 |
| 75,970 | Sumitomo Electric Industries Ltd. | 1,008,339 |
| 32,380 | Sumitomo Heavy Industries Ltd. | 833,639 |
| 59,338 | Sumitomo Mitsui Financial Group, Inc. | 1,925,496 |
| 43,860 | Sumitomo Mitsui Trust Holdings, Inc. | 1,442,724 |
| 51,981 | Sumitomo Realty & Development Co., Ltd. | 1,878,589 |
| 34,600 | Sumitomo Riko Co., Ltd. | 225,399 |
| 142,964 | T&D Holdings, Inc. | 1,833,607 |
| 35,850 | Tachi-S Co., Ltd. | 434,198 |
| 40,460 | Taiheiyo Cement Corp. | 859,623 |
| 59,120 | Takeda Pharmaceutical Co., Ltd. | 1,659,251 |
| 8,960 | Tamron Co., Ltd. | 210,625 |
| 54,030 | THK Co., Ltd. | 1,161,841 |
| 114,150 | Tochigi Bank Ltd. | 177,368 |
| 53,840 | Tokai Rika Co., Ltd. | 753,635 |
| 9,070 | Tokyo Seimitsu Co., Ltd. | 369,294 |
| 74,970 | Tokyo Steel Manufacturing Co., Ltd. | 834,247 |
| 48,960 | Toppan Forms Co., Ltd. | 470,694 |
| 38,140 | Toppan, Inc. | 615,661 |
| 28,290 | Toyota Boshoku Corp. | 543,933 |
| Shares or Principal Amount | | Market Value† |
| COMMON STOCKS - 96.2% - (continued) |
| | Japan - 13.4% - (continued) |
| 45,310 | TS Tech Co., Ltd. | $ 606,249 |
| 15,411 | Tsuruha Holdings, Inc. | 1,900,872 |
| 44,220 | TV Asahi Holdings Corp.(1) | 671,044 |
| 56,700 | Unipres Corp. | 462,598 |
| 51,950 | Ushio, Inc. | 929,405 |
| 57,800 | Xebio Holdings Co., Ltd. | 537,152 |
| 20,730 | Yamato Kogyo Co., Ltd. | 695,083 |
| 16,200 | Yodogawa Steel Works Ltd. | 353,974 |
| | | | 121,003,793 |
| | Luxembourg - 0.1% |
| 20,907 | RTL Group S.A. | 1,207,552 |
| | Macau - 0.2% |
| 796,396 | Sands China Ltd.* | 1,815,125 |
| | Malaysia - 0.6% |
| 747,864 | CIMB Group Holdings Bhd | 943,605 |
| 2,992,297 | DiGi.Com Bhd | 3,062,303 |
| 49,265 | Nestle Malaysia Bhd | 1,600,459 |
| | | | 5,606,367 |
| | Mexico - 0.3% |
| 63,989 | America Movil S.A.B. de C.V. Class L ADR | 1,137,725 |
| 1,663,171 | Telesites S.A.B. de C.V. | 1,518,730 |
| | | | 2,656,455 |
| | Netherlands - 4.3% |
| 98,526 | ABN Amro Bank N.V.(2) | 1,449,092 |
| 1,504 | Adyen N.V.*(2) | 4,538,033 |
| 7,767 | ASML Holding N.V. | 6,313,791 |
| 43,874 | Fugro N.V.* | 371,855 |
| 83,074 | Heineken N.V. | 9,195,381 |
| 136,607 | ING Groep N.V. | 2,072,178 |
| 97,349 | Koninklijke Philips N.V. | 4,592,456 |
| 140,390 | PostNL N.V. | 609,309 |
| 40,506 | QIAGEN N.V.* | 2,228,399 |
| 126,866 | Royal Dutch Shell plc Class A | 2,906,357 |
| 215,976 | Royal Dutch Shell plc Class B | 4,956,373 |
| | | | 39,233,224 |
| | Norway - 0.1% |
| 90,460 | Norsk Hydro ASA | 664,471 |
| | Philippines - 0.4% |
| 1,197,100 | Ayala Land, Inc. | 833,529 |
| 314,717 | BDO Unibank, Inc. | 774,584 |
| 3,320,605 | SM Prime Holdings, Inc. | 2,184,343 |
| | | | 3,792,456 |
| | Portugal - 0.4% |
| 153,346 | Jeronimo Martins SGPS S.A. | 3,474,452 |
| | Russia - 0.5% |
| 150,963 | Gazprom PJSC ADR | 1,481,379 |
| 3,848 | Lukoil PJSC ADR | 392,230 |
| 38,436 | Sberbank of Russia PJSC ADR | 770,835 |
| 163,845 | Surgutneftegas PJSC ADR | 782,620 |
| 370,719 | VEON Ltd. ADR* | 782,217 |
| | | | 4,209,281 |
| | South Africa - 0.4% |
| 39,049 | Astral Foods Ltd. | 452,483 |
| 62,084 | Gold Fields Ltd. | 576,899 |
| 117,673 | Harmony Gold Mining Co., Ltd. ADR(1) | 425,976 |
| 6,114 | Impala Platinum Holdings Ltd. | 79,129 |
| 89,980 | MTN Group Ltd.* | 806,862 |
| 577,664 | Nampak Ltd.* | 146,299 |
The accompanying notes are an integral part of these financial statements.
Hartford International Equity Fund
Schedule of Investments – (continued)
October 31, 2021
| Shares or Principal Amount | | Market Value† |
| COMMON STOCKS - 96.2% - (continued) |
| | South Africa - 0.4% - (continued) |
| 1,048,150 | Old Mutual Ltd. | $ 1,069,765 |
| 89,081 | Raubex Group Ltd. | 190,409 |
| 1 | Thungela Resources Ltd.* | 5 |
| | | | 3,747,827 |
| | South Korea - 4.9% |
| 10,008 | CJ CheilJedang Corp. | 3,252,637 |
| 11,512 | CJ ENM Co., Ltd. | 1,741,208 |
| 9,737 | CJ Logistics Corp.* | 1,183,931 |
| 12,618 | Coway Co., Ltd. | 855,563 |
| 26,521 | Dentium Co., Ltd. | 1,572,151 |
| 95,742 | DGB Financial Group, Inc. | 848,353 |
| 10,423 | E-Mart, Inc. | 1,500,413 |
| 58,015 | Hana Financial Group, Inc. | 2,237,048 |
| 18,419 | Hankook Tire & Technology Co., Ltd. | 652,610 |
| 88,482 | KB Financial Group, Inc. | 4,282,873 |
| 82,259 | Kginicis Co., Ltd. | 1,315,197 |
| 55,727 | KT Corp. | 1,454,975 |
| 1,657 | LG Household & Health Care Ltd. | 1,658,468 |
| 5,762 | Orion Corp. | 582,733 |
| 7,068 | POSCO | 1,792,668 |
| 175,588 | Samsung Electronics Co., Ltd. | 10,513,000 |
| 50,197 | Shinhan Financial Group Co., Ltd. | 1,638,777 |
| 12,899 | SK Innovation Co., Ltd.* | 2,690,087 |
| 14,235 | SK Telecom Co., Ltd.(3)(4) | 3,769,238 |
| 69,836 | Tongyang Life Insurance Co., Ltd. | 408,612 |
| | | | 43,950,542 |
| | Spain - 2.8% |
| 557,490 | CaixaBank S.A. | 1,602,597 |
| 172,019 | Cellnex Telecom S.A.(2) | 10,579,113 |
| 264,599 | Iberdrola S.A. | 3,124,528 |
| 228,289 | Industria de Diseno Textil S.A. | 8,269,594 |
| 228,241 | Prosegur Cia de Seguridad S.A. | 647,681 |
| 725,963 | Unicaja Banco S.A.(2) | 776,756 |
| | | | 25,000,269 |
| | Sweden - 2.1% |
| 288,196 | Assa Abloy AB Class B | 8,456,435 |
| 46,085 | Atlas Copco AB Class A | 2,967,814 |
| 58,645 | Atlas Copco AB Class B | 3,178,196 |
| 180,510 | Sandvik AB | 4,577,500 |
| | | | 19,179,945 |
| | Switzerland - 6.2% |
| 38,702 | Adecco Group AG | 1,949,808 |
| 45,063 | GAM Holding AG* | 72,595 |
| 20,040 | Implenia AG* | 408,854 |
| 88,917 | Julius Baer Group Ltd. | 6,431,551 |
| 16,973 | Kuehne + Nagel International AG | 5,345,654 |
| 43,820 | LafargeHolcim Ltd.* | 2,185,854 |
| 6,670 | Lonza Group AG | 5,481,409 |
| 34,002 | Nestle S.A. | 4,485,108 |
| 78,347 | Novartis AG | 6,480,292 |
| 3,675 | Partners Group Holding AG | 6,420,057 |
| 12,976 | Roche Holding AG | 5,026,824 |
| 6,526 | Schindler Holding AG | 1,699,289 |
| 1,404 | SGS S.A. | 4,156,568 |
| 191,085 | UBS Group AG | 3,478,259 |
| 18,545 | Vifor Pharma AG | 2,394,637 |
| | | | 56,016,759 |
| | Taiwan - 6.5% |
| 216,853 | Advantech Co., Ltd. | 2,836,006 |
| 367,801 | ASE Technology Holding Co., Ltd. | 1,315,630 |
| Shares or Principal Amount | | Market Value† |
| COMMON STOCKS - 96.2% - (continued) |
| | Taiwan - 6.5% - (continued) |
| 153,929 | Catcher Technology Co., Ltd. | $ 892,543 |
| 531,328 | Chailease Holding Co., Ltd. | 5,088,820 |
| 4,370,212 | CTBC Financial Holding Co., Ltd. | 3,649,385 |
| 269,470 | Delta Electronics, Inc. | 2,378,713 |
| 302,747 | Foxconn Technology Co., Ltd. | 751,694 |
| 29,435 | Globalwafers Co., Ltd. | 807,637 |
| 2,088,123 | Hon Hai Precision Industry Co., Ltd. | 8,060,861 |
| 216,212 | Hotai Motor Co., Ltd. | 4,761,013 |
| 59,734 | Lotes Co., Ltd. | 1,244,568 |
| 232,434 | MediaTek, Inc. | 7,650,027 |
| 103,305 | Phison Electronics Corp. | 1,456,631 |
| 1,639,088 | Powerchip Semiconductor Manufacturing Corp. | 3,912,410 |
| 1,451,091 | Shin Kong Financial Holding Co., Ltd. | 511,417 |
| 130,000 | Simplo Technology Co., Ltd. | 1,400,535 |
| 447,917 | Taiwan Semiconductor Manufacturing Co., Ltd. | 9,504,929 |
| 188,757 | Yageo Corp. | 2,954,371 |
| | | | 59,177,190 |
| | Thailand - 0.9% |
| 1,995,978 | CP ALL PCL | 3,849,698 |
| 428,594 | Kasikornbank PCL | 1,808,277 |
| 163,041 | Kasikornbank PCL NVDR | 695,064 |
| 629,900 | PTT PCL | 730,842 |
| 2,709,106 | Thai Beverage PCL | 1,426,103 |
| | | | 8,509,984 |
| | Turkey - 0.3% |
| 249,166 | Anadolu Efes Biracilik Ve Malt Sanayii AS | 575,357 |
| 75,608 | Coca-Cola Icecek AS | 667,912 |
| 860,370 | Turk Telekomunikasyon AS | 673,870 |
| 340,787 | Turkcell Iletisim Hizmetleri AS | 541,984 |
| 253,990 | Ulker Biskuvi Sanayi AS | 533,131 |
| | | | 2,992,254 |
| | United Kingdom - 9.0% |
| 177,479 | Anglo American plc | 6,751,838 |
| 74,608 | AstraZeneca plc | 9,333,557 |
| 411,487 | Auto Trader Group plc(2) | 3,411,407 |
| 193,976 | Babcock International Group plc* | 847,130 |
| 827,033 | BAE Systems plc | 6,235,962 |
| 743,261 | BP plc | 3,560,890 |
| 115,795 | British Land Co. plc REIT | 781,845 |
| 564,901 | BT Group plc* | 1,073,215 |
| 501,593 | Centrica plc* | 414,058 |
| 141,128 | Compass Group plc* | 2,994,826 |
| 37,790 | Croda International plc | 4,891,180 |
| 106,141 | Diageo plc | 5,280,694 |
| 24,089 | Endeavour Mining plc | 611,957 |
| 24,915 | Go-Ahead Group plc* | 267,665 |
| 479,817 | Hays plc | 1,087,385 |
| 340,225 | J Sainsbury plc | 1,393,514 |
| 175,065 | Kingfisher plc | 803,477 |
| 79,351 | Land Securities Group plc REIT | 745,461 |
| 211,157 | Marks & Spencer Group plc* | 530,795 |
| 309,808 | National Grid plc | 3,966,646 |
| 90,657 | Pagegroup plc | 823,816 |
| 146,825 | Provident Financial plc* | 741,754 |
| 112,779 | Prudential plc | 2,301,588 |
| 50,536 | Reckitt Benckiser Group plc | 4,102,654 |
| 377,008 | Sage Group plc | 3,666,598 |
| 246,183 | SIG plc* | 175,027 |
| 215,454 | Smith & Nephew plc | 3,720,905 |
| 165,961 | Smiths Group plc | 3,081,572 |
| 240,811 | Standard Chartered plc | 1,628,605 |
The accompanying notes are an integral part of these financial statements.
Hartford International Equity Fund
Schedule of Investments – (continued)
October 31, 2021
| Shares or Principal Amount | | Market Value† |
| COMMON STOCKS - 96.2% - (continued) |
| | United Kingdom - 9.0% - (continued) |
| 63,713 | SThree plc | $ 513,575 |
| 65,591 | Unilever plc | 3,511,372 |
| 156,251 | WPP plc | 2,258,572 |
| | | | 81,509,540 |
| | United States - 0.3% |
| 727,000 | Allstar Co.(3)(4)(5) | — |
| 79,000 | Bizlink Holding, Inc. | 730,250 |
| 29,437 | Honest Co., Inc.(3)(6) | 269,201 |
| 19,244 | Ovintiv, Inc. | 721,961 |
| 16,188 | Tory Burch LLC(3)(4)(5) | 856,176 |
| | | | 2,577,588 |
| | Total Common Stocks
(cost $723,142,892) | | $ 872,145,293 |
| CONVERTIBLE PREFERRED STOCKS - 0.1% |
| | United States - 0.1% |
| 243,469 | Essence Group Holdings Corp. Series 3(3)(4)(5) | $ 542,936 |
| 38,688 | Lookout, Inc. Series F(3)(4)(5) | 352,447 |
| 15,711 | Rubicon Global Holdings LLC Series C(3)(4)(5) | 321,243 |
| | | | 1,216,626 |
| | Total Convertible Preferred Stocks
(cost $1,140,534) | | $ 1,216,626 |
| EXCHANGE-TRADED FUNDS - 0.1% |
| | Other Investment Pools & Funds - 0.1% |
| 5,460 | iShares Core MSCI EAFE ETF | $ 417,745 |
| | Total Exchange-Traded Funds
(cost $417,510) | | $ 417,745 |
| CLOSED END FUNDS - 0.1% |
| | Canada - 0.1% |
| 50,975 | Sprott Physical Uranium Trust * | $ 566,755 |
| | Total Closed End Funds
(cost $340,172) | $ 566,755 |
| PREFERRED STOCKS - 0.4% |
| | Brazil - 0.4% |
| 1,543,620 | Itau S.A. | $ 2,803,449 |
| 225,200 | Itau Unibanco Holding S.A. | 930,120 |
| | | | 3,733,569 |
| | Total Preferred Stocks
(cost $3,485,124) | | $ 3,733,569 |
| Shares or Principal Amount | | Market Value† |
| RIGHTS - 0.0% |
| | India - 0.0% |
| 19,206 | Bharti Airtel Ltd.(3) | $ 72,868 |
| | Total Rights
(cost $34,309) | | $ 72,868 |
| | Total Long-Term Investments
(cost $728,560,541) | | $ 878,152,856 |
| SHORT-TERM INVESTMENTS - 2.8% |
| | Repurchase Agreements - 2.2% |
| 19,709,787 | Fixed Income Clearing Corp. Repurchase Agreement dated 10/29/2021 at 0.010%, due on 11/01/2021 with a maturity value of $19,709,803; collateralized by U.S. Treasury Bond at 1.875%, maturing 02/15/2041, with a market value of $20,104,013 | $ 19,709,787 |
| | Securities Lending Collateral - 0.6% |
| 35,389 | Fidelity Investments Money Market Funds, Government Portfolio, Institutional Class, 0.01%(7) | 35,389 |
| 5,433,013 | Goldman Sachs Financial Square Funds, Government Fund, Institutional Class, 0.03%(7) | 5,433,013 |
| 390,050 | Invesco Government & Agency Portfolio, Institutional Class, 0.03%(7) | 390,050 |
| | | | 5,858,452 |
| | Total Short-Term Investments
(cost $25,568,239) | $ 25,568,239 |
| | Total Investments
(cost $754,128,780) | 99.7% | $ 903,721,095 |
| | Other Assets and Liabilities | 0.3% | 2,777,207 |
| | Total Net Assets | 100.0% | $ 906,498,302 |
| * | Non-income producing. |
| (1) | Represents entire or partial securities on loan. See Note 8 in the accompanying Notes to Financial Statements for securities lending information. |
| (2) | Security was purchased pursuant to Rule 144A under the Securities Act of 1933 and may be sold in transactions that are exempt from registration (typically only to qualified institutional buyers) or in a public offering registered under the Securities Act of 1933. At October 31, 2021, the aggregate value of these securities was $42,546,114, representing 4.7% of net assets. |
| (3) | These securities are valued in good faith at fair value as determined under policies and procedures established by and under the supervision of the Board of Directors. At October 31, 2021, the aggregate fair value of these securities are $6,184,109, which represented 0.7% of total net assets. This amount excludes securities that are principally traded in certain foreign markets and whose prices are adjusted pursuant to a third party pricing service methodology approved by the Board of Directors. |
The accompanying notes are an integral part of these financial statements.
Hartford International Equity Fund
Schedule of Investments – (continued)
October 31, 2021
| (4) | Investment valued using significant unobservable inputs. |
| (5) | Investment in securities not registered under the Securities Act of 1933 (excluding securities acquired pursuant to Rule 144A and Regulation S). At the end of the period, the value of such restricted securities amounted to $2,072,802 or 0.2% of net assets. |
Period
Acquired | | Security Name | | Shares/
Par Value | | Total Cost | | Market Value |
| 08/2011 | | Allstar Co. | | 727,000 | | $ — | | $ — |
| 05/2014 | | Essence Group Holdings Corp. Series 3 Convertible Preferred | | 243,469 | | 384,998 | | 542,936 |
| 07/2014 | | Lookout, Inc. Series F Convertible Preferred | | 38,688 | | 441,937 | | 352,447 |
| 09/2015 | | Rubicon Global Holdings LLC Series C Convertible Preferred | | 15,711 | | 313,599 | | 321,243 |
| 11/2013 | | Tory Burch LLC | | 16,188 | | 1,268,749 | | 856,176 |
| | | | | | | $ 2,409,283 | | $ 2,072,802 |
| (6) | As of October 31, 2021, investment is restricted from trading. The value of such restricted securities amounted to $269,201 or 0.0% of net assets. |
Period
Acquired | | Security Name | | Shares/
Par Value | | Total Cost | | Market Value |
| 08/2014 | | Honest Co., Inc. | | 29,437 | | $ 376,800 | | $ 269,201 |
| (7) | Current yield as of period end. |
| Futures Contracts Outstanding at October 31, 2021 |
| Description | | Number of
Contracts | | Expiration
Date | | Current
Notional
Amount | | Value and
Unrealized
Appreciation/
(Depreciation) |
| Long position contracts: |
| SPI 200 Future | | 174 | | 12/16/2021 | | $ 23,822,258 | | $ (221,751) |
| Total futures contracts | | $ (221,751) |
† See Significant Accounting Policies of accompanying Notes to Financial Statements regarding valuation of investments.
The accompanying notes are an integral part of these financial statements.
Hartford International Equity Fund
Schedule of Investments – (continued)
October 31, 2021
Fair Value Summary
The following is a summary of the fair valuations according to the inputs used as of October 31, 2021 in valuing the Fund’s investments.
| Description | | Total | | Level 1 | | Level 2 | | Level 3(1) |
| Assets | | | | | | | | |
| Common Stocks | | | | | | | | |
| Argentina | | $ 196,245 | | $ 196,245 | | $ — | | $ — |
| Australia | | 6,342,405 | | 458,332 | | 5,884,073 | | — |
| Austria | | 1,330,788 | | 296,213 | | 1,034,575 | | — |
| Belgium | | 3,855,530 | | 372,370 | | 3,483,160 | | — |
| Brazil | | 11,270,983 | | 11,270,983 | | — | | — |
| Canada | | 55,662,138 | | 55,662,138 | | — | | — |
| Chile | | 545,621 | | 545,621 | | — | | — |
| China | | 65,920,328 | | 9,103,034 | | 56,817,294 | | — |
| Cyprus | | 1,164,285 | | 1,164,285 | | — | | — |
| Denmark | | 10,201,400 | | 749,181 | | 9,452,219 | | — |
| Finland | | 5,153,338 | | — | | 5,153,338 | | — |
| France | | 81,326,881 | | 1,621,439 | | 79,705,442 | | — |
| Germany | | 45,074,574 | | 1,403,893 | | 43,670,681 | | — |
| Greece | | 354,206 | | — | | 354,206 | | — |
| Hong Kong | | 30,216,597 | | 3,666,551 | | 26,550,046 | | — |
| Hungary | | 547,287 | | 547,287 | | — | | — |
| India | | 21,932,503 | | 7,271,028 | | 14,661,475 | | — |
| Indonesia | | 6,475,908 | | — | | 6,475,908 | | — |
| Ireland | | 16,835,138 | | — | | 16,835,138 | | — |
| Italy | | 21,414,064 | | — | | 21,414,064 | | — |
| Japan | | 121,003,793 | | 111,319 | | 120,892,474 | | — |
| Luxembourg | | 1,207,552 | | — | | 1,207,552 | | — |
| Macau | | 1,815,125 | | — | | 1,815,125 | | — |
| Malaysia | | 5,606,367 | | — | | 5,606,367 | | — |
| Mexico | | 2,656,455 | | 2,656,455 | | — | | — |
| Netherlands | | 39,233,224 | | 2,228,399 | | 37,004,825 | | — |
| Norway | | 664,471 | | — | | 664,471 | | — |
| Philippines | | 3,792,456 | | 833,529 | | 2,958,927 | | — |
| Portugal | | 3,474,452 | | 3,474,452 | | — | | — |
| Russia | | 4,209,281 | | 782,217 | | 3,427,064 | | — |
| South Africa | | 3,747,827 | | 2,138,638 | | 1,609,189 | | — |
| South Korea | | 43,950,542 | | — | | 40,181,304 | | 3,769,238 |
| Spain | | 25,000,269 | | 3,124,528 | | 21,875,741 | | — |
| Sweden | | 19,179,945 | | — | | 19,179,945 | | — |
| Switzerland | | 56,016,759 | | 481,449 | | 55,535,310 | | — |
| Taiwan | | 59,177,190 | | — | | 59,177,190 | | — |
| Thailand | | 8,509,984 | | 6,388,817 | | 2,121,167 | | — |
| Turkey | | 2,992,254 | | 2,324,342 | | 667,912 | | — |
| United Kingdom | | 81,509,540 | | 5,903,412 | | 75,606,128 | | — |
| United States | | 2,577,588 | | 721,961 | | 999,451 | | 856,176 |
| Convertible Preferred Stocks | | 1,216,626 | | — | | — | | 1,216,626 |
| Exchange-Traded Funds | | 417,745 | | 417,745 | | — | | — |
| Closed End Funds | | 566,755 | | 566,755 | | — | | — |
| Preferred Stocks | | 3,733,569 | | 3,733,569 | | — | | — |
| Rights | | 72,868 | | — | | 72,868 | | — |
| Short-Term Investments | | 25,568,239 | | 5,858,452 | | 19,709,787 | | — |
| Total | | $ 903,721,095 | | $ 136,074,639 | | $ 761,804,416 | | $ 5,842,040 |
| Liabilities | | | | | | | | |
| Futures Contracts(2) | | $ (221,751) | | $ (221,751) | | $ — | | $ — |
| Total | | $ (221,751) | | $ (221,751) | | $ — | | $ — |
| (1) | For the year ended October 31, 2021, investments valued at $5,424,214 were transferred into Level 3 due to the unavailability of active market pricing, and investments valued at $491,031 were transferred out of Level 3 due to the availability of significant observable inputs. |
| (2) | Derivative instruments (excluding purchased and written options, if applicable) are valued at the unrealized appreciation/(depreciation) on the investments. |
Level 3 investments at the beginning and/or end of the period in relation to net assets were not significant and accordingly, a reconciliation of Level 3 assets for the year ended October 31, 2021 is not presented.
The accompanying notes are an integral part of these financial statements.
The Hartford International Growth Fund
Schedule of Investments
October 31, 2021
| Shares or Principal Amount | | Market Value† |
| COMMON STOCKS - 96.4% |
| �� | Brazil - 1.4% |
| 262,612 | Pagseguro Digital Ltd. Class A* | $ 9,506,554 |
| | Canada - 7.2% |
| 48,447 | Lululemon Athletica, Inc.* | 22,576,787 |
| 89,878 | Nuvei Corp.*(1) | 10,801,918 |
| 10,566 | Shopify, Inc. Class A* | 15,497,469 |
| | | | 48,876,174 |
| | China - 2.7% |
| 299,665 | Tencent Holdings Ltd. | 18,228,560 |
| | Denmark - 2.7% |
| 78,925 | DSV Panalpina A/S | 18,343,527 |
| | France - 11.0% |
| 395,874 | Accor S.A.* | 14,166,910 |
| 141,961 | Airbus SE* | 18,211,044 |
| 37,301 | L'Oreal S.A. | 17,063,519 |
| 100,450 | Schneider Electric SE | 17,319,395 |
| 141,566 | Worldline S.A.*(1) | 8,255,584 |
| | | | 75,016,452 |
| | Germany - 7.2% |
| 387,194 | Infineon Technologies AG | 18,132,811 |
| 71,073 | Volkswagen AG | 15,951,014 |
| 158,382 | Zalando SE*(1) | 14,964,020 |
| | | | 49,047,845 |
| | Hong Kong - 4.4% |
| 225,200 | Hong Kong Exchanges & Clearing Ltd. | 13,566,432 |
| 798,393 | Techtronic Industries Co., Ltd. | 16,403,185 |
| | | | 29,969,617 |
| | India - 2.1% |
| 212,729 | Reliance Industries Ltd. GDR(1) | 14,465,572 |
| | Ireland - 2.6% |
| 93,837 | Flutter Entertainment plc* | 17,707,698 |
| | Italy - 6.6% |
| 1,036,466 | Davide Campari-Milano N.V. | 14,722,122 |
| 54,222 | Ferrari N.V. | 12,866,168 |
| 8,673 | Ferrari N.V. ADR | 2,056,975 |
| 212,572 | Moncler S.p.A. | 15,297,614 |
| | | | 44,942,879 |
| | Japan - 5.0% |
| 110,845 | Eisai Co., Ltd. | 7,854,049 |
| 20,300 | Keyence Corp. | 12,253,379 |
| 76,402 | Shin-Etsu Chemical Co., Ltd. | 13,625,000 |
| | | | 33,732,428 |
| | Netherlands - 7.1% |
| 4,837 | Adyen N.V.*(1) | 14,594,724 |
| 24,859 | ASML Holding N.V. | 20,207,871 |
| 120,341 | Heineken N.V. | 13,320,430 |
| | | | 48,123,025 |
| | South Korea - 2.3% |
| 265,905 | Samsung Electronics Co., Ltd. | 15,920,560 |
| Shares or Principal Amount | | Market Value† |
| COMMON STOCKS - 96.4% - (continued) |
| | Spain - 7.0% |
| 550,449 | Cellnex Telecom S.A.(1) | $ 33,852,437 |
| 386,236 | Industria de Diseno Textil S.A. | 13,991,103 |
| | | | 47,843,540 |
| | Sweden - 4.4% |
| 515,257 | Assa Abloy AB Class B | 15,119,007 |
| 577,194 | Sandvik AB | 14,636,894 |
| | | | 29,755,901 |
| | Switzerland - 8.4% |
| 257,272 | Julius Baer Group Ltd. | 18,609,019 |
| 21,409 | Lonza Group AG | 17,593,925 |
| 11,747 | Partners Group Holding AG | 20,521,471 |
| | | | 56,724,415 |
| | Taiwan - 9.3% |
| 3,725,956 | Hon Hai Precision Industry Co., Ltd. | 14,383,450 |
| 554,725 | MediaTek, Inc. | 18,257,488 |
| 1,434,151 | Taiwan Semiconductor Manufacturing Co., Ltd. | 30,433,100 |
| | | | 63,074,038 |
| | United Kingdom - 5.0% |
| 409,599 | Anglo American plc | 15,582,384 |
| 148,119 | AstraZeneca plc | 18,529,880 |
| | | | 34,112,264 |
| | Total Common Stocks
(cost $478,831,961) | | $ 655,391,049 |
| SHORT-TERM INVESTMENTS - 2.7% |
| | Repurchase Agreements - 2.7% |
| 18,476,137 | Fixed Income Clearing Corp. Repurchase Agreement dated 10/29/2021 at 0.010%, due on 11/01/2021 with a maturity value of $18,476,152; collateralized by U.S. Treasury Bond at 1.375%, maturing 11/15/2040, with a market value of $18,845,663 | $ 18,476,137 |
| | Total Short-Term Investments
(cost $18,476,137) | $ 18,476,137 |
| | Total Investments
(cost $497,308,098) | 99.1% | $ 673,867,186 |
| | Other Assets and Liabilities | 0.9% | 5,845,370 |
| | Total Net Assets | 100.0% | $ 679,712,556 |
| * | Non-income producing. |
| (1) | Security was purchased pursuant to Rule 144A under the Securities Act of 1933 and may be sold in transactions that are exempt from registration (typically only to qualified institutional buyers) or in a public offering registered under the Securities Act of 1933. At October 31, 2021, the aggregate value of these securities was $96,934,255, representing 14.3% of net assets. |
| † | See Significant Accounting Policies of accompanying Notes to Financial Statements regarding valuation of investments. |
The accompanying notes are an integral part of these financial statements.
The Hartford International Growth Fund
Schedule of Investments – (continued)
October 31, 2021
Fair Value Summary
The following is a summary of the fair valuations according to the inputs used as of October 31, 2021 in valuing the Fund’s investments.
| Description | | Total | | Level 1 | | Level 2 | | Level 3(1) |
| Assets | | | | | | | | |
| Common Stocks | | | | | | | | |
| Brazil | | $ 9,506,554 | | $ 9,506,554 | | $ — | | $ — |
| Canada | | 48,876,174 | | 48,876,174 | | — | | — |
| China | | 18,228,560 | | — | | 18,228,560 | | — |
| Denmark | | 18,343,527 | | — | | 18,343,527 | | — |
| France | | 75,016,452 | | — | | 75,016,452 | | — |
| Germany | | 49,047,845 | | — | | 49,047,845 | | — |
| Hong Kong | | 29,969,617 | | — | | 29,969,617 | | — |
| India | | 14,465,572 | | 14,465,572 | | — | | — |
| Ireland | | 17,707,698 | | — | | 17,707,698 | | — |
| Italy | | 44,942,879 | | 2,056,975 | | 42,885,904 | | — |
| Japan | | 33,732,428 | | — | | 33,732,428 | | — |
| Netherlands | | 48,123,025 | | — | | 48,123,025 | | — |
| South Korea | | 15,920,560 | | — | | 15,920,560 | | — |
| Spain | | 47,843,540 | | — | | 47,843,540 | | — |
| Sweden | | 29,755,901 | | — | | 29,755,901 | | — |
| Switzerland | | 56,724,415 | | — | | 56,724,415 | | — |
| Taiwan | | 63,074,038 | | — | | 63,074,038 | | — |
| United Kingdom | | 34,112,264 | | — | | 34,112,264 | | — |
| Short-Term Investments | | 18,476,137 | | — | | 18,476,137 | | — |
| Total | | $ 673,867,186 | | $ 74,905,275 | | $ 598,961,911 | | $ — |
| (1) | For the year ended October 31, 2021, there were no transfers in and out of Level 3. |
The accompanying notes are an integral part of these financial statements.
The Hartford International Opportunities Fund
Schedule of Investments
October 31, 2021
| Shares or Principal Amount | | Market Value† |
| COMMON STOCKS - 95.7% |
| | Australia - 1.7% |
| 4,949,179 | Goodman Group REIT | $ 81,942,964 |
| | Belgium - 1.9% |
| 953,027 | KBC Group N.V. | 88,748,706 |
| | Brazil - 1.5% |
| 3,965,455 | Localiza Rent a Car S.A. | 31,828,752 |
| 93,227 | StoneCo Ltd. Class A* | 3,156,666 |
| 1,156,950 | XP, Inc. Class A* | 37,959,530 |
| | | | 72,944,948 |
| | Canada - 6.5% |
| 1,105,279 | Brookfield Asset Management, Inc. Class A | 66,731,130 |
| 3,224,692 | Cenovus Energy, Inc. | 38,562,897 |
| 60,452 | Constellation Software, Inc. | 106,239,896 |
| 188,944 | Nuvei Corp.*(1) | 22,752,637 |
| 415,295 | Ritchie Bros Auctioneers, Inc. | 28,385,427 |
| 17,194 | Shopify, Inc. Class A* | 25,218,956 |
| 822,579 | Suncor Energy, Inc. | 21,634,572 |
| | | | 309,525,515 |
| | China - 9.9% |
| 392,588 | Alibaba Group Holding Ltd. ADR* | 64,753,465 |
| 15,286,000 | China Longyuan Power Group Corp. Ltd. Class H | 35,754,505 |
| 4,146,500 | China Merchants Bank Co., Ltd. Class H | 34,748,244 |
| 221,900 | China Tourism Group Duty Free Corp. Ltd. Class A | 9,293,791 |
| 1,614,684 | ENN Energy Holdings Ltd. | 27,818,546 |
| 281,628 | Hangzhou Tigermed Consulting Co., Ltd. Class H(1) | 5,492,766 |
| 4,464,000 | Li Ning Co., Ltd. | 49,260,492 |
| 923,100 | Meituan Class B*(1) | 31,411,810 |
| 1,606,897 | Proya Cosmetics Co., Ltd. | 50,434,679 |
| 3,061,800 | Shandong Sinocera Functional Material Co., Ltd. Class A | 20,422,076 |
| 1,606,857 | Tencent Holdings Ltd. | 97,744,779 |
| 1,449,500 | WuXi AppTec Co., Ltd. Class H(1) | 30,948,511 |
| 2,261,310 | Yifeng Pharmacy Chain Co., Ltd. Class A | 16,877,050 |
| | | | 474,960,714 |
| | Denmark - 1.4% |
| 166,088 | Ascendis Pharma A/S ADR* | 25,180,602 |
| 74,652 | DSV Panalpina A/S | 17,350,409 |
| 55,835 | Genmab A/S* | 25,083,955 |
| | | | 67,614,966 |
| | France - 8.1% |
| 2,074,678 | AXA S.A.(2) | 60,358,574 |
| 1,562,138 | BNP Paribas S.A.(2) | 104,565,161 |
| 1,687,416 | Bureau Veritas S.A. | 53,634,557 |
| 216,408 | Cie de Saint-Gobain | 14,934,864 |
| 292,912 | Edenred | 15,849,821 |
| 35,277 | Hermes International | 56,016,870 |
| 95,911 | L'Oreal S.A. | 43,874,940 |
| 219,687 | Schneider Electric SE | 37,878,009 |
| 36,936 | Worldline S.A.*(1) | 2,153,965 |
| | | | 389,266,761 |
| | Germany - 5.7% |
| 6,688,139 | Commerzbank AG* | 48,842,669 |
| 1,775,389 | Infineon Technologies AG | 83,143,835 |
| Shares or Principal Amount | | Market Value† |
| COMMON STOCKS - 95.7% - (continued) |
| | Germany - 5.7% - (continued) |
| 628,457 | Siemens AG | $ 102,175,722 |
| 432,392 | Zalando SE*(1) | 40,852,637 |
| | | | 275,014,863 |
| | Hong Kong - 1.7% |
| 571,200 | Hong Kong Exchanges & Clearing Ltd. | 34,410,062 |
| 2,384,123 | Techtronic Industries Co., Ltd. | 48,982,405 |
| | | | 83,392,467 |
| | India - 3.5% |
| 1,276,501 | HDFC Bank Ltd. | 27,041,188 |
| 6,203,629 | ICICI Bank Ltd. | 66,795,130 |
| 2,114,659 | Reliance Industries Ltd. | 71,761,284 |
| | | | 165,597,602 |
| | Ireland - 1.3% |
| 910,227 | CRH plc | 43,543,151 |
| 331,453 | Smurfit Kappa Group plc | 17,373,637 |
| | | | 60,916,788 |
| | Israel - 1.0% |
| 266,844 | CyberArk Software Ltd.* | 48,061,273 |
| | Italy - 1.9% |
| 387,490 | Ferrari N.V. | 91,946,286 |
| | Japan - 13.7% |
| 473,500 | Bandai Namco Holdings, Inc. | 36,184,180 |
| 1,115,400 | Dai-ichi Life Holdings, Inc. | 23,466,401 |
| 373,720 | Daikin Industries Ltd. | 81,850,192 |
| 295,098 | Eisai Co., Ltd. | 20,909,504 |
| 262,900 | Hoya Corp. | 38,701,106 |
| 143,694 | Keyence Corp. | 86,735,814 |
| 12,284,700 | Mitsubishi UFJ Financial Group, Inc. | 67,363,085 |
| 164,700 | Oriental Land Co., Ltd. | 26,012,666 |
| 1,147,970 | Recruit Holdings Co., Ltd. | 76,361,815 |
| 882,200 | Sony Corp. | 102,155,483 |
| 162,525 | Sysmex Corp. | 20,151,605 |
| 2,173,400 | T&D Holdings, Inc. | 27,875,280 |
| 28,600 | Tokyo Electron Ltd. | 13,328,541 |
| 807,600 | Unicharm Corp. | 32,661,604 |
| | | | 653,757,276 |
| | Luxembourg - 0.8% |
| 1,167,525 | ArcelorMittal S.A. | 39,485,851 |
| | Netherlands - 5.5% |
| 4,438 | Adyen N.V.*(1) | 13,390,818 |
| 499,659 | AerCap Holdings N.V.* | 29,499,867 |
| 89,397 | Argenx SE ADR* | 26,994,318 |
| 56,146 | ASML Holding N.V. | 45,641,061 |
| 257,392 | Koninklijke DSM N.V. | 56,234,536 |
| 1,156,879 | Koninklijke Philips N.V. | 54,575,962 |
| 1,765,383 | Stellantis N.V. | 35,244,898 |
| | | | 261,581,460 |
| | Norway - 1.0% |
| 1,785,630 | Equinor ASA | 45,244,879 |
| | Russia - 0.7% |
| 1,701,300 | Sberbank of Russia PJSC ADR | 34,119,595 |
The accompanying notes are an integral part of these financial statements.
The Hartford International Opportunities Fund
Schedule of Investments – (continued)
October 31, 2021
| Shares or Principal Amount | | Market Value† |
| COMMON STOCKS - 95.7% - (continued) |
| | Singapore - 1.1% |
| 155,918 | Sea Ltd. ADR* | $ 53,568,747 |
| | South Korea - 2.5% |
| 856,117 | Coupang, Inc.* | 25,478,042 |
| 855,120 | Samsung Electronics Co., Ltd. | 51,198,698 |
| 68,490 | Samsung SDI Co., Ltd. | 43,212,246 |
| | | | 119,888,986 |
| | Spain - 2.5% |
| 1,234,600 | Cellnex Telecom S.A.(1) | 75,927,505 |
| 3,737,459 | Iberdrola S.A. | 44,133,929 |
| | | | 120,061,434 |
| | Sweden - 0.7% |
| 106,699 | Spotify Technology S.A.* | 30,878,691 |
| | Switzerland - 5.0% |
| 46,909 | Lonza Group AG | 38,549,836 |
| 434,899 | Nestle S.A. | 57,366,298 |
| 2,107 | Partners Group Holding AG | 3,680,833 |
| 235,067 | Roche Holding AG | 91,063,536 |
| 347,005 | TE Connectivity Ltd. | 50,662,730 |
| | | | 241,323,233 |
| | Taiwan - 3.1% |
| 456,630 | MediaTek, Inc. | 15,028,919 |
| 6,359,440 | Taiwan Semiconductor Manufacturing Co., Ltd. | 134,949,160 |
| | | | 149,978,079 |
| | Thailand - 0.9% |
| 9,813,914 | Kasikornbank PCL | 41,405,800 |
| | United Kingdom - 12.1% |
| 835,967 | Allfunds Group plc* | 16,898,081 |
| 2,185,531 | Anglo American plc | 83,144,206 |
| 827,725 | AstraZeneca plc | 103,549,477 |
| 1,197,947 | Diageo plc | 59,599,886 |
| 2,037,900 | Intermediate Capital Group plc | 61,126,728 |
| 129,848 | London Stock Exchange Group plc | 12,639,891 |
| 2,371,221 | Prudential plc | 48,391,766 |
| 876,974 | Rio Tinto plc | 54,680,613 |
| 4,441,281 | Royal Dutch Shell plc Class A | 102,331,735 |
| 2,148,191 | Segro plc REIT | 37,968,296 |
| | | | 580,330,679 |
| | Total Common Stocks
(cost $3,664,693,869) | | $ 4,581,558,563 |
| EXCHANGE-TRADED FUNDS - 1.9% |
| | Other Investment Pools & Funds - 1.9% |
| 1,635,042 | iShares MSCI ACWI ex U.S. ETF | $ 93,311,847 |
| | Total Exchange-Traded Funds
(cost $91,607,785) | | $ 93,311,847 |
| | Total Long-Term Investments
(cost $3,756,301,654) | | $ 4,674,870,410 |
| Shares or Principal Amount | | Market Value† |
| SHORT-TERM INVESTMENTS - 1.9% |
| | Repurchase Agreements - 1.9% |
| 88,806,320 | Fixed Income Clearing Corp. Repurchase Agreement dated 10/29/2021 at 0.010%, due on 11/01/2021 with a maturity value of $ 88,806,394; collateralized by U.S. Treasury Bond at 1.875%, maturing 02/15/2041, with a market value of $ 90,582,492 | $ 88,806,320 |
| | Total Short-Term Investments
(cost $88,806,320) | $ 88,806,320 |
| | Total Investments
(cost $3,845,107,974) | 99.5% | $ 4,763,676,730 |
| | Other Assets and Liabilities | 0.5% | 25,414,958 |
| | Total Net Assets | 100.0% | $ 4,789,091,688 |
| Note: | Percentage of investments as shown is the ratio of the total market value to total net assets. |
| | Prices of foreign equities that are principally traded on certain foreign markets will generally be adjusted daily pursuant to a fair value pricing service approved by the Board of Directors in order to reflect an adjustment for factors occurring after the close of certain foreign markets but before the close of the New York Stock Exchange. |
| | Equity industry classifications used in this report are the Global Industry Classification Standard, which was developed by and is the exclusive property and service mark of MSCI, Inc. and Standard & Poor’s. |
| | For Fund compliance purposes, the Fund may not use the same classification system. These classifications are used for financial reporting purposes. |
| | See “Glossary” for abbreviation descriptions. |
| * | Non-income producing. |
| (1) | Security was purchased pursuant to Rule 144A under the Securities Act of 1933 and may be sold in transactions that are exempt from registration (typically only to qualified institutional buyers) or in a public offering registered under the Securities Act of 1933. At October 31, 2021, the aggregate value of these securities was $222,930,649, representing 4.7% of net assets. |
| (2) | Represents entire or partial securities on loan. See Note 8 in the accompanying Notes to Financial Statements for securities lending information. |
| † | See Significant Accounting Policies of accompanying Notes to Financial Statements regarding valuation of investments. |
The accompanying notes are an integral part of these financial statements.
The Hartford International Opportunities Fund
Schedule of Investments – (continued)
October 31, 2021
| Description | | Total | | Level 1 | | Level 2 | | Level 3(1) |
| Assets | | | | | | | | |
| Common Stocks | | | | | | | | |
| Australia | | $ 81,942,964 | | $ — | | $ 81,942,964 | | $ — |
| Belgium | | 88,748,706 | | — | | 88,748,706 | | — |
| Brazil | | 72,944,948 | | 72,944,948 | | — | | — |
| Canada | | 309,525,515 | | 309,525,515 | | — | | — |
| China | | 474,960,714 | | 64,753,465 | | 410,207,249 | | — |
| Denmark | | 67,614,966 | | 25,180,602 | | 42,434,364 | | — |
| France | | 389,266,761 | | — | | 389,266,761 | | — |
| Germany | | 275,014,863 | | — | | 275,014,863 | | — |
| Hong Kong | | 83,392,467 | | — | | 83,392,467 | | — |
| India | | 165,597,602 | | — | | 165,597,602 | | — |
| Ireland | | 60,916,788 | | — | | 60,916,788 | | — |
| Israel | | 48,061,273 | | 48,061,273 | | — | | — |
| Italy | | 91,946,286 | | — | | 91,946,286 | | — |
| Japan | | 653,757,276 | | — | | 653,757,276 | | — |
| Luxembourg | | 39,485,851 | | — | | 39,485,851 | | — |
| Netherlands | | 261,581,460 | | 56,494,185 | | 205,087,275 | | — |
| Norway | | 45,244,879 | | — | | 45,244,879 | | — |
| Russia | | 34,119,595 | | — | | 34,119,595 | | — |
| Singapore | | 53,568,747 | | 53,568,747 | | — | | — |
| South Korea | | 119,888,986 | | 25,478,042 | | 94,410,944 | | — |
| Spain | | 120,061,434 | | 44,133,929 | | 75,927,505 | | — |
| Sweden | | 30,878,691 | | 30,878,691 | | — | | — |
| Switzerland | | 241,323,233 | | 50,662,730 | | 190,660,503 | | — |
| Taiwan | | 149,978,079 | | — | | 149,978,079 | | — |
| Thailand | | 41,405,800 | | 41,405,800 | | — | | — |
| United Kingdom | | 580,330,679 | | 16,898,081 | | 563,432,598 | | — |
| Exchange-Traded Funds | | 93,311,847 | | 93,311,847 | | — | | — |
| Short-Term Investments | | 88,806,320 | | — | | 88,806,320 | | — |
| Total | | $ 4,763,676,730 | | $ 933,297,855 | | $ 3,830,378,875 | | $ — |
| (1) | For the year ended October 31, 2021, there were no transfers in and out of Level 3. |
The accompanying notes are an integral part of these financial statements.
The Hartford International Value Fund
Schedule of Investments
October 31, 2021
| Shares or Principal Amount | | Market Value† |
| COMMON STOCKS - 95.5% |
| | Argentina - 0.1% |
| 491,010 | YPF S.A. ADR* | $ 2,062,242 |
| | Australia - 0.5% |
| 1,657,448 | Austal Ltd. | 2,355,713 |
| 2,587,916 | OceanaGold Corp.* | 4,830,386 |
| 3,444,849 | Resolute Mining Ltd.* | 1,082,620 |
| 1,447,961 | Western Areas Ltd. | 3,467,079 |
| | | | 11,735,798 |
| | Austria - 0.6% |
| 253,628 | Erste Group Bank AG | 10,877,016 |
| 261,298 | Zumtobel Group AG | 2,688,338 |
| | | | 13,565,354 |
| | Belgium - 0.8% |
| 245,379 | Ageas S.A. | 11,937,121 |
| 717,929 | AGFA-Gevaert N.V.* | 3,120,521 |
| 322,625 | bpost S.A.* | 2,764,036 |
| | | | 17,821,678 |
| | Brazil - 0.9% |
| 2,424,759 | Caixa Seguridade Participacoes S/A* | 3,759,283 |
| 1,479,645 | Cia de Saneamento Basico do Estado de Sao Paulo | 9,228,446 |
| 826,154 | Telefonica Brasil S.A. | 6,663,335 |
| | | | 19,651,064 |
| | Canada - 2.5% |
| 560,381 | ARC Resources Ltd. | 5,374,695 |
| 575,512 | Barrick Gold Corp. | 10,560,664 |
| 430,504 | Cameco Corp. | 10,459,967 |
| 738,951 | Centerra Gold, Inc. | 5,540,939 |
| 452,079 | Eldorado Gold Corp.* | 4,050,628 |
| 1,010,026 | Kinross Gold Corp. | 6,070,256 |
| 180,034 | Tourmaline Oil Corp. | 6,506,885 |
| 1,879,188 | Trican Well Service Ltd.* | 5,268,893 |
| | | | 53,832,927 |
| | Chile - 0.3% |
| 469,184 | Embotelladora Andina S.A. ADR | 5,756,888 |
| | China - 1.2% |
| 15,823,036 | China BlueChemical Ltd. Class H | 5,290,916 |
| 85,688,733 | China Reinsurance Group Corp. Class H | 8,910,989 |
| 13,582,493 | Dongfeng Motor Group Co., Ltd. Class H | 12,650,150 |
| | | | 26,852,055 |
| | Denmark - 0.4% |
| 303,450 | D/S Norden A/S | 7,323,354 |
| 26,442 | Drilling Co.* | 947,823 |
| | | | 8,271,177 |
| | Finland - 0.9% |
| 3,576,347 | Nokia Oyj* | 20,526,460 |
| | France - 12.7% |
| 895,427 | AXA S.A. | 26,050,643 |
| 432,025 | BNP Paribas S.A. | 28,918,549 |
| 408,249 | Cie de Saint-Gobain | 28,174,297 |
| 211,608 | Criteo S.A. ADR* | 6,991,528 |
| 81,381 | Dassault Aviation S.A. | 8,504,627 |
| 1,742,674 | Engie S.A. | 24,789,794 |
| 166,090 | Imerys S.A. | 7,199,226 |
| 451,185 | Metropole Television S.A. | 9,941,120 |
| 1,255,758 | Orange S.A.(1) | 13,693,977 |
| 345,699 | Quadient S.A. | 8,264,579 |
| 238,146 | Renault S.A.* | 8,581,371 |
| Shares or Principal Amount | | Market Value† |
| COMMON STOCKS - 95.5% - (continued) |
| | France - 12.7% - (continued) |
| 428,982 | Rexel S.A. | $ 8,526,530 |
| 338,896 | SCOR SE | 11,408,977 |
| 595,024 | Societe Generale S.A. | 19,876,136 |
| 17,013 | Sopra Steria Group | 3,345,057 |
| 1,184,183 | Television Francaise | 12,677,690 |
| 878,696 | TotalEnergies SE | 44,000,658 |
| 146,640 | Vicat S.A. | 6,258,408 |
| | | | 277,203,167 |
| | Germany - 2.9% |
| 1,198,697 | CECONOMY AG* | 5,848,371 |
| 107,574 | Continental AG* | 12,647,626 |
| 236,737 | Daimler AG | 23,499,087 |
| 425,014 | Fresenius SE & Co. KGaA | 19,318,478 |
| 246,822 | Metro AG | 3,120,109 |
| | | | 64,433,671 |
| | Greece - 0.2% |
| 206,182 | Hellenic Telecommunications Organization S.A. | 3,660,517 |
| | Hong Kong - 1.8% |
| 2,099,712 | CK Asset Holdings Ltd. | 12,970,035 |
| 1,412,740 | Dah Sing Financial Holdings Ltd. | 4,379,156 |
| 1,760,786 | G-Resources Group Ltd.* | 665,344 |
| 20,772,656 | Pacific Basin Shipping Ltd. | 9,586,715 |
| 7,171,023 | PAX Global Technology Ltd. | 4,969,327 |
| 2,901,803 | Yue Yuen Industrial Holdings Ltd.* | 6,159,689 |
| | | | 38,730,266 |
| | Hungary - 0.3% |
| 4,194,166 | Magyar Telekom Telecommunications plc | 5,780,392 |
| | India - 0.9% |
| 2,051,532 | Canara Bank* | 5,898,324 |
| 4,356,220 | Oil & Natural Gas Corp. Ltd. | 8,668,597 |
| 1,160,691 | Zee Entertainment Enterprises Ltd. | 4,677,298 |
| | | | 19,244,219 |
| | Indonesia - 0.7% |
| 25,916,830 | Bank Mandiri Persero Tbk PT | 13,102,817 |
| 12,195,512 | Perusahaan Perkebunan London Sumatra Indonesia Tbk PT | 1,201,351 |
| | | | 14,304,168 |
| | Ireland - 1.2% |
| 4,700,887 | AIB Group plc* | 12,722,841 |
| 2,094,847 | Bank of Ireland Group plc* | 12,479,394 |
| | | | 25,202,235 |
| | Italy - 3.6% |
| 862,551 | Assicurazioni Generali S.p.A. | 18,782,213 |
| 3,533,155 | BPER Banca | 7,746,677 |
| 1,791,922 | Eni S.p.A. | 25,682,615 |
| 1,993,617 | Saipem S.p.A.*(1) | 4,367,964 |
| 1,728,666 | UniCredit S.p.A. | 22,851,997 |
| | | | 79,431,466 |
| | Japan - 28.0% |
| 268,320 | Aeon Delight Co., Ltd. | 8,240,619 |
| 562,820 | Alfresa Holdings Corp. | 7,934,058 |
| 708,760 | Alps Electric Co., Ltd. | 6,925,335 |
| 45,263 | Benesse Holdings, Inc. | 1,035,535 |
| 774,090 | Chiyoda Corp.* | 2,829,677 |
| 135,787 | Chubu Steel Plate Co., Ltd. | 979,311 |
| 1,988,767 | Citizen Watch Co., Ltd. | 8,673,132 |
| 135,408 | CMIC Holdings Co., Ltd. | 1,763,392 |
| 349,354 | Cosel Co., Ltd. | 2,844,514 |
The accompanying notes are an integral part of these financial statements.
The Hartford International Value Fund
Schedule of Investments – (continued)
October 31, 2021
| Shares or Principal Amount | | Market Value† |
| COMMON STOCKS - 95.5% - (continued) |
| | Japan - 28.0% - (continued) |
| 761,883 | Dai-ichi Life Holdings, Inc. | $ 16,028,915 |
| 559,133 | DeNA Co., Ltd. | 10,328,403 |
| 90,310 | Eisai Co., Ltd. | 6,399,018 |
| 34,826 | Enplas Corp. | 923,560 |
| 320,309 | Exedy Corp. | 4,771,249 |
| 373,284 | Fuji Media Holdings, Inc. | 3,869,271 |
| 78,674 | Gendai Agency, Inc. | 234,704 |
| 1,069,010 | Gree, Inc. | 9,015,875 |
| 1,408,236 | Hino Motors Ltd. | 13,321,462 |
| 267,232 | Hisaka Works Ltd. | 1,982,795 |
| 1,035,554 | Honda Motor Co., Ltd. | 30,629,474 |
| 399,476 | Ichiyoshi Securities Co., Ltd. | 2,279,501 |
| 1,602,097 | Inpex Corp. | 13,360,399 |
| 1,290,158 | Isuzu Motors Ltd. | 17,356,236 |
| 611,040 | Japan Airlines Co., Ltd.* | 13,150,438 |
| 278,199 | Japan Petroleum Exploration Co., Ltd. | 5,062,579 |
| 235,868 | Japan Steel Works Ltd. | 6,929,156 |
| 1,295,317 | JGC Holdings Corp. | 12,172,493 |
| 433,150 | Kamigumi Co., Ltd. | 8,721,454 |
| 216,980 | Kissei Pharmaceutical Co., Ltd. | 4,340,316 |
| 451,681 | Kyoei Steel Ltd. | 5,573,259 |
| 393,120 | Maruichi Steel Tube Ltd. | 8,932,369 |
| 365,693 | Maxell Holdings Ltd. | 4,400,478 |
| 193,623 | Miraial Co., Ltd. | 2,684,971 |
| 949,811 | Mitsubishi Estate Co., Ltd. | 14,434,263 |
| 196,249 | Mitsubishi Heavy Industries Ltd. | 5,018,648 |
| 1,084,163 | Mitsubishi Motors Corp.*(1) | 3,469,887 |
| 4,460,307 | Mitsubishi UFJ Financial Group, Inc. | 24,458,069 |
| 506,567 | Nakayama Steel Works Ltd. | 1,924,173 |
| 194,683 | Neturen Co., Ltd. | 1,040,348 |
| 266,558 | Nichicon Corp. | 2,522,564 |
| 755,080 | Nikon Corp. | 8,325,325 |
| 328,185 | Nippon Chemi-Con Corp.* | 6,167,331 |
| 707,045 | Nippon Television Holdings, Inc. | 7,617,452 |
| 2,382,224 | Nissan Motor Co., Ltd.* | 12,125,184 |
| 762,856 | NOK Corp. | 8,855,049 |
| 1,140,700 | Nomura Holdings, Inc. | 5,432,601 |
| 115,799 | OKUMA Corp. | 5,517,659 |
| 638,630 | Ono Pharmaceutical Co., Ltd. | 13,399,559 |
| 154,842 | Pacific Metals Co., Ltd. | 2,806,651 |
| 152,600 | Paramount Bed Holdings Co., Ltd. | 2,847,378 |
| 4,181,813 | Resona Holdings, Inc. | 15,709,394 |
| 185,391 | Sanyo Shokai Ltd.* | 1,471,648 |
| 51,880 | Shibaura Machine Co., Ltd. | 1,209,376 |
| 126,515 | Shimamura Co., Ltd. | 10,712,325 |
| 548,060 | Subaru Corp. | 10,750,080 |
| 803,990 | Sumitomo Electric Industries Ltd. | 10,671,249 |
| 350,980 | Sumitomo Heavy Industries Ltd. | 9,036,152 |
| 619,156 | Sumitomo Mitsui Financial Group, Inc. | 20,091,385 |
| 455,241 | Sumitomo Mitsui Trust Holdings, Inc. | 14,974,622 |
| 331,679 | Sumitomo Riko Co., Ltd. | 2,160,701 |
| 1,455,005 | T&D Holdings, Inc. | 18,661,393 |
| 300,713 | Tachi-S Co., Ltd. | 3,642,093 |
| 442,260 | Taiheiyo Cement Corp. | 9,396,365 |
| 625,076 | Takeda Pharmaceutical Co., Ltd. | 17,543,265 |
| 75,710 | Tamron Co., Ltd. | 1,779,734 |
| 569,326 | THK Co., Ltd. | 12,242,576 |
| 947,151 | Tochigi Bank Ltd. | 1,471,695 |
| 559,151 | Tokai Rika Co., Ltd. | 7,826,816 |
| 97,979 | Tokyo Seimitsu Co., Ltd. | 3,989,316 |
| 789,402 | Tokyo Steel Manufacturing Co., Ltd. | 8,784,267 |
| 513,908 | Toppan Forms Co., Ltd. | 4,940,632 |
| 410,940 | Toppan, Inc. | 6,633,444 |
| Shares or Principal Amount | | Market Value† |
| COMMON STOCKS - 95.5% - (continued) |
| | Japan - 28.0% - (continued) |
| 302,033 | Toyota Boshoku Corp. | $ 5,807,202 |
| 485,640 | TS Tech Co., Ltd. | 6,497,881 |
| 463,279 | TV Asahi Holdings Corp. | 7,030,320 |
| 464,806 | Unipres Corp. | 3,792,212 |
| 546,534 | Ushio, Inc. | 9,777,702 |
| 474,166 | Xebio Holdings Co., Ltd. | 4,406,562 |
| 219,441 | Yamato Kogyo Co., Ltd. | 7,357,921 |
| 144,400 | Yodogawa Steel Works Ltd. | 3,155,178 |
| | | | 611,179,595 |
| | Luxembourg - 0.6% |
| 219,039 | RTL Group S.A. | 12,651,311 |
| | Malaysia - 0.5% |
| 7,859,407 | CIMB Group Holdings Bhd | 9,916,476 |
| | Mexico - 0.5% |
| 677,830 | America Movil S.A.B. de C.V. Class L ADR | 12,051,817 |
| | Netherlands - 4.5% |
| 1,018,720 | ABN Amro Bank N.V.*(2) | 14,983,037 |
| 457,109 | Fugro N.V.* | 3,874,237 |
| 1,456,439 | ING Groep N.V. | 22,092,580 |
| 1,504,588 | PostNL N.V. | 6,530,092 |
| 2,244,699 | Royal Dutch Shell plc Class B | 51,512,973 |
| | | | 98,992,919 |
| | Norway - 0.3% |
| 964,442 | Norsk Hydro ASA | 7,084,276 |
| | Russia - 1.9% |
| 1,586,398 | Gazprom PJSC ADR | 15,567,108 |
| 40,792 | Lukoil PJSC ADR | 4,157,963 |
| 309,892 | Sberbank of Russia PJSC ADR | 6,214,888 |
| 1,743,781 | Surgutneftegas PJSC ADR | 8,329,322 |
| 3,895,466 | VEON Ltd. ADR* | 8,219,433 |
| | | | 42,488,714 |
| | South Africa - 1.7% |
| 256,426 | Astral Foods Ltd. | 2,971,352 |
| 646,956 | Gold Fields Ltd. | 6,011,664 |
| 1,225,068 | Harmony Gold Mining Co., Ltd. ADR(1) | 4,434,746 |
| 65,640 | Impala Platinum Holdings Ltd. | 849,536 |
| 945,576 | MTN Group Ltd.* | 8,479,101 |
| 4,814,749 | Nampak Ltd.* | 1,219,384 |
| 11,539,255 | Old Mutual Ltd. | 11,777,217 |
| 766,976 | Raubex Group Ltd. | 1,639,395 |
| | | | 37,382,395 |
| | South Korea - 3.7% |
| 133,611 | Coway Co., Ltd. | 9,059,490 |
| 1,006,103 | DGB Financial Group, Inc. | 8,914,902 |
| 181,427 | Hankook Tire & Technology Co., Ltd. | 6,428,203 |
| 402,528 | KB Financial Group, Inc. | 19,483,919 |
| 585,642 | KT Corp. | 15,290,510 |
| 533,361 | Shinhan Financial Group Co., Ltd. | 17,412,592 |
| 726,643 | Tongyang Life Insurance Co., Ltd. | 4,251,608 |
| | | | 80,841,224 |
| | Spain - 1.5% |
| 5,858,127 | CaixaBank S.A. | 16,840,148 |
| 2,443,292 | Prosegur Cia de Seguridad S.A. | 6,933,349 |
| 7,628,443 | Unicaja Banco S.A.(2) | 8,162,182 |
| | | | 31,935,679 |
| | Switzerland - 5.1% |
| 401,709 | Adecco Group AG | 20,238,112 |
| 377,569 | GAM Holding AG* | 608,251 |
The accompanying notes are an integral part of these financial statements.
The Hartford International Value Fund
Schedule of Investments – (continued)
October 31, 2021
| Shares or Principal Amount | | Market Value† |
| COMMON STOCKS - 95.5% - (continued) |
| | Switzerland - 5.1% - (continued) |
| 87,066 | Implenia AG* | $ 1,776,314 |
| 91,023 | Julius Baer Group Ltd. | 6,583,883 |
| 462,300 | LafargeHolcim Ltd. | 23,060,707 |
| 287,316 | Novartis AG | 23,764,683 |
| 2,010,447 | UBS Group AG | 36,595,519 |
| | | | 112,627,469 |
| | Taiwan - 1.6% |
| 1,650,733 | Catcher Technology Co., Ltd. | 9,571,624 |
| 3,326,210 | Foxconn Technology Co., Ltd. | 8,258,683 |
| 2,928,679 | Hon Hai Precision Industry Co., Ltd. | 11,305,691 |
| 15,209,721 | Shin Kong Financial Holding Co., Ltd. | 5,360,460 |
| | | | 34,496,458 |
| | Thailand - 0.7% |
| 2,366,126 | Kasikornbank PCL | 9,982,902 |
| 1,358,923 | Kasikornbank PCL NVDR | 5,793,261 |
| | | | 15,776,163 |
| | Turkey - 1.4% |
| 2,624,403 | Anadolu Efes Biracilik Ve Malt Sanayii AS | 6,060,094 |
| 794,485 | Coca-Cola Icecek AS | 7,018,388 |
| 9,064,494 | Turk Telekomunikasyon AS | 7,099,609 |
| 3,675,048 | Turkcell Iletisim Hizmetleri AS(1) | 5,844,756 |
| 2,728,420 | Ulker Biskuvi Sanayi AS | 5,727,014 |
| | | | 31,749,861 |
| | United Kingdom - 10.7% |
| 522,791 | Anglo American plc | 19,888,550 |
| 2,032,175 | Babcock International Group plc* | 8,874,895 |
| 2,746,677 | BAE Systems plc | 20,710,388 |
| 8,058,236 | BP plc | 38,606,207 |
| 1,217,274 | British Land Co. plc REIT | 8,219,002 |
| 5,935,858 | BT Group plc* | 11,277,115 |
| 5,326,747 | Centrica plc* | 4,397,158 |
| 251,909 | Endeavour Mining plc | 6,399,498 |
| 248,562 | Go-Ahead Group plc* | 2,670,332 |
| 5,029,417 | Hays plc | 11,397,917 |
| 3,611,628 | J Sainsbury plc | 14,792,718 |
| 1,858,382 | Kingfisher plc | 8,529,213 |
| 834,116 | Land Securities Group plc REIT | 7,836,084 |
| 2,241,516 | Marks & Spencer Group plc* | 5,634,601 |
| 971,000 | Pagegroup plc | 8,823,649 |
| 1,543,333 | Provident Financial plc* | 7,796,854 |
| 2,447,863 | SIG plc* | 1,740,338 |
| 2,499,294 | Standard Chartered plc | 16,902,725 |
| 648,267 | SThree plc | 5,225,527 |
| 1,651,724 | WPP plc | 23,875,292 |
| | | | 233,598,063 |
| | United States - 0.3% |
| 199,571 | Ovintiv, Inc. | 7,487,138 |
| | Total Common Stocks
(cost $1,872,586,892) | | $ 2,088,325,302 |
| CLOSED END FUNDS - 0.3% |
| | Canada - 0.3% |
| 535,619 | Sprott Physical Uranium Trust *(1) | $ 5,955,169 |
| | Total Closed End Funds
(cost $3,779,175) | $ 5,955,169 |
| | Total Long-Term Investments
(cost $1,876,366,067) | | $ 2,094,280,471 |
| Shares or Principal Amount | | Market Value† |
| SHORT-TERM INVESTMENTS - 3.2% |
| | Repurchase Agreements - 3.0% |
| 65,027,238 | Fixed Income Clearing Corp. Repurchase Agreement dated 10/29/2021 at 0.01%, due on 11/01/2021 with a maturity value of $65,027,292; collateralized by U.S. Treasury Bond at 1.875%, maturing 02/15/2041, with a market value of $66,327,875 | $ 65,027,238 |
| | Securities Lending Collateral - 0.2% |
| 24,421 | Fidelity Investments Money Market Funds, Government Portfolio, Institutional Class, 0.01%(3) | 24,421 |
| 3,749,110 | Goldman Sachs Financial Square Funds, Government Fund, Institutional Class, 0.03%(3) | 3,749,110 |
| 269,158 | Invesco Government & Agency Portfolio, Institutional Class, 0.03%(3) | 269,158 |
| | | | 4,042,689 |
| | Total Short-Term Investments
(cost $69,069,927) | $ 69,069,927 |
| | Total Investments
(cost $1,945,435,994) | 99.0% | $ 2,163,350,398 |
| | Other Assets and Liabilities | 1.0% | 22,914,801 |
| | Total Net Assets | 100.0% | $ 2,186,265,199 |
| Note: | Percentage of investments as shown is the ratio of the total market value to total net assets. |
| | Prices of foreign equities that are principally traded on certain foreign markets will generally be adjusted daily pursuant to a fair value pricing service approved by the Board of Directors in order to reflect an adjustment for factors occurring after the close of certain foreign markets but before the close of the New York Stock Exchange. |
| | Equity industry classifications used in this report are the Global Industry Classification Standard, which was developed by and is the exclusive property and service mark of MSCI, Inc. and Standard & Poor’s. |
| | For Fund compliance purposes, the Fund may not use the same classification system. These classifications are used for financial reporting purposes. |
| | See “Glossary” for abbreviation descriptions. |
| * | Non-income producing. |
| (1) | Represents entire or partial securities on loan. See Note 8 in the accompanying Notes to Financial Statements for securities lending information. |
| (2) | Security was purchased pursuant to Rule 144A under the Securities Act of 1933 and may be sold in transactions that are exempt from registration (typically only to qualified institutional buyers) or in a public offering registered under the Securities Act of 1933. At October 31, 2021, the aggregate value of these securities was $23,145,219, representing 1.1% of net assets. |
| (3) | Current yield as of period end. |
The accompanying notes are an integral part of these financial statements.
The Hartford International Value Fund
Schedule of Investments – (continued)
October 31, 2021
| Futures Contracts Outstanding at October 31, 2021 |
| Description | | Number of
Contracts | | Expiration
Date | | Current
Notional
Amount | | Value and
Unrealized
Appreciation/
(Depreciation) |
| Long position contracts: |
| MSCI EAFE Index Future | | 299 | | 12/17/2021 | | $ 34,977,020 | | $ 437,291 |
| Total futures contracts | | $ 437,291 |
† See Significant Accounting Policies of accompanying Notes to Financial Statements regarding valuation of investments.
Fair Value Summary
The following is a summary of the fair valuations according to the inputs used as of October 31, 2021 in valuing the Fund’s investments.
| Description | | Total | | Level 1 | | Level 2 | | Level 3(1) |
| Assets | | | | | | | | |
| Common Stocks | | | | | | | | |
| Argentina | | $ 2,062,242 | | $ 2,062,242 | | $ — | | $ — |
| Australia | | 11,735,798 | | 4,830,386 | | 6,905,412 | | — |
| Austria | | 13,565,354 | | 2,688,338 | | 10,877,016 | | — |
| Belgium | | 17,821,678 | | 3,120,521 | | 14,701,157 | | — |
| Brazil | | 19,651,064 | | 19,651,064 | | — | | — |
| Canada | | 53,832,927 | | 53,832,927 | | — | | — |
| Chile | | 5,756,888 | | 5,756,888 | | — | | — |
| China | | 26,852,055 | | — | | 26,852,055 | | — |
| Denmark | | 8,271,177 | | 7,323,354 | | 947,823 | | — |
| Finland | | 20,526,460 | | — | | 20,526,460 | | — |
| France | | 277,203,167 | | 16,932,648 | | 260,270,519 | | — |
| Germany | | 64,433,671 | | — | | 64,433,671 | | — |
| Greece | | 3,660,517 | | — | | 3,660,517 | | — |
| Hong Kong | | 38,730,266 | | 665,344 | | 38,064,922 | | — |
| Hungary | | 5,780,392 | | 5,780,392 | | — | | — |
| India | | 19,244,219 | | — | | 19,244,219 | | — |
| Indonesia | | 14,304,168 | | — | | 14,304,168 | | — |
| Ireland | | 25,202,235 | | — | | 25,202,235 | | — |
| Italy | | 79,431,466 | | — | | 79,431,466 | | — |
| Japan | | 611,179,595 | | 979,311 | | 610,200,284 | | — |
| Luxembourg | | 12,651,311 | | — | | 12,651,311 | | — |
| Malaysia | | 9,916,476 | | — | | 9,916,476 | | — |
| Mexico | | 12,051,817 | | 12,051,817 | | — | | — |
| Netherlands | | 98,992,919 | | — | | 98,992,919 | | — |
| Norway | | 7,084,276 | | — | | 7,084,276 | | — |
| Russia | | 42,488,714 | | 8,219,433 | | 34,269,281 | | — |
| South Africa | | 37,382,395 | | 20,822,710 | | 16,559,685 | | — |
| South Korea | | 80,841,224 | | — | | 80,841,224 | | — |
| Spain | | 31,935,679 | | — | | 31,935,679 | | — |
| Switzerland | | 112,627,469 | | 2,384,565 | | 110,242,904 | | — |
| Taiwan | | 34,496,458 | | — | | 34,496,458 | | — |
| Thailand | | 15,776,163 | | 9,982,902 | | 5,793,261 | | — |
| Turkey | | 31,749,861 | | 24,731,473 | | 7,018,388 | | — |
| United Kingdom | | 233,598,063 | | 24,859,344 | | 208,738,719 | | — |
| United States | | 7,487,138 | | 7,487,138 | | — | | — |
| Closed End Funds | | 5,955,169 | | 5,955,169 | | — | | — |
| Short-Term Investments | | 69,069,927 | | 4,042,689 | | 65,027,238 | | — |
| Futures Contracts(2) | | 437,291 | | 437,291 | | — | | — |
| Total | | $ 2,163,787,689 | | $ 244,597,946 | | $ 1,919,189,743 | | $ — |
| (1) | For the year ended October 31, 2021, there were no transfers in and out of Level 3. |
| (2) | Derivative instruments (excluding purchased and written options, if applicable) are valued at the unrealized appreciation/(depreciation) on the investments. |
The accompanying notes are an integral part of these financial statements.
Hartford International/Global Equity Funds
GLOSSARY: (abbreviations used in preceding Schedules of Investments)
| Counterparty Abbreviations: |
| BNP | BNP Paribas Securities Services |
| UBS | UBS AG |
| Index Abbreviations: |
| EAFE | Europe, Australasia and Far East |
| S&P | Standard & Poor's |
| SPI | Share Price Index |
| Other Abbreviations: |
| ACWI | All Country World Index |
| ADR | American Depositary Receipt |
| Bhd | Berhad |
| ETF | Exchange-Traded Fund |
| GDR | Global Depositary Receipt |
| MSCI | Morgan Stanley Capital International |
| NVDR | Non-Voting Depositary Receipt |
| PJSC | Private Joint Stock Company |
| PT | Perseroan Terbatas |
| REIT | Real Estate Investment Trust |
| Tbk | Terbuka |
Hartford International/Global Equity Funds
Statements of Assets and Liabilities
October 31, 2021
| | Hartford
Climate
Opportunities
Fund | | Hartford
Emerging
Markets Equity
Fund | | Hartford
Global Impact
Fund | | Hartford
International
Equity Fund |
| Assets: | | | | | | | |
| Investments in securities, at market value(1) | $ 149,938,487 | | $ 492,178,793 | | $ 135,899,751 | | $ 884,011,308 |
| Repurchase agreements | 2,624,278 | | 5,672,719 | | 5,763,539 | | 19,709,787 |
| Cash | 1,022,800 | | 1,432,979 | | 2,240,461 | | 4,990,067 |
| Cash collateral held for securities on loan | 25,680 | | 145,826 | | 26,980 | | 308,340 |
| Foreign currency | 40,133 | | 2,369,287 | | 231 | | 396,954 |
| Receivables: | | | | | | | |
| From affiliates | 26,340 | | 36,681 | | 7,933 | | — |
| Investment securities sold | 533,875 | | 17,241,757 | | 349,943 | | 484,107 |
| Fund shares sold | 476,939 | | 359,111 | | 434,138 | | 472,327 |
| Dividends and interest | 98,555 | | 485,184 | | 52,880 | | 1,714,869 |
| Securities lending income | 361 | | 15,493 | | 62 | | 4,222 |
| Variation margin on futures contracts | — | | 299,127 | | — | | 1,541,074 |
| Tax reclaims | 110,009 | | 7,639 | | 101,616 | | 1,534,553 |
| Other assets | 43,969 | | 49,665 | | 35,828 | | 52,121 |
| Total assets | 154,941,426 | | 520,294,261 | | 144,913,362 | | 915,219,729 |
| Liabilities: | | | | | | | |
| Obligation to return securities lending collateral | 513,591 | | 2,916,519 | | 539,597 | | 6,166,792 |
| Payables: | | | | | | | |
| Investment securities purchased | 583,810 | | 14,735,694 | | 3,495,180 | | 502,839 |
| Fund shares redeemed | 43,872 | | 99,298 | | 106,167 | | 899,616 |
| Investment management fees | 77,145 | | 383,504 | | 70,593 | | 354,416 |
| Transfer agent fees | 14,797 | | 74,384 | | 30,422 | | 199,577 |
| Accounting services fees | 4,846 | | 16,518 | | 4,237 | | 26,514 |
| Board of Directors' fees | 278 | | 1,527 | | 301 | | 2,930 |
| Foreign taxes | — | | 2,048,717 | | 20,168 | | 392,182 |
| Distribution fees | 1,834 | | 1,996 | | 3,271 | | 34,751 |
| Accrued expenses | 47,969 | | 176,658 | | 43,288 | | 141,810 |
| Total liabilities | 1,288,142 | | 20,454,815 | | 4,313,224 | | 8,721,427 |
| Net assets | $ 153,653,284 | | $ 499,839,446 | | $ 140,600,138 | | $ 906,498,302 |
| Summary of Net Assets: | | | | | | | |
| Capital stock and paid-in-capital | $ 115,055,177 | | $ 433,253,127 | | $ 121,761,039 | | $ 748,197,868 |
| Distributable earnings (loss) | 38,598,107 | | 66,586,319 | | 18,839,099 | | 158,300,434 |
| Net assets | $ 153,653,284 | | $ 499,839,446 | | $ 140,600,138 | | $ 906,498,302 |
| Shares authorized | 175,000,000 | | 660,000,000 | | 225,000,000 | | 560,000,000 |
| Par value | $ 0.0010 | | $ 0.0010 | | $ 0.0010 | | $ 0.0010 |
| Class A: Net asset value per share | $ 18.26 | | $ 10.88 | | $ 17.43 | | $ 12.86 |
| Maximum offering price per share | 19.32 | | 11.51 | | 18.44 | | 13.61 |
| Shares outstanding | 2,018,299 | | 3,734,798 | | 3,332,015 | | 50,094,757 |
| Net Assets | $ 36,849,358 | | $ 40,629,058 | | $ 58,064,841 | | $ 644,434,807 |
| Class C: Net asset value per share | $ 17.92 | | $ 10.66 | | $ 16.95 | | $ 12.65 |
| Shares outstanding | 119,792 | | 190,236 | | 160,166 | | 1,402,379 |
| Net Assets | $ 2,146,478 | | $ 2,028,519 | | $ 2,715,122 | | $ 17,733,255 |
| Class I: Net asset value per share | $ 18.00 | | $ 10.87 | | $ 17.40 | | $ 13.04 |
| Shares outstanding | 1,111,201 | | 3,505,658 | | 2,513,011 | | 5,137,540 |
| Net Assets | $ 20,001,292 | | $ 38,104,319 | | $ 43,722,956 | | $ 67,018,971 |
| Class R3: Net asset value per share | $ 17.97 | | $ 10.83 | | $ 17.12 | | $ 12.76 |
| Shares outstanding | 13,653 | | 36,983 | | 429,751 | | 1,096,817 |
| Net Assets | $ 245,380 | | $ 400,414 | | $ 7,358,762 | | $ 14,000,852 |
| Class R4: Net asset value per share | $ 17.96 | | $ 11.09 | | $ 17.39 | | $ 12.89 |
| Shares outstanding | 18,758 | | 33,087 | | 57,227 | | 395,426 |
| Net Assets | $ 336,937 | | $ 366,800 | | $ 995,377 | | $ 5,096,684 |
| Class R5: Net asset value per share | $ 17.88 | | $ 10.78 | | $ 17.26 | | $ 11.32 |
| Shares outstanding | 10,897 | | 4,812 | | 26,077 | | 999,002 |
| Net Assets | $ 194,877 | | $ 51,889 | | $ 450,132 | | $ 11,309,401 |
The accompanying notes are an integral part of these financial statements.
Hartford International/Global Equity Funds
Statements of Assets and Liabilities – (continued)
October 31, 2021
| | Hartford
Climate
Opportunities
Fund | | Hartford
Emerging
Markets Equity
Fund | | Hartford
Global Impact
Fund | | Hartford
International
Equity Fund |
| Class R6: Net asset value per share | $ 17.82 | | $ 10.88 | | $ 17.28 | | $ 13.11 |
| Shares outstanding | 17,139 | | 10,422 | | 530,405 | | 3,730,661 |
| Net Assets | $ 305,421 | | $ 113,355 | | $ 9,164,202 | | $ 48,911,396 |
| Class Y: Net asset value per share | $ 18.27 | | $ 10.85 | | $ 17.30 | | $ 13.05 |
| Shares outstanding | 548,171 | | 27,925,080 | | 308,411 | | 991,152 |
| Net Assets | $ 10,014,458 | | $ 302,968,372 | | $ 5,336,288 | | $ 12,934,713 |
| Class F: Net asset value per share | $ 18.48 | | $ 10.81 | | $ 17.40 | | $ 13.12 |
| Shares outstanding | 4,522,754 | | 10,653,408 | | 735,334 | | 6,484,819 |
| Net Assets | $ 83,559,083 | | $ 115,176,720 | | $ 12,792,458 | | $ 85,058,223 |
| Cost of investments | $ 121,556,035 | | $ 428,765,113 | | $ 107,280,262 | | $ 754,128,780 |
| Cost of foreign currency | $ 39,797 | | $ 2,369,214 | | $ 230 | | $ 396,194 |
| (1) Includes Investment in securities on loan, at market value | $ 492,608 | | $ 3,583,530 | | $ 537,135 | | $ 7,246,411 |
The accompanying notes are an integral part of these financial statements.
Hartford International/Global Equity Funds
Statements of Assets and Liabilities – (continued)
October 31, 2021
| | The Hartford
International
Growth Fund | | The Hartford
International
Opportunities
Fund | | The Hartford
International
Value Fund |
| Assets: | | | | | |
| Investments in securities, at market value(1) | $ 655,391,049 | | $ 4,674,870,410 | | $ 2,098,323,160 |
| Repurchase agreements | 18,476,137 | | 88,806,320 | | 65,027,238 |
| Cash | 4,362,803 | | 22,343,699 | | 16,361,145 |
| Cash collateral held for securities on loan | — | | — | | 212,773 |
| Foreign currency | 438 | | — | | 112,237 |
| Receivables: | | | | | |
| From affiliates | 30,549 | | — | | — |
| Investment securities sold | 1,193,622 | | 34,860,701 | | 59,461 |
| Fund shares sold | 943,645 | | 6,904,389 | | 5,906,601 |
| Dividends and interest | 389,962 | | 3,410,938 | | 8,182,845 |
| Securities lending income | — | | 1,977 | | 29,262 |
| Variation margin on futures contracts | — | | — | | 1,226,487 |
| Tax reclaims | 718,257 | | 4,655,902 | | 1,746,054 |
| Other assets | 51,143 | | 97,363 | | 125,112 |
| Total assets | 681,557,605 | | 4,835,951,699 | | 2,197,312,375 |
| Liabilities: | | | | | |
| Due to custodian - foreign currency | — | | 38,683 | | — |
| Obligation to return securities lending collateral | — | | — | | 4,255,462 |
| Payables: | | | | | |
| Investment securities purchased | 759,689 | | 34,800,085 | | 3,224,169 |
| Fund shares redeemed | 386,488 | | 4,160,220 | | 1,337,013 |
| Investment management fees | 435,408 | | 2,596,939 | | 1,449,130 |
| Transfer agent fees | 145,420 | | 512,202 | | 245,115 |
| Accounting services fees | 21,389 | | 110,302 | | 51,839 |
| Board of Directors' fees | 2,024 | | 13,073 | | 5,098 |
| Foreign taxes | — | | 4,386,635 | | 320,296 |
| Distribution fees | 7,740 | | 35,316 | | 3,853 |
| Accrued expenses | 86,891 | | 206,556 | | 155,201 |
| Total liabilities | 1,845,049 | | 46,860,011 | | 11,047,176 |
| Net assets | $ 679,712,556 | | $ 4,789,091,688 | | $ 2,186,265,199 |
| Summary of Net Assets: | | | | | |
| Capital stock and paid-in-capital | $ 499,472,691 | | $ 3,446,007,986 | | $ 2,324,441,313 |
| Distributable earnings (loss) | 180,239,865 | | 1,343,083,702 | | (138,176,114) |
| Net assets | $ 679,712,556 | | $ 4,789,091,688 | | $ 2,186,265,199 |
| Shares authorized | 485,000,000 | | 825,000,000 | | 780,000,000 |
| Par value | $ 0.0010 | | $ 0.0010 | | $ 0.0010 |
| Class A: Net asset value per share | $ 19.44 | | $ 21.23 | | $ 16.64 |
| Maximum offering price per share | 20.57 | | 22.47 | | 17.61 |
| Shares outstanding | 8,598,789 | | 26,540,206 | | 3,488,004 |
| Net Assets | $ 167,200,702 | | $ 563,576,768 | | $ 58,054,742 |
| Class C: Net asset value per share | $ 17.47 | | $ 18.33 | | $ 16.36 |
| Shares outstanding | 294,927 | | 1,520,146 | | 470,351 |
| Net Assets | $ 5,152,921 | | $ 27,867,727 | | $ 7,693,274 |
| Class I: Net asset value per share | $ 19.31 | | $ 21.13 | | $ 16.72 |
| Shares outstanding | 12,825,844 | | 27,437,434 | | 81,979,063 |
| Net Assets | $ 247,619,852 | | $ 579,815,042 | | $ 1,370,818,531 |
| Class R3: Net asset value per share | $ 19.66 | | $ 21.59 | | $ 16.65 |
| Shares outstanding | 41,090 | | 1,680,830 | | 42,267 |
| Net Assets | $ 807,671 | | $ 36,292,679 | | $ 703,886 |
| Class R4: Net asset value per share | $ 20.08 | | $ 22.02 | | $ 16.59 |
| Shares outstanding | 138,613 | | 5,014,267 | | 245,950 |
| Net Assets | $ 2,783,338 | | $ 110,423,543 | | $ 4,080,891 |
| Class R5: Net asset value per share | $ 20.26 | | $ 22.25 | | $ 16.78 |
| Shares outstanding | 1,842,440 | | 16,104,283 | | 2,215,120 |
| Net Assets | $ 37,333,894 | | $ 358,243,533 | | $ 37,167,676 |
The accompanying notes are an integral part of these financial statements.
Hartford International/Global Equity Funds
Statements of Assets and Liabilities – (continued)
October 31, 2021
| | The Hartford
International
Growth Fund | | The Hartford
International
Opportunities
Fund | | The Hartford
International
Value Fund |
| Class R6: Net asset value per share | $ 20.38 | | $ 22.39 | | $ 17.14 |
| Shares outstanding | 410,440 | | 46,324,279 | | 1,804,480 |
| Net Assets | $ 8,366,526 | | $ 1,037,195,110 | | $ 30,932,705 |
| Class Y: Net asset value per share | $ 20.32 | | $ 22.38 | | $ 17.13 |
| Shares outstanding | 744,125 | | 58,067,206 | | 25,598,602 |
| Net Assets | $ 15,124,109 | | $ 1,299,602,936 | | $ 438,441,631 |
| Class F: Net asset value per share | $ 19.35 | | $ 21.15 | | $ 16.74 |
| Shares outstanding | 10,095,846 | | 36,701,046 | | 14,240,414 |
| Net Assets | $ 195,323,543 | | $ 776,074,350 | | $ 238,371,863 |
| Cost of investments | $ 497,308,098 | | $ 3,845,107,974 | | $ 1,945,435,994 |
| Cost of foreign currency | $ 438 | | $ (38,621) | | $ 112,188 |
| (1) Includes Investment in securities on loan, at market value | $ — | | $ 15,371,182 | | $ 3,789,943 |
The accompanying notes are an integral part of these financial statements.
Hartford International/Global Equity Funds
Statements of Operations
For the Year Ended October 31, 2021
| | Hartford
Climate
Opportunities
Fund | | Hartford
Emerging
Markets Equity
Fund | | Hartford
Global Impact
Fund | | Hartford
International
Equity Fund |
| Investment Income: | | | | | | | |
| Dividends | $ 1,864,993 | | $ 16,484,859 | | $ 1,663,062 | | $ 22,471,444 |
| Interest | 1,242 | | 3,425 | | 2,008 | | 4,658 |
| Securities lending | 5,030 | | 75,044 | | 15,435 | | 110,088 |
| Less: Foreign tax withheld | (128,062) | | (1,785,236) | | (182,834) | | (2,340,420) |
| Total investment income, net | 1,743,203 | | 14,778,092 | | 1,497,671 | | 20,245,770 |
| Expenses: | | | | | | | |
| Investment management fees | 707,222 | | 4,320,997 | | 711,847 | | 4,263,839 |
| Transfer agent fees | | | | | | | |
| Class A | 34,477 | | 74,337 | | 122,705 | | 1,110,613 |
| Class C | 2,962 | | 5,355 | | 6,224 | | 46,678 |
| Class I | 19,111 | | 37,211 | | 36,796 | | 61,575 |
| Class R3 | 443 | | 902 | | 13,468 | | 30,203 |
| Class R4 | 534 | | 646 | | 1,631 | | 11,786 |
| Class R5 | 214 | | 442 | | 491 | | 11,851 |
| Class R6 | 8 | | 20 | | 235 | | 1,890 |
| Class Y | 7,671 | | 320,055 | | 1,361 | | 14,688 |
| Class F | 354 | | 328 | | 252 | | 1,591 |
| Distribution fees | | | | | | | |
| Class A | 62,129 | | 106,130 | | 131,393 | | 1,648,426 |
| Class C | 13,068 | | 21,431 | | 24,949 | | 231,199 |
| Class R3 | 1,007 | | 2,050 | | 32,500 | | 69,695 |
| Class R4 | 786 | | 951 | | 2,657 | | 17,332 |
| Custodian fees | 20,213 | | 176,027 | | 14,765 | | 87,027 |
| Registration and filing fees | 134,091 | | 126,918 | | 126,051 | | 120,629 |
| Accounting services fees | 20,083 | | 82,480 | | 19,731 | | 148,104 |
| Board of Directors' fees | 3,109 | | 12,753 | | 3,003 | | 23,804 |
| Audit and tax fees | 38,168 | | 82,765 | | 56,845 | | 67,709 |
| Other expenses | 31,177 | | 84,968 | | 27,386 | | 133,608 |
| Total expenses (before waivers, reimbursements and fees paid indirectly) | 1,096,827 | | 5,456,766 | | 1,334,290 | | 8,102,247 |
| Expense waivers | (135,373) | | (131,139) | | (132,098) | | — |
| Distribution fee reimbursements | (1,804) | | (275) | | (5,358) | | (32,458) |
| Commission recapture | (74) | | — | | (487) | | (1,883) |
| Total waivers, reimbursements and fees paid indirectly | (137,251) | | (131,414) | | (137,943) | | (34,341) |
| Total expenses | 959,576 | | 5,325,352 | | 1,196,347 | | 8,067,906 |
| Net Investment Income (Loss) | 783,627 | | 9,452,740 | | 301,324 | | 12,177,864 |
| Net Realized Gain (Loss) on Investments, Other Financial Instruments and Foreign Currency Transactions on: | | | | | | | |
| Investments | 7,015,355 | | 46,190,734 | | 11,568,178 | | 61,238,283 |
| Less: Foreign taxes paid on realized capital gains | — | | (840,298) | | — | | (142,815) |
| Futures contracts | — | | 763,685 | | — | | 3,754,712 |
| Other foreign currency transactions | (1,171) | | (316,719) | | (20,918) | | (276,147) |
| Net Realized Gain (Loss) on Investments, Other Financial Instruments and Foreign Currency Transactions | 7,014,184 | | 45,797,402 | | 11,547,260 | | 64,574,033 |
| Net Changes in Unrealized Appreciation (Depreciation) of Investments, Other Financial Instruments and Foreign Currency Transactions of: | | | | | | | |
| Investments * | 21,457,189 | | 27,022,941 | | 19,735,205 | | 132,917,616 |
| Futures contracts | — | | (212,722) | | — | | (47,726) |
| Translation of other assets and liabilities in foreign currencies | (2,456) | | (17,911) | | 2,240 | | (40,945) |
| Net Changes in Unrealized Appreciation (Depreciation) of Investments, Other Financial Instruments and Foreign Currency Transactions | 21,454,733 | | 26,792,308 | | 19,737,445 | | 132,828,945 |
| Net Gain (Loss) on Investments, Other Financial Instruments and Foreign Currency Transactions | 28,468,917 | | 72,589,710 | | 31,284,705 | | 197,402,978 |
| Net Increase (Decrease) in Net Assets Resulting from Operations | $ 29,252,544 | | $ 82,042,450 | | $ 31,586,029 | | $ 209,580,842 |
| * Includes change in unrealized appreciation (depreciation) on deferred capital gains tax | $ — | | $ (2,047,167) | | $ (20,168) | | $ (392,182) |
The accompanying notes are an integral part of these financial statements.
Hartford International/Global Equity Funds
Statements of Operations – (continued)
For the Year Ended October 31, 2021
| | The Hartford
International
Growth Fund | | The Hartford
International
Opportunities
Fund | | The Hartford
International
Value Fund |
| Investment Income: | | | | | |
| Dividends | $ 8,922,237 | | $ 84,789,111 | | $ 60,457,140 |
| Interest | 3,809 | | 22,263 | | 21,472 |
| Securities lending | 45,175 | | 589,221 | | 494,647 |
| Less: Foreign tax withheld | (987,814) | | (7,271,545) | | (6,519,862) |
| Total investment income, net | 7,983,407 | | 78,129,050 | | 54,453,397 |
| Expenses: | | | | | |
| Investment management fees | 5,000,180 | | 29,351,547 | | 13,934,000 |
| Transfer agent fees | | | | | |
| Class A | 284,518 | | 769,694 | | 59,422 |
| Class C | 14,421 | | 48,191 | | 9,858 |
| Class I | 466,865 | | 418,199 | | 1,145,648 |
| Class R3 | 1,986 | | 86,441 | | 1,507 |
| Class R4 | 4,501 | | 189,352 | | 6,329 |
| Class R5 | 39,224 | | 373,303 | | 34,403 |
| Class R6 | 294 | | 29,169 | | 500 |
| Class Y | 16,577 | | 1,302,637 | | 245,664 |
| Class F | 2,041 | | 7,449 | | 951 |
| Distribution fees | | | | | |
| Class A | 415,292 | | 1,357,731 | | 110,980 |
| Class C | 57,744 | | 298,589 | | 75,747 |
| Class R3 | 4,520 | | 196,640 | | 3,428 |
| Class R4 | 6,691 | | 290,860 | | 9,324 |
| Custodian fees | 51,672 | | 124,179 | | 123,620 |
| Registration and filing fees | 173,317 | | 179,018 | | 208,937 |
| Accounting services fees | 110,253 | | 653,031 | | 263,093 |
| Board of Directors' fees | 18,138 | | 117,280 | | 45,615 |
| Audit and tax fees | 33,771 | | 32,945 | | 52,274 |
| Other expenses | 156,677 | | 391,407 | | 183,726 |
| Total expenses (before waivers, reimbursements and fees paid indirectly) | 6,858,682 | | 36,217,662 | | 16,515,026 |
| Expense waivers | (93,359) | | — | | — |
| Transfer agent fee waivers | — | | (418,816) | | (30,976) |
| Distribution fee reimbursements | (5,100) | | (13,903) | | (382) |
| Commission recapture | (5,004) | | (21,067) | | (1,903) |
| Total waivers, reimbursements and fees paid indirectly | (103,463) | | (453,786) | | (33,261) |
| Total expenses | 6,755,219 | | 35,763,876 | | 16,481,765 |
| Net Investment Income (Loss) | 1,228,188 | | 42,365,174 | | 37,971,632 |
| Net Realized Gain (Loss) on Investments, Other Financial Instruments and Foreign Currency Transactions on: | | | | | |
| Investments | 4,103,830 | | 817,083,173 | | 84,911,245 |
| Less: Foreign taxes paid on realized capital gains | — | | (346,083) | | — |
| Futures contracts | — | | — | | 7,852,388 |
| Foreign currency contracts | — | | — | | (399,577) |
| Other foreign currency transactions | (35,166) | | (1,594,163) | | (526,809) |
| Net Realized Gain (Loss) on Investments, Other Financial Instruments and Foreign Currency Transactions | 4,068,664 | | 815,142,927 | | 91,837,247 |
| Net Changes in Unrealized Appreciation (Depreciation) of Investments, Other Financial Instruments and Foreign Currency Transactions of: | | | | | |
| Investments * | 128,654,495 | | 186,419,782 | | 421,054,571 |
| Futures contracts | — | | — | | 487,382 |
| Translation of other assets and liabilities in foreign currencies | (11,398) | | (164,545) | | (140,701) |
| Net Changes in Unrealized Appreciation (Depreciation) of Investments, Other Financial Instruments and Foreign Currency Transactions | 128,643,097 | | 186,255,237 | | 421,401,252 |
| Net Gain (Loss) on Investments, Other Financial Instruments and Foreign Currency Transactions | 132,711,761 | | 1,001,398,164 | | 513,238,499 |
| Net Increase (Decrease) in Net Assets Resulting from Operations | $ 133,939,949 | | $ 1,043,763,338 | | $ 551,210,131 |
| * Includes change in unrealized appreciation (depreciation) on deferred capital gains tax | $ — | | $ (4,386,635) | | $ (320,296) |
The accompanying notes are an integral part of these financial statements.
Hartford International/Global Equity Funds
Statements of Changes in Net Assets
For the Year Ended October 31, 2021
| | Hartford
Climate Opportunities Fund | | Hartford
Emerging Markets Equity Fund |
| | For the
Year Ended
October 31,
2021 | | For the
Year Ended
October 31,
2020 | | For the
Year Ended
October 31,
2021 | | For the
Year Ended
October 31,
2020 |
| Operations: | | | | | | | |
| Net investment income (loss) | $ 783,627 | | $ 395,048 | | $ 9,452,740 | | $ 5,178,680 |
| Net realized gain (loss) on investments, other financial instruments and foreign currency transactions | 7,014,184 | | 593,517 | | 45,797,402 | | (19,765,512) |
| Net changes in unrealized appreciation (depreciation) of investments, other financial instruments and foreign currency transactions | 21,454,733 | | 8,324,588 | | 26,792,308 | | 30,885,392 |
| Net Increase (Decrease) in Net Assets Resulting from Operations | 29,252,544 | | 9,313,153 | | 82,042,450 | | 16,298,560 |
| Distributions to Shareholders: | | | | | | | |
| Class A | (145,874) | | (119,368) | | (357,708) | | (930,952) |
| Class C | (4,889) | | (8,961) | | (3,128) | | (30,884) |
| Class I | (70,488) | | (68,860) | | (339,224) | | (551,883) |
| Class R3 | (1,589) | | (6,294) | | (2,122) | | (8,081) |
| Class R4 | (3,274) | | (5,823) | | (3,221) | | (2,567) |
| Class R5 | (2,495) | | (5,744) | | (10,847) | | (16,899) |
| Class R6 | (2,724) | | (6,463) | | (16,072) | | (25,806) |
| Class Y | (37,648) | | (26,904) | | (3,485,488) | | (5,358,106) |
| Class F | (791,120) | | (749,220) | | (1,212,609) | | (781,456) |
| Total distributions | (1,060,101) | | (997,637) | | (5,430,419) | | (7,706,634) |
| Capital Share Transactions: | | | | | | | |
| Sold | 87,432,360 | | 31,639,136 | | 140,044,654 | | 130,581,792 |
| Issued on reinvestment of distributions | 986,448 | | 915,805 | | 4,185,192 | | 7,403,318 |
| Redeemed | (19,183,630) | | (4,714,571) | | (90,258,960) | | (87,080,919) |
| Net increase (decrease) from capital share transactions | 69,235,178 | | 27,840,370 | | 53,970,886 | | 50,904,191 |
| Net Increase (Decrease) in Net Assets | 97,427,621 | | 36,155,886 | | 130,582,917 | | 59,496,117 |
| Net Assets: | | | | | | | |
| Beginning of period | 56,225,663 | | 20,069,777 | | 369,256,529 | | 309,760,412 |
| End of period | $ 153,653,284 | | $ 56,225,663 | | $ 499,839,446 | | $ 369,256,529 |
The accompanying notes are an integral part of these financial statements.
Hartford International/Global Equity Funds
Statements of Changes in Net Assets – (continued)
For the Year Ended October 31, 2021
| | Hartford
Global Impact Fund | | Hartford
International Equity Fund |
| | For the
Year Ended
October 31,
2021 | | For the
Year Ended
October 31,
2020 | | For the
Year Ended
October 31,
2021 | | For the
Year Ended
October 31,
2020 |
| Operations: | | | | | | | |
| Net investment income (loss) | $ 301,324 | | $ 585,903 | | $ 12,177,864 | | $ 9,393,391 |
| Net realized gain (loss) on investments, other financial instruments and foreign currency transactions | 11,547,260 | | 1,395,787 | | 64,574,033 | | (18,252,535) |
| Net changes in unrealized appreciation (depreciation) of investments, other financial instruments and foreign currency transactions | 19,737,445 | | 9,103,263 | | 132,828,945 | | (22,357,263) |
| Net Increase (Decrease) in Net Assets Resulting from Operations | 31,586,029 | | 11,084,953 | | 209,580,842 | | (31,216,407) |
| Distributions to Shareholders: | | | | | | | |
| Class A | (189,333) | | (147,652) | | (6,835,200) | | (15,148,861) |
| Class C | — | | (7,654) | | (42,167) | | (514,273) |
| Class I | (202,896) | | (132,781) | | (876,767) | | (2,054,436) |
| Class R3 | (9,943) | | (22,549) | | (108,861) | | (307,228) |
| Class R4 | (4,869) | | (9,729) | | (80,094) | | (182,968) |
| Class R5 | (2,640) | | (2,372) | | (158,409) | | (50,469) |
| Class R6 | (44,105) | | (7,185) | | (637,579) | | (709,639) |
| Class Y | (15,334) | | (59,070) | | (159,071) | | (845,813) |
| Class F | (48,506) | | (256,406) | | (1,171,764) | | (1,982,075) |
| Total distributions | (517,626) | | (645,398) | | (10,069,912) | | (21,795,762) |
| Capital Share Transactions: | | | | | | | |
| Sold | 52,598,956 | | 20,511,763 | | 56,655,037 | | 91,228,401 |
| Issued in merger | — | | 82,415,575 | | — | | — |
| Issued on reinvestment of distributions | 507,891 | | 635,509 | | 9,906,402 | | 21,151,248 |
| Redeemed | (27,977,798) | | (76,012,743) | | (143,795,967) | | (241,036,381) |
| Net increase (decrease) from capital share transactions | 25,129,049 | | 27,550,104 | | (77,234,528) | | (128,656,732) |
| Net Increase (Decrease) in Net Assets | 56,197,452 | | 37,989,659 | | 122,276,402 | | (181,668,901) |
| Net Assets: | | | | | | | |
| Beginning of period | 84,402,686 | | 46,413,027 | | 784,221,900 | | 965,890,801 |
| End of period | $ 140,600,138 | | $ 84,402,686 | | $ 906,498,302 | | $ 784,221,900 |
The accompanying notes are an integral part of these financial statements.
Hartford International/Global Equity Funds
Statements of Changes in Net Assets – (continued)
For the Year Ended October 31, 2021
| | The Hartford
International Growth Fund | | The Hartford
International Opportunities Fund |
| | For the
Year Ended
October 31,
2021 | | For the
Year Ended
October 31,
2020 | | For the
Year Ended
October 31,
2021 | | For the
Year Ended
October 31,
2020 |
| Operations: | | | | | | | |
| Net investment income (loss) | $ 1,228,188 | | $ 889,888 | | $ 42,365,174 | | $ 21,462,687 |
| Net realized gain (loss) on investments, other financial instruments and foreign currency transactions | 4,068,664 | | 31,658,605 | | 815,142,927 | | (182,390,963) |
| Net changes in unrealized appreciation (depreciation) of investments, other financial instruments and foreign currency transactions | 128,643,097 | | 3,020,790 | | 186,255,237 | | 423,056,540 |
| Net Increase (Decrease) in Net Assets Resulting from Operations | 133,939,949 | | 35,569,283 | | 1,043,763,338 | | 262,128,264 |
| Distributions to Shareholders: | | | | | | | |
| Class A | (4,940,476) | | (721,736) | | (1,966,312) | | (6,181,796) |
| Class C | (211,393) | | — | | — | | (261,125) |
| Class I | (7,211,221) | | (400,088) | | (2,750,046) | | (5,982,588) |
| Class R3 | (25,942) | | (1,745) | | (5,791) | | (460,064) |
| Class R4 | (74,701) | | (16,976) | | (401,758) | | (1,494,778) |
| Class R5 | (1,118,622) | | (263,929) | | (2,159,841) | | (4,277,258) |
| Class R6 | (178,937) | | (34,507) | | (6,004,017) | | (11,152,699) |
| Class Y | (453,767) | | (158,669) | | (7,984,680) | | (16,953,720) |
| Class F | (6,315,668) | | (1,145,422) | | (5,346,154) | | (11,446,722) |
| Total distributions | (20,530,727) | | (2,743,072) | | (26,618,599) | | (58,210,750) |
| Capital Share Transactions: | | | | | | | |
| Sold | 141,357,281 | | 261,096,819 | | 1,086,470,564 | | 851,693,324 |
| Issued on reinvestment of distributions | 20,462,012 | | 2,715,341 | | 25,801,993 | | 55,781,632 |
| Redeemed | (137,602,696) | | (91,978,214) | | (1,048,250,532) | | (985,954,816) |
| Net increase (decrease) from capital share transactions | 24,216,597 | | 171,833,946 | | 64,022,025 | | (78,479,860) |
| Net Increase (Decrease) in Net Assets | 137,625,819 | | 204,660,157 | | 1,081,166,764 | | 125,437,654 |
| Net Assets: | | | | | | | |
| Beginning of period | 542,086,737 | | 337,426,580 | | 3,707,924,924 | | 3,582,487,270 |
| End of period | $ 679,712,556 | | $ 542,086,737 | | $ 4,789,091,688 | | $ 3,707,924,924 |
The accompanying notes are an integral part of these financial statements.
Hartford International/Global Equity Funds
Statements of Changes in Net Assets – (continued)
For the Year Ended October 31, 2021
| | The Hartford
International Value Fund |
| | For the
Year Ended
October 31,
2021 | | For the
Year Ended
October 31,
2020 |
| Operations: | | | |
| Net investment income (loss) | $ 37,971,632 | | $ 24,980,789 |
| Net realized gain (loss) on investments, other financial instruments and foreign currency transactions | 91,837,247 | | (359,750,646) |
| Net changes in unrealized appreciation (depreciation) of investments, other financial instruments and foreign currency transactions | 421,401,252 | | (118,477,641) |
| Net Increase (Decrease) in Net Assets Resulting from Operations | 551,210,131 | | (453,247,498) |
| Distributions to Shareholders: | | | |
| Class A | (394,527) | | (5,897,568) |
| Class C | (57,733) | | (306,110) |
| Class I | (16,322,708) | | (31,692,857) |
| Class R3 | (6,595) | | (11,482) |
| Class R4 | (59,329) | | (87,974) |
| Class R5 | (657,545) | | (1,052,666) |
| Class R6 | (661,246) | | (5,419,824) |
| Class Y | (5,652,207) | | (17,970,437) |
| Class F | (4,332,925) | | (9,066,373) |
| Total distributions | (28,144,815) | | (71,505,291) |
| Capital Share Transactions: | | | |
| Sold | 1,277,251,762 | | 551,353,898 |
| Issued on reinvestment of distributions | 27,765,432 | | 68,483,557 |
| Redeemed | (600,108,950) | | (1,470,688,737) |
| Net increase (decrease) from capital share transactions | 704,908,244 | | (850,851,282) |
| Net Increase (Decrease) in Net Assets | 1,227,973,560 | | (1,375,604,071) |
| Net Assets: | | | |
| Beginning of period | 958,291,639 | | 2,333,895,710 |
| End of period | $ 2,186,265,199 | | $ 958,291,639 |
The accompanying notes are an integral part of these financial statements.
Hartford International/Global Equity Funds
| | | — Selected Per-Share Data(1) — | | — Ratios and Supplemental Data — |
| Class | | Net
Asset
Value at
Beginning
of Period | | Net
Investment
Income
(Loss) | | Net
Realized
and
Unrealized
Gain (Loss)
on
Investments | | Total from
Investment
Operations | | Dividends
from Net
Investment
Income | | Distributions
from
Capital
Gains | | Total
Dividends
and
Distributions | | Net
Asset
Value at
End of
Period | | Total
Return(2) | | Net
Assets
at End
of Period
(000s) | | Ratio of
Expenses
to
Average
Net
Assets
Before
Adjust-
ments(3) | | Ratio of
Expenses
to
Average
Net
Assets
After
Adjust-
ments(3) | | Ratio of
Net
Investment
Income
(Loss) to
Average
Net Assets | | Portfolio
Turnover |
| Hartford Climate Opportunities Fund |
| For the Year Ended October 31, 2021 |
| A | | $ 13.13 | | $ 0.06 | | $ 5.24 | | $ 5.30 | | $ (0.02) | | $ (0.15) | | $ (0.17) | | $ 18.26 | | 40.65% | | $ 36,849 | | 1.23% | | 1.17% | | 0.36% | | 36% |
| C | | 12.97 | | (0.07) | | 5.17 | | 5.10 | | — | | (0.15) | | (0.15) | | 17.92 | | 39.54 | | 2,146 | | 2.06 | | 1.93 | | (0.42) | | 36 |
| I | | 12.95 | | 0.11 | | 5.16 | | 5.27 | | (0.07) | | (0.15) | | (0.22) | | 18.00 | | 41.03 | | 20,001 | | 0.96 | | 0.88 | | 0.67 | | 36 |
| R3 | | 12.90 | | 0.07 | | 5.15 | | 5.22 | | — | | (0.15) | | (0.15) | | 17.97 | | 40.70 | | 245 | | 1.56 | | 1.08 | | 0.44 | | 36 |
| R4 | | 12.91 | | 0.09 | | 5.15 | | 5.24 | | (0.04) | | (0.15) | | (0.19) | | 17.96 | | 40.84 | | 337 | | 1.26 | | 0.99 | | 0.54 | | 36 |
| R5 | | 12.87 | | 0.12 | | 5.12 | | 5.24 | | (0.08) | | (0.15) | | (0.23) | | 17.88 | | 41.09 | | 195 | | 0.96 | | 0.81 | | 0.71 | | 36 |
| R6 | | 12.83 | | 0.15 | | 5.09 | | 5.24 | | (0.10) | | (0.15) | | (0.25) | | 17.82 | | 41.24 | | 305 | | 0.84 | | 0.69 | | 0.90 | | 36 |
| Y | | 13.15 | | 0.13 | | 5.23 | | 5.36 | | (0.09) | | (0.15) | | (0.24) | | 18.27 | | 41.08 | | 10,014 | | 0.95 | | 0.79 | | 0.78 | | 36 |
| F | | 13.29 | | 0.14 | | 5.30 | | 5.44 | | (0.10) | | (0.15) | | (0.25) | | 18.48 | | 41.32 | | 83,559 | | 0.84 | | 0.69 | | 0.83 | | 36 |
| For the Year Ended October 31, 2020 |
| A | | $ 10.92 | | $ 0.07 | | $ 2.42 | | $ 2.49 | | $ (0.05) | | $ (0.23) | | $ (0.28) | | $ 13.13 | | 23.27% | | $ 9,476 | | 1.49% | | 1.10% | | 0.58% | | 36% |
| C | | 10.93 | | (0.03) | | 2.40 | | 2.37 | | (0.10) | | (0.23) | | (0.33) | | 12.97 | | 22.24 | | 403 | | 2.33 | | 1.94 | | (0.26) | | 36 |
| I | | 10.78 | | 0.10 | | 2.39 | | 2.49 | | (0.09) | | (0.23) | | (0.32) | | 12.95 | | 23.58 | | 3,649 | | 1.21 | | 0.83 | | 0.86 | | 36 |
| R3 | | 11.02 | | 0.08 | | 2.41 | | 2.49 | | (0.38) | | (0.23) | | (0.61) | | 12.90 | | 23.51 | | 139 | | 1.80 | | 0.93 | | 0.74 | | 36 |
| R4 | | 10.93 | | 0.09 | | 2.39 | | 2.48 | | (0.27) | | (0.23) | | (0.50) | | 12.91 | | 23.48 | | 229 | | 1.50 | | 0.93 | | 0.76 | | 36 |
| R5 | | 10.94 | | 0.10 | | 2.39 | | 2.49 | | (0.33) | | (0.23) | | (0.56) | | 12.87 | | 23.58 | | 138 | | 1.20 | | 0.81 | | 0.85 | | 36 |
| R6 | | 10.96 | | 0.11 | | 2.39 | | 2.50 | | (0.40) | | (0.23) | | (0.63) | | 12.83 | | 23.73 | | 139 | | 1.08 | | 0.69 | | 0.97 | | 36 |
| Y | | 10.94 | | 0.10 | | 2.43 | | 2.53 | | (0.09) | | (0.23) | | (0.32) | | 13.15 | | 23.66 | | 1,663 | | 1.18 | | 0.79 | | 0.90 | | 36 |
| F | | 11.01 | | 0.11 | | 2.45 | | 2.56 | | (0.05) | | (0.23) | | (0.28) | | 13.29 | | 23.76 | | 40,390 | | 1.08 | | 0.69 | | 1.00 | | 36 |
| For the Year Ended October 31, 2019 |
| A | | $ 10.99 | | $ 0.11 | | $ 1.34 | | $ 1.45 | | $ (0.11) | | $ (1.41) | | $ (1.52) | | $ 10.92 | | 16.47% | | $ 4,510 | | 1.79% | | 1.08% | | 1.12% | | 50% |
| C | | 10.99 | | 0.12 | | 1.35 | | 1.47 | | (0.12) | | (1.41) | | (1.53) | | 10.93 | | 16.68 | | 286 | | 2.38 | | 0.95 | | 1.19 | | 50 |
| I | | 11.00 | | 0.13 | | 1.32 | | 1.45 | | (0.26) | | (1.41) | | (1.67) | | 10.78 | | 16.85 | | 2,314 | | 1.41 | | 0.77 | | 1.25 | | 50 |
| R3 | | 10.98 | | 0.14 | | 1.43 | | 1.57 | | (0.12) | | (1.41) | | (1.53) | | 11.02 | | 17.77 | | 112 | | 1.85 | | 0.75 | | 1.39 | | 50 |
| R4 | | 10.99 | | 0.13 | | 1.35 | | 1.48 | | (0.13) | | (1.41) | | (1.54) | | 10.93 | | 16.78 | | 125 | | 1.61 | | 0.84 | | 1.30 | | 50 |
| R5 | | 10.99 | | 0.13 | | 1.36 | | 1.49 | | (0.13) | | (1.41) | | (1.54) | | 10.94 | | 16.88 | | 112 | | 1.35 | | 0.79 | | 1.35 | | 50 |
| R6 | | 11.01 | | 0.15 | | 1.36 | | 1.51 | | (0.15) | | (1.41) | | (1.56) | | 10.96 | | 17.12 | | 112 | | 1.31 | | 0.67 | | 1.47 | | 50 |
| Y | | 11.00 | | 0.14 | | 1.35 | | 1.49 | | (0.14) | | (1.41) | | (1.55) | | 10.94 | | 17.00 | | 804 | | 1.36 | | 0.71 | | 1.39 | | 50 |
| F | | 11.06 | | 0.16 | | 1.34 | | 1.50 | | (0.14) | | (1.41) | | (1.55) | | 11.01 | | 16.88 | | 11,696 | | 1.41 | | 0.69 | | 1.52 | | 50 |
| For the Year Ended October 31, 2018 |
| A | | $ 13.64 | | $ 0.13 | | $ (1.65) | | $ (1.52) | | $ (0.06) | | $ (1.07) | | $ (1.13) | | $ 10.99 | | (12.08)% | | $ 4,266 | | 1.64% | | 1.07% | | 1.04% | | 42% |
| C | | 13.62 | | 0.14 | | (1.65) | | (1.51) | | (0.05) | | (1.07) | | (1.12) | | 10.99 | | (11.95) | | 1,425 | | 2.34 | | 0.97 | | 1.13 | | 42 |
| I | | 13.68 | | 0.15 | | (1.64) | | (1.49) | | (0.12) | | (1.07) | | (1.19) | | 11.00 | | (11.82) | | 8,157 | | 1.26 | | 0.76 | | 1.25 | | 42 |
| R3 | | 13.63 | | 0.14 | | (1.65) | | (1.51) | | (0.07) | | (1.07) | | (1.14) | | 10.98 | | (12.02) | | 1,231 | | 1.96 | | 0.98 | | 1.13 | | 42 |
| R4 | | 13.64 | | 0.14 | | (1.64) | | (1.50) | | (0.08) | | (1.07) | | (1.15) | | 10.99 | | (11.93) | | 1,247 | | 1.66 | | 0.92 | | 1.18 | | 42 |
| R5 | | 13.65 | | 0.15 | | (1.65) | | (1.50) | | (0.09) | | (1.07) | | (1.16) | | 10.99 | | (11.84) | | 1,241 | | 1.36 | | 0.87 | | 1.24 | | 42 |
| R6 | | 13.66 | | 0.17 | | (1.65) | | (1.48) | | (0.10) | | (1.07) | | (1.17) | | 11.01 | | (11.74) | | 1,244 | | 1.24 | | 0.75 | | 1.35 | | 42 |
| Y | | 13.66 | | 0.16 | | (1.64) | | (1.48) | | (0.11) | | (1.07) | | (1.18) | | 11.00 | | (11.77) | | 1,342 | | 1.29 | | 0.76 | | 1.34 | | 42 |
| F | | 13.68 | | 0.17 | | (1.67) | | (1.50) | | (0.05) | | (1.07) | | (1.12) | | 11.06 | | (11.78) | | 9,263 | | 1.24 | | 0.75 | | 1.38 | | 42 |
The accompanying notes are an integral part of these financial statements.
Hartford International/Global Equity Funds
Financial Highlights – (continued)
| | | — Selected Per-Share Data(1) — | | — Ratios and Supplemental Data — |
| Class | | Net
Asset
Value at
Beginning
of Period | | Net
Investment
Income
(Loss) | | Net
Realized
and
Unrealized
Gain (Loss)
on
Investments | | Total from
Investment
Operations | | Dividends
from Net
Investment
Income | | Distributions
from
Capital
Gains | | Total
Dividends
and
Distributions | | Net
Asset
Value at
End of
Period | | Total
Return(2) | | Net
Assets
at End
of Period
(000s) | | Ratio of
Expenses
to
Average
Net
Assets
Before
Adjust-
ments(3) | | Ratio of
Expenses
to
Average
Net
Assets
After
Adjust-
ments(3) | | Ratio of
Net
Investment
Income
(Loss) to
Average
Net Assets | | Portfolio
Turnover |
| Hartford Climate Opportunities Fund – (continued) |
| For the Year Ended October 31, 2017 |
| A | | $ 11.53 | | $ 0.11 | | $ 2.33 | | $ 2.44 | | $ (0.12) | | $ (0.21) | | $ (0.33) | | $ 13.64 | | 21.76% | | $ 4,336 | | 1.87% | | 1.18% | | 0.87% | | 44% |
| C | | 11.47 | | 0.08 | | 2.33 | | 2.41 | | (0.05) | | (0.21) | | (0.26) | | 13.62 | | 21.48 | | 1,559 | | 2.53 | | 1.37 | | 0.69 | | 44 |
| I | | 11.55 | | 0.14 | | 2.34 | | 2.48 | | (0.14) | | (0.21) | | (0.35) | | 13.68 | | 22.12 | | 19,040 | | 1.53 | | 0.92 | | 1.18 | | 44 |
| R3 | | 11.50 | | 0.10 | | 2.33 | | 2.43 | | (0.09) | | (0.21) | | (0.30) | | 13.63 | | 21.68 | | 1,399 | | 2.20 | | 1.22 | | 0.83 | | 44 |
| R4 | | 11.52 | | 0.12 | | 2.32 | | 2.44 | | (0.11) | | (0.21) | | (0.32) | | 13.64 | | 21.84 | | 1,404 | | 1.90 | | 1.11 | | 0.94 | | 44 |
| R5 | | 11.54 | | 0.13 | | 2.33 | | 2.46 | | (0.14) | | (0.21) | | (0.35) | | 13.65 | | 22.01 | | 1,408 | | 1.60 | | 1.00 | | 1.05 | | 44 |
| R6 | | 11.55 | | 0.14 | | 2.33 | | 2.47 | | (0.15) | | (0.21) | | (0.36) | | 13.66 | | 22.09 | | 1,411 | | 1.50 | | 0.90 | | 1.16 | | 44 |
| Y | | 11.55 | | 0.14 | | 2.33 | | 2.47 | | (0.15) | | (0.21) | | (0.36) | | 13.66 | | 22.09 | | 1,469 | | 1.51 | | 0.90 | | 1.16 | | 44 |
| F (4) | | 11.81 | | 0.08 | | 1.79 | | 1.87 | | — | | — | | — | | 13.68 | | 15.83 (5) | | 6,424 | | 1.58 (6) | | 0.90 (6) | | 0.87 (6) | | 44 |
| Hartford Emerging Markets Equity Fund |
| For the Year Ended October 31, 2021 |
| A | | $ 9.06 | | $ 0.17 | | $ 1.74 | | $ 1.91 | | $ (0.09) | | $ — | | $ (0.09) | | $ 10.88 | | 21.18% | | $ 40,629 | | 1.44% | | 1.44% | | 1.60% | | 95% |
| C | | 8.88 | | 0.09 | | 1.71 | | 1.80 | | (0.02) | | — | | (0.02) | | 10.66 | | 20.23 | | 2,029 | | 2.27 | | 2.20 | | 0.86 | | 95 |
| I | | 9.04 | | 0.22 | | 1.73 | | 1.95 | | (0.12) | | — | | (0.12) | | 10.87 | | 21.64 | | 38,104 | | 1.12 | | 1.12 | | 1.99 | | 95 |
| R3 | | 9.01 | | 0.16 | | 1.73 | | 1.89 | | (0.07) | | — | | (0.07) | | 10.83 | | 20.99 | | 400 | | 1.74 | | 1.70 | | 1.47 | | 95 |
| R4 | | 9.23 | | 0.18 | | 1.77 | | 1.95 | | (0.09) | | — | | (0.09) | | 11.09 | | 21.22 | | 367 | | 1.44 | | 1.43 | | 1.60 | | 95 |
| R5 | | 9.00 | | 0.08 | | 1.82 | | 1.90 | | (0.12) | | — | | (0.12) | | 10.78 | | 21.24 | | 52 | | 1.14 | | 1.13 | | 0.80 | | 95 |
| R6 | | 9.05 | | 0.10 | | 1.87 | | 1.97 | | (0.14) | | — | | (0.14) | | 10.88 | | 21.88 | | 113 | | 1.02 | | 0.98 | | 0.95 | | 95 |
| Y | | 9.03 | | 0.21 | | 1.74 | | 1.95 | | (0.13) | | — | | (0.13) | | 10.85 | | 21.67 | | 302,968 | | 1.13 | | 1.10 | | 1.97 | | 95 |
| F | | 9.00 | | 0.23 | | 1.72 | | 1.95 | | (0.14) | | — | | (0.14) | | 10.81 | | 21.78 | | 115,177 | | 1.02 | | 0.98 | | 2.15 | | 95 |
| For the Year Ended October 31, 2020 |
| A | | $ 8.96 | | $ 0.11 | | $ 0.18 | | $ 0.29 | | $ (0.19) | | $ — | | $ (0.19) | | $ 9.06 | | 3.12% | | $ 36,749 | | 1.47% | | 1.41% | | 1.27% | | 104% |
| C | | 8.78 | | 0.04 | | 0.16 | | 0.20 | | (0.10) | | — | | (0.10) | | 8.88 | | 2.26 | | 1,669 | | 2.29 | | 2.20 | | 0.45 | | 104 |
| I | | 8.94 | | 0.14 | | 0.18 | | 0.32 | | (0.22) | | — | | (0.22) | | 9.04 | | 3.45 | | 26,381 | | 1.14 | | 1.08 | | 1.61 | | 104 |
| R3 | | 8.95 | | 0.09 | | 0.16 | | 0.25 | | (0.19) | | — | | (0.19) | | 9.01 | | 2.68 | | 284 | | 1.76 | | 1.70 | | 1.04 | | 104 |
| R4 | | 9.01 | | 0.12 | | 0.16 | | 0.28 | | (0.06) | | — | | (0.06) | | 9.23 | | 3.12 | | 328 | | 1.46 | | 1.39 | | 1.34 | | 104 |
| R5 | | 8.90 | | 0.14 | | 0.18 | | 0.32 | | (0.22) | | — | | (0.22) | | 9.00 | | 3.46 | | 791 | | 1.16 | | 1.10 | | 1.58 | | 104 |
| R6 | | 8.96 | | 0.15 | | 0.17 | | 0.32 | | (0.23) | | — | | (0.23) | | 9.05 | | 3.43 | | 1,065 | | 1.04 | | 0.98 | | 1.71 | | 104 |
| Y | | 8.93 | | 0.14 | | 0.18 | | 0.32 | | (0.22) | | — | | (0.22) | | 9.03 | | 3.47 | | 244,884 | | 1.14 | | 1.08 | | 1.62 | | 104 |
| F | | 8.90 | | 0.15 | | 0.17 | | 0.32 | | (0.22) | | — | | (0.22) | | 9.00 | | 3.55 | | 57,105 | | 1.04 | | 0.98 | | 1.73 | | 104 |
| For the Year Ended October 31, 2019 |
| A | | $ 8.39 | | $ 0.18 | | $ 0.54 | | $ 0.72 | | $ (0.15) | | $ — | | $ (0.15) | | $ 8.96 | | 8.82% | | $ 45,113 | | 1.50% | | 1.39% | | 2.02% | | 81% |
| C | | 8.18 | | 0.10 | | 0.54 | | 0.64 | | (0.04) | | — | | (0.04) | | 8.78 | | 7.93 | | 2,738 | | 2.34 | | 2.20 | | 1.20 | | 81 |
| I | | 8.39 | | 0.23 | | 0.50 | | 0.73 | | (0.18) | | — | | (0.18) | | 8.94 | | 8.99 | | 23,116 | | 1.19 | | 1.09 | | 2.60 | | 81 |
| R3 | | 8.38 | | 0.16 | | 0.54 | | 0.70 | | (0.13) | | — | | (0.13) | | 8.95 | | 8.45 | | 220 | | 1.81 | | 1.69 | | 1.78 | | 81 |
| R4 | | 8.44 | | 0.14 | | 0.59 | | 0.73 | | (0.16) | | — | | (0.16) | | 9.01 | | 8.87 | | 352 | | 1.51 | | 1.39 | | 1.65 | | 81 |
| R5 | | 8.34 | | 0.22 | | 0.52 | | 0.74 | | (0.18) | | — | | (0.18) | | 8.90 | | 9.14 | | 691 | | 1.21 | | 1.10 | | 2.51 | | 81 |
| R6 | | 8.39 | | 0.22 | | 0.54 | | 0.76 | | (0.19) | | — | | (0.19) | | 8.96 | | 9.26 | | 1,006 | | 1.09 | | 0.98 | | 2.57 | | 81 |
| Y | | 8.38 | | 0.29 | | 0.45 | | 0.74 | | (0.19) | | — | | (0.19) | | 8.93 | | 9.06 | | 205,680 | | 1.19 | | 1.07 | | 3.34 | | 81 |
| F | | 8.35 | | 0.28 | | 0.46 | | 0.74 | | (0.19) | | — | | (0.19) | | 8.90 | | 9.17 | | 30,845 | | 1.09 | | 0.98 | | 3.20 | | 81 |
The accompanying notes are an integral part of these financial statements.
Hartford International/Global Equity Funds
Financial Highlights – (continued)
| | | — Selected Per-Share Data(1) — | | — Ratios and Supplemental Data — |
| Class | | Net
Asset
Value at
Beginning
of Period | | Net
Investment
Income
(Loss) | | Net
Realized
and
Unrealized
Gain (Loss)
on
Investments | | Total from
Investment
Operations | | Dividends
from Net
Investment
Income | | Distributions
from
Capital
Gains | | Total
Dividends
and
Distributions | | Net
Asset
Value at
End of
Period | | Total
Return(2) | | Net
Assets
at End
of Period
(000s) | | Ratio of
Expenses
to
Average
Net
Assets
Before
Adjust-
ments(3) | | Ratio of
Expenses
to
Average
Net
Assets
After
Adjust-
ments(3) | | Ratio of
Net
Investment
Income
(Loss) to
Average
Net Assets | | Portfolio
Turnover |
| Hartford Emerging Markets Equity Fund – (continued) |
| For the Year Ended October 31, 2018 |
| A | | $ 9.85 | | $ 0.20 | | $ (1.52) | | $ (1.32) | | $ (0.14) | | $ — | | $ (0.14) | | $ 8.39 | | (13.61)% | | $ 61,016 | | 1.53% | | 1.38% | | 2.10% | | 85% |
| C | | 9.64 | | 0.08 | | (1.45) | | (1.37) | | (0.09) | | — | | (0.09) | | 8.18 | | (14.32) | | 3,682 | | 2.37 | | 2.20 | | 0.83 | | 85 |
| I | | 9.83 | | 0.22 | | (1.50) | | (1.28) | | (0.16) | | — | | (0.16) | | 8.39 | | (13.30) | | 16,780 | | 1.24 | | 1.07 | | 2.23 | | 85 |
| R3 | | 9.85 | | 0.13 | | (1.48) | | (1.35) | | (0.12) | | — | | (0.12) | | 8.38 | | (13.89) | | 206 | | 1.85 | | 1.68 | | 1.37 | | 85 |
| R4 | | 9.90 | | 0.27 | | (1.59) | | (1.32) | | (0.14) | | — | | (0.14) | | 8.44 | | (13.57) | | 5,580 | | 1.55 | | 1.38 | | 2.90 | | 85 |
| R5 | | 9.79 | | 0.18 | | (1.47) | | (1.29) | | (0.16) | | — | | (0.16) | | 8.34 | | (13.43) | | 611 | | 1.26 | | 1.11 | | 1.88 | | 85 |
| R6 (7) | | 10.24 | | 0.11 | | (1.96) | | (1.85) | | — | | — | | — | | 8.39 | | (18.07) (5) | | 838 | | 1.14 (6) | | 0.98 (6) | | 1.90 (6) | | 85 |
| Y | | 9.83 | | 0.20 | | (1.48) | | (1.28) | | (0.17) | | — | | (0.17) | | 8.38 | | (13.32) | | 47,966 | | 1.19 | | 1.02 | | 2.06 | | 85 |
| F | | 9.85 | | 0.21 | | (1.49) | | (1.28) | | (0.22) | | — | | (0.22) | | 8.35 | | (13.30) | | 1,912 | | 1.14 | | 0.98 | | 2.23 | | 85 |
| For the Year Ended October 31, 2017 |
| A | | $ 7.65 | | $ 0.15 | | $ 2.12 | | $ 2.27 | | $ (0.07) | | $ — | | $ (0.07) | | $ 9.85 | | 30.12% | | $ 23,924 | | 1.76% | | 1.56% | | 1.78% | | 98% |
| C | | 7.49 | | 0.08 | | 2.10 | | 2.18 | | (0.03) | | — | | (0.03) | | 9.64 | | 29.28 | | 5,560 | | 2.50 | | 2.33 | | 0.91 | | 98 |
| I | | 7.64 | | 0.21 | | 2.08 | | 2.29 | | (0.10) | | — | | (0.10) | | 9.83 | | 30.54 | | 11,361 | | 1.42 | | 1.29 | | 2.43 | | 98 |
| R3 | | 7.58 | | 0.12 | | 2.15 | | 2.27 | | — | | — | | — | | 9.85 | | 29.95 | | 197 | | 2.11 | | 1.82 | | 1.41 | | 98 |
| R4 | | 7.61 | | 0.11 | | 2.18 | | 2.29 | | — | | — | | — | | 9.90 | | 30.09 | | 41 | | 1.87 | | 1.56 | | 1.38 | | 98 |
| R5 | | 7.59 | | 0.09 | | 2.20 | | 2.29 | | (0.09) | | — | | (0.09) | | 9.79 | | 30.66 | | 876 | | 1.35 | | 1.17 | | 0.95 | | 98 |
| Y | | 7.64 | | 0.13 | | 2.17 | | 2.30 | | (0.11) | | — | | (0.11) | | 9.83 | | 30.64 | | 38,223 | | 1.32 | | 1.23 | | 1.62 | | 98 |
| F (4) | | 7.96 | | 0.21 | | 1.68 | | 1.89 | | — | | — | | — | | 9.85 | | 23.74 (5) | | 1,500 | | 1.25 (6) | | 1.03 (6) | | 3.54 (6) | | 98 |
| Hartford Global Impact Fund |
| For the Year Ended October 31, 2021 |
| A | | $ 12.90 | | $ 0.02 | | $ 4.57 | | $ 4.59 | | $ (0.06) | | $ — | | $ (0.06) | | $ 17.43 | | 35.64% | | $ 58,065 | | 1.32% | | 1.18% | | 0.12% | | 37% |
| C | | 12.60 | | (0.10) | | 4.45 | | 4.35 | | — | | — | | — | | 16.95 | | 34.52 | | 2,715 | | 2.09 | | 1.93 | | (0.66) | | 37 |
| I | | 12.88 | | 0.07 | | 4.56 | | 4.63 | | (0.11) | | — | | (0.11) | | 17.40 | | 36.03 | | 43,723 | | 0.94 | | 0.87 | | 0.44 | | 37 |
| R3 | | 12.68 | | (0.02) | | 4.49 | | 4.47 | | (0.03) | | — | | (0.03) | | 17.12 | | 35.24 | | 7,359 | | 1.54 | | 1.40 | | (0.11) | | 37 |
| R4 | | 12.88 | | 0.03 | | 4.55 | | 4.58 | | (0.07) | | — | | (0.07) | | 17.39 | | 35.65 | | 995 | | 1.24 | | 1.10 | | 0.21 | | 37 |
| R5 | | 12.78 | | 0.08 | | 4.52 | | 4.60 | | (0.12) | | — | | (0.12) | | 17.26 | | 36.10 | | 450 | | 0.96 | | 0.80 | | 0.50 | | 37 |
| R6 | | 12.79 | | 0.11 | | 4.52 | | 4.63 | | (0.14) | | — | | (0.14) | | 17.28 | | 36.32 | | 9,164 | | 0.84 | | 0.69 | | 0.65 | | 37 |
| Y | | 12.81 | | 0.06 | | 4.55 | | 4.61 | | (0.12) | | — | | (0.12) | | 17.30 | | 36.13 | | 5,336 | | 0.90 | | 0.79 | | 0.40 | | 37 |
| F | | 12.88 | | 0.10 | | 4.56 | | 4.66 | | (0.14) | | — | | (0.14) | | 17.40 | | 36.30 | | 12,792 | | 0.84 | | 0.69 | | 0.62 | | 37 |
| For the Year Ended October 31, 2020 |
| A | | $ 11.32 | | $ 0.06 | | $ 1.56 | | $ 1.62 | | $ (0.04) | | $ — | | $ (0.04) | | $ 12.90 | | 14.37% | | $ 41,474 | | 1.50% | | 1.02% | | 0.56% | | 85% |
| C | | 11.12 | | (0.02) | | 1.53 | | 1.51 | | (0.03) | | — | | (0.03) | | 12.60 | | 13.63 | | 2,132 | | 2.23 | | 1.75 | | (0.17) | | 85 |
| I | | 11.30 | | 0.10 | | 1.56 | | 1.66 | | (0.08) | | — | | (0.08) | | 12.88 | | 14.79 | | 24,403 | | 1.12 | | 0.66 | | 0.90 | | 85 |
| R3 | | 11.14 | | 0.04 | | 1.54 | | 1.58 | | (0.04) | | — | | (0.04) | | 12.68 | | 14.21 | | 5,327 | | 1.72 | | 1.22 | | 0.36 | | 85 |
| R4 | | 11.28 | | 0.08 | | 1.56 | | 1.64 | | (0.04) | | — | | (0.04) | | 12.88 | | 14.59 | | 894 | | 1.38 | | 0.87 | | 0.73 | | 85 |
| R5 | | 11.18 | | 0.11 | | 1.54 | | 1.65 | | (0.05) | | — | | (0.05) | | 12.78 | | 14.77 | | 253 | | 1.10 | | 0.60 | | 0.95 | | 85 |
| R6 | | 11.21 | | 0.10 | | 1.56 | | 1.66 | | (0.08) | | — | | (0.08) | | 12.79 | | 14.87 | | 3,111 | | 1.04 | | 0.59 | | 0.88 | | 85 |
| Y | | 11.17 | | 0.14 | | 1.55 | | 1.69 | | (0.05) | | — | | (0.05) | | 12.81 | | 15.15 | | 2,958 | | 0.93 | | 0.43 | | 1.27 | | 85 |
| F | | 11.36 | | 0.12 | | 1.57 | | 1.69 | | (0.17) | | — | | (0.17) | | 12.88 | | 15.05 | | 3,850 | | 0.98 | | 0.41 | | 1.01 | | 85 |
The accompanying notes are an integral part of these financial statements.
Hartford International/Global Equity Funds
Financial Highlights – (continued)
| | | — Selected Per-Share Data(1) — | | — Ratios and Supplemental Data — |
| Class | | Net
Asset
Value at
Beginning
of Period | | Net
Investment
Income
(Loss) | | Net
Realized
and
Unrealized
Gain (Loss)
on
Investments | | Total from
Investment
Operations | | Dividends
from Net
Investment
Income | | Distributions
from
Capital
Gains | | Total
Dividends
and
Distributions | | Net
Asset
Value at
End of
Period | | Total
Return(2) | | Net
Assets
at End
of Period
(000s) | | Ratio of
Expenses
to
Average
Net
Assets
Before
Adjust-
ments(3) | | Ratio of
Expenses
to
Average
Net
Assets
After
Adjust-
ments(3) | | Ratio of
Net
Investment
Income
(Loss) to
Average
Net Assets | | Portfolio
Turnover |
| Hartford Global Impact Fund – (continued) |
| For the Year Ended October 31, 2019 |
| A | | $ 11.10 | | $ 0.12 | | $ 1.46 | | $ 1.58 | | $ (0.06) | | $ (1.30) | | $ (1.36) | | $ 11.32 | | 16.93% | | $ 872 | | 1.94% (8) | | 1.10% (8) | | 1.17% | | 5% (9) |
| C | | 10.93 | | 0.07 | | 1.45 | | 1.52 | | (0.03) | | (1.30) | | (1.33) | | 11.12 | | 16.45 | | 38 | | 2.74 (8) | | 1.60 (8) | | 0.63 | | 5 (9) |
| I | | 11.05 | | 0.17 | | 1.46 | | 1.63 | | (0.08) | | (1.30) | | (1.38) | | 11.30 | | 17.47 | | 13,351 | | 1.54 (8) | | 0.73 (8) | | 1.60 | | 5 (9) |
| R3 | | 10.98 | | 0.08 | | 1.48 | | 1.56 | | (0.10) | | (1.30) | | (1.40) | | 11.14 | | 16.94 | | 282 | | 2.07 (8) | | 1.19 (8) | | 0.79 | | 5 (9) |
| R4 | | 11.08 | | 0.13 | | 1.46 | | 1.59 | | (0.09) | | (1.30) | | (1.39) | | 11.28 | | 17.11 | | 27 | | 1.91 (8) | | 0.95 (8) | | 1.25 | | 5 (9) |
| R5 | | 11.00 | | 0.15 | | 1.44 | | 1.59 | | (0.11) | | (1.30) | | (1.41) | | 11.18 | | 17.45 | | 13 | | 1.61 (8) | | 0.76 (8) | | 1.43 | | 5 (9) |
| R6 | | 11.01 | | 0.20 | | 1.41 | | 1.61 | | (0.11) | | (1.30) | | (1.41) | | 11.21 | | 17.45 | | 897 | | 1.43 (8) | | 0.63 (8) | | 1.81 | | 5 (9) |
| Y | | 10.99 | | 0.23 | | 1.37 | | 1.60 | | (0.12) | | (1.30) | | (1.42) | | 11.17 | | 17.42 | | 300 | | 1.54 (8) | | 0.67 (8) | | 2.11 | | 5 (9) |
| F | | 11.16 | | 0.16 | | 1.47 | | 1.63 | | (0.13) | | (1.30) | | (1.43) | | 11.36 | | 17.43 | | 30,632 | | 1.49 (8) | | 0.66 (8) | | 1.54 | | 5 (9) |
| For the Year Ended October 31, 2018 |
| A | | $ 11.63 | | $ 0.09 | | $ (0.27) | | $ (0.18) | | $ — | | $ (0.35) | | $ (0.35) | | $ 11.10 | | (1.69)% | | $ 455 | | 2.35% (8) | | 1.20% (8) | | 0.78% | | 79% (10) |
| C | | 11.57 | | 0.03 | | (0.27) | | (0.24) | | (0.05) | | (0.35) | | (0.40) | | 10.93 | | (2.25) | | 40 | | 3.12 (8) | | 1.64 (8) | | 0.28 | | 79 (10) |
| I | | 11.66 | | 0.13 | | (0.26) | | (0.13) | | (0.13) | | (0.35) | | (0.48) | | 11.05 | | (1.34) | | 2,588 | | 1.91 (8) | | 0.79 (8) | | 1.12 | | 79 (10) |
| R3 | | 11.63 | | 0.10 | | (0.25) | | (0.15) | | (0.15) | | (0.35) | | (0.50) | | 10.98 | | (1.54) | | 11 | | 2.60 (8) | | 0.98 (8) | | 0.85 | | 79 (10) |
| R4 | | 11.64 | | 0.10 | | (0.26) | | (0.16) | | (0.05) | | (0.35) | | (0.40) | | 11.08 | | (1.58) | | 23 | | 2.30 (8) | | 1.03 (8) | | 0.88 | | 79 (10) |
| R5 | | 11.65 | | 0.12 | | (0.25) | | (0.13) | | (0.17) | | (0.35) | | (0.52) | | 11.00 | | (1.40) | | 11 | | 1.99 (8) | | 0.85 (8) | | 1.00 | | 79 (10) |
| R6 | | 11.66 | | 0.13 | | (0.25) | | (0.12) | | (0.18) | | (0.35) | | (0.53) | | 11.01 | | (1.23) | | 12 | | 1.88 (8) | | 0.74 (8) | | 1.10 | | 79 (10) |
| Y | | 11.65 | | 0.14 | | (0.27) | | (0.13) | | (0.18) | | (0.35) | | (0.53) | | 10.99 | | (1.31) | | 22 | | 1.93 (8) | | 0.79 (8) | | 1.15 | | 79 (10) |
| F | | 11.66 | | 0.13 | | (0.26) | | (0.13) | | (0.02) | | (0.35) | | (0.37) | | 11.16 | | (1.26) | | 26,117 | | 1.88 (8) | | 0.74 (8) | | 1.10 | | 79 (10) |
| For the Period Ended October 31, 2017(4) |
| A | | $ 10.00 | | $ 0.06 | | $ 1.57 | | $ 1.63 | | $ — | | $ — | | $ — | | $ 11.63 | | 16.30% (5) | | $ 140 | | 5.13% (6)(8) | | 1.19% (6)(8) | | 0.76% (6) | | 50% (10) |
| C | | 10.00 | | 0.01 | | 1.56 | | 1.57 | | — | | — | | — | | 11.57 | | 15.70 (5) | | 16 | | 5.94 (6)(8) | | 2.00 (6)(8) | | 0.11 (6) | | 50 (10) |
| I | | 10.00 | | 0.09 | | 1.57 | | 1.66 | | — | | — | | — | | 11.66 | | 16.60 (5) | | 1,214 | | 4.76 (6)(8) | | 0.86 (6)(8) | | 1.26 (6) | | 50 (10) |
| R3 | | 10.00 | | 0.07 | | 1.56 | | 1.63 | | — | | — | | — | | 11.63 | | 16.30 (5) | | 12 | | 5.54 (6)(8) | | 1.22 (6)(8) | | 0.93 (6) | | 50 (10) |
| R4 | | 10.00 | | 0.07 | | 1.57 | | 1.64 | | — | | — | | — | | 11.64 | | 16.40 (5) | | 12 | | 5.24 (6)(8) | | 1.12 (6)(8) | | 1.01 (6) | | 50 (10) |
| R5 | | 10.00 | | 0.09 | | 1.56 | | 1.65 | | — | | — | | — | | 11.65 | | 16.50 (5) | | 12 | | 4.94 (6)(8) | | 0.95 (6)(8) | | 1.19 (6) | | 50 (10) |
| R6 | | 10.00 | | 0.09 | | 1.57 | | 1.66 | | — | | — | | — | | 11.66 | | 16.60 (5) | | 12 | | 4.84 (6)(8) | | 0.85 (6)(8) | | 1.29 (6) | | 50 (10) |
| Y | | 10.00 | | 0.12 | | 1.53 | | 1.65 | | — | | — | | — | | 11.65 | | 16.50 (5) | | 12 | | 4.79 (6)(8) | | 0.90 (6)(8) | | 1.63 (6) | | 50 (10) |
| F | | 10.00 | | 0.10 | | 1.56 | | 1.66 | | — | | — | | — | | 11.66 | | 16.50 (5) | | 26,456 | | 4.74 (6)(8) | | 0.85 (6)(8) | | 1.28 (6) | | 50 (10) |
| Hartford International Equity Fund |
| For the Year Ended October 31, 2021 |
| A | | $ 10.24 | | $ 0.16 | | $ 2.59 | | $ 2.75 | | $ (0.13) | | $ — | | $ (0.13) | | $ 12.86 | | 26.93% | | $ 644,435 | | 0.94% | | 0.94% | | 1.25% | | 39% |
| C | | 10.05 | | 0.04 | | 2.58 | | 2.62 | | (0.02) | | — | | (0.02) | | 12.65 | | 26.06 | | 17,733 | | 1.72 | | 1.72 | | 0.34 | | 39 |
| I | | 10.38 | | 0.20 | | 2.63 | | 2.83 | | (0.17) | | — | | (0.17) | | 13.04 | | 27.35 | | 67,019 | | 0.61 | | 0.61 | | 1.58 | | 39 |
| R3 | | 10.16 | | 0.12 | | 2.58 | | 2.70 | | (0.10) | | — | | (0.10) | | 12.76 | | 26.61 | | 14,001 | | 1.24 | | 1.23 | | 0.96 | | 39 |
| R4 | | 10.26 | | 0.15 | | 2.61 | | 2.76 | | (0.13) | | — | | (0.13) | | 12.89 | | 27.00 | | 5,097 | | 0.94 | | 0.94 | | 1.21 | | 39 |
| R5 | | 9.03 | | 0.17 | | 2.29 | | 2.46 | | (0.17) | | — | | (0.17) | | 11.32 | | 27.35 | | 11,309 | | 0.63 | | 0.63 | | 1.57 | | 39 |
| R6 | | 10.43 | | 0.22 | | 2.64 | | 2.86 | | (0.18) | | — | | (0.18) | | 13.11 | | 27.52 | | 48,911 | | 0.53 | | 0.53 | | 1.67 | | 39 |
| Y | | 10.38 | | 0.20 | | 2.63 | | 2.83 | | (0.16) | | — | | (0.16) | | 13.05 | | 27.34 | | 12,935 | | 0.63 | | 0.63 | | 1.56 | | 39 |
| F | | 10.44 | | 0.21 | | 2.65 | | 2.86 | | (0.18) | | — | | (0.18) | | 13.12 | | 27.50 | | 85,058 | | 0.52 | | 0.52 | | 1.67 | | 39 |
The accompanying notes are an integral part of these financial statements.
Hartford International/Global Equity Funds
Financial Highlights – (continued)
| | | — Selected Per-Share Data(1) — | | — Ratios and Supplemental Data — |
| Class | | Net
Asset
Value at
Beginning
of Period | | Net
Investment
Income
(Loss) | | Net
Realized
and
Unrealized
Gain (Loss)
on
Investments | | Total from
Investment
Operations | | Dividends
from Net
Investment
Income | | Distributions
from
Capital
Gains | | Total
Dividends
and
Distributions | | Net
Asset
Value at
End of
Period | | Total
Return(2) | | Net
Assets
at End
of Period
(000s) | | Ratio of
Expenses
to
Average
Net
Assets
Before
Adjust-
ments(3) | | Ratio of
Expenses
to
Average
Net
Assets
After
Adjust-
ments(3) | | Ratio of
Net
Investment
Income
(Loss) to
Average
Net Assets | | Portfolio
Turnover |
| Hartford International Equity Fund – (continued) |
| For the Year Ended October 31, 2020 |
| A | | $ 10.74 | | $ 0.11 | | $ (0.37) | | $ (0.26) | | $ (0.24) | | $ — | | $ (0.24) | | $ 10.24 | | (2.57)% | | $ 558,506 | | 0.99% | | 0.99% | | 1.04% | | 77% |
| C | | 10.52 | | 0.02 | | (0.35) | | (0.33) | | (0.14) | | — | | (0.14) | | 10.05 | | (3.28) | | 24,973 | | 1.75 | | 1.75 | | 0.24 | | 77 |
| I | | 10.88 | | 0.14 | | (0.36) | | (0.22) | | (0.28) | | — | | (0.28) | | 10.38 | | (2.21) | | 54,603 | | 0.63 | | 0.63 | | 1.36 | | 77 |
| R3 | | 10.65 | | 0.08 | | (0.36) | | (0.28) | | (0.21) | | — | | (0.21) | | 10.16 | | (2.81) | | 12,115 | | 1.24 | | 1.23 | | 0.79 | | 77 |
| R4 | | 10.74 | | 0.11 | | (0.36) | | (0.25) | | (0.23) | | — | | (0.23) | | 10.26 | | (2.52) | | 6,419 | | 0.95 | | 0.95 | | 1.07 | | 77 |
| R5 | | 9.50 | | 0.15 | | (0.34) | | (0.19) | | (0.28) | | — | | (0.28) | | 9.03 | | (2.20) | | 8,761 | | 0.66 | | 0.66 | | 1.67 | | 77 |
| R6 | | 10.93 | | 0.16 | | (0.37) | | (0.21) | | (0.29) | | — | | (0.29) | | 10.43 | | (2.11) | | 37,296 | | 0.55 | | 0.55 | | 1.53 | | 77 |
| Y | | 10.88 | | 0.13 | | (0.35) | | (0.22) | | (0.28) | | — | | (0.28) | | 10.38 | | (2.20) | | 13,601 | | 0.65 | | 0.65 | | 1.27 | | 77 |
| F | | 10.94 | | 0.16 | | (0.37) | | (0.21) | | (0.29) | | — | | (0.29) | | 10.44 | | (2.11) | | 67,949 | | 0.54 | | 0.54 | | 1.50 | | 77 |
| For the Year Ended October 31, 2019 |
| A | | $ 9.91 | | $ 0.20 | | $ 0.67 | | $ 0.87 | | $ (0.02) | | $ (0.02) | | $ (0.04) | | $ 10.74 | | 8.88% | | $ 685,465 | | 0.97% | | 0.97% | | 1.94% | | 78% |
| C | | 9.76 | | 0.11 | | 0.67 | | 0.78 | | — | | (0.02) | | (0.02) | | 10.52 | | 8.01 | | 43,009 | | 1.71 | | 1.71 | | 1.13 | | 78 |
| I | | 10.01 | | 0.23 | | 0.69 | | 0.92 | | (0.03) | | (0.02) | | (0.05) | | 10.88 | | 9.29 | | 82,136 | | 0.63 | | 0.63 | | 2.20 | | 78 |
| R3 | | 9.85 | | 0.17 | | 0.67 | | 0.84 | | (0.02) | | (0.02) | | (0.04) | | 10.65 | | 8.59 | | 16,410 | | 1.24 | | 1.24 | | 1.67 | | 78 |
| R4 | | 9.91 | | 0.20 | | 0.68 | | 0.88 | | (0.03) | | (0.02) | | (0.05) | | 10.74 | | 8.89 | | 8,653 | | 0.96 | | 0.96 | | 1.99 | | 78 |
| R5 | | 8.75 | | 0.20 | | 0.60 | | 0.80 | | (0.03) | | (0.02) | | (0.05) | | 9.50 | | 9.27 | | 1,686 | | 0.65 | | 0.65 | | 2.23 | | 78 |
| R6 | | 10.06 | | 0.24 | | 0.69 | | 0.93 | | (0.04) | | (0.02) | | (0.06) | | 10.93 | | 9.29 | | 22,624 | | 0.54 | | 0.54 | | 2.32 | | 78 |
| Y | | 10.02 | | 0.25 | | 0.67 | | 0.92 | | (0.04) | | (0.02) | | (0.06) | | 10.88 | | 9.28 | | 33,756 | | 0.62 | | 0.62 | | 2.38 | | 78 |
| F | | 10.06 | | 0.25 | | 0.69 | | 0.94 | | (0.04) | | (0.02) | | (0.06) | | 10.94 | | 9.39 | | 72,152 | | 0.54 | | 0.54 | | 2.38 | | 78 |
| For the Year Ended October 31, 2018 |
| A | | $ 11.42 | | $ 0.13 | | $ (1.28) | | $ (1.15) | | $ (0.18) | | $ (0.18) | | $ (0.36) | | $ 9.91 | | (10.47)% | | $ 750,143 | | 1.15% | | 0.97% | | 1.30% | | 85% |
| C | | 11.28 | | 0.07 | | (1.29) | | (1.22) | | (0.12) | | (0.18) | | (0.30) | | 9.76 | | (11.16) | | 70,348 | | 1.96 | | 1.75 | | 0.65 | | 85 |
| I | | 11.52 | | 0.20 | | (1.33) | | (1.13) | | (0.20) | | (0.18) | | (0.38) | | 10.01 | | (10.21) | | 120,491 | | 0.87 | | 0.66 | | 1.85 | | 85 |
| R3 | | 11.37 | | 0.02 | | (1.21) | | (1.19) | | (0.15) | | (0.18) | | (0.33) | | 9.85 | | (10.84) | | 19,595 | | 1.41 | | 1.27 | | 0.29 | | 85 |
| R4 | | 11.43 | | 0.12 | | (1.28) | | (1.16) | | (0.18) | | (0.18) | | (0.36) | | 9.91 | | (10.58) | | 15,357 | | 1.19 | | 0.99 | | 1.29 | | 85 |
| R5 | | 10.09 | | 0.17 | | (1.13) | | (0.96) | | (0.20) | | (0.18) | | (0.38) | | 8.75 | | (9.97) | | 1,109 | | 0.91 | | 0.69 | | 1.75 | | 85 |
| R6 (7) | | 11.48 | | 0.11 | | (1.53) | | (1.42) | | — | | — | | — | | 10.06 | | (12.37) (5) | | 4,959 | | 0.68 (6) | | 0.53 (6) | | 1.50 (6) | | 85 |
| Y | | 11.51 | | 0.22 | | (1.31) | | (1.09) | | (0.22) | | (0.18) | | (0.40) | | 10.02 | | (9.92) | | 27,321 | | 0.83 | | 0.59 | | 2.02 | | 85 |
| F | | 11.53 | | 0.18 | | (1.28) | | (1.10) | | (0.19) | | (0.18) | | (0.37) | | 10.06 | | (9.94) | | 74,278 | | 0.71 | | 0.55 | | 1.76 | | 85 |
| For the Year Ended October 31, 2017 |
| A | | $ 9.37 | | $ 0.15 | | $ 2.07 | | $ 2.22 | | $ (0.17) | | $ — | | $ (0.17) | | $ 11.42 | | 24.17% | | $ 15,943 | | 1.74% | | 1.16% | | 1.43% | | 133% |
| C | | 9.25 | | 0.07 | | 2.06 | | 2.13 | | (0.10) | | — | | (0.10) | | 11.28 | | 23.29 | | 4,527 | | 2.47 | | 1.91 | | 0.71 | | 133 |
| I | | 9.44 | | 0.20 | | 2.06 | | 2.26 | | (0.18) | | — | | (0.18) | | 11.52 | | 24.49 | | 14,971 | | 1.43 | | 0.88 | | 1.88 | | 133 |
| R3 | | 9.37 | | 0.11 | | 2.07 | | 2.18 | | (0.18) | | — | | (0.18) | | 11.37 | | 23.76 | | 93 | | 2.28 | | 1.46 | | 1.10 | | 133 |
| R4 | | 9.40 | | 0.15 | | 2.07 | | 2.22 | | (0.19) | | — | | (0.19) | | 11.43 | | 24.13 | | 740 | | 1.75 | | 1.17 | | 1.39 | | 133 |
| R5 | | 9.38 | | 0.21 | | 1.75 | | 1.96 | | (1.25) | | — | | (1.25) | | 10.09 | | 24.50 | | 397 | | 1.38 | | 0.85 | | 2.28 | | 133 |
| Y | | 9.44 | | 0.18 | | 2.09 | | 2.27 | | (0.20) | | — | | (0.20) | | 11.51 | | 24.67 | | 11,822 | | 1.31 | | 0.78 | | 1.76 | | 133 |
| F (4) | | 9.65 | | 0.08 | | 1.80 | | 1.88 | | — | | — | | — | | 11.53 | | 19.48 (5) | | 1,739 | | 1.26 (6) | | 0.66 (6) | | 1.01 (6) | | 133 |
The accompanying notes are an integral part of these financial statements.
Hartford International/Global Equity Funds
Financial Highlights – (continued)
| | | — Selected Per-Share Data(1) — | | — Ratios and Supplemental Data — |
| Class | | Net
Asset
Value at
Beginning
of Period | | Net
Investment
Income
(Loss) | | Net
Realized
and
Unrealized
Gain (Loss)
on
Investments | | Total from
Investment
Operations | | Dividends
from Net
Investment
Income | | Distributions
from
Capital
Gains | | Total
Dividends
and
Distributions | | Net
Asset
Value at
End of
Period | | Total
Return(2) | | Net
Assets
at End
of Period
(000s) | | Ratio of
Expenses
to
Average
Net
Assets
Before
Adjust-
ments(3) | | Ratio of
Expenses
to
Average
Net
Assets
After
Adjust-
ments(3) | | Ratio of
Net
Investment
Income
(Loss) to
Average
Net Assets | | Portfolio
Turnover |
| The Hartford International Growth Fund |
| For the Year Ended October 31, 2021 |
| A | | $ 16.10 | | $ (0.01) | | $ 3.93 | | $ 3.92 | | $ — | | $ (0.58) | | $ (0.58) | | $ 19.44 | | 24.68% | | $ 167,201 | | 1.26% | | 1.26% | | (0.05)% | | 32% |
| C | | 14.63 | | (0.15) | | 3.57 | | 3.42 | | — | | (0.58) | | (0.58) | | 17.47 | | 23.72 | | 5,153 | | 2.09 | | 2.05 | | (0.86) | | 32 |
| I | | 15.97 | | 0.04 | | 3.91 | | 3.95 | | (0.03) | | (0.58) | | (0.61) | | 19.31 | | 25.09 | | 247,620 | | 1.04 | | 1.00 | | 0.21 | | 32 |
| R3 | | 16.31 | | (0.06) | | 3.99 | | 3.93 | | — | | (0.58) | | (0.58) | | 19.66 | | 24.42 | | 808 | | 1.56 | | 1.55 | | (0.33) | | 32 |
| R4 | | 16.61 | | — | | 4.05 | | 4.05 | | — | | (0.58) | | (0.58) | | 20.08 | | 24.71 | | 2,783 | | 1.26 | | 1.26 | | (0.02) | | 32 |
| R5 | | 16.73 | | 0.05 | | 4.09 | | 4.14 | | (0.03) | | (0.58) | | (0.61) | | 20.26 | | 25.09 | | 37,334 | | 0.94 | | 0.94 | | 0.26 | | 32 |
| R6 | | 16.83 | | 0.08 | | 4.11 | | 4.19 | | (0.06) | | (0.58) | | (0.64) | | 20.38 | | 25.23 | | 8,367 | | 0.84 | | 0.84 | | 0.40 | | 32 |
| Y | | 16.78 | | 0.05 | | 4.11 | | 4.16 | | (0.04) | | (0.58) | | (0.62) | | 20.32 | | 25.13 | | 15,124 | | 0.95 | | 0.95 | | 0.27 | | 32 |
| F | | 16.00 | | 0.07 | | 3.92 | | 3.99 | | (0.06) | | (0.58) | | (0.64) | | 19.35 | | 25.29 | | 195,324 | | 0.84 | | 0.84 | | 0.37 | | 32 |
| For the Year Ended October 31, 2020 |
| A | | $ 14.40 | | $ 0.00(11) | | $ 1.78 | | $ 1.78 | | $ (0.08) | | $ — | | $ (0.08) | | $ 16.10 | | 12.40% | | $ 137,068 | | 1.36% | | 1.30% | | 0.00% (12) | | 112% |
| C | | 13.12 | | (0.10) | | 1.61 | | 1.51 | | — | | — | | — | | 14.63 | | 11.51 | | 5,435 | | 2.14 | | 2.05 | | (0.76) | | 112 |
| I | | 14.29 | | 0.06 | | 1.75 | | 1.81 | | (0.13) | | — | | (0.13) | | 15.97 | | 12.75 | | 189,631 | | 0.97 | | 0.93 | | 0.40 | | 112 |
| R3 | | 14.59 | | (0.04) | | 1.80 | | 1.76 | | (0.04) | | — | | (0.04) | | 16.31 | | 12.08 | | 711 | | 1.61 | | 1.57 | | (0.26) | | 112 |
| R4 | | 14.83 | | 0.01 | | 1.83 | | 1.84 | | (0.06) | | — | | (0.06) | | 16.61 | | 12.44 | | 2,260 | | 1.30 | | 1.26 | | 0.07 | | 112 |
| R5 | | 14.96 | | 0.05 | | 1.85 | | 1.90 | | (0.13) | | — | | (0.13) | | 16.73 | | 12.76 | | 30,666 | | 0.99 | | 0.95 | | 0.35 | | 112 |
| R6 | | 15.04 | | 0.07 | | 1.86 | | 1.93 | | (0.14) | | — | | (0.14) | | 16.83 | | 12.90 | | 4,560 | | 0.90 | | 0.85 | | 0.48 | | 112 |
| Y | | 15.01 | | 0.05 | | 1.85 | | 1.90 | | (0.13) | | — | | (0.13) | | 16.78 | | 12.74 | | 12,562 | | 1.00 | | 0.95 | | 0.35 | | 112 |
| F | | 14.31 | | 0.07 | | 1.77 | | 1.84 | | (0.15) | | — | | (0.15) | | 16.00 | | 12.88 | | 159,194 | | 0.89 | | 0.85 | | 0.47 | | 112 |
| For the Year Ended October 31, 2019 |
| A | | $ 13.85 | | $ 0.09 | | $ 1.51 | | $ 1.60 | | $ (0.08) | | $ (0.97) | | $ (1.05) | | $ 14.40 | | 12.97% | | $ 128,065 | | 1.38% | | 1.30% | | 0.66% | | 64% |
| C | | 12.71 | | (0.01) | | 1.39 | | 1.38 | | — | | (0.97) | | (0.97) | | 13.12 | | 12.16 | | 6,842 | | 2.15 | | 2.05 | | (0.11) | | 64 |
| I | | 13.75 | | 0.14 | | 1.49 | | 1.63 | | (0.12) | | (0.97) | | (1.09) | | 14.29 | | 13.41 | | 39,175 | | 0.99 | | 0.94 | | 1.04 | | 64 |
| R3 | | 14.00 | | 0.06 | | 1.53 | | 1.59 | | (0.03) | | (0.97) | | (1.00) | | 14.59 | | 12.63 | | 632 | | 1.63 | | 1.57 | | 0.44 | | 64 |
| R4 | | 14.21 | | 0.09 | | 1.56 | | 1.65 | | (0.06) | | (0.97) | | (1.03) | | 14.83 | | 12.99 | | 4,102 | | 1.33 | | 1.27 | | 0.67 | | 64 |
| R5 | | 14.34 | | 0.14 | | 1.57 | | 1.71 | | (0.12) | | (0.97) | | (1.09) | | 14.96 | | 13.40 | | 25,303 | | 1.02 | | 0.96 | | 1.00 | | 64 |
| R6 | | 14.41 | | 0.16 | | 1.57 | | 1.73 | | (0.13) | | (0.97) | | (1.10) | | 15.04 | | 13.48 | | 3,059 | | 0.91 | | 0.85 | | 1.09 | | 64 |
| Y | | 14.39 | | 0.15 | | 1.57 | | 1.72 | | (0.13) | | (0.97) | | (1.10) | | 15.01 | | 13.45 | | 18,100 | | 0.98 | | 0.92 | | 1.05 | | 64 |
| F | | 13.77 | | 0.15 | | 1.49 | | 1.64 | | (0.13) | | (0.97) | | (1.10) | | 14.31 | | 13.50 | | 112,149 | | 0.91 | | 0.85 | | 1.12 | | 64 |
| For the Year Ended October 31, 2018 |
| A | | $ 15.21 | | $ 0.10 | | $ (1.38) | | $ (1.28) | | $ (0.08) | | $ — | | $ (0.08) | | $ 13.85 | | (8.47)% | | $ 123,681 | | 1.40% | | 1.30% | | 0.64% | | 76% |
| C | | 13.99 | | (0.01) | | (1.27) | | (1.28) | | — | | — | | — | | 12.71 | | (9.15) | | 7,962 | | 2.21 | | 2.05 | | (0.09) | | 76 |
| I | | 15.09 | | 0.15 | | (1.37) | | (1.22) | | (0.12) | | — | | (0.12) | | 13.75 | | (8.16) | | 35,144 | | 1.04 | | 0.98 | | 0.98 | | 76 |
| R3 | | 15.36 | | 0.06 | | (1.41) | | (1.35) | | (0.01) | | — | | (0.01) | | 14.00 | | (8.72) | | 556 | | 1.67 | | 1.60 | | 0.36 | | 76 |
| R4 | | 15.59 | | 0.09 | | (1.39) | | (1.30) | | (0.08) | | — | | (0.08) | | 14.21 | | (8.41) | | 8,748 | | 1.36 | | 1.30 | | 0.59 | | 76 |
| R5 | | 15.74 | | 0.17 | | (1.45) | | (1.28) | | (0.12) | | — | | (0.12) | | 14.34 | | (8.19) | | 21,691 | | 1.06 | | 1.00 | | 1.03 | | 76 |
| R6 (7) | | 16.23 | | 0.02 | | (1.84) | | (1.82) | | — | | — | | — | | 14.41 | | (11.21) (5) | | 583 | | 0.94 (6) | | 0.86 (6) | | 0.22 (6) | | 76 |
| Y | | 15.79 | | 0.17 | | (1.44) | | (1.27) | | (0.13) | | — | | (0.13) | | 14.39 | | (8.13) | | 16,422 | | 0.98 | | 0.91 | | 1.05 | | 76 |
| F | | 15.11 | | 0.16 | | (1.37) | | (1.21) | | (0.13) | | — | | (0.13) | | 13.77 | | (8.10) | | 94,527 | | 0.95 | | 0.89 | | 1.07 | | 76 |
| For the Year Ended October 31, 2017 |
| A | | $ 12.24 | | $ 0.09 | | $ 3.02 | | $ 3.11 | | $ (0.14) | | $ — | | $ (0.14) | | $ 15.21 | | 25.79% | | $ 124,332 | | 1.48% | | 1.30% | | 0.71% | | 82% |
| C | | 11.26 | | (0.01) | | 2.79 | | 2.78 | | (0.05) | | — | | (0.05) | | 13.99 | | 24.88 | | 15,539 | | 2.21 | | 2.05 | | (0.06) | | 82 |
| I | | 12.16 | | 0.15 | | 2.96 | | 3.11 | | (0.18) | | — | | (0.18) | | 15.09 | | 26.05 | | 26,644 | | 1.34 | | 1.00 | | 1.18 | | 82 |
| R3 | | 12.33 | | 0.06 | | 3.05 | | 3.11 | | (0.08) | | — | | (0.08) | | 15.36 | | 25.48 | | 649 | | 1.81 | | 1.60 | | 0.45 | | 82 |
| R4 | | 12.55 | | 0.10 | | 3.09 | | 3.19 | | (0.15) | | — | | (0.15) | | 15.59 | | 25.75 | | 11,579 | | 1.39 | | 1.30 | | 0.75 | | 82 |
| R5 | | 12.67 | | 0.13 | | 3.12 | | 3.25 | | (0.18) | | — | | (0.18) | | 15.74 | | 26.23 | | 7,184 | | 1.10 | | 1.00 | | 0.93 | | 82 |
| Y | | 12.71 | | 0.11 | | 3.16 | | 3.27 | | (0.19) | | — | | (0.19) | | 15.79 | | 26.20 | | 11,865 | | 1.01 | | 0.95 | | 0.81 | | 82 |
| F (4) | | 12.18 | | 0.06 | | 2.87 | | 2.93 | | — | | — | | — | | 15.11 | | 24.06 (5) | | 61,131 | | 0.99 (6) | | 0.90 (6) | | 0.65 (6) | | 82 |
The accompanying notes are an integral part of these financial statements.
Hartford International/Global Equity Funds
Financial Highlights – (continued)
| | | — Selected Per-Share Data(1) — | | — Ratios and Supplemental Data — |
| Class | | Net
Asset
Value at
Beginning
of Period | | Net
Investment
Income
(Loss) | | Net
Realized
and
Unrealized
Gain (Loss)
on
Investments | | Total from
Investment
Operations | | Dividends
from Net
Investment
Income | | Distributions
from
Capital
Gains | | Total
Dividends
and
Distributions | | Net
Asset
Value at
End of
Period | | Total
Return(2) | | Net
Assets
at End
of Period
(000s) | | Ratio of
Expenses
to
Average
Net
Assets
Before
Adjust-
ments(3) | | Ratio of
Expenses
to
Average
Net
Assets
After
Adjust-
ments(3) | | Ratio of
Net
Investment
Income
(Loss) to
Average
Net Assets | | Portfolio
Turnover |
| The Hartford International Opportunities Fund |
| For the Year Ended October 31, 2021 |
| A | | $ 16.66 | | $ 0.13 | | $ 4.51 | | $ 4.64 | | $ (0.07) | | $ — | | $ (0.07) | | $ 21.23 | | 27.91% | | $ 563,577 | | 1.08% | | 1.07% | | 0.66% | | 99% |
| C | | 14.44 | | (0.03) | | 3.92 | | 3.89 | | — | | — | | — | | 18.33 | | 26.94 | | 27,868 | | 1.85 | | 1.85 | | (0.14) | | 99 |
| I | | 16.57 | | 0.20 | | 4.49 | | 4.69 | | (0.13) | | — | | (0.13) | | 21.13 | | 28.38 | | 579,815 | | 0.77 | | 0.77 | | 0.97 | | 99 |
| R3 | | 16.93 | | 0.06 | | 4.60 | | 4.66 | | (0.00) (11) | | — | | — | | 21.59 | | 27.54 | | 36,293 | | 1.40 | | 1.40 | | 0.31 | | 99 |
| R4 | | 17.27 | | 0.13 | | 4.69 | | 4.82 | | (0.07) | | — | | (0.07) | | 22.02 | | 27.94 | | 110,424 | | 1.10 | | 1.10 | | 0.63 | | 99 |
| R5 | | 17.44 | | 0.20 | | 4.74 | | 4.94 | | (0.13) | | — | | (0.13) | | 22.25 | | 28.37 | | 358,244 | | 0.79 | | 0.79 | | 0.94 | | 99 |
| R6 | | 17.55 | | 0.23 | | 4.75 | | 4.98 | | (0.14) | | — | | (0.14) | | 22.39 | | 28.47 | | 1,037,195 | | 0.69 | | 0.69 | | 1.06 | | 99 |
| Y | | 17.55 | | 0.21 | | 4.75 | | 4.96 | | (0.13) | | — | | (0.13) | | 22.38 | | 28.34 | | 1,299,603 | | 0.79 | | 0.75 | | 0.97 | | 99 |
| F | | 16.58 | | 0.21 | | 4.50 | | 4.71 | | (0.14) | | — | | (0.14) | | 21.15 | | 28.51 | | 776,074 | | 0.69 | | 0.69 | | 1.04 | | 99 |
| For the Year Ended October 31, 2020 |
| A | | $ 15.70 | | $ 0.05 | | $ 1.12 | | $ 1.17 | | $ (0.21) | | $ — | | $ (0.21) | | $ 16.66 | | 7.48% | | $ 450,001 | | 1.12% | | 1.12% | | 0.29% | | 100% |
| C | | 13.63 | | (0.07) | | 0.98 | | 0.91 | | (0.10) | | — | | (0.10) | | 14.44 | | 6.67 | | 27,825 | | 1.89 | | 1.89 | | (0.48) | | 100 |
| I | | 15.62 | | 0.10 | | 1.12 | | 1.22 | | (0.27) | | — | | (0.27) | | 16.57 | | 7.81 | | 347,719 | | 0.78 | | 0.78 | | 0.63 | | 100 |
| R3 | | 15.95 | | 0.00 (11) | | 1.13 | | 1.13 | | (0.15) | | — | | (0.15) | | 16.93 | | 7.10 | | 37,082 | | 1.42 | | 1.42 | | (0.01) | | 100 |
| R4 | | 16.26 | | 0.05 | | 1.16 | | 1.21 | | (0.20) | | — | | (0.20) | | 17.27 | | 7.45 | | 104,353 | | 1.10 | | 1.10 | | 0.30 | | 100 |
| R5 | | 16.43 | | 0.11 | | 1.16 | | 1.27 | | (0.26) | | — | | (0.26) | | 17.44 | | 7.77 | | 307,347 | | 0.80 | | 0.80 | | 0.66 | | 100 |
| R6 | | 16.53 | | 0.12 | | 1.18 | | 1.30 | | (0.28) | | — | | (0.28) | | 17.55 | | 7.88 | | 739,434 | | 0.70 | | 0.70 | | 0.71 | | 100 |
| Y | | 16.53 | | 0.11 | | 1.18 | | 1.29 | | (0.27) | | — | | (0.27) | | 17.55 | | 7.83 | | 1,074,227 | | 0.80 | | 0.76 | | 0.66 | | 100 |
| F | | 15.63 | | 0.11 | | 1.12 | | 1.23 | | (0.28) | | — | | (0.28) | | 16.58 | | 7.89 | | 619,937 | | 0.70 | | 0.70 | | 0.71 | | 100 |
| For the Year Ended October 31, 2019 |
| A | | $ 14.66 | | $ 0.21 | | $ 1.36 | | $ 1.57 | | $ (0.18) | | $ (0.35) | | $ (0.53) | | $ 15.70 | | 11.32% | | $ 464,083 | | 1.12% | | 1.12% | | 1.42% | | 92% |
| C | | 12.74 | | 0.08 | | 1.19 | | 1.27 | | (0.03) | | (0.35) | | (0.38) | | 13.63 | | 10.46 | | 37,457 | | 1.89 | | 1.89 | | 0.64 | | 92 |
| I | | 14.60 | | 0.25 | | 1.35 | | 1.60 | | (0.23) | | (0.35) | | (0.58) | | 15.62 | | 11.67 | | 350,647 | | 0.79 | | 0.79 | | 1.71 | | 92 |
| R3 | | 14.87 | | 0.17 | | 1.39 | | 1.56 | | (0.13) | | (0.35) | | (0.48) | | 15.95 | | 11.03 | | 51,593 | | 1.42 | | 1.42 | | 1.14 | | 92 |
| R4 | | 15.16 | | 0.22 | | 1.41 | | 1.63 | | (0.18) | | (0.35) | | (0.53) | | 16.26 | | 11.34 | | 133,349 | | 1.12 | | 1.12 | | 1.44 | | 92 |
| R5 | | 15.32 | | 0.27 | | 1.42 | | 1.69 | | (0.23) | | (0.35) | | (0.58) | | 16.43 | | 11.73 | | 265,062 | | 0.80 | | 0.80 | | 1.74 | | 92 |
| R6 | | 15.42 | | 0.30 | | 1.41 | | 1.71 | | (0.25) | | (0.35) | | (0.60) | | 16.53 | | 11.78 | | 638,619 | | 0.70 | | 0.70 | | 1.93 | | 92 |
| Y | | 15.41 | | 0.28 | | 1.43 | | 1.71 | | (0.24) | | (0.35) | | (0.59) | | 16.53 | | 11.80 | | 981,426 | | 0.78 | | 0.75 | | 1.80 | | 92 |
| F | | 14.61 | | 0.27 | | 1.35 | | 1.62 | | (0.25) | | (0.35) | | (0.60) | | 15.63 | | 11.82 | | 660,251 | | 0.70 | | 0.70 | | 1.82 | | 92 |
| For the Year Ended October 31, 2018 |
| A | | $ 17.49 | | $ 0.18 | | $ (2.19) | | $ (2.01) | | $ (0.21) | | $ (0.61) | | $ (0.82) | | $ 14.66 | | (12.07)% | | $ 480,730 | | 1.10% | | 1.10% | | 1.05% | | 76% |
| C | | 15.33 | | 0.05 | | (1.90) | | (1.85) | | (0.13) | | (0.61) | | (0.74) | | 12.74 | | (12.71) | | 48,193 | | 1.87 | | 1.86 | | 0.32 | | 76 |
| I | | 17.41 | | 0.24 | | (2.19) | | (1.95) | | (0.25) | | (0.61) | | (0.86) | | 14.60 | | (11.81) | | 457,499 | | 0.79 | | 0.79 | | 1.41 | | 76 |
| R3 | | 17.73 | | 0.13 | | (2.22) | | (2.09) | | (0.16) | | (0.61) | | (0.77) | | 14.87 | | (12.33) | | 57,967 | | 1.41 | | 1.41 | | 0.73 | | 76 |
| R4 | | 18.06 | | 0.18 | | (2.26) | | (2.08) | | (0.21) | | (0.61) | | (0.82) | | 15.16 | | (12.07) | | 157,811 | | 1.11 | | 1.11 | | 1.04 | | 76 |
| R5 | | 18.24 | | 0.24 | | (2.29) | | (2.05) | | (0.26) | | (0.61) | | (0.87) | | 15.32 | | (11.82) | | 253,440 | | 0.80 | | 0.80 | | 1.35 | | 76 |
| R6 | | 18.34 | | 0.27 | | (2.30) | | (2.03) | | (0.28) | | (0.61) | | (0.89) | | 15.42 | | (11.69) | | 505,433 | | 0.70 | | 0.70 | | 1.56 | | 76 |
| Y | | 18.34 | | 0.25 | | (2.30) | | (2.05) | | (0.27) | | (0.61) | | (0.88) | | 15.41 | | (11.77) | | 1,029,715 | | 0.74 | | 0.74 | | 1.41 | | 76 |
| F | | 17.43 | | 0.25 | | (2.18) | | (1.93) | | (0.28) | | (0.61) | | (0.89) | | 14.61 | | (11.72) | | 599,574 | | 0.70 | | 0.70 | | 1.49 | | 76 |
The accompanying notes are an integral part of these financial statements.
Hartford International/Global Equity Funds
Financial Highlights – (continued)
| | | — Selected Per-Share Data(1) — | | — Ratios and Supplemental Data — |
| Class | | Net
Asset
Value at
Beginning
of Period | | Net
Investment
Income
(Loss) | | Net
Realized
and
Unrealized
Gain (Loss)
on
Investments | | Total from
Investment
Operations | | Dividends
from Net
Investment
Income | | Distributions
from
Capital
Gains | | Total
Dividends
and
Distributions | | Net
Asset
Value at
End of
Period | | Total
Return(2) | | Net
Assets
at End
of Period
(000s) | | Ratio of
Expenses
to
Average
Net
Assets
Before
Adjust-
ments(3) | | Ratio of
Expenses
to
Average
Net
Assets
After
Adjust-
ments(3) | | Ratio of
Net
Investment
Income
(Loss) to
Average
Net Assets | | Portfolio
Turnover |
| The Hartford International Opportunities Fund – (continued) |
| For the Year Ended October 31, 2017 |
| A | | $ 14.36 | | $ 0.18 | | $ 3.10 | | $ 3.28 | | $ (0.15) | | $ — | | $ (0.15) | | $ 17.49 | | 23.07% | | $ 571,753 | | 1.14% | | 1.14% | | 1.11% | | 102% |
| C | | 12.61 | | 0.05 | | 2.73 | | 2.78 | | (0.06) | | — | | (0.06) | | 15.33 | | 22.13 | | 67,778 | | 1.88 | | 1.88 | | 0.37 | | 102 |
| I | | 14.31 | | 0.24 | | 3.07 | | 3.31 | | (0.21) | | — | | (0.21) | | 17.41 | | 23.36 | | 428,563 | | 0.89 | | 0.89 | | 1.54 | | 102 |
| R3 | | 14.58 | | 0.14 | | 3.14 | | 3.28 | | (0.13) | | — | | (0.13) | | 17.73 | | 22.69 | | 69,884 | | 1.42 | | 1.42 | | 0.87 | | 102 |
| R4 | | 14.84 | | 0.19 | | 3.20 | | 3.39 | | (0.17) | | — | | (0.17) | | 18.06 | | 23.07 | | 192,812 | | 1.12 | | 1.12 | | 1.17 | | 102 |
| R5 | | 14.98 | | 0.25 | | 3.22 | | 3.47 | | (0.21) | | — | | (0.21) | | 18.24 | | 23.47 | | 240,029 | | 0.82 | | 0.82 | | 1.52 | | 102 |
| R6 | | 15.06 | | 0.29 | | 3.21 | | 3.50 | | (0.22) | | — | | (0.22) | | 18.34 | | 23.59 | | 218,688 | | 0.71 | | 0.71 | | 1.70 | | 102 |
| Y | | 15.07 | | 0.24 | | 3.25 | | 3.49 | | (0.22) | | — | | (0.22) | | 18.34 | | 23.51 | | 1,131,809 | | 0.74 | | 0.74 | | 1.49 | | 102 |
| F (4) | | 14.79 | | 0.20 | | 2.44 | | 2.64 | | — | | — | | — | | 17.43 | | 17.85 (5) | | 526,321 | | 0.71 (6) | | 0.71 (6) | | 1.75 (6) | | 102 |
| The Hartford International Value Fund |
| For the Year Ended October 31, 2021 |
| A | | $ 11.27 | | $ 0.29 | | $ 5.24 | | $ 5.53 | | $ (0.16) | | $ — | | $ (0.16) | | $ 16.64 | | 49.38% | | $ 58,055 | | 1.23% | | 1.23% | | 1.88% | | 25% |
| C | | 11.12 | | 0.15 | | 5.20 | | 5.35 | | (0.11) | | — | | (0.11) | | 16.36 | | 48.27 | | 7,693 | | 1.97 | | 1.97 | | 1.00 | | 25 |
| I | | 11.40 | | 0.34 | | 5.28 | | 5.62 | | (0.30) | | — | | (0.30) | | 16.72 | | 49.79 | | 1,370,819 | | 0.95 | | 0.95 | | 2.19 | | 25 |
| R3 | | 11.36 | | 0.25 | | 5.26 | | 5.51 | | (0.22) | | — | | (0.22) | | 16.65 | | 48.84 | | 704 | | 1.56 | | 1.56 | | 1.59 | | 25 |
| R4 | | 11.32 | | 0.28 | | 5.24 | | 5.52 | | (0.25) | | — | | (0.25) | | 16.59 | | 49.24 | | 4,081 | | 1.26 | | 1.26 | | 1.79 | | 25 |
| R5 | | 11.44 | | 0.32 | | 5.31 | | 5.63 | | (0.29) | | — | | (0.29) | | 16.78 | | 49.76 | | 37,168 | | 0.94 | | 0.94 | | 2.09 | | 25 |
| R6 | | 11.68 | | 0.31 | | 5.45 | | 5.76 | | (0.30) | | — | | (0.30) | | 17.14 | | 49.88 | | 30,933 | | 0.84 | | 0.84 | | 2.01 | | 25 |
| Y | | 11.67 | | 0.35 | | 5.41 | | 5.76 | | (0.30) | | — | | (0.30) | | 17.13 | | 49.84 | | 438,442 | | 0.91 | | 0.90 | | 2.19 | | 25 |
| F | | 11.41 | | 0.32 | | 5.32 | | 5.64 | | (0.31) | | — | | (0.31) | | 16.74 | | 49.94 | | 238,372 | | 0.84 | | 0.84 | | 2.10 | | 25 |
| For the Year Ended October 31, 2020 |
| A | | $ 14.53 | | $ 0.16 | | $ (3.00) | | $ (2.84) | | $ (0.42) | | $ — | | $ (0.42) | | $ 11.27 | | (20.24)% | | $ 29,857 | | 1.22% | | 1.22% | | 1.31% | | 26% |
| C | | 14.31 | | 0.05 | | (2.96) | | (2.91) | | (0.28) | | — | | (0.28) | | 11.12 | | (20.83) | | 6,692 | | 1.99 | | 1.99 | | 0.37 | | 26 |
| I | | 14.69 | | 0.19 | | (3.01) | | (2.82) | | (0.47) | | — | | (0.47) | | 11.40 | | (19.98) | | 450,897 | | 0.92 | | 0.92 | | 1.56 | | 26 |
| R3 | | 14.62 | | 0.11 | | (3.03) | | (2.92) | | (0.34) | | — | | (0.34) | | 11.36 | | (20.53) | | 344 | | 1.57 | | 1.57 | | 0.88 | | 26 |
| R4 | | 14.62 | | 0.15 | | (3.00) | | (2.85) | | (0.45) | | — | | (0.45) | | 11.32 | | (20.26) | | 2,812 | | 1.27 | | 1.27 | | 1.26 | | 26 |
| R5 | | 14.72 | | 0.20 | | (3.02) | | (2.82) | | (0.46) | | — | | (0.46) | | 11.44 | | (19.94) | | 26,420 | | 0.95 | | 0.95 | | 1.59 | | 26 |
| R6 | | 15.03 | | 0.20 | | (3.07) | | (2.87) | | (0.48) | | — | | (0.48) | | 11.68 | | (19.87) | | 40,184 | | 0.86 | | 0.86 | | 1.58 | | 26 |
| Y | | 15.02 | | 0.19 | | (3.07) | | (2.88) | | (0.47) | | — | | (0.47) | | 11.67 | | (19.93) | | 224,804 | | 0.93 | | 0.91 | | 1.43 | | 26 |
| F | | 14.70 | | 0.19 | | (3.00) | | (2.81) | | (0.48) | | — | | (0.48) | | 11.41 | | (19.91) | | 176,284 | | 0.86 | | 0.86 | | 1.53 | | 26 |
| For the Year Ended October 31, 2019 |
| A | | $ 15.11 | | $ 0.31 | | $ 0.15 | | $ 0.46 | | $ (0.34) | | $ (0.70) | | $ (1.04) | | $ 14.53 | | 3.90% | | $ 205,566 | | 1.20% | | 1.20% | | 2.19% | | 51% |
| C | | 14.86 | | 0.20 | | 0.17 | | 0.37 | | (0.22) | | (0.70) | | (0.92) | | 14.31 | | 3.14 | | 17,367 | | 1.95 | | 1.95 | | 1.45 | | 51 |
| I | | 15.28 | | 0.39 | | 0.12 | | 0.51 | | (0.40) | | (0.70) | | (1.10) | | 14.69 | | 4.20 | | 1,004,021 | | 0.91 | | 0.91 | | 2.74 | | 51 |
| R3 | | 15.17 | | 0.25 | | 0.18 | | 0.43 | | (0.28) | | (0.70) | | (0.98) | | 14.62 | | 3.53 | | 669 | | 1.54 | | 1.54 | | 1.80 | | 51 |
| R4 | | 15.20 | | 0.31 | | 0.15 | | 0.46 | | (0.34) | | (0.70) | | (1.04) | | 14.62 | | 3.85 | | 1,396 | | 1.25 | | 1.25 | | 2.17 | | 51 |
| R5 | | 15.32 | | 0.39 | | 0.11 | | 0.50 | | (0.40) | | (0.70) | | (1.10) | | 14.72 | | 4.13 | | 34,293 | | 0.95 | | 0.95 | | 2.80 | | 51 |
| R6 (13) | | 14.59 | | 0.30 | | 0.14 | | 0.44 | | — | | — | | — | | 15.03 | | 3.05 (5) | | 170,365 | | 0.84 (6) | | 0.84 (6) | | 3.15 (6) | | 51 |
| Y | | 15.60 | | 0.38 | | 0.14 | | 0.52 | | (0.40) | | (0.70) | | (1.10) | | 15.02 | | 4.21 | | 619,624 | | 0.90 | | 0.89 | | 2.63 | | 51 |
| F | | 15.30 | | 0.36 | | 0.15 | | 0.51 | | (0.41) | | (0.70) | | (1.11) | | 14.70 | | 4.24 | | 280,593 | | 0.84 | | 0.84 | | 2.55 | | 51 |
The accompanying notes are an integral part of these financial statements.
Hartford International/Global Equity Funds
Financial Highlights – (continued)
| | | — Selected Per-Share Data(1) — | | — Ratios and Supplemental Data — |
| Class | | Net
Asset
Value at
Beginning
of Period | | Net
Investment
Income
(Loss) | | Net
Realized
and
Unrealized
Gain (Loss)
on
Investments | | Total from
Investment
Operations | | Dividends
from Net
Investment
Income | | Distributions
from
Capital
Gains | | Total
Dividends
and
Distributions | | Net
Asset
Value at
End of
Period | | Total
Return(2) | | Net
Assets
at End
of Period
(000s) | | Ratio of
Expenses
to
Average
Net
Assets
Before
Adjust-
ments(3) | | Ratio of
Expenses
to
Average
Net
Assets
After
Adjust-
ments(3) | | Ratio of
Net
Investment
Income
(Loss) to
Average
Net Assets | | Portfolio
Turnover |
| The Hartford International Value Fund – (continued) |
| For the Year Ended October 31, 2018 |
| A | | $ 17.87 | | $ 0.28 | | $ (1.88) | | $ (1.60) | | $ (0.55) | | $ (0.61) | | $ (1.16) | | $ 15.11 | | (9.67)% | | $ 293,131 | | 1.20% | | 1.20% | | 1.65% | | 22% |
| C | | 17.61 | | 0.15 | | (1.85) | | (1.70) | | (0.44) | | (0.61) | | (1.05) | | 14.86 | | (10.32) | | 26,524 | | 1.92 | | 1.92 | | 0.92 | | 22 |
| I | | 18.07 | | 0.33 | | (1.90) | | (1.57) | | (0.61) | | (0.61) | | (1.22) | | 15.28 | | (9.41) | | 905,960 | | 0.90 | | 0.90 | | 1.91 | | 22 |
| R3 | | 17.99 | | 0.23 | | (1.91) | | (1.68) | | (0.53) | | (0.61) | | (1.14) | | 15.17 | | (10.02) | | 851 | | 1.55 | | 1.55 | | 1.32 | | 22 |
| R4 | | 17.98 | | 0.28 | | (1.90) | | (1.62) | | (0.55) | | (0.61) | | (1.16) | | 15.20 | | (9.71) | | 1,441 | | 1.25 | | 1.25 | | 1.64 | | 22 |
| R5 | | 18.13 | | 0.34 | | (1.93) | | (1.59) | | (0.61) | | (0.61) | | (1.22) | | 15.32 | | (9.46) | | 30,210 | | 0.93 | | 0.93 | | 1.98 | | 22 |
| Y | | 18.43 | | 0.35 | | (1.95) | | (1.60) | | (0.62) | | (0.61) | | (1.23) | | 15.60 | | (9.39) | | 685,942 | | 0.87 | | 0.87 | | 1.99 | | 22 |
| F | | 18.09 | | 0.37 | | (1.93) | | (1.56) | | (0.62) | | (0.61) | | (1.23) | | 15.30 | | (9.31) | | 382,297 | | 0.83 | | 0.83 | | 2.16 | | 22 |
| For the Year Ended October 31, 2017 |
| A | | $ 15.02 | | $ 0.28 | | $ 3.28 | | $ 3.56 | | $ (0.27) | | $ (0.44) | | $ (0.71) | | $ 17.87 | | 24.76% | | $ 379,165 | | 1.32% | | 1.32% | | 1.77% | | 26% |
| C | | 14.80 | | 0.18 | | 3.24 | | 3.42 | | (0.17) | | (0.44) | | (0.61) | | 17.61 | | 24.01 | | 34,949 | | 1.93 | | 1.93 | | 1.14 | | 26 |
| I | | 15.19 | | 0.40 | | 3.26 | | 3.66 | | (0.34) | | (0.44) | | (0.78) | | 18.07 | | 25.21 | | 1,196,683 | | 0.93 | | 0.93 | | 2.43 | | 26 |
| R3 | | 15.14 | | 0.25 | | 3.30 | | 3.55 | | (0.26) | | (0.44) | | (0.70) | | 17.99 | | 24.46 | | 933 | | 1.57 | | 1.57 | | 1.51 | | 26 |
| R4 | | 15.12 | | 0.31 | | 3.28 | | 3.59 | | (0.29) | | (0.44) | | (0.73) | | 17.98 | | 24.83 | | 1,758 | | 1.25 | | 1.25 | | 1.91 | | 26 |
| R5 | | 15.24 | | 0.46 | | 3.21 | | 3.67 | | (0.34) | | (0.44) | | (0.78) | | 18.13 | | 25.18 | | 21,727 | | 0.93 | | 0.93 | | 2.65 | | 26 |
| Y | | 15.48 | | 0.40 | | 3.34 | | 3.74 | | (0.35) | | (0.44) | | (0.79) | | 18.43 | | 25.29 | | 736,027 | | 0.86 | | 0.86 | | 2.37 | | 26 |
| F (4) | | 15.50 | | 0.31 | | 2.28 | | 2.59 | | — | | — | | — | | 18.09 | | 16.71 (5) | | 377,877 | | 0.83 (6) | | 0.83 (6) | | 2.61 (6) | | 26 |
| FINANCIAL HIGHLIGHTS FOOTNOTES |
| (1) | Information presented relates to a share outstanding throughout the indicated period. Net investment income (loss) per share amounts are calculated based on average shares outstanding unless otherwise noted. |
| (2) | Assumes initial investment at net asset value at the beginning of each period, reinvestment of all distributions, the complete redemption of the investment at net asset value at the end of each period and no sales charge. Total return would be reduced if sales charges were taken into account. |
| (3) | Adjustments include waivers and reimbursements, if applicable. Ratios do not include fees paid indirectly (see Expenses in the accompanying Notes to Financial Statements). |
| (4) | Commenced operations on February 28, 2017. |
| (5) | Not annualized. |
| (6) | Annualized. |
| (7) | Commenced operations on February 28, 2018. |
| (8) | Includes the Fund’s share of the Master Portfolio’s allocated expenses. |
| (9) | Effective October 7, 2019, the Global Impact Fund commenced operations as a stand-alone fund. The portfolio turnover is reflective of the activity from October 7, 2019 to October 31, 2019. The blended portfolio turnover rate of the Global Impact Fund and its former master portfolio, the Global Impact Master Portfolio (the “Master Portfolio”), is 108% which reflects the portfolio turnover of the Master Portfolio from November 1, 2018 through October 4, 2019 and the Global Impact Fund from October 7, 2019 to October 31, 2019. |
| (10) | The portfolio turnover of the Fund is reflective of the portfolio turnover of the Master Portfolio. |
| (11) | Amount is less than $0.01 per share. |
| (12) | Amount is less than 0.01%. |
| (13) | Commenced operations on February 28, 2019. |
The accompanying notes are an integral part of these financial statements.
Hartford International/Global Equity Funds
Notes to Financial Statements
October 31, 2021
| 1. | Organization: |
| | The Hartford Mutual Funds, Inc. (the "Company") is an open-end registered management investment company comprised of thirty-six series, as of October 31, 2021. Financial statements for the series of the Company listed below (each, a “Fund” and collectively, the “Funds”) are included in this report. |
| | |
| The Hartford Mutual Funds, Inc.: |
| Hartford Climate Opportunities Fund (the "Climate Opportunities Fund") |
| Hartford Emerging Markets Equity Fund (the "Emerging Markets Equity Fund") |
| Hartford Global Impact Fund (the "Global Impact Fund") |
| Hartford International Equity Fund (the "International Equity Fund") |
| The Hartford International Growth Fund (the "International Growth Fund") |
| The Hartford International Opportunities Fund (the "International Opportunities Fund") |
| The Hartford International Value Fund (the "International Value Fund") |
The assets of each Fund are separate, and a shareholder's interest is limited to the Fund in which shares are held. The Company is organized under the laws of the State of Maryland and is registered with the Securities and Exchange Commission (the “SEC”) under the Investment Company Act of 1940, as amended (the “1940 Act”). Each Fund is a diversified open-end management investment company. Each Fund applies specialized accounting and reporting standards under Accounting Standards Codification Topic 946, "Financial Services – Investment Companies".
Each Fund has registered for sale Class A, Class C, Class I, Class R3, Class R4, Class R5, Class R6, Class Y and Class F shares. Class A shares of each Fund are sold with a front-end sales charge of up to 5.50%. Class C shares of each Fund are sold with a contingent deferred sales charge of up to 1.00% on shares redeemed within twelve months of purchase. Effective April 1, 2021, Class C shares automatically convert to Class A shares of the same Fund after eight years provided that the Fund or the financial intermediary has records verifying that the Class C shares have been held for at least eight years. Classes I, R3, R4, R5, R6, Y and F shares do not have a sales charge. Certain classes of the International Equity Fund are closed to new investors, subject to certain exceptions. For more information, please see the Funds' prospectus.
| 2. | Significant Accounting Policies: |
| | The following is a summary of significant accounting policies of each Fund used in the preparation of its financial statements, which are in accordance with United States Generally Accepted Accounting Principles (“U.S. GAAP”). The preparation of financial statements in accordance with U.S. GAAP may require management to make estimates and assumptions that affect the reported amounts of assets and liabilities and disclosure of contingent assets and liabilities at the date of the financial statements and the reported amounts of increases and decreases in net assets from operations during the reporting period. Actual results could differ from those estimates. |
| a) | Determination of Net Asset Value – The net asset value ("NAV") of each class of each Fund’s shares is determined as of the close of regular trading on the New York Stock Exchange (the "Exchange") (normally 4:00 p.m. Eastern Time) (the “NYSE Close”) on each day that the Exchange is open ("Valuation Date"). If the Exchange is closed due to weather or other extraordinary circumstances on a day it would typically be open for business, each Fund may treat such day as a typical business day and accept purchase and redemption orders and calculate each Fund’s NAV in accordance with applicable law. The NAV of each class of each Fund's shares is determined by dividing the value of the Fund’s net assets attributable to the class of shares by the number of shares outstanding for that class. Information that becomes known to the Funds after the NAV has been calculated on a particular day will not generally be used to retroactively adjust the NAV determined earlier that day. |
| b) | Investment Valuation and Fair Value Measurements – For purposes of calculating the NAV of each class of each Fund, portfolio securities and other assets held in the Fund’s portfolio for which market prices are readily available are valued at market value. Market value is generally determined on the basis of official close price or last reported trade price. If no trades were reported, market value is based on prices obtained from a quotation reporting system, established market makers (including evaluated prices), or independent pricing services. Pricing vendors may use matrix pricing or valuation models that utilize certain inputs and assumptions to derive values, including transaction data, credit quality information, general market conditions, news, and other factors and assumptions. |
| | If market prices are not readily available or are deemed unreliable, a Fund will use the fair value of the security or other instrument as determined in good faith under policies and procedures established by and under the supervision of the Board of Directors of the Company (the “Board of Directors”) (“Valuation Procedures”). Market prices are considered not readily available where there is an absence of current or reliable market-based data (e.g., trade information or broker quotes), including where events occur after the close of the relevant market, but prior to the NYSE Close, that materially affect the values of a Fund’s portfolio holdings or assets. In addition, market prices are considered not readily available when, due to extraordinary circumstances, the exchanges or markets on which the securities or other |
Hartford International/Global Equity Funds
Notes to Financial Statements – (continued)
October 31, 2021
| | instruments trade do not open for trading for the entire day and no other market prices are available. Fair value pricing is subjective in nature and the use of fair value pricing by a Fund may cause the NAV of its shares to differ significantly from the NAV that would have been calculated using market prices at the close of the exchange on which a portfolio holding is primarily traded. There can be no assurance that a Fund could obtain the fair value assigned to an investment if the Fund were to sell the investment at approximately the time at which the Fund determines its NAV. |
| | Prices of foreign equities that are principally traded on certain foreign markets will generally be adjusted daily pursuant to a fair value pricing service in order to reflect an adjustment for the factors occurring after the close of certain foreign markets but before the NYSE Close. Securities and other instruments that are primarily traded on foreign markets may trade on days that are not business days of the Funds. The value of the foreign securities or other instruments in which a Fund invests may change on days when a shareholder will not be able to purchase, redeem or exchange shares of the Fund. |
| | Fixed income investments (other than short-term obligations) and non-exchange traded derivatives held by a Fund are normally valued at prices supplied by independent pricing services in accordance with the Valuation Procedures. Short-term investments maturing in 60 days or less are generally valued at amortized cost which approximates fair value. |
| | Exchange-traded derivatives, such as options, futures and options on futures, are valued at the last sale price determined by the exchange where such instruments principally trade as of the close of such exchange (“Exchange Close”). If a last sale price is not available, the value will be the mean of the most recently quoted bid and ask prices as of the Exchange Close. If a mean of the bid and ask prices cannot be calculated for the day, the value will be the most recently quoted bid price as of the Exchange Close. Over-the-counter derivatives are normally valued based on prices supplied by independent pricing services in accordance with the Valuation Procedures. |
| | Investments valued in currencies other than U.S. dollars are converted to U.S. dollars using the prevailing spot currency exchange rates obtained from independent pricing services for calculation of the NAV. As a result, the NAV of a Fund’s shares may be affected by changes in the value of currencies in relation to the U.S. dollar. The value of securities or other instruments traded in markets outside the United States or denominated in currencies other than the U.S. dollar may be affected significantly on a day that the Exchange is closed and the market value may change on days when an investor is not able to purchase, redeem or exchange shares of a Fund. |
| | Foreign currency contracts represent agreements to exchange currencies on specific future dates at predetermined rates. Foreign currency contracts are valued using foreign currency exchange rates and forward rates as provided by an independent pricing service on the Valuation Date. |
| | Investments in investment companies that are not listed or traded on an exchange ("Non-Traded Funds"), if any, are valued at the respective NAV of each Non-Traded Fund on the Valuation Date. Shares of investment companies listed and traded on an exchange are valued in the same manner as any exchange-listed equity security. Such Non-Traded Funds and listed investment companies may use fair value pricing as disclosed in their prospectuses. |
| | Financial instruments for which prices are not available from an independent pricing service may be valued using market quotations obtained from one or more dealers that make markets in the respective financial instrument in accordance with the Valuation Procedures. |
| | U.S. GAAP defines fair value as the price that a Fund would receive to sell an asset or pay to transfer a liability in an orderly transaction between market participants. The U.S. GAAP fair value measurement standards require disclosure of a fair value hierarchy for each major category of assets and liabilities. Various inputs are used in determining the fair value of each Fund’s investments. These inputs are summarized into three broad hierarchy levels. This hierarchy is based on whether the valuation inputs are observable or unobservable. These levels are: |
| • | Level 1 – Quoted prices in active markets for identical investments. Level 1 may include exchange traded instruments, such as domestic equities, some foreign equities, options, futures, mutual funds, exchange traded funds, rights and warrants. |
| • | Level 2 – Observable inputs other than Level 1 prices, such as quoted prices for similar investments; quoted prices in markets that are not active; or other inputs that are observable or can be corroborated by observable market data. Level 2 may include debt investments that are traded less frequently than exchange traded instruments and which are valued using independent pricing services; foreign equities, which are principally traded on certain foreign markets and are adjusted daily pursuant to a fair value pricing service in order to reflect an adjustment for the factors occurring after the close of certain foreign markets but before the NYSE Close; senior floating rate interests, which are valued using an aggregate of dealer bids; short-term investments, which are valued at amortized cost; and swaps, which are valued based upon the terms of each swap contract. |
| • | Level 3 – Significant unobservable inputs that are supported by limited or no market activity. Level 3 may include financial instruments whose values are determined using indicative market quotes or require significant management judgment or estimation. These unobservable valuation inputs may include estimates for current yields, maturity/duration, prepayment speed, and indicative market quotes for comparable investments along with other assumptions relating to credit quality, collateral value, complexity of the investment |
Hartford International/Global Equity Funds
Notes to Financial Statements – (continued)
October 31, 2021
| | structure, general market conditions and liquidity. This category may include investments where trading has been halted or there are certain restrictions on trading. While these investments are priced using unobservable inputs, the valuation of these investments reflects the best available data and management believes the prices are a reasonable representation of exit price. |
The Board of Directors has delegated the day-to-day responsibility for implementing the Valuation Procedures to the Valuation Committee. The Valuation Committee will consider all relevant factors in determining an investment’s fair value, and may seek the advice of such Fund’s sub-adviser(s), as applicable, knowledgeable brokers, and legal counsel in making such determination. The Valuation Committee reports to the Audit Committee of the Board of Directors.
Valuation levels are not necessarily indicative of the risk associated with investing in such investments. Individual investments within any of the above mentioned asset classes may be assigned a different hierarchical level than those presented above, as individual circumstances dictate.
For additional information, refer to the Fair Value Summary and the Level 3 roll-forward reconciliation, if applicable, which follows each Fund's Schedule of Investments.
| c) | Investment Transactions and Investment Income – Investment transactions are recorded as of the trade date (the date the order to buy or sell is executed) for financial reporting purposes. Investments purchased or sold on a when-issued or delayed-delivery basis may be settled a month or more after the trade date. Realized gains and losses are determined on the basis of identified cost. |
| | Dividend income from domestic securities is accrued on the ex-dividend date. In general, dividend income from foreign securities is recorded on the ex-date; however, dividend notifications in certain foreign jurisdictions may not be available in a timely manner and as a result, a Fund will record the dividend as soon as the relevant details (i.e., rate per share, payment date, shareholders of record, etc.) are publicly available. |
| | Interest income, including amortization of premium, accretion of discounts and additional principal received in-kind in lieu of cash, is accrued on a daily basis. |
Please refer to Note 8 for Securities Lending information.
| d) | Taxes – A Fund may be subject to taxes imposed on realized gains on securities of certain foreign countries in which such Fund invests. A Fund may also be subject to taxes withheld on foreign dividends from securities in which such Fund invests. The amount of any foreign taxes withheld and foreign tax expense is included on the accompanying Statements of Operations as a reduction to net investment income or net realized or unrealized gain (loss) on investments in these securities, if applicable. |
| e) | Foreign Currency Transactions – Assets and liabilities denominated in currencies other than U.S. dollars are translated into U.S. dollars at the exchange rates in effect on the Valuation Date. Purchases and sales of investments, income and expenses are translated into U.S. dollars at the exchange rates on the dates of such transactions. |
| | A Fund does not isolate that portion of portfolio investment valuation resulting from fluctuations in the foreign currency exchange rates from the fluctuations arising from changes in the market prices of investments held. Exchange rate fluctuations are included with the net realized and unrealized gain or loss on investments in the accompanying financial statements. |
| | Net realized foreign exchange gains or losses arise from sales of foreign currencies and the difference between asset and liability amounts initially stated in foreign currencies and the U.S. dollar value of the amounts actually received or paid. Net unrealized foreign exchange gains or losses arise from changes in the value of other assets and liabilities at the end of the reporting period, resulting from changes in the exchange rates. |
| f) | Joint Trading Account – A Fund may invest cash balances into a joint trading account that may be invested in one or more repurchase agreements. |
| g) | Fund Share Valuation and Dividend Distributions to Shareholders – Orders for each class of each Fund’s shares are executed in accordance with the investment instructions of the shareholders. The NAV of each class of each Fund’s shares is determined as of the close of business on each business day of the Exchange (see Note 2(a)). The NAV is determined separately for each class of shares of a Fund by dividing the Fund's net assets attributable to that class by the number of shares of the class outstanding. Each class of shares offered by a Fund has equal rights as to assets and voting privileges (except that shareholders of a class have exclusive voting rights regarding any matter relating solely to that class of shares). Income and non-class specific expenses are allocated daily to each class on the basis of the relative net assets of the class of the Fund. Realized and unrealized gains and losses are allocated daily based on the relative net assets of each class of shares of each Fund. |
| | Orders for the purchase of a Fund's shares received prior to the close of the Exchange on any day the Exchange is open for business are priced at the NAV determined as of the close of the Exchange. Orders received after the close of the Exchange, or on a day on which the Exchange and/or the Funds are not open for business, are priced at the next determined NAV. |
Hartford International/Global Equity Funds
Notes to Financial Statements – (continued)
October 31, 2021
| | Dividends are declared pursuant to a policy adopted by the Company’s Board of Directors. Dividends and/or distributions to shareholders are recorded on ex-date. The policy of each Fund is to pay dividends from net investment income, if any, annually and realized gains, if any, at least once a year. |
| | Income dividends and capital gains distributions are determined in accordance with federal income tax regulations, which may differ from U.S. GAAP with respect to character and timing (see Federal Income Taxes: Distributions and Components of Distributable Earnings and Reclassification of Capital Accounts notes). |
| 3. | Securities and Other Investments: |
| a) | Restricted Securities – Each Fund may invest in securities that are subject to legal or contractual restrictions on resale. These securities generally may be resold in transactions exempt from registration or to the public if the securities are registered. Disposal of these securities may involve time-consuming negotiations and expense, and prompt sale at an acceptable price may be difficult. Information regarding restricted securities, if applicable, is included at the end of each Fund's Schedule of Investments. |
| b) | Repurchase Agreements – A repurchase agreement is an agreement between two parties whereby one party sells the other a security at a specified price with a commitment to repurchase the security later at an agreed-upon price, date and interest payment. Each Fund is permitted to enter into fully collateralized repurchase agreements. The Company's Board of Directors has delegated to the sub-adviser(s), as applicable, the responsibility of evaluating the creditworthiness of the banks and securities dealers with which the Funds will engage in repurchase agreements. The sub-adviser(s) will monitor such transactions to ensure that the value of underlying collateral will be at least equal to the total amount of the repurchase obligation as required by the valuation provision of the repurchase agreement, including the accrued interest. Repurchase agreements carry the risk that the market value of the securities declines below the repurchase price. A Fund could also lose money if it is unable to recover the securities and the value of any collateral held or assets segregated by the Fund to cover the transaction is less than the value of the securities. In the event the borrower commences bankruptcy proceedings, a court may characterize the transaction as a loan. If a Fund has not perfected a security interest in the underlying collateral, the Fund may be required to return the underlying collateral to the borrower’s estate and be treated as an unsecured creditor. As an unsecured creditor, the Fund could lose some or all of the principal and interest involved in the transaction. See each Fund's Schedule of Investments, if applicable, for repurchase agreements as of October 31, 2021. |
| 4. | Financial Derivative Instruments: |
| | The following disclosures contain information on how and why a Fund may use derivative instruments, the credit-risk-related contingent features in certain derivative instruments, and how derivative instruments affect a Fund’s financial position and results of operations. The location and fair value amounts of these instruments on the Statements of Assets and Liabilities and the realized gains and losses and changes in unrealized gains and losses on the Statements of Operations, each categorized by type of derivative contract, are included in the following Additional Derivative Instrument Information footnote. The derivative instruments outstanding as of period-end are disclosed in the notes to the Schedules of Investments, if applicable. The amounts of realized gains and losses and changes in unrealized gains and losses on derivative instruments during the period are disclosed in the Statements of Operations. |
| a) | Futures Contracts – A Fund may enter into futures contracts. A futures contract is an agreement between two parties to buy or sell an asset at a set price on a future date. A Fund may use futures contracts to manage risk or obtain exposure to the investment markets, commodities, or movements in interest rates and currency values. The primary risks associated with the use of futures contracts are the imperfect correlation between the change in market value of the investments held by a Fund and the prices of futures contracts and the possibility of an illiquid market. Upon entering into a futures contract, a Fund is required to deposit with a futures commission merchant (“FCM”) an amount of cash or U.S. Government or Agency Obligations in accordance with the initial margin requirements of the broker or exchange. Futures contracts are marked to market daily and an appropriate amount equal to the change in value (“variation margin”) is paid or received by a Fund. Gains or losses are recognized but not considered realized until the contracts expire or are closed. Futures contracts involve, to varying degrees, risk of loss in excess of the variation margin disclosed on the Statements of Assets and Liabilities. |
| | During the year ended October 31, 2021, each of Emerging Markets Equity Fund, International Equity Fund and International Value Fund had used Futures Contracts. |
| b) | Foreign Currency Contracts – A Fund may enter into foreign currency contracts that obligate the Fund to purchase or sell currencies at specified future dates. Foreign currency contracts may be used in connection with settling purchases or sales of securities to hedge the currency exposure associated with some or all of a Fund’s investments and/or as part of an investment strategy. Foreign currency contracts are marked to market daily and the change in value is recorded by a Fund as an unrealized gain or loss. A Fund will record a realized gain or loss when the foreign currency contract is settled. |
Hartford International/Global Equity Funds
Notes to Financial Statements – (continued)
October 31, 2021
| | Foreign currency contracts involve elements of market risk in excess of the amounts reflected in the Statements of Assets and Liabilities. In addition, risks may arise upon entering into these contracts from the potential inability of the counterparties to meet the terms of the contracts and from unanticipated movements in the value of the foreign currencies relative to the U.S. dollar. Upon entering into a foreign currency contract, a Fund may be required to post margin equal to its outstanding exposure thereunder. |
During the year ended October 31, 2021, the International Value Fund had used Foreign Currency Contracts.
| c) | Additional Derivative Instrument Information: |
| | Emerging Markets Equity Fund |
| | |
| The Effect of Derivative Instruments on the Statement of Assets and Liabilities as of October 31, 2021: |
| | Risk Exposure Category |
| | Interest Rate
Contracts | | Foreign
Currency
Contracts | | Credit
Contracts | | Equity
Contracts | | Commodity
Contracts | | Total |
| Liabilities: | | | | | | | | | | | |
| Unrealized depreciation on futures contracts(1) | $ — | | $ — | | $ — | | $ 159,649 | | $ — | | $ 159,649 |
| Total | $ — | | $ — | | $ — | | $ 159,649 | | $ — | | $ 159,649 |
| (1) | Amount represents the cumulative appreciation and depreciation on futures contracts as disclosed within the Schedule of Investments under the open “Futures Contracts” section. Only current day’s variation margin, if any, is reported within the Statement of Assets and Liabilities. |
| The Effect of Derivative Instruments on the Statement of Operations for the year ended October 31, 2021: |
| | Risk Exposure Category |
| | Interest Rate
Contracts | | Foreign
Currency
Contracts | | Credit
Contracts | | Equity
Contracts | | Commodity
Contracts | | Total |
| Realized Gain (Loss) on Derivatives Recognized as a Result of Operations: | | | | | | | | | | | |
| Net realized gain (loss) on futures contracts | $ — | | $ — | | $ — | | $ 763,685 | | $ — | | $ 763,685 |
| Total | $ — | | $ — | | $ — | | $ 763,685 | | $ — | | $ 763,685 |
| Net Change in Unrealized Appreciation (Depreciation) on Derivatives Recognized as a Result of Operations: | | | | | | | | | | | |
| Net change in unrealized appreciation (depreciation) of futures contracts | $ — | | $ — | | $ — | | $ (212,722) | | $ — | | $ (212,722) |
| Total | $ — | | $ — | | $ — | | $ (212,722) | | $ — | | $ (212,722) |
For the year ended October 31, 2021, the average monthly amount or number per contract outstanding for each derivative type was as follows:
| Derivative Description | | Average Notional
Par, Contracts
or Face Amount |
| Futures Contracts Number of Long Contracts | | 110 |
International Equity Fund
| The Effect of Derivative Instruments on the Statement of Assets and Liabilities as of October 31, 2021: |
| | Risk Exposure Category |
| | Interest Rate
Contracts | | Foreign
Currency
Contracts | | Credit
Contracts | | Equity
Contracts | | Commodity
Contracts | | Total |
| Liabilities: | | | | | | | | | | | |
| Unrealized depreciation on futures contracts(1) | $ — | | $ — | | $ — | | $ 221,751 | | $ — | | $ 221,751 |
| Total | $ — | | $ — | | $ — | | $ 221,751 | | $ — | | $ 221,751 |
| (1) | Amount represents the cumulative appreciation and depreciation on futures contracts as disclosed within the Schedule of Investments under the open “Futures Contracts” section. Only current day’s variation margin, if any, is reported within the Statement of Assets and Liabilities. |
Hartford International/Global Equity Funds
Notes to Financial Statements – (continued)
October 31, 2021
International Equity Fund – (continued)
| The Effect of Derivative Instruments on the Statement of Operations for the year ended October 31, 2021: |
| | Risk Exposure Category |
| | Interest Rate
Contracts | | Foreign
Currency
Contracts | | Credit
Contracts | | Equity
Contracts | | Commodity
Contracts | | Total |
| Realized Gain (Loss) on Derivatives Recognized as a Result of Operations: | | | | | | | | | | | |
| Net realized gain (loss) on futures contracts | $ — | | $ — | | $ — | | $ 3,754,712 | | $ — | | $ 3,754,712 |
| Total | $ — | | $ — | | $ — | | $ 3,754,712 | | $ — | | $ 3,754,712 |
| Net Change in Unrealized Appreciation (Depreciation) on Derivatives Recognized as a Result of Operations: | | | | | | | | | | | |
| Net change in unrealized appreciation (depreciation) of futures contracts | $ — | | $ — | | $ — | | $ (47,726) | | $ — | | $ (47,726) |
| Total | $ — | | $ — | | $ — | | $ (47,726) | | $ — | | $ (47,726) |
For the year ended October 31, 2021, the average monthly amount or number per contract outstanding for each derivative type was as follows:
| Derivative Description | | Average Notional
Par, Contracts
or Face Amount |
| Futures Contracts Number of Long Contracts | | 136 |
International Value Fund
| The Effect of Derivative Instruments on the Statement of Assets and Liabilities as of October 31, 2021: |
| | Risk Exposure Category |
| | Interest Rate
Contracts | | Foreign
Currency
Contracts | | Credit
Contracts | | Equity
Contracts | | Commodity
Contracts | | Total |
| Assets: | | | | | | | | | | | |
| Unrealized appreciation on futures contracts | $ — | | $ — | | $ — | | $ 437,291 | | $ — | | $ 437,291 |
| Total | $ — | | $ — | | $ — | | $ 437,291 | | $ — | | $ 437,291 |
| The Effect of Derivative Instruments on the Statement of Operations for the year ended October 31, 2021: |
| | Risk Exposure Category |
| | Interest Rate
Contracts | | Foreign
Currency
Contracts | | Credit
Contracts | | Equity
Contracts | | Commodity
Contracts | | Total |
| Realized Gain (Loss) on Derivatives Recognized as a Result of Operations: | | | | | | | | | | | |
| Net realized gain (loss) on futures contracts | $ — | | $ — | | $ — | | $ 7,852,388 | | $ — | | $ 7,852,388 |
| Net realized gain (loss) on foreign currency contracts | — | | (399,577) | | — | | — | | — | | (399,577) |
| Total | $ — | | $ (399,577) | | $ — | | $ 7,852,388 | | $ — | | $ 7,452,811 |
| Net Change in Unrealized Appreciation (Depreciation) on Derivatives Recognized as a Result of Operations: | | | | | | | | | | | |
| Net change in unrealized appreciation (depreciation) of futures contracts | $ — | | $ — | | $ — | | $ 487,382 | | $ — | | $ 487,382 |
| Total | $ — | | $ — | | $ — | | $ 487,382 | | $ — | | $ 487,382 |
For the year ended October 31, 2021, the average monthly amount or number per contract outstanding for each derivative type was as follows:
| Derivative Description | | Average Notional
Par, Contracts
or Face Amount |
| Futures Contracts Number of Long Contracts | | 300 |
| Foreign Currency Contracts Purchased at Contract Amount | | $ 9,797,466 |
| Foreign Currency Contracts Sold at Contract Amount | | $ 9,764,168 |
Hartford International/Global Equity Funds
Notes to Financial Statements – (continued)
October 31, 2021
| d) | Balance Sheet Offsetting Information – Set forth below are tables which disclose both gross information and net information about instruments and transactions eligible for offset in the financial statements, and instruments and transactions that are subject to a master netting arrangement, as well as amounts related to margin, reflected as financial collateral (including cash collateral), held at clearing brokers, counterparties and a Fund's custodian. The master netting arrangements allow the clearing brokers to net any collateral held in or on behalf of a Fund, or liabilities or payment obligations of the clearing brokers to a Fund, against any liabilities or payment obligations of a Fund to the clearing brokers. A Fund is required to deposit financial collateral (including cash collateral) at the Fund's custodian on behalf of clearing brokers and counterparties to continually meet the original and maintenance requirements established by the clearing brokers and counterparties. Such requirements are specific to the respective clearing broker or counterparty. Certain master netting arrangements may not be enforceable in a bankruptcy. |
| | The following tables present a Fund's derivative assets and liabilities, presented on a gross basis as no amounts are netted within the Statements of Assets and Liabilities, by counterparty net of amounts available for offset under a master netting agreement or similar agreement ("MNA") and net of the related collateral received/pledged by a Fund as of October 31, 2021: |
| | |
| Emerging Markets Equity Fund | | | | |
| Derivative Financial Instruments: | | Assets | | Liabilities |
| Futures contracts | | $ — | | $ (159,649) |
| Total gross amount of derivative assets and liabilities in the Statement of Assets and Liabilities | | — | | (159,649) |
| Derivatives not subject to a MNA | | — | | 159,649 |
| Total gross amount of assets and liabilities subject to MNA or similar agreements | | $ — | | $ — |
| International Equity Fund | | | | |
| Derivative Financial Instruments: | | Assets | | Liabilities |
| Futures contracts | | $ — | | $ (221,751) |
| Total gross amount of derivative assets and liabilities in the Statement of Assets and Liabilities | | — | | (221,751) |
| Derivatives not subject to a MNA | | — | | 221,751 |
| Total gross amount of assets and liabilities subject to MNA or similar agreements | | $ — | | $ — |
| International Value Fund | | | | |
| Derivative Financial Instruments: | | Assets | | Liabilities |
| Futures contracts | | $ 437,291 | | $ — |
| Total gross amount of derivative assets and liabilities in the Statement of Assets and Liabilities | | 437,291 | | — |
| Derivatives not subject to a MNA | | (437,291) | | — |
| Total gross amount of assets and liabilities subject to MNA or similar agreements | | $ — | | $ — |
| 5. | Principal Risks: |
| | A Fund’s investments expose it to various types of risks associated with financial instruments and the markets. A Fund may be exposed to the risks described below. Each Fund’s prospectus provides details of its principal risks. |
| | The market values of equity securities, such as common stocks and preferred stocks, or equity related derivative investments, such as futures and options, may decline due to general market conditions which are not specifically related to a particular company, such as real or perceived adverse economic conditions, changes in the general outlook for corporate earnings, changes in interest or currency rates or adverse investor sentiment generally. The market value of equity securities may also decline due to factors which affect a particular industry or industries, such as labor shortages or increased production costs and competitive conditions within an industry. Equity securities and equity related investments generally have greater market price volatility than fixed income securities. The extent of each Fund’s exposure to market risk is the market value of the investments held as shown in the Fund’s Schedule of Investments. |
| | A widespread health crisis, such as a global pandemic, could cause substantial market volatility, exchange trading suspensions or restrictions and closures of securities exchanges and businesses, impact the ability to complete redemptions, and adversely impact Fund performance. The current ongoing outbreak of COVID-19, a respiratory disease caused by a novel coronavirus, has negatively affected the worldwide economy, created supply chain disruptions and labor shortages, and impacted the financial health of individual companies and the market in significant and unforeseen ways. The future impact of the ongoing COVID-19 pandemic remains unclear. The effects to public health, business and market conditions resulting from COVID-19 pandemic may have a significant negative impact on the performance of a Fund’s investments, including exacerbating other pre-existing political, social and economic risks. |
Hartford International/Global Equity Funds
Notes to Financial Statements – (continued)
October 31, 2021
| | Investing in the securities of non-U.S. issuers, whether directly or indirectly, involves certain considerations and risks not typically associated with securities of U.S. issuers. Such risks include, but are not limited to: generally less liquid and less efficient securities markets; generally greater price volatility; exchange rate fluctuations; imposition of restrictions on the expatriation of funds or other protectionist measures; less publicly available information about issuers; the imposition of withholding or other taxes; higher transaction and custody costs; settlement delays and risk of loss attendant in settlement procedures; difficulties in enforcing contractual obligations; less regulation of securities markets; different accounting, disclosure and reporting requirements; more substantial governmental involvement in the economy; higher inflation rates; and greater social, economic and political uncertainties. Non-U.S. issuers may also be affected by political, social, economic or diplomatic developments in a foreign country or region or the U.S. (including the imposition of sanctions, tariffs, or other governmental restrictions). These risks are heightened for investments in issuers from countries with less developed markets. |
| | Securities lending involves the risk that a Fund may lose money because the borrower of the loaned securities fails to return the securities in a timely manner or at all. A Fund could also lose money in the event of a decline in the value of the collateral provided for the loaned securities or a decline in the value of any investments made with cash collateral. These events could also trigger adverse tax consequences for a Fund that lends its holdings. |
| a) | Each Fund intends to continue to qualify as a Regulated Investment Company ("RIC") under Subchapter M of the Internal Revenue Code (“IRC”) by distributing substantially all of its taxable net investment income and net realized capital gains to its shareholders each year. Each Fund has distributed substantially all of its income and capital gains in prior years, if applicable, and intends to distribute substantially all of its income and capital gains during the calendar year ending December 31, 2021. Accordingly, no provision for federal income or excise taxes has been made in the accompanying financial statements. Distributions from short-term capital gains are treated as ordinary income distributions for federal income tax purposes. |
| b) | Net Investment Income (Loss), Net Realized Gains (Losses) and Distributions – Net investment income (loss) and net realized gains (losses) may differ for financial statement and tax purposes primarily because of losses deferred due to wash sale adjustments, foreign currency gains and losses, adjustments related to Passive Foreign Investment Companies ("PFICs"), Real Estate Investment Trusts ("REITs"), RICs, certain derivatives and partnerships. The character of distributions made during the year from net investment income or net realized gains may differ from their ultimate characterization for federal income tax purposes. Also, due to the timing of dividend distributions, the fiscal year in which amounts are distributed may differ from the year that the income or realized gains (losses) were recorded by each Fund. |
| c) | Distributions and Components of Distributable Earnings – The tax character of distributions paid by each Fund for the years ended October 31, 2021 and October 31, 2020 are as follows: |
| | |
| | | For the Year Ended
October 31, 2021 | | For the Year Ended
October 31, 2020 |
| Fund | | Ordinary
Income | | Long-Term
Capital Gains(1) | | Ordinary
Income | | Long-Term
Capital Gains(1) |
| Climate Opportunities Fund | | $ 1,060,101 | | $ — | | $ 209,754 | | $ 787,883 |
| Emerging Markets Equity Fund | | 5,430,419 | | — | | 7,706,634 | | — |
| Global Impact Fund | | 517,626 | | — | | 645,398 | | — |
| International Equity Fund | | 10,069,912 | | — | | 21,795,762 | | — |
| International Growth Fund | | 1,028,985 | | 19,501,742 | | 2,743,072 | | — |
| International Opportunities Fund | | 26,618,599 | | — | | 58,210,750 | | — |
| International Value Fund | | 28,144,815 | | — | | 71,505,291 | | — |
| (1) | The Funds designate these distributions as long-term capital gains dividends pursuant to IRC Sec 852(b)(3)(c) |
Hartford International/Global Equity Funds
Notes to Financial Statements – (continued)
October 31, 2021
As of October 31, 2021, the components of total accumulated earnings (deficit) for each Fund on a tax basis are as follows:
| Fund | | Undistributed
Ordinary
Income | | Undistributed
Long-Term
Capital Gains | | Accumulated
Capital and
Other Losses | | Unrealized
Appreciation
(Depreciation)
on Investments(1) | | Total
Accumulated
Earnings
(Deficit) |
| Climate Opportunities Fund | | $ 3,005,074 | | $ 5,058,106 | | $ — | | $ 30,534,927 | | $ 38,598,107 |
| Emerging Markets Equity Fund | | 8,280,511 | | — | | (8,014,081) | | 66,319,889 | | 66,586,319 |
| Global Impact Fund | | 495,938 | | 3,111,568 | | (18,605,425) | | 33,837,018 | | 18,839,099 |
| International Equity Fund | | 15,220,469 | | 11,298,466 | | (5,974,530) | | 137,756,029 | | 158,300,434 |
| International Growth Fund | | 3,012,846 | | 2,188,410 | | — | | 175,038,609 | | 180,239,865 |
| International Opportunities Fund | | 71,153,129 | | 386,397,079 | | — | | 885,533,494 | | 1,343,083,702 |
| International Value Fund | | 60,858,513 | | — | | (353,525,973) | | 154,491,346 | | (138,176,114) |
| (1) | Differences between book-basis and tax basis unrealized appreciation (depreciation) may be attributable to the losses deferred due to wash sale adjustments, foreign currency gains and losses, adjustments related to PFICs, REITS, certain derivatives and partnerships. |
| d) | Reclassification of Capital Accounts – The Funds may record reclassifications in their capital accounts. These reclassifications have no impact on the total net assets of the Funds. The reclassifications are a result of permanent differences between U.S. GAAP and tax accounting for such items as earnings and profits distributed to shareholders on the redemption of shares and non deductible expenses from partnership adjustments. Adjustments are made to reflect the impact these items have on the current and future earnings distributions to shareholders. Therefore, the source of the Funds’ distributions may be shown in the accompanying Statements of Changes in Net Assets as from distributable earnings or from capital depending on the type of book and tax differences that exist. For the year ended October 31, 2021, the Funds recorded reclassifications to increase (decrease) the accounts listed below: |
| | |
| Fund | | Paid-in-Capital | | Distributable
Earnings (Loss) |
| International Equity Fund | | $ (695) | | $ 695 |
| International Opportunities Fund | | 16,997,002 | | (16,997,002) |
| e) | Capital Loss Carryforward – Under the Regulated Investment Company Modernization Act of 2010, funds are permitted to carry forward capital losses for an unlimited period. |
| | At October 31, 2021 (tax year end), each Fund's capital loss carryforwards for U.S. federal income tax purposes were as follows: |
| | |
| Fund | | Short-Term
Capital Loss
Carryforward with
No Expiration | | Long-Term
Capital Loss
Carryforward with
No Expiration |
| Emerging Markets Equity Fund | | $ 8,014,081 | | $ — |
| Global Impact Fund* | | 1,929,144 | | 16,676,281 |
| International Equity Fund* | | 3,428,999 | | 2,545,531 |
| International Value Fund | | 30,092,636 | | 323,433,337 |
| * | Future utilization of losses are subject to limitation under current tax laws. |
The Climate Opportunities Fund, International Growth Fund and International Opportunities Fund have no capital loss carryforwards for U.S. federal income tax purposes as of October 31, 2021.
During the year ended October 31, 2021 Emerging Markets Equity Fund utilized $44,956,375, Global Impact Fund utilized $7,678,446, International Equity Fund utilized $49,948,045, International Opportunities Fund utilized $402,676,050, International Value Fund utilized $75,974,363 of prior year capital loss carryforwards.
| f) | Tax Basis of Investments – The aggregate cost of investments for federal income tax purposes at October 31, 2021 is different from book purposes primarily due to wash sale loss deferrals, partnerships and passive foreign investment company (PFIC) mark-to-market adjustments. The net unrealized appreciation/depreciation on investments for tax purposes, which consists of gross unrealized appreciation and depreciation, was also different from book purposes primarily due to wash sale loss deferrals, and market to market adjustments on futures, PFICs, partnership adjustments and non-taxable distributions from underlying investments. Both the cost and unrealized |
Hartford International/Global Equity Funds
Notes to Financial Statements – (continued)
October 31, 2021
| | appreciation and depreciation for federal income tax purposes are disclosed below: |
| | |
| Fund | | Tax Cost | | Gross Unrealized
Appreciation | | Gross Unrealized
(Depreciation) | | Net Unrealized
Appreciation
(Depreciation) |
| Climate Opportunities Fund | | $ 122,027,150 | | $ 31,968,319 | | $ (1,432,704) | | $ 30,535,615 |
| Emerging Markets Equity Fund | | 429,459,837 | | 89,788,069 | | (21,396,394) | | 68,391,675 |
| Global Impact Fund | | 107,805,192 | | 35,966,111 | | (2,108,013) | | 33,858,098 |
| International Equity Fund | | 765,363,108 | | 174,030,850 | | (35,894,614) | | 138,136,236 |
| International Growth Fund | | 498,846,642 | | 182,886,274 | | (7,865,730) | | 175,020,544 |
| International Opportunities Fund | | 3,873,865,179 | | 948,534,125 | | (58,722,574) | | 889,811,551 |
| International Value Fund | | 2,008,465,230 | | 264,063,479 | | (109,178,311) | | 154,885,168 |
| g) | Accounting for Uncertainty in Income Taxes – Pursuant to provisions set forth by U.S. GAAP, Hartford Funds Management Company, LLC ("HFMC") reviews each Fund’s tax positions for all open tax years. As of October 31, 2021, HFMC had reviewed the open tax years and concluded that there was no reason to record a liability for net unrecognized tax obligations relating to uncertain income tax positions. Each Fund files U.S. tax returns. Although the statute of limitations for examining a Fund’s U.S. tax returns remains open for 3 years, no examination is currently in progress. The Funds recognize interest and penalties, if any, related to unrecognized tax benefits as income tax expense on the Statements of Operations. During the year ended October 31, 2021, the Funds did not incur any interest or penalties. HFMC is not aware of any tax positions for which it is reasonably possible that the total amounts of unrecognized tax obligations will significantly change in the next twelve months. |
| a) | Investment Management Agreement – HFMC serves as each Fund’s investment manager. The Company, on behalf of each Fund, has entered into an Investment Management Agreement with HFMC. HFMC is an indirect subsidiary of The Hartford Financial Services Group, Inc. ("The Hartford"). HFMC has overall investment supervisory responsibility for each Fund. In addition, HFMC provides administrative personnel, services, equipment, facilities and office space for proper operation of each Fund. HFMC has contracted with Wellington Management Company LLP ("Wellington Management") under a sub-advisory agreement and Wellington Management performs the daily investment of the assets of each Fund (or allocated portion of the assets in the case of Climate Opportunities Fund) in accordance with the Fund’s investment objective and policies. With respect to the Climate Opportunities Fund, HFMC has also entered into a sub-advisory agreement with Schroder Investment Management North America Inc. (“SIMNA”) and SIMNA has contracted with Schroder Investment Management North America Limited (“SIMNA Ltd.”) under a sub-sub-advisory agreement. SIMNA performs the daily investment of the assets for a portion of the Climate Opportunities Fund in accordance with Climate Opportunities Fund's investment objectives and policies and SIMNA may allocate assets to or from SIMNA Ltd., an affiliate of SIMNA, in connection with the daily investment of the assets for such portion of the Climate Opportunities Fund. HFMC pays a sub-advisory fee to one or more sub-advisers out of its investment management fee. With respect to Climate Opportunities Fund, SIMNA pays a sub-sub-advisory fee to SIMNA Ltd. out of the sub-advisory fees received from HFMC for the Fund. |
| | The schedule below reflects the rates of compensation paid to HFMC for investment management services rendered as of October 31, 2021; the rates are accrued daily and paid monthly based on each Fund’s average daily net assets, at the following annual rates: |
| | |
| Fund | | Management Fee Rates |
| Climate Opportunities Fund | | 0.6200% on first $500 million and; |
| | | 0.6000% on next $500 million and; |
| | | 0.5800% on next $1.5 billion and; |
| | | 0.5750% on next $2.5 billion and; |
| | | 0.5700% over $5 billion |
| Emerging Markets Equity Fund | | 0.9000% on first $500 million and; |
| | | 0.8500% on next $500 million and; |
| | | 0.8000% over $1 billion |
| Global Impact Fund | | 0.6200% on first $500 million and; |
| | | 0.6000% on next $500 million and; |
| | | 0.5800% on next $1.5 billion and; |
| | | 0.5750% on next $2.5 billion and; |
| | | 0.5700% over $5 billion |
| International Equity Fund | | 0.4600% on first $1 billion and; |
| | | 0.4500% on next $1 billion and; |
| | | 0.4400% on next $3 billion and; |
| | | 0.4300% over $5 billion |
Hartford International/Global Equity Funds
Notes to Financial Statements – (continued)
October 31, 2021
| Fund | | Management Fee Rates |
| International Growth Fund | | 0.8000% on first $250 million and; |
| | | 0.7500% on next $250 million and; |
| | | 0.7000% on next $500 million and; |
| | | 0.6500% over $1 billion |
| International Opportunities Fund | | 0.7500% on first $500 million and; |
| | | 0.6500% on next $500 million and; |
| | | 0.6400% on next $1.5 billion and; |
| | | 0.6350% on next $2.5 billion and; |
| | | 0.6300% on next $5 billion and; |
| | | 0.6250% over $10 billion |
| International Value Fund | | 0.8500% on first $500 million and; |
| | | 0.8000% on next $500 million and; |
| | | 0.7500% on next $4 billion and; |
| | | 0.7475% on next $5 billion and; |
| | �� | 0.7450% over $10 billion |
| b) | Accounting Services Agreement – HFMC provides the Funds with accounting services pursuant to a fund accounting agreement by and between the Company, on behalf of each Fund, and HFMC. HFMC has delegated certain accounting and administrative service functions to State Street Bank and Trust Company (“State Street”). In consideration of services rendered and expenses assumed pursuant to the fund accounting agreement, each Fund pays HFMC a fee. Effective May 1, 2021, the fund accounting fee schedule as set forth in the fund accounting agreement by and between the Company, on behalf of the Funds, and HFMC, was revised. Effective May 1, 2021, the fund accounting fee for each Fund is equal to the greater of: (A) the sum of (i) the sub-accounting fee payable by HFMC with respect to the Fund; (ii) the fee payable for tax preparation services for the Fund; and (iii) the amount of expenses that HFMC allocates for providing the fund accounting services to the Fund; plus a target profit margin; or (B) $40,000 per year; provided, however, that to the extent the annual amount of the fund accounting fee exceeds 0.02% of the Fund’s average net assets (calculated during its current fiscal year), HFMC shall waive such portion of the fund accounting fee. For the period November 1, 2020 through April 30, 2021, HFMC received the following fee with respect to each Fund: any sub-accounting fee payable by HFMC plus the amount of expenses that HFMC allocates for providing the fund accounting services. |
| c) | Operating Expenses – Allocable expenses incurred by the Company are allocated to each series within the Company, and allocated to classes within each such series, in proportion to the average daily net assets of such series and classes, except where allocation of certain expenses is more fairly made directly to a Fund or to specific classes within a Fund. As of October 31, 2021, HFMC contractually agreed to limit the total annual fund operating expenses (exclusive of taxes, interest expenses, brokerage commissions, acquired fund fees and expenses, and extraordinary expenses) through February 28, 2022 (unless the Board of Directors approves its earlier termination) as follows for each of the following Funds: |
| | |
| | | Expense Limit as a Percentage of Average Daily Net Assets |
| Fund | | Class A | | Class C | | Class I | | Class R3 | | Class R4 | | Class R5 | | Class R6 | | Class Y | | Class F |
| Climate Opportunities Fund | | 1.19% | | 1.94% | | 0.89% | | 1.41% | | 1.11% | | 0.81% | | 0.69% | | 0.79% | | 0.69% |
| Emerging Markets Equity Fund | | 1.45% | | 2.20% | | 1.20% | | 1.70% | | 1.45% | | 1.15% | | 0.98% | | 1.10% | | 0.98% |
| Global Impact Fund | | 1.19% | | 1.94% | | 0.89% | | 1.41% | | 1.11% | | 0.81% | | 0.69% | | 0.79% | | 0.69% |
| International Growth Fund | | 1.30% | | 2.05% | | 1.00% | | 1.57% | | 1.27% | | 1.00% | | 0.85% | | 0.95% | | 0.85% |
| d) | Fees Paid Indirectly – Certain Funds have entered into agreements with State Street Global Markets, LLC and Russell Implementation Services, Inc. to partially recapture non-discounted trade commissions. Such rebates are used to pay a portion of a Fund's expenses. For the year ended October 31, 2021, these amounts, if any, are included in the Statements of Operations. |
| | The ratio of expenses to average net assets in the accompanying financial highlights excludes the reduction in expenses related to fees paid indirectly. The annualized expense ratio after waivers reflecting the reduction for fees paid indirectly for the period is as follows: |
| | |
| Fund | | Class A | | Class C | | Class I | | Class R3 | | Class R4 | | Class R5 | | Class R6 | | Class Y | | Class F |
| Climate Opportunities Fund | | 1.17% | | 1.93% | | 0.88% | | 1.08% | | 0.99% | | 0.81% | | 0.69% | | 0.79% | | 0.69% |
| Emerging Markets Equity Fund | | 1.44% | | 2.20% | | 1.12% | | 1.70% | | 1.43% | | 1.13% | | 0.98% | | 1.10% | | 0.98% |
| Global Impact Fund | | 1.18% | | 1.93% | | 0.87% | | 1.40% | | 1.10% | | 0.80% | | 0.69% | | 0.79% | | 0.69% |
| International Equity Fund | | 0.94% | | 1.72% | | 0.61% | | 1.23% | | 0.94% | | 0.63% | | 0.53% | | 0.63% | | 0.52% |
| International Growth Fund | | 1.26% | | 2.05% | | 1.00% | | 1.55% | | 1.26% | | 0.94% | | 0.84% | | 0.95% | | 0.84% |
| International Opportunities Fund | | 1.07% | | 1.85% | | 0.77% | | 1.40% | | 1.10% | | 0.79% | | 0.69% | | 0.75% | | 0.68% |
| International Value Fund | | 1.23% | | 1.97% | | 0.95% | | 1.56% | | 1.26% | | 0.94% | | 0.84% | | 0.90% | | 0.84% |
Hartford International/Global Equity Funds
Notes to Financial Statements – (continued)
October 31, 2021
| e) | Sales Charges and Distribution and Service Plan for Class A, C, R3 and R4 Shares – Hartford Funds Distributors, LLC (“HFD”), an indirect subsidiary of The Hartford, is the principal underwriter and distributor of each Fund. For the year ended October 31, 2021, HFD received front-end sales charges and contingent deferred sales charges for each Fund as follows: |
| | |
| Fund | | Front-End
Sales Charges | | Contingent Deferred
Sales Charges |
| Climate Opportunities Fund | | $ 363,836 | | $ 15 |
| Emerging Markets Equity Fund | | 59,618 | | 124 |
| Global Impact Fund | | 101,176 | | 81 |
| International Equity Fund | | 169,170 | | 1,303 |
| International Growth Fund | | 206,492 | | 3,045 |
| International Opportunities Fund | | 569,176 | | 1,582 |
| International Value Fund | | 138,755 | | 20 |
The Board of Directors of the Company has approved the adoption of a separate distribution plan (each a “Plan”) pursuant to Rule 12b-1 under the 1940 Act for each of Class A, C, R3 and R4 shares. Under a Plan, Class A, Class C, Class R3 and Class R4 shares of a Fund, as applicable, bear distribution and/or service fees paid to HFD, some or all of which may be paid to select broker-dealers. Pursuant to the Class A Plan, a Fund may pay HFD a fee of up to 0.25% of the average daily net assets attributable to Class A shares for distribution financing activities and shareholder account servicing activities. The entire amount of the fee may be used for shareholder servicing expenses and/or distribution expenses. Pursuant to the Class C Plan, a Fund may pay HFD a fee of up to 1.00% of the average daily net assets attributable to Class C shares for distribution financing activities, and up to 0.25% may be used for shareholder account servicing activities. The Class C Plan also provides that HFD will receive all contingent deferred sales charges attributable to Class C shares. Pursuant to the Class R3 Plan, a Fund may pay HFD a fee of up to 0.50% of the average daily net assets attributable to Class R3 shares for distribution financing activities, and up to 0.25% may be used for shareholder account servicing activities. Pursuant to the Class R4 Plan, a Fund may pay HFD a fee of up to 0.25% of the average daily net assets attributable to Class R4 shares for distribution financing activities. The entire amount of the fee may be used for shareholder account servicing activities. Each Fund’s 12b-1 fees are accrued daily and paid monthly or at such other intervals as the Company’s Board of Directors may determine. Any 12b-1 fees attributable to assets held in an account held directly with the Funds’ transfer agent for which there is not a third-party listed as the broker-dealer of record (or HFD does not otherwise have a payment obligation) are generally reimbursed to the applicable Fund. Such amounts are reflected as “Distribution fee reimbursements” on the Statements of Operations.
| f) | Other Related Party Transactions – Certain officers of the Company are directors and/or officers of HFMC and/or The Hartford or its subsidiaries. For the year ended October 31, 2021, a portion of the Company’s Chief Compliance Officer’s (“CCO”) compensation was paid by all of the investment companies in the Hartford fund complex. The portion allocated to each Fund, as represented in other expenses on the Statements of Operations, is outlined in the table below. |
| | |
| Fund | | CCO Compensation
Paid by Fund |
| Climate Opportunities Fund | | $ 231 |
| Emerging Markets Equity Fund | | 844 |
| Global Impact Fund | | 206 |
| International Equity Fund | | 1,607 |
| International Growth Fund | | 1,178 |
| International Opportunities Fund | | 7,890 |
| International Value Fund | | 3,357 |
Hartford Administrative Services Company (“HASCO”), an indirect subsidiary of The Hartford, provides transfer agent services to each Fund. Each Fund pays HASCO a transfer agency fee payable monthly based on the lesser of (i) the costs of providing or overseeing transfer agency services provided to each share class of such Fund plus a target profit margin or (ii) a Specified Amount (as defined in the table below). Such fee is intended to compensate HASCO for: (i) fees payable by HASCO to DST Asset Manager Solutions, Inc. (“DST”) (and any other designated sub-agent) according to the agreed-upon fee schedule under the sub-transfer agency agreement between HASCO and DST (or between HASCO and any other designated sub-agent, as applicable); (ii) sub-transfer agency fees payable by HASCO to financial intermediaries, according to the agreed-upon terms between HASCO and the financial intermediaries, provided that such payments are
Hartford International/Global Equity Funds
Notes to Financial Statements – (continued)
October 31, 2021
within certain limits approved by the Company’s Board of Directors; (iii) certain expenses that HASCO’s parent company, Hartford Funds Management Group, Inc., allocates to HASCO that relate to HASCO’s transfer agency services provided to the Fund; and (iv) a target profit margin.
| Share Class | | Specified Amount
(as a percentage
average daily
net assets) |
| Class A | | 0.25% |
| Class C | | 0.25% |
| Class I | | 0.20% |
| Class R3 | | 0.22% |
| Class R4 | | 0.17% |
| Class R5 | | 0.12% |
| Class R6 | | 0.004% |
| Class Y | | 0.11% |
| Class F | | 0.004% |
Effective March 1, 2021, HASCO has contractually agreed to waive its transfer agency fee and/or reimburse transfer agency-related expenses to the extent necessary to limit the transfer agency fee for the share classes of the Funds listed below through February 28, 2022, unless the Board of Directors approves its earlier termination as follows:
| Fund | | Class Y |
| International Opportunities Fund | | 0.07% |
| International Value Fund | | 0.06% |
From November 1, 2020 through February 28, 2021, HASCO contractually agreed to waive its transfer agency fee and/or reimburse transfer agency-related expenses to the extent necessary to limit the transfer agency fee for the share classes of the Funds listed below as follows:
| Fund | | Class Y |
| International Opportunities Fund | | 0.07% |
| International Value Fund | | 0.06% |
Pursuant to a sub-transfer agency agreement between HASCO and DST, HASCO has delegated certain transfer agent, dividend disbursing agent and shareholder servicing agent functions to DST. Each Fund does not pay any fee directly to DST; rather, HASCO makes all such payments to DST. The accrued amount shown in the Statements of Operations reflects the amounts charged by HASCO. These fees are accrued daily and paid monthly.
For the year ended October 31, 2021, the effective rate of compensation paid to HASCO for transfer agency services as a percentage of each Class' average daily net assets is as follows:
| Fund | | Class A | | Class C | | Class I | | Class R3 | | Class R4 | | Class R5 | | Class R6 | | Class Y | | Class F |
| Climate Opportunities Fund | | 0.14% | | 0.23% | | 0.13% | | 0.22% | | 0.17% | | 0.12% | | 0.00% * | | 0.11% | | 0.00%* |
| Emerging Markets Equity Fund | | 0.18% | | 0.25% | | 0.11% | | 0.22% | | 0.17% | | 0.12% | | 0.00% * | | 0.11% | | 0.00%* |
| Global Impact Fund | | 0.23% | | 0.25% | | 0.11% | | 0.21% | | 0.15% | | 0.12% | | 0.00% * | | 0.06% | | 0.00%* |
| International Equity Fund | | 0.17% | | 0.20% | | 0.09% | | 0.22% | | 0.17% | | 0.11% | | 0.00% * | | 0.11% | | 0.00%* |
| International Growth Fund | | 0.17% | | 0.25% | | 0.20% | | 0.22% | | 0.17% | | 0.11% | | 0.00% * | | 0.11% | | 0.00%* |
| International Opportunities Fund | | 0.14% | | 0.16% | | 0.09% | | 0.22% | | 0.16% | | 0.10% | | 0.00% * | | 0.07% | | 0.00%* |
| International Value Fund | | 0.13% | | 0.13% | | 0.11% | | 0.22% | | 0.17% | | 0.10% | | 0.00% * | | 0.06% | | 0.00%* |
| 8. | Securities Lending: |
| | The Company has entered into a securities lending agency agreement (“lending agreement”) with Citibank, N.A. (“Citibank”). A Fund may lend portfolio securities to certain borrowers in U.S. and non-U.S. markets in an amount not to exceed one-third (33 1/3%) of the value of its total assets. A Fund may lend portfolio securities, provided that the borrower provides collateral that is maintained in an amount at least equal to the current market value of the securities loaned. Cash collateral is invested for the benefit of a Fund by the Fund’s lending agent pursuant to collateral investment guidelines. The collateral is marked to market daily, in an amount at least equal to the current market value of the securities loaned. |
| | A Fund is subject to certain risks while its securities are on loan, including the following: (i) the risk that the borrower defaults on the loan and the collateral is inadequate to cover the Fund’s loss; (ii) the risk that the earnings on the collateral invested are not sufficient to pay fees incurred in connection with the loan; (iii) the Fund could lose money in the event of a decline in the value of the collateral provided for loaned securities or a decline in the value of any investments made with cash collateral; (iv) the risk that the borrower may use the loaned securities to cover a short |
Hartford International/Global Equity Funds
Notes to Financial Statements – (continued)
October 31, 2021
| | sale, which may in turn place downward pressure on the market prices of the loaned securities; (v) the risk that return of loaned securities could be delayed and interfere with portfolio management decisions; and (vi) the risk that any efforts to restrict or recall the securities for purposes of voting may not be effective. These events could also trigger adverse tax consequences for the Fund. |
| | A Fund retains loan fees and the interest on cash collateral investments but is required to pay the borrower a rebate for the use of cash collateral. In cases where the lent security is of high value to borrowers, there may be a negative rebate (i.e., a net payment from the borrower to the applicable Fund). Upon termination of a loan, a Fund is required to return to the borrower an amount equal to the cash collateral, plus any rebate owed to the borrowers. |
| | The net income earned on the securities lending (after payment of rebates and Citibank’s fee) is included on the Statements of Operations as Investment Income from securities lending. A Fund also receives payments from the borrower during the period of the loan, equivalent to dividends and interest earned on the securities loaned, which are recorded as Investment Income from dividends or interest, respectively, on the Statements of Operations. |
| | The following table presents for each Fund that lends its portfolio securities the market value of the securities on loan; the collateral posted by the borrower; and the net amount, if any, due from the borrower in the event of default as of October 31, 2021. |
| | |
| Fund | | Investment Securities on Loan, at market value,
Presented on the Statements of Assets and Liabilities | | Collateral Posted by Borrower(1) | | Net Amount(2) |
| Climate Opportunities Fund | | $ 492,608 | | $ (492,608) | | $ — |
| Emerging Markets Equity Fund | | 3,583,530 | | (3,583,530) (3) | | — |
| Global Impact Fund | | 537,135 | | (537,135) | | — |
| International Equity Fund | | 7,246,411 | | (7,246,411) (3) | | — |
| International Growth Fund | | — | | — (3) | | — |
| International Opportunities Fund | | 15,371,182 | | (15,371,182) (3) | | — |
| International Value Fund | | 3,789,943 | | (3,789,943) (3) | | — |
| (1) | It is each Fund’s policy to obtain additional collateral from, or return excess collateral to, the borrower by the end of the next business day following the valuation date of the securities loaned. Therefore, the value of the collateral held may be temporarily less than that required under the lending contract due to timing. Pursuant to the lending agreement, the borrower will provide collateral in an amount at least equal to the current market value of securities loaned. Collateral received in excess or in deficit of the market value is not presented in this table. |
| (2) | Net amount represents the net amount receivable due from the borrower in the event of default. |
| (3) | Includes non-cash collateral of $1,360,639, $1,604,157, $83,913, $17,435,764, and $1,698,449 for Emerging Markets Equity Fund, International Equity Fund, International Growth Fund, International Opportunities Fund, and International Value Fund, respectively. |
| 9. | Secured Borrowings: |
| | The following tables reflect a breakdown of transactions accounted for as secured borrowings, the gross obligation by the type of collateral pledged, and the remaining contractual maturity of those transactions as of October 31, 2021. |
| | Certain Transfers Accounted For As Secured Borrowings |
| | Remaining Contractual Maturity of the Agreements |
| | |
| | Overnight and
Continuous | | < 30 days | | Between
30 & 90 days | | > 90 days | | Total |
| Climate Opportunities Fund | | | | | | | | | |
| Securities Lending Transactions(1) | | | | | | | | | |
| Common Stocks | $ 513,591 | | $ — | | $ — | | $ — | | $ 513,591 |
| Total Borrowings | $ 513,591 | | $ — | | $ — | | $ — | | $ 513,591 |
| Gross amount of recognized liabilities for securities lending transactions | | $ 513,591 |
| Emerging Markets Equity Fund | | | | | | | | | |
| Securities Lending Transactions(1) | | | | | | | | | |
| Common Stocks | $ 2,916,519 | | $ — | | $ — | | $ — | | $ 2,916,519 |
| Total Borrowings | $ 2,916,519 | | $ — | | $ — | | $ — | | $ 2,916,519 |
| Gross amount of recognized liabilities for securities lending transactions | | $ 2,916,519 |
| Global Impact Fund | | | | | | | | | |
| Securities Lending Transactions(1) | | | | | | | | | |
| Common Stocks | $ 539,597 | | $ — | | $ — | | $ — | | $ 539,597 |
| Total Borrowings | $ 539,597 | | $ — | | $ — | | $ — | | $ 539,597 |
| Gross amount of recognized liabilities for securities lending transactions | | $ 539,597 |
Hartford International/Global Equity Funds
Notes to Financial Statements – (continued)
October 31, 2021
| | Overnight and
Continuous | | < 30 days | | Between
30 & 90 days | | > 90 days | | Total |
| International Equity Fund | | | | | | | | | |
| Securities Lending Transactions(1) | | | | | | | | | |
| Common Stocks | $ 6,166,792 | | $ — | | $ — | | $ — | | $ 6,166,792 |
| Total Borrowings | $ 6,166,792 | | $ — | | $ — | | $ — | | $ 6,166,792 |
| Gross amount of recognized liabilities for securities lending transactions | | $ 6,166,792 |
| International Value Fund | | | | | | | | | |
| Securities Lending Transactions(1) | | | | | | | | | |
| Closed End Funds | $ 1,062 | | $ — | | $ — | | $ — | | $ 1,062 |
| Common Stocks | 4,254,400 | | — | | — | | — | | 4,254,400 |
| Total Borrowings | $ 4,255,462 | | $ — | | $ — | | $ — | | $ 4,255,462 |
| Gross amount of recognized liabilities for securities lending transactions | | $ 4,255,462 |
| (1) | Amount represents the payable for cash collateral received on securities on loan. This will generally be in the “Overnight and Continuous” column as the securities are typically callable on demand. |
| 10. | Affiliate Holdings: |
| | As of October 31, 2021, affiliates of The Hartford had ownership of shares in each Fund as follows: |
| | |
| Percentage of a Class: | | | | | | | | | | | | | | | | | | |
| Fund | | Class A | | Class C | | Class I | | Class R3 | | Class R4 | | Class R5 | | Class R6 | | Class Y | | Class F |
| Climate Opportunities Fund | | — | | — | | — | | 80% | | 58% | | 100% | | 64% | | — | | 31% |
| Emerging Markets Equity Fund | | — | | — | | — | | — | | — | | 19% | | 9% | | — | | — |
| Percentage of Fund by Class: | | | | | | | | | | | | | | | | | | |
| Fund | | Class A | | Class C | | Class I | | Class R3 | | Class R4 | | Class R5 | | Class R6 | | Class Y | | Class F |
| Climate Opportunities Fund | | — | | — | | — | | 0%* | | 0%* | | 0%* | | 0%* | | — | | 17% |
| Emerging Markets Equity Fund | | — | | — | | — | | — | | — | | 0%* | | 0%* | | — | | — |
| * | Percentage rounds to zero. |
As of October 31, 2021, affiliated funds of funds and the 529 plan for which HFMC serves as the program manager (the “529 plan”) in the aggregate owned a portion of the Funds identified below. Therefore, these Funds may experience relatively large purchases or redemptions of their shares as a result of purchase and sale activity from these affiliated funds of funds and the 529 plan. Affiliated funds of funds and the 529 plan owned shares in the Funds listed below as follows:
| Fund | | Percentage
of Fund* |
| International Growth Fund | | 6% |
| International Opportunities Fund | | 5% |
| * | As of October 31, 2021, affiliated funds of funds and the 529 plan were invested in Class F shares. |
| 11. | Investment Transactions: |
| | For the year ended October 31, 2021, the cost of purchases and proceeds from sales of investment securities (excluding short-term investments) were as follows: |
| | |
| Fund | | Cost of Purchases
Excluding U.S.
Government
Obligations | | Sales Proceeds
Excluding U.S.
Government
Obligations | | Total Cost of
Purchases | | Total Sales
Proceeds |
| Climate Opportunities Fund | | $ 104,396,998 | | $ 38,933,874 | | $ 104,396,998 | | $ 38,933,874 |
| Emerging Markets Equity Fund | | 489,047,063 | | 439,711,014 | | 489,047,063 | | 439,711,014 |
| Global Impact Fund | | 65,008,952 | | 40,369,237 | | 65,008,952 | | 40,369,237 |
| International Equity Fund | | 343,959,943 | | 423,823,536 | | 343,959,943 | | 423,823,536 |
| International Growth Fund | | 204,595,670 | | 219,506,580 | | 204,595,670 | | 219,506,580 |
| International Opportunities Fund | | 4,302,094,609 | | 4,309,813,949 | | 4,302,094,609 | | 4,309,813,949 |
| International Value Fund | | 1,079,916,016 | | 414,718,316 | | 1,079,916,016 | | 414,718,316 |
Hartford International/Global Equity Funds
Notes to Financial Statements – (continued)
October 31, 2021
| 12. | Capital Share Transactions: |
| | The following information is for the years ended October 31, 2021 and October 31, 2020: |
| | |
| | For the Year Ended
October 31, 2021 | | For the Year Ended
October 31, 2020 |
| | Shares | | Amount | | Shares | | Amount |
| Climate Opportunities Fund | | | | | | | |
| Class A | | | | | | | |
| Shares Sold | 1,514,018 | | $ 25,396,212 | | 402,312 | | $ 4,790,687 |
| Shares Issued for Reinvested Dividends | 9,647 | | 145,707 | | 10,691 | | 119,096 |
| Shares Redeemed | (226,983) | | (3,867,044) | | (104,270) | | (1,089,575) |
| Net Increase (Decrease) | 1,296,682 | | 21,674,875 | | 308,733 | | 3,820,208 |
| Class C | | | | | | | |
| Shares Sold | 96,240 | | $ 1,602,267 | | 10,430 | | $ 119,335 |
| Shares Issued for Reinvested Dividends | 330 | | 4,889 | | 803 | | 8,961 |
| Shares Redeemed | (7,894) | | (128,559) | | (6,323) | | (66,708) |
| Net Increase (Decrease) | 88,676 | | 1,478,597 | | 4,910 | | 61,588 |
| Class I | | | | | | | |
| Shares Sold | 1,271,177 | | $ 21,117,554 | | 161,953 | | $ 1,858,816 |
| Shares Issued for Reinvested Dividends | 4,132 | | 62,048 | | 5,710 | | 62,820 |
| Shares Redeemed | (445,837) | | (7,545,181) | | (100,594) | | (1,007,509) |
| Net Increase (Decrease) | 829,472 | | 13,634,421 | | 67,069 | | 914,127 |
| Class R3 | | | | | | | |
| Shares Sold | 2,778 | | $ 47,222 | | — | | $ — |
| Shares Issued for Reinvested Dividends | 108 | | 1,589 | | 563 | | 6,294 |
| Net Increase (Decrease) | 2,886 | | 48,811 | | 563 | | 6,294 |
| Class R4 | | | | | | | |
| Shares Sold | 2,304 | | $ 37,640 | | 5,851 | | $ 72,072 |
| Shares Issued for Reinvested Dividends | 220 | | 3,274 | | 522 | | 5,823 |
| Shares Redeemed | (1,531) | | (26,000) | | (7) | | (79) |
| Net Increase (Decrease) | 993 | | 14,914 | | 6,366 | | 77,816 |
| Class R5 | | | | | | | |
| Shares Issued for Reinvested Dividends | 167 | | $ 2,495 | | 515 | | $ 5,744 |
| Net Increase (Decrease) | 167 | | 2,495 | | 515 | | 5,744 |
| Class R6 | | | | | | | |
| Shares Sold | 15,491 | | $ 261,399 | | 16 | | $ 184 |
| Shares Issued for Reinvested Dividends | 183 | | 2,725 | | 582 | | 6,463 |
| Shares Redeemed | (9,347) | | (157,218) | | — | | (2) |
| Net Increase (Decrease) | 6,327 | | 106,906 | | 598 | | 6,645 |
| Class Y | | | | | | | |
| Shares Sold | 520,527 | | $ 8,741,714 | | 56,871 | | $ 652,990 |
| Shares Issued for Reinvested Dividends | 2,323 | | 35,497 | | 2,008 | | 22,455 |
| Shares Redeemed | (101,154) | | (1,740,882) | | (5,864) | | (68,570) |
| Net Increase (Decrease) | 421,696 | | 7,036,329 | | 53,015 | | 606,875 |
| Class F | | | | | | | |
| Shares Sold | 1,771,820 | | $ 30,228,352 | | 2,130,262 | | $ 24,145,052 |
| Shares Issued for Reinvested Dividends | 47,077 | | 728,224 | | 60,316 | | 678,149 |
| Shares Redeemed | (334,792) | | (5,718,746) | | (214,167) | | (2,482,128) |
| Net Increase (Decrease) | 1,484,105 | | 25,237,830 | | 1,976,411 | | 22,341,073 |
| Total Net Increase (Decrease) | 4,131,004 | | $ 69,235,178 | | 2,418,180 | | $ 27,840,370 |
| Emerging Markets Equity Fund | | | | | | | |
| Class A | | | | | | | |
| Shares Sold | 665,447 | | $ 7,278,159 | | 894,498 | | $ 7,161,896 |
| Shares Issued for Reinvested Dividends | 35,475 | | 357,229 | | 98,613 | | 929,923 |
| Shares Redeemed | (1,024,221) | | (11,104,708) | | (1,971,198) | | (16,618,350) |
| Net Increase (Decrease) | (323,299) | | (3,469,320) | | (978,087) | | (8,526,531) |
Hartford International/Global Equity Funds
Notes to Financial Statements – (continued)
October 31, 2021
| | For the Year Ended
October 31, 2021 | | For the Year Ended
October 31, 2020 |
| | Shares | | Amount | | Shares | | Amount |
| Class C | | | | | | | |
| Shares Sold | 67,243 | | $ 711,768 | | 21,622 | | $ 185,277 |
| Shares Issued for Reinvested Dividends | 315 | | 3,126 | | 3,316 | | 30,843 |
| Shares Redeemed | (65,355) | | (707,126) | | (148,981) | | (1,275,026) |
| Net Increase (Decrease) | 2,203 | | 7,768 | | (124,043) | | (1,058,906) |
| Class I | | | | | | | |
| Shares Sold | 1,104,889 | | $ 12,051,683 | | 1,483,032 | | $ 12,145,370 |
| Shares Issued for Reinvested Dividends | 33,821 | | 339,223 | | 58,719 | | 551,371 |
| Shares Redeemed | (550,763) | | (5,936,934) | | (1,209,067) | | (10,407,540) |
| Net Increase (Decrease) | 587,947 | | 6,453,972 | | 332,684 | | 2,289,201 |
| Class R3 | | | | | | | |
| Shares Sold | 12,971 | | $ 141,537 | | 26,732 | | $ 236,413 |
| Shares Issued for Reinvested Dividends | 211 | | 2,122 | | 859 | | 8,081 |
| Shares Redeemed | (7,678) | | (85,184) | | (20,665) | | (181,785) |
| Net Increase (Decrease) | 5,504 | | 58,475 | | 6,926 | | 62,709 |
| Class R4 | | | | | | | |
| Shares Sold | 1,900 | | $ 21,050 | | 6,224 | | $ 54,543 |
| Shares Issued for Reinvested Dividends | 314 | | 3,221 | | 267 | | 2,567 |
| Shares Redeemed | (4,666) | | (50,471) | | (10,003) | | (93,384) |
| Net Increase (Decrease) | (2,452) | | (26,200) | | (3,512) | | (36,274) |
| Class R5 | | | | | | | |
| Shares Sold | 8,159 | | $ 87,366 | | 29,072 | | $ 246,354 |
| Shares Issued for Reinvested Dividends | 1,088 | | 10,847 | | 1,809 | | 16,899 |
| Shares Redeemed | (92,320) | | (989,217) | | (20,633) | | (173,601) |
| Net Increase (Decrease) | (83,073) | | (891,004) | | 10,248 | | 89,652 |
| Class R6 | | | | | | | |
| Shares Sold | 14,033 | | $ 148,773 | | 26,073 | | $ 227,816 |
| Shares Issued for Reinvested Dividends | 1,504 | | 15,071 | | 2,748 | | 25,806 |
| Shares Redeemed | (122,779) | | (1,334,101) | | (23,514) | | (203,559) |
| Net Increase (Decrease) | (107,242) | | (1,170,257) | | 5,307 | | 50,063 |
| Class Y | | | | | | | |
| Shares Sold | 4,322,840 | | $ 46,970,696 | | 10,077,007 | | $ 83,161,874 |
| Shares Issued for Reinvested Dividends | 341,826 | | 3,421,680 | | 566,604 | | 5,314,734 |
| Shares Redeemed | (3,850,791) | | (41,045,720) | | (6,552,988) | | (53,379,951) |
| Net Increase (Decrease) | 813,875 | | 9,346,656 | | 4,090,623 | | 35,096,657 |
| Class F | | | | | | | |
| Shares Sold | 7,214,889 | | $ 72,633,622 | | 3,397,773 | | $ 27,162,249 |
| Shares Issued for Reinvested Dividends | 3,280 | | 32,673 | | 56,006 | | 523,094 |
| Shares Redeemed | (2,908,513) | | (29,005,499) | | (574,643) | | (4,747,723) |
| Net Increase (Decrease) | 4,309,656 | | 43,660,796 | | 2,879,136 | | 22,937,620 |
| Total Net Increase (Decrease) | 5,203,119 | | $ 53,970,886 | | 6,219,282 | | $ 50,904,191 |
| Global Impact Fund | | | | | | | |
| Class A | | | | | | | |
| Shares Sold | 525,228 | | $ 8,545,861 | | 284,403 | | $ 3,220,910 |
| Issued in Merger | — | | — | | 3,556,151 | | 40,870,135 |
| Shares Issued for Reinvested Dividends | 12,025 | | 184,461 | | 12,175 | | 144,394 |
| Shares Redeemed | (419,715) | | (6,775,062) | | (715,309) | | (8,129,845) |
| Net Increase (Decrease) | 117,538 | | 1,955,260 | | 3,137,420 | | 36,105,594 |
| Class C | | | | | | | |
| Shares Sold | 54,890 | | $ 879,257 | | 20,384 | | $ 240,235 |
| Issued in Merger | — | | — | | 241,538 | | 2,726,961 |
| Shares Issued for Reinvested Dividends | — | | — | | 621 | | 7,239 |
| Shares Redeemed | (63,952) | | (997,623) | | (96,758) | | (1,099,336) |
| Net Increase (Decrease) | (9,062) | | (118,366) | | 165,785 | | 1,875,099 |
Hartford International/Global Equity Funds
Notes to Financial Statements – (continued)
October 31, 2021
| | For the Year Ended
October 31, 2021 | | For the Year Ended
October 31, 2020 |
| | Shares | | Amount | | Shares | | Amount |
| Class I | | | | | | | |
| Shares Sold | 1,336,002 | | $ 21,656,101 | | 928,447 | | $ 10,474,481 |
| Issued in Merger | — | | — | | 458,167 | | 5,256,190 |
| Shares Issued for Reinvested Dividends | 13,224 | | 202,057 | | 11,160 | | 131,691 |
| Shares Redeemed | (730,881) | | (11,717,051) | | (685,040) | | (7,482,979) |
| Net Increase (Decrease) | 618,345 | | 10,141,107 | | 712,734 | | 8,379,383 |
| Class R3 | | | | | | | |
| Shares Sold | 124,231 | | $ 1,961,547 | | 117,336 | | $ 1,284,469 |
| Issued in Merger | — | | — | | 569,209 | | 6,439,177 |
| Shares Issued for Reinvested Dividends | 658 | | 9,943 | | 1,931 | | 22,549 |
| Shares Redeemed | (115,264) | | (1,785,425) | | (293,633) | | (3,155,592) |
| Net Increase (Decrease) | 9,625 | | 186,065 | | 394,843 | | 4,590,603 |
| Class R4 | | | | | | | |
| Shares Sold | 37,856 | | $ 621,017 | | 32,878 | | $ 349,452 |
| Issued in Merger | — | | — | | 274,255 | | 3,142,747 |
| Shares Issued for Reinvested Dividends | 318 | | 4,869 | | 822 | | 9,729 |
| Shares Redeemed | (50,354) | | (834,487) | | (240,956) | | (2,528,488) |
| Net Increase (Decrease) | (12,180) | | (208,601) | | 66,999 | | 973,440 |
| Class R5 | | | | | | | |
| Shares Sold | 18,812 | | $ 295,332 | | 12,032 | | $ 135,432 |
| Issued in Merger | — | | — | | 50,594 | | 574,188 |
| Shares Issued for Reinvested Dividends | 174 | | 2,640 | | 203 | | 2,372 |
| Shares Redeemed | (12,675) | | (195,836) | | (44,270) | | (478,813) |
| Net Increase (Decrease) | 6,311 | | 102,136 | | 18,559 | | 233,179 |
| Class R6 | | | | | | | |
| Shares Sold | 335,654 | | $ 5,284,679 | | 201,761 | | $ 2,408,145 |
| Shares Issued for Reinvested Dividends | 2,911 | | 44,105 | | 614 | | 7,185 |
| Shares Redeemed | (51,344) | | (835,401) | | (39,266) | | (422,055) |
| Net Increase (Decrease) | 287,221 | | 4,493,383 | | 163,109 | | 1,993,275 |
| Class Y | | | | | | | |
| Shares Sold | 290,978 | | $ 4,773,794 | | — | | $ — |
| Issued in Merger | — | | — | | 1,943,325 | | 22,049,744 |
| Shares Issued for Reinvested Dividends | 1,009 | | 15,334 | | 5,044 | | 59,070 |
| Shares Redeemed | (214,500) | | (3,289,845) | | (1,744,298) | | (19,883,102) |
| Net Increase (Decrease) | 77,487 | | 1,499,283 | | 204,071 | | 2,225,712 |
| Class F | | | | | | | |
| Shares Sold | 529,354 | | $ 8,581,368 | | 207,700 | | $ 2,398,639 |
| Issued in Merger | — | | — | | 117,529 | | 1,356,433 |
| Shares Issued for Reinvested Dividends | 2,915 | | 44,482 | | 21,331 | | 251,280 |
| Shares Redeemed | (95,810) | | (1,547,068) | | (2,743,407) | | (32,832,533) |
| Net Increase (Decrease) | 436,459 | | 7,078,782 | | (2,396,847) | | (28,826,181) |
| Total Net Increase (Decrease) | 1,531,744 | | $ 25,129,049 | | 2,466,673 | | $ 27,550,104 |
| International Equity Fund | | | | | | | |
| Class A | | | | | | | |
| Shares Sold | 1,509,800 | | $ 19,223,470 | | 1,717,473 | | $ 17,382,409 |
| Shares Issued for Reinvested Dividends | 560,274 | | 6,695,276 | | 1,338,127 | | 14,853,213 |
| Shares Redeemed | (6,525,801) | | (81,760,420) | | (12,356,666) | | (122,375,344) |
| Net Increase (Decrease) | (4,455,727) | | (55,841,674) | | (9,301,066) | | (90,139,722) |
| Class C | | | | | | | |
| Shares Sold | 42,516 | | $ 522,743 | | 70,845 | | $ 703,057 |
| Shares Issued for Reinvested Dividends | 3,549 | | 41,985 | | 45,785 | | 502,256 |
| Shares Redeemed | (1,128,331) | | (14,105,872) | | (1,719,823) | | (17,126,093) |
| Net Increase (Decrease) | (1,082,266) | | (13,541,144) | | (1,603,193) | | (15,920,780) |
| Class I | | | | | | | |
| Shares Sold | 530,494 | | $ 6,648,375 | | 502,110 | | $ 5,132,449 |
| Shares Issued for Reinvested Dividends | 71,123 | | 859,877 | | 180,224 | | 2,022,109 |
| Shares Redeemed | (724,453) | | (9,239,955) | | (2,972,078) | | (29,066,868) |
| Net Increase (Decrease) | (122,836) | | (1,731,703) | | (2,289,744) | | (21,912,310) |
Hartford International/Global Equity Funds
Notes to Financial Statements – (continued)
October 31, 2021
| | For the Year Ended
October 31, 2021 | | For the Year Ended
October 31, 2020 |
| | Shares | | Amount | | Shares | | Amount |
| Class R3 | | | | | | | |
| Shares Sold | 110,626 | | $ 1,399,075 | | 151,619 | | $ 1,418,914 |
| Shares Issued for Reinvested Dividends | 9,156 | | 108,861 | | 27,297 | | 301,361 |
| Shares Redeemed | (214,998) | | (2,604,816) | | (527,820) | | (5,432,886) |
| Net Increase (Decrease) | (95,216) | | (1,096,880) | | (348,904) | | (3,712,611) |
| Class R4 | | | | | | | |
| Shares Sold | 90,189 | | $ 1,125,600 | | 271,470 | | $ 2,843,020 |
| Shares Issued for Reinvested Dividends | 6,342 | | 75,983 | | 13,681 | | 152,127 |
| Shares Redeemed | (326,746) | | (4,187,262) | | (465,288) | | (4,770,067) |
| Net Increase (Decrease) | (230,215) | | (2,985,679) | | (180,137) | | (1,774,920) |
| Class R5 | | | | | | | |
| Shares Sold | 134,726 | | $ 1,495,927 | | 995,404 | | $ 9,612,976 |
| Shares Issued for Reinvested Dividends | 15,062 | | 157,996 | | 5,112 | | 49,894 |
| Shares Redeemed | (121,116) | | (1,321,935) | | (207,657) | | (1,810,439) |
| Net Increase (Decrease) | 28,672 | | 331,988 | | 792,859 | | 7,852,431 |
| Class R6 | | | | | | | |
| Shares Sold | 885,049 | | $ 11,282,620 | | 2,857,395 | | $ 30,123,094 |
| Shares Issued for Reinvested Dividends | 52,437 | | 636,591 | | 62,967 | | 709,639 |
| Shares Redeemed | (782,135) | | (9,985,893) | | (1,414,940) | | (15,013,677) |
| Net Increase (Decrease) | 155,351 | | 1,933,318 | | 1,505,422 | | 15,819,056 |
| Class Y | | | | | | | |
| Shares Sold | 260,063 | | $ 3,324,027 | | 772,069 | | $ 7,602,529 |
| Shares Issued for Reinvested Dividends | 13,146 | | 159,071 | | 75,384 | | 845,813 |
| Shares Redeemed | (592,794) | | (7,247,621) | | (2,639,809) | | (26,294,911) |
| Net Increase (Decrease) | (319,585) | | (3,764,523) | | (1,792,356) | | (17,846,569) |
| Class F | | | | | | | |
| Shares Sold | 923,061 | | $ 11,633,200 | | 1,647,821 | | $ 16,409,953 |
| Shares Issued for Reinvested Dividends | 96,359 | | 1,170,762 | | 152,159 | | 1,714,836 |
| Shares Redeemed | (1,045,625) | | (13,342,193) | | (1,886,570) | | (19,146,096) |
| Net Increase (Decrease) | (26,205) | | (538,231) | | (86,590) | | (1,021,307) |
| Total Net Increase (Decrease) | (6,148,027) | | $ (77,234,528) | | (13,303,709) | | $ (128,656,732) |
| International Growth Fund | | | | | | | |
| Class A | | | | | | | |
| Shares Sold | 944,065 | | $ 17,938,561 | | 971,276 | | $ 14,400,466 |
| Shares Issued for Reinvested Dividends | 274,449 | | 4,898,908 | | 46,525 | | 715,084 |
| Shares Redeemed | (1,135,231) | | (21,660,829) | | (1,394,765) | | (20,391,187) |
| Net Increase (Decrease) | 83,283 | | 1,176,640 | | (376,964) | | (5,275,637) |
| Class C | | | | | | | |
| Shares Sold | 32,549 | | $ 558,605 | | 57,078 | | $ 763,710 |
| Shares Issued for Reinvested Dividends | 13,030 | | 210,431 | | — | | — |
| Shares Redeemed | (122,256) | | (2,119,402) | | (207,135) | | (2,780,174) |
| Net Increase (Decrease) | (76,677) | | (1,350,366) | | (150,057) | | (2,016,464) |
| Class I | | | | | | | |
| Shares Sold | 4,014,754 | | $ 77,200,503 | | 10,174,888 | | $ 167,222,205 |
| Shares Issued for Reinvested Dividends | 406,046 | | 7,197,750 | | 25,665 | | 390,108 |
| Shares Redeemed | (3,468,352) | | (65,288,383) | | (1,068,723) | | (15,065,304) |
| Net Increase (Decrease) | 952,448 | | 19,109,870 | | 9,131,830 | | 152,547,009 |
| Class R3 | | | | | | | |
| Shares Sold | 13,028 | | $ 249,060 | | 13,149 | | $ 202,176 |
| Shares Issued for Reinvested Dividends | 1,429 | | 25,844 | | 96 | | 1,497 |
| Shares Redeemed | (16,963) | | (334,752) | | (12,978) | | (208,683) |
| Net Increase (Decrease) | (2,506) | | (59,848) | | 267 | | (5,010) |
| Class R4 | | | | | | | |
| Shares Sold | 65,848 | | $ 1,297,244 | | 26,402 | | $ 379,426 |
| Shares Issued for Reinvested Dividends | 3,481 | | 64,164 | | 731 | | 11,593 |
| Shares Redeemed | (66,790) | | (1,326,956) | | (167,605) | | (2,525,162) |
| Net Increase (Decrease) | 2,539 | | 34,452 | | (140,472) | | (2,134,143) |
Hartford International/Global Equity Funds
Notes to Financial Statements – (continued)
October 31, 2021
| | For the Year Ended
October 31, 2021 | | For the Year Ended
October 31, 2020 |
| | Shares | | Amount | | Shares | | Amount |
| Class R5 | | | | | | | |
| Shares Sold | 236,790 | | $ 4,651,930 | | 655,417 | | $ 9,962,282 |
| Shares Issued for Reinvested Dividends | 60,150 | | 1,118,622 | | 16,244 | | 258,611 |
| Shares Redeemed | (287,805) | | (5,684,447) | | (529,993) | | (8,120,326) |
| Net Increase (Decrease) | 9,135 | | 86,105 | | 141,668 | | 2,100,567 |
| Class R6 | | | | | | | |
| Shares Sold | 212,134 | | $ 4,171,862 | | 162,782 | | $ 2,527,138 |
| Shares Issued for Reinvested Dividends | 9,554 | | 178,938 | | 2,157 | | 34,507 |
| Shares Redeemed | (82,198) | | (1,631,298) | | (97,329) | | (1,460,254) |
| Net Increase (Decrease) | 139,490 | | 2,719,502 | | 67,610 | | 1,101,391 |
| Class Y | | | | | | | |
| Shares Sold | 167,306 | | $ 3,355,574 | | 143,522 | | $ 2,173,909 |
| Shares Issued for Reinvested Dividends | 24,315 | | 453,763 | | 9,935 | | 158,669 |
| Shares Redeemed | (195,904) | | (3,915,533) | | (610,815) | | (9,561,862) |
| Net Increase (Decrease) | (4,283) | | (106,196) | | (457,358) | | (7,229,284) |
| Class F | | | | | | | |
| Shares Sold | 1,683,934 | | $ 31,933,942 | | 4,196,110 | | $ 63,465,507 |
| Shares Issued for Reinvested Dividends | 355,141 | | 6,313,592 | | 75,248 | | 1,145,272 |
| Shares Redeemed | (1,891,912) | | (35,641,096) | | (2,158,253) | | (31,865,262) |
| Net Increase (Decrease) | 147,163 | | 2,606,438 | | 2,113,105 | | 32,745,517 |
| Total Net Increase (Decrease) | 1,250,592 | | $ 24,216,597 | | 10,329,629 | | $ 171,833,946 |
| International Opportunities Fund | | | | | | | |
| Class A | | | | | | | |
| Shares Sold | 2,709,381 | | $ 54,923,226 | | 2,559,027 | | $ 39,139,569 |
| Shares Issued for Reinvested Dividends | 99,663 | | 1,950,405 | | 372,743 | | 6,142,811 |
| Shares Redeemed | (3,285,979) | | (66,322,203) | | (5,467,450) | | (82,689,207) |
| Net Increase (Decrease) | (476,935) | | (9,448,572) | | (2,535,680) | | (37,406,827) |
| Class C | | | | | | | |
| Shares Sold | 176,141 | | $ 3,099,578 | | 95,789 | | $ 1,290,672 |
| Shares Issued for Reinvested Dividends | — | | — | | 17,705 | | 254,592 |
| Shares Redeemed | (583,447) | | (10,273,144) | | (933,344) | | (12,449,083) |
| Net Increase (Decrease) | (407,306) | | (7,173,566) | | (819,850) | | (10,903,819) |
| Class I | | | | | | | |
| Shares Sold | 10,647,394 | | $ 218,214,458 | | 8,681,629 | | $ 130,649,482 |
| Shares Issued for Reinvested Dividends | 132,254 | | 2,569,689 | | 337,884 | | 5,524,402 |
| Shares Redeemed | (4,321,354) | | (86,985,497) | | (10,481,977) | | (152,525,032) |
| Net Increase (Decrease) | 6,458,294 | | 133,798,650 | | (1,462,464) | | (16,351,148) |
| Class R3 | | | | | | | |
| Shares Sold | 275,460 | | $ 5,687,628 | | 369,682 | | $ 5,642,289 |
| Shares Issued for Reinvested Dividends | 288 | | 5,747 | | 26,493 | | 445,087 |
| Shares Redeemed | (785,102) | | (16,178,274) | | (1,441,041) | | (22,907,066) |
| Net Increase (Decrease) | (509,354) | | (10,484,899) | | (1,044,866) | | (16,819,690) |
| Class R4 | | | | | | | |
| Shares Sold | 1,086,638 | | $ 22,685,773 | | 1,227,863 | | $ 19,552,160 |
| Shares Issued for Reinvested Dividends | 19,303 | | 391,854 | | 84,480 | | 1,443,764 |
| Shares Redeemed | (2,133,674) | | (44,708,896) | | (3,471,669) | | (56,069,772) |
| Net Increase (Decrease) | (1,027,733) | | (21,631,269) | | (2,159,326) | | (35,073,848) |
| Class R5 | | | | | | | |
| Shares Sold | 3,370,668 | | $ 71,458,836 | | 6,580,250 | | $ 108,913,230 |
| Shares Issued for Reinvested Dividends | 91,203 | | 1,865,096 | | 211,605 | | 3,641,724 |
| Shares Redeemed | (4,980,236) | | (104,950,037) | | (5,302,792) | | (87,808,621) |
| Net Increase (Decrease) | (1,518,365) | | (31,626,105) | | 1,489,063 | | 24,746,333 |
| Class R6 | | | | | | | |
| Shares Sold | 14,070,805 | | $ 300,849,068 | | 10,117,011 | | $ 167,078,733 |
| Shares Issued for Reinvested Dividends | 289,660 | | 5,958,302 | | 640,398 | | 11,085,289 |
| Shares Redeemed | (10,168,986) | | (217,521,139) | | (7,261,141) | | (118,819,824) |
| Net Increase (Decrease) | 4,191,479 | | 89,286,231 | | 3,496,268 | | 59,344,198 |
Hartford International/Global Equity Funds
Notes to Financial Statements – (continued)
October 31, 2021
| | For the Year Ended
October 31, 2021 | | For the Year Ended
October 31, 2020 |
| | Shares | | Amount | | Shares | | Amount |
| Class Y | | | | | | | |
| Shares Sold | 10,716,629 | | $ 228,340,557 | | 15,628,576 | | $ 251,384,694 |
| Shares Issued for Reinvested Dividends | 382,178 | | 7,861,398 | | 965,804 | | 16,718,064 |
| Shares Redeemed | (14,255,736) | | (302,674,245) | | (14,752,080) | | (237,271,725) |
| Net Increase (Decrease) | (3,156,929) | | (66,472,290) | | 1,842,300 | | 30,831,033 |
| Class F | | | | | | | |
| Shares Sold | 8,982,521 | | $ 181,211,440 | | 8,718,500 | | $ 128,042,495 |
| Shares Issued for Reinvested Dividends | 267,602 | | 5,199,502 | | 643,786 | | 10,525,899 |
| Shares Redeemed | (9,935,976) | | (198,637,097) | | (14,214,054) | | (215,414,486) |
| Net Increase (Decrease) | (685,853) | | (12,226,155) | | (4,851,768) | | (76,846,092) |
| Total Net Increase (Decrease) | 2,867,298 | | $ 64,022,025 | | (6,046,323) | | $ (78,479,860) |
| International Value Fund | | | | | | | |
| Class A | | | | | | | |
| Shares Sold | 2,508,011 | | $ 39,652,378 | | 4,175,159 | | $ 47,456,730 |
| Shares Issued for Reinvested Dividends | 27,852 | | 385,473 | | 392,547 | | 5,856,795 |
| Shares Redeemed | (1,696,002) | | (26,038,090) | | (16,068,743) | | (186,932,384) |
| Net Increase (Decrease) | 839,861 | | 13,999,761 | | (11,501,037) | | (133,618,859) |
| Class C | | | | | | | |
| Shares Sold | 131,560 | | $ 2,080,333 | | 11,616 | | $ 156,116 |
| Shares Issued for Reinvested Dividends | 4,216 | | 57,718 | | 19,667 | | 291,273 |
| Shares Redeemed | (267,246) | | (3,945,251) | | (643,413) | | (7,736,271) |
| Net Increase (Decrease) | (131,470) | | (1,807,200) | | (612,130) | | (7,288,882) |
| Class I | | | | | | | |
| Shares Sold | 62,920,650 | | $ 952,277,057 | | 26,903,407 | | $ 292,759,802 |
| Shares Issued for Reinvested Dividends | 1,169,552 | | 16,233,382 | | 2,088,548 | | 31,453,537 |
| Shares Redeemed | (21,653,652) | | (337,953,913) | | (57,783,501) | | (661,036,574) |
| Net Increase (Decrease) | 42,436,550 | | 630,556,526 | | (28,791,546) | | (336,823,235) |
| Class R3 | | | | | | | |
| Shares Sold | 21,109 | | $ 312,107 | | 13,719 | | $ 162,717 |
| Shares Issued for Reinvested Dividends | 475 | | 6,595 | | 761 | | 11,482 |
| Shares Redeemed | (9,562) | | (156,202) | | (30,033) | | (389,870) |
| Net Increase (Decrease) | 12,022 | | 162,500 | | (15,553) | | (215,671) |
| Class R4 | | | | | | | |
| Shares Sold | 46,216 | | $ 717,399 | | 213,120 | | $ 2,756,536 |
| Shares Issued for Reinvested Dividends | 2,827 | | 39,047 | | 4,051 | | 60,730 |
| Shares Redeemed | (51,559) | | (762,651) | | (64,217) | | (766,566) |
| Net Increase (Decrease) | (2,516) | | (6,205) | | 152,954 | | 2,050,700 |
| Class R5 | | | | | | | |
| Shares Sold | 359,356 | | $ 5,538,116 | | 990,194 | | $ 11,082,911 |
| Shares Issued for Reinvested Dividends | 47,237 | | 657,545 | | 69,713 | | 1,052,666 |
| Shares Redeemed | (501,405) | | (7,778,255) | | (1,078,983) | | (12,894,290) |
| Net Increase (Decrease) | (94,812) | | (1,582,594) | | (19,076) | | (758,713) |
| Class R6 | | | | | | | |
| Shares Sold | 645,466 | | $ 10,555,486 | | 593,983 | | $ 6,445,915 |
| Shares Issued for Reinvested Dividends | 46,534 | | 661,246 | | 351,708 | | 5,419,824 |
| Shares Redeemed | (2,328,886) | | (34,205,990) | | (8,836,841) | | (107,825,626) |
| Net Increase (Decrease) | (1,636,886) | | (22,989,258) | | (7,891,150) | | (95,959,887) |
| Class Y | | | | | | | |
| Shares Sold | 11,713,320 | | $ 188,751,359 | | 7,689,176 | | $ 93,744,980 |
| Shares Issued for Reinvested Dividends | 381,954 | | 5,427,570 | | 995,869 | | 15,346,347 |
| Shares Redeemed | (5,764,638) | | (92,188,845) | | (30,660,195) | | (358,490,470) |
| Net Increase (Decrease) | 6,330,636 | | 101,990,084 | | (21,975,150) | | (249,399,143) |
| Class F | | | | | | | |
| Shares Sold | 4,816,857 | | $ 77,367,527 | | 7,832,635 | | $ 96,788,191 |
| Shares Issued for Reinvested Dividends | 309,572 | | 4,296,856 | | 597,006 | | 8,990,903 |
| Shares Redeemed | (6,335,674) | | (97,079,753) | | (12,066,272) | | (134,616,686) |
| Net Increase (Decrease) | (1,209,245) | | (15,415,370) | | (3,636,631) | | (28,837,592) |
| Total Net Increase (Decrease) | 46,544,140 | | $ 704,908,244 | | (74,289,319) | | $ (850,851,282) |
Hartford International/Global Equity Funds
Notes to Financial Statements – (continued)
October 31, 2021
| 13. | Fund Reorganization: |
| | At a meeting held August 6-7, 2019, the Board of Directors of the Company approved an Agreement and Plan of Reorganization that provided for the reorganization of The Hartford International Small Company Fund (the "International Small Company Fund"), a series of the Company, with and into the Global Impact Fund, a separate series of the Company (the “Reorganization”). |
| | Pursuant to the terms of the Agreement and Plan of Reorganization, after the close of business on November 22, 2019, the International Small Company Fund transferred all of its assets to the Global Impact Fund, in exchange for shares of the Global Impact Fund and the assumption of all of the liabilities of the International Small Company Fund by the Global Impact Fund. |
| | After the close of business on November 22, 2019, the consummation of the Reorganization was accomplished by a tax-free exchange of shares of the Global Impact Fund in the following amounts: |
| | |
| Share Class | | Net Assets of
International Small Company Fund
as of the close of business on
November 22, 2019
("Reorgnaization Date") | | Shares of the
International Small Company Fund
as of the
Reorganization Date | | Value of Shares Issued by
Global Impact Fund | | Shares Issued by
Global Impact Fund | | Net Assets of the
Global Impact Fund
immediately after
the Reorganization |
| Class A | | $ 40,870,135 | | 3,497,018 | | $ 40,870,135 | | 3,556,151 | | $ 41,662,028 |
| Class C | | 2,726,961 | | 265,134 | | 2,726,961 | | 241,538 | | 2,765,829 |
| Class I | | 5,256,190 | | 453,959 | | 5,256,190 | | 458,167 | | 19,495,626 |
| Class R3 | | 6,439,177 | | 545,236 | | 6,439,177 | | 569,209 | | 6,743,012 |
| Class R4 | | 3,142,747 | | 264,884 | | 3,142,747 | | 274,255 | | 3,170,337 |
| Class R5 | | 574,188 | | 48,210 | | 574,188 | | 50,594 | | 690,320 |
| Class R6 | | N/A | | N/A | | N/A | | N/A | | 986,093 |
| Class Y | | 22,049,744 | | 1,852,131 | | 22,049,744 | | 1,943,325 | | 22,354,435 |
| Class F | | 1,356,433 | | 118,490 | | 1,356,433 | | 117,529 | | 32,567,024 |
| | | $ 82,415,575 | | 7,045,062 | | $ 82,415,575 | | 7,210,768 | | $ 130,434,704 |
Each shareholder of a share class of International Small Company Fund received shares of the same share class of the Global Impact Fund with the same class designation and at the respective class NAV, as determined on the Reorganization Date.
Some of the investments held by International Small Company Fund may have been purchased or sold prior to the Reorganization for the purpose of complying with the anticipated investment policies or limitations of the Global Impact Fund after the Reorganization. The expenses associated with the Reorganization other than brokerage-related expenses, including stamp taxes and other similar transaction costs, were borne by HFMC or its affiliates.
As of the Reorganization Date, the International Small Company Fund had investments valued at $82,029,834 with a cost basis of $80,872,975. For financial reporting purposes, assets received, liabilities assumed and shares issued by the Global Impact Fund were recorded at fair value; however, the cost basis of the investments received by the Global Impact Fund from International Small Company Fund were carried forward to align ongoing reporting of the Global Impact Fund’s realized and unrealized gains and losses with amounts distributable to shareholders for tax purposes.
The aggregate net assets of the Global Impact Fund immediately after the acquisition were $130,434,704 which included $1,156,859 of acquired unrealized appreciation.
Assuming the Reorganization had been completed on November 1, 2019, the Global Impact Fund’s pro-forma results of operations for the year ended October 31, 2020 are as follows:
| Net investment income | $ 578,299 |
| Net realized and unrealized gain (loss) on investments | $ 11,380,118 |
| Net increase (decrease) in net assets from operations | $11,958,417 |
| 14. | Line of Credit: |
| | Each Fund participates in a committed line of credit pursuant to a credit agreement dated March 4, 2021. Each Fund may borrow under the line of credit for temporary or emergency purposes. The Funds (together with certain other Hartford Funds) may borrow up to $350 million in the aggregate, subject to asset coverage and other limitations specified in the credit agreement. The interest rate on borrowings varies depending on the nature of the loan. The facility also charges certain fees, such as an upfront fee and a commitment fee. From November 1, 2020 through March 4, 2021, the Funds (together with certain other Hartford Funds) had a similar agreement that enabled them to participate in a $350 million |
Hartford International/Global Equity Funds
Notes to Financial Statements – (continued)
October 31, 2021
committed line of credit. The fees incurred by the Funds in connection with the committed lines of credit during the period appear in the Statements of Operations under “Other expenses.” During and as of the year ended October 31, 2021, none of the Funds had borrowings under this facility.
| 15. | Indemnifications: |
| | Under the Company’s organizational documents, the Company shall indemnify its officers and directors to the full extent required or permitted under Maryland General Corporation Law and federal securities laws. In addition, the Company, on behalf of each Fund, may enter into contracts that contain a variety of indemnifications. The Company’s maximum exposure under these arrangements is unknown. However, as of the date of these financial statements, the Company has not had prior claims or losses pursuant to these contracts and expects the risk of loss to be remote. |
| 16. | Recent Accounting Pronouncement: |
| | In March 2020, FASB issued Accounting Standards Update (“ASU”) No. 2020-04, Reference Rate Reform (Topic 848); Facilitation of the Effects of Reference Rate Reform on Financial Reporting, which provides optional guidance for a limited period of time to ease the potential burden in accounting for (or recognizing the effects of) reference rate reform. The guidance is applicable to contracts referencing LIBOR or another reference rate that is expected to be discontinued due to reference rate reform. The ASU is effective as of March 12, 2020 and generally can be applied through December 31, 2022. Management is evaluating the underlying securities referencing LIBOR or another reference rate that is expected to be discontinued over the period of time the ASU is effective. |
| 17. | Change in Independent Registered Public Accounting Firm: |
| | On November 6, 2019, the Company, on behalf of the Funds, dismissed Ernst & Young LLP (“EY”) as the Funds’ independent registered public accounting firm effective upon the issuance of EY’s report on the Funds’ financial statements as of and for the fiscal year ended October 31, 2019. EY’s report on the Funds’ financial statements for the fiscal years October 31, 2018 and October 31, 2019 contained no adverse opinion or disclaimer of opinion nor was EY’s report qualified or modified as to uncertainty, audit scope or accounting principles. During the Funds’ fiscal periods ended on October 31, 2018 and October 31, 2019 and through December 30, 2019 (the “Covered Period”), (i) there were no disagreements with EY on any matter of accounting principles or practices, financial statement disclosure or auditing scope or procedure, which disagreements, if not resolved to the satisfaction of EY, would have caused it to make reference to the subject matter of the disagreements in connection with its reports on the Funds’ financial statements for the Covered Period, and (ii) there were no “reportable events” of the kind described in Item 304(a)(1)(v) of Regulation S-K under the Securities Exchange Act of 1934, as amended. |
| | On November 6, 2019, the Audit Committee of the Company’s Board of Directors participated in and approved the decision to engage PricewaterhouseCoopers LLP (“PwC”) as the independent registered public accounting firm for the Funds for the fiscal year ended October 31, 2020. The selection of PwC does not reflect any disagreements with or dissatisfaction by the Company or the Board of Directors with the performance of the Funds’ prior independent registered public accounting firm, EY. During the Covered Period, neither the Funds, nor anyone on their behalf, consulted with PwC on items which: (i) concerned the application of accounting principles to a specified transaction, either completed or proposed, or the type of audit opinion that might be rendered on the Funds’ financial statements; or (ii) concerned the subject of a disagreement (as defined in paragraph (a)(1)(iv) of Item 304 of Regulation S-K) or reportable events (as described in paragraph (a)(1)(v) of Item 304 of Regulation S-K). |
| 18. | Subsequent Events: |
| | Management has evaluated all subsequent transactions and events through the date on which these financial statements were issued and has determined that no additional items require disclosure in these financial statements. |
Report of Independent Registered Public Accounting Firm
To the Board of Directors of The Hartford Mutual Funds, Inc. and Shareholders of Hartford Climate Opportunities Fund, Hartford Emerging Markets Equity Fund, Hartford Global Impact Fund, Hartford International Equity Fund, The Hartford International Growth Fund, The Hartford International Opportunities Fund and The Hartford International Value Fund
Opinion on the Financial Statements
We have audited the accompanying statements of assets and liabilities, including the schedules of investments, of Hartford Climate Opportunities Fund, Hartford Emerging Markets Equity Fund, Hartford Global Impact Fund, Hartford International Equity Fund, The Hartford International Growth Fund, The Hartford International Opportunities Fund and The Hartford International Value Fund (seven of the funds constituting The Hartford Mutual Funds, Inc., hereafter collectively referred to as the "Funds") as of October 31, 2021, the related statements of operations for the year ended October 31, 2021, the statements of changes in net assets for each of the two years in the period ended October 31, 2021, including the related notes, and the financial highlights for each of the two years in the period ended October 31, 2021 (collectively referred to as the “financial statements”). In our opinion, the financial statements present fairly, in all material respects, the financial position of each of the Funds as of October 31, 2021, the results of each of their operations for the year then ended, the changes in each of their net assets for each of the two years in the period ended October 31, 2021 and each of the financial highlights for each of the two years in the period ended October 31, 2021 in conformity with accounting principles generally accepted in the United States of America.
The financial statements of the Funds as of and for the year ended October 31, 2019 and the financial highlights for each of the periods ended on or prior to October 31, 2019 (not presented herein, other than the financial highlights) were audited by other auditors whose report dated December 30, 2019 expressed an unqualified opinion on those financial statements and financial highlights.
Basis for Opinion
These financial statements are the responsibility of the Funds’ management. Our responsibility is to express an opinion on the Funds’ financial statements based on our audits. We are a public accounting firm registered with the Public Company Accounting Oversight Board (United States) (PCAOB) and are required to be independent with respect to the Funds in accordance with the U.S. federal securities laws and the applicable rules and regulations of the Securities and Exchange Commission and the PCAOB.
We conducted our audits of these financial statements in accordance with the standards of the PCAOB. Those standards require that we plan and perform the audit to obtain reasonable assurance about whether the financial statements are free of material misstatement, whether due to error or fraud.
Our audits included performing procedures to assess the risks of material misstatement of the financial statements, whether due to error or fraud, and performing procedures that respond to those risks. Such procedures included examining, on a test basis, evidence regarding the amounts and disclosures in the financial statements. Our audits also included evaluating the accounting principles used and significant estimates made by management, as well as evaluating the overall presentation of the financial statements. Our procedures included confirmation of securities owned as of October 31, 2021 by correspondence with the custodian, transfer agent and brokers; when replies were not received from brokers, we performed other auditing procedures. We believe that our audits provide a reasonable basis for our opinions.
/s/ PricewaterhouseCoopers LLP
Philadelphia, Pennsylvania
December 28, 2021
We have served as the auditor of one or more investment companies in the Hartford Funds group of investment companies since 2020.
Hartford International/Global Equity Funds
Operation of the Liquidity Risk Management Program (Unaudited)
This section describes the operation and effectiveness of the Liquidity Risk Management Program (“LRM Program”) established in accordance with Rule 22e-4 under the Investment Company Act of 1940, as amended (the “Liquidity Rule”). The LRM Program seeks to assess and manage each Fund’s liquidity risk. The Liquidity Rule generally defines liquidity risk as the risk that a Fund could not meet its obligation to redeem shares without significant dilution of the non-redeeming investors’ interests in the Fund. The Board of Directors (“Board”) of The Hartford Mutual Funds, Inc. has appointed Hartford Funds Management Company, LLC (“HFMC”) to serve as the administrator of the LRM Program with respect to each of the Funds, subject to the oversight of the Board. In order to efficiently and effectively administer the LRM Program, HFMC established a Liquidity Risk Oversight Committee.
The LRM Program is comprised of various components designed to support the assessment and/or management of liquidity risk, including: (1) the assessment and periodic review (no less frequently than annually) of certain factors that influence each Fund’s liquidity risk; (2) the classification and periodic review (no less frequently than monthly) of each Fund’s investments into one of four liquidity categories that reflect an estimate of their liquidity under current market conditions; (3) a 15% limit on the acquisition of “illiquid investments” (as defined under the Liquidity Rule); (4) the determination of a minimum percentage of each Fund’s assets that generally will be invested in highly liquid investments (“HLIM”); (5) the periodic review (no less frequently than annually) of the HLIM and the adoption and implementation of policies and procedures for responding to a shortfall of a Fund’s highly liquid investments below its HLIM; and (6) periodic reporting to the Board.
At a meeting of the Board held May 11-13, 2021, HFMC provided an annual written report to the Board covering the period from April 1, 2020 through March 31, 2021. The annual report addressed important aspects of the LRM Program, including, but not limited to:
| • | the operation of the LRM Program (and related policies and procedures utilized in connection with management of the Funds’ liquidity risk); |
| • | an assessment of the adequacy and effectiveness of the LRM Program’s (and related policies and procedures’) implementation; |
| • | the operation, and assessment of the adequacy and effectiveness, of each Fund’s HLIM; |
| • | whether the third-party liquidity vendor’s (“LRM Program Vendor”) processes for determining preliminary liquidity classifications, including the particular methodologies or factors used and metrics analyzed by the LRM Program Vendor, are sufficient under the Liquidity Rule and appropriate in light of each Fund’s specific circumstances; and |
| • | any material changes to the LRM Program. |
In addition, HFMC provides a quarterly report on the LRM Program at each quarterly meeting of the Board’s Compliance and Risk Oversight Committee. The quarterly report included information regarding the Funds’ liquidity as measured by established parameters, a summary of developments within the capital markets that may impact liquidity, and other factors that may impact liquidity. Among other things, HFMC reports any changes to a Fund’s HLIM.
From April 1, 2020 through March 31, 2021, HFMC did not increase or reduce the HLIM for any Fund.
Based on its review and assessment, HFMC has concluded that the LRM Program is operating effectively to assess and manage the liquidity risk of each Fund and that the LRM Program has been and continues to be adequately and effectively implemented with respect to each Fund. Because liquidity in the capital markets in which the Funds invest is beyond the control of the Funds, there can be no assurance that the LRM Program will ensure liquidity under all circumstances and does not protect against the risk of loss.
Hartford International/Global Equity Funds
Directors and Officers of the Company (Unaudited)
The Hartford Mutual Funds, Inc. (the “Company”) is governed by a Board of Directors (the “Directors”). The following tables present certain information regarding the Directors and officers of the Company as of October 31, 2021. For more information regarding the Directors and officers, please refer to the Statement of Additional Information, which is available, without charge, upon request by calling 1-888-843-7824.
NAME, YEAR OF BIRTH
AND ADDRESS(1) | | POSITION
HELD WITH
THE COMPANY | | TERM OF
OFFICE(2) AND
LENGTH OF
TIME SERVED | | PRINCIPAL OCCUPATION(S)
DURING PAST 5 YEARS | | NUMBER OF
PORTFOLIOS
IN FUND
COMPLEX(3)
OVERSEEN
BY DIRECTOR | | OTHER DIRECTORSHIPS
FOR PUBLIC COMPANIES
AND OTHER REGISTERED
INVESTMENT COMPANIES
BY DIRECTOR |
| NON-INTERESTED DIRECTORS |
HILARY E. ACKERMANN
(1956) | | Director | | Since 2014 | | Ms. Ackermann served as Chief Risk Officer at Goldman Sachs Bank USA from October 2008 to November 2011. | | 75 | | Ms. Ackermann served as a Director of Dynegy, Inc. from October 2012 until its acquisition by Vistra Energy Corporation (“Vistra”) in 2018, and since that time she has served as a Director of Vistra. Ms. Ackermann serves as a Director of Credit Suisse Holdings (USA), Inc. from January 2017 to present. |
ROBIN C. BEERY
(1967) | | Director | | Since 2017 | | Ms. Beery has served as a consultant to ArrowMark Partners (an alternative asset manager) since March of 2015 and since November 2018 has been employed by ArrowMark Partners as a Senior Advisor. Previously, she was Executive Vice President, Head of Distribution, for Janus Capital Group, and Chief Executive Officer and President of the Janus Mutual Funds (a global asset manager) from September 2009 to August 2014. | | 75 | | Ms. Beery serves as an independent Director of UMB Financial Corporation (January 2015 to present), has chaired the Compensation Committee since April 2017, and serves on the Audit Committee and the Risk Committee. |
LYNN S. BIRDSONG(4), (5)
(1946) | | Director and Chair of the Board | | Director since 2003; Chair of the Board since 2019 | | From January 1981 through December 2013, Mr. Birdsong was a partner in Birdsong Company, an advertising specialty firm. From 1979 to 2002, Mr. Birdsong was a Managing Director of Zurich Scudder Investments, an investment management firm. | | 75 | | None |
DERRICK D. CEPHAS
(1952) | | Director | | Since 2020 | | Mr. Cephas currently serves as Of Counsel to Squire Patton Boggs LLP, an international law firm with 45 offices in 20 countries. Until his retirement in October 2020, Mr. Cephas was a Partner of Weil, Gotshal & Manges LLP, an international law firm headquartered in New York, where he served as the Head of the Financial Institutions Practice (April 2011 to October 2020). | | 75 | | Mr. Cephas currently serves as a Director of Signature Bank, a New York-based commercial bank, and is a member of the Credit Committee, Examining Committee and Risk Committee. Mr. Cephas currently serves as a Director of Claros Mortgage Trust, Inc., a real estate investment trust. |
CHRISTINE R. DETRICK(5)
(1958) | | Director | | Since 2016 | | Ms. Detrick served as a Senior Partner/Advisor at Bain & Company (a management consulting firm) from September 2002 to December 2012. | | 75 | | Ms. Detrick serves as a Director and Chair of the Nominating and Governance Committee of Reinsurance Group of America (from January 2014 to present). She also serves as a Director of Charles River Associates (May 2020 to present). |
Hartford International/Global Equity Funds
Directors and Officers of the Company (Unaudited) – (continued)
NAME, YEAR OF BIRTH
AND ADDRESS(1) | | POSITION
HELD WITH
THE COMPANY | | TERM OF
OFFICE(2) AND
LENGTH OF
TIME SERVED | | PRINCIPAL OCCUPATION(S)
DURING PAST 5 YEARS | | NUMBER OF
PORTFOLIOS
IN FUND
COMPLEX(3)
OVERSEEN
BY DIRECTOR | | OTHER DIRECTORSHIPS
FOR PUBLIC COMPANIES
AND OTHER REGISTERED
INVESTMENT COMPANIES
BY DIRECTOR |
ANDREW A. JOHNSON
(1962) | | Director | | Since 2020 | | Mr. Johnson currently serves as a Diversity and Inclusion Advisor at Neuberger Berman, a private, global investment management firm. Prior to his current role, Mr. Johnson served as Chief Investment Officer and Head of Global Investment Grade Fixed Income at Neuberger Berman (January 2009 to December 2018). | | 75 | | Mr. Johnson currently serves as a Director of AGNC Investment Corp., a real estate investment trust. |
PAUL L. ROSENBERG
(1953) | | Director | | Since 2020 | | Mr. Rosenberg is a Partner of The Bridgespan Group, a global nonprofit consulting firm that is a social impact advisor to nonprofits, non-governmental organizations, philanthropists and institutional investors (October 2007 to present). | | 75 | | None |
LEMMA W. SENBET(4)
(1946) | | Director | | Since 2005 | | Dr. Senbet currently serves as the William E. Mayer Chair Professor of Finance in the Robert H. Smith School of Business at the University of Maryland, where he was chair of the Finance Department from 1998 to 2006. In June 2013, he began a sabbatical from the University to serve as Executive Director of the African Economic Research Consortium which focuses on economic policy research and training, which he completed in 2018. | | 75 | | None |
DAVID SUNG
(1953) | | Director | | Since 2017 | | Mr. Sung was a Partner at Ernst & Young LLP from October 1995 to July 2014. | | 75 | | Mr. Sung serves as a Trustee of Ironwood Institutional Multi-Strategy Fund, LLC and Ironwood Multi-Strategy Fund, LLC (October 2015 to present). |
| OFFICERS AND INTERESTED DIRECTORS |
JAMES E. DAVEY(6)
(1964) | | Director, President and Chief Executive Officer | | President and Chief Executive Officer since 2010; Director since 2012 | | Mr. Davey serves as Executive Vice President of The Hartford Financial Services Group, Inc. Mr. Davey has served in various positions within The Hartford and its subsidiaries and joined The Hartford in 2002. Additionally, Mr. Davey serves as Director, Chairman, President, and Senior Managing Director for Hartford Funds Management Group, Inc. ("HFMG"). Mr. Davey also serves as President, Manager, Chairman of the Board, and Senior Managing Director for Hartford Funds Management Company, LLC (“HFMC”); Manager, Chairman of the Board, and President of Lattice Strategies LLC (“Lattice”); Chairman of the Board, Manager, and Senior Managing Director of Hartford Funds Distributors, LLC (“HFD”); and Chairman of the Board, President and Senior Managing Director of Hartford Administrative Services Company (“HASCO”), each of which is an affiliate of HFMG. | | 75 | | None |
ANDREW S. DECKER
(1963) | | AML Compliance Officer | | Since 2015 | | Mr. Decker serves as Chief Compliance Officer and AML Compliance Officer of HASCO (since April 2015) and Vice President of HASCO (since April 2018). Mr. Decker serves as AML Officer of HFD (since May 2015). Mr. Decker also serves as Vice President of HFMG (since April 2018). Prior to joining The Hartford, Mr. Decker served as Vice President and AML Officer at Janney Montgomery Scott (a broker dealer) from April 2011 to January 2015. | | N/A | | N/A |
AMY N. FURLONG
(1979) | | Vice President | | Since 2018 | | Ms. Furlong serves as Vice President and Assistant Treasurer of HFMC (since September 2019). From 2018 through March 15, 2021, Ms. Furlong served as the Treasurer of the Company. Ms. Furlong has served in various positions within The Hartford and its subsidiaries in connection with the operation of the Hartford funds. Ms. Furlong joined The Hartford in 2004. | | N/A | | N/A |
Hartford International/Global Equity Funds
Directors and Officers of the Company (Unaudited) – (continued)
NAME, YEAR OF BIRTH
AND ADDRESS(1) | | POSITION
HELD WITH
THE COMPANY | | TERM OF
OFFICE(2) AND
LENGTH OF
TIME SERVED | | PRINCIPAL OCCUPATION(S)
DURING PAST 5 YEARS | | NUMBER OF
PORTFOLIOS
IN FUND
COMPLEX(3)
OVERSEEN
BY DIRECTOR | | OTHER DIRECTORSHIPS
FOR PUBLIC COMPANIES
AND OTHER REGISTERED
INVESTMENT COMPANIES
BY DIRECTOR |
WALTER F. GARGER
(1965) | | Vice President and Chief Legal Officer | | Since 2016 | | Mr. Garger serves as Secretary, Managing Director and General Counsel of HFMG, HFMC, HFD, and HASCO (since 2013). Mr. Garger also serves as Secretary and General Counsel of Lattice (since July 2016). Mr. Garger has served in various positions within The Hartford and its subsidiaries in connection with the operation of the Hartford funds. Mr. Garger joined The Hartford in 1995. | | N/A | | N/A |
THEODORE J. LUCAS
(1966) | | Vice President | | Since 2017 | | Mr. Lucas serves as Executive Vice President of HFMG (since July 2016) and as Executive Vice President of Lattice (since June 2017). Previously, Mr. Lucas served as Managing Partner of Lattice (2003 to 2016). | | N/A | | N/A |
JOSEPH G. MELCHER
(1973) | | Vice President and Chief Compliance Officer | | Since 2013 | | Mr. Melcher serves as Executive Vice President of HFMG and HASCO (since December 2013). Mr. Melcher also serves as Executive Vice President (since December 2013) and Chief Compliance Officer (since December 2012) of HFMC, serves as Executive Vice President and Chief Compliance Officer of Lattice (since July 2016), serves as Executive Vice President of HFD (since December 2013), and served as President and Chief Executive Officer of HFD (from April 2018 to June 2019). | | N/A | | N/A |
VERNON J. MEYER
(1964) | | Vice President | | Since 2006 | | Mr. Meyer serves as Managing Director and Chief Investment Officer of HFMC and Managing Director of HFMG (since 2013). Mr. Meyer also serves as Senior Vice President-Investments of Lattice (since March 2019). Mr. Meyer has served in various positions within The Hartford and its subsidiaries in connection with the operation of the Hartford funds. Mr. Meyer joined The Hartford in 2004. | | N/A | | N/A |
DAVID A. NAAB
(1985) | | Vice President and Treasurer | | Since March 15, 2021 | | Mr. Naab serves as Vice President and Assistant Treasurer of HFMC (since June 2021). Prior to joining HFMC in 2021, Mr. Naab served in various positions as an associate, senior associate, manager, senior manager, and director within the investment management, financial services, and asset & wealth management practice groups of PricewaterhouseCoopers, LLP from 2007 to 2020. | | N/A | | N/A |
ALICE A. PELLEGRINO
(1960) | | Vice President and Assistant Secretary | | Since 2016 | | Ms. Pellegrino serves as Vice President of HFMG (since December 2013). Ms. Pellegrino also serves as Vice President and Assistant Secretary of Lattice (since June 2017). Ms. Pellegrino is a Senior Counsel and has served in various positions within The Hartford and its subsidiaries in connection with the operation of the Hartford funds. Ms. Pellegrino joined The Hartford in 2007. | | N/A | | N/A |
THOMAS R. PHILLIPS
(1960) | | Vice President and Secretary | | Since 2017 | | Mr. Phillips is Deputy General Counsel for HFMG and currently serves as a Senior Vice President (since June 2021) and Assistant Secretary (since June 2017) for HFMG. Mr. Phillips also serves as Vice President of HFMC (since June 2021). Prior to joining HFMG in 2017, Mr. Phillips was a Director and Chief Legal Officer of Saturna Capital Corporation from 2014–2016. Prior to that, Mr. Phillips was a Partner and Deputy General Counsel of Lord, Abbett & Co. LLC. | | N/A | | N/A |
Hartford International/Global Equity Funds
Directors and Officers of the Company (Unaudited) – (continued)
| (1) | The address for each officer and Director is c/o Hartford Funds 690 Lee Road, Wayne, Pennsylvania 19087. |
| (2) | Term of Office: Each Director holds an indefinite term until his or her retirement, resignation, removal, or death. Directors generally must retire no later than December 31 of the year in which the Director turns 75 years of age. Each Fund officer generally serves until his or her resignation, removal, or death. |
| (3) | The portfolios of the “Fund Complex” are operational series of The Hartford Mutual Funds, Inc., The Hartford Mutual Funds II, Inc., Hartford Series Fund, Inc., Hartford HLS Series Fund II, Inc., Lattice Strategies Trust, and Hartford Funds Exchange-Traded Trust. |
| (4) | Effective as of December 31, 2021, Messrs. Birdsong and Senbet will retire as Directors. |
| (5) | Mr. Birdsong will retire effective December 31, 2021. Anticipating Mr. Birdsong's retirement, the Board has elected Christine R. Detrick to serve as Chair of the Board effective November 4, 2021. Accordingly, effective November 4, 2021, Mr. Birdsong will no longer serve as Chair of the Board. Effective November 5, 2021, Ms. Detrick also will serve as a Director of Capital One Financial Corporation. |
| (6) | “Interested person,” as defined in the 1940 Act, of the Company because of the person’s affiliation with, or equity ownership of, HFMC, HFD or affiliated companies. |
Hartford International/Global Equity Funds
HOW TO OBTAIN A COPY OF EACH FUND’S PROXY VOTING POLICIES AND VOTING RECORDS (UNAUDITED)
A description of the policies and procedures that each Fund uses to determine how to vote proxies relating to portfolio securities and information about how each Fund voted proxies relating to portfolio securities during the most recent twelve-month period ended June 30 are available (1) without charge, upon request, by calling 888-843-7824 and (2) on the SEC’s website at http://www.sec.gov.
QUARTERLY PORTFOLIO HOLDINGS INFORMATION (UNAUDITED)
Each Fund files its complete schedule of portfolio holdings with the SEC for the first and third quarters of each fiscal year as an exhibit to its reports on Form N-PORT. Each Fund’s portfolio holdings filed as an exhibit to Form N-PORT for the most recent first and third quarter of the Fund’s fiscal year are available (1) without charge, upon request, by calling 888-843-7824, (2) on the Funds’ website, hartfordfunds.com, and (3) on the SEC’s website at http://www.sec.gov.
Hartford International/Global Equity Funds
Approval of Investment Management and Investment Sub-Advisory Agreements (Unaudited)
The Hartford Mutual Funds, Inc.
Hartford Climate Opportunities Fund
Hartford Emerging Markets Equity Fund
Hartford Global Impact Fund
Hartford International Equity Fund
The Hartford International Growth Fund
The Hartford International Opportunities Fund
The Hartford International Value Fund
(each, a “Fund” and collectively, the “Funds”)
Section 15(c) of the Investment Company Act of 1940, as amended (the “1940 Act”), requires that each mutual fund’s board of directors, including a majority of those directors who are not “interested persons” of the mutual fund, as defined in the 1940 Act (the “Independent Directors”), annually review and consider the continuation of the mutual fund’s investment advisory and sub-advisory agreements. At its meeting held on August 3-4, 2021, the Board of Directors (the “Board”) of The Hartford Mutual Funds, Inc. (“HMF”), including each of the Independent Directors, unanimously voted to approve (i) the continuation of an investment management agreement by and between Hartford Funds Management Company, LLC (“HFMC”) and each of HMF, on behalf of the Hartford Climate Opportunities Fund, Hartford Emerging Markets Equity Fund, Hartford International Equity Fund, The Hartford International Growth Fund, The Hartford International Opportunities Fund and The Hartford International Value Fund, and The Hartford Mutual Funds II, Inc. (“HMF II”), on behalf of its series (the “Management Agreement”); (ii) the continuation of an investment management agreement by and between HFMC and HMF, on behalf of the Hartford Global Impact Fund (the “Global Impact Management Agreement” and together with the Management Agreement, the “Management Agreements”); (iii) the continuation of an investment sub-advisory agreement (the “Schroders Sub-Advisory Agreement”) by and between HFMC and Schroder Investment Management North America Inc. (“SIMNA Inc.”) with respect to the Hartford Climate Opportunities Fund; (iv) the continuation of an investment sub-sub-advisory agreement (the “Sub-Sub-Advisory Agreement” and together with the Schroders Sub-Advisory Agreement, the “Schroders Agreements”) by and between SIMNA Inc. and Schroder Investment Management North America Limited (“SIMNA Ltd.,” and together with SIMNA Inc., “Schroders”) with respect to the Hartford Climate Opportunities Fund (the “Sub-Sub-Advised Fund”); and (v) the continuation of an investment sub-advisory agreement (the “Sub-Advisory Agreement,” and together with the Schroders Sub-Advisory Agreement, the “Sub-Advisory Agreements” and together with the Management Agreements and the Sub-Sub-Advisory Agreement, the “Agreements”) between HFMC and Wellington Management Company LLP (“Wellington,” and together with Schroders, the “Sub-advisers,” and collectively with HFMC, the “Advisers”), with respect to each Fund.
In the months preceding the August 3-4, 2021 meeting, the Board requested and reviewed written responses from the Advisers to questions posed to the Advisers on behalf of the Independent Directors and supporting materials relating to those questions and responses. In addition, the Board considered such additional information as it deemed reasonably necessary to evaluate the Agreements, as applicable, with respect to each Fund, which included information furnished to the Board and its committees at their meetings throughout the year and in between regularly scheduled meetings on particular matters as the need arose, as well as information specifically prepared in connection with the approval of the continuation of the Agreements that was presented at the Board’s meetings held on June 15-16, 2021 and August 3-4, 2021. Information provided to the Board and its committees at their meetings throughout the year included, among other things, reports on Fund performance, legal, compliance and risk management matters, sales and marketing activity, shareholder services, and the other services provided to each Fund by the Advisers and their affiliates. The members of the Board also considered the materials and presentations by Fund officers and representatives of HFMC received at the Board’s meetings on June 15-16, 2021 and August 3-4, 2021 concerning the Agreements and at the special meeting of the Board’s Investment Committee on May 18, 2021 concerning Fund performance and other investment-related matters.
The Independent Directors, advised by independent legal counsel throughout the evaluation process, engaged service providers to assist them with evaluating the Agreements with respect to each Fund, as applicable. Broadridge Financial Solutions, Inc. (“Broadridge”), an independent provider of investment company data, was retained to provide the Board with reports on how each Fund’s contractual management fees, actual management fees, total expense ratios and investment performance compared to those of comparable mutual funds with similar investment objectives. The Independent Directors also engaged an independent financial services consultant (the “Consultant”) to assist them in evaluating each Fund’s contractual management fees, actual management fees, total expense ratios and investment performance. In addition, the Consultant reviewed the profitability methodologies utilized by HFMC in connection with the continuation of the Management Agreements.
In determining whether to approve the continuation of the Agreements for a Fund, the members of the Board reviewed and evaluated information and factors they believed to be relevant and appropriate through the exercise of their reasonable business judgment. While individual members of the Board may have weighed certain factors differently, the Board’s determination to approve the continuation of the Agreements was based on a comprehensive consideration of all information provided to the Board throughout the year and specifically with respect to the continuation of the
Hartford International/Global Equity Funds
Approval of Investment Management and Investment Sub-Advisory Agreements (Unaudited) – (continued)
Agreements. The Board was also furnished with an analysis of its fiduciary obligations in connection with its evaluation of the Agreements. Throughout the evaluation process, the Board was assisted by counsel for the Funds and the Independent Directors were also separately assisted by independent legal counsel. In connection with their deliberations, the Independent Directors met separately with independent legal counsel and the Consultant on June 11, 2021 and in executive session on several occasions to consider their responsibilities under relevant laws and regulations and to discuss the materials presented and other matters deemed relevant to their consideration of the approval of the continuation of the Agreements. As a result of the discussions that occurred during the June 11, 2021 and June 15-16, 2021 meetings, the Independent Directors presented HFMC with requests for additional information on certain topics. HFMC responded to these requests with additional information in connection with the August 3-4, 2021 meeting. A more detailed summary of the important, but not necessarily all, factors the Board considered with respect to its approval of the continuation of the Agreements is provided below.
Nature, Extent and Quality of Services Provided by the Advisers
The Board requested and considered information concerning the nature, extent and quality of the services provided to each Fund by the Advisers. The Board considered, among other things, the terms of the Agreements and the range of services provided by the Advisers. The Board considered the Advisers’ professional personnel who provide services to the Funds, including each Adviser’s ability and experience in attracting and retaining qualified personnel to service the Funds. The Board considered each Adviser’s reputation and overall financial strength, as well as each Adviser’s willingness to consider and implement organizational and operational changes designed to enhance services to the funds managed by HFMC and its affiliates (the “Hartford funds”). In addition, the Board considered the quality of each Adviser’s communications with the Board and responsiveness to Board inquiries and requests made from time to time with respect to the Funds and other Hartford funds. In this regard, the Board took into account the Advisers’ communications with the Board in light of the coronavirus (“COVID-19”) pandemic.
The Board also requested and evaluated information concerning each Adviser’s regulatory and compliance environment. In this regard, the Board requested and reviewed information about each Adviser’s compliance policies and procedures and compliance history, and a report from the Funds’ Chief Compliance Officer about each Adviser’s compliance with applicable laws and regulations, including responses to regulatory developments and any compliance or other issues raised by regulators. The Board also noted the Advisers’ support of the Funds’ compliance control structure, as applicable, including the resources devoted by the Advisers in support of the Funds’ obligations pursuant to Rule 38a-1 under the 1940 Act and the Funds’ liquidity risk management program, as well as the efforts of the Advisers to combat cybersecurity risks. The Board also considered HFMC’s investments in business continuity planning designed to benefit the Funds, and the implementation of HFMC’s business continuity plans due to the COVID-19 pandemic. The Board also noted HFMC’s commitment to maintaining high quality systems and expending substantial resources to prepare for and respond to ongoing changes to the market, regulatory and control environments in which the Funds and their service providers operate, including changes associated with the COVID-19 pandemic.
With respect to HFMC, the Board noted that, under the Management Agreements, HFMC is responsible for the management of the Funds, including oversight of fund operations and service providers, and the provision of administrative and investment advisory services in connection with selecting, monitoring and supervising the Sub-advisers. In this regard, the Board evaluated information about the nature and extent of responsibilities retained and risks assumed by HFMC that were not delegated to or assumed by the Sub-advisers. The Board considered HFMC’s ongoing monitoring of people, process and performance, including its quarterly reviews of each of the Hartford funds, semi-annual meetings with the leaders of each Fund’s portfolio management team, and oversight of the Hartford funds’ portfolio managers. The Board noted that HFMC has demonstrated a record of initiating changes to the portfolio management and/or investment strategies of the Hartford funds when warranted. The Board considered HFMC’s periodic due diligence reviews of each Sub-adviser and ongoing oversight of each Sub-adviser’s investment approach and results, process for monitoring best execution of portfolio trades and other trading operations by each Sub-adviser, and approach to risk management with respect to the Funds and the service providers to the Funds. The Board considered HFMC’s oversight of the securities lending program for the Funds that engage in securities lending and noted the income earned by the Funds that participate in such program. The Board also considered HFMC’s day-to-day oversight of each Fund’s compliance with its investment objective and policies as well as with applicable laws and regulations, noting that regulatory and other developments had over time led to an increase in the scope of HFMC’s oversight in this regard. Moreover, the Board considered HFMC’s oversight of potential conflicts of interest between the Funds’ investments and those of other funds or accounts managed by the Funds’ portfolio management personnel.
In addition, the Board considered HFMC’s ongoing commitment to review and rationalize the Hartford funds product line-up. The Board also considered the expenses that HFMC had incurred, as well as the risks HFMC had assumed, in connection with the launch of new funds and changes to existing Hartford funds in recent years. The Board considered that HFMC is responsible for providing the Funds’ officers.
Hartford International/Global Equity Funds
Approval of Investment Management and Investment Sub-Advisory Agreements (Unaudited) – (continued)
With respect to the Sub-advisers, which provide certain day-to-day portfolio management services for the Funds and the Sub-Sub-Advised Fund, respectively, subject to oversight by HFMC, the Board considered, among other things, each Sub-Adviser’s investment personnel, investment philosophy and process, investment research capabilities and resources, performance record, trade execution capabilities and experience, including with respect to sustainable investing and environmental, social and/or governance (ESG) criteria. The Board considered the experience of each Fund’s portfolio manager(s), the number of accounts managed by the portfolio manager(s), and each Sub-Adviser’s method for compensating the portfolio manager(s). The Board also considered each Sub-adviser’s succession planning practices to ensure continuity of portfolio management services provided to the Funds.
The Board considered the benefits to shareholders of being part of the family of Hartford funds, including, with respect to certain share classes, the right to exchange investments between the same class of shares without a sales charge, the ability to reinvest Fund dividends into other Hartford funds (excluding the Hartford funds that are exchange-traded funds or an interval fund), and the ability to combine holdings in a Fund with holdings in other Hartford funds (excluding the Hartford funds that are exchange-traded funds or an interval fund) and 529 plans for which HFMC serves as the program manager to obtain a reduced sales charge. The Board considered HFMC’s efforts to provide investors in the Hartford funds with a broad range of investment styles and asset classes and the assumption of entrepreneurial and other risks by HFMC in sponsoring and providing ongoing services to new funds to expand these opportunities for shareholders. In addition, the Board observed that in the marketplace there are a range of investment options available to each Fund’s shareholders and such shareholders, having had the opportunity to consider other investment options, have chosen to invest in the Fund.
Based on these considerations, the Board concluded that it was satisfied with the nature, extent and quality of the services provided to each Fund by HFMC and, as applicable, the Sub-advisers.
Performance of each Fund and the Advisers
The Board considered the investment performance of each Fund. In this regard, the Board reviewed the performance of each Fund over different time periods presented in the materials and evaluated HFMC’s analysis of the Fund’s performance for these time periods. The Board considered information and materials provided to the Board by the Advisers concerning Fund performance, as well as information from Broadridge comparing the investment performance of each Fund to an appropriate universe of peer funds. The Board noted that while it found the comparative data provided by Broadridge generally useful in evaluating a Hartford fund’s investment performance, the Board recognized the limitations of such data, including that notable differences may exist between a Hartford fund and its peers. The Board also noted that, for the Hartford Climate Opportunities Fund and the Hartford Global Impact Fund, there existed no peer group with a strong correlation to the Fund’s investment strategy. For each of these Funds, the Board considered that HFMC continues to monitor the competitive landscape and ways to enhance performance assessments. For details regarding each Fund’s performance, see the Fund-by-Fund synopsis below.
The Board considered the detailed investment analytics reports provided by HFMC’s Investment Advisory Group throughout the year, including in connection with the approval of the continuation of the Agreements. These reports included, among other things, information on each Fund’s gross returns and net returns, the Fund’s investment performance compared to one or more appropriate benchmarks and relevant groups or categories of peer funds, various statistics concerning the Fund’s portfolio, a narrative summary of various factors affecting Fund performance, and commentary on the effect of market conditions. The Board also noted that, for the Hartford International Equity Fund, the Fund utilizes a multiple sleeve structure whereby each sleeve uses a different investment style and considered the performance attributions of the underlying managers. With respect to The Hartford International Growth Fund, the Board considered that effective September 1, 2020, the Fund no longer operated in a multiple sleeve structure. With respect to the Hartford Climate Opportunities Fund, the Board noted that each of Wellington and Schroders are responsible for the day-to-day portfolio management services for the allocated sleeve of the Fund and considered the performance attributions of each sleeve. The Board considered the Advisers’ work with the Investment Committee, which assists the Board in evaluating the performance of each Fund at periodic meetings throughout the year and specifically with respect to the approval of the continuation of the Agreements. The Board considered that the Investment Committee, in its evaluation of investment performance at meetings throughout the year, focused particular attention on information indicating less favorable performance of certain Hartford funds for specific time periods and discussed with the Advisers the reasons for such performance as well as any specific actions that the Advisers had taken, or had agreed to take, to seek to enhance Fund investment performance and the results of those actions. The Board also considered the analysis provided by the Consultant relating to each Fund’s performance track record.
Based on these considerations, the Board concluded that it had continued confidence in HFMC’s and each Sub-adviser’s overall capabilities to manage the Funds, as applicable.
Hartford International/Global Equity Funds
Approval of Investment Management and Investment Sub-Advisory Agreements (Unaudited) – (continued)
Costs of the Services and Profitability of the Advisers
The Board reviewed information regarding HFMC’s cost to provide investment management and related services to each Fund and HFMC’s profitability, both overall and for each Fund, on a pre-tax basis without regard to distribution expenses. The Board also requested and reviewed information about the profitability to HFMC and its affiliates from all services provided to each Fund and all aspects of their relationship with the Fund, including information regarding profitability trends over time and information provided by Broadridge analyzing the profitability of managers to other fund complexes. The Board also requested and received information relating to the operations and profitability of the Sub-advisers. The Board considered representations from HFMC and each Sub-adviser that the Sub-adviser’s fees were negotiated at arm’s length on a Fund-by-Fund basis and that the sub-advisory fees are paid by HFMC and not the Funds. The Board also considered that SIMNA Ltd. is an affiliate of SIMNA Inc. and that SIMNA Ltd.’s sub-sub-advisory fees would be paid by SIMNA Inc., not the Sub-Sub-Advised Fund. Accordingly, the Board concluded that the profitability of the Sub-advisers is a less relevant factor with respect to the Board’s consideration of the Sub-Advisory Agreements and the Sub-Sub-Advisory Agreement.
The Board considered the Consultant’s review of the methodologies and estimates used by HFMC in calculating profitability in connection with the continuation of the Management Agreements, including a description of the methodology used to allocate certain expenses. The Board noted the Consultant’s view that HFMC’s process for calculating and reporting Fund profitability is reasonable and consistent with the process previously reviewed by the Consultant. The Board noted that the Consultant had previously performed a full review of this process and reported that such process is reasonable, sound and consistent with common industry practice.
Based on these considerations, the Board concluded that the profits realized by the Advisers and their affiliates from their relationships with each Fund were not excessive.
Comparison of Fees and Services Provided by the Advisers
The Board considered comparative information with respect to the services rendered to and the management fees to be paid by each Fund to HFMC and the total expense ratios of the Fund. The Board also considered comparative information with respect to the sub-advisory fees to be paid by HFMC to the Sub-advisers with respect to each Fund. In this regard, the Board requested and reviewed information from HFMC and the Sub-advisers relating to the management and sub-advisory fees, including the sub-advisory fee schedule(s) for each Fund and the amount of the management fee retained by HFMC, and total operating expenses for each Fund. The Board also reviewed information from Broadridge comparing each Fund’s contractual management fees, actual management fees and total expense ratios relative to an appropriate group of funds selected by Broadridge. The Board considered such information from Broadridge in consultation with the Consultant. For details regarding each Fund’s expenses, see the Fund-by-Fund synopsis below.
The Board considered the methodology used by Broadridge to select the funds included in the expense groups. While the Board recognized that comparisons between a Fund and its peer funds may be imprecise given, among other differences, the different service levels and characteristics of mutual funds and the different business models and cost structures of the Advisers, the comparative information provided by Broadridge assisted the Board in evaluating the reasonableness of each Fund’s fees and total operating expenses. In addition, the Board considered the analysis and views of the Consultant relating to each Fund’s fees and total operating expenses and expense groups.
The Board also received information regarding fees charged by the Sub-advisers to any other clients with investment strategies similar to those of the Funds, including institutional separate account clients and registered fund clients for which a Sub-adviser serves as either primary investment adviser or sub-adviser. The Board considered the explanations provided by the Sub-advisers about any differences between a Sub-adviser’s services to the Funds and the services a Sub-adviser provides to other types of clients. In this regard, the Board reviewed information about the generally broader scope of services and compliance, reporting and other legal burdens and risks of managing registered funds compared with those associated with managing assets of non-registered fund clients such as institutional separate accounts.
Based on these considerations, the Board concluded that each Fund’s fees and total operating expenses, in conjunction with the information about quality of services, profitability, economies of scale, and other matters considered, were reasonable in light of the services provided.
Economies of Scale
The Board considered information regarding economies of scale, including the extent to which economies of scale may be realized as a Fund grows and whether fee levels reflect these economies of scale for the benefit of shareholders of the Fund. The Board reviewed the breakpoints in the management fee schedule for each Fund, if any, which reduce fee rates as the Fund’s assets grow over time. The Board recognized that a Fund with
Hartford International/Global Equity Funds
Approval of Investment Management and Investment Sub-Advisory Agreements (Unaudited) – (continued)
assets beyond the highest breakpoint level will continue to benefit from economies of scale because additional assets are charged the lowest breakpoint fee resulting in lower effective management fee rates. The Board also recognized that a fee schedule that reaches a breakpoint at a lower asset level provides shareholders with the benefit of anticipated or potential economies of scale. The Board considered that expense limitations and fee waivers that reduce a Fund’s expenses at all asset levels can have the same effect as breakpoints in sharing economies of scale with shareholders and provide protection from an increase in expenses if the Fund’s assets decline. In addition, the Board considered that initially setting competitive fee rates, pricing a Fund to scale at inception and making additional investments intended to enhance services available to shareholders are other means of sharing anticipated or potential economies of scale with shareholders. The Board also considered that HFMC has been active in managing expenses, which has resulted in benefits being realized by shareholders. The Board also noted that, for each of the Hartford Climate Opportunities Fund and Hartford Global Impact Fund, the Fund’s current low asset levels have kept the Fund from fully realizing the benefits of anticipated or potential economies of scale.
The Board reviewed and evaluated materials from Broadridge and the Consultant showing how management fee schedules of peer funds reflect economies of scale for the benefit of shareholders as a peer fund’s assets hypothetically increase over time. Based on information provided by HFMC, Broadridge, and the Consultant, the Board recognized that there is no uniform methodology for establishing breakpoints or uniform pattern in asset levels that trigger breakpoints or the amounts of breakpoints triggered.
After considering all of the information available to it, the Board concluded that it was satisfied with the extent to which economies of scale would be shared for the benefit of each Fund’s shareholders based on currently available information and the effective management fees and total expense ratios for the Fund at its current and reasonably anticipated asset levels. The Board noted, however, that it would continue to monitor any future growth in each Fund’s assets and the appropriateness of additional management fee breakpoints or other methods to share benefits from economies of scale as part of its future review of the Agreements.
Other Benefits
The Board considered other benefits to the Advisers and their affiliates from their relationships with the Funds.
The Board noted that HFMC receives fees for fund accounting and related services from the Funds, and the Board considered information on the profitability to HFMC from providing such services to the Funds. The Board also considered that each Fund pays a transfer agency fee to Hartford Administrative Services Company (“HASCO”), an affiliate of HFMC, equal to the lesser of: (i) the actual costs incurred by HASCO in connection with the provisions of transfer agency services, including payments made to sub-transfer agents, plus a reasonable target profit margin; or (ii) a specified amount as set forth in the Transfer Agency and Service Agreement by and between HMF, on behalf of its Funds, HMF II, on behalf of its series, and HASCO. The Board reviewed information about the profitability to HASCO of the Funds’ transfer agency function. The Board considered information provided by HFMC indicating that the transfer agency fees charged by HASCO to the Funds were fair and reasonable based on available industry data about fees charged by transfer agents to other mutual funds. The Board also noted that HFMC and HASCO had delegated certain fund accounting services and transfer agency services, respectively, to external service providers.
The Board also considered that Hartford Funds Distributors, LLC (“HFD”), an affiliate of HFMC, serves as principal underwriter of the Funds. The Board noted that, as principal underwriter, HFD receives distribution and service fees from the Funds and receives all or a portion of the sales charges on sales or redemptions of certain classes of shares. The Board considered that HFD has entered into an agreement with SIMNA Inc. and SEI Trust Company to provide certain marketing support services in connection with four collective investment trust vehicles for which Schroders serve as investment adviser.
The Board considered the benefits, if any, to the Sub-advisers from any use of a Fund’s brokerage commissions to obtain soft dollar research. The Board also considered that SIMNA Inc. has entered into a solicitation agreement with HFMC pursuant to which HFMC provides certain marketing support services with respect to investment strategy models offered by SIMNA Inc. through its managed account platforms.
Fund-by-Fund Factors
For purposes of the Fund-by-Fund discussion below, Fund performance is referred to as “in line with” a Fund’s benchmark where it was 0.5% above or below the benchmark return, and each Fund’s performance relative to its primary benchmark reflects the net performance of the Fund’s Class I shares as of March 31, 2021.
Hartford International/Global Equity Funds
Approval of Investment Management and Investment Sub-Advisory Agreements (Unaudited) – (continued)
Hartford Climate Opportunities Fund
| • | The Board noted that the Fund’s performance was in the 1st quintile of its performance universe for the 1-, 3-, and 5-year periods. The Board also noted that the Fund’s performance was above its benchmark for the 1-, 3-, and 5-year periods. The Board noted recent changes to the Fund’s portfolio management team. |
| • | The Board noted that the Fund’s contractual management fee, actual management fee, and total expenses (less 12b-1 and shareholder service fees) were in the 1st quintile of its expense group. The Board noted that Class A shares of the Fund have a contractual expense cap of 1.19% through February 28, 2022, which resulted in HFMC reimbursing the Fund for certain expenses. |
Hartford Emerging Markets Equity Fund
| • | The Board noted that the Fund’s performance was in the 4th quintile of its performance universe for the 1- and 3-year periods and the 3rd quintile for the 5-year period. The Board also noted that the Fund’s performance was in line with its benchmark for the 1- and 5-year periods and below its benchmark for the 3-year period. |
| • | The Board noted that the Fund’s contractual management fee was in the 2nd quintile of its expense group, while its actual management fee was in the 4th quintile and its total expenses (less 12b-1 and shareholder service fees) were in the 3rd quintile. The Board noted that Class A shares of the Fund have a contractual expense cap of 1.45% through February 28, 2022, which resulted in HFMC reimbursing the Fund for certain expenses. |
Hartford Global Impact Fund
| • | The Board noted that the Fund’s performance was in the 4th quintile of its performance universe for the 1-year period and the 3rd quintile for the 3-year period. The Board also noted that the Fund’s performance was above its benchmark for the 1- and 3-year periods. |
| • | The Board noted that the Fund’s contractual management fee and actual management fee were in the 1st quintile of its expense group, while its total expenses (less 12b-1 and shareholder service fees) were in the 2nd quintile. The Board noted that Class A shares of the Fund have a contractual expense cap of 1.19% through February 28, 2022, which resulted in HFMC reimbursing the Fund for certain expenses. |
Hartford International Equity Fund
| • | The Board noted that the Fund’s performance was in the 3rd quintile of its performance universe for the 1-year period, the 5th quintile for the 3-year period, and the 4th quintile for the 5-year period. The Board also noted that the Fund’s performance was above its benchmark for the 1-year period, below its benchmark for the 3-year period, and in line with its benchmark for the 5-year period. |
| • | The Board noted that the Fund’s contractual management fee, actual management fee, and total expenses (less 12b-1 and shareholder service fees) were in the 1st quintile of its expense group. |
The Hartford International Growth Fund
| • | The Board noted that the Fund’s performance was in the 2nd quintile of its performance universe for the 1-, 3-, and 5-year periods. The Board also noted that the Fund’s performance was above its benchmark for the 1-, 3-, and 5-year periods. The Board noted recent changes to the Fund’s portfolio management team. The Board also noted that certain changes had recently been made to the Fund’s principal investment strategy. |
| • | The Board noted that the Fund’s contractual management fee was in the 2nd quintile of its expense group, while its actual management fee was in the 3rd quintile and its total expenses (less 12b-1 and shareholder service fees) were in the 4th quintile. The Board noted that Class A shares of the Fund have a contractual expense cap of 1.30% through February 28, 2022, which resulted in HFMC reimbursing the Fund for certain expenses. |
The Hartford International Opportunities Fund
| • | The Board noted that the Fund’s performance was in the 2nd quintile of its performance universe for the 1-year period and the 4th quintile for the 3- and 5-year periods. The Board also noted that the Fund’s performance was above its benchmark for the 1- and 3-year periods and in line with its benchmark for the 5-year period. |
| • | The Board noted that the Fund’s contractual management fee, its actual management fee, and its total expenses (less 12b-1 and shareholder service fees) were in the 1st quintile of its expense group. The Board noted that Class Y shares of the Fund have a contractual transfer agency expense cap of 0.07% through February 28, 2022, which resulted in HFMC reimbursing the Fund for certain expenses. |
Hartford International/Global Equity Funds
Approval of Investment Management and Investment Sub-Advisory Agreements (Unaudited) – (continued)
The Hartford International Value Fund
| • | The Board noted that the Fund’s performance was in the 1st quintile of its performance universe for the 1-year period, the 5th quintile for the 3-year period, and the 2nd quintile for the 5-year period. The Board also noted that the Fund’s performance was above its benchmark for the 1- and 5-year periods and below its benchmark for the 3-year period. |
| • | The Board noted that the Fund’s contractual management fee and its total expenses (less 12b-1 and shareholder service fees) were in the 3rd quintile of its expense group, while its actual management fee was in the 5th quintile. The Board noted that Class Y shares of the Fund have a contractual transfer agency expense cap of 0.06% through February 28, 2022, which resulted in HFMC reimbursing the Fund for certain expenses. |
* * * *
Based upon the review of the factors summarized above, among others, the Board concluded that it is in the best interests of each Fund and its shareholders for the Board to approve the continuation of the Agreements for an additional year. In reaching this decision, the Board did not assign relative weights to the factors discussed above or deem any one or group of them to be controlling in and of themselves.
THIS PRIVACY POLICY IS NOT PART OF THIS REPORT
CUSTOMER PRIVACY NOTICE
The Hartford Financial Services Group, Inc. and Affiliates*
(herein called “we, our, and us”)
This Privacy Policy applies to our United States Operations
We value your trust. We are committed to the responsible:
| a) | management; |
| b) | use; and |
| c) | protection; |
of Personal Information.
This notice describes how we collect, disclose, and protect Personal Information.
We collect Personal Information to:
| a) | service your Transactions with us; and |
| b) | support our business functions. |
We may obtain Personal Information from:
| a) | You; |
| b) | your Transactions with us; and |
| c) | third parties such as a consumer-reporting agency. |
Based on the type of product or service You apply for or get from us, Personal Information such as:
| a) | your name; |
| b) | your address; |
| c) | your income; |
| d) | your payment; or |
| e) | your credit history; |
may be gathered from sources such as applications, Transactions, and consumer reports.
To serve You and service our business, we may share certain Personal Information. We will share Personal Information, only as allowed by law, with affiliates such as:
| a) | our insurance companies; |
| b) | our employee agents; |
| c) | our brokerage firms; and |
| d) | our administrators. |
As allowed by law, we may share Personal Financial Information with our affiliates to:
| a) | market our products; or |
| b) | market our services; |
to You without providing You with an option to prevent these disclosures.
We may also share Personal Information, only as allowed by law, with unaffiliated third parties including:
| a) | independent agents; |
| b) | brokerage firms; |
| c) | insurance companies; |
| d) | administrators; and |
| e) | service providers; |
who help us serve You and service our business.
When allowed by law, we may share certain Personal Financial Information with other unaffiliated third parties who assist us by performing services or functions such as:
| a) | taking surveys; |
| b) | marketing our products or services; or |
| c) | offering financial products or services under a joint agreement |
between us and one or more financial institutions.
We, and third parties we partner with, may track some of the pages You visit through the use of:
| a) | cookies; |
| b) | pixel tagging; or |
| c) | other technologies; |
and currently do not process or comply with any web browser’s “do not track” signal or other similar mechanism that indicates a request to disable online tracking of individual users who visit our websites or use our services.
For more information, our Online Privacy Policy, which governs information we collect on our website and our affiliate websites, is available at https://www.thehartford.com/online-privacy-policy.
We will not sell or share your Personal Financial Information with anyone for purposes unrelated to our business functions without offering You the opportunity to:
| a) | “opt-out;” or |
| b) | “opt-in;” |
as required by law.
We only disclose Personal Health Information with:
| a) | your authorization; or |
| b) | as otherwise allowed or required by law. |
Our employees have access to Personal Information in the course of doing their jobs, such as:
| a) | underwriting policies; |
| b) | paying claims; |
| c) | developing new products; or |
| d) | advising customers of our products and services. |
We use manual and electronic security procedures to maintain:
| a) | the confidentiality; and |
Personal Information that we have. We use these procedures to guard against unauthorized access.
Some techniques we use to protect Personal Information include:
| d) | firewall technology; and |
| e) | the use of detection software. |
We are responsible for and must:
| a) | identify information to be protected; |
| b) | provide an adequate level of protection for that data; and |
| c) | grant access to protected data only to those people who must use |
it in the performance of their job-related duties.
Employees who violate our privacy policies and procedures may be subject to discipline, which may include termination of their employment with us.
We will continue to follow our Privacy Policy regarding Personal Information even when a business relationship no longer exists between us.
As used in this Privacy Notice:
Application means your request for our product or service.
Personal Financial Information means financial information such as:
| d) | policy or claim information. |
Personal Financial Information may include Social Security Numbers, Driver’s license numbers, or other government-issued identification numbers, or credit, debit card, or bank account numbers.
Personal Health Information means health information such as:
| a) | your medical records; or |
| b) | information about your illness, disability or injury. |
Personal Information means information that identifies You personally and is not otherwise available to the public. It includes:
| a) | Personal Financial Information; and |
| b) | Personal Health Information. |
Transaction means your business dealings with us, such as:
| b) | your request for us to pay a claim; and |
| c) | your request for us to take an action on your account. |
You means an individual who has given us Personal Information in conjunction with:
a financial product or service from us if the product or service is used mainly for personal, family, or household purposes.
If you have any questions or comments about this privacy notice, please feel free to contact us at The Hartford – Consumer Rights and Privacy Compliance Unit, One Hartford Plaza, Mail Drop: T 04.180, Hartford, CT 06155, or at ConsumerPrivacyInquiriesMailbox@thehartford.com.
This Customer Privacy Notice is being provided on behalf of The Hartford Financial Services Group, Inc. and its affiliates (including the following as of February 2021), to the extent required by the Gramm-Leach-Bliley Act and implementing regulations:
1stAGChoice, Inc.; Access CoverageCorp, Inc.; Access CoverageCorp Technologies, Inc.; Assurances Continentales Continentale Verzekeringen N.V; Bracht, Deckers & Mackelbert N.V.; Business Management Group, Inc.; Canal Re S.A.; Cervus Claim Solutions, LLC; First State Insurance Company; FTC Resolution Company LLC; Hart Re Group L.L.C.; Hartford Accident and Indemnity Company; Hartford Administrative Services Company; Hartford Casualty General Agency, Inc.; Hartford Casualty Insurance Company; Hartford Fire General Agency, Inc.; Hartford Fire Insurance Company; Hartford Funds Distributors, LLC; Hartford Funds Management Company, LLC; Hartford Funds Management Group, Inc.; Hartford Holdings, Inc.; Hartford Insurance Company of Illinois; Hartford Insurance Company of the Midwest; Hartford Insurance Company of the Southeast; Hartford Insurance, Ltd.; Hartford Integrated Technologies, Inc.; Hartford Investment Management Company; Hartford Life and Accident Insurance Company; Hartford Lloyd’s Corporation; Hartford Lloyd’s Insurance Company; Hartford Management, Ltd.; Hartford Productivity Services LLC; Hartford of Texas General Agency, Inc.; Hartford Residual Market, L.C.C.; Hartford Specialty Insurance Services of Texas, LLC; Hartford STAG Ventures LLC; Hartford Strategic Investments, LLC; Hartford Underwriters General Agency, Inc.; Hartford Underwriters Insurance Company; Heritage Holdings, Inc.; Heritage Reinsurance Company, Ltd.; HLA LLC; HL Investment Advisors, LLC; Horizon Management Group, LLC; HRA Brokerage Services, Inc.; Lattice Strategies LLC; Maxum Casualty Insurance Company; Maxum Indemnity Company; Maxum Specialty Services Corporation; Millennium Underwriting Limited; MPC Resolution Company LLC; Navigators (Asia) Limited; Navigators Corporate Underwriters Limited; Navigators Holdings (Europe) N.V.; Navigators Holdings (UK) Limited; Navigators Insurance Company; Navigators International Insurance Company Ltd.; Navigators Management Company, Inc.; Navigators Management (UK) Limited; Navigators N.V.; Navigators Specialty Insurance Company; Navigators Underwriting Agency Limited; Navigators Underwriting Limited; New BDM NV; New England Insurance Company; New England Reinsurance Corporation; New Ocean Insurance Co., Ltd.; NIC Investments (Chile) SpA; Nutmeg Insurance Agency, Inc.; Nutmeg Insurance Company; Pacific Insurance Company, Limited; Property and Casualty Insurance Company of Hartford; Sentinel Insurance Company, Ltd; The Navigators Group, Inc.; Trumbull Flood Management, L.L.C.; Trumbull Insurance Company; Twin City Fire Insurance Company; Y-Risk, LLC.
Revised February 2021
[This page is intentionally left blank]
This report is submitted for the general information of the shareholders of the Funds referenced in this report. It is not authorized for distribution to persons who are not shareholders of one or more Funds referenced in this report unless preceded or accompanied by a current prospectus for the relevant Funds. Nothing herein contained is to be considered an offer of sale or a solicitation of an offer to buy shares of any Fund listed in this report.
The information cannot be used or relied upon for the purpose of avoiding IRS penalties. These materials are not intended to provide tax, accounting or legal advice. As with all matters of a tax or legal nature, you should consult your own tax or legal counsel for advice.
Investors should carefully consider a fund’s investment objectives, risks, charges and expenses. This and other important information is contained in the fund’s prospectus and summary prospectus, which can be obtained by visiting hartfordfunds.com. Please read it carefully before investing.
Mutual funds are distributed by Hartford Funds Distributors, LLC (HFD), Member FINRA. Advisory services are provided by Hartford Funds Management Company, LLC (HFMC). Certain funds are sub-advised by Wellington Management Company LLP and/or Schroder Investment Management North America Inc. Schroder Investment Management North America Ltd. serves as a sub-sub-adviser to certain funds. Hartford Funds refers to HFD and HFMC, which are not affiliated with any sub-adviser.
MFAR-GE21 12/21 226048 Printed in the U.S.A.

Hartford Fixed
Income Funds
Annual Report
October 31, 2021
| ■ The Hartford Emerging Markets Local Debt Fund |
| ■ The Hartford Floating Rate Fund |
| ■ The Hartford Floating Rate High Income Fund |
| ■ The Hartford High Yield Fund |
| ■ The Hartford Inflation Plus Fund |
| ■ The Hartford Municipal Opportunities Fund |
| ■ Hartford Municipal Short Duration Fund |
| ■ The Hartford Short Duration Fund |
| ■ The Hartford Strategic Income Fund |
| ■ Hartford Sustainable Municipal Bond Fund1 |
| ■ The Hartford Total Return Bond Fund |
| ■ The Hartford World Bond Fund |
| 1 | Formerly, Hartford Municipal Income Fund |
A MESSAGE FROM THE PRESIDENT
Dear Shareholders:
Thank you for investing in Hartford Mutual Funds. The following is the Funds’ Annual Report covering the period from November 1, 2020 through October 31, 2021.
Market Review
During the 12 months ended October 31, 2021, U.S. stocks, as measured by the S&P 500 Index,1 gained 42.9%, a number that reflects one of the most remarkable market rebounds in recent memory, particularly when measured against the March 2020 sell-off at the start of the coronavirus (COVID-19) pandemic.
That said, the market’s extraordinary performance occurred against a backdrop of uncertain and sometimes contradictory economic signals: inflation fears; global supply-chain bottlenecks; tightened labor markets; political gridlock; a stubbornly persistent pandemic and a U.S. Federal Reserve (Fed) methodically signaling its intention to cut back on the monetary stimulus that helped fuel the recovery.
A year ago, markets had already bounced back from their March 2020 lows, yet the economy still faced considerable turbulence from a fiercely divisive U.S. presidential election and a resurgence of COVID-19 infections. Once the election was settled in November 2020, the emergence of safe and effective vaccines provided a significant lift to equity markets, as did a major $900 billion economic relief package passed by the U.S. Congress in late December 2020.
In March 2021, the U.S. Congress fast-tracked approval of the Biden administration’s $1.9 trillion economic stimulus package. In August 2021, a $1.2 trillion proposal for an infrastructure spending package received U.S. Senate approval. However, by the period’s end, the outcome for the administration’s $1.75 trillion “Build Back Better” proposal, focused on social-safety-net improvements and climate-change mitigation, remained uncertain.
Inflation headlines dominated the spring and summer of 2021. In July 2021, the Fed’s preferred measure of inflation had risen to levels not seen since 1991.2 The supply-chain disruptions spawned in part by the economic recovery helped drive up prices for gasoline, used cars, airfare tickets, durable goods, and a host of other items toward the end of the period. The Fed's previous assurances that inflation would be mostly transitory were being sorely tested.
Throughout the period, the Fed continued to maintain its ongoing policy of near-zero interest rates in support of the recovery. However, in September 2021, Fed Chairman Jerome Powell rattled markets when he announced preparations for having the Fed gradually cut back the $120 billion in bonds it had been purchasing each month since the start of the pandemic. By period’s end, markets had recovered.
As of the end of the period, the economic recovery appears durable. Yet, inflation remains a wildcard and market volatility may persist. Nowadays, it’s more important than ever to maintain a strong relationship with your financial professional.
Thank you again for investing in Hartford Mutual Funds. For the most up-to-date information on our funds, please take advantage of all the resources available at hartfordfunds.com.
James Davey
President
Hartford Funds
| 1 | S&P 500 Index is a market capitalization-weighted price index composed of 500 widely held common stocks. The index is unmanaged and not available for direct investment. Past performance does not guarantee future results. |
| 2 | The Personal Consumption Expenditures Price Index, which excludes food and energy prices, rose 3.6% in July 2021. Source: U.S. Bureau of Economic Analysis and the St. Louis Fed, as of September 2021. |
Hartford Fixed Income Funds
Table of Contents
The views expressed in each Fund’s Manager Discussion contained in the Fund Overview section are views of that Fund’s portfolio manager(s) through the end of the period and are subject to change based on market and other conditions, and we disclaim any responsibility to update the views contained herein. These views may contain statements that are “forward-looking” statements. Actual results may differ materially from those projected in the “forward-looking” statements. Each Fund’s Manager Discussion is for informational purposes only and does not represent an offer, recommendation or solicitation to buy, hold or sell any security. The specific securities identified and described, if any, do not represent all of the securities purchased or sold and you should not assume that investments in the securities identified and discussed will be profitable. Holdings and characteristics are subject to change. Fund performance reflected in each Fund’s Manager Discussion reflects the returns of such Fund’s Class A shares, before sales charges. Returns for such Fund’s other classes differ only to the extent that the classes do not have the same expenses.
The Hartford Emerging Markets Local Debt Fund
Fund Overview
October 31, 2021 (Unaudited)
Inception 05/31/2011
Sub-advised by Wellington Management Company LLP | Investment objective – The Fund seeks capital appreciation and income. |
Comparison of Change in Value of $10,000 Investment (10/31/2011 - 10/31/2021)
The chart above represents the hypothetical growth of a $10,000 investment in Class A, which includes the maximum sales charge applicable to Class A shares. Returns for the Fund’s other classes will vary from what is seen above due to differences in the expenses charged to those share classes.
| Average Annual Total Returns |
| for the Periods Ending 10/31/2021 |
| | 1 Year | 5 Years | 10 Years |
| Class A1 | 3.20% | 2.14% | 1.14% |
| Class A2 | -1.44% | 1.20% | 0.68% |
| Class C1 | 2.43% | 1.39% | 0.39% |
| Class C3 | 1.43% | 1.39% | 0.39% |
| Class I1 | 3.28% | 2.40% | 1.39% |
| Class R31 | 3.09% | 2.10% | 0.92% |
| Class R41 | 3.02% | 2.12% | 1.12% |
| Class R51 | 3.48% | 2.48% | 1.41% |
| Class Y1 | 3.36% | 2.46% | 1.43% |
| Class F1 | 3.57% | 2.52% | 1.44% |
| JP Morgan GBI Emerging Markets Global Diversified Index | 0.84% | 1.96% | 0.37% |
| 1 | Without sales charge |
| 2 | Reflects maximum sales charge of 4.50% |
| 3 | Reflects a contingent deferred sales charge of 1.00% |
PERFORMANCE DATA QUOTED REPRESENTS PAST PERFORMANCE AND DOES NOT GUARANTEE FUTURE RESULTS. The investment return and principal value of the investment will fluctuate so that investors’ shares, when redeemed, may be worth more or less than their original cost. The chart and table do not reflect the deductions of taxes that a shareholder would pay on Fund distributions or the redemption of Fund shares. Current performance may be lower or higher than the performance data quoted. To obtain performance data current to the most recent month-end, please visit our website hartfordfunds.com.
Total returns presented above were calculated using the applicable class' net asset value available to shareholders for sale or redemption of Fund shares on 10/31/2021, which may exclude investment transactions as of this date. All share class returns assume the reinvestment of all distributions at net asset value and the deduction of all fund expenses. The total returns presented in the Financial Highlights section of the report are calculated in the same manner, but also take into account certain
adjustments that are necessary under generally accepted accounting principles. As a result, the total returns in the Financial Highlights section may differ from the total returns presented above.
Class F shares commenced operations on 02/28/2017. Performance prior to that date is that of the Fund’s Class I shares.
To the extent a share class has adopted the prior performance of another share class that had different operating expenses, such performance has not been adjusted to reflect the different operating expenses. If the performance were adjusted, it may have been higher or lower.
You cannot invest directly in an index.
See “Benchmark Glossary” for benchmark descriptions.
Performance information may reflect expense waivers/reimbursements without which performance would have been lower. For information on current expense waivers/reimbursements, please see the prospectus.
| Operating Expenses* | Gross | Net |
| Class A | 1.42% | 1.18% |
| Class C | 2.18% | 1.93% |
| Class I | 1.07% | 0.93% |
| Class R3 | 1.70% | 1.48% |
| Class R4 | 1.40% | 1.18% |
| Class R5 | 1.10% | 0.88% |
| Class Y | 1.09% | 0.88% |
| Class F | 0.98% | 0.83% |
| * | Expenses as shown in the Fund’s most recent prospectus. Gross expenses do not reflect contractual expense reimbursement arrangements. Net expenses reflect such arrangements in instances when they reduce gross expenses. These arrangements remain in effect until 02/28/2022 unless the Fund’s Board of Directors approves an earlier termination. Actual expenses may be higher or lower. Please see accompanying Financial Highlights for expense ratios for the period ended 10/31/2021. |
The Hartford Emerging Markets Local Debt Fund
Fund Overview – (continued)
October 31, 2021 (Unaudited)
Portfolio Managers
James W. Valone, CFA*
Senior Managing Director and Fixed Income Portfolio Manager
Wellington Management Company LLP
Michael T. Henry
Managing Director and Fixed Income Portfolio Manager
Wellington Management Company LLP
Kevin F. Murphy
Senior Managing Director and Fixed Income Portfolio Manager
Wellington Management Company LLP
*James W. Valone, CFA, announced his plan to retire and withdraw from the partnership of Wellington Management Company LLP's parent company, and effective December 31, 2021, he will no longer serve as a portfolio manager for the Fund. As his retirement date approaches, Mr. Valone's portfolio management responsilites will transition to Michael T. Henry.
Manager Discussion
How did the Fund perform during the period?
The Class A shares of The Hartford Emerging Markets Local Debt Fund returned 3.20%, before sales charges, for the twelve-month period ended October 31, 2021, outperforming the Fund’s benchmark, the JP Morgan GBI Emerging Markets Global Diversified Index (GBI-EMGD Index), which returned 0.84% for the same period. For the same period, the Class A shares of the Fund, before sales charges, outperformed the 1.77% average return of the Lipper Emerging Markets Local Currency Debt Funds peer group, a group of funds that seeks either current income or total return by investing at least 65% of total assets in debt issues denominated in the currency of their market of issuance.
Why did the Fund perform this way?
Performance across the emerging markets fixed income sectors was positive during the period. Local emerging-markets debt, as measured by the GBI-EMGD Index, generated a total return of 0.84% in U.S. dollar terms. Appreciation of emerging-markets currencies versus the U.S. dollar drove the positive return, while emerging-markets rates had a negative impact on relative performance for the period.
Emerging-markets corporate debt finished the period with a return of 5.27%, as measured by the JP Morgan CEMBI Broad Diversified Index (CEMBIBD Index). Credit spreads narrowed by 0.88% to a level of 3.00% by the end of the period.
Among key events during the twelve-month period ended October 31, 2021, COVID-19 continued to headline global news with country lockdowns needed to help slow the spread of the virus earlier in the period. Improvements later in the period as vaccine deployment continued globally reduced the number of weekly coronavirus cases and deaths. During the period, G7 leaders pledged to provide 1 billion COVID-19 vaccine doses for poorer countries to help speed up the vaccination process.
Governments across Europe were forced to subsidize and cap bills to deal with soaring European gas prices during the period. Separately, the Organization of the Petroleum Exporting Countries (OPEC+)
confirmed its plan over the same period to gradually increase oil output, indicating confidence in the ability of the recovering global economy to absorb this additional supply. Following this, Russian President Vladimir Putin confirmed an increase in gas deliveries to Europe to help stave off an energy crisis. The European Union (EU), excluding Bulgaria, approved a new law to make greenhouse gas emissions targets legally binding as the focus on climate change in the EU continues to be a priority.
Israel and Hamas agreed to a cease-fire during the period in efforts to de-escalate the Israeli- Palestinian conflict. Hong Kong passed President Xi Jinping’s plan to end open elections, creating a review committee to approve candidates for elected office. Chile elected the left-leaning special assembly to draft a new constitution during the period, weakening the country’s free-market model. In Peru, left wing candidate Pedro Castillo claimed victory in the presidential election. In Ecuador, career banker Guillermo Lasso won Ecuador’s presidential election during the period. Turkish President Recep Tayyip Erdogan surprisingly replaced the central bank governor Naci Agbal with Sahap Kavcioglu. China’s property giant Evergrande missed interest payments of its offshore bonds during the period, entering the 30-day grace period. In an effort to ring-fence the assets, China's housing regulator boosted oversight of Evergrande's bank accounts to protect funds earmarked for housing projects from being diverted to creditors.
Within the Fund, relative to the GBI-EMGD Index, duration positioning was the driver of relative outperformance during the period, with currency positioning and security selection also contributing favorably to relative results. The Fund’s structural allocation to corporate bonds had a positive impact on relative performance, as generally speaking, corporate bonds outperformed the local rates and coupon component of the GBI-EMGD Index. Within the corporate bond holdings in the Fund, security selection drove positive performance versus the broad CEMBIBD Index, while country allocation had a negative impact. The Fund’s duration strategies contributed favorably to relative performance during the period.
The Fund’s duration strategies contributed favorably to relative performance during the period. The Fund’s underweight exposure to emerging-markets local market duration, as emerging markets’
The Hartford Emerging Markets Local Debt Fund
Fund Overview – (continued)
October 31, 2021 (Unaudited)
interest rates increased over the period, added favorably to relative results over the period. In contrast, the corporate holding duration impact detracted from relative results over the same period. The duration effect for external corporate debt is measured by U.S. Treasury yield movement and over the period U.S. Treasury rates increased. When examining emerging- markets local market duration exposure, underweight exposure to Brazil, Poland, and Chile, drove positive relative performance. In contrast, external debt allocations in China, United Arab Emirates, and Saudi Arabia detracted from performance.
Security selection was beneficial to performance during the period. In Argentina, an allocation to external quasi-sovereign debt in the oil and gas industry proved favorable. In Russia, an allocation to external corporate debt in the metals and mining, oil and gas, and financial industries added to performance. In the United Arab Emirates, allocations to external quasi-sovereign and external corporate debt, contributed positively to relative performance. In contrast, local curve positioning in Turkey, including an underweight across the yield curve, detracted from performance. An underweight to the long-end of the local curve in Poland and in Indonesia, also detracted from performance.
Currency positioning aided results during the period. An underweight exposure to the Turkish lira added to performance. The Fund’s overweight for most of the period to the Mexican peso and to the Russian ruble proved beneficial as well. In contrast, an overweight for most of the period to the Czech koruna, an allocation to the Argentine peso, and short exposure to the New Zealander dollar, detracted from performance.
During the period, the Fund’s interest rate and credit positioning were primarily implemented through cash bond positions and derivatives, such as interest rate and total return swaps, credit default swap contracts, and interest rate futures. During the period, we used local currency denominated cash bonds, currency forwards (deliverable and non-deliverable), and currency options to express our views on currency. Overall, the use of derivatives contributed positively to the Fund’s relative performance during the period.
What is the outlook as of the end of the period?
As of the end of the period, we observed that developed markets are driving a recovery in global growth supported by vaccine distribution and easing of lockdowns combined with ongoing fiscal stimulus and monetary support. The spread of COVID-19 mutations has slowed the reopening process somewhat, but the global economy continues to rebound. The U.S. Federal Reserve (Fed) has taken notice of rising inflation risks but the announced tapering schedule has been well telegraphed, and the Fed has pushed back on market expectations for rate increases. A recovering global economy has supported emerging markets via a boost through the commodity and global trade channels. Oil prices continue to be supported by OPEC+ production cuts as the market rebalances and demand is recovering as social mobility increases. We believe emerging markets’ economic growth will see a slower recovery path than developed-market countries in part due to uneven access to vaccines and challenges in stabilizing fiscal and debt dynamics. As emerging markets’ growth recovers, we expect emerging-markets fundamentals to gradually improve, though country
differentiation remains paramount given remaining vulnerabilities. We remain selective in looking for opportunities to add risk in recognition of the wide range of outcomes around vaccine distribution, ongoing infections, and mutations.
The outlook for emerging-markets local rates is more challenged as both core yields and reflation concerns have limited allocations to local rates markets. Emerging markets’ inflation has increased from all-time lows with further increases expected before moderating later in the second half of 2021 (2H21). This has prompted many emerging-markets central banks to switch to a more aggressive tone and some countries are well into hiking cycles (raising rates) now which has improved attractiveness in select local markets. There are a number of crosswinds impacting emerging-markets foreign exchange (FX) including ongoing U.S. dollar strength and rate volatility weighing on emerging currency markets. Over the longer-term, we do anticipate that proactive central bank action in emerging markets and increasing U.S. external deficit (and as a corollary large external surplus in emerging markets) should bolster emerging-markets currencies.
As of the end of the period, we maintained a modest pro-risk stance in the Fund overall as we see the global backdrop of stronger growth and higher commodity prices as positive for emerging-markets local assets. In rates, we are cautious however and maintained an underweight in the Fund to duration. We have a slightly favorable view on emerging-markets currencies, but we prefer to spread out the Fund’s investments and not tilt meaningfully net short the U.S. dollar more broadly. As of the end of the period, we continued to allocate to emerging-markets local currency-denominated supranationals that show value relative to their respective local rate curves as well as select corporate credits we believe are poised to benefit from the emerging markets’ growth recovery. The Fund’s positioning in emerging-markets currencies is expressed via a broad basket approach aimed at capturing improved fundamentals, while maintaining caution in key trouble areas.
Among emerging-markets corporate issuers, as of the end of the period, we have continued to favor those with a positive fundamental backdrop.
Important Risks
Investing involves risk, including the possible loss of principal. Security prices fluctuate in value depending on general market and economic conditions and the prospects of individual companies. • Fixed income security risks include credit, liquidity, call, duration, and interest-rate risk. As interest rates rise, bond prices generally fall. • Foreign investments may be more volatile and less liquid than U.S. investments and are subject to the risk of currency fluctuations and adverse political, economic and regulatory developments. These risks may be greater, and include additional risks, for investments in emerging markets. • Derivatives are generally more volatile and sensitive to changes in market or economic conditions than other securities; their risks include currency, leverage, liquidity, index, pricing, regulatory and counterparty risk. • Investments in high-yield (“junk”) bonds involve greater risk of price volatility, illiquidity, and default than higher-rated debt securities. • The value of inflation-protected securities (IPS) generally fluctuates with changes in real interest rates, and the market for IPS may be less developed or liquid, and more volatile, than other
The Hartford Emerging Markets Local Debt Fund
Fund Overview – (continued)
October 31, 2021 (Unaudited)
securities markets. • Because the Fund is non-diversified, it may invest in a smaller number of issuers, and may be more exposed to risks and volatility than a more broadly diversified fund. • Restricted securities may be more difficult to sell and price than other securities.
| Composition by Security Type(1) |
| as of 10/31/2021 |
| Category | Percentage of
Net Assets |
| Fixed Income Securities | |
| Corporate Bonds | 33.2% |
| Foreign Government Obligations | 61.2 |
| Total | 94.4% |
| Short-Term Investments | 4.8 |
| Purchased Options | 0.5 |
| Other Assets & Liabilities | 0.3 |
| Total | 100.0% |
| (1) | For Fund compliance purposes, the Fund may not use the same classification system. These classifications are used for financial reporting purposes. |
The Hartford Floating Rate Fund
Fund Overview
October 31, 2021 (Unaudited)
Inception 04/29/2005
Sub-advised by Wellington Management Company LLP | Investment objective – The Fund seeks to provide high current income, and long-term total return. |
Comparison of Change in Value of $10,000 Investment (10/31/2011 - 10/31/2021)
The chart above represents the hypothetical growth of a $10,000 investment in Class A, which includes the maximum sales charge applicable to Class A shares. Returns for the Fund’s other classes will vary from what is seen above due to differences in the expenses charged to those share classes.
| Average Annual Total Returns |
| for the Periods Ending 10/31/2021 |
| | 1 Year | 5 Years | 10 Years |
| Class A1 | 7.70% | 3.63% | 3.90% |
| Class A2 | 4.47% | 3.00% | 3.58% |
| Class C1 | 6.84% | 2.86% | 3.13% |
| Class C3 | 5.84% | 2.86% | 3.13% |
| Class I1 | 8.01% | 3.92% | 4.18% |
| Class R31 | 7.25% | 3.34% | 3.62% |
| Class R41 | 7.55% | 3.61% | 3.89% |
| Class R51 | 7.92% | 3.89% | 4.17% |
| Class Y1 | 7.90% | 3.93% | 4.22% |
| Class F1 | 8.06% | 3.97% | 4.20% |
| S&P/LSTA Leveraged Loan Index | 8.45% | 4.46% | 4.64% |
| 1 | Without sales charge |
| 2 | Reflects maximum sales charge of 3.00% |
| 3 | Reflects a contingent deferred sales charge of 1.00% |
PERFORMANCE DATA QUOTED REPRESENTS PAST PERFORMANCE AND DOES NOT GUARANTEE FUTURE RESULTS. The investment return and principal value of the investment will fluctuate so that investors’ shares, when redeemed, may be worth more or less than their original cost. The chart and table do not reflect the deductions of taxes that a shareholder would pay on Fund distributions or the redemption of Fund shares. Current performance may be lower or higher than the performance data quoted. To obtain performance data current to the most recent month-end, please visit our website hartfordfunds.com.
Total returns presented above were calculated using the applicable class' net asset value available to shareholders for sale or redemption of Fund shares on 10/31/2021, which may exclude investment transactions as of this date. All share class returns assume the reinvestment of all distributions at net asset value and the deduction of all fund expenses. The total returns presented in the Financial Highlights section of the report are calculated in the same manner, but also take into account certain adjustments that are necessary under generally accepted accounting principles. As a result, the total returns in the Financial Highlights section may differ from the total returns presented above.
Class F shares commenced operations on 02/28/2017. Performance prior to that date is that of the Fund’s Class I shares.
To the extent a share class has adopted the prior performance of another share class that had different operating expenses, such performance has not been adjusted to reflect the different operating expenses. If the performance were adjusted, it may have been higher or lower.
Performance information includes performance under the Fund’s previous sub-adviser, Hartford Investment Management Company. As of 04/23/2012, Wellington Management Company LLP became the sub-adviser for the Fund. At the end of a transition period of approximately four weeks ending on 05/18/2012, Hartford Investment Management Company no longer served as a sub-adviser to the Fund.
You cannot invest directly in an index.
See “Benchmark Glossary” for benchmark descriptions.
Performance information may reflect expense waivers/reimbursements without which performance would have been lower. For information on current expense waivers/reimbursements, please see the prospectus.
The Hartford Floating Rate Fund
Fund Overview – (continued)
October 31, 2021 (Unaudited)
| Operating Expenses* | Gross | Net |
| Class A | 1.03% | 1.02% |
| Class C | 1.76% | 1.76% |
| Class I | 0.75% | 0.75% |
| Class R3 | 1.39% | 1.27% |
| Class R4 | 1.09% | 1.02% |
| Class R5 | 0.79% | 0.79% |
| Class Y | 0.73% | 0.73% |
| Class F | 0.67% | 0.67% |
| * | Expenses as shown in the Fund’s most recent prospectus. Gross expenses do not reflect contractual expense reimbursement arrangements. Net expenses reflect such arrangements in instances when they reduce gross expenses. These arrangements remain in effect until at least 02/28/2022. Expenses shown include acquired fund fees and expenses. Actual expenses may be higher or lower. Please see accompanying Financial Highlights for expense ratios for the period ended 10/31/2021. |
Portfolio Managers
David B. Marshak
Managing Director and Fixed Income Portfolio Manager
Wellington Management Company LLP
Jeffrey W. Heuer, CFA
Managing Director and Fixed Income Portfolio Manager
Wellington Management Company LLP
Manager Discussion
How did the Fund perform during the period?
The Class A shares of The Hartford Floating Rate Fund returned 7.70%, before sales charges, for the twelve-month period ended October 31, 2021, underperforming the Fund’s benchmark, the S&P/LSTA Leveraged Loan Index, which returned 8.45% for the same period. For the same period, the Class A shares of the Fund, before sales charges, outperformed the 7.34% average return of the Lipper Loan Participation Funds peer group, a group of funds that invest primarily in interests in collateralized senior corporate loans that have floating or variable rates.
Why did the Fund perform this way?
United States (U.S.) fixed income markets generated mixed total returns during the trailing twelve months ended October 31, 2021, with lower quality sectors such as bank loans and high yield performing the best. The Bloomberg U.S. Aggregate Bond Index generated a return of -0.48% during the period, driven by rising U.S. Treasury yields (which move inversely to prices). Yields drifted higher across several developed markets as major central banks laid the groundwork for withdrawing accommodative policies and started to reduce monetary stimulus at varying speeds in response to mounting inflation pressures. Although it maintained highly accommodative policy stances during the period, the U.S. Federal Reserve (Fed) indicated it could start to taper its large-scale asset purchases by November 2021 and projected three interest-rate increases in 2023. The European
Central Bank (ECB) reduced the pace of quantitative easing purchases by the end of the period after having expanded the program at the end of 2020 and the first quarter of 2021.
Non-government bond sectors generally outperformed duration-equivalent government bonds. Early in the period, spread tightening was driven by encouraging vaccine trials and easing of COVID-19 restrictions, which led to improved economic data. Later in the period, spreads continued to tighten as central banks aimed to mitigate risks, vaccine distribution picked up pace, and credit fundamentals generally improved. Investment-grade corporate spreads compressed by 0.38%, while high-yield corporate spreads compressed by 2.22%, according to Barclays Index data.
Global economic activity dropped off sharply in the aftermath of COVID-19 economic shutdowns but started to rebound as economies reopened. Global gross domestic product (GDP) growth continued to recover during the latter part of the twelve-month period. However, ongoing supply chain disruptions and labor shortages later in the period indicated inflation pressures may prove less “transitory” than previously suspected. The U.S. labor market continued to heal while house prices rose sharply, supported by low mortgage rates and record low supply. During the latter part of the period, Chinese manufacturing Purchasing Managers Index (PMI) contracted to the lowest level since the onset of the pandemic, weighed down by rising costs, while services PMI expanded. Eurozone manufacturing PMI remained elevated during the period but then fell to a six-month low due to lack of shipping capacity and constrained supply to meet demand.
The Hartford Floating Rate Fund
Fund Overview – (continued)
October 31, 2021 (Unaudited)
The U.S. dollar weakened early in the period on the Fed’s pledge to maintain its accommodative monetary policies, but later it rallied versus most currencies, supported by rising U.S. Treasury yields, expectations that the Fed would taper its quantitative easing, and a flight to quality driven by concerns about a potential default by Chinese real estate company Evergrande and the U.S. debt ceiling deadlock. The British pound ended the period lower as supply-chain disruptions created broad challenges for the United Kingdom (U.K.), with spiking gas prices and fuel shortages engulfing the country, as well as record-high job vacancies stemming from staff shortages related to the coronavirus pandemic as well as the U.K.’s withdrawal from the European Union (EU), also known as Brexit. The euro also ended the period lower. Most emerging markets (EM) currencies ended the period lower, driven by China’s economic slowdown, Fed tapering concerns, and political uncertainty.
Over the period, sector allocation contributed positively to relative performance and security selection also had a favorable impact. Within sector allocation, an overweight allocation to the Leisure and Energy sectors contributed positively to the Fund’s performance relative to the S&P/LSTA Leveraged Loan Index, while an underweight allocation to the Transportation and Lodging sectors detracted from performance. Security selection within the Consumer Products, Utilities, and Retailers sectors contributed positively to relative performance, but was partially offset by selection within the Consumer Cyclical Services, Financial Institutions, and Energy sectors. In aggregate, quality positioning had a negative impact on relative performance as the Fund’s underweight to securities rated CCC and below detracted from performance during a time when lower-quality bonds outperformed.
The Fund used derivatives on a limited basis during the period for risk management purposes. Over the period, the Fund employed currency forwards to seek to minimize active currency risk from investments in non-dollar denominated securities. Although we view currency forwards in conjunction with the securities intended to be hedged, on a standalone basis the currency forwards benefited relative performance over the period. The Fund also had a small position in total return swaps (Markit Iboxx USD Liquid High Yield Index). The Fund’s position was used for liquidity purposes and for tactically adjusting the risk posture of the Fund, and it contributed positively to relative performance during the period.
What is the outlook as of the end of the period?
As of the end of the period, we have a positive outlook on the bank loans market. The economic outlook remains supportive, and we expect to see continued strong growth through the end of 2021. Infrastructure spending represents an added support, kicking in as policymakers begin to taper their asset purchases in the fourth quarter. As of the end of the period, we believe bank loan prices are attractive for long‐term investors. As of the end of the period, we believe we are finding the best opportunities in higher‐quality, U.S.-focused issuers in less cyclical industries, though we have increased cyclical exposure given supportive consumer fundamentals. We also continued to focus on the Building Materials sector, which we believe is a secular beneficiary of the increasing number of people working from home. As of the end of the period, we are generally avoiding smaller companies given our concerns over their access to
capital. With respect to quality, the Fund was overweight B-rated loans as of the end of the period, as we believe they offer the best risk/reward profile. We expect defaults to continue to decline over the next year. We have observed ongoing fundamental improvement and expect rating agencies to reverse some of their prior downgrades, which could provide a boost for the sector. We believe valuations adequately compensate investors for downside risks. Spreads have compressed as of the end of the period, but bank loans still offer attractive income and potential for modest price appreciation in our view. Additionally, we believe they can benefit from a rising rate environment. Retail flows remain positive as of the end of the period, and we project a favorable technical backdrop given strong collateralized loan obligation demand and negative net new-issue supply.
At the end of the period, the Fund maintained an out-of-benchmark allocation to high-yield credit. Within quality positioning, the Fund was underweight BB-rated and CCC and below-rated securities and overweight B-rated securities. In terms of sector positioning, the Fund ended the period with the largest overweights to the Leisure, Healthcare, and Food & Beverage sectors and the largest underweights to the Technology, Diversified Manufacturing, and Chemicals sectors relative to the S&P/LSTA Leveraged Loan Index.
Important Risks
Investing involves risk, including the possible loss of principal. Security prices fluctuate in value depending on general market and economic conditions and the prospects of individual companies. • Loans can be difficult to value and less liquid than other types of debt instruments; they are also subject to nonpayment, collateral, bankruptcy, default, extension, prepayment and insolvency risks. • Fixed income security risks include credit, liquidity, call, duration, event and interest-rate risk. As interest rates rise, bond prices generally fall. • Investments in high-yield (“junk”) bonds involve greater risk of price volatility, illiquidity, and default than higher-rated debt securities. • Derivatives are generally more volatile and sensitive to changes in market or economic conditions than other securities; their risks include currency, leverage, liquidity, index, pricing, and counterparty risk. • Foreign investments may be more volatile and less liquid than U.S. investments and are subject to the risk of currency fluctuations and adverse political and economic developments. • The Fund's investments may fluctuate in value over a short period of time.
The Fund should not be considered an alternative to certificates of deposit (CDs) or money market funds. This Fund is intended for investors who are looking to complement their traditional fixed-income investments.
The Hartford Floating Rate Fund
Fund Overview – (continued)
October 31, 2021 (Unaudited)
| Composition by Security Type(1) |
| as of 10/31/2021 |
| Category | Percentage of
Net Assets |
| Equity Securities | |
| Common Stocks | 0.4% |
| Exchange-Traded Funds | 2.0 |
| Warrants | 0.0 * |
| Total | 2.4% |
| Fixed Income Securities | |
| Convertible Bonds | 0.4% |
| Corporate Bonds | 6.9 |
| Senior Floating Rate Interests | 85.5 |
| Total | 92.8% |
| Short-Term Investments | 5.3 |
| Other Assets & Liabilities | (0.5) |
| Total | 100.0% |
| * | Percentage rounds to zero. |
| (1) | For Fund compliance purposes, the Fund may not use the same classification system. These classifications are used for financial reporting purposes. |
The Hartford Floating Rate High Income Fund
Fund Overview
October 31, 2021 (Unaudited)
Inception 09/30/2011
Sub-advised by Wellington Management Company LLP | Investment objective – The Fund seeks to provide high current income, and long-term total return. |
Comparison of Change in Value of $10,000 Investment (10/31/2011 - 10/31/2021)
The chart above represents the hypothetical growth of a $10,000 investment in Class A, which includes the maximum sales charge applicable to Class A shares. Returns for the Fund’s other classes will vary from what is seen above due to differences in the expenses charged to those share classes.
| Average Annual Total Returns |
| for the Periods Ending 10/31/2021 |
| | 1 Year | 5 Years | 10 Years |
| Class A1 | 8.23% | 3.98% | 4.47% |
| Class A2 | 4.98% | 3.35% | 4.15% |
| Class C1 | 7.38% | 3.21% | 3.69% |
| Class C3 | 6.38% | 3.21% | 3.69% |
| Class I1 | 8.52% | 4.18% | 4.71% |
| Class R31 | 7.88% | 3.69% | 4.16% |
| Class R41 | 8.24% | 4.00% | 4.47% |
| Class R51 | 8.58% | 4.30% | 4.88% |
| Class Y1 | 8.43% | 4.29% | 4.76% |
| Class F1 | 8.45% | 4.26% | 4.75% |
| S&P/LSTA Leveraged Loan Index | 8.45% | 4.46% | 4.64% |
| 1 | Without sales charge |
| 2 | Reflects maximum sales charge of 3.00% |
| 3 | Reflects a contingent deferred sales charge of 1.00% |
PERFORMANCE DATA QUOTED REPRESENTS PAST PERFORMANCE AND DOES NOT GUARANTEE FUTURE RESULTS. The investment return and principal value of the investment will fluctuate so that investors’ shares, when redeemed, may be worth more or less than their original cost. The chart and table do not reflect the deductions of taxes that a shareholder would pay on Fund distributions or the redemption of Fund shares. Current performance may be lower or higher than the performance data quoted. To obtain performance data current to the most recent month-end, please visit our website hartfordfunds.com.
Total returns presented above were calculated using the applicable class' net asset value available to shareholders for sale or redemption of Fund shares on 10/31/2021, which may exclude investment transactions as of this date. All share class returns assume the reinvestment of all distributions at net asset value and the deduction of all fund expenses. The total returns presented in the Financial Highlights section of the report are calculated in the same manner, but also take into account certain adjustments that are necessary under generally accepted accounting principles. As a result, the total returns in the Financial Highlights section may differ from the total returns presented above.
Class F shares commenced operations on 02/28/2017. Performance prior to that date is that of the Fund’s Class I shares.
To the extent a share class has adopted the prior performance of another share class that had different operating expenses, such performance has not been adjusted to reflect the different operating expenses. If the performance were adjusted, it may have been higher or lower.
Performance information includes performance under the Fund’s previous sub-adviser, Hartford Investment Management Company. As of 04/23/2012, Wellington Management Company LLP became the sub-adviser for the Fund. At the end of a transition period of approximately four weeks ending on 05/18/2012, Hartford Investment Management Company no longer served as a sub-adviser to the Fund.
You cannot invest directly in an index.
See “Benchmark Glossary” for benchmark descriptions.
Performance information may reflect expense waivers/reimbursements without which performance would have been lower. For information on current expense waivers/reimbursements, please see the prospectus.
The Hartford Floating Rate High Income Fund
Fund Overview – (continued)
October 31, 2021 (Unaudited)
| Operating Expenses* | Gross | Net |
| Class A | 1.17% | 1.07% |
| Class C | 1.91% | 1.82% |
| Class I | 0.89% | 0.82% |
| Class R3 | 1.52% | 1.37% |
| Class R4 | 1.22% | 1.07% |
| Class R5 | 0.92% | 0.77% |
| Class Y | 0.91% | 0.80% |
| Class F | 0.81% | 0.77% |
| * | Expenses as shown in the Fund’s most recent prospectus. Gross expenses do not reflect contractual expense reimbursement arrangements. Net expenses reflect such arrangements in instances when they reduce gross expenses. These arrangements remain in effect until 02/28/2022 unless the Fund’s Board of Directors approves an earlier termination. Expenses shown include acquired fund fees and expenses. Actual expenses may be higher or lower. Please see accompanying Financial Highlights for expense ratios for the period ended 10/31/2021. |
Portfolio Managers
David B. Marshak
Managing Director and Fixed Income Portfolio Manager
Wellington Management Company LLP
Jeffrey W. Heuer, CFA
Managing Director and Fixed Income Portfolio Manager
Wellington Management Company LLP
Manager Discussion
How did the Fund perform during the period?
The Class A shares of The Hartford Floating Rate High Income Fund returned 8.23%, before sales charges, for the twelve-month period ended October 31, 2021, underperforming the Fund’s benchmark, the S&P/LSTA Leveraged Loan Index, which returned 8.45% for the same period. For the same period, the Class A shares of the Fund, before sales charges, outperformed the 7.34% average return of the Lipper Loan Participation Funds peer group, a group of funds that invest primarily in interests in collateralized senior corporate loans that have floating or variable rates.
Why did the Fund perform this way?
United States (U.S.) fixed income markets generated mixed total returns during the trailing twelve months ended October 31, 2021, with lower quality sectors such as bank loans and high yield performing the best. The Bloomberg U.S. Aggregate Bond Index generated a return of -0.48% during the period, driven by rising U.S. Treasury yields (which move inversely to prices). Yields drifted higher across several developed markets as major central banks laid the groundwork for withdrawing accommodative policies and started to reduce monetary stimulus at varying speeds in response to mounting inflation pressures. Although it maintained highly accommodative policy stances during the period, the U.S. Federal Reserve (Fed) indicated it could start to taper its large-scale asset purchases by November 2021 and projected three interest-rate increases in 2023. The European
Central Bank (ECB) reduced the pace of quantitative easing purchases by the end of the period after having expanded the program at the end of 2020 and the first quarter of 2021.
Non-government bond sectors generally outperformed duration-equivalent government bonds. Early in the period, spread tightening was driven by encouraging vaccine trials and easing of COVID-19 restrictions, which led to improved economic data. Later in the period, spreads continued to tighten as central banks aimed to mitigate risks, vaccine distribution picked up pace, and credit fundamentals generally improved. Investment-grade corporate spreads compressed by 0.38%, while high-yield corporate spreads compressed by 2.22%, according to Barclays Index data.
Global economic activity dropped off sharply in the aftermath of COVID-19 economic shutdowns but started to rebound as economies reopened. Global gross domestic product (GDP) growth continued to recover during the latter part of the twelve-month period. However, ongoing supply chain disruptions and labor shortages later in the period indicated inflation pressures may prove less “transitory” than previously suspected. The U.S. labor market continued to heal while house prices rose sharply, supported by low mortgage rates and record low supply. During the latter part of the period, Chinese manufacturing Purchasing Managers Index (PMI) contracted to the lowest level since the onset of the pandemic, weighed down by rising costs, while services PMI expanded. Eurozone manufacturing PMI remained elevated during the period but then fell to a six-month low due to lack of shipping capacity and constrained supply to meet demand.
The Hartford Floating Rate High Income Fund
Fund Overview – (continued)
October 31, 2021 (Unaudited)
The U.S. dollar weakened early in the period on the Fed’s pledge to maintain its accommodative monetary policies, but later it rallied versus most currencies, supported by rising U.S. Treasury yields, expectations that the Fed would taper its quantitative easing, and a flight to quality driven by concerns about a potential default by Chinese real estate company Evergrande and the U.S. debt ceiling deadlock. The British pound ended the period lower as supply-chain disruptions created broad challenges for the United Kingdom (U.K.), with spiking gas prices and fuel shortages engulfing the country, as well as record-high job vacancies stemming from staff shortages related to the coronavirus pandemic as well as the U.K.’s withdrawal from the European Union (EU), also known as Brexit. The euro also ended the period lower. Most emerging markets (EM) currencies ended the period lower, driven by China’s economic slowdown, Fed tapering concerns, and political uncertainty.
During the period, sector allocation contributed positively to the Fund’s performance relative to the S&P/LSTA Leveraged Loan Index, while security selection had a negligible impact on relative performance. From a sector allocation perspective, underweight allocations to the Transportation and Lodging sectors detracted from the Fund’s performance relative to the S&P/LSTA Leveraged Loan Index during the period, but this was offset somewhat by an overweight allocation to the Leisure and Energy sectors, which contributed positively to the Fund’s performance. Security selection within the Consumer Cyclical Services, Financial Institutions, and Energy sectors also detracted from the Fund’s relative performance, while selection within the Consumer Products, Utilities, and Retail sectors contributed positively to performance. In aggregate, quality positioning had a negative impact on relative performance, as the Fund’s underweight to securities rated CCC and below detracted from performance during a time when lower-quality securities outperformed.
The Fund used derivatives on a limited basis during the period for risk management purposes. Over the period, the Fund employed currency forwards to seek to minimize active currency risk from investments in non-dollar denominated securities. Although we view currency forwards in conjunction with the securities intended to be hedged, on a standalone basis the currency forwards contributed positively to relative performance over the period. The Fund also had a small position in total return swaps (Markit Iboxx USD Liquid High Yield Index) during the period. The Fund’s position, which was used for liquidity purposes and for tactically adjusting the risk posture of the Fund, benefited performance relative to the S&P/LSTA Leveraged Loan Index during the period.
What is the outlook as of the end of the period?
As of the end of the period, we have a positive outlook on the bank loans market. The economic outlook remains supportive, and we expect to see continued strong growth through the end of 2021. Infrastructure spending represents an added support, kicking in as policymakers begin to taper their asset purchases in the fourth quarter. As of the end of the period, we believe bank loan prices are attractive for long‐term investors. As of the end of the period, we believe we are finding the best opportunities in higher‐quality, U.S.-focused issuers in less cyclical industries, though we have increased cyclical exposure given supportive consumer fundamentals. We also continued to focus on the Building Materials sector, which we
believe is a secular beneficiary of the increasing number of people working from home. As of the end of the period, we are generally avoiding smaller companies given our concerns over their access to capital. With respect to quality, the Fund was overweight B-rated loans as of the end of the period, as we believe they offer the best risk/reward profile. We expect defaults to continue to decline over the next year. We have observed ongoing fundamental improvement and expect rating agencies to reverse some of their prior downgrades, which could provide a boost for the sector. We believe valuations adequately compensate investors for downside risks. Spreads have compressed as of the end of the period, but bank loans still offer attractive income and potential for modest price appreciation in our view. Additionally, we believe they can benefit from a rising rate environment. Retail flows remain positive as of the end of the period, and we project a favorable technical backdrop given strong collateralized loan obligation demand and negative net new-issue supply.
At the end of the period, the Fund maintained an out-of-benchmark allocation to high-yield credit. Within quality positioning, the Fund was underweight BB-rated and CCC and below-rated securities and overweight B-rated securities. In terms of sector positioning, the Fund ended the period with the largest overweights to the Leisure, Consumer Cyclical Services and Wireless sectors and the largest underweights to the Technology, Diversified Manufacturing, and Chemicals sectors relative to the S&P/LSTA Leveraged Loan Index.
Important Risks
Investing involves risk, including the possible loss of principal. Security prices fluctuate in value depending on general market and economic conditions and the prospects of individual companies. • Loans can be difficult to value and less liquid than other types of debt instruments; they are also subject to nonpayment, collateral, bankruptcy, default, extension, prepayment and insolvency risks. • Fixed income security risks include credit, liquidity, call, duration, event and interest-rate risk. As interest rates rise, bond prices generally fall. • Investments in high-yield (“junk”) bonds involve greater risk of price volatility, illiquidity, and default than higher-rated debt securities. • Derivatives are generally more volatile and sensitive to changes in market or economic conditions than other securities; their risks include currency, leverage, liquidity, index, pricing, regulatory and counterparty risk. • Foreign investments may be more volatile and less liquid than U.S. investments and are subject to the risk of currency fluctuations and adverse political, economic and regulatory developments. • Restricted securities may be more difficult to sell and price than other securities. • The Fund may have high portfolio turnover, which could increase its transaction costs and an investor’s tax liability. • The Fund’s investments may fluctuate in value over a short period of time.
The Fund should not be considered an alternative to CDs or money market funds. This Fund is intended for investors who are looking to complement their traditional fixed-income investments.
The Hartford Floating Rate High Income Fund
Fund Overview – (continued)
October 31, 2021 (Unaudited)
| Composition by Security Type(1) |
| as of 10/31/2021 |
| Category | Percentage of
Net Assets |
| Equity Securities | |
| Common Stocks | 0.3% |
| Exchange-Traded Funds | 2.8 |
| Warrants | 0.0 * |
| Total | 3.1% |
| Fixed Income Securities | |
| Convertible Bonds | 0.5% |
| Corporate Bonds | 9.3 |
| Senior Floating Rate Interests | 83.3 |
| Total | 93.1% |
| Short-Term Investments | 4.1 |
| Other Assets & Liabilities | (0.3) |
| Total | 100.0% |
| * | Percentage rounds to zero. |
| (1) | For Fund compliance purposes, the Fund may not use the same classification system. These classifications are used for financial reporting purposes. |
The Hartford High Yield Fund
Fund Overview
October 31, 2021 (Unaudited)
Inception 09/30/1998
Sub-advised by Wellington Management Company LLP | Investment objective – The Fund seeks to provide high current income, and long-term total return. |
Comparison of Change in Value of $10,000 Investment (10/31/2011 - 10/31/2021)
The chart above represents the hypothetical growth of a $10,000 investment in Class A, which includes the maximum sales charge applicable to Class A shares. Returns for the Fund’s other classes will vary from what is seen above due to differences in the expenses charged to those share classes.
| Average Annual Total Returns |
| for the Periods Ending 10/31/2021 |
| | 1 Year | 5 Years | 10 Years |
| Class A1 | 8.90% | 5.73% | 5.64% |
| Class A2 | 4.00% | 4.76% | 5.16% |
| Class C1 | 8.10% | 4.96% | 4.86% |
| Class C3 | 7.10% | 4.96% | 4.86% |
| Class I1 | 9.03% | 6.03% | 5.92% |
| Class R31 | 8.42% | 5.43% | 5.32% |
| Class R41 | 8.73% | 5.75% | 5.65% |
| Class R51 | 9.07% | 6.09% | 5.97% |
| Class R61 | 9.20% | 5.97% | 5.93% |
| Class Y1 | 9.12% | 5.95% | 5.93% |
| Class F1 | 9.26% | 6.13% | 5.96% |
| Bloomberg U.S. Corporate High Yield Bond Index | 10.53% | 6.40% | 6.78% |
| 1 | Without sales charge |
| 2 | Reflects maximum sales charge of 4.50% |
| 3 | Reflects a contingent deferred sales charge of 1.00% |
PERFORMANCE DATA QUOTED REPRESENTS PAST PERFORMANCE AND DOES NOT GUARANTEE FUTURE RESULTS. The investment return and principal value of the investment will fluctuate so that investors’ shares, when redeemed, may be worth more or less than their original cost. The chart and table do not reflect the deductions of taxes that a shareholder would pay on Fund distributions or the redemption of Fund shares. Current performance may be lower or higher than the performance data quoted. To obtain performance data current to the most recent month-end, please visit our website hartfordfunds.com.
Total returns presented above were calculated using the applicable class' net asset value available to shareholders for sale or redemption of Fund shares on 10/31/2021, which may exclude investment transactions as of this date. All share class returns assume the reinvestment of all distributions at net asset value and the deduction of all fund expenses. The total returns presented in the Financial Highlights section of the report are calculated in the same manner, but also take into account certain
adjustments that are necessary under generally accepted accounting principles. As a result, the total returns in the Financial Highlights section may differ from the total returns presented above.
Class R6 shares commenced operations on 03/01/2021. Performance prior to that date is that of the Fund’s Class Y shares. Class F shares commenced operations on 02/28/2017. Performance prior to that date is that of the Fund’s Class I shares.
To the extent a share class has adopted the prior performance of another share class that had different operating expenses, such performance has not been adjusted to reflect the different operating expenses. If the performance were adjusted, it may have been higher or lower.
Performance information includes performance under the Fund’s previous sub-adviser, Hartford Investment Management Company. As of 03/05/2012, Hartford Investment Management Company no longer served as the sub-adviser to the Fund.
You cannot invest directly in an index.
See “Benchmark Glossary” for benchmark descriptions.
Performance information may reflect expense waivers/reimbursements without which performance would have been lower. For information on current expense waivers/reimbursements, please see the prospectus.
The Hartford High Yield Fund
Fund Overview – (continued)
October 31, 2021 (Unaudited)
| Operating Expenses* | Gross | Net |
| Class A | 1.03% | 0.95% |
| Class C | 1.73% | 1.73% |
| Class I | 0.70% | 0.69% |
| Class R3 | 1.31% | 1.27% |
| Class R4 | 1.01% | 0.97% |
| Class R5 | 0.71% | 0.67% |
| Class R6 | 0.60% | 0.55% |
| Class Y | 0.70% | 0.66% |
| Class F | 0.60% | 0.55% |
| * | Expenses as shown in the Fund’s most recent prospectus. Gross expenses do not reflect contractual expense reimbursement arrangements. Net expenses reflect such arrangements in instances when they reduce gross expenses. These arrangements remain in effect until 02/28/2022 unless the Fund’s Board of Directors approves an earlier termination. Actual expenses may be higher or lower. Please see accompanying Financial Highlights for expense ratios for the period ended 10/31/2021. |
Portfolio Managers
Christopher A. Jones, CFA
Senior Managing Director and Fixed Income Portfolio Manager
Wellington Management Company LLP
Michael V. Barry*
Senior Managing Director and Fixed Income Portfolio Manager
Wellington Management Company LLP
| * | Effective August 9, 2021, Michael V. Barry was added as a portfolio manager to The Hartford High Yield Fund. |
Manager Discussion
How did the Fund perform during the period?
The Class A shares of The Hartford High Yield Fund returned 8.90%, before sales charges, for the twelve-month period ended October 31, 2021, underperforming the Fund’s benchmark, the Bloomberg U.S. Corporate High Yield Bond Index, which returned 10.53% for the same period. For the same period, the Class A shares of the Fund, before sales charges, underperformed the 10.38% average return of the Lipper High Yield Funds peer group, a group of funds with investment strategies similar to those of the Fund.
Why did the Fund perform this way?
United States (U.S.) and European high-yield fixed-income markets generated positive total returns during the trailing twelve months ended October 31, 2021. The Bloomberg U.S. High Yield Corporate Index returned 10.53% for the period, driven by improving credit fundamentals and an increased investor appetite for higher yields. Corporate credit spreads compressed for most of the period as global COVID-19 vaccination rates rose and government imposed restrictions were lifted, leading to improved economic data. Investor confidence in higher yielding assets were further supported during much of the period by central banks’ reassurances that global economies would be backstopped by accommodative monetary policy in the face of any unforeseen coronavirus complications. As coronavirus fears waned towards the end of the period, though, central banks took steps toward policy normalization in response to mounting inflation
pressures. At the start of the period, the U.S. Federal Reserve (the Fed) extended its emergency liquidity provisions, but took steps toward removing policy accommodation by the end of the period. The European Central Bank (ECB) reduced the pace of quantitative easing purchases by the end of the period after having expanded the program at the end of 2020 and the first quarter of 2021.
The Bloomberg U.S. Corporate High Yield Bond Index returned 10.53% for the twelve months ended October 31, 2021 and outperformed duration-equivalent U.S. Treasuries by 11.72% for the same period. The option-adjusted spread (OAS) of the Bloomberg U.S. Corporate High Yield Bond Index was 2.87% on October 31, 2021, tighter than the OAS of 5.09% twelve months ago. Spreads widened significantly at the peak of the pandemic, but then recovered later in the period along with improving economic data, boosted by stimulus measures.
Quality positioning contributed positively to the Fund’s performance relative to the Bloomberg U.S. Corporate High Yield Bond Index during the period, primarily due to an overweight to CCC and below rated securities during a time when lower-quality securities outperformed.
During the period, security selection contributed positively to benchmark-relative returns, driven primarily by selection within the Wirelines and Gaming sectors. This was partially offset by weaker selection in the Restaurant and Financial Institutions sectors.
The Hartford High Yield Fund
Fund Overview – (continued)
October 31, 2021 (Unaudited)
Overall, sector allocation decisions detracted from performance relative to the Bloomberg U.S. Corporate High Yield Bond Index during the period, primarily driven by our underweight allocation to the Transportation sector and overweight allocation to the Cable and Satellite sectors. This was partially offset by an underweight to the Utilities and Chemicals sectors, which benefited relative returns.
The Fund used derivatives on a limited basis during the period for risk management purposes. Over the trailing twelve months ended October 31, 2021, the Fund employed currency forwards to seek to minimize active currency risk from investments in non-dollar denominated securities. Although we typically view currency forwards in conjunction with the securities intended to be hedged, on a standalone basis the currency forwards contributed positively to relative performance over the period.
What is the outlook as of the end of the period?
As of the end of the period, we believe the economic outlook remains supportive and we expect continued strong growth to close out 2021. Infrastructure spending represents an added accommodation, which we believe should bolster the economy as policymakers begin to taper their asset purchases in the fourth quarter of 2021. Defaults have continued to decline as of the end of the period, but in our opinion, the deteriorating quality of new issuance warrants monitoring, particularly as we are seeing more mergers and acquisitions (M&A) activity and heightened capital expenditures intentions. Inflation continues to be a risk and we expect core inflation to settle into the 2.5-3% range over the next twelve to eighteen months. We will continue to closely monitor these readings along with the reaction functions of policymakers. In our view, corporate liquidity profiles are good, but leverage profiles are now worse than pre-pandemic levels. We will scrutinize liquidity conditions for signs that we believe could lead to increased market volatility.
While spreads currently appear tight, we believe they could remain low for a prolonged period as the global economy is still emerging from a recession. We remain selective with a neutral to slightly defensive risk tilt given richer valuations, in our view, while recognizing that low spreads may last longer due to potential ongoing monetary and fiscal support. We will watch for signs of central banks removing accommodative policies or deteriorating market liquidity before turning more defensive. In our view, credit selection is more important than ever, given the lack of dispersion.
At the end of the period, the Fund’s largest overweight relative to the benchmark was to B rated issuers while the Fund’s largest underweight relative to the benchmark was to the BB segment of the market. The Fund’s largest industry overweights were the packaging and home construction industries. The largest sector underweights in the Fund were the Media and Entertainment and Utilities sectors.
Important Risks
Investing involves risk, including the possible loss of principal. Security prices fluctuate in value depending on general market and economic conditions and the prospects of individual companies. • Fixed income security risks include credit, liquidity, call, duration, event and interest-rate risk. As interest rates rise, bond prices generally fall. • Investments in high-yield (“junk”) bonds involve greater risk of price
volatility, illiquidity, and default than higher-rated debt securities. • Foreign investments may be more volatile and less liquid than U.S. investments and are subject to the risk of currency fluctuations and adverse political, economic and regulatory developments. • Derivatives are generally more volatile and sensitive to changes in market or economic conditions than other securities; their risks include currency, leverage, liquidity, index, pricing, regulatory and counterparty risk. • Restricted securities may be more difficult to sell and price than other securities. • Integration of environmental, social, and/or governance (ESG) factors into the investment process may not work as intended.
| Composition by Security Type(1) |
| as of 10/31/2021 |
| Category | Percentage of
Net Assets |
| Equity Securities | |
| Common Stocks | 0.3% |
| Escrows | 0.9 |
| Total | 1.2% |
| Fixed Income Securities | |
| Convertible Bonds | 2.8% |
| Corporate Bonds | 90.3 |
| Senior Floating Rate Interests | 0.7 |
| Total | 93.8% |
| Short-Term Investments | 3.6 |
| Other Assets & Liabilities | 1.4 |
| Total | 100.0% |
| (1) | For Fund compliance purposes, the Fund may not use the same classification system. These classifications are used for financial reporting purposes. |
The Hartford Inflation Plus Fund
Fund Overview
October 31, 2021 (Unaudited)
Inception 10/31/2002
Sub-advised by Wellington Management Company LLP | Investment objective – The Fund seeks a total return that exceeds the rate of inflation over an economic cycle. |
Comparison of Change in Value of $10,000 Investment (10/31/2011 - 10/31/2021)
The chart above represents the hypothetical growth of a $10,000 investment in Class A, which includes the maximum sales charge applicable to Class A shares. Returns for the Fund’s other classes will vary from what is seen above due to differences in the expenses charged to those share classes.
| Average Annual Total Returns |
| for the Periods Ending 10/31/2021 |
| | 1 Year | 5 Years | 10 Years |
| Class A1 | 6.88% | 3.74% | 2.03% |
| Class A2 | 2.07% | 2.79% | 1.56% |
| Class C1 | 6.14% | 2.98% | 1.28% |
| Class C3 | 5.14% | 2.98% | 1.28% |
| Class I1 | 7.15% | 4.04% | 2.30% |
| Class R31 | 6.52% | 3.39% | 1.68% |
| Class R41 | 6.84% | 3.70% | 1.99% |
| Class R51 | 7.18% | 4.01% | 2.28% |
| Class Y1 | 7.13% | 4.05% | 2.34% |
| Class F1 | 7.27% | 4.07% | 2.32% |
| Bloomberg U.S. TIPS 1-10 Year Index | 7.05% | 4.03% | 2.52% |
| Bloomberg U.S. TIPS Index | 7.08% | 4.66% | 3.05% |
| 1 | Without sales charge |
| 2 | Reflects maximum sales charge of 4.50% |
| 3 | Reflects a contingent deferred sales charge of 1.00% |
PERFORMANCE DATA QUOTED REPRESENTS PAST PERFORMANCE AND DOES NOT GUARANTEE FUTURE RESULTS. The investment return and principal value of the investment will fluctuate so that investors’ shares, when redeemed, may be worth more or less than their original cost. The chart and table do not reflect the deductions of taxes that a shareholder would pay on Fund distributions or the redemption of Fund shares. Current performance may be lower or higher than the performance data quoted. To obtain performance data current to the most recent month-end, please visit our website hartfordfunds.com.
Total returns presented above were calculated using the applicable class' net asset value available to shareholders for sale or redemption of Fund shares on 10/31/2021, which may exclude investment transactions as of this date. All share class returns assume the reinvestment of all distributions at net asset value and the deduction of all fund expenses. The total returns presented in the Financial Highlights section of the report are calculated in the same manner, but also take into account certain
adjustments that are necessary under generally accepted accounting principles. As a result, the total returns in the Financial Highlights section may differ from the total returns presented above.
Class F shares commenced operations on 02/28/2017. Performance prior to that date is that of the Fund’s Class I shares.
To the extent a share class has adopted the prior performance of another share class that had different operating expenses, such performance has not been adjusted to reflect the different operating expenses. If the performance were adjusted, it may have been higher or lower.
Performance information includes performance under the Fund’s previous sub-adviser, Hartford Investment Management Company. As of 03/05/2012, Hartford Investment Management Company no longer served as the sub-adviser to the Fund.
You cannot invest directly in an index.
See “Benchmark Glossary” for benchmark descriptions.
Performance information may reflect expense waivers/reimbursements without which performance would have been lower. For information on current expense waivers/reimbursements, please see the prospectus.
The Hartford Inflation Plus Fund
Fund Overview – (continued)
October 31, 2021 (Unaudited)
| Operating Expenses* | Gross | Net |
| Class A | 0.88% | 0.86% |
| Class C | 1.60% | 1.60% |
| Class I | 0.56% | 0.56% |
| Class R3 | 1.17% | 1.17% |
| Class R4 | 0.88% | 0.88% |
| Class R5 | 0.57% | 0.57% |
| Class Y | 0.57% | 0.57% |
| Class F | 0.46% | 0.46% |
| * | Expenses as shown in the Fund’s most recent prospectus. Gross expenses do not reflect contractual fee waivers or expense reimbursement arrangements. Net expenses reflect such arrangements only with respect to Class A. These arrangements remain in effect until 02/28/2022 unless the Fund’s Board of Directors approves an earlier termination. Actual expenses may be higher or lower. Please see accompanying Financial Highlights for expense ratios for the period ended 10/31/2021. |
Portfolio Managers
Joseph F. Marvan, CFA
Senior Managing Director and Fixed Income Portfolio Manager
Wellington Management Company LLP
Allan M. Levin, CFA, FRM, FSA
Managing Director and Fixed Income Portfolio Manager
Wellington Management Company LLP
Brij S. Khurana
Managing Director and Portfolio Manager
Wellington Management Company LLP
Manager Discussion
How did the Fund perform during the period?
The Class A shares of The Hartford Inflation Plus Fund returned 6.88%, before sales charges, for the twelve-month period ended October 31, 2021, underperforming the Fund’s primary benchmark, the Bloomberg U.S. TIPS 1-10 Year Index, which returned 7.05% for the same period, and underperforming the Fund’s secondary benchmark, the Bloomberg U.S. TIPS Index, which returned 7.08% for the same period. For the same period, the Class A shares of the Fund, before sales charges, underperformed the 7.08% average return of the Lipper Inflation Protected Bond Funds peer group, a group of funds that invests primarily in inflation-indexed fixed income securities.
Why did the Fund perform this way?
United States (U.S.) fixed-income markets generated mixed total returns during the trailing twelve months ended October 31, 2021, with lower quality sectors such as bank loans and high yield performing the best. The Bloomberg U.S. Aggregate Bond Index returned -0.48% during the period, driven by rising U.S. Treasury yields. Over the same period, sovereign yields drifted higher across several developed markets as major central banks laid the groundwork for tighter monetary policy and started to reduce monetary stimulus at varying
speeds. The U.S. Federal Reserve (Fed) indicated during the period that it could start to taper its large-scale asset purchases by November 2021 and projected three rate increases in 2023.
Non-government bond sectors generally outperformed duration-equivalent government bonds over the period. Early in the period, spread tightening was driven by encouraging vaccine trials and easing of COVID-19 restrictions, which led to improved economic data. Later in the period, spreads continued to tighten as central banks aimed to mitigate risks, vaccine distribution picked up pace, and credit fundamentals generally improved. By the end of the period, credit spreads had widened slightly.
Global central banks maintained highly accommodative policy stances at the beginning of the period. By the end of the period, though, central banks took further steps toward policy normalization in response to mounting inflation pressures. At the start of the period, the Fed extended its emergency liquidity provisions, but took steps toward removing policy accommodation by the end of the period. The European Central Bank (ECB) reduced the pace of quantitative easing purchases by the end of the period after having expanded the program at the end of 2020 and the first quarter of 2021.
Global economic activity dropped off sharply in the aftermath of coronavirus economic shutdowns but started to rebound as economies reopened during the period. Global gross domestic product
The Hartford Inflation Plus Fund
Fund Overview – (continued)
October 31, 2021 (Unaudited)
(GDP) growth continued to recover during the latter part of the twelve-month period. However, ongoing supply chain disruptions and labor shortages that occurred later in the period indicated inflation pressures may prove less “transitory” than previously suspected. The U.S. labor market continued to heal while house prices rose sharply, supported by low mortgage rates and record low supply. During the latter part of the period, Chinese manufacturing Purchasing Managers’ Index (PMI) contracted to the lowest level since the onset of the pandemic, weighed down by rising costs, while the services PMI expanded. Eurozone manufacturing PMI remained elevated during the period but then fell to a six-month low due to lack of shipping capacity and constrained supply to meet demand.
The U.S. dollar weakened early in the period on the Fed’s pledge to maintain policy accommodation, but later rallied versus most currencies supported by rising U.S. yields, Fed tapering expectations, and a flight to quality driven by concerns about a potential default by Chinese real estate company Evergrande and the U.S. debt ceiling deadlock. The British pound ended the period lower as supply-chain disruptions created significant challenges for the United Kingdom (U.K.), with spiking gas prices and fuel shortages engulfing the country. Additionally, staff shortages stemming from the pandemic and the U.K.’s exit from the European Union (EU), also known as Brexit, drove job vacancies to a record high. The euro also ended the period lower. Most emerging markets (EM) currencies ended the period lower driven by China’s economic slowdown, Fed tapering concerns, and political uncertainty.
Real U.S. Treasury yields fell over the past 12 months across the yield curve while nominal U.S. Treasury yields increased from the pandemic lows. Unprecedented action by central banks to support economies in the wake of the COVID-19 pandemic compressed nominal U.S. Treasury yields, while better-than-expected economic data toward the end of the period, supply shortages and bottlenecks, and optimism about re-opening the economy raised U.S. inflation expectations and contributed positively to the outperformance of Treasury Inflation-Protected Securities (TIPS) relative to nominals. Over the twelve months ended October 31, 2021, five- and ten-year TIPS “real” yields fell 0.54% and 0.20%, respectively, and five- and ten-year inflation breakevens (a market-based measure of expected inflation) rose by 1.34% and 0.88%, respectively.
The Fund’s allocation across various credit sectors, such as bank loans, corporate credit, and non-agency residential mortgage-backed securities (RMBS), had a positive impact on performance relative to the Bloomberg U.S. TIPS 1-10 Year Index during the period. The Fund is invested in these “plus” sectors because of our expectation that these particular sectors will be correlated to inflation over time, and the sectors are overlaid with consumer price index (CPI) swaps so that the overall Fund “beta” to inflation is not diminished. An underweight to U.S. TIPS in favor of credit exposure detracted from relative performance while non-U.S. bond exposure was additive to relative performance. The Fund’s tactical duration positions contributed positively to relative performance.
Over the period, we made use of derivatives within the Fund in pursuit of both risk management and total returns. Derivatives usage included U.S. Treasury futures to manage duration, credit default swaps to
manage sector exposure, currency forwards both to hedge emerging markets currency risk and as part of the developed currency strategy, and CPI swaps and bond forwards to add inflation sensitivity. Over the period, the impact of these derivatives on relative performance was positive overall.
What is the outlook as of the end of the period?
We believe that unprecedented levels of monetary and fiscal stimulus should likely support above-trend growth, pressuring inflation expectations higher over the long term. However, we believe inflation-linked bond prices and breakeven spreads are likely to be volatile as much of the cyclical momentum in growth is already reflected in these prices, in our opinion. As of the end of the period, we have reduced the Fund’s exposure to long breakeven positions as inflation expectations rose during the year, and we are placing a greater emphasis on security-specific opportunities. We believe that most credit sectors remain an important diversifier. Therefore, we continue to see value in being underweight overall inflation exposure versus the Bloomberg U.S. TIPS 1-10 Year Index.
As of the end of the period, the Fund continued to be underweight overall TIPS exposure and slightly overweight to shorter-duration TIPS, given they are most sensitive to short-term changes in inflation, relative to the Bloomberg U.S. TIPS 1-10 Year Index. We are focused on security selection around the 10-year segment of the TIPS yield curve as of the end of the period. As of the end of the period, the Fund maintained allocations to non-agency RMBS, agency mortgage-backed securities (MBS), and senior commercial mortgage-backed securities (CMBS) with attractive collateral, in our view. We also held an allocation to bank loans as of the end of the period due to what we believe are attractive valuations.
Important Risks
Investing involves risk, including the possible loss of principal. Security prices fluctuate in value depending on general market and economic conditions and the prospects of individual companies. The Fund may allocate a portion of its assets to specialist portfolio managers, which may not work as intended. • Fixed income security risks include credit, liquidity, call, duration, and interest-rate risk. As interest rates rise, bond prices generally fall. • The value of inflation-protected securities (IPS) generally fluctuates with changes in real interest rates, and the market for IPS may be less developed or liquid, and more volatile, than other securities markets. • Obligations of U.S. Government agencies are supported by varying degrees of credit but are generally not backed by the full faith and credit of the U.S. Government. • Derivatives are generally more volatile and sensitive to changes in market or economic conditions than other securities; their risks include currency, leverage, liquidity, index, pricing, regulatory and counterparty risk. • Mortgage-related and asset-backed securities’ risks include credit, interest-rate, prepayment, and extension risk. • Foreign investments may be more volatile and less liquid than U.S. investments and are subject to the risk of currency fluctuations and adverse political, economic and regulatory developments. • The purchase of securities in the To-Be-Announced (TBA) market can result in higher portfolio turnover and related expenses as well as price and counterparty risk. • The Fund may have high portfolio turnover, which could increase its transaction costs and an investor’s tax liability.
The Hartford Inflation Plus Fund
Fund Overview – (continued)
October 31, 2021 (Unaudited)
| Composition by Security Type(1) |
| as of 10/31/2021 |
| Category | Percentage of
Net Assets |
| Fixed Income Securities | |
| Asset & Commercial Mortgage-Backed Securities | 2.3% |
| Convertible Bonds | 0.3 |
| Corporate Bonds | 1.7 |
| Foreign Government Obligations | 7.4 |
| Senior Floating Rate Interests | 7.6 |
| U.S. Government Agencies(2) | 0.4 |
| U.S. Government Securities | 78.2 |
| Total | 97.9% |
| Short-Term Investments | 1.8 |
| Other Assets & Liabilities | 0.3 |
| Total | 100.0% |
| (1) | For Fund compliance purposes, the Fund may not use the same classification system. These classifications are used for financial reporting purposes. |
| (2) | All, or a portion of the securities categorized as U.S. Government Agencies, were agency mortgage-backed securities as of October 31, 2021. |
The Hartford Municipal Opportunities Fund
Fund Overview
October 31, 2021 (Unaudited)
Inception 05/31/2007
Sub-advised by Wellington Management Company LLP | Investment objective – The Fund seeks to provide current income that is generally exempt from federal income taxes, and long-term total return. |
Comparison of Change in Value of $10,000 Investment (10/31/2011 - 10/31/2021)
The chart above represents the hypothetical growth of a $10,000 investment in Class A, which includes the maximum sales charge applicable to Class A shares. Returns for the Fund’s other classes will vary from what is seen above due to differences in the expenses charged to those share classes.
| Average Annual Total Returns |
| for the Periods Ending 10/31/2021 |
| | 1 Year | 5 Years | 10 Years |
| Class A1 | 2.94% | 3.11% | 3.99% |
| Class A2 | -1.69% | 2.16% | 3.51% |
| Class C1 | 2.16% | 2.35% | 3.21% |
| Class C3 | 1.16% | 2.35% | 3.21% |
| Class I1 | 3.19% | 3.37% | 4.25% |
| Class Y1 | 3.17% | 3.35% | 4.24% |
| Class F1 | 3.26% | 3.40% | 4.27% |
| Bloomberg Municipal Bond 1-15 Year Blend (1-17) Index | 1.78% | 2.95% | 3.23% |
| 1 | Without sales charge |
| 2 | Reflects maximum sales charge of 4.50% |
| 3 | Reflects a contingent deferred sales charge of 1.00% |
PERFORMANCE DATA QUOTED REPRESENTS PAST PERFORMANCE AND DOES NOT GUARANTEE FUTURE RESULTS. The investment return and principal value of the investment will fluctuate so that investors’ shares, when redeemed, may be worth more or less than their original cost. The chart and table do not reflect the deductions of taxes that a shareholder would pay on Fund distributions or the redemption of Fund shares. Current performance may be lower or higher than the performance data quoted. To obtain performance data current to the most recent month-end, please visit our website hartfordfunds.com.
Total returns presented above were calculated using the applicable class' net asset value available to shareholders for sale or redemption of Fund shares on 10/31/2021, which may exclude investment transactions as of this date. All share class returns assume the reinvestment of all distributions at net asset value and the deduction of all fund expenses. The total returns presented in the Financial Highlights section of the report are calculated in the same manner, but also take into account certain adjustments that are necessary under generally accepted accounting principles. As a result, the total returns in the Financial Highlights section may differ from the total returns presented above.
Class Y shares commenced operations on 05/31/2018. Performance prior to that date is that of the Fund’s Class I shares. Class F shares commenced operations on 02/28/2017. Performance prior to that date is that of the Fund’s Class I shares.
To the extent a share class has adopted the prior performance of another share class that had different operating expenses, such performance has not been adjusted to reflect the different operating expenses. If the performance were adjusted, it may have been higher or lower.
Performance information includes performance under the Fund’s previous sub-adviser, Hartford Investment Management Company, using a modified investment strategy. As of 03/05/2012, Hartford Investment Management Company no longer served as the sub-adviser to the Fund.
You cannot invest directly in an index.
See “Benchmark Glossary” for benchmark descriptions.
Performance information may reflect expense waivers/reimbursements without which performance would have been lower.
| Operating Expenses* | Gross | Net |
| Class A | 0.68% | 0.68% |
| Class C | 1.43% | 1.43% |
| Class I | 0.44% | 0.44% |
| Class Y | 0.46% | 0.46% |
| Class F | 0.37% | 0.37% |
| * | Expenses as shown in the Fund’s most recent prospectus. Actual expenses may be higher or lower. Please see accompanying Financial Highlights for expense ratios for the period ended 10/31/2021. |
The Hartford Municipal Opportunities Fund
Fund Overview – (continued)
October 31, 2021 (Unaudited)
Portfolio Managers
Brad W. Libby
Managing Director and Fixed Income Portfolio Manager/Credit Analyst
Wellington Management Company LLP
Timothy D. Haney, CFA
Senior Managing Director and Fixed Income Portfolio Manager
Wellington Management Company LLP
Manager Discussion
How did the Fund perform during the period?
The Class A shares of The Hartford Municipal Opportunities Fund returned 2.94%, before sales charges, for the twelve-month period ended October 31, 2021, outperforming the Fund’s benchmark, the Bloomberg Municipal Bond 1-15 Year Blend (1-17) Index, which returned 1.78% for the same period. For the same period, the Class A shares of the Fund, before sales charges, outperformed the 2.60% average return of the Lipper Intermediate Municipal Debt Funds peer group, a group of funds with investment strategies similar to those of the Fund.
Why did the Fund perform this way?
United States (U.S.) fixed income markets generated mixed total returns during the trailing twelve months ended October 31, 2021, with lower quality sectors such as bank loans and high yield performing the best. The Bloomberg U.S. Aggregate Bond Index generated a return of -0.48% during the period, driven by rising U.S. Treasury yields. Yields drifted higher during the same period across several developed markets as major central banks laid the groundwork for policy normalization and started to reduce monetary stimulus at varying speeds.
Tax-exempt municipal bonds, as represented by the Bloomberg Municipal Bond 1-15 Year Blend (1-17) Index, posted a positive total return of 1.78% during the period. This index outperformed duration-equivalent Treasuries over the same period. The yield on 10-year AAA-rated general obligation municipal bonds (GOs) increased during the twelve-month period ended October 31, 2021, as did the yield on 10-year Treasuries. The ratio of yields on 10-year AAA GOs to yields on 10-year Treasuries decreased over the period, from 106% to 78%. Over the period, municipal bond fundamentals were generally strong, driven mainly by a high level of fiscal spending. Retail market demand was also supportive on municipal bonds over the period.
The Fed maintained highly accommodative policy stances at the beginning of the period. By the end of the period, central banks took further steps toward the end of quantitative easing in response to mounting inflation pressures. At the start of the period, the Fed extended its emergency liquidity provisions. By the end of the period, it indicated it could start to taper its large-scale asset purchases by November 2021 and projected three rate increases in 2023.
During the period, the primary contributor to the Fund’s returns relative to the Bloomberg Municipal Bond 1-15 Year Blend (1-17) Index was an out-of-benchmark allocation to high-yield municipal bonds, particularly revenue bonds. Also contributing to relative returns was security selection within both investment-grade revenue and general obligation bonds. Within revenue bonds, selection in the Tax/Lease, Healthcare and Transportation sectors each contributed positively to relative returns. Additionally, an overweight credit spread duration position versus the benchmark contributed positively to relative returns. Finally, the Fund’s duration/yield curve positioning was moderately additive to relative returns.
Derivatives were not used in a significant manner in the Fund during the period and did not have a material impact on performance during the period.
What is the outlook as of the end of the period?
As of the end of the period, we believe municipal fundamentals are broadly positive based on what we consider to be strong economic activity and generous direct and indirect federal support in response to the COVID-19 pandemic. As of the end of the period, many issuers are sitting on sizable budget surpluses. Additionally, the prospects of an infrastructure bill could provide even more support to municipal bonds, with issuers across a variety of sectors poised to benefit in our opinion. As a result, as of the end of the period, we continued to favor certain revenue bond sectors, including the Transportation and Healthcare sectors. Transportation issuers, including airports and toll roads, entered the crisis with significant reserves and have received additional aid to weather the weakened demand. Hospital volumes have returned to pre-pandemic levels or better for the most part, with what we expect to be better 2021 operating cash flow than in 2020 for most providers. Ongoing tight cost controls are expected to remain through the balance of 2021 along with further release of capital spending restraints. Given the continuing strength of U.S. housing, we believe fundamentals are on solid footing for housing development sector bonds, and we continue to maintain a positive outlook. Significant fiscal support has helped state and local issuers solidify their budgets, and many of them have a meaningful, sustainable surplus in our view. As of the end of the period, we continued to favor local GOs over state issued GOs due to more attractive valuations in our view and their reliance on property taxes that has provided greater revenue stability.
The Hartford Municipal Opportunities Fund
Fund Overview – (continued)
October 31, 2021 (Unaudited)
Important Risks
Investing involves risk, including the possible loss of principal. Security prices fluctuate in value depending on general market and economic conditions and the prospects of individual companies. • Fixed income security risks include credit, liquidity, call, duration, and interest-rate risk. As interest rates rise, bond prices generally fall. • Municipal securities may be adversely impacted by state/local, political, economic, or market conditions. Although the Fund primarily invests in municipal securities that are exempt from federal income taxes, investors may be subject to the federal Alternative Minimum Tax as well as state and local income taxes. Capital gains, if any, are taxable. • Investments in high-yield (“junk”) bonds involve greater risk of price volatility, illiquidity, and default than higher-rated debt securities. • Integration of environmental, social, and/or governance (ESG) factors into the investment process may not work as intended.
| Composition of Municipal Bonds(1) |
| as of 10/31/2021 |
| Municipal Bonds | Percentage of
Net Assets |
| Airport | 6.5% |
| Bond Bank | 0.1 |
| Development | 3.2 |
| Education | 1.5 |
| Facilities | 0.0 * |
| General Obligation | 11.1 |
| Higher Education | 2.2 |
| Housing | 0.9 |
| Medical | 5.9 |
| Mello-Roos District | 0.6 |
| Multifamily Housing | 0.8 |
| Nursing Homes | 5.7 |
| Other (2) | 25.8 |
| Power | 3.9 |
| School District | 6.8 |
| Single Family Housing | 6.8 |
| Student Loan | 0.6 |
| Tobacco | 2.6 |
| Transportation | 8.8 |
| Utilities | 1.3 |
| Water | 2.0 |
| Total | 97.1% |
| Short-Term Investments | 2.7 |
| Other Assets & Liabilities | 0.2 |
| Total | 100.0% |
| * | Percentage rounds to zero. |
| (1) | For Fund compliance purposes, the Fund may not use the same classification system. These classifications are used for financial reporting purposes. |
| (2) | Other refers to Special Tax District Bonds, Tax Increment Bonds and certain Community Development District bonds. |
Hartford Municipal Short Duration Fund
Fund Overview
October 31, 2021 (Unaudited)
Inception 05/29/2015
Sub-advised by Wellington Management Company LLP | Investment objective – The Fund seeks to provide current income that is generally exempt from federal income taxes, and long-term total return. |
Comparison of Change in Value of $10,000 Investment (05/29/2015 - 10/31/2021)
The chart above represents the hypothetical growth of a $10,000 investment in Class A, which includes the maximum sales charge applicable to Class A shares. Returns for the Fund’s other classes will vary from what is seen above due to differences in the expenses charged to those share classes.
| Average Annual Total Returns |
| for the Periods Ending 10/31/2021 |
| | 1 Year | 5 Years | Since
Inception1 |
| Class A2 | 1.52% | 1.76% | 1.69% |
| Class A3 | -3.05% | 0.82% | 0.96% |
| Class C2 | 0.66% | 1.33% | 1.20% |
| Class C4 | -0.34% | 1.33% | 1.20% |
| Class I2 | 1.65% | 1.97% | 1.91% |
| Class F2 | 1.72% | 2.01% | 1.94% |
| Bloomberg Municipal Bond Short 1-5 Year Index | 0.76% | 1.82% | 1.74% |
| 1 | Inception: 05/29/2015 |
| 2 | Without sales charge |
| 3 | Reflects maximum sales charge of 4.50% |
| 4 | Reflects a contingent deferred sales charge of 1.00% |
PERFORMANCE DATA QUOTED REPRESENTS PAST PERFORMANCE AND DOES NOT GUARANTEE FUTURE RESULTS. The investment return and principal value of the investment will fluctuate so that investors’ shares, when redeemed, may be worth more or less than their original cost. The chart and table do not reflect the deductions of taxes that a shareholder would pay on Fund distributions or the redemption of Fund shares. Current performance may be lower or higher than the performance data quoted. To obtain performance data current to the most recent month-end, please visit our website hartfordfunds.com.
Total returns presented above were calculated using the applicable class' net asset value available to shareholders for sale or redemption of Fund shares on 10/31/2021, which may exclude investment transactions as of this date. All share class returns assume the reinvestment of all distributions at net asset value and the deduction of all fund expenses. The total returns presented in the Financial Highlights section of the report are calculated in the same manner, but also take into account certain adjustments that are necessary under generally accepted accounting principles. As a
result, the total returns in the Financial Highlights section may differ from the total returns presented above.
Class F shares commenced operations on 02/28/2017. Performance prior to that date is that of the Fund’s Class I shares.
To the extent a share class has adopted the prior performance of another share class that had different operating expenses, such performance has not been adjusted to reflect the different operating expenses. If the performance were adjusted, it may have been higher or lower.
You cannot invest directly in an index.
See “Benchmark Glossary” for benchmark descriptions.
Performance information may reflect expense waivers/reimbursements without which performance would have been lower. For information on current expense waivers/reimbursements, please see the prospectus.
| Operating Expenses* | Gross | Net |
| Class A | 1.11% | 0.70% |
| Class C | 1.95% | 1.45% |
| Class I | 0.89% | 0.47% |
| Class F | 0.81% | 0.40% |
| * | Expenses as shown in the Fund’s most recent prospectus. Gross expenses do not reflect contractual expense reimbursement arrangements. Net expenses reflect such arrangements in instances when they reduce gross expenses. These arrangements remain in effect until 02/28/2022 unless the Fund’s Board of Directors approves an earlier termination. Expenses shown include acquired fund fees and expenses. Actual expenses may be higher or lower. Please see accompanying Financial Highlights for expense ratios for the period ended 10/31/2021. |
Hartford Municipal Short Duration Fund
Fund Overview – (continued)
October 31, 2021 (Unaudited)
Portfolio Managers
Brad W. Libby
Managing Director and Fixed Income Portfolio Manager/Credit Analyst
Wellington Management Company LLP
Timothy D. Haney, CFA
Senior Managing Director and Fixed Income Portfolio Manager
Wellington Management Company LLP
Manager Discussion
How did the Fund perform during the period?
The Class A shares of the Hartford Municipal Short Duration Fund returned 1.52%, before sales charges, for the twelve-month period ended October 31, 2021, outperforming the Fund’s benchmark, the Bloomberg Municipal Bond Short 1-5 Year Index, which returned 0.76% for the same period. For the same period, the Class A shares of the Fund, before sales charges, outperformed the 0.62% average return of the Lipper Short Municipal Debt Funds peer group, a group of funds with investment strategies similar to those of the Fund.
Why did the Fund perform this way?
United States (U.S.) fixed income markets generated mixed total returns during the trailing twelve months ended October 31, 2021, with lower quality sectors such as bank loans and high yield performing the best. The Bloomberg U.S. Aggregate Bond Index generated a return of -0.48% during the period, driven by rising U.S. Treasury yields. Yields drifted higher during the same period across several developed markets as major central banks laid the groundwork for policy normalization and started to reduce monetary stimulus at varying speeds.
Tax-exempt municipal bonds, as represented by the Bloomberg Municipal Bond 1-15 Year Blend (1-17) Index, posted a positive total return of 1.78% during the period. This index outperformed duration-equivalent Treasuries over the same period. The yield on 10-year AAA-rated general obligation municipal bonds (GOs) increased during the twelve-month period ended October 31, 2021, as did the yield on 10-year Treasuries. The ratio of yields on 10-year AAA GOs to yields on 10-year Treasuries decreased over the period, from 106% to 78%. Over the period, municipal bond fundamentals were generally strong, driven mainly by a high level of fiscal spending. Retail market demand was also supportive on municipal bonds over the period.
The Fed maintained highly accommodative policy stances at the beginning of the period. By the end of the period, central banks took further steps toward the end of quantitative easing in response to mounting inflation pressures. At the start of the period, the Fed extended its emergency liquidity provisions. By the end of the period, it indicated it could start to taper its large-scale asset purchases by November 2021 and projected three rate increases in 2023.
During the period, the primary contributor to the Fund’s returns relative to the Bloomberg Municipal Bond Short 1-5 Year Index was an out-of-benchmark allocation to high-yield municipal bonds, particularly revenue bonds. Also contributing to relative returns was security selection within both investment-grade revenue and general obligation bonds. Within revenue bonds, selection in the Tax/Lease, Education, Healthcare and Transportation sectors each contributed positively to relative returns. An underweight credit spread duration position versus the benchmark detracted from relative returns. Finally, the Fund’s duration/yield curve positioning detracted from relative returns.
Derivatives were not used in a significant manner in the Fund during the period and did not have a material impact on performance during the period.
What is the outlook as of the end of the period?
As of the end of the period, we believe municipal fundamentals are broadly positive based on what we consider to be strong economic activity and generous direct and indirect federal support in response to the COVID-19 pandemic. As of the end of the period, many issuers are sitting on sizable budget surpluses. Additionally, the prospects of an infrastructure bill could provide even more support to municipal bonds, with issuers across a variety of sectors poised to benefit in our opinion. As a result, as of the end of the period, we continued to favor certain revenue bond sectors, including the Transportation and Healthcare sectors. Transportation issuers, including airports and toll roads, entered the coronavirus crisis with significant reserves and have received additional aid to weather the weakened demand. Hospital volumes have returned to pre-pandemic levels or better for the most part, with operating cash flow that is expected to be better than it was in 2020 for most providers. Ongoing tight cost controls are expected to remain through the balance of 2021 along with further release of capital spending restraints. Given the continuing strength of U.S. housing, we believe fundamentals are on solid footing for housing development sector bonds, and we continue to maintain a positive outlook. Significant fiscal support has helped state and local issuers solidify their budgets, and many of them have a meaningful, sustainable surplus in our view. As of the end of the period, we continued to favor local general obligation bonds over state issued general obligation bonds due to more attractive valuations in our view and a reliance on property taxes, which has provided greater revenue stability.
Hartford Municipal Short Duration Fund
Fund Overview – (continued)
October 31, 2021 (Unaudited)
Important Risks
Investing involves risk, including the possible loss of principal. Security prices fluctuate in value depending on general market and economic conditions and the prospects of individual companies. • Fixed income security risks include credit, liquidity, call, duration, and interest-rate risk. As interest rates rise, bond prices generally fall. • Municipal securities may be adversely impacted by state/local, political, economic, or market conditions. Although the Fund primarily seeks income that is exempt from federal income taxes, investors may be subject to the federal Alternative Minimum Tax as well as state and local income taxes. Capital gains, if any, are taxable. • Investments in high-yield (“junk”) bonds involve greater risk of price volatility, illiquidity, and default than higher-rated debt securities. • Integration of environmental, social, and/or governance (ESG) factors into the investment process may not work as intended.
| Composition of Municipal Bonds(1) |
| as of 10/31/2021 |
| Municipal Bonds | Percentage of
Net Assets |
| Airport | 4.2% |
| Development | 5.1 |
| Education | 1.8 |
| General Obligation | 6.8 |
| Higher Education | 3.4 |
| Housing | 2.3 |
| Medical | 6.4 |
| Multifamily Housing | 0.1 |
| Nursing Homes | 6.1 |
| Other (2) | 27.3 |
| Power | 2.5 |
| School District | 6.9 |
| Single Family Housing | 8.5 |
| Student Loan | 2.3 |
| Tobacco | 1.9 |
| Transportation | 6.6 |
| Utilities | 0.3 |
| Water | 1.0 |
| Total | 93.5% |
| Short-Term Investments | 6.5 |
| Other Assets & Liabilities | (0.0) * |
| Total | 100.0% |
| * | Percentage rounds to zero. |
| (1) | For Fund compliance purposes, the Fund may not use the same classification system. These classifications are used for financial reporting purposes. |
| (2) | Other refers to Special Tax District Bonds, Tax Increment Bonds and certain Community Development District bonds. |
The Hartford Short Duration Fund
Fund Overview
October 31, 2021 (Unaudited)
Inception 10/31/2002
Sub-advised by Wellington Management Company LLP | Investment objective – The Fund seeks to provide current income and long-term total return. |
Comparison of Change in Value of $10,000 Investment (10/31/2011 - 10/31/2021)
The chart above represents the hypothetical growth of a $10,000 investment in Class A, which includes the maximum sales charge applicable to Class A shares. Returns for the Fund’s other classes will vary from what is seen above due to differences in the expenses charged to those share classes.
| Average Annual Total Returns |
| for the Periods Ending 10/31/2021 |
| | 1 Year | 5 Years | 10 Years |
| Class A1 | 1.55% | 2.44% | 2.23% |
| Class A2 | -0.48% | 2.03% | 2.03% |
| Class C1 | 0.81% | 1.68% | 1.47% |
| Class C3 | -0.19% | 1.68% | 1.47% |
| Class I1 | 1.88% | 2.73% | 2.53% |
| Class R31 | 1.33% | 2.17% | 1.95% |
| Class R41 | 1.51% | 2.45% | 2.25% |
| Class R51 | 1.77% | 2.74% | 2.53% |
| Class R61 | 1.90% | 2.79% | 2.59% |
| Class Y1 | 1.87% | 2.74% | 2.57% |
| Class F1 | 1.81% | 2.80% | 2.57% |
| Bloomberg 1-3 Year U.S. Government/Credit Index | -0.05% | 1.83% | 1.41% |
| 1 | Without sales charge |
| 2 | Reflects maximum sales charge of 2.00% |
| 3 | Reflects a contingent deferred sales charge of 1.00% |
PERFORMANCE DATA QUOTED REPRESENTS PAST PERFORMANCE AND DOES NOT GUARANTEE FUTURE RESULTS. The investment return and principal value of the investment will fluctuate so that investors’ shares, when redeemed, may be worth more or less than their original cost. The chart and table do not reflect the deductions of taxes that a shareholder would pay on Fund distributions or the redemption of Fund shares. Current performance may be lower or higher than the performance data quoted. To obtain performance data current to the most recent month-end, please visit our website hartfordfunds.com.
Total returns presented above were calculated using the applicable class' net asset value available to shareholders for sale or redemption of Fund shares on 10/31/2021, which may exclude investment transactions as of this date. All share class returns assume the reinvestment of all distributions at net asset value and the deduction of all fund expenses. The total returns presented in the Financial Highlights section of the report are calculated in the same manner, but also take into account certain
adjustments that are necessary under generally accepted accounting principles. As a result, the total returns in the Financial Highlights section may differ from the total returns presented above.
Class R6 shares commenced operations on 02/28/2019. Performance prior to that date is that of the Fund’s Class Y shares. Class F shares commenced operations on 02/28/2017. Performance for Class F shares prior to 02/28/2017 reflects the performance of Class I shares.
To the extent a share class has adopted the prior performance of another share class that had different operating expenses, such performance has not been adjusted to reflect the different operating expenses. If the performance were adjusted, it may have been higher or lower.
Performance information includes performance under the Fund’s previous sub-adviser, Hartford Investment Management Company, using a modified investment strategy. As of 03/05/2012, Hartford Investment Management Company no longer served as the sub-adviser to the Fund.
You cannot invest directly in an index.
See “Benchmark Glossary” for benchmark descriptions.
Performance information may reflect expense waivers/reimbursements without which performance would have been lower. For information on current expense waivers/reimbursements, please see the prospectus.
The Hartford Short Duration Fund
Fund Overview – (continued)
October 31, 2021 (Unaudited)
| Operating Expenses* | Gross | Net |
| Class A | 0.83% | 0.81% |
| Class C | 1.54% | 1.54% |
| Class I | 0.52% | 0.52% |
| Class R3 | 1.15% | 1.15% |
| Class R4 | 0.86% | 0.86% |
| Class R5 | 0.56% | 0.56% |
| Class R6 | 0.44% | 0.44% |
| Class Y | 0.55% | 0.55% |
| Class F | 0.44% | 0.44% |
| * | Expenses as shown in the Fund’s most recent prospectus. Gross expenses do not reflect contractual fee waivers or expense reimbursement arrangements. Net expenses reflect such arrangements only with respect to Class A. These arrangements remain in effect until 02/28/2022 unless the Fund’s Board of Directors approves an earlier termination. Actual expenses may be higher or lower. Please see accompanying Financial Highlights for expense ratios for the period ended 10/31/2021. |
Portfolio Manager
Timothy E. Smith
Senior Managing Director and Fixed Income Portfolio Manager
Wellington Management Company LLP
Manager Discussion
How did the Fund perform during the period?
The Class A shares of The Hartford Short Duration Fund returned 1.55%, before sales charge, for the twelve-month period ended October 31, 2021, outperforming the Fund’s benchmark, the Bloomberg 1-3 Year U.S. Government/Credit Index, which returned -0.05% for the same period. For the same period, the Class A shares of the Fund, before sales charges, outperformed the 1.15% average return of the Lipper Short Investment Grade Debt Funds peer group, a group of funds with investment strategies similar to those of the Fund.
Why did the Fund perform this way?
United States (U.S.) fixed-income markets generated mixed total returns during the trailing twelve months ended October 31, 2021, with lower quality sectors such as bank loans and high yield performing the best. The Bloomberg U.S. Aggregate Bond Index returned -0.48% during the period, driven by rising U.S. Treasury yields. Over the same period, sovereign yields drifted higher across several developed markets as major central banks laid the groundwork for tighter monetary policy and started to reduce monetary stimulus at varying speeds. The U.S. Federal Reserve (Fed) indicated during the period that it could start to taper its large-scale asset purchases by November 2021 and projected three rate increases in 2023.
Non-government bond sectors generally outperformed duration-equivalent government bonds over the period. Early in the period, spread tightening was driven by encouraging vaccine trials and easing of COVID-19 restrictions, which led to improved economic data. Later in the period, spreads continued to tighten as central banks aimed to mitigate risks, vaccine distribution picked up pace, and credit fundamentals generally improved. By the end of the period, credit spreads had widened slightly.
Global central banks maintained highly accommodative policy stances at the beginning of the period. By the end of the period, though, central banks took further steps toward policy normalization in response to mounting inflation pressures. At the start of the period, the Fed extended its emergency liquidity provisions, but took steps toward removing policy accommodation by the end of the period. The European Central Bank (ECB) reduced the pace of asset purchases by the end of the period after having expanded the program at the end of 2020 and the first quarter of 2021.
Global economic activity dropped off sharply in the aftermath of coronavirus economic shutdowns but started to rebound as economies reopened during the period. Global gross domestic product (GDP) growth continued to recover during the latter part of the twelve-month period. However, ongoing supply chain disruptions and labor shortages that occurred later in the period indicated inflation pressures may prove less “transitory” than previously suspected. The U.S. labor market continued to heal while house prices rose sharply, supported by low mortgage rates and record low supply. During the latter part of the period, Chinese manufacturing Purchasing Managers’ Index (PMI) contracted to the lowest level since the onset of the pandemic, weighed down by rising costs, while the services PMI expanded. Eurozone manufacturing PMI remained elevated during the period but then fell to a six-month low due to lack of shipping capacity and constrained supply to meet demand.
The Fund’s allocation to bank loans outside of the Fund’s benchmark, the Bloomberg 1-3 Year U.S. Government/Credit Index, contributed positively to relative performance over the period. The Fund’s overweight to and security selection within investment-grade corporate bonds and out-of-benchmark allocations to high-yield bonds contributed positively as well. Within investment-grade corporate bonds, those in the Industrials, Financials and Utilities sectors all
The Hartford Short Duration Fund
Fund Overview – (continued)
October 31, 2021 (Unaudited)
contributed positively to relative returns. In the securitized sectors, the Fund’s out-of-benchmark allocations to asset-backed securities (ABS), mortgage-backed securities (MBS) and commercial mortgage-backed securities (CMBS), all contributed positively to relative performance. The Fund’s duration/yield curve positioning detracted from relative returns due to an overweight at the five-year portion of the yield curve as rates increased over the period.
Derivatives were not used in a significant manner in the Fund during the period and did not have a material impact on performance during the period.
What is the outlook as of the end of the period?
As of the end of the period, we favored investment-grade corporate credit and securitized sectors. Our base case expectation is for the U.S. economy to continue to grow at a steady pace, as the employment situation has improved, and strength of the consumer remains high in our view. We believe pent up demand, high savings levels, high business and consumer confidence, and high wages have helped support a continuing economic recovery.
Federal fiscal stimulus has also offered major support for the recovery over the period, and we expect it could continue to be supportive over the near future. The Fund’s overall duration posture is close to neutral as of the end of the period.
As of the end of the period, we continued to see select opportunities when combining fundamentals and valuations across the corporate sector. With this sound fundamental and strong technical backdrop, valuations on corporate credit remained at the tighter end relative to historical levels. Corporate credit spreads are likely to remain rangebound, in our view. A future change from inflows to persistent outflows from the fixed-income market, renewed coronavirus fears, or a spike in mergers and acquisitions (M&A) activity could challenge this view. Issuers have continued to take advantage of the lower cost of debt relative to historical yields. M&A activity has increased and helped support the need for new debt financing. However, we typically see a seasonal decline in this activity late in the calendar year. We expect a similar trend at the end of 2021. We are focusing on higher-quality bonds that offer a sensible source of income in this environment, since the upside potential for credit spread tightening is now limited in our view. As of the end of the period, we continued to favor U.S. banks, as we believe balance sheets are less risky due to improved capital ratios and regulation. We are focused on fixed-rate issues within the primary market and remain diversified within our corporate bond exposure.
With strong economic growth, high inflation, and improved employment statistics, Fed tapering of MBS purchases remains the key risk to watch in the mortgage market, in our view. Valuations have benefited from the strong technical backdrop in the MBS market. However, looking ahead, volatility could remain on the high side, in our view, especially given tapering uncertainty.
U.S. consumer fundamentals continued to hold up very well as of the period’s end, supported by fiscal stimulus. Within the sector, we remain focused on the traditional higher-quality ABS sectors, including auto, credit card, and equipment ABS, as of the end of the period.
Important Risks
Investing involves risk, including the possible loss of principal. Security prices fluctuate in value depending on general market and economic conditions and the prospects of individual companies. The Fund may allocate a portion of its assets to specialist portfolio managers, which may not work as intended. • Fixed income security risks include credit, liquidity, call, duration, event, and interest-rate risk. As interest rates rise, bond prices generally fall. • Loans can be difficult to value and less liquid than other types of debt instruments; they are also subject to nonpayment, collateral, bankruptcy, default, extension, prepayment and insolvency risks. • The risks associated with mortgage-related and asset-backed securities as well as collateralized loan obligations (CLOs) include credit, interest-rate, prepayment, liquidity, default and extension risk. • Investments in high-yield (“junk”) bonds involve greater risk of price volatility, illiquidity, and default than higher-rated debt securities. • Derivatives are generally more volatile and sensitive to changes in market or economic conditions than other securities; their risks include currency, leverage, liquidity, index, pricing, regulatory and counterparty risk. • Foreign investments may be more volatile and less liquid than U.S. investments and are subject to the risk of currency fluctuations and adverse political, economic and regulatory developments. • Restricted securities may be more difficult to sell and price than other securities. • Obligations of U.S. Government agencies are supported by varying degrees of credit but are generally not backed by the full faith and credit of the U.S. Government.
| Composition by Security Type(1) |
| as of 10/31/2021 |
| Category | Percentage of
Net Assets |
| Fixed Income Securities | |
| Asset & Commercial Mortgage-Backed Securities | 24.1% |
| Corporate Bonds | 50.0 |
| Municipal Bonds | 0.6 |
| Senior Floating Rate Interests | 19.4 |
| U.S. Government Agencies(2) | 4.1 |
| U.S. Government Securities | 1.6 |
| Total | 99.8% |
| Short-Term Investments | 0.4 |
| Other Assets & Liabilities | (0.2) |
| Total | 100.0% |
| (1) | For Fund compliance purposes, the Fund may not use the same classification system. These classifications are used for financial reporting purposes. |
| (2) | All, or a portion of the securities categorized as U.S. Government Agencies, were agency mortgage-backed securities as of October 31, 2021. |
The Hartford Strategic Income Fund
Fund Overview
October 31, 2021 (Unaudited)
Inception 05/31/2007
Sub-advised by Wellington Management Company LLP | Investment objective – The Fund seeks to provide current income and long-term total return. |
Comparison of Change in Value of $10,000 Investment (10/31/2011 - 10/31/2021)
The chart above represents the hypothetical growth of a $10,000 investment in Class A, which includes the maximum sales charge applicable to Class A shares. Returns for the Fund’s other classes will vary from what is seen above due to differences in the expenses charged to those share classes.
| Average Annual Total Returns |
| for the Periods Ending 10/31/2021 |
| | 1 Year | 5 Years | 10 Years |
| Class A1 | 5.54% | 5.87% | 5.02% |
| Class A2 | 0.79% | 4.90% | 4.54% |
| Class C1 | 4.89% | 5.09% | 4.26% |
| Class C3 | 3.89% | 5.09% | 4.26% |
| Class I1 | 5.94% | 6.15% | 5.30% |
| Class R31 | 5.18% | 5.52% | 4.68% |
| Class R41 | 5.55% | 5.85% | 5.01% |
| Class R51 | 5.86% | 6.16% | 5.33% |
| Class R61 | 5.96% | 6.28% | 5.40% |
| Class Y1 | 5.86% | 6.20% | 5.36% |
| Class F1 | 5.94% | 6.22% | 5.34% |
| Bloomberg U.S. Aggregate Bond Index | -0.48% | 3.10% | 3.00% |
| 1 | Without sales charge |
| 2 | Reflects maximum sales charge of 4.50% |
| 3 | Reflects a contingent deferred sales charge of 1.00% |
PERFORMANCE DATA QUOTED REPRESENTS PAST PERFORMANCE AND DOES NOT GUARANTEE FUTURE RESULTS. The investment return and principal value of the investment will fluctuate so that investors’ shares, when redeemed, may be worth more or less than their original cost. The chart and table do not reflect the deductions of taxes that a shareholder would pay on Fund distributions or the redemption of Fund shares. Current performance may be lower or higher than the performance data quoted. To obtain performance data current to the most recent month-end, please visit our website hartfordfunds.com.
Total returns presented above were calculated using the applicable class' net asset value available to shareholders for sale or redemption of Fund shares on 10/31/2021, which may exclude investment transactions as of this date. All share class returns assume the reinvestment of all distributions at net asset value and the deduction of all fund expenses. The total returns presented in the Financial Highlights section of the report are calculated in the same manner, but also take into account certain
adjustments that are necessary under generally accepted accounting principles. As a result, the total returns in the Financial Highlights section may differ from the total returns presented above.
Class R6 shares commenced operations on 11/07/2014. Performance prior to that date is that of the Fund’s Class Y shares. Class F shares commenced operations on 02/28/2017. Performance prior to that date is that of the Fund’s Class I shares.
To the extent a share class has adopted the prior performance of another share class that had different operating expenses, such performance has not been adjusted to reflect the different operating expenses. If the performance were adjusted, it may have been higher or lower.
Performance information includes performance under the Fund’s previous sub-adviser, Hartford Investment Management Company, using a modified investment strategy. As of 04/02/2012, Hartford Investment Management Company no longer served as the sub-adviser to the Fund.
You cannot invest directly in an index.
See “Benchmark Glossary” for benchmark descriptions.
Performance information may reflect expense waivers/reimbursements without which performance would have been lower.
The Hartford Strategic Income Fund
Fund Overview – (continued)
October 31, 2021 (Unaudited)
| Operating Expenses* | Gross | Net |
| Class A | 0.98% | 0.98% |
| Class C | 1.70% | 1.70% |
| Class I | 0.70% | 0.70% |
| Class R3 | 1.30% | 1.30% |
| Class R4 | 1.00% | 1.00% |
| Class R5 | 0.70% | 0.70% |
| Class R6 | 0.60% | 0.60% |
| Class Y | 0.70% | 0.70% |
| Class F | 0.59% | 0.59% |
| * | Expenses as shown in the Fund’s most recent prospectus. Expenses shown include acquired fund fees and expenses. Actual expenses may be higher or lower. Please see accompanying Financial Highlights for expense ratios for the period ended 10/31/2021. |
Portfolio Managers
Campe Goodman, CFA
Senior Managing Director and Fixed Income Portfolio Manager
Wellington Management Company LLP
Joseph F. Marvan, CFA
Senior Managing Director and Fixed Income Portfolio Manager
Wellington Management Company LLP
Robert D. Burn, CFA
Managing Director and Fixed Income Portfolio Manager
Wellington Management Company LLP
Manager Discussion
How did the Fund perform during the period?
The Class A shares of The Hartford Strategic Income Fund returned 5.54%, before sales charges, for the twelve-month period ended October 31, 2021, outperforming the Fund’s benchmark, the Bloomberg U.S. Aggregate Bond Index, which returned -0.48% for the same period. For the same period, the Class A shares of the Fund, before sales charges, underperformed the 5.63% average return of the Lipper Multi-Sector Income Funds peer group, a group of funds that seeks current income by allocating assets among several different fixed income sectors (with no more than 65% in any one sector except for defensive purposes), including United States (US) government and foreign governments, with a significant portion of assets in securities rated below investment-grade.
Why did the Fund perform this way?
Over the period, global fixed income markets generated mixed total returns with lower quality sectors such as bank loans and high yield performing the best. Global sovereign debt yields drifted higher across several developed markets as major central banks laid the groundwork for tighter monetary policy and started to reduce monetary stimulus at varying speeds. Over the same period, non-government bond sectors generally outperformed duration-equivalent government bonds. Early in the period, spread tightening was driven by encouraging vaccine trials and easing of COVID-19 restrictions, which led to improved economic data. Spreads continued to narrow over most of the period
as central banks aimed to mitigate risks, vaccine distribution picked up pace, and credit fundamentals generally improved. By the end of the period, credit spreads had widened slightly.
Global central banks maintained highly accommodative policy stances at the beginning of the period. By the end of the period, though, central bankers took further steps toward policy normalization in response to mounting inflation pressures. At the start of the period, the U.S. Federal Reserve (Fed) extended its emergency liquidity provisions but took steps toward removing policy accommodation by the end of the period. The European Central Bank (ECB) reduced the pace of quantitative easing purchases by the end of the period after having expanded the program at the end of 2020 and the first quarter of 2021.
Global economic activity dropped off sharply in the aftermath of coronavirus economic shutdowns but started to rebound as economies reopened during the period. Global gross domestic product (GDP) growth continued to recover during the latter part of the twelve-month period. However, ongoing supply chain disruptions and labor shortages that occurred later in the period indicated inflation pressures may prove less “transitory” than previously suspected. The U.S. labor market continued to heal while house prices rose sharply, supported by low mortgage rates and record low supply. During the latter part of the period, the Chinese manufacturing Purchasing Managers Index (PMI) contracted to the lowest level since the onset of the pandemic, weighed down by rising costs, while the services PMI
The Hartford Strategic Income Fund
Fund Overview – (continued)
October 31, 2021 (Unaudited)
expanded. Eurozone manufacturing PMI remained elevated during the period but then fell to a six-month low due to a lack of shipping capacity and constrained supply to meet demand.
The U.S. dollar weakened early in the period on the Fed’s pledge to maintain policy accommodation, but later rallied versus most currencies supported by rising U.S. Treasury yields, Fed tapering expectations, and a flight to quality driven by concerns about a potential default by Chinese real estate company Evergrande and the U.S. debt ceiling deadlock. The British pound ended the period lower as supply-chain disruptions created significant challenges for the United Kingdom (U.K.), with spiking gas prices and fuel shortages engulfing the country. Additionally, staff shortages stemming from the coronavirus pandemic and the U.K.’s exit from the European Union (EU), also known as Brexit, drove job vacancies to a record high. The euro also ended the period lower. Most emerging markets (EM) currencies ended the period lower driven by China’s economic slowdown, Fed tapering concerns, and political uncertainty.
On an excess return basis (returns over U.S. Treasuries), credit risk sectors generally outperformed over the trailing twelve-month period ending October 31, 2021. The lowest-rated sectors were among the best performers during the period, benefiting from pent-up demand as economies reopened and COVID-19 vaccination rates increased. High-yield bonds and investment-grade corporate bonds generated positive excess returns over the same period, while securitized sectors had mixed results. Agency mortgage-backed securities (MBS) generated negative excess returns, while asset backed securities (ABS) and commercial mortgage-backed securities (CMBS) generated positive excess returns over the period.
Consistent with the Fund’s objective to provide current income and long-term total return, we continued to position the Fund during the period with an overweight to credit risk sectors, including high-yield credit, emerging-markets debt, and bank loans.
Within credit, coupon income helped cushion against the impact of higher sovereign debt yields and widening spreads by the end of the period. The primary contributor to the Fund’s outperformance versus the Bloomberg U.S. Aggregate Bond Index over the period was positioning within global high yield, most notably positioning within the Industrials and Financials sectors. An allocation to bank loans, particularly in the Industrials sector, also contributed positively to relative results. An allocation to convertible bonds also contributed positively to returns over the same period due to their correlation to rising equities. The Fund remained positioned as of the end of the period with an underweight to investment-grade credit in favor of bank loans and high yield bonds during the period. An underweight to investment-grade corporate bonds detracted from relative performance over the same period. The Fund’s allocation to emerging-markets debt was another top contributor to relative results during the period, particularly sovereign external debt and corporate debt exposure, as a recovering global economy supported emerging markets via a boost through the commodity and global trade channels. Allocations to securitized sectors contributed positively to performance, benefiting from continued economic recovery. CMBS aided relative results during the period as well, as collateral performance benefited from continued economic recovery and
demand for higher-yielding assets. An allocation to non-agency residential mortgage-backed securities (NA RMBS), particularly post-crisis “2.0” issuances was the top contributor to relative performance within the securitized sectors during the period. Allocations to agency MBS passthroughs and collateral debt obligations (CLOs) also benefited relative performance. The Fund maintained a structural allocation to developed-market currencies at the end of the period. Overall, currency exposure was a positive contributor to relative results over the period. The Fund’s allocation to Treasury Inflation-Protected Securities (TIPS) had a positive impact on relative results as TIPS outperformed duration-equivalent nominal U.S. Treasuries during the period.
The Fund’s derivative exposure to high-yield bonds contributed positively to relative results, particularly credit default swap indices; exposure to emerging markets Credit Default Swap Index (CDX) was also a positive contributor, while investment-grade CDX exposure detracted from relative results. The Fund’s tactical duration and yield curve positioning had a slightly negative impact overall on the Fund’s performance.
What is the outlook as of the end of the period?
We believe the outlook for global economic growth will continue to be above trend, underpinned by a healing labor market and an improving public health backdrop. We also believe that bouts of market volatility could present opportunities to buy assets at what we consider to be attractive valuations. As of the end of the period, the Fund was positioned with a moderately pro-cyclical risk posture while preserving cash/liquidity and has become shorter in terms of duration positioning. In our view, breakeven inflation rates were attractive at the end of the period and we positioned the Fund for increased inflation expectations. As of the end of the period, the Fund was positioned with an underweight to investment-grade corporates and agency MBS in favor of higher-yielding sectors such as high yield, U.S. bank loans, and parts of the structured finance universe (non-agency RMBS), focusing on companies that have not fully recovered to pre-crisis valuations. Within emerging markets, we believe improved economic data coupled with ample global liquidity could be supportive for emerging asset markets, while lasting coronavirus impacts could drive uneven growth and fiscal trajectories. As a result, we are focused on countries with relatively low repayment needs over the next few years. We believe emerging-markets corporate bonds are better positioned than sovereign bonds to restore their credit profiles, and as of the end of the period, we maintained the Fund’s exposures to corporate issuers with prudent balance sheet management in our view. As of the end of the period, we also held a small exposure to select convertible bond issuers for their strong upside potential, in our view, focusing on the Technology and Biotech sectors.
Important Risks
Investing involves risk, including the possible loss of principal. Security prices fluctuate in value depending on general market and economic conditions and the prospects of individual companies. The Fund may allocate a portion of its assets to specialist portfolio managers, which may not work as intended. • Fixed income security risks include credit, liquidity, call, duration, and interest-rate risk. As interest rates rise, bond prices generally fall. • Investments in high-yield (“junk”) bonds involve greater risk of price volatility, illiquidity, and default than
The Hartford Strategic Income Fund
Fund Overview – (continued)
October 31, 2021 (Unaudited)
higher-rated debt securities. • Foreign investments may be more volatile and less liquid than U.S. investments and are subject to the risk of currency fluctuations and adverse political, economic and regulatory developments. These risks may be greater, and include additional risks, for investments in emerging markets. • Derivatives are generally more volatile and sensitive to changes in market or economic conditions than other securities; their risks include currency, leverage, liquidity, index, pricing, regulatory and counterparty risk. • The risks associated with mortgage-related and asset-backed securities include credit, interest-rate, prepayment, liquidity, default and extension risk. • The purchase of securities in the To-Be-Announced (TBA) market can result in higher portfolio turnover and related expenses as well as price and counterparty risk. • The Fund may have high portfolio turnover, which could increase its transaction costs and an investor’s tax liability. • Restricted securities may be more difficult to sell and price than other securities. • Loans can be difficult to value and less liquid than other types of debt instruments; they are also subject to nonpayment, collateral, bankruptcy, default, extension, prepayment and insolvency risks. • Obligations of U.S. Government agencies are supported by varying degrees of credit but are generally not backed by the full faith and credit of the U.S. Government.
| Composition by Security Type(1) |
| as of 10/31/2021 |
| Category | Percentage of
Net Assets |
| Equity Securities | |
| Common Stocks | 0.0% * |
| Convertible Preferred Stocks | 0.4 |
| Escrows | 0.1 |
| Warrants | 0.0 * |
| Total | 0.5% |
| Fixed Income Securities | |
| Asset & Commercial Mortgage-Backed Securities | 9.5% |
| Convertible Bonds | 3.7 |
| Corporate Bonds | 25.3 |
| Foreign Government Obligations | 21.0 |
| Municipal Bonds | 0.7 |
| Senior Floating Rate Interests | 19.9 |
| U.S. Government Agencies(2) | 10.5 |
| U.S. Government Securities | 13.8 |
| Total | 104.4% |
| Short-Term Investments | 4.4 |
| Purchased Options | 0.0 * |
| Other Assets & Liabilities | (9.3) |
| Total | 100.0% |
| * | Percentage rounds to zero. |
| (1) | For Fund compliance purposes, the Fund may not use the same classification system. These classifications are used for financial reporting purposes. |
| (2) | All, or a portion of the securities categorized as U.S. Government Agencies, were agency mortgage-backed securities as of October 31, 2021. |
Hartford Sustainable Municipal Bond Fund (formerly, Hartford Muncipal Income Fund)
Fund Overview
October 31, 2021 (Unaudited)
Inception 05/29/2015
Sub-advised by Wellington Management Company LLP | Investment objective – The Fund seeks to provide current income that is generally exempt from federal income taxes, and long-term total return, through investments within a sustainability framework. |
Comparison of Change in Value of $10,000 Investment (05/29/2015 - 10/31/2021)
The chart above represents the hypothetical growth of a $10,000 investment in Class A, which includes the maximum sales charge applicable to Class A shares. Returns for the Fund’s other classes will vary from what is seen above due to differences in the expenses charged to those share classes.
| Average Annual Total Returns |
| for the Periods Ending 10/31/2021 |
| | 1 Year | 5 Years | Since
Inception1 |
| Class A2 | 3.15% | 3.52% | 3.72% |
| Class A3 | -1.49% | 2.57% | 2.98% |
| Class C2 | 2.48% | 3.12% | 3.24% |
| Class C4 | 1.48% | 3.12% | 3.24% |
| Class I2 | 3.49% | 3.76% | 3.97% |
| Class F2 | 3.47% | 3.80% | 3.99% |
| Bloomberg Municipal Bond Index | 2.64% | 3.41% | 3.60% |
| 1 | Inception: 05/29/2015 |
| 2 | Without sales charge |
| 3 | Reflects maximum sales charge of 4.50% |
| 4 | Reflects a contingent deferred sales charge of 1.00% |
PERFORMANCE DATA QUOTED REPRESENTS PAST PERFORMANCE AND DOES NOT GUARANTEE FUTURE RESULTS. The investment return and principal value of the investment will fluctuate so that investors’ shares, when redeemed, may be worth more or less than their original cost. The chart and table do not reflect the deductions of taxes that a shareholder would pay on Fund distributions or the redemption of Fund shares. Current performance may be lower or higher than the performance data quoted. To obtain performance data current to the most recent month-end, please visit our website hartfordfunds.com.
Total returns presented above were calculated using the applicable class' net asset value available to shareholders for sale or redemption of Fund shares on 10/31/2021, which may exclude investment transactions as of this date. All share class returns assume the reinvestment of all distributions at net asset value and the deduction of all fund expenses. The total returns presented in the Financial Highlights section of the report are calculated in the same manner, but also take into account certain
adjustments that are necessary under generally accepted accounting principles. As a result, the total returns in the Financial Highlights section may differ from the total returns presented above.
Class F shares commenced operations on 02/28/2017. Performance prior to that date is that of the Fund’s Class I shares.
To the extent a share class has adopted the prior performance of another share class that had different operating expenses, such performance has not been adjusted to reflect the different operating expenses. If the performance were adjusted, it may have been higher or lower.
Effective 04/30/2021, the Hartford Sustainable Municipal Bond Fund (formerly known as the Hartford Municipal Income Fund) changed its name, investment objective and principal investment strategy. Performance prior to 04/30/2021 reflects the Fund’s performance when it pursued a different investment objective and modified investment strategy.
You cannot invest directly in an index.
See “Benchmark Glossary” for benchmark descriptions.
Performance information may reflect expense waivers/reimbursements without which performance would have been lower. For information on current expense waivers/reimbursements, please see the prospectus.
Hartford Sustainable Municipal Bond Fund (formerly, Hartford Muncipal Income Fund)
Fund Overview – (continued)
October 31, 2021 (Unaudited)
| Operating Expenses* | Gross | Net |
| Class A | 0.89% | 0.70% |
| Class C | 1.70% | 1.45% |
| Class I | 0.69% | 0.47% |
| Class F | 0.58% | 0.40% |
| * | Expenses as shown in the Fund’s most recent prospectus. Gross expenses do not reflect contractual expense reimbursement arrangements. Net expenses reflect such arrangements in instances when they reduce gross expenses. These arrangements remain in effect until 02/28/2022 unless the Fund’s Board of Directors approves an earlier termination. Expenses shown include acquired fund fees and expenses. Actual expenses may be higher or lower. Please see accompanying Financial Highlights for expense ratios for the period ended 10/31/2021. |
Portfolio Managers
Brad W. Libby
Managing Director and Fixed Income Portfolio Manager/Credit Analyst
Wellington Management Company LLP
Timothy D. Haney, CFA
Senior Managing Director and Fixed Income Portfolio Manager
Wellington Management Company LLP
Manager Discussion
How did the Fund perform during the period?
The Class A shares of the Hartford Sustainable Municipal Bond Fund returned 3.15%, before sales charges, for the twelve-month period ended October 31, 2021, outperforming the Fund’s benchmark, the Bloomberg Municipal Bond Index, which returned 2.64% for the same period. For the same period, the Class A shares of the Fund, before sales charges, underperformed the 4.02% average return of the Lipper General & Insured Municipal Debt Funds peer group, a group of funds with investment strategies similar to those of the Fund.
Why did the Fund perform this way?
United States (U.S.) fixed income markets generated mixed total returns during the trailing twelve months ended October 31, 2021, with lower quality sectors such as bank loans and high yield performing the best. The Bloomberg U.S. Aggregate Bond Index generated a return of -0.48% during the period, driven by rising U.S. Treasury yields. Yields drifted higher during the same period across several developed markets as major central banks laid the groundwork for policy normalization and started to reduce monetary stimulus at varying speeds.
Tax-exempt municipal bonds, as represented by the Bloomberg Municipal Bond Index, posted a positive total return of 2.64% during the period. This index outperformed duration-equivalent Treasuries over the same period. The yield on 10-year AAA-rated general obligation municipal bonds (GOs) increased during the twelve-month period ended October 31, 2021, as did the yield on 10-year Treasuries. The ratio of yields on 10-year AAA GOs to yields on
10-year Treasuries decreased over the period, from 106% to 78%. Over the period, municipal bond fundamentals were generally strong, driven mainly by a high level of fiscal spending. Retail market demand was also supportive on municipal bonds over the period.
The Fed maintained highly accommodative policy stances at the beginning of the period. By the end of the period, central banks took further steps toward the end of quantitative easing in response to mounting inflation pressures. At the start of the period, the Fed extended its emergency liquidity provisions. By the end of the period, it indicated it could start to taper its large-scale asset purchases by November 2021 and projected three rate increases in 2023.
Effective April 30, 2021, the Fund changed its name, investment objective and principal investment strategy. The primary contributors to the Fund’s performance relative to the Bloomberg Municipal Bond Index were similar for both the period from November 1, 2020 through April 30, 2021 and the period from May 1, 2021 through October 31, 2021. During the twelve-month period, the primary contributor to the Fund’s returns relative to the Bloomberg Municipal Bond Index was an out-of-benchmark allocation to high-yield municipal bonds, particularly revenue bonds. Also contributing to relative returns during the twelve-month period was security selection within both investment-grade revenue and general obligation bonds. Within revenue bonds, selection in the Tax/Lease, Healthcare and Education sectors each contributed positively to relative returns during the twelve-month period. Selection within both state and local general obligation bonds contributed positively to relative returns as well during the twelve-month period. Additionally, an overweight credit spread duration position versus the benchmark contributed positively
Hartford Sustainable Municipal Bond Fund (formerly, Hartford Muncipal Income Fund)
Fund Overview – (continued)
October 31, 2021 (Unaudited)
to relative returns during the twelve-month period. Finally, the Fund’s duration/yield curve positioning was moderately additive to relative returns during the twelve-month period.
Derivatives were not used in a significant manner in the Fund during the period and did not have a material impact on performance during the period.
What is the outlook as of the end of the period?
As of the end of the period, we believe municipal fundamentals are broadly positive based on what we consider to be strong economic activity and generous direct and indirect federal support in response to the COVID-19 pandemic. As of the end of the period, many issuers are sitting on sizable budget surpluses. Additionally, the prospects of an infrastructure bill could provide even more support to municipal bonds, with issuers across a variety of sectors poised to benefit in our opinion. As a result, as of the end of the period, we continued to favor certain revenue bond sectors, especially the Healthcare sector. Hospital volumes have returned to pre-pandemic levels or better for the most part, with what we expect to be better 2021 operating cash flow than in 2020 for most providers. Ongoing tight cost controls are expected to remain through the balance of 2021 along with further release of capital spending restraints. Given the continuing strength of U.S. housing, we believe fundamentals are on solid footing for housing development sector bonds, and we continue to maintain a positive outlook. Significant fiscal support has helped state and local issuers solidify their budgets, and many of them have a meaningful, sustainable surplus in our view. As of the end of the period, we continued to favor local GOs over state issued GOs due to more attractive valuations in our view and their reliance on property taxes that has provided greater revenue stability.
Important Risks
Investing involves risk, including the possible loss of principal. Security prices fluctuate in value depending on general market and economic conditions and the prospects of individual companies. • Fixed income security risks include credit, liquidity, call, duration, and interest-rate risk. As interest rates rise, bond prices generally fall. • Focusing on investments that involve sustainable initiatives may result in foregoing certain investments and underperformance comparative to funds that do not have a similar focus. There is a risk that the municipal bonds identified by the sub-adviser as promoting sustainable initiatives do not operate as anticipated. • Municipal securities may be adversely impacted by state/local, political, economic, or market conditions. Although the Fund primarily seeks income that is exempt from federal income taxes, investors may be subject to the federal Alternative Minimum Tax as well as state and local income taxes. Capital gains, if any, are taxable. • Investments in high-yield (“junk”) bonds involve greater risk of price volatility, illiquidity, and default than higher-rated debt securities.
| Composition of Municipal Bonds(1) |
| as of 10/31/2021 |
| Municipal Bonds | Percentage of
Net Assets |
| Airport | 1.9% |
| Development | 1.7 |
| Education | 2.1 |
| General Obligation | 12.3 |
| Higher Education | 6.3 |
| Housing | 1.4 |
| Medical | 9.1 |
| Mello-Roos District | 0.3 |
| Multifamily Housing | 0.3 |
| Nursing Homes | 7.2 |
| Other (2) | 16.8 |
| Pollution | 0.7 |
| Power | 4.1 |
| School District | 11.8 |
| Single Family Housing | 9.7 |
| Student Loan | 3.9 |
| Transportation | 7.3 |
| Utilities | 0.9 |
| Water | 2.6 |
| Total | 100.4% |
| Short-Term Investments | 2.0 |
| Other Assets & Liabilities | (2.4) |
| Total | 100.0% |
| (1) | For Fund compliance purposes, the Fund may not use the same classification system. These classifications are used for financial reporting purposes. |
| (2) | Other refers to Special Tax District Bonds, Tax Increment Bonds and certain Community Development District bonds. |
The Hartford Total Return Bond Fund
Fund Overview
October 31, 2021 (Unaudited)
Inception 07/22/1996
Sub-advised by Wellington Management Company LLP | Investment objective – The Fund seeks a competitive total return, with income as a secondary objective. |
Comparison of Change in Value of $10,000 Investment (10/31/2011 - 10/31/2021)
The chart above represents the hypothetical growth of a $10,000 investment in Class A, which includes the maximum sales charge applicable to Class A shares. Returns for the Fund’s other classes will vary from what is seen above due to differences in the expenses charged to those share classes.
| Average Annual Total Returns |
| for the Periods Ending 10/31/2021 |
| | 1 Year | 5 Years | 10 Years |
| Class A1 | 0.68% | 3.70% | 3.45% |
| Class A2 | -3.85% | 2.75% | 2.98% |
| Class C1 | -0.11% | 2.90% | 2.67% |
| Class C3 | -1.11% | 2.90% | 2.67% |
| Class I1 | 0.86% | 3.98% | 3.74% |
| Class R31 | 0.27% | 3.34% | 3.11% |
| Class R41 | 0.59% | 3.66% | 3.43% |
| Class R51 | 0.93% | 4.03% | 3.77% |
| Class R61 | 0.98% | 4.10% | 3.84% |
| Class Y1 | 0.89% | 4.03% | 3.83% |
| Class F1 | 0.97% | 4.09% | 3.79% |
| Bloomberg U.S. Aggregate Bond Index | -0.48% | 3.10% | 3.00% |
| 1 | Without sales charge |
| 2 | Reflects maximum sales charge of 4.50% |
| 3 | Reflects a contingent deferred sales charge of 1.00% |
PERFORMANCE DATA QUOTED REPRESENTS PAST PERFORMANCE AND DOES NOT GUARANTEE FUTURE RESULTS. The investment return and principal value of the investment will fluctuate so that investors’ shares, when redeemed, may be worth more or less than their original cost. The chart and table do not reflect the deductions of taxes that a shareholder would pay on Fund distributions or the redemption of Fund shares. Current performance may be lower or higher than the performance data quoted. To obtain performance data current to the most recent month-end, please visit our website hartfordfunds.com.
Total returns presented above were calculated using the applicable class' net asset value available to shareholders for sale or redemption of Fund shares on 10/31/2021, which may exclude investment transactions as of this date. All share class returns assume the reinvestment of all distributions at net asset value and the deduction of all fund expenses. The total returns presented in the Financial Highlights section of the report are calculated in the same manner, but also take into account certain
adjustments that are necessary under generally accepted accounting principles. As a result, the total returns in the Financial Highlights section may differ from the total returns presented above.
Class R6 shares commenced operations on 11/07/2014. Performance prior to that date is that of the Fund’s Class Y shares. Class F shares commenced operations on 02/28/2017. Performance prior to that date is that of the Fund’s Class I shares.
To the extent a share class has adopted the prior performance of another share class that had different operating expenses, such performance has not been adjusted to reflect the different operating expenses. If the performance were adjusted, it may have been higher or lower.
Performance information includes performance under the Fund’s previous sub-adviser, Hartford Investment Management Company. As of 03/05/2012, Hartford Investment Management Company no longer served as the sub-adviser to the Fund.
You cannot invest directly in an index.
See “Benchmark Glossary” for benchmark descriptions.
Performance information may reflect expense waivers/reimbursements without which performance would have been lower.
Class C shares of the Fund are closed to new investors, subject to certain exceptions. For more information, please see the Fund’s prospectus.
The Hartford Total Return Bond Fund
Fund Overview – (continued)
October 31, 2021 (Unaudited)
| Operating Expenses* | Gross | Net |
| Class A | 0.71% | 0.71% |
| Class C | 1.51% | 1.51% |
| Class I | 0.45% | 0.45% |
| Class R3 | 1.06% | 1.06% |
| Class R4 | 0.76% | 0.76% |
| Class R5 | 0.46% | 0.46% |
| Class R6 | 0.35% | 0.35% |
| Class Y | 0.45% | 0.45% |
| Class F | 0.34% | 0.34% |
| * | Expenses as shown in the Fund’s most recent prospectus. Actual expenses may be higher or lower. Please see accompanying Financial Highlights for expense ratios for the period ended 10/31/2021. |
Portfolio Managers
Joseph F. Marvan, CFA
Senior Managing Director and Fixed Income Portfolio Manager
Wellington Management Company LLP
Campe Goodman, CFA
Senior Managing Director and Fixed Income Portfolio Manager
Wellington Management Company LLP
Robert D. Burn, CFA
Managing Director and Fixed Income Portfolio Manager
Wellington Management Company LLP
Manager Discussion
How did the Fund perform during the period?
The Class A shares of The Hartford Total Return Bond Fund returned 0.68%, before sales charges, for the twelve-month period ended October 31, 2021, outperforming the Fund’s benchmark, the Bloomberg U.S. Aggregate Bond Index, which returned -0.48% for the same period. For the same period, the Class A shares of the Fund, before sales charges, also outperformed the 0.63% average return of the Lipper Core Bond Funds peer group, a group of funds with investment strategies similar to those of the Fund.
Why did the Fund perform this way?
United States (U.S.) fixed-income markets generated mixed total returns during the trailing twelve months ended October 31, 2021, with lower quality sectors such as bank loans and high yield performing the best. The Bloomberg U.S. Aggregate Bond Index returned -0.48% during the period, driven by rising U.S. Treasury yields. Over the same period, sovereign yields drifted higher across several developed markets as major central banks laid the groundwork for tighter monetary policy and started to reduce monetary stimulus at varying speeds. The U.S. Federal Reserve (Fed) indicated during the period that it could start to taper its large-scale asset purchases by November 2021 and projected three rate increases in 2023.
Non-government bond sectors generally outperformed duration-equivalent government bonds over the period. Early in the period, spread tightening was driven by encouraging vaccine trials and
easing of COVID-19 restrictions, which led to improved economic data. Later in the period, spreads continued to tighten as central banks aimed to mitigate risks, vaccine distribution picked up pace, and credit fundamentals generally improved. By the end of the period, credit spreads had widened slightly.
Global central banks maintained highly accommodative policy stances at the beginning of the period. By the end of the period, though, central banks took further steps toward policy normalization in response to mounting inflation pressures. At the start of the period, the Fed extended its emergency liquidity provisions, but took steps toward removing policy accommodation by the end of the period. The European Central Bank (ECB) reduced the pace of quantitative easing purchases by the end of the period after having expanded the program at the end of 2020 and the first quarter of 2021.
Global economic activity dropped off sharply in the aftermath of coronavirus economic shutdowns but started to rebound as economies reopened during the period. Global gross domestic product (GDP) growth continued to recover during the latter part of the twelve-month period. However, ongoing supply chain disruptions and labor shortages that occurred later in the period indicated inflation pressures may prove less “transitory” than previously suspected. The U.S. labor market continued to heal while house prices rose sharply, supported by low mortgage rates and record low supply. During the latter part of the period, Chinese manufacturing Purchasing Managers’ Index (PMI) contracted to the lowest level since the onset of the pandemic, weighed down by rising costs, while the services
The Hartford Total Return Bond Fund
Fund Overview – (continued)
October 31, 2021 (Unaudited)
PMI expanded. Eurozone manufacturing PMI remained elevated during the period but then fell to a six-month low due to lack of shipping capacity and constrained supply to meet demand.
The U.S. dollar weakened early in the period on the Fed’s pledge to maintain policy accommodation, but later rallied versus most currencies supported by rising U.S. yields, Fed tapering expectations, and a flight to quality driven by concerns about a potential default by Chinese real estate company Evergrande and the U.S. debt ceiling deadlock. The British pound ended the period lower as supply-chain disruptions created significant challenges for the United Kingdom (U.K.), with spiking gas prices and fuel shortages engulfing the country. Additionally, staff shortages stemming from the pandemic and the U.K.’s exit from the European Union (EU), also known as Brexit, drove job vacancies to a record high. The euro also ended the period lower. Most emerging markets (EM) currencies ended the period lower driven by China’s economic slowdown, Fed tapering concerns, and political uncertainty.
During the period, the Fund’s out-of-benchmark allocations to high yield and bank loans, particularly within the Industrials sector, were the primary drivers of the Fund’s outperformance relative to the Bloomberg U.S. Aggregate Bond Index as spreads continued to narrow across credit sectors for most of the same period. The Fund’s allocation to securitized sectors, including non-agency residential mortgage-backed securities (RMBS), commercial mortgage-backed securities (CMBS), collateralized loan obligations (CLOs), asset-backed securities (ABS), and agency mortgage-backed securities (MBS) all contributed positively to relative performance as spreads narrowed over most of the period in sync with other corporate credit markets, benefiting from continued economic recovery. The Fund’s positioning within investment-grade credit contributed positively to relative performance over the same period. The Fund’s modest allocation to emerging markets (EM), sovereign, and corporate debt had a positive impact on relative performance during the period as a recovering global economy supported emerging markets via a boost through the commodity and global trade channels. The Fund’s allocation to Treasury Inflation-Protected Securities (TIPS) during the period also contributed positively to relative results as inflation expectations increased during the same period.
During the period, we held tactical interest rate positionings in the Fund, implemented partially through interest rate swaps and bond futures, which also contributed positively to relative results.
What is the outlook as of the end of the period?
As of the end of the period, the Fund maintained a moderately pro-cyclical risk posture, which we believe may benefit from continued above trend growth that is underpinned in our opinion by a healing labor market and improving public health backdrop, though coronavirus variants could still hinder the economic recovery. The Fund ended the period with an underweight positioning to investment-grade credit in favor of higher-yielding and securitized sectors relative to the Bloomberg U.S. Aggregate Bond Index. The Fund maintained an overweight to agency MBS pass-throughs relative to the benchmark at the end of the period with a focus on relative value opportunities and income as we believe that income and bank demand can help cushion the impact of Fed tapering. As of the end of
the period, the Fund also held structured finance exposure tied to residential mortgages, high quality CLOs, collateralized mortgage obligations (CMOs), and senior CMBS tranches with attractive collateral in our view. The Fund held an out-of-benchmark allocation to high yield as of the end of the period as we expect default rates to continue to decline over the coming year. The Fund also maintained an allocation to bank loans as of the period’s end. Lastly, the Fund held select exposure to EM debt as of the end of the period in recognition of the wide range of outcomes around vaccine distribution, ongoing infections, and mutations.
Important Risks
Investing involves risk, including the possible loss of principal. Security prices fluctuate in value depending on general market and economic conditions and the prospects of individual companies. The Fund may allocate a portion of its assets to specialist portfolio managers, which may not work as intended. • Fixed income security risks include credit, liquidity, call, duration, event and interest-rate risk. As interest rates rise, bond prices generally fall. • The risks associated with mortgage-related and asset-backed securities as well as collateralized loan obligations (CLOs) include credit, interest-rate, prepayment, liquidity, default and extension risk. • The purchase of securities in the To-Be-Announced (TBA) market can result in higher portfolio turnover and related expenses as well as price and counterparty risk. • Derivatives are generally more volatile and sensitive to changes in market or economic conditions than other securities; their risks include currency, leverage, liquidity, index, pricing, regulatory and counterparty risk. • Foreign investments may be more volatile and less liquid than U.S. investments and are subject to the risk of currency fluctuations and adverse political, economic and regulatory developments. These risks may be greater for investments in emerging markets. • Investments in high-yield (“junk”) bonds involve greater risk of price volatility, illiquidity, and default than higher-rated debt securities. • Obligations of U.S. Government agencies are supported by varying degrees of credit but are generally not backed by the full faith and credit of the U.S. Government. • Restricted securities may be more difficult to sell and price than other securities. • The Fund may have high portfolio turnover, which could increase its transaction costs and an investor’s tax liability.
The Hartford Total Return Bond Fund
Fund Overview – (continued)
October 31, 2021 (Unaudited)
| Composition by Security Type(1) |
| as of 10/31/2021 |
| Category | Percentage of
Net Assets |
| Equity Securities | |
| Common Stocks | 0.0% * |
| Preferred Stocks | 0.0 * |
| Warrants | 0.0 * |
| Total | 0.0% * |
| Fixed Income Securities | |
| Asset & Commercial Mortgage-Backed Securities | 22.4% |
| Corporate Bonds | 27.1 |
| Foreign Government Obligations | 6.9 |
| Municipal Bonds | 1.7 |
| Senior Floating Rate Interests | 4.4 |
| U.S. Government Agencies(2) | 38.5 |
| U.S. Government Securities | 26.9 |
| Total | 127.9% |
| Short-Term Investments | 2.1 |
| Purchased Options | 0.0 * |
| Other Assets & Liabilities | (30.0) |
| Total | 100.0% |
| * | Percentage rounds to zero. |
| (1) | For Fund compliance purposes, the Fund may not use the same classification system. These classifications are used for financial reporting purposes. |
| (2) | All, or a portion of the securities categorized as U.S. Government Agencies, were agency mortgage-backed securities as of October 31, 2021. |
The Hartford World Bond Fund
Fund Overview
October 31, 2021 (Unaudited)
Inception 05/31/2011
Sub-advised by Wellington Management Company LLP | Investment objective – The Fund seeks capital appreciation with income as a secondary goal. |
Comparison of Change in Value of $10,000 Investment (10/31/2011 - 10/31/2021)
The chart above represents the hypothetical growth of a $10,000 investment in Class A, which includes the maximum sales charge applicable to Class A shares. Returns for the Fund’s other classes will vary from what is seen above due to differences in the expenses charged to those share classes.
| Average Annual Total Returns |
| for the Periods Ending 10/31/2021 |
| | 1 Year | 5 Years | 10 Years |
| Class A1 | -0.54% | 1.78% | 2.24% |
| Class A2 | -5.01% | 0.84% | 1.77% |
| Class C1 | -1.25% | 1.04% | 1.50% |
| Class C3 | -2.25% | 1.04% | 1.50% |
| Class I1 | -0.34% | 2.05% | 2.51% |
| Class R31 | -0.90% | 1.44% | 1.90% |
| Class R41 | -0.59% | 1.76% | 2.22% |
| Class R51 | -0.36% | 2.04% | 2.51% |
| Class R61 | -0.16% | 2.16% | 2.62% |
| Class Y1 | -0.25% | 2.10% | 2.59% |
| Class F1 | -0.25% | 2.15% | 2.56% |
| FTSE World Government Bond Index | -3.55% | 1.98% | 0.96% |
| Bloomberg U.S. Aggregate Bond Index | -0.48% | 3.10% | 3.00% |
| 1 | Without sales charge |
| 2 | Reflects maximum sales charge of 4.50% |
| 3 | Reflects a contingent deferred sales charge of 1.00% |
PERFORMANCE DATA QUOTED REPRESENTS PAST PERFORMANCE AND DOES NOT GUARANTEE FUTURE RESULTS. The investment return and principal value of the investment will fluctuate so that investors’ shares, when redeemed, may be worth more or less than their original cost. The chart and table do not reflect the deductions of taxes that a shareholder would pay on Fund distributions or the redemption of Fund shares. Current performance may be lower or higher than the performance data quoted. To obtain performance data current to the most recent month-end, please visit our website hartfordfunds.com.
Total returns presented above were calculated using the applicable class' net asset value available to shareholders for sale or redemption of Fund shares on 10/31/2021, which may exclude investment transactions as of this date. All share class returns assume the reinvestment of all distributions at net asset value and the deduction of all fund expenses. The total returns presented in the Financial Highlights section of the report are calculated in the same manner, but also take into account certain
adjustments that are necessary under generally accepted accounting principles. As a result, the total returns in the Financial Highlights section may differ from the total returns presented above.
Class R6 shares commenced operations on 11/07/2014. Performance prior to that date is that of the Fund’s Class Y shares. Class F shares commenced operations on 02/28/2017. Performance prior to that date is that of the Fund’s Class I shares.
To the extent a share class has adopted the prior performance of another share class that had different operating expenses, such performance has not been adjusted to reflect the different operating expenses. If the performance were adjusted, it may have been higher or lower.
You cannot invest directly in an index.
See “Benchmark Glossary” for benchmark descriptions.
Performance information may reflect expense waivers/reimbursements without which performance would have been lower.
| Operating Expenses* | Gross | Net |
| Class A | 1.03% | 1.03% |
| Class C | 1.76% | 1.76% |
| Class I | 0.74% | 0.74% |
| Class R3 | 1.37% | 1.37% |
| Class R4 | 1.06% | 1.06% |
| Class R5 | 0.76% | 0.76% |
| Class R6 | 0.65% | 0.65% |
| Class Y | 0.75% | 0.75% |
| Class F | 0.65% | 0.65% |
| * | Expenses as shown in the Fund’s most recent prospectus. Expenses shown include acquired fund fees and expenses. Actual expenses may be higher or lower. Please see accompanying Financial Highlights for expense ratios for the period ended 10/31/2021. |
The Hartford World Bond Fund
Fund Overview – (continued)
October 31, 2021 (Unaudited)
Portfolio Managers
Mark H. Sullivan, CFA
Senior Managing Director and Fixed Income Portfolio Manager
Wellington Management Company LLP
Martin Harvey, CFA
Managing Director and Fixed Income Portfolio Manager
Wellington Management Company LLP
Manager Discussion
How did the Fund perform during the period?
The Class A shares of The Hartford World Bond Fund returned -0.54%, before sales charges, for the twelve-month period ended October 31, 2021, outperforming the Fund’s primary benchmark, the FTSE World Government Bond Index, which returned -3.55% for the same period, and underperforming the Fund’s secondary benchmark, the Bloomberg U.S. Aggregate Bond Index, which returned -0.48% for the same period. For the same period, the Class A shares of the Fund, before sales charges, underperformed the 0.56% average return of the Lipper Global Income Funds peer group, a group of funds that invests primarily in United States (US) dollar and non-U.S. dollar debt securities of issuers located in at least three countries, one of which may be the United States.
Why did the Fund perform this way?
Over the period, global fixed income markets were primarily influenced by the rollout of COVID-19 vaccines and global growth recovery, as well as inflationary concerns later in the period. Global sovereign debt yields rose as economies reopened, growth recovered, and major central banks laid the groundwork for monetary policy normalization and began reducing monetary stimulus at varying speeds. Global gross domestic product (GDP) growth accelerated across most regions during the period, buoyed by continued progress on vaccinations and pent-up demand. Ongoing supply-chain disruptions and labor shortages indicated inflation pressures may prove less “transitory” than previously suspected.
Global central banks maintained highly accommodative policy stances, although by the end of the period central bankers took further steps toward policy normalization during the period in response to mounting inflation pressures. At the start of the period, the U.S. Federal Reserve (Fed) extended its emergency liquidity provisions. By the end of the period, it indicated it could start to taper its large-scale asset purchases by November 2021 and projected three interest-rate increases in 2023. The European Central Bank (ECB) reduced the pace of quantitative easing purchases by the end of the period after having expanded the program at the end of 2020 and the first quarter of 2021.
Global economic activity dropped off sharply in the aftermath of COVID-19 economic shutdowns but started to rebound as economies reopened. Global GDP growth continued to recover during the latter part of the twelve-month period. The U.S. labor market continued to
heal while house prices rose sharply, supported by low mortgage rates and record low supply. During the latter part of the period, the Chinese manufacturing Purchasing Managers Index (PMI) contracted to the lowest level since the onset of the pandemic, weighed down by rising costs, while the services PMI expanded. The Eurozone manufacturing PMI remained elevated during the period but then fell to a six-month low due to a lack of shipping capacity and constrained supply to meet demand.
The U.S. dollar weakened early in the period on the Fed’s pledge to maintain policy accommodation, but later rallied versus most currencies supported by rising U.S. Treasury yields, Fed tapering expectations, and a flight to quality driven by concerns about a potential default by Chinese real estate company Evergrande and the U.S. debt ceiling deadlock. The British pound ended the period lower as supply-chain disruptions created broad challenges for the United Kingdom (U.K.), with spiking gas prices and fuel shortages engulfing the country as well as record-high job vacancies due to staff shortages from the coronavirus pandemic and the U.K.’s exit from the European Union (EU), also known as Brexit. The euro also ended the period lower. Most emerging markets (EM) currencies ended the period lower, driven by China’s economic slowdown, Fed tapering concerns, and political uncertainty.
Absolute returns in global sovereigns were generally negative during the twelve-month period due to rising interest rates globally amid the rollout of a COVID-19 vaccine, central bank rhetoric focused on monetary tightening, and persistent inflation concerns as economies reopened. On an excess return basis (returns over U.S. Treasuries), credit risk sectors generally outperformed duration-equivalent government bonds. Early in the period, spread tightening was driven by encouraging vaccine trials and easing of COVID-19 restrictions leading to improved economic data. Later in the period, spreads continued to tighten as central banks aimed to mitigate risks, vaccine distribution picked up pace, and credit fundamentals generally improved. Investment-grade corporate spreads compressed by 0.38% while high-yield corporate spreads compressed by 2.22%, according to Bloomberg Index data.
For the twelve-month period, the Fund’s currency positioning and credit positioning contributed positively to the Fund’s performance, while the Fund’s country positioning detracted from performance. Relative to the FTSE World Government Bond Index, the Fund’s lower-duration positioning in country strategies contributed positively,
The Hartford World Bond Fund
Fund Overview – (continued)
October 31, 2021 (Unaudited)
as sovereign debt yields across most markets moved higher. The Fund’s strategic currency positioning also contributed positively to relative returns, due to select exposures to non-U.S.-dollar currencies.
Within the Fund’s country positioning, the Fund’s core allocation to developed sovereign governments was a negative contributor to the Fund’s performance over the period as bond yields rose throughout the period. Over the period, the Fund had exposure to some of the higher-yielding developed markets such as Australia, New Zealand, and South Korea, which detracted from the Fund’s performance. In macro-based duration strategies, tactical positioning in Australia detracted from relative performance over the period, as yields moved higher across the dollar bloc based on the perceived effectiveness of their pandemic responses. Underweight positions in the euro area throughout the period contributed positively, partially offsetting negative performance. In quantitative strategies, the Fund’s short duration bias through most of 2021 was the key contributor to relative performance during the period. Against the FTSE World Government Bond Index, we maintained a lower duration stance within the Fund for the period, which led to relative outperformance.
Currency positioning had a positive impact on the Fund’s performance. This was due to the Fund’s non-U.S.-dollar exposure held throughout the period, such as the Fund’s exposure to the Swedish krona and Norwegian krone. Most European currencies performed well, specifically in the second quarter of 2021 as growth recovery and a ramp-up in COVID-19 vaccinations benefited the region. Relative to the FTSE World Government Bond Index, the Fund’s higher exposure to the U.S. dollar resulted in outperformance later in the period as the U.S. dollar rallied versus most currencies. In our opportunistic currency strategies, the Fund’s short euro position detracted from performance, particularly in the fourth quarter of 2020 after the euro picked up steam amid positive vaccine rollout news and a Brexit deal.
Within the Fund’s credit positioning, the Fund’s out-of-benchmark opportunistic allocations to high yield and securitized debt sectors contributed positively to absolute returns as the sectors generated positive total returns over the year.
We made use of derivatives in the Fund during the period, including primarily liquid currency forwards and exchange-traded government bond futures, but also (to a lesser extent) credit default swaps, index credit default swaps, as well as interest rate, bond, index and currency futures, and/or options in pursuit of the investment objective as well as to hedge against risk.
The Fund’s macro-driven duration positioning, which is primarily implemented using exchange-traded government bond futures and cash bonds, detracted from the Fund’s performance over the period; the Fund’s country rotation positioning, which is also implemented through exchange-traded government bond futures, contributed positively. The Fund’s macro-driven positioning and strategic market currency positioning are implemented through currency forwards. Macro-driven currency positioning detracted from performance, while strategic currency positioning contributed positively to performance over the period. The Fund’s credit positioning, which is implemented using cash bonds, credit default swaps (index and single name), and interest rate swaps, contributed positively to returns over the period.
What is the outlook as of the end of the period?
As of the end of the period, we believe that central bank policy normalization is imminent. The priority for most developed-markets central banks is to exit quantitative easing (QE). The hurdle to extend QE is high, though timing of tapering for each central bank will vary. We think the recent inflation surge is more than just transitory. Supply disruptions have led to notably persistent price surges across vast swathes of the global economy. Major central banks’ rhetoric remains tilted to a bias for the recent inflationary shock to be transitory, while acknowledging that recent inflation persistence is longer than initially anticipated. Central banks face a delicate balancing act. Is monetary policy tightening supposed to respond to higher consumer prices (driven by supply shortages) or will accelerating prices themselves lay the groundwork for a weaker cycle (by reducing demand)? Policy responses across developed and emerging markets have differed thus far.
Our outlook for the U.S. dollar remains mixed, with a marginally positive skew. As the Fed moves toward somewhat less stimulative policy, the backdrop for broad U.S. dollar depreciation becomes less clear cut. However, after a long period of consolidation, and with Fed expectations priced into a larger extent, we do see scope for a renewed depreciation in the U.S. dollar against certain currencies, such as Australian dollar, Norwegian krone, and New Zealand dollar, which have all performed poorly toward the end of the period. The two scenarios that support this depreciation are i) Fed policy is deemed easy enough for general market optimism to be maintained (benign case); and ii) large U.S. twin deficits (too much liquidity and sticky inflation) will likely cause capital flows out of the dollar (malign case). In our view, the first scenario appears most apparent in the short term. A shift to tighter monetary policy from the Fed or greater market concerns about the negative consequences of stagflation (slower economic growth and higher inflation) are the main threats to the view at this stage – and both scenarios could lead to a further rally in the U.S. dollar.
In high yield, the economic outlook remains supportive, and we expect continued strong growth to close out 2021. In securitized sectors, we continue to have conviction in U.S. housing-related assets in non-agency retail mortgage-backed securities (RMBS). Low mortgage rates, robust demand, and tight inventory are driving strong home price growth in our view, which we believe may continue to be very supportive for RMBS collateral performance. In commercial mortgage-backed securities (CMBS), we maintain a positive outlook overall, but are cautious on certain segments. We believe that the economic recovery bodes well for commercial real estate fundamentals and CMBS collateral performance, and delinquencies have continued to trend down. In asset-backed securities (ABS), we have a constructive outlook for the U.S. consumer. Consumer fundamentals have been holding up very well, supported by continued – albeit reduced – fiscal stimulus, balance sheet strength, and an improving labor market. In corporate credit, while we continue to believe there is scope for further corporate credit outperformance in select markets, we acknowledge the growing potential for market volatility later this year as market participants focus on the risks posed by recently communicated reductions in the Fed’s asset purchases.
The Hartford World Bond Fund
Fund Overview – (continued)
October 31, 2021 (Unaudited)
Important Risks
Investing involves risk, including the possible loss of principal. Security prices fluctuate in value depending on general market and economic conditions and the prospects of individual companies. The Fund may allocate a portion of its assets to specialist portfolio managers, which may not work as intended. • Fixed income security risks include credit, liquidity, call, duration, and interest-rate risk. As interest rates rise, bond prices generally fall. • Foreign investments may be more volatile and less liquid than U.S. investments and are subject to the risk of currency fluctuations and adverse political, economic and regulatory developments. These risks may be greater, and include additional risks, for investments in emerging markets or if the Fund focuses in a particular geographic region or country. • Investments in high-yield (“junk”) bonds involve greater risk of price volatility, illiquidity, and default than higher-rated debt securities. • Mortgage-related and asset-backed securities’ risks include credit, interest-rate, prepayment, and extension risk. • Derivatives are generally more volatile and sensitive to changes in market or economic conditions than other securities; their risks include currency, leverage, liquidity, index, pricing, regulatory and counterparty risk. • The Fund may invest in a smaller number of issuers, so it may be more exposed to risks and volatility than a more broadly diversified fund. • Restricted securities may be more difficult to sell and price than other securities. • Obligations of U.S. Government agencies are supported by varying degrees of credit but are generally not backed by the full faith and credit of the U.S. Government. • The purchase of securities in the To-Be-Announced (TBA) market can result in higher portfolio turnover and related expenses as well as price and counterparty risk. • The Fund may have high portfolio turnover, which could increase its transaction costs and an investor’s tax liability.
| Composition by Security Type(1) |
| as of 10/31/2021 |
| Category | Percentage of
Net Assets |
| Equity Securities | |
| Common Stocks | 0.0% * |
| Escrows | 0.1 |
| Total | 0.1% |
| Fixed Income Securities | |
| Asset & Commercial Mortgage-Backed Securities | 6.5% |
| Convertible Bonds | 0.4 |
| Corporate Bonds | 13.9 |
| Foreign Government Obligations | 63.1 |
| Senior Floating Rate Interests | 3.4 |
| U.S. Government Agencies(2) | 0.9 |
| U.S. Government Securities | 6.6 |
| Total | 94.8% |
| Short-Term Investments | 3.1 |
| Purchased Options | 0.0 * |
| Other Assets & Liabilities | 2.0 |
| Total | 100.0% |
| * | Percentage rounds to zero. |
| (1) | For Fund compliance purposes, the Fund may not use the same classification system. These classifications are used for financial reporting purposes. |
| (2) | All, or a portion of the securities categorized as U.S. Government Agencies, were agency mortgage-backed securities as of October 31, 2021. |
Hartford Fixed Income Funds
Benchmark Glossary (Unaudited)
| Bloomberg 1-3 Year U.S. Government/Credit Index (reflects no deduction for fees, expenses or taxes) is comprised of the U.S. Government/Credit component of the U.S. Aggregate Index. The 1-3 Year Government/Credit Index includes securities in the 1-3 year maturity range in the Government/Credit Index. |
| Bloomberg Municipal Bond 1-15 Year Blend (1-17) Index (reflects no deduction for fees, expenses or taxes) is a sub-index of the Bloomberg Municipal Bond Index. It is a rules-based market value-weighted index of bonds with maturities of one year to 17 years engineered for the tax-exempt bond market. |
| Bloomberg Municipal Bond Short 1-5 Year Index (reflects no deduction for fees, expenses or taxes) measures the performance of municipal bonds with time to maturity of more than one year and less than five years. |
| Bloomberg Municipal Bond Index (reflects no deduction for fees, expenses or taxes) is designed to cover the USD-denominated long-term tax-exempt bond market. |
| Bloomberg U.S. Aggregate Bond Index (reflects no deduction for fees, expenses or taxes) is composed of securities that are U.S. Securities and Exchange Commission registered, taxable, and dollar denominated. The index covers the U.S. investment grade fixed rate bond market, with index components for government and corporate securities, mortgage pass-through securities, and asset-backed securities. These major sectors are subdivided into more specific indices that are calculated and reported on a regular basis. |
| Bloomberg U.S. Corporate High Yield Bond Index (reflects no deduction for fees, expenses or taxes) is a market-value-weighted index that tracks the total return performance of non-investment grade, fixed-rate, publicly placed, dollar denominated and nonconvertible debt registered with the U.S. Securities and Exchange Commission. |
| Bloomberg U.S. TIPS 1-10 Year Index (reflects no deduction for fees, expenses or taxes) represents U.S. Treasury inflation-protected securities having a maturity of at least 1 year and less than 10 years. |
| Bloomberg U.S. TIPS Index (reflects no deduction for fees, expenses or taxes) represents securities that protect against adverse inflation and provide a minimum level of real return. To be included in this index, bonds must have cash flows linked to an inflation index, be sovereign issues denominated in U.S. currency, and have more than one year to maturity. |
| FTSE World Government Bond Index (formerly known as the Citigroup World Government Bond Index) (reflects no deduction for fees, expenses or taxes) is designed to measure the performance of fixed-rate, local currency, investment grade sovereign bonds. |
| JP Morgan GBI Emerging Markets Global Diversified Index (reflects no deduction for fees, expenses or taxes) is a comprehensive global local emerging markets index that consists of regularly traded, liquid fixed-rate, domestic-currency government bonds to which international investors can gain exposure. |
| S& P/LSTA Leveraged Loan Index (reflects no deduction for fees, expenses or taxes) is a market-value-weighted index that is designed to measure the performance of the U.S. leveraged loan market based upon market weightings, spreads and interest payments. |
| “Bloomberg®” and the above referenced Bloomberg index(es) are service marks of Bloomberg Finance L.P. and its affiliates, including Bloomberg Index Services Limited (“BISL”), the administrator of the index (collectively, “Bloomberg”), and have been licensed for use for certain purposes by Hartford Funds Management Company, LLC ("HFMC"). The Funds are not sponsored, endorsed, sold or promoted by Bloomberg. Bloomberg does not make any representation or warranty, express or implied, to the owners of or counterparties to the Funds or any member of the public regarding the advisability of investing in securities generally or in the Funds particularly. The only relationship of Bloomberg to HFMC is the licensing of certain trademarks, trade names and service marks and of the above referenced Bloomberg index(es), which is determined, composed and calculated by BISL without regard to HFMC or the Funds. Bloomberg has no obligation to take the needs of HFMC or the owners of the Funds into consideration in determining, composing or calculating the above referenced Bloomberg index(es). Bloomberg is not responsible for and has not participated in the determination of the timing of, prices at, or quantities of the Funds to be issued. Bloomberg shall not have any obligation or liability, including, without limitation, to the Funds' customers, in connection with the administration, marketing or trading of the Funds. |
| BLOOMBERG DOES NOT GUARANTEE THE ACCURACY AND/OR THE COMPLETENESS OF THE ABOVE REFERENCED BLOOMBERG INDEX(ES) OR ANY DATA RELATED THERETO AND SHALL HAVE NO LIABILITY FOR ANY ERRORS, OMISSIONS OR INTERRUPTIONS THEREIN. BLOOMBERG DOES NOT MAKE ANY WARRANTY, EXPRESS OR IMPLIED, AS TO RESULTS TO BE OBTAINED BY HFMC, OWNERS OF THE FUNDS OR ANY OTHER PERSON OR ENTITY FROM THE USE OF THE ABOVE REFERENCED BLOOMBERG INDEX(ES) OR ANY DATA RELATED THERETO. BLOOMBERG DOES NOT MAKE ANY EXPRESS OR IMPLIED WARRANTIES AND EXPRESSLY DISCLAIMS ALL WARRANTIES OF MERCHANTABILITY OR FITNESS FOR A PARTICULAR PURPOSE OR USE WITH RESPECT TO THE ABOVE REFERENCED BLOOMBERG INDEX(ES) OR ANY DATA RELATED THERETO. WITHOUT LIMITING ANY OF THE FOREGOING, TO THE MAXIMUM EXTENT ALLOWED BY LAW, BLOOMBERG, ITS LICENSORS, AND ITS AND THEIR RESPECTIVE EMPLOYEES, CONTRACTORS, AGENTS, SUPPLIERS, AND VENDORS SHALL HAVE NO LIABILITY OR RESPONSIBILITY WHATSOEVER FOR ANY INJURY OR DAMAGES --WHETHER DIRECT, INDIRECT, CONSEQUENTIAL, INCIDENTAL, PUNITIVE OR OTHERWISE --ARISING IN CONNECTION WITH THE ABOVE REFERENCED BLOOMBERG INDEX(ES) OR ANY DATA OR VALUES RELATING THERETO --WHETHER ARISING FROM THEIR NEGLIGENCE OR OTHERWISE, EVEN IF NOTIFIED OF THE POSSIBILITY THEREOF. |
Hartford Fixed Income Funds
Expense Examples (Unaudited)
Your Fund's Expenses
As a shareholder of a Fund, you incur two types of costs: (1) transaction costs, including sales charges (loads) on purchase payments, if any, and contingent deferred sales charges (CDSC), if any, and (2) ongoing costs, including investment management fees, distribution and/or service (12b-1) fees, if any, and other fund expenses. This example is intended to help you understand your ongoing costs (in dollars) of investing in a Fund and to compare these costs with the ongoing costs of investing in other mutual funds. The example is based on an investment of $1,000 invested at the beginning of the period and held for the entire period of May 1, 2021 through October 31, 2021. To the extent a Fund was subject to acquired fund fees and expenses during the period, acquired fund fees and expenses are not included in the annualized expense ratios below.
Actual Expenses
The first set of columns of the table below provides information about actual account values and actual expenses. You may use this information, together with the amount you invested, to estimate the expenses that you paid over the period. Simply divide your account value by $1,000 (for example, an $8,600 account value divided by $1,000 = 8.6), then multiply the result by the number in the line under the heading entitled “Expenses Paid During The Period” to estimate the expenses you paid on your account during this period.
Hypothetical Example for Comparison Purposes
The second set of columns of the table below provides information about hypothetical account values and hypothetical expenses based on a Fund’s actual expense ratio and an assumed rate of return of 5% per year before expenses, which is not the Fund’s actual return. The hypothetical account values and expenses may not be used to estimate the actual ending account balance or expenses you paid for the period. You may use this information to compare the ongoing costs of investing in a Fund and other funds. To do so, compare this 5% hypothetical example with the 5% hypothetical examples that appear in the shareholder reports of the other funds.
Please note that the expenses shown in the table are meant to highlight your ongoing costs only and do not reflect any transactional costs, such as sales charges (loads and CDSC). Therefore, the second set of columns of the table is useful in comparing ongoing costs only, and will not help you determine the relative total costs of owning different funds. In addition, if these transactional costs were included, your costs would be higher. Expenses for a class of a Fund are equal to the class' annualized expense ratio multiplied by average account value over the period, multiplied by 184/365 (to reflect the one-half year period).
| | Actual Return | | Hypothetical (5% return before expenses) |
| | Beginning
Account Value
May 1, 2021 | | Ending
Account Value
October 31, 2021 | | Expenses paid
during the period
May 1, 2021
through
October 31, 2021 | | Beginning
Account Value
May 1, 2021 | | Ending
Account Value
October 31, 2021 | | Expenses paid
during the period
May 1, 2021
through
October 31, 2021 | | Annualized
expense
ratio |
| The Hartford Emerging Markets Local Debt Fund |
| Class A | $ 1,000.00 | | $ 983.30 | | $ 5.90 | | $ 1,000.00 | | $ 1,019.26 | | $ 6.01 | | 1.18% |
| Class C | $ 1,000.00 | | $ 979.70 | | $ 9.63 | | $ 1,000.00 | | $ 1,015.48 | | $ 9.80 | | 1.93% |
| Class I | $ 1,000.00 | | $ 984.40 | | $ 4.65 | | $ 1,000.00 | | $ 1,020.52 | | $ 4.74 | | 0.93% |
| Class R3 | $ 1,000.00 | | $ 981.80 | | $ 6.34 | | $ 1,000.00 | | $ 1,018.75 | | $ 6.46 | | 1.27% |
| Class R4 | $ 1,000.00 | | $ 983.20 | | $ 5.90 | | $ 1,000.00 | | $ 1,019.31 | | $ 6.01 | | 1.18% |
| Class R5 | $ 1,000.00 | | $ 985.90 | | $ 4.40 | | $ 1,000.00 | | $ 1,020.72 | | $ 4.48 | | 0.88% |
| Class Y | $ 1,000.00 | | $ 984.50 | | $ 4.40 | | $ 1,000.00 | | $ 1,020.77 | | $ 4.48 | | 0.88% |
| Class F | $ 1,000.00 | | $ 984.90 | | $ 4.15 | | $ 1,000.00 | | $ 1,021.02 | | $ 4.23 | | 0.83% |
| The Hartford Floating Rate Fund |
| Class A | $ 1,000.00 | | $ 1,015.30 | | $ 5.08 | | $ 1,000.00 | | $ 1,020.16 | | $ 5.09 | | 1.00% |
| Class C | $ 1,000.00 | | $ 1,011.60 | | $ 8.82 | | $ 1,000.00 | | $ 1,016.43 | | $ 8.84 | | 1.74% |
| Class I | $ 1,000.00 | | $ 1,016.70 | | $ 3.71 | | $ 1,000.00 | | $ 1,021.53 | | $ 3.72 | | 0.73% |
| Class R3 | $ 1,000.00 | | $ 1,012.90 | | $ 6.34 | | $ 1,000.00 | | $ 1,018.90 | | $ 6.36 | | 1.25% |
| Class R4 | $ 1,000.00 | | $ 1,014.10 | | $ 5.08 | | $ 1,000.00 | | $ 1,020.16 | | $ 5.09 | | 1.00% |
| Class R5 | $ 1,000.00 | | $ 1,016.50 | | $ 3.86 | | $ 1,000.00 | | $ 1,021.37 | | $ 3.87 | | 0.76% |
| Class Y | $ 1,000.00 | | $ 1,016.60 | | $ 3.81 | | $ 1,000.00 | | $ 1,021.42 | | $ 3.82 | | 0.75% |
| Class F | $ 1,000.00 | | $ 1,017.10 | | $ 3.30 | | $ 1,000.00 | | $ 1,021.93 | | $ 3.31 | | 0.65% |
Hartford Fixed Income Funds
Expense Examples (Unaudited) – (continued)
| | Actual Return | | Hypothetical (5% return before expenses) |
| | Beginning
Account Value
May 1, 2021 | | Ending
Account Value
October 31, 2021 | | Expenses paid
during the period
May 1, 2021
through
October 31, 2021 | | Beginning
Account Value
May 1, 2021 | | Ending
Account Value
October 31, 2021 | | Expenses paid
during the period
May 1, 2021
through
October 31, 2021 | | Annualized
expense
ratio |
| The Hartford Floating Rate High Income Fund |
| Class A | $ 1,000.00 | | $ 1,015.60 | | $ 5.33 | | $ 1,000.00 | | $ 1,019.91 | | $ 5.35 | | 1.05% |
| Class C | $ 1,000.00 | | $ 1,010.80 | | $ 9.12 | | $ 1,000.00 | | $ 1,016.13 | | $ 9.15 | | 1.80% |
| Class I | $ 1,000.00 | | $ 1,016.90 | | $ 4.07 | | $ 1,000.00 | | $ 1,021.17 | | $ 4.08 | | 0.80% |
| Class R3 | $ 1,000.00 | | $ 1,014.10 | | $ 6.85 | | $ 1,000.00 | | $ 1,018.40 | | $ 6.87 | | 1.35% |
| Class R4 | $ 1,000.00 | | $ 1,015.60 | | $ 5.33 | | $ 1,000.00 | | $ 1,019.91 | | $ 5.35 | | 1.05% |
| Class R5 | $ 1,000.00 | | $ 1,017.10 | | $ 3.81 | | $ 1,000.00 | | $ 1,021.42 | | $ 3.82 | | 0.75% |
| Class Y | $ 1,000.00 | | $ 1,015.90 | | $ 3.96 | | $ 1,000.00 | | $ 1,021.27 | | $ 3.97 | | 0.78% |
| Class F | $ 1,000.00 | | $ 1,016.10 | | $ 3.81 | | $ 1,000.00 | | $ 1,021.42 | | $ 3.82 | | 0.75% |
| The Hartford High Yield Fund |
| Class A | $ 1,000.00 | | $ 1,013.00 | | $ 4.82 | | $ 1,000.00 | | $ 1,020.42 | | $ 4.84 | | 0.95% |
| Class C | $ 1,000.00 | | $ 1,009.10 | | $ 8.66 | | $ 1,000.00 | | $ 1,016.59 | | $ 8.69 | | 1.71% |
| Class I | $ 1,000.00 | | $ 1,013.10 | | $ 3.45 | | $ 1,000.00 | | $ 1,021.78 | | $ 3.47 | | 0.68% |
| Class R3 | $ 1,000.00 | | $ 1,010.10 | | $ 6.38 | | $ 1,000.00 | | $ 1,018.85 | | $ 6.41 | | 1.26% |
| Class R4 | $ 1,000.00 | | $ 1,011.60 | | $ 4.92 | | $ 1,000.00 | | $ 1,020.32 | | $ 4.94 | | 0.97% |
| Class R5 | $ 1,000.00 | | $ 1,013.10 | | $ 3.40 | | $ 1,000.00 | | $ 1,021.83 | | $ 3.41 | | 0.67% |
| Class R6 | $ 1,000.00 | | $ 1,015.00 | | $ 2.79 | | $ 1,000.00 | | $ 1,022.43 | | $ 2.80 | | 0.55% |
| Class Y | $ 1,000.00 | | $ 1,014.40 | | $ 3.35 | | $ 1,000.00 | | $ 1,021.88 | | $ 3.36 | | 0.66% |
| Class F | $ 1,000.00 | | $ 1,015.00 | | $ 2.79 | | $ 1,000.00 | | $ 1,022.43 | | $ 2.80 | | 0.55% |
| The Hartford Inflation Plus Fund |
| Class A | $ 1,000.00 | | $ 1,035.00 | | $ 4.36 | | $ 1,000.00 | | $ 1,020.92 | | $ 4.33 | | 0.85% |
| Class C | $ 1,000.00 | | $ 1,031.30 | | $ 8.04 | | $ 1,000.00 | | $ 1,017.29 | | $ 7.98 | | 1.57% |
| Class I | $ 1,000.00 | | $ 1,037.40 | | $ 2.82 | | $ 1,000.00 | | $ 1,022.43 | | $ 2.80 | | 0.55% |
| Class R3 | $ 1,000.00 | | $ 1,034.20 | | $ 6.00 | | $ 1,000.00 | | $ 1,019.31 | | $ 5.96 | | 1.17% |
| Class R4 | $ 1,000.00 | | $ 1,035.80 | | $ 4.46 | | $ 1,000.00 | | $ 1,020.82 | | $ 4.43 | | 0.87% |
| Class R5 | $ 1,000.00 | | $ 1,036.70 | | $ 2.93 | | $ 1,000.00 | | $ 1,022.33 | | $ 2.91 | | 0.57% |
| Class Y | $ 1,000.00 | | $ 1,036.50 | | $ 2.87 | | $ 1,000.00 | | $ 1,022.38 | | $ 2.85 | | 0.56% |
| Class F | $ 1,000.00 | | $ 1,036.80 | | $ 2.31 | | $ 1,000.00 | | $ 1,022.94 | | $ 2.29 | | 0.45% |
| The Hartford Municipal Opportunities Fund |
| Class A | $ 1,000.00 | | $ 1,000.40 | | $ 3.33 | | $ 1,000.00 | | $ 1,021.88 | | $ 3.36 | | 0.66% |
| Class C | $ 1,000.00 | | $ 996.60 | | $ 7.15 | | $ 1,000.00 | | $ 1,018.05 | | $ 7.22 | | 1.42% |
| Class I | $ 1,000.00 | | $ 1,001.50 | | $ 2.17 | | $ 1,000.00 | | $ 1,023.04 | | $ 2.19 | | 0.43% |
| Class Y | $ 1,000.00 | | $ 1,001.50 | | $ 2.17 | | $ 1,000.00 | | $ 1,023.04 | | $ 2.19 | | 0.43% |
| Class F | $ 1,000.00 | | $ 1,001.90 | | $ 1.77 | | $ 1,000.00 | | $ 1,023.44 | | $ 1.79 | | 0.35% |
| Hartford Municipal Short Duration Fund |
| Class A | $ 1,000.00 | | $ 999.30 | | $ 3.48 | | $ 1,000.00 | | $ 1,021.73 | | $ 3.52 | | 0.69% |
| Class C | $ 1,000.00 | | $ 994.50 | | $ 7.24 | | $ 1,000.00 | | $ 1,017.95 | | $ 7.32 | | 1.44% |
| Class I | $ 1,000.00 | | $ 999.40 | | $ 2.32 | | $ 1,000.00 | | $ 1,022.89 | | $ 2.35 | | 0.46% |
| Class F | $ 1,000.00 | | $ 999.80 | | $ 1.97 | | $ 1,000.00 | | $ 1,023.24 | | $ 1.99 | | 0.39% |
| The Hartford Short Duration Fund |
| Class A | $ 1,000.00 | | $ 1,000.20 | | $ 3.88 | | $ 1,000.00 | | $ 1,021.32 | | $ 3.92 | | 0.77% |
| Class C | $ 1,000.00 | | $ 996.50 | | $ 7.60 | | $ 1,000.00 | | $ 1,017.59 | | $ 7.68 | | 1.51% |
| Class I | $ 1,000.00 | | $ 1,001.60 | | $ 2.47 | | $ 1,000.00 | | $ 1,022.74 | | $ 2.50 | | 0.49% |
| Class R3 | $ 1,000.00 | | $ 999.10 | | $ 5.04 | | $ 1,000.00 | | $ 1,020.16 | | $ 5.09 | | 1.00% |
| Class R4 | $ 1,000.00 | | $ 1,000.50 | | $ 3.63 | | $ 1,000.00 | | $ 1,021.58 | | $ 3.67 | | 0.72% |
| Class R5 | $ 1,000.00 | | $ 1,001.30 | | $ 2.72 | | $ 1,000.00 | | $ 1,022.48 | | $ 2.75 | | 0.54% |
| Class R6 | $ 1,000.00 | | $ 1,001.90 | | $ 2.17 | | $ 1,000.00 | | $ 1,023.04 | | $ 2.19 | | 0.43% |
| Class Y | $ 1,000.00 | | $ 1,001.40 | | $ 2.67 | | $ 1,000.00 | | $ 1,022.53 | | $ 2.70 | | 0.53% |
| Class F | $ 1,000.00 | | $ 1,000.90 | | $ 2.12 | | $ 1,000.00 | | $ 1,023.09 | | $ 2.14 | | 0.42% |
Hartford Fixed Income Funds
Expense Examples (Unaudited) – (continued)
| | Actual Return | | Hypothetical (5% return before expenses) |
| | Beginning
Account Value
May 1, 2021 | | Ending
Account Value
October 31, 2021 | | Expenses paid
during the period
May 1, 2021
through
October 31, 2021 | | Beginning
Account Value
May 1, 2021 | | Ending
Account Value
October 31, 2021 | | Expenses paid
during the period
May 1, 2021
through
October 31, 2021 | | Annualized
expense
ratio |
| The Hartford Strategic Income Fund |
| Class A | $ 1,000.00 | | $ 1,007.80 | | $ 4.66 | | $ 1,000.00 | | $ 1,020.57 | | $ 4.69 | | 0.92% |
| Class C | $ 1,000.00 | | $ 1,004.70 | | $ 8.29 | | $ 1,000.00 | | $ 1,016.94 | | $ 8.34 | | 1.64% |
| Class I | $ 1,000.00 | | $ 1,009.30 | | $ 3.29 | | $ 1,000.00 | | $ 1,021.93 | | $ 3.31 | | 0.65% |
| Class R3 | $ 1,000.00 | | $ 1,005.90 | | $ 6.52 | | $ 1,000.00 | | $ 1,018.70 | | $ 6.56 | | 1.29% |
| Class R4 | $ 1,000.00 | | $ 1,007.90 | | $ 4.61 | | $ 1,000.00 | | $ 1,020.62 | | $ 4.63 | | 0.91% |
| Class R5 | $ 1,000.00 | | $ 1,008.10 | | $ 3.39 | | $ 1,000.00 | | $ 1,021.83 | | $ 3.41 | | 0.67% |
| Class R6 | $ 1,000.00 | | $ 1,009.90 | | $ 2.74 | | $ 1,000.00 | | $ 1,022.48 | | $ 2.75 | | 0.54% |
| Class Y | $ 1,000.00 | | $ 1,009.20 | | $ 3.39 | | $ 1,000.00 | | $ 1,021.83 | | $ 3.41 | | 0.67% |
| Class F | $ 1,000.00 | | $ 1,009.90 | | $ 2.74 | | $ 1,000.00 | | $ 1,022.48 | | $ 2.75 | | 0.54% |
| Hartford Sustainable Municipal Bond Fund (formerly, Hartford Muncipal Income Fund) |
| Class A | $ 1,000.00 | | $ 1,000.80 | | $ 3.48 | | $ 1,000.00 | | $ 1,021.73 | | $ 3.52 | | 0.69% |
| Class C | $ 1,000.00 | | $ 997.00 | | $ 7.25 | | $ 1,000.00 | | $ 1,017.95 | | $ 7.32 | | 1.44% |
| Class I | $ 1,000.00 | | $ 1,001.90 | | $ 2.32 | | $ 1,000.00 | | $ 1,022.89 | | $ 2.35 | | 0.46% |
| Class F | $ 1,000.00 | | $ 1,002.30 | | $ 1.97 | | $ 1,000.00 | | $ 1,023.24 | | $ 1.99 | | 0.39% |
| The Hartford Total Return Bond Fund |
| Class A | $ 1,000.00 | | $ 1,011.30 | | $ 3.45 | | $ 1,000.00 | | $ 1,021.78 | | $ 3.47 | | 0.68% |
| Class C | $ 1,000.00 | | $ 1,007.30 | | $ 7.44 | | $ 1,000.00 | | $ 1,017.80 | | $ 7.48 | | 1.47% |
| Class I | $ 1,000.00 | | $ 1,012.70 | | $ 2.08 | | $ 1,000.00 | | $ 1,023.14 | | $ 2.09 | | 0.41% |
| Class R3 | $ 1,000.00 | | $ 1,009.40 | | $ 5.22 | | $ 1,000.00 | | $ 1,020.01 | | $ 5.24 | | 1.03% |
| Class R4 | $ 1,000.00 | | $ 1,011.10 | | $ 3.60 | | $ 1,000.00 | | $ 1,021.63 | | $ 3.62 | | 0.71% |
| Class R5 | $ 1,000.00 | | $ 1,012.50 | | $ 2.23 | | $ 1,000.00 | | $ 1,022.99 | | $ 2.24 | | 0.44% |
| Class R6 | $ 1,000.00 | | $ 1,014.00 | | $ 1.62 | | $ 1,000.00 | | $ 1,023.59 | | $ 1.63 | | 0.32% |
| Class Y | $ 1,000.00 | | $ 1,012.80 | | $ 1.98 | | $ 1,000.00 | | $ 1,023.24 | | $ 1.99 | | 0.39% |
| Class F | $ 1,000.00 | | $ 1,013.10 | | $ 1.62 | | $ 1,000.00 | | $ 1,023.59 | | $ 1.63 | | 0.32% |
| The Hartford World Bond Fund |
| Class A | $ 1,000.00 | | $ 987.80 | | $ 4.96 | | $ 1,000.00 | | $ 1,020.21 | | $ 5.04 | | 0.99% |
| Class C | $ 1,000.00 | | $ 983.60 | | $ 8.60 | | $ 1,000.00 | | $ 1,016.53 | | $ 8.74 | | 1.72% |
| Class I | $ 1,000.00 | | $ 988.30 | | $ 3.56 | | $ 1,000.00 | | $ 1,021.63 | | $ 3.62 | | 0.71% |
| Class R3 | $ 1,000.00 | | $ 985.10 | | $ 6.70 | | $ 1,000.00 | | $ 1,018.45 | | $ 6.82 | | 1.34% |
| Class R4 | $ 1,000.00 | | $ 987.40 | | $ 5.41 | | $ 1,000.00 | | $ 1,019.76 | | $ 5.50 | | 1.08% |
| Class R5 | $ 1,000.00 | | $ 988.20 | | $ 3.71 | | $ 1,000.00 | | $ 1,021.48 | | $ 3.77 | | 0.74% |
| Class R6 | $ 1,000.00 | | $ 988.80 | | $ 3.11 | | $ 1,000.00 | | $ 1,022.08 | | $ 3.16 | | 0.62% |
| Class Y | $ 1,000.00 | | $ 989.20 | | $ 3.61 | | $ 1,000.00 | | $ 1,021.53 | | $ 3.67 | | 0.72% |
| Class F | $ 1,000.00 | | $ 988.80 | | $ 3.11 | | $ 1,000.00 | | $ 1,022.08 | | $ 3.16 | | 0.62% |
The Hartford Emerging Markets Local Debt Fund
Schedule of Investments
October 31, 2021
| Shares or Principal Amount | | Market Value† |
| CORPORATE BONDS - 33.2% |
| | Argentina - 0.4% |
| | YPF S.A. | |
| $ 240,000 | 6.95%, 07/21/2027(1) | $ 174,002 |
| 61,250 | 8.50%, 03/23/2025 | 55,662 |
| | | | 229,664 |
| | Azerbaijan - 0.3% |
| 165,000 | International Bank of Azerbaijan OJSC 3.50%, 09/01/2024(1) | 165,000 |
| | Bermuda - 0.7% |
| | Ooredoo International Finance Ltd. | |
| 200,000 | 2.63%, 04/08/2031(1) | 201,782 |
| 215,000 | 3.25%, 02/21/2023(1) | 221,093 |
| | | | 422,875 |
| | British Virgin Islands - 1.8% |
| 123,000 | Central American Bottling Corp. 5.75%, 01/31/2027(2) | 127,471 |
| 200,000 | Gold Fields Orogen Holdings BVI Ltd. 6.13%, 05/15/2029(1) | 231,700 |
| 270,000 | Huarong Finance Co., Ltd. 4.50%, 01/24/2022, (4.50% fixed rate until 01/24/2022; 5 year USD CMT + 7.773% thereafter)(1)(3)(4) | 262,575 |
| 250,000 | Sinopec Group Overseas Development Ltd. 2.70%, 05/13/2030(2) | 254,119 |
| 171,933 | Star Energy Geothermal Wayang Windu Ltd. 6.75%, 04/24/2033(1) | 192,136 |
| | | | 1,068,001 |
| | Cayman Islands - 4.1% |
| 265,000 | ADCB Finance Cayman Ltd. 4.00%, 03/29/2023(2) | 275,760 |
| 199,193 | Bioceanico Sovereign Certificate Ltd. 0.00%, 06/05/2034(2)(5) | 147,403 |
| 205,000 | Country Garden Holdings Co., Ltd. 5.63%, 01/14/2030(1) | 201,203 |
| 200,000 | DP World Salaam 6.00%, 10/01/2025, (6.00% fixed rate until 10/01/2025; 5 year USD CMT + 5.750% thereafter)(1)(3)(4) | 218,500 |
| 210,000 | Meituan 2.13%, 10/28/2025(2) | 202,553 |
| 490,000 | QNB Finance Ltd. 2.63%, 05/12/2025(1) | 506,509 |
| 200,000 | Sands China Ltd. 2.30%, 03/08/2027(2) | 189,260 |
| 134,426 | Sparc EM SPC Panama Metro 0.01%, 12/05/2022(1)(5) | 133,350 |
| 225,000 | Tencent Holdings Ltd. 3.24%, 06/03/2050(2) | 218,003 |
| 130,000 | Vale Overseas Ltd. 3.75%, 07/08/2030 | 132,269 |
| 200,000 | Wynn Macau Ltd. 5.13%, 12/15/2029(2) | 180,188 |
| | | | 2,404,998 |
| | Chile - 1.1% |
| | Engie Energia Chile S.A. | |
| 200,000 | 3.40%, 01/28/2030(1) | 200,752 |
| Shares or Principal Amount | | Market Value† |
| CORPORATE BONDS - 33.2% - (continued) |
| | Chile - 1.1% - (continued) |
| $ 200,000 | 4.50%, 01/29/2025(1) | $ 215,124 |
| 210,000 | VTR Comunicaciones S.p.A. 4.38%, 04/15/2029(1) | 211,763 |
| | | | 627,639 |
| | China - 0.8% |
| 200,000 | China Development Bank Financial Leasing Co., Ltd. 2.88%, 09/28/2030, (2.88% fixed rate until 09/28/2025; 5 year USD CMT + 2.750% thereafter)(1)(3) | 201,392 |
| 225,000 | Industrial & Commercial Bank of China Ltd. 4.88%, 09/21/2025(2) | 246,382 |
| | | | 447,774 |
| | Colombia - 1.0% |
| 200,000 | Bancolombia S.A. 3.00%, 01/29/2025 | 201,752 |
| | Ecopetrol S.A. | |
| 135,000 | 4.63%, 11/02/2031 | 133,867 |
| 70,000 | 5.38%, 06/26/2026 | 75,703 |
| 140,000 | 6.88%, 04/29/2030 | 161,700 |
| | | | 573,022 |
| | Cyprus - 0.3% |
| 200,000 | Interpipe Holdings plc 8.38%, 05/13/2026(2) | 195,100 |
| | Hong Kong - 1.0% |
| 260,000 | AIA Group Ltd. 3.38%, 04/07/2030(1) | 279,690 |
| 275,000 | CMB Wing Lung Bank Ltd. 3.75%, 11/22/2027, (3.75% fixed rate until 11/22/2022; 5 year USD CMT + 1.750% thereafter)(1)(3) | 279,304 |
| | | | 558,994 |
| | India - 1.2% |
| | Adani Ports & Special Economic Zone Ltd. | |
| 200,000 | 3.83%, 02/02/2032(2) | 198,160 |
| 200,000 | 4.38%, 07/03/2029(1) | 209,650 |
| 285,000 | Bharti Airtel Ltd. 4.38%, 06/10/2025(1) | 304,566 |
| | | | 712,376 |
| | Ireland - 1.7% |
| 400,000 | Gtlk Europe Capital DAC 4.65%, 03/10/2027(1) | 414,060 |
| 400,000 | Lukoil Capital DAC 2.80%, 04/26/2027(2) | 398,600 |
| 200,000 | PJSC Koks via IMH Capital DAC 5.90%, 09/23/2025(2) | 211,140 |
| | | | 1,023,800 |
| | Isle of Man - 0.3% |
| 200,000 | AngloGold Ashanti Holdings plc 3.38%, 11/01/2028 | 198,859 |
| | Israel - 2.1% |
| 200,000 | Bank Hapoalim BM 3.26%, 01/21/2032, (3.26% fixed rate until 01/21/2027; 12 mo. USD CMT + 2.155% thereafter)(3) | 199,754 |
| | Energean Israel Finance Ltd. | |
| 135,000 | 4.50%, 03/30/2024(1)(2) | 137,700 |
| 25,000 | 4.88%, 03/30/2026(1)(2) | 25,400 |
The accompanying notes are an integral part of these financial statements.
The Hartford Emerging Markets Local Debt Fund
Schedule of Investments – (continued)
October 31, 2021
| Shares or Principal Amount | | Market Value† |
| CORPORATE BONDS - 33.2% - (continued) |
| | Israel - 2.1% - (continued) |
| $ 220,000 | 5.38%, 03/30/2028(1)(2) | $ 222,750 |
| 45,000 | 5.88%, 03/30/2031(1)(2) | 45,563 |
| 200,000 | Israel Electric Corp. Ltd. 4.25%, 08/14/2028(1)(2) | 223,000 |
| | Leviathan Bond Ltd. | |
| 70,000 | 6.50%, 06/30/2027(1)(2) | 76,300 |
| 105,000 | 6.75%, 06/30/2030(1)(2) | 115,106 |
| 200,000 | Mizrahi Tefahot Bank Ltd. 3.08%, 04/07/2031, (3.08% fixed rate until 04/07/2026; 5 year USD CMT + 2.250% thereafter)(1)(2)(3) | 199,600 |
| | | | 1,245,173 |
| | Jersey - 1.1% |
| | Galaxy Pipeline Assets Bidco Ltd. | |
| 230,000 | 2.16%, 03/31/2034(1) | 224,027 |
| 200,000 | 2.16%, 03/31/2034(2) | 194,806 |
| 200,000 | 2.63%, 03/31/2036(2) | 194,843 |
| | | | 613,676 |
| | Luxembourg - 1.7% |
| 196,458 | Guara Norte S.a.r.l. 5.20%, 06/15/2034(2) | 192,285 |
| 200,000 | Kernel Holding S.A. 6.50%, 10/17/2024(2) | 211,145 |
| | Millicom International Cellular S.A. | |
| 180,000 | 5.13%, 01/15/2028(2) | 187,830 |
| 180,000 | 5.13%, 01/15/2028(1) | 187,830 |
| 235,000 | VTB Bank OJSC Via VTB Capital S.A. 6.95%, 10/17/2022(1) | 244,126 |
| | | | 1,023,216 |
| | Mauritius - 1.1% |
| 200,000 | Azure Power Energy Ltd. 3.58%, 08/19/2026(2)(6) | 201,460 |
| 200,000 | Azure Power Solar Energy Pvt Ltd. 5.65%, 12/24/2024(1) | 210,000 |
| 200,000 | MTN Mauritius Investments Ltd. 5.37%, 02/13/2022(1) | 202,440 |
| | | | 613,900 |
| | Mexico - 1.9% |
| 200,000 | BBVA Bancomer S.A. 6.75%, 09/30/2022(1) | 209,500 |
| 200,000 | Braskem Idesa 6.99%, 02/20/2032(2) | 204,719 |
| 205,000 | Mexico City Airport Trust 5.50%, 07/31/2047(1) | 208,177 |
| 200,000 | Nemak S.A.B. de C.V. 3.63%, 06/28/2031 | 187,200 |
| 130,000 | Petroleos Mexicanos 7.69%, 01/23/2050 | 124,800 |
| 200,000 | Unifin Financiera S.A.B. de C.V. 9.88%, 01/28/2029(2) | 185,601 |
| | | | 1,119,997 |
| | Morocco - 0.4% |
| 223,000 | OCP S.A. 3.75%, 06/23/2031(2) | 218,538 |
| | Netherlands - 3.6% |
| 425,000 | Braskem Netherlands Finance B.V. 4.50%, 01/31/2030(1) | 431,273 |
| | Embraer Netherlands Finance B.V. | |
| 200,000 | 6.95%, 01/17/2028(2) | 221,900 |
| 200,000 | 6.95%, 01/17/2028(1) | 221,900 |
| 197,000 | Greenko Dutch B.V. 3.85%, 03/29/2026(2) | 198,477 |
| EUR 100,000 | Metinvest B.V. 5.63%, 06/17/2025(2) | 122,247 |
| | Petrobras Global Finance B.V. | |
| $ 60,000 | 5.50%, 06/10/2051 | 53,025 |
| 100,000 | 6.75%, 06/03/2050 | 102,578 |
| Shares or Principal Amount | | Market Value† |
| CORPORATE BONDS - 33.2% - (continued) |
| | Netherlands - 3.6% - (continued) |
| $ 350,000 | Teva Pharmaceutical Finance Netherlands B.V. 3.15%, 10/01/2026 | $ 329,875 |
| 200,000 | VEON Holdings B.V. 3.38%, 11/25/2027(1) | 200,384 |
| 200,000 | VTR Finance N.V. 6.38%, 07/15/2028(2) | 213,190 |
| | | | 2,094,849 |
| | Peru - 0.9% |
| 295,000 | Kallpa Generacion S.A. 4.13%, 08/16/2027(2) | 306,434 |
| 200,000 | SAN Miguel Industrias Pet S.A. 3.50%, 08/02/2028(2) | 196,452 |
| | | | 502,886 |
| | Qatar - 0.3% |
| 200,000 | Qatar Petroleum Industry 2.25%, 07/12/2031(2) | 197,000 |
| | Saudi Arabia - 0.7% |
| | Saudi Arabian Oil Co. | |
| 200,000 | 3.50%, 04/16/2029(1) | 213,401 |
| 200,000 | 4.25%, 04/16/2039(1) | 223,756 |
| | | | 437,157 |
| | Singapore - 1.5% |
| 205,000 | BOC Aviation Ltd. 3.88%, 04/27/2026(2)(6) | 217,931 |
| 200,000 | Jollibee Worldwide Pte Ltd. 3.90%, 01/23/2025, (3.90% fixed rate until 01/23/2025; 5 year USD CMT + 4.784% thereafter)(1)(3)(4) | 201,084 |
| 270,000 | United Overseas Bank Ltd. 2.88%, 03/08/2027, (2.88% fixed rate until 03/08/2022; 5 year USD Swap + 1.654% thereafter)(1)(3) | 271,680 |
| 200,000 | Vena Energy Capital Pte Ltd. 3.13%, 02/26/2025(1) | 203,612 |
| | | | 894,307 |
| | Spain - 0.4% |
| 250,000 | AI Candelaria Spain SLU 5.75%, 06/15/2033(2)(6) | 244,703 |
| | Thailand - 0.7% |
| | Bangkok Bank PCL | |
| 200,000 | 3.47%, 09/23/2036, (3.47% fixed rate until 09/23/2031; 5 year USD CMT + 2.150% thereafter)(2)(3) | 198,560 |
| 200,000 | 3.73%, 09/25/2034, (3.73% fixed rate until 09/25/2029; 5 year USD CMT + 1.900% thereafter)(1)(3) | 203,392 |
| | | | 401,952 |
| | Turkey - 0.3% |
| 200,000 | Zorlu Yenilenebilir Enerji AS 9.00%, 06/01/2026(2) | 186,612 |
| | United Arab Emirates - 0.8% |
| 200,000 | NBK SPC Ltd. 1.63%, 09/15/2027, (1.63% fixed rate until 09/15/2026; 1 mo. USD SOFR + 1.050% thereafter)(2)(3) | 196,355 |
| 225,000 | Tabreed Sukuk Spc Ltd. 5.50%, 10/31/2025(1) | 255,938 |
| | | | 452,293 |
The accompanying notes are an integral part of these financial statements.
The Hartford Emerging Markets Local Debt Fund
Schedule of Investments – (continued)
October 31, 2021
| Shares or Principal Amount | | Market Value† |
| CORPORATE BONDS - 33.2% - (continued) |
| | United States - 1.0% |
| | DAE Funding LLC | |
| $ 200,000 | 3.38%, 03/20/2028(1) | $ 204,074 |
| 200,000 | 3.38%, 03/20/2028(2) | 204,073 |
| 200,000 | Kosmos Energy Ltd. 7.50%, 03/01/2028(2) | 196,000 |
| | | | 604,147 |
| | Total Corporate Bonds
(cost $19,360,801) | $ 19,478,508 |
| FOREIGN GOVERNMENT OBLIGATIONS - 61.2% |
| | Argentina - 1.4% |
| ARS 7,410,592 | Argentina Treasury Bond 1.20%, 03/18/2022(7) | $ 73,819 |
| | Argentine Bonos del Tesoro | |
| 5,840,763 | 15.50%, 10/17/2026 | 21,785 |
| 8,645,000 | 16.00%, 10/17/2023 | 51,309 |
| | Argentine Republic Government International Bond | |
| $ 379,604 | 0.50%, 07/09/2030(8) | 129,654 |
| 73,605 | 1.00%, 07/09/2029 | 26,867 |
| 1,406,855 | 1.13%, 07/09/2035(8) | 436,139 |
| 195,000 | 2.50%, 07/09/2041(8) | 67,178 |
| ARS 3,970,000 | Autonomous City of Buenos Aires Argentina 37.41%, 03/29/2024, Argentina Deposit Rates Badlar Pvt Banks + 3.250%(8) | 35,478 |
| | | | 842,229 |
| | Azerbaijan - 0.4% |
| $ 200,000 | Republic of Azerbaijan International Bond 4.75%, 03/18/2024(1) | 214,140 |
| | Brazil - 2.0% |
| | Brazil Letras do Tesouro Nacional | |
| BRL 544,000 | 6.74%, 07/01/2022(5) | 89,846 |
| 2,946,000 | 8.12%, 01/01/2024(5) | 406,780 |
| | Brazil Notas do Tesouro Nacional | |
| 16,000 | 10.00%, 01/01/2025 | 2,681 |
| 2,690,000 | 10.00%, 01/01/2027 | 439,434 |
| 785,000 | 10.00%, 01/01/2029 | 125,194 |
| 496,000 | 10.00%, 01/01/2031 | 78,005 |
| | | | 1,141,940 |
| | Chile - 1.5% |
| | Bonos de la Tesoreria de la Republica en pesos | |
| CLP 30,000,000 | 2.80%, 10/01/2033 | 26,600 |
| 255,000,000 | 4.70%, 09/01/2030(1)(2) | 286,521 |
| 405,000,000 | 5.00%, 03/01/2035 | 442,217 |
| 100,000,000 | 6.00%, 01/01/2043 | 116,554 |
| | | | 871,892 |
| | China - 8.2% |
| | China Government Bond | |
| CNY 2,020,000 | 1.99%, 04/09/2025 | 307,572 |
| 6,940,000 | 2.68%, 05/21/2030 | 1,051,677 |
| 1,900,000 | 2.85%, 06/04/2027 | 296,047 |
| 2,070,000 | 3.01%, 05/13/2028 | 324,576 |
| 1,080,000 | 3.02%, 05/27/2031 | 169,499 |
| 3,110,000 | 3.13%, 11/21/2029 | 489,261 |
| 2,280,000 | 3.25%, 06/06/2026 | 363,067 |
| 2,330,000 | 3.25%, 11/22/2028 | 370,926 |
| 3,830,000 | 3.27%, 11/19/2030 | 611,102 |
| 1,500,000 | 3.28%, 12/03/2027 | 239,655 |
| Shares or Principal Amount | | Market Value† |
| FOREIGN GOVERNMENT OBLIGATIONS - 61.2% - (continued) |
| | China - 8.2% - (continued) |
| CNY 2,160,000 | 3.29%, 05/23/2029 | $ 344,819 |
| 650,000 | 3.72%, 04/12/2051 | 105,516 |
| 910,000 | 3.81%, 09/14/2050 | 149,123 |
| | | | 4,822,840 |
| | Colombia - 3.2% |
| | Colombian TES | |
| COP 619,175,677 | 2.25%, 04/18/2029(7) | 160,047 |
| 179,100,000 | 5.75%, 11/03/2027 | 43,518 |
| 164,900,000 | 6.00%, 04/28/2028 | 40,183 |
| 480,500,000 | 6.25%, 07/09/2036 | 105,037 |
| 278,700,000 | 7.00%, 03/26/2031 | 68,917 |
| 766,300,000 | 7.00%, 06/30/2032 | 187,586 |
| 1,012,000,000 | 7.25%, 10/18/2034 | 248,366 |
| 297,000,000 | 7.25%, 10/26/2050 | 67,464 |
| 1,232,000,000 | 7.50%, 08/26/2026 | 331,322 |
| 553,000,000 | 7.75%, 09/18/2030 | 146,332 |
| 1,563,900,000 | 10.00%, 07/24/2024 | 454,510 |
| | | | 1,853,282 |
| | Czech Republic - 2.6% |
| | Czech Republic Government Bond | |
| CZK 2,640,000 | 0.05%, 11/29/2029 | 96,025 |
| 5,140,000 | 0.95%, 05/15/2030(1) | 200,519 |
| 4,490,000 | 1.00%, 06/26/2026(1) | 186,122 |
| 3,200,000 | 1.20%, 03/13/2031 | 126,331 |
| 610,000 | 1.50%, 04/24/2040 | 22,783 |
| 1,330,000 | 1.75%, 06/23/2032 | 54,805 |
| 1,330,000 | 2.00%, 10/13/2033 | 55,658 |
| 10,190,000 | 2.50%, 08/25/2028(1) | 450,341 |
| 7,200,000 | 2.75%, 07/23/2029 | 323,518 |
| 660,000 | 4.20%, 12/04/2036(1) | 35,239 |
| | | | 1,551,341 |
| | Egypt - 1.0% |
| | Egypt Government Bond | |
| EGP 1,620,000 | 14.48%, 04/06/2026 | 103,219 |
| 2,640,000 | 14.56%, 07/06/2026 | 168,606 |
| | Egypt Government International Bond | |
| $ 200,000 | 5.80%, 09/30/2027(2) | 194,000 |
| 130,000 | 6.88%, 04/30/2040(1) | 115,206 |
| | | | 581,031 |
| | Hungary - 0.6% |
| | Hungary Government Bond | |
| HUF 23,820,000 | 1.50%, 04/22/2026 | 71,108 |
| 32,920,000 | 2.25%, 04/20/2033 | 88,614 |
| 25,230,000 | 3.00%, 10/27/2027 | 78,563 |
| 42,490,000 | 3.25%, 10/22/2031 | 130,210 |
| | | | 368,495 |
| | Indonesia - 4.8% |
| | Indonesia Treasury Bond | |
| IDR 1,026,000,000 | 5.13%, 04/15/2027 | 72,967 |
| 1,203,000,000 | 5.50%, 04/15/2026 | 86,280 |
| 1,065,000,000 | 5.63%, 05/15/2023 | 77,126 |
| 6,706,000,000 | 6.13%, 05/15/2028 | 483,987 |
| 1,431,000,000 | 6.38%, 04/15/2032 | 103,430 |
| 1,618,000,000 | 6.50%, 02/15/2031 | 116,375 |
| 2,597,000,000 | 7.00%, 05/15/2027 | 196,321 |
| 3,465,000,000 | 7.50%, 08/15/2032 | 262,183 |
| 1,022,000,000 | 7.50%, 06/15/2035 | 76,321 |
| 3,485,000,000 | 7.50%, 05/15/2038 | 257,301 |
| 4,590,000,000 | 7.50%, 04/15/2040 | 340,245 |
| 3,748,000,000 | 8.25%, 06/15/2032 | 298,921 |
The accompanying notes are an integral part of these financial statements.
The Hartford Emerging Markets Local Debt Fund
Schedule of Investments – (continued)
October 31, 2021
| Shares or Principal Amount | | Market Value† |
| FOREIGN GOVERNMENT OBLIGATIONS - 61.2% - (continued) |
| | Indonesia - 4.8% - (continued) |
| IDR 130,000,000 | 8.25%, 05/15/2036 | $ 10,323 |
| 2,251,000,000 | 8.38%, 04/15/2039 | 179,222 |
| 2,714,000,000 | 8.75%, 05/15/2031 | 223,844 |
| | | | 2,784,846 |
| | Macedonia - 0.7% |
| | North Macedonia Government International Bond | |
| EUR 140,000 | 1.63%, 03/10/2028(2) | 156,422 |
| 100,000 | 2.75%, 01/18/2025(1) | 120,316 |
| 110,000 | 3.68%, 06/03/2026(2) | 137,902 |
| | | | 414,640 |
| | Malaysia - 8.0% |
| | Malaysia Government Bond | |
| MYR 4,645,000 | 3.48%, 03/15/2023 | 1,141,382 |
| 1,725,000 | 3.48%, 06/14/2024 | 424,535 |
| 375,000 | 3.50%, 05/31/2027 | 91,251 |
| 460,000 | 3.73%, 06/15/2028 | 112,895 |
| 3,385,000 | 3.76%, 04/20/2023 | 834,484 |
| 790,000 | 3.76%, 05/22/2040 | 179,483 |
| 1,265,000 | 3.83%, 07/05/2034 | 295,849 |
| 1,215,000 | 3.89%, 08/15/2029 | 299,110 |
| 350,000 | 3.90%, 11/30/2026 | 87,232 |
| 255,000 | 3.90%, 11/16/2027 | 63,238 |
| 480,000 | 3.91%, 07/15/2026 | 119,609 |
| 810,000 | 3.96%, 09/15/2025 | 202,373 |
| 305,000 | 4.25%, 05/31/2035 | 75,055 |
| 55,000 | 4.64%, 11/07/2033 | 14,007 |
| 320,000 | 4.76%, 04/07/2037 | 82,245 |
| | Malaysia Government Investment Issue | |
| 1,295,000 | 3.47%, 10/15/2030 | 306,932 |
| 700,000 | 3.66%, 10/15/2024 | 173,588 |
| 455,000 | 3.73%, 03/31/2026 | 112,598 |
| 35,000 | 4.13%, 08/15/2025 | 8,775 |
| 340,000 | 4.13%, 07/09/2029 | 85,444 |
| | | | 4,710,085 |
| | Mexico - 5.3% |
| | Mexican Bonos | |
| MXN 6,789,900 | 5.50%, 03/04/2027 | 302,040 |
| 13,504,800 | 5.75%, 03/05/2026 | 619,333 |
| 11,981,200 | 7.50%, 06/03/2027 | 584,319 |
| 12,402,100 | 7.75%, 05/29/2031 | 611,762 |
| 2,103,000 | 7.75%, 11/23/2034 | 103,454 |
| 1,330,100 | 7.75%, 11/13/2042 | 63,388 |
| 4,718,600 | 8.00%, 11/07/2047 | 230,152 |
| 2,037,300 | 8.50%, 05/31/2029 | 104,834 |
| 7,720,900 | 8.50%, 11/18/2038 | 395,327 |
| 1,764,500 | 10.00%, 11/20/2036 | 103,377 |
| | | | 3,117,986 |
| | Oman - 0.4% |
| $ 200,000 | Oman Government International Bond 7.00%, 01/25/2051(1) | 208,308 |
| | Peru - 2.0% |
| | Peru Government Bond | |
| PEN 980,000 | 5.40%, 08/12/2034 | 223,950 |
| 585,000 | 5.94%, 02/12/2029 | 151,565 |
| 985,000 | 6.15%, 08/12/2032 | 249,917 |
| 1,045,000 | 6.35%, 08/12/2028 | 277,639 |
| 545,000 | 6.90%, 08/12/2037 | 138,131 |
| Shares or Principal Amount | | Market Value† |
| FOREIGN GOVERNMENT OBLIGATIONS - 61.2% - (continued) |
| | Peru - 2.0% - (continued) |
| PEN 185,000 | 6.95%, 08/12/2031 | $ 50,112 |
| 360,000 | 8.20%, 08/12/2026 | 102,622 |
| | | | 1,193,936 |
| | Poland - 1.8% |
| | Republic of Poland Government Bond | |
| PLN 1,735,000 | 0.25%, 01/25/2026(9) | 430,996 |
| 1,750,000 | 2.50%, 07/25/2026 | 442,539 |
| 795,000 | 3.25%, 07/25/2025 | 206,599 |
| | | | 1,080,134 |
| | Romania - 1.3% |
| | Romania Government Bond | |
| RON 130,000 | 4.40%, 09/25/2023 | 30,615 |
| 410,000 | 4.75%, 02/24/2025 | 96,764 |
| 590,000 | 4.75%, 10/11/2034 | 133,699 |
| | Romanian Government International Bond | |
| EUR 85,000 | 2.63%, 12/02/2040(2) | 89,908 |
| 85,000 | 2.63%, 12/02/2040(1) | 89,908 |
| 100,000 | 2.88%, 03/11/2029(1) | 124,139 |
| 115,000 | 3.62%, 05/26/2030(2) | 146,472 |
| 55,000 | 3.62%, 05/26/2030(1) | 70,052 |
| | | | 781,557 |
| | Russia - 5.6% |
| | Russian Federal Bond - OFZ | |
| RUB 27,720,000 | 5.90%, 03/12/2031 | 336,210 |
| 15,930,000 | 6.00%, 10/06/2027 | 202,231 |
| 16,390,000 | 6.10%, 07/18/2035 | 195,115 |
| 10,935,000 | 6.90%, 05/23/2029 | 144,123 |
| 24,325,000 | 7.00%, 08/16/2023 | 336,167 |
| 28,480,000 | 7.05%, 01/19/2028 | 380,476 |
| 12,370,000 | 7.25%, 05/10/2034 | 164,440 |
| 28,430,000 | 7.65%, 04/10/2030 | 391,526 |
| 6,245,000 | 7.70%, 03/23/2033 | 85,922 |
| 20,950,000 | 7.95%, 10/07/2026 | 292,829 |
| 24,755,000 | 8.15%, 02/03/2027 | 349,144 |
| 29,465,000 | 8.50%, 09/17/2031 | 428,633 |
| | | | 3,306,816 |
| | Serbia - 1.3% |
| EUR 585,000 | Serbia International Bond 3.13%, 05/15/2027(2) | 733,553 |
| | South Africa - 4.6% |
| | Republic of South Africa Government Bond | |
| ZAR 945,000 | 6.25%, 03/31/2036 | 42,464 |
| 5,221,770 | 6.50%, 02/28/2041 | 222,091 |
| 10,780,000 | 7.00%, 02/28/2031 | 579,756 |
| 1,060,000 | 7.75%, 02/28/2023 | 71,240 |
| 4,215,000 | 8.00%, 01/31/2030 | 250,389 |
| 7,425,000 | 8.25%, 03/31/2032 | 426,058 |
| 3,430,000 | 8.50%, 01/31/2037 | 186,826 |
| 2,805,000 | 8.75%, 01/31/2044 | 151,094 |
| 7,930,000 | 8.88%, 02/28/2035 | 458,087 |
| 3,499,000 | 9.00%, 01/31/2040 | 195,094 |
| 1,680,000 | 10.50%, 12/21/2026 | 120,487 |
| | | | 2,703,586 |
| | Supranational - 0.6% |
| 14,700,000 | Asian Development Bank 0.01%, 04/30/2040(5) | 150,401 |
| | International Finance Corp. | |
| TRY 1,000,000 | 0.00%, 05/09/2027(5) | 37,341 |
| MXN 9,600,000 | 0.01%, 01/29/2036(5) | 146,807 |
| | | | 334,549 |
The accompanying notes are an integral part of these financial statements.
The Hartford Emerging Markets Local Debt Fund
Schedule of Investments – (continued)
October 31, 2021
| Shares or Principal Amount | | Market Value† |
| FOREIGN GOVERNMENT OBLIGATIONS - 61.2% - (continued) |
| | Thailand - 3.8% |
| | Thailand Government Bond | |
| THB 7,222,377 | 1.25%, 03/12/2028(1)(7) | $ 214,502 |
| 7,352,000 | 1.60%, 12/17/2029 | 219,102 |
| 2,065,000 | 1.60%, 06/17/2035 | 56,386 |
| 1,095,000 | 1.88%, 06/17/2022 | 33,272 |
| 2,095,000 | 2.00%, 06/17/2042 | 56,121 |
| 6,290,000 | 2.13%, 12/17/2026 | 197,775 |
| 8,165,000 | 3.30%, 06/17/2038 | 267,565 |
| 4,800,000 | 3.40%, 06/17/2036 | 158,734 |
| 9,555,000 | 3.65%, 06/20/2031 | 330,160 |
| 7,820,000 | 3.78%, 06/25/2032 | 273,849 |
| 10,985,000 | 3.85%, 12/12/2025 | 367,101 |
| 1,770,000 | 4.88%, 06/22/2029 | 64,980 |
| | | | 2,239,547 |
| | Uruguay - 0.1% |
| UYU 1,245,000 | Uruguay Government International Bond 8.50%, 03/15/2028(1) | 29,185 |
| | Total Foreign Government Obligations
(cost $37,842,948) | | $ 35,885,918 |
| | Total Long-Term Investments
(cost $57,203,749) | | $ 55,364,426 |
| SHORT-TERM INVESTMENTS - 4.8% |
| | Repurchase Agreements - 3.9% |
| 2,263,762 | Fixed Income Clearing Corp. Repurchase Agreement dated 10/29/2021 at 0.010%, due on 11/01/2021 with a maturity value of $2,263,764; collateralized by U.S. Treasury Bond at 1.875%, maturing 02/15/2041, with a market value of $2,309,047 | $ 2,263,762 |
| | Securities Lending Collateral - 0.9% |
| 3,283 | Fidelity Investments Money Market Funds, Government Portfolio, Institutional Class, 0.01%(10) | 3,283 |
| 503,989 | Goldman Sachs Financial Square Funds, Government Fund, Institutional Class, 0.03%(10) | 503,989 |
| 36,183 | Invesco Government & Agency Portfolio, Institutional Class, 0.03%(10) | 36,183 |
| | | | 543,455 |
| | Total Short-Term Investments
(cost $2,807,217) | $ 2,807,217 |
| | Total Investments Excluding
Purchased Options
(cost $60,010,966) | 99.2% | $ 58,171,643 |
| | Total Purchased Options
(cost $321,365) | 0.5% | $ 291,537 |
| | Total Investments
(cost $60,332,331) | 99.7% | $ 58,463,180 |
| | Other Assets and Liabilities | 0.3% | 152,841 |
| | Total Net Assets | 100.0% | $ 58,616,021 |
| Note: | Percentage of investments as shown is the ratio of the total market value to total net assets. |
| | The Fund may refer to any one or more of the industry classifications used by one or more widely recognized market indices, ratings group and/or as defined by Fund management. Industry classifications may not be identical across all security types. |
| | For Fund compliance purposes, the Fund may not use the same classification system. These classifications are used for financial reporting purposes. |
| | See “Glossary” for abbreviation descriptions. |
| (1) | Security is exempt from registration under Regulation S under the Securities Act of 1933, which exempts from registration securities offered and sold outside of the United States. Security may not be offered or sold in the United States except pursuant to an exemption from, or in a transaction not subject to, the registration requirements of the Securities Act of 1933. At October 31, 2021, the aggregate value of these securities was $12,330,662, representing 21.0% of net assets. |
| (2) | Security was purchased pursuant to Rule 144A under the Securities Act of 1933 and may be sold in transactions that are exempt from registration (typically only to qualified institutional buyers) or in a public offering registered under the Securities Act of 1933. At October 31, 2021, the aggregate value of these securities was $10,325,497, representing 17.6% of net assets. |
| (3) | Fixed to variable rate investment. The rate shown reflects the fixed rate in effect at October 31, 2021. Rate will reset at a future date. Base lending rates may be subject to a floor or cap. |
| (4) | Perpetual maturity security. Maturity date shown is the next call date or final legal maturity date, whichever comes first. |
| (5) | Security is a zero-coupon bond. |
| (6) | Represents entire or partial securities on loan. See Note 8 in the accompanying Notes to Financial Statements for securities lending information. |
| (7) | The principal amount for these securities are adjusted for inflation and the interest payments equal a fixed percentage of the inflation-adjusted principal amount. |
| (8) | Variable rate securities; the rate reported is the coupon rate in effect at October 31, 2021. Base lending rates may be subject to a floor or cap. |
| (9) | Variable or floating rate security, which interest rate adjusts periodically based on changes in current interest rates and prepayments on the underlying pool of assets. Rate shown is the rate in effect as of period end. |
| (10) | Current yield as of period end. |
The accompanying notes are an integral part of these financial statements.
The Hartford Emerging Markets Local Debt Fund
Schedule of Investments – (continued)
October 31, 2021
| OTC Option Contracts Outstanding at October 31, 2021 |
| Description | | Counterparty | | Exercise Price/
FX Rate/Rate | | Expiration
Date | | Number of
Contracts | | Notional
Amount | | Market
Value† | | Premiums
Paid
(Received)
by Fund | | Unrealized
Appreciation/
(Depreciation) |
| Purchased option contracts: |
| Call |
| EUR Call/USD Put | | GSC | | 1.22 | | EUR | | 12/03/2021 | | 1,101,000 | | EUR | 1,101,000 | | $ 23 | | $ 22,733 | | $ (22,710) |
| EUR Call/USD Put | | MSC | | 1.17 | | EUR | | 01/06/2022 | | 514,000 | | EUR | 514,000 | | 3,625 | | 6,121 | | (2,496) |
| EUR Call/USD Put | | GSC | | 1.16 | | EUR | | 01/06/2022 | | 1,024,000 | | EUR | 1,024,000 | | 9,550 | | 12,991 | | (3,441) |
| USD Call/BRL Put | | DEUT | | 6.34 | | USD | | 07/12/2022 | | 915,000 | | USD | 915,000 | | 37,299 | | 27,936 | | 9,363 |
| USD Call/BRL Put | | GSC | | 6.00 | | USD | | 03/10/2022 | | 617,000 | | USD | 617,000 | | 19,435 | | 12,668 | | 6,767 |
| USD Call/CNH Put | | GSC | | 6.46 | | USD | | 12/02/2021 | | 670,000 | | USD | 670,000 | | 1,684 | | 9,716 | | (8,032) |
| USD Call/INR Put | | GSC | | 75.78 | | USD | | 01/10/2022 | | 592,000 | | USD | 592,000 | | 4,973 | | 6,507 | | (1,534) |
| USD Call/INR Put | | CBK | | 76.72 | | USD | | 04/28/2022 | | 586,000 | | USD | 586,000 | | 9,543 | | 9,543 | | — |
| USD Call/MXN Put | | MSC | | 21.00 | | USD | | 04/18/2022 | | 836,000 | | USD | 836,000 | | 26,919 | | 25,640 | | 1,279 |
| USD Call/RUB Put | | CBK | | 73.62 | | USD | | 04/18/2022 | | 896,000 | | USD | 896,000 | | 26,790 | | 28,784 | | (1,994) |
| USD Call/TRY Put | | GSC | | 9.63 | | USD | | 12/17/2021 | | 309,000 | | USD | 309,000 | | 11,755 | | 4,719 | | 7,036 |
| USD Call/ZAR Put | | CBK | | 17.09 | | USD | | 02/22/2022 | | 1,199,000 | | USD | 1,199,000 | | 11,510 | | 22,661 | | (11,151) |
| Total Call | | $ 163,106 | | $ 190,019 | | $ (26,913) |
| Put |
| EUR Put/ USD Call | | MSC | | 1.17 | | EUR | | 01/06/2022 | | 514,000 | | EUR | 514,000 | | $ 7,903 | | $ 6,122 | | $ 1,781 |
| EUR Put/ USD Call | | GSC | | 1.15 | | EUR | | 01/06/2022 | | 1,021,000 | | EUR | 1,021,000 | | 6,492 | | 5,080 | | 1,412 |
| EUR Put/ USD Call | | GSC | | 1.16 | | EUR | | 01/06/2022 | | 1,024,000 | | EUR | 1,024,000 | | 12,081 | | 13,279 | | (1,198) |
| GBP Put/ USD Call | | CBK | | 1.34 | | GBP | | 12/20/2021 | | 447,000 | | GBP | 447,000 | | 2,141 | | 3,543 | | (1,402) |
| GBP Put/ USD Call | | MSC | | 1.31 | | GBP | | 03/29/2022 | | 477,000 | | GBP | 477,000 | | 4,113 | | 5,642 | | (1,529) |
| USD Put/CNH Call | | GSC | | 6.41 | | USD | | 03/11/2022 | | 621,000 | | USD | 621,000 | | 3,761 | | 3,006 | | 755 |
| USD Put/INR Call | | CBK | | 72.95 | | USD | | 12/07/2021 | | 930,000 | | USD | 930,000 | | 186 | | 3,441 | | (3,255) |
| USD Put/MXN Call | | MSC | | 19.67 | | USD | | 11/09/2021 | | 606,000 | | USD | 606,000 | | 1 | | 4,450 | | (4,449) |
| USD Put/MXN Call | | DEUT | | 19.55 | | USD | | 12/15/2021 | | 621,000 | | USD | 621,000 | | 248 | | 4,092 | | (3,844) |
| USD Put/MXN Call | | MSC | | 20.17 | | USD | | 01/06/2022 | | 596,000 | | USD | 596,000 | | 2,915 | | 4,694 | | (1,779) |
| USD Put/MXN Call | | JPM | | 19.50 | | USD | | 03/11/2022 | | 621,000 | | USD | 621,000 | | 1,343 | | 6,076 | | (4,733) |
| USD Put/MXN Call | | MSC | | 21.00 | | USD | | 04/18/2022 | | 836,000 | | USD | 836,000 | | 20,649 | | 25,640 | | (4,991) |
| USD Put/RUB Call | | CBK | | 72.25 | | USD | | 01/26/2022 | | 600,000 | | USD | 600,000 | | 12,629 | | 6,909 | | 5,720 |
| USD Put/RUB Call | | CBK | | 72.14 | | USD | | 02/28/2022 | | 1,231,000 | | USD | 1,231,000 | | 25,476 | | 12,895 | | 12,581 |
| USD Put/RUB Call | | CBK | | 73.62 | | USD | | 04/18/2022 | | 896,000 | | USD | 896,000 | | 28,493 | | 26,477 | | 2,016 |
| Total Put | | $ 128,431 | | $ 131,346 | | $ (2,915) |
| Total purchased OTC option contracts | | $ 291,537 | | $ 321,365 | | $ (29,828) |
| Written option contracts: |
| Call |
| USD Call/CLP Put | | DEUT | | 786.70 | | USD | | 12/02/2021 | | (1,211,000) | | USD | (1,211,000) | | $ (52,844) | | $ (37,080) | | $ (15,764) |
| USD Call/CLP Put | | GSC | | 865.00 | | USD | | 03/10/2022 | | (926,000) | | USD | (926,000) | | (20,002) | | (16,055) | | (3,947) |
| USD Call/CNH Put | | GSC | | 6.63 | | USD | | 12/02/2021 | | (670,000) | | USD | (670,000) | | (120) | | (4,003) | | 3,883 |
| USD Call/INR Put | | GSC | | 77.35 | | USD | | 01/10/2022 | | (592,000) | | USD | (592,000) | | (1,776) | | (2,711) | | 935 |
| USD Call/INR Put | | CBK | | 79.11 | | USD | | 04/28/2022 | | (586,000) | | USD | (586,000) | | (4,026) | | (4,026) | | — |
| Total Call | | $ (78,768) | | $ (63,875) | | $ (14,893) |
| Puts |
| USD Put/BRL Call | | GSC | | 5.09 | | USD | | 03/10/2022 | | (617,000) | | USD | (617,000) | | $ (2,283) | | $ (9,838) | | $ 7,555 |
| USD Put/BRL Call | | MSC | | 5.85 | | USD | | 04/25/2022 | | (584,000) | | USD | (584,000) | | (25,988) | | (28,756) | | 2,768 |
| USD Put/BRL Call | | DEUT | | 5.02 | | USD | | 07/12/2022 | | (915,000) | | USD | (915,000) | | (5,262) | | (20,543) | | 15,281 |
| USD Put/CAD Call | | DEUT | | 1.24 | | USD | | 12/14/2021 | | (621,000) | | USD | (621,000) | | (5,216) | | (2,977) | | (2,239) |
| USD Put/CLP Call | | DEUT | | 786.70 | | USD | | 12/02/2021 | | (1,211,000) | | USD | (1,211,000) | | (7,016) | | (37,080) | | 30,064 |
| USD Put/THB Call | | MSC | | 33.44 | | USD | | 01/24/2022 | | (1,178,000) | | USD | (1,178,000) | | (17,317) | | (16,180) | | (1,137) |
| USD Put/TRY Call | | MSC | | 9.24 | | USD | | 01/19/2022 | | (614,000) | | USD | (614,000) | | (4,421) | | (7,163) | | 2,742 |
| USD Put/ZAR Call | | CBK | | 14.67 | | USD | | 02/22/2022 | | (1,199,000) | | USD | (1,199,000) | | (14,868) | | (17,562) | | 2,694 |
| Total puts | | $ (82,371) | | $ (140,099) | | $ 57,728 |
| Total Written Option Contracts OTC option contracts | | $ (161,139) | | $ (203,974) | | $ 42,835 |
The accompanying notes are an integral part of these financial statements.
The Hartford Emerging Markets Local Debt Fund
Schedule of Investments – (continued)
October 31, 2021
| Futures Contracts Outstanding at October 31, 2021 |
| Description | | Number of
Contracts | | Expiration
Date | | Current
Notional
Amount | | Value and
Unrealized
Appreciation/
(Depreciation) |
| Long position contracts: |
| U.S. Treasury 2-Year Note Future | | 9 | | 12/31/2021 | | $ 1,973,250 | | $ (8,126) |
| U.S. Treasury Long Bond Future | | 1 | | 12/21/2021 | | 160,844 | | (33) |
| U.S. Treasury Ultra Bond Future | | 2 | | 12/21/2021 | | 392,812 | | 10,434 |
| Total | | | | | | | | $ 2,275 |
| Short position contracts: |
| Euro-BOBL Future | | 2 | | 12/08/2021 | | $ 309,253 | | $ 4,749 |
| Euro-BUND Future | | 4 | | 12/08/2021 | | 777,387 | | 18,641 |
| Euro-Schatz Future | | 1 | | 12/08/2021 | | 129,426 | | 259 |
| U.S. Treasury 5-Year Note Future | | 4 | | 12/31/2021 | | 487,000 | | 446 |
| U.S. Treasury 10-Year Note Future | | 45 | | 12/21/2021 | | 5,881,640 | | 111,820 |
| U.S. Treasury 10-Year Ultra Future | | 1 | | 12/21/2021 | | 145,031 | | 139 |
| Total | | | | | | | | $ 136,054 |
| Total futures contracts | | $ 138,329 |
| OTC Interest Rate Swap Contracts Outstanding at October 31, 2021 |
| Counterparty | | Payments
made by
Fund | | Payments received
by Fund | | Notional
Amount | | Expiration
Date | | Periodic
Payment
Frequency | | Upfront
Premiums
Paid | | Upfront
Premiums
Received | | Value † | | Unrealized
Appreciation/
(Depreciation) |
| BOA | | 5.21% Fixed | | 6 Mo. INR MIBOR | | INR | 113,875,000 | | 12/15/2026 | | Semi-Annual | | $ — | | $ — | | $ 33,225 | | $ 33,225 |
| BOA | | 8.59% Fixed | | BZDIOVRA | | BRL | 723,075 | | 01/04/2027 | | Maturity | | — | | — | | 11,848 | | 11,848 |
| BOA | | BZDIOVRA | | 8.35% Fixed | | BRL | 873,821 | | 01/02/2025 | | Maturity | | — | | — | | (11,292) | | (11,292) |
| BOA | | BZDIOVRA | | 8.79% Fixed | | BRL | 3,836,286 | | 01/02/2024 | | Maturity | | — | | — | | (31,465) | | (31,465) |
| GSC | | BZDIOVRA | | 5.59% Fixed | | BRL | 465,709 | | 01/02/2024 | | Maturity | | — | | — | | (7,170) | | (7,170) |
| GSC | | BZDIOVRA | | 10.40% Fixed | | BRL | 385,391 | | 01/02/2029 | | Maturity | | — | | — | | (3,131) | | (3,131) |
| MSC | | BZDIOVRA | | 7.05% Fixed | | BRL | 30,391 | | 07/03/2023 | | Maturity | | — | | — | | (6) | | (6) |
| MSC | | BZDIOVRA | | 7.95% Fixed | | BRL | 737,284 | | 01/02/2029 | | Maturity | | — | | — | | (16,064) | | (16,064) |
| MSC | | BZDIOVRA | | 8.77% Fixed | | BRL | 1,064,756 | | 07/01/2024 | | Maturity | | — | | — | | (10,515) | | (10,515) |
| MSC | | BZDIOVRA | | 10.88% Fixed | | BRL | 995,935 | | 01/02/2025 | | Maturity | | — | | — | | (3,860) | | (3,860) |
| MSC | | 4.88% Fixed | | CLICP Camara Promedio A | | CLP | 208,195,000 | | 12/15/2031 | | Semi-Annual | | — | | — | | 14,957 | | 14,957 |
| MSC | | 4.58% Fixed | | CLICP Camara Promedio A | | CLP | 186,135,000 | | 12/15/2031 | | Semi-Annual | | — | | — | | 18,780 | | 18,780 |
| MSC | | 4.07% Fixed | | CLICP Camara Promedio A | | CLP | 654,700,000 | | 12/15/2023 | | Semi-Annual | | — | | — | | 17,730 | | 17,730 |
| MSC | | 3.39% Fixed | | CLICP Camara Promedio A | | CLP | 982,860,000 | | 12/15/2023 | | Semi-Annual | | — | | — | | 42,235 | | 42,235 |
| MSC | | CLICP Camara Promedio A | | 4.03% Fixed | | CLP | 664,195,000 | | 12/15/2026 | | Semi-Annual | | — | | — | | (50,606) | | (50,606) |
| MSC | | CLICP Camara Promedio A | | 4.51% Fixed | | CLP | 725,605,000 | | 12/15/2026 | | Semi-Annual | | — | | — | | (36,645) | | (36,645) |
| Total OTC interest rate swap contracts | | $ — | | $ — | | $ (31,979) | | $ (31,979) |
| Centrally Cleared Interest Rate Swap Contracts Outstanding at October 31, 2021 |
Payments made
by Fund | | Payments received
by Fund | | Notional
Amount | | Expiration
Date | | Periodic
Payment
Frequency | | Upfront
Premiums
Paid | | Upfront
Premiums
Received | | Value † | | Unrealized
Appreciation/
(Depreciation) |
| 1M MXN TIIE | | 6.40% Fixed | | MXN | 5,615,000 | | 07/16/2026 | | Lunar | | $ — | | $ — | | $ (12,305) | | $ (12,305) |
| 1M MXN TIIE | | 6.42% Fixed | | MXN | 2,765,000 | | 06/05/2028 | | Lunar | | — | | — | | (8,136) | | (8,136) |
| 6.02% Fixed | | 3M ZAR JIBAR | | ZAR | 50,345,000 | | 12/15/2026 | | Quarterly | | — | | — | | 136,075 | | 136,075 |
| 6.36% Fixed | | 3M ZAR JIBAR | | ZAR | 3,415,000 | | 12/15/2026 | | Quarterly | | — | | — | | 6,079 | | 6,079 |
| 3M ZAR JIBAR | | 7.31% Fixed | | ZAR | 30,115,000 | | 12/15/2031 | | Quarterly | | — | | — | | (93,308) | | (93,308) |
| 2.28% Fixed | | 6M CZK PRIBOR | | CZK | 156,700,000 | | 12/15/2023 | | Annual | | — | | — | | 151,309 | | 151,309 |
| 6M CZK PRIBOR | | 2.28% Fixed | | CZK | 103,530,000 | | 12/15/2026 | | Semi-Annual | | — | | — | | (190,476) | | (190,476) |
| 2.08% Fixed | | 6M CZK PRIBOR | | CZK | 21,100,000 | | 12/15/2031 | | Annual | | — | | — | | 55,020 | | 55,020 |
| 2.12% Fixed | | 6M CZK PRIBOR | | CZK | 1,000,000 | | 12/15/2031 | | Annual | | — | | — | | 2,424 | | 2,424 |
| 0.28% Fixed | | 6M EURIBOR | | EUR | 225,000 | | 12/15/2026 | | Annual | | — | | (183) | | 4,427 | | 4,610 |
| 6M HUF BUBOR | | 2.75% Fixed | | HUF | 170,960,000 | | 12/15/2026 | | Semi-Annual | | — | | — | | (24,171) | | (24,171) |
| 6M HUF BUBOR | | 2.75% Fixed | | HUF | 204,540,000 | | 12/15/2026 | | Semi-Annual | | — | | — | | (28,978) | | (28,978) |
| 2.98% Fixed | | 6M HUF BUBOR | | HUF | 100,995,000 | | 12/15/2031 | | Annual | | — | | — | | 23,433 | | 23,433 |
The accompanying notes are an integral part of these financial statements.
The Hartford Emerging Markets Local Debt Fund
Schedule of Investments – (continued)
October 31, 2021
| Centrally Cleared Interest Rate Swap Contracts Outstanding at October 31, 2021 – (continued) |
Payments made
by Fund | | Payments received
by Fund | | Notional
Amount | | Expiration
Date | | Periodic
Payment
Frequency | | Upfront
Premiums
Paid | | Upfront
Premiums
Received | | Value † | | Unrealized
Appreciation/
(Depreciation) |
| 2.97% Fixed | | 6M HUF BUBOR | | HUF | 41,405,000 | | 12/15/2031 | | Annual | | $ — | | $ — | | $ 9,702 | | $ 9,702 |
| 6M WIBOR PLN | | 1.70% Fixed | | PLN | 4,475,000 | | 12/15/2026 | | Semi-Annual | | — | | — | | (54,515) | | (54,515) |
| 2.07% Fixed | | 6M WIBOR PLN | | PLN | 640,000 | | 12/15/2031 | | Annual | | — | | — | | 10,389 | | 10,389 |
| Total centrally cleared interest rate swaps contracts | | $ — | | $ (183) | | $ (13,031) | | $ (12,848) |
| Foreign Currency Contracts Outstanding at October 31, 2021 |
Amount and Description of
Currency to be Purchased | | Amount and Description of
Currency to be Sold | | Counterparty | | Settlement
Date | | Appreciation/
(Depreciation) |
| 1,190,000 | AUD | | 879,189 | USD | | DEUT | | 12/15/2021 | | $ 16,150 |
| 120,000 | AUD | | 86,485 | USD | | GSC | | 12/15/2021 | | 3,801 |
| 120,000 | AUD | | 87,063 | USD | | CBK | | 12/15/2021 | | 3,223 |
| 172,000 | AUD | | 127,137 | USD | | BNP | | 12/15/2021 | | 2,273 |
| 803,000 | BRL | | 151,997 | USD | | BNP | | 11/12/2021 | | (10,061) |
| 2,030,000 | BRL | | 366,303 | USD | | GSC | | 12/02/2021 | | (8,937) |
| 20,609,000 | BRL | | 3,868,430 | USD | | CBK | | 12/02/2021 | | (240,372) |
| 1,587,000 | BRL | | 289,466 | USD | | GSC | | 03/14/2022 | | (17,341) |
| 1,940,000 | BRL | | 331,908 | USD | | MSC | | 04/27/2022 | | (3,347) |
| 2,214,000 | BRL | | 397,308 | USD | | DEUT | | 07/14/2022 | | (31,978) |
| 263,000 | CAD | | 207,189 | USD | | MSC | | 12/15/2021 | | 5,338 |
| 367,000 | CAD | | 293,255 | USD | | DEUT | | 12/15/2021 | | 3,313 |
| 275,000 | CAD | | 219,329 | USD | | CBK | | 12/15/2021 | | 2,895 |
| 90,000 | CAD | | 71,365 | USD | | BNP | | 12/15/2021 | | 1,363 |
| 148,900,000 | CLP | | 182,118 | USD | | UBS | | 12/15/2021 | | (31) |
| 389,300,000 | CLP | | 477,272 | USD | | CBK | | 12/15/2021 | | (1,204) |
| 65,500,000 | CLP | | 82,608 | USD | | DEUT | | 12/15/2021 | | (2,509) |
| 226,330,000 | CLP | | 281,146 | USD | | GSC | | 12/15/2021 | | (4,371) |
| 205,800,000 | CLP | | 259,960 | USD | | BNP | | 12/15/2021 | | (8,291) |
| 666,808,000 | CLP | | 827,582 | USD | | MSC | | 12/15/2021 | | (12,153) |
| 265,561,000 | CLP | | 351,970 | USD | | GSC | | 12/24/2021 | | (27,539) |
| 135,507,000 | CLP | | 184,866 | USD | | DEUT | | 12/30/2021 | | (19,428) |
| 125,635,000 | CLP | | 161,692 | USD | | DEUT | | 02/14/2022 | | (9,220) |
| 197,029,000 | CLP | | 243,999 | USD | | CBK | | 03/14/2022 | | (5,682) |
| 1,181,000 | CNH | | 182,854 | USD | | GSC | | 12/06/2021 | | 939 |
| 11,903,912 | CNH | | 1,828,243 | USD | | DEUT | | 12/15/2021 | | 22,791 |
| 4,775,000 | CNH | | 736,844 | USD | | GSC | | 12/15/2021 | | 5,658 |
| 1,066,000 | CNH | | 166,495 | USD | | CBK | | 12/15/2021 | | (734) |
| 2,650,327,000 | COP | | 687,504 | USD | | MSC | | 12/15/2021 | | 14,085 |
| 697,300,000 | COP | | 181,612 | USD | | GSC | | 12/15/2021 | | 2,975 |
| 952,700,000 | COP | | 249,879 | USD | | BNP | | 12/15/2021 | | 2,318 |
| 483,600,000 | COP | | 127,649 | USD | | NWM | | 12/15/2021 | | 368 |
| 10,230,000 | CZK | | 465,075 | USD | | GSC | | 12/15/2021 | | (5,120) |
| 43,689,000 | CZK | | 2,032,653 | USD | | BNP | | 12/15/2021 | | (68,338) |
| 12,040,000 | EGP | | 749,409 | USD | | JPM | | 12/15/2021 | | 7,843 |
| 6,820,000 | EGP | | 424,551 | USD | | DEUT | | 12/15/2021 | | 4,390 |
| 32,000 | EUR | | 37,586 | USD | | JPM | | 12/15/2021 | | (551) |
| 49,000 | EUR | | 58,171 | USD | | WEST | | 12/15/2021 | | (1,462) |
| 255,000 | EUR | | 296,918 | USD | | DEUT | | 12/15/2021 | | (1,801) |
| 387,000 | EUR | | 449,889 | USD | | MSC | | 12/15/2021 | | (2,006) |
| 251,000 | EUR | | 297,500 | USD | | UBS | | 12/15/2021 | | (7,013) |
| 1,084,000 | EUR | | 1,266,867 | USD | | GSC | | 12/15/2021 | | (12,331) |
| 1,161,000 | EUR | | 1,356,159 | USD | | CBK | | 12/15/2021 | | (12,510) |
| 1,256,000 | EUR | | 1,468,227 | USD | | BNP | | 12/15/2021 | | (14,633) |
| 1,532,000 | EUR | | 1,817,678 | USD | | BCLY | | 12/15/2021 | | (44,665) |
| 235,000 | EUR | | 274,598 | USD | | GSC | | 01/10/2022 | | (2,421) |
| 100,000 | GBP | | 141,600 | USD | | MSC | | 12/13/2021 | | (4,723) |
| 155,000 | GBP | | 209,509 | USD | | MSC | | 12/15/2021 | | 2,656 |
| 145,000 | GBP | | 197,627 | USD | | GSC | | 12/15/2021 | | 849 |
| 126,000 | GBP | | 172,250 | USD | | DEUT | | 12/15/2021 | | 220 |
The accompanying notes are an integral part of these financial statements.
The Hartford Emerging Markets Local Debt Fund
Schedule of Investments – (continued)
October 31, 2021
| Foreign Currency Contracts Outstanding at October 31, 2021 – (continued) |
Amount and Description of
Currency to be Purchased | | Amount and Description of
Currency to be Sold | | Counterparty | | Settlement
Date | | Appreciation/
(Depreciation) |
| 109,000 | GBP | | 150,566 | USD | | BNP | | 12/15/2021 | | $ (1,367) |
| 105,000 | GBP | | 143,627 | USD | | CBK | | 12/22/2021 | | 109 |
| 87,000 | GBP | | 117,895 | USD | | MSC | | 03/31/2022 | | 1,096 |
| 134,200,000 | HUF | | 435,587 | USD | | GSC | | 12/15/2021 | | (5,265) |
| 163,800,000 | HUF | | 539,862 | USD | | DEUT | | 12/15/2021 | | (14,623) |
| 778,913,000 | HUF | | 2,638,889 | USD | | BNP | | 12/15/2021 | | (141,236) |
| 40,787,467,000 | IDR | | 2,834,666 | USD | | BNP | | 12/15/2021 | | 31,737 |
| 4,790,000,000 | IDR | | 335,834 | USD | | GSC | | 12/15/2021 | | 790 |
| 9,000,000 | INR | | 119,880 | USD | | BNP | | 12/15/2021 | | (320) |
| 21,730,000 | INR | | 292,877 | USD | | CSI | | 12/15/2021 | | (4,207) |
| 11,516,000 | INR | | 151,976 | USD | | GSC | | 01/12/2022 | | 498 |
| 10,744,000 | INR | | 140,051 | USD | | CBK | | 05/02/2022 | | 71 |
| 704,736,000 | KRW | | 605,261 | USD | | BNP | | 11/17/2021 | | (2,464) |
| 404,500,000 | KRW | | 338,017 | USD | | BNP | | 12/15/2021 | | 7,775 |
| 251,240,000 | KRW | | 213,603 | USD | | BCLY | | 12/15/2021 | | 1,173 |
| 269,490,000 | KRW | | 229,625 | USD | | GSC | | 12/15/2021 | | 752 |
| 129,800,000 | KZT | | 301,245 | USD | | GSC | | 12/15/2021 | | (1,309) |
| 1,380,000 | MXN | | 66,482 | USD | | CBK | | 12/15/2021 | | 74 |
| 2,020,000 | MXN | | 98,496 | USD | | DEUT | | 12/15/2021 | | (1,073) |
| 10,680,000 | MXN | | 521,424 | USD | | BNP | | 12/15/2021 | | (6,338) |
| 80,668,000 | MXN | | 3,967,495 | USD | | GSC | | 12/15/2021 | | (76,960) |
| 3,345,000 | MYR | | 800,963 | USD | | BNP | | 12/15/2021 | | 5,216 |
| 170,000 | MYR | | 40,582 | USD | | DEUT | | 12/15/2021 | | 389 |
| 187,000 | NZD | | 131,841 | USD | | BNP | | 12/15/2021 | | 2,068 |
| 85,000 | NZD | | 59,172 | USD | | GSC | | 12/15/2021 | | 1,695 |
| 35,000 | NZD | | 25,018 | USD | | DEUT | | 12/15/2021 | | 45 |
| 440,000 | PEN | | 107,046 | USD | | GSC | | 12/15/2021 | | 3,027 |
| 830,000 | PEN | | 207,019 | USD | | CBK | | 12/15/2021 | | 619 |
| 742,000 | PEN | | 185,942 | USD | | NWM | | 12/15/2021 | | (319) |
| 7,440,000 | PHP | | 144,382 | USD | | GSC | | 12/15/2021 | | 3,054 |
| 14,200,000 | PHP | | 280,938 | USD | | BOA | | 12/15/2021 | | 459 |
| 785,000 | PLN | | 197,868 | USD | | BOA | | 12/15/2021 | | (1,308) |
| 1,120,000 | PLN | | 283,706 | USD | | DEUT | | 12/15/2021 | | (3,265) |
| 3,085,000 | PLN | | 780,521 | USD | | GSC | | 12/15/2021 | | (8,055) |
| 10,747,000 | PLN | | 2,817,094 | USD | | BNP | | 12/15/2021 | | (126,106) |
| 6,157,000 | RON | | 1,465,917 | USD | | BNP | | 12/15/2021 | | (32,225) |
| 3,303,000 | RSD | | 33,288 | USD | | CBK | | 12/15/2021 | | (824) |
| 49,574,000 | RUB | | 689,692 | USD | | CBK | | 12/03/2021 | | 4,891 |
| 144,389,000 | RUB | | 1,936,023 | USD | | BCLY | | 12/15/2021 | | 80,480 |
| 52,770,000 | RUB | | 714,897 | USD | | GSC | | 12/15/2021 | | 22,076 |
| 20,270,000 | RUB | | 272,776 | USD | | MSC | | 12/15/2021 | | 10,310 |
| 4,120,000 | RUB | | 57,825 | USD | | DEUT | | 12/15/2021 | | (286) |
| 21,800,000 | RUB | | 306,395 | USD | | CBK | | 12/15/2021 | | (1,941) |
| 265,000 | SGD | | 195,736 | USD | | JPM | | 12/15/2021 | | 738 |
| 115,000 | SGD | | 85,639 | USD | | GSC | | 12/15/2021 | | (376) |
| 22,500,000 | THB | | 670,394 | USD | | GSC | | 12/15/2021 | | 7,463 |
| 5,990,000 | THB | | 177,693 | USD | | MSC | | 12/15/2021 | | 2,767 |
| 4,070,000 | THB | | 122,738 | USD | | DEUT | | 12/15/2021 | | (122) |
| 65,450,000 | THB | | 1,996,054 | USD | | SCB | | 12/15/2021 | | (24,246) |
| 21,312,000 | THB | | 637,321 | USD | | MSC | | 01/26/2022 | | 4,627 |
| 9,709,500 | TRY | | 1,104,834 | USD | | MSC | | 12/15/2021 | | (117,157) |
| 1,219,000 | TRY | | 135,429 | USD | | GSC | | 12/20/2021 | | (11,755) |
| 1,713,000 | TRY | | 175,064 | USD | | MSC | | 01/20/2022 | | (3,782) |
| 1,589,000 | UYU | | 36,614 | USD | | JPM | | 12/15/2021 | | — |
| 2,138,000 | ZAR | | 142,867 | USD | | BNP | | 11/12/2021 | | (3,093) |
| 3,369,000 | ZAR | | 228,562 | USD | | CBK | | 11/12/2021 | | (8,311) |
| 1,828,000 | ZAR | | 121,204 | USD | | CBK | | 12/15/2021 | | (2,215) |
| 1,240,000 | ZAR | | 85,502 | USD | | DEUT | | 12/15/2021 | | (4,788) |
| 1,921,000 | ZAR | | 129,919 | USD | | BNP | | 12/15/2021 | | (4,877) |
| 6,814,000 | ZAR | | 453,568 | USD | | BOA | | 12/15/2021 | | (10,031) |
| 28,981,000 | ZAR | | 1,991,170 | USD | | GSC | | 12/15/2021 | | (104,740) |
The accompanying notes are an integral part of these financial statements.
The Hartford Emerging Markets Local Debt Fund
Schedule of Investments – (continued)
October 31, 2021
| Foreign Currency Contracts Outstanding at October 31, 2021 – (continued) |
Amount and Description of
Currency to be Purchased | | Amount and Description of
Currency to be Sold | | Counterparty | | Settlement
Date | | Appreciation/
(Depreciation) |
| 8,366,000 | ZAR | | 532,188 | USD | | CBK | | 02/24/2022 | | $ 7,349 |
| 33,617 | USD | | 45,000 | AUD | | GSC | | 12/15/2021 | | (241) |
| 171,089 | USD | | 235,000 | AUD | | MSC | | 12/15/2021 | | (5,721) |
| 1,215,445 | USD | | 1,645,000 | AUD | | DEUT | | 12/15/2021 | | (22,229) |
| 66,460 | USD | | 364,000 | BRL | | BNP | | 11/12/2021 | | 2,120 |
| 365,951 | USD | | 1,955,000 | BRL | | GSC | | 12/02/2021 | | 21,788 |
| 122,717 | USD | | 645,000 | BRL | | MSC | | 12/02/2021 | | 9,170 |
| 347,473 | USD | | 1,930,000 | BRL | | CBK | | 12/02/2021 | | 7,712 |
| 178,019 | USD | | 225,000 | CAD | | MSC | | 12/15/2021 | | (3,800) |
| 585,220 | USD | | 741,000 | CAD | | BNP | | 12/15/2021 | | (13,571) |
| 874,453 | USD | | 704,945,000 | CLP | | MSC | | 12/15/2021 | | 12,389 |
| 175,797 | USD | | 138,884,000 | CLP | | DEUT | | 12/15/2021 | | 5,958 |
| 145,482 | USD | | 115,047,000 | CLP | | BCLY | | 12/15/2021 | | 4,793 |
| 150,327 | USD | | 120,609,000 | CLP | | GSC | | 12/15/2021 | | 2,835 |
| 233,645 | USD | | 189,500,000 | CLP | | CBK | | 12/15/2021 | | 1,910 |
| 142,213 | USD | | 116,202,000 | CLP | | BOA | | 12/15/2021 | | 111 |
| 503,642 | USD | | 416,000,000 | CLP | | BNP | | 12/15/2021 | | (5,077) |
| 458,683 | USD | | 382,519,000 | CLP | | NWM | | 12/15/2021 | | (9,093) |
| 124,450 | USD | | 97,880,000 | CLP | | GSC | | 12/24/2021 | | 4,872 |
| 41,624 | USD | | 32,300,000 | CLP | | DEUT | | 12/30/2021 | | 2,189 |
| 88,489 | USD | | 70,589,000 | CLP | | GSC | | 02/14/2022 | | 2,821 |
| 176,957 | USD | | 141,486,000 | CLP | | GSC | | 03/14/2022 | | 5,823 |
| 133,925 | USD | | 111,292,000 | CLP | | DEUT | | 03/14/2022 | | (688) |
| 350,771 | USD | | 2,251,000 | CNH | | UBS | | 12/15/2021 | | 745 |
| 136,512 | USD | | 875,000 | CNH | | GSC | | 12/15/2021 | | 451 |
| 130,300 | USD | | 845,000 | CNH | | BNP | | 12/15/2021 | | (1,096) |
| 173,765 | USD | | 1,128,000 | CNH | | SSG | | 12/15/2021 | | (1,636) |
| 152,283 | USD | | 997,000 | CNH | | GSC | | 03/15/2022 | | (1,600) |
| 143,170 | USD | | 542,900,000 | COP | | NWM | | 12/15/2021 | | (545) |
| 386,006 | USD | | 1,473,200,000 | COP | | BNP | | 12/15/2021 | | (3,977) |
| 458,447 | USD | | 10,049,000 | CZK | | GSC | | 12/15/2021 | | 6,631 |
| 336,204 | USD | | 7,360,000 | CZK | | DEUT | | 12/15/2021 | | 5,288 |
| 298,979 | USD | | 6,560,000 | CZK | | MSC | | 12/15/2021 | | 4,033 |
| 55,972 | USD | | 1,243,000 | CZK | | UBS | | 12/15/2021 | | 85 |
| 1,322,419 | USD | | 1,141,000 | EUR | | GSC | | 12/07/2021 | | 2,311 |
| 3,693,479 | USD | | 3,111,000 | EUR | | BCLY | | 12/15/2021 | | 93,060 |
| 1,101,384 | USD | | 941,000 | EUR | | BNP | | 12/15/2021 | | 12,347 |
| 842,645 | USD | | 722,000 | EUR | | DEUT | | 12/15/2021 | | 7,060 |
| 497,808 | USD | | 428,000 | EUR | | CBK | | 12/15/2021 | | 2,476 |
| 479,486 | USD | | 413,000 | EUR | | GSC | | 12/15/2021 | | 1,514 |
| 135,865 | USD | | 117,000 | EUR | | MSC | | 12/15/2021 | | 458 |
| 125,324 | USD | | 108,000 | EUR | | SCB | | 12/15/2021 | | 334 |
| 11,649 | USD | | 10,000 | EUR | | CBA | | 12/15/2021 | | 76 |
| 469,742 | USD | | 406,000 | EUR | | BNP | | 02/02/2022 | | (698) |
| 99,191 | USD | | 85,000 | EUR | | MSC | | 02/16/2022 | | 670 |
| 388,914 | USD | | 287,000 | GBP | | MSC | | 12/13/2021 | | (3,924) |
| 134,543 | USD | | 97,000 | GBP | | MSC | | 12/15/2021 | | 1,769 |
| 183,697 | USD | | 133,000 | GBP | | CBK | | 12/15/2021 | | 1,646 |
| 481,708 | USD | | 351,000 | GBP | | BNP | | 12/15/2021 | | 1,258 |
| 1,086,162 | USD | | 332,618,000 | HUF | | DEUT | | 12/15/2021 | | 19,593 |
| 145,847 | USD | | 45,300,000 | HUF | | GSC | | 12/15/2021 | | 588 |
| 24,317 | USD | | 7,549,000 | HUF | | SSG | | 12/15/2021 | | 110 |
| 206,694 | USD | | 64,782,000 | HUF | | BOA | | 12/15/2021 | | (1,035) |
| 43,288 | USD | | 615,000,000 | IDR | | BNP | | 12/15/2021 | | 68 |
| 279,656 | USD | | 4,011,000,000 | IDR | | GSC | | 12/15/2021 | | (2,223) |
| 234,337 | USD | | 17,362,000 | INR | | CBK | | 12/09/2021 | | 3,524 |
| 117,600 | USD | | 8,760,000 | INR | | DEUT | | 12/15/2021 | | 1,228 |
| 344,850 | USD | | 26,050,000 | INR | | BNP | | 12/15/2021 | | (1,208) |
| 601,156 | USD | | 704,736,000 | KRW | | MSC | | 11/17/2021 | | (1,641) |
| 147,153 | USD | | 172,640,000 | KRW | | GSC | | 12/15/2021 | | (431) |
| 411,406 | USD | | 483,100,000 | KRW | | BNP | | 12/15/2021 | | (1,579) |
The accompanying notes are an integral part of these financial statements.
The Hartford Emerging Markets Local Debt Fund
Schedule of Investments – (continued)
October 31, 2021
| Foreign Currency Contracts Outstanding at October 31, 2021 – (continued) |
Amount and Description of
Currency to be Purchased | | Amount and Description of
Currency to be Sold | | Counterparty | | Settlement
Date | | Appreciation/
(Depreciation) |
| 171,538 | USD | | 3,489,000 | MXN | | MSC | | 11/12/2021 | | $ 2,383 |
| 9,900 | USD | | 204,000 | MXN | | MSC | | 12/06/2021 | | 47 |
| 883,374 | USD | | 18,138,000 | MXN | | GSC | | 12/15/2021 | | 8,597 |
| 223,613 | USD | | 4,535,000 | MXN | | CBK | | 12/15/2021 | | 4,895 |
| 496,243 | USD | | 10,193,000 | MXN | | BNP | | 12/15/2021 | | 4,646 |
| 218,646 | USD | | 4,447,000 | MXN | | BCLY | | 12/15/2021 | | 4,172 |
| 48,793 | USD | | 1,010,000 | MXN | | DEUT | | 12/15/2021 | | 82 |
| 101,711 | USD | | 2,110,000 | MXN | | MSC | | 12/15/2021 | | (52) |
| 170,889 | USD | | 3,440,000 | MXN | | DEUT | | 12/17/2021 | | 5,035 |
| 167,249 | USD | | 3,493,000 | MXN | | MSC | | 01/10/2022 | | (525) |
| 162,442 | USD | | 3,313,000 | MXN | | JPM | | 03/15/2022 | | 4,999 |
| 67,193 | USD | | 280,000 | MYR | | SCB | | 12/15/2021 | | (290) |
| 259,275 | USD | | 1,079,000 | MYR | | BNP | | 12/15/2021 | | (774) |
| 440,198 | USD | | 1,836,000 | MYR | | DEUT | | 12/15/2021 | | (2,297) |
| 237,575 | USD | | 335,000 | NZD | | GSC | | 12/15/2021 | | (2,314) |
| 427,481 | USD | | 607,000 | NZD | | BNP | | 12/15/2021 | | (7,185) |
| 92,995 | USD | | 385,000 | PEN | | CBK | | 12/15/2021 | | (3,319) |
| 161,636 | USD | | 664,000 | PEN | | JPM | | 12/15/2021 | | (4,474) |
| 136,688 | USD | | 565,000 | PEN | | NWM | | 12/15/2021 | | (4,656) |
| 149,648 | USD | | 617,000 | PEN | | DEUT | | 12/15/2021 | | (4,704) |
| 214,789 | USD | | 10,851,000 | PHP | | DEUT | | 12/15/2021 | | (241) |
| 205,620 | USD | | 10,500,000 | PHP | | CBK | | 12/15/2021 | | (2,455) |
| 350,952 | USD | | 17,930,000 | PHP | | GSC | | 12/15/2021 | | (4,361) |
| 990,415 | USD | | 3,905,000 | PLN | | GSC | | 12/15/2021 | | 12,625 |
| 381,566 | USD | | 1,515,000 | PLN | | MSC | | 12/15/2021 | | 2,219 |
| 51,547 | USD | | 220,000 | RON | | JPM | | 12/15/2021 | | 319 |
| 435,784 | USD | | 31,080,000 | RUB | | DEUT | | 12/15/2021 | | 1,728 |
| 259,625 | USD | | 18,890,000 | RUB | | CBK | | 12/15/2021 | | (4,189) |
| 137,992 | USD | | 10,210,000 | RUB | | MSC | | 12/15/2021 | | (4,599) |
| 268,034 | USD | | 19,990,000 | RUB | | BCLY | | 12/15/2021 | | (11,142) |
| 1,794,390 | USD | | 130,674,000 | RUB | | GSC | | 12/15/2021 | | (30,571) |
| 169,581 | USD | | 12,900,000 | RUB | | CBK | | 01/27/2022 | | (9,066) |
| 333,073 | USD | | 25,197,000 | RUB | | CBK | | 03/01/2022 | | (13,399) |
| 85,460 | USD | | 115,000 | SGD | | MSC | | 12/15/2021 | | 197 |
| 194,699 | USD | | 265,000 | SGD | | BNP | | 12/15/2021 | | (1,775) |
| 64,927 | USD | | 2,140,000 | THB | | GSC | | 12/15/2021 | | 456 |
| 78,608 | USD | | 2,620,000 | THB | | BNP | | 12/15/2021 | | (325) |
| 62,173 | USD | | 2,080,000 | THB | | UBS | | 12/15/2021 | | (491) |
| 140,408 | USD | | 4,750,000 | THB | | SCB | | 12/15/2021 | | (2,695) |
| 793,064 | USD | | 7,355,000 | TRY | | GSC | | 12/15/2021 | | 44,894 |
| 65,383 | USD | | 635,000 | TRY | | UBS | | 12/15/2021 | | 789 |
| 51,663 | USD | | 497,000 | TRY | | MSC | | 12/20/2021 | | 1,240 |
| 16,906 | USD | | 161,000 | TRY | | CBK | | 12/20/2021 | | 572 |
| 390,125 | USD | | 5,918,000 | ZAR | | MSC | | 11/12/2021 | | 3,231 |
| 836,867 | USD | | 12,550,000 | ZAR | | GSC | | 12/15/2021 | | 19,961 |
| 105,907 | USD | | 1,543,000 | ZAR | | CBK | | 12/15/2021 | | 5,470 |
| 245,794 | USD | | 3,702,000 | ZAR | | BNP | | 12/15/2021 | | 4,823 |
| 129,968 | USD | | 1,990,000 | ZAR | | BOA | | 12/15/2021 | | 435 |
| Total foreign currency contracts | | $ (813,243) |
† See Significant Accounting Policies of accompanying Notes to Financial Statements regarding valuation of investments.
The accompanying notes are an integral part of these financial statements.
The Hartford Emerging Markets Local Debt Fund
Schedule of Investments – (continued)
October 31, 2021
Fair Value Summary
The following is a summary of the fair valuations according to the inputs used as of October 31, 2021 in valuing the Fund’s investments.
| Description | | Total | | Level 1 | | Level 2 | | Level 3(1) |
| Assets | | | | | | | | |
| Corporate Bonds | | $ 19,478,508 | | $ — | | $ 19,478,508 | | $ — |
| Foreign Government Obligations | | 35,885,918 | | — | | 35,885,918 | | — |
| Short-Term Investments | | 2,807,217 | | 543,455 | | 2,263,762 | | — |
| Purchased Options | | 291,537 | | — | | 291,537 | | — |
| Foreign Currency Contracts(2) | | 717,595 | | — | | 717,595 | | — |
| Futures Contracts(2) | | 146,488 | | 146,488 | | — | | — |
| Swaps - Interest Rate(2) | | 537,816 | | — | | 537,816 | | — |
| Total | | $ 59,865,079 | | $ 689,943 | | $ 59,175,136 | | $ — |
| Liabilities | | | | | | | | |
| Foreign Currency Contracts(2) | | $ (1,530,838) | | $ — | | $ (1,530,838) | | $ — |
| Futures Contracts(2) | | (8,159) | | (8,159) | | — | | — |
| Swaps - Interest Rate(2) | | (582,643) | | — | | (582,643) | | — |
| Written Options | | (161,139) | | — | | (161,139) | | — |
| Total | | $ (2,282,779) | | $ (8,159) | | $ (2,274,620) | | $ — |
| (1) | For the year ended October 31, 2021, there were no transfers in and out of Level 3. |
| (2) | Derivative instruments (excluding purchased and written options, if applicable) are valued at the unrealized appreciation/(depreciation) on the investments. |
The accompanying notes are an integral part of these financial statements.
The Hartford Floating Rate Fund
Schedule of Investments
October 31, 2021
| Shares or Principal Amount | | Market Value† |
| CONVERTIBLE BONDS - 0.4% |
| | Airlines - 0.2% |
| $ 5,275,000 | JetBlue Airways Corp. 0.50%, 04/01/2026 | $ 5,065,141 |
| | Internet - 0.2% |
| GBP 2,600,000 | Trainline PLC 1.00%, 01/14/2026(1) | 3,115,590 |
| | Total Convertible Bonds
(cost $8,527,985) | $ 8,180,731 |
| CORPORATE BONDS - 6.9% |
| | Commercial Banks - 0.6% |
| | Freedom Mortgage Corp. | |
| $ 3,225,000 | 6.63%, 01/15/2027(2) | $ 3,055,687 |
| 2,015,000 | 7.63%, 05/01/2026(2) | 1,964,625 |
| 1,800,000 | 8.13%, 11/15/2024(2) | 1,817,064 |
| 6,389,000 | 8.25%, 04/15/2025(2) | 6,452,890 |
| | | | 13,290,266 |
| | Commercial Services - 0.6% |
| 2,025,000 | APX Group, Inc. 5.75%, 07/15/2029(2) | 2,007,281 |
| 3,950,000 | Brand Industrial Services, Inc. 8.50%, 07/15/2025(2) | 3,925,313 |
| EUR 885,000 | Q-Park Holding I B.V. 2.00%, 03/31/2026, 3 mo. EURIBOR + 2.000%(2)(3) | 980,859 |
| $ 5,125,000 | WW International, Inc. 4.50%, 04/15/2029(2) | 4,907,187 |
| | | | 11,820,640 |
| | Diversified Financial Services - 0.7% |
| 950,000 | Burford Capital Global Finance LLC 6.25%, 04/15/2028(2) | 1,007,000 |
| 11,465,000 | Home Point Capital, Inc. 5.00%, 02/01/2026(2) | 10,300,041 |
| 1,810,000 | Unifin Financiera S.A.B. de C.V. 9.88%, 01/28/2029(2) | 1,679,689 |
| 2,170,000 | United Wholesale Mortgage LLC 5.50%, 11/15/2025(2) | 2,159,150 |
| | | | 15,145,880 |
| | Electrical Components & Equipment - 0.1% |
| EUR 1,720,000 | Energizer Gamma Acquisition B.V. 3.50%, 06/30/2029(2) | 1,924,515 |
| | Engineering & Construction - 0.1% |
| $ 1,825,000 | Artera Services LLC 9.03%, 12/04/2025(2) | 1,948,188 |
| | Entertainment - 0.6% |
| EUR 815,000 | Banijay Group SAS 6.50%, 03/01/2026(2) | 970,423 |
| | Cinemark USA, Inc. | |
| $ 6,190,000 | 5.25%, 07/15/2028(2) | 6,039,150 |
| 5,125,000 | 5.88%, 03/15/2026(2) | 5,137,812 |
| EUR 800,000 | Scientific Games International, Inc. 3.38%, 02/15/2026(1) | 933,123 |
| | | | 13,080,508 |
| | Insurance - 0.1% |
| $ 2,525,000 | Genworth Holdings, Inc. 4.90%, 08/15/2023 | 2,581,812 |
| | Internet - 0.1% |
| EUR 1,705,000 | United Group B.V. 3.25%, 02/15/2026, 3 mo. EURIBOR + 3.250%(2)(3) | 1,928,052 |
| | Leisure Time - 1.0% |
| $ 7,625,000 | Carnival Corp. 7.63%, 03/01/2026(2) | 8,033,624 |
| | Life Time, Inc. | |
| 2,000,000 | 5.75%, 01/15/2026(2) | 2,053,240 |
| Shares or Principal Amount | | Market Value† |
| CORPORATE BONDS - 6.9% - (continued) |
| | Leisure Time - 1.0% - (continued) |
| $ 2,825,000 | 8.00%, 04/15/2026(2) | $ 2,966,250 |
| | NCL Corp. Ltd. | |
| 2,075,000 | 3.63%, 12/15/2024(2) | 1,953,094 |
| 1,025,000 | 5.88%, 03/15/2026(2) | 1,027,563 |
| 2,975,000 | Royal Caribbean Cruises Ltd. 4.25%, 07/01/2026(2) | 2,885,750 |
| | Viking Cruises Ltd. | |
| 1,025,000 | 5.88%, 09/15/2027(2) | 990,406 |
| 2,125,000 | 7.00%, 02/15/2029 | 2,135,667 |
| | | | 22,045,594 |
| | Lodging - 0.1% |
| | Wynn Macau Ltd. | |
| 1,075,000 | 5.13%, 12/15/2029(2) | 968,511 |
| 1,050,000 | 5.50%, 01/15/2026(2) | 986,863 |
| | | | 1,955,374 |
| | Machinery-Diversified - 0.2% |
| 3,285,000 | OT Merger Corp. 7.88%, 10/15/2029 | 3,235,725 |
| | Media - 0.1% |
| 1,000,000 | Houghton Mifflin Harcourt Publishers, Inc. 9.00%, 02/15/2025(2) | 1,060,000 |
| | Mining - 0.0% |
| EUR 875,000 | Constellium SE 3.13%, 07/15/2029(2) | 994,238 |
| | Oil & Gas - 0.2% |
| 1,400,000 | Petroleos Mexicanos 4.75%, 02/26/2029(1) | 1,596,648 |
| $ 335,000 | Rockcliff Energy LLC 5.50%, 10/15/2029(2) | 343,710 |
| | Southwestern Energy Co. | |
| 1,097,000 | 5.38%, 02/01/2029(2) | 1,157,335 |
| 1,020,000 | 5.38%, 03/15/2030 | 1,076,080 |
| | | | 4,173,773 |
| | Oil & Gas Services - 0.0% |
| 785,914 | KCA Deutag UK Finance plc 9.88%, 12/01/2025 | 855,467 |
| | Packaging & Containers - 0.1% |
| | Mauser Packaging Solutions Holding Co. | |
| EUR 1,475,000 | 4.75%, 04/15/2024(1) | 1,687,026 |
| $ 1,025,000 | 7.25%, 04/15/2025(2) | 992,425 |
| | | | 2,679,451 |
| | Pharmaceuticals - 0.1% |
| EUR 1,825,000 | Teva Pharmaceutical Finance Netherlands B.V. 1.25%, 03/31/2023 | 2,100,565 |
| | Real Estate - 0.3% |
| $ 1,125,000 | Country Garden Holdings Co., Ltd. 3.88%, 10/22/2030 | 1,029,375 |
| 1,000,000 | KWG Group Holdings Ltd. 6.00%, 01/11/2022 | 943,983 |
| | Yuzhou Group Holdings Co., Ltd. | |
| 3,225,000 | 6.00%, 01/25/2022 | 2,261,531 |
| 4,625,000 | 8.50%, 02/26/2024(1) | 2,327,628 |
| | | | 6,562,517 |
| | Retail - 1.4% |
| 720,000 | BCPE Ulysses Intermediate, Inc. (7.75% Cash, 8.50% PIK) 7.75%, 04/01/2027(2)(4) | 693,864 |
| | Dufry One B.V. | |
| EUR 875,000 | 2.00%, 02/15/2027(1) | 953,946 |
| 825,000 | 2.50%, 10/15/2024(1) | 939,211 |
The accompanying notes are an integral part of these financial statements.
The Hartford Floating Rate Fund
Schedule of Investments – (continued)
October 31, 2021
| Shares or Principal Amount | | Market Value† |
| CORPORATE BONDS - 6.9% - (continued) |
| | Retail - 1.4% - (continued) |
| | eG Global Finance plc | |
| EUR 5,350,000 | 4.38%, 02/07/2025(1) | $ 6,100,414 |
| 1,475,000 | 6.25%, 10/30/2025(1) | 1,726,755 |
| $ 2,800,000 | LSF9 Atlantis Holdings LLC / Victra Finance Corp. 7.75%, 02/15/2026(2) | 2,837,968 |
| 1,920,000 | Michaels Cos., Inc. 7.88%, 05/01/2029(2) | 1,939,200 |
| | Staples, Inc. | |
| 10,400,000 | 7.50%, 04/15/2026(2) | 10,504,000 |
| 3,800,000 | 10.75%, 04/15/2027(2) | 3,629,000 |
| | | | 29,324,358 |
| | Telecommunications - 0.5% |
| | Altice France S.A. | |
| EUR 1,750,000 | 4.13%, 01/15/2029(1) | 1,990,126 |
| 4,320,000 | 4.25%, 10/15/2029(2) | 4,943,980 |
| $ 2,975,000 | Frontier Communications Corp. 5.88%, 11/01/2029 | 2,963,844 |
| | | | 9,897,950 |
| | Total Corporate Bonds
(cost $149,139,607) | $ 146,604,873 |
| SENIOR FLOATING RATE INTERESTS - 85.5%(5) |
| | Aerospace/Defense - 0.2% |
| 4,999,976 | TransDigm, Inc. 2.34%, 05/30/2025, 1 mo. USD LIBOR + 2.250% | $ 4,937,976 |
| | Airlines - 1.7% |
| 10,755,000 | AAdvantage Loyalty IP Ltd. 5.50%, 04/20/2028, 1 mo. USD LIBOR + 4.750% | 11,195,310 |
| 6,395,000 | Air Canada 4.25%, 08/11/2028, 1 mo. USD LIBOR + 3.500% | 6,457,607 |
| 6,190,000 | Mileage Plus Holdings LLC 6.25%, 06/21/2027, 1 mo. USD LIBOR + 5.250% | 6,588,512 |
| 4,920,000 | SkyMiles IP Ltd. 4.75%, 10/20/2027, 3 mo. USD LIBOR + 3.750% | 5,237,045 |
| 6,746,100 | United Airlines, Inc. 4.50%, 04/21/2028, 1 mo. USD LIBOR + 3.750% | 6,836,430 |
| | | | 36,314,904 |
| | Asset-Backed - Finance & Insurance - 0.2% |
| EUR 4,350,000 | Kouti B.V. 0.00%, 07/01/2028, 1 mo. USD LIBOR + 3.750%(6) | 5,012,910 |
| | Auto Parts & Equipment - 0.8% |
| 4,336,969 | Clarios Global L.P. 3.25%, 04/30/2026, 3 mo. EURIBOR + 3.250% | 4,963,400 |
| | First Brands Group LLC | |
| $ 6,182,537 | 6.00%, 03/30/2027, 1 mo. USD LIBOR + 5.000% | 6,228,906 |
| 5,530,000 | 9.50%, 03/30/2028, 1 mo. USD LIBOR + 8.500% | 5,571,475 |
| | | | 16,763,781 |
| | Chemicals - 0.6% |
| | NIC Acquisition Corp. | |
| 5,154,100 | 4.50%, 12/29/2027, 1 mo. USD LIBOR + 3.750% | 5,142,812 |
| Shares or Principal Amount | | Market Value† |
| SENIOR FLOATING RATE INTERESTS - 85.5%(5) - (continued) |
| | Chemicals - 0.6% - (continued) |
| $ 1,960,000 | 8.50%, 12/29/2028, 1 mo. USD LIBOR + 7.750% | $ 1,957,550 |
| 4,508,127 | Tronox Finance LLC 2.37%, 03/13/2028, 1 mo. USD LIBOR + 2.250% | 4,471,521 |
| | | | 11,571,883 |
| | Commercial Services - 6.3% |
| 10,390,000 | APX Group, Inc. 4.00%, 07/10/2028, 1 mo. USD LIBOR + 3.500% | 10,349,375 |
| | Belron Finance U.S. LLC | |
| 2,332,197 | 2.44%, 10/30/2026, 1 mo. USD LIBOR + 2.250% | 2,319,090 |
| 7,959,255 | 3.25%, 04/13/2028, 1 mo. USD LIBOR + 2.750% | 7,954,320 |
| EUR 14,300,000 | Belron Luxembourg S.a r.l. 2.75%, 04/13/2028, 3 mo. EURIBOR + 2.750% | 16,399,874 |
| $ 8,886,649 | EVO Payments International LLC 3.34%, 12/22/2023, 3 mo. USD LIBOR + 3.250% | 8,873,674 |
| 25,325,000 | MPH Acquisition Holdings LLC 4.75%, 08/17/2028, 1 mo. USD LIBOR + 4.250% | 24,670,855 |
| 4,971,207 | Trans Union LLC 1.84%, 11/16/2026, 1 mo. USD LIBOR + 1.750% | 4,937,055 |
| EUR 24,330,000 | Verisure Holding AB 3.25%, 03/27/2028, 3 mo. EURIBOR + 3.250% | 27,885,285 |
| $ 2,988,706 | Verscend Holding Corp. 4.09%, 08/27/2025, 1 mo. USD LIBOR + 4.000% | 2,992,442 |
| 12,347,950 | WEX, Inc. 2.34%, 03/31/2028, 1 mo. USD LIBOR + 2.250% | 12,276,949 |
| 15,756,712 | WW International, Inc. 4.00%, 04/13/2028, 1 mo. USD LIBOR + 3.500% | 15,559,754 |
| | | | 134,218,673 |
| | Construction Materials - 1.7% |
| 11,005,000 | Chamberlain Group, Inc. 0.00%, 10/22/2028, 1 mo. USD LIBOR + 4.000%(6) | 10,982,109 |
| 5,092,730 | Cornerstone Building Brands, Inc. 3.75%, 04/12/2028, 1 mo. USD LIBOR + 3.250% | 5,082,544 |
| 4,775,696 | Quikrete Holdings, Inc. 2.59%, 02/01/2027, 1 mo. USD LIBOR + 2.500% | 4,725,933 |
| 7,340,000 | Standard Industries, Inc. 3.00%, 09/22/2028, 1 mo. USD LIBOR + 2.500% | 7,329,504 |
| 2,176,761 | Tamko Building Products LLC 3.09%, 06/01/2026, 1 mo. USD LIBOR + 3.000% | 2,166,791 |
| 987,531 | Watlow Electric Manufacturing Co. 4.50%, 03/02/2028, 1 mo. USD LIBOR + 4.000% | 988,351 |
| 4,338,923 | Wilsonart LLC 4.50%, 12/19/2026, 1 mo. USD LIBOR + 3.500% | 4,341,657 |
| | | | 35,616,889 |
| | Distribution/Wholesale - 0.8% |
| 16,423,882 | American Builders & Contractors Supply Co., Inc. 2.09%, 01/15/2027, 1 mo. USD LIBOR + 2.000% | 16,254,880 |
The accompanying notes are an integral part of these financial statements.
The Hartford Floating Rate Fund
Schedule of Investments – (continued)
October 31, 2021
| Shares or Principal Amount | | Market Value† |
| SENIOR FLOATING RATE INTERESTS - 85.5%(5) - (continued) |
| | Diversified Financial Services - 1.1% |
| | Blackhawk Network Holdings, Inc. | |
| $ 13,106,920 | 3.09%, 06/15/2025, 3 mo. USD LIBOR + 3.000% | $ 12,992,235 |
| 3,010,000 | 7.13%, 06/15/2026, 3 mo. USD LIBOR + 7.000% | 2,979,900 |
| 4,618,425 | Fleetcor Technologies Operating Co. LLC 1.84%, 04/28/2028, 1 mo. USD LIBOR + 1.750% | 4,603,600 |
| 2,093,185 | Minotaur Acquisition, Inc. 4.84%, 03/27/2026, 3 mo. USD LIBOR + 4.750% | 2,081,756 |
| | | | 22,657,491 |
| | Electrical Components & Equipment - 0.8% |
| | Anticimex International AB | |
| 3,040,000 | 0.00%, 07/21/2028, 1 mo. USD LIBOR + 3.500%(6) | 3,036,200 |
| EUR 3,770,000 | 3.75%, 07/21/2028, 1 mo. USD LIBOR + 3.750%(6) | 4,360,865 |
| $ 9,006,938 | Energizer Holdings, Inc. 2.75%, 12/22/2027, 1 mo. USD LIBOR + 2.250% | 8,975,954 |
| | | | 16,373,019 |
| | Engineering & Construction - 1.5% |
| 30,392,481 | Brand Energy & Infrastructure Services, Inc. 5.25%, 06/21/2024, 3 mo. USD LIBOR + 4.250% | 30,108,919 |
| 2,330,000 | PowerTeam Services LLC 8.25%, 03/06/2026, 3 mo. USD LIBOR + 7.250% | 2,312,525 |
| | | | 32,421,444 |
| | Entertainment - 6.0% |
| 13,375,000 | AP Core Holdings, II LLC 6.25%, 09/01/2027, 1 mo. USD LIBOR + 5.500% | 13,399,164 |
| EUR 1,920,000 | Banijay Entertainment S.A.S 3.75%, 03/01/2025, 3 mo. EURIBOR + 3.750% | 2,219,054 |
| $ 5,220,758 | Cinemark USA, Inc. 1.84%, 03/31/2025, 3 mo. USD LIBOR + 1.750% | 4,982,587 |
| | Crown Finance U.S., Inc. | |
| EUR 1,747,712 | 2.63%, 02/28/2025, 3 mo. EURIBOR + 2.625% | 1,663,418 |
| $ 32,114,091 | 3.50%, 02/28/2025, 1 mo. USD LIBOR + 2.500% | 26,429,897 |
| 2,349,836 | 7.13%, 05/23/2024, 1 mo. USD LIBOR + 7.000% | 2,833,902 |
| 1,998,092 | 9.25%, 05/23/2024, 1 mo. USD LIBOR + 8.250% | 2,142,954 |
| 9,903,529 | Delta (LUX) S.a.r.l. 3.50%, 02/01/2024, 3 mo. USD LIBOR + 2.500% | 9,863,320 |
| 5,685,000 | J&J Ventures Gaming LLC 4.75%, 04/07/2028, 1 mo. USD LIBOR + 4.000% | 5,699,212 |
| 5,120,000 | Maverick Gaming LLC 8.50%, 08/19/2028, 1 mo. USD LIBOR + 7.500% | 5,107,200 |
| 4,905,138 | Penn National Gaming, Inc. 3.00%, 10/15/2025, 3 mo. USD LIBOR + 2.250% | 4,894,935 |
| 14,162,780 | Scientific Games International, Inc. 2.84%, 08/14/2024, 1 mo. USD LIBOR + 2.750% | 14,096,782 |
| Shares or Principal Amount | | Market Value† |
| SENIOR FLOATING RATE INTERESTS - 85.5%(5) - (continued) |
| | Entertainment - 6.0% - (continued) |
| $ 23,199,787 | UFC Holdings LLC 3.50%, 04/29/2026, 1 mo. USD LIBOR + 2.750% | $ 23,054,789 |
| 2,940,897 | William Morris Endeavor Entertainment LLC 2.84%, 05/18/2025, 3 mo. USD LIBOR + 2.750% | 2,879,227 |
| 7,345,000 | WMG Acquisition Corp. 2.21%, 01/20/2028, 1 mo. USD LIBOR + 2.125% | 7,306,733 |
| | | | 126,573,174 |
| | Food - 3.0% |
| 4,455,337 | CHG PPC Parent LLC 2.84%, 03/31/2025, 3 mo. USD LIBOR + 2.750% | 4,421,922 |
| | Froneri International Ltd. | |
| 8,692,563 | 2.34%, 01/29/2027, 1 mo. USD LIBOR + 2.250% | 8,563,304 |
| EUR 15,370,000 | 2.63%, 01/29/2027, 3 mo. EURIBOR + 2.625% | 17,323,525 |
| $ 10,251,102 | Post Holdings, Inc. 4.75%, 10/21/2024, 1 mo. USD LIBOR + 4.000% | 10,284,419 |
| 5,400,813 | Simply Good Foods USA, Inc. 4.75%, 07/07/2024, 1 mo. USD LIBOR + 3.750% | 5,424,469 |
| | U.S. Foods, Inc. | |
| 11,056,254 | 1.84%, 06/27/2023, 1 mo. USD LIBOR + 1.750% | 10,980,850 |
| 6,172,896 | 2.09%, 09/13/2026, 3 mo. USD LIBOR + 2.000% | 6,057,154 |
| | | | 63,055,643 |
| | Food Service - 1.0% |
| | Aramark Services, Inc. | |
| 2,456,810 | 1.84%, 01/15/2027, 1 mo. USD LIBOR + 1.750% | 2,393,866 |
| 18,004,938 | 2.59%, 04/06/2028, 1 mo. USD LIBOR + 2.500% | 17,856,397 |
| | | | 20,250,263 |
| | Healthcare - Products - 2.1% |
| | Avantor Funding, Inc. | |
| 6,035,000 | 2.75%, 11/08/2027, 1 mo. USD LIBOR + 2.250% | 6,029,991 |
| EUR 5,895,225 | 2.75%, 06/12/2028, 1 mo. EURIBOR + 2.750%(6) | 6,795,934 |
| $ 2,128,111 | Coty, Inc. 2.34%, 04/07/2025, 3 mo. USD LIBOR + 2.250% | 2,093,529 |
| 5,950,087 | Insulet Corp. 3.75%, 05/04/2028, 1 mo. USD LIBOR + 3.250% | 5,955,681 |
| 8,370,000 | Medline Industries, Inc. 0.00%, 10/23/2028, 1 mo. USD LIBOR + 3.250%(6) | 8,378,286 |
| 15,162,457 | Sunshine Luxembourg S.a.r.l. 4.50%, 10/01/2026, 1 mo. USD LIBOR + 3.750% | 15,187,171 |
| | | | 44,440,592 |
| | Healthcare - Services - 5.8% |
| 15,079,225 | ADMI Corp. 3.63%, 12/23/2027, 1 mo. USD LIBOR + 3.125% | 14,961,456 |
| EUR 10,410,000 | Biogroup-LCD 3.50%, 01/28/2028, 3 mo. EURIBOR + 3.500% | 11,960,431 |
| $ 5,498,920 | Cano Health LLC 5.25%, 11/19/2027, 1 mo. USD LIBOR + 4.500% | 5,498,920 |
The accompanying notes are an integral part of these financial statements.
The Hartford Floating Rate Fund
Schedule of Investments – (continued)
October 31, 2021
| Shares or Principal Amount | | Market Value† |
| SENIOR FLOATING RATE INTERESTS - 85.5%(5) - (continued) |
| | Healthcare - Services - 5.8% - (continued) |
| $ 4,911,616 | Envision Healthcare Corp. 3.84%, 10/10/2025, 3 mo. USD LIBOR + 3.750% | $ 4,054,146 |
| 4,070,183 | eResearchTechnology, Inc. 5.50%, 02/04/2027, 1 mo. USD LIBOR + 4.500% | 4,086,586 |
| | EyeCare Partners LLC | |
| 2,215,000 | 0.00%, 10/14/2029, 1 mo. USD LIBOR + 6.750%(6) | 2,222,376 |
| 19,198,333 | 3.88%, 02/18/2027, 1 mo. USD LIBOR + 3.750%(6) | 19,061,641 |
| 7,256,812 | Heartland Dental, LLC 4.09%, 04/30/2025, 1 mo. USD LIBOR + 4.000% | 7,237,147 |
| 6,240,611 | ICON Luxembourg S.a r.l. 3.00%, 07/03/2028, 1 mo. USD LIBOR + 2.500% | 6,239,924 |
| EUR 3,116,260 | IQVIA, Inc. 2.00%, 06/11/2025, 1 mo. EURIBOR + 2.000% | 3,573,145 |
| $ 11,327,340 | Loire Finco Luxembourg S.a.r.l. 3.25%, 04/21/2027, 1 mo. USD LIBOR + 3.250% | 11,100,793 |
| 22,323,692 | MED ParentCo L.P. 4.34%, 08/31/2026, 1 mo. USD LIBOR + 4.250% | 22,255,381 |
| | Medical Solutions L.L.C. | |
| 8,954,400 | 0.00%, 10/07/2028, 1 mo. USD LIBOR + 3.500%(6) | 8,958,877 |
| 1,705,600 | 0.00%, 11/01/2028 | 1,706,453 |
| | | | 122,917,276 |
| | Holding Companies-Diversified - 0.4% |
| 422,837 | Belfor Holdings, Inc. 4.09%, 04/06/2026, 3 mo. USD LIBOR + 3.750% | 423,894 |
| EUR 7,815,000 | IVC Acquisition Ltd. 0.00%, 02/13/2026, 1 mo. USD LIBOR + 4.000%(6) | 9,020,588 |
| | | | 9,444,482 |
| | Home Builders - 0.7% |
| | Tecta America Corp. | |
| $ 10,653,300 | 5.00%, 04/01/2028, 1 mo. USD LIBOR + 4.250% | 10,666,617 |
| 3,800,000 | 9.25%, 04/01/2029, 1 mo. USD LIBOR + 8.500% | 3,781,000 |
| | | | 14,447,617 |
| | Home Furnishings - 0.9% |
| 18,265,000 | Mattress Firm Inc 5.00%, 09/25/2028, 1 mo. USD LIBOR + 4.250% | 18,169,291 |
| | Insurance - 4.0% |
| 15,953,054 | Acrisure LLC 3.63%, 02/15/2027, 1 mo. USD LIBOR + 3.500% | 15,729,711 |
| | Asurion LLC | |
| 1,989,717 | 3.09%, 11/03/2024, 1 mo. USD LIBOR + 3.000% | 1,974,178 |
| 5,134,523 | 3.21%, 11/03/2023, 1 mo. USD LIBOR + 3.125% | 5,120,609 |
| 1,566,352 | 3.34%, 12/23/2026, 1 mo. USD LIBOR + 3.250% | 1,549,952 |
| 5,739,525 | 3.34%, 07/31/2027, 1 mo. USD LIBOR + 3.250% | 5,682,130 |
| 9,905,000 | 5.34%, 01/31/2028, 1 mo. USD LIBOR + 5.250% | 9,864,290 |
| Shares or Principal Amount | | Market Value† |
| SENIOR FLOATING RATE INTERESTS - 85.5%(5) - (continued) |
| | Insurance - 4.0% - (continued) |
| $ 9,640,000 | 5.34%, 01/20/2029, 1 mo. USD LIBOR + 5.250% | $ 9,593,824 |
| 8,928,545 | Hub International Ltd. 2.87%, 04/25/2025, 1 mo. USD LIBOR + 2.750% | 8,825,063 |
| 11,833,644 | Sedgwick Claims Management Services, Inc. 3.34%, 12/31/2025, 3 mo. USD LIBOR + 3.250% | 11,707,970 |
| 13,857,161 | USI, Inc. 3.13%, 05/16/2024, 3 mo. USD LIBOR + 3.000% | 13,745,750 |
| | | | 83,793,477 |
| | Internet - 4.3% |
| | Adevinta ASA | |
| EUR 4,250,000 | 3.25%, 06/26/2028, 3 mo. EURIBOR + 3.250% | 4,910,641 |
| $ 1,730,662 | 3.75%, 06/26/2028, 1 mo. USD LIBOR + 3.000% | 1,730,230 |
| 15,830,325 | Endure Digital, Inc. 4.25%, 02/10/2028, 1 mo. USD LIBOR + 3.500% | 15,546,646 |
| | MH Sub LLC | |
| 16,259,739 | 3.50%, 09/13/2024, 3 mo. USD LIBOR + 3.500% | 16,194,050 |
| 9,202,538 | 4.75%, 09/13/2024, 1 mo. USD LIBOR + 3.750% | 9,217,906 |
| 2,815,000 | 6.34%, 02/12/2029, 1 mo. USD LIBOR + 6.250% | 2,851,060 |
| 14,650,000 | Proofpoint, Inc. 3.75%, 08/31/2028, 1 mo. USD LIBOR + 3.250% | 14,583,343 |
| 4,009,437 | Rodan & Fields LLC 4.09%, 06/16/2025, 3 mo. USD LIBOR + 4.000% | 2,812,339 |
| 23,235,000 | Shutterfly, Inc. 5.75%, 09/25/2026, 1 mo. USD LIBOR + 5.000% | 22,967,797 |
| | | | 90,814,012 |
| | IT Services - 0.6% |
| 5,386,500 | Panther Commercial Holdings L.P. 5.00%, 01/07/2028, 1 mo. USD LIBOR + 5.000% | 5,399,966 |
| 6,960,443 | Surf Holdings LLC 3.62%, 03/05/2027, 1 mo. USD LIBOR + 3.500% | 6,912,208 |
| | | | 12,312,174 |
| | Leisure Time - 2.9% |
| | Carnival Corp. | |
| EUR 6,674,556 | 3.75%, 06/30/2025, 3 mo. EURIBOR + 3.750% | 7,691,712 |
| $ 12,957,847 | 3.75%, 06/30/2025, 1 mo. USD LIBOR + 3.000% | 12,933,616 |
| 6,370,000 | 4.00%, 10/18/2028, 6 mo. USD LIBOR + 4.000% | 6,362,038 |
| 3,405,000 | Great Canadian Gaming Corp. 0.00%, 11/01/2026, 1 mo. USD LIBOR + 4.000%(6) | 3,420,323 |
| 12,413,888 | Hayward Industries, Inc. 3.00%, 05/12/2028, 1 mo. USD LIBOR + 2.500% | 12,372,549 |
The accompanying notes are an integral part of these financial statements.
The Hartford Floating Rate Fund
Schedule of Investments – (continued)
October 31, 2021
| Shares or Principal Amount | | Market Value† |
| SENIOR FLOATING RATE INTERESTS - 85.5%(5) - (continued) |
| | Leisure Time - 2.9% - (continued) |
| $ 13,117,125 | MajorDrive Holdings LLC 4.50%, 05/12/2028, 1 mo. USD LIBOR + 4.000% | $ 13,117,125 |
| 6,190,504 | SRAM LLC 3.25%, 05/12/2028, 1 mo. USD LIBOR + 2.750% | 6,175,028 |
| | | | 62,072,391 |
| | Lodging - 1.8% |
| 6,275,763 | Boyd Gaming Corp. 2.32%, 09/15/2023, 3 mo. USD LIBOR + 2.250% | 6,264,279 |
| 32,747,412 | Caesars Resort Collection LLC 2.84%, 12/23/2024, 3 mo. USD LIBOR + 2.750% | 32,580,400 |
| | | | 38,844,679 |
| | Machinery-Diversified - 0.9% |
| 7,355,000 | ASP Blade Holdings, Inc. 0.00%, 10/13/2028, 1 mo. USD LIBOR + 4.000%(6) | 7,364,194 |
| 9,630,000 | Filtration Group Corp. 0.00%, 10/21/2028, 1 mo. USD LIBOR + 3.750%(6) | 9,613,147 |
| 1,023,008 | Vertical U.S. Newco, Inc. 4.00%, 07/30/2027, 1 mo. USD LIBOR + 3.500% | 1,024,287 |
| | | | 18,001,628 |
| | Media - 6.1% |
| 1,980,000 | Banijay Entertainment S.A.S 3.83%, 03/01/2025, 1 mo. USD LIBOR + 3.750% | 1,972,575 |
| 13,830,337 | Cable One, Inc. 2.09%, 05/03/2028, 1 mo. USD LIBOR + 2.000% | 13,713,610 |
| 5,072,362 | Charter Communications Operating LLC 1.84%, 02/01/2027, 1 mo. USD LIBOR + 1.750% | 5,035,131 |
| | CSC Holdings LLC | |
| 7,464,437 | 2.34%, 07/17/2025, 3 mo. USD LIBOR + 2.250% | 7,284,843 |
| 3,509,367 | 2.59%, 04/15/2027, 1 mo. USD LIBOR + 2.500% | 3,434,793 |
| 15,440,000 | DirecTV Financing LLC 5.75%, 07/22/2027, 1 mo. USD LIBOR + 5.000% | 15,447,411 |
| 7,096,457 | E.W. Scripps Co. 3.31%, 05/01/2026, 1 mo. USD LIBOR + 2.563% | 7,069,845 |
| 5,730,003 | Entravision Communications Corp. 2.84%, 11/29/2024, 3 mo. USD LIBOR + 2.750% | 5,660,154 |
| 4,573,054 | Gray Television, Inc. 2.58%, 01/02/2026, 3 mo. USD LIBOR + 2.500% | 4,540,493 |
| 38,068 | Houghton Mifflin Harcourt Publishing Co. 7.25%, 11/22/2024, 1 mo. USD LIBOR + 6.250% | 37,985 |
| 8,704,113 | NEP/NCP Holdco, Inc. 3.34%, 10/20/2025, 3 mo. USD LIBOR + 3.250% | 8,433,502 |
| 10,315,000 | Telenet Financing USD LLC 2.09%, 04/30/2028, 6 mo. USD LIBOR + 2.000% | 10,165,433 |
| EUR 2,400,000 | UPC Broadband Holding B.V. 3.00%, 01/31/2029, 3 mo. EURIBOR + 3.000% | 2,754,036 |
| $ 12,625,000 | UPC Financing Partnership 3.09%, 01/31/2029, 1 mo. USD LIBOR + 3.000% | 12,564,526 |
| Shares or Principal Amount | | Market Value† |
| SENIOR FLOATING RATE INTERESTS - 85.5%(5) - (continued) |
| | Media - 6.1% - (continued) |
| EUR 8,480,000 | Virgin Media Ireland Ltd. 3.50%, 07/15/2029, 3 mo. EURIBOR + 3.500% | $ 9,736,023 |
| GBP 7,550,000 | Virgin Media SFA Finance Ltd. 3.32%, 11/15/2027, 1 mo. GBP LIBOR + 3.250% | 10,155,251 |
| EUR 9,985,000 | Ziggo B.V. 3.00%, 01/31/2029, 3 mo. EURIBOR + 3.000% | 11,403,223 |
| | | | 129,408,834 |
| | Metal Fabricate/Hardware - 0.0% |
| $ 1,229,870 | Ameriforge Group, Inc. 7.00%, 12/31/2023, 3 mo. USD LIBOR + 8.000% | 553,442 |
| | Miscellaneous Manufacturing - 1.0% |
| 3,500,000 | International Textile Group, Inc. 9.13%, 05/01/2025, 3 mo. USD LIBOR + 9.000% | 2,590,000 |
| | LTI Holdings, Inc. | |
| 15,426,907 | 3.59%, 09/06/2025, 3 mo. USD LIBOR + 3.500% | 15,220,341 |
| 2,440,000 | 6.84%, 09/06/2026, 3 mo. USD LIBOR + 6.750% | 2,427,043 |
| 231,074 | UTEX Industries Inc. 5.50%, 12/03/2025, 1 mo. USD LIBOR + 5.250% | 225,683 |
| | | | 20,463,067 |
| | Oil & Gas Services - 0.3% |
| 6,855,000 | Oryx Midstream Services Permian Basin LLC 0.00%, 10/05/2028, 1 mo. USD LIBOR + 3.250%(6) | 6,825,592 |
| 12,771,026 | PES Holdings LLC 0.00%, 12/31/2022, 3 mo. USD LIBOR + 6.990%(6)(7) | 127,710 |
| | | | 6,953,302 |
| | Packaging & Containers - 3.2% |
| 19,091,646 | BWAY Holding Co. 3.34%, 04/03/2024, 3 mo. USD LIBOR + 3.250% | 18,569,680 |
| | Flex Acquisition Co., Inc. | |
| 19,425,133 | 3.13%, 06/29/2025, 3 mo. USD LIBOR + 3.000% | 19,265,070 |
| 13,995,177 | 4.00%, 02/23/2028, 1 mo. USD LIBOR + 3.500% | 13,952,351 |
| | Pretium PKG Holdings, Inc. | |
| 4,830,000 | 4.50%, 10/02/2028, 1 mo. USD LIBOR + 4.500% | 4,841,496 |
| 1,170,000 | 7.25%, 10/01/2029, 1 mo. USD LIBOR + 6.750% | 1,181,700 |
| | TricorBraun Holdings, Inc. | |
| 7,898,454 | 3.75%, 03/03/2028, 1 mo. USD LIBOR + 3.250% | 7,843,718 |
| 1,503,535 | 3.75%, 03/03/2028, 1 mo. USD LIBOR + 3.250%(8) | 1,493,116 |
| | | | 67,147,131 |
| | Pharmaceuticals - 4.4% |
| 5,784,285 | Change Healthcare Holdings LLC 3.50%, 03/01/2024, 1 mo. USD LIBOR + 2.500% | 5,777,690 |
| 6,585,366 | Elanco Animal Health, Inc. 1.83%, 08/01/2027, 1 mo. USD LIBOR + 1.750% | 6,526,559 |
| 6,317,324 | Endo Luxembourg Finance Co. S.a r.l. 5.75%, 03/27/2028, 1 mo. USD LIBOR + 5.000% | 6,150,610 |
The accompanying notes are an integral part of these financial statements.
The Hartford Floating Rate Fund
Schedule of Investments – (continued)
October 31, 2021
| Shares or Principal Amount | | Market Value† |
| SENIOR FLOATING RATE INTERESTS - 85.5%(5) - (continued) |
| | Pharmaceuticals - 4.4% - (continued) |
| $ 5,196,536 | Gainwell Acquisition Corp. 4.75%, 10/01/2027, 1 mo. USD LIBOR + 4.000% | $ 5,205,370 |
| EUR 5,015,413 | Grifols S.A. 2.25%, 11/15/2027, 3 mo. EURIBOR + 2.250% | 5,721,343 |
| $ 8,135,000 | HCRX Investments Holdco L.P. 0.00%, 07/14/2028, 1 mo. USD LIBOR + 2.250%(6) | 8,086,190 |
| 9,203,750 | Horizon Therapeutics USA, Inc. 2.50%, 03/15/2028, 1 mo. USD LIBOR + 2.000% | 9,179,084 |
| 1,554,852 | ICON Luxembourg S.a r.l. 3.00%, 07/03/2028, 1 mo. USD LIBOR + 2.500% | 1,554,681 |
| 4,932,638 | Jazz Financing Lux S.a.r.l. 4.00%, 05/05/2028, 1 mo. USD LIBOR + 3.500% | 4,938,803 |
| | Organon & Co. | |
| EUR 2,104,725 | 3.00%, 06/02/2028, 3 mo. EURIBOR + 3.000% | 2,429,145 |
| $ 7,037,362 | 3.50%, 06/02/2028, 1 mo. USD LIBOR + 3.000% | 7,050,593 |
| 5,601,850 | Packaging Coordinators Midco, Inc. 4.25%, 11/30/2027, 1 mo. USD LIBOR + 3.500% | 5,607,676 |
| 24,553,322 | Pathway Vet Alliance LLC 3.84%, 03/31/2027, 1 mo. USD LIBOR + 3.750% | 24,420,243 |
| 832,875 | PetVet Care Centers LLC 0.00%, 02/14/2025(3) | 831,318 |
| | | | 93,479,305 |
| | Pipelines - 1.7% |
| 7,050,779 | BCP Renaissance Parent LLC 4.50%, 10/31/2024, 3 mo. USD LIBOR + 3.500% | 7,024,338 |
| 9,234,776 | Cheniere Corpus Christi Holdings LLC 1.84%, 06/30/2024, 3 mo. USD LIBOR + 1.750% | 9,229,051 |
| 4,957,575 | DT Midstream, Inc. 2.50%, 06/26/2028, 1 mo. USD LIBOR + 2.000% | 4,967,639 |
| 3,701,742 | Medallion Midland Acquisition LLC 4.50%, 10/18/2028, 3 mo. USD LIBOR + 3.750% | 3,698,263 |
| 11,265,820 | Traverse Midstream Partners LLC 5.25%, 09/27/2024, 1 mo. USD LIBOR + 4.250% | 11,249,372 |
| | | | 36,168,663 |
| | Real Estate - 0.7% |
| EUR 4,055,000 | Blitz GmbH 3.50%, 04/28/2028, 3 mo. EURIBOR + 3.500% | 4,657,204 |
| 9,635,000 | Foncia Management 3.50%, 03/27/2028, 3 mo. EURIBOR + 3.500% | 11,025,564 |
| | | | 15,682,768 |
| | REITS - 0.1% |
| $ 1,402,374 | VICI Properties LLC 0.00%, 12/20/2024, 1 mo. USD LIBOR + 1.750%(6) | 1,397,992 |
| | Retail - 6.9% |
| 4,218,125 | 84 Lumber Co. 3.75%, 11/13/2026, 1 mo. USD LIBOR + 3.000% | 4,219,897 |
| Shares or Principal Amount | | Market Value† |
| SENIOR FLOATING RATE INTERESTS - 85.5%(5) - (continued) |
| | Retail - 6.9% - (continued) |
| $ 27,248,079 | B.C. Unlimited Liability Co. 1.84%, 11/19/2026, 1 mo. USD LIBOR + 1.750% | $ 26,698,213 |
| 7,454,611 | Beacon Roofing Supply, Inc. 2.34%, 05/19/2028, 1 mo. USD LIBOR + 2.250% | 7,400,416 |
| EUR 1,725,000 | EG Group Ltd. 7.00%, 04/10/2027, 3 mo. EURIBOR + 7.000% | 1,994,100 |
| $ 18,693,737 | Great Outdoors Group LLC 5.00%, 03/06/2028, 1 mo. USD LIBOR + 4.250% | 18,736,546 |
| 6,470,801 | IRB Holding Corp. 4.25%, 12/15/2027, 1 mo. USD LIBOR + 3.250% | 6,466,207 |
| | LBM Acquisition LLC | |
| 3,160,000 | 0.00%, 12/17/2027, 1 mo. USD LIBOR + 3.750%(6) | 3,115,223 |
| 6,304,160 | 3.88%, 12/17/2027, 1 mo. USD LIBOR + 3.750% | 6,214,830 |
| 10,826,517 | 4.50%, 12/17/2027, 1 mo. USD LIBOR + 3.750% | 10,673,105 |
| 9,940,088 | Michaels Cos., Inc. 5.00%, 04/15/2028, 1 mo. USD LIBOR + 4.250% | 9,921,500 |
| EUR 2,825,000 | Peer Holding B.V. 3.00%, 03/08/2025, 3 mo. EURIBOR + 3.000% | 3,234,414 |
| $ 10,153,425 | Petco Health and Wellness Co., Inc. 4.00%, 03/03/2028, 1 mo. USD LIBOR + 3.250% | 10,146,216 |
| 4,897,725 | PetSmart, Inc. 4.50%, 02/11/2028, 1 mo. USD LIBOR + 3.750% | 4,899,488 |
| 5,915,000 | Specialty Building Products Holdings LLC 0.00%, 10/15/2028, 1 mo. USD LIBOR + 3.750%(6) | 5,890,985 |
| 12,497,655 | Sports Authority, Inc. 0.00%, 11/16/2022, 3 mo. USD LIBOR + 6.000%(6)(9)(10) | 12,498 |
| 5,112,188 | SRS Distribution, Inc. 4.25%, 06/02/2028, 1 mo. USD LIBOR + 3.750% | 5,110,756 |
| 22,857,919 | Staples, Inc. 5.13%, 04/16/2026, 3 mo. USD LIBOR + 5.000% | 21,945,888 |
| | | | 146,680,282 |
| | Semiconductors - 1.0% |
| 11,870,000 | MKS Instruments, Inc. 0.00%, 10/21/2028, 1 mo. USD LIBOR + 2.250%(6) | 11,855,163 |
| 3,715,000 | Synaptics Incorporated 0.00%, 10/21/2028, 1 mo. USD LIBOR + 2.250%(6) | 3,720,795 |
| 6,120,000 | TPG Elf Purchaser LLC 0.00%, 10/14/2028, 1 mo. USD LIBOR + 3.500%(6) | 6,112,350 |
| | | | 21,688,308 |
| | Software - 6.8% |
| 2,457,650 | Athenahealth, Inc. 4.38%, 02/11/2026, 1 mo. USD LIBOR + 4.250% | 2,463,794 |
| | Camelot U.S. Acquisition Co. | |
| 9,825,000 | 3.09%, 10/30/2026, 1 mo. USD LIBOR + 3.000% | 9,766,050 |
| 3,970,000 | 4.00%, 10/30/2026, 1 mo. USD LIBOR + 3.000% | 3,975,955 |
| 2,100,000 | CCC Intelligent Solutions, Inc. 3.00%, 09/21/2028, 1 mo. USD LIBOR + 2.500% | 2,093,175 |
The accompanying notes are an integral part of these financial statements.
The Hartford Floating Rate Fund
Schedule of Investments – (continued)
October 31, 2021
| Shares or Principal Amount | | Market Value† |
| SENIOR FLOATING RATE INTERESTS - 85.5%(5) - (continued) |
| | Software - 6.8% - (continued) |
| | DCert Buyer, Inc. | |
| $ 13,882,987 | 4.09%, 10/16/2026, 3 mo. USD LIBOR + 4.000% | $ 13,884,514 |
| 12,370,000 | 7.09%, 02/16/2029, 1 mo. USD LIBOR + 7.000% | 12,460,548 |
| 5,245,696 | Dun & Bradstreet Corp. 3.34%, 02/06/2026, 1 mo. USD LIBOR + 3.250% | 5,222,300 |
| 6,083,725 | E2open LLC 3.75%, 02/04/2028, 1 mo. USD LIBOR + 3.250% | 6,086,280 |
| | Hyland Software, Inc. | |
| 9,734,389 | 4.25%, 07/01/2024, 1 mo. USD LIBOR + 3.500% | 9,737,407 |
| 2,446,000 | 7.00%, 07/07/2025, 1 mo. USD LIBOR + 6.250% | 2,467,403 |
| 479,004 | MA Finance Co. LLC 2.84%, 06/21/2024, 3 mo. USD LIBOR + 2.750% | 473,764 |
| | Mitchell International, Inc. | |
| 14,005,000 | 4.25%, 10/15/2028, 1 mo. USD LIBOR + 3.750% | 13,871,952 |
| 2,865,000 | 7.00%, 10/15/2029, 1 mo. USD LIBOR + 6.500% | 2,885,771 |
| 1,950,226 | Navicure, Inc. 4.09%, 10/22/2026, 1 mo. USD LIBOR + 4.000% | 1,951,454 |
| | Polaris Newco LLC | |
| EUR 4,630,000 | 4.00%, 06/02/2028, 3 mo. EURIBOR + 4.000% | 5,341,147 |
| $ 16,260,000 | 4.50%, 06/02/2028, 1 mo. USD LIBOR + 4.000% | 16,291,219 |
| 250,000 | Quest Software U.S. Holdings, Inc. 8.38%, 05/18/2026, 3 mo. USD LIBOR + 8.250% | 249,480 |
| 9,680,000 | RealPage, Inc. 3.75%, 04/24/2028, 1 mo. USD LIBOR + 3.250% | 9,656,768 |
| 3,307,631 | Seattle Spinco, Inc. 2.84%, 06/21/2024, 3 mo. USD LIBOR + 2.750% | 3,271,446 |
| 15,648,403 | SS&C Technologies, Inc. 1.84%, 04/16/2025, 1 mo. USD LIBOR + 1.750% | 15,499,743 |
| | Ultimate Software Group, Inc. | |
| 6,140,555 | 3.84%, 05/04/2026, 3 mo. USD LIBOR + 3.750% | 6,147,187 |
| 195,000 | 7.50%, 05/03/2027, 1 mo. USD LIBOR + 6.750% | 198,251 |
| | | | 143,995,608 |
| | Telecommunications - 2.6% |
| 8,231,610 | CenturyLink, Inc. 2.34%, 03/15/2027, 1 mo. USD LIBOR + 2.250% | 8,121,883 |
| 10,485,125 | Frontier Communications Corp. 4.50%, 05/01/2028, 1 mo. USD LIBOR + 3.750% | 10,464,155 |
| EUR 11,140,000 | Lorca Finco plc 0.00%, 09/17/2027, 1 mo. USD LIBOR + 3.750%(6) | 12,784,861 |
| 14,050,621 | Numericable Group S.A. 3.00%, 07/31/2025, 3 mo. EURIBOR + 3.000% | 15,794,222 |
| Shares or Principal Amount | | Market Value† |
| SENIOR FLOATING RATE INTERESTS - 85.5%(5) - (continued) |
| | Telecommunications - 2.6% - (continued) |
| | Xplornet Communications, Inc. | |
| $ 2,230,000 | 0.00%, 10/01/2029, 1 mo. USD LIBOR + 7.000%(6) | $ 2,218,850 |
| 6,535,000 | 0.00%, 10/02/2028, 1 mo. USD LIBOR + 4.000%(6) | 6,521,015 |
| | | | 55,904,986 |
| | Transportation - 0.6% |
| 13,066,856 | PODS LLC 3.75%, 03/31/2028, 1 mo. USD LIBOR + 3.000% | 13,042,421 |
| | Total Senior Floating Rate Interests
(cost $1,831,193,186) | $ 1,809,846,658 |
| COMMON STOCKS - 0.4% |
| | Energy - 0.3% |
| 2,037,975 | Ascent Resources - Marcellus LLC Class A(9)(10) | $ 1,681,329 |
| 71,083 | Foresight Energy LLC | 959,620 |
| 418,220,006 | KCA Deutag(9)(10)(11) | — |
| 15,718 | Kelly Topco Shares(9)(10)(11) | 1,639,388 |
| 544,947 | Philadelphia Energy Solutions Class A(9)(10) | — |
| 112,212 | Texgen Power LLC | 2,917,512 |
| | | | 7,197,849 |
| | Insurance - 0.0% |
| 175,508 | AFG Holdings, Inc. | 263,262 |
| | Materials - 0.1% |
| 37,645 | UTEX Industries, Inc. | 1,806,960 |
| | Total Common Stocks
(cost $27,579,364) | | $ 9,268,071 |
| EXCHANGE-TRADED FUNDS - 2.0% |
| | Other Investment Pools & Funds - 2.0% |
| 1,265,400 | Invesco Senior Loan ETF | $ 27,940,032 |
| 311,000 | SPDR Blackstone Senior Loan ETF | 14,274,900 |
| | | | 42,214,932 |
| | Total Exchange-Traded Funds
(cost $41,854,663) | | $ 42,214,932 |
| WARRANTS - 0.0% |
| | Energy - 0.0% |
| 719,301 | Ascent Resources - Marcellus LLC Expires 3/30/2023(9)(10) | $ 14,519 |
| | Materials - 0.0% |
| 7,500 | UTEX Industries, Inc. Expires 12/03/2025(9)(10) | 56,850 |
| | Total Warrants
(cost $107,156) | | $ 71,369 |
| | Total Long-Term Investments
(Cost $2,058,401,961) | | $ 2,016,186,634 |
The accompanying notes are an integral part of these financial statements.
The Hartford Floating Rate Fund
Schedule of Investments – (continued)
October 31, 2021
| Shares or Principal Amount | | Market Value† |
| SHORT-TERM INVESTMENTS - 5.3% |
| | Other Investment Pools & Funds - 5.3% |
| 111,839,593 | BlackRock Liquidity Funds, FedFund Portfolio, Institutional Class, 0.03%(12) | $ 111,839,593 |
| | Total Short-Term Investments
(cost $111,839,593) | $ 111,839,593 |
| | Total Investments
(cost $2,170,241,554) | 100.5% | $ 2,128,026,227 |
| | Other Assets and Liabilities | (0.5)% | (10,497,810) |
| | Total Net Assets | 100.0% | $ 2,117,528,417 |
| Note: | Percentage of investments as shown is the ratio of the total market value to total net assets. |
| | The Fund may refer to any one or more of the industry classifications used by one or more widely recognized market indices, ratings group and/or as defined by Fund management. Industry classifications may not be identical across all security types. |
| | Equity industry classifications used in this report are the Global Industry Classification Standard, which was developed by and is the exclusive property and service mark of MSCI, Inc. and Standard & Poor’s. |
| | For Fund compliance purposes, the Fund may not use the same classification system. These classifications are used for financial reporting purposes. |
| | See “Glossary” for abbreviation descriptions. |
| (1) | Security is exempt from registration under Regulation S under the Securities Act of 1933, which exempts from registration securities offered and sold outside of the United States. Security may not be offered or sold in the United States except pursuant to an exemption from, or in a transaction not subject to, the registration requirements of the Securities Act of 1933. At October 31, 2021, the aggregate value of these securities was $21,370,467, representing 1.0% of net assets. |
| (2) | Security was purchased pursuant to Rule 144A under the Securities Act of 1933 and may be sold in transactions that are exempt from registration (typically only to qualified institutional buyers) or in a public offering registered under the Securities Act of 1933. At October 31, 2021, the aggregate value of these securities was $109,165,947, representing 5.2% of net assets. |
| (3) | Variable rate securities; the rate reported is the coupon rate in effect at October 31, 2021. Base lending rates may be subject to a floor or cap. |
| (4) | Security has the ability to pay in kind (“PIK”) or pay income in cash. When applicable, separate rates of such payments are disclosed. |
| (5) | Senior floating rate interests generally pay interest rates which are periodically adjusted by reference to a base short-term, floating lending rate plus a premium. The base lending rates are primarily the LIBOR, and secondarily the prime rate offered by one or more major United States banks (the "Prime Rate") and the certificate of deposit rate or other base lending rates used by commercial lenders. Senior floating rate interests often require prepayments from excess cash flows or permit the borrower to repay at its election. The rate at which the borrower repays cannot be predicted with accuracy. As a result, the actual remaining maturity may be substantially less than the stated maturities shown. Base lending rates may be subject to a floor or cap. Unless otherwise noted, the interest rate disclosed for these securities represents the rate in effect as of October 31, 2021. |
| (6) | Represents an unsettled loan commitment. The coupon rate will be determined at time of settlement. |
| (7) | Non-income producing. For long-term debt securities, items identified are in default as to payment of interest and/or principal. |
| (8) | This security, or a portion of this security, has unfunded loan commitments. As of October 31, 2021, the aggregate value of the unfunded commitment was $1,493,116, which rounds to 0.1% of total net assets. |
| (9) | These securities are valued in good faith at fair value as determined under policies and procedures established by and under the supervision of the Board of Directors. At October 31, 2021, the aggregate fair value of these securities are $3,404,584, which represented 0.2% of total net assets. This amount excludes securities that are principally traded in certain foreign markets and whose prices are adjusted pursuant to a third party pricing service methodology approved by the Board of Directors. |
| (10) | Investment valued using significant unobservable inputs. |
| (11) | Investment in securities not registered under the Securities Act of 1933 (excluding securities acquired pursuant to Rule 144A and Regulation S). At the end of the period, the value of such restricted securities amounted to $1,639,388 or 0.1% of net assets. |
Period
Acquired | | Security Name | | Shares/
Par Value | | Total Cost | | Market Value |
| 03/2011 | | KCA Deutag | | 418,220,006 | | $ 5,667,718 | | $ — |
| 09/2021 | | Kelly Topco Shares | | 15,718 | | 1,251,310 | | 1,639,388 |
| | | | | | | $ 6,919,028 | | $ 1,639,388 |
| (12) | Current yield as of period end. |
| OTC Total Return Swap Contracts Outstanding at October 31, 2021 |
| Reference Entity | | Counter-
party | | Notional
Amount | | Payments
received (paid)
by the Fund | | Expiration
Date | | Periodic
Payment
Frequency | | Upfront
Premiums
Paid | | Upfront
Premiums
Received | | Market
Value† | | Unrealized
Appreciation/
Depreciation |
| Markit iBoxx USD Liquid Leveraged Loan Index | | MSC | | USD | 8,340,000 | | (0.12%) | | 12/20/21 | | At Maturity | | $ — | | $ — | | $ 42,232 | | $ 42,232 |
| Markit iBoxx USD Liquid Leveraged Loan Index | | MSC | | USD | 9,695,000 | | (0.12%) | | 12/20/21 | | At Maturity | | — | | — | | 49,093 | | 49,093 |
| Markit iBoxx USD Liquid Leveraged Loan Index | | MSC | | USD | 21,665,000 | | (0.12%) | | 12/20/21 | | At Maturity | | — | | — | | 109,707 | | 109,707 |
| Markit iBoxx USD Liquid Leveraged Loan Index | | MSC | | USD | 40,660,000 | | (0.12%) | | 03/20/22 | | At Maturity | | — | | — | | 285,696 | | 285,696 |
| Total OTC total return swap contracts | | $ — | | $ — | | $ 486,728 | | $ 486,728 |
The accompanying notes are an integral part of these financial statements.
The Hartford Floating Rate Fund
Schedule of Investments – (continued)
October 31, 2021
| Foreign Currency Contracts Outstanding at October 31, 2021 |
Amount and Description of
Currency to be Purchased | | Amount and Description of
Currency to be Sold | | Counterparty | | Settlement
Date | | Appreciation/
(Depreciation) |
| 913,000 | EUR | | 1,061,887 | USD | | WEST | | 11/30/2021 | | $ (5,843) |
| 280,186,922 | USD | | 241,268,399 | EUR | | DEUT | | 11/30/2021 | | 1,118,069 |
| 12,150,816 | USD | | 8,827,321 | GBP | | DEUT | | 11/30/2021 | | 69,959 |
| Total foreign currency contracts | | $ 1,182,185 |
† See Significant Accounting Policies of accompanying Notes to Financial Statements regarding valuation of investments.
Fair Value Summary
The following is a summary of the fair valuations according to the inputs used as of October 31, 2021 in valuing the Fund’s investments.
| Description | | Total | | Level 1 | | Level 2 | | Level 3(1) |
| Assets | | | | | | | | |
| Convertible Bonds | | $ 8,180,731 | | $ — | | $ 8,180,731 | | $ — |
| Corporate Bonds | | 146,604,873 | | — | | 146,604,873 | | — |
| Senior Floating Rate Interests | | 1,809,846,658 | | — | | 1,809,834,160 | | 12,498 |
| Common Stocks | | | | | | | | |
| Energy | | 7,197,849 | | 3,877,132 | | — | | 3,320,717 |
| Insurance | | 263,262 | | 263,262 | | — | | — |
| Materials | | 1,806,960 | | 1,806,960 | | — | | — |
| Exchange-Traded Funds | | 42,214,932 | | 42,214,932 | | — | | — |
| Warrants | | 71,369 | | — | | — | | 71,369 |
| Short-Term Investments | | 111,839,593 | | 111,839,593 | | — | | — |
| Foreign Currency Contracts(2) | | 1,188,028 | | — | | 1,188,028 | | — |
| Swaps- Total Return(2) | | 486,728 | | — | | 486,728 | | — |
| Total | | $ 2,129,700,983 | | $ 160,001,879 | | $ 1,966,294,520 | | $ 3,404,584 |
| Liabilities | | | | | | | | |
| Foreign Currency Contracts(2) | | $ (5,843) | | $ — | | $ (5,843) | | $ — |
| Total | | $ (5,843) | | $ — | | $ (5,843) | | $ — |
| (1) | For the year ended October 31, 2021, investments valued at $4,323,068 were transferred out of Level 3 due to the initiation of a vendor providing prices that are based on market activity which has been determined to be significant observable input. There were no transfers into Level 3. |
| (2) | Derivative instruments (excluding purchased and written options, if applicable) are valued at the unrealized appreciation/(depreciation) on the investments. |
Level 3 investments at the beginning and/or end of the period in relation to net assets were not significant and accordingly, a reconciliation of Level 3 assets for the year ended October 31, 2021 is not presented.
The accompanying notes are an integral part of these financial statements.
The Hartford Floating Rate High Income Fund
Schedule of Investments
October 31, 2021
| Shares or Principal Amount | | Market Value† |
| CONVERTIBLE BONDS - 0.5% |
| | Airlines - 0.2% |
| $ 1,100,000 | JetBlue Airways Corp. 0.50%, 04/01/2026(1) | $ 1,056,238 |
| | Internet - 0.3% |
| GBP 900,000 | Trainline PLC 1.00%, 01/14/2026(2) | 1,078,473 |
| | Total Convertible Bonds
(cost $2,232,201) | $ 2,134,711 |
| CORPORATE BONDS - 9.3% |
| | Commercial Banks - 0.8% |
| | Freedom Mortgage Corp. | |
| $ 875,000 | 6.63%, 01/15/2027(1) | $ 829,062 |
| 450,000 | 7.63%, 05/01/2026(1) | 438,750 |
| 525,000 | 8.13%, 11/15/2024(1) | 529,977 |
| 1,715,000 | 8.25%, 04/15/2025(1) | 1,732,150 |
| | | | 3,529,939 |
| | Commercial Services - 0.7% |
| 620,000 | APX Group, Inc. 5.75%, 07/15/2029(1) | 614,575 |
| 925,000 | Brand Industrial Services, Inc. 8.50%, 07/15/2025(1) | 919,219 |
| EUR 200,000 | Q-Park Holding I B.V. 2.00%, 03/31/2026, 3 mo. EURIBOR + 2.000%(1)(3) | 221,663 |
| $ 1,250,000 | WW International, Inc. 4.50%, 04/15/2029(1) | 1,196,875 |
| | | | 2,952,332 |
| | Diversified Financial Services - 0.9% |
| 3,295,000 | Home Point Capital, Inc. 5.00%, 02/01/2026(1) | 2,960,195 |
| 610,000 | Unifin Financiera S.A.B. de C.V. 9.88%, 01/28/2029(1) | 566,083 |
| 625,000 | United Wholesale Mortgage LLC 5.50%, 11/15/2025(1) | 621,875 |
| | | | 4,148,153 |
| | Electrical Components & Equipment - 0.1% |
| EUR 515,000 | Energizer Gamma Acquisition B.V. 3.50%, 06/30/2029(1) | 576,235 |
| | Engineering & Construction - 0.1% |
| $ 575,000 | Artera Services LLC 9.03%, 12/04/2025(1) | 613,812 |
| | Entertainment - 0.8% |
| EUR 160,000 | Banijay Group SAS 6.50%, 03/01/2026(1) | 190,512 |
| | Cinemark USA, Inc. | |
| $ 1,295,000 | 5.25%, 07/15/2028(1) | 1,263,441 |
| 1,375,000 | 5.88%, 03/15/2026(1) | 1,378,438 |
| EUR 500,000 | Scientific Games International, Inc. 3.38%, 02/15/2026(2) | 583,202 |
| | | | 3,415,593 |
| | Insurance - 0.2% |
| $ 650,000 | Genworth Holdings, Inc. 4.90%, 08/15/2023 | 664,625 |
| | Internet - 0.2% |
| EUR 670,000 | United Group B.V. 3.25%, 02/15/2026, 3 mo. EURIBOR + 3.250%(1)(3) | 757,651 |
| | Leisure Time - 1.6% |
| $ 2,125,000 | Carnival Corp. 7.63%, 03/01/2026(1) | 2,238,879 |
| | Life Time, Inc. | |
| 850,000 | 5.75%, 01/15/2026(1) | 872,627 |
| 775,000 | 8.00%, 04/15/2026(1) | 813,750 |
| | NCL Corp. Ltd. | |
| 625,000 | 3.63%, 12/15/2024(1) | 588,281 |
| 200,000 | 5.88%, 03/15/2026(1) | 200,500 |
| Shares or Principal Amount | | Market Value† |
| CORPORATE BONDS - 9.3% - (continued) |
| | Leisure Time - 1.6% - (continued) |
| $ 1,025,000 | Royal Caribbean Cruises Ltd. 4.25%, 07/01/2026(1) | $ 994,250 |
| | Viking Cruises Ltd. | |
| 425,000 | 5.88%, 09/15/2027(1) | 410,656 |
| 875,000 | 7.00%, 02/15/2029(1) | 879,393 |
| | | | 6,998,336 |
| | Lodging - 0.2% |
| | Wynn Macau Ltd. | |
| 425,000 | 5.13%, 12/15/2029(1) | 382,899 |
| 425,000 | 5.50%, 01/15/2026(1) | 399,445 |
| | | | 782,344 |
| | Machinery-Diversified - 0.2% |
| 850,000 | OT Merger Corp. 7.88%, 10/15/2029(1) | 837,250 |
| | Media - 0.1% |
| 350,000 | Houghton Mifflin Harcourt Publishers, Inc. 9.00%, 02/15/2025(1) | 371,000 |
| | Mining - 0.0% |
| EUR 175,000 | Constellium SE 3.13%, 07/15/2029(1) | 198,848 |
| | Oil & Gas - 0.3% |
| 500,000 | Petroleos Mexicanos 4.75%, 02/26/2029(2) | 570,232 |
| $ 135,000 | Rockcliff Energy LLC 5.50%, 10/15/2029(1) | 138,510 |
| | Southwestern Energy Co. | |
| 224,000 | 5.38%, 02/01/2029(1) | 236,320 |
| 205,000 | 5.38%, 03/15/2030 | 216,271 |
| | | | 1,161,333 |
| | Oil & Gas Services - 0.0% |
| 145,375 | KCA Deutag UK Finance plc 9.88%, 12/01/2025(1) | 158,241 |
| | Packaging & Containers - 0.1% |
| | Mauser Packaging Solutions Holding Co. | |
| EUR 400,000 | 4.75%, 04/15/2024(2) | 457,498 |
| $ 200,000 | 7.25%, 04/15/2025(1) | 193,644 |
| | | | 651,142 |
| | Pharmaceuticals - 0.2% |
| EUR 575,000 | Teva Pharmaceutical Finance Netherlands B.V. 1.25%, 03/31/2023 | 661,822 |
| | Real Estate - 0.5% |
| $ 475,000 | Country Garden Holdings Co., Ltd. 3.88%, 10/22/2030 | 434,625 |
| 450,000 | KWG Group Holdings Ltd. 6.00%, 01/11/2022 | 424,792 |
| | Yuzhou Group Holdings Co., Ltd. | |
| 950,000 | 6.00%, 01/25/2022 | 666,188 |
| 1,225,000 | 8.50%, 02/26/2024(2) | 616,507 |
| | | | 2,142,112 |
| | Retail - 1.7% |
| 195,000 | BCPE Ulysses Intermediate, Inc. (7.75% Cash, 8.50% PIK) 7.75%, 04/01/2027(1)(4) | 187,922 |
| | Dufry One B.V. | |
| EUR 350,000 | 2.00%, 02/15/2027(2) | 381,578 |
| 350,000 | 2.50%, 10/15/2024(2) | 398,453 |
| | eG Global Finance plc | |
| 1,300,000 | 4.38%, 02/07/2025(2) | 1,482,344 |
| 250,000 | 6.25%, 10/30/2025(2) | 292,670 |
| $ 1,000,000 | LSF9 Atlantis Holdings LLC / Victra Finance Corp. 7.75%, 02/15/2026(1) | 1,013,560 |
The accompanying notes are an integral part of these financial statements.
The Hartford Floating Rate High Income Fund
Schedule of Investments – (continued)
October 31, 2021
| Shares or Principal Amount | | Market Value† |
| CORPORATE BONDS - 9.3% - (continued) |
| | Retail - 1.7% - (continued) |
| $ 600,000 | Michaels Cos., Inc. 7.88%, 05/01/2029(1) | $ 606,000 |
| | Staples, Inc. | |
| 1,950,000 | 7.50%, 04/15/2026(1) | 1,969,500 |
| 1,400,000 | 10.75%, 04/15/2027(1) | 1,337,000 |
| | | | 7,669,027 |
| | Software - 0.0% |
| 205,000 | MicroStrategy, Inc. 6.13%, 06/15/2028(1) | 210,357 |
| | Telecommunications - 0.6% |
| | Altice France S.A. | |
| EUR 550,000 | 4.13%, 01/15/2029(2) | 625,468 |
| 905,000 | 4.25%, 10/15/2029(1) | 1,035,718 |
| $ 825,000 | Frontier Communications Corp. 5.88%, 11/01/2029 | 821,906 |
| | | | 2,483,092 |
| | Total Corporate Bonds
(cost $41,824,338) | $ 40,983,244 |
| SENIOR FLOATING RATE INTERESTS - 83.3%(5) |
| | Airlines - 1.9% |
| 2,880,000 | AAdvantage Loyalty IP Ltd. 5.50%, 04/20/2028, 1 mo. USD LIBOR + 4.750% | $ 2,997,907 |
| 1,825,000 | Air Canada 4.25%, 08/11/2028, 1 mo. USD LIBOR + 3.500% | 1,842,867 |
| 1,040,000 | Mileage Plus Holdings LLC 6.25%, 06/21/2027, 1 mo. USD LIBOR + 5.250% | 1,106,955 |
| 1,035,000 | SkyMiles IP Ltd. 4.75%, 10/20/2027, 3 mo. USD LIBOR + 3.750% | 1,101,695 |
| 1,283,550 | United Airlines, Inc. 4.50%, 04/21/2028, 1 mo. USD LIBOR + 3.750% | 1,300,737 |
| | | | 8,350,161 |
| | Asset-Backed - Finance & Insurance - 0.2% |
| EUR 875,000 | Kouti B.V. 0.00%, 07/01/2028, 1 mo. USD LIBOR + 3.750%(6) | 1,008,344 |
| | Auto Parts & Equipment - 0.6% |
| | First Brands Group LLC | |
| $ 1,124,546 | 6.00%, 03/30/2027, 1 mo. USD LIBOR + 5.000% | 1,132,980 |
| 1,675,000 | 9.50%, 03/30/2028, 1 mo. USD LIBOR + 8.500% | 1,687,562 |
| | | | 2,820,542 |
| | Chemicals - 0.4% |
| | NIC Acquisition Corp. | |
| 1,104,450 | 4.50%, 12/29/2027, 1 mo. USD LIBOR + 3.750% | 1,102,031 |
| 540,000 | 8.50%, 12/29/2028, 1 mo. USD LIBOR + 7.750% | 539,325 |
| | | | 1,641,356 |
| | Commercial Services - 6.2% |
| 2,170,000 | APX Group, Inc. 4.00%, 07/10/2028, 1 mo. USD LIBOR + 3.500% | 2,161,515 |
| | Belron Finance U.S. LLC | |
| 843,561 | 2.44%, 10/30/2026, 1 mo. USD LIBOR + 2.250% | 838,820 |
| 584,800 | 3.25%, 04/13/2028, 1 mo. USD LIBOR + 2.750% | 584,437 |
| EUR 2,700,000 | Belron Luxembourg S.a r.l. 2.75%, 04/13/2028, 3 mo. EURIBOR + 2.750% | 3,096,480 |
| Shares or Principal Amount | | Market Value† |
| SENIOR FLOATING RATE INTERESTS - 83.3%(5) - (continued) |
| | Commercial Services - 6.2% - (continued) |
| $ 1,661,318 | EVO Payments International LLC 3.34%, 12/22/2023, 3 mo. USD LIBOR + 3.250% | $ 1,658,892 |
| 6,375,000 | MPH Acquisition Holdings LLC 4.75%, 08/17/2028, 1 mo. USD LIBOR + 4.250% | 6,210,334 |
| EUR 5,690,000 | Verisure Holding AB 3.25%, 03/27/2028, 3 mo. EURIBOR + 3.250% | 6,521,466 |
| $ 2,059,650 | WEX, Inc. 2.34%, 03/31/2028, 1 mo. USD LIBOR + 2.250% | 2,047,807 |
| 4,041,187 | WW International, Inc. 4.00%, 04/13/2028, 1 mo. USD LIBOR + 3.500% | 3,990,673 |
| | | | 27,110,424 |
| | Construction Materials - 1.3% |
| 2,190,000 | Chamberlain Group, Inc. 0.00%, 10/22/2028, 1 mo. USD LIBOR + 4.000%(6) | 2,185,445 |
| 1,050,274 | Cornerstone Building Brands, Inc. 3.75%, 04/12/2028, 1 mo. USD LIBOR + 3.250% | 1,048,173 |
| 895,443 | Quikrete Holdings, Inc. 2.59%, 02/01/2027, 1 mo. USD LIBOR + 2.500% | 886,113 |
| 426,376 | Tamko Building Products LLC 3.09%, 06/01/2026, 1 mo. USD LIBOR + 3.000% | 424,423 |
| 1,126,262 | Wilsonart LLC 4.50%, 12/19/2026, 1 mo. USD LIBOR + 3.500% | 1,126,972 |
| | | | 5,671,126 |
| | Distribution/Wholesale - 0.5% |
| 2,166,082 | American Builders & Contractors Supply Co., Inc. 2.09%, 01/15/2027, 1 mo. USD LIBOR + 2.000% | 2,143,793 |
| | Diversified Financial Services - 0.9% |
| | Blackhawk Network Holdings, Inc. | |
| 2,694,408 | 3.09%, 06/15/2025, 3 mo. USD LIBOR + 3.000% | 2,670,832 |
| 560,000 | 7.13%, 06/15/2026, 3 mo. USD LIBOR + 7.000% | 554,400 |
| 862,838 | Fleetcor Technologies Operating Co. LLC 1.84%, 04/28/2028, 1 mo. USD LIBOR + 1.750% | 860,068 |
| | | | 4,085,300 |
| | Engineering & Construction - 1.9% |
| 8,040,971 | Brand Energy & Infrastructure Services, Inc. 5.25%, 06/21/2024, 3 mo. USD LIBOR + 4.250% | 7,965,949 |
| 585,000 | PowerTeam Services LLC 8.25%, 03/06/2026, 3 mo. USD LIBOR + 7.250% | 580,612 |
| | | | 8,546,561 |
| | Entertainment - 6.4% |
| 4,195,000 | AP Core Holdings, II LLC 6.25%, 09/01/2027, 1 mo. USD LIBOR + 5.500% | 4,202,778 |
| EUR 620,000 | Banijay Entertainment S.A.S 3.75%, 03/01/2025, 3 mo. EURIBOR + 3.750% | 716,569 |
| $ 592,937 | Cinemark USA, Inc. 1.84%, 03/31/2025, 3 mo. USD LIBOR + 1.750% | 565,888 |
| | Crown Finance U.S., Inc. | |
| EUR 203,132 | 2.63%, 02/28/2025, 3 mo. EURIBOR + 2.625% | 193,335 |
| $ 9,179,582 | 3.50%, 02/28/2025, 1 mo. USD LIBOR + 2.500% | 7,554,796 |
| 455,722 | 7.13%, 05/23/2024, 1 mo. USD LIBOR + 7.000% | 549,600 |
| 505,748 | 9.25%, 05/23/2024, 1 mo. USD LIBOR + 8.250% | 542,415 |
The accompanying notes are an integral part of these financial statements.
The Hartford Floating Rate High Income Fund
Schedule of Investments – (continued)
October 31, 2021
| Shares or Principal Amount | | Market Value† |
| SENIOR FLOATING RATE INTERESTS - 83.3%(5) - (continued) |
| | Entertainment - 6.4% - (continued) |
| $ 1,095,000 | J&J Ventures Gaming LLC 4.75%, 04/07/2028, 1 mo. USD LIBOR + 4.000% | $ 1,097,738 |
| 1,450,000 | Maverick Gaming LLC 8.50%, 08/19/2028, 1 mo. USD LIBOR + 7.500% | 1,446,375 |
| 2,858,067 | Scientific Games International, Inc. 2.84%, 08/14/2024, 1 mo. USD LIBOR + 2.750% | 2,844,748 |
| 5,009,150 | UFC Holdings LLC 3.50%, 04/29/2026, 1 mo. USD LIBOR + 2.750% | 4,977,843 |
| 586,536 | William Morris Endeavor Entertainment LLC 2.84%, 05/18/2025, 3 mo. USD LIBOR + 2.750% | 574,236 |
| 2,655,000 | WMG Acquisition Corp. 2.21%, 01/20/2028, 1 mo. USD LIBOR + 2.125% | 2,641,167 |
| | | | 27,907,488 |
| | Food - 1.8% |
| EUR 3,990,000 | Froneri International Ltd. 2.63%, 01/29/2027, 3 mo. EURIBOR + 2.625% | 4,497,128 |
| $ 1,798,570 | Post Holdings, Inc. 4.75%, 10/21/2024, 1 mo. USD LIBOR + 4.000% | 1,804,416 |
| 835,698 | Simply Good Foods USA, Inc. 4.75%, 07/07/2024, 1 mo. USD LIBOR + 3.750% | 839,358 |
| 923,460 | U.S. Foods, Inc. 2.09%, 09/13/2026, 3 mo. USD LIBOR + 2.000% | 906,145 |
| | | | 8,047,047 |
| | Food Service - 0.5% |
| | Aramark Services, Inc. | |
| 247,112 | 1.84%, 01/15/2027, 1 mo. USD LIBOR + 1.750% | 240,782 |
| 1,807,006 | 2.59%, 04/06/2028, 1 mo. USD LIBOR + 2.500% | 1,792,098 |
| | | | 2,032,880 |
| | Healthcare - Products - 1.4% |
| | Avantor Funding, Inc. | |
| 1,270,000 | 2.75%, 11/08/2027, 1 mo. USD LIBOR + 2.250%(6) | 1,268,946 |
| EUR 1,246,875 | 2.75%, 06/12/2028, 1 mo. EURIBOR + 2.750% | 1,437,380 |
| $ 459,252 | Coty, Inc. 2.34%, 04/07/2025, 3 mo. USD LIBOR + 2.250% | 451,789 |
| 1,162,087 | Insulet Corp. 3.75%, 05/04/2028, 1 mo. USD LIBOR + 3.250% | 1,163,180 |
| 2,025,748 | Sunshine Luxembourg S.a.r.l. 4.50%, 10/01/2026, 1 mo. USD LIBOR + 3.750% | 2,029,050 |
| | | | 6,350,345 |
| | Healthcare - Services - 6.4% |
| 4,373,025 | ADMI Corp. 3.63%, 12/23/2027, 1 mo. USD LIBOR + 3.125% | 4,338,872 |
| EUR 2,460,000 | Biogroup-LCD 3.50%, 01/28/2028, 3 mo. EURIBOR + 3.500% | 2,826,384 |
| $ 1,473,163 | Cano Health LLC 5.25%, 11/19/2027, 1 mo. USD LIBOR + 4.500% | 1,473,163 |
| 736,742 | Envision Healthcare Corp. 3.84%, 10/10/2025, 3 mo. USD LIBOR + 3.750% | 608,122 |
| 949,376 | eResearchTechnology, Inc. 5.50%, 02/04/2027, 1 mo. USD LIBOR + 4.500% | 953,202 |
| | EyeCare Partners LLC | |
| 460,000 | 0.00%, 10/14/2029, 1 mo. USD LIBOR + 6.750%(6) | 461,532 |
| Shares or Principal Amount | | Market Value† |
| SENIOR FLOATING RATE INTERESTS - 83.3%(5) - (continued) |
| | Healthcare - Services - 6.4% - (continued) |
| $ 5,412,718 | 3.88%, 02/18/2027, 1 mo. USD LIBOR + 3.750% | $ 5,374,179 |
| 842,462 | ICON Luxembourg S.a r.l. 3.00%, 07/03/2028, 1 mo. USD LIBOR + 2.500% | 842,370 |
| 3,446,593 | Loire Finco Luxembourg S.a.r.l. 3.25%, 04/21/2027, 1 mo. USD LIBOR + 3.250% | 3,377,661 |
| 5,088,737 | MED ParentCo L.P. 4.34%, 08/31/2026, 1 mo. USD LIBOR + 4.250% | 5,073,165 |
| | Medical Solutions L.L.C. | |
| 2,238,600 | 0.00%, 10/07/2028, 1 mo. USD LIBOR + 3.500%(6) | 2,239,719 |
| 426,400 | 0.00%, 11/01/2028(6) | 426,613 |
| | | | 27,994,982 |
| | Holding Companies-Diversified - 0.6% |
| 99,491 | Belfor Holdings, Inc. 4.09%, 04/06/2026, 3 mo. USD LIBOR + 3.750% | 99,740 |
| EUR 2,205,000 | IVC Acquisition Ltd. 0.00%, 02/13/2026, 1 mo. USD LIBOR + 4.000%(6) | 2,545,156 |
| | | | 2,644,896 |
| | Home Builders - 0.9% |
| | Tecta America Corp. | |
| $ 2,997,488 | 5.00%, 04/01/2028, 1 mo. USD LIBOR + 4.250% | 3,001,234 |
| 1,000,000 | 9.25%, 04/01/2029, 1 mo. USD LIBOR + 8.500% | 995,000 |
| | | | 3,996,234 |
| | Home Furnishings - 1.1% |
| 4,710,000 | Mattress Firm Inc 5.00%, 09/25/2028, 1 mo. USD LIBOR + 4.250% | 4,685,320 |
| | Insurance - 4.5% |
| 2,236,482 | Acrisure LLC 3.63%, 02/15/2027, 1 mo. USD LIBOR + 3.500% | 2,205,172 |
| | Asurion LLC | |
| 3,154,909 | 3.09%, 11/03/2024, 1 mo. USD LIBOR + 3.000% | 3,130,269 |
| 159,928 | 3.21%, 11/03/2023, 1 mo. USD LIBOR + 3.125% | 159,495 |
| 576,318 | 3.34%, 12/23/2026, 1 mo. USD LIBOR + 3.250% | 570,283 |
| 4,030,000 | 5.34%, 01/31/2028, 1 mo. USD LIBOR + 5.250% | 4,013,437 |
| 3,310,000 | 5.34%, 01/20/2029, 1 mo. USD LIBOR + 5.250% | 3,294,145 |
| 2,443,611 | Sedgwick Claims Management Services, Inc. 3.34%, 12/31/2025, 3 mo. USD LIBOR + 3.250% | 2,417,660 |
| 4,089,328 | USI, Inc. 3.13%, 05/16/2024, 3 mo. USD LIBOR + 3.000% | 4,056,449 |
| | | | 19,846,910 |
| | Internet - 4.1% |
| 3,236,887 | Endure Digital, Inc. 4.25%, 02/10/2028, 1 mo. USD LIBOR + 3.500% | 3,178,882 |
| | MH Sub LLC | |
| 4,055,339 | 3.50%, 09/13/2024, 3 mo. USD LIBOR + 3.500% | 4,038,955 |
| 1,677,293 | 4.75%, 09/13/2024, 1 mo. USD LIBOR + 3.750% | 1,680,094 |
| 625,000 | 6.34%, 02/12/2029, 1 mo. USD LIBOR + 6.250% | 633,006 |
The accompanying notes are an integral part of these financial statements.
The Hartford Floating Rate High Income Fund
Schedule of Investments – (continued)
October 31, 2021
| Shares or Principal Amount | | Market Value† |
| SENIOR FLOATING RATE INTERESTS - 83.3%(5) - (continued) |
| | Internet - 4.1% - (continued) |
| $ 1,985,000 | Proofpoint, Inc. 3.75%, 08/31/2028, 1 mo. USD LIBOR + 3.250% | $ 1,975,968 |
| 822,909 | Rodan & Fields LLC 4.09%, 06/16/2025, 3 mo. USD LIBOR + 4.000% | 577,213 |
| 5,935,000 | Shutterfly, Inc. 5.75%, 09/25/2026, 1 mo. USD LIBOR + 5.000% | 5,866,748 |
| | | | 17,950,866 |
| | IT Services - 0.3% |
| 997,500 | Panther Commercial Holdings L.P. 5.00%, 01/07/2028, 1 mo. USD LIBOR + 5.000% | 999,994 |
| 302,702 | Surf Holdings LLC 3.62%, 03/05/2027, 1 mo. USD LIBOR + 3.500% | 300,604 |
| | | | 1,300,598 |
| | Leisure Time - 4.0% |
| | Carnival Corp. | |
| EUR 2,044,190 | 3.75%, 06/30/2025, 3 mo. EURIBOR + 3.750% | 2,355,711 |
| $ 3,335,423 | 3.75%, 06/30/2025, 1 mo. USD LIBOR + 3.000% | 3,329,186 |
| 1,300,000 | 4.00%, 10/18/2028, 6 mo. USD LIBOR + 4.000% | 1,298,375 |
| 1,105,000 | Great Canadian Gaming Corp. 0.00%, 11/01/2026, 1 mo. USD LIBOR + 4.000%(6) | 1,109,972 |
| 2,184,638 | Hayward Industries, Inc. 3.00%, 05/12/2028, 1 mo. USD LIBOR + 2.500% | 2,177,363 |
| 4,039,875 | MajorDrive Holdings LLC 4.50%, 05/12/2028, 1 mo. USD LIBOR + 4.000% | 4,039,875 |
| 3,149,419 | SRAM LLC 3.25%, 05/12/2028, 1 mo. USD LIBOR + 2.750% | 3,141,546 |
| | | | 17,452,028 |
| | Lodging - 1.7% |
| 7,292,163 | Caesars Resort Collection LLC 2.84%, 12/23/2024, 3 mo. USD LIBOR + 2.750% | 7,254,973 |
| | Machinery-Diversified - 0.8% |
| 1,110,000 | ASP Blade Holdings, Inc. 0.00%, 10/13/2028, 1 mo. USD LIBOR + 4.000%(6) | 1,111,388 |
| 2,405,000 | Filtration Group Corp. 0.00%, 10/21/2028, 1 mo. USD LIBOR + 3.750%(6) | 2,400,791 |
| | | | 3,512,179 |
| | Media - 4.4% |
| 945,450 | Banijay Entertainment S.A.S 3.83%, 03/01/2025, 1 mo. USD LIBOR + 3.750% | 941,905 |
| 3,745,613 | Cable One, Inc. 2.09%, 05/03/2028, 1 mo. USD LIBOR + 2.000% | 3,714,000 |
| 806,391 | Charter Communications Operating LLC 1.84%, 02/01/2027, 1 mo. USD LIBOR + 1.750% | 800,473 |
| 4,215,000 | DirecTV Financing LLC 5.75%, 07/22/2027, 1 mo. USD LIBOR + 5.000% | 4,217,023 |
| 11,897 | Houghton Mifflin Harcourt Publishing Co. 7.25%, 11/22/2024, 1 mo. USD LIBOR + 6.250% | 11,871 |
| 1,818,852 | NEP/NCP Holdco, Inc. 3.34%, 10/20/2025, 3 mo. USD LIBOR + 3.250% | 1,762,303 |
| 2,100,000 | Telenet Financing USD LLC 2.09%, 04/30/2028, 6 mo. USD LIBOR + 2.000% | 2,069,550 |
| EUR 625,000 | UPC Broadband Holding B.V. 3.00%, 01/31/2029, 3 mo. EURIBOR + 3.000% | 717,197 |
| Shares or Principal Amount | | Market Value† |
| SENIOR FLOATING RATE INTERESTS - 83.3%(5) - (continued) |
| | Media - 4.4% - (continued) |
| $ 1,115,000 | UPC Financing Partnership 3.09%, 01/31/2029, 1 mo. USD LIBOR + 3.000% | $ 1,109,659 |
| GBP 1,525,000 | Virgin Media SFA Finance Ltd. 3.32%, 11/15/2027, 1 mo. GBP LIBOR + 3.250% | 2,051,226 |
| EUR 595,000 | Ziggo B.V. 3.00%, 01/31/2029, 3 mo. EURIBOR + 3.000% | 679,511 |
| $ 1,300,000 | Ziggo Financing Partnership 2.59%, 04/30/2028, 1 mo. USD LIBOR + 2.500% | 1,283,204 |
| | | | 19,357,922 |
| | Metal Fabricate/Hardware - 0.0% |
| 243,957 | Ameriforge Group, Inc. 7.00%, 12/31/2023, 3 mo. USD LIBOR + 8.000% | 109,781 |
| | Miscellaneous Manufacturing - 1.0% |
| 750,000 | International Textile Group, Inc. 9.13%, 05/01/2025, 3 mo. USD LIBOR + 9.000% | 555,000 |
| | LTI Holdings, Inc. | |
| 3,143,529 | 3.59%, 09/06/2025, 3 mo. USD LIBOR + 3.500% | 3,101,437 |
| 815,000 | 6.84%, 09/06/2026, 3 mo. USD LIBOR + 6.750% | 810,673 |
| 15,535 | UTEX Industries Inc. 5.50%, 12/03/2025, 1 mo. USD LIBOR + 5.250% | 15,172 |
| | | | 4,482,282 |
| | Oil & Gas Services - 0.3% |
| 1,425,000 | Oryx Midstream Services Permian Basin LLC 0.00%, 10/05/2028, 1 mo. USD LIBOR + 3.250%(6) | 1,418,887 |
| | Packaging & Containers - 3.7% |
| 4,728,498 | BWAY Holding Co. 3.34%, 04/03/2024, 3 mo. USD LIBOR + 3.250% | 4,599,221 |
| | Flex Acquisition Co., Inc. | |
| 5,962,796 | 3.13%, 06/29/2025, 3 mo. USD LIBOR + 3.000% | 5,913,662 |
| 2,265,006 | 4.00%, 02/23/2028, 1 mo. USD LIBOR + 3.500% | 2,258,075 |
| | Pretium PKG Holdings, Inc. | |
| 1,330,000 | 4.50%, 10/02/2028, 1 mo. USD LIBOR + 4.500% | 1,333,166 |
| 490,000 | 7.25%, 10/01/2029, 1 mo. USD LIBOR + 6.750% | 494,900 |
| | TricorBraun Holdings, Inc. | |
| 1,557,004 | 3.75%, 03/03/2028, 1 mo. USD LIBOR + 3.250% | 1,546,214 |
| 294,469 | 3.75%, 03/03/2028, 1 mo. USD LIBOR + 3.250%(7) | 292,428 |
| | | | 16,437,666 |
| | Pharmaceuticals - 3.4% |
| 1,257,931 | Elanco Animal Health, Inc. 1.83%, 08/01/2027, 1 mo. USD LIBOR + 1.750% | 1,246,697 |
| 1,344,121 | Endo Luxembourg Finance Co. S.a r.l. 5.75%, 03/27/2028, 1 mo. USD LIBOR + 5.000% | 1,308,649 |
| 1,465,000 | HCRX Investments Holdco L.P. 0.00%, 07/14/2028, 1 mo. USD LIBOR + 2.250%(6) | 1,456,210 |
| 2,656,650 | Horizon Therapeutics USA, Inc. 2.50%, 03/15/2028, 1 mo. USD LIBOR + 2.000% | 2,649,530 |
| 209,900 | ICON Luxembourg S.a r.l. 3.00%, 07/03/2028, 1 mo. USD LIBOR + 2.500% | 209,877 |
The accompanying notes are an integral part of these financial statements.
The Hartford Floating Rate High Income Fund
Schedule of Investments – (continued)
October 31, 2021
| Shares or Principal Amount | | Market Value† |
| SENIOR FLOATING RATE INTERESTS - 83.3%(5) - (continued) |
| | Pharmaceuticals - 3.4% - (continued) |
| $ 1,002,487 | Jazz Financing Lux S.a.r.l. 4.00%, 05/05/2028, 1 mo. USD LIBOR + 3.500% | $ 1,003,741 |
| | Organon & Co. | |
| EUR 389,025 | 3.00%, 06/02/2028, 3 mo. EURIBOR + 3.000% | 448,989 |
| $ 1,216,950 | 3.50%, 06/02/2028, 1 mo. USD LIBOR + 3.000% | 1,219,238 |
| 5,025,800 | Pathway Vet Alliance LLC 3.84%, 03/31/2027, 1 mo. USD LIBOR + 3.750% | 4,998,560 |
| 164,580 | PetVet Care Centers LLC 0.00%, 02/14/2025(6) | 164,273 |
| | | | 14,705,764 |
| | Pipelines - 1.1% |
| 1,287,463 | BCP Renaissance Parent LLC 4.50%, 10/31/2024, 3 mo. USD LIBOR + 3.500% | 1,282,635 |
| 1,065,316 | Cheniere Corpus Christi Holdings LLC 1.84%, 06/30/2024, 3 mo. USD LIBOR + 1.750% | 1,064,656 |
| 514,358 | Medallion Midland Acquisition LLC 4.50%, 10/18/2028, 3 mo. USD LIBOR + 3.750% | 513,875 |
| 2,203,396 | Traverse Midstream Partners LLC 5.25%, 09/27/2024, 1 mo. USD LIBOR + 4.250% | 2,200,179 |
| | | | 5,061,345 |
| | Real Estate - 0.7% |
| EUR 750,000 | Blitz GmbH 3.50%, 04/28/2028, 3 mo. EURIBOR + 3.500% | 861,381 |
| 1,865,000 | Foncia Management 3.50%, 03/27/2028, 3 mo. EURIBOR + 3.500% | 2,134,165 |
| | | | 2,995,546 |
| | REITS - 0.1% |
| $ 265,000 | VICI Properties LLC 0.00%, 12/20/2024, 1 mo. USD LIBOR + 1.750%(6) | 264,172 |
| | Retail - 8.0% |
| 744,375 | 84 Lumber Co. 3.75%, 11/13/2026, 1 mo. USD LIBOR + 3.000% | 744,688 |
| 5,122,130 | B.C. Unlimited Liability Co. 1.84%, 11/19/2026, 1 mo. USD LIBOR + 1.750% | 5,018,765 |
| 1,760,985 | Beacon Roofing Supply, Inc. 2.34%, 05/19/2028, 1 mo. USD LIBOR + 2.250% | 1,748,182 |
| EUR 530,000 | EG Group Ltd. 7.00%, 04/10/2027, 3 mo. EURIBOR + 7.000% | 612,680 |
| $ 5,017,087 | Great Outdoors Group LLC 5.00%, 03/06/2028, 1 mo. USD LIBOR + 4.250% | 5,028,577 |
| 2,063,128 | IRB Holding Corp. 4.25%, 12/15/2027, 1 mo. USD LIBOR + 3.250% | 2,061,663 |
| | LBM Acquisition LLC | |
| 638,333 | 0.00%, 12/17/2027, 1 mo. USD LIBOR + 3.750%(6) | 629,288 |
| 1,273,467 | 3.88%, 12/17/2027, 1 mo. USD LIBOR + 3.750% | 1,255,422 |
| 3,668,737 | 4.50%, 12/17/2027, 1 mo. USD LIBOR + 3.750% | 3,616,751 |
| 2,004,975 | Michaels Cos., Inc. 5.00%, 04/15/2028, 1 mo. USD LIBOR + 4.250% | 2,001,226 |
| 2,701,906 | Petco Health and Wellness Co., Inc. 4.00%, 03/03/2028, 1 mo. USD LIBOR + 3.250% | 2,699,987 |
| 1,007,475 | PetSmart, Inc. 4.50%, 02/11/2028, 1 mo. USD LIBOR + 3.750% | 1,007,838 |
| 1,235,000 | Specialty Building Products Holdings LLC 0.00%, 10/15/2028, 1 mo. USD LIBOR + 3.750%(6) | 1,229,986 |
| Shares or Principal Amount | | Market Value† |
| SENIOR FLOATING RATE INTERESTS - 83.3%(5) - (continued) |
| | Retail - 8.0% - (continued) |
| $ 1,928,771 | Sports Authority, Inc. 0.00%, 11/16/2022, 3 mo. USD LIBOR + 6.000%(6)(8)(9)(10) | $ 1,929 |
| 1,067,325 | SRS Distribution, Inc. 4.25%, 06/02/2028, 1 mo. USD LIBOR + 3.750% | 1,067,026 |
| 6,817,234 | Staples, Inc. 5.13%, 04/16/2026, 3 mo. USD LIBOR + 5.000% | 6,545,226 |
| | | | 35,269,234 |
| | Semiconductors - 1.3% |
| 3,105,000 | MKS Instruments, Inc. 0.00%, 10/21/2028, 1 mo. USD LIBOR + 2.250%(6) | 3,101,119 |
| 775,000 | Synaptics Incorporated 0.00%, 10/21/2028, 1 mo. USD LIBOR + 2.250%(6) | 776,209 |
| 1,655,000 | TPG Elf Purchaser LLC 0.00%, 10/14/2028, 1 mo. USD LIBOR + 3.500%(6) | 1,652,931 |
| | | | 5,530,259 |
| | Software - 6.7% |
| | Camelot U.S. Acquisition Co. | |
| 2,437,595 | 3.09%, 10/30/2026, 1 mo. USD LIBOR + 3.000% | 2,422,969 |
| 729,487 | 4.00%, 10/30/2026, 1 mo. USD LIBOR + 3.000% | 730,582 |
| | DCert Buyer, Inc. | |
| 4,051,809 | 4.09%, 10/16/2026, 3 mo. USD LIBOR + 4.000% | 4,052,255 |
| 3,450,000 | 7.09%, 02/16/2029, 1 mo. USD LIBOR + 7.000% | 3,475,254 |
| 745,000 | E2open LLC 3.75%, 02/04/2028, 1 mo. USD LIBOR + 3.250% | 745,313 |
| | Hyland Software, Inc. | |
| 1,812,139 | 4.25%, 07/01/2024, 1 mo. USD LIBOR + 3.500% | 1,812,700 |
| 812,800 | 7.00%, 07/07/2025, 1 mo. USD LIBOR + 6.250% | 819,912 |
| | Mitchell International, Inc. | |
| 3,280,000 | 4.25%, 10/15/2028, 1 mo. USD LIBOR + 3.750% | 3,248,840 |
| 820,000 | 7.00%, 10/15/2029, 1 mo. USD LIBOR + 6.500% | 825,945 |
| | Polaris Newco LLC | |
| EUR 1,920,000 | 4.00%, 06/02/2028, 3 mo. EURIBOR + 4.000% | 2,214,903 |
| $ 4,855,000 | 4.50%, 06/02/2028, 1 mo. USD LIBOR + 4.000% | 4,864,322 |
| 1,780,000 | RealPage, Inc. 3.75%, 04/24/2028, 1 mo. USD LIBOR + 3.250% | 1,775,728 |
| 1,091,746 | SS&C Technologies, Inc. 1.84%, 04/16/2025, 1 mo. USD LIBOR + 1.750% | 1,081,375 |
| | Ultimate Software Group, Inc. | |
| 1,002,729 | 3.84%, 05/04/2026, 3 mo. USD LIBOR + 3.750% | 1,003,812 |
| 105,000 | 7.50%, 05/03/2027, 1 mo. USD LIBOR + 6.750% | 106,750 |
| | | | 29,180,660 |
| | Telecommunications - 3.3% |
| 2,507,731 | CenturyLink, Inc. 2.34%, 03/15/2027, 1 mo. USD LIBOR + 2.250% | 2,474,303 |
| 2,173,300 | Frontier Communications Corp. 4.50%, 05/01/2028, 1 mo. USD LIBOR + 3.750% | 2,168,953 |
| EUR 2,315,000 | Lorca Finco plc 0.00%, 09/17/2027, 1 mo. USD LIBOR + 3.750%(6) | 2,656,818 |
The accompanying notes are an integral part of these financial statements.
The Hartford Floating Rate High Income Fund
Schedule of Investments – (continued)
October 31, 2021
| Shares or Principal Amount | | Market Value† |
| SENIOR FLOATING RATE INTERESTS - 83.3%(5) - (continued) |
| | Telecommunications - 3.3% - (continued) |
| | Numericable Group S.A. | |
| $ 824,335 | 2.88%, 07/31/2025, 3 mo. USD LIBOR + 2.750% | $ 809,736 |
| EUR 3,240,878 | 3.00%, 07/31/2025, 3 mo. EURIBOR + 3.000% | 3,643,052 |
| | Xplornet Communications, Inc. | |
| $ 770,000 | 0.00%, 10/01/2029, 1 mo. USD LIBOR + 7.000%(6) | 766,150 |
| 1,815,000 | 0.00%, 10/02/2028, 1 mo. USD LIBOR + 4.000%(6) | 1,811,116 |
| | | | 14,330,128 |
| | Transportation - 0.9% |
| 3,877,582 | PODS LLC 3.75%, 03/31/2028, 1 mo. USD LIBOR + 3.000% | 3,870,331 |
| | Total Senior Floating Rate Interests
(cost $367,444,319) | $ 365,368,330 |
| COMMON STOCKS - 0.3% |
| | Energy - 0.2% |
| 190,736 | Ascent Resources - Marcellus LLC Class A*(9)(10) | $ 157,357 |
| 13,824 | Foresight Energy LLC* | 186,619 |
| 2,907 | Kelly Topco Shares(9)(10)(11) | 303,200 |
| 13,865 | Texgen Power LLC* | 360,490 |
| | | | 1,007,666 |
| | Insurance - 0.0% |
| 34,814 | AFG Holdings, Inc. | 52,221 |
| | Materials - 0.1% |
| 3,079 | UTEX Industries, Inc. | 147,792 |
| | Total Common Stocks
(cost $2,453,675) | | $ 1,207,679 |
| EXCHANGE-TRADED FUNDS - 2.8% |
| | Other Investment Pools & Funds - 2.8% |
| 290,400 | Invesco Senior Loan ETF | $ 6,412,032 |
| 124,600 | SPDR Blackstone Senior Loan ETF | 5,719,140 |
| | | | 12,131,172 |
| | Total Exchange-Traded Funds
(cost $12,229,460) | | $ 12,131,172 |
| WARRANTS - 0.0% |
| | Energy - 0.0% |
| 94,294 | Ascent Resources - Marcellus LLC Expires 3/30/2023*(9)(10) | $ 2,660 |
| Shares or Principal Amount | | Market Value† |
| WARRANTS - 0.0% - (continued) |
| | Materials - 0.0% |
| 1,875 | UTEX Industries, Inc. Expires 12/03/2025(9)(10) | $ 14,212 |
| | Total Warrants
(cost $19,724) | | $ 16,872 |
| | Total Long-Term Investments
(Cost $426,203,717) | | $ 421,842,008 |
| SHORT-TERM INVESTMENTS - 4.1% |
| | Other Investment Pools & Funds - 4.1% |
| 17,942,226 | BlackRock Liquidity Funds, FedFund Portfolio, Institutional Class, 0.03%(12) | $ 17,942,226 |
| | Total Short-Term Investments
(cost $17,942,226) | $ 17,942,226 |
| | Total Investments
(cost $444,145,943) | 100.3% | $ 439,784,234 |
| | Other Assets and Liabilities | (0.3)% | (1,418,225) |
| | Total Net Assets | 100.0% | $ 438,366,009 |
| Note: | Percentage of investments as shown is the ratio of the total market value to total net assets. |
| | The Fund may refer to any one or more of the industry classifications used by one or more widely recognized market indices, ratings group and/or as defined by Fund management. Industry classifications may not be identical across all security types. |
| | Equity industry classifications used in this report are the Global Industry Classification Standard, which was developed by and is the exclusive property and service mark of MSCI, Inc. and Standard & Poor’s. |
| | For Fund compliance purposes, the Fund may not use the same classification system. These classifications are used for financial reporting purposes. |
| | See “Glossary” for abbreviation descriptions. |
| * | Non-income producing. |
| (1) | Security was purchased pursuant to Rule 144A under the Securities Act of 1933 and may be sold in transactions that are exempt from registration (typically only to qualified institutional buyers) or in a public offering registered under the Securities Act of 1933. At October 31, 2021, the aggregate value of these securities was $32,741,301, representing 7.5% of net assets. |
| (2) | Security is exempt from registration under Regulation S under the Securities Act of 1933, which exempts from registration securities offered and sold outside of the United States. Security may not be offered or sold in the United States except pursuant to an exemption from, or in a transaction not subject to, the registration requirements of the Securities Act of 1933. At October 31, 2021, the aggregate value of these securities was $6,486,425, representing 1.5% of net assets. |
The accompanying notes are an integral part of these financial statements.
The Hartford Floating Rate High Income Fund
Schedule of Investments – (continued)
October 31, 2021
| (3) | Variable rate securities; the rate reported is the coupon rate in effect at October 31, 2021. Base lending rates may be subject to a floor or cap. |
| (4) | Security has the ability to pay in kind (“PIK”) or pay income in cash. When applicable, separate rates of such payments are disclosed. |
| (5) | Senior floating rate interests generally pay interest rates which are periodically adjusted by reference to a base short-term, floating lending rate plus a premium. The base lending rates are primarily the LIBOR, and secondarily the prime rate offered by one or more major United States banks (the "Prime Rate") and the certificate of deposit rate or other base lending rates used by commercial lenders. Senior floating rate interests often require prepayments from excess cash flows or permit the borrower to repay at its election. The rate at which the borrower repays cannot be predicted with accuracy. As a result, the actual remaining maturity may be substantially less than the stated maturities shown. Base lending rates may be subject to a floor or cap. Unless otherwise noted, the interest rate disclosed for these securities represents the rate in effect as of October 31, 2021. |
| (6) | Represents an unsettled loan commitment. The coupon rate will be determined at time of settlement. |
| (7) | This security, or a portion of this security, has unfunded loan commitments. As of October 31, 2021, the aggregate value of the unfunded commitment was $292,428, which rounds to 0.1% of total net assets. |
| (8) | Non-income producing. For long-term debt securities, items identified are in default as to payment of interest and/or principal. |
| (9) | These securities are valued in good faith at fair value as determined under policies and procedures established by and under the supervision of the Board of Directors. At October 31, 2021, the aggregate fair value of these securities are $479,358, which represented 0.1% of total net assets. This amount excludes securities that are principally traded in certain foreign markets and whose prices are adjusted pursuant to a third party pricing service methodology approved by the Board of Directors. |
| (10) | Investment valued using significant unobservable inputs. |
| (11) | Investment in securities not registered under the Securities Act of 1933 (excluding securities acquired pursuant to Rule 144A and Regulation S). At the end of the period, the value of such restricted securities amounted to $303,200 or 0.1% of net assets. |
Period
Acquired | | Security Name | | Shares/
Par Value | | Total Cost | | Market Value |
| 9/2021 | | Kelly Topco Shares | | 2,907 | | $ 231,426 | | $ 303,200 |
| (12) | Current yield as of period end. |
| OTC Total Return Swap Contracts Outstanding at October 31, 2021 |
| Reference Entity | | Counter-
party | | Notional
Amount | | Payments
received (paid)
by the Fund | | Expiration
Date | | Periodic
Payment
Frequency | | Upfront
Premiums
Paid | | Upfront
Premiums
Received | | Market
Value† | | Unrealized
Appreciation/
Depreciation |
| Markit iBoxx USD Liquid Leveraged Loan Index | | MSC | | USD | 1,650,000 | | (0.12%) | | 12/20/21 | | At Maturity | | $ — | | $ — | | $ 8,355 | | $ 8,355 |
| Markit iBoxx USD Liquid Leveraged Loan Index | | MSC | | USD | 1,920,000 | | (0.12%) | | 12/20/21 | | At Maturity | | — | | — | | 9,722 | | 9,722 |
| Markit iBoxx USD Liquid Leveraged Loan Index | | MSC | | USD | 4,290,000 | | (0.12%) | | 12/20/21 | | At Maturity | | — | | — | | 21,724 | | 21,724 |
| Markit iBoxx USD Liquid Leveraged Loan Index | | MSC | | USD | 8,315,000 | | (0.12%) | | 03/20/22 | | At Maturity | | — | | — | | 58,425 | | 58,425 |
| Total OTC total return swap contracts | | $ — | | $ — | | $ 98,226 | | $ 98,226 |
| Foreign Currency Contracts Outstanding at October 31, 2021 |
Amount and Description of
Currency to be Purchased | | Amount and Description of
Currency to be Sold | | Counterparty | | Settlement
Date | | Appreciation/
(Depreciation) |
| 374,000 | EUR | | 434,989 | USD | | WEST | | 11/30/2021 | | $ (2,394) |
| 55,893,185 | USD | | 48,129,510 | EUR | | DEUT | | 11/30/2021 | | 223,038 |
| 3,216,883 | USD | | 2,337,000 | GBP | | DEUT | | 11/30/2021 | | 18,522 |
| Total foreign currency contracts | | $ 239,166 |
† See Significant Accounting Policies of accompanying Notes to Financial Statements regarding valuation of investments.
The accompanying notes are an integral part of these financial statements.
The Hartford Floating Rate High Income Fund
Schedule of Investments – (continued)
October 31, 2021
Fair Value Summary
The following is a summary of the fair valuations according to the inputs used as of October 31, 2021 in valuing the Fund’s investments.
| Description | | Total | | Level 1 | | Level 2 | | Level 3(1) |
| Assets | | | | | | | | |
| Convertible Bonds | | $ 2,134,711 | | $ — | | $ 2,134,711 | | $ — |
| Corporate Bonds | | 40,983,244 | | — | | 40,983,244 | | — |
| Senior Floating Rate Interests | | 365,368,330 | | — | | 365,366,401 | | 1,929 |
| Common Stocks | | | | | | | | |
| Energy | | 1,007,666 | | 547,109 | | — | | 460,557 |
| Insurance | | 52,221 | | 52,221 | | — | | — |
| Materials | | 147,792 | | 147,792 | | — | | — |
| Exchange-Traded Funds | | 12,131,172 | | 12,131,172 | | — | | — |
| Warrants | | 16,872 | | — | | — | | 16,872 |
| Short-Term Investments | | 17,942,226 | | 17,942,226 | | — | | — |
| Foreign Currency Contracts(2) | | 241,560 | | — | | 241,560 | | — |
| Swaps- Total Return(2) | | 98,226 | | — | | 98,226 | | — |
| Total | | $ 440,124,020 | | $ 30,820,520 | | $ 408,824,142 | | $ 479,358 |
| Liabilities | | | | | | | | |
| Foreign Currency Contracts(2) | | $ (2,394) | | $ — | | $ (2,394) | | $ — |
| Total | | $ (2,394) | | $ — | | $ (2,394) | | $ — |
| (1) | For the year ended October 31, 2021, investments valued at $2,010 were transferred into Level 3 due to the unavailability of active market pricing, and investments valued at $574,147 were transferred out of Level 3 due to the availability of significant observable inputs. |
| (2) | Derivative instruments (excluding purchased and written options, if applicable) are valued at the unrealized appreciation/(depreciation) on the investments. |
Level 3 investments at the beginning and/or end of the period in relation to net assets were not significant and accordingly, a reconciliation of Level 3 assets for the year ended October 31, 2021 is not presented.
The accompanying notes are an integral part of these financial statements.
The Hartford High Yield Fund
Schedule of Investments
October 31, 2021
| Shares or Principal Amount | | Market Value† |
| CONVERTIBLE BONDS - 2.8% |
| | Airlines - 0.2% |
| $ 975,000 | JetBlue Airways Corp. 0.50%, 04/01/2026(1) | $ 936,211 |
| | Auto Manufacturers - 0.4% |
| 1,658,000 | Ford Motor Co. 0.00%, 03/15/2026(1)(2) | 1,961,226 |
| | Commercial Services - 0.2% |
| EUR 900,000 | Nexi S.p.A. 1.75%, 04/24/2027(3) | 1,186,578 |
| | Engineering & Construction - 0.3% |
| 600,000 | Cellnex Telecom S.A. 1.50%, 01/16/2026(3) | 1,264,086 |
| | Entertainment - 0.2% |
| $ 1,128,000 | DraftKings, Inc. 0.00%, 03/15/2028(1)(2) | 983,549 |
| | Healthcare - Products - 0.2% |
| 825,000 | NuVasive, Inc. 0.38%, 03/15/2025 | 777,563 |
| | Machinery-Diversified - 0.3% |
| 866,000 | Middleby Corp. 1.00%, 09/01/2025 | 1,304,011 |
| | Oil & Gas - 0.3% |
| 775,000 | Pioneer Natural Resources Co. 0.25%, 05/15/2025 | 1,369,633 |
| | REITS - 0.2% |
| 1,075,000 | Pebblebrook Hotel Trust 1.75%, 12/15/2026 | 1,196,584 |
| | Retail - 0.2% |
| 975,000 | Shake Shack, Inc. 0.00%, 03/01/2028(1)(2) | 800,590 |
| | Software - 0.3% |
| 1,258,000 | Western Digital Corp. 1.50%, 02/01/2024 | 1,244,912 |
| | Total Convertible Bonds
(cost $11,558,824) | $ 13,024,943 |
| CORPORATE BONDS - 90.3% |
| | Aerospace/Defense - 1.2% |
| | TransDigm, Inc. | |
| 2,150,000 | 5.50%, 11/15/2027 | $ 2,201,062 |
| 3,480,000 | 6.25%, 03/15/2026(1) | 3,636,600 |
| | | | 5,837,662 |
| | Apparel - 0.3% |
| 1,200,000 | PVH Corp. 4.63%, 07/10/2025 | 1,314,509 |
| | Auto Manufacturers - 3.4% |
| | Ford Motor Co. | |
| 355,000 | 4.35%, 12/08/2026 | 379,538 |
| 1,370,000 | 8.50%, 04/21/2023 | 1,502,205 |
| | Ford Motor Credit Co. LLC | |
| 1,265,000 | 3.09%, 01/09/2023 | 1,286,252 |
| 310,000 | 3.34%, 03/28/2022 | 311,767 |
| 665,000 | 3.35%, 11/01/2022 | 674,975 |
| 3,375,000 | 3.37%, 11/17/2023 | 3,463,594 |
| 1,013,000 | 4.06%, 11/01/2024 | 1,062,333 |
| 490,000 | 4.13%, 08/04/2025 | 517,562 |
| 3,530,000 | 4.54%, 08/01/2026 | 3,801,033 |
| 1,225,000 | 5.13%, 06/16/2025 | 1,329,125 |
| 1,272,000 | 5.58%, 03/18/2024 | 1,367,400 |
| | | | 15,695,784 |
| | Auto Parts & Equipment - 1.1% |
| | Adient Global Holdings Ltd. | |
| EUR 1,225,000 | 3.50%, 08/15/2024(3) | 1,432,031 |
| Shares or Principal Amount | | Market Value† |
| CORPORATE BONDS - 90.3% - (continued) |
| | Auto Parts & Equipment - 1.1% - (continued) |
| $ 2,035,000 | 4.88%, 08/15/2026(1) | $ 2,071,803 |
| 1,690,000 | Meritor, Inc. 4.50%, 12/15/2028(1) | 1,681,550 |
| | | | 5,185,384 |
| | Chemicals - 0.1% |
| 320,000 | Diamond (BC) B.V. 4.63%, 10/01/2029(1) | 321,638 |
| | Commercial Banks - 0.6% |
| 2,515,000 | Credit Suisse Group AG 6.25%, 12/18/2024, (6.25% fixed rate until 12/18/2024; 5 year USD Swap + 3.455% thereafter)(3)(4)(5) | 2,703,625 |
| | Commercial Services - 4.5% |
| 1,745,000 | APX Group, Inc. 6.75%, 02/15/2027(1) | 1,840,975 |
| 1,710,000 | Ashtead Capital, Inc. 4.00%, 05/01/2028(1) | 1,804,305 |
| 2,225,000 | Herc Holdings, Inc. 5.50%, 07/15/2027(1) | 2,319,563 |
| EUR 2,100,000 | La Financiere Atalian SASU 4.00%, 05/15/2024(3) | 2,386,588 |
| 1,550,000 | Loxam SAS 3.25%, 01/14/2025(3) | 1,791,800 |
| $ 3,401,000 | Nielsen Finance LLC / Nielsen Finance Co. 4.50%, 07/15/2029(1) | 3,325,328 |
| | Service Corp. International | |
| 460,000 | 4.63%, 12/15/2027 | 482,425 |
| 355,000 | 5.13%, 06/01/2029 | 383,311 |
| 1,981,000 | Signal Parent, Inc. 6.13%, 04/01/2029(1) | 1,842,330 |
| | United Rentals North America, Inc. | |
| 500,000 | 3.75%, 01/15/2032 | 498,800 |
| 2,360,000 | 4.88%, 01/15/2028 | 2,491,098 |
| EUR 983,000 | Verisure Holding AB 3.25%, 02/15/2027(1) | 1,132,109 |
| 630,000 | Verisure Midholding AB 5.25%, 02/15/2029(1) | 737,383 |
| | | | 21,036,015 |
| | Construction Materials - 0.8% |
| $ 1,635,000 | Builders FirstSource, Inc. 5.00%, 03/01/2030(1) | 1,726,969 |
| 520,000 | Standard Industries, Inc. 4.75%, 01/15/2028(1) | 536,250 |
| 1,530,000 | Victors Merger Corp. 6.38%, 05/15/2029(1) | 1,438,200 |
| | | | 3,701,419 |
| | Distribution/Wholesale - 1.4% |
| 1,000,000 | American Builders & Contractors Supply Co., Inc. 4.00%, 01/15/2028(1) | 1,013,750 |
| 1,250,000 | G-III Apparel Group Ltd. 7.88%, 08/15/2025(1) | 1,332,812 |
| 600,000 | IAA, Inc. 5.50%, 06/15/2027(1) | 623,250 |
| EUR 2,655,000 | Parts Europe S.A. 6.50%, 07/16/2025(3) | 3,188,878 |
| $ 550,000 | Performance Food Group, Inc. 5.50%, 10/15/2027(1) | 573,375 |
| | | | 6,732,065 |
| | Diversified Financial Services - 5.3% |
| | Credit Acceptance Corp. | |
| 730,000 | 5.13%, 12/31/2024(1) | 746,425 |
| 1,445,000 | 6.63%, 03/15/2026 | 1,504,606 |
| 2,000,000 | Enact Holdings, Inc. 6.50%, 08/15/2025(1) | 2,190,000 |
| | goeasy Ltd. | |
| 465,000 | 4.38%, 05/01/2026(1) | 474,300 |
| 1,745,000 | 5.38%, 12/01/2024(1) | 1,790,806 |
| 2,110,000 | Home Point Capital, Inc. 5.00%, 02/01/2026(1) | 1,895,603 |
| | LD Holdings Group LLC | |
| 690,000 | 6.13%, 04/01/2028(1) | 632,213 |
| 2,395,000 | 6.50%, 11/01/2025(1) | 2,347,100 |
The accompanying notes are an integral part of these financial statements.
The Hartford High Yield Fund
Schedule of Investments – (continued)
October 31, 2021
| Shares or Principal Amount | | Market Value† |
| CORPORATE BONDS - 90.3% - (continued) |
| | Diversified Financial Services - 5.3% - (continued) |
| $ 1,130,000 | Nationstar Mortgage Holdings, Inc. 5.13%, 12/15/2030(1) | $ 1,138,870 |
| | OneMain Finance Corp. | |
| 1,245,000 | 4.00%, 09/15/2030 | 1,209,206 |
| 2,610,000 | 5.38%, 11/15/2029 | 2,786,175 |
| 430,000 | 6.13%, 03/15/2024 | 457,413 |
| 1,650,000 | 6.88%, 03/15/2025 | 1,841,812 |
| | PennyMac Financial Services, Inc. | |
| 1,190,000 | 4.25%, 02/15/2029(1) | 1,121,575 |
| 1,895,000 | 5.38%, 10/15/2025(1) | 1,954,219 |
| 2,760,000 | United Wholesale Mortgage LLC 5.50%, 04/15/2029(1) | 2,684,100 |
| | | | 24,774,423 |
| | Electric - 0.3% |
| | Clearway Energy Operating LLC | |
| 1,205,000 | 3.75%, 02/15/2031(1) | 1,192,950 |
| 390,000 | 3.75%, 01/15/2032(1) | 388,120 |
| | | | 1,581,070 |
| | Electrical Components & Equipment - 0.4% |
| EUR 1,880,000 | Energizer Gamma Acquisition B.V. 3.50%, 06/30/2029(1) | 2,103,539 |
| | Electronics - 0.6% |
| $ 2,635,000 | Imola Merger Corp. 4.75%, 05/15/2029(1) | 2,707,331 |
| | Entertainment - 3.6% |
| | Caesars Entertainment, Inc. | |
| 800,000 | 4.63%, 10/15/2029(1) | 803,840 |
| 1,340,000 | 6.25%, 07/01/2025(1) | 1,409,479 |
| 2,080,000 | 8.13%, 07/01/2027(1) | 2,329,704 |
| 440,000 | Caesars Resort Collection LLC / CRC Finco, Inc. 5.75%, 07/01/2025(1) | 462,330 |
| | Cinemark USA, Inc. | |
| 2,800,000 | 5.25%, 07/15/2028(1) | 2,731,764 |
| 830,000 | 5.88%, 03/15/2026(1) | 832,075 |
| 1,920,000 | Jacobs Entertainment, Inc. 7.88%, 02/01/2024(1) | 1,977,600 |
| | Penn National Gaming, Inc. | |
| 505,000 | 4.13%, 07/01/2029(1) | 492,375 |
| 3,210,000 | 5.63%, 01/15/2027(1) | 3,314,325 |
| EUR 1,650,000 | Scientific Games International, Inc. 5.50%, 02/15/2026(3) | 1,972,251 |
| $ 540,000 | Speedway Motorsports LLC / Speedway Funding II, Inc. 4.88%, 11/01/2027(1) | 551,135 |
| | | | 16,876,878 |
| | Environmental Control - 0.6% |
| 1,307,000 | Clean Harbors, Inc. 4.88%, 07/15/2027(1) | 1,360,914 |
| | Stericycle, Inc. | |
| 340,000 | 3.88%, 01/15/2029(1) | 334,900 |
| 975,000 | 5.38%, 07/15/2024(1) | 1,004,250 |
| | | | 2,700,064 |
| | Food - 1.8% |
| 1,865,000 | B&G Foods, Inc. 5.25%, 09/15/2027 | 1,912,627 |
| GBP 802,000 | Bellis Acquisition Co. plc 3.25%, 02/16/2026(1) | 1,049,501 |
| $ 1,470,000 | Performance Food Group, Inc. 4.25%, 08/01/2029(1) | 1,470,000 |
| Shares or Principal Amount | | Market Value† |
| CORPORATE BONDS - 90.3% - (continued) |
| | Food - 1.8% - (continued) |
| | Post Holdings, Inc. | |
| $ 2,720,000 | 5.63%, 01/15/2028(1) | $ 2,838,864 |
| 990,000 | 5.75%, 03/01/2027(1) | 1,027,125 |
| | | | 8,298,117 |
| | Gas - 0.6% |
| | AmeriGas Partners L.P. / AmeriGas Finance Corp. | |
| 1,069,000 | 5.50%, 05/20/2025 | 1,158,529 |
| 40,000 | 5.63%, 05/20/2024 | 43,200 |
| 278,000 | 5.75%, 05/20/2027 | 310,984 |
| 1,143,000 | 5.88%, 08/20/2026 | 1,274,445 |
| | | | 2,787,158 |
| | Healthcare - Products - 1.7% |
| 1,740,000 | Avantor Funding, Inc. 4.63%, 07/15/2028(1) | 1,805,163 |
| 1,030,000 | Hill-Rom Holdings, Inc. 4.38%, 09/15/2027(1) | 1,069,642 |
| | Mozart Debt Merger Sub, Inc. | |
| 3,395,000 | 3.88%, 04/01/2029(1) | 3,380,470 |
| 1,532,000 | 5.25%, 10/01/2029(1) | 1,554,980 |
| | | | 7,810,255 |
| | Healthcare - Services - 3.6% |
| 420,000 | Acadia Healthcare Co., Inc. 5.00%, 04/15/2029(1) | 428,400 |
| | Catalent Pharma Solutions, Inc. | |
| 445,000 | 3.13%, 02/15/2029(1) | 432,206 |
| 485,000 | 3.50%, 04/01/2030(1) | 481,362 |
| 265,000 | 5.00%, 07/15/2027(1) | 273,613 |
| | CHS/Community Health Systems, Inc. | |
| 4,150,000 | 4.75%, 02/15/2031(1) | 4,139,127 |
| 580,000 | 5.63%, 03/15/2027(1) | 606,941 |
| 2,195,000 | 6.63%, 02/15/2025(1) | 2,282,800 |
| | HCA, Inc. | |
| 3,465,000 | 5.38%, 02/01/2025 | 3,854,812 |
| 2,620,000 | 5.38%, 09/01/2026 | 2,983,783 |
| 100,000 | 5.63%, 09/01/2028 | 117,198 |
| 80,000 | 5.88%, 02/01/2029 | 95,217 |
| 836,000 | 7.50%, 11/15/2095 | 1,248,148 |
| | | | 16,943,607 |
| | Home Builders - 3.3% |
| 305,000 | Adams Homes, Inc. 7.50%, 02/15/2025(1) | 317,963 |
| | Ashton Woods USA LLC / Ashton Woods Finance Co. | |
| 1,025,000 | 4.63%, 08/01/2029(1) | 1,016,031 |
| 835,000 | 4.63%, 04/01/2030(1) | 820,388 |
| 1,295,000 | 6.63%, 01/15/2028(1) | 1,369,462 |
| 2,455,000 | Century Communities, Inc. 3.88%, 08/15/2029(1) | 2,446,555 |
| 1,160,000 | Empire Communities Corp. 7.00%, 12/15/2025(1) | 1,200,600 |
| 420,000 | KB Home 4.80%, 11/15/2029 | 452,550 |
| | M/I Homes, Inc. | |
| 1,365,000 | 3.95%, 02/15/2030(1) | 1,347,937 |
| 790,000 | 4.95%, 02/01/2028 | 821,600 |
| 1,285,000 | STL Holding Co. LLC 7.50%, 02/15/2026(1) | 1,346,037 |
| | Taylor Morrison Communities, Inc. | |
| 500,000 | 5.13%, 08/01/2030(1) | 530,000 |
| 1,790,000 | 5.75%, 01/15/2028(1) | 1,970,647 |
| 1,816,000 | Williams Scotsman International, Inc. 4.63%, 08/15/2028(1) | 1,877,290 |
| | | | 15,517,060 |
The accompanying notes are an integral part of these financial statements.
The Hartford High Yield Fund
Schedule of Investments – (continued)
October 31, 2021
| Shares or Principal Amount | | Market Value† |
| CORPORATE BONDS - 90.3% - (continued) |
| | Household Products/Wares - 0.3% |
| $ 1,400,000 | Prestige Brands, Inc. 5.13%, 01/15/2028(1) | $ 1,459,500 |
| | Insurance - 2.4% |
| | Acrisure LLC / Acrisure Finance, Inc. | |
| 2,335,000 | 7.00%, 11/15/2025(1) | 2,358,350 |
| 875,000 | 10.13%, 08/01/2026(1) | 966,875 |
| 725,000 | AssuredPartners, Inc. 5.63%, 01/15/2029(1) | 719,563 |
| | Genworth Holdings, Inc. | |
| 135,000 | 4.80%, 02/15/2024 | 138,025 |
| 1,855,000 | 4.90%, 08/15/2023 | 1,896,737 |
| 750,000 | 6.50%, 06/15/2034 | 780,938 |
| 1,620,000 | MGIC Investment Corp. 5.25%, 08/15/2028 | 1,723,437 |
| 675,000 | NMI Holdings, Inc. 7.38%, 06/01/2025(1) | 775,555 |
| 1,675,000 | Radian Group, Inc. 6.63%, 03/15/2025 | 1,867,625 |
| | | | 11,227,105 |
| | Internet - 2.1% |
| | Arches Buyer, Inc. | |
| 1,183,000 | 4.25%, 06/01/2028(1) | 1,192,535 |
| 1,500,000 | 6.13%, 12/01/2028(1) | 1,513,125 |
| 3,325,000 | Endure Digital, Inc. 6.00%, 02/15/2029(1) | 3,059,000 |
| 1,650,000 | Go Daddy Operating Co. LLC 3.50%, 03/01/2029(1) | 1,592,250 |
| EUR 2,100,000 | United Group B.V. 3.63%, 02/15/2028(3) | 2,324,621 |
| | | | 9,681,531 |
| | IT Services - 0.7% |
| | Presidio Holdings, Inc. | |
| $ 2,315,000 | 4.88%, 02/01/2027(1) | 2,355,513 |
| 890,000 | 8.25%, 02/01/2028(1) | 945,625 |
| | | | 3,301,138 |
| | Leisure Time - 2.3% |
| | Carnival Corp. | |
| 297,000 | 5.75%, 03/01/2027(1) | 302,287 |
| 3,840,000 | 6.00%, 05/01/2029 | 3,847,680 |
| 600,000 | 7.63%, 03/01/2026(1) | 681,021 |
| 2,340,000 | MajorDrive Holdings LLC 6.38%, 06/01/2029(1) | 2,251,080 |
| 3,425,000 | Royal Caribbean Cruises Ltd. 5.50%, 08/31/2026(1) | 3,489,219 |
| | | | 10,571,287 |
| | Lodging - 0.9% |
| 270,000 | Boyd Gaming Corp. 4.75%, 12/01/2027 | 278,181 |
| 1,110,000 | Sugarhouse HSP Gaming Prop Mezz L.P. / Sugarhouse HSP Gaming Finance Corp. 5.88%, 05/15/2025(1) | 1,098,900 |
| | Wynn Las Vegas LLC / Wynn Las Vegas Capital Corp. | |
| 960,000 | 5.25%, 05/15/2027(1) | 972,000 |
| 1,690,000 | 5.50%, 03/01/2025(1) | 1,717,462 |
| | | | 4,066,543 |
| | Media - 6.7% |
| 895,000 | Cable One, Inc. 4.00%, 11/15/2030(1) | 879,132 |
| | CCO Holdings LLC / CCO Holdings Capital Corp. | |
| 1,570,000 | 4.25%, 02/01/2031(1) | 1,562,935 |
| 2,250,000 | 4.25%, 01/15/2034(1) | 2,182,072 |
| 1,875,000 | 4.50%, 08/15/2030(1) | 1,907,812 |
| 925,000 | 4.50%, 05/01/2032 | 929,375 |
| | CSC Holdings LLC | |
| 1,800,000 | 5.25%, 06/01/2024 | 1,894,500 |
| 770,000 | 5.50%, 04/15/2027(1) | 795,025 |
| Shares or Principal Amount | | Market Value† |
| CORPORATE BONDS - 90.3% - (continued) |
| | Media - 6.7% - (continued) |
| $ 1,970,000 | 6.50%, 02/01/2029(1) | $ 2,112,825 |
| | DISH DBS Corp. | |
| 965,000 | 5.00%, 03/15/2023 | 998,775 |
| 3,100,000 | 5.88%, 07/15/2022 | 3,177,500 |
| 1,405,000 | 5.88%, 11/15/2024 | 1,496,325 |
| 975,000 | 7.38%, 07/01/2028 | 1,024,969 |
| 530,000 | 7.75%, 07/01/2026 | 588,963 |
| 2,185,000 | Nexstar Broadcasting, Inc. 5.63%, 07/15/2027(1) | 2,305,175 |
| 925,000 | Quebecor Media, Inc. 5.75%, 01/15/2023 | 973,563 |
| | Sirius XM Radio, Inc. | |
| 355,000 | 3.13%, 09/01/2026(1) | 355,444 |
| 1,095,000 | 4.00%, 07/15/2028(1) | 1,101,788 |
| 1,470,000 | 5.50%, 07/01/2029(1) | 1,585,762 |
| 830,000 | TK Elevator U.S. Newco, Inc. 5.25%, 07/15/2027(1) | 844,774 |
| 2,255,000 | Virgin Media Secured Finance plc 4.50%, 08/15/2030(1) | 2,252,181 |
| | Ziggo B.V. | |
| 365,000 | 4.88%, 01/15/2030(1) | 370,979 |
| 1,859,000 | 5.50%, 01/15/2027(1) | 1,905,475 |
| | | | 31,245,349 |
| | Metal Fabricate/Hardware - 0.6% |
| 300,000 | Advanced Drainage Systems, Inc. 5.00%, 09/30/2027(1) | 312,000 |
| | Novelis Corp. | |
| 630,000 | 3.25%, 11/15/2026(1) | 628,425 |
| 650,000 | 3.88%, 08/15/2031(1) | 634,595 |
| 1,310,000 | 4.75%, 01/30/2030(1) | 1,362,400 |
| | | | 2,937,420 |
| | Mining - 0.7% |
| | Constellium SE | |
| 565,000 | 3.75%, 04/15/2029(1) | 545,197 |
| 755,000 | 5.63%, 06/15/2028(1) | 791,942 |
| 1,740,000 | 5.88%, 02/15/2026(1) | 1,768,710 |
| | | | 3,105,849 |
| | Office/Business Equipment - 0.6% |
| 2,000,000 | Xerox Corp. 4.38%, 03/15/2023 | 2,063,340 |
| 790,000 | Xerox Holdings Corp. 5.00%, 08/15/2025(1) | 820,613 |
| | | | 2,883,953 |
| | Oil & Gas - 5.4% |
| | Apache Corp. | |
| 1,125,000 | 4.38%, 10/15/2028 | 1,206,979 |
| 2,250,000 | 4.63%, 11/15/2025 | 2,425,477 |
| 689,000 | 5.10%, 09/01/2040 | 772,128 |
| | Continental Resources, Inc. | |
| 2,080,000 | 4.38%, 01/15/2028 | 2,269,800 |
| 520,000 | 4.90%, 06/01/2044 | 590,018 |
| 455,000 | 5.75%, 01/15/2031(1) | 544,863 |
| | EQT Corp. | |
| 740,000 | 3.13%, 05/15/2026(1) | 745,550 |
| 1,020,000 | 3.90%, 10/01/2027 | 1,088,340 |
| | Occidental Petroleum Corp. | |
| 2,320,000 | 3.00%, 02/15/2027 | 2,320,000 |
| 1,545,000 | 3.20%, 08/15/2026 | 1,564,313 |
| 2,280,000 | 3.40%, 04/15/2026 | 2,326,375 |
| 3,836,000 | 4.20%, 03/15/2048 | 3,738,297 |
| 679,000 | 4.40%, 04/15/2046 | 686,989 |
| 715,000 | 5.50%, 12/01/2025 | 786,428 |
| 395,000 | 6.13%, 01/01/2031 | 473,013 |
The accompanying notes are an integral part of these financial statements.
The Hartford High Yield Fund
Schedule of Investments – (continued)
October 31, 2021
| Shares or Principal Amount | | Market Value† |
| CORPORATE BONDS - 90.3% - (continued) |
| | Oil & Gas - 5.4% - (continued) |
| $ 258,000 | 6.38%, 09/01/2028 | $ 302,410 |
| | Ovintiv Exploration, Inc. | |
| 775,000 | 5.38%, 01/01/2026 | 863,208 |
| 1,470,000 | 5.63%, 07/01/2024 | 1,618,434 |
| 1,485,000 | Transocean, Inc. 6.80%, 03/15/2038 | 888,550 |
| | | | 25,211,172 |
| | Packaging & Containers - 4.1% |
| 2,920,000 | ARD Finance S.A. (6.50% Cash, 7.25% PIK) 6.50%, 06/30/2027(1)(6) | 3,058,700 |
| | Ardagh Packaging Finance plc / Ardagh Holdings USA, Inc. | |
| 680,000 | 4.13%, 08/15/2026(1) | 693,620 |
| 4,330,000 | 5.25%, 08/15/2027(1) | 4,319,175 |
| 340,000 | Berry Global, Inc. 5.63%, 07/15/2027(1) | 356,102 |
| 1,200,000 | Crown Americas LLC / Crown Americas Capital Corp. 4.75%, 02/01/2026 | 1,236,360 |
| | Flex Acquisition Co., Inc. | |
| 2,170,000 | 6.88%, 01/15/2025(1) | 2,191,700 |
| 775,000 | 7.88%, 07/15/2026(1) | 809,054 |
| 1,075,000 | Mauser Packaging Solutions Holding Co. 7.25%, 04/15/2025(1) | 1,040,836 |
| | Owens-Brockway Glass Container, Inc. | |
| 65,000 | 5.38%, 01/15/2025(1) | 68,413 |
| 3,224,000 | 5.88%, 08/15/2023(1) | 3,393,260 |
| 46,000 | 6.38%, 08/15/2025(1) | 50,313 |
| EUR 1,645,000 | Silgan Holdings, Inc. 2.25%, 06/01/2028 | 1,901,658 |
| $ 270,000 | Trivium Packaging Finance B.V. 5.50%, 08/15/2026(1) | 280,457 |
| | | | 19,399,648 |
| | Pharmaceuticals - 2.1% |
| | Bausch Health Cos., Inc. | |
| 3,105,000 | 5.00%, 01/30/2028(1) | 2,865,977 |
| 2,125,000 | 5.00%, 02/15/2029(1) | 1,949,687 |
| 2,690,000 | 5.25%, 01/30/2030(1) | 2,424,336 |
| 815,000 | 6.13%, 04/15/2025(1) | 830,094 |
| 1,875,000 | 7.00%, 01/15/2028(1) | 1,898,691 |
| | | | 9,968,785 |
| | Pipelines - 6.5% |
| 1,890,000 | Antero Midstream Partners L.P. / Antero Midstream Finance Corp. 5.75%, 01/15/2028(1) | 1,975,050 |
| | Buckeye Partners L.P. | |
| 1,520,000 | 3.95%, 12/01/2026 | 1,558,258 |
| 640,000 | 4.13%, 03/01/2025(1) | 656,000 |
| 900,000 | 4.13%, 12/01/2027 | 906,750 |
| 655,000 | 4.50%, 03/01/2028(1) | 646,813 |
| 738,000 | Cheniere Energy Partners L.P. 4.50%, 10/01/2029 | 787,948 |
| 3,395,000 | DCP Midstream Operating L.P. 5.38%, 07/15/2025 | 3,751,475 |
| 2,231,000 | DT Midstream, Inc. 4.13%, 06/15/2029(1) | 2,246,952 |
| 1,793,000 | EnLink Midstream LLC 5.63%, 01/15/2028(1) | 1,901,176 |
| | EQM Midstream Partners L.P. | |
| 955,000 | 4.50%, 01/15/2029(1) | 978,875 |
| 730,000 | 4.75%, 01/15/2031(1) | 755,787 |
| 435,000 | 6.00%, 07/01/2025(1) | 471,975 |
| 845,000 | 6.50%, 07/01/2027(1) | 940,063 |
| 950,000 | 6.50%, 07/15/2048 | 1,129,949 |
| | Targa Resources Partners L.P. / Targa Resources Partners Finance Corp. | |
| 550,000 | 4.00%, 01/15/2032(1) | 567,584 |
| 1,050,000 | 4.88%, 02/01/2031 | 1,132,141 |
| Shares or Principal Amount | | Market Value† |
| CORPORATE BONDS - 90.3% - (continued) |
| | Pipelines - 6.5% - (continued) |
| $ 3,050,000 | 6.50%, 07/15/2027 | $ 3,267,312 |
| | Venture Global Calcasieu Pass LLC | |
| 1,200,000 | 3.88%, 08/15/2029(1) | 1,223,040 |
| 970,000 | 4.13%, 08/15/2031(1) | 1,003,902 |
| | Western Midstream Operating L.P. | |
| 2,950,000 | 5.30%, 02/01/2030 | 3,233,937 |
| 925,000 | 6.50%, 02/01/2050 | 1,107,206 |
| | | | 30,242,193 |
| | Real Estate - 0.3% |
| 875,000 | CIFI Holdings Group Co., Ltd. 5.95%, 10/20/2025(3) | 848,755 |
| 900,000 | KWG Group Holdings Ltd. 7.40%, 01/13/2027(3) | 717,574 |
| | | | 1,566,329 |
| | Real Estate Investment Trusts - 1.5% |
| | Ladder Capital Finance Holdings LLLP / Ladder Capital Finance Corp. | |
| 2,150,000 | 4.25%, 02/01/2027(1) | 2,160,728 |
| 220,000 | 5.25%, 10/01/2025(1) | 221,650 |
| 2,425,000 | Service Properties Trust 7.50%, 09/15/2025 | 2,684,018 |
| | VICI Properties L.P. / VICI Note Co., Inc. | |
| 195,000 | 3.50%, 02/15/2025(1) | 198,413 |
| 130,000 | 3.75%, 02/15/2027(1) | 133,575 |
| 124,000 | 4.13%, 08/15/2030(1) | 130,200 |
| 780,000 | 4.25%, 12/01/2026(1) | 809,983 |
| 655,000 | 4.63%, 12/01/2029(1) | 698,803 |
| | | | 7,037,370 |
| | Retail - 8.4% |
| | 1011778 BC ULC / New Red Finance, Inc. | |
| 2,055,000 | 3.50%, 02/15/2029(1) | 1,993,350 |
| 1,100,000 | 3.88%, 01/15/2028(1) | 1,097,338 |
| 1,190,000 | 4.00%, 10/15/2030(1) | 1,152,789 |
| 1,210,000 | 4.38%, 01/15/2028(1) | 1,216,340 |
| | Ambience Merger Sub, Inc. | |
| 270,000 | 4.88%, 07/15/2028(1) | 265,091 |
| 290,000 | 7.13%, 07/15/2029(1) | 279,450 |
| 830,000 | Bloomin' Brands, Inc. / OSI Restaurant Partners LLC 5.13%, 04/15/2029(1) | 820,414 |
| | eG Global Finance plc | |
| EUR 975,000 | 4.38%, 02/07/2025(3) | 1,111,758 |
| 1,516,000 | 6.25%, 10/30/2025(3) | 1,774,752 |
| $ 1,900,000 | FirstCash, Inc. 4.63%, 09/01/2028(1) | 1,959,375 |
| | Gap, Inc. | |
| 1,315,000 | 3.63%, 10/01/2029(1) | 1,288,700 |
| 1,315,000 | 3.88%, 10/01/2031(1) | 1,288,700 |
| 680,000 | Group 1 Automotive, Inc. 4.00%, 08/15/2028(1) | 680,136 |
| 820,000 | KFC Holding Co. / Pizza Hut Holdings LLC / Taco Bell of America LLC 4.75%, 06/01/2027(1) | 848,700 |
| | L Brands, Inc. | |
| 1,260,000 | 5.25%, 02/01/2028 | 1,358,280 |
| 1,275,000 | 6.63%, 10/01/2030(1) | 1,427,618 |
| 2,730,000 | LBM Acquisition LLC 6.25%, 01/15/2029(1) | 2,651,103 |
| 1,735,000 | Lithia Motors, Inc. 4.63%, 12/15/2027(1) | 1,834,320 |
| | Macy's Retail Holdings LLC | |
| 43,000 | 2.88%, 02/15/2023 | 43,430 |
| 356,000 | 3.63%, 06/01/2024 | 367,908 |
| 411,000 | 5.88%, 04/01/2029(1) | 437,997 |
| | Michaels Cos., Inc. | |
| 1,485,000 | 5.25%, 05/01/2028(1) | 1,499,850 |
| 815,000 | 7.88%, 05/01/2029(1) | 823,150 |
The accompanying notes are an integral part of these financial statements.
The Hartford High Yield Fund
Schedule of Investments – (continued)
October 31, 2021
| Shares or Principal Amount | | Market Value† |
| CORPORATE BONDS - 90.3% - (continued) |
| | Retail - 8.4% - (continued) |
| | PetSmart, Inc. | |
| $ 1,750,000 | 4.75%, 02/15/2028(1) | $ 1,798,125 |
| 265,000 | 7.75%, 02/15/2029(1) | 286,391 |
| 2,998,000 | Specialty Building Products Holdings LLC / SBP Finance Corp. 6.38%, 09/30/2026(1) | 3,121,667 |
| 1,180,000 | SRS Distribution, Inc. 4.63%, 07/01/2028(1) | 1,206,314 |
| 4,380,000 | Staples, Inc. 7.50%, 04/15/2026(1) | 4,423,800 |
| GBP 1,205,000 | Wheel Bidco Ltd. 6.75%, 07/15/2026(1) | 1,611,768 |
| $ 435,000 | Yum! Brands, Inc. 4.75%, 01/15/2030(1) | 465,450 |
| | | | 39,134,064 |
| | Semiconductors - 0.4% |
| | Sensata Technologies B.V. | |
| 1,005,000 | 5.00%, 10/01/2025(1) | 1,100,897 |
| 770,000 | 5.63%, 11/01/2024(1) | 848,925 |
| | | | 1,949,822 |
| | Software - 2.4% |
| 1,175,000 | Black Knight InfoServ LLC 3.63%, 09/01/2028(1) | 1,169,125 |
| 775,000 | CDK Global, Inc. 5.25%, 05/15/2029(1) | 831,188 |
| 1,150,000 | Change Healthcare Holdings LLC / Change Healthcare Finance, Inc. 5.75%, 03/01/2025(1) | 1,158,625 |
| 885,000 | IQVIA, Inc. 5.00%, 05/15/2027(1) | 917,364 |
| 1,210,000 | Open Text Corp. 3.88%, 02/15/2028(1) | 1,219,075 |
| 1,030,000 | Open Text Holdings, Inc. 4.13%, 02/15/2030(1) | 1,047,098 |
| | PTC, Inc. | |
| 240,000 | 3.63%, 02/15/2025(1) | 243,906 |
| 265,000 | 4.00%, 02/15/2028(1) | 268,644 |
| 1,875,000 | ROBLOX Corp. 3.88%, 05/01/2030 | 1,867,969 |
| 2,290,000 | SS&C Technologies, Inc. 5.50%, 09/30/2027(1) | 2,410,225 |
| | | | 11,133,219 |
| | Telecommunications - 6.2% |
| | Altice France S.A. | |
| 1,830,000 | 5.13%, 07/15/2029(1) | 1,782,292 |
| 640,000 | 5.50%, 01/15/2028(1) | 641,440 |
| 2,215,000 | 8.13%, 02/01/2027(1) | 2,381,125 |
| 1,280,000 | Embarq Corp. 8.00%, 06/01/2036 | 1,414,400 |
| | Frontier Communications Corp. | |
| 1,755,000 | 5.00%, 05/01/2028(1) | 1,783,519 |
| 1,085,000 | 5.88%, 10/15/2027(1) | 1,136,538 |
| 1,810,161 | 5.88%, 11/01/2029 | 1,803,373 |
| 1,925,000 | 6.75%, 05/01/2029(1) | 1,992,375 |
| 350,000 | Frontier Communications Holdings LLC 6.00%, 01/15/2030 | 351,656 |
| | Iliad Holding SAS | |
| 755,000 | 6.50%, 10/15/2026 | 777,801 |
| 490,000 | 7.00%, 10/15/2028 | 504,955 |
| EUR 1,865,000 | Kaixo Bondco Telecom S.A. 5.13%, 09/30/2029 | 2,133,992 |
| 2,410,000 | Lorca Telecom Bondco S.A. 4.00%, 09/18/2027 | 2,802,954 |
| Shares or Principal Amount | | Market Value† |
| CORPORATE BONDS - 90.3% - (continued) |
| | Telecommunications - 6.2% - (continued) |
| | Sprint Corp. | |
| $ 2,574,000 | 7.13%, 06/15/2024 | $ 2,908,620 |
| 10,000 | 7.63%, 02/15/2025 | 11,625 |
| 1,900,000 | 7.88%, 09/15/2023 | 2,106,625 |
| | T-Mobile USA, Inc. | |
| 1,605,000 | 2.25%, 02/15/2026(1) | 1,615,031 |
| 825,000 | 2.25%, 02/15/2026 | 830,156 |
| 2,050,000 | 2.63%, 04/15/2026 | 2,081,016 |
| | | | 29,059,493 |
| | Toys/Games/Hobbies - 0.3% |
| | Mattel, Inc. | |
| 665,000 | 3.38%, 04/01/2026(1) | 684,105 |
| 695,000 | 5.88%, 12/15/2027(1) | 747,125 |
| | | | 1,431,230 |
| | Transportation - 0.2% |
| 1,045,000 | First Student Bidco, Inc. 4.00%, 07/31/2029(1) | 1,021,488 |
| | Total Corporate Bonds
(cost $409,270,593) | $ 422,262,091 |
| SENIOR FLOATING RATE INTERESTS - 0.7%(7) |
| | Entertainment - 0.7% |
| | Crown Finance U.S., Inc. | |
| 3,677,657 | 3.50%, 02/28/2025, 1 mo. USD LIBOR + 2.500% | $ 3,026,712 |
| 159,082 | 9.25%, 05/23/2024, 1 mo. USD LIBOR + 8.250% | 170,616 |
| | | | 3,197,328 |
| | Total Senior Floating Rate Interests
(cost $3,354,455) | $ 3,197,328 |
| COMMON STOCKS - 0.3% |
| | Energy - 0.0% |
| 2,141 | Foresight Energy LLC* | $ 28,898 |
| 104,555,002 | KCA Deutag*(8)(9)(10) | — |
| | | | 28,898 |
| | Telecommunication Services - 0.3% |
| 45,675 | Frontier Communications Parent, Inc.* | 1,414,098 |
| | Total Common Stocks
(cost $2,656,765) | | $ 1,442,996 |
| ESCROWS - 0.9%(11) |
| | Media & Entertainment - 0.7% |
| 3,460,000 | Scripps Escrow, Inc. Expires 07/15/2027(1) | $ 3,511,900 |
The accompanying notes are an integral part of these financial statements.
The Hartford High Yield Fund
Schedule of Investments – (continued)
October 31, 2021
| Shares or Principal Amount | | Market Value† |
| ESCROWS - 0.9%(11) - (continued) |
| | Pharmaceuticals, Biotechnology & Life Sciences - 0.2% |
| 700,000 | Grifols Escrow Issuer S.A. Expires 10/15/2028(1) | $ 710,500 |
| | Total Escrows
(cost $4,245,763) | | $ 4,222,400 |
| | Total Long-Term Investments
(Cost $431,086,400) | | $ 444,149,758 |
| SHORT-TERM INVESTMENTS - 3.6% |
| | Repurchase Agreements - 3.6% |
| $ 16,977,787 | Fixed Income Clearing Corp. Repurchase Agreement dated 10/29/2021 at 0.010%, due on 11/01/2021 with a maturity value of $16,977,801; collateralized by U.S. Treasury Bond at 1.875%, maturing 02/15/2041, with a market value of $17,317,412 | $ 16,977,787 |
| | Total Short-Term Investments
(cost $16,977,787) | $ 16,977,787 |
| | Total Investments
(cost $448,064,187) | 98.6% | $ 461,127,545 |
| | Other Assets and Liabilities | 1.4% | 6,318,920 |
| | Total Net Assets | 100.0% | $ 467,446,465 |
| Note: | Percentage of investments as shown is the ratio of the total market value to total net assets. |
| | The Fund may refer to any one or more of the industry classifications used by one or more widely recognized market indices, ratings group and/or as defined by Fund management. Industry classifications may not be identical across all security types. |
| | Equity industry classifications used in this report are the Global Industry Classification Standard, which was developed by and is the exclusive property and service mark of MSCI, Inc. and Standard & Poor’s. |
| | For Fund compliance purposes, the Fund may not use the same classification system. These classifications are used for financial reporting purposes. |
| | See “Glossary” for abbreviation descriptions. |
| * | Non-income producing. |
| (1) | Security was purchased pursuant to Rule 144A under the Securities Act of 1933 and may be sold in transactions that are exempt from registration (typically only to qualified institutional buyers) or in a public offering registered under the Securities Act of 1933. At October 31, 2021, the aggregate value of these securities was $274,111,676, representing 58.6% of net assets. |
| (2) | Security is a zero-coupon bond. |
| (3) | Security is exempt from registration under Regulation S under the Securities Act of 1933, which exempts from registration securities offered and sold outside of the United States. Security may not be offered or sold in the United States except pursuant to an exemption from, or in a transaction not subject to, the registration requirements of the Securities Act of 1933. At October 31, 2021, the aggregate value of these securities was $22,703,297, representing 4.9% of net assets. |
| (4) | Fixed to variable rate investment. The rate shown reflects the fixed rate in effect at October 31, 2021. Rate will reset at a future date. Base lending rates may be subject to a floor or cap. |
| (5) | Perpetual maturity security. Maturity date shown is the next call date or final legal maturity date, whichever comes first. |
| (6) | Security has the ability to pay in kind (“PIK”) or pay income in cash. When applicable, separate rates of such payments are disclosed. |
| (7) | Senior floating rate interests generally pay interest rates which are periodically adjusted by reference to a base short-term, floating lending rate plus a premium. The base lending rates are primarily the LIBOR, and secondarily the prime rate offered by one or more major United States banks (the "Prime Rate") and the certificate of deposit rate or other base lending rates used by commercial lenders. Senior floating rate interests often require prepayments from excess cash flows or permit the borrower to repay at its election. The rate at which the borrower repays cannot be predicted with accuracy. As a result, the actual remaining maturity may be substantially less than the stated maturities shown. Base lending rates may be subject to a floor or cap. Unless otherwise noted, the interest rate disclosed for these securities represents the rate in effect as of October 31, 2021. |
| (8) | This security is valued in good faith at fair value as determined under policies and procedures established by and under the supervision of the Board of Directors. At October 31, 2021, the aggregate fair value of this security was $0, which represented 0.0% of total net assets. This amount excludes securities that are principally traded in certain foreign markets and whose prices are adjusted pursuant to a third party pricing service methodology approved by the Board of Directors. |
| (9) | Investment in securities not registered under the Securities Act of 1933 (excluding securities acquired pursuant to Rule 144A and Regulation S). At the end of the period, the value of such restricted securities amounted to $0 or 0.0% of net assets. |
Period
Acquired | | Security Name | | Shares/
Par Value | | Total Cost | | Market Value |
| 03/2011 | | KCA Deutag | | 104,555,002 | | $ 1,416,929 | | $ — |
| (10) | Investment valued using significant unobservable inputs. |
| (11) | Share amount represents shares of the issuer previously held that resulted in receipt of the escrow. |
| Foreign Currency Contracts Outstanding at October 31, 2021 |
Amount and Description of
Currency to be Purchased | | Amount and Description of
Currency to be Sold | | Counterparty | | Settlement
Date | | Appreciation/
(Depreciation) |
| 29,785,228 | USD | | 25,648,000 | EUR | | DEUT | | 11/30/2021 | | $ 118,856 |
| 2,775,026 | USD | | 2,016,000 | GBP | | DEUT | | 11/30/2021 | | 15,978 |
| Total foreign currency contracts | | $ 134,834 |
† See Significant Accounting Policies of accompanying Notes to Financial Statements regarding valuation of investments.
The accompanying notes are an integral part of these financial statements.
The Hartford High Yield Fund
Schedule of Investments – (continued)
October 31, 2021
Fair Value Summary
The following is a summary of the fair valuations according to the inputs used as of October 31, 2021 in valuing the Fund’s investments.
| Description | | Total | | Level 1 | | Level 2 | | Level 3(1) |
| Assets | | | | | | | | |
| Convertible Bonds | | $ 13,024,943 | | $ — | | $ 13,024,943 | | $ — |
| Corporate Bonds | | 422,262,091 | | — | | 422,262,091 | | — |
| Senior Floating Rate Interests | | 3,197,328 | | — | | 3,197,328 | | — |
| Common Stocks | | | | | | | | |
| Energy | | 28,898 | | 28,898 | | — | | — |
| Telecommunication Services | | 1,414,098 | | 1,414,098 | | — | | — |
| Escrows | | 4,222,400 | | — | | 4,222,400 | | — |
| Short-Term Investments | | 16,977,787 | | — | | 16,977,787 | | — |
| Foreign Currency Contracts(2) | | 134,834 | | — | | 134,834 | | — |
| Total | | $ 461,262,379 | | $ 1,442,996 | | $ 459,819,383 | | $ — |
| (1) | For the year ended October 31, 2021, investments valued at $16,979 were transferred out of Level 3 due to the initiation of a vendor providing prices that are based on market activity which has been determined to be significant observable input. There were no transfers into Level 3. |
| (2) | Derivative instruments (excluding purchased and written options, if applicable) are valued at the unrealized appreciation/(depreciation) on the investments. |
Level 3 investments at the beginning and/or end of the period in relation to net assets were not significant and accordingly, a reconciliation of Level 3 assets for the year ended October 31, 2021 is not presented.
The accompanying notes are an integral part of these financial statements.
The Hartford Inflation Plus Fund
Schedule of Investments
October 31, 2021
| Shares or Principal Amount | | Market Value† |
| ASSET & COMMERCIAL MORTGAGE-BACKED SECURITIES - 2.3% |
| | Asset-Backed - Automobile - 0.1% |
| $ 505,000 | Tesla Auto Lease Trust 5.48%, 05/22/2023(1) | $ 523,503 |
| | Asset-Backed - Credit Card - 0.1% |
| 505,000 | Mercury Financial Credit Card Master Trust 1.54%, 03/20/2026(1) | 505,878 |
| | Asset-Backed - Finance & Insurance - 0.3% |
| 224,932 | Aaset Trust 3.35%, 01/16/2040(1) | 220,726 |
| 260,438 | CF Hippolyta LLC 1.99%, 07/15/2060(1) | 258,871 |
| 1,360,000 | HSI Asset Securitization Corp. Trust 0.63%, 02/25/2036, 1 mo. USD LIBOR + 0.270%(2) | 1,353,253 |
| | | | 1,832,850 |
| | Asset-Backed - Home Equity - 0.1% |
| 585,679 | GSAA Home Equity Trust 5.98%, 06/25/2036(3) | 234,171 |
| 695,005 | Renaissance Home Equity Loan Trust 6.12%, 11/25/2036(4) | 382,122 |
| | | | 616,293 |
| | Commercial Mortgage-Backed Securities - 0.3% |
| | Benchmark Mortgage Trust | |
| 6,370,286 | 1.23%, 03/15/2062(3)(5) | 454,950 |
| 2,376,169 | 1.52%, 01/15/2054(3)(5) | 276,772 |
| 276,746 | Chase Mortgage Finance Trust 3.05%, 12/25/2035(3) | 278,363 |
| 1,751,037 | DBJPM Mortgage Trust 1.71%, 09/15/2053(3)(5) | 168,018 |
| 5,830,360 | Wells Fargo N.A. 0.90%, 05/15/2062(3)(5) | 335,505 |
| | | | 1,513,608 |
| | FNMA Collateral - 0.0% |
| 298,142 | Connecticut Avenue Securities Trust 2.49%, 04/25/2031, 1 mo. USD LIBOR + 2.400%(1)(2) | 299,646 |
| | Whole Loan Collateral CMO - 1.4% |
| 245,558 | Adjustable Rate Mortgage Trust 0.63%, 11/25/2035, 1 mo. USD LIBOR + 0.540%(2) | 248,549 |
| 556,511 | Bank of America Funding Trust 6.05%, 10/25/2036(4) | 549,651 |
| 95,727 | Bear Stearns Adjustable Rate Mortgage Trust 2.38%, 10/25/2035, 12 mo. USD CMT + 2.300%(2) | 98,211 |
| | Connecticut Avenue Securities Trust | |
| 364,037 | 2.19%, 10/25/2039, 1 mo. USD LIBOR + 2.100%(1)(2) | 365,099 |
| 326,213 | 2.24%, 09/25/2031, 1 mo. USD LIBOR + 2.150%(1)(2) | 327,857 |
| 331,288 | 2.39%, 08/25/2031, 1 mo. USD LIBOR + 2.300%(1)(2) | 333,062 |
| 272,343 | Deutsche Alt-A Securities Mortgage Loan Trust 0.24%, 12/25/2036, 1 mo. USD LIBOR + 0.150%(2) | 266,558 |
| | Fannie Mae Connecticut Avenue Securities | |
| 519,224 | 3.09%, 07/25/2024, 1 mo. USD LIBOR + 3.000%(2) | 527,951 |
| 116,149 | 4.99%, 11/25/2024, 1 mo. USD LIBOR + 4.900%(2) | 120,822 |
| Shares or Principal Amount | | Market Value† |
| ASSET & COMMERCIAL MORTGAGE-BACKED SECURITIES - 2.3% - (continued) |
| | Whole Loan Collateral CMO - 1.4% - (continued) |
| $ 92,326 | 5.79%, 04/25/2028, 1 mo. USD LIBOR + 5.700%(2) | $ 97,683 |
| 61,342 | 6.09%, 09/25/2028, 1 mo. USD LIBOR + 6.000%(2) | 64,160 |
| 142,020 | GreenPoint Mortgage Funding Trust 1.49%, 10/25/2045, 12 mo. USD MTA + 1.400%(2) | 119,802 |
| 281,549 | GSR Mortgage Loan Trust 2.61%, 10/25/2035(3) | 196,159 |
| 341,682 | HarborView Mortgage Loan Trust 0.27%, 01/19/2038, 1 mo. USD LIBOR + 0.190%(2) | 333,713 |
| 1,660,310 | IndyMac Index Mortgage Loan Trust 0.67%, 01/25/2036, 1 mo. USD LIBOR + 0.580%(2) | 1,322,993 |
| 383,926 | JP Morgan Mortgage Trust 3.13%, 01/25/2037(3) | 358,373 |
| | MASTR Adjustable Rate Mortgages Trust | |
| 782,661 | 0.57%, 05/25/2037, 1 mo. USD LIBOR + 0.480%(2) | 412,922 |
| 4,314 | 2.72%, 11/21/2034(3) | 4,378 |
| 202,455 | Preston Ridge Partners Mortgage Trust LLC 2.36%, 11/25/2025(1)(4) | 202,835 |
| | Residential Funding Mortgage Securities, Inc. | |
| 91,673 | 3.93%, 02/25/2036(3) | 86,775 |
| 199,278 | 6.00%, 07/25/2037 | 191,780 |
| 317,195 | Structured Adjustable Rate Mortgage Loan Trust 2.70%, 06/25/2035(3) | 273,821 |
| 76,591 | Traingle Re Ltd. 3.09%, 10/25/2030, 1 mo. USD LIBOR + 3.000%(1)(2) | 76,591 |
| 631,116 | VOLT XCIV LLC 2.24%, 02/27/2051(1)(4) | 630,039 |
| 288,057 | WaMu Mortgage Pass-Through Certificates Trust 0.93%, 06/25/2044, 1 mo. USD LIBOR + 0.840%(2) | 285,698 |
| 467,189 | Washington Mutual Mortgage Pass-Through Certificates WMALT Trust 0.92%, 11/25/2046, 12 mo. USD MTA + 0.830%(2) | 429,648 |
| | | | 7,925,130 |
| | Total Asset & Commercial Mortgage-Backed Securities
(cost $13,186,814) | $ 13,216,908 |
| CONVERTIBLE BONDS - 0.3% |
| | Entertainment - 0.1% |
| 430,000 | IMAX Corp. 0.50%, 04/01/2026(1) | $ 424,513 |
| | Leisure Time - 0.0% |
| 160,000 | Royal Caribbean Cruises Ltd. 4.25%, 06/15/2023 | 215,812 |
| | REITS - 0.1% |
| 365,000 | Pebblebrook Hotel Trust 1.75%, 12/15/2026 | 406,282 |
The accompanying notes are an integral part of these financial statements.
The Hartford Inflation Plus Fund
Schedule of Investments – (continued)
October 31, 2021
| Shares or Principal Amount | | Market Value† |
| CONVERTIBLE BONDS - 0.3% - (continued) |
| | Retail - 0.1% |
| $ 405,000 | Cracker Barrel Old Country Store, Inc. 0.63%, 06/15/2026(1) | $ 395,567 |
| | Total Convertible Bonds
(cost $1,431,248) | $ 1,442,174 |
| CORPORATE BONDS - 1.7% |
| | Airlines - 0.1% |
| 515,000 | British Airways Trust 2.90%, 09/15/2036(1) | $ 520,059 |
| | Apparel - 0.1% |
| 225,000 | William Carter Co. 5.63%, 03/15/2027(1) | 232,875 |
| | Construction Materials - 0.2% |
| 1,156,000 | Builders FirstSource, Inc. 5.00%, 03/01/2030(1) | 1,221,025 |
| | Diversified Financial Services - 0.7% |
| 945,000 | BOC Aviation USA Corp. 1.63%, 04/29/2024(1) | 946,811 |
| 1,315,000 | Home Point Capital, Inc. 5.00%, 02/01/2026(1) | 1,181,383 |
| 1,070,000 | PennyMac Financial Services, Inc. 4.25%, 02/15/2029(1) | 1,008,475 |
| 1,050,000 | United Wholesale Mortgage LLC 5.50%, 04/15/2029(1) | 1,021,125 |
| | | | 4,157,794 |
| | Engineering & Construction - 0.1% |
| 245,000 | TopBuild Corp. 3.63%, 03/15/2029(1) | 246,301 |
| | Machinery-Diversified - 0.0% |
| 220,000 | Westinghouse Air Brake Technologies Corp. 3.20%, 06/15/2025 | 232,860 |
| | Pipelines - 0.4% |
| 1,335,000 | Galaxy Pipeline Assets Bidco Ltd. 2.94%, 09/30/2040(1) | 1,311,302 |
| 785,000 | Gray Oak Pipeline LLC 3.45%, 10/15/2027(1) | 822,324 |
| | | | 2,133,626 |
| | Retail - 0.1% |
| 208,000 | FirstCash, Inc. 4.63%, 09/01/2028(1) | 214,500 |
| | Gap, Inc. | |
| 100,000 | 3.63%, 10/01/2029(1) | 98,000 |
| 100,000 | 3.88%, 10/01/2031(1) | 98,000 |
| | | | 410,500 |
| | Software - 0.0% |
| 220,000 | Black Knight InfoServ LLC 3.63%, 09/01/2028(1) | 218,900 |
| | Total Corporate Bonds
(cost $9,537,020) | $ 9,373,940 |
| FOREIGN GOVERNMENT OBLIGATIONS - 7.4% |
| | Argentina - 0.1% |
| ARS 37,599,058 | Argentina Treasury Bond 1.20%, 03/18/2022(6) | $ 374,537 |
| | Brazil - 0.7% |
| BRL 8,297,520 | Brazil Letras do Tesouro Nacional 6.00%, 05/15/2055(6) | 1,547,575 |
| Shares or Principal Amount | | Market Value† |
| FOREIGN GOVERNMENT OBLIGATIONS - 7.4% - (continued) |
| | Brazil - 0.7% - (continued) |
| | Brazil Notas do Tesouro Nacional | |
| BRL 4,056,401 | 6.00%, 08/15/2050(6) | $ 756,748 |
| 12,186,000 | 10.00%, 01/01/2029 | 1,943,455 |
| | | | 4,247,778 |
| | Chile - 0.2% |
| EUR 1,180,000 | Chile Government International Bond 1.25%, 01/22/2051 | 1,194,443 |
| | Colombia - 0.6% |
| | Colombia Government International Bond | |
| 1,860,000 | 3.88%, 03/22/2026 | 2,356,605 |
| $ 685,000 | 3.88%, 02/15/2061 | 559,412 |
| 685,000 | 6.13%, 01/18/2041 | 758,741 |
| | | | 3,674,758 |
| | Croatia - 0.2% |
| EUR 800,000 | Croatia Government International Bond 1.50%, 06/17/2031(7) | 960,153 |
| | Egypt - 0.1% |
| $ 530,000 | Egypt Government International Bond 7.90%, 02/21/2048(7) | 466,167 |
| | Ghana - 0.1% |
| 310,000 | Ghana Government International Bond 10.75%, 10/14/2030(7) | 358,527 |
| | Hungary - 0.3% |
| EUR 1,420,000 | Hungary Government International Bond 1.63%, 04/28/2032(7) | 1,705,569 |
| | Indonesia - 0.4% |
| | Indonesia Government International Bond | |
| 990,000 | 1.10%, 03/12/2033 | 1,097,010 |
| 1,050,000 | 1.40%, 10/30/2031 | 1,213,775 |
| | | | 2,310,785 |
| | Ivory Coast - 0.1% |
| 330,000 | Ivory Coast Government International Bond 4.88%, 01/30/2032(7) | 372,369 |
| | Jordan - 0.1% |
| $ 265,000 | Jordan Government International Bond 7.38%, 10/10/2047(7) | 273,666 |
| | Macedonia - 0.3% |
| | North Macedonia Government International Bond | |
| EUR 440,000 | 2.75%, 01/18/2025(7) | 529,393 |
| 1,085,000 | 3.68%, 06/03/2026(1) | 1,360,217 |
| | | | 1,889,610 |
| | Mexico - 0.3% |
| | Mexico Government International Bond | |
| 1,360,000 | 1.45%, 10/25/2033 | 1,455,505 |
| 370,000 | 3.63%, 04/09/2029 | 495,129 |
| | | | 1,950,634 |
| | Morocco - 0.0% |
| $ 200,000 | Morocco Government International Bond 4.00%, 12/15/2050(7) | 179,786 |
The accompanying notes are an integral part of these financial statements.
The Hartford Inflation Plus Fund
Schedule of Investments – (continued)
October 31, 2021
| Shares or Principal Amount | | Market Value† |
| FOREIGN GOVERNMENT OBLIGATIONS - 7.4% - (continued) |
| | New Zealand - 0.4% |
| | New Zealand Government Bond | |
| NZD 1,761,084 | 2.50%, 09/20/2035(6)(7) | $ 1,720,916 |
| 843,997 | 2.50%, 09/20/2040(6)(7) | 760,769 |
| | | | 2,481,685 |
| | Panama - 0.3% |
| $ 1,520,000 | Panama Government International Bond 4.50%, 04/01/2056 | 1,668,914 |
| | Romania - 0.4% |
| | Romanian Government International Bond | |
| EUR 1,417,000 | 2.12%, 07/16/2031(7) | 1,603,587 |
| 100,000 | 2.75%, 04/14/2041(1) | 106,222 |
| 332,000 | 3.62%, 05/26/2030(1) | 422,859 |
| | | | 2,132,668 |
| | Russia - 1.4% |
| RUB 270,120,000 | Russian Federal Bond - OFZ 7.65%, 04/10/2030 | 3,719,977 |
| 312,584,067 | Russian Federal Inflation Linked Bond - OFZ 2.50%, 02/02/2028(6) | 4,276,138 |
| | | | 7,996,115 |
| | Saudi Arabia - 0.4% |
| | Saudi Government International Bond | |
| EUR 800,000 | 2.00%, 07/09/2039(7) | 966,416 |
| $ 1,092,000 | 2.25%, 02/02/2033(1) | 1,053,588 |
| | | | 2,020,004 |
| | Senegal - 0.0% |
| 200,000 | Senegal Government International Bond 6.75%, 03/13/2048(7) | 198,012 |
| | Serbia - 0.1% |
| EUR 655,000 | Serbia International Bond 1.65%, 03/03/2033(1) | 710,803 |
| | South Korea - 0.9% |
| KRW 6,124,215,525 | Inflation Linked Korea Treasury Bond 1.13%, 06/10/2030(6) | 5,193,355 |
| | Total Foreign Government Obligations
(cost $45,851,362) | | $ 42,360,338 |
| SENIOR FLOATING RATE INTERESTS - 7.6%(8) |
| | Advertising - 0.0% |
| $ 117,909 | Terrier Media Buyer, Inc. 3.59%, 12/17/2026, 1 mo. USD LIBOR + 3.500% | $ 117,408 |
| | Aerospace/Defense - 0.1% |
| | Spirit Aerosystems, Inc. | |
| 100,000 | 0.00%, 01/15/2025, 1 mo. USD LIBOR + 3.750%(9) | 100,250 |
| 99,250 | 6.00%, 01/15/2025, 1 mo. USD LIBOR + 5.250% | 99,498 |
| 574,682 | TransDigm, Inc. 2.34%, 12/09/2025, 1 mo. USD LIBOR + 2.250% | 567,332 |
| | | | 767,080 |
| | Airlines - 0.1% |
| 110,000 | Air Canada 4.25%, 08/11/2028, 1 mo. USD LIBOR + 3.500% | 111,077 |
| Shares or Principal Amount | | Market Value† |
| SENIOR FLOATING RATE INTERESTS - 7.6%(8) - (continued) |
| | Airlines - 0.1% - (continued) |
| $ 98,250 | Kestrel Bidco, Inc. 4.00%, 12/11/2026, 3 mo. USD LIBOR + 3.000% | $ 96,593 |
| 180,000 | Mileage Plus Holdings LLC 6.25%, 06/21/2027, 1 mo. USD LIBOR + 5.250% | 191,588 |
| 245,000 | SkyMiles IP Ltd. 4.75%, 10/20/2027, 3 mo. USD LIBOR + 3.750% | 260,788 |
| 139,300 | United Airlines, Inc. 4.50%, 04/21/2028, 1 mo. USD LIBOR + 3.750% | 141,165 |
| | | | 801,211 |
| | Auto Parts & Equipment - 0.1% |
| 119,700 | Adient U.S. LLC 3.59%, 04/08/2028, 1 mo. USD LIBOR + 3.500% | 119,678 |
| 169,360 | Clarios Global L.P. 3.34%, 04/30/2026, 1 mo. USD LIBOR + 3.250% | 168,231 |
| 159,269 | First Brands Group LLC 6.00%, 03/30/2027, 1 mo. USD LIBOR + 5.000% | 160,463 |
| | | | 448,372 |
| | Chemicals - 0.3% |
| 195,026 | Axalta Coating Systems U.S. Holdings, Inc. 1.88%, 06/01/2024, 3 mo. USD LIBOR + 1.750% | 194,539 |
| 450,000 | Diamond (BC) B.V. 3.50%, 09/29/2028, 1 mo. USD LIBOR + 3.000% | 448,762 |
| 249,364 | Element Solutions, Inc. 2.09%, 01/31/2026, 1 mo. USD LIBOR + 2.000%(9) | 248,740 |
| 87,461 | H.B. Fuller Co. 2.09%, 10/20/2024, 3 mo. USD LIBOR + 2.000% | 87,402 |
| 99,750 | INEOS Styrolution U.S. Holding LLC 3.25%, 01/29/2026, 1 mo. USD LIBOR + 2.750% | 99,750 |
| 251,167 | Minerals Technologies, Inc. 3.00%, 02/14/2024, 3 mo. USD LIBOR + 2.250% | 250,853 |
| 200,024 | Tronox Finance LLC 2.37%, 03/13/2028, 1 mo. USD LIBOR + 2.250% | 198,400 |
| | | | 1,528,446 |
| | Commercial Services - 0.8% |
| 273,625 | AlixPartners LLP 3.25%, 02/04/2028, 1 mo. USD LIBOR + 2.750% | 272,599 |
| | Amentum Government Services Holdings LLC | |
| 197,500 | 3.59%, 01/29/2027, 1 mo. USD LIBOR + 3.500% | 196,349 |
| 199,000 | 5.50%, 01/29/2027, 1 mo. USD LIBOR + 4.750% | 198,938 |
| 200,000 | APX Group, Inc. 4.00%, 07/10/2028, 1 mo. USD LIBOR + 3.500% | 199,218 |
| 196,746 | Belron Finance U.S. LLC 2.44%, 10/30/2026, 1 mo. USD LIBOR + 2.250% | 195,641 |
| EUR 290,000 | Boels Topholding B.V. 3.25%, 02/06/2027, 3 mo. EURIBOR + 3.250% | 333,634 |
| $ 196,947 | BrightView Landscapes LLC 2.63%, 08/15/2025, 3 mo. USD LIBOR + 2.500% | 195,879 |
The accompanying notes are an integral part of these financial statements.
The Hartford Inflation Plus Fund
Schedule of Investments – (continued)
October 31, 2021
| Shares or Principal Amount | | Market Value† |
| SENIOR FLOATING RATE INTERESTS - 7.6%(8) - (continued) |
| | Commercial Services - 0.8% - (continued) |
| $ 454,814 | EVO Payments International LLC 3.34%, 12/22/2023, 3 mo. USD LIBOR + 3.250% | $ 454,150 |
| 300,000 | MPH Acquisition Holdings LLC 4.75%, 08/17/2028, 1 mo. USD LIBOR + 4.250% | 292,251 |
| 322,284 | Trans Union LLC 1.84%, 11/16/2026, 1 mo. USD LIBOR + 1.750% | 320,069 |
| 470,450 | United Rentals, Inc. 1.84%, 10/31/2025, 3 mo. USD LIBOR + 1.750% | 472,129 |
| | Verisure Holding AB | |
| EUR 430,000 | 3.25%, 07/20/2026, 3 mo. EURIBOR + 3.250% | 493,198 |
| 205,000 | 3.25%, 03/27/2028, 3 mo. EURIBOR + 3.250% | 234,956 |
| $ 402,975 | WEX, Inc. 2.34%, 03/31/2028, 1 mo. USD LIBOR + 2.250% | 400,658 |
| 189,525 | WW International, Inc. 4.00%, 04/13/2028, 1 mo. USD LIBOR + 3.500% | 187,156 |
| | | | 4,446,825 |
| | Construction Materials - 0.3% |
| 190,000 | Chamberlain Group, Inc. 0.00%, 10/22/2028, 1 mo. USD LIBOR + 4.000%(9) | 189,605 |
| 99,500 | CP Atlas Buyer, Inc. 4.25%, 11/23/2027, 1 mo. USD LIBOR + 3.750% | 98,847 |
| 275,800 | Ingersoll-Rand Services Co. 1.84%, 03/01/2027, 1 mo. USD LIBOR + 1.750% | 271,748 |
| 236,477 | Quikrete Holdings, Inc. 2.59%, 02/01/2027, 1 mo. USD LIBOR + 2.500% | 234,013 |
| 250,000 | Rexnord LLC 2.75%, 10/04/2028, 1 mo. USD LIBOR + 2.250% | 249,883 |
| 385,000 | Standard Industries, Inc. 3.00%, 09/22/2028, 1 mo. USD LIBOR + 2.500% | 384,449 |
| | | | 1,428,545 |
| | Distribution/Wholesale - 0.4% |
| 478,240 | American Builders & Contractors Supply Co., Inc. 2.09%, 01/15/2027, 1 mo. USD LIBOR + 2.000% | 473,319 |
| 670,812 | Core & Main L.P. 2.59%, 07/27/2028, 1 mo. USD LIBOR + 2.500% | 665,224 |
| 98,000 | KAR Auction Services, Inc. 2.38%, 09/19/2026, 1 mo. USD LIBOR + 2.250% | 95,060 |
| 114,425 | PAI Holdco, Inc. 4.25%, 10/28/2027, 1 mo. USD LIBOR + 3.500% | 114,425 |
| 698,250 | Univar Solutions USA Inc. 2.09%, 06/03/2028, 1 mo. USD LIBOR + 2.000% | 696,630 |
| | | | 2,044,658 |
| Shares or Principal Amount | | Market Value† |
| SENIOR FLOATING RATE INTERESTS - 7.6%(8) - (continued) |
| | Diversified Financial Services - 0.2% |
| $ 317,707 | Blackhawk Network Holdings, Inc. 3.09%, 06/15/2025, 3 mo. USD LIBOR + 3.000% | $ 314,928 |
| 197,747 | Deerfield Dakota Holding LLC 4.75%, 04/09/2027, 1 mo. USD LIBOR + 3.750% | 198,119 |
| 350,000 | Delos Finance S.a.r.l. 1.88%, 10/06/2023, 3 mo. USD LIBOR + 1.750% | 349,507 |
| 194,513 | Fleetcor Technologies Operating Co. LLC 1.84%, 04/28/2028, 1 mo. USD LIBOR + 1.750% | 193,888 |
| 193,776 | Russell Investments U.S. Inst'l Holdco, Inc. 4.50%, 05/30/2025, 1 mo. USD LIBOR + 3.500% | 194,442 |
| | | | 1,250,884 |
| | Electric - 0.0% |
| 122,187 | ExGen Renewables LLC 3.50%, 12/15/2027, 1 mo. USD LIBOR + 2.500% | 122,274 |
| | Electrical Components & Equipment - 0.0% |
| 100,000 | Anticimex International AB 0.00%, 07/21/2028, 1 mo. USD LIBOR + 3.500%(9) | 99,875 |
| 99,250 | Energizer Holdings, Inc. 2.75%, 12/22/2027, 1 mo. USD LIBOR + 2.250% | 98,909 |
| | | | 198,784 |
| | Engineering & Construction - 0.1% |
| 215,437 | Brand Energy & Infrastructure Services, Inc. 5.25%, 06/21/2024, 3 mo. USD LIBOR + 4.250% | 213,428 |
| 350,000 | Brown Group Holding LLC 3.25%, 06/07/2028, 1 mo. USD LIBOR + 2.750%(9) | 348,908 |
| 100,000 | KKR Apple Bidco LLC 3.50%, 09/22/2028, 1 mo. USD LIBOR + 3.000% | 99,750 |
| | | | 662,086 |
| | Entertainment - 0.3% |
| | Crown Finance U.S., Inc. | |
| 104,935 | 3.50%, 02/28/2025, 1 mo. USD LIBOR + 2.500% | 86,362 |
| 4,539 | 9.25%, 05/23/2024, 1 mo. USD LIBOR + 8.250% | 4,868 |
| 200,000 | Delta (LUX) S.a.r.l. 3.50%, 02/01/2024, 3 mo. USD LIBOR + 2.500% | 199,188 |
| 215,157 | Golden Entertainment, Inc. 3.75%, 10/21/2024, 3 mo. USD LIBOR + 3.000% | 214,709 |
| 148,568 | NASCAR Holdings, Inc. 2.59%, 10/19/2026, 3 mo. USD LIBOR + 2.500% | 148,011 |
| 351,553 | Penn National Gaming, Inc. 3.00%, 10/15/2025, 3 mo. USD LIBOR + 2.250% | 350,822 |
The accompanying notes are an integral part of these financial statements.
The Hartford Inflation Plus Fund
Schedule of Investments – (continued)
October 31, 2021
| Shares or Principal Amount | | Market Value† |
| SENIOR FLOATING RATE INTERESTS - 7.6%(8) - (continued) |
| | Entertainment - 0.3% - (continued) |
| $ 247,436 | Scientific Games International, Inc. 2.84%, 08/14/2024, 1 mo. USD LIBOR + 2.750% | $ 246,283 |
| 335,000 | UFC Holdings LLC 3.50%, 04/29/2026, 1 mo. USD LIBOR + 2.750%(9) | 332,906 |
| | | | 1,583,149 |
| | Environmental Control - 0.1% |
| | Clean Harbors, Inc. | |
| 143,625 | 1.84%, 06/28/2024, 3 mo. USD LIBOR + 1.750% | 143,585 |
| 345,000 | 2.09%, 10/08/2028, 1 mo. USD LIBOR + 2.087% | 344,786 |
| | | | 488,371 |
| | Food - 0.1% |
| 158,000 | Froneri International Ltd. 2.34%, 01/29/2027, 1 mo. USD LIBOR + 2.250% | 155,650 |
| 211,192 | U.S. Foods, Inc. 2.09%, 09/13/2026, 3 mo. USD LIBOR + 2.000% | 207,233 |
| | | | 362,883 |
| | Food Service - 0.1% |
| | Aramark Services, Inc. | |
| 218,266 | 1.84%, 03/11/2025, 1 mo. USD LIBOR + 1.750% | 212,810 |
| 93,250 | 1.84%, 01/15/2027, 1 mo. USD LIBOR + 1.750% | 90,861 |
| | | | 303,671 |
| | Gas - 0.1% |
| 371,450 | UGI Energy Services LLC 3.84%, 08/13/2026, 1 mo. USD LIBOR + 3.750% | 372,613 |
| | Hand/Machine Tools - 0.0% |
| 171,813 | Alliance Laundry Systems LLC 4.25%, 10/08/2027, 1 mo. USD LIBOR + 3.500% | 172,118 |
| | Healthcare - Products - 0.2% |
| | Avantor Funding, Inc. | |
| 432,825 | 2.75%, 11/08/2027, 1 mo. USD LIBOR + 2.250% | 432,466 |
| EUR 114,713 | 2.75%, 06/12/2028, 1 mo. EURIBOR + 2.750% | 132,239 |
| $ 365,000 | Medline Industries, Inc. 0.00%, 10/23/2028, 1 mo. USD LIBOR + 3.250%(9) | 365,361 |
| 162,533 | Sunshine Luxembourg S.a.r.l. 4.50%, 10/01/2026, 1 mo. USD LIBOR + 3.750% | 162,798 |
| | | | 1,092,864 |
| | Healthcare - Services - 0.3% |
| 203,975 | ADMI Corp. 3.63%, 12/23/2027, 1 mo. USD LIBOR + 3.125% | 202,382 |
| EUR 300,000 | Biogroup-LCD 3.50%, 01/28/2028, 3 mo. EURIBOR + 3.500% | 344,681 |
| $ 199,499 | Catalent Pharma Solutions, Inc. 2.00%, 02/22/2028, 1 mo. USD LIBOR + 2.500% | 199,549 |
| Shares or Principal Amount | | Market Value† |
| SENIOR FLOATING RATE INTERESTS - 7.6%(8) - (continued) |
| | Healthcare - Services - 0.3% - (continued) |
| $ 99,818 | ICON Luxembourg S.a r.l. 3.00%, 07/03/2028, 1 mo. USD LIBOR + 2.500% | $ 99,807 |
| | IQVIA, Inc. | |
| 254,025 | 1.84%, 03/07/2024, 1 mo. USD LIBOR + 1.750% | 253,581 |
| EUR 147,774 | 2.00%, 06/11/2025, 1 mo. EURIBOR + 2.000% | 169,439 |
| $ 298,500 | PPD, Inc. 2.50%, 01/13/2028, 1 mo. USD LIBOR + 2.000% | 297,801 |
| | | | 1,567,240 |
| | Insurance - 0.3% |
| 232,294 | Acrisure LLC 3.63%, 02/15/2027, 1 mo. USD LIBOR + 3.500% | 229,042 |
| 98,473 | Alliant Holdings Intermediate LLC 3.34%, 05/09/2025, 1 mo. USD LIBOR + 3.250% | 97,581 |
| | Asurion LLC | |
| 383,680 | 3.21%, 11/03/2023, 1 mo. USD LIBOR + 3.125% | 382,640 |
| 206,546 | 3.34%, 12/23/2026, 1 mo. USD LIBOR + 3.250% | 204,384 |
| 306,486 | Hub International Ltd. 2.87%, 04/25/2025, 1 mo. USD LIBOR + 2.750% | 302,934 |
| | Sedgwick Claims Management Services, Inc. | |
| 175,050 | 3.34%, 12/31/2025, 3 mo. USD LIBOR + 3.250% | 173,191 |
| 146,625 | 3.84%, 09/03/2026, 1 mo. USD LIBOR + 3.750% | 146,222 |
| 49,000 | 5.25%, 09/03/2026, 1 mo. USD LIBOR + 4.250% | 49,079 |
| 240,000 | USI, Inc. 3.13%, 05/16/2024, 3 mo. USD LIBOR + 3.000% | 238,070 |
| | | | 1,823,143 |
| | Internet - 0.2% |
| | Adevinta ASA | |
| EUR 130,000 | 3.25%, 06/26/2028, 3 mo. EURIBOR + 3.250% | 150,208 |
| $ 99,750 | 3.75%, 06/26/2028, 1 mo. USD LIBOR + 3.000% | 99,725 |
| 154,612 | Endure Digital, Inc. 4.25%, 02/10/2028, 1 mo. USD LIBOR + 3.500% | 151,842 |
| | Go Daddy Operating Co. LLC | |
| 213,697 | 1.84%, 02/15/2024, 1 mo. USD LIBOR + 1.750% | 212,041 |
| 237,000 | 2.09%, 08/10/2027, 1 mo. USD LIBOR + 2.000% | 235,289 |
| 232,397 | MH Sub LLC 4.75%, 09/13/2024, 1 mo. USD LIBOR + 3.750% | 232,784 |
| 160,000 | Proofpoint, Inc. 3.75%, 08/31/2028, 1 mo. USD LIBOR + 3.250% | 159,272 |
| | | | 1,241,161 |
| | Investment Company Security - 0.0% |
| 106,532 | FinCo LLC 2.59%, 06/27/2025, 1 mo. USD LIBOR + 2.500% | 106,132 |
The accompanying notes are an integral part of these financial statements.
The Hartford Inflation Plus Fund
Schedule of Investments – (continued)
October 31, 2021
| Shares or Principal Amount | | Market Value† |
| SENIOR FLOATING RATE INTERESTS - 7.6%(8) - (continued) |
| | IT Services - 0.1% |
| $ 184,075 | Peraton Corp. 4.50%, 02/01/2028, 1 mo. USD LIBOR + 3.750% | $ 184,275 |
| 242,500 | Science Applications International Corp. 1.96%, 10/31/2025, 1 mo. USD LIBOR + 1.875% | 242,350 |
| 244,535 | Tempo Acquisition LLC 3.75%, 11/02/2026, 1 mo. USD LIBOR + 3.250% | 245,044 |
| | | | 671,669 |
| | Leisure Time - 0.2% |
| | Carnival Corp. | |
| 466,351 | 3.75%, 06/30/2025, 1 mo. USD LIBOR + 3.000% | 465,479 |
| 165,000 | 4.00%, 10/18/2028, 6 mo. USD LIBOR + 4.000% | 164,794 |
| 309,225 | Hayward Industries, Inc. 3.00%, 05/12/2028, 1 mo. USD LIBOR + 2.500% | 308,195 |
| 129,675 | MajorDrive Holdings LLC 4.50%, 05/12/2028, 1 mo. USD LIBOR + 4.000% | 129,675 |
| 94,091 | SRAM LLC 3.25%, 05/12/2028, 1 mo. USD LIBOR + 2.750% | 93,856 |
| | | | 1,161,999 |
| | Lodging - 0.2% |
| 452,620 | Boyd Gaming Corp. 2.32%, 09/15/2023, 3 mo. USD LIBOR + 2.250% | 451,792 |
| | Caesars Resort Collection LLC | |
| 428,468 | 2.84%, 12/23/2024, 3 mo. USD LIBOR + 2.750% | 426,282 |
| 242,550 | 3.59%, 07/21/2025, 1 mo. USD LIBOR + 3.500% | 242,691 |
| 123,701 | Four Seasons Hotels Ltd. 2.09%, 11/30/2023, 3 mo. USD LIBOR + 2.000% | 123,408 |
| 147,739 | Station Casinos LLC 2.50%, 02/08/2027, 1 mo. USD LIBOR + 2.250% | 146,195 |
| | | | 1,390,368 |
| | Machinery-Diversified - 0.1% |
| 143,280 | Altra Industrial Motion Corp. 2.09%, 10/01/2025, 3 mo. USD LIBOR + 2.000% | 142,205 |
| 153,575 | Circor International, Inc. 4.25%, 12/11/2024, 1 mo. USD LIBOR + 3.250% | 153,335 |
| 435,616 | Vertical U.S. Newco, Inc. 4.00%, 07/30/2027, 1 mo. USD LIBOR + 3.500% | 436,161 |
| | | | 731,701 |
| | Media - 0.5% |
| 383,015 | Charter Communications Operating LLC 1.84%, 02/01/2027, 1 mo. USD LIBOR + 1.750% | 380,203 |
| | CSC Holdings LLC | |
| 288,291 | 2.34%, 07/17/2025, 3 mo. USD LIBOR + 2.250% | 281,354 |
| 184,775 | 2.34%, 01/15/2026, 3 mo. USD LIBOR + 2.250% | 180,849 |
| 108,437 | E.W. Scripps Co. 3.75%, 01/07/2028, 1 mo. USD LIBOR + 3.000% | 108,488 |
| Shares or Principal Amount | | Market Value† |
| SENIOR FLOATING RATE INTERESTS - 7.6%(8) - (continued) |
| | Media - 0.5% - (continued) |
| $ 311,432 | Gray Television, Inc. 2.58%, 01/02/2026, 3 mo. USD LIBOR + 2.500% | $ 309,215 |
| 142,353 | Nexstar Broadcasting, Inc. 2.58%, 09/18/2026, 1 mo. USD LIBOR + 2.500% | 142,068 |
| 225,000 | Telenet Financing USD LLC 2.09%, 04/30/2028, 6 mo. USD LIBOR + 2.000% | 221,738 |
| EUR 200,000 | UPC Broadband Holding B.V. 3.00%, 01/31/2029, 3 mo. EURIBOR + 3.000% | 229,503 |
| $ 360,000 | UPC Financing Partnership 3.09%, 01/31/2029, 1 mo. USD LIBOR + 3.000% | 358,276 |
| | Virgin Media Bristol LLC | |
| 670,000 | 2.59%, 01/31/2028, 1 mo. USD LIBOR + 2.500% | 662,556 |
| EUR 170,000 | 3.25%, 01/31/2029, 3 mo. EURIBOR + 3.250% | 196,131 |
| | | | 3,070,381 |
| | Miscellaneous Manufacturing - 0.0% |
| 197,643 | CeramTec AcquiCo GmbH 2.50%, 03/07/2025, 3 mo. EURIBOR + 2.500% | 227,010 |
| | Oil & Gas Services - 0.0% |
| $ 140,000 | Oryx Midstream Services Permian Basin LLC 0.00%, 10/05/2028, 1 mo. USD LIBOR + 3.250%(9) | 139,399 |
| | Packaging & Containers - 0.2% |
| 176,040 | Berry Global, Inc. 1.84%, 07/01/2026, 1 mo. USD LIBOR + 1.836% | 174,808 |
| 237,464 | Flex Acquisition Co., Inc. 4.00%, 02/23/2028, 1 mo. USD LIBOR + 3.500% | 236,737 |
| 100,000 | Pretium PKG Holdings, Inc. 4.50%, 10/02/2028, 1 mo. USD LIBOR + 4.500% | 100,238 |
| 154,225 | Proampac PG Borrower LLC 4.50%, 11/03/2025, 1 mo. USD LIBOR + 3.750% | 154,225 |
| | TricorBraun Holdings, Inc. | |
| 154,723 | 3.75%, 03/03/2028, 1 mo. USD LIBOR + 3.250% | 153,651 |
| 34,859 | 3.75%, 03/03/2028, 1 mo. USD LIBOR + 3.250%(10) | 34,618 |
| | | | 854,277 |
| | Pharmaceuticals - 0.4% |
| | Bausch Health Cos., Inc. | |
| 132,278 | 2.84%, 11/27/2025, 3 mo. USD LIBOR + 2.750% | 131,848 |
| 142,918 | 3.09%, 06/02/2025, 3 mo. USD LIBOR + 3.000% | 142,553 |
| 425,976 | Change Healthcare Holdings LLC 3.50%, 03/01/2024, 1 mo. USD LIBOR + 2.500% | 425,490 |
| 424,996 | Elanco Animal Health, Inc. 1.83%, 08/01/2027, 1 mo. USD LIBOR + 1.750% | 421,200 |
| 188,575 | Gainwell Acquisition Corp. 4.75%, 10/01/2027, 1 mo. USD LIBOR + 4.000% | 188,896 |
The accompanying notes are an integral part of these financial statements.
The Hartford Inflation Plus Fund
Schedule of Investments – (continued)
October 31, 2021
| Shares or Principal Amount | | Market Value† |
| SENIOR FLOATING RATE INTERESTS - 7.6%(8) - (continued) |
| | Pharmaceuticals - 0.4% - (continued) |
| $ 135,000 | HCRX Investments Holdco L.P. 0.00%, 07/14/2028, 1 mo. USD LIBOR + 2.250%(9) | $ 134,190 |
| 213,925 | Horizon Therapeutics USA, Inc. 2.50%, 03/15/2028, 1 mo. USD LIBOR + 2.000% | 213,352 |
| 24,870 | ICON Luxembourg S.a r.l. 3.00%, 07/03/2028, 1 mo. USD LIBOR + 2.500% | 24,867 |
| 184,537 | Jazz Financing Lux S.a.r.l. 4.00%, 05/05/2028, 1 mo. USD LIBOR + 3.500% | 184,768 |
| 189,525 | Organon & Co. 3.50%, 06/02/2028, 1 mo. USD LIBOR + 3.000% | 189,881 |
| 246,357 | Pathway Vet Alliance LLC 3.84%, 03/31/2027, 1 mo. USD LIBOR + 3.750% | 245,022 |
| | | | 2,302,067 |
| | Pipelines - 0.1% |
| 168,750 | BCP Renaissance Parent LLC 4.50%, 10/31/2024, 3 mo. USD LIBOR + 3.500% | 168,117 |
| 299,250 | DT Midstream, Inc. 2.50%, 06/26/2028, 1 mo. USD LIBOR + 2.000% | 299,857 |
| 101,850 | NorthRiver Midstream Finance L.P. 3.38%, 10/01/2025, 3 mo. USD LIBOR + 3.250% | 101,609 |
| | | | 569,583 |
| | Real Estate - 0.0% |
| EUR 100,000 | Blitz GmbH 3.50%, 04/28/2028, 3 mo. EURIBOR + 3.500% | 114,851 |
| | Retail - 0.6% |
| $ 454,533 | B.C. Unlimited Liability Co. 1.84%, 11/19/2026, 1 mo. USD LIBOR + 1.750% | 445,361 |
| 208,251 | Beacon Roofing Supply, Inc. 2.34%, 05/19/2028, 1 mo. USD LIBOR + 2.250% | 206,737 |
| 258,050 | Great Outdoors Group LLC 5.00%, 03/06/2028, 1 mo. USD LIBOR + 4.250% | 258,641 |
| 373,033 | Harbor Freight Tools USA, Inc. 3.25%, 10/19/2027, 1 mo. USD LIBOR + 2.750% | 371,593 |
| 163,763 | IRB Holding Corp. 4.25%, 12/15/2027, 1 mo. USD LIBOR + 3.250% | 163,646 |
| 331,315 | KFC Holding Co. 1.84%, 03/15/2028, 1 mo. USD LIBOR + 1.750% | 330,832 |
| 157,232 | LBM Acquisition LLC 4.50%, 12/17/2027, 1 mo. USD LIBOR + 3.750% | 155,003 |
| 129,675 | PetSmart, Inc. 4.50%, 02/11/2028, 1 mo. USD LIBOR + 3.750% | 129,722 |
| 500,000 | Pilot Travel Centers LLC 2.09%, 07/28/2028, 1 mo. USD LIBOR + 2.000% | 496,785 |
| 279,300 | SRS Distribution, Inc. 4.25%, 06/02/2028, 1 mo. USD LIBOR + 3.750% | 279,222 |
| Shares or Principal Amount | | Market Value† |
| SENIOR FLOATING RATE INTERESTS - 7.6%(8) - (continued) |
| | Retail - 0.6% - (continued) |
| $ 125,487 | Staples, Inc. 5.13%, 04/16/2026, 3 mo. USD LIBOR + 5.000% | $ 120,480 |
| 267,300 | White Cap Buyer LLC 4.50%, 10/19/2027, 1 mo. USD LIBOR + 4.000% | 267,816 |
| | | | 3,225,838 |
| | Semiconductors - 0.1% |
| 112,998 | CMC Materials, Inc. 2.13%, 11/17/2025, 1 mo. USD LIBOR + 2.000% | 112,645 |
| 280,000 | MKS Instruments, Inc. 0.00%, 10/21/2028, 1 mo. USD LIBOR + 2.250%(9) | 279,650 |
| 100,209 | ON Semiconductor Corp. 2.09%, 09/19/2026, 1 mo. USD LIBOR + 2.000% | 100,092 |
| | | | 492,387 |
| | Software - 0.6% |
| 150,000 | CCC Intelligent Solutions, Inc. 3.00%, 09/21/2028, 1 mo. USD LIBOR + 2.500% | 149,513 |
| 618,638 | Dun & Bradstreet Corp. 3.34%, 02/06/2026, 1 mo. USD LIBOR + 3.250% | 615,879 |
| 204,487 | E2open LLC 3.75%, 02/04/2028, 1 mo. USD LIBOR + 3.250% | 204,573 |
| 150,323 | Finastra USA, Inc. 4.50%, 06/13/2024, 3 mo. USD LIBOR + 3.500% | 149,458 |
| 296,939 | Hyland Software, Inc. 4.25%, 07/01/2024, 1 mo. USD LIBOR + 3.500% | 297,031 |
| 17,461 | MA Finance Co. LLC 2.84%, 06/21/2024, 3 mo. USD LIBOR + 2.750% | 17,270 |
| 250,000 | Mitchell International, Inc. 4.25%, 10/15/2028, 1 mo. USD LIBOR + 3.750% | 247,625 |
| 215,000 | Polaris Newco LLC 4.50%, 06/02/2028, 1 mo. USD LIBOR + 4.000% | 215,413 |
| 117,921 | Seattle Spinco, Inc. 2.84%, 06/21/2024, 3 mo. USD LIBOR + 2.750% | 116,631 |
| 29,305 | SS&C European Holdings S.a.r.l. 1.84%, 04/16/2025, 1 mo. USD LIBOR + 1.750% | 28,981 |
| 336,157 | SS&C Technologies, Inc. 1.84%, 04/16/2025, 1 mo. USD LIBOR + 1.750% | 332,904 |
| | Ultimate Software Group, Inc. | |
| 393,477 | 3.84%, 05/04/2026, 3 mo. USD LIBOR + 3.750% | 393,902 |
| 267,305 | 4.00%, 05/04/2026, 1 mo. USD LIBOR + 3.250% | 267,607 |
| 49,412 | Verint Systems, Inc. 2.08%, 06/28/2024, 3 mo. USD LIBOR + 2.000% | 49,165 |
| 295,020 | Zelis Healthcare Corporation 3.58%, 09/30/2026, 1 mo. USD LIBOR + 3.500% | 293,613 |
| | | | 3,379,565 |
| | Telecommunications - 0.2% |
| 486,732 | Altice France S.A. 3.81%, 01/31/2026, 3 mo. USD LIBOR + 3.688% | 481,134 |
| 99,500 | Frontier Communications Corp. 4.50%, 05/01/2028, 1 mo. USD LIBOR + 3.750% | 99,301 |
| 252,996 | Level 3 Financing, Inc. 1.84%, 03/01/2027, 1 mo. USD LIBOR + 1.750% | 249,563 |
The accompanying notes are an integral part of these financial statements.
The Hartford Inflation Plus Fund
Schedule of Investments – (continued)
October 31, 2021
| Shares or Principal Amount | | Market Value† |
| SENIOR FLOATING RATE INTERESTS - 7.6%(8) - (continued) |
| | Telecommunications - 0.2% - (continued) |
| EUR 275,000 | Lorca Finco plc 0.00%, 09/17/2027, 1 mo. USD LIBOR + 3.750%(9) | $ 315,605 |
| $ 100,000 | Xplornet Communications, Inc. 0.00%, 10/02/2028, 1 mo. USD LIBOR + 4.000%(9) | 99,786 |
| | | | 1,245,389 |
| | Transportation - 0.2% |
| 230,000 | First Student Bidco, Inc. 3.50%, 07/21/2028, 1 mo. USD LIBOR + 3.000% | 228,305 |
| 492,500 | Genesee & Wyoming, Inc. 2.13%, 12/30/2026, 1 mo. USD LIBOR + 2.000% | 489,476 |
| 209,475 | Savage Enterprises LLC 3.75%, 09/15/2028, 1 mo. USD LIBOR + 3.250% | 209,825 |
| | | | 927,606 |
| | Total Senior Floating Rate Interests
(cost $43,364,051) | $ 43,434,008 |
| U.S. GOVERNMENT AGENCIES - 0.4% |
| | Mortgage-Backed Agencies - 0.4% |
| | FHLMC - 0.4% |
| 6,410,619 | 0.85%, 11/25/2030(3)(5) | $ 417,714 |
| 963,815 | 0.88%, 11/25/2030(3)(5) | 66,140 |
| 1,755,260 | 1.03%, 10/25/2030(3)(5) | 136,985 |
| 5,225,268 | 1.12%, 06/25/2030(3)(5) | 442,204 |
| 57,325 | 2.05%, 01/25/2051, 3 mo. USD SOFR + 2.000%(1)(2) | 57,754 |
| 1,011,736 | 2.14%, 07/25/2049, 1 mo. USD LIBOR + 2.050%(1)(2) | 1,020,272 |
| | Total U.S. Government Agencies
(cost $2,094,990) | | $ 2,141,069 |
| U.S. GOVERNMENT SECURITIES - 78.2% |
| | U.S. Treasury Securities - 78.2% |
| | Short position contracts - 9.9% |
| 52,374,329 | 0.13%, 04/15/2025(6) | $ 56,438,454 |
| | | | 56,438,454 |
| | U.S. Treasury Bonds - 3.6% |
| 2,777,040 | 0.25%, 02/15/2050(6) | 3,236,879 |
| 9,340,000 | 1.75%, 08/15/2041(11) | 8,975,156 |
| 7,660,000 | 2.25%, 05/15/2041(12) | 7,980,762 |
| | | | 20,192,797 |
| | U.S. Treasury Notes - 64.7% |
| 10,284,769 | 0.13%, 04/15/2026(6) | 11,195,734 |
| 10,579,017 | 0.13%, 07/15/2026(6) | 11,590,635 |
| 18,884,484 | 0.13%, 07/15/2030(6) | 21,021,898 |
| 4,733,989 | 0.13%, 01/15/2031(6) | 5,250,475 |
| 22,127,041 | 0.13%, 07/15/2031(6) | 24,623,248 |
| Shares or Principal Amount | | Market Value† |
| U.S. GOVERNMENT SECURITIES - 78.2% - (continued) |
| | U.S. Treasury Securities - 78.2% - (continued) |
| | U.S. Treasury Notes - 64.7% - (continued) |
| $ 31,424,613 | 0.25%, 07/15/2029(6) | $ 35,220,731 |
| 18,022,623 | 0.38%, 01/15/2027(6) | 19,989,976 |
| 5,522,770 | 0.50%, 01/15/2028(6) | 6,209,341 |
| 73,906,901 | 0.63%, 04/15/2023(6) | 77,716,282 |
| 87,526,084 | 0.63%, 01/15/2026(6) | 96,960,780 |
| 50,153,688 | 0.88%, 01/15/2029(6) | 58,247,828 |
| | | | 368,026,928 |
| | Total U.S. Government Securities
(cost $426,844,034) | | $ 444,658,179 |
| | Total Long-Term Investments
(Cost $542,309,519) | | $ 556,626,616 |
| SHORT-TERM INVESTMENTS - 1.8% |
| | Repurchase Agreements - 0.7% |
| 4,075,558 | Fixed Income Clearing Corp. Repurchase Agreement dated 10/29/2021 at 0.010%, due on 11/01/2021 with a maturity value of $4,075,561; collateralized by U.S. Treasury Bond at 1.875%, maturing 02/15/2041, with a market value of $4,157,114 | $ 4,075,558 |
| | U.S. Treasury Securities - 1.1% |
| | U.S. Treasury Bills | |
| 560,000 | 0.01%, 11/02/2021(13) | 560,000 |
| 1,120,000 | 0.01%, 11/02/2021(13) | 1,120,000 |
| 1,110,000 | 0.01%, 11/02/2021(13) | 1,109,999 |
| 2,840,000 | 0.01%, 11/02/2021(13) | 2,839,999 |
| 550,000 | 0.01%, 11/02/2021(13) | 550,000 |
| | | | 6,179,998 |
| | Total Short-Term Investments
(cost $10,255,556) | $ 10,255,556 |
| | Total Investments
(cost $552,565,075) | 99.7% | $ 566,882,172 |
| | Other Assets and Liabilities | 0.3% | 1,853,537 |
| | Total Net Assets | 100.0% | $ 568,735,709 |
| Note: | Percentage of investments as shown is the ratio of the total market value to total net assets. |
| | The Fund may refer to any one or more of the industry classifications used by one or more widely recognized market indices, ratings group and/or as defined by Fund management. Industry classifications may not be identical across all security types. |
| | For Fund compliance purposes, the Fund may not use the same classification system. These classifications are used for financial reporting purposes. |
The accompanying notes are an integral part of these financial statements.
The Hartford Inflation Plus Fund
Schedule of Investments – (continued)
October 31, 2021
See “Glossary” for abbreviation descriptions.
| (1) | Security was purchased pursuant to Rule 144A under the Securities Act of 1933 and may be sold in transactions that are exempt from registration (typically only to qualified institutional buyers) or in a public offering registered under the Securities Act of 1933. At October 31, 2021, the aggregate value of these securities was $18,436,982, representing 3.2% of net assets. |
| (2) | Variable rate securities; the rate reported is the coupon rate in effect at October 31, 2021. Base lending rates may be subject to a floor or cap. |
| (3) | Variable or floating rate security, which interest rate adjusts periodically based on changes in current interest rates and prepayments on the underlying pool of assets. Rate shown is the rate in effect as of period end. |
| (4) | Security is a “step-up” bond where coupon increases or steps up at a predetermined date. Rate shown is current coupon rate. |
| (5) | Securities disclosed are interest-only strips. |
| (6) | The principal amount for these securities are adjusted for inflation and the interest payments equal a fixed percentage of the inflation-adjusted principal amount. |
| (7) | Security is exempt from registration under Regulation S under the Securities Act of 1933, which exempts from registration securities offered and sold outside of the United States. Security may not be offered or sold in the United States except pursuant to an exemption from, or in a transaction not subject to, the registration requirements of the Securities Act of 1933. At October 31, 2021, the aggregate value of these securities was $10,095,330, representing 1.8% of net assets. |
| (8) | Senior floating rate interests generally pay interest rates which are periodically adjusted by reference to a base short-term, floating lending rate plus a premium. The base lending rates are primarily the LIBOR, and secondarily the prime rate offered by one or more major United States banks (the "Prime Rate") and the certificate of deposit rate or other base lending rates used by commercial lenders. Senior floating rate interests often require prepayments from excess cash flows or permit the borrower to repay at its election. The rate at which the borrower repays cannot be predicted with accuracy. As a result, the actual remaining maturity may be substantially less than the stated maturities shown. Base lending rates may be subject to a floor or cap. Unless otherwise noted, the interest rate disclosed for these securities represents the rate in effect as of October 31, 2021. |
| (9) | Represents an unsettled loan commitment. The coupon rate will be determined at time of settlement. |
| (10) | This security, or a portion of this security, has unfunded loan commitments. As of October 31, 2021, the aggregate value of the unfunded commitment was $34,618, which rounds to 0.0% of total net assets. |
| (11) | All, or a portion of the security, was pledged as collateral in connection with futures contracts. As of October 31, 2021, the market value of securities pledged was $1,345,313. |
| (12) | All, or a portion of the security, was pledged as collateral in connection with centrally cleared swap contracts. As of October 31, 2021, the market value of securities pledged was $3,646,563. |
| (13) | The rate shown represents current yield to maturity. |
| Futures Contracts Outstanding at October 31, 2021 |
| Description | | Number of
Contracts | | Expiration
Date | | Current
Notional
Amount | | Value and
Unrealized
Appreciation/
(Depreciation) |
| Long position contracts: |
| Australian 10-Year Bond Future | | 34 | | 12/15/2021 | | $ 3,449,027 | | $ (126,604) |
| U.S. Treasury 2-Year Note Future | | 112 | | 12/31/2021 | | 24,556,000 | | 1,545 |
| U.S. Treasury 10-Year Note Future | | 464 | | 12/21/2021 | | 60,646,250 | | (1,025,789) |
| Total | | | | | | | | $ (1,150,848) |
| Short position contracts: |
| Euro-BTP Future | | 84 | | 12/08/2021 | | $ 14,396,637 | | $ 406,109 |
| Euro-BUND Future | | 79 | | 12/08/2021 | | 15,353,389 | | 381,088 |
| U.S. Treasury 5-Year Note Future | | 411 | | 12/31/2021 | | 50,039,250 | | 272,196 |
| U.S. Treasury 10-Year Ultra Future | | 136 | | 12/21/2021 | | 19,724,250 | | 23,704 |
| U.S. Treasury Ultra Bond Future | | 58 | | 12/21/2021 | | 11,391,563 | | (102,669) |
| Total | | | | | | | | $ 980,428 |
| Total futures contracts | | $ (170,420) |
The accompanying notes are an integral part of these financial statements.
The Hartford Inflation Plus Fund
Schedule of Investments – (continued)
October 31, 2021
| OTC Interest Rate Swap Contracts Outstanding at October 31, 2021 |
| Counterparty | | Payments
made by
Fund | | Payments received
by Fund | | Notional
Amount | | Expiration
Date | | Periodic
Payment
Frequency | | Upfront
Premiums
Paid | | Upfront
Premiums
Received | | Value † | | Unrealized
Appreciation/
(Depreciation) |
| BCLY | | 2.29% Fixed | | CPURNSA | | USD | 25,572,000 | | 01/15/2022 | | At Maturity | | $ — | | $ — | | $ 662,041 | | $ 662,041 |
| BCLY | | 2.00% Fixed | | CPURNSA | | USD | 7,810,000 | | 01/15/2022 | | At Maturity | | — | | — | | 236,227 | | 236,227 |
| BOA | | 2.12% Fixed | | CPURNSA | | USD | 8,580,000 | | 01/15/2024 | | At Maturity | | — | | — | | 471,572 | | 471,572 |
| BOA | | 1.24% Fixed | | CPURNSA | | USD | 6,050,000 | | 01/15/2029 | | At Maturity | | — | | — | | 1,020,917 | | 1,020,917 |
| CBK | | 2.83% Fixed | | CPURNSA | | USD | 6,600,000 | | 04/15/2026 | | At Maturity | | — | | — | | 256,120 | | 256,120 |
| CBK | | 2.60% Fixed | | CPURNSA | | USD | 18,520,000 | | 01/15/2031 | | At Maturity | | — | | — | | 917,931 | | 917,931 |
| Total OTC interest rate swap contracts | | $ — | | $ — | | $ 3,564,808 | | $ 3,564,808 |
| OTC Total Return Swap Contracts Outstanding at October 31, 2021 |
| Reference Entity | | Counter-
party | | Notional
Amount | | Payments
received (paid)
by the Fund | | Expiration
Date | | Periodic
Payment
Frequency | | Upfront
Premiums
Paid | | Upfront
Premiums
Received | | Market
Value† | | Unrealized
Appreciation/
Depreciation |
| iBoxx USD Liquide High Yield | | GSC | | USD | 2,540,000 | | (0.12%) | | 12/20/21 | | At Maturity | | $ — | | $ — | | $ (11,383) | | $ (11,383) |
| Centrally Cleared Credit Default Swap Contracts Outstanding at October 31, 2021 |
| Reference Entity | | Notional
Amount(1) | | (Pay)/Receive
Fixed Rate | | Expiration
Date | | Periodic
Payment
Frequency | | Cost Basis | | Value † | | Unrealized
Appreciation/
(Depreciation) |
| Credit default swaps on single-name issues: |
| Sell protection: |
| Panama Republic (BBB) | | USD | 1,090,000 | | 1.00% | | 06/20/2026 | | Quarterly | | $ 8,267 | | $ 8,375 | | $ 108 |
| Total centrally cleared credit default swap contracts | | $ 8,267 | | $ 8,375 | | $ 108 |
| (1) | The maximum potential amount the Fund could be required to pay as a seller of credit protection or receive as a buyer of credit protection if a credit event occurs as defined under the terms of that particular swap agreement. |
| Centrally Cleared Interest Rate Swap Contracts Outstanding at October 31, 2021 |
Payments made
by Fund | | Payments received
by Fund | | Notional
Amount | | Expiration
Date | | Periodic
Payment
Frequency | | Upfront
Premiums
Paid | | Upfront
Premiums
Received | | Value † | | Unrealized
Appreciation/
(Depreciation) |
| 0.94% Fixed | | 12 Mo. Federal Funds Rate | | USD | 13,439,000 | | 08/22/2024 | | Annual | | $ — | | $ — | | $ (99,064) | | $ (99,064) |
| 1.03% Fixed | | 12 Mo. Federal Funds Rate | | USD | 9,012,000 | | 09/06/2026 | | Annual | | — | | — | | (26,270) | | (26,270) |
| 1.00% Fixed | | 12 Mo. Federal Funds Rate | | USD | 3,322,000 | | 09/29/2026 | | Annual | | 49,461 | | — | | (1,286) | | (50,747) |
| MXN-TIIE-Banxico-Bloomberg | | 7.13% Fixed | | MXN | 61,332,600 | | 06/04/2031 | | Lunar | | 29,637 | | — | | (98,257) | | (127,894) |
| MXN-TIIE-Banxico-Bloomberg | | 6.91% Fixed | | MXN | 147,390,000 | | 09/03/2031 | | Lunar | | — | | (295) | | (360,633) | | (360,338) |
| MXN-TIIE-Banxico-Bloomberg | | 7.59% Fixed | | MXN | 40,850,000 | | 12/03/2031 | | Lunar | | — | | (5,103) | | (12,685) | | (7,582) |
| Total centrally cleared interest rate swaps contracts | | $ 79,098 | | $ (5,398) | | $ (598,195) | | $ (671,895) |
| Bond Forward Contracts Outstanding at October 31, 2021 |
| Counterparty | | Reference Obligation | | Notional Amount | | Expiration Date | | Unrealized
Appreciation/
(Depreciation) |
| MSC | | U.S. Treasury Bonds, 0.13%, 04/15/2025(1) | | USD | 13,108,909 | | 04/15/2025 | | $(40,445) |
| GSC | | U.S. Treasury Bonds, 0.50%, 04/15/2024(1) | | USD | 34,626,955 | | 04/15/2024 | | (80,000) |
| BOA | | U.S. Treasury Bonds, 0.50%, 01/15/2028(1) | | USD | 833,978 | | 01/15/2028 | | (7,431) |
| MSC | | U.S. Treasury Bonds, 0.63%, 01/15/2026(1) | | USD | 13,181,408 | | 01/15/2026 | | (49,115) |
| BOA | | U.S. Treasury Bonds, 0.75%, 07/15/2028(1) | | USD | 3,081,414 | | 07/15/2028 | | (35,068) |
| Total Bond Forward Contracts | | $(212,059) |
| (1) | The principal amount for these securities are adjusted for inflation and the interest payments equal a fixed percentage of the inflation-adjusted principal amount. |
The accompanying notes are an integral part of these financial statements.
The Hartford Inflation Plus Fund
Schedule of Investments – (continued)
October 31, 2021
| Foreign Currency Contracts Outstanding at October 31, 2021 |
Amount and Description of
Currency to be Purchased | | Amount and Description of
Currency to be Sold | | Counterparty | | Settlement
Date | | Appreciation/
(Depreciation) |
| 29,165,000 | BRL | | 5,239,655 | USD | | CBK | | 11/03/2021 | | $ (75,193) |
| 1,143,000 | BRL | | 203,907 | USD | | CBK | | 12/02/2021 | | (2,691) |
| 6,610,000 | CAD | | 5,334,732 | USD | | TDB | | 11/30/2021 | | 6,151 |
| 5,547,455,000 | COP | | 1,469,544 | USD | | BNP | | 11/30/2021 | | 376 |
| 754,800,000 | JPY | | 6,628,262 | USD | | MSC | | 11/30/2021 | | (4,415) |
| 114,665,000 | MXN | | 5,644,490 | USD | | CBK | | 11/30/2021 | | (100,994) |
| 175,410,000 | RUB | | 2,489,257 | USD | | BCLY | | 11/30/2021 | | (29,589) |
| 162,000 | ZAR | | 11,000 | USD | | MSC | | 11/30/2021 | | (433) |
| 5,389,843 | USD | | 29,165,000 | BRL | | CBK | | 11/03/2021 | | 225,382 |
| 4,999,019 | USD | | 28,022,000 | BRL | | CBK | | 12/02/2021 | | 65,959 |
| 20,433,214 | USD | | 17,595,000 | EUR | | DEUT | | 11/30/2021 | | 81,537 |
| 5,268,539 | USD | | 6,156,288,000 | KRW | | MSC | | 11/30/2021 | | 4,730 |
| 2,361,177 | USD | | 3,299,000 | NZD | | MSC | | 11/30/2021 | | (1,926) |
| 5,601,702 | USD | | 394,734,000 | RUB | | BCLY | | 11/30/2021 | | 66,586 |
| Total foreign currency contracts | | $ 235,480 |
† See Significant Accounting Policies of accompanying Notes to Financial Statements regarding valuation of investments.
Fair Value Summary
The following is a summary of the fair valuations according to the inputs used as of October 31, 2021 in valuing the Fund’s investments.
| Description | | Total | | Level 1 | | Level 2 | | Level 3(1) |
| Assets | | | | | | | | |
| Asset & Commercial Mortgage-Backed Securities | | $ 13,216,908 | | $ — | | $ 13,216,908 | | $ — |
| Convertible Bonds | | 1,442,174 | | — | | 1,442,174 | | — |
| Corporate Bonds | | 9,373,940 | | — | | 9,373,940 | | — |
| Foreign Government Obligations | | 42,360,338 | | — | | 42,360,338 | | — |
| Senior Floating Rate Interests | | 43,434,008 | | — | | 43,434,008 | | — |
| U.S. Government Agencies | | 2,141,069 | | — | | 2,141,069 | | — |
| U.S. Government Securities | | 444,658,179 | | — | | 444,658,179 | | — |
| Short-Term Investments | | 10,255,556 | | — | | 10,255,556 | | — |
| Foreign Currency Contracts(2) | | 450,721 | | — | | 450,721 | | — |
| Futures Contracts(2) | | 1,084,642 | | 1,084,642 | | — | | — |
| Swaps - Credit Default(2) | | 108 | | — | | 108 | | — |
| Swaps - Interest Rate(2) | | 3,564,808 | | — | | 3,564,808 | | — |
| Total | | $ 571,982,451 | | $ 1,084,642 | | $ 570,897,809 | | $ — |
| Liabilities | | | | | | | | |
| Bond Forward Contracts(2) | | $ (212,059) | | $ — | | $ (212,059) | | $ — |
| Foreign Currency Contracts(2) | | (215,241) | | — | | (215,241) | | — |
| Futures Contracts(2) | | (1,255,062) | | (1,255,062) | | — | | — |
| Swaps - Interest Rate(2) | | (671,895) | | — | | (671,895) | | — |
| Swaps - Total Return(2) | | (11,383) | | — | | (11,383) | | — |
| Total | | $ (2,365,640) | | $ (1,255,062) | | $ (1,110,578) | | $ — |
| (1) | For the year ended October 31, 2021, there were no transfers in and out of Level 3. |
| (2) | Derivative instruments (excluding purchased and written options, if applicable) are valued at the unrealized appreciation/(depreciation) on the investments. |
The accompanying notes are an integral part of these financial statements.
The Hartford Municipal Opportunities Fund
Schedule of Investments
October 31, 2021
| Shares or Principal Amount | | Market Value† |
| MUNICIPAL BONDS - 97.1% |
| | Alabama - 1.3% |
| | Alabama Federal Aid Highway Finance Auth | |
| $ 1,615,000 | 5.00%, 09/01/2026 | $ 1,679,503 |
| 1,250,000 | 5.00%, 09/01/2034 | 1,549,295 |
| 1,415,000 | Birmingham, AL, Water Works Board Water Rev 5.00%, 01/01/2029 | 1,724,369 |
| | Black Belt Energy Gas Dist, AL | |
| 1,250,000 | 4.00%, 12/01/2023 | 1,340,633 |
| 1,570,000 | 4.00%, 12/01/2024 | 1,729,942 |
| 2,955,000 | 4.00%, 12/01/2025 | 3,328,317 |
| 3,000,000 | Jefferson County, AL, Board of Education Special Tax 5.00%, 02/01/2042 | 3,618,650 |
| 2,660,000 | Jefferson County, AL, GO 5.00%, 04/01/2024 | 2,950,611 |
| | State of Alabama, Docks Department, (AGM Insured) | |
| 230,000 | 5.00%, 10/01/2024 | 258,531 |
| 1,000,000 | 5.00%, 10/01/2032 | 1,192,731 |
| | State of Alabama, Troy University, Rev, (BAM Insured) | |
| 1,000,000 | 5.00%, 11/01/2025 | 1,167,804 |
| 1,250,000 | 5.00%, 11/01/2026 | 1,501,449 |
| 1,620,000 | 5.00%, 11/01/2027 | 1,992,449 |
| | | | 24,034,284 |
| | Alaska - 0.4% |
| | CIVICVentures, AK, Rev | |
| 2,000,000 | 5.00%, 09/01/2025 | 2,221,256 |
| 1,000,000 | 5.00%, 09/01/2026 | 1,108,677 |
| | Northern Tobacco Securitization Corp. | |
| 1,385,000 | 4.00%, 06/01/2036 | 1,630,503 |
| 1,350,000 | 4.00%, 06/01/2037 | 1,583,038 |
| 1,000,000 | 4.00%, 06/01/2038 | 1,169,828 |
| | | | 7,713,302 |
| | Arizona - 0.3% |
| 2,000,000 | City of Phoenix, AZ, Civic Improvement Corp. 4.00%, 07/01/2038 | 2,276,915 |
| 54,000 | Sundance, AZ, Community Facs Dist 7.13%, 07/01/2027(1) | 54,064 |
| | Tempe, AZ, Industrial Dev Auth Rev | |
| 2,870,000 | 1.13%, 12/01/2026 | 2,830,025 |
| 220,000 | 4.00%, 10/01/2023(1) | 220,063 |
| | | | 5,381,067 |
| | California - 6.7% |
| | Alameda County, Oakland, CA, Unified School Dist, GO, (AGM Insured) | |
| 475,000 | 4.00%, 08/01/2034 | 549,988 |
| 1,000,000 | 4.00%, 08/01/2036 | 1,154,191 |
| 11,700,000 | Bay Area, CA, Toll Auth 2.25%, 04/01/2045(2) | 11,718,498 |
| | California County, CA, Tobacco Securitization Agency | |
| 1,050,000 | 5.00%, 06/01/2022 | 1,070,966 |
| 150,000 | 5.00%, 06/01/2030 | 193,317 |
| 300,000 | 5.00%, 06/01/2032 | 382,434 |
| 500,000 | 5.00%, 06/01/2033 | 635,322 |
| | California Enterprise Dev Auth | |
| 1,250,000 | 5.00%, 08/01/2035 | 1,543,875 |
| 1,075,000 | 5.00%, 08/01/2055 | 1,279,358 |
| | California Municipal Finance Auth | |
| 1,650,000 | 4.00%, 10/01/2046 | 1,899,925 |
| 3,285,000 | 4.00%, 10/01/2049 | 3,761,635 |
| 775,000 | 5.00%, 05/15/2028 | 956,975 |
| 800,000 | 5.00%, 05/15/2031 | 1,039,952 |
| Shares or Principal Amount | | Market Value† |
| MUNICIPAL BONDS - 97.1% - (continued) |
| | California - 6.7% - (continued) |
| | California Public Finance Auth | |
| $ 1,195,000 | 2.38%, 11/15/2028(1) | $ 1,204,816 |
| 1,000,000 | 3.13%, 05/15/2029(1) | 1,009,943 |
| | California State Communities Dev Auth Rev | |
| 185,000 | 5.00%, 10/01/2022 | 192,946 |
| 1,000,000 | 5.63%, 10/01/2032 | 1,049,127 |
| 1,000,000 | California State Health Facs Finance Auth Rev 5.00%, 02/01/2029 | 1,211,345 |
| 2,000,000 | California State Public Works Board 5.25%, 10/01/2023 | 2,003,077 |
| | California State, GO Taxable | |
| 17,940,000 | 0.01%, 05/01/2033(2) | 17,940,000 |
| 3,000,000 | 5.00%, 08/01/2029 | 3,608,545 |
| 1,000,000 | Cathedral City, CA, Redev Agency Successor Agency 4.00%, 08/01/2034 | 1,176,150 |
| | City of Los Angeles, CA, Department of Airports | |
| 4,000,000 | 4.00%, 05/15/2035 | 4,786,894 |
| 1,000,000 | 5.00%, 05/15/2029 | 1,228,093 |
| | Elk Grove, CA, Finance Auth Special Tax, (BAM Insured) | |
| 315,000 | 5.00%, 09/01/2031 | 366,680 |
| 910,000 | 5.00%, 09/01/2032 | 1,058,548 |
| 2,600,000 | Fresno, CA, Unified School Dist, GO 0.00%, 08/01/2031(3) | 2,024,009 |
| | Hemet, CA, Unified School Dist Financing Auth Special Tax | |
| 1,440,000 | 5.00%, 09/01/2030 | 1,603,014 |
| 1,535,000 | 5.00%, 09/01/2031 | 1,705,579 |
| | Inglewood, CA, Redevelopment Agency, (BAM Insured) | |
| 1,000,000 | 5.00%, 05/01/2028 | 1,209,076 |
| 1,000,000 | 5.00%, 05/01/2029 | 1,207,436 |
| 5,225,000 | Long Beach, CA, Finance Auth Natural Gas 1.53%, 11/15/2027, 3 mo. USD LIBOR + 0.000%(4) | 5,406,735 |
| 500,000 | Oakland, CA, Airport Rev 5.00%, 05/01/2023 | 511,794 |
| | Orange County, CA, Community Facs Dist, Special Tax | |
| 980,000 | 5.00%, 08/15/2034 | 1,098,284 |
| 1,000,000 | 5.00%, 08/15/2036 | 1,145,888 |
| 2,500,000 | 5.00%, 08/15/2041 | 2,850,375 |
| 1,000,000 | Rancho Cucamonga, CA, Redevelopment Agency Successor Agency, (AGM Insured) 5.00%, 09/01/2029 | 1,116,074 |
| 2,000,000 | Romoland, CA, School Dist Special Tax 5.00%, 09/01/2048 | 2,266,336 |
| 60,000 | San Diego, CA, Redevelopment Agency Successor Agency 5.25%, 09/01/2026 | 60,232 |
| | San Diego, CA, United School Dist, GO | |
| 805,000 | 4.00%, 07/01/2034 | 902,488 |
| 865,000 | 4.00%, 07/01/2035 | 968,913 |
| | San Francisco, CA, City & County Airport Comm-San Francisco International Airport | |
| 1,400,000 | 5.00%, 05/01/2042 | 1,666,081 |
| 8,650,000 | 5.00%, 05/01/2043 | 10,402,962 |
| | Santa Margarita, CA, Water Dist Special Tax | |
| 485,000 | 5.00%, 09/01/2022 | 502,340 |
| 475,000 | 5.00%, 09/01/2023 | 511,697 |
| 480,000 | 5.00%, 09/01/2024 | 515,606 |
| 480,000 | 5.00%, 09/01/2025 | 514,228 |
| 2,065,000 | 5.00%, 09/01/2028 | 2,269,885 |
The accompanying notes are an integral part of these financial statements.
The Hartford Municipal Opportunities Fund
Schedule of Investments – (continued)
October 31, 2021
| Shares or Principal Amount | | Market Value† |
| MUNICIPAL BONDS - 97.1% - (continued) |
| | California - 6.7% - (continued) |
| $ 9,960,000 | Southern California Public Power Auth 0.01%, 07/01/2036(2) | $ 9,960,000 |
| 2,315,000 | State of California, GO 4.00%, 11/01/2041 | 2,599,009 |
| 1,500,000 | Stockton, CA, Redevelopment Agency, (AGM Insured) 5.00%, 09/01/2029 | 1,776,692 |
| 8,930,000 | Tobacco Securitization Auth of Northern California 0.00%, 06/01/2060(3) | 1,970,814 |
| | | | 119,788,147 |
| | Colorado - 2.1% |
| | Arapahoe County, CO, School Dist No. 6 Littleton, GO, (State Aid Withholding Insured) | |
| 1,230,000 | 5.50%, 12/01/2032 | 1,599,707 |
| 1,655,000 | 5.50%, 12/01/2034 | 2,143,934 |
| | City & County of Denver, CO, Airport System Rev | |
| 7,985,000 | 5.00%, 12/01/2029 | 9,837,959 |
| 1,000,000 | 5.00%, 12/01/2034 | 1,335,017 |
| 1,575,000 | 5.00%, 12/01/2036 | 2,151,958 |
| | Colorado Health Facs Auth Rev | |
| 1,320,000 | 4.00%, 12/01/2040 | 1,512,370 |
| 6,665,000 | 5.00%, 08/01/2044 | 8,001,750 |
| 1,470,000 | Denver, CO, Convention Center Hotel Auth 5.00%, 12/01/2031 | 1,701,726 |
| 3,650,000 | E-470 Public Highway, CO, Auth Rev 0.38%, 09/01/2039, 1 mo. USD SOFR + 0.350%(4) | 3,657,788 |
| | Park Creek, CO, Metropolitan Dist Rev | |
| 2,000,000 | 5.00%, 12/01/2029 | 2,308,338 |
| 1,195,000 | 5.00%, 12/01/2033 | 1,460,884 |
| 1,035,000 | Regional, CO, Transportation Dist 5.00%, 07/15/2031 | 1,325,265 |
| | Vauxmont, CO, Metropolitan Dist, GO, (AGM Insured) | |
| 230,000 | 5.00%, 12/15/2023 | 251,161 |
| 125,000 | 5.00%, 12/15/2025 | 144,641 |
| 50,000 | 5.00%, 12/15/2026 | 57,792 |
| 225,000 | 5.00%, 12/15/2030 | 257,944 |
| 160,000 | 5.00%, 12/15/2032 | 182,964 |
| | | | 37,931,198 |
| | Connecticut - 2.3% |
| | City of Bridgeport, CT, GO, (AGM Insured) | |
| 280,000 | 5.00%, 08/15/2025 | 327,102 |
| 6,220,000 | 5.00%, 08/15/2025 | 7,235,003 |
| | Connecticut Housing Finance Auth Rev | |
| 4,615,000 | 3.00%, 11/15/2050 | 4,924,320 |
| 105,000 | 4.00%, 11/15/2044 | 107,404 |
| 565,000 | 4.00%, 11/15/2045 | 589,501 |
| 1,110,000 | 4.00%, 05/15/2047 | 1,196,669 |
| | Connecticut State Health & Educational Facs Auth | |
| 440,000 | 5.00%, 07/01/2027 | 521,127 |
| 430,000 | 5.00%, 07/01/2028 | 518,366 |
| 1,150,000 | 5.00%, 07/01/2029 | 1,433,445 |
| 720,000 | 5.00%, 07/01/2030 | 875,274 |
| 545,000 | 5.00%, 07/01/2031 | 668,633 |
| 950,000 | Hartford, CT, GO, (AGM ST GTD Insured) 5.00%, 07/01/2027 | 1,091,794 |
| 1,500,000 | New Britain, CT, GO, (AGM Insured) 5.00%, 03/01/2031 | 1,786,990 |
| 2,600,000 | New Haven, CT, GO, (AGM Insured) 5.00%, 08/01/2024 | 2,921,376 |
| | State of Connecticut, GO | |
| 3,090,000 | 3.00%, 01/15/2023 | 3,193,254 |
| Shares or Principal Amount | | Market Value† |
| MUNICIPAL BONDS - 97.1% - (continued) |
| | Connecticut - 2.3% - (continued) |
| $ 470,000 | 5.00%, 04/15/2022 | $ 480,340 |
| 250,000 | 5.00%, 03/15/2024 | 277,466 |
| 1,450,000 | 5.00%, 03/15/2025 | 1,669,783 |
| 750,000 | 5.00%, 05/15/2025 | 868,486 |
| 2,425,000 | 5.00%, 06/15/2026 | 2,903,478 |
| 2,500,000 | 5.00%, 04/15/2029 | 3,032,964 |
| | State of Connecticut, Special Tax Rev | |
| 1,000,000 | 5.00%, 05/01/2032 | 1,290,332 |
| 750,000 | 5.00%, 05/01/2033 | 965,591 |
| | Waterbury, CT, GO | |
| 405,000 | 5.00%, 11/15/2031 | 494,022 |
| 1,000,000 | 5.00%, 11/15/2032 | 1,218,797 |
| | | | 40,591,517 |
| | District of Columbia - 0.1% |
| | Dist of Columbia Rev | |
| 735,000 | 5.00%, 07/01/2032 | 791,716 |
| 270,000 | 5.00%, 07/01/2037 | 289,530 |
| 755,000 | Metropolitan Washington, DC, Airports Auth System Rev 5.00%, 10/01/2028 | 936,275 |
| | | | 2,017,521 |
| | Florida - 5.0% |
| | Broward County, FL, Airport System Rev | |
| 2,175,000 | 4.00%, 10/01/2044 | 2,454,076 |
| 1,250,000 | 5.00%, 10/01/2024 | 1,408,931 |
| 2,830,000 | 5.00%, 09/01/2028 | 3,560,407 |
| | Capital Projects, FL, Finance Auth | |
| 1,315,000 | 5.00%, 10/01/2027 | 1,554,094 |
| 1,000,000 | 5.00%, 10/01/2028 | 1,200,663 |
| 1,925,901 | Capital Trust Agency, FL, MF Rev, (FNMA Collateral Insured) 2.77%, 09/01/2027 | 1,953,681 |
| 1,430,000 | City of Atlantic Beach, FL, Health Care Facs Auth 5.00%, 11/15/2048 | 1,611,160 |
| | City of Tampa, FL, Rev | |
| 1,000,000 | 0.00%, 09/01/2036(3) | 650,046 |
| 1,000,000 | 0.00%, 09/01/2038(3) | 593,470 |
| 2,065,000 | Escambia County, FL, Health Facs Auth Rev 4.00%, 08/15/2050 | 2,272,512 |
| | Florida Dev Finance Corp. | |
| 350,000 | 5.00%, 04/01/2023 | 372,409 |
| 500,000 | 5.00%, 04/01/2024 | 552,585 |
| 200,000 | 5.00%, 04/01/2025 | 228,755 |
| 3,380,000 | Gainesville, FL, Utilities System Rev 5.00%, 10/01/2047 | 4,166,640 |
| | Greater Orlando, FL, Aviation Auth | |
| 485,000 | 5.00%, 10/01/2024 | 486,733 |
| 5,000,000 | 5.00%, 10/01/2033 | 6,220,634 |
| 5,000,000 | 5.00%, 10/01/2034 | 6,221,241 |
| 500,000 | Magnolia Creek, FL, Community Dev Dist Capital Improvement 5.90%, 05/01/2039(5) | 116,250 |
| 1,000,000 | Manatee County, FL, School Dist, (AGM Insured) 5.00%, 10/01/2030 | 1,207,932 |
| 1,000,000 | Miami Beach, FL, Redevelopment Agency 5.00%, 02/01/2026 | 1,101,884 |
| | Miami-Dade County, FL, Aviation Rev | |
| 1,000,000 | 5.00%, 10/01/2024 | 1,042,133 |
| 2,500,000 | 5.00%, 10/01/2026 | 2,607,453 |
| 530,000 | 5.00%, 10/01/2027 | 594,927 |
| | Orange County, FL, Convention Center/Orlando | |
| 1,000,000 | 5.00%, 10/01/2024 | 1,128,697 |
| 1,520,000 | 5.00%, 10/01/2025 | 1,771,947 |
| | Orange County, FL, Health Facs Auth | |
| 1,190,000 | 5.00%, 08/01/2024 | 1,315,156 |
The accompanying notes are an integral part of these financial statements.
The Hartford Municipal Opportunities Fund
Schedule of Investments – (continued)
October 31, 2021
| Shares or Principal Amount | | Market Value† |
| MUNICIPAL BONDS - 97.1% - (continued) |
| | Florida - 5.0% - (continued) |
| $ 1,280,000 | 5.00%, 08/01/2025 | $ 1,411,849 |
| 1,350,000 | 5.00%, 08/01/2026 | 1,485,508 |
| 8,075,000 | Orlando, FL, Utilities Commission 1.25%, 10/01/2046(2) | 8,078,052 |
| | Osceola County, FL, Transportation Rev | |
| 1,330,000 | 0.00%, 10/01/2031(3) | 1,057,977 |
| 1,000,000 | 0.00%, 10/01/2032(3) | 764,157 |
| | Palm Beach County, FL, Health Facs Auth | |
| 6,265,000 | 2.63%, 06/01/2025 | 6,366,969 |
| 660,000 | 6.75%, 06/01/2024 | 692,351 |
| 1,000,000 | 6.80%, 06/01/2025 | 1,049,063 |
| | Polk County, FL, Industrial Dev Auth | |
| 1,750,000 | 5.00%, 01/01/2039 | 1,933,315 |
| 4,850,000 | 5.00%, 01/01/2055 | 5,300,868 |
| | Port St. Lucie, FL, Special Assessment | |
| 3,000,000 | 4.00%, 07/01/2028 | 3,423,476 |
| 3,000,000 | 4.00%, 07/01/2029 | 3,408,934 |
| 1,150,000 | Putnam County, FL, Dev Auth 5.00%, 03/15/2042 | 1,364,905 |
| 3,330,000 | Seminole County, FL, Industrial Dev Auth 3.75%, 11/15/2025 | 3,343,860 |
| 1,000,000 | St. Johns County, FL, Industrial Dev Auth 4.00%, 12/15/2050 | 1,073,458 |
| 840,000 | Village Community Dev. Dist. No. 13 2.55%, 05/01/2031 | 837,889 |
| | Volusia County, FL, Educational Facs Auth | |
| 60,000 | 4.00%, 10/15/2035 | 69,115 |
| 55,000 | 4.00%, 10/15/2036 | 63,207 |
| 750,000 | 4.00%, 10/15/2037 | 859,782 |
| 750,000 | 4.00%, 10/15/2038 | 858,053 |
| | | | 89,837,204 |
| | Georgia - 2.9% |
| 10,000,000 | Bartow County, GA, Dev Auth 1.55%, 08/01/2043(2) | 10,097,551 |
| | Burke County, GA, Dev Auth Rev | |
| 4,995,000 | 1.50%, 01/01/2040(2) | 5,117,985 |
| 3,000,000 | 1.55%, 12/01/2049(2) | 3,029,265 |
| 1,740,000 | 2.05%, 10/01/2032(2) | 1,741,435 |
| 2,665,000 | 2.25%, 10/01/2032(2) | 2,739,124 |
| 4,450,000 | 3.00%, 11/01/2045(2) | 4,588,713 |
| | Main Street Natural Gas, Inc., GA | |
| 2,150,000 | 4.00%, 08/01/2049(2) | 2,363,240 |
| 4,165,000 | 5.00%, 05/15/2032 | 5,126,556 |
| | Municipal Electric Auth, GA | |
| 1,100,000 | 4.00%, 01/01/2051 | 1,220,978 |
| 1,170,000 | 5.00%, 01/01/2022 | 1,179,010 |
| 1,000,000 | 5.00%, 11/01/2022 | 1,046,441 |
| 1,075,000 | 5.00%, 01/01/2024 | 1,131,701 |
| 4,595,000 | 5.00%, 01/01/2028 | 5,424,644 |
| 1,825,000 | 5.00%, 01/01/2028 | 2,159,083 |
| 740,000 | 5.00%, 01/01/2031 | 949,528 |
| 1,100,000 | 5.00%, 01/01/2032 | 1,400,705 |
| 515,000 | 5.00%, 01/01/2033 | 653,573 |
| 1,700,000 | 5.00%, 01/01/2056 | 2,030,491 |
| | | | 52,000,023 |
| | Hawaii - 0.1% |
| 2,000,000 | State of Hawaii Airports System Rev 5.00%, 08/01/2022 | 2,069,923 |
| Shares or Principal Amount | | Market Value† |
| MUNICIPAL BONDS - 97.1% - (continued) |
| | Illinois - 15.2% |
| | Champaign County, IL, Community Unit School Dist No. 4 Champaign, GO | |
| $ 530,000 | 0.00%, 01/01/2025(3) | $ 516,494 |
| 765,000 | 0.00%, 01/01/2027(3) | 719,038 |
| | Chicago, IL, Board of Education Rev | |
| 1,000,000 | 5.00%, 04/01/2046 | 1,174,465 |
| 715,000 | 6.00%, 04/01/2046 | 859,755 |
| | Chicago, IL, Board of Education, GO | |
| 2,500,000 | 0.00%, 12/01/2025(3) | 2,368,965 |
| 1,030,000 | 5.00%, 12/01/2022 | 1,079,811 |
| 600,000 | 5.00%, 12/01/2023 | 653,887 |
| 1,000,000 | 5.00%, 12/01/2024 | 1,132,649 |
| 4,500,000 | 5.00%, 12/01/2032 | 5,599,146 |
| 2,470,000 | 5.00%, 12/01/2033 | 3,063,948 |
| 6,460,000 | 5.00%, 12/01/2034 | 7,793,859 |
| 1,510,000 | 5.00%, 12/01/2042 | 1,566,750 |
| 3,760,000 | 5.00%, 12/01/2046 | 4,450,530 |
| | Chicago, IL, Metropolitan Water Reclamation Dist, GO | |
| 3,500,000 | 5.00%, 12/01/2027 | 4,257,651 |
| 2,530,000 | 5.00%, 12/01/2031 | 2,539,855 |
| 1,700,000 | 5.25%, 12/01/2032 | 2,321,717 |
| | Chicago, IL, O'Hare International Airport | |
| 3,705,000 | 5.00%, 01/01/2031 | 4,705,422 |
| 6,295,000 | 5.00%, 01/01/2032 | 7,950,426 |
| | Chicago, IL, Transit Auth | |
| 1,000,000 | 4.00%, 12/01/2050 | 1,137,231 |
| 1,250,000 | 4.00%, 12/01/2055 | 1,399,813 |
| 415,000 | 5.00%, 06/01/2025 | 478,705 |
| 8,250,000 | 5.00%, 12/01/2046 | 9,708,697 |
| 1,000,000 | 5.00%, 12/01/2055 | 1,207,725 |
| 800,000 | 5.25%, 12/01/2027 | 803,284 |
| 5,000,000 | 5.25%, 12/01/2028 | 5,020,524 |
| | City of Chicago, IL, GO, (NATL Insured) | |
| 325,000 | 0.00%, 01/01/2026(3) | 307,867 |
| 215,000 | 5.00%, 01/01/2022 | 216,630 |
| 65,000 | 5.00%, 01/01/2023 | 68,315 |
| 2,000,000 | 5.00%, 01/01/2024 | 2,184,525 |
| | City of Chicago, IL, Wastewater Transmission Rev | |
| 1,000,000 | 5.00%, 01/01/2028 | 1,135,066 |
| 2,500,000 | 5.00%, 01/01/2029 | 2,836,823 |
| | City of Chicago, IL, Waterworks Rev | |
| 135,000 | 5.00%, 11/01/2023 | 141,182 |
| 1,000,000 | 5.00%, 11/01/2027 | 1,202,828 |
| 1,020,000 | 5.00%, 11/01/2028 | 1,140,489 |
| 1,205,000 | 5.00%, 11/01/2029 | 1,254,045 |
| 3,465,000 | Cook County, IL, Community Consolidated School Dist No. 15, GO 5.00%, 12/01/2024 | 3,924,628 |
| | Cook County, IL, Community High School Dist No. 212 Leyden, (BAM Insured) | |
| 1,775,000 | 5.00%, 12/01/2026 | 2,023,905 |
| 310,000 | 5.00%, 12/01/2027 | 352,958 |
| 1,000,000 | 5.00%, 12/01/2034 | 1,134,291 |
| | Cook County, IL, GO | |
| 1,000,000 | 5.00%, 11/15/2026 | 1,206,708 |
| 4,300,000 | 5.00%, 11/15/2027 | 5,158,865 |
| 2,940,000 | 5.00%, 11/15/2031 | 3,823,103 |
| | County of Cook, IL, Sales Tax Rev | |
| 1,000,000 | 5.00%, 11/15/2030 | 1,295,705 |
| 1,690,000 | 5.00%, 11/15/2031 | 2,217,690 |
| | Illinois State Finance Auth Rev | |
| 240,000 | 5.00%, 09/01/2022 | 248,754 |
The accompanying notes are an integral part of these financial statements.
The Hartford Municipal Opportunities Fund
Schedule of Investments – (continued)
October 31, 2021
| Shares or Principal Amount | | Market Value† |
| MUNICIPAL BONDS - 97.1% - (continued) |
| | Illinois - 15.2% - (continued) |
| $ 1,000,000 | 5.00%, 10/01/2023 | $ 1,088,648 |
| 1,000,000 | 5.00%, 11/15/2023 | 1,092,357 |
| 5,000,000 | 5.00%, 02/15/2027 | 6,080,728 |
| 700,000 | 5.00%, 10/01/2028 | 829,838 |
| 1,000,000 | 5.00%, 11/15/2028 | 1,159,641 |
| 2,650,000 | 5.00%, 11/15/2031 | 3,027,489 |
| 1,420,000 | 5.00%, 08/15/2033 | 1,830,672 |
| 2,500,000 | 5.00%, 11/15/2033 | 2,852,366 |
| 2,135,000 | 5.00%, 11/15/2034 | 2,468,488 |
| 1,045,000 | 5.00%, 08/15/2035 | 1,341,332 |
| 3,035,000 | 5.00%, 05/15/2050(2) | 3,376,605 |
| | Illinois State Toll Highway Auth, Taxable Rev | |
| 1,000,000 | 5.00%, 01/01/2027 | 1,055,123 |
| 2,500,000 | 5.00%, 01/01/2031 | 3,068,400 |
| 10,000,000 | 5.00%, 01/01/2044 | 12,262,781 |
| | Kane Cook & DuPage Counties, IL, GO | |
| 4,200,000 | 5.00%, 01/01/2031 | 4,604,261 |
| 1,700,000 | 5.00%, 01/01/2034 | 1,861,308 |
| 1,700,000 | 5.00%, 01/01/2035 | 1,859,762 |
| | Kane McHenry Cook & DeKalb Counties, IL, Unified School Dist No. 300, GO | |
| 1,875,000 | 5.00%, 01/01/2027 | 2,139,031 |
| 2,000,000 | 5.00%, 01/01/2029 | 2,448,014 |
| | Kendall Kane & Will Counties, IL, Unified School Dist, GO, (AGM Insured) | |
| 1,150,000 | 5.00%, 02/01/2025 | 1,300,894 |
| 4,000,000 | 5.00%, 02/01/2026 | 4,655,279 |
| 1,665,000 | 5.00%, 02/01/2034 | 1,939,269 |
| | Metropolitan Pier & Exposition Auth, IL, (NATL Insured) | |
| 4,000,000 | 0.00%, 12/15/2024(3) | 3,874,974 |
| 2,000,000 | 0.00%, 06/15/2027(3) | 1,838,227 |
| 3,895,000 | 0.00%, 12/15/2042(6) | 3,289,592 |
| 2,980,000 | 4.00%, 12/15/2042(7) | 3,351,682 |
| 1,000,000 | 5.00%, 12/15/2035 | 1,138,273 |
| | Railsplitter, IL, Tobacco Settlement Auth | |
| 1,000,000 | 5.00%, 06/01/2026 | 1,183,037 |
| 1,940,000 | 5.00%, 06/01/2027 | 2,278,960 |
| | Regional Transportation, IL, Auth Rev | |
| 600,000 | 5.00%, 06/01/2035 | 705,689 |
| 8,775,000 | 6.00%, 07/01/2024 | 9,528,095 |
| 3,525,000 | 6.00%, 07/01/2031 | 4,633,121 |
| | Sales Tax Securitization Corp., IL Rev | |
| 2,560,000 | 5.00%, 01/01/2029 | 3,199,711 |
| 5,545,000 | 5.00%, 01/01/2030 | 7,021,402 |
| | State of Illinois, GO | |
| 7,100,000 | 5.00%, 11/01/2021 | 7,100,000 |
| 3,500,000 | 5.00%, 11/01/2024 | 3,939,974 |
| 1,500,000 | 5.00%, 08/01/2025 | 1,550,188 |
| 4,785,000 | 5.00%, 11/01/2025 | 5,525,931 |
| 1,985,000 | 5.00%, 02/01/2026 | 2,172,153 |
| 2,000,000 | 5.00%, 10/01/2026 | 2,354,261 |
| 6,540,000 | 5.00%, 11/01/2026 | 7,713,991 |
| 1,200,000 | 5.00%, 02/01/2027 | 1,422,029 |
| 2,715,000 | 5.00%, 11/01/2028 | 3,236,794 |
| 1,215,000 | 5.00%, 03/01/2029 | 1,485,975 |
| 4,750,000 | 5.00%, 03/01/2030 | 5,876,089 |
| 5,480,000 | 5.00%, 10/01/2031 | 6,793,058 |
| 950,000 | 5.00%, 05/01/2033 | 1,043,241 |
| 5,240,000 | 5.00%, 12/01/2034 | 6,128,918 |
| 3,460,000 | 5.00%, 03/01/2046 | 4,145,017 |
| Shares or Principal Amount | | Market Value† |
| MUNICIPAL BONDS - 97.1% - (continued) |
| | Illinois - 15.2% - (continued) |
| $ 835,000 | 5.38%, 05/01/2023 | $ 896,110 |
| | State of Illinois, Sales Tax Rev | |
| 1,185,000 | 5.00%, 06/15/2024 | 1,269,843 |
| 280,000 | 6.50%, 06/15/2022 | 290,782 |
| | | | 271,714,127 |
| | Indiana - 1.2% |
| 1,970,014 | City of Evansville, IN, Rev, (FNMA Insured) 3.00%, 06/01/2034 | 2,104,329 |
| | Indiana Housing & Community Dev Auth Rev, (GNMA/FNMA/FHLMC/COLL Insured) | |
| 4,500,000 | 3.00%, 07/01/2050 | 4,845,283 |
| 2,270,000 | 3.00%, 07/01/2051 | 2,439,154 |
| 1,770,000 | 3.25%, 07/01/2049 | 1,890,597 |
| | Indiana Municipal Power Agency | |
| 1,050,000 | 5.00%, 01/01/2032 | 1,287,276 |
| 870,000 | 5.00%, 01/01/2033 | 1,064,032 |
| 180,000 | 5.00%, 01/01/2034 | 219,684 |
| | Indiana State Finance Auth Rev | |
| 1,625,000 | 5.00%, 03/01/2023 | 1,709,123 |
| 1,000,000 | 5.00%, 12/01/2029 | 1,136,925 |
| | Indianapolis, IN, Local Public Improvement Bond Bank | |
| 1,000,000 | 5.00%, 01/01/2029 | 1,088,316 |
| 1,000,000 | 5.00%, 01/01/2031 | 1,175,486 |
| 775,000 | Richmond, IN, Hospital Auth Rev 5.00%, 01/01/2035 | 853,498 |
| 2,000,000 | Whiting, IN, Environmental Facs Rev 5.00%, 03/01/2046(2) | 2,119,190 |
| | | | 21,932,893 |
| | Iowa - 0.2% |
| | Iowa Student Loan Liquidity Corp. | |
| 180,000 | 5.00%, 12/01/2022 | 188,944 |
| 650,000 | 5.00%, 12/01/2024 | 731,546 |
| 305,000 | State of Iowa, Finance Auth Rev 2.88%, 05/15/2049 | 306,213 |
| 2,645,000 | State of Iowa, Tobacco Settlement Auth 4.00%, 06/01/2049 | 2,926,454 |
| | | | 4,153,157 |
| | Kansas - 0.2% |
| | Wyandotte County-Kansas City, KS, System Rev | |
| 1,000,000 | 5.00%, 09/01/2025 | 1,124,636 |
| 1,390,000 | 5.00%, 09/01/2028 | 1,605,729 |
| | | | 2,730,365 |
| | Kentucky - 1.1% |
| 4,750,000 | County of Trimble, KY 1.30%, 09/01/2044(2) | 4,738,640 |
| | Kentucky Bond Dev Corp. | |
| 1,000,000 | 5.00%, 09/01/2032 | 1,240,997 |
| 1,100,000 | 5.00%, 09/01/2033 | 1,360,409 |
| 1,200,000 | 5.00%, 09/01/2034 | 1,478,145 |
| 1,025,000 | 5.00%, 09/01/2035 | 1,258,722 |
| 2,910,000 | Kentucky Economic Dev Finance Auth, (AGM Insured) 5.00%, 12/01/2047 | 3,039,997 |
The accompanying notes are an integral part of these financial statements.
The Hartford Municipal Opportunities Fund
Schedule of Investments – (continued)
October 31, 2021
| Shares or Principal Amount | | Market Value† |
| MUNICIPAL BONDS - 97.1% - (continued) |
| | Kentucky - 1.1% - (continued) |
| $ 4,000,000 | Kentucky Public Energy Auth 4.00%, 01/01/2049(2) | $ 4,389,513 |
| 2,600,000 | Louisville & Jefferson County, KY, Metropolitan Gov't Rev Catholic Health Initiatives 5.00%, 12/01/2023 | 2,671,552 |
| | | | 20,177,975 |
| | Louisiana - 1.4% |
| 1,965,000 | East Baton Rouge, LA, Sewerage Commission 1.30%, 02/01/2041(2) | 1,991,171 |
| | Louisiana State Local Gov't Environmental Facs & Community Dev Auth Rev | |
| 975,000 | 5.75%, 11/15/2030 | 1,065,334 |
| 1,155,000 | 6.00%, 11/15/2030 | 1,272,843 |
| 1,750,000 | 6.00%, 11/15/2035 | 1,900,961 |
| 4,000,000 | Louisiana State, GO 5.00%, 12/01/2031 | 4,533,231 |
| | New Orleans, LA, Aviation Board | |
| 750,000 | 5.00%, 01/01/2026 | 875,889 |
| 500,000 | 5.00%, 01/01/2027 | 598,357 |
| 1,250,000 | 5.00%, 01/01/2034 | 1,403,339 |
| 710,000 | 5.00%, 01/01/2035 | 837,055 |
| 3,740,000 | Parish of St. John the Baptist, LA 2.38%, 06/01/2037(2) | 3,919,605 |
| | Regional Transportation Auth, LA, Sales Tax Rev, (AGM Insured) | |
| 1,815,000 | 5.00%, 01/01/2026 | 2,133,492 |
| 1,220,000 | 5.00%, 01/01/2027 | 1,475,008 |
| 2,000,000 | Shreveport, LA, Water & Sewer Rev, (AGM Insured) 5.00%, 12/01/2027 | 2,336,937 |
| | | | 24,343,222 |
| | Maine - 0.3% |
| | Finance Auth of Maine Rev, (AGM Insured) | |
| 225,000 | 5.00%, 12/01/2021 | 225,854 |
| 1,000,000 | 5.00%, 12/01/2023 | 1,088,380 |
| | Maine Health & Higher Educational Facs Auth, (AGM Insured) | |
| 520,000 | 5.00%, 07/01/2022 | 536,664 |
| 535,000 | 5.00%, 07/01/2023 | 576,699 |
| 675,000 | 5.00%, 07/01/2024 | 757,029 |
| 1,905,000 | Maine State Housing Auth Rev 4.00%, 11/15/2050 | 2,098,772 |
| | | | 5,283,398 |
| | Maryland - 0.2% |
| 480,000 | Howard County, MD, Special Obligation 4.00%, 02/15/2028(1) | 510,165 |
| 1,840,000 | State of Maryland, GO 5.00%, 03/15/2028 | 2,236,839 |
| | | | 2,747,004 |
| | Massachusetts - 1.7% |
| | Massachusetts Dev Finance Agency, Rev | |
| 1,000,000 | 4.00%, 10/01/2024(1) | 1,080,370 |
| 1,000,000 | 4.00%, 10/01/2025(1) | 1,079,784 |
| 635,000 | 4.00%, 10/01/2026(1) | 684,919 |
| 165,000 | 4.00%, 07/15/2036 | 188,221 |
| 1,000,000 | 5.00%, 07/01/2025 | 1,158,077 |
| 1,720,000 | 5.00%, 07/01/2028 | 2,016,234 |
| 1,850,000 | 5.00%, 07/01/2029 | 2,222,193 |
| 3,350,000 | 5.00%, 07/01/2030 | 3,988,471 |
| 955,000 | 5.00%, 07/01/2031 | 1,173,688 |
| 855,000 | 5.00%, 07/01/2035 | 996,428 |
| 2,180,000 | 5.00%, 07/01/2043 | 2,620,267 |
| | Massachusetts Educational Financing Auth | |
| 500,000 | 5.00%, 01/01/2025 | 566,691 |
| Shares or Principal Amount | | Market Value† |
| MUNICIPAL BONDS - 97.1% - (continued) |
| | Massachusetts - 1.7% - (continued) |
| $ 1,030,000 | 5.00%, 07/01/2026 | $ 1,217,164 |
| 1,050,000 | 5.00%, 07/01/2027 | 1,266,346 |
| 1,125,000 | 5.00%, 07/01/2030 | 1,425,390 |
| 1,250,000 | 5.00%, 07/01/2031 | 1,600,343 |
| | Massachusetts Housing Finance Agency | |
| 400,000 | 2.90%, 06/01/2022 | 405,077 |
| 500,000 | 3.10%, 06/01/2023 | 517,510 |
| 900,000 | 3.15%, 06/01/2023 | 932,079 |
| 400,000 | 3.25%, 06/01/2024 | 421,815 |
| 2,170,000 | Massachusetts Port Auth 5.00%, 07/01/2034 | 2,420,118 |
| 200,000 | Massachusetts School Building Auth 5.00%, 11/15/2030 | 238,760 |
| 2,200,000 | Massachusetts State, Port Auth Rev 5.00%, 07/01/2034 | 2,837,710 |
| | | | 31,057,655 |
| | Michigan - 2.1% |
| 5,000,000 | Great Lakes, MI, Water Auth Water Supply System Rev 5.00%, 07/01/2029 | 5,969,049 |
| 1,200,000 | Lincoln Park, MI, School Dist, GO, (Q-SBLF Insured) 5.00%, 05/01/2030 | 1,535,940 |
| | Michigan Finance Auth Rev | |
| 1,000,000 | 5.00%, 07/01/2027 | 1,157,683 |
| 1,000,000 | 5.00%, 07/01/2028 | 1,154,927 |
| 1,000,000 | 5.00%, 07/01/2029 | 1,121,241 |
| 2,700,000 | 5.00%, 10/01/2030 | 3,034,280 |
| 2,555,000 | 5.00%, 06/01/2033 | 2,862,018 |
| 1,000,000 | 5.00%, 06/01/2034 | 1,120,164 |
| 915,000 | 5.00%, 11/01/2034 | 1,139,162 |
| 1,000,000 | 5.00%, 11/01/2035 | 1,242,857 |
| 1,000,000 | 5.00%, 11/01/2036 | 1,240,360 |
| 1,000,000 | 5.00%, 11/01/2038 | 1,235,476 |
| 1,000,000 | Michigan State Building Auth Rev 5.00%, 04/15/2027 | 1,207,814 |
| | Michigan State Hospital Finance Auth | |
| 1,505,000 | 4.00%, 11/15/2031 | 1,755,495 |
| 345,000 | 4.00%, 11/15/2032 | 401,588 |
| 2,075,000 | 5.00%, 11/15/2047 | 2,583,767 |
| 2,690,000 | Michigan State Housing Dev Auth 4.25%, 12/01/2049 | 2,954,219 |
| 1,375,000 | Richmond, MI, Community Schools, GO, (Q-SBLF Insured) 5.00%, 05/01/2030 | 1,748,594 |
| 370,000 | State of Michigan Rev 5.00%, 03/15/2027 | 452,023 |
| 2,465,000 | Wayne County, MI, Airport Auth Rev 5.00%, 12/01/2030 | 2,833,396 |
| | | | 36,750,053 |
| | Minnesota - 1.7% |
| 1,180,000 | Duluth, MN, Independent School Dist No. 709, (SD CRED PROG Insured) 4.00%, 02/01/2027 | 1,335,415 |
| 1,974,959 | Freddie Mac Multifamily, MN, Certificates 2.54%, 06/25/2037 | 2,045,652 |
| 1,750,000 | Minnesota Higher Education Facs Auth 4.00%, 10/01/2046 | 2,040,059 |
| | Minnesota Housing Finance Agency | |
| 4,935,000 | 3.00%, 01/01/2051 | 5,297,026 |
| 6,925,000 | 3.00%, 07/01/2052 | 7,487,871 |
| 9,000,000 | 5.00%, 09/01/2024 | 10,176,511 |
| | Minnesota Housing Finance Agency Rev, (GNMA/FNMA/FHLMC Insured) | |
| 345,000 | 1.45%, 07/01/2024 | 350,089 |
| 410,000 | 1.55%, 07/01/2025 | 416,922 |
The accompanying notes are an integral part of these financial statements.
The Hartford Municipal Opportunities Fund
Schedule of Investments – (continued)
October 31, 2021
| Shares or Principal Amount | | Market Value† |
| MUNICIPAL BONDS - 97.1% - (continued) |
| | Minnesota - 1.7% - (continued) |
| | St. Francis, MN, Independent School Dist No. 15, GO, (SD CRED PROG Insured) | |
| $ 315,000 | 4.00%, 02/01/2029 | $ 327,479 |
| 365,000 | 4.00%, 02/01/2030 | 379,159 |
| 750,000 | 4.00%, 02/01/2031 | 778,275 |
| | | | 30,634,458 |
| | Mississippi - 0.8% |
| 1,970,000 | Mississippi Dev Bank, Special Obligation, (BAM Insured) 5.00%, 10/01/2033 | 2,442,957 |
| | Mississippi Home Corp., (GNMA/FNMA/FHLMC Insured) | |
| 780,000 | 3.00%, 12/01/2050 | 838,452 |
| 3,335,000 | 3.00%, 06/01/2051 | 3,599,435 |
| | State of Mississippi, Gaming Tax Rev | |
| 1,000,000 | 5.00%, 10/15/2025 | 1,162,854 |
| 2,450,000 | 5.00%, 10/15/2029 | 2,814,887 |
| 1,000,000 | 5.00%, 10/15/2036 | 1,227,000 |
| 1,600,000 | 5.00%, 10/15/2037 | 1,958,961 |
| | | | 14,044,546 |
| | Missouri - 0.6% |
| | City of St. Louis, MO, Airport Rev | |
| 540,000 | 5.00%, 07/01/2030 | 671,662 |
| 1,000,000 | 5.00%, 07/01/2032 | 1,206,548 |
| 1,000,000 | 5.00%, 07/01/2047 | 1,200,918 |
| 5,400,000 | Kirkwood, MO, Industrial Dev Auth Retirement Community 5.25%, 05/15/2042 | 5,957,490 |
| 1,255,000 | St. Louis County, MO, Industrial Dev Auth 5.00%, 09/01/2026 | 1,447,299 |
| 1,000,000 | Stone Canyon, MO, Community Improvement Dist Rev 5.75%, 04/01/2027(5) | 260,000 |
| | | | 10,743,917 |
| | Montana - 0.3% |
| 2,070,000 | Montana Board of Housing 4.00%, 12/01/2043 | 2,220,734 |
| 2,500,000 | Montana Facs Finance Auth Rev 5.00%, 02/15/2028 | 2,993,693 |
| | | | 5,214,427 |
| | Nebraska - 2.0% |
| | Central Plains, NE, Energy Project | |
| 1,000,000 | 5.00%, 09/01/2022 | 1,038,398 |
| 210,000 | 5.00%, 09/01/2025 | 242,726 |
| 3,325,000 | 5.00%, 09/01/2028 | 4,084,768 |
| 1,530,000 | 5.00%, 09/01/2033 | 2,026,787 |
| 3,890,000 | 5.00%, 09/01/2042 | 5,575,154 |
| 4,820,000 | Nebraska Investment Finance Auth, (GNMA/FNMA/FHLMC Insured) 3.00%, 09/01/2045 | 5,186,097 |
| | Nebraska Investment Finance Auth Rev, (GNMA/FNMA/FHLMC Insured) | |
| 8,385,000 | 3.00%, 09/01/2050 | 9,053,395 |
| 3,865,000 | 5.00%, 01/01/2024 | 4,254,672 |
| 4,300,000 | Washington County, NE, Rev 0.90%, 09/01/2030(2) | 4,320,739 |
| | | | 35,782,736 |
| | Nevada - 1.7% |
| | City of North Las Vegas, NV | |
| 465,000 | 4.50%, 06/01/2039 | 516,188 |
| 720,000 | 4.63%, 06/01/2043 | 795,995 |
| 965,000 | 4.63%, 06/01/2049 | 1,059,680 |
| Shares or Principal Amount | | Market Value† |
| MUNICIPAL BONDS - 97.1% - (continued) |
| | Nevada - 1.7% - (continued) |
| | City of Reno, NV, Sales Tax Rev | |
| $ 250,000 | 5.00%, 06/01/2024 | $ 273,327 |
| 250,000 | 5.00%, 06/01/2026 | 287,504 |
| 535,000 | City of Sparks, NV 2.50%, 06/15/2024(1) | 542,032 |
| 7,500,000 | Clark County, NV, School Dist 5.00%, 06/15/2024 | 8,372,084 |
| | Clark County, NV, School Dist, GO | |
| 830,000 | 5.00%, 06/15/2026 | 972,853 |
| 1,000,000 | 5.00%, 06/15/2028 | 1,231,680 |
| 4,560,000 | 5.00%, 06/15/2029 | 5,819,615 |
| 1,900,000 | 5.00%, 06/15/2029 | 2,331,539 |
| 1,500,000 | 5.00%, 06/15/2031 | 1,942,489 |
| | Las Vegas, NV, New Convention Center Auth Rev | |
| 1,900,000 | 5.00%, 07/01/2029 | 2,217,003 |
| 400,000 | 5.00%, 07/01/2031 | 437,811 |
| 365,000 | 5.00%, 07/01/2032 | 399,084 |
| 300,000 | 5.00%, 07/01/2033 | 327,771 |
| 475,000 | 5.00%, 07/01/2034 | 518,511 |
| 750,000 | 5.00%, 07/01/2043 | 896,781 |
| | Las Vegas, NV, Special Improvement Dist | |
| 290,000 | 5.00%, 06/01/2027 | 313,119 |
| 315,000 | 5.00%, 06/01/2028 | 339,135 |
| 550,000 | 5.00%, 06/01/2029 | 590,302 |
| 10,000 | Nevada State, GO 5.00%, 03/01/2026 | 10,619 |
| | | | 30,195,122 |
| | New Hampshire - 0.2% |
| 920,000 | New Hampshire Business Finance Auth 4.00%, 01/01/2041 | 996,427 |
| 1,715,000 | New Hampshire Health and Education Facs Auth Act Rev 5.00%, 08/01/2059 | 2,643,994 |
| | | | 3,640,421 |
| | New Jersey - 2.0% |
| 400,000 | City of Atlantic City, NJ, GO, (BAM State Aid Withholding Insured) 5.00%, 03/01/2022 | 405,933 |
| 705,000 | City of Bayonne, NJ, GO, (AGM School Board Reserve Fund Insured) 0.00%, 07/01/2023(3) | 698,468 |
| | New Jersey Economic Dev Auth | |
| 565,000 | 5.00%, 03/01/2023 | 573,543 |
| 1,200,000 | 5.00%, 06/15/2023 | 1,288,257 |
| 830,000 | New Jersey Educational Facs Auth Rev, (AGM Insured) 4.00%, 07/01/2050 | 934,597 |
| | New Jersey Higher Education Student Assistance Auth | |
| 1,420,000 | 5.00%, 12/01/2025 | 1,648,168 |
| 1,000,000 | 5.00%, 12/01/2026 | 1,189,447 |
| | New Jersey Transportation Trust Fund Auth, (AGM Insured) | |
| 5,000,000 | 0.00%, 12/15/2032(3) | 4,002,964 |
| 1,000,000 | 5.00%, 12/15/2023 | 1,096,002 |
| 1,610,000 | 5.00%, 12/15/2024 | 1,829,315 |
| 5,715,000 | 5.00%, 06/15/2031 | 7,403,985 |
| 3,365,000 | New Jersey Turnpike Auth Rev 4.00%, 01/01/2042 | 3,908,694 |
| 1,000,000 | Newark Board of Education, GO 4.00%, 07/15/2034 | 1,202,804 |
| | State of New Jersey, GO | |
| 3,440,000 | 5.00%, 06/01/2026 | 4,073,045 |
The accompanying notes are an integral part of these financial statements.
The Hartford Municipal Opportunities Fund
Schedule of Investments – (continued)
October 31, 2021
| Shares or Principal Amount | | Market Value† |
| MUNICIPAL BONDS - 97.1% - (continued) |
| | New Jersey - 2.0% - (continued) |
| $ 2,000,000 | 5.00%, 06/01/2027 | $ 2,299,733 |
| 2,870,000 | Tobacco Settlement Financing Corp., NJ 5.00%, 06/01/2029 | 3,513,287 |
| | | | 36,068,242 |
| | New Mexico - 0.3% |
| 1,045,000 | City of Santa Fe, NM, Rev 5.00%, 05/15/2049 | 1,162,295 |
| 4,000,000 | New Mexico Mortgage Finance Auth 3.00%, 01/01/2052 | 4,320,899 |
| | | | 5,483,194 |
| | New York - 11.8% |
| 6,470,000 | Brookhaven, NY, Local Dev Corp. 1.63%, 11/01/2025 | 6,633,193 |
| | City of New York, NY, GO | |
| 785,000 | 4.00%, 03/01/2038 | 923,194 |
| 4,900,000 | 5.00%, 08/01/2026 | 5,878,703 |
| 1,000,000 | 5.00%, 08/01/2032 | 1,245,856 |
| 2,445,000 | 5.00%, 08/01/2034 | 3,029,969 |
| 2,250,000 | 5.00%, 03/01/2038 | 2,814,691 |
| 1,375,000 | Huntington, NY, Local Dev Corp. 3.00%, 07/01/2025 | 1,409,584 |
| 7,500,000 | Long Island, NY, Power Auth Rev 0.85%, 09/01/2050(2) | 7,511,158 |
| | Metropolitan Transportation Auth, NY, Rev, (AGM Insured) | |
| 370,000 | 0.01%, 11/15/2027(3) | 334,643 |
| 16,355,000 | 5.00%, 03/01/2022 | 16,609,232 |
| 1,000,000 | 5.00%, 11/15/2030 | 1,270,252 |
| 1,025,000 | 5.00%, 11/15/2032 | 1,276,332 |
| 4,000,000 | 5.00%, 11/15/2034(2) | 4,436,382 |
| 845,000 | 5.00%, 11/15/2036 | 1,005,100 |
| 9,005,000 | 5.00%, 11/15/2045(2) | 11,311,374 |
| 5,755,000 | 5.00%, 11/15/2052 | 6,749,463 |
| 2,750,000 | New York City Industrial Dev Agency, (AGM Insured) 3.00%, 01/01/2039 | 2,915,139 |
| | New York City Transitional Finance Auth, Future Tax Secured Rev | |
| 6,170,000 | 3.00%, 08/01/2048 | 6,436,648 |
| 2,000,000 | 4.00%, 11/01/2036 | 2,344,936 |
| 2,525,000 | 4.00%, 11/01/2037 | 2,966,232 |
| 3,460,000 | 4.00%, 05/01/2038 | 4,049,248 |
| 1,000,000 | 4.00%, 05/01/2039 | 1,167,498 |
| 5,250,000 | 5.00%, 11/01/2031 | 6,842,013 |
| 2,995,000 | 5.00%, 05/01/2036 | 3,751,598 |
| 3,335,000 | New York City Water & Sewer System 5.00%, 06/15/2044 | 4,295,855 |
| 1,335,000 | New York City, NY, Housing Dev Corp. 4.50%, 02/15/2048 | 1,376,743 |
| 1,180,000 | New York City, NY, Industrial Dev Agency, (AGM Insured) 5.00%, 03/01/2030 | 1,492,397 |
| 1,000,000 | New York City, NY, Transitional Finance Auth Building Aid Rev, (State Aid Withholding Insured) 5.00%, 07/15/2026 | 1,180,033 |
| | New York City, NY, Transitional Finance Auth, Future Tax Secured Rev | |
| 1,875,000 | 4.00%, 05/01/2035 | 2,217,634 |
| 2,345,000 | 5.00%, 11/01/2032 | 3,043,238 |
| | New York Liberty Dev Corp. | |
| 2,370,000 | 0.95%, 11/15/2027 | 2,315,504 |
| 2,145,000 | 1.20%, 11/15/2028 | 2,107,082 |
| 3,375,000 | 5.00%, 11/15/2044(1) | 3,679,090 |
| | New York State Dormitory Auth Rev | |
| 11,030,000 | 0.05%, 07/01/2031(2) | 11,030,000 |
| Shares or Principal Amount | | Market Value† |
| MUNICIPAL BONDS - 97.1% - (continued) |
| | New York - 11.8% - (continued) |
| $ 2,500,000 | 5.00%, 03/15/2030 | $ 2,853,867 |
| 2,500,000 | 5.00%, 03/15/2031 | 2,992,518 |
| 2,500,000 | 5.00%, 03/15/2033 | 2,983,289 |
| 3,800,000 | 5.00%, 03/15/2035 | 4,738,171 |
| 4,000,000 | 5.00%, 03/15/2043 | 4,787,376 |
| 2,300,000 | New York State Liberty Dev Corp. Rev 5.15%, 11/15/2034(1) | 2,553,312 |
| 1,000,000 | New York State Thruway Auth Rev 4.00%, 01/01/2037 | 1,101,387 |
| | New York State Urban Dev Corp. Rev | |
| 2,235,000 | 5.00%, 03/15/2022 | 2,274,989 |
| 3,315,000 | 5.00%, 03/15/2023 | 3,530,184 |
| 1,000,000 | 5.00%, 03/15/2026 | 1,064,769 |
| | New York Transportation Dev Corp. | |
| 1,350,000 | 5.00%, 12/01/2023 | 1,466,379 |
| 265,000 | 5.00%, 12/01/2025 | 305,282 |
| 1,000,000 | 5.00%, 12/01/2029 | 1,249,072 |
| 1,000,000 | 5.00%, 12/01/2030 | 1,266,737 |
| 1,000,000 | New York Transportation Dev Corp. Rev 5.00%, 12/01/2031 | 1,250,419 |
| | Port Auth of New York & New Jersey Rev | |
| 1,190,000 | 4.00%, 07/15/2040 | 1,410,832 |
| 2,750,000 | 5.00%, 10/15/2025 | 3,086,697 |
| 1,000,000 | 5.00%, 10/15/2028 | 1,160,735 |
| 4,500,000 | 5.00%, 11/01/2038 | 5,512,115 |
| 2,250,000 | 5.00%, 11/01/2044 | 2,720,191 |
| 2,500,000 | Sales Tax Asset Receivable Corp., NY 5.00%, 10/15/2029 | 2,841,810 |
| | State of New York Mortgage Agency | |
| 1,000,000 | 3.15%, 04/01/2024 | 1,041,729 |
| 1,330,000 | 3.25%, 10/01/2024 | 1,414,053 |
| 4,195,000 | 3.50%, 10/01/2032 | 4,527,321 |
| 260,000 | 3.50%, 10/01/2034 | 268,364 |
| | Syracuse, NY, Industrial Dev Agency | |
| 320,000 | 5.00%, 01/01/2029 | 317,132 |
| 2,635,000 | 5.00%, 01/01/2031 | 2,523,669 |
| 2,340,000 | Town of Oyster Bay, NY, GO, (BAM Insured) 5.00%, 08/15/2024 | 2,635,822 |
| 1,325,000 | Triborough, NY, Bridge & Tunnel Auth 0.00%, 11/15/2031(3) | 1,074,127 |
| 2,000,000 | TSASC, Inc., NY 5.00%, 06/01/2026 | 2,367,076 |
| | Westchester City, NY, Local Dev | |
| 3,420,000 | 2.88%, 07/01/2026 | 3,420,365 |
| 3,950,000 | 3.20%, 07/01/2028 | 3,951,049 |
| | | | 210,340,852 |
| | North Carolina - 2.1% |
| | North Carolina Housing Finance Agency | |
| 8,880,000 | 3.00%, 07/01/2051 | 9,600,371 |
| 1,580,000 | 4.00%, 07/01/2047 | 1,692,075 |
| | North Carolina Medical Care Commission Rev | |
| 245,000 | 4.00%, 01/01/2026 | 260,239 |
| 565,000 | 5.00%, 01/01/2027 | 633,593 |
| 795,000 | 5.00%, 01/01/2028 | 905,421 |
| 275,000 | 5.00%, 01/01/2029 | 313,622 |
| 1,050,000 | 5.00%, 01/01/2039 | 1,171,352 |
| 3,670,000 | 5.00%, 01/01/2044 | 4,114,220 |
| | North Carolina Raleigh Durham Airport Auth Rev | |
| 1,500,000 | 5.00%, 05/01/2027 | 1,811,523 |
The accompanying notes are an integral part of these financial statements.
The Hartford Municipal Opportunities Fund
Schedule of Investments – (continued)
October 31, 2021
| Shares or Principal Amount | | Market Value† |
| MUNICIPAL BONDS - 97.1% - (continued) |
| | North Carolina - 2.1% - (continued) |
| $ 1,000,000 | 5.00%, 05/01/2030 | $ 1,202,179 |
| 15,000,000 | University of North Carolina at Chapel Hill 0.18%, 12/01/2041, 1 mo. USD LIBOR + 0.125%(4) | 15,000,933 |
| | | | 36,705,528 |
| | North Dakota - 0.8% |
| | North Dakota Housing Finance Agency | |
| 3,490,000 | 3.00%, 07/01/2051 | 3,743,616 |
| 5,590,000 | 3.00%, 01/01/2052 | 6,027,065 |
| 3,365,000 | 4.25%, 07/01/2049 | 3,678,375 |
| | | | 13,449,056 |
| | Ohio - 2.7% |
| | Allen County, OH, Hospital Facs Rev | |
| 2,000,000 | 5.00%, 05/01/2023 | 2,047,990 |
| 2,750,000 | 5.00%, 12/01/2029 | 3,533,091 |
| 380,000 | 5.00%, 12/01/2030 | 490,513 |
| | Buckeye, OH, Tobacco Settlement Finance Auth | |
| 18,645,000 | 0.00%, 06/01/2057(3) | 2,911,361 |
| 18,255,000 | 5.00%, 06/01/2055 | 20,484,651 |
| | Cleveland, OH, Airport System Rev, (AGM Insured) | |
| 1,165,000 | 5.00%, 01/01/2022 | 1,174,167 |
| 1,385,000 | 5.00%, 01/01/2023 | 1,461,513 |
| 430,000 | Hamilton County, OH, Sales Tax Rev 5.00%, 12/01/2027 | 533,064 |
| 1,805,000 | Ohio Housing Finance Agency Rev, (GNMA/FNMA/FHLMC Insured) 3.75%, 09/01/2050 | 1,979,745 |
| 7,500,000 | Southern Ohio Port Auth Rev 6.50%, 12/01/2030(1) | 8,614,983 |
| | State of Ohio, Rev | |
| 2,000,000 | 4.00%, 12/15/2021 | 2,009,234 |
| 2,210,000 | 5.00%, 12/15/2022 | 2,328,543 |
| | | | 47,568,855 |
| | Oklahoma - 0.4% |
| | Oklahoma Dev Finance Auth | |
| 5,305,000 | 1.63%, 07/06/2023 | 5,341,113 |
| 935,000 | 5.25%, 08/15/2048 | 1,132,358 |
| 935,000 | 5.50%, 08/15/2057 | 1,141,548 |
| 115,000 | Oklahoma Housing Finance Agency, (GNMA Collateral Insured) 5.00%, 09/01/2043 | 116,667 |
| | | | 7,731,686 |
| | Oregon - 2.6% |
| 1,665,000 | Benton & Linn Counties, OR, Consolidated School Dist No. 509J & 509A Corvallis, GO, (School Board Guaranty Insured) 5.00%, 06/15/2038(6) | 2,047,495 |
| | Clackamas & Washington Counties, OR, School Dist No. 3, GO, (School Bond Guaranty) | |
| 2,500,000 | 0.01%, 06/15/2036(3) | 1,781,255 |
| 405,000 | 0.01%, 06/15/2037(3) | 278,229 |
| 8,200,000 | Clackamas County, OR, School Dist No. 12, GO, (School Bond Guaranty Insured) 0.01%, 06/15/2040(3) | 4,123,422 |
| 10,420,000 | Columbia County, OR, School Dist No. 502, GO, (School Board Guaranty Insured) 0.00%, 06/15/2050(3) | 4,753,417 |
| Shares or Principal Amount | | Market Value† |
| MUNICIPAL BONDS - 97.1% - (continued) |
| | Oregon - 2.6% - (continued) |
| $ 625,000 | Jackson County, OR, School Dist No. 4, GO, (School Bond Guaranty Insured) 0.01%, 06/15/2034(3) | $ 437,364 |
| 1,105,000 | Marion County, OR, School Dist No. 15 North Marion, GO, (School Bond Guaranty Insured) 0.00%, 06/15/2037(3) | 664,981 |
| 850,000 | Multnomah & Clackamas Counties, OR, School Dist No. 10 JT Gresham-Barlow, GO, (School Board Guaranty Insured) 0.00%, 06/15/2038(3) | 530,162 |
| 2,500,000 | Oregon Health & Science University 4.00%, 07/01/2046 | 2,833,204 |
| | Port of Portland, OR, Airport Rev | |
| 4,880,000 | 5.00%, 07/01/2031 | 6,014,248 |
| 3,920,000 | 5.00%, 07/01/2032 | 4,837,678 |
| 1,045,000 | 5.00%, 07/01/2033 | 1,328,022 |
| | Salem Hospital Facs Auth, OR Rev | |
| 910,000 | 5.00%, 05/15/2038 | 1,035,476 |
| 720,000 | 5.00%, 05/15/2048 | 811,256 |
| | State of Oregon Housing & Community Services Department | |
| 3,095,000 | 3.00%, 01/01/2052 | 3,321,337 |
| 1,640,000 | 4.50%, 01/01/2049 | 1,771,394 |
| 5,965,000 | 4.50%, 07/01/2049 | 6,480,094 |
| | Umatilla County, OR, School Dist No. 8R Hermiston, GO, (School Board Guaranty Insured) | |
| 1,500,000 | 0.01%, 06/15/2036(3) | 1,056,047 |
| 1,600,000 | 0.01%, 06/15/2037(3) | 1,084,386 |
| 1,790,000 | 0.01%, 06/15/2038(3) | 1,166,304 |
| | | | 46,355,771 |
| | Pennsylvania - 3.8% |
| 840,000 | Allegheny County, PA, Industrial Dev Auth, Charter School 6.75%, 08/15/2035 | 843,108 |
| | City of Philadelphia, PA, GO | |
| 1,550,000 | 5.00%, 02/01/2033 | 1,947,483 |
| 2,000,000 | 5.00%, 02/01/2034 | 2,509,608 |
| 1,555,000 | 5.00%, 02/01/2035 | 1,937,819 |
| 225,000 | City of Philadelphia, PA, Redev Auth 5.00%, 04/15/2025 | 257,078 |
| 930,000 | City of Philadelphia, PA, Water & Wastewater Rev 5.00%, 11/01/2029 | 1,147,769 |
| | Commonwealth Finance Auth, PA | |
| 4,230,000 | 5.00%, 06/01/2026 | 4,929,155 |
| 125,000 | 5.00%, 06/01/2028 | 155,391 |
| 1,070,000 | 5.00%, 06/01/2029 | 1,318,837 |
| 145,000 | 5.00%, 06/01/2031 | 176,799 |
| | County of Beaver, PA, GO, (BAM Insured) | |
| 1,285,000 | , (BAM Insured) 5.00%, 11/15/2021 | 1,287,185 |
| 1,345,000 | , (BAM Insured) 5.00%, 11/15/2022 | 1,410,097 |
| 1,000,000 | Delaware River, PA, Joint Toll Bridge Commission 5.00%, 07/01/2031 | 1,210,917 |
| | Erie, PA, City School Dist, GO, (AGM State Aid Withholding Insured) | |
| 2,440,000 | , (AGM State Aid Withholding Insured) 5.00%, 04/01/2028 | 2,993,188 |
| 1,105,000 | , (AGM State Aid Withholding Insured) 5.00%, 04/01/2029 | 1,382,365 |
| 2,410,000 | Harrisburg, PA, School Dist, GO, (AGM State Aid Withholding Insured) 5.00%, 11/15/2026 | 2,888,389 |
| | Lancaster County, PA, Hospital Auth | |
| 635,000 | 5.00%, 07/01/2024 | 689,856 |
The accompanying notes are an integral part of these financial statements.
The Hartford Municipal Opportunities Fund
Schedule of Investments – (continued)
October 31, 2021
| Shares or Principal Amount | | Market Value† |
| MUNICIPAL BONDS - 97.1% - (continued) |
| | Pennsylvania - 3.8% - (continued) |
| $ 515,000 | 5.00%, 07/01/2025 | $ 573,555 |
| | Lancaster Industrial, PA, Dev Auth | |
| 1,250,000 | 4.00%, 07/01/2051 | 1,338,515 |
| 1,750,000 | 4.00%, 07/01/2056 | 1,867,731 |
| | Montgomery County, PA, Industrial Dev Auth Rev | |
| 1,760,000 | 5.00%, 12/01/2044 | 2,011,353 |
| 2,455,000 | 5.00%, 12/01/2046 | 2,677,895 |
| 920,000 | Pennsylvania Higher Educational Facs Auth 5.00%, 05/01/2032 | 1,125,951 |
| | Pennsylvania Turnpike Commission Rev | |
| 2,000,000 | 0.95%, 12/01/2021, SIFMA(4) | 2,001,058 |
| 1,000,000 | 5.00%, 12/01/2021 | 1,003,879 |
| 500,000 | 5.00%, 12/01/2027 | 595,115 |
| 1,000,000 | 5.00%, 12/01/2029 | 1,198,793 |
| 1,590,000 | 5.00%, 12/01/2030 | 1,903,204 |
| 2,000,000 | 5.00%, 12/01/2033 | 2,385,836 |
| 2,615,000 | 5.00%, 12/01/2037 | 2,750,487 |
| 755,000 | 5.00%, 12/01/2042 | 906,251 |
| | Philadelphia, PA, School Dist, GO, (State Aid Withholding Insured) | |
| 1,560,000 | 5.00%, 09/01/2022 | 1,621,771 |
| 2,000,000 | 5.00%, 09/01/2023 | 2,170,602 |
| 1,105,000 | 5.00%, 09/01/2025(7) | 1,286,488 |
| 1,100,000 | 5.00%, 09/01/2031 | 1,393,436 |
| 1,060,000 | 5.00%, 09/01/2032 | 1,340,182 |
| | Pittsburgh, PA, Water & Sewer Auth, (AGM Insured) | |
| 195,000 | 5.00%, 09/01/2032 | 247,535 |
| 950,000 | 5.00%, 09/01/2033 | 1,203,695 |
| 735,000 | 5.00%, 09/01/2034 | 928,948 |
| 500,000 | Reading, PA, School Dist, GO, (AGM State Aid Withholding Insured) 5.00%, 03/01/2038 | 594,145 |
| | School Dist. of Philadelphia/The | |
| 1,200,000 | 5.00%, 09/01/2024(7) | 1,352,574 |
| 1,310,000 | 5.00%, 09/01/2025(7) | 1,525,157 |
| 1,000,000 | 5.00%, 09/01/2026(7) | 1,197,633 |
| 1,000,000 | 5.00%, 09/01/2027(7) | 1,220,724 |
| 1,500,000 | Wilkes-Barre Area, PA, School Dist, GO, (BAM State Aid Withholding Insured) 5.00%, 04/15/2059 | 1,821,486 |
| | | | 67,329,043 |
| | Puerto Rico - 1.0% |
| 975,000 | Puerto Rico Highway & Transportation Auth, (AGM Insured) 4.95%, 07/01/2026 | 981,331 |
| | Puerto Rico Sales Tax Financing Corp. Sales Tax Rev | |
| 10,000,000 | 4.33%, 07/01/2040 | 10,974,729 |
| 4,750,000 | 5.00%, 07/01/2058 | 5,362,501 |
| | | | 17,318,561 |
| | Rhode Island - 0.9% |
| 1,975,000 | City of Cranston RI 1.00%, 08/23/2022 | 1,987,508 |
| | Rhode Island Health & Educational Building Corp., (AGM ST APPROP Insured) | |
| 2,700,000 | 5.00%, 05/15/2027 | 3,104,985 |
| 2,020,000 | 5.00%, 05/15/2028 | 2,455,581 |
| | Rhode Island Housing & Mortgage Finance Corp., (GNMA/FNMA/FHLMC Insured) | |
| 740,000 | 2.75%, 04/01/2040 | 768,450 |
| Shares or Principal Amount | | Market Value† |
| MUNICIPAL BONDS - 97.1% - (continued) |
| | Rhode Island - 0.9% - (continued) |
| $ 5,085,000 | 4.00%, 10/01/2048 | $ 5,560,235 |
| | Rhode Island Student Loan Auth | |
| 225,000 | 5.00%, 12/01/2027 | 272,117 |
| 1,000,000 | 5.00%, 12/01/2028 | 1,231,222 |
| | | | 15,380,098 |
| | South Carolina - 2.1% |
| 1,987,000 | Lancaster County, SC, Sun City Assessment Rev 7.70%, 11/01/2017(5) | 417,270 |
| 3,485,000 | Piedmont Municipal Power Agency 5.00%, 01/01/2023 | 3,675,421 |
| | South Carolina Jobs-Economic Dev Auth | |
| 4,355,000 | 5.00%, 05/01/2029 | 5,380,020 |
| 1,375,000 | 5.00%, 05/01/2048 | 1,636,463 |
| 1,000,000 | 5.25%, 08/01/2024 | 1,086,518 |
| | South Carolina Port Auth | |
| 1,420,000 | 4.00%, 07/01/2034 | 1,550,877 |
| 1,240,000 | 5.00%, 07/01/2029 | 1,563,204 |
| 1,100,000 | 5.00%, 07/01/2030 | 1,377,204 |
| 5,090,000 | 5.00%, 07/01/2031 | 6,297,727 |
| 1,000,000 | 5.00%, 07/01/2033 | 1,224,388 |
| | South Carolina Public Service Auth | |
| 3,000,000 | 4.00%, 12/01/2033 | 3,603,920 |
| 1,000,000 | 5.00%, 12/01/2026 | 1,208,123 |
| | South Carolina State Public Service Auth | |
| 3,125,000 | 5.00%, 12/01/2031 | 3,763,071 |
| 1,400,000 | 5.00%, 12/01/2032 | 1,805,020 |
| 2,350,000 | 5.00%, 12/01/2034 | 2,644,805 |
| | | | 37,234,031 |
| | South Dakota - 0.5% |
| | South Dakota Housing Dev Auth Rev, (GNMA/FNMA/FHLMC Insured) | |
| 1,125,000 | 2.45%, 11/01/2023 | 1,167,291 |
| 1,015,000 | 3.00%, 11/01/2051 | 1,089,798 |
| 1,190,000 | 3.50%, 11/01/2046 | 1,255,866 |
| 2,470,000 | 3.75%, 11/01/2050 | 2,698,543 |
| 525,000 | 4.00%, 11/01/2047 | 565,347 |
| | South Dakota State Educational Enhancement Funding Corp. | |
| 1,395,000 | 5.00%, 06/01/2024 | 1,498,832 |
| 1,000,000 | 5.00%, 06/01/2026 | 1,074,431 |
| | | | 9,350,108 |
| | Tennessee - 0.7% |
| 890,000 | Chattanooga, TN, Health Educational & Housing Facs Board Rev 5.00%, 08/01/2044 | 1,068,501 |
| 2,940,000 | Metropolitan Gov't Nashville & Davidson County Health & Educational Facs Bd 0.00%, 07/01/2031 | 3,767,204 |
| 570,000 | Tennessee Energy Acquisition Corp. 5.25%, 09/01/2026 | 673,478 |
| | Tennessee Housing Dev Agency | |
| 1,015,000 | 3.50%, 07/01/2045 | 1,073,701 |
| 2,800,000 | 3.50%, 01/01/2047 | 2,957,074 |
| 3,150,000 | 4.00%, 01/01/2049 | 3,406,978 |
| | | | 12,946,936 |
The accompanying notes are an integral part of these financial statements.
The Hartford Municipal Opportunities Fund
Schedule of Investments – (continued)
October 31, 2021
| Shares or Principal Amount | | Market Value† |
| MUNICIPAL BONDS - 97.1% - (continued) |
| | Texas - 7.5% |
| $ 1,000,000 | Arlington, TX, Higher Education Finance Corp. Rev, (PSF-GTD Insured) 5.00%, 08/15/2027 | $ 1,127,725 |
| 1,000,000 | Arlington, TX, Special Tax Rev, (AGM Insured) 5.00%, 02/15/2034 | 1,134,949 |
| 1,620,000 | Austin, TX, Independent School Dist, GO, (PSF-GTD Insured) 4.00%, 08/01/2033 | 1,907,765 |
| | Central Texas Regional Mobility Auth | |
| 3,805,000 | 4.00%, 01/01/2037 | 4,409,040 |
| 1,000,000 | 5.00%, 01/01/2033 | 1,281,718 |
| 1,000,000 | 5.00%, 01/01/2036 | 1,267,842 |
| 1,500,000 | Central Texas Turnpike System 5.00%, 08/15/2037 | 1,675,433 |
| | City of Austin, TX, Airport System Rev | |
| 2,100,000 | 5.00%, 11/15/2022 | 2,202,602 |
| 595,000 | 5.00%, 11/15/2026 | 711,490 |
| 1,125,000 | 5.00%, 11/15/2028 | 1,337,834 |
| 560,000 | 5.00%, 11/15/2030 | 665,801 |
| | City of Dallas TX Hotel Occupancy Tax Rev. | |
| 2,015,000 | 4.00%, 08/15/2031(7) | 2,260,702 |
| 1,075,000 | 4.00%, 08/15/2033(7) | 1,203,568 |
| 1,250,000 | 4.00%, 08/15/2034(7) | 1,399,078 |
| | City of Houston, TX, Airport System Rev | |
| 1,300,000 | 5.00%, 07/01/2030 | 1,650,718 |
| 1,000,000 | 5.00%, 07/01/2031 | 1,263,559 |
| 1,200,000 | 5.00%, 07/01/2033 | 1,507,356 |
| 1,060,000 | City of Houston, TX, Hotel Occupancy Tax & Special, (AGM-CR AMBAC Insured) 0.00%, 09/01/2025(3) | 1,012,299 |
| 3,685,000 | City of San Antonio, TX, Electric & Gas Systems Rev 1.75%, 02/01/2049(2) | 3,850,434 |
| 2,550,000 | Clear Creek, TX, Independent School Dist 0.28%, 02/15/2038(2) | 2,537,297 |
| | Clifton, TX, Higher Education Finance Corp., (PSF-GTD Insured) | |
| 1,000,000 | 4.00%, 08/15/2029 | 1,162,369 |
| 1,050,000 | 4.00%, 08/15/2030 | 1,185,361 |
| 500,000 | 4.00%, 08/15/2031 | 563,216 |
| 1,000,000 | Dallas, TX, Area Rapid Transit Sales Tax Rev 5.00%, 12/01/2030 | 1,172,954 |
| | Dallas-Fort Worth, TX, International Airport Rev | |
| 1,570,000 | 5.00%, 11/01/2021 | 1,570,000 |
| 1,000,000 | 5.00%, 11/01/2023 | 1,092,577 |
| 1,000,000 | 5.00%, 11/01/2024 | 1,135,290 |
| 1,500,000 | Grapevine-Colleyville, TX, Independent School Dist, GO, (PSF-GTD Insured) 5.00%, 08/15/2027 | 1,749,838 |
| | Harris County - Houston, TX, Sports Auth | |
| 2,640,000 | 5.00%, 11/15/2030 | 2,914,052 |
| 500,000 | 5.00%, 11/15/2032 | 551,936 |
| 2,950,000 | 5.00%, 11/15/2034 | 3,256,841 |
| 1,605,000 | Harris County, TX, Toll Road Auth Rev 5.00%, 08/15/2032 | 1,978,727 |
| | Kerrville, TX, Health Facs Dev Corp. | |
| 1,300,000 | 5.00%, 08/15/2024 | 1,453,949 |
| 1,500,000 | 5.00%, 08/15/2035 | 1,679,632 |
| 1,580,000 | La Joya, TX, Independent School Dist, GO, (PSF-GTD Insured) 5.00%, 02/15/2025 | 1,746,425 |
| | Lower Alabama Gas District, Rev | |
| 9,855,000 | 4.00%, 12/01/2050(2) | 11,053,130 |
| 4,000,000 | 5.00%, 09/01/2031 | 5,069,204 |
| Shares or Principal Amount | | Market Value† |
| MUNICIPAL BONDS - 97.1% - (continued) |
| | Texas - 7.5% - (continued) |
| | New Hope, TX, Cultural Education Facs Finance Corp. | |
| $ 1,000,000 | 4.00%, 11/01/2049 | $ 1,114,875 |
| 1,000,000 | 4.00%, 11/01/2055 | 1,109,501 |
| 3,375,000 | 5.00%, 11/01/2031 | 3,645,137 |
| 1,000,000 | 5.00%, 11/01/2046 | 1,068,585 |
| | North Texas Tollway Auth Rev, (AGC Insured) | |
| 5,000,000 | 0.00%, 01/01/2032(3) | 4,106,239 |
| 1,000,000 | 5.00%, 01/01/2030 | 1,094,205 |
| 1,200,000 | 5.00%, 01/01/2035 | 1,399,816 |
| 1,440,000 | San Antonio, TX, Water Rev 5.00%, 05/15/2031 | 1,703,592 |
| 1,000,000 | Spring Branch, TX, Independent School Dist, GO, (PSF-GTD Insured) 5.00%, 02/01/2026 | 1,144,721 |
| | State of Texas, GO | |
| 22,175,000 | 0.06%, 06/01/2043(2) | 22,175,000 |
| 1,500,000 | 4.00%, 08/01/2029 | 1,682,027 |
| 1,085,000 | 4.00%, 08/01/2030 | 1,214,954 |
| 2,575,000 | Tarrant County, TX, Cultural Education Facs 5.00%, 10/01/2034 | 2,820,163 |
| 6,900,000 | Texas Municipal Gas Acquisition & Supply Corp. III 5.00%, 12/15/2030 | 8,772,872 |
| 1,540,000 | Texas Municipal Gas Acquisition & Supply Corp. Rev 6.25%, 12/15/2026 | 1,781,064 |
| 1,755,000 | Texas Transportation Commission 0.00%, 08/01/2038(3) | 946,340 |
| 3,000,000 | Waco Educational Finance Corp. 4.00%, 03/01/2051 | 3,452,682 |
| | | | 132,974,484 |
| | Utah - 0.2% |
| 490,000 | Salt Lake County, UT, Rev, (AMBAC Insured) 5.13%, 02/15/2033 | 555,125 |
| 1,125,000 | State of Utah, GO 3.00%, 07/01/2034 | 1,240,841 |
| 1,165,000 | Utah Housing Corp. Rev, (FHA Insured) 4.00%, 01/01/2045 | 1,239,488 |
| | | | 3,035,454 |
| | Vermont - 0.2% |
| | Vermont Housing Finance Agency | |
| 945,000 | 4.00%, 11/01/2045 | 980,020 |
| 1,050,000 | 4.00%, 11/01/2046 | 1,125,936 |
| 1,540,000 | 4.00%, 05/01/2048 | 1,636,302 |
| | | | 3,742,258 |
| | Virginia - 0.8% |
| 880,000 | Arlington County, VA, Industrial Dev Auth Rev 5.00%, 07/01/2030 | 1,142,129 |
| 6,020,000 | Hampton Roads Transportation, VA, Accountability Commission 5.00%, 07/01/2026 | 7,198,957 |
| 4,300,000 | Virginia State College Building Auth 5.00%, 02/01/2025 | 4,932,813 |
| 1,470,000 | Virginia State Small Business Financing Auth Rev 5.00%, 01/01/2027 | 1,769,012 |
| | | | 15,042,911 |
| | Washington - 1.1% |
| 2,060,000 | Chelan County, WA, Public Utility Dist No. 1, (NATL Insured) 0.00%, 06/01/2028(3) | 1,886,350 |
| 1,400,000 | County of King, WA, GO 5.00%, 01/01/2031 | 1,764,490 |
| 3,000,000 | Port of Seattle, WA, Rev 5.00%, 05/01/2033 | 3,545,108 |
The accompanying notes are an integral part of these financial statements.
The Hartford Municipal Opportunities Fund
Schedule of Investments – (continued)
October 31, 2021
| Shares or Principal Amount | | Market Value† |
| MUNICIPAL BONDS - 97.1% - (continued) |
| | Washington - 1.1% - (continued) |
| | Washington State Health Care Facs Auth Rev | |
| $ 780,000 | 5.00%, 07/01/2028 | $ 888,264 |
| 2,000,000 | 5.00%, 03/01/2029 | 2,261,064 |
| 1,400,000 | Washington State Housing Finance Commission 5.00%, 01/01/2049(1) | 1,559,476 |
| 6,365,000 | Washington State Housing Finance Commission Rev, (GNMA/FNMA/FHLMC Insured) 3.00%, 12/01/2049 | 6,861,487 |
| | | | 18,766,239 |
| | West Virginia - 0.1% |
| 1,000,000 | West Virginia Housing Dev Fund 2.80%, 11/01/2022 | 1,020,013 |
| 1,555,000 | West Virginia State Economic Dev Auth 2.55%, 03/01/2040(2) | 1,620,809 |
| | | | 2,640,822 |
| | Wisconsin - 3.3% |
| 1,790,000 | Milwaukee County, WI, Airport Rev 5.00%, 12/01/2025 | 1,954,444 |
| | Public Finance Auth, WI | |
| 2,550,000 | 4.00%, 07/01/2046 | 2,900,904 |
| 1,530,000 | 4.00%, 07/01/2050 | 1,696,667 |
| 1,305,000 | 5.00%, 09/01/2025(1) | 1,393,847 |
| 2,940,000 | 5.00%, 07/01/2035 | 3,543,648 |
| 1,050,000 | 5.00%, 07/01/2036 | 1,262,713 |
| 2,875,000 | 5.00%, 10/01/2043(1) | 3,149,022 |
| 2,340,000 | 5.00%, 10/01/2044 | 2,817,379 |
| 2,015,000 | 5.00%, 10/01/2053(1) | 2,196,062 |
| | Univ. of Wisconsin Hospitals & Clinics | |
| 1,060,000 | 4.00%, 04/01/2036(7) | 1,253,439 |
| 1,595,000 | 4.00%, 04/01/2039(7) | 1,869,426 |
| 1,350,000 | Wisconsin Center Dist, WI, (AGM Insured) 0.00%, 12/15/2031(3) | 1,074,530 |
| | Wisconsin Health & Educational Facs Auth Rev | |
| 1,205,000 | 0.50%, 11/01/2050(2) | 1,202,121 |
| 9,140,000 | 3.00%, 03/01/2052 | 9,859,543 |
| 1,200,000 | 4.00%, 08/15/2051 | 1,354,254 |
| 1,700,000 | 4.00%, 08/15/2055 | 1,904,421 |
| 3,000,000 | 5.00%, 11/15/2027 | 3,405,560 |
| 1,700,000 | 5.00%, 12/01/2028 | 1,925,634 |
| 7,275,000 | 5.00%, 11/01/2039 | 8,133,636 |
| 1,000,000 | 5.00%, 11/01/2054 | 1,100,754 |
| 5,670,000 | Wisconsin Housing & Economic Dev Auth 0.20%, 11/01/2038(2) | 5,670,000 |
| | | | 59,668,004 |
| | Wyoming - 0.1% |
| 850,000 | Wyoming Community Dev Auth 4.00%, 12/01/2046 | 907,356 |
| | Total Municipal Bonds
(cost $1,664,288,096) | | $ 1,732,549,151 |
| Shares or Principal Amount | | Market Value† |
| SHORT-TERM INVESTMENTS - 2.7% |
| | Repurchase Agreements - 2.7% |
| $ 48,645,768 | Fixed Income Clearing Corp. Repurchase Agreement dated 10/29/2021 at 0.010%, due on 11/01/2021 with a maturity value of $48,645,809; collateralized by U.S. Treasury Bond at 1.875%, maturing 02/15/2041, with a market value of $49,618,725 | $ 48,645,768 |
| | Total Short-Term Investments
(cost $48,645,768) | $ 48,645,768 |
| | Total Investments
(cost $1,712,933,864) | 99.8% | $ 1,781,194,919 |
| | Other Assets and Liabilities | 0.2% | 3,235,539 |
| | Total Net Assets | 100.0% | $ 1,784,430,458 |
| Note: | Percentage of investments as shown is the ratio of the total market value to total net assets. |
| | The Fund may refer to any one or more of the industry classifications used by one or more widely recognized market indices, ratings group and/or as defined by Fund management. Industry classifications may not be identical across all security types. |
| | For Fund compliance purposes, the Fund may not use the same classification system. These classifications are used for financial reporting purposes. |
| | See “Glossary” for abbreviation descriptions. |
| (1) | Security was purchased pursuant to Rule 144A under the Securities Act of 1933 and may be sold in transactions that are exempt from registration (typically only to qualified institutional buyers) or in a public offering registered under the Securities Act of 1933. At October 31, 2021, the aggregate value of these securities was $29,531,948, representing 1.7% of net assets. |
| (2) | Variable or floating rate security, which interest rate adjusts periodically based on changes in current interest rates and prepayments on the underlying pool of assets. Rate shown is the rate in effect as of period end. |
| (3) | Security is a zero-coupon bond. |
| (4) | Variable rate securities; the rate reported is the coupon rate in effect at October 31, 2021. Base lending rates may be subject to a floor or cap. |
| (5) | Non-income producing. For long-term debt securities, items identified are in default as to payment of interest and/or principal. |
| (6) | Security is a “step-up” bond where coupon increases or steps up at a predetermined date. Rate shown is current coupon rate. |
| (7) | This security, or a portion of this security, was purchased on a when-issued, delayed-delivery or delayed-draw basis. The cost of these securities was $18,006,687 at October 31, 2021. |
| † | See Significant Accounting Policies of accompanying Notes to Financial Statements regarding valuation of investments. |
The accompanying notes are an integral part of these financial statements.
The Hartford Municipal Opportunities Fund
Schedule of Investments – (continued)
October 31, 2021
Fair Value Summary
The following is a summary of the fair valuations according to the inputs used as of October 31, 2021 in valuing the Fund’s investments.
| Description | | Total | | Level 1 | | Level 2 | | Level 3(1) |
| Assets | | | | | | | | |
| Municipal Bonds | | $ 1,732,549,151 | | $ — | | $ 1,732,549,151 | | $ — |
| Short-Term Investments | | 48,645,768 | | — | | 48,645,768 | | — |
| Total | | $ 1,781,194,919 | | $ — | | $ 1,781,194,919 | | $ — |
| (1) | For the year ended October 31, 2021, there were no transfers in and out of Level 3. |
The accompanying notes are an integral part of these financial statements.
Hartford Municipal Short Duration Fund
Schedule of Investments
October 31, 2021
| Shares or Principal Amount | | Market Value† |
| MUNICIPAL BONDS - 93.5% |
| | Alabama - 3.0% |
| $ 400,000 | Black Belt Energy Gas Dist, AL, 4.00%, 12/01/2022 | $ 415,521 |
| 250,000 | State of Alabama, Docks Department, (AGM Insured) 5.00%, 10/01/2024 | 281,012 |
| 350,000 | State of Alabama, Troy University, (BAM Insured) 5.00%, 11/01/2024 | 396,454 |
| | | | 1,092,987 |
| | Alaska - 0.3% |
| 100,000 | Northern Tobacco Securitization Corp. 0.50%, 06/01/2031 | 97,693 |
| | Arizona - 0.9% |
| 100,000 | Maricopa County, AZ, Industrial Dev Auth 5.00%, 09/01/2022 | 103,968 |
| | Tempe, AZ, Industrial Dev Auth Rev | |
| 10,000 | 4.00%, 10/01/2023(1) | 10,003 |
| 215,000 | 4.00%, 12/01/2023 | 226,058 |
| | | | 340,029 |
| | California - 2.8% |
| 100,000 | California County, CA, Tobacco Securitization Agency 4.00%, 06/01/2022 | 101,976 |
| 200,000 | California Enterprise Dev Auth 5.00%, 08/01/2025 | 229,348 |
| 40,000 | California Public Finance Auth 2.38%, 11/15/2028(1) | 40,328 |
| | Cathedral City, CA, Redev Agency Successor Agency | |
| 55,000 | 4.00%, 08/01/2022 | 56,316 |
| 10,000 | 4.00%, 08/01/2023 | 10,565 |
| | City of Fontana, CA, Special Tax | |
| 100,000 | 3.00%, 09/01/2025 | 106,194 |
| 125,000 | 4.00%, 09/01/2026 | 139,171 |
| 120,000 | 4.00%, 09/01/2027 | 134,903 |
| 100,000 | Foothill-Eastern Transportation Corridor Agency, CA 5.00%, 01/15/2027 | 118,057 |
| 75,000 | Roseville, CA, Natural Gas Financing Auth 5.00%, 02/15/2023 | 79,418 |
| | | | 1,016,276 |
| | Colorado - 2.5% |
| 150,000 | Denver, CO, Convention Center Hotel Auth 5.00%, 12/01/2022 | 157,001 |
| 70,000 | E-470 Public Highway, CO, Auth Rev 0.38%, 09/01/2039, 1 mo. USD SOFR + 0.350%(2) | 70,150 |
| 150,000 | Park Creek, CO, Metropolitan Dist Rev 5.00%, 12/01/2021 | 150,545 |
| | Regional, CO, Transportation Dist | |
| 325,000 | 5.00%, 01/15/2025 | 367,366 |
| 60,000 | 5.00%, 07/15/2025 | 68,831 |
| 105,000 | Vauxmont, CO, Metropolitan Dist, GO, (AGM Insured) 5.00%, 12/15/2022 | 110,186 |
| | | | 924,079 |
| | Florida - 6.7% |
| 250,000 | Alachua County, FL, Health Facs Auth 4.00%, 12/01/2023 | 268,397 |
| 175,000 | Capital Projects, FL, Finance Auth 5.00%, 10/01/2024 | 193,295 |
| 200,000 | City of Atlantic Beach, FL 3.00%, 11/15/2023 | 200,287 |
| | Florida Dev Finance Corp. | |
| 15,000 | 5.00%, 04/01/2023 | 15,960 |
| 125,000 | 5.00%, 04/01/2025 | 142,972 |
| 100,000 | JEA, FL, Electric System Rev 5.00%, 10/01/2022 | 104,324 |
| Shares or Principal Amount | | Market Value† |
| MUNICIPAL BONDS - 93.5% - (continued) |
| | Florida - 6.7% - (continued) |
| $ 360,000 | Miami-Dade County Expressway Auth, (BAM-TCRS Insured) 5.00%, 07/01/2025 | $ 403,647 |
| 50,000 | Miami-Dade County, FL, Aviation Rev 5.00%, 10/01/2024 | 56,357 |
| 145,000 | Miami-Dade County, FL, Seaport Department Rev 5.00%, 10/01/2022 | 151,164 |
| 250,000 | Orange County, FL, Convention Center/Orlando 5.00%, 10/01/2023 | 271,659 |
| 100,000 | Osceola County, FL, Transportation Rev 5.00%, 10/01/2025 | 115,912 |
| 115,000 | Palm Beach County, FL, Health Facs Auth 2.63%, 06/01/2025 | 116,872 |
| 135,000 | Seminole County, FL, Industrial Dev Auth 3.75%, 11/15/2025 | 135,562 |
| 145,000 | St. Johns County, FL, Industrial Dev Auth 4.00%, 12/15/2024 | 155,409 |
| 100,000 | Village Community Dev Dist No. 13 1.80%, 05/01/2026 | 99,871 |
| | | | 2,431,688 |
| | Georgia - 2.1% |
| | Burke County, GA, Dev Auth Rev | |
| 250,000 | 1.55%, 12/01/2049(3) | 252,439 |
| 100,000 | 3.00%, 11/01/2045(3) | 103,117 |
| 50,000 | Main Street Natural Gas, Inc., GA 4.00%, 08/01/2049(3) | 54,959 |
| | Municipal Electric Auth, GA | |
| 100,000 | 5.00%, 11/01/2021 | 100,000 |
| 100,000 | 5.00%, 11/01/2022 | 104,644 |
| 140,000 | 5.00%, 01/01/2024 | 153,667 |
| | | | 768,826 |
| | Illinois - 16.8% |
| 40,000 | Champaign County, IL, Community Unit School Dist No. 4 Champaign, GO 0.00%, 01/01/2025(4) | 38,981 |
| | Chicago, IL, Board of Education, GO, (NATL Insured) | |
| 45,000 | 0.00%, 12/01/2021(4) | 44,983 |
| 55,000 | 0.00%, 12/01/2022(4) | 54,647 |
| 150,000 | 0.00%, 12/01/2024(4) | 145,755 |
| 200,000 | 5.00%, 12/01/2021 | 200,744 |
| 200,000 | 5.00%, 12/01/2022 | 209,672 |
| 225,000 | Chicago, IL, Midway International Airport Rev 5.00%, 01/01/2023 | 237,077 |
| 280,000 | Chicago, IL, O'Hare International Airport 5.00%, 01/01/2023 | 295,164 |
| 100,000 | Chicago, IL, Transit Auth 5.00%, 12/01/2022 | 100,390 |
| | City of Chicago, IL, GO | |
| 135,000 | 5.00%, 01/01/2022 | 136,040 |
| 50,000 | 5.00%, 01/01/2023 | 52,550 |
| | City of Chicago, IL, Wastewater Transmission Rev, (NATL Insured) | |
| 160,000 | 0.00%, 01/01/2022 | 159,899 |
| 210,000 | 0.00%, 01/01/2024 | 206,980 |
| | City of Decatur, IL, GO, (AGM Insured) | |
| 65,000 | 3.00%, 03/01/2022 | 65,488 |
| 150,000 | 5.00%, 03/01/2023 | 158,390 |
| 200,000 | Cook County, IL, GO 5.00%, 11/15/2022 | 209,922 |
| 120,000 | Illinois Housing Dev Auth 3.05%, 08/01/2022 | 122,078 |
| | Illinois State Finance Auth Rev | |
| 100,000 | 5.00%, 11/15/2021 | 100,170 |
| 75,000 | 5.00%, 05/15/2050(3) | 83,442 |
The accompanying notes are an integral part of these financial statements.
Hartford Municipal Short Duration Fund
Schedule of Investments – (continued)
October 31, 2021
| Shares or Principal Amount | | Market Value† |
| MUNICIPAL BONDS - 93.5% - (continued) |
| | Illinois - 16.8% - (continued) |
| $ 100,000 | Kane County, IL, School Dist No. 131 Aurora East Side, GO, (AGM Insured) 5.00%, 12/01/2026 | $ 118,890 |
| | Kendall Kane & Will Counties, IL, Unified School Dist, GO, (AGM Insured) | |
| 225,000 | 0.00%, 02/01/2025(4) | 219,660 |
| 205,000 | 5.00%, 02/01/2027 | 244,649 |
| | Metropolitan Pier & Exposition Auth, IL, (NATL Insured) | |
| 310,000 | 5.50%, 12/15/2022 | 307,617 |
| 75,000 | 5.50%, 12/15/2023 | 80,413 |
| 150,000 | Railsplitter, IL, Tobacco Settlement Auth 5.00%, 06/01/2022 | 154,073 |
| 200,000 | Regional Transportation Auth 6.50%, 07/01/2026 | 238,365 |
| | Sales Tax Securitization Corp., IL | |
| 150,000 | 5.00%, 01/01/2024 | 164,199 |
| 500,000 | 5.00%, 01/01/2026 | 584,150 |
| 45,000 | 5.00%, 01/01/2027 | 54,003 |
| | State of Illinois, GO | |
| 120,000 | 5.00%, 02/01/2022 | 121,415 |
| 200,000 | 5.00%, 11/01/2022 | 209,235 |
| 100,000 | 5.00%, 10/01/2023 | 108,470 |
| 300,000 | 5.00%, 11/01/2025 | 346,453 |
| 250,000 | 5.00%, 03/01/2026 | 290,863 |
| 70,000 | State of Illinois, Sales Tax Rev 5.00%, 06/15/2026 | 82,570 |
| 150,000 | Village of Bolingbrook, IL, GO, (AGM Insured) 5.00%, 01/01/2023 | 158,087 |
| | | | 6,105,484 |
| | Indiana - 0.9% |
| 250,000 | Crown Point Multi School Building Corp. 5.00%, 07/15/2024 | 279,725 |
| 55,000 | Indiana Housing & Community Dev Auth Rev, (GNMA/FNMA/FHLMC Insured) 3.00%, 07/01/2051 | 59,098 |
| | | | 338,823 |
| | Iowa - 1.2% |
| 225,000 | Iowa Finance Auth, (GNMA/FNMA/FHLMC Insured) 3.00%, 07/01/2051 | 242,573 |
| 30,000 | Iowa Student Loan Liquidity Corp. 5.00%, 12/01/2022 | 31,490 |
| 145,000 | Iowa Tobacco Settlement Auth 0.38%, 06/01/2030 | 144,887 |
| 10,000 | State of Iowa, Finance Auth Rev 2.88%, 05/15/2049 | 10,040 |
| | | | 428,990 |
| | Kentucky - 0.7% |
| 40,000 | Kentucky Bond Dev Corp. 5.00%, 09/01/2023 | 43,281 |
| 200,000 | Kentucky Public Energy Auth 4.00%, 01/01/2049(3) | 219,476 |
| | | | 262,757 |
| | Louisiana - 1.1% |
| 200,000 | New Orleans, LA, Aviation Board 5.00%, 01/01/2023 | 210,808 |
| 170,000 | Parish of St. John the Baptist, LA 2.13%, 06/01/2037(3) | 175,150 |
| | | | 385,958 |
| Shares or Principal Amount | | Market Value† |
| MUNICIPAL BONDS - 93.5% - (continued) |
| | Maine - 1.0% |
| $ 70,000 | Finance Auth of Maine Rev, (AGM Insured) 5.00%, 12/01/2021 | $ 70,266 |
| 250,000 | Maine Health & Higher Educational Facs Auth, (AGM Insured) 5.00%, 07/01/2025 | 290,013 |
| | | | 360,279 |
| | Massachusetts - 4.1% |
| | Massachusetts Dev Finance Agency, Rev | |
| 100,000 | 3.50%, 10/01/2022(1) | 102,713 |
| 150,000 | 5.00%, 07/01/2022 | 154,674 |
| 150,000 | 5.00%, 07/01/2024 | 167,931 |
| 770,000 | 5.00%, 07/01/2025 | 888,733 |
| | Massachusetts Educational Financing Auth | |
| 80,000 | 5.00%, 07/01/2023 | 85,985 |
| 80,000 | 5.00%, 07/01/2024 | 89,201 |
| | | | 1,489,237 |
| | Michigan - 1.0% |
| 70,000 | City of Detroit, MI, GO, 5.00%, 04/01/2022 | 71,145 |
| 235,000 | Delton Kellogg Schools, MI, GO, (Q-SBLF Insured) 5.00%, 05/01/2026 | 279,319 |
| | | | 350,464 |
| | Minnesota - 3.3% |
| 200,000 | Duluth, MN, Independent School Dist No. 709, (SCP Insured) 5.00%, 02/01/2022 | 202,115 |
| | Minnesota Housing Finance Agency | |
| 500,000 | 3.00%, 01/01/2051 | 536,679 |
| 400,000 | 5.00%, 09/01/2024 | 452,289 |
| | | | 1,191,083 |
| | Mississippi - 0.6% |
| 20,000 | Mississippi Home Corp., (GNMA/FNMA/FHLMC Insured) 3.00%, 12/01/2050 | 21,499 |
| 165,000 | Mississippi State Gaming Tax Rev 5.00%, 10/15/2026 | 191,274 |
| | | | 212,773 |
| | Missouri - 0.9% |
| 50,000 | City of St. Louis, MO, Airport Rev, (AGM Insured) 5.00%, 07/01/2023 | 53,828 |
| 100,000 | Kirkwood, MO, Industrial Dev Auth Retirement Community 5.00%, 05/15/2022 | 101,742 |
| 150,000 | St. Louis County, MO, Industrial Dev Auth 5.00%, 09/01/2023 | 160,061 |
| | | | 315,631 |
| | Nebraska - 2.0% |
| 120,000 | Central Plains, NE, Energy Project 5.25%, 12/01/2021 | 120,479 |
| | Nebraska Investment Finance Auth Rev | |
| 145,000 | 4.00%, 09/01/2048 | 157,713 |
| 300,000 | 5.00%, 01/01/2026 | 353,184 |
| 100,000 | Washington County, NE, Rev 0.90%, 09/01/2030(3) | 100,482 |
| | | | 731,858 |
| | Nevada - 2.0% |
| 95,000 | City of North Las Vegas, NV 3.50%, 06/01/2022 | 96,062 |
| 150,000 | City of Reno, NV, Sales Tax Rev, (AGM Insured) 5.00%, 06/01/2024 | 165,002 |
| 25,000 | City of Sparks, NV 2.50%, 06/15/2024(1) | 25,329 |
| | Clark County, NV, School Dist, GO | |
| 100,000 | 5.00%, 06/15/2025 | 115,489 |
| 270,000 | 5.00%, 06/15/2026 | 321,103 |
| | | | 722,985 |
The accompanying notes are an integral part of these financial statements.
Hartford Municipal Short Duration Fund
Schedule of Investments – (continued)
October 31, 2021
| Shares or Principal Amount | | Market Value† |
| MUNICIPAL BONDS - 93.5% - (continued) |
| | New Hampshire - 0.6% |
| $ 220,000 | New Hampshire Business Finance Auth 4.00%, 01/01/2024 | $ 232,631 |
| | New Jersey - 4.5% |
| 200,000 | City of Bayonne, NJ, GO, (AGM School Board Reserve Fund Insured) 0.00%, 07/01/2023(4) | 198,147 |
| | New Jersey Economic Dev Auth | |
| 290,000 | 5.00%, 06/15/2022 | 298,404 |
| 75,000 | 5.00%, 06/15/2023 | 80,516 |
| 140,000 | New Jersey Educational Facs Auth 5.00%, 07/01/2024 | 154,884 |
| | New Jersey Transportation Trust Fund Auth | |
| 410,000 | 0.00%, 12/15/2026 | 381,221 |
| 60,000 | 5.00%, 12/15/2023 | 65,760 |
| 40,000 | 5.00%, 12/15/2024 | 45,449 |
| 105,000 | Newark Board of Education, GO 5.00%, 07/15/2024 | 117,692 |
| 70,000 | State of New Jersey, GO 5.00%, 06/01/2026 | 82,882 |
| | Tobacco Settlement Financing Corp., NJ | |
| 125,000 | 5.00%, 06/01/2023 | 133,551 |
| 70,000 | 5.00%, 06/01/2025 | 80,119 |
| | | | 1,638,625 |
| | New Mexico - 1.9% |
| 250,000 | City of Santa Fe, NM, Rev 2.63%, 05/15/2025 | 250,219 |
| | New Mexico Mortgage Finance Auth, (GNMA/FNMA/FHLMC Insured) | |
| 55,000 | 3.75%, 03/01/2048 | 59,389 |
| 250,000 | 3.75%, 01/01/2050 | 272,388 |
| 105,000 | 4.00%, 01/01/2049 | 114,198 |
| | | | 696,194 |
| | New York - 5.2% |
| 135,000 | Brookhaven, NY, Local Dev Corp. 1.63%, 11/01/2025 | 138,405 |
| 25,000 | Huntington, NY, Local Dev Corp. 3.00%, 07/01/2025 | 25,629 |
| | Metropolitan Transportation Auth, NY, Rev | |
| 340,000 | 5.00%, 03/01/2022 | 345,285 |
| 265,000 | 5.00%, 11/15/2024 | 301,593 |
| 500,000 | 5.00%, 11/15/2034(3) | 554,548 |
| 180,000 | New York Liberty Dev Corp. 0.95%, 11/15/2027 | 175,861 |
| 310,000 | New York Transportation Dev Corp. 5.00%, 12/01/2025 | 355,938 |
| | | | 1,897,259 |
| | North Carolina - 1.1% |
| 400,000 | University of North Carolina at Chapel Hill 0.18%, 12/01/2041, 1 mo. USD LIBOR + 0.125%(2) | 400,025 |
| | North Dakota - 0.2% |
| 60,000 | North Dakota Housing Finance Agency 3.50%, 07/01/2046 | 63,613 |
| | Ohio - 1.5% |
| | Cleveland, OH, Airport System Rev, (AGM Insured) | |
| 60,000 | 5.00%, 01/01/2022 | 60,472 |
| 60,000 | 5.00%, 01/01/2023 | 63,315 |
| 150,000 | 5.00%, 01/01/2024 | 164,438 |
| 90,000 | County of Lucas, OH 5.00%, 11/15/2021 | 90,144 |
| 150,000 | Southern Ohio Port Auth Rev 6.25%, 12/01/2025(1) | 163,023 |
| | | | 541,392 |
| Shares or Principal Amount | | Market Value† |
| MUNICIPAL BONDS - 93.5% - (continued) |
| | Oklahoma - 0.6% |
| $ 225,000 | Oklahoma Dev Finance Auth 1.63%, 07/06/2023 | $ 226,532 |
| | Oregon - 1.0% |
| 60,000 | Salem Hospital Facs Auth, OR, Rev 5.00%, 05/15/2025 | 67,692 |
| | State of Oregon Housing & Community Services Department | |
| 190,000 | 3.00%, 01/01/2052 | 203,895 |
| 85,000 | 3.50%, 07/01/2048 | 89,977 |
| | | | 361,564 |
| | Pennsylvania - 2.6% |
| 100,000 | City of Philadelphia, PA, Redev Auth 5.00%, 04/15/2025 | 114,257 |
| | Lehigh County, PA, Industrial Dev Auth | |
| 65,000 | 1.80%, 02/15/2027(3) | 65,707 |
| 55,000 | 1.80%, 09/01/2029(3) | 55,631 |
| 300,000 | Pennsylvania Housing Finance Agency 3.00%, 10/01/2051 | 320,279 |
| 150,000 | Reading, PA, School Dist, GO, (AGM State Aid Withholding Insured) 5.00%, 03/01/2023 | 159,031 |
| 210,000 | Wilkes-Barre Area, PA, School Dist, GO, (BAM State Aid Withholding Insured) 5.00%, 04/15/2023 | 223,588 |
| | | | 938,493 |
| | Puerto Rico - 1.0% |
| | Puerto Rico Sales Tax Financing Corp. Sales Tax Rev | |
| 158,000 | 0.00%, 07/01/2024(4) | 151,027 |
| 244,000 | 0.00%, 07/01/2029(4) | 208,817 |
| | | | 359,844 |
| | Rhode Island - 2.1% |
| 40,000 | City of Cranston RI 1.00%, 08/23/2022 | 40,253 |
| 150,000 | Rhode Island Health & Educational Building Corp., (Municipal Government Guaranteed Insured) 5.00%, 05/15/2022 | 153,854 |
| 5,000 | Rhode Island Housing & Mortgage Finance Corp. 4.00%, 10/01/2032 | 5,070 |
| | Rhode Island Student Loan Auth | |
| 25,000 | 3.00%, 12/01/2024 | 25,608 |
| 100,000 | 5.00%, 12/01/2023 | 109,056 |
| 350,000 | 5.00%, 12/01/2027 | 423,294 |
| | | | 757,135 |
| | South Carolina - 0.9% |
| | Piedmont Municipal Power Agency | |
| 15,000 | 5.00%, 01/01/2023 | 15,820 |
| 70,000 | 5.00%, 01/01/2024 | 76,913 |
| 150,000 | South Carolina Jobs-Economic Dev Auth 5.00%, 05/01/2024 | 166,642 |
| 65,000 | South Carolina Public Service Auth 5.00%, 12/01/2025 | 76,385 |
| | | | 335,760 |
| | South Dakota - 1.1% |
| | South Dakota Housing Dev Auth Rev, (GNMA/FNMA/FHLMC Insured) | |
| 25,000 | 3.00%, 11/01/2051 | 26,842 |
| 340,000 | 4.00%, 05/01/2039 | 362,377 |
| | | | 389,219 |
The accompanying notes are an integral part of these financial statements.
Hartford Municipal Short Duration Fund
Schedule of Investments – (continued)
October 31, 2021
| Shares or Principal Amount | | Market Value† |
| MUNICIPAL BONDS - 93.5% - (continued) |
| | Tennessee - 3.3% |
| $ 250,000 | Chattanooga, TN, Health Educational & Housing Facs Board 5.00%, 08/01/2025 | $ 289,868 |
| 150,000 | Shelby County, TN, Health Educational & Housing Facs Board 4.00%, 09/01/2022(1) | 149,360 |
| | Tennessee Housing Dev Agency | |
| 465,000 | 1.25%, 01/01/2026 | 469,064 |
| 70,000 | 3.50%, 07/01/2045 | 74,048 |
| 110,000 | 3.50%, 01/01/2047 | 116,155 |
| 110,000 | 3.50%, 01/01/2048 | 116,485 |
| | | | 1,214,980 |
| | Texas - 6.2% |
| 100,000 | Arlington, TX, Higher Education Finance Corp., (PSF-GTD Insured) 4.00%, 12/01/2022 | 104,036 |
| 70,000 | Big Sandy, TX, Independent School Dist Upshur County, GO, (PSF-GTD Insured) 5.00%, 02/15/2024 | 77,349 |
| 100,000 | Central Texas Turnpike System Rev 5.00%, 08/15/2024 | 112,374 |
| 350,000 | City of Dallas TX Hotel Occupancy Tax Rev 4.00%, 08/15/2027 | 399,380 |
| 180,000 | City of Houston, TX, Airport System Rev 5.00%, 07/01/2027 | 185,756 |
| | City of Houston, TX, Hotel Occupancy Tax & Special Rev | |
| 40,000 | 4.00%, 09/01/2024 | 43,889 |
| 30,000 | 4.00%, 09/01/2026 | 34,395 |
| 105,000 | City of San Antonio, TX, Airport System Rev 5.00%, 07/01/2022 | 108,300 |
| 95,000 | City of San Antonio, TX, Electric & Gas Systems Rev 1.75%, 02/01/2049(3) | 99,265 |
| 290,000 | City of San Antonio, TX, GO 5.00%, 08/01/2024 | 326,867 |
| 50,000 | Harris County, TX, Metropolitan Transportation Auth 5.00%, 11/01/2022 | 52,394 |
| 300,000 | San Antonio Water System 1.00%, 05/01/2043(3) | 301,801 |
| 350,000 | Texas Municipal Gas Acquisition & Supply Corp. Rev 5.00%, 12/15/2027 | 425,469 |
| | | | 2,271,275 |
| | Utah - 0.4% |
| 130,000 | Salt Lake County, UT, Rev, (AMBAC Insured) 5.13%, 02/15/2033 | 147,278 |
| | Virginia - 0.4% |
| 120,000 | Hampton Roads Transportation, VA, Accountability Commission 5.00%, 07/01/2026 | 143,501 |
| | Washington - 1.3% |
| 195,000 | Tobacco Settlement Auth, WA 5.00%, 06/01/2024 | 208,473 |
| 250,000 | Washington State Housing Finance Commission 2.38%, 01/01/2026(1) | 250,166 |
| | | | 458,639 |
| | West Virginia - 1.8% |
| 500,000 | West Virginia Parkways Auth 5.00%, 06/01/2026 | 596,230 |
| 55,000 | West Virginia State Economic Dev Auth 2.55%, 03/01/2040(3) | 57,328 |
| | | | 653,558 |
| | Wisconsin - 1.9% |
| | Public Finance Auth, WI, (AGM Insured) | |
| 150,000 | 4.00%, 07/01/2025 | 167,246 |
| Shares or Principal Amount | | Market Value† |
| MUNICIPAL BONDS - 93.5% - (continued) |
| | Wisconsin - 1.9% - (continued) |
| $ 225,000 | 4.00%, 07/01/2026 | $ 256,100 |
| | Wisconsin Health & Educational Facs Auth Rev | |
| 40,000 | 0.50%, 11/01/2050(3) | 39,904 |
| 200,000 | 5.00%, 11/01/2025 | 221,155 |
| | | | 684,405 |
| | Total Municipal Bonds
(cost $33,587,275) | | $ 33,979,822 |
| SHORT-TERM INVESTMENTS - 6.5% |
| | Repurchase Agreements - 6.5% |
| 2,382,463 | Fixed Income Clearing Corp. Repurchase Agreement dated 10/29/2021 at 0.010%, due on 11/01/2021 with a maturity value of $2,382,465; collateralized by U.S. Treasury Bond at 1.875%, maturing 02/15/2041, with a market value of $2,430,187 | $ 2,382,463 |
| | Total Short-Term Investments
(cost $2,382,463) | $ 2,382,463 |
| | Total Investments
(cost $35,969,738) | 100.0% | $ 36,362,285 |
| | Other Assets and Liabilities | (0.0)% | (17,848) |
| | Total Net Assets | 100.0% | $ 36,344,437 |
| Note: | Percentage of investments as shown is the ratio of the total market value to total net assets. |
| | The Fund may refer to any one or more of the industry classifications used by one or more widely recognized market indices, ratings group and/or as defined by Fund management. Industry classifications may not be identical across all security types. |
| | For Fund compliance purposes, the Fund may not use the same classification system. These classifications are used for financial reporting purposes. |
| | See “Glossary” for abbreviation descriptions. |
| (1) | Security was purchased pursuant to Rule 144A under the Securities Act of 1933 and may be sold in transactions that are exempt from registration (typically only to qualified institutional buyers) or in a public offering registered under the Securities Act of 1933. At October 31, 2021, the aggregate value of these securities was $740,922, representing 2.0% of net assets. |
| (2) | Variable rate securities; the rate reported is the coupon rate in effect at October 31, 2021. Base lending rates may be subject to a floor or cap. |
| (3) | Variable or floating rate security, which interest rate adjusts periodically based on changes in current interest rates and prepayments on the underlying pool of assets. Rate shown is the rate in effect as of period end. |
| (4) | Security is a zero-coupon bond. |
| † | See Significant Accounting Policies of accompanying Notes to Financial Statements regarding valuation of investments. |
The accompanying notes are an integral part of these financial statements.
Hartford Municipal Short Duration Fund
Schedule of Investments – (continued)
October 31, 2021
Fair Value Summary
The following is a summary of the fair valuations according to the inputs used as of October 31, 2021 in valuing the Fund’s investments.
| Description | | Total | | Level 1 | | Level 2 | | Level 3(1) |
| Assets | | | | | | | | |
| Municipal Bonds | | $ 33,979,822 | | $ — | | $ 33,979,822 | | $ — |
| Short-Term Investments | | 2,382,463 | | — | | 2,382,463 | | — |
| Total | | $ 36,362,285 | | $ — | | $ 36,362,285 | | $ — |
| (1) | For the year ended October 31, 2021, there were no transfers in and out of Level 3. |
The accompanying notes are an integral part of these financial statements.
The Hartford Short Duration Fund
Schedule of Investments
October 31, 2021
| Shares or Principal Amount | | Market Value† |
| ASSET & COMMERCIAL MORTGAGE-BACKED SECURITIES - 24.1% |
| | Asset-Backed - Automobile - 1.1% |
| $ 1,700,000 | Avid Automobile Receivables Trust 1.18%, 08/15/2025(1) | $ 1,694,455 |
| | Credit Acceptance Auto Loan Trust | |
| 1,790,000 | 1.00%, 05/15/2030(1) | 1,782,690 |
| 1,565,000 | 1.26%, 10/15/2030(1) | 1,561,233 |
| 3,600,000 | Hertz Vehicle Financing LLC 1.21%, 12/26/2025(1) | 3,580,656 |
| | JP Morgan Chase Bank NA | |
| 3,466,731 | 0.89%, 12/26/2028(1) | 3,456,981 |
| 3,710,026 | 0.99%, 01/25/2028(1) | 3,716,812 |
| 8,000,000 | Lendbuzz Securitization Trust 1.46%, 06/15/2026(1) | 7,996,552 |
| | �� | | 23,789,379 |
| | Asset-Backed - Credit Card - 0.3% |
| 5,575,000 | Mercury Financial Credit Card Master Trust 1.54%, 03/20/2026(1) | 5,584,693 |
| | Asset-Backed - Finance & Insurance - 2.0% |
| 2,250,000 | Apidos CLO 1.20%, 04/15/2031, 3 mo. USD LIBOR + 1.080%(1)(2) | 2,252,043 |
| 4,935,000 | Aqua Finance Trust 1.54%, 07/17/2046(1) | 4,897,829 |
| 163,090 | Bayview Koitere Fund Trust 4.00%, 11/28/2053(1)(3) | 165,945 |
| | CIFC Funding Ltd. | |
| 3,550,000 | 1.17%, 04/20/2031, 3 mo. USD LIBOR + 1.040%(1)(2) | 3,550,160 |
| 3,425,000 | 1.24%, 01/22/2031, 3 mo. USD LIBOR + 1.110%(1)(2) | 3,430,610 |
| 697,209 | Conn's Receivables Funding LLC 1.71%, 06/16/2025(1) | 698,471 |
| | DB Master Finance LLC | |
| 7,250,000 | 2.05%, 11/20/2051(1) | 7,244,619 |
| 996,660 | 4.02%, 05/20/2049(1) | 1,037,618 |
| 380,363 | Ellington Financial Mortgage Trust 2.74%, 11/25/2059(1)(3) | 384,538 |
| 1,807,781 | FCI Funding LLC 1.13%, 04/15/2033(1) | 1,807,239 |
| 1,250,000 | Octagon Investment Partners Ltd. 1.14%, 07/17/2030, 3 mo. USD LIBOR + 1.020%(1)(2) | 1,250,886 |
| 1,353,231 | OneMain Financial Issuance Trust 3.48%, 02/14/2031(1) | 1,354,614 |
| 2,813,000 | Planet Fitness Master Issuer LLC 4.26%, 09/05/2048(1) | 2,812,460 |
| 1,450,000 | Regional Management Issuance Trust 3.05%, 11/15/2028(1) | 1,462,700 |
| 930,741 | Residential Mortgage Loan Trust 2.38%, 02/25/2024(1)(3) | 938,053 |
| | Towd Point Mortgage Trust | |
| 435,951 | 2.25%, 07/25/2056(1)(3) | 438,196 |
| 42,212 | 2.75%, 04/25/2055(1)(3) | 42,268 |
| 722,706 | 2.75%, 10/25/2057(1)(3) | 735,229 |
| 1,356,458 | 3.25%, 03/25/2058(1)(3) | 1,390,905 |
| 4,054,507 | Tryon Park CLO Ltd. 1.01%, 04/15/2029, 3 mo. USD LIBOR + 0.890%(1)(2) | 4,059,142 |
| Shares or Principal Amount | | Market Value† |
| ASSET & COMMERCIAL MORTGAGE-BACKED SECURITIES - 24.1% - (continued) |
| | Asset-Backed - Finance & Insurance - 2.0% - (continued) |
| $ 1,266,938 | Vantage Data Centers Issuer LLC 4.20%, 11/16/2043(1) | $ 1,305,938 |
| 2,755,000 | Z Capital Credit Partners CLO Ltd. 1.57%, 07/16/2027, 3 mo. USD LIBOR + 1.450%(1)(2) | 2,751,655 |
| | | | 44,011,118 |
| | Asset-Backed - Home Equity - 0.0% |
| 185,375 | Accredited Mortgage Loan Trust 0.77%, 01/25/2035, 1 mo. USD LIBOR + 0.680%(2) | 185,331 |
| 471,782 | Morgan Stanley Asset-Backed Securities Capital, Inc. Trust 0.85%, 01/25/2035, 1 mo. USD LIBOR + 0.760%(2) | 471,640 |
| | | | 656,971 |
| | Commercial Mortgage-Backed Securities - 2.3% |
| 1,390,000 | BBCMS Mortgage Trust 2.02%, 04/15/2053 | 1,408,345 |
| 2,535,000 | BX Commercial Mortgage Trust 0.74%, 05/15/2038, 1 mo. USD LIBOR + 0.652%(1)(2) | 2,526,340 |
| 1,185,394 | CF Hippolyta LLC 2.28%, 07/15/2060(1) | 1,192,449 |
| | Citigroup Mortgage Loan Trust | |
| 946,358 | 2.71%, 02/25/2058(1)(3) | 968,401 |
| 1,224,104 | 3.25%, 03/25/2061(1)(3) | 1,258,422 |
| 2,360,000 | CityLine Commercial Mortgage Trust 2.78%, 11/10/2031(1)(3) | 2,418,390 |
| 4,490,000 | CSMC Trust 2.26%, 08/15/2037(1) | 4,555,682 |
| | FREMF Mortgage Trust | |
| 2,900,000 | 3.85%, 01/25/2048(1)(3) | 3,091,186 |
| 900,000 | 4.01%, 05/25/2045(1)(3) | 909,054 |
| | GS Mortgage Securities Trust | |
| 4,235,000 | 2.75%, 02/10/2037(1) | 4,346,392 |
| 6,830,000 | 3.12%, 11/10/2045 | 6,961,275 |
| 1,504,774 | JP Morgan Chase Commercial Mortgage Securities Trust 3.91%, 05/05/2030(1) | 1,251,285 |
| 5,500,000 | Morgan Stanley Capital Trust 3.91%, 09/09/2032(1) | 5,801,725 |
| 2,235,000 | Natixis Commercial Mortgage Securities Trust 2.51%, 10/15/2036(1) | 2,233,219 |
| 9,500,000 | SG Commercial Mortgage Securities Trust 2.63%, 03/15/2037(1) | 9,749,786 |
| | | | 48,671,951 |
| | Other Asset-Backed Securities - 6.2% |
| | Affirm Asset Securitization Trust | |
| 2,536,636 | 1.07%, 08/15/2025(1) | 2,537,245 |
| 2,405,769 | 1.90%, 01/15/2025(1) | 2,421,757 |
| 825,447 | 3.46%, 10/15/2024(1) | 834,288 |
| 1,387,040 | Amur Equipment Finance Receivables LLC 0.75%, 11/20/2026(1) | 1,384,128 |
| 2,235,000 | Avant Loans Funding Trust 1.21%, 07/15/2030(1) | 2,224,124 |
| 502,795 | Bayview Mortgage Fund Trust 3.50%, 01/28/2058(1)(3) | 506,300 |
| | Bayview Opportunity Master Fund Trust | |
| 230,779 | 3.50%, 01/28/2055(1)(3) | 234,365 |
| 408,181 | 3.50%, 06/28/2057(1)(3) | 415,683 |
| 561,404 | 4.00%, 10/28/2064(1)(3) | 570,625 |
The accompanying notes are an integral part of these financial statements.
The Hartford Short Duration Fund
Schedule of Investments – (continued)
October 31, 2021
| Shares or Principal Amount | | Market Value† |
| ASSET & COMMERCIAL MORTGAGE-BACKED SECURITIES - 24.1% - (continued) |
| | Other Asset-Backed Securities - 6.2% - (continued) |
| $ 3,000,000 | Benefit Street Partners CLO Ltd. 1.07%, 10/15/2030, 3 mo. USD LIBOR + 0.950%(1)(2) | $ 3,000,579 |
| | Carlyle Global Market Strategies CLO Ltd. | |
| 157,372 | 1.01%, 01/18/2029, 3 mo. USD LIBOR + 0.890%(1)(2) | 157,386 |
| 1,495,453 | 1.09%, 04/17/2031, 3 mo. USD LIBOR + 0.970%(1)(2) | 1,497,335 |
| 4,115,000 | 1.12%, 07/20/2031, 3 mo. USD LIBOR + 0.980%(1)(2) | 4,115,658 |
| 1,000,000 | 1.52%, 04/17/2031, 3 mo. USD LIBOR + 1.400%(1)(2) | 996,946 |
| 4,745,000 | CIFC Funding Ltd. 1.27%, 07/15/2036, 3 mo. USD LIBOR + 1.150%(1)(2) | 4,746,618 |
| 1,080,000 | Dryden Senior Loan Fund 1.09%, 04/15/2031, 3 mo. USD LIBOR + 0.970%(1)(2) | 1,081,337 |
| 2,271,971 | Falcon Aerospace Ltd. 3.60%, 09/15/2039(1) | 2,238,098 |
| 1,650,000 | Goldentree Loan Management U.S. CLO Ltd. 1.03%, 11/20/2030, 3 mo. USD LIBOR + 0.910%(1)(2) | 1,649,998 |
| | KKR CLO Ltd. | |
| 1,190,000 | 1.12%, 04/15/2031, 3 mo. USD LIBOR + 1.000%(1)(2) | 1,190,048 |
| 1,450,000 | 1.30%, 01/15/2031, 3 mo. USD LIBOR + 1.180%(1)(2) | 1,450,551 |
| 3,270,000 | LCM XXIV Ltd. 1.11%, 03/20/2030, 3 mo. USD LIBOR + 0.980%(1)(2) | 3,272,263 |
| | Marlette Funding Trust | |
| 1,465,000 | 1.06%, 09/15/2031(1) | 1,458,777 |
| 7,449,000 | 1.30%, 12/15/2031(1) | 7,380,725 |
| 317,233 | 2.39%, 12/17/2029(1) | 317,961 |
| | Mill City Mortgage Loan Trust | |
| 72,466 | 2.50%, 04/25/2057(1)(3) | 72,622 |
| 895,536 | 2.75%, 01/25/2061(1)(3) | 908,960 |
| 1,160,322 | 3.45%, 08/25/2058(1)(3) | 1,190,604 |
| | Neuberger Berman Loan Advisers CLO Ltd. | |
| 5,415,000 | 1.05%, 10/18/2029, 3 mo. USD LIBOR + 0.930%(1)(2) | 5,425,944 |
| 3,825,000 | 1.14%, 04/19/2030, 3 mo. USD LIBOR + 1.020%(1)(2) | 3,825,692 |
| | Palmer Square Loan Funding Ltd. | |
| 3,525,000 | 0.93%, 10/15/2029, 3 mo. USD LIBOR + 0.080%(1)(2) | 3,525,536 |
| 7,260,000 | 0.97%, 07/20/2029, 3 mo. USD LIBOR + 0.800%(1)(2) | 7,262,381 |
| 780,000 | Progress Residential Trust 1.05%, 04/17/2038(1) | 759,956 |
| 1,700,932 | Sapphire Aviation Finance Ltd. 3.23%, 03/15/2040(1) | 1,673,455 |
| 2,940,000 | SCF Equipment Leasing 0.83%, 08/21/2028(1) | 2,926,621 |
| | SoFi Consumer Loan Program Trust | |
| 1,010,000 | 1.30%, 09/25/2030(1) | 1,003,476 |
| 252,542 | 2.02%, 01/25/2029(1) | 253,961 |
| | Stack Infrastructure Issuer LLC | |
| 935,000 | 1.88%, 03/26/2046(1) | 930,294 |
| 3,285,000 | 1.89%, 08/25/2045(1) | 3,275,121 |
| 3,560,000 | 3.08%, 10/25/2044(1) | 3,625,797 |
| 2,770,000 | Symphony Static CLO Ltd. 0.94%, 10/25/2029, 3 mo. USD LIBOR + 0.830%(1)(2) | 2,770,573 |
| Shares or Principal Amount | | Market Value† |
| ASSET & COMMERCIAL MORTGAGE-BACKED SECURITIES - 24.1% - (continued) |
| | Other Asset-Backed Securities - 6.2% - (continued) |
| $ 6,450,000 | TCI Symphony CLO 1.14%, 10/13/2032 | $ 6,450,000 |
| | Towd Point Mortgage Trust | |
| 3,318,719 | 1.75%, 10/25/2060(1) | 3,337,752 |
| 105,108 | 2.25%, 04/25/2056(1)(3) | 105,282 |
| 859,723 | 2.75%, 10/25/2056(1)(3) | 870,525 |
| 544,017 | 2.75%, 04/25/2057(1)(3) | 550,112 |
| 406,399 | 2.75%, 07/25/2057(1)(3) | 411,649 |
| 5,964,184 | 2.90%, 10/25/2059(1)(3) | 6,133,462 |
| 4,875,000 | Vantage Data Centers Issue LLC 2.17%, 10/15/2046(1) | 4,875,000 |
| | Vantage Data Centers Issuer LLC | |
| 7,080,000 | 1.65%, 09/15/2045(1) | 7,000,503 |
| 2,519,208 | 3.19%, 07/15/2044(1) | 2,577,542 |
| 5,450,000 | Venture CLO Ltd. 1.30%, 07/15/2032, 3 mo. USD LIBOR + 1.180%(1)(2) | 5,448,627 |
| 700,969 | Verus Securitization Trust 2.64%, 11/25/2059(1)(4) | 710,577 |
| | Voya CLO Ltd. | |
| 4,000,000 | 1.09%, 04/25/2031, 3 mo. USD LIBOR + 0.970%(1)(2) | 4,004,956 |
| 4,968,686 | 1.14%, 04/17/2030, 3 mo. USD LIBOR + 1.020%(1)(2) | 4,972,030 |
| 1,650,000 | 1.18%, 04/15/2031, 3 mo. USD LIBOR + 1.060%(1)(2) | 1,651,841 |
| | | | 134,213,646 |
| | Whole Loan Collateral CMO - 12.2% |
| | Angel Oak Mortgage Trust | |
| 2,187,097 | 0.91%, 01/25/2066(1)(3) | 2,204,020 |
| 7,041,118 | 0.95%, 07/25/2066(1)(3) | 7,010,982 |
| 2,193,434 | 0.99%, 04/25/2053(1)(3) | 2,188,285 |
| 2,766,139 | 1.04%, 01/20/2065(1)(3) | 2,746,004 |
| 3,270,968 | 1.07%, 05/25/2066(1)(3) | 3,258,454 |
| 4,965,442 | 1.46%, 09/25/2066(1)(3) | 4,969,938 |
| 2,266,572 | 1.47%, 06/25/2065(1)(3) | 2,279,965 |
| 3,393,351 | 1.69%, 04/25/2065(1)(3) | 3,412,870 |
| 586,286 | 2.47%, 12/25/2059(1)(3) | 588,401 |
| | Angel Oak Mortgage Trust LLC | |
| 1,017,340 | 2.99%, 07/26/2049(1)(3) | 1,023,155 |
| 391,601 | 3.92%, 11/25/2048(1)(3) | 395,165 |
| | Arroyo Mortgage Trust | |
| 3,138,279 | 1.18%, 10/25/2048(1)(3) | 3,135,261 |
| 2,162,455 | 2.96%, 10/25/2048(1)(3) | 2,173,753 |
| 586,058 | 3.81%, 01/25/2049(1)(3) | 591,645 |
| | BRAVO Residential Funding Trust | |
| 1,216,000 | 0.94%, 02/25/2049(1)(3) | 1,212,220 |
| 2,077,995 | 1.45%, 05/25/2060(1)(3) | 2,082,309 |
| | Bunker Hill Loan Depositary Trust | |
| 1,426,617 | 1.72%, 02/25/2055(1)(3) | 1,439,152 |
| 1,546,161 | 2.72%, 11/25/2059(1)(4) | 1,561,195 |
| 889,681 | CIM Trust 3.00%, 04/25/2057(1)(3) | 900,523 |
| 1,230,053 | Colombia Cent CLO Ltd. 1.27%, 10/25/2028, 3 mo. USD LIBOR + 1.150%(1)(2) | 1,230,652 |
| | COLT Mortgage Loan Trust | |
| 1,159,313 | 0.80%, 07/27/2054(1) | 1,156,179 |
| 3,724,769 | 0.86%, 05/25/2065(1)(3) | 3,712,195 |
| 3,324,156 | 0.91%, 06/25/2066(1)(3) | 3,293,039 |
| 2,059,951 | 0.92%, 08/25/2066(1)(3) | 2,047,608 |
| 5,563,297 | 0.96%, 09/27/2066(1)(3) | 5,511,112 |
| 7,435,981 | 1.11%, 10/25/2066(1)(3) | 7,398,551 |
| 2,305,595 | 1.26%, 09/25/2065(1)(3) | 2,310,798 |
| 2,078,510 | 1.33%, 10/26/2065(1)(3) | 2,082,179 |
The accompanying notes are an integral part of these financial statements.
The Hartford Short Duration Fund
Schedule of Investments – (continued)
October 31, 2021
| Shares or Principal Amount | | Market Value† |
| ASSET & COMMERCIAL MORTGAGE-BACKED SECURITIES - 24.1% - (continued) |
| | Whole Loan Collateral CMO - 12.2% - (continued) |
| $ 6,613,728 | 1.39%, 01/25/2065(1)(3) | $ 6,557,569 |
| 5,000,000 | 1.40%, 10/25/2066(1)(3) | 4,992,640 |
| 92,633 | 1.85%, 03/25/2065(1)(3) | 92,986 |
| 1,141,159 | 2.49%, 02/25/2050(1)(3) | 1,140,709 |
| | CSMC Trust | |
| 4,128,360 | 0.81%, 05/25/2065(1)(3) | 4,110,444 |
| 3,193,114 | 0.83%, 03/25/2056(1)(3) | 3,213,550 |
| 5,452,634 | 1.02%, 04/25/2066(1)(3) | �� 5,426,276 |
| 6,034,020 | 1.10%, 05/25/2066(1)(3) | 5,999,660 |
| 4,330,318 | 1.17%, 07/25/2066(1)(3) | 4,317,505 |
| 3,493,003 | 1.21%, 05/25/2065(1)(4) | 3,498,559 |
| 5,633,252 | 2.00%, 01/25/2060(1)(3) | 5,699,930 |
| 1,310,177 | 2.24%, 02/25/2050(1)(3) | 1,317,903 |
| | Deephaven Residential Mortgage Trust | |
| 1,335,106 | 0.72%, 05/25/2065(1)(3) | 1,329,696 |
| 1,596,884 | 0.90%, 04/25/2066(1)(3) | 1,589,849 |
| 897,038 | 1.69%, 05/25/2065(1) | 898,103 |
| 2,003,474 | 2.34%, 01/25/2060(1)(3) | 2,006,606 |
| 1,148,811 | 2.79%, 10/25/2059(1)(3) | 1,150,073 |
| | Ellington Financial Mortgage Trust | |
| 819,161 | 0.80%, 02/25/2066(1)(3) | 814,884 |
| 1,186,689 | 0.93%, 06/25/2066(1)(3) | 1,178,705 |
| 1,330,867 | 1.18%, 10/25/2065(1)(3) | 1,332,590 |
| 4,571,957 | FirstKey Homes Trust 1.27%, 10/19/2037(1) | 4,510,744 |
| 273,454 | Galton Funding Mortgage Trust 2.66%, 10/25/2059(1)(3) | 276,985 |
| | GCAT Trust | |
| 3,709,265 | 0.87%, 01/25/2066(1)(3) | 3,736,488 |
| 3,043,223 | 1.04%, 05/25/2066(1)(3) | 3,043,223 |
| 4,208,880 | 1.09%, 05/25/2066(1)(3) | 4,190,431 |
| 5,293,121 | 1.09%, 08/25/2066(1)(3) | 5,254,777 |
| 7,447,818 | 1.26%, 07/25/2066(1)(3) | 7,425,467 |
| 3,753,574 | 1.47%, 04/25/2065(1)(3) | 3,745,673 |
| 1,284,966 | 1.56%, 04/25/2065(1)(4) | 1,289,732 |
| 1,175,727 | 2.25%, 01/25/2060(1)(4) | 1,181,824 |
| 1,397,888 | 2.65%, 10/25/2068(1)(3) | 1,425,588 |
| 298,894 | Home Re Ltd. 1.69%, 10/25/2028, 1 mo. USD LIBOR + 1.600%(1)(2) | 299,315 |
| | Imperial Fund Mortgage Trust | |
| 4,585,219 | 1.07%, 06/25/2056(1)(3) | 4,539,317 |
| 3,036,877 | 1.07%, 09/25/2056(1)(3) | 3,019,749 |
| 3,285,000 | 1.60%, 11/25/2056(1)(3) | 3,284,462 |
| 2,575,000 | IMS Ecuadorian Mortgage Trust 3.40%, 08/18/2043(1) | 2,694,718 |
| 505,707 | MetLife Securitization Trust 3.00%, 04/25/2055(1)(3) | 517,365 |
| | MFA Trust | |
| 1,629,717 | 1.01%, 01/26/2065(1)(3) | 1,625,721 |
| 1,985,704 | 1.03%, 11/25/2064(1)(3) | 1,978,017 |
| 2,058,052 | 1.15%, 04/25/2065(1)(3) | 2,070,833 |
| | MFRA Trust | |
| 2,850,603 | 0.85%, 01/25/2056(1)(3) | 2,832,976 |
| 1,084,882 | 1.48%, 03/25/2065(1)(3) | 1,088,288 |
| | Mill City Mortgage Loan Trust | |
| 5,949,710 | 1.13%, 11/25/2060(1)(3) | 5,936,776 |
| 2,824,803 | 2.75%, 07/25/2059(1)(3) | 2,885,863 |
| 546,214 | 3.25%, 05/25/2062(1)(3) | 555,431 |
| 930,612 | 3.50%, 05/25/2058(1)(3) | 945,970 |
| 1,245,386 | New Residential Mortgage LLC 3.79%, 07/25/2054(1) | 1,248,143 |
| | New Residential Mortgage Loan Trust | |
| 1,729,162 | 0.84%, 01/25/2048, 1 mo. USD LIBOR + 0.750%(1)(2) | 1,729,162 |
| Shares or Principal Amount | | Market Value† |
| ASSET & COMMERCIAL MORTGAGE-BACKED SECURITIES - 24.1% - (continued) |
| | Whole Loan Collateral CMO - 12.2% - (continued) |
| $ 858,751 | 0.94%, 10/25/2058(1)(3) | $ 857,165 |
| 1,354,750 | 1.65%, 05/24/2060(1)(3) | 1,360,458 |
| 1,616,913 | 2.46%, 01/26/2060(1)(3) | 1,626,087 |
| 343,001 | 3.25%, 09/25/2056(1)(3) | 358,074 |
| 541,159 | 3.50%, 12/25/2057(1)(3) | 554,609 |
| 336,555 | 3.75%, 11/26/2035(1)(3) | 357,158 |
| 237,302 | 3.75%, 03/25/2056(1)(3) | 251,777 |
| 405,678 | 3.75%, 11/25/2056(1)(3) | 431,333 |
| 701,616 | 4.00%, 02/25/2057(1)(3) | 745,025 |
| 703,830 | 4.00%, 03/25/2057(1)(3) | 750,790 |
| 493,953 | 4.00%, 04/25/2057(1)(3) | 525,703 |
| 622,554 | 4.00%, 05/25/2057(1)(3) | 657,923 |
| 1,185,538 | 4.00%, 09/25/2057(1)(3) | 1,240,387 |
| 570,203 | 4.00%, 12/25/2057(1)(3) | 604,539 |
| 984,613 | NRZ Excess Spread-Collateralized Notes 3.61%, 05/25/2023(1) | 985,061 |
| 1,442,455 | OBX Trust 1.05%, 07/25/2061(1)(3) | 1,432,582 |
| | Onslow Bay Mortgage Loan Trust | |
| 5,151,943 | 1.10%, 05/25/2061(1)(3) | 5,141,528 |
| 1,258,926 | 3.50%, 12/25/2049(1)(3) | 1,278,393 |
| 286,265 | Radnor RE Ltd. 1.29%, 06/25/2029, 1 mo. USD LIBOR + 1.200%(1)(2) | 286,267 |
| 298,343 | Sequoia Mortgage Trust 4.50%, 08/25/2048(1)(3) | 302,423 |
| 7,361,083 | SG Residential Mortgage Trust 1.16%, 07/25/2061(1)(3) | 7,319,986 |
| | Starwood Mortgage Residential Trust | |
| 3,725,386 | 1.13%, 06/25/2056(1)(3) | 3,700,107 |
| 819,255 | 1.49%, 04/25/2065(1)(3) | 820,891 |
| 1,340,801 | 2.28%, 02/25/2050(1)(3) | 1,349,305 |
| 2,899,244 | Starwood Residential Mortgage Trust 1.22%, 05/25/2065(1)(3) | 2,897,044 |
| 2,519,787 | Toorak Mortgage Corp. Ltd. 1.15%, 07/25/2056(1)(3) | 2,507,209 |
| | Verus Securitization Trust | |
| 4,066,394 | 0.82%, 10/25/2063(1)(3) | 4,060,040 |
| 2,286,846 | 0.82%, 01/25/2066(1)(3) | 2,277,824 |
| 2,795,628 | 0.92%, 02/25/2064(1)(3) | 2,787,704 |
| 4,660,388 | 1.01%, 09/25/2066(1)(3) | 4,640,558 |
| 3,016,923 | 1.02%, 04/25/2064(1)(3) | 3,003,733 |
| 1,636,977 | 1.03%, 02/25/2066(1)(3) | 1,628,562 |
| 1,664,608 | 1.50%, 05/25/2065(1)(4) | 1,667,454 |
| 725,947 | 2.42%, 01/25/2060(1)(4) | 733,178 |
| 1,586,732 | Visio Trust 1.28%, 05/25/2056(1) | 1,584,730 |
| | | | 262,642,492 |
| | Total Asset & Commercial Mortgage-Backed Securities
(cost $520,805,010) | $ 519,570,250 |
| CORPORATE BONDS - 50.0% |
| | Aerospace/Defense - 0.3% |
| 3,600,000 | Boeing Co. 2.20%, 02/04/2026 | $ 3,609,140 |
| | L3Harris Technologies, Inc. | |
| 1,475,000 | 3.83%, 04/27/2025 | 1,592,437 |
| 2,275,000 | 3.85%, 06/15/2023 | 2,385,174 |
| | | | 7,586,751 |
| | Agriculture - 0.2% |
| 5,000,000 | BAT Capital Corp. 2.79%, 09/06/2024 | 5,199,514 |
The accompanying notes are an integral part of these financial statements.
The Hartford Short Duration Fund
Schedule of Investments – (continued)
October 31, 2021
| Shares or Principal Amount | | Market Value† |
| CORPORATE BONDS - 50.0% - (continued) |
| | Apparel - 0.3% |
| $ 2,520,000 | PVH Corp. 4.63%, 07/10/2025 | $ 2,760,468 |
| 4,000,000 | VF Corp. 2.40%, 04/23/2025 | 4,140,282 |
| | | | 6,900,750 |
| | Auto Manufacturers - 3.3% |
| 3,575,000 | Daimler Finance NA LLC 1.45%, 03/02/2026(1) | 3,558,862 |
| 5,250,000 | Ford Motor Co. 8.50%, 04/21/2023 | 5,756,625 |
| | Ford Motor Credit Co. LLC | |
| 4,275,000 | 2.70%, 08/10/2026 | 4,270,041 |
| 3,125,000 | 3.35%, 11/01/2022 | 3,171,875 |
| 3,185,000 | 3.37%, 11/17/2023 | 3,268,606 |
| 2,800,000 | 4.06%, 11/01/2024 | 2,936,360 |
| | General Motors Financial Co., Inc. | |
| 3,650,000 | 1.20%, 10/15/2024 | 3,634,587 |
| 2,500,000 | 1.25%, 01/08/2026 | 2,451,380 |
| 4,000,000 | 1.50%, 06/10/2026 | 3,941,102 |
| 1,500,000 | 1.70%, 08/18/2023 | 1,520,534 |
| 2,850,000 | 2.90%, 02/26/2025 | 2,965,940 |
| | Hyundai Capital America | |
| 4,250,000 | 1.00%, 09/17/2024(1) | 4,207,964 |
| 2,500,000 | 2.38%, 02/10/2023(1) | 2,547,912 |
| 1,825,000 | 4.13%, 06/08/2023(1) | 1,911,906 |
| 2,500,000 | Nissan Motor Co., Ltd. 3.04%, 09/15/2023(1) | 2,585,541 |
| 12,150,000 | Stellantis Finance U.S., Inc. 1.71%, 01/29/2027(1) | 11,960,697 |
| | Volkswagen Group of America Finance LLC | |
| 3,500,000 | 0.88%, 11/22/2023(1) | 3,497,525 |
| 1,800,000 | 2.85%, 09/26/2024(1) | 1,884,448 |
| 2,000,000 | 3.13%, 05/12/2023(1) | 2,068,703 |
| 3,025,000 | 4.25%, 11/13/2023(1) | 3,226,380 |
| | | | 71,366,988 |
| | Beverages - 1.0% |
| 3,000,000 | Bacardi Ltd. 4.45%, 05/15/2025(1) | 3,277,595 |
| 7,095,000 | Coca-Cola Europacific Partners plc 1.50%, 01/15/2027(1) | 7,010,864 |
| | JDE Peet's N.V. | |
| 5,325,000 | 0.80%, 09/24/2024(1) | 5,264,478 |
| 5,375,000 | 1.38%, 01/15/2027(1) | 5,249,157 |
| | | | 20,802,094 |
| | Biotechnology - 0.5% |
| | Royalty Pharma plc | |
| 3,800,000 | 0.75%, 09/02/2023 | 3,792,290 |
| 6,200,000 | 1.20%, 09/02/2025 | 6,109,656 |
| | | | 9,901,946 |
| | Chemicals - 0.4% |
| 915,000 | Celanese U.S. Holdings LLC 3.50%, 05/08/2024 | 966,087 |
| 3,600,000 | DuPont de Nemours, Inc. 4.21%, 11/15/2023 | 3,837,956 |
| 2,350,000 | International Flavors & Fragrances, Inc. 1.23%, 10/01/2025(1) | 2,321,067 |
| 1,825,000 | LYB International Finance LLC 1.25%, 10/01/2025 | 1,806,886 |
| | | | 8,931,996 |
| | Commercial Banks - 13.2% |
| | Banco Santander S.A. | |
| 3,000,000 | 0.70%, 06/30/2024, (0.70% fixed rate until 06/30/2023; 12 mo. USD CMT + 0.450% thereafter)(5) | 2,991,032 |
| 1,600,000 | 3.13%, 02/23/2023 | 1,649,084 |
| Shares or Principal Amount | | Market Value† |
| CORPORATE BONDS - 50.0% - (continued) |
| | Commercial Banks - 13.2% - (continued) |
| $ 600,000 | 3.85%, 04/12/2023 | $ 626,787 |
| | Bank of America Corp. | |
| 4,700,000 | 0.98%, 09/25/2025, (0.98% fixed rate until 09/25/2024; 3 mo. USD SOFR + 0.910% thereafter)(5) | 4,670,944 |
| 6,000,000 | 1.20%, 10/24/2026, (1.20% fixed rate until 10/24/2025; 3 mo. USD SOFR + 1.010% thereafter)(5) | 5,900,842 |
| 2,500,000 | 1.32%, 06/19/2026, (1.32% fixed rate until 06/19/2025; 1 mo. USD SOFR + 1.150% thereafter)(5) | 2,480,958 |
| 2,000,000 | 1.49%, 05/19/2024, (1.49% fixed rate until 05/19/2023; 1 mo. USD SOFR + 1.460% thereafter)(5) | 2,022,118 |
| 4,000,000 | 1.73%, 07/22/2027, (1.73% fixed rate until 07/22/2026; 3 mo. USD SOFR + 0.960% thereafter)(5) | 3,974,844 |
| 5,125,000 | 2.02%, 02/13/2026, (2.02% fixed rate until 02/13/2025; 3 mo. USD LIBOR + 0.640% thereafter)(5) | 5,218,926 |
| 3,750,000 | 3.88%, 08/01/2025 | 4,090,707 |
| 4,225,000 | Banque Federative du Credit Mutuel S.A. 0.65%, 02/27/2024(1)(6) | 4,191,309 |
| 4,425,000 | Barclays plc 1.01%, 12/10/2024, (1.01% fixed rate until 12/10/2023; 12 mo. USD CMT + 0.800% thereafter)(5) | 4,425,271 |
| | BNP Paribas S.A. | |
| 2,915,000 | 1.32%, 01/13/2027, (1.32% fixed rate until 01/13/2026; 3 mo. USD SOFR + 1.004% thereafter)(1)(5) | 2,849,650 |
| 2,025,000 | 1.68%, 06/30/2027, (1.68% fixed rate until 06/30/2026; 1 mo. USD SOFR + 0.912% thereafter)(1)(5) | 1,997,040 |
| | BPCE S.A. | |
| 2,000,000 | 1.00%, 01/20/2026(1) | 1,948,137 |
| 4,860,000 | 1.65%, 10/06/2026, (1.65% fixed rate until 10/06/2025; 3 mo. USD SOFR + 1.520% thereafter)(1)(5) | 4,822,741 |
| 840,000 | 2.05%, 10/19/2027, (2.05% fixed rate until 10/19/2026; 3 mo. USD SOFR + 1.087% thereafter)(1)(5) | 836,809 |
| 3,000,000 | 2.38%, 01/14/2025(1) | 3,075,824 |
| 1,500,000 | 4.00%, 09/12/2023(1) | 1,583,167 |
| 4,500,000 | Canadian Imperial Bank of Commerce 3.10%, 04/02/2024 | 4,734,124 |
| | CIT Group, Inc. | |
| 1,620,000 | 5.00%, 08/15/2022 | 1,670,625 |
| 3,980,000 | 5.00%, 08/01/2023 | 4,223,775 |
| | Citigroup, Inc. | |
| 1,695,000 | 0.98%, 05/01/2025, (0.98% fixed rate until 05/01/2024; 3 mo. USD SOFR + 0.669% thereafter)(5) | 1,687,425 |
| 3,550,000 | 1.12%, 01/28/2027, (1.12% fixed rate until 01/28/2026; 3 mo. USD SOFR + 0.765% thereafter)(5) | 3,466,393 |
| 1,740,000 | 1.28%, 11/03/2025, (1.52% fixed rate until 11/03/2024; 3 mo. USD SOFR + 0.528% thereafter)(5) | 1,741,773 |
| 4,860,000 | 1.46%, 06/09/2027, (1.46% fixed rate until 06/09/2026; 3 mo. USD SOFR + 0.770% thereafter)(5) | 4,788,446 |
The accompanying notes are an integral part of these financial statements.
The Hartford Short Duration Fund
Schedule of Investments – (continued)
October 31, 2021
| Shares or Principal Amount | | Market Value† |
| CORPORATE BONDS - 50.0% - (continued) |
| | Commercial Banks - 13.2% - (continued) |
| $ 3,000,000 | 2.31%, 11/04/2022, (2.31% fixed rate until 11/04/2021; 1 mo. USD SOFR + 0.867% thereafter)(5) | $ 3,000,270 |
| 3,550,000 | Comerica, Inc. 3.70%, 07/31/2023 | 3,722,815 |
| 4,000,000 | Cooperatieve Rabobank UA 1.00%, 09/24/2026, (1.00% fixed rate until 09/24/2025; 12 mo. USD CMT + 0.730% thereafter)(1)(5) | 3,917,703 |
| | Credit Agricole S.A. | |
| 3,525,000 | 1.25%, 01/26/2027, (1.25% fixed rate until 01/26/2026; 3 mo. USD SOFR + 0.892% thereafter)(1)(5) | 3,441,590 |
| 2,794,000 | 1.91%, 06/16/2026, (1.91% fixed rate until 06/16/2025; 3 mo. USD SOFR + 1.676% thereafter)(1)(5) | 2,821,750 |
| 735,000 | 3.75%, 04/24/2023(1) | 768,317 |
| 5,000,000 | Credit Suisse AG 1.25%, 08/07/2026 | 4,894,925 |
| | Credit Suisse Group AG | |
| 2,280,000 | 1.31%, 02/02/2027, (1.31% fixed rate until 02/02/2026; 3 mo. USD SOFR + 0.980% thereafter)(1)(5) | 2,203,840 |
| 3,420,000 | 2.59%, 09/11/2025, (2.59% fixed rate until 09/11/2024; 3 mo. USD SOFR + 1.560% thereafter)(1)(5) | 3,516,546 |
| 2,001,000 | 3.57%, 01/09/2023(1) | 2,011,985 |
| | Danske Bank A/S | |
| 3,000,000 | 1.17%, 12/08/2023, (1.17% fixed rate until 12/08/2022; 12 mo. USD CMT + 1.030% thereafter)(1)(5) | 3,008,514 |
| 7,340,000 | 1.55%, 09/10/2027, (1.55% fixed rate until 09/10/2026; 12 mo. USD CMT + 0.730% thereafter)(1)(5) | 7,184,713 |
| 5,510,000 | 5.00%, 01/12/2022(1) | 5,556,531 |
| | Deutsche Bank AG | |
| 1,055,000 | 0.90%, 05/28/2024 | 1,046,737 |
| 2,000,000 | 1.45%, 04/01/2025, (1.45% fixed rate until 04/01/2024; 3 mo. USD SOFR + 1.131% thereafter)(5) | 2,000,375 |
| 3,000,000 | 2.22%, 09/18/2024, (2.22% fixed rate until 09/18/2023; 1 mo. USD SOFR + 2.159% thereafter)(5) | 3,057,447 |
| 2,425,000 | Discover Bank 2.45%, 09/12/2024 | 2,508,200 |
| 3,000,000 | DNB Bank ASA 1.54%, 05/25/2027, (1.54% fixed rate until 05/25/2026; 12 mo. USD CMT + 0.720% thereafter)(1)(5) | 2,964,983 |
| | Fifth Third Bancorp | |
| 2,430,000 | 2.38%, 01/28/2025 | 2,508,134 |
| 2,000,000 | 3.65%, 01/25/2024 | 2,115,557 |
| | Goldman Sachs Group, Inc. | |
| 2,000,000 | 0.66%, 09/10/2024, (0.66% fixed rate until 09/10/2023; 3 mo. USD SOFR + 0.505% thereafter)(5) | 1,989,686 |
| 1,250,000 | 0.86%, 02/12/2026, (0.86% fixed rate until 02/12/2025; 3 mo. USD SOFR + 0.609% thereafter)(5) | 1,227,215 |
| 2,360,000 | 1.09%, 12/09/2026, (1.09% fixed rate until 12/09/2025; 3 mo. USD SOFR + 0.789% thereafter)(5) | 2,301,991 |
| 2,000,000 | 1.54%, 09/10/2027, (1.54% fixed rate until 09/10/2026; 3 mo. USD SOFR + 0.818% thereafter)(5) | 1,966,830 |
| 2,500,000 | 3.63%, 02/20/2024 | 2,643,796 |
| Shares or Principal Amount | | Market Value† |
| CORPORATE BONDS - 50.0% - (continued) |
| | Commercial Banks - 13.2% - (continued) |
| | HSBC Holdings plc | |
| $ 7,455,000 | 1.59%, 05/24/2027, (1.59% fixed rate until 05/24/2026; 3 mo. USD SOFR + 1.290% thereafter)(5) | $ 7,327,449 |
| 3,500,000 | 2.63%, 11/07/2025, (2.63% fixed rate until 11/07/2024; 3 mo. USD SOFR + 1.402% thereafter)(5) | 3,618,747 |
| 2,470,000 | ING Groep N.V. 1.73%, 04/01/2027, (1.73% fixed rate until 04/01/2026; 3 mo. USD SOFR + 1.005% thereafter)(5) | 2,465,671 |
| | Intesa Sanpaolo S.p.A. | |
| 2,000,000 | 3.25%, 09/23/2024(1) | 2,096,980 |
| 1,675,000 | 3.38%, 01/12/2023(1) | 1,724,831 |
| | JP Morgan Chase & Co. | |
| 2,345,000 | 0.56%, 02/16/2025, (0.56% fixed rate until 02/16/2024; 3 mo. USD SOFR + 0.420% thereafter)(5) | 2,320,941 |
| 4,450,000 | 1.04%, 02/04/2027, (1.04% fixed rate until 02/04/2026; 3 mo. USD SOFR + 0.695% thereafter)(5) | 4,323,302 |
| 4,200,000 | 1.05%, 11/19/2026, (1.05% fixed rate until 11/19/2025; 3 mo. USD SOFR + 0.800% thereafter)(5) | 4,098,748 |
| 3,000,000 | 1.51%, 06/01/2024, (1.51% fixed rate until 06/01/2023; 1 mo. USD SOFR + 1.455% thereafter)(5) | 3,037,406 |
| 4,600,000 | 2.30%, 10/15/2025, (2.30% fixed rate until 10/15/2024; 3 mo. USD SOFR + 1.160% thereafter)(5) | 4,734,665 |
| 3,750,000 | 3.90%, 07/15/2025 | 4,074,181 |
| | Macquarie Group Ltd. | |
| 2,340,000 | 1.34%, 01/12/2027, (1.34% fixed rate until 01/12/2026; 3 mo. USD SOFR + 1.069% thereafter)(1)(5) | 2,297,933 |
| 2,065,000 | 1.63%, 09/23/2027, (1.63% fixed rate until 09/23/2026; 3 mo. USD SOFR + 0.910% thereafter)(1)(5) | 2,025,892 |
| 3,000,000 | 3.19%, 11/28/2023, (3.19% fixed rate until 11/28/2022; 3 mo. USD LIBOR + 1.023% thereafter)(1)(5) | 3,076,820 |
| | Morgan Stanley | |
| 8,615,000 | 0.86%, 10/21/2025, (0.86% fixed rate until 10/21/2024; 3 mo. USD SOFR + 0.745% thereafter)(5) | 8,524,844 |
| 3,425,000 | 0.99%, 12/10/2026, (0.99% fixed rate until 12/10/2025; 3 mo. USD SOFR + 0.720% thereafter)(5) | 3,324,260 |
| 3,000,000 | 1.51%, 07/20/2027, (1.51% fixed rate until 07/20/2026; 3 mo. USD SOFR + 0.858% thereafter)(5) | 2,954,321 |
| 3,000,000 | 1.59%, 05/04/2027, (1.59% fixed rate until 05/04/2026; 3 mo. USD SOFR + 0.879% thereafter)(5) | 2,972,469 |
| 2,675,000 | 4.00%, 07/23/2025 | 2,919,816 |
| 3,425,000 | National Bank of Canada 0.55%, 11/15/2024, (0.55% fixed rate until 11/15/2023; 12 mo. USD CMT + 0.400% thereafter)(5) | 3,401,585 |
| | Natwest Group plc | |
| 3,335,000 | 1.64%, 06/14/2027, (1.64% fixed rate until 06/14/2026; 12 mo. USD CMT + 0.900% thereafter)(5) | 3,296,828 |
The accompanying notes are an integral part of these financial statements.
The Hartford Short Duration Fund
Schedule of Investments – (continued)
October 31, 2021
| Shares or Principal Amount | | Market Value† |
| CORPORATE BONDS - 50.0% - (continued) |
| | Commercial Banks - 13.2% - (continued) |
| $ 800,000 | 6.00%, 12/19/2023 | $ 880,385 |
| 3,385,000 | NatWest Markets plc 0.80%, 08/12/2024(1) | 3,351,822 |
| 1,500,000 | Regions Financial Corp. 2.25%, 05/18/2025 | 1,547,620 |
| 3,900,000 | Royal Bank of Canada 2.25%, 11/01/2024(6) | 4,042,855 |
| 3,035,000 | Santander Holdings USA, Inc. 3.45%, 06/02/2025 | 3,220,805 |
| | Standard Chartered plc | |
| 770,000 | 1.21%, 03/23/2025, (1.21% fixed rate until 03/23/2024; 12 mo. USD CMT + 0.880% thereafter)(1)(5) | 766,067 |
| 2,070,000 | 1.46%, 01/14/2027, (1.46% fixed rate until 01/14/2026; 12 mo. USD CMT + 1.000% thereafter)(1)(5) | 2,014,963 |
| 2,000,000 | Truist Financial Corp. 1.20%, 08/05/2025(6) | 1,998,587 |
| 740,000 | UBS AG 1.25%, 06/01/2026(1) | 729,540 |
| | UBS Group AG | |
| 4,230,000 | 1.01%, 07/30/2024, (1.01% fixed rate until 07/30/2023; 12 mo. USD CMT + 0.830% thereafter)(1)(5) | 4,234,988 |
| 5,170,000 | 1.49%, 08/10/2027, (1.49% fixed rate until 08/10/2026; 12 mo. USD CMT + 0.850% thereafter)(1)(5) | 5,065,644 |
| 2,100,000 | 4.13%, 04/15/2026(1) | 2,311,686 |
| | UniCredit S.p.A. | |
| 5,230,000 | 1.98%, 06/03/2027, (1.98% fixed rate until 06/03/2026; 12 mo. USD CMT + 1.200% thereafter)(1)(5) | 5,141,635 |
| 3,250,000 | 3.75%, 04/12/2022(1) | 3,294,492 |
| 3,035,000 | 6.57%, 01/14/2022(1) | 3,069,098 |
| | Wells Fargo & Co. | |
| 1,635,000 | 0.81%, 05/19/2025, (0.81% fixed rate until 05/19/2024; 3 mo. USD SOFR + 0.510% thereafter)(5) | 1,627,313 |
| 7,500,000 | 2.16%, 02/11/2026, (2.16% fixed rate until 02/11/2025; 3 mo. USD LIBOR + 0.750% thereafter)(5) | 7,678,627 |
| 4,650,000 | 2.41%, 10/30/2025, (2.41% fixed rate until 10/30/2024; 3 mo. USD SOFR + 1.087% thereafter)(5) | 4,803,590 |
| | | | 284,446,607 |
| | Commercial Services - 1.5% |
| 2,995,000 | Ashtead Capital, Inc. 1.50%, 08/12/2026(1) | 2,939,335 |
| | Equifax, Inc. | |
| 3,365,000 | 2.60%, 12/01/2024 | 3,503,385 |
| 2,555,000 | 3.95%, 06/15/2023 | 2,680,261 |
| | Global Payments, Inc. | |
| 9,000,000 | 1.20%, 03/01/2026 | 8,787,533 |
| 2,345,000 | 2.65%, 02/15/2025 | 2,432,607 |
| 1,500,000 | 4.00%, 06/01/2023 | 1,573,343 |
| | Howard University | |
| 1,965,000 | 2.42%, 10/01/2024 | 1,995,877 |
| 655,000 | 2.52%, 10/01/2025 | 660,219 |
| | Howard University, (AGM Insured) | |
| 500,000 | 1.99%, 10/01/2025, (AGM Insured) | 495,521 |
| 1,685,000 | 2.74%, 10/01/2022, (AGM Insured) | 1,701,648 |
| 2,750,000 | IHS Markit Ltd. 4.13%, 08/01/2023 | 2,897,681 |
| 2,775,000 | Sodexo, Inc. 1.63%, 04/16/2026(1) | 2,765,193 |
| | | | 32,432,603 |
| Shares or Principal Amount | | Market Value† |
| CORPORATE BONDS - 50.0% - (continued) |
| | Construction Materials - 0.4% |
| $ 6,100,000 | Carrier Global Corp. 2.24%, 02/15/2025 | $ 6,262,946 |
| 2,380,000 | Lennox International, Inc. 1.35%, 08/01/2025 | 2,365,416 |
| | | | 8,628,362 |
| | Diversified Financial Services - 3.1% |
| | AerCap Ireland Capital DAC / AerCap Global Aviation Trust | |
| 4,550,000 | 1.75%, 10/29/2024 | 4,552,295 |
| 1,000,000 | 1.75%, 01/30/2026 | 983,996 |
| 3,420,000 | 2.45%, 10/29/2026 | 3,451,670 |
| 5,650,000 | 3.15%, 02/15/2024 | 5,865,995 |
| 910,000 | 3.30%, 01/23/2023 | 935,805 |
| 1,880,000 | 4.50%, 09/15/2023 | 1,992,266 |
| 2,500,000 | Air Lease Corp. 2.25%, 01/15/2023 | 2,543,957 |
| | Aircastle Ltd. | |
| 1,200,000 | 4.13%, 05/01/2024 | 1,265,193 |
| 1,400,000 | 4.40%, 09/25/2023 | 1,482,327 |
| 3,050,000 | 5.25%, 08/11/2025(1) | 3,369,992 |
| | Ally Financial, Inc. | |
| 2,690,000 | 3.88%, 05/21/2024 | 2,867,626 |
| 3,000,000 | 5.13%, 09/30/2024 | 3,332,234 |
| 2,650,000 | Aviation Capital Group LLC 3.88%, 05/01/2023(1) | 2,754,104 |
| | Avolon Holdings Funding Ltd. | |
| 4,250,000 | 2.88%, 02/15/2025(1) | 4,358,530 |
| 2,000,000 | 4.25%, 04/15/2026(1) | 2,149,810 |
| 2,950,000 | 5.13%, 10/01/2023(1) | 3,145,495 |
| 2,490,000 | BOC Aviation USA Corp. 1.63%, 04/29/2024(1) | 2,494,772 |
| 1,755,000 | Capital One Financial Corp. 3.90%, 01/29/2024 | 1,863,439 |
| 2,500,000 | CNA Financial Corp. 7.25%, 11/15/2023 | 2,815,294 |
| 4,125,000 | LeasePlan Corp. N.V. 2.88%, 10/24/2024(1) | 4,293,048 |
| 300,000 | Park Aerospace Holdings Ltd. 5.25%, 08/15/2022(1) | 309,432 |
| 1,245,000 | Synchrony Financial 4.38%, 03/19/2024 | 1,331,018 |
| | Western Union Co. | |
| 4,000,000 | 1.35%, 03/15/2026 | 3,917,602 |
| 4,925,000 | 2.85%, 01/10/2025 | 5,125,246 |
| | | | 67,201,146 |
| | Electric - 1.7% |
| 4,000,000 | AES Corp. 1.38%, 01/15/2026 | 3,913,475 |
| 2,500,000 | Ameren Corp. 2.50%, 09/15/2024 | 2,598,800 |
| 1,700,000 | CenterPoint Energy, Inc. 3.85%, 02/01/2024 | 1,797,463 |
| 2,280,000 | Cleco Corporate Holdings LLC 3.74%, 05/01/2026 | 2,455,373 |
| 2,475,000 | Dominion Energy, Inc. 3.07%, 08/15/2024(4) | 2,597,376 |
| | Edison International | |
| 2,750,000 | 2.95%, 03/15/2023 | 2,806,721 |
| 1,840,000 | 3.55%, 11/15/2024 | 1,941,041 |
| 3,230,000 | Enel Finance International N.V. 1.38%, 07/12/2026(1) | 3,176,839 |
| 3,760,000 | Evergy, Inc. 2.45%, 09/15/2024 | 3,893,859 |
| 890,000 | Eversource Energy 3.80%, 12/01/2023 | 942,502 |
| 970,000 | FirstEnergy Corp. 3.35%, 07/15/2022 | 977,275 |
| | Israel Electric Corp. Ltd. | |
| 1,300,000 | 6.88%, 06/21/2023(1) | 1,419,509 |
| 410,000 | 6.88%, 06/21/2023(7) | 447,691 |
| | Public Service Enterprise Group, Inc. | |
| 3,500,000 | 0.80%, 08/15/2025 | 3,411,804 |
| 3,410,000 | 2.88%, 06/15/2024 | 3,557,333 |
| | | | 35,937,061 |
The accompanying notes are an integral part of these financial statements.
The Hartford Short Duration Fund
Schedule of Investments – (continued)
October 31, 2021
| Shares or Principal Amount | | Market Value† |
| CORPORATE BONDS - 50.0% - (continued) |
| | Electronics - 1.2% |
| $ 4,850,000 | Flex Ltd. 3.75%, 02/01/2026 | $ 5,213,214 |
| 4,000,000 | Jabil, Inc. 1.70%, 04/15/2026 | 3,966,842 |
| 870,000 | Keysight Technologies, Inc. 4.55%, 10/30/2024 | 952,370 |
| | Roper Technologies, Inc. | |
| 5,325,000 | 1.00%, 09/15/2025 | 5,240,467 |
| 3,225,000 | 2.35%, 09/15/2024 | 3,340,660 |
| 6,200,000 | SYNNEX Corp. 1.25%, 08/09/2024(1) | 6,181,515 |
| | | | 24,895,068 |
| | Environmental Control - 0.1% |
| 1,140,000 | Republic Services, Inc. 0.88%, 11/15/2025 | 1,113,287 |
| | Food - 0.5% |
| 3,325,000 | Conagra Brands, Inc. 4.30%, 05/01/2024 | 3,580,526 |
| 4,500,000 | Kraft Heinz Foods Co. 3.00%, 06/01/2026 | 4,707,880 |
| 1,850,000 | Sysco Corp. 5.65%, 04/01/2025 | 2,106,032 |
| | | | 10,394,438 |
| | Gas - 0.3% |
| 975,000 | East Ohio Gas Co. 1.30%, 06/15/2025(1) | 969,681 |
| 6,180,000 | NiSource, Inc. 0.95%, 08/15/2025 | 6,060,391 |
| | | | 7,030,072 |
| | Healthcare - Products - 0.2% |
| 2,260,000 | Boston Scientific Corp. 3.45%, 03/01/2024 | 2,383,272 |
| 2,870,000 | Zimmer Biomet Holdings, Inc. 3.05%, 01/15/2026 | 3,029,757 |
| | | | 5,413,029 |
| | Healthcare - Services - 1.1% |
| 2,720,000 | Anthem, Inc. 2.38%, 01/15/2025 | 2,815,808 |
| 1,960,000 | Bon Secours Mercy Health, Inc. 1.35%, 06/01/2025 | 1,960,698 |
| | CommonSpirit Health | |
| 2,985,000 | 1.55%, 10/01/2025 | 2,976,952 |
| 3,771,000 | 2.76%, 10/01/2024 | 3,932,754 |
| 2,000,000 | HCA, Inc. 4.75%, 05/01/2023 | 2,113,964 |
| 6,225,000 | Humana, Inc. 1.35%, 02/03/2027 | 6,062,776 |
| 1,905,000 | PeaceHealth Obligated Group 1.38%, 11/15/2025 | 1,908,509 |
| 1,590,000 | UnitedHealth Group, Inc. 1.25%, 01/15/2026 | 1,588,845 |
| | | | 23,360,306 |
| | Home Builders - 0.3% |
| | Lennar Corp. | |
| 850,000 | 4.50%, 04/30/2024 | 908,438 |
| 834,000 | 4.88%, 12/15/2023 | 894,131 |
| 1,750,000 | 5.38%, 10/01/2022 | 1,820,000 |
| 2,000,000 | Toll Brothers Finance Corp. 5.88%, 02/15/2022 | 2,002,800 |
| | | | 5,625,369 |
| | Insurance - 1.4% |
| 3,000,000 | American International Group, Inc. 2.50%, 06/30/2025 | 3,116,518 |
| 1,250,000 | Assurant, Inc. 4.20%, 09/27/2023(6) | 1,322,955 |
| 3,000,000 | Athene Global Funding 1.73%, 10/02/2026(1) | 2,967,134 |
| | Brighthouse Financial Global Funding | |
| 590,000 | 1.00%, 04/12/2024(1) | 588,590 |
| 3,020,000 | 1.55%, 05/24/2026(1) | 3,000,918 |
| 2,355,000 | CNO Global Funding Secured 1.75%, 10/07/2026(1) | 2,338,201 |
| Shares or Principal Amount | | Market Value† |
| CORPORATE BONDS - 50.0% - (continued) |
| | Insurance - 1.4% - (continued) |
| | Equitable Financial Life Global Funding | |
| $ 2,000,000 | 1.00%, 01/09/2026(1) | $ 1,948,318 |
| 2,020,000 | 1.40%, 07/07/2025(1) | 2,011,771 |
| 2,315,000 | Marsh & McLennan Cos., Inc. 3.88%, 03/15/2024 | 2,471,429 |
| 4,735,000 | Pacific Life Global Funding 1.20%, 06/24/2025(1) | 4,713,322 |
| 785,000 | Principal Life Global Funding 1.25%, 06/23/2025(1) | 778,933 |
| 3,000,000 | Radian Group, Inc. 6.63%, 03/15/2025 | 3,345,000 |
| 2,250,000 | Willis North America, Inc. 3.60%, 05/15/2024 | 2,381,284 |
| | | | 30,984,373 |
| | Internet - 0.8% |
| 1,535,000 | Meituan 2.13%, 10/28/2025(1) | 1,480,568 |
| | Netflix, Inc. | |
| 7,550,000 | 3.63%, 06/15/2025(1) | 8,027,495 |
| 2,500,000 | 4.38%, 11/15/2026 | 2,784,375 |
| 5,000,000 | 5.50%, 02/15/2022 | 5,068,750 |
| | | | 17,361,188 |
| | Investment Company Security - 0.4% |
| 6,075,000 | FS KKR Capital Corp. 1.65%, 10/12/2024 | 6,000,373 |
| 3,700,000 | Owl Rock Capital Corp. 2.63%, 01/15/2027 | 3,661,740 |
| | | | 9,662,113 |
| | Iron/Steel - 0.4% |
| | Steel Dynamics, Inc. | |
| 395,000 | 2.40%, 06/15/2025 | 407,042 |
| 7,000,000 | 2.80%, 12/15/2024 | 7,320,602 |
| | | | 7,727,644 |
| | IT Services - 1.4% |
| 4,225,000 | DXC Technology Co. 1.80%, 09/15/2026 | 4,162,337 |
| 4,550,000 | Hewlett Packard Enterprise Co. 2.25%, 04/01/2023 | 4,644,030 |
| 4,000,000 | HP, Inc. 2.20%, 06/17/2025 | 4,103,493 |
| 5,775,000 | International Business Machines Corp. 3.00%, 05/15/2024 | 6,075,835 |
| 3,850,000 | Leidos, Inc. 2.95%, 05/15/2023 | 3,969,416 |
| | Seagate HDD Cayman | |
| 3,150,000 | 4.75%, 06/01/2023 | 3,295,688 |
| 700,000 | 4.88%, 03/01/2024 | 746,410 |
| 4,150,000 | SYNNEX Corp. 1.75%, 08/09/2026(1) | 4,064,124 |
| | | | 31,061,333 |
| | Lodging - 0.9% |
| 4,325,000 | Genting New York LLC 3.30%, 02/15/2026(1) | 4,261,159 |
| | Hyatt Hotels Corp. | |
| 1,525,000 | 1.30%, 10/01/2023 | 1,526,222 |
| 2,570,000 | 1.80%, 10/01/2024 | 2,579,446 |
| 5,090,000 | Las Vegas Sands Corp. 3.20%, 08/08/2024 | 5,204,002 |
| | Marriott International, Inc. | |
| 1,565,000 | 2.13%, 10/03/2022(6) | 1,583,590 |
| 2,500,000 | 3.60%, 04/15/2024 | 2,638,621 |
| 2,300,000 | MGM Resorts International 6.00%, 03/15/2023 | 2,427,006 |
| | | | 20,220,046 |
The accompanying notes are an integral part of these financial statements.
The Hartford Short Duration Fund
Schedule of Investments – (continued)
October 31, 2021
| Shares or Principal Amount | | Market Value† |
| CORPORATE BONDS - 50.0% - (continued) |
| | Machinery-Diversified - 0.1% |
| $ 995,000 | CNH Industrial Capital LLC 4.38%, 04/05/2022 | $ 1,010,057 |
| 1,850,000 | Otis Worldwide Corp. 2.06%, 04/05/2025 | 1,895,104 |
| | | | 2,905,161 |
| | Media - 0.4% |
| 2,500,000 | Charter Communications Operating LLC / Charter Communications Operating Capital 4.46%, 07/23/2022 | 2,550,888 |
| 3,185,000 | Comcast Corp. 3.70%, 04/15/2024 | 3,396,445 |
| 1,776,000 | Cox Communications, Inc. 3.15%, 08/15/2024(1) | 1,866,029 |
| 735,000 | Fox Corp. 4.03%, 01/25/2024 | 782,556 |
| | | | 8,595,918 |
| | Miscellaneous Manufacturing - 0.2% |
| 1,480,000 | Parker-Hannifin Corp. 2.70%, 06/14/2024 | 1,543,023 |
| 2,780,000 | Siemens Financieringsmaatschappij N.V. 1.20%, 03/11/2026(1) | 2,752,369 |
| | | | 4,295,392 |
| | Office/Business Equipment - 0.2% |
| 2,090,000 | CDW LLC / CDW Finance Corp. 4.13%, 05/01/2025 | 2,150,088 |
| 1,495,000 | Xerox Corp. 4.07%, 03/17/2022 | 1,510,772 |
| | | | 3,660,860 |
| | Oil & Gas - 2.1% |
| | Aker BP ASA | |
| 2,000,000 | 2.88%, 01/15/2026(1) | 2,087,483 |
| 5,845,000 | 3.00%, 01/15/2025(1) | 6,100,216 |
| | Canadian Natural Resources Ltd. | |
| 1,250,000 | 2.05%, 07/15/2025 | 1,269,145 |
| 875,000 | 2.95%, 01/15/2023 | 896,117 |
| 3,000,000 | Chevron USA, Inc. 3.90%, 11/15/2024 | 3,247,807 |
| 2,795,000 | Coterra Energy, Inc. 4.38%, 06/01/2024(1) | 2,991,401 |
| 3,400,000 | Eni S.p.A. 4.00%, 09/12/2023(1) | 3,590,530 |
| 2,233,000 | Hess Corp. 3.50%, 07/15/2024 | 2,344,188 |
| 3,355,000 | Lundin Energy Finance B.V. 2.00%, 07/15/2026(1) | 3,343,454 |
| 3,000,000 | Marathon Petroleum Corp. 4.50%, 05/01/2023 | 3,151,527 |
| 4,530,000 | Phillips 66 0.90%, 02/15/2024 | 4,518,029 |
| 5,920,000 | Pioneer Natural Resources Co. 0.75%, 01/15/2024 | 5,885,611 |
| 1,310,000 | Saudi Arabian Oil Co. 1.25%, 11/24/2023(1) | 1,313,380 |
| 4,360,000 | Valero Energy Corp. 2.85%, 04/15/2025 | 4,557,411 |
| | | | 45,296,299 |
| | Packaging & Containers - 0.7% |
| | Berry Global, Inc. | |
| 2,950,000 | 0.95%, 02/15/2024 | 2,930,147 |
| 5,200,000 | 1.57%, 01/15/2026 | 5,136,664 |
| 2,000,000 | 1.65%, 01/15/2027 | 1,956,360 |
| 4,450,000 | Silgan Holdings, Inc. 1.40%, 04/01/2026(1) | 4,325,088 |
| | | | 14,348,259 |
| | Pharmaceuticals - 1.4% |
| 5,000,000 | AbbVie, Inc. 2.60%, 11/21/2024 | 5,206,936 |
| 5,275,000 | Astrazeneca Finance LLC 1.20%, 05/28/2026 | 5,228,599 |
| 5,000,000 | AstraZeneca plc 0.70%, 04/08/2026 | 4,857,863 |
| 1,400,000 | Bayer U.S. Finance LLC 3.88%, 12/15/2023(1) | 1,478,140 |
| 1,060,000 | CVS Health Corp. 2.63%, 08/15/2024 | 1,104,669 |
| Shares or Principal Amount | | Market Value† |
| CORPORATE BONDS - 50.0% - (continued) |
| | Pharmaceuticals - 1.4% - (continued) |
| $ 2,560,000 | Elanco Animal Health, Inc. 5.27%, 08/28/2023 | $ 2,725,888 |
| 2,500,000 | McKesson Corp. 1.30%, 08/15/2026 | 2,451,012 |
| 6,400,000 | Teva Pharmaceutical Finance Netherlands B.V. 2.80%, 07/21/2023 | 6,446,720 |
| 755,000 | Viatris, Inc. Co. 1.65%, 06/22/2025 | 756,361 |
| | | | 30,256,188 |
| | Pipelines - 1.8% |
| | Energy Transfer L.P. | |
| 1,870,000 | 2.90%, 05/15/2025 | 1,951,919 |
| 1,130,000 | 4.20%, 09/15/2023 | 1,191,393 |
| 2,150,000 | 4.50%, 04/15/2024 | 2,307,619 |
| 935,000 | EQM Midstream Partners L.P. 4.75%, 07/15/2023 | 984,190 |
| 7,500,000 | Gray Oak Pipeline LLC 2.00%, 09/15/2023(1) | 7,618,994 |
| | MPLX L.P. | |
| 2,160,000 | 1.75%, 03/01/2026 | 2,151,878 |
| 240,000 | 3.50%, 12/01/2022 | 246,768 |
| 1,575,000 | ONEOK, Inc. 5.85%, 01/15/2026 | 1,832,083 |
| 5,200,000 | Phillips 66 Partners L.P. 2.45%, 12/15/2024 | 5,361,055 |
| | Western Midstream Operating L.P. | |
| 5,250,000 | 4.00%, 07/01/2022 | 5,302,500 |
| 5,725,000 | 4.35%, 02/01/2025 | 5,996,937 |
| 4,500,000 | Williams Cos., Inc. 4.30%, 03/04/2024 | 4,813,749 |
| | | | 39,759,085 |
| | Real Estate Investment Trusts - 2.9% |
| | American Tower Corp. | |
| 905,000 | 1.30%, 09/15/2025 | 899,134 |
| 3,250,000 | 1.60%, 04/15/2026 | 3,232,704 |
| 1,750,000 | 3.00%, 06/15/2023 | 1,813,255 |
| 2,350,000 | 3.38%, 05/15/2024 | 2,479,189 |
| 3,890,000 | Brandywine Operating Partnership L.P. 4.10%, 10/01/2024 | 4,156,701 |
| | Crown Castle International Corp. | |
| 4,150,000 | 1.05%, 07/15/2026 | 4,018,495 |
| 1,500,000 | 3.15%, 07/15/2023 | 1,558,444 |
| | Equinix, Inc. | |
| 5,500,000 | 1.00%, 09/15/2025 | 5,391,094 |
| 2,000,000 | 1.25%, 07/15/2025 | 1,979,713 |
| 3,825,000 | 1.45%, 05/15/2026 | 3,780,063 |
| 5,715,000 | Federal Realty Investment Trust 1.25%, 02/15/2026 | 5,653,169 |
| 3,200,000 | Mid-America Apartments L.P. 1.10%, 09/15/2026 | 3,119,976 |
| | SBA Tower Trust | |
| 1,010,000 | 1.63%, 05/15/2051(1) | 996,519 |
| 1,390,000 | 1.88%, 07/15/2050(1) | 1,408,858 |
| 1,745,000 | 2.84%, 01/15/2050(1) | 1,810,094 |
| 4,020,000 | Scentre Group Trust 1 / Scentre Group Trust 2 3.63%, 01/28/2026(1) | 4,314,918 |
| 3,325,000 | Simon Property Group L.P. 3.50%, 09/01/2025 | 3,582,725 |
| 3,700,000 | Ventas Realty L.P. 2.65%, 01/15/2025 | 3,839,679 |
| 5,000,000 | VICI Properties L.P. / VICI Note Co., Inc. 4.25%, 12/01/2026(1) | 5,192,200 |
| 1,575,000 | Vornado Realty L.P. 2.15%, 06/01/2026 | 1,586,432 |
| 2,000,000 | Welltower, Inc. 3.63%, 03/15/2024 | 2,121,386 |
| | | | 62,934,748 |
The accompanying notes are an integral part of these financial statements.
The Hartford Short Duration Fund
Schedule of Investments – (continued)
October 31, 2021
| Shares or Principal Amount | | Market Value† |
| CORPORATE BONDS - 50.0% - (continued) |
| | Retail - 0.4% |
| $ 6,200,000 | 7-eleven, Inc. 0.80%, 02/10/2024(1) | $ 6,156,993 |
| 2,865,000 | Nordstrom, Inc. 2.30%, 04/08/2024 | 2,879,039 |
| | | | 9,036,032 |
| | Semiconductors - 1.3% |
| 3,232,000 | Broadcom Corp. / Broadcom Cayman Finance Ltd. 3.88%, 01/15/2027 | 3,504,129 |
| | Broadcom, Inc. | |
| 1,563,000 | 3.46%, 09/15/2026 | 1,668,598 |
| 1,500,000 | 4.70%, 04/15/2025 | 1,656,292 |
| 5,275,000 | Marvell Technology, Inc. 1.65%, 04/15/2026 | 5,239,340 |
| | Microchip Technology, Inc. | |
| 5,915,000 | 0.97%, 02/15/2024(1) | 5,883,537 |
| 4,775,000 | 0.98%, 09/01/2024(1) | 4,725,513 |
| 2,400,000 | 2.67%, 09/01/2023 | 2,473,721 |
| 860,000 | NXP B.V. / NXP Funding LLC 4.88%, 03/01/2024(1) | 929,665 |
| | Skyworks Solutions, Inc. | |
| 795,000 | 0.90%, 06/01/2023 | 795,131 |
| 1,110,000 | 1.80%, 06/01/2026 | 1,111,338 |
| | | | 27,987,264 |
| | Software - 0.7% |
| | Fidelity National Information Services, Inc. | |
| 2,720,000 | 0.60%, 03/01/2024 | 2,696,290 |
| 3,000,000 | 1.15%, 03/01/2026 | 2,940,375 |
| 1,380,000 | Fiserv, Inc. 3.80%, 10/01/2023 | 1,455,876 |
| 3,425,000 | Oracle Corp. 1.65%, 03/25/2026 | 3,437,115 |
| 5,150,000 | VMware, Inc. 1.00%, 08/15/2024 | 5,156,408 |
| | | | 15,686,064 |
| | Telecommunications - 1.6% |
| 4,500,000 | AT&T, Inc. 1.70%, 03/25/2026 | 4,519,048 |
| 650,000 | Motorola Solutions, Inc. 4.00%, 09/01/2024 | 700,722 |
| 5,500,000 | Nokia Oyj 3.38%, 06/12/2022 | 5,575,625 |
| 1,430,000 | NTT Finance Corp. 1.16%, 04/03/2026(1) | 1,408,765 |
| 4,500,000 | Sprint Communications, Inc. 6.00%, 11/15/2022 | 4,720,410 |
| 7,450,000 | Telecom Italia S.p.A. 5.30%, 05/30/2024(1) | 7,934,250 |
| 2,000,000 | T-Mobile USA, Inc. 3.50%, 04/15/2025 | 2,133,307 |
| | Verizon Communications, Inc. | |
| 3,000,000 | 0.84%, 03/20/2026, 3 mo. USD SOFR + 0.790%(2) | 3,052,830 |
| 1,000,000 | 0.85%, 11/20/2025 | 979,771 |
| 3,000,000 | 1.45%, 03/20/2026 | 2,992,787 |
| | | | 34,017,515 |
| | Transportation - 0.4% |
| | Penske Truck Leasing Co. L.P. / PTL Finance Corp. | |
| 2,065,000 | 3.45%, 07/01/2024(1) | 2,182,925 |
| 1,250,000 | 3.90%, 02/01/2024(1) | 1,322,778 |
| 4,450,000 | TTX Co. 3.60%, 01/15/2025(1) | 4,768,679 |
| | | | 8,274,382 |
| | Trucking & Leasing - 0.9% |
| | DAE Funding LLC | |
| 6,400,000 | 1.55%, 08/01/2024(1) | 6,313,600 |
| 1,450,000 | 2.63%, 03/20/2025(1) | 1,465,289 |
| 2,500,000 | GATX Corp. 4.35%, 02/15/2024 | 2,671,167 |
| Shares or Principal Amount | | Market Value† |
| CORPORATE BONDS - 50.0% - (continued) |
| | Trucking & Leasing - 0.9% - (continued) |
| | Penske Truck Leasing Co. L.P. / PTL Finance Corp. | |
| $ 3,000,000 | 1.20%, 11/15/2025(1) | $ 2,945,126 |
| 1,500,000 | 2.70%, 03/14/2023(1) | 1,536,416 |
| 1,425,000 | 2.70%, 11/01/2024(1) | 1,481,113 |
| 2,000,000 | 4.13%, 08/01/2023(1) | 2,104,493 |
| | | | 18,517,204 |
| | Total Corporate Bonds
(cost $1,068,588,894) | $ 1,079,754,455 |
| MUNICIPAL BONDS - 0.6% |
| | General - 0.3% |
| 1,000,000 | Chicago, IL, Transit Auth 2.06%, 12/01/2024 | $ 1,021,843 |
| 4,620,000 | State Board of Administration Finance Corp. 1.26%, 07/01/2025 | 4,620,676 |
| | | | 5,642,519 |
| | General Obligation - 0.1% |
| 2,805,000 | Cook County, IL, GO 4.74%, 11/15/2022 | 2,813,239 |
| | Higher Education - 0.1% |
| 2,630,000 | Chicago, IL, Board of Education, GO 5.28%, 12/01/2022 | 2,726,758 |
| | Transportation - 0.1% |
| 1,750,000 | Alameda Corridor, CA, Transportation Auth, (NATL Insured) 0.00%, 10/01/2022(8) | 1,730,134 |
| | Total Municipal Bonds
(cost $12,730,973) | | $ 12,912,650 |
| SENIOR FLOATING RATE INTERESTS - 19.4%(9) |
| | Advertising - 0.1% |
| 987,584 | Clear Channel Outdoor Holdings, Inc. 3.63%, 08/21/2026, 1 mo. USD LIBOR + 3.500% | $ 971,091 |
| 1,360,866 | Terrier Media Buyer, Inc. 3.59%, 12/17/2026, 1 mo. USD LIBOR + 3.500% | 1,355,083 |
| | | | 2,326,174 |
| | Aerospace/Defense - 0.2% |
| | Spirit Aerosystems, Inc. | |
| 334,438 | 0.00%, 01/15/2025, 1 mo. USD LIBOR + 3.750%(10) | 335,274 |
| 352,337 | 6.00%, 01/15/2025, 1 mo. USD LIBOR + 5.250% | 353,218 |
| 3,704,776 | TransDigm, Inc. 2.34%, 12/09/2025, 1 mo. USD LIBOR + 2.250% | 3,657,392 |
| | | | 4,345,884 |
| | Airlines - 0.3% |
| 1,175,000 | AAdvantage Loyalty IP Ltd. 5.50%, 04/20/2028, 1 mo. USD LIBOR + 4.750% | 1,223,104 |
| 495,000 | Air Canada 4.25%, 08/11/2028, 1 mo. USD LIBOR + 3.500% | 499,846 |
| 938,287 | Kestrel Bidco, Inc. 4.00%, 12/11/2026, 3 mo. USD LIBOR + 3.000% | 922,459 |
| 455,000 | Mileage Plus Holdings LLC 6.25%, 06/21/2027, 1 mo. USD LIBOR + 5.250% | 484,293 |
The accompanying notes are an integral part of these financial statements.
The Hartford Short Duration Fund
Schedule of Investments – (continued)
October 31, 2021
| Shares or Principal Amount | | Market Value† |
| SENIOR FLOATING RATE INTERESTS - 19.4%(9) - (continued) |
| | Airlines - 0.3% - (continued) |
| $ 1,195,000 | SkyMiles IP Ltd. 4.75%, 10/20/2027, 3 mo. USD LIBOR + 3.750% | $ 1,272,006 |
| 1,422,850 | United Airlines, Inc. 4.50%, 04/21/2028, 1 mo. USD LIBOR + 3.750% | 1,441,902 |
| | | | 5,843,610 |
| | Apparel - 0.1% |
| 1,551,113 | Birkenstock GmbH & Co. KG 4.25%, 04/27/2028, 1 mo. USD LIBOR + 3.750% | 1,550,151 |
| | Auto Parts & Equipment - 0.3% |
| 1,311,713 | Adient U.S. LLC 3.59%, 04/08/2028, 1 mo. USD LIBOR + 3.500% | 1,311,476 |
| | Clarios Global L.P. | |
| EUR 2,013,890 | 3.25%, 04/30/2026, 3 mo. EURIBOR + 3.250% | 2,304,776 |
| $ 1,299,527 | 3.34%, 04/30/2026, 1 mo. USD LIBOR + 3.250% | 1,290,859 |
| 563,760 | First Brands Group LLC 6.00%, 03/30/2027, 1 mo. USD LIBOR + 5.000% | 567,989 |
| | | | 5,475,100 |
| | Beverages - 0.0% |
| 612,500 | Sunshine Investments B.V. 2.87%, 03/28/2025, 3 mo. USD LIBOR + 2.750% | 608,482 |
| | Chemicals - 0.5% |
| 923,562 | Axalta Coating Systems U.S. Holdings, Inc. 1.88%, 06/01/2024, 3 mo. USD LIBOR + 1.750% | 921,253 |
| 4,000,000 | Diamond (BC) B.V. 3.50%, 09/29/2028, 1 mo. USD LIBOR + 3.000% | 3,989,000 |
| 1,164,993 | Element Solutions, Inc. 2.09%, 01/31/2026, 1 mo. USD LIBOR + 2.000% | 1,162,081 |
| 617,088 | H.B. Fuller Co. 2.09%, 10/20/2024, 3 mo. USD LIBOR + 2.000% | 616,668 |
| 733,125 | Hexion, Inc. 3.64%, 07/01/2026, 3 mo. USD LIBOR + 3.500% | 731,901 |
| 488,775 | INEOS Styrolution U.S. Holding LLC 3.25%, 01/29/2026, 1 mo. USD LIBOR + 2.750% | 488,775 |
| | Messer Industries GmbH | |
| EUR 108,333 | 2.50%, 03/01/2026, 3 mo. EURIBOR + 2.500% | 124,154 |
| $ 498,351 | 2.63%, 03/01/2026, 3 mo. USD LIBOR + 2.500% | 494,768 |
| 251,167 | Minerals Technologies, Inc. 3.00%, 02/14/2024, 3 mo. USD LIBOR + 2.250% | 250,853 |
| 915,400 | NIC Acquisition Corp. 4.50%, 12/29/2027, 1 mo. USD LIBOR + 3.750% | 913,395 |
| | Starfruit Finco B.V | |
| 278,545 | 2.84%, 10/01/2025, 1 mo. USD LIBOR + 2.750% | 276,283 |
| EUR 141,620 | 3.00%, 10/01/2025, 3 mo. EURIBOR + 3.000% | 161,485 |
| $ 985,145 | Tronox Finance LLC 2.37%, 03/13/2028, 1 mo. USD LIBOR + 2.250% | 977,145 |
| | | | 11,107,761 |
| | Commercial Services - 1.6% |
| | AlixPartners LLP | |
| EUR 199,000 | 3.25%, 02/04/2028, 3 mo. EURIBOR + 3.250% | 229,184 |
| $ 1,920,350 | 3.25%, 02/04/2028, 1 mo. USD LIBOR + 2.750% | 1,913,149 |
| Shares or Principal Amount | | Market Value† |
| SENIOR FLOATING RATE INTERESTS - 19.4%(9) - (continued) |
| | Commercial Services - 1.6% - (continued) |
| $ 935,133 | Allied Universal Holdco LLC 4.25%, 05/12/2028, 1 mo. USD LIBOR + 3.750% | $ 934,553 |
| | Amentum Government Services Holdings LLC | |
| 632,000 | 3.59%, 01/29/2027, 1 mo. USD LIBOR + 3.500% | 628,315 |
| 1,572,100 | 5.50%, 01/29/2027, 1 mo. USD LIBOR + 4.750% | 1,571,613 |
| 1,245,000 | APX Group, Inc. 4.00%, 07/10/2028, 1 mo. USD LIBOR + 3.500% | 1,240,132 |
| | Belron Finance U.S. LLC | |
| 486,250 | 2.38%, 11/13/2025, 3 mo. USD LIBOR + 2.250% | 483,819 |
| 383,175 | 2.44%, 10/30/2026, 1 mo. USD LIBOR + 2.250% | 381,022 |
| 786,050 | 3.25%, 04/13/2028, 1 mo. USD LIBOR + 2.750% | 785,563 |
| EUR 1,675,000 | Boels Topholding B.V. 3.25%, 02/06/2027, 3 mo. EURIBOR + 3.250% | 1,927,025 |
| 240,000 | Boluda Corporacion Maritima S.L 3.50%, 07/30/2026, 3 mo. EURIBOR + 3.500% | 276,588 |
| $ 814,240 | BrightView Landscapes LLC 2.63%, 08/15/2025, 3 mo. USD LIBOR + 2.500% | 809,827 |
| 1,091,894 | Ensemble RCM LLC 3.88%, 08/03/2026, 3 mo. USD LIBOR + 3.750% | 1,092,865 |
| 990,692 | EVO Payments International LLC 3.34%, 12/22/2023, 3 mo. USD LIBOR + 3.250% | 989,246 |
| 449,669 | Fly Funding S.a.r.l. 1.88%, 08/11/2025, 1 mo. USD LIBOR + 1.160% | 440,815 |
| 1,147,580 | Hertz Corp. 0.00%, 06/30/2028, 1 mo. USD LIBOR + 3.500%(10) | 1,148,636 |
| 2,500,000 | MPH Acquisition Holdings LLC 4.75%, 08/17/2028, 1 mo. USD LIBOR + 4.250% | 2,435,425 |
| 1,500,000 | Parexel International Corp. 0.00%, 08/11/2028, 1 mo. USD LIBOR + 3.500%(10) | 1,501,035 |
| 1,027,425 | Signal Parent, Inc. 4.25%, 04/03/2028, 1 mo. USD LIBOR + 3.500% | 1,006,876 |
| EUR 465,797 | Techem Verwaltungsgesellschaft 675 mbH 2.38%, 07/15/2025, 3 mo. EURIBOR + 2.375% | 528,812 |
| $ 1,296,171 | Trans Union LLC 1.84%, 11/16/2026, 1 mo. USD LIBOR + 1.750% | 1,287,266 |
| 3,506,550 | United Rentals, Inc. 1.84%, 10/31/2025, 3 mo. USD LIBOR + 1.750% | 3,519,068 |
| | Verisure Holding AB | |
| EUR 1,510,000 | 3.25%, 07/20/2026, 3 mo. EURIBOR + 3.250% | 1,731,927 |
| 3,280,000 | 3.25%, 03/27/2028, 3 mo. EURIBOR + 3.250% | 3,759,299 |
| $ 605,888 | Verscend Holding Corp. 4.09%, 08/27/2025, 1 mo. USD LIBOR + 4.000% | 606,645 |
| 2,681,525 | WEX, Inc. 2.34%, 03/31/2028, 1 mo. USD LIBOR + 2.250% | 2,666,106 |
| 1,655,850 | WW International, Inc. 4.00%, 04/13/2028, 1 mo. USD LIBOR + 3.500% | 1,635,152 |
| | | | 35,529,963 |
| | Construction Materials - 0.9% |
| 2,269,312 | ACProducts, Inc. 4.75%, 05/17/2028, 1 mo. USD LIBOR + 4.250% | 2,262,232 |
| 1,345,000 | Chamberlain Group, Inc. 0.00%, 10/22/2028, 1 mo. USD LIBOR + 4.000%(10) | 1,342,202 |
The accompanying notes are an integral part of these financial statements.
The Hartford Short Duration Fund
Schedule of Investments – (continued)
October 31, 2021
| Shares or Principal Amount | | Market Value† |
| SENIOR FLOATING RATE INTERESTS - 19.4%(9) - (continued) |
| | Construction Materials - 0.9% - (continued) |
| $ 1,868,290 | Cornerstone Building Brands, Inc. 3.75%, 04/12/2028, 1 mo. USD LIBOR + 3.250% | $ 1,864,553 |
| 1,014,900 | CP Atlas Buyer, Inc. 4.25%, 11/23/2027, 1 mo. USD LIBOR + 3.750% | 1,008,242 |
| 1,226,325 | Ingersoll-Rand Services Co. 1.84%, 03/01/2027, 1 mo. USD LIBOR + 1.750% | 1,208,310 |
| 1,745,625 | Jeld-Wen Inc. 2.34%, 07/28/2028, 1 mo. USD LIBOR + 2.250% | 1,736,897 |
| | Quikrete Holdings, Inc. | |
| 1,750,000 | 0.00%, 01/31/2027, 1 mo. USD LIBOR + 3.000%(10) | 1,743,000 |
| 1,952,910 | 2.59%, 02/01/2027, 1 mo. USD LIBOR + 2.500% | 1,932,561 |
| 1,775,000 | Rexnord LLC 2.75%, 10/04/2028, 1 mo. USD LIBOR + 2.250% | 1,774,166 |
| 3,285,000 | Standard Industries, Inc. 3.00%, 09/22/2028, 1 mo. USD LIBOR + 2.500% | 3,280,303 |
| 575,781 | Tamko Building Products LLC 3.09%, 06/01/2026, 1 mo. USD LIBOR + 3.000% | 573,144 |
| 477,600 | Watlow Electric Manufacturing Co. 4.50%, 03/02/2028, 1 mo. USD LIBOR + 4.000% | 477,996 |
| | | | 19,203,606 |
| | Distribution/Wholesale - 0.4% |
| 2,548,000 | American Builders & Contractors Supply Co., Inc. 2.09%, 01/15/2027, 1 mo. USD LIBOR + 2.000% | 2,521,781 |
| 3,047,072 | Core & Main L.P. 2.59%, 07/27/2028, 1 mo. USD LIBOR + 2.500% | 3,021,690 |
| 509,600 | KAR Auction Services, Inc. 2.38%, 09/19/2026, 1 mo. USD LIBOR + 2.250% | 494,312 |
| 791,025 | PAI Holdco, Inc. 4.25%, 10/28/2027, 1 mo. USD LIBOR + 3.500% | 791,025 |
| 2,518,688 | Univar Solutions USA Inc. 2.09%, 06/03/2028, 1 mo. USD LIBOR + 2.000% | 2,512,844 |
| | | | 9,341,652 |
| | Diversified Financial Services - 0.6% |
| 1,975,669 | Blackhawk Network Holdings, Inc. 3.09%, 06/15/2025, 3 mo. USD LIBOR + 3.000% | 1,958,382 |
| | Deerfield Dakota Holding LLC | |
| EUR 1,975,000 | 4.00%, 04/09/2027, 3 mo. EURIBOR + 4.000% | 2,284,241 |
| $ 2,760,063 | 4.75%, 04/09/2027, 1 mo. USD LIBOR + 3.750% | 2,765,251 |
| 479,500 | Delos Finance S.a.r.l. 1.88%, 10/06/2023, 3 mo. USD LIBOR + 1.750% | 478,824 |
| 1,795,500 | Fleetcor Technologies Operating Co. LLC 1.84%, 04/28/2028, 1 mo. USD LIBOR + 1.750% | 1,789,737 |
| 610,564 | NFP Corp. 3.34%, 02/15/2027, 1 mo. USD LIBOR + 3.250% | 602,804 |
| 2,004,380 | Russell Investments U.S. Inst'l Holdco, Inc. 4.50%, 05/30/2025, 1 mo. USD LIBOR + 3.500% | 2,011,275 |
| | | | 11,890,514 |
| Shares or Principal Amount | | Market Value† |
| SENIOR FLOATING RATE INTERESTS - 19.4%(9) - (continued) |
| | Electric - 0.1% |
| $ 1,217,699 | ExGen Renewables LLC 3.50%, 12/15/2027, 1 mo. USD LIBOR + 2.500% | $ 1,218,564 |
| | Electrical Components & Equipment - 0.1% |
| 590,000 | Anticimex International AB 0.00%, 07/21/2028, 1 mo. USD LIBOR + 3.500%(10) | 589,263 |
| 754,300 | Energizer Holdings, Inc. 2.75%, 12/22/2027, 1 mo. USD LIBOR + 2.250% | 751,705 |
| | | | 1,340,968 |
| | Electronics - 0.1% |
| 1,097,250 | Ingram Micro, Inc. 4.00%, 06/30/2028, 1 mo. USD LIBOR + 3.500% | 1,099,444 |
| EUR 225,000 | Zephyr German BidCo GmbH 3.75%, 03/10/2028, 3 mo. EURIBOR + 3.750% | 259,476 |
| | | | 1,358,920 |
| | Engineering & Construction - 0.3% |
| $ 763,088 | Artera Services LLC 4.50%, 03/06/2025, 1 mo. USD LIBOR + 3.500% | 759,592 |
| 1,915,000 | Brand Energy & Infrastructure Services, Inc. 5.25%, 06/21/2024, 3 mo. USD LIBOR + 4.250% | 1,897,133 |
| 2,147,007 | Brown Group Holding LLC 3.25%, 06/07/2028, 1 mo. USD LIBOR + 2.750% | 2,140,308 |
| EUR 395,751 | Fluidra S.A. 2.00%, 07/02/2025, 3 mo. EURIBOR + 2.000% | 455,489 |
| $ 548,073 | Hamilton Holdco LLC 2.14%, 01/02/2027, 1 mo. USD LIBOR + 2.000% | 543,048 |
| 890,000 | KKR Apple Bidco LLC 3.50%, 09/22/2028, 1 mo. USD LIBOR + 3.000% | 887,775 |
| | | | 6,683,345 |
| | Entertainment - 0.6% |
| 1,425,381 | Aristocrat Technologies, Inc. 1.88%, 10/19/2024, 3 mo. USD LIBOR + 1.750% | 1,414,876 |
| EUR 370,000 | Banijay Entertainment S.A.S 3.75%, 03/01/2025, 3 mo. EURIBOR + 3.750% | 427,630 |
| | Crown Finance U.S., Inc. | |
| $ 1,621,108 | 3.50%, 02/28/2025, 1 mo. USD LIBOR + 2.500% | 1,334,172 |
| 279,621 | 7.13%, 05/23/2024, 1 mo. USD LIBOR + 7.000% | 337,223 |
| 143,909 | 9.25%, 05/23/2024, 1 mo. USD LIBOR + 8.250% | 154,342 |
| 2,733,990 | Delta (LUX) S.a.r.l. 3.50%, 02/01/2024, 3 mo. USD LIBOR + 2.500% | 2,722,890 |
| 1,425,937 | Golden Entertainment, Inc. 3.75%, 10/21/2024, 3 mo. USD LIBOR + 3.000% | 1,422,972 |
| 248,840 | NASCAR Holdings, Inc. 2.59%, 10/19/2026, 3 mo. USD LIBOR + 2.500% | 247,907 |
| 889,121 | Penn National Gaming, Inc. 3.00%, 10/15/2025, 3 mo. USD LIBOR + 2.250% | 887,271 |
| 989,744 | Scientific Games International, Inc. 2.84%, 08/14/2024, 1 mo. USD LIBOR + 2.750% | 985,131 |
| 2,493,402 | UFC Holdings LLC 3.50%, 04/29/2026, 1 mo. USD LIBOR + 2.750% | 2,477,818 |
| | | | 12,412,232 |
The accompanying notes are an integral part of these financial statements.
The Hartford Short Duration Fund
Schedule of Investments – (continued)
October 31, 2021
| Shares or Principal Amount | | Market Value† |
| SENIOR FLOATING RATE INTERESTS - 19.4%(9) - (continued) |
| | Environmental Control - 0.2% |
| | Clean Harbors, Inc. | |
| $ 1,690,084 | 1.84%, 06/28/2024, 3 mo. USD LIBOR + 1.750% | $ 1,689,611 |
| 1,500,000 | 2.09%, 10/08/2028, 1 mo. USD LIBOR + 2.087% | 1,499,070 |
| 476,513 | U.S. Ecology Holdings, Inc. 2.59%, 11/01/2026, 3 mo. USD LIBOR + 2.500% | 474,726 |
| | | | 3,663,407 |
| | Food - 0.5% |
| 345,238 | 8th Avenue Food & Provisions, Inc. 3.84%, 10/01/2025, 3 mo. USD LIBOR + 3.750% | 343,297 |
| 1,719,687 | B&G Foods, Inc. 2.59%, 10/10/2026, 1 mo. USD LIBOR + 2.500% | 1,723,264 |
| EUR 1,290,000 | Bellis Acquisition Co. plc 2.75%, 02/12/2026, 3 mo. EURIBOR + 2.750% | 1,469,617 |
| $ 227,363 | CHG PPC Parent LLC 2.84%, 03/31/2025, 3 mo. USD LIBOR + 2.750% | 225,657 |
| | Froneri International Ltd. | |
| 943,062 | 2.34%, 01/29/2027, 1 mo. USD LIBOR + 2.250% | 929,039 |
| EUR 1,015,000 | 2.63%, 01/29/2027, 3 mo. EURIBOR + 2.625% | 1,144,006 |
| $ 797,650 | Hostess Brands LLC 3.00%, 08/03/2025, 1 mo. USD LIBOR + 2.250% | 795,744 |
| | U.S. Foods, Inc. | |
| 1,674,819 | 1.84%, 06/27/2023, 1 mo. USD LIBOR + 1.750% | 1,663,397 |
| 1,156,400 | 2.09%, 09/13/2026, 3 mo. USD LIBOR + 2.000% | 1,134,718 |
| 943,249 | UTZ Quality Foods LLC 3.09%, 01/20/2028, 1 mo. USD LIBOR + 3.000% | 940,495 |
| | | | 10,369,234 |
| | Food Service - 0.1% |
| | Aramark Services, Inc. | |
| 554,934 | 1.84%, 03/11/2025, 1 mo. USD LIBOR + 1.750% | 541,061 |
| 951,150 | 1.84%, 01/15/2027, 1 mo. USD LIBOR + 1.750% | 926,781 |
| 1,231,985 | 2.59%, 04/06/2028, 1 mo. USD LIBOR + 2.500% | 1,221,821 |
| | | | 2,689,663 |
| | Gas - 0.1% |
| 2,233,587 | UGI Energy Services LLC 3.84%, 08/13/2026, 1 mo. USD LIBOR + 3.750% | 2,240,579 |
| | Hand/Machine Tools - 0.1% |
| 1,217,414 | Alliance Laundry Systems LLC 4.25%, 10/08/2027, 1 mo. USD LIBOR + 3.500% | 1,219,581 |
| | Healthcare - Products - 0.7% |
| | Agiliti Health, Inc. | |
| 835,987 | 2.88%, 01/04/2026, 3 mo. USD LIBOR + 2.875% | 832,852 |
| 676,657 | 3.50%, 01/04/2026, 1 mo. USD LIBOR + 2.750% | 674,965 |
| | Avantor Funding, Inc. | |
| 1,844,501 | 2.50%, 11/21/2024, 1 mo. USD LIBOR + 2.000% | 1,841,623 |
| 3,676,325 | 2.75%, 11/08/2027, 1 mo. USD LIBOR + 2.250% | 3,673,274 |
| Shares or Principal Amount | | Market Value† |
| SENIOR FLOATING RATE INTERESTS - 19.4%(9) - (continued) |
| | Healthcare - Products - 0.7% - (continued) |
| EUR 713,213 | 2.75%, 06/12/2028, 1 mo. EURIBOR + 2.750% | $ 822,182 |
| $ 878,555 | Coty, Inc. 2.34%, 04/07/2025, 3 mo. USD LIBOR + 2.250% | 864,278 |
| 320,869 | CPI Holdco LLC 3.84%, 11/04/2026, 1 mo. USD LIBOR + 3.750% | 320,670 |
| 733,162 | Insulet Corp. 3.75%, 05/04/2028, 1 mo. USD LIBOR + 3.250% | 733,852 |
| 2,495,000 | Medline Industries, Inc. 0.00%, 10/23/2028, 1 mo. USD LIBOR + 3.250%(10) | 2,497,470 |
| 2,248,899 | Sunshine Luxembourg S.a.r.l. 4.50%, 10/01/2026, 1 mo. USD LIBOR + 3.750% | 2,252,565 |
| | | | 14,513,731 |
| | Healthcare - Services - 1.1% |
| | ADMI Corp. | |
| 1,626,825 | 3.63%, 12/23/2027, 1 mo. USD LIBOR + 3.125% | 1,614,120 |
| 590,000 | 4.00%, 12/23/2027, 1 mo. USD LIBOR + 3.500% | 589,369 |
| 2,000,000 | AHP Health Partners, Inc. 4.00%, 08/04/2028, 1 mo. USD LIBOR + 3.500% | 2,005,620 |
| EUR 2,495,000 | Biogroup-LCD 3.50%, 01/28/2028, 3 mo. EURIBOR + 3.500% | 2,866,597 |
| $ 1,242,709 | Catalent Pharma Solutions, Inc. 2.00%, 02/22/2028, 1 mo. USD LIBOR + 2.500% | 1,243,019 |
| EUR 1,090,000 | Cerba Healthcare S.A.S. 3.75%, 05/24/2028, 3 mo. EURIBOR + 3.750% | 1,256,537 |
| 950,000 | Elsan SAS 3.50%, 06/16/2028, 3 mo. EURIBOR + 3.500% | 1,095,345 |
| $ 804,732 | Envision Healthcare Corp. 3.84%, 10/10/2025, 3 mo. USD LIBOR + 3.750% | 664,242 |
| 313,413 | eResearchTechnology, Inc. 5.50%, 02/04/2027, 1 mo. USD LIBOR + 4.500% | 314,676 |
| | EyeCare Partners LLC | |
| 1,305,000 | 0.00%, 10/14/2028, 1 mo. USD LIBOR + 3.750%(10) | 1,301,738 |
| 1,524,088 | 3.88%, 02/18/2027, 1 mo. USD LIBOR + 3.750% | 1,513,236 |
| 1,411,463 | Heartland Dental, LLC 4.09%, 04/30/2025, 1 mo. USD LIBOR + 4.000% | 1,407,637 |
| 702,717 | ICON Luxembourg S.a r.l. 3.00%, 07/03/2028, 1 mo. USD LIBOR + 2.500% | 702,640 |
| | IQVIA, Inc. | |
| 499,144 | 1.84%, 03/07/2024, 1 mo. USD LIBOR + 1.750% | 498,271 |
| EUR 532,882 | 2.00%, 06/11/2025, 1 mo. EURIBOR + 2.000% | 611,009 |
| 925,000 | LGC Group Holdings Ltd. 3.00%, 04/21/2027, 3 mo. EURIBOR + 3.000% | 1,045,647 |
| $ 702,446 | MED ParentCo L.P. 4.34%, 08/31/2026, 1 mo. USD LIBOR + 4.250% | 700,297 |
| | Medical Solutions L.L.C. | |
| 424,200 | 0.00%, 10/07/2028, 1 mo. USD LIBOR + 3.500%(10) | 424,412 |
| 80,800 | 0.00%, 11/01/2028, 1 mo. USD LIBOR + 3.500%(10) | 80,840 |
The accompanying notes are an integral part of these financial statements.
The Hartford Short Duration Fund
Schedule of Investments – (continued)
October 31, 2021
| Shares or Principal Amount | | Market Value† |
| SENIOR FLOATING RATE INTERESTS - 19.4%(9) - (continued) |
| | Healthcare - Services - 1.1% - (continued) |
| $ 1,985,025 | PPD, Inc. 2.50%, 01/13/2028, 1 mo. USD LIBOR + 2.000% | $ 1,980,380 |
| 2,056,809 | Surgery Center Holdings, Inc. 4.50%, 08/31/2026, 1 mo. USD LIBOR + 3.750% | 2,060,532 |
| | | | 23,976,164 |
| | Holding Companies-Diversified - 0.1% |
| EUR 1,445,000 | IVC Acquisition Ltd. 0.00%, 02/13/2026, 1 mo. USD LIBOR + 4.000%(10) | 1,667,914 |
| | Home Builders - 0.1% |
| $ 1,000,000 | Installed Building Products, Inc. 2.34%, 04/15/2025, 1 mo. USD LIBOR + 2.250% | 996,750 |
| 1,132,163 | Tecta America Corp. 5.00%, 04/01/2028, 1 mo. USD LIBOR + 4.250% | 1,133,578 |
| | | | 2,130,328 |
| | Home Furnishings - 0.1% |
| 1,315,000 | Mattress Firm Inc 5.00%, 09/25/2028, 1 mo. USD LIBOR + 4.250% | 1,308,109 |
| 796,010 | Weber-Stephen Products LLC 4.00%, 10/30/2027, 1 mo. USD LIBOR + 3.250% | 797,339 |
| | | | 2,105,448 |
| | Household Products - 0.0% |
| 781,728 | Reynolds Consumer Products LLC 1.84%, 02/04/2027, 1 mo. USD LIBOR + 1.750% | 777,999 |
| | Insurance - 0.9% |
| 2,190,967 | Acrisure LLC 3.63%, 02/15/2027, 1 mo. USD LIBOR + 3.500% | 2,160,294 |
| | Alliant Holdings Intermediate LLC | |
| 920,000 | 0.00%, 11/19/2027, 1 mo. USD LIBOR + 3.500%(10) | 917,700 |
| 487,738 | 4.25%, 11/05/2027, 1 mo. USD LIBOR + 3.750% | 486,763 |
| | Asurion LLC | |
| 1,079,540 | 3.21%, 11/03/2023, 1 mo. USD LIBOR + 3.125% | 1,076,614 |
| 2,812,731 | 3.34%, 12/23/2026, 1 mo. USD LIBOR + 3.250% | 2,783,281 |
| 870,625 | 3.34%, 07/31/2027, 1 mo. USD LIBOR + 3.250% | 861,919 |
| 1,055,000 | 5.34%, 01/31/2028, 1 mo. USD LIBOR + 5.250% | 1,050,664 |
| 1,240,000 | 5.34%, 01/20/2029, 1 mo. USD LIBOR + 5.250% | 1,234,060 |
| | Hub International Ltd. | |
| 1,339,987 | 2.87%, 04/25/2025, 1 mo. USD LIBOR + 2.750% | 1,324,457 |
| 530,587 | 4.00%, 04/25/2025, 1 mo. USD LIBOR + 3.250% | 529,924 |
| 983,661 | Ryan Specialty Group LLC 3.75%, 09/01/2027, 1 mo. USD LIBOR + 3.000% | 983,906 |
| | Sedgwick Claims Management Services, Inc. | |
| 1,739,351 | 3.34%, 12/31/2025, 3 mo. USD LIBOR + 3.250% | 1,720,879 |
| 1,642,423 | 3.84%, 09/03/2026, 1 mo. USD LIBOR + 3.750% | 1,637,907 |
| Shares or Principal Amount | | Market Value† |
| SENIOR FLOATING RATE INTERESTS - 19.4%(9) - (continued) |
| | Insurance - 0.9% - (continued) |
| $ 166,600 | 5.25%, 09/03/2026, 1 mo. USD LIBOR + 4.250% | $ 166,868 |
| 1,685,307 | USI, Inc. 3.13%, 05/16/2024, 3 mo. USD LIBOR + 3.000% | 1,671,757 |
| | | | 18,606,993 |
| | Internet - 0.4% |
| | Adevinta ASA | |
| EUR 800,000 | 3.25%, 06/26/2028, 3 mo. EURIBOR + 3.250% | 924,356 |
| $ 548,625 | 3.75%, 06/26/2028, 1 mo. USD LIBOR + 3.000% | 548,488 |
| 329,975 | Buzz Merger Sub Ltd. 2.84%, 01/29/2027, 1 mo. USD LIBOR + 2.750% | 327,913 |
| 1,965,075 | Endure Digital, Inc. 4.25%, 02/10/2028, 1 mo. USD LIBOR + 3.500% | 1,929,861 |
| | Go Daddy Operating Co. LLC | |
| 1,102,927 | 1.84%, 02/15/2024, 1 mo. USD LIBOR + 1.750% | 1,094,379 |
| 962,812 | 2.09%, 08/10/2027, 1 mo. USD LIBOR + 2.000% | 955,861 |
| 816,991 | MH Sub LLC 4.75%, 09/13/2024, 1 mo. USD LIBOR + 3.750% | 818,355 |
| 1,145,000 | Proofpoint, Inc. 3.75%, 08/31/2028, 1 mo. USD LIBOR + 3.250% | 1,139,790 |
| 510,000 | Shutterfly, Inc. 5.75%, 09/25/2026, 1 mo. USD LIBOR + 5.000% | 504,135 |
| | | | 8,243,138 |
| | Investment Company Security - 0.0% |
| 525,785 | FinCo LLC 2.59%, 06/27/2025, 1 mo. USD LIBOR + 2.500% | 523,813 |
| | IT Services - 0.4% |
| 1,580,547 | CDW LLC 1.84%, 10/13/2026, 1 mo. USD LIBOR + 1.750% | 1,581,859 |
| 1,940,800 | Peraton Corp. 4.50%, 02/01/2028, 1 mo. USD LIBOR + 3.750% | 1,942,915 |
| | Science Applications International Corp. | |
| 1,838,150 | 1.96%, 10/31/2025, 1 mo. USD LIBOR + 1.875% | 1,837,010 |
| 1,590,667 | 1.96%, 03/12/2027, 1 mo. USD LIBOR + 1.875% | 1,587,358 |
| 563,572 | Surf Holdings LLC 3.62%, 03/05/2027, 1 mo. USD LIBOR + 3.500% | 559,667 |
| | Tempo Acquisition LLC | |
| 425,000 | 3.50%, 08/31/2028, 1 mo. USD LIBOR + 3.000% | 425,268 |
| 1,642,501 | 3.75%, 11/02/2026, 1 mo. USD LIBOR + 3.250% | 1,645,917 |
| | | | 9,579,994 |
| | Leisure Time - 0.3% |
| | Carnival Corp. | |
| 1,429,674 | 3.75%, 06/30/2025, 1 mo. USD LIBOR + 3.000% | 1,427,000 |
| 1,680,000 | 4.00%, 10/18/2028, 6 mo. USD LIBOR + 4.000% | 1,677,900 |
| 535,000 | Great Canadian Gaming Corp. 0.00%, 11/01/2026, 1 mo. USD LIBOR + 4.000%(10) | 537,408 |
| 2,234,400 | Hayward Industries, Inc. 3.00%, 05/12/2028, 1 mo. USD LIBOR + 2.500% | 2,226,959 |
The accompanying notes are an integral part of these financial statements.
The Hartford Short Duration Fund
Schedule of Investments – (continued)
October 31, 2021
| Shares or Principal Amount | | Market Value† |
| SENIOR FLOATING RATE INTERESTS - 19.4%(9) - (continued) |
| | Leisure Time - 0.3% - (continued) |
| $ 987,525 | MajorDrive Holdings LLC 4.50%, 05/12/2028, 1 mo. USD LIBOR + 4.000% | $ 987,525 |
| 619,050 | SRAM LLC 3.25%, 05/12/2028, 1 mo. USD LIBOR + 2.750% | 617,503 |
| | | | 7,474,295 |
| | Lodging - 0.4% |
| 1,366,151 | Boyd Gaming Corp. 2.32%, 09/15/2023, 3 mo. USD LIBOR + 2.250% | 1,363,651 |
| | Caesars Resort Collection LLC | |
| 2,910,010 | 2.84%, 12/23/2024, 3 mo. USD LIBOR + 2.750% | 2,895,169 |
| 742,500 | 3.59%, 07/21/2025, 1 mo. USD LIBOR + 3.500% | 742,931 |
| 973,097 | Four Seasons Hotels Ltd. 2.09%, 11/30/2023, 3 mo. USD LIBOR + 2.000% | 970,791 |
| 974,847 | Hilton Worldwide Finance LLC 1.84%, 06/22/2026, 3 mo. USD LIBOR + 1.750% | 967,087 |
| 1,487,238 | Station Casinos LLC 2.50%, 02/08/2027, 1 mo. USD LIBOR + 2.250% | 1,471,696 |
| | | | 8,411,325 |
| | Machinery - Construction & Mining - 0.1% |
| 1,862,229 | Brookfield WEC Holdings, Inc. 3.25%, 08/01/2025, 1 mo. USD LIBOR + 2.750% | 1,848,262 |
| | Machinery-Diversified - 0.2% |
| 535,224 | Altra Industrial Motion Corp. 2.09%, 10/01/2025, 3 mo. USD LIBOR + 2.000% | 531,210 |
| 1,163,936 | Circor International, Inc. 4.25%, 12/11/2024, 1 mo. USD LIBOR + 3.250% | 1,162,120 |
| 370,000 | Filtration Group Corp. 0.00%, 10/21/2028, 1 mo. USD LIBOR + 3.750%(10) | 369,352 |
| 967,646 | Gardner Denver, Inc. 1.84%, 03/01/2027, 1 mo. USD LIBOR + 1.750% | 953,432 |
| 1,865,375 | Vertical U.S. Newco, Inc. 4.00%, 07/30/2027, 1 mo. USD LIBOR + 3.500% | 1,867,707 |
| | | | 4,883,821 |
| | Media - 1.4% |
| 835,200 | Altice Financing S.A. 2.87%, 01/31/2026, 3 mo. USD LIBOR + 2.750% | 818,195 |
| 678,150 | Banijay Entertainment S.A.S 3.83%, 03/01/2025, 1 mo. USD LIBOR + 3.750% | 675,607 |
| 2,837,887 | Cable One, Inc. 2.09%, 05/03/2028, 1 mo. USD LIBOR + 2.000% | 2,813,936 |
| 1,598,858 | Charter Communications Operating LLC 1.84%, 02/01/2027, 1 mo. USD LIBOR + 1.750% | 1,587,122 |
| | CSC Holdings LLC | |
| 904,862 | 2.34%, 07/17/2025, 3 mo. USD LIBOR + 2.250% | 883,091 |
| 1,215,625 | 2.34%, 01/15/2026, 3 mo. USD LIBOR + 2.250% | 1,189,793 |
| 1,083,759 | 2.59%, 04/15/2027, 1 mo. USD LIBOR + 2.500% | 1,060,729 |
| 1,175,000 | DirecTV Financing LLC 5.75%, 07/22/2027, 1 mo. USD LIBOR + 5.000% | 1,175,564 |
| | E.W. Scripps Co. | |
| 692,321 | 3.31%, 05/01/2026, 1 mo. USD LIBOR + 2.563% | 689,725 |
| 763,400 | 3.75%, 01/07/2028, 1 mo. USD LIBOR + 3.000% | 763,759 |
| Shares or Principal Amount | | Market Value† |
| SENIOR FLOATING RATE INTERESTS - 19.4%(9) - (continued) |
| | Media - 1.4% - (continued) |
| $ 1,193,748 | Gray Television, Inc. 2.58%, 01/02/2026, 3 mo. USD LIBOR + 2.500% | $ 1,185,249 |
| 9,201 | Houghton Mifflin Harcourt Publishing Co. 7.25%, 11/22/2024, 1 mo. USD LIBOR + 6.250% | 9,181 |
| | Nexstar Broadcasting, Inc. | |
| 219,662 | 2.34%, 01/17/2024, 3 mo. USD LIBOR + 2.250% | 219,020 |
| 1,915,296 | 2.58%, 09/18/2026, 1 mo. USD LIBOR + 2.500% | 1,911,465 |
| 875,000 | Sinclair Television Group, Inc. 2.59%, 09/30/2026, 1 mo. USD LIBOR + 2.500% | 859,959 |
| 2,630,000 | Telenet Financing USD LLC 2.09%, 04/30/2028, 6 mo. USD LIBOR + 2.000% | 2,591,865 |
| EUR 1,250,000 | UPC Broadband Holding B.V. 3.00%, 01/31/2029, 3 mo. EURIBOR + 3.000% | 1,434,394 |
| $ 2,230,000 | UPC Financing Partnership 3.09%, 01/31/2029, 1 mo. USD LIBOR + 3.000% | 2,219,318 |
| | Virgin Media Bristol LLC | |
| 2,325,000 | 2.59%, 01/31/2028, 1 mo. USD LIBOR + 2.500% | 2,299,169 |
| EUR 800,000 | 3.25%, 01/31/2029, 3 mo. EURIBOR + 3.250% | 922,969 |
| $ 585,000 | 3.34%, 01/31/2029, 1 mo. USD LIBOR + 3.250% | 584,514 |
| EUR 1,400,000 | Virgin Media SFA Finance Ltd. 2.50%, 01/31/2029, 3 mo. EURIBOR + 2.500% | 1,589,269 |
| 1,310,000 | Ziggo B.V. 3.00%, 01/31/2029, 3 mo. EURIBOR + 3.000% | 1,496,066 |
| $ 1,345,000 | Ziggo Financing Partnership 2.59%, 04/30/2028, 1 mo. USD LIBOR + 2.500% | 1,327,623 |
| | | | 30,307,582 |
| | Mining - 0.0% |
| 748,125 | American Rock Salt Company LLC 4.75%, 06/04/2028, 1 mo. USD LIBOR + 4.000% | 750,931 |
| | Miscellaneous Manufacturing - 0.1% |
| EUR 1,227,702 | CeramTec AcquiCo GmbH 2.50%, 03/07/2025, 3 mo. EURIBOR + 2.500% | 1,410,126 |
| $ 503,412 | Momentive Performance Materials USA LLC 3.34%, 05/15/2024, 3 mo. USD LIBOR + 3.250% | 502,365 |
| | | | 1,912,491 |
| | Oil & Gas Services - 0.0% |
| 920,000 | Oryx Midstream Services Permian Basin LLC 0.00%, 10/05/2028, 1 mo. USD LIBOR + 3.250%(10) | 916,053 |
| | Packaging & Containers - 0.4% |
| | Berlin Packaging LLC | |
| 1,840,761 | 3.75%, 03/05/2028, 1 mo. USD LIBOR + 3.250% | 1,830,177 |
| 785,000 | 4.25%, 03/11/2028, 1 mo. USD LIBOR + 3.750% | 785,141 |
| 189,261 | Berry Global, Inc. 1.84%, 07/01/2026, 1 mo. USD LIBOR + 1.836% | 187,936 |
| | Flex Acquisition Co., Inc. | |
| 985,562 | 3.13%, 06/29/2025, 3 mo. USD LIBOR + 3.000% | 977,441 |
| 1,814,422 | 4.00%, 02/23/2028, 1 mo. USD LIBOR + 3.500% | 1,808,870 |
The accompanying notes are an integral part of these financial statements.
The Hartford Short Duration Fund
Schedule of Investments – (continued)
October 31, 2021
| Shares or Principal Amount | | Market Value† |
| SENIOR FLOATING RATE INTERESTS - 19.4%(9) - (continued) |
| | Packaging & Containers - 0.4% - (continued) |
| $ 330,000 | Pretium PKG Holdings, Inc. 4.50%, 10/02/2028, 1 mo. USD LIBOR + 4.500% | $ 330,785 |
| 1,288,525 | Proampac PG Borrower LLC 4.50%, 11/03/2025, 1 mo. USD LIBOR + 3.750% | 1,288,525 |
| | TricorBraun Holdings, Inc. | |
| 1,596,091 | 3.75%, 03/03/2028, 1 mo. USD LIBOR + 3.250% | 1,585,031 |
| 359,601 | 3.75%, 03/03/2028, 1 mo. USD LIBOR + 3.250%(11) | 357,109 |
| | | | 9,151,015 |
| | Pharmaceuticals - 1.0% |
| | Bausch Health Cos., Inc. | |
| 876,342 | 2.84%, 11/27/2025, 3 mo. USD LIBOR + 2.750% | 873,494 |
| 686,854 | 3.09%, 06/02/2025, 3 mo. USD LIBOR + 3.000% | 685,096 |
| 980,368 | Change Healthcare Holdings LLC 3.50%, 03/01/2024, 1 mo. USD LIBOR + 2.500% | 979,250 |
| 5,104,777 | Elanco Animal Health, Inc. 1.83%, 08/01/2027, 1 mo. USD LIBOR + 1.750% | 5,059,191 |
| 1,432,423 | Endo Luxembourg Finance Co. S.a r.l. 5.75%, 03/27/2028, 1 mo. USD LIBOR + 5.000% | 1,394,621 |
| 1,629,889 | Gainwell Acquisition Corp. 4.75%, 10/01/2027, 1 mo. USD LIBOR + 4.000% | 1,632,660 |
| 1,095,000 | HCRX Investments Holdco L.P. 0.00%, 07/14/2028, 1 mo. USD LIBOR + 2.250%(10) | 1,088,430 |
| 1,840,750 | Horizon Therapeutics USA, Inc. 2.50%, 03/15/2028, 1 mo. USD LIBOR + 2.000% | 1,835,817 |
| 175,082 | ICON Luxembourg S.a r.l. 3.00%, 07/03/2028, 1 mo. USD LIBOR + 2.500% | 175,063 |
| 1,740,637 | Jazz Financing Lux S.a.r.l. 4.00%, 05/05/2028, 1 mo. USD LIBOR + 3.500% | 1,742,813 |
| 1,870,312 | Organon & Co. 3.50%, 06/02/2028, 1 mo. USD LIBOR + 3.000% | 1,873,829 |
| 606,950 | Packaging Coordinators Midco, Inc. 4.25%, 11/30/2027, 1 mo. USD LIBOR + 3.500% | 607,581 |
| 1,898,549 | Pathway Vet Alliance LLC 3.84%, 03/31/2027, 1 mo. USD LIBOR + 3.750% | 1,888,258 |
| 1,050,000 | Prestige Brands, Inc. 2.50%, 07/03/2028, 1 mo. USD LIBOR + 2.000% | 1,048,520 |
| | | | 20,884,623 |
| | Pipelines - 0.4% |
| 1,409,292 | BCP Renaissance Parent LLC 4.50%, 10/31/2024, 3 mo. USD LIBOR + 3.500% | 1,404,007 |
| 728,941 | Buckeye Partners L.P. 2.33%, 11/01/2026, 1 mo. USD LIBOR + 2.250% | 725,209 |
| 2,259,337 | DT Midstream, Inc. 2.50%, 06/26/2028, 1 mo. USD LIBOR + 2.000% | 2,263,924 |
| 2,198,781 | Medallion Midland Acquisition LLC 4.50%, 10/18/2028, 3 mo. USD LIBOR + 3.750% | 2,196,714 |
| 761,450 | NorthRiver Midstream Finance L.P. 3.38%, 10/01/2025, 3 mo. USD LIBOR + 3.250% | 759,645 |
| 640,678 | Traverse Midstream Partners LLC 5.25%, 09/27/2024, 1 mo. USD LIBOR + 4.250% | 639,743 |
| | | | 7,989,242 |
| Shares or Principal Amount | | Market Value† |
| SENIOR FLOATING RATE INTERESTS - 19.4%(9) - (continued) |
| | Real Estate - 0.0% |
| EUR 640,000 | Blitz GmbH 3.50%, 04/28/2028, 3 mo. EURIBOR + 3.500% | $ 735,046 |
| | Retail - 1.5% |
| $ 910,000 | At Home Group, Inc. 4.75%, 07/24/2028, 1 mo. USD LIBOR + 4.250% | 905,832 |
| 1,763,516 | B.C. Unlimited Liability Co. 1.84%, 11/19/2026, 1 mo. USD LIBOR + 1.750% | 1,727,928 |
| 1,998,997 | Beacon Roofing Supply, Inc. 2.34%, 05/19/2028, 1 mo. USD LIBOR + 2.250% | 1,984,464 |
| 872,104 | EG Group Ltd. 4.75%, 03/31/2026, 1 mo. USD LIBOR + 4.250% | 870,796 |
| 952,613 | Foundation Building Materials Holding Co. LLC 3.75%, 02/03/2028, 1 mo. USD LIBOR + 3.250% | 944,477 |
| 3,086,675 | Great Outdoors Group LLC 5.00%, 03/06/2028, 1 mo. USD LIBOR + 4.250% | 3,093,744 |
| 1,536,018 | Harbor Freight Tools USA, Inc. 3.25%, 10/19/2027, 1 mo. USD LIBOR + 2.750% | 1,530,090 |
| | IRB Holding Corp. | |
| 470,377 | 3.75%, 02/05/2025, 1 mo. USD LIBOR + 2.750% | 469,003 |
| 1,195,962 | 4.25%, 12/15/2027, 1 mo. USD LIBOR + 3.250% | 1,195,113 |
| 1,733,038 | KFC Holding Co. 1.84%, 03/15/2028, 1 mo. USD LIBOR + 1.750% | 1,730,508 |
| | LBM Acquisition LLC | |
| 411,667 | 0.00%, 12/17/2027, 1 mo. USD LIBOR + 3.750%(10) | 405,833 |
| 821,270 | 3.88%, 12/17/2027, 1 mo. USD LIBOR + 3.750% | 809,633 |
| 1,497,444 | 4.50%, 12/17/2027, 1 mo. USD LIBOR + 3.750% | 1,476,225 |
| 1,717,025 | Les Schwab Tire Centers 4.00%, 11/02/2027, 1 mo. USD LIBOR + 3.250% | 1,713,814 |
| 1,745,625 | Michaels Cos., Inc. 5.00%, 04/15/2028, 1 mo. USD LIBOR + 4.250% | 1,742,361 |
| 1,358,175 | Petco Health and Wellness Co., Inc. 4.00%, 03/03/2028, 1 mo. USD LIBOR + 3.250% | 1,357,211 |
| 1,147,125 | PetSmart, Inc. 4.50%, 02/11/2028, 1 mo. USD LIBOR + 3.750% | 1,147,538 |
| 4,500,000 | Pilot Travel Centers LLC 2.09%, 07/28/2028, 1 mo. USD LIBOR + 2.000% | 4,471,065 |
| 560,000 | Specialty Building Products Holdings LLC 0.00%, 10/15/2028, 1 mo. USD LIBOR + 3.750%(10) | 557,727 |
| 2,224,425 | SRS Distribution, Inc. 4.25%, 06/02/2028, 1 mo. USD LIBOR + 3.750% | 2,223,802 |
| 991,246 | Staples, Inc. 5.13%, 04/16/2026, 3 mo. USD LIBOR + 5.000% | 951,695 |
| 1,460,250 | White Cap Buyer LLC 4.50%, 10/19/2027, 1 mo. USD LIBOR + 4.000% | 1,463,068 |
| | | | 32,771,927 |
| | Semiconductors - 0.2% |
| 834,446 | CMC Materials, Inc. 2.13%, 11/17/2025, 1 mo. USD LIBOR + 2.000% | 831,842 |
| 552,812 | Entegris, Inc. 2.09%, 11/06/2025, 3 mo. USD LIBOR + 2.000% | 552,121 |
The accompanying notes are an integral part of these financial statements.
The Hartford Short Duration Fund
Schedule of Investments – (continued)
October 31, 2021
| Shares or Principal Amount | | Market Value† |
| SENIOR FLOATING RATE INTERESTS - 19.4%(9) - (continued) |
| | Semiconductors - 0.2% - (continued) |
| $ 2,240,000 | MKS Instruments, Inc. 0.00%, 10/21/2028, 1 mo. USD LIBOR + 2.250%(10) | $ 2,237,200 |
| 559,305 | ON Semiconductor Corp. 2.09%, 09/19/2026, 1 mo. USD LIBOR + 2.000% | 558,651 |
| 505,000 | Synaptics Incorporated 0.00%, 10/21/2028, 1 mo. USD LIBOR + 2.250%(10) | 505,788 |
| 535,000 | TPG Elf Purchaser LLC 0.00%, 10/14/2028, 1 mo. USD LIBOR + 3.500%(10) | 534,331 |
| | | | 5,219,933 |
| | Software - 1.5% |
| 482,575 | Athenahealth, Inc. 4.38%, 02/11/2026, 1 mo. USD LIBOR + 4.250% | 483,781 |
| 471,437 | Camelot U.S. Acquisition Co. 4.00%, 10/30/2026, 1 mo. USD LIBOR + 3.000% | 472,145 |
| 1,120,000 | CCC Intelligent Solutions, Inc. 3.00%, 09/21/2028, 1 mo. USD LIBOR + 2.500% | 1,116,360 |
| EUR 850,000 | Concorde Midco Ltd. 4.00%, 03/01/2028, 3 mo. EURIBOR + 4.000% | 981,549 |
| $ 2,446,100 | DCert Buyer, Inc. 4.09%, 10/16/2026, 3 mo. USD LIBOR + 4.000% | 2,446,369 |
| 4,953,654 | Dun & Bradstreet Corp. 3.34%, 02/06/2026, 1 mo. USD LIBOR + 3.250% | 4,931,561 |
| 1,926,925 | E2open LLC 3.75%, 02/04/2028, 1 mo. USD LIBOR + 3.250% | 1,927,734 |
| 529,200 | Emerald TopCo, Inc. 3.63%, 07/24/2026, 1 mo. USD LIBOR + 3.500% | 525,099 |
| 538,867 | Epicor Software Corp. 4.00%, 07/30/2027, 1 mo. USD LIBOR + 3.250% | 538,150 |
| 1,006,706 | Finastra USA, Inc. 4.50%, 06/13/2024, 3 mo. USD LIBOR + 3.500% | 1,000,918 |
| 1,589,177 | Hyland Software, Inc. 4.25%, 07/01/2024, 1 mo. USD LIBOR + 3.500% | 1,589,669 |
| 143,728 | MA Finance Co. LLC 2.84%, 06/21/2024, 3 mo. USD LIBOR + 2.750% | 142,156 |
| 1,260,000 | Mitchell International, Inc. 4.25%, 10/15/2028, 1 mo. USD LIBOR + 3.750% | 1,248,030 |
| 307,639 | Navicure, Inc. 4.09%, 10/22/2026, 1 mo. USD LIBOR + 4.000% | 307,833 |
| 1,572,100 | Playtika Holding Corp. 2.84%, 03/13/2028, 1 mo. USD LIBOR + 2.750% | 1,568,657 |
| 2,110,000 | Polaris Newco LLC 4.50%, 06/02/2028, 1 mo. USD LIBOR + 4.000% | 2,114,051 |
| 124,375 | Press Ganey Holdings, Inc. 4.50%, 07/24/2026, 1 mo. USD LIBOR + 3.750% | 124,530 |
| 2,200,000 | RealPage, Inc. 3.75%, 04/24/2028, 1 mo. USD LIBOR + 3.250% | 2,194,720 |
| 970,634 | Seattle Spinco, Inc. 2.84%, 06/21/2024, 3 mo. USD LIBOR + 2.750% | 960,015 |
| 242,427 | SS&C European Holdings S.a.r.l. 1.84%, 04/16/2025, 1 mo. USD LIBOR + 1.750% | 239,751 |
| 1,796,092 | SS&C Technologies, Inc. 1.84%, 04/16/2025, 1 mo. USD LIBOR + 1.750% | 1,778,537 |
| | Ultimate Software Group, Inc. | |
| 632,100 | 3.84%, 05/04/2026, 3 mo. USD LIBOR + 3.750% | 632,783 |
| 1,539,727 | 4.00%, 05/04/2026, 1 mo. USD LIBOR + 3.250% | 1,541,467 |
| Shares or Principal Amount | | Market Value† |
| SENIOR FLOATING RATE INTERESTS - 19.4%(9) - (continued) |
| | Software - 1.5% - (continued) |
| $ 196,471 | Verint Systems, Inc. 2.08%, 06/28/2024, 3 mo. USD LIBOR + 2.000% | $ 195,489 |
| 3,523,425 | Zelis Healthcare Corporation 3.58%, 09/30/2026, 1 mo. USD LIBOR + 3.500% | 3,506,618 |
| | | | 32,567,972 |
| | Telecommunications - 0.6% |
| 1,648,344 | Altice France S.A. 3.81%, 01/31/2026, 3 mo. USD LIBOR + 3.688% | 1,629,388 |
| 1,011,975 | CenturyLink, Inc. 2.34%, 03/15/2027, 1 mo. USD LIBOR + 2.250% | 998,485 |
| 1,702,181 | Ciena Corp. 1.84%, 09/26/2025, 1 mo. USD LIBOR + 1.750% | 1,700,054 |
| 375,211 | Consolidated Communications, Inc. 4.25%, 10/02/2027, 1 mo. USD LIBOR + 3.500% | 375,125 |
| 487,550 | Frontier Communications Corp. 4.50%, 05/01/2028, 1 mo. USD LIBOR + 3.750% | 486,575 |
| 1,344,926 | Level 3 Financing, Inc. 1.84%, 03/01/2027, 1 mo. USD LIBOR + 1.750% | 1,326,675 |
| | Lorca Finco plc | |
| EUR 1,390,000 | 0.00%, 09/17/2027, 1 mo. USD LIBOR + 3.750%(10) | 1,595,238 |
| 1,237,234 | 4.25%, 09/17/2027, 3 mo. EURIBOR + 4.250% | 1,429,270 |
| $ 701,925 | Numericable Group S.A. 2.88%, 07/31/2025, 3 mo. USD LIBOR + 2.750% | 689,494 |
| 830,000 | Xplornet Communications, Inc. 0.00%, 10/02/2028, 1 mo. USD LIBOR + 4.000%(10) | 828,224 |
| | Zayo Group Holdings, Inc. | |
| 1,898,777 | 3.09%, 03/09/2027, 1 mo. USD LIBOR + 3.000% | 1,867,769 |
| EUR 428,475 | 3.25%, 03/09/2027, 3 mo. EURIBOR + 3.250% | 484,485 |
| | | | 13,410,782 |
| | Transportation - 0.3% |
| $ 1,770,000 | First Student Bidco, Inc. 3.50%, 07/21/2028, 1 mo. USD LIBOR + 3.000% | 1,756,955 |
| 3,102,750 | Genesee & Wyoming, Inc. 2.13%, 12/30/2026, 1 mo. USD LIBOR + 2.000% | 3,083,699 |
| 666,650 | PODS LLC 3.75%, 03/31/2028, 1 mo. USD LIBOR + 3.000% | 665,403 |
| 1,795,500 | Savage Enterprises LLC 3.75%, 09/15/2028, 1 mo. USD LIBOR + 3.250% | 1,798,499 |
| | | | 7,304,556 |
| | Total Senior Floating Rate Interests
(cost $419,941,019) | $ 419,084,768 |
| U.S. GOVERNMENT AGENCIES - 4.1% |
| | Mortgage-Backed Agencies - 4.1% |
| | FHLMC - 1.7% |
| 1,501,272 | 1.00%, 05/25/2033 | $ 1,503,715 |
| 5,865,162 | 1.00%, 01/15/2041 | 5,850,513 |
| 4,051,753 | 1.00%, 05/15/2041 | 4,075,492 |
| 1,920,419 | 1.00%, 06/15/2044 | 1,925,669 |
| 1,309,685 | 1.04%, 11/25/2048, 1 mo. USD LIBOR + 0.950%(1)(2) | 1,310,101 |
| 2,438,219 | 1.25%, 07/15/2031 | 2,460,393 |
| 707,535 | 1.50%, 01/15/2027 | 717,196 |
| 2,338,432 | 2.00%, 09/15/2041 | 2,379,229 |
The accompanying notes are an integral part of these financial statements.
The Hartford Short Duration Fund
Schedule of Investments – (continued)
October 31, 2021
| Shares or Principal Amount | | Market Value† |
| U.S. GOVERNMENT AGENCIES - 4.1% - (continued) |
| | Mortgage-Backed Agencies - 4.1% - (continued) |
| | FHLMC - 1.7% - (continued) |
| $ 2,916,672 | 2.50%, 12/15/2042 | $ 3,015,419 |
| 2,611,786 | 3.00%, 04/01/2031 | 2,754,096 |
| 416,581 | 3.50%, 04/01/2027 | 444,015 |
| 3,623,775 | 3.50%, 03/01/2032 | 3,859,045 |
| 233,534 | 3.50%, 09/15/2043 | 241,303 |
| 725,193 | 3.75%, 05/15/2039(4) | 738,798 |
| 4,283,744 | 4.79%, 04/25/2028, 1 mo. USD LIBOR + 4.700%(2) | 4,435,153 |
| | | | 35,710,137 |
| | FNMA - 1.6% |
| 1,284,514 | 1.50%, 11/25/2042 | 1,300,575 |
| 329,469 | 1.75%, 05/25/2040 | 331,418 |
| 3,119,036 | 2.00%, 04/25/2034 | 3,194,482 |
| 223,388 | 2.00%, 07/25/2039 | 223,760 |
| 3,018,007 | 2.00%, 12/25/2042 | 3,031,410 |
| 4,918,861 | 2.50%, 03/25/2035 | 5,051,185 |
| 3,996,710 | 3.00%, 02/25/2043 | 4,123,372 |
| 129,010 | 3.00%, 04/25/2043 | 132,238 |
| 1,253,766 | 3.00%, 05/25/2047 | 1,286,968 |
| 3,548,471 | 3.25%, 11/25/2043 | 3,651,072 |
| 553,341 | 3.50%, 11/01/2026 | 587,389 |
| 1,845,501 | 3.50%, 12/01/2026 | 1,968,890 |
| 239,923 | 3.50%, 12/01/2028 | 255,583 |
| 3,570,417 | 3.50%, 10/25/2035 | 3,801,534 |
| 1,921,036 | 3.50%, 07/25/2045 | 1,989,855 |
| 903,285 | 3.50%, 05/25/2056 | 939,374 |
| 3,139,511 | 4.00%, 11/25/2041 | 3,350,138 |
| | | | 35,219,243 |
| | GNMA - 0.5% |
| 1,908,747 | 2.00%, 05/20/2046 | 1,935,286 |
| 4,969,642 | 2.50%, 10/20/2041 | 5,115,593 |
| 2,307,637 | 2.50%, 07/20/2042 | 2,406,846 |
| 974,277 | 3.00%, 08/20/2045 | 1,011,460 |
| 943,870 | 3.50%, 05/20/2048 | 1,012,626 |
| 95,487 | 5.00%, 08/20/2039 | 104,310 |
| | | | 11,586,121 |
| | UMBS - 0.3% |
| 5,600,000 | 3.50%, 11/16/2036(12) | 5,940,763 |
| | | | 5,940,763 |
| | Total U.S. Government Agencies
(cost $86,694,197) | | $ 88,456,264 |
| U.S. GOVERNMENT SECURITIES - 1.6% |
| | U.S. Treasury Securities - 1.6% |
| | U.S. Treasury Notes - 1.6% |
| 10,000,000 | 0.13%, 05/15/2023 | $ 9,960,937 |
| 5,000,000 | 0.13%, 02/15/2024 | 4,947,461 |
| 10,000,000 | 0.25%, 06/15/2024 | 9,884,766 |
| Shares or Principal Amount | | Market Value† |
| U.S. GOVERNMENT SECURITIES - 1.6% - (continued) |
| | U.S. Treasury Securities - 1.6% - (continued) |
| | U.S. Treasury Notes - 1.6% - (continued) |
| $ 9,950,000 | 1.38%, 02/15/2023 | $ 10,090,311 |
| | Total U.S. Government Securities
(cost $34,954,440) | | $ 34,883,475 |
| | Total Long-Term Investments
(Cost $2,143,714,533) | | $ 2,154,661,862 |
| SHORT-TERM INVESTMENTS - 0.4% |
| | Repurchase Agreements - 0.4% |
| 7,139,780 | Fixed Income Clearing Corp. Repurchase Agreement dated 10/29/2021 at 0.010%, due on 11/01/2021 with a maturity value of $7,139,786; collateralized by U.S. Treasury Bond at 1.875%, maturing 02/15/2041, with a market value of $7,282,669 | $ 7,139,780 |
| | Securities Lending Collateral - 0.0% |
| 2,586 | Fidelity Investments Money Market Funds, Government Portfolio, Institutional Class, 0.01%(13) | 2,586 |
| 396,982 | Goldman Sachs Financial Square Funds, Government Fund, Institutional Class, 0.03%(13) | 396,982 |
| 28,500 | Invesco Government & Agency Portfolio, Institutional Class, 0.03%(13) | 28,500 |
| | | | 428,068 |
| | Total Short-Term Investments
(cost $7,567,848) | $ 7,567,848 |
| | Total Investments
(cost $2,151,282,381) | 100.2% | $ 2,162,229,710 |
| | Other Assets and Liabilities | (0.2)% | (3,646,065) |
| | Total Net Assets | 100.0% | $ 2,158,583,645 |
| Note: | Percentage of investments as shown is the ratio of the total market value to total net assets. |
| | The Fund may refer to any one or more of the industry classifications used by one or more widely recognized market indices, ratings group and/or as defined by Fund management. Industry classifications may not be identical across all security types. |
| | For Fund compliance purposes, the Fund may not use the same classification system. These classifications are used for financial reporting purposes. |
| | See “Glossary” for abbreviation descriptions. |
The accompanying notes are an integral part of these financial statements.
The Hartford Short Duration Fund
Schedule of Investments – (continued)
October 31, 2021
| (1) | Security was purchased pursuant to Rule 144A under the Securities Act of 1933 and may be sold in transactions that are exempt from registration (typically only to qualified institutional buyers) or in a public offering registered under the Securities Act of 1933. At October 31, 2021, the aggregate value of these securities was $844,737,002, representing 39.1% of net assets. |
| (2) | Variable rate securities; the rate reported is the coupon rate in effect at October 31, 2021. Base lending rates may be subject to a floor or cap. |
| (3) | Variable or floating rate security, which interest rate adjusts periodically based on changes in current interest rates and prepayments on the underlying pool of assets. Rate shown is the rate in effect as of period end. |
| (4) | Security is a “step-up” bond where coupon increases or steps up at a predetermined date. Rate shown is current coupon rate. |
| (5) | Fixed to variable rate investment. The rate shown reflects the fixed rate in effect at October 31, 2021. Rate will reset at a future date. Base lending rates may be subject to a floor or cap. |
| (6) | Represents entire or partial securities on loan. See Note 8 in the accompanying Notes to Financial Statements for securities lending information. |
| (7) | Security is exempt from registration under Regulation S under the Securities Act of 1933, which exempts from registration securities offered and sold outside of the United States. Security may not be offered or sold in the United States except pursuant to an exemption from, or in a transaction not subject to, the registration requirements of the Securities Act of 1933. At October 31, 2021, the aggregate value of this security was $447,691, representing 0.0% of net assets. |
| (8) | Security is a zero-coupon bond. |
| (9) | Senior floating rate interests generally pay interest rates which are periodically adjusted by reference to a base short-term, floating lending rate plus a premium. The base lending rates are primarily the LIBOR, and secondarily the prime rate offered by one or more major United States banks (the "Prime Rate") and the certificate of deposit rate or other base lending rates used by commercial lenders. Senior floating rate interests often require prepayments from excess cash flows or permit the borrower to repay at its election. The rate at which the borrower repays cannot be predicted with accuracy. As a result, the actual remaining maturity may be substantially less than the stated maturities shown. Base lending rates may be subject to a floor or cap. Unless otherwise noted, the interest rate disclosed for these securities represents the rate in effect as of October 31, 2021. |
| (10) | Represents an unsettled loan commitment. The coupon rate will be determined at time of settlement. |
| (11) | This security, or a portion of this security, has unfunded loan commitments. As of October 31, 2021, the aggregate value of the unfunded commitment was $357,109, which rounds to 0.0% of total net assets. |
| (12) | Represents or includes a TBA transaction. |
| (13) | Current yield as of period end. |
| Futures Contracts Outstanding at October 31, 2021 |
| Description | | Number of
Contracts | | Expiration
Date | | Current
Notional
Amount | | Value and
Unrealized
Appreciation/
(Depreciation) |
| Long position contracts: |
| U.S. Treasury 2-Year Note Future | | 1,484 | | 12/31/2021 | | $ 325,367,000 | | $ (1,382,498) |
| Short position contracts: |
| U.S. Treasury 5-Year Note Future | | 1,683 | | 12/31/2021 | | $ 204,905,250 | | $ 2,895,384 |
| U.S. Treasury 10-Year Note Future | | 264 | | 12/21/2021 | | 34,505,625 | | 696,581 |
| Total | | | | | | | | $ 3,591,965 |
| Total futures contracts | | $ 2,209,467 |
| Foreign Currency Contracts Outstanding at October 31, 2021 |
Amount and Description of
Currency to be Purchased | | Amount and Description of
Currency to be Sold | | Counterparty | | Settlement
Date | | Appreciation/
(Depreciation) |
| 2,614,000 | EUR | | 3,044,278 | USD | | UBS | | 11/04/2021 | | $ (22,259) |
| 3,035,458 | USD | | 2,614,000 | EUR | | BCLY | | 11/04/2021 | | 13,440 |
| 40,930,536 | USD | | 35,245,203 | EUR | | DEUT | | 11/30/2021 | | 163,331 |
| 3,046,225 | USD | | 2,614,000 | EUR | | UBS | | 12/07/2021 | | 21,892 |
| Total foreign currency contracts | | $ 176,404 |
† See Significant Accounting Policies of accompanying Notes to Financial Statements regarding valuation of investments.
The accompanying notes are an integral part of these financial statements.
The Hartford Short Duration Fund
Schedule of Investments – (continued)
October 31, 2021
Fair Value Summary
The following is a summary of the fair valuations according to the inputs used as of October 31, 2021 in valuing the Fund’s investments.
| Description | | Total | | Level 1 | | Level 2 | | Level 3(1) |
| Assets | | | | | | | | |
| Asset & Commercial Mortgage-Backed Securities | | $ 519,570,250 | | $ — | | $ 519,570,250 | | $ — |
| Corporate Bonds | | 1,079,754,455 | | — | | 1,079,754,455 | | — |
| Municipal Bonds | | 12,912,650 | | — | | 12,912,650 | | — |
| Senior Floating Rate Interests | | 419,084,768 | | — | | 419,084,768 | | — |
| U.S. Government Agencies | | 88,456,264 | | — | | 88,456,264 | | — |
| U.S. Government Securities | | 34,883,475 | | — | | 34,883,475 | | — |
| Short-Term Investments | | 7,567,848 | | 428,068 | | 7,139,780 | | — |
| Foreign Currency Contracts(2) | | 198,663 | | — | | 198,663 | | — |
| Futures Contracts(2) | | 3,591,965 | | 3,591,965 | | — | | — |
| Total | | $ 2,166,020,338 | | $ 4,020,033 | | $ 2,162,000,305 | | $ — |
| Liabilities | | | | | | | | |
| Foreign Currency Contracts(2) | | $ (22,259) | | $ — | | $ (22,259) | | $ — |
| Futures Contracts(2) | | (1,382,498) | | (1,382,498) | | — | | — |
| Total | | $ (1,404,757) | | $ (1,382,498) | | $ (22,259) | | $ — |
| (1) | For the year ended October 31, 2021, there were no transfers in and out of Level 3. |
| (2) | Derivative instruments (excluding purchased and written options, if applicable) are valued at the unrealized appreciation/(depreciation) on the investments. |
The accompanying notes are an integral part of these financial statements.
The Hartford Strategic Income Fund
Schedule of Investments
October 31, 2021
| Shares or Principal Amount | | Market Value† |
| ASSET & COMMERCIAL MORTGAGE-BACKED SECURITIES - 9.5% |
| | Asset-Backed - Automobile - 1.3% |
| | American Credit Acceptance Receivables Trust | |
| $ 5,750,000 | 3.64%, 05/15/2028(1) | $ 5,668,843 |
| 7,760,000 | 4.21%, 07/13/2028(1) | 7,709,556 |
| 2,100,000 | Carvana Auto Receivables Trust 4.55%, 01/10/2028(1) | 2,094,145 |
| 7,450,000 | DT Auto Owner Trust 1.31%, 05/17/2027(1) | 7,321,829 |
| | Exeter Automobile Receivables Trust | |
| 6,500,000 | 1.55%, 06/15/2027 | 6,425,594 |
| 3,340,000 | 5.56%, 06/15/2027(1) | 3,501,573 |
| 536,169 | Securitized Term Auto Loan Receivables Trust 4.57%, 03/25/2026(1) | 547,965 |
| 8,830,000 | Westlake Automobile Receivables Trust 3.66%, 12/15/2027(1) | 8,745,093 |
| | | | 42,014,598 |
| | Asset-Backed - Credit Card - 0.1% |
| 4,000,000 | Mercury Financial Credit Card Master Trust 6.26%, 03/20/2026(1) | 4,007,475 |
| | Asset-Backed - Finance & Insurance - 1.3% |
| 1,012,824 | Aaset Trust 6.41%, 01/16/2040(1) | 485,608 |
| 2,235,000 | Aligned Data Centers Issuer LLC 2.48%, 08/15/2046(1) | 2,241,981 |
| 2,875,000 | Ares CLO Ltd. 5.83%, 07/22/2030, 3 mo. USD LIBOR + 5.700%(1)(2) | 2,777,376 |
| 2,183,000 | Atlas Senior Loan Fund Ltd. 5.88%, 07/26/2031, 3 mo. USD LIBOR + 5.750%(1)(2) | 1,992,153 |
| 305,000 | Ballyrock CLO Ltd. 7.13%, 01/20/2034, 3 mo. USD LIBOR + 7.000%(1)(2) | 305,243 |
| 31,978 | Bayview Koitere Fund Trust 4.00%, 11/28/2053(1)(3) | 32,538 |
| | CIFC Funding Ltd. | |
| 2,660,000 | 5.07%, 04/19/2029, 3 mo. USD LIBOR + 4.950%(1)(2) | 2,590,154 |
| 2,270,000 | 6.97%, 01/15/2034, 3 mo. USD LIBOR + 6.850%(1)(2) | 2,285,540 |
| 2,500,000 | Dryden 64 CLO Ltd. 5.72%, 04/18/2031, 3 mo. USD LIBOR + 5.600%(1)(2) | 2,456,207 |
| 18,616 | Equity One Mortgage Pass-Through Trust 5.46%, 12/25/2033(3) | 17,236 |
| 1,260,534 | GSAMP Trust 0.18%, 01/25/2037, 1 mo. USD LIBOR + 0.090%(2) | 916,347 |
| 4,899,990 | Madison Park Funding Ltd. 5.93%, 10/22/2030, 3 mo. USD LIBOR + 5.800%(1)(2) | 4,796,865 |
| 3,400,000 | Oaktree CLO Ltd. 7.36%, 10/20/2032, 3 mo. USD LIBOR + 7.230%(1)(2) | 3,400,588 |
| 3,000,000 | Octagon Loan Funding Ltd. 6.13%, 11/18/2031, 3 mo. USD LIBOR + 6.000%(1)(2) | 2,916,588 |
| 2,000,000 | Sound Point CLO Ltd. 7.03%, 10/20/2028, 3 mo. USD LIBOR + 6.900%(1)(2) | 1,980,976 |
| 34,924 | Springleaf Funding Trust 2.68%, 07/15/2030(1) | 34,962 |
| 4,250,000 | Symphony CLO Ltd. 6.22%, 10/15/2031, 3 mo. USD LIBOR + 6.100%(1)(2) | 4,074,067 |
| Shares or Principal Amount | | Market Value† |
| ASSET & COMMERCIAL MORTGAGE-BACKED SECURITIES - 9.5% - (continued) |
| | Asset-Backed - Finance & Insurance - 1.3% - (continued) |
| $ 1,715,000 | Vericrest Opportunity Loan Transferee 4.21%, 08/25/2051(1)(4) | $ 1,702,750 |
| 6,150,000 | Webster Park CLO Ltd. 5.63%, 07/20/2030, 3 mo. USD LIBOR + 5.500%(1)(2) | 6,074,835 |
| 572,688 | Wendy's Funding LLC 3.88%, 03/15/2048(1) | 604,838 |
| | | | 41,686,852 |
| | Asset-Backed - Home Equity - 0.1% |
| | GSAA Home Equity Trust | |
| 487,407 | 0.23%, 12/25/2046, 1 mo. USD LIBOR + 0.140%(2) | 183,445 |
| 846,801 | 0.25%, 02/25/2037, 1 mo. USD LIBOR + 0.160%(2) | 332,494 |
| 882,640 | 0.45%, 11/25/2036, 1 mo. USD LIBOR + 0.360%(2) | 320,374 |
| 612,885 | 0.55%, 04/25/2047, 1 mo. USD LIBOR + 0.460%(2) | 372,825 |
| 2,091,104 | Morgan Stanley Mortgage Loan Trust 0.43%, 11/25/2036, 1 mo. USD LIBOR + 0.340%(2) | 807,936 |
| | Soundview Home Loan Trust | |
| 2,251,000 | 0.33%, 07/25/2036, 1 mo. USD LIBOR + 0.240%(2) | 2,151,196 |
| 115,000 | 0.59%, 11/25/2036, 1 mo. USD LIBOR + 0.500%(2) | 111,725 |
| | | | 4,279,995 |
| | Commercial Mortgage-Backed Securities - 0.9% |
| 2,060,000 | BAMLL Commercial Mortgage Securities Trust 3.72%, 11/05/2032(1)(3) | 1,737,634 |
| | BBCMS Mortgage Trust | |
| 2,490,000 | 0.99%, 04/15/2053(3)(5) | 196,528 |
| 4,338,998 | 1.63%, 04/15/2053(3)(5) | 435,183 |
| | Benchmark Mortgage Trust | |
| 15,287,693 | 1.23%, 03/15/2062(3)(5) | 1,091,809 |
| 8,682,004 | 1.52%, 01/15/2054(3)(5) | 1,011,265 |
| | BX Commercial Mortgage Trust | |
| 853,596 | 2.59%, 12/15/2036, 1 mo. USD LIBOR + 2.500%(1)(2) | 849,315 |
| 1,742,000 | 2.94%, 09/15/2036, 1 mo. USD LIBOR + 2.850%(1)(2) | 1,729,995 |
| 1,120,000 | BX Trust 5.02%, 06/15/2023, 1 mo. USD LIBOR + 4.930%(1)(2) | 1,113,063 |
| 2,260,000 | CAMB Commercial Mortgage Trust 3.34%, 12/15/2037, 1 mo. USD LIBOR + 3.250%(1)(2) | 2,254,294 |
| 180,000 | Citigroup Commercial Mortgage Trust 4.57%, 03/10/2047(1)(3) | 181,641 |
| | Commercial Mortgage Trust | |
| 1,350,000 | 4.65%, 08/10/2047(3) | 1,381,574 |
| 981,000 | 4.75%, 10/15/2045(1)(3) | 314,960 |
| 3,012 | Credit Suisse First Boston Mortgage Securities Corp. 4.88%, 04/15/2037 | 3,048 |
| | DBJPM Mortgage Trust | |
| 20,610,143 | 1.44%, 08/10/2049(3)(5) | 1,189,430 |
| 4,152,972 | 1.71%, 09/15/2053(3)(5) | 398,493 |
| | GS Mortgage Securities Trust | |
| 3,772,943 | 0.07%, 07/10/2046(3)(5) | 3,871 |
| 66,398 | 0.09%, 08/10/2044(1)(3)(5) | 0 |
| 7,553,068 | 0.67%, 02/13/2053(3)(5) | 341,934 |
| 565,333 | 3.67%, 04/10/2047(1) | 22,613 |
The accompanying notes are an integral part of these financial statements.
The Hartford Strategic Income Fund
Schedule of Investments – (continued)
October 31, 2021
| Shares or Principal Amount | | Market Value† |
| ASSET & COMMERCIAL MORTGAGE-BACKED SECURITIES - 9.5% - (continued) |
| | Commercial Mortgage-Backed Securities - 0.9% - (continued) |
| $ 1,450,000 | 4.65%, 10/15/2036, 1 mo. USD LIBOR + 4.550%(1)(2) | $ 1,451,322 |
| 2,190,000 | 4.74%, 11/10/2045(1)(3) | 2,206,467 |
| 175,000 | 4.96%, 04/10/2047(1)(3) | 95,967 |
| | JP Morgan Chase Commercial Mortgage Securities Trust | |
| 860,000 | 2.73%, 10/15/2045(1)(3) | 653,050 |
| 485,000 | 4.36%, 12/15/2047(1)(3) | 386,123 |
| 315,444 | 5.57%, 08/15/2046(1)(3) | 313,110 |
| | Morgan Stanley Capital Trust | |
| 2,055,000 | 4.28%, 06/15/2050(3) | 2,183,473 |
| 465,000 | 5.09%, 07/15/2049(1)(3) | 210,160 |
| 4,551 | 5.66%, 10/12/2052(1)(3) | 1,411 |
| 255,000 | MTRO Commercial Mortgage Trust 2.14%, 12/15/2033, 1 mo. USD LIBOR + 2.050%(1)(2) | 247,083 |
| 1,700,000 | Natixis Commercial Mortgage Securities Trust 4.30%, 10/15/2036(1) | 1,670,683 |
| 15,000 | Wells Fargo Commercial Mortgage Trust 4.15%, 05/15/2048(3) | 15,219 |
| | Wells Fargo N.A. | |
| 6,546,556 | 0.60%, 11/15/2062(3)(5) | 278,015 |
| 28,736,848 | 0.65%, 11/15/2062(3)(5) | 1,347,750 |
| 5,347,781 | 0.70%, 12/15/2052(3)(5) | 266,603 |
| 12,388,761 | 0.89%, 01/15/2063(3)(5) | 768,293 |
| 9,324,617 | 0.90%, 05/15/2062(3)(5) | 536,580 |
| 4,273,458 | 1.23%, 03/15/2063(3)(5) | 352,323 |
| 14,105,101 | 1.78%, 03/15/2063(3)(5) | 1,848,960 |
| | WF-RBS Commercial Mortgage Trust | |
| 142,141 | 3.02%, 11/15/2047(1) | 8,528 |
| 2,125,000 | 4.81%, 11/15/2045(1)(3) | 1,932,882 |
| 215,000 | 4.89%, 06/15/2044(1)(3) | 129,562 |
| | | | 31,160,214 |
| | Other Asset-Backed Securities - 0.9% |
| 69,074 | Bayview Mortgage Fund Trust 3.50%, 01/28/2058(1)(3) | 69,556 |
| | Bayview Opportunity Master Fund Trust | |
| 33,848 | 3.50%, 01/28/2055(1)(3) | 34,374 |
| 57,177 | 3.50%, 06/28/2057(1)(3) | 58,228 |
| 68,421 | 4.00%, 10/28/2064(1)(3) | 69,545 |
| 1,500,000 | Burnham Park CLO Ltd. 5.53%, 10/20/2029, 3 mo. USD LIBOR + 5.400%(1)(2) | 1,473,267 |
| 929,206 | CF Hippolyta LLC 2.60%, 07/15/2060(1) | 932,580 |
| | Domino's Pizza Master Issuer LLC | |
| 471,600 | 3.67%, 10/25/2049(1) | 507,068 |
| 649,900 | 4.12%, 07/25/2048(1) | 668,093 |
| | Octagon Investment Partners Ltd. | |
| 5,000,000 | 5.87%, 07/17/2030, 3 mo. USD LIBOR + 5.750%(1)(2) | 4,807,660 |
| 2,825,000 | 6.07%, 07/15/2030, 3 mo. USD LIBOR + 5.950%(1)(2) | 2,744,151 |
| | Pretium Mortgage Credit Partners LLC | |
| 3,705,000 | 3.72%, 07/25/2051(1)(4) | 3,688,746 |
| 6,350,000 | 3.84%, 07/25/2051(1)(4) | 6,322,016 |
| Shares or Principal Amount | | Market Value† |
| ASSET & COMMERCIAL MORTGAGE-BACKED SECURITIES - 9.5% - (continued) |
| | Other Asset-Backed Securities - 0.9% - (continued) |
| $ 1,890,000 | 3.84%, 06/27/2060(1)(4) | $ 1,875,215 |
| 6,750,000 | Stewart Park CLO Ltd. 5.40%, 01/15/2030, 3 mo. USD LIBOR + 5.280%(1)(2) | 6,440,296 |
| 10,757 | Towd Point Mortgage Trust 2.25%, 04/25/2056(1)(3) | 10,775 |
| | | | 29,701,570 |
| | Whole Loan Collateral CMO - 4.9% |
| | Alternative Loan Trust | |
| 28,957 | 0.59%, 12/25/2035, 1 mo. USD LIBOR + 0.500%(2) | 14,102 |
| 112,094 | 0.63%, 01/25/2036, 1 mo. USD LIBOR + 0.540%(2) | 112,229 |
| 193,679 | 0.73%, 11/25/2035, 1 mo. USD LIBOR + 0.640%(2) | 174,762 |
| 591,558 | 5.75%, 05/25/2036 | 353,426 |
| 605,218 | 6.00%, 05/25/2036 | 455,468 |
| 131,830 | Bank of America Mortgage Trust 2.69%, 09/25/2035(3) | 130,478 |
| 114,530 | Bear Stearns Adjustable Rate Mortgage Trust 2.38%, 10/25/2035, 12 mo. USD CMT + 2.300%(2) | 117,503 |
| 56,204 | Bear Stearns Alt-A Trust 0.59%, 01/25/2036, 1 mo. USD LIBOR + 0.500%(2) | 68,250 |
| | Bellemeade Re Ltd. | |
| 30,043 | 1.19%, 07/25/2029, 1 mo. USD LIBOR + 1.100%(1)(2) | 30,043 |
| 665,000 | 6.09%, 08/26/2030, 1 mo. USD LIBOR + 6.000%(1)(2) | 696,405 |
| 540,464 | Chase Mortgage Finance Trust 5.50%, 11/25/2035 | 505,014 |
| 309,764 | CHL Mortgage Pass-Through Trust 2.90%, 09/25/2047(3) | 298,274 |
| 1,727,000 | COLT Mortgage Loan Trust 5.31%, 09/25/2065(1)(3) | 1,737,970 |
| | Connecticut Avenue Securities Trust | |
| 2,240,000 | 3.09%, 01/25/2040, 1 mo. USD LIBOR + 3.000%(1)(2) | 2,218,954 |
| 9,000,000 | 3.34%, 01/25/2040, 1 mo. USD LIBOR + 3.250%(1)(2) | 9,036,371 |
| 5,885,000 | 3.49%, 10/25/2039, 1 mo. USD LIBOR + 3.400%(1)(2) | 5,940,171 |
| 7,957,000 | 3.84%, 09/25/2039, 1 mo. USD LIBOR + 3.750%(1)(2) | 8,016,854 |
| 990,000 | 4.19%, 07/25/2039, 1 mo. USD LIBOR + 4.100%(1)(2) | 1,005,366 |
| 990,000 | 5.34%, 06/25/2039, 1 mo. USD LIBOR + 5.250%(1)(2) | 1,016,690 |
| 76,240 | CSMC Trust 3.25%, 04/25/2047(1)(3) | 79,183 |
| | Eagle RE Ltd. | |
| 217,145 | 1.79%, 11/25/2028, 1 mo. USD LIBOR + 1.700%(1)(2) | 217,361 |
| 8,870,000 | 5.80%, 10/25/2033, SOFR30A + 5.750%(1)(2) | 9,201,463 |
| 5,881,000 | Ellington Financial Mortgage Trust 3.86%, 06/25/2066(1)(3) | 5,885,135 |
The accompanying notes are an integral part of these financial statements.
The Hartford Strategic Income Fund
Schedule of Investments – (continued)
October 31, 2021
| Shares or Principal Amount | | Market Value† |
| ASSET & COMMERCIAL MORTGAGE-BACKED SECURITIES - 9.5% - (continued) |
| | Whole Loan Collateral CMO - 4.9% - (continued) |
| | Fannie Mae Connecticut Avenue Securities | |
| $ 1,156,953 | 2.69%, 05/25/2024, 1 mo. USD LIBOR + 2.600%(2) | $ 1,171,146 |
| 4,348,959 | 3.09%, 07/25/2024, 1 mo. USD LIBOR + 3.000%(2) | 4,422,057 |
| 6,890,000 | 3.84%, 10/25/2030, 1 mo. USD LIBOR + 3.750%(2) | 7,184,849 |
| 657,000 | 4.99%, 11/25/2024, 1 mo. USD LIBOR + 4.900%(2) | 683,433 |
| 34,072 | GMACM Mortgage Loan Trust 2.98%, 04/19/2036(3) | 29,759 |
| 351,712 | GSR Mortgage Loan Trust 2.95%, 01/25/2036(3) | 359,842 |
| 1,060,908 | HarborView Mortgage Loan Trust 0.32%, 12/19/2036, 1 mo. USD LIBOR + 0.240%(2) | 1,064,414 |
| 21,102 | Impac CMB Trust 2.34%, 02/25/2036, 1 mo. USD LIBOR + 2.250%(2) | 21,734 |
| 388,434 | IndyMac IMSC Mortgage Loan Trust 0.24%, 03/25/2047, 1 mo. USD LIBOR + 0.150%(2) | 311,213 |
| | JP Morgan Mortgage Trust | |
| 134,064 | 2.76%, 11/25/2035(3) | 129,217 |
| 27,516 | 3.00%, 04/25/2037(3) | 24,559 |
| 174,246 | 3.06%, 05/25/2036(3) | 156,850 |
| 1,229,744 | Legacy Mortgage Asset Trust 3.25%, 11/25/2059(1)(4) | 1,235,345 |
| 2,000,000 | LHOME Mortgage Trust 4.61%, 06/25/2026(1)(4) | 2,000,682 |
| 62,548 | MASTR Adjustable Rate Mortgages Trust 2.72%, 11/21/2034(3) | 63,484 |
| | New Residential Mortgage Loan Trust | |
| 74,095 | 3.75%, 11/25/2056(1)(3) | 78,780 |
| 80,329 | 4.00%, 05/25/2057(1)(3) | 84,893 |
| 219,935 | Nomura Asset Acceptance Corp. Alternative Loan Trust 3.60%, 06/25/2036(3) | 194,415 |
| 3,970,000 | NYMT Loan Trust 3.56%, 08/25/2061(1)(4) | 3,933,003 |
| 1,878,240 | Oaktown Re Ltd. 7.09%, 07/25/2030, 1 mo. USD LIBOR + 7.000%(1)(2) | 1,909,699 |
| 4,645,000 | OSAT Trust 3.97%, 05/25/2065(1)(4) | 4,611,532 |
| | PMT Credit Risk Transfer Trust | |
| 279,023 | 2.09%, 03/27/2024, 1 mo. USD LIBOR + 2.000%(1)(2) | 279,047 |
| 2,289,987 | 2.99%, 02/27/2024, 1 mo. USD LIBOR + 2.900%(1)(2) | 2,323,877 |
| | Preston Ridge Partners Mortgage Trust LLC | |
| 1,265,000 | 3.47%, 04/25/2026(1)(4) | 1,269,363 |
| 3,505,000 | 3.47%, 07/25/2026(1)(4) | 3,476,273 |
| 5,370,000 | 3.67%, 08/25/2026(1)(4) | 5,346,216 |
| 9,255,000 | 3.97%, 10/25/2026(1)(3)(6)(7) | 9,254,722 |
| 996,000 | 4.70%, 11/25/2025(1)(4) | 997,951 |
| 1,495,040 | 4.75%, 10/25/2024(1)(3) | 1,496,078 |
| 9,920,000 | Pretium Mortgage Credit Partners LLC 3.60%, 02/25/2061(1)(4) | 9,845,322 |
| Shares or Principal Amount | | Market Value† |
| ASSET & COMMERCIAL MORTGAGE-BACKED SECURITIES - 9.5% - (continued) |
| | Whole Loan Collateral CMO - 4.9% - (continued) |
| $ 1,450,000 | Radnor RE Ltd. 5.69%, 10/25/2030, 1 mo. USD LIBOR + 5.600%(1)(2) | $ 1,468,712 |
| 875,000 | RCO Mortgage LLC 3.97%, 05/26/2026(1)(4) | 873,772 |
| 954,520 | Structured Asset Mortgage Investments Trust 0.55%, 02/25/2036, 1 mo. USD LIBOR + 0.460%(2) | 923,537 |
| 4,675,000 | Triangle Re Ltd. 5.59%, 10/25/2033, 1 mo. USD LIBOR + 5.500%(1)(2) | 4,908,402 |
| | VCAT LLC | |
| 13,902,000 | 3.84%, 08/25/2051(1)(4) | 13,869,260 |
| 2,140,000 | 4.21%, 03/27/2051(1)(4) | 2,156,033 |
| 2,170,000 | Verus Securitization Trust 5.68%, 08/25/2050(1)(4) | 2,177,558 |
| 2,385,000 | VOLT C LLC 4.83%, 05/25/2051(1)(4) | 2,368,838 |
| 2,205,000 | VOLT CI LLC 4.83%, 05/25/2051(1)(4) | 2,192,464 |
| 2,065,000 | VOLT XCIII LLC 4.83%, 02/27/2051(1)(4) | 2,054,867 |
| 5,705,000 | VOLT XCIV LLC 4.95%, 02/27/2051(1)(4) | 5,675,299 |
| 4,195,000 | VOLT XCIX LLC 4.95%, 04/25/2051(1)(4) | 4,223,967 |
| 5,145,000 | VOLT XCV LLC 4.95%, 03/27/2051(1)(4) | 5,143,780 |
| 2,864,000 | VOLT XCVIII LLC 4.95%, 04/25/2051(1)(4) | 2,882,991 |
| 18,283 | WaMu Mortgage Pass-Through Certificates Trust 0.93%, 06/25/2044, 1 mo. USD LIBOR + 0.840%(2) | 18,133 |
| 383,985 | Washington Mutual Mortgage Pass-Through Certificates WMALT Trust 0.69%, 07/25/2036, 1 mo. USD LIBOR + 0.600%(2) | 261,137 |
| 1,460,000 | ZH Trust 2.25%, 02/18/2027(1) | 1,456,957 |
| | | | 163,926,934 |
| | Total Asset & Commercial Mortgage-Backed Securities
(cost $317,916,705) | $ 316,777,638 |
| CONVERTIBLE BONDS - 3.7% |
| | Auto Manufacturers - 0.1% |
| 3,991,000 | Ford Motor Co. 0.00%, 03/15/2026(1)(8) | $ 4,720,902 |
| | Biotechnology - 0.2% |
| 1,896,000 | Apellis Pharmaceuticals, Inc. 3.50%, 09/15/2026 | 2,246,760 |
| 2,660,000 | Exact Sciences Corp. 0.38%, 03/15/2027 | 3,007,462 |
| | | | 5,254,222 |
| | Commercial Services - 0.5% |
| 4,293,000 | Alarm.com Holdings, Inc. 0.01%, 01/15/2026(1)(8) | 3,939,404 |
| EUR 2,300,000 | Nexi S.p.A. 1.75%, 04/24/2027(9) | 3,032,366 |
| $ 3,552,000 | Repay Holdings Corp. 0.01%, 02/01/2026(1)(8) | 3,279,852 |
The accompanying notes are an integral part of these financial statements.
The Hartford Strategic Income Fund
Schedule of Investments – (continued)
October 31, 2021
| Shares or Principal Amount | | Market Value† |
| CONVERTIBLE BONDS - 3.7% - (continued) |
| | Commercial Services - 0.5% - (continued) |
| | Square, Inc. | |
| $ 1,688,000 | 0.13%, 03/01/2025 | $ 3,614,448 |
| 1,925,000 | 0.25%, 11/01/2027(1)(10) | 2,325,691 |
| | | | 16,191,761 |
| | Energy-Alternate Sources - 0.2% |
| 2,795,000 | Enphase Energy, Inc. 0.01%, 03/01/2028(1)(8) | 3,132,808 |
| 1,286,000 | Maxeon Solar Technologies Ltd. 6.50%, 07/15/2025 | 1,871,773 |
| | | | 5,004,581 |
| | Engineering & Construction - 0.0% |
| 800,000 | Vinci S.A. 0.38%, 02/16/2022(9) | 888,104 |
| | Entertainment - 0.2% |
| 4,800,000 | DraftKings, Inc. 0.00%, 03/15/2028(1)(8) | 4,185,317 |
| 800,000 | Penn National Gaming, Inc. 2.75%, 05/15/2026 | 2,520,740 |
| | | | 6,706,057 |
| | Healthcare - Products - 0.4% |
| 4,337,000 | Insulet Corp. 0.38%, 09/01/2026 | 6,433,122 |
| 3,894,000 | Integra LifeSciences Holdings Corp. 0.50%, 08/15/2025 | 4,222,264 |
| 3,265,000 | NuVasive, Inc. 0.38%, 03/15/2025 | 3,077,263 |
| | | | 13,732,649 |
| | Internet - 0.5% |
| | ETSY, Inc. | |
| 945,000 | 0.13%, 10/01/2026 | 2,732,341 |
| 2,458,000 | 0.25%, 06/15/2028(1) | 3,139,784 |
| 2,500,000 | Sea Ltd. 0.25%, 09/15/2026 | 2,625,563 |
| 3,050,000 | Snap, Inc. 0.01%, 05/01/2027(1) | 3,088,454 |
| 885,000 | Trip.com Group Ltd. 1.99%, 07/01/2025 | 822,596 |
| 5,068,000 | Uber Technologies, Inc. 0.01%, 12/15/2025(1)(8) | 4,875,547 |
| | | | 17,284,285 |
| | IT Services - 0.1% |
| 2,450,000 | PAR Technology Corp. 1.50%, 10/15/2027 | 2,680,344 |
| | Leisure Time - 0.1% |
| 3,606,000 | Royal Caribbean Cruises Ltd. 4.25%, 06/15/2023 | 4,863,872 |
| | Machinery-Diversified - 0.3% |
| 5,748,000 | Middleby Corp. 1.00%, 09/01/2025 | 8,655,258 |
| | Miscellaneous Manufacturing - 0.1% |
| 4,474,000 | John Bean Technologies Corp. 0.25%, 05/15/2026(1) | 4,833,308 |
| | Oil & Gas - 0.2% |
| 3,065,000 | Pioneer Natural Resources Co. 0.25%, 05/15/2025 | 5,416,677 |
| Shares or Principal Amount | | Market Value† |
| CONVERTIBLE BONDS - 3.7% - (continued) |
| | Pharmaceuticals - 0.2% |
| $ 2,025,000 | Aerie Pharmaceuticals, Inc. 1.50%, 10/01/2024(10) | $ 1,809,844 |
| 3,930,000 | Dexcom, Inc. 0.25%, 11/15/2025 | 5,016,848 |
| | | | 6,826,692 |
| | Real Estate Investment Trusts - 0.2% |
| 4,423,000 | Pebblebrook Hotel Trust 1.75%, 12/15/2026 | 4,923,249 |
| 1,256,000 | PennyMac Corp. 5.50%, 03/15/2026(1) | 1,293,680 |
| | | | 6,216,929 |
| | Retail - 0.1% |
| 3,725,000 | Shake Shack, Inc. 0.00%, 03/01/2028(1)(8) | 3,058,666 |
| | Software - 0.3% |
| 6,225,000 | Ringcentral, Inc. 0.01%, 03/01/2025(8) | 6,384,516 |
| 1,935,000 | Workday, Inc. 0.25%, 10/01/2022 | 3,819,303 |
| | | | 10,203,819 |
| | Total Convertible Bonds
(cost $112,383,406) | $ 122,538,126 |
| CORPORATE BONDS - 25.3% |
| | Aerospace/Defense - 0.2% |
| | Embraer Netherlands Finance B.V. | |
| 4,420,000 | 6.95%, 01/17/2028(1) | $ 4,903,990 |
| 1,840,000 | 6.95%, 01/17/2028(9) | 2,041,480 |
| 16,000 | Howmet Aerospace, Inc. 6.88%, 05/01/2025 | 18,540 |
| 279,000 | SSL Robotics LLC 9.75%, 12/31/2023(1) | 301,320 |
| | | | 7,265,330 |
| | Agriculture - 0.2% |
| | Kernel Holding S.A. | |
| 3,975,000 | 6.50%, 10/17/2024(1) | 4,196,514 |
| 1,745,000 | 6.75%, 10/27/2027(1) | 1,850,084 |
| 1,090,000 | 6.75%, 10/27/2027(9) | 1,155,640 |
| | | | 7,202,238 |
| | Airlines - 0.4% |
| 3,175,000 | American Airlines, Inc. 5.75%, 04/20/2029(1) | 3,417,094 |
| 6,600,396 | Hawaiian Brand Intellectual Property Ltd. 5.75%, 01/20/2026(1) | 6,922,165 |
| 3,197,999 | Spirit Loyalty Cayman Ltd. / Spirit IP Cayman Ltd. 8.00%, 09/20/2025(1) | 3,579,640 |
| | | | 13,918,899 |
| | Auto Manufacturers - 0.4% |
| | Daimler Canada Finance, Inc. | |
| CAD 3,135,000 | 2.23%, 12/16/2021 | 2,538,547 |
| 2,080,000 | 3.05%, 05/16/2022 | 1,702,583 |
| 1,500,000 | 3.30%, 08/16/2022 | 1,234,332 |
| 4,200,000 | General Motors Financial of Canada Ltd. 2.60%, 06/01/2022 | 3,427,738 |
The accompanying notes are an integral part of these financial statements.
The Hartford Strategic Income Fund
Schedule of Investments – (continued)
October 31, 2021
| Shares or Principal Amount | | Market Value† |
| CORPORATE BONDS - 25.3% - (continued) |
| | Auto Manufacturers - 0.4% - (continued) |
| CAD 1,000,000 | Honda Canada Finance, Inc. 2.27%, 07/15/2022 | $ 816,757 |
| 3,800,000 | VW Credit Canada, Inc. 2.65%, 06/27/2022(9) | 3,107,836 |
| | | | 12,827,793 |
| | Auto Parts & Equipment - 0.3% |
| | Adient Global Holdings Ltd. | |
| EUR 1,945,000 | 3.50%, 08/15/2024(9) | 2,273,714 |
| $ 1,050,000 | 4.88%, 08/15/2026(1) | 1,068,989 |
| EUR 2,645,000 | Clarios Global L.P. / Clarios U.S. Finance Co. 4.38%, 05/15/2026(9) | 3,126,930 |
| $ 3,690,000 | Nemak S.A.B. de C.V. 3.63%, 06/28/2031(1) | 3,453,840 |
| | | | 9,923,473 |
| | Chemicals - 0.6% |
| 7,940,000 | Braskem Idesa 6.99%, 02/20/2032(1) | 8,127,344 |
| 980,000 | Braskem Netherlands Finance B.V. 4.50%, 01/10/2028(9) | 1,000,835 |
| | OCP S.A. | |
| 200,000 | 3.75%, 06/23/2031(1) | 195,999 |
| 495,000 | 4.50%, 10/22/2025(9) | 525,965 |
| 4,684,000 | 5.13%, 06/23/2051(1) | 4,559,874 |
| 200,000 | 6.88%, 04/25/2044(9) | 239,456 |
| | Syngenta Finance N.V. | |
| 3,036,000 | 5.68%, 04/24/2048(1) | 3,744,797 |
| 595,000 | 5.68%, 04/24/2048(9) | 733,911 |
| | | | 19,128,181 |
| | Commercial Banks - 2.6% |
| | Abanca Corp. Bancaria S.A. | |
| EUR 600,000 | 4.63%, 04/07/2030, (4.62% fixed rate until 04/07/2025; 5 year EUR Swap + 5.014% thereafter)(9)(11) | 748,394 |
| 400,000 | 6.00%, 01/20/2026, (6.00% fixed rate until 01/20/2026; 5 year EUR Swap + 6.570% thereafter)(9)(11)(12) | 487,046 |
| 1,000,000 | 7.50%, 10/02/2023, (7.50% fixed rate until 10/02/2023; 5 year EUR Swap + 7.326% thereafter)(9)(11)(12) | 1,241,255 |
| $ 1,500,000 | Agricultural Bank of China Ltd. 0.81%, 07/30/2022 | 1,503,091 |
| | Argenta Spaarbank N.V. | |
| EUR 1,000,000 | 1.00%, 10/13/2026(9) | 1,176,406 |
| 1,500,000 | 1.00%, 01/29/2027(9) | 1,762,299 |
| | Banca Monte dei Paschi di Siena S.p.A. | |
| 275,000 | 0.88%, 10/08/2027(9) | 326,631 |
| 675,000 | 1.88%, 01/09/2026(9) | 770,262 |
| 750,000 | 2.63%, 04/28/2025(9) | 874,914 |
| 975,000 | 3.63%, 09/24/2024(9) | 1,156,629 |
| 200,000 | Banco BPM S.p.A. 1.33%, 12/21/2021, 3 mo. EURIBOR + 1.880%(2)(12) | 225,420 |
| 1,300,000 | Banco Comercial Portugues S.A. 1.13%, 02/12/2027, (1.13% fixed rate until 02/12/2026; 1 year EUR Swap + 1.550% thereafter) | 1,455,666 |
| Shares or Principal Amount | | Market Value† |
| CORPORATE BONDS - 25.3% - (continued) |
| | Commercial Banks - 2.6% - (continued) |
| | Banco de Credito del Peru | |
| $ 220,000 | 3.13%, 07/01/2030, (3.13% fixed rate until 07/01/2025; 5 year USD CMT + 3.000% thereafter)(9)(11) | $ 218,284 |
| 185,000 | 3.13%, 07/01/2030, (3.13% fixed rate until 07/01/2025; 5 year USD CMT + 3.000% thereafter)(1)(11) | 183,557 |
| 60,000 | 3.25%, 09/30/2031, (3.25% fixed rate until 09/30/2026; 5 year USD CMT + 2.450% thereafter)(1)(11) | 59,460 |
| | Banco de Credito Social Cooperativo S.A. | |
| EUR 1,400,000 | 5.25%, 11/27/2031, (5.25% fixed rate until 05/27/2026; 5 year EUR Swap + 5.419% thereafter)(9)(11) | 1,703,366 |
| 1,100,000 | 7.75%, 06/07/2027, (7.75% fixed rate until 06/07/2022; 5 year EUR Swap + 7.591% thereafter)(9)(11) | 1,327,344 |
| | Banco do Brasil S.A. | |
| $ 200,000 | 4.63%, 01/15/2025, 5 year EUR Swap + 7.591%(1)(12) | 209,402 |
| 570,000 | 4.63%, 01/15/2025 | 596,796 |
| 1,075,000 | 4.75%, 03/20/2024 | 1,127,417 |
| EUR 1,140,000 | Banco Santander S.A. 1.00%, 12/15/2024(3)(12) | 1,254,768 |
| $ 760,000 | Bancolombia S.A. 4.63%, 12/18/2029, (4.62% fixed rate until 12/18/2024; 5 year USD CMT + 2.944% thereafter)(11) | 774,216 |
| 710,000 | Bangkok Bank PCL 3.47%, 09/23/2036, (3.47% fixed rate until 09/23/2031; 5 year USD CMT + 2.150% thereafter)(1)(11) | 704,889 |
| 400,000 | Bank Leumi Le-Israel BM 3.28%, 01/29/2031, (3.28% fixed rate until 01/29/2026; 5 year USD CMT + 1.631% thereafter)(1)(9)(11) | 403,000 |
| | Bank of China Ltd. | |
| 500,000 | 0.70%, 01/16/2022, 3 mo. USD LIBOR + 0.580%(2)(9) | 500,202 |
| 2,500,000 | 1.01%, 11/22/2022, 3 mo. USD LIBOR + 0.880%(2)(9) | 2,512,674 |
| 1,000,000 | 2.88%, 04/20/2022(9) | 1,009,120 |
| | Barclays plc | |
| EUR 450,000 | 0.58%, 08/09/2029, (0.58% fixed rate until 08/09/2028; 1 year EUR Swap + 1.260% thereafter)(9)(11) | 507,182 |
| $ 425,000 | 2.67%, 03/10/2032, (2.67% fixed rate until 03/10/2031; 12 mo. USD CMT + 1.200% thereafter)(11) | 423,487 |
| GBP 400,000 | 3.00%, 05/08/2026(9) | 572,317 |
| EUR 375,000 | 3.38%, 04/02/2025, (3.38% fixed rate until 04/02/2024; 1 year EUR Swap + 3.700% thereafter)(9)(11) | 466,343 |
| GBP 875,000 | 5.88%, 09/15/2024, (5.87% fixed rate until 09/15/2024; 5 year GBP Swap + 5.187% thereafter)(9)(11)(12) | 1,248,207 |
| $ 550,000 | 7.75%, 09/15/2023, (7.75% fixed rate until 09/15/2023; 5 year USD Swap + 4.842% thereafter)(11)(12) | 597,328 |
The accompanying notes are an integral part of these financial statements.
The Hartford Strategic Income Fund
Schedule of Investments – (continued)
October 31, 2021
| Shares or Principal Amount | | Market Value† |
| CORPORATE BONDS - 25.3% - (continued) |
| | Commercial Banks - 2.6% - (continued) |
| $ 850,000 | 7.88%, 03/15/2022, (7.87% fixed rate until 03/15/2022; 5 year USD Swap + 6.772% thereafter)(9)(11)(12) | $ 868,062 |
| 490,000 | BBVA Global Finance Ltd. 7.00%, 12/01/2025 | 575,792 |
| 750,000 | BNP Paribas S.A. 2.22%, 06/09/2026, (2.22% fixed rate until 06/09/2025; 3 mo. USD SOFR + 2.074% thereafter)(9)(11) | 763,513 |
| JPY 200,000,000 | BPCE S.A. 0.64%, 01/27/2022 | 1,756,483 |
| | CaixaBank S.A. | |
| GBP 400,000 | 1.50%, 12/03/2026, (1.50% fixed rate until 12/03/2025; 12 mo. UK Government Bond + 1.320% thereafter)(9)(11) | 539,661 |
| EUR 1,400,000 | 6.00%, 07/18/2022, (6.00% fixed rate until 07/18/2022; 5 year EUR Swap + 5.819% thereafter)(9)(11)(12) | 1,666,952 |
| | Credit Agricole S.A. | |
| JPY 200,000,000 | 0.44%, 06/09/2022(9) | 1,757,064 |
| EUR 500,000 | 1.63%, 06/05/2030, (1.63% fixed rate until 06/05/2025; 5 year EUR Swap + 1.900% thereafter)(9)(11) | 594,471 |
| $ 525,000 | 1.91%, 06/16/2026, (1.91% fixed rate until 06/16/2025; 3 mo. USD SOFR + 1.676% thereafter)(9)(11) | 530,214 |
| 1,070,000 | 6.88%, 09/23/2024, (6.87% fixed rate until 09/23/2024; 5 year USD Swap + 4.319% thereafter)(9)(11)(12) | 1,179,675 |
| GBP 700,000 | 7.50%, 06/23/2026, (7.50% fixed rate until 06/23/2026; 5 year GBP Swap + 4.812% thereafter)(1)(11)(12) | 1,100,486 |
| $ 375,000 | 8.13%, 12/23/2025, (8.12% fixed rate until 12/23/2025; 5 year USD Swap + 6.185% thereafter)(9)(11)(12) | 449,063 |
| | Credit Suisse Group AG | |
| 1,155,000 | 0.50%, 02/04/2022, 3 mo. USD SOFR + 0.450%(2) | 1,155,959 |
| 1,075,000 | 6.25%, 12/18/2024, (6.25% fixed rate until 12/18/2024; 5 year USD Swap + 3.455% thereafter)(9)(11)(12) | 1,155,625 |
| 625,000 | 7.25%, 09/12/2025, (7.25% fixed rate until 09/12/2025; 5 year USD ICE Swap + 4.332% thereafter)(9)(11)(12) | 693,650 |
| 2,350,000 | 7.50%, 12/11/2023, (7.50% fixed rate until 12/11/2023; 5 year USD Swap + 4.598% thereafter)(1)(11)(12) | 2,561,500 |
| | Danske Bank A/S | |
| 300,000 | 1.62%, 09/11/2026, (1.62% fixed rate until 09/11/2025; 12 mo. USD CMT + 1.350% thereafter)(1)(11) | 297,970 |
| Shares or Principal Amount | | Market Value† |
| CORPORATE BONDS - 25.3% - (continued) |
| | Commercial Banks - 2.6% - (continued) |
| GBP 1,300,000 | 2.25%, 01/14/2028, (2.25% fixed rate until 01/14/2027; 1 year UK Government Bond + 1.650% thereafter)(9)(11) | $ 1,790,388 |
| $ 958,000 | 4.38%, 05/18/2026, (4.37% fixed rate until 05/18/2026; 5 year USD CMT + 3.387% thereafter)(9)(11)(12) | 965,185 |
| 325,000 | 5.38%, 01/12/2024(1) | 353,867 |
| 1,655,000 | 7.00%, 06/26/2025, (7.00% fixed rate until 06/26/2025; 7 year USD CMT + 4.130% thereafter)(9)(11)(12) | 1,841,187 |
| 1,375,000 | DNB Bank ASA 4.88%, 11/12/2024, (4.87% fixed rate until 11/12/2024; 5 year USD CMT + 3.140% thereafter)(9)(11)(12) | 1,440,312 |
| EUR 1,000,000 | Eurobank S.A. 2.00%, 05/05/2027, (2.00% fixed rate until 05/05/2026; 1 year EUR Swap + 2.398% thereafter)(9)(11) | 1,113,632 |
| 925,000 | FinecoBank Banca Fineco S.p.A. 5.88%, 12/03/2024, (5.87% fixed rate until 12/03/2024; 5 year EUR Swap + 6.144% thereafter)(9)(11)(12) | 1,164,200 |
| | Freedom Mortgage Corp. | |
| $ 7,000,000 | 7.63%, 05/01/2026(1) | 6,825,000 |
| 1,320,000 | 8.13%, 11/15/2024(1) | 1,332,514 |
| 100,000 | Goldman Sachs Group, Inc. 0.88%, 02/23/2023, 3 mo. USD LIBOR + 0.750%(2) | 100,651 |
| 200,000 | Grupo Aval Ltd. 4.75%, 09/26/2022(9) | 204,700 |
| | HSBC Holdings plc | |
| GBP 425,000 | 1.75%, 07/24/2027, (1.75% fixed rate until 07/24/2026; SONIA + 1.307% thereafter)(11) | 572,947 |
| $ 385,000 | 2.80%, 05/24/2032, (2.80% fixed rate until 05/24/2031; 3 mo. USD SOFR + 1.187% thereafter)(11) | 387,789 |
| EUR 1,000,000 | 4.75%, 07/04/2029, (4.75% fixed rate until 07/04/2029; 5 year EUR Swap + 3.844% thereafter)(9)(11)(12) | 1,258,595 |
| $ 225,000 | 6.50%, 03/23/2028, (6.50% fixed rate until 03/23/2028; 5 year USD ICE Swap + 3.606% thereafter)(11)(12) | 251,028 |
| EUR 800,000 | IKB Deutsche Industriebank AG 4.00%, 01/31/2028, (4.00% fixed rate until 01/31/2023; 5 year EUR Swap + 3.617% thereafter)(9)(11) | 943,296 |
| | Industrial & Commercial Bank of China Ltd. | |
| $ 1,000,000 | 0.79%, 09/16/2022, 3 mo. USD LIBOR + 0.670%(2)(9) | 1,001,994 |
| 1,000,000 | 0.84%, 04/25/2022 | 1,001,461 |
| 2,090,000 | 1.00%, 05/23/2022, 3 mo. USD LIBOR + 0.870%(2)(9) | 2,095,246 |
| GBP 1,000,000 | 1.50%, 07/31/2022(9) | 1,371,583 |
The accompanying notes are an integral part of these financial statements.
The Hartford Strategic Income Fund
Schedule of Investments – (continued)
October 31, 2021
| Shares or Principal Amount | | Market Value† |
| CORPORATE BONDS - 25.3% - (continued) |
| | Commercial Banks - 2.6% - (continued) |
| $ 400,000 | 2.88%, 02/21/2022(9) | $ 402,372 |
| 435,000 | 4.88%, 09/21/2025(9) | 476,339 |
| 525,000 | ING Groep N.V. 4.05%, 04/09/2029 | 592,412 |
| | Itau Unibanco Holding S.A. | |
| 725,000 | 2.90%, 01/24/2023(1) | 733,845 |
| 305,000 | 2.90%, 01/24/2023(9) | 308,721 |
| EUR 550,000 | Jyske Bank A/S 3.63%, 12/04/2028, (3.63% fixed rate until 12/04/2028; 5 year EUR Swap + 3.688% thereafter)(9)(11)(12) | 642,158 |
| $ 815,000 | Mizrahi Tefahot Bank Ltd. 3.08%, 04/07/2031, (3.08% fixed rate until 04/07/2026; 5 year USD CMT + 2.250% thereafter)(1)(9)(11) | 813,370 |
| | Natwest Group plc | |
| EUR 550,000 | 0.78%, 02/26/2030, (0.78% fixed rate until 02/26/2029; 3 mo. EURIBOR + 0.949% thereafter)(9)(11) | 624,515 |
| GBP 525,000 | 2.11%, 11/28/2031, (2.11% fixed rate until 08/26/2026; 5 year UK Government Bond + 1.750% thereafter)(9)(11) | 706,513 |
| $ 1,175,000 | 3.03%, 11/28/2035, (3.03% fixed rate until 08/28/2030; 5 year USD CMT + 2.350% thereafter)(11) | 1,169,817 |
| EUR 700,000 | Nykredit Realkredit AS 0.88%, 07/28/2031, (0.88% fixed rate until 04/28/2026; 5 year EUR Swap + 1.180% thereafter)(9)(11) | 802,283 |
| | QNB Finance Ltd. | |
| $ 200,000 | 1.63%, 09/22/2025(9) | 199,988 |
| 485,000 | 2.63%, 05/12/2025(9) | 501,341 |
| 400,000 | 3.50%, 03/28/2024(9) | 421,856 |
| 600,000 | Skandinaviska Enskilda Banken AB 5.13%, 05/13/2025, (5.12% fixed rate until 05/13/2025; 5 year USD CMT + 3.463% thereafter)(9)(11)(12) | 635,250 |
| EUR 375,000 | Stichting AK Rabobank Certificaten 19.44%, 12/29/2049(4)(9)(12) | 601,932 |
| | UBS Group AG | |
| $ 500,000 | 5.00%, 01/31/2023, (5.00% fixed rate until 01/31/2023; 5 year USD Swap + 2.432% thereafter)(9)(11)(12) | 502,208 |
| 400,000 | 6.88%, 08/07/2025, (6.87% fixed rate until 08/07/2025; 5 year USD Swap + 4.590% thereafter)(9)(11)(12) | 451,000 |
| 1,050,000 | 7.00%, 02/19/2025, (7.00% fixed rate until 02/19/2025; 5 year USD Swap + 4.866% thereafter)(9)(11)(12) | 1,179,937 |
| Shares or Principal Amount | | Market Value† |
| CORPORATE BONDS - 25.3% - (continued) |
| | Commercial Banks - 2.6% - (continued) |
| $ 850,000 | 7.00%, 01/31/2024, (7.00% fixed rate until 01/31/2024; 5 year USD Swap + 4.344% thereafter)(9)(11)(12) | $ 919,062 |
| | Virgin Money UK PLC | |
| GBP 325,000 | 2.63%, 08/19/2031, (2.63% fixed rate until 05/19/2026; 5 year UK Government Bond + 2.250% thereafter)(9)(11) | 441,857 |
| 763,000 | 8.00%, 12/08/2022, (8.00% fixed rate until 12/08/2022; 5 year GBP Swap + 6.527% thereafter)(9)(11) | 1,093,610 |
| | | | 86,009,473 |
| | Commercial Services - 0.5% |
| | IPD 3 B.V. | |
| EUR 925,000 | 5.50%, 12/01/2025(9) | 1,096,139 |
| 390,000 | 5.50%, 12/01/2025(1) | 462,156 |
| 4,980,000 | La Financiere Atalian SASU 4.00%, 05/15/2024(9) | 5,659,623 |
| | Nexi S.p.A. | |
| 2,495,000 | 1.63%, 04/30/2026(9) | 2,866,193 |
| 1,000,000 | 2.13%, 04/30/2029(9) | 1,141,550 |
| | Q-Park Holding I B.V. | |
| 910,000 | 2.00%, 03/01/2026, 3 mo. EURIBOR + 2.000%(2)(9) | 1,008,566 |
| 540,000 | 2.00%, 03/31/2026, 3 mo. EURIBOR + 2.000%(1)(2) | 598,490 |
| $ 2,232,000 | Signal Parent, Inc. 6.13%, 04/01/2029(1) | 2,075,760 |
| | Verisure Holding AB | |
| EUR 308,000 | 3.25%, 02/15/2027(1) | 354,720 |
| 555,000 | 3.88%, 07/15/2026(1) | 653,680 |
| 410,000 | 3.88%, 07/15/2026(9) | 482,899 |
| | Verisure Midholding AB | |
| 306,000 | 5.25%, 02/15/2029(1) | 358,158 |
| 140,000 | 5.25%, 02/15/2029(9) | 163,863 |
| | | | 16,921,797 |
| | Construction Materials - 0.2% |
| $ 5,500,000 | Victors Merger Corp. 6.38%, 05/15/2029(1) | 5,170,000 |
| | Distribution/Wholesale - 0.0% |
| 40,000 | G-III Apparel Group Ltd. 7.88%, 08/15/2025(1) | 42,650 |
| | Diversified Financial Services - 1.6% |
| 500,000 | AerCap Ireland Capital DAC / AerCap Global Aviation Trust 0.73%, 09/29/2023, 3 mo. USD SOFR + 0.680%(2) | 500,865 |
| 7,995,000 | BOC Aviation USA Corp. 1.63%, 04/29/2024(1) | 8,010,324 |
| | GE Capital Canada Funding Co. | |
| CAD 1,020,000 | 0.79%, 02/15/2022, 3 mo. CDOR + 0.350%(2) | 824,692 |
The accompanying notes are an integral part of these financial statements.
The Hartford Strategic Income Fund
Schedule of Investments – (continued)
October 31, 2021
| Shares or Principal Amount | | Market Value† |
| CORPORATE BONDS - 25.3% - (continued) |
| | Diversified Financial Services - 1.6% - (continued) |
| CAD 3,987,000 | 4.60%, 01/26/2022 | $ 3,250,700 |
| $ 1,405,000 | goeasy Ltd. 4.38%, 05/01/2026(1) | 1,433,100 |
| 1,475,000 | Gtlk Europe Capital DAC 4.80%, 02/26/2028(9) | 1,535,770 |
| 7,442,000 | Home Point Capital, Inc. 5.00%, 02/01/2026(1) | 6,685,818 |
| 1,000,000 | ICBCIL Finance Co., Ltd. 3.65%, 03/05/2022 | 1,008,378 |
| | LD Holdings Group LLC | |
| 1,780,000 | 6.13%, 04/01/2028(1) | 1,630,925 |
| 4,320,000 | 6.50%, 11/01/2025(1) | 4,233,600 |
| EUR 965,000 | LeasePlan Corp. N.V. 7.38%, 05/29/2024, (7.37% fixed rate until 05/29/2024; 5 year EUR CMS + 7.556% thereafter)(9)(11)(12) | 1,239,795 |
| $ 1,604,000 | LFS Topco LLC 5.88%, 10/15/2026(1) | 1,650,115 |
| | Midcap Financial Issuer Trust | |
| 1,389,000 | 5.63%, 01/15/2030(1) | 1,366,429 |
| 5,230,000 | 6.50%, 05/01/2028(1) | 5,426,125 |
| 1,607,000 | Nationstar Mortgage Holdings, Inc. 5.13%, 12/15/2030(1) | 1,619,615 |
| | PennyMac Financial Services, Inc. | |
| 225,000 | 4.25%, 02/15/2029(1) | 212,063 |
| 2,475,000 | 5.38%, 10/15/2025(1) | 2,552,344 |
| 200,000 | Power Finance Corp. Ltd. 3.95%, 04/23/2030(9) | 205,784 |
| 7,230,000 | Unifin Financiera S.A.B. de C.V. 9.88%, 01/28/2029(1) | 6,709,476 |
| 2,911,000 | United Wholesale Mortgage LLC 5.50%, 11/15/2025(1) | 2,896,445 |
| | | | 52,992,363 |
| | Electric - 1.9% |
| 755,000 | Alfa Desarrollo S.p.A. 4.55%, 09/27/2051(1) | 737,710 |
| EUR 6,260,000 | Bulgarian Energy Holding 2.45%, 07/22/2028(9) | 7,175,396 |
| | Centrais Eletricas Brasileiras S.A. | |
| $ 3,640,000 | 4.63%, 02/04/2030(1) | 3,567,236 |
| 2,685,000 | 4.63%, 02/04/2030(9) | 2,631,327 |
| | Comision Federal de Electricidad | |
| 215,000 | 4.68%, 02/09/2051(9) | 199,683 |
| 200,000 | 4.68%, 02/09/2051(1) | 185,752 |
| 200,000 | Engie Energia Chile S.A. 4.50%, 01/29/2025(9) | 215,124 |
| | FirstEnergy Corp. | |
| 8,065,000 | 3.40%, 03/01/2050 | 8,000,480 |
| 5,060,000 | 5.35%, 07/15/2047 | 6,134,479 |
| 3,170,000 | Inkia Energy Ltd. 5.88%, 11/09/2027(9) | 3,296,800 |
| 200,000 | Instituto Costarricense de Electricidad 6.95%, 11/10/2021(9) | 199,752 |
| | Israel Electric Corp. Ltd. | |
| 2,030,000 | 4.25%, 08/14/2028(1)(9) | 2,263,450 |
| 475,000 | 5.00%, 11/12/2024(1)(9) | 522,457 |
| 430,000 | Kallpa Generacion S.A. 4.88%, 05/24/2026(9) | 458,488 |
| 6,825,000 | Oryx Funding Ltd. 5.80%, 02/03/2031(1) | 7,260,872 |
| | Perusahaan Perseroan Persero PT Perusahaan Listrik Negara | |
| 420,000 | 3.88%, 07/17/2029(9) | 444,150 |
| 200,000 | 5.25%, 05/15/2047(9) | 221,500 |
| Shares or Principal Amount | | Market Value† |
| CORPORATE BONDS - 25.3% - (continued) |
| | Electric - 1.9% - (continued) |
| $ 755,000 | 6.15%, 05/21/2048(9) | $ 931,904 |
| 200,000 | Star Energy Geothermal Darajat / Star Energy Geothermal Salak 4.85%, 10/14/2038(1) | 222,500 |
| 430,000 | Star Energy Geothermal Darajat II / Star Energy Geothermal Salak 4.85%, 10/14/2038(9) | 478,375 |
| 185,000 | Termocandelaria Power Ltd. 7.88%, 01/30/2029(1) | 190,321 |
| 20,590,000 | Zorlu Yenilenebilir Enerji AS 9.00%, 06/01/2026(1) | 19,211,705 |
| | | | 64,549,461 |
| | Electrical Components & Equipment - 0.0% |
| EUR 800,000 | Energizer Gamma Acquisition B.V. 3.50%, 06/30/2029(1) | 895,123 |
| | Energy-Alternate Sources - 0.7% |
| $ 4,233,013 | Continuum Energy Levanter Pte Ltd. 4.50%, 02/09/2027(1) | 4,344,129 |
| 6,720,000 | FS Luxembourg S.a.r.l. 10.00%, 12/15/2025(1) | 7,408,800 |
| | Greenko Dutch B.V. | |
| 1,994,625 | 3.85%, 03/29/2026(1) | 2,009,585 |
| 197,000 | 3.85%, 03/29/2026 | 198,478 |
| | Greenko Mauritius Ltd. | |
| 4,060,000 | 6.25%, 02/21/2023(1) | 4,160,112 |
| 2,355,000 | 6.25%, 02/21/2023(9) | 2,413,070 |
| 1,145,000 | Investment Energy Resources Ltd. 6.25%, 04/26/2029(1) | 1,226,478 |
| | | | 21,760,652 |
| | Engineering & Construction - 0.6% |
| 925,000 | Aeropuerto Internacional de Tocumen S.A. 5.13%, 08/11/2061(1) | 963,166 |
| 1,280,000 | Artera Services LLC 9.03%, 12/04/2025(1) | 1,366,400 |
| 383,811 | Bioceanico Sovereign Certificate Ltd. 0.00%, 06/05/2034(1)(8) | 284,020 |
| 780,000 | Interchile S.A. 4.50%, 06/30/2056(1) | 822,572 |
| | International Airport Finance S.A. | |
| 8,440,986 | 12.00%, 03/15/2033(9) | 9,177,124 |
| 7,717,472 | 12.00%, 03/15/2033(1)(10) | 8,390,513 |
| 515,000 | Mexico City Airport Trust 4.25%, 10/31/2026(9) | 554,758 |
| | | | 21,558,553 |
| | Entertainment - 0.1% |
| | Caesars Entertainment, Inc. | |
| 900,000 | 4.63%, 10/15/2029(1) | 904,320 |
| 500,000 | 8.13%, 07/01/2027(1) | 560,025 |
| | Cinemark USA, Inc. | |
| 1,855,000 | 5.25%, 07/15/2028(1) | 1,809,794 |
| 1,090,000 | 5.88%, 03/15/2026(1) | 1,092,725 |
| EUR 400,000 | Scientific Games International, Inc. 5.50%, 02/15/2026(9) | 478,121 |
| | | | 4,844,985 |
| | Environmental Control - 0.0% |
| 1,265,000 | Verde Bidco S.p.A. 4.63%, 10/01/2026(1) | 1,480,204 |
The accompanying notes are an integral part of these financial statements.
The Hartford Strategic Income Fund
Schedule of Investments – (continued)
October 31, 2021
| Shares or Principal Amount | | Market Value† |
| CORPORATE BONDS - 25.3% - (continued) |
| | Food - 0.1% |
| | BRF S.A. | |
| $ 640,000 | 4.88%, 01/24/2030(9) | $ 635,846 |
| 200,000 | 4.88%, 01/24/2030(1) | 198,702 |
| 1,270,000 | United Natural Foods, Inc. 6.75%, 10/15/2028(1) | 1,374,775 |
| | | | 2,209,323 |
| | Food Service - 0.1% |
| 2,000,000 | Aramark Services, Inc. 6.38%, 05/01/2025(1) | 2,104,780 |
| | Forest Products & Paper - 0.0% |
| 200,000 | Celulosa Arauco y Constitucion S.A. 5.50%, 04/30/2049(1) | 231,152 |
| 200,000 | Inversiones CMPC S.A. 3.85%, 01/13/2030(9) | 207,175 |
| | | | 438,327 |
| | Gas - 0.1% |
| CAD 3,000,000 | Enbridge Gas, Inc. 4.77%, 12/17/2021(1) | 2,436,625 |
| | Healthcare - Products - 0.1% |
| $ 770,000 | Avantor Funding, Inc. 4.63%, 07/15/2028(1) | 798,836 |
| 3,933,000 | Mozart Debt Merger Sub, Inc. 5.25%, 10/01/2029(1) | 3,991,995 |
| | | | 4,790,831 |
| | Healthcare - Services - 0.1% |
| 700,000 | Acadia Healthcare Co., Inc. 5.00%, 04/15/2029(1) | 714,000 |
| | CHS/Community Health Systems, Inc. | |
| 1,000,000 | 4.75%, 02/15/2031(1) | 997,380 |
| 1,230,000 | 5.63%, 03/15/2027(1) | 1,287,134 |
| | | | 2,998,514 |
| | Home Builders - 0.3% |
| 3,378,000 | Adams Homes, Inc. 7.50%, 02/15/2025(1) | 3,521,565 |
| 3,201,000 | STL Holding Co. LLC 7.50%, 02/15/2026(1) | 3,353,047 |
| 2,140,000 | Williams Scotsman International, Inc. 4.63%, 08/15/2028(1) | 2,212,225 |
| | | | 9,086,837 |
| | Insurance - 0.6% |
| 4,094,000 | Acrisure LLC / Acrisure Finance, Inc. 6.00%, 08/01/2029(1) | 4,017,238 |
| EUR 118,000 | Aegon N.V. 0.11%, 01/15/2022, 10 year GNTH + 0.100%(2)(12) | 122,972 |
| | AIA Group Ltd. | |
| $ 400,000 | 3.20%, 03/11/2025(1) | 419,525 |
| 270,000 | 3.20%, 09/16/2040(1) | 275,481 |
| 200,000 | 3.20%, 09/16/2040(9) | 204,060 |
| 475,000 | 3.38%, 04/07/2030(1) | 510,972 |
| 6,625,000 | AmWINS Group, Inc. 4.88%, 06/30/2029(1) | 6,613,737 |
| | AXA S.A. | |
| 475,000 | 6.38%, 12/14/2036, (6.38% fixed rate until 12/14/2036; 3 mo. USD LIBOR + 2.256% thereafter)(9)(11)(12) | 659,062 |
| 500,000 | 8.60%, 12/15/2030 | 735,956 |
| | Genworth Holdings, Inc. | |
| 4,911,000 | 4.80%, 02/15/2024 | 5,021,056 |
| Shares or Principal Amount | | Market Value† |
| CORPORATE BONDS - 25.3% - (continued) |
| | Insurance - 0.6% - (continued) |
| $ 1,939,000 | 6.50%, 06/15/2034(10) | $ 2,018,984 |
| | Mutuelle Assurance Des Commercants et Industriels de France et Des Cadres et Sal | |
| EUR 500,000 | 0.63%, 06/21/2027(9) | 566,545 |
| 200,000 | 2.13%, 06/21/2052, (2.13% fixed rate until 03/21/2032; 3 mo. EURIBOR + 3.449% thereafter)(9)(11) | 230,882 |
| | | | 21,396,470 |
| | Internet - 0.2% |
| $ 4,773,000 | Arches Buyer, Inc. 6.13%, 12/01/2028(1) | 4,814,764 |
| | Meituan | |
| 630,000 | 3.05%, 10/28/2030(1) | 585,482 |
| 420,000 | 3.05%, 10/28/2030(9) | 390,321 |
| | Tencent Holdings Ltd. | |
| 200,000 | 2.39%, 06/03/2030(1) | 195,204 |
| 200,000 | 3.24%, 06/03/2050(1) | 193,780 |
| 200,000 | 3.24%, 06/03/2050(9) | 193,780 |
| 445,000 | 3.68%, 04/22/2041(9) | 460,753 |
| 200,000 | 3.68%, 04/22/2041(1) | 207,080 |
| 200,000 | 3.84%, 04/22/2051(1) | 211,016 |
| 215,000 | 3.93%, 01/19/2038(9) | 228,958 |
| | | | 7,481,138 |
| | Investment Company Security - 0.9% |
| 3,018,000 | Compass Group Diversified Holdings LLC 5.25%, 04/15/2029(1) | 3,138,720 |
| 6,993,000 | Hightower Holding LLC 6.75%, 04/15/2029(1) | 7,132,860 |
| | Huarong Finance Co., Ltd. | |
| 440,000 | 2.13%, 09/30/2023(9) | 413,332 |
| 3,240,000 | 3.25%, 11/13/2024(9) | 3,079,013 |
| 3,530,000 | 3.38%, 02/24/2030(9) | 3,115,225 |
| 3,685,000 | 3.75%, 04/27/2022(9) | 3,648,150 |
| 4,191,000 | 3.75%, 05/29/2024(9) | 4,094,104 |
| 3,945,000 | 4.50%, 01/24/2022, (4.50% fixed rate until 01/24/2022; 5 year USD CMT + 7.773% thereafter)(9)(11)(12) | 3,836,512 |
| 3,255,000 | 4.50%, 05/29/2029(9) | 3,071,906 |
| | | | 31,529,822 |
| | Iron/Steel - 0.7% |
| | CSN Inova Ventures | |
| 4,970,000 | 6.75%, 01/28/2028(1) | 5,278,140 |
| 1,620,000 | 6.75%, 01/28/2028(9) | 1,720,440 |
| 200,000 | CSN Resources S.A. 7.63%, 04/17/2026(1) | 211,502 |
| | Metinvest B.V. | |
| EUR 2,525,000 | 5.63%, 06/17/2025(1) | 3,086,736 |
| $ 3,287,000 | 7.65%, 10/01/2027(1) | 3,604,196 |
| 465,000 | 7.75%, 10/17/2029(1) | 505,548 |
| 6,889,000 | PJSC Koks via IMH Capital DAC 5.90%, 09/23/2025(1) | 7,272,717 |
| 265,000 | Vale Overseas Ltd. 3.75%, 07/08/2030 | 269,624 |
| | | | 21,948,903 |
| | Leisure Time - 0.6% |
| | Carnival Corp. | |
| 9,660,000 | 5.75%, 03/01/2027(1) | 9,831,948 |
| 4,530,000 | 6.00%, 05/01/2029(1)(13) | 4,539,060 |
The accompanying notes are an integral part of these financial statements.
The Hartford Strategic Income Fund
Schedule of Investments – (continued)
October 31, 2021
| Shares or Principal Amount | | Market Value† |
| CORPORATE BONDS - 25.3% - (continued) |
| | Leisure Time - 0.6% - (continued) |
| EUR 515,000 | 7.63%, 03/01/2026(1) | $ 639,395 |
| $ 710,000 | MajorDrive Holdings LLC 6.38%, 06/01/2029(1) | 683,020 |
| 4,000,000 | Royal Caribbean Cruises Ltd. 5.50%, 08/31/2026(1) | 4,075,000 |
| | | | 19,768,423 |
| | Lodging - 0.3% |
| 10,350,000 | Wynn Macau Ltd. 5.13%, 12/15/2029(1)(10) | 9,324,729 |
| | Machinery-Diversified - 0.3% |
| 8,190,000 | OT Merger Corp. 7.88%, 10/15/2029(1) | 8,067,150 |
| | TK Elevator Midco GmbH Co. | |
| EUR 815,000 | 4.38%, 07/15/2027(9) | 968,661 |
| 410,000 | 4.38%, 07/15/2027(1) | 487,302 |
| | | | 9,523,113 |
| | Media - 0.6% |
| $ 200,000 | Cable Onda S.A. 4.50%, 01/30/2030(9) | 207,450 |
| 2,700,000 | Houghton Mifflin Harcourt Publishers, Inc. 9.00%, 02/15/2025(1) | 2,862,000 |
| | Virgin Media Secured Finance plc | |
| GBP 1,285,000 | 4.13%, 08/15/2030(9) | 1,741,441 |
| 785,000 | 4.13%, 08/15/2030(1) | 1,063,838 |
| $ 2,310,000 | 4.50%, 08/15/2030(1) | 2,307,112 |
| | Virgin Media Vendor Financing Notes DAC | |
| GBP 3,345,000 | 4.88%, 07/15/2028(9) | 4,589,247 |
| 790,000 | 4.88%, 07/15/2028(1) | 1,083,858 |
| | VTR Finance N.V. | |
| $ 2,855,000 | 6.38%, 07/15/2028(1) | 3,043,287 |
| 1,590,000 | 6.38%, 07/15/2028(9) | 1,694,861 |
| | | | 18,593,094 |
| | Metal Fabricate/Hardware - 0.2% |
| 7,300,000 | Interpipe Holdings plc 8.38%, 05/13/2026(1) | 7,121,150 |
| | Mining - 0.0% |
| | AngloGold Ashanti Holdings plc | |
| 365,000 | 3.38%, 11/01/2028 | 362,918 |
| 205,000 | 3.75%, 10/01/2030 | 207,306 |
| 325,000 | Nacional del Cobre de Chile Corp. 3.70%, 01/30/2050(1) | 329,238 |
| | | | 899,462 |
| | Office/Business Equipment - 0.0% |
| 1,000,000 | Xerox Holdings Corp. 5.50%, 08/15/2028(1) | 1,011,257 |
| | Oil & Gas - 3.7% |
| | Ecopetrol S.A. | |
| 5,710,000 | 4.63%, 11/02/2031 | 5,662,065 |
| 465,000 | 5.38%, 06/26/2026 | 502,888 |
| 200,000 | Empresa Nacional del Petroleo 5.25%, 11/06/2029(9) | 218,490 |
| | Energean Israel Finance Ltd. | |
| 2,065,000 | 4.50%, 03/30/2024(1)(9) | 2,106,300 |
| 2,455,000 | 4.88%, 03/30/2026(1)(9) | 2,494,280 |
| 6,205,000 | 5.38%, 03/30/2028(1)(9) | 6,282,562 |
| 9,845,000 | 5.88%, 03/30/2031(1)(9) | 9,968,062 |
| | KazMunayGas National Co. JSC | |
| 200,000 | 5.75%, 04/19/2047(9) | 241,108 |
| Shares or Principal Amount | | Market Value† |
| CORPORATE BONDS - 25.3% - (continued) |
| | Oil & Gas - 3.7% - (continued) |
| $ 400,000 | 6.38%, 10/24/2048(9) | $ 514,024 |
| 7,515,000 | Kosmos Energy Ltd. 7.50%, 03/01/2028(1)(10) | 7,364,700 |
| | Leviathan Bond Ltd. | |
| 317,000 | 6.13%, 06/30/2025(1)(9) | 341,568 |
| 3,177,000 | 6.50%, 06/30/2027(1)(9) | 3,462,930 |
| 4,385,000 | 6.75%, 06/30/2030(1)(9) | 4,807,056 |
| 780,000 | Lukoil Capital DAC 2.80%, 04/26/2027(1) | 777,270 |
| 6,350,000 | Matador Resources Co. 5.88%, 09/15/2026 | 6,557,073 |
| 7,055,000 | NAK Naftogaz Ukraine via Kondor Finance plc 7.63%, 11/08/2026(1) | 6,943,032 |
| | Occidental Petroleum Corp. | |
| 4,360,000 | 4.40%, 04/15/2046 | 4,411,300 |
| 4,355,000 | 6.13%, 01/01/2031 | 5,215,112 |
| | Pertamina Persero PT | |
| 610,000 | 4.15%, 02/25/2060(9) | 604,725 |
| 920,000 | 4.18%, 01/21/2050(9) | 939,055 |
| | Petrobras Global Finance B.V. | |
| 1,825,000 | 5.50%, 06/10/2051 | 1,612,844 |
| 300,000 | 5.60%, 01/03/2031 | 313,425 |
| 880,000 | 5.75%, 02/01/2029 | 954,360 |
| 3,130,000 | 6.75%, 06/03/2050 | 3,210,691 |
| 175,000 | 6.90%, 03/19/2049 | 183,926 |
| 220,000 | 7.38%, 01/17/2027 | 257,407 |
| | Petroleos de Venezuela S.A. | |
| 290,000 | 6.00%, 05/16/2024(9)(14) | 14,500 |
| 125,000 | 9.00%, 11/17/2021*(9)(14) | 6,250 |
| | Petroleos Mexicanos | |
| 10,000 | 5.95%, 01/28/2031 | 9,825 |
| 2,460,000 | 6.38%, 01/23/2045 | 2,123,005 |
| 640,000 | 6.50%, 06/02/2041 | 579,136 |
| 10,000 | 6.75%, 09/21/2047 | 8,845 |
| 30,000 | 6.84%, 01/23/2030 | 31,362 |
| 11,230,000 | 7.69%, 01/23/2050 | 10,780,800 |
| 620,000 | Qatar Petroleum Industry 2.25%, 07/12/2031(1) | 610,700 |
| 495,000 | Qatar Petroleum SR Unsecured 1.38%, 09/12/2026(1) | 488,599 |
| 1,815,000 | Range Resources Corp. 8.25%, 01/15/2029(1) | 2,049,135 |
| 4,823,000 | SM Energy Co. 6.50%, 07/15/2028(10) | 5,040,035 |
| | Tullow Oil plc | |
| 3,305,000 | 7.00%, 03/01/2025(9) | 2,891,875 |
| 13,765,000 | 10.25%, 05/15/2026(1) | 14,501,427 |
| | YPF S.A. | |
| 8,655,000 | 6.95%, 07/21/2027(9) | 6,274,962 |
| 1,426,250 | 8.50%, 03/23/2025 | 1,296,119 |
| 84,875 | 8.50%, 03/23/2025(1) | 77,131 |
| 160,000 | 8.75%, 04/04/2024(1) | 144,402 |
| | | | 122,874,361 |
| | Oil & Gas Services - 0.3% |
| 6,885,000 | Borets Finance DAC 6.00%, 09/17/2026(1) | 7,129,417 |
| 4,204,201 | Guara Norte S.a.r.l. 5.20%, 06/15/2034(1) | 4,114,904 |
| | | | 11,244,321 |
The accompanying notes are an integral part of these financial statements.
The Hartford Strategic Income Fund
Schedule of Investments – (continued)
October 31, 2021
| Shares or Principal Amount | | Market Value† |
| CORPORATE BONDS - 25.3% - (continued) |
| | Packaging & Containers - 0.3% |
| EUR 785,000 | ARD Finance S.A. (5.00% Cash, 5.75% PIK) 5.00%, 06/30/2027(1)(15) | $ 932,923 |
| $ 1,105,000 | Ardagh Packaging Finance plc / Ardagh Holdings USA, Inc. 5.25%, 08/15/2027(1) | 1,102,238 |
| 7,405,000 | SAN Miguel Industrias Pet S.A. 3.50%, 08/02/2028(1) | 7,273,635 |
| | | | 9,308,796 |
| | Pharmaceuticals - 0.9% |
| | Bausch Health Cos., Inc. | |
| 7,350,000 | 5.00%, 01/30/2028(1) | 6,784,197 |
| 4,035,000 | 5.00%, 02/15/2029(1) | 3,702,113 |
| 2,464,000 | Endo Dac / Endo Finance LLC / Endo Finco, Inc. 9.50%, 07/31/2027(1)(10) | 2,445,520 |
| 1,005,000 | Organon & Co. 5.13%, 04/30/2031(1) | 1,036,587 |
| 787,000 | Par Pharmaceutical, Inc. 7.50%, 04/01/2027(1) | 793,886 |
| | Teva Pharmaceutical Finance Netherlands B.V. | |
| 14,945,000 | 3.15%, 10/01/2026 | 14,085,662 |
| EUR 1,745,000 | 4.50%, 03/01/2025 | 2,070,636 |
| | | | 30,918,601 |
| | Pipelines - 0.5% |
| $ 200,000 | Abu Dhabi Crude Oil Pipeline LLC 4.60%, 11/02/2047(9) | 232,168 |
| 7,310,000 | AI Candelaria Spain SLU 5.75%, 06/15/2033(1) | 7,155,101 |
| CAD 3,240,000 | Enbridge, Inc. 4.85%, 02/22/2022 | 2,650,637 |
| $ 1,865,000 | EQM Midstream Partners L.P. 4.75%, 01/15/2031(1) | 1,930,881 |
| | Galaxy Pipeline Assets Bidco Ltd. | |
| 195,730 | 1.75%, 09/30/2027(1) | 196,730 |
| 320,000 | 2.16%, 03/31/2034(1) | 311,689 |
| 580,000 | 2.63%, 03/31/2036(9) | 565,046 |
| 440,000 | 2.63%, 03/31/2036(1) | 428,655 |
| 325,000 | 2.94%, 09/30/2040(1) | 319,231 |
| 200,000 | 3.25%, 09/30/2040(1) | 198,799 |
| CAD 2,400,000 | TransCanada PipeLines Ltd. 3.65%, 11/15/2021 | 1,941,241 |
| | | | 15,930,178 |
| | Real Estate - 1.0% |
| | CIFI Holdings Group Co., Ltd. | |
| $ 7,180,000 | 5.25%, 05/13/2026(9) | 6,829,925 |
| 200,000 | 6.00%, 07/16/2025(9) | 195,056 |
| | Country Garden Holdings Co., Ltd. | |
| 3,525,000 | 3.88%, 10/22/2030 | 3,225,375 |
| 410,000 | 5.63%, 01/14/2030(9) | 402,407 |
| 200,000 | 6.15%, 09/17/2025(9) | 201,093 |
| | KWG Group Holdings Ltd. | |
| 695,000 | 5.95%, 08/10/2025(9) | 542,100 |
| 1,200,000 | 6.00%, 01/11/2022 | 1,132,780 |
| 5,665,000 | 6.30%, 02/13/2026(9) | 4,503,207 |
| | Times China Holdings Ltd. | |
| 8,235,000 | 6.20%, 03/22/2026(9) | 6,270,697 |
| 4,145,000 | 6.75%, 07/08/2025(9) | 3,278,311 |
| | Yuzhou Group Holdings Co., Ltd. | |
| 4,075,000 | 6.00%, 01/25/2022 | 2,857,594 |
| 3,715,000 | 6.35%, 01/13/2027(9) | 1,641,070 |
| Shares or Principal Amount | | Market Value† |
| CORPORATE BONDS - 25.3% - (continued) |
| | Real Estate - 1.0% - (continued) |
| $ 1,050,000 | 7.38%, 01/13/2026(9) | $ 474,597 |
| 3,145,000 | 7.70%, 02/20/2025(9) | 1,564,146 |
| | | | 33,118,358 |
| | Real Estate Investment Trusts - 0.2% |
| | Ladder Capital Finance Holdings LLLP / Ladder Capital Finance Corp. | |
| 4,470,000 | 4.25%, 02/01/2027(1) | 4,492,305 |
| 1,125,000 | 5.25%, 10/01/2025(1) | 1,133,438 |
| | | | 5,625,743 |
| | Retail - 1.3% |
| 610,000 | Ambience Merger Sub, Inc. 7.13%, 07/15/2029(1) | 587,808 |
| 5,343,000 | BCPE Ulysses Intermediate, Inc. (7.75% Cash, 8.50% PIK) 7.75%, 04/01/2027(1)(15) | 5,149,049 |
| 2,910,000 | Beacon Roofing Supply, Inc. 4.13%, 05/15/2029(1) | 2,862,713 |
| 1,155,000 | CEC Entertainment LLC 6.75%, 05/01/2026(1) | 1,154,284 |
| 1,359,000 | Dave & Buster's, Inc. 7.63%, 11/01/2025(1) | 1,459,376 |
| EUR 2,527,000 | eG Global Finance plc 4.38%, 02/07/2025(9) | 2,881,448 |
| $ 705,000 | FirstCash, Inc. 4.63%, 09/01/2028(1) | 727,031 |
| 7,425,000 | Jollibee Worldwide Pte Ltd. 3.90%, 01/23/2025, (3.90% fixed rate until 01/23/2025; 5 year USD CMT + 4.784% thereafter)(9)(11)(12) | 7,465,243 |
| 4,556,000 | LBM Acquisition LLC 6.25%, 01/15/2029(1) | 4,424,332 |
| 92,000 | Macy's Retail Holdings LLC 5.88%, 04/01/2029(1)(10) | 98,043 |
| 5,339,000 | Michaels Cos., Inc. 7.88%, 05/01/2029(1)(10) | 5,392,390 |
| 4,458,000 | PetSmart, Inc. 7.75%, 02/15/2029(1) | 4,817,850 |
| 4,704,000 | Specialty Building Products Holdings LLC / SBP Finance Corp. 6.38%, 09/30/2026(1) | 4,898,040 |
| 400,000 | SRS Distribution, Inc. 6.13%, 07/01/2029(1) | 411,500 |
| 610,000 | Suburban Propane Partners L.P. / Suburban Energy Finance Corp. 5.00%, 06/01/2031(1) | 625,250 |
| | | | 42,954,357 |
| | Savings & Loans - 0.0% |
| GBP 3,398 | Nationwide Building Society 10.25% | 883,564 |
| | Software - 0.1% |
| EUR 2,420,000 | Brunello Bidco S.p.A. 3.75%, 02/15/2028, 3 mo. EURIBOR + 3.750%(1)(2) | 2,794,068 |
| $ 465,000 | Change Healthcare Holdings LLC / Change Healthcare Finance, Inc. 5.75%, 03/01/2025(1) | 468,487 |
| | | | 3,262,555 |
| | Telecommunications - 1.5% |
| | Altice France S.A. | |
| EUR 2,301,000 | 4.00%, 07/15/2029(9) | 2,593,723 |
| 720,000 | 4.00%, 07/15/2029(1) | 811,595 |
| 620,000 | 4.25%, 10/15/2029(1) | 709,553 |
The accompanying notes are an integral part of these financial statements.
The Hartford Strategic Income Fund
Schedule of Investments – (continued)
October 31, 2021
| Shares or Principal Amount | | Market Value† |
| CORPORATE BONDS - 25.3% - (continued) |
| | Telecommunications - 1.5% - (continued) |
| $ 365,000 | Bharti Airtel Ltd. 4.38%, 06/10/2025(9) | $ 390,058 |
| 465,000 | Empresa Nacional de Telecomunicaciones S.A. 3.05%, 09/14/2032(1) | 453,933 |
| 1,370,000 | Frontier Communications Corp. 5.88%, 10/15/2027(1) | 1,435,075 |
| 6,750,000 | Frontier Communications Holdings LLC 6.00%, 01/15/2030(1) | 6,781,927 |
| | Iliad Holding SAS | |
| EUR 1,055,000 | 5.13%, 10/15/2026 | 1,253,533 |
| 1,250,000 | 5.63%, 10/15/2028 | 1,491,962 |
| $ 1,780,000 | 6.50%, 10/15/2026(1) | 1,833,756 |
| | Lorca Telecom Bondco S.A. | |
| EUR 4,810,000 | 4.00%, 09/18/2027(9) | 5,594,278 |
| 2,010,000 | 4.00%, 09/18/2027(1) | 2,337,733 |
| $ 180,000 | Millicom International Cellular S.A. 6.25%, 03/25/2029(9) | 195,750 |
| 6,870,000 | Network i2i Ltd. 5.65%, 01/15/2025, (5.65% fixed rate until 01/15/2025; 5 year USD CMT + 4.274% thereafter)(9)(11)(12) | 7,265,025 |
| 405,000 | Ooredoo International Finance Ltd. 2.63%, 04/08/2031(1) | 408,609 |
| | Telecom Argentina S.A. | |
| 5,675,000 | 8.00%, 07/18/2026 | 5,277,807 |
| 3,230,000 | 8.00%, 07/18/2026(1) | 3,003,932 |
| 570,000 | Telefonica Celular del Paraguay S.A. 5.88%, 04/15/2027(1) | 591,375 |
| | VEON Holdings B.V. | |
| 420,000 | 3.38%, 11/25/2027(1) | 420,806 |
| 305,000 | 3.38%, 11/25/2027(9) | 305,586 |
| 400,000 | 4.00%, 04/09/2025(9) | 414,164 |
| 1,550,000 | Vmed UK Financing plc 4.25%, 01/31/2031(1) | 1,509,096 |
| 1,690,000 | Vodafone Group plc 7.00%, 04/04/2079, (7.00% fixed rate until 01/04/2029; 5 year USD Swap + 4.873% thereafter)(11) | 2,044,183 |
| | VTR Comunicaciones S.p.A. | |
| 2,930,000 | 4.38%, 04/15/2029(1) | 2,954,597 |
| 178,000 | 5.13%, 01/15/2028(9) | 184,675 |
| 160,000 | 5.13%, 01/15/2028(1) | 166,000 |
| | | | 50,428,731 |
| | Total Corporate Bonds
(cost $843,560,682) | $ 845,703,538 |
| FOREIGN GOVERNMENT OBLIGATIONS - 21.0% |
| | Angola - 0.5% |
| | Angolan Government International Bond | |
| 6,150,000 | 8.00%, 11/26/2029(9) | $ 6,089,238 |
| 10,205,000 | 8.25%, 05/09/2028(9) | 10,258,474 |
| 900,000 | 9.38%, 05/08/2048(9) | 893,070 |
| | | | 17,240,782 |
| | Argentina - 0.8% |
| | Argentine Republic Government International Bond | |
| 26,170,601 | 0.50%, 07/09/2030(4) | 8,938,569 |
| 780,658 | 1.00%, 07/09/2029 | 284,948 |
| 29,086,093 | 1.13%, 07/09/2035(4)(10) | 9,016,980 |
| Shares or Principal Amount | | Market Value† |
| FOREIGN GOVERNMENT OBLIGATIONS - 21.0% - (continued) |
| | Argentina - 0.8% - (continued) |
| $ 4,785,000 | 2.00%, 01/09/2038(4) | $ 1,751,310 |
| 21,227,195 | 2.50%, 07/09/2041(4) | 7,312,769 |
| 164,367 | Provincia de Cordoba 5.00%, 06/01/2027(4)(9) | 109,098 |
| | | | 27,413,674 |
| | Armenia - 0.1% |
| | Republic of Armenia International Bond | |
| 470,000 | 3.60%, 02/02/2031(1) | 438,971 |
| 480,000 | 3.60%, 02/02/2031(9) | 448,310 |
| 200,000 | 3.95%, 09/26/2029(9) | 194,500 |
| 410,000 | 7.15%, 03/26/2025(9) | 465,481 |
| | | | 1,547,262 |
| | Azerbaijan - 0.2% |
| | Republic of Azerbaijan International Bond | |
| 2,754,000 | 3.50%, 09/01/2032(9) | 2,815,921 |
| 1,040,000 | 4.75%, 03/18/2024(9) | 1,113,528 |
| 1,515,000 | Southern Gas Corridor CJSC 6.88%, 03/24/2026(9) | 1,774,762 |
| | | | 5,704,211 |
| | Benin - 0.4% |
| | Benin Government International Bond | |
| EUR 5,055,000 | 4.88%, 01/19/2032(1) | 5,697,490 |
| 7,530,000 | 4.95%, 01/22/2035(1) | 8,270,315 |
| | | | 13,967,805 |
| | Bermuda - 0.0% |
| | Bermuda Government International Bond | |
| $ 350,000 | 3.38%, 08/20/2050(9) | 349,125 |
| 200,000 | 4.75%, 02/15/2029(1) | 230,708 |
| | | | 579,833 |
| | Brazil - 1.0% |
| | Brazil Notas do Tesouro Nacional | |
| BRL 19,962,000 | 10.00%, 01/01/2025 | 3,344,966 |
| 20,182,000 | 10.00%, 01/01/2027 | 3,296,902 |
| 102,133,000 | 10.00%, 01/01/2031 | 16,062,230 |
| | Brazilian Government International Bond | |
| $ 2,070,000 | 3.75%, 09/12/2031 | 1,888,875 |
| 1,610,000 | 3.88%, 06/12/2030 | 1,510,840 |
| 3,095,000 | 4.75%, 01/14/2050 | 2,643,718 |
| 3,765,000 | 5.00%, 01/27/2045 | 3,369,298 |
| | | | 32,116,829 |
| | Bulgaria - 0.0% |
| EUR 485,000 | Bulgaria Government International Bond 1.38%, 09/23/2050(9) | 524,509 |
| | Canada - 1.3% |
| | Alberta T-Bill | |
| CAD 1,000,000 | 0.19%, 01/11/2022(16) | 807,555 |
| 3,000,000 | 0.22%, 01/04/2022(16) | 2,422,665 |
| 4,000,000 | 0.24%, 04/12/2022(16) | 3,225,760 |
| | City of Montreal Canada | |
| 650,000 | 0.25%, 05/11/2022 | 524,478 |
| 2,100,000 | 4.50%, 12/01/2021 | 1,702,340 |
| 1,600,000 | City of Vancouver 3.45%, 12/02/2021 | 1,296,542 |
| 1,960,000 | Hydro Quebec Interest Strip 0.00%, 01/16/2022(8) | 1,582,136 |
The accompanying notes are an integral part of these financial statements.
The Hartford Strategic Income Fund
Schedule of Investments – (continued)
October 31, 2021
| Shares or Principal Amount | | Market Value† |
| FOREIGN GOVERNMENT OBLIGATIONS - 21.0% - (continued) |
| | Canada - 1.3% - (continued) |
| CAD 2,000,000 | Montreal Que 0.00%, 11/18/2021(8) | $ 1,615,675 |
| 5,000,000 | Municipal Finance Authority of British Columbia 3.35%, 06/01/2022 | 4,107,163 |
| 3,340,000 | Nova Scotia T-Bill 0.19%, 01/06/2022 | 2,697,287 |
| | Ontario T-Bill | |
| 1,550,000 | 0.21%, 01/12/2022(16) | 1,251,931 |
| 5,030,000 | 0.21%, 01/26/2022(16) | 4,062,347 |
| 2,000,000 | 0.22%, 01/05/2022(16) | 1,615,464 |
| 2,000,000 | 0.22%, 02/09/2022(16) | 1,615,024 |
| 3,810,000 | 0.69%, 09/14/2022 | 3,063,054 |
| 5,350,000 | OPB Finance Trust 1.88%, 02/24/2022(9) | 4,341,199 |
| 2,500,000 | Province of British Columbia Canada 3.25%, 12/18/2021 | 2,027,422 |
| 1,000,000 | Province of Nova Scotia Canada Residual Strip 0.01%, 01/30/2022(8) | 807,098 |
| 3,500,000 | PSP Capital, Inc. 1.73%, 06/21/2022(9) | 2,849,949 |
| 1,500,000 | Quebec T-Bill 0.21%, 02/25/2022 | 1,210,920 |
| | | | 42,826,009 |
| | Chile - 0.3% |
| | Bonos de la Tesoreria de la Republica en pesos | |
| CLP 1,435,000,000 | 2.80%, 10/01/2033 | 1,272,372 |
| 6,055,000,000 | 4.70%, 09/01/2030(1)(9) | 6,803,457 |
| $ 1,585,000 | Chile Government International Bond 2.55%, 07/27/2033 | 1,532,996 |
| | | | 9,608,825 |
| | China - 0.3% |
| CNY 52,150,000 | Agricultural Development Bank of China 2.96%, 04/17/2030 | 7,909,447 |
| $ 1,000,000 | China Development Bank 0.82%, 03/06/2022, 3 mo. USD LIBOR + 0.700%(2)(9) | 1,001,280 |
| | | | 8,910,727 |
| | Colombia - 1.3% |
| | Colombia Government International Bond | |
| 2,935,000 | 3.00%, 01/30/2030 | 2,768,644 |
| 4,565,000 | 3.13%, 04/15/2031 | 4,272,886 |
| 1,830,000 | 3.25%, 04/22/2032 | 1,708,945 |
| 2,240,000 | 4.13%, 05/15/2051 | 1,954,915 |
| 20,120,000 | 5.00%, 06/15/2045 | 19,810,152 |
| 820,000 | 5.20%, 05/15/2049 | 825,010 |
| 3,445,000 | 5.63%, 02/26/2044 | 3,631,168 |
| 835,000 | 6.13%, 01/18/2041 | 924,888 |
| COP 30,707,200,000 | Colombian TES 7.00%, 06/30/2032 | 7,516,944 |
| | | | 43,413,552 |
| | Croatia - 0.2% |
| | Croatia Government International Bond | |
| EUR 1,875,000 | 1.13%, 03/04/2033(9) | 2,139,899 |
| 2,930,000 | 1.50%, 06/17/2031(9) | 3,516,561 |
| 1,820,000 | 1.75%, 03/04/2041(9) | 2,135,899 |
| | | | 7,792,359 |
| | Dominican Republic - 0.4% |
| | Dominican Republic International Bond | |
| $ 695,000 | 4.50%, 01/30/2030(9) | 701,081 |
| 197,000 | 4.88%, 09/23/2032(1) | 199,216 |
| 310,000 | 4.88%, 09/23/2032(9) | 313,487 |
| 410,000 | 5.30%, 01/21/2041(1) | 405,904 |
| Shares or Principal Amount | | Market Value† |
| FOREIGN GOVERNMENT OBLIGATIONS - 21.0% - (continued) |
| | Dominican Republic - 0.4% - (continued) |
| $ 365,000 | 5.30%, 01/21/2041(9) | $ 361,354 |
| 210,000 | 5.95%, 01/25/2027(9) | 234,045 |
| 825,000 | 6.40%, 06/05/2049(9) | 877,396 |
| 10,125,000 | 6.40%, 06/05/2049(1) | 10,768,039 |
| 115,000 | 6.85%, 01/27/2045(9) | 127,938 |
| | | | 13,988,460 |
| | Ecuador - 0.0% |
| 274,483 | Ecuador Government International Bond 1.00%, 07/31/2035(4)(9) | 180,818 |
| | Egypt - 0.5% |
| | Egypt Government International Bond | |
| 325,000 | 3.88%, 02/16/2026(1) | 302,718 |
| EUR 570,000 | 4.75%, 04/16/2026(9) | 645,702 |
| $ 480,000 | 5.58%, 02/21/2023(1) | 491,856 |
| 3,800,000 | 5.88%, 02/16/2031(1) | 3,430,488 |
| 300,000 | 6.59%, 02/21/2028(1) | 294,246 |
| 200,000 | 6.59%, 02/21/2028(9) | 196,164 |
| 725,000 | 7.50%, 02/16/2061(1) | 614,438 |
| 200,000 | 7.60%, 03/01/2029(9) | 201,000 |
| 5,200,000 | 7.63%, 05/29/2032(1) | 5,027,620 |
| 380,000 | 7.63%, 05/29/2032(9) | 367,403 |
| 650,000 | 7.90%, 02/21/2048(9) | 571,714 |
| 3,240,000 | 8.50%, 01/31/2047(9) | 2,993,630 |
| 895,000 | 8.88%, 05/29/2050(1) | 842,974 |
| | | | 15,979,953 |
| | Ethiopia - 0.0% |
| 205,000 | Ethiopia International Bond 6.63%, 12/11/2024(9) | 166,357 |
| | Gabon - 0.1% |
| | Gabon Government International Bond | |
| 245,000 | 6.63%, 02/06/2031(9) | 244,211 |
| 600,000 | 6.63%, 02/06/2031(1) | 598,068 |
| 1,650,000 | 6.95%, 06/16/2025(9) | 1,773,123 |
| | | | 2,615,402 |
| | Ghana - 0.1% |
| | Ghana Government International Bond | |
| 1,500,000 | 6.38%, 02/11/2027(1) | 1,341,450 |
| 841,000 | 7.88%, 02/11/2035(1) | 714,307 |
| 2,585,000 | 7.88%, 02/11/2035(9) | 2,195,580 |
| | | | 4,251,337 |
| | Honduras - 0.0% |
| | Honduras Government International Bond | |
| 300,000 | 5.63%, 06/24/2030(1) | 300,750 |
| 150,000 | 5.63%, 06/24/2030(9) | 150,375 |
| | | | 451,125 |
| | Hungary - 0.1% |
| | Hungary Government International Bond | |
| EUR 955,000 | 1.50%, 11/17/2050(9) | 1,015,595 |
| 809,000 | 1.63%, 04/28/2032(9) | 971,694 |
| 855,000 | 1.75%, 06/05/2035(9) | 1,024,859 |
| $ 470,000 | 2.13%, 09/22/2031(1) | 458,481 |
| 395,000 | 3.13%, 09/21/2051(1) | 384,249 |
| | | | 3,854,878 |
The accompanying notes are an integral part of these financial statements.
The Hartford Strategic Income Fund
Schedule of Investments – (continued)
October 31, 2021
| Shares or Principal Amount | | Market Value† |
| FOREIGN GOVERNMENT OBLIGATIONS - 21.0% - (continued) |
| | India - 0.2% |
| INR 600,350,000 | India Government Bond 5.77%, 08/03/2030 | $ 7,703,080 |
| | Indonesia - 0.6% |
| | Indonesia Government International Bond | |
| EUR 115,000 | 1.10%, 03/12/2033 | 127,430 |
| $ 1,625,000 | 1.85%, 03/12/2031 | 1,551,567 |
| 2,150,000 | 4.63%, 04/15/2043(9) | 2,448,799 |
| 1,770,000 | 4.75%, 02/11/2029 | 2,052,698 |
| 1,585,000 | 4.75%, 07/18/2047(9) | 1,875,837 |
| 2,500,000 | 5.13%, 01/15/2045(9) | 3,036,813 |
| | Indonesia Treasury Bond | |
| IDR 50,229,000,000 | 7.00%, 09/15/2030 | 3,731,500 |
| 51,037,000,000 | 7.50%, 06/15/2035 | 3,811,339 |
| | | | 18,635,983 |
| | Italy - 0.0% |
| EUR 1,000,000 | Italy Buoni Poliennali Del Tesoro 1.20%, 04/01/2022(9) | 1,164,057 |
| | Ivory Coast - 0.2% |
| | Ivory Coast Government International Bond | |
| 965,000 | 4.88%, 01/30/2032(1) | 1,088,899 |
| 1,000,000 | 4.88%, 01/30/2032(9) | 1,128,392 |
| 995,000 | 5.88%, 10/17/2031(1) | 1,192,893 |
| 3,235,000 | 5.88%, 10/17/2031(9) | 3,878,401 |
| $ 245,000 | 6.13%, 06/15/2033(9) | 257,191 |
| EUR 150,000 | 6.88%, 10/17/2040(9) | 181,806 |
| | | | 7,727,582 |
| | Japan - 4.4% |
| | Japan Treasury Discount Bill | |
| JPY 880,250,000 | (0.14%), 01/06/2022(16) | 7,724,756 |
| 890,400,000 | (0.13%), 01/11/2022(16) | 7,813,940 |
| 1,143,700,000 | (0.12%), 11/22/2021(16) | 10,035,298 |
| 800,000,000 | (0.12%), 11/29/2021(16) | 7,019,702 |
| 1,157,800,000 | (0.12%), 12/06/2021(16) | 10,159,484 |
| 1,742,150,000 | (0.12%), 12/13/2021(16) | 15,287,379 |
| 578,250,000 | (0.12%), 01/17/2022(16) | 5,074,671 |
| 1,213,600,000 | (0.12%), 01/24/2022(16) | 10,650,654 |
| 294,450,000 | (0.12%), 01/25/2022(16) | 2,584,125 |
| 490,800,000 | (0.12%), 02/10/2022(16) | 4,307,526 |
| 1,378,800,000 | (0.11%), 11/08/2021(16) | 12,097,626 |
| 456,400,000 | (0.11%), 11/15/2021(16) | 4,004,551 |
| 1,462,500,000 | (0.11%), 12/20/2021(16) | 12,833,724 |
| 449,800,000 | (0.11%), 01/31/2022(16) | 3,947,564 |
| 1,748,950,000 | (0.11%), 02/07/2022(16) | 15,349,543 |
| 298,450,000 | (0.11%), 04/11/2022(16) | 2,619,861 |
| 152,850,000 | (0.10%), 04/25/2022(16) | 1,341,810 |
| 1,749,550,000 | 0.00%, 11/01/2021(8)(16) | 15,350,296 |
| | | | 148,202,510 |
| | Jordan - 0.1% |
| | Jordan Government International Bond | |
| $ 200,000 | 4.95%, 07/07/2025(1) | 208,492 |
| 230,000 | 5.85%, 07/07/2030(9) | 237,268 |
| 2,160,000 | 6.13%, 01/29/2026(9) | 2,330,100 |
| | | | 2,775,860 |
| | Macedonia - 0.1% |
| | North Macedonia Government International Bond | |
| EUR 635,000 | 1.63%, 03/10/2028(1) | 709,484 |
| Shares or Principal Amount | | Market Value† |
| FOREIGN GOVERNMENT OBLIGATIONS - 21.0% - (continued) |
| �� | Macedonia - 0.1% - (continued) |
| EUR 425,000 | 1.63%, 03/10/2028(9) | $ 474,851 |
| 375,000 | 3.68%, 06/03/2026(1) | 470,121 |
| 665,000 | 3.68%, 06/03/2026(9) | 833,681 |
| | | | 2,488,137 |
| | Mexico - 1.6% |
| | Mexican Bonos | |
| MXN 79,986,700 | 5.75%, 03/05/2026 | 3,668,207 |
| 295,189,400 | 7.75%, 05/29/2031 | 14,560,890 |
| 72,114,500 | 8.50%, 11/18/2038 | 3,692,418 |
| | Mexico Government International Bond | |
| EUR 1,114,000 | 1.13%, 01/17/2030 | 1,244,386 |
| 5,600,000 | 1.45%, 10/25/2033 | 5,993,258 |
| 1,770,000 | 2.13%, 10/25/2051 | 1,697,911 |
| $ 1,125,000 | 4.35%, 01/15/2047 | 1,159,470 |
| 8,230,000 | 4.50%, 01/31/2050 | 8,642,899 |
| 2,035,000 | 4.75%, 04/27/2032 | 2,282,354 |
| 2,686,000 | 4.75%, 03/08/2044 | 2,942,997 |
| 6,735,000 | 5.00%, 04/27/2051 | 7,557,141 |
| | | | 53,441,931 |
| | Morocco - 0.0% |
| | Morocco Government International Bond | |
| EUR 408,000 | 1.50%, 11/27/2031(9) | 432,086 |
| 140,000 | 2.00%, 09/30/2030(9) | 156,232 |
| $ 520,000 | 4.00%, 12/15/2050(9) | 467,444 |
| 350,000 | 4.25%, 12/11/2022(9) | 360,822 |
| | | | 1,416,584 |
| | Oman - 0.4% |
| | Oman Government International Bond | |
| 670,000 | 5.38%, 03/08/2027(9) | 703,559 |
| 1,530,000 | 5.63%, 01/17/2028(9) | 1,608,412 |
| 460,000 | 6.25%, 01/25/2031(1) | 497,375 |
| 430,000 | 6.25%, 01/25/2031(9) | 464,938 |
| 6,685,000 | 6.50%, 03/08/2047(9) | 6,594,993 |
| 2,305,000 | 6.75%, 01/17/2048(9) | 2,327,958 |
| | | | 12,197,235 |
| | Pakistan - 0.0% |
| 250,000 | Pakistan Government International Bond 6.88%, 12/05/2027(9) | 255,358 |
| | Panama - 0.2% |
| | Panama Government International Bond | |
| 1,325,000 | 2.25%, 09/29/2032 | 1,248,203 |
| 1,780,000 | 3.16%, 01/23/2030 | 1,838,402 |
| 275,000 | 3.87%, 07/23/2060 | 273,864 |
| 495,000 | 4.30%, 04/29/2053 | 530,160 |
| 585,000 | 4.50%, 04/16/2050 | 645,296 |
| 1,345,000 | 4.50%, 04/01/2056 | 1,476,769 |
| 465,000 | Panama Notas del Tesoro 3.75%, 04/17/2026 | 493,658 |
| | | | 6,506,352 |
| | Peru - 0.2% |
| | Peruvian Government International Bond | |
| 3,295,000 | 2.78%, 01/23/2031 | 3,283,962 |
| 905,000 | 3.00%, 01/15/2034 | 895,045 |
The accompanying notes are an integral part of these financial statements.
The Hartford Strategic Income Fund
Schedule of Investments – (continued)
October 31, 2021
| Shares or Principal Amount | | Market Value† |
| FOREIGN GOVERNMENT OBLIGATIONS - 21.0% - (continued) |
| | Peru - 0.2% - (continued) |
| $ 1,700,000 | 4.13%, 08/25/2027 | $ 1,867,552 |
| 300,000 | 7.35%, 07/21/2025 | 359,976 |
| | | | 6,406,535 |
| | Philippines - 0.1% |
| | Philippine Government International Bond | |
| 1,810,000 | 3.70%, 03/01/2041 | 1,945,861 |
| 650,000 | 3.95%, 01/20/2040 | 719,336 |
| | | | 2,665,197 |
| | Qatar - 0.0% |
| 410,000 | Qatar Government International Bond 3.40%, 04/16/2025(9) | 438,700 |
| | Romania - 0.7% |
| | Romanian Government International Bond | |
| EUR 340,000 | 1.38%, 12/02/2029(1) | 378,691 |
| 535,000 | 1.38%, 12/02/2029(9) | 595,881 |
| 345,000 | 1.75%, 07/13/2030(1) | 381,360 |
| 1,980,000 | 2.00%, 01/28/2032(9) | 2,182,534 |
| 120,000 | 2.00%, 01/28/2032(1) | 132,275 |
| 460,000 | 2.00%, 04/14/2033(1) | 497,195 |
| 6,170,000 | 2.63%, 12/02/2040(1) | 6,526,255 |
| 2,260,000 | 2.63%, 12/02/2040(9) | 2,390,492 |
| 1,615,000 | 2.75%, 04/14/2041(1) | 1,715,490 |
| 655,000 | 2.75%, 04/14/2041(9) | 695,756 |
| 5,455,000 | 2.88%, 04/13/2042(1) | 5,809,383 |
| 400,000 | 3.38%, 02/08/2038(9) | 470,287 |
| 263,000 | 3.88%, 10/29/2035(9) | 330,745 |
| | | | 22,106,344 |
| | Russia - 1.3% |
| | Russian Federal Bond - OFZ | |
| RUB 612,825,000 | 5.90%, 03/12/2031 | 7,432,818 |
| 282,580,000 | 7.15%, 11/12/2025 | 3,838,577 |
| 270,925,000 | 7.65%, 04/10/2030 | 3,731,063 |
| | Russian Foreign Bond - Eurobond | |
| $ 2,800,000 | 4.25%, 06/23/2027(9) | 3,101,778 |
| 600,000 | 4.38%, 03/21/2029(1) | 676,152 |
| 2,000,000 | 4.38%, 03/21/2029(9) | 2,253,840 |
| 1,800,000 | 4.75%, 05/27/2026(9) | 2,018,250 |
| 12,200,000 | 5.10%, 03/28/2035(9) | 14,594,641 |
| 2,800,000 | 5.25%, 06/23/2047(9) | 3,564,120 |
| 2,400,000 | 5.63%, 04/04/2042(9) | 3,114,000 |
| | | | 44,325,239 |
| | Senegal - 0.3% |
| | Senegal Government International Bond | |
| EUR 5,310,000 | 4.75%, 03/13/2028(9) | 6,247,254 |
| 1,250,000 | 5.38%, 06/08/2037(1) | 1,387,200 |
| $ 685,000 | 6.25%, 05/23/2033(9) | 706,090 |
| 405,000 | 6.75%, 03/13/2048(9) | 400,975 |
| | | | 8,741,519 |
| | Serbia - 0.2% |
| | Serbia International Bond | |
| EUR 415,000 | 1.00%, 09/23/2028 | 462,949 |
| 120,000 | 1.50%, 06/26/2029(1) | 135,772 |
| 2,375,000 | 1.50%, 06/26/2029(9) | 2,687,158 |
| 250,000 | 1.65%, 03/03/2033(1) | 271,299 |
| Shares or Principal Amount | | Market Value† |
| FOREIGN GOVERNMENT OBLIGATIONS - 21.0% - (continued) |
| | Serbia - 0.2% - (continued) |
| $ 825,000 | 2.13%, 12/01/2030(9) | $ 768,982 |
| EUR 565,000 | 3.13%, 05/15/2027(9) | 708,474 |
| | | | 5,034,634 |
| | South Africa - 0.3% |
| ZAR 120,850,000 | Republic of South Africa Government Bond 8.00%, 01/31/2030 | 7,179,004 |
| | Republic of South Africa Government International Bond | |
| $ 600,000 | 5.00%, 10/12/2046 | 532,500 |
| 1,275,000 | 5.75%, 09/30/2049 | 1,216,325 |
| 610,000 | 6.25%, 03/08/2041 | 636,901 |
| | | | 9,564,730 |
| | South Korea - 0.5% |
| | Export-Import Bank of Korea | |
| 4,500,000 | 0.93%, 07/05/2022, 3 mo. USD LIBOR + 0.800%(2)(9) | 4,519,225 |
| 3,300,000 | 1.34%, 04/27/2023, 3 mo. USD LIBOR + 1.200%(2)(9) | 3,346,560 |
| 800,000 | Industrial Bank of Korea 0.57%, 10/23/2022, 3 mo. USD LIBOR + 0.450%(2)(9) | 801,504 |
| | Korea Development Bank | |
| 6,200,000 | 0.83%, 02/27/2022, 3 mo. USD LIBOR + 0.705%(2) | 6,211,488 |
| 2,000,000 | 0.93%, 10/30/2022, 3 mo. USD LIBOR + 0.800%(2)(9) | 2,012,484 |
| 1,300,000 | 1.57%, 04/16/2023, 3 mo. USD LIBOR + 1.450%(2)(9) | 1,323,733 |
| | | | 18,214,994 |
| | Supranational - 0.2% |
| TRY 33,450,000 | Asian Infrastructure Investment Bank 19.50%, 08/16/2023 | 3,375,792 |
| 7,550,000 | European Bank for Reconstruction & Development 12.50%, 02/09/2023 | 721,995 |
| 33,000,000 | European Investment Bank 12.00%, 05/12/2022 | 3,278,821 |
| MXN 19,800,000 | International Finance Corp. 0.00%, 02/22/2038(8) | 264,667 |
| | | | 7,641,275 |
| | Thailand - 0.2% |
| THB 270,465,000 | Thailand Government Bond 1.60%, 06/17/2035 | 7,385,241 |
| | Turkey - 0.7% |
| | Turkey Government International Bond | |
| $ 1,140,000 | 4.88%, 10/09/2026 | 1,080,223 |
| 5,700,000 | 4.88%, 04/16/2043 | 4,424,796 |
| 5,246,000 | 5.13%, 02/17/2028 | 4,920,696 |
| 1,010,000 | 5.25%, 03/13/2030 | 917,326 |
| 11,310,000 | 5.75%, 05/11/2047 | 9,302,475 |
| 510,000 | 6.00%, 03/25/2027 | 503,115 |
| 1,575,000 | 6.00%, 01/14/2041 | 1,358,122 |
| | | | 22,506,753 |
| | Ukraine - 0.5% |
| | Ukraine Government International Bond | |
| 2,230,000 | 6.88%, 05/21/2029(1) | 2,271,433 |
| 1,810,000 | 7.25%, 03/15/2033(1) | 1,842,287 |
| 3,785,000 | 7.25%, 03/15/2033(9) | 3,852,517 |
The accompanying notes are an integral part of these financial statements.
The Hartford Strategic Income Fund
Schedule of Investments – (continued)
October 31, 2021
| Shares or Principal Amount | | Market Value† |
| FOREIGN GOVERNMENT OBLIGATIONS - 21.0% - (continued) |
| | Ukraine - 0.5% - (continued) |
| $ 1,715,000 | 7.38%, 09/25/2032(9) | $ 1,763,843 |
| 620,000 | 7.75%, 09/01/2022(9) | 642,351 |
| 755,000 | 7.75%, 09/01/2023(9) | 804,092 |
| 865,000 | 7.75%, 09/01/2024(9) | 932,048 |
| 3,135,000 | 7.75%, 09/01/2026(9) | 3,378,916 |
| 2,125,000 | 7.75%, 09/01/2027(9) | 2,289,449 |
| | | | 17,776,936 |
| | United Arab Emirates - 0.4% |
| 1,385,000 | Abu Dhabi Government International Bond 3.00%, 09/15/2051(1) | 1,367,826 |
| 12,600,000 | Emirate of Dubai Government International Bonds 3.90%, 09/09/2050(9) | 11,889,486 |
| 290,000 | Finance Department Government of Sharjah 3.63%, 03/10/2033(9) | 284,937 |
| | | | 13,542,249 |
| | Venezuela - 0.0% |
| | Venezuela Government International Bond | |
| 1,224,000 | 7.75%, 10/13/2019(9)(14) | 117,871 |
| 380,000 | 9.00%, 05/07/2023(9)(14) | 36,594 |
| 800,000 | 9.25%, 05/07/2028(9)(14) | 77,040 |
| 1,355,300 | 12.75%, 08/23/2022(9)(14) | 130,516 |
| | | | 362,021 |
| | Total Foreign Government Obligations
(cost $736,173,798) | | $ 702,361,743 |
| MUNICIPAL BONDS - 0.7% |
| | Education - 0.1% |
| | Chicago, IL, Board of Education, GO | |
| 630,000 | 5.18%, 12/01/2021 | $ 631,944 |
| 380,000 | 6.04%, 12/01/2029 | 429,372 |
| 2,870,000 | 6.14%, 12/01/2039 | 3,455,194 |
| | | | 4,516,510 |
| | General - 0.1% |
| | Chicago, IL, Transit Auth | |
| 1,150,000 | 3.91%, 12/01/2040 | 1,296,825 |
| 665,000 | 6.90%, 12/01/2040 | 941,142 |
| | | | 2,237,967 |
| | General Obligation - 0.0% |
| | State of Illinois, GO | |
| 375,709 | 4.95%, 06/01/2023 | 394,614 |
| 70,000 | 5.00%, 01/01/2023 | 72,755 |
| | | | 467,369 |
| | Nursing Homes - 0.1% |
| 2,000,000 | Seminole County, FL, Industrial Dev Auth 6.00%, 11/15/2025 | 2,003,409 |
| | School District - 0.3% |
| 9,610,000 | Chicago, IL, Board of Education, GO 6.32%, 11/01/2029 | 11,259,309 |
| Shares or Principal Amount | | Market Value† |
| MUNICIPAL BONDS - 0.7% - (continued) |
| | Transportation - 0.1% |
| | Metropolitan Transportation Auth, NY, Rev | |
| $ 1,150,000 | 5.00%, 11/15/2050 | $ 1,366,584 |
| 850,000 | 5.18%, 11/15/2049 | 1,158,942 |
| 1,235,000 | 6.81%, 11/15/2040 | 1,781,285 |
| | | | 4,306,811 |
| | Total Municipal Bonds
(cost $23,893,432) | | $ 24,791,375 |
| SENIOR FLOATING RATE INTERESTS - 19.9%(17) |
| | Advertising - 0.0% |
| 1,386,700 | Clear Channel Outdoor Holdings, Inc. 3.63%, 08/21/2026, 1 mo. USD LIBOR + 3.500% | $ 1,363,542 |
| | Aerospace/Defense - 0.2% |
| 825,264 | Dynasty Acquisition Co., Inc. 3.63%, 04/06/2026, 1 mo. USD LIBOR + 3.500% | 805,317 |
| | Spirit Aerosystems, Inc. | |
| 679,437 | 0.00%, 01/15/2025, 1 mo. USD LIBOR + 3.750%(18) | 681,136 |
| 530,987 | 6.00%, 01/15/2025, 1 mo. USD LIBOR + 5.250% | 532,315 |
| | TransDigm, Inc. | |
| 2,002,677 | 2.34%, 05/30/2025, 1 mo. USD LIBOR + 2.250% | 1,977,844 |
| 1,333,694 | 2.34%, 12/09/2025, 1 mo. USD LIBOR + 2.250% | 1,316,636 |
| | | | 5,313,248 |
| | Airlines - 0.3% |
| 2,355,000 | AAdvantage Loyalty IP Ltd. 5.50%, 04/20/2028, 1 mo. USD LIBOR + 4.750% | 2,451,414 |
| 1,655,000 | Air Canada 4.25%, 08/11/2028, 1 mo. USD LIBOR + 3.500% | 1,671,203 |
| 1,901,237 | Kestrel Bidco, Inc. 4.00%, 12/11/2026, 3 mo. USD LIBOR + 3.000% | 1,869,163 |
| 685,000 | Mileage Plus Holdings LLC 6.25%, 06/21/2027, 1 mo. USD LIBOR + 5.250% | 729,100 |
| 1,880,000 | SkyMiles IP Ltd. 4.75%, 10/20/2027, 3 mo. USD LIBOR + 3.750% | 2,001,147 |
| 2,666,600 | United Airlines, Inc. 4.50%, 04/21/2028, 1 mo. USD LIBOR + 3.750% | 2,702,306 |
| | | | 11,424,333 |
| | Apparel - 0.1% |
| 2,423,925 | Birkenstock GmbH & Co. KG 4.25%, 04/27/2028, 1 mo. USD LIBOR + 3.750% | 2,422,422 |
| | Auto Parts & Equipment - 0.3% |
| 1,576,050 | Adient U.S. LLC 3.59%, 04/08/2028, 1 mo. USD LIBOR + 3.500% | 1,575,766 |
The accompanying notes are an integral part of these financial statements.
The Hartford Strategic Income Fund
Schedule of Investments – (continued)
October 31, 2021
| Shares or Principal Amount | | Market Value† |
| SENIOR FLOATING RATE INTERESTS - 19.9%(17) - (continued) |
| | Auto Parts & Equipment - 0.3% - (continued) |
| | Clarios Global L.P. | |
| EUR 2,841,252 | 3.25%, 04/30/2026, 3 mo. EURIBOR + 3.250% | $ 3,251,642 |
| $ 1,945,083 | 3.34%, 04/30/2026, 1 mo. USD LIBOR + 3.250% | 1,932,110 |
| | First Brands Group LLC | |
| 809,461 | 6.00%, 03/30/2027, 1 mo. USD LIBOR + 5.000% | 815,532 |
| 1,765,000 | 9.50%, 03/30/2028, 1 mo. USD LIBOR + 8.500% | 1,778,237 |
| | | | 9,353,287 |
| | Beverages - 0.0% |
| 406,700 | Sunshine Investments B.V. 2.87%, 03/28/2025, 3 mo. USD LIBOR + 2.750% | 404,032 |
| | Chemicals - 0.5% |
| 1,726,389 | ASP Unifrax Holdings, Inc. 3.88%, 12/12/2025, 3 mo. USD LIBOR + 3.750% | 1,697,904 |
| 989,304 | Axalta Coating Systems U.S. Holdings, Inc. 1.88%, 06/01/2024, 3 mo. USD LIBOR + 1.750% | 986,830 |
| 7,250,000 | Diamond (BC) B.V. 3.50%, 09/29/2028, 1 mo. USD LIBOR + 3.000% | 7,230,063 |
| 1,600,502 | Element Solutions, Inc. 2.09%, 01/31/2026, 1 mo. USD LIBOR + 2.000% | 1,596,501 |
| | Messer Industries GmbH | |
| EUR 72,222 | 2.50%, 03/01/2026, 3 mo. EURIBOR + 2.500% | 82,769 |
| $ 549,031 | 2.63%, 03/01/2026, 3 mo. USD LIBOR + 2.500% | 545,083 |
| 1,592,000 | NIC Acquisition Corp. 4.50%, 12/29/2027, 1 mo. USD LIBOR + 3.750% | 1,588,514 |
| 1,694,289 | Starfruit Finco B.V 2.84%, 10/01/2025, 1 mo. USD LIBOR + 2.750% | 1,680,531 |
| 2,311,447 | Tronox Finance LLC 2.37%, 03/13/2028, 1 mo. USD LIBOR + 2.250% | 2,292,678 |
| | | | 17,700,873 |
| | Commercial Services - 1.8% |
| | AlixPartners LLP | |
| EUR 696,500 | 3.25%, 02/04/2028, 3 mo. EURIBOR + 3.250% | 802,143 |
| $ 4,218,800 | 3.25%, 02/04/2028, 1 mo. USD LIBOR + 2.750% | 4,202,979 |
| 2,500,000 | Allied Universal Holdco LLC 4.25%, 05/12/2028, 1 mo. USD LIBOR + 3.750% | 2,498,450 |
| | Amentum Government Services Holdings LLC | |
| 518,438 | 3.59%, 01/29/2027, 1 mo. USD LIBOR + 3.500% | 515,415 |
| 3,980,000 | 5.50%, 01/29/2027, 1 mo. USD LIBOR + 4.750% | 3,978,766 |
| 3,515,000 | APX Group, Inc. 4.00%, 07/10/2028, 1 mo. USD LIBOR + 3.500% | 3,501,256 |
| Shares or Principal Amount | | Market Value† |
| SENIOR FLOATING RATE INTERESTS - 19.9%(17) - (continued) |
| | Commercial Services - 1.8% - (continued) |
| | AVSC Holding Corp. | |
| $ 979,528 | 4.25%, 03/03/2025, 3 mo. USD LIBOR + 3.250% | $ 883,651 |
| 1,638,778 | 5.50%, 10/15/2026, 1 mo. USD LIBOR + 4.500% | 1,530,619 |
| | Belron Finance U.S. LLC | |
| 243,734 | 2.38%, 11/13/2025, 3 mo. USD LIBOR + 2.250% | 242,516 |
| 831,444 | 2.44%, 10/30/2026, 1 mo. USD LIBOR + 2.250% | 826,771 |
| 1,417,875 | 3.25%, 04/13/2028, 1 mo. USD LIBOR + 2.750% | 1,416,996 |
| EUR 2,220,000 | Boels Topholding B.V. 3.25%, 02/06/2027, 3 mo. EURIBOR + 3.250% | 2,554,027 |
| 1,235,000 | Boluda Corporacion Maritima S.L 3.50%, 07/30/2026, 3 mo. EURIBOR + 3.500% | 1,423,277 |
| $ 1,310,733 | BrightView Landscapes LLC 2.63%, 08/15/2025, 3 mo. USD LIBOR + 2.500% | 1,303,629 |
| 1,710,072 | Ensemble RCM LLC 3.88%, 08/03/2026, 3 mo. USD LIBOR + 3.750% | 1,711,594 |
| 2,503,306 | EVO Payments International LLC 3.34%, 12/22/2023, 3 mo. USD LIBOR + 3.250% | 2,499,652 |
| 533,780 | Fly Funding S.a.r.l. 1.88%, 08/11/2025, 1 mo. USD LIBOR + 1.160% | 523,270 |
| 1,821,161 | Hertz Corp. 0.00%, 06/30/2028, 1 mo. USD LIBOR + 3.500%(18) | 1,822,836 |
| 5,000,000 | MPH Acquisition Holdings LLC 4.75%, 08/17/2028, 1 mo. USD LIBOR + 4.250% | 4,870,850 |
| 3,015,000 | Parexel International Corp. 0.00%, 08/11/2028, 1 mo. USD LIBOR + 3.500%(18) | 3,017,080 |
| 3,226,913 | Signal Parent, Inc. 4.25%, 04/03/2028, 1 mo. USD LIBOR + 3.500% | 3,162,374 |
| EUR 231,666 | Techem Verwaltungsgesellschaft 675 mbH 2.38%, 07/15/2025, 3 mo. EURIBOR + 2.375% | 263,007 |
| $ 756,585 | Trans Union LLC 1.84%, 11/16/2026, 1 mo. USD LIBOR + 1.750% | 751,388 |
| | Verisure Holding AB | |
| EUR 1,650,000 | 3.25%, 07/20/2026, 3 mo. EURIBOR + 3.250% | 1,892,503 |
| 5,045,000 | 3.25%, 03/27/2028, 3 mo. EURIBOR + 3.250% | 5,782,214 |
| $ 601,292 | Verscend Holding Corp. 4.09%, 08/27/2025, 1 mo. USD LIBOR + 4.000% | 602,044 |
| 2,766,100 | WEX, Inc. 2.34%, 03/31/2028, 1 mo. USD LIBOR + 2.250% | 2,750,195 |
| 3,321,675 | WW International, Inc. 4.00%, 04/13/2028, 1 mo. USD LIBOR + 3.500% | 3,280,154 |
| | | | 58,609,656 |
| | Construction Materials - 0.9% |
| 4,174,537 | ACProducts, Inc. 4.75%, 05/17/2028, 1 mo. USD LIBOR + 4.250% | 4,161,513 |
The accompanying notes are an integral part of these financial statements.
The Hartford Strategic Income Fund
Schedule of Investments – (continued)
October 31, 2021
| Shares or Principal Amount | | Market Value† |
| SENIOR FLOATING RATE INTERESTS - 19.9%(17) - (continued) |
| | Construction Materials - 0.9% - (continued) |
| $ 4,590,000 | Chamberlain Group, Inc. 0.00%, 10/22/2028, 1 mo. USD LIBOR + 4.000%(18) | $ 4,580,453 |
| 5,599,422 | Cornerstone Building Brands, Inc. 3.75%, 04/12/2028, 1 mo. USD LIBOR + 3.250% | 5,588,223 |
| 2,912,625 | CP Atlas Buyer, Inc. 4.25%, 11/23/2027, 1 mo. USD LIBOR + 3.750% | 2,893,518 |
| 1,934,312 | Ingersoll-Rand Services Co. 1.84%, 03/01/2027, 1 mo. USD LIBOR + 1.750% | 1,905,898 |
| | Quikrete Holdings, Inc. | |
| 1,750,000 | 0.00%, 01/31/2027, 1 mo. USD LIBOR + 3.000%(18) | 1,743,000 |
| 2,464,555 | 2.59%, 02/01/2027, 1 mo. USD LIBOR + 2.500% | 2,438,874 |
| 3,230,000 | Standard Industries, Inc. 3.00%, 09/22/2028, 1 mo. USD LIBOR + 2.500% | 3,225,381 |
| 640,026 | Summit Materials LLC 2.09%, 11/21/2024, 3 mo. USD LIBOR + 2.000% | 638,624 |
| 439,077 | Tamko Building Products LLC 3.09%, 06/01/2026, 1 mo. USD LIBOR + 3.000% | 437,066 |
| 1,004,950 | Watlow Electric Manufacturing Co. 4.50%, 03/02/2028, 1 mo. USD LIBOR + 4.000% | 1,005,784 |
| 2,170,480 | Wilsonart LLC 4.50%, 12/19/2026, 1 mo. USD LIBOR + 3.500% | 2,171,847 |
| | | | 30,790,181 |
| | Distribution/Wholesale - 0.2% |
| 1,501,169 | American Builders & Contractors Supply Co., Inc. 2.09%, 01/15/2027, 1 mo. USD LIBOR + 2.000% | 1,485,722 |
| 3,915,858 | Core & Main L.P. 2.59%, 07/27/2028, 1 mo. USD LIBOR + 2.500% | 3,883,239 |
| 441,000 | KAR Auction Services, Inc. 2.38%, 09/19/2026, 1 mo. USD LIBOR + 2.250% | 427,770 |
| 1,099,475 | PAI Holdco, Inc. 4.25%, 10/28/2027, 1 mo. USD LIBOR + 3.500% | 1,099,475 |
| | | | 6,896,206 |
| | Diversified Financial Services - 0.6% |
| 1,573,216 | Aretec Group, Inc. 4.34%, 10/01/2025, 3 mo. USD LIBOR + 4.250% | 1,569,283 |
| | Blackhawk Network Holdings, Inc. | |
| 3,335,293 | 3.09%, 06/15/2025, 3 mo. USD LIBOR + 3.000% | 3,306,109 |
| 900,000 | 7.13%, 06/15/2026, 3 mo. USD LIBOR + 7.000% | 891,000 |
| | Deerfield Dakota Holding LLC | |
| EUR 2,197,188 | 4.00%, 04/09/2027, 3 mo. EURIBOR + 4.000% | 2,541,219 |
| $ 4,156,694 | 4.75%, 04/09/2027, 1 mo. USD LIBOR + 3.750% | 4,164,509 |
| 2,094,750 | Fleetcor Technologies Operating Co. LLC 1.84%, 04/28/2028, 1 mo. USD LIBOR + 1.750% | 2,088,026 |
| Shares or Principal Amount | | Market Value† |
| SENIOR FLOATING RATE INTERESTS - 19.9%(17) - (continued) |
| | Diversified Financial Services - 0.6% - (continued) |
| | GreenSky Holdings LLC | |
| $ 823,915 | 3.38%, 03/31/2025, 3 mo. USD LIBOR + 3.250% | $ 817,735 |
| 1,036,875 | 5.50%, 03/29/2025, 1 mo. USD LIBOR + 4.500% | 1,031,691 |
| | HighTower Holdings LLC | |
| 449,000 | 4.00%, 04/21/2028, 1 mo. USD LIBOR + 4.00% | 449,000 |
| 2,096,000 | 4.75%, 04/21/2028, 1 mo. USD LIBOR + 4.00% | 2,096,000 |
| 170,625 | Minotaur Acquisition, Inc. 4.84%, 03/27/2026, 3 mo. USD LIBOR + 4.750% | 169,693 |
| 1,190,431 | NFP Corp. 3.34%, 02/15/2027, 1 mo. USD LIBOR + 3.250% | 1,175,301 |
| 1,464,717 | Russell Investments U.S. Inst'l Holdco, Inc. 4.50%, 05/30/2025, 1 mo. USD LIBOR + 3.500% | 1,469,755 |
| | | | 21,769,321 |
| | Electric - 0.0% |
| 1,432,032 | ExGen Renewables LLC 3.50%, 12/15/2027, 1 mo. USD LIBOR + 2.500% | 1,433,049 |
| | Electrical Components & Equipment - 0.1% |
| 970,000 | Anticimex International AB 0.00%, 07/21/2028, 1 mo. USD LIBOR + 3.500%(18) | 968,787 |
| 1,156,263 | Energizer Holdings, Inc. 2.75%, 12/22/2027, 1 mo. USD LIBOR + 2.250% | 1,152,285 |
| | | | 2,121,072 |
| | Electronics - 0.1% |
| 2,194,500 | Ingram Micro, Inc. 4.00%, 06/30/2028, 1 mo. USD LIBOR + 3.500% | 2,198,889 |
| | Engineering & Construction - 0.4% |
| 2,299,237 | Artera Services LLC 4.50%, 03/06/2025, 1 mo. USD LIBOR + 3.500% | 2,288,707 |
| 2,293,644 | Brand Energy & Infrastructure Services, Inc. 5.25%, 06/21/2024, 3 mo. USD LIBOR + 4.250% | 2,272,244 |
| 4,918,764 | Brown Group Holding LLC 3.25%, 06/07/2028, 1 mo. USD LIBOR + 2.750% | 4,903,417 |
| EUR 246,411 | Fluidra S.A. 2.00%, 07/02/2025, 3 mo. EURIBOR + 2.000% | 283,606 |
| $ 214,586 | Hamilton Holdco LLC 2.14%, 01/02/2027, 1 mo. USD LIBOR + 2.000% | 212,618 |
| 1,265,000 | KKR Apple Bidco LLC 3.50%, 09/22/2028, 1 mo. USD LIBOR + 3.000% | 1,261,838 |
| 903,806 | PowerTeam Services LLC 4.25%, 03/06/2025, 3 mo. USD LIBOR + 3.250% | 896,748 |
| | | | 12,119,178 |
| | Entertainment - 0.9% |
| 1,500,000 | AP Core Holdings, II LLC 6.25%, 09/01/2027, 1 mo. USD LIBOR + 5.500% | 1,502,505 |
The accompanying notes are an integral part of these financial statements.
The Hartford Strategic Income Fund
Schedule of Investments – (continued)
October 31, 2021
| Shares or Principal Amount | | Market Value† |
| SENIOR FLOATING RATE INTERESTS - 19.9%(17) - (continued) |
| | Entertainment - 0.9% - (continued) |
| EUR 875,000 | Banijay Entertainment S.A.S 3.75%, 03/01/2025, 3 mo. EURIBOR + 3.750% | $ 1,011,287 |
| | Crown Finance U.S., Inc. | |
| $ 2,186,828 | 3.50%, 02/28/2025, 1 mo. USD LIBOR + 2.500% | 1,799,759 |
| 387,656 | 7.13%, 05/23/2024, 1 mo. USD LIBOR + 7.000% | 467,514 |
| 197,104 | 9.25%, 05/23/2024, 1 mo. USD LIBOR + 8.250% | 211,394 |
| 3,455,844 | Delta (LUX) S.a.r.l. 3.50%, 02/01/2024, 3 mo. USD LIBOR + 2.500% | 3,441,813 |
| 1,018,599 | Golden Entertainment, Inc. 3.75%, 10/21/2024, 3 mo. USD LIBOR + 3.000% | 1,016,481 |
| 2,810,000 | J&J Ventures Gaming LLC 4.75%, 04/07/2028, 1 mo. USD LIBOR + 4.000% | 2,817,025 |
| 1,675,000 | Maverick Gaming LLC 8.50%, 08/19/2028, 1 mo. USD LIBOR + 7.500% | 1,670,813 |
| | Motion Finco S.a.r.l. | |
| EUR 335,000 | 3.00%, 11/12/2026, 3 mo. EURIBOR + 3.000% | 373,532 |
| $ 491,315 | 3.38%, 11/12/2026, 1 mo. USD LIBOR + 3.250% | 477,725 |
| 686,808 | NASCAR Holdings, Inc. 2.59%, 10/19/2026, 3 mo. USD LIBOR + 2.500% | 684,232 |
| 2,206,267 | Penn National Gaming, Inc. 3.00%, 10/15/2025, 3 mo. USD LIBOR + 2.250% | 2,201,678 |
| 2,642,717 | Scientific Games International, Inc. 2.84%, 08/14/2024, 1 mo. USD LIBOR + 2.750% | 2,630,402 |
| 2,480,583 | SeaWorld Parks & Entertainment, Inc. 3.50%, 08/25/2028, 1 mo. USD LIBOR + 3.000% | 2,471,281 |
| 4,660,893 | UFC Holdings LLC 3.50%, 04/29/2026, 1 mo. USD LIBOR + 2.750% | 4,631,762 |
| 3,333,134 | William Morris Endeavor Entertainment LLC 2.84%, 05/18/2025, 3 mo. USD LIBOR + 2.750% | 3,263,238 |
| | | | 30,672,441 |
| | Environmental Control - 0.1% |
| 3,105,000 | Clean Harbors, Inc. 2.09%, 10/08/2028, 1 mo. USD LIBOR + 2.087% | 3,103,075 |
| 314,400 | U.S. Ecology Holdings, Inc. 2.59%, 11/01/2026, 3 mo. USD LIBOR + 2.500% | 313,221 |
| | | | 3,416,296 |
| | Food - 0.5% |
| | 8th Avenue Food & Provisions, Inc. | |
| 218,812 | 3.84%, 10/01/2025, 3 mo. USD LIBOR + 3.750% | 217,583 |
| 135,000 | 7.84%, 10/01/2026, 3 mo. USD LIBOR + 7.750% | 133,538 |
| Shares or Principal Amount | | Market Value† |
| SENIOR FLOATING RATE INTERESTS - 19.9%(17) - (continued) |
| | Food - 0.5% - (continued) |
| $ 2,239,258 | B&G Foods, Inc. 2.59%, 10/10/2026, 1 mo. USD LIBOR + 2.500% | $ 2,243,916 |
| EUR 1,290,000 | Bellis Acquisition Co. plc 2.75%, 02/12/2026, 3 mo. EURIBOR + 2.750% | 1,469,617 |
| $ 1,427,439 | CHG PPC Parent LLC 2.84%, 03/31/2025, 3 mo. USD LIBOR + 2.750% | 1,416,733 |
| | Froneri International Ltd. | |
| 2,446,476 | 2.34%, 01/29/2027, 1 mo. USD LIBOR + 2.250% | 2,410,097 |
| EUR 1,270,000 | 2.63%, 01/29/2027, 3 mo. EURIBOR + 2.625% | 1,431,417 |
| $ 2,282,555 | Hostess Brands LLC 3.00%, 08/03/2025, 1 mo. USD LIBOR + 2.250% | 2,277,099 |
| 800,777 | Post Holdings, Inc. 4.75%, 10/21/2024, 1 mo. USD LIBOR + 4.000% | 803,380 |
| 627,286 | Simply Good Foods USA, Inc. 4.75%, 07/07/2024, 1 mo. USD LIBOR + 3.750% | 630,033 |
| | U.S. Foods, Inc. | |
| 1,701,862 | 1.84%, 06/27/2023, 1 mo. USD LIBOR + 1.750% | 1,690,255 |
| 1,144,175 | 2.09%, 09/13/2026, 3 mo. USD LIBOR + 2.000% | 1,122,722 |
| 1,538,625 | UTZ Quality Foods LLC 3.09%, 01/20/2028, 1 mo. USD LIBOR + 3.000% | 1,534,132 |
| | | | 17,380,522 |
| | Food Service - 0.0% |
| | Aramark Services, Inc. | |
| 928,502 | 1.84%, 03/11/2025, 1 mo. USD LIBOR + 1.750% | 905,290 |
| 456,925 | 1.84%, 01/15/2027, 1 mo. USD LIBOR + 1.750% | 445,218 |
| | | | 1,350,508 |
| | Gas - 0.1% |
| 2,130,999 | UGI Energy Services LLC 3.84%, 08/13/2026, 1 mo. USD LIBOR + 3.750% | 2,137,669 |
| | Hand/Machine Tools - 0.0% |
| 1,624,855 | Alliance Laundry Systems LLC 4.25%, 10/08/2027, 1 mo. USD LIBOR + 3.500% | 1,627,748 |
| | Healthcare - Products - 0.6% |
| 1,791,603 | Agiliti Health, Inc. 3.50%, 01/04/2026, 1 mo. USD LIBOR + 2.750% | 1,787,124 |
| | Avantor Funding, Inc. | |
| 4,537,200 | 2.75%, 11/08/2027, 1 mo. USD LIBOR + 2.250% | 4,533,434 |
| EUR 1,426,425 | 2.75%, 06/12/2028, 1 mo. EURIBOR + 2.750% | 1,644,363 |
| $ 161,932 | Coty, Inc. 2.34%, 04/07/2025, 3 mo. USD LIBOR + 2.250% | 159,300 |
| 1,276,319 | CPI Holdco LLC 3.84%, 11/04/2026, 1 mo. USD LIBOR + 3.750% | 1,275,528 |
The accompanying notes are an integral part of these financial statements.
The Hartford Strategic Income Fund
Schedule of Investments – (continued)
October 31, 2021
| Shares or Principal Amount | | Market Value† |
| SENIOR FLOATING RATE INTERESTS - 19.9%(17) - (continued) |
| | Healthcare - Products - 0.6% - (continued) |
| $ 1,426,425 | Insulet Corp. 3.75%, 05/04/2028, 1 mo. USD LIBOR + 3.250% | $ 1,427,766 |
| 4,240,000 | Medline Industries, Inc. 0.00%, 10/23/2028, 1 mo. USD LIBOR + 3.250%(18) | 4,244,198 |
| 4,428,979 | Sunshine Luxembourg S.a.r.l. 4.50%, 10/01/2026, 1 mo. USD LIBOR + 3.750% | 4,436,198 |
| | | | 19,507,911 |
| | Healthcare - Services - 1.3% |
| | ADMI Corp. | |
| 2,840,725 | 3.63%, 12/23/2027, 1 mo. USD LIBOR + 3.125% | 2,818,539 |
| 1,715,000 | 4.00%, 12/23/2027, 1 mo. USD LIBOR + 3.500% | 1,713,165 |
| 2,315,000 | AHP Health Partners, Inc. 4.00%, 08/04/2028, 1 mo. USD LIBOR + 3.500% | 2,321,505 |
| EUR 6,105,000 | Biogroup-LCD 3.50%, 01/28/2028, 3 mo. EURIBOR + 3.500% | 7,014,259 |
| $ 2,154,554 | Cano Health LLC 5.25%, 11/19/2027, 1 mo. USD LIBOR + 4.500% | 2,154,554 |
| 1,053,425 | Catalent Pharma Solutions, Inc. 2.00%, 02/22/2028, 1 mo. USD LIBOR + 2.500% | 1,053,688 |
| EUR 1,815,000 | Cerba Healthcare S.A.S. 3.75%, 05/24/2028, 3 mo. EURIBOR + 3.750% | 2,092,307 |
| 1,180,000 | Elsan SAS 3.50%, 06/16/2028, 3 mo. EURIBOR + 3.500% | 1,360,533 |
| $ 578,638 | Envision Healthcare Corp. 3.84%, 10/10/2025, 3 mo. USD LIBOR + 3.750% | 477,619 |
| 537,280 | eResearchTechnology, Inc. 5.50%, 02/04/2027, 1 mo. USD LIBOR + 4.500% | 539,445 |
| | EyeCare Partners LLC | |
| 790,000 | 0.00%, 10/14/2029, 1 mo. USD LIBOR + 6.750%(18) | 792,631 |
| 2,335,000 | 0.00%, 10/14/2028, 1 mo. USD LIBOR + 3.750%(18) | 2,329,162 |
| 2,007,455 | 3.88%, 02/18/2027, 1 mo. USD LIBOR + 3.750% | 1,993,162 |
| 2,967,562 | Heartland Dental, LLC 4.09%, 04/30/2025, 1 mo. USD LIBOR + 4.000% | 2,959,520 |
| 1,153,894 | ICON Luxembourg S.a r.l. 3.00%, 07/03/2028, 1 mo. USD LIBOR + 2.500% | 1,153,767 |
| EUR 640,000 | LGC Group Holdings Ltd. 3.00%, 04/21/2027, 3 mo. EURIBOR + 3.000% | 723,475 |
| $ 1,584,895 | MED ParentCo L.P. 4.34%, 08/31/2026, 1 mo. USD LIBOR + 4.250% | 1,580,045 |
| | Medical Solutions L.L.C. | |
| 1,646,400 | 0.00%, 10/07/2028, 1 mo. USD LIBOR + 3.500%(18) | 1,647,223 |
| 313,600 | 0.00%, 11/01/2028(18) | 313,757 |
| 580,140 | Midwest Physician Administrative Services LLC 4.00%, 03/12/2028, 1 mo. USD LIBOR + 3.250% | 577,239 |
| Shares or Principal Amount | | Market Value† |
| SENIOR FLOATING RATE INTERESTS - 19.9%(17) - (continued) |
| | Healthcare - Services - 1.3% - (continued) |
| $ 1,094,500 | PPD, Inc. 2.50%, 01/13/2028, 1 mo. USD LIBOR + 2.000% | $ 1,091,939 |
| | Sound Inpatient Physicians Holdings LLC | |
| 246,713 | 2.84%, 06/27/2025, 3 mo. USD LIBOR + 2.750% | 245,876 |
| 1,197,000 | 3.50%, 06/27/2025, 1 mo. USD LIBOR + 3.000% | 1,194,762 |
| 5,501,387 | Surgery Center Holdings, Inc. 4.50%, 08/31/2026, 1 mo. USD LIBOR + 3.750% | 5,511,345 |
| | | | 43,659,517 |
| | Holding Companies-Diversified - 0.1% |
| EUR 3,580,000 | IVC Acquisition Ltd. 0.00%, 02/13/2026, 1 mo. USD LIBOR + 4.000%(18) | 4,132,272 |
| | Home Builders - 0.1% |
| | Tecta America Corp. | |
| $ 3,361,575 | 5.00%, 04/01/2028, 1 mo. USD LIBOR + 4.250% | 3,365,777 |
| 1,120,000 | 9.25%, 04/01/2029, 1 mo. USD LIBOR + 8.500% | 1,114,400 |
| | | | 4,480,177 |
| | Home Furnishings - 0.2% |
| 4,535,000 | Mattress Firm Inc 5.00%, 09/25/2028, 1 mo. USD LIBOR + 4.250% | 4,511,237 |
| 1,085,839 | Weber-Stephen Products LLC 4.00%, 10/30/2027, 1 mo. USD LIBOR + 3.250% | 1,087,652 |
| | | | 5,598,889 |
| | Insurance - 1.0% |
| 4,953,203 | Acrisure LLC 3.63%, 02/15/2027, 1 mo. USD LIBOR + 3.500% | 4,883,858 |
| | Alliant Holdings Intermediate LLC | |
| 1,010,000 | 0.00%, 11/19/2027, 1 mo. USD LIBOR + 3.500%(18) | 1,007,475 |
| 1,162,980 | 3.34%, 05/09/2025, 1 mo. USD LIBOR + 3.250% | 1,152,443 |
| 1,124,784 | 4.25%, 11/05/2027, 1 mo. USD LIBOR + 3.750% | 1,122,535 |
| | Asurion LLC | |
| 509,765 | 3.09%, 11/03/2024, 1 mo. USD LIBOR + 3.000% | 505,784 |
| 1,220,094 | 3.21%, 11/03/2023, 1 mo. USD LIBOR + 3.125% | 1,216,788 |
| 1,816,520 | 3.34%, 12/23/2026, 1 mo. USD LIBOR + 3.250% | 1,797,501 |
| 2,616,850 | 3.34%, 07/31/2027, 1 mo. USD LIBOR + 3.250% | 2,590,681 |
| 1,440,000 | 5.34%, 01/31/2028, 1 mo. USD LIBOR + 5.250% | 1,434,082 |
| 3,035,000 | 5.34%, 01/20/2029, 1 mo. USD LIBOR + 5.250% | 3,020,462 |
| | Hub International Ltd. | |
| 2,524,400 | 2.87%, 04/25/2025, 1 mo. USD LIBOR + 2.750% | 2,495,142 |
| 3,862,135 | 4.00%, 04/25/2025, 1 mo. USD LIBOR + 3.250% | 3,857,308 |
The accompanying notes are an integral part of these financial statements.
The Hartford Strategic Income Fund
Schedule of Investments – (continued)
October 31, 2021
| Shares or Principal Amount | | Market Value† |
| SENIOR FLOATING RATE INTERESTS - 19.9%(17) - (continued) |
| | Insurance - 1.0% - (continued) |
| $ 986,353 | Ryan Specialty Group LLC 3.75%, 09/01/2027, 1 mo. USD LIBOR + 3.000% | $ 986,599 |
| | Sedgwick Claims Management Services, Inc. | |
| 2,519,853 | 3.34%, 12/31/2025, 3 mo. USD LIBOR + 3.250% | 2,493,092 |
| 1,642,423 | 3.84%, 09/03/2026, 1 mo. USD LIBOR + 3.750% | 1,637,907 |
| 254,800 | 5.25%, 09/03/2026, 1 mo. USD LIBOR + 4.250% | 255,210 |
| 2,499,338 | USI, Inc. 3.13%, 05/16/2024, 3 mo. USD LIBOR + 3.000% | 2,479,243 |
| | | | 32,936,110 |
| | Internet - 0.5% |
| | Adevinta ASA | |
| EUR 1,335,000 | 3.25%, 06/26/2028, 3 mo. EURIBOR + 3.250% | 1,542,519 |
| $ 364,087 | 3.75%, 06/26/2028, 1 mo. USD LIBOR + 3.000% | 363,997 |
| 280,725 | Buzz Merger Sub Ltd. 2.84%, 01/29/2027, 1 mo. USD LIBOR + 2.750% | 278,970 |
| 3,860,325 | Endure Digital, Inc. 4.25%, 02/10/2028, 1 mo. USD LIBOR + 3.500% | 3,791,148 |
| | Go Daddy Operating Co. LLC | |
| 1,719,228 | 1.84%, 02/15/2024, 1 mo. USD LIBOR + 1.750% | 1,705,904 |
| 1,254,125 | 2.09%, 08/10/2027, 1 mo. USD LIBOR + 2.000% | 1,245,070 |
| | MH Sub LLC | |
| 1,800,989 | 4.75%, 09/13/2024, 1 mo. USD LIBOR + 3.750% | 1,803,996 |
| 545,000 | 6.34%, 02/12/2029, 1 mo. USD LIBOR + 6.250% | 551,981 |
| 2,670,000 | Proofpoint, Inc. 3.75%, 08/31/2028, 1 mo. USD LIBOR + 3.250% | 2,657,852 |
| 1,146,773 | Rodan & Fields LLC 4.09%, 06/16/2025, 3 mo. USD LIBOR + 4.000% | 804,381 |
| 1,635,000 | Shutterfly, Inc. 5.75%, 09/25/2026, 1 mo. USD LIBOR + 5.000% | 1,616,198 |
| | | | 16,362,016 |
| | IT Services - 0.3% |
| 866,334 | McAfee LLC 3.84%, 09/30/2024, 3 mo. USD LIBOR + 3.750% | 866,880 |
| 2,154,600 | Panther Commercial Holdings L.P. 5.00%, 01/07/2028, 1 mo. USD LIBOR + 5.000% | 2,159,987 |
| 2,593,025 | Peraton Corp. 4.50%, 02/01/2028, 1 mo. USD LIBOR + 3.750% | 2,595,851 |
| | Tempo Acquisition LLC | |
| 1,500,000 | 3.50%, 08/31/2028, 1 mo. USD LIBOR + 3.000% | 1,500,945 |
| 1,963,839 | 3.75%, 11/02/2026, 1 mo. USD LIBOR + 3.250% | 1,967,924 |
| | | | 9,091,587 |
| Shares or Principal Amount | | Market Value† |
| SENIOR FLOATING RATE INTERESTS - 19.9%(17) - (continued) |
| | Leisure Time - 0.3% |
| | Carnival Corp. | |
| $ 794,938 | 3.75%, 06/30/2025, 1 mo. USD LIBOR + 3.000% | $ 793,451 |
| 2,900,000 | 4.00%, 10/18/2028, 6 mo. USD LIBOR + 4.000% | 2,896,375 |
| 870,000 | Great Canadian Gaming Corp. 0.00%, 11/01/2026, 1 mo. USD LIBOR + 4.000%(18) | 873,915 |
| 3,042,375 | Hayward Industries, Inc. 3.00%, 05/12/2028, 1 mo. USD LIBOR + 2.500% | 3,032,244 |
| 2,299,237 | MajorDrive Holdings LLC 4.50%, 05/12/2028, 1 mo. USD LIBOR + 4.000% | 2,299,237 |
| 1,603,340 | SRAM LLC 3.25%, 05/12/2028, 1 mo. USD LIBOR + 2.750% | 1,599,332 |
| | | | 11,494,554 |
| | Lodging - 0.2% |
| 2,158,780 | Boyd Gaming Corp. 2.32%, 09/15/2023, 3 mo. USD LIBOR + 2.250% | 2,154,830 |
| | Caesars Resort Collection LLC | |
| 2,457,990 | 2.84%, 12/23/2024, 3 mo. USD LIBOR + 2.750% | 2,445,454 |
| 2,207,700 | 3.59%, 07/21/2025, 1 mo. USD LIBOR + 3.500% | 2,208,980 |
| | | | 6,809,264 |
| | Machinery - Construction & Mining - 0.1% |
| 2,001,547 | Brookfield WEC Holdings, Inc. 3.25%, 08/01/2025, 1 mo. USD LIBOR + 2.750% | 1,986,535 |
| | Machinery-Diversified - 0.4% |
| 199,363 | AI Alpine AT Bidco GmbH 2.87%, 10/31/2025, 1 mo. USD LIBOR + 2.750% | 195,375 |
| 1,151,953 | Altra Industrial Motion Corp. 2.09%, 10/01/2025, 3 mo. USD LIBOR + 2.000% | 1,143,314 |
| 3,275,000 | ASP Blade Holdings, Inc. 0.00%, 10/13/2028, 1 mo. USD LIBOR + 4.000%(18) | 3,279,094 |
| 1,331,676 | Circor International, Inc. 4.25%, 12/11/2024, 1 mo. USD LIBOR + 3.250% | 1,329,598 |
| 1,315,000 | Filtration Group Corp. 0.00%, 10/21/2028, 1 mo. USD LIBOR + 3.750%(18) | 1,312,699 |
| 2,782,005 | Vertical U.S. Newco, Inc. 4.00%, 07/30/2027, 1 mo. USD LIBOR + 3.500% | 2,785,482 |
| 2,550,000 | Welbilt, Inc. 2.59%, 10/23/2025, 3 mo. USD LIBOR + 2.500% | 2,538,321 |
| | | | 12,583,883 |
| | Media - 1.3% |
| 772,800 | Altice Financing S.A. 2.87%, 01/31/2026, 3 mo. USD LIBOR + 2.750% | 757,066 |
The accompanying notes are an integral part of these financial statements.
The Hartford Strategic Income Fund
Schedule of Investments – (continued)
October 31, 2021
| Shares or Principal Amount | | Market Value† |
| SENIOR FLOATING RATE INTERESTS - 19.9%(17) - (continued) |
| | Media - 1.3% - (continued) |
| $ 1,133,550 | Banijay Entertainment S.A.S 3.83%, 03/01/2025, 1 mo. USD LIBOR + 3.750% | $ 1,129,299 |
| 4,164,562 | Cable One, Inc. 2.09%, 05/03/2028, 1 mo. USD LIBOR + 2.000% | 4,129,414 |
| 924,697 | Charter Communications Operating LLC 1.84%, 02/01/2027, 1 mo. USD LIBOR + 1.750% | 917,910 |
| | CSC Holdings LLC | |
| 243,622 | 2.34%, 07/17/2025, 3 mo. USD LIBOR + 2.250% | 237,761 |
| 1,794,948 | 2.59%, 04/15/2027, 1 mo. USD LIBOR + 2.500% | 1,756,805 |
| 2,355,000 | DirecTV Financing LLC 5.75%, 07/22/2027, 1 mo. USD LIBOR + 5.000% | 2,356,130 |
| | E.W. Scripps Co. | |
| 1,989,650 | 3.31%, 05/01/2026, 1 mo. USD LIBOR + 2.563% | 1,982,188 |
| 1,114,737 | 3.75%, 01/07/2028, 1 mo. USD LIBOR + 3.000% | 1,115,261 |
| 632,807 | Entravision Communications Corp. 2.84%, 11/29/2024, 3 mo. USD LIBOR + 2.750% | 625,093 |
| 1,849,643 | Gray Television, Inc. 2.58%, 01/02/2026, 3 mo. USD LIBOR + 2.500% | 1,836,473 |
| 15,489 | Houghton Mifflin Harcourt Publishing Co. 7.25%, 11/22/2024, 1 mo. USD LIBOR + 6.250% | 15,455 |
| 210,000 | NEP Group, Inc. 7.09%, 10/19/2026, 3 mo. USD LIBOR + 7.000% | 202,703 |
| 8,939,238 | NEP/NCP Holdco, Inc. 3.34%, 10/20/2025, 3 mo. USD LIBOR + 3.250% | 8,661,317 |
| 1,500,000 | Telenet Financing USD LLC 2.09%, 04/30/2028, 6 mo. USD LIBOR + 2.000% | 1,478,250 |
| EUR 1,375,000 | UPC Broadband Holding B.V. 3.00%, 01/31/2029, 3 mo. EURIBOR + 3.000% | 1,577,833 |
| $ 3,980,000 | UPC Financing Partnership 3.09%, 01/31/2029, 1 mo. USD LIBOR + 3.000% | 3,960,936 |
| | Virgin Media Bristol LLC | |
| 1,125,000 | 2.59%, 01/31/2028, 1 mo. USD LIBOR + 2.500% | 1,112,501 |
| EUR 1,515,000 | 3.25%, 01/31/2029, 3 mo. EURIBOR + 3.250% | 1,747,872 |
| $ 1,010,000 | 3.34%, 01/31/2029, 1 mo. USD LIBOR + 3.250% | 1,009,162 |
| EUR 3,785,000 | Virgin Media Ireland Ltd. 3.50%, 07/15/2029, 3 mo. EURIBOR + 3.500% | 4,345,619 |
| 700,000 | Virgin Media SFA Finance Ltd. 2.50%, 01/31/2029, 3 mo. EURIBOR + 2.500% | 794,634 |
| Shares or Principal Amount | | Market Value† |
| SENIOR FLOATING RATE INTERESTS - 19.9%(17) - (continued) |
| | Media - 1.3% - (continued) |
| EUR 785,000 | Ziggo B.V. 3.00%, 01/31/2029, 3 mo. EURIBOR + 3.000% | $ 896,498 |
| $ 1,100,000 | Ziggo Financing Partnership 2.59%, 04/30/2028, 1 mo. USD LIBOR + 2.500% | 1,085,788 |
| | | | 43,731,968 |
| | Miscellaneous Manufacturing - 0.1% |
| EUR 3,345,920 | CeramTec AcquiCo GmbH 2.50%, 03/07/2025, 3 mo. EURIBOR + 2.500% | 3,843,090 |
| $ 281,300 | LTI Holdings, Inc. 3.59%, 09/06/2025, 3 mo. USD LIBOR + 3.500% | 277,534 |
| 760,517 | Momentive Performance Materials USA LLC 3.34%, 05/15/2024, 3 mo. USD LIBOR + 3.250% | 758,935 |
| | | | 4,879,559 |
| | Oil & Gas Services - 0.1% |
| 2,075,000 | Oryx Midstream Services Permian Basin LLC 0.00%, 10/05/2028, 1 mo. USD LIBOR + 3.250%(18) | 2,066,098 |
| 86,285 | PES Holdings LLC 0.00%, 12/31/2022, 3 mo. USD LIBOR + 6.990%(14)(18) | 863 |
| | | | 2,066,961 |
| | Packaging & Containers - 0.7% |
| | Berlin Packaging LLC | |
| 2,985,019 | 3.75%, 03/05/2028, 1 mo. USD LIBOR + 3.250% | 2,967,855 |
| 2,325,000 | 4.25%, 03/11/2028, 1 mo. USD LIBOR + 3.750% | 2,325,419 |
| 880,200 | Berry Global, Inc. 1.84%, 07/01/2026, 1 mo. USD LIBOR + 1.836% | 874,038 |
| 2,934,675 | BWAY Holding Co. 3.34%, 04/03/2024, 3 mo. USD LIBOR + 3.250% | 2,854,441 |
| | Flex Acquisition Co., Inc. | |
| 1,014,800 | 3.13%, 06/29/2025, 3 mo. USD LIBOR + 3.000% | 1,006,438 |
| 2,739,949 | 4.00%, 02/23/2028, 1 mo. USD LIBOR + 3.500% | 2,731,565 |
| | Pregis TopCo Corp. | |
| 402,825 | 4.09%, 07/31/2026, 1 mo. USD LIBOR + 4.000% | 403,453 |
| 1,445,000 | 4.50%, 07/31/2026, 1 mo. USD LIBOR + 4.000% | 1,447,717 |
| | Pretium PKG Holdings, Inc. | |
| 1,080,000 | 4.50%, 10/02/2028, 1 mo. USD LIBOR + 4.500% | 1,082,570 |
| 890,000 | 7.25%, 10/01/2029, 1 mo. USD LIBOR + 6.750% | 898,900 |
| 4,557,498 | Proampac PG Borrower LLC 4.50%, 11/03/2025, 1 mo. USD LIBOR + 3.750% | 4,557,498 |
| | TricorBraun Holdings, Inc. | |
| 2,736,157 | 3.75%, 03/03/2028, 1 mo. USD LIBOR + 3.250% | 2,717,195 |
| 616,458 | 3.75%, 03/03/2028, 1 mo. USD LIBOR + 3.250%(19) | 612,186 |
| | | | 24,479,275 |
The accompanying notes are an integral part of these financial statements.
The Hartford Strategic Income Fund
Schedule of Investments – (continued)
October 31, 2021
| Shares or Principal Amount | | Market Value† |
| SENIOR FLOATING RATE INTERESTS - 19.9%(17) - (continued) |
| | Pharmaceuticals - 0.8% |
| | Bausch Health Cos., Inc. | |
| $ 518,848 | 2.84%, 11/27/2025, 3 mo. USD LIBOR + 2.750% | $ 517,161 |
| 1,461,360 | 3.09%, 06/02/2025, 3 mo. USD LIBOR + 3.000% | 1,457,618 |
| 2,391,343 | Change Healthcare Holdings LLC 3.50%, 03/01/2024, 1 mo. USD LIBOR + 2.500% | 2,388,617 |
| 2,964,298 | Elanco Animal Health, Inc. 1.83%, 08/01/2027, 1 mo. USD LIBOR + 1.750% | 2,937,827 |
| 798,080 | Endo Luxembourg Finance Co. S.a r.l. 5.75%, 03/27/2028, 1 mo. USD LIBOR + 5.000% | 777,019 |
| 2,743,180 | Gainwell Acquisition Corp. 4.75%, 10/01/2027, 1 mo. USD LIBOR + 4.000% | 2,747,844 |
| 1,735,000 | HCRX Investments Holdco L.P. 0.00%, 07/14/2028, 1 mo. USD LIBOR + 2.250%(18) | 1,724,590 |
| 2,149,200 | Horizon Therapeutics USA, Inc. 2.50%, 03/15/2028, 1 mo. USD LIBOR + 2.000% | 2,143,440 |
| 287,493 | ICON Luxembourg S.a r.l. 3.00%, 07/03/2028, 1 mo. USD LIBOR + 2.500% | 287,462 |
| | Jazz Financing Lux S.a.r.l. | |
| EUR 456,667 | 3.50%, 05/05/2028, 3 mo. EURIBOR + 3.500% | 528,456 |
| $ 2,319,188 | 4.00%, 05/05/2028, 1 mo. USD LIBOR + 3.500% | 2,322,086 |
| 3,117,188 | Organon & Co. 3.50%, 06/02/2028, 1 mo. USD LIBOR + 3.000% | 3,123,048 |
| 1,084,550 | Packaging Coordinators Midco, Inc. 4.25%, 11/30/2027, 1 mo. USD LIBOR + 3.500% | 1,085,678 |
| 3,296,073 | Pathway Vet Alliance LLC 3.84%, 03/31/2027, 1 mo. USD LIBOR + 3.750% | 3,278,209 |
| | | | 25,319,055 |
| | Pipelines - 0.3% |
| 263,294 | BCP Raptor LLC 5.25%, 06/24/2024, 3 mo. USD LIBOR + 4.250% | 263,439 |
| 697,576 | BCP Renaissance Parent LLC 4.50%, 10/31/2024, 3 mo. USD LIBOR + 3.500% | 694,960 |
| 462,977 | Buckeye Partners L.P. 2.33%, 11/01/2026, 1 mo. USD LIBOR + 2.250% | 460,606 |
| 2,613,450 | DT Midstream, Inc. 2.50%, 06/26/2028, 1 mo. USD LIBOR + 2.000% | 2,618,756 |
| 3,636,199 | Medallion Midland Acquisition LLC 4.50%, 10/18/2028, 3 mo. USD LIBOR + 3.750% | 3,632,781 |
| 1,149,721 | NorthRiver Midstream Finance L.P. 3.38%, 10/01/2025, 3 mo. USD LIBOR + 3.250% | 1,146,996 |
| | | | 8,817,538 |
| Shares or Principal Amount | | Market Value† |
| SENIOR FLOATING RATE INTERESTS - 19.9%(17) - (continued) |
| | Real Estate - 0.0% |
| EUR 855,000 | Blitz GmbH 3.50%, 04/28/2028, 3 mo. EURIBOR + 3.500% | $ 981,975 |
| | Retail - 1.5% |
| $ 1,895,000 | At Home Group, Inc. 4.75%, 07/24/2028, 1 mo. USD LIBOR + 4.250% | 1,886,321 |
| 1,332,441 | B.C. Unlimited Liability Co. 1.84%, 11/19/2026, 1 mo. USD LIBOR + 1.750% | 1,305,552 |
| 3,517,369 | Beacon Roofing Supply, Inc. 2.34%, 05/19/2028, 1 mo. USD LIBOR + 2.250% | 3,491,798 |
| | EG Group Ltd. | |
| 2,392,057 | 4.75%, 03/31/2026, 1 mo. USD LIBOR + 4.250% | 2,388,469 |
| EUR 1,715,000 | 7.00%, 04/10/2027, 3 mo. EURIBOR + 7.000% | 1,982,540 |
| $ 1,700,738 | Foundation Building Materials Holding Co. LLC 3.75%, 02/03/2028, 1 mo. USD LIBOR + 3.250% | 1,686,213 |
| 5,195,737 | Great Outdoors Group LLC 5.00%, 03/06/2028, 1 mo. USD LIBOR + 4.250% | 5,207,636 |
| 2,438,169 | Harbor Freight Tools USA, Inc. 3.25%, 10/19/2027, 1 mo. USD LIBOR + 2.750% | 2,428,757 |
| | IRB Holding Corp. | |
| 734,772 | 3.75%, 02/05/2025, 1 mo. USD LIBOR + 2.750% | 732,626 |
| 1,771,613 | 4.25%, 12/15/2027, 1 mo. USD LIBOR + 3.250% | 1,770,355 |
| | LBM Acquisition LLC | |
| 926,667 | 0.00%, 12/17/2027, 1 mo. USD LIBOR + 3.750%(18) | 913,536 |
| 1,848,688 | 3.88%, 12/17/2027, 1 mo. USD LIBOR + 3.750% | 1,822,492 |
| 1,984,113 | 4.50%, 12/17/2027, 1 mo. USD LIBOR + 3.750% | 1,955,998 |
| 2,292,675 | Les Schwab Tire Centers 4.00%, 11/02/2027, 1 mo. USD LIBOR + 3.250% | 2,288,388 |
| 3,276,787 | Michaels Cos., Inc. 5.00%, 04/15/2028, 1 mo. USD LIBOR + 4.250% | 3,270,660 |
| EUR 1,250,000 | Peer Holding B.V. 3.00%, 03/08/2025, 3 mo. EURIBOR + 3.000% | 1,431,157 |
| $ 1,701,450 | Petco Health and Wellness Co., Inc. 4.00%, 03/03/2028, 1 mo. USD LIBOR + 3.250% | 1,700,242 |
| 2,758,087 | PetSmart, Inc. 4.50%, 02/11/2028, 1 mo. USD LIBOR + 3.750% | 2,759,080 |
| 1,470,000 | Specialty Building Products Holdings LLC 0.00%, 10/15/2028, 1 mo. USD LIBOR + 3.750%(18) | 1,464,032 |
| 5,147,100 | SRS Distribution, Inc. 4.25%, 06/02/2028, 1 mo. USD LIBOR + 3.750% | 5,145,659 |
The accompanying notes are an integral part of these financial statements.
The Hartford Strategic Income Fund
Schedule of Investments – (continued)
October 31, 2021
| Shares or Principal Amount | | Market Value† |
| SENIOR FLOATING RATE INTERESTS - 19.9%(17) - (continued) |
| | Retail - 1.5% - (continued) |
| $ 1,870,792 | Staples, Inc. 5.13%, 04/16/2026, 3 mo. USD LIBOR + 5.000% | $ 1,796,147 |
| 3,747,150 | White Cap Buyer LLC 4.50%, 10/19/2027, 1 mo. USD LIBOR + 4.000% | 3,754,382 |
| | | | 51,182,040 |
| | Semiconductors - 0.2% |
| 2,940,000 | MKS Instruments, Inc. 0.00%, 10/21/2028, 1 mo. USD LIBOR + 2.250%(18) | 2,936,325 |
| 585,000 | Synaptics Incorporated 0.00%, 10/21/2028, 1 mo. USD LIBOR + 2.250%(18) | 585,913 |
| 1,615,000 | TPG Elf Purchaser LLC 0.00%, 10/14/2028, 1 mo. USD LIBOR + 3.500%(18) | 1,612,981 |
| | | | 5,135,219 |
| | Software - 2.0% |
| 791,025 | Athenahealth, Inc. 4.38%, 02/11/2026, 1 mo. USD LIBOR + 4.250% | 793,003 |
| 615,350 | Camelot U.S. Acquisition Co. 4.00%, 10/30/2026, 1 mo. USD LIBOR + 3.000% | 616,273 |
| 1,820,000 | CCC Intelligent Solutions, Inc. 3.00%, 09/21/2028, 1 mo. USD LIBOR + 2.500% | 1,814,085 |
| 706,588 | Ceridian HCM Holding, Inc. 2.57%, 04/30/2025, 1 mo. USD LIBOR + 2.500% | 697,883 |
| EUR 1,360,000 | Concorde Midco Ltd. 4.00%, 03/01/2028, 3 mo. EURIBOR + 4.000% | 1,570,478 |
| | DCert Buyer, Inc. | |
| $ 2,958,099 | 4.09%, 10/16/2026, 3 mo. USD LIBOR + 4.000% | 2,958,424 |
| 3,605,000 | 7.09%, 02/16/2029, 1 mo. USD LIBOR + 7.000% | 3,631,389 |
| 7,322,877 | Dun & Bradstreet Corp. 3.34%, 02/06/2026, 1 mo. USD LIBOR + 3.250% | 7,290,217 |
| 3,324,300 | E2open LLC 3.75%, 02/04/2028, 1 mo. USD LIBOR + 3.250% | 3,325,696 |
| 445,900 | Emerald TopCo, Inc. 3.63%, 07/24/2026, 1 mo. USD LIBOR + 3.500% | 442,444 |
| | Epicor Software Corp. | |
| 1,962,124 | 4.00%, 07/30/2027, 1 mo. USD LIBOR + 3.250% | 1,959,514 |
| 400,000 | 8.75%, 07/31/2028, 1 mo. USD LIBOR + 7.750% | 410,100 |
| 243,773 | Evertec Group LLC 3.59%, 11/27/2024, 3 mo. USD LIBOR + 3.500% | 243,849 |
| 601,291 | Finastra USA, Inc. 4.50%, 06/13/2024, 3 mo. USD LIBOR + 3.500% | 597,833 |
| | Hyland Software, Inc. | |
| 3,570,995 | 4.25%, 07/01/2024, 1 mo. USD LIBOR + 3.500% | 3,572,103 |
| 464,000 | 7.00%, 07/07/2025, 1 mo. USD LIBOR + 6.250% | 468,060 |
| Shares or Principal Amount | | Market Value† |
| SENIOR FLOATING RATE INTERESTS - 19.9%(17) - (continued) |
| | Software - 2.0% - (continued) |
| $ 123,562 | MA Finance Co. LLC 2.84%, 06/21/2024, 3 mo. USD LIBOR + 2.750% | $ 122,210 |
| | Mitchell International, Inc. | |
| 4,550,000 | 4.25%, 10/15/2028, 1 mo. USD LIBOR + 3.750% | 4,506,775 |
| 1,775,000 | 7.00%, 10/15/2029, 1 mo. USD LIBOR + 6.500% | 1,787,869 |
| 1,383,330 | Navicure, Inc. 4.09%, 10/22/2026, 1 mo. USD LIBOR + 4.000% | 1,384,201 |
| 2,338,250 | Playtika Holding Corp. 2.84%, 03/13/2028, 1 mo. USD LIBOR + 2.750% | 2,333,129 |
| | Polaris Newco LLC | |
| EUR 1,975,000 | 4.00%, 06/02/2028, 3 mo. EURIBOR + 4.000% | 2,278,351 |
| $ 3,380,000 | 4.50%, 06/02/2028, 1 mo. USD LIBOR + 4.000% | 3,386,490 |
| 99,500 | Press Ganey Holdings, Inc. 4.50%, 07/24/2026, 1 mo. USD LIBOR + 3.750% | 99,624 |
| 2,294,339 | Quest Software U.S. Holdings, Inc. 4.38%, 05/16/2025, 3 mo. USD LIBOR + 4.250% | 2,289,842 |
| 3,475,000 | RealPage, Inc. 3.75%, 04/24/2028, 1 mo. USD LIBOR + 3.250% | 3,466,660 |
| 834,443 | Seattle Spinco, Inc. 2.84%, 06/21/2024, 3 mo. USD LIBOR + 2.750% | 825,315 |
| 437,566 | SS&C European Holdings S.a.r.l. 1.84%, 04/16/2025, 1 mo. USD LIBOR + 1.750% | 432,735 |
| 2,091,485 | SS&C Technologies, Inc. 1.84%, 04/16/2025, 1 mo. USD LIBOR + 1.750% | 2,070,729 |
| | Ultimate Software Group, Inc. | |
| 2,153,646 | 3.84%, 05/04/2026, 3 mo. USD LIBOR + 3.750% | 2,155,972 |
| 1,475,575 | 4.00%, 05/04/2026, 1 mo. USD LIBOR + 3.250% | 1,477,242 |
| 7,834,845 | Zelis Healthcare Corporation 3.58%, 09/30/2026, 1 mo. USD LIBOR + 3.500% | 7,797,472 |
| | | | 66,805,967 |
| | Telecommunications - 0.5% |
| 1,044,447 | Altice France S.A. 3.81%, 01/31/2026, 3 mo. USD LIBOR + 3.688% | 1,032,436 |
| 556,924 | Consolidated Communications, Inc. 4.25%, 10/02/2027, 1 mo. USD LIBOR + 3.500% | 556,796 |
| 2,039,750 | Frontier Communications Corp. 4.50%, 05/01/2028, 1 mo. USD LIBOR + 3.750% | 2,035,671 |
| 472,259 | Level 3 Financing, Inc. 1.84%, 03/01/2027, 1 mo. USD LIBOR + 1.750% | 465,850 |
| | Lorca Finco plc | |
| EUR 3,855,000 | 0.00%, 09/17/2027, 1 mo. USD LIBOR + 3.750%(18) | 4,424,204 |
| 1,836,915 | 4.25%, 09/17/2027, 3 mo. EURIBOR + 4.250% | 2,122,029 |
The accompanying notes are an integral part of these financial statements.
The Hartford Strategic Income Fund
Schedule of Investments – (continued)
October 31, 2021
| Shares or Principal Amount | | Market Value† |
| SENIOR FLOATING RATE INTERESTS - 19.9%(17) - (continued) |
| | Telecommunications - 0.5% - (continued) |
| $ 763,177 | Numericable Group S.A. 2.88%, 07/31/2025, 3 mo. USD LIBOR + 2.750% | $ 749,662 |
| 2,250,000 | Xplornet Communications, Inc. 0.00%, 10/02/2028, 1 mo. USD LIBOR + 4.000%(18) | 2,245,185 |
| 979,515 | Zacapa LLC 4.63%, 07/02/2025, 3 mo. USD LIBOR + 4.500%(2) | 980,739 |
| 988,776 | Zayo Group Holdings, Inc. 3.09%, 03/09/2027, 1 mo. USD LIBOR + 3.000% | 972,630 |
| | | | 15,585,202 |
| | Transportation - 0.2% |
| 2,820,000 | First Student Bidco, Inc. 3.50%, 07/21/2028, 1 mo. USD LIBOR + 3.000% | 2,799,217 |
| 1,970,000 | Genesee & Wyoming, Inc. 2.13%, 12/30/2026, 1 mo. USD LIBOR + 2.000% | 1,957,904 |
| 1,184,050 | PODS LLC 3.75%, 03/31/2028, 1 mo. USD LIBOR + 3.000% | 1,181,836 |
| 2,004,975 | Savage Enterprises LLC 3.75%, 09/15/2028, 1 mo. USD LIBOR + 3.250% | 2,008,323 |
| | | | 7,947,280 |
| | Total Senior Floating Rate Interests
(cost $664,744,082) | $ 666,079,227 |
| U.S. GOVERNMENT AGENCIES - 10.5% |
| | Mortgage-Backed Agencies - 10.5% |
| | FHLMC - 2.0% |
| 3,173 | 0.01%, 11/15/2036(20) | $ 2,892 |
| 12,232,218 | 1.12%, 06/25/2030(3)(5) | 1,035,188 |
| 3,955,546 | 1.13%, 01/25/2030(3)(5) | 318,385 |
| 2,240,704 | 1.70%, 04/25/2030(3)(5) | 273,039 |
| 2,658,480 | 1.87%, 11/25/2047(3)(5) | 333,017 |
| 2,355,000 | 1.90%, 02/25/2047(3)(5) | 318,111 |
| 4,759,080 | 1.95%, 10/25/2047(3)(5) | 624,684 |
| 3,345,000 | 2.01%, 09/25/2047(3)(5) | 283,207 |
| 1,150,193 | 2.02%, 09/25/2046(3)(5) | 156,620 |
| 1,890,000 | 2.10%, 08/25/2047(3)(5) | 264,801 |
| 3,870,000 | 2.15%, 05/25/2047(3)(5) | 338,748 |
| 2,605,748 | 2.25%, 05/25/2047(3)(5) | 383,898 |
| 6,060,000 | 2.44%, 01/25/2050, 1 mo. USD LIBOR + 2.350%(1)(2) | 6,071,746 |
| 3,000,000 | 2.59%, 02/25/2050, 1 mo. USD LIBOR + 2.500%(1)(2) | 3,016,463 |
| 3,990,000 | 2.70%, 01/25/2051, SOFR30A + 2.650%(1)(2) | 4,008,190 |
| 8,884,675 | 2.74%, 01/25/2049, 1 mo. USD LIBOR + 2.650%(1)(2) | 8,990,293 |
| 25,674 | 3.00%, 03/15/2033(5) | 2,323 |
| 1,605,000 | 3.24%, 07/25/2030, 1 mo. USD LIBOR + 3.150%(2) | 1,629,048 |
| 1,955,000 | 3.40%, 06/25/2048(3)(5) | 477,740 |
| 4,315,947 | 3.69%, 04/25/2024, 1 mo. USD LIBOR + 3.600%(2) | 4,397,294 |
| 180,000 | 3.80%, 01/25/2051, SOFR30A + 3.750%(1)(2) | 186,871 |
| 39,303 | 4.00%, 07/15/2027(5) | 1,728 |
| Shares or Principal Amount | | Market Value† |
| U.S. GOVERNMENT AGENCIES - 10.5% - (continued) |
| | Mortgage-Backed Agencies - 10.5% - (continued) |
| | FHLMC - 2.0% - (continued) |
| $ 6,166,789 | 4.34%, 11/25/2023, 1 mo. USD LIBOR + 4.250%(2) | $ 6,358,648 |
| 2,110,000 | 4.44%, 09/25/2030, 1 mo. USD LIBOR + 4.350%(2) | 2,201,319 |
| 88,142 | 4.50%, 03/15/2041 | 99,111 |
| 11,830,783 | 4.59%, 02/25/2024, 1 mo. USD LIBOR + 4.500%(2) | 12,242,591 |
| 70,445 | 4.75%, 07/15/2039 | 78,555 |
| 1,955,000 | 5.34%, 09/25/2050, 1 mo. USD LIBOR + 5.250%(1)(2) | 2,044,749 |
| 6,506 | 5.50%, 08/15/2033 | 7,398 |
| 2,450,000 | 5.84%, 07/25/2050, 1 mo. USD LIBOR + 5.750%(1)(2) | 2,581,179 |
| 3,520,000 | 6.09%, 08/25/2050, 1 mo. USD LIBOR + 6.000%(1)(2) | 3,739,597 |
| 21,788 | 6.50%, 07/15/2036 | 24,566 |
| 2,770,000 | 7.80%, 01/25/2051, SOFR30A + 7.750%(1)(2) | 3,275,306 |
| | | | 65,767,305 |
| | FNMA - 0.0% |
| 31,206 | 0.00%, 06/25/2036(8)(20) | 29,193 |
| 83,934 | 1.72%, 04/25/2055(3)(5) | 4,369 |
| 5,000 | 2.44%, 01/01/2023 | 5,071 |
| 18,252 | 2.50%, 06/25/2028(5) | 944 |
| 105,797 | 3.00%, 01/25/2028(5) | 6,026 |
| 28,034 | 3.16%, 12/01/2026 | 30,298 |
| 22,690 | 3.24%, 12/01/2026 | 24,600 |
| 8,796 | 3.47%, 01/01/2024 | 9,166 |
| 39,336 | 3.50%, 05/25/2030(5) | 3,437 |
| 21,952 | 3.67%, 08/01/2023 | 22,792 |
| 10,000 | 3.76%, 03/01/2024 | 10,528 |
| 14,387 | 3.86%, 12/01/2025 | 15,745 |
| 21,686 | 3.87%, 10/01/2025 | 23,658 |
| 32,041 | 3.89%, 05/01/2030 | 36,869 |
| 8,833 | 3.96%, 05/01/2034 | 10,268 |
| 19,459 | 4.00%, 03/25/2042(5) | 2,090 |
| 9,823 | 4.50%, 07/25/2027(5) | 458 |
| 4,458 | 5.49%, 05/25/2042(3)(5) | 464 |
| 55,721 | 5.50%, 04/25/2035 | 63,228 |
| 15,998 | 5.50%, 04/25/2037 | 18,270 |
| 168,863 | 5.50%, 06/25/2042(5) | 34,917 |
| | | | 352,391 |
| | GNMA - 0.0% |
| 18,651 | 4.00%, 05/16/2042(5) | 2,247 |
| 44,037 | 5.00%, 10/16/2041(5) | 7,317 |
| | | | 9,564 |
| | UMBS - 8.5% |
| 174,690,000 | 2.00%, 11/10/2051(21) | 174,655,879 |
| 108,430,000 | 2.00%, 12/13/2051(21) | 108,184,338 |
| | | | 282,840,217 |
| | Total U.S. Government Agencies
(cost $346,756,909) | | $ 348,969,477 |
| U.S. GOVERNMENT SECURITIES - 13.8% |
| | U.S. Treasury Securities - 13.8% |
| | U.S. Treasury Bonds - 5.7% |
| 1,991,058 | 0.13%, 02/15/2051(22) | $ 2,262,261 |
| 13,723,173 | 0.88%, 02/15/2047(22) | 18,033,643 |
The accompanying notes are an integral part of these financial statements.
The Hartford Strategic Income Fund
Schedule of Investments – (continued)
October 31, 2021
| Shares or Principal Amount | | Market Value† |
| U.S. GOVERNMENT SECURITIES - 13.8% - (continued) |
| | U.S. Treasury Securities - 13.8% - (continued) |
| | U.S. Treasury Bonds - 5.7% - (continued) |
| $ 848,614 | 1.00%, 02/15/2048(22) | $ 1,156,005 |
| 70,360,000 | 1.75%, 08/15/2041(13) | 67,611,562 |
| 12,270,000 | 1.88%, 02/15/2051 | 12,053,358 |
| 63,660,000 | 2.25%, 05/15/2041(23) | 66,325,762 |
| 4,040,000 | 3.00%, 11/15/2044 | 4,794,502 |
| 920,000 | 3.13%, 02/15/2043 | 1,100,838 |
| 6,740,000 | 3.38%, 05/15/2044(23) | 8,440,797 |
| 5,980,000 | 3.63%, 02/15/2044(23)(24) | 7,744,334 |
| 610,000 | 3.75%, 11/15/2043 | 801,602 |
| | | | 190,324,664 |
| | U.S. Treasury Notes - 8.1% |
| 14,227,379 | 0.13%, 07/15/2030(22) | 15,837,684 |
| 51,480,000 | 0.25%, 07/31/2025(23)(25) | 50,102,508 |
| 2,989,615 | 0.38%, 01/15/2027(22)(23) | 3,315,962 |
| 121,460,000 | 0.63%, 05/15/2030(23) | 112,919,844 |
| 2,881,711 | 0.88%, 01/15/2029(22)(23) | 3,346,781 |
| 722,908 | 1.00%, 02/15/2049(22) | 995,453 |
| 26,200,000 | 1.13%, 02/15/2031(23) | 25,283,000 |
| 6,544,000 | 2.63%, 02/15/2029(23) | 7,072,632 |
| 36,775,000 | 2.88%, 08/15/2028(23)(24) | 40,232,712 |
| 9,025,000 | 3.00%, 10/31/2025 | 9,723,380 |
| | | | 268,829,956 |
| | Total U.S. Government Securities
(cost $461,890,967) | | $ 459,154,620 |
| COMMON STOCKS - 0.0% |
| | Energy - 0.0% |
| 32,328 | Ascent Resources - Marcellus LLC Class A(6)(7) | $ 26,671 |
| 7,026 | Foresight Energy LLC | 94,856 |
| 83,644,001 | KCA Deutag(6)(7)(26) | — |
| 3,682 | Philadelphia Energy Solutions Class A(6)(7) | — |
| | Total Common Stocks
(cost $1,330,837) | | $ 121,527 |
| CONVERTIBLE PREFERRED STOCKS - 0.4% |
| | Capital Goods - 0.0% |
| 74 | Fluor Corp., 6.50%(1)(12) | $ 84,273 |
| | Health Care Equipment & Services - 0.2% |
| 77,085 | Becton Dickinson and Co. Series B, 6.00%(10) | 4,054,671 |
| 2,676 | Danaher Corp., 5.00% | 4,444,167 |
| | | | 8,498,838 |
| | Utilities - 0.2% |
| 29,384 | American Electric Power Co., Inc., 6.13%(10) | 1,517,390 |
| Shares or Principal Amount | | Market Value† |
| CONVERTIBLE PREFERRED STOCKS - 0.4% - (continued) |
| | Utilities - 0.2% - (continued) |
| 46,297 | DTE Energy Co., 6.25% | $ 2,337,072 |
| 38,600 | Southern Co. Series 2019, 6.75% | 1,975,934 |
| | | | 5,830,396 |
| | Total Convertible Preferred Stocks
(cost $14,086,992) | | $ 14,413,507 |
| ESCROWS - 0.1%(27) |
| | Consumer Services - 0.1% |
| 2,270,000 | Grifols Escrow Issuer S.A. Expires 10/15/2028(1) | $ 2,623,490 |
| | Total Escrows
(cost $2,652,836) | | $ 2,623,490 |
| WARRANTS - 0.0% |
| | Energy - 0.0% |
| 8,370 | Ascent Resources - Marcellus LLC Expires 3/30/2023*(6)(7) | $ 84 |
| | Total Warrants
(cost $670) | | $ 84 |
| | Total Long-Term Investments
(Cost $3,525,391,316) | | $ 3,503,534,352 |
| SHORT-TERM INVESTMENTS - 4.4% |
| | Commercial Paper - 1.1% |
| | CNPC Finance | |
| $ 2,000,000 | 0.00%, 11/01/2021(8) | $ 2,000,000 |
| 2,300,000 | 0.27%, 11/15/2021 | 2,299,741 |
| 2,000,000 | 0.30%, 12/20/2021 | 1,999,183 |
| | Financiere CDP, Inc. | |
| CAD 2,000,000 | 0.13%, 11/03/2021 | 1,616,014 |
| 2,000,000 | 0.13%, 11/03/2021 | 1,616,014 |
| | Municipal Finance Authority of British Columbia Bills | |
| 185,000 | 0.13%, 11/03/2021 | 149,481 |
| 615,000 | 0.13%, 11/03/2021 | 496,924 |
| 1,750,000 | 0.13%, 11/03/2021 | 1,414,013 |
| 250,000 | 0.16%, 11/17/2021 | 201,989 |
| 155,000 | 0.17%, 11/10/2021 | 125,237 |
| 670,000 | 0.17%, 11/10/2021 | 541,345 |
| 475,000 | 0.17%, 11/10/2021 | 383,790 |
| 810,000 | 0.19%, 01/12/2022 | 654,061 |
| 440,000 | 0.20%, 01/12/2022 | 355,292 |
| | Newfoundland T-Bill | |
| 4,900,000 | 0.20%, 01/06/2022 | 3,957,217 |
| 500,000 | 0.20%, 01/06/2022 | 403,798 |
| 2,000,000 | 0.20%, 01/10/2022 | 1,615,191 |
| 8,500,000 | 0.22%, 01/27/2022 | 6,864,423 |
| | Province of British Columbia | |
| 1,200,000 | 0.21%, 02/08/2022 | 968,775 |
| 6,705,000 | 0.22%, 02/07/2022 | 5,412,326 |
The accompanying notes are an integral part of these financial statements.
The Hartford Strategic Income Fund
Schedule of Investments – (continued)
October 31, 2021
| Shares or Principal Amount | | Market Value† |
| SHORT-TERM INVESTMENTS - 4.4% - (continued) |
| | Commercial Paper - 1.1% - (continued) |
| CAD 3,355,000 | 0.23%, 04/26/2022 | $ 2,704,332 |
| 1,000,000 | 0.27%, 06/10/2022 | 805,171 |
| 1,000,000 | Province of British Columbia Promissory Note 0.21%, 01/28/2022 | 807,531 |
| | | | 37,391,848 |
| | Repurchase Agreements - 2.7% |
| $ 91,510,498 | Fixed Income Clearing Corp. Repurchase Agreement dated 10/29/2021 at 0.010%, due on 11/01/2021 with a maturity value of $91,510,574; collateralized by U.S. Treasury Bond at 1.375%, maturing 11/15/2040, with a market value of $83,220,279; collateralized by U.S. Treasury Goverment Bond at 3.875%, maturing 08/15/2041, with a market value of $10,120,538 | 91,510,498 |
| | Securities Lending Collateral - 0.6% |
| 114,605 | Fidelity Investments Money Market Funds, Government Portfolio, Institutional Class, 0.01%(28) | 114,604 |
| 17,594,170 | Goldman Sachs Financial Square Funds, Government Fund, Institutional Class, 0.03%(28) | 17,594,170 |
| 1,263,132 | Invesco Government & Agency Portfolio, Institutional Class, 0.03%(28) | 1,263,132 |
| | | | 18,971,906 |
| | Total Short-Term Investments
(cost $147,735,852) | $ 147,874,252 |
| | Total Investments Excluding
Purchased Options
(cost $3,673,127,168) | 109.3% | $ 3,651,408,604 |
| | Total Purchased Options
(cost $2,303,472) | 0.0% | $ 493,880 |
| | Total Investments
(cost $3,675,430,640) | 109.3% | $ 3,651,902,484 |
| | Other Assets and Liabilities | (9.3)% | (311,554,931) |
| | Total Net Assets | 100.0% | $ 3,340,347,553 |
| Note: | Percentage of investments as shown is the ratio of the total market value to total net assets. |
| | The Fund may refer to any one or more of the industry classifications used by one or more widely recognized market indices, ratings group and/or as defined by Fund management. Industry classifications may not be identical across all security types. |
| | Equity industry classifications used in this report are the Global Industry Classification Standard, which was developed by and is the exclusive property and service mark of MSCI, Inc. and Standard & Poor’s. |
For Fund compliance purposes, the Fund may not use the same classification system. These classifications are used for financial reporting purposes.
See “Glossary” for abbreviation descriptions.
| * | Non-income producing. |
| (1) | Security was purchased pursuant to Rule 144A under the Securities Act of 1933 and may be sold in transactions that are exempt from registration (typically only to qualified institutional buyers) or in a public offering registered under the Securities Act of 1933. At October 31, 2021, the aggregate value of these securities was $914,988,368, representing 27.4% of net assets. |
| (2) | Variable rate securities; the rate reported is the coupon rate in effect at October 31, 2021. Base lending rates may be subject to a floor or cap. |
| (3) | Variable or floating rate security, which interest rate adjusts periodically based on changes in current interest rates and prepayments on the underlying pool of assets. Rate shown is the rate in effect as of period end. |
| (4) | Security is a “step-up” bond where coupon increases or steps up at a predetermined date. Rate shown is current coupon rate. |
| (5) | Securities disclosed are interest-only strips. |
| (6) | These securities are valued in good faith at fair value as determined under policies and procedures established by and under the supervision of the Board of Directors. At October 31, 2021, the aggregate fair value of these securities are $9,281,477, which represented 0.3% of total net assets. This amount excludes securities that are principally traded in certain foreign markets and whose prices are adjusted pursuant to a third party pricing service methodology approved by the Board of Directors. |
| (7) | Investment valued using significant unobservable inputs. |
| (8) | Security is a zero-coupon bond. |
| (9) | Security is exempt from registration under Regulation S under the Securities Act of 1933, which exempts from registration securities offered and sold outside of the United States. Security may not be offered or sold in the United States except pursuant to an exemption from, or in a transaction not subject to, the registration requirements of the Securities Act of 1933. At October 31, 2021, the aggregate value of these securities was $432,257,504, representing 12.9% of net assets. |
| (10) | Represents entire or partial securities on loan. See Note 8 in the accompanying Notes to Financial Statements for securities lending information. |
| (11) | Fixed to variable rate investment. The rate shown reflects the fixed rate in effect at October 31, 2021. Rate will reset at a future date. Base lending rates may be subject to a floor or cap. |
| (12) | Perpetual maturity security. Maturity date shown is the next call date or final legal maturity date, whichever comes first. |
| (13) | This security, or a portion of this security, was purchased on a when-issued, delayed-delivery or delayed-draw basis. The cost of these securities was $72,786,682 at October 31, 2021. |
| (14) | Non-income producing. For long-term debt securities, items identified are in default as to payment of interest and/or principal. |
| (15) | Security has the ability to pay in kind (“PIK”) or pay income in cash. When applicable, separate rates of such payments are disclosed. |
The accompanying notes are an integral part of these financial statements.
The Hartford Strategic Income Fund
Schedule of Investments – (continued)
October 31, 2021
| (16) | The rate shown represents current yield to maturity. |
| (17) | Senior floating rate interests generally pay interest rates which are periodically adjusted by reference to a base short-term, floating lending rate plus a premium. The base lending rates are primarily the LIBOR, and secondarily the prime rate offered by one or more major United States banks (the "Prime Rate") and the certificate of deposit rate or other base lending rates used by commercial lenders. Senior floating rate interests often require prepayments from excess cash flows or permit the borrower to repay at its election. The rate at which the borrower repays cannot be predicted with accuracy. As a result, the actual remaining maturity may be substantially less than the stated maturities shown. Base lending rates may be subject to a floor or cap. Unless otherwise noted, the interest rate disclosed for these securities represents the rate in effect as of October 31, 2021. |
| (18) | Represents an unsettled loan commitment. The coupon rate will be determined at time of settlement. |
| (19) | This security, or a portion of this security, has unfunded loan commitments. As of October 31, 2021, the aggregate value of the unfunded commitment was $612,186, which rounds to 0.0% of total net assets. |
| (20) | Securities disclosed are principal-only strips. |
| (21) | Represents or includes a TBA transaction. |
| (22) | The principal amount for these securities are adjusted for inflation and the interest payments equal a fixed percentage of the inflation-adjusted principal amount. |
| (23) | All, or a portion of the security, was pledged as collateral in connection with OTC swap contracts. As of October 31, 2021, the market value of securities pledged was $11,277,823. |
| (24) | All, or a portion of the security, was pledged as collateral in connection with futures contracts. As of October 31, 2021, the market value of securities pledged was $11,349,381. |
| (25) | All, or a portion of the security, was pledged as collateral in connection with centrally cleared swap contracts. As of October 31, 2021, the market value of securities pledged was $4,866,211. |
| (26) | Investment in securities not registered under the Securities Act of 1933 (excluding securities acquired pursuant to Rule 144A and Regulation S). At the end of the period, the value of such restricted securities amounted to $0 or 0.0% of net assets. |
Period
Acquired | | Security Name | | Shares/
Par Value | | Total Cost | | Market Value |
| 03/2011 | | KCA Deutag | | 83,644,001 | | $ 1,133,544 | | $ — |
| (27) | Share amount represents shares of the issuer previously held that resulted in receipt of the escrow. |
| (28) | Current yield as of period end. |
| OTC Swaptions Outstanding at October 31, 2021 |
| Description | | Counter-
party | | Exercise Price/
FX Rate/Rate | | Pay/
Receive
Floating
Rate | | Expiration
Date | | Notional
Amount | | Market
Value† | | Premiums
Paid
(Received)
by Fund | | Unrealized
Appreciation/
(Depreciation) |
| Purchased swaptions: |
| Put |
| 3 Month USD-LIBOR-BBA-Interest Rate Swap Expiring 03/14/22* | | BOA | | 2.20% | | Pay | | 03/14/2022 | | USD | 132,765,000 | | $ 493,880 | | $ 2,303,472 | | $ (1,809,592) |
| Written swaptions: |
| Put |
| 3 Month USD-LIBOR-BBA-Interest Rate Swap Expiring 03/14/22* | | BOA | | 1.50% | | Receive | | 03/14/2022 | | USD | (132,765,000) | | $ (875,883) | | $ (1,327,650) | | $ 451,767 |
| * | Swaptions with forward premiums. |
| Futures Contracts Outstanding at October 31, 2021 |
| Description | | Number of
Contracts | | Expiration
Date | | Current
Notional
Amount | | Value and
Unrealized
Appreciation/
(Depreciation) |
| Long position contracts: |
| Australian 10-Year Bond Future | | 268 | | 12/15/2021 | | $ 27,186,449 | | $ (998,121) |
| Euro-Schatz Future | | 5 | | 12/08/2021 | | 647,129 | | (1,942) |
| U.S. Treasury 2-Year Note Future | | 2,323 | | 12/31/2021 | | 509,317,750 | | (1,092,165) |
| U.S. Treasury 5-Year Note Future | | 2,142 | | 12/31/2021 | | 260,788,500 | | (2,182,679) |
| U.S. Treasury 10-Year Note Future | | 755 | | 12/21/2021 | | 98,680,859 | | (431,022) |
| U.S. Treasury Long Bond Future | | 423 | | 12/21/2021 | | 68,036,906 | | (1,043,899) |
| U.S. Treasury Ultra Bond Future | | 280 | | 12/21/2021 | | 54,993,750 | | 1,249,113 |
| Total | | | | | | | | $ (4,500,715) |
| Short position contracts: |
| Euro-BOBL Future | | 44 | | 12/08/2021 | | $ 6,803,568 | | $ 104,503 |
| Euro-BTP Future | | 663 | | 12/08/2021 | | 113,630,603 | | 3,190,319 |
| Euro-BUND Future | | 234 | | 12/08/2021 | | 45,477,127 | | 957,528 |
The accompanying notes are an integral part of these financial statements.
The Hartford Strategic Income Fund
Schedule of Investments – (continued)
October 31, 2021
| Futures Contracts Outstanding at October 31, 2021 – (continued) |
| Description | | Number of
Contracts | | Expiration
Date | | Current
Notional
Amount | | Value and
Unrealized
Appreciation/
(Depreciation) |
| Short position contracts – (continued): |
| Euro-BUXL 30-Year Bond Future | | 72 | | 12/08/2021 | | $ 17,393,822 | | $ 63,506 |
| Long Gilt Future | | 1 | | 12/29/2021 | | 170,959 | | 5,678 |
| U.S. Treasury 10-Year Ultra Future | | 937 | | 12/21/2021 | | 135,894,281 | | 18,652 |
| Total | | | | | | | | $ 4,340,186 |
| Total futures contracts | | $ (160,529) |
| OTC Credit Default Swap Contracts Outstanding at October 31, 2021 |
| Reference Entity | | Counter-
party | | Notional
Amount(1) | | (Pay)/Receive
Fixed Rate | | Expiration
Date | | Periodic
Payment
Frequency | | Upfront
Premiums
Paid | | Upfront
Premiums
Received | | Market
Value† | | Unrealized
Appreciation/
(Depreciation) |
| Credit default swaps on indices: |
| Buy protection: |
| ABX.HE.AAA.07 | | GSC | | USD | 313,181 | | (0.09%) | | 08/25/2037 | | Monthly | | $ 66,883 | | $ — | | $ 13,247 | | $ (53,636) |
| ABX.HE.AAA.07 | | CSI | | USD | 894,399 | | (0.09%) | | 08/25/2037 | | Monthly | | 219,625 | | — | | 37,831 | | (181,794) |
| ABX.HE.PENAAA.06 | | JPM | | USD | 130,245 | | (0.11%) | | 05/25/2046 | | Monthly | | 14,892 | | — | | 9,425 | | (5,467) |
| ABX.HE.PENAAA.06 | | CSI | | USD | 204,636 | | (0.11%) | | 05/25/2046 | | Monthly | | 23,453 | | — | | 14,808 | | (8,645) |
| PrimeX.ARM.2 (2)(3) | | MSC | | USD | 60,808 | | (4.58%) | | 12/25/2037 | | Monthly | | — | | (133) | | (287) | | (154) |
| Total | | $ 324,853 | | $ (133) | | $ 75,024 | | $ (249,696) |
| Sell protection: |
| ABX.HE.AAA.07 | | MSC | | USD | 313,181 | | 0.09% | | 08/25/2037 | | Monthly | | $ 2,451 | | $ — | | $ (13,247) | | $ (15,698) |
| ABX.HE.AAA.07 | | MSC | | USD | 894,399 | | 0.09% | | 08/25/2037 | | Monthly | | 7,047 | | — | | (37,831) | | (44,878) |
| ABX.HE.PENAAA.06 | | BCLY | | USD | 334,882 | | 0.11% | | 05/25/2046 | | Monthly | | — | | (7,614) | | (24,234) | | (16,620) |
| CMBX.NA.BB.8 | | CSI | | USD | 818,468 | | 5.00% | | 10/17/2057 | | Monthly | | — | | (203,175) | | (299,570) | | (96,395) |
| CMBX.NA.BB.8 | | CSI | | USD | 1,420,481 | | 5.00% | | 10/17/2057 | | Monthly | | — | | (352,618) | | (519,413) | | (166,795) |
| CMBX.NA.BBB-.6 | | GSC | | USD | 10,000,000 | | 3.00% | | 05/11/2063 | | Monthly | | — | | (3,095,953) | | (2,774,461) | | 321,492 |
| CMBX.NA.BBB-.6 | | GSC | | USD | 3,507,000 | | 3.00% | | 05/11/2063 | | Monthly | | — | | (1,149,354) | | (972,738) | | 176,616 |
| CMBX.NA.BBB-.6 | | CSI | | USD | 90,000 | | 3.00% | | 05/11/2063 | | Monthly | | — | | (12,032) | | (24,970) | | (12,938) |
| CMBX.NA.BBB-.6 | | MSC | | USD | 1,160,000 | | 3.00% | | 05/11/2063 | | Monthly | | — | | (158,585) | | (321,814) | | (163,229) |
| PrimeX.ARM.2 (Caa2)(2)(3) | | JPM | | USD | 60,808 | | 4.58% | | 12/25/2037 | | Monthly | | 1,865 | | — | | 287 | | (1,578) |
| Total | | $ 11,363 | | $ (4,979,331) | | $ (4,987,991) | | $ (20,023) |
| Total | | $ 336,216 | | $ (4,979,464) | | $ (4,912,967) | | $ (269,719) |
| Credit default swaps on single-name issues: |
| Buy protection: |
| Aviva plc | | BCLY | | EUR | 2,050,000 | | (1.00%) | | 12/20/2026 | | Quarterly | | $ — | | $ (25,054) | | $ (17,737) | | $ 7,317 |
| Total | | $ — | | $ (25,054) | | $ (17,737) | | $ 7,317 |
| Total OTC credit default swap contracts | | $ 336,216 | | $ (5,004,518) | | $ (4,930,704) | | $ (262,402) |
| (1) | The maximum potential amount the Fund could be required to pay as a seller of credit protection or receive as a buyer of credit protection if a credit event occurs as defined under the terms of that particular swap agreement. |
| (2) | These investments are valued in good faith at fair value as determined under policies and procedures established by and under the supervision of the Board of Directors. At October 31, 2021, the aggregate fair value of these investments are $(1,732), which represented (0.0)% of total net assets. This amount excludes investments that are principally traded in certain foreign markets and whose prices are adjusted pursuant to a third party pricing service methodology approved by the Board of Directors. |
| (3) | Investment valued using significant unobservable inputs. |
| OTC Total Return Swap Contracts Outstanding at October 31, 2021 |
| Reference Entity | | Counter-
party | | Notional
Amount | | Payments
received (paid)
by the Fund | | Expiration
Date | | Periodic
Payment
Frequency | | Upfront
Premiums
Paid | | Upfront
Premiums
Received | | Market
Value† | | Unrealized
Appreciation/
Depreciation |
| iBoxx USD Liquid High Yield | | MSC | | USD | 12,735,000 | | (0.12%) | | 12/20/21 | | At Maturity | | $ — | | $ — | | $ (252,244) | | $ (252,244) |
| iBoxx USD Liquid High Yield | | MSC | | USD | 9,700,000 | | (0.12%) | | 12/20/21 | | At Maturity | | — | | — | | (123,603) | | (123,603) |
The accompanying notes are an integral part of these financial statements.
The Hartford Strategic Income Fund
Schedule of Investments – (continued)
October 31, 2021
| OTC Total Return Swap Contracts Outstanding at October 31, 2021 – (continued) |
| Reference Entity | | Counter-
party | | Notional
Amount | | Payments
received (paid)
by the Fund | | Expiration
Date | | Periodic
Payment
Frequency | | Upfront
Premiums
Paid | | Upfront
Premiums
Received | | Market
Value† | | Unrealized
Appreciation/
Depreciation |
| iBoxx USD Liquid High Yield | | MSC | | USD | 8,730,000 | | (0.12%) | | 12/20/21 | | At Maturity | | $ — | | $ — | | $ 17,172 | | $ 17,172 |
| iBoxx USD Liquid High Yield | | GSC | | USD | 7,660,000 | | (0.12%) | | 12/20/21 | | At Maturity | | — | | — | | (187,026) | | (187,026) |
| iBoxx USD Liquid High Yield | | BCLY | | USD | 103,570,000 | | (0.13%) | | 12/20/21 | | At Maturity | | — | | — | | (3,073,829) | | (3,073,829) |
| iBoxx USD Liquid High Yield | | GSC | | USD | 14,915,000 | | (0.13%) | | 12/20/21 | | At Maturity | | — | | — | | (404,324) | | (404,324) |
| Total OTC total return swap contracts | | $ — | | $ — | | $ (4,023,854) | | $ (4,023,854) |
| Centrally Cleared Credit Default Swap Contracts Outstanding at October 31, 2021 |
| Reference Entity | | Notional
Amount(1) | | (Pay)/Receive
Fixed Rate | | Expiration
Date | | Periodic
Payment
Frequency | | Cost Basis | | Value † | | Unrealized
Appreciation/
(Depreciation) |
| Credit default swaps on indices: |
| Buy protection: |
| CDX.EM.35.V1 | | USD | 44,278,000 | | (1.00%) | | 06/20/2026 | | Quarterly | | $ 1,263,123 | | $ 1,447,288 | | $ 184,165 |
| CDX.EM.36.V1 | | USD | 5,600,000 | | (1.00%) | | 12/20/2026 | | Quarterly | | 183,903 | | 226,173 | | 42,270 |
| Total | | $ 1,447,026 | | $ 1,673,461 | | $ 226,435 |
| Sell protection: |
| CDX.NA.HY.36.V1 | | USD | 8,995,000 | | 5.00% | | 06/20/2026 | | Quarterly | | $ 726,717 | | $ 850,021 | | $ 123,304 |
| Credit default swaps on single-name issues: |
| Buy protection: |
| Standard Chartered | | EUR | 2,192,500 | | (1.00%) | | 12/20/2026 | | Quarterly | | $ (53,611) | | $ (53,920) | | $ (309) |
| United Mexican States | | USD | 1,825,000 | | (1.00%) | | 12/20/2026 | | Quarterly | | (5,431) | | 743 | | 6,174 |
| Total | | $ (59,042) | | $ (53,177) | | $ 5,865 |
| Sell protection: |
| Aviva plc (A) | | EUR | 2,050,000 | | (1.00%) | | 12/20/2026 | | Quarterly | | $ 64,522 | | $ 60,727 | | $ (3,795) |
| Panama Republic (BBB) | | USD | 3,520,000 | | 1.00% | | 06/20/2026 | | Quarterly | | 26,532 | | 27,051 | | 519 |
| Total | | $ 91,054 | | $ 87,778 | | $ (3,276) |
| Total | | $ 32,012 | | $ 34,601 | | $ 2,589 |
| Total centrally cleared credit default swap contracts | | $ 2,205,755 | | $ 2,558,083 | | $ 352,328 |
| (1) | The maximum potential amount the Fund could be required to pay as a seller of credit protection or receive as a buyer of credit protection if a credit event occurs as defined under the terms of that particular swap agreement. |
��
| Centrally Cleared Interest Rate Swap Contracts Outstanding at October 31, 2021 |
Payments made
by Fund | | Payments received
by Fund | | Notional
Amount | | Expiration
Date | | Periodic
Payment
Frequency | | Upfront
Premiums
Paid | | Upfront
Premiums
Received | | Value † | | Unrealized
Appreciation/
(Depreciation) |
| 6.88% Fixed | | 1M MXIBTIIE | | MXN | 12,720,000 | | 06/06/2031 | | Monthly | | $ — | | $ — | | $ 31,340 | | $ 31,340 |
| Total centrally cleared interest rate swaps contracts | | $ — | | $ — | | $ 31,340 | | $ 31,340 |
| Foreign Currency Contracts Outstanding at October 31, 2021 |
Amount and Description of
Currency to be Purchased | | Amount and Description of
Currency to be Sold | | Counterparty | | Settlement
Date | | Appreciation/
(Depreciation) |
| 11,535,000 | BRL | | 2,097,654 | USD | | MSC | | 12/15/2021 | | $ (73,260) |
| 114,200,000 | EGP | | 7,108,179 | USD | | JPM | | 12/15/2021 | | 74,392 |
| 13,790,000 | EGP | | 856,921 | USD | | GSC | | 12/15/2021 | | 10,396 |
| 315,777 | EUR | | 365,629 | USD | | BNP | | 11/30/2021 | | (379) |
| 446,000 | EUR | | 518,201 | USD | | SSG | | 11/30/2021 | | (2,324) |
| 502,000 | EUR | | 586,809 | USD | | MSC | | 11/30/2021 | | (6,159) |
| 279,000 | EUR | | 323,914 | USD | | WEST | | 12/15/2021 | | (1,022) |
| 420,000 | EUR | | 487,296 | USD | | CIBC | | 12/15/2021 | | (1,222) |
| 239,000 | EUR | | 280,093 | USD | | BNP | | 12/15/2021 | | (3,494) |
| 2,404,000 | EUR | | 2,786,215 | USD | | SSG | | 12/15/2021 | | (4,020) |
| 592,000 | EUR | | 690,872 | USD | | MSC | | 12/15/2021 | | (5,739) |
The accompanying notes are an integral part of these financial statements.
The Hartford Strategic Income Fund
Schedule of Investments – (continued)
October 31, 2021
| Foreign Currency Contracts Outstanding at October 31, 2021 – (continued) |
Amount and Description of
Currency to be Purchased | | Amount and Description of
Currency to be Sold | | Counterparty | | Settlement
Date | | Appreciation/
(Depreciation) |
| 435,000 | EUR | | 512,233 | USD | | CBK | | 12/15/2021 | | $ (8,800) |
| 1,372,000 | EUR | | 1,600,089 | USD | | BCLY | | 12/15/2021 | | (12,247) |
| 47,000 | GBP | | 64,426 | USD | | BNP | | 11/30/2021 | | (103) |
| 40,793,000 | MXN | | 1,963,189 | USD | | GSC | | 12/15/2021 | | 4,216 |
| 9,645,217 | USD | | 13,055,000 | AUD | | DEUT | | 12/15/2021 | | (177,178) |
| 13,966,761 | USD | | 75,299,000 | BRL | | GSC | | 12/15/2021 | | 751,774 |
| 1,646,846 | USD | | 2,000,000 | CAD | | CBK | | 11/03/2021 | | 30,818 |
| 2,277,593 | USD | | 2,800,000 | CAD | | JPM | | 11/03/2021 | | 15,155 |
| 1,394,462 | USD | | 1,750,000 | CAD | | DEUT | | 11/03/2021 | | (19,561) |
| 1,030,523 | USD | | 1,300,000 | CAD | | MSC | | 11/10/2021 | | (19,890) |
| 745,944 | USD | | 900,000 | CAD | | BOA | | 11/15/2021 | | 18,738 |
| 1,193,744 | USD | | 1,500,000 | CAD | | WEST | | 11/15/2021 | | (18,267) |
| 197,679 | USD | | 250,000 | CAD | | MSC | | 11/17/2021 | | (4,323) |
| 1,588,125 | USD | | 2,000,000 | CAD | | SSG | | 11/18/2021 | | (27,887) |
| 1,650,491 | USD | | 2,100,000 | CAD | | GSC | | 12/01/2021 | | (46,322) |
| 797,371 | USD | | 1,000,000 | CAD | | MSC | | 12/02/2021 | | (10,641) |
| 467,741 | USD | | 600,000 | CAD | | GSC | | 12/02/2021 | | (17,067) |
| 9,490,391 | USD | | 11,995,000 | CAD | | MSC | | 12/15/2021 | | (202,585) |
| 440,201 | USD | | 550,000 | CAD | | RBC | | 12/16/2021 | | (4,249) |
| 464,635 | USD | | 585,000 | CAD | | CIBC | | 12/16/2021 | | (8,098) |
| 1,581,833 | USD | | 2,000,000 | CAD | | WEST | | 12/16/2021 | | (34,348) |
| 814,886 | USD | | 1,000,000 | CAD | | MSC | | 12/17/2021 | | 6,790 |
| 1,591,691 | USD | | 2,000,000 | CAD | | GSC | | 12/17/2021 | | (24,501) |
| 1,961,890 | USD | | 2,500,000 | CAD | | MSC | | 12/20/2021 | | (58,393) |
| 2,396,688 | USD | | 3,000,000 | CAD | | BNP | | 01/04/2022 | | (27,788) |
| 1,606,375 | USD | | 2,000,000 | CAD | | GSC | | 01/05/2022 | | (9,937) |
| 397,161 | USD | | 500,000 | CAD | | WEST | | 01/06/2022 | | (6,916) |
| 2,681,624 | USD | | 3,340,000 | CAD | | MSC | | 01/06/2022 | | (17,609) |
| 3,934,267 | USD | | 4,900,000 | CAD | | BOA | | 01/06/2022 | | (25,686) |
| 1,607,699 | USD | | 2,000,000 | CAD | | WEST | | 01/10/2022 | | (8,588) |
| 809,177 | USD | | 1,000,000 | CAD | | BNP | | 01/11/2022 | | 1,036 |
| 1,004,989 | USD | | 1,250,000 | CAD | | UBS | | 01/12/2022 | | (5,184) |
| 1,232,457 | USD | | 1,550,000 | CAD | | JPM | | 01/12/2022 | | (20,157) |
| 1,618,576 | USD | | 1,960,000 | CAD | | JPM | | 01/18/2022 | | 34,655 |
| 392,306 | USD | | 500,000 | CAD | | UBS | | 01/26/2022 | | (11,746) |
| 1,543,074 | USD | | 1,925,000 | CAD | | DEUT | | 01/26/2022 | | (12,524) |
| 794,794 | USD | | 1,000,000 | CAD | | RBC | | 01/26/2022 | | (13,308) |
| 4,476,550 | USD | | 5,592,000 | CAD | | MSC | | 01/26/2022 | | (42,360) |
| 6,868,448 | USD | | 8,500,000 | CAD | | GSC | | 01/27/2022 | | (404) |
| 798,754 | USD | | 1,000,000 | CAD | | GSC | | 01/28/2022 | | (9,344) |
| 796,075 | USD | | 1,000,000 | CAD | | DEUT | | 01/31/2022 | | (12,018) |
| 5,361,090 | USD | | 6,705,000 | CAD | | MSC | | 02/07/2022 | | (56,801) |
| 954,366 | USD | | 1,200,000 | CAD | | MSC | | 02/08/2022 | | (15,270) |
| 1,617,688 | USD | | 2,000,000 | CAD | | DEUT | | 02/09/2022 | | 1,645 |
| 800,633 | USD | | 1,020,000 | CAD | | BOA | | 02/15/2022 | | (23,501) |
| 2,345,951 | USD | | 2,905,000 | CAD | | SSG | | 02/22/2022 | | (1,055) |
| 264,570 | USD | | 335,000 | CAD | | BOA | | 02/22/2022 | | (6,083) |
| 1,193,925 | USD | | 1,480,000 | CAD | | DEUT | | 02/24/2022 | | (1,773) |
| 1,090,069 | USD | | 1,370,000 | CAD | | WEST | | 02/24/2022 | | (16,759) |
| 1,993,662 | USD | | 2,500,000 | CAD | | CBK | | 02/24/2022 | | (26,098) |
| 1,210,750 | USD | | 1,500,000 | CAD | | MSC | | 02/25/2022 | | (1,094) |
| 794,730 | USD | | 1,000,000 | CAD | | CIBC | | 03/28/2022 | | (12,922) |
| 3,224,701 | USD | | 4,000,000 | CAD | | GSC | | 04/12/2022 | | (5,439) |
| 2,683,270 | USD | | 3,355,000 | CAD | | MSC | | 04/26/2022 | | (25,641) |
| 537,864 | USD | | 650,000 | CAD | | JPM | | 05/11/2022 | | 13,164 |
| 1,308,012 | USD | | 1,580,000 | CAD | | CBK | | 05/16/2022 | | 32,698 |
| 397,364 | USD | | 500,000 | CAD | | DEUT | | 05/16/2022 | | (6,216) |
| 562,748 | USD | | 700,000 | CAD | | SSG | | 06/01/2022 | | (2,107) |
| 398,587 | USD | | 500,000 | CAD | | JPM | | 06/01/2022 | | (4,881) |
| 801,896 | USD | | 1,000,000 | CAD | | GSC | | 06/01/2022 | | (5,040) |
| 4,028,966 | USD | | 5,000,000 | CAD | | MSC | | 06/01/2022 | | (5,710) |
The accompanying notes are an integral part of these financial statements.
The Hartford Strategic Income Fund
Schedule of Investments – (continued)
October 31, 2021
| Foreign Currency Contracts Outstanding at October 31, 2021 – (continued) |
Amount and Description of
Currency to be Purchased | | Amount and Description of
Currency to be Sold | | Counterparty | | Settlement
Date | | Appreciation/
(Depreciation) |
| 1,587,916 | USD | | 2,000,000 | CAD | | BOA | | 06/01/2022 | | $ (25,955) |
| 812,252 | USD | | 1,000,000 | CAD | | MSC | | 06/10/2022 | | 5,443 |
| 791,765 | USD | | 1,000,000 | CAD | | DEUT | | 06/21/2022 | | (14,889) |
| 1,994,077 | USD | | 2,500,000 | CAD | | BOA | | 06/21/2022 | | (22,558) |
| 1,856,602 | USD | | 2,300,000 | CAD | | WEST | | 06/27/2022 | | 1,492 |
| 807,275 | USD | | 1,000,000 | CAD | | CBK | | 06/27/2022 | | 705 |
| 159,837 | USD | | 200,000 | CAD | | DEUT | | 06/27/2022 | | (1,477) |
| 239,277 | USD | | 300,000 | CAD | | BOA | | 06/27/2022 | | (2,694) |
| 798,748 | USD | | 1,000,000 | CAD | | CBK | | 07/15/2022 | | (7,569) |
| 570,029 | USD | | 700,000 | CAD | | GSC | | 07/27/2022 | | 5,725 |
| 1,208,978 | USD | | 1,500,000 | CAD | | SSG | | 08/16/2022 | | 230 |
| 3,068,470 | USD | | 3,810,000 | CAD | | BOA | | 09/14/2022 | | 242 |
| 168,292,588 | USD | | 144,893,820 | EUR | | DEUT | | 11/30/2021 | | 697,692 |
| 577,455 | USD | | 497,000 | EUR | | CBK | | 11/30/2021 | | 2,588 |
| 114,522,264 | USD | | 96,476,051 | EUR | | BCLY | | 12/15/2021 | | 2,868,695 |
| 5,948,370 | USD | | 5,122,000 | EUR | | CIBC | | 12/15/2021 | | 20,582 |
| 1,126,931 | USD | | 969,000 | EUR | | UBS | | 12/15/2021 | | 5,488 |
| 322,657 | USD | | 277,000 | EUR | | MSC | | 12/15/2021 | | 2,080 |
| 147,940 | USD | | 127,000 | EUR | | CBA | | 12/15/2021 | | 961 |
| 921,546 | USD | | 798,000 | EUR | | BNP | | 12/15/2021 | | (1,995) |
| 1,199,214 | USD | | 1,000,000 | EUR | | GSC | | 04/01/2022 | | 39,032 |
| 9,324,418 | USD | | 6,774,000 | GBP | | DEUT | | 11/30/2021 | | 53,686 |
| 19,112,685 | USD | | 13,852,000 | GBP | | BNP | | 12/15/2021 | | 152,023 |
| 796,299 | USD | | 580,000 | GBP | | DEUT | | 12/15/2021 | | 2,393 |
| 1,367,998 | USD | | 1,000,000 | GBP | | BNP | | 08/01/2022 | | 3,275 |
| 15,978,943 | USD | | 1,749,550,000 | JPY | | BOA | | 11/01/2021 | | 628,543 |
| 12,564,682 | USD | | 1,378,800,000 | JPY | | BOA | | 11/08/2021 | | 466,631 |
| 4,136,336 | USD | | 456,400,000 | JPY | | JPM | | 11/15/2021 | | 131,542 |
| 10,429,952 | USD | | 1,143,700,000 | JPY | | MSC | | 11/22/2021 | | 393,801 |
| 7,279,630 | USD | | 800,000,000 | JPY | | JPM | | 11/29/2021 | | 259,171 |
| 10,531,072 | USD | | 1,157,800,000 | JPY | | BOA | | 12/06/2021 | | 369,280 |
| 15,865,355 | USD | | 1,742,150,000 | JPY | | BCLY | | 12/13/2021 | | 572,435 |
| 19,050,081 | USD | | 2,094,500,000 | JPY | | MSC | | 12/15/2021 | | 663,343 |
| 1,506,049 | USD | | 172,000,000 | JPY | | RBC | | 12/15/2021 | | (3,867) |
| 13,322,641 | USD | | 1,462,500,000 | JPY | | MSC | | 12/20/2021 | | 482,528 |
| 7,981,709 | USD | | 880,250,000 | JPY | | JPM | | 01/06/2022 | | 251,358 |
| 8,014,974 | USD | | 890,400,000 | JPY | | BOA | | 01/11/2022 | | 195,143 |
| 5,175,131 | USD | | 578,250,000 | JPY | | JPM | | 01/18/2022 | | 96,408 |
| 10,663,984 | USD | | 1,213,600,000 | JPY | | JPM | | 01/24/2022 | | 4,471 |
| 2,695,147 | USD | | 294,450,000 | JPY | | BOA | | 01/25/2022 | | 108,857 |
| 910,982 | USD | | 100,000,000 | JPY | | WEST | | 01/27/2022 | | 32,620 |
| 876,777 | USD | | 100,000,000 | JPY | | BCLY | | 01/27/2022 | | (1,585) |
| 3,948,146 | USD | | 449,800,000 | JPY | | BOA | | 01/31/2022 | | (2,828) |
| 15,411,244 | USD | | 1,748,950,000 | JPY | | JPM | | 02/07/2022 | | 47,560 |
| 2,889,950 | USD | | 316,400,000 | JPY | | BOA | | 02/10/2022 | | 110,436 |
| 1,530,949 | USD | | 174,400,000 | JPY | | MSC | | 02/10/2022 | | (1,121) |
| 2,683,419 | USD | | 298,450,000 | JPY | | BNP | | 04/11/2022 | | 59,869 |
| 1,340,930 | USD | | 152,850,000 | JPY | | BOA | | 04/25/2022 | | (2,917) |
| 1,760,541 | USD | | 200,000,000 | JPY | | JPM | | 06/09/2022 | | 777 |
| 9,282,441 | USD | | 187,574,000 | MXN | | GSC | | 12/15/2021 | | 235,940 |
| 3,555,635 | USD | | 265,180,000 | RUB | | BCLY | | 12/15/2021 | | (147,807) |
| Total foreign currency contracts | | $ 8,499,222 |
The accompanying notes are an integral part of these financial statements.
The Hartford Strategic Income Fund
Schedule of Investments – (continued)
October 31, 2021
| Foreign Cross Currency Contracts Outstanding at October 31, 2021 |
Contract
Amount | | Counterparty | | Delivery Date | | Contract
Amount | | Unrealized
Appreciation/
Depreciation |
| EUR | 7,429,901 | | DEUT | | 11/30/2021 | | GBP | 6,271,000 | | $ 11,634 |
| GBP | 74,000 | | BNP | | 11/30/2021 | | EUR | 87,606 | | (57) |
| Total foreign cross currency contracts | | $ 11,577 |
† See Significant Accounting Policies of accompanying Notes to Financial Statements regarding valuation of investments.
Fair Value Summary
The following is a summary of the fair valuations according to the inputs used as of October 31, 2021 in valuing the Fund’s investments.
| Description | | Total | | Level 1 | | Level 2 | | Level 3(1) |
| Assets | | | | | | | | |
| Asset & Commercial Mortgage-Backed Securities | | $ 316,777,638 | | $ — | | $ 307,522,916 | | $ 9,254,722 |
| Convertible Bonds | | 122,538,126 | | — | | 122,538,126 | | — |
| Corporate Bonds | | 845,703,538 | | — | | 845,703,538 | | — |
| Foreign Government Obligations | | 702,361,743 | | — | | 702,361,743 | | — |
| Municipal Bonds | | 24,791,375 | | — | | 24,791,375 | | — |
| Senior Floating Rate Interests | | 666,079,227 | | — | | 666,079,227 | | — |
| U.S. Government Agencies | | 348,969,477 | | — | | 348,969,477 | | — |
| U.S. Government Securities | | 459,154,620 | | — | | 459,154,620 | | — |
| Common Stocks | | | | | | | | |
| Energy | | 121,527 | | 94,856 | | — | | 26,671 |
| Convertible Preferred Stocks | | 14,413,507 | | 14,413,507 | | — | | — |
| Escrows | | 2,623,490 | | — | | 2,623,490 | | — |
| Warrants | | 84 | | — | | — | | 84 |
| Short-Term Investments | | 147,874,252 | | 18,971,906 | | 128,902,346 | | — |
| Purchased Options | | 493,880 | | — | | 493,880 | | — |
| Foreign Currency Contracts(2) | | 10,018,661 | | — | | 10,018,661 | | — |
| Futures Contracts(2) | | 5,589,299 | | 5,589,299 | | — | | — |
| Swaps - Credit Default(2) | | 861,857 | | — | | 861,857 | | — |
| Swaps - Interest Rate(2) | | 31,340 | | — | | 31,340 | | — |
| Swaps- Total Return(2) | | 17,172 | | — | | 17,172 | | — |
| Total | | $ 3,668,420,813 | | $ 39,069,568 | | $ 3,620,069,768 | | $ 9,281,477 |
| Liabilities | | | | | | | | |
| Foreign Currency Contracts(2) | | $ (1,507,862) | | $ — | | $ (1,507,862) | | $ — |
| Futures Contracts(2) | | (5,749,828) | | (5,749,828) | | — | | — |
| Swaps - Credit Default(2) | | (771,931) | | — | | (770,199) | | (1,732) |
| Swaps - Total Return(2) | | (4,041,026) | | — | | (4,041,026) | | — |
| Written Options | | (875,883) | | — | | (875,883) | | — |
| Total | | $ (12,946,530) | | $ (5,749,828) | | $ (7,194,970) | | $ (1,732) |
| (1) | For the year ended October 31, 2021, investments valued at $55,747 were transferred out of Level 3 due to the initiation of a vendor providing prices that are based on market activity which has been determined to be significant observable input. There were no transfers into Level 3. |
| (2) | Derivative instruments (excluding purchased and written options, if applicable) are valued at the unrealized appreciation/(depreciation) on the investments. |
Level 3 investments at the beginning and/or end of the period in relation to net assets were not significant and accordingly, a reconciliation of Level 3 assets for the year ended October 31, 2021 is not presented.
The accompanying notes are an integral part of these financial statements.
Hartford Sustainable Municipal Bond Fund (formerly, Hartford Muncipal Income Fund)
Schedule of Investments
October 31, 2021
| Shares or Principal Amount | | Market Value† |
| MUNICIPAL BONDS - 100.4% |
| | Alabama - 0.7% |
| $ 150,000 | Jefferson County, AL, Board of Education Special Tax 5.00%, 02/01/2046 | $ 181,056 |
| 300,000 | State of Alabama, Docks Department, (AGM Insured) 5.00%, 10/01/2024 | 337,214 |
| 335,000 | State of Alabama, Troy University Rev, (BAM Insured) 5.00%, 11/01/2023 | 365,591 |
| | | | 883,861 |
| | Arizona - 1.9% |
| 325,000 | City of Phoenix, AZ, Civic Improvement Corp. 5.00%, 07/01/2031 | 393,946 |
| | Maricopa County, AZ, Industrial Dev Auth | |
| 775,000 | 3.00%, 09/01/2039 | 829,715 |
| 100,000 | 5.00%, 09/01/2042 | 121,725 |
| 200,000 | Salt Verde Financial Corp., AZ, Rev 5.00%, 12/01/2037 | 274,191 |
| | Tempe, AZ, Industrial Dev Auth Rev | |
| 15,000 | 4.00%, 10/01/2023(1) | 15,004 |
| 225,000 | 4.00%, 12/01/2024 | 241,237 |
| 270,000 | 4.00%, 12/01/2025 | 294,044 |
| 240,000 | 4.00%, 12/01/2026 | 264,418 |
| | | | 2,434,280 |
| | California - 4.5% |
| 50,000 | Alameda County, Oakland, CA, Unified School Dist, GO, (AGM Insured) 4.00%, 08/01/2034 | 57,893 |
| 195,000 | California Enterprise Dev Auth 5.00%, 08/01/2045 | 234,611 |
| | California Municipal Finance Auth, (BAM Insured) | |
| 500,000 | 4.00%, 05/15/2038 | 583,163 |
| 350,000 | 4.00%, 10/01/2046 | 403,014 |
| 165,000 | California Public Finance Auth 2.38%, 11/15/2028(1) | 166,355 |
| | Cathedral City, CA, Redev Agency Successor Agency | |
| 145,000 | 4.00%, 08/01/2022 | 148,469 |
| 340,000 | 4.00%, 08/01/2032 | 400,643 |
| 100,000 | City of Los Angeles, CA, Department of Airports Rev 5.00%, 05/15/2026 | 114,810 |
| 45,000 | Elk Grove, CA, Finance Auth Special Tax, (BAM Insured) 5.00%, 09/01/2032 | 52,346 |
| 150,000 | Foothill-Eastern Transportation Corridor Agency, CA 5.00%, 01/15/2029 | 183,360 |
| 90,000 | Los Angeles County, CA, Metropolitan Transportation Auth 4.00%, 06/01/2034 | 101,600 |
| | Orange County, CA, Community Facs Dist Special Tax | |
| 100,000 | 5.00%, 08/15/2023 | 107,750 |
| 150,000 | 5.00%, 08/15/2033 | 172,600 |
| 100,000 | Romoland, CA, School Dist Special Tax 5.00%, 09/01/2043 | 113,694 |
| 100,000 | San Bernardino City, CA, Unified School Dist, GO, (NATL Insured) 0.00%, 08/01/2027(2) | 91,945 |
| 255,000 | San Joaquin Hills, CA, Transportation Corridor Agency, (NATL Insured) 0.01%, 01/15/2025(2) | 248,292 |
| | State of California, GO | |
| 1,000,000 | 4.00%, 03/01/2036 | 1,184,409 |
| Shares or Principal Amount | | Market Value† |
| MUNICIPAL BONDS - 100.4% - (continued) |
| | California - 4.5% - (continued) |
| $ 140,000 | 4.00%, 11/01/2041 | $ 157,176 |
| 1,000,000 | University of California, Rev 4.00%, 05/15/2038 | 1,196,911 |
| | | | 5,719,041 |
| | Colorado - 3.8% |
| 175,000 | City & County of Denver, CO, Airport System Rev 5.00%, 12/01/2036 | 239,106 |
| | Colorado Health Facs Auth Rev | |
| 200,000 | 4.00%, 12/01/2040 | 229,147 |
| 1,500,000 | 4.00%, 11/15/2046 | 1,750,208 |
| 150,000 | Denver, CO, Convention Center Hotel Auth 5.00%, 12/01/2040 | 170,184 |
| 305,000 | E-470 Public Highway, CO, Auth Rev 0.38%, 09/01/2039, 1 mo. USD SOFR + 0.350%(3) | 305,651 |
| | Park Creek, CO, Metropolitan Dist Rev | |
| 100,000 | 5.00%, 12/01/2023 | 109,056 |
| 120,000 | 5.00%, 12/01/2029 | 149,029 |
| 500,000 | Regional Transportation Dist, CO 4.00%, 07/15/2039 | 633,024 |
| 1,000,000 | State of Colorado 5.00%, 12/15/2033 | 1,303,386 |
| 25,000 | Vauxmont, CO, Metropolitan Dist, GO, (AGM Insured) 5.00%, 12/15/2030 | 28,660 |
| | | | 4,917,451 |
| | Connecticut - 3.2% |
| 200,000 | City of Bridgeport, CT, GO, (BAM Insured) 5.00%, 07/15/2048 | 239,991 |
| | Connecticut State Health & Educational Facs Auth | |
| 750,000 | 5.00%, 07/01/2040 | 935,803 |
| 60,000 | 5.00%, 07/01/2042 | 70,271 |
| | Connecticut State Higher Education Supplement Loan Auth | |
| 700,000 | 5.00%, 11/15/2025 | 811,447 |
| 720,000 | 5.00%, 11/15/2026 | 855,116 |
| 250,000 | Hamden, CT, GO, (AGM Insured) 5.00%, 08/15/2025 | 290,821 |
| 50,000 | Hartford, CT, GO, (AGM ST GTD Insured) 5.00%, 07/01/2027 | 57,463 |
| | State of Connecticut, GO | |
| 160,000 | 3.00%, 01/15/2023 | 165,347 |
| 170,000 | 5.00%, 06/15/2026 | 196,698 |
| 250,000 | State of Connecticut, Special Tax Rev 5.00%, 05/01/2033 | 321,864 |
| 100,000 | Waterbury, CT, GO 5.00%, 11/15/2047 | 120,204 |
| | | | 4,065,025 |
| | District of Columbia - 0.3% |
| 150,000 | Dist of Columbia Rev 5.00%, 07/01/2042 | 160,050 |
| 150,000 | Dist of Columbia, GO 5.00%, 06/01/2032 | 167,242 |
| | | | 327,292 |
| | Florida - 4.5% |
| 300,000 | Broward County, FL, Airport System Rev 5.00%, 09/01/2028 | 377,428 |
| 135,000 | Capital Projects, FL, Finance Auth 5.00%, 10/01/2027 | 159,546 |
| 70,000 | City of Atlantic Beach, FL, Health Care Facs Auth 5.00%, 11/15/2048 | 78,868 |
The accompanying notes are an integral part of these financial statements.
Hartford Sustainable Municipal Bond Fund (formerly, Hartford Muncipal Income Fund)
Schedule of Investments – (continued)
October 31, 2021
| Shares or Principal Amount | | Market Value† |
| MUNICIPAL BONDS - 100.4% - (continued) |
| | Florida - 4.5% - (continued) |
| $ 200,000 | Jacksonville, FL, Sales Tax Rev 5.00%, 10/01/2030 | $ 208,596 |
| 150,000 | JEA, FL, Electric System Rev 5.00%, 10/01/2028 | 185,334 |
| 150,000 | JEA, FL, Water & Sewer System Rev 5.00%, 10/01/2028 | 186,213 |
| 125,000 | Lee County, FL, Airport Rev 5.00%, 10/01/2032 | 145,193 |
| 65,000 | Miami-Dade County, FL, Seaport Department Rev 5.00%, 10/01/2023 | 70,684 |
| | Orange County, FL, Convention Center/Orlando | |
| 500,000 | 5.00%, 10/01/2023 | 543,319 |
| 285,000 | 5.00%, 10/01/2024 | 321,679 |
| 125,000 | 5.00%, 10/01/2027 | 153,455 |
| 100,000 | Orange County, FL, Health Facs Auth 5.00%, 08/01/2031 | 109,417 |
| 475,000 | Orlando, FL, Utilities Commission 1.25%, 10/01/2046(3) | 475,180 |
| 430,000 | Palm Beach County, FL, Health Facs Auth 2.63%, 06/01/2025 | 436,999 |
| 240,000 | Polk County, FL, Industrial Dev Auth 5.00%, 01/01/2029 | 270,458 |
| 200,000 | Port St. Lucie, FL, Special Assessment 4.00%, 07/01/2027 | 229,306 |
| 60,000 | Putnam County, FL, Dev Auth 5.00%, 03/15/2042 | 71,212 |
| 200,000 | Seminole County, FL, Industrial Dev Auth 3.75%, 11/15/2025 | 200,832 |
| 750,000 | St. Johns County, FL, Industrial Dev Auth 4.00%, 12/15/2041 | 815,689 |
| 70,000 | Volusia County, FL, Educational Facs Auth 4.00%, 10/15/2035 | 80,634 |
| 550,000 | Wildwood Utility Dependent Dist 5.00%, 10/01/2031 | 712,229 |
| | | | 5,832,271 |
| | Georgia - 3.3% |
| 100,000 | Appling County, GA, Dev Auth Rev 1.50%, 01/01/2038(3) | 102,462 |
| | Burke County, GA, Dev Auth Rev | |
| 280,000 | 1.50%, 01/01/2040(3) | 286,894 |
| 1,000,000 | 1.55%, 12/01/2049(3) | 1,009,755 |
| 165,000 | 2.25%, 10/01/2032(3) | 169,589 |
| 125,000 | 3.00%, 11/01/2045(3) | 128,896 |
| 20,000 | Georgia Housing & Finance Auth Rev 3.50%, 06/01/2039 | 20,907 |
| | Main Street Natural Gas, Inc., GA | |
| 170,000 | 5.00%, 05/15/2032 | 209,247 |
| 315,000 | 5.50%, 09/15/2028 | 395,872 |
| 1,000,000 | Municipal Electric Auth of Georgia 5.00%, 01/01/2035 | 1,291,075 |
| | Municipal Electric Auth, GA | |
| 135,000 | 5.00%, 01/01/2024 | 148,179 |
| 100,000 | 5.00%, 01/01/2028 | 118,055 |
| 235,000 | 5.00%, 01/01/2033 | 298,232 |
| 85,000 | 5.00%, 01/01/2056 | 101,525 |
| | | | 4,280,688 |
| | Idaho - 0.5% |
| 500,000 | Idaho Housing & Finance Association 4.00%, 07/15/2036 | 597,811 |
| Shares or Principal Amount | | Market Value† |
| MUNICIPAL BONDS - 100.4% - (continued) |
| | Illinois - 12.0% |
| $ 65,000 | Champaign County, IL, Community Unit School Dist No. 4 Champaign, GO 0.00%, 01/01/2025(2) | $ 63,344 |
| 100,000 | Chicago, IL, Board of Education Rev 5.75%, 04/01/2035 | 120,538 |
| | Chicago, IL, Board of Education, GO | |
| 150,000 | 5.00%, 12/01/2027 | 180,832 |
| 500,000 | 5.00%, 12/01/2041 | 607,309 |
| 200,000 | 5.00%, 12/01/2046 | 236,730 |
| 200,000 | 5.25%, 12/01/2023 | 212,546 |
| 140,000 | 5.25%, 12/01/2039 | 154,236 |
| | Chicago, IL, Metropolitan Water Reclamation Dist, GO | |
| 235,000 | 5.00%, 12/01/2025 | 275,852 |
| 270,000 | 5.25%, 12/01/2032 | 368,743 |
| | Chicago, IL, Transit Auth, (AGM-CR Insured) | |
| 100,000 | 5.00%, 12/01/2044 | 112,872 |
| 175,000 | 5.00%, 12/01/2045 | 214,333 |
| 250,000 | 5.00%, 12/01/2046 | 294,203 |
| 160,000 | 5.25%, 12/01/2024 | 160,657 |
| | City of Chicago, IL, GO | |
| 85,000 | 5.00%, 01/01/2022 | 85,645 |
| 250,000 | 5.00%, 01/01/2026 | 281,722 |
| | City of Decatur, IL, GO, (AGM Insured) | |
| 110,000 | 5.00%, 03/01/2034 | 128,564 |
| 150,000 | 5.00%, 03/01/2035 | 175,036 |
| 865,000 | City of Granite, IL, Rev 1.25%, 05/01/2027(3) | 859,976 |
| | Cook County, IL, Community High School Dist No. 212 Leyden, (BAM Insured) | |
| 105,000 | 5.00%, 12/01/2027 | 119,550 |
| 170,000 | 5.00%, 12/01/2030 | 193,221 |
| 185,000 | Cook County, IL, GO 5.00%, 11/15/2031 | 240,569 |
| 1,665,000 | Cook County, IL, School Dist No. 78 Rosemont, GO, (AGM Insured) 5.00%, 12/01/2029 | 2,114,250 |
| 225,000 | County of Cook IL Sales Tax Rev 5.00%, 11/15/2029 | 286,846 |
| | Illinois State Finance Auth Rev | |
| 150,000 | 5.00%, 11/15/2030 | 171,649 |
| 115,000 | 5.00%, 08/15/2033 | 148,259 |
| 245,000 | 5.00%, 08/15/2035 | 280,937 |
| 150,000 | 5.00%, 10/01/2041 | 176,253 |
| 230,000 | 5.00%, 05/15/2050(3) | 255,888 |
| | Illinois State Toll Highway Auth, Taxable Rev | |
| 300,000 | 5.00%, 01/01/2030 | 383,906 |
| 100,000 | 5.00%, 01/01/2031 | 125,411 |
| 150,000 | Kane Cook & DuPage Counties, IL, GO 5.00%, 01/01/2035 | 164,097 |
| | Kane County, IL, School Dist No. 131 Aurora East Side, GO, (AGM Insured) | |
| 75,000 | 5.00%, 12/01/2025 | 86,888 |
| 130,000 | 5.00%, 12/01/2026 | 154,557 |
| 100,000 | Kane McHenry Cook & DeKalb Counties, IL, Unified School Dist, GO 5.00%, 01/01/2023 | 105,380 |
| | Kendall Kane & Will Counties, IL, Unified School Dist, GO, (AGM Insured) | |
| 515,000 | 5.00%, 02/01/2025 | 582,574 |
| 495,000 | 5.00%, 02/01/2025 | 559,950 |
| | Metropolitan Pier & Exposition Auth, IL | |
| 105,000 | 0.00%, 12/15/2042(4) | 88,680 |
| 200,000 | 5.00%, 12/15/2045 | 237,118 |
The accompanying notes are an integral part of these financial statements.
Hartford Sustainable Municipal Bond Fund (formerly, Hartford Muncipal Income Fund)
Schedule of Investments – (continued)
October 31, 2021
| Shares or Principal Amount | | Market Value† |
| MUNICIPAL BONDS - 100.4% - (continued) |
| | Illinois - 12.0% - (continued) |
| | Regional Transportation, IL, Auth Rev | |
| $ 80,000 | 5.00%, 06/01/2026 | $ 89,501 |
| 125,000 | 6.25%, 07/01/2022 | 129,999 |
| | Sales Tax Securitization Corp., IL Rev | |
| 150,000 | 5.00%, 01/01/2029 | 183,762 |
| 1,000,000 | 5.00%, 01/01/2037 | 1,254,874 |
| | State of Illinois, GO | |
| 225,000 | 5.00%, 11/01/2021 | 225,000 |
| 400,000 | 5.00%, 11/01/2026 | 471,804 |
| 50,000 | 5.00%, 02/01/2027 | 59,251 |
| 150,000 | 5.00%, 11/01/2028 | 178,828 |
| 355,000 | 5.00%, 03/01/2029 | 434,174 |
| 250,000 | 5.00%, 05/01/2029 | 275,320 |
| 330,000 | 5.00%, 10/01/2031 | 409,071 |
| 315,000 | 5.00%, 12/01/2034 | 368,437 |
| 215,000 | 5.00%, 03/01/2046 | 257,566 |
| 90,000 | University of Illinois, IL, Auxiliary Facs Rev 5.00%, 04/01/2024 | 95,948 |
| | | | 15,442,656 |
| | Indiana - 2.0% |
| 82,488 | City of Evansville, IN, Rev, (FNMA Insured) 3.00%, 06/01/2034 | 88,112 |
| 1,470,000 | Crown Point Multi School Building Corp. 5.00%, 01/15/2029(5) | 1,841,134 |
| | Indiana Housing & Community Dev Auth Rev, (GNMA/FNMA/FHLMC Insured) | |
| 230,000 | 3.00%, 07/01/2051 | 247,139 |
| 250,000 | 3.25%, 07/01/2049 | 267,034 |
| 115,000 | Indiana Municipal Power Agency 5.00%, 01/01/2033 | 140,648 |
| | | | 2,584,067 |
| | Iowa - 0.6% |
| 675,000 | Iowa Finance Auth, (GNMA/FNMA/FHLMC Insured) 3.00%, 07/01/2051 | 727,718 |
| 15,000 | State of Iowa, Finance Auth Rev 2.88%, 05/15/2049 | 15,060 |
| | | | 742,778 |
| | Kentucky - 0.3% |
| 225,000 | Kentucky Bond Dev Corp. 5.00%, 09/01/2035 | 276,305 |
| 90,000 | Kentucky Economic Dev Finance Auth, (AGM Insured) 5.00%, 12/01/2047 | 94,020 |
| | | | 370,325 |
| | Louisiana - 0.8% |
| 325,000 | East Baton Rouge, LA, Sewerage Commission 1.30%, 02/01/2041(3) | 329,329 |
| | Louisiana State Local Gov't Environmental Facs & Community Dev Auth Rev | |
| 100,000 | 5.75%, 11/15/2030 | 109,265 |
| 100,000 | 6.00%, 11/15/2030 | 110,203 |
| | Louisiana State Public Facs Auth Rev | |
| 100,000 | 5.00%, 05/15/2035 | 111,686 |
| 100,000 | 5.00%, 05/15/2047 | 114,924 |
| 185,000 | Regional Transportation Auth, LA, Sales Tax Rev, (AGM Insured) 5.00%, 01/01/2026 | 217,463 |
| | | | 992,870 |
| Shares or Principal Amount | | Market Value† |
| MUNICIPAL BONDS - 100.4% - (continued) |
| | Maine - 0.4% |
| $ 465,000 | Maine Health & Higher Educational Facs Auth, (AGM Insured) 4.00%, 07/01/2046 | $ 539,967 |
| | Maryland - 1.5% |
| 665,000 | Maryland Community Dev Administration 3.00%, 09/01/2051 | 714,563 |
| 810,000 | Maryland Stadium Auth Rev, (ST INTERCEPT Insured) 5.00%, 05/01/2050 | 1,172,247 |
| | | | 1,886,810 |
| | Massachusetts - 5.6% |
| 1,500,000 | Massachusetts Clean Water Trust 5.00%, 02/01/2040 | 1,944,682 |
| | Massachusetts Dev Finance Agency, Rev | |
| 1,500,000 | 5.00%, 07/01/2025 | 1,736,524 |
| 105,000 | 5.00%, 07/01/2034 | 121,033 |
| 150,000 | 5.00%, 07/01/2048 | 179,310 |
| | Massachusetts Educational Financing Auth | |
| 880,000 | 5.00%, 07/01/2024 | 973,509 |
| 500,000 | 5.00%, 01/01/2025 | 566,691 |
| | Massachusetts Housing Finance Agency | |
| 145,000 | 3.00%, 12/01/2050 | 156,354 |
| 330,000 | 3.15%, 06/01/2023 | 341,762 |
| 300,000 | 3.30%, 06/01/2024 | 316,663 |
| | Massachusetts State Dev Finance Agency | |
| 115,000 | 5.00%, 07/15/2022(1) | 118,154 |
| 145,000 | 5.00%, 07/01/2037 | 174,849 |
| 150,000 | 5.00%, 07/01/2044 | 178,868 |
| 100,000 | 5.00%, 10/01/2047(1) | 108,145 |
| 200,000 | Massachusetts State, Port Auth Rev 4.00%, 07/01/2046 | 221,070 |
| | | | 7,137,614 |
| | Michigan - 1.9% |
| 85,000 | City of Detroit, MI, GO, 5.00%, 04/01/2022 | 86,391 |
| 450,000 | Ecorse, MI, Public School Dist, GO, (Q-SBLF Insured) 5.00%, 05/01/2027 | 550,723 |
| 150,000 | Great Lakes, MI, Water Auth Water Supply System Rev 5.00%, 07/01/2046 | 174,649 |
| 250,000 | Lansing, MI, School Dist, GO, (Q-SBLF Insured) 5.00%, 05/01/2037 | 311,629 |
| | Michigan Finance Auth Rev | |
| 165,000 | 5.00%, 11/01/2034 | 205,423 |
| 100,000 | 5.00%, 07/01/2035 | 114,709 |
| 100,000 | 5.00%, 05/15/2038 | 113,870 |
| 90,000 | Michigan State Hospital Finance Auth 5.00%, 11/15/2047 | 112,067 |
| 300,000 | New Haven, MI, Community Schools, GO, (Q-SBLF Insured) 5.00%, 05/01/2032 | 380,790 |
| 255,000 | Richmond, MI, Community Schools, GO, (Q-SBLF Insured) 5.00%, 05/01/2030 | 324,285 |
| 50,000 | State of Michigan Rev 5.00%, 03/15/2027 | 61,084 |
| | | | 2,435,620 |
| | Minnesota - 4.3% |
| | Duluth, MN, Independent School Dist No. 709, (SD CRED PROG Insured) | |
| 20,000 | 4.00%, 02/01/2027 | 22,634 |
| 250,000 | 5.00%, 02/01/2024 | 273,638 |
| 78,411 | Freddie Mac Multifamily, MN, Certificates 2.54%, 06/25/2037 | 81,217 |
The accompanying notes are an integral part of these financial statements.
Hartford Sustainable Municipal Bond Fund (formerly, Hartford Muncipal Income Fund)
Schedule of Investments – (continued)
October 31, 2021
| Shares or Principal Amount | | Market Value† |
| MUNICIPAL BONDS - 100.4% - (continued) |
| | Minnesota - 4.3% - (continued) |
| $ 100,000 | Minneapolis-St. Paul, MN, Metropolitan Airports Commission 5.00%, 01/01/2031 | $ 117,890 |
| 1,000,000 | Minnesota Higher Education Facs Auth 4.00%, 10/01/2050 | 1,161,533 |
| | Minnesota Housing Finance Agency | |
| 990,000 | 3.00%, 01/01/2051 | 1,062,625 |
| 1,040,000 | 3.00%, 07/01/2052 | 1,124,532 |
| 1,300,000 | 5.00%, 09/01/2024 | 1,469,941 |
| 200,000 | St. Francis, MN, Independent School Dist No. 15, GO, (SD CRED PROG Insured) 4.00%, 02/01/2029 | 207,924 |
| | | | 5,521,934 |
| | Mississippi - 0.8% |
| 80,000 | Mississippi Home Corp., (GNMA/FNMA/FHLMC Insured) 3.00%, 12/01/2050 | 85,995 |
| | State of Mississippi, Gaming Tax Rev | |
| 200,000 | 5.00%, 10/15/2022 | 208,683 |
| 175,000 | 5.00%, 10/15/2026 | 209,293 |
| 400,000 | 5.00%, 10/15/2037 | 489,740 |
| | | | 993,711 |
| | Missouri - 1.2% |
| 250,000 | Bi-State Dev Agency of the Missouri-Illinois Metropolitan Dist 4.00%, 10/01/2036 | 294,959 |
| 165,000 | City of St. Louis, MO, Airport Rev 5.00%, 07/01/2031 | 204,995 |
| | Kirkwood, MO, Industrial Dev Auth Retirement Community | |
| 100,000 | 5.25%, 05/15/2032 | 112,319 |
| 100,000 | 5.25%, 05/15/2050 | 109,474 |
| 200,000 | St. Louis County, MO, Industrial Dev Auth 5.00%, 09/01/2023 | 213,415 |
| 550,000 | State of Missouri, Health & Educational Facs Auth 4.00%, 07/01/2035 | 664,748 |
| | | | 1,599,910 |
| | Montana - 0.2% |
| 105,000 | Montana Board of Housing Rev, (FHA HUD VA Insured) 4.25%, 12/01/2045 | 114,486 |
| 150,000 | Montana Facs Finance Auth Rev 5.00%, 02/15/2033 | 177,716 |
| | | | 292,202 |
| | Nebraska - 0.9% |
| 300,000 | Central Plains, NE, Energy Project 5.00%, 09/01/2025 | 346,751 |
| 480,000 | Nebraska Investment Finance Auth, (GNMA/FNMA/FHLMC Insured) 3.00%, 09/01/2045 | 516,458 |
| 300,000 | Washington County, NE, Rev 0.90%, 09/01/2030(3) | 301,447 |
| | | | 1,164,656 |
| | Nevada - 2.3% |
| 100,000 | City of North Las Vegas, NV 3.50%, 06/01/2023 | 102,868 |
| 150,000 | City of Reno, NV, Sales Tax Rev, (AGM Insured) 5.00%, 06/01/2033 | 179,654 |
| 30,000 | City of Sparks, NV 2.50%, 06/15/2024(1) | 30,394 |
| | Clark County, NV, School Dist, GO, (AGM Insured) | |
| 250,000 | 4.00%, 06/15/2036 | 294,950 |
| 1,415,000 | 5.00%, 06/15/2026 | 1,682,817 |
| Shares or Principal Amount | | Market Value† |
| MUNICIPAL BONDS - 100.4% - (continued) |
| | Nevada - 2.3% - (continued) |
| $ 225,000 | 5.00%, 06/15/2028 | $ 270,454 |
| 100,000 | 5.00%, 06/15/2029 | 122,713 |
| 250,000 | Las Vegas, NV, New Convention Center Auth Rev 5.00%, 07/01/2043 | 298,927 |
| | | | 2,982,777 |
| | New Hampshire - 0.9% |
| 1,000,000 | New Hampshire Business Finance Auth 4.00%, 01/01/2051 | 1,073,141 |
| 70,000 | New Hampshire Health and Education Facs Auth Act Rev 5.00%, 08/01/2059 | 107,918 |
| | | | 1,181,059 |
| | New Jersey - 1.4% |
| 175,000 | New Jersey Economic Dev Auth 5.00%, 06/15/2023 | 187,871 |
| 40,000 | New Jersey Educational Facs Auth Rev, (AGM Insured) 4.00%, 07/01/2050 | 45,041 |
| | New Jersey Transportation Trust Fund Auth | |
| 65,000 | 5.00%, 12/15/2023 | 71,240 |
| 70,000 | 5.00%, 12/15/2024 | 79,535 |
| 570,000 | 5.00%, 06/15/2031 | 738,455 |
| 350,000 | New Jersey Turnpike Auth Rev, (AGM Insured) 5.25%, 01/01/2026 | 415,211 |
| 230,000 | State of New Jersey, GO 5.00%, 06/01/2026 | 272,326 |
| | | | 1,809,679 |
| | New Mexico - 0.9% |
| 205,000 | City of Santa Fe, NM, Rev 5.00%, 05/15/2039 | 230,070 |
| 825,000 | New Mexico Mortgage Finance Auth, (GNMA/FNMA/FHLMC Insured) 3.00%, 01/01/2052 | 889,159 |
| | | | 1,119,229 |
| | New York - 12.2% |
| 405,000 | Brookhaven, NY, Local Dev Corp. 1.63%, 11/01/2025 | 415,215 |
| | City of New York, NY, GO | |
| 1,800,000 | 0.03%, 08/01/2040(3) | 1,800,000 |
| 130,000 | 4.00%, 03/01/2038 | 152,886 |
| 1,500,000 | 4.00%, 08/01/2040 | 1,764,919 |
| 125,000 | 5.00%, 03/01/2039 | 156,029 |
| 140,000 | City of New York, NY, Rev 4.00%, 11/01/2035 | 165,467 |
| 85,000 | Huntington, NY, Local Dev Corp. 3.00%, 07/01/2025 | 87,138 |
| 500,000 | Long Island, NY, Power Auth Rev 0.85%, 09/01/2050(3) | 500,744 |
| | Metropolitan Transportation Auth, NY, Rev | |
| 1,240,000 | 5.00%, 03/01/2022 | 1,259,275 |
| 650,000 | 5.00%, 11/15/2023 | 681,680 |
| 200,000 | 5.00%, 11/15/2033 | 248,387 |
| 500,000 | 5.00%, 11/15/2034(3) | 554,548 |
| 300,000 | 5.00%, 11/15/2036 | 356,840 |
| 500,000 | 5.00%, 11/15/2045 | 601,916 |
| 400,000 | 5.00%, 11/15/2052 | 469,120 |
| 100,000 | 5.25%, 11/15/2027 | 121,151 |
| 100,000 | 5.25%, 11/15/2036 | 120,506 |
| | New York City, NY, Transitional Finance Auth, Future Tax Secured Rev | |
| 125,000 | 4.00%, 05/01/2035 | 147,842 |
| 215,000 | 4.00%, 05/01/2040 | 250,501 |
| 265,000 | 5.00%, 11/01/2032 | 343,905 |
The accompanying notes are an integral part of these financial statements.
Hartford Sustainable Municipal Bond Fund (formerly, Hartford Muncipal Income Fund)
Schedule of Investments – (continued)
October 31, 2021
| Shares or Principal Amount | | Market Value† |
| MUNICIPAL BONDS - 100.4% - (continued) |
| | New York - 12.2% - (continued) |
| | New York State Dormitory Auth Rev | |
| $ 1,870,000 | 0.05%, 07/01/2031(3) | $ 1,870,000 |
| 450,000 | 4.00%, 02/15/2037 | 527,397 |
| 150,000 | 5.00%, 03/15/2031 | 174,003 |
| 500,000 | New York State Urban Dev Corp. Rev 5.00%, 03/15/2032 | 645,565 |
| | State of New York Mortgage Agency | |
| 300,000 | 3.25%, 10/01/2024 | 318,959 |
| 300,000 | 3.25%, 04/01/2025 | 312,657 |
| 745,000 | 3.25%, 10/01/2050 | 804,972 |
| 185,000 | 3.50%, 10/01/2032 | 199,656 |
| | Syracuse, NY, Industrial Dev Agency | |
| 110,000 | 5.00%, 01/01/2031 | 105,353 |
| 50,000 | 5.00%, 01/01/2033 | 47,552 |
| 525,000 | Westchester City, NY, Local Dev 2.88%, 07/01/2026 | 525,056 |
| | | | 15,729,239 |
| | North Carolina - 2.3% |
| | North Carolina Medical Care Commission Retirement Finance Auth Rev, First Mortgage Galloway Ridge | |
| 100,000 | 2.88%, 10/01/2026 | 100,332 |
| 175,000 | 4.00%, 09/01/2033 | 203,171 |
| 185,000 | 4.00%, 09/01/2034 | 214,131 |
| 250,000 | 5.00%, 01/01/2031 | 282,890 |
| | North Carolina Medical Care Commission Rev | |
| 30,000 | 5.00%, 01/01/2039 | 33,467 |
| 120,000 | 5.00%, 01/01/2044 | 134,525 |
| 2,000,000 | University of North Carolina at Chapel Hill 0.18%, 12/01/2041, 1 mo. USD LIBOR + 0.125%(3) | 2,000,125 |
| | | | 2,968,641 |
| | North Dakota - 0.5% |
| 560,000 | North Dakota Housing Finance Agency 3.00%, 01/01/2052 | 603,785 |
| | Ohio - 1.0% |
| 50,000 | Allen County, OH, Hospital Facs Rev 5.00%, 12/01/2035 | 63,150 |
| 200,000 | American Municipal Power, Inc., OH Rev 4.00%, 02/15/2036 | 220,659 |
| 150,000 | Cleveland, OH, Department of Public Utilities, (AGM Insured) 5.00%, 11/15/2030 | 183,825 |
| 500,000 | Southern Ohio Port Auth Rev 6.50%, 12/01/2030(1) | 574,332 |
| 140,000 | State of Ohio, GO 5.00%, 06/15/2036 | 176,371 |
| | | | 1,218,337 |
| | Oklahoma - 0.3% |
| | Oklahoma Dev Finance Auth | |
| 340,000 | 1.63%, 07/06/2023 | 342,314 |
| 35,000 | 5.25%, 08/15/2048 | 42,388 |
| 35,000 | 5.50%, 08/15/2057 | 42,732 |
| | | | 427,434 |
| | Oregon - 1.5% |
| 55,000 | Benton & Linn Counties, OR, Consolidated School Dist No. 509J & 509A Corvallis, GO, (School Board Guaranty Insured) 5.00%, 06/15/2038 | 67,635 |
| Shares or Principal Amount | | Market Value† |
| MUNICIPAL BONDS - 100.4% - (continued) |
| | Oregon - 1.5% - (continued) |
| $ 480,000 | Columbia County, OR, School Dist No. 502, GO, (School Board Guaranty Insured) 0.00%, 06/15/2050(2) | $ 218,967 |
| 1,000,000 | Lane County, OR, School Dist No. 52 Bethel, GO, (School Board Guaranty Insured) 0.01%, 06/15/2041(2) | 593,099 |
| 40,000 | Marion County, OR, School Dist No. 15 North Marion, GO, (School Bond Guaranty Insured) 0.00%, 06/15/2037(2) | 24,072 |
| 35,000 | Multnomah & Clackamas Counties, OR, School Dist No. 10 JT Gresham-Barlow, GO, (School Board Guaranty Insured) 0.00%, 06/15/2038(2) | 21,830 |
| 55,000 | Salem Hospital Facs Auth, OR, Rev 5.00%, 05/15/2025 | 62,051 |
| 150,000 | Salem-Keizer, OR, School Dist No. 24J, GO, (School Board Guaranty Insured) 5.00%, 06/15/2022 | 154,468 |
| | State of Oregon Housing & Community Services Department | |
| 495,000 | 3.00%, 01/01/2052 | 531,199 |
| 80,000 | 4.50%, 01/01/2049 | 86,410 |
| 210,000 | Umatilla County, OR, School Dist No. 8R Hermiston, GO, (School Board Guaranty Insured) 0.01%, 06/15/2038(2) | 136,829 |
| | | | 1,896,560 |
| | Pennsylvania - 2.4% |
| 300,000 | City of Philadelphia, PA, GO 5.00%, 02/01/2039 | 370,093 |
| 160,000 | City of Philadelphia, PA, Redev Auth 5.00%, 04/15/2025 | 182,811 |
| 155,000 | City of Pittsburgh, PA, GO 4.00%, 09/01/2040 | 178,494 |
| 195,000 | Erie, PA, City School Dist, GO, (AGM State Aid Withholding Insured) 5.00%, 04/01/2029 | 243,947 |
| 90,000 | Harrisburg, PA, School Dist, GO, (AGM State Aid Withholding Insured) 5.00%, 11/15/2026 | 107,865 |
| 100,000 | Lancaster County, PA, Hospital Auth 5.13%, 07/01/2037 | 112,766 |
| 215,000 | Lancaster Industrial, PA, Dev Auth 4.00%, 07/01/2051 | 230,225 |
| 100,000 | Montgomery County, PA, Industrial Dev Auth Rev 5.00%, 12/01/2025 | 112,870 |
| 155,000 | Pennsylvania Housing Finance Agency 4.75%, 04/01/2033 | 169,039 |
| | Pennsylvania Turnpike Commission Rev | |
| 90,000 | 5.00%, 12/01/2031 | 106,459 |
| 145,000 | 5.00%, 12/01/2037 | 152,513 |
| | Philadelphia, PA, School Dist, GO, (State Aid Withholding Insured) | |
| 250,000 | 4.00%, 09/01/2036 | 290,116 |
| 560,000 | 5.00%, 09/01/2025(5) | 651,976 |
| 50,000 | Pittsburgh, PA, Water & Sewer Auth, (AGM Insured) 5.00%, 09/01/2033 | 63,352 |
| 75,000 | Wilkes-Barre Area, PA, School Dist, GO, (BAM State Aid Withholding Insured) 5.00%, 04/15/2059 | 91,074 |
| | | | 3,063,600 |
The accompanying notes are an integral part of these financial statements.
Hartford Sustainable Municipal Bond Fund (formerly, Hartford Muncipal Income Fund)
Schedule of Investments – (continued)
October 31, 2021
| Shares or Principal Amount | | Market Value† |
| MUNICIPAL BONDS - 100.4% - (continued) |
| | Puerto Rico - 0.5% |
| | Puerto Rico Sales Tax Financing Corp. Sales Tax Rev | |
| $ 400,000 | 4.33%, 07/01/2040 | $ 438,989 |
| 175,000 | 5.00%, 07/01/2058 | 197,566 |
| | | | 636,555 |
| | Rhode Island - 1.8% |
| 140,000 | City of Cranston RI 1.00%, 08/23/2022 | 140,887 |
| 340,000 | Rhode Island Commerce Corp. Rev 5.00%, 05/15/2030 | 441,214 |
| 80,000 | Rhode Island Health & Educational Building Corp., (AGM Municipal Government Insured) 5.00%, 05/15/2028 | 97,251 |
| | Rhode Island Housing & Mortgage Finance Corp. | |
| 10,000 | 4.00%, 10/01/2032 | 10,140 |
| 775,000 | 4.00%, 10/01/2048 | 847,430 |
| | Rhode Island Student Loan Auth | |
| 130,000 | 3.00%, 12/01/2024 | 133,163 |
| 110,000 | 5.00%, 12/01/2027 | 133,035 |
| 460,000 | 5.00%, 12/01/2028 | 566,362 |
| | | | 2,369,482 |
| | South Carolina - 0.8% |
| 365,000 | Piedmont Municipal Power Agency 5.00%, 01/01/2024 | 401,048 |
| 150,000 | South Carolina Jobs-Economic Dev Auth 5.00%, 05/01/2028 | 186,445 |
| | South Carolina State Public Service Auth | |
| 200,000 | 4.00%, 12/01/2035 | 236,271 |
| 50,000 | 5.00%, 12/01/2031 | 56,240 |
| 50,000 | 5.00%, 12/01/2034 | 56,273 |
| 100,000 | 5.00%, 12/01/2050 | 113,688 |
| | | | 1,049,965 |
| | South Dakota - 0.9% |
| 255,000 | South Dakota Housing Dev Auth 4.00%, 11/01/2049 | 280,562 |
| 760,000 | South Dakota Housing Dev Auth Rev, (GNMA/FNMA/FHLMC Insured) 3.00%, 11/01/2051 | 816,007 |
| | | | 1,096,569 |
| | Tennessee - 1.4% |
| 300,000 | Chattanooga, TN, Health Educational & Housing Facs Board Rev 5.00%, 08/01/2039 | 366,206 |
| 885,000 | Metropolitan Gov't Nashville & Davidson County Health & Educational Facs Bd 0.00%, 07/01/2031 | 1,134,005 |
| 200,000 | Tennessee Energy Acquisition Corp. 5.25%, 09/01/2026 | 236,308 |
| 110,000 | Tennessee Housing Dev Agency 3.50%, 01/01/2047 | 116,155 |
| | | | 1,852,674 |
| | Texas - 8.8% |
| | Arlington, TX, Higher Education Finance Corp. Rev, (PSF-GTD Insured) | |
| 150,000 | 4.00%, 08/15/2030 | 167,411 |
| 250,000 | 5.00%, 02/15/2027 | 302,594 |
| 100,000 | Austin, TX, Independent School Dist, GO, (PSF-GTD Insured) 4.00%, 08/01/2033 | 117,763 |
| | Central Texas Regional Mobility Auth | |
| 315,000 | 4.00%, 01/01/2036 | 369,680 |
| Shares or Principal Amount | | Market Value† |
| MUNICIPAL BONDS - 100.4% - (continued) |
| | Texas - 8.8% - (continued) |
| $ 600,000 | 4.00%, 01/01/2040 | $ 691,502 |
| 250,000 | Central Texas Turnpike System Rev 5.00%, 08/15/2042 | 278,825 |
| 210,000 | City of San Antonio, TX, Airport System Rev 5.00%, 07/01/2026 | 248,686 |
| 165,000 | City of San Antonio, TX, Electric & Gas Systems Rev 1.75%, 02/01/2049(3) | 172,408 |
| 1,455,000 | City of San Antonio, TX, GO 5.00%, 08/01/2024 | 1,639,969 |
| 320,000 | Clear Creek, TX, Independent School Dist 0.28%, 02/15/2038 | 318,406 |
| 250,000 | Conroe, TX, Independent School Dist, GO, (PSF-GTD Insured) 3.00%, 02/15/2036 | 275,341 |
| 1,250,000 | Dallas-Fort Worth, TX, International Airport Rev 0.00%, 11/01/2045 | 1,434,914 |
| 750,000 | Del Valle Independent School Dist TX, GO, (PSF-GTD Insured) 5.00%, 06/15/2030 | 978,293 |
| 150,000 | El Paso, TX, Independent School Dist, GO, (PSF-GTD Insured) 5.00%, 08/15/2027 | 180,238 |
| 400,000 | Harris County - Houston, TX, Sports Auth 5.00%, 11/15/2033 | 441,713 |
| 1,130,000 | Harris County, TX, Cultural Education Facs Finance Corp. 3.00%, 10/01/2051 | 1,176,110 |
| 110,000 | Harris County, TX, Toll Road Auth Rev 5.00%, 08/15/2031 | 135,836 |
| 290,000 | Keller, TX, Independent School Dist, GO, (PSF-GTD Insured) 4.00%, 02/15/2037 | 341,613 |
| 75,000 | Kerrville, TX, Health Facs Dev Corp. 5.00%, 08/15/2023 | 81,078 |
| 150,000 | Lower Colorado River, TX, Auth Rev 5.00%, 05/15/2040 | 170,692 |
| | New Hope, TX, Cultural Education Facs Finance Corp. | |
| 190,000 | 4.00%, 11/01/2049 | 211,826 |
| 100,000 | 5.00%, 11/01/2031 | 108,004 |
| 130,000 | North Texas Tollway Auth Rev 5.00%, 01/01/2031 | 162,529 |
| 250,000 | Northside, TX, Independent School Dist, GO, (PSF-GTD Insured) 4.00%, 08/15/2034 | 293,269 |
| 245,000 | SA Energy Acquisition, TX, Public Facs Corp. Rev 5.50%, 08/01/2022 | 254,384 |
| 180,000 | State of Texas, GO 4.00%, 08/01/2031 | 201,346 |
| 250,000 | Texas Municipal Gas Acquisition & Supply Corp. Rev 5.25%, 12/15/2025 | 294,333 |
| 60,000 | Texas Transportation Commission 0.00%, 08/01/2038(2) | 32,353 |
| 200,000 | Wylie, TX, Independent School Dist, GO, (PSF-GTD Insured) 4.00%, 08/15/2036 | 237,191 |
| | | | 11,318,307 |
| | Utah - 0.3% |
| 175,000 | Salt Lake County, UT, Rev, (AMBAC Insured) 5.13%, 02/15/2033 | 198,259 |
| 110,000 | State of Utah, GO 3.00%, 07/01/2034 | 121,327 |
| | | | 319,586 |
| | Vermont - 0.8% |
| 875,000 | Vermont Student Assistance Corp. 5.00%, 06/15/2030 | 1,073,957 |
The accompanying notes are an integral part of these financial statements.
Hartford Sustainable Municipal Bond Fund (formerly, Hartford Muncipal Income Fund)
Schedule of Investments – (continued)
October 31, 2021
| Shares or Principal Amount | | Market Value† |
| MUNICIPAL BONDS - 100.4% - (continued) |
| | Virginia - 0.9% |
| $ 65,000 | Arlington County, VA, Industrial Dev Auth Rev 5.00%, 07/01/2030 | $ 84,362 |
| 450,000 | Hampton Roads Transportation, VA, Accountability Commission 5.00%, 07/01/2026 | 538,128 |
| 500,000 | Virginia State Small Business Financing Auth Rev 4.00%, 01/01/2039 | 569,589 |
| | | | 1,192,079 |
| | Washington - 1.5% |
| 140,000 | Port of Seattle, WA, Rev 5.00%, 05/01/2028 | 172,534 |
| | Washington State Health Care Facs Auth Rev | |
| 115,000 | 5.00%, 01/01/2026 | 132,365 |
| 500,000 | 5.00%, 09/01/2040 | 629,302 |
| 145,000 | 5.38%, 01/01/2040 | 153,537 |
| 150,000 | Washington State Housing Finance Commission 5.00%, 01/01/2039(1) | 168,847 |
| 635,000 | Washington State Housing Finance Commission Rev, (GNMA/FNMA/FHLMC Insured) 3.00%, 12/01/2049 | 684,532 |
| | | | 1,941,117 |
| | Wisconsin - 1.8% |
| | Public Finance Auth, WI, (AGM Insured) | |
| 500,000 | 4.00%, 07/01/2059 | 552,491 |
| 300,000 | 5.00%, 07/01/2035 | 380,331 |
| 100,000 | 5.00%, 07/01/2037 | 126,054 |
| 200,000 | 5.00%, 10/01/2043(1) | 219,062 |
| 95,000 | 5.00%, 10/01/2044 | 114,381 |
| 150,000 | 5.00%, 07/01/2048 | 177,043 |
| 100,000 | Wisconsin Center Dist, WI, (AGM Insured) 0.00%, 12/15/2029(2) | 85,332 |
| | Wisconsin Health & Educational Facs Auth Rev | |
| 160,000 | 0.50%, 11/01/2050(3) | 159,618 |
| 255,000 | 4.00%, 08/15/2046 | 288,962 |
| 155,000 | 5.00%, 11/01/2024 | 167,850 |
| 45,000 | 5.00%, 11/01/2025 | 49,760 |
| | | | 2,320,884 |
| | Total Municipal Bonds
(cost $126,052,974) | | $ 128,934,355 |
| SHORT-TERM INVESTMENTS - 2.0% |
| | Repurchase Agreements - 2.0% |
| 2,610,344 | Fixed Income Clearing Corp. Repurchase Agreement dated 10/29/2021 at 0.01%, due on 11/01/2021 with a maturity value of $2,610,346; collateralized by U.S. Treasury Bond at 1.875%, maturing 02/15/2041, with a market value of $2,662,601 | $ 2,610,344 |
| | Total Short-Term Investments
(cost $2,610,344) | $ 2,610,344 |
| | Total Investments
(cost $128,663,318) | 102.4% | $ 131,544,699 |
| | Other Assets and Liabilities | (2.4)% | (3,038,587) |
| | Total Net Assets | 100.0% | $ 128,506,112 |
| Note: | Percentage of investments as shown is the ratio of the total market value to total net assets. |
| | The Fund may refer to any one or more of the industry classifications used by one or more widely recognized market indices, ratings group and/or as defined by Fund management. Industry classifications may not be identical across all security types. |
| | For Fund compliance purposes, the Fund may not use the same classification system. These classifications are used for financial reporting purposes. |
| | See “Glossary” for abbreviation descriptions. |
| (1) | Security was purchased pursuant to Rule 144A under the Securities Act of 1933 and may be sold in transactions that are exempt from registration (typically only to qualified institutional buyers) or in a public offering registered under the Securities Act of 1933. At October 31, 2021, the aggregate value of these securities was $1,400,293, representing 1.1% of net assets. |
| (2) | Security is a zero-coupon bond. |
| (3) | Variable or floating rate security, which interest rate adjusts periodically based on changes in current interest rates and prepayments on the underlying pool of assets. Rate shown is the rate in effect as of period end. |
| (4) | Security is a “step-up” bond where coupon increases or steps up at a predetermined date. Rate shown is current coupon rate. |
| (5) | This security, or a portion of this security, was purchased on a when-issued, delayed-delivery or delayed-draw basis. The cost of these securities was $2,493,849 at October 31, 2021. |
| † | See Significant Accounting Policies of accompanying Notes to Financial Statements regarding valuation of investments. |
The accompanying notes are an integral part of these financial statements.
Hartford Sustainable Municipal Bond Fund (formerly, Hartford Muncipal Income Fund)
Schedule of Investments – (continued)
October 31, 2021
Fair Value Summary
The following is a summary of the fair valuations according to the inputs used as of October 31, 2021 in valuing the Fund’s investments.
| Description | | Total | | Level 1 | | Level 2 | | Level 3(1) |
| Assets | | | | | | | | |
| Municipal Bonds | | $ 128,934,355 | | $ — | | $ 128,934,355 | | $ — |
| Short-Term Investments | | 2,610,344 | | — | | 2,610,344 | | — |
| Total | | $ 131,544,699 | | $ — | | $ 131,544,699 | | $ — |
| (1) | For the year ended October 31, 2021, there were no transfers in and out of Level 3. |
The accompanying notes are an integral part of these financial statements.
The Hartford Total Return Bond Fund
Schedule of Investments
October 31, 2021
| Shares or Principal Amount | | Market Value† |
| ASSET & COMMERCIAL MORTGAGE-BACKED SECURITIES - 22.4% |
| | Asset-Backed - Automobile - 0.7% |
| $ 2,320,000 | AmeriCredit Automobile Receivables Trust 2.58%, 09/18/2025 | $ 2,369,134 |
| 2,295,000 | Credit Acceptance Auto Loan Trust 1.00%, 05/15/2030(1) | 2,285,628 |
| 2,000,000 | Drive Auto Receivables Trust 2.70%, 02/16/2027 | 2,042,912 |
| 4,600,000 | Exeter Automobile Receivables Trust 2.58%, 09/15/2025(1) | 4,695,432 |
| 1,330,000 | Ford Credit Auto Owner Trust 3.61%, 01/15/2030(1) | 1,392,550 |
| 2,505,000 | Prestige Auto Receivables Trust 1.62%, 11/16/2026(1) | 2,504,163 |
| 865,000 | Santander Drive Auto Receivables Trust 1.48%, 01/15/2027 | 871,898 |
| 385,000 | Toyota Auto Loan Extended Note Trust 2.56%, 11/25/2031(1) | 400,395 |
| | Westlake Automobile Receivables Trust | |
| 2,430,000 | 1.65%, 02/17/2026(1) | 2,444,779 |
| 3,400,000 | 2.72%, 11/15/2024(1) | 3,473,346 |
| | | | 22,480,237 |
| | Asset-Backed - Credit Card - 0.1% |
| 3,160,000 | Mercury Financial Credit Card Master Trust 1.54%, 03/20/2026(1) | 3,165,494 |
| | Asset-Backed - Finance & Insurance - 3.8% |
| 915,023 | Aaset Trust 3.35%, 01/16/2040(1) | 897,913 |
| 3,755,032 | Apex Credit CLO Ltd. 1.12%, 04/24/2029, 3 mo. USD LIBOR + 1.000%(1)(2) | 3,755,208 |
| 5,579,170 | Atrium XII 0.96%, 04/22/2027, 3 mo. USD LIBOR + 0.830%(1)(2) | 5,583,316 |
| | Bayview Koitere Fund Trust | |
| 2,704,298 | 3.50%, 07/28/2057(1)(3) | 2,759,465 |
| 988,135 | 4.00%, 11/28/2053(1)(3) | 1,005,431 |
| 2,640,995 | Bayview Opportunity Master Fund Trust 3.50%, 10/28/2057(1)(3) | 2,652,655 |
| | BlueMountain CLO Ltd. | |
| 5,235,000 | 1.23%, 04/20/2034, 3 mo. USD LIBOR + 1.100%(1)(2) | 5,238,083 |
| 10,110,000 | 1.27%, 04/19/2034, 3 mo. USD LIBOR + 1.150%(1)(2) | 10,112,962 |
| 4,355,000 | Buckhorn Park CLO Ltd. 1.24%, 07/18/2034, 3 mo. USD LIBOR + 1.120%(1)(2) | 4,355,740 |
| | Carlyle U.S. CLO Ltd. | |
| 7,230,000 | 1.15%, 04/20/2031, 3 mo. USD LIBOR + 1.020%(1)(2) | 7,237,642 |
| 2,735,000 | 1.18%, 04/15/2034, 3 mo. USD LIBOR + 1.060%(1)(2) | 2,737,809 |
| 1,327,040 | CF Hippolyta LLC 1.99%, 07/15/2060(1) | 1,319,052 |
| 4,140,000 | Cirrus Funding Ltd. 4.80%, 01/25/2037(1) | 4,316,161 |
| 6,230,000 | Dryden CLO Ltd. 1.14%, 04/15/2031, 3 mo. USD LIBOR + 1.020%(1)(2) | 6,234,834 |
| | First Franklin Mortgage Loan Trust | |
| 1,065,000 | 0.40%, 09/25/2036, 1 mo. USD LIBOR + 0.310%(2) | 1,032,769 |
| 2,250,478 | 0.57%, 04/25/2036, 1 mo. USD LIBOR + 0.480%(2) | 2,164,718 |
| 5,030,000 | Madison Park Funding Ltd. 1.38%, 01/15/2033, 3 mo. USD LIBOR + 1.260%(1)(2) | 5,037,676 |
| 929,741 | NRZ Excess Spread-Collateralized Notes 3.84%, 12/25/2025(1) | 934,785 |
| Shares or Principal Amount | | Market Value† |
| ASSET & COMMERCIAL MORTGAGE-BACKED SECURITIES - 22.4% - (continued) |
| | Asset-Backed - Finance & Insurance - 3.8% - (continued) |
| $ 1,954,046 | Preston Ridge Partners Mortgage Trust LLC 2.12%, 03/25/2026(1)(3) | $ 1,950,239 |
| 7,365,000 | Regatta Funding Ltd. 1.29%, 04/20/2034, 3 mo. USD LIBOR + 1.160%(1)(2) | 7,369,338 |
| 7,545,000 | RR Ltd. 1.23%, 07/15/2036, 3 mo. USD LIBOR + 1.110%(1)(2) | 7,550,161 |
| 8,270,000 | Sound Point CLO Ltd. 1.19%, 04/25/2034, 3 mo. USD LIBOR + 1.070%(1)(2) | 8,267,924 |
| 812,835 | Springleaf Funding Trust 2.68%, 07/15/2030(1) | 813,701 |
| | Symphony CLO Ltd. | |
| 1,339,926 | 1.08%, 07/14/2026, 3 mo. USD LIBOR + 0.950%(1)(2) | 1,340,876 |
| 9,400,000 | 1.10%, 04/19/2034, 3 mo. USD LIBOR + 0.980%(1)(2) | 9,406,918 |
| 8,315,000 | Thompson Park CLO Ltd. 1.12%, 04/15/2034, 3 mo. USD LIBOR + 1.000%(1)(2) | 8,312,913 |
| | Towd Point Mortgage Trust | |
| 3,440,827 | 2.75%, 10/25/2057(1)(3) | 3,500,452 |
| 4,118,295 | 3.25%, 03/25/2058(1)(3) | 4,222,877 |
| 3,160,000 | Venture CLO Ltd. 1.36%, 04/15/2034, 3 mo. USD LIBOR + 1.240%(1)(2) | 3,163,704 |
| 7,781,326 | Voya CLO Ltd. 1.02%, 01/18/2029, 3 mo. USD LIBOR + 0.900%(1)(2) | 7,787,170 |
| 1,313,812 | Wendy's Funding LLC 3.88%, 03/15/2048(1) | 1,387,570 |
| | | | 132,450,062 |
| | Asset-Backed - Home Equity - 0.4% |
| 3,120,000 | CPT Mortgage Trust 2.87%, 11/13/2039(1) | 3,273,957 |
| | GSAA Home Equity Trust | |
| 19,296 | 0.23%, 12/25/2046, 1 mo. USD LIBOR + 0.140%(2) | 7,262 |
| 2,526,922 | 0.25%, 02/25/2037, 1 mo. USD LIBOR + 0.160%(2) | 992,188 |
| 817,074 | 0.27%, 12/25/2036, 1 mo. USD LIBOR + 0.180%(2) | 296,336 |
| 1,198,412 | 0.45%, 11/25/2036, 1 mo. USD LIBOR + 0.360%(2) | 434,990 |
| 1,190,597 | 5.98%, 06/25/2036(3) | 476,035 |
| 2,753,398 | Legacy Mortgage Asset Trust 3.00%, 06/25/2059(1) | 2,761,112 |
| 29,930 | Morgan Stanley Asset-Backed Securities Capital, Inc. Trust 0.39%, 06/25/2036, 1 mo. USD LIBOR + 0.300%(2) | 27,533 |
| 1,152,539 | Morgan Stanley Mortgage Loan Trust 0.43%, 11/25/2036, 1 mo. USD LIBOR + 0.340%(2) | 445,304 |
| 486,737 | Renaissance Home Equity Loan Trust 5.91%, 04/25/2037 | 214,482 |
| | Soundview Home Loan Trust | |
| 2,237,453 | 0.27%, 07/25/2037, 1 mo. USD LIBOR + 0.180%(2) | 2,150,730 |
| 830,000 | 0.33%, 07/25/2036, 1 mo. USD LIBOR + 0.240%(2) | 793,200 |
| 1,110,000 | 0.59%, 11/25/2036, 1 mo. USD LIBOR + 0.500%(2) | 1,078,388 |
| | | | 12,951,517 |
| | Commercial Mortgage-Backed Securities - 4.2% |
| 3,215,000 | 1211 Avenue of the Americas Trust 3.90%, 08/10/2035(1) | 3,455,880 |
The accompanying notes are an integral part of these financial statements.
The Hartford Total Return Bond Fund
Schedule of Investments – (continued)
October 31, 2021
| Shares or Principal Amount | | Market Value† |
| ASSET & COMMERCIAL MORTGAGE-BACKED SECURITIES - 22.4% - (continued) |
| | Commercial Mortgage-Backed Securities - 4.2% - (continued) |
| $ 3,475,000 | BAMLL Commercial Mortgage Securities Trust 3.11%, 11/05/2032(1) | $ 3,566,488 |
| | BBCMS Mortgage Trust | |
| 7,661,000 | 0.94%, 08/15/2036, 1 mo. USD LIBOR + 0.850%(1)(2) | 7,656,223 |
| 6,535,000 | 0.99%, 04/15/2053(3)(4) | 515,787 |
| 22,383,749 | 1.45%, 02/15/2050(3)(4) | 1,368,936 |
| 2,660,000 | 4.97%, 12/15/2051(3) | 2,969,110 |
| 7,600,000 | Benchmark 2019-B9 Mortgage Trust 4.02%, 03/15/2052 | 8,575,373 |
| | Benchmark Mortgage Trust | |
| 11,765,049 | 0.51%, 07/15/2051(3)(4) | 294,193 |
| 58,765,878 | 0.63%, 04/10/2051(3)(4) | 1,619,276 |
| 33,028,554 | 0.64%, 01/15/2052(3)(4) | 1,217,059 |
| 8,445,175 | 1.06%, 08/15/2052(3)(4) | 499,518 |
| 23,092,907 | 1.23%, 03/15/2062(3)(4) | 1,649,238 |
| 14,244,038 | 1.52%, 01/15/2054(3)(4) | 1,659,121 |
| 6,979,867 | 1.79%, 07/15/2053(3)(4) | 753,712 |
| 3,000,000 | 3.04%, 08/15/2052 | 3,205,040 |
| 4,461,385 | BX Commercial Mortgage Trust 1.01%, 10/15/2036, 1 mo. USD LIBOR + 0.920%(1)(2) | 4,462,760 |
| 2,535,000 | CAMB Commercial Mortgage Trust 2.64%, 12/15/2037, 1 mo. USD LIBOR + 2.550%(1)(2) | 2,528,598 |
| 2,508,525 | Cantor Commercial Real Estate 1.11%, 05/15/2052(3)(4) | 159,814 |
| 4,145,000 | CD Mortgage Trust 2.46%, 08/10/2049 | 4,237,818 |
| 289,631 | Chase Mortgage Finance Trust 3.05%, 12/25/2035(3) | 291,324 |
| | Citigroup Commercial Mortgage Trust | |
| 9,692,945 | 0.91%, 07/10/2047(3)(4) | 209,238 |
| 12,607,217 | 1.03%, 04/10/2048(3)(4) | 387,855 |
| 415,000 | 4.57%, 03/10/2047(1)(3) | 418,784 |
| 1,520,907 | Citigroup Mortgage Loan Trust 3.23%, 11/25/2070(1) | 1,522,064 |
| | Commercial Mortgage Trust | |
| 2,871,432 | 0.71%, 08/10/2046(3)(4) | 31,419 |
| 687,000 | 2.77%, 12/10/2045 | 700,324 |
| 939,511 | 2.85%, 10/15/2045 | 953,654 |
| 564,008 | 2.94%, 01/10/2046 | 573,800 |
| 735,000 | 3.10%, 03/10/2046 | 745,233 |
| 3,895,000 | 3.18%, 02/10/2048 | 4,108,625 |
| 626,089 | 3.21%, 03/10/2046 | 643,462 |
| 54,441 | 3.33%, 06/10/2046 | 55,235 |
| 3,050,000 | 3.42%, 03/10/2031(1) | 3,149,753 |
| 905,000 | 3.61%, 06/10/2046(3) | 937,783 |
| 131,463 | 4.02%, 07/10/2045 | 134,873 |
| 420,000 | 4.07%, 02/10/2047(3) | 445,165 |
| 660,000 | 4.21%, 08/10/2046(3) | 693,210 |
| 379,062 | 4.21%, 08/10/2046 | 397,342 |
| 595,000 | 4.25%, 07/10/2045(3) | 622,559 |
| 1,825,000 | 4.75%, 10/15/2045(1)(3) | 585,934 |
| 22,407 | Credit Suisse First Boston Mortgage Securities Corp. 4.88%, 04/15/2037 | 22,673 |
| | CSAIL Commercial Mortgage Trust | |
| 25,580,507 | 0.74%, 06/15/2057(3)(4) | 546,617 |
| 1,307,023 | 0.82%, 04/15/2050(3)(4) | 28,396 |
| 3,862,841 | 0.93%, 11/15/2048(3)(4) | 121,558 |
| 6,594,740 | 1.87%, 01/15/2049(3)(4) | 462,311 |
| | DBJPM Mortgage Trust | |
| 5,702,350 | 1.71%, 09/15/2053(3)(4) | 547,162 |
| 3,600,000 | 2.89%, 08/10/2049 | 3,785,251 |
| Shares or Principal Amount | | Market Value† |
| ASSET & COMMERCIAL MORTGAGE-BACKED SECURITIES - 22.4% - (continued) |
| | Commercial Mortgage-Backed Securities - 4.2% - (continued) |
| | FREMF Mortgage Trust | |
| $ 440,000 | 3.73%, 10/25/2049(1)(3) | $ 478,378 |
| 350,000 | 3.80%, 02/25/2050(1)(3) | 371,169 |
| 230,000 | 3.84%, 10/25/2049(1)(3) | 250,039 |
| 1,610,000 | 3.97%, 04/25/2051(1)(3) | 1,766,601 |
| | GS Mortgage Securities Corp. | |
| 2,010,000 | 2.95%, 11/05/2034(1) | 2,033,673 |
| 2,845,000 | 4.11%, 07/10/2051(3) | 3,128,720 |
| | GS Mortgage Securities Trust | |
| 21,464,880 | 0.07%, 07/10/2046(3)(4) | 22,023 |
| 553,315 | 0.09%, 08/10/2044(1)(3)(4) | 3 |
| 3,980,000 | 3.04%, 07/10/2052 | 4,256,686 |
| 695,000 | 3.67%, 04/10/2047(1) | 27,800 |
| 825,000 | 4.07%, 01/10/2047 | 870,364 |
| 1,310,000 | 4.96%, 04/10/2047(1)(3) | 718,382 |
| | JP Morgan Chase Commercial Mortgage Securities Trust | |
| 1,325,000 | 2.73%, 10/15/2045(1)(3) | 1,006,152 |
| 1,770,000 | 2.81%, 01/16/2037(1) | 1,823,173 |
| 617,923 | 2.84%, 12/15/2047 | 626,513 |
| 730,000 | 4.36%, 12/15/2047(1)(3) | 581,175 |
| 399,975 | 5.57%, 08/15/2046(1)(3) | 397,015 |
| | JPMBB Commercial Mortgage Securities Trust | |
| 9,132,586 | 0.61%, 09/15/2047(3)(4) | 134,869 |
| 2,739,645 | 0.62%, 05/15/2048(3)(4) | 48,850 |
| 237,306 | 3.36%, 07/15/2045 | 241,972 |
| 8,715,000 | JPMCC Commercial Mortgage Securities Trust 3.72%, 03/15/2050 | 9,534,208 |
| 1,330,000 | Life Mortgage Trust 1.49%, 03/15/2038, 1 mo. USD LIBOR + 1.400%(1)(2) | 1,312,949 |
| | Morgan Stanley Bank of America Merrill Lynch Trust | |
| 5,984,064 | 0.97%, 12/15/2047(3)(4) | 145,114 |
| 3,728,645 | 0.99%, 10/15/2048(3)(4) | 108,435 |
| 700,000 | 2.92%, 02/15/2046 | 711,956 |
| 1,465,000 | 3.13%, 12/15/2048 | 1,494,985 |
| 880,000 | 3.18%, 08/15/2045 | 885,103 |
| 730,173 | 4.26%, 10/15/2046(3) | 767,329 |
| | Morgan Stanley Capital Trust | |
| 2,417,619 | 1.34%, 06/15/2050(3)(4) | 130,758 |
| 885,000 | 5.09%, 07/15/2049(1)(3) | 399,982 |
| 37,927 | 5.66%, 10/12/2052(1)(3) | 11,757 |
| 2,165,000 | MTRO Commercial Mortgage Trust 1.89%, 12/15/2033, 1 mo. USD LIBOR + 1.800%(1)(2) | 2,120,625 |
| | Natixis Commercial Mortgage Securities Trust | |
| 1,385,000 | 2.91%, 10/15/2036(1) | 1,383,432 |
| 1,187,000 | 4.40%, 06/17/2038(1) | 1,310,092 |
| 826,212 | Oaktown Re Ltd. 1.64%, 07/25/2028, 1 mo. USD LIBOR + 1.550%(1)(2) | 826,240 |
| 5,770,000 | SG Commercial Mortgage Securities Trust 2.63%, 03/15/2037(1) | 5,921,712 |
| 5,104,505 | UBS Commercial Mortgage Trust 1.06%, 08/15/2050(3)(4) | 235,423 |
| | UBS-Barclays Commercial Mortgage Trust | |
| 920,000 | 2.85%, 12/10/2045 | 934,888 |
| 1,777,101 | 3.09%, 08/10/2049 | 1,800,845 |
| | Wells Fargo Commercial Mortgage Trust | |
| 9,541,273 | 1.09%, 05/15/2048(3)(4) | 283,996 |
| 10,000 | 3.17%, 02/15/2048 | 10,524 |
| 255,000 | 4.15%, 05/15/2048(3) | 258,723 |
The accompanying notes are an integral part of these financial statements.
The Hartford Total Return Bond Fund
Schedule of Investments – (continued)
October 31, 2021
| Shares or Principal Amount | | Market Value† |
| ASSET & COMMERCIAL MORTGAGE-BACKED SECURITIES - 22.4% - (continued) |
| | Commercial Mortgage-Backed Securities - 4.2% - (continued) |
| $ 45,894 | Wells Fargo Mortgage Backed Securities Trust 3.99%, 11/25/2048(1)(3) | $ 46,066 |
| | Wells Fargo N.A. | |
| 20,692,574 | 0.60%, 11/15/2062(3)(4) | 878,760 |
| 10,540,984 | 0.65%, 11/15/2062(3)(4) | 494,369 |
| 18,137,682 | 0.70%, 12/15/2052(3)(4) | 904,218 |
| 29,757,409 | 0.73%, 11/15/2050(3)(4) | 1,122,116 |
| 21,376,710 | 0.83%, 09/15/2062(3)(4) | 1,201,724 |
| 37,855,533 | 0.89%, 01/15/2063(3)(4) | 2,347,622 |
| 21,293,189 | 0.90%, 05/15/2062(3)(4) | 1,225,304 |
| 37,802,866 | 1.78%, 03/15/2063(3)(4) | 4,955,370 |
| 3,540,000 | 2.04%, 02/15/2054 | 3,504,775 |
| | WF-RBS Commercial Mortgage Trust | |
| 1,398,826 | 1.25%, 03/15/2047(3)(4) | 32,072 |
| 785,078 | 2.87%, 11/15/2045 | 795,326 |
| 1,490,000 | 3.00%, 08/15/2045 | 1,504,582 |
| 243,846 | 3.02%, 11/15/2047(1) | 14,631 |
| 732,205 | 3.07%, 03/15/2045 | 745,956 |
| 350,000 | 3.35%, 05/15/2045 | 359,284 |
| 225,000 | 4.05%, 03/15/2047 | 238,327 |
| 1,070,000 | 4.15%, 08/15/2046(3) | 1,114,063 |
| 345,000 | 4.89%, 06/15/2044(1)(3) | 207,903 |
| 770,000 | 5.77%, 04/15/2045(1)(3) | 776,099 |
| | | | 145,356,748 |
| | Other Asset-Backed Securities - 3.0% |
| | Affirm Asset Securitization Trust | |
| 2,207,355 | 1.90%, 01/15/2025(1) | 2,222,024 |
| 860,489 | 3.46%, 10/15/2024(1) | 869,706 |
| 1,280,000 | Arbor Realty Commercial Real Estate Notes Ltd. 1.19%, 05/15/2036, 1 mo. USD LIBOR + 1.100%(1)(2) | 1,279,801 |
| 2,820,000 | Avant Loans Funding Trust 1.21%, 07/15/2030(1) | 2,806,277 |
| 8,230,000 | Bain Capital Credit CLO Ltd. 1.30%, 07/25/2034, 3 mo. USD LIBOR + 1.180%(1)(2) | 8,235,703 |
| 1,728,457 | Bayview Mortgage Fund Trust 3.50%, 01/28/2058(1)(3) | 1,740,508 |
| | Bayview Opportunity Master Fund Trust | |
| 1,101,583 | 3.50%, 01/28/2055(1)(3) | 1,118,704 |
| 1,324,601 | 3.50%, 06/28/2057(1)(3) | 1,348,949 |
| 2,115,793 | 4.00%, 10/28/2064(1)(3) | 2,150,542 |
| 732,345 | CF Hippolyta LLC 1.98%, 03/15/2061(1) | 727,621 |
| | Domino's Pizza Master Issuer LLC | |
| 3,248,675 | 2.66%, 04/25/2051(1) | 3,321,335 |
| 1,483,575 | 3.67%, 10/25/2049(1) | 1,595,152 |
| 3,196,150 | 4.12%, 07/25/2048(1) | 3,285,623 |
| 8,925,000 | Madison Park Funding Ltd. 1.25%, 07/17/2034, 3 mo. USD LIBOR + 1.120%(1)(2) | 8,930,998 |
| 1,500,000 | Marlette Funding Trust 1.06%, 09/15/2031(1) | 1,493,628 |
| 1,529,591 | Mill City Mortgage Loan Trust 2.75%, 01/25/2061(1)(3) | 1,552,520 |
| 3,100,877 | Pretium Mortgage Credit Partners LLC 1.87%, 07/25/2051(1) | 3,087,277 |
| 8,425,000 | RR LLC 1.27%, 07/15/2035, 3 mo. USD LIBOR + 1.150%(1)(2) | 8,435,093 |
| 532,065 | Sapphire Aviation Finance Ltd. 3.23%, 03/15/2040(1) | 523,470 |
| 4,828,702 | Seasoned Credit Risk Transfer Trust 3.50%, 03/25/2058 | 5,102,564 |
| Shares or Principal Amount | | Market Value† |
| ASSET & COMMERCIAL MORTGAGE-BACKED SECURITIES - 22.4% - (continued) |
| | Other Asset-Backed Securities - 3.0% - (continued) |
| $ 1,895,000 | Summit Issuer LLC 2.29%, 12/20/2050(1) | $ 1,878,895 |
| | Towd Point Mortgage Trust | |
| 1,393,017 | 0.69%, 02/25/2057, 1 mo. USD LIBOR + 0.600%(1)(2) | 1,393,007 |
| 242,264 | 2.25%, 04/25/2056(1)(3) | 242,665 |
| 380,868 | 2.75%, 08/25/2055(1)(3) | 382,481 |
| 3,468,409 | 2.75%, 10/25/2056(1)(3) | 3,511,988 |
| 545,220 | 2.75%, 04/25/2057(1)(3) | 551,328 |
| 1,332,149 | 2.75%, 06/25/2057(1)(3) | 1,358,627 |
| 1,203,106 | 2.75%, 07/25/2057(1)(3) | 1,218,647 |
| 2,106,056 | Upstart Securitization Trust 0.83%, 07/20/2031(1) | 2,102,987 |
| 4,152,402 | VCAT LLC 1.74%, 05/25/2051(1) | 4,128,426 |
| 8,270,000 | Venture CLO Ltd. 1.25%, 04/15/2034, 3 mo. USD LIBOR + 1.130%(1)(2) | 8,273,622 |
| 4,228,172 | VOLT XCV LLC 2.24%, 03/27/2051(1) | 4,243,867 |
| 6,545,000 | Wellfleet CLO Ltd. 1.30%, 07/20/2032, 3 mo. USD LIBOR + 1.170%(1)(2) | 6,543,357 |
| 7,376,512 | Wendy's Funding LLC 2.37%, 06/15/2051(1) | 7,388,212 |
| 975,100 | Wingstop Funding LLC 2.84%, 12/05/2050(1) | 1,003,603 |
| | | | 104,049,207 |
| | Whole Loan Collateral CMO - 10.2% |
| 6,920,106 | 510 Asset Backed Trust 2.12%, 06/25/2061(1) | 6,895,132 |
| 92,277 | Adjustable Rate Mortgage Trust 0.63%, 11/25/2035, 1 mo. USD LIBOR + 0.540%(2) | 93,401 |
| | Alternative Loan Trust | |
| 1,223,137 | 0.63%, 01/25/2036, 1 mo. USD LIBOR + 0.540%(2) | 1,224,610 |
| 330,207 | 0.73%, 11/25/2035, 1 mo. USD LIBOR + 0.640%(2) | 297,955 |
| 786,130 | 1.44%, 08/25/2035, 12 mo. USD MTA + 1.350%(2) | 709,945 |
| 208,222 | 5.75%, 05/25/2036 | 124,402 |
| 179,898 | 6.00%, 05/25/2036 | 135,385 |
| 134,258 | 6.00%, 12/25/2036 | 80,978 |
| | Angel Oak Mortgage Trust | |
| 4,035,018 | 0.91%, 01/25/2066(1)(3) | 4,066,241 |
| 6,920,519 | 0.95%, 07/25/2066(1)(3) | 6,890,899 |
| 3,494,763 | 0.99%, 04/25/2053(1)(3) | 3,486,558 |
| 3,149,104 | 0.99%, 04/25/2066(1)(3) | 3,146,058 |
| 5,624,062 | 1.07%, 05/25/2066(1)(3) | 5,602,546 |
| 8,629,938 | 1.46%, 09/25/2066(1)(3) | 8,637,753 |
| 1,354,621 | 1.47%, 06/25/2065(1)(3) | 1,362,626 |
| 2,478,068 | 2.53%, 01/26/2065(1)(3) | 2,512,195 |
| 266,092 | Angel Oak Mortgage Trust LLC 3.63%, 03/25/2049(1)(3) | 268,464 |
| | Banc of America Funding Trust | |
| 349,803 | 0.69%, 05/20/2047, 1 mo. USD LIBOR + 0.600%(2) | 354,569 |
| 1,162,523 | 5.77%, 05/25/2037(3) | 1,203,258 |
| 45,396 | 6.35%, 01/25/2037 | 46,017 |
| | Bear Stearns Adjustable Rate Mortgage Trust | |
| 187,215 | 2.16%, 02/25/2036(3) | 170,752 |
| 207,146 | 2.38%, 10/25/2035, 12 mo. USD CMT + 2.300%(2) | 212,522 |
The accompanying notes are an integral part of these financial statements.
The Hartford Total Return Bond Fund
Schedule of Investments – (continued)
October 31, 2021
| Shares or Principal Amount | | Market Value† |
| ASSET & COMMERCIAL MORTGAGE-BACKED SECURITIES - 22.4% - (continued) |
| | Whole Loan Collateral CMO - 10.2% - (continued) |
| $ 1,009,401 | Bear Stearns Alt-A Trust 0.59%, 01/25/2036, 1 mo. USD LIBOR + 0.500%(2) | $ 1,225,746 |
| 316,995 | Bear Stearns Mortgage Funding Trust 0.27%, 10/25/2036, 1 mo. USD LIBOR + 0.180%(2) | 304,936 |
| | Bellemeade Re Ltd. | |
| 102,873 | 1.19%, 07/25/2029, 1 mo. USD LIBOR + 1.100%(1)(2) | 102,873 |
| 1,858,555 | 1.49%, 10/25/2029, 1 mo. USD LIBOR + 1.400%(1)(2) | 1,858,555 |
| | BRAVO Residential Funding Trust | |
| 2,133,596 | 0.94%, 02/25/2049(1)(3) | 2,126,962 |
| 3,081,221 | 0.97%, 03/25/2060(1)(3) | 3,065,966 |
| 2,119,762 | Bunker Hill Loan Depositary Trust 1.72%, 02/25/2055(1)(3) | 2,138,387 |
| | CHL Mortgage Pass-Through Trust | |
| 370,720 | 0.77%, 03/25/2035, 1 mo. USD LIBOR + 0.680%(2) | 349,141 |
| 110,801 | 2.58%, 06/20/2035(3) | 111,336 |
| 460,349 | 2.73%, 11/20/2035(3) | 424,855 |
| 534,192 | 2.90%, 09/25/2047(3) | 514,378 |
| 306,038 | 3.18%, 04/20/2036(3) | 247,833 |
| 1,520,643 | CIM Trust 3.00%, 04/25/2057(1)(3) | 1,539,174 |
| 1,854,765 | Colombia Cent CLO Ltd. 1.27%, 10/25/2028, 3 mo. USD LIBOR + 1.150%(1)(2) | 1,855,669 |
| | COLT Mortgage Loan Trust | |
| 1,936,698 | 0.80%, 07/27/2054(1) | 1,931,462 |
| 4,280,420 | 0.91%, 06/25/2066(1)(3) | 4,240,352 |
| | Connecticut Avenue Securities Trust | |
| 363,669 | 2.09%, 07/25/2039, 1 mo. USD LIBOR + 2.000%(1)(2) | 364,372 |
| 389,704 | 2.19%, 06/25/2039, 1 mo. USD LIBOR + 2.100%(1)(2) | 390,456 |
| 474,012 | 2.24%, 09/25/2031, 1 mo. USD LIBOR + 2.150%(1)(2) | 476,401 |
| 1,143,767 | 2.24%, 11/25/2039, 1 mo. USD LIBOR + 2.150%(1)(2) | 1,149,331 |
| 660,555 | 2.39%, 08/25/2031, 1 mo. USD LIBOR + 2.300%(1)(2) | 664,092 |
| 566,698 | Credit Suisse First Boston Mortgage Securities Corp. 5.50%, 06/25/2035 | 517,127 |
| 3,798,328 | Credit Suisse Mortgage Capital Certificates 0.94%, 05/25/2066(1)(3) | 3,758,979 |
| | CSMC Trust | |
| 1,594,799 | 0.81%, 05/25/2065(1)(3) | 1,587,878 |
| 2,965,335 | 0.83%, 03/25/2056(1)(3) | 2,984,314 |
| 6,306,379 | 1.18%, 02/25/2066(1)(3) | 6,354,181 |
| 2,219,854 | 1.80%, 12/27/2060(1)(3) | 2,219,093 |
| 1,462,671 | 3.25%, 04/25/2047(1)(3) | 1,519,145 |
| | Deephaven Residential Mortgage Trust | |
| 1,971,844 | 0.90%, 04/25/2066(1)(3) | 1,963,157 |
| 1,338,922 | 1.69%, 05/25/2065(1) | 1,340,512 |
| 95,178 | DSLA Mortgage Loan Trust 0.80%, 01/19/2045, 1 mo. USD LIBOR + 0.720%(2) | 83,520 |
| | Ellington Financial Mortgage Trust | |
| 919,643 | 0.80%, 02/25/2066(1)(3) | 914,842 |
| 1,683,035 | 0.93%, 06/25/2066(1)(3) | 1,671,712 |
| | Fannie Mae Connecticut Avenue Securities | |
| 148,197 | 2.09%, 03/25/2031, 1 mo. USD LIBOR + 2.000%(2) | 149,355 |
| Shares or Principal Amount | | Market Value† |
| ASSET & COMMERCIAL MORTGAGE-BACKED SECURITIES - 22.4% - (continued) |
| | Whole Loan Collateral CMO - 10.2% - (continued) |
| $ 690,403 | 2.64%, 12/25/2030, 1 mo. USD LIBOR + 2.550%(2) | $ 701,650 |
| 950,324 | 4.44%, 05/25/2029, 1 mo. USD LIBOR + 4.350%(2) | 990,924 |
| 403,767 | 4.54%, 01/25/2029, 1 mo. USD LIBOR + 4.450%(2) | 420,293 |
| | GCAT Trust | |
| 4,877,738 | 0.87%, 01/25/2066(1)(3) | 4,913,536 |
| 3,823,077 | 1.04%, 05/25/2066(1)(3) | 3,823,077 |
| 6,264,248 | 1.09%, 08/25/2066(1)(3) | 6,218,868 |
| | GMACM Mortgage Loan Trust | |
| 238,594 | 2.64%, 09/19/2035(3) | 229,110 |
| 49,825 | 2.98%, 04/19/2036(3) | 43,518 |
| | GSR Mortgage Loan Trust | |
| 1,709,217 | 0.39%, 01/25/2037, 1 mo. USD LIBOR + 0.300%(2) | 416,080 |
| 93,189 | 2.61%, 10/25/2035(3) | 64,926 |
| 716,488 | 2.95%, 01/25/2036(3) | 733,051 |
| | HarborView Mortgage Loan Trust | |
| 530,982 | 0.27%, 01/19/2038, 1 mo. USD LIBOR + 0.190%(2) | 518,598 |
| 985,326 | 0.32%, 12/19/2036, 1 mo. USD LIBOR + 0.240%(2) | 988,581 |
| 689,529 | Home Re Ltd. 1.69%, 10/25/2028, 1 mo. USD LIBOR + 1.600%(1)(2) | 690,498 |
| | IndyMac Index Mortgage Loan Trust | |
| 194,137 | 2.89%, 01/25/2036(3) | 192,329 |
| 340,435 | 2.95%, 03/25/2036(3) | 299,526 |
| 975,769 | 3.05%, 04/25/2037(3) | 673,269 |
| | JP Morgan Mortgage Trust | |
| 135,623 | 2.62%, 09/25/2035(3) | 137,235 |
| 64,125 | 3.00%, 04/25/2037(3) | 57,233 |
| 176,215 | 3.06%, 05/25/2036(3) | 158,622 |
| 1,466,781 | LCM L.P. 1.17%, 10/20/2027, 3 mo. USD LIBOR + 1.040%(1)(2) | 1,468,629 |
| | Legacy Mortgage Asset Trust | |
| 1,510,168 | 1.65%, 11/25/2060(1) | 1,504,194 |
| 2,187,211 | 1.75%, 04/25/2061(1) | 2,199,259 |
| 2,808,828 | 1.75%, 07/25/2061(1) | 2,792,907 |
| 3,760,581 | 3.25%, 11/25/2059(1) | 3,777,709 |
| 326,122 | Lehman XS Trust 0.51%, 07/25/2046, 1 mo. USD LIBOR + 0.420%(2) | 337,839 |
| | LSTAR Securities Investment Ltd. | |
| 6,135,701 | 1.78%, 03/02/2026, 1 mo. USD LIBOR + 1.700%(1)(2) | 6,137,063 |
| 3,874,046 | 1.88%, 02/01/2026, 1 mo. USD LIBOR + 1.800%(1)(2) | 3,871,024 |
| 1,151,812 | 2.58%, 04/01/2024, 1 mo. USD LIBOR + 2.500%(1)(2) | 1,149,360 |
| 2,550,563 | 2.58%, 05/01/2024, 1 mo. USD LIBOR + 1.250%(1)(2) | 2,535,631 |
| 1,780,741 | Luminent Mortgage Trust 0.47%, 05/25/2046, 1 mo. USD LIBOR + 0.380%(2) | 1,633,039 |
| | MetLife Securitization Trust | |
| 858,441 | 3.00%, 04/25/2055(1)(3) | 878,232 |
| 1,954,503 | 3.75%, 03/25/2057(1)(3) | 2,024,463 |
| | MFA Trust | |
| 741,029 | 1.01%, 01/26/2065(1)(3) | 739,212 |
| 3,291,247 | 1.03%, 11/25/2064(1)(3) | 3,278,506 |
| 3,202,156 | 1.15%, 04/25/2065(1)(3) | 3,222,041 |
| 284,104 | Mill City Mortgage Loan Trust 3.25%, 05/25/2062(1)(3) | 288,899 |
The accompanying notes are an integral part of these financial statements.
The Hartford Total Return Bond Fund
Schedule of Investments – (continued)
October 31, 2021
| Shares or Principal Amount | | Market Value† |
| ASSET & COMMERCIAL MORTGAGE-BACKED SECURITIES - 22.4% - (continued) |
| | Whole Loan Collateral CMO - 10.2% - (continued) |
| $ 476,033 | Morgan Stanley Mortgage Loan Trust 3.29%, 05/25/2036(3) | $ 316,922 |
| 1,906,321 | New Residential Mortgage LLC 3.79%, 07/25/2054(1) | 1,910,542 |
| | New Residential Mortgage Loan Trust | |
| 2,695,353 | 0.84%, 01/25/2048, 1 mo. USD LIBOR + 0.750%(1)(2) | 2,695,353 |
| 2,855,502 | 0.94%, 07/25/2055(1)(3) | 2,843,371 |
| 2,427,358 | 0.94%, 10/25/2058(1)(3) | 2,422,874 |
| 1,875,163 | 1.59%, 06/25/2057, 1 mo. USD LIBOR + 1.500%(1)(2) | 1,900,637 |
| 705,568 | 2.49%, 09/25/2059(1)(3) | 710,135 |
| 2,337,339 | 3.50%, 12/25/2057(1)(3) | 2,395,430 |
| 2,008,384 | 3.50%, 08/25/2059(1)(3) | 2,077,618 |
| 1,644,044 | 3.75%, 11/26/2035(1)(3) | 1,744,689 |
| 661,364 | 3.75%, 01/25/2054(1)(3) | 690,283 |
| 30,710 | 3.75%, 05/25/2054(1)(3) | 32,172 |
| 1,854,884 | 3.75%, 11/25/2056(1)(3) | 1,972,183 |
| 3,961,793 | 3.75%, 11/25/2058(1)(3) | 4,171,260 |
| 3,231,487 | 4.00%, 02/25/2057(1)(3) | 3,431,420 |
| 3,328,088 | 4.00%, 03/25/2057(1)(3) | 3,550,140 |
| 2,252,523 | 4.00%, 04/25/2057(1)(3) | 2,397,309 |
| 1,893,481 | 4.00%, 05/25/2057(1)(3) | 2,001,057 |
| 2,748,095 | 4.00%, 08/27/2057(1)(3) | 2,908,462 |
| 386,556 | 4.00%, 12/25/2057(1)(3) | 409,833 |
| 6,697,580 | NMLT Trust 1.19%, 05/25/2056(1)(3) | 6,669,276 |
| 252,546 | Oaktown Re Ltd. 1.49%, 07/25/2029, 1 mo. USD LIBOR + 1.400%(1)(2) | 252,656 |
| | OBX Trust | |
| 321,266 | 0.74%, 06/25/2057, 1 mo. USD LIBOR + 0.650%(1)(2) | 321,884 |
| 4,136,942 | 1.05%, 07/25/2061(1)(3) | 4,108,628 |
| 5,940,884 | 1.07%, 02/25/2066(1)(3) | 5,912,319 |
| | OZLM Ltd. | |
| 1,014,932 | 1.13%, 07/17/2029, 3 mo. USD LIBOR + 1.010%(1)(2) | 1,015,570 |
| 1,145,680 | 1.18%, 04/30/2027, 3 mo. USD LIBOR + 1.050%(1)(2) | 1,145,694 |
| | PMT Credit Risk Transfer Trust | |
| 1,028,159 | 2.09%, 03/27/2024, 1 mo. USD LIBOR + 2.000%(1)(2) | 1,028,246 |
| 2,296,752 | 2.99%, 02/27/2024, 1 mo. USD LIBOR + 2.900%(1)(2) | 2,330,742 |
| | Preston Ridge Partners Mortgage Trust LLC | |
| 4,027,123 | 1.79%, 06/25/2026(1) | 3,997,705 |
| 4,239,723 | 1.79%, 07/25/2026(1) | 4,242,814 |
| 7,614,787 | 1.87%, 04/25/2026(1) | 7,648,287 |
| 6,488,569 | 1.87%, 08/25/2026(1) | 6,464,237 |
| 1,252,220 | 2.36%, 11/25/2025(1) | 1,254,574 |
| 8,570,000 | 2.36%, 10/25/2026(1)(3) | 8,563,572 |
| 1,285,661 | 3.50%, 10/25/2024(1)(3) | 1,287,221 |
| 7,940,284 | Pretium Mortgage Credit Partners LLC 1.99%, 02/25/2061(1) | 7,884,956 |
| 324,545 | Radnor RE Ltd. 1.29%, 06/25/2029, 1 mo. USD LIBOR + 1.200%(1)(2) | 324,547 |
| 594,776 | RBSGC Mortgage Loan Trust 6.25%, 01/25/2037 | 601,219 |
| 3,208,298 | RCO VII Mortgage LLC 1.87%, 05/26/2026(1) | 3,186,276 |
| | Residential Accredit Loans, Inc. | |
| 1,620,066 | 0.69%, 04/25/2036, 1 mo. USD LIBOR + 0.600%(2) | 1,550,662 |
| Shares or Principal Amount | | Market Value† |
| ASSET & COMMERCIAL MORTGAGE-BACKED SECURITIES - 22.4% - (continued) |
| | Whole Loan Collateral CMO - 10.2% - (continued) |
| $ 712,207 | 6.00%, 12/25/2035 | $ 718,686 |
| 354,494 | Residential Funding Mortgage Securities, Inc. 2.95%, 08/25/2035(3) | 216,701 |
| 2,619,714 | Residential Mortgage Loan Trust 0.86%, 01/25/2065(1)(3) | 2,612,157 |
| | Seasoned Credit Risk Transfer Trust | |
| 2,819,020 | 2.50%, 08/25/2059 | 2,896,833 |
| 2,095,606 | 3.50%, 11/25/2057 | 2,260,802 |
| 5,594,393 | 3.50%, 07/25/2058 | 6,049,566 |
| 1,139,955 | 3.50%, 08/25/2058 | 1,235,458 |
| 4,948,729 | 3.50%, 10/25/2058 | 5,251,867 |
| 1,994,622 | Starwood Mortgage Residential Trust 0.94%, 05/25/2065(1)(3) | 1,992,823 |
| 5,193,429 | Starwood Residential Mortgage Trust 1.22%, 05/25/2065(1)(3) | 5,189,488 |
| 7,594 | Structured Agency Credit Risk Trust 0.84%, 09/25/2048, 1 mo. USD LIBOR + 0.750%(1)(2) | 7,594 |
| 519,512 | TBW Mortgage-Backed Trust 6.00%, 07/25/2036 | 327,506 |
| 4,130,000 | Toorak Mortgage Corp. Ltd. 2.24%, 06/25/2024(1) | 4,119,290 |
| 7,967,563 | Towd Point Mortgage Trust 2.92%, 11/30/2060(1)(3) | 8,007,400 |
| 3,470,000 | Triangle Re Ltd. 1.95%, 02/25/2034, 3 mo. USD SOFR + 1.900%(1)(2) | 3,469,999 |
| | VCAT LLC | |
| 6,327,837 | 1.87%, 08/25/2051(1) | 6,301,811 |
| 1,350,797 | 2.12%, 03/27/2051(1) | 1,351,731 |
| | Verus Securitization Trust | |
| 1,577,867 | 0.82%, 10/25/2063(1)(3) | 1,575,401 |
| 3,071,977 | 0.92%, 02/25/2064(1)(3) | 3,063,270 |
| 2,951,482 | 0.94%, 07/25/2066(1)(3) | 2,938,481 |
| 2,538,756 | 1.03%, 02/25/2066(1)(3) | 2,525,706 |
| 1,441,171 | 1.50%, 05/25/2065(1) | 1,443,635 |
| 990,023 | 2.78%, 07/25/2059(1) | 992,503 |
| 1,382,610 | 3.60%, 08/25/2050(1) | 1,383,564 |
| 5,111,875 | VOLT XCIII LLC 1.89%, 02/27/2051(1) | 5,099,366 |
| 3,940,629 | VOLT XCIV LLC 2.24%, 02/27/2051(1) | 3,933,899 |
| 4,060,182 | VOLT XCVII LLC 2.24%, 04/25/2051(1) | 4,084,599 |
| 1,344,200 | VOLT XCVIII LLC 2.12%, 04/25/2051(1) | 1,349,190 |
| | WaMu Mortgage Pass-Through Certificates Trust | |
| 307,941 | 0.97%, 10/25/2046, 12 mo. USD MTA + 0.880%(2) | 296,909 |
| 229,564 | 1.07%, 07/25/2046, 12 mo. USD MTA + 0.980%(2) | 217,360 |
| 642,150 | 2.80%, 06/25/2037(3) | 629,251 |
| | Washington Mutual Mortgage Pass-Through Certificates WMALT Trust | |
| 782,164 | 0.69%, 07/25/2036, 1 mo. USD LIBOR + 0.600%(2) | 531,927 |
| 428,068 | 0.92%, 11/25/2046, 12 mo. USD MTA + 0.830%(2) | 393,671 |
| 17,575,383 | Wells Fargo Commercial Mortgage Trust 0.90%, 09/15/2057(3)(4) | 526,780 |
The accompanying notes are an integral part of these financial statements.
The Hartford Total Return Bond Fund
Schedule of Investments – (continued)
October 31, 2021
| Shares or Principal Amount | | Market Value† |
| ASSET & COMMERCIAL MORTGAGE-BACKED SECURITIES - 22.4% - (continued) |
| | Whole Loan Collateral CMO - 10.2% - (continued) |
| $ 119,908 | Wells Fargo Mortgage-Backed Securities Trust 2.51%, 09/25/2036(3) | $ 118,633 |
| 1,834,037 | Wells Fargo N.A. 1.03%, 04/15/2052(3)(4) | ��� 121,035 |
| | | | 351,384,956 |
| | Total Asset & Commercial Mortgage-Backed Securities
(cost $771,436,782) | $ 771,838,221 |
| CORPORATE BONDS - 27.1% |
| | Advertising - 0.0% |
| 615,000 | Lamar Media Corp. 3.75%, 02/15/2028 | $ 621,642 |
| | Aerospace/Defense - 0.4% |
| | Boeing Co. | |
| 2,420,000 | 5.04%, 05/01/2027 | 2,750,291 |
| 1,675,000 | 5.15%, 05/01/2030 | 1,954,916 |
| | L3Harris Technologies, Inc. | |
| 465,000 | 2.90%, 12/15/2029 | 486,924 |
| 2,105,000 | 3.85%, 06/15/2023 | 2,206,941 |
| 1,410,000 | Northrop Grumman Corp. 5.15%, 05/01/2040 | 1,838,402 |
| | Raytheon Technologies Corp. | |
| 43,000 | 3.65%, 08/16/2023 | 45,131 |
| 2,790,000 | 3.95%, 08/16/2025 | 3,045,998 |
| 1,020,000 | 4.45%, 11/16/2038 | 1,228,646 |
| | | | 13,557,249 |
| | Agriculture - 0.3% |
| 1,895,000 | Altria Group, Inc. 3.70%, 02/04/2051 | 1,801,010 |
| | BAT Capital Corp. | |
| 1,670,000 | 2.26%, 03/25/2028 | 1,640,220 |
| 2,525,000 | 2.79%, 09/06/2024 | 2,625,755 |
| 3,425,000 | BAT International Finance plc 1.67%, 03/25/2026 | 3,387,534 |
| 1,945,000 | Kernel Holding S.A. 6.50%, 10/17/2024(5) | 2,053,389 |
| | | | 11,507,908 |
| | Airlines - 0.0% |
| 115,000 | United Airlines, Inc. 4.63%, 04/15/2029(1) | 118,563 |
| | Apparel - 0.2% |
| 940,000 | Hanesbrands, Inc. 4.88%, 05/15/2026(1) | 1,004,846 |
| 4,510,000 | William Carter Co. 5.63%, 03/15/2027(1) | 4,667,850 |
| | | | 5,672,696 |
| | Auto Manufacturers - 0.2% |
| | General Motors Co. | |
| 1,395,000 | 5.20%, 04/01/2045 | 1,741,026 |
| 735,000 | 6.13%, 10/01/2025 | 853,147 |
| | General Motors Financial Co., Inc. | |
| 840,000 | 1.25%, 01/08/2026 | 823,663 |
| 4,080,000 | 1.50%, 06/10/2026 | 4,019,924 |
| | | | 7,437,760 |
| | Auto Parts & Equipment - 0.0% |
| 342,000 | Clarios Global L.P. / Clarios U.S. Finance Co. 6.25%, 05/15/2026(1) | 357,818 |
| | Beverages - 0.4% |
| | Anheuser-Busch InBev Worldwide, Inc. | |
| 2,008,000 | 3.75%, 07/15/2042 | 2,188,039 |
| 710,000 | 4.60%, 04/15/2048 | 878,058 |
| 700,000 | 4.75%, 04/15/2058 | 891,782 |
| 3,890,000 | 5.45%, 01/23/2039 | 5,104,155 |
| Shares or Principal Amount | | Market Value† |
| CORPORATE BONDS - 27.1% - (continued) |
| | Beverages - 0.4% - (continued) |
| | Constellation Brands, Inc. | |
| $ 500,000 | 2.25%, 08/01/2031 | $ 489,421 |
| 560,000 | 2.88%, 05/01/2030 | 579,837 |
| 273,000 | 3.15%, 08/01/2029 | 290,318 |
| 251,000 | 3.60%, 02/15/2028 | 275,033 |
| 1,540,000 | 4.40%, 11/15/2025 | 1,707,784 |
| | | | 12,404,427 |
| | Biotechnology - 0.2% |
| 77,000 | Baxalta, Inc. 3.60%, 06/23/2022 | 78,119 |
| 4,935,000 | Gilead Sciences, Inc. 1.65%, 10/01/2030 | 4,723,070 |
| | Royalty Pharma plc | |
| 3,065,000 | 2.15%, 09/02/2031 | 2,916,303 |
| 655,000 | 3.30%, 09/02/2040 | 653,441 |
| 65,000 | 3.55%, 09/02/2050 | 64,521 |
| | | | 8,435,454 |
| | Chemicals - 0.1% |
| 290,000 | Chemours Co. 5.38%, 05/15/2027(6) | 305,950 |
| 2,940,000 | DuPont de Nemours, Inc. 4.21%, 11/15/2023 | 3,134,331 |
| 875,000 | LYB International Finance LLC 1.25%, 10/01/2025 | 866,315 |
| 385,000 | Olin Corp. 5.13%, 09/15/2027 | 399,919 |
| | | | 4,706,515 |
| | Commercial Banks - 5.3% |
| 5,990,000 | Bangkok Bank PCL 3.47%, 09/23/2036, (3.47% fixed rate until 09/23/2031; 5 year USD CMT + 2.150% thereafter)(1)(2)(7) | 5,946,878 |
| | Bank of America Corp. | |
| 2,175,000 | 2.46%, 10/22/2025, (2.46% fixed rate until 10/22/2024; 3 mo. USD LIBOR + 0.870% thereafter)(7) | 2,249,129 |
| 1,445,000 | 2.57%, 10/20/2032, (2.57% fixed rate until 10/20/2031; 3 mo. USD SOFR + 1.210% thereafter)(7) | 1,450,807 |
| 550,000 | 2.69%, 04/22/2032, (2.69% fixed rate until 04/22/2031; 3 mo. USD SOFR + 1.320% thereafter)(7) | 557,160 |
| 2,370,000 | 3.19%, 07/23/2030, (3.19% fixed rate until 07/23/2029; 3 mo. USD LIBOR + 1.180% thereafter)(7) | 2,514,165 |
| 3,465,000 | 3.31%, 04/22/2042, (3.31% fixed rate until 04/22/2041; 3 mo. USD SOFR + 1.580% thereafter)(7) | 3,666,010 |
| 5,870,000 | 3.37%, 01/23/2026, (3.37% fixed rate until 01/23/2025; 3 mo. USD LIBOR + 0.810% thereafter)(7) | 6,228,755 |
| 5,215,000 | 4.08%, 03/20/2051, (4.08% fixed rate until 03/20/2050; 3 mo. USD LIBOR + 3.150% thereafter)(7) | 6,290,494 |
| 2,640,000 | 7.75%, 05/14/2038 | 4,131,365 |
| 2,640,000 | Bank of New York Mellon Corp. 2.10%, 10/24/2024 | 2,732,757 |
| | BNP Paribas S.A. | |
| 1,600,000 | 1.32%, 01/13/2027, (1.32% fixed rate until 01/13/2026; 3 mo. USD SOFR + 1.004% thereafter)(1)(7) | 1,564,130 |
| 730,000 | 2.16%, 09/15/2029, (2.16% fixed rate until 09/15/2028; 3 mo. USD SOFR + 1.218% thereafter)(1)(7) | 717,268 |
The accompanying notes are an integral part of these financial statements.
The Hartford Total Return Bond Fund
Schedule of Investments – (continued)
October 31, 2021
| Shares or Principal Amount | | Market Value† |
| CORPORATE BONDS - 27.1% - (continued) |
| | Commercial Banks - 5.3% - (continued) |
| $ 2,435,000 | 2.22%, 06/09/2026, (2.22% fixed rate until 06/09/2025; 3 mo. USD SOFR + 2.074% thereafter)(1)(7) | $ 2,478,872 |
| | Citigroup, Inc. | |
| 2,325,000 | 2.31%, 11/04/2022, (2.31% fixed rate until 11/04/2021; 1 mo. USD SOFR + 0.867% thereafter)(7) | 2,325,209 |
| 2,655,000 | 2.52%, 11/03/2032, (2.83% fixed rate until 11/03/2031; 3 mo. USD SOFR + 1.177% thereafter)(7)(8) | 2,647,112 |
| 1,165,000 | 2.56%, 05/01/2032, (2.56% fixed rate until 05/01/2031; 3 mo. USD SOFR + 1.167% thereafter)(7) | 1,170,556 |
| 1,355,000 | 3.20%, 10/21/2026 | 1,440,750 |
| 3,590,000 | 3.35%, 04/24/2025, (3.35% fixed rate until 04/24/2024; 3 mo. USD LIBOR + 0.897% thereafter)(7) | 3,782,075 |
| 3,950,000 | 3.70%, 01/12/2026 | 4,284,978 |
| 1,240,000 | 3.98%, 03/20/2030, (3.98% fixed rate until 03/20/2029; 3 mo. USD LIBOR + 1.338% thereafter)(7) | 1,383,308 |
| 2,090,000 | 4.41%, 03/31/2031, (4.41% fixed rate until 03/31/2030; 3 mo. USD SOFR + 3.914% thereafter)(7) | 2,396,247 |
| 1,780,000 | 4.45%, 09/29/2027 | 1,996,713 |
| | Credit Suisse Group AG | |
| 360,000 | 0.50%, 02/04/2022, 3 mo. USD SOFR + 0.450%(2) | 360,299 |
| 1,255,000 | 3.09%, 05/14/2032, (3.09% fixed rate until 05/14/2031; 3 mo. USD SOFR + 1.730% thereafter)(1)(7) | 1,278,531 |
| | Danske Bank A/S | |
| 1,615,000 | 5.00%, 01/12/2022(1) | 1,628,638 |
| 1,685,000 | 5.38%, 01/12/2024(1) | 1,834,666 |
| 2,110,000 | Fifth Third Bancorp 2.38%, 01/28/2025 | 2,177,844 |
| | Goldman Sachs Group, Inc. | |
| 2,295,000 | 0.93%, 10/21/2024, (0.93% fixed rate until 10/21/2023; 3 mo. USD SOFR + 0.486% thereafter)(7) | 2,292,866 |
| 4,130,000 | 2.38%, 07/21/2032, (2.38% fixed rate until 07/21/2031; 3 mo. USD SOFR + 1.248% thereafter)(7) | 4,061,915 |
| 5,380,000 | 2.62%, 04/22/2032, (2.62% fixed rate until 04/22/2031; 3 mo. USD SOFR + 1.281% thereafter)(7) | 5,405,284 |
| 480,000 | 2.65%, 10/21/2032, (2.65% fixed rate until 10/21/2031; 3 mo. USD SOFR + 1.264% thereafter)(7) | 482,679 |
| 2,720,000 | 2.91%, 07/24/2023, (2.91% fixed rate until 07/24/2022; 3 mo. USD LIBOR + 0.990% thereafter)(7) | 2,763,230 |
| 1,540,000 | 3.81%, 04/23/2029, (3.81% fixed rate until 04/23/2028; 3 mo. USD LIBOR + 1.158% thereafter)(7) | 1,688,088 |
| 3,020,000 | 4.22%, 05/01/2029, (4.22% fixed rate until 05/01/2028; 3 mo. USD LIBOR + 1.301% thereafter)(7) | 3,383,374 |
| 2,245,000 | 6.75%, 10/01/2037 | 3,194,216 |
| Shares or Principal Amount | | Market Value† |
| CORPORATE BONDS - 27.1% - (continued) |
| | Commercial Banks - 5.3% - (continued) |
| | HSBC Holdings plc | |
| $ 2,985,000 | 0.98%, 05/24/2025, (0.98% fixed rate until 05/24/2024; 3 mo. USD SOFR + 0.708% thereafter)(7) | $ 2,960,114 |
| 1,335,000 | 1.59%, 05/24/2027, (1.59% fixed rate until 05/24/2026; 3 mo. USD SOFR + 1.290% thereafter)(7) | 1,312,159 |
| 1,125,000 | 3.60%, 05/25/2023 | 1,175,963 |
| 4,130,000 | 4.58%, 06/19/2029, (4.58% fixed rate until 06/19/2028; 3 mo. USD LIBOR + 1.535% thereafter)(7) | 4,666,296 |
| | JP Morgan Chase & Co. | |
| 1,345,000 | 2.58%, 04/22/2032, (2.58% fixed rate until 04/22/2031; 3 mo. USD SOFR + 1.250% thereafter)(7) | 1,357,122 |
| 3,015,000 | 2.96%, 05/13/2031, (2.96% fixed rate until 05/13/2030; 3 mo. USD SOFR + 2.515% thereafter)(7) | 3,114,162 |
| 1,095,000 | 3.11%, 04/22/2041, (3.11% fixed rate until 04/22/2040; 3 mo. USD SOFR + 2.460% thereafter)(7) | 1,132,404 |
| 665,000 | 3.11%, 04/22/2051, (3.11% fixed rate until 04/22/2050; 3 mo. USD SOFR + 2.440% thereafter)(7) | 687,224 |
| 5,415,000 | 3.16%, 04/22/2042, (3.16% fixed rate until 04/22/2041; 3 mo. USD SOFR + 1.460% thereafter)(7) | 5,639,125 |
| 3,765,000 | 3.22%, 03/01/2025, (3.22% fixed rate until 03/01/2024; 3 mo. USD LIBOR + 1.155% thereafter)(7) | 3,946,646 |
| 1,785,000 | 3.51%, 01/23/2029, (3.51% fixed rate until 01/23/2028; 3 mo. USD LIBOR + 0.945% thereafter)(7) | 1,928,189 |
| 2,290,000 | 3.70%, 05/06/2030, (3.70% fixed rate until 05/06/2029; 3 mo. USD LIBOR + 1.160% thereafter)(7) | 2,503,555 |
| 6,955,000 | 3.96%, 01/29/2027, (3.96% fixed rate until 01/29/2026; 3 mo. USD LIBOR + 1.245% thereafter)(7) | 7,579,362 |
| 1,285,000 | 4.01%, 04/23/2029, (4.00% fixed rate until 04/23/2028; 3 mo. USD LIBOR + 1.120% thereafter)(7) | 1,426,640 |
| 410,000 | 4.02%, 12/05/2024, (4.02% fixed rate until 12/05/2023; 3 mo. USD LIBOR + 1.000% thereafter)(7) | 435,893 |
| 1,795,000 | 4.49%, 03/24/2031, (4.49% fixed rate until 03/24/2030; 3 mo. USD SOFR + 3.790% thereafter)(7) | 2,082,312 |
| 25,000 | JPMorgan Chase & Co. 1.47%, 09/22/2027, (1.47% fixed rate until 09/22/2026; 3 mo. USD SOFR + 0.765% thereafter)(7) | 24,550 |
| | Morgan Stanley | |
| 1,025,000 | 1.16%, 10/21/2025, (1.16% fixed rate until 10/21/2024; 3 mo. USD SOFR + 0.560% thereafter)(7) | 1,020,108 |
| 5,915,000 | 1.79%, 02/13/2032, (1.79% fixed rate until 02/13/2031; 3 mo. USD SOFR + 1.034% thereafter)(7) | 5,575,348 |
The accompanying notes are an integral part of these financial statements.
The Hartford Total Return Bond Fund
Schedule of Investments – (continued)
October 31, 2021
| Shares or Principal Amount | | Market Value† |
| CORPORATE BONDS - 27.1% - (continued) |
| | Commercial Banks - 5.3% - (continued) |
| $ 4,240,000 | 1.93%, 04/28/2032, (1.93% fixed rate until 04/28/2031; 3 mo. USD SOFR + 1.020% thereafter)(7) | $ 4,039,601 |
| 2,575,000 | 2.24%, 07/21/2032, (2.24% fixed rate until 07/21/2031; 3 mo. USD SOFR + 1.178% thereafter)(7) | 2,514,217 |
| 360,000 | 2.51%, 10/20/2032, (2.51% fixed rate until 10/20/2031; 3 mo. USD SOFR + 1.200% thereafter)(7) | 359,212 |
| 1,030,000 | 2.63%, 11/17/2021 | 1,031,018 |
| 2,005,000 | 2.70%, 01/22/2031, (2.70% fixed rate until 01/22/2030; 3 mo. USD SOFR + 1.143% thereafter)(7) | 2,050,446 |
| 2,720,000 | 3.59%, 07/22/2028, (3.59% fixed rate until 07/22/2027; 3 mo. USD LIBOR + 1.340% thereafter)(7) | 2,941,364 |
| 2,710,000 | 4.00%, 07/23/2025 | 2,958,019 |
| 1,250,000 | 4.43%, 01/23/2030, (4.43% fixed rate until 01/23/2029; 3 mo. USD LIBOR + 1.628% thereafter)(7) | 1,431,764 |
| 595,000 | PNC Bank NA 2.70%, 10/22/2029 | 620,956 |
| 2,725,000 | PNC Financial Services Group, Inc. 2.20%, 11/01/2024 | 2,830,704 |
| 1,375,000 | Santander Holdings USA, Inc. 3.70%, 03/28/2022 | 1,388,222 |
| 2,670,000 | Truist Bank 2.25%, 03/11/2030 | 2,671,922 |
| 1,620,000 | UBS Group AG 2.65%, 02/01/2022(1) | 1,628,764 |
| 2,275,000 | UniCredit S.p.A. 6.57%, 01/14/2022(1) | 2,300,560 |
| | Wells Fargo & Co. | |
| 3,250,000 | 2.41%, 10/30/2025, (2.41% fixed rate until 10/30/2024; 3 mo. USD SOFR + 1.087% thereafter)(7) | 3,357,348 |
| 1,190,000 | 3.00%, 04/22/2026 | 1,259,674 |
| 1,555,000 | 3.00%, 10/23/2026 | 1,642,907 |
| 2,715,000 | 3.75%, 01/24/2024 | 2,880,718 |
| 580,000 | 4.90%, 11/17/2045 | 744,424 |
| 925,000 | 5.01%, 04/04/2051, (5.01% fixed rate until 04/04/2050; 3 mo. USD SOFR + 4.502% thereafter)(7) | 1,276,138 |
| 410,000 | 5.61%, 01/15/2044 | 559,888 |
| | | | 181,561,406 |
| | Commercial Services - 1.0% |
| | Ashtead Capital, Inc. | |
| 1,550,000 | 4.00%, 05/01/2028(1) | 1,635,481 |
| 5,335,000 | 4.38%, 08/15/2027(1) | 5,575,235 |
| 1,255,000 | Equifax, Inc. 2.60%, 12/15/2025 | 1,308,321 |
| | Gartner, Inc. | |
| 635,000 | 3.63%, 06/15/2029(1) | 638,175 |
| 2,460,000 | 3.75%, 10/01/2030(1) | 2,493,825 |
| 3,991,000 | 4.50%, 07/01/2028(1) | 4,155,429 |
| 2,000,000 | Howard University 2.70%, 10/01/2029 | 2,011,988 |
| 1,205,000 | Howard University (AGM Insured) 3.48%, 10/01/2041 | 1,268,518 |
| 3,295,000 | IHS Markit Ltd. 4.13%, 08/01/2023 | 3,471,949 |
| | Service Corp. International | |
| 7,045,000 | 3.38%, 08/15/2030 | 6,934,394 |
| 4,657,000 | 5.13%, 06/01/2029 | 5,028,396 |
| Shares or Principal Amount | | Market Value† |
| CORPORATE BONDS - 27.1% - (continued) |
| | Commercial Services - 1.0% - (continued) |
| | United Rentals North America, Inc. | |
| $ 205,000 | 4.00%, 07/15/2030 | $ 209,159 |
| 750,000 | 4.88%, 01/15/2028 | 791,663 |
| | | | 35,522,533 |
| | Construction Materials - 0.3% |
| 4,567,000 | Builders FirstSource, Inc. 5.00%, 03/01/2030(1) | 4,823,894 |
| | Standard Industries, Inc. | |
| 830,000 | 3.38%, 01/15/2031(1) | 769,634 |
| 4,355,000 | 4.38%, 07/15/2030(1) | 4,355,000 |
| 285,000 | 4.75%, 01/15/2028(1) | 293,906 |
| 145,000 | 5.00%, 02/15/2027(1) | 148,806 |
| | | | 10,391,240 |
| | Diversified Financial Services - 0.8% |
| 3,475,000 | AerCap Ireland Capital DAC / AerCap Global Aviation Trust 3.30%, 01/30/2032 | 3,543,113 |
| 6,395,000 | BOC Aviation USA Corp. 1.63%, 04/29/2024(1) | 6,407,257 |
| 1,490,000 | Capital One Financial Corp. 3.90%, 01/29/2024 | 1,582,065 |
| 1,630,000 | GE Capital Funding LLC 4.40%, 05/15/2030 | 1,907,729 |
| 1,330,000 | GE Capital International Funding Co. 4.42%, 11/15/2035 | 1,619,302 |
| 4,500,000 | GTP Acquisition Partners LLC 3.48%, 06/15/2050(1) | 4,700,326 |
| 1,415,000 | Mastercard, Inc. 2.95%, 03/15/2051 | 1,495,710 |
| | Navient Corp. | |
| 70,000 | 5.88%, 10/25/2024 | 74,806 |
| 190,000 | 6.13%, 03/25/2024 | 203,300 |
| 90,000 | 7.25%, 09/25/2023 | 97,988 |
| 4,450,000 | Power Finance Corp. Ltd. 3.95%, 04/23/2030(1) | 4,578,701 |
| | | | 26,210,297 |
| | Electric - 2.3% |
| 3,100,000 | AES Corp. 3.30%, 07/15/2025(1) | 3,258,410 |
| | Alabama Power Co. | |
| 2,120,000 | 3.45%, 10/01/2049 | 2,347,598 |
| 1,480,000 | 4.15%, 08/15/2044 | 1,757,070 |
| | Berkshire Hathaway Energy Co. | |
| 865,000 | 1.65%, 05/15/2031 | 822,470 |
| 1,550,000 | 3.25%, 04/15/2028 | 1,680,208 |
| | Cleco Corporate Holdings LLC | |
| 1,105,000 | 3.38%, 09/15/2029 | 1,130,079 |
| 70,000 | 4.97%, 05/01/2046 | 86,475 |
| | Commonwealth Edison Co. | |
| 1,735,000 | 3.65%, 06/15/2046 | 1,967,662 |
| 360,000 | 4.00%, 03/01/2048 | 431,852 |
| 365,000 | Connecticut Light & Power Co. 4.00%, 04/01/2048 | 446,099 |
| | Duke Energy Carolinas LLC | |
| 35,000 | 3.45%, 04/15/2051 | 38,397 |
| 575,000 | 4.25%, 12/15/2041 | 683,777 |
| 3,375,000 | Duke Energy Corp. 2.55%, 06/15/2031 | 3,393,057 |
| 1,185,000 | Duke Energy Florida LLC 3.40%, 10/01/2046 | 1,283,856 |
| | Duke Energy Indiana LLC | |
| 2,160,000 | 2.75%, 04/01/2050 | 2,098,791 |
| 1,215,000 | 3.25%, 10/01/2049 | 1,282,647 |
The accompanying notes are an integral part of these financial statements.
The Hartford Total Return Bond Fund
Schedule of Investments – (continued)
October 31, 2021
| Shares or Principal Amount | | Market Value† |
| CORPORATE BONDS - 27.1% - (continued) |
| | Electric - 2.3% - (continued) |
| $ 1,435,000 | Duke Energy Progress LLC 4.38%, 03/30/2044 | $ 1,746,381 |
| 1,645,000 | Duquesne Light Holdings, Inc. 2.78%, 01/07/2032(1) | 1,636,196 |
| 2,745,000 | Enel Finance International N.V. 1.38%, 07/12/2026(1) | 2,699,821 |
| 305,000 | Evergy Metro, Inc. 2.25%, 06/01/2030 | 306,026 |
| | Evergy, Inc. | |
| 710,000 | 2.45%, 09/15/2024 | 735,276 |
| 2,010,000 | 2.90%, 09/15/2029 | 2,095,538 |
| 2,095,000 | Exelon Corp. 3.95%, 06/15/2025 | 2,262,851 |
| | FirstEnergy Corp. | |
| 350,000 | 1.60%, 01/15/2026 | 344,778 |
| 825,000 | 2.25%, 09/01/2030 | 793,279 |
| 2,625,000 | 3.40%, 03/01/2050 | 2,604,000 |
| 1,145,000 | 5.35%, 07/15/2047 | 1,388,138 |
| 1,590,000 | Georgia Power Co. 4.30%, 03/15/2042 | 1,831,162 |
| 1,230,000 | IPALCO Enterprises, Inc. 3.70%, 09/01/2024 | 1,302,051 |
| 1,935,000 | ITC Holdings Corp. 2.95%, 05/14/2030(1) | 2,015,803 |
| 1,570,000 | Jersey Central Power & Light Co. 2.75%, 03/01/2032(1) | 1,605,721 |
| | MidAmerican Energy Co. | |
| 765,000 | 3.15%, 04/15/2050 | 815,912 |
| 130,000 | 3.65%, 08/01/2048 | 148,717 |
| 380,000 | NextEra Energy Operating Partners L.P. 3.88%, 10/15/2026(1) | 404,225 |
| | NRG Energy, Inc. | |
| 1,025,000 | 2.00%, 12/02/2025(1) | 1,036,784 |
| 2,190,000 | 2.45%, 12/02/2027(1) | 2,191,811 |
| | Oglethorpe Power Corp. | |
| 295,000 | 3.75%, 08/01/2050 | 321,514 |
| 1,425,000 | 5.05%, 10/01/2048 | 1,806,272 |
| | Pacific Gas and Electric Co. | |
| 4,630,000 | 2.50%, 02/01/2031 | 4,424,203 |
| 260,000 | 4.50%, 07/01/2040 | 270,243 |
| 4,660,000 | 4.95%, 07/01/2050 | 5,152,436 |
| | PacifiCorp | |
| 394,000 | 4.13%, 01/15/2049 | 470,789 |
| 350,000 | 4.15%, 02/15/2050 | 421,675 |
| 1,630,000 | Public Service Enterprise Group, Inc. 2.88%, 06/15/2024 | 1,700,426 |
| | Puget Energy, Inc. | |
| 1,925,000 | 3.65%, 05/15/2025 | 2,045,323 |
| 2,220,000 | 4.10%, 06/15/2030 | 2,442,980 |
| | Sempra Energy | |
| 1,680,000 | 3.40%, 02/01/2028 | 1,806,228 |
| 1,110,000 | 3.80%, 02/01/2038 | 1,227,828 |
| 210,000 | 4.00%, 02/01/2048 | 236,999 |
| | Southern California Edison Co. | |
| 980,000 | 3.65%, 02/01/2050 | 1,052,746 |
| 506,000 | 4.00%, 04/01/2047 | 561,945 |
| 299,000 | 4.13%, 03/01/2048 | 336,526 |
| | Southern Co. | |
| 490,000 | 2.95%, 07/01/2023 | 506,004 |
| 1,520,000 | 3.25%, 07/01/2026 | 1,619,187 |
| 135,000 | 3.70%, 04/30/2030 | 146,380 |
| 30,000 | 4.40%, 07/01/2046 | 35,708 |
| 370,000 | Union Electric Co. 4.00%, 04/01/2048 | 445,960 |
| 315,000 | Xcel Energy, Inc. 3.50%, 12/01/2049 | 342,124 |
| | | | 78,046,414 |
| Shares or Principal Amount | | Market Value† |
| CORPORATE BONDS - 27.1% - (continued) |
| | Electronics - 0.0% |
| $ 200,000 | Imola Merger Corp. 4.75%, 05/15/2029(1) | $ 205,490 |
| | Energy-Alternate Sources - 0.1% |
| 1,495,000 | FS Luxembourg S.a.r.l. 10.00%, 12/15/2025(1) | 1,648,237 |
| 1,180,000 | Investment Energy Resources Ltd. 6.25%, 04/26/2029(1) | 1,263,969 |
| | | | 2,912,206 |
| | Engineering & Construction - 0.1% |
| 3,578,029 | International Airport Finance S.A. 12.00%, 03/15/2033(1)(6) | 3,890,069 |
| | Entertainment - 0.2% |
| 6,310,000 | WMG Acquisition Corp. 3.88%, 07/15/2030(1) | 6,538,737 |
| | Environmental Control - 0.3% |
| | Clean Harbors, Inc. | |
| 8,118,000 | 4.88%, 07/15/2027(1) | 8,452,867 |
| 275,000 | 5.13%, 07/15/2029(1) | 297,688 |
| | | | 8,750,555 |
| | Food - 0.2% |
| | Conagra Brands, Inc. | |
| 655,000 | 4.30%, 05/01/2024 | 705,337 |
| 220,000 | 4.60%, 11/01/2025 | 245,102 |
| 1,068,000 | 4.85%, 11/01/2028 | 1,245,931 |
| 330,000 | 5.40%, 11/01/2048 | 447,042 |
| 1,445,000 | Kellogg Co. 3.40%, 11/15/2027 | 1,560,888 |
| 115,000 | Kraft Heinz Foods Co. 4.25%, 03/01/2031 | 129,953 |
| 2,745,000 | NBM U.S. Holdings, Inc. 7.00%, 05/14/2026(1) | 2,905,582 |
| 375,000 | Post Holdings, Inc. 5.63%, 01/15/2028(1) | 391,388 |
| | | | 7,631,223 |
| | Food Service - 0.0% |
| 160,000 | Aramark Services, Inc. 5.00%, 02/01/2028(1) | 163,600 |
| | Forest Products & Paper - 0.1% |
| 3,510,000 | Suzano Austria GmbH 3.13%, 01/15/2032 | 3,313,440 |
| | Gas - 0.1% |
| | AmeriGas Partners L.P. / AmeriGas Finance Corp. | |
| 40,000 | 5.63%, 05/20/2024 | 43,200 |
| 500,000 | 5.88%, 08/20/2026 | 557,500 |
| | NiSource, Inc. | |
| 995,000 | 3.49%, 05/15/2027 | 1,076,239 |
| 2,095,000 | 3.60%, 05/01/2030 | 2,282,777 |
| | | | 3,959,716 |
| | Healthcare - Products - 0.5% |
| | Alcon Finance Corp. | |
| 2,130,000 | 2.75%, 09/23/2026(1) | 2,218,451 |
| 1,120,000 | 3.00%, 09/23/2029(1) | 1,180,141 |
| | Boston Scientific Corp. | |
| 1,820,000 | 1.90%, 06/01/2025 | 1,854,934 |
| 4,120,000 | 3.75%, 03/01/2026 | 4,479,145 |
| 685,000 | Hill-Rom Holdings, Inc. 4.38%, 09/15/2027(1) | 711,364 |
| 6,485,000 | Hologic, Inc. 4.63%, 02/01/2028(1) | 6,728,188 |
| 285,000 | Teleflex, Inc. 4.25%, 06/01/2028(1) | 292,823 |
| | | | 17,465,046 |
The accompanying notes are an integral part of these financial statements.
The Hartford Total Return Bond Fund
Schedule of Investments – (continued)
October 31, 2021
| Shares or Principal Amount | | Market Value† |
| CORPORATE BONDS - 27.1% - (continued) |
| | Healthcare - Services - 0.7% |
| $ 1,895,000 | Anthem, Inc. 3.50%, 08/15/2024 | $ 2,013,936 |
| | Centene Corp. | |
| 75,000 | 4.25%, 12/15/2027 | 78,562 |
| 8,035,000 | 4.63%, 12/15/2029 | 8,667,756 |
| 335,000 | CommonSpirit Health 3.35%, 10/01/2029 | 357,372 |
| | HCA, Inc. | |
| 80,000 | 3.50%, 09/01/2030 | 84,132 |
| 650,000 | 5.63%, 09/01/2028 | 761,787 |
| 1,335,000 | Humana, Inc. 2.15%, 02/03/2032 | 1,292,402 |
| | Kaiser Foundation Hospitals | |
| 1,265,000 | 2.81%, 06/01/2041 | 1,280,115 |
| 2,090,000 | 3.00%, 06/01/2051 | 2,169,591 |
| 1,270,000 | Sutter Health 3.36%, 08/15/2050 | 1,360,554 |
| | UnitedHealth Group, Inc. | |
| 1,335,000 | 2.38%, 08/15/2024 | 1,388,075 |
| 2,305,000 | 2.75%, 05/15/2040 | 2,316,658 |
| 590,000 | 3.50%, 08/15/2039 | 654,891 |
| | | | 22,425,831 |
| | Home Builders - 0.2% |
| 3,270,000 | PulteGroup, Inc. 5.50%, 03/01/2026 | 3,750,527 |
| 375,000 | Taylor Morrison Communities, Inc. / Taylor Morrison Holdings II, Inc. 5.63%, 03/01/2024(1) | 400,781 |
| | Toll Brothers Finance Corp. | |
| 310,000 | 3.80%, 11/01/2029(6) | 331,700 |
| 475,000 | 4.88%, 11/15/2025 | 524,281 |
| | | | 5,007,289 |
| | Insurance - 0.9% |
| 5,475,000 | American International Group, Inc. 2.50%, 06/30/2025 | 5,687,645 |
| 1,580,000 | Aon Corp. 2.20%, 11/15/2022 | 1,606,472 |
| 2,555,000 | Athene Global Funding 2.65%, 10/04/2031(1) | 2,545,895 |
| 3,030,000 | Brighthouse Financial, Inc. 5.63%, 05/15/2030 | 3,636,980 |
| 4,730,000 | Equitable Financial Life Global Funding 1.80%, 03/08/2028(1) | 4,652,254 |
| | Marsh & McLennan Cos., Inc. | |
| 1,275,000 | 3.88%, 03/15/2024 | 1,361,154 |
| 1,290,000 | 4.38%, 03/15/2029 | 1,490,664 |
| 1,025,000 | 4.75%, 03/15/2039 | 1,296,947 |
| 282,000 | Massachusetts Mutual Life Insurance Co. 3.73%, 10/15/2070(1) | 313,038 |
| | MGIC Investment Corp. | |
| 95,000 | 5.25%, 08/15/2028 | 101,066 |
| 380,000 | 5.75%, 08/15/2023 | 405,175 |
| 2,730,000 | New York Life Global Funding 2.00%, 01/22/2025(1) | 2,799,512 |
| 415,000 | New York Life Insurance Co. 3.75%, 05/15/2050(1) | 475,467 |
| | Unum Group | |
| 720,000 | 4.13%, 06/15/2051 | 742,762 |
| 1,360,000 | 4.50%, 12/15/2049 | 1,472,727 |
| 45,000 | Voya Financial, Inc. 4.80%, 06/15/2046 | 57,472 |
| | Willis North America, Inc. | |
| 795,000 | 3.60%, 05/15/2024 | 841,387 |
| 2,135,000 | 4.50%, 09/15/2028 | 2,416,136 |
| | | | 31,902,753 |
| | Internet - 0.5% |
| | Alibaba Group Holding Ltd. | |
| 2,280,000 | 3.40%, 12/06/2027 | 2,421,275 |
| Shares or Principal Amount | | Market Value† |
| CORPORATE BONDS - 27.1% - (continued) |
| | Internet - 0.5% - (continued) |
| $ 200,000 | 4.20%, 12/06/2047 | $ 224,630 |
| 2,030,000 | Amazon.com, Inc. 3.88%, 08/22/2037 | 2,384,753 |
| | Go Daddy Operating Co. LLC | |
| 330,000 | 3.50%, 03/01/2029(1) | 318,450 |
| 4,537,000 | 5.25%, 12/01/2027(1) | 4,707,137 |
| 5,970,000 | NortonLifeLock, Inc. 5.00%, 04/15/2025(1) | 6,014,775 |
| | Tencent Holdings Ltd. | |
| 495,000 | 2.39%, 06/03/2030(1) | 483,131 |
| 1,105,000 | 3.60%, 01/19/2028(1) | 1,172,560 |
| | | | 17,726,711 |
| | Iron/Steel - 0.1% |
| 285,000 | Commercial Metals Co. 5.38%, 07/15/2027 | 297,825 |
| EUR 1,985,000 | Metinvest B.V. 5.63%, 06/17/2025(1) | 2,426,603 |
| $ 1,520,000 | Vale Overseas Ltd. 3.75%, 07/08/2030 | 1,546,524 |
| | | | 4,270,952 |
| | IT Services - 0.7% |
| | Apple, Inc. | |
| 2,840,000 | 1.13%, 05/11/2025 | 2,839,105 |
| 255,000 | 2.20%, 09/11/2029 | 260,896 |
| 2,840,000 | 2.65%, 02/08/2051 | 2,800,957 |
| 505,000 | 3.45%, 02/09/2045 | 565,604 |
| 255,000 | 3.85%, 05/04/2043 | 300,823 |
| 355,000 | 4.38%, 05/13/2045 | 453,549 |
| 9,130,000 | Booz Allen Hamilton, Inc. 3.88%, 09/01/2028(1) | 9,261,016 |
| 745,000 | HP, Inc. 2.20%, 06/17/2025 | 764,276 |
| | International Business Machines Corp. | |
| 135,000 | 2.95%, 05/15/2050 | 133,958 |
| 1,800,000 | 3.00%, 05/15/2024 | 1,893,767 |
| 2,180,000 | Kyndryl Holdings, Inc. 3.15%, 10/15/2031(1) | 2,136,590 |
| 1,370,000 | Leidos, Inc. 3.63%, 05/15/2025 | 1,469,270 |
| 250,000 | Western Digital Corp. 4.75%, 02/15/2026 | 274,063 |
| | | | 23,153,874 |
| | Lodging - 0.1% |
| 170,000 | Hilton Domestic Operating Co., Inc. 5.38%, 05/01/2025(1) | 177,216 |
| 2,075,000 | Las Vegas Sands Corp. 3.50%, 08/18/2026 | 2,124,582 |
| | | | 2,301,798 |
| | Machinery-Construction & Mining - 0.0% |
| | BWX Technologies, Inc. | |
| 5,000 | 4.13%, 06/30/2028(1) | 5,063 |
| 600,000 | 4.13%, 04/15/2029(1) | 608,850 |
| | | | 613,913 |
| | Machinery-Diversified - 0.1% |
| | John Deere Capital Corp. | |
| 725,000 | 1.20%, 04/06/2023 | 733,207 |
| 820,000 | 1.75%, 03/09/2027 | 826,909 |
| 2,065,000 | Otis Worldwide Corp. 2.57%, 02/15/2030 | 2,107,130 |
| | | | 3,667,246 |
| | Media - 1.5% |
| | CCO Holdings LLC / CCO Holdings Capital Corp. | |
| 1,410,000 | 4.25%, 02/01/2031(1) | 1,403,655 |
| 1,468,000 | 4.50%, 08/15/2030(1) | 1,493,690 |
| 380,000 | 5.00%, 02/01/2028(1) | 395,200 |
| 30,000 | 5.13%, 05/01/2027(1) | 31,088 |
The accompanying notes are an integral part of these financial statements.
The Hartford Total Return Bond Fund
Schedule of Investments – (continued)
October 31, 2021
| Shares or Principal Amount | | Market Value† |
| CORPORATE BONDS - 27.1% - (continued) |
| | Media - 1.5% - (continued) |
| | Charter Communications Operating LLC / Charter Communications Operating Capital | |
| $ 695,000 | 2.30%, 02/01/2032 | $ 658,498 |
| 775,000 | 4.80%, 03/01/2050 | 879,936 |
| 465,000 | 5.75%, 04/01/2048 | 593,770 |
| 4,930,000 | 6.48%, 10/23/2045 | 6,794,662 |
| 1,060,000 | 6.83%, 10/23/2055 | 1,571,173 |
| | Comcast Corp. | |
| 225,000 | 2.89%, 11/01/2051(1) | 218,582 |
| 2,906,000 | 2.94%, 11/01/2056(1) | 2,798,028 |
| 1,025,000 | 2.99%, 11/01/2063(1) | 979,000 |
| 295,000 | 3.20%, 07/15/2036 | 313,700 |
| 525,000 | 3.25%, 11/01/2039 | 551,278 |
| 220,000 | 3.40%, 07/15/2046 | 236,741 |
| 1,930,000 | 3.75%, 04/01/2040 | 2,155,178 |
| | Cox Communications, Inc. | |
| 2,150,000 | 2.60%, 06/15/2031(1) | 2,170,436 |
| 662,000 | 3.15%, 08/15/2024(1) | 695,558 |
| | CSC Holdings LLC | |
| 6,410,000 | 3.38%, 02/15/2031(1) | 5,837,907 |
| 320,000 | 4.13%, 12/01/2030(1) | 306,400 |
| 200,000 | 5.38%, 02/01/2028(1) | 206,000 |
| 575,000 | 5.50%, 04/15/2027(1) | 593,687 |
| | Discovery Communications LLC | |
| 948,000 | 3.80%, 03/13/2024 | 1,005,354 |
| 2,000 | 3.95%, 06/15/2025 | 2,162 |
| 2,255,000 | 4.00%, 09/15/2055 | 2,391,372 |
| 954,000 | 5.30%, 05/15/2049 | 1,215,082 |
| 655,000 | 6.35%, 06/01/2040 | 904,212 |
| | DISH DBS Corp. | |
| 95,000 | 5.88%, 07/15/2022 | 97,375 |
| 505,000 | 5.88%, 11/15/2024 | 537,825 |
| | Sirius XM Radio, Inc. | |
| 5,175,000 | 3.13%, 09/01/2026(1) | 5,181,469 |
| 320,000 | 4.13%, 07/01/2030(1) | 317,976 |
| 390,000 | TEGNA, Inc. 4.63%, 03/15/2028 | 393,413 |
| 2,482,000 | Time Warner Cable LLC 4.50%, 09/15/2042 | 2,709,116 |
| 1,910,000 | Time Warner Entertainment Co., L.P. 8.38%, 07/15/2033 | 2,809,261 |
| 380,000 | TK Elevator U.S. Newco, Inc. 5.25%, 07/15/2027(1) | 386,764 |
| | ViacomCBS, Inc. | |
| 45,000 | 5.88%, 02/28/2057, (5.87% fixed rate until 02/28/2022; 3 mo. USD LIBOR + 3.895% thereafter)(7) | 45,042 |
| 50,000 | 6.25%, 02/28/2057, (6.25% fixed rate until 02/28/2027; 3 mo. USD LIBOR + 3.899% thereafter)(7) | 57,163 |
| | Videotron Ltd. | |
| 380,000 | 5.13%, 04/15/2027(1) | 392,825 |
| 480,000 | 5.38%, 06/15/2024(1) | 515,400 |
| | | | 49,845,978 |
| | Mining - 0.0% |
| 613,000 | Anglo American Capital plc 4.88%, 05/14/2025(1) | 678,540 |
| 250,000 | Kaiser Aluminum Corp. 4.63%, 03/01/2028(1) | 253,050 |
| | | | 931,590 |
| | Miscellaneous Manufacturing - 0.0% |
| 385,000 | Ingersoll-Rand Luxembourg Finance S.A. 4.50%, 03/21/2049 | 482,255 |
| Shares or Principal Amount | | Market Value† |
| CORPORATE BONDS - 27.1% - (continued) |
| | Office/Business Equipment - 0.3% |
| | CDW LLC / CDW Finance Corp. | |
| $ 8,841,000 | 3.25%, 02/15/2029 | $ 8,964,774 |
| 320,000 | 4.13%, 05/01/2025 | 329,200 |
| 250,000 | 4.25%, 04/01/2028 | 258,750 |
| 470,000 | Xerox Holdings Corp. 5.50%, 08/15/2028(1) | 475,291 |
| | | | 10,028,015 |
| | Oil & Gas - 1.2% |
| | Apache Corp. | |
| 70,000 | 4.25%, 01/15/2030(6) | 74,375 |
| 310,000 | 4.88%, 11/15/2027 | 336,350 |
| | BP Capital Markets America, Inc. | |
| 1,005,000 | 2.94%, 06/04/2051 | 979,612 |
| 775,000 | 3.06%, 06/17/2041 | 781,292 |
| 1,385,000 | 3.38%, 02/08/2061 | 1,418,050 |
| 2,390,000 | 3.63%, 04/06/2030 | 2,645,780 |
| | Continental Resources, Inc. | |
| 95,000 | 4.38%, 01/15/2028 | 103,669 |
| 260,000 | 5.75%, 01/15/2031(1) | 311,350 |
| 2,590,000 | Ecopetrol S.A. 4.63%, 11/02/2031(8) | 2,568,257 |
| | Energean Israel Finance Ltd. | |
| 1,185,000 | 4.50%, 03/30/2024(1)(5) | 1,208,700 |
| 1,030,000 | 4.88%, 03/30/2026(1)(5) | 1,046,480 |
| 1,180,000 | 5.88%, 03/30/2031(1)(5) | 1,194,750 |
| | Equinor ASA | |
| 1,650,000 | 1.75%, 01/22/2026 | 1,673,098 |
| 890,000 | 3.63%, 04/06/2040 | 1,001,633 |
| 1,230,000 | 3.70%, 04/06/2050 | 1,440,537 |
| 2,125,000 | Exxon Mobil Corp. 4.23%, 03/19/2040 | 2,537,256 |
| | Hess Corp. | |
| 606,000 | 7.13%, 03/15/2033 | 816,257 |
| 1,925,000 | 7.30%, 08/15/2031 | 2,584,324 |
| 3,025,000 | Leviathan Bond Ltd. 6.50%, 06/30/2027(1)(5) | 3,297,250 |
| | Lundin Energy Finance B.V. | |
| 970,000 | 2.00%, 07/15/2026(1) | 966,662 |
| 3,565,000 | 3.10%, 07/15/2031(1) | 3,594,755 |
| 2,270,000 | Marathon Petroleum Corp. 4.70%, 05/01/2025 | 2,508,279 |
| | Occidental Petroleum Corp. | |
| 5,000 | 3.20%, 08/15/2026 | 5,062 |
| 20,000 | 3.40%, 04/15/2026 | 20,407 |
| 50,000 | 3.50%, 08/15/2029 | 50,750 |
| 25,000 | 4.10%, 02/15/2047 | 24,375 |
| 30,000 | 6.13%, 01/01/2031 | 35,925 |
| 10,000 | 6.38%, 09/01/2028 | 11,721 |
| | Ovintiv, Inc. | |
| 55,000 | 6.50%, 08/15/2034 | 74,268 |
| 50,000 | 6.50%, 02/01/2038 | 67,804 |
| 13,000 | 7.20%, 11/01/2031 | 17,425 |
| 102,000 | 7.38%, 11/01/2031 | 137,823 |
| 1,255,000 | Qatar Petroleum 3.30%, 07/12/2051(1) | 1,278,895 |
| 3,760,000 | Qatar Petroleum Industry 2.25%, 07/12/2031(1) | 3,703,600 |
| 849,000 | Saudi Arabian Oil Co. 2.88%, 04/16/2024(1) | 881,517 |
| 1,035,000 | Shell International Finance B.V. 3.25%, 04/06/2050 | 1,128,716 |
| 505,000 | Sunoco L.P. / Sunoco Finance Corp. 4.50%, 04/30/2030(1) | 509,454 |
| 1,870,000 | Tullow Oil plc 7.00%, 03/01/2025(1) | 1,636,250 |
| | | | 42,672,708 |
| | Oil & Gas Services - 0.0% |
| 1,035,000 | Halliburton Co. 4.85%, 11/15/2035 | 1,228,439 |
The accompanying notes are an integral part of these financial statements.
The Hartford Total Return Bond Fund
Schedule of Investments – (continued)
October 31, 2021
| Shares or Principal Amount | | Market Value† |
| CORPORATE BONDS - 27.1% - (continued) |
| | Packaging & Containers - 0.3% |
| $ 430,000 | Ardagh Packaging Finance plc / Ardagh Holdings USA, Inc. 4.13%, 08/15/2026(1) | $ 438,613 |
| 8,115,000 | Ball Corp. 4.00%, 11/15/2023 | 8,510,606 |
| 630,000 | Graphic Packaging International LLC 3.50%, 03/01/2029(1) | 623,700 |
| | Owens-Brockway Glass Container, Inc. | |
| 110,000 | 5.38%, 01/15/2025(1) | 115,775 |
| 700,000 | 5.88%, 08/15/2023(1) | 736,750 |
| | | | 10,425,444 |
| | Pharmaceuticals - 0.9% |
| | AbbVie, Inc. | |
| 440,000 | 3.20%, 11/21/2029 | 470,426 |
| 180,000 | 4.25%, 11/21/2049 | 216,239 |
| 1,020,000 | 4.63%, 10/01/2042 | 1,235,371 |
| 5,055,000 | Astrazeneca Finance LLC 1.75%, 05/28/2028 | 5,038,904 |
| | Bausch Health Cos., Inc. | |
| 460,000 | 5.75%, 08/15/2027(1) | 481,613 |
| 270,000 | 7.00%, 01/15/2028(1) | 273,411 |
| 2,580,000 | Bayer U.S. Finance LLC 4.25%, 12/15/2025(1) | 2,828,883 |
| | Bristol-Myers Squibb Co. | |
| 4,265,000 | 0.75%, 11/13/2025 | 4,186,342 |
| 1,110,000 | 2.55%, 11/13/2050 | 1,060,272 |
| 5,660,000 | Cigna Corp. 1.25%, 03/15/2026(6) | 5,596,917 |
| | CVS Health Corp. | |
| 1,105,000 | 4.13%, 04/01/2040 | 1,265,831 |
| 1,215,000 | 5.13%, 07/20/2045 | 1,597,063 |
| 3,015,000 | GlaxoSmithKline Capital, Inc. 3.63%, 05/15/2025 | 3,276,959 |
| 440,000 | Organon & Co. 4.13%, 04/30/2028(1) | 446,050 |
| 3,875,000 | Teva Pharmaceutical Finance Netherlands B.V. 3.15%, 10/01/2026 | 3,652,187 |
| | | | 31,626,468 |
| | Pipelines - 0.8% |
| 55,000 | Cheniere Energy Partners L.P. 4.50%, 10/01/2029 | 58,722 |
| | DCP Midstream Operating L.P. | |
| 100,000 | 3.88%, 03/15/2023 | 103,125 |
| 200,000 | 4.95%, 04/01/2022 | 201,000 |
| 70,000 | 5.60%, 04/01/2044 | 84,000 |
| 985,000 | Energy Transfer L.P. 4.00%, 10/01/2027 | 1,070,151 |
| | Energy Transfer Operating L.P. | |
| 145,000 | 4.95%, 06/15/2028 | 165,655 |
| 880,000 | 5.15%, 03/15/2045 | 1,024,588 |
| 1,420,000 | 5.25%, 04/15/2029 | 1,650,055 |
| 165,000 | 5.30%, 04/01/2044 | 193,199 |
| 2,710,000 | 6.13%, 12/15/2045 | 3,471,685 |
| 445,000 | 6.25%, 04/15/2049 | 590,386 |
| | Enterprise Products Operating LLC | |
| 265,000 | 3.30%, 02/15/2053 | 265,187 |
| 815,000 | 4.25%, 02/15/2048 | 931,731 |
| 955,000 | 4.95%, 10/15/2054 | 1,226,240 |
| | EQM Midstream Partners L.P. | |
| 135,000 | 5.50%, 07/15/2028 | 148,693 |
| 145,000 | 6.50%, 07/01/2027(1) | 161,313 |
| | Galaxy Pipeline Assets Bidco Ltd. | |
| 3,335,000 | 2.16%, 03/31/2034(1) | 3,248,388 |
| 7,410,000 | 2.63%, 03/31/2036(1) | 7,218,946 |
| 1,555,000 | 2.94%, 09/30/2040(1) | 1,527,397 |
| Shares or Principal Amount | | Market Value† |
| CORPORATE BONDS - 27.1% - (continued) |
| | Pipelines - 0.8% - (continued) |
| | MPLX L.P. | |
| $ 945,000 | 1.75%, 03/01/2026 | $ 941,447 |
| 40,000 | 4.00%, 02/15/2025 | 42,966 |
| 1,260,000 | NGPL PipeCo LLC 3.25%, 07/15/2031(1) | 1,283,279 |
| 825,000 | Sabine Pass Liquefaction LLC 5.88%, 06/30/2026 | 957,636 |
| 320,000 | Targa Resources Partners L.P. / Targa Resources Partners Finance Corp. 4.88%, 02/01/2031 | 345,034 |
| | Venture Global Calcasieu Pass LLC | |
| 210,000 | 3.88%, 08/15/2029(1) | 214,032 |
| 220,000 | 4.13%, 08/15/2031(1) | 227,689 |
| | Western Midstream Operating L.P. | |
| 95,000 | 4.75%, 08/15/2028 | 104,519 |
| 360,000 | 5.30%, 02/01/2030 | 394,650 |
| | | | 27,851,713 |
| | Real Estate Investment Trusts - 0.6% |
| | American Tower Corp. | |
| 1,115,000 | 1.45%, 09/15/2026 | 1,098,588 |
| 1,125,000 | 1.50%, 01/31/2028 | 1,080,589 |
| 1,140,000 | 2.40%, 03/15/2025 | 1,174,427 |
| | EPR Properties | |
| 1,060,000 | 3.60%, 11/15/2031 | 1,063,202 |
| 560,000 | 3.75%, 08/15/2029 | 575,350 |
| 2,280,000 | 4.95%, 04/15/2028 | 2,497,301 |
| | Equinix, Inc. | |
| 1,070,000 | 2.00%, 05/15/2028 | 1,058,563 |
| 60,000 | 2.50%, 05/15/2031 | 60,040 |
| | GLP Capital L.P. / GLP Financing II, Inc. | |
| 1,590,000 | 4.00%, 01/15/2031 | 1,694,685 |
| 2,155,000 | 5.30%, 01/15/2029 | 2,465,449 |
| 1,605,000 | 5.75%, 06/01/2028 | 1,863,678 |
| | SBA Tower Trust | |
| 2,245,000 | 2.84%, 01/15/2050(1) | 2,328,746 |
| 2,040,000 | 3.45%, 03/15/2048(1) | 2,059,312 |
| | VEREIT Operating Partnership L.P. | |
| 160,000 | 2.20%, 06/15/2028 | 160,576 |
| 190,000 | 2.85%, 12/15/2032 | 197,088 |
| 570,000 | 3.40%, 01/15/2028 | 614,048 |
| | VICI Properties L.P. / VICI Note Co., Inc. | |
| 150,000 | 3.75%, 02/15/2027(1) | 154,125 |
| 145,000 | 4.25%, 12/01/2026(1) | 150,574 |
| | | | 20,296,341 |
| | Retail - 0.4% |
| 995,000 | 1011778 BC ULC / New Red Finance, Inc. 3.88%, 01/15/2028(1) | 992,592 |
| 715,000 | AutoZone, Inc. 3.63%, 04/15/2025 | 768,146 |
| 4,533,000 | FirstCash, Inc. 4.63%, 09/01/2028(1) | 4,674,656 |
| | Gap, Inc. | |
| 610,000 | 3.63%, 10/01/2029(1) | 597,800 |
| 625,000 | 3.88%, 10/01/2031(1) | 612,500 |
| 2,425,000 | Home Depot, Inc. 3.30%, 04/15/2040 | 2,631,624 |
| 390,000 | KFC Holding Co. / Pizza Hut Holdings LLC / Taco Bell of America LLC 4.75%, 06/01/2027(1) | 403,650 |
| 330,000 | Lithia Motors, Inc. 4.63%, 12/15/2027(1) | 348,891 |
| | McDonald's Corp. | |
| 1,495,000 | 3.35%, 04/01/2023 | 1,551,337 |
The accompanying notes are an integral part of these financial statements.
The Hartford Total Return Bond Fund
Schedule of Investments – (continued)
October 31, 2021
| Shares or Principal Amount | | Market Value† |
| CORPORATE BONDS - 27.1% - (continued) |
| | Retail - 0.4% - (continued) |
| $ 1,890,000 | 3.63%, 09/01/2049 | $ 2,109,472 |
| 295,000 | Suburban Propane Partners L.P. / Suburban Energy Finance Corp. 5.88%, 03/01/2027 | 305,694 |
| | | | 14,996,362 |
| | Semiconductors - 1.0% |
| 2,000 | Broadcom Corp. / Broadcom Cayman Finance Ltd. 3.14%, 11/15/2035(1) | 1,971 |
| | Broadcom, Inc. | |
| 135,000 | 2.60%, 02/15/2033(1) | 130,289 |
| 4,890,000 | 3.19%, 11/15/2036(1) | 4,813,381 |
| 3,045,000 | 3.42%, 04/15/2033(1) | 3,143,453 |
| 1,183,000 | 3.47%, 04/15/2034(1) | 1,221,805 |
| 385,000 | 4.30%, 11/15/2032 | 428,949 |
| | Entegris, Inc. | |
| 205,000 | 3.63%, 05/01/2029(1) | 206,538 |
| 540,000 | 4.38%, 04/15/2028(1) | 559,575 |
| | Intel Corp. | |
| 2,735,000 | 3.05%, 08/12/2051 | 2,783,093 |
| 1,095,000 | 3.10%, 02/15/2060 | 1,104,752 |
| | Marvell Technology, Inc. | |
| 3,065,000 | 2.45%, 04/15/2028 | 3,078,210 |
| 2,350,000 | 2.95%, 04/15/2031 | 2,399,250 |
| | Microchip Technology, Inc. | |
| 3,640,000 | 2.67%, 09/01/2023 | 3,751,810 |
| 110,000 | 4.25%, 09/01/2025 | 114,416 |
| 2,500,000 | NVIDIA Corp. 3.50%, 04/01/2040 | 2,792,350 |
| | NXP B.V. / NXP Funding LLC | |
| 900,000 | 4.63%, 06/01/2023(1) | 952,438 |
| 3,892,000 | 4.88%, 03/01/2024(1) | 4,207,275 |
| 1,131,000 | 5.35%, 03/01/2026(1) | 1,295,654 |
| 1,205,000 | 5.55%, 12/01/2028(1) | 1,458,428 |
| 40,000 | NXP B.V. / NXP Funding LLC / NXP USA, Inc. 3.15%, 05/01/2027(1) | 42,245 |
| 245,000 | Qorvo, Inc. 3.38%, 04/01/2031(1) | 253,279 |
| 300,000 | Sensata Technologies B.V. 5.00%, 10/01/2025(1) | 328,626 |
| | | | 35,067,787 |
| | Software - 1.2% |
| 9,975,000 | Black Knight InfoServ LLC 3.63%, 09/01/2028(1) | 9,925,125 |
| 2,180,839 | Cascade MH Asset Trust 1.75%, 02/25/2046(1) | 2,217,407 |
| | CDK Global, Inc. | |
| 150,000 | 4.88%, 06/01/2027 | 156,143 |
| 5,532,000 | 5.25%, 05/15/2029(1) | 5,933,070 |
| 369,000 | Fair Isaac Corp. 4.00%, 06/15/2028(1) | 372,690 |
| 1,155,000 | IQVIA, Inc. 5.00%, 05/15/2027(1) | 1,197,238 |
| | Microsoft Corp. | |
| 179,000 | 2.68%, 06/01/2060 | 177,826 |
| 525,000 | 2.92%, 03/17/2052 | 555,346 |
| 1,221,000 | 3.04%, 03/17/2062 | 1,311,979 |
| | MSCI, Inc. | |
| 45,000 | 3.63%, 09/01/2030(1) | 46,125 |
| 747,000 | 3.88%, 02/15/2031(1) | 770,603 |
| 165,000 | 4.00%, 11/15/2029(1) | 172,631 |
| | Open Text Corp. | |
| 440,000 | 3.88%, 02/15/2028(1) | 443,300 |
| 255,000 | 5.88%, 06/01/2026(1) | 263,287 |
| | Oracle Corp. | |
| 2,345,000 | 2.88%, 03/25/2031 | 2,402,972 |
| Shares or Principal Amount | | Market Value† |
| CORPORATE BONDS - 27.1% - (continued) |
| | Software - 1.2% - (continued) |
| $ 85,000 | 3.60%, 04/01/2040 | $ 88,457 |
| 4,945,000 | 3.85%, 04/01/2060 | 5,158,251 |
| 1,330,000 | 3.95%, 03/25/2051 | 1,440,400 |
| 890,000 | 4.00%, 11/15/2047 | 961,560 |
| 1,415,000 | 4.10%, 03/25/2061 | 1,549,113 |
| 4,480,000 | SS&C Technologies, Inc. 5.50%, 09/30/2027(1) | 4,715,200 |
| | | | 39,858,723 |
| | Telecommunications - 2.0% |
| 6,870,000 | Apple, Inc. 1.40%, 08/05/2028 | 6,700,679 |
| | AT&T, Inc. | |
| 4,190,000 | 3.50%, 02/01/2061 | 4,079,387 |
| 3,141,000 | 3.55%, 09/15/2055 | 3,182,119 |
| 4,155,000 | 3.65%, 06/01/2051 | 4,325,072 |
| 177,000 | 3.65%, 09/15/2059 | 179,533 |
| 1,529,000 | 3.80%, 12/01/2057 | 1,606,092 |
| 1,465,000 | 4.50%, 05/15/2035 | 1,692,813 |
| | Nokia Oyj | |
| 4,300,000 | 4.38%, 06/12/2027 | 4,622,500 |
| 455,000 | 6.63%, 05/15/2039 | 611,975 |
| 3,955,000 | NTT Finance Corp. 1.16%, 04/03/2026(1) | 3,896,269 |
| 325,000 | Sprint Corp. 7.13%, 06/15/2024 | 367,250 |
| | Telecom Italia Capital S.A. | |
| 145,000 | 6.00%, 09/30/2034 | 161,312 |
| 215,000 | 7.72%, 06/04/2038 | 274,125 |
| 3,065,000 | Telefonica Celular del Paraguay S.A. 5.88%, 04/15/2027(1) | 3,179,937 |
| | T-Mobile USA, Inc. | |
| 3,130,000 | 2.05%, 02/15/2028 | 3,105,264 |
| 90,000 | 3.38%, 04/15/2029(1) | 92,475 |
| 4,605,000 | 3.50%, 04/15/2025 | 4,911,940 |
| 90,000 | 3.50%, 04/15/2031(1) | 93,150 |
| 2,865,000 | 3.88%, 04/15/2030 | 3,134,156 |
| 1,330,000 | 4.50%, 04/15/2050 | 1,570,270 |
| 2,710,000 | VEON Holdings B.V. 3.38%, 11/25/2027(1) | 2,715,203 |
| | Verizon Communications, Inc. | |
| 1,640,000 | 2.65%, 11/20/2040 | 1,548,167 |
| 1,130,000 | 2.85%, 09/03/2041 | 1,101,289 |
| 877,000 | 2.99%, 10/30/2056 | 831,512 |
| 4,100,000 | 3.40%, 03/22/2041 | 4,294,411 |
| 3,410,000 | 3.55%, 03/22/2051 | 3,670,951 |
| 1,971,000 | 4.27%, 01/15/2036 | 2,305,609 |
| 465,000 | 4.40%, 11/01/2034 | 542,455 |
| 350,000 | 4.50%, 08/10/2033 | 413,470 |
| 860,000 | 4.81%, 03/15/2039 | 1,061,844 |
| 610,000 | Vmed UK Financing plc 4.25%, 01/31/2031(1) | 593,902 |
| 1,510,000 | Vodafone Group plc 6.15%, 02/27/2037 | 2,068,358 |
| | | | 68,933,489 |
| | Transportation - 0.2% |
| | Union Pacific Corp. | |
| 3,810,000 | 2.38%, 05/20/2031 | 3,891,499 |
| 1,130,000 | 2.97%, 09/16/2062 | 1,134,329 |
| | | | 5,025,828 |
| | Trucking & Leasing - 0.3% |
| 5,510,000 | DAE Funding LLC 1.55%, 08/01/2024(1) | 5,435,615 |
The accompanying notes are an integral part of these financial statements.
The Hartford Total Return Bond Fund
Schedule of Investments – (continued)
October 31, 2021
| Shares or Principal Amount | | Market Value† |
| CORPORATE BONDS - 27.1% - (continued) |
| | Trucking & Leasing - 0.3% - (continued) |
| | Penske Truck Leasing Co. L.P. / PTL Finance Corp. | |
| $ 2,445,000 | 2.70%, 11/01/2024(1) | $ 2,541,278 |
| 2,650,000 | 4.00%, 07/15/2025(1) | 2,872,989 |
| | | | 10,849,882 |
| | Water - 0.0% |
| 750,000 | American Water Capital Corp. 4.15%, 06/01/2049 | 905,165 |
| | Total Corporate Bonds
(cost $905,312,237) | $ 933,478,558 |
| FOREIGN GOVERNMENT OBLIGATIONS - 6.9% |
| | Angola - 0.1% |
| | Angolan Government International Bond | |
| 2,215,000 | 8.00%, 11/26/2029(5) | $ 2,193,116 |
| 1,250,000 | 8.25%, 05/09/2028(5) | 1,256,550 |
| | | | 3,449,666 |
| | Argentina - 0.0% |
| | Argentine Republic Government International Bond | |
| 65,273 | 1.00%, 07/09/2029 | 23,825 |
| 1,914,641 | 1.13%, 07/09/2035(2) | 593,558 |
| | | | 617,383 |
| | Benin - 0.1% |
| EUR 3,830,000 | Benin Government International Bond 4.95%, 01/22/2035(1) | 4,206,548 |
| | Bermuda - 0.0% |
| $ 980,000 | Bermuda Government International Bond 2.38%, 08/20/2030(1) | 970,200 |
| | Brazil - 0.7% |
| BRL 68,742,000 | Brazil Notas do Tesouro Nacional 10.00%, 01/01/2031 | 10,810,901 |
| $ 13,985,000 | Brazilian Government International Bond 3.88%, 06/12/2030 | 13,123,664 |
| | | | 23,934,565 |
| | Chile - 0.4% |
| | Chile Government International Bond | |
| EUR 6,885,000 | 1.25%, 01/22/2051 | 6,969,271 |
| $ 1,070,000 | 2.55%, 07/27/2033 | 1,034,893 |
| 2,915,000 | 3.10%, 05/07/2041 | 2,842,358 |
| 760,000 | 3.25%, 09/21/2071 | 700,272 |
| 525,000 | 3.50%, 01/25/2050 | 533,788 |
| | | | 12,080,582 |
| | Colombia - 0.5% |
| | Colombia Government International Bond | |
| 9,535,000 | 3.88%, 04/25/2027 | 9,903,051 |
| 3,900,000 | 5.00%, 06/15/2045 | 3,839,940 |
| 570,000 | 5.20%, 05/15/2049 | 573,483 |
| 1,710,000 | 5.63%, 02/26/2044 | 1,802,408 |
| | | | 16,118,882 |
| | Croatia - 0.2% |
| EUR 6,630,000 | Croatia Government International Bond 1.50%, 06/17/2031(5) | 7,957,269 |
| Shares or Principal Amount | | Market Value† |
| FOREIGN GOVERNMENT OBLIGATIONS - 6.9% - (continued) |
| | Dominican Republic - 0.2% |
| $ 7,375,000 | Dominican Republic International Bond 6.40%, 06/05/2049(1) | $ 7,843,386 |
| | Egypt - 0.1% |
| | Egypt Government International Bond | |
| 700,000 | 7.30%, 09/30/2033(1) | 657,020 |
| 1,400,000 | 7.63%, 05/29/2032(1) | 1,353,590 |
| 725,000 | 8.50%, 01/31/2047(5) | 669,871 |
| 660,000 | 8.88%, 05/29/2050(1) | 621,634 |
| | | | 3,302,115 |
| | Ghana - 0.1% |
| 1,517,000 | Ghana Government International Bond 6.38%, 02/11/2027(1) | 1,356,653 |
| | Hungary - 0.3% |
| EUR 8,135,000 | Hungary Government International Bond 1.63%, 04/28/2032(5) | 9,770,987 |
| | Indonesia - 0.3% |
| | Indonesia Government International Bond | |
| 7,745,000 | 1.10%, 03/12/2033 | 8,582,162 |
| 290,000 | 2.15%, 07/18/2024(5) | 350,521 |
| 565,000 | 2.63%, 06/14/2023(5) | 677,959 |
| | | | 9,610,642 |
| | Ivory Coast - 0.1% |
| 2,850,000 | Ivory Coast Government International Bond 4.88%, 01/30/2032(5) | 3,215,918 |
| | Jordan - 0.1% |
| $ 2,655,000 | Jordan Government International Bond 5.85%, 07/07/2030(5) | 2,738,898 |
| | Macedonia - 0.2% |
| | North Macedonia Government International Bond | |
| EUR 2,645,000 | 2.75%, 01/18/2025(5) | 3,182,371 |
| 3,615,000 | 3.68%, 06/03/2026(1) | 4,531,968 |
| | | | 7,714,339 |
| | Mexico - 1.2% |
| MXN 446,667,200 | Mexican Bonos 7.75%, 05/29/2031 | 22,032,877 |
| | Mexico Government International Bond | |
| EUR 1,148,000 | 1.13%, 01/17/2030 | 1,282,365 |
| 8,990,000 | 1.45%, 10/25/2033 | 9,621,320 |
| $ 2,075,000 | 3.77%, 05/24/2061 | 1,915,246 |
| 2,130,000 | 4.28%, 08/14/2041 | 2,213,518 |
| 3,995,000 | 4.75%, 04/27/2032 | 4,480,592 |
| | | | 41,545,918 |
| | Morocco - 0.1% |
| EUR 3,940,000 | Morocco Government International Bond 2.00%, 09/30/2030(5) | 4,396,831 |
| | Oman - 0.2% |
| $ 5,395,000 | Oman Government International Bond 6.75%, 01/17/2048(1) | 5,448,734 |
| | Panama - 0.3% |
| | Panama Government International Bond | |
| 7,400,000 | 3.87%, 07/23/2060 | 7,369,438 |
The accompanying notes are an integral part of these financial statements.
The Hartford Total Return Bond Fund
Schedule of Investments – (continued)
October 31, 2021
| Shares or Principal Amount | | Market Value† |
| FOREIGN GOVERNMENT OBLIGATIONS - 6.9% - (continued) |
| | Panama - 0.3% - (continued) |
| $ 1,220,000 | 4.30%, 04/29/2053 | $ 1,306,657 |
| 735,000 | 4.50%, 04/16/2050 | 810,756 |
| | | | 9,486,851 |
| | Philippines - 0.3% |
| | Philippine Government International Bond | |
| EUR 7,030,000 | 1.20%, 04/28/2033 | 8,045,413 |
| 1,465,000 | 1.75%, 04/28/2041 | 1,651,750 |
| | | | 9,697,163 |
| | Romania - 0.4% |
| | Romanian Government International Bond | |
| 5,115,000 | 2.63%, 12/02/2040(1) | 5,410,339 |
| 2,175,000 | 2.75%, 04/14/2041(5) | 2,310,335 |
| 2,180,000 | 3.38%, 02/08/2038(5) | 2,563,062 |
| 3,473,000 | 4.63%, 04/03/2049(5) | 4,639,328 |
| | | | 14,923,064 |
| | Russia - 0.3% |
| RUB 922,120,000 | Russian Federal Bond - OFZ 5.90%, 03/12/2031 | 11,184,188 |
| | Saudi Arabia - 0.4% |
| | Saudi Government International Bond | |
| EUR 5,060,000 | 2.00%, 07/09/2039(5) | 6,112,580 |
| $ 7,149,000 | 2.25%, 02/02/2033(1) | 6,897,527 |
| | | | 13,010,107 |
| | Senegal - 0.1% |
| | Senegal Government International Bond | |
| EUR 1,615,000 | 4.75%, 03/13/2028(5) | 1,900,059 |
| $ 2,000,000 | 6.25%, 05/23/2033(5) | 2,061,576 |
| | | | 3,961,635 |
| | Serbia - 0.1% |
| EUR 4,275,000 | Serbia International Bond 1.65%, 03/03/2033(1) | 4,639,208 |
| | United Arab Emirates - 0.1% |
| $ 3,500,000 | Finance Department Government of Sharjah 3.63%, 03/10/2033(1) | 3,438,890 |
| | Total Foreign Government Obligations
(cost $251,610,741) | | $ 236,620,622 |
| MUNICIPAL BONDS - 1.7% |
| | Development - 0.2% |
| 6,810,000 | New York Transportation Dev Corp. Rev 4.25%, 09/01/2035 | $ 7,567,418 |
| | Education - 0.0% |
| | Chicago, IL, Board of Education, GO | |
| 380,000 | 6.04%, 12/01/2029 | 429,371 |
| 1,145,000 | 6.14%, 12/01/2039 | 1,378,466 |
| | | | 1,807,837 |
| | General - 0.8% |
| 965,000 | Chicago, IL, Transit Auth 3.91%, 12/01/2040 | 1,088,205 |
| | County of Riverside, CA | |
| 5,885,000 | 2.86%, 02/15/2026 | 6,214,111 |
| 5,895,000 | 3.07%, 02/15/2028 | 6,305,919 |
| Shares or Principal Amount | | Market Value† |
| MUNICIPAL BONDS - 1.7% - (continued) |
| | General - 0.8% - (continued) |
| $ 5,345,000 | Philadelphia, PA, Auth Industrial Dev, (NATL Insured) 6.55%, 10/15/2028 | $ 6,789,561 |
| 5,580,000 | State Board of Administration Finance Corp. 1.26%, 07/01/2025 | 5,580,816 |
| | | | 25,978,612 |
| | General Obligation - 0.1% |
| | State of Illinois, GO | |
| 1,801,163 | 4.95%, 06/01/2023 | 1,891,796 |
| 210,000 | 5.00%, 01/01/2023 | 218,265 |
| 840,000 | 6.88%, 07/01/2025 | 935,110 |
| | | | 3,045,171 |
| | School District - 0.1% |
| 4,470,000 | Chicago, IL, Board of Education, GO 6.32%, 11/01/2029 | 5,237,160 |
| | Transportation - 0.4% |
| | Metropolitan Transportation Auth, NY, Rev | |
| 2,540,000 | 5.00%, 11/15/2050 | 3,018,369 |
| 7,005,000 | 5.18%, 11/15/2049 | 9,551,046 |
| | | | 12,569,415 |
| | Utility - Electric - 0.1% |
| 1,316,000 | Municipal Electric Auth, GA 6.64%, 04/01/2057 | 2,023,770 |
| | Total Municipal Bonds
(cost $52,360,803) | | $ 58,229,383 |
| SENIOR FLOATING RATE INTERESTS - 4.4%(9) |
| | Advertising - 0.0% |
| 294,000 | Clear Channel Outdoor Holdings, Inc. 3.63%, 08/21/2026, 1 mo. USD LIBOR + 3.500% | $ 289,090 |
| 466,723 | Terrier Media Buyer, Inc. 3.59%, 12/17/2026, 1 mo. USD LIBOR + 3.500% | 464,740 |
| | | | 753,830 |
| | Aerospace/Defense - 0.0% |
| 99,250 | Spirit Aerosystems, Inc. 6.00%, 01/15/2025, 1 mo. USD LIBOR + 5.250% | 99,498 |
| 704,178 | TransDigm, Inc. 2.34%, 05/30/2025, 1 mo. USD LIBOR + 2.250% | 695,447 |
| | | | 794,945 |
| | Airlines - 0.1% |
| 355,000 | AAdvantage Loyalty IP Ltd. 5.50%, 04/20/2028, 1 mo. USD LIBOR + 4.750% | 369,533 |
| 215,000 | Air Canada 4.25%, 08/11/2028, 1 mo. USD LIBOR + 3.500% | 217,105 |
| 383,175 | Kestrel Bidco, Inc. 4.00%, 12/11/2026, 3 mo. USD LIBOR + 3.000% | 376,711 |
| 180,000 | Mileage Plus Holdings LLC 6.25%, 06/21/2027, 1 mo. USD LIBOR + 5.250% | 191,588 |
| 395,000 | SkyMiles IP Ltd. 4.75%, 10/20/2027, 3 mo. USD LIBOR + 3.750% | 420,454 |
| 363,175 | United Airlines, Inc. 4.50%, 04/21/2028, 1 mo. USD LIBOR + 3.750% | 368,038 |
| | | | 1,943,429 |
The accompanying notes are an integral part of these financial statements.
The Hartford Total Return Bond Fund
Schedule of Investments – (continued)
October 31, 2021
| Shares or Principal Amount | | Market Value† |
| SENIOR FLOATING RATE INTERESTS - 4.4%(9) - (continued) |
| | Apparel - 0.0% |
| $ 349,125 | Birkenstock GmbH & Co. KG 4.25%, 04/27/2028, 1 mo. USD LIBOR + 3.750% | $ 348,909 |
| | Auto Parts & Equipment - 0.1% |
| 324,188 | Adient U.S. LLC 3.59%, 04/08/2028, 1 mo. USD LIBOR + 3.500% | 324,129 |
| | Clarios Global L.P. | |
| EUR 713,887 | 3.25%, 04/30/2026, 3 mo. EURIBOR + 3.250% | 817,001 |
| $ 437,928 | 3.34%, 04/30/2026, 1 mo. USD LIBOR + 3.250% | 435,007 |
| | First Brands Group LLC | |
| 100,135 | 6.00%, 03/30/2027, 1 mo. USD LIBOR + 5.000% | 100,886 |
| 245,000 | 9.50%, 03/30/2028, 1 mo. USD LIBOR + 8.500% | 246,838 |
| | | | 1,923,861 |
| | Chemicals - 0.2% |
| 4,812,636 | Axalta Coating Systems U.S. Holdings, Inc. 1.88%, 06/01/2024, 3 mo. USD LIBOR + 1.750% | 4,800,604 |
| 875,000 | Diamond (BC) B.V. 3.50%, 09/29/2028, 1 mo. USD LIBOR + 3.000% | 872,594 |
| 104,475 | NIC Acquisition Corp. 4.50%, 12/29/2027, 1 mo. USD LIBOR + 3.750% | 104,246 |
| | Starfruit Finco B.V | |
| 179,314 | 2.84%, 10/01/2025, 1 mo. USD LIBOR + 2.750% | 177,858 |
| EUR 94,413 | 3.00%, 10/01/2025, 3 mo. EURIBOR + 3.000% | 107,657 |
| $ 327,007 | Tronox Finance LLC 2.37%, 03/13/2028, 1 mo. USD LIBOR + 2.250% | 324,351 |
| | | | 6,387,310 |
| | Commercial Services - 0.5% |
| 497,500 | AlixPartners LLP 3.25%, 02/04/2028, 1 mo. USD LIBOR + 2.750% | 495,634 |
| 374,053 | Allied Universal Holdco LLC 4.25%, 05/12/2028, 1 mo. USD LIBOR + 3.750% | 373,821 |
| 470,000 | APX Group, Inc. 4.00%, 07/10/2028, 1 mo. USD LIBOR + 3.500% | 468,162 |
| 615,912 | AVSC Holding Corp. 4.25%, 03/03/2025, 3 mo. USD LIBOR + 3.250% | 555,627 |
| | Belron Finance U.S. LLC | |
| 378,940 | 2.44%, 10/30/2026, 1 mo. USD LIBOR + 2.250% | 376,810 |
| 154,225 | 3.25%, 04/13/2028, 1 mo. USD LIBOR + 2.750% | 154,129 |
| EUR 315,000 | Boels Topholding B.V. 3.25%, 02/06/2027, 3 mo. EURIBOR + 3.250% | 362,396 |
| 100,000 | Boluda Corporacion Maritima S.L 3.50%, 07/30/2026, 3 mo. EURIBOR + 3.500% | 115,245 |
| $ 223,291 | Ensemble RCM LLC 3.88%, 08/03/2026, 3 mo. USD LIBOR + 3.750% | 223,490 |
| 650,000 | MPH Acquisition Holdings LLC 4.75%, 08/17/2028, 1 mo. USD LIBOR + 4.250% | 633,210 |
| Shares or Principal Amount | | Market Value† |
| SENIOR FLOATING RATE INTERESTS - 4.4%(9) - (continued) |
| | Commercial Services - 0.5% - (continued) |
| $ 525,000 | Parexel International Corp. 0.00%, 08/11/2028, 1 mo. USD LIBOR + 3.500%(10) | $ 525,362 |
| EUR 105,975 | Techem Verwaltungsgesellschaft 675 mbH 2.38%, 07/15/2025, 3 mo. EURIBOR + 2.375% | 120,312 |
| $ 5,085,891 | Trans Union LLC 1.84%, 11/16/2026, 1 mo. USD LIBOR + 1.750% | 5,050,951 |
| | Verisure Holding AB | |
| EUR 430,000 | 3.25%, 07/20/2026, 3 mo. EURIBOR + 3.250% | 493,198 |
| 735,000 | 3.25%, 03/27/2028, 3 mo. EURIBOR + 3.250% | 842,404 |
| $ 5,432,700 | WEX, Inc. 2.34%, 03/31/2028, 1 mo. USD LIBOR + 2.250% | 5,401,462 |
| 284,287 | WW International, Inc. 4.00%, 04/13/2028, 1 mo. USD LIBOR + 3.500% | 280,734 |
| | | | 16,472,947 |
| | Construction Materials - 0.3% |
| 493,762 | ACProducts, Inc. 4.75%, 05/17/2028, 1 mo. USD LIBOR + 4.250% | 492,222 |
| 355,000 | Chamberlain Group, Inc. 0.00%, 10/22/2028, 1 mo. USD LIBOR + 4.000%(10) | 354,261 |
| 784,455 | Cornerstone Building Brands, Inc. 3.75%, 04/12/2028, 1 mo. USD LIBOR + 3.250% | 782,886 |
| 248,750 | CP Atlas Buyer, Inc. 4.25%, 11/23/2027, 1 mo. USD LIBOR + 3.750% | 247,118 |
| 5,597,865 | Ingersoll-Rand Services Co. 1.84%, 03/01/2027, 1 mo. USD LIBOR + 1.750% | 5,515,633 |
| 768,793 | Quikrete Holdings, Inc. 2.59%, 02/01/2027, 1 mo. USD LIBOR + 2.500% | 760,782 |
| 600,000 | Standard Industries, Inc. 3.00%, 09/22/2028, 1 mo. USD LIBOR + 2.500%(10) | 599,142 |
| 144,275 | Watlow Electric Manufacturing Co. 4.50%, 03/02/2028, 1 mo. USD LIBOR + 4.000% | 144,395 |
| | | | 8,896,439 |
| | Distribution/Wholesale - 0.2% |
| 6,257,550 | American Builders & Contractors Supply Co., Inc. 2.09%, 01/15/2027, 1 mo. USD LIBOR + 2.000% | 6,193,160 |
| | Diversified Financial Services - 0.2% |
| 259,951 | Aretec Group, Inc. 4.34%, 10/01/2025, 3 mo. USD LIBOR + 4.250% | 259,301 |
| 774,954 | Blackhawk Network Holdings, Inc. 3.09%, 06/15/2025, 3 mo. USD LIBOR + 3.000% | 768,173 |
| 1,071,685 | Deerfield Dakota Holding LLC 4.75%, 04/09/2027, 1 mo. USD LIBOR + 3.750% | 1,073,700 |
The accompanying notes are an integral part of these financial statements.
The Hartford Total Return Bond Fund
Schedule of Investments – (continued)
October 31, 2021
| Shares or Principal Amount | | Market Value† |
| SENIOR FLOATING RATE INTERESTS - 4.4%(9) - (continued) |
| | Diversified Financial Services - 0.2% - (continued) |
| $ 3,635,888 | Fleetcor Technologies Operating Co. LLC 1.84%, 04/28/2028, 1 mo. USD LIBOR + 1.750% | $ 3,624,216 |
| 136,500 | Minotaur Acquisition, Inc. 4.84%, 03/27/2026, 3 mo. USD LIBOR + 4.750% | 135,755 |
| | | | 5,861,145 |
| | Electrical Components & Equipment - 0.0% |
| 130,000 | Anticimex International AB 0.00%, 07/21/2028, 1 mo. USD LIBOR + 3.500%(10) | 129,837 |
| | Electronics - 0.0% |
| 408,975 | Ingram Micro, Inc. 4.00%, 06/30/2028, 1 mo. USD LIBOR + 3.500% | 409,793 |
| EUR 100,000 | Zephyr German BidCo GmbH 3.75%, 03/10/2028, 3 mo. EURIBOR + 3.750% | 115,322 |
| | | | 525,115 |
| | Engineering & Construction - 0.0% |
| $ 314,213 | Artera Services LLC 4.50%, 03/06/2025, 1 mo. USD LIBOR + 3.500% | 312,773 |
| 496,643 | Brand Energy & Infrastructure Services, Inc. 5.25%, 06/21/2024, 3 mo. USD LIBOR + 4.250% | 492,009 |
| 641,548 | Brown Group Holding LLC 3.25%, 06/07/2028, 1 mo. USD LIBOR + 2.750% | 639,547 |
| 205,000 | KKR Apple Bidco LLC 3.50%, 09/22/2028, 1 mo. USD LIBOR + 3.000% | 204,488 |
| | | | 1,648,817 |
| | Entertainment - 0.1% |
| EUR 300,000 | Banijay Entertainment S.A.S 3.75%, 03/01/2025, 3 mo. EURIBOR + 3.750% | 346,727 |
| | Crown Finance U.S., Inc. | |
| 31,130 | 2.63%, 02/28/2025, 3 mo. EURIBOR + 2.625% | 29,629 |
| $ 181,873 | 3.50%, 02/28/2025, 1 mo. USD LIBOR + 2.500% | 149,681 |
| 9,451 | 9.25%, 05/23/2024, 1 mo. USD LIBOR + 8.250% | 10,137 |
| 663,717 | Delta (LUX) S.a.r.l. 3.50%, 02/01/2024, 3 mo. USD LIBOR + 2.500% | 661,022 |
| 624,375 | Golden Entertainment, Inc. 3.75%, 10/21/2024, 3 mo. USD LIBOR + 3.000% | 623,076 |
| 262,838 | Penn National Gaming, Inc. 3.00%, 10/15/2025, 3 mo. USD LIBOR + 2.250% | 262,292 |
| 583,404 | Scientific Games International, Inc. 2.84%, 08/14/2024, 1 mo. USD LIBOR + 2.750% | 580,685 |
| 536,641 | UFC Holdings LLC 3.50%, 04/29/2026, 1 mo. USD LIBOR + 2.750% | 533,287 |
| 489,184 | William Morris Endeavor Entertainment LLC 2.84%, 05/18/2025, 3 mo. USD LIBOR + 2.750% | 478,926 |
| | | | 3,675,462 |
| Shares or Principal Amount | | Market Value† |
| SENIOR FLOATING RATE INTERESTS - 4.4%(9) - (continued) |
| | Food - 0.1% |
| $ 286,713 | B&G Foods, Inc. 2.59%, 10/10/2026, 1 mo. USD LIBOR + 2.500% | $ 287,309 |
| | Froneri International Ltd. | |
| 177,750 | 2.34%, 01/29/2027, 1 mo. USD LIBOR + 2.250% | 175,107 |
| EUR 200,000 | 2.63%, 01/29/2027, 3 mo. EURIBOR + 2.625% | 225,420 |
| $ 531,754 | Hostess Brands LLC 3.00%, 08/03/2025, 1 mo. USD LIBOR + 2.250% | 530,484 |
| | U.S. Foods, Inc. | |
| 341,699 | 1.84%, 06/27/2023, 1 mo. USD LIBOR + 1.750% | 339,368 |
| 382,200 | 2.09%, 09/13/2026, 3 mo. USD LIBOR + 2.000% | 375,034 |
| | | | 1,932,722 |
| | Food Service - 0.0% |
| | Aramark Services, Inc. | |
| 207,256 | 1.84%, 03/11/2025, 1 mo. USD LIBOR + 1.750% | 202,075 |
| 279,750 | 1.84%, 01/15/2027, 1 mo. USD LIBOR + 1.750% | 272,583 |
| | | | 474,658 |
| | Gas - 0.0% |
| 762,450 | UGI Energy Services LLC 3.84%, 08/13/2026, 1 mo. USD LIBOR + 3.750% | 764,836 |
| | Hand/Machine Tools - 0.0% |
| 284,718 | Alliance Laundry Systems LLC 4.25%, 10/08/2027, 1 mo. USD LIBOR + 3.500% | 285,225 |
| | Healthcare - Products - 0.1% |
| | Avantor Funding, Inc. | |
| 771,125 | 2.75%, 11/08/2027, 1 mo. USD LIBOR + 2.250% | 770,485 |
| EUR 249,375 | 2.75%, 06/12/2028, 1 mo. EURIBOR + 2.750% | 287,476 |
| $ 208,513 | Coty, Inc. 2.34%, 04/07/2025, 3 mo. USD LIBOR + 2.250% | 205,125 |
| 209,475 | Insulet Corp. 3.75%, 05/04/2028, 1 mo. USD LIBOR + 3.250% | 209,672 |
| 675,000 | Medline Industries, Inc. 0.00%, 10/23/2028, 1 mo. USD LIBOR + 3.250%(10) | 675,668 |
| 714,161 | Sunshine Luxembourg S.a.r.l. 4.50%, 10/01/2026, 1 mo. USD LIBOR + 3.750% | 715,325 |
| | | | 2,863,751 |
| | Healthcare - Services - 0.3% |
| | ADMI Corp. | |
| 407,950 | 3.63%, 12/23/2027, 1 mo. USD LIBOR + 3.125%(10) | 404,764 |
| 245,000 | 4.00%, 12/23/2027, 1 mo. USD LIBOR + 3.500% | 244,738 |
| EUR 780,000 | Biogroup-LCD 3.50%, 01/28/2028, 3 mo. EURIBOR + 3.500% | 896,171 |
| 220,000 | Elsan SAS 3.50%, 06/16/2028, 3 mo. EURIBOR + 3.500%(10) | 253,659 |
The accompanying notes are an integral part of these financial statements.
The Hartford Total Return Bond Fund
Schedule of Investments – (continued)
October 31, 2021
| Shares or Principal Amount | | Market Value† |
| SENIOR FLOATING RATE INTERESTS - 4.4%(9) - (continued) |
| | Healthcare - Services - 0.3% - (continued) |
| $ 267,437 | Envision Healthcare Corp. 3.84%, 10/10/2025, 3 mo. USD LIBOR + 3.750% | $ 220,748 |
| 99,496 | eResearchTechnology, Inc. 5.50%, 02/04/2027, 1 mo. USD LIBOR + 4.500% | 99,897 |
| | EyeCare Partners LLC | |
| 270,000 | 0.00%, 10/14/2028, 1 mo. USD LIBOR + 3.750%(10) | 269,325 |
| 271,278 | 3.88%, 02/18/2027, 1 mo. USD LIBOR + 3.750% | 269,346 |
| 155,716 | ICON Luxembourg S.a r.l. 3.00%, 07/03/2028, 1 mo. USD LIBOR + 2.500% | 155,699 |
| | IQVIA, Inc. | |
| 4,615,107 | 1.84%, 03/07/2024, 1 mo. USD LIBOR + 1.750% | 4,607,031 |
| EUR 304,504 | 2.00%, 06/11/2025, 1 mo. EURIBOR + 2.000% | 349,148 |
| 185,000 | LGC Group Holdings Ltd. 3.00%, 04/21/2027, 3 mo. EURIBOR + 3.000% | 209,129 |
| $ 280,979 | MED ParentCo L.P. 4.34%, 08/31/2026, 1 mo. USD LIBOR + 4.250% | 280,119 |
| 278,600 | PPD, Inc. 2.50%, 01/13/2028, 1 mo. USD LIBOR + 2.000% | 277,948 |
| 517,400 | Surgery Center Holdings, Inc. 4.50%, 08/31/2026, 1 mo. USD LIBOR + 3.750% | 518,336 |
| | | | 9,056,058 |
| | Home Furnishings - 0.0% |
| 224,516 | Weber-Stephen Products LLC 4.00%, 10/30/2027, 1 mo. USD LIBOR + 3.250% | 224,890 |
| | Insurance - 0.1% |
| 612,077 | Acrisure LLC 3.63%, 02/15/2027, 1 mo. USD LIBOR + 3.500% | 603,508 |
| | Asurion LLC | |
| 285,740 | 3.21%, 11/03/2023, 1 mo. USD LIBOR + 3.125% | 284,966 |
| 736,192 | 3.34%, 12/23/2026, 1 mo. USD LIBOR + 3.250% | 728,484 |
| 265,000 | 5.34%, 01/31/2028, 1 mo. USD LIBOR + 5.250% | 263,911 |
| 370,000 | 5.34%, 01/20/2029, 1 mo. USD LIBOR + 5.250% | 368,227 |
| | Hub International Ltd. | |
| 469,967 | 2.87%, 04/25/2025, 1 mo. USD LIBOR + 2.750% | 464,520 |
| 132,647 | 4.00%, 04/25/2025, 1 mo. USD LIBOR + 3.250% | 132,481 |
| | Sedgwick Claims Management Services, Inc. | |
| 345,238 | 3.34%, 12/31/2025, 3 mo. USD LIBOR + 3.250% | 341,571 |
| 552,287 | 3.84%, 09/03/2026, 1 mo. USD LIBOR + 3.750% | 550,769 |
| Shares or Principal Amount | | Market Value† |
| SENIOR FLOATING RATE INTERESTS - 4.4%(9) - (continued) |
| | Insurance - 0.1% - (continued) |
| $ 49,000 | 5.25%, 09/03/2026, 1 mo. USD LIBOR + 4.250% | $ 49,079 |
| 412,313 | USI, Inc. 3.13%, 05/16/2024, 3 mo. USD LIBOR + 3.000% | 408,998 |
| | | | 4,196,514 |
| | Internet - 0.2% |
| EUR 220,000 | Adevinta ASA 3.25%, 06/26/2028, 3 mo. EURIBOR + 3.250% | 254,198 |
| $ 438,900 | Endure Digital, Inc. 4.25%, 02/10/2028, 1 mo. USD LIBOR + 3.500% | 431,035 |
| | Go Daddy Operating Co. LLC | |
| 5,278,082 | 1.84%, 02/15/2024, 1 mo. USD LIBOR + 1.750% | 5,237,177 |
| 577,687 | 2.09%, 08/10/2027, 1 mo. USD LIBOR + 2.000% | 573,517 |
| 250,000 | Proofpoint, Inc. 3.75%, 08/31/2028, 1 mo. USD LIBOR + 3.250% | 248,862 |
| 154,800 | Rodan & Fields LLC 4.09%, 06/16/2025, 3 mo. USD LIBOR + 4.000% | 108,581 |
| 225,000 | Shutterfly, Inc. 5.75%, 09/25/2026, 1 mo. USD LIBOR + 5.000% | 222,412 |
| | | | 7,075,782 |
| | IT Services - 0.2% |
| 383,075 | Peraton Corp. 4.50%, 02/01/2028, 1 mo. USD LIBOR + 3.750% | 383,493 |
| 5,278,100 | Science Applications International Corp. 1.96%, 10/31/2025, 1 mo. USD LIBOR + 1.875% | 5,274,827 |
| 750,471 | Tempo Acquisition LLC 3.75%, 11/02/2026, 1 mo. USD LIBOR + 3.250% | 752,032 |
| | | | 6,410,352 |
| | Leisure Time - 0.0% |
| | Carnival Corp. | |
| 222,187 | 3.75%, 06/30/2025, 1 mo. USD LIBOR + 3.000% | 221,772 |
| 355,000 | 4.00%, 10/18/2028, 6 mo. USD LIBOR + 4.000% | 354,556 |
| 309,225 | Hayward Industries, Inc. 3.00%, 05/12/2028, 1 mo. USD LIBOR + 2.500% | 308,195 |
| 279,300 | MajorDrive Holdings LLC 4.50%, 05/12/2028, 1 mo. USD LIBOR + 4.000% | 279,300 |
| 131,549 | SRAM LLC 3.25%, 05/12/2028, 1 mo. USD LIBOR + 2.750% | 131,220 |
| | | | 1,295,043 |
| | Lodging - 0.0% |
| 577,416 | Boyd Gaming Corp. 2.32%, 09/15/2023, 3 mo. USD LIBOR + 2.250% | 576,359 |
| | Caesars Resort Collection LLC | |
| 531,656 | 2.84%, 12/23/2024, 3 mo. USD LIBOR + 2.750% | 528,945 |
| 554,400 | 3.59%, 07/21/2025, 1 mo. USD LIBOR + 3.500% | 554,722 |
| | | | 1,660,026 |
The accompanying notes are an integral part of these financial statements.
The Hartford Total Return Bond Fund
Schedule of Investments – (continued)
October 31, 2021
| Shares or Principal Amount | | Market Value† |
| SENIOR FLOATING RATE INTERESTS - 4.4%(9) - (continued) |
| | Machinery - Construction & Mining - 0.0% |
| $ 511,162 | Brookfield WEC Holdings, Inc. 3.25%, 08/01/2025, 1 mo. USD LIBOR + 2.750% | $ 507,328 |
| | Machinery-Diversified - 0.1% |
| 4,108,926 | Altra Industrial Motion Corp. 2.09%, 10/01/2025, 3 mo. USD LIBOR + 2.000% | 4,078,109 |
| 290,984 | Circor International, Inc. 4.25%, 12/11/2024, 1 mo. USD LIBOR + 3.250% | 290,530 |
| 569,271 | Vertical U.S. Newco, Inc. 4.00%, 07/30/2027, 1 mo. USD LIBOR + 3.500% | 569,983 |
| 400,000 | Welbilt, Inc. 2.59%, 10/23/2025, 3 mo. USD LIBOR + 2.500% | 398,168 |
| | | | 5,336,790 |
| | Media - 0.2% |
| 306,900 | Banijay Entertainment S.A.S 3.83%, 03/01/2025, 1 mo. USD LIBOR + 3.750% | 305,749 |
| 568,575 | Cable One, Inc. 2.09%, 05/03/2028, 1 mo. USD LIBOR + 2.000% | 563,776 |
| 894,863 | Charter Communications Operating LLC 1.84%, 02/01/2027, 1 mo. USD LIBOR + 1.750% | 888,295 |
| 566,595 | CSC Holdings LLC 2.59%, 04/15/2027, 1 mo. USD LIBOR + 2.500% | 554,555 |
| | E.W. Scripps Co. | |
| 320,101 | 3.31%, 05/01/2026, 1 mo. USD LIBOR + 2.563% | 318,900 |
| 160,488 | 3.75%, 01/07/2028, 1 mo. USD LIBOR + 3.000% | 160,563 |
| 573,687 | Gray Television, Inc. 2.58%, 01/02/2026, 3 mo. USD LIBOR + 2.500% | 569,603 |
| 3,490 | Houghton Mifflin Harcourt Publishing Co. 7.25%, 11/22/2024, 1 mo. USD LIBOR + 6.250% | 3,482 |
| 306,250 | Sinclair Television Group, Inc. 2.59%, 09/30/2026, 1 mo. USD LIBOR + 2.500% | 300,986 |
| 595,000 | Telenet Financing USD LLC 2.09%, 04/30/2028, 6 mo. USD LIBOR + 2.000% | 586,373 |
| 795,000 | UPC Financing Partnership 3.09%, 01/31/2029, 1 mo. USD LIBOR + 3.000% | 791,192 |
| | Virgin Media Bristol LLC | |
| EUR 400,000 | 3.25%, 01/31/2029, 3 mo. EURIBOR + 3.250% | 461,485 |
| $ 290,000 | 3.34%, 01/31/2029, 1 mo. USD LIBOR + 3.250% | 289,759 |
| | | | 5,794,718 |
| | Miscellaneous Manufacturing - 0.0% |
| EUR 595,285 | CeramTec AcquiCo GmbH 2.50%, 03/07/2025, 3 mo. EURIBOR + 2.500% | 683,738 |
| Shares or Principal Amount | | Market Value† |
| SENIOR FLOATING RATE INTERESTS - 4.4%(9) - (continued) |
| | Miscellaneous Manufacturing - 0.0% - (continued) |
| $ 121,250 | LTI Holdings, Inc. 3.59%, 09/06/2025, 3 mo. USD LIBOR + 3.500% | $ 119,627 |
| 492,443 | Momentive Performance Materials USA LLC 3.34%, 05/15/2024, 3 mo. USD LIBOR + 3.250% | 491,419 |
| | | | 1,294,784 |
| | Oil & Gas Services - 0.0% |
| 319,253 | PES Holdings LLC 0.00%, 12/31/2022, 3 mo. USD LIBOR + 6.990%(10)(11) | 3,193 |
| | Packaging & Containers - 0.1% |
| 560,000 | Berlin Packaging LLC 4.25%, 03/11/2028, 1 mo. USD LIBOR + 3.750% | 560,101 |
| | Flex Acquisition Co., Inc. | |
| 96,668 | 3.13%, 06/29/2025, 3 mo. USD LIBOR + 3.000% | 95,871 |
| 929,972 | 4.00%, 02/23/2028, 1 mo. USD LIBOR + 3.500% | 927,126 |
| 135,000 | Pretium PKG Holdings, Inc. 4.50%, 10/02/2028, 1 mo. USD LIBOR + 4.500% | 135,321 |
| 372,689 | Proampac PG Borrower LLC 4.50%, 11/03/2025, 1 mo. USD LIBOR + 3.750% | 372,690 |
| | TricorBraun Holdings, Inc. | |
| 313,518 | 3.75%, 03/03/2028, 1 mo. USD LIBOR + 3.250% | 311,345 |
| 70,636 | 3.75%, 03/03/2028, 1 mo. USD LIBOR + 3.250%(12) | 70,147 |
| | | | 2,472,601 |
| | Pharmaceuticals - 0.3% |
| 180,205 | Bausch Health Cos., Inc. 3.09%, 06/02/2025, 3 mo. USD LIBOR + 3.000% | 179,744 |
| 588,897 | Change Healthcare Holdings LLC 3.50%, 03/01/2024, 1 mo. USD LIBOR + 2.500% | 588,226 |
| 6,065,040 | Elanco Animal Health, Inc. 1.83%, 08/01/2027, 1 mo. USD LIBOR + 1.750% | 6,010,880 |
| 532,250 | Endo Luxembourg Finance Co. S.a r.l. 5.75%, 03/27/2028, 1 mo. USD LIBOR + 5.000% | 518,204 |
| 511,759 | Gainwell Acquisition Corp. 4.75%, 10/01/2027, 1 mo. USD LIBOR + 4.000% | 512,629 |
| 225,000 | HCRX Investments Holdco L.P. 0.00%, 07/14/2028, 1 mo. USD LIBOR + 2.250%(10) | 223,650 |
| 338,300 | Horizon Therapeutics USA, Inc. 2.50%, 03/15/2028, 1 mo. USD LIBOR + 2.000% | 337,393 |
| 38,797 | ICON Luxembourg S.a r.l. 3.00%, 07/03/2028, 1 mo. USD LIBOR + 2.500% | 38,793 |
| 483,788 | Jazz Financing Lux S.a.r.l. 4.00%, 05/05/2028, 1 mo. USD LIBOR + 3.500% | 484,392 |
The accompanying notes are an integral part of these financial statements.
The Hartford Total Return Bond Fund
Schedule of Investments – (continued)
October 31, 2021
| Shares or Principal Amount | | Market Value† |
| SENIOR FLOATING RATE INTERESTS - 4.4%(9) - (continued) |
| | Pharmaceuticals - 0.3% - (continued) |
| $ 513,712 | Organon & Co. 3.50%, 06/02/2028, 1 mo. USD LIBOR + 3.000% | $ 514,678 |
| 295,629 | Pathway Vet Alliance LLC 3.84%, 03/31/2027, 1 mo. USD LIBOR + 3.750% | 294,026 |
| | | | 9,702,615 |
| | Pipelines - 0.0% |
| 205,848 | BCP Raptor LLC 5.25%, 06/24/2024, 3 mo. USD LIBOR + 4.250% | 205,962 |
| 223,480 | BCP Renaissance Parent LLC 4.50%, 10/31/2024, 3 mo. USD LIBOR + 3.500% | 222,642 |
| 396,250 | Medallion Midland Acquisition LLC 4.50%, 10/18/2028, 3 mo. USD LIBOR + 3.750% | 395,877 |
| 341,347 | NorthRiver Midstream Finance L.P. 3.38%, 10/01/2025, 3 mo. USD LIBOR + 3.250% | 340,537 |
| | | | 1,165,018 |
| | Real Estate - 0.0% |
| EUR 170,000 | Blitz GmbH 3.50%, 04/28/2028, 3 mo. EURIBOR + 3.500% | 195,247 |
| | Retail - 0.5% |
| $ 8,329,828 | B.C. Unlimited Liability Co. 1.84%, 11/19/2026, 1 mo. USD LIBOR + 1.750% | 8,161,731 |
| 500,399 | Beacon Roofing Supply, Inc. 2.34%, 05/19/2028, 1 mo. USD LIBOR + 2.250% | 496,761 |
| | EG Group Ltd. | |
| 299,007 | 4.75%, 03/31/2026, 1 mo. USD LIBOR + 4.250% | 298,559 |
| EUR 185,000 | 7.00%, 04/10/2027, 3 mo. EURIBOR + 7.000% | 213,860 |
| $ 214,463 | Foundation Building Materials Holding Co. LLC 3.75%, 02/03/2028, 1 mo. USD LIBOR + 3.250% | 212,631 |
| 848,587 | Great Outdoors Group LLC 5.00%, 03/06/2028, 1 mo. USD LIBOR + 4.250% | 850,531 |
| 630,330 | Harbor Freight Tools USA, Inc. 3.25%, 10/19/2027, 1 mo. USD LIBOR + 2.750% | 627,897 |
| 297,750 | IRB Holding Corp. 4.25%, 12/15/2027, 1 mo. USD LIBOR + 3.250% | 297,538 |
| 2,605,889 | KFC Holding Co. 1.84%, 03/15/2028, 1 mo. USD LIBOR + 1.750% | 2,602,084 |
| | LBM Acquisition LLC | |
| 128,333 | 0.00%, 12/17/2027, 1 mo. USD LIBOR + 3.750%(10) | 126,515 |
| 256,023 | 3.88%, 12/17/2027, 1 mo. USD LIBOR + 3.750% | 252,395 |
| 299,489 | 4.50%, 12/17/2027, 1 mo. USD LIBOR + 3.750% | 295,245 |
| 426,775 | Les Schwab Tire Centers 4.00%, 11/02/2027, 1 mo. USD LIBOR + 3.250% | 425,977 |
| 478,800 | Michaels Cos., Inc. 5.00%, 04/15/2028, 1 mo. USD LIBOR + 4.250% | 477,905 |
| 264,338 | PetSmart, Inc. 4.50%, 02/11/2028, 1 mo. USD LIBOR + 3.750% | 264,433 |
| Shares or Principal Amount | | Market Value† |
| SENIOR FLOATING RATE INTERESTS - 4.4%(9) - (continued) |
| | Retail - 0.5% - (continued) |
| $ 708,225 | SRS Distribution, Inc. 4.25%, 06/02/2028, 1 mo. USD LIBOR + 3.750% | $ 708,027 |
| 351,379 | Staples, Inc. 5.13%, 04/16/2026, 3 mo. USD LIBOR + 5.000% | 337,359 |
| 292,050 | White Cap Buyer LLC 4.50%, 10/19/2027, 1 mo. USD LIBOR + 4.000% | 292,614 |
| | | | 16,942,062 |
| | Semiconductors - 0.0% |
| 490,000 | MKS Instruments, Inc. 0.00%, 10/21/2028, 1 mo. USD LIBOR + 2.250%(10) | 489,387 |
| | Software - 0.4% |
| 206,400 | Ascend Learning LLC 4.00%, 07/12/2024, 3 mo. USD LIBOR + 3.000% | 206,142 |
| EUR 310,000 | Concorde Midco Ltd. 4.00%, 03/01/2028, 3 mo. EURIBOR + 4.000% | 357,977 |
| $ 647,631 | DCert Buyer, Inc. 4.09%, 10/16/2026, 3 mo. USD LIBOR + 4.000% | 647,703 |
| 1,880,910 | Dun & Bradstreet Corp. 3.34%, 02/06/2026, 1 mo. USD LIBOR + 3.250% | 1,872,521 |
| 253,114 | Epicor Software Corp. 4.00%, 07/30/2027, 1 mo. USD LIBOR + 3.250% | 252,777 |
| 441,858 | Finastra USA, Inc. 4.50%, 06/13/2024, 3 mo. USD LIBOR + 3.500% | 439,317 |
| 478,033 | Hyland Software, Inc. 4.25%, 07/01/2024, 1 mo. USD LIBOR + 3.500% | 478,181 |
| 545,000 | Mitchell International, Inc. 4.25%, 10/15/2028, 1 mo. USD LIBOR + 3.750% | 539,823 |
| 198,743 | Navicure, Inc. 4.09%, 10/22/2026, 1 mo. USD LIBOR + 4.000% | 198,868 |
| 460,000 | Polaris Newco LLC 4.50%, 06/02/2028, 1 mo. USD LIBOR + 4.000% | 460,883 |
| 392,739 | Quest Software U.S. Holdings, Inc. 4.38%, 05/16/2025, 3 mo. USD LIBOR + 4.250% | 391,970 |
| 640,000 | RealPage, Inc. 3.75%, 04/24/2028, 1 mo. USD LIBOR + 3.250% | 638,464 |
| 1,343,444 | SS&C European Holdings S.a.r.l. 1.84%, 04/16/2025, 1 mo. USD LIBOR + 1.750% | 1,328,612 |
| 3,924,703 | SS&C Technologies, Inc. 1.84%, 04/16/2025, 1 mo. USD LIBOR + 1.750% | 3,884,695 |
| | Ultimate Software Group, Inc. | |
| 324,385 | 3.84%, 05/04/2026, 3 mo. USD LIBOR + 3.750% | 324,735 |
| 247,505 | 4.00%, 05/04/2026, 1 mo. USD LIBOR + 3.250% | 247,784 |
| 1,082,818 | Zelis Healthcare Corporation 3.58%, 09/30/2026, 1 mo. USD LIBOR + 3.500% | 1,077,653 |
| | | | 13,348,105 |
| | Telecommunications - 0.1% |
| 520,229 | Altice France S.A. 3.81%, 01/31/2026, 3 mo. USD LIBOR + 3.688% | 514,246 |
| 162,112 | CenturyLink, Inc. 2.34%, 03/15/2027, 1 mo. USD LIBOR + 2.250% | 159,952 |
| 233,825 | Frontier Communications Corp. 4.50%, 05/01/2028, 1 mo. USD LIBOR + 3.750% | 233,357 |
The accompanying notes are an integral part of these financial statements.
The Hartford Total Return Bond Fund
Schedule of Investments – (continued)
October 31, 2021
| Shares or Principal Amount | | Market Value† |
| SENIOR FLOATING RATE INTERESTS - 4.4%(9) - (continued) |
| | Telecommunications - 0.1% - (continued) |
| $ 195,650 | Level 3 Financing, Inc. 1.84%, 03/01/2027, 1 mo. USD LIBOR + 1.750% | $ 192,995 |
| | Lorca Finco plc | |
| EUR 460,000 | 0.00%, 09/17/2027, 1 mo. USD LIBOR + 3.750%(10) | 527,921 |
| 425,000 | 4.25%, 09/17/2027, 3 mo. EURIBOR + 4.250% | 490,966 |
| $ 155,200 | Zacapa LLC 4.63%, 07/02/2025, 3 mo. USD LIBOR + 4.500% | 155,394 |
| | Zayo Group Holdings, Inc. | |
| 765,053 | 3.09%, 03/09/2027, 1 mo. USD LIBOR + 3.000% | 752,559 |
| EUR 98,500 | 3.25%, 03/09/2027, 3 mo. EURIBOR + 3.250% | 111,376 |
| | | | 3,138,766 |
| | Transportation - 0.0% |
| $ 520,000 | First Student Bidco, Inc. 3.50%, 07/21/2028, 1 mo. USD LIBOR + 3.000% | 516,168 |
| 139,300 | PODS LLC 3.75%, 03/31/2028, 1 mo. USD LIBOR + 3.000% | 139,039 |
| 523,688 | Savage Enterprises LLC 3.75%, 09/15/2028, 1 mo. USD LIBOR + 3.250% | 524,562 |
| | | | 1,179,769 |
| | Total Senior Floating Rate Interests
(cost $154,092,562) | $ 153,365,446 |
| U.S. GOVERNMENT AGENCIES - 38.5% |
| | Mortgage-Backed Agencies - 38.5% |
| | FHLMC - 2.7% |
| 53,098 | 0.01%, 11/15/2036(13) | $ 48,387 |
| 7,129,418 | 0.29%, 01/25/2027(3)(4) | 95,585 |
| 10,113,282 | 0.48%, 01/25/2034(3)(4) | 482,545 |
| 21,443,860 | 0.60%, 03/25/2027(3)(4) | 627,657 |
| 5,779,151 | 0.64%, 10/25/2026(3)(4) | 157,261 |
| 24,129,360 | 0.72%, 12/25/2030(3)(4) | 1,402,905 |
| 12,245,732 | 0.75%, 06/25/2027(3)(4) | 457,469 |
| 5,757,920 | 0.88%, 11/25/2030(3)(4) | 395,125 |
| 10,477,645 | 1.03%, 10/25/2030(3)(4) | 817,703 |
| 17,063,220 | 1.12%, 06/25/2030(3)(4) | 1,444,026 |
| 11,846,687 | 1.13%, 01/25/2030(3)(4) | 953,548 |
| 12,405,868 | 1.43%, 05/25/2030(3)(4) | 1,331,793 |
| 7,760,675 | 1.57%, 05/25/2030(3)(4) | 903,318 |
| 881,101 | 1.75%, 10/15/2042 | 887,952 |
| 1,634,767 | 1.94%, 09/25/2049, 1 mo. USD LIBOR + 1.850%(1)(2) | 1,641,668 |
| 3,679,461 | 2.00%, 03/01/2051 | 3,680,905 |
| 766,905 | 2.39%, 09/25/2030, 1 mo. USD LIBOR + 2.300%(2) | 773,329 |
| 3,967,081 | 2.44%, 02/25/2049, 1 mo. USD LIBOR + 2.350%(1)(2) | 3,996,997 |
| 433,190 | 2.50%, 12/15/2026(4) | 12,127 |
| 572,704 | 2.50%, 03/15/2028(4) | 29,836 |
| 438,632 | 2.50%, 05/15/2028(4) | 24,935 |
| 629,813 | 2.54%, 03/25/2049, 1 mo. USD LIBOR + 2.450%(1)(2) | 639,264 |
| 1,119,557 | 2.75%, 12/15/2041 | 1,159,980 |
| 781,941 | 3.00%, 03/15/2028(4) | 48,153 |
| 563,430 | 3.00%, 08/01/2029 | 597,398 |
| 475,058 | 3.00%, 05/15/2032(4) | 20,641 |
| 5,278,741 | 3.00%, 10/01/2032 | 5,560,380 |
| Shares or Principal Amount | | Market Value† |
| U.S. GOVERNMENT AGENCIES - 38.5% - (continued) |
| | Mortgage-Backed Agencies - 38.5% - (continued) |
| | FHLMC - 2.7% - (continued) |
| $ 418,539 | 3.00%, 03/15/2033(4) | $ 37,876 |
| 2,201,004 | 3.00%, 04/01/2033 | 2,317,467 |
| 2,032,808 | 3.00%, 11/01/2036 | 2,143,946 |
| 1,976,030 | 3.00%, 01/01/2037 | 2,084,590 |
| 302,000 | 3.00%, 04/15/2042 | 317,405 |
| 4,050,000 | 3.00%, 08/15/2043 | 4,223,274 |
| 4,625,155 | 3.00%, 11/01/2046 | 4,907,161 |
| 9,867,755 | 3.00%, 12/01/2046 | 10,444,590 |
| 995,000 | 3.12%, 10/25/2031(3) | 1,110,250 |
| 529,167 | 3.25%, 11/15/2041 | 564,553 |
| 208,067 | 3.50%, 06/15/2026(4) | 2,738 |
| 195,508 | 3.50%, 09/15/2026(4) | 10,593 |
| 277,664 | 3.50%, 03/15/2027(4) | 14,430 |
| 6,365,620 | 3.50%, 01/15/2033(4) | 699,013 |
| 1,014,630 | 3.50%, 08/01/2034 | 1,085,827 |
| 1,313,618 | 3.50%, 03/15/2041(4) | 73,409 |
| 2,271,089 | 3.50%, 01/15/2043(4) | 341,517 |
| 346,392 | 3.50%, 06/01/2046 | 371,130 |
| 1,850,584 | 3.50%, 10/01/2047 | 1,964,738 |
| 845,914 | 3.50%, 12/01/2047 | 908,315 |
| 2,129,836 | 3.50%, 01/01/2048 | 2,260,771 |
| 1,659,954 | 3.50%, 03/01/2048 | 1,797,745 |
| 167,584 | 3.50%, 04/01/2048 | 178,235 |
| 809,581 | 3.50%, 05/01/2048 | 857,993 |
| 1,524,255 | 3.50%, 12/01/2048 | 1,615,189 |
| 3,883,284 | 3.50%, 07/01/2051 | 4,116,587 |
| 785,289 | 4.00%, 08/01/2025 | 830,938 |
| 200,502 | 4.00%, 08/15/2026(4) | 9,226 |
| 825,288 | 4.00%, 07/15/2027(4) | 39,735 |
| 1,146,122 | 4.00%, 03/15/2028(4) | 62,243 |
| 287,539 | 4.00%, 06/15/2028(4) | 17,265 |
| 747,923 | 4.00%, 07/15/2030(4) | 64,625 |
| 2,340,447 | 4.00%, 05/25/2040(4) | 320,815 |
| 989,678 | 4.00%, 05/01/2042 | 1,089,959 |
| 301,082 | 4.00%, 08/01/2042 | 330,172 |
| 501,982 | 4.00%, 09/01/2042 | 553,936 |
| 166,787 | 4.00%, 07/01/2044 | 182,265 |
| 437,126 | 4.00%, 02/01/2046 | 477,003 |
| 1,196,797 | 4.00%, 11/01/2047 | 1,290,847 |
| 171,355 | 4.00%, 09/01/2048 | 184,091 |
| 243,327 | 4.50%, 02/01/2039 | 270,905 |
| 1,842,774 | 4.50%, 05/01/2042 | 2,051,234 |
| 480,754 | 4.50%, 07/01/2042 | 536,877 |
| 288,508 | 4.50%, 09/01/2044 | 317,285 |
| 1,048,896 | 4.75%, 07/15/2039 | 1,169,640 |
| 28,487 | 5.00%, 03/01/2024 | 31,282 |
| 75,996 | 5.00%, 02/01/2028 | 83,602 |
| 64,282 | 5.00%, 04/01/2028 | 70,720 |
| 69,251 | 5.00%, 10/01/2028 | 76,250 |
| 186,927 | 5.00%, 09/01/2029 | 207,516 |
| 293,712 | 5.00%, 01/01/2030 | 326,087 |
| 170,853 | 5.00%, 09/01/2031 | 187,783 |
| 147,870 | 5.00%, 11/01/2031 | 162,586 |
| 32,777 | 5.00%, 09/01/2033 | 37,261 |
| 603,301 | 5.00%, 09/15/2033(4) | 96,999 |
| 5,248 | 5.00%, 07/01/2035 | 5,995 |
| 89,981 | 5.00%, 04/01/2038 | 103,022 |
| 214,013 | 5.00%, 05/01/2039 | 244,336 |
| 275,384 | 5.00%, 08/01/2039 | 314,809 |
| 158,959 | 5.00%, 09/01/2039 | 180,362 |
| 246,076 | 5.00%, 01/01/2040 | 281,818 |
| 87,631 | 5.00%, 08/01/2040 | 100,358 |
| 4,315 | 5.00%, 02/01/2041 | 4,901 |
The accompanying notes are an integral part of these financial statements.
The Hartford Total Return Bond Fund
Schedule of Investments – (continued)
October 31, 2021
| Shares or Principal Amount | | Market Value† |
| U.S. GOVERNMENT AGENCIES - 38.5% - (continued) |
| | Mortgage-Backed Agencies - 38.5% - (continued) |
| | FHLMC - 2.7% - (continued) |
| $ 121,983 | 5.00%, 07/01/2041 | $ 139,521 |
| 187,892 | 5.00%, 04/01/2044 | 214,913 |
| 4,890,096 | 5.00%, 03/15/2045(4) | 1,018,831 |
| 622,085 | 5.00%, 03/01/2047 | 693,288 |
| 377,368 | 5.00%, 04/01/2047 | 420,308 |
| 20,381 | 5.00%, 11/01/2047 | 22,480 |
| 858,876 | 5.00%, 02/15/2048(4) | 169,610 |
| 399,268 | 5.00%, 09/01/2048 | 441,168 |
| 177,657 | 5.00%, 10/01/2048 | 196,229 |
| 279,940 | 5.00%, 03/01/2049 | 309,170 |
| 26,025 | 5.50%, 08/15/2033 | 29,593 |
| 497,213 | 5.50%, 04/15/2036(4) | 90,295 |
| 4,792 | 5.50%, 11/01/2037 | 5,605 |
| 584 | 5.50%, 02/01/2038 | 683 |
| 200,725 | 5.50%, 04/01/2038 | 234,733 |
| 20,399 | 5.50%, 06/01/2038 | 23,866 |
| 1,156,598 | 5.50%, 08/01/2038 | 1,317,912 |
| 59,966 | 5.50%, 05/01/2040 | 70,051 |
| 250,186 | 5.50%, 08/01/2040 | 292,260 |
| 269,311 | 5.50%, 06/01/2041 | 314,598 |
| 1,832,860 | 5.50%, 10/15/2046(4) | 376,184 |
| 930,512 | 5.50%, 12/15/2046(4) | 166,938 |
| 14,176 | 6.00%, 01/01/2023 | 14,401 |
| 20,517 | 6.00%, 11/01/2032 | 23,061 |
| 71,555 | 6.00%, 11/01/2033 | 83,976 |
| 51,907 | 6.00%, 02/01/2034 | 60,939 |
| 77,017 | 6.00%, 07/01/2034 | 90,644 |
| 22,379 | 6.00%, 08/01/2034 | 26,339 |
| 37,204 | 6.00%, 09/01/2034 | 43,219 |
| 21,176 | 6.00%, 01/01/2035 | 23,898 |
| 21,215 | 6.00%, 03/01/2035 | 24,875 |
| 19,818 | 6.00%, 05/01/2038 | 22,256 |
| 108,216 | 6.00%, 06/01/2038 | 125,245 |
| 359,501 | 6.00%, 05/15/2039 | 415,601 |
| 323,736 | 6.50%, 07/15/2036 | 365,022 |
| | | | 92,822,689 |
| | FNMA - 3.6% |
| 55,510 | 0.00%, 03/25/2036(13) | 49,670 |
| 523,845 | 0.00%, 06/25/2036(13) | 490,056 |
| 798,965 | 0.00%, 06/25/2041(13) | 735,468 |
| 100,000 | 0.00%, 09/25/2041(13) | 76,147 |
| 9,018,507 | 0.33%, 01/25/2030(3)(4) | 183,487 |
| 14,079,208 | 1.44%, 05/25/2029(3)(4) | 1,309,607 |
| 1,207,562 | 1.47%, 05/25/2046(3)(4) | 65,832 |
| 1,215,865 | 1.64%, 08/25/2044(3)(4) | 69,013 |
| 1,175,388 | 1.64%, 06/25/2055(3)(4) | 66,370 |
| 1,435,893 | 1.72%, 04/25/2055(3)(4) | 74,747 |
| 1,438,869 | 1.75%, 12/25/2042 | 1,443,859 |
| 959,997 | 2.00%, 09/25/2039 | 969,254 |
| 104,373 | 2.00%, 08/25/2043 | 104,714 |
| 18,922,713 | 2.00%, 03/01/2051 | 18,930,135 |
| 301,662 | 2.50%, 06/25/2028(4) | 15,594 |
| 196,709 | 2.50%, 01/01/2043 | 203,500 |
| 1,256,773 | 2.50%, 02/01/2043 | 1,303,249 |
| 1,140,522 | 2.50%, 03/01/2043 | 1,180,704 |
| 420,000 | 2.50%, 03/25/2043 | 430,513 |
| 576,408 | 2.50%, 04/01/2043 | 597,724 |
| 264,903 | 2.50%, 06/01/2043 | 274,646 |
| 463,718 | 2.50%, 08/01/2043 | 480,868 |
| 110,986 | 2.55%, 07/25/2044 | 113,436 |
| 796,451 | 3.00%, 02/25/2027(4) | 31,220 |
| Shares or Principal Amount | | Market Value† |
| U.S. GOVERNMENT AGENCIES - 38.5% - (continued) |
| | Mortgage-Backed Agencies - 38.5% - (continued) |
| | FNMA - 3.6% - (continued) |
| $ 300,756 | 3.00%, 09/25/2027(4) | $ 18,142 |
| 187,704 | 3.00%, 12/25/2027(4) | 12,531 |
| 1,507,921 | 3.00%, 01/25/2028(4) | 85,892 |
| 403,471 | 3.00%, 01/01/2030 | 424,332 |
| 4,361,000 | 3.00%, 04/25/2033(4) | 322,478 |
| 1,118,888 | 3.00%, 08/01/2033 | 1,177,951 |
| 419,760 | 3.00%, 06/01/2035 | 446,196 |
| 406,969 | 3.00%, 07/01/2035 | 432,133 |
| 2,403,149 | 3.00%, 03/01/2037 | 2,542,302 |
| 79,987 | 3.00%, 10/01/2037 | 84,430 |
| 602,770 | 3.00%, 05/25/2047 | 618,732 |
| 2,166,004 | 3.00%, 09/01/2048 | 2,284,239 |
| 1,917,274 | 3.00%, 08/25/2049 | 2,001,022 |
| 2,469,273 | 3.00%, 10/01/2051 | 2,591,031 |
| 600,000 | 3.00%, 09/25/2057 | 630,139 |
| 238,786 | 3.24%, 12/01/2026 | 258,884 |
| 611,247 | 3.30%, 12/01/2026 | 662,500 |
| 327,750 | 3.38%, 12/01/2029 | 362,877 |
| 515,439 | 3.41%, 11/01/2024 | 547,680 |
| 841,034 | 3.50%, 05/25/2027(4) | 54,286 |
| 586,692 | 3.50%, 10/25/2027(4) | 41,537 |
| 548,038 | 3.50%, 05/25/2030(4) | 47,879 |
| 215,649 | 3.50%, 08/25/2030(4) | 17,528 |
| 398,766 | 3.50%, 02/25/2031(4) | 22,987 |
| 3,604,226 | 3.50%, 08/25/2033(4) | 393,629 |
| 461,075 | 3.50%, 09/25/2035(4) | 53,158 |
| 3,744,654 | 3.50%, 11/25/2039(4) | 405,921 |
| 119,014 | 3.50%, 09/01/2043 | 128,836 |
| 884,058 | 3.50%, 10/01/2044 | 957,448 |
| 830,879 | 3.50%, 02/01/2045 | 894,211 |
| 1,089,715 | 3.50%, 01/01/2046 | 1,166,582 |
| 156,311 | 3.50%, 02/01/2046 | 167,931 |
| 834,034 | 3.50%, 03/01/2046 | 895,663 |
| 1,475,587 | 3.50%, 09/01/2046 | 1,576,983 |
| 573,781 | 3.50%, 10/01/2046 | 611,722 |
| 499,234 | 3.50%, 10/25/2046(4) | 81,447 |
| 751,617 | 3.50%, 11/01/2046 | 805,981 |
| 4,173,192 | 3.50%, 12/01/2046 | 4,525,075 |
| 1,498,245 | 3.50%, 05/01/2047 | 1,603,154 |
| 2,904,099 | 3.50%, 09/01/2047 | 3,086,269 |
| 530,462 | 3.50%, 12/01/2047 | 569,069 |
| 1,562,614 | 3.50%, 01/01/2048 | 1,657,765 |
| 495,551 | 3.50%, 02/01/2048 | 532,041 |
| 592,472 | 3.50%, 02/25/2048 | 615,618 |
| 500,000 | 3.50%, 05/25/2048 | 543,089 |
| 2,187,497 | 3.50%, 07/01/2048 | 2,339,873 |
| 489,439 | 3.50%, 11/01/2048 | 518,959 |
| 5,885,905 | 3.50%, 01/01/2050 | 6,236,229 |
| 6,804,579 | 3.50%, 09/01/2057 | 7,402,846 |
| 2,823,831 | 3.50%, 05/01/2058 | 3,058,701 |
| 3,752,389 | 3.50%, 12/25/2058 | 4,040,239 |
| 200,000 | 3.55%, 02/01/2030 | 222,499 |
| 184,864 | 4.00%, 06/01/2025 | 195,528 |
| 1,014,893 | 4.00%, 05/25/2027(4) | 54,651 |
| 1,135,511 | 4.00%, 01/25/2038(4) | 163,345 |
| 789,912 | 4.00%, 04/01/2038 | 860,164 |
| 1,422,806 | 4.00%, 10/01/2040 | 1,571,763 |
| 551,024 | 4.00%, 11/01/2040 | 608,873 |
| 566,134 | 4.00%, 12/01/2040 | 623,308 |
| 195,003 | 4.00%, 02/01/2041 | 214,696 |
| 571,303 | 4.00%, 03/01/2041 | 629,171 |
| 1,714,679 | 4.00%, 06/01/2041 | 1,875,956 |
The accompanying notes are an integral part of these financial statements.
The Hartford Total Return Bond Fund
Schedule of Investments – (continued)
October 31, 2021
| Shares or Principal Amount | | Market Value† |
| U.S. GOVERNMENT AGENCIES - 38.5% - (continued) |
| | Mortgage-Backed Agencies - 38.5% - (continued) |
| | FNMA - 3.6% - (continued) |
| $ 251,020 | 4.00%, 03/25/2042(4) | $ 26,962 |
| 209,935 | 4.00%, 08/01/2042 | 232,008 |
| 518,932 | 4.00%, 09/01/2042 | 573,475 |
| 139,386 | 4.00%, 11/25/2042(4) | 18,940 |
| 245,879 | 4.00%, 11/25/2043 | 268,509 |
| 72,219 | 4.00%, 06/01/2044 | 79,775 |
| 9,165 | 4.00%, 08/01/2044 | 10,092 |
| 74,100 | 4.00%, 10/01/2044 | 81,208 |
| 141,063 | 4.00%, 11/01/2044 | 154,601 |
| 79,145 | 4.00%, 03/01/2045 | 86,762 |
| 135,053 | 4.00%, 05/01/2045 | 148,340 |
| 697,660 | 4.00%, 07/01/2045 | 769,658 |
| 497,781 | 4.00%, 05/01/2046 | 542,920 |
| 572,318 | 4.00%, 06/01/2046 | 624,348 |
| 702,593 | 4.00%, 04/01/2047 | 769,506 |
| 1,447,455 | 4.00%, 10/01/2047 | 1,563,587 |
| 1,547,889 | 4.00%, 11/01/2047 | 1,668,145 |
| 1,393,452 | 4.00%, 09/01/2048 | 1,493,345 |
| 2,802,129 | 4.00%, 01/01/2049 | 3,004,812 |
| 465,880 | 4.06%, 03/01/2030 | 532,682 |
| 105,393 | 4.50%, 08/01/2024 | 109,956 |
| 6,736 | 4.50%, 04/01/2025 | 7,075 |
| 171,857 | 4.50%, 07/25/2027(4) | 8,019 |
| 422,068 | 4.50%, 09/01/2035 | 469,159 |
| 83,223 | 4.50%, 08/01/2040 | 92,300 |
| 1,052,337 | 4.50%, 10/01/2040 | 1,170,402 |
| 52,023 | 4.50%, 08/01/2041 | 57,965 |
| 11,898 | 4.50%, 09/01/2041 | 13,306 |
| 488,514 | 4.50%, 10/01/2041 | 543,501 |
| 2,082,305 | 4.50%, 08/25/2043(4) | 341,198 |
| 428,272 | 4.50%, 09/01/2043 | 477,708 |
| 364,047 | 4.50%, 09/25/2048(4) | 52,685 |
| 1,263,497 | 4.50%, 04/01/2049 | 1,366,626 |
| 3,216,797 | 4.50%, 01/01/2051 | 3,601,374 |
| 5,270 | 5.00%, 01/01/2022 | 5,455 |
| 8,841 | 5.00%, 11/01/2023 | 9,708 |
| 131,825 | 5.00%, 04/25/2038 | 143,579 |
| 1,828,547 | 5.00%, 12/25/2043(4) | 324,676 |
| 914,117 | 5.00%, 02/01/2049 | 1,008,662 |
| 456,379 | 5.00%, 03/01/2049 | 504,417 |
| 35,233 | 5.00%, 04/01/2049 | 38,844 |
| 77,324 | 5.49%, 05/25/2042(3)(4) | 8,049 |
| 14,317 | 5.50%, 06/01/2022 | 14,396 |
| 80,181 | 5.50%, 06/01/2033 | 92,513 |
| 315,417 | 5.50%, 07/01/2033 | 363,145 |
| 18,927 | 5.50%, 08/01/2033 | 21,836 |
| 1,191,105 | 5.50%, 11/01/2035 | 1,384,124 |
| 267,103 | 5.50%, 04/01/2036 | 307,431 |
| 240,959 | 5.50%, 04/25/2037 | 275,176 |
| 320,203 | 5.50%, 11/01/2037 | 364,654 |
| 2,171,044 | 5.50%, 11/25/2040(4) | 350,736 |
| 590,764 | 5.50%, 06/25/2042(4) | 122,156 |
| 1,017,696 | 5.50%, 09/25/2044(4) | 205,527 |
| 822,031 | 5.50%, 07/25/2045(4) | 149,078 |
| 6,363 | 6.00%, 11/01/2031 | 7,141 |
| 105,958 | 6.00%, 12/01/2032 | 120,787 |
| 111,398 | 6.00%, 03/01/2033 | 128,956 |
| 221,783 | 6.00%, 02/01/2037 | 261,860 |
| 165,980 | 6.00%, 12/01/2037 | 195,948 |
| 116,654 | 6.00%, 03/01/2038 | 137,865 |
| 53,499 | 6.00%, 10/01/2038 | 62,545 |
| 1,684,551 | 6.00%, 01/25/2042(4) | 221,886 |
| Shares or Principal Amount | | Market Value† |
| U.S. GOVERNMENT AGENCIES - 38.5% - (continued) |
| | Mortgage-Backed Agencies - 38.5% - (continued) |
| | FNMA - 3.6% - (continued) |
| $ 1,163,684 | 6.00%, 09/25/2047(4) | $ 249,336 |
| 1,801 | 7.50%, 12/01/2029 | 1,879 |
| 8,055 | 7.50%, 03/01/2030 | 9,277 |
| 10,232 | 7.50%, 09/01/2031 | 10,478 |
| | | | 124,838,983 |
| | GNMA - 9.5% |
| 713,591 | 1.75%, 09/20/2043 | 722,621 |
| 9,126 | 2.00%, 10/20/2040 | 9,125 |
| 598,468 | 2.00%, 01/20/2042 | 609,707 |
| 548,176 | 2.14%, 04/20/2040 | 532,925 |
| 635,970 | 2.50%, 12/16/2039 | 657,465 |
| 1,186,174 | 2.50%, 07/20/2041 | 1,217,648 |
| 8,131,647 | 2.50%, 08/20/2051 | 8,366,123 |
| 3,960,686 | 2.50%, 09/20/2051 | 4,072,792 |
| 12,987,108 | 2.50%, 10/20/2051(8) | 13,363,670 |
| 48,795,000 | 2.50%, 11/18/2051(14) | 50,155,923 |
| 48,775,000 | 2.50%, 12/20/2051(14) | 50,034,386 |
| 394,942 | 3.00%, 09/20/2028(4) | 23,387 |
| 5,916,800 | 3.00%, 05/20/2035(4) | 406,865 |
| 303,234 | 3.00%, 09/16/2042 | 314,636 |
| 295,379 | 3.00%, 09/20/2042 | 316,970 |
| 92,750 | 3.00%, 11/15/2042 | 98,434 |
| 396,104 | 3.00%, 02/16/2043(4) | 52,744 |
| 111,607 | 3.00%, 06/15/2043 | 117,614 |
| 57,966 | 3.00%, 07/15/2043 | 60,347 |
| 47,128 | 3.00%, 10/15/2044 | 49,330 |
| 69,832 | 3.00%, 02/15/2045 | 72,784 |
| 43,313 | 3.00%, 03/15/2045 | 45,503 |
| 194,044 | 3.00%, 04/15/2045 | 203,422 |
| 416,179 | 3.00%, 04/20/2045 | 439,255 |
| 41,965 | 3.00%, 06/15/2045 | 43,966 |
| 1,273,206 | 3.00%, 07/15/2045 | 1,331,492 |
| 17,766 | 3.00%, 08/15/2045 | 18,573 |
| 53,207 | 3.00%, 11/20/2045 | 55,731 |
| 169,000 | 3.00%, 02/20/2046 | 180,966 |
| 709,780 | 3.00%, 10/20/2047 | 734,606 |
| 4,100,000 | 3.00%, 10/20/2051 | 4,280,339 |
| 44,680,000 | 3.00%, 11/18/2051(14) | 46,388,661 |
| 44,650,000 | 3.00%, 12/20/2051(14) | 46,301,701 |
| 164,684 | 3.50%, 02/16/2027(4) | 9,784 |
| 423,274 | 3.50%, 03/20/2027(4) | 26,547 |
| 380,134 | 3.50%, 07/20/2040(4) | 16,527 |
| 426,744 | 3.50%, 12/20/2040 | 448,916 |
| 516,158 | 3.50%, 02/20/2041(4) | 16,495 |
| 1,073,567 | 3.50%, 04/20/2042(4) | 63,509 |
| 285,385 | 3.50%, 05/15/2042 | 306,459 |
| 2,131,695 | 3.50%, 10/20/2042(4) | 324,717 |
| 647,964 | 3.50%, 12/15/2042 | 699,078 |
| 699,921 | 3.50%, 03/15/2043 | 755,155 |
| 674,195 | 3.50%, 04/15/2043 | 727,469 |
| 1,404,841 | 3.50%, 05/15/2043 | 1,500,439 |
| 201,735 | 3.50%, 05/20/2043(4) | 27,334 |
| 871,191 | 3.50%, 07/20/2043(4) | 106,730 |
| 3,073,987 | 3.50%, 06/20/2046 | 3,252,597 |
| 3,060,869 | 3.50%, 02/20/2047 | 3,231,801 |
| 438,032 | 3.50%, 07/20/2047 | 461,656 |
| 3,441,687 | 3.50%, 08/20/2047 | 3,631,304 |
| 125,013 | 3.50%, 09/20/2047 | 131,879 |
| 153,534 | 3.50%, 10/20/2047 | 162,751 |
| 727,104 | 3.50%, 11/20/2047 | 768,172 |
| 661,162 | 3.50%, 03/20/2048 | 698,280 |
| 2,709,592 | 3.50%, 07/20/2049 | 2,836,672 |
The accompanying notes are an integral part of these financial statements.
The Hartford Total Return Bond Fund
Schedule of Investments – (continued)
October 31, 2021
| Shares or Principal Amount | | Market Value† |
| U.S. GOVERNMENT AGENCIES - 38.5% - (continued) |
| | Mortgage-Backed Agencies - 38.5% - (continued) |
| | GNMA - 9.5% - (continued) |
| $ 22,970,000 | 3.50%, 11/19/2050(14) | $ 24,030,568 |
| 1,953,765 | 3.88%, 08/15/2042 | 2,172,124 |
| 435,783 | 4.00%, 04/16/2026(4) | 21,842 |
| 107,245 | 4.00%, 12/16/2026(4) | 5,456 |
| 1,570,823 | 4.00%, 05/20/2029(4) | 92,444 |
| 991,711 | 4.00%, 09/20/2040 | 1,085,804 |
| 157,777 | 4.00%, 10/20/2040 | 172,299 |
| 436,406 | 4.00%, 12/20/2040 | 480,720 |
| 84,014 | 4.00%, 02/15/2041 | 93,056 |
| 177,188 | 4.00%, 05/16/2042(4) | 21,346 |
| 2,496,644 | 4.00%, 09/16/2042(4) | 526,050 |
| 398,894 | 4.00%, 03/20/2043(4) | 64,720 |
| 146,186 | 4.00%, 01/20/2044(4) | 23,638 |
| 2,369,771 | 4.00%, 02/20/2045 | 2,588,420 |
| 1,912,312 | 4.00%, 08/20/2045 | 2,084,537 |
| 1,340,556 | 4.00%, 03/20/2047(4) | 157,568 |
| 604,370 | 4.00%, 11/20/2047 | 656,264 |
| 1,777,981 | 4.00%, 03/20/2048 | 1,920,265 |
| 7,449,478 | 4.00%, 07/20/2048 | 7,948,732 |
| 6,975,000 | 4.00%, 11/18/2051(14) | 7,408,758 |
| 20,972 | 4.50%, 07/15/2033 | 23,699 |
| 39,973 | 4.50%, 05/15/2040 | 45,416 |
| 302,775 | 4.50%, 06/15/2041 | 343,878 |
| 25,701 | 4.50%, 09/20/2041 | 28,724 |
| 13,678 | 4.50%, 05/20/2044 | 15,262 |
| 710,659 | 4.50%, 06/20/2044 | 794,273 |
| 600,702 | 4.50%, 10/20/2044 | 667,312 |
| 580,487 | 4.50%, 04/20/2045(4) | 90,879 |
| 1,024,322 | 4.50%, 05/20/2045(4) | 155,709 |
| 3,285,615 | 4.50%, 08/20/2045(4) | 520,571 |
| 518,882 | 4.50%, 01/20/2046 | 576,027 |
| 2,003,680 | 4.50%, 12/16/2046(4) | 319,314 |
| 2,129,413 | 4.50%, 01/20/2047(4) | 230,585 |
| 2,150,460 | 4.50%, 05/20/2048(4) | 305,333 |
| 2,195,496 | 4.50%, 08/20/2049 | 2,343,914 |
| 3,755,690 | 4.50%, 09/20/2049 | 4,002,464 |
| 81,942 | 5.00%, 05/20/2034 | 92,413 |
| 27,043 | 5.00%, 07/15/2039 | 31,553 |
| 1,625,698 | 5.00%, 02/16/2040(4) | 290,297 |
| 260,344 | 5.00%, 05/20/2040(4) | 52,995 |
| 420,391 | 5.00%, 06/15/2041 | 484,671 |
| 605,193 | 5.00%, 10/16/2041(4) | 100,557 |
| 615,061 | 5.00%, 03/15/2044 | 708,597 |
| 989,046 | 5.00%, 06/20/2046(4) | 166,734 |
| 357,514 | 5.00%, 01/16/2047(4) | 68,589 |
| 244,325 | 5.00%, 09/16/2047(4) | 46,401 |
| 296,894 | 5.00%, 06/20/2048(4) | 47,165 |
| 5,200,000 | 5.00%, 11/18/2051(14) | 5,889,812 |
| 288,916 | 5.50%, 05/15/2033 | 335,302 |
| 16,803 | 5.50%, 06/15/2035 | 19,297 |
| 31,274 | 5.50%, 04/15/2038 | 35,208 |
| 219,313 | 5.50%, 05/20/2038 | 245,218 |
| 1,195,949 | 5.50%, 03/20/2039(4) | 158,198 |
| 1,125,043 | 5.50%, 02/16/2047(4) | 188,748 |
| 563,506 | 5.50%, 02/20/2047(4) | 99,714 |
| 259,026 | 5.50%, 05/20/2047(4) | 46,022 |
| 1,000,000 | 5.50%, 11/18/2051(14) | 1,120,625 |
| 944,217 | 5.86%, 07/20/2039(3)(4) | 116,280 |
| 54,563 | 6.00%, 02/15/2029 | 61,135 |
| 51,901 | 6.00%, 11/15/2032 | 59,077 |
| 85,496 | 6.00%, 02/15/2033 | 95,945 |
| 10,128 | 6.00%, 07/15/2033 | 11,347 |
| Shares or Principal Amount | | Market Value† |
| U.S. GOVERNMENT AGENCIES - 38.5% - (continued) |
| | Mortgage-Backed Agencies - 38.5% - (continued) |
| | GNMA - 9.5% - (continued) |
| $ 33,360 | 6.00%, 10/15/2034 | $ 37,432 |
| 153,978 | 6.00%, 03/15/2036 | 175,281 |
| 1,861 | 6.00%, 05/15/2036 | 2,155 |
| 58,702 | 6.00%, 10/15/2036 | 69,422 |
| 21,326 | 6.00%, 01/15/2037 | 24,091 |
| 71,052 | 6.00%, 02/15/2037 | 83,908 |
| 123,660 | 6.00%, 06/15/2037 | 145,164 |
| 60,051 | 6.00%, 11/15/2037 | 68,063 |
| 39,555 | 6.00%, 06/15/2038 | 44,830 |
| 54,193 | 6.00%, 08/15/2038 | 62,386 |
| 101,060 | 6.00%, 10/15/2038 | 114,043 |
| 74,155 | 6.00%, 11/15/2038 | 84,800 |
| 41,383 | 6.00%, 12/15/2038 | 46,871 |
| 55,084 | 6.00%, 01/15/2039 | 62,938 |
| 2,549 | 6.00%, 03/15/2039 | 2,858 |
| 144,201 | 6.00%, 04/15/2039 | 161,755 |
| 176,389 | 6.00%, 08/15/2039 | 198,054 |
| 5,542 | 6.00%, 09/15/2039 | 6,213 |
| 26,395 | 6.00%, 11/15/2039 | 30,252 |
| 10,830 | 6.00%, 06/15/2040 | 12,139 |
| 82,285 | 6.00%, 09/15/2040 | 95,489 |
| 1,274,115 | 6.00%, 09/20/2040(4) | 250,392 |
| 79,302 | 6.00%, 12/15/2040 | 91,740 |
| 263,345 | 6.00%, 06/15/2041 | 310,776 |
| 1,074,264 | 6.00%, 02/20/2046(4) | 175,241 |
| 9,266 | 6.50%, 09/15/2028 | 10,356 |
| 935 | 6.50%, 10/15/2028 | 1,045 |
| 3,679 | 6.50%, 12/15/2028 | 4,112 |
| 24,597 | 6.50%, 05/15/2029 | 27,917 |
| 25,354 | 6.50%, 08/15/2031 | 28,336 |
| 2,495 | 6.50%, 09/15/2031 | 2,788 |
| 9,872 | 6.50%, 10/15/2031 | 11,033 |
| 101,963 | 6.50%, 11/15/2031 | 113,957 |
| 21,392 | 6.50%, 01/15/2032 | 23,908 |
| 4,863 | 6.50%, 03/15/2032 | 5,435 |
| 4,953 | 6.50%, 04/15/2032 | 5,535 |
| | | | 326,664,568 |
| | UMBS - 22.7% |
| 3,865,000 | 1.50%, 11/10/2051(14) | 3,742,558 |
| 29,300,000 | 2.00%, 11/16/2036(14) | 30,061,113 |
| 340,047,000 | 2.00%, 11/10/2051(14) | 339,980,582 |
| 189,430,000 | 2.00%, 12/13/2051(14) | 189,000,822 |
| 28,420,000 | 2.50%, 11/16/2036(14) | 29,521,830 |
| 80,277,000 | 2.50%, 11/10/2051(14) | 82,440,716 |
| 42,285,000 | 2.50%, 12/13/2051(14) | 43,323,955 |
| 6,405,000 | 3.00%, 11/16/2036(14) | 6,713,241 |
| 28,986,000 | 3.00%, 11/10/2051(14) | 30,243,947 |
| 9,340,000 | 3.50%, 11/10/2051(14) | 9,870,483 |
| 8,057,000 | 4.00%, 11/10/2051(14) | 8,626,639 |
| 7,005,000 | 4.50%, 11/10/2051(14) | 7,571,967 |
| | | | 781,097,853 |
| | Total U.S. Government Agencies
(cost $1,319,880,656) | | $ 1,325,424,093 |
| U.S. GOVERNMENT SECURITIES - 26.9% |
| | Other Direct Federal Obligations - 0.0% |
| | FHLB - 0.0% |
| 700,000 | 4.25%, 09/15/2065 | $ 1,008,185 |
The accompanying notes are an integral part of these financial statements.
The Hartford Total Return Bond Fund
Schedule of Investments – (continued)
October 31, 2021
| Shares or Principal Amount | | Market Value† |
| U.S. GOVERNMENT SECURITIES - 26.9% - (continued) |
| | U.S. Treasury Securities - 26.9% |
| | U.S. Treasury Bonds - 14.9% |
| $ 2,448,108 | 0.13%, 02/15/2051(15) | $ 2,781,567 |
| 12,867,600 | 0.88%, 02/15/2047(15) | 16,909,333 |
| 1,935,728 | 1.00%, 02/15/2048(15) | 2,636,901 |
| 21,970,000 | 1.25%, 05/15/2050 | 18,543,195 |
| 17,030,000 | 1.38%, 11/15/2040 | 15,319,682 |
| 23,005,000 | 1.38%, 08/15/2050 | 20,030,525 |
| 53,750,000 | 1.75%, 08/15/2041(8) | 51,650,391 |
| 20,855,000 | 1.88%, 02/15/2041 | 20,441,159 |
| 30,160,000 | 1.88%, 02/15/2051 | 29,627,487 |
| 58,615,000 | 2.25%, 05/15/2041 | 61,069,503 |
| 5,455,000 | 2.25%, 08/15/2049 | 5,805,313 |
| 18,100,000 | 2.50%, 02/15/2046(16)(17) | 19,919,899 |
| 23,034,000 | 2.88%, 11/15/2046(18) | 27,259,299 |
| 6,035,000 | 3.00%, 05/15/2045 | 7,199,802 |
| 12,500,000 | 3.00%, 02/15/2047 | 15,147,949 |
| 17,840,000 | 3.00%, 02/15/2048 | 21,706,262 |
| 985,000 | 3.13%, 02/15/2043(17) | 1,178,614 |
| 55,100,000 | 3.13%, 08/15/2044(17) | 66,511,727 |
| 22,900,000 | 3.13%, 05/15/2048 | 28,523,024 |
| 63,465,000 | 3.38%, 05/15/2044(17) | 79,479,996 |
| | | | 511,741,628 |
| | U.S. Treasury Notes - 12.0% |
| 3,110,072 | 0.13%, 07/15/2030(15) | 3,462,081 |
| 6,256,676 | 0.38%, 01/15/2027(15) | 6,939,655 |
| 25,955,000 | 0.63%, 11/30/2027 | 24,841,774 |
| 63,395,000 | 0.63%, 12/31/2027 | 60,589,276 |
| 30,559,000 | 0.63%, 05/15/2030 | 28,410,320 |
| 124,910,000 | 0.63%, 08/15/2030(17) | 115,819,870 |
| 34,495,000 | 0.75%, 04/30/2026 | 33,912,897 |
| 1,264,121 | 0.75%, 07/15/2028(15) | 1,453,814 |
| 52,390,000 | 1.25%, 08/15/2031 | 50,941,089 |
| 7,180,000 | 1.63%, 02/15/2026 | 7,341,269 |
| 35,920,000 | 1.63%, 05/15/2031 | 36,189,400 |
| 30,700,000 | 2.88%, 08/15/2028 | 33,586,520 |
| 10,320,000 | 3.13%, 11/15/2028 | 11,483,016 |
| | | | 414,970,981 |
| | Total U.S. Government Securities
(cost $915,869,986) | | $ 927,720,794 |
| COMMON STOCKS - 0.0% |
| | Energy - 0.0% |
| 38,914 | Ascent Resources - Marcellus LLC Class A*(19)(20) | $ 32,104 |
| 4,601 | Foresight Energy LLC* | 62,111 |
| 13,623 | Philadelphia Energy Solutions Class A*(19)(20) | — |
| | Total Common Stocks
(cost $281,412) | | $ 94,215 |
| Shares or Principal Amount | | Market Value† |
| PREFERRED STOCKS - 0.0% |
| | Banks - 0.0% |
| 469 | U.S. Bancorp Series A, 3.50%(2) | $ 452,585 |
| | Total Preferred Stocks
(cost $332,990) | | $ 452,585 |
| WARRANTS - 0.0% |
| | Energy - 0.0% |
| 10,075 | Ascent Resources - Marcellus LLC Expires 3/30/2023(19)(20) | $ 101 |
| | Total Warrants
(cost $806) | | $ 101 |
| | Total Long-Term Investments
(Cost $4,371,178,975) | | $ 4,407,224,018 |
| SHORT-TERM INVESTMENTS - 2.1% |
| | Repurchase Agreements - 2.0% |
| $ 70,018,924 | Fixed Income Clearing Corp. Repurchase Agreement dated 10/29/2021 at 0.010%, due on 11/01/2021 with a maturity value of $70,018,982; collateralized by U.S. Treasury Bond at 1.875%, maturing 02/15/2041, with a market value of $71,419,380 | $ 70,018,924 |
| | Securities Lending Collateral - 0.1% |
| 8,224 | Fidelity Investments Money Market Funds, Government Portfolio, Institutional Class, 0.01%(21) | 8,224 |
| 1,262,504 | Goldman Sachs Financial Square Funds, Government Fund, Institutional Class, 0.03%(21) | 1,262,504 |
| 90,639 | Invesco Government & Agency Portfolio, Institutional Class, 0.03%(21) | 90,639 |
| | | | 1,361,367 |
| | Total Short-Term Investments
(cost $71,380,291) | $ 71,380,291 |
| | Total Investments Excluding
Purchased Options
(cost $4,442,559,266) | 130.0% | $ 4,478,604,309 |
| | Total Purchased Options
(cost $3,759,358) | 0.0% | $ 802,343 |
| | Total Investments
(cost $4,446,318,624) | 130.0% | $ 4,479,406,652 |
| | Other Assets and Liabilities | (30.0)% | (1,034,814,530) |
| | Total Net Assets | 100.0% | $ 3,444,592,122 |
| Note: | Percentage of investments as shown is the ratio of the total market value to total net assets. |
| | The Fund may refer to any one or more of the industry classifications used by one or more widely recognized market indices, ratings group and/or as defined by Fund management. Industry classifications may not be identical across all security types. |
The accompanying notes are an integral part of these financial statements.
The Hartford Total Return Bond Fund
Schedule of Investments – (continued)
October 31, 2021
Equity industry classifications used in this report are the Global Industry Classification Standard, which was developed by and is the exclusive property and service mark of MSCI, Inc. and Standard & Poor’s.
For Fund compliance purposes, the Fund may not use the same classification system. These classifications are used for financial reporting purposes.
See “Glossary” for abbreviation descriptions.
| * | Non-income producing. |
| (1) | Security was purchased pursuant to Rule 144A under the Securities Act of 1933 and may be sold in transactions that are exempt from registration (typically only to qualified institutional buyers) or in a public offering registered under the Securities Act of 1933. At October 31, 2021, the aggregate value of these securities was $968,866,657, representing 28.1% of net assets. |
| (2) | Variable rate securities; the rate reported is the coupon rate in effect at October 31, 2021. Base lending rates may be subject to a floor or cap. |
| (3) | Variable or floating rate security, which interest rate adjusts periodically based on changes in current interest rates and prepayments on the underlying pool of assets. Rate shown is the rate in effect as of period end. |
| (4) | Securities disclosed are interest-only strips. |
| (5) | Security is exempt from registration under Regulation S under the Securities Act of 1933, which exempts from registration securities offered and sold outside of the United States. Security may not be offered or sold in the United States except pursuant to an exemption from, or in a transaction not subject to, the registration requirements of the Securities Act of 1933. At October 31, 2021, the aggregate value of these securities was $64,797,800, representing 1.9% of net assets. |
| (6) | Represents entire or partial securities on loan. See Note 8 in the accompanying Notes to Financial Statements for securities lending information. |
| (7) | Fixed to variable rate investment. The rate shown reflects the fixed rate in effect at October 31, 2021. Rate will reset at a future date. Base lending rates may be subject to a floor or cap. |
| (8) | This security, or a portion of this security, was purchased on a when-issued, delayed-delivery or delayed-draw basis. The cost of these securities was $70,913,799 at October 31, 2021. |
| (9) | Senior floating rate interests generally pay interest rates which are periodically adjusted by reference to a base short-term, floating lending rate plus a premium. The base lending rates are primarily the LIBOR, and secondarily the prime rate offered by one or more major United States banks (the "Prime Rate") and the certificate of deposit rate or other base lending rates used by commercial lenders. Senior floating rate interests often require prepayments from excess cash flows or permit the borrower to repay at its election. The rate at which the borrower repays cannot be predicted with accuracy. As a result, the actual remaining maturity may be substantially less than the stated maturities shown. Base lending rates may be subject to a floor or cap. Unless otherwise noted, the interest rate disclosed for these securities represents the rate in effect as of October 31, 2021. |
| (10) | Represents an unsettled loan commitment. The coupon rate will be determined at time of settlement. |
| (11) | Non-income producing. For long-term debt securities, items identified are in default as to payment of interest and/or principal. |
| (12) | This security, or a portion of this security, has unfunded loan commitments. As of October 31, 2021, the aggregate value of the unfunded commitment was $70,147, which rounds to 0.0% of total net assets. |
| (13) | Securities disclosed are principal-only strips. |
| (14) | Represents or includes a TBA transaction. |
| (15) | The principal amount for these securities are adjusted for inflation and the interest payments equal a fixed percentage of the inflation-adjusted principal amount. |
| (16) | All, or a portion of the security, was pledged as collateral in connection with futures contracts. As of October 31, 2021, the market value of securities pledged was $14,527,219. |
| (17) | All, or a portion of the security, was pledged as collateral in connection with OTC swap contracts. As of October 31, 2021, the market value of securities pledged was $4,602,928. |
| (18) | All, or a portion of the security, was pledged as collateral in connection with centrally cleared swap contracts. As of October 31, 2021, the market value of securities pledged was $9,389,393. |
| (19) | These securities are valued in good faith at fair value as determined under policies and procedures established by and under the supervision of the Board of Directors. At October 31, 2021, the aggregate fair value of these securities are $32,205, which represented 0.0% of total net assets. This amount excludes securities that are principally traded in certain foreign markets and whose prices are adjusted pursuant to a third party pricing service methodology approved by the Board of Directors. |
| (20) | Investment valued using significant unobservable inputs. |
| (21) | Current yield as of period end. |
The accompanying notes are an integral part of these financial statements.
The Hartford Total Return Bond Fund
Schedule of Investments – (continued)
October 31, 2021
| OTC Swaptions Outstanding at October 31, 2021 |
| Description | | Counter-
party | | Exercise Price/
FX Rate/Rate | | Pay/
Receive
Floating
Rate | | Expiration
Date | | Notional
Amount | | Market
Value† | | Premiums
Paid
(Received)
by Fund | | Unrealized
Appreciation/
(Depreciation) |
| Purchased swaptions: |
| Put |
| 3 Month USD-LIBOR-BBA-Interest Rate Swap Expiring 03/14/22* | | CBK | | 2.20% | | Pay | | 03/14/2022 | | USD | 105,715,000 | | $ 393,266 | | $ 1,884,370 | | $ (1,491,104) |
| 3 Month USD-LIBOR-BBA-Interest Rate Swap Expiring 03/14/22* | | BOA | | 2.20% | | Pay | | 03/14/2022 | | USD | 109,970,000 | | 409,077 | | 1,874,988 | | (1,465,911) |
| Total Put | | $ 802,343 | | $ 3,759,358 | | $ (2,957,015) | |
| Written swaptions: |
| Put |
| 3 Month USD-LIBOR-BBA-Interest Rate Swap Expiring 03/14/22* | | BOA | | 1.50% | | Receive | | 03/14/2022 | | USD | (109,970,000) | | $ (725,499) | | $ (1,099,700) | | $ 374,201 |
| 3 Month USD-LIBOR-BBA-Interest Rate Swap Expiring 03/14/22* | | CBK | | 1.50% | | Receive | | 03/14/2022 | | USD | (105,715,000) | | (697,449) | | (1,162,865) | | 465,416 |
| Total Put | | $ (1,422,948) | | $ (2,262,565) | | $ 839,617 | |
| * | Swaptions with forward premiums. |
| Futures Contracts Outstanding at October 31, 2021 |
| Description | | Number of
Contracts | | Expiration
Date | | Current
Notional
Amount | | Value and
Unrealized
Appreciation/
(Depreciation) |
| Long position contracts: |
| Australian 10-Year Bond Future | | 210 | | 12/15/2021 | | $ 21,302,814 | | $ (782,139) |
| U.S. Treasury 2-Year Note Future | | 1,415 | | 12/31/2021 | | 310,238,750 | | (459,867) |
| Total | | | | | | | | $ (1,242,006) |
| Short position contracts: |
| Euro-BTP Future | | 518 | | 12/08/2021 | | $ 88,779,264 | | $ 2,502,904 |
| Euro-BUND Future | | 351 | | 12/08/2021 | | 68,215,691 | | 1,644,539 |
| Euro-BUXL 30-Year Bond Future | | 87 | | 12/08/2021 | | 21,017,534 | | 96,622 |
| U.S. Treasury 5-Year Note Future | | 442 | | 12/31/2021 | | 53,813,500 | | (54,246) |
| U.S. Treasury 10-Year Note Future | | 901 | | 12/21/2021 | | 117,763,516 | | 1,870,569 |
| U.S. Treasury 10-Year Ultra Future | | 1,789 | | 12/21/2021 | | 259,460,906 | | 2,904,870 |
| U.S. Treasury Long Bond Future | | 212 | | 12/21/2021 | | 34,098,875 | | 557,919 |
| U.S. Treasury Ultra Bond Future | | 413 | | 12/21/2021 | | 81,115,781 | | (559,990) |
| Total | | | | | | | | $ 8,963,187 |
| Total futures contracts | | $ 7,721,181 |
| TBA Sale Commitments Outstanding at October 31, 2021 |
| Description | | Principal
Amount | | Maturity
Date | | Market
Value† | | Unrealized
Appreciation/
(Depreciation) |
| GNMA, 2.00% | | $ 28,900,000 | | 11/18/2051 | | $ (29,252,218) | | $ 20,727 |
| GNMA, 4.50% | | 985,000 | | 11/18/2051 | | (1,050,564) | | 3,117 |
| UMBS, 1.50% | | 17,840,000 | | 11/16/2036 | | (17,944,531) | | 21,603 |
| UMBS, 2.00% | | 50,000 | | 11/16/2036 | | (51,299) | | 109 |
| UMBS, 5.00% | | 1,013,500 | | 11/10/2051 | | (1,115,642) | | (2,077) |
| UMBS, 5.50% | | 1,700,000 | | 11/10/2051 | | (1,905,063) | | 1,328 |
| Total TBA sale commitments (proceeds receivable $51,364,124) | | $ (51,319,317) | | $ 44,807 |
| At October 31, 2021, the aggregate market value of TBA Sale Commitments represents (1.5)% of total net assets. |
The accompanying notes are an integral part of these financial statements.
The Hartford Total Return Bond Fund
Schedule of Investments – (continued)
October 31, 2021
| OTC Credit Default Swap Contracts Outstanding at October 31, 2021 |
| Reference Entity | | Counter-
party | | Notional
Amount(1) | | (Pay)/Receive
Fixed Rate | | Expiration
Date | | Periodic
Payment
Frequency | | Upfront
Premiums
Paid | | Upfront
Premiums
Received | | Market
Value† | | Unrealized
Appreciation/
(Depreciation) |
| Credit default swaps on indices: |
| Buy protection: |
| ABX.HE.AAA.06 | | CSI | | USD | 961 | | (0.18%) | | 07/25/2045 | | Monthly | | $ 15 | | $ — | | $ 12 | | $ (3) |
| ABX.HE.AAA.07 | | GSC | | USD | 141,072 | | (0.09%) | | 08/25/2037 | | Monthly | | 29,973 | | — | | 5,967 | | (24,006) |
| ABX.HE.AAA.07 | | GSC | | USD | 617,897 | | (0.09%) | | 08/25/2037 | | Monthly | | 131,958 | | — | | 26,135 | | (105,823) |
| ABX.HE.AAA.07 | | CSI | | USD | 1,340,188 | | (0.09%) | | 08/25/2037 | | Monthly | | 329,091 | | — | | 56,686 | | (272,405) |
| ABX.HE.PENAAA.06 | | MSC | | USD | 121,533 | | (0.11%) | | 05/25/2046 | | Monthly | | 13,929 | | — | | 8,794 | | (5,135) |
| ABX.HE.PENAAA.06 | | JPM | | USD | 401,610 | | (0.11%) | | 05/25/2046 | | Monthly | | 45,920 | | — | | 29,061 | | (16,859) |
| ABX.HE.PENAAA.06 | | GSC | | USD | 324,007 | | (0.11%) | | 05/25/2046 | | Monthly | | 78,903 | | — | | 23,446 | | (55,457) |
| PrimeX.ARM.2 (2)(3) | | MSC | | USD | 69,436 | | (4.58%) | | 12/25/2037 | | Monthly | | — | | (152) | | (327) | | (175) |
| Total | | $ 629,789 | | $ (152) | | $ 149,774 | | $ (479,863) |
| Sell protection: |
| ABX.HE.AAA.06 | | MSC | | USD | 961 | | 0.18% | | 07/25/2045 | | Monthly | | $ — | | $ — | | $ (12) | | $ (12) |
| ABX.HE.AAA.07 | | MSC | | USD | 141,072 | | 0.09% | | 08/25/2037 | | Monthly | | 1,112 | | — | | (5,967) | | (7,079) |
| ABX.HE.AAA.07 | | MSC | | USD | 617,897 | | 0.09% | | 08/25/2037 | | Monthly | | 4,835 | | — | | (26,135) | | (30,970) |
| ABX.HE.AAA.07 | | MSC | | USD | 1,340,187 | | 0.09% | | 08/25/2037 | | Monthly | | 10,560 | | — | | (56,686) | | (67,246) |
| ABX.HE.PENAAA.06 | | BCLY | | USD | 847,152 | | 0.11% | | 05/25/2046 | | Monthly | | — | | (19,259) | | (61,301) | | (42,042) |
| CMBX.NA.BB.8 | | CSI | | USD | 512,146 | | 5.00% | | 10/17/2057 | | Monthly | | — | | (127,134) | | (187,452) | | (60,318) |
| CMBX.NA.BB.8 | | MSC | | USD | 1,844,694 | | 5.00% | | 10/17/2057 | | Monthly | | — | | (457,954) | | (675,182) | | (217,228) |
| CMBX.NA.BB.8 | | GSC | | USD | 2,681,522 | | 5.00% | | 10/17/2057 | | Monthly | | — | | (596,021) | | (981,472) | | (385,451) |
| CMBX.NA.BBB-.6 | | MSC | | USD | 690,000 | | 3.00% | | 05/11/2063 | | Monthly | | — | | (94,330) | | (191,424) | | (97,094) |
| CMBX.NA.BBB-.6 | | GSC | | USD | 1,415,000 | | 3.00% | | 05/11/2063 | | Monthly | | — | | (145,227) | | (392,559) | | (247,332) |
| PrimeX.ARM.2 (Caa2)(2)(3) | | JPM | | USD | 69,436 | | 4.58% | | 12/25/2037 | | Monthly | | 2,129 | | — | | 327 | | (1,802) |
| Total | | $ 18,636 | | $ (1,439,925) | | $ (2,577,863) | | $ (1,156,574) |
| Total OTC credit default swap contracts | | $ 648,425 | | $ (1,440,077) | | $ (2,428,089) | | $ (1,636,437) |
| (1) | The maximum potential amount the Fund could be required to pay as a seller of credit protection or receive as a buyer of credit protection if a credit event occurs as defined under the terms of that particular swap agreement. |
| (2) | These investments are valued in good faith at fair value as determined under policies and procedures established by and under the supervision of the Board of Directors. At October 31, 2021, the aggregate fair value of these investments are $(1,977), which represented (0.0)% of total net assets. This amount excludes investments that are principally traded in certain foreign markets and whose prices are adjusted pursuant to a third party pricing service methodology approved by the Board of Directors. |
| (3) | Investment valued using significant unobservable inputs. |
| Centrally Cleared Credit Default Swap Contracts Outstanding at October 31, 2021 |
| Reference Entity | | Notional
Amount | | (Pay)/Receive
Fixed Rate | | Expiration
Date | | Periodic
Payment
Frequency | | Cost Basis | | Value † | | Unrealized
Appreciation/
(Depreciation) |
| Credit default swaps on indices: |
| Buy protection: |
| CDX.EM.35.V1 | | USD | 24,850,000 | | (1.00%) | | 06/20/2026 | | Quarterly | | $ 706,767 | | $ 812,212 | | $ 105,445 |
| Total | | $ 706,767 | | $ 812,212 | | $ 105,445 |
| Credit default swaps on single-name issues: |
| Sell protection: |
| Panama Republic (BBB) | | USD | 4,475,000 | | 1.00% | | 06/20/2026 | | Quarterly | | $ 33,734 | | $ 34,390 | | $ 656 |
| Total | | $ 33,734 | | $ 34,390 | | $ 656 |
| Total centrally cleared credit default swap contracts | | $ 740,501 | | $ 846,602 | | $ 106,101 |
The accompanying notes are an integral part of these financial statements.
The Hartford Total Return Bond Fund
Schedule of Investments – (continued)
October 31, 2021
| Centrally Cleared Interest Rate Swap Contracts Outstanding at October 31, 2021 |
Payments made
by Fund | | Payments received
by Fund | | Notional
Amount | | Expiration
Date | | Periodic
Payment
Frequency | | Upfront
Premiums
Paid | | Upfront
Premiums
Received | | Value † | | Unrealized
Appreciation/
(Depreciation) |
| 1.56% Fixed | | 12 Mo. USD SOFR | | USD | 12,720,000 | | 12/15/2051 | | Annual | | $ — | | $ (79,502) | | $ (308,017) | | $ (228,515) |
| Total centrally cleared interest rate swaps contracts | | $ — | | $ (79,502) | | $ (308,017) | | $ (228,515) |
| Foreign Currency Contracts Outstanding at October 31, 2021 |
Amount and Description of
Currency to be Purchased | | Amount and Description of
Currency to be Sold | | Counterparty | | Settlement
Date | | Appreciation/
(Depreciation) |
| 7,515,000 | BRL | | 1,366,612 | USD | | MSC | | 12/15/2021 | | $ (47,728) |
| 1,782,000 | EUR | | 2,084,640 | USD | | MSC | | 12/15/2021 | | (22,297) |
| 28,620,000 | MXN | | 1,377,231 | USD | | GSC | | 12/15/2021 | | 3,082 |
| 7,019,643 | USD | | 37,845,000 | BRL | | GSC | | 12/15/2021 | | 377,839 |
| 10,252,059 | USD | | 8,828,028 | EUR | | DEUT | | 11/30/2021 | | 40,910 |
| 111,156,980 | USD | | 93,627,000 | EUR | | BCLY | | 12/15/2021 | | 2,800,673 |
| 1,246,735 | USD | | 1,049,000 | EUR | | MSC | | 12/15/2021 | | 32,708 |
| 15,988,202 | USD | | 323,080,000 | MXN | | GSC | | 12/15/2021 | | 406,386 |
| 6,682,605 | USD | | 498,390,000 | RUB | | BCLY | | 12/15/2021 | | (277,795) |
| Total foreign currency contracts | | $ 3,313,778 |
† See Significant Accounting Policies of accompanying Notes to Financial Statements regarding valuation of investments.
Fair Value Summary
The following is a summary of the fair valuations according to the inputs used as of October 31, 2021 in valuing the Fund’s investments.
| Description | | Total | | Level 1 | | Level 2 | | Level 3(1) |
| Assets | | | | | | | | |
| Asset & Commercial Mortgage-Backed Securities | | $ 771,838,221 | | $ — | | $ 771,838,221 | | $ — |
| Corporate Bonds | | 933,478,558 | | — | | 933,478,558 | | — |
| Foreign Government Obligations | | 236,620,622 | | — | | 236,620,622 | | — |
| Municipal Bonds | | 58,229,383 | | — | | 58,229,383 | | — |
| Senior Floating Rate Interests | | 153,365,446 | | — | | 153,365,446 | | — |
| U.S. Government Agencies | | 1,325,424,093 | | — | | 1,325,424,093 | | — |
| U.S. Government Securities | | 927,720,794 | | — | | 927,720,794 | | — |
| Common Stocks | | | | | | | | |
| Energy | | 94,215 | | 62,111 | | — | | 32,104 |
| Preferred Stocks | | 452,585 | | 452,585 | | — | | — |
| Warrants | | 101 | | — | | — | | 101 |
| Short-Term Investments | | 71,380,291 | | 1,361,367 | | 70,018,924 | | — |
| Purchased Options | | 802,343 | | — | | 802,343 | | — |
| Foreign Currency Contracts(2) | | 3,661,598 | | — | | 3,661,598 | | — |
| Futures Contracts(2) | | 9,577,423 | | 9,577,423 | | — | | — |
| Swaps - Credit Default(2) | | 106,101 | | — | | 106,101 | | — |
| Total | | $ 4,492,751,774 | | $ 11,453,486 | | $ 4,481,266,083 | | $ 32,205 |
| Liabilities | | | | | | | | |
| Foreign Currency Contracts(2) | | $ (347,820) | | $ — | | $ (347,820) | | $ — |
| Futures Contracts(2) | | (1,856,242) | | (1,856,242) | | — | | — |
| Swaps - Credit Default(2) | | (1,636,437) | | — | | (1,634,460) | | (1,977) |
| Swaps - Interest Rate(2) | | (228,515) | | — | | (228,515) | | — |
| TBA Sale Commitments | | (51,319,317) | | — | | (51,319,317) | | — |
| Written Options | | (1,422,948) | | — | | (1,422,948) | | — |
| Total | | $ (56,811,279) | | $ (1,856,242) | | $ (54,953,060) | | $ (1,977) |
| (1) | For the year ended October 31, 2021, investments valued at $36,503 were transferred out of Level 3 due to the initiation of a vendor providing prices. There were no transfers into Level 3. |
| (2) | Derivative instruments (excluding purchased and written options, if applicable) are valued at the unrealized appreciation/(depreciation) on the investments. |
Level 3 investments at the beginning and/or end of the period in relation to net assets were not significant and accordingly, a reconciliation of Level 3 assets for the year ended October 31, 2021 is not presented.
The accompanying notes are an integral part of these financial statements.
The Hartford World Bond Fund
Schedule of Investments
October 31, 2021
| Shares or Principal Amount | | Market Value† |
| ASSET & COMMERCIAL MORTGAGE-BACKED SECURITIES - 6.5% |
| | Bermuda - 0.1% |
| | Bellemeade Re Ltd. | |
| $ 875,000 | 1.80%, 03/25/2031, 3 mo. USD SOFR + 1.750%(1)(2) | $ 877,136 |
| 290,099 | 2.69%, 06/25/2030, 1 mo. USD LIBOR + 2.600%(1)(2) | 290,168 |
| 1,545,000 | Home Re Ltd. 1.64%, 07/25/2033, 1 mo. USD LIBOR + 1.550%(1)(2) | 1,537,498 |
| 1,085,000 | Traingle Re Ltd. 4.59%, 10/25/2030, 1 mo. USD LIBOR + 4.500%(1)(2) | 1,093,101 |
| | | | 3,797,903 |
| | Cayman Islands - 1.0% |
| 810,000 | ACRE Commercial Mortgage Ltd. 1.48%, 12/18/2037, 1 mo. USD LIBOR + 1.400%(1)(2) | 808,036 |
| 2,125,000 | Apidos CLO 2.72%, 04/15/2031, 3 mo. USD LIBOR + 2.600%(1)(2) | 2,051,566 |
| | Arbor Realty Collateralized Loan Obligation Ltd. | |
| 2,290,000 | 2.21%, 02/15/2035, 3 mo. USD SOFR + 2.164%(1)(2) | 2,291,406 |
| 2,500,000 | 2.86%, 02/15/2035, 3 mo. USD SOFR + 2.814%(1)(2) | 2,501,534 |
| | Arbor Realty Commercial Real Estate Notes Ltd. | |
| 1,060,000 | 1.49%, 05/15/2036, 1 mo. USD LIBOR + 1.400%(1)(2) | 1,060,332 |
| 895,000 | 1.69%, 08/15/2034, 1 mo. USD LIBOR + 1.600%(1)(2) | 894,459 |
| 1,295,000 | 1.91%, 09/15/2034, 3 mo. USD SOFR + 1.864%(1)(2) | 1,295,401 |
| 500,000 | Atrium IX 3.72%, 05/28/2030, 3 mo. USD LIBOR + 3.600%(1)(2) | 499,241 |
| 1,335,000 | BlueMountain CLO Ltd. 2.13%, 11/20/2028, 3 mo. USD LIBOR + 2.000%(1)(2) | 1,338,733 |
| 500,000 | Carlyle CLO Ltd. 2.93%, 04/30/2031, 3 mo. USD LIBOR + 2.800%(1)(2) | 495,061 |
| 1,015,000 | Covenant Credit Partners CLO Ltd. 1.97%, 10/15/2029, 3 mo. USD LIBOR + 1.850%(1)(2) | 1,015,359 |
| | Dryden Senior Loan Fund | |
| 940,000 | 7.00%, 04/15/2029, 3 mo. USD LIBOR + 6.880%(1)(2) | 940,043 |
| 1,805,000 | 7.09%, 04/15/2029, 3 mo. USD LIBOR + 6.970%(1)(2) | 1,805,722 |
| 770,000 | Greystone Commercial Real Estate 2.09%, 07/15/2039, 1 mo. USD LIBOR + 2.000%(1)(2) | 769,280 |
| 1,500,000 | Harriman Park CLO Ltd. 3.23%, 04/20/2034, 3 mo. USD LIBOR + 3.100%(1)(2) | 1,500,208 |
| 2,240,000 | LCM L.P. 2.08%, 10/20/2027, 3 mo. USD LIBOR + 1.950%(1)(2) | 2,242,775 |
| 3,000,000 | Madison Park Funding Ltd. 2.02%, 04/19/2030, 3 mo. USD LIBOR + 1.900%(1)(2) | 3,000,468 |
| | Magnetite Ltd. | |
| 430,000 | 2.87%, 07/25/2031, 3 mo. USD LIBOR + 2.750%(1)(2) | 429,598 |
| 2,470,000 | 3.42%, 01/25/2032, 3 mo. USD LIBOR + 3.300%(1)(2) | 2,473,169 |
| 750,000 | OCP CLO Ltd. 3.87%, 01/17/2032, 3 mo. USD LIBOR + 3.750%(1)(2) | 753,186 |
| Shares or Principal Amount | | Market Value† |
| ASSET & COMMERCIAL MORTGAGE-BACKED SECURITIES - 6.5% - (continued) |
| | Cayman Islands - 1.0% - (continued) |
| | Octagon Investment Partners Ltd. | |
| $ 2,765,000 | 2.37%, 10/24/2030, 3 mo. USD LIBOR + 2.250%(1)(2) | $ 2,765,794 |
| 970,000 | 7.13%, 02/14/2031, 3 mo. USD LIBOR + 7.000%(1)(2) | 962,847 |
| 1,500,000 | OZLM Ltd. 1.97%, 04/15/2031, 3 mo. USD LIBOR + 1.850%(1)(2) | 1,480,256 |
| 1,110,000 | Palmer Square Loan Funding Ltd. 2.53%, 05/20/2029, 3 mo. USD LIBOR + 2.400%(1)(2) | 1,110,239 |
| 1,840,000 | Point Au Roche Park CLO Ltd. 1.78%, 07/20/2034, 3 mo. USD LIBOR + 1.600%(1)(2) | 1,846,059 |
| 1,155,000 | Race Point CLO Ltd. 3.63%, 02/20/2030, 3 mo. USD LIBOR + 3.500%(1)(2) | 1,154,987 |
| | Sound Point CLO Ltd. | |
| 1,500,000 | 1.98%, 01/26/2031, 3 mo. USD LIBOR + 1.850%(1)(2) | 1,484,092 |
| 835,000 | 3.22%, 07/18/2031, 3 mo. USD LIBOR + 3.100%(1)(2) | 801,729 |
| 884,606 | Thunderbolt Aircraft Lease Ltd. 4.15%, 09/15/2038(1)(3) | 872,821 |
| | | | 40,644,401 |
| | United States - 5.4% |
| 1,691,432 | Aaset Trust 3.84%, 05/15/2039(1) | 1,668,260 |
| 1,400,000 | Ajax Mortgage Loan Trust 2.35%, 09/25/2065(1)(4) | 1,363,865 |
| 2,384,000 | AMSR Trust 2.01%, 11/17/2037(1) | 2,339,663 |
| 1,675,000 | Angel Oak Mortgage Trust 3.81%, 04/25/2065(1)(4) | 1,704,010 |
| 1,650,000 | Antler Mortgage Trust 2.12%, 11/25/2024(1)(4) | 1,655,410 |
| 1,570,000 | Avant Loans Funding Trust 1.21%, 07/15/2030(1) | 1,562,360 |
| | BBCMS Mortgage Trust | |
| 5,239,639 | 1.63%, 04/15/2053(4)(5) | 525,514 |
| 545,000 | 1.79%, 08/15/2036, 1 mo. USD LIBOR + 1.700%(1)(2) | 542,941 |
| | Benchmark Mortgage Trust | |
| 20,721,098 | 0.51%, 07/15/2051(4)(5) | 518,146 |
| 2,752,800 | 1.04%, 03/15/2052(4)(5) | 176,537 |
| 3,344,608 | 1.52%, 01/15/2054(4)(5) | 389,574 |
| 915,000 | BFLD Trust 2.14%, 11/15/2028, 1 mo. USD LIBOR + 2.050%(1)(2) | 916,150 |
| | BRAVO Residential Funding Trust | |
| 2,913,077 | 1.99%, 04/25/2031(1)(3) | 2,902,968 |
| 432,000 | 2.29%, 03/25/2060(1)(4) | 429,889 |
| 1,090,000 | 2.32%, 02/25/2049(1)(4) | 1,087,532 |
| 1,334,000 | 5.09%, 05/25/2060(1)(4) | 1,363,139 |
| | BX Commercial Mortgage Trust | |
| 1,169,000 | 2.09%, 09/15/2036, 1 mo. USD LIBOR + 2.000%(1)(2) | 1,168,999 |
| 2,214,250 | 2.09%, 10/15/2036, 1 mo. USD LIBOR + 2.000%(1)(2) | 2,210,083 |
| 1,126,726 | 2.19%, 10/15/2037, 1 mo. USD LIBOR + 2.100%(1)(2) | 1,126,054 |
| 690,000 | 2.34%, 01/15/2034, 1 mo. USD LIBOR + 2.250%(1)(2) | 689,999 |
| 1,109,674 | 2.59%, 12/15/2036, 1 mo. USD LIBOR + 2.500%(1)(2) | 1,104,110 |
| 2,508,405 | 2.84%, 10/15/2037, 1 mo. USD LIBOR + 2.750%(1)(2) | 2,506,843 |
The accompanying notes are an integral part of these financial statements.
The Hartford World Bond Fund
Schedule of Investments – (continued)
October 31, 2021
| Shares or Principal Amount | | Market Value† |
| ASSET & COMMERCIAL MORTGAGE-BACKED SECURITIES - 6.5% - (continued) |
| | United States - 5.4% - (continued) |
| | BX Trust | |
| $ 3,100,000 | 1.68%, 09/15/2034, 1 mo. USD LIBOR + 1.587%(1)(2) | $ 3,039,699 |
| 2,269,805 | 2.07%, 09/15/2037, 1 mo. USD LIBOR + 1.975%(1)(2) | 2,204,681 |
| 895,000 | CAMB Commercial Mortgage Trust 1.84%, 12/15/2037, 1 mo. USD LIBOR + 1.750%(1)(2) | 895,002 |
| 7,063,610 | Cantor Commercial Real Estate 1.11%, 05/15/2052(4)(5) | 450,010 |
| | Castlelake Aircraft Structured Trust | |
| 520,779 | 2.74%, 08/15/2041(1) | 518,308 |
| 1,322,267 | 3.97%, 04/15/2039(1) | 1,321,058 |
| 4,187,087 | CF Hippolyta LLC 2.28%, 07/15/2060(1) | 4,212,006 |
| | Citigroup Commercial Mortgage Trust | |
| 1,120,000 | 4.68%, 01/10/2036(1) | 1,182,580 |
| 1,865,000 | 4.75%, 01/10/2036(1)(4) | 1,957,236 |
| 1,746,556 | Citigroup Mortgage Loan Trust 3.23%, 11/25/2070(1)(3) | 1,747,885 |
| 2,258,000 | COLT Mortgage Loan Trust 3.31%, 07/27/2054(1)(4) | 2,250,804 |
| | Commercial Mortgage Trust | |
| 3,730,000 | 1.29%, 03/15/2038, 1 mo. USD LIBOR + 1.200%(1)(2) | 3,686,603 |
| 770,000 | 4.72%, 02/10/2047(4) | 815,738 |
| 1,385,000 | 4.88%, 11/10/2046(4) | 1,471,230 |
| | Connecticut Avenue Securities Trust | |
| 649,555 | 2.19%, 10/25/2039, 1 mo. USD LIBOR + 2.100%(1)(2) | 651,452 |
| 2,312,811 | 2.24%, 11/25/2039, 1 mo. USD LIBOR + 2.150%(1)(2) | 2,324,062 |
| 485,000 | 3.34%, 01/25/2040, 1 mo. USD LIBOR + 3.250%(1)(2) | 486,960 |
| 2,105,000 | 3.74%, 02/25/2040, 1 mo. USD LIBOR + 3.650%(1)(2) | 2,192,253 |
| 2,400,000 | 4.44%, 07/25/2031, 1 mo. USD LIBOR + 4.350%(1)(2) | 2,462,357 |
| 3,990,000 | 5.34%, 06/25/2039, 1 mo. USD LIBOR + 5.250%(1)(2) | 4,097,568 |
| | CSAIL Commercial Mortgage Trust | |
| 10,741,425 | 0.57%, 08/15/2051(4)(5) | 344,959 |
| 12,937,821 | 0.82%, 04/15/2050(4)(5) | 281,079 |
| 686,156 | CSMC Trust 3.25%, 04/25/2047(1)(4) | 712,649 |
| 2,245,000 | DataBank Issuer 2.06%, 02/27/2051(1) | 2,227,918 |
| 225,111 | Diamond Resorts Owner Trust 1.51%, 11/21/2033(1) | 224,269 |
| 375,000 | DT Auto Owner Trust 2.65%, 09/15/2028(1) | 368,174 |
| 3,000,000 | Eagle RE Ltd. 1.89%, 01/25/2030, 1 mo. USD LIBOR + 1.800%(1)(2) | 2,957,479 |
| 1,315,000 | ExteNet LLC 3.20%, 07/26/2049(1) | 1,345,470 |
| | Fannie Mae Connecticut Avenue Securities | |
| 1,783,856 | 2.09%, 03/25/2031, 1 mo. USD LIBOR + 2.000%(2) | 1,797,791 |
| 2,026,403 | 2.24%, 10/25/2030, 1 mo. USD LIBOR + 2.150%(2) | 2,047,931 |
| 1,909,190 | 2.29%, 08/25/2030, 1 mo. USD LIBOR + 2.200%(2) | 1,927,407 |
| 3,168,264 | 2.34%, 07/25/2030, 1 mo. USD LIBOR + 2.250%(2) | 3,209,607 |
| Shares or Principal Amount | | Market Value† |
| ASSET & COMMERCIAL MORTGAGE-BACKED SECURITIES - 6.5% - (continued) |
| | United States - 5.4% - (continued) |
| $ 2,381,791 | 2.44%, 01/25/2031, 1 mo. USD LIBOR + 2.350%(2) | $ 2,410,847 |
| 2,146,331 | 2.64%, 12/25/2030, 1 mo. USD LIBOR + 2.550%(2) | 2,181,295 |
| 2,118,758 | 2.69%, 05/25/2024, 1 mo. USD LIBOR + 2.600%(2) | 2,144,750 |
| 2,337,646 | 2.89%, 02/25/2030, 1 mo. USD LIBOR + 2.800%(2) | 2,388,956 |
| 1,873,510 | 3.74%, 09/25/2029, 1 mo. USD LIBOR + 3.650%(2) | 1,939,208 |
| 1,737,000 | 3.84%, 10/25/2030, 1 mo. USD LIBOR + 3.750%(2) | 1,811,333 |
| 3,650,000 | 4.34%, 01/25/2031, 1 mo. USD LIBOR + 4.250%(2) | 3,839,546 |
| 195,122 | 4.49%, 01/25/2024, 1 mo. USD LIBOR + 4.400%(2) | 201,392 |
| 282,346 | 4.99%, 11/25/2024, 1 mo. USD LIBOR + 4.900%(2) | 293,706 |
| 315,690 | FCI Funding LLC 3.63%, 02/18/2031(1) | 318,427 |
| 600,000 | First Investors Auto Owner Trust 3.14%, 11/15/2028(1) | 593,708 |
| 2,040,000 | FirstKey Homes Trust 3.02%, 10/19/2037(1) | 2,055,578 |
| | FREMF Mortgage Trust | |
| 3,645,000 | 3.59%, 04/25/2048(1)(4) | 3,777,199 |
| 2,180,000 | 4.08%, 09/25/2025(1)(4) | 2,320,023 |
| 960,000 | FRTKL 3.17%, 09/17/2038(1) | 955,775 |
| 617,320 | FWD Securitization Trust 2.44%, 01/25/2050(1)(4) | 617,495 |
| | GS Mortgage Securities Corp. Trust | |
| 940,000 | 1.24%, 05/15/2026, 1 mo. USD LIBOR + 1.150%(1)(2) | 940,186 |
| 2,234,010 | 1.79%, 09/15/2031, 1 mo. USD LIBOR + 1.700%(1)(2) | 2,225,698 |
| | GS Mortgage Securities Trust | |
| 3,581,288 | 0.96%, 02/10/2052(4)(5) | 212,169 |
| 370,000 | 4.32%, 05/10/2050(4) | 396,151 |
| | Horizon Aircraft Finance Ltd. | |
| 2,208,719 | 3.43%, 11/15/2039(1) | 2,195,436 |
| 1,207,799 | 4.46%, 12/15/2038(1) | 1,197,840 |
| 510,684 | JP Morgan Chase & Co. 2.10%, 02/26/2029(1) | 509,080 |
| | JP Morgan Chase Bank NA | |
| 603,321 | 1.35%, 03/25/2051, 3 mo. USD SOFR + 1.300%(1)(2) | 606,746 |
| 1,698,302 | 2.34%, 10/25/2057, 1 mo. USD LIBOR + 2.250%(1)(2) | 1,735,694 |
| 1,830,000 | JP Morgan Chase Commercial Mortgage Securities Corp. 1.79%, 04/15/2038, 1 mo. USD LIBOR + 1.700%(1)(2) | 1,828,323 |
| 2,580,000 | JP Morgan Chase Commercial Mortgage Securities Trust 3.62%, 01/16/2037(1) | 2,599,202 |
| 41,634,456 | JPMBB Commercial Mortgage Securities Trust 0.61%, 09/15/2047(4)(5) | 614,853 |
| 1,272,750 | KKR Industrial Portfolio Trust 1.64%, 12/15/2037, 1 mo. USD LIBOR + 1.550%(1)(2) | 1,242,361 |
| | Legacy Mortgage Asset Trust | |
| 370,374 | 1.89%, 10/25/2066(1)(3) | 370,433 |
The accompanying notes are an integral part of these financial statements.
The Hartford World Bond Fund
Schedule of Investments – (continued)
October 31, 2021
| Shares or Principal Amount | | Market Value† |
| ASSET & COMMERCIAL MORTGAGE-BACKED SECURITIES - 6.5% - (continued) |
| | United States - 5.4% - (continued) |
| $ 3,483,574 | 3.25%, 11/25/2059(1)(3) | $ 3,499,440 |
| 3,105,000 | Lendbuzz Securitization Trust 1.46%, 06/15/2026(1) | 3,103,662 |
| | LHOME Mortgage Trust | |
| 1,680,000 | 2.09%, 06/25/2026(1)(3) | 1,678,930 |
| 1,450,000 | 2.09%, 09/25/2026(1)(4) | 1,450,342 |
| 1,720,000 | Life Mortgage Trust 2.44%, 03/15/2038, 1 mo. USD LIBOR + 2.350%(1)(2) | 1,718,925 |
| | LSTAR Securities Investment Ltd. | |
| 1,447,218 | 1.88%, 02/01/2026, 1 mo. USD LIBOR + 1.800%(1)(2) | 1,446,089 |
| 1,444,552 | 2.58%, 04/01/2024, 1 mo. USD LIBOR + 2.500%(1)(2) | 1,441,477 |
| 885,000 | Mercury Financial Credit Card Master Trust 1.54%, 03/20/2026(1) | 886,539 |
| 3,025,000 | MF1 Ltd. 2.16%, 12/25/2034, 3 mo. USD SOFR + 2.114%(1)(2) | 3,024,996 |
| 3,000,000 | MHC Commercial Mortgage Trust 1.69%, 04/15/2038, 1 mo. USD LIBOR + 1.601%(1)(2) | 3,000,000 |
| | Morgan Stanley Capital Trust | |
| 1,600,000 | 1.29%, 07/15/2035, 1 mo. USD LIBOR + 1.200%(1)(2) | 1,595,963 |
| 8,154,419 | 1.34%, 06/15/2050(4)(5) | 441,034 |
| 1,620,000 | 3.74%, 12/15/2036, 1 mo. USD LIBOR + 2.244%(1)(2) | 1,619,787 |
| 1,392,417 | Mortgage Insurance-Linked Notes 2.99%, 11/26/2029, 1 mo. USD LIBOR + 2.900%(1)(2) | 1,392,718 |
| 1,127,175 | Neighborly Issuer LLC 3.58%, 04/30/2051(1) | 1,155,671 |
| 417,053 | New Residential Mortgage LLC 4.09%, 07/25/2054(1) | 417,053 |
| 3,115,000 | New York Mortgage Trust 2.24%, 05/25/2026(1)(3) | 3,121,064 |
| 505,000 | Oaktown Re VI Ltd. 1.70%, 10/25/2033, 3 mo. USD SOFR + 1.650%(1)(2) | 506,522 |
| 2,295,000 | OPG TR 1.63%, 10/15/2036, 1 mo. USD LIBOR + 1.529%(1)(2) | 2,271,100 |
| | PMT Credit Risk Transfer Trust | |
| 793,103 | 2.09%, 03/27/2024, 1 mo. USD LIBOR + 2.000%(1)(2) | 793,170 |
| 281,506 | 2.79%, 10/27/2022, 1 mo. USD LIBOR + 2.700%(1)(2) | 281,587 |
| | Preston Ridge Partners Mortgage Trust LLC | |
| 1,746,359 | 1.79%, 06/25/2026(1)(3) | 1,733,602 |
| 1,923,255 | 1.87%, 04/25/2026(1)(3) | 1,931,315 |
| 660,092 | 2.12%, 03/25/2026(1)(4) | 658,806 |
| 689,846 | 2.36%, 11/25/2025(1)(3) | 691,142 |
| 780,000 | 3.47%, 07/25/2026(1)(3) | 773,607 |
| 1,215,868 | 3.50%, 10/25/2024(1)(4) | 1,217,344 |
| 1,399,135 | 3.67%, 08/25/2025(1)(3) | 1,401,629 |
| 1,145,000 | 3.67%, 08/25/2026(1)(3) | 1,139,929 |
| 970,000 | 3.72%, 04/25/2026(1)(3) | 962,413 |
| 1,870,000 | 3.97%, 10/25/2026(1)(4) | 1,869,944 |
| | Pretium Mortgage Credit Partners LLC | |
| 565,000 | 3.72%, 07/25/2051(1)(3) | 562,521 |
| Shares or Principal Amount | | Market Value† |
| ASSET & COMMERCIAL MORTGAGE-BACKED SECURITIES - 6.5% - (continued) |
| | United States - 5.4% - (continued) |
| $ 1,325,000 | 3.84%, 07/25/2051(1)(3) | $ 1,319,161 |
| | Progress Residential Trust | |
| 755,000 | 2.30%, 10/17/2027(1) | 745,484 |
| 1,335,000 | 2.55%, 04/19/2038(1) | 1,330,141 |
| 1,970,000 | 3.18%, 10/17/2038(1) | 1,961,277 |
| 395,000 | Ready Capital Mortgage Financing LLC 1.99%, 07/25/2036, 1 mo. USD LIBOR + 1.900%(1)(2) | 394,878 |
| 1,181,435 | Sapphire Aviation Finance Ltd. 3.23%, 03/15/2040(1) | 1,162,350 |
| 955,000 | SFO Commercial Mortgage Trust 1.59%, 05/15/2038, 1 mo. USD LIBOR + 1.500%(1)(2) | 955,584 |
| 845,000 | SG Commercial Mortgage Securities Trust 4.82%, 10/10/2048(4) | 860,176 |
| 6,632,284 | SLG Office Trust 0.26%, 07/15/2041(1)(4)(5) | 137,138 |
| 764,363 | Sonic Capital LLC 2.19%, 08/20/2051(1) | 758,014 |
| 1,635,000 | Starwood Residential Mortgage 2.49%, 04/17/2038, 1 mo. USD LIBOR + 2.400%(1)(2) | 1,633,809 |
| 675,000 | Stonepeak 2.68%, 02/28/2033 | 676,841 |
| | Toorak Mortgage Corp. Ltd. | |
| 1,370,000 | 2.24%, 06/25/2024(1)(3) | 1,366,447 |
| 2,200,000 | 4.21%, 09/25/2022(3) | 2,212,500 |
| 3,325,000 | Vantage Data Centers Issuer LLC 1.65%, 09/15/2045(1) | 3,287,666 |
| | VCAT LLC | |
| 268,421 | 2.29%, 12/26/2050(1)(3) | 268,684 |
| 3,476,000 | 3.84%, 08/25/2051(1)(3) | 3,469,190 |
| 1,270,000 | 3.97%, 09/25/2051(1)(3) | 1,264,875 |
| | Verus Securitization Trust | |
| 2,767,906 | 3.00%, 11/25/2059(1)(3) | 2,802,507 |
| 1,700,000 | 3.20%, 10/25/2063(1)(4) | 1,700,220 |
| 1,069,000 | Vista Point Securitization Trust 3.40%, 04/25/2065(1)(4) | 1,094,286 |
| 688,618 | VOLT C LLC 1.99%, 05/25/2051(1)(3) | 692,258 |
| 387,336 | VOLT XCII LLC 1.89%, 02/27/2051(1)(3) | 386,769 |
| 750,000 | VOLT XCIII LLC 4.83%, 02/27/2051(1)(3) | 746,320 |
| 1,888,498 | VOLT XCV LLC 2.24%, 03/27/2051(1)(3) | 1,895,508 |
| 1,123,052 | VOLT XCVI LLC 2.12%, 03/27/2051(1)(3) | 1,131,675 |
| 1,865,000 | VOLT XCVII LLC 4.83%, 04/25/2051(1)(3) | 1,852,929 |
| 1,904,231 | Wave LLC 3.60%, 09/15/2044(1) | 1,880,879 |
| | Wells Fargo Commercial Mortgage Trust | |
| 2,000,000 | 3.07%, 08/15/2049(4) | 1,906,161 |
| 1,455,000 | 3.15%, 09/15/2057 | 1,420,160 |
| | Wells Fargo N.A. | |
| 3,615,327 | 0.96%, 02/15/2052(4)(5) | 207,330 |
| 10,286,428 | 1.03%, 04/15/2052(4)(5) | 678,842 |
| 9,597,930 | 1.23%, 03/15/2063(4)(5) | 791,296 |
| 1,825,000 | Westlake Automobile Receivables Trust 2.33%, 08/17/2026(1) | 1,811,022 |
| | WF-RBS Commercial Mortgage Trust | |
| 9,573,590 | 1.25%, 03/15/2047(4)(5) | 219,500 |
The accompanying notes are an integral part of these financial statements.
The Hartford World Bond Fund
Schedule of Investments – (continued)
October 31, 2021
| Shares or Principal Amount | | Market Value† |
| ASSET & COMMERCIAL MORTGAGE-BACKED SECURITIES - 6.5% - (continued) |
| | United States - 5.4% - (continued) |
| $ 2,602,271 | 4.89%, 06/15/2044(1)(4) | $ 2,600,487 |
| 425,000 | ZH Trust 2.25%, 02/18/2027(1) | 424,114 |
| | | | 223,722,480 |
| | Total Asset & Commercial Mortgage-Backed Securities
(cost $267,797,145) | $ 268,164,784 |
| CONVERTIBLE BONDS - 0.4% |
| | Italy - 0.2% |
| EUR 7,300,000 | Telecom Italia S.p.A. 1.13%, 03/26/2022(6) | $ 8,460,993 |
| | United Kingdom - 0.0% |
| GBP 900,000 | Trainline PLC 1.00%, 01/14/2026(6) | 1,078,473 |
| | United States - 0.2% |
| $ 1,152,000 | Ford Motor Co. 0.00%, 03/15/2026(1)(7) | 1,362,686 |
| 825,000 | JetBlue Airways Corp. 0.50%, 04/01/2026(1) | 792,178 |
| 580,000 | NuVasive, Inc. 0.38%, 03/15/2025 | 546,650 |
| 550,000 | Pioneer Natural Resources Co. 0.25%, 05/15/2025 | 971,997 |
| 675,000 | Shake Shack, Inc. 0.00%, 03/01/2028(1)(7) | 554,255 |
| 4,555,000 | Teva Pharmaceutical Finance Co. LLC 0.25%, 02/01/2026 | 4,452,074 |
| | | | 8,679,840 |
| | Total Convertible Bonds
(cost $18,085,823) | $ 18,219,306 |
| CORPORATE BONDS - 13.9% |
| | Canada - 0.1% |
| | Bausch Health Cos., Inc. | |
| 2,425,000 | 5.00%, 02/15/2029(1) | $ 2,224,938 |
| 2,491,000 | 6.13%, 04/15/2025(1) | 2,537,133 |
| 535,000 | goeasy Ltd. 4.38%, 05/01/2026(1) | 545,700 |
| | | | 5,307,771 |
| | Cayman Islands - 0.1% |
| 875,000 | Country Garden Holdings Co., Ltd. 3.88%, 10/22/2030 | 800,625 |
| 440,000 | Hawaiian Brand Intellectual Property Ltd. 5.75%, 01/20/2026(1) | 461,450 |
| 4,260,000 | Meituan 2.13%, 10/28/2025 | 4,108,938 |
| 1,075,000 | Yuzhou Group Holdings Co., Ltd. 6.00%, 01/25/2022 | 753,844 |
| | | | 6,124,857 |
| | Chile - 0.2% |
| 3,220,000 | Alfa Desarrollo S.p.A. 4.55%, 09/27/2051(1) | 3,146,262 |
| 3,000,000 | Nacional del Cobre de Chile Corp. 3.70%, 01/30/2050(1) | 3,039,120 |
| | | | 6,185,382 |
| | Colombia - 0.1% |
| 6,225,000 | Ecopetrol S.A. 4.63%, 11/02/2031 | 6,172,741 |
| Shares or Principal Amount | | Market Value† |
| CORPORATE BONDS - 13.9% - (continued) |
| | France - 0.4% |
| | Altice France S.A. | |
| EUR 3,685,000 | 2.50%, 01/15/2025(1) | $ 4,172,209 |
| 4,555,000 | 3.38%, 01/15/2028(1) | 5,042,751 |
| 400,000 | 4.13%, 01/15/2029(6) | 454,886 |
| 985,000 | 4.25%, 10/15/2029(1) | 1,127,273 |
| $ 1,425,000 | 5.13%, 01/15/2029(1) | 1,382,250 |
| EUR 1,635,000 | 5.88%, 02/01/2027(6) | 1,975,869 |
| 1,024,000 | CAB SELAS 3.38%, 02/01/2028(1) | 1,176,395 |
| 680,000 | Iliad Holding SAS 5.13%, 10/15/2026 | 807,964 |
| | | | 16,139,597 |
| | Germany - 0.1% |
| 2,006,000 | Techem Verwaltungsgesellschaft 675 mbH 2.00%, 07/15/2025(1) | 2,273,216 |
| | Ireland - 0.3% |
| $ 7,800,000 | AerCap Ireland Capital DAC / AerCap Global Aviation Trust 1.75%, 10/29/2024 | 7,803,934 |
| | Ardagh Packaging Finance plc / Ardagh Holdings USA, Inc. | |
| 1,645,000 | 4.13%, 08/15/2026(1) | 1,677,949 |
| 1,310,000 | 5.25%, 08/15/2027(1) | 1,306,725 |
| | | | 10,788,608 |
| | Jersey - 0.1% |
| | Adient Global Holdings Ltd. | |
| EUR 1,605,000 | 3.50%, 08/15/2024(6) | 1,876,253 |
| $ 960,000 | 4.88%, 08/15/2026(1) | 977,361 |
| | | | 2,853,614 |
| | Liberia - 0.1% |
| 4,000,000 | Royal Caribbean Cruises Ltd. 5.50%, 08/31/2026(1) | 4,075,000 |
| | Luxembourg - 0.1% |
| EUR 2,075,000 | Altice Financing S.A. 2.25%, 01/15/2025(1) | 2,310,164 |
| 1,585,000 | ARD Finance S.A. (5.00% Cash, 5.75% PIK) 5.00%, 06/30/2027(1)(8) | 1,883,673 |
| | | | 4,193,837 |
| | Mexico - 0.0% |
| $ 1,860,000 | Unifin Financiera S.A.B. de C.V. 9.88%, 01/28/2029(1) | 1,726,089 |
| | Mult - 0.3% |
| | Clarios Global L.P. / Clarios U.S. Finance Co. | |
| EUR 6,876,000 | 4.38%, 05/15/2026(6) | 8,128,835 |
| 1,115,000 | 4.38%, 05/15/2026(1) | 1,318,158 |
| $ 3,245,000 | 6.25%, 05/15/2026(1) | 3,395,081 |
| | | | 12,842,074 |
| | Netherlands - 0.6% |
| EUR 2,235,000 | Energizer Gamma Acquisition B.V. 3.50%, 06/30/2029(1) | 2,500,750 |
| $ 2,667,000 | NXP B.V. / NXP Funding LLC 3.88%, 09/01/2022(1) | 2,740,338 |
| 8,950,000 | Siemens Financieringsmaatschappij N.V. 2.90%, 05/27/2022(1) | 9,081,905 |
| EUR 2,005,000 | Titan Holdings II B.V. 5.13%, 07/15/2029(1) | 2,286,953 |
The accompanying notes are an integral part of these financial statements.
The Hartford World Bond Fund
Schedule of Investments – (continued)
October 31, 2021
| Shares or Principal Amount | | Market Value† |
| CORPORATE BONDS - 13.9% - (continued) |
| | Netherlands - 0.6% - (continued) |
| | United Group B.V. | |
| EUR 1,750,000 | 3.63%, 02/15/2028(6) | $ 1,937,184 |
| 545,000 | 4.00%, 11/15/2027(1) | 615,845 |
| | Volkswagen International Finance N.V. | |
| 2,100,000 | 3.38%, 06/27/2024, (3.38% fixed rate until 06/27/2024; 6 mo. EURIBOR +2.970% thereafter)(6)(9)(10) | 2,566,764 |
| 1,503,000 | 5.13%, 09/04/2023, (5.12% fixed rate until 09/04/2023; 1 mo. EURIBOR + 3.350% thereafter)(6)(9)(10) | 1,869,363 |
| | | | 23,599,102 |
| | Panama - 0.1% |
| | Carnival Corp. | |
| $ 2,435,000 | 6.00%, 05/01/2029(1) | 2,439,870 |
| 1,265,000 | 9.88%, 08/01/2027(1) | 1,456,331 |
| | | | 3,896,201 |
| | Spain - 0.4% |
| | Lorca Telecom Bondco S.A. | |
| EUR 8,595,000 | 4.00%, 09/18/2027(1) | 9,996,428 |
| 6,475,000 | 4.00%, 09/18/2027(6) | 7,530,758 |
| | | | 17,527,186 |
| | Switzerland - 0.2% |
| | Credit Suisse Group AG | |
| $ 1,475,000 | 6.25%, 12/18/2024, (6.25% fixed rate until 12/18/2024; 5 year USD Swap + 3.455% thereafter)(9)(10) | 1,585,625 |
| 7,175,000 | 7.50%, 12/11/2023, (7.50% fixed rate until 12/11/2023; 5 year USD Swap + 4.598% thereafter)(6)(9)(10) | 7,820,750 |
| | | | 9,406,375 |
| | United Kingdom - 0.2% |
| 7,375,000 | Sky Ltd. 3.13%, 11/26/2022(1) | 7,590,877 |
| | United States - 10.5% |
| 7,370,000 | Abbott Laboratories 2.95%, 03/15/2025 | 7,797,334 |
| | AbbVie, Inc. | |
| 6,995,000 | 2.15%, 11/19/2021 | 7,000,992 |
| 2,190,000 | 3.38%, 11/14/2021 | 2,192,079 |
| 610,000 | Acadia Healthcare Co., Inc. 5.00%, 04/15/2029(1) | 622,200 |
| 600,000 | Acrisure LLC / Acrisure Finance, Inc. 10.13%, 08/01/2026(1) | 663,000 |
| 3,590,000 | Alabama Power Co. 2.45%, 03/30/2022 | 3,615,128 |
| | Ambience Merger Sub, Inc. | |
| 185,000 | 4.88%, 07/15/2028(1) | 181,637 |
| 195,000 | 7.13%, 07/15/2029(1) | 187,906 |
| | American Tower Corp. | |
| 4,315,000 | 2.40%, 03/15/2025 | 4,445,309 |
| 770,000 | 2.95%, 01/15/2025 | 807,024 |
| 1,000,000 | 4.00%, 06/01/2025 | 1,081,648 |
| 1,085,000 | Antero Midstream Partners L.P. / Antero Midstream Finance Corp. 5.75%, 01/15/2028(1) | 1,133,825 |
| Shares or Principal Amount | | Market Value† |
| CORPORATE BONDS - 13.9% - (continued) |
| | United States - 10.5% - (continued) |
| | Apache Corp. | |
| $ 1,370,000 | 4.38%, 10/15/2028 | $ 1,469,832 |
| 2,060,000 | 4.63%, 11/15/2025 | 2,220,659 |
| 1,275,000 | APX Group, Inc. 5.75%, 07/15/2029(1) | 1,263,844 |
| 725,000 | Artera Services LLC 9.03%, 12/04/2025(1) | 773,938 |
| | AT&T, Inc. | |
| EUR 2,535,000 | 1.45%, 06/01/2022 | 2,947,896 |
| 2,714,000 | 2.65%, 12/17/2021 | 3,149,161 |
| $ 3,015,000 | Avantor Funding, Inc. 4.63%, 07/15/2028(1) | 3,127,912 |
| EUR 1,585,000 | Ball Corp. 1.50%, 03/15/2027 | 1,857,571 |
| $ 455,000 | BCPE Ulysses Intermediate, Inc. (7.75% Cash, 8.50% PIK) 7.75%, 04/01/2027(1)(8) | 438,484 |
| 3,775,000 | Becton Dickinson and Co. 3.73%, 12/15/2024 | 4,048,608 |
| 1,720,000 | Berry Global, Inc. 4.88%, 07/15/2026(1) | 1,801,700 |
| 595,000 | Bloomin' Brands, Inc. / OSI Restaurant Partners LLC 5.13%, 04/15/2029(1) | 588,128 |
| 18,525,000 | Boeing Co. 4.51%, 05/01/2023 | 19,424,716 |
| 950,000 | Brand Industrial Services, Inc. 8.50%, 07/15/2025(1) | 944,063 |
| | Brighthouse Financial Global Funding | |
| 3,225,000 | 0.81%, 04/12/2024, 3 mo. USD SOFR + 0.760%(1)(2) | 3,251,026 |
| 945,000 | 1.00%, 04/12/2024(1) | 942,742 |
| 8,115,000 | Broadcom, Inc. 3.42%, 04/15/2033(1) | 8,377,380 |
| | Buckeye Partners L.P. | |
| 900,000 | 4.13%, 03/01/2025(1) | 922,500 |
| 895,000 | 4.50%, 03/01/2028(1) | 883,813 |
| 3,375,000 | CenterPoint Energy, Inc. 2.50%, 09/01/2022 | 3,424,432 |
| | Charter Communications Operating LLC / Charter Communications Operating Capital | |
| 4,756,000 | 4.50%, 02/01/2024 | 5,100,137 |
| 9,300,000 | 4.91%, 07/23/2025 | 10,343,065 |
| | CHS/Community Health Systems, Inc. | |
| 970,000 | 4.75%, 02/15/2031(1) | 967,459 |
| 1,035,000 | 5.63%, 03/15/2027(1) | 1,083,076 |
| 2,645,000 | 6.63%, 02/15/2025(1) | 2,750,800 |
| 8,460,000 | Cigna Corp. 4.13%, 11/15/2025 | 9,306,345 |
| | Cinemark USA, Inc. | |
| 3,240,000 | 5.25%, 07/15/2028(1) | 3,161,041 |
| 590,000 | 5.88%, 03/15/2026(1) | 591,475 |
| | Continental Resources, Inc. | |
| 730,000 | 4.38%, 01/15/2028 | 796,613 |
| 785,000 | 4.90%, 06/01/2044 | 890,700 |
| 570,000 | 5.75%, 01/15/2031(1) | 682,575 |
| 670,000 | Cornerstone Building Brands, Inc. 6.13%, 01/15/2029(1) | 695,125 |
| 3,300,000 | Crown Castle International Corp. 3.20%, 09/01/2024 | 3,475,950 |
| 578,000 | CVS Health Corp. 3.70%, 03/09/2023 | 600,335 |
| | Discovery Communications LLC | |
| 4,185,000 | 2.95%, 03/20/2023 | 4,308,709 |
| 1,750,000 | 3.80%, 03/13/2024 | 1,855,875 |
| | Dominion Energy, Inc. | |
| 4,970,000 | 2.45%, 01/15/2023(1) | 5,080,034 |
| 4,365,000 | 3.30%, 03/15/2025 | 4,635,831 |
The accompanying notes are an integral part of these financial statements.
The Hartford World Bond Fund
Schedule of Investments ��� (continued)
October 31, 2021
| Shares or Principal Amount | | Market Value† |
| CORPORATE BONDS - 13.9% - (continued) |
| | United States - 10.5% - (continued) |
| $ 4,132,000 | DT Midstream, Inc. 4.13%, 06/15/2029(1) | $ 4,161,544 |
| 395,000 | Dun & Bradstreet Corp. 10.25%, 02/15/2027(1) | 423,835 |
| 5,150,000 | Eli Lilly & Co. 2.35%, 05/15/2022 | 5,207,688 |
| 2,111,000 | EnLink Midstream LLC 5.63%, 01/15/2028(1) | 2,238,362 |
| | EQM Midstream Partners L.P. | |
| 925,000 | 4.50%, 01/15/2029(1) | 948,125 |
| 705,000 | 4.75%, 01/15/2031(1) | 729,904 |
| 1,135,000 | 6.00%, 07/01/2025(1) | 1,231,475 |
| 930,000 | 6.50%, 07/15/2048 | 1,106,161 |
| | EQT Corp. | |
| 690,000 | 3.13%, 05/15/2026(1) | 695,175 |
| 930,000 | 3.90%, 10/01/2027 | 992,310 |
| | ERAC USA Finance LLC | |
| 937,000 | 2.60%, 12/01/2021(1) | 937,000 |
| 1,550,000 | 3.30%, 10/15/2022(1) | 1,588,208 |
| 2,325,000 | Exelon Corp. 3.95%, 06/15/2025 | 2,511,279 |
| EUR 23,275,000 | Fidelity National Information Services, Inc. 0.63%, 12/03/2025 | 27,239,369 |
| $ 1,950,000 | Fiserv, Inc. 2.75%, 07/01/2024 | 2,035,546 |
| 6,575,000 | Ford Motor Co. 8.50%, 04/21/2023 | 7,209,487 |
| | Ford Motor Credit Co. LLC | |
| 3,928,000 | 2.98%, 08/03/2022 | 3,958,481 |
| 500,000 | 3.09%, 01/09/2023 | 508,400 |
| 5,885,000 | 3.37%, 11/17/2023 | 6,039,481 |
| 399,000 | 4.06%, 11/01/2024 | 418,431 |
| 6,950,000 | 4.14%, 02/15/2023 | 7,137,650 |
| 2,585,000 | 5.13%, 06/16/2025 | 2,804,725 |
| 501,000 | 5.58%, 03/18/2024 | 538,575 |
| 7,325,000 | Fox Corp. 3.05%, 04/07/2025 | 7,734,862 |
| | Freedom Mortgage Corp. | |
| 850,000 | 6.63%, 01/15/2027(1) | 805,375 |
| 1,150,000 | 7.63%, 05/01/2026(1) | 1,121,250 |
| 700,000 | 8.13%, 11/15/2024(1) | 706,636 |
| 2,040,000 | 8.25%, 04/15/2025(1) | 2,060,400 |
| 3,725,000 | Frontier Communications Corp. 5.88%, 11/01/2029 | 3,711,031 |
| 10,590,000 | General Motors Co. 5.40%, 10/02/2023 | 11,459,489 |
| | Genworth Holdings, Inc. | |
| 660,000 | 4.80%, 02/15/2024 | 674,791 |
| 1,525,000 | 4.90%, 08/15/2023 | 1,559,312 |
| | Global Payments, Inc. | |
| 1,495,000 | 2.65%, 02/15/2025 | 1,550,852 |
| 825,000 | 3.75%, 06/01/2023 | 857,362 |
| 2,975,000 | 4.00%, 06/01/2023 | 3,120,463 |
| 1,215,000 | HCA, Inc. 7.50%, 11/15/2095 | 1,813,995 |
| 4,180,000 | Hewlett Packard Enterprise Co. 4.45%, 10/02/2023 | 4,446,463 |
| 2,025,000 | Hill-Rom Holdings, Inc. 4.38%, 09/15/2027(1) | 2,102,937 |
| 5,350,000 | Home Point Capital, Inc. 5.00%, 02/01/2026(1) | 4,806,386 |
| EUR 2,015,000 | IQVIA, Inc. 2.25%, 01/15/2028(1) | 2,320,908 |
| | L Brands, Inc. | |
| $ 15,000 | 5.25%, 02/01/2028 | 16,170 |
| 1,095,000 | 6.63%, 10/01/2030(1) | 1,226,071 |
| 740,000 | Lumen Technologies, Inc. 5.38%, 06/15/2029(1) | 742,775 |
| | Macy's Retail Holdings LLC | |
| 26,000 | 2.88%, 02/15/2023 | 26,260 |
| 255,000 | 3.63%, 06/01/2024(11) | 263,530 |
| Shares or Principal Amount | | Market Value† |
| CORPORATE BONDS - 13.9% - (continued) |
| | United States - 10.5% - (continued) |
| $ 475,000 | 5.88%, 04/01/2029(1)(11) | $ 506,201 |
| 1,575,000 | Mauser Packaging Solutions Holding Co. 7.25%, 04/15/2025(1) | 1,524,946 |
| 5,875,000 | McDonald's Corp. 3.30%, 07/01/2025 | 6,273,513 |
| 1,205,000 | Meritor, Inc. 4.50%, 12/15/2028(1) | 1,198,975 |
| | Michaels Cos., Inc. | |
| 1,595,000 | 5.25%, 05/01/2028(1) | 1,610,950 |
| 565,000 | 7.88%, 05/01/2029(1) | 570,650 |
| 615,000 | MicroStrategy, Inc. 6.13%, 06/15/2028(1)(11) | 631,070 |
| 1,990,000 | Midcap Financial Issuer Trust 6.50%, 05/01/2028(1) | 2,064,625 |
| | Mozart Debt Merger Sub, Inc. | |
| 2,335,000 | 3.88%, 04/01/2029(1) | 2,325,006 |
| 1,048,000 | 5.25%, 10/01/2029(1) | 1,063,720 |
| 4,500,000 | Netflix, Inc. 5.88%, 02/15/2025 | 5,094,405 |
| 12,956,000 | NextEra Energy Capital Holdings, Inc. 2.75%, 05/01/2025 | 13,594,645 |
| 2,680,000 | Nielsen Finance LLC / Nielsen Finance Co. 4.50%, 07/15/2029(1) | 2,620,370 |
| | Novelis Corp. | |
| 780,000 | 3.25%, 11/15/2026(1) | 778,050 |
| 800,000 | 3.88%, 08/15/2031(1) | 781,040 |
| | Occidental Petroleum Corp. | |
| 750,000 | 3.20%, 08/15/2026 | 759,375 |
| 1,100,000 | 3.40%, 04/15/2026 | 1,122,374 |
| 2,848,000 | 4.20%, 03/15/2048 | 2,775,461 |
| 510,000 | 5.50%, 12/01/2025 | 560,949 |
| 545,000 | 6.13%, 01/01/2031 | 652,638 |
| 745,000 | OT Merger Corp. 7.88%, 10/15/2029 | 733,825 |
| | Ovintiv Exploration, Inc. | |
| 685,000 | 5.38%, 01/01/2026 | 762,965 |
| 725,000 | 5.63%, 07/01/2024 | 798,207 |
| 2,500,000 | Penn National Gaming, Inc. 5.63%, 01/15/2027(1) | 2,581,250 |
| 1,620,000 | PennyMac Financial Services, Inc. 5.75%, 09/15/2031(1) | 1,593,675 |
| | Penske Truck Leasing Co. L.P. / PTL Finance Corp. | |
| 1,000,000 | 2.70%, 03/14/2023(1) | 1,024,277 |
| 4,815,000 | 3.38%, 02/01/2022(1) | 4,826,514 |
| 2,225,000 | 3.45%, 07/01/2024(1) | 2,352,062 |
| 1,083,000 | 3.90%, 02/01/2024(1) | 1,146,055 |
| 1,625,000 | 4.25%, 01/17/2023(1) | 1,692,672 |
| 6,865,000 | PepsiCo, Inc. 2.25%, 03/19/2025 | 7,141,156 |
| | PetSmart, Inc. | |
| 250,000 | 4.75%, 02/15/2028(1) | 256,875 |
| 250,000 | 7.75%, 02/15/2029(1) | 270,180 |
| 650,000 | Photo Holdings Merger Sub, Inc. 8.50%, 10/01/2026(1) | 682,435 |
| 1,280,000 | Presidio Holdings, Inc. 8.25%, 02/01/2028(1) | 1,360,000 |
| 2,400,000 | Southern Co. 2.95%, 07/01/2023 | 2,478,387 |
| 2,980,000 | Sprint Communications, Inc. 6.00%, 11/15/2022 | 3,125,960 |
| 17,650,000 | Sprint Corp. 7.88%, 09/15/2023 | 19,569,437 |
| | Sprint Spectrum Co. LLC / Sprint Spectrum Co. II LLC / Sprint Spectrum Co. III LLC | |
| 3,202,500 | 4.74%, 03/20/2025(1) | 3,378,637 |
| 4,660,000 | 5.15%, 09/20/2029(1) | 5,259,975 |
| | Staples, Inc. | |
| 2,950,000 | 7.50%, 04/15/2026(1) | 2,979,500 |
| 900,000 | 10.75%, 04/15/2027(1) | 859,500 |
The accompanying notes are an integral part of these financial statements.
The Hartford World Bond Fund
Schedule of Investments – (continued)
October 31, 2021
| Shares or Principal Amount | | Market Value† |
| CORPORATE BONDS - 13.9% - (continued) |
| | United States - 10.5% - (continued) |
| $ 670,000 | Stericycle, Inc. 3.88%, 01/15/2029(1) | $ 659,950 |
| 2,010,000 | Sugarhouse HSP Gaming Prop Mezz L.P. / Sugarhouse HSP Gaming Finance Corp. 5.88%, 05/15/2025(1) | 1,989,900 |
| 5,600,000 | T-Mobile USA, Inc. 2.25%, 02/15/2026 | 5,635,000 |
| 950,000 | TransDigm, Inc. 5.50%, 11/15/2027 | 972,562 |
| 1,435,000 | United Wholesale Mortgage LLC 5.50%, 11/15/2025(1) | 1,427,825 |
| | Venture Global Calcasieu Pass LLC | |
| 865,000 | 3.88%, 08/15/2029(1) | 881,608 |
| 750,000 | 4.13%, 08/15/2031(1) | 776,213 |
| 22,985,000 | Volkswagen Group of America Finance LLC 2.90%, 05/13/2022(1) | 23,287,711 |
| 725,000 | Williams Scotsman International, Inc. 4.63%, 08/15/2028(1) | 749,469 |
| 1,125,000 | WW International, Inc. 4.50%, 04/15/2029(1) | 1,077,187 |
| 865,000 | Xerox Corp. 4.07%, 03/17/2022 | 874,126 |
| | | | 431,414,219 |
| | Total Corporate Bonds
(cost $558,203,550) | $ 572,116,746 |
| FOREIGN GOVERNMENT OBLIGATIONS - 63.1% |
| | Argentina - 0.0% |
| | Argentine Republic Government International Bond | |
| 850,000 | 1.13%, 07/09/2035(3) | $ 263,509 |
| 850,000 | 2.50%, 07/09/2041(3) | 292,825 |
| | | | 556,334 |
| | Australia - 6.6% |
| | Australia Government Bond | |
| AUD 44,192,000 | 1.75%, 06/21/2051(6) | 26,320,473 |
| 142,376,000 | 2.75%, 11/21/2027(6) | 113,647,026 |
| 43,898,000 | 2.75%, 05/21/2041(6) | 33,287,085 |
| 26,772,000 | 3.00%, 03/21/2047(6) | 20,925,383 |
| 73,792,000 | 4.75%, 04/21/2027(6) | 64,588,035 |
| 19,219,000 | Queensland Treasury Corp. 1.50%, 03/02/2032(1)(6) | 13,239,156 |
| | | | 272,007,158 |
| | Canada - 17.6% |
| CAD 51,125,000 | Canada Housing Trust No. 1 1.95%, 12/15/2025(1) | 41,884,082 |
| | Canadian Government Bond | |
| 86,012,000 | 0.25%, 11/01/2022 | 69,139,790 |
| 123,417,000 | 0.25%, 08/01/2023 | 98,406,010 |
| 102,523,000 | 0.25%, 04/01/2024 | 81,088,933 |
| 171,525,000 | 1.25%, 03/01/2025 | 138,453,494 |
| 115,002,000 | 2.00%, 09/01/2023 | 94,518,430 |
| 9,203,000 | 2.00%, 12/01/2051 | 7,454,884 |
| 187,086,000 | 2.25%, 03/01/2024 | 155,080,326 |
| 49,801,000 | Province of Ontario Canada 2.65%, 02/05/2025 | 41,757,350 |
| | | | 727,783,299 |
| Shares or Principal Amount | | Market Value† |
| FOREIGN GOVERNMENT OBLIGATIONS - 63.1% - (continued) |
| | China - 4.8% |
| | China Development Bank | |
| CNY 171,500,000 | 3.66%, 03/01/2031 | $ 27,414,861 |
| 996,730,000 | 3.70%, 10/20/2030 | 159,659,150 |
| 71,150,000 | China Government Bond 3.72%, 04/12/2051 | 11,549,909 |
| | | | 198,623,920 |
| | Colombia - 0.2% |
| $ 10,421,000 | Colombia Government International Bond 3.00%, 01/30/2030 | 9,830,338 |
| | Hungary - 0.1% |
| EUR 4,800,000 | Hungary Government International Bond 1.50%, 11/17/2050(6) | 5,104,563 |
| | Japan - 12.2% |
| | Japan Treasury Discount Bill | |
| JPY 18,411,400,000 | (0.14%), 01/06/2022(12) | 161,571,788 |
| 6,106,550,000 | (0.12%), 11/29/2021(12) | 53,582,703 |
| 15,132,600,000 | (0.12%), 01/17/2022(12) | 132,802,366 |
| 4,729,650,000 | (0.12%), 01/24/2022(12) | 41,507,799 |
| 12,927,150,000 | (0.11%), 01/31/2022(12) | 113,452,090 |
| | | | 502,916,746 |
| | Mexico - 0.2% |
| $ 7,155,000 | Mexico Government International Bond 4.28%, 08/14/2041 | 7,435,548 |
| | New Zealand - 1.4% |
| | Housing New Zealand Ltd. | |
| NZD 8,200,000 | 1.53%, 09/10/2035(6) | 4,718,056 |
| 26,240,000 | 3.36%, 06/12/2025(6) | 19,180,071 |
| 46,779,000 | New Zealand Government Bond 2.75%, 05/15/2051 | 31,825,619 |
| | | | 55,723,746 |
| | Norway - 5.7% |
| | Norway Government Bond | |
| NOK 659,109,000 | 1.50%, 02/19/2026(1)(6) | 77,779,528 |
| 43,948,000 | 1.75%, 09/06/2029(1)(6) | 5,227,418 |
| 1,237,584,000 | 3.00%, 03/14/2024(1)(6) | 151,985,259 |
| | | | 234,992,205 |
| | Romania - 0.3% |
| | Romanian Government International Bond | |
| EUR 6,235,000 | 1.38%, 12/02/2029(1) | 6,944,522 |
| 5,570,000 | 2.00%, 04/14/2033(1) | 6,020,389 |
| | | | 12,964,911 |
| | Serbia - 0.2% |
| 6,075,000 | Serbia International Bond 1.65%, 03/03/2033(1) | 6,592,559 |
| | South Korea - 8.0% |
| | Korea Treasury Bond | |
| KRW 115,821,760,000 | 1.25%, 03/10/2026 | 94,187,094 |
| 94,542,680,000 | 1.38%, 09/10/2024 | 79,046,717 |
The accompanying notes are an integral part of these financial statements.
The Hartford World Bond Fund
Schedule of Investments – (continued)
October 31, 2021
| Shares or Principal Amount | | Market Value† |
| FOREIGN GOVERNMENT OBLIGATIONS - 63.1% - (continued) |
| | South Korea - 8.0% - (continued) |
| KRW 68,977,340,000 | 1.50%, 03/10/2025 | $ 57,530,227 |
| 115,298,380,000 | 2.25%, 06/10/2025 | 98,333,036 |
| | | | 329,097,074 |
| | Supranational - 2.6% |
| | European Union | |
| EUR 88,353,000 | 0.00%, 03/04/2026(6)(7) | 103,105,941 |
| 3,007,000 | 0.70%, 07/06/2051(6) | 3,684,358 |
| | | | 106,790,299 |
| | Sweden - 3.2% |
| SEK 1,126,450,000 | Kommuninvest I Sverige AB 1.00%, 11/13/2023(6) | 133,260,550 |
| | Total Foreign Government Obligations
(cost $2,590,998,454) | | $ 2,603,679,250 |
| SENIOR FLOATING RATE INTERESTS - 3.4% |
| | Canada - 0.1% |
| $ 960,000 | Air Canada 4.25%, 08/11/2028, 1 mo. USD LIBOR + 3.500% | $ 969,398 |
| 805,000 | Great Canadian Gaming Corp. 0.00%, 11/01/2026, 1 mo. USD LIBOR + 4.000%(13) | 808,623 |
| | | | 1,778,021 |
| | Cayman Islands - 0.0% |
| 1,010,000 | AAdvantage Loyalty IP Ltd. 5.50%, 04/20/2028, 1 mo. USD LIBOR + 4.750% | 1,051,349 |
| | France - 0.0% |
| EUR 573,499 | Numericable Group S.A. 3.00%, 07/31/2025, 3 mo. EURIBOR + 3.000% | 644,667 |
| | Ireland - 0.1% |
| 2,325,000 | Virgin Media Ireland Ltd. 3.50%, 07/15/2029, 3 mo. EURIBOR + 3.500% | 2,669,370 |
| | Luxembourg - 0.0% |
| $ 1,004,950 | Sunshine Luxembourg S.a.r.l. 4.50%, 10/01/2026, 1 mo. USD LIBOR + 3.750% | 1,006,588 |
| | Sweden - 0.1% |
| | Anticimex International AB | |
| 590,000 | 0.00%, 07/21/2028, 1 mo. USD LIBOR + 3.500%(13) | 589,263 |
| EUR 890,000 | 3.75%, 07/21/2028, 1 mo. USD LIBOR + 3.750% | 1,029,488 |
| 2,485,000 | Verisure Holding AB 3.25%, 07/20/2026, 3 mo. EURIBOR + 3.250% | 2,850,224 |
| | | | 4,468,975 |
| | United Kingdom - 0.5% |
| 1,230,000 | Concorde Midco Ltd. 4.00%, 03/01/2028, 3 mo. EURIBOR + 4.000% | 1,420,358 |
| $ 2,576,862 | Crown Finance U.S., Inc. 3.50%, 02/28/2025, 1 mo. USD LIBOR + 2.500% | 2,120,757 |
| Shares or Principal Amount | | Market Value† |
| SENIOR FLOATING RATE INTERESTS - 3.4% - (continued) |
| | United Kingdom - 0.5% - (continued) |
| | Froneri International Ltd. | |
| $ 720,875 | 2.34%, 01/29/2027, 1 mo. USD LIBOR + 2.250% | $ 710,156 |
| EUR 1,645,000 | 2.63%, 01/29/2027, 3 mo. EURIBOR + 2.625% | 1,854,079 |
| 585,000 | LGC Group Holdings Ltd. 3.00%, 04/21/2027, 3 mo. EURIBOR + 3.000% | 661,301 |
| $ 2,715,796 | Loire Finco Luxembourg S.a.r.l. 3.25%, 04/21/2027, 1 mo. USD LIBOR + 3.250% | 2,661,481 |
| | Lorca Finco plc | |
| EUR 1,730,000 | 0.00%, 09/17/2027, 1 mo. USD LIBOR + 3.750%(13) | 1,985,441 |
| 2,715,000 | 4.25%, 09/17/2027, 3 mo. EURIBOR + 4.250% | 3,136,405 |
| 3,505,000 | Verisure Holding AB 3.25%, 03/27/2028, 3 mo. EURIBOR + 3.250% | 4,017,177 |
| | | | 18,567,155 |
| | United States - 2.6% |
| $ 975,150 | Acrisure LLC 3.63%, 02/15/2027, 1 mo. USD LIBOR + 3.500% | 961,498 |
| 2,115,000 | APX Group, Inc. 4.00%, 07/10/2028, 1 mo. USD LIBOR + 3.500% | 2,106,730 |
| 3,530,000 | ASP Blade Holdings, Inc. 0.00%, 10/13/2028, 1 mo. USD LIBOR + 4.000%(13) | 3,534,412 |
| | Asurion LLC | |
| 1,649,385 | 3.21%, 11/03/2023, 1 mo. USD LIBOR + 3.125% | 1,644,916 |
| 240,326 | 3.34%, 12/23/2026, 1 mo. USD LIBOR + 3.250% | 237,809 |
| 1,920,350 | 3.34%, 07/31/2027, 1 mo. USD LIBOR + 3.250% | 1,901,147 |
| 2,215,000 | 5.34%, 01/31/2028, 1 mo. USD LIBOR + 5.250% | 2,205,896 |
| 2,385,000 | 5.34%, 01/20/2029, 1 mo. USD LIBOR + 5.250% | 2,373,576 |
| | Blackhawk Network Holdings, Inc. | |
| 2,897,662 | 3.09%, 06/15/2025, 3 mo. USD LIBOR + 3.000% | 2,872,308 |
| 600,000 | 7.13%, 06/15/2026, 3 mo. USD LIBOR + 7.000% | 594,000 |
| 6,411,230 | Brand Energy & Infrastructure Services, Inc. 5.25%, 06/21/2024, 3 mo. USD LIBOR + 4.250% | 6,351,413 |
| 2,803,087 | Caesars Resort Collection LLC 2.84%, 12/23/2024, 3 mo. USD LIBOR + 2.750% | 2,788,791 |
| 2,045,000 | Chamberlain Group, Inc. 0.00%, 10/22/2028, 1 mo. USD LIBOR + 4.000%(13) | 2,040,746 |
| 111,466 | Crown Finance U.S., Inc. 9.25%, 05/23/2024, 1 mo. USD LIBOR + 8.250% | 119,547 |
| 1,731,840 | CSC Holdings LLC 2.59%, 04/15/2027, 1 mo. USD LIBOR + 2.500% | 1,695,039 |
| | DCert Buyer, Inc. | |
| 2,818,539 | 4.09%, 10/16/2026, 3 mo. USD LIBOR + 4.000% | 2,818,849 |
The accompanying notes are an integral part of these financial statements.
The Hartford World Bond Fund
Schedule of Investments – (continued)
October 31, 2021
| Shares or Principal Amount | | Market Value† |
| SENIOR FLOATING RATE INTERESTS - 3.4% - (continued) |
| | United States - 2.6% - (continued) |
| $ 985,000 | 7.09%, 02/16/2029, 1 mo. USD LIBOR + 7.000% | $ 992,210 |
| 1,395,343 | Dun & Bradstreet Corp. 3.34%, 02/06/2026, 1 mo. USD LIBOR + 3.250% | 1,389,119 |
| 1,042,388 | Endure Digital, Inc. 4.25%, 02/10/2028, 1 mo. USD LIBOR + 3.500% | 1,023,708 |
| 2,843,792 | Epicor Software Corp. 4.00%, 07/30/2027, 1 mo. USD LIBOR + 3.250% | 2,840,010 |
| 3,911,406 | EVO Payments International LLC 3.34%, 12/22/2023, 3 mo. USD LIBOR + 3.250% | 3,905,695 |
| 1,480,000 | Filtration Group Corp. 0.00%, 10/21/2028, 1 mo. USD LIBOR + 3.750%(13) | 1,477,410 |
| 2,840,348 | Flex Acquisition Co., Inc. 3.13%, 06/29/2025, 3 mo. USD LIBOR + 3.000% | 2,816,944 |
| 1,845,725 | Frontier Communications Corp. 4.50%, 05/01/2028, 1 mo. USD LIBOR + 3.750% | 1,842,034 |
| 697,265 | Hertz Corp. 0.00%, 06/30/2028, 1 mo. USD LIBOR + 3.500%(13) | 697,906 |
| 2,900,019 | Hub International Ltd. 2.87%, 04/25/2025, 1 mo. USD LIBOR + 2.750% | 2,866,408 |
| 1,117,589 | Hyland Software, Inc. 4.25%, 07/01/2024, 1 mo. USD LIBOR + 3.500% | 1,117,935 |
| 1,285,288 | IRB Holding Corp. 4.25%, 12/15/2027, 1 mo. USD LIBOR + 3.250% | 1,284,375 |
| | LBM Acquisition LLC | |
| 623,333 | 0.00%, 12/17/2027, 1 mo. USD LIBOR + 3.750%(13) | 614,501 |
| 1,243,542 | 3.88%, 12/17/2027, 1 mo. USD LIBOR + 3.750% | 1,225,921 |
| 1,609,752 | 4.50%, 12/17/2027, 1 mo. USD LIBOR + 3.750% | 1,586,942 |
| 2,448,863 | MajorDrive Holdings LLC 4.50%, 05/12/2028, 1 mo. USD LIBOR + 4.000% | 2,448,863 |
| 5,191,452 | MH Sub LLC 3.50%, 09/13/2024, 3 mo. USD LIBOR + 3.500% | 5,170,478 |
| | Mitchell International, Inc. | |
| 3,445,000 | 4.25%, 10/15/2028, 1 mo. USD LIBOR + 3.750% | 3,412,272 |
| 630,000 | 7.00%, 10/15/2029, 1 mo. USD LIBOR + 6.500% | 634,568 |
| 1,206,975 | Panther Commercial Holdings L.P. 5.00%, 01/07/2028, 1 mo. USD LIBOR + 5.000% | 1,209,992 |
| 973,475 | PODS LLC 3.75%, 03/31/2028, 1 mo. USD LIBOR + 3.000% | 971,655 |
| | Polaris Newco LLC | |
| EUR 1,045,000 | 4.00%, 06/02/2028, 3 mo. EURIBOR + 4.000% | 1,205,507 |
| $ 2,825,000 | 4.50%, 06/02/2028, 1 mo. USD LIBOR + 4.000% | 2,830,424 |
| Shares or Principal Amount | | Market Value† |
| SENIOR FLOATING RATE INTERESTS - 3.4% - (continued) |
| | United States - 2.6% - (continued) |
| $ 1,947,483 | Post Holdings, Inc. 4.75%, 10/21/2024, 1 mo. USD LIBOR + 4.000% | $ 1,953,813 |
| 2,300,000 | Proofpoint, Inc. 3.75%, 08/31/2028, 1 mo. USD LIBOR + 3.250% | 2,289,535 |
| 2,240,000 | RealPage, Inc. 3.75%, 04/24/2028, 1 mo. USD LIBOR + 3.250% | 2,234,624 |
| 3,185,641 | Scientific Games International, Inc. 2.84%, 08/14/2024, 1 mo. USD LIBOR + 2.750% | 3,170,796 |
| 3,580,000 | Shutterfly, Inc. 5.75%, 09/25/2026, 1 mo. USD LIBOR + 5.000% | 3,538,830 |
| 1,045,000 | SkyMiles IP Ltd. 4.75%, 10/20/2027, 3 mo. USD LIBOR + 3.750% | 1,112,340 |
| 2,478,787 | SRS Distribution, Inc. 4.25%, 06/02/2028, 1 mo. USD LIBOR + 3.750% | 2,478,093 |
| 3,655,114 | Staples, Inc. 5.13%, 04/16/2026, 3 mo. USD LIBOR + 5.000% | 3,509,275 |
| 2,498,737 | Tecta America Corp. 5.00%, 04/01/2028, 1 mo. USD LIBOR + 4.250% | 2,501,861 |
| 1,225,000 | TPG Elf Purchaser LLC 0.00%, 10/14/2028, 1 mo. USD LIBOR + 3.500%(13) | 1,223,469 |
| 3,643,200 | USI, Inc. 3.13%, 05/16/2024, 3 mo. USD LIBOR + 3.000% | 3,613,909 |
| 3,206,962 | WW International, Inc. 4.00%, 04/13/2028, 1 mo. USD LIBOR + 3.500% | 3,166,875 |
| | | | 108,604,974 |
| | Total Senior Floating Rate Interests
(cost $138,481,410) | $ 138,791,099 |
| U.S. GOVERNMENT AGENCIES - 0.9% |
| | United States - 0.9% |
| | FHLMC - 0.7% |
| 1,255 | 1.35%, 01/25/2030(4)(5) | $ 123 |
| 14,895,000 | 1.66%, 07/25/2041(4)(5) | 365,093 |
| 3,690,853 | 1.72%, 09/25/2041(4)(5) | 107,057 |
| 2,709,712 | 1.77%, 01/25/2048(4)(5) | 215,414 |
| 760,289 | 1.85%, 07/25/2041, 3 mo. USD SOFR + 1.800%(1)(2) | 764,103 |
| 1,730,000 | 1.85%, 01/25/2051, 3 mo. USD SOFR + 1.800%(1)(2) | 1,731,629 |
| 5,047,170 | 1.87%, 11/25/2047(4)(5) | 632,239 |
| 6,240,000 | 1.92%, 03/25/2048(4)(5) | 843,136 |
| 2,067,394 | 1.94%, 09/25/2049, 1 mo. USD LIBOR + 1.850%(1)(2) | 2,076,123 |
| 5,823,080 | 1.95%, 10/25/2047(4)(5) | 764,347 |
| 1,479,915 | 2.02%, 09/25/2046(4)(5) | 201,517 |
| 1,410,000 | 2.05%, 12/25/2050, 3 mo. USD SOFR + 2.000%(1)(2) | 1,420,565 |
| 215,649 | 2.05%, 01/25/2051, 3 mo. USD SOFR + 2.000%(1)(2) | 217,266 |
| 2,075,000 | 2.10%, 08/25/2047(4)(5) | 290,720 |
| 7,245,592 | 2.11%, 06/25/2044(4)(5) | 638,480 |
| 6,087,872 | 2.21%, 01/25/2042(4)(5) | 287,291 |
| 1,465,000 | 2.24%, 11/25/2048, 1 mo. USD LIBOR + 2.150%(1)(2) | 1,465,912 |
| 3,742,315 | 2.31%, 12/25/2045(4)(5) | 527,425 |
The accompanying notes are an integral part of these financial statements.
The Hartford World Bond Fund
Schedule of Investments – (continued)
October 31, 2021
| Shares or Principal Amount | | Market Value† |
| U.S. GOVERNMENT AGENCIES - 0.9% - (continued) |
| | United States - 0.9% - (continued) |
| | FHLMC - 0.7% - (continued) |
| $ 1,070,000 | 2.32%, 01/25/2046(4)(5) | $ 153,366 |
| 2,303,019 | 2.39%, 09/25/2030, 1 mo. USD LIBOR + 2.300%(2) | 2,322,310 |
| 560,212 | 2.54%, 12/25/2042, 1 mo. USD LIBOR + 2.450%(2) | 563,738 |
| 1,092,419 | 2.54%, 03/25/2049, 1 mo. USD LIBOR + 2.450%(1)(2) | 1,108,812 |
| 1,038,099 | 2.60%, 04/25/2028(4)(5) | 153,052 |
| 1,671,418 | 2.74%, 01/25/2049, 1 mo. USD LIBOR + 2.650%(1)(2) | 1,691,287 |
| 775,000 | 2.79%, 04/25/2031(4)(5) | 166,766 |
| 1,776,320 | 2.80%, 10/25/2055(4)(5) | 412,082 |
| 5,376,907 | 3.00%, 05/15/2034(5) | 423,636 |
| 2,570,000 | 3.04%, 11/25/2049, 1 mo. USD LIBOR + 2.950%(1)(2) | 2,583,352 |
| 2,422,822 | 3.50%, 01/15/2033(5) | 274,618 |
| 1,147,437 | 3.50%, 05/15/2036(5) | 145,855 |
| 1,809,182 | 3.82%, 02/25/2041(4)(5) | 15,438 |
| 356,361 | 4.34%, 11/25/2023, 1 mo. USD LIBOR + 4.250%(2) | 367,448 |
| 1,095,000 | 4.44%, 09/25/2030, 1 mo. USD LIBOR + 4.350%(2) | 1,142,391 |
| 2,775,000 | 4.84%, 12/25/2029, 1 mo. USD LIBOR + 4.750%(2) | 3,009,992 |
| 906,639 | 5.00%, 09/15/2036(5) | 159,187 |
| 577,849 | 5.00%, 02/15/2048(5) | 114,113 |
| | | | 27,355,883 |
| | FNMA - 0.1% |
| 3,254,061 | 3.00%, 01/25/2028(5) | 207,382 |
| 2,890,168 | 3.50%, 04/25/2028(5) | 197,865 |
| 2,240,430 | 4.00%, 01/25/2028(5) | 165,640 |
| 932,596 | 4.00%, 04/25/2032(5) | 105,998 |
| 2,400,698 | 4.50%, 03/25/2048(5) | 384,228 |
| 3,047,969 | 4.50%, 05/25/2049(5) | 472,991 |
| 1,743,771 | 5.50%, 09/25/2044(5) | 352,160 |
| 774,069 | 5.50%, 06/25/2048(5) | 147,903 |
| 2,608,516 | 6.50%, 03/25/2045(5) | 638,294 |
| | | | 2,672,461 |
| | GNMA - 0.1% |
| 2,590,829 | 3.50%, 10/20/2029(5) | 222,645 |
| 2,392,648 | 3.50%, 01/20/2030(5) | 213,758 |
| 2,657,314 | 3.50%, 11/20/2031(5) | 224,024 |
| 664,436 | 4.00%, 01/16/2046(5) | 81,832 |
| 3,541,118 | 4.50%, 12/16/2039(5) | 523,272 |
| 196,155 | 4.50%, 04/20/2045(5) | 28,886 |
| 3,074,283 | 4.50%, 08/20/2045(5) | 487,087 |
| 1,024,793 | 5.00%, 05/16/2044(5) | 158,836 |
| 311,114 | 5.00%, 07/16/2044(5) | 57,443 |
| 946,719 | 5.00%, 12/16/2045(5) | 153,651 |
| 1,547,004 | 5.00%, 07/16/2047(5) | 278,741 |
| 753,267 | 5.00%, 09/20/2047(5) | 131,007 |
| 841,710 | 5.00%, 11/16/2047(5) | 149,382 |
| 1,702,350 | 5.00%, 06/20/2048(5) | 270,440 |
| 3,252,993 | 5.50%, 11/16/2046(5) | 659,735 |
| Shares or Principal Amount | | Market Value† |
| U.S. GOVERNMENT AGENCIES - 0.9% - (continued) |
| | United States - 0.9% - (continued) |
| | GNMA - 0.1% - (continued) |
| $ 673,008 | 5.50%, 02/20/2047(5) | $ 105,380 |
| 1,114,304 | 5.86%, 07/20/2039(4)(5) | 137,226 |
| 1,333,674 | 6.00%, 09/20/2045(5) | 273,305 |
| | | | 4,156,650 |
| | SLC Student Loan Trust - 0.0% |
| 666,061 | SLC Student Loan Trust
1.02%, 06/15/2021, 3 mo. USD LIBOR + 0.900%(2) | 660,416 |
| | | | 660,416 |
| | SLM Student Loan Trust - 0.0% |
| 1,319,277 | SLM Student Loan Trust
0.87%, 04/25/2023, 3 mo. USD LIBOR + 0.750%(2) | 1,303,834 |
| | | | 1,303,834 |
| | Total U.S. Government Agencies
(cost $38,601,093) | | $ 36,149,244 |
| U.S. GOVERNMENT SECURITIES - 6.6% |
| | United States - 6.6% |
| | U.S. Treasury Bonds - 1.7% |
| 50,986,000 | 0.01%, 11/15/2050 | $ 28,803,376 |
| 17,332,000 | 2.25%, 08/15/2049 | 18,445,040 |
| 18,461,000 | 3.00%, 02/15/2047 | 22,371,703 |
| | | | 69,620,119 |
| | U.S. Treasury Notes - 4.9% |
| 97,350,100 | 0.38%, 08/15/2024(14) | 96,445,048 |
| 39,617,000 | 1.75%, 04/30/2022(14) | 39,941,983 |
| 62,936,000 | 2.25%, 02/15/2027(14)(15)(16) | 66,173,762 |
| | | | 202,560,793 |
| | Total U.S. Government Securities
(cost $272,162,372) | | $ 272,180,912 |
| COMMON STOCKS - 0.0% |
| | United States - 0.0% |
| 2,270 | Foresight Energy LLC | $ 30,638 |
| | Total Common Stocks
(cost $9,487) | | $ 30,638 |
| ESCROWS - 0.1% |
| | Spain - 0.1% |
| 2,150,000 | Grifols Escrow Issuer S.A. Expires 10/15/2028(1) | $ 2,484,803 |
The accompanying notes are an integral part of these financial statements.
The Hartford World Bond Fund
Schedule of Investments – (continued)
October 31, 2021
| Shares or Principal Amount | | Market Value† |
| ESCROWS - 0.1% - (continued) |
| | United States - 0.0% |
| 615,000 | Scripps Escrow, Inc. Expires 01/15/2029(1) | $ 611,925 |
| | Total Escrows
(cost $3,129,412) | | $ 3,096,728 |
| | Total Long-Term Investments
(cost $3,887,468,746) | | $ 3,912,428,707 |
| SHORT-TERM INVESTMENTS - 3.1% |
| | Repurchase Agreements - 3.1% |
| 125,653,299 | Fixed Income Clearing Corp. Repurchase Agreement dated 10/29/2021 at 0.010%, due on 11/01/2021 with a maturity value of $125,653,404; collateralized by U.S. Treasury Bond at 1.875%, maturing 02/15/2041, with a market value of $128,166,390 | $ 125,653,299 |
| | Securities Lending Collateral - 0.0% |
| 8,246 | Fidelity Investments Money Market Funds, Government Portfolio, Institutional Class, 0.01%(17) | 8,246 |
| 1,265,934 | Goldman Sachs Financial Square Funds, Government Fund, Institutional Class, 0.03%(17) | 1,265,934 |
| 90,885 | Invesco Government & Agency Portfolio, Institutional Class, 0.03%(17) | 90,885 |
| | | | 1,365,065 |
| | Total Short-Term Investments
(cost $127,018,364) | $ 127,018,364 |
| | Total Investments Excluding
Purchased Options
(cost $4,014,487,110) | 98.0% | $ 4,039,447,071 |
| | Total Purchased Options
(cost $1,571,497) | 0.0% | $ 226,889 |
| | Total Investments
(cost $4,016,058,607) | 98.0% | $ 4,039,673,960 |
| | Other Assets and Liabilities | 2.0% | 84,219,906 |
| | Total Net Assets | 100.0% | $ 4,123,893,866 |
| Note: | Percentage of investments as shown is the ratio of the total market value to total net assets. |
| | The Fund may refer to any one or more of the industry classifications used by one or more widely recognized market indices, ratings group and/or as defined by Fund management. Industry classifications may not be identical across all security types. |
| | Equity industry classifications used in this report are the Global Industry Classification Standard, which was developed by and is the exclusive property and service mark of MSCI, Inc. and Standard & Poor’s. |
| | For Fund compliance purposes, the Fund may not use the same classification system. These classifications are used for financial reporting purposes. |
See “Glossary” for abbreviation descriptions.
| (1) | Security was purchased pursuant to Rule 144A under the Securities Act of 1933 and may be sold in transactions that are exempt from registration (typically only to qualified institutional buyers) or in a public offering registered under the Securities Act of 1933. At October 31, 2021, the aggregate value of these securities was $786,158,340, representing 19.1% of net assets. |
| (2) | Variable rate securities; the rate reported is the coupon rate in effect at October 31, 2021. Base lending rates may be subject to a floor or cap. |
| (3) | Security is a “step-up” bond where coupon increases or steps up at a predetermined date. Rate shown is current coupon rate. |
| (4) | Variable or floating rate security, which interest rate adjusts periodically based on changes in current interest rates and prepayments on the underlying pool of assets. Rate shown is the rate in effect as of period end. |
| (5) | Securities disclosed are interest-only strips. |
| (6) | Security is exempt from registration under Regulation S under the Securities Act of 1933, which exempts from registration securities offered and sold outside of the United States. Security may not be offered or sold in the United States except pursuant to an exemption from, or in a transaction not subject to, the registration requirements of the Securities Act of 1933. At October 31, 2021, the aggregate value of these securities was $819,753,030, representing 19.9% of net assets. |
| (7) | Security is a zero-coupon bond. |
| (8) | Security has the ability to pay in kind (“PIK”) or pay income in cash. When applicable, separate rates of such payments are disclosed. |
| (9) | Fixed to variable rate investment. The rate shown reflects the fixed rate in effect at October 31, 2021. Rate will reset at a future date. Base lending rates may be subject to a floor or cap. |
| (10) | Perpetual maturity security. Maturity date shown is the next call date or final legal maturity date, whichever comes first. |
| (11) | Represents entire or partial securities on loan. See Note 8 in the accompanying Notes to Financial Statements for securities lending information. |
| (12) | The rate shown represents current yield to maturity. |
| (13) | Represents an unsettled loan commitment. The coupon rate will be determined at time of settlement. |
| (14) | All, or a portion of the security, was pledged as collateral in connection with OTC swap contracts. As of October 31, 2021, the market value of securities pledged was $6,250,708. |
| (15) | All, or a portion of the security, was pledged as collateral in connection with centrally cleared swap contracts. As of October 31, 2021, the market value of securities pledged was $25,550,121. |
| (16) | All, or a portion of the security, was pledged as collateral in connection with futures contracts. As of October 31, 2021, the market value of securities pledged was $21,028,906. |
| (17) | Current yield as of period end. |
The accompanying notes are an integral part of these financial statements.
The Hartford World Bond Fund
Schedule of Investments – (continued)
October 31, 2021
| OTC Option Contracts Outstanding at October 31, 2021 |
| Description | | Counterparty | | Exercise Price/
FX Rate/Rate | | Expiration
Date | | Number of
Contracts | | Notional
Amount | | Market
Value† | | Premiums
Paid
(Received)
by Fund | | Unrealized
Appreciation/
(Depreciation) |
| Purchased option contracts: |
| Call |
| USD Call/CHF Put | | GSC | | 0.94 | | USD | | 11/11/2021 | | 106,622,000 | | USD | 106,622,000 | | $ 13,541 | | $ 297,902 | | $ (284,361) |
| Put |
| NZD Put/USD Call | | MSC | | 0.67 | | NZD | | 12/17/2021 | | 151,205,000 | | NZD | 151,205,000 | | $ 108,353 | | $ 509,069 | | $ (400,716) |
| NZD Put/USD Call | | MSC | | 0.67 | | NZD | | 12/17/2021 | | 151,205,000 | | NZD | 151,205,000 | | 104,995 | | 764,526 | | (659,531) |
| Total Put | | $ 213,348 | | $ 1,273,595 | | $ (1,060,247) |
| Total purchased OTC option contracts | | $ 226,889 | | $ 1,571,497 | | $ (1,344,608) |
| Futures Contracts Outstanding at October 31, 2021 |
| Description | | Number of
Contracts | | Expiration
Date | | Current
Notional
Amount | | Value and
Unrealized
Appreciation/
(Depreciation) |
| Long position contracts: |
| 3-Month Bank Bill Future | | 2,842 | | 12/08/2022 | | $ 2,129,545,985 | | $ (6,171,161) |
| 3-Month Sterling Future | | 3,210 | | 12/21/2022 | | 541,415,680 | | (5,010,344) |
| 3-Month Sterling Future | | 965 | | 09/20/2023 | | 162,704,256 | | (298,560) |
| U.S. Treasury 10-Year Ultra Future | | 255 | | 12/21/2021 | | 36,982,969 | | (368,373) |
| Total | | | | | | | | $ (11,848,438) |
| Short position contracts: |
| 3-Month Sterling Future | | 965 | | 09/18/2024 | | $ 163,009,657 | | $ 158,023 |
| 90-Day Euro Future | | 2,019 | | 12/19/2022 | | 500,358,675 | | 1,850,907 |
| Australian 10-Year Bond Future | | 555 | | 12/15/2021 | | 56,300,295 | | 3,605,565 |
| Canadian Government 10-Year Bond Future | | 50 | | 12/20/2021 | | 5,694,489 | | 39,434 |
| Canadian Government 5-Year Bond Future | | 122 | | 12/20/2021 | | 12,093,536 | | 274,583 |
| Euro-BOBL Future | | 3,109 | | 12/08/2021 | | 480,733,921 | | 2,103,196 |
| Euro-BTP Future | | 36 | | 12/08/2021 | | 6,169,987 | | (7,112) |
| Euro-BUND Future | | 546 | | 12/08/2021 | | 106,113,297 | | 929,192 |
| Euro-BUXL 30-Year Bond Future | | 168 | | 12/08/2021 | | 40,585,583 | | (3,309) |
| Euro-OAT Future | | 429 | | 12/08/2021 | | 81,331,527 | | 1,939,766 |
| Euro-Schatz Future | | 194 | | 12/08/2021 | | 25,108,595 | | 74,571 |
| Long Gilt Future | | 635 | | 12/29/2021 | | 108,559,190 | | 325,056 |
| U.S. Treasury 2-Year Note Future | | 4,712 | | 12/31/2021 | | 1,033,106,000 | | 941,135 |
| U.S. Treasury 5-Year Note Future | | 2,032 | | 12/31/2021 | | 247,396,000 | | 248,228 |
| U.S. Treasury 10-Year Note Future | | 2,128 | | 12/21/2021 | | 278,136,250 | | 940,619 |
| U.S. Treasury Long Bond Future | | 37 | | 12/21/2021 | | 5,951,219 | | 97,373 |
| U.S. Treasury Ultra Bond Future | | 154 | | 12/21/2021 | | 30,246,563 | | (37,838) |
| Total | | | | | | | | $ 13,479,389 |
| Total futures contracts | | $ 1,630,951 |
| OTC Credit Default Swap Contracts Outstanding at October 31, 2021 |
| Reference Entity | | Counter-
party | | Notional
Amount | | (Pay)/Receive
Fixed Rate | | Expiration
Date | | Periodic
Payment
Frequency | | Upfront
Premiums
Paid | | Upfront
Premiums
Received | | Market
Value† | | Unrealized
Appreciation/
(Depreciation) |
| Credit default swaps on indices: |
| Buy protection: |
| CMBX.NA.BBB-.12 | | MSC | | USD | 1,290,000 | | (3.00%) | | 08/17/2061 | | Monthly | | $ 87,911 | | $ — | | $ 63,878 | | $ (24,033) |
| CMBX.NA.BBB-.12 | | CBK | | USD | 2,110,000 | | (3.00%) | | 08/17/2061 | | Monthly | | 142,965 | | — | | 104,482 | | (38,483) |
| CMBX.NA.BBB-.13 | | MSC | | USD | 3,250,000 | | (3.00%) | | 12/16/2072 | | Monthly | | 242,947 | | — | | 174,551 | | (68,396) |
| Total OTC credit default swap contracts | | $ 473,823 | | $ — | | $ 342,911 | | $ (130,912) |
The accompanying notes are an integral part of these financial statements.
The Hartford World Bond Fund
Schedule of Investments – (continued)
October 31, 2021
| OTC Interest Rate Swap Contracts Outstanding at October 31, 2021 |
| Counterparty | | Payments
made by
Fund | | Payments received
by Fund | | Notional
Amount | | Expiration
Date | | Periodic
Payment
Frequency | | Upfront
Premiums
Paid | | Upfront
Premiums
Received | | Value † | | Unrealized
Appreciation/
(Depreciation) |
| BOA | | 3 Mo. CNY CNRR | | 2.88% Fixed | | CNY | 24,947,000 | | 09/15/2026 | | Quarterly | | $ 837 | | $ — | | $ 46,721 | | $ 45,884 |
| GSC | | 3 Mo. South Korean Won | | 1.73% Fixed | | KRW | 51,786,178,000 | | 12/15/2026 | | Quarterly | | — | | — | | (1,098,371) | | (1,098,371) |
| JPM | | 3 Mo. CNY CNRR | | 2.86% Fixed | | CNY | 199,394,000 | | 09/15/2026 | | Quarterly | | — | | — | | 344,141 | | 344,141 |
| JPM | | 3 Mo. CNY CNRR | | 2.86% Fixed | | CNY | 81,991,000 | | 09/15/2026 | | Quarterly | | — | | — | | 141,511 | | 141,511 |
| JPM | | 3 Mo. South Korean Won | | 1.76% Fixed | | KRW | 26,870,554,000 | | 12/15/2031 | | Quarterly | | — | | — | | (967,343) | | (967,343) |
| MSC | | 12 Mo. EUR EURIBOR | | 0.51% Fixed | | EUR | 34,955,000 | | 09/20/2025 | | Annual | | 119,333 | | — | | 395,863 | | 276,530 |
| MSC | | 3 Mo. South Korean Won | | 1.67% Fixed | | KRW | 34,826,802,000 | | 12/15/2026 | | Quarterly | | — | | — | | (812,383) | | (812,383) |
| MSC | | 6 Mo. EUR EURIBOR | | 0.28% Fixed | | EUR | 105,166,000 | | 06/21/2025 | | Annual | | — | | (3,810) | | 1,143,487 | | 1,147,297 |
| Total OTC interest rate swap contracts | | $ 120,170 | | $ (3,810) | | $ (806,374) | | $ (922,734) |
| Centrally Cleared Credit Default Swap Contracts Outstanding at October 31, 2021 |
| Reference Entity | | Notional
Amount | | (Pay)/Receive
Fixed Rate | | Expiration
Date | | Periodic
Payment
Frequency | | Cost Basis | | Value † | | Unrealized
Appreciation/
(Depreciation) |
| Credit default swaps on indices: |
| Buy protection: |
| CDX.NA.HY.37.V1 | | USD | 10,900,000 | | (5.00%) | | 12/20/2026 | | Quarterly | | $ (1,029,561) | | $ (1,043,058) | | $ (13,497) |
| ITRAXX-FINSUBS.36.V1 | | EUR | 38,925,000 | | (1.00%) | | 12/20/2026 | | Quarterly | | 298,493 | | 242,492 | | (56,001) |
| Total | | $ (731,068) | | $ (800,566) | | $ (69,498) |
| Sell protection: |
| ITRAXX-FINSENS.36.V1 (B) | | EUR | 69,250,000 | | 1.00% | | 12/20/2026 | | Quarterly | | $ 1,730,279 | | $ 1,811,514 | | $ 81,235 |
| Credit default swaps on single-name issues: |
| Buy protection: |
| Bouygues S.A. | | EUR | 12,275,000 | | (1.00%) | | 12/20/2026 | | Quarterly | | $ (444,442) | | $ (434,329) | | $ 10,113 |
| Dillard's, Inc. | | USD | 3,670,000 | | (5.00%) | | 12/20/2024 | | Quarterly | | (349,729) | | (512,765) | | (163,036) |
| Kohl’s Corp. | | USD | 4,080,000 | | (1.00%) | | 12/20/2024 | | Quarterly | | 56,042 | | (27,587) | | (83,629) |
| Total | | $ (738,129) | | $ (974,681) | | $ (236,552) |
| Sell protection: |
| Virgin Media Finance plc (B) | | EUR | 12,350,000 | | (5.00%) | | 12/20/2025 | | Quarterly | | $ 1,237,204 | | $ 1,779,291 | | $ 542,087 |
| Total | | $ 499,075 | | $ 804,610 | | $ 305,535 |
| Total centrally cleared credit default swap contracts | | $ 1,498,286 | | $ 1,815,558 | | $ 317,272 |
| Centrally Cleared Interest Rate Swap Contracts Outstanding at October 31, 2021 |
Payments made
by Fund | | Payments received
by Fund | | Notional
Amount | | Expiration
Date | | Periodic
Payment
Frequency | | Upfront
Premiums
Paid | | Upfront
Premiums
Received | | Value † | | Unrealized
Appreciation/
(Depreciation) |
| 12 Mo. EUR EURIBOR | | 0.04% Fixed | | EUR | 42,293,000 | | 09/16/2031 | | Annual | | $ — | | $ (643,607) | | $ (852,703) | | $ (209,096) |
| 12 Mo. JPY LIBOR | | 0.05% Fixed | | JPY | 2,332,608,000 | | 03/21/2027 | | Annual | | 6,761 | | — | | 45,215 | | 38,454 |
| 12 Mo. JPY LIBOR | | 0.03% Fixed | | JPY | 700,616,000 | | 03/16/2032 | | Annual | | 12,494 | | — | | 42,450 | | 29,956 |
| 12 Mo. SONIA | | 0.13% Fixed | | GBP | 919,494,000 | | 02/03/2022 | | Annual | | — | | (83,237) | | (346,279) | | (263,042) |
| 12 Mo. SONIA | | 0.63% Fixed | | GBP | 31,218,000 | | 06/21/2025 | | Annual | | 8,155 | | — | | (464,907) | | (473,062) |
| 12 Mo. SONIA | | 0.59% Fixed | | GBP | 62,812,000 | | 06/21/2025 | | Annual | | 169 | | — | | (1,002,156) | | (1,002,325) |
| 12 Mo. SONIA | | 0.63% Fixed | | GBP | 31,268,000 | | 09/20/2025 | | Annual | | 9,484 | | — | | (430,815) | | (440,299) |
| 12 Mo. SONIA | | 0.50% Fixed | | GBP | 10,567,000 | | 12/15/2026 | | Annual | | — | | (766) | | 401,467 | | 402,233 |
| 12 Mo. SONIA | | 0.72% Fixed | | GBP | 15,527,000 | | 12/20/2026 | | Annual | | — | | (31,273) | | 204,765 | | 236,038 |
| 12 Mo. SONIA | | 0.91% Fixed | | GBP | 26,114,000 | | 06/17/2031 | | Annual | | 84,433 | | — | | (21,815) | | (106,248) |
| 12 Mo. SONIA | | 0.91% Fixed | | GBP | 39,157,000 | | 06/17/2031 | | Annual | | 114,135 | | — | | (45,140) | | (159,275) |
| 12 Mo. SONIA | | 1.16% Fixed | | GBP | 12,879,000 | | 06/17/2031 | | Annual | | — | | (32,021) | | (219,252) | | (187,231) |
| 12 Mo. SONIA | | 1.13% Fixed | | GBP | 29,373,000 | | 09/16/2031 | | Annual | | 132,124 | | — | | 445,906 | | 313,782 |
| 12 Mo. SONIA | | 1.00% Fixed | | GBP | 25,491,000 | | 09/16/2031 | | Annual | | — | | (210,901) | | (176,898) | | 34,003 |
| 12 Mo. SONIA | | 0.97% Fixed | | GBP | 12,920,000 | | 09/16/2031 | | Annual | | — | | (16,410) | | (65,107) | | (48,697) |
| 12 Mo. SONIA | | 0.78% Fixed | | GBP | 4,775,000 | | 12/15/2031 | | Annual | | — | | (10,133) | | 125,267 | | 135,400 |
| 12 Mo. SONIA | | 0.94% Fixed | | GBP | 39,155,000 | | 12/15/2031 | | Annual | | — | | (286,761) | | (222,357) | | 64,404 |
| 12 Mo. SONIA | | 1.06% Fixed | | GBP | 10,944,000 | | 12/16/2031 | | Annual | | — | | (9,821) | | (119,234) | | (109,413) |
The accompanying notes are an integral part of these financial statements.
The Hartford World Bond Fund
Schedule of Investments – (continued)
October 31, 2021
| Centrally Cleared Interest Rate Swap Contracts Outstanding at October 31, 2021 – (continued) |
Payments made
by Fund | | Payments received
by Fund | | Notional
Amount | | Expiration
Date | | Periodic
Payment
Frequency | | Upfront
Premiums
Paid | | Upfront
Premiums
Received | | Value † | | Unrealized
Appreciation/
(Depreciation) |
| 12 Mo. SONIA | | 0.91% Fixed | | GBP | 12,088,000 | | 09/17/2051 | | Annual | | $ — | | $ (92,161) | | $ (609,172) | | $ (517,011) |
| 12 Mo. SONIA | | 1.00% Fixed | | GBP | 14,454,000 | | 12/15/2051 | | Annual | | 240,587 | | — | | (1,102,897) | | (1,343,484) |
| 3 Mo. AUD BBSW | | 1.16% Fixed | | AUD | 290,063,000 | | 12/20/2024 | | Quarterly | | — | | (936,093) | | (1,809,065) | | (872,972) |
| 3 Mo. CAD CDOR | | 1.47% Fixed | | CAD | 35,528,000 | | 12/15/2026 | | Semi-Annual | | 30,298 | | — | | (732,258) | | (762,556) |
| 3 Mo. CAD CDOR | | 1.88% Fixed | | CAD | 26,933,000 | | 12/20/2026 | | Semi-Annual | | 20,907 | | — | | (242,356) | | (263,263) |
| 3 Mo. CAD CDOR | | 2.00% Fixed | | CAD | 8,435,000 | | 12/15/2031 | | Semi-Annual | | 42,086 | | — | | (121,257) | | (163,343) |
| 3 Mo. NZD NZDBBR FRA | | 1.89% Fixed | | NZD | 41,857,000 | | 03/16/2027 | | Semi-Annual | | — | | (11,048) | | (1,241,277) | | (1,230,229) |
| 3 Mo. NZD NZDBBR FRA | | 2.66% Fixed | | NZD | 31,462,000 | | 03/20/2027 | | Semi-Annual | | 74,959 | | — | | 130,725 | | 55,766 |
| 3 Mo. NZD NZDBBR FRA | | 2.14% Fixed | | NZD | 10,029,000 | | 03/16/2032 | | Semi-Annual | | — | | (5,644) | | (434,798) | | (429,154) |
| 3 Mo. NZD NZDBBR FRA | | 2.81% Fixed | | NZD | 23,628,000 | | 03/17/2032 | | Semi-Annual | | 41,979 | | — | | 50,396 | | 8,417 |
| 3 Mo. SEK STIBOR | | 0.44% Fixed | | SEK | 123,003,000 | | 12/15/2026 | | Annual | | — | | (29,993) | | 266,029 | | 296,022 |
| 3 Mo. SEK STIBOR | | 0.69% Fixed | | SEK | 183,567,000 | | 03/20/2027 | | Annual | | — | | (36,097) | | (266,097) | | (230,000) |
| 3 Mo. SEK STIBOR | | 1.28% Fixed | | SEK | 755,436,000 | | 06/17/2031 | | Annual | | — | | (16,910) | | 1,956 | | 18,866 |
| 3 Mo. SEK STIBOR | | 1.22% Fixed | | SEK | 147,683,000 | | 09/16/2031 | | Annual | | — | | (3,123) | | 56,681 | | 59,804 |
| 3 Mo. USD LIBOR | | 1.28% Fixed | | USD | 210,475,000 | | 12/20/2024 | | Semi-Annual | | 495,936 | | — | | 538,166 | | 42,230 |
| 3 Mo. USD LIBOR | | 0.40% Fixed | | USD | 36,925,000 | | 10/08/2025 | | Semi-Annual | | — | | (14,057) | | 1,014,626 | | 1,028,683 |
| 3 Mo. USD LIBOR | | 0.91% Fixed | | USD | 21,851,000 | | 06/21/2026 | | Semi-Annual | | 33,249 | | — | | (411,395) | | (444,644) |
| 3 Mo. USD LIBOR | | 1.03% Fixed | | USD | 28,565,000 | | 03/16/2027 | | Semi-Annual | | — | | (21,268) | | (437,701) | | (416,433) |
| 3 Mo. USD LIBOR | | 2.25% Fixed | | USD | 27,620,000 | | 06/17/2031 | | Semi-Annual | | 44,590 | | — | | (446,807) | | (491,397) |
| 3 Mo. USD LIBOR | | 1.75% Fixed | | USD | 15,286,000 | | 12/16/2031 | | Semi-Annual | | — | | (16,871) | | 122,882 | | 139,753 |
| 3 Mo. USD LIBOR | | 1.41% Fixed | | USD | 6,724,000 | | 03/16/2032 | | Semi-Annual | | — | | (22,655) | | (141,699) | | (119,044) |
| 6 Mo. AUD BBSW | | 0.97% Fixed | | AUD | 37,562,000 | | 12/15/2026 | | Semi-Annual | | 9,152 | | — | | (1,107,187) | | (1,116,339) |
| 6 Mo. AUD BBSW | | 1.38% Fixed | | AUD | 28,943,000 | | 03/20/2027 | | Semi-Annual | | 15,357 | | — | | (521,841) | | (537,198) |
| 6 Mo. AUD BBSW | | 1.72% Fixed | | AUD | 8,902,000 | | 12/15/2031 | | Semi-Annual | | 25,310 | | — | | (274,586) | | (299,896) |
| 6 Mo. EUR EURIBOR | | 0.22% Fixed | | EUR | 11,759,000 | | 12/15/2026 | | Annual | | — | | (62,981) | | 189,437 | | 252,418 |
| 6 Mo. EUR EURIBOR | | 0.47% Fixed | | EUR | 91,023,000 | | 06/17/2031 | | Annual | | 5,944 | | — | | (124,509) | | (130,453) |
| 6 Mo. EUR EURIBOR | | 0.44% Fixed | | EUR | 41,583,000 | | 06/17/2031 | | Annual | | 36,797 | | — | | (135,106) | | (171,903) |
| 6 Mo. EUR EURIBOR | | 0.41% Fixed | | EUR | 42,035,000 | | 06/17/2031 | | Annual | | — | | (21,136) | | (212,609) | | (191,473) |
| 6 Mo. EUR EURIBOR | | 0.50% Fixed | | EUR | 13,810,000 | | 09/16/2031 | | Annual | | 14,132 | | — | | (10,898) | | (25,030) |
| 6 Mo. EUR EURIBOR | | 0.53% Fixed | | EUR | 53,072,000 | | 09/16/2031 | | Annual | | 805,954 | | — | | 50,199 | | (755,755) |
| 6 Mo. EUR EURIBOR | | 0.16% Fixed | | EUR | 5,269,000 | | 12/15/2031 | | Annual | | — | | (14,615) | | 84,143 | | 98,758 |
| 6 Mo. EUR EURIBOR | | 0.63% Fixed | | EUR | 18,538,000 | | 09/17/2051 | | Annual | | — | | (783,274) | | (1,381,586) | | (598,312) |
| 6 Mo. NOK NIBOR | | 1.84% Fixed | | NOK | 195,669,000 | | 12/20/2026 | | Annual | | 3,823 | | — | | 167,255 | | 163,432 |
| 6 Mo. NOK NIBOR | | 1.56% Fixed | | NOK | 132,467,000 | | 03/16/2027 | | Annual | | 4,217 | | — | | 305,108 | | 300,891 |
| 6 Mo. NOK NIBOR | | 1.47% Fixed | | NOK | 146,196,000 | | 03/18/2031 | | Annual | | 7,991 | | — | | 430,231 | | 422,240 |
| 6 Mo. NOK NIBOR | | 1.47% Fixed | | NOK | 62,620,000 | | 12/15/2031 | | Annual | | 13,767 | | — | | 334,441 | | 320,674 |
| Total centrally cleared interest rate swaps contracts | | $ 2,334,790 | | $ (3,412,856) | | $ (10,724,419) | | $ (9,646,353) |
| Foreign Currency Contracts Outstanding at October 31, 2021 |
Amount and Description of
Currency to be Purchased | | Amount and Description of
Currency to be Sold | | Counterparty | | Settlement
Date | | Appreciation/
(Depreciation) |
| 209,224,000 | AUD | | 156,934,774 | USD | | JPM | | 11/04/2021 | | $ 457,005 |
| 4,293,000 | AUD | | 3,092,177 | USD | | CIB | | 11/04/2021 | | 137,294 |
| 2,181,000 | AUD | | 1,570,017 | USD | | CBK | | 11/04/2021 | | 70,672 |
| 5,608,000 | AUD | | 4,200,339 | USD | | RBC | | 11/04/2021 | | 18,360 |
| 203,329,000 | AUD | | 153,246,572 | USD | | BNP | | 11/04/2021 | | (289,393) |
| 125,915,000 | AUD | | 94,695,887 | USD | | JPM | | 12/07/2021 | | 37,565 |
| 125,915,000 | AUD | | 94,999,140 | USD | | BNP | | 12/07/2021 | | (265,689) |
| 90,165,000 | BRL | | 16,614,101 | USD | | CBK | | 11/03/2021 | | (647,922) |
| 69,160,000 | BRL | | 12,337,882 | USD | | CBK | | 12/02/2021 | | (162,791) |
| 974,027,000 | CAD | | 785,885,913 | USD | | BNP | | 11/04/2021 | | 1,140,471 |
| 4,205,000 | CAD | | 3,373,903 | USD | | BCLY | | 11/04/2021 | | 23,791 |
| 15,250,000 | CAD | | 12,315,671 | USD | | JPM | | 11/04/2021 | | 6,526 |
| 8,525,000 | CAD | | 6,905,039 | USD | | SSG | | 11/04/2021 | | (16,730) |
The accompanying notes are an integral part of these financial statements.
The Hartford World Bond Fund
Schedule of Investments – (continued)
October 31, 2021
| Foreign Currency Contracts Outstanding at October 31, 2021 – (continued) |
Amount and Description of
Currency to be Purchased | | Amount and Description of
Currency to be Sold | | Counterparty | | Settlement
Date | | Appreciation/
(Depreciation) |
| 5,150,000 | CAD | | 4,180,195 | USD | | BOA | | 11/04/2021 | | $ (18,928) |
| 51,045,000 | CAD | | 41,241,690 | USD | | CIBC | | 12/07/2021 | | 4,702 |
| 4,345,000 | CAD | | 3,511,378 | USD | | RBC | | 12/07/2021 | | (445) |
| 5,885,000 | CAD | | 4,768,425 | USD | | JPM | | 12/07/2021 | | (13,111) |
| 3,915,000 | CHF | | 4,240,400 | USD | | CBK | | 11/04/2021 | | 35,925 |
| 12,050,000 | CHF | | 13,217,908 | USD | | UBS | | 11/04/2021 | | (55,784) |
| 2,432,133,000 | CLP | | 2,953,019 | USD | | UBS | | 11/04/2021 | | 35,373 |
| 1,728,827,000 | CLP | | 2,107,555 | USD | | JPM | | 11/04/2021 | | 16,677 |
| 1,026,040,000 | CLP | | 1,244,499 | USD | | BNP | | 11/04/2021 | | 16,209 |
| 403,401,000 | CLP | | 500,498 | USD | | CBK | | 11/04/2021 | | (4,834) |
| 2,359,100,000 | CLP | | 2,929,104 | USD | | BOA | | 11/04/2021 | | (30,448) |
| 35,301,000 | CNH | | 5,476,250 | USD | | SCB | | 11/04/2021 | | 31,424 |
| 14,600,000 | CNH | | 2,287,503 | USD | | MSC | | 11/04/2021 | | (9,606) |
| 48,909,000 | CNH | | 7,659,588 | USD | | UBS | | 11/04/2021 | | (28,790) |
| 92,909,000 | CNH | | 14,549,809 | USD | | GSC | | 11/04/2021 | | (54,117) |
| 1,494,294,000 | CNH | | 233,596,066 | USD | | CBK | | 11/04/2021 | | (455,834) |
| 18,299,000 | CNH | | 2,855,469 | USD | | JPM | | 12/07/2021 | | (7,944) |
| 181,873,000 | CNH | | 28,411,885 | USD | | CBK | | 12/07/2021 | | (110,456) |
| 19,044,000,000 | COP | | 5,032,486 | USD | | CBK | | 11/04/2021 | | 23,198 |
| 10,245,500,000 | COP | | 2,711,167 | USD | | DEUT | | 11/04/2021 | | 8,745 |
| 31,577,800,000 | COP | | 8,474,987 | USD | | BNP | | 11/04/2021 | | (91,906) |
| 51,719,408,000 | COP | | 13,745,291 | USD | | CBK | | 12/07/2021 | | (47,241) |
| 101,270,000 | CZK | | 4,621,468 | USD | | CBK | | 11/04/2021 | | (61,127) |
| 73,590,000 | CZK | | 3,327,466 | USD | | CBK | | 12/07/2021 | | (18,455) |
| 66,860,000 | CZK | | 3,029,864 | USD | | BNP | | 12/07/2021 | | (23,470) |
| 4,162,000 | EUR | | 4,815,176 | USD | | BOA | | 11/04/2021 | | (3,531) |
| 5,406,000 | EUR | | 6,276,414 | USD | | JPM | | 11/04/2021 | | (26,593) |
| 8,883,000 | EUR | | 10,339,522 | USD | | CBA | | 11/04/2021 | | (69,979) |
| 14,846,000 | EUR | | 17,239,637 | USD | | BCLY | | 11/04/2021 | | (76,331) |
| 120,493,000 | EUR | | 140,326,750 | USD | | UBS | | 11/04/2021 | | (1,026,049) |
| 3,551,000 | EUR | | 4,138,823 | USD | | CBK | | 12/07/2021 | | (30,406) |
| 14,846,000 | EUR | | 17,300,786 | USD | | UBS | | 12/07/2021 | | (124,338) |
| 71,567,000 | EUR | | 83,634,177 | USD | | BCLY | | 12/07/2021 | | (832,958) |
| 84,000 | GBP | | 113,269 | USD | | GSC | | 11/04/2021 | | 1,689 |
| 22,000 | GBP | | 29,578 | USD | | BCLY | | 11/04/2021 | | 530 |
| 1,983,000 | GBP | | 2,727,607 | USD | | JPM | | 11/04/2021 | | (13,758) |
| 11,129,000 | GBP | | 15,324,633 | USD | | TDB | | 11/04/2021 | | (93,962) |
| 102,000 | GBP | | 140,403 | USD | | DEUT | | 11/30/2021 | | (808) |
| 22,000 | GBP | | 30,294 | USD | | TDB | | 12/07/2021 | | (183) |
| 720,100,000 | HUF | | 2,300,529 | USD | | BCLY | | 11/04/2021 | | 12,549 |
| 2,926,800,000 | HUF | | 9,462,512 | USD | | BOA | | 11/04/2021 | | (61,158) |
| 2,279,288,000 | HUF | | 7,342,783 | USD | | BNP | | 12/07/2021 | | (32,343) |
| 69,280,000,000 | IDR | | 4,832,421 | USD | | CBK | | 11/04/2021 | | 55,772 |
| 69,280,000,000 | IDR | | 4,865,681 | USD | | CBK | | 12/07/2021 | | 6,913 |
| 46,006,000 | ILS | | 14,542,556 | USD | | BCLY | | 11/04/2021 | | (3,607) |
| 1,195,286,000 | INR | | 15,979,759 | USD | | CBK | | 11/03/2021 | | (22,818) |
| 1,396,557,000 | INR | | 18,749,507 | USD | | JPM | | 11/03/2021 | | (105,619) |
| 43,131,000 | JPY | | 379,259 | USD | | BNP | | 11/04/2021 | | (823) |
| 349,500,000 | JPY | | 3,137,991 | USD | | BOA | | 11/04/2021 | | (71,445) |
| 467,400,000 | JPY | | 4,179,640 | USD | | MSC | | 11/04/2021 | | (78,629) |
| 610,300,000 | JPY | | 5,504,208 | USD | | CBK | | 11/04/2021 | | (149,379) |
| 571,200,000 | JPY | | 5,023,822 | USD | | BNP | | 12/07/2021 | | (10,395) |
| 397,026,365,000 | KRW | | 339,570,959 | USD | | MSC | | 11/04/2021 | | 152,337 |
| 10,137,370,000 | KRW | | 8,568,093 | USD | | BNP | | 11/04/2021 | | 106,144 |
| 4,286,230,000 | KRW | | 3,593,780 | USD | | JPM | | 11/04/2021 | | 73,815 |
| 3,237,980,000 | KRW | | 2,737,786 | USD | | BCLY | | 11/04/2021 | | 32,854 |
| 4,889,660,000 | KRW | | 4,177,947 | USD | | MSC | | 12/07/2021 | | 2,482 |
| 120,850,000 | MXN | | 5,770,838 | USD | | BCLY | | 11/04/2021 | | 95,537 |
| 839,462,000 | MXN | | 40,713,032 | USD | | GSC | | 11/04/2021 | | 36,647 |
| 131,050,000 | MXN | | 6,385,803 | USD | | SSG | | 11/04/2021 | | (24,293) |
| 592,592,000 | MXN | | 28,596,412 | USD | | CBK | | 12/07/2021 | | 20,367 |
The accompanying notes are an integral part of these financial statements.
The Hartford World Bond Fund
Schedule of Investments – (continued)
October 31, 2021
| Foreign Currency Contracts Outstanding at October 31, 2021 – (continued) |
Amount and Description of
Currency to be Purchased | | Amount and Description of
Currency to be Sold | | Counterparty | | Settlement
Date | | Appreciation/
(Depreciation) |
| 3,253,946,000 | NOK | | 382,385,556 | USD | | MSC | | 11/04/2021 | | $ 2,787,325 |
| 36,690,000 | NOK | | 4,190,006 | USD | | CBK | | 11/04/2021 | | 153,026 |
| 36,690,000 | NOK | | 4,285,047 | USD | | GSC | | 11/04/2021 | | 57,985 |
| 34,750,000 | NOK | | 4,149,135 | USD | | JPM | | 11/04/2021 | | (35,742) |
| 20,690,000 | NOK | | 2,461,036 | USD | | BCLY | | 12/07/2021 | | (12,566) |
| 34,910,000 | NOK | | 4,179,887 | USD | | BOA | | 12/07/2021 | | (48,612) |
| 1,097,582,000 | NOK | | 131,064,739 | USD | | MSC | | 12/07/2021 | | (1,176,086) |
| 5,975,000 | NZD | | 4,130,649 | USD | | SSG | | 11/04/2021 | | 150,830 |
| 4,290,000 | NZD | | 2,957,569 | USD | | JPM | | 11/04/2021 | | 116,497 |
| 102,526,000 | NZD | | 73,398,363 | USD | | TDB | | 11/04/2021 | | 68,234 |
| 9,060,000 | NZD | | 6,454,100 | USD | | BNP | | 11/04/2021 | | 37,984 |
| 4,566,000 | NZD | | 3,267,270 | USD | | TDB | | 12/07/2021 | | 2,925 |
| 4,340,000 | NZD | | 3,121,597 | USD | | SSG | | 12/07/2021 | | (13,265) |
| 5,408,000 | PEN | | 1,308,018 | USD | | CBK | | 11/04/2021 | | 47,031 |
| 4,407,000 | PEN | | 1,108,958 | USD | | MSC | | 11/04/2021 | | (4,724) |
| 140,465,000 | PHP | | 2,782,587 | USD | | BOA | | 11/04/2021 | | 3,785 |
| 13,545,000 | PLN | | 3,437,163 | USD | | BOA | | 11/04/2021 | | (42,354) |
| 9,834,000 | PLN | | 2,479,670 | USD | | BNP | | 12/07/2021 | | (16,815) |
| 859,160,000 | RUB | | 11,760,535 | USD | | GSC | | 11/03/2021 | | 350,777 |
| 382,790,000 | RUB | | 5,230,801 | USD | | JPM | | 11/03/2021 | | 165,271 |
| 285,830,000 | RUB | | 3,962,432 | USD | | CBK | | 11/03/2021 | | 66,825 |
| 192,540,000 | RUB | | 2,727,968 | USD | | MSC | | 11/03/2021 | | (13,792) |
| 888,630,000 | RUB | | 12,603,787 | USD | | BCLY | | 11/03/2021 | | (77,046) |
| 1,528,650,000 | RUB | | 21,536,652 | USD | | BCLY | | 12/07/2021 | | (141,801) |
| 272,978,000 | SEK | | 31,282,284 | USD | | BOA | | 11/04/2021 | | 504,680 |
| 1,074,770,000 | SEK | | 125,042,809 | USD | | BCLY | | 11/04/2021 | | 108,944 |
| 36,600,000 | SEK | | 4,193,204 | USD | | UBS | | 11/04/2021 | | 68,689 |
| 1,249,716,000 | SEK | | 146,671,845 | USD | | MSC | | 11/04/2021 | | (1,148,478) |
| 35,430,000 | SEK | | 4,124,972 | USD | | BOA | | 12/07/2021 | | 2,362 |
| 1,075,340,000 | SEK | | 126,252,513 | USD | | MSC | | 12/07/2021 | | (983,347) |
| 10,608,000 | SGD | | 7,793,410 | USD | | MSC | | 11/03/2021 | | 73,003 |
| 8,835,000 | SGD | | 6,519,145 | USD | | JPM | | 11/03/2021 | | 32,491 |
| 3,970,000 | SGD | | 2,935,301 | USD | | BNP | | 11/03/2021 | | 8,672 |
| 3,658,000 | SGD | | 2,714,596 | USD | | MSC | | 12/07/2021 | | (2,402) |
| 474,737,000 | THB | | 14,280,692 | USD | | SCB | | 11/04/2021 | | 25,639 |
| 68,960,000 | THB | | 2,067,456 | USD | | SCB | | 12/07/2021 | | 10,127 |
| 62,207,000 | TRY | | 6,891,757 | USD | | BCLY | | 11/04/2021 | | (432,923) |
| 998,393,000 | TRY | | 105,290,795 | USD | | GSC | | 11/04/2021 | | (1,629,547) |
| 251,275,000 | TWD | | 9,038,669 | USD | | JPM | | 11/04/2021 | | (2,763) |
| 106,930,000 | TWD | | 3,849,519 | USD | | CBK | | 11/04/2021 | | (4,291) |
| 28,250,000 | ZAR | | 1,856,708 | USD | | MSC | | 11/04/2021 | | (8,080) |
| 52,030,000 | ZAR | | 3,464,578 | USD | | UBS | | 11/04/2021 | | (59,831) |
| 374,903,000 | ZAR | | 24,605,101 | USD | | BCLY | | 11/04/2021 | | (72,139) |
| 44,590,000 | ZAR | | 3,003,659 | USD | | BNP | | 11/04/2021 | | (85,771) |
| 92,160,000 | ZAR | | 6,192,092 | USD | | BOA | | 11/04/2021 | | (161,311) |
| 187,470,000 | ZAR | | 12,446,739 | USD | | GSC | | 11/04/2021 | | (179,048) |
| 116,070,000 | ZAR | | 7,586,964 | USD | | BCLY | | 12/07/2021 | | (23,319) |
| 65,470,000 | ZAR | | 4,306,706 | USD | | BOA | | 12/07/2021 | | (40,385) |
| 272,553,000 | AUD | | 197,900,461 | USD | | MSC | | 11/04/2021 | | 7,131,473 |
| 98,623,720 | USD | | 130,821,000 | AUD | | BNP | | 11/04/2021 | | 211,732 |
| 2,282,002 | USD | | 3,045,000 | AUD | | BOA | | 11/04/2021 | | (8,643) |
| 4,162,078 | USD | | 5,555,000 | AUD | | SSG | | 11/04/2021 | | (16,751) |
| 4,278,667 | USD | | 5,770,000 | AUD | | CBK | | 11/04/2021 | | (61,899) |
| 124,127,292 | USD | | 165,630,000 | AUD | | JPM | | 11/04/2021 | | (470,270) |
| 280,540,692 | USD | | 386,367,000 | AUD | | MSC | | 11/04/2021 | | (10,109,468) |
| 148,052,744 | USD | | 196,234,000 | AUD | | BNP | | 12/07/2021 | | 414,067 |
| 147,582,391 | USD | | 196,237,000 | AUD | | JPM | | 12/07/2021 | | (58,544) |
| 16,146,380 | USD | | 90,165,000 | BRL | | CBK | | 11/03/2021 | | 180,202 |
| 4,317,218 | USD | | 5,380,000 | CAD | | GSC | | 11/04/2021 | | (29,892) |
| 4,225,364 | USD | | 5,380,000 | CAD | | CBK | | 11/04/2021 | | (121,746) |
| 54,774,305 | USD | | 68,786,000 | CAD | | SSG | | 11/04/2021 | | (805,670) |
The accompanying notes are an integral part of these financial statements.
The Hartford World Bond Fund
Schedule of Investments – (continued)
October 31, 2021
| Foreign Currency Contracts Outstanding at October 31, 2021 – (continued) |
Amount and Description of
Currency to be Purchased | | Amount and Description of
Currency to be Sold | | Counterparty | | Settlement
Date | | Appreciation/
(Depreciation) |
| 732,489,383 | USD | | 927,611,000 | CAD | | MSC | | 11/04/2021 | | $ (17,032,273) |
| 785,871,963 | USD | | 974,027,000 | CAD | | BNP | | 12/07/2021 | | (1,180,621) |
| 4,222,891 | USD | | 3,915,000 | CHF | | UBS | | 11/04/2021 | | (53,434) |
| 4,218,809 | USD | | 3,915,000 | CHF | | SSG | | 11/04/2021 | | (57,516) |
| 8,719,326 | USD | | 8,135,000 | CHF | | MSC | | 11/04/2021 | | (166,474) |
| 13,229,111 | USD | | 12,050,000 | CHF | | UBS | | 12/07/2021 | | 54,352 |
| 9,830,583 | USD | | 7,949,501,000 | CLP | | UBS | | 11/04/2021 | | 62,931 |
| 6,462,232 | USD | | 41,597,000 | CNH | | JPM | | 11/04/2021 | | (27,745) |
| 7,335,015 | USD | | 47,422,000 | CNH | | GSC | | 11/04/2021 | | (63,781) |
| 246,770,734 | USD | | 1,596,994,000 | CNH | | CBK | | 11/04/2021 | | (2,392,785) |
| 198,913,190 | USD | | 1,273,303,000 | CNH | | CBK | | 12/07/2021 | | 773,311 |
| 13,773,478 | USD | | 51,719,408,000 | COP | | CBK | | 11/04/2021 | | 43,327 |
| 2,379,661 | USD | | 9,147,892,000 | COP | | BNP | | 11/04/2021 | | (48,865) |
| 3,035,021 | USD | | 66,860,000 | CZK | | BNP | | 11/04/2021 | | 24,214 |
| 1,564,668 | USD | | 34,410,000 | CZK | | BCLY | | 11/04/2021 | | 15,133 |
| 151,670,716 | USD | | 130,612,000 | EUR | | BCLY | | 11/04/2021 | | 671,544 |
| 17,289,726 | USD | | 14,846,000 | EUR | | UBS | | 11/04/2021 | | 126,420 |
| 2,309,744 | USD | | 1,985,000 | EUR | | CBK | | 11/04/2021 | | 14,906 |
| 7,328,132 | USD | | 6,347,000 | EUR | | BOA | | 11/04/2021 | | (9,569) |
| 208,450,569 | USD | | 179,496,369 | EUR | | DEUT | | 11/30/2021 | | 831,810 |
| 140,416,518 | USD | | 120,493,000 | EUR | | UBS | | 12/07/2021 | | 1,009,147 |
| 15,251,526 | USD | | 13,129,000 | EUR | | JPM | | 12/07/2021 | | 61,603 |
| 30,294 | USD | | 22,000 | GBP | | TDB | | 11/04/2021 | | 186 |
| 8,043,874 | USD | | 5,983,000 | GBP | | BCLY | | 11/04/2021 | | (144,203) |
| 9,722,778 | USD | | 7,213,000 | GBP | | BOA | | 11/04/2021 | | (148,624) |
| 4,023,512 | USD | | 2,923,000 | GBP | | DEUT | | 11/30/2021 | | 23,166 |
| 15,324,611 | USD | | 11,129,000 | GBP | | TDB | | 12/07/2021 | | 92,550 |
| 11,757,103 | USD | | 3,646,900,000 | HUF | | BNP | | 11/04/2021 | | 42,672 |
| 4,880,936 | USD | | 69,280,000,000 | IDR | | CBK | | 11/04/2021 | | (7,257) |
| 3,422,144 | USD | | 10,996,000 | ILS | | BCLY | | 11/04/2021 | | (52,843) |
| 10,871,067 | USD | | 35,010,000 | ILS | | CBK | | 11/04/2021 | | (192,894) |
| 12,461,416 | USD | | 39,321,000 | ILS | | BCLY | | 12/07/2021 | | 32,404 |
| 8,317,372 | USD | | 622,967,000 | INR | | SCB | | 11/03/2021 | | 829 |
| 3,753,029 | USD | | 281,890,000 | INR | | UBS | | 11/03/2021 | | (10,173) |
| 1,548,674 | USD | | 116,832,000 | INR | | MSC | | 11/03/2021 | | (11,020) |
| 13,598,821 | USD | | 1,022,468,000 | INR | | JPM | | 11/03/2021 | | (51,017) |
| 7,252,149 | USD | | 547,686,000 | INR | | CBK | | 11/03/2021 | | (59,402) |
| 15,914,336 | USD | | 1,195,286,000 | INR | | CBK | | 12/07/2021 | | 20,192 |
| 8,040,317 | USD | | 899,131,000 | JPY | | MSC | | 11/04/2021 | | 151,258 |
| 5,022,664 | USD | | 571,200,000 | JPY | | BNP | | 11/04/2021 | | 10,902 |
| 55,566,778 | USD | | 6,106,550,000 | JPY | | JPM | | 11/29/2021 | | 1,978,300 |
| 4,573,106 | USD | | 518,700,000 | JPY | | JPM | | 12/07/2021 | | 20,472 |
| 379,346 | USD | | 43,131,000 | JPY | | BNP | | 12/07/2021 | | 785 |
| 166,946,249 | USD | | 18,411,400,000 | JPY | | JPM | | 01/06/2022 | | 5,257,437 |
| 135,431,368 | USD | | 15,132,600,000 | JPY | | JPM | | 01/18/2022 | | 2,522,953 |
| 41,559,750 | USD | | 4,729,650,000 | JPY | | JPM | | 01/24/2022 | | 17,423 |
| 113,468,822 | USD | | 12,927,150,000 | JPY | | BOA | | 01/31/2022 | | (81,270) |
| 4,182,056 | USD | | 4,889,660,000 | KRW | | MSC | | 11/04/2021 | | (1,876) |
| 2,728,507 | USD | | 3,215,000,000 | KRW | | BCLY | | 11/04/2021 | | (22,470) |
| 342,908,589 | USD | | 406,583,285,000 | KRW | | BNP | | 11/04/2021 | | (4,992,270) |
| 339,237,292 | USD | | 397,026,365,000 | KRW | | MSC | | 12/07/2021 | | (201,572) |
| 12,518,533 | USD | | 255,520,000 | MXN | | BCLY | | 11/04/2021 | | 114,925 |
| 4,132,457 | USD | | 84,010,000 | MXN | | SSG | | 11/04/2021 | | 54,392 |
| 36,460,453 | USD | | 751,832,000 | MXN | | CBK | | 11/04/2021 | | (35,436) |
| 4,507,296 | USD | | 92,670,000 | MXN | | TDB | | 12/07/2021 | | 32,182 |
| 2,084,208 | USD | | 17,930,000 | NOK | | BCLY | | 11/04/2021 | | (38,185) |
| 3,363,985 | USD | | 29,440,000 | NOK | | JPM | | 11/04/2021 | | (120,857) |
| 383,246,752 | USD | | 3,314,706,000 | NOK | | MSC | | 11/04/2021 | | (9,118,351) |
| 257,496,283 | USD | | 2,156,364,000 | NOK | | MSC | | 12/07/2021 | | 2,310,596 |
| 3,268,799 | USD | | 4,566,000 | NZD | | TDB | | 11/04/2021 | | (3,039) |
| 8,320,832 | USD | | 11,780,000 | NZD | | SSG | | 11/04/2021 | | (120,310) |
The accompanying notes are an integral part of these financial statements.
The Hartford World Bond Fund
Schedule of Investments – (continued)
October 31, 2021
| Foreign Currency Contracts Outstanding at October 31, 2021 – (continued) |
Amount and Description of
Currency to be Purchased | | Amount and Description of
Currency to be Sold | | Counterparty | | Settlement
Date | | Appreciation/
(Depreciation) |
| 28,409,367 | USD | | 40,378,000 | NZD | | ANZ | | 11/04/2021 | | $ (524,115) |
| 45,124,610 | USD | | 65,127,000 | NZD | | BCLY | | 11/04/2021 | | (1,543,154) |
| 73,364,017 | USD | | 102,526,000 | NZD | | TDB | | 12/07/2021 | | (65,682) |
| 2,481,669 | USD | | 9,815,000 | PEN | | BOA | | 11/04/2021 | | 22,385 |
| 1,107,704 | USD | | 4,407,000 | PEN | | MSC | | 12/07/2021 | | 4,848 |
| 2,741,583 | USD | | 140,465,000 | PHP | | CBK | | 11/04/2021 | | (44,789) |
| 2,774,891 | USD | | 140,465,000 | PHP | | BOA | | 12/07/2021 | | (9,249) |
| 2,481,360 | USD | | 9,834,000 | PLN | | BNP | | 11/04/2021 | | 16,645 |
| 930,526 | USD | | 3,711,000 | PLN | | BCLY | | 11/04/2021 | | 431 |
| 21,681,441 | USD | | 1,528,650,000 | RUB | | BCLY | | 11/03/2021 | | 132,537 |
| 12,608,258 | USD | | 888,630,000 | RUB | | MSC | | 11/03/2021 | | 81,517 |
| 2,686,335 | USD | | 191,670,000 | RUB | | BOA | | 11/03/2021 | | (15,577) |
| 12,519,618 | USD | | 888,630,000 | RUB | | BCLY | | 12/07/2021 | | 82,432 |
| 4,171,191 | USD | | 35,800,000 | SEK | | BOA | | 11/04/2021 | | 2,455 |
| 452,193 | USD | | 3,882,000 | SEK | | DEUT | | 11/04/2021 | | 153 |
| 33,382,826 | USD | | 293,261,000 | SEK | | JPM | | 11/04/2021 | | (765,995) |
| 265,823,187 | USD | | 2,301,121,000 | SEK | | MSC | | 11/04/2021 | | (2,131,190) |
| 146,151,954 | USD | | 1,244,831,000 | SEK | | MSC | | 12/07/2021 | | 1,138,338 |
| 5,420,585 | USD | | 7,303,000 | SGD | | MSC | | 11/03/2021 | | 5,010 |
| 6,067,232 | USD | | 8,195,000 | SGD | | JPM | | 11/03/2021 | | (9,809) |
| 5,850,793 | USD | | 7,915,000 | SGD | | BNP | | 11/03/2021 | | (18,613) |
| 14,093,424 | USD | | 474,737,000 | THB | | SCB | | 11/04/2021 | | (212,907) |
| 5,815,494 | USD | | 194,127,000 | THB | | SCB | | 12/07/2021 | | (33,042) |
| 64,320,418 | USD | | 583,911,000 | TRY | | GSC | | 11/04/2021 | | 3,694,048 |
| 49,851,383 | USD | | 454,269,000 | TRY | | BCLY | | 11/04/2021 | | 2,685,495 |
| 2,480,226 | USD | | 22,420,000 | TRY | | BOA | | 11/04/2021 | | 152,400 |
| 41,009,854 | USD | | 399,827,000 | TRY | | GSC | | 12/07/2021 | | 166,199 |
| 6,095,581 | USD | | 169,320,000 | TWD | | CBK | | 11/04/2021 | | 6,795 |
| 6,749,200 | USD | | 188,885,000 | TWD | | JPM | | 11/04/2021 | | (43,148) |
| 9,057,240 | USD | | 251,275,000 | TWD | | JPM | | 12/07/2021 | | 20,803 |
| 6,275,724 | USD | | 92,860,000 | ZAR | | GSC | | 11/04/2021 | | 199,136 |
| 3,704,845 | USD | | 54,100,000 | ZAR | | BOA | | 11/04/2021 | | 164,641 |
| 33,938,193 | USD | | 516,373,000 | ZAR | | MSC | | 11/04/2021 | | 147,694 |
| 7,617,741 | USD | | 116,070,000 | ZAR | | BCLY | | 11/04/2021 | | 22,334 |
| 24,505,690 | USD | | 374,903,000 | ZAR | | BCLY | | 12/07/2021 | | 75,320 |
| Total foreign currency contracts | | $ (24,601,062) |
† See Significant Accounting Policies of accompanying Notes to Financial Statements regarding valuation of investments.
The accompanying notes are an integral part of these financial statements.
The Hartford World Bond Fund
Schedule of Investments – (continued)
October 31, 2021
Fair Value Summary
The following is a summary of the fair valuations according to the inputs used as of October 31, 2021 in valuing the Fund’s investments.
| Description | | Total | | Level 1 | | Level 2 | | Level 3(1) |
| Assets | | | | | | | | |
| Asset & Commercial Mortgage-Backed Securities | | $ 268,164,784 | | $ — | | $ 266,294,840 | | $ 1,869,944 |
| Convertible Bonds | | 18,219,306 | | — | | 18,219,306 | | — |
| Corporate Bonds | | 572,116,746 | | — | | 572,116,746 | | — |
| Foreign Government Obligations | | 2,603,679,250 | | — | | 2,603,679,250 | | — |
| Senior Floating Rate Interests | | 138,791,099 | | — | | 138,791,099 | | — |
| U.S. Government Agencies | | 36,149,244 | | — | | 36,149,244 | | — |
| U.S. Government Securities | | 272,180,912 | | — | | 272,180,912 | | — |
| Common Stocks | | | | | | | | |
| United States | | 30,638 | | 30,638 | | — | | — |
| Escrows | | 3,096,728 | | — | | 3,096,728 | | — |
| Short-Term Investments | | 127,018,364 | | 1,365,065 | | 125,653,299 | | — |
| Purchased Options | | 226,889 | | — | | 226,889 | | — |
| Foreign Currency Contracts(2) | | 46,128,803 | | — | | 46,128,803 | | — |
| Futures Contracts(2) | | 13,527,648 | | 13,527,648 | | — | | — |
| Swaps - Credit Default(2) | | 633,435 | | — | | 633,435 | | — |
| Swaps - Interest Rate(2) | | 6,417,587 | | — | | 6,417,587 | | — |
| Total | | $ 4,106,381,433 | | $ 14,923,351 | | $ 4,089,588,138 | | $ 1,869,944 |
| Liabilities | | | | | | | | |
| Foreign Currency Contracts(2) | | $ (70,729,865) | | $ — | | $ (70,729,865) | | $ — |
| Futures Contracts(2) | | (11,896,697) | | (11,896,697) | | — | | — |
| Swaps - Credit Default(2) | | (447,075) | | — | | (447,075) | | — |
| Swaps - Interest Rate(2) | | (16,986,674) | | — | | (16,986,674) | | — |
| Total | | $ (100,060,311) | | $ (11,896,697) | | $ (88,163,614) | | $ — |
| (1) | For the year ended October 31, 2021, investments valued at $18,002 were transferred out of Level 3 due to the initiation of a vendor providing prices that are based on market activity which has been determined to be significant observable input. There were no transfers into Level 3. |
| (2) | Derivative instruments (excluding purchased and written options, if applicable) are valued at the unrealized appreciation/(depreciation) on the investments. |
Level 3 investments at the beginning and/or end of the period in relation to net assets were not significant and accordingly, a reconciliation of Level 3 assets for the year ended October 31, 2021 is not presented.
The accompanying notes are an integral part of these financial statements.
Hartford Fixed Income Funds
GLOSSARY: (abbreviations used in preceding Schedules of Investments)
| Counterparty Abbreviations: |
| ANZ | Australia and New Zealand Banking Group |
| BCLY | Barclays |
| BNP | BNP Paribas Securities Services |
| BOA | Bank of America Securities LLC |
| CBA | Commonwealth Bank of Australia |
| CBK | Citibank NA |
| CIB | Credit Agricole |
| CIBC | Canadian Imperial Bank of Commerce |
| CSI | Credit Suisse International |
| DEUT | Deutsche Bank Securities, Inc. |
| GSC | Goldman Sachs & Co. |
| HSBC | HSBC Bank USA |
| JPM | JP Morgan Chase & Co. |
| MSC | Morgan Stanley |
| NWM | NatWest Markets Plc |
| RBC | RBC Dominion Securities, Inc. |
| RBS | RBS Greenwich Capital |
| SCB | Standard Chartered Bank |
| SSG | State Street Global Markets LLC |
| TDB | Toronto-Dominion Bank |
| UBS | UBS AG |
| WEST | Westpac International |
| Currency Abbreviations: |
| ARS | Argentine Peso |
| AUD | Australia Dollar |
| BRL | Brazil Real |
| CAD | Canadian Dollar |
| CLP | Chile Peso |
| CNY | China Yuan Renminbi |
| COP | Colombia Peso |
| CZK | Czech Republic Koruna |
| EGP | Egypt Pound |
| EUR | Euro Member Countries |
| GBP | British Pound |
| HUF | Hungary Forint |
| IDR | Indonesia Rupiah |
| INR | Indian Rupee |
| JPY | Japan Yen |
| KRW | Korean Won |
| MXN | Mexican Peso |
| MYR | Malaysia Ringgit |
| NOK | Norway Krone |
| NZD | New Zealand Dollar |
| PEN | Peru Nuevo Sol |
| PLN | Poland Zloty |
| RON | Romania New Leu |
| RUB | Russia Ruble |
| SEK | Sweden Krona |
| THB | Thailand Baht |
| USD | United States Dollar |
| UYU | Uruguay Peso |
| ZAR | South Africa Rand |
| Index Abbreviations: |
| BADLAR | Buenos Aires Deposits of Large Amount Rate |
| CMS | Constant Maturity Swap |
| CMT | Constant Maturity Treasury Index |
| CPI | Consumer Price Index |
| CPURNSA | Consumer Price All Urban Non-Seasonally Adjusted |
| iBoxx | Markit iBoxx Indices - Euro, Sterling, Asian, US Dollar and European High-Yield Bond Markets |
| ICE | Intercontinental Exchange, Inc. |
| MTA | Monthly Treasury Average Index |
| Municipal Abbreviations: |
| Auth | Authority |
| Dev | Development |
| Dist | District |
| Facs | Facilities |
| GO | General Obligation |
| PA | Port Authority |
| Redev | Redevelopment |
| Rev | Revenue |
| VA | Veterans Administration |
| Other Abbreviations: |
| AGC | Assured Guarantee Corp. |
| AGM | Assured Guaranty Municipal |
| AMBAC | American Municipal Bond Assurance Co. |
| BAM | Build America Mutual Assurance Corp. |
| BBSW | Bank Bill Swap Reference Rate |
| BUBOR | Budapest Interbank Offered Rate |
| BZDIOVRA | Brazil Cetip Interbank Deposit Rate |
| CD | Certificate of Deposit |
| CDOR | Canadian Dollar Offered Rate |
| CJSC | Closed Joint Stock Company |
| CLICP | Sinacofi Chile Interbank Offered Rate |
| CLO | Collateralized Loan Obligation |
| CMO | Collateralized Mortgage Obligation |
| CR | Custodial Receipts |
| EM | Emerging Markets |
| ETF | Exchange-Traded Fund |
| EURIBOR | Euro Interbank Offered Rate |
| FHLB | Federal Home Loan Bank |
| FHLMC | Federal Home Loan Mortgage Corp. |
| FNMA | Federal National Mortgage Association |
| GNMA | Government National Mortgage Association |
| HUD | Housing and Urban Development |
| JIBAR | Johannesburg Interbank Agreed Rate |
| JSC | Joint Stock Company |
| LIBOR | London Interbank Offered Rate |
| MIBOR | Mumbai Inter-Bank Offered Rate |
| MSCI | Morgan Stanley Capital International |
| MXIBTIIE | Mexico Interbank Equilibrium Interest Rate |
| NATL | National Public Finance Guarantee Corp. |
| NIBOR | Norwegian Interbank Offered Rate |
| OJSC | Open Joint Stock Company |
| PIK | Payment-in-kind |
| PJSC | Private Joint Stock Company |
| PRIBOR | Prague Interbank Offered Rate |
| PSF-GTD | Permanent School Fund Guaranteed |
| PT | Perseroan Terbatas |
| Q-SBLF | Qualified School Bond Loan Fund |
| SCP | State Credit Enhancement Program |
| SOFR | Secured Overnight Financing Rate |
| SONIA | Sterling Overnight Index Average |
| SPDR | Standard & Poor's Depositary Receipt |
| ST GTD | State Guaranteed |
| STIBOR | Stockholm Interbank Offered Rate |
| TBA | To Be Announced |
| TIIE | Interbank Equilibrium Interest Rate |
| UMBS | Uniform Mortgage-Backed Securities |
| WIBOR | Warsaw Interbank Offered Rate |
Hartford Fixed Income Funds
Statements of Assets and Liabilities
October 31, 2021
| | The Hartford
Emerging
Markets Local
Debt Fund | | The Hartford
Floating Rate
Fund | | The Hartford
Floating Rate
High Income
Fund | | The Hartford
High Yield
Fund | | The Hartford
Inflation Plus
Fund | | The Hartford
Municipal
Opportunities
Fund |
| Assets: | | | | | | | | | | | |
| Investments in securities, at market value(1) | $ 56,199,418 | | $ 2,128,026,227 | | $ 439,784,234 | | $ 444,149,758 | | $ 562,806,614 | | $ 1,732,549,151 |
| Repurchase agreements | 2,263,762 | | — | | — | | 16,977,787 | | 4,075,558 | | 48,645,768 |
| Cash | 543,583 | | — | | 10 | | 5,634,710 | | 5,604,057 | | 12,239,706 |
| Cash collateral due from broker on swap contracts | 330,000 | | — | | — | | — | | — | | — |
| Cash collateral held for securities on loan | 28,603 | | — | | — | | — | | — | | — |
| Foreign currency | 221,492 | | 32,924,354 | | 4,262,273 | | — | | 637,044 | | — |
| Unrealized appreciation on OTC swap contracts | 138,775 | | 486,728 | | 98,226 | | — | | 3,564,808 | | — |
| Unrealized appreciation on foreign currency contracts | 717,595 | | 1,188,028 | | 241,560 | | 134,834 | | 450,721 | | — |
| Receivables: | | | | | | | | | | | |
| From affiliates | 12,649 | | — | | 33,194 | | 18,031 | | — | | — |
| Investment securities sold | 225,301 | | 179,241,131 | | 48,838,266 | | 383,190 | | 268,799 | | — |
| Fund shares sold | 105,638 | | 5,312,570 | | 737,231 | | 870,187 | | 1,056,788 | | 7,914,674 |
| Dividends and interest | 680,058 | | 9,738,527 | | 2,072,442 | | 5,657,854 | | 1,227,745 | | 19,493,071 |
| Securities lending income | 134 | | — | | — | | — | | — | | — |
| Variation margin on futures contracts | 60,682 | | — | | — | | — | | 133,289 | | — |
| Variation margin on centrally cleared swap contracts | 6,341 | | — | | — | | — | | 66,486 | | — |
| Tax reclaims | 75,725 | | — | | — | | — | | — | | — |
| Other assets | 40,782 | | 83,187 | | 65,724 | | 58,251 | | 55,010 | | 78,347 |
| Total assets | 61,650,538 | | 2,357,000,752 | | 496,133,160 | | 473,884,602 | | 579,946,919 | | 1,820,920,717 |
| Liabilities: | | | | | | | | | | | |
| Unrealized depreciation on foreign currency contracts | 1,530,838 | | 5,843 | | 2,394 | | — | | 215,241 | | — |
| Unrealized depreciation on bond forward contracts | — | | — | | — | | — | | 212,059 | | — |
| Obligation to return securities lending collateral | 572,058 | | — | | — | | — | | — | | — |
| Unrealized depreciation on OTC swap contracts | 170,754 | | — | | — | | — | | 11,383 | | — |
| Cash collateral due to broker on swap contracts | — | | 280,000 | | 80,000 | | — | | 3,019,825 | | — |
| Unfunded loan commitments | — | | — | | 20,946 | | — | | — | | — |
| Payables: | | | | | | | | | | | |
| Investment securities purchased | 482,959 | | 233,583,050 | | 56,520,984 | | 5,511,895 | | 7,202,366 | | 33,141,945 |
| Fund shares redeemed | 10,084 | | 2,975,860 | | 739,006 | | 539,704 | | 187,368 | | 2,328,466 |
| Investment management fees | 37,719 | | 1,089,096 | | 258,895 | | 198,309 | | 185,327 | | 466,580 |
| Transfer agent fees | 11,009 | | 282,532 | | 58,775 | | 86,036 | | 90,282 | | 172,274 |
| Accounting services fees | 2,021 | | 51,461 | | 13,859 | | 14,987 | | 18,317 | | 44,807 |
| Board of Directors' fees | 213 | | 5,493 | | 1,053 | | 1,098 | | 1,370 | | 4,513 |
| Foreign taxes | 9,405 | | — | | — | | — | | — | | — |
| Distribution fees | 450 | | 48,429 | | 7,559 | | 14,825 | | 16,163 | | 27,917 |
| Distributions payable | — | | 1,050,401 | | 4,719 | | 16,849 | | — | | 253,275 |
| Written options | 161,139 | | — | | — | | — | | — | | — |
| Accrued expenses | 45,868 | | 100,170 | | 58,961 | | 54,434 | | 51,509 | | 50,482 |
| Total liabilities | 3,034,517 | | 239,472,335 | | 57,767,151 | | 6,438,137 | | 11,211,210 | | 36,490,259 |
| Net assets | $ 58,616,021 | | $ 2,117,528,417 | | $ 438,366,009 | | $ 467,446,465 | | $ 568,735,709 | | $ 1,784,430,458 |
| Summary of Net Assets: | | | | | | | | | | | |
| Capital stock and paid-in-capital | $ 131,899,069 | | $ 2,609,401,984 | | $ 496,973,585 | | $ 471,275,476 | | $ 591,820,461 | | $ 1,718,367,728 |
| Distributable earnings (loss) | (73,283,048) | | (491,873,567) | | (58,607,576) | | (3,829,011) | | (23,084,752) | | 66,062,730 |
| Net assets | $ 58,616,021 | | $ 2,117,528,417 | | $ 438,366,009 | | $ 467,446,465 | | $ 568,735,709 | | $ 1,784,430,458 |
| Shares authorized | 550,000,000 | | 3,200,000,000 | | 550,000,000 | | 485,000,000 | | 6,190,000,000 | | 670,000,000 |
| Par value | $ 0.0010 | | $ 0.0010 | | $ 0.0010 | | $ 0.0010 | | $ 0.0010 | | $ 0.0010 |
| Class A: Net asset value per share | $ 5.39 | | $ 8.40 | | $ 9.68 | | $ 7.62 | | $ 11.63 | | $ 9.04 |
| Maximum offering price per share | 5.64 | | 8.66 | | 9.98 | | 7.98 | | 12.18 | | 9.47 |
| Shares outstanding | 741,185 | | 87,897,903 | | 8,464,020 | | 37,715,724 | | 20,015,894 | | 53,753,127 |
| Net Assets | $ 3,995,946 | | $ 738,311,103 | | $ 81,906,525 | | $ 287,360,782 | | $ 232,828,358 | | $ 486,105,616 |
| Class C: Net asset value per share | $ 5.40 | | $ 8.48 | | $ 9.76 | | $ 7.60 | | $ 11.23 | | $ 9.05 |
| Shares outstanding | 328,156 | | 13,082,119 | | 2,597,861 | | 2,337,344 | | 2,082,433 | | 5,385,418 |
| Net Assets | $ 1,771,489 | | $ 110,915,416 | | $ 25,357,431 | | $ 17,756,954 | | $ 23,381,536 | | $ 48,739,740 |
| Class I: Net asset value per share | $ 5.36 | | $ 8.37 | | $ 9.63 | | $ 7.63 | | $ 11.88 | | $ 9.05 |
| Shares outstanding | 2,081,995 | | 127,453,337 | | 28,677,864 | | 6,141,745 | | 4,827,691 | | 99,725,035 |
| Net Assets | $ 11,164,241 | | $ 1,066,434,997 | | $ 276,041,480 | | $ 46,881,592 | | $ 57,343,109 | | $ 902,080,944 |
The accompanying notes are an integral part of these financial statements.
Hartford Fixed Income Funds
Statements of Assets and Liabilities – (continued)
October 31, 2021
| | The Hartford
Emerging
Markets Local
Debt Fund | | The Hartford
Floating Rate
Fund | | The Hartford
Floating Rate
High Income
Fund | | The Hartford
High Yield
Fund | | The Hartford
Inflation Plus
Fund | | The Hartford
Municipal
Opportunities
Fund |
| Class R3: Net asset value per share | $ 5.38 | | $ 8.45 | | $ 9.69 | | $ 7.62 | | $ 11.40 | | $ — |
| Shares outstanding | 2,072 | | 542,413 | | 16,538 | | 261,861 | | 2,878,580 | | — |
| Net Assets | $ 11,154 | | $ 4,585,675 | | $ 160,325 | | $ 1,995,687 | | $ 32,804,182 | | $ — |
| Class R4: Net asset value per share | $ 5.36 | | $ 8.39 | | $ 9.66 | | $ 7.63 | | $ 11.65 | | $ — |
| Shares outstanding | 8,332 | | 259,756 | | 41,289 | | 134,714 | | 372,321 | | — |
| Net Assets | $ 44,696 | | $ 2,180,496 | | $ 398,726 | | $ 1,028,318 | | $ 4,336,044 | | $ — |
| Class R5: Net asset value per share | $ 5.14 | | $ 8.37 | | $ 9.63 | | $ 7.59 | | $ 11.83 | | $ — |
| Shares outstanding | 2,205 | | 137,213 | | 1,329,828 | | 97,140 | | 153,615 | | — |
| Net Assets | $ 11,328 | | $ 1,148,121 | | $ 12,801,306 | | $ 737,349 | | $ 1,817,601 | | $ — |
| Class R6: Net asset value per share | $ — | | $ — | | $ — | | $ 7.54 | | $ — | | $ — |
| Shares outstanding | — | | — | | — | | 1,358 | | — | | — |
| Net Assets | $ — | | $ — | | $ — | | $ 10,233 | | $ — | | $ — |
| Class Y: Net asset value per share | $ 5.32 | | $ 8.34 | | $ 9.63 | | $ 7.54 | | $ 11.90 | | $ 9.04 |
| Shares outstanding | 6,974,331 | | 5,930,476 | | 1,371,497 | | 128,923 | | 2,870,266 | | 1,694,552 |
| Net Assets | $ 37,127,311 | | $ 49,433,869 | | $ 13,206,251 | | $ 971,792 | | $ 34,155,631 | | $ 15,318,974 |
| Class F: Net asset value per share | $ 5.37 | | $ 8.35 | | $ 9.64 | | $ 7.61 | | $ 11.88 | | $ 9.03 |
| Shares outstanding | 836,677 | | 17,306,710 | | 2,954,690 | | 14,550,060 | | 15,331,864 | | 36,771,858 |
| Net Assets | $ 4,489,856 | | $ 144,518,740 | | $ 28,493,965 | | $ 110,703,758 | | $ 182,069,248 | | $ 332,185,184 |
| Cost of investments | $ 60,332,331 | | $ 2,170,241,554 | | $ 444,145,943 | | $ 448,064,187 | | $ 552,565,075 | | $ 1,712,933,864 |
| Cost of foreign currency | $ 221,693 | | $ 32,959,973 | | $ 4,266,888 | | $ — | | $ 655,645 | | $ — |
| Written option contracts premiums received | $ 203,974 | | $ — | | $ — | | $ — | | $ — | | $ — |
| (1) Includes Investment in securities on loan, at market value | $ 558,516 | | $ — | | $ — | | $ — | | $ — | | $ — |
The accompanying notes are an integral part of these financial statements.
Hartford Fixed Income Funds
Statements of Assets and Liabilities – (continued)
October 31, 2021
| | Hartford
Municipal Short
Duration Fund | | The Hartford
Short Duration
Fund | | The Hartford
Strategic Income
Fund | | Hartford
Sustainable
Municipal
Bond Fund | | The Hartford
Total Return
Bond Fund | | The Hartford
World Bond
Fund |
| Assets: | | | | | | | | | | | |
| Investments in securities, at market value(1) | $ 33,979,822 | | $ 2,155,089,930 | | $ 3,560,391,986 | | $ 128,934,355 | | $ 4,409,387,728 | | $ 3,914,020,661 |
| Repurchase agreements | 2,382,463 | | 7,139,780 | | 91,510,498 | | 2,610,344 | | 70,018,924 | | 125,653,299 |
| Cash | 599,459 | | 28,652,600 | | 69,255,695 | | 656,882 | | 23,198,413 | | 50,655,942 |
| Cash collateral due from broker on swap contracts | — | | — | | — | | — | | 205,000 | | — |
| Cash collateral held for securities on loan | — | | 22,530 | | 998,521 | | — | | 71,651 | | 71,845 |
| Foreign currency | — | | 5,219,113 | | 15,570,269 | | — | | 723,598 | | 33,138,453 |
| Unrealized appreciation on OTC swap contracts | — | | — | | 522,597 | | — | | — | | 1,955,363 |
| Unrealized appreciation on foreign currency contracts | — | | 198,663 | | 10,018,661 | | — | | 3,661,598 | | 46,128,803 |
| Receivables: | | | | | | | | | | | |
| From affiliates | 11,733 | | — | | — | | 14,537 | | — | | — |
| Investment securities sold | — | | 6,112,586 | | 103,528,768 | | 348,340 | | 628,371,101 | | 52,305,771 |
| Fund shares sold | 27 | | 9,450,845 | | 13,436,837 | | 351,941 | | 5,109,387 | | 7,936,238 |
| Dividends and interest | 389,084 | | 8,901,488 | | 26,436,266 | | 1,300,243 | | 19,974,935 | | 20,520,210 |
| Securities lending income | — | | 233 | | 9,551 | | — | | 345 | | 1,987 |
| Variation margin on futures contracts | — | | 1,401,037 | | 1,642,766 | | — | | 640,743 | | 3,880,963 |
| Variation margin on centrally cleared swap contracts | — | | — | | 70,747 | | — | | — | | — |
| Tax reclaims | — | | 4,983 | | 23,589 | | — | | — | | — |
| OTC swap contracts premiums paid | — | | — | | 336,216 | | — | | 648,425 | | 593,994 |
| Other assets | 23,726 | | 111,158 | | 156,956 | | 28,976 | | 124,119 | | 121,299 |
| Total assets | 37,386,314 | | 2,222,304,946 | | 3,893,909,923 | | 134,245,618 | | 5,162,135,967 | | 4,256,984,828 |
| Liabilities: | | | | | | | | | | | |
| Unrealized depreciation on foreign currency contracts | — | | 22,259 | | 1,507,862 | | — | | 347,820 | | 70,729,865 |
| Obligation to return securities lending collateral | — | | 450,598 | | 19,970,427 | | — | | 1,433,018 | | 1,436,910 |
| Unrealized depreciation on OTC swap contracts | — | | — | | 4,808,853 | | — | | 1,636,437 | | 3,009,009 |
| Cash collateral due to broker on swap contracts | — | | — | | 49,000 | | — | | — | | 10 |
| TBA sale commitments, at market value | — | | — | | — | | — | | 51,319,317 | | — |
| Unfunded loan commitments | — | | — | | 423,035 | | — | | — | | — |
| Payables: | | | | | | | | | | | |
| Investment securities purchased | 982,863 | | 57,666,705 | | 516,260,716 | | 5,587,894 | | 1,654,228,164 | | 37,479,467 |
| Fund shares redeemed | 7,332 | | 4,221,241 | | 2,538,884 | | 58,101 | | 3,863,120 | | 17,130,149 |
| Investment management fees | 10,581 | | 685,336 | | 1,372,979 | | 38,015 | | 815,739 | | 2,088,673 |
| Transfer agent fees | 3,117 | | 278,709 | | 447,280 | | 14,942 | | 320,827 | | 453,516 |
| Accounting services fees | 1,124 | | 52,503 | | 74,913 | | 4,120 | | 83,338 | | 101,391 |
| Board of Directors' fees | 78 | | 5,148 | | 6,221 | | 265 | | 9,440 | | 12,763 |
| Variation margin on centrally cleared swap contracts | — | | — | | — | | — | | 77,542 | | 277,732 |
| Foreign taxes | — | | — | | 22,960 | | — | | — | | — |
| Distribution fees | 1,012 | | 48,215 | | 32,818 | | 2,473 | | 55,238 | | 21,068 |
| Distributions payable | 244 | | 204,304 | | — | | 296 | | 320,538 | | — |
| Written options | — | | — | | 875,883 | | — | | 1,422,948 | | — |
| Accrued expenses | 35,526 | | 86,283 | | 166,021 | | 33,400 | | 170,282 | | 346,599 |
| OTC swap contracts premiums received | — | | — | | 5,004,518 | | — | | 1,440,077 | | 3,810 |
| Total liabilities | 1,041,877 | | 63,721,301 | | 553,562,370 | | 5,739,506 | | 1,717,543,845 | | 133,090,962 |
| Net assets | $ 36,344,437 | | $ 2,158,583,645 | | $ 3,340,347,553 | | $ 128,506,112 | | $ 3,444,592,122 | | $ 4,123,893,866 |
| Summary of Net Assets: | | | | | | | | | | | |
| Capital stock and paid-in-capital | $ 35,962,226 | | $ 2,145,821,456 | | $ 3,321,326,275 | | $ 124,984,519 | | $ 3,380,776,818 | | $ 4,128,793,846 |
| Distributable earnings (loss) | 382,211 | | 12,762,189 | | 19,021,278 | | 3,521,593 | | 63,815,304 | | (4,899,980) |
| Net assets | $ 36,344,437 | | $ 2,158,583,645 | | $ 3,340,347,553 | | $ 128,506,112 | | $ 3,444,592,122 | | $ 4,123,893,866 |
| Shares authorized | 300,000,000 | | 685,000,000 | | 1,300,000,000 | | 300,000,000 | | 1,225,000,000 | | 1,500,000,000 |
| Par value | $ 0.0010 | | $ 0.0010 | | $ 0.0010 | | $ 0.0010 | | $ 0.0010 | | $ 0.0010 |
| Class A: Net asset value per share | $ 10.19 | | $ 10.00 | | $ 9.17 | | $ 11.02 | | $ 10.92 | | $ 10.45 |
| Maximum offering price per share | 10.67 | | 10.20 | | 9.60 | | 11.54 | | 11.43 | | 10.94 |
| Shares outstanding | 2,125,514 | | 92,408,254 | | 44,717,324 | | 3,980,822 | | 116,203,544 | | 33,921,849 |
| Net Assets | $ 21,655,228 | | $ 923,939,426 | | $ 410,004,421 | | $ 43,870,168 | | $ 1,268,773,446 | | $ 354,409,179 |
The accompanying notes are an integral part of these financial statements.
Hartford Fixed Income Funds
Statements of Assets and Liabilities – (continued)
October 31, 2021
| | Hartford
Municipal Short
Duration Fund | | The Hartford
Short Duration
Fund | | The Hartford
Strategic Income
Fund | | Hartford
Sustainable
Municipal
Bond Fund | | The Hartford
Total Return
Bond Fund | | The Hartford
World Bond
Fund |
| Class C: Net asset value per share | $ 10.18 | | $ 10.00 | | $ 9.25 | | $ 11.02 | | $ 11.05 | | $ 10.19 |
| Shares outstanding | 136,490 | | 6,923,029 | | 10,051,002 | | 437,489 | | 1,369,479 | | 3,740,461 |
| Net Assets | $ 1,389,630 | | $ 69,234,465 | | $ 92,929,478 | | $ 4,819,464 | | $ 15,129,801 | | $ 38,120,212 |
| Class I: Net asset value per share | $ 10.17 | | $ 9.97 | | $ 9.20 | | $ 10.99 | | $ 10.88 | | $ 10.53 |
| Shares outstanding | 811,406 | | 71,864,116 | | 222,249,957 | | 4,680,577 | | 27,366,348 | | 169,284,808 |
| Net Assets | $ 8,252,645 | | $ 716,235,744 | | $ 2,044,204,324 | | $ 51,423,139 | | $ 297,839,003 | | $ 1,783,317,408 |
| Class R3: Net asset value per share | $ — | | $ 9.98 | | $ 9.15 | | $ — | | $ 11.22 | | $ 10.37 |
| Shares outstanding | — | | 159,623 | | 349,097 | | — | | 406,778 | | 95,163 |
| Net Assets | $ — | | $ 1,593,386 | | $ 3,194,696 | | $ — | | $ 4,565,693 | | $ 986,799 |
| Class R4: Net asset value per share | $ — | | $ 9.98 | | $ 9.16 | | $ — | | $ 11.12 | | $ 10.45 |
| Shares outstanding | — | | 441,998 | | 1,486,304 | | — | | 1,310,617 | | 370,652 |
| Net Assets | $ — | | $ 4,412,001 | | $ 13,609,922 | | $ — | | $ 14,580,384 | | $ 3,872,600 |
| Class R5: Net asset value per share | $ — | | $ 9.95 | | $ 9.16 | | $ — | | $ 11.06 | | $ 10.54 |
| Shares outstanding | — | | 155,365 | | 5,116,098 | | — | | 213,609 | | 818,605 |
| Net Assets | $ — | | $ 1,546,201 | | $ 46,839,557 | | $ — | | $ 2,361,887 | | $ 8,624,709 |
| Class R6: Net asset value per share | $ — | | $ 9.91 | | $ 9.16 | | $ — | | $ 10.97 | | $ 10.58 |
| Shares outstanding | — | | 203,783 | | 17,579,649 | | — | | 18,601,227 | | 11,900,523 |
| Net Assets | $ — | | $ 2,020,163 | | $ 161,021,474 | | $ — | | $ 203,981,668 | | $ 125,885,030 |
| Class Y: Net asset value per share | $ — | | $ 9.94 | | $ 9.14 | | $ — | | $ 10.99 | | $ 10.57 |
| Shares outstanding | — | | 898,490 | | 22,192,526 | | — | | 37,761,717 | | 27,664,371 |
| Net Assets | $ — | | $ 8,926,645 | | $ 202,890,398 | | $ — | | $ 415,024,303 | | $ 292,318,516 |
| Class F: Net asset value per share | $ 10.18 | | $ 9.95 | | $ 9.19 | | $ 10.99 | | $ 10.81 | | $ 10.55 |
| Shares outstanding | 495,554 | | 43,263,761 | | 39,789,332 | | 2,583,603 | | 113,042,068 | | 143,705,492 |
| Net Assets | $ 5,046,934 | | $ 430,675,614 | | $ 365,653,283 | | $ 28,393,341 | | $ 1,222,335,937 | | $ 1,516,359,413 |
| Cost of investments | $ 35,969,738 | | $ 2,151,282,381 | | $ 3,675,430,640 | | $ 128,663,318 | | $ 4,446,318,624 | | $ 4,016,058,607 |
| Cost of foreign currency | $ — | | $ 5,224,754 | | $ 15,702,074 | | $ — | | $ 724,380 | | $ 32,564,804 |
| Proceeds of TBA sale commitments | $ — | | $ — | | $ — | | $ — | | $ 51,364,124 | | $ — |
| Written option contracts premiums received | $ — | | $ — | | $ 1,327,650 | | $ — | | $ 2,262,565 | | $ — |
| (1) Includes Investment in securities on loan, at market value | $ — | | $ 437,372 | | $ 19,306,224 | | $ — | | $ 1,385,753 | | $ 1,385,188 |
The accompanying notes are an integral part of these financial statements.
Hartford Fixed Income Funds
Statements of Operations
For the Year Ended October 31, 2021
| | The Hartford
Emerging
Markets Local
Debt Fund | | The Hartford
Floating Rate
Fund | | The Hartford
Floating Rate
High Income
Fund | | The Hartford
High Yield
Fund | | The Hartford
Inflation Plus
Fund | | The Hartford
Municipal
Opportunities
Fund |
| Investment Income: | | | | | | | | | | | |
| Dividends | $ — | | $ 2,725,604 | | $ 550,719 | | $ — | | $ — | | $ — |
| Interest | 2,875,970 | | 85,875,403 | | 17,362,480 | | 20,363,774 | | 21,014,264 | | 38,610,767 |
| Securities lending | 621 | | — | | — | | — | | 75 | | — |
| Less: Foreign tax withheld | (30,299) | | — | | — | | (5,651) | | (71,326) | | — |
| Total investment income, net | 2,846,292 | | 88,601,007 | | 17,913,199 | | 20,358,123 | | 20,943,013 | | 38,610,767 |
| Expenses: | | | | | | | | | | | |
| Investment management fees | 487,974 | | 11,851,296 | | 2,655,210 | | 2,120,462 | | 2,063,613 | | 5,154,585 |
| Transfer agent fees | | | | | | | | | | | |
| Class A | 8,602 | | 721,610 | | 85,895 | | 443,655 | | 327,017 | | 288,317 |
| Class C | 4,078 | | 156,065 | | 33,015 | | 31,151 | | 27,707 | | 37,005 |
| Class I | 12,395 | | 685,355 | | 196,338 | | 28,963 | | 49,505 | | 595,299 |
| Class R3 | 25 | | 9,641 | | 288 | | 3,416 | | 75,585 | | — |
| Class R4 | 78 | | 3,826 | | 625 | | 1,831 | | 8,029 | | — |
| Class R5 | 29 | | 1,227 | | 12,429 | | 798 | | 2,069 | | — |
| Class Y | 46,240 | | 44,009 | | 11,753 | | 1,090 | | 35,187 | | 13,728 |
| Class F | 162 | | 1,747 | | 371 | | 1,672 | | 205 | | 1,699 |
| Distribution fees | | | | | | | | | | | |
| Class A | 10,741 | | 1,780,587 | | 179,774 | | 676,110 | | 537,943 | | 1,170,610 |
| Class C | 19,179 | | 1,611,313 | | 316,840 | | 230,538 | | 213,315 | | 547,087 |
| Class R3 | 57 | | 23,223 | | 662 | | 8,097 | | 171,811 | | — |
| Class R4 | 115 | | 5,626 | | 922 | | 2,693 | | 11,912 | | — |
| Custodian fees | 10,044 | | 16,147 | | 5,113 | | 8,488 | | 9,400 | | 8,355 |
| Registration and filing fees | 107,136 | | 169,590 | | 115,348 | | 137,651 | | 120,907 | | 182,798 |
| Accounting services fees | 11,064 | | 289,229 | | 65,407 | | 72,579 | | 90,536 | | 250,389 |
| Board of Directors' fees | 1,566 | | 47,427 | | 9,583 | | 10,903 | | 13,210 | | 43,289 |
| Audit and tax fees | 33,056 | | 43,717 | | 43,628 | | 30,012 | | 36,029 | | 30,073 |
| Other expenses | 22,913 | | 170,517 | | 52,343 | | 85,708 | | 59,912 | | 113,115 |
| Total expenses (before waivers, reimbursements and fees paid indirectly) | 775,454 | | 17,632,152 | | 3,785,544 | | 3,895,817 | | 3,853,892 | | 8,436,349 |
| Expense waivers | (166,073) | | (17,232) | | (270,768) | | (154,279) | | — | | — |
| Transfer agent fee waivers | — | | — | | — | | — | | (4,251) | | — |
| Distribution fee reimbursements | (197) | | (8,045) | | (144) | | (5,749) | | (7,612) | | (2,809) |
| Total waivers, reimbursements and fees paid indirectly | (166,270) | | (25,277) | | (270,912) | | (160,028) | | (11,863) | | (2,809) |
| Total expenses | 609,184 | | 17,606,875 | | 3,514,632 | | 3,735,789 | | 3,842,029 | | 8,433,540 |
| Net Investment Income (Loss) | 2,237,108 | | 70,994,132 | | 14,398,567 | | 16,622,334 | | 17,100,984 | | 30,177,227 |
| Net Realized Gain (Loss) on Investments, Other Financial Instruments and Foreign Currency Transactions on: | | | | | | | | | | | |
| Investments | 162,348 | | 14,080,131 | | 6,562,639 | | 6,824,389 | | 8,342,399 | | (222,907) |
| Less: Foreign taxes paid on realized capital gains | (22,771) | | — | | — | | — | | (26,004) | | — |
| Purchased options contracts | (125,876) | | — | | — | | — | | (72,770) | | — |
| Futures contracts | (42,920) | | — | | — | | — | | 313,073 | | — |
| Written options contracts | 71,578 | | — | | — | | — | | — | | — |
| Swap contracts | (105,305) | | 5,959,493 | | 1,390,595 | | — | | 2,921,461 | | — |
| Bond Forwards | — | | — | | — | | — | | 3,341,445 | | — |
| Foreign currency contracts | 1,224,436 | | 7,589,538 | | 1,301,421 | | 844,283 | | 329,832 | | — |
| Other foreign currency transactions | (18,166) | | (1,254,296) | | (42,964) | | 28,445 | | 23,039 | | — |
| Net Realized Gain (Loss) on Investments, Other Financial Instruments and Foreign Currency Transactions | 1,143,324 | | 26,374,866 | | 9,211,691 | | 7,697,117 | | 15,172,475 | | (222,907) |
| Net Changes in Unrealized Appreciation (Depreciation) of Investments, Other Financial Instruments and Foreign Currency Transactions of: | | | | | | | | | | | |
| Investments * | (729,311) | | 45,904,417 | | 6,113,800 | | 9,114,134 | | (151,801) | | 16,090,687 |
| Purchased options contracts | (241) | | — | | — | | — | | 72,723 | | — |
| Futures contracts | 141,007 | | — | | — | | — | | (96,197) | | — |
| Written options contracts | (56,833) | | — | | — | | — | | — | | — |
| Swap contracts | 23,225 | | (2,320,956) | | (647,852) | | — | | 3,209,697 | | — |
| Bond forward contracts | — | | — | | — | | — | | 8,249 | | — |
| Foreign currency contracts | (513,552) | | (2,774,811) | | (664,257) | | (230,246) | | (172,867) | | — |
| Translation of other assets and liabilities in foreign currencies | (2,947) | | (274,942) | | (128,259) | | (3,120) | | (27,841) | | — |
The accompanying notes are an integral part of these financial statements.
Hartford Fixed Income Funds
Statements of Operations – (continued)
For the Year Ended October 31, 2021
| | The Hartford
Emerging
Markets Local
Debt Fund | | The Hartford
Floating Rate
Fund | | The Hartford
Floating Rate
High Income
Fund | | The Hartford
High Yield
Fund | | The Hartford
Inflation Plus
Fund | | The Hartford
Municipal
Opportunities
Fund |
| Net Changes in Unrealized Appreciation (Depreciation) of Investments, Other Financial Instruments and Foreign Currency Transactions | (1,138,652) | | 40,533,708 | | 4,673,432 | | 8,880,768 | | 2,841,963 | | 16,090,687 |
| Net Gain (Loss) on Investments, Other Financial Instruments and Foreign Currency Transactions | 4,672 | | 66,908,574 | | 13,885,123 | | 16,577,885 | | 18,014,438 | | 15,867,780 |
| Net Increase (Decrease) in Net Assets Resulting from Operations | $ 2,241,780 | | $ 137,902,706 | | $ 28,283,690 | | $ 33,200,219 | | $ 35,115,422 | | $ 46,045,007 |
| * Includes change in unrealized appreciation (depreciation) on deferred capital gains tax | $ 876 | | $ — | | $ — | | $ — | | $ 12,104 | | $ — |
The accompanying notes are an integral part of these financial statements.
Hartford Fixed Income Funds
Statements of Operations – (continued)
For the Year Ended October 31, 2021
| | Hartford
Municipal Short
Duration Fund | | The Hartford
Short Duration
Fund | | The Hartford
Strategic Income
Fund | | Hartford
Sustainable
Municipal
Bond Fund | | The Hartford
Total Return
Bond Fund | | The Hartford
World Bond
Fund |
| Investment Income: | | | | | | | | | | | |
| Dividends | $ — | | $ — | | $ 546,840 | | $ — | | $ 89,952 | | $ 121,665 |
| Interest | 561,696 | | 44,058,412 | | 99,145,818 | | 2,191,887 | | 77,807,355 | | 63,299,106 |
| Securities lending | — | | 6,553 | | 50,459 | | — | | 46,968 | | 27,639 |
| Less: Foreign tax withheld | — | | — | | (115,326) | | — | | (390) | | (649,513) |
| Total investment income, net | 561,696 | | 44,064,965 | | 99,627,791 | | 2,191,887 | | 77,943,885 | | 62,798,897 |
| Expenses: | | | | | | | | | | | |
| Investment management fees | 105,729 | | 7,229,119 | | 12,965,791 | | 376,044 | | 9,340,445 | | 25,439,347 |
| Transfer agent fees | | | | | | | | | | | |
| Class A | 10,512 | | 1,072,224 | | 451,131 | | 22,833 | | 1,353,860 | | 481,897 |
| Class C | 1,602 | | 76,687 | | 82,402 | | 5,487 | | 37,002 | | 55,100 |
| Class I | 4,840 | | 391,696 | | 1,480,255 | | 45,581 | | 265,935 | | 1,736,276 |
| Class R3 | — | | 3,952 | | 4,867 | | — | | 10,644 | | 2,585 |
| Class R4 | — | | 2,392 | | 10,042 | | — | | 25,163 | | 24,058 |
| Class R5 | — | | 2,158 | | 40,240 | | — | | 2,913 | | 9,886 |
| Class R6 | — | | 63 | | 2,357 | | — | | 2,552 | | 4,883 |
| Class Y | — | | 9,287 | | 165,742 | | — | | 280,415 | | 342,814 |
| Class F | 141 | | 7,204 | | 1,261 | | 159 | | 10,872 | | 60,934 |
| Distribution fees | | | | | | | | | | | |
| Class A | 50,522 | | 2,237,568 | | 926,305 | | 107,151 | | 3,124,410 | | 943,568 |
| Class C | 14,044 | | 798,054 | | 876,590 | | 49,438 | | 231,449 | | 506,054 |
| Class R3 | — | | 8,982 | | 11,061 | | — | | 24,190 | | 5,903 |
| Class R4 | — | | 11,622 | | 20,259 | | — | | 37,676 | | 35,539 |
| Custodian fees | 355 | | 12,306 | | 146,214 | | 915 | | 43,705 | | 164,419 |
| Registration and filing fees | 62,386 | | 241,695 | | 344,300 | | 78,031 | | 244,960 | | 345,483 |
| Accounting services fees | 5,204 | | 285,909 | | 383,374 | | 18,600 | | 489,532 | | 631,028 |
| Board of Directors' fees | 781 | | 50,006 | | 71,034 | | 2,828 | | 87,270 | | 107,065 |
| Audit and tax fees | 29,993 | | 36,090 | | 49,262 | | 29,997 | | 54,666 | | 45,751 |
| Other expenses | 17,248 | | 196,397 | | 265,011 | | 17,916 | | 427,174 | | 573,935 |
| Total expenses (before waivers, reimbursements and fees paid indirectly) | 303,357 | | 12,673,411 | | 18,297,498 | | 754,980 | | 16,094,833 | | 31,516,525 |
| Expense waivers | (106,037) | | — | | — | | (128,687) | | — | | — |
| Transfer agent fee waivers | — | | — | | — | | — | | — | | (23,685) |
| Distribution fee reimbursements | (735) | | (132,627) | | (1,972) | | (280) | | (23,511) | | (2,111) |
| Total waivers, reimbursements and fees paid indirectly | (106,772) | | (132,627) | | (1,972) | | (128,967) | | (23,511) | | (25,796) |
| Total expenses | 196,585 | | 12,540,784 | | 18,295,526 | | 626,013 | | 16,071,322 | | 31,490,729 |
| Net Investment Income (Loss) | 365,111 | | 31,524,181 | | 81,332,265 | | 1,565,874 | | 61,872,563 | | 31,308,168 |
| Net Realized Gain (Loss) on Investments, Other Financial Instruments and Foreign Currency Transactions on: | | | | | | | | | | | |
| Investments | (10,314) | | 8,785,160 | | 34,218,592 | | 668,157 | | 17,157,519 | | 63,380,566 |
| Less: Foreign taxes paid on realized capital gains | — | | — | | (14,207) | | — | | — | | — |
| Purchased options contracts | — | | — | | (152,429) | | — | | (180,459) | | (13,203,694) |
| Futures contracts | — | | 2,228,534 | | (17,998,688) | | — | | 4,678,719 | | 25,502,106 |
| Written options contracts | — | | — | | 16,581,835 | | — | | 6,828,864 | | 4,763,281 |
| Swap contracts | — | | — | | (2,224,285) | | — | | 3,131,514 | | (15,462,940) |
| Foreign currency contracts | — | | 1,471,421 | | 8,992,117 | | — | | 4,633,823 | | 1,114,263 |
| Other foreign currency transactions | — | | (189,782) | | (246,100) | | — | | (105,700) | | 2,500,392 |
| Net Realized Gain (Loss) on Investments, Other Financial Instruments and Foreign Currency Transactions | (10,314) | | 12,295,333 | | 39,156,835 | | 668,157 | | 36,144,280 | | 68,593,974 |
| Net Changes in Unrealized Appreciation (Depreciation) of Investments, Other Financial Instruments and Foreign Currency Transactions of: | | | | | | | | | | | |
| Investments * | 17,714 | | (17,756,502) | | (22,579,223) | | 487,346 | | (83,035,023) | | (99,328,670) |
| Purchased options contracts | — | | — | | (1,657,262) | | — | | (2,682,648) | | 2,097,403 |
| Futures contracts | — | | 1,730,144 | | 2,780,460 | | — | | 7,091,629 | | 264,012 |
| Written options contracts | — | | — | | 850,429 | | — | | 1,356,467 | | (1,691,041) |
| Swap contracts | — | | — | | (675,333) | | — | | 153,236 | | (10,433,439) |
| Foreign currency contracts | — | | (287,301) | | 5,968,776 | | — | | 2,728,568 | | (1,571,047) |
| Translation of other assets and liabilities in foreign currencies | — | | (33,589) | | (249,465) | | — | | (77,040) | | 767,054 |
The accompanying notes are an integral part of these financial statements.
Hartford Fixed Income Funds
Statements of Operations – (continued)
For the Year Ended October 31, 2021
| | Hartford
Municipal Short
Duration Fund | | The Hartford
Short Duration
Fund | | The Hartford
Strategic Income
Fund | | Hartford
Sustainable
Municipal
Bond Fund | | The Hartford
Total Return
Bond Fund | | The Hartford
World Bond
Fund |
| Net Changes in Unrealized Appreciation (Depreciation) of Investments, Other Financial Instruments and Foreign Currency Transactions | 17,714 | | (16,347,248) | | (15,561,618) | | 487,346 | | (74,464,811) | | (109,895,728) |
| Net Gain (Loss) on Investments, Other Financial Instruments and Foreign Currency Transactions | 7,400 | | (4,051,915) | | 23,595,217 | | 1,155,503 | | (38,320,531) | | (41,301,754) |
| Net Increase (Decrease) in Net Assets Resulting from Operations | $ 372,511 | | $ 27,472,266 | | $ 104,927,482 | | $ 2,721,377 | | $ 23,552,032 | | $ (9,993,586) |
| * Includes change in unrealized appreciation (depreciation) on deferred capital gains tax | $ — | | $ — | | $ (15,551) | | $ — | | $ — | | $ — |
The accompanying notes are an integral part of these financial statements.
Hartford Fixed Income Funds
Statements of Changes in Net Assets
For the Year Ended October 31, 2021
| | The Hartford
Emerging Markets
Local Debt Fund | | The Hartford
Floating Rate Fund |
| | For the
Year Ended
October 31,
2021 | | For the
Year Ended
October 31,
2020 | | For the
Year Ended
October 31,
2021 | | For the
Year Ended
October 31,
2020 |
| Operations: | | | | | | | |
| Net investment income (loss) | $ 2,237,108 | | $ 4,281,657 | | $ 70,994,132 | | $ 85,315,726 |
| Net realized gain (loss) on investments, other financial instruments and foreign currency transactions | 1,143,324 | | (10,031,982) | | 26,374,866 | | (179,120,064) |
| Net changes in unrealized appreciation (depreciation) of investments, other financial instruments and foreign currency transactions | (1,138,652) | | (3,643,356) | | 40,533,708 | | 29,885,112 |
| Net Increase (Decrease) in Net Assets Resulting from Operations | 2,241,780 | | (9,393,681) | | 137,902,706 | | (63,919,226) |
| Distributions to Shareholders: | | | | | | | |
| From distributable earnings: | | | | | | | |
| Class A | (133,250) | | — | | (21,641,093) | | (24,453,650) |
| Class C | (45,865) | | — | | (3,702,166) | | (9,949,548) |
| Class I | (373,191) | | — | | (31,415,921) | | (39,342,068) |
| Class R3 | (328) | | — | | (128,958) | | (179,234) |
| Class R4 | (1,455) | | — | | (68,153) | | (94,566) |
| Class R5 | (816) | | — | | (37,242) | | (42,641) |
| Class Y | (1,515,399) | | — | | (1,586,807) | | (2,006,371) |
| Class F | (143,206) | | — | | (4,114,279) | | (9,332,178) |
| From return of capital: | | | | | | | |
| Class A | — | | (206,607) | | — | | — |
| Class C | — | | (74,958) | | — | | — |
| Class I | — | | (992,618) | | — | | — |
| Class R3 | — | | (466) | | — | | — |
| Class R4 | — | | (1,856) | | — | | — |
| Class R5 | — | | (1,784) | | — | | — |
| Class Y | — | | (2,882,353) | | — | | — |
| Class F | — | | (169,883) | | — | | — |
| Total distributions | (2,213,510) | | (4,330,525) | | (62,694,619) | | (85,400,256) |
| Capital Share Transactions: | | | | | | | |
| Sold | 16,289,948 | | 26,616,670 | | 816,933,177 | | 799,880,095 |
| Issued on reinvestment of distributions | 2,154,350 | | 4,258,769 | | 50,166,714 | | 64,039,864 |
| Redeemed | (23,049,369) | | (95,080,240) | | (609,208,793) | | (1,939,547,666) |
| Net increase (decrease) from capital share transactions | (4,605,071) | | (64,204,801) | | 257,891,098 | | (1,075,627,707) |
| Net Increase (Decrease) in Net Assets | (4,576,801) | | (77,929,007) | | 333,099,185 | | (1,224,947,189) |
| Net Assets: | | | | | | | |
| Beginning of period | 63,192,822 | | 141,121,829 | | 1,784,429,232 | | 3,009,376,421 |
| End of period | $ 58,616,021 | | $ 63,192,822 | | $ 2,117,528,417 | | $ 1,784,429,232 |
The accompanying notes are an integral part of these financial statements.
Hartford Fixed Income Funds
Statements of Changes in Net Assets – (continued)
For the Year Ended October 31, 2021
| | The Hartford
Floating Rate High
Income Fund | | The Hartford
High Yield Fund |
| | For the
Year Ended
October 31,
2021 | | For the
Year Ended
October 31,
2020 | | For the
Year Ended
October 31,
2021 | | For the
Year Ended
October 31,
2020 |
| Operations: | | | | | | | |
| Net investment income (loss) | $ 14,398,567 | | $ 14,597,360 | | $ 16,622,334 | | $ 15,958,859 |
| Net realized gain (loss) on investments, other financial instruments and foreign currency transactions | 9,211,691 | | (27,625,448) | | 7,697,117 | | (7,136,191) |
| Net changes in unrealized appreciation (depreciation) of investments, other financial instruments and foreign currency transactions | 4,673,432 | | 6,653,957 | | 8,880,768 | | 2,010,800 |
| Net Increase (Decrease) in Net Assets Resulting from Operations | 28,283,690 | | (6,374,131) | | 33,200,219 | | 10,833,468 |
| Distributions to Shareholders: | | | | | | | |
| Class A | (2,260,387) | | (2,847,261) | | (10,337,734) | | (10,231,936) |
| Class C | (767,793) | | (1,464,610) | | (718,263) | | (1,085,876) |
| Class I | (7,889,739) | | (8,549,096) | | (1,281,113) | | (923,770) |
| Class R3 | (3,765) | | (6,253) | | (56,962) | | (80,559) |
| Class R4 | (11,610) | | (13,270) | | (41,134) | | (44,563) |
| Class R5 | (408,844) | | (444,267) | | (28,190) | | (33,552) |
| Class R6 | — | | — | | (275) (1) | | — |
| Class Y | (361,445) | | (420,519) | | (40,983) | | (342,680) |
| Class F | (685,903) | | (670,561) | | (4,169,785) | | (3,088,310) |
| Total distributions | (12,389,486) | | (14,415,837) | | (16,674,439) | | (15,831,246) |
| Capital Share Transactions: | | | | | | | |
| Sold | 243,398,409 | | 154,359,016 | | 154,200,806 | | 120,102,240 |
| Issued on reinvestment of distributions | 12,325,072 | | 14,307,557 | | 16,437,697 | | 15,473,341 |
| Redeemed | (162,394,797) | | (231,415,277) | | (82,007,013) | | (126,762,424) |
| Net increase (decrease) from capital share transactions | 93,328,684 | | (62,748,704) | | 88,631,490 | | 8,813,157 |
| Net Increase (Decrease) in Net Assets | 109,222,888 | | (83,538,672) | | 105,157,270 | | 3,815,379 |
| Net Assets: | | | | | | | |
| Beginning of period | 329,143,121 | | 412,681,793 | | 362,289,195 | | 358,473,816 |
| End of period | $ 438,366,009 | | $ 329,143,121 | | $ 467,446,465 | | $ 362,289,195 |
| (1) | Commenced operations on March 1, 2021. |
The accompanying notes are an integral part of these financial statements.
Hartford Fixed Income Funds
Statements of Changes in Net Assets – (continued)
For the Year Ended October 31, 2021
| | The Hartford
Inflation Plus Fund | | The Hartford
Municipal Opportunities Fund |
| | For the
Year Ended
October 31,
2021 | | For the
Year Ended
October 31,
2020 | | For the
Year Ended
October 31,
2021 | | For the
Year Ended
October 31,
2020 |
| Operations: | | | | | | | |
| Net investment income (loss) | $ 17,100,984 | | $ 6,208,864 | | $ 30,177,227 | | $ 26,662,077 |
| Net realized gain (loss) on investments, other financial instruments and foreign currency transactions | 15,172,475 | | 18,505,277 | | (222,907) | | 2,602,363 |
| Net changes in unrealized appreciation (depreciation) of investments, other financial instruments and foreign currency transactions | 2,841,963 | | 9,482,777 | | 16,090,687 | | 4,622,938 |
| Net Increase (Decrease) in Net Assets Resulting from Operations | 35,115,422 | | 34,196,918 | | 46,045,007 | | 33,887,378 |
| Distributions to Shareholders: | | | | | | | |
| Class A | (4,366,189) | | (3,116,147) | | (7,830,709) | | (8,611,735) |
| Class C | (241,079) | | (177,866) | | (505,567) | | (842,411) |
| Class I | (1,166,904) | | (1,004,272) | | (15,905,916) | | (14,056,299) |
| Class R3 | (623,956) | | (542,803) | | — | | — |
| Class R4 | (105,614) | | (124,519) | | — | | — |
| Class R5 | (38,900) | | (30,265) | | — | | — |
| Class Y | (738,520) | | (473,560) | | (297,401) | | (344,446) |
| Class F | (4,427,834) | | (3,168,242) | | (5,642,177) | | (2,928,839) |
| Total distributions | (11,708,996) | | (8,637,674) | | (30,181,770) | | (26,783,730) |
| Capital Share Transactions: | | | | | | | |
| Sold | 190,542,110 | | 122,816,206 | | 588,219,542 | | 742,743,519 |
| Issued on reinvestment of distributions | 11,424,933 | | 8,418,722 | | 26,743,790 | | 23,411,132 |
| Redeemed | (180,414,897) | | (137,359,960) | | (313,751,683) | | (396,074,833) |
| Net increase (decrease) from capital share transactions | 21,552,146 | | (6,125,032) | | 301,211,649 | | 370,079,818 |
| Net Increase (Decrease) in Net Assets | 44,958,572 | | 19,434,212 | | 317,074,886 | | 377,183,466 |
| Net Assets: | | | | | | | |
| Beginning of period | 523,777,137 | | 504,342,925 | | 1,467,355,572 | | 1,090,172,106 |
| End of period | $ 568,735,709 | | $ 523,777,137 | | $ 1,784,430,458 | | $ 1,467,355,572 |
The accompanying notes are an integral part of these financial statements.
Hartford Fixed Income Funds
Statements of Changes in Net Assets – (continued)
For the Year Ended October 31, 2021
| | Hartford Municipal
Short Duration Fund | | The Hartford
Short Duration Fund |
| | For the
Year Ended
October 31,
2021 | | For the
Year Ended
October 31,
2020 | | For the
Year Ended
October 31,
2021 | | For the
Year Ended
October 31,
2020 |
| Operations: | | | | | | | |
| Net investment income (loss) | $ 365,111 | | $ 389,588 | | $ 31,524,181 | | $ 33,744,343 |
| Net realized gain (loss) on investments, other financial instruments and foreign currency transactions | (10,314) | | 3,123 | | 12,295,333 | | (4,469,572) |
| Net changes in unrealized appreciation (depreciation) of investments, other financial instruments and foreign currency transactions | 17,714 | | 295 | | (16,347,248) | | 10,540,610 |
| Net Increase (Decrease) in Net Assets Resulting from Operations | 372,511 | | 393,006 | | 27,472,266 | | 39,815,381 |
| Distributions to Shareholders: | | | | | | | |
| Class A | (241,664) | | (341,182) | | (13,765,749) | | (15,890,843) |
| Class C | (6,519) | | (15,127) | | (650,763) | | (1,242,314) |
| Class I | (70,845) | | (53,178) | | (11,271,779) | | (10,500,742) |
| Class R3 | — | | — | | (24,103) | | (29,075) |
| Class R4 | — | | — | | (74,418) | | (136,354) |
| Class R5 | — | | — | | (33,325) | | (40,924) |
| Class R6 | — | | — | | (29,252) | | (320) |
| Class Y | — | | — | | (168,858) | | (238,467) |
| Class F | (51,426) | | (39,099) | | (6,693,662) | | (6,474,377) |
| Total distributions | (370,454) | | (448,586) | | (32,711,909) | | (34,553,416) |
| Capital Share Transactions: | | | | | | | |
| Sold | 18,254,920 | | 15,709,425 | | 1,252,229,093 | | 1,100,570,097 |
| Issued on reinvestment of distributions | 368,228 | | 447,981 | | 30,042,870 | | 31,656,945 |
| Redeemed | (8,165,674) | | (11,632,817) | | (781,083,476) | | (864,409,842) |
| Net increase (decrease) from capital share transactions | 10,457,474 | | 4,524,589 | | 501,188,487 | | 267,817,200 |
| Net Increase (Decrease) in Net Assets | 10,459,531 | | 4,469,009 | | 495,948,844 | | 273,079,165 |
| Net Assets: | | | | | | | |
| Beginning of period | 25,884,906 | | 21,415,897 | | 1,662,634,801 | | 1,389,555,636 |
| End of period | $ 36,344,437 | | $ 25,884,906 | | $ 2,158,583,645 | | $ 1,662,634,801 |
The accompanying notes are an integral part of these financial statements.
Hartford Fixed Income Funds
Statements of Changes in Net Assets – (continued)
For the Year Ended October 31, 2021
| | The Hartford
Strategic Income Fund | | Hartford
Sustainable Municipal Bond Fund |
| | For the
Year Ended
October 31,
2021 | | For the
Year Ended
October 31,
2020 | | For the
Year Ended
October 31,
2021 | | For the
Year Ended
October 31,
2020 |
| Operations: | | | | | | | |
| Net investment income (loss) | $ 81,332,265 | | $ 32,677,573 | | $ 1,565,874 | | $ 1,074,542 |
| Net realized gain (loss) on investments, other financial instruments and foreign currency transactions | 39,156,835 | | 34,811,038 | | 668,157 | | (27,478) |
| Net changes in unrealized appreciation (depreciation) of investments, other financial instruments and foreign currency transactions | (15,561,618) | | 6,574,831 | | 487,346 | | 712,473 |
| Net Increase (Decrease) in Net Assets Resulting from Operations | 104,927,482 | | 74,063,442 | | 2,721,377 | | 1,759,537 |
| Distributions to Shareholders: | | | | | | | |
| Class A | (13,415,885) | | (7,667,575) | | (583,161) | | (719,963) |
| Class C | (2,498,541) | | (1,525,386) | | (30,346) | | (68,864) |
| Class I | (58,862,872) | | (17,139,916) | | (597,267) | | (359,398) |
| Class R3 | (76,238) | | (28,423) | | — | | — |
| Class R4 | (276,821) | | (46,207) | | — | | — |
| Class R5 | (1,436,033) | | (405,048) | | — | | — |
| Class R6 | (2,476,456) | | (126,449) | | — | | — |
| Class Y | (5,957,462) | | (1,532,416) | | — | | — |
| Class F | (13,930,487) | | (7,044,452) | | (354,323) | | (180,768) |
| Total distributions | (98,930,795) | | (35,515,872) | | (1,565,097) | | (1,328,993) |
| Capital Share Transactions: | | | | | | | |
| Sold | 2,604,992,032 | | 1,364,984,101 | | 58,514,592 | | 57,550,170 |
| Issued on reinvestment of distributions | 98,446,517 | | 35,272,451 | | 1,561,109 | | 1,325,741 |
| Redeemed | (1,052,171,798) | | (448,742,996) | | (16,076,394) | | (12,194,309) |
| Net increase (decrease) from capital share transactions | 1,651,266,751 | | 951,513,556 | | 43,999,307 | | 46,681,602 |
| Net Increase (Decrease) in Net Assets | 1,657,263,438 | | 990,061,126 | | 45,155,587 | | 47,112,146 |
| Net Assets: | | | | | | | |
| Beginning of period | 1,683,084,115 | | 693,022,989 | | 83,350,524 | | 36,238,378 |
| End of period | $ 3,340,347,553 | | $ 1,683,084,115 | | $ 128,506,111 | | $ 83,350,524 |
The accompanying notes are an integral part of these financial statements.
Hartford Fixed Income Funds
Statements of Changes in Net Assets – (continued)
For the Year Ended October 31, 2021
| | The Hartford
Total Return Bond Fund | | The Hartford
World Bond Fund |
| | For the
Year Ended
October 31,
2021 | | For the
Year Ended
October 31,
2020 | | For the
Year Ended
October 31,
2021 | | For the
Year Ended
October 31,
2020 |
| Operations: | | | | | | | |
| Net investment income (loss) | $ 61,872,563 | | $ 57,931,670 | | $ 31,308,168 | | $ 43,040,810 |
| Net realized gain (loss) on investments, other financial instruments and foreign currency transactions | 36,144,280 | | 46,435,924 | | 68,593,974 | | (117,536,664) |
| Net changes in unrealized appreciation (depreciation) of investments, other financial instruments and foreign currency transactions | (74,464,811) | | 57,519,243 | | (109,895,728) | | 109,200,566 |
| Net Increase (Decrease) in Net Assets Resulting from Operations | 23,552,032 | | 161,886,837 | | (9,993,586) | | 34,704,712 |
| Distributions to Shareholders: | | | | | | | |
| Class A | (32,137,413) | | (24,713,615) | | (3,010,998) | | (9,714,634) |
| Class C | (472,610) | | (403,472) | | (125,450) | | (1,530,082) |
| Class I | (9,730,043) | | (4,973,747) | | (20,651,050) | | (55,886,615) |
| Class R3 | (109,854) | | (94,664) | | (5,791) | | (37,373) |
| Class R4 | (391,047) | | (248,950) | | (120,174) | | (258,182) |
| Class R5 | (70,122) | | (42,277) | | (88,533) | | (159,088) |
| Class R6 | (4,246,736) | | (1,608,114) | | (1,415,295) | | (699,005) |
| Class Y | (12,144,844) | | (10,770,483) | | (3,546,250) | | (12,150,614) |
| Class F | (32,813,903) | | (22,805,593) | | (17,628,017) | | (51,436,468) |
| Total distributions | (92,116,572) | | (65,660,915) | | (46,591,558) | | (131,872,061) |
| Capital Share Transactions: | | | | | | | |
| Sold | 1,350,276,016 | | 1,206,382,514 | | 1,356,935,358 | | 2,017,345,877 |
| Issued in merger | — | | 62,746,951 | | — | | — |
| Issued on reinvestment of distributions | 88,860,837 | | 64,083,599 | | 43,738,556 | | 124,555,264 |
| Redeemed | (917,559,808) | | (622,728,515) | | (1,693,085,720) | | (2,882,971,265) |
| Net increase (decrease) from capital share transactions | 521,577,045 | | 710,484,549 | | (292,411,806) | | (741,070,124) |
| Net Increase (Decrease) in Net Assets | 453,012,505 | | 806,710,471 | | (348,996,950) | | (838,237,473) |
| Net Assets: | | | | | | | |
| Beginning of period | 2,991,579,617 | | 2,184,869,146 | | 4,472,890,816 | | 5,311,128,289 |
| End of period | $ 3,444,592,122 | | $ 2,991,579,617 | | $ 4,123,893,866 | | $ 4,472,890,816 |
The accompanying notes are an integral part of these financial statements.
Hartford Fixed Income Funds
| | | — Selected Per-Share Data(1) — | | — Ratios and Supplemental Data — |
| Class | | Net
Asset
Value at
Beginning
of Period | | Net
Investment
Income
(Loss) | | Net
Realized
and
Unrealized
Gain (Loss)
on
Investments | | Total from
Investment
Operations | | Dividends
from Net
Investment
Income | | Distributions
from
Capital
Gains | | Returns
of
Capital | | Total
Dividends
and
Distributions | | Net
Asset
Value at
End of
Period | | Total
Return(2) | | Net
Assets
at End
of Period
(000s) | | Ratio of
Expenses
to
Average
Net
Assets
Before
Adjust-
ments(3)(4) | | Ratio of
Expenses
to
Average
Net
Assets
After
Adjust-
ments(3)(4) | | Ratio of
Net
Investment
Income
(Loss) to
Average
Net Assets(4) | | Portfolio
Turnover |
| The Hartford Emerging Markets Local Debt Fund |
| For the Year Ended October 31, 2021 |
| A | | $ 5.39 | | $ 0.18 | | $ —(5) | | $ 0.18 | | $ (0.18) | | $ — | | $ — | | $ (0.18) | | $ 5.39 | | 3.20% | | $ 3,996 | | 1.49% | | 1.18% | | 3.20% | | 99% |
| C | | 5.40 | | 0.14 | | — (5) | | 0.14 | | (0.14) | | — | | — | | (0.14) | | 5.40 | | 2.43 | | 1,771 | | 2.25 | | 1.93 | | 2.45 | | 99 |
| I | | 5.37 | | 0.19 | | (0.01) | | 0.18 | | (0.19) | | — | | — | | (0.19) | | 5.36 | | 3.28 | | 11,164 | | 1.15 | | 0.93 | | 3.45 | | 99 |
| R3 | | 5.37 | | 0.18 | | (0.01) | | 0.17 | | (0.16) | | — | | — | | (0.16) | | 5.38 | | 3.09 | | 11 | | 1.76 | | 1.21 | | 3.18 | | 99 |
| R4 | | 5.37 | | 0.18 | | (0.01) | | 0.17 | | (0.18) | | — | | — | | (0.18) | | 5.36 | | 3.02 | | 45 | | 1.46 | | 1.18 | | 3.20 | | 99 |
| R5 | | 5.15 | | 0.19 | | (0.01) | | 0.18 | | (0.19) | | — | | — | | (0.19) | | 5.14 | | 3.48 | | 11 | | 1.16 | | 0.88 | | 3.56 | | 99 |
| Y | | 5.33 | | 0.20 | | (0.02) | | 0.18 | | (0.19) | | — | | — | | (0.19) | | 5.32 | | 3.36 | | 37,127 | | 1.14 | | 0.88 | | 3.49 | | 99 |
| F | | 5.37 | | 0.20 | | — (5) | | 0.20 | | (0.20) | | — | | — | | (0.20) | | 5.37 | | 3.57 | | 4,490 | | 1.04 | | 0.83 | | 3.54 | | 99 |
| For the Year Ended October 31, 2020 |
| A | | $ 5.86 | | $ 0.22 | | $ (0.46) | | $ (0.24) | | $ — | | $ — | | $ (0.23) | | $ (0.23) | | $ 5.39 | | (4.02)% | | $ 4,441 | | 1.42% | | 1.18% | | 4.08% | | 99% |
| C | | 5.86 | | 0.19 | | (0.46) | | (0.27) | | — | | — | | (0.19) | | (0.19) | | 5.40 | | (4.66) | | 1,795 | | 2.18 | | 1.93 | | 3.35 | | 99 |
| I | | 5.84 | | 0.25 | | (0.47) | | (0.22) | | — | | — | | (0.25) | | (0.25) | | 5.37 | | (3.73) | | 10,596 | | 1.07 | | 0.93 | | 4.43 | | 99 |
| R3 | | 5.84 | | 0.23 | | (0.46) | | (0.23) | | — | | — | | (0.24) | | (0.24) | | 5.37 | | (3.97) | | 11 | | 1.70 | | 1.06 | | 4.20 | | 99 |
| R4 | | 5.83 | | 0.22 | | (0.45) | | (0.23) | | — | | — | | (0.23) | | (0.23) | | 5.37 | | (3.87) | | 43 | | 1.40 | | 1.18 | | 4.07 | | 99 |
| R5 | | 5.60 | | 0.22 | | (0.42) | | (0.20) | | — | | — | | (0.25) | | (0.25) | | 5.15 | | (3.52) | | 45 | | 1.10 | | 0.88 | | 4.31 | | 99 |
| Y | | 5.80 | | 0.24 | | (0.46) | | (0.22) | | — | | — | | (0.25) | | (0.25) | | 5.33 | | (3.72) | | 43,062 | | 1.09 | | 0.88 | | 4.43 | | 99 |
| F | | 5.84 | | 0.25 | | (0.47) | | (0.22) | | — | | — | | (0.25) | | (0.25) | | 5.37 | | (3.65) | | 3,201 | | 0.98 | | 0.83 | | 4.46 | | 99 |
| For the Year Ended October 31, 2019 |
| A | | $ 5.50 | | $ 0.29 | | $ 0.48 | | $ 0.77 | | $ (0.27) | | $ — | | $ (0.14) | | $ (0.41) | | $ 5.86 | | 14.52% | | $ 5,691 | | 1.45% | | 1.25% | | 5.10% | | 110% |
| C | | 5.50 | | 0.25 | | 0.47 | | 0.72 | | (0.23) | | — | | (0.13) | | (0.36) | | 5.86 | | 13.57 | | 2,495 | | 2.19 | | 2.00 | | 4.35 | | 110 |
| I | | 5.48 | | 0.31 | | 0.48 | | 0.79 | | (0.28) | | — | | (0.15) | | (0.43) | | 5.84 | | 14.92 | | 41,300 | | 1.11 | | 0.98 | | 5.36 | | 110 |
| R3 | | 5.47 | | 0.29 | | 0.49 | | 0.78 | | (0.27) | | — | | (0.14) | | (0.41) | | 5.84 | | 14.82 | | 12 | | 1.74 | | 1.17 | | 5.16 | | 110 |
| R4 | | 5.47 | | 0.29 | | 0.48 | | 0.77 | | (0.27) | | — | | (0.14) | | (0.41) | | 5.83 | | 14.58 | | 49 | | 1.44 | | 1.25 | | 5.09 | | 110 |
| R5 | | 5.27 | | 0.29 | | 0.47 | | 0.76 | | (0.28) | | — | | (0.15) | | (0.43) | | 5.60 | | 14.96 | | 11 | | 1.14 | | 0.95 | | 5.36 | | 110 |
| Y | | 5.44 | | 0.31 | | 0.48 | | 0.79 | | (0.28) | | — | | (0.15) | | (0.43) | | 5.80 | | 15.12 | | 87,413 | | 1.10 | | 0.90 | | 5.44 | | 110 |
| F | | 5.48 | | 0.31 | | 0.48 | | 0.79 | | (0.28) | | — | | (0.15) | | (0.43) | | 5.84 | | 15.00 | | 4,150 | | 1.02 | | 0.90 | | 5.44 | | 110 |
| For the Year Ended October 31, 2018 |
| A | | $ 7.62 | | $ 0.30 | | $ (0.75) | | $ (0.45) | | $ (1.67) | | $ — | | $ — | | $ (1.67) | | $ 5.50 | | (8.25)% | | $ 6,774 | | 1.41% | | 1.25% | | 4.78% | | 130% |
| C | | 7.62 | | 0.25 | | (0.75) | | (0.50) | | (1.62) | | — | | — | | (1.62) | | 5.50 | | (8.86) | | 2,951 | | 2.19 | | 2.00 | | 4.04 | | 130 |
| I | | 7.61 | | 0.32 | | (0.76) | | (0.44) | | (1.69) | | — | | — | | (1.69) | | 5.48 | | (8.00) | | 62,924 | | 1.07 | | 0.96 | | 5.08 | | 130 |
| R3 | | 7.60 | | 0.29 | | (0.76) | | (0.47) | | (1.66) | | — | | — | | (1.66) | | 5.47 | | (8.44) | | 11 | | 1.73 | | 1.39 | | 4.65 | | 130 |
| R4 | | 7.60 | | 0.30 | | (0.76) | | (0.46) | | (1.67) | | — | | — | | (1.67) | | 5.47 | | (8.29) | | 60 | | 1.43 | | 1.25 | | 4.79 | | 130 |
| R5 | | 7.38 | | 0.31 | | (0.73) | | (0.42) | | (1.69) | | — | | — | | (1.69) | | 5.27 | | (7.98) | | 10 | | 1.13 | | 0.95 | | 5.11 | | 130 |
| Y | | 7.57 | | 0.32 | | (0.75) | | (0.43) | | (1.70) | | — | | — | | (1.70) | | 5.44 | | (7.99) | | 86,121 | | 1.06 | | 0.90 | | 5.13 | | 130 |
| F | | 7.61 | | 0.32 | | (0.76) | | (0.44) | | (1.69) | | — | | — | | (1.69) | | 5.48 | | (7.93) | | 4,599 | | 1.01 | | 0.90 | | 5.15 | | 130 |
| For the Year Ended October 31, 2017 |
| A | | $ 7.48 | | $ 0.37 | | $ 0.11 | | $ 0.48 | | $ (0.34) | | $ — | | $ — | | $ (0.34) | | $ 7.62 | | 6.80% | | $ 8,324 | | 1.44% | | 1.25% | | 4.87% | | 151% |
| C | | 7.47 | | 0.31 | | 0.13 | | 0.44 | | (0.29) | | — | | — | | (0.29) | | 7.62 | | 5.98 | | 2,777 | | 2.20 | | 2.00 | | 4.13 | | 151 |
| I | | 7.46 | | 0.39 | | 0.13 | | 0.52 | | (0.37) | | — | | — | | (0.37) | | 7.61 | | 7.11 | | 46,768 | | 1.18 | | 1.00 | | 5.10 | | 151 |
| R3 | | 7.43 | | 0.35 | | 0.13 | | 0.48 | | (0.31) | | — | | — | | (0.31) | | 7.60 | | 6.61 | | 12 | | 1.96 | | 1.50 | | 4.67 | | 151 |
| R4 | | 7.45 | | 0.37 | | 0.12 | | 0.49 | | (0.34) | | — | | — | | (0.34) | | 7.60 | | 6.73 | | 46 | | 1.50 | | 1.25 | | 4.86 | | 151 |
| R5 | | 7.24 | | 0.38 | | 0.11 | | 0.49 | | (0.35) | | — | | — | | (0.35) | | 7.38 | | 7.00 | | 11 | | 1.21 | | 0.95 | | 5.22 | | 151 |
| Y | | 7.43 | | 0.39 | | 0.12 | | 0.51 | | (0.37) | | — | | — | | (0.37) | | 7.57 | | 7.11 | | 94,802 | | 1.07 | | 0.90 | | 5.24 | | 151 |
| F (6) | | 7.29 | | 0.26 | | 0.31 | | 0.57 | | (0.25) | | — | | — | | (0.25) | | 7.61 | | 7.87 (7) | | 2,210 | | 1.04 (8) | | 0.90 (8) | | 4.99 (8) | | 151 |
The accompanying notes are an integral part of these financial statements.
Hartford Fixed Income Funds
Financial Highlights – (continued)
| | | — Selected Per-Share Data(1) — | | — Ratios and Supplemental Data — |
| Class | | Net
Asset
Value at
Beginning
of Period | | Net
Investment
Income
(Loss) | | Net
Realized
and
Unrealized
Gain (Loss)
on
Investments | | Total from
Investment
Operations | | Dividends
from Net
Investment
Income | | Distributions
from
Capital
Gains | | Returns
of
Capital | | Total
Dividends
and
Distributions | | Net
Asset
Value at
End of
Period | | Total
Return(2) | | Net
Assets
at End
of Period
(000s) | | Ratio of
Expenses
to
Average
Net
Assets
Before
Adjust-
ments(3)(4) | | Ratio of
Expenses
to
Average
Net
Assets
After
Adjust-
ments(3)(4) | | Ratio of
Net
Investment
Income
(Loss) to
Average
Net Assets(4) | | Portfolio
Turnover |
| The Hartford Floating Rate Fund |
| For the Year Ended October 31, 2021 |
| A | | $ 8.04 | | $ 0.30 | | $ 0.31 | | $ 0.61 | | $ (0.25) | | $ — | | $ — | | $ (0.25) | | $ 8.40 | | 7.70% | | $ 738,311 | | 1.00% | | 1.00% | | 3.59% | | 99% |
| C | | 8.12 | | 0.24 | | 0.31 | | 0.55 | | (0.19) | | — | | — | | (0.19) | | 8.48 | | 6.84 | | 110,915 | | 1.75 | | 1.75 | | 2.86 | | 99 |
| I | | 8.03 | | 0.32 | | 0.32 | | 0.64 | | (0.30) | | — | | — | | (0.30) | | 8.37 | | 8.01 | | 1,066,435 | | 0.73 | | 0.73 | | 3.85 | | 99 |
| R3 | | 8.10 | | 0.28 | | 0.30 | | 0.58 | | (0.23) | | — | | — | | (0.23) | | 8.45 | | 7.25 | | 4,586 | | 1.36 | | 1.25 | | 3.34 | | 99 |
| R4 | | 8.04 | | 0.30 | | 0.30 | | 0.60 | | (0.25) | | — | | — | | (0.25) | | 8.39 | | 7.55 | | 2,180 | | 1.07 | | 1.00 | | 3.59 | | 99 |
| R5 | | 8.03 | | 0.32 | | 0.31 | | 0.63 | | (0.29) | | — | | — | | (0.29) | | 8.37 | | 7.92 | | 1,148 | | 0.77 | | 0.77 | | 3.82 | | 99 |
| Y | | 8.01 | | 0.32 | | 0.31 | | 0.63 | | (0.30) | | — | | — | | (0.30) | | 8.34 | | 7.90 | | 49,434 | | 0.75 | | 0.75 | | 3.83 | | 99 |
| F | | 8.02 | | 0.33 | | 0.31 | | 0.64 | | (0.31) | | — | | — | | (0.31) | | 8.35 | | 8.06 | | 144,519 | | 0.65 | | 0.65 | | 3.92 | | 99 |
| For the Year Ended October 31, 2020 |
| A | | $ 8.37 | | $ 0.29 | | $ (0.33) | | $ (0.04) | | $ (0.29) | | $ — | | $ — | | $ (0.29) | | $ 8.04 | | (0.40)% | | $ 659,749 | | 1.01% | | 1.00% | | 3.62% | | 86% |
| C | | 8.45 | | 0.24 | | (0.34) | | (0.10) | | (0.23) | | — | | — | | (0.23) | | 8.12 | | (1.10) | | 231,747 | | 1.74 | | 1.74 | | 2.91 | | 86 |
| I | | 8.36 | | 0.32 | | (0.34) | | (0.02) | | (0.31) | | — | | — | | (0.31) | | 8.03 | | (0.14) | | 749,601 | | 0.73 | | 0.73 | | 3.93 | | 86 |
| R3 | | 8.42 | | 0.27 | | (0.32) | | (0.05) | | (0.27) | | — | | — | | (0.27) | | 8.10 | | (0.51) | | 4,684 | | 1.37 | | 1.25 | | 3.38 | | 86 |
| R4 | | 8.36 | | 0.29 | | (0.32) | | (0.03) | | (0.29) | | — | | — | | (0.29) | | 8.04 | | (0.29) | | 2,274 | | 1.07 | | 1.00 | | 3.63 | | 86 |
| R5 | | 8.35 | | 0.31 | | (0.32) | | (0.01) | | (0.31) | | — | | — | | (0.31) | | 8.03 | | (0.07) | | 987 | | 0.77 | | 0.77 | | 3.84 | | 86 |
| Y | | 8.33 | | 0.32 | | (0.33) | | (0.01) | | (0.31) | | — | | — | | (0.31) | | 8.01 | | (0.00) (9) | | 42,538 | | 0.71 | | 0.71 | | 3.93 | | 86 |
| F | | 8.36 | | 0.33 | | (0.35) | | (0.02) | | (0.32) | | — | | — | | (0.32) | | 8.02 | | (0.20) | | 92,849 | | 0.65 | | 0.65 | | 4.09 | | 86 |
| For the Year Ended October 31, 2019 |
| A | | $ 8.68 | | $ 0.39 | | $ (0.23) | | $ 0.16 | | $ (0.45) | | $ — | | $ (0.02) | | $ (0.47) | | $ 8.37 | | 1.98% | | $ 762,132 | | 1.00% | | 1.00% | | 4.61% | | 46% |
| C | | 8.67 | | 0.33 | | (0.23) | | 0.10 | | (0.31) | | — | | (0.01) | | (0.32) | | 8.45 | | 1.22 | | 458,641 | | 1.73 | | 1.73 | | 3.89 | | 46 |
| I | | 8.69 | | 0.41 | | (0.23) | | 0.18 | | (0.49) | | — | | (0.02) | | (0.51) | | 8.36 | | 2.29 | | 1,316,224 | | 0.71 | | 0.71 | | 4.90 | | 46 |
| R3 | | 8.70 | | 0.37 | | (0.23) | | 0.14 | | (0.41) | | — | | (0.01) | | (0.42) | | 8.42 | | 1.72 | | 6,708 | | 1.33 | | 1.25 | | 4.35 | | 46 |
| R4 | | 8.67 | | 0.39 | | (0.22) | | 0.17 | | (0.46) | | — | | (0.02) | | (0.48) | | 8.36 | | 2.04 | | 2,807 | | 1.05 | | 1.00 | | 4.66 | | 46 |
| R5 | | 8.68 | | 0.41 | | (0.23) | | 0.18 | | (0.49) | | — | | (0.02) | | (0.51) | | 8.35 | | 2.18 | | 1,193 | | 0.77 | | 0.77 | | 4.84 | | 46 |
| Y | | 8.67 | | 0.42 | | (0.24) | | 0.18 | | (0.50) | | — | | (0.02) | | (0.52) | | 8.33 | | 2.25 | | 63,586 | | 0.71 | | 0.71 | | 4.93 | | 46 |
| F | | 8.70 | | 0.41 | | (0.22) | | 0.19 | | (0.51) | | — | | (0.02) | | (0.53) | | 8.36 | | 2.32 | | 398,085 | | 0.64 | | 0.64 | | 4.83 | | 46 |
| For the Year Ended October 31, 2018 |
| A | | $ 8.74 | | $ 0.37 | | $ (0.08) | | $ 0.29 | | $ (0.35) | | $ — | | $ — | | $ (0.35) | | $ 8.68 | | 3.41% | | $ 909,677 | | 0.99% | | 0.99% | | 4.21% | | 55% |
| C | | 8.73 | | 0.30 | | (0.07) | | 0.23 | | (0.29) | | — | | — | | (0.29) | | 8.67 | | 2.65 | | 744,791 | | 1.73 | | 1.73 | | 3.48 | | 55 |
| I | | 8.75 | | 0.39 | | (0.07) | | 0.32 | | (0.38) | | — | | — | | (0.38) | | 8.69 | | 3.70 | | 1,903,730 | | 0.72 | | 0.72 | | 4.50 | | 55 |
| R3 | | 8.76 | | 0.35 | | (0.08) | | 0.27 | | (0.33) | | — | | — | | (0.33) | | 8.70 | | 3.15 | | 8,479 | | 1.37 | | 1.25 | | 3.95 | | 55 |
| R4 | | 8.73 | | 0.37 | | (0.08) | | 0.29 | | (0.35) | | — | | — | | (0.35) | | 8.67 | | 3.40 | | 5,804 | | 1.07 | | 1.00 | | 4.21 | | 55 |
| R5 | | 8.74 | | 0.39 | | (0.08) | | 0.31 | | (0.37) | | — | | — | | (0.37) | | 8.68 | | 3.67 | | 1,897 | | 0.77 | | 0.74 | | 4.45 | | 55 |
| Y | | 8.73 | | 0.39 | | (0.07) | | 0.32 | | (0.38) | | — | | — | | (0.38) | | 8.67 | | 3.71 | | 470,887 | | 0.71 | | 0.70 | | 4.53 | | 55 |
| F | | 8.76 | | 0.39 | | (0.07) | | 0.32 | | (0.38) | | — | | — | | (0.38) | | 8.70 | | 3.88 | | 67,464 | | 0.65 | | 0.65 | | 4.52 | | 55 |
| For the Year Ended October 31, 2017 |
| A | | $ 8.58 | | $ 0.32 | | $ 0.16 | | $ 0.48 | | $ (0.31) | | $ — | | $ (0.01) | | $ (0.32) | | $ 8.74 | | 5.66% | | $ 806,759 | | 0.98% | | 0.98% | | 3.68% | | 62% |
| C | | 8.57 | | 0.26 | | 0.15 | | 0.41 | | (0.24) | | — | | (0.01) | | (0.25) | | 8.73 | | 4.89 | | 1,046,990 | | 1.72 | | 1.72 | | 2.95 | | 62 |
| I | | 8.59 | | 0.34 | | 0.16 | | 0.50 | | (0.33) | | — | | (0.01) | | (0.34) | | 8.75 | | 5.95 | | 1,817,213 | | 0.71 | | 0.71 | | 3.94 | | 62 |
| R3 | | 8.61 | | 0.30 | | 0.15 | | 0.45 | | (0.29) | | — | | (0.01) | | (0.30) | | 8.76 | | 5.25 | | 9,993 | | 1.37 | | 1.25 | | 3.41 | | 62 |
| R4 | | 8.58 | | 0.32 | | 0.15 | | 0.47 | | (0.31) | | — | | (0.01) | | (0.32) | | 8.73 | | 5.52 | | 6,359 | | 1.06 | | 1.00 | | 3.65 | | 62 |
| R5 | | 8.58 | | 0.34 | | 0.16 | | 0.50 | | (0.33) | | — | | (0.01) | | (0.34) | | 8.74 | | 5.96 | | 2,200 | | 0.80 | | 0.70 | | 3.96 | | 62 |
| Y | | 8.57 | | 0.35 | | 0.16 | | 0.51 | | (0.34) | | — | | (0.01) | | (0.35) | | 8.73 | | 5.99 | | 374,594 | | 0.67 | | 0.67 | | 3.98 | | 62 |
| F (6) | | 8.74 | | 0.23 | | 0.02 | | 0.25 | | (0.22) | | — | | (0.01) | | (0.23) | | 8.76 | | 2.78 (7) | | 48,407 | | 0.65 (8) | | 0.65 (8) | | 3.95 (8) | | 62 |
The accompanying notes are an integral part of these financial statements.
Hartford Fixed Income Funds
Financial Highlights – (continued)
| | | — Selected Per-Share Data(1) — | | — Ratios and Supplemental Data — |
| Class | | Net
Asset
Value at
Beginning
of Period | | Net
Investment
Income
(Loss) | | Net
Realized
and
Unrealized
Gain (Loss)
on
Investments | | Total from
Investment
Operations | | Dividends
from Net
Investment
Income | | Distributions
from
Capital
Gains | | Returns
of
Capital | | Total
Dividends
and
Distributions | | Net
Asset
Value at
End of
Period | | Total
Return(2) | | Net
Assets
at End
of Period
(000s) | | Ratio of
Expenses
to
Average
Net
Assets
Before
Adjust-
ments(3)(4) | | Ratio of
Expenses
to
Average
Net
Assets
After
Adjust-
ments(3)(4) | | Ratio of
Net
Investment
Income
(Loss) to
Average
Net Assets(4) | | Portfolio
Turnover |
| The Hartford Floating Rate High Income Fund |
| For the Year Ended October 31, 2021 |
| A | | $ 9.23 | | $ 0.35 | | $ 0.40 | | $ 0.75 | | $ (0.30) | | $ — | | $ — | | $ (0.30) | | $ 9.68 | | 8.23% | | $ 81,907 | | 1.15% | | 1.05% | | 3.67% | | 132% |
| C | | 9.31 | | 0.29 | | 0.39 | | 0.68 | | (0.23) | | — | | — | | (0.23) | | 9.76 | | 7.38 | | 25,357 | | 1.88 | | 1.80 | | 2.95 | | 132 |
| I | | 9.18 | | 0.38 | | 0.40 | | 0.78 | | (0.33) | | — | | — | | (0.33) | | 9.63 | | 8.52 | | 276,041 | | 0.86 | | 0.80 | | 3.92 | | 132 |
| R3 | | 9.25 | | 0.33 | | 0.38 | | 0.71 | | (0.27) | | — | | — | | (0.27) | | 9.69 | | 7.77 | | 160 | | 1.49 | | 1.35 | | 3.37 | | 132 |
| R4 | | 9.21 | | 0.35 | | 0.40 | | 0.75 | | (0.30) | | — | | — | | (0.30) | | 9.66 | | 8.24 | | 399 | | 1.20 | | 1.05 | | 3.68 | | 132 |
| R5 | | 9.18 | | 0.38 | | 0.40 | | 0.78 | | (0.33) | | — | | — | | (0.33) | | 9.63 | | 8.58 | | 12,801 | | 0.88 | | 0.75 | | 3.97 | | 132 |
| Y | | 9.19 | | 0.38 | | 0.39 | | 0.77 | | (0.33) | | — | | — | | (0.33) | | 9.63 | | 8.43 | | 13,206 | | 0.89 | | 0.78 | | 3.92 | | 132 |
| F | | 9.20 | | 0.38 | | 0.39 | | 0.77 | | (0.33) | | — | | — | | (0.33) | | 9.64 | | 8.45 | | 28,494 | | 0.78 | | 0.75 | | 3.94 | | 132 |
| For the Year Ended October 31, 2020 |
| A | | $ 9.64 | | $ 0.37 | | $ (0.42) | | $ (0.05) | | $ (0.36) | | $ — | | $ — | | $ (0.36) | | $ 9.23 | | (0.46)% | | $ 64,414 | | 1.15% | | 1.05% | | 3.95% | | 120% |
| C | | 9.72 | | 0.30 | | (0.42) | | (0.12) | | (0.29) | | — | | — | | (0.29) | | 9.31 | | (1.17) | | 38,246 | | 1.89 | | 1.80 | | 3.21 | | 120 |
| I | | 9.62 | | 0.39 | | (0.45) | | (0.06) | | (0.38) | | — | | — | | (0.38) | | 9.18 | | (0.54) | | 194,107 | | 0.87 | | 0.80 | | 4.18 | | 120 |
| R3 | | 9.66 | | 0.34 | | (0.42) | | (0.08) | | (0.33) | | — | | — | | (0.33) | | 9.25 | | (0.75) | | 128 | | 1.50 | | 1.35 | | 3.68 | | 120 |
| R4 | | 9.61 | | 0.36 | | (0.40) | | (0.04) | | (0.36) | | — | | — | | (0.36) | | 9.21 | | (0.36) | | 347 | | 1.20 | | 1.05 | | 3.93 | | 120 |
| R5 | | 9.58 | | 0.39 | | (0.41) | | (0.02) | | (0.38) | | — | | — | | (0.38) | | 9.18 | | (0.08) | | 10,605 | | 0.90 | | 0.75 | | 4.23 | | 120 |
| Y | | 9.59 | | 0.40 | | (0.42) | | (0.02) | | (0.38) | | — | | — | | (0.38) | | 9.19 | | (0.10) | | 7,422 | | 0.89 | | 0.78 | | 4.25 | | 120 |
| F | | 9.61 | | 0.40 | | (0.42) | | (0.02) | | (0.39) | | — | | — | | (0.39) | | 9.20 | | (0.17) | | 13,874 | | 0.79 | | 0.75 | | 4.28 | | 120 |
| For the Year Ended October 31, 2019 |
| A | | $10.01 | | $ 0.46 | | $ (0.24) | | $ 0.22 | | $ (0.57) | | $ — | | $ (0.02) | | $ (0.59) | | $ 9.64 | | 2.34% | | $ 87,122 | | 1.14% | | 1.05% | | 4.71% | | 78% |
| C | | 10.01 | | 0.39 | | (0.24) | | 0.15 | | (0.42) | | — | | (0.02) | | (0.44) | | 9.72 | | 1.60 | | 56,859 | | 1.88 | | 1.80 | | 3.97 | | 78 |
| I | | 10.02 | | 0.48 | | (0.24) | | 0.24 | | (0.61) | | — | | (0.03) | | (0.64) | | 9.62 | | 2.63 | | 220,436 | | 0.87 | | 0.80 | | 4.97 | | 78 |
| R3 | | 10.00 | | 0.43 | | (0.23) | | 0.20 | | (0.52) | | — | | (0.02) | | (0.54) | | 9.66 | | 2.13 | | 227 | | 1.50 | | 1.35 | | 4.41 | | 78 |
| R4 | | 9.99 | | 0.46 | | (0.24) | | 0.22 | | (0.58) | | — | | (0.02) | | (0.60) | | 9.61 | | 2.33 | | 346 | | 1.20 | | 1.05 | | 4.76 | | 78 |
| R5 | | 9.98 | | 0.49 | | (0.24) | | 0.25 | | (0.62) | | — | | (0.03) | | (0.65) | | 9.58 | | 2.72 | | 11,015 | | 0.88 | | 0.75 | | 5.01 | | 78 |
| Y | | 9.99 | | 0.48 | | (0.23) | | 0.25 | | (0.62) | | — | | (0.03) | | (0.65) | | 9.59 | | 2.71 | | 14,773 | | 0.86 | | 0.77 | | 4.98 | | 78 |
| F | | 10.01 | | 0.49 | | (0.24) | | 0.25 | | (0.62) | | — | | (0.03) | | (0.65) | | 9.61 | | 2.73 | | 21,903 | | 0.78 | | 0.75 | | 5.04 | | 78 |
| For the Year Ended October 31, 2018 |
| A | | $10.06 | | $ 0.43 | | $ (0.07) | | $ 0.36 | | $ (0.41) | | $ — | | $ — | | $ (0.41) | | $ 10.01 | | 3.62% | | $ 119,920 | | 1.14% | | 1.05% | | 4.29% | | 84% |
| C | | 10.06 | | 0.36 | | (0.08) | | 0.28 | | (0.33) | | — | | — | | (0.33) | | 10.01 | | 2.85 | | 78,122 | | 1.88 | | 1.80 | | 3.54 | | 84 |
| I | | 10.07 | | 0.46 | | (0.08) | | 0.38 | | (0.43) | | — | | — | | (0.43) | | 10.02 | | 3.88 | | 313,336 | | 0.86 | | 0.80 | | 4.56 | | 84 |
| R3 | | 10.05 | | 0.40 | | (0.07) | | 0.33 | | (0.38) | | — | | — | | (0.38) | | 10.00 | | 3.31 | | 267 | | 1.50 | | 1.35 | | 4.00 | | 84 |
| R4 | | 10.04 | | 0.43 | | (0.07) | | 0.36 | | (0.41) | | — | | — | | (0.41) | | 9.99 | | 3.62 | | 809 | | 1.20 | | 1.05 | | 4.30 | | 84 |
| R5 | | 10.03 | | 0.47 | | (0.08) | | 0.39 | | (0.44) | | — | | — | | (0.44) | | 9.98 | | 3.93 | | 12,192 | | 0.89 | | 0.75 | | 4.65 | | 84 |
| Y | | 10.04 | | 0.46 | | (0.07) | | 0.39 | | (0.44) | | — | | — | | (0.44) | | 9.99 | | 3.93 | | 20,412 | | 0.83 | | 0.75 | | 4.62 | | 84 |
| F | | 10.07 | | 0.46 | | (0.08) | | 0.38 | | (0.44) | | — | | — | | (0.44) | | 10.01 | | 3.93 | | 31,840 | | 0.78 | | 0.75 | | 4.61 | | 84 |
| For the Year Ended October 31, 2017 |
| A | | $ 9.82 | | $ 0.40 | | $ 0.22 | | $ 0.62 | | $ (0.38) | | $ — | | $ — | | $ (0.38) | | $ 10.06 | | 6.38% | | $ 145,099 | | 1.10% | | 1.05% | | 3.97% | | 77% |
| C | | 9.82 | | 0.32 | | 0.22 | | 0.54 | | (0.30) | | — | | — | | (0.30) | | 10.06 | | 5.59 | | 89,003 | | 1.86 | | 1.80 | | 3.23 | | 77 |
| I | | 9.83 | | 0.42 | | 0.22 | | 0.64 | | (0.40) | | — | | — | | (0.40) | | 10.07 | | 6.64 | | 250,468 | | 0.87 | | 0.80 | | 4.19 | | 77 |
| R3 | | 9.81 | | 0.37 | | 0.22 | | 0.59 | | (0.35) | | — | | — | | (0.35) | | 10.05 | | 6.07 | | 339 | | 1.53 | | 1.35 | | 3.69 | | 77 |
| R4 | | 9.80 | | 0.39 | | 0.23 | | 0.62 | | (0.38) | | — | | — | | (0.38) | | 10.04 | | 6.38 | | 709 | | 1.18 | | 1.05 | | 3.94 | | 77 |
| R5 | | 9.80 | | 0.42 | | 0.22 | | 0.64 | | (0.41) | | — | | — | | (0.41) | | 10.03 | | 6.59 | | 1,851 | | 0.87 | | 0.75 | | 4.17 | | 77 |
| Y | | 9.80 | | 0.43 | | 0.22 | | 0.65 | | (0.41) | | — | | — | | (0.41) | | 10.04 | | 6.71 | | 7,121 | | 0.80 | | 0.75 | | 4.28 | | 77 |
| F (6) | | 10.03 | | 0.29 | | 0.01 | | 0.30 | | (0.26) | | — | | — | | (0.26) | | 10.07 | | 2.98 (7) | | 17,138 | | 0.77 (8) | | 0.75 (8) | | 4.27 (8) | | 77 |
The accompanying notes are an integral part of these financial statements.
Hartford Fixed Income Funds
Financial Highlights – (continued)
| | | — Selected Per-Share Data(1) — | | — Ratios and Supplemental Data — |
| Class | | Net
Asset
Value at
Beginning
of Period | | Net
Investment
Income
(Loss) | | Net
Realized
and
Unrealized
Gain (Loss)
on
Investments | | Total from
Investment
Operations | | Dividends
from Net
Investment
Income | | Distributions
from
Capital
Gains | | Returns
of
Capital | | Total
Dividends
and
Distributions | | Net
Asset
Value at
End of
Period | | Total
Return(2) | | Net
Assets
at End
of Period
(000s) | | Ratio of
Expenses
to
Average
Net
Assets
Before
Adjust-
ments(3)(4) | | Ratio of
Expenses
to
Average
Net
Assets
After
Adjust-
ments(3)(4) | | Ratio of
Net
Investment
Income
(Loss) to
Average
Net Assets(4) | | Portfolio
Turnover |
| The Hartford High Yield Fund |
| For the Year Ended October 31, 2021 |
| A | | $ 7.27 | | $ 0.29 | | $ 0.35 | | $ 0.64 | | $ (0.29) | | $ — | | $ — | | $ (0.29) | | $ 7.62 | | 8.90% | | $ 287,361 | | 1.00% | | 0.95% | | 3.85% | | 38% |
| C | | 7.25 | | 0.24 | | 0.34 | | 0.58 | | (0.23) | | — | | — | | (0.23) | | 7.60 | | 8.10 | | 17,757 | | 1.72 | | 1.71 | | 3.15 | | 38 |
| I | | 7.30 | | 0.31 | | 0.34 | | 0.65 | | (0.32) | | — | | — | | (0.32) | | 7.63 | | 9.03 | | 46,882 | | 0.68 | | 0.67 | | 4.10 | | 38 |
| R3 | | 7.28 | | 0.27 | | 0.34 | | 0.61 | | (0.27) | | — | | — | | (0.27) | | 7.62 | | 8.42 | | 1,996 | | 1.29 | | 1.26 | | 3.55 | | 38 |
| R4 | | 7.29 | | 0.29 | | 0.34 | | 0.63 | | (0.29) | | — | | — | | (0.29) | | 7.63 | | 8.73 | | 1,028 | | 1.00 | | 0.97 | | 3.85 | | 38 |
| R5 | | 7.26 | | 0.32 | | 0.33 | | 0.65 | | (0.32) | | — | | — | | (0.32) | | 7.59 | | 9.07 | | 737 | | 0.70 | | 0.67 | | 4.14 | | 38 |
| R6 (10) | | 7.57 | | 0.21 | | (0.03) (11) | | 0.18 | | (0.21) | | — | | — | | (0.21) | | 7.54 | | 2.35 (7) | | 10 | | 0.59 (8) | | 0.55 (8) | | 4.12 (8) | | 38 |
| Y | | 7.20 | | 0.31 | | 0.34 | | 0.65 | | (0.31) | | — | | — | | (0.31) | | 7.54 | | 9.12 | | 972 | | 0.69 | | 0.66 | | 4.15 | | 38 |
| F | | 7.28 | | 0.32 | | 0.35 | | 0.67 | | (0.34) | | — | | — | | (0.34) | | 7.61 | | 9.26 | | 110,704 | | 0.58 | | 0.55 | | 4.23 | | 38 |
| For the Year Ended October 31, 2020 |
| A | | $ 7.36 | | $ 0.33 | | $ (0.10) | | $ 0.23 | | $ (0.32) | | $ — | | $ — | | $ (0.32) | | $ 7.27 | | 3.31% | | $ 239,310 | | 1.15% | | 1.03% | | 4.54% | | 59% |
| C | | 7.33 | | 0.27 | | (0.08) | | 0.19 | | (0.27) | | — | | — | | (0.27) | | 7.25 | | 2.68 | | 26,125 | | 1.86 | | 1.78 | | 3.81 | | 59 |
| I | | 7.38 | | 0.35 | | (0.09) | | 0.26 | | (0.34) | | — | | — | | (0.34) | | 7.30 | | 3.74 | | 20,666 | | 0.82 | | 0.77 | | 4.80 | | 59 |
| R3 | | 7.36 | | 0.30 | | (0.08) | | 0.22 | | (0.30) | | — | | — | | (0.30) | | 7.28 | | 3.14 | | 1,866 | | 1.44 | | 1.34 | | 4.25 | | 59 |
| R4 | | 7.37 | | 0.33 | | (0.09) | | 0.24 | | (0.32) | | — | | — | | (0.32) | | 7.29 | | 3.45 | | 997 | | 1.14 | | 1.04 | | 4.54 | | 59 |
| R5 | | 7.33 | | 0.35 | | (0.07) | | 0.28 | | (0.35) | | — | | — | | (0.35) | | 7.26 | | 3.95 | | 614 | | 0.84 | | 0.74 | | 4.86 | | 59 |
| Y | | 7.30 | | 0.35 | | (0.12) | | 0.23 | | (0.33) | | — | | — | | (0.33) | | 7.20 | | 3.35 | | 849 | | 0.83 | | 0.77 | | 4.84 | | 59 |
| F | | 7.37 | | 0.35 | | (0.08) | | 0.27 | | (0.36) | | — | | — | | (0.36) | | 7.28 | | 3.78 | | 71,863 | | 0.72 | | 0.67 | | 4.90 | | 59 |
| For the Year Ended October 31, 2019 |
| A | | $ 7.15 | | $ 0.36 | | $ 0.22 | | $ 0.58 | | $ (0.37) | | $ — | | $ — | | $ (0.37) | | $ 7.36 | | 8.27% | | $ 229,615 | | 1.17% | | 1.05% | | 5.00% | | 36% |
| C | | 7.12 | | 0.31 | | 0.21 | | 0.52 | | (0.31) | | — | | — | | (0.31) | | 7.33 | | 7.42 | | 32,746 | | 1.87 | | 1.80 | | 4.27 | | 36 |
| I | | 7.19 | | 0.38 | | 0.21 | | 0.59 | | (0.40) | | — | | — | | (0.40) | | 7.38 | | 8.55 | | 20,575 | | 0.83 | | 0.79 | | 5.25 | | 36 |
| R3 | | 7.14 | | 0.34 | | 0.22 | | 0.56 | | (0.34) | | — | | — | | (0.34) | | 7.36 | | 8.03 | | 1,501 | | 1.46 | | 1.35 | | 4.72 | | 36 |
| R4 | | 7.16 | | 0.36 | | 0.22 | | 0.58 | | (0.37) | | — | | — | | (0.37) | | 7.37 | | 8.26 | | 1,009 | | 1.16 | | 1.05 | | 5.02 | | 36 |
| R5 | | 7.15 | | 0.38 | | 0.21 | | 0.59 | | (0.41) | | — | | — | | (0.41) | | 7.33 | | 8.50 | | 793 | | 0.85 | | 0.75 | | 5.29 | | 36 |
| Y | | 7.13 | | 0.37 | | 0.21 | | 0.58 | | (0.41) | | — | | — | | (0.41) | | 7.30 | | 8.42 | | 11,647 | | 0.83 | | 0.78 | | 5.09 | | 36 |
| F | | 7.18 | | 0.39 | | 0.22 | | 0.61 | | (0.42) | | — | | — | | (0.42) | | 7.37 | | 8.74 | | 60,588 | | 0.74 | | 0.70 | | 5.35 | | 36 |
| For the Year Ended October 31, 2018 |
| A | | $ 7.49 | | $ 0.36 | | $ (0.34) | | $ 0.02 | | $ (0.36) | | $ — | | $ — | | $ (0.36) | | $ 7.15 | | 0.27% | | $ 214,430 | | 1.17% | | 1.05% | | 4.92% | | 29% |
| C | | 7.47 | | 0.31 | | (0.36) | | (0.05) | | (0.30) | | — | | — | | (0.30) | | 7.12 | | (0.63) | | 38,727 | | 1.87 | | 1.80 | | 4.17 | | 29 |
| I | | 7.54 | | 0.38 | | (0.35) | | 0.03 | | (0.38) | | — | | — | | (0.38) | | 7.19 | | 0.44 | | 18,652 | | 0.83 | | 0.78 | | 5.19 | | 29 |
| R3 | | 7.49 | | 0.34 | | (0.35) | | (0.01) | | (0.34) | | — | | — | | (0.34) | | 7.14 | | (0.17) | | 1,964 | | 1.47 | | 1.35 | | 4.62 | | 29 |
| R4 | | 7.51 | | 0.36 | | (0.35) | | 0.01 | | (0.36) | | — | | — | | (0.36) | | 7.16 | | 0.15 | | 1,144 | | 1.17 | | 1.05 | | 4.92 | | 29 |
| R5 | | 7.49 | | 0.38 | | (0.34) | | 0.04 | | (0.38) | | — | | — | | (0.38) | | 7.15 | | 0.57 | | 628 | | 0.87 | | 0.75 | | 5.22 | | 29 |
| Y | | 7.48 | | 0.39 | | (0.35) | | 0.04 | | (0.39) | | — | | — | | (0.39) | | 7.13 | | 0.48 | | 867 | | 0.81 | | 0.70 | | 5.27 | | 29 |
| F | | 7.53 | | 0.39 | | (0.35) | | 0.04 | | (0.39) | | — | | — | | (0.39) | | 7.18 | | 0.51 | | 52,810 | | 0.75 | | 0.70 | | 5.27 | | 29 |
| For the Year Ended October 31, 2017 |
| A | | $ 7.28 | | $ 0.37 | | $ 0.21 | | $ 0.58 | | $ (0.36) | | $ — | | $ (0.01) | | $ (0.37) | | $ 7.49 | | 8.16% | | $ 224,824 | | 1.17% | | 1.05% | | 5.04% | | 49% |
| C | | 7.25 | | 0.32 | | 0.22 | | 0.54 | | (0.31) | | — | | (0.01) | | (0.32) | | 7.47 | | 7.52 | | 57,139 | | 1.85 | | 1.80 | | 4.29 | | 49 |
| I | | 7.31 | | 0.39 | | 0.23 | | 0.62 | | (0.38) | | — | | (0.01) | | (0.39) | | 7.54 | | 8.70 | | 28,998 | | 0.95 | | 0.80 | | 5.28 | | 49 |
| R3 | | 7.27 | | 0.35 | | 0.22 | | 0.57 | | (0.34) | | — | | (0.01) | | (0.35) | | 7.49 | | 7.99 | | 2,586 | | 1.48 | | 1.35 | | 4.74 | | 49 |
| R4 | | 7.28 | | 0.37 | | 0.23 | | 0.60 | | (0.36) | | — | | (0.01) | | (0.37) | | 7.51 | | 8.45 | | 1,463 | | 1.18 | | 1.05 | | 5.03 | | 49 |
| R5 | | 7.27 | | 0.39 | | 0.22 | | 0.61 | | (0.38) | | — | | (0.01) | | (0.39) | | 7.49 | | 8.63 | | 885 | | 0.87 | | 0.75 | | 5.33 | | 49 |
| Y | | 7.26 | | 0.40 | | 0.22 | | 0.62 | | (0.39) | | — | | (0.01) | | (0.40) | | 7.48 | | 8.69 | | 7,330 | | 0.75 | | 0.70 | | 5.40 | | 49 |
| F (6) | | 7.48 | | 0.27 | | 0.05 | | 0.32 | | (0.26) | | — | | (0.01) | | (0.27) | | 7.53 | | 4.33 (7) | | 45,699 | | 0.75 (8) | | 0.70 (8) | | 5.31 (8) | | 49 |
The accompanying notes are an integral part of these financial statements.
Hartford Fixed Income Funds
Financial Highlights – (continued)
| | | — Selected Per-Share Data(1) — | | — Ratios and Supplemental Data — |
| Class | | Net
Asset
Value at
Beginning
of Period | | Net
Investment
Income
(Loss) | | Net
Realized
and
Unrealized
Gain (Loss)
on
Investments | | Total from
Investment
Operations | | Dividends
from Net
Investment
Income | | Distributions
from
Capital
Gains | | Returns
of
Capital | | Total
Dividends
and
Distributions | | Net
Asset
Value at
End of
Period | | Total
Return(2) | | Net
Assets
at End
of Period
(000s) | | Ratio of
Expenses
to
Average
Net
Assets
Before
Adjust-
ments(3)(4) | | Ratio of
Expenses
to
Average
Net
Assets
After
Adjust-
ments(3)(4) | | Ratio of
Net
Investment
Income
(Loss) to
Average
Net Assets(4) | | Portfolio
Turnover |
| The Hartford Inflation Plus Fund |
| For the Year Ended October 31, 2021 |
| A | | $11.11 | | $ 0.36 | | $ 0.40 | | $ 0.76 | | $ (0.24) | | $ — | | $ — | | $ (0.24) | | $ 11.63 | | 6.88% | | $ 232,828 | | 0.85% | | 0.85% | | 3.18% | | 73% (12) |
| C | | 10.70 | | 0.26 | | 0.39 | | 0.65 | | (0.12) | | — | | — | | (0.12) | | 11.23 | | 6.14 | | 23,382 | | 1.58 | | 1.58 | | 2.41 | | 73 (12) |
| I | | 11.35 | | 0.40 | | 0.40 | | 0.80 | | (0.27) | | — | | — | | (0.27) | | 11.88 | | 7.15 | | 57,343 | | 0.55 | | 0.55 | | 3.42 | | 73 (12) |
| R3 | | 10.89 | | 0.31 | | 0.39 | | 0.70 | | (0.19) | | — | | — | | (0.19) | | 11.40 | | 6.52 | | 32,804 | | 1.17 | | 1.17 | | 2.75 | | 73 (12) |
| R4 | | 11.12 | | 0.32 | | 0.43 | | 0.75 | | (0.22) | | — | | — | | (0.22) | | 11.65 | | 6.84 | | 4,336 | | 0.87 | | 0.87 | | 2.85 | | 73 (12) |
| R5 | | 11.30 | | 0.40 | | 0.40 | | 0.80 | | (0.27) | | — | | — | | (0.27) | | 11.83 | | 7.18 | | 1,818 | | 0.57 | | 0.57 | | 3.49 | | 73 (12) |
| Y | | 11.37 | | 0.40 | | 0.40 | | 0.80 | | (0.27) | | — | | — | | (0.27) | | 11.90 | | 7.13 | | 34,156 | | 0.56 | | 0.56 | | 3.44 | | 73 (12) |
| F | �� | 11.34 | | 0.39 | | 0.43 | | 0.82 | | (0.28) | | — | | — | | (0.28) | | 11.88 | | 7.36 | | 182,069 | | 0.45 | | 0.45 | | 3.40 | | 73 (12) |
| For the Year Ended October 31, 2020 |
| A | | $10.54 | | $ 0.13 | | $ 0.62 | | $ 0.75 | | $ (0.18) | | $ — | | $ — | | $ (0.18) | | $ 11.11 | | 7.23% | | $ 200,745 | | 0.92% | | 0.85% | | 1.17% | | 78% (12) |
| C | | 10.11 | | 0.03 | | 0.62 | | 0.65 | | (0.06) | | — | | — | | (0.06) | | 10.70 | | 6.45 | | 20,713 | | 1.65 | | 1.59 | | 0.29 | | 78 (12) |
| I | | 10.75 | | 0.16 | | 0.65 | | 0.81 | | (0.21) | | — | | — | | (0.21) | | 11.35 | | 7.64 | | 54,119 | | 0.60 | | 0.57 | | 1.49 | | 78 (12) |
| R3 | | 10.33 | | 0.08 | | 0.62 | | 0.70 | | (0.14) | | — | | — | | (0.14) | | 10.89 | | 6.89 | | 35,410 | | 1.21 | | 1.18 | | 0.81 | | 78 (12) |
| R4 | | 10.54 | | 0.11 | | 0.64 | | 0.75 | | (0.17) | | — | | — | | (0.17) | | 11.12 | | 7.24 | | 5,663 | | 0.92 | | 0.89 | | 1.07 | | 78 (12) |
| R5 | | 10.71 | | 0.17 | | 0.63 | | 0.80 | | (0.21) | | — | | — | | (0.21) | | 11.30 | | 7.56 | | 1,650 | | 0.61 | | 0.58 | | 1.57 | | 78 (12) |
| Y | | 10.77 | | 0.15 | | 0.66 | | 0.81 | | (0.21) | | — | | — | | (0.21) | | 11.37 | | 7.64 | | 30,813 | | 0.60 | | 0.57 | | 1.38 | | 78 (12) |
| F | | 10.75 | | 0.16 | | 0.64 | | 0.80 | | (0.21) | | — | | — | | (0.21) | | 11.34 | | 7.61 | | 174,665 | | 0.49 | | 0.49 | | 1.49 | | 78 (12) |
| For the Year Ended October 31, 2019 |
| A | | $10.34 | | $ 0.18 | | $ 0.40 | | $ 0.58 | | $ (0.38) | | $ — | | $ — | | $ (0.38) | | $ 10.54 | | 5.81% | | $ 185,301 | | 0.99% | | 0.85% | | 1.71% | | 77% |
| C | | 9.88 | | 0.09 | | 0.39 | | 0.48 | | (0.25) | | — | | — | | (0.25) | | 10.11 | | 5.00 | | 34,060 | | 1.70 | | 1.60 | | 0.87 | | 77 |
| I | | 10.53 | | 0.21 | | 0.41 | | 0.62 | | (0.40) | | — | | — | | (0.40) | | 10.75 | | 6.17 | | 52,182 | | 0.66 | | 0.60 | | 1.98 | | 77 |
| R3 | | 10.13 | | 0.14 | | 0.40 | | 0.54 | | (0.34) | | — | | — | | (0.34) | | 10.33 | | 5.50 | | 40,395 | | 1.28 | | 1.20 | | 1.36 | | 77 |
| R4 | | 10.33 | | 0.18 | | 0.40 | | 0.58 | | (0.37) | | — | | — | | (0.37) | | 10.54 | | 5.79 | | 7,831 | | 0.98 | | 0.90 | | 1.72 | | 77 |
| R5 | | 10.50 | | 0.20 | | 0.41 | | 0.61 | | (0.40) | | — | | — | | (0.40) | | 10.71 | | 6.18 | | 1,975 | | 0.68 | | 0.60 | | 1.88 | | 77 |
| Y | | 10.56 | | 0.21 | | 0.41 | | 0.62 | | (0.41) | | — | | — | | (0.41) | | 10.77 | | 6.11 | | 24,678 | | 0.65 | | 0.58 | | 1.97 | | 77 |
| F | | 10.53 | | 0.22 | | 0.41 | | 0.63 | | (0.41) | | — | | — | | (0.41) | | 10.75 | | 6.22 | | 157,921 | | 0.56 | | 0.55 | | 2.05 | | 77 |
| For the Year Ended October 31, 2018 |
| A | | $10.95 | | $ 0.25 | | $ (0.37) | | $ (0.12) | | $ (0.49) | | $ — | | $ — | | $ (0.49) | | $ 10.34 | | (1.19)% | | $ 193,398 | | 0.98% | | 0.85% | | 2.34% | | 18% |
| C | | 10.47 | | 0.16 | | (0.36) | | (0.20) | | (0.39) | | — | | — | | (0.39) | | 9.88 | | (1.95) | | 60,373 | | 1.69 | | 1.60 | | 1.61 | | 18 |
| I | | 11.15 | | 0.27 | | (0.38) | | (0.11) | | (0.51) | | — | | — | | (0.51) | | 10.53 | | (0.99) | | 51,586 | | 0.67 | | 0.60 | | 2.57 | | 18 |
| R3 | | 10.74 | | 0.20 | | (0.36) | | (0.16) | | (0.45) | | — | | — | | (0.45) | | 10.13 | | (1.57) | | 45,035 | | 1.28 | | 1.20 | | 1.99 | | 18 |
| R4 | | 10.94 | | 0.24 | | (0.37) | | (0.13) | | (0.48) | | — | | — | | (0.48) | | 10.33 | | (1.28) | | 9,723 | | 0.98 | | 0.90 | | 2.32 | | 18 |
| R5 | | 11.12 | | 0.27 | | (0.37) | | (0.10) | | (0.52) | | — | | — | | (0.52) | | 10.50 | | (0.99) | | 2,711 | | 0.68 | | 0.60 | | 2.54 | | 18 |
| Y | | 11.18 | | 0.28 | | (0.38) | | (0.10) | | (0.52) | | — | | — | | (0.52) | | 10.56 | | (0.93) | | 28,512 | | 0.62 | | 0.55 | | 2.64 | | 18 |
| F | | 11.16 | | 0.28 | | (0.39) | | (0.11) | | (0.52) | | — | | — | | (0.52) | | 10.53 | | (1.03) | | 151,498 | | 0.56 | | 0.55 | | 2.61 | | 18 |
| For the Year Ended October 31, 2017 |
| A | | $11.05 | | $ 0.15 | | $ (0.12) | | $ 0.03 | | $ (0.13) | | $ — | | $ — | | $ (0.13) | | $ 10.95 | | 0.27% | | $ 203,962 | | 0.95% | | 0.85% | | 1.39% | | 72% |
| C | | 10.56 | | 0.07 | | (0.12) | | (0.05) | | (0.04) | | — | | — | | (0.04) | | 10.47 | | (0.46) | | 110,182 | | 1.67 | | 1.60 | | 0.65 | | 72 |
| I | | 11.25 | | 0.18 | | (0.12) | | 0.06 | | (0.16) | | — | | — | | (0.16) | | 11.15 | | 0.53 | | 57,101 | | 0.74 | | 0.60 | | 1.66 | | 72 |
| R3 | | 10.84 | | 0.11 | | (0.12) | | (0.01) | | (0.09) | | — | | — | | (0.09) | | 10.74 | | (0.07) | | 48,953 | | 1.27 | | 1.20 | | 1.05 | | 72 |
| R4 | | 11.04 | | 0.15 | | (0.13) | | 0.02 | | (0.12) | | — | | — | | (0.12) | | 10.94 | | 0.22 | | 11,278 | | 0.97 | | 0.90 | | 1.33 | | 72 |
| R5 | | 11.22 | | 0.18 | | (0.12) | | 0.06 | | (0.16) | | — | | — | | (0.16) | | 11.12 | | 0.54 | | 2,924 | | 0.69 | | 0.60 | | 1.67 | | 72 |
| Y | | 11.28 | | 0.19 | | (0.13) | | 0.06 | | (0.16) | | — | | — | | (0.16) | | 11.18 | | 0.59 | | 31,947 | | 0.57 | | 0.55 | | 1.75 | | 72 |
| F (6) | | 11.08 | | 0.12 | | (0.04) | | 0.08 | | — | | — | | — | | — | | 11.16 | | 0.72 (7) | | 119,654 | | 0.55 (8) | | 0.55 (8) | | 1.65 (8) | | 72 |
The accompanying notes are an integral part of these financial statements.
Hartford Fixed Income Funds
Financial Highlights – (continued)
| | | — Selected Per-Share Data(1) — | | — Ratios and Supplemental Data — |
| Class | | Net
Asset
Value at
Beginning
of Period | | Net
Investment
Income
(Loss) | | Net
Realized
and
Unrealized
Gain (Loss)
on
Investments | | Total from
Investment
Operations | | Dividends
from Net
Investment
Income | | Distributions
from
Capital
Gains | | Returns
of
Capital | | Total
Dividends
and
Distributions | | Net
Asset
Value at
End of
Period | | Total
Return(2) | | Net
Assets
at End
of Period
(000s) | | Ratio of
Expenses
to
Average
Net
Assets
Before
Adjust-
ments(3)(4) | | Ratio of
Expenses
to
Average
Net
Assets
After
Adjust-
ments(3)(4) | | Ratio of
Net
Investment
Income
(Loss) to
Average
Net Assets(4) | | Portfolio
Turnover |
| The Hartford Municipal Opportunities Fund |
| For the Year Ended October 31, 2021 |
| A | | $ 8.93 | | $ 0.15 | | $ 0.11 | | $ 0.26 | | $ (0.15) | | $ — | | $ — | | $ (0.15) | | $ 9.04 | | 2.94% | | $ 486,106 | | 0.66% | | 0.66% | | 1.67% | | 8% |
| C | | 8.94 | | 0.08 | | 0.11 | | 0.19 | | (0.08) | | — | | — | | (0.08) | | 9.05 | | 2.16 | | 48,740 | | 1.42 | | 1.42 | | 0.92 | | 8 |
| I | | 8.94 | | 0.17 | | 0.11 | | 0.28 | | (0.17) | | — | | — | | (0.17) | | 9.05 | | 3.19 | | 902,081 | | 0.42 | | 0.42 | | 1.91 | | 8 |
| Y | | 8.93 | | 0.17 | | 0.11 | | 0.28 | | (0.17) | | — | | — | | (0.17) | | 9.04 | | 3.17 | | 15,319 | | 0.44 | | 0.44 | | 1.90 | | 8 |
| F | | 8.92 | | 0.18 | | 0.11 | | 0.29 | | (0.18) | | — | | — | | (0.18) | | 9.03 | | 3.26 | | 332,185 | | 0.35 | | 0.35 | | 1.98 | | 8 |
| For the Year Ended October 31, 2020 |
| A | | $ 8.88 | | $ 0.18 | | $ 0.05 | | $ 0.23 | | $ (0.18) | | $ — | | $ — | | $ (0.18) | | $ 8.93 | | 2.63% | | $ 437,341 | | 0.68% | | 0.68% | | 2.03% | | 26% |
| C | | 8.89 | | 0.11 | | 0.05 | | 0.16 | | (0.11) | | — | | — | | (0.11) | | 8.94 | | 1.86 | | 59,074 | | 1.43 | | 1.43 | | 1.28 | | 26 |
| I | | 8.88 | | 0.20 | | 0.06 | | 0.26 | | (0.20) | | — | | — | | (0.20) | | 8.94 | | 2.99 | | 724,260 | | 0.44 | | 0.44 | | 2.26 | | 26 |
| Y | | 8.88 | | 0.20 | | 0.05 | | 0.25 | | (0.20) | | — | | — | | (0.20) | | 8.93 | | 2.86 | | 15,559 | | 0.45 | | 0.45 | | 2.25 | | 26 |
| F | | 8.87 | | 0.21 | | 0.05 | | 0.26 | | (0.21) | | — | | — | | (0.21) | | 8.92 | | 2.95 | | 231,121 | | 0.37 | | 0.37 | | 2.32 | | 26 |
| For the Year Ended October 31, 2019 |
| A | | $ 8.37 | | $ 0.22 | | $ 0.51 | | $ 0.73 | | $ (0.22) | | $ — | | $ — | | $ (0.22) | | $ 8.88 | | 8.79% | | $ 394,518 | | 0.69% | | 0.69% | | 2.49% | | 15% |
| C | | 8.37 | | 0.15 | | 0.52 | | 0.67 | | (0.15) | | — | | — | | (0.15) | | 8.89 | | 8.08 | | 66,792 | | 1.44 | | 1.44 | | 1.75 | | 15 |
| I | | 8.38 | | 0.24 | | 0.52 | | 0.76 | | (0.26) | | — | | — | | (0.26) | | 8.88 | | 9.15 | | 516,299 | | 0.44 | | 0.44 | | 2.72 | | 15 |
| Y | | 8.38 | | 0.24 | | 0.52 | | 0.76 | | (0.26) | | — | | — | | (0.26) | | 8.88 | | 9.17 | | 14,391 | | 0.45 | | 0.45 | | 2.74 | | 15 |
| F | | 8.38 | | 0.24 | | 0.51 | | 0.75 | | (0.26) | | — | | — | | (0.26) | | 8.87 | | 9.15 | | 98,172 | | 0.37 | | 0.37 | | 2.76 | | 15 |
| For the Year Ended October 31, 2018 |
| A | | $ 8.60 | | $ 0.22 | | $ (0.23) | | $ (0.01) | | $ (0.22) | | $ — | | $ — | | $ (0.22) | | $ 8.37 | | (0.11)% | | $ 325,322 | | 0.70% | | 0.69% | | 2.60% | | 23% |
| C | | 8.60 | | 0.16 | | (0.23) | | (0.07) | | (0.16) | | — | | — | | (0.16) | | 8.37 | | (0.86) | | 77,408 | | 1.46 | | 1.44 | | 1.85 | | 23 |
| I | | 8.61 | | 0.24 | | (0.23) | | 0.01 | | (0.24) | | — | | — | | (0.24) | | 8.38 | | 0.14 | | 325,853 | | 0.45 | | 0.44 | | 2.85 | | 23 |
| Y (13) | | 8.52 | | 0.10 | | (0.14) | | (0.04) | | (0.10) | | — | | — | | (0.10) | | 8.38 | | (0.46) (7) | | 14,574 | | 0.44 (8) | | 0.44 (8) | | 2.87 (8) | | 23 |
| F | | 8.61 | | 0.25 | | (0.23) | | 0.02 | | (0.25) | | — | | — | | (0.25) | | 8.38 | | 0.20 | | 43,617 | | 0.38 | | 0.38 | | 2.90 | | 23 |
| For the Year Ended October 31, 2017 |
| A | | $ 8.69 | | $ 0.22 | | $ (0.09) | | $ 0.13 | | $ (0.22) | | $ — | | $ — | | $ (0.22) | | $ 8.60 | | 1.50% | | $ 251,143 | | 0.68% | | 0.68% | | 2.53% | | 23% |
| C | | 8.69 | | 0.15 | | (0.09) | | 0.06 | | (0.15) | | — | | — | | (0.15) | | 8.60 | | 0.73 | | 100,507 | | 1.44 | | 1.44 | | 1.77 | | 23 |
| I | | 8.71 | | 0.24 | | (0.10) | | 0.14 | | (0.24) | | — | | — | | (0.24) | | 8.61 | | 1.63 | | 302,855 | | 0.44 | | 0.44 | | 2.77 | | 23 |
| F (6) | | 8.46 | | 0.16 | | 0.15 | | 0.31 | | (0.16) | | — | | — | | (0.16) | | 8.61 | | 3.69 (7) | | 25,280 | | 0.39 (8) | | 0.39 (8) | | 2.77 (8) | | 23 |
| Hartford Municipal Short Duration Fund |
| For the Year Ended October 31, 2021 |
| A | | $10.16 | | $ 0.12 | | $ 0.03 | | $ 0.15 | | $ (0.12) | | $ (0.00) (14) | | $ — | | $ (0.12) | | $ 10.19 | | 1.52% | | $ 21,655 | | 1.04% | | 0.69% | | 1.18% | | 16% |
| C | | 10.16 | | 0.05 | | 0.02 | | 0.07 | | (0.05) | | (0.00) (14) | | — | | (0.05) | | 10.18 | | 0.66 | | 1,390 | | 1.85 | | 1.44 | | 0.44 | | 16 |
| I | | 10.15 | | 0.14 | | 0.03 | | 0.17 | | (0.15) | | (0.00) (14) | | — | | (0.15) | | 10.17 | | 1.65 | | 8,253 | | 0.83 | | 0.46 | | 1.38 | | 16 |
| F | | 10.16 | | 0.15 | | 0.02 | | 0.17 | | (0.15) | | (0.00) (14) | | — | | (0.15) | | 10.18 | | 1.72 | | 5,047 | | 0.74 | | 0.39 | | 1.44 | | 16 |
| For the Year Ended October 31, 2020 |
| A | | $10.16 | | $ 0.16 | | $ 0.03 | | $ 0.19 | | $ (0.16) | | $ (0.03) | | $ — | | $ (0.19) | | $ 10.16 | | 1.88% | | $ 18,359 | | 1.10% | | 0.69% | | 1.62% | | 26% |
| C | | 10.15 | | 0.09 | | 0.04 | | 0.13 | | (0.09) | | (0.03) | | — | | (0.12) | | 10.16 | | 1.23 | | 1,483 | | 1.94 | | 1.44 | | 0.87 | | 26 |
| I | | 10.15 | | 0.18 | | 0.04 | | 0.22 | | (0.19) | | (0.03) | | — | | (0.22) | | 10.15 | | 2.12 | | 3,879 | | 0.88 | | 0.46 | | 1.83 | | 26 |
| F | | 10.16 | | 0.19 | | 0.03 | | 0.22 | | (0.19) | | (0.03) | | — | | (0.22) | | 10.16 | | 2.19 | | 2,164 | | 0.80 | | 0.39 | | 1.91 | | 26 |
| For the Year Ended October 31, 2019 |
| A | | $ 9.88 | | $ 0.18 | | $ 0.28 | | $ 0.46 | | $ (0.18) | | $ — | | $ — | | $ (0.18) | | $ 10.16 | | 4.66% | | $ 16,141 | | 1.09% | | 0.66% | | 1.77% | | 73% |
| C | | 9.87 | | 0.17 | | 0.27 | | 0.44 | | (0.16) | | — | | — | | (0.16) | | 10.15 | | 4.54 | | 1,362 | | 1.82 | | 0.76 | | 1.66 | | 73 |
| I | | 9.88 | | 0.20 | | 0.28 | | 0.48 | | (0.21) | | — | | — | | (0.21) | | 10.15 | | 4.92 | | 2,212 | | 0.80 | | 0.41 | | 2.01 | | 73 |
| F | | 9.88 | | 0.20 | | 0.28 | | 0.48 | | (0.20) | | — | | — | | (0.20) | | 10.16 | | 4.94 | | 1,700 | | 0.79 | | 0.39 | | 2.03 | | 73 |
The accompanying notes are an integral part of these financial statements.
Hartford Fixed Income Funds
Financial Highlights – (continued)
| | | — Selected Per-Share Data(1) — | | — Ratios and Supplemental Data — |
| Class | | Net
Asset
Value at
Beginning
of Period | | Net
Investment
Income
(Loss) | | Net
Realized
and
Unrealized
Gain (Loss)
on
Investments | | Total from
Investment
Operations | | Dividends
from Net
Investment
Income | | Distributions
from
Capital
Gains | | Returns
of
Capital | | Total
Dividends
and
Distributions | | Net
Asset
Value at
End of
Period | | Total
Return(2) | | Net
Assets
at End
of Period
(000s) | | Ratio of
Expenses
to
Average
Net
Assets
Before
Adjust-
ments(3)(4) | | Ratio of
Expenses
to
Average
Net
Assets
After
Adjust-
ments(3)(4) | | Ratio of
Net
Investment
Income
(Loss) to
Average
Net Assets(4) | | Portfolio
Turnover |
| Hartford Municipal Short Duration Fund – (continued) |
| For the Year Ended October 31, 2018 |
| A | | $10.04 | | $ 0.16 | | $ (0.16) | | $ — | | $ (0.16) | | $ — | | $ — | | $ (0.16) | | $ 9.88 | | (0.03)% | | $ 8,984 | | 1.20% | | 0.61% | | 1.58% | | 24% |
| C | | 10.04 | | 0.15 | | (0.17) | | (0.02) | | (0.15) | | — | | — | | (0.15) | | 9.87 | | (0.24) | | 3,157 | | 1.94 | | 0.73 | | 1.46 | | 24 |
| I | | 10.05 | | 0.18 | | (0.17) | | 0.01 | | (0.18) | | — | | — | | (0.18) | | 9.88 | | 0.08 | | 6,789 | | 0.92 | | 0.41 | | 1.78 | | 24 |
| F | | 10.05 | | 0.18 | | (0.17) | | 0.01 | | (0.18) | | — | | — | | (0.18) | | 9.88 | | 0.09 | | 979 | | 0.90 | | 0.39 | | 1.80 | | 24 |
| For the Year Ended October 31, 2017 |
| A | | $10.08 | | $ 0.12 | | $ (0.04) | | $ 0.08 | | $ (0.12) | | $ — | | $ — | | $ (0.12) | | $ 10.04 | | 0.81% | | $ 8,363 | | 1.15% | | 0.67% | | 1.21% | | 20% |
| C | | 10.08 | | 0.09 | | (0.04) | | 0.05 | | (0.09) | | — | | — | | (0.09) | | 10.04 | | 0.54 | | 3,614 | | 1.88 | | 0.95 | | 0.92 | | 20 |
| I | | 10.08 | | 0.14 | | (0.03) | | 0.11 | | (0.14) | | — | | — | | (0.14) | | 10.05 | | 1.15 | | 7,246 | | 0.87 | | 0.44 | | 1.44 | | 20 |
| F (6) | | 9.96 | | 0.10 | | 0.09 | | 0.19 | | (0.10) | | — | | — | | (0.10) | | 10.05 | | 1.91 (7) | | 509 | | 0.87 (8) | | 0.39 (8) | | 1.53 (8) | | 20 |
| The Hartford Short Duration Fund |
| For the Year Ended October 31, 2021 |
| A | | $10.00 | | $ 0.15 | | $ 0.01(11) | | $ 0.16 | | $ (0.16) | | $ — | | $ — | | $ (0.16) | | $ 10.00 | | 1.55% | | $ 923,939 | | 0.79% | | 0.78% | | 1.54% | | 35% (15) |
| C | | 10.00 | | 0.08 | | — (5) | | 0.08 | | (0.08) | | — | | — | | (0.08) | | 10.00 | | 0.81 | | 69,234 | | 1.52 | | 1.52 | | 0.81 | | 35 (15) |
| I | | 9.98 | | 0.18 | | 0.01 (11) | | 0.19 | | (0.20) | | — | | — | | (0.20) | | 9.97 | | 1.88 | | 716,236 | | 0.49 | | 0.49 | | 1.81 | | 35 (15) |
| R3 | | 9.98 | | 0.13 | | — (5) | | 0.13 | | (0.13) | | — | | — | | (0.13) | | 9.98 | | 1.33 | | 1,593 | | 1.14 | | 1.00 | | 1.34 | | 35 (15) |
| R4 | | 9.99 | | 0.16 | | (0.01) | | 0.15 | | (0.16) | | — | | — | | (0.16) | | 9.98 | | 1.51 | | 4,412 | | 0.72 | | 0.72 | | 1.60 | | 35 (15) |
| R5 | | 9.96 | | 0.18 | | — (5) | | 0.18 | | (0.19) | | — | | — | | (0.19) | | 9.95 | | 1.77 | | 1,546 | | 0.54 | | 0.54 | | 1.78 | | 35 (15) |
| R6 | | 9.93 | | 0.18 | | 0.01 (11) | | 0.19 | | (0.21) | | — | | — | | (0.21) | | 9.91 | | 1.90 | | 2,020 | | 0.43 | | 0.43 | | 1.84 | | 35 (15) |
| Y | | 9.94 | | 0.18 | | 0.01 (11) | | 0.19 | | (0.19) | | — | | — | | (0.19) | | 9.94 | | 1.87 | | 8,927 | | 0.52 | | 0.52 | | 1.78 | | 35 (15) |
| F | | 9.98 | | 0.19 | | (0.01) | | 0.18 | | (0.21) | | — | | — | | (0.21) | | 9.95 | | 1.81 | | 430,676 | | 0.42 | | 0.42 | | 1.87 | | 35 (15) |
| For the Year Ended October 31, 2020 |
| A | | $ 9.92 | | $ 0.22 | | $ 0.08 | | $ 0.30 | | $ (0.22) | | $ — | | $ — | | $ (0.22) | | $ 10.00 | | 3.07% | | $ 847,571 | | 0.84% | | 0.80% | | 2.21% | | 38% (15) |
| C | | 9.92 | | 0.15 | | 0.08 | | 0.23 | | (0.15) | | — | | — | | (0.15) | | 10.00 | | 2.31 | | 90,816 | | 1.55 | | 1.55 | | 1.49 | | 38 (15) |
| I | | 9.92 | | 0.25 | | 0.07 | | 0.32 | | (0.26) | | — | | — | | (0.26) | | 9.98 | | 3.27 | | 452,754 | | 0.53 | | 0.53 | | 2.50 | | 38 (15) |
| R3 | | 9.90 | | 0.19 | | 0.07 | | 0.26 | | (0.18) | | — | | — | | (0.18) | | 9.98 | | 2.71 | | 2,376 | | 1.15 | | 1.15 | | 1.88 | | 38 (15) |
| R4 | | 9.91 | | 0.23 | | 0.08 | | 0.31 | | (0.23) | | — | | — | | (0.23) | | 9.99 | | 3.15 | | 4,777 | | 0.78 | | 0.78 | | 2.29 | | 38 (15) |
| R5 | | 9.89 | | 0.24 | | 0.08 | | 0.32 | | (0.25) | | — | | — | | (0.25) | | 9.96 | | 3.31 | | 2,140 | | 0.56 | | 0.56 | | 2.45 | | 38 (15) |
| R6 | | 9.87 | | 0.25 | | 0.08 | | 0.33 | | (0.27) | | — | | — | | (0.27) | | 9.93 | | 3.40 | | 13 | | 0.45 | | 0.45 | | 2.57 | | 38 (15) |
| Y | | 9.87 | | 0.25 | | 0.07 | | 0.32 | | (0.25) | | — | | — | | (0.25) | | 9.94 | | 3.33 | | 6,999 | | 0.55 | | 0.55 | | 2.53 | | 38 (15) |
| F | | 9.91 | | 0.25 | | 0.09 | | 0.34 | | (0.27) | | — | | — | | (0.27) | | 9.98 | | 3.52 | | 255,190 | | 0.44 | | 0.44 | | 2.58 | | 38 (15) |
| For the Year Ended October 31, 2019 |
| A | | $ 9.70 | | $ 0.26 | | $ 0.22 | | $ 0.48 | | $ (0.26) | | $ — | | $ — | | $ (0.26) | | $ 9.92 | | 5.05% | | $ 653,304 | | 0.84% | | 0.81% | | 2.67% | | 30% |
| C | | 9.69 | | 0.19 | | 0.23 | | 0.42 | | (0.19) | | — | | — | | (0.19) | | 9.92 | | 4.34 | | 80,498 | | 1.55 | | 1.55 | | 1.93 | | 30 |
| I | | 9.71 | | 0.29 | | 0.24 | | 0.53 | | (0.32) | | — | | — | | (0.32) | | 9.92 | | 5.52 | | 404,974 | | 0.52 | | 0.52 | | 2.95 | | 30 |
| R3 | | 9.67 | | 0.23 | | 0.23 | | 0.46 | | (0.23) | | — | | — | | (0.23) | | 9.90 | | 4.78 | | 1,676 | | 1.16 | | 1.15 | | 2.31 | | 30 |
| R4 | | 9.68 | | 0.26 | | 0.23 | | 0.49 | | (0.26) | | — | | — | | (0.26) | | 9.91 | | 5.16 | | 7,764 | | 0.74 | | 0.74 | | 2.66 | | 30 |
| R5 | | 9.69 | | 0.29 | | 0.22 | | 0.51 | | (0.31) | | — | | — | | (0.31) | | 9.89 | | 5.37 | | 1,412 | | 0.56 | | 0.55 | | 2.93 | | 30 |
| R6 (16) | | 9.70 | | 0.20 | | 0.17 | | 0.37 | | (0.20) | | — | | — | | (0.20) | | 9.87 | | 3.85 | | 11 | | 0.45 | | 0.45 | | 2.99 | | 30 |
| Y | | 9.67 | | 0.29 | | 0.23 | | 0.52 | | (0.32) | | — | | — | | (0.32) | | 9.87 | | 5.43 | | 11,831 | | 0.52 | | 0.52 | | 2.97 | | 30 |
| F | | 9.72 | | 0.30 | | 0.22 | | 0.52 | | (0.33) | | — | | — | | (0.33) | | 9.91 | | 5.44 | | 228,084 | | 0.44 | | 0.44 | | 3.03 | | 30 |
The accompanying notes are an integral part of these financial statements.
Hartford Fixed Income Funds
Financial Highlights – (continued)
| | | — Selected Per-Share Data(1) — | | — Ratios and Supplemental Data — |
| Class | | Net
Asset
Value at
Beginning
of Period | | Net
Investment
Income
(Loss) | | Net
Realized
and
Unrealized
Gain (Loss)
on
Investments | | Total from
Investment
Operations | | Dividends
from Net
Investment
Income | | Distributions
from
Capital
Gains | | Returns
of
Capital | | Total
Dividends
and
Distributions | | Net
Asset
Value at
End of
Period | | Total
Return(2) | | Net
Assets
at End
of Period
(000s) | | Ratio of
Expenses
to
Average
Net
Assets
Before
Adjust-
ments(3)(4) | | Ratio of
Expenses
to
Average
Net
Assets
After
Adjust-
ments(3)(4) | | Ratio of
Net
Investment
Income
(Loss) to
Average
Net Assets(4) | | Portfolio
Turnover |
| The Hartford Short Duration Fund – (continued) |
| For the Year Ended October 31, 2018 |
| A | | $ 9.87 | | $ 0.23 | | $ (0.17) | | $ 0.06 | | $ (0.23) | | $ — | | $ — | | $ (0.23) | | $ 9.70 | | 0.66% | | $ 516,715 | | 0.91% | | 0.85% | | 2.39% | | 29% |
| C | | 9.87 | | 0.16 | | (0.18) | | (0.02) | | (0.16) | | — | | — | | (0.16) | | 9.69 | | (0.19) | | 71,192 | | 1.61 | | 1.60 | | 1.63 | | 29 |
| I | | 9.89 | | 0.26 | | (0.18) | | 0.08 | | (0.26) | | — | | — | | (0.26) | | 9.71 | | 0.85 | | 227,412 | | 0.56 | | 0.56 | | 2.68 | | 29 |
| R3 | | 9.84 | | 0.22 | | (0.17) | | 0.05 | | (0.22) | | — | | — | | (0.22) | | 9.67 | | 0.52 | | 960 | | 1.21 | | 0.99 | | 2.25 | | 29 |
| R4 | | 9.85 | | 0.23 | | (0.17) | | 0.06 | | (0.23) | | — | | — | | (0.23) | | 9.68 | | 0.66 | | 645 | | 0.91 | | 0.85 | | 2.39 | | 29 |
| R5 | | 9.86 | | 0.26 | | (0.17) | | 0.09 | | (0.26) | | — | | — | | (0.26) | | 9.69 | | 0.96 | | 1,125 | | 0.61 | | 0.55 | | 2.71 | | 29 |
| Y | | 9.84 | | 0.27 | | (0.18) | | 0.09 | | (0.26) | | — | | — | | (0.26) | | 9.67 | | 0.97 | | 14,983 | | 0.54 | | 0.54 | | 2.73 | | 29 |
| F | | 9.89 | | 0.27 | | (0.17) | | 0.10 | | (0.27) | | — | | — | | (0.27) | | 9.72 | | 1.02 | | 173,198 | | 0.49 | | 0.49 | | 2.76 | | 29 |
| For the Year Ended October 31, 2017 |
| A | | $ 9.88 | | $ 0.20 | | $ (0.01) | | $ 0.19 | | $ (0.20) | | $ — | | $ — | | $ (0.20) | | $ 9.87 | | 1.94% | | $ 523,916 | | 0.86% | | 0.84% | | 2.02% | | 42% |
| C | | 9.88 | | 0.13 | | (0.01) | | 0.12 | | (0.13) | | — | | — | | (0.13) | | 9.87 | | 1.20 | | 103,013 | | 1.58 | | 1.57 | | 1.29 | | 42 |
| I | | 9.90 | | 0.23 | | (0.01) | | 0.22 | | (0.23) | | — | | — | | (0.23) | | 9.89 | | 2.21 | | 185,948 | | 0.58 | | 0.58 | | 2.29 | | 42 |
| R3 | | 9.86 | | 0.17 | | (0.02) | | 0.15 | | (0.17) | | — | | — | | (0.17) | | 9.84 | | 1.58 | | 1,175 | | 1.22 | | 1.09 | | 1.77 | | 42 |
| R4 | | 9.87 | | 0.20 | | (0.02) | | 0.18 | | (0.20) | | — | | — | | (0.20) | | 9.85 | | 1.83 | | 626 | | 0.92 | | 0.85 | | 2.01 | | 42 |
| R5 | | 9.86 | | 0.23 | | — | | 0.23 | | (0.23) | | — | | — | | (0.23) | | 9.86 | | 2.33 | | 807 | | 0.60 | | 0.55 | | 2.33 | | 42 |
| Y | | 9.86 | | 0.23 | | (0.02) | | 0.21 | | (0.23) | | — | | — | | (0.23) | | 9.84 | �� | 2.17 | | 5,549 | | 0.50 | | 0.50 | | 2.32 | | 42 |
| F (6) | | 9.88 | | 0.16 | | 0.01 | | 0.17 | | (0.16) | | — | | — | | (0.16) | | 9.89 | | 1.73 (7) | | 103,896 | | 0.49 (8) | | 0.49 (8) | | 2.45 (8) | | 42 |
| The Hartford Strategic Income Fund |
| For the Year Ended October 31, 2021 |
| A | | $ 9.02 | | $ 0.27 | | $ 0.23 | | $ 0.50 | | $ (0.25) | | $ (0.10) | | $ — | | $ (0.35) | | $ 9.17 | | 5.54% | | $ 410,004 | | 0.91% | | 0.91% | | 2.87% | | 52% (17) |
| C | | 9.08 | | 0.20 | | 0.24 | | 0.44 | | (0.17) | | (0.10) | | — | | (0.27) | | 9.25 | | 4.89 | | 92,929 | | 1.63 | | 1.63 | | 2.14 | | 52 (17) |
| I | | 9.04 | | 0.29 | | 0.25 | | 0.54 | | (0.28) | | (0.10) | | — | | (0.38) | | 9.20 | | 5.94 | | 2,044,204 | | 0.64 | | 0.64 | | 3.16 | | 52 (17) |
| R3 | | 9.00 | | 0.23 | | 0.24 | | 0.47 | | (0.22) | | (0.10) | | — | | (0.32) | | 9.15 | | 5.18 | | 3,195 | | 1.26 | | 1.26 | | 2.53 | | 52 (17) |
| R4 | | 9.01 | | 0.27 | | 0.23 | | 0.50 | | (0.25) | | (0.10) | | — | | (0.35) | | 9.16 | | 5.55 | | 13,610 | | 0.91 | | 0.91 | | 2.90 | | 52 (17) |
| R5 | | 9.00 | | 0.29 | | 0.25 | | 0.54 | | (0.28) | | (0.10) | | — | | (0.38) | | 9.16 | | 5.98 | | 46,840 | | 0.64 | | 0.64 | | 3.15 | | 52 (17) |
| R6 | | 9.01 | | 0.30 | | 0.23 | | 0.53 | | (0.28) | | (0.10) | | — | | (0.38) | | 9.16 | | 5.96 | | 161,021 | | 0.54 | | 0.54 | | 3.28 | | 52 (17) |
| Y | | 8.99 | | 0.29 | | 0.23 | | 0.52 | | (0.27) | | (0.10) | | — | | (0.37) | | 9.14 | | 5.86 | | 202,890 | | 0.64 | | 0.64 | | 3.14 | | 52 (17) |
| F | | 9.04 | | 0.30 | | 0.23 | | 0.53 | | (0.28) | | (0.10) | | — | | (0.38) | | 9.19 | | 5.94 | | 365,653 | | 0.54 | | 0.54 | | 3.23 | | 52 (17) |
| For the Year Ended October 31, 2020 |
| A | | $ 8.64 | | $ 0.28 | | $ 0.41 | | $ 0.69 | | $ (0.31) | | $ — | | $ — | | $ (0.31) | | $ 9.02 | | 8.21% | | $ 279,447 | | 0.97% | | 0.95% | | 3.21% | | 69% (17) |
| C | | 8.69 | | 0.22 | | 0.41 | | 0.63 | | (0.24) | | — | | — | | (0.24) | | 9.08 | | 7.40 | | 72,030 | | 1.69 | | 1.69 | | 2.47 | | 69 (17) |
| I | | 8.67 | | 0.30 | | 0.41 | | 0.71 | | (0.34) | | — | | — | | (0.34) | | 9.04 | | 8.41 | | 930,484 | | 0.67 | | 0.67 | | 3.44 | | 69 (17) |
| R3 | | 8.63 | | 0.25 | | 0.40 | | 0.65 | | (0.28) | | — | | — | | (0.28) | | 9.00 | | 7.77 | | 1,502 | | 1.29 | | 1.25 | | 2.87 | | 69 (17) |
| R4 | | 8.64 | | 0.27 | | 0.41 | | 0.68 | | (0.31) | | — | | — | | (0.31) | | 9.01 | | 8.12 | | 4,348 | | 1.00 | | 0.95 | | 2.96 | | 69 (17) |
| R5 | | 8.63 | | 0.30 | | 0.41 | | 0.71 | | (0.34) | | — | | — | | (0.34) | | 9.00 | | 8.46 | | 15,336 | | 0.69 | | 0.65 | | 3.48 | | 69 (17) |
| R6 | | 8.63 | | 0.30 | | 0.43 | | 0.73 | | (0.35) | | — | | — | | (0.35) | | 9.01 | | 8.65 | | 10,360 | | 0.59 | | 0.59 | | 3.45 | | 69 (17) |
| Y | | 8.63 | | 0.30 | | 0.40 | | 0.70 | | (0.34) | | — | | — | | (0.34) | | 8.99 | | 8.36 | | 95,044 | | 0.64 | | 0.64 | | 3.40 | | 69 (17) |
| F | | 8.67 | | 0.32 | | 0.40 | | 0.72 | | (0.35) | | — | | — | | (0.35) | | 9.04 | | 8.49 | | 274,532 | | 0.59 | | 0.59 | | 3.58 | | 69 (17) |
| For the Year Ended October 31, 2019 |
| A | | $ 8.41 | | $ 0.32 | | $ 0.44 | | $ 0.76 | | $ (0.53) | | $ — | | $ — | | $ (0.53) | | $ 8.64 | | 9.42% | | $ 193,608 | | 1.03% | | 0.95% | | 3.80% | | 74% |
| C | | 8.45 | | 0.26 | | 0.44 | | 0.70 | | (0.46) | | — | | — | | (0.46) | | 8.69 | | 8.59 | | 50,793 | | 1.75 | | 1.70 | | 3.05 | | 74 |
| I | | 8.43 | | 0.34 | | 0.45 | | 0.79 | | (0.55) | | — | | — | | (0.55) | | 8.67 | | 9.82 | | 264,537 | | 0.73 | | 0.70 | | 4.04 | | 74 |
| R3 | | 8.39 | | 0.30 | | 0.44 | | 0.74 | | (0.50) | | — | | — | | (0.50) | | 8.63 | | 9.22 | | 634 | | 1.34 | | 1.25 | | 3.50 | | 74 |
| R4 | | 8.40 | | 0.32 | | 0.45 | | 0.77 | | (0.53) | | — | | — | | (0.53) | | 8.64 | | 9.54 | | 209 | | 1.05 | | 0.95 | | 3.80 | | 74 |
| R5 | | 8.40 | | 0.35 | | 0.43 | | 0.78 | | (0.55) | | — | | — | | (0.55) | | 8.63 | | 9.78 | | 8,280 | | 0.74 | | 0.65 | | 4.09 | | 74 |
| R6 | | 8.40 | | 0.35 | | 0.44 | | 0.79 | | (0.56) | | — | | — | | (0.56) | | 8.63 | | 9.84 | | 1,673 | | 0.63 | | 0.60 | | 4.12 | | 74 |
| Y | | 8.39 | | 0.35 | | 0.44 | | 0.79 | | (0.55) | | — | | — | | (0.55) | | 8.63 | | 9.91 | | 4,824 | | 0.71 | | 0.66 | | 4.09 | | 74 |
| F | | 8.43 | | 0.35 | | 0.45 | | 0.80 | | (0.56) | | — | | — | | (0.56) | | 8.67 | | 9.93 | | 168,465 | | 0.63 | | 0.60 | | 4.15 | | 74 |
The accompanying notes are an integral part of these financial statements.
Hartford Fixed Income Funds
Financial Highlights – (continued)
| | | — Selected Per-Share Data(1) — | | — Ratios and Supplemental Data — |
| Class | | Net
Asset
Value at
Beginning
of Period | | Net
Investment
Income
(Loss) | | Net
Realized
and
Unrealized
Gain (Loss)
on
Investments | | Total from
Investment
Operations | | Dividends
from Net
Investment
Income | | Distributions
from
Capital
Gains | | Returns
of
Capital | | Total
Dividends
and
Distributions | | Net
Asset
Value at
End of
Period | | Total
Return(2) | | Net
Assets
at End
of Period
(000s) | | Ratio of
Expenses
to
Average
Net
Assets
Before
Adjust-
ments(3)(4) | | Ratio of
Expenses
to
Average
Net
Assets
After
Adjust-
ments(3)(4) | | Ratio of
Net
Investment
Income
(Loss) to
Average
Net Assets(4) | | Portfolio
Turnover |
| The Hartford Strategic Income Fund – (continued) |
| For the Year Ended October 31, 2018 |
| A | | $ 9.00 | | $ 0.33 | | $ (0.40) | | $ (0.07) | | $ (0.52) | | $ — | | $ — | | $ (0.52) | | $ 8.41 | | (0.77)% | | $ 164,749 | | 1.05% | | 0.95% | | 3.78% | | 63% |
| C | | 9.03 | | 0.26 | | (0.39) | | (0.13) | | (0.45) | | — | | — | | (0.45) | | 8.45 | | (1.49) | | 48,099 | | 1.78 | | 1.70 | | 3.03 | | 63 |
| I | | 9.03 | | 0.35 | | (0.40) | | (0.05) | | (0.55) | | — | | — | | (0.55) | | 8.43 | | (0.63) | | 88,704 | | 0.77 | | 0.70 | | 4.03 | | 63 |
| R3 | | 8.98 | | 0.30 | | (0.39) | | (0.09) | | (0.50) | | — | | — | | (0.50) | | 8.39 | | (1.10) | | 306 | | 1.37 | | 1.25 | | 3.48 | | 63 |
| R4 | | 8.99 | | 0.33 | | (0.40) | | (0.07) | | (0.52) | | — | | — | | (0.52) | | 8.40 | | (0.79) | | 560 | | 1.08 | | 0.95 | | 3.78 | | 63 |
| R5 | | 8.99 | | 0.35 | | (0.39) | | (0.04) | | (0.55) | | — | | — | | (0.55) | | 8.40 | | (0.46) | | 4,446 | | 0.78 | | 0.65 | | 4.12 | | 63 |
| R6 | | 8.99 | | 0.36 | | (0.39) | | (0.03) | | (0.56) | | — | | — | | (0.56) | | 8.40 | | (0.41) | | 150 | | 0.66 | | 0.60 | | 4.15 | | 63 |
| Y | | 8.99 | | 0.36 | | (0.40) | | (0.04) | | (0.56) | | — | | — | | (0.56) | | 8.39 | | (0.49) | | 2,513 | | 0.72 | | 0.60 | | 4.14 | | 63 |
| F | | 9.02 | | 0.36 | | (0.39) | | (0.03) | | (0.56) | | — | | — | | (0.56) | | 8.43 | | (0.41) | | 153,833 | | 0.66 | | 0.60 | | 4.13 | | 63 |
| For the Year Ended October 31, 2017 |
| A | | $ 8.76 | | $ 0.36 | | $ 0.26 | | $ 0.62 | | $ (0.38) | | $ — | | $ — | | $ (0.38) | | $ 9.00 | | 7.26% | | $ 161,969 | | 1.03% | | 0.95% | | 4.02% | | 82% |
| C | | 8.79 | | 0.29 | | 0.26 | | 0.55 | | (0.31) | | — | | — | | (0.31) | | 9.03 | | 6.38 | | 74,017 | | 1.74 | | 1.70 | | 3.29 | | 82 |
| I | | 8.79 | | 0.37 | | 0.27 | | 0.64 | | (0.40) | | — | | — | | (0.40) | | 9.03 | | 7.51 | | 83,345 | | 0.76 | | 0.70 | | 4.11 | | 82 |
| R3 | | 8.75 | | 0.33 | | 0.25 | | 0.58 | | (0.35) | | — | | — | | (0.35) | | 8.98 | | 6.83 | | 329 | | 1.45 | | 1.25 | | 3.70 | | 82 |
| R4 | | 8.76 | | 0.35 | | 0.26 | | 0.61 | | (0.38) | | — | | — | | (0.38) | | 8.99 | | 7.13 | | 748 | | 1.08 | | 0.95 | | 4.00 | | 82 |
| R5 | | 8.76 | | 0.38 | | 0.26 | | 0.64 | | (0.41) | | — | | — | | (0.41) | | 8.99 | | 7.48 | | 1,467 | | 0.75 | | 0.65 | | 4.25 | | 82 |
| R6 | | 8.75 | | 0.39 | | 0.26 | | 0.65 | | (0.41) | | — | | — | | (0.41) | | 8.99 | | 7.66 | | 11 | | 0.70 | | 0.60 | | 4.41 | | 82 |
| Y | | 8.75 | | 0.42 | | 0.23 | | 0.65 | | (0.41) | | — | | — | | (0.41) | | 8.99 | | 7.67 | | 657 | | 0.64 | | 0.60 | | 4.79 | | 82 |
| F (6) | | 8.79 | | 0.25 | | 0.20 | | 0.45 | | (0.22) | | — | | — | | (0.22) | | 9.02 | | 5.21 (7) | | 180,163 | | 0.64 (8) | | 0.60 (8) | | 4.08 (8) | | 82 |
| Hartford Sustainable Municipal Bond Fund |
| For the Year Ended October 31, 2021 |
| A | | $10.83 | | $ 0.15 | | $ 0.19 | | $ 0.34 | | $ (0.15) | | $ — | | $ — | | $ (0.15) | | $ 11.02 | | 3.15% | | $ 43,870 | | 0.79% | | 0.69% | | 1.36% | | 19% |
| C | | 10.82 | | 0.07 | | 0.20 | | 0.27 | | (0.07) | | — | | — | | (0.07) | | 11.02 | | 2.48 | | 4,819 | | 1.60 | | 1.44 | | 0.61 | | 19 |
| I | | 10.79 | | 0.17 | | 0.21 | | 0.38 | | (0.18) | | — | | — | | (0.18) | | 10.99 | | 3.49 | | 51,423 | | 0.61 | | 0.46 | | 1.57 | | 19 |
| F | | 10.80 | | 0.18 | | 0.19 | | 0.37 | | (0.18) | | — | | — | | (0.18) | | 10.99 | | 3.47 | | 28,393 | | 0.49 | | 0.39 | | 1.64 | | 19 |
| For the Year Ended October 31, 2020 |
| A | | $10.78 | | $ 0.20 | | $ 0.12 | | $ 0.32 | | $ (0.20) | | $ (0.07) | | $ — | | $ (0.27) | | $ 10.83 | | 3.00% | | $ 37,551 | | 0.88% | | 0.69% | | 1.84% | | 16% |
| C | | 10.79 | | 0.12 | | 0.10 | | 0.22 | | (0.12) | | (0.07) | | — | | (0.19) | | 10.82 | | 2.05 | | 4,642 | | 1.69 | | 1.44 | | 1.09 | | 16 |
| I | | 10.75 | | 0.21 | | 0.12 | | 0.33 | | (0.22) | | (0.07) | | — | | (0.29) | | 10.79 | | 3.14 | | 26,866 | | 0.68 | | 0.46 | | 2.00 | | 16 |
| F | | 10.75 | | 0.22 | | 0.13 | | 0.35 | | (0.23) | | (0.07) | | — | | (0.30) | | 10.80 | | 3.30 | | 14,292 | | 0.57 | | 0.39 | | 2.04 | | 16 |
| For the Year Ended October 31, 2019 |
| A | | $10.04 | | $ 0.26 | | $ 0.74 | | $ 1.00 | | $ (0.26) | | $ — | | $ — | | $ (0.26) | | $ 10.78 | | 10.05% | | $ 22,713 | | 0.99% | | 0.67% | | 2.45% | | 47% |
| C | | 10.04 | | 0.24 | | 0.74 | | 0.98 | | (0.23) | | — | | — | | (0.23) | | 10.79 | | 9.85 | | 2,714 | | 1.74 | | 0.88 | | 2.27 | | 47 |
| I | | 10.04 | | 0.28 | | 0.74 | | 1.02 | | (0.31) | | — | | — | | (0.31) | | 10.75 | | 10.30 | | 7,227 | | 0.74 | | 0.44 | | 2.69 | | 47 |
| F | | 10.03 | | 0.29 | | 0.74 | | 1.03 | | (0.31) | | — | | — | | (0.31) | | 10.75 | | 10.38 | | 3,584 | | 0.69 | | 0.39 | | 2.71 | | 47 |
| For the Year Ended October 31, 2018 |
| A | | $10.32 | | $ 0.24 | | $ (0.28) | | $ (0.04) | | $ (0.24) | | $ — | | $ — | | $ (0.24) | | $ 10.04 | | (0.36)% | | $ 15,155 | | 1.09% | | 0.65% | | 2.39% | | 15% |
| C | | 10.32 | | 0.24 | | (0.28) | | (0.04) | | (0.24) | | — | | — | | (0.24) | | 10.04 | | (0.38) | | 3,488 | | 1.82 | | 0.67 | | 2.37 | | 15 |
| I | | 10.32 | | 0.27 | | (0.28) | | (0.01) | | (0.27) | | — | | — | | (0.27) | | 10.04 | | (0.11) | | 6,320 | | 0.80 | | 0.40 | | 2.64 | | 15 |
| F | | 10.32 | | 0.27 | | (0.29) | | (0.02) | | (0.27) | | — | | — | | (0.27) | | 10.03 | | (0.20) | | 1,673 | | 0.78 | | 0.39 | | 2.65 | | 15 |
| For the Year Ended October 31, 2017 |
| A | | $10.34 | | $ 0.22 | | $ (0.02) | | $ 0.20 | | $ (0.22) | | $ — | | $ — | | $ (0.22) | | $ 10.32 | | 2.03% | | $ 12,913 | | 1.10% | | 0.69% | | 2.21% | | 10% |
| C | | 10.34 | | 0.21 | | (0.02) | | 0.19 | | (0.21) | | — | | — | | (0.21) | | 10.32 | | 1.87 | | 3,317 | | 1.81 | | 0.84 | | 2.06 | | 10 |
| I | | 10.34 | | 0.25 | | (0.02) | | 0.23 | | (0.25) | | — | | — | | (0.25) | | 10.32 | | 2.29 | | 5,917 | | 0.81 | | 0.44 | | 2.46 | | 10 |
| F (6) | | 10.04 | | 0.17 | | 0.28 | | 0.45 | | (0.17) | | — | | — | | (0.17) | | 10.32 | | 4.52 (7) | | 1,127 | | 0.80 (8) | | 0.39 (8) | | 2.48 (8) | | 10 |
The accompanying notes are an integral part of these financial statements.
Hartford Fixed Income Funds
Financial Highlights – (continued)
| | | — Selected Per-Share Data(1) — | | — Ratios and Supplemental Data — |
| Class | | Net
Asset
Value at
Beginning
of Period | | Net
Investment
Income
(Loss) | | Net
Realized
and
Unrealized
Gain (Loss)
on
Investments | | Total from
Investment
Operations | | Dividends
from Net
Investment
Income | | Distributions
from
Capital
Gains | | Returns
of
Capital | | Total
Dividends
and
Distributions | | Net
Asset
Value at
End of
Period | | Total
Return(2) | | Net
Assets
at End
of Period
(000s) | | Ratio of
Expenses
to
Average
Net
Assets
Before
Adjust-
ments(3)(4) | | Ratio of
Expenses
to
Average
Net
Assets
After
Adjust-
ments(3)(4) | | Ratio of
Net
Investment
Income
(Loss) to
Average
Net Assets(4) | | Portfolio
Turnover |
| The Hartford Total Return Bond Fund |
| For the Year Ended October 31, 2021 |
| A | | $ 11.13 | | $ 0.18 | | $ (0.10) | | $ 0.08 | | $ (0.21) | | $ (0.08) | | $ — | | $ (0.29) | | $ 10.92 | | 0.68% | | $ 1,268,773 | | 0.68% | | 0.68% | | 1.65% | | 51% (18) |
| C | | 11.26 | | 0.09 | | (0.10) | | (0.01) | | (0.12) | | (0.08) | | — | | (0.20) | | 11.05 | | (0.11) | | 15,130 | | 1.48 | | 1.48 | | 0.83 | | 51 (18) |
| I | | 11.10 | | 0.21 | | (0.11) | | 0.10 | | (0.24) | | (0.08) | | — | | (0.32) | | 10.88 | | 0.86 | | 297,839 | | 0.40 | | 0.40 | | 1.93 | | 51 (18) |
| R3 | | 11.44 | | 0.15 | | (0.12) | | 0.03 | | (0.17) | | (0.08) | | — | | (0.25) | | 11.22 | | 0.27 | | 4,566 | | 1.04 | | 1.03 | | 1.30 | | 51 (18) |
| R4 | | 11.34 | | 0.18 | | (0.11) | | 0.07 | | (0.21) | | (0.08) | | — | | (0.29) | | 11.12 | | 0.59 | | 14,580 | | 0.74 | | 0.70 | | 1.63 | | 51 (18) |
| R5 | | 11.27 | | 0.21 | | (0.10) | | 0.11 | | (0.24) | | (0.08) | | — | | (0.32) | | 11.06 | | 0.93 | | 2,362 | | 0.44 | | 0.44 | | 1.89 | | 51 (18) |
| R6 | | 11.19 | | 0.22 | | (0.11) | | 0.11 | | (0.25) | | (0.08) | | — | | (0.33) | | 10.97 | | 0.98 | | 203,982 | | 0.32 | | 0.32 | | 2.03 | | 51 (18) |
| Y | | 11.21 | | 0.22 | | (0.12) | | 0.10 | | (0.24) | | (0.08) | | — | | (0.32) | | 10.99 | | 0.89 | | 415,024 | | 0.39 | | 0.39 | | 1.94 | | 51 (18) |
| F | | 11.03 | | 0.22 | | (0.11) | | 0.11 | | (0.25) | | (0.08) | | — | | (0.33) | | 10.81 | | 0.97 | | 1,222,336 | | 0.32 | | 0.32 | | 2.01 | | 51 (18) |
| For the Year Ended October 31, 2020 |
| A | | $10.66 | | $ 0.24 | | $ 0.49 | | $ 0.73 | | $ (0.26) | | $ — | | $ — | | $ (0.26) | | $ 11.13 | | 6.88% | | $ 1,202,398 | | 0.71% | | 0.71% | | 2.17% | | 50% (18) |
| C | | 10.77 | | 0.15 | | 0.51 | | 0.66 | | (0.17) | | — | | — | | (0.17) | | 11.26 | | 6.13 | | 32,105 | | 1.51 | | 1.51 | | 1.37 | | 50 (18) |
| I | | 10.65 | | 0.26 | | 0.51 | | 0.77 | | (0.32) | | — | | — | | (0.32) | | 11.10 | | 7.35 | | 299,511 | | 0.41 | | 0.41 | | 2.43 | | 50 (18) |
| R3 | | 10.95 | | 0.21 | | 0.50 | | 0.71 | | (0.22) | | — | | — | | (0.22) | | 11.44 | | 6.55 | | 5,075 | | 1.06 | | 1.04 | | 1.84 | | 50 (18) |
| R4 | | 10.85 | | 0.24 | | 0.50 | | 0.74 | | (0.25) | | — | | — | | (0.25) | | 11.34 | | 6.90 | | 13,365 | | 0.76 | | 0.76 | | 2.12 | | 50 (18) |
| R5 | | 10.81 | | 0.27 | | 0.50 | | 0.77 | | (0.31) | | — | | — | | (0.31) | | 11.27 | | 7.20 | | 2,651 | | 0.46 | | 0.46 | | 2.40 | | 50 (18) |
| R6 | | 10.74 | | 0.28 | | 0.50 | | 0.78 | | (0.33) | | — | | — | | (0.33) | | 11.19 | | 7.41 | | 63,656 | | 0.34 | | 0.34 | | 2.53 | | 50 (18) |
| Y | | 10.76 | | 0.27 | | 0.50 | | 0.77 | | (0.32) | | — | | — | | (0.32) | | 11.21 | | 7.27 | | 410,349 | | 0.40 | | 0.40 | | 2.49 | | 50 (18) |
| F | | 10.59 | | 0.27 | | 0.50 | | 0.77 | | (0.33) | | — | | — | | (0.33) | | 11.03 | | 7.38 | | 962,471 | | 0.34 | | 0.34 | | 2.53 | | 50 (18) |
| For the Year Ended October 31, 2019 |
| A | | $ 9.92 | | $ 0.30 | | $ 0.79 | | $ 1.09 | | $ (0.35) | | $ — | | $ — | | $ (0.35) | | $ 10.66 | | 11.24% | | $ 940,594 | | 0.74% | | 0.74% | | 2.90% | | 71% |
| C | | 9.97 | | 0.22 | | 0.80 | | 1.02 | | (0.22) | | — | | — | | (0.22) | | 10.77 | | 10.37 | | 27,334 | | 1.54 | | 1.54 | | 2.12 | | 71 |
| I | | 9.95 | | 0.33 | | 0.79 | | 1.12 | | (0.42) | | — | | — | | (0.42) | | 10.65 | | 11.49 | | 108,633 | | 0.42 | | 0.42 | | 3.19 | | 71 |
| R3 | | 10.14 | | 0.27 | | 0.82 | | 1.09 | | (0.28) | | — | | — | | (0.28) | | 10.95 | | 10.93 | | 4,769 | | 1.08 | | 1.07 | | 2.58 | | 71 |
| R4 | | 10.09 | | 0.30 | | 0.81 | | 1.11 | | (0.35) | | — | | — | | (0.35) | | 10.85 | | 11.20 | | 11,476 | | 0.77 | | 0.76 | | 2.89 | | 71 |
| R5 | | 10.06 | | 0.33 | | 0.83 | | 1.16 | | (0.41) | | — | | — | | (0.41) | | 10.81 | | 11.80 | | 1,049 | | 0.48 | | 0.48 | | 3.22 | | 71 |
| R6 | | 10.03 | | 0.32 | | 0.82 | | 1.14 | | (0.43) | | — | | — | | (0.43) | | 10.74 | | 11.67 | | 40,368 | | 0.35 | | 0.34 | | 3.04 | | 71 |
| Y | | 10.04 | | 0.34 | | 0.81 | | 1.15 | | (0.43) | | — | | — | | (0.43) | | 10.76 | | 11.68 | | 488,228 | | 0.41 | | 0.40 | | 3.25 | | 71 |
| F | | 9.90 | | 0.34 | | 0.78 | | 1.12 | | (0.43) | | — | | — | | (0.43) | | 10.59 | | 11.58 | | 562,418 | | 0.36 | | 0.36 | | 3.29 | | 71 |
| For the Year Ended October 31, 2018 |
| A | | $10.44 | | $ 0.28 | | $ (0.48) | | $ (0.20) | | $ (0.32) | | $ — | | $ — | | $ (0.32) | | $ 9.92 | | (1.95)% | | $ 774,821 | | 0.82% | | 0.82% | | 2.72% | | 74% |
| C | | 10.46 | | 0.20 | | (0.49) | | (0.29) | | (0.20) | | — | | — | | (0.20) | | 9.97 | | (2.79) | | 30,760 | | 1.61 | | 1.60 | | 1.93 | | 74 |
| I | | 10.45 | | 0.31 | | (0.48) | | (0.17) | | (0.33) | | — | | — | | (0.33) | | 9.95 | | (1.68) | | 51,131 | | 0.51 | | 0.51 | | 3.03 | | 74 |
| R3 | | 10.64 | | 0.25 | | (0.50) | | (0.25) | | (0.25) | | — | | — | | (0.25) | | 10.14 | | (2.37) | | 5,000 | | 1.16 | | 1.15 | | 2.38 | | 74 |
| R4 | | 10.62 | | 0.28 | | (0.49) | | (0.21) | | (0.32) | | — | | — | | (0.32) | | 10.09 | | (2.04) | | 11,153 | | 0.85 | | 0.85 | | 2.67 | | 74 |
| R5 | | 10.62 | | 0.31 | | (0.49) | | (0.18) | | (0.38) | | — | | — | | (0.38) | | 10.06 | | (1.74) | | 1,548 | | 0.56 | | 0.56 | | 2.98 | | 74 |
| R6 | | 10.61 | | 0.32 | | (0.50) | | (0.18) | | (0.40) | | — | | — | | (0.40) | | 10.03 | | (1.72) | | 1,678 | | 0.44 | | 0.44 | | 3.11 | | 74 |
| Y | | 10.61 | | 0.32 | | (0.50) | | (0.18) | | (0.39) | | — | | — | | (0.39) | | 10.04 | | (1.69) | | 449,292 | | 0.48 | | 0.48 | | 3.06 | | 74 |
| F | | 10.46 | | 0.31 | | (0.47) | | (0.16) | | (0.40) | | — | | — | | (0.40) | | 9.90 | | (1.59) | | 678,207 | | 0.44 | | 0.44 | | 3.10 | | 74 |
The accompanying notes are an integral part of these financial statements.
Hartford Fixed Income Funds
Financial Highlights – (continued)
| | | — Selected Per-Share Data(1) — | | — Ratios and Supplemental Data — |
| Class | | Net
Asset
Value at
Beginning
of Period | | Net
Investment
Income
(Loss) | | Net
Realized
and
Unrealized
Gain (Loss)
on
Investments | | Total from
Investment
Operations | | Dividends
from Net
Investment
Income | | Distributions
from
Capital
Gains | | Returns
of
Capital | | Total
Dividends
and
Distributions | | Net
Asset
Value at
End of
Period | | Total
Return(2) | | Net
Assets
at End
of Period
(000s) | | Ratio of
Expenses
to
Average
Net
Assets
Before
Adjust-
ments(3)(4) | | Ratio of
Expenses
to
Average
Net
Assets
After
Adjust-
ments(3)(4) | | Ratio of
Net
Investment
Income
(Loss) to
Average
Net Assets(4) | | Portfolio
Turnover |
| The Hartford Total Return Bond Fund – (continued) |
| For the Year Ended October 31, 2017 |
| A | | $10.48 | | $ 0.26 | | $ (0.04) | | $ 0.22 | | $ (0.26) | | $ — | | $ — | | $ (0.26) | | $ 10.44 | | 2.19% | | $ 772,486 | | 0.84% | | 0.84% | | 2.55% | | 56% |
| C | | 10.50 | | 0.19 | | (0.04) | | 0.15 | | (0.19) | | — | | — | | (0.19) | | 10.46 | | 1.43 | | 59,204 | | 1.58 | | 1.58 | | 1.82 | | 56 |
| I | | 10.49 | | 0.29 | | (0.04) | | 0.25 | | (0.29) | | — | | — | | (0.29) | | 10.45 | | 2.41 | | 35,182 | | 0.77 | | 0.62 | | 2.78 | | 56 |
| R3 | | 10.68 | | 0.23 | | (0.04) | | 0.19 | | (0.23) | | — | | — | | (0.23) | | 10.64 | | 1.86 | | 5,851 | | 1.17 | | 1.17 | | 2.22 | | 56 |
| R4 | | 10.66 | | 0.27 | | (0.04) | | 0.23 | | (0.27) | | — | | — | | (0.27) | | 10.62 | | 2.18 | | 14,290 | | 0.85 | | 0.85 | | 2.54 | | 56 |
| R5 | | 10.65 | | 0.30 | | (0.03) | | 0.27 | | (0.30) | | — | | — | | (0.30) | | 10.62 | | 2.48 | | 1,548 | | 0.55 | | 0.55 | | 2.84 | | 56 |
| R6 | | 10.64 | | 0.30 | | (0.02) | | 0.28 | | (0.31) | | — | | — | | (0.31) | | 10.61 | | 2.69 | | 1,092 | | 0.45 | | 0.44 | | 2.87 | | 56 |
| Y | | 10.65 | | 0.31 | | (0.04) | | 0.27 | | (0.31) | | — | | — | | (0.31) | | 10.61 | | 2.57 | | 438,589 | | 0.46 | | 0.46 | | 2.96 | | 56 |
| F (6) | | 10.32 | | 0.20 | | 0.14 | | 0.34 | | (0.20) | | — | | — | | (0.20) | | 10.46 | | 3.36 (7) | | 937,170 | | 0.44 (8) | | 0.44 (8) | | 2.88 (8) | | 56 |
| The Hartford World Bond Fund |
| For the Year Ended October 31, 2021 |
| A | | $10.59 | | $ 0.05 | | $ (0.11) | | $ (0.06) | | $ (0.08) | | $ — | | $ — | | $ (0.08) | | $ 10.45 | | (0.54)% | | $ 354,409 | | 1.01% | | 1.01% | | 0.44% | | 104% (19) |
| C | | 10.34 | | (0.03) | | (0.10) | | (0.13) | | (0.02) | | — | | — | | (0.02) | | 10.19 | | (1.25) | | 38,120 | | 1.74 | | 1.74 | | (0.29) | | 104 (19) |
| I | | 10.68 | | 0.08 | | (0.12) | | (0.04) | | (0.11) | | — | | — | | (0.11) | | 10.53 | | (0.34) | | 1,783,317 | | 0.72 | | 0.72 | | 0.73 | | 104 (19) |
| R3 | | 10.51 | | 0.01 | | (0.10) | | (0.09) | | (0.05) | | — | | — | | (0.05) | | 10.37 | | (0.90) | | 987 | | 1.35 | | 1.35 | | 0.10 | | 104 (19) |
| R4 | | 10.59 | | 0.04 | | (0.10) | | (0.06) | | (0.08) | | — | | — | | (0.08) | | 10.45 | | (0.59) | | 3,873 | | 1.05 | | 1.05 | | 0.39 | | 104 (19) |
| R5 | | 10.68 | | 0.08 | | (0.11) | | (0.03) | | (0.11) | | — | | — | | (0.11) | | 10.54 | | (0.27) | | 8,625 | | 0.75 | | 0.75 | | 0.70 | | 104 (19) |
| R6 | | 10.72 | | 0.09 | | (0.11) | | (0.02) | | (0.12) | | — | | — | | (0.12) | | 10.58 | | (0.16) | | 125,885 | | 0.63 | | 0.63 | | 0.82 | | 104 (19) |
| Y | | 10.71 | | 0.08 | | (0.11) | | (0.03) | | (0.11) | | — | | — | | (0.11) | | 10.57 | | (0.25) | | 292,319 | | 0.74 | | 0.73 | | 0.72 | | 104 (19) |
| F | | 10.70 | | 0.09 | | (0.12) | | (0.03) | | (0.12) | | — | | — | | (0.12) | | 10.55 | | (0.25) | | 1,516,359 | | 0.63 | | 0.63 | | 0.82 | | 104 (19) |
| For the Year Ended October 31, 2020 |
| A | | $10.75 | | $ 0.06 | | $ 0.02 | | $ 0.08 | | $ (0.19) | | $ (0.05) | | $ — | | $ (0.24) | | $ 10.59 | | 0.80% | | $ 414,356 | | 1.02% | | 1.02% | | 0.59% | | 125% (19) |
| C | | 10.54 | | (0.01) | | 0.01 | | 0.00 (14) | | (0.15) | | (0.05) | | — | | (0.20) | | 10.34 | | 0.00 (9) | | 64,578 | | 1.75 | | 1.75 | | (0.14) | | 125 (19) |
| I | | 10.83 | | 0.09 | | 0.03 | | 0.12 | | (0.22) | | (0.05) | | — | | (0.27) | | 10.68 | | 1.10 | | 2,008,606 | | 0.73 | | 0.73 | | 0.88 | | 125 (19) |
| R3 | | 10.68 | | 0.03 | | 0.02 | | 0.05 | | (0.17) | | (0.05) | | — | | (0.22) | | 10.51 | | 0.44 | | 1,400 | | 1.36 | | 1.36 | | 0.25 | | 125 (19) |
| R4 | | 10.76 | | 0.06 | | 0.02 | | 0.08 | | (0.20) | | (0.05) | | — | | (0.25) | | 10.59 | | 0.74 | | 18,666 | | 1.05 | | 1.05 | | 0.54 | | 125 (19) |
| R5 | | 10.84 | | 0.09 | | 0.01 | | 0.10 | | (0.21) | | (0.05) | | — | | (0.26) | | 10.68 | | 0.99 | | 8,229 | | 0.75 | | 0.75 | | 0.85 | | 125 (19) |
| R6 | | 10.88 | | 0.10 | | 0.01 | | 0.11 | | (0.22) | | (0.05) | | — | | (0.27) | | 10.72 | | 1.08 | | 113,838 | | 0.65 | | 0.65 | | 0.93 | | 125 (19) |
| Y | | 10.87 | | 0.09 | | 0.02 | | 0.11 | | (0.22) | | (0.05) | | — | | (0.27) | | 10.71 | | 1.02 | | 366,177 | | 0.75 | | 0.72 | | 0.89 | | 125 (19) |
| F | | 10.85 | | 0.10 | | 0.01 | | 0.12 | | (0.22) | | (0.05) | | — | | (0.27) | | 10.70 | | 1.17 | | 1,477,042 | | 0.64 | | 0.64 | | 0.97 | | 125 (19) |
| For the Year Ended October 31, 2019 |
| A | | $10.65 | | $ 0.10 | | $ 0.49 | | $ 0.59 | | $ (0.48) | | $ (0.01) | | $ — | | $ (0.49) | | $ 10.75 | | 5.68% | | $ 419,891 | | 1.02% | | 1.02% | | 0.98% | | 93% |
| C | | 10.45 | | 0.03 | | 0.47 | | 0.50 | | (0.40) | | (0.01) | | — | | (0.41) | | 10.54 | | 4.92 | | 81,694 | | 1.75 | | 1.75 | | 0.26 | | 93 |
| I | | 10.72 | | 0.14 | | 0.48 | | 0.62 | | (0.50) | | (0.01) | | — | | (0.51) | | 10.83 | | 6.02 | | 2,223,706 | | 0.74 | | 0.74 | | 1.26 | | 93 |
| R3 | | 10.58 | | 0.07 | | 0.48 | | 0.55 | | (0.44) | | (0.01) | | — | | (0.45) | | 10.68 | | 5.39 | | 1,946 | | 1.36 | | 1.35 | | 0.63 | | 93 |
| R4 | | 10.65 | | 0.09 | | 0.51 | | 0.60 | | (0.48) | | (0.01) | | — | | (0.49) | | 10.76 | | 5.71 | | 10,651 | | 0.96 | | 0.96 | | 0.84 | | 93 |
| R5 | | 10.72 | | 0.13 | | 0.50 | | 0.63 | | (0.50) | | (0.01) | | — | | (0.51) | | 10.84 | | 6.00 | | 6,404 | | 0.76 | | 0.76 | | 1.23 | | 93 |
| R6 | | 10.76 | | 0.14 | | 0.50 | | 0.64 | | (0.51) | | (0.01) | | — | | (0.52) | | 10.88 | | 6.09 | | 17,230 | | 0.64 | | 0.64 | | 1.34 | | 93 |
| Y | | 10.75 | | 0.14 | | 0.50 | | 0.64 | | (0.51) | | (0.01) | | — | | (0.52) | | 10.87 | | 6.04 | | 522,050 | | 0.73 | | 0.70 | | 1.31 | | 93 |
| F | | 10.74 | | 0.15 | | 0.48 | | 0.63 | | (0.51) | | (0.01) | | — | | (0.52) | | 10.85 | | 6.11 | | 2,027,555 | | 0.64 | | 0.64 | | 1.35 | | 93 |
The accompanying notes are an integral part of these financial statements.
Hartford Fixed Income Funds
Financial Highlights – (continued)
| | | — Selected Per-Share Data(1) — | | — Ratios and Supplemental Data — |
| Class | | Net
Asset
Value at
Beginning
of Period | | Net
Investment
Income
(Loss) | | Net
Realized
and
Unrealized
Gain (Loss)
on
Investments | | Total from
Investment
Operations | | Dividends
from Net
Investment
Income | | Distributions
from
Capital
Gains | | Returns
of
Capital | | Total
Dividends
and
Distributions | | Net
Asset
Value at
End of
Period | | Total
Return(2) | | Net
Assets
at End
of Period
(000s) | | Ratio of
Expenses
to
Average
Net
Assets
Before
Adjust-
ments(3)(4) | | Ratio of
Expenses
to
Average
Net
Assets
After
Adjust-
ments(3)(4) | | Ratio of
Net
Investment
Income
(Loss) to
Average
Net Assets(4) | | Portfolio
Turnover |
| The Hartford World Bond Fund – (continued) |
| For the Year Ended October 31, 2018 |
| A | | $10.45 | | $ 0.11 | | $ 0.12 | | $ 0.23 | | $ (0.03) | | $ — | | $ — | | $ (0.03) | | $ 10.65 | | 2.18% | | $ 339,123 | | 1.04% | | 1.04% | | 1.04% | | 115% |
| C | | 10.31 | | 0.03 | | 0.12 | | 0.15 | | (0.01) | | — | | — | | (0.01) | | 10.45 | | 1.44 | | 78,993 | | 1.77 | | 1.77 | | 0.30 | | 115 |
| I | | 10.50 | | 0.14 | | 0.12 | | 0.26 | | (0.04) | | — | | — | | (0.04) | | 10.72 | | 2.45 | | 1,943,254 | | 0.76 | | 0.76 | | 1.32 | | 115 |
| R3 | | 10.41 | | 0.07 | | 0.12 | | 0.19 | | (0.02) | | — | | — | | (0.02) | | 10.58 | | 1.82 | | 1,161 | | 1.38 | | 1.36 | | 0.67 | | 115 |
| R4 | | 10.46 | | 0.11 | | 0.11 | | 0.22 | | (0.03) | | — | | — | | (0.03) | | 10.65 | | 2.09 | | 847 | | 1.08 | | 1.07 | | 1.02 | | 115 |
| R5 | | 10.51 | | 0.14 | | 0.11 | | 0.25 | | (0.04) | | — | | — | | (0.04) | | 10.72 | | 2.35 | | 3,840 | | 0.78 | | 0.77 | | 1.34 | | 115 |
| R6 | | 10.53 | | 0.16 | | 0.11 | | 0.27 | | (0.04) | | — | | — | | (0.04) | | 10.76 | | 2.58 | | 10,009 | | 0.67 | | 0.67 | | 1.50 | | 115 |
| Y | | 10.53 | | 0.15 | | 0.11 | | 0.26 | | (0.04) | | — | | — | | (0.04) | | 10.75 | | 2.44 | | 670,390 | | 0.71 | | 0.71 | | 1.40 | | 115 |
| F | | 10.51 | | 0.15 | | 0.12 | | 0.27 | | (0.04) | | — | | — | | (0.04) | | 10.74 | | 2.58 | | 1,571,981 | | 0.66 | | 0.66 | | 1.43 | | 115 |
| For the Year Ended October 31, 2017 |
| A | | $10.36 | | $ 0.11 | | $ (0.02) (11) | | $ 0.09 | | $ — | | $ — | | $ — | | $ — | | $ 10.45 | | 0.87% | | $ 331,084 | | 1.08% | | 1.05% | | 1.02% | | 100% |
| C | | 10.29 | | 0.03 | | (0.01) (11) | | 0.02 | | — | | — | | — | | — | | 10.31 | | 0.19 | | 101,882 | | 1.78 | | 1.78 | | 0.30 | | 100 |
| I | | 10.39 | | 0.13 | | (0.02) (11) | | 0.11 | | — | | — | | — | | — | | 10.50 | | 1.16 | | 1,880,345 | | 0.85 | | 0.80 | | 1.26 | | 100 |
| R3 | | 10.35 | | 0.07 | | (0.01) (11) | | 0.06 | | — | | — | | — | | — | | 10.41 | | 0.58 | | 2,139 | | 1.40 | | 1.35 | | 0.70 | | 100 |
| R4 | | 10.37 | | 0.11 | | (0.02) (11) | | 0.09 | | — | | — | | — | | — | | 10.46 | | 0.87 | | 664 | | 1.10 | | 1.05 | | 1.03 | | 100 |
| R5 | | 10.38 | | 0.13 | | — | | 0.13 | | — | | — | | — | | — | | 10.51 | | 1.25 | | 2,087 | | 0.79 | | 0.75 | | 1.27 | | 100 |
| R6 | | 10.40 | | 0.14 | | (0.01) (11) | | 0.13 | | — | | — | | — | | — | | 10.53 | | 1.25 | | 1,176 | | 0.71 | | 0.69 | | 1.36 | | 100 |
| Y | | 10.40 | | 0.14 | | (0.01) (11) | | 0.13 | | — | | — | | — | | — | | 10.53 | | 1.25 | | 490,321 | | 0.70 | | 0.70 | | 1.37 | | 100 |
| F (6) | | 10.32 | | 0.08 | | 0.11 (11) | | 0.19 | | — | | — | | — | | — | | 10.51 | | 1.84 (7) | | 1,235,664 | | 0.68 (8) | | 0.68 (8) | | 1.14 (8) | | 100 |
| FINANCIAL HIGHLIGHTS FOOTNOTES |
| (1) | Information presented relates to a share outstanding throughout the indicated period. Net investment income (loss) per share amounts are calculated based on average shares outstanding unless otherwise noted. |
| (2) | Assumes initial investment at net asset value at the beginning of each period, reinvestment of all distributions, the complete redemption of the investment at net asset value at the end of each period and no sales charge. Total return would be reduced if sales charges were taken into account. |
| (3) | Adjustments include waivers and reimbursements, if applicable. Ratios do not include fees paid indirectly (see Expenses in the accompanying Notes to Financial Statements). |
| (4) | Ratios do not include expenses of the Underlying Funds and/or other investment companies, if applicable. |
| (5) | Per share amount is less than $0.005. |
| (6) | Commenced operations on February 28, 2017. |
| (7) | Not annualized. |
| (8) | Annualized. |
| (9) | Amount is less than 0.01%. |
| (10) | Commenced operations on March 1, 2021. |
| (11) | Per share amount was not in accord with the net realized and unrealized gain (loss) for the period because of the timing of transactions in shares of the Fund and the amount and timing of per-share net realized and unrealized gain (loss) on such shares. |
| (12) | Portfolio turnover excludes TBA roll transactions. Had TBA roll transactions been included, the portfolio turnover rate would have been 84% and 211% for the fiscal years ended October 31, 2021 and October 31, 2020, respectively. |
| (13) | Commenced operations on May 31, 2018. |
| (14) | Amount is less than $0.01 per share. |
| (15) | Portfolio turnover excludes TBA roll transactions. Had TBA roll transactions been included, the portfolio turnover rate would have been 38% and 43% for the fiscal years ended October 31, 2021 and October 31, 2020, respectively. |
| (16) | Commenced operations on February 28, 2019. |
| (17) | Portfolio turnover excludes TBA roll transactions. Had TBA roll transactions been included, the portfolio turnover rate would have been 141% and 180% for the fiscal years ended October 31, 2021 and October 31, 2020, respectively. |
| (18) | Portfolio turnover excludes TBA roll transactions. Had TBA roll transactions been included, the portfolio turnover rate would have been 473% and 545% for the fiscal years ended October 31, 2021 and October 31, 2020, respectively. |
| (19) | Portfolio turnover excludes TBA roll transactions. Had TBA roll transactions been included, the portfolio turnover rate would have been 132% and 168% for the fiscal years ended October 31, 2021 and October 31, 2020, respectively. |
The accompanying notes are an integral part of these financial statements.
Hartford Fixed Income Funds
Notes to Financial Statements
October 31, 2021
| 1. | Organization: |
| | The Hartford Mutual Funds, Inc. (the "Company") is an open-end registered management investment company comprised of thirty-six series, as of October 31, 2021. Financial statements for the series of the Company listed below (each, a “Fund” and collectively, the “Funds”) are included in this report. |
| | |
| The Hartford Mutual Funds, Inc.: |
| The Hartford Emerging Markets Local Debt Fund (the "Emerging Markets Local Debt Fund") |
| The Hartford Floating Rate Fund (the "Floating Rate Fund") |
| The Hartford Floating Rate High Income Fund (the "Floating Rate High Income Fund") |
| The Hartford High Yield Fund (the "High Yield Fund") |
| The Hartford Inflation Plus Fund (the "Inflation Plus Fund") |
| The Hartford Municipal Opportunities Fund (the "Municipal Opportunities Fund") |
| Hartford Municipal Short Duration Fund (the "Municipal Short Duration Fund") |
| The Hartford Short Duration Fund (the "Short Duration Fund") |
| The Hartford Strategic Income Fund (the "Strategic Income Fund") |
| Hartford Sustainable Municipal Bond Fund (the "Sustainable Municipal Bond Fund") (formerly, Hartford Municipal Income Fund) |
| The Hartford Total Return Bond Fund (the "Total Return Bond Fund") |
| The Hartford World Bond Fund (the "World Bond Fund") |
The assets of each Fund are separate, and a shareholder's interest is limited to the Fund in which shares are held. The Company is organized under the laws of the State of Maryland and is registered with the Securities and Exchange Commission (the “SEC”) under the Investment Company Act of 1940, as amended (the “1940 Act”). Each Fund, except Emerging Markets Local Debt Fund and World Bond Fund, is a diversified open-end management investment company. Emerging Markets Local Debt Fund and World Bond Fund are non-diversified open-end management investment companies. Each Fund applies specialized accounting and reporting standards under Accounting Standards Codification Topic 946, "Financial Services – Investment Companies."
Each Fund has registered for sale Class A, Class C, Class I and Class F shares. In addition, each Fund, except Municipal Opportunities Fund, Municipal Short Duration Fund and Sustainable Municipal Bond Fund, offers Class R3, Class R4 and Class R5 shares. Each Fund, except Municipal Short Duration Fund and Sustainable Municipal Bond Fund, has registered for sale Class Y shares. High Yield Fund, Strategic Income Fund, Short Duration Fund, Total Return Bond Fund and World Bond Fund have registered for sale Class R6 shares. Class A shares of each Fund, except Floating Rate Fund, Floating Rate High Income Fund and Short Duration Fund, are sold with a front-end sales charge of up to 4.50%. Class A shares of Floating Rate Fund and Floating Rate High Income Fund are sold with a front-end sales charge of up to 3.00%. Class A shares of Short Duration Fund are sold with a front-end sales charge of up to 2.00%. Class C shares of each Fund are sold with a contingent deferred sales charge of up to 1.00% on shares redeemed within twelve months of purchase. Effective April 1, 2021, Class C shares automatically convert to Class A shares of the same Fund after eight years provided that the Fund or the financial intermediary has records verifying that the Class C shares have been held for at least eight years. Classes I, R3, R4, R5, R6, Y and F shares do not have a sales charge. Class C shares of the Total Return Bond Fund are closed to new investors, subject to certain exceptions. For more information, please see the Funds' prospectus.
| 2. | Significant Accounting Policies: |
| | The following is a summary of significant accounting policies of each Fund used in the preparation of its financial statements, which are in accordance with United States Generally Accepted Accounting Principles (“U.S. GAAP”). The preparation of financial statements in accordance with U.S. GAAP may require management to make estimates and assumptions that affect the reported amounts of assets and liabilities and disclosure of contingent assets and liabilities at the date of the financial statements and the reported amounts of increases and decreases in net assets from operations during the reporting period. Actual results could differ from those estimates. |
| a) | Determination of Net Asset Value – The net asset value ("NAV") of each class of each Fund’s shares is determined as of the close of regular trading on the New York Stock Exchange (the "Exchange") (normally 4:00 p.m. Eastern Time) (the “NYSE Close”) on each day that the Exchange is open ("Valuation Date"). If the Exchange is closed due to weather or other extraordinary circumstances on a day it would typically be open for business, each Fund may treat such day as a typical business day and accept purchase and redemption orders and calculate each Fund’s NAV in accordance with applicable law. The NAV of each class of each Fund's shares is determined by dividing the value of the Fund’s net assets attributable to the class of shares by the number of shares outstanding for that class. Information that becomes known to the Funds after the NAV has been calculated on a particular day will not generally be used to retroactively adjust the NAV determined earlier that day. |
Hartford Fixed Income Funds
Notes to Financial Statements – (continued)
October 31, 2021
| b) | Investment Valuation and Fair Value Measurements – For purposes of calculating the NAV of each class of each Fund, portfolio securities and other assets held in the Fund’s portfolio for which market prices are readily available are valued at market value. Market value is generally determined on the basis of official close price or last reported trade price. If no trades were reported, market value is based on prices obtained from a quotation reporting system, established market makers (including evaluated prices), or independent pricing services. Pricing vendors may use matrix pricing or valuation models that utilize certain inputs and assumptions to derive values, including transaction data, credit quality information, general market conditions, news, and other factors and assumptions. |
| | If market prices are not readily available or are deemed unreliable, a Fund will use the fair value of the security or other instrument as determined in good faith under policies and procedures established by and under the supervision of the Board of Directors of the Company (the “Board of Directors”) (“Valuation Procedures”). Market prices are considered not readily available where there is an absence of current or reliable market-based data (e.g., trade information or broker quotes), including where events occur after the close of the relevant market, but prior to the NYSE Close, that materially affect the values of a Fund’s portfolio holdings or assets. In addition, market prices are considered not readily available when, due to extraordinary circumstances, the exchanges or markets on which the securities or other instruments trade do not open for trading for the entire day and no other market prices are available. Fair value pricing is subjective in nature and the use of fair value pricing by a Fund may cause the NAV of its shares to differ significantly from the NAV that would have been calculated using market prices at the close of the exchange on which a portfolio holding is primarily traded. There can be no assurance that a Fund could obtain the fair value assigned to an investment if the Fund were to sell the investment at approximately the time at which the Fund determines its NAV. |
| | Prices of foreign equities that are principally traded on certain foreign markets will generally be adjusted daily pursuant to a fair value pricing service in order to reflect an adjustment for the factors occurring after the close of certain foreign markets but before the NYSE Close. Securities and other instruments that are primarily traded on foreign markets may trade on days that are not business days of the Funds. The value of the foreign securities or other instruments in which a Fund invests may change on days when a shareholder will not be able to purchase, redeem or exchange shares of the Fund. |
| | Fixed income investments (other than short-term obligations) and non-exchange traded derivatives held by a Fund are normally valued at prices supplied by independent pricing services in accordance with the Valuation Procedures. Short-term investments maturing in 60 days or less are generally valued at amortized cost which approximates fair value. |
| | Exchange-traded derivatives, such as options, futures and options on futures, are valued at the last sale price determined by the exchange where such instruments principally trade as of the close of such exchange (“Exchange Close”). If a last sale price is not available, the value will be the mean of the most recently quoted bid and ask prices as of the Exchange Close. If a mean of the bid and ask prices cannot be calculated for the day, the value will be the most recently quoted bid price as of the Exchange Close. Over-the-counter derivatives are normally valued based on prices supplied by independent pricing services in accordance with the Valuation Procedures. |
| | Investments valued in currencies other than U.S. dollars are converted to U.S. dollars using the prevailing spot currency exchange rates obtained from independent pricing services for calculation of the NAV. As a result, the NAV of a Fund’s shares may be affected by changes in the value of currencies in relation to the U.S. dollar. The value of securities or other instruments traded in markets outside the United States or denominated in currencies other than the U.S. dollar may be affected significantly on a day that the Exchange is closed and the market value may change on days when an investor is not able to purchase, redeem or exchange shares of a Fund. |
| | Foreign currency contracts represent agreements to exchange currencies on specific future dates at predetermined rates. Foreign currency contracts are valued using foreign currency exchange rates and forward rates as provided by an independent pricing service on the Valuation Date. |
| | Investments in investment companies that are not listed or traded on an exchange ("Non-Traded Funds"), if any, are valued at the respective NAV of each Non-Traded Fund on the Valuation Date. Shares of investment companies listed and traded on an exchange are valued in the same manner as any exchange-listed equity security. Such Non-Traded Funds and listed investment companies may use fair value pricing as disclosed in their prospectuses. |
| | Financial instruments for which prices are not available from an independent pricing service may be valued using market quotations obtained from one or more dealers that make markets in the respective financial instrument in accordance with the Valuation Procedures. |
Hartford Fixed Income Funds
Notes to Financial Statements – (continued)
October 31, 2021
| | U.S. GAAP defines fair value as the price that a Fund would receive to sell an asset or pay to transfer a liability in an orderly transaction between market participants. The U.S. GAAP fair value measurement standards require disclosure of a fair value hierarchy for each major category of assets and liabilities. Various inputs are used in determining the fair value of each Fund’s investments. These inputs are summarized into three broad hierarchy levels. This hierarchy is based on whether the valuation inputs are observable or unobservable. These levels are: |
| • | Level 1 – Quoted prices in active markets for identical investments. Level 1 may include exchange traded instruments, such as domestic equities, some foreign equities, options, futures, mutual funds, exchange traded funds, rights and warrants. |
| • | Level 2 – Observable inputs other than Level 1 prices, such as quoted prices for similar investments; quoted prices in markets that are not active; or other inputs that are observable or can be corroborated by observable market data. Level 2 may include debt investments that are traded less frequently than exchange traded instruments and which are valued using independent pricing services; foreign equities, which are principally traded on certain foreign markets and are adjusted daily pursuant to a fair value pricing service in order to reflect an adjustment for the factors occurring after the close of certain foreign markets but before the NYSE Close; senior floating rate interests, which are valued using an aggregate of dealer bids; short-term investments, which are valued at amortized cost; and swaps, which are valued based upon the terms of each swap contract. |
| • | Level 3 – Significant unobservable inputs that are supported by limited or no market activity. Level 3 may include financial instruments whose values are determined using indicative market quotes or require significant management judgment or estimation. These unobservable valuation inputs may include estimates for current yields, maturity/duration, prepayment speed, and indicative market quotes for comparable investments along with other assumptions relating to credit quality, collateral value, complexity of the investment structure, general market conditions and liquidity. This category may include investments where trading has been halted or there are certain restrictions on trading. While these investments are priced using unobservable inputs, the valuation of these investments reflects the best available data and management believes the prices are a reasonable representation of exit price. |
The Board of Directors has delegated the day-to-day responsibility for implementing the Valuation Procedures to the Valuation Committee. The Valuation Committee will consider all relevant factors in determining an investment’s fair value, and may seek the advice of such Fund’s sub-adviser(s), as applicable, knowledgeable brokers, and legal counsel in making such determination. The Valuation Committee reports to the Audit Committee of the Board of Directors.
Valuation levels are not necessarily indicative of the risk associated with investing in such investments. Individual investments within any of the above mentioned asset classes may be assigned a different hierarchical level than those presented above, as individual circumstances dictate.
For additional information, refer to the Fair Value Summary and the Level 3 roll-forward reconciliation, if applicable, which follows each Fund's Schedule of Investments.
| c) | Investment Transactions and Investment Income – Investment transactions are recorded as of the trade date (the date the order to buy or sell is executed) for financial reporting purposes. Investments purchased or sold on a when-issued or delayed-delivery basis may be settled a month or more after the trade date. Realized gains and losses are determined on the basis of identified cost. |
| | The trade date for senior floating rate interests purchased in the primary loan market is considered the date on which the loan allocations are determined. The trade date for senior floating rate interests purchased in the secondary loan market is the date on which the transaction is entered into. |
| | Dividend income from domestic securities is accrued on the ex-dividend date. In general, dividend income from foreign securities is recorded on the ex-date; however, dividend notifications in certain foreign jurisdictions may not be available in a timely manner and as a result, a Fund will record the dividend as soon as the relevant details (i.e., rate per share, payment date, shareholders of record, etc.) are publicly available. |
| | Interest income, including amortization of premium, accretion of discounts, inflation adjustments and additional principal received in-kind in lieu of cash, is accrued on a daily basis. Paydown gains and losses on mortgage-related and other asset-backed securities are included in interest income in the Statements of Operations, as applicable. |
Please refer to Note 8 for Securities Lending information.
| d) | Taxes – A Fund may be subject to taxes imposed on realized gains on securities of certain foreign countries in which such Fund invests. A Fund may also be subject to taxes withheld on foreign dividends and interest from securities in which a Fund invests. The amount of any foreign taxes withheld and foreign tax expense is included on the accompanying Statements of Operations as a reduction to net investment income or net realized or unrealized gain (loss) on investments in these securities, if applicable. |
| e) | Foreign Currency Transactions – Assets and liabilities denominated in currencies other than U.S. dollars are translated into U.S. dollars at the exchange rates in effect on the Valuation Date. Purchases and sales of investments, income and expenses are translated into U.S. dollars at the exchange rates on the dates of such transactions. |
Hartford Fixed Income Funds
Notes to Financial Statements – (continued)
October 31, 2021
| | A Fund does not isolate that portion of portfolio investment valuation resulting from fluctuations in the foreign currency exchange rates from the fluctuations arising from changes in the market prices of investments held. Exchange rate fluctuations are included with the net realized and unrealized gain or loss on investments in the accompanying financial statements. |
| | Net realized foreign exchange gains or losses arise from sales of foreign currencies and the difference between asset and liability amounts initially stated in foreign currencies and the U.S. dollar value of the amounts actually received or paid. Net unrealized foreign exchange gains or losses arise from changes in the value of other assets and liabilities at the end of the reporting period, resulting from changes in the exchange rates. |
| f) | Joint Trading Account – A Fund may invest cash balances into a joint trading account that may be invested in one or more repurchase agreements. |
| g) | Fund Share Valuation and Dividend Distributions to Shareholders – Orders for each class of each Fund’s shares are executed in accordance with the investment instructions of the shareholders. The NAV of each class of each Fund’s shares is determined as of the close of business on each business day of the Exchange (see Note 2(a)). The NAV is determined separately for each class of shares of a Fund by dividing the Fund's net assets attributable to that class by the number of shares of the class outstanding. Each class of shares offered by a Fund has equal rights as to assets and voting privileges (except that shareholders of a class have exclusive voting rights regarding any matter relating solely to that class of shares). Income and non-class specific expenses are allocated daily to each class on the basis of the relative net assets of the class of the Fund. Realized and unrealized gains and losses are allocated daily based on the relative net assets of each class of shares of each Fund. |
| | Orders for the purchase of a Fund's shares received prior to the close of the Exchange on any day the Exchange is open for business are priced at the NAV determined as of the close of the Exchange. Orders received after the close of the Exchange, or on a day on which the Exchange and/or the Funds are not open for business, are priced at the next determined NAV. |
| | Dividends are declared pursuant to a policy adopted by the Company’s Board of Directors. Dividends and/or distributions to shareholders are recorded on ex-date. Normally, for each Fund, except Emerging Markets Local Debt Fund, Strategic Income Fund, and World Bond Fund, dividends from net investment income are declared daily and paid monthly. The policy of Emerging Markets Local Debt Fund and Strategic Income Fund is to declare and pay dividends from net investment income, if any, monthly. The policy of World Bond Fund is to declare and pay dividends from net investment income, if any, quarterly. Dividends from realized gains, if any, are paid at least once a year. |
| | Income dividends and capital gains distributions are determined in accordance with federal income tax regulations, which may differ from U.S. GAAP with respect to character and timing (see Federal Income Taxes: Distributions and Components of Distributable Earnings and Reclassification of Capital Accounts notes). |
| 3. | Securities and Other Investments: |
| a) | Restricted Securities – Each Fund may invest in securities that are subject to legal or contractual restrictions on resale. These securities generally may be resold in transactions exempt from registration or to the public if the securities are registered. Disposal of these securities may involve time-consuming negotiations and expense, and prompt sale at an acceptable price may be difficult. Information regarding restricted securities, if applicable, is included at the end of each Fund's Schedule of Investments. |
| b) | Investments Purchased on a When-Issued or Delayed-Delivery Basis – Delivery and payment for investments that have been purchased by a Fund on a forward commitment, or when-issued or delayed-delivery basis, take place beyond the customary settlement period. A Fund may dispose of or renegotiate a delayed-delivery transaction after it is entered into, and may sell delayed-delivery investments before they are delivered, which may result in a realized gain or loss. During this period, such investments are subject to market fluctuations, and a Fund identifies investments segregated in its records with a value at least equal to the amount of the commitment. See each Fund’s Schedule of Investments, if applicable, for when-issued or delayed-delivery investments as of October 31, 2021. |
| | In connection with a Fund's ability to purchase investments on a when-issued or forward commitment basis, the Fund may enter into to-be announced (“TBA”) commitments. TBA commitments are forward agreements for the purchase or sale of mortgage-backed securities for a fixed price, with payment and delivery on an agreed-upon future settlement date. The specific securities to be delivered are not identified at the trade date; however, delivered securities must meet specified terms, including issuer, rate and mortgage terms. Although a Fund may enter into TBA commitments with the intention of acquiring or delivering securities for its portfolio, the Fund can extend the settlement date, roll the transaction, or dispose of a commitment prior to settlement if deemed appropriate to do so. If the TBA commitment is closed through the acquisition of an offsetting TBA commitment, a Fund realizes a gain or loss. In a TBA roll transaction, a Fund generally purchases or sells the initial TBA commitment prior to the agreed upon settlement date and enters into a new TBA commitment for future delivery or receipt of |
Hartford Fixed Income Funds
Notes to Financial Statements – (continued)
October 31, 2021
the mortgage-backed securities. TBA commitments involve a risk of loss if the value of the security to be purchased or sold declines or increases, respectively, prior to settlement date. These transactions are excluded from a Fund's portfolio turnover rate. See each Fund's Schedule of Investments, if applicable, for TBA commitments as of October 31, 2021.
| c) | Senior Floating Rate Interests – Certain Funds may invest in senior floating rate interests. Senior floating rate interests generally hold the most senior position in the capital structure of a business entity (the “Borrower”), are typically secured by specific collateral and have a claim on the assets and/or stock of the Borrower that is senior to that held by subordinated debt holders and stockholders of the Borrower. Senior floating rate interests are typically structured and administered by a financial institution that acts as the agent of the lenders participating in the senior floating rate interest. A Fund may invest in multiple series or tranches of a senior floating rate interest, which may have varying terms and carry different associated risks. A Fund may also enter into unfunded loan commitments, which are contractual obligations for future funding. Unfunded loan commitments may include revolving credit facilities, which may obligate the Fund to supply additional cash to the Borrower on demand. Unfunded loan commitments represent a future obligation in full. A Fund may receive a commitment fee based on the undrawn portion of the underlying line of credit portion of a senior floating rate interest. In certain circumstances, a Fund may receive various fees upon the restructure of a senior floating rate interest by a borrower. Fees earned/paid may be recorded as a component of income or realized gain/loss in the Statements of Operations. |
| | Senior floating rate interests are typically rated below-investment-grade, which suggests they are more likely to default and generally pay higher interest rates than investment-grade loans. A default could lead to non-payment of income, which would result in a reduction of income to a Fund, and there can be no assurance that the liquidation of any collateral would satisfy the Borrower’s obligation in the event of non-payment of scheduled interest or principal payments, or that such collateral could be readily liquidated. See each Fund's Schedule of Investments, if applicable, for outstanding senior floating rate interests as of October 31, 2021. |
| d) | Mortgage-Related and Other Asset-Backed Securities – A Fund may invest in mortgage-related and other asset-backed securities. These securities include mortgage pass-through securities, collateralized mortgage obligations, commercial mortgage-backed securities, stripped mortgage-backed securities, asset-backed securities, collateralized debt obligations and other securities that directly or indirectly represent a participation in, or are secured by and payable from, mortgage loans on real property. Mortgage-related securities are created from pools of residential or commercial mortgage loans, including mortgage loans made by savings and loan institutions, mortgage bankers, commercial banks and others. Asset-backed securities are created from many types of assets, including auto loans, credit card receivables, home equity loans, and student loans. These securities provide a monthly payment that consists of both interest and principal payments. Interest payments may be determined by fixed or adjustable rates. The rate of prepayments on underlying mortgages will affect the price and volatility of a mortgage-related security, and may have the effect of shortening or extending the effective duration of the security relative to what was anticipated at the time of purchase. The timely payment of principal and interest of certain mortgage-related securities is guaranteed by the full faith and credit of the United States Government. Mortgage-related and other asset-backed securities created and guaranteed by non-governmental issuers, including government-sponsored corporations, may be supported by various forms of insurance or guarantees, but there can be no assurance that the private insurers or guarantors can meet their obligations under the insurance policies or guarantee arrangements. See each Fund's Schedule of Investments, if applicable, for mortgage-related and other asset-backed securities as of October 31, 2021. |
| e) | Inflation-Indexed Bonds – A Fund may invest in inflation-indexed bonds. Inflation-indexed bonds are fixed income investments whose principal value is periodically adjusted to the rate of inflation. The interest rate on these bonds is generally fixed at issuance at a rate lower than typical bonds. Over the life of an inflation-indexed bond, however, interest will be paid based on a principal value, which is adjusted for inflation. Any increase or decrease in the principal amount of an inflation-indexed bond will be included as interest income on the Statements of Operations, even though investors do not receive the principal amount until maturity. See each Fund's Schedule of Investments, if applicable, for inflation-indexed bonds as of October 31, 2021. |
| f) | Repurchase Agreements – A repurchase agreement is an agreement between two parties whereby one party sells the other a security at a specified price with a commitment to repurchase the security later at an agreed-upon price, date and interest payment. Each Fund is permitted to enter into fully collateralized repurchase agreements. The Company's Board of Directors has delegated to the sub-adviser(s), as applicable, the responsibility of evaluating the creditworthiness of the banks and securities dealers with which the Funds will engage in repurchase agreements. The sub-adviser(s) will monitor such transactions to ensure that the value of underlying collateral will be at least equal to the total amount of the repurchase obligation as required by the valuation provision of the repurchase agreement, including the accrued interest. Repurchase agreements carry the risk that the market value of the securities declines below the repurchase price. A Fund could also lose money if it is unable to recover the securities and the value of any collateral held or assets segregated by the Fund to cover the transaction is less than the value of the securities. In the event the borrower commences bankruptcy proceedings, a court may characterize the transaction as a loan. If a Fund has not perfected a security interest in the underlying collateral, the Fund may be required to return the underlying collateral to the borrower’s estate and be treated as an unsecured creditor. As an unsecured creditor, the Fund could lose some or all of the principal and interest involved in the transaction. See each Fund's Schedule of Investments, if applicable, for repurchase agreements as of October 31, 2021. |
Hartford Fixed Income Funds
Notes to Financial Statements – (continued)
October 31, 2021
| 4. | Financial Derivative Instruments: |
| | The following disclosures contain information on how and why a Fund may use derivative instruments, the credit-risk-related contingent features in certain derivative instruments, and how derivative instruments affect a Fund’s financial position and results of operations. The location and fair value amounts of these instruments on the Statements of Assets and Liabilities and the realized gains and losses and changes in unrealized gains and losses on the Statements of Operations, each categorized by type of derivative contract, are included in the following Additional Derivative Instrument Information footnote. The derivative instruments outstanding as of period-end are disclosed in the notes to the Schedules of Investments, if applicable. The amounts of realized gains and losses and changes in unrealized gains and losses on derivative instruments during the period are disclosed in the Statements of Operations. |
| a) | Bond Forwards – A Fund may enter into bond forwards. A bond forward is a contractual agreement between a Fund and another party to buy or sell an underlying asset at an agreed-upon future price and date. In a bond forward transaction, no cash premium is paid when the parties enter into the bond forward. If the transaction is collateralized, an exchange of margin collateral will take place according to an agreed-upon schedule. Otherwise, no asset of any kind changes hands until the bond forward matures (typically in 30 days) or is rolled over for another agreed-upon period. Generally, the value of the bond forward will change based on changes in the value of the underlying asset. Bond forwards are subject to market risk (the risk that the market value of the underlying bond may change), non-correlation risk (the risk that the market value of the bond forward might move independently of the market value of the underlying bond) and counterparty credit risk (the risk that a counterparty will be unable to meet its obligation under the contract). If there is no cash exchanged at the time a Fund enters into the bond forward, counterparty risk may be limited to the loss of any marked-to-market profit on the contract and any delays or limitations on the Fund’s ability to sell or otherwise use the investments used as collateral for the bond forward. |
During the year ended October 31, 2021, the Inflation Plus Fund had entered into Bond Forwards.
| b) | Futures Contracts – A Fund may enter into futures contracts. A futures contract is an agreement between two parties to buy or sell an asset at a set price on a future date. A Fund may use futures contracts to manage risk or obtain exposure to the investment markets, commodities, or movements in interest rates and currency values. The primary risks associated with the use of futures contracts are the imperfect correlation between the change in market value of the investments held by a Fund and the prices of futures contracts and the possibility of an illiquid market. Upon entering into a futures contract, a Fund is required to deposit with a futures commission merchant (“FCM”) an amount of cash or U.S. Government or Agency Obligations in accordance with the initial margin requirements of the broker or exchange. Futures contracts are marked to market daily and an appropriate amount equal to the change in value (“variation margin”) is paid or received by a Fund. Gains or losses are recognized but not considered realized until the contracts expire or are closed. Futures contracts involve, to varying degrees, risk of loss in excess of the variation margin disclosed on the Statements of Assets and Liabilities. |
| | During the year ended October 31, 2021, each of Emerging Markets Local Debt Fund, Inflation Plus Fund, Short Duration Fund, Strategic Income Fund, Total Return Bond Fund and World Bond Fund had used Futures Contracts. |
| c) | Foreign Currency Contracts – A Fund may enter into foreign currency contracts that obligate the Fund to purchase or sell currencies at specified future dates. Foreign currency contracts may be used in connection with settling purchases or sales of securities to hedge the currency exposure associated with some or all of a Fund’s investments and/or as part of an investment strategy. Foreign currency contracts are marked to market daily and the change in value is recorded by a Fund as an unrealized gain or loss. A Fund will record a realized gain or loss when the foreign currency contract is settled. |
| | Foreign currency contracts involve elements of market risk in excess of the amounts reflected in the Statements of Assets and Liabilities. In addition, risks may arise upon entering into these contracts from the potential inability of the counterparties to meet the terms of the contracts and from unanticipated movements in the value of the foreign currencies relative to the U.S. dollar. Upon entering into a foreign currency contract, a Fund may be required to post margin equal to its outstanding exposure thereunder. |
| | During the year ended October 31, 2021, each of Emerging Markets Local Debt Fund, Floating Rate Fund, Floating Rate High Income Fund, High Yield Fund, Inflation Plus Fund, Short Duration Fund, Strategic Income Fund, Total Return Bond Fund and World Bond Fund had used Foreign Currency Contracts. |
| d) | Options Contracts – An option contract is a contract sold by one party to another party that offers the buyer the right, but not the obligation, to buy (call) or sell (put) an investment or other financial asset at an agreed-upon price during a specific period of time or on a specific date. Option contracts are either over-the-counter ("OTC") options or executed in a registered exchange (“exchange-traded options”). A Fund may write (sell) covered call and put options on futures, swaps (“swaptions”), securities, commodities or currencies. “Covered” means that so long as a Fund is obligated as the writer of an option, it will own either the underlying investments or currency or an option to purchase the same underlying investments or currency having an expiration date of the covered option and an exercise price equal to or less than the exercise price of the covered option, or will segregate or earmark cash or other liquid investments having, for written call options, a value equal to the greater of the exercise price or the market value of the underlying instrument and, for written put options, a value equal to the exercise price. Writing put options may increase a Fund’s exposure to the underlying instrument. Writing call options may decrease a Fund’s exposure to |
Hartford Fixed Income Funds
Notes to Financial Statements – (continued)
October 31, 2021
| | the underlying instrument. Premiums received from writing options that expire are treated as realized gains. Premiums received from writing options that are exercised or closed are added to the proceeds or offset amounts paid on the underlying futures, swaps, investments or currency transactions to determine the realized gain or loss. A Fund, as a writer of an option, has no control over whether the underlying instrument may be sold (call) or purchased (put) and as a result bears the market risk of an unfavorable change in the price of the instrument underlying the written option. There is the risk a Fund may not be able to enter into a closing transaction because of an illiquid market. A Fund may also purchase put and call options. Purchasing call options may increase a Fund’s exposure to the underlying instrument. Purchasing put options may decrease a Fund’s exposure to the underlying instrument. A Fund pays a premium, which is included on the Fund’s Statements of Assets and Liabilities as an investment and is subsequently marked to market to reflect the current value of the option. Premiums paid for purchasing options that expire are treated as realized losses. Certain options may be purchased with premiums to be determined on a future date. The premiums for these options are based upon implied volatility parameters at specified terms. The risk associated with purchasing put and call options is generally limited to the premium paid. Premiums paid for purchasing options that are exercised or closed are added to the amounts paid or offset against the proceeds on the underlying investment transaction to determine the realized gain or loss. Entering into OTC options also exposes a Fund to counterparty risk. Counterparty risk is the possibility that the counterparty to the agreements may default on its obligation to perform or disagree as to the meaning of the contractual terms in the agreements. |
| | During the year ended October 31, 2021, each of Emerging Markets Local Debt Fund, Inflation Plus Fund, Strategic Income Fund, Total Return Bond Fund and World Bond Fund had used Options Contracts. |
| e) | Swap Contracts – A Fund may invest in swap contracts. Swap contracts are agreements to exchange or swap investment cash flows, assets, foreign currencies or market-linked returns at specified future intervals. Swap contracts are either privately negotiated in the over-the-counter market (“OTC swaps”) or cleared through a central counterparty or derivatives clearing organization (“centrally cleared swaps”). A Fund may enter into credit default, total return, cross-currency, interest rate, inflation and other forms of swap contracts to manage its exposure to credit, currency, interest rate, commodity and inflation risk. Swap contracts are also used to gain exposure to certain markets. In connection with these contracts, investments or cash may be identified as collateral or margin in accordance with the terms of the respective swap contracts and/or master netting arrangement to provide assets of value and recourse in the event of default or bankruptcy/insolvency. |
| | Swaps are valued in accordance with the Valuation Procedures. Changes in market value, if any, are reflected as a component of net changes in unrealized appreciation or depreciation on the Statements of Operations. Daily changes in valuation of centrally cleared swaps, if any, are recorded as a receivable or payable for the change in value (“variation margin”) on the Statements of Assets and Liabilities. Realized gains or losses on centrally cleared swaps are recorded upon the termination of the swaps. OTC swap payments received or paid at the beginning of the measurement period are reflected as such on the Statements of Assets and Liabilities and represent premiums paid or received upon entering into the swap contract to compensate for differences between the stated terms of the swap contract and prevailing market conditions (credit spreads, currency exchange rates, interest rates and other relevant factors). These upfront premiums are recorded as realized gains or losses on the Statements of Operations upon termination or maturity of the swap. A liquidation payment received or made at the termination or maturity of the swap is recorded as a realized gain or loss on the Statements of Operations. Net periodic payments received or paid by a Fund are included as part of realized gains or losses on the Statements of Operations. |
| | Entering into these contracts involves, to varying degrees, elements of liquidation, counterparty, credit and market risk in excess of the amounts recognized on the Statements of Assets and Liabilities. Such risks involve the possibility that there will be no liquid market for these contracts, that the counterparty to the contracts may default on its obligation to perform or disagree as to the meaning of contractual terms in the contracts, and that there may be unfavorable changes in market conditions (credit spreads, currency exchange rates, interest rates and other relevant factors). |
| | A Fund’s maximum risk of loss from counterparty risk for OTC swaps is the net value of the discounted cash flows to be received from the counterparty over the contract’s remaining life, and current market value, to the extent that amount is positive. The risk is mitigated by having a master netting arrangement between a Fund and the counterparty, which allows for the netting of payments made or received (although such amounts are presented on a gross basis within the Statements of Assets and Liabilities, as applicable) as well as the posting of collateral to a Fund to cover the Fund’s exposure to the counterparty. In a centrally cleared swap, while a Fund enters into an agreement with a clearing broker to execute contracts with a counterparty, the performance of the swap is guaranteed by the central clearinghouse, which reduces the Fund’s exposure to counterparty risk. However, the Fund is still exposed to a certain amount of counterparty risk through the clearing broker and clearinghouse. The clearinghouse attempts to minimize this risk to its participants through the use of mandatory margin requirements, daily cash settlements and other procedures. Likewise, the clearing broker reduces its risk through margin requirements and required segregation of customer balances. |
| | Credit Default Swap Contracts – The credit default swap market allows a Fund to manage credit risk through buying and selling credit protection on a specific issuer, asset or basket of assets. Certain credit default swaps involve the exchange of a fixed rate premium for protection against the loss in value of an underlying investment or index in the event of a credit event, such as payment default or bankruptcy. |
Hartford Fixed Income Funds
Notes to Financial Statements – (continued)
October 31, 2021
| | Under a credit default swap contract, one party acts as guarantor by receiving the fixed periodic payment in exchange for the commitment to purchase the underlying investment at par if the defined credit event occurs. Upon the occurrence of a defined credit event, the difference between the value of the reference obligation and the swap’s notional amount is recorded as realized gain or loss on swap transactions in the Statements of Operations. A “buyer” of credit protection agrees to pay a counterparty to assume the credit risk of an issuer upon the occurrence of certain events. The “seller” of the protection receives periodic payments and agrees to assume the credit risk of an issuer upon the occurrence of certain events. Although specified events are contract specific, credit events are generally defined as bankruptcy, failure to pay, restructuring, obligation acceleration, obligation default or repudiation/moratorium. A “seller’s” exposure is limited to the total notional amount of the credit default swap contract. These potential amounts would be partially offset by any recovery values of the respective referenced obligations or upfront payments received upon entering into the contract. |
| | Implied credit spreads, represented in absolute terms, utilized in determining the market value of credit default swap contracts on corporate issues, sovereign government issues or U.S. municipal issues as of year-end are disclosed in the notes to the Schedules of Investments, as applicable, and serve as an indicator of the current status of the payment/performance risk and represent the likelihood or risk of default for the credit derivative. The implied credit spread of a particular referenced entity reflects the cost of buying/selling protection and there may also be upfront payments required to be made to enter into the contract. Wider credit spreads represent a deterioration of the referenced entity’s credit soundness and a greater likelihood or risk of default or other credit event occurring as defined under the terms of the contract. For credit default swap contracts on credit indices, the quoted market prices and resulting values serve as the indicator of the current status of the payment/performance risk. Increasing market values, in absolute terms when compared to the notional amount of the swap, represent a deterioration of the referenced equity’s credit soundness and a greater likelihood or risk of default or other credit event occurring as defined under the terms of the contract. |
| | During the year ended October 31, 2021, each of Emerging Markets Local Debt Fund, High Yield Fund, Inflation Plus Fund, Strategic Income Fund, Total Return Bond Fund and World Bond Fund had used Credit Default Swap Contracts. |
| | Interest Rate Swap Contracts – Certain Funds are subject to interest rate risk exposure in the normal course of pursuing its investment objectives. A Fund may use interest rate swaps to hedge interest rate and duration risk across a portfolio at particular duration points to maintain its ability to generate income at prevailing market rates. In a typical interest rate swap, one party agrees to make regular payments equal to a floating interest rate, based on a specified interest rate or benchmark (e.g. London Interbank Offered Rate (“LIBOR”), multiplied by a notional amount, in return for payments equal to a fixed rate multiplied by the same amount, for a specific period of time. The net interest received or paid on interest rate swap contracts is recorded as a realized gain or loss. Interest rate swaps are marked to market daily and the change, if any, is recorded as an unrealized gain or loss in the Statements of Operations. When the interest rate swap contract is terminated early, a Fund records a realized gain or loss equal to the difference between the current market value and the upfront premium or cost. |
| | If an interest rate swap contract provides for payments in different currencies, the parties might agree to exchange the notional amount as well. Interest rate swaps may also depend on other prices or rates, such as the value of an index. The risks of interest rate swaps include changes in market conditions, which will affect the value of the contract or the cash flows and the possible inability of the counterparty to fulfill its obligations under the contract. A Fund’s maximum risk of loss from counterparty credit risk is the discounted net value of the cash flows to be received from the counterparty over the contract’s remaining life, to the extent that amount is positive. |
| | During the year ended October 31, 2021, each of Emerging Markets Local Debt Fund, Inflation Plus Fund, Strategic Income Fund, Total Return Bond Fund and World Bond Fund had used Interest Rate Swap Contracts. |
| | Total Return Swap Contracts – Certain Funds may invest in total return swap contracts in pursuit of the Fund's investment objective or for hedging purposes. An investment in a total return swap allows a Fund to gain or mitigate exposure to underlying reference assets. Total return swap contracts involve commitments where cash flows are exchanged based on the price of underlying reference assets and based on a fixed or variable interest rate. One party receives payments based on the price appreciation or depreciation of the underlying reference asset, in exchange for paying to or receiving from the counterparty seller an agreed-upon interest rate. A variable interest rate may be correlated to a base rate, such as the LIBOR, and is adjusted each reset period, which is defined at the beginning of the contract. Therefore, if interest rates increase over the term of the swap contract, the party paying the rate may be required to pay a higher rate at each swap reset date. |
| | Total return swap contracts on indices involve commitments to pay interest in exchange for a market-linked return. One party pays out the total return of a specific reference asset, which may be an equity, index, or bond, and in return receives a regular stream of payments. To the extent the total return of the security or index underlying the transaction exceeds or falls short of the offsetting interest rate obligation, a Fund will receive a payment from or make a payment to the counterparty. If the Fund is a payer in a total return swap, it may be subject to unlimited losses. They are also subject to counterparty risk. If the counterparty fails to meet its obligations, the Fund may lose money. |
Hartford Fixed Income Funds
Notes to Financial Statements – (continued)
October 31, 2021
| | During the year ended October 31, 2021, each of Floating Rate Fund, Floating Rate High Income Fund, Inflation Plus Fund, Strategic Income Fund and Total Return Bond Fund had used Total Return Swap Contracts. |
| | Cross Currency Swaps – Certain Funds may enter into cross currency swap agreements to gain or mitigate exposure to currency risk. A cross currency swap is an agreement to exchange cash flows on a notional amount of two or more currencies based on the relative value differential among them. Such swaps may involve initial and final exchanges that correspond to the agreed upon notional amount. Cross currency swaps usually involve the delivery of the entire principal value of one designated currency in exchange for the other designated currency. Therefore, the entire principal value of a cross currency swap is subject to the risk that the other party to the swap will default on its contractual delivery obligations. If there is a default by the counterparty, the Fund may have contractual remedies pursuant to the agreements related to the transaction. |
During the year ended October 31, 2021, the Emerging Markets Local Debt Fund had used Cross Currency Swaps.
| f) | Additional Derivative Instrument Information: |
| | Emerging Markets Local Debt Fund |
| | |
| The Effect of Derivative Instruments on the Statement of Assets and Liabilities as of October 31, 2021: |
| | Risk Exposure Category |
| | Interest Rate
Contracts | | Foreign
Currency
Contracts | | Credit
Contracts | | Equity
Contracts | | Commodity
Contracts | | Total |
| Assets: | | | | | | | | | | | |
| Investments in securities, at value (purchased options), market value | $ — | | $ 291,537 | | $ — | | $ — | | $ — | | $ 291,537 |
| Unrealized appreciation on futures contracts(1) | 146,488 | | — | | — | | — | | — | | 146,488 |
| Unrealized appreciation on foreign currency contracts | — | | 717,595 | | — | | — | | — | | 717,595 |
| Unrealized appreciation on swap contracts(2) | 537,816 | | — | | — | | — | | — | | 537,816 |
| Total | $ 684,304 | | $ 1,009,132 | | $ — | | $ — | | $ — | | $ 1,693,436 |
| Liabilities: | | | | | | | | | | | |
| Unrealized depreciation on futures contracts(1) | $ 8,159 | | $ — | | $ — | | $ — | | $ — | | $ 8,159 |
| Unrealized depreciation on foreign currency contracts | — | | 1,530,838 | | — | | — | | — | | 1,530,838 |
| Written options, market value | — | | 161,139 | | — | | — | | — | | 161,139 |
| Unrealized depreciation on swap contracts(2) | 582,643 | | — | | — | | — | | — | | 582,643 |
| Total | $ 590,802 | | $ 1,691,977 | | $ — | | $ — | | $ — | | $ 2,282,779 |
| (1) | Amount represents the cumulative appreciation and depreciation on futures contracts as disclosed within the Schedule of Investments under the open “Futures Contracts” section. Only current day’s variation margin, if any, is reported within the Statement of Assets and Liabilities. |
| (2) | Amount represents the cumulative appreciation and depreciation on centrally cleared swaps, if applicable, as disclosed within the Schedule of Investments. Only the current day’s variation margin, if any, are reported within the Statements of Assets and Liabilities. OTC swaps are reported within the Statement of Assets and Liabilities within Unrealized appreciation and depreciation on OTC swap contracts, if applicable. |
Hartford Fixed Income Funds
Notes to Financial Statements – (continued)
October 31, 2021
Emerging Markets Local Debt Fund – (continued)
| The Effect of Derivative Instruments on the Statement of Operations for the year ended October 31, 2021: |
| | Risk Exposure Category |
| | Interest Rate
Contracts | | Foreign
Currency
Contracts | | Credit
Contracts | | Equity
Contracts | | Commodity
Contracts | | Total |
| Realized Gain (Loss) on Derivatives Recognized as a Result of Operations: | | | | | | | | | | | |
| Net realized gain (loss) on purchased options contracts | $ — | | $ 125,876 | | $ — | | $ — | | $ — | | $ 125,876 |
| Net realized gain (loss) on futures contracts | (42,920) | | — | | — | | — | | — | | (42,920) |
| Net realized gain (loss) on written options contracts | — | | 71,578 | | — | | — | | — | | 71,578 |
| Net realized gain (loss) on swap contracts | (105,305) | | — | | — | | — | | — | | (105,305) |
| Net realized gain (loss) on foreign currency contracts | — | | 1,224,436 | | — | | — | | — | | 1,224,436 |
| Total | $ (148,225) | | $ 1,421,890 | | $ — | | $ — | | $ — | | $ 1,273,665 |
| Net Change in Unrealized Appreciation (Depreciation) on Derivatives Recognized as a Result of Operations: | | | | | | | | | | | |
| Net change in unrealized appreciation (depreciation) of investments in purchased options contracts | $ — | | $ (241) | | $ — | | $ — | | $ — | | $ (241) |
| Net change in unrealized appreciation (depreciation) of futures contracts | 141,007 | | — | | — | | — | | — | | 141,007 |
| Net change in unrealized appreciation (depreciation) of written options contracts | — | | (56,833) | | — | | — | | — | | (56,833) |
| Net change in unrealized appreciation (depreciation) of swap contracts | 23,225 | | — | | — | | — | | — | | 23,225 |
| Net change in unrealized appreciation (depreciation) of foreign currency contracts | — | | (513,552) | | — | | — | | — | | (513,552) |
| Total | $ 164,232 | | $ (570,626) | | $ — | | $ — | | $ — | | $ (406,394) |
For the year ended October 31, 2021, the average monthly amount or number per contract outstanding for each derivative type was as follows:
| Derivative Description | | Average Notional
Par, Contracts
or Face Amount |
| Purchased Options at Notional Amount | | $ 11,331,667 |
| Futures Contracts Number of Long Contracts | | 34 |
| Futures Contracts Number of Short Contracts | | (59) |
| Written Options at Notional Amount | | $ (8,584,667) |
| Swap Contracts at Notional Amount | | 7,176,660,193 |
| Foreign Currency Contracts Purchased at Contract Amount | | $ 57,853,187 |
| Foreign Currency Contracts Sold at Contract Amount | | $ 32,296,795 |
Floating Rate Fund
| The Effect of Derivative Instruments on the Statement of Assets and Liabilities as of October 31, 2021: |
| | Risk Exposure Category |
| | Interest Rate
Contracts | | Foreign
Currency
Contracts | | Credit
Contracts | | Equity
Contracts | | Commodity
Contracts | | Total |
| Assets: | | | | | | | | | | | |
| Unrealized appreciation on foreign currency contracts | $ — | | $ 1,188,028 | | $ — | | $ — | | $ — | | $ 1,188,028 |
| Unrealized appreciation on swap contracts(1) | 486,728 | | — | | — | | — | | — | | 486,728 |
| Total | $ 486,728 | | $ 1,188,028 | | $ — | | $ — | | $ — | | $ 1,674,756 |
| Liabilities: | | | | | | | | | | | |
| Unrealized depreciation on foreign currency contracts | $ — | | $ 5,843 | | $ — | | $ — | | $ — | | $ 5,843 |
| Total | $ — | | $ 5,843 | | $ — | | $ — | | $ — | | $ 5,843 |
| (1) | Amount represents the cumulative appreciation and depreciation on centrally cleared swaps, if applicable, as disclosed within the Schedule of Investments. Only the current day’s variation margin, if any, are reported within the Statements of Assets and Liabilities. OTC swaps are reported within the Statement of Assets and Liabilities within Unrealized appreciation and depreciation on OTC swap contracts, if applicable. |
Hartford Fixed Income Funds
Notes to Financial Statements – (continued)
October 31, 2021
Floating Rate Fund – (continued)
| The Effect of Derivative Instruments on the Statement of Operations for the year ended October 31, 2021: |
| | Risk Exposure Category |
| | Interest Rate
Contracts | | Foreign
Currency
Contracts | | Credit
Contracts | | Equity
Contracts | | Commodity
Contracts | | Total |
| Net realized gain (loss) on swap contracts | $ 5,959,493 | | $ — | | $ — | | $ — | | $ — | | $ 5,959,493 |
| Net realized gain (loss) on foreign currency contracts | — | | 7,589,538 | | — | | — | | — | | 7,589,538 |
| Total | $ 5,959,493 | | $ 7,589,538 | | $ — | | $ — | | $ — | | $ 13,549,031 |
| Net Change in Unrealized Appreciation (Depreciation) on Derivatives Recognized as a Result of Operations: | | | | | | | | | | | |
| Net change in unrealized appreciation (depreciation) of swap contracts | $ (2,320,956) | | $ — | | $ — | | $ — | | $ — | | $ (2,320,956) |
| Net change in unrealized appreciation (depreciation) of foreign currency contracts | — | | (2,774,811) | | — | | — | | — | | (2,774,811) |
| Total | $ (2,320,956) | | $ (2,774,811) | | $ — | | $ — | | $ — | | $ (5,095,767) |
For the year ended October 31, 2021, the average monthly amount or number per contract outstanding for each derivative type was as follows:
| Derivative Description | | Average Notional
Par, Contracts
or Face Amount |
| Swap Contracts at Notional Amount | | 80,360,000 |
| Foreign Currency Contracts Purchased at Contract Amount | | $ 8,206,078 |
| Foreign Currency Contracts Sold at Contract Amount | | $ 275,403,349 |
Floating Rate High Income Fund
| The Effect of Derivative Instruments on the Statement of Assets and Liabilities as of October 31, 2021: |
| | Risk Exposure Category |
| | Interest Rate
Contracts | | Foreign
Currency
Contracts | | Credit
Contracts | | Equity
Contracts | | Commodity
Contracts | | Total |
| Assets: | | | | | | | | | | | |
| Unrealized appreciation on foreign currency contracts | $ — | | $ 241,560 | | $ — | | $ — | | $ — | | $ 241,560 |
| Unrealized appreciation on swap contracts(1) | 98,226 | | — | | — | | — | | — | | 98,226 |
| Total | $ 98,226 | | $ 241,560 | | $ — | | $ — | | $ — | | $ 339,786 |
| Liabilities: | | | | | | | | | | | |
| Unrealized depreciation on foreign currency contracts | $ — | | $ 2,394 | | $ — | | $ — | | $ — | | $ 2,394 |
| Total | $ — | | $ 2,394 | | $ — | | $ — | | $ — | | $ 2,394 |
| (1) | Amount represents the cumulative appreciation and depreciation on centrally cleared swaps, if applicable, as disclosed within the Schedule of Investments. Only the current day’s variation margin, if any, are reported within the Statements of Assets and Liabilities. OTC swaps are reported within the Statement of Assets and Liabilities within Unrealized appreciation and depreciation on OTC swap contracts, if applicable. |
| The Effect of Derivative Instruments on the Statement of Operations for the year ended October 31, 2021: |
| | Risk Exposure Category |
| | Interest Rate
Contracts | | Foreign
Currency
Contracts | | Credit
Contracts | | Equity
Contracts | | Commodity
Contracts | | Total |
| Net realized gain (loss) on swap contracts | $ 1,390,595 | | $ — | | $ — | | $ — | | $ — | | $ 1,390,595 |
| Net realized gain (loss) on foreign currency contracts | — | | 1,301,421 | | — | | — | | — | | 1,301,421 |
| Total | $ 1,390,595 | | $ 1,301,421 | | $ — | | $ — | | $ — | | $ 2,692,016 |
| Net Change in Unrealized Appreciation (Depreciation) on Derivatives Recognized as a Result of Operations: | | | | | | | | | | | |
| Net change in unrealized appreciation (depreciation) of swap contracts | $ (647,852) | | $ — | | $ — | | $ — | | $ — | | $ (647,852) |
| Net change in unrealized appreciation (depreciation) of foreign currency contracts | — | | (664,257) | | — | | — | | — | | (664,257) |
| Total | $ (647,852) | | $ (664,257) | | $ — | | $ — | | $ — | | $ (1,312,109) |
Hartford Fixed Income Funds
Notes to Financial Statements – (continued)
October 31, 2021
Floating Rate High Income Fund – (continued)
For the year ended October 31, 2021, the average monthly amount or number per contract outstanding for each derivative type was as follows:
| Derivative Description | | Average Notional
Par, Contracts
or Face Amount |
| Swap Contracts at Notional Amount | | 16,175,000 |
| Foreign Currency Contracts Purchased at Contract Amount | | $ 2,175,891 |
| Foreign Currency Contracts Sold at Contract Amount | | $ 56,648,396 |
High Yield Fund
| The Effect of Derivative Instruments on the Statement of Assets and Liabilities as of October 31, 2021: |
| | Risk Exposure Category |
| | Interest Rate
Contracts | | Foreign
Currency
Contracts | | Credit
Contracts | | Equity
Contracts | | Commodity
Contracts | | Total |
| Assets: | | | | | | | | | | | |
| Unrealized appreciation on foreign currency contracts | $ — | | $ 134,834 | | $ — | | $ — | | $ — | | $ 134,834 |
| Total | $ — | | $ 134,834 | | $ — | | $ — | | $ — | | $ 134,834 |
| The Effect of Derivative Instruments on the Statement of Operations for the year ended October 31, 2021: |
| | Risk Exposure Category |
| | Interest Rate
Contracts | | Foreign
Currency
Contracts | | Credit
Contracts | | Equity
Contracts | | Commodity
Contracts | | Total |
| Net realized gain (loss) on foreign currency contracts | $ — | | $ 844,283 | | $ — | | $ — | | $ — | | $ 844,283 |
| Total | $ — | | $ 844,283 | | $ — | | $ — | | $ — | | $ 844,283 |
| Net Change in Unrealized Appreciation (Depreciation) on Derivatives Recognized as a Result of Operations: | | | | | | | | | | | |
| Net change in unrealized appreciation (depreciation) of foreign currency contracts | $ — | | $ (230,246) | | $ — | | $ — | | $ — | | $ (230,246) |
| Total | $ — | | $ (230,246) | | $ — | | $ — | | $ — | | $ (230,246) |
For the year ended October 31, 2021, the average monthly amount or number per contract outstanding for each derivative type was as follows:
| Derivative Description | | Average Notional
Par, Contracts
or Face Amount |
| Foreign Currency Contracts Purchased at Contract Amount | | $ 104,258 |
| Foreign Currency Contracts Sold at Contract Amount | | $ 29,168,647 |
Hartford Fixed Income Funds
Notes to Financial Statements – (continued)
October 31, 2021
Inflation Plus Fund
| The Effect of Derivative Instruments on the Statement of Assets and Liabilities as of October 31, 2021: |
| | Risk Exposure Category |
| | Interest Rate
Contracts | | Foreign
Currency
Contracts | | Credit
Contracts | | Equity
Contracts | | Commodity
Contracts | | Total |
| Assets: | | | | | | | | | | | |
| Unrealized appreciation on futures contracts(1) | $ 1,084,642 | | $ — | | $ — | | $ — | | $ — | | $ 1,084,642 |
| Unrealized appreciation on foreign currency contracts | — | | 450,721 | | — | | — | | — | | 450,721 |
| Unrealized appreciation on swap contracts(2) | 3,564,808 | | — | | 108 | | — | | — | | 3,564,916 |
| Total | $ 4,649,450 | | $ 450,721 | | $ 108 | | $ — | | $ — | | $ 5,100,279 |
| Liabilities: | | | | | | | | | | | |
| Unrealized depreciation on futures contracts(1) | $ 1,255,062 | | $ — | | $ — | | $ — | | $ — | | $ 1,255,062 |
| Unrealized depreciation on bond forward contracts | 212,059 | | — | | — | | — | | — | | 212,059 |
| Unrealized depreciation on foreign currency contracts | — | | 215,241 | | — | | — | | — | | 215,241 |
| Unrealized depreciation on swap contracts(2) | 683,278 | | — | | — | | — | | — | | 683,278 |
| Total | $ 2,150,399 | | $ 215,241 | | $ — | | $ — | | $ — | | $ 2,365,640 |
| (1) | Amount represents the cumulative appreciation and depreciation on futures contracts as disclosed within the Schedule of Investments under the open “Futures Contracts” section. Only current day’s variation margin, if any, is reported within the Statement of Assets and Liabilities. |
| (2) | Amount represents the cumulative appreciation and depreciation on centrally cleared swaps, if applicable, as disclosed within the Schedule of Investments. Only the current day’s variation margin, if any, are reported within the Statements of Assets and Liabilities. OTC swaps are reported within the Statement of Assets and Liabilities within Unrealized appreciation and depreciation on OTC swap contracts, if applicable. |
| The Effect of Derivative Instruments on the Statement of Operations for the year ended October 31, 2021: |
| | Risk Exposure Category |
| | Interest Rate
Contracts | | Foreign
Currency
Contracts | | Credit
Contracts | | Equity
Contracts | | Commodity
Contracts | | Total |
| Realized Gain (Loss) on Derivatives Recognized as a Result of Operations: | | | | | | | | | | | |
| Net realized gain (loss) on purchased options contracts | $ (72,770) | | $ — | | $ — | | $ — | | $ — | | $ (72,770) |
| Net realized gain (loss) on futures contracts | 313,073 | | — | | — | | — | | — | | 313,073 |
| Net realized gain (loss) on swap contracts | 941,999 | | — | | 1,979,462 | | — | | — | | 2,921,461 |
| Net realized gain (loss) on bond forward contracts | 3,341,445 | | — | | — | | — | | — | | 3,341,445 |
| Net realized gain (loss) on foreign currency contracts | — | | 329,832 | | — | | — | | — | | 329,832 |
| Total | $ 4,523,747 | | $ 329,832 | | $ 1,979,462 | | $ — | | $ — | | $ 6,833,041 |
| Net Change in Unrealized Appreciation (Depreciation) on Derivatives Recognized as a Result of Operations: | | | | | | | | | | | |
| Net change in unrealized appreciation (depreciation) of futures contracts | $ (96,197) | | $ — | | $ — | | $ — | | $ — | | $ (96,197) |
| Net change in unrealized appreciation (depreciation) of swap contracts | 3,941,407 | | — | | (731,710) | | — | | — | | 3,209,697 |
| Net change in unrealized appreciation (depreciation) of bond forward contracts | 8,249 | | — | | — | | — | | — | | 8,249 |
| Net change in unrealized appreciation (depreciation) of foreign currency contracts | — | | (172,867) | | — | | — | | — | | (172,867) |
| Total | $ 3,853,459 | | $ (172,867) | | $ (731,710) | | $ — | | $ — | | $ 2,948,882 |
For the year ended October 31, 2021, the average monthly amount or number per contract outstanding for each derivative type was as follows:
| Derivative Description | | Average Notional
Par, Contracts
or Face Amount |
| Futures Contracts Number of Long Contracts | | 529 |
| Futures Contracts Number of Short Contracts | | (679) |
| Swap Contracts at Notional Amount | | 214,220,267 |
| Bond Forward Contracts at Notional Amount | | $ 47,574,200 |
| Foreign Currency Contracts Purchased at Contract Amount | | $ 22,871,651 |
| Foreign Currency Contracts Sold at Contract Amount | | $ 48,252,804 |
Hartford Fixed Income Funds
Notes to Financial Statements – (continued)
October 31, 2021
Short Duration Fund
| The Effect of Derivative Instruments on the Statement of Assets and Liabilities as of October 31, 2021: |
| | Risk Exposure Category |
| | Interest Rate
Contracts | | Foreign
Currency
Contracts | | Credit
Contracts | | Equity
Contracts | | Commodity
Contracts | | Total |
| Assets: | | | | | | | | | | | |
| Unrealized appreciation on futures contracts(1) | $ 3,591,965 | | $ — | | $ — | | $ — | | $ — | | $ 3,591,965 |
| Unrealized appreciation on foreign currency contracts | — | | 198,663 | | — | | — | | — | | 198,663 |
| Total | $ 3,591,965 | | $ 198,663 | | $ — | | $ — | | $ — | | $ 3,790,628 |
| Liabilities: | | | | | | | | | | | |
| Unrealized depreciation on futures contracts(1) | $ 1,382,498 | | $ — | | $ — | | $ — | | $ — | | $ 1,382,498 |
| Unrealized depreciation on foreign currency contracts | — | | 22,259 | | — | | — | | — | | 22,259 |
| Total | $ 1,382,498 | | $ 22,259 | | $ — | | $ — | | $ — | | $ 1,404,757 |
| (1) | Amount represents the cumulative appreciation and depreciation on futures contracts as disclosed within the Schedule of Investments under the open “Futures Contracts” section. Only current day’s variation margin, if any, is reported within the Statement of Assets and Liabilities. |
| The Effect of Derivative Instruments on the Statement of Operations for the year ended October 31, 2021: |
| | Risk Exposure Category |
| | Interest Rate
Contracts | | Foreign
Currency
Contracts | | Credit
Contracts | | Equity
Contracts | | Commodity
Contracts | | Total |
| Realized Gain (Loss) on Derivatives Recognized as a Result of Operations: | | | | | | | | | | | |
| Net realized gain (loss) on futures contracts | $ 2,228,534 | | $ — | | $ — | | $ — | | $ — | | $ 2,228,534 |
| Net realized gain (loss) on foreign currency contracts | — | | 1,471,421 | | — | | — | | — | | 1,471,421 |
| Total | $ 2,228,534 | | $ 1,471,421 | | $ — | | $ — | | $ — | | $ 3,699,955 |
| Net Change in Unrealized Appreciation (Depreciation) on Derivatives Recognized as a Result of Operations: | | | | | | | | | | | |
| Net change in unrealized appreciation (depreciation) of futures contracts | $ 1,730,144 | | $ — | | $ — | | $ — | | $ — | | $ 1,730,144 |
| Net change in unrealized appreciation (depreciation) of foreign currency contracts | — | | (287,301) | | — | | — | | — | | (287,301) |
| Total | $ 1,730,144 | | $ (287,301) | | $ — | | $ — | | $ — | | $ 1,442,843 |
For the year ended October 31, 2021, the average monthly amount or number per contract outstanding for each derivative type was as follows:
| Derivative Description | | Average Notional
Par, Contracts
or Face Amount |
| Futures Contracts Number of Long Contracts | | 1,490 |
| Futures Contracts Number of Short Contracts | | (1,851) |
| Foreign Currency Contracts Purchased at Contract Amount | | $ 2,664,618 |
| Foreign Currency Contracts Sold at Contract Amount | | $ 45,700,772 |
Hartford Fixed Income Funds
Notes to Financial Statements – (continued)
October 31, 2021
Strategic Income Fund
| The Effect of Derivative Instruments on the Statement of Assets and Liabilities as of October 31, 2021: |
| | Risk Exposure Category |
| | Interest Rate
Contracts | | Foreign
Currency
Contracts | | Credit
Contracts | | Equity
Contracts | | Commodity
Contracts | | Total |
| Assets: | | | | | | | | | | | |
| Investments in securities, at value (purchased options), market value | $ 493,880 | | $ — | | $ — | | $ — | | $ — | | $ 493,880 |
| Unrealized appreciation on futures contracts(1) | 5,589,299 | | — | | — | | — | | — | | 5,589,299 |
| Unrealized appreciation on foreign currency contracts | — | | 10,018,661 | | — | | — | | — | | 10,018,661 |
| Unrealized appreciation on swap contracts(2) | 48,512 | | — | | 861,857 | | — | | — | | 910,369 |
| Total | $ 6,131,691 | | $ 10,018,661 | | $ 861,857 | | $ — | | $ — | | $ 17,012,209 |
| Liabilities: | | | | | | | | | | | |
| Unrealized depreciation on futures contracts(1) | $ 5,749,828 | | $ — | | $ — | | $ — | | $ — | | $ 5,749,828 |
| Unrealized depreciation on foreign currency contracts | — | | 1,507,862 | | — | | — | | — | | 1,507,862 |
| Written options, market value | 875,883 | | — | | — | | — | | — | | 875,883 |
| Unrealized depreciation on swap contracts(2) | 4,041,026 | | — | | 771,931 | | — | | — | | 4,812,957 |
| Total | $ 10,666,737 | | $ 1,507,862 | | $ 771,931 | | $ — | | $ — | | $ 12,946,530 |
| (1) | Amount represents the cumulative appreciation and depreciation on futures contracts as disclosed within the Schedule of Investments under the open “Futures Contracts” section. Only current day’s variation margin, if any, is reported within the Statement of Assets and Liabilities. |
| (2) | Amount represents the cumulative appreciation and depreciation on centrally cleared swaps, if applicable, as disclosed within the Schedule of Investments. Only the current day’s variation margin, if any, are reported within the Statements of Assets and Liabilities. OTC swaps are reported within the Statement of Assets and Liabilities within Unrealized appreciation and depreciation on OTC swap contracts, if applicable. |
| The Effect of Derivative Instruments on the Statement of Operations for the year ended October 31, 2021: |
| | Risk Exposure Category |
| | Interest Rate
Contracts | | Foreign
Currency
Contracts | | Credit
Contracts | | Equity
Contracts | | Commodity
Contracts | | Total |
| Realized Gain (Loss) on Derivatives Recognized as a Result of Operations: | | | | | | | | | | | |
| Net realized gain (loss) on purchased options contracts | $ (152,429) | | $ — | | $ — | | $ — | | $ — | | $ (152,429) |
| Net realized gain (loss) on futures contracts | (17,998,688) | | — | | — | | — | | — | | (17,998,688) |
| Net realized gain (loss) on written options contracts | 16,581,835 | | — | | — | | — | | — | | 16,581,835 |
| Net realized gain (loss) on swap contracts | 1,722,208 | | — | | (3,946,493) | | — | | — | | (2,224,285) |
| Net realized gain (loss) on foreign currency contracts | — | | 8,992,117 | | — | | — | | — | | 8,992,117 |
| Total | $ 152,926 | | $ 8,992,117 | | $ (3,946,493) | | $ — | | $ — | | $ 5,198,550 |
| Net Change in Unrealized Appreciation (Depreciation) on Derivatives Recognized as a Result of Operations: | | | | | | | | | | | |
| Net change in unrealized appreciation (depreciation) of investments in purchased options contracts | $ (1,657,262) | | $ — | | $ — | | $ — | | $ — | | $ (1,657,262) |
| Net change in unrealized appreciation (depreciation) of futures contracts | 2,780,460 | | — | | — | | — | | — | | 2,780,460 |
| Net change in unrealized appreciation (depreciation) of written options contracts | 850,429 | | — | | — | | — | | — | | 850,429 |
| Net change in unrealized appreciation (depreciation) of swap contracts | (4,488,364) | | — | | 3,813,031 | | — | | — | | (675,333) |
| Net change in unrealized appreciation (depreciation) of foreign currency contracts | — | | 5,968,776 | | — | | — | | — | | 5,968,776 |
| Total | $ (2,514,737) | | $ 5,968,776 | | $ 3,813,031 | | $ — | | $ — | | $ 7,267,070 |
Hartford Fixed Income Funds
Notes to Financial Statements – (continued)
October 31, 2021
Strategic Income Fund – (continued)
For the year ended October 31, 2021, the average monthly amount or number per contract outstanding for each derivative type was as follows:
| Derivative Description | | Average Notional
Par, Contracts
or Face Amount |
| Purchased Options at Notional Amount | | $ 88,510,000 |
| Futures Contracts Number of Long Contracts | | 3,444 |
| Futures Contracts Number of Short Contracts | | (1,931) |
| Written Options at Notional Amount | | $ (192,218,667) |
| Swap Contracts at Notional Amount | | 3,004,969,890 |
| Foreign Currency Contracts Purchased at Contract Amount | | $ 29,628,210 |
| Foreign Currency Contracts Sold at Contract Amount | | $ 523,740,982 |
Total Return Bond Fund
| The Effect of Derivative Instruments on the Statement of Assets and Liabilities as of October 31, 2021: |
| | Risk Exposure Category |
| | Interest Rate
Contracts | | Foreign
Currency
Contracts | | Credit
Contracts | | Equity
Contracts | | Commodity
Contracts | | Total |
| Assets: | | | | | | | | | | | |
| Investments in securities, at value (purchased options), market value | $ 802,343 | | $ — | | $ — | | $ — | | $ — | | $ 802,343 |
| Unrealized appreciation on futures contracts(1) | 9,577,423 | | — | | — | | — | | — | | 9,577,423 |
| Unrealized appreciation on foreign currency contracts | — | | 3,661,598 | | — | | — | | — | | 3,661,598 |
| Unrealized appreciation on swap contracts(2) | — | | — | | 106,101 | | — | | — | | 106,101 |
| Total | $ 10,379,766 | | $ 3,661,598 | | $ 106,101 | | $ — | | $ — | | $ 14,147,465 |
| Liabilities: | | | | | | | | | | | |
| Unrealized depreciation on futures contracts(1) | $ 1,856,242 | | $ — | | $ — | | $ — | | $ — | | $ 1,856,242 |
| Unrealized depreciation on foreign currency contracts | — | | 347,820 | | — | | — | | — | | 347,820 |
| Written options, market value | 1,422,948 | | — | | — | | — | | — | | 1,422,948 |
| Unrealized depreciation on swap contracts(2) | 228,515 | | — | | 1,636,437 | | — | | — | | 1,864,952 |
| Total | $ 3,507,705 | | $ 347,820 | | $ 1,636,437 | | $ — | | $ — | | $ 5,491,962 |
| (1) | Amount represents the cumulative appreciation and depreciation on futures contracts as disclosed within the Schedule of Investments under the open “Futures Contracts” section. Only current day’s variation margin, if any, is reported within the Statement of Assets and Liabilities. |
| (2) | Amount represents the cumulative appreciation and depreciation on centrally cleared swaps, if applicable, as disclosed within the Schedule of Investments. Only the current day’s variation margin, if any, are reported within the Statements of Assets and Liabilities. OTC swaps are reported within the Statement of Assets and Liabilities within Unrealized appreciation and depreciation on OTC swap contracts, if applicable. |
Hartford Fixed Income Funds
Notes to Financial Statements – (continued)
October 31, 2021
Total Return Bond Fund – (continued)
| The Effect of Derivative Instruments on the Statement of Operations for the year ended October 31, 2021: |
| | Risk Exposure Category |
| | Interest Rate
Contracts | | Foreign
Currency
Contracts | | Credit
Contracts | | Equity
Contracts | | Commodity
Contracts | | Total |
| Realized Gain (Loss) on Derivatives Recognized as a Result of Operations: | | | | | | | | | | | |
| Net realized gain (loss) on futures contracts | $ 4,678,719 | | $ — | | $ — | | $ — | | $ — | | $ 4,678,719 |
| Net realized gain (loss) on written options contracts | 6,828,864 | | — | | — | | — | | — | | 6,828,864 |
| Net realized gain (loss) on swap contracts | 2,329,082 | | — | | 802,432 | | — | | — | | 3,131,514 |
| Net realized gain (loss) on foreign currency contracts | — | | 4,633,823 | | — | | — | | — | | 4,633,823 |
| Total | $ 13,836,665 | | $ 4,633,823 | | $ 802,432 | | $ — | | $ — | | $ 19,272,920 |
| Net Change in Unrealized Appreciation (Depreciation) on Derivatives Recognized as a Result of Operations: | | | | | | | | | | | |
| Net change in unrealized appreciation (depreciation) of investments in purchased options contracts | $ (2,682,648) | | $ — | | $ — | | $ — | | $ — | | $ (2,682,648) |
| Net change in unrealized appreciation (depreciation) of futures contracts | 7,091,629 | | — | | — | | — | | — | | 7,091,629 |
| Net change in unrealized appreciation (depreciation) of written options contracts | 839,617 | | — | | 516,850 | | — | | — | | 1,356,467 |
| Net change in unrealized appreciation (depreciation) of swap contracts | (2,926,342) | | — | | 3,079,578 | | — | | — | | 153,236 |
| Net change in unrealized appreciation (depreciation) of foreign currency contracts | — | | 2,728,568 | | — | | — | | — | | 2,728,568 |
| Total | $ 2,322,256 | | $ 2,728,568 | | $ 3,596,428 | | $ — | | $ — | | $ 8,647,252 |
For the year ended October 31, 2021, the average monthly amount or number per contract outstanding for each derivative type was as follows:
| Derivative Description | | Average Notional
Par, Contracts
or Face Amount |
| Purchased Options at Notional Amount | | $ 150,349,333 |
| Futures Contracts Number of Long Contracts | | 1,311 |
| Futures Contracts Number of Short Contracts | | (4,305) |
| Written Options at Notional Amount | | $ (427,459,333) |
| Swap Contracts at Notional Amount | | 4,759,980,758 |
| Foreign Currency Contracts Purchased at Contract Amount | | $ 4,090,342 |
| Foreign Currency Contracts Sold at Contract Amount | | $ 130,379,070 |
Hartford Fixed Income Funds
Notes to Financial Statements – (continued)
October 31, 2021
World Bond Fund
| The Effect of Derivative Instruments on the Statement of Assets and Liabilities as of October 31, 2021: |
| | Risk Exposure Category |
| | Interest Rate
Contracts | | Foreign
Currency
Contracts | | Credit
Contracts | | Equity
Contracts | | Commodity
Contracts | | Total |
| Assets: | | | | | | | | | | | |
| Investments in securities, at value (purchased options), market value | $ — | | $ 226,889 | | $ — | | $ — | | $ — | | $ 226,889 |
| Unrealized appreciation on futures contracts(1) | 13,527,648 | | — | | — | | — | | — | | 13,527,648 |
| Unrealized appreciation on foreign currency contracts | — | | 46,128,803 | | — | | — | | — | | 46,128,803 |
| Unrealized appreciation on swap contracts(2) | 6,417,587 | | — | | 633,435 | | — | | — | | 7,051,022 |
| Total | $ 19,945,235 | | $ 46,355,692 | | $ 633,435 | | $ — | | $ — | | $ 66,934,362 |
| Liabilities: | | | | | | | | | | | |
| Unrealized depreciation on futures contracts(1) | $ 11,896,697 | | $ — | | $ — | | $ — | | $ — | | $ 11,896,697 |
| Unrealized depreciation on foreign currency contracts | — | | 70,729,865 | | — | | — | | — | | 70,729,865 |
| Unrealized depreciation on swap contracts(2) | 14,108,577 | | — | | 3,325,172 | | — | | — | | 17,433,749 |
| Total | $ 26,005,274 | | $ 70,729,865 | | $ 3,325,172 | | $ — | | $ — | | $ 100,060,311 |
| (1) | Amount represents the cumulative appreciation and depreciation on futures contracts as disclosed within the Schedule of Investments under the open “Futures Contracts” section. Only current day’s variation margin, if any, is reported within the Statement of Assets and Liabilities. |
| (2) | Amount represents the cumulative appreciation and depreciation on centrally cleared swaps, if applicable, as disclosed within the Schedule of Investments. Only the current day’s variation margin, if any, are reported within the Statements of Assets and Liabilities. OTC swaps are reported within the Statement of Assets and Liabilities within Unrealized appreciation and depreciation on OTC swap contracts, if applicable. |
| The Effect of Derivative Instruments on the Statement of Operations for the year ended October 31, 2021: |
| | Risk Exposure Category |
| | Interest Rate
Contracts | | Foreign
Currency
Contracts | | Credit
Contracts | | Equity
Contracts | | Commodity
Contracts | | Total |
| Realized Gain (Loss) on Derivatives Recognized as a Result of Operations: | | | | | | | | | | | |
| Net realized gain (loss) on purchased options contracts | $ (19,002,049) | | $ 5,798,355 | | $ — | | $ — | | $ — | | $ (13,203,694) |
| Net realized gain (loss) on futures contracts | 25,502,106 | | — | | — | | — | | — | | 25,502,106 |
| Net realized gain (loss) on written options contracts | 6,475,304 | | (1,712,023) | | — | | — | | — | | 4,763,281 |
| Net realized gain (loss) on swap contracts | 1,505,612 | | — | | (16,968,552) | | — | | — | | (15,462,940) |
| Net realized gain (loss) on foreign currency contracts | — | | 1,114,263 | | — | | — | | — | | 1,114,263 |
| Total | $ 14,480,973 | | $ 5,200,595 | | $ (16,968,552) | | $ — | | $ — | | $ 2,713,016 |
| Net Change in Unrealized Appreciation (Depreciation) on Derivatives Recognized as a Result of Operations: | | | | | | | | | | | |
| Net change in unrealized appreciation (depreciation) of investments in purchased options contracts | $ (96,682) | | $ 1,507,801 | | $ — | | $ 686,284 | | $ — | | $ 2,097,403 |
| Net change in unrealized appreciation (depreciation) of futures contracts | 264,012 | | — | | — | | — | | — | | 264,012 |
| Net change in unrealized appreciation (depreciation) of written options contracts | (315,685) | | (1,375,356) | | — | | — | | — | | (1,691,041) |
| Net change in unrealized appreciation (depreciation) of swap contracts | (6,025,865) | | — | | (4,407,574) | | — | | — | | (10,433,439) |
| Net change in unrealized appreciation (depreciation) of foreign currency contracts | — | | (1,571,047) | | — | | — | | — | | (1,571,047) |
| Total | $ (6,174,220) | | $ (1,438,602) | | $ (4,407,574) | | $ 686,284 | | $ — | | $ (11,334,112) |
Hartford Fixed Income Funds
Notes to Financial Statements – (continued)
October 31, 2021
World Bond Fund – (continued)
For the year ended October 31, 2021, the average monthly amount or number per contract outstanding for each derivative type was as follows:
| Derivative Description | | Average Notional
Par, Contracts
or Face Amount |
| Purchased Options at Notional Amount | | $ 259,817,016 |
| Futures Contracts Number of Long Contracts | | 3,091 |
| Futures Contracts Number of Short Contracts | | (8,073) |
| Written Options at Notional Amount | | $ (27,238,411) |
| Swap Contracts at Notional Amount | | 67,150,288,845 |
| Foreign Currency Contracts Purchased at Contract Amount | | $ 3,672,118,613 |
| Foreign Currency Contracts Sold at Contract Amount | | $ 6,220,134,612 |
| g) | Balance Sheet Offsetting Information – Set forth below are tables which disclose both gross information and net information about instruments and transactions eligible for offset in the financial statements, and instruments and transactions that are subject to a master netting arrangement, as well as amounts related to margin, reflected as financial collateral (including cash collateral), held at clearing brokers, counterparties and a Fund's custodian. The master netting arrangements allow the clearing brokers to net any collateral held in or on behalf of a Fund, or liabilities or payment obligations of the clearing brokers to a Fund, against any liabilities or payment obligations of a Fund to the clearing brokers. A Fund is required to deposit financial collateral (including cash collateral) at the Fund's custodian on behalf of clearing brokers and counterparties to continually meet the original and maintenance requirements established by the clearing brokers and counterparties. Such requirements are specific to the respective clearing broker or counterparty. Certain master netting arrangements may not be enforceable in a bankruptcy. |
| | The following tables present a Fund's derivative assets and liabilities, presented on a gross basis as no amounts are netted within the Statements of Assets and Liabilities, by counterparty net of amounts available for offset under a master netting agreement or similar agreement ("MNA") and net of the related collateral received/pledged by a Fund as of October 31, 2021: |
| | |
| Emerging Markets Local Debt Fund | | | | |
| Derivative Financial Instruments: | | Assets | | Liabilities |
| Foreign currency contracts | | $ 717,595 | | $ (1,530,838) |
| Futures contracts | | 146,488 | | (8,159) |
| Purchased options | | 291,537 | | — |
| Swap contracts | | 537,816 | | (582,643) |
| Written options | | — | | (161,139) |
| Total gross amount of derivative assets and liabilities in the Statement of Assets and Liabilities | | 1,693,436 | | (2,282,779) |
| Derivatives not subject to a MNA | | (545,529) | | 420,048 |
| Total gross amount of assets and liabilities subject to MNA or similar agreements | | $ 1,147,907 | | $ (1,862,731) |
| Counterparty | | Gross Amount
of Assets | | Financial
Instruments
and Derivatives
Available
for Offset | | Non-cash
Collateral
Received* | | Cash
Collateral
Received* | | Net Amount
of Assets |
| Bank of America Securities LLC | | $ 46,078 | | $ (46,078) | | $ — | | $ — | | $ — |
| Barclays | | 183,678 | | (55,807) | | — | | — | | 127,871 |
| BNP Paribas Securities Services | | 82,420 | | (82,420) | | — | | — | | — |
| Citibank NA | | 166,304 | | (166,304) | | — | | — | | — |
| Commonwealth Bank of Australia | | 76 | | — | | — | | — | | 76 |
| Deutsche Bank Securities, Inc. | | 135,826 | | (135,826) | | — | | — | | — |
| Goldman Sachs & Co. | | 273,125 | | (273,125) | | — | | — | | — |
| JP Morgan Chase & Co. | | 15,242 | | (5,025) | | — | | — | | 10,217 |
| Morgan Stanley | | 238,963 | | (238,963) | | — | | — | | — |
| NatWest Markets Plc | | 368 | | (368) | | — | | — | | — |
| Standard Chartered Bank | | 4,098 | | (4,098) | | — | | — | | — |
| State Street Global Markets LLC | | 110 | | (110) | | — | | — | | — |
| UBS AG | | 1,619 | | (1,619) | | — | | — | | — |
| Total | | $ 1,147,907 | | $ (1,009,743) | | $ — | | $ — | | $ 138,164 |
| | | | | | | | | | | |
| | | | | | | | | | | |
Hartford Fixed Income Funds
Notes to Financial Statements – (continued)
October 31, 2021
| Counterparty | | Gross Amount
of Liabilities | | Financial
Instruments
and Derivatives
Available
for Offset | | Non-cash
Collateral
Pledged* | | Cash
Collateral
Pledged* | | Net Amount
of Liabilities |
| Bank of America Securities LLC | | $ (55,131) | | $ 46,078 | | $ — | | $ — | | $ (9,053) |
| Barclays | | (55,807) | | 55,807 | | — | | — | | — |
| BNP Paribas Securities Services | | (461,022) | | 82,420 | | — | | — | | (378,602) |
| Citibank NA | | (327,215) | | 166,304 | | — | | — | | (160,911) |
| Credit Suisse International | | (4,207) | | — | | — | | — | | (4,207) |
| Deutsche Bank Securities, Inc. | | (192,410) | | 135,826 | | — | | 56,584 | | — |
| Goldman Sachs & Co. | | (376,370) | | 273,125 | | — | | — | | (103,245) |
| JP Morgan Chase & Co. | | (5,025) | | 5,025 | | — | | — | | — |
| Morgan Stanley | | (329,303) | | 238,963 | | — | | 90,340 | | — |
| NatWest Markets Plc | | (14,613) | | 368 | | — | | — | | (14,245) |
| Standard Chartered Bank | | (30,995) | | 4,098 | | — | | — | | (26,897) |
| State Street Global Markets LLC | | (1,636) | | 110 | | — | | — | | (1,526) |
| UBS AG | | (7,535) | | 1,619 | | — | | — | | (5,916) |
| Westpac International | | (1,462) | | — | | — | | — | | (1,462) |
| Total | | $ (1,862,731) | | $ 1,009,743 | | $ — | | $ 146,924 | | $ (706,064) |
| * | In some instances, the actual collateral received and/or pledged may be more than the amount shown. |
| Floating Rate Fund | | | | |
| Derivative Financial Instruments: | | Assets | | Liabilities |
| Foreign currency contracts | | $ 1,188,028 | | $ (5,843) |
| Swap contracts | | 486,728 | | — |
| Total gross amount of derivative assets and liabilities in the Statement of Assets and Liabilities | | 1,674,756 | | (5,843) |
| Derivatives not subject to a MNA | | — | | — |
| Total gross amount of assets and liabilities subject to MNA or similar agreements | | $ 1,674,756 | | $ (5,843) |
| Counterparty | | Gross Amount
of Assets | | Financial
Instruments
and Derivatives
Available
for Offset | | Non-cash
Collateral
Received* | | Cash
Collateral
Received* | | Net Amount
of Assets |
| Deutsche Bank Securities, Inc. | | $ 1,188,028 | | $ — | | $ — | | $ — | | $ 1,188,028 |
| Morgan Stanley | | 486,728 | | — | | — | | (280,000) | | 206,728 |
| Total | | $ 1,674,756 | | $ — | | $ — | | $ (280,000) | | $ 1,394,756 |
| | | | | | | | | | | |
| | | | | | | | | | | |
| Counterparty | | Gross Amount
of Liabilities | | Financial
Instruments
and Derivatives
Available
for Offset | | Non-cash
Collateral
Pledged* | | Cash
Collateral
Pledged* | | Net Amount
of Liabilities |
| Westpac International | | $ (5,843) | | $ — | | $ — | | $ — | | $ (5,843) |
| Total | | $ (5,843) | | $ — | | $ — | | $ — | | $ (5,843) |
| * | In some instances, the actual collateral received and/or pledged may be more than the amount shown. |
| Floating Rate High Income Fund | | | | |
| Derivative Financial Instruments: | | Assets | | Liabilities |
| Foreign currency contracts | | $ 241,560 | | $ (2,394) |
| Swap contracts | | 98,226 | | — |
| Total gross amount of derivative assets and liabilities in the Statement of Assets and Liabilities | | 339,786 | | (2,394) |
| Derivatives not subject to a MNA | | — | | — |
| Total gross amount of assets and liabilities subject to MNA or similar agreements | | $ 339,786 | | $ (2,394) |
Hartford Fixed Income Funds
Notes to Financial Statements – (continued)
October 31, 2021
| Counterparty | | Gross Amount
of Assets | | Financial
Instruments
and Derivatives
Available
for Offset | | Non-cash
Collateral
Received* | | Cash
Collateral
Received* | | Net Amount
of Assets |
| Deutsche Bank Securities, Inc. | | $ 241,560 | | $ — | | $ — | | $ — | | $ 241,560 |
| Morgan Stanley | | 98,226 | | — | | — | | (80,000) | | 18,226 |
| Total | | $ 339,786 | | $ — | | $ — | | $ (80,000) | | $ 259,786 |
| | | | | | | | | | | |
| | | | | | | | | | | |
| Counterparty | | Gross Amount
of Liabilities | | Financial
Instruments
and Derivatives
Available
for Offset | | Non-cash
Collateral
Pledged* | | Cash
Collateral
Pledged* | | Net Amount
of Liabilities |
| Westpac International | | $ (2,394) | | $ — | | $ — | | $ — | | $ (2,394) |
| Total | | $ (2,394) | | $ — | | $ — | | $ — | | $ (2,394) |
| * | In some instances, the actual collateral received and/or pledged may be more than the amount shown. |
| High Yield Fund | | | | |
| Derivative Financial Instruments: | | Assets | | Liabilities |
| Foreign currency contracts | | $ 134,834 | | $ — |
| Total gross amount of derivative assets and liabilities in the Statement of Assets and Liabilities | | 134,834 | | — |
| Derivatives not subject to a MNA | | — | | — |
| Total gross amount of assets and liabilities subject to MNA or similar agreements | | $ 134,834 | | $ — |
| Counterparty | | Gross Amount
of Assets | | Financial
Instruments
and Derivatives
Available
for Offset | | Non-cash
Collateral
Received* | | Cash
Collateral
Received* | | Net Amount
of Assets |
| Deutsche Bank Securities, Inc. | | $ 134,834 | | $ — | | $ — | | $ — | | $ 134,834 |
| Total | | $ 134,834 | | $ — | | $ — | | $ — | | $ 134,834 |
| | | | | | | | | | | |
| | | | | | | | | | | |
| * | In some instances, the actual collateral received and/or pledged may be more than the amount shown. |
| Inflation Plus Fund | | | | |
| Derivative Financial Instruments: | | Assets | | Liabilities |
| Bond forward contracts | | — | | (212,059) |
| Foreign currency contracts | | $ 450,721 | | $ (215,241) |
| Futures contracts | | 1,084,642 | | (1,255,062) |
| Swap contracts | | 3,564,916 | | (683,278) |
| Total gross amount of derivative assets and liabilities in the Statement of Assets and Liabilities | | 5,100,279 | | (2,365,640) |
| Derivatives not subject to a MNA | | (1,084,750) | | 1,926,957 |
| Total gross amount of assets and liabilities subject to MNA or similar agreements | | $ 4,015,529 | | $ (438,683) |
Hartford Fixed Income Funds
Notes to Financial Statements – (continued)
October 31, 2021
| Counterparty | | Gross Amount
of Assets | | Financial
Instruments
and Derivatives
Available
for Offset | | Non-cash
Collateral
Received* | | Cash
Collateral
Received* | | Net Amount
of Assets |
| Bank of America Securities LLC | | $ 1,492,489 | | $ (7,431) | | $ — | | $ — | | $ 1,485,058 |
| Barclays | | 964,854 | | (29,589) | | — | | (811,000) | | 124,265 |
| BNP Paribas Securities Services | | 376 | | — | | — | | — | | 376 |
| Citibank NA | | 1,465,392 | | (178,878) | | — | | (1,286,514) | | — |
| Deutsche Bank Securities, Inc. | | 81,537 | | — | | — | | — | | 81,537 |
| Morgan Stanley | | 4,730 | | (4,730) | | — | | — | | — |
| Toronto-Dominion Bank | | 6,151 | | — | | — | | — | | 6,151 |
| Total | | $ 4,015,529 | | $ (220,628) | | $ — | | $ (2,097,514) | | $ 1,697,387 |
| | | | | | | | | | | |
| | | | | | | | | | | |
| Counterparty | | Gross Amount
of Liabilities | | Financial
Instruments
and Derivatives
Available
for Offset | | Non-cash
Collateral
Pledged* | | Cash
Collateral
Pledged* | | Net Amount
of Liabilities |
| Bank of America Securities LLC | | $ (7,431) | | $ 7,431 | | $ — | | $ — | | $ — |
| Barclays | | (29,589) | | 29,589 | | — | | — | | — |
| Citibank NA | | (178,878) | | 178,878 | | — | | — | | — |
| Goldman Sachs & Co. | | (91,383) | | — | | — | | — | | (91,383) |
| Morgan Stanley | | (131,402) | | 4,730 | | — | | — | | (126,672) |
| Total | | $ (438,683) | | $ 220,628 | | $ — | | $ — | | $ (218,055) |
| * | In some instances, the actual collateral received and/or pledged may be more than the amount shown. |
| Short Duration Fund | | | | |
| Derivative Financial Instruments: | | Assets | | Liabilities |
| Foreign currency contracts | | $ 198,663 | | $ (22,259) |
| Futures contracts | | 3,591,965 | | (1,382,498) |
| Total gross amount of derivative assets and liabilities in the Statement of Assets and Liabilities | | 3,790,628 | | (1,404,757) |
| Derivatives not subject to a MNA | | (3,591,965) | | 1,382,498 |
| Total gross amount of assets and liabilities subject to MNA or similar agreements | | $ 198,663 | | $ (22,259) |
| Counterparty | | Gross Amount
of Assets | | Financial
Instruments
and Derivatives
Available
for Offset | | Non-cash
Collateral
Received* | | Cash
Collateral
Received* | | Net Amount
of Assets |
| Barclays | | $ 13,440 | | $ — | | $ — | | $ — | | $ 13,440 |
| Deutsche Bank Securities, Inc. | | 163,331 | | — | | — | | — | | 163,331 |
| UBS AG | | 21,892 | | (21,892) | | — | | — | | — |
| Total | | $ 198,663 | | $ (21,892) | | $ — | | $ — | | $ 176,771 |
| | | | | | | | | | | |
| | | | | | | | | | | |
| Counterparty | | Gross Amount
of Liabilities | | Financial
Instruments
and Derivatives
Available
for Offset | | Non-cash
Collateral
Pledged* | | Cash
Collateral
Pledged* | | Net Amount
of Liabilities |
| UBS AG | | $ (22,259) | | $ 21,892 | | $ — | | $ — | | $ (367) |
| Total | | $ (22,259) | | $ 21,892 | | $ — | | $ — | | $ (367) |
| * | In some instances, the actual collateral received and/or pledged may be more than the amount shown. |
Hartford Fixed Income Funds
Notes to Financial Statements – (continued)
October 31, 2021
| Strategic Income Fund | | | | |
| Derivative Financial Instruments: | | Assets | | Liabilities |
| Foreign currency contracts | | $ 10,018,661 | | $ (1,507,862) |
| Futures contracts | | 5,589,299 | | (5,749,828) |
| Purchased options | | 493,880 | | — |
| Swap contracts | | 910,369 | | (4,812,957) |
| Written options | | — | | (875,883) |
| Total gross amount of derivative assets and liabilities in the Statement of Assets and Liabilities | | 17,012,209 | | (12,946,530) |
| Derivatives not subject to a MNA | | (5,977,071) | | 5,753,932 |
| Total gross amount of assets and liabilities subject to MNA or similar agreements | | $ 11,035,138 | | $ (7,192,598) |
| Counterparty | | Gross Amount
of Assets | | Financial
Instruments
and Derivatives
Available
for Offset | | Non-cash
Collateral
Received* | | Cash
Collateral
Received* | | Net Amount
of Assets |
| Bank of America Securities LLC | | $ 2,391,750 | | $ (988,105) | | $ — | | $ — | | $ 1,403,645 |
| Barclays | | 3,448,447 | | (3,252,088) | | — | | — | | 196,359 |
| BNP Paribas Securities Services | | 216,203 | | (33,816) | | — | | — | | 182,387 |
| Canadian Imperial Bank of Commerce | | 20,582 | | (20,582) | | — | | — | | — |
| Citibank NA | | 66,809 | | (42,467) | | — | | — | | 24,342 |
| Commonwealth Bank | | 961 | | — | | — | | — | | 961 |
| Deutsche Bank Securities, Inc. | | 767,050 | | (245,636) | | — | | — | | 521,414 |
| Goldman Sachs & Co. | | 1,545,342 | | (763,191) | | — | | — | | 782,151 |
| JP Morgan Chase & Co. | | 946,996 | | (50,426) | | — | | — | | 896,570 |
| Morgan Stanley | | 1,590,456 | | (1,165,701) | | — | | (49,000) | | 375,755 |
| State Street Global Markets LLC | | 942 | | (942) | | — | | — | | — |
| UBS AG | | 5,488 | | (5,488) | | — | | — | | — |
| Westpac International | | 34,112 | | (34,112) | | — | | — | | — |
| Total | | $ 11,035,138 | | $ (6,602,554) | | $ — | | $ (49,000) | | $ 4,383,584 |
| | | | | | | | | | | |
| | | | | | | | | | | |
| Counterparty | | Gross Amount
of Liabilities | | Financial
Instruments
and Derivatives
Available
for Offset | | Non-cash
Collateral
Pledged* | | Cash
Collateral
Pledged* | | Net Amount
of Liabilities |
| Bank of America Securities LLC | | $ (988,105) | | $ 988,105 | | $ — | | $ — | | $ — |
| Barclays | | (3,252,088) | | 3,252,088 | | — | | — | | — |
| BNP Paribas Securities Services | | (33,816) | | 33,816 | | — | | — | | — |
| Canadian Imperial Bank of Commerce | | (22,242) | | 20,582 | | — | | — | | (1,660) |
| Citibank NA | | (42,467) | | 42,467 | | — | | — | | — |
| Credit Suisse First Boston Corp. | | (466,567) | | — | | — | | — | | (466,567) |
| Deutsche Bank Securities, Inc. | | (245,636) | | 245,636 | | — | | — | | — |
| Goldman Sachs & Co. | | (763,191) | | 763,191 | | — | | — | | — |
| JP Morgan Chase & Co. | | (50,426) | | 50,426 | | — | | — | | — |
| Morgan Stanley | | (1,165,701) | | 1,165,701 | | — | | — | | — |
| RBC Dominion Securities, Inc. | | (21,424) | | — | | — | | — | | (21,424) |
| State Street Global Markets LLC | | (38,105) | | 942 | | — | | — | | (37,163) |
| UBS AG | | (16,930) | | 5,488 | | — | | — | | (11,442) |
| Westpac International | | (85,900) | | 34,112 | | — | | — | | (51,788) |
| Total | | $ (7,192,598) | | $ 6,602,554 | | $ — | | $ — | | $ (590,044) |
| * | In some instances, the actual collateral received and/or pledged may be more than the amount shown. |
Hartford Fixed Income Funds
Notes to Financial Statements – (continued)
October 31, 2021
| Total Return Bond Fund | | | | |
| Derivative Financial Instruments: | | Assets | | Liabilities |
| Foreign currency contracts | | $ 3,661,598 | | $ (347,820) |
| Futures contracts | | 9,577,423 | | (1,856,242) |
| Purchased options | | 802,343 | | — |
| Swap contracts | | 106,101 | | (1,864,952) |
| Written options | | — | | (1,422,948) |
| Total gross amount of derivative assets and liabilities in the Statement of Assets and Liabilities | | 14,147,465 | | (5,491,962) |
| Derivatives not subject to a MNA | | (9,683,524) | | 2,084,757 |
| Total gross amount of assets and liabilities subject to MNA or similar agreements | | $ 4,463,941 | | $ (3,407,205) |
| Counterparty | | Gross Amount
of Assets | | Financial
Instruments
and Derivatives
Available
for Offset | | Non-cash
Collateral
Received* | | Cash
Collateral
Received* | | Net Amount
of Assets |
| Bank of America Securities LLC | | $ 409,077 | | $ (409,077) | | $ — | | $ — | | $ — |
| Barclays | | 2,800,673 | | (319,837) | | — | | — | | 2,480,836 |
| Citibank NA | | 393,266 | | (393,266) | | — | | — | | — |
| Goldman Sachs & Co. | | 784,225 | | (784,225) | | — | | — | | — |
| Morgan Stanley | | 76,700 | | (76,700) | | — | | — | | — |
| Total | | $ 4,463,941 | | $ (1,983,105) | | $ — | | $ — | | $ 2,480,836 |
| | | | | | | | | | | |
| | | | | | | | | | | |
| Counterparty | | Gross Amount
of Liabilities | | Financial
Instruments
and Derivatives
Available
for Offset | | Non-cash
Collateral
Pledged* | | Cash
Collateral
Pledged* | | Net Amount
of Liabilities |
| Bank of America Securities LLC | | $ (725,499) | | $ 409,077 | | $ 316,422 | | $ — | | $ — |
| Barclays | | (319,837) | | 319,837 | | — | | — | | — |
| Citibank NA | | (697,449) | | 393,266 | | 304,183 | | — | | — |
| Credit Suisse International | | (332,726) | | — | | — | | 205,000 | | (127,726) |
| Goldman Sachs & Co. | | (818,069) | | 784,225 | | 33,844 | | — | | — |
| JP Morgan Chase & Co. | | (18,661) | | — | | — | | — | | (18,661) |
| Morgan Stanley | | (494,964) | | 76,700 | | 418,264 | | — | | — |
| Total | | $ (3,407,205) | | $ 1,983,105 | | $ 1,072,713 | | $ 205,000 | | $ (146,387) |
| * | In some instances, the actual collateral received and/or pledged may be more than the amount shown. |
| World Bond Fund | | | | |
| Derivative Financial Instruments: | | Assets | | Liabilities |
| Foreign currency contracts | | $ 46,128,803 | | $ (70,729,865) |
| Futures contracts | | 13,527,648 | | (11,896,697) |
| Purchased options | | 226,889 | | — |
| Swap contracts | | 7,051,022 | | (17,433,749) |
| Total gross amount of derivative assets and liabilities in the Statement of Assets and Liabilities | | 66,934,362 | | (100,060,311) |
| Derivatives not subject to a MNA | | (18,623,307) | | 26,321,437 |
| Total gross amount of assets and liabilities subject to MNA or similar agreements | | $ 48,311,055 | | $ (73,738,874) |
Hartford Fixed Income Funds
Notes to Financial Statements – (continued)
October 31, 2021
| Counterparty | | Gross Amount
of Assets | | Financial
Instruments
and Derivatives
Available
for Offset | | Non-cash
Collateral
Received* | | Cash
Collateral
Received* | | Net Amount
of Assets |
| Bank of America Securities LLC | | $ 906,485 | | $ (758,997) | | $ — | | $ — | | $ 147,488 |
| Barclays | | 4,135,942 | | (3,502,727) | | — | | — | | 633,215 |
| BNP Paribas Securities Services | | 2,216,772 | | (2,216,772) | | — | | — | | — |
| Canadian Imperial Bank of Commerce | | 4,702 | | — | | — | | — | | 4,702 |
| Citibank NA | | 1,937,671 | | (1,937,671) | | — | | — | | — |
| Credit Agricole | | 137,294 | | — | | — | | — | | 137,294 |
| Deutsche Bank Securities, Inc. | | 863,874 | | (808) | | — | | — | | 863,066 |
| Goldman Sachs & Co. | | 4,797,995 | | (3,332,729) | | (446,864) | | — | | 1,018,402 |
| JP Morgan Chase & Co. | | 11,311,727 | | (2,761,495) | | (592,790) | | — | | 7,957,442 |
| Morgan Stanley | | 20,121,725 | | (20,121,725) | | — | | — | | — |
| Royal Bank of Canada | | 18,360 | | (445) | | — | | — | | 17,915 |
| Standard Chartered Bank | | 100,297 | | (100,297) | | — | | — | | — |
| State Street Global Markets LLC | | 205,222 | | (205,222) | | — | | — | | — |
| Toronto-Dominion Bank | | 196,077 | | (162,866) | | — | | — | | 33,211 |
| UBS AG | | 1,356,912 | | (1,356,912) | | — | | — | | — |
| Total | | $ 48,311,055 | | $ (36,458,666) | | $ (1,039,654) | | $ — | | $ 10,812,735 |
| | | | | | | | | | | |
| | | | | | | | | | | |
| Counterparty | | Gross Amount
of Liabilities | | Financial
Instruments
and Derivatives
Available
for Offset | | Non-cash
Collateral
Pledged* | | Cash
Collateral
Pledged* | | Net Amount
of Liabilities |
| Australia and New Zealand Banking Group | | $ (524,115) | | $ — | | $ — | | $ — | | $ (524,115) |
| Bank of America Securities LLC | | (758,997) | | 758,997 | | — | | — | | — |
| Barclays | | (3,502,727) | | 3,502,727 | | — | | — | | — |
| BNP Paribas Securities Services | | (7,243,249) | | 2,216,772 | | 4,894,478 | | — | | (131,999) |
| Citibank NA | | (5,089,454) | | 1,937,671 | | — | | — | | (3,151,783) |
| Commonwealth Bank of Australia | | (69,979) | | — | | — | | — | | (69,979) |
| Deutsche Bank Securities, Inc. | | (808) | | 808 | | — | | — | | — |
| Goldman Sachs & Co. | | (3,332,729) | | 3,332,729 | | — | | — | | — |
| JP Morgan Chase & Co. | | (2,761,495) | | 2,761,495 | | — | | — | | — |
| Morgan Stanley | | (47,600,849) | | 20,121,725 | | 316,576 | | — | | (27,162,548) |
| Royal Bank of Canada | | (445) | | 445 | | — | | — | | — |
| Standard Chartered Bank | | (278,227) | | 100,297 | | — | | — | | (177,930) |
| State Street Global Markets LLC | | (1,054,535) | | 205,222 | | — | | — | | (849,313) |
| Toronto-Dominion Bank | | (162,866) | | 162,866 | | — | | — | | — |
| UBS AG | | (1,358,399) | | 1,356,912 | | — | | — | | (1,487) |
| Total | | $ (73,738,874) | | $ 36,458,666 | | $ 5,211,054 | | $ — | | $ (32,069,154) |
| * | In some instances, the actual collateral received and/or pledged may be more than the amount shown. |
| 5. | Principal Risks: |
| | A Fund’s investments expose it to various types of risks associated with financial instruments and the markets. A Fund may be exposed to the risks described below. Each Fund’s prospectus provides details of its principal risks. |
| | A widespread health crisis, such as a global pandemic, could cause substantial market volatility, exchange trading suspensions or restrictions and closures of securities exchanges and businesses, impact the ability to complete redemptions, and adversely impact Fund performance. The current ongoing outbreak of COVID-19, a respiratory disease caused by a novel coronavirus, has negatively affected the worldwide economy, created supply chain disruptions and labor shortages, and impacted the financial health of individual companies and the market in significant and unforeseen ways. The future impact of the ongoing COVID-19 pandemic remains unclear. The effects to public health, business and market conditions resulting from COVID-19 pandemic may have a significant negative impact on the performance of a Fund’s investments, including exacerbating other pre-existing political, social and economic risks. |
| | Certain investments held by a Fund expose the Fund to various risks which may include, but are not limited to, interest rate, prepayment, and extension risks. Interest rate risk is the risk that fixed income securities will decline in value because of changes in interest rates. As nominal interest rates rise, the values of certain fixed income securities held by a Fund are likely to decrease. A nominal interest rate can be described as the sum of a real interest rate and an expected inflation rate. Fixed income securities with longer durations tend to be more sensitive to changes in interest rates, usually making them more volatile than securities with shorter durations. Duration is useful primarily as a measure of |
Hartford Fixed Income Funds
Notes to Financial Statements – (continued)
October 31, 2021
| | the sensitivity of a fixed income security’s market price to interest rate (i.e., yield) movements. Senior floating rate interests and securities subject to prepayment and extension risk generally offer less potential for gains when interest rates decline. Rising interest rates may cause prepayments to occur at a slower than expected rate, thereby effectively lengthening the maturity of the security and making the security more sensitive to interest rate changes. Prepayment and extension risk are major risks of mortgage-backed securities, senior floating rate interests and certain asset-backed securities. For certain asset-backed securities, the actual maturity may be less than the stated maturity shown in the Schedule of Investments, if applicable. As a result, the timing of income recognition relating to these securities may vary based upon the actual maturity. |
| | Investing in the securities of non-U.S. issuers, whether directly or indirectly, involves certain considerations and risks not typically associated with securities of U.S. issuers. Such risks include, but are not limited to: generally less liquid and less efficient securities markets; generally greater price volatility; exchange rate fluctuations; imposition of restrictions on the expatriation of funds or other protectionist measures; less publicly available information about issuers; the imposition of withholding or other taxes; higher transaction and custody costs; settlement delays and risk of loss attendant in settlement procedures; difficulties in enforcing contractual obligations; less regulation of securities markets; different accounting, disclosure and reporting requirements; more substantial governmental involvement in the economy; higher inflation rates; and greater social, economic and political uncertainties. Non-U.S. issuers may also be affected by political, social, economic or diplomatic developments in a foreign country or region or the U.S. (including the imposition of sanctions, tariffs, or other governmental restrictions). These risks are heightened for investments in issuers from countries with less developed markets. |
| | Securities lending involves the risk that a Fund may lose money because the borrower of the loaned securities fails to return the securities in a timely manner or at all. A Fund could also lose money in the event of a decline in the value of the collateral provided for the loaned securities or a decline in the value of any investments made with cash collateral. These events could also trigger adverse tax consequences for a Fund that lends its holdings. |
| | Credit risk depends largely on the perceived financial health of bond issuers. In general, the credit rating is inversely related to the credit risk of the issuer. Higher rated bonds generally are deemed to have less credit risk, while lower or unrated bonds are deemed to have higher risk of default. The share price, yield and total return of a fund that holds securities with higher credit risk may be more volatile than those of a fund that holds bonds with lower credit risk. A Fund may be exposed to counterparty risk, or the risk that an institution or other entity with which a Fund has unsettled or open transactions will default. |
| | A Fund may invest in certain debt securities, derivatives or other financial instruments that utilize one or more London Interbank Offered Rates (collectively, “LIBOR”), as a “benchmark” or “reference rate” for various interest rate calculations. The use of certain LIBORs is expected to be phased out by the end of 2021. However, it is possible that certain LIBORs may continue beyond 2021 and the most widely used LIBORs may continue until mid-2023. There remains uncertainty regarding the future use of LIBOR and the nature of any replacement rate. As such, the potential effect of a transition away from LIBOR on a Fund or the LIBOR-based instruments in which the Fund invests cannot yet be determined. The transition process away from LIBOR may involve, among other things, increased volatility or illiquidity in markets for instruments that currently rely on LIBOR. The transition process may also result in a reduction in the value of certain instruments held by a Fund or reduce the effectiveness of related Fund transactions, such as hedges. Volatility, the potential reduction in value, and/or the hedge effectiveness of financial instruments may be heightened for financial instruments that do not include fallback provisions that address the cessation of LIBOR. Any potential effects of the transition away from LIBOR on the Fund or on financial instruments in which a Fund invests, as well as other unforeseen effects, could result in losses to the Fund. Since the usefulness of LIBOR as a benchmark or reference rate could deteriorate during the transition period, these effects could occur prior to and/or subsequent to the end of 2021 with respect to certain LIBORs or mid-2023 for the remaining LIBORs. |
| a) | Each Fund intends to continue to qualify as a Regulated Investment Company ("RIC") under Subchapter M of the Internal Revenue Code (“IRC”) by distributing substantially all of its taxable net investment income and net realized capital gains to its shareholders each year. Each Fund has distributed substantially all of its income and capital gains in prior years, if applicable, and intends to distribute substantially all of its income and capital gains during the calendar year ending December 31, 2021. Accordingly, no provision for federal income or excise taxes has been made in the accompanying financial statements. Distributions from short-term capital gains are treated as ordinary income distributions for federal income tax purposes. |
| b) | Net Investment Income (Loss), Net Realized Gains (Losses) and Distributions – Net investment income (loss) and net realized gains (losses) may differ for financial statement and tax purposes primarily because of losses deferred due to wash sale adjustments, foreign currency gains and losses, adjustments related to RICs and certain derivatives. The character of distributions made during the year from net investment income or net realized gains may differ from their ultimate characterization for federal income tax purposes. Also, due to the timing of dividend distributions, the fiscal year in which amounts are distributed may differ from the year that the income or realized gains (losses) were recorded by each Fund. |
Hartford Fixed Income Funds
Notes to Financial Statements – (continued)
October 31, 2021
| c) | Distributions and Components of Distributable Earnings – The tax character of distributions paid by each Fund for the years ended October 31, 2021 and October 31, 2020 are as follows: |
| | |
| | | For the Year Ended
October 31, 2021 | | For the Year Ended
October 31, 2020 |
| Fund | | Tax Exempt
Income | | Ordinary
Income | | Long-Term
Capital Gains(1) | | Tax Exempt
Income | | Ordinary
Income | | Long-Term
Capital Gains(1) | | Return of
Capital |
| Emerging Markets Local Debt Fund | | $ — | | $ 2,213,510 | | $ — | | $ — | | $ — | | $ — | | $ 4,330,525 |
| Floating Rate Fund | | — | | 62,694,619 | | — | | — | | 85,400,256 | | — | | — |
| Floating Rate High Income Fund | | — | | 12,389,486 | | — | | — | | 14,415,837 | | — | | — |
| High Yield Fund | | — | | 16,674,439 | | — | | — | | 15,831,246 | | — | | — |
| Inflation Plus Fund | | — | | 11,708,996 | | — | | — | | 8,637,674 | | — | | — |
| Municipal Opportunities Fund | | 30,091,832 | | 89,938 | | — | | 26,196,378 | | 587,352 | | — | | — |
| Municipal Short Duration Fund | | 366,649 | | 682 | | 3,123 | | 379,909 | | 68,677 | | — | | — |
| Short Duration Fund | | — | | 32,711,909 | | — | | — | | 34,553,416 | | — | | — |
| Strategic Income Fund | | — | | 98,930,795 | | — | | — | | 35,515,872 | | — | | — |
| Sustainable Municipal Bond Fund | | 1,562,626 | | 2,471 | | — | | 1,059,845 | | 205,094 | | 64,053 | | — |
| Total Return Bond Fund | | — | | 92,116,572 | | — | | — | | 65,660,915 | | — | | — |
| World Bond Fund | | — | | 46,591,558 | | — | | — | | 131,872,061 | | — | | — |
| (1) | The Funds designate these distributions as long-term capital gains dividends pursuant to IRC Sec 852(b)(3)(c) |
As of October 31, 2021, the components of total accumulated earnings (deficit) for each Fund on a tax basis are as follows:
| Fund | | Tax Exempt
Income | | Undistributed
Ordinary
Income | | Undistributed
Long-Term
Capital Gains | | Accumulated
Capital and
Other Losses | | Other
Temporary
Differences | | Unrealized
Appreciation
(Depreciation)
on Investments(1) | | Total
Accumulated
Earnings
(Deficit) |
| Emerging Markets Local Debt Fund | | $ — | | $ 1,008,760 | | $ — | | $ (70,418,207) | | $ (66,202) | | $ (3,807,399) | | $ (73,283,048) |
| Floating Rate Fund | | — | | 4,361,112 | | — | | (452,367,415) | | (1,050,401) | | (42,816,863) | | (491,873,567) |
| Floating Rate High Income Fund | | — | | 996,360 | | — | | (55,337,210) | | (4,719) | | (4,262,007) | | (58,607,576) |
| High Yield Fund | | — | | 416,065 | | — | | (17,753,581) | | (16,849) | | 13,525,354 | | (3,829,011) |
| Inflation Plus Fund | | — | | 9,944,211 | | — | | (49,258,070) | | (2,194,155) | | 18,423,262 | | (23,084,752) |
| Municipal Opportunities Fund | | — | | — | | — | | (1,815,386) | | (253,275) | | 68,131,391 | | 66,062,730 |
| Municipal Short Duration Fund | | 222 | | — | | — | | (10,314) | | (244) | | 392,547 | | 382,211 |
| Short Duration Fund | | — | | 1,728,105 | | — | | (233,108) | | (248,266) | | 11,515,458 | | 12,762,189 |
| Strategic Income Fund | | — | | 38,426,496 | | 4,708,259 | | (4,401,338) | | (6,192,047) | | (13,520,092) | | 19,021,278 |
| Sustainable Municipal Bond Fund | | — | | 263,547 | | 376,961 | | — | | (296) | | 2,881,381 | | 3,521,593 |
| Total Return Bond Fund | | — | | 28,612,626 | | 34,075,496 | | — | | (35,155,962) | | 36,283,144 | | 63,815,304 |
| World Bond Fund | | — | | 34,422,361 | | 8,321,364 | | — | | (2,111,917) | | (45,531,788) | | (4,899,980) |
| (1) | Differences between book-basis and tax basis unrealized appreciation (depreciation) may be attributable to the losses deferred due to wash sale adjustments, foreign currency gains and losses, adjustments related to PFICs, REITS, certain derivatives and partnerships. |
| d) | Reclassification of Capital Accounts – The Funds may record reclassifications in their capital accounts. These reclassifications have no impact on the total net assets of the Funds. The reclassifications are a result of permanent differences between U.S. GAAP and tax accounting for such items as adjustments to prior year accumulated balances and distributions in excess. Adjustments are made to reflect the impact these items have on the current and future earnings distributions to shareholders. Therefore, the source of the Funds’ distributions may be shown in the accompanying Statements of Changes in Net Assets as from distributable earnings or from capital depending on the type of book and tax differences that exist. For the year ended October 31, 2021, the Funds recorded reclassifications to increase (decrease) the accounts listed below: |
| | |
| Fund | | Paid-in-Capital | | Distributable
Earnings (Loss) |
| Emerging Markets Local Debt Fund | | $ 22,585 | | $ (22,585) |
| Municipal Opportunities Fund | | (36,185) | | 36,185 |
| e) | Capital Loss Carryforward – Under the Regulated Investment Company Modernization Act of 2010, funds are permitted to carry forward capital losses for an unlimited period. |
Hartford Fixed Income Funds
Notes to Financial Statements – (continued)
October 31, 2021
| | At October 31, 2021 (tax year end), each Fund's capital loss carryforwards for U.S. federal income tax purposes were as follows: |
| | |
| Fund | | Short-Term
Capital Loss
Carryforward with
No Expiration | | Long-Term
Capital Loss
Carryforward with
No Expiration |
| Emerging Markets Local Debt Fund | | $ 18,731,307 | | $ 51,686,900 |
| Floating Rate Fund | | 21,597,887 | | 430,769,528 |
| Floating Rate High Income Fund | | — | | 55,337,210 |
| High Yield Fund | | — | | 17,753,581 |
| Inflation Plus Fund | | — | | 49,258,070 |
| Municipal Opportunities Fund | | 1,815,386 | | — |
| Municipal Short Duration Fund | | 2,863 | | 7,451 |
| Short Duration Fund | | 233,108 | | — |
| Strategic Income Fund* | | 3,358,643 | | 1,042,695 |
| * | Future utilization of losses are subject to limitation under current tax laws. |
The Sustainable Municipal Bond Fund, Total Return Bond Fund and World Bond Fund had no capital loss carryforwards for U.S. federal income tax purposes as of October 31, 2021.
During the year ended October 31, 2021 Emerging Markets Local Debt Fund utilized $510,738, Floating Rate Fund utilized $24,898,472, Floating Rate High Income Fund utilized $5,773,723, High Yield Fund utilized $6,679,407, Inflation Plus Fund utilized $18,515,390, Short Duration Fund utilized $10,798,816, Strategic Income Fund utilized $1,041,138, Sustainable Municipal Bond Fund utilized $27,478, World Bond Fund Utilized $7,643,233 of prior year capital loss carryforwards.
| f) | Tax Basis of Investments – The aggregate cost of investments for federal income tax purposes at October 31, 2021 is different from book purposes primarily due to wash sale loss deferrals. The net unrealized appreciation/(depreciation) on investments for tax purposes, which consists of gross unrealized appreciation and depreciation was also different from book purposes primarily due to wash sale loss deferrals and mark-to-market adjustments on swaps, forwards, futures and options. Both the cost and unrealized appreciation and depreciation for federal income tax purposes are disclosed below: |
| | |
| Fund | | Tax Cost | | Gross Unrealized
Appreciation | | Gross Unrealized
(Depreciation) | | Net Unrealized
Appreciation
(Depreciation) |
| Emerging Markets Local Debt Fund | | $ 62,227,924 | | $ 2,338,516 | | $ (6,125,938) | | $ (3,787,422) |
| Floating Rate Fund | | 2,170,167,647 | | 18,794,114 | | (60,935,534) | | (42,141,420) |
| Floating Rate High Income Fund | | 443,862,764 | | 3,102,226 | | (7,180,756) | | (4,078,530) |
| High Yield Fund | | 447,596,180 | | 19,166,358 | | (5,634,993) | | 13,531,365 |
| Inflation Plus Fund | | 551,006,632 | | 24,224,622 | | (5,768,290) | | 18,456,332 |
| Municipal Opportunities Fund | | 1,713,063,528 | | 75,534,981 | | (7,403,590) | | 68,131,391 |
| Municipal Short Duration Fund | | 35,969,738 | | 500,790 | | (108,243) | | 392,547 |
| Short Duration Fund | | 2,150,731,166 | | 22,726,427 | | (11,227,883) | | 11,498,544 |
| Strategic Income Fund | | 3,664,659,466 | | 66,434,470 | | (79,620,981) | | (13,186,511) |
| Sustainable Municipal Bond Fund | | 128,663,318 | | 3,487,746 | | (606,365) | | 2,881,381 |
| Total Return Bond Fund | | 4,442,922,396 | | 97,806,682 | | (61,448,656) | | 36,358,026 |
| World Bond Fund | | 4,073,082,434 | | 86,349,610 | | (132,642,085) | | (46,292,475) |
| g) | Accounting for Uncertainty in Income Taxes – Pursuant to provisions set forth by U.S. GAAP, Hartford Funds Management Company, LLC ("HFMC") reviews each Fund’s tax positions for all open tax years. As of October 31, 2021, HFMC had reviewed the open tax years and concluded that there was no reason to record a liability for net unrecognized tax obligations relating to uncertain income tax positions. Each Fund files U.S. tax returns. Although the statute of limitations for examining a Fund’s U.S. tax returns remains open for 3 years, no examination is currently in progress. The Funds recognize interest and penalties, if any, related to unrecognized tax benefits as income tax expense on the Statements of Operations. During the year ended October 31, 2021, the Funds did not incur any interest or penalties. HFMC is not aware of any tax positions for which it is reasonably possible that the total amounts of unrecognized tax obligations will significantly change in the next twelve months. |
| a) | Investment Management Agreement – HFMC serves as each Fund’s investment manager. The Company, on behalf of each Fund, has entered into an Investment Management Agreement with HFMC. HFMC is an indirect subsidiary of The Hartford Financial Services Group, Inc. (“The Hartford”). HFMC has overall investment supervisory responsibility for each Fund. In addition, HFMC provides administrative personnel, services, equipment, facilities and office space for proper operation of each Fund. HFMC has contracted with Wellington |
Hartford Fixed Income Funds
Notes to Financial Statements – (continued)
October 31, 2021
| | Management Company LLP (“Wellington Management”) under a sub-advisory agreement and Wellington Management performs the daily investment of the assets of each Fund in accordance with the Fund’s investment objective and policies. Each Fund pays a fee to HFMC. HFMC pays a sub-advisory fee to Wellington Management out of its management fee. |
| | The schedule below reflects the rates of compensation paid to HFMC for investment management services rendered as of October 31, 2021; the rates are accrued daily and paid monthly based on each Fund’s average daily net assets, at the following annual rates: |
| | |
| Fund | | Management Fee Rates |
| Emerging Markets Local Debt Fund | | 0.7500% on first $500 million and; |
| | | 0.7000% on next $500 million and; |
| | | 0.6900% over $1 billion |
| Floating Rate Fund | | 0.6500% on first $500 million and; |
| | | 0.6000% on next $2 billion and; |
| | | 0.5900% on next $2.5 billion and; |
| | | 0.5800% on next $5 billion and; |
| | | 0.5700% over $10 billion |
| Floating Rate High Income Fund | | 0.7000% on first $500 million and; |
| | | 0.6500% on next $2 billion and; |
| | | 0.6400% on next $2.5 billion and; |
| | | 0.6300% on next $5 billion and; |
| | | 0.6200% over $10 billion |
| High Yield Fund | | 0.5000% on first $1 billion and; |
| | | 0.4500% on next $4 billion and; |
| | | 0.4400% on next $5 billion and; |
| | | 0.4350% over $10 billion |
| Inflation Plus Fund | | 0.3900% on first $500 million and; |
| | | 0.3800% on next $500 million and; |
| | | 0.3750% on next $1.5 billion and; |
| | | 0.3700% on next $2.5 billion and; |
| | | 0.3675% on next $5 billion and; |
| | | 0.3650% over $10 billion |
| Municipal Opportunities Fund | | 0.3500% on first $500 million and; |
| | | 0.3000% on next $500 million and; |
| | | 0.2900% on next $1.5 billion and; |
| | | 0.2850% on next $2.5 billion and; |
| | | 0.2800% over $5 billion |
| Municipal Short Duration Fund | | 0.3500% on first $500 million and; |
| | | 0.3000% on next $500 million and; |
| | | 0.2900% on next $1.5 billion and; |
| | | 0.2850% on next $2.5 billion and; |
| | | 0.2800% over $5 billion |
| Short Duration Fund | | 0.4100% on the first $500 million and; |
| | | 0.3700% on the next $500 million and; |
| | | 0.3650% on the next $1.5 billion and; |
| | | 0.3600% on the next $2.5 billion and; |
| | | 0.3500% on the next $5 billion and; |
| | | 0.3400% over $10 billion |
| Strategic Income Fund | | 0.5500% on first $500 million and; |
| | | 0.5000% on next $500 million and; |
| | | 0.4750% on next $1.5 billion and; |
| | | 0.4650% on next $2.5 billion and; |
| | | 0.4550% on next $5 billion and; |
| | | 0.4450% over $10 billion |
| Sustainable Municipal Bond Fund | | 0.3500% on first $500 million and; |
| | | 0.3000% on next $500 million and; |
| | | 0.2900% on next $1.5 billion and; |
| | | 0.2850% on next $2.5 billion and; |
| | | 0.2800% over $5 billion |
Hartford Fixed Income Funds
Notes to Financial Statements – (continued)
October 31, 2021
| Fund | | Management Fee Rates |
| Total Return Bond Fund | | 0.3500% on first $500 million and; |
| | | 0.3000% on next $500 million and; |
| | | 0.2600% on next $4 billion and; |
| | | 0.2500% over $5 billion |
| World Bond Fund | | 0.7000% on first $250 million and; |
| | | 0.6500% on next $250 million and; |
| | | 0.6000% on next $2 billion and; |
| | | 0.5500% on next $2.5 billion and; |
| | | 0.4750% on next $5 billion and; |
| | | 0.4500% over $10 billion |
| b) | Accounting Services Agreement – HFMC provides the Funds with accounting services pursuant to a fund accounting agreement by and between the Company, on behalf of each Fund, and HFMC. HFMC has delegated certain accounting and administrative service functions to State Street Bank and Trust Company (“State Street”). In consideration of services rendered and expenses assumed pursuant to the fund accounting agreement, each Fund pays HFMC a fee. Effective May 1, 2021, the fund accounting fee schedule as set forth in the fund accounting agreement by and between the Company, on behalf of the Funds, and HFMC, was revised. Effective May 1, 2021, the fund accounting fee for each Fund is equal to the greater of: (A) the sum of (i) the sub-accounting fee payable by HFMC with respect to the Fund; (ii) the fee payable for tax preparation services for the Fund; and (iii) the amount of expenses that HFMC allocates for providing the fund accounting services to the Fund; plus a target profit margin; or (B) $40,000 per year; provided, however, that to the extent the annual amount of the fund accounting fee exceeds 0.02% of the Fund’s average net assets (calculated during its current fiscal year), HFMC shall waive such portion of the fund accounting fee. For the period November 1, 2020 through April 30, 2021, HFMC received the following fee with respect to each Fund: any sub-accounting fee payable by HFMC plus the amount of expenses that HFMC allocates for providing the fund accounting services. |
| c) | Operating Expenses – Allocable expenses incurred by the Company are allocated to each series within the Company, and allocated to classes within each such series, in proportion to the average daily net assets of such series and classes, except where allocation of certain expenses is more fairly made directly to a Fund or to specific classes within a Fund. As of October 31, 2021, HFMC contractually agreed to limit the total annual fund operating expenses (exclusive of taxes, interest expenses, brokerage commissions, acquired fund fees and expenses, and extraordinary expenses), through February 28, 2022 (unless the Board of Directors approves its earlier termination) as follows for each of the following Funds: |
| | |
| | | Expense Limit as a Percentage of Average Daily Net Assets |
| Fund | | Class A | | Class C | | Class I | | Class R3 | | Class R4 | | Class R5 | | Class R6 | | Class Y | | Class F |
| Emerging Markets Local Debt Fund | | 1.18% | | 1.93% | | 0.93% | | 1.48% | | 1.18% | | 0.88% | | N/A | | 0.88% | | 0.83% |
| Floating Rate Fund(1) | | 1.00% | | 1.75% | | 0.75% | | 1.25% | | 1.00% | | 0.85% | | N/A | | 0.75% | | N/A |
| Floating Rate High Income Fund | | 1.05% | | 1.80% | | 0.80% | | 1.35% | | 1.05% | | 0.75% | | N/A | | 0.78% | | 0.75% |
| High Yield Fund | | 0.95% | | 1.75% | | 0.69% | | 1.27% | | 0.97% | | 0.67% | | 0.55% | | 0.66% | | 0.55% |
| Inflation Plus Fund(1) | | 1.00% | | 1.75% | | 0.75% | | 1.25% | | 1.00% | | 0.85% | | N/A | | 0.75% | | N/A |
| Municipal Short Duration Fund | | 0.69% | | 1.44% | | 0.46% | | N/A | | N/A | | N/A | | N/A | | N/A | | 0.39% |
| Short Duration Fund(1) | | 1.00% | | 1.75% | | 0.75% | | N/A | | N/A | | N/A | | N/A | | 0.75% | | N/A |
| Sustainable Municipal Bond Fund | | 0.69% | | 1.44% | | 0.46% | | N/A | | N/A | | N/A | | N/A | | N/A | | 0.39% |
| Total Return Bond Fund(1) | | 1.00% | | 1.75% | | 0.75% | | 1.25% | | 1.00% | | 0.85% | | N/A | | 0.75% | | N/A |
| (1) | Expense limitation arrangements described above for certain classes of shares of each of Floating Rate Fund, Inflation Plus Fund, Short Duration Fund and Total Return Bond Fund extend beyond February 28, 2022. Please see the Funds’ statement of additional information for more information. |
From November 1, 2020 through February 28, 2021, HFMC contractually limited the total operating expenses (exclusive of taxes, interest expenses, brokerage commissions, acquired fund fees and expenses and extraordinary expenses), as follows:
| | | Expense Limit as a Percentage of Average Daily Net Assets |
| Fund | | Class A | | Class C | | Class I | | Class R3 | | Class R4 | | Class R5 | | Class R6 | | Class Y | | Class F |
| Strategic Income Fund | | 0.95% | | 1.70% | | 0.70% | | 1.25% | | 0.95% | | 0.65% | | 0.60% | | 0.69% | | 0.60% |
| d) | Fees Paid Indirectly – Certain Funds have entered into agreements with State Street Global Markets, LLC and Russell Implementation Services, Inc. to partially recapture non-discounted trade commissions. Such rebates are used to pay a portion of a Fund's expenses. For the year ended October 31, 2021, these amounts, if any, are included in the Statements of Operations. |
Hartford Fixed Income Funds
Notes to Financial Statements – (continued)
October 31, 2021
| | The ratio of expenses to average net assets in the accompanying financial highlights excludes the reduction in expenses related to fees paid indirectly. The annualized expense ratio after waivers reflecting the reduction for fees paid indirectly for the period is as follows: |
| | |
| Fund | | Class A | | Class C | | Class I | | Class R3 | | Class R4 | | Class R5 | | Class R6 | | Class Y | | Class F |
| Emerging Markets Local Debt Fund | | 1.18% | | 1.93% | | 0.93% | | 1.21% | | 1.18% | | 0.88% | | N/A | | 0.88% | | 0.83% |
| Floating Rate Fund | | 1.00% | | 1.75% | | 0.73% | | 1.25% | | 1.00% | | 0.77% | | N/A | | 0.75% | | 0.65% |
| Floating Rate High Income Fund | | 1.05% | | 1.80% | | 0.80% | | 1.35% | | 1.05% | | 0.75% | | N/A | | 0.78% | | 0.75% |
| High Yield Fund | | 0.95% | | 1.71% | | 0.67% | | 1.26% | | 0.97% | | 0.67% | | 0.55% (1) | | 0.66% | | 0.55% |
| Inflation Plus Fund | | 0.85% | | 1.58% | | 0.55% | | 1.17% | | 0.87% | | 0.57% | | N/A | | 0.56% | | 0.45% |
| Municipal Opportunities Fund | | 0.66% | | 1.42% | | 0.42% | | N/A | | N/A | | N/A | | N/A | | 0.44% | | 0.35% |
| Municipal Short Duration Fund | | 0.69% | | 1.44% | | 0.46% | | N/A | | N/A | | N/A | | N/A | | N/A | | 0.39% |
| Short Duration Fund | | 0.78% | | 1.52% | | 0.49% | | 1.00% | | 0.72% | | 0.54% | | 0.43% | | 0.52% | | 0.42% |
| Strategic Income Fund | | 0.91% | | 1.63% | | 0.64% | | 1.26% | | 0.91% | | 0.64% | | 0.54% | | 0.64% | | 0.54% |
| Sustainable Municipal Bond Fund | | 0.69% | | 1.44% | | 0.46% | | N/A | | N/A | | N/A | | N/A | | N/A | | 0.39% |
| Total Return Bond Fund | | 0.68% | | 1.48% | | 0.40% | | 1.03% | | 0.70% | | 0.44% | | 0.32% | | 0.39% | | 0.32% |
| World Bond Fund | | 1.01% | | 1.74% | | 0.72% | | 1.35% | | 1.05% | | 0.75% | | 0.63% | | 0.73% | | 0.63% |
| (1) | Commenced operations on March 1, 2021. |
| e) | Sales Charges and Distribution and Service Plan for Class A, C, R3 and R4 Shares – Hartford Funds Distributors, LLC (“HFD”), an indirect subsidiary of The Hartford, is the principal underwriter and distributor of each Fund. For the year ended October 31, 2021, HFD received front-end sales charges and contingent deferred sales charges for each Fund as follows: |
| | |
| Fund | | Front-End
Sales Charges | | Contingent Deferred
Sales Charges |
| Emerging Markets Local Debt Fund | | $ 3,771 | | $ 229 |
| Floating Rate Fund | | 237,391 | | 26,289 |
| Floating Rate High Income Fund | | 68,763 | | 4,619 |
| High Yield Fund | | 473,479 | | 3,122 |
| Inflation Plus Fund | | 308,227 | | 5,302 |
| Municipal Opportunities Fund | | 722,388 | | 16,579 |
| Municipal Short Duration Fund | | 35,959 | | 5,498 |
| Short Duration Fund | | 1,204,755 | | 46,993 |
| Strategic Income Fund | | 698,580 | | 20,397 |
| Sustainable Municipal Bond Fund | | 97,215 | | 1,574 |
| Total Return Bond Fund | | 2,041,111 | | 25,999 |
| World Bond Fund | | 416,787 | | 8,759 |
The Board of Directors of the Company has approved the adoption of a separate distribution plan (each a “Plan”) pursuant to Rule 12b-1 under the 1940 Act for each of Class A, C, R3 and R4 shares. Under a Plan, Class A, Class C, Class R3 and Class R4 shares of a Fund, as applicable, bear distribution and/or service fees paid to HFD, some or all of which may be paid to select broker-dealers. Pursuant to the Class A Plan, a Fund may pay HFD a fee of up to 0.25% of the average daily net assets attributable to Class A shares for distribution financing activities and shareholder account servicing activities. The entire amount of the fee may be used for shareholder servicing expenses and/or distribution expenses. Pursuant to the Class C Plan, a Fund may pay HFD a fee of up to 1.00% of the average daily net assets attributable to Class C shares for distribution financing activities, and up to 0.25% may be used for shareholder account servicing activities. The Class C Plan also provides that HFD will receive all contingent deferred sales charges attributable to Class C shares. Pursuant to the Class R3 Plan, a Fund may pay HFD a fee of up to 0.50% of the average daily net assets attributable to Class R3 shares for distribution financing activities, and up to 0.25% may be used for shareholder account servicing activities. Pursuant to the Class R4 Plan, a Fund may pay HFD a fee of up to 0.25% of the average daily net assets attributable to Class R4 shares for distribution financing activities. The entire amount of the fee may be used for shareholder account servicing activities. Each Fund’s 12b-1 fees are accrued daily and paid monthly or at such other intervals as the Company’s Board of Directors may determine. Any 12b-1 fees attributable to assets held in an account held directly with the Funds’ transfer agent for which there is not a third-party listed as the broker-dealer of record (or HFD does not otherwise have a payment obligation) are generally reimbursed to the applicable Fund. Such amounts are reflected as “Distribution fee reimbursements” on the Statements of Operations.
| f) | Other Related Party Transactions – Certain officers of the Company are directors and/or officers of HFMC and/or The Hartford or its subsidiaries. For the year ended October 31, 2021, a portion of the Company’s Chief Compliance Officer’s (“CCO”) compensation was paid by all of the investment companies in the Hartford fund complex. The portion allocated to each Fund, as represented in other expenses on |
Hartford Fixed Income Funds
Notes to Financial Statements – (continued)
October 31, 2021
| | the Statements of Operations, is outlined in the table below. |
| | |
| Fund | | CCO Compensation
Paid by Fund |
| Emerging Markets Local Debt Fund | | $ 107 |
| Floating Rate Fund | | 3,412 |
| Floating Rate High Income Fund | | 672 |
| High Yield Fund | | 747 |
| Inflation Plus Fund | | 903 |
| Municipal Opportunities Fund | | 2,930 |
| Municipal Short Duration Fund | | 54 |
| Short Duration Fund | | 3,445 |
| Strategic Income Fund | | 4,943 |
| Sustainable Municipal Bond Fund | | 200 |
| Total Return Bond Fund | | 5,797 |
| World Bond Fund | | 7,310 |
Hartford Administrative Services Company (“HASCO”), an indirect subsidiary of The Hartford, provides transfer agent services to each Fund. Each Fund pays HASCO a transfer agency fee payable monthly based on the lesser of (i) the costs of providing or overseeing transfer agency services provided to each share class of such Fund plus a target profit margin or (ii) a Specified Amount (as defined in the table below). Such fee is intended to compensate HASCO for: (i) fees payable by HASCO to DST Asset Manager Solutions, Inc. (“DST”) (and any other designated sub-agent) according to the agreed-upon fee schedule under the sub-transfer agency agreement between HASCO and DST (or between HASCO and any other designated sub-agent, as applicable); (ii) sub-transfer agency fees payable by HASCO to financial intermediaries, according to the agreed-upon terms between HASCO and the financial intermediaries, provided that such payments are within certain limits approved by the Company’s Board of Directors; (iii) certain expenses that HASCO’s parent company, Hartford Funds Management Group, Inc., allocates to HASCO that relate to HASCO’s transfer agency services provided to the Fund; and (iv) a target profit margin.
| Share Class | | Specified Amount
(as a percentage
average daily
net assets) |
| Class A | | 0.25% |
| Class C | | 0.25% |
| Class I | | 0.20% |
| Class R3 | | 0.22% |
| Class R4 | | 0.17% |
| Class R5 | | 0.12% |
| Class R6 | | 0.004% |
| Class Y | | 0.11% |
| Class F | | 0.004% |
Effective March 1, 2021, HASCO has contractually agreed to waive its transfer agency fee and/or reimburse transfer agency-related expenses to the extent necessary to limit the transfer agency fee for the share classes of the Funds listed below through February 28, 2022, unless the Board of Directors approves its earlier termination as follows:
| Fund | | Class A |
| Inflation Plus Fund | | 0.15% |
| Short Duration Fund | | 0.12% |
From November 1, 2020 through February 28, 2021, HASCO contractually agreed to waive and/or reimburse a portion of the transfer agency fees for the share classes of the Funds listed below to the extent necessary to limit the transfer agency fees as follows:
| Fund | | Class A | | Class Y |
| Inflation Plus Fund | | 0.15% | | N/A |
| Short Duration Fund | | 0.12% | | N/A |
| World Bond Fund | | N/A | | 0.09% |
Pursuant to a sub-transfer agency agreement between HASCO and DST, HASCO has delegated certain transfer agent, dividend disbursing agent and shareholder servicing agent functions to DST. Each Fund does not pay any fee directly to DST; rather, HASCO makes all such payments to DST. The accrued amount shown in the Statements of Operations reflects the amounts charged by HASCO. These fees are accrued daily and paid monthly.
Hartford Fixed Income Funds
Notes to Financial Statements – (continued)
October 31, 2021
For the year ended October 31, 2021, the effective rate of compensation paid to HASCO for transfer agency services as a percentage of each Class' average daily net assets is as follows:
| Fund | | Class A | | Class C | | Class I | | Class R3 | | Class R4 | | Class R5 | | Class R6 | | Class Y | | Class F |
| Emerging Markets Local Debt Fund | | 0.20% | | 0.21% | | 0.11% | | 0.22% | | 0.17% | | 0.12% | | N/A | | 0.11% | | 0.00%* |
| Floating Rate Fund | | 0.10% | | 0.10% | | 0.08% | | 0.21% | | 0.17% | | 0.11% | | N/A | | 0.10% | | 0.00%* |
| Floating Rate High Income Fund | | 0.12% | | 0.10% | | 0.08% | | 0.22% | | 0.17% | | 0.10% | | N/A | | 0.11% | | 0.00%* |
| High Yield Fund | | 0.16% | | 0.14% | | 0.09% | | 0.21% | | 0.17% | | 0.12% | | 0.00% *(1) | | 0.11% | | 0.00%* |
| Inflation Plus Fund | | 0.15% | | 0.13% | | 0.10% | | 0.22% | | 0.17% | | 0.12% | | N/A | | 0.11% | | 0.00%* |
| Municipal Opportunities Fund | | 0.06% | | 0.07% | | 0.07% | | N/A | | N/A | | N/A | | N/A | | 0.09% | | 0.00%* |
| Municipal Short Duration Fund | | 0.05% | | 0.11% | | 0.10% | | N/A | | N/A | | N/A | | N/A | | N/A | | 0.00%* |
| Short Duration Fund | | 0.12% | | 0.10% | | 0.07% | | 0.22% | | 0.05% | | 0.12% | | 0.00% * | | 0.10% | | 0.00%* |
| Strategic Income Fund | | 0.12% | | 0.09% | | 0.10% | | 0.22% | | 0.12% | | 0.10% | | 0.00% * | | 0.10% | | 0.00%* |
| Sustainable Municipal Bond Fund | | 0.05% | | 0.11% | | 0.12% | | N/A | | N/A | | N/A | | N/A | | N/A | | 0.00%* |
| Total Return Bond Fund | | 0.11% | | 0.16% | | 0.08% | | 0.22% | | 0.17% | | 0.12% | | 0.00% * | | 0.07% | | 0.00%* |
| World Bond Fund | | 0.13% | | 0.11% | | 0.09% | | 0.22% | | 0.17% | | 0.12% | | 0.00% * | | 0.10% | | 0.00%* |
| * | Amount rounds to 0.00%. |
| (1) | Commenced operations on March 1, 2021. |
| 8. | Securities Lending: |
| | The Company has entered into a securities lending agency agreement (“lending agreement”) with Citibank, N.A. (“Citibank”). A Fund may lend portfolio securities to certain borrowers in U.S. and non-U.S. markets in an amount not to exceed one-third (33 1/3%) of the value of its total assets. A Fund may lend portfolio securities, provided that the borrower provides collateral that is maintained in an amount at least equal to the current market value of the securities loaned. Cash collateral is invested for the benefit of a Fund by the Fund’s lending agent pursuant to collateral investment guidelines. The collateral is marked to market daily, in an amount at least equal to the current market value of the securities loaned. Each of the Floating Rate Fund, the Floating Rate High Income Fund, and the High Yield Fund do not currently engage in securities lending. |
| | A Fund is subject to certain risks while its securities are on loan, including the following: (i) the risk that the borrower defaults on the loan and the collateral is inadequate to cover the Fund’s loss; (ii) the risk that the earnings on the collateral invested are not sufficient to pay fees incurred in connection with the loan; (iii) the Fund could lose money in the event of a decline in the value of the collateral provided for loaned securities or a decline in the value of any investments made with cash collateral; (iv) the risk that the borrower may use the loaned securities to cover a short sale, which may in turn place downward pressure on the market prices of the loaned securities; (v) the risk that return of loaned securities could be delayed and interfere with portfolio management decisions; and (vi) the risk that any efforts to restrict or recall the securities for purposes of voting may not be effective. These events could also trigger adverse tax consequences for the Fund. |
| | A Fund retains loan fees and the interest on cash collateral investments but is required to pay the borrower a rebate for the use of cash collateral. In cases where the lent security is of high value to borrowers, there may be a negative rebate (i.e., a net payment from the borrower to the applicable Fund). Upon termination of a loan, a Fund is required to return to the borrower an amount equal to the cash collateral, plus any rebate owed to the borrowers. |
| | The net income earned on the securities lending (after payment of rebates and Citibank’s fee) is included on the Statements of Operations as Investment Income from securities lending. A Fund also receives payments from the borrower during the period of the loan, equivalent to dividends and interest earned on the securities loaned, which are recorded as Investment Income from dividends or interest, respectively, on the Statements of Operations. |
Hartford Fixed Income Funds
Notes to Financial Statements – (continued)
October 31, 2021
| | The following table presents for each Fund that lends its portfolio securities the market value of the securities on loan; the collateral posted by the borrower; and the net amount, if any, due from the borrower in the event of default as of October 31, 2021. |
| | |
| Fund | | Investment Securities on Loan, at market value,
Presented on the Statements of Assets and Liabilities | | Collateral Posted by Borrower(1) | | Net Amount(2) |
| Emerging Markets Local Debt Fund | | $ 558,516 | | $ (558,516) | | $ — |
| Inflation Plus Fund | | — | | — | | — |
| Municipal Opportunities Fund | | — | | — | | — |
| Municipal Short Duration Fund | | — | | — | | — |
| Short Duration Fund | | 437,372 | | (437,372) | | — |
| Strategic Income Fund | | 19,306,224 | | (19,306,224) | | — |
| Sustainable Municipal Bond Fund | | — | | — | | — |
| Total Return Bond Fund | | 1,385,753 | | (1,385,753) | | — |
| World Bond Fund | | 1,385,188 | | (1,385,188) | | — |
| (1) | It is each Fund’s policy to obtain additional collateral from, or return excess collateral to, the borrower by the end of the next business day following the valuation date of the securities loaned. Therefore, the value of the collateral held may be temporarily less than that required under the lending contract due to timing. Pursuant to the lending agreement, the borrower will provide collateral in an amount at least equal to the current market value of securities loaned. Collateral received in excess or in deficit of the market value is not presented in this table. |
| (2) | Net amount represents the net amount receivable due from the borrower in the event of default. |
| 9. | Secured Borrowings: |
| | The following tables reflect a breakdown of transactions accounted for as secured borrowings, the gross obligation by the type of collateral pledged, and the remaining contractual maturity of those transactions as of October 31, 2021. |
| | Certain Transfers Accounted For As Secured Borrowings |
| | Remaining Contractual Maturity of the Agreements |
| | |
| | Overnight and
Continuous | | < 30 days | | Between
30 & 90 days | | > 90 days | | Total |
| Emerging Markets Local Debt Fund | | | | | | | | | |
| Securities Lending Transactions(1) | | | | | | | | | |
| Corporate Bonds | $ 572,058 | | $ — | | $ — | | $ — | | $ 572,058 |
| Total Borrowings | $ 572,058 | | $ — | | $ — | | $ — | | $ 572,058 |
| Gross amount of recognized liabilities for securities lending transactions | | $ 572,058 |
| Short Duration Fund | | | | | | | | | |
| Securities Lending Transactions(1) | | | | | | | | | |
| Corporate Bonds | $ 450,598 | | $ — | | $ — | | $ — | | $ 450,598 |
| Total Borrowings | $ 450,598 | | $ — | | $ — | | $ — | | $ 450,598 |
| Gross amount of recognized liabilities for securities lending transactions | | $ 450,598 |
| Strategic Income Fund | | | | | | | | | |
| Securities Lending Transactions(1) | | | | | | | | | |
| Convertible Bonds | $ 20,350 | | $ — | | $ — | | $ — | | $ 20,350 |
| Convertible Preferred Stocks | 19,352,440 | | — | | — | | — | | 19,352,440 |
| Corporate Bonds | 597,583 | | — | | — | | — | | 597,583 |
| Foreign Government Obligations | 54 | | — | | — | | — | | 54 |
| Total Borrowings | $ 19,970,427 | | $ — | | $ — | | $ — | | $ 19,970,427 |
| Gross amount of recognized liabilities for securities lending transactions | | $ 19,970,427 |
| Total Return Bond Fund | | | | | | | | | |
| Securities Lending Transactions(1) | | | | | | | | | |
| Corporate Bonds | $ 1,433,018 | | $ — | | $ — | | $ — | | $ 1,433,018 |
| Total Borrowings | $ 1,433,018 | | $ — | | $ — | | $ — | | $ 1,433,018 |
| Gross amount of recognized liabilities for securities lending transactions | | $ 1,433,018 |
| World Bond Fund | | | | | | | | | |
| Securities Lending Transactions(1) | | | | | | | | | |
| Corporate Bonds | $ 1,436,910 | | $ — | | $ — | | $ — | | $ 1,436,910 |
| Total Borrowings | $ 1,436,910 | | $ — | | $ — | | $ — | | $ 1,436,910 |
| Gross amount of recognized liabilities for securities lending transactions | | $ 1,436,910 |
Hartford Fixed Income Funds
Notes to Financial Statements – (continued)
October 31, 2021
| (1) | Amount represents the payable for cash collateral received on securities on loan. This will generally be in the “Overnight and Continuous” column as the securities are typically callable on demand. |
| 10. | Affiliate Holdings: |
| | As of October 31, 2021, affiliates of The Hartford had ownership of shares in each Fund as follows: |
| | |
| Percentage of a Class: | | | | | | | | | | | | | | | | | | |
| Fund | | Class A | | Class C | | Class I | | Class R3 | | Class R4 | | Class R5 | | Class R6 | | Class Y | | Class F |
| Emerging Markets Local Debt Fund | | — | | — | | — | | 100% | | 25% | | 100% | | N/A | | — | | — |
| High Yield Fund | | — | | — | | — | | — | | — | | — | | 100% | | — | | — |
| Municipal Short Duration Fund | | — | | — | | — | | N/A | | N/A | | N/A | | N/A | | N/A | | 0%* |
| Short Duration Fund | | — | | — | | — | | — | | — | | — | | 1% | | — | | — |
| Percentage of Fund by Class: | | | | | | | | | | | | | | | | | | |
| Fund | | Class A | | Class C | | Class I | | Class R3 | | Class R4 | | Class R5 | | Class R6 | | Class Y | | Class F |
| Emerging Markets Local Debt Fund | | — | | — | | — | | 0%* | | 0%* | | 0%* | | N/A | | — | | — |
| High Yield Fund | | — | | — | | — | | — | | — | | — | | 0%* | | — | | — |
| Municipal Short Duration Fund | | — | | — | | — | | N/A | | N/A | | N/A | | N/A | | N/A | | 0%* |
| Short Duration Fund | | — | | — | | — | | — | | — | | — | | 0%* | | — | | — |
| * | Percentage rounds to zero. |
As of October 31, 2021, affiliated funds of funds and the 529 plan for which HFMC serves as the program manager (the “529 plan”) in the aggregate owned a portion of the Funds identified below. Therefore, these Funds may experience relatively large purchases or redemptions of their shares as a result of purchase and sale activity from these affiliated funds of funds and the 529 plan. Affiliated funds of funds and the 529 plan owned shares in the Funds listed below as follows:
| Fund | | Percentage
of Fund* |
| High Yield Fund | | 2% |
| Inflation Plus Fund | | 24% |
| Strategic Income Fund | | 3% |
| Total Return Bond Fund | | 1% |
| World Bond Fund | | 3% |
| * | As of October 31, 2021, affiliated funds of funds and the 529 plan were invested in Class F shares. |
| 11. | Investment Transactions: |
| | For the year ended October 31, 2021, the cost of purchases and proceeds from sales of investment securities (excluding short-term investments) were as follows: |
| | |
| Fund | | Cost of Purchases
Excluding U.S.
Government
Obligations | | Sales Proceeds
Excluding U.S.
Government
Obligations | | Cost of Purchases
For U.S. Government
Obligations | | Sales Proceeds
For U.S. Government
Obligations | | Total Cost of
Purchases | | Total Sales
Proceeds |
| Emerging Markets Local Debt Fund | | $ 55,996,420 | | $ 58,939,240 | | $ — | | $ — | | $ 55,996,420 | | $ 58,939,240 |
| Floating Rate Fund | | 2,054,132,369 | | 1,857,563,520 | | — | | — | | 2,054,132,369 | | 1,857,563,520 |
| Floating Rate High Income Fund | | 560,675,747 | | 487,809,704 | | — | | — | | 560,675,747 | | 487,809,704 |
| High Yield Fund | | 237,185,886 | | 153,448,643 | | — | | — | | 237,185,886 | | 153,448,643 |
| Inflation Plus Fund | | 145,894,459 | | 66,091,229 | | 338,805,036 | | 314,159,440 | | 484,699,495 | | 380,250,669 |
| Municipal Opportunities Fund | | 477,326,622 | | 124,750,759 | | — | | — | | 477,326,622 | | 124,750,759 |
| Municipal Short Duration Fund | | 15,644,387 | | 4,250,327 | | — | | — | | 15,644,387 | | 4,250,327 |
| Short Duration Fund | | 1,135,175,240 | | 615,101,839 | | 38,402,263 | | 45,470,969 | | 1,173,577,503 | | 660,572,808 |
| Strategic Income Fund | | 2,124,057,110 | | 978,046,710 | | 541,413,490 | | 230,968,117 | | 2,665,470,600 | | 1,209,014,827 |
| Sustainable Municipal Bond Fund | | 68,314,289 | | 18,990,856 | | — | | — | | 68,314,289 | | 18,990,856 |
| Total Return Bond Fund | | 1,452,031,235 | | 987,768,007 | | 889,359,444 | | 634,015,931 | | 2,341,390,679 | | 1,621,783,938 |
| World Bond Fund | | 3,356,775,348 | | 3,310,444,668 | | 195,046,806 | | 240,879,333 | | 3,551,822,154 | | 3,551,324,001 |
Hartford Fixed Income Funds
Notes to Financial Statements – (continued)
October 31, 2021
| 12. | Capital Share Transactions: |
| | The following information is for the years ended October 31, 2021 and October 31, 2020: |
| | |
| | For the Year Ended
October 31, 2021 | | For the Year Ended
October 31, 2020 |
| | Shares | | Amount | | Shares | | Amount |
| Emerging Markets Local Debt Fund | | | | | | | |
| Class A | | | | | | | |
| Shares Sold | 457,896 | | $ 2,565,221 | | 134,392 | | $ 760,164 |
| Shares Issued for Reinvested Dividends | 23,448 | | 132,075 | | 37,719 | | 204,790 |
| Shares Redeemed | (563,759) | | (3,170,715) | | (319,756) | | (1,753,111) |
| Net Increase (Decrease) | (82,415) | | (473,419) | | (147,645) | | (788,157) |
| Class C | | | | | | | |
| Shares Sold | 64,826 | | $ 372,614 | | 105,544 | | $ 612,753 |
| Shares Issued for Reinvested Dividends | 8,134 | | 45,865 | | 13,757 | | 74,858 |
| Shares Redeemed | (77,167) | | (444,880) | | (212,602) | | (1,168,974) |
| Net Increase (Decrease) | (4,207) | | (26,401) | | (93,301) | | (481,363) |
| Class I | | | | | | | |
| Shares Sold | 1,235,312 | | $ 6,971,915 | | 2,545,777 | | $ 14,145,120 |
| Shares Issued for Reinvested Dividends | 60,402 | | 338,202 | | 177,208 | | 978,115 |
| Shares Redeemed | (1,188,421) | | (6,664,914) | | (7,824,110) | | (40,873,043) |
| Net Increase (Decrease) | 107,293 | | 645,203 | | (5,101,125) | | (25,749,808) |
| Class R3 | | | | | | | |
| Shares Sold | — | | $ — | | 1 | | $ 4 |
| Shares Issued for Reinvested Dividends | 59 | | 328 | | 85 | | 462 |
| Shares Redeemed | — | | — | | (184) | | (1,057) |
| Net Increase (Decrease) | 59 | | 328 | | (98) | | (591) |
| Class R4 | | | | | | | |
| Shares Sold | — | | $ — | | 68 | | $ 400 |
| Shares Issued for Reinvested Dividends | 259 | | 1,454 | | 343 | | 1,856 |
| Shares Redeemed | — | | — | | (776) | | (4,628) |
| Net Increase (Decrease) | 259 | | 1,454 | | (365) | | (2,372) |
| Class R5 | | | | | | | |
| Shares Sold | 119 | | $ 660 | | 6,390 | | $ 36,359 |
| Shares Issued for Reinvested Dividends | 151 | | 816 | | 348 | | 1,784 |
| Shares Redeemed | (6,762) | | (37,117) | | (68) | | (350) |
| Net Increase (Decrease) | (6,492) | | (35,641) | | 6,670 | | 37,793 |
| Class Y | | | | | | | |
| Shares Sold | 844,108 | | $ 4,750,135 | | 1,750,399 | | $ 9,515,902 |
| Shares Issued for Reinvested Dividends | 268,211 | | 1,493,075 | | 523,951 | | 2,827,886 |
| Shares Redeemed | (2,221,204) | | (12,314,119) | | (9,274,328) | | (49,111,325) |
| Net Increase (Decrease) | (1,108,885) | | (6,070,909) | | (6,999,978) | | (36,767,537) |
| Class F | | | | | | | |
| Shares Sold | 289,259 | | $ 1,629,403 | | 270,149 | | $ 1,545,968 |
| Shares Issued for Reinvested Dividends | 25,464 | | 142,535 | | 31,190 | | 169,018 |
| Shares Redeemed | (74,199) | | (417,624) | | (415,940) | | (2,167,752) |
| Net Increase (Decrease) | 240,524 | | 1,354,314 | | (114,601) | | (452,766) |
| Total Net Increase (Decrease) | (853,864) | | $ (4,605,071) | | (12,450,443) | | $ (64,204,801) |
| Floating Rate Fund | | | | | | | |
| Class A | | | | | | | |
| Shares Sold | 20,184,428 | | $ 169,213,315 | | 22,715,140 | | $ 182,043,746 |
| Shares Issued for Reinvested Dividends | 2,323,250 | | 19,456,055 | | 2,783,969 | | 22,370,965 |
| Shares Redeemed | (16,622,522) | | (138,914,120) | | (34,530,403) | | (274,801,624) |
| Net Increase (Decrease) | 5,885,156 | | 49,755,250 | | (9,031,294) | | (70,386,913) |
| Class C | | | | | | | |
| Shares Sold | 1,900,322 | | $ 16,085,382 | | 1,913,326 | | $ 15,459,940 |
| Shares Issued for Reinvested Dividends | 415,801 | | 3,509,590 | | 1,100,612 | | 8,934,776 |
| Shares Redeemed | (17,772,594) | | (150,204,448) | | (28,757,381) | | (231,627,065) |
| Net Increase (Decrease) | (15,456,471) | | (130,609,476) | | (25,743,443) | | (207,232,349) |
Hartford Fixed Income Funds
Notes to Financial Statements – (continued)
October 31, 2021
| | For the Year Ended
October 31, 2021 | | For the Year Ended
October 31, 2020 |
| | Shares | | Amount | | Shares | | Amount |
| Class I | | | | | | | |
| Shares Sold | 64,073,314 | | $ 535,267,879 | | 57,805,041 | | $ 458,641,839 |
| Shares Issued for Reinvested Dividends | 2,845,728 | | 23,740,849 | | 3,529,631 | | 28,399,544 |
| Shares Redeemed | (32,771,524) | | (273,048,547) | | (125,477,198) | | (987,910,277) |
| Net Increase (Decrease) | 34,147,518 | | 285,960,181 | | (64,142,526) | | (500,868,894) |
| Class R3 | | | | | | | |
| Shares Sold | 100,693 | | $ 848,718 | | 59,902 | | $ 490,500 |
| Shares Issued for Reinvested Dividends | 15,094 | | 127,186 | | 21,364 | | 172,803 |
| Shares Redeemed | (151,957) | | (1,281,948) | | (299,206) | | (2,452,297) |
| Net Increase (Decrease) | (36,170) | | (306,044) | | (217,940) | | (1,788,994) |
| Class R4 | | | | | | | |
| Shares Sold | 23,459 | | $ 195,696 | | 96,310 | | $ 794,320 |
| Shares Issued for Reinvested Dividends | 6,062 | | 50,727 | | 8,674 | | 69,552 |
| Shares Redeemed | (52,685) | | (441,423) | | (157,920) | | (1,222,761) |
| Net Increase (Decrease) | (23,164) | | (195,000) | | (52,936) | | (358,889) |
| Class R5 | | | | | | | |
| Shares Sold | 87,114 | | $ 728,833 | | 11,035 | | $ 89,492 |
| Shares Issued for Reinvested Dividends | 4,111 | | 34,288 | | 4,935 | | 39,528 |
| Shares Redeemed | (76,911) | | (642,785) | | (35,909) | | (290,850) |
| Net Increase (Decrease) | 14,314 | | 120,336 | | (19,939) | | (161,830) |
| Class Y | | | | | | | |
| Shares Sold | 2,593,081 | | $ 21,554,503 | | 2,850,842 | | $ 22,683,282 |
| Shares Issued for Reinvested Dividends | 184,928 | | 1,536,355 | | 239,275 | | 1,920,632 |
| Shares Redeemed | (2,160,853) | | (17,873,905) | | (5,411,327) | | (42,525,785) |
| Net Increase (Decrease) | 617,156 | | 5,216,953 | | (2,321,210) | | (17,921,871) |
| Class F | | | | | | | |
| Shares Sold | 8,757,258 | | $ 73,038,851 | | 14,960,687 | | $ 119,676,976 |
| Shares Issued for Reinvested Dividends | 205,524 | | 1,711,664 | | 265,700 | | 2,132,064 |
| Shares Redeemed | (3,226,515) | | (26,801,617) | | (51,269,502) | | (398,717,007) |
| Net Increase (Decrease) | 5,736,267 | | 47,948,898 | | (36,043,115) | | (276,907,967) |
| Total Net Increase (Decrease) | 30,884,606 | | $ 257,891,098 | | (137,572,403) | | $ (1,075,627,707) |
| Floating Rate High Income Fund | | | | | | | |
| Class A | | | | | | | |
| Shares Sold | 2,854,044 | | $ 27,586,915 | | 1,398,470 | | $ 12,942,405 |
| Shares Issued for Reinvested Dividends | 232,717 | | 2,245,141 | | 303,917 | | 2,804,899 |
| Shares Redeemed | (1,599,460) | | (15,420,568) | | (3,761,564) | | (33,422,658) |
| Net Increase (Decrease) | 1,487,301 | | 14,411,488 | | (2,059,177) | | (17,675,354) |
| Class C | | | | | | | |
| Shares Sold | 270,564 | | $ 2,640,690 | | 362,804 | | $ 3,349,789 |
| Shares Issued for Reinvested Dividends | 78,448 | | 762,515 | | 155,830 | | 1,449,058 |
| Shares Redeemed | (1,857,875) | | (18,077,095) | | (2,260,595) | | (20,844,664) |
| Net Increase (Decrease) | (1,508,863) | | (14,673,890) | | (1,741,961) | | (16,045,817) |
| Class I | | | | | | | |
| Shares Sold | 18,674,472 | | $ 179,213,709 | | 13,072,588 | | $ 116,255,880 |
| Shares Issued for Reinvested Dividends | 818,649 | | 7,859,066 | | 927,364 | | 8,514,869 |
| Shares Redeemed | (11,952,075) | | (114,622,911) | | (15,784,908) | | (140,526,418) |
| Net Increase (Decrease) | 7,541,046 | | 72,449,864 | | (1,784,956) | | (15,755,669) |
| Class R3 | | | | | | | |
| Shares Sold | 12,267 | | $ 118,999 | | 3,922 | | $ 36,154 |
| Shares Issued for Reinvested Dividends | 283 | | 2,738 | | 350 | | 3,240 |
| Shares Redeemed | (9,873) | | (95,730) | | (13,918) | | (127,740) |
| Net Increase (Decrease) | 2,677 | | 26,007 | | (9,646) | | (88,346) |
| Class R4 | | | | | | | |
| Shares Sold | 3,875 | | $ 37,404 | | 3,403 | | $ 32,161 |
| Shares Issued for Reinvested Dividends | 355 | | 3,416 | | 428 | | 3,941 |
| Shares Redeemed | (590) | | (5,597) | | (2,129) | | (20,926) |
| Net Increase (Decrease) | 3,640 | | 35,223 | | 1,702 | | 15,176 |
Hartford Fixed Income Funds
Notes to Financial Statements – (continued)
October 31, 2021
| | For the Year Ended
October 31, 2021 | | For the Year Ended
October 31, 2020 |
| | Shares | | Amount | | Shares | | Amount |
| Class R5 | | | | | | | |
| Shares Sold | 329,970 | | $ 3,156,427 | | 124,461 | | $ 1,145,917 |
| Shares Issued for Reinvested Dividends | 42,482 | | 407,750 | | 48,510 | | 444,260 |
| Shares Redeemed | (197,294) | | (1,883,524) | | (167,667) | | (1,513,716) |
| Net Increase (Decrease) | 175,158 | | 1,680,653 | | 5,304 | | 76,461 |
| Class Y | | | | | | | |
| Shares Sold | 1,274,252 | | $ 12,253,988 | | 1,781,345 | | $ 16,289,241 |
| Shares Issued for Reinvested Dividends | 37,434 | | 359,644 | | 45,232 | | 419,036 |
| Shares Redeemed | (748,043) | | (7,199,195) | | (2,559,448) | | (23,055,578) |
| Net Increase (Decrease) | 563,643 | | 5,414,437 | | (732,871) | | (6,347,301) |
| Class F | | | | | | | |
| Shares Sold | 1,907,549 | | $ 18,390,277 | | 464,170 | | $ 4,307,469 |
| Shares Issued for Reinvested Dividends | 71,148 | | 684,802 | | 72,535 | | 668,254 |
| Shares Redeemed | (531,784) | | (5,090,177) | | (1,307,260) | | (11,903,577) |
| Net Increase (Decrease) | 1,446,913 | | 13,984,902 | | (770,555) | | (6,927,854) |
| Total Net Increase (Decrease) | 9,711,515 | | $ 93,328,684 | | (7,092,160) | | $ (62,748,704) |
| High Yield Fund | | | | | | | |
| Class A | | | | | | | |
| Shares Sold | 9,211,240 | | $ 70,465,233 | | 7,982,568 | | $ 57,178,942 |
| Shares Issued for Reinvested Dividends | 1,323,309 | | 10,121,722 | | 1,394,996 | | 9,984,138 |
| Shares Redeemed | (5,714,699) | | (43,688,747) | | (7,699,857) | | (54,391,234) |
| Net Increase (Decrease) | 4,819,850 | | 36,898,208 | | 1,677,707 | | 12,771,846 |
| Class C | | | | | | | |
| Shares Sold | 772,108 | | $ 5,882,862 | | 720,947 | | $ 5,165,342 |
| Shares Issued for Reinvested Dividends | 92,034 | | 701,430 | | 145,751 | | 1,040,364 |
| Shares Redeemed | (2,128,324) | | (16,226,483) | | (1,730,291) | | (12,196,760) |
| Net Increase (Decrease) | (1,264,182) | | (9,642,191) | | (863,593) | | (5,991,054) |
| Class I | | | | | | | |
| Shares Sold | 3,814,373 | | $ 29,323,042 | | 1,576,935 | | $ 10,987,256 |
| Shares Issued for Reinvested Dividends | 166,912 | | 1,279,229 | | 127,736 | | 918,879 |
| Shares Redeemed | (672,285) | | (5,148,723) | | (1,660,866) | | (11,578,456) |
| Net Increase (Decrease) | 3,309,000 | | 25,453,548 | | 43,805 | | 327,679 |
| Class R3 | | | | | | | |
| Shares Sold | 105,819 | | $ 811,238 | | 112,009 | | $ 816,725 |
| Shares Issued for Reinvested Dividends | 7,431 | | 56,835 | | 11,257 | | 80,520 |
| Shares Redeemed | (107,719) | | (821,694) | | (70,941) | | (500,399) |
| Net Increase (Decrease) | 5,531 | | 46,379 | | 52,325 | | 396,846 |
| Class R4 | | | | | | | |
| Shares Sold | 29,988 | | $ 230,237 | | 26,012 | | $ 188,053 |
| Shares Issued for Reinvested Dividends | 5,347 | | 40,971 | | 6,207 | | 44,493 |
| Shares Redeemed | (37,389) | | (287,613) | | (32,464) | | (238,238) |
| Net Increase (Decrease) | (2,054) | | (16,405) | | (245) | | (5,692) |
| Class R5 | | | | | | | |
| Shares Sold | 29,449 | | $ 224,854 | | 66,470 | | $ 474,328 |
| Shares Issued for Reinvested Dividends | 3,675 | | 28,004 | | 4,687 | | 33,480 |
| Shares Redeemed | (20,564) | | (156,615) | | (94,762) | | (674,816) |
| Net Increase (Decrease) | 12,560 | | 96,243 | | (23,605) | | (167,008) |
| Class R6(1) | | | | | | | |
| Shares Sold | 1,322 | | $ 10,001 | | — | | $ — |
| Shares Issued for Reinvested Dividends | 36 | | 275 | | — | | — |
| Net Increase (Decrease) | 1,358 | | 10,276 | | — | | — |
| Class Y | | | | | | | |
| Shares Sold | 48,050 | | $ 364,072 | | 3,088,142 | | $ 21,482,670 |
| Shares Issued for Reinvested Dividends | 5,391 | | 40,799 | | 38,973 | | 283,912 |
| Shares Redeemed | (42,465) | | (322,300) | | (4,604,281) | | (32,546,308) |
| Net Increase (Decrease) | 10,976 | | 82,571 | | (1,477,166) | | (10,779,726) |
Hartford Fixed Income Funds
Notes to Financial Statements – (continued)
October 31, 2021
| | For the Year Ended
October 31, 2021 | | For the Year Ended
October 31, 2020 |
| | Shares | | Amount | | Shares | | Amount |
| Class F | | | | | | | |
| Shares Sold | 6,143,690 | | $ 46,889,267 | | 3,292,512 | | $ 23,808,924 |
| Shares Issued for Reinvested Dividends | 545,461 | | 4,168,432 | | 430,586 | | 3,087,555 |
| Shares Redeemed | (2,011,489) | | (15,354,838) | | (2,076,306) | | (14,636,213) |
| Net Increase (Decrease) | 4,677,662 | | 35,702,861 | | 1,646,792 | | 12,260,266 |
| Total Net Increase (Decrease) | 11,570,701 | | $ 88,631,490 | | 1,056,020 | | $ 8,813,157 |
| Inflation Plus Fund | | | | | | | |
| Class A | | | | | | | |
| Shares Sold | 4,267,374 | | $ 48,561,390 | | 3,416,712 | | $ 36,760,046 |
| Shares Issued for Reinvested Dividends | 367,548 | | 4,150,990 | | 284,425 | | 2,969,394 |
| Shares Redeemed | (2,683,474) | | (30,454,466) | | (3,214,757) | | (34,234,638) |
| Net Increase (Decrease) | 1,951,448 | | 22,257,914 | | 486,380 | | 5,494,802 |
| Class C | | | | | | | |
| Shares Sold | 1,457,134 | | $ 15,958,259 | | 353,723 | | $ 3,707,981 |
| Shares Issued for Reinvested Dividends | 21,912 | | 240,360 | | 16,560 | | 167,587 |
| Shares Redeemed | (1,331,823) | | (14,545,308) | | (1,803,410) | | (18,549,888) |
| Net Increase (Decrease) | 147,223 | | 1,653,311 | | (1,433,127) | | (14,674,320) |
| Class I | | | | | | | |
| Shares Sold | 2,845,813 | | $ 33,146,327 | | 2,020,576 | | $ 22,374,318 |
| Shares Issued for Reinvested Dividends | 99,976 | | 1,151,612 | | 93,581 | | 994,771 |
| Shares Redeemed | (2,888,281) | | (33,385,260) | | (2,199,103) | | (23,710,342) |
| Net Increase (Decrease) | 57,508 | | 912,679 | | (84,946) | | (341,253) |
| Class R3 | | | | | | | |
| Shares Sold | 668,119 | | $ 7,426,224 | | 673,544 | | $ 7,093,135 |
| Shares Issued for Reinvested Dividends | 56,332 | | 623,832 | | 52,401 | | 537,110 |
| Shares Redeemed | (1,098,765) | | (12,215,259) | | (1,385,375) | | (14,251,182) |
| Net Increase (Decrease) | (374,314) | | (4,165,203) | | (659,430) | | (6,620,937) |
| Class R4 | | | | | | | |
| Shares Sold | 126,075 | | $ 1,442,615 | | 216,766 | | $ 2,289,573 |
| Shares Issued for Reinvested Dividends | 8,816 | | 99,550 | | 11,266 | | 117,726 |
| Shares Redeemed | (272,025) | | (3,082,148) | | (461,632) | | (4,923,802) |
| Net Increase (Decrease) | (137,134) | | (1,539,983) | | (233,600) | | (2,516,503) |
| Class R5 | | | | | | | |
| Shares Sold | 174,654 | | $ 2,031,951 | | 133,252 | | $ 1,474,320 |
| Shares Issued for Reinvested Dividends | 3,394 | | 38,900 | | 2,858 | | 30,265 |
| Shares Redeemed | (170,408) | | (1,985,922) | | (174,426) | | (1,873,550) |
| Net Increase (Decrease) | 7,640 | | 84,929 | | (38,316) | | (368,965) |
| Class Y | | | | | | | |
| Shares Sold | 350,993 | | $ 4,098,257 | | 659,312 | | $ 7,130,008 |
| Shares Issued for Reinvested Dividends | 59,997 | | 692,032 | | 40,716 | | 433,627 |
| Shares Redeemed | (251,898) | | (2,924,349) | | (279,632) | | (3,063,939) |
| Net Increase (Decrease) | 159,092 | | 1,865,940 | | 420,396 | | 4,499,696 |
| Class F | | | | | | | |
| Shares Sold | 6,699,447 | | $ 77,877,087 | | 3,855,004 | | $ 41,986,825 |
| Shares Issued for Reinvested Dividends | 385,379 | | 4,427,657 | | 298,328 | | 3,168,242 |
| Shares Redeemed | (7,151,979) | | (81,822,185) | | (3,444,902) | | (36,752,619) |
| Net Increase (Decrease) | (67,153) | | 482,559 | | 708,430 | | 8,402,448 |
| Total Net Increase (Decrease) | 1,744,310 | | $ 21,552,146 | | (834,213) | | $ (6,125,032) |
| Municipal Opportunities Fund | | | | | | | |
| Class A | | | | | | | |
| Shares Sold | 10,315,060 | | $ 94,029,978 | | 13,705,812 | | $ 121,518,705 |
| Shares Issued for Reinvested Dividends | 821,396 | | 7,479,752 | | 920,975 | | 8,178,106 |
| Shares Redeemed | (6,341,004) | | (57,788,316) | | (10,088,440) | | (88,468,489) |
| Net Increase (Decrease) | 4,795,452 | | 43,721,414 | | 4,538,347 | | 41,228,322 |
Hartford Fixed Income Funds
Notes to Financial Statements – (continued)
October 31, 2021
| | For the Year Ended
October 31, 2021 | | For the Year Ended
October 31, 2020 |
| | Shares | | Amount | | Shares | | Amount |
| Class C | | | | | | | |
| Shares Sold | 1,046,421 | | $ 9,532,922 | | 1,895,643 | | $ 16,820,563 |
| Shares Issued for Reinvested Dividends | 49,127 | | 447,431 | | 80,275 | | 713,061 |
| Shares Redeemed | (2,317,969) | | (21,145,391) | | (2,880,616) | | (25,479,837) |
| Net Increase (Decrease) | (1,222,421) | | (11,165,038) | | (904,698) | | (7,946,213) |
| Class I | | | | | | | |
| Shares Sold | 39,075,110 | | $ 356,010,648 | | 50,133,652 | | $ 443,070,863 |
| Shares Issued for Reinvested Dividends | 1,416,474 | | 12,907,017 | | 1,269,430 | | 11,279,654 |
| Shares Redeemed | (21,822,694) | | (198,850,063) | | (28,476,329) | | (250,888,458) |
| Net Increase (Decrease) | 18,668,890 | | 170,067,602 | | 22,926,753 | | 203,462,059 |
| Class Y | | | | | | | |
| Shares Sold | 72,852 | | $ 667,079 | | 216,487 | | $ 1,933,106 |
| Shares Issued for Reinvested Dividends | 29,840 | | 271,451 | | 35,516 | | 315,113 |
| Shares Redeemed | (150,426) | | (1,368,437) | | (130,412) | | (1,148,573) |
| Net Increase (Decrease) | (47,734) | | (429,907) | | 121,591 | | 1,099,646 |
| Class F | | | | | | | |
| Shares Sold | 14,055,180 | | $ 127,978,915 | | 17,953,655 | | $ 159,400,282 |
| Shares Issued for Reinvested Dividends | 619,714 | | 5,638,139 | | 329,626 | | 2,925,198 |
| Shares Redeemed | (3,802,494) | | (34,599,476) | | (3,445,684) | | (30,089,476) |
| Net Increase (Decrease) | 10,872,400 | | 99,017,578 | | 14,837,597 | | 132,236,004 |
| Total Net Increase (Decrease) | 33,066,587 | | $ 301,211,649 | | 41,519,590 | | $ 370,079,818 |
| Municipal Short Duration Fund | | | | | | | |
| Class A | | | | | | | |
| Shares Sold | 772,030 | | $ 7,911,677 | | 1,145,838 | | $ 11,586,580 |
| Shares Issued for Reinvested Dividends | 23,554 | | 241,180 | | 33,692 | | 340,581 |
| Shares Redeemed | (476,567) | | (4,881,571) | | (962,122) | | (9,659,221) |
| Net Increase (Decrease) | 319,017 | | 3,271,286 | | 217,408 | | 2,267,940 |
| Class C | | | | | | | |
| Shares Sold | 28,349 | | $ 290,561 | | 96,134 | | $ 967,062 |
| Shares Issued for Reinvested Dividends | 637 | | 6,519 | | 1,497 | | 15,127 |
| Shares Redeemed | (38,489) | | (394,011) | | (85,818) | | (861,322) |
| Net Increase (Decrease) | (9,503) | | (96,931) | | 11,813 | | 120,867 |
| Class I | | | | | | | |
| Shares Sold | 648,580 | | $ 6,634,474 | | 213,769 | | $ 2,164,033 |
| Shares Issued for Reinvested Dividends | 6,761 | | 69,103 | | 5,264 | | 53,174 |
| Shares Redeemed | (226,117) | | (2,314,122) | | (54,837) | | (545,570) |
| Net Increase (Decrease) | 429,224 | | 4,389,455 | | 164,196 | | 1,671,637 |
| Class F | | | | | | | |
| Shares Sold | 333,658 | | $ 3,418,208 | | 98,768 | | $ 991,750 |
| Shares Issued for Reinvested Dividends | 5,024 | | 51,426 | | 3,867 | | 39,099 |
| Shares Redeemed | (56,197) | | (575,970) | | (56,960) | | (566,704) |
| Net Increase (Decrease) | 282,485 | | 2,893,664 | | 45,675 | | 464,145 |
| Total Net Increase (Decrease) | 1,021,223 | | $ 10,457,474 | | 439,092 | | $ 4,524,589 |
| Short Duration Fund | | | | | | | |
| Class A | | | | | | | |
| Shares Sold | 43,741,511 | | $ 440,448,337 | | 51,243,837 | | $ 504,354,186 |
| Shares Issued for Reinvested Dividends | 1,319,453 | | 13,284,320 | | 1,527,630 | | 15,095,226 |
| Shares Redeemed | (37,388,717) | | (376,539,631) | | (33,867,669) | | (331,858,219) |
| Net Increase (Decrease) | 7,672,247 | | 77,193,026 | | 18,903,798 | | 187,591,193 |
| Class C | | | | | | | |
| Shares Sold | 2,780,029 | | $ 27,999,710 | | 6,109,317 | | $ 59,943,618 |
| Shares Issued for Reinvested Dividends | 62,203 | | 626,563 | | 117,376 | | 1,159,082 |
| Shares Redeemed | (4,996,698) | | (50,315,297) | | (5,260,757) | | (51,359,254) |
| Net Increase (Decrease) | (2,154,466) | | (21,689,024) | | 965,936 | | 9,743,446 |
Hartford Fixed Income Funds
Notes to Financial Statements – (continued)
October 31, 2021
| | For the Year Ended
October 31, 2021 | | For the Year Ended
October 31, 2020 |
| | Shares | | Amount | | Shares | | Amount |
| Class I | | | | | | | |
| Shares Sold | 51,681,169 | | $ 518,814,313 | | 41,547,078 | | $ 411,117,591 |
| Shares Issued for Reinvested Dividends | 910,548 | | 9,136,895 | | 860,944 | | 8,498,126 |
| Shares Redeemed | (26,078,348) | | (261,778,917) | | (37,899,515) | | (369,038,007) |
| Net Increase (Decrease) | 26,513,369 | | 266,172,291 | | 4,508,507 | | 50,577,710 |
| Class R3 | | | | | | | |
| Shares Sold | 58,651 | | $ 590,044 | | 144,618 | | $ 1,438,625 |
| Shares Issued for Reinvested Dividends | 2,339 | | 23,516 | | 2,937 | | 28,968 |
| Shares Redeemed | (139,320) | | (1,401,932) | | (78,871) | | (755,948) |
| Net Increase (Decrease) | (78,330) | | (788,372) | | 68,684 | | 711,645 |
| Class R4 | | | | | | | |
| Shares Sold | 9,647 | | $ 96,960 | | 109,508 | | $ 1,087,435 |
| Shares Issued for Reinvested Dividends | 7,323 | | 73,618 | | 13,530 | | 132,100 |
| Shares Redeemed | (53,374) | | (536,328) | | (428,264) | | (4,221,379) |
| Net Increase (Decrease) | (36,404) | | (365,750) | | (305,226) | | (3,001,844) |
| Class R5 | | | | | | | |
| Shares Sold | 41,379 | | $ 415,342 | | 105,028 | | $ 1,042,408 |
| Shares Issued for Reinvested Dividends | 3,151 | | 31,584 | | 3,785 | | 37,255 |
| Shares Redeemed | (103,923) | | (1,042,384) | | (36,827) | | (360,633) |
| Net Increase (Decrease) | (59,393) | | (595,458) | | 71,986 | | 719,030 |
| Class R6(1) | | | | | | | |
| Shares Sold | 210,310 | | $ 2,109,037 | | 180 | | $ 1,768 |
| Shares Issued for Reinvested Dividends | 2,932 | | 29,249 | | 33 | | 320 |
| Shares Redeemed | (10,763) | | (107,394) | | — | | — |
| Net Increase (Decrease) | 202,479 | | 2,030,892 | | 213 | | 2,088 |
| Class Y | | | | | | | |
| Shares Sold | 742,042 | | $ 7,436,923 | | 1,236,976 | | $ 12,231,240 |
| Shares Issued for Reinvested Dividends | 16,550 | | 165,554 | | 23,955 | | 234,836 |
| Shares Redeemed | (563,950) | | (5,637,674) | | (1,755,749) | | (16,923,506) |
| Net Increase (Decrease) | 194,642 | | 1,964,803 | | (494,818) | | (4,457,430) |
| Class F | | | | | | | |
| Shares Sold | 25,375,037 | | $ 254,318,427 | | 11,110,634 | | $ 109,353,226 |
| Shares Issued for Reinvested Dividends | 665,611 | | 6,671,571 | | 656,086 | | 6,471,032 |
| Shares Redeemed | (8,351,073) | | (83,723,919) | | (9,197,312) | | (89,892,896) |
| Net Increase (Decrease) | 17,689,575 | | 177,266,079 | | 2,569,408 | | 25,931,362 |
| Total Net Increase (Decrease) | 49,943,719 | | $ 501,188,487 | | 26,288,488 | | $ 267,817,200 |
| Strategic Income Fund | | | | | | | |
| Class A | | | | | | | |
| Shares Sold | 21,611,349 | | $ 200,787,943 | | 13,346,771 | | $ 118,837,640 |
| Shares Issued for Reinvested Dividends | 1,426,879 | | 13,237,420 | | 866,819 | | 7,532,677 |
| Shares Redeemed | (9,312,754) | | (86,337,130) | | (5,624,519) | | (48,357,802) |
| Net Increase (Decrease) | 13,725,474 | | 127,688,233 | | 8,589,071 | | 78,012,515 |
| Class C | | | | | | | |
| Shares Sold | 4,935,359 | | $ 46,192,486 | | 4,433,541 | | $ 39,397,046 |
| Shares Issued for Reinvested Dividends | 265,511 | | 2,484,171 | | 172,344 | | 1,505,044 |
| Shares Redeemed | (3,079,574) | | (28,759,095) | | (2,518,682) | | (21,967,538) |
| Net Increase (Decrease) | 2,121,296 | | 19,917,562 | | 2,087,203 | | 18,934,552 |
| Class I | | | | | | | |
| Shares Sold | 186,113,585 | | $ 1,732,669,528 | | 107,606,359 | | $ 949,984,625 |
| Shares Issued for Reinvested Dividends | 6,309,325 | | 58,680,821 | | 1,953,846 | | 17,112,338 |
| Shares Redeemed | (73,046,767) | | (678,854,755) | | (37,195,826) | | (321,439,864) |
| Net Increase (Decrease) | 119,376,143 | | 1,112,495,594 | | 72,364,379 | | 645,657,099 |
| Class R3 | | | | | | | |
| Shares Sold | 324,094 | | $ 2,997,167 | | 95,140 | | $ 849,021 |
| Shares Issued for Reinvested Dividends | 8,229 | | 76,238 | | 3,268 | | 28,423 |
| Shares Redeemed | (150,155) | | (1,396,134) | | (5,016) | | (45,001) |
| Net Increase (Decrease) | 182,168 | | 1,677,271 | | 93,392 | | 832,443 |
Hartford Fixed Income Funds
Notes to Financial Statements – (continued)
October 31, 2021
| | For the Year Ended
October 31, 2021 | | For the Year Ended
October 31, 2020 |
| | Shares | | Amount | | Shares | | Amount |
| Class R4 | | | | | | | |
| Shares Sold | 1,070,834 | | $ 9,909,554 | | 491,161 | | $ 4,299,455 |
| Shares Issued for Reinvested Dividends | 29,891 | | 276,821 | | 5,175 | | 46,207 |
| Shares Redeemed | (97,082) | | (901,561) | | (37,816) | | (337,964) |
| Net Increase (Decrease) | 1,003,643 | | 9,284,814 | | 458,520 | | 4,007,698 |
| Class R5 | | | | | | | |
| Shares Sold | 5,161,245 | | $ 47,935,127 | | 1,128,324 | | $ 9,846,175 |
| Shares Issued for Reinvested Dividends | 153,409 | | 1,419,428 | | 41,860 | | 364,909 |
| Shares Redeemed | (1,901,630) | | (17,650,166) | | (426,229) | | (3,659,866) |
| Net Increase (Decrease) | 3,413,024 | | 31,704,389 | | 743,955 | | 6,551,218 |
| Class R6(1) | | | | | | | |
| Shares Sold | 18,386,599 | | $ 170,670,634 | | 1,095,884 | | $ 9,817,038 |
| Shares Issued for Reinvested Dividends | 267,829 | | 2,475,775 | | 14,400 | | 126,449 |
| Shares Redeemed | (2,224,924) | | (20,580,644) | | (153,866) | | (1,365,949) |
| Net Increase (Decrease) | 16,429,504 | | 152,565,765 | | 956,418 | | 8,577,538 |
| Class Y | | | | | | | |
| Shares Sold | 18,666,089 | | $ 172,834,492 | | 11,044,742 | | $ 98,123,559 |
| Shares Issued for Reinvested Dividends | 641,022 | | 5,924,383 | | 174,069 | | 1,523,119 |
| Shares Redeemed | (7,682,585) | | (70,860,509) | | (1,209,957) | | (10,394,818) |
| Net Increase (Decrease) | 11,624,526 | | 107,898,366 | | 10,008,854 | | 89,251,860 |
| Class F | | | | | | | |
| Shares Sold | 23,749,838 | | $ 220,995,101 | | 14,928,674 | | $ 133,829,542 |
| Shares Issued for Reinvested Dividends | 1,491,887 | | 13,871,460 | | 807,195 | | 7,033,285 |
| Shares Redeemed | (15,824,966) | | (146,831,804) | | (4,803,713) | | (41,174,194) |
| Net Increase (Decrease) | 9,416,759 | | 88,034,757 | | 10,932,156 | | 99,688,633 |
| Total Net Increase (Decrease) | 177,292,537 | | $ 1,651,266,751 | | 106,233,948 | | $ 951,513,556 |
| Sustainable Municipal Bond Fund | | | | | | | |
| Class A | | | | | | | |
| Shares Sold | 1,038,275 | | $ 11,501,133 | | 1,810,083 | | $ 19,362,123 |
| Shares Issued for Reinvested Dividends | 52,290 | | 579,257 | | 66,661 | | 716,775 |
| Shares Redeemed | (578,524) | | (6,403,924) | | (514,527) | | (5,472,708) |
| Net Increase (Decrease) | 512,041 | | 5,676,466 | | 1,362,217 | | 14,606,190 |
| Class C | | | | | | | |
| Shares Sold | 89,333 | | $ 988,285 | | 273,882 | | $ 2,935,669 |
| Shares Issued for Reinvested Dividends | 2,742 | | 30,346 | | 6,407 | | 68,800 |
| Shares Redeemed | (83,549) | | (926,027) | | (102,934) | | (1,107,063) |
| Net Increase (Decrease) | 8,526 | | 92,604 | | 177,355 | | 1,897,406 |
| Class I | | | | | | | |
| Shares Sold | 2,649,639 | | $ 29,356,756 | | 2,159,787 | | $ 23,139,936 |
| Shares Issued for Reinvested Dividends | 54,058 | | 597,267 | | 33,470 | | 359,362 |
| Shares Redeemed | (512,529) | | (5,662,535) | | (376,105) | | (3,914,265) |
| Net Increase (Decrease) | 2,191,168 | | 24,291,488 | | 1,817,152 | | 19,585,033 |
| Class F | | | | | | | |
| Shares Sold | 1,506,806 | | $ 16,668,418 | | 1,136,896 | | $ 12,112,442 |
| Shares Issued for Reinvested Dividends | 32,048 | | 354,239 | | 16,823 | | 180,804 |
| Shares Redeemed | (279,172) | | (3,083,908) | | (163,103) | | (1,700,273) |
| Net Increase (Decrease) | 1,259,682 | | 13,938,749 | | 990,616 | | 10,592,973 |
| Total Net Increase (Decrease) | 3,971,417 | | $ 43,999,307 | | 4,347,340 | | $ 46,681,602 |
| Total Return Bond Fund | | | | | | | |
| Class A | | | | | | | |
| Shares Sold | 20,613,425 | | $ 227,547,696 | | 28,885,483 | | $ 314,770,359 |
| Issued in Merger | — | | — | | 2,156,231 | | 24,253,074 |
| Shares Issued for Reinvested Dividends | 2,886,135 | | 31,930,027 | | 2,247,855 | | 24,550,223 |
| Shares Redeemed | (15,294,992) | | (168,418,987) | | (13,562,584) | | (146,714,479) |
| Net Increase (Decrease) | 8,204,568 | | 91,058,736 | | 19,726,985 | | 216,859,177 |
Hartford Fixed Income Funds
Notes to Financial Statements – (continued)
October 31, 2021
| | For the Year Ended
October 31, 2021 | | For the Year Ended
October 31, 2020 |
| | Shares | | Amount | | Shares | | Amount |
| Class C | | | | | | | |
| Shares Sold | 125,459 | | $ 1,408,851 | | 287,581 | | $ 3,198,791 |
| Issued in Merger | — | | — | | 1,148,560 | | 13,070,389 |
| Shares Issued for Reinvested Dividends | 40,769 | | 458,303 | | 34,775 | | 384,209 |
| Shares Redeemed | (1,646,762) | | (18,235,828) | | (1,157,868) | | (12,799,289) |
| Net Increase (Decrease) | (1,480,534) | | (16,368,674) | | 313,048 | | 3,854,100 |
| Class I | | | | | | | |
| Shares Sold | 23,065,926 | | $ 254,537,428 | | 20,059,875 | | $ 219,445,628 |
| Issued in Merger | — | | — | | 2,022,055 | | 22,674,107 |
| Shares Issued for Reinvested Dividends | 792,424 | | 8,734,672 | | 389,549 | | 4,249,385 |
| Shares Redeemed | (23,478,054) | | (257,215,051) | | (5,681,806) | | (61,207,596) |
| Net Increase (Decrease) | 380,296 | | 6,057,049 | | 16,789,673 | | 185,161,524 |
| Class R3 | | | | | | | |
| Shares Sold | 91,409 | | $ 1,043,059 | | 146,280 | | $ 1,654,997 |
| Issued in Merger | — | | — | | 2,655 | | 30,689 |
| Shares Issued for Reinvested Dividends | 9,621 | | 109,580 | | 8,416 | | 94,367 |
| Shares Redeemed | (137,749) | | (1,570,585) | | (149,521) | | (1,646,936) |
| Net Increase (Decrease) | (36,719) | | (417,946) | | 7,830 | | 133,117 |
| Class R4 | | | | | | | |
| Shares Sold | 526,077 | | $ 5,961,648 | | 534,048 | | $ 5,997,115 |
| Issued in Merger | — | | — | | 1,126 | | 12,908 |
| Shares Issued for Reinvested Dividends | 34,664 | | 390,822 | | 22,339 | | 248,694 |
| Shares Redeemed | (428,368) | | (4,829,537) | | (436,828) | | (4,809,979) |
| Net Increase (Decrease) | 132,373 | | 1,522,933 | | 120,685 | | 1,448,738 |
| Class R5 | | | | | | | |
| Shares Sold | 116,923 | | $ 1,302,795 | | 291,949 | | $ 3,243,533 |
| Issued in Merger | — | | — | | 1,516 | | 17,269 |
| Shares Issued for Reinvested Dividends | 6,254 | | 70,111 | | 3,809 | | 42,181 |
| Shares Redeemed | (144,702) | | (1,624,422) | | (159,149) | | (1,748,398) |
| Net Increase (Decrease) | (21,525) | | (251,516) | | 138,125 | | 1,554,585 |
| Class R6(1) | | | | | | | |
| Shares Sold | 16,030,448 | | $ 178,285,324 | | 3,175,849 | | $ 34,624,258 |
| Shares Issued for Reinvested Dividends | 369,410 | | 4,083,124 | | 142,818 | | 1,565,097 |
| Shares Redeemed | (3,488,529) | | (38,462,160) | | (1,385,972) | | (15,104,521) |
| Net Increase (Decrease) | 12,911,329 | | 143,906,288 | | 1,932,695 | | 21,084,834 |
| Class Y | | | | | | | |
| Shares Sold | 12,616,432 | | $ 141,220,192 | | 13,484,725 | | $ 149,148,655 |
| Issued in Merger | — | | — | | 23,303 | | 263,851 |
| Shares Issued for Reinvested Dividends | 1,058,709 | | 11,793,835 | | 939,760 | | 10,303,444 |
| Shares Redeemed | (12,528,486) | | (140,027,793) | | (23,222,388) | | (249,279,226) |
| Net Increase (Decrease) | 1,146,655 | | 12,986,234 | | (8,774,600) | | (89,563,276) |
| Class F | | | | | | | |
| Shares Sold | 49,398,947 | | $ 538,969,023 | | 43,913,726 | | $ 474,299,178 |
| Issued in Merger | — | | — | | 217,574 | | 2,424,664 |
| Shares Issued for Reinvested Dividends | 2,857,485 | | 31,290,363 | | 2,095,170 | | 22,645,999 |
| Shares Redeemed | (26,467,617) | | (287,175,445) | | (12,058,383) | | (129,418,091) |
| Net Increase (Decrease) | 25,788,815 | | 283,083,941 | | 34,168,087 | | 369,951,750 |
| Total Net Increase (Decrease) | 47,025,258 | | $ 521,577,045 | | 64,422,528 | | $ 710,484,549 |
| World Bond Fund | | | | | | | |
| Class A | | | | | | | |
| Shares Sold | 8,513,912 | | $ 90,142,866 | | 11,853,572 | | $ 124,563,268 |
| Shares Issued for Reinvested Dividends | 279,709 | | 2,956,330 | | 916,828 | | 9,618,889 |
| Shares Redeemed | (13,997,130) | | (148,236,262) | | (12,689,889) | | (132,649,893) |
| Net Increase (Decrease) | (5,203,509) | | (55,137,066) | | 80,511 | | 1,532,264 |
| Class C | | | | | | | |
| Shares Sold | 312,916 | | $ 3,236,579 | | 1,578,580 | | $ 16,215,963 |
| Shares Issued for Reinvested Dividends | 11,650 | | 120,581 | | 131,186 | | 1,353,066 |
| Shares Redeemed | (2,826,792) | | (29,225,428) | | (3,216,831) | | (33,065,235) |
| Net Increase (Decrease) | (2,502,226) | | (25,868,268) | | (1,507,065) | | (15,496,206) |
Hartford Fixed Income Funds
Notes to Financial Statements – (continued)
October 31, 2021
| | For the Year Ended
October 31, 2021 | | For the Year Ended
October 31, 2020 |
| | Shares | | Amount | | Shares | | Amount |
| Class I | | | | | | | |
| Shares Sold | 59,331,742 | | $ 633,620,407 | | 91,513,500 | | $ 970,005,731 |
| Shares Issued for Reinvested Dividends | 1,754,865 | | 18,693,876 | | 4,663,389 | | 49,256,832 |
| Shares Redeemed | (79,906,986) | | (852,961,122) | | (113,328,621) | | (1,193,910,175) |
| Net Increase (Decrease) | (18,820,379) | | (200,646,839) | | (17,151,732) | | (174,647,612) |
| Class R3 | | | | | | | |
| Shares Sold | 17,002 | | $ 178,617 | | 108,636 | | $ 1,129,269 |
| Shares Issued for Reinvested Dividends | 547 | | 5,738 | | 3,518 | | 36,727 |
| Shares Redeemed | (55,582) | | (583,418) | | (161,163) | | (1,659,947) |
| Net Increase (Decrease) | (38,033) | | (399,063) | | (49,009) | | (493,951) |
| Class R4 | | | | | | | |
| Shares Sold | 546,957 | | $ 5,787,608 | | 849,081 | | $ 8,855,360 |
| Shares Issued for Reinvested Dividends | 11,364 | | 120,174 | | 24,403 | | 255,884 |
| Shares Redeemed | (1,950,796) | | (20,588,967) | | (100,526) | | (1,053,542) |
| Net Increase (Decrease) | (1,392,475) | | (14,681,185) | | 772,958 | | 8,057,702 |
| Class R5 | | | | | | | |
| Shares Sold | 325,631 | | $ 3,478,070 | | 465,869 | | $ 4,906,254 |
| Shares Issued for Reinvested Dividends | 8,130 | | 86,626 | | 14,524 | | 153,384 |
| Shares Redeemed | (285,640) | | (3,048,914) | | (300,932) | | (3,180,962) |
| Net Increase (Decrease) | 48,121 | | 515,782 | | 179,461 | | 1,878,676 |
| Class R6(1) | | | | | | | |
| Shares Sold | 4,045,683 | | $ 43,376,011 | | 11,886,116 | | $ 125,598,122 |
| Shares Issued for Reinvested Dividends | 130,007 | | 1,390,466 | | 65,574 | | 691,752 |
| Shares Redeemed | (2,892,880) | | (31,028,566) | | (2,918,313) | | (30,795,658) |
| Net Increase (Decrease) | 1,282,810 | | 13,737,911 | | 9,033,377 | | 95,494,216 |
| Class Y | | | | | | | |
| Shares Sold | 13,791,314 | | $ 147,739,299 | | 18,859,020 | | $ 200,397,393 |
| Shares Issued for Reinvested Dividends | 329,316 | | 3,519,884 | | 1,138,357 | | 12,064,039 |
| Shares Redeemed | (20,642,223) | | (221,281,303) | | (33,849,252) | | (357,158,394) |
| Net Increase (Decrease) | (6,521,593) | | (70,022,120) | | (13,851,875) | | (144,696,962) |
| Class F | | | | | | | |
| Shares Sold | 40,147,261 | | $ 429,375,901 | | 53,456,392 | | $ 565,674,517 |
| Shares Issued for Reinvested Dividends | 1,579,053 | | 16,844,881 | | 4,833,555 | | 51,124,691 |
| Shares Redeemed | (36,122,937) | | (386,131,740) | | (107,074,605) | | (1,129,497,459) |
| Net Increase (Decrease) | 5,603,377 | | 60,089,042 | | (48,784,658) | | (512,698,251) |
| Total Net Increase (Decrease) | (27,543,907) | | $ (292,411,806) | | (71,278,032) | | $ (741,070,124) |
| (1) | Commenced operations on March 1, 2021. |
| 13. | Fund Reorganization: |
| | At a meeting held February 4-5, 2020, the Board of Directors of the Company approved an Agreement and Plan of Reorganization that provided for the reorganization of The Hartford Quality Bond Fund (the “Quality Bond Fund”), a series of the Company, with and into the Total Return Bond Fund, a separate series of the Company (the “Reorganization”). |
| | Pursuant to the terms of the Agreement and Plan of Reorganization, after the close of business on July 24, 2020, the Quality Bond Fund transferred all of its assets to the Total Return Bond Fund, in exchange for shares of the Total Return Bond Fund and the assumption of all of the liabilities of the Quality Bond Fund by the Total Return Bond Fund. |
Hartford Fixed Income Funds
Notes to Financial Statements – (continued)
October 31, 2021
| | After the close of business on July 24, 2020, the consummation of the Reorganization was accomplished by a tax-free exchange of shares of the Total Return Bond Fund in the following amounts: |
| | |
| Share Class | | Net Assets of the
Quality Bond Fund
as of the close of business on
July 24, 2020
("Reorgnaization Date") | | Shares of the
Quality Bond Fund
as of the
Reorganization Date | | Value of Shares Issued by
Total Return Bond Fund | | Shares Issued by
Total Return Bond Fund | | Net Assets of the
Total Return Bond Fund
immediately after
the Reorganization |
| Class A | | $ 24,253,074 | | 2,383,212 | | $ 24,253,074 | | 2,156,231 | | $ 1,151,027,274 |
| Class C | | 13,070,389 | | 1,294,146 | | 13,070,389 | | 1,148,560 | | 34,326,690 |
| Class I | | 22,674,107 | | 2,237,310 | | 22,674,107 | | 2,022,055 | | 219,198,829 |
| Class R3 | | 30,689 | | 3,014 | | 30,689 | | 2,655 | | 5,054,080 |
| Class R4 | | 12,908 | | 1,270 | | 12,908 | | 1,126 | | 12,348,018 |
| Class R5 | | 17,269 | | 1,701 | | 17,269 | | 1,516 | | 1,873,131 |
| Class R6 | | N/A | | N/A | | N/A | | N/A | | 58,735,611 |
| Class Y | | 263,851 | | 25,859 | | 263,851 | | 23,303 | | 334,195,150 |
| Class F | | 2,424,664 | | 239,494 | | 2,424,664 | | 217,574 | | 849,103,140 |
| | | $ 62,746,951 | | 6,186,006 | | $ 62,746,951 | | 5,573,020 | | $ 2,665,861,923 |
Each shareholder of a share class of the Quality Bond Fund received shares of the same share class of the Total Return Bond Fund with the same class designation and at the respective class NAV, as determined on the Reorganization Date.
Some of the investments held by the Quality Bond Fund may have been purchased or sold prior to the Reorganization for the purpose of complying with the anticipated investment policies or limitations of the Total Return Bond Fund after the Reorganization. The expenses associated with the Reorganization other than brokerage-related expenses, including stamp taxes and other similar transaction costs, were borne by HFMC or its affiliates.
As of the Reorganization Date, the Quality Bond Fund had investments valued at $61,543,600 with a cost basis of $58,380,594. For financial reporting purposes, assets received, liabilities assumed and shares issued by the Total Return Bond Fund were recorded at fair value; however,the cost basis of the investments received by the Total Return Bond Fund from the Quality Bond Fund were carried forward to align ongoing reporting of the Total Return Bond Fund’s realized and unrealized gains and losses with amounts distributable to shareholders for tax purposes.
The aggregate net assets of the Total Return Bond Fund immediately after the acquisition were $2,665,861,923 which included $3,163,006 of acquired unrealized appreciation.
Assuming the Reorganization had been completed on November 1, 2019, the Total Return Bond Fund’s pro-forma results of operations for the year ended October 31, 2020 are as follows:
| Net investment income | $ 57,820,897 |
| Net realized and unrealized gain (loss) on investments | $ 109,427,219 |
| Net increase (decrease) in net assets from operations | $167,248,116 |
| 14. | Line of Credit: |
| | Each Fund participates in a committed line of credit pursuant to a credit agreement dated March 4, 2021. Each Fund may borrow under the line of credit for temporary or emergency purposes. The Funds (together with certain other Hartford Funds) may borrow up to $350 million in the aggregate, subject to asset coverage and other limitations specified in the credit agreement. The interest rate on borrowings varies depending on the nature of the loan. The facility also charges certain fees, such as an upfront fee and a commitment fee. From November 1, 2020 through March 4, 2021, the Funds (together with certain other Hartford Funds) had a similar agreement that enabled them to participate in a $350 million committed line of credit. The fees incurred by the Funds in connection with the committed lines of credit during the period appear in the Statements of Operations under “Other expenses.” During and as of the year ended October 31, 2021, none of the Funds had borrowings under this facility. |
| 15. | Indemnifications: |
| | Under the Company’s organizational documents, the Company shall indemnify its officers and directors to the full extent required or permitted under Maryland General Corporation Law and federal securities laws. In addition, the Company, on behalf of each Fund, may enter into contracts that contain a variety of indemnifications. The Company’s maximum exposure under these arrangements is unknown. However, as of the date of these financial statements, the Company has not had prior claims or losses pursuant to these contracts and expects the risk of loss to be remote. |
Hartford Fixed Income Funds
Notes to Financial Statements – (continued)
October 31, 2021
| 16. | Recent Accounting Pronouncement: |
| | In March 2020, FASB issued Accounting Standards Update (“ASU”) No. 2020-04, Reference Rate Reform (Topic 848); Facilitation of the Effects of Reference Rate Reform on Financial Reporting, which provides optional guidance for a limited period of time to ease the potential burden in accounting for (or recognizing the effects of) reference rate reform. The guidance is applicable to contracts referencing LIBOR or another reference rate that is expected to be discontinued due to reference rate reform. The ASU is effective as of March 12, 2020 and generally can be applied through December 31, 2022. Management is evaluating the underlying securities referencing LIBOR or another reference rate that is expected to be discontinued over the period of time the ASU is effective. |
| 17. | Change in Independent Registered Public Accounting Firm: |
| | On November 6, 2019, the Company, on behalf of the Funds, dismissed Ernst & Young LLP (“EY”) as the Funds’ independent registered public accounting firm effective upon the issuance of EY’s report on the Funds’ financial statements as of and for the fiscal year ended October 31, 2019. EY’s report on the Funds’ financial statements for the fiscal years October 31, 2018 and October 31, 2019 contained no adverse opinion or disclaimer of opinion nor was EY’s report qualified or modified as to uncertainty, audit scope or accounting principles. During the Funds’ fiscal periods ended on October 31, 2018 and October 31, 2019 and through December 30, 2019 (the “Covered Period”), (i) there were no disagreements with EY on any matter of accounting principles or practices, financial statement disclosure or auditing scope or procedure, which disagreements, if not resolved to the satisfaction of EY, would have caused it to make reference to the subject matter of the disagreements in connection with its reports on the Funds’ financial statements for the Covered Period, and (ii) there were no “reportable events” of the kind described in Item 304(a)(1)(v) of Regulation S-K under the Securities Exchange Act of 1934, as amended. |
| | On November 6, 2019, the Audit Committee of the Company’s Board of Directors participated in and approved the decision to engage PricewaterhouseCoopers LLP (“PwC”) as the independent registered public accounting firm for the Funds for the fiscal year ended October 31, 2020. The selection of PwC does not reflect any disagreements with or dissatisfaction by the Company or the Board of Directors with the performance of the Funds’ prior independent registered public accounting firm, EY. During the Covered Period, neither the Funds, nor anyone on their behalf, consulted with PwC on items which: (i) concerned the application of accounting principles to a specified transaction, either completed or proposed, or the type of audit opinion that might be rendered on the Funds’ financial statements; or (ii) concerned the subject of a disagreement (as defined in paragraph (a)(1)(iv) of Item 304 of Regulation S-K) or reportable events (as described in paragraph (a)(1)(v) of Item 304 of Regulation S-K). |
| 18. | Subsequent Events: |
| | In connection with the preparation of the financial statements of the Funds as of and for the year ended October 31, 2021, events and transactions subsequent to October 31, 2021, through the date the financial statements were issued have been evaluated by the Funds’ management for possible adjustment and/or disclosure. |
| | Effective November 1, 2021, the management fee of HFMC set forth in the investment management agreement with respect to the World Bond Fund is as follows: 0.6800% of the first $250 million, 0.6300% of the next $250 million, 0.5800% of the next $2 billion, 0.5300% of the next $2.5 billion, 0.4750% of the next $5 billion, and 0.4500% in excess of $10 billion annually of the Fund’s average daily net assets. |
Report of Independent Registered Public Accounting Firm
To the Board of Directors of The Hartford Mutual Funds, Inc. and Shareholders of The Hartford Emerging Markets Local Debt Fund, The Hartford Floating Rate Fund, The Hartford Floating Rate High Income Fund, The Hartford High Yield Fund, The Hartford Inflation Plus Fund, The Hartford Municipal Opportunities Fund, Hartford Municipal Short Duration Fund, The Hartford Short Duration Fund, The Hartford Strategic Income Fund, Hartford Sustainable Municipal Bond Fund, The Hartford Total Return Bond Fund and The Hartford World Bond Fund
Opinion on the Financial Statements
We have audited the accompanying statements of assets and liabilities, including the schedules of investments, of The Hartford Emerging Markets Local Debt Fund, The Hartford Floating Rate Fund, The Hartford Floating Rate High Income Fund, The Hartford High Yield Fund, The Hartford Inflation Plus Fund, The Hartford Municipal Opportunities Fund, Hartford Municipal Short Duration Fund, The Hartford Short Duration Fund, The Hartford Strategic Income Fund, Hartford Sustainable Municipal Bond Fund , The Hartford Total Return Bond Fund and The Hartford World Bond Fund (twelve of the funds constituting The Hartford Mutual Funds, Inc., hereafter collectively referred to as the "Funds") as of October 31, 2021, the related statements of operations for the year ended October 31, 2021, the statements of changes in net assets for each of the two years in the period ended October 31, 2021, including the related notes, and the financial highlights for each of the periods indicated therein ended on or subsequent to October 31, 2020 (collectively referred to as the “financial statements”). In our opinion, the financial statements present fairly, in all material respects, the financial position of each of the Funds as of October 31, 2021, the results of each of their operations for the year then ended, the changes in each of their net assets for each of the two years in the period ended October 31, 2021 and each of the financial highlights for each of the periods indicated therein ended on or subsequent to October 31, 2020 in conformity with accounting principles generally accepted in the United States of America.
The financial statements of the Funds as of and for the year ended October 31, 2019 and the financial highlights for each of the periods ended on or prior to October 31, 2019 (not presented herein, other than the financial highlights) were audited by other auditors whose report dated December 30, 2019 expressed an unqualified opinion on those financial statements and financial highlights.
Basis for Opinion
These financial statements are the responsibility of the Funds’ management. Our responsibility is to express an opinion on the Funds’ financial statements based on our audits. We are a public accounting firm registered with the Public Company Accounting Oversight Board (United States) (PCAOB) and are required to be independent with respect to the Funds in accordance with the U.S. federal securities laws and the applicable rules and regulations of the Securities and Exchange Commission and the PCAOB.
We conducted our audits of these financial statements in accordance with the standards of the PCAOB. Those standards require that we plan and perform the audit to obtain reasonable assurance about whether the financial statements are free of material misstatement, whether due to error or fraud.
Our audits included performing procedures to assess the risks of material misstatement of the financial statements, whether due to error or fraud, and performing procedures that respond to those risks. Such procedures included examining, on a test basis, evidence regarding the amounts and disclosures in the financial statements. Our audits also included evaluating the accounting principles used and significant estimates made by management, as well as evaluating the overall presentation of the financial statements. Our procedures included confirmation of securities owned as of October 31, 2021 by correspondence with the custodian, transfer agent, agent banks and brokers; when replies were not received from brokers, we performed other auditing procedures. We believe that our audits provide a reasonable basis for our opinions.
/s/ PricewaterhouseCoopers LLP
Philadelphia, Pennsylvania
December 28, 2021
We have served as the auditor of one or more investment companies in the Hartford Funds group of investment companies since 2020.
Hartford Fixed Income Funds
Operation of the Liquidity Risk Management Program (Unaudited)
This section describes the operation and effectiveness of the Liquidity Risk Management Program (“LRM Program”) established in accordance with Rule 22e-4 under the Investment Company Act of 1940, as amended (the “Liquidity Rule”). The LRM Program seeks to assess and manage each Fund’s liquidity risk. The Liquidity Rule generally defines liquidity risk as the risk that a Fund could not meet its obligation to redeem shares without significant dilution of the non-redeeming investors’ interests in the Fund. The Board of Directors (“Board”) of The Hartford Mutual Funds, Inc. has appointed Hartford Funds Management Company, LLC (“HFMC”) to serve as the administrator of the LRM Program with respect to each of the Funds, subject to the oversight of the Board. In order to efficiently and effectively administer the LRM Program, HFMC established a Liquidity Risk Oversight Committee.
The LRM Program is comprised of various components designed to support the assessment and/or management of liquidity risk, including: (1) the assessment and periodic review (no less frequently than annually) of certain factors that influence each Fund’s liquidity risk; (2) the classification and periodic review (no less frequently than monthly) of each Fund’s investments into one of four liquidity categories that reflect an estimate of their liquidity under current market conditions; (3) a 15% limit on the acquisition of “illiquid investments” (as defined under the Liquidity Rule); (4) the determination of a minimum percentage of each Fund’s assets that generally will be invested in highly liquid investments (“HLIM”); (5) the periodic review (no less frequently than annually) of the HLIM and the adoption and implementation of policies and procedures for responding to a shortfall of a Fund’s highly liquid investments below its HLIM; and (6) periodic reporting to the Board.
At a meeting of the Board held May 11-13, 2021, HFMC provided an annual written report to the Board covering the period from April 1, 2020 through March 31, 2021. The annual report addressed important aspects of the LRM Program, including, but not limited to:
| • | the operation of the LRM Program (and related policies and procedures utilized in connection with management of the Funds’ liquidity risk); |
| • | an assessment of the adequacy and effectiveness of the LRM Program’s (and related policies and procedures’) implementation; |
| • | the operation, and assessment of the adequacy and effectiveness, of each Fund’s HLIM; |
| • | whether the third-party liquidity vendor’s (“LRM Program Vendor”) processes for determining preliminary liquidity classifications, including the particular methodologies or factors used and metrics analyzed by the LRM Program Vendor, are sufficient under the Liquidity Rule and appropriate in light of each Fund’s specific circumstances; and |
| • | any material changes to the LRM Program. |
In addition, HFMC provides a quarterly report on the LRM Program at each quarterly meeting of the Board’s Compliance and Risk Oversight Committee. The quarterly report included information regarding the Funds’ liquidity as measured by established parameters, a summary of developments within the capital markets that may impact liquidity, and other factors that may impact liquidity. Among other things, HFMC reports any changes to a Fund’s HLIM.
From April 1, 2020 through March 31, 2021, HFMC did not increase or reduce the HLIM for any Fund.
Based on its review and assessment, HFMC has concluded that the LRM Program is operating effectively to assess and manage the liquidity risk of each Fund and that the LRM Program has been and continues to be adequately and effectively implemented with respect to each Fund. Because liquidity in the capital markets in which the Funds invest is beyond the control of the Funds, there can be no assurance that the LRM Program will ensure liquidity under all circumstances and does not protect against the risk of loss.
Hartford Fixed Income Funds
Directors and Officers of the Company (Unaudited)
The Hartford Mutual Funds, Inc. (the “Company”) is governed by a Board of Directors (the “Directors”). The following tables present certain information regarding the Directors and officers of the Company as of October 31, 2021. For more information regarding the Directors and officers, please refer to the Statement of Additional Information, which is available, without charge, upon request by calling 1-888-843-7824.
NAME, YEAR OF BIRTH
AND ADDRESS(1) | | POSITION
HELD WITH
THE COMPANY | | TERM OF
OFFICE(2) AND
LENGTH OF
TIME SERVED | | PRINCIPAL OCCUPATION(S)
DURING PAST 5 YEARS | | NUMBER OF
PORTFOLIOS
IN FUND
COMPLEX(3)
OVERSEEN
BY DIRECTOR | | OTHER DIRECTORSHIPS
FOR PUBLIC COMPANIES
AND OTHER REGISTERED
INVESTMENT COMPANIES
BY DIRECTOR |
| NON-INTERESTED DIRECTORS |
HILARY E. ACKERMANN
(1956) | | Director | | Since 2014 | | Ms. Ackermann served as Chief Risk Officer at Goldman Sachs Bank USA from October 2008 to November 2011. | | 75 | | Ms. Ackermann served as a Director of Dynegy, Inc. from October 2012 until its acquisition by Vistra Energy Corporation (“Vistra”) in 2018, and since that time she has served as a Director of Vistra. Ms. Ackermann serves as a Director of Credit Suisse Holdings (USA), Inc. from January 2017 to present. |
ROBIN C. BEERY
(1967) | | Director | | Since 2017 | | Ms. Beery has served as a consultant to ArrowMark Partners (an alternative asset manager) since March of 2015 and since November 2018 has been employed by ArrowMark Partners as a Senior Advisor. Previously, she was Executive Vice President, Head of Distribution, for Janus Capital Group, and Chief Executive Officer and President of the Janus Mutual Funds (a global asset manager) from September 2009 to August 2014. | | 75 | | Ms. Beery serves as an independent Director of UMB Financial Corporation (January 2015 to present), has chaired the Compensation Committee since April 2017, and serves on the Audit Committee and the Risk Committee. |
LYNN S. BIRDSONG(4), (5)
(1946) | | Director and Chair of the Board | | Director since 2003; Chair of the Board since 2019 | | From January 1981 through December 2013, Mr. Birdsong was a partner in Birdsong Company, an advertising specialty firm. From 1979 to 2002, Mr. Birdsong was a Managing Director of Zurich Scudder Investments, an investment management firm. | | 75 | | None |
DERRICK D. CEPHAS
(1952) | | Director | | Since 2020 | | Mr. Cephas currently serves as Of Counsel to Squire Patton Boggs LLP, an international law firm with 45 offices in 20 countries. Until his retirement in October 2020, Mr. Cephas was a Partner of Weil, Gotshal & Manges LLP, an international law firm headquartered in New York, where he served as the Head of the Financial Institutions Practice (April 2011 to October 2020). | | 75 | | Mr. Cephas currently serves as a Director of Signature Bank, a New York-based commercial bank, and is a member of the Credit Committee, Examining Committee and Risk Committee. Mr. Cephas currently serves as a Director of Claros Mortgage Trust, Inc., a real estate investment trust. |
CHRISTINE R. DETRICK(5)
(1958) | | Director | | Since 2016 | | Ms. Detrick served as a Senior Partner/Advisor at Bain & Company (a management consulting firm) from September 2002 to December 2012. | | 75 | | Ms. Detrick serves as a Director and Chair of the Nominating and Governance Committee of Reinsurance Group of America (from January 2014 to present). She also serves as a Director of Charles River Associates (May 2020 to present). |
Hartford Fixed Income Funds
Directors and Officers of the Company (Unaudited) – (continued)
NAME, YEAR OF BIRTH
AND ADDRESS(1) | | POSITION
HELD WITH
THE COMPANY | | TERM OF
OFFICE(2) AND
LENGTH OF
TIME SERVED | | PRINCIPAL OCCUPATION(S)
DURING PAST 5 YEARS | | NUMBER OF
PORTFOLIOS
IN FUND
COMPLEX(3)
OVERSEEN
BY DIRECTOR | | OTHER DIRECTORSHIPS
FOR PUBLIC COMPANIES
AND OTHER REGISTERED
INVESTMENT COMPANIES
BY DIRECTOR |
ANDREW A. JOHNSON
(1962) | | Director | | Since 2020 | | Mr. Johnson currently serves as a Diversity and Inclusion Advisor at Neuberger Berman, a private, global investment management firm. Prior to his current role, Mr. Johnson served as Chief Investment Officer and Head of Global Investment Grade Fixed Income at Neuberger Berman (January 2009 to December 2018). | | 75 | | Mr. Johnson currently serves as a Director of AGNC Investment Corp., a real estate investment trust. |
PAUL L. ROSENBERG
(1953) | | Director | | Since 2020 | | Mr. Rosenberg is a Partner of The Bridgespan Group, a global nonprofit consulting firm that is a social impact advisor to nonprofits, non-governmental organizations, philanthropists and institutional investors (October 2007 to present). | | 75 | | None |
LEMMA W. SENBET(4)
(1946) | | Director | | Since 2005 | | Dr. Senbet currently serves as the William E. Mayer Chair Professor of Finance in the Robert H. Smith School of Business at the University of Maryland, where he was chair of the Finance Department from 1998 to 2006. In June 2013, he began a sabbatical from the University to serve as Executive Director of the African Economic Research Consortium which focuses on economic policy research and training, which he completed in 2018. | | 75 | | None |
DAVID SUNG
(1953) | | Director | | Since 2017 | | Mr. Sung was a Partner at Ernst & Young LLP from October 1995 to July 2014. | | 75 | | Mr. Sung serves as a Trustee of Ironwood Institutional Multi-Strategy Fund, LLC and Ironwood Multi-Strategy Fund, LLC (October 2015 to present). |
| OFFICERS AND INTERESTED DIRECTORS |
JAMES E. DAVEY(6)
(1964) | | Director, President and Chief Executive Officer | | President and Chief Executive Officer since 2010; Director since 2012 | | Mr. Davey serves as Executive Vice President of The Hartford Financial Services Group, Inc. Mr. Davey has served in various positions within The Hartford and its subsidiaries and joined The Hartford in 2002. Additionally, Mr. Davey serves as Director, Chairman, President, and Senior Managing Director for Hartford Funds Management Group, Inc. ("HFMG"). Mr. Davey also serves as President, Manager, Chairman of the Board, and Senior Managing Director for Hartford Funds Management Company, LLC (“HFMC”); Manager, Chairman of the Board, and President of Lattice Strategies LLC (“Lattice”); Chairman of the Board, Manager, and Senior Managing Director of Hartford Funds Distributors, LLC (“HFD”); and Chairman of the Board, President and Senior Managing Director of Hartford Administrative Services Company (“HASCO”), each of which is an affiliate of HFMG. | | 75 | | None |
ANDREW S. DECKER
(1963) | | AML Compliance Officer | | Since 2015 | | Mr. Decker serves as Chief Compliance Officer and AML Compliance Officer of HASCO (since April 2015) and Vice President of HASCO (since April 2018). Mr. Decker serves as AML Officer of HFD (since May 2015). Mr. Decker also serves as Vice President of HFMG (since April 2018). Prior to joining The Hartford, Mr. Decker served as Vice President and AML Officer at Janney Montgomery Scott (a broker dealer) from April 2011 to January 2015. | | N/A | | N/A |
AMY N. FURLONG
(1979) | | Vice President | | Since 2018 | | Ms. Furlong serves as Vice President and Assistant Treasurer of HFMC (since September 2019). From 2018 through March 15, 2021, Ms. Furlong served as the Treasurer of the Company. Ms. Furlong has served in various positions within The Hartford and its subsidiaries in connection with the operation of the Hartford funds. Ms. Furlong joined The Hartford in 2004. | | N/A | | N/A |
Hartford Fixed Income Funds
Directors and Officers of the Company (Unaudited) – (continued)
NAME, YEAR OF BIRTH
AND ADDRESS(1) | | POSITION
HELD WITH
THE COMPANY | | TERM OF
OFFICE(2) AND
LENGTH OF
TIME SERVED | | PRINCIPAL OCCUPATION(S)
DURING PAST 5 YEARS | | NUMBER OF
PORTFOLIOS
IN FUND
COMPLEX(3)
OVERSEEN
BY DIRECTOR | | OTHER DIRECTORSHIPS
FOR PUBLIC COMPANIES
AND OTHER REGISTERED
INVESTMENT COMPANIES
BY DIRECTOR |
WALTER F. GARGER
(1965) | | Vice President and Chief Legal Officer | | Since 2016 | | Mr. Garger serves as Secretary, Managing Director and General Counsel of HFMG, HFMC, HFD, and HASCO (since 2013). Mr. Garger also serves as Secretary and General Counsel of Lattice (since July 2016). Mr. Garger has served in various positions within The Hartford and its subsidiaries in connection with the operation of the Hartford funds. Mr. Garger joined The Hartford in 1995. | | N/A | | N/A |
THEODORE J. LUCAS
(1966) | | Vice President | | Since 2017 | | Mr. Lucas serves as Executive Vice President of HFMG (since July 2016) and as Executive Vice President of Lattice (since June 2017). Previously, Mr. Lucas served as Managing Partner of Lattice (2003 to 2016). | | N/A | | N/A |
JOSEPH G. MELCHER
(1973) | | Vice President and Chief Compliance Officer | | Since 2013 | | Mr. Melcher serves as Executive Vice President of HFMG and HASCO (since December 2013). Mr. Melcher also serves as Executive Vice President (since December 2013) and Chief Compliance Officer (since December 2012) of HFMC, serves as Executive Vice President and Chief Compliance Officer of Lattice (since July 2016), serves as Executive Vice President of HFD (since December 2013), and served as President and Chief Executive Officer of HFD (from April 2018 to June 2019). | | N/A | | N/A |
VERNON J. MEYER
(1964) | | Vice President | | Since 2006 | | Mr. Meyer serves as Managing Director and Chief Investment Officer of HFMC and Managing Director of HFMG (since 2013). Mr. Meyer also serves as Senior Vice President-Investments of Lattice (since March 2019). Mr. Meyer has served in various positions within The Hartford and its subsidiaries in connection with the operation of the Hartford funds. Mr. Meyer joined The Hartford in 2004. | | N/A | | N/A |
DAVID A. NAAB
(1985) | | Vice President and Treasurer | | Since March 15, 2021 | | Mr. Naab serves as Vice President and Assistant Treasurer of HFMC (since June 2021). Prior to joining HFMC in 2021, Mr. Naab served in various positions as an associate, senior associate, manager, senior manager, and director within the investment management, financial services, and asset & wealth management practice groups of PricewaterhouseCoopers, LLP from 2007 to 2020. | | N/A | | N/A |
ALICE A. PELLEGRINO
(1960) | | Vice President and Assistant Secretary | | Since 2016 | | Ms. Pellegrino serves as Vice President of HFMG (since December 2013). Ms. Pellegrino also serves as Vice President and Assistant Secretary of Lattice (since June 2017). Ms. Pellegrino is a Senior Counsel and has served in various positions within The Hartford and its subsidiaries in connection with the operation of the Hartford funds. Ms. Pellegrino joined The Hartford in 2007. | | N/A | | N/A |
THOMAS R. PHILLIPS
(1960) | | Vice President and Secretary | | Since 2017 | | Mr. Phillips is Deputy General Counsel for HFMG and currently serves as a Senior Vice President (since June 2021) and Assistant Secretary (since June 2017) for HFMG. Mr. Phillips also serves as Vice President of HFMC (since June 2021). Prior to joining HFMG in 2017, Mr. Phillips was a Director and Chief Legal Officer of Saturna Capital Corporation from 2014–2016. Prior to that, Mr. Phillips was a Partner and Deputy General Counsel of Lord, Abbett & Co. LLC. | | N/A | | N/A |
Hartford Fixed Income Funds
Directors and Officers of the Company (Unaudited) – (continued)
| (1) | The address for each officer and Director is c/o Hartford Funds 690 Lee Road, Wayne, Pennsylvania 19087. |
| (2) | Term of Office: Each Director holds an indefinite term until his or her retirement, resignation, removal, or death. Directors generally must retire no later than December 31 of the year in which the Director turns 75 years of age. Each Fund officer generally serves until his or her resignation, removal, or death. |
| (3) | The portfolios of the “Fund Complex” are operational series of The Hartford Mutual Funds, Inc., The Hartford Mutual Funds II, Inc., Hartford Series Fund, Inc., Hartford HLS Series Fund II, Inc., Lattice Strategies Trust, and Hartford Funds Exchange-Traded Trust. |
| (4) | Effective as of December 31, 2021, Messrs. Birdsong and Senbet will retire as Directors. |
| (5) | Mr. Birdsong will retire effective December 31, 2021. Anticipating Mr. Birdsong's retirement, the Board has elected Christine R. Detrick to serve as Chair of the Board effective November 4, 2021. Accordingly, effective November 4, 2021, Mr. Birdsong will no longer serve as Chair of the Board. Effective November 5, 2021, Ms. Detrick also will serve as a Director of Capital One Financial Corporation. |
| (6) | “Interested person,” as defined in the 1940 Act, of the Company because of the person’s affiliation with, or equity ownership of, HFMC, HFD or affiliated companies. |
Hartford Fixed Income Funds
HOW TO OBTAIN A COPY OF EACH FUND’S PROXY VOTING POLICIES AND VOTING RECORDS (UNAUDITED)
A description of the policies and procedures that each Fund uses to determine how to vote proxies relating to portfolio securities and information about how each Fund voted proxies relating to portfolio securities during the most recent twelve-month period ended June 30 are available (1) without charge, upon request, by calling 888-843-7824 and (2) on the SEC’s website at http://www.sec.gov.
QUARTERLY PORTFOLIO HOLDINGS INFORMATION (UNAUDITED)
Each Fund files its complete schedule of portfolio holdings with the SEC for the first and third quarters of each fiscal year as an exhibit to its reports on Form N-PORT. Each Fund’s portfolio holdings filed as an exhibit to Form N-PORT for the most recent first and third quarter of the Fund’s fiscal year are available (1) without charge, upon request, by calling 888-843-7824, (2) on the Funds’ website, hartfordfunds.com, and (3) on the SEC’s website at http://www.sec.gov.
Hartford Fixed Income Funds
Approval of Investment Management and Investment Sub-Advisory Agreements (Unaudited)
The Hartford Mutual Funds, Inc.
The Hartford Emerging Markets Local Debt Fund
The Hartford Floating Rate Fund
The Hartford Floating Rate High Income Fund
The Hartford High Yield Fund
The Hartford Inflation Plus Fund
The Hartford Municipal Opportunities Fund
Hartford Municipal Short Duration Fund
The Hartford Short Duration Fund
The Hartford Strategic Income Fund
Hartford Sustainable Municipal Bond Fund (formerly, Hartford Municipal Income Fund)
The Hartford Total Return Bond Fund
The Hartford World Bond Fund
(each, a “Fund” and collectively, the “Funds”)
Section 15(c) of the Investment Company Act of 1940, as amended (the “1940 Act”), requires that each mutual fund’s board of directors, including a majority of those directors who are not “interested persons” of the mutual fund, as defined in the 1940 Act (the “Independent Directors”), annually review and consider the continuation of the mutual fund’s investment advisory and sub-advisory agreements. At its meeting held on August 3-4, 2021, the Board of Directors (the “Board”) of The Hartford Mutual Funds, Inc. (“HMF”), including each of the Independent Directors, unanimously voted to approve (i) the continuation of an investment management agreement by and between Hartford Funds Management Company, LLC (“HFMC”) and each of HMF, on behalf of The Hartford Emerging Markets Local Debt Fund, The Hartford Floating Rate Fund, The Hartford High Yield Fund, The Hartford Inflation Plus Fund, Hartford Municipal Short Duration Fund, The Hartford Short Duration Fund, The Hartford Strategic Income Fund, Hartford Sustainable Municipal Bond Fund, The Hartford Total Return Bond Fund and The Hartford World Bond Fund, and The Hartford Mutual Funds II, Inc. (“HMF II”), on behalf of its series (the “Management Agreement”); (ii) the continuation of a separate investment management agreement by and between HFMC and HMF, on behalf of The Hartford Floating Rate High Income Fund and The Hartford Municipal Opportunities Fund (the “2013 Investment Management Agreement” and together with the Management Agreement, the “Management Agreements”); and (iii) the continuation of an investment sub-advisory agreement (the “Sub-Advisory Agreement,” and together with the Management Agreements, the “Agreements”) between HFMC and each Fund’s sub-adviser, Wellington Management Company LLP (the “Sub-adviser,” and together with HFMC, the “Advisers”), with respect to each Fund.
In the months preceding the August 3-4, 2021 meeting, the Board requested and reviewed written responses from the Advisers to questions posed to the Advisers on behalf of the Independent Directors and supporting materials relating to those questions and responses. In addition, the Board considered such additional information as it deemed reasonably necessary to evaluate the Agreements, as applicable, with respect to each Fund, which included information furnished to the Board and its committees at their meetings throughout the year and in between regularly scheduled meetings on particular matters as the need arose, as well as information specifically prepared in connection with the approval of the continuation of the Agreements that was presented at the Board’s meetings held on June 15-16, 2021 and August 3-4, 2021. Information provided to the Board and its committees at their meetings throughout the year included, among other things, reports on Fund performance, legal, compliance and risk management matters, sales and marketing activity, shareholder services, and the other services provided to each Fund by the Advisers and their affiliates. The members of the Board also considered the materials and presentations by Fund officers and representatives of HFMC received at the Board’s meetings on June 15-16, 2021 and August 3-4, 2021 concerning the Agreements and at the special meeting of the Board’s Investment Committee on May 18, 2021 concerning Fund performance and other investment-related matters.
The Independent Directors, advised by independent legal counsel throughout the evaluation process, engaged service providers to assist them with evaluating the Agreements with respect to each Fund, as applicable. Broadridge Financial Solutions, Inc. (“Broadridge”), an independent provider of investment company data, was retained to provide the Board with reports on how each Fund’s contractual management fees, actual management fees, total expense ratios and investment performance compared to those of comparable mutual funds with similar investment objectives. The Independent Directors also engaged an independent financial services consultant (the “Consultant”) to assist them in evaluating each Fund’s contractual management fees, actual management fees, total expense ratios and investment performance. In addition, the Consultant reviewed the profitability methodologies utilized by HFMC in connection with the continuation of the Management Agreements.
Hartford Fixed Income Funds
Approval of Investment Management and Investment Sub-Advisory Agreements (Unaudited) – (continued)
In determining whether to approve the continuation of the Agreements for a Fund, the members of the Board reviewed and evaluated information and factors they believed to be relevant and appropriate through the exercise of their reasonable business judgment. While individual members of the Board may have weighed certain factors differently, the Board’s determination to approve the continuation of the Agreements was based on a comprehensive consideration of all information provided to the Board throughout the year and specifically with respect to the continuation of the Agreements. The Board was also furnished with an analysis of its fiduciary obligations in connection with its evaluation of the Agreements. Throughout the evaluation process, the Board was assisted by counsel for the Funds and the Independent Directors were also separately assisted by independent legal counsel. In connection with their deliberations, the Independent Directors met separately with independent legal counsel and the Consultant on June 11, 2021 and in executive session on several occasions to consider their responsibilities under relevant laws and regulations and to discuss the materials presented and other matters deemed relevant to their consideration of the approval of the continuation of the Agreements. As a result of the discussions that occurred during the June 11, 2021 and June 15-16, 2021 meetings, the Independent Directors presented HFMC with requests for additional information on certain topics. HFMC responded to these requests with additional information in connection with the August 3-4, 2021 meeting. A more detailed summary of the important, but not necessarily all, factors the Board considered with respect to its approval of the continuation of the Agreements is provided below.
Nature, Extent and Quality of Services Provided by the Advisers
The Board requested and considered information concerning the nature, extent and quality of the services provided to each Fund by the Advisers. The Board considered, among other things, the terms of the Agreements and the range of services provided by the Advisers. The Board considered the Advisers’ professional personnel who provide services to the Funds, including each Adviser’s ability and experience in attracting and retaining qualified personnel to service the Funds. The Board considered each Adviser’s reputation and overall financial strength, as well as each Adviser’s willingness to consider and implement organizational and operational changes designed to enhance services to the funds managed by HFMC and its affiliates (the “Hartford funds”). In addition, the Board considered the quality of each Adviser’s communications with the Board and responsiveness to Board inquiries and requests made from time to time with respect to the Funds and other Hartford funds. In this regard, the Board took into account the Advisers’ communications with the Board in light of the coronavirus (“COVID-19”) pandemic.
The Board also requested and evaluated information concerning each Adviser’s regulatory and compliance environment. In this regard, the Board requested and reviewed information about each Adviser’s compliance policies and procedures and compliance history, and a report from the Funds’ Chief Compliance Officer about each Adviser’s compliance with applicable laws and regulations, including responses to regulatory developments and any compliance or other issues raised by regulators. The Board also noted the Advisers’ support of the Funds’ compliance control structure, as applicable, including the resources devoted by the Advisers in support of the Funds’ obligations pursuant to Rule 38a-1 under the 1940 Act and the Funds’ liquidity risk management program, as well as the efforts of the Advisers to combat cybersecurity risks. The Board also considered HFMC’s investments in business continuity planning designed to benefit the Funds, and the implementation of HFMC’s business continuity plans due to the COVID-19 pandemic. The Board also noted HFMC’s commitment to maintaining high quality systems and expending substantial resources to prepare for and respond to ongoing changes to the market, regulatory and control environments in which the Funds and their service providers operate, including changes associated with the COVID-19 pandemic.
With respect to HFMC, the Board noted that, under the Management Agreements, HFMC is responsible for the management of the Funds, including oversight of fund operations and service providers, and the provision of administrative and investment advisory services in connection with selecting, monitoring and supervising the Sub-adviser. In this regard, the Board evaluated information about the nature and extent of responsibilities retained and risks assumed by HFMC that were not delegated to or assumed by the Sub-adviser. The Board considered HFMC’s ongoing monitoring of people, process and performance, including its quarterly reviews of each of the Hartford funds, semi-annual meetings with the leaders of each Fund’s portfolio management team, and oversight of the Hartford funds’ portfolio managers. The Board noted that HFMC has demonstrated a record of initiating changes to the portfolio management and/or investment strategies of the Hartford funds when warranted. The Board considered HFMC’s periodic due diligence reviews of the Sub-adviser and ongoing oversight of the Sub-adviser’s investment approach and results, process for monitoring best execution of portfolio trades and other trading operations by the Sub-adviser, and approach to risk management with respect to the Funds and the service providers to the Funds. The Board considered HFMC’s oversight of the securities lending program for the Funds that engage in securities lending and noted the income earned by the Funds that participate in such program. The Board also considered HFMC’s day-to-day oversight of each Fund’s compliance with its investment objective and policies as well as with applicable laws and regulations, noting that regulatory and other developments had over time led to an increase in the scope of HFMC’s oversight in this regard. Moreover, the Board considered HFMC’s oversight of potential conflicts of interest between the Funds’ investments and those of other funds or accounts managed by the Funds’ portfolio management personnel.
Hartford Fixed Income Funds
Approval of Investment Management and Investment Sub-Advisory Agreements (Unaudited) – (continued)
In addition, the Board considered HFMC’s ongoing commitment to review and rationalize the Hartford funds product line-up. The Board also considered the expenses that HFMC had incurred, as well as the risks HFMC had assumed, in connection with the launch of new funds and changes to existing Hartford funds in recent years. The Board considered that HFMC is responsible for providing the Funds’ officers.
With respect to the Sub-adviser, which provides certain day-to-day portfolio management services for the Funds, subject to oversight by HFMC, the Board considered, among other things, the Sub-adviser’s investment personnel, investment philosophy and process, investment research capabilities and resources, performance record, trade execution capabilities and experience, including with respect to sustainable investing and environmental, social and/or governance (ESG) criteria. The Board considered the experience of each Fund’s portfolio manager(s), the number of accounts managed by the portfolio manager(s), and the Sub-adviser’s method for compensating the portfolio manager(s). The Board also considered the Sub-adviser’s succession planning practices to ensure continuity of portfolio management services provided to the Funds.
The Board considered the benefits to shareholders of being part of the family of Hartford funds, including, with respect to certain share classes, the right to exchange investments between the same class of shares without a sales charge, the ability to reinvest Fund dividends into other Hartford funds (excluding the Hartford funds that are exchange-traded funds or an interval fund), and the ability to combine holdings in a Fund with holdings in other Hartford funds (excluding the Hartford funds that are exchange-traded funds or an interval fund) and 529 plans for which HFMC serves as the program manager to obtain a reduced sales charge. The Board considered HFMC’s efforts to provide investors in the Hartford funds with a broad range of investment styles and asset classes and the assumption of entrepreneurial and other risks by HFMC in sponsoring and providing ongoing services to new funds to expand these opportunities for shareholders. In addition, the Board observed that in the marketplace there are a range of investment options available to each Fund’s shareholders and such shareholders, having had the opportunity to consider other investment options, have chosen to invest in the Fund.
Based on these considerations, the Board concluded that it was satisfied with the nature, extent and quality of the services provided to each Fund by HFMC and the Sub-adviser.
Performance of each Fund and the Advisers
The Board considered the investment performance of each Fund. In this regard, the Board reviewed the performance of each Fund over different time periods presented in the materials and evaluated HFMC’s analysis of the Fund’s performance for these time periods. The Board considered information and materials provided to the Board by the Advisers concerning Fund performance, as well as information from Broadridge comparing the investment performance of each Fund to an appropriate universe of peer funds. The Board noted that while it found the comparative data provided by Broadridge generally useful in evaluating a Hartford fund’s investment performance, the Board recognized the limitations of such data, including that notable differences may exist between a Hartford fund and its peers. For details regarding each Fund’s performance, see the Fund-by-Fund synopsis below.
The Board considered the detailed investment analytics reports provided by HFMC’s Investment Advisory Group throughout the year, including in connection with the approval of the continuation of the Agreements. These reports included, among other things, information on each Fund’s gross returns and net returns, the Fund’s investment performance compared to one or more appropriate benchmarks and relevant groups or categories of peer funds, various statistics concerning the Fund’s portfolio, a narrative summary of various factors affecting Fund performance, and commentary on the effect of market conditions. The Board considered the Advisers’ work with the Investment Committee, which assists the Board in evaluating the performance of each Fund at periodic meetings throughout the year and specifically with respect to the approval of the continuation of the Agreements. The Board considered that the Investment Committee, in its evaluation of investment performance at meetings throughout the year, focused particular attention on information indicating less favorable performance of certain Hartford funds for specific time periods and discussed with the Advisers the reasons for such performance as well as any specific actions that the Advisers had taken, or had agreed to take, to seek to enhance Fund investment performance and the results of those actions. The Board also considered the analysis provided by the Consultant relating to each Fund’s performance track record.
Based on these considerations, the Board concluded that it had continued confidence in HFMC’s and the Sub-adviser’s overall capabilities to manage the Funds.
Costs of the Services and Profitability of the Advisers
The Board reviewed information regarding HFMC’s cost to provide investment management and related services to each Fund and HFMC’s profitability, both overall and for each Fund, on a pre-tax basis without regard to distribution expenses. The Board also requested and reviewed information about the profitability to HFMC and its affiliates from all services provided to each Fund and all aspects of their relationship with the Fund,
Hartford Fixed Income Funds
Approval of Investment Management and Investment Sub-Advisory Agreements (Unaudited) – (continued)
including information regarding profitability trends over time and information provided by Broadridge analyzing the profitability of managers to other fund complexes. The Board also requested and received information relating to the operations and profitability of the Sub-adviser. The Board considered representations from HFMC and the Sub-adviser that the Sub-adviser’s fees were negotiated at arm’s length on a Fund-by-Fund basis and that the sub-advisory fees are paid by HFMC and not the Funds. Accordingly, the Board concluded that the profitability of the Sub-adviser is a less relevant factor with respect to the Board’s consideration of the Sub-Advisory Agreement.
The Board considered the Consultant’s review of the methodologies and estimates used by HFMC in calculating profitability in connection with the continuation of the Management Agreements, including a description of the methodology used to allocate certain expenses. The Board noted the Consultant’s view that HFMC’s process for calculating and reporting Fund profitability is reasonable and consistent with the process previously reviewed by the Consultant. The Board noted that the Consultant had previously performed a full review of this process and reported that such process is reasonable, sound and consistent with common industry practice.
Based on these considerations, the Board concluded that the profits realized by the Advisers and their affiliates from their relationships with each Fund were not excessive.
Comparison of Fees and Services Provided by the Advisers
The Board considered comparative information with respect to the services rendered to and the management fees to be paid by each Fund to HFMC and the total expense ratios of the Fund. The Board also considered comparative information with respect to the sub-advisory fees to be paid by HFMC to the Sub-adviser with respect to each Fund. In this regard, the Board requested and reviewed information from HFMC and the Sub-adviser relating to the management and sub-advisory fees, including the sub-advisory fee schedule for each Fund and the amount of the management fee retained by HFMC, and total operating expenses for each Fund. The Board also reviewed information from Broadridge comparing each Fund’s contractual management fees, actual management fees and total expense ratios relative to an appropriate group of funds selected by Broadridge. The Board considered such information from Broadridge in consultation with the Consultant. For details regarding each Fund’s expenses, see the Fund-by-Fund synopsis below.
The Board considered the methodology used by Broadridge to select the funds included in the expense groups. While the Board recognized that comparisons between a Fund and its peer funds may be imprecise given, among other differences, the different service levels and characteristics of mutual funds and the different business models and cost structures of the Advisers, the comparative information provided by Broadridge assisted the Board in evaluating the reasonableness of each Fund’s fees and total operating expenses. In addition, the Board considered the analysis and views of the Consultant relating to each Fund’s fees and total operating expenses and expense groups.
The Board received information regarding fees charged by HFMC to other Hartford funds that are exchange-traded funds (“ETFs”) with investment strategies similar to those of The Hartford Municipal Opportunities Fund, The Hartford Short Duration Fund, and The Hartford Total Return Bond Fund. The Board reviewed information about structural, operational and other differences between the ETFs and the Funds, including differences in the services provided to each type of product and differences in the marketplace in which each type of product must compete. The Board also received information regarding fees charged by the Sub-adviser to any other clients with investment strategies similar to those of the Funds, including institutional separate account clients and registered fund clients for which the Sub-adviser serves as either primary investment adviser or sub-adviser. The Board considered the explanations provided by the Sub-adviser about any differences between the Sub-adviser’s services to the Funds and the services the Sub-adviser provides to other types of clients. In this regard, the Board reviewed information about the generally broader scope of services and compliance, reporting and other legal burdens and risks of managing registered funds compared with those associated with managing assets of non-registered fund clients such as institutional separate accounts.
Based on these considerations, the Board concluded that each Fund’s fees and total operating expenses, in conjunction with the information about quality of services, profitability, economies of scale, and other matters considered, were reasonable in light of the services provided.
Economies of Scale
The Board considered information regarding economies of scale, including the extent to which economies of scale may be realized as a Fund grows and whether fee levels reflect these economies of scale for the benefit of shareholders of the Fund. The Board reviewed the breakpoints in the management fee schedule for each Fund, if any, which reduce fee rates as the Fund’s assets grow over time. The Board recognized that a Fund with assets beyond the highest breakpoint level will continue to benefit from economies of scale because additional assets are charged the lowest breakpoint fee resulting in lower effective management fee rates. The Board also recognized that a fee schedule that reaches a breakpoint at a lower asset level provides shareholders with the benefit of anticipated or potential economies of scale. The Board considered that expense limitations and
Hartford Fixed Income Funds
Approval of Investment Management and Investment Sub-Advisory Agreements (Unaudited) – (continued)
fee waivers that reduce a Fund’s expenses at all asset levels can have the same effect as breakpoints in sharing economies of scale with shareholders and provide protection from an increase in expenses if the Fund’s assets decline. In addition, the Board considered that initially setting competitive fee rates, pricing a Fund to scale at inception and making additional investments intended to enhance services available to shareholders are other means of sharing anticipated or potential economies of scale with shareholders. The Board also considered that HFMC has been active in managing expenses, which has resulted in benefits being realized by shareholders. The Board also noted that, for each of The Hartford Emerging Markets Local Debt Fund, Hartford Municipal Short Duration Fund, and Hartford Sustainable Municipal Bond Fund, the Fund’s current low asset levels have kept the Fund from fully realizing the benefits of anticipated or potential economies of scale.
The Board reviewed and evaluated materials from Broadridge and the Consultant showing how management fee schedules of peer funds reflect economies of scale for the benefit of shareholders as a peer fund’s assets hypothetically increase over time. Based on information provided by HFMC, Broadridge, and the Consultant, the Board recognized that there is no uniform methodology for establishing breakpoints or uniform pattern in asset levels that trigger breakpoints or the amounts of breakpoints triggered.
After considering all of the information available to it, the Board concluded that it was satisfied with the extent to which economies of scale would be shared for the benefit of each Fund’s shareholders based on currently available information and the effective management fees and total expense ratios for the Fund at its current and reasonably anticipated asset levels. The Board noted, however, that it would continue to monitor any future growth in each Fund’s assets and the appropriateness of additional management fee breakpoints or other methods to share benefits from economies of scale as part of its future review of the Agreements.
Other Benefits
The Board considered other benefits to the Advisers and their affiliates from their relationships with the Funds.
The Board noted that HFMC receives fees for fund accounting and related services from the Funds, and the Board considered information on the profitability to HFMC from providing such services to the Funds. The Board also considered that each Fund pays a transfer agency fee to Hartford Administrative Services Company (“HASCO”), an affiliate of HFMC, equal to the lesser of: (i) the actual costs incurred by HASCO in connection with the provisions of transfer agency services, including payments made to sub-transfer agents, plus a reasonable target profit margin; or (ii) a specified amount as set forth in the Transfer Agency and Service Agreement by and between HMF, on behalf of its Funds, HMF II, on behalf of its series, and HASCO. The Board reviewed information about the profitability to HASCO of the Funds’ transfer agency function. The Board considered information provided by HFMC indicating that the transfer agency fees charged by HASCO to the Funds were fair and reasonable based on available industry data about fees charged by transfer agents to other mutual funds. The Board also noted that HFMC and HASCO had delegated certain fund accounting services and transfer agency services, respectively, to external service providers.
The Board also considered that Hartford Funds Distributors, LLC (“HFD”), an affiliate of HFMC, serves as principal underwriter of the Funds. The Board noted that, as principal underwriter, HFD receives distribution and service fees from the Funds and receives all or a portion of the sales charges on sales or redemptions of certain classes of shares.
The Board considered the benefits, if any, to the Sub-adviser from any use of a Fund’s brokerage commissions to obtain soft dollar research.
Fund-by-Fund Factors
For purposes of the Fund-by-Fund discussion below, Fund performance is referred to as “in line with” a Fund’s benchmark where it was 0.5% above or below the benchmark return, and each Fund’s performance relative to its primary benchmark reflects the net performance of the Fund’s Class I shares as of March 31, 2021.
The Hartford Emerging Markets Local Debt Fund
| • | The Board noted that the Fund’s performance was in the 1st quintile of its performance universe for the 1-year period and the 3rd quintile for the 3- and 5-year periods. The Board also noted that the Fund’s performance was above its benchmark for the 1-year period and in line with its benchmark for the 3- and 5-year periods. The Board noted upcoming changes to the Fund’s portfolio management team. |
| • | The Board noted that the Fund’s contractual management fee and its total expenses (less 12b-1 and shareholder service fees) were in the 4th quintile of its expense group, while its actual management fee was in the 3rd quintile. The Board noted that Class A shares of the Fund have a contractual expense cap of 1.18% through February 28, 2022, which resulted in HFMC reimbursing the Fund for certain expenses. |
Hartford Fixed Income Funds
Approval of Investment Management and Investment Sub-Advisory Agreements (Unaudited) – (continued)
The Hartford Floating Rate Fund
| • | The Board noted that the Fund’s performance was in the 2nd quintile of its performance universe for the 1- and 5-year periods and the 3rd quintile for the 3-year period. The Board also noted that the Fund’s performance was below its benchmark for the 1- and 3-year periods and in line with its benchmark for the 5-year period. |
| • | The Board noted that the Fund’s contractual management fee was in the 4th quintile of its expense group, while its actual management fee was in the 5th quintile and its total expenses (less 12b-1 and shareholder service fees) were in the 2nd quintile. The Board noted that Class A shares of the Fund have a contractual expense cap of 1.00%, which resulted in HFMC reimbursing the Fund for certain expenses. |
The Hartford Floating Rate High Income Fund
| • | The Board noted that the Fund’s performance was in the 1st quintile of its performance universe for the 1- and 5-year periods and the 2nd quintile for the 5-year period. The Board also noted that the Fund’s performance was above its benchmark for the 1-year period, below its benchmark for the 3-year period, and in line with its benchmark for the 5-year period. |
| • | The Board noted that the Fund’s contractual management fee was in the 4th quintile of its expense group, while its actual management fee was in the 5th quintile and its total expenses (less 12b-1 and shareholder service fees) were in the 3rd quintile. The Board noted that Class A shares of the Fund have a contractual expense cap of 1.05% through February 28, 2022, which resulted in HFMC reimbursing the Fund for certain expenses. |
The Hartford High Yield Fund
| • | The Board noted that the Fund’s performance was in the 2nd quintile of its performance universe for the 1- and 3-year periods and the 3rd quintile for the 5-year period. The Board also noted that the Fund’s performance was in line with its benchmark for the 1- and 3-year periods and below its benchmark for the 5-year period. The Board noted that certain changes had recently been made to the Fund’s principal investment strategy. |
| • | The Board noted that the Fund’s contractual management fee and actual management fee were in the 1st quintile of its expense group, while its total expenses (less 12b-1 and shareholder service fees) were in the 2nd quintile. In considering the Fund’s expenses, the Board noted the shareholder savings resulting from a permanent fee reduction implemented in 2020. The Board noted that Class A shares of the Fund have a contractual expense cap of 0.95% through February 28, 2022, which resulted in HFMC reimbursing the Fund for certain expenses. |
The Hartford Inflation Plus Fund
| • | The Board noted that the Fund’s performance was in the 1st quintile of its performance universe for the 1-year period, the 3rd quintile for the 3-year period, and the 4th quintile for the 5-year period. The Board also noted that the Fund’s performance was above its benchmark for the 1-year period and in line with its benchmark for the 3- and 5-year periods. The Board noted recent changes to the Fund’s portfolio management team. |
| • | The Board noted that the Fund’s contractual management fee was in the 3rd quintile of its expense group, while its actual management fee and its total expenses (less 12b-1 and shareholder service fees) were in the 4th quintile. The Board noted that Class A shares of the Fund have a contractual transfer agency expense cap of 0.15% through February 28, 2022, which resulted in HFMC reimbursing the Fund for certain expenses. |
The Hartford Municipal Opportunities Fund
| • | The Board noted that the Fund’s performance was in the 2nd quintile of its performance universe for the 1-year period and the 1st quintile for the 3- and 5-year periods. The Board also noted that the Fund’s performance was below its benchmark for the 1-year period and in line with its benchmark for the 3- and 5- year periods. |
| • | The Board noted that the Fund’s contractual management fee and actual management fee were in the 1st quintile of its expense group, while its total expenses (less 12b-1 and shareholder service fees) were in the 2nd quintile. |
Hartford Fixed Income Funds
Approval of Investment Management and Investment Sub-Advisory Agreements (Unaudited) – (continued)
Hartford Municipal Short Duration Fund
| • | The Board noted that the Fund’s performance was in the 1st quintile of its performance universe for the 1-, 3-, and 5-year periods. The Board also noted that the Fund’s performance was above its benchmark for the 1-year period and in line with its benchmark for the 3- and 5-year periods. |
| • | The Board noted that the Fund’s contractual management fee was in the 3rd quintile of its expense group, while its actual management fee was in the 1st quintile and its total expenses (less 12b-1 and shareholder service fees) were in the 4th quintile. The Board noted that Class A shares of the Fund have a contractual expense cap of 0.69% through February 28, 2022, which resulted in HFMC reimbursing the Fund for certain expenses. |
The Hartford Short Duration Fund
| • | The Board noted that the Fund’s performance was in the 1st quintile of its performance universe for the 1-year period and the 2nd quintile for the 3- and 5-year periods. The Board also noted that the Fund’s performance was above its benchmark for the 1-, 3-, and 5-year periods. |
| • | The Board noted that the Fund’s contractual management fee was in the 2nd quintile of its expense group, while its actual management fee and its total expenses (less 12b-1 and shareholder service fees) were in the 4th quintile. The Board noted that Class A shares of the Fund have a contractual transfer agency expense cap of 0.12% through February 28, 2022, which resulted in HFMC reimbursing the Fund for certain expenses. |
The Hartford Strategic Income Fund
| • | The Board noted that the Fund’s performance was in the 1st quintile of its performance universe for the 1-, 3-, and 5-year periods. The Board also noted that the Fund’s performance was above its benchmark for the 1-, 3-, and 5-year periods. |
| • | The Board noted that the Fund’s contractual management fee, actual management fee, and total expenses (less 12b-1 and shareholder service fees) were in the 2nd quintile of its expense group. |
Hartford Sustainable Municipal Bond Fund
| • | The Board noted that the Fund’s performance was in the 3rd quintile of its performance universe for the 1-year period and the 2nd quintile for the 3- and 5-year periods. The Board also noted that the Fund’s performance was above its benchmark for the 1-year period and in line with its benchmark for the 3- and 5-year periods. The Board noted that certain changes had recently been made to the Fund’s principal investment strategy. |
| • | The Board noted that the Fund’s contractual management fee, actual management fee, and total expenses (less 12b-1 and shareholder service fees) were in the 1st quintile of its expense group. The Board noted that Class A shares of the Fund have a contractual expense cap of 0.69% through February 28, 2022, which resulted in HFMC reimbursing the Fund for certain expenses. |
The Hartford Total Return Bond Fund
| • | The Board noted that the Fund’s performance was in the 2nd quintile of its performance universe for the 1- and 3-year periods and the 1st quintile for the 5-year period. The Board also noted that the Fund’s performance was above its benchmark for the 1-, 3-, and 5-year periods. |
| • | The Board noted that the Fund’s contractual management fee was in the 1st quintile of its expense group, while its actual management fee was in the 3rd quintile and its total expenses (less 12b-1 and shareholder service fees) were in the 2nd quintile. |
The Hartford World Bond Fund
| • | The Board noted that the Fund’s performance was in the 5th quintile of its performance universe for the 1- and 5-year periods and the 4th quintile for the 3-year period. The Board also noted that the Fund’s performance was above its benchmark for the 1- and 3-year periods and in line with its benchmark for the 5-year period. |
| • | The Board noted that the Fund’s contractual management fee, actual management fee, and total expenses (less 12b-1 and shareholder service fees) were in the 5th quintile. In considering the Fund’s expenses, the Board noted an investment management fee reduction at certain breakpoints would be implemented in November 2021. |
* * * *
Hartford Fixed Income Funds
Approval of Investment Management and Investment Sub-Advisory Agreements (Unaudited) – (continued)
Based upon its review of the factors summarized above, among others, the Board concluded that it is in the best interests of each Fund and its shareholders for the Board to approve the continuation of the Agreements for an additional year. In reaching this decision, the Board did not assign relative weights to the factors discussed above or deem any one or group of them to be controlling in and of themselves.
THIS PRIVACY POLICY IS NOT PART OF THIS REPORT
CUSTOMER PRIVACY NOTICE
The Hartford Financial Services Group, Inc. and Affiliates*
(herein called “we, our, and us”)
This Privacy Policy applies to our United States Operations
We value your trust. We are committed to the responsible:
| a) | management; |
| b) | use; and |
| c) | protection; |
of Personal Information.
This notice describes how we collect, disclose, and protect Personal Information.
We collect Personal Information to:
| a) | service your Transactions with us; and |
| b) | support our business functions. |
We may obtain Personal Information from:
| a) | You; |
| b) | your Transactions with us; and |
| c) | third parties such as a consumer-reporting agency. |
Based on the type of product or service You apply for or get from us, Personal Information such as:
| a) | your name; |
| b) | your address; |
| c) | your income; |
| d) | your payment; or |
| e) | your credit history; |
may be gathered from sources such as applications, Transactions, and consumer reports.
To serve You and service our business, we may share certain Personal Information. We will share Personal Information, only as allowed by law, with affiliates such as:
| a) | our insurance companies; |
| b) | our employee agents; |
| c) | our brokerage firms; and |
| d) | our administrators. |
As allowed by law, we may share Personal Financial Information with our affiliates to:
| a) | market our products; or |
| b) | market our services; |
to You without providing You with an option to prevent these disclosures.
We may also share Personal Information, only as allowed by law, with unaffiliated third parties including:
| a) | independent agents; |
| b) | brokerage firms; |
| c) | insurance companies; |
| d) | administrators; and |
| e) | service providers; |
who help us serve You and service our business.
When allowed by law, we may share certain Personal Financial Information with other unaffiliated third parties who assist us by performing services or functions such as:
| a) | taking surveys; |
| b) | marketing our products or services; or |
| c) | offering financial products or services under a joint agreement |
between us and one or more financial institutions.
We, and third parties we partner with, may track some of the pages You visit through the use of:
| a) | cookies; |
| b) | pixel tagging; or |
| c) | other technologies; |
and currently do not process or comply with any web browser’s “do not track” signal or other similar mechanism that indicates a request to disable online tracking of individual users who visit our websites or use our services.
For more information, our Online Privacy Policy, which governs information we collect on our website and our affiliate websites, is available at https://www.thehartford.com/online-privacy-policy.
We will not sell or share your Personal Financial Information with anyone for purposes unrelated to our business functions without offering You the opportunity to:
| a) | “opt-out;” or |
| b) | “opt-in;” |
as required by law.
We only disclose Personal Health Information with:
| a) | your authorization; or |
| b) | as otherwise allowed or required by law. |
Our employees have access to Personal Information in the course of doing their jobs, such as:
| a) | underwriting policies; |
| b) | paying claims; |
| c) | developing new products; or |
| d) | advising customers of our products and services. |
We use manual and electronic security procedures to maintain:
| a) | the confidentiality; and |
Personal Information that we have. We use these procedures to guard against unauthorized access.
Some techniques we use to protect Personal Information include:
| d) | firewall technology; and |
| e) | the use of detection software. |
We are responsible for and must:
| a) | identify information to be protected; |
| b) | provide an adequate level of protection for that data; and |
| c) | grant access to protected data only to those people who must use |
it in the performance of their job-related duties.
Employees who violate our privacy policies and procedures may be subject to discipline, which may include termination of their employment with us.
We will continue to follow our Privacy Policy regarding Personal Information even when a business relationship no longer exists between us.
As used in this Privacy Notice:
Application means your request for our product or service.
Personal Financial Information means financial information such as:
| d) | policy or claim information. |
Personal Financial Information may include Social Security Numbers, Driver’s license numbers, or other government-issued identification numbers, or credit, debit card, or bank account numbers.
Personal Health Information means health information such as:
| a) | your medical records; or |
| b) | information about your illness, disability or injury. |
Personal Information means information that identifies You personally and is not otherwise available to the public. It includes:
| a) | Personal Financial Information; and |
| b) | Personal Health Information. |
Transaction means your business dealings with us, such as:
| b) | your request for us to pay a claim; and |
| c) | your request for us to take an action on your account. |
You means an individual who has given us Personal Information in conjunction with:
a financial product or service from us if the product or service is used mainly for personal, family, or household purposes.
If you have any questions or comments about this privacy notice, please feel free to contact us at The Hartford – Consumer Rights and Privacy Compliance Unit, One Hartford Plaza, Mail Drop: T 04.180, Hartford, CT 06155, or at ConsumerPrivacyInquiriesMailbox@thehartford.com.
This Customer Privacy Notice is being provided on behalf of The Hartford Financial Services Group, Inc. and its affiliates (including the following as of February 2021), to the extent required by the Gramm-Leach-Bliley Act and implementing regulations:
1stAGChoice, Inc.; Access CoverageCorp, Inc.; Access CoverageCorp Technologies, Inc.; Assurances Continentales Continentale Verzekeringen N.V; Bracht, Deckers & Mackelbert N.V.; Business Management Group, Inc.; Canal Re S.A.; Cervus Claim Solutions, LLC; First State Insurance Company; FTC Resolution Company LLC; Hart Re Group L.L.C.; Hartford Accident and Indemnity Company; Hartford Administrative Services Company; Hartford Casualty General Agency, Inc.; Hartford Casualty Insurance Company; Hartford Fire General Agency, Inc.; Hartford Fire Insurance Company; Hartford Funds Distributors, LLC; Hartford Funds Management Company, LLC; Hartford Funds Management Group, Inc.; Hartford Holdings, Inc.; Hartford Insurance Company of Illinois; Hartford Insurance Company of the Midwest; Hartford Insurance Company of the Southeast; Hartford Insurance, Ltd.; Hartford Integrated Technologies, Inc.; Hartford Investment Management Company; Hartford Life and Accident Insurance Company; Hartford Lloyd’s Corporation; Hartford Lloyd’s Insurance Company; Hartford Management, Ltd.; Hartford Productivity Services LLC; Hartford of Texas General Agency, Inc.; Hartford Residual Market, L.C.C.; Hartford Specialty Insurance Services of Texas, LLC; Hartford STAG Ventures LLC; Hartford Strategic Investments, LLC; Hartford Underwriters General Agency, Inc.; Hartford Underwriters Insurance Company; Heritage Holdings, Inc.; Heritage Reinsurance Company, Ltd.; HLA LLC; HL Investment Advisors, LLC; Horizon Management Group, LLC; HRA Brokerage Services, Inc.; Lattice Strategies LLC; Maxum Casualty Insurance Company; Maxum Indemnity Company; Maxum Specialty Services Corporation; Millennium Underwriting Limited; MPC Resolution Company LLC; Navigators (Asia) Limited; Navigators Corporate Underwriters Limited; Navigators Holdings (Europe) N.V.; Navigators Holdings (UK) Limited; Navigators Insurance Company; Navigators International Insurance Company Ltd.; Navigators Management Company, Inc.; Navigators Management (UK) Limited; Navigators N.V.; Navigators Specialty Insurance Company; Navigators Underwriting Agency Limited; Navigators Underwriting Limited; New BDM NV; New England Insurance Company; New England Reinsurance Corporation; New Ocean Insurance Co., Ltd.; NIC Investments (Chile) SpA; Nutmeg Insurance Agency, Inc.; Nutmeg Insurance Company; Pacific Insurance Company, Limited; Property and Casualty Insurance Company of Hartford; Sentinel Insurance Company, Ltd; The Navigators Group, Inc.; Trumbull Flood Management, L.L.C.; Trumbull Insurance Company; Twin City Fire Insurance Company; Y-Risk, LLC.
Revised February 2021
[This page is intentionally left blank]
[This page is intentionally left blank]
This report is submitted for the general information of the shareholders of the Funds referenced in this report. It is not authorized for distribution to persons who are not shareholders of one or more Funds referenced in this report unless preceded or accompanied by a current prospectus for the relevant Funds. Nothing herein contained is to be considered an offer of sale or a solicitation of an offer to buy shares of any Fund listed in this report.
The information cannot be used or relied upon for the purpose of avoiding IRS penalties. These materials are not intended to provide tax, accounting or legal advice. As with all matters of a tax or legal nature, you should consult your own tax or legal counsel for advice.
Investors should carefully consider a fund’s investment objectives, risks, charges and expenses. This and other important information is contained in the fund’s prospectus and summary prospectus, which can be obtained by visiting hartfordfunds.com. Please read it carefully before investing.
The Funds are distributed by Hartford Funds Distributors, LLC (HFD), Member FINRA. Hartford Funds Management Company, LLC (HFMC) is the Funds’ investment manager. The Funds referenced herein are sub-advised by Wellington Management Company LLP. HFD and HFMC are not affiliated with the Funds’ sub-adviser.
MFAR-FI21 12/21 225985 Printed in the U.S.A.

Hartford Multi-Strategy Funds
Annual Report
October 31, 2021
| ■ The Hartford Balanced Income Fund |
| ■ Hartford AARP Balanced Retirement Fund |
| ■ The Hartford Checks and Balances Fund |
| ■ The Hartford Conservative Allocation Fund |
| ■ The Hartford Global Real Asset Fund |
| ■ The Hartford Growth Allocation Fund |
| ■ Hartford Moderate Allocation Fund |
| ■ Hartford Multi-Asset Income Fund1 |
| 1 | Formerly, Hartford Multi-Asset Income and Growth Fund |
A MESSAGE FROM THE PRESIDENT
Dear Shareholders:
Thank you for investing in Hartford Mutual Funds. The following is the Funds’ Annual Report covering the period from November 1, 2020 through October 31, 2021.
Market Review
During the 12 months ended October 31, 2021, U.S. stocks, as measured by the S&P 500 Index,1 gained 42.9%, a number that reflects one of the most remarkable market rebounds in recent memory, particularly when measured against the March 2020 sell-off at the start of the coronavirus (COVID-19) pandemic.
That said, the market’s extraordinary performance occurred against a backdrop of uncertain and sometimes contradictory economic signals: inflation fears; global supply-chain bottlenecks; tightened labor markets; political gridlock; a stubbornly persistent pandemic and a U.S. Federal Reserve (Fed) methodically signaling its intention to cut back on the monetary stimulus that helped fuel the recovery.
A year ago, markets had already bounced back from their March 2020 lows, yet the economy still faced considerable turbulence from a fiercely divisive U.S. presidential election and a resurgence of COVID-19 infections. Once the election was settled in November 2020, the emergence of safe and effective vaccines provided a significant lift to equity markets, as did a major $900 billion economic relief package passed by the U.S. Congress in late December 2020.
In March 2021, the U.S. Congress fast-tracked approval of the Biden administration’s $1.9 trillion economic stimulus package. In August 2021, a $1.2 trillion proposal for an infrastructure spending package received U.S. Senate approval. However, by the period’s end, the outcome for the administration’s $1.75 trillion “Build Back Better” proposal, focused on social-safety-net improvements and climate-change mitigation, remained uncertain.
Inflation headlines dominated the spring and summer of 2021. In July 2021, the Fed’s preferred measure of inflation had risen to levels not seen since 1991.2 The supply-chain disruptions spawned in part by the economic recovery helped drive up prices for gasoline, used cars, airfare tickets, durable goods, and a host of other items toward the end of the period. The Fed's previous assurances that inflation would be mostly transitory were being sorely tested.
Throughout the period, the Fed continued to maintain its ongoing policy of near-zero interest rates in support of the recovery. However, in September 2021, Fed Chairman Jerome Powell rattled markets when he announced preparations for having the Fed gradually cut back the $120 billion in bonds it had been purchasing each month since the start of the pandemic. By period’s end, markets had recovered.
As of the end of the period, the economic recovery appears durable. Yet, inflation remains a wildcard and market volatility may persist. Nowadays, it’s more important than ever to maintain a strong relationship with your financial professional.
Thank you again for investing in Hartford Mutual Funds. For the most up-to-date information on our funds, please take advantage of all the resources available at hartfordfunds.com.
James Davey
President
Hartford Funds
| 1 | S&P 500 Index is a market capitalization-weighted price index composed of 500 widely held common stocks. The index is unmanaged and not available for direct investment. Past performance does not guarantee future results. |
| 2 | The Personal Consumption Expenditures Price Index, which excludes food and energy prices, rose 3.6% in July 2021. Source: U.S. Bureau of Economic Analysis and the St. Louis Fed, as of September 2021. |
Hartford Multi-Strategy Funds
Table of Contents
The views expressed in each Fund’s Manager Discussion contained in the Fund Overview section are views of that Fund’s portfolio manager(s) through the end of the period and are subject to change based on market and other conditions, and we disclaim any responsibility to update the views contained herein. These views may contain statements that are “forward-looking” statements. Actual results may differ materially from those projected in the “forward-looking” statements. Each Fund’s Manager Discussion is for informational purposes only and does not represent an offer, recommendation or solicitation to buy, hold or sell any security. The specific securities identified and described, if any, do not represent all of the securities purchased or sold and you should not assume that investments in the securities identified and discussed will be profitable. Holdings and characteristics are subject to change. Fund performance reflected in each Fund’s Manager Discussion reflects the returns of such Fund’s Class A shares, before sales charges. Returns for such Fund’s other classes differ only to the extent that the classes do not have the same expenses.
The Hartford Balanced Income Fund
Fund Overview
October 31, 2021 (Unaudited)
Inception 07/31/2006
Sub-advised by Wellington Management Company LLP | Investment objective – The Fund seeks to provide current income with growth of capital as a secondary objective. |
Comparison of Change in Value of $10,000 Investment (10/31/2011 - 10/31/2021)
The chart above represents the hypothetical growth of a $10,000 investment in Class A, which includes the maximum sales charge applicable to Class A shares. Returns for the Fund’s other classes will vary from what is seen above due to differences in the expenses charged to those share classes.
| Average Annual Total Returns |
| for the Periods Ending 10/31/2021 |
| | 1 Year | 5 Years | 10 Years |
| Class A1 | 17.97% | 8.48% | 8.49% |
| Class A2 | 11.48% | 7.26% | 7.88% |
| Class C1 | 17.16% | 7.68% | 7.68% |
| Class C3 | 16.16% | 7.68% | 7.68% |
| Class I1 | 18.26% | 8.74% | 8.76% |
| Class R31 | 17.51% | 8.10% | 8.15% |
| Class R41 | 17.93% | 8.42% | 8.47% |
| Class R51 | 18.25% | 8.73% | 8.75% |
| Class R61 | 18.33% | 8.83% | 8.89% |
| Class Y1 | 18.21% | 8.76% | 8.86% |
| Class F1 | 18.33% | 8.84% | 8.80% |
| 45% Russell 1000 Value Index/44% Bloomberg Corporate Index/ 5.5% JP Morgan Emerging Markets Bond Index Plus/ 5.5% Bloomberg U.S. Corporate High Yield Bond 2% Issuer Cap Index4 | 20.02% | 8.44% | 8.62% |
| Russell 1000 Value Index | 43.76% | 12.39% | 12.85% |
| Bloomberg Corporate Index | 2.18% | 4.83% | 4.71% |
| JP Morgan Emerging Markets Bond Index Plus | 1.59% | 2.70% | 4.33% |
| Bloomberg U.S. Corporate High Yield Bond 2% Issuer Cap Index | 10.53% | 6.38% | 6.78% |
| 1 | Without sales charge |
| 2 | Reflects maximum sales charge of 5.50% |
| 3 | Reflects a contingent deferred sales charge of 1.00% |
| 4 | Calculated by Hartford Funds Management Company, LLC |
PERFORMANCE DATA QUOTED REPRESENTS PAST PERFORMANCE AND DOES NOT GUARANTEE FUTURE RESULTS. The investment return and principal value of the investment will fluctuate so that investors’ shares, when redeemed, may be worth more or less than their original cost. The chart and table do not reflect the deductions of taxes that a shareholder would pay on Fund distributions or the
redemption or sale of Fund shares. Current performance may be lower or higher than the performance data quoted. To obtain performance data current to the most recent month-end, please visit our website hartfordfunds.com.
Total returns presented above were calculated using the applicable class' net asset value available to shareholders for sale or redemption of Fund shares on 10/31/2021, which may exclude investment transactions as of this date. All share class returns assume the reinvestment of all distributions at net asset value and the deduction of all fund expenses. The total returns presented in the Financial Highlights section of the report are calculated in the same manner, but also take into account certain adjustments that are necessary under generally accepted accounting principles. As a result, the total returns in the Financial Highlights section may differ from the total returns presented above.
Class R6 shares commenced operations on 11/07/2014. Performance prior to that date is that of the Fund’s Class Y shares. Class F shares commenced operations on 02/28/2017. Performance for Class F shares prior to 02/28/2017 reflects the performance of Class I shares.
To the extent a share class has adopted the prior performance of another share class that had different operating expenses, such performance has not been adjusted to reflect the different operating expenses. If the performance were adjusted, it may have been higher or lower.
You cannot invest directly in an index.
See “Benchmark Glossary” for benchmark descriptions.
Performance information may reflect expense waivers/reimbursements without which performance would have been lower.
The Hartford Balanced Income Fund
Fund Overview – (continued)
October 31, 2021 (Unaudited)
| Operating Expenses* | Gross | Net |
| Class A | 0.89% | 0.89% |
| Class C | 1.64% | 1.64% |
| Class I | 0.63% | 0.63% |
| Class R3 | 1.24% | 1.24% |
| Class R4 | 0.95% | 0.95% |
| Class R5 | 0.66% | 0.66% |
| Class R6 | 0.56% | 0.56% |
| Class Y | 0.67% | 0.67% |
| Class F | 0.56% | 0.56% |
| * | Expenses as shown in the Fund’s most recent prospectus. Actual expenses may be higher or lower. Please see accompanying Financial Highlights for expense ratios for the period ended 10/31/2021. |
Portfolio Managers
Scott I. St. John, CFA
Senior Managing Director and Fixed Income Portfolio Manager
Wellington Management Company LLP
W. Michael Reckmeyer, III, CFA*
Senior Managing Director and Equity Portfolio Manager
Wellington Management Company LLP
Adam H. Illfelder, CFA
Senior Managing Director and Equity Portfolio Manager
Wellington Management Company LLP
Matthew Hand, CFA
Managing Director and Equity Portfolio Manager
Wellington Management Company LLP
*W. Michael Reckmeyer, III, CFA announced his plan to retire and withdraw from the partnership of Wellington Management Company LLP’s parent company, and effective June 30, 2022, he will no longer serve as a portfolio manager for the Fund. Mr. Reckmeyer’s portfolio management responsibilities will transition to Matthew Hand, CFA in the months leading up to his departure.
Manager Discussion
How did the Fund perform during the period?
The Class A shares of The Hartford Balanced Income Fund returned 17.97%, before sales charges, for the twelve-month period ended October 31, 2021, underperforming the Fund’s custom benchmark (45% Russell 1000 Value Index/ 44% Bloomberg Corporate Index/ 5.5% JP Morgan Emerging Markets Bond Index Plus/ 5.5% Bloomberg U.S. Corporate High Yield Bond 2% Issuer Cap Index) which returned 20.02% for the same period. For the period, the Russell 1000 Value Index returned 43.76%, the Bloomberg Corporate Index returned 2.18%, the JP Morgan Emerging Markets Bond Index Plus returned 1.59%, and the Bloomberg U.S. Corporate High Yield Bond 2% Issuer Cap Index returned 10.53%. For the same period, the Class A shares of the Fund, before sales charges, underperformed the 21.91% average return of the Lipper Mixed-Asset Target Allocation Moderate Funds peer group, a group of funds that hold between 40-60% in equity securities and the remainder in bonds, cash, and cash equivalents.
Why did the Fund perform this way?
United States (U.S.) equities, as measured by the S&P 500 Index, posted positive results over the trailing twelve-month period ending October 31, 2021. In the first half of 2021, U.S. equities gained amid a backdrop of improving vaccination rates, accelerating economic growth, and a broader reopening of the economy. Inflation rose sharply, as robust demand for goods and services, along with significant global supply-chain disruptions, drove consumer and producer prices sharply higher. The U.S. Federal Reserve (Fed) maintained its view that elevated price pressures may prove transitory, but the Fed rattled markets by considerably raising its inflation forecast for 2021 and signaling the potential for two interest-rate increases in 2023. This shift in expectations toward tighter monetary policy triggered a rotation from value and cyclically sensitive equities to growth equities. U.S. equities continued to climb in the third quarter of 2021 against a backdrop of accommodative monetary policy, robust corporate earnings, and strong demand for goods and services, while risk sentiment was pressured by anxiety about rising inflation, imminent monetary tightening by the Fed, moderating economic growth, and uncertainty about fiscal stimulus and the federal debt ceiling. Growth equities outperformed their value counterparts for the
The Hartford Balanced Income Fund
Fund Overview – (continued)
October 31, 2021 (Unaudited)
quarter; however, surging U.S. Treasury yields sparked a sharp sell-off in shares of large technology companies at the end of September 2021, triggering a powerful rotation into value equities. COVID-19 cases fell sharply in September, although the proliferation of the Delta variant in July and August 2021 weighed on consumer confidence and dampened momentum from businesses reopening. The Fed trimmed its 2021 gross domestic product (GDP) growth forecast to 5.9%, from 7%, and delivered a clearer signal that it would begin to taper asset purchases later this year if economic conditions remain stable.
U.S. fixed income markets generated mixed total returns during the trailing twelve months ended October 31, 2021, with lower-quality sectors in the lead. The Bloomberg U.S. Aggregate Bond Index generated a return of -0.48% during the period, driven by rising Treasury yields. Sovereign bond yields drifted higher across several developed markets as major central banks laid the groundwork for policy normalization and started to reduce monetary stimulus at varying speeds.
Spread sectors generally outperformed duration-equivalent government bonds. Early in the period, spread tightening was driven by encouraging vaccine trials and easing of coronavirus pandemic restrictions leading to improved economic data. Spreads continued to become narrower over most of the period as central banks aimed to mitigate risks, vaccine distribution picked up pace, and credit fundamentals generally improved. By the end of the period, credit spreads had widened slightly.
Global central banks maintained highly accommodative policy stances, although by the end of the period central banks took further steps toward policy normalization in response to mounting inflation pressures. At the start of the period, the Fed extended its emergency liquidity provisions but took steps toward removing policy accommodation by the end of the period. The European Central Bank (ECB) reduced the pace of quantitative easing purchases by the end of the period after having expanded the program at the end of 2020 and the first quarter of 2021.
Global economic activity dropped off sharply in the aftermath of COVID-19 economic shutdowns but started to rebound as economies reopened. Global gross domestic product (GDP) growth continued to recover during the latter part of the twelve-month period. However, ongoing supply chain disruptions and labor shortages later in the period indicated inflation pressures may prove less “transitory” than previously suspected. The U.S. labor market continued to heal while house prices rose sharply, supported by low mortgage rates and record low supply. During the latter part of the period, Chinese manufacturing Purchasing Managers Index (PMI) contracted to the lowest level since the onset of the pandemic, weighed down by rising costs, while services PMI expanded. Eurozone manufacturing PMI remained elevated during the period but then fell to a six-month low due to lack of shipping capacity and constrained supply to meet demand.
The U.S. dollar weakened early in the period on the Fed’s pledge to maintain its accommodative monetary policies, but later it rallied versus most currencies, supported by rising U.S. Treasury yields, expectations that the Fed would taper its quantitative easing, and a flight to quality driven by concerns about a potential default by
Chinese real estate company Evergrande and the U.S. debt ceiling deadlock. The British pound ended the period lower as supply-chain disruptions created broad challenges for the United Kingdom (U.K.), with spiking gas prices and fuel shortages engulfing the country, as well as record-high job vacancies stemming from staff shortages related to the coronavirus pandemic as well as the U.K.’s withdrawal from the European Union (EU), also known as Brexit. The euro also ended the period lower. Most emerging markets (EM) currencies ended the period lower, driven by China’s economic slowdown, Fed tapering concerns, and political uncertainty.
At the overall Fund level, performance within the equity portion of the Fund was the primary detractor from performance relative to the custom benchmark, while the Fund’s underweight to fixed-income securities contributed positively to performance relative to the custom benchmark.
Within the equity portion of the Fund, sector allocation, a result of our bottom-up stock selection process, was the primary driver of relative underperformance versus the Russell 1000 Value Index, due primarily to overweights to the Consumer Staples and Utilities sectors given their defensiveness, as well as an underweight to the Energy sector (which was by far the best-performing sector during the period due to strength in oil prices). This was partially offset by positive contributions from underweights to the Communication Services and Information Technology sectors, along with an overweight to the Financials sector. Security selection also detracted from relative results. Weak selection in the Communication Services, Real Estate, and Energy sectors was partially offset by selection in the Healthcare, Industrials, and Information Technology sectors.
Among the top detractors from relative performance in the equity portion of the Fund were Lockheed Martin (Industrials), Dominion Energy (Utilities), and not holding Exxon Mobil (Energy). Shares of Lockheed Martin, a U.S.-based aerospace and defense company, declined after third quarter 2021 sales missed estimates and management released 2022 guidance that was below expectations due to the withdrawal of the U.S. military presence in Afghanistan, re-basing of F-35 aircraft related revenue, and accelerated payments to suppliers to ensure supply-chain health. Dominion Energy, an electricity and natural gas provider, faced challenges at the start of the period from a lawsuit brought by the U.S. Securities and Exchange Commission (SEC) charging subsidiaries SCANA and SCE&G with defrauding investors with misleading statements about a nuclear power plant expansion.
Among the top contributors to relative returns in the equity portion of the Fund were ConocoPhillips (Energy), Morgan Stanley (Financials), and Bank of America (Financials). Shares of oil and gas conglomerate ConocoPhillips rose strongly on news that the company had purchased the entirety of Royal Dutch Shell’s Permian Basin assets. The all-cash purchase makes ConocoPhillips the second-largest producer in the world’s top shale basin. Morgan Stanley, a diversified financial services company, reported third quarter earnings ahead of consensus estimates, benefiting from strong core performance as well as contributions from subsidiaries E*TRADE and Eaton Vance. Finally,
The Hartford Balanced Income Fund
Fund Overview – (continued)
October 31, 2021 (Unaudited)
financial services provider Bank of America reported third quarter 2021 results that beat consensus estimates on strong fees and rising net interest income.
The fixed-income portion of the Fund outperformed the fixed-income portion of the Fund’s custom benchmark for the period due primarily to strong security selection within emerging-markets debt. An underweight to high-yield credit and the Fund’s duration and yield curve positioning also contributed positively to relative results. Security selection within investment-grade credit detracted from relative performance over the period.
Equity derivatives were not used in the Fund during the period. Credit default swaps were used in the Fund during the period to manage credit exposure both for individual issuers as well as for the overall credit markets, via credit default swap indices. Collectively, these positions had a positive impact on Fund performance during the period. Currency forwards were also used in the Fund during the period to seek to manage currency risk and had a slightly positive impact on Fund performance during the period. Finally, bond futures were used in the Fund for duration and yield curve management during the period and did not have a material impact on performance during the period.
What is the outlook as of the end of the period?
As of the end of the period, the market’s concern continues to shift among inflation, stagnating growth, supply chain disruptions, the coronavirus Delta variant, and labor market tightness—to name several. Meanwhile, we have continued to focus on what we believe are high-quality businesses with strong balance sheets and sustainable dividends. While these issues are topical and worth monitoring, they have not been the driver of decision making. We stress test the Fund across a number of scenarios and feel comfortable with the equity portion’s posturing relative to the Russell 1000 Value Index.
On the equity side, the Consumer Staples and Utilities sectors represented the Fund’s largest sector overweights relative to the equity portion of the Fund’s benchmark at the end of the period, while the Communication Services and Information Technology sectors were the Fund’s largest underweight allocations.
On the fixed income side, the Fund maintained a duration posture similar to the fixed-income portion of the Fund’s benchmark as of the end of the period. We maintained an underweight to investment-grade credit throughout the period in the Fund, from a contribution to spread duration perspective, and we favor maintaining a defensive credit risk posture in the Fund while preserving a liquidity buffer to seek to take advantage of any dislocations.
The equity and fixed income managers will continue to work collaboratively to make decisions regarding the Fund’s mix of equities and fixed income. At the end of the period, the Fund was positioned in line with its custom benchmark from an equity/fixed income weighting perspective.
Important Risks
Investing involves risk, including the possible loss of principal. Security prices fluctuate in value depending on general market and economic conditions and the prospects of individual companies. The Fund may allocate a portion of its assets to specialist portfolio managers, which may not work as intended. • Fixed income security risks include credit, liquidity, call, duration, and interest-rate risk. As interest rates rise, bond prices generally fall. • For dividend-paying stocks, dividends are not guaranteed and may decrease without notice. • Different investment styles may go in and out favor, which may cause the Fund to underperform the broader stock market. • Foreign investments may be more volatile and less liquid than U.S. investments and are subject to the risk of currency fluctuations and adverse political and economic developments.
| Composition by Security Type(1) |
| as of 10/31/2021 |
| Category | Percentage of
Net Assets |
| Equity Securities | |
| Common Stocks | 46.9% |
| Escrows | 0.0 * |
| Preferred Stocks | 0.3 |
| Total | 47.2% |
| Fixed Income Securities | |
| Convertible Bonds | 0.1% |
| Corporate Bonds | 42.1 |
| Foreign Government Obligations | 4.1 |
| Municipal Bonds | 0.2 |
| Senior Floating Rate Interests | 0.1 |
| U.S. Government Securities | 1.4 |
| Total | 48.0% |
| Short-Term Investments | 3.9 |
| Other Assets & Liabilities | 0.9 |
| Total | 100.0% |
| * | Percentage rounds to zero. |
| (1) | For Fund compliance purposes, the Fund may not use the same classification system. These classifications are used for financial reporting purposes. |
Hartford AARP Balanced Retirement Fund
Fund Overview
October 31, 2021 (Unaudited)
Inception 04/30/2014
Sub-advised by Wellington Management Company LLP | Investment objective – The Fund seeks long-term total return while seeking to mitigate downside risk. |
Comparison of Change in Value of $10,000 Investment (04/30/2014 - 10/31/2021)
The chart above represents the hypothetical growth of a $10,000 investment in Class A, which includes the maximum sales charge applicable to Class A shares. Returns for the Fund’s other classes will vary from what is seen above due to differences in the expenses charged to those share classes.
| Average Annual Total Returns |
| for the Periods Ending 10/31/2021 |
| | 1 Year | 5 Years | Since
Inception1 |
| Class A2 | 13.60% | 6.24% | 4.31% |
| Class A3 | 8.49% | 5.27% | 3.68% |
| Class C2 | 12.74% | 5.49% | 3.56% |
| Class C4 | 11.74% | 5.49% | 3.56% |
| Class I2 | 14.08% | 6.47% | 4.55% |
| Class R32 | 13.46% | 6.14% | 4.13% |
| Class R42 | 13.75% | 6.33% | 4.37% |
| Class R52 | 14.13% | 6.46% | 4.52% |
| Class R62 | 14.21% | 6.56% | 4.62% |
| Class Y2 | 14.16% | 6.51% | 4.59% |
| Class F2 | 14.31% | 6.58% | 4.62% |
| 70% Bloomberg U.S. Aggregate Bond Index/ 30% MSCI ACWI Index (Net)5 | 9.86% | 6.71% | 5.49% |
| Bloomberg U.S. Aggregate Bond Index | -0.48% | 3.10% | 3.22% |
| MSCI ACWI Index (Net) | 37.28% | 14.72% | 10.22% |
| 1 | Inception: 04/30/2014 |
| 2 | Without sales charge |
| 3 | Reflects maximum sales charge of 4.50% |
| 4 | Reflects a contingent deferred sales charge of 1.00% |
| 5 | Calculated by Hartford Funds Management Company, LLC |
PERFORMANCE DATA QUOTED REPRESENTS PAST PERFORMANCE AND DOES NOT GUARANTEE FUTURE RESULTS. The investment return and principal value of the investment will fluctuate so that investors’ shares, when redeemed, may be worth more or less than their original cost. The chart and table do not reflect the deductions of taxes that a shareholder would pay on Fund distributions or the redemption or sale of Fund shares. Current performance may be lower or higher than the performance data quoted. To obtain performance data current to the most recent month-end, please visit our website hartfordfunds.com.
Total returns presented above were calculated using the applicable class' net asset value available to shareholders for sale or redemption of Fund shares on 10/31/2021, which may exclude investment transactions as of this date. All share class returns assume the reinvestment of all distributions at net asset value and the deduction of all fund expenses. The total returns presented in the Financial Highlights section of the report are calculated in the same manner, but also take into account certain adjustments that are necessary under generally accepted accounting principles. As a result, the total returns in the Financial Highlights section may differ from the total returns presented above.
Class F shares commenced operations on 02/28/2017. Performance prior to that date is that of the Fund’s Class I shares. Class R6 shares commenced operations on 02/28/2019. Performance prior to that date is that of the Fund’s Class Y shares.
To the extent a share class has adopted the prior performance of another share class that had different operating expenses, such performance has not been adjusted to reflect the different operating expenses. If the performance were adjusted, it may have been higher or lower.
Performance information prior to 07/10/2019 includes the Fund’s performance when the Fund pursued a different investment objective and principal investment strategy.
You cannot invest directly in an index.
See “Benchmark Glossary” for benchmark descriptions.
Performance information may reflect expense waivers/reimbursements without which performance would have been lower. For information on current expense waivers/reimbursements, please see the prospectus.
Hartford AARP Balanced Retirement Fund
Fund Overview – (continued)
October 31, 2021 (Unaudited)
| Operating Expenses* | Gross | Net |
| Class A | 1.12% | 1.00% |
| Class C | 1.87% | 1.75% |
| Class I | 0.81% | 0.70% |
| Class R3 | 1.44% | 1.22% |
| Class R4 | 1.14% | 0.92% |
| Class R5 | 0.84% | 0.59% |
| Class R6 | 0.73% | 0.49% |
| Class Y | 0.83% | 0.59% |
| Class F | 0.73% | 0.49% |
| * | Expenses as shown in the Fund’s most recent prospectus. Gross expenses do not reflect contractual expense reimbursement arrangements. Net expenses reflect such arrangements in instances when they reduce gross expenses. These arrangements remain in effect until 02/28/2022 unless the Fund’s Board of Directors approves an earlier termination. Expenses shown include acquired fund fees and expenses. Actual expenses may be higher or lower. Please see accompanying Financial Highlights for expense ratios for the period ended 10/31/2021. |
Portfolio Managers
Christopher J. Goolgasian, CFA, CPA, CAIA
Senior Managing Director and Portfolio Manager
Wellington Management Company LLP
Lutz-Peter Wilke, CFA
Managing Director and Portfolio Manager
Wellington Management Company LLP
Manager Discussion
How did the Fund perform during the period?
The Class A shares of the Hartford AARP Balanced Retirement Fund returned 13.60%, before sales charges, for the twelve-month period ended October 31, 2021, outperforming the Fund’s custom benchmark (70% Bloomberg U.S. Aggregate Bond Index, 30% MSCI ACWI Index (Net)), which returned 9.86% for the same period. Individually, the Bloomberg U.S. Aggregate Bond Index and the MSCI ACWI Index (Net) returned -0.48% and 37.28%, respectively, for the same period. For the same period, the Class A shares of the Fund, before sales charges, outperformed the 12.22% average return of the Lipper Mixed-Asset Target Allocation Conservative Funds peer group, a group of funds that allocate investments across various asset classes, including domestic common equities, bonds, and money market instruments with a focus on total return.
Why did the Fund perform this way?
For the twelve-month period ended October 31, 2021, global equities rose 37.28% as measured by the MSCI ACWI Index (Net). In the first half of 2021, United States (U.S.) equities gained amid a backdrop of improving vaccination rates, accelerating economic growth, and a broader reopening of the economy. Inflation rose sharply, as robust demand for goods and services, along with significant global supply-chain disruptions, drove consumer and producer prices sharply higher.
The U.S. Federal Reserve (Fed) maintained its view that elevated price pressures may prove transitory, but the Fed rattled markets by considerably raising its inflation forecast for 2021 and signaling the potential for two interest-rate increases in 2023. This shift in expectations toward tighter monetary policy triggered a rotation from value and cyclically sensitive equities to growth equities. U.S. equities continued to climb in the third quarter of 2021 against a backdrop of accommodative monetary policy, robust corporate earnings, and strong demand for goods and services, while risk sentiment was pressured by anxiety about rising inflation, imminent monetary tightening by the Fed, moderating economic growth, and uncertainty about fiscal stimulus and the federal debt ceiling. Growth equities outperformed their value counterparts for the quarter; however, surging U.S. Treasury yields sparked a sharp sell-off in shares of large technology companies at the end of September 2021, triggering a powerful rotation into value equities. COVID-19 cases fell sharply in September, although the proliferation of the Delta variant in July and August 2021 weighed on consumer confidence and dampened momentum from businesses reopening. The Fed trimmed its 2021 gross domestic product (GDP) growth forecast to 5.9%, from 7%, and delivered a clearer signal that it would begin to taper asset purchases later this year if economic conditions remain stable.
Over the period, the Fed acknowledged that it had discussed the appropriate timing to begin tapering its large-scale asset purchases. Global GDP growth continued to recover during the first quarter, although GDP contracted further in Europe and Japan. In the U.S., the labor market strengthened, while the housing market remained
Hartford AARP Balanced Retirement Fund
Fund Overview – (continued)
October 31, 2021 (Unaudited)
supported by low mortgage rates and scarce supply. Global sovereign debt yields generally moved higher as major central banks reined in policy support, while intensifying supply constraints added to inflationary pressures. Major central banks’ rhetoric remained tilted to a bias that the recent inflationary shock will be transitory, while also acknowledging that upward price pressures have persisted longer than initially anticipated. United Kingdom (U.K.) sovereign bond yields increased the most during the period among developed markets after the Bank of England (BOE) signaled that interest-rate increases could occur sooner than markets expected. Canadian bond yields increased during the period, as the Bank of Canada suggested its initial move to withdraw emergency stimulus would be to raise the policy rate instead of winding down bond holdings.
We believe it is important to note that the Fund is designed for investors at or near retirement with total return and risk reduction goals and may behave differently from its peer group and benchmark.
At the overall Fund level, outperformance relative to the custom benchmark was driven by both the equity and fixed income allocations. Specifically, the Fund’s overweight to equities and underweight to fixed income were the primary drivers of relative performance. Allocation decisions in fixed income and security selection in equities also contributed positively to overall performance.
Within the equity and fixed income portions of the Fund, we allocated a portion of the Fund’s assets to various specialized investment teams at Wellington Management Company LLP (“Wellington Management”) that invested the allocated assets in accordance with the Fund’s investment strategy.
Within the fixed income portion of the Fund, the Fund’s underweight to the asset class and allocation decisions and security selection within the asset class all contributed positively to relative performance. Notably, the allocation to the custom core bond plus strategy drove outperformance, largely due to the allocation impact, while security selection within the strategy was also additive to performance. The allocation to The Hartford World Bond Fund had a slightly negative impact in aggregate, as positive security selection was more than offset by the negative allocation impact. Duration management detracted over the period.
Within the equity portion of the Fund, the Fund’s overweight to and security selection within the asset class were positive for the period, while allocation decisions within equities detracted from performance. In aggregate, the Fund’s purchase of equity put options and allocations to precious metals equities and global dividend growth equities were the biggest detractors from relative performance, while developed market equities, emerging market equities, and industrial metals equities also detracted from performance. A put option contract is a contract sold by one party to another party that offers the buyer the right, but not the obligation, to sell an investment or other financial asset at an agreed-upon price during a specific period of time or on a specific date. Allocation decisions had a negative impact primarily due to allocating away from the MSCI ACWI Index (Net) and allocating to global dividend growth equities and equity put protection. Underperformance from global dividend growth equities and emerging-markets equities was partially alleviated by strong security selection within both allocations. Energy and agriculture equities
contributed positively over the period, primarily due to the allocation impact. Currency hedging was also additive.
During the period, the Fund used derivatives for risk management, duration management, and currency hedging. Over the period, the Fund’s use of derivatives detracted from performance overall, primarily stemming from the Fund’s structural allocation to equity put protection. Duration management also detracted over the period, while currency hedging was positive.
What is the outlook as of the end of the period?
As of the end of the period, we favor equities over bonds based on our belief that the economic growth momentum may strengthen again in the fourth quarter of 2021 after recent growth downgrades in both the U.S. and China at the end of the period. In our view, the combination of lower growth and higher inflation forecasts that have weighed on risk assets are most likely transitory in nature. Although a more difficult situation unfolds in the Chinese economy, we believe Asian equities are attractive as we expect growth concerns to dissipate later this year and into 2022. We maintain a positive view on Europe as the structural outlook for renewables remains strong. In the U.S., we continue to have a bias towards value within our equity allocation, which we have expressed through our exposure to U.S. homebuilders. Within fixed income, we expect markets to remain under pressure in the current environment, given higher inflation expectations. We believe credit markets should remain well-supported by the strength in corporate balance sheets; however, there may be limited potential for upside as this is likely reflected in tight spreads.
Important Risks
Investing involves risk, including the possible loss of principal. Security prices fluctuate in value depending on general market and economic conditions and the prospects of individual companies. The Fund may allocate a portion of its assets to specialist portfolio managers, which may not work as intended. • Fixed income security risks include credit, liquidity, call, duration, and interest-rate risk. As interest rates rise, bond prices generally fall. • Loans can be difficult to value and less liquid than other types of debt instruments; they are also subject to nonpayment, collateral, bankruptcy, default, extension, prepayment and insolvency risks. • Investments in high-yield (“junk”) bonds involve greater risk of price volatility, illiquidity, and default than higher-rated debt securities. • Foreign investments may be more volatile and less liquid than U.S. investments and are subject to the risk of currency fluctuations and adverse political, economic and regulatory developments. These risks may be greater, and include additional risks, for investments in emerging markets. • Derivatives are generally more volatile and sensitive to changes in market or economic conditions than other securities; their risks include currency, leverage, liquidity, index, pricing, regulatory and counterparty risk. • Mortgage-related and asset-backed securities’ risks include credit, interest-rate, prepayment, and extension risk. • Restricted securities may be more difficult to sell and price than other securities. • For dividend-paying stocks, dividends are not guaranteed and may decrease without notice. • Investments in securities of other investment companies includes the risks that apply to such other investment companies’ strategies and holdings. • Obligations of U.S. Government agencies are supported by varying degrees of credit but are generally not backed by the full faith and credit of the
Hartford AARP Balanced Retirement Fund
Fund Overview – (continued)
October 31, 2021 (Unaudited)
U.S. Government. • The purchase of securities in the To-Be-Announced (TBA) market can result in higher portfolio turnover and related expenses as well as price and counterparty risk. • The Fund may have high portfolio turnover, which could increase its transaction costs and an investor’s tax liability.
| Composition by Security Type(1) |
| as of 10/31/2021 |
| Category | Percentage of
Net Assets |
| Equity Securities | |
| Affiliated Investment Companies | 23.0% |
| Common Stocks | 36.4 |
| Preferred Stocks | 0.0 * |
| Warrants | 0.0 * |
| Total | 59.4% |
| Fixed Income Securities | |
| Asset & Commercial Mortgage-Backed Securities | 12.2% |
| Corporate Bonds | 18.8 |
| Municipal Bonds | 0.6 |
| U.S. Government Agencies(2) | 4.4 |
| U.S. Government Securities | 3.0 |
| Total | 39.0% |
| Short-Term Investments | 1.6 |
| Purchased Options | 0.6 |
| Other Assets & Liabilities | (0.6) |
| Total | 100.0% |
| * | Percentage rounds to zero. |
| (1) | For Fund compliance purposes, the Fund may not use the same classification system. These classifications are used for financial reporting purposes. |
| (2) | All, or a portion of the securities categorized as U.S. Government Agencies, were agency mortgage-backed securities as of October 31, 2021. |
The Hartford Checks and Balances Fund
Fund Overview
October 31, 2021 (Unaudited)
Inception 05/31/2007
Advised by Hartford Funds Management Company, LLC
(“HFMC” or the “Investment Manager”) | Investment objective – The Fund seeks long-term capital appreciation and income. |
Comparison of Change in Value of $10,000 Investment (10/31/2011 - 10/31/2021)
The chart above represents the hypothetical growth of a $10,000 investment in Class A, which includes the maximum sales charge applicable to Class A shares. Returns for the Fund’s other classes will vary from what is seen above due to differences in the expenses charged to those share classes.
| Average Annual Total Returns |
| for the Periods Ending 10/31/2021 |
| | 1 Year | 5 Years | 10 Years |
| Class A1 | 25.55% | 12.08% | 10.68% |
| Class A2 | 18.64% | 10.82% | 10.06% |
| Class C1 | 24.52% | 11.24% | 9.85% |
| Class C3 | 23.52% | 11.24% | 9.85% |
| Class I1 | 25.80% | 12.37% | 10.95% |
| Class R31 | 24.94% | 11.67% | 10.28% |
| Class R41 | 25.32% | 12.01% | 10.60% |
| Class R51 | 25.69% | 12.27% | 10.91% |
| Class F1 | 25.93% | 12.45% | 10.99% |
| 33.4% Russell 3000 Index/ 33.3% S&P 500 Index/ 33.3% Bloomberg U.S. Aggregate Bond Index4 | 27.34% | 13.74% | 11.84% |
| Russell 3000 Index | 43.90% | 18.91% | 16.10% |
| S&P 500 Index | 42.91% | 18.93% | 16.21% |
| Bloomberg U.S. Aggregate Bond Index | -0.48% | 3.10% | 3.00% |
| 1 | Without sales charge |
| 2 | Reflects maximum sales charge of 5.50% |
| 3 | Reflects a contingent deferred sales charge of 1.00% |
| 4 | Calculated by Hartford Funds Management Company, LLC |
PERFORMANCE DATA QUOTED REPRESENTS PAST PERFORMANCE AND DOES NOT GUARANTEE FUTURE RESULTS. The investment return and principal value of the investment will fluctuate so that investors’ shares, when redeemed, may be worth more or less than their original cost. The chart and table do not reflect the deductions of taxes that a shareholder would pay on Fund distributions or the redemption or sale of Fund shares. Current performance may be lower or higher than the performance data quoted. To obtain performance data current to the most recent month-end, please visit our website hartfordfunds.com.
Total returns presented above were calculated using the applicable class' net asset value available to shareholders for sale or redemption of Fund shares on 10/31/2021, which may exclude investment transactions as of this date. All share class returns
assume the reinvestment of all distributions at net asset value and the deduction of all fund expenses. The total returns presented in the Financial Highlights section of the report are calculated in the same manner, but also take into account certain adjustments that are necessary under generally accepted accounting principles. As a result, the total returns in the Financial Highlights section may differ from the total returns presented above.
Class F shares commenced operations on 02/28/2017. Performance for Class F shares prior to 02/28/2017 reflects the performance of Class I shares.
To the extent a share class has adopted the prior performance of another share class that had different operating expenses, such performance has not been adjusted to reflect the different operating expenses. If the performance were adjusted, it may have been higher or lower.
You cannot invest directly in an index.
See “Benchmark Glossary” for benchmark descriptions.
Performance information may reflect expense waivers/reimbursements without which performance would have been lower.
| Operating Expenses* | Gross | Net |
| Class A | 0.93% | 0.93% |
| Class C | 1.71% | 1.71% |
| Class I | 0.67% | 0.67% |
| Class R3 | 1.29% | 1.29% |
| Class R4 | 0.97% | 0.97% |
| Class R5 | 0.70% | 0.70% |
| Class F | 0.59% | 0.59% |
| * | Expenses as shown in the Fund’s most recent prospectus. Expenses shown include acquired fund fees and expenses. Actual expenses may be higher or lower. Please see accompanying Financial Highlights for expense ratios for the period ended 10/31/2021. |
The Hartford Checks and Balances Fund
Fund Overview – (continued)
October 31, 2021 (Unaudited)
Portfolio Managers
Vernon J. Meyer, CFA
Managing Director and Chief Investment Officer of Hartford Funds Management Company, LLC (the “Investment Manager”)
Allison Z. Mortensen, CFA
Head of Multi-Asset Solutions and Managing Director at Hartford Funds and Vice President of the Investment Manager
Manager Discussion
How did the Fund perform during the period?
The Class A shares of The Hartford Checks and Balances Fund returned 25.55%, before sales charges, for the twelve-month period ended October 31, 2021, underperforming the Fund’s custom benchmark (which is comprised of 33.4% Russell 3000 Index, 33.3% S&P 500 Index, 33.3% Bloomberg U.S. Aggregate Bond Index), which returned 27.34% for the same period. Individually, the Russell 3000 Index, the S&P 500 Index, and the Bloomberg U.S. Aggregate Bond Index returned 43.90%, 42.91%, and -0.48% respectively, for the same period. For the same period, Class A shares of the Fund, before sales charges, underperformed the 28.65% average return of the Lipper Mixed-Asset Target Allocation Growth Funds category, a group of funds that hold between 60%-80% equity securities, with the remainder invested in bonds, cash, and cash equivalents.
Why did the Fund perform this way?
United States (U.S.) markets rebounded substantially following the first emergency approval of the Pfizer-BioNTech coronavirus vaccine in December 2020 by the U.S. Food and Drug Administration (FDA). The rally was led by a sharp recovery for companies most affected by the business and travel restrictions during the coronavirus pandemic; these same companies saw their share prices decline significantly earlier in 2020.
Globally, markets continued to advance early in 2021 amid the accelerating global rollout of vaccines, a favorable outlook for global economic growth, and substantial support from governments and central banks. The combination of surging commodity prices, pent-up demand, global supply-chain disruptions, and stimulus-powered economic growth drove inflation expectations higher, prompting some central banks to raise interest rates or consider tighter monetary policy. The global decline in coronavirus cases came to a halt during the second quarter of 2021, as the rapid spread of the highly infectious coronavirus Delta variant disrupted plans to lift lockdowns in many countries and reopen economies.
Toward the end of the period, global markets contended with pandemic uncertainty, moderating economic growth, the imminent prospect of reduced quantitative easing and policy tightening, and persistent supply-chain dislocations that amplified the risk of more sustained inflation. Although global equity markets generally experienced positive results for the period, domestic equity markets had the strongest gains overall, outpacing international developed and emerging markets.
During the period, the return of The Hartford Capital Appreciation Fund detracted most from performance relative to the custom benchmark. The Fund’s performance relative to the custom benchmark benefited most from the performance of The Hartford Dividend and Growth Fund.
The Hartford Capital Appreciation Fund underperformed the Russell 3000 Index during the period, primarily due to weak stock selection within the Consumer Discretionary, Information Technology, and Healthcare sectors. Conversely, stronger selection within the Energy, Consumer Staples, and Financials sectors contributed positively to the fund’s relative returns during the period. Sector allocation, a result of bottom-up stock selection, detracted during the period primarily due to the fund’s underweight exposure to the Energy sector and overweight exposure to the Consumer Staples sector. An underweight to the Utilities sector relative to the Russell 3000 Index contributed positively to performance.
The Hartford Dividend and Growth Fund outperformed the S&P 500 Index over the period with strong security selection serving as the main driver of outperformance. Stock selection was strongest within the Financials, Industrials, and Healthcare sectors. This was partially offset by weaker selection within the Materials and Communication Services sectors, which detracted from relative performance over the same period. Sector allocation, a result of the bottom-up stock selection process, also contributed positively to the fund’s performance relative to the S&P 500 Index over the period. An overweight to the Financials and Energy sectors added the most to returns relative to the S&P 500 Index during the period. This was partially offset by an underweight allocation to the Information Technology sector over the same period.
The Hartford Total Return Bond ETF outperformed the Bloomberg U.S. Aggregate Bond Index during the period. The ETF’s out-of-benchmark allocations to high yield bonds and bank loans, particularly within the Industrials sectors, were the primary drivers of relative outperformance as spreads continued to narrow across credit sectors for most of the period. The ETF’s allocation to securitized sectors including non-agency residential mortgage-backed securities (RMBS), commercial mortgage-backed securities (CMBS), collateralized loan obligations (CLOs), asset-backed securities (ABS), and agency mortgage-backed securities (MBS) all contributed favorably to relative performance as spreads narrowed over most of the period in sync with other corporate credit markets, benefitting from the continued economic recovery during the period. The ETF’s positioning within investment-grade credit contributed favorably to relative performance. Additionally, the ETF’s modest allocation to
The Hartford Checks and Balances Fund
Fund Overview – (continued)
October 31, 2021 (Unaudited)
emerging-markets sovereign and corporate debt had a positive impact on relative performance, as a recovering global economy supported emerging markets given increased activity through the commodity and global trade channels. Finally, an allocation to Treasury Inflation Protected Securities (TIPS) contributed positively to the ETF’s relative results as inflation expectations increased during the period.
Derivatives were not used at the aggregate fund level during the period but were used at the underlying fund level.
What is the outlook as of the end of the period?
As of the end of the period, markets have been volatile, driven by inflation and interest rate concerns, slower growth, and an uneven global economic recovery as different regions experience resurgences in coronavirus cases. As of October 2021, the U.S. unemployment rate fell to 4.6%, but companies and industries are still grappling with prolonged labor shortages. We expect continued volatility in the coming months driven by the uneven global recovery, inflation expectations, and the pace and magnitude of changes in interest rates.
The 10-year Treasury yield rose from 0.79% at the beginning of the twelve-month period to 1.55% at the end of the twelve-month period. At its September 2021 meeting, the U.S. Federal Reserve (Fed) left interest rates unchanged and continued its current pace of bond-buying. However, the Fed stated that it may begin to reduce its bond purchases if economic data such as employment and inflation continue to normalize. At the end of the period, through its investment in The Hartford Capital Appreciation Fund and The Hartford Dividend and Growth Fund, the Fund’s largest equity overweights were to the Financials, Industrials, and Consumer Staples sectors, while the Fund’s largest underweights were to the Technology, Communication Services, and Consumer Discretionary sectors, relative to the S&P 500 Index and the Russell 3000 Index. At the end of the period, through its investment in the Hartford Total Return Bond ETF, the Fund’s largest fixed income overweights relative to the Bloomberg U.S. Aggregate Bond Index were to Mortgage-Backed Securities, as well as to High-Yield Credit and Bank Loans, both of which are outside of the Bloomberg U.S. Aggregate Bond Index. In addition, as of the end of the period, through its investment in the Hartford Total Return Bond ETF, the Fund’s largest underweight was to U.S. government bonds and investment-grade credit, relative to the Bloomberg U.S. Aggregate Bond Index.
Important Risks
Investing involves risk, including the possible loss of principal. Security prices fluctuate in value depending on general market and economic conditions and the prospects of individual companies. • Since the Fund is not actively managed, it may underperform actively managed funds during certain markets. • The ability of the Fund to meet its investment objective is directly related to the ability of the underlying funds to meet their objectives as well as the investment manager’s allocation among those underlying funds. The Fund is subject to the risks of the underlying funds in direct proportion to the amount of assets it invests in each underlying fund. The underlying funds are subject to the risks of the general equity market, small- and mid-cap securities, foreign and emerging-markets securities, fixed-income
securities (which carry credit, liquidity, call, duration, and interest-rate risk), high-yield (“junk”) bonds, mortgage-related and asset-backed securities, and derivatives.
| Asset Allocation(1) |
| as of 10/31/2021 |
| Fund Type | Percentage of
Net Assets |
| Domestic Equity Funds | 66.5% |
| Taxable Fixed Income Funds | 33.3 |
| Short-Term Investments | 0.2 |
| Other Assets & Liabilities | 0.0 * |
| Total | 100.0% |
| * | Percentage rounds to zero. |
| (1) | For Fund compliance purposes, the Fund may not use the same classification system. These classifications are used for financial reporting purposes. |
The Hartford Conservative Allocation Fund
Fund Overview
October 31, 2021 (Unaudited)
Inception 05/28/2004
Advised by Hartford Funds Management Company, LLC
(“HFMC” or the “Investment Manager”) | Investment objective – The Fund seeks current income and long-term capital appreciation. |
Comparison of Change in Value of $10,000 Investment (10/31/2011 - 10/31/2021)
The chart above represents the hypothetical growth of a $10,000 investment in Class A, which includes the maximum sales charge applicable to Class A shares. Returns for the Fund’s other classes will vary from what is seen above due to differences in the expenses charged to those share classes.
| Average Annual Total Returns |
| for the Periods Ending 10/31/2021 |
| | 1 Year | 5 Years | 10 Years |
| Class A1 | 12.13% | 6.78% | 4.29% |
| Class A2 | 5.96% | 5.57% | 3.70% |
| Class C1 | 11.29% | 5.99% | 3.50% |
| Class C3 | 10.29% | 5.99% | 3.50% |
| Class I1 | 12.48% | 7.06% | 4.57% |
| Class R31 | 11.84% | 6.45% | 3.97% |
| Class R41 | 12.17% | 6.78% | 4.29% |
| Class R51 | 12.47% | 7.09% | 4.59% |
| Class F1 | 12.48% | 7.15% | 4.61% |
| 65% Bloomberg U.S. Aggregate Bond Index/ 25% Russell 3000 Index/ 10% MSCI ACWI ex USA Index (Net)4 | 12.38% | 7.84% | 6.75% |
| Bloomberg U.S. Aggregate Bond Index | -0.48% | 3.10% | 3.00% |
| Russell 3000 Index | 43.90% | 18.91% | 16.10% |
| MSCI ACWI ex USA Index (Net) | 29.66% | 9.77% | 6.66% |
| 1 | Without sales charge |
| 2 | Reflects maximum sales charge of 5.50% |
| 3 | Reflects a contingent deferred sales charge of 1.00% |
| 4 | Calculated by Hartford Funds Management Company, LLC |
PERFORMANCE DATA QUOTED REPRESENTS PAST PERFORMANCE AND DOES NOT GUARANTEE FUTURE RESULTS. The investment return and principal value of the investment will fluctuate so that investors’ shares, when redeemed, may be worth more or less than their original cost. The chart and table do not reflect the deductions of taxes that a shareholder would pay on Fund distributions or the redemption or sale of Fund shares. Current performance may be lower or higher than the performance data quoted. To obtain performance data current to the most recent month-end, please visit our website hartfordfunds.com.
Total returns presented above were calculated using the applicable class' net asset value available to shareholders for sale or redemption of Fund shares on 10/31/2021, which may exclude investment transactions as of this date. All share class returns
assume the reinvestment of all distributions at net asset value and the deduction of all fund expenses. The total returns presented in the Financial Highlights section of the report are calculated in the same manner, but also take into account certain adjustments that are necessary under generally accepted accounting principles. As a result, the total returns in the Financial Highlights section may differ from the total returns presented above.
Class F shares commenced operations on 02/28/2017. Performance prior to that date is that of the Fund’s Class I shares.
To the extent a share class has adopted the prior performance of another share class that had different operating expenses, such performance has not been adjusted to reflect the different operating expenses. If the performance were adjusted, it may have been higher or lower.
Performance information includes performance under the Fund’s previous sub-advisers, Hartford Investment Management Company and Wellington Management Company LLP (��Wellington Management”). For the period 06/04/2012 through 11/30/2015, Wellington Management served as the sub-adviser to the Fund, using a modified investment strategy. Prior to 06/04/2012, Hartford Investment Management Company served as the sub-adviser to the Fund, using a modified investment strategy.
You cannot invest directly in an index.
See “Benchmark Glossary” for benchmark descriptions.
Performance information may reflect expense waivers/reimbursements without which performance would have been lower. For information on current expense waivers/reimbursements, please see the prospectus.
The Hartford Conservative Allocation Fund
Fund Overview – (continued)
October 31, 2021 (Unaudited)
| Operating Expenses* | Gross | Net |
| Class A | 1.09% | 1.09% |
| Class C | 1.88% | 1.88% |
| Class I | 0.86% | 0.86% |
| Class R3 | 1.45% | 1.44% |
| Class R4 | 1.15% | 1.14% |
| Class R5 | 0.85% | 0.84% |
| Class F | 0.73% | 0.73% |
| * | Expenses as shown in the Fund’s most recent prospectus. Gross expenses do not reflect contractual expense reimbursement arrangements. Net expenses reflect such arrangements in instances when they reduce gross expenses. These arrangements remain in effect until 02/28/2022 unless the Fund’s Board of Directors approves an earlier termination. Expenses shown include acquired fund fees and expenses. Actual expenses may be higher or lower. Please see accompanying Financial Highlights for expense ratios for the period ended 10/31/2021. |
Portfolio Managers
Vernon J. Meyer, CFA
Managing Director and Chief Investment Officer of Hartford Funds Management Company, LLC (the “Investment Manager”)
Allison Z. Mortensen, CFA
Head of Multi-Asset Solutions and Managing Director at Hartford Funds and Vice President of the Investment Manager
Manager Discussion
How did the Fund perform during the period?
The Class A shares of The Hartford Conservative Allocation Fund returned 12.13%, before sales charges, for the twelve-month period ended October 31, 2021, underperforming the Fund’s custom benchmark, which is comprised of 65% Bloomberg U.S. Aggregate Bond Index, 25% Russell 3000 Index and 10% MSCI ACWI ex USA Index (Net), which returned 12.38% for the same period. Individually, the Bloomberg U.S. Aggregate Bond Index, the Russell 3000 Index, and the MSCI ACWI ex USA Index (Net) returned -0.48%, 43.90%, and 29.66%, respectively, for the same period. For the same period, Class A shares of the Fund, before sales charges, underperformed the average return of the Lipper Mixed-Asset Target Allocation Conservative Funds category, a group of funds with equity weights of 20%-40%, which returned 12.22%.
Why did the Fund perform this way?
United States (U.S.) markets rebounded substantially following the first emergency approval of the Pfizer-BioNTech coronavirus vaccine in December 2020 by the U.S. Food and Drug Administration (FDA). The rally was led by a sharp recovery for companies most affected by the business and travel restrictions during the coronavirus pandemic; these same companies saw their share prices decline significantly earlier in 2020.
Globally, markets continued to advance early in 2021 amid the accelerating global rollout of vaccines, a favorable outlook for global economic growth, and substantial support from governments and central banks. The combination of surging commodity prices, pent-up demand, global supply-chain disruptions, and stimulus-powered
economic growth drove inflation expectations higher, prompting some central banks to raise interest rates or consider tighter monetary policy. The global decline in coronavirus cases came to a halt during the second quarter of 2021, as the rapid spread of the highly infectious coronavirus Delta variant disrupted plans to lift lockdowns in many countries and reopen economies.
Toward the end of the period, global markets contended with pandemic uncertainty, moderating economic growth, the imminent prospect of reduced quantitative easing and policy tightening, and persistent supply-chain dislocations that amplified the risk of more sustained inflation. Although global equity markets generally experienced positive results for the period, domestic equity markets had the strongest gains overall, outpacing international developed and emerging markets.
The Fund seeks to meet its investment objective through investment in a combination of other mutual funds and exchange traded funds ("ETFs") advised by the Investment Manager or a wholly owned subsidiary of the Investment Manager (the "Underlying Funds"). The main driver of the Fund’s underperformance relative to the custom benchmark over the twelve-month period ended October 31, 2021 was the performance of certain Underlying Funds relative to their individual benchmarks. In particular, the Hartford Core Equity Fund, The Hartford Growth Opportunities Fund, and the Hartford Multifactor Developed Markets (ex-US) ETF underperformed their respective benchmarks. Partially offsetting this effect was the outperformance of The Hartford World Bond Fund and The Hartford Strategic Income Fund relative to their respective benchmarks.
The Hartford Conservative Allocation Fund
Fund Overview – (continued)
October 31, 2021 (Unaudited)
Asset allocation effects were positive over the twelve-month period ended October 31, 2021. In particular, the Fund’s underweight position to fixed income contributed positively to relative performance.
The Fund’s exposure to US small-cap value equities through its investment in the Hartford Small Cap Value Fund, as well as its exposure to U.S. Treasury Inflation-Protected Securities (TIPS) through its investment in The Hartford Inflation Plus Fund was positive over the twelve-month period ended October 31, 2021.
Derivatives were not used at the aggregate fund level during the period but were used at the underlying fund level.
What is the outlook as of the end of the period?
As of the end of the period, markets have been volatile, driven by inflation and interest rate concerns, slower growth, and an uneven global economic recovery as different regions experience resurgences in coronavirus cases. As of October 2021, the U.S. unemployment rate fell to 4.6%, but companies and industries are still grappling with prolonged labor shortages. We expect continued volatility in the coming months driven by the uneven global recovery, inflation expectations, and the pace and magnitude of changes in interest rates.
The 10-year Treasury yield rose from 0.79% at the beginning of the twelve-month period to 1.55% at the end of the twelve-month period. At its September 2021 meeting, the U.S. Federal Reserve (Fed) left interest rates unchanged and continued its current pace of bond-buying. However, the Fed stated that it may begin to reduce its bond purchases if economic data such as employment and inflation continue to normalize. As of the end of the period, we have maintained the Fund’s modest overweight to equities relative to the custom benchmark, with a focus on quality within the asset class. Within the fixed-income portion of the Fund, we maintained a shorter duration posture, as we do not believe longer-term interest rates sufficiently compensate for the increased volatility risk. We believe the fixed-income portion of the Fund is diversified in terms of geographic and credit exposures.
Important Risks
Investing involves risk, including the possible loss of principal. Security prices fluctuate in value depending on general market and economic conditions and the prospects of individual companies. • The ability of the Fund to meet its investment objective is directly related to the ability of the underlying funds to meet their objectives as well as the investment manager’s allocation among those underlying funds. The Fund is subject to the risks of the underlying funds, in direct proportion to the amount of assets it invests in each underlying fund. The underlying funds are subject to the risks of the general equity market, small- and mid-cap securities, foreign and emerging-markets securities, fixed-income securities (which carry credit, liquidity, call, duration, and interest-rate risk), high-yield (“junk”) bonds, mortgage-related and asset-backed securities, and derivatives.
| Asset Allocation(1) |
| as of 10/31/2021 |
| Fund Type | Percentage of
Net Assets |
| Domestic Equity Funds | 26.4% |
| International/Global Equity Funds | 11.0 |
| Taxable Fixed Income Funds | 62.3 |
| Short-Term Investments | 0.3 |
| Other Assets & Liabilities | 0.0 * |
| Total | 100.0% |
| * | Percentage rounds to zero. |
| (1) | For Fund compliance purposes, the Fund may not use the same classification system. These classifications are used for financial reporting purposes. |
The Hartford Global Real Asset Fund (consolidated)
Fund Overview
October 31, 2021 (Unaudited)
Inception 05/28/2010
Sub-advised by Wellington Management Company LLP | Investment objective – The Fund seeks to provide long-term total returns that outpace inflation over a macroeconomic cycle. |
Comparison of Change in Value of $10,000 Investment (10/31/2011 - 10/31/2021)
The chart above represents the hypothetical growth of a $10,000 investment in Class A, which includes the maximum sales charge applicable to Class A shares. Returns for the Fund’s other classes will vary from what is seen above due to differences in the expenses charged to those share classes.
| Average Annual Total Returns |
| for the Periods Ending 10/31/2021 |
| | 1 Year | 5 Years | 10 Years |
| Class A1 | 37.82% | 6.04% | 0.78% |
| Class A2 | 30.24% | 4.84% | 0.21% |
| Class C1 | 36.89% | 5.26% | 0.03% |
| Class C3 | 35.89% | 5.26% | 0.03% |
| Class I1 | 38.30% | 6.35% | 1.05% |
| Class R31 | 37.54% | 5.79% | 0.54% |
| Class R41 | 38.00% | 6.11% | 0.83% |
| Class R51 | 38.36% | 6.37% | 1.08% |
| Class Y1 | 38.31% | 6.42% | 1.14% |
| Class F1 | 38.45% | 6.42% | 1.08% |
| 40% Bloomberg U.S. TIPS 1-10 Year Index/ 30% MSCI ACWI Commodity Producers Index (Net)/ 10% Bloomberg Commodity Index Total Return/ 10% MSCI World IMI Core Real Estate Index (Net)/ 10% MSCI ACWI Infrastructure Index (Net)4 | 30.74% | 5.81% | 2.66% |
| Bloomberg U.S. TIPS 1-10 Year Index | 7.05% | 4.03% | 2.52% |
| MSCI ACWI Commodity Producers Index (Net) | 65.36% | 6.35% | 0.63% |
| Bloomberg Commodity Index Total Return | 43.94% | 5.17% | -3.04% |
| MSCI World IMI Core Real Estate Index (Net) | 41.33% | 7.43% | 8.27% |
| MSCI ACWI Infrastructure Index (Net) | 13.57% | 4.90% | 5.15% |
| 1 | Without sales charge |
| 2 | Reflects maximum sales charge of 5.50% |
| 3 | Reflects a contingent deferred sales charge of 1.00% |
| 4 | Calculated by Hartford Funds Management Company, LLC |
PERFORMANCE DATA QUOTED REPRESENTS PAST PERFORMANCE AND DOES NOT GUARANTEE FUTURE RESULTS. The investment return and principal value of the investment will fluctuate so that investors’ shares, when redeemed, may be worth more or less than their original cost. The chart and table do not reflect the deductions of taxes that a shareholder would pay on Fund distributions or the redemption or sale of Fund shares. Current performance may be lower or higher than the performance data quoted. To obtain performance data current to the most recent month-end, please visit our website hartfordfunds.com.
Total returns presented above were calculated using the applicable class' net asset value available to shareholders for sale or redemption of Fund shares on 10/31/2021, which may exclude investment transactions as of this date. All share class returns assume the reinvestment of all distributions at net asset value and the deduction of all fund expenses. The total returns presented in the Financial Highlights section of the report are calculated in the same manner, but also take into account certain adjustments that are necessary under generally accepted accounting principles. As a result, the total returns in the Financial Highlights section may differ from the total returns presented above.
Class F shares commenced operations on 02/28/2017. Performance prior to that date is that of the Fund’s Class I shares.
To the extent a share class has adopted the prior performance of another share class that had different operating expenses, such performance has not been adjusted to reflect the different operating expenses.If the performance were adjusted, it may have been higher or lower.
You cannot invest directly in an index.
See “Benchmark Glossary” for benchmark descriptions.
Performance information may reflect expense waivers/reimbursements without which performance would have been lower. For information on current expense waivers/reimbursements, please see the prospectus.
The Hartford Global Real Asset Fund (consolidated)
Fund Overview – (continued)
October 31, 2021 (Unaudited)
| Operating Expenses* | Gross | Net |
| Class A | 1.55% | 1.27% |
| Class C | 2.34% | 2.02% |
| Class I | 1.16% | 1.02% |
| Class R3 | 1.81% | 1.52% |
| Class R4 | 1.50% | 1.22% |
| Class R5 | 1.21% | 0.97% |
| Class Y | 1.16% | 0.92% |
| Class F | 1.09% | 0.92% |
| * | Expenses as shown in the Fund’s most recent prospectus. Gross expenses do not reflect contractual expense reimbursement or fee waiver arrangements. Net expenses reflect such arrangements in instances when they reduce gross expenses. The expense reimbursement arrangement remains in effect until 02/28/2022 unless the Fund’s Board of Directors approves an earlier termination. The fee waiver remains in effect as long as the Fund remains invested in the subsidiary. Expenses shown include acquired fund fees and expenses and expenses of the Fund’s wholly-owned Cayman Islands subsidiary, The Hartford Cayman Global Real Asset Fund, Ltd. (“Cayman Subsidiary”). Actual expenses may be higher or lower. Please see accompanying Financial Highlights for expense ratios for the period ended 10/31/2021. |
Portfolio Managers
Scott M. Elliott*
Senior Managing Director and Multi-Asset Portfolio Manager
Wellington Management Company LLP
Brian M. Garvey
Senior Managing Director and Multi-Asset Portfolio Manager
Wellington Management Company LLP
Nicholas J. Petrucelli
Managing Director and Portfolio Manager
Wellington Management Company LLP
*Scott M. Elliott announced his plan to retire and withdraw from the partnership of Wellington Management Company LLP’s parent company, and effective June 30, 2022, he will no longer serve as a portfolio manager for the Fund. Mr. Elliott’s portfolio management responsibilities will transition to Nicholas J. Petrucelli in the months leading up to his departure.
Manager Discussion
How did the Fund perform during the period?
The Class A shares of The Hartford Global Real Asset Fund returned 37.82%, before sales charges, for the twelve-month period ended October 31, 2021, outperforming the Fund’s custom benchmark (40% Bloomberg U.S. TIPS 1-10 Year Index/ 30% MSCI ACWI Commodity Producers Index (Net)/ 10% Bloomberg Commodity Index Total Return/ 10% MSCI World IMI Core Real Estate Index (Net)/ 10% MSCI ACWI Infrastructure Index (Net)), which returned 30.74%, for the same period. Individually, the Bloomberg U.S. TIPS 1–10 Year Index, MSCI ACWI Commodity Producers Index (Net), Bloomberg Commodity Index Total Return, MSCI World IMI Core Real Estate Index (Net), and MSCI ACWI Infrastructure Index (Net) returned 7.05%, 65.36%, 43.94%, 41.33%, and 13.57%, respectively, for the same period. For the same period, the Class A shares of the Fund, before sales charges, outperformed the 32.23% average return of the Lipper Real Return Funds peer group, a group of funds that seek to maximize real return through investing primarily in domestic and foreign inflation-protected securities across asset classes.
Why did the Fund perform this way?
For the twelve-month period ended October 31, 2021, global equities rose 37.28%, as measured by the MSCI ACWI Index (Net). Towards the end of 2020, global equities rose, ending the year with a gain of 14.80% for the fourth quarter of 2020. Markets rebounded sharply after two COVID-19 vaccines demonstrated high efficacy rates in Phase 3 trials, fueling optimism that the pandemic could be alleviated in the near term. In the first quarter of 2021, markets continued to advance amid the accelerating global rollout of vaccines, a favorable outlook for global economic growth, and substantial support from governments and central banks. Massive stimulus measures combined with pent-up savings and significant supply-chain disruptions throughout the global economy fueled expectations for higher inflation. Despite a broadening rollout of vaccines, global coronavirus trends remained volatile.
In the second quarter of 2021, markets were bolstered by improving global economic data, fiscal and monetary stimulus, strong corporate earnings, and higher vaccination rates. Surging commodity prices, pent-up demand, and stimulus-powered economic growth continued to
The Hartford Global Real Asset Fund (consolidated)
Fund Overview – (continued)
October 31, 2021 (Unaudited)
drive inflation expectations higher, prompting some central banks to raise interest rates or consider tighter monetary policy. The global decline in COVID-19 cases since mid-April 2021 came to a halt, with the rapid spread of the highly infectious coronavirus Delta variant disrupting plans to lift lockdowns and reopen economies in many countries.
In the third quarter of 2021, global equities fell for the first time in six quarters. Markets contended with pandemic uncertainty, moderating economic growth, and the imminent prospect of reduced quantitative easing and monetary policy tightening. In Asia, the spread of the coronavirus Delta variant shuttered factories and snarled traffic at several major ports, exacerbating supply chain disruptions and driving shipping costs and goods prices even higher. Mounting inflation forced many emerging markets countries to raise interest rates, while other central banks assessed plans for curbing their asset purchases. An energy supply crunch emerged in Europe and Asia, as soaring prices for natural gas and coal drove inflation higher and posed risks to the global economic recovery. In the final month of the period, global equities rebounded. Risk sentiment was bolstered by strong corporate earnings, robust global equity inflows, and improving coronavirus pandemic trends and vaccine coverage. However, inflation swelled across most developed markets, ratcheting up pressure on central banks to start scaling back some of their extraordinary monetary support and prompting markets to expect near-term interest-rate increases by the U.S. Federal Reserve (Fed) and the European Central Bank (ECB). A combination of strong demand and depleted supplies drove oil, gas, and coal prices sharply higher, sending shock waves through economies across the globe.
The Fund has four primary levers to seek to generate investment performance: inflation-related equity investments, inflation-related fixed income investments, commodity investments, and asset allocation among equities, bonds, commodities, and cash. During the twelve-month period, we allocated a portion of the Fund’s assets to active strategies managed by specialized investment teams at Wellington Management Company LLP that invest the Fund’s assets in accordance with the Fund’s investment strategy. Strong asset allocation and security selection decisions contributed positively to the Fund’s outperformance relative to the custom benchmark during the period. The positive security selection effects were driven by selection within commodities, infrastructure equities via the Enduring Assets strategy (this strategy includes investments in companies that own long-lived physical assets that the specialist team believes possess an advantaged competitive position from regulatory, contractual, or physical qualities), and fixed income. These results were partially offset by weaker selection within the Energy and Metals and Mining sectors. Positive asset allocation effects were due to the Fund’s underweight to fixed income and the Metals and Mining sector as well as an out-of-benchmark allocation to the Cyclical Opportunities strategy (this strategy includes investments in industrials, transportation, housing, and building materials companies). An underweight to the Energy sector detracted from relative performance.
During the twelve-month period, the Fund’s commodity exposure was gained through derivatives, primarily total return swaps and futures, which contributed positively to relative performance over the period, driven by tactical decision-making in the Industrial Metals sector and by an overweight to energy commodities.
What is the outlook as of the end of the period?
As of the end of the period, the Fund was positioned with an overweight to inflation-sensitive equities relative to the custom benchmark. As of the end of the period, we also added exposure in the Fund to equities in the Energy sector where we believe valuations are most attractive. We believe that the developing energy crisis could potentially drive high profitability and spur more investor interest as Energy equities, in our view, become a useful portfolio hedge for the first time in years. As of the end of the period, a shortage of materials and labor coupled with lower lumber prices led us to trim the Fund’s exposure to the Cyclical Opportunities strategy and we moved the proceeds into the Inflation Opportunities strategy (this strategy includes exposure to inflation sensitive equity sectors that Wellington Management’s Inflation Opportunities specialist team believes have attractive supply/demand dynamics such as cement, staffing, and chemical companies and specific financials) where we believe a regime shift should lead to companies in the Financials sector (such as banks) benefiting from higher interest rates. We trimmed the Fund’s overweight position in commodities relative to the custom benchmark as of the end of the period.
After a quick run-up in inflation during the first half of 2021, many of those pressures have persisted through the last several months of the period. As we head into the end of 2021, we are optimistic overall about the global economic recovery and about risk assets, especially in the inflation hedging space. We would also expect headline inflation numbers to pull back from recent highs as the worst supply bottlenecks get resolved and year-over-year comparisons normalize. However, we continue to believe that there is a regime shift underway that should lead to more persistent drivers of inflation and higher averages than most market participants are accustomed to, which may increase demand for inflation assets and re-rate a segment of the market that has been highly out of favor for years.
Important Risks
Investing involves risk, including the possible loss of principal. Security prices fluctuate in value depending on general market and economic conditions and the prospects of individual companies. The Fund may allocate a portion of its assets to specialist portfolio managers, which may not work as intended. • Investments in the commodities market and the natural-resource industry may increase the Fund’s liquidity risk, volatility and risk of loss if adverse developments occur. • The value of inflation-protected securities (IPS) generally fluctuates with changes in real interest rates, and the market for IPS may be less developed or liquid, and more volatile, than other securities markets. • Foreign investments may be more volatile and less liquid than U.S. investments and are subject to the risk of currency fluctuations and adverse political, economic and regulatory developments. These risks may be greater, and include additional risks, for investments in emerging markets. • Fixed income security risks include credit, liquidity, call, duration, and interest-rate risk. As interest rates rise, bond prices generally fall. • Derivatives are generally more volatile and
The Hartford Global Real Asset Fund (consolidated)
Fund Overview – (continued)
October 31, 2021 (Unaudited)
sensitive to changes in market or economic conditions than other securities; their risks include currency, leverage, liquidity, index, pricing, regulatory and counterparty risk. • The value of the underlying real estate of real estate related securities may go down due to various factors, including but not limited to, strength of the economy, amount of new construction, laws and regulations, costs of real estate, availability of mortgages and changes in interest rates. • By investing in a Cayman Subsidiary, the Fund is indirectly exposed to the risks associated with a non-U.S. subsidiary and its investments. • The Fund may have high portfolio turnover, which could increase its transaction costs and an investor’s tax liability.
| Composition by Security Type(1) |
| as of 10/31/2021 |
| Category | Percentage of
Net Assets |
| Equity Securities | |
| Closed End Funds | 0.1% |
| Common Stocks | 55.5 |
| Exchange-Traded Funds | 1.6 |
| Total | 57.2% |
| Fixed Income Securities | |
| Foreign Government Obligations | 4.7% |
| U.S. Government Securities | 17.9 |
| Total | 22.6% |
| Short-Term Investments | 17.6 |
| Other Assets & Liabilities | 2.6 |
| Total | 100.0% |
| (1) | For Fund compliance purposes, the Fund may not use the same classification system. These classifications are used for financial reporting purposes. |
The Hartford Growth Allocation Fund
Fund Overview
October 31, 2021 (Unaudited)
Inception 05/28/2004
Advised by Hartford Funds Management Company, LLC
(“HFMC” or the “Investment Manager”) | Investment objective – The Fund seeks long-term capital appreciation. |
Comparison of Change in Value of $10,000 Investment (10/31/2011 - 10/31/2021)
The chart above represents the hypothetical growth of a $10,000 investment in Class A, which includes the maximum sales charge applicable to Class A shares. Returns for the Fund’s other classes will vary from what is seen above due to differences in the expenses charged to those share classes.
| Average Annual Total Returns |
| for the Periods Ending 10/31/2021 |
| | 1 Year | 5 Years | 10 Years |
| Class A1 | 28.32% | 12.00% | 9.14% |
| Class A2 | 21.26% | 10.74% | 8.52% |
| Class C1 | 27.24% | 11.13% | 8.32% |
| Class C3 | 26.24% | 11.13% | 8.32% |
| Class I1 | 28.57% | 12.31% | 9.47% |
| Class R31 | 27.85% | 11.64% | 8.80% |
| Class R41 | 28.17% | 11.95% | 9.12% |
| Class R51 | 28.58% | 12.30% | 9.46% |
| Class F1 | 28.74% | 12.41% | 9.52% |
| 55% Russell 3000 Index/ 25% MSCI ACWI ex USA Index (Net)/ 20% Bloomberg U.S. Aggregate Bond Index4 | 30.54% | 13.56% | 11.20% |
| Russell 3000 Index | 43.90% | 18.91% | 16.10% |
| MSCI ACWI ex USA Index (Net) | 29.66% | 9.77% | 6.66% |
| Bloomberg U.S. Aggregate Bond Index | -0.48% | 3.10% | 3.00% |
| 1 | Without sales charge |
| 2 | Reflects maximum sales charge of 5.50% |
| 3 | Reflects a contingent deferred sales charge of 1.00% |
| 4 | Calculated by Hartford Funds Management Company, LLC |
PERFORMANCE DATA QUOTED REPRESENTS PAST PERFORMANCE AND DOES NOT GUARANTEE FUTURE RESULTS. The investment return and principal value of the investment will fluctuate so that investors’ shares, when redeemed, may be worth more or less than their original cost. The chart and table do not reflect the deductions of taxes that a shareholder would pay on Fund distributions or the redemption or sale of Fund shares. Current performance may be lower or higher than the performance data quoted. To obtain performance data current to the most recent month-end, please visit our website hartfordfunds.com.
Total returns presented above were calculated using the applicable class' net asset value available to shareholders for sale or redemption of Fund shares on 10/31/2021, which may exclude investment transactions as of this date. All share class returns
assume the reinvestment of all distributions at net asset value and the deduction of all fund expenses. The total returns presented in the Financial Highlights section of the report are calculated in the same manner, but also take into account certain adjustments that are necessary under generally accepted accounting principles. As a result, the total returns in the Financial Highlights section may differ from the total returns presented above.
Class F shares commenced operations on 02/28/2017. Performance prior to that date is that of the Fund’s Class I shares.
To the extent a share class has adopted the prior performance of another share class that had different operating expenses, such performance has not been adjusted to reflect the different operating expenses. If the performance were adjusted, it may have been higher or lower.
Performance information includes performance under the Fund’s previous sub-advisers, Hartford Investment Management Company and Wellington Management Company LLP (“Wellington Management”). For the period 06/04/2012 through 05/31/2014, Wellington Management served as the sub-adviser to the Fund, using a modified investment strategy. Prior to 06/04/2012, Hartford Investment Management Company served as the sub-adviser to the Fund, using a modified investment strategy.
You cannot invest directly in an index.
See “Benchmark Glossary” for benchmark descriptions.
Performance information may reflect expense waivers/reimbursements without which performance would have been lower.
The Hartford Growth Allocation Fund
Fund Overview – (continued)
October 31, 2021 (Unaudited)
| Operating Expenses* | Gross | Net |
| Class A | 1.11% | 1.11% |
| Class C | 1.90% | 1.90% |
| Class I | 0.80% | 0.80% |
| Class R3 | 1.42% | 1.42% |
| Class R4 | 1.11% | 1.11% |
| Class R5 | 0.82% | 0.82% |
| Class F | 0.71% | 0.71% |
| * | Expenses as shown in the Fund’s most recent prospectus. Expenses shown include acquired fund fees and expenses. Actual expenses may be higher or lower. Please see accompanying Financial Highlights for expense ratios for the period ended 10/31/2021. |
Portfolio Managers
Vernon J. Meyer, CFA
Managing Director and Chief Investment Officer of Hartford Funds Management Company, LLC (the “Investment Manager”)
Allison Z. Mortensen, CFA
Head of Multi-Asset Solutions and Managing Director at Hartford Funds and Vice President of the Investment Manager
Manager Discussion
How did the Fund perform during the period?
The Class A shares of The Hartford Growth Allocation Fund returned 28.32%, before sales charges, for the twelve-month period ended October 31, 2021, underperforming the Fund’s custom benchmark, comprised of 55% Russell 3000 Index, 25% MSCI ACWI ex USA Index (Net), 20% Bloomberg U.S. Aggregate Bond Index, which returned 30.54% for the same period. Individually, the Russell 3000 Index, the MSCI ACWI ex USA Index (Net), and the Bloomberg U.S. Aggregate Bond Index, returned 43.90%, 29.66%, and -0.48%, respectively, for the same period. For the same period, Class A shares of the Fund, before sales charges, underperformed the average return of the Lipper Mixed-Asset Target Allocation Growth Funds category, a group of funds with equity weights of 60%-80%, which returned 28.65%.
Why did the Fund perform this way?
United States (U.S.) markets rebounded substantially following the first emergency approval of the Pfizer-BioNTech coronavirus vaccine in December 2020 by the U.S. Food and Drug Administration (FDA). The rally was led by a sharp recovery for companies most affected by the business and travel restrictions during the coronavirus pandemic; these same companies saw their share prices decline significantly earlier in 2020.
Globally, markets continued to advance early in 2021 amid the accelerating global rollout of vaccines, a favorable outlook for global economic growth, and substantial support from governments and central banks. The combination of surging commodity prices, pent-up demand, global supply-chain disruptions, and stimulus-powered economic growth drove inflation expectations higher, prompting some central banks to raise interest rates or consider tighter monetary policy. The global decline in coronavirus cases came to a halt during
the second quarter of 2021, as the rapid spread of the highly infectious coronavirus Delta variant disrupted plans to lift lockdowns in many countries and reopen economies.
Toward the end of the period, global markets contended with pandemic uncertainty, moderating economic growth, the imminent prospect of reduced quantitative easing and policy tightening, and persistent supply-chain dislocations that amplified the risk of more sustained inflation. Although global equity markets generally experienced positive results for the period, domestic equity markets had the strongest gains overall, outpacing international developed and emerging markets.
The Fund seeks to meet its investment objective through investment in a combination of other mutual funds and exchange traded funds ("ETFs") advised by the Investment Manager or a wholly owned subsidiary of the Investment Manager (the "Underlying Funds"). The main driver of the Fund’s underperformance relative to the custom benchmark over the twelve-month period ended October 31, 2021 was the performance of certain Underlying Funds relative to their individual benchmarks. In particular, the Hartford Core Equity Fund, The Hartford Growth Opportunities Fund, and the Hartford Multifactor Developed Markets (ex-US) ETF underperformed their respective benchmarks. Partially offsetting this effect was the outperformance of The Hartford World Bond Fund and The Hartford Strategic Income Fund relative to their respective benchmarks.
Asset allocation effects were positive over the twelve-month period ended October 31, 2021. In particular, the Fund’s underweight position to fixed income contributed positively to relative performance.
The Hartford Growth Allocation Fund
Fund Overview – (continued)
October 31, 2021 (Unaudited)
The Fund’s exposure to US small-cap value equities through its investment in the Hartford Small Cap Value Fund, as well as its exposure to non-U.S. developed markets equities through its investment in Hartford Multifactor Developed Markets (ex-US) ETF was positive over the twelve-month period ended October 31, 2021.
Derivatives were not used at the aggregate fund level during the period but were used at the underlying fund level.
What is the outlook as of the end of the period?
As of the end of the period, markets have been volatile, driven by inflation and interest rate concerns, slower growth, and an uneven global economic recovery as different regions experience resurgences in coronavirus cases. As of October 2021, the U.S. unemployment rate fell to 4.6%, but companies and industries are still grappling with prolonged labor shortages. We expect continued volatility in the coming months driven by the uneven global recovery, inflation expectations, and the pace and magnitude of changes in interest rates.
The 10-year Treasury yield rose from 0.79% at the beginning of the twelve-month period to 1.55% at the end of the twelve-month period. At its September 2021 meeting, the U.S. Federal Reserve (Fed) left interest rates unchanged and continued its current pace of bond-buying. However, the Fed stated that it may begin to reduce its bond purchases if economic data such as employment and inflation continue to normalize. As of the end of the period, we have maintained the Fund’s modest overweight to equities relative to the custom benchmark, with a focus on quality within the asset class. Within the fixed-income portion of the Fund, we maintained a shorter-duration posture, as we do not believe longer-term interest rates sufficiently compensate for the increased volatility risk. We believe the fixed-income portion of the Fund is diversified in terms of geographic and credit exposures.
Important Risks
Investing involves risk, including the possible loss of principal. Security prices fluctuate in value depending on general market and economic conditions and the prospects of individual companies. • The ability of the Fund to meet its investment objective is directly related to the ability of the underlying funds to meet their objectives as well as the investment manager’s allocation among those underlying funds. The Fund is subject to the risks of the underlying funds, in direct proportion to the amount invested in each underlying fund. The underlying funds are subject to the risks of the general equity market, small- and mid-cap securities, foreign securities, emerging-market securities, fixed-income securities (which carry credit, liquidity, call, duration, and interest-rate risk), high-yield (“junk”) bonds, mortgage-related and asset-backed securities, and derivatives.
| Asset Allocation(1) |
| as of 10/31/2021 |
| Fund Type | Percentage of
Net Assets |
| Domestic Equity Funds | 58.3% |
| International/Global Equity Funds | 26.2 |
| Taxable Fixed Income Funds | 15.3 |
| Short-Term Investments | 0.2 |
| Other Assets & Liabilities | (0.0) * |
| Total | 100.0% |
| * | Percentage rounds to zero. |
| (1) | For Fund compliance purposes, the Fund may not use the same classification system. These classifications are used for financial reporting purposes. |
Hartford Moderate Allocation Fund
Fund Overview
October 31, 2021 (Unaudited)
Inception 05/28/2004
Advised by Hartford Funds Management Company, LLC
(“HFMC” or the “Investment Manager”) | Investment objective – The Fund seeks long-term capital appreciation and income. |
Comparison of Change in Value of $10,000 Investment (10/31/2011 - 10/31/2021)
The chart above represents the hypothetical growth of a $10,000 investment in Class A, which includes the maximum sales charge applicable to Class A shares. Returns for the Fund’s other classes will vary from what is seen above due to differences in the expenses charged to those share classes.
| Average Annual Total Returns |
| for the Periods Ending 10/31/2021 |
| | 1 Year | 5 Years | 10 Years |
| Class A1 | 20.72% | 9.55% | 6.72% |
| Class A2 | 14.08% | 8.32% | 6.12% |
| Class C1 | 19.70% | 8.73% | 5.92% |
| Class C3 | 18.70% | 8.73% | 5.92% |
| Class I1 | 21.01% | 9.85% | 7.02% |
| Class R31 | 20.27% | 9.18% | 6.36% |
| Class R41 | 20.63% | 9.51% | 6.67% |
| Class R51 | 20.97% | 9.84% | 7.00% |
| Class F1 | 21.09% | 9.94% | 7.06% |
| 40% Bloomberg U.S. Aggregate Bond Index/ 40% Russell 3000 Index/ 20% MSCI ACWI ex USA Index (Net)4 | 21.99% | 10.90% | 9.10% |
| Bloomberg U.S. Aggregate Bond Index | -0.48% | 3.10% | 3.00% |
| Russell 3000 Index | 43.90% | 18.91% | 16.10% |
| MSCI ACWI ex USA Index (Net) | 29.66% | 9.77% | 6.66% |
| 1 | Without sales charge |
| 2 | Reflects maximum sales charge of 5.50% |
| 3 | Reflects a contingent deferred sales charge of 1.00% |
| 4 | Calculated by Hartford Funds Management Company, LLC |
PERFORMANCE DATA QUOTED REPRESENTS PAST PERFORMANCE AND DOES NOT GUARANTEE FUTURE RESULTS. The investment return and principal value of the investment will fluctuate so that investors’ shares, when redeemed, may be worth more or less than their original cost. The chart and table do not reflect the deductions of taxes that a shareholder would pay on Fund distributions or the redemption or sale of Fund shares. Current performance may be lower or higher than the performance data quoted. To obtain performance data current to the most recent month-end, please visit our website hartfordfunds.com.
Total returns presented above were calculated using the applicable class' net asset value available to shareholders for sale or redemption of Fund shares on 10/31/2021, which may exclude investment transactions as of this date. All share class returns
assume the reinvestment of all distributions at net asset value and the deduction of all fund expenses. The total returns presented in the Financial Highlights section of the report are calculated in the same manner, but also take into account certain adjustments that are necessary under generally accepted accounting principles. As a result, the total returns in the Financial Highlights section may differ from the total returns presented above.
Class F shares commenced operations on 02/28/2017. Performance prior to that date is that of the Fund’s Class I shares.
To the extent a share class has adopted the prior performance of another share class that had different operating expenses, such performance has not been adjusted to reflect the different operating expenses. If the performance were adjusted, it may have been higher or lower.
Performance information includes performance under the Fund’s previous sub-advisers, Hartford Investment Management Company and Wellington Management Company LLP (“Wellington Management”). For the period 06/04/2012 through 11/30/2015, Wellington Management served as the sub-adviser to the Fund, using a modified investment strategy. Prior to 06/04/2012, Hartford Investment Management Company served as the sub-adviser to the Fund, using a modified investment strategy.
You cannot invest directly in an index.
See “Benchmark Glossary” for benchmark descriptions.
Performance information may reflect expense waivers/reimbursements without which performance would have been lower.
Hartford Moderate Allocation Fund
Fund Overview – (continued)
October 31, 2021 (Unaudited)
| Operating Expenses* | Gross | Net |
| Class A | 1.07% | 1.07% |
| Class C | 1.86% | 1.86% |
| Class I | 0.78% | 0.78% |
| Class R3 | 1.40% | 1.40% |
| Class R4 | 1.06% | 1.06% |
| Class R5 | 0.81% | 0.81% |
| Class F | 0.70% | 0.70% |
| * | Expenses as shown in the Fund’s most recent prospectus. Expenses shown include acquired fund fees and expenses. Actual expenses may be higher or lower. Please see accompanying Financial Highlights for expense ratios for the period ended 10/31/2021. |
Portfolio Managers
Vernon J. Meyer, CFA
Managing Director and Chief Investment Officer of Hartford Funds Management Company, LLC (the “Investment Manager”)
Allison Z. Mortensen, CFA
Head of Multi-Asset Solutions and Managing Director at Hartford Funds and Vice President of the Investment Manager
Manager Discussion
How did the Fund perform during the period?
The Class A shares of the Hartford Moderate Allocation Fund returned 20.72%, before sales charges, for the twelve-month period ended October 31, 2021, underperforming the Fund’s custom benchmark, comprised of 40% Bloomberg U.S. Aggregate Bond Index, 40% Russell 3000 Index, and 20% MSCI ACWI ex USA Index (Net), which returned 21.99% for the same period. Individually, the Bloomberg U.S. Aggregate Bond Index, the Russell 3000 Index, and the MSCI ACWI ex USA Index (Net) returned -0.48%, 43.90%, and 29.66%, respectively, for the same period. For the same period, Class A shares of the Fund, before sales charges, underperformed the average return of the Lipper Mixed-Asset Target Allocation Moderate Funds category, a group of funds with equity weights of 40%-60%, which returned 21.91%.
Why did the Fund perform this way?
United States (U.S.) markets rebounded substantially following the first emergency approval of the Pfizer-BioNTech coronavirus vaccine in December 2020 by the U.S. Food and Drug Administration (FDA). The rally was led by a sharp recovery for companies most affected by the business and travel restrictions during the coronavirus pandemic; these same companies saw their share prices decline significantly earlier in 2020.
Globally, markets continued to advance early in 2021 amid the accelerating global rollout of vaccines, a favorable outlook for global economic growth, and substantial support from governments and central banks. The combination of surging commodity prices, pent-up demand, global supply-chain disruptions, and stimulus-powered economic growth drove inflation expectations higher, prompting some central banks to raise interest rates or consider tighter monetary policy. The global decline in coronavirus cases came to a halt during
the second quarter of 2021, as the rapid spread of the highly infectious coronavirus Delta variant disrupted plans to lift lockdowns in many countries and reopen economies.
Toward the end of the period, global markets contended with pandemic uncertainty, moderating economic growth, the imminent prospect of reduced quantitative easing and policy tightening, and persistent supply-chain dislocations that amplified the risk of more sustained inflation. Although global equity markets generally experienced positive results for the period, domestic equity markets had the strongest gains overall, outpacing international developed and emerging markets.
The Fund seeks to meet its investment objective through investment in a combination of other mutual funds and exchange traded funds ("ETFs") advised by the Investment Manager or a wholly owned subsidiary of the Investment Manager (the "Underlying Funds"). The main driver of the Fund’s underperformance relative to the custom benchmark over the twelve-month period ended October 31, 2021 was the performance of certain Underlying Funds relative to their individual benchmarks. In particular, the Hartford Core Equity Fund, The Hartford Growth Opportunities Fund, and the Hartford Multifactor Developed Markets (ex-US) ETF underperformed their respective benchmarks. Partially offsetting this effect was the outperformance of The Hartford World Bond Fund and The Hartford Strategic Income Fund relative to their respective benchmarks.
Asset allocation effects were positive over the twelve-month period ended October 31, 2021. In particular, the Fund’s underweight position to fixed income contributed positively to relative performance.
Hartford Moderate Allocation Fund
Fund Overview – (continued)
October 31, 2021 (Unaudited)
The Fund’s exposure to U.S. small cap value equities through its investment in the Hartford Small Cap Value Fund, as well as its exposure to non-U.S. developed markets equities through its investment in Hartford Multifactor Developed Markets (ex-US) ETF was positive over the twelve-month period ended October 31, 2021.
Derivatives were not used at the aggregate fund level during the period but were used at the underlying fund level.
What is the outlook as of the end of the period?
As of the end of the period, markets have been volatile, driven by inflation and interest rate concerns, slower growth, and an uneven global economic recovery as different regions experience resurgences in coronavirus cases. As of October 2021, the U.S. unemployment rate fell to 4.6%, but companies and industries are still grappling with prolonged labor shortages. We expect continued volatility in the coming months driven by the uneven global recovery, inflation expectations, and the pace and magnitude of changes in interest rates.
The 10-year Treasury yield rose from 0.79% at the beginning of the twelve-month period to 1.55% at the end of the twelve-month period. At its September 2021 meeting, the U.S. Federal Reserve (Fed) left interest rates unchanged and continued its current pace of bond-buying. However, the Fed stated that it may begin to reduce its bond purchases if economic data such as employment and inflation continue to normalize. As of the end of the period, we have maintained the Fund’s modest overweight to equities relative to the custom benchmark, with a focus on quality within the asset class. Within the fixed-income portion of the Fund, we maintained a shorter-duration posture, as we do not believe longer-term interest rates sufficiently compensate for the increased volatility risk. We believe the fixed-income portion of the Fund is diversified in terms of geographic and credit exposures.
Important Risks
Investing involves risk, including the possible loss of principal. Security prices fluctuate in value depending on general market and economic conditions and the prospects of individual companies. • The ability of the Fund to meet its investment objective is directly related to the ability of the underlying funds to meet their objectives as well as the investment manager’s allocation among those underlying funds. The Fund is subject to the risks of the underlying funds, in direct proportion to the amount it invests in each underlying fund. The underlying funds are subject to the risks of the general equity market, small- and mid-cap securities, foreign securities, emerging-market securities, fixed-income securities (which carry credit, liquidity, call, duration, and interest-rate risk), high-yield (“junk”) bonds, mortgage-related and asset-backed securities, and derivatives.
| Asset Allocation(1) |
| as of 10/31/2021 |
| Fund Type | Percentage of
Net Assets |
| Domestic Equity Funds | 42.3% |
| International/Global Equity Funds | 21.3 |
| Taxable Fixed Income Funds | 36.1 |
| Short-Term Investments | 0.3 |
| Other Assets & Liabilities | (0.0) * |
| Total | 100.0% |
| * | Percentage rounds to zero. |
| (1) | For Fund compliance purposes, the Fund may not use the same classification system. These classifications are used for financial reporting purposes. |
Hartford Multi-Asset Income Fund (formerly, Hartford Multi-Asset Income and Growth Fund)
Fund Overview
October 31, 2021 (Unaudited)
Inception 07/22/1996
Sub-advised by Wellington Management Company LLP | Investment objective – The Fund seeks to provide a high level of current income consistent with growth of capital. |
Comparison of Change in Value of $10,000 Investment (10/31/2011 - 10/31/2021)
The chart above represents the hypothetical growth of a $10,000 investment in Class A, which includes the maximum sales charge applicable to Class A shares. Returns for the Fund’s other classes will vary from what is seen above due to differences in the expenses charged to those share classes.
| Average Annual Total Returns |
| for the Periods Ending 10/31/2021 |
| | 1 Year | 5 Years | 10 Years |
| Class A1 | 14.01% | 7.69% | 8.23% |
| Class A2 | 7.74% | 6.48% | 7.62% |
| Class C1 | 13.23% | 6.92% | 7.47% |
| Class C3 | 12.23% | 6.92% | 7.47% |
| Class I1 | 14.41% | 8.01% | 8.45% |
| Class R31 | 13.75% | 7.39% | 7.96% |
| Class R41 | 13.99% | 7.67% | 8.25% |
| Class R51 | 14.35% | 7.98% | 8.57% |
| Class R61 | 14.44% | 8.09% | 8.66% |
| Class Y1 | 14.35% | 8.04% | 8.64% |
| Class F1 | 14.47% | 8.09% | 8.49% |
| 55% Bloomberg U.S. Aggregate Bond Index/ 45% S&P 500 Index4 | 17.48% | 10.29% | 9.01% |
| Bloomberg U.S. Aggregate Bond Index | -0.48% | 3.10% | 3.00% |
| S&P 500 Index | 42.91% | 18.93% | 16.21% |
| 1 | Without sales charge |
| 2 | Reflects maximum sales charge of 5.50% |
| 3 | Reflects a contingent deferred sales charge of 1.00% |
| 4 | Calculated by Hartford Funds Management Company, LLC |
PERFORMANCE DATA QUOTED REPRESENTS PAST PERFORMANCE AND DOES NOT GUARANTEE FUTURE RESULTS. The investment return and principal value of the investment will fluctuate so that investors’ shares, when redeemed, may be worth more or less than their original cost. The chart and table do not reflect the deductions of taxes that a shareholder would pay on Fund distributions or the redemption or sale of Fund shares. Current performance may be lower or higher than the performance data quoted. To obtain performance data current to the most recent month-end, please visit our website hartfordfunds.com.
Total returns presented above were calculated using the applicable class' net asset value available to shareholders for sale or redemption of Fund shares on 10/31/2021, which may exclude investment transactions as of this date. All share class returns assume the reinvestment of all distributions at net asset value and the deduction of all fund expenses. The total returns presented in the Financial Highlights section of the report are calculated in the same manner, but also take into account certain adjustments that are necessary under generally accepted accounting principles. As a result, the total returns in the Financial Highlights section may differ from the total returns presented above.
Class I shares commenced operations on 03/31/2015. Performance prior to that date is that of the Fund’s Class A shares (excluding sales charges). Class R6 shares commenced operations on 02/28/2018. Performance prior to that date is that of the Fund’s Class Y shares. Class F shares commenced operations on 02/28/2017. Performance for Class F shares prior to 02/28/2017 reflects the performance of Class I shares from 03/31/2015 through 02/27/2017 and Class A shares (excluding sales charges) prior to 03/31/2015.
To the extent a share class has adopted the prior performance of another share class that had different operating expenses, such performance has not been adjusted to reflect the different operating expenses. If the performance were adjusted, it may have been higher or lower.
Performance information prior to 05/01/2019 includes the Fund’s performance when the Fund pursued a different investment objective and principal investment strategy.
You cannot invest directly in an index.
See “Benchmark Glossary” for benchmark descriptions.
Performance information may reflect expense waivers/reimbursements without which performance would have been lower.
Hartford Multi-Asset Income Fund (formerly, Hartford Multi-Asset Income and Growth Fund)
Fund Overview – (continued)
October 31, 2021 (Unaudited)
| Operating Expenses* | Gross | Net |
| Class A | 1.03% | 1.03% |
| Class C | 1.74% | 1.74% |
| Class I | 0.70% | 0.70% |
| Class R3 | 1.35% | 1.35% |
| Class R4 | 1.05% | 1.05% |
| Class R5 | 0.75% | 0.75% |
| Class R6 | 0.63% | 0.63% |
| Class Y | 0.73% | 0.73% |
| Class F | 0.63% | 0.63% |
| * | Expenses as shown in the Fund’s most recent prospectus. Actual expenses may be higher or lower. Please see accompanying Financial Highlights for expense ratios for the period ended 10/31/2021. |
Portfolio Managers
Lutz-Peter Wilke, CFA
Managing Director and Portfolio Manager
Wellington Management Company LLP
Loren Moran, CFA
Senior Managing Director and Fixed Income Portfolio Manager
Wellington Management Company LLP
Manager Discussion
How did the Fund perform during the period?
The Class A shares of the Hartford Multi-Asset Income Fund returned 14.01%, before sales charges, for the twelve-month period ended October 31, 2021, underperforming the Fund’s custom benchmark (55% Bloomberg U.S. Aggregate Bond Index / 45% S&P 500 Index), which returned 17.48% over the same period. Individually, the Bloomberg U.S. Aggregate Bond Index and the S&P 500 Index returned -0.48% and 42.91%, respectively, for the period. For the same period, the Class A shares of the Fund, before sales charges, also underperformed the 21.91% average return of the Lipper Mixed-Asset Target Allocation Moderate Funds category, a group of funds that by portfolio practice maintain a mix of between 40%-60% equity securities, with the remainder invested in bonds, cash, and cash equivalents.
Why did the Fund perform this way?
For the twelve-month period ended October 31, 2021, global equities rose 37.28% as measured by the MSCI ACWI Index (Net). In the first half of 2021, United States (U.S.) equities gained amid a backdrop of improving vaccination rates, accelerating economic growth, and a broader reopening of the economy. Inflation rose sharply, as robust demand for goods and services, along with significant global supply-chain disruptions, drove consumer and producer prices sharply higher. The U.S. Federal Reserve (Fed) maintained its view that elevated price pressures may prove transitory, but the Fed rattled markets by considerably raising its inflation forecast for 2021 and signaling the potential for two interest-rate increases in 2023. This shift in expectations toward tighter monetary policy triggered a rotation
from value and cyclically sensitive equities to growth equities. U.S. equities continued to climb in the third quarter of 2021 against a backdrop of accommodative monetary policy, robust corporate earnings, and strong demand for goods and services, while risk sentiment was pressured by anxiety about rising inflation, imminent monetary tightening by the Fed, moderating economic growth, and uncertainty about fiscal stimulus and the federal debt ceiling. Growth equities outperformed their value counterparts for the quarter; however, surging U.S. Treasury yields sparked a sharp sell-off in shares of large technology companies at the end of September 2021, triggering a powerful rotation into value equities. COVID-19 cases fell sharply in September, although the proliferation of the Delta variant in July and August 2021 weighed on consumer confidence and dampened momentum from businesses reopening. The Fed trimmed its 2021 gross domestic product (GDP) growth forecast to 5.9%, from 7%, and delivered a clearer signal that it would begin to taper asset purchases later this year if economic conditions remain stable.
Over the period, the Fed acknowledged that it had discussed the appropriate timing to begin tapering its large-scale asset purchases. Global GDP growth continued to recover during the first quarter, although GDP contracted further in Europe and Japan. In the U.S., the labor market strengthened, while the housing market remained supported by low mortgage rates and scarce supply. Global sovereign debt yields generally moved higher as major central banks reined in policy support, while intensifying supply constraints added to inflationary pressures. Major central banks’ rhetoric remained tilted to a bias that the recent inflationary shock will be transitory, while also acknowledging that upward price pressures have persisted longer than initially anticipated. United Kingdom (U.K.) sovereign bond yields
Hartford Multi-Asset Income Fund (formerly, Hartford Multi-Asset Income and Growth Fund)
Fund Overview – (continued)
October 31, 2021 (Unaudited)
increased the most during the period among developed markets after the Bank of England (BOE) signaled that interest-rate increases could occur sooner than markets expected. Canadian bond yields increased during the period as the Bank of Canada suggested its initial move to withdraw emergency stimulus would be to raise the policy rate instead of winding down bond holdings.
Within the equity and fixed income portions of the Fund, we allocated a portion of the Fund’s assets to various specialized investment teams at Wellington Management Company LLP (“Wellington Management”) that invested the allocated assets in accordance with the Fund’s investment strategy.
Over the period, the Fund’s asset allocation within equities relative to the S&P 500 Index, as well as the Fund’s security selection within the equity portion of the Fund, detracted from performance on a relative basis versus the custom benchmark. Within equities, the allocations to volatility management strategy (this strategy uses an overlay of derivatives to seek to hedge equity risk), equity-linked notes, global dividend growth strategy, global low volatility income strategy (this strategy invests in securities that Wellington Management believes exhibit low volatility) and Chinese equities drove underperformance. Investments in real estate investment trusts (REITs) and global cyclicals also detracted from performance. The Fund’s allocation to an upside capture strategy (this strategy adds exposure, typically using index options, during strong market rallies to seek to capture more market upside) and security selection within broad equities and green equities, which are stocks that we believe should benefit from increasing investment and technological progress in decarbonization trends, were additive over the period. The Fund’s overweight to equities relative to the Fund’s custom benchmark made a slightly positive contribution to performance relative to the custom benchmark.
Within the fixed-income portion of the Fund, both allocation decisions and security selection were positive over the period. Allocations to income opportunities strategy, convertible bonds, and core fixed income strategy contributed positively to performance, while our duration management strategy detracted from relative performance. The Fund’s underweight to fixed income relative to the custom benchmark made a slightly positive contribution to relative performance.
During the period, the Fund used derivatives to hedge currency risk, to hedge portfolio volatility, to manage duration, and to tactically gain exposure to fixed income and equity markets. Over the period, the Fund’s use of derivatives for volatility management purposes, which sought to tactically hedge exposures to manage the volatility profile of the Fund, detracted from performance due in particular to short exposure to the U.S. equity market. The allocation of the Fund’s assets to our upside capture strategy, which sought tactical exposures to equity and fixed income markets, was additive over the period primarily due to positions in the U.S. Financials sector. Derivatives used for currency hedging in the Fund contributed positively to performance, while the Fund’s duration management exposure detracted from performance.
What is the outlook as of the end of the period?
As of the end of the period, we favor equities over bonds based on our belief that the economic growth momentum may strengthen again in the fourth quarter of 2021 after recent growth downgrades in both the U.S. and China at the end of the period. In our view, the combination of lower growth and higher inflation forecasts that have weighed on risk assets are most likely transitory in nature. Although a more difficult situation unfolds in the Chinese economy, we believe Asian equities are attractive as we expect growth concerns to dissipate later this year and into 2022. We maintain a positive view on Europe as the structural outlook for renewables remains strong. In the U.S., we continue to have a bias towards value within our equity allocation, which we have expressed through our exposure to U.S. homebuilders. Within fixed income, we expect markets to remain under pressure in the current environment, given higher inflation expectations. We believe credit markets should remain well-supported by the strength in corporate balance sheets; however, there may be limited potential for upside as this is likely reflected in tight spreads. As of the end of the period, we maintained conviction in the income potential of our equity-linked notes strategy; although index volatility has returned to low levels, we believe that single securities offer attractive opportunities.
Important Risks
Investing involves risk, including the possible loss of principal. Security prices fluctuate in value depending on general market and economic conditions and the prospects of individual companies. The Fund may allocate a portion of its assets to specialist portfolio managers, which may not work as intended. • Fixed income security risks include credit, liquidity, call, duration, and interest-rate risk. As interest rates rise, bond prices generally fall. • Investments in Equity Linked Notes (ELNs) are subject to interest, credit, management, counterparty, liquidity, and market risks, and as applicable, foreign security and currency risks. • Loans can be difficult to value and less liquid than other types of debt instruments; they are also subject to nonpayment, collateral, bankruptcy, default, extension, prepayment and insolvency risks. • Investments in high-yield (“junk”) bonds involve greater risk of price volatility, illiquidity, and default than higher-rated debt securities. • Obligations of U.S. Government agencies are supported by varying degrees of credit but are generally not backed by the full faith and credit of the U.S. Government. • Foreign investments may be more volatile and less liquid than U.S. investments and are subject to the risk of currency fluctuations and adverse political, economic and regulatory developments. These risks may be greater for investments in emerging markets. • Derivatives are generally more volatile and sensitive to changes in market or economic conditions than other securities; their risks include currency, leverage, liquidity, index, pricing, regulatory and counterparty risk. • Mortgage-related and asset-backed securities’ risks include credit, interest-rate, prepayment, and extension risk. • Restricted securities may be more difficult to sell and price than other securities. • For dividend-paying stocks, dividends are not guaranteed and may decrease without notice. • Investments in ETFs are subject to the risks that apply to the ETF’s strategies and portfolio holdings.
Hartford Multi-Asset Income Fund (formerly, Hartford Multi-Asset Income and Growth Fund)
Fund Overview – (continued)
October 31, 2021 (Unaudited)
| Composition by Security Type(1) |
| as of 10/31/2021 |
| Category | Percentage of
Net Assets |
| Equity Securities | |
| Common Stocks | 33.6% |
| Convertible Preferred Stocks | 0.5 |
| Equity Linked Securities | 11.2 |
| Total | 45.3% |
| Fixed Income Securities | |
| Asset & Commercial Mortgage-Backed Securities | 17.1% |
| Convertible Bonds | 0.5 |
| Corporate Bonds | 14.1 |
| Foreign Government Obligations | 1.0 |
| Municipal Bonds | 0.6 |
| Senior Floating Rate Interests | 9.0 |
| U.S. Government Agencies(2) | 1.2 |
| U.S. Government Securities | 7.5 |
| Total | 51.0% |
| Short-Term Investments | 3.4 |
| Purchased Options | 0.0 * |
| Other Assets & Liabilities | 0.3 |
| Total | 100.0% |
| * | Percentage rounds to zero. |
| (1) | For Fund compliance purposes, the Fund may not use the same classification system. These classifications are used for financial reporting purposes. |
| (2) | All, or a portion of the securities categorized as U.S. Government Agencies, were agency mortgage-backed securities as of October 31, 2021. |
Hartford Multi-Strategy Funds
Benchmark Glossary (Unaudited)
| Bloomberg Corporate Index (reflects no deduction for fees, expenses or taxes) is the Corporate component of the U.S. Credit Index within the Bloomberg U.S. Aggregate Bond Index. |
| Bloomberg U.S. Aggregate Bond Index (reflects no deduction for fees, expenses or taxes) is composed of securities that are U.S. Securities and Exchange Commission registered, taxable, and dollar denominated. The index covers the U.S. investment grade fixed rate bond market, with index components for government and corporate securities, mortgage pass-through securities, and asset-backed securities. These major sectors are subdivided into more specific indices that are calculated and reported on a regular basis. |
| Bloomberg U.S. Corporate High Yield Bond 2% Issuer Cap Index (reflects no deduction for fees, expenses or taxes) is the 2% issuer cap component of the Bloomberg U.S. High Yield Index, which is an unmanaged broad-based market value-weighted index that tracks the total return performance of non-investment grade, fixed-rate, publicly placed, dollar denominated and non convertible debt registered with the Securities and Exchange Commission. |
| Bloomberg U.S. TIPS 1-10 Year Index (reflects no deduction for fees, expenses or taxes) represents U.S. Treasury inflation-protected securities having a maturity of at least 1 year and less than 10 years. |
| Bloomberg Commodity Index Total Return (reflects no deduction for fees, expenses or taxes) is composed of futures contracts and reflects the returns on a fully collateralized investment in the Bloomberg Commodity Index ("BCOM"). This combines the returns of the BCOM with the returns on cash collateral invested in 13 week (3 Month) U.S. Treasury bills. |
| JP Morgan Emerging Markets Bond Index Plus (reflects no deduction for fees, expenses or taxes) is a market capitalization-weighted index that tracks returns for actively traded external debt instruments in emerging markets. |
| MSCI ACWI (All Country World) Index (Net) (reflects reinvested dividends net of withholding taxes but reflects no deduction for fees, expenses or other taxes) is designed to capture large and mid cap representation across developed markets and emerging markets countries. |
| MSCI ACWI (All Country World) Commodity Producers Index (Net) (reflects reinvested dividends net of withholding taxes but reflects no deduction for fees, expenses or other taxes) is designed to capture the global opportunity set of commodity producers in the energy, metal and agricultural sectors. Constituents are selected from the equity universe of MSCI ACWI Index, the parent index, which covers mid and large cap securities across developed market and emerging market countries. |
| MSCI ACWI (All Country World) ex USA Index (Net) (reflects reinvested dividends net of withholding taxes but reflects no deduction for fees, expenses or other taxes) is designed to capture large and mid cap representation across developed markets (excluding the United States) and emerging market countries. |
| MSCI ACWI (All Country World) Infrastructure Index (Net) (reflects reinvested dividends net of withholding taxes but reflects no deduction for fees, expenses or other taxes) is designed to capture the global opportunity set of companies that are owners or operators of infrastructure assets. |
| MSCI World IMI Core Real Estate Index (Net) (reflects reinvested dividends net of withholding taxes but reflects no deduction for fees, expenses or other taxes) is designed to capture large, mid and small cap stocks across developed countries engaged in the ownership, development and management of specific core property type real estate. |
| Russell 1000 Value Index (reflects no deduction for fees, expenses or taxes) is designed to measure the performance of those Russell 1000 Index companies with lower price-to-book ratios and lower forecasted growth values. The Russell 1000 Index is designed to measure the performance of the 1,000 largest companies in the Russell 3000 Index based on their market capitalization and current index membership. |
| Russell 3000 Index (reflects no deduction for fees, expenses or taxes) is designed to measure the performance of the 3,000 largest U.S. companies based on total market capitalization. |
| S&P 500 Index (reflects no deduction for fees, expenses or taxes) is a float-adjusted market capitalization-weighted price index composed of 500 widely held common stocks. |
| Neither MSCI nor any other party involved in or related to compiling, computing or creating the MSCI data makes any express or implied warranties or representations with respect to such data (or the results to be obtained by the use thereof), and all such parties hereby expressly disclaim all warranties of originality, accuracy, completeness, merchantability or fitness for a particular purpose with respect to any of such data. Without limiting any of the foregoing, in no event shall MSCI, any of its affiliates or any third party involved in or related to compiling, computing or creating the data have any liability for any direct, indirect, special, punitive, consequential or any other damages (including lost profits) even if notified of the possibility of such damages. No further distribution or dissemination of the MSCI data is permitted without MSCI’s express written consent. |
Hartford Multi-Strategy Funds
Benchmark Glossary (Unaudited) – (continued)
| “Bloomberg®” and the above referenced Bloomberg index(es) are service marks of Bloomberg Finance L.P. and its affiliates, including Bloomberg Index Services Limited (“BISL”), the administrator of the index (collectively, “Bloomberg”), and have been licensed for use for certain purposes by Hartford Funds Management Company, LLC ("HFMC"). The Funds are not sponsored, endorsed, sold or promoted by Bloomberg. Bloomberg does not make any representation or warranty, express or implied, to the owners of or counterparties to the Funds or any member of the public regarding the advisability of investing in securities generally or in the Funds particularly. The only relationship of Bloomberg to HFMC is the licensing of certain trademarks, trade names and service marks and of the above referenced Bloomberg index(es), which is determined, composed and calculated by BISL without regard to HFMC or the Funds. Bloomberg has no obligation to take the needs of HFMC or the owners of the Funds into consideration in determining, composing or calculating the above referenced Bloomberg index(es). Bloomberg is not responsible for and has not participated in the determination of the timing of, prices at, or quantities of the Funds to be issued. Bloomberg shall not have any obligation or liability, including, without limitation, to the Funds' customers, in connection with the administration, marketing or trading of the Funds. |
| BLOOMBERG DOES NOT GUARANTEE THE ACCURACY AND/OR THE COMPLETENESS OF THE ABOVE REFERENCED BLOOMBERG INDEX(ES) OR ANY DATA RELATED THERETO AND SHALL HAVE NO LIABILITY FOR ANY ERRORS, OMISSIONS OR INTERRUPTIONS THEREIN. BLOOMBERG DOES NOT MAKE ANY WARRANTY, EXPRESS OR IMPLIED, AS TO RESULTS TO BE OBTAINED BY HFMC, OWNERS OF THE FUNDS OR ANY OTHER PERSON OR ENTITY FROM THE USE OF THE ABOVE REFERENCED BLOOMBERG INDEX(ES) OR ANY DATA RELATED THERETO. BLOOMBERG DOES NOT MAKE ANY EXPRESS OR IMPLIED WARRANTIES AND EXPRESSLY DISCLAIMS ALL WARRANTIES OF MERCHANTABILITY OR FITNESS FOR A PARTICULAR PURPOSE OR USE WITH RESPECT TO THE ABOVE REFERENCED BLOOMBERG INDEX(ES) OR ANY DATA RELATED THERETO. WITHOUT LIMITING ANY OF THE FOREGOING, TO THE MAXIMUM EXTENT ALLOWED BY LAW, BLOOMBERG, ITS LICENSORS, AND ITS AND THEIR RESPECTIVE EMPLOYEES, CONTRACTORS, AGENTS, SUPPLIERS, AND VENDORS SHALL HAVE NO LIABILITY OR RESPONSIBILITY WHATSOEVER FOR ANY INJURY OR DAMAGES --WHETHER DIRECT, INDIRECT, CONSEQUENTIAL, INCIDENTAL, PUNITIVE OR OTHERWISE --ARISING IN CONNECTION WITH THE ABOVE REFERENCED BLOOMBERG INDEX(ES) OR ANY DATA OR VALUES RELATING THERETO --WHETHER ARISING FROM THEIR NEGLIGENCE OR OTHERWISE, EVEN IF NOTIFIED OF THE POSSIBILITY THEREOF. |
Hartford Multi-Strategy Funds
Expense Examples (Unaudited)
Your Fund's Expenses
As a shareholder of a Fund, you incur two types of costs: (1) transaction costs, including sales charges (loads) on purchase payments, if any, and contingent deferred sales charges (CDSC), if any, and (2) ongoing costs, including investment management fees, distribution and/or service (12b-1) fees, if any, and other fund expenses. This example is intended to help you understand your ongoing costs (in dollars) of investing in a Fund and to compare these costs with the ongoing costs of investing in other mutual funds. The example is based on an investment of $1,000 invested at the beginning of the period and held for the entire period of May 1, 2021 through October 31, 2021. To the extent a Fund was subject to acquired fund fees and expenses during the period, acquired fund fees and expenses are not included in the annualized expense ratios below.
Actual Expenses
The first set of columns of the table below provides information about actual account values and actual expenses. You may use this information, together with the amount you invested, to estimate the expenses that you paid over the period. Simply divide your account value by $1,000 (for example, an $8,600 account value divided by $1,000 = 8.6), then multiply the result by the number in the line under the heading entitled “Expenses Paid During The Period” to estimate the expenses you paid on your account during this period.
Hypothetical Example for Comparison Purposes
The second set of columns of the table below provides information about hypothetical account values and hypothetical expenses based on a Fund’s actual expense ratio and an assumed rate of return of 5% per year before expenses, which is not the Fund’s actual return. The hypothetical account values and expenses may not be used to estimate the actual ending account balance or expenses you paid for the period. You may use this information to compare the ongoing costs of investing in a Fund and other funds. To do so, compare this 5% hypothetical example with the 5% hypothetical examples that appear in the shareholder reports of the other funds.
Please note that the expenses shown in the table are meant to highlight your ongoing costs only and do not reflect any transactional costs, such as sales charges (loads and CDSC). Therefore, the second set of columns of the table is useful in comparing ongoing costs only, and will not help you determine the relative total costs of owning different funds. In addition, if these transactional costs were included, your costs would be higher. Expenses for a class of a Fund are equal to the class' annualized expense ratio multiplied by average account value over the period, multiplied by 184/365 (to reflect the one-half year period).
| | Actual Return | | Hypothetical (5% return before expenses) |
| | Beginning
Account Value
May 1, 2021 | | Ending
Account Value
October 31, 2021 | | Expenses paid
during the period
May 1, 2021
through
October 31, 2021 | | Beginning
Account Value
May 1, 2021 | | Ending
Account Value
October 31, 2021 | | Expenses paid
during the period
May 1, 2021
through
October 31, 2021 | | Annualized
expense
ratio |
| The Hartford Balanced Income Fund |
| Class A | $ 1,000.00 | | $ 1,042.80 | | $ 4.38 | | $ 1,000.00 | | $ 1,020.92 | | $ 4.33 | | 0.85% |
| Class C | $ 1,000.00 | | $ 1,038.80 | | $ 8.27 | | $ 1,000.00 | | $ 1,017.09 | | $ 8.19 | | 1.61% |
| Class I | $ 1,000.00 | | $ 1,043.40 | | $ 3.14 | | $ 1,000.00 | | $ 1,022.13 | | $ 3.11 | | 0.61% |
| Class R3 | $ 1,000.00 | | $ 1,040.60 | | $ 6.33 | | $ 1,000.00 | | $ 1,019.00 | | $ 6.26 | | 1.23% |
| Class R4 | $ 1,000.00 | | $ 1,042.20 | | $ 4.79 | | $ 1,000.00 | | $ 1,020.52 | | $ 4.74 | | 0.93% |
| Class R5 | $ 1,000.00 | | $ 1,043.70 | | $ 3.25 | | $ 1,000.00 | | $ 1,022.03 | | $ 3.21 | | 0.63% |
| Class R6 | $ 1,000.00 | | $ 1,044.60 | | $ 2.73 | | $ 1,000.00 | | $ 1,022.53 | | $ 2.70 | | 0.53% |
| Class Y | $ 1,000.00 | | $ 1,043.40 | | $ 3.30 | | $ 1,000.00 | | $ 1,021.98 | | $ 3.26 | | 0.64% |
| Class F | $ 1,000.00 | | $ 1,044.50 | | $ 2.73 | | $ 1,000.00 | | $ 1,022.53 | | $ 2.70 | | 0.53% |
| Hartford AARP Balanced Retirement Fund |
| Class A | $ 1,000.00 | | $ 1,027.90 | | $ 4.34 | | $ 1,000.00 | | $ 1,020.92 | | $ 4.33 | | 0.85% |
| Class C | $ 1,000.00 | | $ 1,024.00 | | $ 8.16 | | $ 1,000.00 | | $ 1,017.14 | | $ 8.13 | | 1.60% |
| Class I | $ 1,000.00 | | $ 1,029.50 | | $ 2.81 | | $ 1,000.00 | | $ 1,022.43 | | $ 2.80 | | 0.55% |
| Class R3 | $ 1,000.00 | | $ 1,026.80 | | $ 5.47 | | $ 1,000.00 | | $ 1,019.81 | | $ 5.45 | | 1.07% |
| Class R4 | $ 1,000.00 | | $ 1,028.50 | | $ 3.94 | | $ 1,000.00 | | $ 1,021.32 | | $ 3.92 | | 0.77% |
| Class R5 | $ 1,000.00 | | $ 1,030.20 | | $ 2.25 | | $ 1,000.00 | | $ 1,022.99 | | $ 2.24 | | 0.44% |
| Class R6 | $ 1,000.00 | | $ 1,030.60 | | $ 1.74 | | $ 1,000.00 | | $ 1,023.49 | | $ 1.73 | | 0.34% |
| Class Y | $ 1,000.00 | | $ 1,030.20 | | $ 2.25 | | $ 1,000.00 | | $ 1,022.99 | | $ 2.24 | | 0.44% |
| Class F | $ 1,000.00 | | $ 1,030.80 | | $ 1.74 | | $ 1,000.00 | | $ 1,023.49 | | $ 1.73 | | 0.34% |
Hartford Multi-Strategy Funds
Expense Examples (Unaudited) – (continued)
| | Actual Return | | Hypothetical (5% return before expenses) |
| | Beginning
Account Value
May 1, 2021 | | Ending
Account Value
October 31, 2021 | | Expenses paid
during the period
May 1, 2021
through
October 31, 2021 | | Beginning
Account Value
May 1, 2021 | | Ending
Account Value
October 31, 2021 | | Expenses paid
during the period
May 1, 2021
through
October 31, 2021 | | Annualized
expense
ratio |
| The Hartford Checks and Balances Fund |
| Class A | $ 1,000.00 | | $ 1,045.30 | | $ 1.91 | | $ 1,000.00 | | $ 1,023.34 | | $ 1.89 | | 0.37% |
| Class C | $ 1,000.00 | | $ 1,041.60 | | $ 5.81 | | $ 1,000.00 | | $ 1,019.51 | | $ 5.75 | | 1.13% |
| Class I | $ 1,000.00 | | $ 1,046.50 | | $ 0.67 | | $ 1,000.00 | | $ 1,024.55 | | $ 0.66 | | 0.13% |
| Class R3 | $ 1,000.00 | | $ 1,043.20 | | $ 3.86 | | $ 1,000.00 | | $ 1,021.42 | | $ 3.82 | | 0.75% |
| Class R4 | $ 1,000.00 | | $ 1,044.20 | | $ 2.32 | | $ 1,000.00 | | $ 1,022.94 | | $ 2.29 | | 0.45% |
| Class R5 | $ 1,000.00 | | $ 1,046.40 | | $ 0.83 | | $ 1,000.00 | | $ 1,024.40 | | $ 0.82 | | 0.16% |
| Class F | $ 1,000.00 | | $ 1,047.00 | | $ 0.21 | | $ 1,000.00 | | $ 1,025.00 | | $ 0.20 | | 0.04% |
| The Hartford Conservative Allocation Fund |
| Class A | $ 1,000.00 | | $ 1,018.50 | | $ 2.95 | | $ 1,000.00 | | $ 1,022.28 | | $ 2.96 | | 0.58% |
| Class C | $ 1,000.00 | | $ 1,015.20 | | $ 6.91 | | $ 1,000.00 | | $ 1,018.35 | | $ 6.92 | | 1.36% |
| Class I | $ 1,000.00 | | $ 1,020.10 | | $ 1.58 | | $ 1,000.00 | | $ 1,023.64 | | $ 1.58 | | 0.31% |
| Class R3 | $ 1,000.00 | | $ 1,016.70 | | $ 4.83 | | $ 1,000.00 | | $ 1,020.42 | | $ 4.84 | | 0.95% |
| Class R4 | $ 1,000.00 | | $ 1,018.40 | | $ 3.36 | | $ 1,000.00 | | $ 1,021.88 | | $ 3.36 | | 0.66% |
| Class R5 | $ 1,000.00 | | $ 1,019.20 | | $ 1.78 | | $ 1,000.00 | | $ 1,023.44 | | $ 1.79 | | 0.35% |
| Class F | $ 1,000.00 | | $ 1,020.10 | | $ 1.17 | | $ 1,000.00 | | $ 1,024.05 | | $ 1.17 | | 0.23% |
| The Hartford Global Real Asset Fund (consolidated) |
| Class A | $ 1,000.00 | | $ 1,079.90 | | $ 6.55 | | $ 1,000.00 | | $ 1,018.90 | | $ 6.36 | | 1.25% |
| Class C | $ 1,000.00 | | $ 1,077.10 | | $ 10.42 | | $ 1,000.00 | | $ 1,015.17 | | $ 10.11 | | 1.99% |
| Class I | $ 1,000.00 | | $ 1,082.00 | | $ 5.25 | | $ 1,000.00 | | $ 1,020.16 | | $ 5.09 | | 1.00% |
| Class R3 | $ 1,000.00 | | $ 1,079.40 | | $ 7.86 | | $ 1,000.00 | | $ 1,017.64 | | $ 7.63 | | 1.50% |
| Class R4 | $ 1,000.00 | | $ 1,080.60 | | $ 6.29 | | $ 1,000.00 | | $ 1,019.16 | | $ 6.11 | | 1.20% |
| Class R5 | $ 1,000.00 | | $ 1,082.60 | | $ 4.99 | | $ 1,000.00 | | $ 1,020.42 | | $ 4.84 | | 0.95% |
| Class Y | $ 1,000.00 | | $ 1,082.10 | | $ 4.67 | | $ 1,000.00 | | $ 1,020.72 | | $ 4.53 | | 0.89% |
| Class F | $ 1,000.00 | | $ 1,084.30 | | $ 4.68 | | $ 1,000.00 | | $ 1,020.72 | | $ 4.53 | | 0.89% |
| The Hartford Growth Allocation Fund |
| Class A | $ 1,000.00 | | $ 1,038.30 | | $ 2.67 | | $ 1,000.00 | | $ 1,022.58 | | $ 2.65 | | 0.52% |
| Class C | $ 1,000.00 | | $ 1,033.80 | | $ 6.77 | | $ 1,000.00 | | $ 1,018.55 | | $ 6.72 | | 1.32% |
| Class I | $ 1,000.00 | | $ 1,039.20 | | $ 1.44 | | $ 1,000.00 | | $ 1,023.79 | | $ 1.43 | | 0.28% |
| Class R3 | $ 1,000.00 | | $ 1,036.60 | | $ 4.47 | | $ 1,000.00 | | $ 1,020.82 | | $ 4.43 | | 0.87% |
| Class R4 | $ 1,000.00 | | $ 1,037.10 | | $ 2.98 | | $ 1,000.00 | | $ 1,022.28 | | $ 2.96 | | 0.58% |
| Class R5 | $ 1,000.00 | | $ 1,038.90 | | $ 1.34 | | $ 1,000.00 | | $ 1,023.89 | | $ 1.33 | | 0.26% |
| Class F | $ 1,000.00 | | $ 1,039.90 | | $ 0.77 | | $ 1,000.00 | | $ 1,024.45 | | $ 0.77 | | 0.15% |
| Hartford Moderate Allocation Fund |
| Class A | $ 1,000.00 | | $ 1,029.00 | | $ 2.66 | | $ 1,000.00 | | $ 1,022.58 | | $ 2.65 | | 0.52% |
| Class C | $ 1,000.00 | | $ 1,024.70 | | $ 6.63 | | $ 1,000.00 | | $ 1,018.65 | | $ 6.61 | | 1.30% |
| Class I | $ 1,000.00 | | $ 1,030.30 | | $ 1.23 | | $ 1,000.00 | | $ 1,024.00 | | $ 1.22 | | 0.24% |
| Class R3 | $ 1,000.00 | | $ 1,027.10 | | $ 4.50 | | $ 1,000.00 | | $ 1,020.77 | | $ 4.48 | | 0.88% |
| Class R4 | $ 1,000.00 | | $ 1,028.90 | | $ 2.97 | | $ 1,000.00 | | $ 1,022.28 | | $ 2.96 | | 0.58% |
| Class R5 | $ 1,000.00 | | $ 1,029.50 | | $ 1.38 | | $ 1,000.00 | | $ 1,023.84 | | $ 1.38 | | 0.27% |
| Class F | $ 1,000.00 | | $ 1,030.30 | | $ 0.87 | | $ 1,000.00 | | $ 1,024.35 | | $ 0.87 | | 0.17% |
| Hartford Multi-Asset Income Fund (formerly, Hartford Multi-Asset Income and Growth Fund) |
| Class A | $ 1,000.00 | | $ 1,023.80 | | $ 5.10 | | $ 1,000.00 | | $ 1,020.16 | | $ 5.09 | | 1.00% |
| Class C | $ 1,000.00 | | $ 1,020.40 | | $ 8.81 | | $ 1,000.00 | | $ 1,016.48 | | $ 8.79 | | 1.73% |
| Class I | $ 1,000.00 | | $ 1,025.50 | | $ 3.62 | | $ 1,000.00 | | $ 1,021.63 | | $ 3.62 | | 0.71% |
| Class R3 | $ 1,000.00 | | $ 1,022.60 | | $ 6.68 | | $ 1,000.00 | | $ 1,018.60 | | $ 6.67 | | 1.31% |
| Class R4 | $ 1,000.00 | | $ 1,023.70 | | $ 5.41 | | $ 1,000.00 | | $ 1,019.86 | | $ 5.40 | | 1.06% |
| Class R5 | $ 1,000.00 | | $ 1,025.30 | | $ 3.78 | | $ 1,000.00 | | $ 1,021.48 | | $ 3.77 | | 0.74% |
| Class R6 | $ 1,000.00 | | $ 1,025.50 | | $ 3.22 | | $ 1,000.00 | | $ 1,022.03 | | $ 3.21 | | 0.63% |
| Class Y | $ 1,000.00 | | $ 1,025.30 | | $ 3.78 | | $ 1,000.00 | | $ 1,021.48 | | $ 3.77 | | 0.74% |
| Class F | $ 1,000.00 | | $ 1,026.00 | | $ 3.22 | | $ 1,000.00 | | $ 1,022.03 | | $ 3.21 | | 0.63% |
The Hartford Balanced Income Fund
Schedule of Investments
October 31, 2021
| Shares or Principal Amount | | Market Value† |
| CONVERTIBLE BONDS - 0.1% |
| | Airlines - 0.0% |
| $ 1,474,000 | JetBlue Airways Corp. 0.50%, 04/01/2026(1) | $ 1,415,359 |
| | Auto Manufacturers - 0.1% |
| 2,654,000 | Ford Motor Co. 0.00%, 03/15/2026(1)(2) | 3,139,382 |
| | Engineering & Construction - 0.0% |
| EUR 900,000 | Cellnex Telecom S.A. 1.50%, 01/16/2026(3) | 1,896,129 |
| | Entertainment - 0.0% |
| $ 1,804,000 | DraftKings, Inc. 0.00%, 03/15/2028(1)(2) | 1,572,982 |
| | Healthcare - Products - 0.0% |
| 1,275,000 | NuVasive, Inc. 0.38%, 03/15/2025 | 1,201,688 |
| | Machinery-Diversified - 0.0% |
| 1,451,000 | Middleby Corp. 1.00%, 09/01/2025 | 2,184,895 |
| | Oil & Gas - 0.0% |
| 1,200,000 | Pioneer Natural Resources Co. 0.25%, 05/15/2025 | 2,120,722 |
| | REITS - 0.0% |
| 1,575,000 | Pebblebrook Hotel Trust 1.75%, 12/15/2026 | 1,753,135 |
| | Retail - 0.0% |
| 1,600,000 | Shake Shack, Inc. 0.00%, 03/01/2028(1)(2) | 1,313,789 |
| | Software - 0.0% |
| 2,226,000 | Western Digital Corp. 1.50%, 02/01/2024 | 2,202,840 |
| | Total Convertible Bonds
(cost $16,502,114) | $ 18,800,921 |
| CORPORATE BONDS - 42.1% |
| | Advertising - 0.0% |
| 2,985,000 | Lamar Media Corp. 3.75%, 02/15/2028 | $ 3,017,238 |
| | Aerospace/Defense - 1.2% |
| 2,455,000 | BAE Systems plc 3.40%, 04/15/2030(1) | 2,626,426 |
| | Boeing Co. | |
| 7,000,000 | 3.25%, 02/01/2035 | 7,019,668 |
| 13,025,000 | 5.04%, 05/01/2027 | 14,802,700 |
| 3,415,000 | 5.71%, 05/01/2040 | 4,385,863 |
| 5,960,000 | 5.81%, 05/01/2050 | 8,166,801 |
| | L3Harris Technologies, Inc. | |
| 32,890,000 | 3.85%, 06/15/2023 | 34,482,804 |
| 7,545,000 | 4.40%, 06/15/2028 | 8,611,659 |
| 6,025,000 | Lockheed Martin Corp. 4.50%, 05/15/2036 | 7,380,050 |
| | Northrop Grumman Corp. | |
| 10,830,000 | 2.93%, 01/15/2025 | 11,360,719 |
| 3,200,000 | 3.25%, 01/15/2028 | 3,447,689 |
| 4,000,000 | 4.03%, 10/15/2047 | 4,791,094 |
| | Raytheon Technologies Corp. | |
| 5,000,000 | 3.75%, 11/01/2046 | 5,648,317 |
| 8,945,000 | 3.95%, 08/16/2025 | 9,765,753 |
| 1,925,000 | 4.50%, 06/01/2042 | 2,366,412 |
| 3,425,000 | 4.63%, 11/16/2048 | 4,434,728 |
| 7,960,000 | 5.70%, 04/15/2040 | 11,034,574 |
| 1,890,000 | 6.13%, 07/15/2038 | 2,672,353 |
| | Teledyne Technologies, Inc. | |
| 24,370,000 | 0.95%, 04/01/2024 | 24,350,194 |
| Shares or Principal Amount | | Market Value† |
| CORPORATE BONDS - 42.1% - (continued) |
| | Aerospace/Defense - 1.2% - (continued) |
| $ 2,270,000 | 1.60%, 04/01/2026 | $ 2,267,466 |
| 17,800,000 | 2.75%, 04/01/2031 | 18,154,356 |
| | TransDigm, Inc. | |
| 2,700,000 | 5.50%, 11/15/2027 | 2,764,125 |
| 4,970,000 | 6.25%, 03/15/2026(1) | 5,193,650 |
| 505,000 | 8.00%, 12/15/2025(1) | 537,194 |
| | | | 196,264,595 |
| | Agriculture - 0.5% |
| | Altria Group, Inc. | |
| 8,645,000 | 3.88%, 09/16/2046 | 8,558,789 |
| 3,970,000 | 5.38%, 01/31/2044 | 4,648,413 |
| | BAT Capital Corp. | |
| 35,610,000 | 2.26%, 03/25/2028 | 34,974,985 |
| 8,515,000 | 3.22%, 09/06/2026 | 8,978,790 |
| 5,395,000 | 3.46%, 09/06/2029 | 5,647,181 |
| | Imperial Brands Finance plc | |
| 6,455,000 | 3.50%, 02/11/2023(1) | 6,623,985 |
| 10,360,000 | 3.75%, 07/21/2022(1) | 10,529,990 |
| | | | 79,962,133 |
| | Airlines - 0.0% |
| 201 | Continental Airlines, Inc. 6.90%, 10/19/2023 | 202 |
| | Apparel - 0.0% |
| 4,675,000 | NIKE, Inc. 3.25%, 03/27/2040 | 5,134,200 |
| 2,865,000 | William Carter Co. 5.50%, 05/15/2025(1) | 2,997,506 |
| | | | 8,131,706 |
| | Auto Manufacturers - 0.5% |
| | Ford Motor Co. | |
| 505,000 | 4.35%, 12/08/2026 | 539,906 |
| 2,560,000 | 8.50%, 04/21/2023 | 2,807,040 |
| | Ford Motor Credit Co. LLC | |
| 2,040,000 | 3.35%, 11/01/2022 | 2,070,600 |
| 1,940,000 | 3.37%, 11/17/2023 | 1,990,925 |
| 705,000 | 4.13%, 08/04/2025 | 744,656 |
| 3,200,000 | 4.54%, 08/01/2026 | 3,445,696 |
| 2,690,000 | 5.13%, 06/16/2025 | 2,918,650 |
| | General Motors Co. | |
| 9,235,000 | 5.15%, 04/01/2038 | 11,141,021 |
| 2,215,000 | 6.13%, 10/01/2025 | 2,571,047 |
| 1,325,000 | 6.25%, 10/02/2043 | 1,805,243 |
| | General Motors Financial Co., Inc. | |
| 19,670,000 | 1.50%, 06/10/2026 | 19,380,370 |
| 7,985,000 | 3.50%, 11/07/2024 | 8,471,344 |
| 4,245,000 | 4.35%, 01/17/2027 | 4,687,455 |
| 16,350,000 | Hyundai Capital America 2.10%, 09/15/2028(1) | 15,990,481 |
| | | | 78,564,434 |
| | Auto Parts & Equipment - 0.1% |
| | Adient Global Holdings Ltd. | |
| EUR 1,930,000 | 3.50%, 08/15/2024(3) | 2,256,180 |
| $ 3,665,000 | 4.88%, 08/15/2026(1) | 3,731,281 |
| 3,080,000 | Meritor, Inc. 4.50%, 12/15/2028(1) | 3,064,600 |
| 525,000 | Nemak S.A.B. de C.V. 3.63%, 06/28/2031(1) | 491,400 |
| | | | 9,543,461 |
| | Beverages - 1.1% |
| | Anheuser-Busch Cos. LLC / Anheuser-Busch InBev Worldwide, Inc. | |
| 15,055,000 | 4.70%, 02/01/2036 | 18,227,185 |
The accompanying notes are an integral part of these financial statements.
The Hartford Balanced Income Fund
Schedule of Investments – (continued)
October 31, 2021
| Shares or Principal Amount | | Market Value† |
| CORPORATE BONDS - 42.1% - (continued) |
| | Beverages - 1.1% - (continued) |
| $ 11,111,000 | 4.90%, 02/01/2046 | $ 14,122,553 |
| | Anheuser-Busch InBev Worldwide, Inc. | |
| 9,174,000 | 3.75%, 07/15/2042 | 9,996,550 |
| 3,440,000 | 4.38%, 04/15/2038 | 4,049,155 |
| 7,750,000 | 4.60%, 04/15/2048 | 9,584,433 |
| 6,130,000 | 4.75%, 04/15/2058 | 7,809,461 |
| | Bacardi Ltd. | |
| 6,215,000 | 2.75%, 07/15/2026(1) | 6,432,076 |
| 9,960,000 | 4.45%, 05/15/2025(1) | 10,881,616 |
| 5,365,000 | 5.15%, 05/15/2038(1) | 6,631,530 |
| | Coca-Cola Co. | |
| 11,690,000 | 1.50%, 03/05/2028(4) | 11,508,805 |
| 10,000,000 | 2.50%, 06/01/2040 | 9,840,571 |
| 2,270,000 | 3.00%, 03/05/2051 | 2,411,867 |
| 11,720,000 | Coca-Cola European Partners plc 0.50%, 05/05/2023(1) | 11,667,103 |
| | Constellation Brands, Inc. | |
| 1,585,000 | 3.15%, 08/01/2029 | 1,685,543 |
| 7,893,000 | 3.60%, 02/15/2028 | 8,648,757 |
| 15,297,000 | Diageo Capital plc 2.00%, 04/29/2030 | 15,197,862 |
| | Pernod Ricard International Finance LLC | |
| 18,810,000 | 1.25%, 04/01/2028(1) | 17,862,551 |
| 12,840,000 | 1.63%, 04/01/2031(1) | 12,094,738 |
| | | | 178,652,356 |
| | Biotechnology - 0.5% |
| | Amgen, Inc. | |
| 2,400,000 | 1.90%, 02/21/2025 | 2,452,844 |
| 8,140,000 | 2.80%, 08/15/2041 | 7,885,730 |
| 20,390,000 | 3.15%, 02/21/2040 | 20,875,532 |
| | Gilead Sciences, Inc. | |
| 7,060,000 | 1.20%, 10/01/2027 | 6,808,315 |
| 3,965,000 | 2.60%, 10/01/2040 | 3,791,304 |
| 5,235,000 | 2.80%, 10/01/2050 | 5,068,283 |
| | Royalty Pharma plc | |
| 8,060,000 | 1.75%, 09/02/2027 | 7,907,468 |
| 4,220,000 | 2.15%, 09/02/2031 | 4,015,269 |
| 16,060,000 | 2.20%, 09/02/2030 | 15,550,802 |
| 5,305,000 | 3.35%, 09/02/2051 | 5,078,864 |
| 1,570,000 | 3.55%, 09/02/2050 | 1,558,422 |
| | | | 80,992,833 |
| | Chemicals - 0.3% |
| | Air Products and Chemicals, Inc. | |
| 2,560,000 | 1.50%, 10/15/2025 | 2,587,752 |
| 4,840,000 | 1.85%, 05/15/2027 | 4,925,947 |
| 1,760,000 | Braskem Idesa 6.99%, 02/20/2032(1) | 1,801,527 |
| | Braskem Netherlands Finance B.V. | |
| 800,000 | 4.50%, 01/10/2028(3) | 817,008 |
| 485,000 | 4.50%, 01/10/2028(1) | 495,311 |
| 880,000 | 4.50%, 01/31/2030(3) | 892,989 |
| 475,000 | Diamond (BC) B.V. 4.63%, 10/01/2029(1) | 477,432 |
| 617,000 | Dow Chemical Co. 4.55%, 11/30/2025 | 683,446 |
| 6,360,000 | EI du Pont de Nemours and Co. 1.70%, 07/15/2025 | 6,445,324 |
| 26,575,000 | International Flavors & Fragrances, Inc. 1.83%, 10/15/2027(1) | 26,229,228 |
| | OCP S.A. | |
| 980,000 | 3.75%, 06/23/2031(1) | 960,392 |
| 1,804,000 | 4.50%, 10/22/2025(3) | 1,916,851 |
| 1,376,000 | 5.13%, 06/23/2051(1) | 1,339,536 |
| 340,000 | 6.88%, 04/25/2044(3) | 407,075 |
| Shares or Principal Amount | | Market Value† |
| CORPORATE BONDS - 42.1% - (continued) |
| | Chemicals - 0.3% - (continued) |
| $ 1,740,000 | Sherwin-Williams Co. 4.50%, 06/01/2047 | $ 2,175,317 |
| 1,625,000 | TPC Group, Inc. 10.50%, 08/01/2024(1) | 1,478,750 |
| | | | 53,633,885 |
| | Commercial Banks - 8.9% |
| 7,500,000 | ABN Amro Bank N.V. 1.54%, 06/16/2027, (1.54% fixed rate until 06/16/2026; 12 mo. USD CMT + 0.800% thereafter)(1)(4)(5) | 7,384,367 |
| 1,250,000 | Banco de Credito del Peru 3.13%, 07/01/2030, (3.13% fixed rate until 07/01/2025; 5 year USD CMT + 3.000% thereafter)(1)(5) | 1,240,250 |
| | Banco do Brasil S.A. | |
| 845,000 | 4.63%, 01/15/2025, 5 year EUR Swap + 7.591%(1) | 884,723 |
| 475,000 | 4.63%, 01/15/2025(3) | 497,330 |
| 1,210,000 | 4.75%, 03/20/2024, 5 year EUR Swap + 7.591%(1) | 1,269,000 |
| 210,000 | 4.88%, 04/19/2023(1) | 218,402 |
| | Bancolombia S.A. | |
| 1,380,000 | 3.00%, 01/29/2025 | 1,392,089 |
| 835,000 | 4.63%, 12/18/2029, (4.62% fixed rate until 12/18/2024; 5 year USD CMT + 2.944% thereafter)(5) | 850,619 |
| 1,975,000 | Bangkok Bank PCL 3.47%, 09/23/2036, (3.47% fixed rate until 09/23/2031; 5 year USD CMT + 2.150% thereafter)(1)(5) | 1,960,782 |
| 1,410,000 | Bank Leumi Le-Israel BM 3.28%, 01/29/2031, (3.28% fixed rate until 01/29/2026; 5 year USD CMT + 1.631% thereafter)(1)(3)(5) | 1,420,575 |
| | Bank of America Corp. | |
| 10,000,000 | 1.90%, 07/23/2031, (1.90% fixed rate until 07/23/2030; 3 mo. USD SOFR + 1.530% thereafter)(5) | 9,559,256 |
| 12,000,000 | 2.09%, 06/14/2029, (2.09% fixed rate until 06/14/2028; 3 mo. USD SOFR + 1.060% thereafter)(5) | 11,871,129 |
| 11,000,000 | 2.30%, 07/21/2032, (2.30% fixed rate until 07/21/2031; 3 mo. USD SOFR + 1.220% thereafter)(5) | 10,767,896 |
| 16,525,000 | 2.48%, 09/21/2036, (2.48% fixed rate until 09/21/2031; 5 year USD CMT + 1.200% thereafter)(5) | 16,079,012 |
| 40,135,000 | 2.50%, 02/13/2031, (2.50% fixed rate until 02/13/2030; 3 mo. USD LIBOR + 0.990% thereafter)(5) | 40,271,847 |
| 15,400,000 | 2.65%, 03/11/2032, (2.65% fixed rate until 03/11/2031; 3 mo. USD SOFR + 1.220% thereafter)(5) | 15,549,087 |
| 8,800,000 | 2.68%, 06/19/2041, (2.68% fixed rate until 06/19/2040; 3 mo. USD SOFR + 1.930% thereafter)(5) | 8,479,397 |
| 1,600,000 | 2.88%, 10/22/2030, (2.88% fixed rate until 10/22/2029; 3 mo. USD LIBOR + 1.190% thereafter)(5) | 1,657,212 |
| 3,733,000 | 3.00%, 12/20/2023, (3.00% fixed rate until 12/20/2022; 3 mo. USD LIBOR + 0.790% thereafter)(5) | 3,830,900 |
The accompanying notes are an integral part of these financial statements.
The Hartford Balanced Income Fund
Schedule of Investments – (continued)
October 31, 2021
| Shares or Principal Amount | | Market Value† |
| CORPORATE BONDS - 42.1% - (continued) |
| | Commercial Banks - 8.9% - (continued) |
| $ 5,270,000 | 3.09%, 10/01/2025, (3.09% fixed rate until 10/01/2024; 3 mo. USD LIBOR + 1.090% thereafter)(5) | $ 5,540,661 |
| 7,500,000 | 3.12%, 01/20/2023, (3.12% fixed rate until 01/20/2022; 3 mo. USD LIBOR + 1.160% thereafter)(5) | 7,543,554 |
| 7,740,000 | 3.31%, 04/22/2042, (3.31% fixed rate until 04/22/2041; 3 mo. USD SOFR + 1.580% thereafter)(5) | 8,189,009 |
| 6,550,000 | 3.82%, 01/20/2028, (3.82% fixed rate until 01/20/2027; 3 mo. USD LIBOR + 1.575% thereafter)(5) | 7,145,015 |
| 5,015,000 | 3.86%, 07/23/2024, (3.86% fixed rate until 07/23/2023; 3 mo. USD LIBOR + 0.940% thereafter)(5) | 5,265,468 |
| 15,235,000 | 4.08%, 03/20/2051, (4.08% fixed rate until 03/20/2050; 3 mo. USD LIBOR + 3.150% thereafter)(5) | 18,376,928 |
| 3,225,000 | 4.24%, 04/24/2038, (4.24% fixed rate until 04/24/2037; 3 mo. USD LIBOR + 1.814% thereafter)(5) | 3,771,303 |
| 13,375,000 | 4.33%, 03/15/2050, (4.33% fixed rate until 03/15/2049; 3 mo. USD LIBOR + 1.520% thereafter)(5) | 16,622,929 |
| 1,760,000 | 5.00%, 01/21/2044 | 2,308,106 |
| 9,525,000 | 7.75%, 05/14/2038 | 14,905,778 |
| 13,960,000 | Bank of Nova Scotia 0.65%, 07/31/2024 | 13,830,049 |
| 3,220,000 | Barclays plc 2.67%, 03/10/2032, (2.67% fixed rate until 03/10/2031; 12 mo. USD CMT + 1.200% thereafter)(5) | 3,208,540 |
| | BNP Paribas S.A. | |
| 2,365,000 | 1.32%, 01/13/2027, (1.32% fixed rate until 01/13/2026; 3 mo. USD SOFR + 1.004% thereafter)(1)(5) | 2,311,980 |
| 20,555,000 | 1.90%, 09/30/2028, (1.90% fixed rate until 09/30/2027; 3 mo. USD SOFR + 1.609% thereafter)(1)(5) | 20,206,014 |
| 5,125,000 | 2.16%, 09/15/2029, (2.16% fixed rate until 09/15/2028; 3 mo. USD SOFR + 1.218% thereafter)(1)(5) | 5,035,612 |
| 16,725,000 | 2.87%, 04/19/2032, (2.87% fixed rate until 04/19/2031; 3 mo. USD SOFR + 1.387% thereafter)(1)(5) | 17,021,817 |
| | BPCE S.A. | |
| 17,135,000 | 1.00%, 01/20/2026(1) | 16,690,665 |
| 3,100,000 | 2.05%, 10/19/2027, (2.05% fixed rate until 10/19/2026; 3 mo. USD SOFR + 1.087% thereafter)(1)(5) | 3,088,223 |
| 2,750,000 | 3.00%, 05/22/2022(1) | 2,789,133 |
| 1,135,000 | 4.00%, 09/12/2023(1) | 1,197,930 |
| | Citigroup, Inc. | |
| 8,335,000 | 0.98%, 05/01/2025, (0.98% fixed rate until 05/01/2024; 3 mo. USD SOFR + 0.669% thereafter)(5) | 8,297,749 |
| 38,630,000 | 1.12%, 01/28/2027, (1.12% fixed rate until 01/28/2026; 3 mo. USD SOFR + 0.765% thereafter)(5) | 37,720,212 |
| 10,515,000 | 1.28%, 11/03/2025, (1.52% fixed rate until 11/03/2024; 3 mo. USD SOFR + 0.528% thereafter)(5) | 10,525,715 |
| 10,800,000 | 1.46%, 06/09/2027, (1.46% fixed rate until 06/09/2026; 3 mo. USD SOFR + 0.770% thereafter)(5) | 10,640,992 |
| Shares or Principal Amount | | Market Value† |
| CORPORATE BONDS - 42.1% - (continued) |
| | Commercial Banks - 8.9% - (continued) |
| $ 1,880,000 | 2.52%, 11/03/2032, (2.83% fixed rate until 11/03/2031; 3 mo. USD SOFR + 1.177% thereafter)(5) | $ 1,874,414 |
| 9,705,000 | 2.56%, 05/01/2032, (2.56% fixed rate until 05/01/2031; 3 mo. USD SOFR + 1.167% thereafter)(5) | 9,751,284 |
| 2,500,000 | 2.57%, 06/03/2031, (2.57% fixed rate until 06/03/2030; 3 mo. USD SOFR + 2.107% thereafter)(5) | 2,521,975 |
| 1,915,000 | 2.90%, 11/03/2042, (3.23% fixed rate until 11/03/2041; 3 mo. USD SOFR + 1.379% thereafter)(5) | 1,899,103 |
| 3,770,000 | 3.20%, 10/21/2026 | 4,008,582 |
| 24,410,000 | 3.35%, 04/24/2025, (3.35% fixed rate until 04/24/2024; 3 mo. USD LIBOR + 0.897% thereafter)(5) | 25,716,006 |
| 7,325,000 | 4.30%, 11/20/2026 | 8,130,444 |
| 5,180,000 | 4.45%, 09/29/2027 | 5,810,659 |
| 5,350,000 | 4.60%, 03/09/2026 | 5,968,326 |
| 7,931,000 | Credit Agricole S.A. 1.91%, 06/16/2026, (1.91% fixed rate until 06/16/2025; 3 mo. USD SOFR + 1.676% thereafter)(1)(5) | 8,009,769 |
| | Credit Suisse Group AG | |
| 6,795,000 | 1.31%, 02/02/2027, (1.31% fixed rate until 02/02/2026; 3 mo. USD SOFR + 0.980% thereafter)(1)(5) | 6,568,022 |
| 3,155,000 | 3.09%, 05/14/2032, (3.09% fixed rate until 05/14/2031; 3 mo. USD SOFR + 1.730% thereafter)(1)(5) | 3,214,155 |
| 9,725,000 | 4.21%, 06/12/2024, (4.21% fixed rate until 06/12/2023; 3 mo. USD LIBOR + 1.240% thereafter)(1)(5) | 10,211,800 |
| 4,160,000 | 6.25%, 12/18/2024, (6.25% fixed rate until 12/18/2024; 5 year USD Swap + 3.455% thereafter)(3)(5)(6) | 4,472,000 |
| | Danske Bank A/S | |
| 6,504,000 | 1.62%, 09/11/2026, (1.62% fixed rate until 09/11/2025; 12 mo. USD CMT + 1.350% thereafter)(1)(5) | 6,459,982 |
| 587,000 | 4.38%, 06/12/2028(1) | 652,671 |
| 18,135,000 | Deutsche Bank AG 0.90%, 05/28/2024 | 17,992,958 |
| 19,000,000 | Fifth Third Bank NA 3.95%, 07/28/2025 | 20,855,665 |
| | Goldman Sachs Group, Inc. | |
| 15,000,000 | 0.48%, 01/27/2023 | 14,959,884 |
| 8,710,000 | 0.93%, 10/21/2024, (0.93% fixed rate until 10/21/2023; 3 mo. USD SOFR + 0.486% thereafter)(5) | 8,701,902 |
| 30,010,000 | 1.09%, 12/09/2026, (1.09% fixed rate until 12/09/2025; 3 mo. USD SOFR + 0.789% thereafter)(5) | 29,272,354 |
| 8,120,000 | 1.43%, 03/09/2027, (1.43% fixed rate until 03/09/2026; 3 mo. USD SOFR + 0.798% thereafter)(5) | 7,996,222 |
| 11,615,000 | 1.99%, 01/27/2032, (1.99% fixed rate until 01/27/2031; 3 mo. USD SOFR + 1.090% thereafter)(5) | 11,134,912 |
| 18,610,000 | 2.38%, 07/21/2032, (2.38% fixed rate until 07/21/2031; 3 mo. USD SOFR + 1.248% thereafter)(5) | 18,303,207 |
| 9,325,000 | 2.62%, 04/22/2032, (2.62% fixed rate until 04/22/2031; 3 mo. USD SOFR + 1.281% thereafter)(5) | 9,368,824 |
The accompanying notes are an integral part of these financial statements.
The Hartford Balanced Income Fund
Schedule of Investments – (continued)
October 31, 2021
| Shares or Principal Amount | | Market Value† |
| CORPORATE BONDS - 42.1% - (continued) |
| | Commercial Banks - 8.9% - (continued) |
| $ 1,635,000 | 2.65%, 10/21/2032, (2.65% fixed rate until 10/21/2031; 3 mo. USD SOFR + 1.264% thereafter)(5) | $ 1,644,125 |
| 28,540,000 | 3.27%, 09/29/2025, (3.27% fixed rate until 09/29/2024; 3 mo. USD LIBOR + 1.201% thereafter)(5) | 30,119,894 |
| 6,345,000 | 3.50%, 01/23/2025 | 6,747,885 |
| 7,345,000 | 4.00%, 03/03/2024 | 7,841,846 |
| 23,347,000 | 4.02%, 10/31/2038, (4.02% fixed rate until 10/31/2037; 3 mo. USD LIBOR + 1.373% thereafter)(5) | 26,708,859 |
| 5,000,000 | 4.22%, 05/01/2029, (4.22% fixed rate until 05/01/2028; 3 mo. USD LIBOR + 1.301% thereafter)(5) | 5,601,613 |
| 2,015,000 | Grupo Aval Ltd. 4.75%, 09/26/2022(3) | 2,062,352 |
| | HSBC Holdings plc | |
| 4,765,000 | 0.98%, 05/24/2025, (0.98% fixed rate until 05/24/2024; 3 mo. USD SOFR + 0.708% thereafter)(5) | 4,725,275 |
| 11,240,000 | 1.59%, 05/24/2027, (1.59% fixed rate until 05/24/2026; 3 mo. USD SOFR + 1.290% thereafter)(5) | 11,047,689 |
| 12,355,000 | 2.80%, 05/24/2032, (2.80% fixed rate until 05/24/2031; 3 mo. USD SOFR + 1.187% thereafter)(5) | 12,444,517 |
| 14,695,000 | 3.26%, 03/13/2023, (3.26% fixed rate until 03/13/2022; 3 mo. USD LIBOR + 1.055% thereafter)(5) | 14,840,105 |
| 13,270,000 | 3.60%, 05/25/2023 | 13,871,140 |
| 4,780,000 | 3.97%, 05/22/2030, (3.97% fixed rate until 05/22/2029; 3 mo. USD LIBOR + 1.610% thereafter)(5) | 5,230,335 |
| 5,000,000 | 4.04%, 03/13/2028, (4.04% fixed rate until 03/13/2027; 3 mo. USD LIBOR + 1.546% thereafter)(5) | 5,445,246 |
| 7,245,000 | 4.25%, 03/14/2024 | 7,714,984 |
| 6,755,000 | 4.30%, 03/08/2026 | 7,442,019 |
| 12,695,000 | 4.58%, 06/19/2029, (4.58% fixed rate until 06/19/2028; 3 mo. USD LIBOR + 1.535% thereafter)(5) | 14,343,494 |
| 4,440,000 | 6.80%, 06/01/2038 | 6,351,205 |
| 1,205,000 | Industrial & Commercial Bank of China Ltd. 4.88%, 09/21/2025(3) | 1,319,512 |
| 7,315,000 | ING Groep N.V. 1.73%, 04/01/2027, (1.73% fixed rate until 04/01/2026; 3 mo. USD SOFR + 1.005% thereafter)(5) | 7,302,180 |
| 2,985,000 | Itau Unibanco Holding S.A. 2.90%, 01/24/2023(1) | 3,021,417 |
| | JP Morgan Chase & Co. | |
| 15,755,000 | 0.82%, 06/01/2025, (0.82% fixed rate until 06/01/2024; 3 mo. USD SOFR + 0.540% thereafter)(5) | 15,631,365 |
| 15,385,000 | 2.30%, 10/15/2025, (2.30% fixed rate until 10/15/2024; 3 mo. USD SOFR + 1.160% thereafter)(5) | 15,835,396 |
| 4,500,000 | 2.58%, 04/22/2032, (2.58% fixed rate until 04/22/2031; 3 mo. USD SOFR + 1.250% thereafter)(5) | 4,540,557 |
| Shares or Principal Amount | | Market Value† |
| CORPORATE BONDS - 42.1% - (continued) |
| | Commercial Banks - 8.9% - (continued) |
| $ 11,585,000 | 2.74%, 10/15/2030, (2.74% fixed rate until 10/15/2029; 3 mo. USD SOFR + 1.510% thereafter)(5) | $ 11,879,070 |
| 2,725,000 | 2.96%, 05/13/2031, (2.96% fixed rate until 05/13/2030; 3 mo. USD SOFR + 2.515% thereafter)(5) | 2,814,624 |
| 22,475,000 | 2.97%, 01/15/2023 | 22,594,693 |
| 6,860,000 | 3.11%, 04/22/2041, (3.11% fixed rate until 04/22/2040; 3 mo. USD SOFR + 2.460% thereafter)(5) | 7,094,333 |
| 4,500,000 | 3.16%, 04/22/2042, (3.16% fixed rate until 04/22/2041; 3 mo. USD SOFR + 1.460% thereafter)(5) | 4,686,254 |
| 9,440,000 | 3.22%, 03/01/2025, (3.22% fixed rate until 03/01/2024; 3 mo. USD LIBOR + 1.155% thereafter)(5) | 9,895,442 |
| 19,950,000 | 3.30%, 04/01/2026 | 21,338,939 |
| 27,970,000 | 3.33%, 04/22/2052, (3.33% fixed rate until 04/22/2051; 3 mo. USD SOFR + 1.580% thereafter)(5) | 30,152,763 |
| 6,290,000 | 3.88%, 07/24/2038, (3.88% fixed rate until 07/24/2037; 3 mo. USD LIBOR + 1.360% thereafter)(5) | 7,183,870 |
| 15,520,000 | 3.96%, 11/15/2048, (3.96% fixed rate until 11/15/2047; 3 mo. USD LIBOR + 1.380% thereafter)(5) | 18,278,326 |
| 2,251,000 | 4.02%, 12/05/2024, (4.02% fixed rate until 12/05/2023; 3 mo. USD LIBOR + 1.000% thereafter)(5) | 2,393,159 |
| 4,055,000 | 4.26%, 02/22/2048, (4.26% fixed rate until 02/22/2047; 3 mo. USD LIBOR + 1.580% thereafter)(5) | 4,969,251 |
| 6,000,000 | 4.49%, 03/24/2031, (4.49% fixed rate until 03/24/2030; 3 mo. USD SOFR + 3.790% thereafter)(5) | 6,960,376 |
| 22,080,000 | JPMorgan Chase & Co. 1.47%, 09/22/2027, (1.47% fixed rate until 09/22/2026; 3 mo. USD SOFR + 0.765% thereafter)(5) | 21,682,314 |
| 8,575,000 | Lloyds Banking Group plc 4.05%, 08/16/2023 | 9,073,125 |
| 10,875,000 | Macquarie Group Ltd. 1.63%, 09/23/2027, (1.63% fixed rate until 09/23/2026; 3 mo. USD SOFR + 0.910% thereafter)(1)(5) | 10,669,045 |
| 1,800,000 | Mizrahi Tefahot Bank Ltd. 3.08%, 04/07/2031, (3.08% fixed rate until 04/07/2026; 5 year USD CMT + 2.250% thereafter)(1)(3)(5) | 1,796,400 |
| | Morgan Stanley | |
| 16,420,000 | 0.75%, 01/20/2023, 3 mo. USD SOFR + 0.700%(7) | 16,447,577 |
| 20,010,000 | 0.79%, 05/30/2025, (0.79% fixed rate until 05/30/2024; 3 mo. USD SOFR + 0.525% thereafter)(5) | 19,793,448 |
| 21,340,000 | 0.99%, 12/10/2026, (0.99% fixed rate until 12/10/2025; 3 mo. USD SOFR + 0.720% thereafter)(5) | 20,712,326 |
| 16,820,000 | 1.79%, 02/13/2032, (1.79% fixed rate until 02/13/2031; 3 mo. USD SOFR + 1.034% thereafter)(5) | 15,854,159 |
The accompanying notes are an integral part of these financial statements.
The Hartford Balanced Income Fund
Schedule of Investments – (continued)
October 31, 2021
| Shares or Principal Amount | | Market Value† |
| CORPORATE BONDS - 42.1% - (continued) |
| | Commercial Banks - 8.9% - (continued) |
| $ 7,800,000 | 1.93%, 04/28/2032, (1.93% fixed rate until 04/28/2031; 3 mo. USD SOFR + 1.020% thereafter)(5) | $ 7,431,341 |
| 12,660,000 | 2.24%, 07/21/2032, (2.24% fixed rate until 07/21/2031; 3 mo. USD SOFR + 1.178% thereafter)(5) | 12,361,162 |
| 9,795,000 | 2.48%, 09/16/2036, (2.48% fixed rate until 09/16/2031; 3 mo. USD SOFR + 1.360% thereafter)(5) | 9,522,556 |
| 2,950,000 | 2.51%, 10/20/2032, (2.51% fixed rate until 10/20/2031; 3 mo. USD SOFR + 1.200% thereafter)(5) | 2,943,541 |
| 7,795,000 | 2.72%, 07/22/2025, (2.72% fixed rate until 07/22/2024; 3 mo. USD SOFR + 1.152% thereafter)(5) | 8,092,890 |
| 8,665,000 | 3.13%, 07/27/2026 | 9,206,775 |
| 6,000,000 | 3.22%, 04/22/2042, (3.22% fixed rate until 04/22/2041; 3 mo. USD SOFR + 1.485% thereafter)(5) | 6,292,675 |
| 5,000,000 | 3.62%, 04/01/2031, (3.62% fixed rate until 04/01/2030; 3 mo. USD SOFR + 3.120% thereafter)(5) | 5,464,510 |
| 2,935,000 | 3.70%, 10/23/2024 | 3,147,402 |
| 6,880,000 | 3.74%, 04/24/2024, (3.74% fixed rate until 04/24/2023; 3 mo. USD LIBOR + 0.847% thereafter)(5) | 7,174,118 |
| 9,690,000 | 4.00%, 07/23/2025 | 10,576,829 |
| 16,825,000 | 4.46%, 04/22/2039, (4.46% fixed rate until 04/22/2038; 3 mo. USD LIBOR + 1.431% thereafter)(5) | 20,347,360 |
| 5,095,000 | Natwest Group plc 1.64%, 06/14/2027, (1.64% fixed rate until 06/14/2026; 12 mo. USD CMT + 0.900% thereafter)(5) | 5,036,683 |
| 9,310,000 | PNC Financial Services Group, Inc. 3.90%, 04/29/2024 | 9,952,085 |
| | QNB Finance Ltd. | |
| 600,000 | 1.63%, 09/22/2025(3) | 599,964 |
| 970,000 | 2.63%, 05/12/2025(3) | 1,002,681 |
| | Santander Holdings USA, Inc. | |
| 6,970,000 | 3.40%, 01/18/2023 | 7,173,339 |
| 6,145,000 | 3.70%, 03/28/2022 | 6,204,089 |
| 14,530,000 | Santander UK Group Holdings plc 3.57%, 01/10/2023 | 14,614,545 |
| 15,570,000 | Societe Generale S.A. 1.79%, 06/09/2027, (1.79% fixed rate until 06/09/2026; 12 mo. USD CMT + 1.000% thereafter)(1)(5) | 15,330,953 |
| 7,165,000 | Standard Chartered plc 1.46%, 01/14/2027, (1.46% fixed rate until 01/14/2026; 12 mo. USD CMT + 1.000% thereafter)(1)(5) | 6,974,497 |
| 11,680,000 | Truist Bank 2.25%, 03/11/2030 | 11,688,406 |
| 4,360,000 | Truist Financial Corp. 1.89%, 06/07/2029, (1.89% fixed rate until 06/07/2028; 3 mo. USD SOFR + 0.862% thereafter)(5) | 4,315,732 |
| 14,860,000 | UBS AG 0.38%, 06/01/2023(1) | 14,785,038 |
| Shares or Principal Amount | | Market Value† |
| CORPORATE BONDS - 42.1% - (continued) |
| | Commercial Banks - 8.9% - (continued) |
| $ 6,815,000 | UniCredit S.p.A. 1.98%, 06/03/2027, (1.98% fixed rate until 06/03/2026; 12 mo. USD CMT + 1.200% thereafter)(1)(5) | $ 6,699,855 |
| 2,655,000 | Wachovia Corp. 5.50%, 08/01/2035 | 3,404,438 |
| | Wells Fargo & Co. | |
| 4,715,000 | 0.81%, 05/19/2025, (0.81% fixed rate until 05/19/2024; 3 mo. USD SOFR + 0.510% thereafter)(5) | 4,692,833 |
| 19,030,000 | 2.41%, 10/30/2025, (2.41% fixed rate until 10/30/2024; 3 mo. USD SOFR + 1.087% thereafter)(5) | 19,658,565 |
| 8,925,000 | 3.07%, 04/30/2041, (3.07% fixed rate until 04/30/2040; 3 mo. USD SOFR + 2.530% thereafter)(5) | 9,146,556 |
| 9,965,000 | 3.45%, 02/13/2023 | 10,310,155 |
| 6,500,000 | 3.58%, 05/22/2028, (3.58% fixed rate until 05/22/2027; 3 mo. USD LIBOR + 1.310% thereafter)(5) | 7,011,747 |
| 11,840,000 | 3.75%, 01/24/2024 | 12,562,689 |
| 880,000 | 4.40%, 06/14/2046 | 1,067,999 |
| 690,000 | 4.65%, 11/04/2044 | 849,397 |
| 2,280,000 | 4.75%, 12/07/2046 | 2,886,791 |
| 3,026,000 | 4.90%, 11/17/2045 | 3,883,840 |
| 4,490,000 | 5.01%, 04/04/2051, (5.01% fixed rate until 04/04/2050; 3 mo. USD SOFR + 4.502% thereafter)(5) | 6,194,443 |
| 1,475,000 | 5.38%, 11/02/2043 | 1,961,576 |
| 4,408,000 | 5.61%, 01/15/2044 | 6,019,483 |
| | | | 1,415,964,417 |
| | Commercial Services - 0.8% |
| 5,595,000 | Ashtead Capital, Inc. 1.50%, 08/12/2026(1) | 5,491,012 |
| 4,495,000 | Duke University 2.83%, 10/01/2055 | 4,697,052 |
| 19,085,000 | Equifax, Inc. 2.60%, 12/01/2024 | 19,869,868 |
| | Global Payments, Inc. | |
| 25,405,000 | 1.20%, 03/01/2026 | 24,805,252 |
| 7,750,000 | 2.65%, 02/15/2025 | 8,039,532 |
| 8,085,000 | 2.90%, 05/15/2030 | 8,253,930 |
| 7,075,000 | 4.45%, 06/01/2028 | 7,962,152 |
| 2,570,000 | Herc Holdings, Inc. 5.50%, 07/15/2027(1) | 2,679,225 |
| | IHS Markit Ltd. | |
| 11,565,000 | 4.13%, 08/01/2023 | 12,186,068 |
| 9,500,000 | 4.75%, 08/01/2028 | 11,070,808 |
| 380,000 | Jaguar Holding Co. 5.00%, 06/15/2028(1) | 407,550 |
| 5,075,000 | Nielsen Finance LLC / Nielsen Finance Co. 4.50%, 07/15/2029(1) | 4,962,081 |
| | Service Corp. International | |
| 775,000 | 4.63%, 12/15/2027 | 812,781 |
| 550,000 | 5.13%, 06/01/2029 | 593,863 |
| 3,127,000 | Signal Parent, Inc. 6.13%, 04/01/2029(1) | 2,908,110 |
| 4,915,000 | United Rentals North America, Inc. 4.88%, 01/15/2028 | 5,188,028 |
| | | | 119,927,312 |
| | Construction Materials - 0.2% |
| 2,880,000 | Builders FirstSource, Inc. 5.00%, 03/01/2030(1) | 3,042,000 |
| 13,585,000 | Carrier Global Corp. 2.49%, 02/15/2027 | 13,988,262 |
The accompanying notes are an integral part of these financial statements.
The Hartford Balanced Income Fund
Schedule of Investments – (continued)
October 31, 2021
| Shares or Principal Amount | | Market Value† |
| CORPORATE BONDS - 42.1% - (continued) |
| | Construction Materials - 0.2% - (continued) |
| $ 2,971,000 | Johnson Controls International plc 4.63%, 07/02/2044 | $ 3,618,172 |
| 4,285,000 | Lennox International, Inc. 1.70%, 08/01/2027 | 4,220,389 |
| 515,000 | Standard Industries, Inc. 3.38%, 01/15/2031(1) | 477,544 |
| 1,320,000 | Victors Merger Corp. 6.38%, 05/15/2029(1) | 1,240,800 |
| | | | 26,587,167 |
| | Distribution/Wholesale - 0.0% |
| 1,145,000 | American Builders & Contractors Supply Co., Inc. 4.00%, 01/15/2028(1) | 1,160,744 |
| 385,000 | G-III Apparel Group Ltd. 7.88%, 08/15/2025(1) | 410,506 |
| 2,690,000 | Performance Food Group, Inc. 5.50%, 10/15/2027(1) | 2,804,325 |
| | | | 4,375,575 |
| | Diversified Financial Services - 1.2% |
| | AerCap Ireland Capital DAC / AerCap Global Aviation Trust | |
| 15,095,000 | 2.45%, 10/29/2026 | 15,234,783 |
| 5,830,000 | 3.40%, 10/29/2033 | 5,949,880 |
| 440,000 | 4.63%, 10/15/2027 | 489,757 |
| 1,835,000 | AGFC Capital Trust 1.87%, 01/15/2067, 3 mo. USD LIBOR + 1.750%(1)(7) | 1,065,204 |
| 500,000 | Avolon Holdings Funding Ltd. 2.13%, 02/21/2026(1) | 494,378 |
| 1,795,000 | BOC Aviation USA Corp. 1.63%, 04/29/2024(1) | 1,798,440 |
| | Capital One Financial Corp. | |
| 27,550,000 | 3.65%, 05/11/2027 | 29,945,995 |
| 2,675,000 | 3.80%, 01/31/2028 | 2,951,898 |
| 200,000 | CDBL Funding 2.00%, 03/04/2026(3) | 198,039 |
| 515,000 | Coinbase Global, Inc. 3.38%, 10/01/2028(1) | 496,975 |
| | Credit Acceptance Corp. | |
| 1,585,000 | 5.13%, 12/31/2024(1) | 1,620,663 |
| 1,325,000 | 6.63%, 03/15/2026 | 1,379,656 |
| 3,470,000 | Enact Holdings, Inc. 6.50%, 08/15/2025(1) | 3,799,650 |
| 12,240,000 | GE Capital Funding LLC 4.40%, 05/15/2030 | 14,325,523 |
| 10,189,000 | GE Capital International Funding Co. 4.42%, 11/15/2035 | 12,405,311 |
| | goeasy Ltd. | |
| 520,000 | 4.38%, 05/01/2026(1) | 530,400 |
| 3,675,000 | 5.38%, 12/01/2024(1) | 3,771,469 |
| | Gtlk Europe Capital DAC | |
| 1,410,000 | 4.65%, 03/10/2027(3) | 1,459,562 |
| 1,300,000 | 4.80%, 02/26/2028(3) | 1,353,560 |
| 4,579,000 | Home Point Capital, Inc. 5.00%, 02/01/2026(1)(4) | 4,113,728 |
| 3,470,000 | Intercontinental Exchange, Inc. 2.65%, 09/15/2040 | 3,330,844 |
| | LD Holdings Group LLC | |
| 1,000,000 | 6.13%, 04/01/2028(1) | 916,250 |
| 3,740,000 | 6.50%, 11/01/2025(1) | 3,665,200 |
| | LSEGA Financing plc | |
| 6,950,000 | 1.38%, 04/06/2026(1) | 6,851,489 |
| 5,685,000 | 2.00%, 04/06/2028(1) | 5,658,669 |
| 9,615,000 | 2.50%, 04/06/2031(1) | 9,711,280 |
| 4,270,000 | Mastercard, Inc. 2.95%, 03/15/2051 | 4,513,557 |
| Shares or Principal Amount | | Market Value† |
| CORPORATE BONDS - 42.1% - (continued) |
| | Diversified Financial Services - 1.2% - (continued) |
| | Nasdaq, Inc. | |
| $ 1,805,000 | 3.85%, 06/30/2026 | $ 1,987,783 |
| 16,765,000 | 4.25%, 06/01/2024 | 18,002,103 |
| 1,865,000 | Nationstar Mortgage Holdings, Inc. 5.13%, 12/15/2030(1) | 1,879,640 |
| 1,666,000 | Navient Corp. 6.50%, 06/15/2022 | 1,713,898 |
| | OneMain Finance Corp. | |
| 2,335,000 | 4.00%, 09/15/2030 | 2,267,869 |
| 5,045,000 | 5.38%, 11/15/2029 | 5,385,537 |
| 575,000 | 6.13%, 03/15/2024 | 611,656 |
| 980,000 | 6.88%, 03/15/2025 | 1,093,925 |
| 990,000 | 7.13%, 03/15/2026 | 1,123,650 |
| | PennyMac Financial Services, Inc. | |
| 2,405,000 | 4.25%, 02/15/2029(1) | 2,266,713 |
| 3,245,000 | 5.38%, 10/15/2025(1) | 3,346,406 |
| 975,000 | Power Finance Corp. Ltd. 3.95%, 04/23/2030(3) | 1,003,198 |
| 4,425,000 | United Wholesale Mortgage LLC 5.50%, 04/15/2029(1) | 4,303,312 |
| | | | 183,017,850 |
| | Electric - 3.5% |
| 11,685,000 | AES Corp. 3.30%, 07/15/2025(1) | 12,282,104 |
| 1,215,000 | Alfa Desarrollo S.p.A. 4.55%, 09/27/2051(1) | 1,187,177 |
| 9,630,000 | Appalachian Power Co. 4.50%, 03/01/2049 | 11,946,169 |
| | Berkshire Hathaway Energy Co. | |
| 7,650,000 | 2.85%, 05/15/2051 | 7,473,365 |
| 1,833,000 | 5.95%, 05/15/2037 | 2,503,834 |
| 6,167,000 | 6.13%, 04/01/2036 | 8,483,994 |
| | Centrais Eletricas Brasileiras S.A. | |
| 1,610,000 | 4.63%, 02/04/2030(3) | 1,577,816 |
| 595,000 | 4.63%, 02/04/2030(1) | 583,106 |
| | Clearway Energy Operating LLC | |
| 1,240,000 | 3.75%, 02/15/2031(1) | 1,227,600 |
| 315,000 | 3.75%, 01/15/2032(1) | 313,482 |
| 1,235,000 | 4.75%, 03/15/2028(1) | 1,306,630 |
| | Cleco Corporate Holdings LLC | |
| 5,340,000 | 3.38%, 09/15/2029 | 5,461,198 |
| 5,095,000 | 4.97%, 05/01/2046 | 6,294,131 |
| | Comision Federal de Electricidad | |
| 200,000 | 3.88%, 07/26/2033(1) | 192,500 |
| 660,000 | 4.68%, 02/09/2051(1) | 612,982 |
| 610,000 | 4.68%, 02/09/2051(3) | 566,544 |
| 5,050,000 | Consolidated Edison Co. of New York, Inc. 4.50%, 05/15/2058 | 6,286,400 |
| 6,500,000 | Consumers Energy Co. 3.95%, 07/15/2047 | 7,724,353 |
| | Dominion Energy, Inc. | |
| 4,735,000 | 3.30%, 04/15/2041 | 4,990,504 |
| 11,710,000 | 3.90%, 10/01/2025 | 12,737,010 |
| 3,390,000 | 7.00%, 06/15/2038 | 5,022,681 |
| | Duke Energy Carolinas LLC | |
| 6,965,000 | 3.20%, 08/15/2049 | 7,377,990 |
| 3,270,000 | 3.75%, 06/01/2045 | 3,692,184 |
| 3,305,000 | 3.88%, 03/15/2046 | 3,812,874 |
| 3,000,000 | 5.30%, 02/15/2040 | 3,987,682 |
| 7,240,000 | Duke Energy Corp. 3.30%, 06/15/2041 | 7,394,781 |
| | Duke Energy Progress LLC | |
| 1,940,000 | 4.15%, 12/01/2044 | 2,302,222 |
| 6,845,000 | 4.20%, 08/15/2045 | 8,299,913 |
| 2,730,000 | 4.38%, 03/30/2044 | 3,322,383 |
The accompanying notes are an integral part of these financial statements.
The Hartford Balanced Income Fund
Schedule of Investments – (continued)
October 31, 2021
| Shares or Principal Amount | | Market Value† |
| CORPORATE BONDS - 42.1% - (continued) |
| | Electric - 3.5% - (continued) |
| | Duquesne Light Holdings, Inc. | |
| $ 3,755,000 | 2.53%, 10/01/2030(1) | $ 3,692,394 |
| 7,265,000 | 2.78%, 01/07/2032(1) | 7,226,116 |
| | Edison International | |
| 3,542,000 | 2.40%, 09/15/2022 | �� 3,585,737 |
| 5,285,000 | 3.13%, 11/15/2022 | 5,386,067 |
| 1,755,000 | Emera U.S. Finance L.P. 4.75%, 06/15/2046 | 2,100,924 |
| 15,985,000 | Enel Finance International N.V. 1.88%, 07/12/2028(1) | 15,690,523 |
| 560,000 | Engie Energia Chile S.A. 4.50%, 01/29/2025(3) | 602,346 |
| | Evergy, Inc. | |
| 5,000,000 | 2.45%, 09/15/2024 | 5,178,003 |
| 14,501,000 | 2.90%, 09/15/2029 | 15,118,109 |
| 14,905,000 | Eversource Energy 3.80%, 12/01/2023 | 15,784,263 |
| 5,557,000 | Exelon Corp. 4.70%, 04/15/2050 | 7,148,144 |
| | FirstEnergy Corp. | |
| 1,890,000 | 4.40%, 07/15/2027 | 2,050,815 |
| 4,525,000 | 7.38%, 11/15/2031 | 6,164,453 |
| | FirstEnergy Transmission LLC | |
| 4,655,000 | 4.35%, 01/15/2025(1) | 5,037,594 |
| 2,790,000 | 5.45%, 07/15/2044(1) | 3,525,167 |
| 4,372,000 | Fortis, Inc. 3.06%, 10/04/2026 | 4,601,466 |
| | Georgia Power Co. | |
| 7,610,000 | 2.65%, 09/15/2029 | 7,871,629 |
| 1,955,000 | 3.70%, 01/30/2050 | 2,124,391 |
| 835,000 | Instituto Costarricense de Electricidad 6.95%, 11/10/2021(3) | 833,965 |
| 8,683,000 | IPALCO Enterprises, Inc. 3.70%, 09/01/2024 | 9,191,636 |
| | Israel Electric Corp. Ltd. | |
| 5,685,000 | 4.25%, 08/14/2028(1)(3) | 6,338,775 |
| 1,195,000 | 5.00%, 11/12/2024(1)(3) | 1,314,392 |
| 6,355,000 | ITC Holdings Corp. 3.25%, 06/30/2026 | 6,772,862 |
| 1,220,000 | Kallpa Generacion S.A. 4.88%, 05/24/2026(3) | 1,300,825 |
| 495,000 | Lamar Funding Ltd. 3.96%, 05/07/2025(3) | 495,054 |
| 4,308,000 | Metropolitan Edison Co. 4.30%, 01/15/2029(1) | 4,818,315 |
| 2,598,000 | MidAmerican Energy Co. 4.40%, 10/15/2044 | 3,211,048 |
| 8,400,000 | Mid-Atlantic Interstate Transmission LLC 4.10%, 05/15/2028(1) | 9,376,677 |
| 970,000 | Minejesa Capital B.V. 4.63%, 08/10/2030(3) | 999,100 |
| 5,955,000 | NextEra Energy Capital Holdings, Inc. 1.90%, 06/15/2028 | 5,888,959 |
| | NRG Energy, Inc. | |
| 14,380,000 | 2.00%, 12/02/2025(1) | 14,545,321 |
| 7,800,000 | 2.45%, 12/02/2027(1) | 7,806,449 |
| 6,635,000 | Oklahoma Gas and Electric Co. 0.55%, 05/26/2023 | 6,615,040 |
| | Pacific Gas and Electric Co. | |
| 22,815,000 | 1.37%, 03/10/2023 | 22,741,097 |
| 8,225,000 | 2.50%, 02/01/2031 | 7,859,410 |
| 6,110,000 | 3.50%, 08/01/2050 | 5,802,413 |
| 2,875,000 | 3.95%, 12/01/2047 | 2,834,487 |
| 6,000,000 | 4.25%, 08/01/2023 | 6,249,303 |
| 2,395,000 | 4.50%, 07/01/2040 | 2,489,351 |
| 12,210,000 | 4.95%, 07/01/2050 | 13,500,268 |
| | PacifiCorp | |
| 3,500,000 | 4.10%, 02/01/2042 | 4,068,436 |
| Shares or Principal Amount | | Market Value† |
| CORPORATE BONDS - 42.1% - (continued) |
| | Electric - 3.5% - (continued) |
| $ 9,280,000 | 4.15%, 02/15/2050 | $ 11,180,401 |
| 9,625,000 | PECO Energy Co. 3.90%, 03/01/2048 | 11,345,041 |
| 7,975,000 | Pennsylvania Electric Co. 3.25%, 03/15/2028(1) | 8,405,495 |
| | Perusahaan Perseroan Persero PT Perusahaan Listrik Negara | |
| 2,075,000 | 3.88%, 07/17/2029(3) | 2,194,313 |
| 1,035,000 | 5.25%, 05/15/2047(3) | 1,146,263 |
| 3,525,000 | 6.15%, 05/21/2048(3) | 4,350,943 |
| 2,700,000 | Potomac Electric Power Co. 4.15%, 03/15/2043 | 3,209,894 |
| 8,830,000 | Public Service Enterprise Group, Inc. 2.88%, 06/15/2024 | 9,211,511 |
| 9,894,000 | Puget Energy, Inc. 4.10%, 06/15/2030 | 10,887,769 |
| 5,110,000 | Puget Sound Energy, Inc. 3.25%, 09/15/2049 | 5,398,431 |
| 6,140,000 | Rochester Gas and Electric Corp. 1.85%, 12/01/2030(1) | 5,928,804 |
| 2,155,000 | San Diego Gas & Electric Co. 3.32%, 04/15/2050 | 2,300,543 |
| | Sempra Energy | |
| 3,938,000 | 3.40%, 02/01/2028 | 4,233,885 |
| 5,300,000 | 3.80%, 02/01/2038 | 5,862,605 |
| 3,480,000 | 4.00%, 02/01/2048 | 3,927,412 |
| 9,647,000 | Sierra Pacific Power Co. 2.60%, 05/01/2026 | 10,087,444 |
| | Southern California Edison Co. | |
| 11,085,000 | 0.39%, 12/03/2021, 3 mo. USD LIBOR + 0.270%(7) | 11,086,583 |
| 4,565,000 | 3.65%, 02/01/2050 | 4,903,863 |
| 4,585,000 | 4.00%, 04/01/2047 | 5,091,935 |
| 580,000 | 4.65%, 10/01/2043 | 687,872 |
| 595,000 | 5.63%, 02/01/2036 | 747,058 |
| 1,775,000 | 5.95%, 02/01/2038 | 2,322,260 |
| | Southern Co. | |
| 3,000,000 | 3.25%, 07/01/2026 | 3,195,763 |
| 17,255,000 | 3.70%, 04/30/2030 | 18,709,576 |
| 5,345,000 | 4.40%, 07/01/2046 | 6,361,935 |
| 780,000 | Star Energy Geothermal Darajat / Star Energy Geothermal Salak 4.85%, 10/14/2038(1) | 867,750 |
| 430,000 | Star Energy Geothermal Darajat II / Star Energy Geothermal Salak 4.85%, 10/14/2038(3) | 478,375 |
| 503,220 | Star Energy Geothermal Wayang Windu Ltd. 6.75%, 04/24/2033(1) | 562,348 |
| 716,875 | Termocandelaria Power Ltd. 7.88%, 01/30/2029(1) | 737,492 |
| 460,000 | Vistra Operations Co. LLC 3.55%, 07/15/2024(1) | 479,268 |
| | | | 552,807,765 |
| | Electronics - 0.1% |
| 9,996,000 | Fortive Corp. 3.15%, 06/15/2026 | 10,662,100 |
| 4,040,000 | Imola Merger Corp. 4.75%, 05/15/2029(1) | 4,150,898 |
| | | | 14,812,998 |
| | Energy-Alternate Sources - 0.0% |
| | Greenko Dutch B.V. | |
| 856,950 | 3.85%, 03/29/2026(1) | 863,377 |
| 265,950 | 3.85%, 03/29/2026(3) | 267,945 |
| | | | 1,131,322 |
The accompanying notes are an integral part of these financial statements.
The Hartford Balanced Income Fund
Schedule of Investments – (continued)
October 31, 2021
| Shares or Principal Amount | | Market Value† |
| CORPORATE BONDS - 42.1% - (continued) |
| | Engineering & Construction - 0.1% |
| $ 2,697,000 | Aeropuerto Internacional de Tocumen S.A. 5.13%, 08/11/2061(1) | $ 2,808,278 |
| 2,764,412 | Bioceanico Sovereign Certificate Ltd. 0.00%, 06/05/2034(1)(2) | 2,045,665 |
| 2,190,000 | Interchile S.A. 4.50%, 06/30/2056(1) | 2,309,530 |
| 1,430,000 | Mexico City Airport Trust 4.25%, 10/31/2026(3) | 1,540,396 |
| | | | 8,703,869 |
| | Entertainment - 0.2% |
| | Caesars Entertainment, Inc. | |
| 1,190,000 | 4.63%, 10/15/2029(1) | 1,195,712 |
| 2,345,000 | 6.25%, 07/01/2025(1) | 2,466,588 |
| 3,110,000 | 8.13%, 07/01/2027(1) | 3,483,356 |
| 775,000 | Caesars Resort Collection LLC / CRC Finco, Inc. 5.75%, 07/01/2025(1) | 814,331 |
| | Cinemark USA, Inc. | |
| 4,560,000 | 5.25%, 07/15/2028(1) | 4,448,873 |
| 1,285,000 | 5.88%, 03/15/2026(1) | 1,288,213 |
| 710,000 | Codere Finance Luxembourg S.A. (4.50% Cash, 7.125% PIK) 11.63%, 11/01/2023(1)(8) | 426,000 |
| 4,110,000 | Jacobs Entertainment, Inc. 7.88%, 02/01/2024(1) | 4,233,300 |
| | Penn National Gaming, Inc. | |
| 805,000 | 4.13%, 07/01/2029(1) | 784,875 |
| 5,775,000 | 5.63%, 01/15/2027(1)(4) | 5,962,687 |
| 883,000 | Speedway Motorsports LLC / Speedway Funding II, Inc. 4.88%, 11/01/2027(1) | 901,207 |
| | | | 26,005,142 |
| | Environmental Control - 0.2% |
| 2,042,000 | Clean Harbors, Inc. 4.88%, 07/15/2027(1) | 2,126,233 |
| | Republic Services, Inc. | |
| 4,515,000 | 0.88%, 11/15/2025 | 4,409,203 |
| 19,005,000 | 2.50%, 08/15/2024 | 19,745,285 |
| | Stericycle, Inc. | |
| 590,000 | 3.88%, 01/15/2029(1) | 581,150 |
| 1,535,000 | 5.38%, 07/15/2024(1) | 1,581,050 |
| | | | 28,442,921 |
| | Food - 0.7% |
| 2,900,000 | B&G Foods, Inc. 5.25%, 09/15/2027(4) | 2,974,058 |
| | BRF S.A. | |
| 1,690,000 | 4.88%, 01/24/2030(3) | 1,679,032 |
| 1,030,000 | 4.88%, 01/24/2030(1) | 1,023,315 |
| | Conagra Brands, Inc. | |
| 7,570,000 | 1.38%, 11/01/2027 | 7,293,847 |
| 22,425,000 | 4.60%, 11/01/2025 | 24,983,670 |
| 8,410,000 | 5.30%, 11/01/2038 | 10,652,186 |
| 1,545,000 | 5.40%, 11/01/2048 | 2,092,970 |
| 6,705,000 | Danone S.A. 2.59%, 11/02/2023(1) | 6,926,877 |
| 7,710,000 | General Mills, Inc. 4.20%, 04/17/2028 | 8,737,115 |
| 4,720,000 | Hershey Co. 3.13%, 11/15/2049 | 5,106,352 |
| | Hormel Foods Corp. | |
| 5,035,000 | 0.65%, 06/03/2024 | 5,018,387 |
| 1,530,000 | 1.70%, 06/03/2028 | 1,517,554 |
| 6,000,000 | Kraft Heinz Foods Co. 3.00%, 06/01/2026 | 6,277,173 |
| 515,000 | MARB BondCo plc 3.95%, 01/29/2031(1) | 490,023 |
| 535,000 | MINERVA LUXEMBOURG S.A. Co. GUAR REGS 03/31 4.375 4.38%, 03/18/2031 | 508,625 |
| Shares or Principal Amount | | Market Value† |
| CORPORATE BONDS - 42.1% - (continued) |
| | Food - 0.7% - (continued) |
| $ 5,020,000 | Mondelez International Holdings Netherlands B.V. 2.13%, 09/19/2022(1) | $ 5,095,772 |
| 1,285,000 | Performance Food Group, Inc. 4.25%, 08/01/2029(1) | 1,285,000 |
| | Post Holdings, Inc. | |
| 2,495,000 | 5.63%, 01/15/2028(1) | 2,604,031 |
| 2,865,000 | 5.75%, 03/01/2027(1) | 2,972,437 |
| 9,005,000 | Tyson Foods, Inc. 4.00%, 03/01/2026 | 9,902,594 |
| | | | 107,141,018 |
| | Forest Products & Paper - 0.1% |
| | Celulosa Arauco y Constitucion S.A. | |
| 870,000 | 4.50%, 08/01/2024 | 925,471 |
| 610,000 | 5.15%, 01/29/2050(3) | 678,994 |
| 350,000 | 5.15%, 01/29/2050(1) | 389,587 |
| 305,000 | 5.50%, 04/30/2049(1) | 352,507 |
| | Inversiones CMPC S.A. | |
| 560,000 | 3.85%, 01/13/2030(3) | 580,090 |
| 370,000 | 3.85%, 01/13/2030(1) | 383,274 |
| 5,735,000 | Suzano Austria GmbH 3.13%, 01/15/2032 | 5,413,840 |
| | | | 8,723,763 |
| | Gas - 0.2% |
| | AmeriGas Partners L.P. / AmeriGas Finance Corp. | |
| 692,000 | 5.50%, 05/20/2025 | 749,955 |
| 680,000 | 5.75%, 05/20/2027 | 760,682 |
| 2,738,000 | 5.88%, 08/20/2026 | 3,052,870 |
| 11,000,000 | Brooklyn Union Gas Co. 3.87%, 03/04/2029(1) | 11,988,060 |
| | NiSource, Inc. | |
| 9,340,000 | 0.95%, 08/15/2025 | 9,159,232 |
| 2,260,000 | 3.49%, 05/15/2027 | 2,444,522 |
| | | | 28,155,321 |
| | Hand/Machine Tools - 0.1% |
| 9,715,000 | Stanley Black & Decker, Inc. 3.40%, 03/01/2026 | 10,499,357 |
| | Healthcare - Products - 0.3% |
| 6,550,000 | Abbott Laboratories 4.75%, 11/30/2036 | 8,379,290 |
| | Alcon Finance Corp. | |
| 4,300,000 | 2.60%, 05/27/2030(1) | 4,385,527 |
| 2,670,000 | 3.00%, 09/23/2029(1) | 2,813,373 |
| 2,785,000 | 3.80%, 09/23/2049(1) | 3,141,697 |
| 3,090,000 | Avantor Funding, Inc. 4.63%, 07/15/2028(1) | 3,205,720 |
| 1,640,000 | Hill-Rom Holdings, Inc. 4.38%, 09/15/2027(1) | 1,703,120 |
| | Mozart Debt Merger Sub, Inc. | |
| 5,025,000 | 3.88%, 04/01/2029(1) | 5,003,493 |
| 2,272,000 | 5.25%, 10/01/2029(1) | 2,306,080 |
| 22,120,000 | Thermo Fisher Scientific, Inc. 0.80%, 10/18/2023 | 22,122,206 |
| | | | 53,060,506 |
| | Healthcare - Services - 1.4% |
| 715,000 | Acadia Healthcare Co., Inc. 5.00%, 04/15/2029(1) | 729,300 |
| 10,065,000 | Aetna, Inc. 2.80%, 06/15/2023 | 10,373,024 |
| | Anthem, Inc. | |
| 2,115,000 | 1.50%, 03/15/2026 | 2,115,988 |
| 3,145,000 | 2.38%, 01/15/2025 | 3,255,778 |
The accompanying notes are an integral part of these financial statements.
The Hartford Balanced Income Fund
Schedule of Investments – (continued)
October 31, 2021
| Shares or Principal Amount | | Market Value† |
| CORPORATE BONDS - 42.1% - (continued) |
| | Healthcare - Services - 1.4% - (continued) |
| $ 8,480,000 | 2.55%, 03/15/2031 | $ 8,663,603 |
| 3,235,000 | 3.30%, 01/15/2023 | 3,340,695 |
| 3,175,000 | 3.50%, 08/15/2024 | 3,374,272 |
| 14,000,000 | 3.65%, 12/01/2027 | 15,370,196 |
| | Catalent Pharma Solutions, Inc. | |
| 700,000 | 3.13%, 02/15/2029(1) | 679,875 |
| 695,000 | 3.50%, 04/01/2030(1) | 689,788 |
| 415,000 | 5.00%, 07/15/2027(1) | 428,488 |
| | Centene Corp. | |
| 26,280,000 | 2.45%, 07/15/2028 | 26,190,853 |
| 755,000 | 4.25%, 12/15/2027 | 790,863 |
| 790,000 | 4.63%, 12/15/2029 | 852,213 |
| | CHS/Community Health Systems, Inc. | |
| 5,850,000 | 4.75%, 02/15/2031(1) | 5,834,673 |
| 1,235,000 | 5.63%, 03/15/2027(1) | 1,292,366 |
| 3,255,000 | 6.63%, 02/15/2025(1) | 3,385,200 |
| 12,840,000 | CommonSpirit Health 2.76%, 10/01/2024 | 13,390,763 |
| | HCA, Inc. | |
| 2,950,000 | 5.13%, 06/15/2039 | 3,649,869 |
| 7,585,000 | 5.38%, 02/01/2025 | 8,438,312 |
| 1,500,000 | 5.38%, 09/01/2026 | 1,708,273 |
| 115,000 | 5.63%, 09/01/2028 | 134,778 |
| 90,000 | 5.88%, 02/01/2029 | 107,119 |
| 1,627,000 | 7.50%, 11/15/2095 | 2,429,111 |
| | Humana, Inc. | |
| 8,245,000 | 2.15%, 02/03/2032 | 7,981,911 |
| 3,555,000 | 3.85%, 10/01/2024 | 3,817,385 |
| 6,000,000 | 3.95%, 03/15/2027 | 6,613,338 |
| EUR 820,000 | IQVIA, Inc. 2.25%, 01/15/2028(1) | 944,488 |
| | Kaiser Foundation Hospitals | |
| $ 8,755,000 | 2.81%, 06/01/2041 | 8,859,610 |
| 9,130,000 | 3.00%, 06/01/2051 | 9,477,687 |
| 14,225,000 | Laboratory Corp. of America Holdings 2.30%, 12/01/2024 | 14,693,357 |
| 10,660,000 | Partners Healthcare System, Inc. 3.19%, 07/01/2049 | 11,696,331 |
| | Sutter Health | |
| 3,150,000 | 1.32%, 08/15/2025 | 3,138,406 |
| 3,645,000 | 3.16%, 08/15/2040 | 3,782,952 |
| | UnitedHealth Group, Inc. | |
| 3,065,000 | 2.75%, 05/15/2040 | 3,080,502 |
| 5,550,000 | 3.05%, 05/15/2041 | 5,773,403 |
| 6,925,000 | 3.75%, 07/15/2025 | 7,556,065 |
| 13,530,000 | 5.80%, 03/15/2036 | 18,629,580 |
| 1,981,000 | 6.88%, 02/15/2038 | 3,049,912 |
| | | | 226,320,327 |
| | Home Builders - 0.2% |
| | Ashton Woods USA LLC / Ashton Woods Finance Co. | |
| 1,105,000 | 4.63%, 08/01/2029(1) | 1,095,331 |
| 810,000 | 4.63%, 04/01/2030(1) | 795,825 |
| 2,990,000 | 6.63%, 01/15/2028(1) | 3,161,925 |
| 3,875,000 | Century Communities, Inc. 3.88%, 08/15/2029(1) | 3,861,670 |
| 1,880,000 | Empire Communities Corp. 7.00%, 12/15/2025(1) | 1,945,800 |
| 640,000 | KB Home 4.80%, 11/15/2029 | 689,600 |
| | M/I Homes, Inc. | |
| 2,040,000 | 3.95%, 02/15/2030(1) | 2,014,500 |
| 1,325,000 | 4.95%, 02/01/2028 | 1,378,000 |
| Shares or Principal Amount | | Market Value† |
| CORPORATE BONDS - 42.1% - (continued) |
| | Home Builders - 0.2% - (continued) |
| $ 2,230,000 | STL Holding Co. LLC 7.50%, 02/15/2026(1) | $ 2,335,925 |
| | Taylor Morrison Communities, Inc. | |
| 1,055,000 | 5.13%, 08/01/2030(1) | 1,118,300 |
| 2,735,000 | 5.75%, 01/15/2028(1) | 3,011,016 |
| 2,903,000 | Williams Scotsman International, Inc. 4.63%, 08/15/2028(1) | 3,000,977 |
| | | | 24,408,869 |
| | Household Products/Wares - 0.0% |
| 1,035,000 | Prestige Brands, Inc. 5.13%, 01/15/2028(1) | 1,078,987 |
| | S.C. Johnson & Son, Inc. | |
| 2,520,000 | 4.00%, 05/15/2043(1) | 2,958,157 |
| 1,840,000 | 4.75%, 10/15/2046(1) | 2,433,353 |
| | | | 6,470,497 |
| | Insurance - 1.9% |
| 1,470,000 | ACE Capital Trust 9.70%, 04/01/2030 | 2,193,429 |
| | Acrisure LLC / Acrisure Finance, Inc. | |
| 4,280,000 | 7.00%, 11/15/2025(1) | 4,322,800 |
| 1,335,000 | 10.13%, 08/01/2026(1) | 1,475,175 |
| 1,615,000 | AIA Group Ltd. 3.20%, 09/16/2040(1) | 1,647,785 |
| 13,575,000 | Allstate Corp. 0.75%, 12/15/2025 | 13,301,585 |
| | American International Group, Inc. | |
| 7,510,000 | 2.50%, 06/30/2025 | 7,801,682 |
| 8,225,000 | 4.38%, 06/30/2050 | 10,238,566 |
| 5,348,000 | 4.70%, 07/10/2035 | 6,434,330 |
| | Aon plc | |
| 4,775,000 | 3.50%, 06/14/2024 | 5,061,422 |
| 3,480,000 | 3.88%, 12/15/2025 | 3,802,349 |
| 2,300,000 | 4.25%, 12/12/2042 | 2,659,698 |
| 1,200,000 | AssuredPartners, Inc. 5.63%, 01/15/2029(1) | 1,191,000 |
| 7,000,000 | Athene Global Funding 2.67%, 06/07/2031(1) | 7,014,646 |
| 3,460,000 | Berkshire Hathaway Finance Corp. 4.40%, 05/15/2042 | 4,271,043 |
| 3,995,000 | Brighthouse Financial Global Funding 1.55%, 05/24/2026(1) | 3,969,757 |
| 21,570,000 | Brighthouse Financial, Inc. 5.63%, 05/15/2030 | 25,890,980 |
| 6,100,000 | Equitable Financial Life Global Funding 1.80%, 03/08/2028(1) | 5,999,736 |
| 21,555,000 | Equitable Holdings, Inc. 4.35%, 04/20/2028 | 24,407,698 |
| | Genworth Holdings, Inc. | |
| 205,000 | 4.80%, 02/15/2024 | 209,594 |
| 1,480,000 | 4.90%, 08/15/2023 | 1,513,300 |
| 1,200,000 | 6.50%, 06/15/2034 | 1,249,500 |
| 3,980,000 | Guardian Life Global Funding 1.25%, 05/13/2026(1) | 3,942,329 |
| 15,255,000 | Liberty Mutual Group, Inc. 4.30%, 02/01/2061(1) | 14,225,288 |
| 7,455,000 | Marsh & McLennan Cos., Inc. 4.75%, 03/15/2039 | 9,432,920 |
| 1,625,000 | Massachusetts Mutual Life Insurance Co. 3.73%, 10/15/2070(1) | 1,803,854 |
| 10,000,000 | MassMutual Global Funding II 2.35%, 01/14/2027(1) | 10,318,002 |
| 13,735,000 | Metropolitan Life Global Funding 3.00%, 09/19/2027(1) | 14,611,410 |
The accompanying notes are an integral part of these financial statements.
The Hartford Balanced Income Fund
Schedule of Investments – (continued)
October 31, 2021
| Shares or Principal Amount | | Market Value† |
| CORPORATE BONDS - 42.1% - (continued) |
| | Insurance - 1.9% - (continued) |
| $ 2,795,000 | MGIC Investment Corp. 5.25%, 08/15/2028 | $ 2,973,461 |
| | Nationwide Mutual Insurance Co. | |
| 12,700,000 | 4.35%, 04/30/2050(1) | 14,771,462 |
| 4,940,000 | 9.38%, 08/15/2039(1) | 8,580,269 |
| 14,205,000 | New York Life Global Funding 3.00%, 01/10/2028(1) | 15,227,088 |
| 2,775,000 | New York Life Insurance Co. 3.75%, 05/15/2050(1) | 3,179,330 |
| 1,170,000 | NMI Holdings, Inc. 7.38%, 06/01/2025(1) | 1,344,295 |
| 12,790,000 | Northwestern Mutual Global Funding 1.70%, 06/01/2028(1) | 12,651,620 |
| 6,320,000 | Pacific Life Global Funding 1.38%, 04/14/2026(1) | 6,312,716 |
| 10,250,000 | Protective Life Global Funding 1.62%, 04/15/2026(1) | 10,240,790 |
| | Unum Group | |
| 865,000 | 4.00%, 06/15/2029 | 958,269 |
| 18,000,000 | 4.50%, 12/15/2049 | 19,491,975 |
| | Willis North America, Inc. | |
| 11,435,000 | 3.60%, 05/15/2024 | 12,102,216 |
| 6,752,000 | 4.50%, 09/15/2028 | 7,641,100 |
| | | | 304,464,469 |
| | Internet - 0.4% |
| 9,179,000 | Alibaba Group Holding Ltd. 4.00%, 12/06/2037 | 9,948,067 |
| | Amazon.com, Inc. | |
| 9,165,000 | 3.88%, 08/22/2037 | 10,766,630 |
| 4,320,000 | 4.25%, 08/22/2057 | 5,657,244 |
| 5,535,000 | 4.95%, 12/05/2044 | 7,438,934 |
| | Arches Buyer, Inc. | |
| 3,004,000 | 4.25%, 06/01/2028(1) | 3,028,212 |
| 2,395,000 | 6.13%, 12/01/2028(1) | 2,415,956 |
| 5,200,000 | Endure Digital, Inc. 6.00%, 02/15/2029(1) | 4,784,000 |
| 2,590,000 | Go Daddy Operating Co. LLC 3.50%, 03/01/2029(1) | 2,499,350 |
| | Meituan | |
| 335,000 | 2.13%, 10/28/2025(1) | 323,121 |
| 1,745,000 | 3.05%, 10/28/2030(3) | 1,621,691 |
| 1,569,000 | 3.05%, 10/28/2030(1) | 1,458,128 |
| 505,000 | MercadoLibre, Inc. 2.38%, 01/14/2026 | 491,112 |
| | Tencent Holdings Ltd. | |
| 1,305,000 | 2.39%, 06/03/2030(1) | 1,273,708 |
| 975,000 | 3.24%, 06/03/2050(1) | 944,679 |
| 15,410,000 | 3.60%, 01/19/2028(1) | 16,352,168 |
| 285,000 | 3.68%, 04/22/2041(1) | 295,089 |
| 435,000 | 3.84%, 04/22/2051(1) | 458,960 |
| 255,000 | 3.93%, 01/19/2038(1) | 271,555 |
| | | | 70,028,604 |
| | Investment Company Security - 0.0% |
| 5,970,000 | JAB Holdings B.V. 3.75%, 05/28/2051(1) | 6,539,486 |
| | Iron/Steel - 0.1% |
| 1,025,000 | CSN Resources S.A. 7.63%, 04/17/2026(1) | 1,083,948 |
| 505,000 | JSW Steel Ltd. 3.95%, 04/05/2027(1) | 509,838 |
| 1,545,000 | Nucor Corp. 2.00%, 06/01/2025 | 1,577,309 |
| 4,159,000 | Steel Dynamics, Inc. 2.80%, 12/15/2024 | 4,349,483 |
| 8,975,000 | Vale Overseas Ltd. 3.75%, 07/08/2030 | 9,131,614 |
| | | | 16,652,192 |
| Shares or Principal Amount | | Market Value† |
| CORPORATE BONDS - 42.1% - (continued) |
| | IT Services - 1.2% |
| | Apple, Inc. | |
| $ 13,900,000 | 1.20%, 02/08/2028 | $ 13,490,270 |
| 10,895,000 | 2.38%, 02/08/2041 | 10,590,838 |
| 13,645,000 | 2.65%, 02/08/2051 | 13,457,416 |
| 12,960,000 | 2.70%, 08/05/2051 | 12,895,657 |
| 4,545,000 | 2.95%, 09/11/2049 | 4,707,716 |
| 2,600,000 | 3.75%, 11/13/2047 | 3,059,987 |
| 1,300,000 | 3.85%, 05/04/2043 | 1,533,610 |
| 6,520,000 | 3.85%, 08/04/2046 | 7,761,691 |
| 2,895,000 | 4.25%, 02/09/2047 | 3,652,184 |
| 4,420,000 | 4.38%, 05/13/2045 | 5,647,010 |
| 10,000,000 | 4.65%, 02/23/2046 | 13,201,225 |
| | HP, Inc. | |
| 9,370,000 | 2.20%, 06/17/2025 | 9,612,433 |
| 9,370,000 | 3.00%, 06/17/2027 | 9,904,270 |
| | International Business Machines Corp. | |
| 8,545,000 | 1.70%, 05/15/2027 | 8,553,483 |
| 4,755,000 | 4.15%, 05/15/2039 | 5,566,065 |
| 1,545,000 | 4.25%, 05/15/2049 | 1,896,128 |
| 9,385,000 | Kyndryl Holdings, Inc. 3.15%, 10/15/2031(1) | 9,198,118 |
| 10,065,000 | Leidos, Inc. 2.30%, 02/15/2031 | 9,691,890 |
| | Presidio Holdings, Inc. | |
| 3,526,000 | 4.88%, 02/01/2027(1) | 3,587,705 |
| 1,375,000 | 8.25%, 02/01/2028(1) | 1,460,938 |
| | SYNNEX Corp. | |
| 16,660,000 | 1.75%, 08/09/2026(1) | 16,315,256 |
| 16,660,000 | 2.38%, 08/09/2028(1) | 16,323,062 |
| 1,293,000 | Western Digital Corp. 4.75%, 02/15/2026 | 1,417,451 |
| | | | 183,524,403 |
| | Leisure Time - 0.1% |
| | Carnival Corp. | |
| 471,000 | 5.75%, 03/01/2027(1) | 479,384 |
| 5,640,000 | 6.00%, 05/01/2029(1) | 5,651,280 |
| 995,000 | 7.63%, 03/01/2026(1) | 1,128,202 |
| 3,800,000 | MajorDrive Holdings LLC 6.38%, 06/01/2029(1) | 3,655,600 |
| 5,350,000 | Royal Caribbean Cruises Ltd. 5.50%, 08/31/2026(1) | 5,450,313 |
| | | | 16,364,779 |
| | Lodging - 0.2% |
| 525,000 | Boyd Gaming Corp. 4.75%, 12/01/2027 | 540,908 |
| 10,870,000 | Las Vegas Sands Corp. 3.50%, 08/18/2026 | 11,129,736 |
| | Sands China Ltd. | |
| 1,005,000 | 2.30%, 03/08/2027(1) | 951,032 |
| 1,125,000 | 2.85%, 03/08/2029(1) | 1,055,767 |
| 12,950,000 | 3.25%, 08/08/2031(1)(4) | 12,125,473 |
| 1,725,000 | Sugarhouse HSP Gaming Prop Mezz L.P. / Sugarhouse HSP Gaming Finance Corp. 5.88%, 05/15/2025(1) | 1,707,750 |
| | Wynn Las Vegas LLC / Wynn Las Vegas Capital Corp. | |
| 2,195,000 | 5.25%, 05/15/2027(1)(4) | 2,222,437 |
| 2,660,000 | 5.50%, 03/01/2025(1) | 2,703,225 |
| 1,505,000 | Wynn Macau Ltd. 5.13%, 12/15/2029(1) | 1,355,915 |
| | | | 33,792,243 |
| | Machinery-Diversified - 0.2% |
| 21,890,000 | Otis Worldwide Corp. 2.29%, 04/05/2027 | 22,448,401 |
| 2,205,000 | Westinghouse Air Brake Technologies Corp. 3.20%, 06/15/2025 | 2,333,893 |
| | | | 24,782,294 |
The accompanying notes are an integral part of these financial statements.
The Hartford Balanced Income Fund
Schedule of Investments – (continued)
October 31, 2021
| Shares or Principal Amount | | Market Value† |
| CORPORATE BONDS - 42.1% - (continued) |
| | Media - 1.9% |
| $ 200,000 | Cable Onda S.A. 4.50%, 01/30/2030(1) | $ 207,450 |
| | CCO Holdings LLC / CCO Holdings Capital Corp. | |
| 13,200,000 | 4.25%, 02/01/2031(1) | 13,140,600 |
| 20,135,000 | 4.25%, 01/15/2034(1) | 19,527,124 |
| 1,270,000 | 4.50%, 08/15/2030(1) | 1,292,225 |
| | Charter Communications Operating LLC / Charter Communications Operating Capital | |
| 11,180,000 | 2.25%, 01/15/2029 | 10,999,934 |
| 7,910,000 | 3.90%, 06/01/2052 | 7,993,300 |
| 4,445,000 | 4.40%, 12/01/2061 | 4,714,067 |
| 10,428,000 | 4.80%, 03/01/2050 | 11,839,969 |
| 8,240,000 | 4.91%, 07/23/2025 | 9,164,178 |
| 10,990,000 | 5.38%, 05/01/2047 | 13,310,286 |
| 4,595,000 | 5.75%, 04/01/2048 | 5,867,469 |
| 6,903,000 | 6.48%, 10/23/2045 | 9,513,905 |
| | Comcast Corp. | |
| 25,484,000 | 2.89%, 11/01/2051(1) | 24,757,028 |
| 7,000,000 | 2.94%, 11/01/2056(1) | 6,739,917 |
| 7,884,000 | 2.99%, 11/01/2063(1) | 7,530,182 |
| 10,280,000 | 3.20%, 07/15/2036 | 10,931,655 |
| 2,810,000 | 3.25%, 11/01/2039 | 2,950,649 |
| 6,640,000 | 3.40%, 07/15/2046 | 7,145,264 |
| 1,925,000 | 3.75%, 04/01/2040 | 2,149,595 |
| 2,520,000 | 3.97%, 11/01/2047 | 2,897,174 |
| 4,530,000 | 4.40%, 08/15/2035 | 5,370,932 |
| 4,557,000 | Cox Communications, Inc. 3.15%, 08/15/2024(1) | 4,788,004 |
| | CSC Holdings LLC | |
| 530,000 | 3.38%, 02/15/2031(1) | 482,698 |
| 5,360,000 | 5.50%, 04/15/2027(1) | 5,534,200 |
| 3,480,000 | 6.50%, 02/01/2029(1) | 3,732,300 |
| | Discovery Communications LLC | |
| 14,315,000 | 3.63%, 05/15/2030 | 15,408,602 |
| 855,000 | 3.90%, 11/15/2024 | 916,685 |
| 6,110,000 | 3.95%, 06/15/2025 | 6,604,160 |
| 1,941,000 | 4.00%, 09/15/2055 | 2,058,383 |
| 3,846,000 | 4.65%, 05/15/2050 | 4,529,161 |
| 13,920,000 | 5.20%, 09/20/2047 | 17,390,417 |
| 5,395,000 | 5.30%, 05/15/2049 | 6,871,456 |
| | DISH DBS Corp. | |
| 2,680,000 | 5.00%, 03/15/2023 | 2,773,800 |
| 1,500,000 | 5.13%, 06/01/2029 | 1,443,750 |
| 1,525,000 | 5.88%, 07/15/2022 | 1,563,125 |
| 2,170,000 | 5.88%, 11/15/2024 | 2,311,050 |
| 2,210,000 | 7.38%, 07/01/2028 | 2,323,262 |
| 830,000 | 7.75%, 07/01/2026 | 922,338 |
| 2,930,000 | Nexstar Broadcasting, Inc. 5.63%, 07/15/2027(1) | 3,091,150 |
| 335,000 | Quebecor Media, Inc. 5.75%, 01/15/2023 | 352,588 |
| 490,000 | Sinclair Television Group, Inc. 4.13%, 12/01/2030(1) | 466,725 |
| | Sirius XM Radio, Inc. | |
| 1,010,000 | 3.13%, 09/01/2026(1) | 1,011,262 |
| 1,770,000 | 4.00%, 07/15/2028(1) | 1,780,973 |
| | Time Warner Cable LLC | |
| 10,340,000 | 5.88%, 11/15/2040 | 13,013,649 |
| 2,825,000 | 6.75%, 06/15/2039 | 3,863,746 |
| 1,565,000 | Time Warner Entertainment Co., L.P. 8.38%, 07/15/2033 | 2,301,829 |
| 1,470,000 | TK Elevator U.S. Newco, Inc. 5.25%, 07/15/2027(1) | 1,496,166 |
| Shares or Principal Amount | | Market Value† |
| CORPORATE BONDS - 42.1% - (continued) |
| | Media - 1.9% - (continued) |
| $ 7,947,000 | ViacomCBS, Inc. 4.38%, 03/15/2043 | $ 9,072,280 |
| 4,475,000 | Virgin Media Secured Finance plc 4.50%, 08/15/2030(1) | 4,469,406 |
| | Walt Disney Co. | |
| 1,177,000 | 5.40%, 10/01/2043 | 1,622,872 |
| 2,440,000 | 6.40%, 12/15/2035 | 3,519,337 |
| | Ziggo B.V. | |
| 435,000 | 4.88%, 01/15/2030(1) | 442,125 |
| 3,493,000 | 5.50%, 01/15/2027(1) | 3,580,325 |
| | | | 307,780,727 |
| | Metal Fabricate/Hardware - 0.0% |
| 470,000 | Advanced Drainage Systems, Inc. 5.00%, 09/30/2027(1) | 488,800 |
| | Novelis Corp. | |
| 795,000 | 3.25%, 11/15/2026(1) | 793,012 |
| 820,000 | 3.88%, 08/15/2031(1) | 800,566 |
| 3,230,000 | 4.75%, 01/30/2030(1) | 3,359,200 |
| | | | 5,441,578 |
| | Mining - 0.2% |
| | Anglo American Capital plc | |
| 1,001,000 | 4.88%, 05/14/2025(1) | 1,108,024 |
| 6,485,000 | 5.63%, 04/01/2030(1) | 7,760,749 |
| | AngloGold Ashanti Holdings plc | |
| 750,000 | 3.38%, 11/01/2028 | 745,721 |
| 730,000 | 3.75%, 10/01/2030 | 738,212 |
| | Constellium SE | |
| 680,000 | 3.75%, 04/15/2029(1)(4) | 656,166 |
| 1,716,000 | 5.63%, 06/15/2028(1) | 1,799,964 |
| 2,640,000 | 5.88%, 02/15/2026(1) | 2,683,560 |
| 940,000 | FMG Resources August Pty Ltd. 4.38%, 04/01/2031(1) | 951,750 |
| 795,000 | Nacional del Cobre de Chile Corp. 3.70%, 01/30/2050(1) | 805,367 |
| 8,355,000 | Rio Tinto Finance USA Ltd. 2.75%, 11/02/2051 | 8,263,295 |
| | | | 25,512,808 |
| | Miscellaneous Manufacturing - 0.2% |
| | General Electric Co. | |
| 5,655,000 | 3.45%, 05/01/2027 | 6,167,631 |
| 2,845,000 | 4.25%, 05/01/2040 | 3,399,257 |
| 8,506,000 | Ingersoll-Rand Luxembourg Finance S.A. 4.50%, 03/21/2049 | 10,654,702 |
| | Siemens Financieringsmaatschappij N.V. | |
| 11,475,000 | 1.20%, 03/11/2026(1) | 11,360,946 |
| 8,365,000 | 1.70%, 03/11/2028(1) | 8,286,014 |
| | | | 39,868,550 |
| | Office/Business Equipment - 0.0% |
| | CDW LLC / CDW Finance Corp. | |
| 730,000 | 4.13%, 05/01/2025 | 750,987 |
| 1,050,000 | 4.25%, 04/01/2028 | 1,086,750 |
| | Xerox Corp. | |
| 4,050,000 | 4.38%, 03/15/2023 | 4,178,263 |
| 145,000 | 4.80%, 03/01/2035 | 144,638 |
| 1,525,000 | Xerox Holdings Corp. 5.00%, 08/15/2025(1) | 1,584,094 |
| | | | 7,744,732 |
| | Oil & Gas - 1.7% |
| | Aker BP ASA | |
| 2,920,000 | 3.75%, 01/15/2030(1) | 3,121,023 |
| 8,995,000 | 4.00%, 01/15/2031(1) | 9,778,379 |
The accompanying notes are an integral part of these financial statements.
The Hartford Balanced Income Fund
Schedule of Investments – (continued)
October 31, 2021
| Shares or Principal Amount | | Market Value† |
| CORPORATE BONDS - 42.1% - (continued) |
| | Oil & Gas - 1.7% - (continued) |
| | Apache Corp. | |
| $ 1,975,000 | 4.38%, 10/15/2028 | $ 2,118,918 |
| 2,880,000 | 4.63%, 11/15/2025 | 3,104,611 |
| 1,163,000 | 5.10%, 09/01/2040 | 1,303,316 |
| | BP Capital Markets America, Inc. | |
| 4,750,000 | 2.94%, 06/04/2051 | 4,630,007 |
| 6,170,000 | 3.00%, 03/17/2052 | 6,075,099 |
| 7,125,000 | 3.06%, 06/17/2041 | 7,182,849 |
| 11,380,000 | 3.38%, 02/08/2061 | 11,651,556 |
| 3,945,000 | 3.63%, 04/06/2030 | 4,367,198 |
| 1,389,000 | Canadian Natural Resources Ltd. 3.90%, 02/01/2025 | 1,485,804 |
| | Continental Resources, Inc. | |
| 3,470,000 | 4.38%, 01/15/2028 | 3,786,637 |
| 875,000 | 4.90%, 06/01/2044 | 992,819 |
| 785,000 | 5.75%, 01/15/2031(1) | 940,038 |
| 2,415,000 | Coterra Energy, Inc. 3.90%, 05/15/2027(1) | 2,635,026 |
| 490,000 | Delek & Avner Tamar Bond Ltd. 5.41%, 12/30/2025(1)(3) | 490,594 |
| 3,345,000 | Devon Financing Co. LLC 7.88%, 09/30/2031 | 4,743,672 |
| | Ecopetrol S.A. | |
| 1,755,000 | 4.63%, 11/02/2031 | 1,740,267 |
| 1,290,000 | 5.38%, 06/26/2026 | 1,395,109 |
| | Empresa Nacional del Petroleo | |
| 200,000 | 4.50%, 09/14/2047(3) | 197,564 |
| 630,000 | 5.25%, 11/06/2029(3) | 688,244 |
| | Energean Israel Finance Ltd. | |
| 835,000 | 4.50%, 03/30/2024(1)(3) | 851,700 |
| 795,000 | 4.88%, 03/30/2026(1)(3) | 807,720 |
| | EQT Corp. | |
| 1,285,000 | 3.13%, 05/15/2026(1) | 1,294,638 |
| 1,650,000 | 3.90%, 10/01/2027 | 1,760,550 |
| | Equinor ASA | |
| 3,685,000 | 2.38%, 05/22/2030 | 3,776,904 |
| 3,365,000 | 3.63%, 04/06/2040 | 3,787,073 |
| 2,055,000 | 3.70%, 04/06/2050 | 2,406,750 |
| 495,000 | Frontera Energy Corp. 7.88%, 06/21/2028(1) | 476,438 |
| | Hess Corp. | |
| 2,980,000 | 7.13%, 03/15/2033 | 4,013,938 |
| 10,742,000 | 7.30%, 08/15/2031 | 14,421,198 |
| | KazMunayGas National Co. JSC | |
| 600,000 | 5.75%, 04/19/2047(3) | 723,324 |
| 800,000 | 6.38%, 10/24/2048(3) | 1,028,048 |
| | Leviathan Bond Ltd. | |
| 705,000 | 6.13%, 06/30/2025(1)(3) | 759,638 |
| 1,165,000 | 6.50%, 06/30/2027(1)(3) | 1,269,850 |
| 715,000 | 6.75%, 06/30/2030(1)(3) | 783,819 |
| 1,905,000 | Lukoil Capital DAC 2.80%, 04/26/2027(1) | 1,898,333 |
| | Lundin Energy Finance B.V. | |
| 7,470,000 | 2.00%, 07/15/2026(1) | 7,444,293 |
| 8,100,000 | 3.10%, 07/15/2031(1) | 8,167,606 |
| 14,745,000 | Marathon Petroleum Corp. 4.70%, 05/01/2025 | 16,292,767 |
| | Occidental Petroleum Corp. | |
| 3,145,000 | 3.00%, 02/15/2027 | 3,145,000 |
| 1,980,000 | 3.20%, 08/15/2026 | 2,004,750 |
| 3,190,000 | 3.40%, 04/15/2026 | 3,254,885 |
| 6,972,000 | 4.20%, 03/15/2048 | 6,794,423 |
| 1,098,000 | 4.40%, 04/15/2046 | 1,110,919 |
| 1,285,000 | 5.50%, 12/01/2025 | 1,413,372 |
| 640,000 | 6.13%, 01/01/2031 | 766,400 |
| Shares or Principal Amount | | Market Value† |
| CORPORATE BONDS - 42.1% - (continued) |
| | Oil & Gas - 1.7% - (continued) |
| $ 1,234,000 | 6.38%, 09/01/2028 | $ 1,446,408 |
| | Ovintiv Exploration, Inc. | |
| 1,310,000 | 5.38%, 01/01/2026 | 1,459,101 |
| 2,180,000 | 5.63%, 07/01/2024 | 2,400,127 |
| | Petrobras Global Finance B.V. | |
| 2,320,000 | 5.50%, 06/10/2051 | 2,050,300 |
| 1,510,000 | 6.75%, 06/03/2050 | 1,548,928 |
| | Petroleos de Venezuela S.A. | |
| 435,000 | 6.00%, 05/16/2024(3)(9) | 21,750 |
| 190,000 | 9.00%, 11/17/2021(3)(9) | 9,500 |
| | Petroleos Mexicanos | |
| 2,550,000 | 5.63%, 01/23/2046 | 2,072,614 |
| 12,785,000 | 5.95%, 01/28/2031 | 12,560,623 |
| 300,000 | 6.38%, 01/23/2045 | 258,903 |
| 50,000 | 6.75%, 09/21/2047 | 44,225 |
| 4,830,000 | 7.69%, 01/23/2050 | 4,636,800 |
| 12,235,000 | Qatar Petroleum Industry 2.25%, 07/12/2031(1) | 12,051,475 |
| 22,900,000 | Qatar Petroleum SR Unsecured 1.38%, 09/12/2026(1) | 22,603,857 |
| | Saudi Arabian Oil Co. | |
| 2,425,000 | 1.63%, 11/24/2025(1) | 2,410,741 |
| 2,975,000 | 2.25%, 11/24/2030(1) | 2,881,644 |
| 6,174,000 | 2.88%, 04/16/2024(1) | 6,410,464 |
| | Shell International Finance B.V. | |
| 4,199,000 | 4.00%, 05/10/2046 | 5,028,578 |
| 1,056,000 | 4.38%, 05/11/2045 | 1,323,032 |
| 2,320,000 | 4.55%, 08/12/2043 | 2,923,309 |
| | State Oil Co. of the Azerbaijan Republic | |
| 725,000 | 4.75%, 03/13/2023(3) | 752,940 |
| 1,570,000 | 6.95%, 03/18/2030(3) | 1,919,287 |
| | Suncor Energy, Inc. | |
| 1,510,000 | 3.75%, 03/04/2051 | 1,646,894 |
| 3,735,000 | 4.00%, 11/15/2047 | 4,211,696 |
| 2,365,000 | Transocean, Inc. 6.80%, 03/15/2038(4) | 1,415,098 |
| | Valero Energy Corp. | |
| 3,130,000 | 4.00%, 04/01/2029 | 3,435,882 |
| 3,460,000 | 4.35%, 06/01/2028 | 3,883,605 |
| | YPF S.A. | |
| 2,060,625 | 8.50%, 03/23/2025 | 1,872,614 |
| 720,125 | 8.50%, 03/23/2025(1) | 654,421 |
| | | | 266,817,882 |
| | Oil & Gas Services - 0.1% |
| 7,675,000 | Halliburton Co. 4.85%, 11/15/2035 | 9,109,441 |
| | Packaging & Containers - 0.3% |
| 4,700,000 | ARD Finance S.A. (6.50% Cash, 7.25% PIK) 6.50%, 06/30/2027(1)(8) | 4,923,250 |
| | Ardagh Packaging Finance plc / Ardagh Holdings USA, Inc. | |
| 1,040,000 | 4.13%, 08/15/2026(1) | 1,060,831 |
| 870,000 | 5.25%, 04/30/2025(1) | 904,800 |
| 4,595,000 | 5.25%, 08/15/2027(1) | 4,583,512 |
| 2,510,000 | Berry Global, Inc. 5.63%, 07/15/2027(1) | 2,628,874 |
| 2,283,000 | Crown Americas LLC / Crown Americas Capital Corp. 4.75%, 02/01/2026 | 2,352,175 |
| 5,230,000 | Flex Acquisition Co., Inc. 6.88%, 01/15/2025(1) | 5,282,300 |
| 495,000 | Graphic Packaging International LLC 3.50%, 03/01/2029(1) | 490,050 |
| 1,125,000 | Klabin Austria GmbH 3.20%, 01/12/2031(1) | 1,035,225 |
The accompanying notes are an integral part of these financial statements.
The Hartford Balanced Income Fund
Schedule of Investments – (continued)
October 31, 2021
| Shares or Principal Amount | | Market Value† |
| CORPORATE BONDS - 42.1% - (continued) |
| | Packaging & Containers - 0.3% - (continued) |
| $ 1,725,000 | Mauser Packaging Solutions Holding Co. 7.25%, 04/15/2025(1) | $ 1,670,179 |
| 390,000 | OI European Group B.V. 4.00%, 03/15/2023(1) | 398,873 |
| | Owens-Brockway Glass Container, Inc. | |
| 2,960,000 | 5.88%, 08/15/2023(1) | 3,115,400 |
| 2,710,000 | 6.38%, 08/15/2025(1) | 2,964,062 |
| 16,225,000 | Sealed Air Corp. 1.57%, 10/15/2026(1) | 15,958,974 |
| EUR 2,830,000 | Silgan Holdings, Inc. 2.25%, 06/01/2028 | 3,271,545 |
| 2,990,000 | Titan Holdings II B.V. 5.13%, 07/15/2029(1) | 3,410,469 |
| $ 1,590,000 | Trivium Packaging Finance B.V. 5.50%, 08/15/2026(1) | 1,651,581 |
| | | | 55,702,100 |
| | Pharmaceuticals - 1.9% |
| | AbbVie, Inc. | |
| 7,100,000 | 2.30%, 11/21/2022 | 7,223,088 |
| 15,320,000 | 2.95%, 11/21/2026 | 16,200,354 |
| 4,630,000 | 4.05%, 11/21/2039 | 5,315,583 |
| 7,060,000 | 4.25%, 11/21/2049 | 8,481,374 |
| 7,590,000 | 4.45%, 05/14/2046 | 9,254,227 |
| 2,840,000 | 4.63%, 10/01/2042 | 3,439,659 |
| 1,118,000 | 4.70%, 05/14/2045 | 1,399,540 |
| 3,702,000 | 4.85%, 06/15/2044 | 4,677,411 |
| 17,470,000 | AmerisourceBergen Corp. 2.70%, 03/15/2031 | 17,773,863 |
| | Astrazeneca Finance LLC | |
| 8,555,000 | 1.20%, 05/28/2026 | 8,479,748 |
| 8,785,000 | 1.75%, 05/28/2028 | 8,757,027 |
| | AstraZeneca plc | |
| 1,620,000 | 3.00%, 05/28/2051(4) | 1,711,452 |
| 11,865,000 | 3.38%, 11/16/2025 | 12,844,498 |
| | Bausch Health Cos., Inc. | |
| 4,635,000 | 5.00%, 01/30/2028(1) | 4,278,198 |
| 4,640,000 | 5.00%, 02/15/2029(1) | 4,257,200 |
| 2,050,000 | 5.25%, 01/30/2030(1) | 1,847,542 |
| 1,606,000 | 6.13%, 04/15/2025(1) | 1,635,743 |
| 2,550,000 | 7.00%, 01/15/2028(1) | 2,582,219 |
| 360,000 | 9.00%, 12/15/2025(1) | 377,665 |
| | Bayer U.S. Finance LLC | |
| 2,900,000 | 4.20%, 07/15/2034(1) | 3,241,152 |
| 7,820,000 | 4.25%, 12/15/2025(1) | 8,574,368 |
| 7,426,000 | Becton Dickinson and Co. 3.36%, 06/06/2024 | 7,831,041 |
| | Bristol-Myers Squibb Co. | |
| 4,125,000 | 1.13%, 11/13/2027(4) | 4,015,599 |
| 5,000,000 | 1.45%, 11/13/2030(4) | 4,777,984 |
| 5,935,000 | 2.35%, 11/13/2040 | 5,666,724 |
| 7,410,000 | 2.55%, 11/13/2050 | 7,078,030 |
| 2,000,000 | 3.25%, 08/01/2042 | 2,186,265 |
| 4,384,000 | 3.88%, 08/15/2025 | 4,795,341 |
| 4,655,000 | 4.25%, 10/26/2049 | 5,845,276 |
| | Cigna Corp. | |
| 7,085,000 | 1.25%, 03/15/2026(4) | 7,006,035 |
| 1,655,000 | 3.20%, 03/15/2040 | 1,701,650 |
| 4,305,000 | 3.25%, 04/15/2025 | 4,570,722 |
| 15,680,000 | 4.13%, 11/15/2025 | 17,248,640 |
| | CVS Health Corp. | |
| 3,280,000 | 3.00%, 08/15/2026 | 3,491,664 |
| 4,605,000 | 4.13%, 04/01/2040 | 5,275,249 |
| 14,295,000 | 4.78%, 03/25/2038 | 17,468,042 |
| 3,455,000 | 5.13%, 07/20/2045 | 4,541,443 |
| Shares or Principal Amount | | Market Value† |
| CORPORATE BONDS - 42.1% - (continued) |
| | Pharmaceuticals - 1.9% - (continued) |
| | CVS Pass-Through Trust | |
| $ 9,447 | 6.04%, 12/10/2028 | $ 10,936 |
| 22,250 | 6.94%, 01/10/2030 | 26,707 |
| 3,655,000 | Eli Lilly & Co. 2.50%, 09/15/2060 | 3,434,442 |
| 8,110,000 | GlaxoSmithKline Capital, Inc. 3.63%, 05/15/2025 | 8,814,639 |
| 6,420,000 | Johnson & Johnson 3.63%, 03/03/2037 | 7,450,024 |
| | Pfizer, Inc. | |
| 16,740,000 | 1.75%, 08/18/2031 | 16,273,831 |
| 4,525,000 | 4.00%, 12/15/2036 | 5,377,069 |
| 2,725,000 | 4.00%, 03/15/2049 | 3,361,677 |
| | Teva Pharmaceutical Finance Netherlands B.V. | |
| 15,000 | 2.80%, 07/21/2023 | 15,110 |
| 18,390,000 | 3.15%, 10/01/2026 | 17,332,575 |
| | | | 297,948,626 |
| | Pipelines - 1.7% |
| 3,100,000 | Antero Midstream Partners L.P. / Antero Midstream Finance Corp. 5.75%, 01/15/2028(1) | 3,239,500 |
| | Buckeye Partners L.P. | |
| 1,997,000 | 3.95%, 12/01/2026 | 2,047,264 |
| 1,005,000 | 4.13%, 03/01/2025(1) | 1,030,125 |
| 1,360,000 | 4.13%, 12/01/2027 | 1,370,200 |
| 1,030,000 | 4.50%, 03/01/2028(1) | 1,017,125 |
| 1,154,000 | Cheniere Energy Partners L.P. 4.50%, 10/01/2029 | 1,232,103 |
| 5,510,000 | DCP Midstream Operating L.P. 5.38%, 07/15/2025 | 6,088,550 |
| 3,630,000 | DT Midstream, Inc. 4.13%, 06/15/2029(1) | 3,655,954 |
| 7,180,000 | Eastern Gas Transmission & Storage, Inc. 3.00%, 11/15/2029(1) | 7,469,808 |
| 23,150,000 | Enbridge, Inc. 2.50%, 08/01/2033 | 22,942,202 |
| | Energy Transfer Operating L.P. | |
| 7,950,000 | 3.75%, 05/15/2030 | 8,477,605 |
| 2,275,000 | 4.90%, 03/15/2035 | 2,581,773 |
| 1,190,000 | 5.15%, 03/15/2045 | 1,385,523 |
| 9,000,000 | 5.25%, 04/15/2029 | 10,458,094 |
| 5,100,000 | 5.30%, 04/01/2044 | 5,971,611 |
| 4,958,000 | 5.30%, 04/15/2047 | 5,873,149 |
| 1,065,000 | 5.35%, 05/15/2045 | 1,258,170 |
| 775,000 | 6.00%, 06/15/2048 | 988,603 |
| 4,045,000 | 6.13%, 12/15/2045 | 5,181,906 |
| 3,910,000 | 6.25%, 04/15/2049 | 5,187,438 |
| 2,935,000 | EnLink Midstream LLC 5.63%, 01/15/2028(1) | 3,112,076 |
| | Enterprise Products Operating LLC | |
| 4,050,000 | 3.30%, 02/15/2053 | 4,052,854 |
| 5,430,000 | 4.20%, 01/31/2050 | 6,206,815 |
| 2,760,000 | 4.25%, 02/15/2048 | 3,155,312 |
| 6,975,000 | 4.80%, 02/01/2049 | 8,598,178 |
| 1,516,000 | 4.85%, 08/15/2042 | 1,832,841 |
| | EQM Midstream Partners L.P. | |
| 1,505,000 | 4.50%, 01/15/2029(1) | 1,542,625 |
| 1,150,000 | 4.75%, 01/15/2031(1) | 1,190,624 |
| 795,000 | 6.00%, 07/01/2025(1) | 862,575 |
| 805,000 | 6.50%, 07/01/2027(1) | 895,563 |
| 1,500,000 | 6.50%, 07/15/2048 | 1,784,130 |
| | Galaxy Pipeline Assets Bidco Ltd. | |
| 1,164,595 | 1.75%, 09/30/2027(1) | 1,170,543 |
| 14,955,000 | 2.16%, 03/31/2034(1) | 14,566,610 |
| 1,585,000 | 2.63%, 03/31/2036(1) | 1,544,133 |
The accompanying notes are an integral part of these financial statements.
The Hartford Balanced Income Fund
Schedule of Investments – (continued)
October 31, 2021
| Shares or Principal Amount | | Market Value† |
| CORPORATE BONDS - 42.1% - (continued) |
| | Pipelines - 1.7% - (continued) |
| $ 920,000 | 2.94%, 09/30/2040(1) | $ 903,669 |
| 790,000 | 3.25%, 09/30/2040(1) | 785,254 |
| 2,730,000 | Gray Oak Pipeline LLC 2.00%, 09/15/2023(1) | 2,773,314 |
| | MPLX L.P. | |
| 3,750,000 | 4.00%, 02/15/2025 | 4,028,056 |
| 6,490,000 | 4.25%, 12/01/2027 | 7,234,656 |
| 2,770,000 | 4.90%, 04/15/2058 | 3,285,829 |
| 4,780,000 | 5.20%, 12/01/2047 | 5,841,839 |
| 4,490,000 | NGPL PipeCo LLC 3.25%, 07/15/2031(1) | 4,572,956 |
| 4,000,000 | ONEOK, Inc. 6.35%, 01/15/2031 | 5,084,965 |
| 8,305,000 | Phillips 66 Partners L.P. 3.15%, 12/15/2029 | 8,684,832 |
| | Sabine Pass Liquefaction LLC | |
| 1,345,000 | 5.00%, 03/15/2027 | 1,525,372 |
| 4,000,000 | 5.88%, 06/30/2026 | 4,643,085 |
| 5,065,000 | Southern Natural Gas Co. LLC 0.63%, 04/28/2023(1) | 5,048,771 |
| 495,000 | Tallgrass Energy Partners L.P. / Tallgrass Energy Finance Corp. 6.00%, 09/01/2031(1) | 486,956 |
| | Targa Resources Partners L.P. / Targa Resources Partners Finance Corp. | |
| 1,375,000 | 4.00%, 01/15/2032(1) | 1,418,959 |
| 870,000 | 4.88%, 02/01/2031 | 938,060 |
| 5,175,000 | 6.50%, 07/15/2027 | 5,543,719 |
| | TransCanada PipeLines Ltd. | |
| 6,025,000 | 1.00%, 10/12/2024 | 6,000,221 |
| 13,360,000 | 2.50%, 10/12/2031 | 13,295,520 |
| 5,840,000 | 4.63%, 03/01/2034 | 6,857,646 |
| 2,870,000 | Valero Energy Partners L.P. 4.50%, 03/15/2028 | 3,225,789 |
| | Venture Global Calcasieu Pass LLC | |
| 1,890,000 | 3.88%, 08/15/2029(1) | 1,926,288 |
| 1,470,000 | 4.13%, 08/15/2031(1) | 1,521,377 |
| | Western Midstream Operating L.P. | |
| 5,845,000 | 5.30%, 02/01/2030 | 6,407,581 |
| 1,675,000 | 6.50%, 02/01/2050 | 2,004,942 |
| | Williams Cos., Inc. | |
| 4,145,000 | 5.10%, 09/15/2045 | 5,183,133 |
| 4,100,000 | 5.40%, 03/04/2044 | 5,163,638 |
| 2,224,000 | 6.30%, 04/15/2040 | 3,033,087 |
| | | | 265,391,096 |
| | Real Estate - 0.0% |
| | CIFI Holdings Group Co., Ltd. | |
| 1,035,000 | 5.25%, 05/13/2026(3) | 984,536 |
| 200,000 | 6.00%, 07/16/2025(3) | 195,056 |
| | Country Garden Holdings Co., Ltd. | |
| 1,090,000 | 3.30%, 01/12/2031(3) | 981,264 |
| 200,000 | 4.20%, 02/06/2026(3) | 188,442 |
| 200,000 | 5.40%, 05/27/2025(3) | 197,189 |
| 860,000 | 5.63%, 01/14/2030(3) | 844,072 |
| 225,000 | 6.15%, 09/17/2025(3) | 226,230 |
| 1,435,000 | Shimao Group Holdings Ltd. 3.45%, 01/11/2031(3) | 1,211,291 |
| | Times China Holdings Ltd. | |
| 1,440,000 | 6.20%, 03/22/2026(3) | 1,096,515 |
| Shares or Principal Amount | | Market Value† |
| CORPORATE BONDS - 42.1% - (continued) |
| | Real Estate - 0.0% - (continued) |
| $ 575,000 | 6.75%, 07/08/2025(3) | $ 454,772 |
| 1,905,000 | Yuzhou Group Holdings Co., Ltd. 7.70%, 02/20/2025(3) | 947,440 |
| | | | 7,326,807 |
| | Real Estate Investment Trusts - 0.9% |
| | American Tower Corp. | |
| 1,000,000 | 1.45%, 09/15/2026 | 985,280 |
| 27,070,000 | 1.60%, 04/15/2026 | 26,925,935 |
| | Brixmor Operating Partnership L.P. | |
| 3,195,000 | 2.50%, 08/16/2031 | 3,129,091 |
| 14,470,000 | 4.13%, 05/15/2029 | 16,173,345 |
| 8,745,000 | Crown Castle International Corp. 3.20%, 09/01/2024 | 9,211,267 |
| | Equinix, Inc. | |
| 11,210,000 | 1.45%, 05/15/2026 | 11,078,301 |
| 2,645,000 | 1.80%, 07/15/2027 | 2,628,167 |
| 2,730,000 | 2.00%, 05/15/2028 | 2,700,821 |
| | GLP Capital L.P. / GLP Financing II, Inc. | |
| 7,675,000 | 4.00%, 01/15/2031 | 8,180,322 |
| 4,750,000 | 5.30%, 01/15/2029 | 5,434,285 |
| 4,815,000 | 5.75%, 06/01/2028 | 5,591,034 |
| | Ladder Capital Finance Holdings LLLP / Ladder Capital Finance Corp. | |
| 3,435,000 | 4.25%, 02/01/2027(1) | 3,452,141 |
| 365,000 | 5.25%, 10/01/2025(1) | 367,737 |
| | Service Properties Trust | |
| 530,000 | 3.95%, 01/15/2028 | 494,225 |
| 3,875,000 | 7.50%, 09/15/2025 | 4,288,894 |
| 3,885,000 | Simon Property Group L.P. 3.25%, 09/13/2049 | 4,028,785 |
| 5,605,000 | UDR, Inc. 2.10%, 08/01/2032 | 5,367,037 |
| 3,675,000 | VEREIT Operating Partnership L.P. 3.40%, 01/15/2028 | 3,958,995 |
| | VICI Properties L.P. / VICI Note Co., Inc. | |
| 285,000 | 3.50%, 02/15/2025(1) | 289,987 |
| 185,000 | 3.75%, 02/15/2027(1) | 190,088 |
| 213,000 | 4.13%, 08/15/2030(1) | 223,650 |
| 1,200,000 | 4.25%, 12/01/2026(1) | 1,246,128 |
| 1,000,000 | 4.63%, 12/01/2029(1) | 1,066,875 |
| | Welltower, Inc. | |
| 18,460,000 | 3.63%, 03/15/2024 | 19,580,394 |
| 2,620,000 | 4.00%, 06/01/2025 | 2,839,013 |
| | | | 139,431,797 |
| | Retail - 1.0% |
| | 1011778 BC ULC / New Red Finance, Inc. | |
| 2,830,000 | 3.50%, 02/15/2029(1) | 2,745,100 |
| 1,780,000 | 3.88%, 01/15/2028(1) | 1,775,692 |
| 840,000 | 4.00%, 10/15/2030(1) | 813,733 |
| 4,020,000 | 4.38%, 01/15/2028(1) | 4,041,065 |
| | Ambience Merger Sub, Inc. | |
| 430,000 | 4.88%, 07/15/2028(1) | 422,183 |
| 460,000 | 7.13%, 07/15/2029(1) | 443,265 |
| 2,125,000 | FirstCash, Inc. 4.63%, 09/01/2028(1) | 2,191,406 |
| | Gap, Inc. | |
| 1,945,000 | 3.63%, 10/01/2029(1) | 1,906,100 |
| 1,945,000 | 3.88%, 10/01/2031(1) | 1,906,100 |
| 1,180,000 | Group 1 Automotive, Inc. 4.00%, 08/15/2028(1) | 1,180,236 |
The accompanying notes are an integral part of these financial statements.
The Hartford Balanced Income Fund
Schedule of Investments – (continued)
October 31, 2021
| Shares or Principal Amount | | Market Value† |
| CORPORATE BONDS - 42.1% - (continued) |
| | Retail - 1.0% - (continued) |
| | Home Depot, Inc. | |
| $ 3,627,000 | 3.50%, 09/15/2056 | $ 4,125,037 |
| 2,815,000 | 4.50%, 12/06/2048 | 3,684,964 |
| 5,215,000 | 5.88%, 12/16/2036 | 7,351,862 |
| 1,275,000 | KFC Holding Co. / Pizza Hut Holdings LLC / Taco Bell of America LLC 4.75%, 06/01/2027(1) | 1,319,625 |
| | L Brands, Inc. | |
| 2,295,000 | 5.25%, 02/01/2028 | 2,474,010 |
| 2,190,000 | 6.63%, 10/01/2030(1) | 2,452,143 |
| 4,870,000 | LBM Acquisition LLC 6.25%, 01/15/2029(1) | 4,729,257 |
| 735,000 | Lithia Motors, Inc. 4.63%, 12/15/2027(1) | 777,075 |
| | Lowe's Cos., Inc. | |
| 5,000,000 | 2.80%, 09/15/2041 | 4,911,257 |
| 7,370,000 | 3.70%, 04/15/2046 | 8,194,695 |
| | Macy's Retail Holdings LLC | |
| 75,000 | 2.88%, 02/15/2023 | 75,750 |
| 599,000 | 3.63%, 06/01/2024(4) | 619,037 |
| 632,000 | 5.88%, 04/01/2029(1)(4) | 673,513 |
| | McDonald's Corp. | |
| 9,130,000 | 1.45%, 09/01/2025 | 9,184,988 |
| 5,262,000 | 3.38%, 05/26/2025 | 5,631,744 |
| 3,615,000 | 4.60%, 05/26/2045 | 4,528,454 |
| 5,000,000 | 6.30%, 10/15/2037 | 7,168,732 |
| | Michaels Cos., Inc. | |
| 2,400,000 | 5.25%, 05/01/2028(1) | 2,424,000 |
| 1,305,000 | 7.88%, 05/01/2029(1)(4) | 1,318,050 |
| 7,340,000 | O'Reilly Automotive, Inc. 3.90%, 06/01/2029 | 8,172,626 |
| | PetSmart, Inc. | |
| 2,800,000 | 4.75%, 02/15/2028(1) | 2,877,000 |
| 425,000 | 7.75%, 02/15/2029(1) | 459,306 |
| 4,818,000 | Specialty Building Products Holdings LLC / SBP Finance Corp. 6.38%, 09/30/2026(1) | 5,016,742 |
| 1,915,000 | SRS Distribution, Inc. 4.63%, 07/01/2028(1) | 1,957,705 |
| 6,485,000 | Staples, Inc. 7.50%, 04/15/2026(1) | 6,549,850 |
| | Walmart, Inc. | |
| 32,900,000 | 1.50%, 09/22/2028 | 32,558,498 |
| 9,490,000 | 2.50%, 09/22/2041 | 9,529,424 |
| | Yum! Brands, Inc. | |
| 690,000 | 4.75%, 01/15/2030(1) | 738,300 |
| 220,000 | 7.75%, 04/01/2025(1) | 233,959 |
| | | | 157,162,483 |
| | Semiconductors - 1.6% |
| 29,603,000 | Broadcom Corp. / Broadcom Cayman Finance Ltd. 3.14%, 11/15/2035(1) | 29,170,072 |
| | Broadcom, Inc. | |
| 5,600,000 | 2.60%, 02/15/2033(1) | 5,404,596 |
| 2,843,000 | 3.19%, 11/15/2036(1) | 2,798,454 |
| 17,971,000 | 3.42%, 04/15/2033(1) | 18,552,051 |
| 5,034,000 | 3.47%, 04/15/2034(1) | 5,199,127 |
| 5,255,000 | 3.50%, 02/15/2041(1) | 5,220,969 |
| 10,362,000 | 4.11%, 09/15/2028 | 11,444,449 |
| 10,462,000 | 4.15%, 11/15/2030 | 11,500,593 |
| 6,700,000 | 4.30%, 11/15/2032 | 7,464,829 |
| | Intel Corp. | |
| 18,600,000 | 2.80%, 08/12/2041 | 18,523,046 |
| Shares or Principal Amount | | Market Value† |
| CORPORATE BONDS - 42.1% - (continued) |
| | Semiconductors - 1.6% - (continued) |
| $ 4,860,000 | 3.10%, 02/15/2060 | $ 4,903,283 |
| 2,976,000 | 4.10%, 05/11/2047 | 3,548,474 |
| | Marvell Technology, Inc. | |
| 23,675,000 | 1.65%, 04/15/2026 | 23,514,952 |
| 10,375,000 | 2.45%, 04/15/2028 | 10,419,716 |
| | Microchip Technology, Inc. | |
| 15,455,000 | 0.97%, 02/15/2024(1) | 15,372,791 |
| 17,755,000 | 2.67%, 09/01/2023 | 18,300,383 |
| | Micron Technology, Inc. | |
| 8,695,000 | 2.70%, 04/15/2032 | 8,680,132 |
| 4,150,000 | 4.98%, 02/06/2026 | 4,664,849 |
| | NVIDIA Corp. | |
| 4,740,000 | 3.50%, 04/01/2050 | 5,419,986 |
| 1,180,000 | 3.70%, 04/01/2060 | 1,397,704 |
| | NXP B.V. / NXP Funding LLC | |
| 10,000,000 | 3.88%, 09/01/2022(1) | 10,274,982 |
| 14,163,000 | 4.88%, 03/01/2024(1) | 15,310,285 |
| 3,676,000 | QUALCOMM, Inc. 4.80%, 05/20/2045 | 4,867,632 |
| | Sensata Technologies B.V. | |
| 1,020,000 | 5.00%, 10/01/2025(1) | 1,117,328 |
| 1,475,000 | 5.63%, 11/01/2024(1) | 1,626,187 |
| 2,285,000 | Skyworks Solutions, Inc. 1.80%, 06/01/2026 | 2,287,755 |
| | | | 246,984,625 |
| | Software - 1.3% |
| 2,485,000 | Black Knight InfoServ LLC 3.63%, 09/01/2028(1) | 2,472,575 |
| 1,215,000 | CDK Global, Inc. 5.25%, 05/15/2029(1) | 1,303,088 |
| | Fiserv, Inc. | |
| 13,810,000 | 2.25%, 06/01/2027 | 14,040,418 |
| 11,730,000 | 3.20%, 07/01/2026 | 12,471,002 |
| 1,390,000 | IQVIA, Inc. 5.00%, 05/15/2027(1) | 1,440,832 |
| | Microsoft Corp. | |
| 13,045,000 | 2.53%, 06/01/2050 | 12,831,551 |
| 16,040,000 | 2.92%, 03/17/2052 | 16,967,134 |
| 3,045,000 | 3.45%, 08/08/2036 | 3,495,675 |
| 3,805,000 | 3.50%, 02/12/2035 | 4,366,233 |
| 9,860,000 | MSCI, Inc. 3.25%, 08/15/2033(1) | 9,898,158 |
| 1,910,000 | Open Text Corp. 3.88%, 02/15/2028(1) | 1,924,325 |
| 1,625,000 | Open Text Holdings, Inc. 4.13%, 02/15/2030(1) | 1,651,975 |
| | Oracle Corp. | |
| 8,410,000 | 2.30%, 03/25/2028 | 8,537,690 |
| 6,000,000 | 2.65%, 07/15/2026 | 6,237,107 |
| 19,255,000 | 2.88%, 03/25/2031 | 19,731,014 |
| 16,315,000 | 3.60%, 04/01/2040 | 16,978,460 |
| 7,785,000 | 3.60%, 04/01/2050 | 7,938,676 |
| 7,555,000 | 3.65%, 03/25/2041 | 7,904,809 |
| 2,100,000 | 3.85%, 07/15/2036 | 2,270,742 |
| 12,610,000 | 3.85%, 04/01/2060 | 13,153,800 |
| 14,500,000 | 3.90%, 05/15/2035 | 15,732,331 |
| 4,685,000 | 3.95%, 03/25/2051 | 5,073,891 |
| 3,385,000 | 4.00%, 11/15/2047 | 3,657,169 |
| 4,300,000 | 6.50%, 04/15/2038 | 6,001,653 |
| | PTC, Inc. | |
| 400,000 | 3.63%, 02/15/2025(1) | 406,510 |
| 440,000 | 4.00%, 02/15/2028(1) | 446,050 |
| 2,880,000 | ROBLOX Corp. 3.88%, 05/01/2030(1) | 2,869,200 |
| | salesforce.com, Inc. | |
| 2,760,000 | 1.50%, 07/15/2028 | 2,718,178 |
The accompanying notes are an integral part of these financial statements.
The Hartford Balanced Income Fund
Schedule of Investments – (continued)
October 31, 2021
| Shares or Principal Amount | | Market Value† |
| CORPORATE BONDS - 42.1% - (continued) |
| | Software - 1.3% - (continued) |
| $ 7,880,000 | 2.70%, 07/15/2041 | $ 7,906,802 |
| 4,095,000 | SS&C Technologies, Inc. 5.50%, 09/30/2027(1) | 4,309,988 |
| | | | 214,737,036 |
| | Telecommunications - 2.4% |
| | Altice France S.A. | |
| 2,825,000 | 5.13%, 07/15/2029(1) | 2,751,352 |
| 660,000 | 5.50%, 01/15/2028(1) | 661,485 |
| 4,075,000 | 8.13%, 02/01/2027(1) | 4,380,625 |
| 15,000,000 | Apple, Inc. 1.40%, 08/05/2028 | 14,630,302 |
| | AT&T, Inc. | |
| 19,395,000 | 1.70%, 03/25/2026 | 19,477,097 |
| 49,013,000 | 2.55%, 12/01/2033 | 47,634,278 |
| 4,450,000 | 3.30%, 02/01/2052 | 4,361,683 |
| 14,619,000 | 3.50%, 09/15/2053 | 14,796,574 |
| 9,502,000 | 3.55%, 09/15/2055 | 9,626,393 |
| 10,000,000 | 3.65%, 06/01/2051 | 10,409,318 |
| 17,067,000 | 3.65%, 09/15/2059 | 17,311,198 |
| 13,720,000 | 3.80%, 12/01/2057 | 14,411,756 |
| 2,000,000 | 3.90%, 03/11/2024 | 2,120,782 |
| 870,000 | 4.35%, 03/01/2029 | 988,221 |
| 905,000 | 4.50%, 05/15/2035 | 1,045,731 |
| 1,085,000 | Bharti Airtel International Netherlands B.V. 5.35%, 05/20/2024(3) | 1,178,494 |
| 1,905,000 | Embarq Corp. 8.00%, 06/01/2036 | 2,105,025 |
| 1,285,000 | Empresa Nacional de Telecomunicaciones S.A. 3.05%, 09/14/2032(1) | 1,254,417 |
| | Frontier Communications Corp. | |
| 2,405,000 | 5.00%, 05/01/2028(1) | 2,444,081 |
| 1,850,000 | 5.88%, 10/15/2027(1) | 1,937,875 |
| 2,815,029 | 5.88%, 11/01/2029 | 2,804,473 |
| 2,985,000 | 6.75%, 05/01/2029(1) | 3,089,475 |
| 875,000 | Frontier Communications Holdings LLC 6.00%, 01/15/2030(1) | 879,139 |
| | Iliad Holding SAS | |
| 1,110,000 | 6.50%, 10/15/2026(1) | 1,143,522 |
| 730,000 | 7.00%, 10/15/2028(1) | 752,280 |
| EUR 2,775,000 | Kaixo Bondco Telecom S.A. 5.13%, 09/30/2029(1) | 3,175,243 |
| $ 540,472 | Ligado Networks LLC (15.50% Cash, 15.50% PIK) 15.50%, 11/01/2023(1)(8) | 487,641 |
| EUR 3,575,000 | Lorca Telecom Bondco S.A. 4.00%, 09/18/2027(1) | 4,157,909 |
| | Millicom International Cellular S.A. | |
| $ 295,000 | 4.50%, 04/27/2031(1) | 304,145 |
| 603,000 | 6.25%, 03/25/2029(1) | 655,763 |
| 16,425,000 | NTT Finance Corp. 1.16%, 04/03/2026(1) | 16,181,090 |
| | Ooredoo International Finance Ltd. | |
| 1,290,000 | 2.63%, 04/08/2031(1) | 1,301,494 |
| 400,000 | 2.63%, 04/08/2031(3) | 403,564 |
| | Sprint Corp. | |
| 3,253,000 | 7.13%, 06/15/2024 | 3,675,890 |
| 3,725,000 | 7.88%, 09/15/2023 | 4,130,094 |
| 2,555,000 | Sprint Spectrum Co. LLC / Sprint Spectrum Co. II LLC / Sprint Spectrum Co. III LLC 5.15%, 09/20/2029(1) | 2,883,956 |
| 570,000 | Telecom Italia S.p.A. 5.30%, 05/30/2024(1) | 607,050 |
| 500,000 | Telefonica Celular del Paraguay S.A. 5.88%, 04/15/2027(1) | 518,750 |
| Shares or Principal Amount | | Market Value† |
| CORPORATE BONDS - 42.1% - (continued) |
| | Telecommunications - 2.4% - (continued) |
| | Telefonica Emisiones S.A. | |
| $ 2,510,000 | 4.67%, 03/06/2038 | $ 2,912,125 |
| 10,820,000 | 5.21%, 03/08/2047 | 13,635,795 |
| | T-Mobile USA, Inc. | |
| 2,160,000 | 2.05%, 02/15/2028 | 2,142,930 |
| 3,920,000 | 2.25%, 02/15/2026(1) | 3,944,500 |
| 1,330,000 | 2.25%, 02/15/2026 | 1,338,312 |
| 3,175,000 | 2.63%, 04/15/2026 | 3,223,038 |
| 8,545,000 | 3.88%, 04/15/2030 | 9,347,772 |
| 13,135,000 | 4.38%, 04/15/2040 | 14,984,978 |
| 3,215,000 | 4.50%, 04/15/2050 | 3,795,804 |
| | VEON Holdings B.V. | |
| 1,120,000 | 3.38%, 11/25/2027(1) | 1,122,150 |
| 860,000 | 3.38%, 11/25/2027(3) | 861,651 |
| 1,555,000 | 4.00%, 04/09/2025(3) | 1,610,063 |
| | Verizon Communications, Inc. | |
| 9,700,000 | 2.36%, 03/15/2032(1) | 9,553,097 |
| 2,660,000 | 2.85%, 09/03/2041 | 2,592,415 |
| 10,683,000 | 2.99%, 10/30/2056 | 10,128,898 |
| 12,025,000 | 3.40%, 03/22/2041 | 12,595,193 |
| 9,585,000 | 4.13%, 08/15/2046 | 11,202,694 |
| 13,115,000 | 4.50%, 08/10/2033 | 15,493,295 |
| 11,923,000 | 4.52%, 09/15/2048 | 15,105,758 |
| 4,790,000 | 4.81%, 03/15/2039 | 5,914,224 |
| | Vodafone Group plc | |
| 7,585,000 | 5.13%, 06/04/2081, (5.13% fixed rate until 12/04/2050; 5 year USD CMT + 3.073% thereafter)(5) | 7,769,619 |
| 6,355,000 | 5.25%, 05/30/2048 | 8,365,737 |
| 1,049,000 | VTR Comunicaciones S.p.A. 5.13%, 01/15/2028(1) | 1,088,337 |
| | | | 379,406,550 |
| | Toys/Games/Hobbies - 0.0% |
| | Mattel, Inc. | |
| 1,045,000 | 3.38%, 04/01/2026(1) | 1,075,023 |
| 1,040,000 | 5.88%, 12/15/2027(1) | 1,118,000 |
| | | | 2,193,023 |
| | Transportation - 0.4% |
| 8,215,000 | Burlington Northern Santa Fe LLC 4.55%, 09/01/2044 | 10,422,935 |
| 4,000,000 | FedEx Corp. 4.10%, 02/01/2045 | 4,547,255 |
| 1,660,000 | First Student Bidco, Inc. 4.00%, 07/31/2029(1)(4) | 1,622,650 |
| 3,734,000 | Norfolk Southern Corp. 4.65%, 01/15/2046 | 4,764,188 |
| | Penske Truck Leasing Co. L.P. / PTL Finance Corp. | |
| 10,395,000 | 1.70%, 06/15/2026(1) | 10,351,074 |
| 4,520,000 | 3.45%, 07/01/2024(1) | 4,778,122 |
| 12,000,000 | 3.90%, 02/01/2024(1) | 12,698,673 |
| 9,895,000 | 4.88%, 07/11/2022(1) | 10,186,809 |
| | Rumo Luxembourg S.a.r.l. | |
| 530,000 | 4.20%, 01/18/2032(1) | 496,213 |
| 800,000 | 5.88%, 01/18/2025(3) | 826,080 |
| | Russian Railways Via RZD Capital plc | |
| 200,000 | 4.38%, 03/01/2024(3) | 212,800 |
| 675,000 | 5.70%, 04/05/2022(3) | 688,406 |
The accompanying notes are an integral part of these financial statements.
The Hartford Balanced Income Fund
Schedule of Investments – (continued)
October 31, 2021
| Shares or Principal Amount | | Market Value† |
| CORPORATE BONDS - 42.1% - (continued) |
| | Transportation - 0.4% - (continued) |
| | Union Pacific Corp. | |
| $ 2,770,000 | 2.38%, 05/20/2031 | $ 2,829,253 |
| 2,800,000 | 2.95%, 03/10/2052 | 2,867,226 |
| | | | 67,291,684 |
| | Trucking & Leasing - 0.0% |
| 635,000 | DAE Funding LLC 1.55%, 08/01/2024(1) | 626,428 |
| 2,000,000 | Penske Truck Leasing Co. L.P. / PTL Finance Corp. 2.70%, 11/01/2024(1) | 2,078,755 |
| | | | 2,705,183 |
| | Water - 0.0% |
| 3,365,000 | American Water Capital Corp. 3.45%, 05/01/2050 | 3,660,200 |
| | Total Corporate Bonds
(cost $6,413,993,929) | $ 6,693,684,237 |
| FOREIGN GOVERNMENT OBLIGATIONS - 4.1% |
| | Angola - 0.0% |
| | Angolan Government International Bond | |
| 3,180,000 | 8.00%, 11/26/2029(3) | $ 3,148,582 |
| 2,720,000 | 9.38%, 05/08/2048(3) | 2,699,056 |
| | | | 5,847,638 |
| | Argentina - 0.3% |
| | Argentine Republic Government International Bond | |
| 34,605,922 | 0.50%, 07/09/2030(10) | 11,819,653 |
| 3,299,015 | 1.00%, 07/09/2029 | 1,204,173 |
| 61,012,751 | 1.13%, 07/09/2035(10) | 18,914,563 |
| 4,797,161 | 2.00%, 01/09/2038(10) | 1,755,761 |
| 34,290,000 | 2.50%, 07/09/2041(10) | 11,812,905 |
| | Provincia de Cordoba | |
| 432,603 | 5.00%, 12/10/2025(1)(10) | 326,658 |
| 300,340 | 5.00%, 06/01/2027(3)(10) | 199,351 |
| | | | 46,033,064 |
| | Armenia - 0.0% |
| | Republic of Armenia International Bond | |
| 1,850,000 | 3.60%, 02/02/2031(1) | 1,727,863 |
| 700,000 | 3.60%, 02/02/2031(3) | 653,786 |
| 940,000 | 3.95%, 09/26/2029(3) | 914,150 |
| 685,000 | 7.15%, 03/26/2025(3) | 777,694 |
| | | | 4,073,493 |
| | Azerbaijan - 0.1% |
| | Republic of Azerbaijan International Bond | |
| 4,705,000 | 3.50%, 09/01/2032(3) | 4,810,787 |
| 1,315,000 | 4.75%, 03/18/2024(3) | 1,407,971 |
| | Southern Gas Corridor CJSC | |
| 1,394,000 | 6.88%, 03/24/2026(1) | 1,633,015 |
| 3,210,000 | 6.88%, 03/24/2026(3) | 3,760,387 |
| | | | 11,612,160 |
| | Benin - 0.0% |
| EUR 2,030,000 | Benin Government International Bond 4.95%, 01/22/2035(1) | 2,229,580 |
| Shares or Principal Amount | | Market Value† |
| FOREIGN GOVERNMENT OBLIGATIONS - 4.1% - (continued) |
| | Bermuda - 0.0% |
| | Bermuda Government International Bond | |
| $ 325,000 | 3.38%, 08/20/2050(1) | $ 324,188 |
| 1,525,000 | 4.75%, 02/15/2029(1) | 1,759,148 |
| | | | 2,083,336 |
| | Brazil - 0.1% |
| | Brazilian Government International Bond | |
| 3,660,000 | 3.75%, 09/12/2031 | 3,339,750 |
| 2,135,000 | 3.88%, 06/12/2030 | 2,003,505 |
| 5,285,000 | 4.75%, 01/14/2050 | 4,514,394 |
| 11,904,000 | 5.00%, 01/27/2045 | 10,652,890 |
| 1,520,000 | 5.63%, 02/21/2047 | 1,462,073 |
| | | | 21,972,612 |
| | Bulgaria - 0.0% |
| EUR 825,000 | Bulgaria Government International Bond 1.38%, 09/23/2050(3) | 892,205 |
| | Chile - 0.0% |
| $ 1,635,000 | Chile Government International Bond 2.55%, 07/27/2033 | 1,581,356 |
| | Colombia - 0.5% |
| | Colombia Government International Bond | |
| 8,030,000 | 3.00%, 01/30/2030 | 7,574,860 |
| 10,285,000 | 3.13%, 04/15/2031 | 9,626,863 |
| 3,435,000 | 3.25%, 04/22/2032 | 3,207,775 |
| 22,025,000 | 3.88%, 04/25/2027 | 22,875,165 |
| 620,000 | 3.88%, 02/15/2061 | 506,329 |
| 9,110,000 | 4.13%, 05/15/2051 | 7,950,570 |
| 17,210,000 | 5.00%, 06/15/2045 | 16,944,966 |
| 3,115,000 | 5.63%, 02/26/2044 | 3,283,335 |
| 2,285,000 | 6.13%, 01/18/2041 | 2,530,980 |
| | | | 74,500,843 |
| | Croatia - 0.2% |
| | Croatia Government International Bond | |
| EUR 8,465,000 | 1.13%, 06/19/2029(3) | 10,026,165 |
| 2,590,000 | 1.13%, 03/04/2033(3) | 2,955,914 |
| 3,595,000 | 1.50%, 06/17/2031(3) | 4,314,688 |
| 5,075,000 | 1.75%, 03/04/2041(3) | 5,955,873 |
| | | | 23,252,640 |
| | Dominican Republic - 0.1% |
| | Dominican Republic International Bond | |
| $ 791,000 | 4.88%, 09/23/2032(1) | 799,899 |
| 4,510,000 | 4.88%, 09/23/2032(3) | 4,560,737 |
| 695,000 | 5.50%, 01/27/2025(3) | 754,082 |
| 2,160,000 | 6.40%, 06/05/2049(3) | 2,297,182 |
| 410,000 | 6.40%, 06/05/2049(1) | 436,039 |
| 150,000 | 6.50%, 02/15/2048(3) | 160,351 |
| 345,000 | 6.88%, 01/29/2026(3) | 394,166 |
| | | | 9,402,456 |
| | Ecuador - 0.0% |
| 841,288 | Ecuador Government International Bond 1.00%, 07/31/2035(3)(10) | 554,207 |
| | Egypt - 0.0% |
| | Egypt Government International Bond | |
| EUR 240,000 | 5.63%, 04/16/2030(3) | 255,017 |
| 250,000 | 5.63%, 04/16/2030(1) | 265,643 |
| $ 285,000 | 6.59%, 02/21/2028(3) | 279,534 |
| 2,280,000 | 7.50%, 02/16/2061(1) | 1,932,300 |
The accompanying notes are an integral part of these financial statements.
The Hartford Balanced Income Fund
Schedule of Investments – (continued)
October 31, 2021
| Shares or Principal Amount | | Market Value† |
| FOREIGN GOVERNMENT OBLIGATIONS - 4.1% - (continued) |
| | Egypt - 0.0% - (continued) |
| $ 720,000 | 7.50%, 02/16/2061(3) | $ 610,200 |
| 470,000 | 7.60%, 03/01/2029(3) | 472,350 |
| 235,000 | 7.63%, 05/29/2032(3) | 227,210 |
| 210,000 | 7.90%, 02/21/2048(3) | 184,707 |
| 2,030,000 | 8.50%, 01/31/2047(3) | 1,875,639 |
| | | | 6,102,600 |
| | Ethiopia - 0.0% |
| 1,543,000 | Ethiopia International Bond 6.63%, 12/11/2024(3) | 1,252,138 |
| | Gabon - 0.1% |
| | Gabon Government International Bond | |
| 1,323,480 | 6.38%, 12/12/2024(3) | 1,402,994 |
| 750,000 | 6.63%, 02/06/2031(3) | 747,585 |
| 515,000 | 6.63%, 02/06/2031(1) | 513,342 |
| 4,400,000 | 6.95%, 06/16/2025(3) | 4,728,328 |
| | | | 7,392,249 |
| | Honduras - 0.0% |
| | Honduras Government International Bond | |
| 1,225,000 | 5.63%, 06/24/2030(1) | 1,228,063 |
| 230,000 | 5.63%, 06/24/2030(3) | 230,575 |
| | | | 1,458,638 |
| | Hungary - 0.1% |
| | Hungary Government International Bond | |
| EUR 315,000 | 1.50%, 11/17/2050(3) | 334,987 |
| 6,440,000 | 1.63%, 04/28/2032(3) | 7,735,114 |
| 2,460,000 | 1.75%, 06/05/2035(3) | 2,948,717 |
| $ 1,645,000 | 2.13%, 09/22/2031(1) | 1,604,684 |
| 1,395,000 | 3.13%, 09/21/2051(1) | 1,357,031 |
| | | | 13,980,533 |
| | Indonesia - 0.2% |
| | Indonesia Government International Bond | |
| EUR 460,000 | 1.10%, 03/12/2033 | 509,722 |
| $ 7,965,000 | 4.63%, 04/15/2043(3) | 9,071,947 |
| 980,000 | 4.75%, 07/18/2047(3) | 1,159,823 |
| 8,294,000 | 5.13%, 01/15/2045(3) | 10,074,932 |
| 1,411,000 | 5.25%, 01/08/2047(3) | 1,774,769 |
| | | | 22,591,193 |
| | Ivory Coast - 0.1% |
| | Ivory Coast Government International Bond | |
| EUR 1,540,000 | 4.88%, 01/30/2032(3) | 1,737,724 |
| 356,000 | 5.25%, 03/22/2030(1) | 422,757 |
| 250,000 | 5.25%, 03/22/2030(3) | 296,880 |
| 1,680,000 | 5.88%, 10/17/2031(3) | 2,014,131 |
| 295,000 | 6.63%, 03/22/2048(3) | 339,219 |
| 1,430,000 | 6.88%, 10/17/2040(3) | 1,733,221 |
| | | | 6,543,932 |
| | Jordan - 0.0% |
| | Jordan Government International Bond | |
| $ 1,235,000 | 4.95%, 07/07/2025(1) | 1,287,438 |
| 1,885,000 | 5.85%, 07/07/2030(3) | 1,944,566 |
| 2,425,000 | 6.13%, 01/29/2026(3) | 2,615,969 |
| | | | 5,847,973 |
| Shares or Principal Amount | | Market Value† |
| FOREIGN GOVERNMENT OBLIGATIONS - 4.1% - (continued) |
| | Macedonia - 0.0% |
| | North Macedonia Government International Bond | |
| EUR 1,480,000 | 1.63%, 03/10/2028(1) | $ 1,653,600 |
| 1,455,000 | 1.63%, 03/10/2028(3) | 1,625,667 |
| 2,045,000 | 3.68%, 06/03/2026(1) | 2,563,727 |
| | | | 5,842,994 |
| | Mexico - 0.4% |
| | Mexico Government International Bond | |
| 730,000 | 1.45%, 10/25/2033 | 781,264 |
| 955,000 | 2.13%, 10/25/2051 | 916,105 |
| 240,000 | 2.25%, 08/12/2036 | 267,988 |
| $ 200,000 | 4.35%, 01/15/2047 | 206,128 |
| 30,708,000 | 4.50%, 01/31/2050 | 32,248,620 |
| 5,507,000 | 4.60%, 01/23/2046 | 5,877,621 |
| 2,075,000 | 4.75%, 04/27/2032 | 2,327,216 |
| 3,528,000 | 4.75%, 03/08/2044 | 3,865,559 |
| 16,835,000 | 5.00%, 04/27/2051 | 18,890,049 |
| | | | 65,380,550 |
| | Morocco - 0.0% |
| | Morocco Government International Bond | |
| EUR 2,288,000 | 1.50%, 11/27/2031(3) | 2,423,071 |
| 910,000 | 2.00%, 09/30/2030(3) | 1,015,512 |
| | | | 3,438,583 |
| | Oman - 0.1% |
| | Oman Government International Bond | |
| $ 3,140,000 | 5.38%, 03/08/2027(3) | 3,297,276 |
| 3,675,000 | 5.63%, 01/17/2028(3) | 3,863,344 |
| 12,190,000 | 6.25%, 01/25/2031(1) | 13,180,438 |
| 200,000 | 6.25%, 01/25/2031(3) | 216,250 |
| 685,000 | 6.50%, 03/08/2047(3) | 675,777 |
| 400,000 | 7.00%, 01/25/2051(1) | 416,616 |
| | | | 21,649,701 |
| | Pakistan - 0.0% |
| 935,000 | Pakistan Government International Bond 6.88%, 12/05/2027(3) | 955,039 |
| | Panama - 0.1% |
| | Panama Government International Bond | |
| 1,910,000 | 3.16%, 01/23/2030 | 1,972,667 |
| 2,243,000 | 4.30%, 04/29/2053 | 2,402,320 |
| 475,000 | 4.50%, 04/16/2050 | 523,958 |
| 5,585,000 | 4.50%, 04/01/2056 | 6,132,163 |
| 3,615,000 | Panama Notas del Tesoro 3.75%, 04/17/2026 | 3,837,793 |
| | | | 14,868,901 |
| | Peru - 0.1% |
| | Peruvian Government International Bond | |
| 6,140,000 | 2.78%, 01/23/2031 | 6,119,431 |
| 2,315,000 | 3.00%, 01/15/2034 | 2,289,535 |
| 4,409,000 | 4.13%, 08/25/2027 | 4,843,551 |
| 751,000 | 7.35%, 07/21/2025 | 901,140 |
| | | | 14,153,657 |
| | Philippines - 0.0% |
| 4,695,000 | Philippine Government International Bond 3.95%, 01/20/2040 | 5,195,819 |
| | Qatar - 0.0% |
| | Qatar Government International Bond | |
| 600,000 | 3.40%, 04/16/2025(3) | 642,000 |
The accompanying notes are an integral part of these financial statements.
The Hartford Balanced Income Fund
Schedule of Investments – (continued)
October 31, 2021
| Shares or Principal Amount | | Market Value† |
| FOREIGN GOVERNMENT OBLIGATIONS - 4.1% - (continued) |
| | Qatar - 0.0% - (continued) |
| $ 750,000 | 4.82%, 03/14/2049(1) | $ 964,200 |
| 750,000 | 5.10%, 04/23/2048(1) | 995,034 |
| | | | 2,601,234 |
| | Romania - 0.1% |
| | Romanian Government International Bond | |
| EUR 1,165,000 | 1.38%, 12/02/2029(1) | 1,297,573 |
| 1,470,000 | 1.38%, 12/02/2029(3) | 1,637,281 |
| 680,000 | 1.75%, 07/13/2030(1) | 751,665 |
| 3,585,000 | 2.00%, 01/28/2032(3) | 3,951,709 |
| 445,000 | 2.00%, 01/28/2032(1) | 490,519 |
| 2,005,000 | 2.00%, 04/14/2033(1) | 2,167,124 |
| 855,000 | 2.63%, 12/02/2040(1) | 904,368 |
| 430,000 | 2.63%, 12/02/2040(3) | 454,828 |
| 5,270,000 | 2.75%, 04/14/2041(1) | 5,597,914 |
| 1,400,000 | 3.38%, 02/08/2038(3) | 1,646,003 |
| 2,336,000 | 3.88%, 10/29/2035(3) | 2,937,718 |
| | | | 21,836,702 |
| | Russia - 0.5% |
| | Russian Foreign Bond - Eurobond | |
| $ 2,200,000 | 4.25%, 06/23/2027(3) | 2,437,112 |
| 3,400,000 | 4.38%, 03/21/2029(1) | 3,831,528 |
| 5,400,000 | 4.38%, 03/21/2029(3) | 6,085,368 |
| 2,200,000 | 4.75%, 05/27/2026(3) | 2,466,750 |
| 40,000,000 | 5.10%, 03/28/2035(3) | 47,851,280 |
| 4,200,000 | 5.25%, 06/23/2047(3) | 5,346,180 |
| 3,800,000 | 5.63%, 04/04/2042(3) | 4,930,500 |
| | | | 72,948,718 |
| | Saudi Arabia - 0.1% |
| 8,959,000 | Saudi Government International Bond 2.25%, 02/02/2033(1) | 8,643,858 |
| | Senegal - 0.1% |
| | Senegal Government International Bond | |
| EUR 1,795,000 | 5.38%, 06/08/2037(1) | 1,992,019 |
| $ 1,875,000 | 6.25%, 05/23/2033(3) | 1,932,727 |
| 218,000 | 6.75%, 03/13/2048(1) | 215,834 |
| 2,465,000 | 6.75%, 03/13/2048(3) | 2,440,503 |
| | | | 6,581,083 |
| | Serbia - 0.1% |
| | Serbia International Bond | |
| EUR 586,000 | 1.50%, 06/26/2029(1) | 663,021 |
| 4,670,000 | 1.50%, 06/26/2029(3) | 5,283,801 |
| 655,000 | 1.65%, 03/03/2033(1) | 710,803 |
| 1,416,000 | 3.13%, 05/15/2027(1) | 1,775,573 |
| 3,373,000 | 3.13%, 05/15/2027(3) | 4,229,527 |
| | | | 12,662,725 |
| | South Africa - 0.0% |
| $ 5,680,000 | Republic of South Africa Government International Bond 5.75%, 09/30/2049 | 5,418,606 |
| | Turkey - 0.4% |
| | Turkey Government International Bond | |
| 8,995,000 | 4.88%, 10/09/2026 | 8,523,338 |
| 9,380,000 | 4.88%, 04/16/2043 | 7,281,506 |
| 14,840,000 | 5.13%, 02/17/2028 | 13,919,772 |
| 27,035,000 | 5.75%, 05/11/2047 | 22,236,287 |
| Shares or Principal Amount | | Market Value† |
| FOREIGN GOVERNMENT OBLIGATIONS - 4.1% - (continued) |
| | Turkey - 0.4% - (continued) |
| $ 405,000 | 5.95%, 01/15/2031 | $ 378,456 |
| 9,855,000 | 6.00%, 01/14/2041 | 8,497,967 |
| | | | 60,837,326 |
| | Ukraine - 0.3% |
| | Ukraine Government International Bond | |
| 8,500,000 | 6.88%, 05/21/2029(1) | 8,657,930 |
| 2,265,000 | 6.88%, 05/21/2029(3) | 2,307,084 |
| 6,430,000 | 7.25%, 03/15/2033(1) | 6,544,698 |
| 2,890,000 | 7.25%, 03/15/2033(3) | 2,941,552 |
| 4,330,000 | 7.38%, 09/25/2032(3) | 4,453,318 |
| 4,500,000 | 7.75%, 09/01/2022(3) | 4,662,225 |
| 155,000 | 7.75%, 09/01/2026(1) | 167,060 |
| 5,190,000 | 7.75%, 09/01/2026(3) | 5,593,803 |
| 11,575,000 | 7.75%, 09/01/2027(3) | 12,470,766 |
| | | | 47,798,436 |
| | United Arab Emirates - 0.0% |
| | Abu Dhabi Government International Bond | |
| 1,200,000 | 3.00%, 09/15/2051(1) | 1,185,120 |
| 225,000 | 3.13%, 09/30/2049(3) | 226,602 |
| 3,860,000 | Emirate of Dubai Government International Bonds 3.90%, 09/09/2050(3) | 3,642,334 |
| 370,000 | Finance Department Government of Sharjah 3.63%, 03/10/2033(3) | 363,540 |
| | | | 5,417,596 |
| | Venezuela - 0.0% |
| | Venezuela Government International Bond | |
| 1,015,000 | 7.00%, 12/01/2018(3)(9) | 97,745 |
| 3,170,000 | 7.00%, 03/31/2038(3)(9) | 324,925 |
| 4,085,000 | 7.65%, 04/21/2025(3)(9) | 393,386 |
| 4,765,000 | 7.75%, 10/13/2019(3)(9) | 458,870 |
| 11,205,000 | 8.25%, 10/13/2024(3)(9) | 1,079,041 |
| 11,937,200 | 9.00%, 05/07/2023(3)(9) | 1,149,552 |
| 12,825,000 | 9.25%, 05/07/2028(3)(9) | 1,235,047 |
| | | | 4,738,566 |
| | Total Foreign Government Obligations
(cost $688,321,342) | | $ 650,174,940 |
| MUNICIPAL BONDS - 0.2% |
| | Higher Education - 0.1% |
| 12,000,000 | Rutgers The State University of New Jersey 3.92%, 05/01/2119 | $ 14,089,595 |
| 5,660,000 | University of California 1.32%, 05/15/2027 | 5,572,071 |
| | | | 19,661,666 |
| | Transportation - 0.1% |
| 5,015,000 | New York State Thruway Auth Rev 2.90%, 01/01/2035 | 5,237,327 |
| 1,510,000 | Port Auth of New York & New Jersey Rev 4.46%, 10/01/2062 | 2,069,310 |
| | | | 7,306,637 |
| | Total Municipal Bonds
(cost $24,463,021) | | $ 26,968,303 |
The accompanying notes are an integral part of these financial statements.
The Hartford Balanced Income Fund
Schedule of Investments – (continued)
October 31, 2021
| Shares or Principal Amount | | Market Value† |
| SENIOR FLOATING RATE INTERESTS - 0.1%(11) |
| | Auto Parts & Equipment - 0.0% |
| $ 1,348,106 | Clarios Global L.P. 3.34%, 04/30/2026, 1 mo. USD LIBOR + 3.250%(7) | $ 1,339,115 |
| | Entertainment - 0.1% |
| | Crown Finance U.S., Inc. | |
| 5,904,266 | 3.50%, 02/28/2025, 1 mo. USD LIBOR + 2.500%(7)(12) | 4,859,211 |
| 255,397 | 9.25%, 05/23/2024, 1 mo. USD LIBOR + 8.250%(7) | 273,913 |
| | | | 5,133,124 |
| | Insurance - 0.0% |
| 2,730,638 | Asurion LLC 3.09%, 11/03/2024, 1 mo. USD LIBOR + 3.000%(7) | 2,709,312 |
| 1,649,588 | Hub International Ltd. 2.87%, 04/25/2025, 1 mo. USD LIBOR + 2.750%(7) | 1,630,469 |
| | | | 4,339,781 |
| | Software - 0.0% |
| 3,136,043 | Dun & Bradstreet Corp. 3.34%, 02/06/2026, 1 mo. USD LIBOR + 3.250%(7) | 3,122,056 |
| | Total Senior Floating Rate Interests
(cost $14,184,224) | $ 13,934,076 |
| U.S. GOVERNMENT SECURITIES - 1.4% |
| | U.S. Treasury Securities - 1.4% |
| | U.S. Treasury Bonds - 0.6% |
| 4,055,000 | 1.13%, 08/15/2040(13) | $ 3,493,161 |
| 17,000,000 | 1.75%, 08/15/2041 | 16,335,937 |
| 20,160,000 | 2.00%, 08/15/2051 | 20,427,750 |
| 5,890,000 | 4.25%, 11/15/2040(13) | 8,079,884 |
| 5,800,000 | 4.38%, 02/15/2038(14) | 7,973,867 |
| 31,130,000 | 6.25%, 05/15/2030 | 43,033,577 |
| | | | 99,344,176 |
| | U.S. Treasury Notes - 0.8% |
| 24,450,000 | 0.25%, 09/30/2025 | 23,734,647 |
| 24,660,000 | 0.63%, 10/15/2024 | 24,563,672 |
| 47,500,000 | 0.88%, 09/30/2026 | 46,813,477 |
| 7,825,000 | 1.25%, 09/30/2028 | 7,719,852 |
| 455,000 | 1.25%, 08/15/2031 | 442,416 |
| 28,385,000 | 1.63%, 05/15/2031 | 28,597,887 |
| | | | 131,871,951 |
| | Total U.S. Government Securities
(cost $229,607,835) | | $ 231,216,127 |
| COMMON STOCKS - 46.9% |
| | Banks - 4.7% |
| 4,178,959 | Bank of America Corp. | $ 199,670,661 |
| 1,599,244 | JP Morgan Chase & Co. | 271,695,563 |
| 671,668 | PNC Financial Services Group, Inc. | 141,742,098 |
| 2,092,733 | Truist Financial Corp. | 132,825,764 |
| | | | 745,934,086 |
| | Capital Goods - 5.9% |
| 200,609 | Caterpillar, Inc. | 40,926,242 |
| 1,205,037 | Eaton Corp. plc | 198,541,896 |
| 679,709 | General Dynamics Corp. | 137,811,000 |
| 526,398 | Honeywell International, Inc. | 115,081,131 |
| 1,483,569 | Johnson Controls International plc | 108,849,458 |
| Shares or Principal Amount | | Market Value† |
| COMMON STOCKS - 46.9% - (continued) |
| | Capital Goods - 5.9% - (continued) |
| 306,300 | L3Harris Technologies, Inc. | $ 70,614,402 |
| 399,197 | Lockheed Martin Corp. | 132,661,147 |
| 1,505,433 | Raytheon Technologies Corp. | 133,772,776 |
| | | | 938,258,052 |
| | Commercial & Professional Services - 0.2% |
| 235,617 | Waste Management, Inc. | 37,752,912 |
| | Consumer Services - 0.7% |
| 204,559 | Darden Restaurants, Inc. | 29,485,134 |
| 336,012 | McDonald's Corp. | 82,507,747 |
| | | | 111,992,881 |
| | Diversified Financials - 2.9% |
| 1,039,667 | Ares Management Corp. Class A | 88,101,382 |
| 170,864 | BlackRock, Inc. | 161,203,349 |
| 2,036,612 | Morgan Stanley | 209,322,981 |
| | | | 458,627,712 |
| | Energy - 2.7% |
| 2,021,369 | ConocoPhillips | 150,571,777 |
| 3,816 | Foresight Energy LLC | 51,516 |
| 376,904 | Phillips 66 | 28,184,881 |
| 778,560 | Pioneer Natural Resources Co. | 145,575,149 |
| 1,768,619 | TC Energy Corp. | 95,676,343 |
| | | | 420,059,666 |
| | Food & Staples Retailing - 0.1% |
| 274,213 | Sysco Corp. | 21,086,980 |
| | Food, Beverage & Tobacco - 4.3% |
| 1,589,700 | Archer-Daniels-Midland Co. | 102,122,328 |
| 984,233 | Kellogg Co. | 60,333,483 |
| 2,774,384 | Mondelez International, Inc. Class A | 168,516,084 |
| 542,533 | Nestle S.A. ADR | 71,516,700 |
| 574,835 | PepsiCo., Inc. | 92,893,336 |
| 2,042,645 | Philip Morris International, Inc. | 193,111,658 |
| | | | 688,493,589 |
| | Health Care Equipment & Services - 2.3% |
| 964,710 | CVS Health Corp. | 86,129,309 |
| 1,369,260 | Koninklijke Philips N.V. ADR | 64,697,535 |
| 1,747,620 | Medtronic plc | 209,469,733 |
| | | | 360,296,577 |
| | Household & Personal Products - 2.0% |
| 588,471 | Kimberly-Clark Corp. | 76,201,110 |
| 1,161,736 | Procter & Gamble Co. | 166,116,630 |
| 1,475,608 | Unilever plc ADR | 79,063,077 |
| | | | 321,380,817 |
| | Insurance - 3.2% |
| 1,022,932 | Chubb Ltd. | 199,860,454 |
| 3,136,493 | MetLife, Inc. | 196,971,760 |
| 1,237,775 | Progressive Corp. | 117,440,092 |
| | | | 514,272,306 |
| | Materials - 0.8% |
| 891,235 | LyondellBasell Industries N.V. Class A | 82,724,433 |
| 549,649 | Rio Tinto plc ADR(4) | 34,776,292 |
| | | | 117,500,725 |
| | Media & Entertainment - 1.3% |
| 3,999,803 | Comcast Corp. Class A | 205,709,868 |
| | Pharmaceuticals, Biotechnology & Life Sciences - 5.0% |
| 1,865,259 | AstraZeneca plc ADR | 116,354,856 |
The accompanying notes are an integral part of these financial statements.
The Hartford Balanced Income Fund
Schedule of Investments – (continued)
October 31, 2021
| Shares or Principal Amount | | Market Value† |
| COMMON STOCKS - 46.9% - (continued) |
| | Pharmaceuticals, Biotechnology & Life Sciences - 5.0% -
(continued) |
| 366,539 | Eli Lilly & Co. | $ 93,379,476 |
| 1,467,971 | Johnson & Johnson | 239,103,116 |
| 1,974,165 | Merck & Co., Inc. | 173,825,228 |
| 381,530 | Novartis AG | 31,557,378 |
| 3,231,690 | Pfizer, Inc. | 141,354,121 |
| | | | 795,574,175 |
| | Real Estate - 1.4% |
| 783,522 | Crown Castle International Corp. REIT | 141,269,016 |
| 1,625,269 | Gaming and Leisure Properties, Inc. REIT | 78,809,294 |
| | | | 220,078,310 |
| | Retailing - 1.5% |
| 632,123 | Home Depot, Inc. | 234,985,404 |
| | Semiconductors & Semiconductor Equipment - 1.2% |
| 641,776 | Analog Devices, Inc. | 111,341,718 |
| 429,300 | Texas Instruments, Inc. | 80,485,164 |
| | | | 191,826,882 |
| | Technology Hardware & Equipment - 2.2% |
| 4,493,036 | Cisco Systems, Inc. | 251,475,225 |
| 2,661,575 | Corning, Inc. | 94,672,223 |
| | | | 346,147,448 |
| | Telecommunication Services - 0.5% |
| 70,071 | Frontier Communications Parent, Inc.* | 2,169,398 |
| 1,508,109 | Verizon Communications, Inc. | 79,914,696 |
| | | | 82,084,094 |
| | Transportation - 0.5% |
| 320,233 | Union Pacific Corp. | 77,304,246 |
| | Utilities - 3.5% |
| 938,953 | American Electric Power Co., Inc. | 79,538,709 |
| 1,391,968 | Dominion Energy, Inc. | 105,692,130 |
| 292,427 | DTE Energy Co. | 33,146,601 |
| 880,887 | Duke Energy Corp. | 89,859,283 |
| 481,670 | Entergy Corp. | 49,621,643 |
| 2,049,028 | Exelon Corp. | 108,987,799 |
| 725,314 | Sempra Energy | 92,571,826 |
| | | | 559,417,991 |
| | Total Common Stocks
(cost $5,261,675,585) | | $ 7,448,784,721 |
| ESCROWS - 0.0%(15) |
| | Media & Entertainment - 0.0% |
| 3,800,000 | Scripps Escrow, Inc. Expires 07/15/2027*(1) | $ 3,857,000 |
| | Pharmaceuticals, Biotechnology & Life Sciences - 0.0% |
| 1,030,000 | Grifols Escrow Issuer S.A. Expires 10/15/2028*(1) | 1,045,450 |
| | Retailing - 0.0% |
| 760,000 | 99 Escrow Issuer, Inc. Expires 01/15/2026*(1)(4) | 684,000 |
| | Total Escrows
(cost $5,624,893) | | $ 5,586,450 |
| Shares or Principal Amount | | Market Value† |
| PREFERRED STOCKS - 0.3% |
| | Banks - 0.1% |
| 770,000 | Bank of America Corp., 4.13%*(4)(6) | $ 19,280,800 |
| | Diversified Financials - 0.2% |
| 900,000 | Charles Schwab Corp., 4.45%*(6) | 23,706,000 |
| | Total Preferred Stocks
(cost $41,750,000) | | $ 42,986,800 |
| | Total Long-Term Investments
(Cost $12,696,122,943) | | $ 15,132,136,575 |
| SHORT-TERM INVESTMENTS - 3.9% |
| | Repurchase Agreements - 3.4% |
| $ 538,971,007 | Fixed Income Clearing Corp. Repurchase Agreement dated 10/29/2021 at 0.010%, due on 11/01/2021 with a maturity value of $538,971,456; collateralized by U.S. Treasury Bond at 1.875%, maturing 02/15/2041, with a market value of $549,750,499 | $ 538,971,007 |
| | Securities Lending Collateral - 0.5% |
| 479,434 | Fidelity Investments Money Market Funds, Government Portfolio, Institutional Class, 0.01%(16) | 479,434 |
| 73,603,066 | Goldman Sachs Financial Square Funds, Government Fund, Institutional Class, 0.03%(16) | 73,603,066 |
| 5,284,157 | Invesco Government & Agency Portfolio, Institutional Class, 0.03%(16) | 5,284,157 |
| | | | 79,366,657 |
| | Total Short-Term Investments
(cost $618,337,664) | $ 618,337,664 |
| | Total Investments
(cost $13,314,460,607) | 99.1% | $ 15,750,474,239 |
| | Other Assets and Liabilities | 0.9% | 145,432,397 |
| | Total Net Assets | 100.0% | $ 15,895,906,636 |
| Note: | Percentage of investments as shown is the ratio of the total market value to total net assets. |
| | Prices of foreign equities that are principally traded on certain foreign markets will generally be adjusted daily pursuant to a fair value pricing service approved by the Board of Directors in order to reflect an adjustment for factors occurring after the close of certain foreign markets but before the close of the New York Stock Exchange. |
| | The Fund may refer to any one or more of the industry classifications used by one or more widely recognized market indices, ratings group and/or as defined by Fund management. Industry classifications may not be identical across all security types. |
| | Equity industry classifications used in this report are the Global Industry Classification Standard, which was developed by and is the exclusive property and service mark of MSCI, Inc. and Standard & Poor’s. |
| | For Fund compliance purposes, the Fund may not use the same classification system. These classifications are used for financial reporting purposes. |
The accompanying notes are an integral part of these financial statements.
The Hartford Balanced Income Fund
Schedule of Investments – (continued)
October 31, 2021
See “Glossary” for abbreviation descriptions.
| * | Non-income producing. |
| (1) | Security was purchased pursuant to Rule 144A under the Securities Act of 1933 and may be sold in transactions that are exempt from registration (typically only to qualified institutional buyers) or in a public offering registered under the Securities Act of 1933. At October 31, 2021, the aggregate value of these securities was $1,705,917,321, representing 10.7% of net assets. |
| (2) | Security is a zero-coupon bond. |
| (3) | Security is exempt from registration under Regulation S under the Securities Act of 1933, which exempts from registration securities offered and sold outside of the United States. Security may not be offered or sold in the United States except pursuant to an exemption from, or in a transaction not subject to, the registration requirements of the Securities Act of 1933. At October 31, 2021, the aggregate value of these securities was $334,380,730, representing 2.1% of net assets. |
| (4) | Represents entire or partial securities on loan. See Note 8 in the accompanying Notes to Financial Statements for securities lending information. |
| (5) | Fixed to variable rate investment. The rate shown reflects the fixed rate in effect at October 31, 2021. Rate will reset at a future date. Base lending rates may be subject to a floor or cap. |
| (6) | Perpetual maturity security. Maturity date shown is the next call date or final legal maturity date, whichever comes first. |
| (7) | Variable rate securities; the rate reported is the coupon rate in effect at October 31, 2021. Base lending rates may be subject to a floor or cap. |
| (8) | Security has the ability to pay in kind (“PIK”) or pay income in cash. When applicable, separate rates of such payments are disclosed. |
| (9) | Non-income producing. For long-term debt securities, items identified are in default as to payment of interest and/or principal. |
| (10) | Security is a “step-up” bond where coupon increases or steps up at a predetermined date. Rate shown is current coupon rate. |
| (11) | Senior floating rate interests generally pay interest rates which are periodically adjusted by reference to a base short-term, floating lending rate plus a premium. The base lending rates are primarily the LIBOR, and secondarily the prime rate offered by one or more major United States banks (the "Prime Rate") and the certificate of deposit rate or other base lending rates used by commercial lenders. Senior floating rate interests often require prepayments from excess cash flows or permit the borrower to repay at its election. The rate at which the borrower repays cannot be predicted with accuracy. As a result, the actual remaining maturity may be substantially less than the stated maturities shown. Base lending rates may be subject to a floor or cap. Unless otherwise noted, the interest rate disclosed for these securities represents the rate in effect as of October 31, 2021. |
| (12) | This security, or a portion of this security, has unfunded loan commitments. As of October 31, 2021, the aggregate value of the unfunded commitment was $4,859,211, which rounds to 0.0% of total net assets. |
| (13) | All, or a portion of the security, was pledged as collateral in connection with futures contracts. As of October 31, 2021, the market value of securities pledged was $10,405,786. |
| (14) | All, or a portion of the security, was pledged as collateral in connection with centrally cleared swap contracts. As of October 31, 2021, the market value of securities pledged was $7,973,867. |
| (15) | Share amount represents shares of the issuer previously held that resulted in receipt of the escrow. |
| (16) | Current yield as of period end. |
| Futures Contracts Outstanding at October 31, 2021 |
| Description | | Number of
Contracts | | Expiration
Date | | Current
Notional
Amount | | Value and
Unrealized
Appreciation/
(Depreciation) |
| Long position contracts: |
| Euro-Schatz Future | | 1 | | 12/08/2021 | | $ 129,426 | | $ (388) |
| U.S. Treasury 2-Year Note Future | | 1,078 | | 12/31/2021 | | 236,351,500 | | (1,004,258) |
| U.S. Treasury 5-Year Note Future | | 2,786 | | 12/31/2021 | | 339,195,500 | | (4,759,664) |
| U.S. Treasury Long Bond Future | | 1,286 | | 12/21/2021 | | 206,845,062 | | (3,007,057) |
| U.S. Treasury Ultra Bond Future | | 869 | | 12/21/2021 | | 170,677,031 | | (377,761) |
| Total | | | | | | | | $ (9,149,128) |
| Short position contracts: |
| Euro-BOBL Future | | 11 | | 12/08/2021 | | $ 1,700,892 | | $ 26,126 |
| Euro-BUND Future | | 323 | | 12/08/2021 | | 62,773,983 | | 1,611,744 |
| Euro-BUXL 30-Year Bond Future | | 69 | | 12/08/2021 | | 16,669,079 | | 73,266 |
| U.S. Treasury 10-Year Note Future | | 4,423 | | 12/21/2021 | | 578,099,922 | | 11,481,888 |
| U.S. Treasury 10-Year Ultra Future | | 160 | | 12/21/2021 | | 23,205,000 | | 268,488 |
| Total | | | | | | | | $ 13,461,512 |
| Total futures contracts | | $ 4,312,384 |
The accompanying notes are an integral part of these financial statements.
The Hartford Balanced Income Fund
Schedule of Investments – (continued)
October 31, 2021
| OTC Credit Default Swap Contracts Outstanding at October 31, 2021 |
| Reference Entity | | Counter-
party | | Notional
Amount | | (Pay)/Receive
Fixed Rate | | Expiration
Date | | Periodic
Payment
Frequency | | Upfront
Premiums
Paid | | Upfront
Premiums
Received | | Market
Value† | | Unrealized
Appreciation/
(Depreciation) |
| Credit default swaps on indices: |
| Sell protection: |
| CDX.NA.HY.34.V1 | | GSC | | USD | 430,000 | | 5.00% | | 06/20/2025 | | Quarterly | | $ 26,329 | | $ — | | $ 50,113 | | $ 23,784 |
| Total OTC credit default swap contracts | | $ 26,329 | | $ — | | $ 50,113 | | $ 23,784 |
| Centrally Cleared Credit Default Swap Contracts Outstanding at October 31, 2021 |
| Reference Entity | | Notional
Amount(1) | | (Pay)/Receive
Fixed Rate | | Expiration
Date | | Periodic
Payment
Frequency | | Cost Basis | | Value † | | Unrealized
Appreciation/
(Depreciation) |
| Credit default swaps on indices: |
| Buy protection: |
| CDX.EM.36.V1 | | USD | 20,300,000 | | (1.00%) | | 12/20/2026 | | Quarterly | | $ 666,644 | | $ 819,877 | | $ 153,233 |
| Sell protection: |
| CDX.NA.HY.33.V12 | | USD | 65,116,850 | | 5.00% | | 12/20/2024 | | Quarterly | | $ 1,171,308 | | $ 5,842,132 | | $ 4,670,824 |
| CDX.NA.HY.35.V1 | | USD | 445,000 | | 5.00% | | 12/20/2025 | | Quarterly | | 30,466 | | (36,594) | | (67,060) |
| CDX.NA.HY.36.V1 | | USD | 915,000 | | 5.00% | | 06/20/2026 | | Quarterly | | 77,840 | | 86,467 | | 8,627 |
| CDX.NA.IG.35.V1 | | USD | 117,725,000 | | 1.00% | | 12/20/2025 | | Quarterly | | 2,332,019 | | 2,949,393 | | 617,374 |
| Total | | $ 3,611,633 | | $ 8,841,398 | | $ 5,229,765 |
| Credit default swaps on single-name issues: |
| Buy protection: |
| United Mexican States | | USD | 12,955,000 | | (1.00%) | | 12/20/2026 | | Quarterly | | $ (38,554) | | $ 5,273 | | $ 43,827 |
| Total | | $ (38,554) | | $ 5,273 | | $ 43,827 |
| Total centrally cleared credit default swap contracts | | $ 4,239,723 | | $ 9,666,548 | | $ 5,426,825 |
| (1) | The maximum potential amount the Fund could be required to pay as a seller of credit protection or receive as a buyer of credit protection if a credit event occurs as defined under the terms of that particular swap agreement. |
| Foreign Currency Contracts Outstanding at October 31, 2021 |
Amount and Description of
Currency to be Purchased | | Amount and Description of
Currency to be Sold | | Counterparty | | Settlement
Date | | Appreciation/
(Depreciation) |
| 14,900,000 | EGP | | 927,424 | USD | | JPM | | 12/15/2021 | | $ 9,706 |
| 209,000 | EUR | | 241,931 | USD | | RBC | | 12/15/2021 | | (51) |
| 700,000 | EUR | | 812,687 | USD | | WEST | | 12/15/2021 | | (2,564) |
| 3,219,000 | EUR | | 3,728,307 | USD | | SSG | | 12/15/2021 | | (2,896) |
| 1,129,000 | EUR | | 1,309,899 | USD | | CIBC | | 12/15/2021 | | (3,285) |
| 702,000 | EUR | | 822,700 | USD | | BNP | | 12/15/2021 | | (10,262) |
| 1,481,000 | EUR | | 1,728,720 | USD | | MSC | | 12/15/2021 | | (14,731) |
| 3,925,000 | EUR | | 4,576,387 | USD | | BCLY | | 12/15/2021 | | (33,910) |
| 24,191,207 | USD | | 20,831,000 | EUR | | DEUT | | 11/30/2021 | | 96,533 |
| 106,338,005 | USD | | 89,568,000 | EUR | | BCLY | | 12/15/2021 | | 2,679,255 |
| 2,131,961 | USD | | 1,825,000 | EUR | | MSC | | 12/15/2021 | | 19,853 |
| 1,214,636 | USD | | 1,039,000 | EUR | | BMO | | 12/15/2021 | | 12,181 |
| 64,069 | USD | | 55,000 | EUR | | CBA | | 12/15/2021 | | 416 |
| 5,885 | USD | | 5,000 | EUR | | CBK | | 12/15/2021 | | 99 |
| 22,024 | USD | | 16,000 | GBP | | DEUT | | 11/30/2021 | | 127 |
| Total foreign currency contracts | | $ 2,750,471 |
† See Significant Accounting Policies of accompanying Notes to Financial Statements regarding valuation of investments.
The accompanying notes are an integral part of these financial statements.
The Hartford Balanced Income Fund
Schedule of Investments – (continued)
October 31, 2021
Fair Value Summary
The following is a summary of the fair valuations according to the inputs used as of October 31, 2021 in valuing the Fund’s investments.
| Description | | Total | | Level 1 | | Level 2 | | Level 3(1) |
| Assets | | | | | | | | |
| Convertible Bonds | | $ 18,800,921 | | $ — | | $ 18,800,921 | | $ — |
| Corporate Bonds | | 6,693,684,237 | | — | | 6,693,684,237 | | — |
| Foreign Government Obligations | | 650,174,940 | | — | | 650,174,940 | | — |
| Municipal Bonds | | 26,968,303 | | — | | 26,968,303 | | — |
| Senior Floating Rate Interests | | 13,934,076 | | — | | 13,934,076 | | — |
| U.S. Government Securities | | 231,216,127 | | — | | 231,216,127 | | — |
| Common Stocks | | | | | | | | |
| Banks | | 745,934,086 | | 745,934,086 | | — | | — |
| Capital Goods | | 938,258,052 | | 938,258,052 | | — | | — |
| Commercial & Professional Services | | 37,752,912 | | 37,752,912 | | — | | — |
| Consumer Services | | 111,992,881 | | 111,992,881 | | — | | — |
| Diversified Financials | | 458,627,712 | | 458,627,712 | | — | | — |
| Energy | | 420,059,666 | | 420,059,666 | | — | | — |
| Food & Staples Retailing | | 21,086,980 | | 21,086,980 | | — | | — |
| Food, Beverage & Tobacco | | 688,493,589 | | 688,493,589 | | — | | — |
| Health Care Equipment & Services | | 360,296,577 | | 360,296,577 | | — | | — |
| Household & Personal Products | | 321,380,817 | | 321,380,817 | | — | | — |
| Insurance | | 514,272,306 | | 514,272,306 | | — | | — |
| Materials | | 117,500,725 | | 117,500,725 | | — | | — |
| Media & Entertainment | | 205,709,868 | | 205,709,868 | | — | | — |
| Pharmaceuticals, Biotechnology & Life Sciences | | 795,574,175 | | 764,016,797 | | 31,557,378 | | — |
| Real Estate | | 220,078,310 | | 220,078,310 | | — | | — |
| Retailing | | 234,985,404 | | 234,985,404 | | — | | — |
| Semiconductors & Semiconductor Equipment | | 191,826,882 | | 191,826,882 | | — | | — |
| Technology Hardware & Equipment | | 346,147,448 | | 346,147,448 | | — | | — |
| Telecommunication Services | | 82,084,094 | | 82,084,094 | | — | | — |
| Transportation | | 77,304,246 | | 77,304,246 | | — | | — |
| Utilities | | 559,417,991 | | 559,417,991 | | — | | — |
| Escrows | | 5,586,450 | | — | | 5,586,450 | | — |
| Preferred Stocks | | 42,986,800 | | 42,986,800 | | — | | — |
| Short-Term Investments | | 618,337,664 | | 79,366,657 | | 538,971,007 | | — |
| Foreign Currency Contracts(2) | | 2,820,021 | | — | | 2,820,021 | | — |
| Futures Contracts(2) | | 13,461,512 | | 13,461,512 | | — | | — |
| Swaps - Credit Default(2) | | 5,517,669 | | — | | 5,517,669 | | — |
| Total | | $ 15,772,273,441 | | $ 7,553,042,312 | | $ 8,219,231,129 | | $ — |
| Liabilities | | | | | | | | |
| Foreign Currency Contracts(2) | | $ (69,550) | | $ — | | $ (69,550) | | $ — |
| Futures Contracts(2) | | (9,149,128) | | (9,149,128) | | — | | — |
| Swaps - Credit Default(2) | | (67,060) | | — | | (67,060) | | — |
| Total | | $ (9,285,738) | | $ (9,149,128) | | $ (136,610) | | $ — |
| (1) | For the year ended October 31, 2021, investments valued at $30,276 were transferred out of Level 3 due to the initiation of a vendor providing prices. There were no transfers into Level 3. |
| (2) | Derivative instruments (excluding purchased and written options, if applicable) are valued at the unrealized appreciation/(depreciation) on the investments. |
The accompanying notes are an integral part of these financial statements.
Hartford AARP Balanced Retirement Fund
Schedule of Investments
October 31, 2021
| Shares or Principal Amount | | Market Value† |
| ASSET & COMMERCIAL MORTGAGE-BACKED SECURITIES - 12.2% |
| | Asset-Backed - Finance & Insurance - 1.8% |
| $ 250,000 | Bain Capital Credit CLO Ltd. 2.23%, 10/23/2034, 3 mo. USD LIBOR + 2.150%(1) | $ 250,051 |
| 250,000 | Carlyle Global Market Strategies CLO Ltd. 1.92%, 04/17/2031, 3 mo. USD LIBOR + 1.800%(1)(2) | 248,990 |
| 250,000 | CIFC Funding Ltd. 2.58%, 04/23/2029, 3 mo. USD LIBOR + 2.450%(1)(2) | 250,266 |
| 280,000 | Madison Park Funding Ltd. 2.62%, 04/15/2029, 3 mo. USD LIBOR + 2.500%(1)(2) | 277,619 |
| | Octagon Investment Partners Ltd. | |
| 275,000 | 2.17%, 10/20/2034, 3 mo. USD LIBOR + 2.050%(1) | 275,000 |
| 250,000 | 3.22%, 10/20/2034, 3 mo. USD LIBOR + 3.100%(1) | 250,000 |
| 250,000 | OHA Loan Funding Ltd. 1.74%, 01/19/2037, 3 mo. USD LIBOR + 1.700%(1) | 250,000 |
| | | | 1,801,926 |
| | Asset-Backed - Home Equity - 0.3% |
| | FirstKey Homes Trust | |
| 120,000 | 1.67%, 10/19/2037(2) | 118,265 |
| 210,000 | 3.02%, 10/19/2037(2) | 211,604 |
| | | | 329,869 |
| | Commercial Mortgage-Backed Securities - 3.6% |
| 165,000 | BAMLL Commercial Mortgage Securities Trust 2.84%, 11/15/2030, 1 mo. USD LIBOR + 2.750%(1)(2) | 167,219 |
| | Benchmark Mortgage Trust | |
| 937,948 | 0.51%, 07/15/2051(3)(4) | 23,454 |
| 3,177,695 | 1.23%, 03/15/2062(3)(4) | 226,943 |
| 99,855 | 1.79%, 07/15/2053(3)(4) | 10,783 |
| 90,000 | 3.21%, 09/15/2053 | 90,714 |
| 40,000 | BFLD Trust 2.14%, 11/15/2028, 1 mo. USD LIBOR + 2.050%(1)(2) | 40,050 |
| | BX Commercial Mortgage Trust | |
| 153,000 | 1.54%, 10/15/2036, 1 mo. USD LIBOR + 1.450%(1)(2) | 152,909 |
| 86,208 | 1.64%, 11/15/2032, 1 mo. USD LIBOR + 1.550%(1)(2) | 86,208 |
| 127,500 | 2.09%, 10/15/2036, 1 mo. USD LIBOR + 2.000%(1)(2) | 127,260 |
| 2,799,522 | CD Mortgage Trust 0.98%, 02/10/2050(3)(4) | 123,186 |
| 82,883 | Citigroup Mortgage Loan Trust 3.23%, 11/25/2070(2)(5) | 82,946 |
| 200,000 | CSMC Trust 3.65%, 11/13/2039(2)(4) | 188,753 |
| 1,584,893 | DBGS Mortgage Trust 0.20%, 10/15/2051(3)(4) | 17,935 |
| | DBJPM Mortgage Trust | |
| 1,730,623 | 1.44%, 08/10/2049(3)(4) | 99,876 |
| 1,849,870 | 1.71%, 09/15/2053(3)(4) | 177,502 |
| 210,000 | Hudson Yards Mortgage Trust 3.44%, 07/10/2039(2)(4) | 216,434 |
| 15,000 | JP Morgan Chase Commercial Mortgage Securities Trust 2.81%, 01/16/2037(2) | 15,451 |
| 2,931,539 | JPMDB Commercial Mortgage Securities Trust 0.63%, 06/15/2051(3)(4) | 86,657 |
| | Morgan Stanley Capital Trust | |
| 931,575 | 0.82%, 07/15/2051(3)(4) | 40,232 |
| 282,579 | 1.34%, 06/15/2050(3)(4) | 15,283 |
| 136,000 | 1.49%, 11/15/2034, 1 mo. USD LIBOR + 1.400%(1)(2) | 135,917 |
| 255,000 | One Market Plaza Trust 4.15%, 02/10/2032(2) | 256,401 |
| Shares or Principal Amount | | Market Value† |
| ASSET & COMMERCIAL MORTGAGE-BACKED SECURITIES - 12.2% - (continued) |
| | Commercial Mortgage-Backed Securities - 3.6% - (continued) |
| $ 60,000 | SG Commercial Mortgage Securities Trust 2.63%, 03/15/2037(2) | $ 61,578 |
| | SREIT Trust | |
| 220,000 | 1.12%, 07/15/2036, 1 mo. USD LIBOR + 1.026%(1)(2) | 218,346 |
| 80,000 | 1.47%, 07/15/2036, 1 mo. USD LIBOR + 1.375%(1)(2) | 79,295 |
| 15,000 | Wells Fargo Commercial Mortgage Trust 4.15%, 05/15/2048(4) | 15,219 |
| | Wells Fargo N.A. | |
| 933,534 | 0.50%, 08/15/2061(3)(4) | 23,865 |
| 2,930,028 | 0.90%, 05/15/2062(3)(4) | 168,607 |
| 2,737,614 | 0.98%, 08/15/2061(3)(4) | 172,146 |
| 2,662,236 | 1.23%, 03/15/2063(3)(4) | 219,487 |
| 1,743,215 | 1.78%, 03/15/2063(3)(4) | 228,508 |
| 65,000 | 2.34%, 03/15/2063 | 64,647 |
| | | | 3,633,811 |
| | Other Asset-Backed Securities - 5.1% |
| | AMMC CLO Ltd. | |
| 250,000 | 1.72%, 05/26/2031, 3 mo. USD LIBOR + 1.600%(1)(2) | 249,635 |
| 250,000 | 1.92%, 10/16/2028, 3 mo. USD LIBOR + 1.800%(1)(2) | 250,167 |
| 250,000 | Bain Capital Credit CLO Ltd. 2.12%, 01/15/2029, 3 mo. USD LIBOR + 2.000%(1)(2) | 250,027 |
| 250,000 | Carlyle U.S. CLO Ltd. 3.08%, 04/20/2034, 3 mo. USD LIBOR + 2.950%(1)(2) | 250,035 |
| | Domino's Pizza Master Issuer LLC | |
| 84,575 | 2.66%, 04/25/2051(2) | 86,467 |
| 145,500 | 4.12%, 07/25/2048(2) | 149,573 |
| 250,000 | Dryden 80 CLO Ltd. 2.02%, 01/17/2033, 3 mo. USD LIBOR + 1.900%(1)(2) | 250,128 |
| 250,000 | LCM XXIII Ltd. 3.43%, 10/20/2029, 3 mo. USD LIBOR + 3.300%(1)(2) | 248,782 |
| | Madison Park Funding Ltd. | |
| 250,000 | 1.82%, 01/23/2031, 3 mo. USD LIBOR + 1.700%(1)(2) | 250,090 |
| 250,000 | 1.83%, 10/22/2030, 3 mo. USD LIBOR + 1.700%(1)(2) | 250,036 |
| 250,000 | 1.97%, 01/15/2033, 3 mo. USD LIBOR + 1.850%(1)(2) | 250,111 |
| 27,096 | Mill City Mortgage Loan Trust 2.75%, 01/25/2061(2)(4) | 27,502 |
| 250,000 | Niagara Park Clo Ltd. 1.72%, 07/17/2032, 3 mo. USD LIBOR + 1.600%(1)(2) | 250,089 |
| | Octagon Investment Partners Ltd. | |
| 250,000 | 1.87%, 07/25/2030, 3 mo. USD LIBOR + 1.750%(1)(2) | 249,707 |
| 250,000 | 2.18%, 07/20/2030, 3 mo. USD LIBOR + 2.050%(1)(2) | 250,059 |
| 275,000 | 2.68%, 10/20/2031, 3 mo. USD LIBOR + 2.550%(1)(2) | 275,000 |
| 250,000 | 4.13%, 10/20/2031, 3 mo. USD LIBOR + 4.000%(1)(2) | 249,625 |
| 250,000 | OHA Loan Funding Ltd. 2.03%, 11/15/2032, 3 mo. USD LIBOR + 1.900%(1)(2) | 250,019 |
| 250,000 | Race Point CLO Ltd. 2.18%, 02/20/2030, 3 mo. USD LIBOR + 2.050%(1)(2) | 245,388 |
| 250,000 | RR Ltd. 2.12%, 01/15/2033, 3 mo. USD LIBOR + 2.000%(1)(2) | 250,150 |
The accompanying notes are an integral part of these financial statements.
Hartford AARP Balanced Retirement Fund
Schedule of Investments – (continued)
October 31, 2021
| Shares or Principal Amount | | Market Value† |
| ASSET & COMMERCIAL MORTGAGE-BACKED SECURITIES - 12.2% - (continued) |
| | Other Asset-Backed Securities - 5.1% - (continued) |
| $ 250,000 | Shackleton CLO Ltd. 1.85%, 07/17/2028, 3 mo. USD LIBOR + 1.730%(1)(2) | $ 250,519 |
| | Stack Infrastructure Issuer LLC | |
| 100,000 | 1.88%, 03/26/2046(2) | 99,497 |
| 30,000 | 1.89%, 08/25/2045(2) | 29,910 |
| | Vantage Data Centers Issuer LLC | |
| 130,000 | 1.65%, 09/15/2045(2) | 128,540 |
| 24,458 | 3.19%, 07/15/2044(2) | 25,025 |
| | | | 5,066,081 |
| | Whole Loan Collateral CMO - 1.4% |
| 23,580 | Angel Oak Mortgage Trust 2.59%, 10/25/2049(2)(4) | 23,547 |
| 39,034 | Arroyo Mortgage Trust 2.96%, 10/25/2048(2)(4) | 39,237 |
| 19,063 | Bunker Hill Loan Depositary Trust 2.88%, 07/25/2049(2)(5) | 19,227 |
| | GS Mortgage-Backed Securities Corp. Trust | |
| 98,170 | 2.77%, 06/25/2051(2)(4) | 94,608 |
| 451,117 | 2.81%, 05/25/2051(2)(4) | 439,391 |
| 195,722 | 3.31%, 03/27/2051(4) | 198,794 |
| 321,822 | JP Morgan Mortgage Trust 4.16%, 11/25/2050(2)(4) | 333,533 |
| | New Residential Mortgage Loan Trust | |
| 42,501 | 3.25%, 09/25/2056(2)(4) | 44,369 |
| 45,210 | 3.50%, 12/25/2057(2)(4) | 46,333 |
| 37,065 | 3.75%, 11/25/2056(2)(4) | 39,409 |
| | Seasoned Credit Risk Transfer Trust | |
| 23,044 | 2.50%, 08/25/2059 | 23,532 |
| 9,182 | 3.50%, 10/25/2058 | 9,931 |
| 23,554 | Verus Securitization Trust 3.14%, 11/25/2059(2)(4) | 23,950 |
| 77,923 | Wells Fargo Mortgage Backed Securities Trust 3.00%, 07/25/2050(2)(4) | 78,997 |
| | | | 1,414,858 |
| | Total Asset & Commercial Mortgage-Backed Securities
(cost $12,157,042) | $ 12,246,545 |
| CORPORATE BONDS - 18.8% |
| | Advertising - 0.1% |
| 125,000 | Lamar Media Corp. 4.88%, 01/15/2029 | $ 130,938 |
| | Aerospace/Defense - 0.4% |
| 10,000 | Boeing Co. 3.25%, 02/01/2035 | 10,028 |
| 130,000 | Moog, Inc. 4.25%, 12/15/2027(2) | 133,821 |
| 100,000 | Northrop Grumman Corp. 4.75%, 06/01/2043 | 127,882 |
| | Raytheon Technologies Corp. | |
| 25,000 | 4.45%, 11/16/2038 | 30,114 |
| 75,000 | 5.70%, 04/15/2040 | 103,969 |
| 20,000 | TransDigm, Inc. 6.25%, 03/15/2026(2) | 20,900 |
| | | | 426,714 |
| | Agriculture - 0.3% |
| | Altria Group, Inc. | |
| 10,000 | 3.40%, 05/06/2030 | 10,476 |
| 35,000 | 3.88%, 09/16/2046 | 34,651 |
| 90,000 | 4.80%, 02/14/2029 | 102,566 |
| 130,000 | BAT Capital Corp. 4.91%, 04/02/2030 | 147,373 |
| | | | 295,066 |
| Shares or Principal Amount | | Market Value† |
| CORPORATE BONDS - 18.8% - (continued) |
| | Apparel - 0.1% |
| $ 125,000 | William Carter Co. 5.50%, 05/15/2025(2) | $ 130,781 |
| | Auto Manufacturers - 0.2% |
| | General Motors Co. | |
| 5,000 | 6.13%, 10/01/2025 | 5,804 |
| 120,000 | 6.75%, 04/01/2046 | 173,350 |
| | | | 179,154 |
| | Auto Parts & Equipment - 0.4% |
| 115,000 | Adient U.S. LLC 9.00%, 04/15/2025(2) | 123,050 |
| 112,000 | Clarios Global L.P. / Clarios U.S. Finance Co. 6.25%, 05/15/2026(2) | 117,180 |
| 125,000 | Dana, Inc. 5.63%, 06/15/2028 | 132,225 |
| | | | 372,455 |
| | Beverages - 0.2% |
| 93,000 | Anheuser-Busch InBev Worldwide, Inc. 3.75%, 07/15/2042 | 101,338 |
| 155,000 | Coca-Cola Femsa S.A.B. de C.V. 1.85%, 09/01/2032 | 146,263 |
| | | | 247,601 |
| | Biotechnology - 0.1% |
| | Amgen, Inc. | |
| 51,000 | 2.77%, 09/01/2053 | 48,063 |
| 38,000 | 5.15%, 11/15/2041 | 48,989 |
| 5,000 | Royalty Pharma plc 1.75%, 09/02/2027 | 4,905 |
| | | | 101,957 |
| | Chemicals - 0.9% |
| 5,000 | Dow Chemical Co. 4.80%, 05/15/2049 | 6,448 |
| 115,000 | DuPont de Nemours, Inc. 5.32%, 11/15/2038 | 148,191 |
| 145,000 | Huntsman International LLC 4.50%, 05/01/2029 | 162,962 |
| | Nutrien Ltd. | |
| 135,000 | 2.95%, 05/13/2030 | 141,733 |
| 10,000 | 3.95%, 05/13/2050 | 11,710 |
| | Sherwin-Williams Co. | |
| 10,000 | 3.30%, 05/15/2050 | 10,603 |
| 85,000 | 4.50%, 06/01/2047 | 106,265 |
| 125,000 | Tronox, Inc. 6.50%, 05/01/2025(2) | 131,406 |
| 145,000 | Yara International ASA 3.15%, 06/04/2030(2) | 152,031 |
| | | | 871,349 |
| | Commercial Banks - 0.7% |
| 250,000 | Bank of America Corp. 6.11%, 01/29/2037 | 337,781 |
| 60,000 | Citigroup, Inc. 3.98%, 03/20/2030, (3.98% fixed rate until 03/20/2029; 3 mo. USD LIBOR + 1.338% thereafter)(6) | 66,934 |
| | Wells Fargo & Co. | |
| 20,000 | 4.75%, 12/07/2046 | 25,323 |
| 180,000 | 4.90%, 11/17/2045 | 231,028 |
| | | | 661,066 |
| | Commercial Services - 0.3% |
| 5,000 | Equifax, Inc. 3.10%, 05/15/2030 | 5,263 |
| 10,000 | ERAC USA Finance LLC 7.00%, 10/15/2037(2) | 14,882 |
| 15,000 | Gartner, Inc. 3.75%, 10/01/2030(2) | 15,206 |
| | Global Payments, Inc. | |
| 15,000 | 2.90%, 05/15/2030 | 15,313 |
| 10,000 | 3.20%, 08/15/2029 | 10,460 |
The accompanying notes are an integral part of these financial statements.
Hartford AARP Balanced Retirement Fund
Schedule of Investments – (continued)
October 31, 2021
| Shares or Principal Amount | | Market Value† |
| CORPORATE BONDS - 18.8% - (continued) |
| | Commercial Services - 0.3% - (continued) |
| $ 125,000 | Service Corp. International 4.63%, 12/15/2027 | $ 131,094 |
| 120,000 | United Rentals North America, Inc. 5.25%, 01/15/2030 | 129,900 |
| | | | 322,118 |
| | Construction Materials - 0.7% |
| 55,000 | Boise Cascade Co. 4.88%, 07/01/2030(2) | 57,750 |
| 107,000 | Builders FirstSource, Inc. 6.75%, 06/01/2027(2) | 112,751 |
| | Carrier Global Corp. | |
| 10,000 | 2.70%, 02/15/2031 | 10,214 |
| 100,000 | 2.72%, 02/15/2030 | 102,681 |
| 120,000 | Eagle Materials, Inc. 2.50%, 07/01/2031 | 118,831 |
| 130,000 | Jeld-Wen, Inc. 4.88%, 12/15/2027(2) | 134,550 |
| 65,000 | Masonite International Corp. 3.50%, 02/15/2030(2) | 63,436 |
| 125,000 | Standard Industries, Inc. 4.75%, 01/15/2028(2) | 128,906 |
| | | | 729,119 |
| | Distribution/Wholesale - 0.1% |
| 125,000 | American Builders & Contractors Supply Co., Inc. 4.00%, 01/15/2028(2) | 126,719 |
| | Diversified Financial Services - 0.2% |
| 100,000 | Brookfield Finance LLC 3.45%, 04/15/2050 | 104,961 |
| 40,000 | Enact Holdings, Inc. 6.50%, 08/15/2025(2) | 43,800 |
| | | | 148,761 |
| | Electric - 1.0% |
| 135,000 | Ameren Corp. 3.50%, 01/15/2031 | 146,176 |
| 130,000 | CenterPoint Energy, Inc. 4.25%, 11/01/2028 | 147,113 |
| 120,000 | Clearway Energy Operating LLC 4.75%, 03/15/2028(2) | 126,960 |
| 10,000 | Cleco Corporate Holdings LLC 3.74%, 05/01/2026 | 10,769 |
| 115,000 | Exelon Corp. 5.10%, 06/15/2045 | 152,740 |
| 5,000 | FirstEnergy Corp. 2.25%, 09/01/2030 | 4,808 |
| 20,000 | ITC Holdings Corp. 2.95%, 05/14/2030(2) | 20,835 |
| 120,000 | NextEra Energy Operating Partners L.P. 4.50%, 09/15/2027(2) | 128,376 |
| 30,000 | Oglethorpe Power Corp. 5.05%, 10/01/2048 | 38,027 |
| | Puget Energy, Inc. | |
| 40,000 | 3.65%, 05/15/2025 | 42,500 |
| 15,000 | 4.10%, 06/15/2030 | 16,507 |
| 5,000 | Sempra Energy 4.00%, 02/01/2048 | 5,643 |
| 125,000 | Southern Co. 4.40%, 07/01/2046 | 148,782 |
| | | | 989,236 |
| | Electrical Components & Equipment - 0.1% |
| 120,000 | WESCO Distribution, Inc. 7.25%, 06/15/2028(2) | 132,349 |
| | Electronics - 0.2% |
| 150,000 | Jabil, Inc. 3.60%, 01/15/2030 | 163,047 |
| | Food - 0.3% |
| 100,000 | Conagra Brands, Inc. 5.30%, 11/01/2038 | 126,661 |
| 75,000 | Kellogg Co. 4.50%, 04/01/2046 | 94,014 |
| 120,000 | Post Holdings, Inc. 4.63%, 04/15/2030(2) | 120,600 |
| | | | 341,275 |
| | Gas - 0.1% |
| 85,000 | NiSource, Inc. 5.65%, 02/01/2045 | 118,053 |
| | Healthcare - Products - 0.5% |
| 75,000 | Boston Scientific Corp. 4.70%, 03/01/2049 | 96,752 |
| Shares or Principal Amount | | Market Value† |
| CORPORATE BONDS - 18.8% - (continued) |
| | Healthcare - Products - 0.5% - (continued) |
| $ 125,000 | Hologic, Inc. 4.63%, 02/01/2028(2) | $ 129,688 |
| 125,000 | Teleflex, Inc. 4.25%, 06/01/2028(2) | 128,431 |
| 110,000 | Zimmer Biomet Holdings, Inc. 3.55%, 03/20/2030 | 119,503 |
| | | | 474,374 |
| | Healthcare - Services - 0.5% |
| 125,000 | Charles River Laboratories International, Inc. 4.25%, 05/01/2028(2) | 129,375 |
| | HCA, Inc. | |
| 120,000 | 5.13%, 06/15/2039 | 148,469 |
| 115,000 | 5.88%, 02/01/2029 | 136,874 |
| 125,000 | Tenet Healthcare Corp. 4.63%, 09/01/2024(2) | 127,657 |
| | | | 542,375 |
| | Home Builders - 0.3% |
| 20,000 | Lennar Corp. 4.75%, 11/29/2027 | 22,733 |
| 130,000 | M/I Homes, Inc. 4.95%, 02/01/2028 | 135,200 |
| 120,000 | Taylor Morrison Communities, Inc. 5.88%, 06/15/2027(2) | 134,250 |
| | | | 292,183 |
| | Insurance - 0.7% |
| 110,000 | American International Group, Inc. 6.25%, 05/01/2036 | 151,879 |
| 85,000 | Equitable Holdings, Inc. 5.00%, 04/20/2048 | 108,713 |
| 135,000 | Globe Life, Inc. 4.55%, 09/15/2028 | 155,575 |
| 125,000 | Radian Group, Inc. 6.63%, 03/15/2025 | 139,375 |
| 100,000 | Unum Group 5.75%, 08/15/2042 | 127,218 |
| 20,000 | Willis North America, Inc. 2.95%, 09/15/2029 | 20,662 |
| | | | 703,422 |
| | Internet - 0.1% |
| 125,000 | Go Daddy Operating Co. LLC 5.25%, 12/01/2027(2) | 129,688 |
| | Iron/Steel - 0.2% |
| 145,000 | Steel Dynamics, Inc. 3.25%, 01/15/2031 | 153,794 |
| 25,000 | Vale Overseas Ltd. 3.75%, 07/08/2030 | 25,436 |
| | | | 179,230 |
| | IT Services - 0.2% |
| 125,000 | Leidos, Inc. 4.38%, 05/15/2030 | 139,825 |
| | Presidio Holdings, Inc. | |
| 49,000 | 4.88%, 02/01/2027(2) | 49,858 |
| 20,000 | 8.25%, 02/01/2028(2) | 21,250 |
| | | | 210,933 |
| | Lodging - 0.2% |
| 35,000 | Boyd Gaming Corp. 8.63%, 06/01/2025(2) | 37,825 |
| 125,000 | Hilton Domestic Operating Co., Inc. 5.38%, 05/01/2025(2) | 130,306 |
| | | | 168,131 |
| | Machinery-Diversified - 0.3% |
| 120,000 | Stevens Holding Co., Inc. 6.13%, 10/01/2026(2) | 129,300 |
| 155,000 | Westinghouse Air Brake Technologies Corp. 3.20%, 06/15/2025 | 164,061 |
| | | | 293,361 |
| | Media - 1.2% |
| 125,000 | CCO Holdings LLC / CCO Holdings Capital Corp. 4.75%, 03/01/2030(2) | 129,063 |
| 110,000 | Charter Communications Operating LLC / Charter Communications Operating Capital 6.48%, 10/23/2045 | 151,605 |
The accompanying notes are an integral part of these financial statements.
Hartford AARP Balanced Retirement Fund
Schedule of Investments – (continued)
October 31, 2021
| Shares or Principal Amount | | Market Value† |
| CORPORATE BONDS - 18.8% - (continued) |
| | Media - 1.2% - (continued) |
| $ 6,000 | Cox Communications, Inc. 4.50%, 06/30/2043(2) | $ 7,084 |
| | Discovery Communications LLC | |
| 152,000 | 4.00%, 09/15/2055 | 161,192 |
| 15,000 | 5.30%, 05/15/2049 | 19,105 |
| 140,000 | Fox Corp. 3.50%, 04/08/2030(7) | 152,094 |
| 120,000 | Sirius XM Radio, Inc. 5.50%, 07/01/2029(2) | 129,450 |
| 130,000 | TEGNA, Inc. 4.63%, 03/15/2028 | 131,138 |
| 120,000 | ViacomCBS, Inc. 5.85%, 09/01/2043 | 163,113 |
| 40,000 | Videotron Ltd. 3.63%, 06/15/2029(2) | 40,200 |
| 150,000 | Ziggo B.V. 5.50%, 01/15/2027(2) | 153,750 |
| | | | 1,237,794 |
| | Office/Business Equipment - 0.1% |
| 55,000 | Xerox Holdings Corp. 5.50%, 08/15/2028(2) | 55,619 |
| | Oil & Gas - 0.8% |
| 135,000 | Apache Corp. 4.25%, 01/15/2030(7) | 143,437 |
| 10,000 | Canadian Natural Resources Ltd. 6.50%, 02/15/2037 | 13,386 |
| 91,000 | Devon Energy Corp. 4.50%, 01/15/2030(2) | 98,955 |
| | Diamondback Energy, Inc. | |
| 160,000 | 3.50%, 12/01/2029 | 170,078 |
| 5,000 | 4.75%, 05/31/2025 | 5,537 |
| | Hess Corp. | |
| 135,000 | 5.60%, 02/15/2041 | 169,891 |
| 5,000 | 7.30%, 08/15/2031 | 6,713 |
| 135,000 | Valero Energy Corp. 4.00%, 04/01/2029 | 148,193 |
| 85,000 | Viper Energy Partners L.P. 5.38%, 11/01/2027(2) | 88,613 |
| | | | 844,803 |
| | Packaging & Containers - 0.6% |
| 125,000 | Berry Global, Inc. 5.63%, 07/15/2027(2) | 130,920 |
| 110,000 | Crown Cork & Seal Co., Inc. 7.38%, 12/15/2026 | 133,101 |
| 70,000 | Graphic Packaging International LLC 3.50%, 03/01/2029(2) | 69,300 |
| 120,000 | Owens-Brockway Glass Container, Inc. 6.63%, 05/13/2027(2) | 128,250 |
| 125,000 | Silgan Holdings, Inc. 4.13%, 02/01/2028 | 127,031 |
| | | | 588,602 |
| | Pharmaceuticals - 0.7% |
| | AbbVie, Inc. | |
| 5,000 | 4.55%, 03/15/2035 | 5,958 |
| 115,000 | 4.75%, 03/15/2045 | 143,984 |
| 120,000 | Bausch Health Cos., Inc. 5.75%, 08/15/2027(2) | 125,638 |
| 125,000 | Becton Dickinson and Co. 2.82%, 05/20/2030 | 130,091 |
| | CVS Health Corp. | |
| 100,000 | 3.75%, 04/01/2030 | 110,238 |
| 35,000 | 5.13%, 07/20/2045 | 46,006 |
| 100,000 | Zoetis, Inc. 4.70%, 02/01/2043 | 127,051 |
| | | | 688,966 |
| | Pipelines - 1.4% |
| 140,000 | Cheniere Corpus Christi Holdings LLC 5.13%, 06/30/2027 | 160,029 |
| 125,000 | Cheniere Energy Partners L.P. 4.50%, 10/01/2029 | 133,460 |
| | Energy Transfer Operating L.P. | |
| 125,000 | 5.25%, 04/15/2029 | 145,251 |
| 10,000 | 5.30%, 04/01/2044 | 11,709 |
| 10,000 | 5.35%, 05/15/2045 | 11,814 |
| | MPLX L.P. | |
| 20,000 | 4.00%, 03/15/2028 | 21,996 |
| 15,000 | 4.13%, 03/01/2027 | 16,543 |
| 90,000 | 4.80%, 02/15/2029 | 103,698 |
| 5,000 | 5.20%, 03/01/2047 | 6,166 |
| Shares or Principal Amount | | Market Value† |
| CORPORATE BONDS - 18.8% - (continued) |
| | Pipelines - 1.4% - (continued) |
| $ 5,000 | 5.20%, 12/01/2047 | $ 6,111 |
| 5,000 | 5.50%, 02/15/2049 | 6,444 |
| | ONEOK, Inc. | |
| 5,000 | 4.00%, 07/13/2027 | 5,474 |
| 110,000 | 4.35%, 03/15/2029 | 122,750 |
| 10,000 | 5.85%, 01/15/2026 | 11,632 |
| 125,000 | Rattler Midstream L.P. 5.63%, 07/15/2025(2) | 130,625 |
| 125,000 | Targa Resources Partners L.P. / Targa Resources Partners Finance Corp. 6.50%, 07/15/2027 | 133,906 |
| 150,000 | Tennessee Gas Pipeline Co. LLC 2.90%, 03/01/2030(2) | 152,804 |
| 25,000 | TransCanada PipeLines Ltd. 4.75%, 05/15/2038 | 29,910 |
| 35,000 | Venture Global Calcasieu Pass LLC 3.88%, 08/15/2029(2) | 35,672 |
| 145,000 | Williams Cos., Inc. 3.75%, 06/15/2027 | 157,818 |
| | | | 1,403,812 |
| | Real Estate Investment Trusts - 1.1% |
| 135,000 | American Tower Corp. 3.80%, 08/15/2029 | 148,425 |
| 150,000 | Brixmor Operating Partnership L.P. 4.05%, 07/01/2030 | 165,876 |
| 140,000 | Crown Castle International Corp. 3.30%, 07/01/2030 | 148,077 |
| 155,000 | Equinix, Inc. 2.15%, 07/15/2030 | 151,068 |
| 140,000 | GLP Capital L.P. / GLP Financing II, Inc. 5.75%, 06/01/2028 | 162,564 |
| 115,000 | Host Hotels & Resorts L.P. 3.50%, 09/15/2030 | 118,674 |
| 25,000 | SBA Tower Trust 2.84%, 01/15/2050(2) | 25,933 |
| 5,000 | VEREIT Operating Partnership L.P. 3.40%, 01/15/2028 | 5,386 |
| 125,000 | VICI Properties L.P. / VICI Note Co., Inc. 4.63%, 12/01/2029(2) | 133,359 |
| | | | 1,059,362 |
| | Retail - 1.3% |
| 125,000 | 1011778 BC ULC / New Red Finance, Inc. 4.38%, 01/15/2028(2) | 125,655 |
| | Alimentation Couche-Tard, Inc. | |
| 140,000 | 2.95%, 01/25/2030(2)(7) | 145,321 |
| 5,000 | 3.80%, 01/25/2050(2) | 5,420 |
| 100,000 | Arcos Dorados Holdings, Inc. 5.88%, 04/04/2027(2) | 103,100 |
| 135,000 | Dollar General Corp. 3.50%, 04/03/2030 | 147,051 |
| 35,000 | FirstCash, Inc. 4.63%, 09/01/2028(2) | 36,094 |
| 90,000 | Group 1 Automotive, Inc. 4.00%, 08/15/2028(2) | 90,018 |
| | Lowe's Cos., Inc. | |
| 10,000 | 3.70%, 04/15/2046 | 11,119 |
| 100,000 | 4.38%, 09/15/2045 | 121,634 |
| | McDonald's Corp. | |
| 15,000 | 3.63%, 09/01/2049 | 16,742 |
| 7,000 | 3.70%, 02/15/2042 | 7,804 |
| 15,000 | 4.20%, 04/01/2050 | 18,357 |
| 65,000 | 4.45%, 09/01/2048 | 81,454 |
| 130,000 | O'Reilly Automotive, Inc. 4.20%, 04/01/2030 | 148,149 |
| 100,000 | Starbucks Corp. 4.45%, 08/15/2049 | 124,377 |
| 95,000 | Suburban Propane Partners L.P. / Suburban Energy Finance Corp. 5.88%, 03/01/2027 | 98,444 |
| 35,000 | Yum! Brands, Inc. 4.75%, 01/15/2030(2) | 37,450 |
| | | | 1,318,189 |
| | Semiconductors - 0.4% |
| 40,000 | Broadcom Corp. / Broadcom Cayman Finance Ltd. 3.14%, 11/15/2035 | 39,415 |
| | Broadcom, Inc. | |
| 65,000 | 3.19%, 11/15/2036 | 63,981 |
The accompanying notes are an integral part of these financial statements.
Hartford AARP Balanced Retirement Fund
Schedule of Investments – (continued)
October 31, 2021
| Shares or Principal Amount | | Market Value† |
| CORPORATE BONDS - 18.8% - (continued) |
| | Semiconductors - 0.4% - (continued) |
| $ 25,000 | 4.30%, 11/15/2032 | $ 27,854 |
| 124,000 | Micron Technology, Inc. 5.33%, 02/06/2029 | 146,264 |
| | NXP B.V. / NXP Funding LLC / NXP USA, Inc. | |
| 5,000 | 3.15%, 05/01/2027(2) | 5,281 |
| 100,000 | 4.30%, 06/18/2029(2) | 112,657 |
| | | | 395,452 |
| | Software - 0.3% |
| 35,000 | Black Knight InfoServ LLC 3.63%, 09/01/2028(2) | 34,825 |
| 12,000 | Dun & Bradstreet Corp. 10.25%, 02/15/2027(2) | 12,876 |
| 20,000 | MSCI, Inc. 3.88%, 02/15/2031(2) | 20,632 |
| 125,000 | PTC, Inc. 4.00%, 02/15/2028(2) | 126,719 |
| 120,000 | SS&C Technologies, Inc. 5.50%, 09/30/2027(2) | 126,300 |
| | | | 321,352 |
| | Telecommunications - 1.2% |
| | AT&T, Inc. | |
| 40,000 | 3.50%, 02/01/2061 | 38,944 |
| 35,000 | 4.35%, 06/15/2045 | 40,051 |
| 10,000 | 4.50%, 03/09/2048 | 11,805 |
| 100,000 | Deutsche Telekom International Finance B.V. 8.75%, 06/15/2030 | 146,179 |
| 160,000 | Motorola Solutions, Inc. 2.30%, 11/15/2030 | 156,289 |
| 200,000 | NBN Co., Ltd. 2.50%, 01/08/2032(2) | 198,745 |
| 160,000 | Nokia Oyj 6.63%, 05/15/2039 | 215,200 |
| | T-Mobile USA, Inc. | |
| 50,000 | 2.88%, 02/15/2031 | 49,687 |
| 105,000 | 4.38%, 04/15/2040 | 119,789 |
| 3,000 | 4.50%, 04/15/2050 | 3,542 |
| | Verizon Communications, Inc. | |
| 5,000 | 4.00%, 03/22/2050 | 5,726 |
| 65,000 | 4.13%, 08/15/2046 | 75,970 |
| | Vodafone Group plc | |
| 5,000 | 4.25%, 09/17/2050 | 5,854 |
| 6,000 | 4.38%, 02/19/2043 | 6,999 |
| 100,000 | 5.25%, 05/30/2048 | 131,640 |
| | | | 1,206,420 |
| | Transportation - 0.3% |
| 120,000 | FedEx Corp. 5.10%, 01/15/2044 | 153,298 |
| 120,000 | Union Pacific Corp. 2.97%, 09/16/2062 | 120,460 |
| | | | 273,758 |
| | Total Corporate Bonds
(cost $18,914,762) | $ 18,875,584 |
| MUNICIPAL BONDS - 0.6% |
| | Airport - 0.0% |
| 25,000 | Chicago, IL, O'Hare International Airport 3.01%, 01/01/2038 | $ 25,952 |
| | Development - 0.0% |
| 15,000 | New York City Industrial Dev Agency, (AGM Insured) 3.19%, 03/01/2040 | 15,308 |
| | General - 0.2% |
| 80,000 | Dist of Columbia Rev 3.43%, 04/01/2042 | 84,736 |
| 40,000 | Philadelphia, PA, Auth Industrial Dev, (NATL Insured) 6.55%, 10/15/2028 | 50,811 |
| | | | 135,547 |
| Shares or Principal Amount | | Market Value† |
| MUNICIPAL BONDS - 0.6% - (continued) |
| | Transportation - 0.4% |
| $ 235,000 | Chicago, IL, Transit Auth 3.40%, 12/01/2032 | $ 253,599 |
| 100,000 | Golden State, CA, Tobacco Securitization Corp. 2.25%, 06/01/2029 | 100,035 |
| 30,000 | Metropolitan Transportation Auth, NY, Rev 5.18%, 11/15/2049 | 40,904 |
| | | | 394,538 |
| | Total Municipal Bonds
(cost $533,890) | | $ 571,345 |
| U.S. GOVERNMENT AGENCIES - 4.4% |
| | Mortgage-Backed Agencies - 4.4% |
| | FHLMC - 0.6% |
| 4,247,790 | 0.07%, 10/25/2026(3)(4) | $ 17,725 |
| 1,213,707 | 0.27%, 11/25/2023(3)(4) | 5,601 |
| 711,029 | 0.60%, 03/25/2027(3)(4) | 20,812 |
| 2,126,040 | 1.12%, 06/25/2030(3)(4) | 179,922 |
| 119,714 | 1.13%, 01/25/2030(3)(4) | 9,636 |
| 550,175 | 1.33%, 06/25/2030(3)(4) | 54,773 |
| 1,790,000 | 1.38%, 06/25/2030(3)(4) | 180,913 |
| 1,053,190 | 1.43%, 07/25/2030(3)(4) | 110,692 |
| 13,178 | 1.50%, 10/15/2042 | 13,074 |
| 16,615 | 1.70%, 10/15/2039 | 16,810 |
| 32,187 | 2.50%, 12/15/2042 | 33,276 |
| | | | 643,234 |
| | FNMA - 1.8% |
| 362,366 | 1.20%, 06/25/2034(3)(4) | 34,800 |
| 22,016 | 1.50%, 08/25/2041 | 22,321 |
| 8,249 | 1.50%, 11/25/2042 | 8,171 |
| 15,533 | 1.70%, 06/25/2043 | 15,728 |
| 13,019 | 1.75%, 01/25/2040 | 13,133 |
| 17,197 | 2.00%, 06/25/2043 | 17,441 |
| 31,271 | 2.50%, 09/25/2049 | 32,390 |
| 14,833 | 2.50%, 03/25/2053 | 15,189 |
| 450,000 | 3.50%, 08/25/2048 | 485,335 |
| 46,537 | 3.50%, 04/25/2053 | 47,701 |
| 425,000 | 4.00%, 01/25/2042 | 483,242 |
| 450,000 | 4.00%, 06/25/2042 | 497,949 |
| 72,043 | 4.00%, 08/01/2049 | 77,100 |
| | | | 1,750,500 |
| | GNMA - 2.0% |
| 19,862 | 1.50%, 04/16/2040 | 20,020 |
| 500,000 | 3.00%, 09/20/2045 | 518,523 |
| 480,000 | 3.00%, 04/20/2046 | 497,402 |
| 464,675 | 3.00%, 08/20/2047 | 481,597 |
| 450,000 | 3.50%, 02/20/2049 | 487,579 |
| | | | 2,005,121 |
| | Total U.S. Government Agencies
(cost $4,538,983) | | $ 4,398,855 |
| U.S. GOVERNMENT SECURITIES - 3.0% |
| | U.S. Treasury Securities - 3.0% |
| | U.S. Treasury Bonds - 3.0% |
| 245,000 | 2.38%, 05/15/2051 | $ 268,888 |
| 140,000 | 3.13%, 08/15/2044(8) | 168,995 |
| 40,000 | 3.13%, 05/15/2048 | 49,822 |
| 345,000 | 3.63%, 08/15/2043 | 444,794 |
The accompanying notes are an integral part of these financial statements.
Hartford AARP Balanced Retirement Fund
Schedule of Investments – (continued)
October 31, 2021
| Shares or Principal Amount | | Market Value† |
| U.S. GOVERNMENT SECURITIES - 3.0% - (continued) |
| | U.S. Treasury Securities - 3.0% - (continued) |
| | U.S. Treasury Bonds - 3.0% - (continued) |
| $ 1,360,000 | 3.63%, 02/15/2044 | $ 1,761,253 |
| 260,000 | 3.75%, 11/15/2043 | 341,666 |
| | Total U.S. Government Securities
(cost $3,230,027) | | $ 3,035,418 |
| COMMON STOCKS - 36.4% |
| | Banks - 1.2% |
| 7,356 | Bank of Nova Scotia | $ 482,259 |
| 3,460 | PNC Financial Services Group, Inc. | 730,164 |
| | | | 1,212,423 |
| | Capital Goods - 3.1% |
| 311 | AGCO Corp. | 38,007 |
| 10,811 | Assa Abloy AB Class B | 317,223 |
| 67,376 | BAE Systems plc | 508,026 |
| 360 | Deere & Co. | 123,232 |
| 3,604 | Fortive Corp. | 272,859 |
| 5,216 | Kone Oyj Class B | 355,726 |
| 4,351 | Kubota Corp. | 92,689 |
| 1,054 | Lockheed Martin Corp. | 350,265 |
| 5,587 | Raytheon Technologies Corp. | 496,461 |
| 5,327 | Vinci S.A. | 569,511 |
| | | | 3,123,999 |
| | Commercial & Professional Services - 0.3% |
| 6,024 | Experian plc | 276,208 |
| | Consumer Durables & Apparel - 0.5% |
| 2,820 | NIKE, Inc. Class B | 471,758 |
| 477 | Open House Co., Ltd. | 30,420 |
| | | | 502,178 |
| | Consumer Services - 1.4% |
| 189 | Caesars Entertainment, Inc.* | 20,688 |
| 25,148 | Compass Group plc* | 533,657 |
| 2,984 | McDonald's Corp. | 732,721 |
| 210 | Oriental Land Co., Ltd. | 33,167 |
| 3,728 | Playa Hotels & Resorts N.V.* | 31,725 |
| | | | 1,351,958 |
| | Diversified Financials - 0.0% |
| 806 | Brookfield Asset Management, Inc. Class A | 48,674 |
| | Energy - 3.3% |
| 804 | ARC Resources Ltd. | 7,711 |
| 44,900 | Ascent Resources - Marcellus LLC Class A*(9)(10) | 37,042 |
| 47,637 | BP plc | 228,224 |
| 1,087 | Chesapeake Energy Corp. | 69,285 |
| 4,222 | ConocoPhillips | 314,497 |
| 4,921 | Coterra Energy, Inc. | 104,916 |
| 3,458 | Enbridge, Inc. | 144,847 |
| 171 | EOG Resources, Inc. | 15,811 |
| 6,502 | Equinor ASA | 164,750 |
| 463 | Green Plains, Inc. | 17,571 |
| 1,490 | Hess Corp. | 123,029 |
| 1,636 | Lukoil PJSC ADR | 166,759 |
| 3,715 | Marathon Petroleum Corp. | 244,930 |
| 13,651 | Petroleo Brasileiro S.A. | 66,927 |
| 1,099 | Pioneer Natural Resources Co. | 205,491 |
| 13,799 | Royal Dutch Shell plc Class A | 316,120 |
| 3,199 | Royal Dutch Shell plc Class B | 73,413 |
| 226 | Royal Dutch Shell plc Class B ADR | 10,360 |
| 1,862 | TC Energy Corp. | 100,728 |
| Shares or Principal Amount | | Market Value† |
| COMMON STOCKS - 36.4% - (continued) |
| | Energy - 3.3% - (continued) |
| 5,958 | Tenaris S.A. | $ 65,872 |
| 14,975 | TotalEnergies SE | 749,872 |
| 3,092 | Williams Cos., Inc. | 86,854 |
| | | | 3,315,009 |
| | Food & Staples Retailing - 0.0% |
| 14,296 | Olam International Ltd. | 18,022 |
| | Food, Beverage & Tobacco - 3.3% |
| 1,856 | Archer-Daniels-Midland Co. | 119,229 |
| 22,803 | Astra Agro Lestari Tbk PT | 17,291 |
| 301 | Beyond Meat, Inc.*(7) | 29,793 |
| 585 | Bunge Ltd. | 54,194 |
| 422 | Cal-Maine Foods, Inc. | 15,217 |
| 7,519 | Coca-Cola Co. | 423,846 |
| 651 | Darling Ingredients, Inc.* | 55,023 |
| 13,983 | Diageo plc | 695,678 |
| 1,343 | Glanbia plc | 21,933 |
| 83,102 | Golden Agri-Resources Ltd. | 16,298 |
| 5,060 | Heineken N.V. | 560,087 |
| 293 | Ingredion, Inc. | 27,902 |
| 28,136 | IOI Corp. Bhd | 26,701 |
| 4,599 | Kuala Lumpur Kepong Bhd | 24,011 |
| 584 | Lamb Weston Holdings, Inc. | 32,967 |
| 3,668 | Nestle S.A. | 483,835 |
| 409 | NH Foods Ltd. | 14,384 |
| 2,723 | PepsiCo., Inc. | 440,037 |
| 1,018 | Pilgrim's Pride Corp.* | 28,667 |
| 515 | Prima Meat Packers Ltd. | 12,104 |
| 96 | Sanderson Farms, Inc. | 18,187 |
| 2,104 | Tate & Lyle plc | 18,664 |
| 957 | Tyson Foods, Inc. Class A | 76,531 |
| 23,723 | Wilmar International Ltd. | 75,846 |
| | | | 3,288,425 |
| | Health Care Equipment & Services - 2.5% |
| 6,413 | Baxter International, Inc. | 506,371 |
| 2,092 | Brookdale Senior Living, Inc.* | 13,598 |
| 13,703 | Koninklijke Philips N.V. | 646,441 |
| 4,727 | Medtronic plc | 566,578 |
| 1,774 | UnitedHealth Group, Inc. | 816,874 |
| | | | 2,549,862 |
| | Household & Personal Products - 1.7% |
| 7,737 | Colgate-Palmolive Co. | 589,482 |
| 4,095 | Procter & Gamble Co. | 585,544 |
| 6,141 | Reckitt Benckiser Group plc | 498,544 |
| | | | 1,673,570 |
| | Insurance - 1.9% |
| 46,111 | AIA Group Ltd. | 516,766 |
| 14,184 | AXA S.A. | 412,655 |
| 3,044 | Chubb Ltd. | 594,737 |
| 2,234 | Marsh & McLennan Cos., Inc. | 372,631 |
| | | | 1,896,789 |
| | Materials - 5.9% |
| 7,675 | Anglo American plc | 291,980 |
| 5,835 | ArcelorMittal S.A. | 197,340 |
| 20,645 | B2Gold Corp. | 85,242 |
| 10,847 | Barrick Gold Corp. | 199,249 |
| 24,615 | BHP Group plc | 650,121 |
| 3,527 | Boliden AB* | 124,342 |
| 58,340 | Centamin plc | 74,536 |
| 6,741 | Centerra Gold, Inc. | 50,547 |
The accompanying notes are an integral part of these financial statements.
Hartford AARP Balanced Retirement Fund
Schedule of Investments – (continued)
October 31, 2021
| Shares or Principal Amount | | Market Value† |
| COMMON STOCKS - 36.4% - (continued) |
| | Materials - 5.9% - (continued) |
| 887 | CF Industries Holdings, Inc. | $ 50,382 |
| 82,062 | China Hongqiao Group Ltd. | 91,175 |
| 13,512 | Cia Siderurgica Nacional S.A. | 54,538 |
| 2,413 | Corteva, Inc. | 104,121 |
| 8,133 | Dundee Precious Metals, Inc. | 53,493 |
| 4,953 | Eldorado Gold Corp.* | 44,303 |
| 5,555 | Endeavour Mining plc | 141,119 |
| 51,640 | Eregli Demir ve Celik Fabrikalari T.A.S. | 107,824 |
| 13,338 | Evraz plc | 113,293 |
| 531 | FMC Corp. | 48,326 |
| 11,702 | Fortescue Metals Group Ltd. | 121,935 |
| 505 | Franco-Nevada Corp. | 72,057 |
| 4,164 | Gold Fields Ltd. | 38,693 |
| 26,789 | Gold Road Resources Ltd. | 27,785 |
| 32,488 | Grupo Mexico S.A.B. de C.V. Series B | 142,368 |
| 36,366 | Hochschild Mining plc | 70,970 |
| 5,534 | Israel Chemicals Ltd. | 47,426 |
| 14,763 | Kinross Gold Corp. | 88,750 |
| 1,518 | Kirkland Lake Gold Ltd. | 63,990 |
| 2,380 | Kumba Iron Ore Ltd. | 72,424 |
| 2,012 | Linde plc* | 642,230 |
| 5,258 | MMC Norilsk Nickel PJSC ADR | 164,317 |
| 1,550 | Mosaic Co. | 64,434 |
| 21,627 | New Gold, Inc. | 30,406 |
| 1,636 | Newmont Corp. | 88,344 |
| 3,694 | Novolipetsk Steel PJSC GDR | 116,742 |
| 1,959 | Nutrien Ltd. | 136,921 |
| 1,579 | PhosAgro PJSC GDR | 37,770 |
| 594 | POSCO | 150,657 |
| 6,946 | Pretium Resources, Inc.* | 84,019 |
| 43,608 | Ramelius Resources Ltd. | 52,025 |
| 61,995 | Regis Resources Ltd. | 92,971 |
| 6,962 | Rio Tinto plc | 434,091 |
| 5,353 | Severstal PAO GDR | 122,418 |
| 36,710 | Silver Lake Resources Ltd.* | 46,490 |
| 3,221 | SSR Mining, Inc. | 50,803 |
| 4,822 | Torex Gold Resources, Inc.* | 56,067 |
| 30,980 | Vedanta Ltd. | 126,073 |
| 2,808 | voestalpine AG | 106,651 |
| 5,658 | Yamana Gold, Inc. | 22,219 |
| 1,079 | Yara International ASA | 56,392 |
| | | | 5,910,369 |
| | Pharmaceuticals, Biotechnology & Life Sciences - 2.7% |
| 5,884 | AstraZeneca plc ADR | 367,044 |
| 269 | Genus plc | 20,399 |
| 3,994 | Johnson & Johnson | 650,543 |
| 3,892 | Merck & Co., Inc. | 342,690 |
| 5,375 | Novartis AG | 444,581 |
| 8,346 | Pfizer, Inc. | 365,054 |
| 1,282 | Roche Holding AG | 496,639 |
| | | | 2,686,950 |
| | Real Estate - 3.0% |
| 241 | Alexandria Real Estate Equities, Inc. REIT | 49,198 |
| 1,475 | American Tower Corp. REIT | 415,906 |
| 75 | AvalonBay Communities, Inc. | 17,751 |
| 2,937 | Brixmor Property Group, Inc. REIT | 68,843 |
| 315 | Camden Property Trust REIT | 51,377 |
| 13,400 | Capitaland Investment Ltd.* | 34,183 |
| 555 | Catena AB | 33,799 |
| 580 | CBRE Group, Inc. Class A* | 60,366 |
| 20,000 | Central Pattana PCL | 35,712 |
| 8,696 | CK Asset Holdings Ltd. | 53,716 |
| Shares or Principal Amount | | Market Value† |
| COMMON STOCKS - 36.4% - (continued) |
| | Real Estate - 3.0% - (continued) |
| 9 | Comforia Residential REIT, Inc. REIT | $ 26,216 |
| 6,100 | Corp. Inmobiliaria Vesta S.A.B. de C.V. | 10,619 |
| 12 | CRE Logistics REIT, Inc.* | 23,346 |
| 742 | Douglas Emmett, Inc. REIT | 24,249 |
| 57 | Equinix, Inc. REIT | 47,713 |
| 355 | Extra Space Storage, Inc. REIT | 70,066 |
| 612 | Fastighets AB Balder Class B* | 44,375 |
| 2,251 | Goodman Group REIT | 37,270 |
| 14 | Heiwa Real Estate REIT, Inc. REIT | 19,546 |
| 5,500 | Hongkong Land Holdings Ltd. | 30,373 |
| 4 | Hoshino Resorts REIT, Inc. | 26,118 |
| 2,315 | Independence Realty Trust, Inc. REIT | 54,703 |
| 1,524 | Invitation Homes, Inc. REIT | 62,865 |
| 1,081 | Kojamo Oyj | 24,219 |
| 385 | Life Storage, Inc. REIT | 51,517 |
| 1,429 | Lifestyle Communities Ltd. | 23,593 |
| 1,315 | Mercialys S.A. | 14,285 |
| 20,570 | Mirvac Group REIT | 43,900 |
| 2,930 | Mitsui Fudosan Co., Ltd. REIT | 66,991 |
| 139 | Phillips Edison & Co., Inc. REIT | 4,189 |
| 1,009 | Prologis, Inc. REIT | 146,265 |
| 1,518 | Public Storage REIT | 504,249 |
| 1,964 | Retail Opportunity Investments Corp. REIT | 34,900 |
| 747 | Rexford Industrial Realty, Inc. REIT | 50,198 |
| 407 | Ryman Hospitality Properties, Inc. REIT* | 34,815 |
| 2,287 | Safestore Holdings plc REIT | 37,621 |
| 778 | Sagax AB | 30,450 |
| 2,310 | Savills plc | 44,828 |
| 116 | SBA Communications Corp. REIT | 40,058 |
| 413 | Simon Property Group, Inc. REIT | 60,538 |
| 659 | SL Green Realty Corp. | 46,176 |
| 7,049 | StorageVault Canada, Inc. | 35,313 |
| 273 | Sun Communities, Inc. REIT | 53,503 |
| 1,150 | TAG Immobilien AG | 34,938 |
| 2,540 | Tokyo Tatemono Co., Ltd. | 37,334 |
| 1,250 | UDR, Inc. REIT | 69,413 |
| 2,218 | UNITE Group plc REIT | 33,117 |
| 1,750 | VICI Properties, Inc. REIT | 51,363 |
| 845 | Welltower, Inc. REIT | 67,938 |
| 4,049 | Workspace Group plc REIT | 45,549 |
| | | | 2,985,570 |
| | Retailing - 0.4% |
| 4,754 | TJX Cos., Inc. | 311,339 |
| 406 | Tractor Supply Co. | 88,171 |
| | | | 399,510 |
| | Software & Services - 2.7% |
| 1,771 | Accenture plc Class A | 635,417 |
| 1,729 | Automatic Data Processing, Inc. | 388,143 |
| 1,723 | Capgemini SE | 401,740 |
| 2,584 | Microsoft Corp. | 856,906 |
| 1,940 | Visa, Inc. Class A | 410,834 |
| | | | 2,693,040 |
| | Telecommunication Services - 0.5% |
| 962 | Cellnex Telecom S.A.(2) | 59,163 |
| 14,917 | KDDI Corp. | 456,161 |
| | | | 515,324 |
| | Transportation - 1.1% |
| 5,370 | Canadian National Railway Co. | 713,686 |
| 1,627 | United Parcel Service, Inc. Class B | 347,316 |
| | | | 1,061,002 |
The accompanying notes are an integral part of these financial statements.
Hartford AARP Balanced Retirement Fund
Schedule of Investments – (continued)
October 31, 2021
| Shares or Principal Amount | | Market Value† |
| COMMON STOCKS - 36.4% - (continued) |
| | Utilities - 0.9% |
| 231 | American Electric Power Co., Inc. | $ 19,568 |
| 224 | Avangrid, Inc. | 11,805 |
| 484 | CenterPoint Energy, Inc. | 12,603 |
| 2,945 | China Gas Holdings Ltd. | 7,351 |
| 1,800 | China Yangtze Power Co., Ltd. | 5,977 |
| 208 | China Yangtze Power Co., Ltd. GDR(2) | 6,614 |
| 360 | Duke Energy Corp. | 36,724 |
| 360 | Edison International | 22,655 |
| 3,292 | Enel S.p.A. | 27,560 |
| 2,613 | Engie S.A. | 37,170 |
| 730 | Exelon Corp. | 38,829 |
| 705 | FirstEnergy Corp. | 27,164 |
| 2,407 | Iberdrola S.A. | 28,423 |
| 41,171 | National Grid plc | 527,135 |
| 418 | NextEra Energy, Inc. | 35,668 |
| 7,688 | Power Grid Corp. of India Ltd. | 19,044 |
| 393 | RWE AG | 15,127 |
| 145 | Sempra Energy | 18,506 |
| 425 | Southern Co. | 26,486 |
| | | | 924,409 |
| | Total Common Stocks
(cost $27,167,059) | | $ 36,433,291 |
| PREFERRED STOCKS - 0.0% |
| | Materials - 0.0% |
| 588 | Sociedad Quimica y Minera de Chile S.A. Class B | $ 31,997 |
| | Total Preferred Stocks
(cost $14,358) | | $ 31,997 |
| WARRANTS - 0.0% |
| | Energy - 0.0% |
| 11,625 | Ascent Resources - Marcellus LLC Expires 3/30/2023*(9)(10) | $ 116 |
| | Total Warrants
(cost $930) | | $ 116 |
| AFFILIATED INVESTMENT COMPANIES - 23.0% |
| | Domestic Equity Funds - 2.9% |
| 69,517 | Hartford Multifactor US Equity ETF | $ 2,928,751 |
| | International/Global Equity Funds - 9.7% |
| 157,541 | Hartford Multifactor Developed Markets (ex-US) ETF | 4,836,509 |
| 196,795 | Hartford Multifactor Emerging Markets ETF | 4,827,480 |
| | Total International/Global Equity Funds
(cost $8,190,217) | $ 9,663,989 |
| Shares or Principal Amount | | Market Value† |
| AFFILIATED INVESTMENT COMPANIES - 23.0% - (continued) |
| | Taxable Fixed Income Funds - 10.4% |
| 987,285 | The Hartford World Bond Fund, Class F | $ 10,415,856 |
| | Total Affiliated Investment Companies
(cost $20,912,215) | $ 23,008,596 |
| | Total Long-Term Investments
(Cost $87,469,266) | | $ 98,601,747 |
| SHORT-TERM INVESTMENTS - 1.6% |
| | Repurchase Agreements - 1.2% |
| $ 1,162,974 | Fixed Income Clearing Corp. Repurchase Agreement dated 10/29/2021 at 0.010%, due on 11/01/2021 with a maturity value of $1,162,975; collateralized by U.S. Treasury Bond at 1.875%, maturing 02/15/2041, with a market value of $1,186,239 | $ 1,162,974 |
| | Securities Lending Collateral - 0.4% |
| 2,715 | Fidelity Investments Money Market Funds, Government Portfolio, Institutional Class, 0.01%(11) | 2,715 |
| 416,817 | Goldman Sachs Financial Square Funds, Government Fund, Institutional Class, 0.03%(11) | 416,817 |
| 29,924 | Invesco Government & Agency Portfolio, Institutional Class, 0.03%(11) | 29,924 |
| | | | 449,456 |
| | Total Short-Term Investments
(cost $1,612,430) | $ 1,612,430 |
| | Total Investments Excluding
Purchased Options
(cost $89,081,696) | 100.0% | $ 100,214,177 |
| | Total Purchased Options
(cost $975,570) | 0.6% | $ 529,939 |
| | Total Investments
(cost $90,057,266) | 100.6% | $ 100,744,116 |
| | Other Assets and Liabilities | (0.6)% | (552,440) |
| | Total Net Assets | 100.0% | $ 100,191,676 |
| Note: | Percentage of investments as shown is the ratio of the total market value to total net assets. |
| | Prices of foreign equities that are principally traded on certain foreign markets will generally be adjusted daily pursuant to a fair value pricing service approved by the Board of Directors in order to reflect an adjustment for factors occurring after the close of certain foreign markets but before the close of the New York Stock Exchange. |
| | The Fund may refer to any one or more of the industry classifications used by one or more widely recognized market indices, ratings group and/or as defined by Fund management. Industry classifications may not be identical across all security types. |
The accompanying notes are an integral part of these financial statements.
Hartford AARP Balanced Retirement Fund
Schedule of Investments – (continued)
October 31, 2021
Equity industry classifications used in this report are the Global Industry Classification Standard, which was developed by and is the exclusive property and service mark of MSCI, Inc. and Standard & Poor’s.
For Fund compliance purposes, the Fund may not use the same classification system. These classifications are used for financial reporting purposes.
See “Glossary” for abbreviation descriptions.
| * | Non-income producing. |
| (1) | Variable rate securities; the rate reported is the coupon rate in effect at October 31, 2021. Base lending rates may be subject to a floor or cap. |
| (2) | Security was purchased pursuant to Rule 144A under the Securities Act of 1933 and may be sold in transactions that are exempt from registration (typically only to qualified institutional buyers) or in a public offering registered under the Securities Act of 1933. At October 31, 2021, the aggregate value of these securities was $15,250,215, representing 15.2% of net assets. |
| (3) | Securities disclosed are interest-only strips. |
| (4) | Variable or floating rate security, which interest rate adjusts periodically based on changes in current interest rates and prepayments on the underlying pool of assets. Rate shown is the rate in effect as of period end. |
| (5) | Security is a “step-up” bond where coupon increases or steps up at a predetermined date. Rate shown is current coupon rate. |
| (6) | Fixed to variable rate investment. The rate shown reflects the fixed rate in effect at October 31, 2021. Rate will reset at a future date. Base lending rates may be subject to a floor or cap. |
| (7) | Represents entire or partial securities on loan. See Note 8 in the accompanying Notes to Financial Statements for securities lending information. |
| (8) | All, or a portion of the security, was pledged as collateral in connection with futures contracts. As of October 31, 2021, the market value of securities pledged was $163,540. |
| (9) | These securities are valued in good faith at fair value as determined under policies and procedures established by and under the supervision of the Board of Directors. At October 31, 2021, the aggregate fair value of these securities are $37,158, which represented 0.0% of total net assets. This amount excludes securities that are principally traded in certain foreign markets and whose prices are adjusted pursuant to a third party pricing service methodology approved by the Board of Directors. |
| (10) | Investment valued using significant unobservable inputs. |
| (11) | Current yield as of period end. |
| Exchange-Traded Option Contracts Outstanding at October 31, 2021 |
| Description | | Exercise Price/
FX Rate/ Rate | | Expiration
Date | | Number of
Contracts | | Notional
Amount | | Market
Value† | | Premiums
Paid
(Received)
by Fund | | Unrealized
Appreciation/
(Depreciation) |
| Purchased option contracts: |
| Put |
| iShares MSCI EAFE ETF Option | | 69.00 | USD | | 03/18/2022 | | 243 | | USD | 24,300 | | $ 19,926 | | $ 68,362 | | $ (48,436) |
| iShares MSCI EAFE ETF Option | | 71.00 | USD | | 06/17/2022 | | 243 | | USD | 24,300 | | 33,534 | | 71,521 | | (37,987) |
| iShares MSCI EAFE ETF Option | | 70.00 | USD | | 09/16/2022 | | 243 | | USD | 24,300 | | 54,554 | | 85,136 | | (30,582) |
| iShares MSCI Emerging Markets Option | | 50.00 | USD | | 03/18/2022 | | 170 | | USD | 17,000 | | 41,140 | | 52,397 | | (11,257) |
| iShares MSCI Emerging Markets Option | | 49.50 | USD | | 06/17/2022 | | 170 | | USD | 17,000 | | 53,550 | | 46,975 | | 6,575 |
| iShares MSCI Emerging Markets Option | | 45.00 | USD | | 09/16/2022 | | 170 | | USD | 17,000 | | 41,055 | | 54,793 | | (13,738) |
| S&P 500 Index Option | | 3,675.00 | USD | | 03/18/2022 | | 10 | | USD | 1,000 | | 39,880 | | 182,060 | | (142,180) |
| S&P 500 Index Option | | 3,875.00 | USD | | 06/17/2022 | | 10 | | USD | 1,000 | | 101,800 | | 182,323 | | (80,523) |
| S&P 500 Index Option | | 3,875.00 | USD | | 09/16/2022 | | 10 | | USD | 1,000 | | 144,500 | | 232,003 | | (87,503) |
| Total purchased exchange-traded option contracts | | $ 529,939 | | $ 975,570 | | $ (445,631) |
| Futures Contracts Outstanding at October 31, 2021 |
| Description | | Number of
Contracts | | Expiration
Date | | Current
Notional
Amount | | Value and
Unrealized
Appreciation/
(Depreciation) |
| Long position contracts: |
| U.S. Treasury 10-Year Note Future | | 56 | | 12/21/2021 | | $ 7,319,375 | | $ (149,122) |
| Total futures contracts | | $ (149,122) |
The accompanying notes are an integral part of these financial statements.
Hartford AARP Balanced Retirement Fund
Schedule of Investments – (continued)
October 31, 2021
| Foreign Currency Contracts Outstanding at October 31, 2021 |
Amount and Description of
Currency to be Purchased | | Amount and Description of
Currency to be Sold | | Counterparty | | Settlement
Date | | Appreciation/
(Depreciation) |
| 5,938,929 | USD | | 5,114,000 | EUR | | DEUT | | 11/30/2021 | | $ 23,699 |
| 3,991,853 | USD | | 2,900,000 | GBP | | DEUT | | 11/30/2021 | | 22,984 |
| 4,750,782 | USD | | 541,000,000 | JPY | | MSC | | 11/30/2021 | | 3,164 |
| Total foreign currency contracts | | $ 49,847 |
† See Significant Accounting Policies of accompanying Notes to Financial Statements regarding valuation of investments.
Fair Value Summary
The following is a summary of the fair valuations according to the inputs used as of October 31, 2021 in valuing the Fund’s investments.
| Description | | Total | | Level 1 | | Level 2 | | Level 3(1) |
| Assets | | | | | | | | |
| Asset & Commercial Mortgage-Backed Securities | | $ 12,246,545 | | $ — | | $ 12,246,545 | | $ — |
| Corporate Bonds | | 18,875,584 | | — | | 18,875,584 | | — |
| Municipal Bonds | | 571,345 | | — | | 571,345 | | — |
| U.S. Government Agencies | | 4,398,855 | | — | | 4,398,855 | | — |
| U.S. Government Securities | | 3,035,418 | | — | | 3,035,418 | | — |
| Common Stocks | | | | | | | | |
| Banks | | 1,212,423 | | 1,212,423 | | — | | — |
| Capital Goods | | 3,123,999 | | 1,280,824 | | 1,843,175 | | — |
| Commercial & Professional Services | | 276,208 | | — | | 276,208 | | — |
| Consumer Durables & Apparel | | 502,178 | | 471,758 | | 30,420 | | — |
| Consumer Services | | 1,351,958 | | 785,134 | | 566,824 | | — |
| Diversified Financials | | 48,674 | | 48,674 | | — | | — |
| Energy | | 3,315,009 | | 1,578,829 | | 1,699,138 | | 37,042 |
| Food & Staples Retailing | | 18,022 | | — | | 18,022 | | — |
| Food, Beverage & Tobacco | | 3,288,425 | | 1,364,268 | | 1,924,157 | | — |
| Health Care Equipment & Services | | 2,549,862 | | 1,903,421 | | 646,441 | | — |
| Household & Personal Products | | 1,673,570 | | 1,175,026 | | 498,544 | | — |
| Insurance | | 1,896,789 | | 967,368 | | 929,421 | | — |
| Materials | | 5,910,369 | | 2,482,668 | | 3,427,701 | | — |
| Pharmaceuticals, Biotechnology & Life Sciences | | 2,686,950 | | 1,725,331 | | 961,619 | | — |
| Real Estate | | 2,985,570 | | 2,441,999 | | 543,571 | | — |
| Retailing | | 399,510 | | 399,510 | | — | | — |
| Software & Services | | 2,693,040 | | 2,291,300 | | 401,740 | | — |
| Telecommunication Services | | 515,324 | | — | | 515,324 | | — |
| Transportation | | 1,061,002 | | 1,061,002 | | — | | — |
| Utilities | | 924,409 | | 291,022 | | 633,387 | | — |
| Preferred Stocks | | 31,997 | | — | | 31,997 | | — |
| Warrants | | 116 | | — | | — | | 116 |
| Affiliated Investment Companies | | 23,008,596 | | 23,008,596 | | — | | — |
| Short-Term Investments | | 1,612,430 | | 449,456 | | 1,162,974 | | — |
| Purchased Options | | 529,939 | | 529,939 | | — | | — |
| Foreign Currency Contracts(2) | | 49,847 | | — | | 49,847 | | — |
| Total | | $ 100,793,963 | | $ 45,468,548 | | $ 55,288,257 | | $ 37,158 |
| Liabilities | | | | | | | | |
| Futures Contracts(2) | | $ (149,122) | | $ (149,122) | | $ — | | $ — |
| Total | | $ (149,122) | | $ (149,122) | | $ — | | $ — |
| (1) | For the year ended October 31, 2021, investments valued at $204,254 were transferred out of Level 3 due to the initiation of a vendor providing prices. There were no transfers into Level 3. |
| (2) | Derivative instruments (excluding purchased and written options, if applicable) are valued at the unrealized appreciation/(depreciation) on the investments. |
Level 3 investments at the beginning and/or end of the period in relation to net assets were not significant and accordingly, a reconciliation of Level 3 assets for the year ended October 31, 2021 is not presented.
The accompanying notes are an integral part of these financial statements.
The Hartford Checks and Balances Fund
Schedule of Investments
October 31, 2021
| Shares or Principal Amount | | Market Value† |
| AFFILIATED INVESTMENT COMPANIES - 99.8% |
| | Domestic Equity Funds - 66.5% |
| 11,611,948 | The Hartford Capital Appreciation Fund, Class F | $ 572,004,569 |
| 16,844,409 | The Hartford Dividend and Growth Fund, Class F | 574,394,330 |
| | Total Domestic Equity Funds
(cost $818,223,988) | $ 1,146,398,899 |
| | Taxable Fixed Income Funds - 33.3% |
| 14,109,493 | Hartford Total Return Bond ETF | 573,409,796 |
| | Total Affiliated Investment Companies
(cost $1,371,038,752) | $ 1,719,808,695 |
| SHORT-TERM INVESTMENTS - 0.2% |
| | Other Investment Pools & Funds - 0.2% |
| 3,271,412 | BlackRock Liquidity Funds, FedFund Portfolio, Institutional Class, 0.03%(1) | $ 3,271,412 |
| | Total Short-Term Investments
(cost $3,271,412) | $ 3,271,412 |
| | Total Investments
(cost $1,374,310,164) | 100.0% | $ 1,723,080,107 |
| | Other Assets and Liabilities | 0.0% | 326,469 |
| | Total Net Assets | 100.0% | $ 1,723,406,576 |
| Note: | Percentage of investments as shown is the ratio of the total market value to total net assets. |
| | For Fund compliance purposes, the Fund may not use the same classification system. These classifications are used for financial reporting purposes. |
| | See “Glossary” for abbreviation descriptions. |
| (1) | Current yield as of period end. |
| † | See Significant Accounting Policies of accompanying Notes to Financial Statements regarding valuation of investments. |
Fair Value Summary
The following is a summary of the fair valuations according to the inputs used as of October 31, 2021 in valuing the Fund’s investments.
| Description | | Total | | Level 1 | | Level 2 | | Level 3(1) |
| Assets | | | | | | | | |
| Affiliated Investment Companies | | $ 1,719,808,695 | | $ 1,719,808,695 | | $ — | | $ — |
| Short-Term Investments | | 3,271,412 | | 3,271,412 | | — | | — |
| Total | | $ 1,723,080,107 | | $ 1,723,080,107 | | $ — | | $ — |
| (1) | For the year ended October 31, 2021, there were no transfers in and out of Level 3. |
The accompanying notes are an integral part of these financial statements.
The Hartford Conservative Allocation Fund
Schedule of Investments
October 31, 2021
| Shares or Principal Amount | | Market Value† |
| AFFILIATED INVESTMENT COMPANIES - 99.7% |
| | Domestic Equity Funds - 26.4% |
| 240,763 | Hartford Core Equity Fund, Class F | $ 11,953,894 |
| 158,963 | Hartford Multifactor US Equity ETF | 6,697,111 |
| 256,683 | Hartford Small Cap Value Fund, Class F | 3,439,546 |
| 303,479 | The Hartford Equity Income Fund, Class F | 7,186,382 |
| 56,279 | The Hartford Growth Opportunities Fund, Class F | 3,809,522 |
| 106,492 | The Hartford Small Company Fund, Class F | 3,509,978 |
| | Total Domestic Equity Funds
(cost $25,845,153) | $ 36,596,433 |
| | International/Global Equity Funds - 11.0% |
| 164,918 | Hartford Multifactor Developed Markets (ex-US) ETF | 5,062,983 |
| 50,806 | Hartford Schroders Emerging Markets Equity Fund, Class F | 1,024,258 |
| 201,955 | Hartford Schroders International Multi-Cap Value Fund, Class F | 2,082,154 |
| 126,621 | The Hartford International Growth Fund, Class F | 2,450,108 |
| 214,364 | The Hartford International Opportunities Fund, Class F | 4,533,809 |
| | Total International/Global Equity Funds
(cost $13,104,275) | $ 15,153,312 |
| | Taxable Fixed Income Funds - 62.3% |
| 700,743 | Hartford Core Bond ETF | 28,705,306 |
| 310,376 | Hartford Short Duration ETF | 12,646,270 |
| 727,631 | The Hartford Inflation Plus Fund, Class F | 8,636,981 |
| 1,202,540 | The Hartford Strategic Income Fund, Class F | 11,051,345 |
| 2,384,807 | The Hartford World Bond Fund, Class F | 25,159,712 |
| | Total Taxable Fixed Income Funds
(cost $85,634,154) | $ 86,199,614 |
| | Total Affiliated Investment Companies
(cost $124,583,582) | $ 137,949,359 |
| Shares or Principal Amount | | Market Value† |
| SHORT-TERM INVESTMENTS - 0.3% |
| | Other Investment Pools & Funds - 0.3% |
| 399,772 | BlackRock Liquidity Funds, FedFund Portfolio, Institutional Class, 0.03%(1) | $ 399,772 |
| | Total Short-Term Investments
(cost $399,772) | $ 399,772 |
| | Total Investments
(cost $124,983,354) | 100.0% | $ 138,349,131 |
| | Other Assets and Liabilities | 0.0% | 63,309 |
| | Total Net Assets | 100.0% | $ 138,412,440 |
| Note: | Percentage of investments as shown is the ratio of the total market value to total net assets. |
| | For Fund compliance purposes, the Fund may not use the same classification system. These classifications are used for financial reporting purposes. |
| | See “Glossary” for abbreviation descriptions. |
| (1) | Current yield as of period end. |
| † | See Significant Accounting Policies of accompanying Notes to Financial Statements regarding valuation of investments. |
Fair Value Summary
The following is a summary of the fair valuations according to the inputs used as of October 31, 2021 in valuing the Fund’s investments.
| Description | | Total | | Level 1 | | Level 2 | | Level 3(1) |
| Assets | | | | | | | | |
| Affiliated Investment Companies | | $ 137,949,359 | | $ 137,949,359 | | $ — | | $ — |
| Short-Term Investments | | 399,772 | | 399,772 | | — | | — |
| Total | | $ 138,349,131 | | $ 138,349,131 | | $ — | | $ — |
| (1) | For the year ended October 31, 2021, there were no transfers in and out of Level 3. |
The accompanying notes are an integral part of these financial statements.
The Hartford Global Real Asset Fund (consolidated)
Schedule of Investments
October 31, 2021
| Shares or Principal Amount | | Market Value† |
| FOREIGN GOVERNMENT OBLIGATIONS - 4.7% |
| | Australia - 1.3% |
| AUD 1,610,850 | Australia Government Bond 0.75%, 11/21/2027 | $ 1,296,574 |
| | Canada - 1.7% |
| CAD 1,664,262 | Canadian Government Real Return Bond 4.25%, 12/01/2026 | 1,685,620 |
| | Japan - 1.7% |
| JPY 193,636,600 | Japanese Government CPI Linked Bond 0.10%, 03/10/2026 | 1,746,000 |
| | Total Foreign Government Obligations
(cost $4,776,630) | | $ 4,728,194 |
| U.S. GOVERNMENT SECURITIES - 17.9% |
| | U.S. Treasury Securities - 17.9% |
| | U.S. Treasury Bonds - 3.2% |
| $ 1,222,708 | 0.13%, 01/15/2030(1) | $ 1,354,532 |
| 124,045 | 1.75%, 01/15/2028(1) | 149,816 |
| 585,755 | 2.00%, 01/15/2026(1) | 684,910 |
| 612,414 | 2.38%, 01/15/2025(1) | 704,646 |
| 88,169 | 2.38%, 01/15/2027(1) | 107,520 |
| 144,775 | 3.63%, 04/15/2028(1) | 193,859 |
| | | | 3,195,283 |
| | U.S. Treasury Notes - 14.7% |
| 1,433,989 | 0.13%, 01/15/2023(1) | 1,489,024 |
| 2,263,786 | 0.13%, 07/15/2024(1)(2) | 2,427,027 |
| 833,087 | 0.13%, 07/15/2026(1) | 912,751 |
| 1,303,034 | 0.13%, 01/15/2031(1)(2) | 1,445,198 |
| 340,705 | 0.25%, 01/15/2025(1) | 367,556 |
| 641,649 | 0.25%, 07/15/2029(1) | 719,160 |
| 292,335 | 0.38%, 07/15/2023(1) | 309,361 |
| 1,216,969 | 0.38%, 07/15/2025(1) | 1,333,175 |
| 821,016 | 0.38%, 01/15/2027(1) | 910,638 |
| 626,234 | 0.38%, 07/15/2027(1) | 700,098 |
| 349,333 | 0.50%, 01/15/2028(1) | 392,761 |
| 1,138,259 | 0.63%, 01/15/2024(1) | 1,218,537 |
| 587,140 | 0.63%, 01/15/2026(1) | 650,429 |
| 496,061 | 0.75%, 07/15/2028(1) | 570,499 |
| 1,088,772 | 0.88%, 01/15/2029(1) | 1,264,485 |
| | | | 14,710,699 |
| | Total U.S. Government Securities
(cost $17,070,000) | | $ 17,905,982 |
| COMMON STOCKS - 55.5% |
| | Automobiles & Components - 0.2% |
| 681 | Aptiv plc* | $ 117,738 |
| 1,451 | Ford Motor Co.* | 24,783 |
| 4,190 | NOK Corp. | 48,637 |
| 28 | Volkswagen AG | 6,284 |
| | | | 197,442 |
| | Banks - 1.3% |
| 5,399 | ABN Amro Bank N.V.(3) | 79,407 |
| 25,418 | AIB Group plc* | 68,793 |
| 11,495 | Bank of Ireland Group plc* | 68,478 |
| 19,240 | BPER Banca | 42,185 |
| 30,740 | CaixaBank S.A. | 88,367 |
| 2,270 | KB Financial Group, Inc. | 109,877 |
| 16,676 | Mitsubishi UFJ Financial Group, Inc. | 91,443 |
| 21,057 | Resona Holdings, Inc. | 79,103 |
| 2,830 | Shinhan Financial Group Co., Ltd. | 92,391 |
| 25 | Signature Bank | 7,446 |
| 757 | Silvergate Capital Corp.* | 118,561 |
| Shares or Principal Amount | | Market Value† |
| COMMON STOCKS - 55.5% - (continued) |
| | Banks - 1.3% - (continued) |
| 2,792 | Societe Generale S.A. | $ 93,264 |
| 11,825 | Standard Chartered plc | 79,972 |
| 2,627 | Sumitomo Mitsui Financial Group, Inc. | 85,245 |
| 2,286 | Sumitomo Mitsui Trust Holdings, Inc. | 75,195 |
| 40,554 | Unicaja Banco S.A.(3) | 43,391 |
| 7,660 | UniCredit S.p.A. | 101,261 |
| | | | 1,324,379 |
| | Capital Goods - 2.2% |
| 1,305 | ABB Ltd. | 43,174 |
| 234 | Acuity Brands, Inc. | 48,071 |
| 875 | AECOM * | 59,824 |
| 420 | AZEK Co., Inc.* | 15,410 |
| 1,747 | Builders FirstSource, Inc.* | 101,798 |
| 4,359 | Chiyoda Corp.* | 15,934 |
| 3,033 | Cie de Saint-Gobain | 209,315 |
| 185 | Daikin Industries Ltd. | 40,518 |
| 176 | Deere & Co. | 60,246 |
| 303 | Eaton Corp. plc | 49,922 |
| 1,915 | Fluor Corp.* | 37,228 |
| 731 | Fortune Brands Home & Security, Inc. | 74,123 |
| 2,588 | Fugro N.V.* | 21,935 |
| 1,484 | Hitachi Ltd. | 85,515 |
| 205 | Hubbell, Inc. | 40,871 |
| 396 | Ingersoll Rand, Inc.* | 21,289 |
| 2,195 | JELD-WEN Holding, Inc.* | 60,165 |
| 6,998 | JGC Holdings Corp. | 65,762 |
| 753 | Johnson Controls International plc | 55,248 |
| 193 | Kennametal, Inc. | 7,672 |
| 2,162 | Kubota Corp. | 46,057 |
| 317 | Mercury Systems, Inc.* | 16,338 |
| 572 | Middleby Corp.* | 104,356 |
| 2,689 | PGT Innovations, Inc.* | 57,410 |
| 215 | Raytheon Technologies Corp. | 19,105 |
| 563 | Siemens AG | 91,533 |
| 488 | Spirit AeroSystems Holdings, Inc. | 20,149 |
| 535 | Triumph Group, Inc.* | 10,941 |
| 1,536 | Vestas Wind Systems A/S | 66,401 |
| 4,175 | Vinci S.A. | 446,350 |
| 1,243 | Westinghouse Air Brake Technologies Corp. | 112,777 |
| 423 | Xylem, Inc. | 55,239 |
| | | | 2,160,676 |
| | Commercial & Professional Services - 0.5% |
| 2,121 | Adecco Group AG | 106,856 |
| 756 | Clean Harbors, Inc.* | 85,080 |
| 27,837 | Hays plc | 63,086 |
| 5,098 | Pagegroup plc | 46,326 |
| 930 | US Ecology, Inc.* | 29,937 |
| 455 | Verisk Analytics, Inc. | 95,673 |
| 575 | Waste Management, Inc. | 92,132 |
| | | | 519,090 |
| | Consumer Durables & Apparel - 0.6% |
| 320 | Cavco Industries, Inc.* | 76,922 |
| 975 | Century Communities, Inc. | 65,383 |
| 471 | D.R. Horton, Inc. | 42,046 |
| 706 | Kaufman & Broad S.A. | 28,324 |
| 742 | Lennar Corp. Class A | 74,148 |
| 1,520 | Open House Co., Ltd. | 96,935 |
| 1,997 | Persimmon plc | 74,405 |
| 1,799 | Skyline Champion Corp.* | 113,913 |
| | | | 572,076 |
The accompanying notes are an integral part of these financial statements.
The Hartford Global Real Asset Fund (consolidated)
Schedule of Investments – (continued)
October 31, 2021
| Shares or Principal Amount | | Market Value† |
| COMMON STOCKS - 55.5% - (continued) |
| | Consumer Services - 0.3% |
| 599 | Caesars Entertainment, Inc.* | $ 65,566 |
| 660 | Oriental Land Co., Ltd. | 104,240 |
| 11,821 | Playa Hotels & Resorts N.V.* | 100,597 |
| | | | 270,403 |
| | Diversified Financials - 1.3% |
| 90 | ASX Ltd. | 5,660 |
| 1,384 | Berkshire Hathaway, Inc. Class B* | 397,222 |
| 2,556 | Brookfield Asset Management, Inc. Class A | 154,357 |
| 55 | CME Group, Inc. | 12,130 |
| 625 | Coinbase Global, Inc. Class A* | 199,637 |
| 5,858 | Galaxy Digital Holdings Ltd.* | 158,473 |
| 963 | Hannon Armstrong Sustainable Infrastructure Capital, Inc. REIT | 58,165 |
| 326 | Julius Baer Group Ltd. | 23,580 |
| 172 | Moody's Corp. | 69,514 |
| 961 | Power & Digital Infrastructure Acquisition Corp.* | 12,013 |
| 142 | S&P Global, Inc. | 67,331 |
| 8,602 | UBS Group AG | 156,579 |
| | | | 1,314,661 |
| | Energy - 16.4% |
| 950 | Ampol Ltd. | 21,975 |
| 14,895 | APA Corp. | 390,398 |
| 40,609 | ARC Resources Ltd. | 389,487 |
| 8,400 | Baker Hughes Co. | 210,672 |
| 222,069 | BP plc | 1,063,911 |
| 4,481 | BP plc ADR | 129,008 |
| 850 | Brigham Minerals, Inc. Class A | 19,703 |
| 5,926 | Cameco Corp. | 143,984 |
| 1,743 | Cheniere Energy, Inc.* | 180,226 |
| 3,911 | Chesapeake Energy Corp. | 249,287 |
| 1,600 | Chevron Corp. | 183,184 |
| 44,435 | China Oilfield Services Ltd. Class H | 42,496 |
| 7,796 | ConocoPhillips | 580,724 |
| 18,703 | Coterra Energy, Inc. | 398,748 |
| 692 | Diamondback Energy, Inc. | 74,175 |
| 147 | Drilling Co.* | 5,269 |
| 1,275 | DTE Midstream LLC* | 61,149 |
| 9,092 | Enbridge, Inc. | 380,841 |
| 28,040 | ENEOS Holdings, Inc. | 113,064 |
| 44,088 | Eni S.p.A. | 631,889 |
| 4,481 | EOG Resources, Inc. | 414,313 |
| 783 | EQT Corp.* | 15,590 |
| 8,531 | Equinor ASA | 216,161 |
| 2,884 | Exxon Mobil Corp. | 185,932 |
| 11,429 | Galp Energia SGPS S.A. | 118,724 |
| 47,468 | Gazprom PJSC ADR | 465,797 |
| 5,788 | Headwater Exploration, Inc.* | 22,916 |
| 25,908 | Inpex Corp. | 216,055 |
| 1,524 | Japan Petroleum Exploration Co., Ltd. | 27,733 |
| 2,515 | Lukoil PJSC ADR | 256,356 |
| 7,324 | Lundin Energy AB | 289,250 |
| 2,709 | Marathon Petroleum Corp. | 178,604 |
| 1,496 | Neste Oyj | 83,285 |
| 1,314 | Noble Corp.*(4) | 33,060 |
| 274 | Novatek PJSC | 69,459 |
| 34,081 | Oil & Natural Gas Corp. Ltd. | 67,819 |
| 340 | OMV AG | 20,585 |
| 8,549 | Ovintiv, Inc. | 320,754 |
| 19,013 | Parex Resources, Inc. | 369,168 |
| 4,879 | PDC Energy, Inc. | 255,221 |
| 63,264 | Petroleo Brasileiro S.A. | 310,166 |
| 937 | Phillips 66 | 70,069 |
| Shares or Principal Amount | | Market Value† |
| COMMON STOCKS - 55.5% - (continued) |
| | Energy - 16.4% - (continued) |
| 908 | Pioneer Natural Resources Co. | $ 169,778 |
| 5,332 | Reliance Industries Ltd. | 180,942 |
| 3,515 | Repsol S.A. | 45,022 |
| 15,663 | Royal Dutch Shell plc Class A | 358,822 |
| 3,065 | Royal Dutch Shell plc Class A ADR | 140,745 |
| 40,096 | Royal Dutch Shell plc Class B | 920,152 |
| 34,797 | Royal Dutch Shell plc Class B ADR | 1,595,095 |
| 12,309 | Saipem S.p.A.* | 26,969 |
| 113 | SK Innovation Co., Ltd.* | 23,566 |
| 7,086 | Southwestern Energy Co.* | 34,580 |
| 42,647 | Surgutneftegas PJSC ADR | 203,707 |
| 5,419 | Targa Resources Corp. | 296,257 |
| 12,770 | TC Energy Corp. | 690,823 |
| 12,418 | Tenaris S.A. | 138,290 |
| 2,472 | Tenaris S.A. ADR | 55,076 |
| 1 | Thungela Resources Ltd.* | 5 |
| 33,362 | TotalEnergies SE | 1,670,600 |
| 3,168 | TotalEnergies SE ADR | 158,748 |
| 2,830 | Tourmaline Oil Corp. | 102,283 |
| 11,136 | Trican Well Service Ltd.* | 31,223 |
| 1,200 | Valaris Ltd.* | 42,264 |
| 5,007 | Viper Energy Partners L.P. | 110,404 |
| 793 | Whiting Petroleum Corp.* | 51,648 |
| 3,699 | YPF S.A. ADR* | 15,536 |
| | | | 16,339,742 |
| | Food & Staples Retailing - 0.1% |
| 19,123 | J Sainsbury plc | 78,325 |
| | Food, Beverage & Tobacco - 0.6% |
| 7,600 | Archer-Daniels-Midland Co. | 488,224 |
| 1,053 | Darling Ingredients, Inc.* | 89,000 |
| 73,166 | Perusahaan Perkebunan London Sumatra Indonesia Tbk PT | 7,207 |
| | | | 584,431 |
| | Health Care Equipment & Services - 0.1% |
| 6,673 | Brookdale Senior Living, Inc.* | 43,374 |
| | Insurance - 0.4% |
| 3,890 | Assicurazioni Generali S.p.A. | 84,705 |
| 3,441 | Dai-ichi Life Holdings, Inc. | 72,394 |
| 234 | Muenchener Rueckversicherungs-Gesellschaft AG in Muenchen | 69,284 |
| 59,881 | Old Mutual Ltd. | 61,116 |
| 85,878 | Shin Kong Financial Holding Co., Ltd. | 30,267 |
| 7,967 | T&D Holdings, Inc. | 102,182 |
| 3,581 | Tongyang Life Insurance Co., Ltd. | 20,952 |
| | | | 440,900 |
| | Materials - 11.2% |
| 29,456 | Alrosa PJSC | 51,901 |
| 33,265 | Alumina Ltd. | 50,274 |
| 23,484 | Anglo American plc | 891,894 |
| 5,151 | Antofagasta plc | 100,471 |
| 12,977 | ArcelorMittal S.A. | 438,884 |
| 35,060 | B2Gold Corp. | 144,761 |
| 24,988 | Barrick Gold Corp. | 458,531 |
| 39,806 | BHP Group plc | 1,051,339 |
| 2,483 | BlueScope Steel Ltd. | 38,800 |
| 4,077 | Boliden AB | 143,731 |
| 102,084 | Centamin plc | 130,424 |
| 15,215 | Centerra Gold, Inc. | 114,088 |
| 4,270 | CF Industries Holdings, Inc. | 242,536 |
| 86,302 | China BlueChemical Ltd. Class H | 28,858 |
| 11,400 | Cia Siderurgica Nacional S.A. | 46,014 |
The accompanying notes are an integral part of these financial statements.
The Hartford Global Real Asset Fund (consolidated)
Schedule of Investments – (continued)
October 31, 2021
| Shares or Principal Amount | | Market Value† |
| COMMON STOCKS - 55.5% - (continued) |
| | Materials - 11.2% - (continued) |
| 5,940 | Corteva, Inc. | $ 256,311 |
| 12,270 | Dundee Precious Metals, Inc. | 80,703 |
| 10,248 | Eldorado Gold Corp.* | 91,708 |
| 10,578 | Endeavour Mining plc | 268,724 |
| 5,937 | First Quantum Minerals Ltd. | 140,558 |
| 5,920 | FMC Corp. | 538,779 |
| 25,331 | Fortescue Metals Group Ltd. | 263,950 |
| 720 | Franco-Nevada Corp. | 102,735 |
| 5,444 | Freeport-McMoRan, Inc. | 205,348 |
| 12,574 | Gold Fields Ltd. | 116,840 |
| 36,158 | Gold Road Resources Ltd.(4) | 37,503 |
| 7,564 | Harmony Gold Mining Co., Ltd. | 27,148 |
| 96,677 | Hochschild Mining plc | 188,670 |
| 923 | Imerys S.A. | 40,008 |
| 2,436 | Impala Platinum Holdings Ltd. | 31,528 |
| 1,065 | Johnson Matthey plc | 39,805 |
| 31,847 | Kinross Gold Corp. | 191,437 |
| 2,510 | Kirkland Lake Gold Ltd. | 105,807 |
| 1,722 | Kumba Iron Ore Ltd. | 52,401 |
| 2,713 | Kyoei Steel Ltd. | 33,475 |
| 2,182 | LafargeHolcim Ltd. | 108,844 |
| 4,086 | Louisiana-Pacific Corp. | 240,788 |
| 20,404 | Lundin Mining Corp. | 177,562 |
| 2,120 | Maruichi Steel Tube Ltd. | 48,170 |
| 29,040 | New Gold, Inc.* | 40,829 |
| 2,419 | Newmont Corp. | 130,626 |
| 24,845 | Norsk Hydro ASA | 182,498 |
| 1,947 | Nucor Corp. | 217,382 |
| 9,280 | Nutrien Ltd. | 648,610 |
| 15,480 | OceanaGold Corp.* | 28,894 |
| 1,098 | Pacific Metals Co., Ltd. | 19,902 |
| 563 | POSCO | 142,795 |
| 11,150 | Pretium Resources, Inc.* | 134,870 |
| 68,643 | Ramelius Resources Ltd. | 81,892 |
| 101,388 | Regis Resources Ltd. | 152,046 |
| 26,542 | Resolute Mining Ltd.* | 8,341 |
| 13,299 | Rio Tinto plc | 829,212 |
| 57,565 | Silver Lake Resources Ltd.* | 72,900 |
| 65,897 | South32 Ltd. | 177,763 |
| 4,570 | SSR Mining, Inc. | 72,080 |
| 562 | Steel Dynamics, Inc. | 37,137 |
| 2,240 | Taiheiyo Cement Corp. | 47,592 |
| 7,528 | Torex Gold Resources, Inc.* | 87,531 |
| 21,466 | Vale S.A. ADR | 273,262 |
| 772 | Vicat S.A. | 32,948 |
| 1,261 | Warrior Met Coal, Inc. | 30,226 |
| 1,629 | West Fraser Timber Co., Ltd. | 130,428 |
| 8,478 | Western Areas Ltd. | 20,300 |
| 8,000 | Yamana Gold, Inc. | 31,416 |
| 1,234 | Yamato Kogyo Co., Ltd. | 41,376 |
| 4,163 | Yara International ASA | 217,570 |
| | | | 11,211,734 |
| | Media & Entertainment - 0.8% |
| 574 | Charter Communications, Inc. Class A* | 387,387 |
| 7,381 | Comcast Corp. Class A | 379,605 |
| | | | 766,992 |
| | Real Estate - 7.7% |
| 756 | Alexandria Real Estate Equities, Inc. REIT | 154,330 |
| 1,661 | American Tower Corp. REIT | 468,352 |
| 236 | AvalonBay Communities, Inc. | 55,856 |
| 6,086 | British Land Co. plc REIT | 41,093 |
| 9,313 | Brixmor Property Group, Inc. REIT | 218,297 |
| Shares or Principal Amount | | Market Value† |
| COMMON STOCKS - 55.5% - (continued) |
| | Real Estate - 7.7% - (continued) |
| 999 | Camden Property Trust REIT | $ 162,937 |
| 42,200 | Capitaland Investment Ltd.* | 107,651 |
| 1,743 | Catena AB | 106,147 |
| 1,840 | CBRE Group, Inc. Class A* | 191,507 |
| 22,000 | Central Pattana PCL | 39,283 |
| 36,911 | CK Asset Holdings Ltd. | 228,001 |
| 28 | Comforia Residential REIT, Inc. REIT | 81,562 |
| 19,400 | Corp. Inmobiliaria Vesta S.A.B. de C.V. | 33,772 |
| 38 | CRE Logistics REIT, Inc. | 73,931 |
| 2,354 | Douglas Emmett, Inc. REIT | 76,929 |
| 180 | Equinix, Inc. REIT | 150,673 |
| 1,125 | Extra Space Storage, Inc. REIT | 222,041 |
| 1,916 | Fastighets AB Balder Class B* | 138,925 |
| 812 | Five Point Holdings LLC Class A* | 5,976 |
| 6,990 | Goodman Group REIT | 115,733 |
| 2,164 | Heiwa Real Estate Co., Ltd. | 68,320 |
| 45 | Heiwa Real Estate REIT, Inc. REIT | 62,827 |
| 17,300 | Hongkong Land Holdings Ltd. | 95,535 |
| 13 | Hoshino Resorts REIT, Inc. | 84,884 |
| 7,340 | Independence Realty Trust, Inc. REIT | 173,444 |
| 4,831 | Invitation Homes, Inc. REIT | 199,279 |
| 3,394 | Kojamo Oyj | 76,041 |
| 4,089 | Land Securities Group plc REIT | 38,414 |
| 1,210 | Life Storage, Inc. REIT | 161,910 |
| 4,440 | Lifestyle Communities Ltd. | 73,306 |
| 18,463 | Medical Properties Trust, Inc. REIT | 393,816 |
| 4,197 | Mercialys S.A. | 45,593 |
| 63,931 | Mirvac Group REIT | 136,439 |
| 4,282 | Mitsubishi Estate Co., Ltd. | 65,073 |
| 9,191 | Mitsui Fudosan Co., Ltd. REIT | 210,142 |
| 462 | Phillips Edison & Co., Inc. REIT | 13,925 |
| 3,199 | Prologis, Inc. REIT | 463,727 |
| 6,167 | Retail Opportunity Investments Corp. REIT | 109,588 |
| 2,348 | Rexford Industrial Realty, Inc. REIT | 157,786 |
| 1,280 | Ryman Hospitality Properties, Inc. REIT* | 109,491 |
| 7,125 | Safestore Holdings plc REIT | 117,206 |
| 2,420 | Sagax AB | 94,717 |
| 7,189 | Savills plc | 139,510 |
| 366 | SBA Communications Corp. REIT | 126,391 |
| 1,311 | Simon Property Group, Inc. REIT | 192,166 |
| 2,071 | SL Green Realty Corp. | 145,115 |
| 22,092 | StorageVault Canada, Inc. | 110,674 |
| 867 | Sun Communities, Inc. REIT | 169,915 |
| 3,612 | TAG Immobilien AG | 109,736 |
| 8,100 | Tokyo Tatemono Co., Ltd. | 119,057 |
| 3,965 | UDR, Inc. REIT | 220,176 |
| 6,971 | UNITE Group plc REIT | 104,083 |
| 5,550 | VICI Properties, Inc. REIT | 162,892 |
| 18,040 | Vinhomes JSC(3) | 67,712 |
| 2,679 | Welltower, Inc. REIT | 215,392 |
| 1,957 | Weyerhaeuser Co., REIT | 69,904 |
| 12,659 | Workspace Group plc REIT | 142,407 |
| | | | 7,719,589 |
| | Retailing - 0.0% |
| 1,160 | Rakuten Group, Inc. | 12,700 |
| 3,196 | Xebio Holdings Co., Ltd. | 29,701 |
| | | | 42,401 |
| | Semiconductors & Semiconductor Equipment - 0.1% |
| 179 | Advanced Micro Devices, Inc.* | 21,521 |
The accompanying notes are an integral part of these financial statements.
The Hartford Global Real Asset Fund (consolidated)
Schedule of Investments – (continued)
October 31, 2021
| Shares or Principal Amount | | Market Value† |
| COMMON STOCKS - 55.5% - (continued) |
| | Semiconductors & Semiconductor Equipment - 0.1% - (continued) |
| 581 | First Solar, Inc.* | $ 69,482 |
| 98 | NVIDIA Corp. | 25,056 |
| | | | 116,059 |
| | Software & Services - 0.7% |
| 139,947 | Arcane Crypto AB* | 3,878 |
| 19,150 | Argo Blockchain plc* | 32,019 |
| 755 | Argo Blockchain plc ADR* | 12,722 |
| 434 | Aspen Technology, Inc.* | 68,003 |
| 175 | Bakkt Holdings, Inc.* | 7,441 |
| 12,129 | Bitfarms Ltd.* | 61,253 |
| 19,315 | Hive Blockchain Technologies Ltd.* | 68,202 |
| 8,037 | Hut Mining Corp.* | 107,931 |
| 2,112 | Marathon Digital Holdings, Inc.* | 110,331 |
| 8 | Microsoft Corp. | 2,653 |
| 207 | MicroStrategy, Inc. Class A*(4) | 148,017 |
| 1,193 | Riot Blockchain, Inc.*(4) | 32,473 |
| 53 | Square, Inc. Class A* | 13,488 |
| 3,307 | Voyager Digital Ltd.* | 50,396 |
| | | | 718,807 |
| | Technology Hardware & Equipment - 0.1% |
| 5,067 | Hexagon AB Class B | 81,547 |
| 619 | Trimble, Inc.* | 54,082 |
| | | | 135,629 |
| | Telecommunication Services - 2.2% |
| 3,498 | America Movil S.A.B. de C.V. Class L ADR | 62,195 |
| 26,365 | BT Group plc* | 50,089 |
| 10,863 | Cellnex Telecom S.A.(3) | 668,071 |
| 12,500 | KDDI Corp. | 382,250 |
| 1,946 | KT Corp. | 50,808 |
| 2,969 | KT Corp. ADR | 38,033 |
| 5,224 | MTN Group Ltd.* | 46,844 |
| 12,578 | Nippon Telegraph & Telephone Corp. | 352,422 |
| 5,309 | Orange S.A. | 57,894 |
| 1,588 | SK Telecom Co., Ltd.*(5)(6) | 420,481 |
| 4,517 | Telefonica Brasil S.A. | 36,432 |
| 47,096 | Turk Telekomunikasyon AS | 36,887 |
| 19,068 | Turkcell Iletisim Hizmetleri AS | 30,326 |
| | | | 2,232,732 |
| | Transportation - 1.1% |
| 3,493 | Canadian National Railway Co. | 464,228 |
| 1,552 | D/S Norden A/S | 37,456 |
| 787 | East Japan Railway Co. | 49,020 |
| 115,126 | Pacific Basin Shipping Ltd. | 53,131 |
| 8,263 | PostNL N.V. | 35,862 |
| 206 | Ryanair Holdings plc ADR* | 23,383 |
| 56,999 | Shanghai International Airport Co., Ltd. Class A* | 471,336 |
| | | | 1,134,416 |
| | Utilities - 7.6% |
| 856 | Acciona S.A. | 164,389 |
| 4,644 | American Electric Power Co., Inc. | 393,393 |
| 1,152 | Atlantica Sustainable Infrastructure plc | 45,331 |
| 7,494 | Avangrid, Inc. | 394,934 |
| 54,277 | Beijing Enterprises Holdings Ltd. | 208,635 |
| 29,654 | Centrica plc* | 24,479 |
| 136,100 | China Gas Holdings Ltd. | 339,708 |
| 342,370 | China Longyuan Power Group Corp. Ltd. Class H | 800,816 |
| Shares or Principal Amount | | Market Value† |
| COMMON STOCKS - 55.5% - (continued) |
| | Utilities - 7.6% - (continued) |
| 32,244 | Cia de Saneamento Basico do Estado de Sao Paulo | $ 201,104 |
| 849 | Consolidated Edison, Inc. | 64,015 |
| 3,747 | Duke Energy Corp. | 382,232 |
| 31,921 | E.ON SE | 404,752 |
| 6,079 | Edison International | 382,552 |
| 6,941 | Electricite de France S.A. | 102,296 |
| 51,342 | Enel S.p.A. | 429,824 |
| 44,652 | Engie S.A. | 635,181 |
| 1,086 | Eversource Energy | 92,201 |
| 9,402 | Exelon Corp. | 500,092 |
| 9,175 | FirstEnergy Corp. | 353,513 |
| 32,629 | Iberdrola S.A. | 385,301 |
| 39,222 | National Grid plc | 502,181 |
| 2,924 | Sempra Energy | 373,190 |
| 1,038 | Sunnova Energy International, Inc.* | 46,253 |
| 5,413 | UGI Corp. | 234,978 |
| 2,559 | Veolia Environnement S.A. | 83,574 |
| | | | 7,544,924 |
| | Total Common Stocks
(cost $41,745,028) | | $ 55,468,782 |
| EXCHANGE-TRADED FUNDS - 1.6% |
| | Other Investment Pools & Funds - 1.6% |
| 25,860 | iShares Global Energy ETF (4) | $ 751,233 |
| 801 | iShares MSCI Global Metals & Mining Producers ETF | 33,983 |
| 4,980 | VanEck Vectors Agribusiness ETF (4) | 476,536 |
| 8,935 | VanEck Vectors Gold Miners ETF | 283,329 |
| | | | 1,545,081 |
| | Total Exchange-Traded Funds
(cost $1,350,977) | | $ 1,545,081 |
| CLOSED END FUNDS - 0.1% |
| | Investment Company Securities - 0.1% |
| 3,080 | Sprott Physical Uranium Trust * | $ 34,244 |
| | Total Closed End Funds
(cost $19,682) | $ 34,244 |
| | Total Long-Term Investments
(Cost $64,962,317) | | $ 79,682,283 |
| SHORT-TERM INVESTMENTS - 17.6% |
| | Other Investment Pools & Funds - 8.2% |
| 8,166,630 | Morgan Stanley Institutional Liquidity Funds, Government Portfolio, Institutional Class, 0.03%(7) | $ 8,166,630 |
| | Repurchase Agreements - 8.5% |
| $ 8,489,907 | Fixed Income Clearing Corp. Repurchase Agreement dated 10/29/2021 at 0.010%, due on 11/01/2021 with a maturity value of $8,489,914; collateralized by U.S. Treasury Bond at 1.875%, maturing 02/15/2041, with a market value of $8,659,791 | 8,489,907 |
The accompanying notes are an integral part of these financial statements.
The Hartford Global Real Asset Fund (consolidated)
Schedule of Investments – (continued)
October 31, 2021
| Shares or Principal Amount | | Market Value† |
| SHORT-TERM INVESTMENTS - 17.6% - (continued) |
| | Securities Lending Collateral - 0.9% |
| 5,678 | Fidelity Investments Money Market Funds, Government Portfolio, Institutional Class, 0.01%(7) | $ 5,678 |
| 871,624 | Goldman Sachs Financial Square Funds, Government Fund, Institutional Class, 0.03%(7) | 871,624 |
| 62,576 | Invesco Government & Agency Portfolio, Institutional Class, 0.03%(7) | 62,576 |
| | | | 939,878 |
| | Total Short-Term Investments
(cost $17,596,415) | $ 17,596,415 |
| | Total Investments
(cost $82,558,732) | 97.4% | $ 97,278,698 |
| | Other Assets and Liabilities | 2.6% | 2,636,608 |
| | Total Net Assets | 100.0% | $ 99,915,306 |
| Note: | Percentage of investments as shown is the ratio of the total market value to total net assets. |
| | Prices of foreign equities that are principally traded on certain foreign markets will generally be adjusted daily pursuant to a fair value pricing service approved by the Board of Directors in order to reflect an adjustment for factors occurring after the close of certain foreign markets but before the close of the New York Stock Exchange. |
| | The Fund may refer to any one or more of the industry classifications used by one or more widely recognized market indices, ratings group and/or as defined by Fund management. Industry classifications may not be identical across all security types. |
| | Equity industry classifications used in this report are the Global Industry Classification Standard, which was developed by and is the exclusive property and service mark of MSCI, Inc. and Standard & Poor’s. |
| | The Consolidated Schedule of Investments includes investments held by The Hartford Cayman Global Real-Asset Fund, Ltd. (the “Subsidiary”), a wholly owned subsidiary of the Fund, which primarily invests in commodity-related |
instruments. The Fund may invest up to 25% of its total assets in the Subsidiary. As of October 31, 2021, the Fund invested 14.7% of its total assets in the Subsidiary.
For Fund compliance purposes, the Fund may not use the same classification system. These classifications are used for financial reporting purposes.
See “Glossary” for abbreviation descriptions.
| * | Non-income producing. |
| (1) | The principal amount for these securities are adjusted for inflation and the interest payments equal a fixed percentage of the inflation-adjusted principal amount. |
| (2) | All, or a portion of the security, was pledged as collateral in connection with futures contracts. As of October 31, 2021, the market value of securities pledged was $1,384,511. |
| (3) | Security was purchased pursuant to Rule 144A under the Securities Act of 1933 and may be sold in transactions that are exempt from registration (typically only to qualified institutional buyers) or in a public offering registered under the Securities Act of 1933. At October 31, 2021, the aggregate value of these securities was $858,581, representing 0.9% of net assets. |
| (4) | Represents entire or partial securities on loan. See Note 8 in the accompanying Notes to Financial Statements for securities lending information. |
| (5) | This security is valued in good faith at fair value as determined under policies and procedures established by and under the supervision of the Board of Directors. At October 31, 2021, the aggregate fair value of this security was $420,481, which represented 0.4% of total net assets. This amount excludes securities that are principally traded in certain foreign markets and whose prices are adjusted pursuant to a third party pricing service methodology approved by the Board of Directors. |
| (6) | Investment valued using significant unobservable inputs. |
| (7) | Current yield as of period end. |
| Futures Contracts Outstanding at October 31, 2021 |
| Description | | Number of
Contracts | | Expiration
Date | | Current
Notional
Amount | | Value and
Unrealized
Appreciation/
(Depreciation) |
| Long position contracts: |
| Brent Crude Oil Future | | 11 | | 03/31/2022 | | $ 875,930 | | $ 25,089 |
| Brent Crude Oil Future | | 7 | | 11/30/2021 | | 586,040 | | 2,107 |
| Copper Future | | 4 | | 12/29/2021 | | 436,800 | | 13,457 |
| Copper Future | | 7 | | 03/29/2022 | | 759,500 | | 6,349 |
| Corn Future | | 18 | | 12/14/2021 | | 511,425 | | 26,641 |
| Cotton No. 2 Future | | 8 | | 03/09/2022 | | 444,880 | | 73,049 |
| Gasoline RBOB Future | | 6 | | 02/28/2022 | | 578,063 | | 65,275 |
| Gold 100oz Future | | 11 | | 04/27/2022 | | 1,966,360 | | 10,305 |
| Live Cattle Future | | 8 | | 04/29/2022 | | 439,120 | | (1,917) |
| LME Nickel Future | | 8 | | 11/15/2021 | | 937,248 | | 87,295 |
| LME Nickel Future | | 7 | | 01/17/2022 | | 817,362 | | 52,338 |
| LME Nickel Future | | 11 | | 03/14/2022 | | 1,280,796 | | 16,645 |
| LME Zinc Future | | 11 | | 11/15/2021 | | 946,618 | | 122,636 |
| LME Zinc Future | | 11 | | 01/17/2022 | | 930,944 | | 124,285 |
| LME Zinc Future | | 16 | | 03/14/2022 | | 1,340,000 | | 109,370 |
| Natural Gas Future | | 3 | | 01/27/2022 | | 162,990 | | 3,077 |
The accompanying notes are an integral part of these financial statements.
The Hartford Global Real Asset Fund (consolidated)
Schedule of Investments – (continued)
October 31, 2021
| Futures Contracts Outstanding at October 31, 2021 – (continued) |
| Description | | Number of
Contracts | | Expiration
Date | | Current
Notional
Amount | | Value and
Unrealized
Appreciation/
(Depreciation) |
| Long position contracts – (continued): |
| NY Harbor ULSD Future | | 5 | | 02/28/2022 | | $ 505,638 | | $ 64,047 |
| Silver Future | | 2 | | 12/29/2021 | | 239,490 | | (3,193) |
| Silver Future | | 1 | | 03/29/2022 | | 119,960 | | 7,556 |
| Soybean Future | | 13 | | 03/14/2022 | | 818,350 | | (17,107) |
| Soybean Meal Future | | 16 | | 03/14/2022 | | 530,240 | | (26,925) |
| Wheat Future | | 12 | | 12/14/2021 | | 463,650 | | 29,886 |
| WTI Crude Future | | 9 | | 11/19/2021 | | 752,130 | | (10,574) |
| Total | | | | | | | | $ 779,691 |
| Short position contracts: |
| LME Nickel Future | | 8 | | 11/15/2021 | | $ 937,248 | | $ (64,048) |
| LME Nickel Future | | 7 | | 01/17/2022 | | 817,362 | | (5,689) |
| LME Nickel Future | | 6 | | 03/14/2022 | | 698,616 | | (265) |
| LME Zinc Future | | 11 | | 11/15/2021 | | 946,618 | | (141,178) |
| LME Zinc Future | | 11 | | 01/17/2022 | | 930,944 | | (96,441) |
| LME Zinc Future | | 9 | | 03/14/2022 | | 753,750 | | (56,737) |
| U.S. Treasury 10-Year Note Future | | 40 | | 12/21/2021 | | 5,228,125 | | 99,242 |
| Total | | | | | | | | $ (265,116) |
| Total futures contracts | | $ 514,575 |
| Bond Forward Contracts Outstanding at October 31, 2021 |
| Counterparty | | Reference Obligation | | Notional Amount | | Expiration Date | | Unrealized
Appreciation/
(Depreciation) |
| BOA | | U.S. Treasury Bonds, 0.75%, 07/15/2028 | | USD | 3,731,571 | | 07/15/2028 | | $(34,230) |
| Foreign Currency Contracts Outstanding at October 31, 2021 |
Amount and Description of
Currency to be Purchased | | Amount and Description of
Currency to be Sold | | Counterparty | | Settlement
Date | | Appreciation/
(Depreciation) |
| 2,860,000 | AUD | | 2,143,313 | USD | | TDB | | 11/30/2021 | | $ 8,375 |
| 610,200,000 | CLP | | 749,770 | USD | | MSC | | 11/30/2021 | | (2,342) |
| 4,945,000 | CNH | | 773,260 | USD | | CBK | | 11/30/2021 | | (3,275) |
| 13,341,000,000 | IDR | | 937,592 | USD | | GSC | | 11/30/2021 | | 1,353 |
| 225,800,000 | JPY | | 1,982,859 | USD | | MSC | | 11/30/2021 | | (1,321) |
| 10,840,000 | MXN | | 533,609 | USD | | CBK | | 11/30/2021 | | (9,548) |
| 390,000 | NZD | | 279,133 | USD | | MSC | | 11/30/2021 | | 228 |
| 4,290,000 | SEK | | 499,036 | USD | | JPM | | 11/30/2021 | | 614 |
| 1,322,879 | USD | | 1,752,000 | AUD | | RBCA | | 11/30/2021 | | 4,783 |
| 1,717,010 | USD | | 2,118,000 | CAD | | RBCA | | 11/30/2021 | | 5,664 |
| 2,821,978 | USD | | 2,430,000 | EUR | | DEUT | | 11/30/2021 | | 11,261 |
| 2,792,920 | USD | | 2,029,000 | GBP | | DEUT | | 11/30/2021 | | 16,080 |
| 1,763,293 | USD | | 199,861,000 | JPY | | BNP | | 11/30/2021 | | 9,386 |
| 643,716 | USD | | 9,480,000 | ZAR | | MSC | | 11/30/2021 | | 25,354 |
| Total foreign currency contracts | | $ 66,612 |
† See Significant Accounting Policies of accompanying Notes to Financial Statements regarding valuation of investments.
The accompanying notes are an integral part of these financial statements.
The Hartford Global Real Asset Fund (consolidated)
Schedule of Investments – (continued)
October 31, 2021
Fair Value Summary
The following is a summary of the fair valuations according to the inputs used as of October 31, 2021 in valuing the Fund’s investments.
| Description | | Total | | Level 1 | | Level 2 | | Level 3(1) |
| Assets | | | | | | | | |
| Foreign Government Obligations | | $ 4,728,194 | | $ — | | $ 4,728,194 | | $ — |
| U.S. Government Securities | | 17,905,982 | | — | | 17,905,982 | | — |
| Common Stocks | | | | | | | | |
| Automobiles & Components | | 197,442 | | 142,521 | | 54,921 | | — |
| Banks | | 1,324,379 | | 126,007 | | 1,198,372 | | — |
| Capital Goods | | 2,160,676 | | 1,028,182 | | 1,132,494 | | — |
| Commercial & Professional Services | | 519,090 | | 349,148 | | 169,942 | | — |
| Consumer Durables & Apparel | | 572,076 | | 372,412 | | 199,664 | | — |
| Consumer Services | | 270,403 | | 166,163 | | 104,240 | | — |
| Diversified Financials | | 1,314,661 | | 1,128,842 | | 185,819 | | — |
| Energy | | 16,339,742 | | 9,131,303 | | 7,208,439 | | — |
| Food & Staples Retailing | | 78,325 | | — | | 78,325 | | — |
| Food, Beverage & Tobacco | | 584,431 | | 577,224 | | 7,207 | | — |
| Health Care Equipment & Services | | 43,374 | | 43,374 | | — | | — |
| Insurance | | 440,900 | | 61,116 | | 379,784 | | — |
| Materials | | 11,211,734 | | 5,510,252 | | 5,701,482 | | — |
| Media & Entertainment | | 766,992 | | 766,992 | | — | | — |
| Real Estate | | 7,719,589 | | 5,670,027 | | 2,049,562 | | — |
| Retailing | | 42,401 | | — | | 42,401 | | — |
| Semiconductors & Semiconductor Equipment | | 116,059 | | 116,059 | | — | | — |
| Software & Services | | 718,807 | | 686,788 | | 32,019 | | — |
| Technology Hardware & Equipment | | 135,629 | | 54,082 | | 81,547 | | — |
| Telecommunication Services | | 2,232,732 | | 203,873 | | 1,608,378 | | 420,481 |
| Transportation | | 1,134,416 | | 525,067 | | 609,349 | | — |
| Utilities | | 7,544,924 | | 3,849,089 | | 3,695,835 | | — |
| Exchange-Traded Funds | | 1,545,081 | | 1,545,081 | | — | | — |
| Closed End Funds | | 34,244 | | 34,244 | | — | | — |
| Short-Term Investments | | 17,596,415 | | 9,106,508 | | 8,489,907 | | — |
| Foreign Currency Contracts(2) | | 83,098 | | — | | 83,098 | | — |
| Futures Contracts(2) | | 938,649 | | 938,649 | | — | | — |
| Total | | $ 98,300,445 | | $ 42,133,003 | | $ 55,746,961 | | $���420,481 |
| Liabilities | | | | | | | | |
| Bond Forward Contracts(2) | | $ (34,230) | | $ — | | $ (34,230) | | $ — |
| Foreign Currency Contracts(2) | | (16,486) | | — | | (16,486) | | — |
| Futures Contracts(2) | | (424,074) | | (424,074) | | — | | — |
| Total | | $ (474,790) | | $ (424,074) | | $ (50,716) | | $ — |
| (1) | For the year ended October 31, 2021, there were no transfers in and out of Level 3. |
| (2) | Derivative instruments (excluding purchased and written options, if applicable) are valued at the unrealized appreciation/(depreciation) on the investments. |
Level 3 investments at the beginning and/or end of the period in relation to net assets were not significant and accordingly, a reconciliation of Level 3 assets for the year ended October 31, 2021 is not presented.
The accompanying notes are an integral part of these financial statements.
The Hartford Growth Allocation Fund
Schedule of Investments
October 31, 2021
| Shares or Principal Amount | | Market Value† |
| AFFILIATED INVESTMENT COMPANIES - 99.8% |
| | Domestic Equity Funds - 58.3% |
| 2,475,450 | Hartford Core Equity Fund, Class F | $ 122,906,092 |
| 1,525,275 | Hartford Multifactor US Equity ETF | 64,259,836 |
| 2,913,549 | Hartford Small Cap Value Fund, Class F | 39,041,552 |
| 3,278,328 | The Hartford Equity Income Fund, Class F | 77,630,805 |
| 525,326 | The Hartford Growth Opportunities Fund, Class F | 35,559,329 |
| 1,182,428 | The Hartford Small Company Fund, Class F | 38,972,840 |
| | Total Domestic Equity Funds
(cost $260,732,552) | $ 378,370,454 |
| | International/Global Equity Funds - 26.2% |
| 1,958,588 | Hartford Multifactor Developed Markets (ex-US) ETF | 60,128,652 |
| 591,288 | Hartford Schroders Emerging Markets Equity Fund, Class F | 11,920,371 |
| 2,110,128 | Hartford Schroders International Multi-Cap Value Fund, Class F | 21,755,417 |
| 1,285,081 | The Hartford International Growth Fund, Class F | 24,866,328 |
| 2,419,189 | The Hartford International Opportunities Fund, Class F | 51,165,840 |
| | Total International/Global Equity Funds
(cost $147,905,099) | $ 169,836,608 |
| | Taxable Fixed Income Funds - 15.3% |
| 911,258 | Hartford Core Bond ETF | 37,328,864 |
| 289,354 | Hartford Short Duration ETF | 11,789,728 |
| 933,174 | The Hartford Inflation Plus Fund, Class F | 11,076,769 |
| 1,356,011 | The Hartford Strategic Income Fund, Class F | 12,461,743 |
| 2,499,235 | The Hartford World Bond Fund, Class F | 26,366,929 |
| | Total Taxable Fixed Income Funds
(cost $98,501,896) | $ 99,024,033 |
| | Total Affiliated Investment Companies
(cost $507,139,547) | $ 647,231,095 |
| Shares or Principal Amount | | Market Value† |
| SHORT-TERM INVESTMENTS - 0.2% |
| | Other Investment Pools & Funds - 0.2% |
| 1,635,064 | BlackRock Liquidity Funds, FedFund Portfolio, Institutional Class, 0.03%(1) | $ 1,635,064 |
| | Total Short-Term Investments
(cost $1,635,064) | $ 1,635,064 |
| | Total Investments
(cost $508,774,611) | 100.0% | $ 648,866,159 |
| | Other Assets and Liabilities | (0.0)% | (143,925) |
| | Total Net Assets | 100.0% | $ 648,722,234 |
| Note: | Percentage of investments as shown is the ratio of the total market value to total net assets. |
| | For Fund compliance purposes, the Fund may not use the same classification system. These classifications are used for financial reporting purposes. |
| | See “Glossary” for abbreviation descriptions. |
| (1) | Current yield as of period end. |
| † | See Significant Accounting Policies of accompanying Notes to Financial Statements regarding valuation of investments. |
Fair Value Summary
The following is a summary of the fair valuations according to the inputs used as of October 31, 2021 in valuing the Fund’s investments.
| Description | | Total | | Level 1 | | Level 2 | | Level 3(1) |
| Assets | | | | | | | | |
| Affiliated Investment Companies | | $ 647,231,095 | | $ 647,231,095 | | $ — | | $ — |
| Short-Term Investments | | 1,635,064 | | 1,635,064 | | — | | — |
| Total | | $ 648,866,159 | | $ 648,866,159 | | $ — | | $ — |
| (1) | For the year ended October 31, 2021, there were no transfers in and out of Level 3. |
The accompanying notes are an integral part of these financial statements.
Hartford Moderate Allocation Fund
Schedule of Investments
October 31, 2021
| Shares or Principal Amount | | Market Value† |
| AFFILIATED INVESTMENT COMPANIES - 99.7% |
| | Domestic Equity Funds - 42.3% |
| 1,199,471 | Hartford Core Equity Fund, Class F | $ 59,553,749 |
| 714,546 | Hartford Multifactor US Equity ETF | 30,103,823 |
| 1,379,650 | Hartford Small Cap Value Fund, Class F | 18,487,318 |
| 1,517,324 | The Hartford Equity Income Fund, Class F | 35,930,231 |
| 247,182 | The Hartford Growth Opportunities Fund, Class F | 16,731,724 |
| 509,263 | The Hartford Small Company Fund, Class F | 16,785,310 |
| | Total Domestic Equity Funds
(cost $121,308,647) | $ 177,592,155 |
| | International/Global Equity Funds - 21.3% |
| 996,329 | Hartford Multifactor Developed Markets (ex-US) ETF | 30,587,300 |
| 296,479 | Hartford Schroders Emerging Markets Equity Fund, Class F | 5,977,018 |
| 1,177,278 | Hartford Schroders International Multi-Cap Value Fund, Class F | 12,137,732 |
| 731,275 | The Hartford International Growth Fund, Class F | 14,150,176 |
| 1,271,398 | The Hartford International Opportunities Fund, Class F | 26,890,060 |
| | Total International/Global Equity Funds
(cost $78,005,511) | $ 89,742,286 |
| | Taxable Fixed Income Funds - 36.1% |
| 1,442,533 | Hartford Core Bond ETF | 59,092,066 |
| 496,261 | Hartford Short Duration ETF | 20,220,155 |
| 1,291,301 | The Hartford Inflation Plus Fund, Class F | 15,327,750 |
| 2,006,577 | The Hartford Strategic Income Fund, Class F | 18,440,440 |
| 3,663,333 | The Hartford World Bond Fund, Class F | 38,648,162 |
| | Total Taxable Fixed Income Funds
(cost $150,780,356) | $ 151,728,573 |
| | Total Affiliated Investment Companies
(cost $350,094,514) | $ 419,063,014 |
| Shares or Principal Amount | | Market Value† |
| SHORT-TERM INVESTMENTS - 0.3% |
| | Other Investment Pools & Funds - 0.3% |
| 1,127,042 | BlackRock Liquidity Funds, FedFund Portfolio, Institutional Class, 0.03%(1) | $ 1,127,042 |
| | Total Short-Term Investments
(cost $1,127,042) | $ 1,127,042 |
| | Total Investments
(cost $351,221,556) | 100.0% | $ 420,190,056 |
| | Other Assets and Liabilities | (0.0)% | (27,842) |
| | Total Net Assets | 100.0% | $ 420,162,214 |
| Note: | Percentage of investments as shown is the ratio of the total market value to total net assets. |
| | For Fund compliance purposes, the Fund may not use the same classification system. These classifications are used for financial reporting purposes. |
| | See “Glossary” for abbreviation descriptions. |
| (1) | Current yield as of period end. |
| † | See Significant Accounting Policies of accompanying Notes to Financial Statements regarding valuation of investments. |
Fair Value Summary
The following is a summary of the fair valuations according to the inputs used as of October 31, 2021 in valuing the Fund’s investments.
| Description | | Total | | Level 1 | | Level 2 | | Level 3(1) |
| Assets | | | | | | | | |
| Affiliated Investment Companies | | $ 419,063,014 | | $ 419,063,014 | | $ — | | $ — |
| Short-Term Investments | | 1,127,042 | | 1,127,042 | | — | | — |
| Total | | $ 420,190,056 | | $ 420,190,056 | | $ — | | $ — |
| (1) | For the year ended October 31, 2021, there were no transfers in and out of Level 3. |
The accompanying notes are an integral part of these financial statements.
Hartford Multi-Asset Income Fund (formerly, Hartford Multi-Asset Income and Growth Fund)
Schedule of Investments
October 31, 2021
| Shares or Principal Amount | | Market Value† |
| ASSET & COMMERCIAL MORTGAGE-BACKED SECURITIES - 17.1% |
| | Asset-Backed - Automobile - 0.6% |
| $ 30,461 | ARI Fleet Lease Trust 3.22%, 08/16/2027(1) | $ 30,542 |
| 250,000 | Atrium IX 3.72%, 05/28/2030, 3 mo. USD LIBOR + 3.600%(1)(2) | 249,620 |
| 2,420 | Canadian Pacer Auto Receivables Trust 3.27%, 12/19/2022(1) | 2,424 |
| 188,917 | Chesapeake Funding LLC 0.87%, 08/16/2032(1) | 189,533 |
| | Enterprise Fleet Financing LLC | |
| 148,156 | 2.06%, 05/20/2025(1) | 149,703 |
| 34,110 | 2.98%, 10/20/2024(1) | 34,260 |
| 20,451 | 3.38%, 05/20/2024(1) | 20,515 |
| 160,000 | Ford Credit Auto Lease Trust 0.78%, 09/15/2025 | 159,237 |
| | Ford Credit Auto Owner Trust | |
| 100,000 | 1.61%, 10/17/2033(1) | 99,117 |
| 100,000 | 1.91%, 10/17/2033(1) | 99,259 |
| | Magnetite Ltd. | |
| 250,000 | 1.52%, 01/15/2034, 3 mo. USD LIBOR + 1.400%(1)(2) | 250,010 |
| 400,000 | 2.47%, 10/25/2031, 3 mo. USD LIBOR + 2.350%(1)(2) | 400,915 |
| 350,000 | 3.62%, 10/25/2031, 3 mo. USD LIBOR + 3.500%(1)(2) | 350,636 |
| 870,000 | 6.47%, 01/25/2032, 3 mo. USD LIBOR + 6.350%(1)(2) | 870,556 |
| 400,000 | Palmer Square Loan Funding Ltd. 3.37%, 10/24/2027, 3 mo. USD LIBOR + 3.250%(1)(2) | 401,042 |
| | Symphony CLO Ltd. | |
| 540,000 | 2.62%, 01/15/2034, 3 mo. USD LIBOR + 2.500%(1)(2) | 541,183 |
| 645,000 | 7.12%, 01/23/2032, 3 mo. USD LIBOR + 7.000%(1)(2) | 636,514 |
| 500,000 | Venture CLO Ltd. 3.63%, 10/22/2031, 3 mo. USD LIBOR + 3.500%(1)(2) | 481,916 |
| | | | 4,966,982 |
| | Asset-Backed - Credit Card - 0.0% |
| 165,000 | Mercury Financial Credit Card Master Trust 1.54%, 03/20/2026(1) | 165,287 |
| | Asset-Backed - Finance & Insurance - 7.8% |
| 305,000 | Affirm Asset Securitization Trust 1.03%, 08/17/2026(1) | 303,612 |
| 380,000 | Aligned Data Centers Issuer LLC 1.94%, 08/15/2046(1) | 378,203 |
| | Apidos CLO | |
| 270,000 | 1.98%, 10/24/2034, 3 mo. USD LIBOR + 1.900%(1)(2) | 270,019 |
| 520,000 | 2.43%, 01/20/2033, 3 mo. USD LIBOR + 2.300%(1)(2) | 524,221 |
| 1,250,000 | Babson CLO Ltd. 2.72%, 10/15/2033, 3 mo. USD LIBOR + 2.600%(1)(2) | 1,250,000 |
| | Bain Capital Credit CLO Ltd. | |
| 290,000 | 1.35%, 07/24/2034(1)(2) | 290,347 |
| 925,000 | 2.23%, 10/23/2034, 3 mo. USD LIBOR + 2.150%(1)(2) | 925,190 |
| 970,000 | 3.28%, 10/23/2034(1)(2) | 970,199 |
| Shares or Principal Amount | | Market Value† |
| ASSET & COMMERCIAL MORTGAGE-BACKED SECURITIES - 17.1% - (continued) |
| | Asset-Backed - Finance & Insurance - 7.8% - (continued) |
| $ 260,000 | Ballyrock CLO 2020-2 Ltd. 2.08%, 10/20/2031(1)(2) | $ 260,025 |
| | Barings CLO Ltd. | |
| 1,000,000 | 2.03%, 07/20/2029, 3 mo. USD LIBOR + 1.900%(1)(2) | 996,246 |
| 1,250,000 | 2.12%, 10/15/2036, 3 mo. USD LIBOR + 2.000%(1)(2) | 1,250,236 |
| 1,110,000 | 3.32%, 10/15/2036, 3 mo. USD LIBOR + 3.200%(1)(2) | 1,110,201 |
| 1,095,000 | Barings Clo Ltd. 2020-IIII 2.07%, 10/15/2033(1)(2) | 1,095,000 |
| | Battalion CLO Ltd. | |
| 500,000 | 1.89%, 07/15/2034(1)(2) | 500,410 |
| 750,000 | 3.37%, 01/20/2035, 3 mo. USD LIBOR + 3.350%(1)(2) | 750,112 |
| | Bayview Koitere Fund Trust | |
| 204,247 | 3.50%, 07/28/2057(1)(3) | 208,414 |
| 92,737 | 4.00%, 11/28/2053(1)(3) | 94,361 |
| 775,000 | BCRED BSL CLO Ltd. 1.83%, 10/20/2034(1)(2) | 774,612 |
| 605,000 | Benefit Street Partners CLO Ltd. 7.13%, 01/20/2032, 3 mo. USD LIBOR + 7.000%(1)(2) | 606,345 |
| | BlueMountain CLO Ltd. | |
| 1,400,000 | 1.62%, 07/15/2031, 3 mo. USD LIBOR + 1.500%(1)(2) | 1,400,522 |
| 1,200,000 | 1.82%, 08/15/2031, 3 mo. USD LIBOR + 1.700%(1)(2) | 1,199,615 |
| 2,000,000 | 1.83%, 07/30/2030, 3 mo. USD LIBOR + 1.700%(1)(2) | 2,001,022 |
| 965,000 | Broad River BSL Funding CLO Ltd. 1.83%, 07/20/2034, 3 mo. USD LIBOR + 1.700%(1)(2) | 965,658 |
| | Carlyle Global Market Strategies CLO Ltd. | |
| 1,000,000 | 1.92%, 04/17/2031, 3 mo. USD LIBOR + 1.800%(1)(2) | 995,959 |
| 560,000 | 1.93%, 07/20/2032, 3 mo. USD LIBOR + 1.800%(1)(2) | 559,998 |
| 825,000 | 2.52%, 01/18/2029, 3 mo. USD LIBOR + 2.400%(1)(2) | 812,599 |
| 995,000 | 3.09%, 07/20/2031, 3 mo. USD LIBOR + 2.950%(1)(2) | 995,108 |
| 1,500,000 | Carlyle U.S. CLO Ltd. 6.38%, 04/20/2034, 3 mo. USD LIBOR + 6.250%(1)(2) | 1,489,401 |
| 1,255,000 | Cayuga Park CLO Ltd. 3.22%, 07/17/2034, 3 mo. USD LIBOR + 3.100%(1)(2) | 1,255,624 |
| | CIFC Funding Ltd. | |
| 955,000 | 1.23%, 04/20/2032(1)(2) | 955,090 |
| 1,200,000 | 1.93%, 10/22/2031, 3 mo. USD LIBOR + 1.800%(1)(2) | 1,196,987 |
| 785,000 | 2.02%, 01/16/2033, 3 mo. USD LIBOR + 1.900%(1)(2) | 785,409 |
| 835,000 | 2.53%, 10/20/2031, 3 mo. USD LIBOR + 2.400%(1)(2) | 836,070 |
| 640,000 | 3.12%, 04/17/2034, 3 mo. USD LIBOR + 3.000%(1)(2) | 640,088 |
The accompanying notes are an integral part of these financial statements.
Hartford Multi-Asset Income Fund (formerly, Hartford Multi-Asset Income and Growth Fund)
Schedule of Investments – (continued)
October 31, 2021
| Shares or Principal Amount | | Market Value† |
| ASSET & COMMERCIAL MORTGAGE-BACKED SECURITIES - 17.1% - (continued) |
| | Asset-Backed - Finance & Insurance - 7.8% - (continued) |
| $ 1,250,000 | 4.03%, 10/20/2031, 3 mo. USD LIBOR + 3.900%(1)(2) | $ 1,252,967 |
| 530,000 | Credit Acceptance Auto Loan Trust 1.24%, 10/15/2029(1) | 532,349 |
| 400,000 | Dewolf Park CLO Ltd. 1.97%, 10/15/2030(1)(2) | 400,017 |
| 243,775 | Domino's Pizza Master Issuer LLC 3.15%, 04/25/2051(1) | 253,212 |
| | Dryden CLO Ltd. | |
| 1,215,000 | 2.17%, 10/15/2035, 3 mo. USD LIBOR + 2.050%(1)(2) | 1,215,230 |
| 1,300,000 | 3.32%, 10/15/2035, 3 mo. USD LIBOR + 3.200%(1)(2) | 1,300,235 |
| 1,200,000 | Dryden Senior Loan Fund 1.57%, 04/15/2029, 3 mo. USD LIBOR + 1.450%(1)(2) | 1,200,266 |
| 459,862 | FirstKey Homes Trust 1.54%, 08/17/2038(1) | 462,009 |
| 694,000 | FS Rialto 2021-FL3 1.90%, 11/16/2036(1)(2) | 693,804 |
| 28,549 | GreatAmerica Leasing Receivables Funding LLC 2.83%, 06/17/2024(1) | 28,580 |
| 355,000 | Home Partners of America 2021-2 Trust 2.30%, 12/17/2026(1) | 354,997 |
| 230,555 | Horizon Aircraft Finance Ltd. 3.43%, 11/15/2039(1) | 229,169 |
| | LCM L.P. | |
| 1,200,000 | 1.71%, 07/20/2031, 3 mo. USD LIBOR + 1.580%(1)(2) | 1,193,588 |
| 250,000 | 2.08%, 10/20/2027, 3 mo. USD LIBOR + 1.950%(1)(2) | 250,310 |
| | LCM XXV Ltd. | |
| 1,473,000 | 1.78%, 07/20/2030, 3 mo. USD LIBOR + 1.650%(1)(2) | 1,470,537 |
| 931,334 | 2.43%, 07/20/2030, 3 mo. USD LIBOR + 2.300%(1)(2) | 932,079 |
| 1,000,000 | 3.58%, 07/20/2030, 3 mo. USD LIBOR + 3.450%(1)(2) | 972,105 |
| | Madison Park Funding Ltd. | |
| 353,113 | 0.87%, 04/15/2029, 3 mo. USD LIBOR + 0.750%(1)(2) | 353,184 |
| 1,200,000 | 1.62%, 04/19/2030, 3 mo. USD LIBOR + 1.500%(1)(2) | 1,200,025 |
| 850,000 | 2.62%, 04/15/2029, 3 mo. USD LIBOR + 2.500%(1)(2) | 842,771 |
| 1,500,000 | 3.37%, 07/23/2029, 3 mo. USD LIBOR + 3.250%(1)(2) | 1,495,123 |
| | Magnetite Ltd. | |
| 1,068,812 | 0.92%, 01/15/2028, 3 mo. USD LIBOR + 0.800%(1)(2) | 1,069,708 |
| 715,000 | 1.62%, 11/15/2028, 3 mo. USD LIBOR + 1.500%(1)(2) | 715,312 |
| | Magnetite XXVIII Ltd. | |
| 400,000 | 2.02%, 01/20/2035(1)(2) | 400,000 |
| 350,000 | 3.02%, 01/20/2035(1)(2) | 350,000 |
| 295,000 | MMAF Equipment Finance LLC 2.21%, 12/15/2032(1) | 299,249 |
| | Neuberger Berman CLO Ltd. | |
| 700,000 | 2.02%, 04/15/2034, 3 mo. USD LIBOR + 1.900%(1)(2) | 699,647 |
| Shares or Principal Amount | | Market Value† |
| ASSET & COMMERCIAL MORTGAGE-BACKED SECURITIES - 17.1% - (continued) |
| | Asset-Backed - Finance & Insurance - 7.8% - (continued) |
| $ 930,000 | 2.02%, 07/15/2034(1)(2) | $ 931,104 |
| | Neuberger Berman Loan Advisers CLO Ltd. | |
| 1,250,000 | 1.68%, 04/20/2031, 3 mo. USD LIBOR + 1.550%(1)(2) | 1,250,595 |
| 990,000 | 2.07%, 10/20/2035, 3 mo. USD LIBOR + 2.000%(1)(2) | 990,190 |
| 1,250,000 | 3.07%, 10/20/2035, 3 mo. USD LIBOR + 3.000%(1)(2) | 1,249,992 |
| 125,000 | New Economy Assets Phase 1 Sponsor LLC 2.41%, 10/20/2061(1) | 125,554 |
| | Oaktree CLO Ltd. | |
| 1,250,000 | 1.77%, 07/15/2034, 3 mo. USD LIBOR + 1.650%(1)(2) | 1,250,635 |
| 250,000 | 3.29%, 10/20/2034, 3 mo. USD LIBOR + 3.210%(1)(2) | 248,212 |
| 690,000 | Octagon Investment Partners Ltd. 3.22%, 10/20/2034, 3 mo. USD LIBOR + 3.100%(1)(2) | 690,000 |
| | OHA Credit Funding Ltd. | |
| 1,215,000 | 2.52%, 10/19/2032, 3 mo. USD LIBOR + 2.400%(1)(2) | 1,216,870 |
| 250,000 | 3.77%, 10/19/2032, 3 mo. USD LIBOR + 3.650%(1)(2) | 250,479 |
| | Shackleton CLO Ltd. | |
| 250,000 | 1.33%, 10/20/2034(1)(2) | 249,981 |
| 1,250,000 | 3.43%, 04/20/2029(1)(2) | 1,237,987 |
| | Sound Point CLO Ltd. | |
| 2,340,000 | 1.78%, 07/20/2034(1)(2) | 2,341,196 |
| 250,000 | 1.78%, 10/25/2034(1)(2) | 250,034 |
| 1,200,000 | 1.93%, 10/20/2031, 3 mo. USD LIBOR + 1.800%(1)(2) | 1,208,875 |
| | Taco Bell Funding LLC | |
| 180,000 | 1.95%, 08/25/2051(1) | 178,225 |
| 160,000 | 2.29%, 08/25/2051(1) | 159,601 |
| 698,887 | Treman Park CLO Ltd. 1.20%, 10/20/2028, 3 mo. USD LIBOR + 1.070%(1)(2) | 699,505 |
| | Voya CLO Ltd. | |
| 990,000 | 2.02%, 10/15/2030, 3 mo. USD LIBOR + 1.900%(1)(2) | 980,836 |
| 1,200,000 | 2.22%, 07/14/2031, 3 mo. USD LIBOR + 2.090%(1)(2) | 1,192,133 |
| 800,000 | 2.32%, 10/18/2031, 3 mo. USD LIBOR + 2.200%(1)(2) | 793,201 |
| 1,000,000 | Voya Ltd. 2.07%, 10/15/2030, 3 mo. USD LIBOR + 1.950%(1)(2) | 1,000,067 |
| 1,205,000 | Whetstone Park CLO Ltd. 3.09%, 01/20/2035(1)(2) | 1,205,000 |
| | | | 68,513,648 |
| | Asset-Backed - Home Equity - 0.4% |
| | FirstKey Homes Trust | |
| 650,000 | 1.67%, 10/19/2037(1) | 640,602 |
| 1,305,000 | 3.02%, 10/19/2037(1) | 1,314,965 |
| | Progress Residential Trust | |
| 205,000 | 1.50%, 10/17/2027(1) | 201,615 |
The accompanying notes are an integral part of these financial statements.
Hartford Multi-Asset Income Fund (formerly, Hartford Multi-Asset Income and Growth Fund)
Schedule of Investments – (continued)
October 31, 2021
| Shares or Principal Amount | | Market Value† |
| ASSET & COMMERCIAL MORTGAGE-BACKED SECURITIES - 17.1% - (continued) |
| | Asset-Backed - Home Equity - 0.4% - (continued) |
| $ 820,000 | 1.81%, 04/17/2038(1) | $ 798,973 |
| 305,000 | Tricon American Homes Trust 2.03%, 11/17/2039(1) | 298,899 |
| | | | 3,255,054 |
| | Commercial Mortgage-Backed Securities - 5.0% |
| 1,125,000 | 1211 Avenue of the Americas Trust 4.14%, 08/10/2035(1)(3) | 1,195,853 |
| 1,250,000 | 280 Park Avenue Mortgage Trust 1.63%, 09/15/2034, 1 mo. USD LIBOR + 1.537%(1)(2) | 1,246,840 |
| 190,000 | Arbor Multifamily Mortgage Securities Trust 2.57%, 10/15/2054(1) | 195,381 |
| 905,000 | BAMLL Commercial Mortgage Securities Trust 2.84%, 11/15/2030, 1 mo. USD LIBOR + 2.750%(1)(2) | 917,171 |
| | Benchmark Mortgage Trust | |
| 30,129,417 | 0.48%, 07/15/2051(3)(4) | 783,995 |
| 22,187,598 | 0.64%, 01/15/2052(3)(4) | 817,584 |
| 2,942,639 | 1.04%, 05/15/2052(3)(4) | 183,418 |
| 14,885,516 | 1.23%, 03/15/2062(3)(4) | 1,063,086 |
| 470,000 | 3.21%, 09/15/2053 | 473,727 |
| 325,000 | 3.72%, 12/15/2072(3) | 334,903 |
| 1,210,000 | BF NYT Mortgage Trust 1.79%, 12/15/2035, 1 mo. USD LIBOR + 1.700%(1)(2) | 1,206,279 |
| 330,000 | BFLD Trust 2.14%, 11/15/2028, 1 mo. USD LIBOR + 2.050%(1)(2) | 330,415 |
| | BX Commercial Mortgage Trust | |
| 748,000 | 1.54%, 10/15/2036, 1 mo. USD LIBOR + 1.450%(1)(2) | 747,553 |
| 206,900 | 1.64%, 11/15/2032, 1 mo. USD LIBOR + 1.550%(1)(2) | 206,900 |
| 960,500 | 2.09%, 10/15/2036, 1 mo. USD LIBOR + 2.000%(1)(2) | 958,692 |
| 860,000 | BX Trust 1.54%, 11/15/2032, 1 mo. USD LIBOR + 1.450%(1)(2) | 850,845 |
| 380,000 | BX Trust 2021-ARIA 1.38%, 10/15/2036(1)(2) | 379,166 |
| | BXHPP Trust | |
| 210,000 | 0.74%, 08/15/2036(1)(2) | 209,747 |
| 185,000 | 0.99%, 08/15/2036(1)(2) | 183,670 |
| 1,190,000 | CAMB Commercial Mortgage Trust 1.84%, 12/15/2037, 1 mo. USD LIBOR + 1.750%(1)(2) | 1,190,002 |
| 18,663,480 | CD Mortgage Trust 0.98%, 02/10/2050(3)(4) | 821,238 |
| | Commercial Mortgage Trust | |
| 175,000 | 2.68%, 11/10/2046(1)(3) | 172,382 |
| 944,000 | 4.32%, 12/10/2045(1)(3) | 941,486 |
| | CSAIL Commercial Mortgage Trust | |
| 19,385,383 | 0.57%, 08/15/2051(3)(4) | 622,558 |
| 24,299,209 | 0.71%, 11/15/2050(3)(4) | 813,183 |
| 1,000,000 | CSMC Trust 3.65%, 11/13/2039(1)(3) | 943,768 |
| | DBJPM Mortgage Trust | |
| 9,056,329 | 1.44%, 08/10/2049(3)(4) | 522,649 |
| 3,368,300 | 1.71%, 09/15/2053(3)(4) | 323,201 |
| 335,000 | DC Office Trust 3.07%, 09/15/2045(1)(3) | 330,397 |
| 350,000 | ExteNet LLC 3.20%, 07/26/2049(1) | 358,110 |
| | FREMF Mortgage Trust | |
| 75,000 | 3.51%, 11/25/2045(1)(3) | 76,796 |
| 135,000 | 3.67%, 01/25/2048(1)(3) | 143,090 |
| Shares or Principal Amount | | Market Value† |
| ASSET & COMMERCIAL MORTGAGE-BACKED SECURITIES - 17.1% - (continued) |
| | Commercial Mortgage-Backed Securities - 5.0% - (continued) |
| $ 75,000 | 3.69%, 04/25/2048(1)(3) | $ 79,654 |
| 95,000 | 3.78%, 10/25/2048(1)(3) | 101,585 |
| 80,000 | 3.88%, 02/25/2050(1)(3) | 84,352 |
| 460,000 | 4.08%, 09/25/2025(1)(3) | 498,973 |
| 120,000 | 4.16%, 04/25/2049(1)(3) | 131,082 |
| | GS Mortgage Securities Trust | |
| 34,899,489 | 0.43%, 03/10/2051(3)(4) | 836,670 |
| 15,186,528 | 1.09%, 07/10/2052(3)(4) | 986,480 |
| 5,799,244 | 1.13%, 05/10/2052(3)(4) | 371,886 |
| 469,000 | 3.97%, 05/10/2052 | 514,875 |
| 489,305 | GS Mortgage-Backed Securities Corp. Trust 3.31%, 03/27/2051(3) | 504,399 |
| | Hudson Yards Mortgage Trust | |
| 500,000 | 2.98%, 08/10/2038(1)(3) | 500,273 |
| 1,240,000 | 3.44%, 07/10/2039(1)(3) | 1,277,990 |
| | JP Morgan Chase Commercial Mortgage Securities Trust | |
| 1,195,000 | 3.62%, 01/16/2037(1) | 1,203,894 |
| 1,190,000 | 3.75%, 06/05/2039(1)(3) | 1,284,444 |
| 1,056,715 | JP Morgan Mortgage Trust 4.15%, 11/25/2050(1)(3) | 1,105,628 |
| 920,000 | KNDL Mortgage Trust 1.44%, 05/15/2036, 1 mo. USD LIBOR + 1.350%(1)(2) | 919,438 |
| 100,000 | Life Mortgage Trust 0.79%, 03/15/2038(1)(2) | 99,562 |
| | MHP STOR | |
| 225,000 | 1.14%, 07/15/2038, 1 mo. USD LIBOR + 1.050%(1)(2) | 224,648 |
| 230,000 | 1.44%, 07/15/2038, 1 mo. USD LIBOR + 1.350%(1)(2) | 229,568 |
| | Morgan Stanley Capital Trust | |
| 660,000 | 1.49%, 11/15/2034, 1 mo. USD LIBOR + 1.400%(1)(2) | 659,599 |
| 1,250,000 | 1.74%, 10/15/2037, 1 mo. USD LIBOR + 1.650%(1)(2) | 1,249,228 |
| 275,000 | 3.30%, 12/15/2036, 1 mo. USD LIBOR + 1.800%(1)(2) | 276,050 |
| 1,250,000 | One Market Plaza Trust 4.15%, 02/10/2032(1) | 1,256,868 |
| 125,000 | SFAVE Commercial Mortgage Securities Trust 4.14%, 01/05/2043(1)(3) | 138,055 |
| 3,151,080 | SLG Office Trust 0.26%, 07/15/2041(1)(3)(4) | 65,156 |
| | SREIT Trust | |
| 1,450,000 | 1.12%, 07/15/2036, 1 mo. USD LIBOR + 1.026%(1)(2) | 1,439,101 |
| 550,000 | 1.47%, 07/15/2036, 1 mo. USD LIBOR + 1.375%(1)(2) | 545,150 |
| | Wells Fargo N.A. | |
| 12,461,573 | 0.70%, 12/15/2052(3)(4) | 621,247 |
| 29,996,160 | 0.73%, 11/15/2050(3)(4) | 1,131,119 |
| 12,193,273 | 0.90%, 05/15/2062(3)(4) | 701,655 |
| 31,623,648 | 0.98%, 08/15/2061(3)(4) | 1,988,552 |
| 14,149,014 | 1.23%, 03/15/2063(3)(4) | 1,166,508 |
| 8,840,591 | 1.78%, 03/15/2063(3)(4) | 1,158,864 |
| 581,460 | WF-RBS Commercial Mortgage Trust 4.89%, 06/15/2044(1)(3) | 581,061 |
| | | | 43,477,699 |
| | Other Asset-Backed Securities - 1.4% |
| 189,198 | Aaset Trust 3.84%, 05/15/2039(1) | 186,606 |
The accompanying notes are an integral part of these financial statements.
Hartford Multi-Asset Income Fund (formerly, Hartford Multi-Asset Income and Growth Fund)
Schedule of Investments – (continued)
October 31, 2021
| Shares or Principal Amount | | Market Value† |
| ASSET & COMMERCIAL MORTGAGE-BACKED SECURITIES - 17.1% - (continued) |
| | Other Asset-Backed Securities - 1.4% - (continued) |
| | Affirm Asset Securitization Trust | |
| $ 180,000 | 0.88%, 08/15/2025(1) | $ 180,180 |
| 99,287 | 3.46%, 10/15/2024(1) | 100,351 |
| 650,000 | Atlas Senior Loan Fund Ltd. 1.62%, 01/15/2031, 3 mo. USD LIBOR + 1.500%(1)(2) | 644,482 |
| | Bayview Opportunity Master Fund Trust | |
| 96,927 | 3.50%, 01/28/2055(1)(3) | 98,434 |
| 131,825 | 3.50%, 06/28/2057(1)(3) | 134,248 |
| 126,316 | 4.00%, 10/28/2064(1)(3) | 128,391 |
| 545,000 | BlueMountain CLO Ltd. 1.58%, 11/20/2028, 3 mo. USD LIBOR + 1.450%(1)(2) | 545,063 |
| 645,000 | Carlyle U.S. CLO Ltd. 3.08%, 04/20/2034, 3 mo. USD LIBOR + 2.950%(1)(2) | 645,090 |
| 203,711 | Castlelake Aircraft Structured Trust 3.97%, 04/15/2039(1) | 203,524 |
| | CF Hippolyta LLC | |
| 97,646 | 1.53%, 03/15/2061(1) | 96,756 |
| 244,115 | 1.98%, 03/15/2061(1) | 242,540 |
| 11,049 | Cloud Pass-Through Trust 3.55%, 12/05/2022(1)(3) | 11,094 |
| 750,000 | LCM XXIII Ltd. 3.43%, 10/20/2029, 3 mo. USD LIBOR + 3.300%(1)(2) | 746,345 |
| 1,750,000 | Long Point Park CLO Ltd. 1.82%, 01/17/2030, 3 mo. USD LIBOR + 1.700%(1)(2) | 1,742,414 |
| | Mill City Mortgage Loan Trust | |
| 7,886 | 2.50%, 04/25/2057(1)(3) | 7,903 |
| 117,869 | 2.75%, 01/25/2061(1)(3) | 119,636 |
| | Octagon Investment Partners Ltd. | |
| 250,000 | 1.52%, 01/25/2031, 3 mo. USD LIBOR + 1.400%(1)(2) | 250,006 |
| 750,000 | 2.18%, 07/20/2030, 3 mo. USD LIBOR + 2.050%(1)(2) | 750,176 |
| 690,000 | 4.13%, 10/20/2031, 3 mo. USD LIBOR + 4.000%(1)(2) | 688,965 |
| 1,250,000 | Race Point CLO Ltd. 2.18%, 02/20/2030, 3 mo. USD LIBOR + 2.050%(1)(2) | 1,226,940 |
| 289,075 | Sapphire Aviation Finance Ltd. 3.23%, 03/15/2040(1) | 284,405 |
| 585,000 | SCF Equipment Leasing 0.83%, 08/21/2028(1) | 582,338 |
| 194,837 | Sonic Capital LLC 2.19%, 08/20/2051(1) | 193,219 |
| | Stack Infrastructure Issuer LLC | |
| 625,000 | 1.88%, 03/26/2046(1) | 621,854 |
| 100,000 | 1.89%, 08/25/2045(1) | 99,699 |
| 340,000 | 3.08%, 10/25/2044(1) | 346,284 |
| 151,153 | START Ireland 4.09%, 03/15/2044(1) | 150,593 |
| | Towd Point Mortgage Trust | |
| 20,170 | 2.25%, 04/25/2056(1)(3) | 20,203 |
| 100,301 | 2.75%, 10/25/2056(1)(3) | 101,561 |
| 35,867 | 2.75%, 04/25/2057(1)(3) | 36,269 |
| 178,480 | 2.75%, 06/25/2057(1)(3) | 182,027 |
| 66,966 | 3.00%, 01/25/2058(1)(3) | 67,944 |
| Shares or Principal Amount | | Market Value† |
| ASSET & COMMERCIAL MORTGAGE-BACKED SECURITIES - 17.1% - (continued) |
| | Other Asset-Backed Securities - 1.4% - (continued) |
| | Vantage Data Centers Issuer LLC | |
| $ 495,000 | 1.65%, 09/15/2045(1) | $ 489,442 |
| 161,425 | 3.19%, 07/15/2044(1) | 165,163 |
| | | | 12,090,145 |
| | Whole Loan Collateral CMO - 1.9% |
| 87,232 | Angel Oak Mortgage Trust 2.62%, 11/25/2059(1)(3) | 87,374 |
| 44,364 | Bravo Residential Funding Trust 2.41%, 05/25/2060(1)(3) | 44,570 |
| 50,000 | Connecticut Avenue Securities Trust 2021-R01 1.60%, 10/25/2041(1)(2) | 50,220 |
| 344,633 | Deephaven Residential Mortgage Trust 3.05%, 10/25/2059(1)(3) | 339,675 |
| | Fannie Mae Connecticut Avenue Securities | |
| 359,291 | 2.24%, 10/25/2030, 1 mo. USD LIBOR + 2.150%(2) | 363,108 |
| 162,167 | 2.29%, 01/25/2030, 1 mo. USD LIBOR + 2.200%(2) | 165,055 |
| 318,198 | 2.29%, 08/25/2030, 1 mo. USD LIBOR + 2.200%(2) | 321,234 |
| 353,996 | 2.34%, 07/25/2030, 1 mo. USD LIBOR + 2.250%(2) | 358,615 |
| 357,722 | 2.64%, 12/25/2030, 1 mo. USD LIBOR + 2.550%(2) | 363,549 |
| 793,269 | 2.74%, 02/25/2030, 1 mo. USD LIBOR + 2.650%(2) | 807,882 |
| 742,361 | 3.64%, 07/25/2029, 1 mo. USD LIBOR + 3.550%(2) | 766,081 |
| 136,065 | 4.34%, 01/25/2029, 1 mo. USD LIBOR + 4.250%(2) | 140,828 |
| 463,231 | 4.39%, 02/25/2025, 1 mo. USD LIBOR + 4.300%(2) | 472,910 |
| 592,222 | 4.44%, 05/25/2029, 1 mo. USD LIBOR + 4.350%(2) | 617,523 |
| 641,277 | 4.54%, 01/25/2029, 1 mo. USD LIBOR + 4.450%(2) | 667,524 |
| 72,525 | 4.99%, 11/25/2024, 1 mo. USD LIBOR + 4.900%(2) | 75,443 |
| 358,017 | 5.09%, 07/25/2025, 1 mo. USD LIBOR + 5.000%(2) | 368,403 |
| 983,159 | 5.39%, 10/25/2028, 1 mo. USD LIBOR + 5.300%(2) | 1,032,477 |
| 627,461 | 5.79%, 04/25/2028, 1 mo. USD LIBOR + 5.700%(2) | 663,863 |
| 669,528 | 5.99%, 10/25/2028, 1 mo. USD LIBOR + 5.900%(2) | 704,848 |
| 977,912 | 6.09%, 09/25/2028, 1 mo. USD LIBOR + 6.000%(2) | 1,022,834 |
| 575,435 | 6.84%, 08/25/2028, 1 mo. USD LIBOR + 6.750%(2) | 607,444 |
| | Flagstar Mortgage Trust | |
| 200,953 | 2.00%, 09/25/2041(1)(3) | 202,972 |
| 126,833 | 4.00%, 05/25/2048(1)(3) | 129,371 |
| | GS Mortgage-Backed Securities Corp. Trust | |
| 319,051 | 2.77%, 06/25/2051(1)(3) | 307,475 |
| 882,620 | 2.81%, 05/25/2051(1)(3) | 858,632 |
| 694,813 | 3.31%, 03/27/2051(3) | 705,330 |
The accompanying notes are an integral part of these financial statements.
Hartford Multi-Asset Income Fund (formerly, Hartford Multi-Asset Income and Growth Fund)
Schedule of Investments – (continued)
October 31, 2021
| Shares or Principal Amount | | Market Value† |
| ASSET & COMMERCIAL MORTGAGE-BACKED SECURITIES - 17.1% - (continued) |
| | Whole Loan Collateral CMO - 1.9% - (continued) |
| $ 697,980 | JP Morgan Chase Bank NA 2.59%, 10/25/2057, 1 mo. USD LIBOR + 2.500%(1)(2) | $ 712,623 |
| | JP Morgan Mortgage Trust | |
| 795,428 | 2.83%, 12/25/2051(1)(3) | 704,740 |
| 2,536,313 | 4.16%, 11/25/2050(1)(3) | 2,630,266 |
| 129,576 | MetLife Securitization Trust 3.00%, 04/25/2055(1)(3) | 132,563 |
| 187,506 | New Residential Mortgage Loan Trust 4.00%, 04/25/2057(1)(3) | 199,559 |
| 298,670 | Seasoned Credit Risk Transfer Trust 3.50%, 10/25/2058 | 310,827 |
| | | | 16,935,818 |
| | Total Asset & Commercial Mortgage-Backed Securities
(cost $149,320,606) | $ 149,404,633 |
| CONVERTIBLE BONDS - 0.5% |
| | Electric - 0.5% |
| 3,259,000 | Atlantica Sustainable Infrastructure Jersey Ltd. 4.00%, 07/15/2025 | $ 4,086,134 |
| | Total Convertible Bonds
(cost $3,259,000) | $ 4,086,134 |
| CORPORATE BONDS - 14.1% |
| | Aerospace/Defense - 0.4% |
| | Boeing Co. | |
| 345,000 | 1.43%, 02/04/2024 | $ 345,197 |
| 180,000 | 2.20%, 02/04/2026 | 180,457 |
| 603,000 | 3.25%, 03/01/2028 | 629,905 |
| 170,000 | 3.45%, 11/01/2028 | 179,660 |
| 685,000 | 5.15%, 05/01/2030 | 799,473 |
| 135,000 | Lockheed Martin Corp. 4.85%, 09/15/2041 | 173,046 |
| 900,000 | Raytheon Technologies Corp. 4.13%, 11/16/2028 | 1,020,409 |
| | | | 3,328,147 |
| | Agriculture - 0.3% |
| 140,000 | Altria Group, Inc. 4.50%, 05/02/2043 | 149,358 |
| 990,000 | BAT Capital Corp. 3.56%, 08/15/2027 | 1,050,582 |
| 1,250,000 | Imperial Brands Finance plc 3.75%, 07/21/2022(1) | 1,270,510 |
| | | | 2,470,450 |
| | Airlines - 0.0% |
| 113,405 | Continental Airlines, Inc. 5.98%, 10/19/2023 | 115,075 |
| 101,518 | Southwest Airlines Co. 6.15%, 02/01/2024 | 103,481 |
| 50,968 | United Airlines Class B Pass-Through Trust 4.60%, 09/01/2027 | 52,050 |
| | | | 270,606 |
| Shares or Principal Amount | | Market Value† |
| CORPORATE BONDS - 14.1% - (continued) |
| | Auto Manufacturers - 0.1% |
| $ 460,000 | Hyundai Capital America 0.80%, 04/03/2023(1) | $ 459,835 |
| 485,000 | Volkswagen Group of America Finance LLC 3.35%, 05/13/2025(1) | 514,001 |
| | | | 973,836 |
| | Auto Parts & Equipment - 0.1% |
| 608,000 | Clarios Global L.P. / Clarios U.S. Finance Co. 6.25%, 05/15/2026(1) | 636,120 |
| | Beverages - 0.1% |
| | Anheuser-Busch InBev Worldwide, Inc. | |
| 115,000 | 3.75%, 07/15/2042 | 125,311 |
| 575,000 | 5.55%, 01/23/2049 | 805,690 |
| | | | 931,001 |
| | Biotechnology - 0.1% |
| 450,000 | Gilead Sciences, Inc. 2.80%, 10/01/2050 | 435,669 |
| 225,000 | Royalty Pharma plc 3.55%, 09/02/2050 | 223,341 |
| | | | 659,010 |
| | Chemicals - 0.2% |
| 575,000 | DuPont de Nemours, Inc. 5.42%, 11/15/2048 | 803,358 |
| 785,000 | NOVA Chemicals Corp. 4.25%, 05/15/2029(1) | 774,795 |
| | | | 1,578,153 |
| | Commercial Banks - 3.6% |
| | Bank of America Corp. | |
| 430,000 | 1.73%, 07/22/2027, (1.73% fixed rate until 07/22/2026; 3 mo. USD SOFR + 0.960% thereafter)(5) | 427,296 |
| 545,000 | 2.30%, 07/21/2032, (2.30% fixed rate until 07/21/2031; 3 mo. USD SOFR + 1.220% thereafter)(5) | 533,500 |
| 630,000 | 2.48%, 09/21/2036, (2.48% fixed rate until 09/21/2031; 5 year USD CMT + 1.200% thereafter)(5) | 612,997 |
| 961,000 | 3.42%, 12/20/2028, (3.42% fixed rate until 12/20/2027; 3 mo. USD LIBOR + 1.040% thereafter)(5) | 1,027,728 |
| 450,000 | 3.59%, 07/21/2028, (3.59% fixed rate until 07/21/2027; 3 mo. USD LIBOR + 1.370% thereafter)(5) | 487,133 |
| 200,000 | Bank of New York Mellon Corp. 3.00%, 02/24/2025 | 211,601 |
| 720,000 | Barclays plc 3.93%, 05/07/2025, (3.93% fixed rate until 05/07/2024; 3 mo. USD LIBOR + 1.610% thereafter)(5) | 765,760 |
| 390,000 | BNP Paribas S.A. 2.82%, 11/19/2025, (2.82% fixed rate until 11/19/2024; 3 mo. USD LIBOR + 1.111% thereafter)(1)(5) | 405,125 |
| | BPCE S.A. | |
| 425,000 | 5.15%, 07/21/2024(1) | 465,362 |
| 1,200,000 | 5.70%, 10/22/2023(1) | 1,304,845 |
| | Citigroup, Inc. | |
| 500,000 | 4.45%, 09/29/2027 | 560,874 |
| 1,400,000 | 5.30%, 05/06/2044 | 1,848,623 |
The accompanying notes are an integral part of these financial statements.
Hartford Multi-Asset Income Fund (formerly, Hartford Multi-Asset Income and Growth Fund)
Schedule of Investments – (continued)
October 31, 2021
| Shares or Principal Amount | | Market Value† |
| CORPORATE BONDS - 14.1% - (continued) |
| | Commercial Banks - 3.6% - (continued) |
| $ 715,000 | Commonwealth Bank of Australia 2.69%, 03/11/2031(1) | $ 707,915 |
| 320,000 | Cooperatieve Rabobank UA 1.11%, 02/24/2027, (1.11% fixed rate until 02/24/2026; 3 mo. USD SOFR + 0.55% thereafter)(1)(5) | 312,335 |
| 360,000 | Credit Agricole S.A. 3.25%, 10/04/2024(1) | 380,666 |
| | Credit Suisse Group AG | |
| 1,000,000 | 3.09%, 05/14/2032, (3.09% fixed rate until 05/14/2031; 3 mo. USD SOFR + 1.730% thereafter)(1)(5) | 1,018,750 |
| 850,000 | 3.57%, 01/09/2023(1) | 854,666 |
| | Danske Bank A/S | |
| 805,000 | 1.62%, 09/11/2026, (1.62% fixed rate until 09/11/2025; 12 mo. USD CMT + 1.350% thereafter)(1)(5) | 799,552 |
| 200,000 | 5.00%, 01/12/2022(1) | 201,689 |
| 250,000 | 5.38%, 01/12/2024(1) | 272,206 |
| | Goldman Sachs Group, Inc. | |
| 495,000 | 1.43%, 03/09/2027, (1.43% fixed rate until 03/09/2026; 3 mo. USD SOFR + 0.798% thereafter)(5) | 487,454 |
| 135,000 | 2.62%, 04/22/2032, (2.62% fixed rate until 04/22/2031; 3 mo. USD SOFR + 1.281% thereafter)(5) | 135,634 |
| 155,000 | 2.65%, 10/21/2032, (2.65% fixed rate until 10/21/2031; 3 mo. USD SOFR + 1.264% thereafter)(5) | 155,865 |
| 530,000 | 3.27%, 09/29/2025, (3.27% fixed rate until 09/29/2024; 3 mo. USD LIBOR + 1.201% thereafter)(5) | 559,339 |
| 1,000,000 | 4.25%, 10/21/2025 | 1,096,465 |
| | HSBC Holdings plc | |
| 650,000 | 1.59%, 05/24/2027, (1.59% fixed rate until 05/24/2026; 3 mo. USD SOFR + 1.290% thereafter)(5) | 638,879 |
| 540,000 | 2.21%, 08/17/2029 (2.21% fixed rate until 08/17/2028; thereafter)(5) | 529,912 |
| 225,000 | 2.80%, 05/24/2032, (2.80% fixed rate until 05/24/2031; 3 mo. USD SOFR + 1.187% thereafter)(5) | 226,630 |
| | JP Morgan Chase & Co. | |
| 535,000 | 2.52%, 04/22/2031, (2.52% fixed rate until 04/22/2030; 3 mo. USD LIBOR 2.040% thereafter)(5) | 541,697 |
| 140,000 | 2.58%, 04/22/2032, (2.58% fixed rate until 04/22/2031; 3 mo. USD SOFR + 1.250% thereafter)(5) | 141,262 |
| 105,000 | 3.11%, 04/22/2041, (3.11% fixed rate until 04/22/2040; 3 mo. USD SOFR + 2.460% thereafter)(5) | 108,587 |
| 100,000 | 3.38%, 05/01/2023 | 103,995 |
| 125,000 | 3.70%, 05/06/2030, (3.70% fixed rate until 05/06/2029; 3 mo. USD LIBOR + 1.160% thereafter)(5) | 136,657 |
| Shares or Principal Amount | | Market Value† |
| CORPORATE BONDS - 14.1% - (continued) |
| | Commercial Banks - 3.6% - (continued) |
| $ 905,000 | Macquarie Group Ltd. 2.87%, 01/14/2033, (2.87% fixed rate until 01/14/2032; 3 mo. USD SOFR + 1.53% thereafter)(1)(5) | $ 900,236 |
| | Morgan Stanley | |
| 650,000 | 1.93%, 04/28/2032, (1.93% fixed rate until 04/28/2031; 3 mo. USD SOFR + 1.020% thereafter)(5) | 619,278 |
| 870,000 | 2.48%, 09/16/2036, (2.48% fixed rate until 09/16/2031; 3 mo. USD SOFR + 1.360% thereafter)(5) | 845,801 |
| 135,000 | 2.51%, 10/20/2032, (2.51% fixed rate until 10/20/2031; 3 mo. USD SOFR + 1.200% thereafter)(5) | 134,704 |
| 575,000 | 4.10%, 05/22/2023 | 604,255 |
| | National Australia Bank Ltd. | |
| 1,090,000 | 2.33%, 08/21/2030(1) | 1,049,722 |
| 250,000 | 2.99%, 05/21/2031(1) | 251,323 |
| 1,795,000 | NBK SPC Ltd. 2.75%, 05/30/2022(1) | 1,812,950 |
| | Santander Holdings USA, Inc. | |
| 205,000 | 3.40%, 01/18/2023 | 210,981 |
| 1,095,000 | 3.70%, 03/28/2022 | 1,105,529 |
| 330,000 | Standard Chartered plc 0.99%, 01/12/2025, (0.99% fixed rate until 01/12/2024; 3 mo. USD LIBOR + 0.78% thereafter)(1)(5) | 327,167 |
| 450,000 | UBS Group AG 1.49%, 08/10/2027, (1.49% fixed rate until 08/10/2026; 12 mo. USD CMT + 0.850% thereafter)(1)(5) | 440,917 |
| 285,000 | UniCredit S.p.A. 1.98%, 06/03/2027, (1.98% fixed rate until 06/03/2026; 12 mo. USD CMT + 1.200% thereafter)(1)(5) | 280,185 |
| 1,010,000 | US Bancorp 2.49%, 11/03/2036 (2.49% fixed rate until 11/03/2031; thereafter)(5) | 1,007,332 |
| | Wells Fargo & Co. | |
| 1,794,000 | 4.48%, 01/16/2024 | 1,927,606 |
| 1,420,000 | 5.38%, 11/02/2043 | 1,888,432 |
| | | | 31,467,417 |
| | Commercial Services - 0.2% |
| | Ashtead Capital, Inc. | |
| 600,000 | 2.45%, 08/12/2031(1) | 590,442 |
| 260,000 | 4.25%, 11/01/2029(1) | 281,776 |
| 85,000 | Gartner, Inc. 3.75%, 10/01/2030(1) | 86,169 |
| 540,000 | TriNet Group, Inc. 3.50%, 03/01/2029(1) | 541,415 |
| 155,000 | United Rentals North America, Inc. 3.88%, 02/15/2031 | 156,147 |
| | | | 1,655,949 |
| | Construction Materials - 0.4% |
| 795,000 | Eagle Materials, Inc. 2.50%, 07/01/2031 | 787,256 |
| 956,000 | Jeld-Wen, Inc. 4.88%, 12/15/2027(1) | 989,460 |
The accompanying notes are an integral part of these financial statements.
Hartford Multi-Asset Income Fund (formerly, Hartford Multi-Asset Income and Growth Fund)
Schedule of Investments – (continued)
October 31, 2021
| Shares or Principal Amount | | Market Value† |
| CORPORATE BONDS - 14.1% - (continued) |
| | Construction Materials - 0.4% - (continued) |
| $ 410,000 | Masonite International Corp. 3.50%, 02/15/2030(1) | $ 400,135 |
| 1,045,000 | Standard Industries, Inc. 3.38%, 01/15/2031(1) | 968,997 |
| | | | 3,145,848 |
| | Distribution/Wholesale - 0.1% |
| 640,000 | G-III Apparel Group Ltd. 7.88%, 08/15/2025(1) | 682,400 |
| | Diversified Financial Services - 0.6% |
| 354,000 | AerCap Ireland Capital DAC / AerCap Global Aviation Trust 3.88%, 01/23/2028 | 379,419 |
| 1,250,000 | Aviation Capital Group LLC 3.50%, 11/01/2027(1) | 1,304,997 |
| | Avolon Holdings Funding Ltd. | |
| 323,000 | 2.13%, 02/21/2026(1) | 319,368 |
| 760,000 | 2.53%, 11/18/2027(1) | 744,898 |
| 840,000 | 2.75%, 02/21/2028(1) | 831,795 |
| 197,000 | 4.38%, 05/01/2026(1) | 212,523 |
| 775,000 | Brookfield Finance LLC 3.45%, 04/15/2050 | 813,448 |
| 195,000 | Enact Holdings, Inc. 6.50%, 08/15/2025(1) | 213,525 |
| 500,000 | Intercontinental Exchange, Inc. 1.85%, 09/15/2032 | 469,166 |
| | | | 5,289,139 |
| | Electric - 0.8% |
| | Cleco Corporate Holdings LLC | |
| 275,000 | 3.38%, 09/15/2029 | 281,241 |
| 473,000 | 3.74%, 05/01/2026 | 509,382 |
| | Dominion Energy South Carolina, Inc. | |
| 105,000 | 4.60%, 06/15/2043 | 131,710 |
| 156,000 | 6.63%, 02/01/2032 | 213,243 |
| | Duke Energy Corp. | |
| 105,000 | 2.65%, 09/01/2026 | 109,674 |
| 120,000 | 3.40%, 06/15/2029 | 129,170 |
| 575,000 | Exelon Corp. 5.10%, 06/15/2045 | 763,702 |
| 425,000 | Indianapolis Power and Light Co. 6.60%, 06/01/2037(1) | 598,492 |
| 85,000 | Mid-Atlantic Interstate Transmission LLC 4.10%, 05/15/2028(1) | 94,883 |
| 345,000 | NextEra Energy Capital Holdings, Inc. 1.90%, 06/15/2028 | 341,174 |
| 160,000 | Niagara Mohawk Power Corp. 3.03%, 06/27/2050(1) | 156,872 |
| 215,000 | Oglethorpe Power Corp. 5.25%, 09/01/2050 | 273,687 |
| 85,000 | PacifiCorp 4.13%, 01/15/2049 | 101,566 |
| 66,000 | Pennsylvania Electric Co. 3.60%, 06/01/2029(1) | 70,669 |
| | San Diego Gas & Electric Co. | |
| 480,000 | 1.70%, 10/01/2030 | 459,132 |
| 40,000 | 3.75%, 06/01/2047 | 45,837 |
| 10,000 | 4.15%, 05/15/2048 | 12,139 |
| | SCE Recovery Funding LLC | |
| 150,000 | 0.86%, 11/15/2031 | 143,871 |
| 65,000 | 1.94%, 05/15/2038 | 61,951 |
| 35,000 | 2.51%, 11/15/2043 | 33,413 |
| Shares or Principal Amount | | Market Value† |
| CORPORATE BONDS - 14.1% - (continued) |
| | Electric - 0.8% - (continued) |
| $ 1,075,000 | Sempra Energy 3.25%, 06/15/2027 | $ 1,145,606 |
| | Southern Co. | |
| 475,000 | 3.75%, 09/15/2051, (3.75% fixed rate until 06/15/2026; 3 mo. USD LIBOR + 2.915% thereafter)(5) | 482,581 |
| 245,000 | 4.40%, 07/01/2046 | 291,614 |
| 485,000 | Trans-Allegheny Interstate Line Co. 3.85%, 06/01/2025(1) | 518,990 |
| 90,000 | Tucson Electric Power Co. 4.00%, 06/15/2050 | 107,108 |
| 106,000 | Union Electric Co. 4.00%, 04/01/2048 | 127,761 |
| | | | 7,205,468 |
| | Electrical Components & Equipment - 0.1% |
| 955,000 | WESCO Distribution, Inc. 7.25%, 06/15/2028(1) | 1,053,279 |
| | Engineering & Construction - 0.0% |
| 320,000 | TopBuild Corp. 3.63%, 03/15/2029(1) | 321,699 |
| | Environmental Control - 0.1% |
| 445,000 | Republic Services, Inc. 2.30%, 03/01/2030 | 449,666 |
| 180,000 | Stericycle, Inc. 3.88%, 01/15/2029(1) | 177,300 |
| | | | 626,966 |
| | Food - 0.1% |
| 200,000 | Conagra Brands, Inc. 4.60%, 11/01/2025 | 222,820 |
| 150,000 | McCormick & Co., Inc. 2.50%, 04/15/2030 | 152,480 |
| 510,000 | Sigma Alimentos S.A. de C.V. 4.13%, 05/02/2026(1) | 547,617 |
| | | | 922,917 |
| | Forest Products & Paper - 0.1% |
| 940,000 | Glatfelter Corp. 4.75%, 11/15/2029(1) | 956,826 |
| | Gas - 0.0% |
| 125,000 | Boston Gas Co. 3.15%, 08/01/2027(1) | 131,235 |
| | Healthcare - Products - 0.2% |
| 805,000 | Alcon Finance Corp. 3.00%, 09/23/2029(1) | 848,226 |
| | Boston Scientific Corp. | |
| 660,000 | 2.65%, 06/01/2030 | 677,094 |
| 60,000 | 4.00%, 03/01/2029 | 67,464 |
| 150,000 | Thermo Fisher Scientific, Inc. 1.75%, 10/15/2028 | 147,812 |
| | | | 1,740,596 |
| | Healthcare - Services - 0.5% |
| 245,000 | Centene Corp. 4.25%, 12/15/2027 | 256,638 |
| | CommonSpirit Health | |
| 80,000 | 2.78%, 10/01/2030 | 81,771 |
| 305,000 | 4.20%, 08/01/2023 | 321,891 |
| | Dignity Health | |
| 214,000 | 3.81%, 11/01/2024 | 229,331 |
| 352,000 | 4.50%, 11/01/2042(6) | 419,706 |
| 1,000,000 | HCA, Inc. 5.50%, 06/15/2047 | 1,318,190 |
| | Mercy Health | |
| 565,000 | 3.56%, 08/01/2027 | 612,791 |
| 95,000 | 4.30%, 07/01/2028 | 107,841 |
The accompanying notes are an integral part of these financial statements.
Hartford Multi-Asset Income Fund (formerly, Hartford Multi-Asset Income and Growth Fund)
Schedule of Investments – (continued)
October 31, 2021
| Shares or Principal Amount | | Market Value† |
| CORPORATE BONDS - 14.1% - (continued) |
| | Healthcare - Services - 0.5% - (continued) |
| $ 275,000 | Ochsner LSU Health System of North Louisiana 2.51%, 05/15/2031 | $ 267,838 |
| 260,000 | Sutter Health 2.29%, 08/15/2030 | 261,280 |
| | Toledo Hospital | |
| 400,000 | 5.33%, 11/15/2028 | 453,291 |
| 145,000 | 5.75%, 11/15/2038 | 172,952 |
| 5,000 | UnitedHealth Group, Inc. 3.85%, 06/15/2028 | 5,635 |
| | | | 4,509,155 |
| | Home Builders - 0.0% |
| 480,000 | Meritage Homes Corp. 3.88%, 04/15/2029(1) | 497,400 |
| | Insurance - 0.6% |
| | American International Group, Inc. | |
| 205,000 | 3.40%, 06/30/2030 | 222,134 |
| 590,000 | 4.25%, 03/15/2029 | 671,761 |
| 99,000 | 4.50%, 07/16/2044 | 120,698 |
| 800,000 | Athene Global Funding 2.50%, 03/24/2028(1) | 810,044 |
| 350,000 | Equitable Financial Life Global Funding 1.40%, 08/27/2027(1) | 342,085 |
| 1,100,000 | Equitable Holdings, Inc. 5.00%, 04/20/2048 | 1,406,879 |
| 115,000 | Five Corners Funding Trust 4.42%, 11/15/2023(1) | 123,404 |
| 77,000 | Liberty Mutual Group, Inc. 4.57%, 02/01/2029(1) | 88,881 |
| 860,000 | Nippon Life Insurance Co. 2.90%, 09/16/2051, (2.90% fixed rate until 09/16/2031; 5 year USD CMT + 2.600% thereafter)(1)(5) | 836,724 |
| 100,000 | Teachers Insurance & Annuity Association of America 4.90%, 09/15/2044(1) | 130,583 |
| 675,000 | Unum Group 5.75%, 08/15/2042 | 858,719 |
| | | | 5,611,912 |
| | Investment Company Security - 0.0% |
| 250,000 | JAB Holdings B.V. 3.75%, 05/28/2051(1) | 273,848 |
| | IT Services - 0.2% |
| 35,000 | Apple, Inc. 4.45%, 05/06/2044 | 44,639 |
| 475,000 | Booz Allen Hamilton, Inc. 3.88%, 09/01/2028(1) | 481,816 |
| 825,000 | Western Digital Corp. 4.75%, 02/15/2026 | 904,407 |
| | | | 1,430,862 |
| | Lodging - 0.1% |
| 800,000 | Genting New York LLC 3.30%, 02/15/2026(1) | 788,191 |
| | Media - 0.8% |
| | Charter Communications Operating LLC / Charter Communications Operating Capital | |
| 650,000 | 2.30%, 02/01/2032 | 615,862 |
| 25,000 | 3.70%, 04/01/2051 | 24,521 |
| 85,000 | 4.80%, 03/01/2050 | 96,509 |
| 63,000 | 5.13%, 07/01/2049 | 74,484 |
| 950,000 | 6.48%, 10/23/2045 | 1,309,316 |
| Shares or Principal Amount | | Market Value† |
| CORPORATE BONDS - 14.1% - (continued) |
| | Media - 0.8% - (continued) |
| | Comcast Corp. | |
| $ 144,000 | 2.89%, 11/01/2051(1) | $ 139,892 |
| 59,000 | 2.99%, 11/01/2063(1) | 56,352 |
| 52,000 | 4.05%, 11/01/2052 | 61,156 |
| 575,000 | 4.40%, 08/15/2035 | 681,741 |
| | Discovery Communications LLC | |
| 155,000 | 4.00%, 09/15/2055 | 164,374 |
| 305,000 | 4.65%, 05/15/2050 | 359,177 |
| 1,000,000 | 5.20%, 09/20/2047 | 1,249,312 |
| | Time Warner Cable LLC | |
| 80,000 | 6.55%, 05/01/2037 | 107,390 |
| 60,000 | 7.30%, 07/01/2038 | 86,253 |
| 30,000 | Time Warner Entertainment Co., L.P. 8.38%, 03/15/2023 | 33,093 |
| 1,000,000 | ViacomCBS, Inc. 5.85%, 09/01/2043 | 1,359,275 |
| 250,000 | Videotron Ltd. 3.63%, 06/15/2029(1) | 251,250 |
| | | | 6,669,957 |
| | Office/Business Equipment - 0.0% |
| 275,000 | Xerox Holdings Corp. 5.50%, 08/15/2028(1) | 278,096 |
| | Oil & Gas - 0.7% |
| | Aker BP ASA | |
| 1,760,000 | 3.75%, 01/15/2030(1) | 1,881,164 |
| 665,000 | 4.00%, 01/15/2031(1) | 722,915 |
| 406,000 | Devon Energy Corp. 5.88%, 06/15/2028(1) | 445,115 |
| 750,000 | Diamondback Energy, Inc. 3.50%, 12/01/2029 | 797,242 |
| | Equinor ASA | |
| 35,000 | 2.88%, 04/06/2025 | 36,894 |
| 560,000 | 3.00%, 04/06/2027 | 595,775 |
| | Hess Corp. | |
| 135,000 | 5.60%, 02/15/2041 | 169,891 |
| 525,000 | 7.30%, 08/15/2031 | 704,816 |
| 210,000 | Qatar Petroleum 3.13%, 07/12/2041(1) | 211,930 |
| 245,000 | Qatar Petroleum Industry 2.25%, 07/12/2031(1) | 241,325 |
| | | | 5,807,067 |
| | Packaging & Containers - 0.0% |
| 340,000 | Graphic Packaging International LLC 3.50%, 03/01/2029(1) | 336,600 |
| | Pharmaceuticals - 0.3% |
| | AbbVie, Inc. | |
| 450,000 | 3.45%, 03/15/2022 | 452,769 |
| 525,000 | 3.80%, 03/15/2025 | 565,883 |
| 600,000 | 4.75%, 03/15/2045 | 751,223 |
| 160,000 | CVS Health Corp. 4.88%, 07/20/2035 | 192,671 |
| 465,000 | Organon & Co. 4.13%, 04/30/2028(1) | 471,394 |
| 675,000 | Teva Pharmaceutical Finance Netherlands B.V. 2.80%, 07/21/2023 | 679,927 |
| | | | 3,113,867 |
| | Pipelines - 1.0% |
| 1,200,000 | Enable Midstream Partners L.P. 4.40%, 03/15/2027 | 1,312,328 |
| | Energy Transfer Operating L.P. | |
| 1,125,000 | 4.75%, 01/15/2026 | 1,245,739 |
| 155,000 | 4.95%, 06/15/2028 | 177,080 |
| 385,000 | 5.00%, 05/15/2050 | 450,300 |
The accompanying notes are an integral part of these financial statements.
Hartford Multi-Asset Income Fund (formerly, Hartford Multi-Asset Income and Growth Fund)
Schedule of Investments – (continued)
October 31, 2021
| Shares or Principal Amount | | Market Value† |
| CORPORATE BONDS - 14.1% - (continued) |
| | Pipelines - 1.0% - (continued) |
| $ 1,100,000 | 5.25%, 04/15/2029 | $ 1,278,211 |
| 214,000 | 7.60%, 02/01/2024 | 238,440 |
| 900,000 | Galaxy Pipeline Assets Bidco Ltd. 2.16%, 03/31/2034(1) | 876,626 |
| | Gray Oak Pipeline LLC | |
| 258,000 | 2.60%, 10/15/2025(1) | 263,387 |
| 40,000 | 3.45%, 10/15/2027(1) | 41,902 |
| 1,175,000 | ONEOK, Inc. 4.00%, 07/13/2027 | 1,286,444 |
| 675,000 | Targa Resources Partners L.P. / Targa Resources Partners Finance Corp. 5.88%, 04/15/2026 | 704,747 |
| 235,000 | Venture Global Calcasieu Pass LLC 3.88%, 08/15/2029(1) | 239,512 |
| 780,000 | Western Midstream Operating L.P. 4.00%, 07/01/2022 | 787,800 |
| | | | 8,902,516 |
| | Real Estate Investment Trusts - 0.5% |
| | American Tower Corp. | |
| 150,000 | 4.40%, 02/15/2026 | 165,910 |
| 85,000 | 5.00%, 02/15/2024 | 92,543 |
| | Brixmor Operating Partnership L.P. | |
| 285,000 | 4.05%, 07/01/2030 | 315,165 |
| 440,000 | 4.13%, 05/15/2029 | 491,795 |
| | EPR Properties | |
| 265,000 | 3.60%, 11/15/2031 | 265,800 |
| 398,000 | 3.75%, 08/15/2029 | 408,910 |
| 65,000 | 4.75%, 12/15/2026 | 70,641 |
| 60,000 | 4.95%, 04/15/2028 | 65,718 |
| 240,000 | Equinix, Inc. 3.00%, 07/15/2050 | 234,043 |
| 750,000 | GLP Capital L.P. / GLP Financing II, Inc. 4.00%, 01/15/2030 | 795,592 |
| | SBA Tower Trust | |
| 100,000 | 1.63%, 05/15/2051(1) | 98,665 |
| 100,000 | 1.88%, 07/15/2050(1) | 101,357 |
| 215,000 | 2.84%, 01/15/2050(1) | 223,020 |
| 300,000 | 3.45%, 03/15/2048(1) | 302,840 |
| 504,000 | Scentre Group Trust 1 / Scentre Group Trust 2 3.63%, 01/28/2026(1) | 540,975 |
| | | | 4,172,974 |
| | Retail - 0.2% |
| 825,000 | AutoZone, Inc. 3.13%, 04/21/2026 | 878,273 |
| 575,000 | Lowe's Cos., Inc. 1.30%, 04/15/2028 | 553,599 |
| | | | 1,431,872 |
| | Semiconductors - 0.2% |
| | Broadcom, Inc. | |
| 895,000 | 3.42%, 04/15/2033(1) | 923,938 |
| 225,000 | 3.50%, 02/15/2041(1) | 223,543 |
| 675,000 | Microchip Technology, Inc. 0.97%, 02/15/2024(1) | 671,409 |
| | | | 1,818,890 |
| | Software - 0.2% |
| 170,000 | Black Knight InfoServ LLC 3.63%, 09/01/2028(1) | 169,150 |
| | Oracle Corp. | |
| 320,000 | 3.60%, 04/01/2050 | 326,317 |
| 110,000 | 3.65%, 03/25/2041 | 115,093 |
| Shares or Principal Amount | | Market Value† |
| CORPORATE BONDS - 14.1% - (continued) |
| | Software - 0.2% - (continued) |
| $ 275,000 | 3.95%, 03/25/2051 | $ 297,827 |
| 650,000 | ROBLOX Corp. 3.88%, 05/01/2030(1) | 647,563 |
| | | | 1,555,950 |
| | Telecommunications - 0.9% |
| | AT&T, Inc. | |
| 578,000 | 2.55%, 12/01/2033 | 561,741 |
| 300,000 | 3.10%, 02/01/2043 | 289,405 |
| 395,000 | 3.30%, 02/01/2052 | 387,161 |
| 460,000 | 4.45%, 04/01/2024 | 494,753 |
| 575,000 | 5.65%, 02/15/2047 | 777,026 |
| 425,000 | NBN Co., Ltd. 1.63%, 01/08/2027(1) | 419,191 |
| 730,625 | Sprint Spectrum Co. LLC / Sprint Spectrum Co. II LLC / Sprint Spectrum Co. III LLC 4.74%, 03/20/2025(1) | 770,809 |
| | T-Mobile USA, Inc. | |
| 625,000 | 2.25%, 02/15/2026 | 628,906 |
| 290,000 | 2.88%, 02/15/2031 | 288,188 |
| 95,000 | 4.38%, 04/15/2040 | 108,380 |
| 775,000 | 4.50%, 04/15/2050 | 915,007 |
| | Verizon Communications, Inc. | |
| 589,000 | 2.36%, 03/15/2032(1) | 580,080 |
| 406,000 | 4.52%, 09/15/2048 | 514,379 |
| 130,000 | 4.75%, 11/01/2041 | 160,355 |
| 93,000 | 4.81%, 03/15/2039 | 114,827 |
| 575,000 | Vodafone Group plc 5.25%, 05/30/2048 | 756,931 |
| | | | 7,767,139 |
| | Transportation - 0.2% |
| 600,000 | FedEx Corp. 5.25%, 05/15/2050 | 810,957 |
| 745,000 | Penske Truck Leasing Co. L.P. / PTL Finance Corp. 3.95%, 03/10/2025(1) | 802,118 |
| | | | 1,613,075 |
| | Trucking & Leasing - 0.1% |
| 580,000 | DAE Funding LLC 1.55%, 08/01/2024(1) | 572,170 |
| 90,000 | Penske Truck Leasing Co. L.P. / PTL Finance Corp. 2.70%, 11/01/2024(1) | 93,544 |
| | | | 665,714 |
| | Total Corporate Bonds
(cost $119,805,128) | $ 123,292,147 |
| FOREIGN GOVERNMENT OBLIGATIONS - 1.0% |
| | Chile - 0.1% |
| 995,000 | Chile Government International Bond 2.55%, 07/27/2033 | $ 962,354 |
| | Indonesia - 0.6% |
| IDR 75,000,000,000 | Indonesia Treasury Bond 7.00%, 09/15/2030 | 5,571,731 |
| | Mexico - 0.1% |
| $ 550,000 | Mexico Government International Bond 4.28%, 08/14/2041 | 571,566 |
| | Panama - 0.1% |
| | Panama Government International Bond | |
| 395,000 | 2.25%, 09/29/2032 | 372,106 |
| 450,000 | 4.50%, 04/16/2050 | 496,381 |
| | | | 868,487 |
The accompanying notes are an integral part of these financial statements.
Hartford Multi-Asset Income Fund (formerly, Hartford Multi-Asset Income and Growth Fund)
Schedule of Investments – (continued)
October 31, 2021
| Shares or Principal Amount | | Market Value† |
| FOREIGN GOVERNMENT OBLIGATIONS - 1.0% - (continued) |
| | Qatar - 0.1% |
| | Qatar Government International Bond | |
| $ 250,000 | 3.38%, 03/14/2024(1) | $ 263,798 |
| 315,000 | 3.88%, 04/23/2023(1) | 329,648 |
| | | | 593,446 |
| | Saudi Arabia - 0.0% |
| 460,000 | Saudi Government International Bond 2.88%, 03/04/2023(1) | 473,381 |
| | Total Foreign Government Obligations
(cost $8,946,877) | | $ 9,040,965 |
| MUNICIPAL BONDS - 0.6% |
| | Airport - 0.0% |
| 90,000 | Broward County, FL, Airport System Rev 3.48%, 10/01/2043 | $ 95,223 |
| | General - 0.2% |
| | Chicago, IL, Transit Auth | |
| 130,000 | 6.30, 12/01/2021, | 130,625 |
| 320,000 | 6.90, 12/01/2040, | 452,503 |
| 140,000 | City of Sacramento, CA, (AGM Insured) 6.42%, 08/01/2023 | 153,648 |
| 190,000 | Kansas, Dev Finance Auth, (AGM Insured) 5.37%, 05/01/2026 | 209,670 |
| 65,000 | Metropolitan Transportation Auth, NY, Rev 6.67%, 11/15/2039 | 93,074 |
| 575,000 | Philadelphia, PA, Auth Industrial Dev, (NATL Insured) 6.55%, 10/15/2028 | 730,402 |
| 350,000 | Sales Tax Securitization Corp., IL Rev 4.79%, 01/01/2048 | 449,875 |
| | | | 2,219,797 |
| | General Obligation - 0.1% |
| 580,000 | State of Illinois, GO 5.10%, 06/01/2033 | 676,370 |
| | Power - 0.0% |
| 83,000 | New York Utility Debt Securitization Auth 3.44%, 12/15/2025 | 85,000 |
| | Tobacco - 0.0% |
| | Golden State, CA, Tobacco Securitization Corp. | |
| 10,000 | 2.75%, 06/01/2034 | 10,079 |
| 45,000 | 3.00%, 06/01/2046 | 46,152 |
| 20,000 | 3.29%, 06/01/2042 | 20,269 |
| | | | 76,500 |
| | Transportation - 0.2% |
| | Foothill-Eastern Transportation Corridor Agency, CA,, (AGM Insured) | |
| 335,000 | 3.92%, 01/15/2053 | 353,275 |
| 45,000 | 4.09%, 01/15/2049 | 47,281 |
| 150,000 | Illinois State Toll Highway Auth, Taxable Rev 6.18%, 01/01/2034 | 207,297 |
| | Metropolitan Transportation Auth, NY, Rev | |
| 165,000 | 5.18%, 11/15/2049 | 224,971 |
| 20,000 | 6.20%, 11/15/2026 | 22,750 |
| Shares or Principal Amount | | Market Value† |
| MUNICIPAL BONDS - 0.6% - (continued) |
| | Transportation - 0.2% - (continued) |
| $ 195,000 | 6.81%, 11/15/2040 | $ 281,255 |
| 275,000 | New York and New Jersey Port Auth, Taxable Rev 3.18%, 07/15/2060 | 279,640 |
| | | | 1,416,469 |
| | Utility - Electric - 0.1% |
| 375,000 | Illinois Municipal Electric Agency 6.83%, 02/01/2035 | 484,472 |
| 229,000 | Municipal Electric Auth, GA 6.64%, 04/01/2057 | 352,161 |
| | | | 836,633 |
| | Total Municipal Bonds
(cost $4,775,455) | | $ 5,405,992 |
| SENIOR FLOATING RATE INTERESTS - 9.0%(7) |
| | Advertising - 0.0% |
| 410,246 | Clear Channel Outdoor Holdings, Inc. 3.63%, 08/21/2026, 1 mo. USD LIBOR + 3.500%(2) | $ 403,395 |
| | Aerospace/Defense - 0.1% |
| 99,250 | Spirit Aerosystems, Inc. 6.00%, 01/15/2025, 1 mo. USD LIBOR + 5.250%(2) | 99,498 |
| 877,551 | TransDigm, Inc. 2.34%, 12/09/2025, 1 mo. USD LIBOR + 2.250%(2) | 866,327 |
| | | | 965,825 |
| | Airlines - 0.2% |
| 285,000 | AAdvantage Loyalty IP Ltd. 5.50%, 04/20/2028, 1 mo. USD LIBOR + 4.750%(2) | 296,668 |
| 185,000 | Air Canada 4.25%, 08/11/2028, 1 mo. USD LIBOR + 3.500%(2) | 186,811 |
| 230,000 | Mileage Plus Holdings LLC 6.25%, 06/21/2027, 1 mo. USD LIBOR + 5.250%(2) | 244,807 |
| 295,000 | SkyMiles IP Ltd. 4.75%, 10/20/2027, 3 mo. USD LIBOR + 3.750%(2) | 314,010 |
| 303,475 | United Airlines, Inc. 4.50%, 04/21/2028, 1 mo. USD LIBOR + 3.750%(2) | 307,539 |
| | | | 1,349,835 |
| | Apparel - 0.0% |
| 274,312 | Birkenstock GmbH & Co. KG 4.25%, 04/27/2028, 1 mo. USD LIBOR + 3.750%(2) | 274,142 |
| | Auto Parts & Equipment - 0.1% |
| 636,040 | Clarios Global L.P. 3.34%, 04/30/2026, 1 mo. USD LIBOR + 3.250%(2) | 631,798 |
| 224,875 | First Brands Group LLC 6.00%, 03/30/2027, 1 mo. USD LIBOR + 5.000%(2) | 226,561 |
| | | | 858,359 |
| | Beverages - 0.0% |
| 122,500 | Sunshine Investments B.V. 2.87%, 03/28/2025, 3 mo. USD LIBOR + 2.750%(2) | 121,696 |
The accompanying notes are an integral part of these financial statements.
Hartford Multi-Asset Income Fund (formerly, Hartford Multi-Asset Income and Growth Fund)
Schedule of Investments – (continued)
October 31, 2021
| Shares or Principal Amount | | Market Value† |
| SENIOR FLOATING RATE INTERESTS - 9.0%(7) - (continued) |
| | Chemicals - 0.3% |
| $ 243,734 | ASP Unifrax Holdings, Inc. 3.88%, 12/12/2025, 3 mo. USD LIBOR + 3.750%(2) | $ 239,713 |
| 425,022 | Axalta Coating Systems U.S. Holdings, Inc. 1.88%, 06/01/2024, 3 mo. USD LIBOR + 1.750%(2) | 423,959 |
| 675,000 | Diamond (BC) B.V. 3.50%, 09/29/2028, 1 mo. USD LIBOR + 3.000% | 673,144 |
| 506,798 | Messer Industries GmbH 2.63%, 03/01/2026, 3 mo. USD LIBOR + 2.500%(2) | 503,154 |
| 543,049 | Starfruit Finco B.V 2.84%, 10/01/2025, 1 mo. USD LIBOR + 2.750%(2) | 538,639 |
| 327,007 | Tronox Finance LLC 2.37%, 03/13/2028, 1 mo. USD LIBOR + 2.250%(2) | 324,351 |
| | | | 2,702,960 |
| | Commercial Services - 0.8% |
| 636,800 | AlixPartners LLP 3.25%, 02/04/2028, 1 mo. USD LIBOR + 2.750%(2) | 634,412 |
| 374,053 | Allied Universal Holdco LLC 4.25%, 05/12/2028, 1 mo. USD LIBOR + 3.750%(2) | 373,821 |
| | Amentum Government Services Holdings LLC | |
| 153,063 | 3.59%, 01/29/2027, 1 mo. USD LIBOR + 3.500%(2) | 152,170 |
| 398,000 | 5.50%, 01/29/2027, 1 mo. USD LIBOR + 4.750%(2) | 397,877 |
| 370,000 | APX Group, Inc. 4.00%, 07/10/2028, 1 mo. USD LIBOR + 3.500%(2) | 368,553 |
| 475,295 | AVSC Holding Corp. 5.50%, 10/15/2026, 1 mo. USD LIBOR + 4.500%(2) | 443,926 |
| | Belron Finance U.S. LLC | |
| 243,734 | 2.38%, 11/13/2025, 3 mo. USD LIBOR + 2.250%(2) | 242,516 |
| 98,250 | 2.44%, 10/30/2026, 1 mo. USD LIBOR + 2.250%(2) | 97,698 |
| 246,183 | BrightView Landscapes LLC 2.63%, 08/15/2025, 3 mo. USD LIBOR + 2.500%(2) | 244,849 |
| 231,975 | Ensemble RCM LLC 3.88%, 08/03/2026, 3 mo. USD LIBOR + 3.750%(2) | 232,181 |
| 214,547 | Hertz Corp. 0.00%, 06/30/2028, 1 mo. USD LIBOR + 3.500%(2)(8) | 214,744 |
| 750,000 | MPH Acquisition Holdings LLC 4.75%, 08/17/2028, 1 mo. USD LIBOR + 4.250%(2) | 730,627 |
| 748,125 | Signal Parent, Inc. 4.25%, 04/03/2028, 1 mo. USD LIBOR + 3.500%(2) | 733,162 |
| | Verisure Holding AB | |
| EUR 575,000 | 3.25%, 07/20/2026, 3 mo. EURIBOR + 3.250%(2) | 659,509 |
| 430,000 | 3.25%, 03/27/2028, 3 mo. EURIBOR + 3.250%(2) | 492,835 |
| Shares or Principal Amount | | Market Value† |
| SENIOR FLOATING RATE INTERESTS - 9.0%(7) - (continued) |
| | Commercial Services - 0.8% - (continued) |
| $ 626,850 | WEX, Inc. 2.34%, 03/31/2028, 1 mo. USD LIBOR + 2.250%(2) | $ 623,246 |
| 199,500 | WW International, Inc. 4.00%, 04/13/2028, 1 mo. USD LIBOR + 3.500%(2) | 197,006 |
| | | | 6,839,132 |
| | Construction Materials - 0.4% |
| 493,763 | ACProducts, Inc. 4.75%, 05/17/2028, 1 mo. USD LIBOR + 4.250%(2) | 492,222 |
| 385,000 | Chamberlain Group, Inc. 0.00%, 10/22/2028, 1 mo. USD LIBOR + 4.000%(8) | 384,199 |
| 695,184 | Cornerstone Building Brands, Inc. 3.75%, 04/12/2028, 1 mo. USD LIBOR + 3.250%(2) | 693,794 |
| 363,675 | CP Atlas Buyer, Inc. 4.25%, 11/23/2027, 1 mo. USD LIBOR + 3.750%(2) | 361,289 |
| 177,300 | Ingersoll-Rand Services Co. 1.84%, 03/01/2027, 1 mo. USD LIBOR + 1.750%(2) | 174,695 |
| 639,739 | Quikrete Holdings, Inc. 2.59%, 02/01/2027, 1 mo. USD LIBOR + 2.500%(2) | 633,073 |
| 410,000 | Standard Industries, Inc. 3.00%, 09/22/2028, 1 mo. USD LIBOR + 2.500%(2) | 409,414 |
| 279,300 | Tamko Building Products LLC 3.09%, 06/01/2026, 1 mo. USD LIBOR + 3.000%(2) | 278,021 |
| | | | 3,426,707 |
| | Distribution/Wholesale - 0.2% |
| 735,000 | American Builders & Contractors Supply Co., Inc. 2.09%, 01/15/2027, 1 mo. USD LIBOR + 2.000%(2) | 727,437 |
| 686,572 | Core & Main L.P. 2.59%, 07/27/2028, 1 mo. USD LIBOR + 2.500%(2) | 680,852 |
| 186,200 | KAR Auction Services, Inc. 2.38%, 09/19/2026, 1 mo. USD LIBOR + 2.250%(2) | 180,614 |
| 194,025 | PAI Holdco, Inc. 4.25%, 10/28/2027, 1 mo. USD LIBOR + 3.500%(2) | 194,025 |
| | | | 1,782,928 |
| | Diversified Financial Services - 0.4% |
| 667,832 | Aretec Group, Inc. 4.34%, 10/01/2025, 3 mo. USD LIBOR + 4.250%(2) | 666,163 |
| 974,811 | Blackhawk Network Holdings, Inc. 3.09%, 06/15/2025, 3 mo. USD LIBOR + 3.000%(2) | 966,281 |
| 652,047 | Deerfield Dakota Holding LLC 4.75%, 04/09/2027, 1 mo. USD LIBOR + 3.750%(2) | 653,273 |
| 309,225 | Fleetcor Technologies Operating Co. LLC 1.84%, 04/28/2028, 1 mo. USD LIBOR + 1.750%(2) | 308,232 |
| 613,721 | NFP Corp. 3.34%, 02/15/2027, 1 mo. USD LIBOR + 3.250%(2) | 605,921 |
| | | | 3,199,870 |
The accompanying notes are an integral part of these financial statements.
Hartford Multi-Asset Income Fund (formerly, Hartford Multi-Asset Income and Growth Fund)
Schedule of Investments – (continued)
October 31, 2021
| Shares or Principal Amount | | Market Value† |
| SENIOR FLOATING RATE INTERESTS - 9.0%(7) - (continued) |
| | Electrical Components & Equipment - 0.0% |
| $ 110,000 | Anticimex International AB 0.00%, 07/21/2028, 1 mo. USD LIBOR + 3.500%(8) | $ 109,863 |
| | Electronics - 0.0% |
| 274,313 | Ingram Micro, Inc. 4.00%, 06/30/2028, 1 mo. USD LIBOR + 3.500%(2) | 274,861 |
| | Engineering & Construction - 0.1% |
| 487,277 | Brand Energy & Infrastructure Services, Inc. 5.25%, 06/21/2024, 3 mo. USD LIBOR + 4.250%(2) | 482,731 |
| 750,000 | Brown Group Holding LLC 3.25%, 06/07/2028, 1 mo. USD LIBOR + 2.750%(8) | 747,660 |
| | | | 1,230,391 |
| | Entertainment - 0.5% |
| | Crown Finance U.S., Inc. | |
| 768,847 | 3.50%, 02/28/2025, 1 mo. USD LIBOR + 2.500%(2) | 632,761 |
| 152,521 | 7.13%, 05/23/2024, 1 mo. USD LIBOR + 7.000% | 183,940 |
| 73,504 | 9.25%, 05/23/2024, 1 mo. USD LIBOR + 8.250%(2) | 78,833 |
| 900,000 | Delta (LUX) S.a.r.l. 3.50%, 02/01/2024, 3 mo. USD LIBOR + 2.500%(2) | 896,346 |
| 743,200 | Golden Entertainment, Inc. 3.75%, 10/21/2024, 3 mo. USD LIBOR + 3.000%(2) | 741,654 |
| 490,496 | Scientific Games International, Inc. 2.84%, 08/14/2024, 1 mo. USD LIBOR + 2.750%(2) | 488,211 |
| 488,520 | SeaWorld Parks & Entertainment, Inc. 3.50%, 08/25/2028, 1 mo. USD LIBOR + 3.000%(2) | 486,688 |
| 519,040 | UFC Holdings LLC 3.50%, 04/29/2026, 1 mo. USD LIBOR + 2.750%(2) | 515,795 |
| | | | 4,024,228 |
| | Environmental Control - 0.1% |
| 510,000 | Clean Harbors, Inc. 2.09%, 10/08/2028, 1 mo. USD LIBOR + 2.087% | 509,684 |
| | Food - 0.3% |
| 315,617 | B&G Foods, Inc. 2.59%, 10/10/2026, 1 mo. USD LIBOR + 2.500%(2) | 316,273 |
| 494,493 | Froneri International Ltd. 2.34%, 01/29/2027, 1 mo. USD LIBOR + 2.250%(2) | 487,140 |
| 731,278 | Hostess Brands LLC 3.00%, 08/03/2025, 1 mo. USD LIBOR + 2.250%(2) | 729,531 |
| 104,462 | Simply Good Foods USA, Inc. 4.75%, 07/07/2024, 1 mo. USD LIBOR + 3.750%(2) | 104,920 |
| Shares or Principal Amount | | Market Value† |
| SENIOR FLOATING RATE INTERESTS - 9.0%(7) - (continued) |
| | Food - 0.3% - (continued) |
| | U.S. Foods, Inc. | |
| $ 542,148 | 1.84%, 06/27/2023, 1 mo. USD LIBOR + 1.750%(2) | $ 538,450 |
| 289,100 | 2.09%, 09/13/2026, 3 mo. USD LIBOR + 2.000%(2) | 283,679 |
| | | | 2,459,993 |
| | Food Service - 0.0% |
| 177,175 | Aramark Services, Inc. 1.84%, 01/15/2027, 1 mo. USD LIBOR + 1.750%(2) | 172,636 |
| | Gas - 0.1% |
| 816,212 | UGI Energy Services LLC 3.84%, 08/13/2026, 1 mo. USD LIBOR + 3.750%(2) | 818,767 |
| | Healthcare - Products - 0.2% |
| 681,575 | Avantor Funding, Inc. 2.75%, 11/08/2027, 1 mo. USD LIBOR + 2.250%(2) | 681,009 |
| 570,000 | Medline Industries, Inc. 0.00%, 10/23/2028, 1 mo. USD LIBOR + 3.250%(8) | 570,565 |
| 799,383 | Sunshine Luxembourg S.a.r.l. 4.50%, 10/01/2026, 1 mo. USD LIBOR + 3.750%(2) | 800,686 |
| | | | 2,052,260 |
| | Healthcare - Services - 0.3% |
| | ADMI Corp. | |
| 343,275 | 3.63%, 12/23/2027, 1 mo. USD LIBOR + 3.125%(2) | 340,594 |
| 265,000 | 4.00%, 12/23/2027, 1 mo. USD LIBOR + 3.500%(2) | 264,716 |
| EUR 465,000 | Biogroup-LCD 3.50%, 01/28/2028, 3 mo. EURIBOR + 3.500%(2) | 534,256 |
| $ 99,496 | eResearchTechnology, Inc. 5.50%, 02/04/2027, 1 mo. USD LIBOR + 4.500%(2) | 99,897 |
| 374,062 | Heartland Dental, LLC 4.09%, 04/30/2025, 1 mo. USD LIBOR + 4.000%(2) | 373,049 |
| 127,767 | ICON Luxembourg S.a r.l. 3.00%, 07/03/2028, 1 mo. USD LIBOR + 2.500%(2) | 127,753 |
| 472,625 | PPD, Inc. 2.50%, 01/13/2028, 1 mo. USD LIBOR + 2.000%(2) | 471,519 |
| 683,986 | Surgery Center Holdings, Inc. 4.50%, 08/31/2026, 1 mo. USD LIBOR + 3.750%(2) | 685,223 |
| | | | 2,897,007 |
| | Home Furnishings - 0.0% |
| 445,000 | Mattress Firm Inc 5.00%, 09/25/2028, 1 mo. USD LIBOR + 4.250%(2) | 442,668 |
| | Insurance - 0.5% |
| 684,250 | Acrisure LLC 3.63%, 02/15/2027, 1 mo. USD LIBOR + 3.500%(2) | 674,670 |
The accompanying notes are an integral part of these financial statements.
Hartford Multi-Asset Income Fund (formerly, Hartford Multi-Asset Income and Growth Fund)
Schedule of Investments – (continued)
October 31, 2021
| Shares or Principal Amount | | Market Value† |
| SENIOR FLOATING RATE INTERESTS - 9.0%(7) - (continued) |
| | Insurance - 0.5% - (continued) |
| | Asurion LLC | |
| $ 284,249 | 3.21%, 11/03/2023, 1 mo. USD LIBOR + 3.125%(2) | $ 283,479 |
| 596,913 | 3.34%, 12/23/2026, 1 mo. USD LIBOR + 3.250%(2) | 590,664 |
| 145,000 | 5.34%, 01/31/2028, 1 mo. USD LIBOR + 5.250%(2) | 144,404 |
| 877,330 | Hub International Ltd. 2.87%, 04/25/2025, 1 mo. USD LIBOR + 2.750%(2) | 867,162 |
| | Sedgwick Claims Management Services, Inc. | |
| 877,444 | 3.34%, 12/31/2025, 3 mo. USD LIBOR + 3.250%(2) | 868,125 |
| 49,000 | 5.25%, 09/03/2026, 1 mo. USD LIBOR + 4.250%(2) | 49,079 |
| 487,310 | USI, Inc. 3.13%, 05/16/2024, 3 mo. USD LIBOR + 3.000%(2) | 483,392 |
| | | | 3,960,975 |
| | Internet - 0.1% |
| 364,087 | Endure Digital, Inc. 4.25%, 02/10/2028, 1 mo. USD LIBOR + 3.500%(2) | 357,563 |
| 589,284 | MH Sub LLC 4.75%, 09/13/2024, 1 mo. USD LIBOR + 3.750%(2) | 590,268 |
| 305,000 | Proofpoint, Inc. 3.75%, 08/31/2028, 1 mo. USD LIBOR + 3.250%(2) | 303,612 |
| | | | 1,251,443 |
| | IT Services - 0.2% |
| 367,248 | CDW LLC 1.84%, 10/13/2026, 1 mo. USD LIBOR + 1.750%(2) | 367,553 |
| 348,250 | Peraton Corp. 4.50%, 02/01/2028, 1 mo. USD LIBOR + 3.750%(2) | 348,629 |
| 643,684 | Tempo Acquisition LLC 3.75%, 11/02/2026, 1 mo. USD LIBOR + 3.250%(2) | 645,023 |
| | | | 1,361,205 |
| | Leisure Time - 0.1% |
| | Carnival Corp. | |
| 276,500 | 3.75%, 06/30/2025, 1 mo. USD LIBOR + 3.000%(2) | 275,983 |
| 295,000 | 4.00%, 10/18/2028, 6 mo. USD LIBOR + 4.000% | 294,631 |
| 110,000 | Great Canadian Gaming Corp. 0.00%, 11/01/2026, 1 mo. USD LIBOR + 4.000%(2)(8) | 110,495 |
| 374,062 | Hayward Industries, Inc. 3.00%, 05/12/2028, 1 mo. USD LIBOR + 2.500%(2) | 372,817 |
| 269,325 | MajorDrive Holdings LLC 4.50%, 05/12/2028, 1 mo. USD LIBOR + 4.000%(2) | 269,325 |
| | | | 1,323,251 |
| Shares or Principal Amount | | Market Value† |
| SENIOR FLOATING RATE INTERESTS - 9.0%(7) - (continued) |
| | Lodging - 0.2% |
| $ 329,889 | Boyd Gaming Corp. 2.32%, 09/15/2023, 3 mo. USD LIBOR + 2.250%(2) | $ 329,286 |
| | Caesars Resort Collection LLC | |
| 731,013 | 2.84%, 12/23/2024, 3 mo. USD LIBOR + 2.750%(2) | 727,285 |
| 371,250 | 3.59%, 07/21/2025, 1 mo. USD LIBOR + 3.500%(2) | 371,465 |
| | | | 1,428,036 |
| | Machinery-Diversified - 0.2% |
| 339,114 | Altra Industrial Motion Corp. 2.09%, 10/01/2025, 3 mo. USD LIBOR + 2.000%(2) | 336,570 |
| 428,055 | Circor International, Inc. 4.25%, 12/11/2024, 1 mo. USD LIBOR + 3.250%(2) | 427,388 |
| 185,000 | Filtration Group Corp. 0.00%, 10/21/2028, 1 mo. USD LIBOR + 3.750%(8) | 184,676 |
| 524,720 | Vertical U.S. Newco, Inc. 4.00%, 07/30/2027, 1 mo. USD LIBOR + 3.500%(2) | 525,376 |
| | | | 1,474,010 |
| | Media - 0.6% |
| 133,650 | Banijay Entertainment S.A.S 3.83%, 03/01/2025, 1 mo. USD LIBOR + 3.750%(2) | 133,149 |
| 379,050 | Cable One, Inc. 2.09%, 05/03/2028, 1 mo. USD LIBOR + 2.000%(2) | 375,851 |
| | CSC Holdings LLC | |
| 487,245 | 2.34%, 07/17/2025, 3 mo. USD LIBOR + 2.250%(2) | 475,522 |
| 358,613 | 2.59%, 04/15/2027, 1 mo. USD LIBOR + 2.500%(2) | 350,992 |
| 405,000 | DirecTV Financing LLC 5.75%, 07/22/2027, 1 mo. USD LIBOR + 5.000%(2) | 405,194 |
| 494,949 | E.W. Scripps Co. 3.31%, 05/01/2026, 1 mo. USD LIBOR + 2.563%(2) | 493,093 |
| 425,886 | Gray Television, Inc. 2.58%, 01/02/2026, 3 mo. USD LIBOR + 2.500%(2) | 422,854 |
| 2,221 | Houghton Mifflin Harcourt Publishing Co. 7.25%, 11/22/2024, 1 mo. USD LIBOR + 6.250%(2) | 2,216 |
| 750,000 | Telenet Financing USD LLC 2.09%, 04/30/2028, 6 mo. USD LIBOR + 2.000%(2) | 739,125 |
| 595,000 | UPC Financing Partnership 3.09%, 01/31/2029, 1 mo. USD LIBOR + 3.000%(2) | 592,150 |
The accompanying notes are an integral part of these financial statements.
Hartford Multi-Asset Income Fund (formerly, Hartford Multi-Asset Income and Growth Fund)
Schedule of Investments – (continued)
October 31, 2021
| Shares or Principal Amount | | Market Value† |
| SENIOR FLOATING RATE INTERESTS - 9.0%(7) - (continued) |
| | Media - 0.6% - (continued) |
| $ 410,000 | Virgin Media Bristol LLC 3.34%, 01/31/2029, 1 mo. USD LIBOR + 3.250%(2) | $ 409,660 |
| 500,000 | Ziggo Financing Partnership 2.59%, 04/30/2028, 1 mo. USD LIBOR + 2.500%(2) | 493,540 |
| | | | 4,893,346 |
| | Oil & Gas Services - 0.0% |
| 270,000 | Oryx Midstream Services Permian Basin LLC 0.00%, 10/05/2028, 1 mo. USD LIBOR + 3.250%(8) | 268,842 |
| | Packaging & Containers - 0.3% |
| 560,000 | Berlin Packaging LLC 4.25%, 03/11/2028, 1 mo. USD LIBOR + 3.750%(2) | 560,101 |
| | Flex Acquisition Co., Inc. | |
| 491,261 | 3.13%, 06/29/2025, 3 mo. USD LIBOR + 3.000%(2) | 487,213 |
| 319,654 | 4.00%, 02/23/2028, 1 mo. USD LIBOR + 3.500%(2) | 318,676 |
| 137,550 | Pregis TopCo Corp. 4.09%, 07/31/2026, 1 mo. USD LIBOR + 4.000%(2) | 137,764 |
| 115,000 | Pretium PKG Holdings, Inc. 4.50%, 10/02/2028, 1 mo. USD LIBOR + 4.500% | 115,274 |
| 631,825 | Proampac PG Borrower LLC 4.50%, 11/03/2025, 1 mo. USD LIBOR + 3.750%(2) | 631,825 |
| | | | 2,250,853 |
| | Pharmaceuticals - 0.4% |
| 334,123 | Bausch Health Cos., Inc. 3.09%, 06/02/2025, 3 mo. USD LIBOR + 3.000%(2) | 333,268 |
| 562,134 | Change Healthcare Holdings LLC 3.50%, 03/01/2024, 1 mo. USD LIBOR + 2.500%(2) | 561,493 |
| 444,314 | Elanco Animal Health, Inc. 1.83%, 08/01/2027, 1 mo. USD LIBOR + 1.750%(2) | 440,346 |
| 422,248 | Gainwell Acquisition Corp. 4.75%, 10/01/2027, 1 mo. USD LIBOR + 4.000%(2) | 422,966 |
| 308,450 | Horizon Therapeutics USA, Inc. 2.50%, 03/15/2028, 1 mo. USD LIBOR + 2.000%(2) | 307,623 |
| 31,833 | ICON Luxembourg S.a r.l. 3.00%, 07/03/2028, 1 mo. USD LIBOR + 2.500%(2) | 31,830 |
| 349,125 | Jazz Financing Lux S.a.r.l. 4.00%, 05/05/2028, 1 mo. USD LIBOR + 3.500%(2) | 349,561 |
| 403,987 | Organon & Co. 3.50%, 06/02/2028, 1 mo. USD LIBOR + 3.000%(2) | 404,747 |
| 662,714 | Pathway Vet Alliance LLC 3.84%, 03/31/2027, 1 mo. USD LIBOR + 3.750%(2) | 659,122 |
| | | | 3,510,956 |
| Shares or Principal Amount | | Market Value† |
| SENIOR FLOATING RATE INTERESTS - 9.0%(7) - (continued) |
| | Pipelines - 0.3% |
| $ 468,825 | DT Midstream, Inc. 2.50%, 06/26/2028, 1 mo. USD LIBOR + 2.000%(2) | $ 469,777 |
| 809,810 | Medallion Midland Acquisition LLC 4.50%, 10/18/2028, 3 mo. USD LIBOR + 3.750% | 809,049 |
| 487,437 | NorthRiver Midstream Finance L.P. 3.38%, 10/01/2025, 3 mo. USD LIBOR + 3.250%(2) | 486,282 |
| 459,927 | Traverse Midstream Partners LLC 5.25%, 09/27/2024, 1 mo. USD LIBOR + 4.250%(2) | 459,255 |
| | | | 2,224,363 |
| | Retail - 0.7% |
| 205,000 | At Home Group, Inc. 4.75%, 07/24/2028, 1 mo. USD LIBOR + 4.250%(2) | 204,061 |
| 448,148 | B.C. Unlimited Liability Co. 1.84%, 11/19/2026, 1 mo. USD LIBOR + 1.750%(2) | 439,104 |
| 429,622 | Beacon Roofing Supply, Inc. 2.34%, 05/19/2028, 1 mo. USD LIBOR + 2.250%(2) | 426,499 |
| 289,040 | EG Group Ltd. 4.75%, 03/31/2026, 1 mo. USD LIBOR + 4.250%(2) | 288,607 |
| 179,550 | Foundation Building Materials Holding Co. LLC 3.75%, 02/03/2028, 1 mo. USD LIBOR + 3.250%(2) | 178,017 |
| 511,137 | Great Outdoors Group LLC 5.00%, 03/06/2028, 1 mo. USD LIBOR + 4.250%(2) | 512,308 |
| 709,389 | Harbor Freight Tools USA, Inc. 3.25%, 10/19/2027, 1 mo. USD LIBOR + 2.750%(2) | 706,651 |
| | IRB Holding Corp. | |
| 244,924 | 3.75%, 02/05/2025, 1 mo. USD LIBOR + 2.750%(2) | 244,209 |
| 238,200 | 4.25%, 12/15/2027, 1 mo. USD LIBOR + 3.250%(2) | 238,031 |
| | LBM Acquisition LLC | |
| 103,333 | 0.00%, 12/17/2027, 1 mo. USD LIBOR + 3.750%(2)(8) | 101,869 |
| 206,149 | 3.88%, 12/17/2027, 1 mo. USD LIBOR + 3.750%(2) | 203,227 |
| 299,489 | 4.50%, 12/17/2027, 1 mo. USD LIBOR + 3.750%(2)(9) | 295,245 |
| 426,775 | Les Schwab Tire Centers 4.00%, 11/02/2027, 1 mo. USD LIBOR + 3.250%(2) | 425,977 |
| 379,050 | Michaels Cos., Inc. 5.00%, 04/15/2028, 1 mo. USD LIBOR + 4.250%(2) | 378,341 |
| 268,650 | Petco Health and Wellness Co., Inc. 4.00%, 03/03/2028, 1 mo. USD LIBOR + 3.250%(2) | 268,459 |
| 179,550 | PetSmart, Inc. 4.50%, 02/11/2028, 1 mo. USD LIBOR + 3.750%(2) | 179,615 |
| 240,000 | Specialty Building Products Holdings LLC 0.00%, 10/15/2028, 1 mo. USD LIBOR + 3.750%(8) | 239,025 |
The accompanying notes are an integral part of these financial statements.
Hartford Multi-Asset Income Fund (formerly, Hartford Multi-Asset Income and Growth Fund)
Schedule of Investments – (continued)
October 31, 2021
| Shares or Principal Amount | | Market Value† |
| SENIOR FLOATING RATE INTERESTS - 9.0%(7) - (continued) |
| | Retail - 0.7% - (continued) |
| $ 473,813 | SRS Distribution, Inc. 4.25%, 06/02/2028, 1 mo. USD LIBOR + 3.750%(2) | $ 473,680 |
| 488,750 | Staples, Inc. 5.13%, 04/16/2026, 3 mo. USD LIBOR + 5.000%(2) | 469,249 |
| 267,300 | White Cap Buyer LLC 4.50%, 10/19/2027, 1 mo. USD LIBOR + 4.000%(2) | 267,816 |
| | | | 6,539,990 |
| | Semiconductors - 0.0% |
| 445,000 | MKS Instruments, Inc. 0.00%, 10/21/2028, 1 mo. USD LIBOR + 2.250%(8) | 444,444 |
| | Software - 0.8% |
| EUR 210,000 | Concorde Midco Ltd. 4.00%, 03/01/2028, 3 mo. EURIBOR + 4.000%(2) | 242,500 |
| $ 647,631 | DCert Buyer, Inc. 4.09%, 10/16/2026, 3 mo. USD LIBOR + 4.000%(2) | 647,703 |
| 917,777 | Dun & Bradstreet Corp. 3.34%, 02/06/2026, 1 mo. USD LIBOR + 3.250%(2) | 913,684 |
| 314,212 | E2open LLC 3.75%, 02/04/2028, 1 mo. USD LIBOR + 3.250%(2) | 314,344 |
| 156,800 | Emerald TopCo, Inc. 3.63%, 07/24/2026, 1 mo. USD LIBOR + 3.500%(2) | 155,585 |
| 404,150 | Epicor Software Corp. 4.00%, 07/30/2027, 1 mo. USD LIBOR + 3.250%(2) | 403,612 |
| 455,814 | Hyland Software, Inc. 4.25%, 07/01/2024, 1 mo. USD LIBOR + 3.500%(2) | 455,955 |
| 630,000 | Mitchell International, Inc. 4.25%, 10/15/2028, 1 mo. USD LIBOR + 3.750% | 624,015 |
| 582,893 | Navicure, Inc. 4.09%, 10/22/2026, 1 mo. USD LIBOR + 4.000%(2) | 583,260 |
| 430,000 | Polaris Newco LLC 4.50%, 06/02/2028, 1 mo. USD LIBOR + 4.000%(2) | 430,826 |
| 109,450 | Press Ganey Holdings, Inc. 4.50%, 07/24/2026, 1 mo. USD LIBOR + 3.750%(2) | 109,587 |
| 520,000 | RealPage, Inc. 3.75%, 04/24/2028, 1 mo. USD LIBOR + 3.250%(2) | 518,752 |
| 208,303 | SS&C European Holdings S.a.r.l. 1.84%, 04/16/2025, 1 mo. USD LIBOR + 1.750%(2) | 206,004 |
| 274,134 | SS&C Technologies, Inc. 1.84%, 04/16/2025, 1 mo. USD LIBOR + 1.750%(2) | 271,107 |
| 510,108 | Ultimate Software Group, Inc. 4.00%, 05/04/2026, 1 mo. USD LIBOR + 3.250%(2) | 510,684 |
| 761,496 | Zelis Healthcare Corporation 3.58%, 09/30/2026, 1 mo. USD LIBOR + 3.500%(2) | 757,863 |
| | | | 7,145,481 |
| Shares or Principal Amount | | Market Value† |
| SENIOR FLOATING RATE INTERESTS - 9.0%(7) - (continued) |
| | Telecommunications - 0.3% |
| $ 487,310 | Altice France S.A. 3.81%, 01/31/2026, 3 mo. USD LIBOR + 3.688%(2) | $ 481,706 |
| 407,950 | Frontier Communications Corp. 4.50%, 05/01/2028, 1 mo. USD LIBOR + 3.750%(2) | 407,134 |
| EUR 1,048,617 | Lorca Finco plc 4.25%, 09/17/2027, 3 mo. EURIBOR + 4.250%(2) | 1,211,377 |
| $ 298,414 | Zayo Group Holdings, Inc. 3.09%, 03/09/2027, 1 mo. USD LIBOR + 3.000%(2) | 293,541 |
| | | | 2,393,758 |
| | Transportation - 0.2% |
| 390,000 | First Student Bidco, Inc. 3.50%, 07/21/2028, 1 mo. USD LIBOR + 3.000%(2) | 387,125 |
| 1,034,250 | Genesee & Wyoming, Inc. 2.13%, 12/30/2026, 1 mo. USD LIBOR + 2.000%(2) | 1,027,900 |
| | | | 1,415,025 |
| | Total Senior Floating Rate Interests
(cost $78,810,833) | $ 78,803,185 |
| U.S. GOVERNMENT AGENCIES - 1.2% |
| | Mortgage-Backed Agencies - 1.2% |
| | FHLMC - 1.2% |
| 88,759 | 0.70%, 01/25/2051, 1 mo. USD SOFR + 0.650%(1)(2) | $ 88,759 |
| 179,848 | 0.85%, 08/25/2033, 1 mo. USD SOFR + 0.800%(1)(2) | 179,962 |
| 2,968,885 | 1.33%, 06/25/2030(3)(4) | 295,571 |
| 5,580,410 | 1.43%, 07/25/2030(3)(4) | 586,509 |
| 1,740,000 | 2.59%, 03/25/2030, 1 mo. USD LIBOR + 2.500%(2) | 1,777,169 |
| 314,835 | 2.74%, 12/25/2029, 1 mo. USD LIBOR + 2.650%(2) | 321,554 |
| 236,651 | 2.85%, 10/25/2050, SOFR + 2.800%(1)(2) | 239,317 |
| 1,100,000 | 3.54%, 10/25/2029, 1 mo. USD LIBOR + 3.450%(2) | 1,135,388 |
| 412,964 | 3.64%, 08/25/2029, 1 mo. USD LIBOR + 3.550%(2) | 426,917 |
| 223,532 | 3.69%, 07/25/2050, 1 mo. USD LIBOR + 3.600%(1)(2) | 225,102 |
| 11,255 | 4.00%, 03/01/2041 | 12,398 |
| 171,513 | 4.64%, 10/25/2024, 1 mo. USD LIBOR + 4.550%(2) | 176,650 |
| 667,803 | 4.79%, 03/25/2028, 1 mo. USD LIBOR + 4.700%(2) | 683,403 |
| 996,219 | 4.79%, 04/25/2028, 1 mo. USD LIBOR + 4.700%(2) | 1,031,431 |
| 47,653 | 4.84%, 10/25/2024, 1 mo. USD LIBOR + 4.750%(2) | 47,912 |
| 173,284 | 5.09%, 12/25/2028, 1 mo. USD LIBOR + 5.000%(2) | 180,787 |
| 865,590 | 5.24%, 11/25/2028, 1 mo. USD LIBOR + 5.150%(2) | 898,355 |
The accompanying notes are an integral part of these financial statements.
Hartford Multi-Asset Income Fund (formerly, Hartford Multi-Asset Income and Growth Fund)
Schedule of Investments – (continued)
October 31, 2021
| Shares or Principal Amount | | Market Value† |
| U.S. GOVERNMENT AGENCIES - 1.2% - (continued) |
| | Mortgage-Backed Agencies - 1.2% - (continued) |
| | FHLMC - 1.2% - (continued) |
| $ 759,514 | 5.64%, 07/25/2028, 1 mo. USD LIBOR + 5.550%(2) | $ 795,645 |
| 1,077,465 | 6.44%, 09/25/2028, 1 mo. USD LIBOR + 6.350%(2) | 1,132,053 |
| | | | 10,234,882 |
| | FNMA - 0.0% |
| 50,415 | 0.49%, 10/25/2024, 1 mo. USD LIBOR + 0.400%(2) | 50,428 |
| 150,000 | 3.07%, 02/01/2025 | 158,680 |
| 5,465 | 4.50%, 04/01/2041 | 6,088 |
| | | | 215,196 |
| | GNMA - 0.0% |
| 77 | 6.00%, 11/20/2023 | 85 |
| 184 | 6.00%, 12/20/2023 | 203 |
| 19 | 6.00%, 01/20/2024 | 22 |
| 60 | 6.00%, 02/20/2024 | 66 |
| 70 | 6.00%, 02/20/2026 | 78 |
| 425 | 6.00%, 02/20/2027 | 471 |
| 122 | 6.00%, 01/20/2028 | 135 |
| 2,679 | 6.00%, 02/20/2028 | 2,973 |
| 4,379 | 6.00%, 04/20/2028 | 4,959 |
| 1,341 | 6.00%, 06/15/2028 | 1,503 |
| 10,038 | 6.00%, 07/20/2028 | 11,363 |
| 10,627 | 6.00%, 08/20/2028 | 12,047 |
| 2,133 | 6.00%, 10/15/2028 | 2,388 |
| 11,546 | 6.00%, 11/15/2028 | 12,959 |
| 10,039 | 6.00%, 03/20/2029 | 11,375 |
| 10,176 | 6.00%, 09/20/2029 | 11,370 |
| 17,575 | 6.00%, 04/20/2030 | 19,491 |
| 2,199 | 6.00%, 06/20/2030 | 2,438 |
| 1,619 | 6.00%, 08/15/2034 | 1,850 |
| 17,872 | 6.50%, 03/15/2028 | 19,974 |
| 2,351 | 6.50%, 05/15/2028 | 2,628 |
| 3,358 | 6.50%, 07/15/2028 | 3,766 |
| 5,583 | 6.50%, 10/15/2028 | 6,241 |
| 500 | 6.50%, 12/15/2028 | 560 |
| 9,210 | 6.50%, 01/15/2029 | 10,293 |
| 6,757 | 6.50%, 02/15/2029 | 7,551 |
| 32,304 | 6.50%, 03/15/2029 | 36,104 |
| 7,281 | 6.50%, 04/15/2029 | 8,138 |
| 5,496 | 6.50%, 05/15/2029 | 6,152 |
| 5,087 | 6.50%, 06/15/2029 | 5,686 |
| 7,099 | 6.50%, 02/15/2035 | 8,102 |
| 11,150 | 7.00%, 11/15/2031 | 12,293 |
| 7,605 | 7.00%, 03/15/2032 | 8,393 |
| 92,058 | 7.00%, 11/15/2032 | 108,022 |
| 2,285 | 7.00%, 01/15/2033 | 2,627 |
| 8,299 | 7.00%, 05/15/2033 | 9,506 |
| 13,045 | 7.00%, 07/15/2033 | 14,797 |
| 22,195 | 7.00%, 11/15/2033 | 25,516 |
| 1,312 | 8.00%, 04/15/2030 | 1,362 |
| 5,850 | 8.00%, 05/15/2030 | 5,920 |
| 176 | 8.00%, 07/15/2030 | 180 |
| 3,958 | 8.00%, 08/15/2030 | 4,112 |
| Shares or Principal Amount | | Market Value† |
| U.S. GOVERNMENT AGENCIES - 1.2% - (continued) |
| | Mortgage-Backed Agencies - 1.2% - (continued) |
| | GNMA - 0.0% - (continued) |
| $ 6,278 | 8.00%, 11/15/2030 | $ 6,428 |
| 62,489 | 8.00%, 02/15/2031 | 67,965 |
| | | | 478,092 |
| | Total U.S. Government Agencies
(cost $11,195,391) | | $ 10,928,170 |
| U.S. GOVERNMENT SECURITIES - 7.5% |
| | U.S. Treasury Securities - 7.5% |
| | U.S. Treasury Bonds - 3.2% |
| 350,000 | 1.38%, 08/15/2050 | $ 304,746 |
| 990,000 | 1.63%, 11/15/2050 | 916,833 |
| 1,565,000 | 1.75%, 08/15/2041 | 1,503,867 |
| 3,525,000 | 1.88%, 02/15/2051 | 3,462,762 |
| 2,565,000 | 2.00%, 08/15/2051 | 2,599,066 |
| 7,895,000 | 2.25%, 05/15/2041 | 8,225,603 |
| 820,000 | 2.38%, 05/15/2051 | 899,950 |
| 3,805,000 | 2.88%, 05/15/2043 | 4,388,384 |
| 4,765,000 | 3.00%, 08/15/2048(10) | 5,811,439 |
| | | | 28,112,650 |
| | U.S. Treasury Notes - 4.3% |
| 1,600,000 | 0.13%, 05/31/2023 | 1,593,625 |
| 1,415,000 | 0.13%, 10/15/2023 | 1,404,830 |
| 3,400,000 | 0.25%, 09/30/2023 | 3,386,453 |
| 2,740,000 | 0.25%, 03/15/2024 | 2,715,704 |
| 1,300,000 | 0.25%, 06/30/2025 | 1,266,688 |
| 1,070,000 | 0.25%, 07/31/2025 | 1,041,369 |
| 4,130,000 | 0.25%, 08/31/2025 | 4,012,714 |
| 5,290,000 | 0.25%, 09/30/2025 | 5,135,226 |
| 185,000 | 0.38%, 08/15/2024 | 183,280 |
| 610,000 | 0.38%, 11/30/2025 | 593,201 |
| 1,020,000 | 0.38%, 12/31/2025 | 990,795 |
| 1,355,000 | 0.38%, 01/31/2026 | 1,314,403 |
| 485,000 | 0.63%, 10/15/2024 | 483,105 |
| 320,000 | 0.63%, 07/31/2026 | 311,975 |
| 1,630,000 | 0.75%, 03/31/2026 | 1,603,831 |
| 470,000 | 0.75%, 04/30/2026 | 462,069 |
| 860,000 | 0.75%, 05/31/2026 | 844,950 |
| 620,000 | 0.75%, 08/31/2026 | 607,697 |
| 2,545,000 | 0.88%, 06/30/2026 | 2,512,293 |
| 2,910,000 | 0.88%, 09/30/2026 | 2,867,941 |
| 1,145,000 | 1.13%, 10/31/2026 | 1,141,511 |
| 45,000 | 1.13%, 02/15/2031 | 43,425 |
| 350,000 | 1.25%, 03/31/2028 | 346,732 |
| 440,000 | 1.25%, 05/31/2028 | 435,359 |
| 215,000 | 1.25%, 06/30/2028 | 212,472 |
| 520,000 | 1.25%, 09/30/2028 | 513,013 |
| 1,035,000 | 1.25%, 08/15/2031 | 1,006,376 |
| 120,000 | 1.63%, 05/15/2031 | 120,900 |
| | | | 37,151,937 |
| | Total U.S. Government Securities
(cost $62,961,624) | | $ 65,264,587 |
| COMMON STOCKS - 33.6% |
| | Automobiles & Components - 0.6% |
| 2,436,000 | Dongfeng Motor Group Co., Ltd. Class H | $ 2,268,786 |
| 45,290 | Isuzu Motors Ltd. | 609,277 |
The accompanying notes are an integral part of these financial statements.
Hartford Multi-Asset Income Fund (formerly, Hartford Multi-Asset Income and Growth Fund)
Schedule of Investments – (continued)
October 31, 2021
| Shares or Principal Amount | | Market Value† |
| COMMON STOCKS - 33.6% - (continued) |
| | Automobiles & Components - 0.6% - (continued) |
| 746 | Thor Industries, Inc. | $ 76,062 |
| 11,023 | Volkswagen AG | 2,473,907 |
| | | | 5,428,032 |
| | Banks - 2.7% |
| 169,457 | Abu Dhabi Commercial Bank PJSC | 382,912 |
| 156,007 | Abu Dhabi Islamic Bank PJSC | 248,393 |
| 1,271,000 | Agricultural Bank of China Ltd. Class H | 431,895 |
| 29,710 | Ameris Bancorp | 1,556,507 |
| 431,000 | Bank of Beijing Co. Ltd. | 298,315 |
| 3,600,000 | Bank of China Ltd. Class H | 1,274,046 |
| 724,822 | Bank of Communications Co., Ltd. Class H | 431,184 |
| 25,381 | Bank of Nova Scotia | 1,663,978 |
| 27,989 | BAWAG Group AG(1) | 1,760,374 |
| 574,000 | China CITIC Bank Corp. Ltd. Class H | 251,785 |
| 122,712 | Credit Agricole S.A. | 1,851,351 |
| 20,362 | KBC Group N.V. | 1,896,170 |
| 11,938 | PNC Financial Services Group, Inc. | 2,519,276 |
| 21,180 | Popular, Inc. | 1,724,899 |
| 21,829 | Qatar Islamic Bank SAQ | 110,434 |
| 17,240 | Shinhan Financial Group Co., Ltd. | 562,833 |
| 133,295 | Svenska Handelsbanken AB Class A | 1,527,872 |
| 32,880 | Synovus Financial Corp. | 1,531,879 |
| 43,120 | United Community Banks, Inc. | 1,502,301 |
| 15,610 | Western Alliance Bancorp | 1,812,165 |
| | | | 23,338,569 |
| | Capital Goods - 4.2% |
| 21,282 | American Woodmark Corp.* | 1,462,925 |
| 37,302 | Assa Abloy AB Class B | 1,094,540 |
| 232,467 | BAE Systems plc | 1,752,839 |
| 41,513 | Builders FirstSource, Inc.* | 2,418,963 |
| 35,640 | Cie de Saint-Gobain | 2,459,607 |
| 140,500 | CK Hutchison Holdings Ltd. | 941,971 |
| 12,436 | Fortive Corp. | 941,530 |
| 17,295 | Fortune Brands Home & Security, Inc. | 1,753,713 |
| 62,576 | JELD-WEN Holding, Inc.* | 1,715,208 |
| 17,876 | Kone Oyj Class B | 1,219,126 |
| 5,166 | Lennox International, Inc. | 1,546,080 |
| 3,636 | Lockheed Martin Corp. | 1,208,316 |
| 14,896 | Masonite International Corp.* | 1,787,669 |
| 10,100 | Mitsubishi Corp. | 321,159 |
| 55,965 | Mitsui & Co., Ltd. | 1,280,732 |
| 19,481 | Nexans S.A. | 1,954,598 |
| 14,414 | OC Oerlikon Corp. AG | 146,759 |
| 16,795 | Owens Corning | 1,568,821 |
| 19,276 | Raytheon Technologies Corp. | 1,712,865 |
| 3,519 | Rockwool International A/S Class B | 1,609,293 |
| 15,695 | Schneider Electric SE | 2,706,102 |
| 27,377 | Signify N.V.(1) | 1,326,590 |
| 17,100 | Sumitomo Corp. | 243,669 |
| 49,253 | Vestas Wind Systems A/S | 2,129,188 |
| 18,379 | Vinci S.A. | 1,964,902 |
| | | | 37,267,165 |
| | Commercial & Professional Services - 1.1% |
| 1,572,073 | Aker Carbon Capture ASA* | 5,696,720 |
| 101,794 | Bureau Veritas S.A. | 3,235,524 |
| 20,786 | Experian plc | 953,063 |
| | | | 9,885,307 |
| Shares or Principal Amount | | Market Value† |
| COMMON STOCKS - 33.6% - (continued) |
| | Consumer Durables & Apparel - 2.7% |
| 7,844 | Cavco Industries, Inc.* | $ 1,885,541 |
| 22,691 | Century Communities, Inc. | 1,521,659 |
| 19,156 | D.R. Horton, Inc. | 1,710,056 |
| 6,100 | Iida Group Holdings Co., Ltd. | 150,392 |
| 14,721 | Installed Building Products, Inc. | 1,870,303 |
| 38,690 | KB Home | 1,553,404 |
| 18,509 | Lennar Corp. Class A | 1,849,604 |
| 9,730 | NIKE, Inc. Class B | 1,627,732 |
| 365 | NVR, Inc.* | 1,786,602 |
| 31,192 | PulteGroup, Inc. | 1,499,711 |
| 20,100 | Sankyo Co., Ltd. | 487,865 |
| 91,600 | Shenzhou International Group Holdings Ltd. | 1,973,449 |
| 28,204 | Toll Brothers, Inc. | 1,697,035 |
| 9,073 | TopBuild Corp.* | 2,331,489 |
| 76,318 | TRI Pointe Group, Inc.* | 1,846,132 |
| | | | 23,790,974 |
| | Consumer Services - 0.6% |
| 86,770 | Compass Group plc* | 1,841,315 |
| 9,324 | H&R Block, Inc. | 215,105 |
| 10,297 | McDonald's Corp. | 2,528,428 |
| 11,800 | McDonald's Holdings Co. Japan Ltd. | 527,360 |
| | | | 5,112,208 |
| | Diversified Financials - 0.9% |
| 11,977 | AGNC Investment Corp. REIT | 190,674 |
| 6,015 | Blackstone Group, Inc. Class A | 832,596 |
| 12,598 | DWS Group GmbH & Co. KgaA(1) | 544,933 |
| 36,700 | Hannon Armstrong Sustainable Infrastructure Capital, Inc. REIT | 2,216,680 |
| 14,500 | Hong Kong Exchanges & Clearing Ltd. | 873,505 |
| 2,050 | Industrivarden AB Class A(6) | 67,626 |
| 17,790 | Morgan Stanley | 1,828,456 |
| 23,621 | OneMain Holdings, Inc. | 1,247,425 |
| 81,224 | REC Ltd. | 161,660 |
| 3,168 | Starwood Property Trust, Inc. REIT | 80,689 |
| | | | 8,044,244 |
| | Energy - 0.4% |
| 786,000 | China Petroleum & Chemical Corp. Class H | 382,965 |
| 558,301 | China Shenhua Energy Co., Ltd. Class H | 1,200,511 |
| 31,298 | TotalEnergies SE | 1,567,246 |
| | | | 3,150,722 |
| | Food & Staples Retailing - 0.8% |
| 6,603 | Alimentation Couche-Tard, Inc. Class B | 247,666 |
| 120,041 | Cencosud S.A. | 175,598 |
| 37,649 | J Sainsbury plc | 154,205 |
| 52,400 | Kesko Oyj Class B | 1,705,331 |
| 39,444 | Koninklijke Ahold Delhaize N.V. | 1,283,210 |
| 19,894 | Kroger Co. | 796,158 |
| 74,807 | Magnit PJSC GDR | 1,385,425 |
| 16,901 | Metro AG | 213,648 |
| 16,870 | Seven & i Holdings Co., Ltd. | 708,283 |
| | | | 6,669,524 |
| | Food, Beverage & Tobacco - 2.3% |
| 42,734 | Altria Group, Inc. | 1,884,997 |
| 37,218 | British American Tobacco plc | 1,294,606 |
| 25,943 | Coca-Cola Co. | 1,462,407 |
| 1,753 | Coca-Cola Europacific Partners plc | 92,296 |
| 48,246 | Diageo plc | 2,400,320 |
The accompanying notes are an integral part of these financial statements.
Hartford Multi-Asset Income Fund (formerly, Hartford Multi-Asset Income and Growth Fund)
Schedule of Investments – (continued)
October 31, 2021
| Shares or Principal Amount | | Market Value† |
| COMMON STOCKS - 33.6% - (continued) |
| | Food, Beverage & Tobacco - 2.3% - (continued) |
| 7,016 | Flowers Foods, Inc. | $ 173,646 |
| 17,458 | Heineken N.V. | 1,932,409 |
| 47,076 | Imperial Brands plc | 993,359 |
| 141,070 | Inner Mongolia Yili Industrial Group Co., Ltd. Class A | 945,759 |
| 4,274 | JM Smucker Co. | 525,104 |
| 6,442 | Kweichow Moutai Co., Ltd. Class A | 1,838,281 |
| 12,656 | Nestle S.A. | 1,669,417 |
| 9,394 | PepsiCo., Inc. | 1,518,070 |
| 15,867 | Philip Morris International, Inc. | 1,500,066 |
| 365,213 | WH Group Ltd.(1) | 256,020 |
| 48,595 | Wuliangye Yibin Co., Ltd. Class A | 1,642,093 |
| | | | 20,128,850 |
| | Health Care Equipment & Services - 1.6% |
| 22,127 | Baxter International, Inc. | 1,747,148 |
| 6,062 | CVS Health Corp. | 541,215 |
| 2,918 | Dr Lal PathLabs Ltd.(1) | 137,060 |
| 290,200 | Hartalega Holdings Bhd | 410,667 |
| 7,640 | Hoya Corp. | 1,124,673 |
| 47,280 | Koninklijke Philips N.V. | 2,230,442 |
| 147,900 | Kossan Rubber Industries | 84,290 |
| 37,500 | Medipal Holdings Corp. | 678,458 |
| 16,311 | Medtronic plc | 1,955,036 |
| 21,200 | Miraca Holdings, Inc. | 522,819 |
| 15,400 | Shenzhen Mindray Bio-Medical Electronics Co., Ltd. Class A | 902,403 |
| 48 | Straumann Holding AG | 99,921 |
| 741,100 | Top Glove Corp. Bhd | 486,789 |
| 6,123 | UnitedHealth Group, Inc. | 2,819,458 |
| | | | 13,740,379 |
| | Household & Personal Products - 0.6% |
| 26,695 | Colgate-Palmolive Co. | 2,033,892 |
| 14,127 | Procter & Gamble Co. | 2,020,020 |
| 21,190 | Reckitt Benckiser Group plc | 1,720,263 |
| | | | 5,774,175 |
| | Insurance - 1.0% |
| 159,039 | AIA Group Ltd. | 1,782,352 |
| 48,938 | AXA S.A. | 1,423,752 |
| 10,502 | Chubb Ltd. | 2,051,881 |
| 32,810 | Dai-ichi Life Holdings, Inc. | 690,275 |
| 8,389 | Fidelity National Financial, Inc. | 401,917 |
| 7,708 | Marsh & McLennan Cos., Inc. | 1,285,694 |
| 20,193 | Old Republic International Corp. | 521,585 |
| 46,870 | T&D Holdings, Inc. | 601,139 |
| | | | 8,758,595 |
| | Materials - 1.1% |
| 202,000 | Asia Cement Corp. | 321,739 |
| 4,994 | BASF SE | 359,436 |
| 9,964 | BHP Group Ltd.(6) | 273,681 |
| 114,000 | China Resources Cement Holdings Ltd. | 95,863 |
| 6,802 | Dow, Inc. | 380,708 |
| 493,722 | Elkem ASA(1) | 1,962,482 |
| 103,441 | Evraz plc | 878,628 |
| 52,284 | Fortescue Metals Group Ltd. | 544,801 |
| 7,433 | LafargeHolcim Ltd. | 370,777 |
| 6,942 | Linde plc | 2,215,887 |
| 27,684 | Louisiana-Pacific Corp. | 1,631,418 |
| Shares or Principal Amount | | Market Value† |
| COMMON STOCKS - 33.6% - (continued) |
| | Materials - 1.1% - (continued) |
| 1,662 | Rio Tinto Ltd. | $ 113,868 |
| 831 | Sika AG | 281,526 |
| | | | 9,430,814 |
| | Media & Entertainment - 0.9% |
| 535 | Alphabet, Inc. Class A* | 1,584,092 |
| 44,521 | Eutelsat Communications S.A. | 632,783 |
| 36,361 | Interpublic Group of Cos., Inc. | 1,329,722 |
| 18,700 | Koei Tecmo Holdings Co., Ltd. | 870,452 |
| 50,114 | News Corp. Class A | 1,147,611 |
| 2,900 | Nintendo Co., Ltd. | 1,280,805 |
| 23,100 | Tencent Holdings Ltd. | 1,405,168 |
| | | | 8,250,633 |
| | Pharmaceuticals, Biotechnology & Life Sciences - 2.4% |
| 15,818 | AbbVie, Inc. | 1,813,850 |
| 4,207 | Amgen, Inc. | 870,723 |
| 20,300 | AstraZeneca plc ADR | 1,266,314 |
| 22,166 | Bristol-Myers Squibb Co. | 1,294,494 |
| 25,658 | Gilead Sciences, Inc. | 1,664,691 |
| 24,939 | Johnson & Johnson | 4,062,064 |
| 23,890 | Merck & Co., Inc. | 2,103,515 |
| 535 | Moderna, Inc.* | 184,687 |
| 18,546 | Novartis AG | 1,533,990 |
| 58,736 | Pfizer, Inc. | 2,569,113 |
| 9,387 | QIAGEN N.V.* | 523,419 |
| 4,424 | Roche Holding AG | 1,713,831 |
| 2,577 | Royalty Pharma plc Class A | 101,869 |
| 1,712 | Sanofi | 171,960 |
| 11,400 | Takeda Pharmaceutical Co., Ltd. | 319,950 |
| 8,300 | Zai Lab Ltd.* | 861,051 |
| | | | 21,055,521 |
| | Real Estate - 1.6% |
| 238,612 | Aldar Properties PJSC | 262,543 |
| 4,250 | American Tower Corp. REIT | 1,198,372 |
| 297,088 | Barwa Real Estate Co. | 257,579 |
| 142,000 | CK Asset Holdings Ltd. | 877,142 |
| 80,781 | Equity LifeStyle Properties, Inc. REIT | 6,826,802 |
| 32,800 | Hongkong Land Holdings Ltd. | 181,130 |
| 148,500 | Kerry Properties Ltd. | 419,765 |
| 38,150 | Mitsubishi Estate Co., Ltd. | 579,765 |
| 25,580 | Mitsui Fudosan Co., Ltd. REIT | 584,857 |
| 1,275 | PSP Swiss Property AG | 159,383 |
| 5,233 | Public Storage REIT | 1,738,298 |
| 16,500 | Sun Hung Kai Properties Ltd. | 218,762 |
| 111,400 | Swire Properties Ltd. | 298,660 |
| 3,343 | WP Carey, Inc. REIT | 257,779 |
| | | | 13,860,837 |
| | Retailing - 0.9% |
| 2,006,600 | Allstar Co.(11)(12)(13) | — |
| 1,260 | Best Buy Co., Inc. | 154,022 |
| 2,476 | Genuine Parts Co. | 324,628 |
| 5,687 | Home Depot, Inc. | 2,114,085 |
| 9,321 | Lowe's Cos., Inc. | 2,179,436 |
| 3,000 | momo.com, Inc. | 193,321 |
| 73,165 | Qurate Retail, Inc. Series A | 763,843 |
| 2,364 | Ross Stores, Inc. | 267,605 |
| 2,400 | Shimamura Co., Ltd. | 203,214 |
| 16,402 | TJX Cos., Inc. | 1,074,167 |
The accompanying notes are an integral part of these financial statements.
Hartford Multi-Asset Income Fund (formerly, Hartford Multi-Asset Income and Growth Fund)
Schedule of Investments – (continued)
October 31, 2021
| Shares or Principal Amount | | Market Value† |
| COMMON STOCKS - 33.6% - (continued) |
| | Retailing - 0.9% - (continued) |
| 1,322 | Williams-Sonoma, Inc. | $ 245,535 |
| 18,100 | Yamada Denki Co., Ltd. | 69,166 |
| | | | 7,589,022 |
| | Semiconductors & Semiconductor Equipment - 0.8% |
| 68,000 | Chipbond Technology Corp. | 157,840 |
| 11,890 | First Solar, Inc.* | 1,421,925 |
| 8,791 | Intel Corp. | 430,759 |
| 18,000 | MediaTek, Inc. | 592,428 |
| 5,272 | QUALCOMM, Inc. | 701,387 |
| 106,650 | Radiant Opto-Electronics Corp. | 373,670 |
| 28,000 | Realtek Semiconductor Corp. | 503,654 |
| 4,611 | Silicon Motion Technology Corp. ADR | 329,271 |
| 6,056 | SK Hynix, Inc. | 533,840 |
| 24,294 | STMicroelectronics N.V. | 1,153,450 |
| 1,450 | Tokyo Electron Ltd. | 675,748 |
| 94,468 | United Microelectronics Corp. | 196,113 |
| | | | 7,070,085 |
| | Software & Services - 2.4% |
| 6,112 | Accenture plc Class A | 2,192,924 |
| 10,342 | Amdocs Ltd. | 805,021 |
| 5,967 | Automatic Data Processing, Inc. | 1,339,532 |
| 5,944 | Capgemini SE | 1,385,920 |
| 852 | CGI, Inc.* | 76,113 |
| 4,505 | Cognizant Technology Solutions Corp. Class A | 351,795 |
| 302 | Constellation Software, Inc. | 530,743 |
| 1,555 | Crowdstrike Holdings, Inc.* | 438,199 |
| 5,719 | Dassault Systemes SE | 333,975 |
| 8,480 | Dropbox, Inc. Class A* | 258,555 |
| 7,441 | Fidelity National Information Services, Inc. | 824,016 |
| 2,317 | Fortinet, Inc.* | 779,300 |
| 706 | Gartner, Inc.* | 234,328 |
| 1,188 | Global Payments, Inc. | 169,872 |
| 715 | HubSpot, Inc.* | 579,314 |
| 12,916 | International Business Machines Corp. | 1,615,792 |
| 3,710 | McAfee Corp. | 79,283 |
| 11,853 | Microsoft Corp. | 3,930,692 |
| 16,441 | Nortonlifelock, Inc. | 418,423 |
| 9,241 | Nutanix, Inc.* | 317,059 |
| 4,268 | Oracle Corp. | 409,472 |
| 2,290 | Palo Alto Networks, Inc.* | 1,165,816 |
| 8,308 | SS&C Technologies Holdings, Inc. | 660,237 |
| 1,842 | Teradata Corp.* | 104,184 |
| 6,664 | Visa, Inc. Class A | 1,411,235 |
| 32,296 | Western Union Co. | 588,433 |
| 373 | Zscaler, Inc.* | 118,935 |
| | | | 21,119,168 |
| | Technology Hardware & Equipment - 0.3% |
| 83,000 | Asustek Computer, Inc. | 1,055,247 |
| 151,000 | Hon Hai Precision Industry Co., Ltd. | 582,911 |
| 12,743 | HP, Inc. | 386,495 |
| 47,500 | VTech Holdings Ltd. | 365,772 |
| | | | 2,390,425 |
| | Telecommunication Services - 0.8% |
| 74,238 | AT&T, Inc. | 1,875,252 |
| 51,460 | KDDI Corp. | 1,573,646 |
| 2,183 | KT Corp. | 56,996 |
| 55,028 | Orange S.A. | 600,077 |
| Shares or Principal Amount | | Market Value† |
| COMMON STOCKS - 33.6% - (continued) |
| | Telecommunication Services - 0.8% - (continued) |
| 2,209 | SK Telecom Co., Ltd.*(11)(13) | $ 584,914 |
| 268,475 | Telefonica Deutschland Holding AG | 699,489 |
| 32,731 | Verizon Communications, Inc. | 1,734,416 |
| 53,613 | Vodafone Group plc | 79,018 |
| | | | 7,203,808 |
| | Transportation - 0.7% |
| 18,529 | Canadian National Railway Co. | 2,462,548 |
| 2,050 | Kuehne + Nagel International AG | 645,648 |
| 4,600 | Nippon Yusen KK | 331,463 |
| 1,690 | Ryder System, Inc. | 143,566 |
| 42,240 | Schneider National, Inc. Class B | 1,053,466 |
| 196,000 | SITC International Holdings Co., Ltd. | 662,449 |
| 5,614 | United Parcel Service, Inc. Class B | 1,198,421 |
| | | | 6,497,561 |
| | Utilities - 2.2% |
| 2,294 | BKW AG | 303,925 |
| 1,334,000 | China Longyuan Power Group Corp. Ltd. Class H | 3,120,274 |
| 166,000 | China Resources Gas Group Ltd. | 891,819 |
| 15,910 | Edison International | 1,001,216 |
| 78,741 | EDP Renovaveis S.A. | 2,193,692 |
| 50,138 | Encavis AG(6) | 1,050,688 |
| 2,423 | Endesa S.A. | 55,881 |
| 329,052 | Enel S.p.A. | 2,754,752 |
| 59,040 | Engie S.A. | 839,853 |
| 148,100 | ENN Energy Holdings Ltd. | 2,551,537 |
| 70,469 | Iberdrola S.A. | 832,136 |
| 1,104,000 | Kunlun Energy Co., Ltd. | 1,005,501 |
| 135,861 | National Grid plc | 1,739,505 |
| 32,200 | Osaka Gas Co., Ltd. | 518,999 |
| 4,799 | Rubis SCA | 153,805 |
| | | | 19,013,583 |
| | Total Common Stocks
(cost $239,041,891) | | $ 294,570,201 |
| CONVERTIBLE PREFERRED STOCKS - 0.5% |
| | Diversified Financials - 0.5% |
| 18,485 | KKR & Co., Inc. Series C, 6.00%(6) | $ 1,849,240 |
| 1,297 | Mandatory Exchangeable Trust, 6.50%(1) | 2,212,224 |
| | Total Convertible Preferred Stocks
(cost $2,221,250) | | $ 4,061,464 |
| EQUITY LINKED SECURITIES - 11.2% |
| | Automobiles & Components - 1.3% |
| $ 24,280 | General Dynamics Corp. (Societe Generale S.A.) 12.00% 01/26/2022(1) | $ 4,960,793 |
| 5,606 | Tesla, Inc. (Bank of America Securities LLC) 12.00% 01/26/2022*(1)(11) | 6,206,907 |
| | | | 11,167,700 |
| | Diversified Financials - 7.6% |
| 14,705 | Accenture plc (Canadian Imperial Bank of Commerce) 12.00% 11/24/2021(1) | 5,136,880 |
The accompanying notes are an integral part of these financial statements.
Hartford Multi-Asset Income Fund (formerly, Hartford Multi-Asset Income and Growth Fund)
Schedule of Investments – (continued)
October 31, 2021
| Shares or Principal Amount | | Market Value† |
| EQUITY LINKED SECURITIES - 11.2% - (continued) |
| | Diversified Financials - 7.6% - (continued) |
| $ 30,179 | Analog Devices, Inc. (BNP Paribas Securities Services) 12.00% 11/24/2021(1) | $ 5,202,463 |
| 11,283 | Atlassian Corp. (BNP Paribas Securities Services) 12.00% 02/24/2022(1) | 5,148,997 |
| 86,880 | BristolMyers Squibb Co. (BNP Paribas Securities Services) 12.00% 01/26/2022(1) | 5,052,941 |
| 10,398 | Broadcom, Inc. (Bank of Montreal) 12.00% 11/24/2021(1) | 5,403,804 |
| 29,966 | Capital One Financial Corp. (Societe Generale S.A.) 12.00% 12/22/2021(1) | 4,582,570 |
| 21,313 | Cummins, Inc. (Bank of Montreal) 12.00% 11/24/2021(1) | 5,091,323 |
| 40,832 | Fidelity National Information (Societe Generale S.A.) 12.00% 01/26/2022(1) | 4,609,755 |
| 392,057 | Ford Motor Co. (Citigroup Global Markets Inc) 12.00% 12/22/2021(1) | 6,331,392 |
| 68,625 | Johnson Controls International plc (BNP Paribas Securities Services) 12.00% 02/24/2022(1) | 5,024,036 |
| 15,334 | Microsoft Corp. (BNP Paribas Securities Services) 12.00% 01/26/2022(1) | 5,043,506 |
| 109,056 | Pfizer, Inc. (Canadian Imperial Bank of Commerce) 12.00% 11/24/2021(1) | 4,763,854 |
| 60,257 | Welltower, Inc. (Societe Generale S.A.) 12.00% 01/26/2022(1) | 4,894,840 |
| | | | 66,286,361 |
| | Food & Staples Retailing - 0.6% |
| 65,465 | Sysco Corp. (Bank of America Securities LLC)
12.00%, 01/26/2022(1) | 5,039,444 |
| | Media & Entertainment - 0.6% |
| 1,768 | Alphabet, Inc. (Canadian Imperial Bank of Commerce)
12.00%, 12/22/2021*(1) | 5,136,786 |
| | Real Estate - 0.5% |
| 57,730 | Equity Residential (BNP Paribas Securities Services)
12.00%, 02/24/2022(1) | 4,971,130 |
| Shares or Principal Amount | | Market Value† |
| EQUITY LINKED SECURITIES - 11.2% - (continued) |
| | Technology Hardware & Equipment - 0.6% |
| $ 45,620 | Dell Technologies (Societe Generale S.A.)
12.00%, 12/22/2021*(1) | $ 5,020,368 |
| | Total Equity Linked Securities
(cost $98,281,375) | | $ 97,621,789 |
| | Total Long-Term Investments
(Cost $778,619,430) | | $ 842,479,267 |
| SHORT-TERM INVESTMENTS - 3.4% |
| | Repurchase Agreements - 3.3% |
| 29,147,703 | Fixed Income Clearing Corp. Repurchase Agreement dated 10/29/2021 at 0.01%, due on 11/01/2021 with a maturity value of $ 29,147,727; collateralized by U.S. Treasury Bond at 1.875%, maturing 02/15/2041, with a market value of $ 29,730,750 | $ 29,147,703 |
| | Securities Lending Collateral - 0.1% |
| 5,108 | Fidelity Investments Money Market Funds, Government Portfolio, Institutional Class, 0.01%(14) | 5,107 |
| 784,201 | Goldman Sachs Financial Square Funds, Government Fund, Institutional Class, 0.03%(14) | 784,201 |
| 56,300 | Invesco Government & Agency Portfolio, Institutional Class, 0.03%(14) | 56,300 |
| | | | 845,608 |
| | Total Short-Term Investments
(cost $29,993,311) | $ 29,993,311 |
| | Total Investments Excluding
Purchased Options
(cost $808,612,741) | 99.7% | $ 872,472,578 |
| | Total Purchased Options
(cost $747,365) | 0.0% | $ 56,306 |
| | Total Investments
(cost $809,360,106) | 99.7% | $ 872,528,884 |
| | Other Assets and Liabilities | 0.3% | 2,953,002 |
| | Total Net Assets | 100.0% | $ 875,481,886 |
| Note: | Percentage of investments as shown is the ratio of the total market value to total net assets. |
| | Prices of foreign equities that are principally traded on certain foreign markets will generally be adjusted daily pursuant to a fair value pricing service approved by the Board of Directors in order to reflect an adjustment for factors occurring after the close of certain foreign markets but before the close of the New York Stock Exchange. |
The accompanying notes are an integral part of these financial statements.
Hartford Multi-Asset Income Fund (formerly, Hartford Multi-Asset Income and Growth Fund)
Schedule of Investments – (continued)
October 31, 2021
The Fund may refer to any one or more of the industry classifications used by one or more widely recognized market indices, ratings group and/or as defined by Fund management. Industry classifications may not be identical across all security types.
Equity industry classifications used in this report are the Global Industry Classification Standard, which was developed by and is the exclusive property and service mark of MSCI, Inc. and Standard & Poor’s.
For Fund compliance purposes, the Fund may not use the same classification system. These classifications are used for financial reporting purposes.
See “Glossary” for abbreviation descriptions.
| * | Non-income producing. |
| (1) | Security was purchased pursuant to Rule 144A under the Securities Act of 1933 and may be sold in transactions that are exempt from registration (typically only to qualified institutional buyers) or in a public offering registered under the Securities Act of 1933. At October 31, 2021, the aggregate value of these securities was $276,644,928, representing 31.6% of net assets. |
| (2) | Variable rate securities; the rate reported is the coupon rate in effect at October 31, 2021. Base lending rates may be subject to a floor or cap. |
| (3) | Variable or floating rate security, which interest rate adjusts periodically based on changes in current interest rates and prepayments on the underlying pool of assets. Rate shown is the rate in effect as of period end. |
| (4) | Securities disclosed are interest-only strips. |
| (5) | Fixed to variable rate investment. The rate shown reflects the fixed rate in effect at October 31, 2021. Rate will reset at a future date. Base lending rates may be subject to a floor or cap. |
| (6) | Represents entire or partial securities on loan. See Note 8 in the accompanying Notes to Financial Statements for securities lending information. |
| (7) | Senior floating rate interests generally pay interest rates which are periodically adjusted by reference to a base short-term, floating lending rate plus a premium. The base lending rates are primarily the LIBOR, and secondarily the prime rate offered by one or more major United States banks (the "Prime Rate") and the certificate of deposit rate or other base lending rates used by commercial lenders. Senior floating rate interests often require prepayments from excess cash flows or permit the borrower to repay at its election. The rate at which the borrower repays cannot be predicted with accuracy. As a result, the actual remaining maturity may be substantially less than the stated maturities shown. Base lending rates may be subject to a floor or cap. Unless otherwise noted, the interest rate disclosed for these securities represents the rate in effect as of October 31, 2021. |
| (8) | Represents an unsettled loan commitment. The coupon rate will be determined at time of settlement. |
| (9) | This security, or a portion of this security, has unfunded loan commitments. As of October 31, 2021, the aggregate value of the unfunded commitment was $295,245, which rounds to 0.0% of total net assets. |
| (10) | All, or a portion of the security, was pledged as collateral in connection with futures contracts. As of October 31, 2021, the market value of securities pledged was $2,805,102. |
| (11) | These securities are valued in good faith at fair value as determined under policies and procedures established by and under the supervision of the Board of Directors. At October 31, 2021, the aggregate fair value of these securities are $6,791,821, which represented 0.8% of total net assets. This amount excludes securities that are principally traded in certain foreign markets and whose prices are adjusted pursuant to a third party pricing service methodology approved by the Board of Directors. |
| (12) | Investment in securities not registered under the Securities Act of 1933 (excluding securities acquired pursuant to Rule 144A and Regulation S). At the end of the period, the value of such restricted securities amounted to $0 or 0.0% of net assets. |
Period
Acquired | | Security Name | | Shares/
Par Value | | Total Cost | | Market Value |
| 08/2011 | | Allstar Co. | | 2,006,600 | | $ — | | $ — |
| (13) | Investment valued using significant unobservable inputs. |
| (14) | Current yield as of period end. |
| Exchange-Traded Option Contracts Outstanding at October 31, 2021 |
| Description | | Exercise Price/
FX Rate/ Rate | | Expiration
Date | | Number of
Contracts | | Notional
Amount | | Market
Value† | | Premiums
Paid
(Received)
by Fund | | Unrealized
Appreciation/
(Depreciation) |
| Purchased option contracts: |
| Put |
| Coinbase Global, Inc. | | 105.00 | USD | | 12/17/2021 | | 1,966 | | USD | 196,600 | | $ 29,490 | | $ 338,790 | | $ (309,300) |
| Microstrategy, Inc. | | 150.00 | USD | | 12/17/2021 | | 838 | | USD | 83,800 | | 26,816 | | 408,575 | | (381,759) |
| Total purchased exchange-traded option contracts | | $ 56,306 | | $ 747,365 | | $ (691,059) |
The accompanying notes are an integral part of these financial statements.
Hartford Multi-Asset Income Fund (formerly, Hartford Multi-Asset Income and Growth Fund)
Schedule of Investments – (continued)
October 31, 2021
| Futures Contracts Outstanding at October 31, 2021 |
| Description | | Number of
Contracts | | Expiration
Date | | Current
Notional
Amount | | Value and
Unrealized
Appreciation/
(Depreciation) |
| Long position contracts: |
| U.S. Treasury 5-Year Note Future | | 192 | | 12/31/2021 | | $ 23,376,000 | | $ (300,272) |
| U.S. Treasury 10-Year Ultra Future | | 86 | | 12/21/2021 | | 12,472,687 | | (230,010) |
| Total | | | | | | | | $ (530,282) |
| Short position contracts: |
| U.S. Treasury 10-Year Note Future | | 950 | | 12/21/2021 | | $ 124,167,969 | | $ 2,483,062 |
| U.S. Treasury Ultra Bond Future | | 106 | | 12/21/2021 | | 20,819,062 | | 172,806 |
| Total | | | | | | | | $ 2,655,868 |
| Total futures contracts | | $ 2,125,586 |
| Foreign Currency Contracts Outstanding at October 31, 2021 |
Amount and Description of
Currency to be Purchased | | Amount and Description of
Currency to be Sold | | Counterparty | | Settlement
Date | | Appreciation/
(Depreciation) |
| 40,855,977 | USD | | 35,181,000 | EUR | | DEUT | | 11/30/2021 | | $ 163,033 |
† See Significant Accounting Policies of accompanying Notes to Financial Statements regarding valuation of investments.
The accompanying notes are an integral part of these financial statements.
Hartford Multi-Asset Income Fund (formerly, Hartford Multi-Asset Income and Growth Fund)
Schedule of Investments – (continued)
October 31, 2021
Fair Value Summary
The following is a summary of the fair valuations according to the inputs used as of October 31, 2021 in valuing the Fund’s investments.
| Description | | Total | | Level 1 | | Level 2 | | Level 3(1) |
| Assets | | | | | | | | |
| Asset & Commercial Mortgage-Backed Securities | | $ 149,404,633 | | $ — | | $ 149,404,633 | | $ — |
| Convertible Bonds | | 4,086,134 | | — | | 4,086,134 | | — |
| Corporate Bonds | | 123,292,147 | | — | | 123,292,147 | | — |
| Foreign Government Obligations | | 9,040,965 | | — | | 9,040,965 | | — |
| Municipal Bonds | | 5,405,992 | | — | | 5,405,992 | | — |
| Senior Floating Rate Interests | | 78,803,185 | | — | | 78,803,185 | | — |
| U.S. Government Agencies | | 10,928,170 | | — | | 10,928,170 | | — |
| U.S. Government Securities | | 65,264,587 | | — | | 65,264,587 | | — |
| Common Stocks | | | | | | | | |
| Automobiles & Components | | 5,428,032 | | 76,062 | | 5,351,970 | | — |
| Banks | | 23,338,569 | | 12,804,351 | | 10,534,218 | | — |
| Capital Goods | | 37,267,165 | | 16,116,090 | | 21,151,075 | | — |
| Commercial & Professional Services | | 9,885,307 | | — | | 9,885,307 | | — |
| Consumer Durables & Apparel | | 23,790,974 | | 21,179,268 | | 2,611,706 | | — |
| Consumer Services | | 5,112,208 | | 2,743,533 | | 2,368,675 | | — |
| Diversified Financials | | 8,044,244 | | 6,396,520 | | 1,647,724 | | — |
| Energy | | 3,150,722 | | — | | 3,150,722 | | — |
| Food & Staples Retailing | | 6,669,524 | | 2,604,847 | | 4,064,677 | | — |
| Food, Beverage & Tobacco | | 20,128,850 | | 7,156,586 | | 12,972,264 | | — |
| Health Care Equipment & Services | | 13,740,379 | | 8,044,603 | | 5,695,776 | | — |
| Household & Personal Products | | 5,774,175 | | 4,053,912 | | 1,720,263 | | — |
| Insurance | | 8,758,595 | | 4,261,077 | | 4,497,518 | | — |
| Materials | | 9,430,814 | | 4,228,013 | | 5,202,801 | | — |
| Media & Entertainment | | 8,250,633 | | 4,061,425 | | 4,189,208 | | — |
| Pharmaceuticals, Biotechnology & Life Sciences | | 21,055,521 | | 16,454,739 | | 4,600,782 | | — |
| Real Estate | | 13,860,837 | | 10,021,251 | | 3,839,586 | | — |
| Retailing | | 7,589,022 | | 7,123,321 | | 465,701 | | — |
| Semiconductors & Semiconductor Equipment | | 7,070,085 | | 2,883,342 | | 4,186,743 | | — |
| Software & Services | | 21,119,168 | | 19,399,273 | | 1,719,895 | | — |
| Technology Hardware & Equipment | | 2,390,425 | | 386,495 | | 2,003,930 | | — |
| Telecommunication Services | | 7,203,808 | | 3,609,668 | | 3,009,226 | | 584,914 |
| Transportation | | 6,497,561 | | 4,858,001 | | 1,639,560 | | — |
| Utilities | | 19,013,583 | | 5,222,788 | | 13,790,795 | | — |
| Convertible Preferred Stocks | | 4,061,464 | | 4,061,464 | | — | | — |
| Equity Linked Securities | | 97,621,789 | | — | | 97,621,789 | | — |
| Short-Term Investments | | 29,993,311 | | 845,608 | | 29,147,703 | | — |
| Purchased Options | | 56,306 | | 56,306 | | — | | — |
| Foreign Currency Contracts(2) | | 163,033 | | — | | 163,033 | | — |
| Futures Contracts(2) | | 2,655,868 | | 2,655,868 | | — | | — |
| Total | | $ 875,347,785 | | $ 171,304,411 | | $ 703,458,460 | | $ 584,914 |
| Liabilities | | | | | | | | |
| Futures Contracts(2) | | $ (530,282) | | $ (530,282) | | $ — | | $ — |
| Total | | $ (530,282) | | $ (530,282) | | $ — | | $ — |
| (1) | For the year ended October 31, 2021, investments valued at $1,685,544 were transferred into Level 3 due to the unavailability of active market pricing, and investments valued at $1,259,980 were transferred out of Level 3 due to the availability of significant observable inputs. |
| (2) | Derivative instruments (excluding purchased and written options, if applicable) are valued at the unrealized appreciation/(depreciation) on the investments. |
Level 3 investments at the beginning and/or end of the period in relation to net assets were not significant and accordingly, a reconciliation of Level 3 assets for the year ended October 31, 2021 is not presented.
The accompanying notes are an integral part of these financial statements.
Hartford Multi-Strategy Funds
GLOSSARY: (abbreviations used in preceding Schedules of Investments)
| Counterparty Abbreviations: |
| BCLY | Barclays |
| BMO | Bank of Montreal |
| BNP | BNP Paribas Securities Services |
| BOA | Bank of America Securities LLC |
| CBA | Commonwealth Bank of Australia |
| CBK | Citibank NA |
| CIBC | Canadian Imperial Bank of Commerce |
| CME | Chicago Mercantile Exchange |
| DEUT | Deutsche Bank Securities, Inc. |
| GSC | Goldman Sachs & Co. |
| HSBC | HSBC Bank USA |
| JPM | JP Morgan Chase & Co. |
| MSC | Morgan Stanley |
| RBC | RBC Dominion Securities, Inc. |
| RBCA | Royal Bank of Canada |
| RBS | RBS Greenwich Capital |
| SSG | State Street Global Markets LLC |
| TDB | Toronto-Dominion Bank |
| UBS | UBS AG |
| WEST | Westpac International |
| Currency Abbreviations: |
| AUD | Australia Dollar |
| CAD | Canadian Dollar |
| EUR | Euro Member Countries |
| IDR | Indonesia Rupiah |
| JPY | Japan Yen |
| USD | United States Dollar |
| Index Abbreviations: |
| ASX | Australian Securities Exchange |
| CMT | Constant Maturity Treasury Index |
| CPI | Consumer Price Index |
| EAFE | Europe, Australasia and Far East |
| S&P | Standard & Poor's |
| Municipal Abbreviations: |
| Auth | Authority |
| Dev | Development |
| Dist | District |
| GO | General Obligation |
| PA | Port Authority |
| Rev | Revenue |
| Other Abbreviations: |
| ADR | American Depositary Receipt |
| AGM | Assured Guaranty Municipal |
| Bhd | Berhad |
| CD | Certificate of Deposit |
| CJSC | Closed Joint Stock Company |
| CLO | Collateralized Loan Obligation |
| CMO | Collateralized Mortgage Obligation |
| ETF | Exchange-Traded Fund |
| EURIBOR | Euro Interbank Offered Rate |
| FHLMC | Federal Home Loan Mortgage Corp. |
| FNMA | Federal National Mortgage Association |
| GDR | Global Depositary Receipt |
| GNMA | Government National Mortgage Association |
| JSC | Joint Stock Company |
| LIBOR | London Interbank Offered Rate |
| MSCI | Morgan Stanley Capital International |
| NATL | National Public Finance Guarantee Corp. |
| PIK | Payment-in-kind |
| PJSC | Private Joint Stock Company |
| PT | Perseroan Terbatas |
| REIT | Real Estate Investment Trust |
| SOFR | Secured Overnight Financing Rate |
| Tbk | Terbuka |
Hartford Multi-Strategy Funds
Statements of Assets and Liabilities
October 31, 2021
| | The Hartford
Balanced
Income Fund | | Hartford AARP
Balanced
Retirement Fund | | The Hartford
Checks and
Balances Fund | | The Hartford
Conservative
Allocation Fund |
| Assets: | | | | | | | |
| Investments in securities, at market value(1) | $ 15,211,503,232 | | $ 76,572,546 | | $ 3,271,412 | | $ 399,772 |
| Repurchase agreements | 538,971,007 | | 1,162,974 | | — | | — |
| Investments in affiliated investment companies, at market value | — | | 23,008,596 | | 1,719,808,695 | | 137,949,359 |
| Cash | 149,217,072 | | 286,676 | | — | | 41,402 |
| Cash collateral held for securities on loan | 4,177,192 | | 23,656 | | — | | — |
| Foreign currency | 8,276,888 | | 8,129 | | — | | — |
| Unrealized appreciation on OTC swap contracts | 23,784 | | — | | — | | — |
| Unrealized appreciation on foreign currency contracts | 2,820,021 | | 49,847 | | — | | — |
| Receivables: | | | | | | | |
| From affiliates | — | | — | | — | | — |
| Investment securities sold | 54,280,830 | | 34,370 | | 239,848 | | — |
| Fund shares sold | 21,178,706 | | 1,020 | | 681,536 | | 84,796 |
| Dividends and interest | 72,496,983 | | 337,443 | | 1,000,179 | | 45,988 |
| Securities lending income | 31,173 | | 102 | | — | | — |
| Variation margin on futures contracts | 450,176 | | — | | — | | — |
| Variation margin on centrally cleared swap contracts | 98,971 | | — | | — | | — |
| Tax reclaims | 3,148,227 | | 92,019 | | — | | — |
| OTC swap contracts premiums paid | 26,329 | | — | | — | | — |
| Other assets | 203,458 | | 38,995 | | 54,659 | | 38,173 |
| Total assets | 16,066,904,049 | | 101,616,373 | | 1,725,056,329 | | 138,559,490 |
| Liabilities: | | | | | | | |
| Unrealized depreciation on foreign currency contracts | 69,550 | | — | | — | | — |
| Unrealized depreciation on bond forward contracts | — | | — | | — | | — |
| Obligation to return securities lending collateral | 83,543,849 | | 473,112 | | — | | — |
| Cash collateral due to broker on future contracts | — | | — | | — | | — |
| Unfunded loan commitments | — | | — | | — | | — |
| Payables: | | | | | | | |
| Investment securities purchased | 67,987,995 | | 796,169 | | — | | 35,751 |
| Fund shares redeemed | 9,481,613 | | 17,865 | | 1,215,335 | | 37,921 |
| Investment management fees | 6,686,159 | | 25,270 | | — | | 11,714 |
| Transfer agent fees | 1,702,209 | | 22,602 | | 249,637 | | 24,141 |
| Accounting services fees | 360,100 | | 3,382 | | 44,096 | | 4,642 |
| Board of Directors' fees | 42,850 | | 324 | | 4,792 | | 416 |
| Variation margin on futures contracts | — | | 2,552 | | — | | — |
| Foreign taxes | — | | 6,792 | | — | | — |
| Distribution fees | 682,059 | | 4,451 | | 80,126 | | 6,523 |
| Distributions payable | — | | — | | — | | — |
| Accrued expenses | 441,029 | | 72,178 | | 55,767 | | 25,942 |
| Total liabilities | 170,997,413 | | 1,424,697 | | 1,649,753 | | 147,050 |
| Net assets | $ 15,895,906,636 | | $ 100,191,676 | | $ 1,723,406,576 | | $ 138,412,440 |
| Summary of Net Assets: | | | | | | | |
| Capital stock and paid-in-capital | $ 12,690,275,996 | | $ 116,431,543 | | $ 1,328,955,099 | | $ 121,125,173 |
| Distributable earnings (loss) | 3,205,630,640 | | (16,239,867) | | 394,451,477 | | 17,287,267 |
| Net assets | $ 15,895,906,636 | | $ 100,191,676 | | $ 1,723,406,576 | | $ 138,412,440 |
| Shares authorized | 1,950,000,000 | | 560,000,000 | | 850,000,000 | | 400,000,000 |
| Par value | $ 0.0010 | | $ 0.0010 | | $ 0.0010 | | $ 0.0010 |
| Class A: Net asset value per share | $ 16.72 | | $ 10.03 | | $ 11.34 | | $ 12.14 |
| Maximum offering price per share | 17.69 | | 10.50 | | 12.00 | | 12.85 |
| Shares outstanding | 284,017,462 | | 7,574,503 | | 131,910,845 | | 10,158,170 |
| Net Assets | $ 4,748,602,122 | | $ 76,009,291 | | $ 1,495,255,643 | | $ 123,368,593 |
| Class C: Net asset value per share | $ 16.45 | | $ 10.05 | | $ 11.26 | | $ 12.04 |
| Shares outstanding | 173,866,516 | | 901,053 | | 9,709,039 | | 682,002 |
| Net Assets | $ 2,859,546,931 | | $ 9,059,500 | | $ 109,277,990 | | $ 8,208,036 |
| Class I: Net asset value per share | $ 16.72 | | $ 10.02 | | $ 11.36 | | $ 12.17 |
| Shares outstanding | 290,591,250 | | 1,121,151 | | 8,903,575 | | 179,773 |
| Net Assets | $ 4,859,868,181 | | $ 11,234,997 | | $ 101,120,885 | | $ 2,187,970 |
The accompanying notes are an integral part of these financial statements.
Hartford Multi-Strategy Funds
Statements of Assets and Liabilities – (continued)
October 31, 2021
| | The Hartford
Balanced
Income Fund | | Hartford AARP
Balanced
Retirement Fund | | The Hartford
Checks and
Balances Fund | | The Hartford
Conservative
Allocation Fund |
| Class R3: Net asset value per share | $ 16.79 | | $ 10.04 | | $ 11.28 | | $ 12.15 |
| Shares outstanding | 9,117,788 | | 78,525 | | 978,957 | | 192,952 |
| Net Assets | $ 153,098,918 | | $ 788,511 | | $ 11,045,756 | | $ 2,344,023 |
| Class R4: Net asset value per share | $ 16.80 | | $ 9.99 | | $ 11.29 | | $ 12.15 |
| Shares outstanding | 5,560,178 | | 24,912 | | 310,295 | | 56,279 |
| Net Assets | $ 93,400,519 | | $ 248,849 | | $ 3,504,166 | | $ 683,518 |
| Class R5: Net asset value per share | $ 16.82 | | $ 9.99 | | $ 11.15 | | $ 12.19 |
| Shares outstanding | 2,585,474 | | 73,153 | | 59,991 | | 119,065 |
| Net Assets | $ 43,487,116 | | $ 731,073 | | $ 669,023 | | $ 1,451,630 |
| Class R6: Net asset value per share | $ 16.92 | | $ 10.01 | | $ — | | $ — |
| Shares outstanding | 16,885,601 | | 1,323 | | — | | — |
| Net Assets | $ 285,748,787 | | $ 13,242 | | $ — | | $ — |
| Class Y: Net asset value per share | $ 16.92 | | $ 9.97 | | $ — | | $ — |
| Shares outstanding | 7,821,162 | | 195,735 | | — | | — |
| Net Assets | $ 132,363,623 | | $ 1,950,681 | | $ — | | $ — |
| Class F: Net asset value per share | $ 16.73 | | $ 9.95 | | $ 11.35 | | $ 12.18 |
| Shares outstanding | 162,546,726 | | 15,636 | | 223,152 | | 13,846 |
| Net Assets | $ 2,719,790,439 | | $ 155,532 | | $ 2,533,113 | | $ 168,670 |
| Cost of investments | $ 13,314,460,607 | | $ 69,145,051 | | $ 3,271,412 | | $ 399,772 |
| Cost of investments in affiliated investment companies | $ — | | $ 20,912,215 | | $ 1,371,038,752 | | $ 124,583,582 |
| Cost of foreign currency | $ 7,066,336 | | $ 8,131 | | $ — | | $ — |
| (1) Includes Investment in securities on loan, at market value | $ 80,483,013 | | $ 463,842 | | $ — | | $ — |
The accompanying notes are an integral part of these financial statements.
Hartford Multi-Strategy Funds
Statements of Assets and Liabilities – (continued)
October 31, 2021
| | The Hartford
Global Real
Asset Fund
(consolidated) | | The Hartford
Growth
Allocation Fund | | Hartford
Moderate
Allocation Fund | | Hartford
Multi-Asset
Income Fund |
| Assets: | | | | | | | |
| Investments in securities, at market value(1) | $ 88,788,791 | | $ 1,635,064 | | $ 1,127,042 | | $ 843,381,181 |
| Repurchase agreements | 8,489,907 | | — | | — | | 29,147,703 |
| Investments in affiliated investment companies, at market value | — | | 647,231,095 | | 419,063,014 | | — |
| Cash | 8,136,787 | | 48,767 | | 70,584 | | 9,754,063 |
| Cash collateral held for securities on loan | 49,467 | | — | | — | | 44,506 |
| Foreign currency | 58,825 | | — | | — | | 1,317,239 |
| Unrealized appreciation on OTC swap contracts | — | | — | | — | | — |
| Unrealized appreciation on foreign currency contracts | 83,098 | | — | | — | | 163,033 |
| Receivables: | | | | | | | |
| From affiliates | 37,679 | | — | | — | | — |
| Investment securities sold | 1,294,623 | | 319,802 | | 34,121 | | 43,552,986 |
| Fund shares sold | 265,403 | | 64,808 | | 96,000 | | 272,799 |
| Dividends and interest | 137,612 | | 52,986 | | 86,134 | | 2,717,630 |
| Securities lending income | 510 | | — | | — | | 2,942 |
| Variation margin on futures contracts | 84,819 | | — | | — | | 132,960 |
| Variation margin on centrally cleared swap contracts | — | | — | | — | | — |
| Tax reclaims | 71,784 | | — | | — | | 329,485 |
| OTC swap contracts premiums paid | — | | — | | — | | — |
| Other assets | 43,754 | | 41,578 | | 40,006 | | 56,404 |
| Total assets | 107,543,059 | | 649,394,100 | | 420,516,901 | | 930,872,931 |
| Liabilities: | | | | | | | |
| Unrealized depreciation on foreign currency contracts | 16,486 | | — | | — | | — |
| Unrealized depreciation on bond forward contracts | 34,230 | | — | | — | | — |
| Obligation to return securities lending collateral | 989,345 | | — | | — | | 890,114 |
| Cash collateral due to broker on future contracts | 50 | | — | | — | | — |
| Unfunded loan commitments | — | | — | | — | | 468 |
| Payables: | | | | | | | |
| Investment securities purchased | 6,387,876 | | — | | — | | 52,960,682 |
| Fund shares redeemed | 7,741 | | 398,936 | | 176,675 | | 788,381 |
| Investment management fees | 82,584 | | 53,783 | | 35,315 | | 419,265 |
| Transfer agent fees | 15,955 | | 130,822 | | 77,690 | | 161,826 |
| Accounting services fees | 3,862 | | 20,145 | | 14,015 | | 25,595 |
| Board of Directors' fees | 737 | | 1,891 | | 1,211 | | 2,689 |
| Variation margin on futures contracts | — | | — | | — | | — |
| Foreign taxes | 10,352 | | — | | — | | 20,851 |
| Distribution fees | 895 | | 29,274 | | 18,779 | | 35,057 |
| Distributions payable | — | | — | | — | | 14 |
| Accrued expenses | 77,640 | | 37,015 | | 31,002 | | 86,103 |
| Total liabilities | 7,627,753 | | 671,866 | | 354,687 | | 55,391,045 |
| Net assets | $ 99,915,306 | | $ 648,722,234 | | $ 420,162,214 | | $ 875,481,886 |
| Summary of Net Assets: | | | | | | | |
| Capital stock and paid-in-capital | $ 176,698,375 | | $ 470,181,381 | | $ 332,003,828 | | $ 778,377,649 |
| Distributable earnings (loss) | (76,783,069) | | 178,540,853 | | 88,158,386 | | 97,104,237 |
| Net assets | $ 99,915,306 | | $ 648,722,234 | | $ 420,162,214 | | $ 875,481,886 |
| Shares authorized | 700,000,000 | | 400,000,000 | | 400,000,000 | | 845,000,000 |
| Par value | $ 0.0010 | | $ 0.0010 | | $ 0.0010 | | $ 0.0010 |
| Class A: Net asset value per share | $ 10.41 | | $ 15.72 | | $ 13.86 | | $ 21.77 |
| Maximum offering price per share | 11.02 | | 16.63 | | 14.67 | | 23.04 |
| Shares outstanding | 1,803,761 | | 37,669,887 | | 26,347,636 | | 28,571,550 |
| Net Assets | $ 18,782,882 | | $ 591,998,667 | | $ 365,226,430 | | $ 622,085,451 |
| Class C: Net asset value per share | $ 10.20 | | $ 15.58 | | $ 13.69 | | $ 21.85 |
| Shares outstanding | 64,585 | | 1,873,236 | | 1,212,622 | | 2,729,814 |
| Net Assets | $ 658,749 | | $ 29,185,727 | | $ 16,604,823 | | $ 59,640,426 |
| Class I: Net asset value per share | $ 10.42 | | $ 15.63 | | $ 13.93 | | $ 21.74 |
| Shares outstanding | 1,657,240 | | 767,566 | | 790,786 | | 4,599,000 |
| Net Assets | $ 17,266,294 | | $ 11,996,906 | | $ 11,018,427 | | $ 99,966,845 |
The accompanying notes are an integral part of these financial statements.
Hartford Multi-Strategy Funds
Statements of Assets and Liabilities – (continued)
October 31, 2021
| | The Hartford
Global Real
Asset Fund
(consolidated) | | The Hartford
Growth
Allocation Fund | | Hartford
Moderate
Allocation Fund | | Hartford
Multi-Asset
Income Fund |
| Class R3: Net asset value per share | $ 10.47 | | $ 15.31 | | $ 13.63 | | $ 22.11 |
| Shares outstanding | 11,446 | | 447,415 | | 1,156,909 | | 47,230 |
| Net Assets | $ 119,812 | | $ 6,848,497 | | $ 15,765,091 | | $ 1,044,067 |
| Class R4: Net asset value per share | $ 10.46 | | $ 15.64 | | $ 13.89 | | $ 22.16 |
| Shares outstanding | 1,209 | | 196,201 | | 238,135 | | 43,840 |
| Net Assets | $ 12,644 | | $ 3,069,333 | | $ 3,307,476 | | $ 971,348 |
| Class R5: Net asset value per share | $ 10.35 | | $ 15.75 | | $ 13.94 | | $ 22.15 |
| Shares outstanding | 29,955 | | 304,422 | | 551,125 | | 6,946 |
| Net Assets | $ 309,933 | | $ 4,795,598 | | $ 7,684,507 | | $ 153,855 |
| Class R6: Net asset value per share | $ — | | $ — | | $ — | | $ 22.15 |
| Shares outstanding | — | | — | | — | | 15,454 |
| Net Assets | $ — | | $ — | | $ — | | $ 342,365 |
| Class Y: Net asset value per share | $ 10.41 | | $ — | | $ — | | $ 22.17 |
| Shares outstanding | 5,814,506 | | — | | — | | 326,503 |
| Net Assets | $ 60,538,786 | | $ — | | $ — | | $ 7,237,851 |
| Class F: Net asset value per share | $ 10.42 | | $ 15.65 | | $ 13.94 | | $ 21.72 |
| Shares outstanding | 213,744 | | 52,864 | | 39,845 | | 3,868,866 |
| Net Assets | $ 2,226,206 | | $ 827,506 | | $ 555,460 | | $ 84,039,678 |
| Cost of investments | $ 82,558,732 | | $ 1,635,064 | | $ 1,127,042 | | $ 809,360,106 |
| Cost of investments in affiliated investment companies | $ — | | $ 507,139,547 | | $ 350,094,514 | | $ — |
| Cost of foreign currency | $ 69,537 | | $ — | | $ — | | $ 1,318,662 |
| (1) Includes Investment in securities on loan, at market value | $ 964,188 | | $ — | | $ — | | $ 1,659,385 |
The accompanying notes are an integral part of these financial statements.
Hartford Multi-Strategy Funds
Statements of Operations
For the Year Ended October 31, 2021
| | The Hartford
Balanced
Income Fund | | Hartford AARP
Balanced
Retirement Fund | | The Hartford
Checks and
Balances Fund | | The Hartford
Conservative
Allocation Fund |
| Investment Income: | | | | | | | |
| Dividends | $ 206,130,155 | | $ 1,115,183 | | $ — | | $ — |
| Dividends from affiliated investment companies | — | | 522,257 | | 23,696,311 | | 2,023,925 |
| Interest | 239,149,539 | | 1,161,642 | | 1,173 | | 82 |
| Securities lending | 369,036 | | 5,028 | | — | | — |
| Less: Foreign tax withheld | (1,515,325) | | (61,662) | | — | | — |
| Total investment income, net | 444,133,405 | | 2,742,448 | | 23,697,484 | | 2,024,007 |
| Expenses: | | | | | | | |
| Investment management fees | 76,272,233 | | 322,245 | | — | | 137,897 |
| Transfer agent fees | | | | | | | |
| Class A | 3,211,926 | | 108,939 | | 1,268,528 | | 126,587 |
| Class C | 2,370,495 | | 22,214 | | 135,609 | | 13,905 |
| Class I | 3,538,490 | | 12,678 | | 73,674 | | 1,963 |
| Class R3 | 320,402 | | 1,756 | | 28,415 | | 5,758 |
| Class R4 | 144,945 | | 437 | | 5,485 | | 1,536 |
| Class R5 | 47,566 | | 753 | | 607 | | 1,770 |
| Class R6 | 9,616 | | — | | — | | — |
| Class Y | 145,713 | | 2,177 | | — | | — |
| Class F | 36,893 | | 5 | | 99 | | 6 |
| Distribution fees | | | | | | | |
| Class A | 10,874,820 | | 190,646 | | 3,614,912 | | 302,489 |
| Class C | 30,190,892 | | 151,774 | | 1,204,425 | | 97,071 |
| Class R3 | 785,928 | | 3,994 | | 64,635 | | 13,091 |
| Class R4 | 236,337 | | 643 | | 8,214 | | 2,268 |
| Custodian fees | 169,846 | | 164 | | 1,803 | | 521 |
| Registration and filing fees | 358,486 | | 117,131 | | 116,421 | | 100,607 |
| Accounting services fees | 2,155,616 | | 18,301 | | 252,209 | | 23,655 |
| Board of Directors' fees | 387,576 | | 2,612 | | 42,204 | | 3,537 |
| Audit and tax fees | 40,097 | | 20,220 | | 21,694 | | 21,611 |
| Other expenses | 1,216,828 | | 25,758 | | 148,828 | | 23,116 |
| Total expenses (before waivers, reimbursements and fees paid indirectly) | 132,514,705 | | 1,002,447 | | 6,987,762 | | 877,388 |
| Expense waivers | — | | (40,734) | | — | | — |
| Transfer agent fee waivers | (4,679) | | — | | — | | — |
| Distribution fee reimbursements | (19,466) | | (1,364) | | (15,934) | | (4,236) |
| Commission recapture | (28,893) | | (57) | | — | | — |
| Total waivers, reimbursements and fees paid indirectly | (53,038) | | (42,155) | | (15,934) | | (4,236) |
| Total expenses | 132,461,667 | | 960,292 | | 6,971,828 | | 873,152 |
| Net Investment Income (Loss) | 311,671,738 | | 1,782,156 | | 16,725,656 | | 1,150,855 |
| Net Realized Gain (Loss) on Investments, Other Financial Instruments and Foreign Currency Transactions on: | | | | | | | |
| Capital gain distributions received from underlying funds | — | | — | | 36,248,455 | | 1,484,406 |
| Investments | 709,321,037 | | 3,567,460 | | — | | — |
| Less: Foreign taxes paid on realized capital gains | — | | (5,652) | | — | | — |
| Investments in affiliated investment companies | — | | 724,258 | | 27,846,431 | | 4,004,118 |
| Purchased options contracts | — | | (1,162,817) | | — | | — |
| Futures contracts | 15,182,510 | | (131,952) | | — | | — |
| Written options contracts | — | | — | | — | | — |
| Swap contracts | 536,492 | | — | | — | | — |
| Foreign currency contracts | 1,155,356 | | 382,857 | | — | | — |
| Other foreign currency transactions | 36,778 | | 3,772 | | — | | — |
| Net Realized Gain (Loss) on Investments, Other Financial Instruments and Foreign Currency Transactions | 726,232,173 | | 3,377,926 | | 64,094,886 | | 5,488,524 |
| Net Changes in Unrealized Appreciation (Depreciation) of Investments, Other Financial Instruments and Foreign Currency Transactions of: | | | | | | | |
| Investments * | 1,374,050,481 | | 6,380,628 | | — | | — |
| Investments in affiliated investment companies | — | | 2,935,641 | | 284,235,027 | | 8,803,031 |
| Purchased options contracts | — | | (174,482) | | — | | — |
| Futures contracts | 2,928,698 | | (105,114) | | — | | — |
| Swap contracts | 4,345,279 | | — | | — | | — |
| Foreign currency contracts | 1,462,124 | | (58,874) | | — | | — |
| Translation of other assets and liabilities in foreign currencies | (15,329) | | (753) | | — | | — |
The accompanying notes are an integral part of these financial statements.
Hartford Multi-Strategy Funds
Statements of Operations – (continued)
For the Year Ended October 31, 2021
| | The Hartford
Balanced
Income Fund | | Hartford AARP
Balanced
Retirement Fund | | The Hartford
Checks and
Balances Fund | | The Hartford
Conservative
Allocation Fund |
| Net Changes in Unrealized Appreciation (Depreciation) of Investments, Other Financial Instruments and Foreign Currency Transactions | 1,382,771,253 | | 8,977,046 | | 284,235,027 | | 8,803,031 |
| Net Gain (Loss) on Investments, Other Financial Instruments and Foreign Currency Transactions | 2,109,003,426 | | 12,354,972 | | 348,329,913 | | 14,291,555 |
| Net Increase (Decrease) in Net Assets Resulting from Operations | $ 2,420,675,164 | | $ 14,137,128 | | $ 365,055,569 | | $ 15,442,410 |
| * Includes change in unrealized appreciation (depreciation) on deferred capital gains tax | $ — | | $ (1,742) | | $ — | | $ — |
The accompanying notes are an integral part of these financial statements.
Hartford Multi-Strategy Funds
Statements of Operations – (continued)
For the Year Ended October 31, 2021
| | The Hartford
Global Real
Asset Fund
(consolidated) | | The Hartford
Growth
Allocation Fund | | Hartford
Moderate
Allocation Fund | | Hartford
Multi-Asset
Income Fund |
| Investment Income: | | | | | | | |
| Dividends | $ 3,305,923 | | $ — | | $ — | | $ 20,116,562 |
| Dividends from affiliated investment companies | — | | 8,157,979 | | 5,692,908 | | — |
| Interest | 1,696,599 | | 343 | | 240 | | 13,541,766 |
| Securities lending | 18,367 | | — | | — | | 50,513 |
| Less: Foreign tax withheld | (199,451) | | — | | — | | (585,876) |
| Total investment income, net | 4,821,438 | | 8,158,322 | | 5,693,148 | | 33,122,965 |
| Expenses: | | | | | | | |
| Investment management fees | 1,366,627 | | 628,412 | | 414,396 | | 5,061,653 |
| Transfer agent fees | | | | | | | |
| Class A | 26,745 | | 737,499 | | 398,279 | | 851,988 |
| Class C | 2,718 | | 61,597 | | 33,679 | | 79,265 |
| Class I | 13,222 | | 14,877 | | 10,020 | | 85,852 |
| Class R3 | 232 | | 14,042 | | 31,591 | | 2,484 |
| Class R4 | 39 | | 4,973 | | 5,493 | | 1,293 |
| Class R5 | 238 | | 5,550 | | 7,129 | | 178 |
| Class R6 | — | | — | | — | | 13 |
| Class Y | 50,264 | | — | | — | | 8,283 |
| Class F | 156 | | 26 | | 21 | | 2,047 |
| Distribution fees | | | | | | | |
| Class A | 37,835 | | 1,435,773 | | 890,297 | | 1,564,156 |
| Class C | 10,938 | | 349,604 | | 228,004 | | 708,827 |
| Class R3 | 531 | | 32,207 | | 74,632 | | 5,666 |
| Class R4 | 57 | | 7,320 | | 8,215 | | 1,902 |
| Custodian fees | 65,896 | | 824 | | 765 | | 37,020 |
| Registration and filing fees | 106,671 | | 104,970 | | 104,475 | | 135,380 |
| Accounting services fees | 26,787 | | 106,564 | | 71,053 | | 143,926 |
| Board of Directors' fees | 3,947 | | 16,338 | | 10,590 | | 22,630 |
| Audit and tax fees | 53,793 | | 21,637 | | 21,808 | | 61,128 |
| Other expenses | 27,546 | | 72,651 | | 47,785 | | 129,143 |
| Total expenses (before waivers, reimbursements and fees paid indirectly) | 1,794,242 | | 3,614,864 | | 2,358,232 | | 8,902,834 |
| Expense waivers | (191,397) | | — | | — | | — |
| Management fee waivers | (185,953) | | — | | — | | — |
| Transfer agent fee waivers | — | | — | | — | | (433) |
| Distribution fee reimbursements | (223) | | (25,092) | | (15,528) | | (34,919) |
| Commission recapture | (411) | | — | | — | | (161) |
| Total waivers, reimbursements and fees paid indirectly | (377,984) | | (25,092) | | (15,528) | | (35,513) |
| Total expenses | 1,416,258 | | 3,589,772 | | 2,342,704 | | 8,867,321 |
| Net Investment Income (Loss) | 3,405,180 | | 4,568,550 | | 3,350,444 | | 24,255,644 |
| Net Realized Gain (Loss) on Investments, Other Financial Instruments and Foreign Currency Transactions on: | | | | | | | |
| Capital gain distributions received from underlying funds | — | | 11,900,177 | | 6,300,264 | | — |
| Investments | 29,490,843 | | — | | — | | 56,687,794 |
| Less: Foreign taxes paid on realized capital gains | (63,595) | | — | | — | | — |
| Investments in affiliated investment companies | — | | 25,683,068 | | 14,161,449 | | — |
| Purchased options contracts | (55,645) | | — | | — | | — |
| Futures contracts | 9,217,007 | | — | | — | | (1,702,661) |
| Written options contracts | 7,585 | | — | | — | | (9,340,244) |
| Swap contracts | 28,805 | | — | | — | | — |
| Bond Forwards | 465,506 | | — | | — | | — |
| Foreign currency contracts | 540,367 | | — | | — | | 922,482 |
| Other foreign currency transactions | (25,853) | | — | | — | | (64,673) |
| Net Realized Gain (Loss) on Investments, Other Financial Instruments and Foreign Currency Transactions | 39,605,020 | | 37,583,245 | | 20,461,713 | | 46,502,698 |
| Net Changes in Unrealized Appreciation (Depreciation) of Investments, Other Financial Instruments and Foreign Currency Transactions of: | | | | | | | |
| Investments * | 6,029,293 | | — | | — | | 45,511,209 |
| Investments in affiliated investment companies | — | | 109,833,015 | | 51,542,379 | | — |
| Purchased options contracts | 639 | | — | | — | | (691,059) |
| Futures contracts | 527,078 | | — | | — | | 2,207,345 |
| Written options contracts | (2,221) | | — | | — | | — |
The accompanying notes are an integral part of these financial statements.
Hartford Multi-Strategy Funds
Statements of Operations – (continued)
For the Year Ended October 31, 2021
| | The Hartford
Global Real
Asset Fund
(consolidated) | | The Hartford
Growth
Allocation Fund | | Hartford
Moderate
Allocation Fund | | Hartford
Multi-Asset
Income Fund |
| Swap contracts | $ 2,009 | | $ — | | $ — | | $ — |
| Bond forward contracts | 26,948 | | — | | — | | — |
| Foreign currency contracts | (121,778) | | — | | — | | (227,003) |
| Translation of other assets and liabilities in foreign currencies | (11,243) | | — | | — | | (9,231) |
| Net Changes in Unrealized Appreciation (Depreciation) of Investments, Other Financial Instruments and Foreign Currency Transactions | 6,450,725 | | 109,833,015 | | 51,542,379 | | 46,791,261 |
| Net Gain (Loss) on Investments, Other Financial Instruments and Foreign Currency Transactions | 46,055,745 | | 147,416,260 | | 72,004,092 | | 93,293,959 |
| Net Increase (Decrease) in Net Assets Resulting from Operations | $ 49,460,925 | | $ 151,984,810 | | $ 75,354,536 | | $ 117,549,603 |
| * Includes change in unrealized appreciation (depreciation) on deferred capital gains tax | $ (8,758) | | $ — | | $ — | | $ (12,446) |
The accompanying notes are an integral part of these financial statements.
Hartford Multi-Strategy Funds
Statements of Changes in Net Assets
For the Year Ended October 31, 2021
| | The Hartford
Balanced Income Fund | | Hartford
AARP Balanced Retirement Fund |
| | For the
Year Ended
October 31,
2021 | | For the
Year Ended
October 31,
2020 | | For the
Year Ended
October 31,
2021 | | For the
Year Ended
October 31,
2020 |
| Operations: | | | | | | | |
| Net investment income (loss) | $ 311,671,738 | | $ 317,362,177 | | $ 1,782,156 | | $ 2,051,486 |
| Net realized gain (loss) on investments, other financial instruments and foreign currency transactions | 726,232,173 | | 42,028,944 | | 3,377,926 | | (1,933,787) |
| Net changes in unrealized appreciation (depreciation) of investments, other financial instruments and foreign currency transactions | 1,382,771,253 | | (199,710,522) | | 8,977,046 | | (626,616) |
| Net Increase (Decrease) in Net Assets Resulting from Operations | 2,420,675,164 | | 159,680,599 | | 14,137,128 | | (508,917) |
| Distributions to Shareholders: | | | | | | | |
| Class A | (105,888,100) | | (116,699,873) | | (1,547,600) | | (1,512,068) |
| Class C | (53,926,969) | | (83,323,496) | | (201,631) | | (418,764) |
| Class I | (122,778,784) | | (132,837,623) | | (284,413) | | (441,202) |
| Class R3 | (3,318,673) | | (5,044,990) | | (14,497) | | (14,895) |
| Class R4 | (2,251,844) | | (3,067,138) | | (5,200) | | (7,433) |
| Class R5 | (1,205,149) | | (1,539,667) | | (15,361) | | (15,695) |
| Class R6 | (7,317,166) | | (5,772,348) | | (309) | | (261) |
| Class Y | (3,512,087) | | (5,334,841) | | (51,628) | | (54,939) |
| Class F | (69,037,210) | | (69,891,681) | | (4,686) | | (22,042) |
| Total distributions | (369,235,982) | | (423,511,657) | | (2,125,325) | | (2,487,299) |
| Capital Share Transactions: | | | | | | | |
| Sold | 3,021,103,036 | | 3,479,475,130 | | 14,970,603 | | 10,485,934 |
| Issued on reinvestment of distributions | 345,074,897 | | 394,527,278 | | 2,009,130 | | 2,364,504 |
| Redeemed | (3,036,090,714) | | (3,145,641,592) | | (39,595,737) | | (57,327,491) |
| Net increase (decrease) from capital share transactions | 330,087,219 | | 728,360,816 | | (22,616,004) | | (44,477,053) |
| Net Increase (Decrease) in Net Assets | 2,381,526,401 | | 464,529,758 | | (10,604,201) | | (47,473,269) |
| Net Assets: | | | | | | | |
| Beginning of period | 13,514,380,235 | | 13,049,850,477 | | 110,795,877 | | 158,269,146 |
| End of period | $ 15,895,906,636 | | $ 13,514,380,235 | | $ 100,191,676 | | $ 110,795,877 |
The accompanying notes are an integral part of these financial statements.
Hartford Multi-Strategy Funds
Statements of Changes in Net Assets – (continued)
For the Year Ended October 31, 2021
| | The Hartford
Checks and Balances Fund | | The Hartford
Conservative Allocation Fund |
| | For the
Year Ended
October 31,
2021 | | For the
Year Ended
October 31,
2020 | | For the
Year Ended
October 31,
2021 | | For the
Year Ended
October 31,
2020 |
| Operations: | | | | | | | |
| Net investment income (loss) | $ 16,725,656 | | $ 22,132,042 | | $ 1,150,855 | | $ 1,902,082 |
| Net realized gain (loss) on investments, other financial instruments and foreign currency transactions | 64,094,886 | | 51,093,339 | | 5,488,524 | | 3,266,509 |
| Net changes in unrealized appreciation (depreciation) of investments, other financial instruments and foreign currency transactions | 284,235,027 | | (4,311,369) | | 8,803,031 | | (439,470) |
| Net Increase (Decrease) in Net Assets Resulting from Operations | 365,055,569 | | 68,914,012 | | 15,442,410 | | 4,729,121 |
| Distributions to Shareholders: | | | | | | | |
| Class A | (58,420,540) | | (93,188,691) | | (1,732,353) | | (2,715,202) |
| Class C | (4,603,811) | | (10,606,943) | | (84,523) | | (207,113) |
| Class I | (3,248,166) | | (4,737,593) | | (33,672) | | (35,559) |
| Class R3 | (506,110) | | (1,069,179) | | (31,199) | | (65,407) |
| Class R4 | (132,561) | | (409,168) | | (17,999) | | (51,541) |
| Class R5 | (19,781) | | (24,460) | | (27,577) | | (55,546) |
| Class F | (109,578) | | (424,135) | | (2,956) | | (329) |
| Total distributions | (67,040,547) | | (110,460,169) | | (1,930,279) | | (3,130,697) |
| Capital Share Transactions: | | | | | | | |
| Sold | 157,352,613 | | 140,829,650 | | 20,374,703 | | 25,005,752 |
| Issued on reinvestment of distributions | 66,624,935 | | 109,729,534 | | 1,903,333 | | 3,084,773 |
| Redeemed | (265,774,758) | | (315,401,639) | | (26,134,417) | | (30,300,277) |
| Net increase (decrease) from capital share transactions | (41,797,210) | | (64,842,455) | | (3,856,381) | | (2,209,752) |
| Net Increase (Decrease) in Net Assets | 256,217,812 | | (106,388,612) | | 9,655,750 | | (611,328) |
| Net Assets: | | | | | | | |
| Beginning of period | 1,467,188,764 | | 1,573,577,376 | | 128,756,690 | | 129,368,018 |
| End of period | $ 1,723,406,576 | | $ 1,467,188,764 | | $ 138,412,440 | | $ 128,756,690 |
The accompanying notes are an integral part of these financial statements.
Hartford Multi-Strategy Funds
Statements of Changes in Net Assets – (continued)
For the Year Ended October 31, 2021
| | The Hartford
Global Real Asset Fund
(consolidated) | | The Hartford
Growth Allocation Fund |
| | For the
Year Ended
October 31,
2021 | | For the
Year Ended
October 31,
2020 | | For the
Year Ended
October 31,
2021 | | For the
Year Ended
October 31,
2020 |
| Operations: | | | | | | | |
| Net investment income (loss) | $ 3,405,180 | | $ 3,874,063 | | $ 4,568,550 | | $ 6,569,271 |
| Net realized gain (loss) on investments, other financial instruments and foreign currency transactions | 39,605,020 | | (32,055,945) | | 37,583,245 | | 16,164,245 |
| Net changes in unrealized appreciation (depreciation) of investments, other financial instruments and foreign currency transactions | 6,450,725 | | 3,636,228 | | 109,833,015 | | (2,612,332) |
| Net Increase (Decrease) in Net Assets Resulting from Operations | 49,460,925 | | (24,545,654) | | 151,984,810 | | 20,121,184 |
| Distributions to Shareholders: | | | | | | | |
| Class A | (329,819) | | (392,987) | | (21,810,671) | | (22,821,778) |
| Class C | (36,155) | | (54,081) | | (1,290,134) | | (1,733,204) |
| Class I | (412,806) | | (1,091,737) | | (431,330) | | (509,475) |
| Class R3 | (2,264) | | (1,984) | | (237,006) | | (270,958) |
| Class R4 | (701) | | (1,562) | | (108,753) | | (249,170) |
| Class R5 | (4,816) | | (1,553) | | (226,949) | | (246,703) |
| Class Y | (1,507,488) | | (2,745,947) | | — | | — |
| Class F | (2,428,791) | | (3,429,830) | | (18,332) | | (11,831) |
| Total distributions | (4,722,840) | | (7,719,681) | | (24,123,175) | | (25,843,119) |
| Capital Share Transactions: | | | | | | | |
| Sold | 28,845,028 | | 34,439,424 | | 40,126,741 | | 38,392,636 |
| Issued on reinvestment of distributions | 4,696,558 | | 7,528,291 | | 23,792,802 | | 25,480,822 |
| Redeemed | (124,602,280) | | (126,702,200) | | (94,887,976) | | (108,823,696) |
| Net increase (decrease) from capital share transactions | (91,060,694) | | (84,734,485) | | (30,968,433) | | (44,950,238) |
| Net Increase (Decrease) in Net Assets | (46,322,609) | | (116,999,820) | | 96,893,202 | | (50,672,173) |
| Net Assets: | | | | | | | |
| Beginning of period | 146,237,915 | | 263,237,735 | | 551,829,032 | | 602,501,205 |
| End of period | $ 99,915,306 | | $ 146,237,915 | | $ 648,722,234 | | $ 551,829,032 |
The accompanying notes are an integral part of these financial statements.
Hartford Multi-Strategy Funds
Statements of Changes in Net Assets – (continued)
For the Year Ended October 31, 2021
| | Hartford
Moderate Allocation Fund | | Hartford
Multi-Asset Income Fund |
| | For the
Year Ended
October 31,
2021 | | For the
Year Ended
October 31,
2020 | | For the
Year Ended
October 31,
2021 | | For the
Year Ended
October 31,
2020 |
| Operations: | | | | | | | |
| Net investment income (loss) | $ 3,350,444 | | $ 5,107,074 | | $ 24,255,644 | | $ 30,231,847 |
| Net realized gain (loss) on investments, other financial instruments and foreign currency transactions | 20,461,713 | | 9,048,656 | | 46,502,698 | | (15,437,754) |
| Net changes in unrealized appreciation (depreciation) of investments, other financial instruments and foreign currency transactions | 51,542,379 | | (393,878) | | 46,791,261 | | (16,192,062) |
| Net Increase (Decrease) in Net Assets Resulting from Operations | 75,354,536 | | 13,761,852 | | 117,549,603 | | (1,397,969) |
| Distributions to Shareholders: | | | | | | | |
| Class A | (12,523,759) | | (11,455,327) | | (16,657,687) | | (107,059,343) |
| Class C | (816,678) | | (907,187) | | (1,243,342) | | (15,955,771) |
| Class I | (385,848) | | (372,728) | | (3,157,825) | | (16,840,972) |
| Class R3 | (449,855) | | (458,385) | | (25,363) | | (263,604) |
| Class R4 | (120,555) | | (106,871) | | (20,362) | | (194,734) |
| Class R5 | (225,988) | | (222,154) | | (4,297) | | (55,804) |
| Class R6 | — | | — | | (10,192) | | (26,195) |
| Class Y | — | | — | | (217,232) | | (2,154,579) |
| Class F | (18,539) | | (10,148) | | (2,640,085) | | (16,129,608) |
| Total distributions | (14,541,222) | | (13,532,800) | | (23,976,385) | | (158,680,610) |
| Capital Share Transactions: | | | | | | | |
| Sold | 39,603,812 | | 33,178,241 | | 98,059,502 | | 143,867,680 |
| Issued on reinvestment of distributions | 14,383,731 | | 13,378,851 | | 23,608,908 | | 155,816,239 |
| Redeemed | (67,458,268) | | (72,121,441) | | (202,085,952) | | (269,458,658) |
| Net increase (decrease) from capital share transactions | (13,470,725) | | (25,564,349) | | (80,417,542) | | 30,225,261 |
| Net Increase (Decrease) in Net Assets | 47,342,589 | | (25,335,297) | | 13,155,676 | | (129,853,318) |
| Net Assets: | | | | | | | |
| Beginning of period | 372,819,625 | | 398,154,922 | | 862,326,210 | | 992,179,528 |
| End of period | $ 420,162,214 | | $ 372,819,625 | | $ 875,481,886 | | $ 862,326,210 |
The accompanying notes are an integral part of these financial statements.
Hartford Multi-Strategy Funds
| | | — Selected Per-Share Data(1) — | | — Ratios and Supplemental Data — |
| Class | | Net
Asset
Value at
Beginning
of Period | | Net
Investment
Income
(Loss) | | Net
Realized
and
Unrealized
Gain (Loss)
on
Investments | | Total from
Investment
Operations | | Dividends
from Net
Investment
Income | | Distributions
from
Capital
Gains | | Total
Dividends
and
Distributions | | Net
Asset
Value at
End of
Period | | Total
Return(2) | | Net
Assets
at End
of Period
(000s) | | Ratio of
Expenses
to
Average
Net
Assets
Before
Adjust-
ments(3)(4) | | Ratio of
Expenses
to
Average
Net
Assets
After
Adjust-
ments(3)(4) | | Ratio of
Net
Investment
Income
(Loss) to
Average
Net Assets(3) | | Portfolio
Turnover |
| The Hartford Balanced Income Fund |
| For the Year Ended October 31, 2021 |
| A | | $ 14.53 | | $ 0.33 | | $ 2.26 | | $ 2.59 | | $ (0.33) | | $ (0.07) | | $ (0.40) | | $ 16.72 | | 17.97% | | $ 4,748,602 | | 0.86% | | 0.86% | | 2.08% | | 44% |
| C | | 14.29 | | 0.21 | | 2.22 | | 2.43 | | (0.20) | | (0.07) | | (0.27) | | 16.45 | | 17.16 | | 2,859,547 | | 1.61 | | 1.61 | | 1.34 | | 44 |
| I | | 14.53 | | 0.37 | | 2.25 | | 2.62 | | (0.36) | | (0.07) | | (0.43) | | 16.72 | | 18.26 | | 4,859,868 | | 0.61 | | 0.61 | | 2.33 | | 44 |
| R3 | | 14.59 | | 0.28 | | 2.25 | | 2.53 | | (0.26) | | (0.07) | | (0.33) | | 16.79 | | 17.51 | | 153,099 | | 1.24 | | 1.24 | | 1.71 | | 44 |
| R4 | | 14.59 | | 0.32 | | 2.27 | | 2.59 | | (0.31) | | (0.07) | | (0.38) | | 16.80 | | 17.93 | | 93,401 | | 0.94 | | 0.94 | | 2.01 | | 44 |
| R5 | | 14.61 | | 0.37 | | 2.27 | | 2.64 | | (0.36) | | (0.07) | | (0.43) | | 16.82 | | 18.25 | | 43,487 | | 0.64 | | 0.64 | | 2.31 | | 44 |
| R6 | | 14.70 | | 0.39 | | 2.28 | | 2.67 | | (0.38) | | (0.07) | | (0.45) | | 16.92 | | 18.33 | | 285,749 | | 0.54 | | 0.54 | | 2.40 | | 44 |
| Y | | 14.70 | | 0.38 | | 2.27 | | 2.65 | | (0.36) | | (0.07) | | (0.43) | | 16.92 | | 18.21 | | 132,364 | | 0.64 | | 0.64 | | 2.31 | | 44 |
| F | | 14.54 | | 0.39 | | 2.25 | | 2.64 | | (0.38) | | (0.07) | | (0.45) | | 16.73 | | 18.33 | | 2,719,790 | | 0.53 | | 0.53 | | 2.40 | | 44 |
| For the Year Ended October 31, 2020 |
| A | | $ 14.76 | | $ 0.35 | | $ (0.10) | | $ 0.25 | | $ (0.35) | | $ (0.13) | | $ (0.48) | | $ 14.53 | | 1.75% | | $ 3,747,275 | | 0.89% | | 0.89% | | 2.44% | | 63% |
| C | | 14.53 | | 0.24 | | (0.11) | | 0.13 | | (0.24) | | (0.13) | | (0.37) | | 14.29 | | 0.92 | | 2,994,151 | | 1.64 | | 1.64 | | 1.70 | | 63 |
| I | | 14.77 | | 0.39 | | (0.12) | | 0.27 | | (0.38) | | (0.13) | | (0.51) | | 14.53 | | 1.94 | | 3,960,448 | | 0.63 | | 0.63 | | 2.69 | | 63 |
| R3 | | 14.82 | | 0.31 | | (0.12) | | 0.19 | | (0.29) | | (0.13) | | (0.42) | | 14.59 | | 1.36 | | 154,953 | | 1.24 | | 1.24 | | 2.10 | | 63 |
| R4 | | 14.83 | | 0.35 | | (0.12) | | 0.23 | | (0.34) | | (0.13) | | (0.47) | | 14.59 | | 1.60 | | 88,942 | | 0.95 | | 0.95 | | 2.38 | | 63 |
| R5 | | 14.85 | | 0.39 | | (0.12) | | 0.27 | | (0.38) | | (0.13) | | (0.51) | | 14.61 | | 1.90 | | 42,220 | | 0.66 | | 0.66 | | 2.67 | | 63 |
| R6 | | 14.93 | | 0.40 | | (0.11) | | 0.29 | | (0.39) | | (0.13) | | (0.52) | | 14.70 | | 2.06 | | 240,876 | | 0.56 | | 0.56 | | 2.74 | | 63 |
| Y | | 14.93 | | 0.39 | | (0.11) | | 0.28 | | (0.38) | | (0.13) | | (0.51) | | 14.70 | | 1.96 | | 154,356 | | 0.67 | | 0.66 | | 2.67 | | 63 |
| F | | 14.77 | | 0.40 | | (0.10) | | 0.30 | | (0.40) | | (0.13) | | (0.53) | | 14.54 | | 2.08 | | 2,131,158 | | 0.56 | | 0.56 | | 2.76 | | 63 |
| For the Year Ended October 31, 2019 |
| A | | $ 13.86 | | $ 0.38 | | $ 1.43 | | $ 1.81 | | $ (0.38) | | $ (0.53) | | $ (0.91) | | $ 14.76 | | 13.88% | | $ 3,517,691 | | 0.90% | | 0.90% | | 2.73% | | 54% |
| C | | 13.65 | | 0.28 | | 1.41 | | 1.69 | | (0.28) | | (0.53) | | (0.81) | | 14.53 | | 13.08 | | 3,365,430 | | 1.65 | | 1.65 | | 1.99 | | 54 |
| I | | 13.86 | | 0.42 | | 1.44 | | 1.86 | | (0.42) | | (0.53) | | (0.95) | | 14.77 | | 14.24 | | 3,670,729 | | 0.65 | | 0.65 | | 2.98 | | 54 |
| R3 | | 13.90 | | 0.34 | | 1.44 | | 1.78 | | (0.33) | | (0.53) | | (0.86) | | 14.82 | | 13.54 | | 190,851 | | 1.26 | | 1.26 | | 2.38 | | 54 |
| R4 | | 13.91 | | 0.38 | | 1.44 | | 1.82 | | (0.37) | | (0.53) | | (0.90) | | 14.83 | | 13.88 | | 103,304 | | 0.97 | | 0.97 | | 2.68 | | 54 |
| R5 | | 13.93 | | 0.42 | | 1.45 | | 1.87 | | (0.42) | | (0.53) | | (0.95) | | 14.85 | | 14.14 | | 43,770 | | 0.67 | | 0.67 | | 2.99 | | 54 |
| R6 | | 14.01 | | 0.43 | | 1.45 | | 1.88 | | (0.43) | | (0.53) | | (0.96) | | 14.93 | | 14.24 | | 192,279 | | 0.58 | | 0.58 | | 3.01 | | 54 |
| Y | | 14.01 | | 0.43 | | 1.44 | | 1.87 | | (0.42) | | (0.53) | | (0.95) | | 14.93 | | 14.16 | | 150,620 | | 0.66 | | 0.65 | | 3.00 | | 54 |
| F | | 13.87 | | 0.43 | | 1.43 | | 1.86 | | (0.43) | | (0.53) | | (0.96) | | 14.77 | | 14.24 | | 1,815,178 | | 0.57 | | 0.57 | | 3.06 | | 54 |
| For the Year Ended October 31, 2018 |
| A | | $ 14.80 | | $ 0.38 | | $ (0.53) | | $ (0.15) | | $ (0.36) | | $ (0.43) | | $ (0.79) | | $ 13.86 | | (1.14)% | | $ 3,127,224 | | 0.91% | | 0.91% | | 2.64% | | 48% |
| C | | 14.59 | | 0.27 | | (0.52) | | (0.25) | | (0.26) | | (0.43) | | (0.69) | | 13.65 | | (1.90) | | 3,350,560 | | 1.66 | | 1.66 | | 1.89 | | 48 |
| I | | 14.80 | | 0.42 | | (0.53) | | (0.11) | | (0.40) | | (0.43) | | (0.83) | | 13.86 | | (0.89) | | 3,092,500 | | 0.65 | | 0.65 | | 2.89 | | 48 |
| R3 | | 14.84 | | 0.33 | | (0.53) | | (0.20) | | (0.31) | | (0.43) | | (0.74) | | 13.90 | | (1.49) | | 196,578 | | 1.28 | | 1.27 | | 2.28 | | 48 |
| R4 | | 14.85 | | 0.37 | | (0.53) | | (0.16) | | (0.35) | | (0.43) | | (0.78) | | 13.91 | | (1.19) | | 121,239 | | 0.98 | | 0.97 | | 2.57 | | 48 |
| R5 | | 14.87 | | 0.41 | | (0.53) | | (0.12) | | (0.39) | | (0.43) | | (0.82) | | 13.93 | | (0.91) | | 52,640 | | 0.68 | | 0.68 | | 2.86 | | 48 |
| R6 | | 14.94 | | 0.43 | | (0.52) | | (0.09) | | (0.41) | | (0.43) | | (0.84) | | 14.01 | | (0.74) | | 87,445 | | 0.58 | | 0.58 | | 2.95 | | 48 |
| Y | | 14.94 | | 0.42 | | (0.52) | | (0.10) | | (0.40) | | (0.43) | | (0.83) | | 14.01 | | (0.79) | | 146,051 | | 0.63 | | 0.63 | | 2.92 | | 48 |
| F | | 14.80 | | 0.43 | | (0.52) | | (0.09) | | (0.41) | | (0.43) | | (0.84) | | 13.87 | | (0.75) | | 1,445,583 | | 0.58 | | 0.58 | | 2.96 | | 48 |
The accompanying notes are an integral part of these financial statements.
Hartford Multi-Strategy Funds
Financial Highlights – (continued)
| | | — Selected Per-Share Data(1) — | | — Ratios and Supplemental Data — |
| Class | | Net
Asset
Value at
Beginning
of Period | | Net
Investment
Income
(Loss) | | Net
Realized
and
Unrealized
Gain (Loss)
on
Investments | | Total from
Investment
Operations | | Dividends
from Net
Investment
Income | | Distributions
from
Capital
Gains | | Total
Dividends
and
Distributions | | Net
Asset
Value at
End of
Period | | Total
Return(2) | | Net
Assets
at End
of Period
(000s) | | Ratio of
Expenses
to
Average
Net
Assets
Before
Adjust-
ments(3)(4) | | Ratio of
Expenses
to
Average
Net
Assets
After
Adjust-
ments(3)(4) | | Ratio of
Net
Investment
Income
(Loss) to
Average
Net Assets(3) | | Portfolio
Turnover |
| The Hartford Balanced Income Fund – (continued) |
| For the Year Ended October 31, 2017 |
| A | | $ 13.80 | | $ 0.37 | | $ 1.14 | | $ 1.51 | | $ (0.36) | | $ (0.15) | | $ (0.51) | | $ 14.80 | | 11.16% | | $ 3,297,181 | | 0.92% | | 0.92% | | 2.63% | | 39% |
| C | | 13.61 | | 0.26 | | 1.12 | | 1.38 | | (0.25) | | (0.15) | | (0.40) | | 14.59 | | 10.37 | | 3,657,126 | | 1.66 | | 1.66 | | 1.89 | | 39 |
| I | | 13.80 | | 0.41 | | 1.13 | | 1.54 | | (0.39) | | (0.15) | | (0.54) | | 14.80 | | 11.41 | | 3,351,891 | | 0.69 | | 0.69 | | 2.86 | | 39 |
| R3 | | 13.84 | | 0.33 | | 1.13 | | 1.46 | | (0.31) | | (0.15) | | (0.46) | | 14.84 | | 10.79 | | 222,526 | | 1.30 | | 1.24 | | 2.30 | | 39 |
| R4 | | 13.85 | | 0.37 | | 1.13 | | 1.50 | | (0.35) | | (0.15) | | (0.50) | | 14.85 | | 11.10 | | 109,315 | | 1.00 | | 0.94 | | 2.61 | | 39 |
| R5 | | 13.86 | | 0.41 | | 1.14 | | 1.55 | | (0.39) | | (0.15) | | (0.54) | | 14.87 | | 11.44 | | 45,300 | | 0.70 | | 0.69 | | 2.85 | | 39 |
| R6 | | 13.93 | | 0.42 | | 1.14 | | 1.56 | | (0.40) | | (0.15) | | (0.55) | | 14.94 | | 11.48 | | 31,234 | | 0.60 | | 0.60 | | 2.89 | | 39 |
| Y | | 13.93 | | 0.42 | | 1.14 | | 1.56 | | (0.40) | | (0.15) | | (0.55) | | 14.94 | | 11.46 | | 124,655 | | 0.62 | | 0.62 | | 2.91 | | 39 |
| F (5) | | 14.20 | | 0.24 | | 0.66 | | 0.90 | | (0.30) | | — | | (0.30) | | 14.80 | | 6.41 (6) | | 1,126,948 | | 0.60 (7) | | 0.60 (7) | | 2.47 (7) | | 39 |
| Hartford AARP Balanced Retirement Fund |
| For the Year Ended October 31, 2021 |
| A | | $ 9.01 | | $ 0.12 | | $ 1.10 | | $ 1.22 | | $ (0.20) | | $ — | | $ (0.20) | | $ 10.03 | | 13.60% | | $ 76,009 | | 0.86% | | 0.83% | | 1.24% | | 23% |
| C | | 9.03 | | 0.04 | | 1.11 | | 1.15 | | (0.13) | | — | | (0.13) | | 10.05 | | 12.74 | | 9,060 | | 1.62 | | 1.58 | | 0.45 | | 23 |
| I | | 8.99 | | 0.15 | | 1.11 | | 1.26 | | (0.23) | | — | | (0.23) | | 10.02 | | 14.08 | | 11,235 | | 0.58 | | 0.53 | | 1.53 | | 23 |
| R3 | | 9.01 | | 0.10 | | 1.11 | | 1.21 | | (0.18) | | — | | (0.18) | | 10.04 | | 13.46 | | 789 | | 1.19 | | 1.07 | | 0.99 | | 23 |
| R4 | | 8.97 | | 0.12 | | 1.11 | | 1.23 | | (0.21) | | — | | (0.21) | | 9.99 | | 13.75 | | 249 | | 0.89 | | 0.77 | | 1.26 | | 23 |
| R5 | | 8.97 | | 0.16 | | 1.10 | | 1.26 | | (0.24) | | — | | (0.24) | | 9.99 | | 14.13 | | 731 | | 0.59 | | 0.45 | | 1.61 | | 23 |
| R6 | | 8.99 | | 0.17 | | 1.10 | | 1.27 | | (0.25) | | — | | (0.25) | | 10.01 | | 14.21 | | 13 | | 0.47 | | 0.34 | | 1.74 | | 23 |
| Y | | 8.95 | | 0.16 | | 1.10 | | 1.26 | | (0.24) | | — | | (0.24) | | 9.97 | | 14.16 | | 1,951 | | 0.57 | | 0.45 | | 1.61 | | 23 |
| F | | 8.93 | | 0.17 | | 1.10 | | 1.27 | | (0.25) | | — | | (0.25) | | 9.95 | | 14.31 | | 156 | | 0.48 | | 0.35 | | 1.73 | | 23 |
| For the Year Ended October 31, 2020 |
| A | | $ 9.20 | | $ 0.15 | | $ (0.15) | | $ 0.00(8) | | $ (0.19) | | $ — | | $ (0.19) | | $ 9.01 | | (0.05)% | | $ 70,601 | | 1.01% | | 0.77% | | 1.70% | | 104% (9) |
| C | | 9.21 | | 0.09 | | (0.16) | | (0.07) | | (0.11) | | — | | (0.11) | | 9.03 | | (0.80) | | 23,512 | | 1.75 | | 1.51 | | 0.99 | | 104 (9) |
| I | | 9.20 | | 0.19 | | (0.18) | | 0.01 | | (0.22) | | — | | (0.22) | | 8.99 | | 0.09 | | 12,661 | | 0.69 | | 0.46 | | 2.07 | | 104 (9) |
| R3 | | 9.21 | | 0.13 | | (0.18) | | (0.05) | | (0.15) | | — | | (0.15) | | 9.01 | | (0.54) | | 785 | | 1.33 | | 1.08 | | 1.39 | | 104 (9) |
| R4 | | 9.16 | | 0.15 | | (0.16) | | (0.01) | | (0.18) | | — | | (0.18) | | 8.97 | | (0.09) | | 386 | | 1.03 | | 0.78 | | 1.66 | | 104 (9) |
| R5 | | 9.17 | | 0.18 | | (0.17) | | 0.01 | | (0.21) | | — | | (0.21) | | 8.97 | | 0.10 | | 605 | | 0.73 | | 0.47 | | 2.01 | | 104 (9) |
| R6 | | 9.19 | | 0.19 | | (0.16) | | 0.03 | | (0.23) | | — | | (0.23) | | 8.99 | | 0.27 | | 11 | | 0.61 | | 0.37 | | 2.10 | | 104 (9) |
| Y | | 9.14 | | 0.18 | | (0.16) | | 0.02 | | (0.21) | | — | | (0.21) | | 8.95 | | 0.18 | | 2,030 | | 0.71 | | 0.47 | | 2.04 | | 104 (9) |
| F | | 9.13 | | 0.20 | | (0.17) | | 0.03 | | (0.23) | | — | | (0.23) | | 8.93 | | 0.30 | | 206 | | 0.61 | | 0.37 | | 2.23 | | 104 (9) |
| For the Year Ended October 31, 2019 |
| A | | $ 9.08 | | $ 0.27 | | $ 0.40 | | $ 0.67 | | $ (0.55) | | $ — | | $ (0.55) | | $ 9.20 | | 7.95% | | $ 83,998 | | 1.06% | | 0.71% | | 3.00% | | 207% |
| C | | 9.08 | | 0.23 | | 0.38 | | 0.61 | | (0.48) | | — | | (0.48) | | 9.21 | | 7.14 | | 39,757 | | 1.85 | | 1.45 | | 2.57 | | 207 |
| I | | 9.07 | | 0.36 | | 0.34 | | 0.70 | | (0.57) | | — | | (0.57) | | 9.20 | | 8.16 | | 26,433 | | 0.86 | | 0.61 | | 3.99 | | 207 |
| R3 | | 9.08 | | 0.36 | | 0.35 | | 0.71 | | (0.58) | | — | | (0.58) | | 9.21 | | 8.24 | | 1,279 | | 1.31 | | 0.55 | | 4.02 | | 207 |
| R4 | | 9.08 | | 0.38 | | 0.33 | | 0.71 | | (0.63) | | — | | (0.63) | | 9.16 | | 8.35 | | 349 | | 1.05 | | 0.54 | | 4.16 | | 207 |
| R5 | | 9.07 | | 0.36 | | 0.34 | | 0.70 | | (0.60) | | — | | (0.60) | | 9.17 | | 8.28 | | 806 | | 0.79 | | 0.54 | | 3.93 | | 207 |
| R6 (10) | | 8.93 | | 0.21 | | 0.27 | | 0.48 | | (0.22) | | — | | (0.22) | | 9.19 | | 5.42 | | 11 | | 0.75 | | 0.48 | | 3.43 | | 207 |
| Y | | 9.07 | | 0.38 | | 0.31 | | 0.69 | | (0.62) | | — | | (0.62) | | 9.14 | | 8.21 | | 3,746 | | 0.79 | | 0.53 | | 4.17 | | 207 |
| F | | 9.07 | | 0.26 | | 0.44 | | 0.70 | | (0.64) | | — | | (0.64) | | 9.13 | | 8.27 | | 1,889 | | 0.73 | | 0.44 | | 3.02 | | 207 |
The accompanying notes are an integral part of these financial statements.
Hartford Multi-Strategy Funds
Financial Highlights – (continued)
| | | — Selected Per-Share Data(1) — | | — Ratios and Supplemental Data — |
| Class | | Net
Asset
Value at
Beginning
of Period | | Net
Investment
Income
(Loss) | | Net
Realized
and
Unrealized
Gain (Loss)
on
Investments | | Total from
Investment
Operations | | Dividends
from Net
Investment
Income | | Distributions
from
Capital
Gains | | Total
Dividends
and
Distributions | | Net
Asset
Value at
End of
Period | | Total
Return(2) | | Net
Assets
at End
of Period
(000s) | | Ratio of
Expenses
to
Average
Net
Assets
Before
Adjust-
ments(3)(4) | | Ratio of
Expenses
to
Average
Net
Assets
After
Adjust-
ments(3)(4) | | Ratio of
Net
Investment
Income
(Loss) to
Average
Net Assets(3) | | Portfolio
Turnover |
| Hartford AARP Balanced Retirement Fund – (continued) |
| For the Year Ended October 31, 2018 |
| A | | $ 9.46 | | $ 0.41 | | $ (0.28) | | $ 0.13 | | $ (0.51) | | $ — | | $ (0.51) | | $ 9.08 | | 1.26% | | $ 13,324 | | 1.20% | | 0.78% | | 4.35% | | 61% |
| C | | 9.47 | | 0.35 | | (0.29) | | 0.06 | | (0.45) | | — | | (0.45) | | 9.08 | | 0.55 | | 11,686 | | 1.98 | | 1.47 | | 3.71 | | 61 |
| I | | 9.46 | | 0.42 | | (0.28) | | 0.14 | | (0.53) | | — | | (0.53) | | 9.07 | | 1.40 | | 20,780 | | 0.98 | | 0.68 | | 4.51 | | 61 |
| R3 | | 9.47 | | 0.40 | | (0.28) | | 0.12 | | (0.51) | | — | | (0.51) | | 9.08 | | 1.21 | | 2,225 | | 1.61 | | 0.84 | | 4.28 | | 61 |
| R4 | | 9.46 | | 0.41 | | (0.28) | | 0.13 | | (0.51) | | — | | (0.51) | | 9.08 | | 1.27 | | 2,241 | | 1.31 | | 0.78 | | 4.34 | | 61 |
| R5 | | 9.46 | | 0.41 | | (0.28) | | 0.13 | | (0.52) | | — | | (0.52) | | 9.07 | | 1.27 | | 2,256 | | 1.01 | | 0.72 | | 4.40 | | 61 |
| Y | | 9.46 | | 0.42 | | (0.28) | | 0.14 | | (0.53) | | — | | (0.53) | | 9.07 | | 1.37 | | 26,398 | | 0.89 | | 0.61 | | 4.51 | | 61 |
| F | | 9.46 | | 0.42 | | (0.27) | | 0.15 | | (0.54) | | — | | (0.54) | | 9.07 | | 1.39 | | 391 | | 0.89 | | 0.61 | | 4.50 | | 61 |
| For the Year Ended October 31, 2017 |
| A | | $ 9.04 | | $ 0.39 | | $ 0.41 | | $ 0.80 | | $ (0.38) | | $ — | | $ (0.38) | | $ 9.46 | | 9.06% | | $ 11,877 | | 1.26% | | 0.95% | | 4.26% | | 85% |
| C | | 9.04 | | 0.34 | | 0.41 | | 0.75 | | (0.32) | | — | | (0.32) | | 9.47 | | 8.42 | | 6,972 | | 2.05 | | 1.58 | | 3.65 | | 85 |
| I | | 9.04 | | 0.41 | | 0.41 | | 0.82 | | (0.40) | | — | | (0.40) | | 9.46 | | 9.22 | | 13,310 | | 1.07 | | 0.83 | | 4.40 | | 85 |
| R3 | | 9.04 | | 0.38 | | 0.41 | | 0.79 | | (0.36) | | — | | (0.36) | | 9.47 | | 8.95 | | 2,197 | | 1.68 | | 1.12 | | 4.11 | | 85 |
| R4 | | 9.04 | | 0.39 | | 0.41 | | 0.80 | | (0.38) | | — | | (0.38) | | 9.46 | | 9.00 | | 2,211 | | 1.38 | | 1.00 | | 4.22 | | 85 |
| R5 | | 9.04 | | 0.40 | | 0.41 | | 0.81 | | (0.39) | | — | | (0.39) | | 9.46 | | 9.18 | | 2,225 | | 1.08 | | 0.87 | | 4.36 | | 85 |
| Y | | 9.04 | | 0.40 | | 0.42 | | 0.82 | | (0.40) | | — | | (0.40) | | 9.46 | | 9.29 | | 25,587 | | 0.98 | | 0.79 | | 4.40 | | 85 |
| F (5) | | 9.21 | | 0.28 | | 0.24 | | 0.52 | | (0.27) | | — | | (0.27) | | 9.46 | | 5.72 (6) | | 419 | | 0.97 (7) | | 0.66 (7) | | 4.48 (7) | | 85 |
| The Hartford Checks and Balances Fund |
| For the Year Ended October 31, 2021 |
| A | | $ 9.42 | | $ 0.11 | | $ 2.25 | | $ 2.36 | | $ (0.18) | | $ (0.26) | | $ (0.44) | | $ 11.34 | | 25.55% | | $ 1,495,256 | | 0.37% | | 0.37% | | 1.05% | | 8% |
| C | | 9.36 | | 0.03 | | 2.23 | | 2.26 | | (0.10) | | (0.26) | | (0.36) | | 11.26 | | 24.52 | | 109,278 | | 1.15 | | 1.15 | | 0.30 | | 8 |
| I | | 9.44 | | 0.14 | | 2.25 | | 2.39 | | (0.21) | | (0.26) | | (0.47) | | 11.36 | | 25.80 | | 101,121 | | 0.13 | | 0.13 | | 1.29 | | 8 |
| R3 | | 9.38 | | 0.07 | | 2.23 | | 2.30 | | (0.14) | | (0.26) | | (0.40) | | 11.28 | | 24.94 | | 11,046 | | 0.75 | | 0.75 | | 0.68 | | 8 |
| R4 | | 9.39 | | 0.10 | | 2.23 | | 2.33 | | (0.17) | | (0.26) | | (0.43) | | 11.29 | | 25.32 | | 3,504 | | 0.45 | | 0.45 | | 0.97 | | 8 |
| R5 | | 9.28 | | 0.13 | | 2.21 | | 2.34 | | (0.21) | | (0.26) | | (0.47) | | 11.15 | | 25.69 | | 669 | | 0.15 | | 0.15 | | 1.25 | | 8 |
| F | | 9.43 | | 0.15 | | 2.25 | | 2.40 | | (0.22) | | (0.26) | | (0.48) | | 11.35 | | 25.93 | | 2,533 | | 0.04 | | 0.04 | | 1.39 | | 8 |
| For the Year Ended October 31, 2020 |
| A | | $ 9.64 | | $ 0.14 | | $ 0.32 | | $ 0.46 | | $ (0.22) | | $ (0.46) | | $ (0.68) | | $ 9.42 | | 4.98% | | $ 1,258,232 | | 0.39% | | 0.39% | | 1.53% | | 14% |
| C | | 9.57 | | 0.07 | | 0.33 | | 0.40 | | (0.15) | | (0.46) | | (0.61) | | 9.36 | | 4.27 | | 127,228 | | 1.17 | | 1.17 | | 0.77 | | 14 |
| I | | 9.66 | | 0.16 | | 0.32 | | 0.48 | | (0.24) | | (0.46) | | (0.70) | | 9.44 | | 5.25 | | 64,175 | | 0.13 | | 0.13 | | 1.76 | | 14 |
| R3 | | 9.60 | | 0.11 | | 0.32 | | 0.43 | | (0.19) | | (0.46) | | (0.65) | | 9.38 | | 4.62 | | 12,010 | | 0.75 | | 0.75 | | 1.22 | | 14 |
| R4 | | 9.61 | | 0.15 | | 0.31 | | 0.46 | | (0.22) | | (0.46) | | (0.68) | | 9.39 | | 4.94 | | 3,093 | | 0.43 | | 0.43 | | 1.65 | | 14 |
| R5 | | 9.50 | | 0.16 | | 0.32 | | 0.48 | | (0.24) | | (0.46) | | (0.70) | | 9.28 | | 5.31 | | 369 | | 0.16 | | 0.16 | | 1.71 | | 14 |
| F | | 9.66 | | 0.16 | | 0.32 | | 0.48 | | (0.25) | | (0.46) | | (0.71) | | 9.43 | | 5.23 | | 2,083 | | 0.05 | | 0.05 | | 1.77 | | 14 |
| For the Year Ended October 31, 2019 |
| A | | $ 9.36 | | $ 0.15 | | $ 1.01 | | $ 1.16 | | $ (0.32) | | $ (0.56) | | $ (0.88) | | $ 9.64 | | 13.95% | | $ 1,311,955 | | 0.39% | | 0.39% | | 1.63% | | 28% |
| C | | 9.29 | | 0.08 | | 1.00 | | 1.08 | | (0.24) | | (0.56) | | (0.80) | | 9.57 | | 13.06 | | 166,663 | | 1.16 | | 1.16 | | 0.85 | | 28 |
| I | | 9.37 | | 0.17 | | 1.03 | | 1.20 | | (0.35) | | (0.56) | | (0.91) | | 9.66 | | 14.36 | | 66,574 | | 0.13 | | 0.13 | | 1.89 | | 28 |
| R3 | | 9.32 | | 0.12 | | 1.01 | | 1.13 | | (0.29) | | (0.56) | | (0.85) | | 9.60 | | 13.57 | | 15,733 | | 0.75 | | 0.74 | | 1.27 | | 28 |
| R4 | | 9.33 | | 0.15 | | 1.01 | | 1.16 | | (0.32) | | (0.56) | | (0.88) | | 9.61 | | 13.92 | | 5,847 | | 0.43 | | 0.43 | | 1.58 | | 28 |
| R5 | | 9.37 | | 0.12 | | 1.04 | | 1.16 | | (0.47) | | (0.56) | | (1.03) | | 9.50 | | 13.91 | | 336 | | 0.16 | | 0.16 | | 1.29 | | 28 |
| F | | 9.37 | | 0.20 | | 1.01 | | 1.21 | | (0.36) | | (0.56) | | (0.92) | | 9.66 | | 14.47 | | 6,470 | | 0.04 | | 0.04 | | 2.07 | | 28 |
The accompanying notes are an integral part of these financial statements.
Hartford Multi-Strategy Funds
Financial Highlights – (continued)
| | | — Selected Per-Share Data(1) — | | — Ratios and Supplemental Data — |
| Class | | Net
Asset
Value at
Beginning
of Period | | Net
Investment
Income
(Loss) | | Net
Realized
and
Unrealized
Gain (Loss)
on
Investments | | Total from
Investment
Operations | | Dividends
from Net
Investment
Income | | Distributions
from
Capital
Gains | | Total
Dividends
and
Distributions | | Net
Asset
Value at
End of
Period | | Total
Return(2) | | Net
Assets
at End
of Period
(000s) | | Ratio of
Expenses
to
Average
Net
Assets
Before
Adjust-
ments(3)(4) | | Ratio of
Expenses
to
Average
Net
Assets
After
Adjust-
ments(3)(4) | | Ratio of
Net
Investment
Income
(Loss) to
Average
Net Assets(3) | | Portfolio
Turnover |
| The Hartford Checks and Balances Fund – (continued) |
| For the Year Ended October 31, 2018 |
| A | | $ 10.45 | | $ 0.18 | | $ 0.05 | | $ 0.23 | | $ (0.37) | | $ (0.95) | | $ (1.32) | | $ 9.36 | | 2.17% | | $ 1,246,869 | | 0.38% | | 0.38% | | 1.87% | | 28% |
| C | | 10.38 | | 0.11 | | 0.05 | | 0.16 | | (0.30) | | (0.95) | | (1.25) | | 9.29 | | 1.39 | | 195,591 | | 1.15 | | 1.15 | | 1.12 | | 28 |
| I | | 10.47 | | 0.20 | | 0.05 | | 0.25 | | (0.40) | | (0.95) | | (1.35) | | 9.37 | | 2.33 | | 62,762 | | 0.13 | | 0.13 | | 2.10 | | 28 |
| R3 | | 10.41 | | 0.15 | | 0.05 | | 0.20 | | (0.34) | | (0.95) | | (1.29) | | 9.32 | | 1.80 | | 16,209 | | 0.76 | | 0.75 | | 1.51 | | 28 |
| R4 | | 10.42 | | 0.17 | | 0.06 | | 0.23 | | (0.37) | | (0.95) | | (1.32) | | 9.33 | | 2.10 | | 5,162 | | 0.47 | | 0.47 | | 1.77 | | 28 |
| R5 | | 10.47 | | 0.21 | | 0.03 | | 0.24 | | (0.39) | | (0.95) | | (1.34) | | 9.37 | | 2.29 | | 478 | | 0.16 | | 0.16 | | 2.18 | | 28 |
| F | | 10.46 | | 0.19 | | 0.08 | | 0.27 | | (0.41) | | (0.95) | | (1.36) | | 9.37 | | 2.51 | | 417 | | 0.04 | | 0.04 | | 1.96 | | 28 |
| For the Year Ended October 31, 2017 |
| A | | $ 9.85 | | $ 0.14 | | $ 1.28 | | $ 1.42 | | $ (0.13) | | $ (0.69) | | $ (0.82) | | $ 10.45 | | 15.27% | | $ 1,326,959 | | 0.38% | | 0.38% | | 1.44% | | 3% |
| C | | 9.78 | | 0.07 | | 1.27 | | 1.34 | | (0.05) | | (0.69) | | (0.74) | | 10.38 | | 14.46 | | 303,378 | | 1.13 | | 1.13 | | 0.70 | | 3 |
| I | | 9.86 | | 0.16 | | 1.29 | | 1.45 | | (0.15) | | (0.69) | | (0.84) | | 10.47 | | 15.63 | | 58,494 | | 0.16 | | 0.16 | | 1.63 | | 3 |
| R3 | | 9.81 | | 0.10 | | 1.28 | | 1.38 | | (0.09) | | (0.69) | | (0.78) | | 10.41 | | 14.89 | | 18,645 | | 0.75 | | 0.75 | | 1.04 | | 3 |
| R4 | | 9.82 | | 0.13 | | 1.28 | | 1.41 | | (0.12) | | (0.69) | | (0.81) | | 10.42 | | 15.24 | | 5,372 | | 0.45 | | 0.45 | | 1.35 | | 3 |
| R5 | | 9.86 | | 0.20 | | 1.25 | | 1.45 | | (0.15) | | (0.69) | | (0.84) | | 10.47 | | 15.66 | | 2,082 | | 0.14 | | 0.14 | | 1.99 | | 3 |
| F (5) | | 9.86 | | 0.11 | | 0.60 | | 0.71 | | (0.11) | | — | | (0.11) | | 10.46 | | 7.27 (6) | | 1,441 | | 0.04 (7) | | 0.04 (7) | | 1.57 (7) | | 3 |
| The Hartford Conservative Allocation Fund |
| For the Year Ended October 31, 2021 |
| A | | $ 10.99 | | $ 0.11 | | $ 1.21 | | $ 1.32 | | $ (0.17) | | $ — | | $ (0.17) | | $ 12.14 | | 12.13% | | $ 123,369 | | 0.58% | | 0.58% | | 0.89% | | 14% |
| C | | 10.90 | | 0.02 | | 1.21 | | 1.23 | | (0.09) | | — | | (0.09) | | 12.04 | | 11.29 | | 8,208 | | 1.37 | | 1.37 | | 0.14 | | 14 |
| I | | 11.01 | | 0.14 | | 1.22 | | 1.36 | | (0.20) | | — | | (0.20) | | 12.17 | | 12.48 | | 2,188 | | 0.32 | | 0.32 | | 1.14 | | 14 |
| R3 | | 11.00 | | 0.06 | | 1.23 | | 1.29 | | (0.14) | | — | | (0.14) | | 12.15 | | 11.84 | | 2,344 | | 0.95 | | 0.95 | | 0.50 | | 14 |
| R4 | | 11.00 | | 0.10 | | 1.23 | | 1.33 | | (0.18) | | — | | (0.18) | | 12.15 | | 12.17 | | 684 | | 0.64 | | 0.64 | | 0.87 | | 14 |
| R5 | | 11.04 | | 0.13 | | 1.24 | | 1.37 | | (0.22) | | — | | (0.22) | | 12.19 | | 12.47 | | 1,452 | | 0.35 | | 0.35 | | 1.13 | | 14 |
| F | | 11.03 | | 0.16 | | 1.21 | | 1.37 | | (0.22) | | — | | (0.22) | | 12.18 | | 12.48 | | 169 | | 0.23 | | 0.23 | | 1.31 | | 14 |
| For the Year Ended October 31, 2020 |
| A | | $ 10.83 | | $ 0.17 | | $ 0.26 | | $ 0.43 | | $ (0.27) | | $ — | | $ (0.27) | | $ 10.99 | | 4.04% | | $ 110,425 | | 0.59% | | 0.59% | | 1.55% | | 45% |
| C | | 10.71 | | 0.09 | | 0.26 | | 0.35 | | (0.16) | | — | | (0.16) | | 10.90 | | 3.25 | | 11,131 | | 1.38 | | 1.38 | | 0.83 | | 45 |
| I | | 10.85 | | 0.18 | | 0.28 | | 0.46 | | (0.30) | | — | | (0.30) | | 11.01 | | 4.28 | | 1,862 | | 0.36 | | 0.36 | | 1.66 | | 45 |
| R3 | | 10.83 | | 0.13 | | 0.26 | | 0.39 | | (0.22) | | — | | (0.22) | | 11.00 | | 3.61 | | 2,742 | | 0.95 | | 0.94 | | 1.25 | | 45 |
| R4 | | 10.84 | | 0.19 | | 0.23 | | 0.42 | | (0.26) | | — | | (0.26) | | 11.00 | | 3.95 | | 1,108 | | 0.65 | | 0.64 | | 1.75 | | 45 |
| R5 | | 10.88 | | 0.21 | | 0.25 | | 0.46 | | (0.30) | | — | | (0.30) | | 11.04 | | 4.27 | | 1,477 | | 0.35 | | 0.34 | | 1.91 | | 45 |
| F | | 10.86 | | 0.20 | | 0.28 | | 0.48 | | (0.31) | | — | | (0.31) | | 11.03 | | 4.47 | | 12 | | 0.23 | | 0.23 | | 1.89 | | 45 |
| For the Year Ended October 31, 2019 |
| A | | $ 10.23 | | $ 0.31 | | $ 0.60 | | $ 0.91 | | $ (0.31) | | $ — | | $ (0.31) | | $ 10.83 | | 9.28% | | $ 105,569 | | 0.60% | | 0.59% | | 3.02% | | 38% |
| C | | 10.05 | | 0.22 | | 0.62 | | 0.84 | | (0.18) | | — | | (0.18) | | 10.71 | | 8.41 | | 14,947 | | 1.36 | | 1.36 | | 2.15 | | 38 |
| I | | 10.25 | | 0.38 | | 0.55 | | 0.93 | | (0.33) | | — | | (0.33) | | 10.85 | | 9.49 | | 1,253 | | 0.34 | | 0.34 | | 3.63 | | 38 |
| R3 | | 10.21 | | 0.29 | | 0.59 | | 0.88 | | (0.26) | | — | | (0.26) | | 10.83 | | 8.89 | | 3,481 | | 0.95 | | 0.93 | | 2.81 | | 38 |
| R4 | | 10.24 | | 0.32 | | 0.59 | | 0.91 | | (0.31) | | — | | (0.31) | | 10.84 | | 9.22 | | 2,094 | | 0.65 | | 0.63 | | 3.06 | | 38 |
| R5 | | 10.28 | | 0.34 | | 0.60 | | 0.94 | | (0.34) | | — | | (0.34) | | 10.88 | | 9.56 | | 2,013 | | 0.35 | | 0.33 | | 3.28 | | 38 |
| F | | 10.26 | | 0.31 | | 0.64 | | 0.95 | | (0.35) | | — | | (0.35) | | 10.86 | | 9.62 | | 12 | | 0.24 | | 0.24 | | 2.98 | | 38 |
The accompanying notes are an integral part of these financial statements.
Hartford Multi-Strategy Funds
Financial Highlights – (continued)
| | | — Selected Per-Share Data(1) — | | — Ratios and Supplemental Data — |
| Class | | Net
Asset
Value at
Beginning
of Period | | Net
Investment
Income
(Loss) | | Net
Realized
and
Unrealized
Gain (Loss)
on
Investments | | Total from
Investment
Operations | | Dividends
from Net
Investment
Income | | Distributions
from
Capital
Gains | | Total
Dividends
and
Distributions | | Net
Asset
Value at
End of
Period | | Total
Return(2) | | Net
Assets
at End
of Period
(000s) | | Ratio of
Expenses
to
Average
Net
Assets
Before
Adjust-
ments(3)(4) | | Ratio of
Expenses
to
Average
Net
Assets
After
Adjust-
ments(3)(4) | | Ratio of
Net
Investment
Income
(Loss) to
Average
Net Assets(3) | | Portfolio
Turnover |
| The Hartford Conservative Allocation Fund – (continued) |
| For the Year Ended October 31, 2018 |
| A | | $ 10.60 | | $ 0.31 | | $ (0.37) | | $ (0.06) | | $ (0.31) | | $ — | | $ (0.31) | | $ 10.23 | | (0.59)% | | $ 84,379 | | 0.61% | | 0.60% | | 2.91% | | 32% |
| C | | 10.41 | | 0.21 | | (0.35) | | (0.14) | | (0.22) | | — | | (0.22) | | 10.05 | | (1.38) | | 17,552 | | 1.37 | | 1.36 | | 2.04 | | 32 |
| I | | 10.63 | | 0.35 | | (0.38) | | (0.03) | | (0.35) | | — | | (0.35) | | 10.25 | | (0.39) | | 1,217 | | 0.38 | | 0.36 | | 3.38 | | 32 |
| R3 | | 10.57 | | 0.29 | | (0.37) | | (0.08) | | (0.28) | | — | | (0.28) | | 10.21 | | (0.80) | | 4,327 | | 0.96 | | 0.86 | | 2.80 | | 32 |
| R4 | | 10.61 | | 0.31 | | (0.36) | | (0.05) | | (0.32) | | — | | (0.32) | | 10.24 | | (0.51) | | 2,461 | | 0.66 | | 0.56 | | 3.00 | | 32 |
| R5 | | 10.66 | | 0.33 | | (0.36) | | (0.03) | | (0.35) | | — | | (0.35) | | 10.28 | | (0.32) | | 1,845 | | 0.36 | | 0.26 | | 3.13 | | 32 |
| F | | 10.63 | | 0.34 | | (0.36) | | (0.02) | | (0.35) | | — | | (0.35) | | 10.26 | | (0.23) | | 11 | | 0.24 | | 0.24 | | 3.19 | | 32 |
| For the Year Ended October 31, 2017 |
| A | | $ 9.81 | | $ 0.13 | | $ 0.79 | | $ 0.92 | | $ (0.13) | | $ — | | $ (0.13) | | $ 10.60 | | 9.51% | | $ 86,987 | | 0.58% | | 0.55% | | 1.24% | | 17% (11) |
| C | | 9.62 | | 0.05 | | 0.79 | | 0.84 | | (0.05) | | — | | (0.05) | | 10.41 | | 8.80 | | 26,424 | | 1.33 | | 1.30 | | 0.49 | | 17 (11) |
| I | | 9.83 | | 0.15 | | 0.81 | | 0.96 | | (0.16) | | — | | (0.16) | | 10.63 | | 9.92 | | 1,835 | | 0.29 | | 0.27 | | 1.47 | | 17 (11) |
| R3 | | 9.79 | | 0.10 | | 0.79 | | 0.89 | | (0.11) | | — | | (0.11) | | 10.57 | | 9.21 | | 7,135 | | 0.94 | | 0.80 | | 1.02 | | 17 (11) |
| R4 | | 9.82 | | 0.13 | | 0.80 | | 0.93 | | (0.14) | | — | | (0.14) | | 10.61 | | 9.57 | | 2,693 | | 0.64 | | 0.50 | | 1.25 | | 17 (11) |
| R5 | | 9.86 | | 0.16 | | 0.81 | | 0.97 | | (0.17) | | — | | (0.17) | | 10.66 | | 9.99 | | 2,251 | | 0.34 | | 0.20 | | 1.58 | | 17 (11) |
| F (5) | | 10.03 | | 0.08 | | 0.52 | | 0.60 | | — | | — | | — | | 10.63 | | 5.98 (6) | | 11 | | 0.23 (7) | | 0.20 (7) | | 1.22 (7) | | 17 (11) |
| The Hartford Global Real Asset Fund (consolidated) |
| For the Year Ended October 31, 2021 |
| A | | $ 7.76 | | $ 0.20 | | $ 2.69 | | $ 2.89 | | $ (0.24) | | $ — | | $ (0.24) | | $ 10.41 | | 37.82% | | $ 18,783 | | 1.54% | | 1.25% | | 2.11% | | 202% (12) |
| C | | 7.60 | | 0.09 | | 2.68 | | 2.77 | | (0.17) | | — | | (0.17) | | 10.20 | | 36.89 | | 659 | | 2.36 | | 2.00 | | 1.01 | | 202 (12) |
| I | | 7.76 | | 0.22 | | 2.70 | | 2.92 | | (0.26) | | — | | (0.26) | | 10.42 | | 38.30 | | 17,266 | | 1.20 | | 0.99 | | 2.31 | | 202 (12) |
| R3 | | 7.80 | | 0.17 | | 2.71 | | 2.88 | | (0.21) | | — | | (0.21) | | 10.47 | | 37.54 | | 120 | | 1.83 | | 1.50 | | 1.83 | | 202 (12) |
| R4 | | 7.79 | | 0.19 | | 2.72 | | 2.91 | | (0.24) | | — | | (0.24) | | 10.46 | | 38.00 | | 13 | | 1.53 | | 1.20 | | 2.03 | | 202 (12) |
| R5 | | 7.71 | | 0.23 | | 2.67 | | 2.90 | | (0.26) | | — | | (0.26) | | 10.35 | | 38.36 | | 310 | | 1.23 | | 0.95 | | 2.41 | | 202 (12) |
| Y | | 7.76 | | 0.23 | | 2.69 | | 2.92 | | (0.27) | | — | | (0.27) | | 10.41 | | 38.31 | | 60,539 | | 1.20 | | 0.90 | | 2.45 | | 202 (12) |
| F | | 7.76 | | 0.20 | | 2.73 | | 2.93 | | (0.27) | | — | | (0.27) | | 10.42 | | 38.45 | | 2,226 | | 1.11 | | 0.90 | | 2.20 | | 202 (12) |
| For the Year Ended October 31, 2020 |
| A | | $ 8.84 | | $ 0.13 | | $ (0.97) | | $ (0.84) | | $ (0.24) | | $ — | | $ (0.24) | | $ 7.76 | | (9.85)% | | $ 11,732 | | 1.54% | | 1.25% | | 1.58% | | 316% (12) |
| C | | 8.64 | | 0.07 | | (0.95) | | (0.88) | | (0.16) | | — | | (0.16) | | 7.60 | | (10.44) | | 1,732 | | 2.32 | | 2.00 | | 0.84 | | 316 (12) |
| I | | 8.83 | | 0.16 | | (0.96) | | (0.80) | | (0.27) | | — | | (0.27) | | 7.76 | | (9.50) | | 13,318 | | 1.15 | | 0.98 | | 1.92 | | 316 (12) |
| R3 | | 8.88 | | 0.11 | | (0.97) | | (0.86) | | (0.22) | | — | | (0.22) | | 7.80 | | (10.03) | | 82 | | 1.79 | | 1.50 | | 1.31 | | 316 (12) |
| R4 | | 8.86 | | 0.14 | | (0.98) | | (0.84) | | (0.23) | | — | | (0.23) | | 7.79 | | (9.82) | | 22 | | 1.48 | | 1.20 | | 1.70 | | 316 (12) |
| R5 | | 8.78 | | 0.14 | | (0.95) | | (0.81) | | (0.26) | | — | | (0.26) | | 7.71 | | (9.59) | | 115 | | 1.19 | | 0.95 | | 1.85 | | 316 (12) |
| Y | | 8.84 | | 0.16 | | (0.96) | | (0.80) | | (0.28) | | — | | (0.28) | | 7.76 | | (9.48) | | 46,915 | | 1.14 | | 0.90 | | 1.95 | | 316 (12) |
| F | | 8.83 | | 0.16 | | (0.95) | | (0.79) | | (0.28) | | — | | (0.28) | | 7.76 | | (9.43) | | 72,321 | | 1.07 | | 0.90 | | 1.99 | | 316 (12) |
| For the Year Ended October 31, 2019 |
| A | | $ 9.00 | | $ 0.20 | | $ (0.19) | | $ 0.01 | | $ (0.17) | | $ — | | $ (0.17) | | $ 8.84 | | 0.27% | | $ 14,360 | | 1.51% | | 1.25% | | 2.32% | | 201% |
| C | | 8.78 | | 0.13 | | (0.18) | | (0.05) | | (0.09) | | — | | (0.09) | | 8.64 | | (0.49) | | 3,038 | | 2.29 | | 2.00 | | 1.53 | | 201 |
| I | | 9.00 | | 0.23 | | (0.20) | | 0.03 | | (0.20) | | — | | (0.20) | | 8.83 | | 0.47 | | 38,226 | | 1.16 | | 0.99 | | 2.63 | | 201 |
| R3 | | 9.04 | | 0.18 | | (0.19) | | (0.01) | | (0.15) | | — | | (0.15) | | 8.88 | | 0.02 | | 70 | | 1.80 | | 1.50 | | 2.01 | | 201 |
| R4 | | 9.02 | | 0.20 | | (0.19) | | 0.01 | | (0.17) | | — | | (0.17) | | 8.86 | | 0.27 | | 59 | | 1.49 | | 1.20 | | 2.29 | | 201 |
| R5 | | 9.01 | | 0.23 | | (0.20) | | 0.03 | | (0.26) | | — | | (0.26) | | 8.78 | | 0.54 | | 39 | | 1.19 | | 0.95 | | 2.59 | | 201 |
| Y | | 9.00 | | 0.24 | | (0.19) | | 0.05 | | (0.21) | | — | | (0.21) | | 8.84 | | 0.67 | | 96,453 | | 1.14 | | 0.90 | | 2.68 | | 201 |
| F | | 9.00 | | 0.24 | | (0.20) | | 0.04 | | (0.21) | | — | | (0.21) | | 8.83 | | 0.55 | | 110,993 | | 1.08 | | 0.90 | | 2.67 | | 201 |
The accompanying notes are an integral part of these financial statements.
Hartford Multi-Strategy Funds
Financial Highlights – (continued)
| | | — Selected Per-Share Data(1) — | | — Ratios and Supplemental Data — |
| Class | | Net
Asset
Value at
Beginning
of Period | | Net
Investment
Income
(Loss) | | Net
Realized
and
Unrealized
Gain (Loss)
on
Investments | | Total from
Investment
Operations | | Dividends
from Net
Investment
Income | | Distributions
from
Capital
Gains | | Total
Dividends
and
Distributions | | Net
Asset
Value at
End of
Period | | Total
Return(2) | | Net
Assets
at End
of Period
(000s) | | Ratio of
Expenses
to
Average
Net
Assets
Before
Adjust-
ments(3)(4) | | Ratio of
Expenses
to
Average
Net
Assets
After
Adjust-
ments(3)(4) | | Ratio of
Net
Investment
Income
(Loss) to
Average
Net Assets(3) | | Portfolio
Turnover |
| The Hartford Global Real Asset Fund (consolidated) – (continued) |
| For the Year Ended October 31, 2018 |
| A | | $ 9.38 | | $ 0.14 | | $ (0.22) | | $ (0.08) | | $ (0.30) | | $ — | | $ (0.30) | | $ 9.00 | | (0.97)% | | $ 17,794 | | 1.55% | | 1.25% | | 1.48% | | 111% |
| C | | 9.15 | | 0.07 | | (0.23) | | (0.16) | | (0.21) | | — | | (0.21) | | 8.78 | | (1.71) | | 4,622 | | 2.31 | | 2.00 | | 0.73 | | 111 |
| I | | 9.38 | | 0.17 | | (0.22) | | (0.05) | | (0.33) | | — | | (0.33) | | 9.00 | | (0.68) | | 35,607 | | 1.17 | | 0.95 | | 1.77 | | 111 |
| R3 | | 9.40 | | 0.12 | | (0.23) | | (0.11) | | (0.25) | | — | | (0.25) | | 9.04 | | (1.26) | | 103 | | 1.83 | | 1.50 | | 1.23 | | 111 |
| R4 | | 9.39 | | 0.15 | | (0.21) | | (0.06) | | (0.31) | | — | | (0.31) | | 9.02 | | (0.82) | | 207 | | 1.53 | | 1.20 | | 1.59 | | 111 |
| R5 | | 9.39 | | 0.17 | | (0.22) | | (0.05) | | (0.33) | | — | | (0.33) | | 9.01 | | (0.68) | | 10 | | 1.22 | | 0.95 | | 1.82 | | 111 |
| Y | | 9.39 | | 0.17 | | (0.22) | | (0.05) | | (0.34) | | — | | (0.34) | | 9.00 | | (0.67) | | 128,897 | | 1.16 | | 0.90 | | 1.83 | | 111 |
| F | | 9.38 | | 0.17 | | (0.22) | | (0.05) | | (0.33) | | — | | (0.33) | | 9.00 | | (0.64) | | 111,062 | | 1.11 | | 0.90 | | 1.82 | | 111 |
| For the Year Ended October 31, 2017 |
| A | | $ 8.67 | | $ 0.11 | | $ 0.64 | | $ 0.75 | | $ (0.04) | | $ — | | $ (0.04) | | $ 9.38 | | 8.65% | | $ 16,990 | | 1.55% | | 1.25% | | 1.20% | | 103% |
| C | | 8.48 | | 0.04 | | 0.63 | | 0.67 | | — | | — | | — | | 9.15 | | 7.90 | | 7,138 | | 2.25 | | 2.00 | | 0.44 | | 103 |
| I | | 8.67 | | 0.13 | | 0.64 | | 0.77 | | (0.06) | | — | | (0.06) | | 9.38 | | 8.93 | | 29,092 | | 1.16 | | 0.99 | | 1.46 | | 103 |
| R3 | | 8.69 | | 0.08 | | 0.65 | | 0.73 | | (0.02) | | — | | (0.02) | | 9.40 | | 8.43 | | 151 | | 1.92 | | 1.50 | | 0.94 | | 103 |
| R4 | | 8.67 | | 0.11 | | 0.64 | | 0.75 | | (0.03) | | — | | (0.03) | | 9.39 | | 8.71 | | 433 | | 1.49 | | 1.20 | | 1.24 | | 103 |
| R5 | | 8.68 | | 0.14 | | 0.64 | | 0.78 | | (0.07) | | — | | (0.07) | | 9.39 | | 9.00 | | 67 | | 1.17 | | 0.95 | | 1.53 | | 103 |
| Y | | 8.68 | | 0.13 | | 0.65 | | 0.78 | | (0.07) | | — | | (0.07) | | 9.39 | | 9.01 | | 123,742 | | 1.09 | | 0.90 | | 1.46 | | 103 |
| F (5) | | 8.93 | | 0.11 | | 0.34 | | 0.45 | | — | | — | | — | | 9.38 | | 5.04 (6) | | 112,016 | | 1.08 (7) | | 0.90 (7) | | 1.79 (7) | | 103 |
| The Hartford Growth Allocation Fund |
| For the Year Ended October 31, 2021 |
| A | | $ 12.75 | | $ 0.11 | | $ 3.42 | | $ 3.53 | | $ (0.19) | | $ (0.37) | | $ (0.56) | | $ 15.72 | | 28.32% | | $ 591,999 | | 0.53% | | 0.52% | | 0.76% | | 14% |
| C | | 12.64 | | — (8) | | 3.39 | | 3.39 | | (0.08) | | (0.37) | | (0.45) | | 15.58 | | 27.24 | | 29,186 | | 1.33 | | 1.33 | | 0.03 | | 14 |
| I | | 12.69 | | 0.15 | | 3.39 | | 3.54 | | (0.23) | | (0.37) | | (0.60) | | 15.63 | | 28.57 | | 11,997 | | 0.29 | | 0.29 | | 0.99 | | 14 |
| R3 | | 12.44 | | 0.06 | | 3.33 | | 3.39 | | (0.15) | | (0.37) | | (0.52) | | 15.31 | | 27.85 | | 6,848 | | 0.87 | | 0.87 | | 0.42 | | 14 |
| R4 | | 12.69 | | 0.10 | | 3.40 | | 3.50 | | (0.18) | | (0.37) | | (0.55) | | 15.64 | | 28.17 | | 3,069 | | 0.57 | | 0.57 | | 0.71 | | 14 |
| R5 | | 12.78 | | 0.16 | | 3.41 | | 3.57 | | (0.23) | | (0.37) | | (0.60) | | 15.75 | | 28.58 | | 4,796 | | 0.26 | | 0.26 | | 1.05 | | 14 |
| F | | 12.70 | | 0.15 | | 3.41 | | 3.56 | | (0.24) | | (0.37) | | (0.61) | | 15.65 | | 28.74 | | 828 | | 0.15 | | 0.15 | | 1.02 | | 14 |
| For the Year Ended October 31, 2020 |
| A | | $ 12.81 | | $ 0.15 | | $ 0.35 | | $ 0.50 | | $ (0.19) | | $ (0.37) | | $ (0.56) | | $ 12.75 | | 3.90% | | $ 491,747 | | 0.56% | | 0.56% | | 1.21% | | 19% |
| C | | 12.69 | | 0.06 | | 0.34 | | 0.40 | | (0.08) | | (0.37) | | (0.45) | | 12.64 | | 3.10 | | 37,446 | | 1.35 | | 1.35 | | 0.47 | | 19 |
| I | | 12.75 | | 0.19 | | 0.35 | | 0.54 | | (0.23) | | (0.37) | | (0.60) | | 12.69 | | 4.23 | | 9,024 | | 0.25 | | 0.25 | | 1.56 | | 19 |
| R3 | | 12.48 | | 0.12 | | 0.34 | | 0.46 | | (0.13) | | (0.37) | | (0.50) | | 12.44 | | 3.64 | | 5,649 | | 0.87 | | 0.87 | | 0.96 | | 19 |
| R4 | | 12.74 | | 0.20 | | 0.30 | | 0.50 | | (0.18) | | (0.37) | | (0.55) | | 12.69 | | 3.92 | | 2,563 | | 0.55 | | 0.55 | | 1.62 | | 19 |
| R5 | | 12.83 | | 0.19 | | 0.36 | | 0.55 | | (0.23) | | (0.37) | | (0.60) | | 12.78 | | 4.26 | | 5,067 | | 0.27 | | 0.27 | | 1.51 | | 19 |
| F | | 12.76 | | 0.19 | | 0.36 | | 0.55 | | (0.24) | | (0.37) | | (0.61) | | 12.70 | | 4.31 | | 334 | | 0.16 | | 0.16 | | 1.53 | | 19 |
| For the Year Ended October 31, 2019 |
| A | | $ 12.07 | | $ 0.23 | | $ 0.94 | | $ 1.17 | | $ (0.29) | | $ (0.14) | | $ (0.43) | | $ 12.81 | | 10.25% | | $ 522,271 | | 0.55% | | 0.54% | | 1.90% | | 25% |
| C | | 11.83 | | 0.15 | | 0.92 | | 1.07 | | (0.07) | | (0.14) | | (0.21) | | 12.69 | | 9.33 | | 50,463 | | 1.33 | | 1.32 | | 1.22 | | 25 |
| I | | 12.02 | | 0.26 | | 0.93 | | 1.19 | | (0.32) | | (0.14) | | (0.46) | | 12.75 | | 10.54 | | 11,245 | | 0.24 | | 0.24 | | 2.16 | | 25 |
| R3 | | 11.77 | | 0.21 | | 0.88 | | 1.09 | | (0.24) | | (0.14) | | (0.38) | | 12.48 | | 9.81 | | 6,921 | | 0.86 | | 0.86 | | 1.74 | | 25 |
| R4 | | 12.00 | | 0.24 | | 0.91 | | 1.15 | | (0.27) | | (0.14) | | (0.41) | | 12.74 | | 10.15 | | 5,657 | | 0.57 | | 0.57 | | 2.01 | | 25 |
| R5 | | 12.10 | | 0.27 | | 0.92 | | 1.19 | | (0.32) | | (0.14) | | (0.46) | | 12.83 | | 10.44 | | 5,692 | | 0.25 | | 0.25 | | 2.22 | | 25 |
| F | | 12.03 | | 0.22 | | 0.98 | | 1.20 | | (0.33) | | (0.14) | | (0.47) | | 12.76 | | 10.65 | | 252 | | 0.15 | | 0.15 | | 1.77 | | 25 |
The accompanying notes are an integral part of these financial statements.
Hartford Multi-Strategy Funds
Financial Highlights – (continued)
| | | — Selected Per-Share Data(1) — | | — Ratios and Supplemental Data — |
| Class | | Net
Asset
Value at
Beginning
of Period | | Net
Investment
Income
(Loss) | | Net
Realized
and
Unrealized
Gain (Loss)
on
Investments | | Total from
Investment
Operations | | Dividends
from Net
Investment
Income | | Distributions
from
Capital
Gains | | Total
Dividends
and
Distributions | | Net
Asset
Value at
End of
Period | | Total
Return(2) | | Net
Assets
at End
of Period
(000s) | | Ratio of
Expenses
to
Average
Net
Assets
Before
Adjust-
ments(3)(4) | | Ratio of
Expenses
to
Average
Net
Assets
After
Adjust-
ments(3)(4) | | Ratio of
Net
Investment
Income
(Loss) to
Average
Net Assets(3) | | Portfolio
Turnover |
| The Hartford Growth Allocation Fund – (continued) |
| For the Year Ended October 31, 2018 |
| A | | $ 12.32 | | $ 0.22 | | $ (0.18) | | $ 0.04 | | $ (0.29) | | $ — | | $ (0.29) | | $ 12.07 | | 0.28% | | $ 504,720 | | 0.54% | | 0.54% | | 1.78% | | 32% |
| C | | 12.07 | | 0.13 | | (0.17) | | (0.04) | | (0.20) | | — | | (0.20) | | 11.83 | | (0.41) | | 64,208 | | 1.30 | | 1.29 | | 1.09 | | 32 |
| I | | 12.27 | | 0.26 | | (0.18) | | 0.08 | | (0.33) | | — | | (0.33) | | 12.02 | | 0.60 | | 11,033 | | 0.24 | | 0.24 | | 2.05 | | 32 |
| R3 | | 12.02 | | 0.18 | | (0.18) | | — | | (0.25) | | — | | (0.25) | | 11.77 | | (0.06) | | 10,776 | | 0.86 | | 0.86 | | 1.43 | | 32 |
| R4 | | 12.25 | | 0.23 | | (0.19) | | 0.04 | | (0.29) | | — | | (0.29) | | 12.00 | | 0.24 | | 8,129 | | 0.56 | | 0.56 | | 1.86 | | 32 |
| R5 | | 12.35 | | 0.24 | | (0.16) | | 0.08 | | (0.33) | | — | | (0.33) | | 12.10 | | 0.55 | | 5,706 | | 0.26 | | 0.26 | | 1.93 | | 32 |
| F | | 12.28 | | 0.27 | | (0.18) | | 0.09 | | (0.34) | | — | | (0.34) | | 12.03 | | 0.66 | | 11 | | 0.15 | | 0.15 | | 2.12 | | 32 |
| For the Year Ended October 31, 2017 |
| A | | $ 10.35 | | $ 0.07 | | $ 1.95 | | $ 2.02 | | $ (0.05) | | $ — | | $ (0.05) | | $ 12.32 | | 19.54% | | $ 503,042 | | 0.53% | | 0.52% | | 0.63% | | 11% (13) |
| C | | 10.17 | | (0.01) | | 1.91 | | 1.90 | | — | | — | | — | | 12.07 | | 18.68 | | 140,855 | | 1.27 | | 1.27 | | (0.10) | | 11 (13) |
| I | | 10.31 | | 0.10 | | 1.94 | | 2.04 | | (0.08) | | — | | (0.08) | | 12.27 | | 19.91 | | 10,468 | | 0.22 | | 0.22 | | 0.87 | | 11 (13) |
| R3 | | 10.09 | | 0.03 | | 1.91 | | 1.94 | | (0.01) | | — | | (0.01) | | 12.02 | | 19.26 | | 11,840 | | 0.86 | | 0.86 | | 0.29 | | 11 (13) |
| R4 | | 10.29 | | 0.07 | | 1.94 | | 2.01 | | (0.05) | | — | | (0.05) | | 12.25 | | 19.56 | | 10,699 | | 0.55 | | 0.55 | | 0.64 | | 11 (13) |
| R5 | | 10.37 | | 0.10 | | 1.96 | | 2.06 | | (0.08) | | — | | (0.08) | | 12.35 | | 19.98 | | 5,709 | | 0.25 | | 0.25 | | 0.86 | | 11 (13) |
| F (5) | | 11.07 | | 0.04 | | 1.17 | | 1.21 | | — | | — | | — | | 12.28 | | 10.93 (6) | | 11 | | 0.15 (7) | | 0.15 (7) | | 0.47 (7) | | 11 (13) |
| Hartford Moderate Allocation Fund |
| For the Year Ended October 31, 2021 |
| A | | $ 11.91 | | $ 0.11 | | $ 2.32 | | $ 2.43 | | $ (0.19) | | $ (0.29) | | $ (0.48) | | $ 13.86 | | 20.72% | | $ 365,226 | | 0.52% | | 0.52% | | 0.85% | | 14% |
| C | | 11.77 | | 0.02 | | 2.27 | | 2.29 | | (0.08) | | (0.29) | | (0.37) | | 13.69 | | 19.70 | | 16,605 | | 1.31 | | 1.31 | | 0.14 | | 14 |
| I | | 11.97 | | 0.15 | | 2.32 | | 2.47 | | (0.22) | | (0.29) | | (0.51) | | 13.93 | | 21.01 | | 11,018 | | 0.26 | | 0.26 | | 1.12 | | 14 |
| R3 | | 11.72 | | 0.06 | | 2.28 | | 2.34 | | (0.14) | | (0.29) | | (0.43) | | 13.63 | | 20.27 | | 15,765 | | 0.87 | | 0.87 | | 0.48 | | 14 |
| R4 | | 11.94 | | 0.11 | | 2.31 | | 2.42 | | (0.18) | | (0.29) | | (0.47) | | 13.89 | | 20.63 | | 3,307 | | 0.58 | | 0.58 | | 0.80 | | 14 |
| R5 | | 11.98 | | 0.14 | | 2.33 | | 2.47 | | (0.22) | | (0.29) | | (0.51) | | 13.94 | | 20.97 | | 7,685 | | 0.27 | | 0.27 | | 1.07 | | 14 |
| F | | 11.98 | | 0.16 | | 2.32 | | 2.48 | | (0.23) | | (0.29) | | (0.52) | | 13.94 | | 21.09 | | 555 | | 0.17 | | 0.17 | | 1.20 | | 14 |
| For the Year Ended October 31, 2020 |
| A | | $ 11.87 | | $ 0.16 | | $ 0.30 | | $ 0.46 | | $ (0.24) | | $ (0.18) | | $ (0.42) | | $ 11.91 | | 3.87% | | $ 314,358 | | 0.54% | | 0.54% | | 1.41% | | 27% |
| C | | 11.72 | | 0.08 | | 0.28 | | 0.36 | | (0.13) | | (0.18) | | (0.31) | | 11.77 | | 3.08 | | 26,485 | | 1.33 | | 1.33 | | 0.69 | | 27 |
| I | | 11.93 | | 0.20 | | 0.29 | | 0.49 | | (0.27) | | (0.18) | | (0.45) | | 11.97 | | 4.15 | | 9,115 | | 0.25 | | 0.25 | | 1.70 | | 27 |
| R3 | | 11.67 | | 0.12 | | 0.30 | | 0.42 | | (0.19) | | (0.18) | | (0.37) | | 11.72 | | 3.58 | | 13,491 | | 0.87 | | 0.87 | | 1.08 | | 27 |
| R4 | | 11.86 | | 0.16 | | 0.30 | | 0.46 | | (0.20) | | (0.18) | | (0.38) | | 11.94 | | 3.90 | | 3,503 | | 0.53 | | 0.53 | | 1.38 | | 27 |
| R5 | | 11.94 | | 0.20 | | 0.29 | | 0.49 | | (0.27) | | (0.18) | | (0.45) | | 11.98 | | 4.14 | | 5,520 | | 0.28 | | 0.28 | | 1.74 | | 27 |
| F | | 11.93 | | 0.20 | | 0.31 | | 0.51 | | (0.28) | | (0.18) | | (0.46) | | 11.98 | | 4.32 | | 347 | | 0.17 | | 0.17 | | 1.75 | | 27 |
| For the Year Ended October 31, 2019 |
| A | | $ 11.80 | | $ 0.28 | | $ 0.74 | | $ 1.02 | | $ (0.31) | | $ (0.64) | | $ (0.95) | | $ 11.87 | | 9.72% | | $ 328,639 | | 0.54% | | 0.53% | | 2.46% | | 25% |
| C | | 11.54 | | 0.20 | | 0.74 | | 0.94 | | (0.12) | | (0.64) | | (0.76) | | 11.72 | | 8.96 | | 35,454 | | 1.31 | | 1.30 | | 1.79 | | 25 |
| I | | 11.85 | | 0.33 | | 0.73 | | 1.06 | | (0.34) | | (0.64) | | (0.98) | | 11.93 | | 10.08 | | 9,817 | | 0.25 | | 0.25 | | 2.85 | | 25 |
| R3 | | 11.60 | | 0.25 | | 0.72 | | 0.97 | | (0.26) | | (0.64) | | (0.90) | | 11.67 | | 9.38 | | 14,880 | | 0.87 | | 0.87 | | 2.19 | | 25 |
| R4 | | 11.79 | | 0.31 | | 0.70 | | 1.01 | | (0.30) | | (0.64) | | (0.94) | | 11.86 | | 9.65 | | 3,325 | | 0.58 | | 0.58 | | 2.73 | | 25 |
| R5 | | 11.85 | | 0.30 | | 0.76 | | 1.06 | | (0.33) | | (0.64) | | (0.97) | | 11.94 | | 10.11 | | 5,788 | | 0.26 | | 0.26 | | 2.63 | | 25 |
| F | | 11.86 | | 0.21 | | 0.85 | | 1.06 | | (0.35) | | (0.64) | | (0.99) | | 11.93 | | 10.08 | | 252 | | 0.17 | | 0.17 | | 1.81 | | 25 |
The accompanying notes are an integral part of these financial statements.
Hartford Multi-Strategy Funds
Financial Highlights – (continued)
| | | — Selected Per-Share Data(1) — | | — Ratios and Supplemental Data — |
| Class | | Net
Asset
Value at
Beginning
of Period | | Net
Investment
Income
(Loss) | | Net
Realized
and
Unrealized
Gain (Loss)
on
Investments | | Total from
Investment
Operations | | Dividends
from Net
Investment
Income | | Distributions
from
Capital
Gains | | Total
Dividends
and
Distributions | | Net
Asset
Value at
End of
Period | | Total
Return(2) | | Net
Assets
at End
of Period
(000s) | | Ratio of
Expenses
to
Average
Net
Assets
Before
Adjust-
ments(3)(4) | | Ratio of
Expenses
to
Average
Net
Assets
After
Adjust-
ments(3)(4) | | Ratio of
Net
Investment
Income
(Loss) to
Average
Net Assets(3) | | Portfolio
Turnover |
| Hartford Moderate Allocation Fund – (continued) |
| For the Year Ended October 31, 2018 |
| A | | $ 12.42 | | $ 0.30 | | $ (0.32) | | $ (0.02) | | $ (0.33) | | $ (0.27) | | $ (0.60) | | $ 11.80 | | (0.29)% | | $ 329,641 | | 0.53% | | 0.52% | | 2.44% | | 32% |
| C | | 12.16 | | 0.21 | | (0.33) | | (0.12) | | (0.23) | | (0.27) | | (0.50) | | 11.54 | | (1.08) | | 46,067 | | 1.28 | | 1.28 | | 1.74 | | 32 |
| I | | 12.48 | | 0.31 | | (0.31) | | — | | (0.36) | | (0.27) | | (0.63) | | 11.85 | | (0.08) | | 11,014 | | 0.25 | | 0.25 | | 2.51 | | 32 |
| R3 | | 12.23 | | 0.26 | | (0.33) | | (0.07) | | (0.29) | | (0.27) | | (0.56) | | 11.60 | | (0.72) | | 17,865 | | 0.87 | | 0.87 | | 2.15 | | 32 |
| R4 | | 12.41 | | 0.30 | | (0.33) | | (0.03) | | (0.32) | | (0.27) | | (0.59) | | 11.79 | | (0.33) | | 7,104 | | 0.58 | | 0.58 | | 2.41 | | 32 |
| R5 | | 12.48 | | 0.33 | | (0.33) | | — | | (0.36) | | (0.27) | | (0.63) | | 11.85 | | (0.12) | | 6,283 | | 0.27 | | 0.27 | | 2.65 | | 32 |
| F | | 12.48 | | 0.34 | | (0.32) | | 0.02 | | (0.37) | | (0.27) | | (0.64) | | 11.86 | | 0.07 | | 11 | | 0.16 | | 0.16 | | 2.74 | | 32 |
| For the Year Ended October 31, 2017 |
| A | | $ 10.90 | | $ 0.10 | | $ 1.52 | | $ 1.62 | | $ (0.10) | | $ — | | $ (0.10) | | $ 12.42 | | 15.02% | | $ 333,803 | | 0.52% | | 0.51% | | 0.89% | | 14% (14) |
| C | | 10.66 | | 0.02 | | 1.50 | | 1.52 | | (0.02) | | — | | (0.02) | | 12.16 | | 14.25 | | 96,532 | | 1.26 | | 1.25 | | 0.17 | | 14 (14) |
| I | | 10.95 | | 0.13 | | 1.54 | | 1.67 | | (0.14) | | — | | (0.14) | | 12.48 | | 15.40 | | 9,319 | | 0.23 | | 0.23 | | 1.13 | | 14 (14) |
| R3 | | 10.73 | | 0.06 | | 1.51 | | 1.57 | | (0.07) | | — | | (0.07) | | 12.23 | | 14.70 | | 22,023 | | 0.87 | | 0.87 | | 0.53 | | 14 (14) |
| R4 | | 10.89 | | 0.09 | | 1.53 | | 1.62 | | (0.10) | | — | | (0.10) | | 12.41 | | 15.00 | | 7,528 | | 0.57 | | 0.57 | | 0.82 | | 14 (14) |
| R5 | | 10.95 | | 0.13 | | 1.54 | | 1.67 | | (0.14) | | — | | (0.14) | | 12.48 | | 15.38 | | 6,508 | | 0.26 | | 0.26 | | 1.13 | | 14 (14) |
| F (5) | | 11.48 | | 0.06 | | 0.94 | | 1.00 | | — | | — | | — | | 12.48 | | 8.71 (6) | | 11 | | 0.16 (7) | | 0.16 (7) | | 0.69 (7) | | 14 (14) |
| Hartford Multi-Asset Income Fund |
| For the Year Ended October 31, 2021 |
| A | | $ 19.61 | | $ 0.58 | | $ 2.15 | | $ 2.73 | | $ (0.57) | | $ — | | $ (0.57) | | $ 21.77 | | 14.01% | | $ 622,085 | | 1.01% | | 1.00% | | 2.69% | | 63% (15) |
| C | | 19.65 | | 0.41 | | 2.18 | | 2.59 | | (0.39) | | — | | (0.39) | | 21.85 | | 13.23 | | 59,640 | | 1.73 | | 1.73 | | 1.93 | | 63 (15) |
| I | | 19.58 | | 0.64 | | 2.16 | | 2.80 | | (0.64) | | — | | (0.64) | | 21.74 | | 14.41 | | 99,967 | | 0.70 | | 0.70 | | 2.99 | | 63 (15) |
| R3 | | 19.89 | | 0.52 | | 2.20 | | 2.72 | | (0.50) | | — | | (0.50) | | 22.11 | | 13.75 | | 1,044 | | 1.34 | | 1.26 | | 2.39 | | 63 (15) |
| R4 | | 19.95 | | 0.59 | | 2.19 | | 2.78 | | (0.57) | | — | | (0.57) | | 22.16 | | 13.99 | | 971 | | 1.04 | | 1.04 | | 2.69 | | 63 (15) |
| R5 | | 19.94 | | 0.64 | | 2.20 | | 2.84 | | (0.63) | | — | | (0.63) | | 22.15 | | 14.35 | | 154 | | 0.74 | | 0.74 | | 2.95 | | 63 (15) |
| R6 | | 19.95 | | 0.67 | | 2.19 | | 2.86 | | (0.66) | | — | | (0.66) | | 22.15 | | 14.44 | | 342 | | 0.63 | | 0.63 | | 3.07 | | 63 |
| Y | | 19.96 | | 0.64 | | 2.21 | | 2.85 | | (0.64) | | — | | (0.64) | | 22.17 | | 14.35 | | 7,238 | | 0.73 | | 0.73 | | 2.95 | | 63 (15) |
| F | | 19.57 | | 0.65 | | 2.16 | | 2.81 | | (0.66) | | — | | (0.66) | | 21.72 | | 14.47 | | 84,040 | | 0.63 | | 0.63 | | 3.06 | | 63 (15) |
| For the Year Ended October 31, 2020 |
| A | | $ 23.33 | | $ 0.67 | | $ (0.66) | | $ 0.01 | | $ (0.74) | | $ (2.99) | | $ (3.73) | | $ 19.61 | | (0.04)% | | $ 589,745 | | 1.03% | | 1.03% | | 3.35% | | 86% (15) |
| C | | 23.36 | | 0.53 | | (0.67) | | (0.14) | | (0.58) | | (2.99) | | (3.57) | | 19.65 | | (0.83) | | 77,719 | | 1.75 | | 1.75 | | 2.63 | | 86 (15) |
| I | | 23.32 | | 0.74 | | (0.67) | | 0.07 | | (0.82) | | (2.99) | | (3.81) | | 19.58 | | 0.19 | | 98,762 | | 0.70 | | 0.70 | | 3.67 | | 86 (15) |
| R3 | | 23.61 | | 4.32 | | (4.37) | | (0.05) | | (0.68) | | (2.99) | | (3.67) | | 19.89 | | (0.36) | | 1,203 | | 1.35 | | 1.27 | | 3.13 | | 86 (15) |
| R4 | | 23.67 | | 0.38 | | (0.38) | | 0.00 (8) | | (0.73) | | (2.99) | | (3.72) | | 19.95 | | (0.13) | | 527 | | 1.05 | | 1.05 | | 3.37 | | 86 (15) |
| R5 | | 23.67 | | 0.26 | | (0.20) | | 0.06 | | (0.80) | | (2.99) | | (3.79) | | 19.94 | | 0.18 | | 141 | | 0.75 | | 0.75 | | 3.66 | | 86 (15) |
| R6 | | 23.68 | | 0.59 | | (0.50) | | 0.09 | | (0.83) | | (2.99) | | (3.82) | | 19.95 | | 0.33 | | 306 | | 0.64 | | 0.64 | | 3.70 | | 86 (15) |
| Y | | 23.69 | | 0.75 | | (0.67) | | 0.08 | | (0.82) | | (2.99) | | (3.81) | | 19.96 | | 0.23 | | 10,812 | | 0.74 | | 0.70 | | 3.66 | | 86 (15) |
| F | | 23.31 | | 0.75 | | (0.67) | | 0.08 | | (0.83) | | (2.99) | | (3.82) | | 19.57 | | 0.26 | | 83,111 | | 0.64 | | 0.64 | | 3.74 | | 86 (15) |
| For the Year Ended October 31, 2019 |
| A | | $ 23.62 | | $ 0.65 | | $ 1.23 | | $ 1.88 | | $ (0.77) | | $ (1.40) | | $ (2.17) | | $ 23.33 | | 8.81% | | $ 666,684 | | 1.02% | | 1.01% | | 2.85% | | 83% |
| C | | 23.61 | | 0.48 | | 1.24 | | 1.72 | | (0.57) | | (1.40) | | (1.97) | | 23.36 | | 8.08 | | 106,874 | | 1.73 | | 1.73 | | 2.11 | | 83 |
| I | | 23.61 | | 0.75 | | 1.21 | | 1.96 | | (0.85) | | (1.40) | | (2.25) | | 23.32 | | 9.21 | | 104,284 | | 0.69 | | 0.69 | | 3.27 | | 83 |
| R3 | | 23.86 | | 0.59 | | 1.25 | | 1.84 | | (0.69) | | (1.40) | | (2.09) | | 23.61 | | 8.56 | | 1,843 | | 1.35 | | 1.29 | | 2.56 | | 83 |
| R4 | | 23.91 | | 0.59 | | 1.32 | | 1.91 | | (0.75) | | (1.40) | | (2.15) | | 23.67 | | 8.84 | | 1,301 | | 1.04 | | 1.04 | | 2.55 | | 83 |
| R5 | | 23.94 | | 0.80 | | 1.17 | | 1.97 | | (0.84) | | (1.40) | | (2.24) | | 23.67 | | 9.13 | | 349 | | 0.74 | | 0.74 | | 3.42 | | 83 |
| R6 | | 23.95 | | 0.70 | | 1.30 | | 2.00 | | (0.87) | | (1.40) | | (2.27) | | 23.68 | | 9.24 | | 131 | | 0.63 | | 0.63 | | 3.02 | | 83 |
| Y | | 23.95 | | 0.74 | | 1.25 | | 1.99 | | (0.85) | | (1.40) | | (2.25) | | 23.69 | | 9.21 | | 13,185 | | 0.70 | | 0.68 | | 3.19 | | 83 |
| F | | 23.61 | | 0.74 | | 1.22 | | 1.96 | | (0.86) | | (1.40) | | (2.26) | | 23.31 | | 9.29 | | 97,529 | | 0.62 | | 0.62 | | 3.23 | | 83 |
The accompanying notes are an integral part of these financial statements.
Hartford Multi-Strategy Funds
Financial Highlights – (continued)
| | | — Selected Per-Share Data(1) — | | — Ratios and Supplemental Data — |
| Class | | Net
Asset
Value at
Beginning
of Period | | Net
Investment
Income
(Loss) | | Net
Realized
and
Unrealized
Gain (Loss)
on
Investments | | Total from
Investment
Operations | | Dividends
from Net
Investment
Income | | Distributions
from
Capital
Gains | | Total
Dividends
and
Distributions | | Net
Asset
Value at
End of
Period | | Total
Return(2) | | Net
Assets
at End
of Period
(000s) | | Ratio of
Expenses
to
Average
Net
Assets
Before
Adjust-
ments(3)(4) | | Ratio of
Expenses
to
Average
Net
Assets
After
Adjust-
ments(3)(4) | | Ratio of
Net
Investment
Income
(Loss) to
Average
Net Assets(3) | | Portfolio
Turnover |
| Hartford Multi-Asset Income Fund – (continued) |
| For the Year Ended October 31, 2018 |
| A | | $ 23.53 | | $ 0.36 | | $ 0.05 | | $ 0.41 | | $ (0.32) | | $ — | | $ (0.32) | | $ 23.62 | | 1.76% | | $ 650,813 | | 1.05% | | 1.04% | | 1.48% | | 65% |
| C | | 23.53 | | 0.19 | | 0.04 | | 0.23 | | (0.15) | | — | | (0.15) | | 23.61 | | 0.99 | | 109,060 | | 1.77 | | 1.76 | | 0.77 | | 65 |
| I | | 23.53 | | 0.43 | | 0.05 | | 0.48 | | (0.40) | | — | | (0.40) | | 23.61 | | 2.05 | | 56,280 | | 0.73 | | 0.73 | | 1.79 | | 65 |
| R3 | | 23.77 | | 0.29 | | 0.05 | | 0.34 | | (0.25) | | — | | (0.25) | | 23.86 | | 1.45 | | 1,794 | | 1.38 | | 1.33 | | 1.19 | | 65 |
| R4 | | 23.82 | | 0.36 | | 0.05 | | 0.41 | | (0.32) | | — | | (0.32) | | 23.91 | | 1.73 | | 2,669 | | 1.07 | | 1.06 | | 1.44 | | 65 |
| R5 | | 23.85 | | 0.43 | | 0.05 | | 0.48 | | (0.39) | | — | | (0.39) | | 23.94 | | 2.03 | | 134 | | 0.78 | | 0.76 | | 1.75 | | 65 |
| R6 (16) | | 24.62 | | 0.27 | | (0.62) (17) | | (0.35) | | (0.32) | | — | | (0.32) | | 23.95 | | (1.40) (6) | | 1,586 | | 0.63 (7) | | 0.63 (7) | | 1.65 (7) | | 65 |
| Y | | 23.86 | | 0.45 | | 0.05 | | 0.50 | | (0.41) | | — | | (0.41) | | 23.95 | | 2.10 | | 15,367 | | 0.70 | | 0.70 | | 1.82 | | 65 |
| F | | 23.52 | | 0.45 | | 0.06 | | 0.51 | | (0.42) | | — | | (0.42) | | 23.61 | | 2.12 | | 97,776 | | 0.65 | | 0.65 | | 1.87 | | 65 |
| For the Year Ended October 31, 2017 |
| A | | $ 20.76 | | $ 0.31 | | $ 2.74 | | $ 3.05 | | $ (0.28) | | $ — | | $ (0.28) | | $ 23.53 | | 14.76% | | $ 628,048 | | 1.11% | | 1.10% | | 1.37% | | 34% |
| C | | 20.76 | | 0.15 | | 2.74 | | 2.89 | | (0.12) | | — | | (0.12) | | 23.53 | | 13.95 | | 168,686 | | 1.82 | | 1.81 | | 0.67 | | 34 |
| I | | 20.76 | | 0.36 | | 2.74 | | 3.10 | | (0.33) | | — | | (0.33) | | 23.53 | | 15.02 | | 52,216 | | 0.88 | | 0.88 | | 1.61 | | 34 |
| R3 | | 20.97 | | 0.25 | | 2.76 | | 3.01 | | (0.21) | | — | | (0.21) | | 23.77 | | 14.40 | | 2,412 | | 1.45 | | 1.40 | | 1.11 | | 34 |
| R4 | | 21.02 | | 0.30 | | 2.78 | | 3.08 | | (0.28) | | — | | (0.28) | | 23.82 | | 14.75 | | 1,464 | | 1.15 | | 1.10 | | 1.32 | | 34 |
| R5 | | 21.04 | | 0.38 | | 2.77 | | 3.15 | | (0.34) | | — | | (0.34) | | 23.85 | | 15.09 | | 139 | | 0.87 | | 0.80 | | 1.71 | | 34 |
| Y | | 21.05 | | 0.38 | | 2.79 | | 3.17 | | (0.36) | | — | | (0.36) | | 23.86 | | 15.16 | | 12,753 | | 0.75 | | 0.75 | | 1.68 | | 34 |
| F (5) | | 22.21 | | 0.20 | | 1.39 | | 1.59 | | (0.28) | | — | | (0.28) | | 23.52 | | 7.23 (6) | | 69,874 | | 0.72 (7) | | 0.72 (7) | | 1.25 (7) | | 34 |
| FINANCIAL HIGHLIGHTS FOOTNOTES |
| (1) | Information presented relates to a share outstanding throughout the indicated period. Net investment income (loss) per share amounts are calculated based on average shares outstanding unless otherwise noted. |
| (2) | Assumes initial investment at net asset value at the beginning of each period, reinvestment of all distributions, the complete redemption of the investment at net asset value at the end of each period and no sales charge. Total return would be reduced if sales charges were taken into account. |
| (3) | Ratios do not include expenses of the Underlying Funds and/or ETFs/ETNs, if applicable. |
| (4) | Adjustments include waivers and reimbursements, if applicable. Ratios do not include fees paid indirectly (see Expenses in the accompanying Notes to Financial Statements). |
| (5) | Commenced operations on February 28, 2017. |
| (6) | Not annualized. |
| (7) | Annualized. |
| (8) | Per share amount is less than $0.005. |
| (9) | Portfolio turnover excludes TBA roll transactions. Had TBA roll transactions been included, the portfolio turnover rate would have been 204%. |
| (10) | Commenced operations on February 28, 2019. |
| (11) | Excludes transactions related to the change of investments of share classes from Class Y to Class F; including these transactions the portfolio turnover rate would have been 115%, for the year ended October 31, 2017. |
| (12) | Portfolio turnover excludes TBA roll transactions. Had TBA roll transactions been included, the portfolio turnover rate would have been 202% and 319% for the fiscal years ended October 31, 2021 and October 31, 2020, respectively. |
| (13) | Excludes transactions related to the change of investments of share classes from Class Y to Class F; including these transactions the portfolio turnover rate would have been 110%, for the year ended October 31, 2017. |
| (14) | Excludes transactions related to the change of investments of share classes from Class Y to Class F; including these transactions the portfolio turnover rate would have been 113%, for the year ended October 31, 2017. |
| (15) | Portfolio turnover excludes TBA roll transactions. Had TBA roll transactions been included, the portfolio turnover rate would have been 63% and 91% for the fiscal years ended October 31, 2021 and October 31, 2020, respectively. |
| (16) | Commenced operations on February 28, 2018. |
| (17) | Per share amount was not in accord with the net realized and unrealized gain (loss) for the period because of the timing of transactions in shares of the Fund and the amount and timing of per-share net realized and unrealized gain (loss) on such shares. |
The accompanying notes are an integral part of these financial statements.
Hartford Multi-Strategy Funds
Notes to Financial Statements
October 31, 2021
| 1. | Organization: |
| | The Hartford Mutual Funds, Inc. (the "Company") is an open-end registered management investment company comprised of thirty-six series, as of October 31, 2021. Financial statements for the series of the Company listed below (each a “Fund” and collectively, the “Funds”) are included in this report. |
| | |
| The Hartford Mutual Funds, Inc.: |
| The Hartford Balanced Income Fund (the "Balanced Income Fund") |
| Hartford AARP Balanced Retirement Fund (the "Balanced Retirement Fund") |
| The Hartford Checks and Balances Fund (the "Checks and Balances Fund") |
| The Hartford Conservative Allocation Fund (the "Conservative Allocation Fund") |
| The Hartford Global Real Asset Fund (the "Global Real Asset Fund") |
| The Hartford Growth Allocation Fund (the "Growth Allocation Fund") |
| Hartford Moderate Allocation Fund (the "Moderate Allocation Fund") |
| Hartford Multi-Asset Income Fund (the "Multi-Asset Income Fund") (formerly, Hartford Multi-Asset Income and Growth Fund) |
The assets of each Fund are separate, and a shareholder's interest is limited to the Fund in which shares are held. The Company is organized under the laws of the State of Maryland and is registered with the U.S. Securities and Exchange Commission (the “SEC”) under the Investment Company Act of 1940, as amended (the “1940 Act”). Each Fund is a diversified open-end management investment company. Each Fund applies specialized accounting and reporting standards under Accounting Standards Codification Topic 946, "Financial Services – Investment Companies".
Each Fund has registered for sale Class A, Class C, Class I, Class R3, Class R4, Class R5 and Class F shares. Balanced Income Fund, Balanced Retirement Fund, and Multi-Asset Income Fund have registered for sale Class R6 shares. Also, each Fund, except Checks and Balances Fund, Conservative Allocation Fund, Growth Allocation Fund and Moderate Allocation Fund, has registered for sale Class Y shares. Class A shares of each Fund, except Balanced Retirement Fund, are sold with a front-end sales charge of up to 5.50%. Balanced Retirement Fund's Class A shares are sold with a front-end sales charge of up to 4.50%. Class C shares of each Fund are sold with a contingent deferred sales charge of up to 1.00% on shares redeemed within twelve months of purchase. Effective April 1, 2021, Class C shares automatically convert to Class A shares of the same Fund after eight years provided that the Fund or the financial intermediary has records verifying that the Class C shares have been held for at least eight years. Classes I, R3, R4, R5, R6, Y and F shares do not have a sales charge. For more information, please see the Funds' prospectus.
Each of the Balanced Retirement Fund, Checks and Balances Fund, Conservative Allocation Fund, Growth Allocation Fund and Moderate Allocation Fund invested in affiliated mutual funds and affiliated exchange-traded funds (“Affiliated Investment Companies” or "Underlying Funds") during the year ended October 31, 2021.
Hartford Funds Management Company, LLC (“HFMC” or “Investment Manager”) serves as the investment manager to each Fund.
The Investment Manager and The Hartford Mutual Funds, Inc. have entered into a licensing arrangement with AARP, Inc. (“AARP”) under which AARP receives a royalty from the Investment Manager out of its own resources for licensing its brand to the Hartford AARP Balanced Retirement Fund. Hartford AARP Balanced Retirement Fund is managed by the Investment Manager, an investment adviser registered with the SEC, and distributed by Hartford Funds Distributors, LLC, a broker-dealer registered with the SEC and an affiliate of the Investment Manager. The Investment Manager and its affiliates are not affiliated with AARP and its affiliates. AARP and its affiliates are not broker-dealers or investment advisers and are not acting in any such capacity with respect to Hartford AARP Balanced Retirement Fund. AARP and its affiliates do not offer, recommend, or endorse the Investment Manager or any of its affiliates and are not making any recommendations regarding an investment in Hartford AARP Balanced Retirement Fund.
| 2. | Significant Accounting Policies: |
| | The following is a summary of significant accounting policies of each Fund used in the preparation of its financial statements, which are in accordance with United States Generally Accepted Accounting Principles (“U.S. GAAP”). The preparation of financial statements in accordance with U.S. GAAP may require management to make estimates and assumptions that affect the reported amounts of assets and liabilities and disclosure of contingent assets and liabilities at the date of the financial statements and the reported amounts of increases and decreases in net assets from operations during the reporting period. Actual results could differ from those estimates. |
| a) | Determination of Net Asset Value – The net asset value ("NAV") of each class of each Fund’s shares is determined as of the close of regular trading on the New York Stock Exchange (the "Exchange") (normally 4:00 p.m. Eastern Time) (the “NYSE Close”) on each day that the Exchange is open ("Valuation Date"). If the Exchange is closed due to weather or other extraordinary circumstances on a day it would |
Hartford Multi-Strategy Funds
Notes to Financial Statements – (continued)
October 31, 2021
| | typically be open for business, each Fund may treat such day as a typical business day and accept purchase and redemption orders and calculate each Fund’s NAV in accordance with applicable law. The NAV of each class of each Fund's shares is determined by dividing the value of the Fund’s net assets attributable to the class of shares by the number of shares outstanding for that class. Information that becomes known to the Funds after the NAV has been calculated on a particular day will not generally be used to retroactively adjust the NAV determined earlier that day. |
| b) | Investment Valuation and Fair Value Measurements – For purposes of calculating the NAV of each class of each Fund, portfolio securities and other assets held in a Fund’s portfolio for which market prices are readily available are valued at market value. Market value is generally determined on the basis of official close price or last reported trade price. If no trades were reported, market value is based on prices obtained from a quotation reporting system, established market makers (including evaluated prices), or independent pricing services. Pricing vendors may use matrix pricing or valuation models that utilize certain inputs and assumptions to derive values, including transaction data, credit quality information, general market conditions, news, and other factors and assumptions. |
| | If market prices are not readily available or are deemed unreliable, a Fund will use the fair value of the security or other instrument as determined in good faith under policies and procedures established by and under the supervision of the Board of Directors of the Company (the “Board of Directors”) (“Valuation Procedures”). Market prices are considered not readily available where there is an absence of current or reliable market-based data (e.g., trade information or broker quotes), including where events occur after the close of the relevant market, but prior to the NYSE Close, that materially affect the values of a Fund’s portfolio holdings or assets. In addition, market prices are considered not readily available when, due to extraordinary circumstances, the exchanges or markets on which the securities or other instruments trade do not open for trading for the entire day and no other market prices are available. Fair value pricing is subjective in nature and the use of fair value pricing by a Fund may cause the NAV of its shares to differ significantly from the NAV that would have been calculated using market prices at the close of the exchange on which a portfolio holding is primarily traded. There can be no assurance that a Fund could obtain the fair value assigned to an investment if the Fund were to sell the investment at approximately the time at which the Fund determines its NAV. |
| | Prices of foreign equities that are principally traded on certain foreign markets will generally be adjusted daily pursuant to a fair value pricing service in order to reflect an adjustment for the factors occurring after the close of certain foreign markets but before the NYSE Close. Securities and other instruments that are primarily traded on foreign markets may trade on days that are not business days of the Funds. The value of the foreign securities or other instruments in which a Fund invests may change on days when a shareholder will not be able to purchase, redeem or exchange shares of the Fund. |
| | Fixed income investments (other than short-term obligations) and non-exchange traded derivatives held by a Fund are normally valued at prices supplied by independent pricing services in accordance with the Valuation Procedures. Short-term investments maturing in 60 days or less are generally valued at amortized cost which approximates fair value. |
| | Exchange-traded derivatives, such as options, futures and options on futures, are valued at the last sale price determined by the exchange where such instruments principally trade as of the close of such exchange (“Exchange Close”). If a last sale price is not available, the value will be the mean of the most recently quoted bid and ask prices as of the Exchange Close. If a mean of the bid and ask prices cannot be calculated for the day, the value will be the most recently quoted bid price as of the Exchange Close. Over-the-counter derivatives are normally valued based on prices supplied by independent pricing services in accordance with the Valuation Procedures. |
| | Investments valued in currencies other than U.S. dollars are converted to U.S. dollars using the prevailing spot currency exchange rates obtained from independent pricing services for calculation of the NAV. As a result, the NAV of a Fund’s shares may be affected by changes in the value of currencies in relation to the U.S. dollar. The value of securities or other instruments traded in markets outside the United States or denominated in currencies other than the U.S. dollar may be affected significantly on a day that the Exchange is closed and the market value may change on days when an investor is not able to purchase, redeem or exchange shares of a Fund. |
| | Foreign currency contracts represent agreements to exchange currencies on specific future dates at predetermined rates. Foreign currency contracts are valued using foreign currency exchange rates and forward rates as provided by an independent pricing service on the Valuation Date. |
| | Investments in investment companies that are not listed or traded on an exchange ("Non-Traded Funds"), if any, are valued at the respective NAV of each Non-Traded Fund on the Valuation Date. Shares of investment companies listed and traded on an exchange are valued in the same manner as any exchange-listed equity security. Such Non-Traded Funds and listed investment companies may use fair value pricing as disclosed in their prospectuses. |
| | Financial instruments for which prices are not available from an independent pricing service may be valued using market quotations obtained from one or more dealers that make markets in the respective financial instrument in accordance with the Valuation Procedures. |
Hartford Multi-Strategy Funds
Notes to Financial Statements – (continued)
October 31, 2021
| | U.S. GAAP defines fair value as the price that a Fund would receive to sell an asset or pay to transfer a liability in an orderly transaction between market participants. The U.S. GAAP fair value measurement standards require disclosure of a fair value hierarchy for each major category of assets and liabilities. Various inputs are used in determining the fair value of each Fund’s investments. These inputs are summarized into three broad hierarchy levels. This hierarchy is based on whether the valuation inputs are observable or unobservable. These levels are: |
| • | Level 1 – Quoted prices in active markets for identical investments. Level 1 may include exchange traded instruments, such as domestic equities, some foreign equities, options, futures, mutual funds, exchange traded funds, rights and warrants. |
| • | Level 2 – Observable inputs other than Level 1 prices, such as quoted prices for similar investments; quoted prices in markets that are not active; or other inputs that are observable or can be corroborated by observable market data. Level 2 may include debt investments that are traded less frequently than exchange traded instruments and which are valued using independent pricing services; foreign equities, which are principally traded on certain foreign markets and are adjusted daily pursuant to a fair value pricing service in order to reflect an adjustment for the factors occurring after the close of certain foreign markets but before the NYSE Close; senior floating rate interests, which are valued using an aggregate of dealer bids; short-term investments, which are valued at amortized cost; and swaps, which are valued based upon the terms of each swap contract. |
| • | Level 3 – Significant unobservable inputs that are supported by limited or no market activity. Level 3 may include financial instruments whose values are determined using indicative market quotes or require significant management judgment or estimation. These unobservable valuation inputs may include estimates for current yields, maturity/duration, prepayment speed, and indicative market quotes for comparable investments along with other assumptions relating to credit quality, collateral value, complexity of the investment structure, general market conditions and liquidity. This category may include investments where trading has been halted or there are certain restrictions on trading. While these investments are priced using unobservable inputs, the valuation of these investments reflects the best available data and management believes the prices are a reasonable representation of exit price. |
The Board of Directors has delegated the day-to-day responsibility for implementing the Valuation Procedures to the Valuation Committee. The Valuation Committee will consider all relevant factors in determining an investment’s fair value, and may seek the advice of such Fund’s sub-adviser, as applicable, knowledgeable brokers, and legal counsel in making such determination. The Valuation Committee reports to the Audit Committee of the Board of Directors.
Valuation levels are not necessarily indicative of the risk associated with investing in such investments. Individual investments within any of the above mentioned asset classes may be assigned a different hierarchical level than those presented above, as individual circumstances dictate.
For additional information, refer to the Fair Value Summary and the Level 3 roll-forward reconciliation, if applicable, which follows each Fund's Schedule of Investments.
| c) | Investment Transactions and Investment Income – Investment transactions are recorded as of the trade date (the date the order to buy or sell is executed) for financial reporting purposes. Investments purchased or sold on a when-issued or delayed-delivery basis may be settled a month or more after the trade date. Realized gains and losses are determined on the basis of identified cost. |
| | The trade date for senior floating rate interests purchased in the primary loan market is considered the date on which the loan allocations are determined. The trade date for senior floating rate interests purchased in the secondary loan market is the date on which the transaction is entered into. |
| | Dividend income from domestic securities is accrued on the ex-dividend date. In general, dividend income from foreign securities is recorded on the ex-date; however, dividend notifications in certain foreign jurisdictions may not be available in a timely manner and as a result, a Fund will record the dividend as soon as the relevant details (i.e., rate per share, payment date, shareholders of record, etc.) are publicly available. |
| | Interest income, including amortization of premium, accretion of discounts, inflation adjustments and additional principal received in-kind in lieu of cash, is accrued on a daily basis. Paydown gains and losses on mortgage-related and other asset-backed securities are included in interest income in the Statements of Operations, as applicable. |
Please refer to Note 8 for Securities Lending information.
| d) | Taxes – A Fund may be subject to taxes imposed on realized gains on securities of certain foreign countries in which such Fund invests. A Fund may also be subject to taxes withheld on foreign dividends and interest from securities in which a Fund invests. The amount of any foreign taxes withheld and foreign tax expense is included on the accompanying Statements of Operations as a reduction to net investment income or net realized or unrealized gain (loss) on investments in these securities, if applicable. |
| e) | Foreign Currency Transactions – Assets and liabilities denominated in currencies other than U.S. dollars are translated into U.S. dollars at the exchange rates in effect on the Valuation Date. Purchases and sales of investments, income and expenses are translated into U.S. dollars at the exchange rates on the dates of such transactions. |
Hartford Multi-Strategy Funds
Notes to Financial Statements – (continued)
October 31, 2021
| | A Fund does not isolate that portion of portfolio investment valuation resulting from fluctuations in the foreign currency exchange rates from the fluctuations arising from changes in the market prices of investments held. Exchange rate fluctuations are included with the net realized and unrealized gain or loss on investments in the accompanying financial statements. |
| | Net realized foreign exchange gains or losses arise from sales of foreign currencies and the difference between asset and liability amounts initially stated in foreign currencies and the U.S. dollar value of the amounts actually received or paid. Net unrealized foreign exchange gains or losses arise from changes in the value of other assets and liabilities at the end of the reporting period, resulting from changes in the exchange rates. |
| f) | Joint Trading Account – A Fund may invest cash balances into a joint trading account that may be invested in one or more repurchase agreements. |
| g) | Fund Share Valuation and Dividend Distributions to Shareholders – Orders for each class of each Fund’s shares are executed in accordance with the investment instructions of the shareholders. The NAV of each class of each Fund’s shares is determined as of the close of business on each business day of the Exchange (see Note 2(a)). The NAV is determined separately for each class of shares of a Fund by dividing the Fund's net assets attributable to that class by the number of shares of the class outstanding. Each class of shares offered by a Fund has equal rights as to assets and voting privileges (except that shareholders of a class have exclusive voting rights regarding any matter relating solely to that class of shares). Income and non-class specific expenses are allocated daily to each class on the basis of the relative net assets of the class of the Fund. Realized and unrealized gains and losses are allocated daily based on the relative net assets of each class of shares of each Fund. |
| | Orders for the purchase of a Fund's shares received prior to the close of the Exchange on any day the Exchange is open for business are priced at the NAV determined as of the close of the Exchange. Orders received after the close of the Exchange, or on a day on which the Exchange and/or the Funds are not open for business, are priced at the next determined NAV. |
| | Dividends are declared pursuant to a policy adopted by the Company’s Board of Directors. Dividends and/or distributions to shareholders are recorded on ex-date. The policy of each of Balanced Income Fund and Checks and Balances Fund is to pay dividends from net investment income, if any, quarterly and realized gains, if any, at least once a year. The policy of each of Conservative Allocation Fund, Global Real Asset Fund, Growth Allocation Fund and Moderate Allocation Fund is to pay dividends from net investment income and realized gains, if any; at least once a year. Normally, dividends from net investment income of each of Balanced Retirement Fund and Multi-Asset Income Fund are declared and paid monthly and dividends from realized gains, if any, are paid at least once a year. |
| | Long-term capital gains distributions received from Underlying Funds, if applicable, are distributed at least annually, when required. Unless shareholders specify otherwise, all dividends and distributions from a Fund will be automatically reinvested in additional full or fractional shares of the Fund. |
| | Income dividends and capital gains distributions are determined in accordance with federal income tax regulations, which may differ from U.S. GAAP with respect to character and timing (see Federal Income Taxes: Distributions and Components of Distributable Earnings and Reclassification of Capital Accounts notes). |
| h) | Basis for Consolidation – The Global Real Asset Fund may invest up to 25% of its total assets in a wholly-owned subsidiary of the Global Real Asset Fund (the "Subsidiary"). The Subsidiary is organized under the laws of the Cayman Islands and is consolidated in the Global Real Asset Fund’s financial statements. All intercompany balances, income, and expenses have been eliminated in consolidation. The Subsidiary acts as an investment vehicle in order to enter into certain investments (primarily commodities) for the Global Real Asset Fund consistent with the investment objectives and policies specified in the Prospectus and Statement of Additional Information. |
| 3. | Securities and Other Investments: |
| a) | Restricted Securities – Each Fund may invest in securities that are subject to legal or contractual restrictions on resale. These securities generally may be resold in transactions exempt from registration or to the public if the securities are registered. Disposal of these securities may involve time-consuming negotiations and expense, and prompt sale at an acceptable price may be difficult. Information regarding restricted securities, if applicable, is included at the end of each Fund's Schedule of Investments. |
| b) | Investments Purchased on a When-Issued or Delayed-Delivery Basis – Delivery and payment for investments that have been purchased by a Fund on a forward commitment, or when-issued or delayed-delivery basis, take place beyond the customary settlement period. A Fund may dispose of or renegotiate a delayed-delivery transaction after it is entered into, and may sell delayed-delivery investments before they are delivered, which may result in a realized gain or loss. During this period, such investments are subject to market fluctuations, and a Fund identifies investments segregated in its records with a value at least equal to the amount of the commitment. See each Fund’s Schedule of Investments, if applicable, for when-issued or delayed-delivery investments as of October 31, 2021. |
Hartford Multi-Strategy Funds
Notes to Financial Statements – (continued)
October 31, 2021
In connection with a Fund's ability to purchase investments on a when-issued or forward commitment basis, the Fund may enter into to-be announced (“TBA”) commitments. TBA commitments are forward agreements for the purchase or sale of mortgage-backed securities for a fixed price, with payment and delivery on an agreed-upon future settlement date. The specific securities to be delivered are not identified at the trade date; however, delivered securities must meet specified terms, including issuer, rate and mortgage terms. Although a Fund may enter into TBA commitments with the intention of acquiring or delivering securities for its portfolio, the Fund can extend the settlement date, roll the transaction, or dispose of a commitment prior to settlement if deemed appropriate to do so. If the TBA commitment is closed through the acquisition of an offsetting TBA commitment, a Fund realizes a gain or loss. In a TBA roll transaction, a Fund generally purchases or sells the initial TBA commitment prior to the agreed upon settlement date and enters into a new TBA commitment for future delivery or receipt of the mortgage-backed securities. TBA commitments involve a risk of loss if the value of the security to be purchased or sold declines or increases, respectively, prior to settlement date. These transactions are excluded from a Fund's portfolio turnover rate. See each Fund's Schedule of Investments, if applicable, for TBA commitments as of October 31, 2021.
| c) | Senior Floating Rate Interests – Certain Funds may invest in senior floating rate interests. Senior floating rate interests generally hold the most senior position in the capital structure of a business entity (the “Borrower”), are typically secured by specific collateral and have a claim on the assets and/or stock of the Borrower that is senior to that held by subordinated debt holders and stockholders of the Borrower. Senior floating rate interests are typically structured and administered by a financial institution that acts as the agent of the lenders participating in the senior floating rate interest. A Fund may invest in multiple series or tranches of a senior floating rate interest, which may have varying terms and carry different associated risks. A Fund may also enter into unfunded loan commitments, which are contractual obligations for future funding. Unfunded loan commitments may include revolving credit facilities, which may obligate the Fund to supply additional cash to the Borrower on demand. Unfunded loan commitments represent a future obligation in full. A Fund may receive a commitment fee based on the undrawn portion of the underlying line of credit portion of a senior floating rate interest. In certain circumstances, a Fund may receive various fees upon the restructure of a senior floating rate interest by a borrower. Fees earned/paid may be recorded as a component of income or realized gain/loss in the Statements of Operations. |
| | Senior floating rate interests are typically rated below-investment-grade, which suggests they are more likely to default and generally pay higher interest rates than investment-grade loans. A default could lead to non-payment of income, which would result in a reduction of income to a Fund, and there can be no assurance that the liquidation of any collateral would satisfy the Borrower’s obligation in the event of non-payment of scheduled interest or principal payments, or that such collateral could be readily liquidated. See each Fund's Schedule of Investments, if applicable, for outstanding senior floating rate interests as of October 31, 2021. |
| d) | Mortgage-Related and Other Asset-Backed Securities – A Fund may invest in mortgage-related and other asset-backed securities. These securities include mortgage pass-through securities, collateralized mortgage obligations, commercial mortgage-backed securities, stripped mortgage-backed securities, asset-backed securities, collateralized debt obligations and other securities that directly or indirectly represent a participation in, or are secured by and payable from, mortgage loans on real property. Mortgage-related securities are created from pools of residential or commercial mortgage loans, including mortgage loans made by savings and loan institutions, mortgage bankers, commercial banks and others. Asset-backed securities are created from many types of assets, including auto loans, credit card receivables, home equity loans, and student loans. These securities provide a monthly payment that consists of both interest and principal payments. Interest payments may be determined by fixed or adjustable rates. The rate of prepayments on underlying mortgages will affect the price and volatility of a mortgage-related security, and may have the effect of shortening or extending the effective duration of the security relative to what was anticipated at the time of purchase. The timely payment of principal and interest of certain mortgage-related securities is guaranteed by the full faith and credit of the United States Government. Mortgage-related and other asset-backed securities created and guaranteed by non-governmental issuers, including government-sponsored corporations, may be supported by various forms of insurance or guarantees, but there can be no assurance that the private insurers or guarantors can meet their obligations under the insurance policies or guarantee arrangements. See each Fund's Schedule of Investments, if applicable, for mortgage-related and other asset-backed securities as of October 31, 2021. |
| e) | Inflation-Indexed Bonds – A Fund may invest in inflation-indexed bonds. Inflation-indexed bonds are fixed income investments whose principal value is periodically adjusted to the rate of inflation. The interest rate on these bonds is generally fixed at issuance at a rate lower than typical bonds. Over the life of an inflation-indexed bond, however, interest will be paid based on a principal value, which is adjusted for inflation. Any increase or decrease in the principal amount of an inflation-indexed bond will be included as interest income on the Statements of Operations, even though investors do not receive the principal amount until maturity. See each Fund's Schedule of Investments, if applicable, for inflation-indexed bonds as of October 31, 2021. |
| f) | Equity Linked Securities – Certain Funds may invest in equity linked securities, which usually convert into common stock at a date predetermined by the issuer. These securities generally offer a higher dividend yield than that of the common stock to which the security is linked. These instruments are issued by a company other than the one to which the security is linked and carry the credit of the issuer, not that of the underlying common stock. The securities’ appreciation is limited based on a predetermined final cap price at the date of the conversion. Risks of investing in these securities include, but are not limited to, a set time to capture the yield advantage, limited appreciation potential, decline in value of the underlying stock, and failure of the issuer to pay dividends or to deliver common stock at maturity. Since |
Hartford Multi-Strategy Funds
Notes to Financial Statements – (continued)
October 31, 2021
| | equity linked securities are in note form, equity linked securities are also subject to certain debt securities risks. Investments in equity linked securities are also subject to liquidity risk, which may make equity linked securities difficult to sell and value. See each Fund's Schedule of Investments, if applicable, for equity linked securities as of October 31, 2021. |
| g) | Repurchase Agreements – A repurchase agreement is an agreement between two parties whereby one party sells the other a security at a specified price with a commitment to repurchase the security later at an agreed-upon price, date and interest payment. Each Fund is permitted to enter into fully collateralized repurchase agreements. The Company's Board of Directors has delegated to the sub-adviser(s), as applicable, the responsibility of evaluating the creditworthiness of the banks and securities dealers with which the Funds will engage in repurchase agreements. The sub-adviser(s) will monitor such transactions to ensure that the value of underlying collateral will be at least equal to the total amount of the repurchase obligation as required by the valuation provision of the repurchase agreement, including the accrued interest. Repurchase agreements carry the risk that the market value of the securities declines below the repurchase price. A Fund could also lose money if it is unable to recover the securities and the value of any collateral held or assets segregated by the Fund to cover the transaction is less than the value of the securities. In the event the borrower commences bankruptcy proceedings, a court may characterize the transaction as a loan. If a Fund has not perfected a security interest in the underlying collateral, the Fund may be required to return the underlying collateral to the borrower’s estate and be treated as an unsecured creditor. As an unsecured creditor, the Fund could lose some or all of the principal and interest involved in the transaction. See each Fund's Schedule of Investments, if applicable, for repurchase agreements as of October 31, 2021. |
| 4. | Financial Derivative Instruments: |
| | The following disclosures contain information on how and why a Fund may use derivative instruments, the credit-risk-related contingent features in certain derivative instruments, and how derivative instruments affect a Fund’s financial position and results of operations. The location and fair value amounts of these instruments on the Statements of Assets and Liabilities and the realized gains and losses and changes in unrealized gains and losses on the Statements of Operations, each categorized by type of derivative contract, are included in the following Additional Derivative Instrument Information footnote. The derivative instruments outstanding as of period-end are disclosed in the notes to the Schedules of Investments, if applicable. The amounts of realized gains and losses and changes in unrealized gains and losses on derivative instruments during the period are disclosed in the Statements of Operations. |
| a) | Futures Contracts – A Fund may enter into futures contracts. A futures contract is an agreement between two parties to buy or sell an asset at a set price on a future date. A Fund may use futures contracts to manage risk or obtain exposure to the investment markets, commodities, or movements in interest rates and currency values. The primary risks associated with the use of futures contracts are the imperfect correlation between the change in market value of the investments held by a Fund and the prices of futures contracts and the possibility of an illiquid market. Upon entering into a futures contract, a Fund is required to deposit with a futures commission merchant (“FCM”) an amount of cash or U.S. Government or Agency Obligations in accordance with the initial margin requirements of the broker or exchange. Futures contracts are marked to market daily and an appropriate amount equal to the change in value (“variation margin”) is paid or received by a Fund. Gains or losses are recognized but not considered realized until the contracts expire or are closed. Futures contracts involve, to varying degrees, risk of loss in excess of the variation margin disclosed on the Statements of Assets and Liabilities. |
| | During the year ended October 31, 2021, each of Balanced Income Fund, Balanced Retirement Fund, Global Real Asset Fund and Multi-Asset Income Fund had used Futures Contracts. |
| b) | Foreign Currency Contracts – A Fund may enter into foreign currency contracts that obligate the Fund to purchase or sell currencies at specified future dates. Foreign currency contracts may be used in connection with settling purchases or sales of securities to hedge the currency exposure associated with some or all of a Fund’s investments and/or as part of an investment strategy. Foreign currency contracts are marked to market daily and the change in value is recorded by a Fund as an unrealized gain or loss. A Fund will record a realized gain or loss when the foreign currency contract is settled. |
| | Foreign currency contracts involve elements of market risk in excess of the amounts reflected in the Statements of Assets and Liabilities. In addition, risks may arise upon entering into these contracts from the potential inability of the counterparties to meet the terms of the contracts and from unanticipated movements in the value of the foreign currencies relative to the U.S. dollar. Upon entering into a foreign currency contract, a Fund may be required to post margin equal to its outstanding exposure thereunder. |
| | During the year ended October 31, 2021, each of Balanced Income Fund, Balanced Retirement Fund, Global Real Asset Fund and Multi-Asset Income Fund had used Foreign Currency Contracts. |
| c) | Options Contracts – An option contract is a contract sold by one party to another party that offers the buyer the right, but not the obligation, to buy (call) or sell (put) an investment or other financial asset at an agreed-upon price during a specific period of time or on a specific date. Option contracts are either over-the-counter ("OTC") options or executed in a registered exchange (“exchange-traded options”). A Fund may write (sell) covered call and put options on futures, swaps (“swaptions”), securities, commodities or currencies. “Covered” means that so long |
Hartford Multi-Strategy Funds
Notes to Financial Statements – (continued)
October 31, 2021
| | as a Fund is obligated as the writer of an option, it will own either the underlying investments or currency or an option to purchase the same underlying investments or currency having an expiration date of the covered option and an exercise price equal to or less than the exercise price of the covered option, or will segregate or earmark cash or other liquid investments having, for written call options, a value equal to the greater of the exercise price or the market value of the underlying instrument and, for written put options, a value equal to the exercise price. Writing put options may increase a Fund’s exposure to the underlying instrument. Writing call options may decrease a Fund’s exposure to the underlying instrument. Premiums received from writing options that expire are treated as realized gains. Premiums received from writing options that are exercised or closed are added to the proceeds or offset amounts paid on the underlying futures, swaps, investments or currency transactions to determine the realized gain or loss. A Fund, as a writer of an option, has no control over whether the underlying instrument may be sold (call) or purchased (put) and as a result bears the market risk of an unfavorable change in the price of the instrument underlying the written option. There is the risk a Fund may not be able to enter into a closing transaction because of an illiquid market. A Fund may also purchase put and call options. Purchasing call options may increase a Fund’s exposure to the underlying instrument. Purchasing put options may decrease a Fund’s exposure to the underlying instrument. A Fund pays a premium, which is included on the Fund’s Statements of Assets and Liabilities as an investment and is subsequently marked to market to reflect the current value of the option. Premiums paid for purchasing options that expire are treated as realized losses. Certain options may be purchased with premiums to be determined on a future date. The premiums for these options are based upon implied volatility parameters at specified terms. The risk associated with purchasing put and call options is generally limited to the premium paid. Premiums paid for purchasing options that are exercised or closed are added to the amounts paid or offset against the proceeds on the underlying investment transaction to determine the realized gain or loss. Entering into OTC options also exposes a Fund to counterparty risk. Counterparty risk is the possibility that the counterparty to the agreements may default on its obligation to perform or disagree as to the meaning of the contractual terms in the agreements. |
| | During the year ended October 31, 2021, each of Balanced Retirement Fund, Global Real Asset Fund and Multi-Asset Income Fund had used Options Contracts. |
| d) | Swap Contracts – A Fund may invest in swap contracts. Swap contracts are agreements to exchange or swap investment cash flows, assets, foreign currencies or market-linked returns at specified future intervals. Swap contracts are either privately negotiated in the over-the-counter market (“OTC swaps”) or cleared through a central counterparty or derivatives clearing organization (“centrally cleared swaps”). A Fund may enter into credit default, total return, cross-currency, interest rate, inflation and other forms of swap contracts to manage its exposure to credit, currency, interest rate, commodity and inflation risk. Swap contracts are also used to gain exposure to certain markets. In connection with these contracts, investments or cash may be identified as collateral or margin in accordance with the terms of the respective swap contracts and/or master netting arrangement to provide assets of value and recourse in the event of default or bankruptcy/insolvency. |
| | Swaps are valued in accordance with the Valuation Procedures. Changes in market value, if any, are reflected as a component of net changes in unrealized appreciation or depreciation on the Statements of Operations. Daily changes in valuation of centrally cleared swaps, if any, are recorded as a receivable or payable for the change in value (“variation margin”) on the Statements of Assets and Liabilities. Realized gains or losses on centrally cleared swaps are recorded upon the termination of the swaps. OTC swap payments received or paid at the beginning of the measurement period are reflected as such on the Statements of Assets and Liabilities and represent premiums paid or received upon entering into the swap contract to compensate for differences between the stated terms of the swap contract and prevailing market conditions (credit spreads, currency exchange rates, interest rates and other relevant factors). These upfront premiums are recorded as realized gains or losses on the Statements of Operations upon termination or maturity of the swap. A liquidation payment received or made at the termination or maturity of the swap is recorded as a realized gain or loss on the Statements of Operations. Net periodic payments received or paid by a Fund are included as part of realized gains or losses on the Statements of Operations. |
| | Entering into these contracts involves, to varying degrees, elements of liquidation, counterparty, credit and market risk in excess of the amounts recognized on the Statements of Assets and Liabilities. Such risks involve the possibility that there will be no liquid market for these contracts, that the counterparty to the contracts may default on its obligation to perform or disagree as to the meaning of contractual terms in the contracts, and that there may be unfavorable changes in market conditions (credit spreads, currency exchange rates, interest rates and other relevant factors). |
| | A Fund’s maximum risk of loss from counterparty risk for OTC swaps is the net value of the discounted cash flows to be received from the counterparty over the contract’s remaining life, and current market value, to the extent that amount is positive. The risk is mitigated by having a master netting arrangement between a Fund and the counterparty, which allows for the netting of payments made or received (although such amounts are presented on a gross basis within the Statements of Assets and Liabilities, as applicable) as well as the posting of collateral to a Fund to cover the Fund’s exposure to the counterparty. In a centrally cleared swap, while a Fund enters into an agreement with a clearing broker to execute contracts with a counterparty, the performance of the swap is guaranteed by the central clearinghouse, which reduces the Fund’s exposure to counterparty risk. However, the Fund is still exposed to a certain amount of counterparty risk through the |
Hartford Multi-Strategy Funds
Notes to Financial Statements – (continued)
October 31, 2021
| | clearing broker and clearinghouse. The clearinghouse attempts to minimize this risk to its participants through the use of mandatory margin requirements, daily cash settlements and other procedures. Likewise, the clearing broker reduces its risk through margin requirements and required segregation of customer balances. |
| | Credit Default Swap Contracts – The credit default swap market allows a Fund to manage credit risk through buying and selling credit protection on a specific issuer, asset or basket of assets. Certain credit default swaps involve the exchange of a fixed rate premium for protection against the loss in value of an underlying investment or index in the event of a credit event, such as payment default or bankruptcy. |
| | Under a credit default swap contract, one party acts as guarantor by receiving the fixed periodic payment in exchange for the commitment to purchase the underlying investment at par if the defined credit event occurs. Upon the occurrence of a defined credit event, the difference between the value of the reference obligation and the swap’s notional amount is recorded as realized gain or loss on swap transactions in the Statements of Operations. A “buyer” of credit protection agrees to pay a counterparty to assume the credit risk of an issuer upon the occurrence of certain events. The “seller” of the protection receives periodic payments and agrees to assume the credit risk of an issuer upon the occurrence of certain events. Although specified events are contract specific, credit events are generally defined as bankruptcy, failure to pay, restructuring, obligation acceleration, obligation default or repudiation/moratorium. A “seller’s” exposure is limited to the total notional amount of the credit default swap contract. These potential amounts would be partially offset by any recovery values of the respective referenced obligations or upfront payments received upon entering into the contract. |
| | Implied credit spreads, represented in absolute terms, utilized in determining the market value of credit default swap contracts on corporate issues, sovereign government issues or U.S. municipal issues as of year-end are disclosed in the notes to the Schedules of Investments, as applicable, and serve as an indicator of the current status of the payment/performance risk and represent the likelihood or risk of default for the credit derivative. The implied credit spread of a particular referenced entity reflects the cost of buying/selling protection and there may also be upfront payments required to be made to enter into the contract. Wider credit spreads represent a deterioration of the referenced entity’s credit soundness and a greater likelihood or risk of default or other credit event occurring as defined under the terms of the contract. For credit default swap contracts on credit indices, the quoted market prices and resulting values serve as the indicator of the current status of the payment/performance risk. Increasing market values, in absolute terms when compared to the notional amount of the swap, represent a deterioration of the referenced equity’s credit soundness and a greater likelihood or risk of default or other credit event occurring as defined under the terms of the contract. |
| | During the year ended October 31, 2021, each of Balanced Income Fund, Balanced Retirement Fund, Global Real Asset Fund and Multi-Asset Income Fund had used Credit Default Swap Contracts. |
| | Interest Rate Swap Contracts – Certain Funds are subject to interest rate risk exposure in the normal course of pursuing its investment objectives. A Fund may use interest rate swaps to hedge interest rate and duration risk across a portfolio at particular duration points to maintain its ability to generate income at prevailing market rates. In a typical interest rate swap, one party agrees to make regular payments equal to a floating interest rate, based on a specified interest rate or benchmark (e.g. London Interbank Offered Rate (“LIBOR”), multiplied by a notional amount, in return for payments equal to a fixed rate multiplied by the same amount, for a specific period of time. The net interest received or paid on interest rate swap contracts is recorded as a realized gain or loss. Interest rate swaps are marked to market daily and the change, if any, is recorded as an unrealized gain or loss in the Statements of Operations. When the interest rate swap contract is terminated early, a Fund records a realized gain or loss equal to the difference between the current market value and the upfront premium or cost. |
| | If an interest rate swap contract provides for payments in different currencies, the parties might agree to exchange the notional amount as well. Interest rate swaps may also depend on other prices or rates, such as the value of an index. The risks of interest rate swaps include changes in market conditions, which will affect the value of the contract or the cash flows and the possible inability of the counterparty to fulfill its obligations under the contract. A Fund’s maximum risk of loss from counterparty credit risk is the discounted net value of the cash flows to be received from the counterparty over the contract’s remaining life, to the extent that amount is positive. |
| | During the year ended October 31, 2021, each of Balanced Retirement Fund, Global Real Asset Fund and Multi-Asset Income Fund had used Interest Rate Swap Contracts. |
| | Total Return Swap Contracts – Certain Funds may invest in total return swap contracts in pursuit of the Fund's investment objective or for hedging purposes. An investment in a total return swap allows a Fund to gain or mitigate exposure to underlying reference assets. Total return swap contracts involve commitments where cash flows are exchanged based on the price of underlying reference assets and based on a fixed or variable interest rate. One party receives payments based on the price appreciation or depreciation of the underlying reference asset, in exchange for paying to or receiving from the counterparty seller an agreed-upon interest rate. A variable interest rate may be correlated to a base rate, such as the LIBOR, and is adjusted each reset period, which is defined at the beginning of the contract. Therefore, if interest rates increase over the term of the swap contract, the party paying the rate may be required to pay a higher rate at each swap reset date. |
Hartford Multi-Strategy Funds
Notes to Financial Statements – (continued)
October 31, 2021
| | Total return swap contracts on indices involve commitments to pay interest in exchange for a market-linked return. One party pays out the total return of a specific reference asset, which may be an equity, index, or bond, and in return receives a regular stream of payments. To the extent the total return of the security or index underlying the transaction exceeds or falls short of the offsetting interest rate obligation, a Fund will receive a payment from or make a payment to the counterparty. If the Fund is a payer in a total return swap, it may be subject to unlimited losses. They are also subject to counterparty risk. If the counterparty fails to meet its obligations, the Fund may lose money. |
| | During the year ended October 31, 2021, each of Balanced Retirement Fund and Global Real Asset Fund had used Total Return Swap Contracts. |
| e) | Additional Derivative Instrument Information: |
| | Balanced Income Fund |
| | |
| The Effect of Derivative Instruments on the Statement of Assets and Liabilities as of October 31, 2021: |
| | Risk Exposure Category |
| | Interest Rate
Contracts | | Foreign
Currency
Contracts | | Credit
Contracts | | Equity
Contracts | | Commodity
Contracts | | Total |
| Assets: | | | | | | | | | | | |
| Unrealized appreciation on futures contracts(1) | $ 13,461,512 | | $ — | | $ — | | $ — | | $ — | | $ 13,461,512 |
| Unrealized appreciation on foreign currency contracts | — | | 2,820,021 | | — | | — | | — | | 2,820,021 |
| Unrealized appreciation on swap contracts(2) | — | | — | | 5,517,669 | | — | | — | | 5,517,669 |
| Total | $ 13,461,512 | | $ 2,820,021 | | $ 5,517,669 | | $ — | | $ — | | $ 21,799,202 |
| Liabilities: | | | | | | | | | | | |
| Unrealized depreciation on futures contracts(1) | $ 9,149,128 | | $ — | | $ — | | $ — | | $ — | | $ 9,149,128 |
| Unrealized depreciation on foreign currency contracts | — | | 69,550 | | — | | — | | — | | 69,550 |
| Unrealized depreciation on swap contracts(2) | — | | — | | 67,060 | | — | | — | | 67,060 |
| Total | $ 9,149,128 | | $ 69,550 | | $ 67,060 | | $ — | | $ — | | $ 9,285,738 |
| (1) | Amount represents the cumulative appreciation and depreciation on futures contracts as disclosed within the Schedule of Investments under the open “Futures Contracts” section. Only current day’s variation margin, if any, is reported within the Statement of Assets and Liabilities. |
| (2) | Amount represents the cumulative appreciation and depreciation on centrally cleared swaps, if applicable, as disclosed within the Schedule of Investments. Only the current day’s variation margin, if any, are reported within the Statements of Assets and Liabilities. OTC swaps are reported within the Statement of Assets and Liabilities within Unrealized appreciation and depreciation on OTC swap contracts, if applicable. |
| The Effect of Derivative Instruments on the Statement of Operations for the year ended October 31, 2021: |
| | Risk Exposure Category |
| | Interest Rate
Contracts | | Foreign
Currency
Contracts | | Credit
Contracts | | Equity
Contracts | | Commodity
Contracts | | Total |
| Realized Gain (Loss) on Derivatives Recognized as a Result of Operations: | | | | | | | | | | | |
| Net realized gain (loss) on futures contracts | $ 15,182,510 | | $ — | | $ — | | $ — | | $ — | | $ 15,182,510 |
| Net realized gain (loss) on swap contracts | — | | — | | 536,492 | | — | | — | | 536,492 |
| Net realized gain (loss) on foreign currency contracts | — | | 1,155,356 | | — | | — | | — | | 1,155,356 |
| Total | $ 15,182,510 | | $ 1,155,356 | | $ 536,492 | | $ — | | $ — | | $ 16,874,358 |
| Net Change in Unrealized Appreciation (Depreciation) on Derivatives Recognized as a Result of Operations: | | | | | | | | | | | |
| Net change in unrealized appreciation (depreciation) of futures contracts | $ 2,928,698 | | $ — | | $ — | | $ — | | $ — | | $ 2,928,698 |
| Net change in unrealized appreciation (depreciation) of swap contracts | — | | — | | 4,345,279 | | — | | — | | 4,345,279 |
| Net change in unrealized appreciation (depreciation) of foreign currency contracts | — | | 1,462,124 | | — | | — | | — | | 1,462,124 |
| Total | $ 2,928,698 | | $ 1,462,124 | | $ 4,345,279 | | $ — | | $ — | | $ 8,736,101 |
Hartford Multi-Strategy Funds
Notes to Financial Statements – (continued)
October 31, 2021
Balanced Income Fund – (continued)
For the year ended October 31, 2021, the average monthly amount or number per contract outstanding for each derivative type was as follows:
| Derivative Description | | Average Notional
Par, Contracts
or Face Amount |
| Futures Contracts Number of Long Contracts | | 6,586 |
| Futures Contracts Number of Short Contracts | | (4,867) |
| Swap Contracts at Notional Amount | | 198,533,933 |
| Foreign Currency Contracts Purchased at Contract Amount | | $ 36,776,158 |
| Foreign Currency Contracts Sold at Contract Amount | | $ 140,991,326 |
Balanced Retirement Fund
| The Effect of Derivative Instruments on the Statement of Assets and Liabilities as of October 31, 2021: |
| | Risk Exposure Category |
| | Interest Rate
Contracts | | Foreign
Currency
Contracts | | Credit
Contracts | | Equity
Contracts | | Commodity
Contracts | | Total |
| Assets: | | | | | | | | | | | |
| Investments in securities, at value (purchased options), market value | $ — | | $ — | | $ — | | $ 529,939 | | $ — | | $ 529,939 |
| Unrealized appreciation on foreign currency contracts | — | | 49,847 | | — | | — | | — | | 49,847 |
| Total | $ — | | $ 49,847 | | $ — | | $ 529,939 | | $ — | | $ 579,786 |
| Liabilities: | | | | | | | | | | | |
| Unrealized depreciation on futures contracts(1) | $ 149,122 | | $ — | | $ — | | $ — | | $ — | | $ 149,122 |
| Total | $ 149,122 | | $ — | | $ — | | $ — | | $ — | | $ 149,122 |
| (1) | Amount represents the cumulative appreciation and depreciation on futures contracts as disclosed within the Schedule of Investments under the open “Futures Contracts” section. Only current day’s variation margin, if any, is reported within the Statement of Assets and Liabilities. |
| The Effect of Derivative Instruments on the Statement of Operations for the year ended October 31, 2021: |
| | Risk Exposure Category |
| | Interest Rate
Contracts | | Foreign
Currency
Contracts | | Credit
Contracts | | Equity
Contracts | | Commodity
Contracts | | Total |
| Realized Gain (Loss) on Derivatives Recognized as a Result of Operations: | | | | | | | | | | | |
| Net realized gain (loss) on purchased options contracts | $ — | | $ — | | $ — | | $ (1,162,817) | | $ — | | $ (1,162,817) |
| Net realized gain (loss) on futures contracts | (131,952) | | — | | — | | — | | — | | (131,952) |
| Net realized gain (loss) on foreign currency contracts | — | | 382,857 | | — | | — | | — | | 382,857 |
| Total | $ (131,952) | | $ 382,857 | | $ — | | $ (1,162,817) | | $ — | | $ (911,912) |
| Net Change in Unrealized Appreciation (Depreciation) on Derivatives Recognized as a Result of Operations: | | | | | | | | | | | |
| Net change in unrealized appreciation (depreciation) of investments in purchased options contracts | $ — | | $ — | | $ — | | $ (174,482) | | $ — | | $ (174,482) |
| Net change in unrealized appreciation (depreciation) of futures contracts | (105,114) | | — | | — | | — | | — | | (105,114) |
| Net change in unrealized appreciation (depreciation) of foreign currency contracts | — | | (58,874) | | — | | — | | — | | (58,874) |
| Total | $ (105,114) | | $ (58,874) | | $ — | | $ (174,482) | | $ — | | $ (338,470) |
For the year ended October 31, 2021, the average monthly amount or number per contract outstanding for each derivative type was as follows:
| Derivative Description | | Average Notional
Par, Contracts
or Face Amount |
| Purchased Options at Notional Amount | | $ 1,269 |
| Futures Contracts Number of Long Contracts | | 55 |
| Foreign Currency Contracts Sold at Contract Amount | | $ 15,153,989 |
Hartford Multi-Strategy Funds
Notes to Financial Statements – (continued)
October 31, 2021
Global Real Asset Fund (consolidated)
| The Effect of Derivative Instruments on the Statement of Assets and Liabilities as of October 31, 2021: |
| | Risk Exposure Category |
| | Interest Rate
Contracts | | Foreign
Currency
Contracts | | Credit
Contracts | | Equity
Contracts | | Commodity
Contracts | | Total |
| Assets: | | | | | | | | | | | |
| Unrealized appreciation on futures contracts(1) | $ 99,242 | | $ — | | $ — | | $ — | | $ 839,407 | | $ 938,649 |
| Unrealized appreciation on foreign currency contracts | — | | 83,098 | | — | | — | | — | | 83,098 |
| Total | $ 99,242 | | $ 83,098 | | $ — | | $ — | | $ 839,407 | | $ 1,021,747 |
| Liabilities: | | | | | | | | | | | |
| Unrealized depreciation on futures contracts(1) | $ — | | $ — | | $ — | | $ — | | $ 424,074 | | $ 424,074 |
| Unrealized depreciation on bond forward contracts | 34,230 | | — | | — | | — | | — | | 34,230 |
| Unrealized depreciation on foreign currency contracts | — | | 16,486 | | — | | — | | — | | 16,486 |
| Total | $ 34,230 | | $ 16,486 | | $ — | | $ — | | $ 424,074 | | $ 474,790 |
| (1) | Amount represents the cumulative appreciation and depreciation on futures contracts as disclosed within the Schedule of Investments under the open “Futures Contracts” section. Only current day’s variation margin, if any, is reported within the Statement of Assets and Liabilities. |
| The Effect of Derivative Instruments on the Statement of Operations for the year ended October 31, 2021: |
| | Risk Exposure Category |
| | Interest Rate
Contracts | | Foreign
Currency
Contracts | | Credit
Contracts | | Equity
Contracts | | Commodity
Contracts | | Total |
| Realized Gain (Loss) on Derivatives Recognized as a Result of Operations: | | | | | | | | | | | |
| Net realized gain (loss) on purchased options contracts | $ — | | $ (1,005) | | $ — | | $ — | | $ (54,640) | | $ (55,645) |
| Net realized gain (loss) on futures contracts | 333,043 | | — | | — | | — | | 8,883,964 | | 9,217,007 |
| Net realized gain (loss) on written options contracts | — | | — | | — | | — | | 7,585 | | 7,585 |
| Net realized gain (loss) on swap contracts | 22,601 | | — | | 6,204 | | — | | — | | 28,805 |
| Net realized gain (loss) on bond forward contracts | 465,506 | | — | | — | | — | | — | | 465,506 |
| Net realized gain (loss) on foreign currency contracts | — | | 540,367 | | — | | — | | — | | 540,367 |
| Total | $ 821,150 | | $ 539,362 | | $ 6,204 | | $ — | | $ 8,836,909 | | $ 10,203,625 |
| Net Change in Unrealized Appreciation (Depreciation) on Derivatives Recognized as a Result of Operations: | | | | | | | | | | | |
| Net change in unrealized appreciation (depreciation) of investments in purchased options contracts | $ — | | $ — | | $ — | | $ — | | $ 639 | | $ 639 |
| Net change in unrealized appreciation (depreciation) of futures contracts | 1,732 | | — | | — | | — | | 525,346 | | 527,078 |
| Net change in unrealized appreciation (depreciation) of written options contracts | — | | — | | — | | — | | (2,221) | | (2,221) |
| Net change in unrealized appreciation (depreciation) of swap contracts | 10,238 | | — | | (8,229) | | — | | — | | 2,009 |
| Net change in unrealized appreciation (depreciation) of bond forward contracts | 26,948 | | — | | — | | — | | — | | 26,948 |
| Net change in unrealized appreciation (depreciation) of foreign currency contracts | — | | (121,778) | | — | | — | | — | | (121,778) |
| Total | $ 38,918 | | $ (121,778) | | $ (8,229) | | $ — | | $ 523,764 | | $ 432,675 |
For the year ended October 31, 2021, the average monthly amount or number per contract outstanding for each derivative type was as follows:
| Derivative Description | | Average Notional
Par, Contracts
or Face Amount |
| Purchased Options at Notional Amount | | $ 39,163 |
| Futures Contracts Number of Long Contracts | | 381 |
| Futures Contracts Number of Short Contracts | | (134) |
| Written Options at Notional Amount | | $ (5,584) |
| Swap Contracts at Notional Amount | | 3,024,183 |
| Bond Forward Contracts at Notional Amount | | $ 5,911,969 |
| Foreign Currency Contracts Purchased at Contract Amount | | $ 9,899,043 |
| Foreign Currency Contracts Sold at Contract Amount | | $ 13,680,198 |
Hartford Multi-Strategy Funds
Notes to Financial Statements – (continued)
October 31, 2021
Multi-Asset Income Fund
| The Effect of Derivative Instruments on the Statement of Assets and Liabilities as of October 31, 2021: |
| | Risk Exposure Category |
| | Interest Rate
Contracts | | Foreign
Currency
Contracts | | Credit
Contracts | | Equity
Contracts | | Commodity
Contracts | | Total |
| Assets: | | | | | | | | | | | |
| Investments in securities, at value (purchased options), market value | $ — | | $ — | | $ — | | $ 56,306 | | $ — | | $ 56,306 |
| Unrealized appreciation on futures contracts(1) | 2,655,868 | | — | | — | | — | | — | | 2,655,868 |
| Unrealized appreciation on foreign currency contracts | — | | 163,033 | | — | | — | | — | | 163,033 |
| Total | $ 2,655,868 | | $ 163,033 | | $ — | | $ 56,306 | | $ — | | $ 2,875,207 |
| Liabilities: | | | | | | | | | | | |
| Unrealized depreciation on futures contracts(1) | $ 530,282 | | $ — | | $ — | | $ — | | $ — | | $ 530,282 |
| Total | $ 530,282 | | $ — | | $ — | | $ — | | $ — | | $ 530,282 |
| (1) | Amount represents the cumulative appreciation and depreciation on futures contracts as disclosed within the Schedule of Investments under the open “Futures Contracts” section. Only current day’s variation margin, if any, is reported within the Statement of Assets and Liabilities. |
| The Effect of Derivative Instruments on the Statement of Operations for the year ended October 31, 2021: |
| | Risk Exposure Category |
| | Interest Rate
Contracts | | Foreign
Currency
Contracts | | Credit
Contracts | | Equity
Contracts | | Commodity
Contracts | | Total |
| Realized Gain (Loss) on Derivatives Recognized as a Result of Operations: | | | | | | | | | | | |
| Net realized gain (loss) on futures contracts | $ (3,692,670) | | $ — | | $ — | | $ 1,990,009 | | $ — | | $ (1,702,661) |
| Net realized gain (loss) on written options contracts | — | | — | | — | | (9,340,244) | | — | | (9,340,244) |
| Net realized gain (loss) on foreign currency contracts | — | | 922,482 | | — | | — | | — | | 922,482 |
| Total | $ (3,692,670) | | $ 922,482 | | $ — | | $ (7,350,235) | | $ — | | $ (10,120,423) |
| Net Change in Unrealized Appreciation (Depreciation) on Derivatives Recognized as a Result of Operations: | | | | | | | | | | | |
| Net change in unrealized appreciation (depreciation) of investments in purchased options contracts | $ — | | $ — | | $ — | | $ (691,059) | | $ — | | $ (691,059) |
| Net change in unrealized appreciation (depreciation) of futures contracts | 2,207,345 | | — | | — | | — | | — | | 2,207,345 |
| Net change in unrealized appreciation (depreciation) of foreign currency contracts | — | | (227,003) | | — | | — | | — | | (227,003) |
| Total | $ 2,207,345 | | $ (227,003) | | $ — | | $ (691,059) | | $ — | | $ 1,289,283 |
For the year ended October 31, 2021, the average monthly amount or number per contract outstanding for each derivative type was as follows:
| Derivative Description | | Average Notional
Par, Contracts
or Face Amount |
| Purchased Options at Notional Amount | | $ 1,796 |
| Futures Contracts Number of Long Contracts | | 233 |
| Futures Contracts Number of Short Contracts | | (584) |
| Written Options at Notional Amount | | $ (225) |
| Foreign Currency Contracts Purchased at Contract Amount | | $ 14,890 |
| Foreign Currency Contracts Sold at Contract Amount | | $ 41,571,472 |
| f) | Balance Sheet Offsetting Information – Set forth below are tables which disclose both gross information and net information about instruments and transactions eligible for offset in the financial statements, and instruments and transactions that are subject to a master netting arrangement, as well as amounts related to margin, reflected as financial collateral (including cash collateral), held at clearing brokers, counterparties and a Fund's custodian. The master netting arrangements allow the clearing brokers to net any collateral held in or on behalf of a Fund, or liabilities or payment obligations of the clearing brokers to a Fund, against any liabilities or payment obligations of a Fund to the clearing brokers. A Fund is required to deposit financial collateral (including cash collateral) at the Fund's custodian on behalf of clearing brokers and counterparties to continually meet the original and maintenance requirements established by the clearing brokers and counterparties. Such requirements are specific to the respective clearing broker or counterparty. Certain master netting arrangements may not be enforceable in a bankruptcy. |
Hartford Multi-Strategy Funds
Notes to Financial Statements – (continued)
October 31, 2021
| | The following tables present a Fund's derivative assets and liabilities, presented on a gross basis as no amounts are netted within the Statements of Assets and Liabilities, by counterparty net of amounts available for offset under a master netting agreement or similar agreement ("MNA") and net of the related collateral received/pledged by a Fund as of October 31, 2021: |
| | |
| Balanced Income Fund | | | | |
| Derivative Financial Instruments: | | Assets | | Liabilities |
| Foreign currency contracts | | $ 2,820,021 | | $ (69,550) |
| Futures contracts | | 13,461,512 | | (9,149,128) |
| Swap contracts | | 5,517,669 | | (67,060) |
| Total gross amount of derivative assets and liabilities in the Statement of Assets and Liabilities | | 21,799,202 | | (9,285,738) |
| Derivatives not subject to a MNA | | (18,955,397) | | 9,216,188 |
| Total gross amount of assets and liabilities subject to MNA or similar agreements | | $ 2,843,805 | | $ (69,550) |
| Counterparty | | Gross Amount
of Assets | | Financial
Instruments
and Derivatives
Available
for Offset | | Non-cash
Collateral
Received* | | Cash
Collateral
Received* | | Net Amount
of Assets |
| Bank of Montreal | | $ 12,181 | | $ — | | $ — | | $ — | | $ 12,181 |
| Barclays | | 2,679,255 | | (33,910) | | — | | — | | 2,645,345 |
| Citibank NA | | 99 | | — | | — | | — | | 99 |
| Commonwealth Bank of Australia | | 416 | | — | | — | | — | | 416 |
| Deutsche Bank Securities, Inc. | | 96,660 | | — | | — | | — | | 96,660 |
| Goldman Sachs & Co. | | 23,784 | | — | | — | | — | | 23,784 |
| JP Morgan Chase & Co. | | 9,706 | | — | | — | | — | | 9,706 |
| Morgan Stanley | | 19,853 | | (14,731) | | — | | — | | 5,122 |
| State Street Global Markets LLC | | 1,851 | | (1,851) | | — | | — | | — |
| Total | | $ 2,843,805 | | $ (50,492) | | $ — | | $ — | | $ 2,793,313 |
| | | | | | | | | | | |
| | | | | | | | | | | |
| Counterparty | | Gross Amount
of Liabilities | | Financial
Instruments
and Derivatives
Available
for Offset | | Non-cash
Collateral
Pledged* | | Cash
Collateral
Pledged* | | Net Amount
of Liabilities |
| Barclays | | $ (33,910) | | $ 33,910 | | $ — | | $ — | | $ — |
| BNP Paribas Securities Services | | (10,262) | | — | | — | | — | | (10,262) |
| Canadian Imperial Bank of Commerce | | (3,285) | | — | | — | | — | | (3,285) |
| Morgan Stanley | | (14,731) | | 14,731 | | — | | — | | — |
| RBC Dominion Securities, Inc. | | (51) | | — | | — | | — | | (51) |
| State Street Global Markets LLC | | (4,747) | | 1,851 | | — | | — | | (2,896) |
| Westpac International | | (2,564) | | — | | — | | — | | (2,564) |
| Total | | $ (69,550) | | $ 50,492 | | $ — | | $ — | | $ (19,058) |
| * | In some instances, the actual collateral received and/or pledged may be more than the amount shown. |
| Balanced Retirement Fund | | | | |
| Derivative Financial Instruments: | | Assets | | Liabilities |
| Foreign currency contracts | | $ 49,847 | | $ — |
| Futures contracts | | — | | (149,122) |
| Purchased options | | 529,939 | | — |
| Total gross amount of derivative assets and liabilities in the Statement of Assets and Liabilities | | 579,786 | | (149,122) |
| Derivatives not subject to a MNA | | (529,939) | | 149,122 |
| Total gross amount of assets and liabilities subject to MNA or similar agreements | | $ 49,847 | | $ — |
Hartford Multi-Strategy Funds
Notes to Financial Statements – (continued)
October 31, 2021
| Counterparty | | Gross Amount
of Assets | | Financial
Instruments
and Derivatives
Available
for Offset | | Non-cash
Collateral
Received* | | Cash
Collateral
Received* | | Net Amount
of Assets |
| Deutsche Bank Securities, Inc. | | $ 46,683 | | $ — | | $ — | | $ — | | $ 46,683 |
| Morgan Stanley | | 3,164 | | — | | — | | — | | 3,164 |
| Total | | $ 49,847 | | $ — | | $ — | | $ — | | $ 49,847 |
| | | | | | | | | | | |
| | | | | | | | | | | |
| * | In some instances, the actual collateral received and/or pledged may be more than the amount shown. |
| Global Real Asset Fund (consolidated) | | | | |
| Derivative Financial Instruments: | | Assets | | Liabilities |
| Bond forward contracts | | — | | (34,230) |
| Foreign currency contracts | | $ 83,098 | | $ (16,486) |
| Futures contracts | | 938,649 | | (424,074) |
| Total gross amount of derivative assets and liabilities in the Statement of Assets and Liabilities | | 1,021,747 | | (474,790) |
| Derivatives not subject to a MNA | | (938,649) | | 424,074 |
| Total gross amount of assets and liabilities subject to MNA or similar agreements | | $ 83,098 | | $ (50,716) |
| Counterparty | | Gross Amount
of Assets | | Financial
Instruments
and Derivatives
Available
for Offset | | Non-cash
Collateral
Received* | | Cash
Collateral
Received* | | Net Amount
of Assets |
| BNP Paribas Securities Services | | $ 9,386 | | $ — | | $ — | | $ — | | $ 9,386 |
| Deutsche Bank Securities, Inc. | | 27,341 | | — | | — | | — | | 27,341 |
| Goldman Sachs & Co. | | 1,353 | | — | | — | | — | | 1,353 |
| JP Morgan Chase & Co. | | 614 | | — | | — | | — | | 614 |
| Morgan Stanley | | 25,582 | | (3,663) | | — | | — | | 21,919 |
| Royal Bank of Canada | | 10,447 | | — | | — | | — | | 10,447 |
| Toronto-Dominion Bank | | 8,375 | | — | | — | | — | | 8,375 |
| Total | | $ 83,098 | | $ (3,663) | | $ — | | $ — | | $ 79,435 |
| | | | | | | | | | | |
| | | | | | | | | | | |
| Counterparty | | Gross Amount
of Liabilities | | Financial
Instruments
and Derivatives
Available
for Offset | | Non-cash
Collateral
Pledged* | | Cash
Collateral
Pledged* | | Net Amount
of Liabilities |
| Bank of America Securities LLC | | $ (34,230) | | $ — | | $ — | | $ — | | $ (34,230) |
| Citibank NA | | (12,823) | | — | | — | | — | | (12,823) |
| Morgan Stanley | | (3,663) | | 3,663 | | — | | — | | — |
| Total | | $ (50,716) | | $ 3,663 | | $ — | | $ — | | $ (47,053) |
| * | In some instances, the actual collateral received and/or pledged may be more than the amount shown. |
| Multi-Asset Income Fund | | | | |
| Derivative Financial Instruments: | | Assets | | Liabilities |
| Foreign currency contracts | | $ 163,033 | | $ — |
| Futures contracts | | 2,655,868 | | (530,282) |
| Purchased options | | 56,306 | | — |
| Total gross amount of derivative assets and liabilities in the Statement of Assets and Liabilities | | 2,875,207 | | (530,282) |
| Derivatives not subject to a MNA | | (2,712,174) | | 530,282 |
| Total gross amount of assets and liabilities subject to MNA or similar agreements | | $ 163,033 | | $ — |
Hartford Multi-Strategy Funds
Notes to Financial Statements – (continued)
October 31, 2021
| Counterparty | | Gross Amount
of Assets | | Financial
Instruments
and Derivatives
Available
for Offset | | Non-cash
Collateral
Received* | | Cash
Collateral
Received* | | Net Amount
of Assets |
| Deutsche Bank Securities, Inc. | | $ 163,033 | | $ — | | $ — | | $ — | | $ 163,033 |
| Total | | $ 163,033 | | $ — | | $ — | | $ — | | $ 163,033 |
| | | | | | | | | | | |
| | | | | | | | | | | |
| * | In some instances, the actual collateral received and/or pledged may be more than the amount shown. |
| 5. | Principal Risks: |
| | A Fund’s investments expose it to various types of risks associated with financial instruments and the markets. A Fund may be exposed to the risks described below. Each Fund’s prospectus provides details of its principal risks. |
| | The market values of equity securities, such as common stocks and preferred stocks, or equity related derivative investments, such as futures and options, may decline due to general market conditions which are not specifically related to a particular company, such as real or perceived adverse economic conditions, changes in the general outlook for corporate earnings, changes in interest or currency rates or adverse investor sentiment generally. The market value of equity securities may also decline due to factors which affect a particular industry or industries, such as labor shortages or increased production costs and competitive conditions within an industry. Equity securities and equity related investments generally have greater market price volatility than fixed income securities. The extent of each Fund’s exposure to market risk is the market value of the investments held as shown in the Fund’s schedule of investments. |
| | A widespread health crisis, such as a global pandemic, could cause substantial market volatility, exchange trading suspensions or restrictions and closures of securities exchanges and businesses, impact the ability to complete redemptions, and adversely impact Fund performance. The current ongoing outbreak of COVID-19, a respiratory disease caused by a novel coronavirus, has negatively affected the worldwide economy, created supply chain disruptions and labor shortages, and impacted the financial health of individual companies and the market in significant and unforeseen ways. The future impact of the ongoing COVID-19 pandemic remains unclear. The effects to public health, business and market conditions resulting from COVID-19 pandemic may have a significant negative impact on the performance of a Fund’s investments, including exacerbating other pre-existing political, social and economic risks. |
| | Certain Funds are exposed to the risks of the Underlying Funds and/or other investment companies in direct proportion to the amount of assets those Funds allocate to each Underlying Fund and/or other investment companies. The market values of the Underlying Funds and/or other investment companies may decline due to general market conditions which are not specifically related to a particular company in which the Underlying Fund and/or other investment companies invested, such as real or perceived adverse economic conditions, changes in the general outlook for corporate earnings, changes in interest or currency rates or adverse investor sentiment generally. The market value of equity securities in which the Underlying Funds and/or other investment companies invest may also decline due to factors which affect a particular industry or industries, such as labor shortages or increased production costs and competitive conditions within an industry. |
| | Certain investments held by a Fund expose the Fund to various risks which may include, but are not limited to, interest rate, prepayment, and extension risks. Interest rate risk is the risk that fixed income securities will decline in value because of changes in interest rates. As nominal interest rates rise, the values of certain fixed income securities held by a Fund are likely to decrease. A nominal interest rate can be described as the sum of a real interest rate and an expected inflation rate. Fixed income securities with longer durations tend to be more sensitive to changes in interest rates, usually making them more volatile than securities with shorter durations. Duration is useful primarily as a measure of the sensitivity of a fixed income security’s market price to interest rate (i.e., yield) movements. Senior floating rate interests and securities subject to prepayment and extension risk generally offer less potential for gains when interest rates decline. Rising interest rates may cause prepayments to occur at a slower than expected rate, thereby effectively lengthening the maturity of the security and making the security more sensitive to interest rate changes. Prepayment and extension risk are major risks of mortgage-backed securities, senior floating rate interests and certain asset-backed securities. For certain asset-backed securities, the actual maturity may be less than the stated maturity shown in the Schedule of Investments, if applicable. As a result, the timing of income recognition relating to these securities may vary based upon the actual maturity. |
| | Investing in the securities of non-U.S. issuers, whether directly or indirectly, involves certain considerations and risks not typically associated with securities of U.S. issuers. Such risks include, but are not limited to: generally less liquid and less efficient securities markets; generally greater price volatility; exchange rate fluctuations; imposition of restrictions on the expatriation of funds or other protectionist measures; less publicly available information about issuers; the imposition of withholding or other taxes; higher transaction and custody costs; settlement delays and risk of loss attendant in settlement procedures; difficulties in enforcing contractual obligations; less regulation of securities markets; different accounting, disclosure and reporting requirements; more substantial governmental involvement in the economy; higher inflation rates; and |
Hartford Multi-Strategy Funds
Notes to Financial Statements – (continued)
October 31, 2021
| | greater social, economic and political uncertainties. Non-U.S. issuers may also be affected by political, social, economic or diplomatic developments in a foreign country or region or the U.S. (including the imposition of sanctions, tariffs, or other governmental restrictions).These risks are heightened for investments in issuers from countries with less developed markets. |
| | Securities lending involves the risk that a Fund may lose money because the borrower of the loaned securities fails to return the securities in a timely manner or at all. A Fund could also lose money in the event of a decline in the value of the collateral provided for the loaned securities or a decline in the value of any investments made with cash collateral. These events could also trigger adverse tax consequences for a Fund that lends its holdings. |
| | Credit risk depends largely on the perceived financial health of bond issuers. In general, the credit rating is inversely related to the credit risk of the issuer. Higher rated bonds generally are deemed to have less credit risk, while lower or unrated bonds are deemed to have higher risk of default. The share price, yield and total return of a fund that holds securities with higher credit risk may be more volatile than those of a fund that holds bonds with lower credit risk. A Fund may be exposed to counterparty risk, or the risk that an institution or other entity with which a Fund has unsettled or open transactions will default. |
| | The Funds may invest in certain debt securities, derivatives or other financial instruments that utilize the London Interbank Offered Rate (“LIBOR”) as a “benchmark” or “reference rate” for various interest rate calculations. The use of certain LIBORs are expected to be phased out by the end of 2021. However, it is possible that certain LIBORs may continue beyond 2021 and the most widely used LIBORs may continue until mid-2023. There remains uncertainty regarding the future use of LIBOR and the nature of any replacement rate. As such, the potential effect of a transition away from LIBOR on a Fund or the LIBOR-based instruments in which the Fund invests cannot yet be determined. The transition process away from LIBOR may involve, among other things, increased volatility or illiquidity in markets for instruments that currently rely on LIBOR. The transition process may also result in a reduction in the value of certain instruments held by a Fund or reduce the effectiveness of related Fund transactions, such as hedges. Volatility, the potential reduction in value, and/or the hedge effectiveness of financial instruments may be heightened for financial instruments that do not include fallback provisions that address the cessation of LIBOR. Any potential effects of the transition away from LIBOR on a Fund or on financial instruments in which the Fund invests, as well as other unforeseen effects, could result in losses to the Fund. Since the usefulness of LIBOR as a benchmark or reference rate could deteriorate during the transition period, these effects could occur prior to and/or subsequent to the end of 2021 with respect to certain LIBORs or mid-2023 for the remaining LIBORs. |
| a) | Each Fund intends to continue to qualify as a Regulated Investment Company ("RIC") under Subchapter M of the Internal Revenue Code (“IRC”) by distributing substantially all of its taxable net investment income and net realized capital gains to its shareholders each year. Each Fund has distributed substantially all of its income and capital gains in prior years, if applicable, and intends to distribute substantially all of its income and capital gains during the calendar year ending December 31, 2021. Accordingly, no provision for federal income or excise taxes has been made in the accompanying financial statements. Distributions from short-term capital gains are treated as ordinary income distributions for federal income tax purposes. |
| b) | Net Investment Income (Loss), Net Realized Gains (Losses) and Distributions – Net investment income (loss) and net realized gains (losses) may differ for financial statement and tax purposes primarily because of losses deferred due to wash sale adjustments, foreign currency gains and losses, adjustments related to Passive Foreign Investment Companies ("PFICs"), Real Estate Investment Trusts ("REITs"), RICs, certain derivatives and partnerships. The character of distributions made during the year from net investment income or net realized gains may differ from their ultimate characterization for federal income tax purposes. Also, due to the timing of dividend distributions, the fiscal year in which amounts are distributed may differ from the year that the income or realized gains (losses) were recorded by each Fund. |
Hartford Multi-Strategy Funds
Notes to Financial Statements – (continued)
October 31, 2021
| c) | Distributions and Components of Distributable Earnings – The tax character of distributions paid by each Fund for the years ended October 31, 2021 and October 31, 2020 are as follows: |
| | |
| | | For the Year Ended
October 31, 2021 | | For the Year Ended
October 31, 2020 |
| Fund | | Ordinary
Income | | Long-Term
Capital Gains(1) | | Ordinary
Income | | Long-Term
Capital Gains(1) |
| Balanced Income Fund | | $ 324,819,389 | | $ 44,416,593 | | $ 350,387,313 | | $ 73,124,344 |
| Balanced Retirement Fund | | 2,125,325 | | — | | 2,487,299 | | — |
| Checks and Balances Fund | | 27,520,979 | | 39,519,568 | | 35,733,653 | | 74,726,516 |
| Conservative Allocation Fund | | 1,930,279 | | — | | 3,130,697 | | — |
| Global Real Asset Fund (consolidated) | | 4,722,840 | | — | | 7,719,681 | | — |
| Growth Allocation Fund | | 8,270,136 | | 15,853,039 | | 8,969,680 | | 16,873,439 |
| Moderate Allocation Fund | | 5,720,549 | | 8,820,673 | | 7,649,611 | | 5,883,189 |
| Multi-Asset Income Fund | | 23,976,385 | | — | | 33,631,516 | | 125,049,094 |
| (1) | The Funds designate these distributions as long-term capital gains dividends pursuant to IRC Sec 852(b)(3)(c) |
As of October 31, 2021, the components of total accumulated earnings (deficit) for each Fund on a tax basis are as follows:
| Fund | | Undistributed
Ordinary
Income | | Undistributed
Long-Term
Capital Gains | | Accumulated
Capital and
Other Losses | | Other
Temporary
Differences | | Unrealized
Appreciation
(Depreciation)
on Investments(1) | | Total
Accumulated
Earnings
(Deficit) |
| Balanced Income Fund | | $ 165,026,788 | | $ 604,603,128 | | $ — | | $ (2,827,968) | | $ 2,438,828,692 | | $ 3,205,630,640 |
| Balanced Retirement Fund | | 286,673 | | — | | (25,819,366) | | (82,897) | | 9,375,723 | | (16,239,867) |
| Checks and Balances Fund | | 1,167,487 | | 62,758,084 | | — | | — | | 330,525,906 | | 394,451,477 |
| Conservative Allocation Fund | | 661,255 | | 3,962,638 | | — | | — | | 12,663,374 | | 17,287,267 |
| Global Real Asset Fund (consolidated) | | 18,794,232 | | — | | (105,220,818) | | (286,748) | | 9,930,265 | | (76,783,069) |
| Growth Allocation Fund | | 5,774,887 | | 33,693,585 | | — | | — | | 139,072,381 | | 178,540,853 |
| Moderate Allocation Fund | | 1,773,185 | | 18,079,564 | | — | | — | | 68,305,637 | | 88,158,386 |
| Multi-Asset Income Fund | | 22,796,593 | | 15,358,799 | | — | | (2,878,319) | | 61,827,164 | | 97,104,237 |
| (1) | Differences between book-basis and tax basis unrealized appreciation (depreciation) may be attributable to the losses deferred due to wash sale adjustments, foreign currency gains and losses, adjustments related to PFICs, REITS, certain derivatives and partnerships. |
| d) | Reclassification of Capital Accounts – The Funds may record reclassifications in their capital accounts. These reclassifications have no impact on the total net assets of the Funds. The reclassifications are a result of permanent differences between U.S. GAAP and tax accounting for such items as adjustments to prior year accumulated balances and book income/loss from Cayman subsidiary. Adjustments are made to reflect the impact these items have on the current and future earnings distributions to shareholders. Therefore, the source of the Funds’ distributions may be shown in the accompanying Statements of Changes in Net Assets as from distributable earnings or from capital depending on the type of book and tax differences that exist. For the year ended October 31, 2021, the Funds recorded reclassifications to increase (decrease) the accounts listed below: |
| | |
| Fund | | Paid-in-Capital | | Distributable
Earnings (Loss) |
| Balanced Income Fund | | $ (1) | | $ 1 |
| Global Real Asset Fund (consolidated) | | (500,055) | | 500,055 |
| Multi-Asset Income Fund | | (531) | | 531 |
| e) | Capital Loss Carryforward – Under the Regulated Investment Company Modernization Act of 2010, funds are permitted to carry forward capital losses for an unlimited period. |
| | At October 31, 2021 (tax year end), each Fund's capital loss carryforwards for U.S. federal income tax purposes were as follows: |
| | |
| Fund | | Short-Term
Capital Loss
Carryforward with
No Expiration | | Long-Term
Capital Loss
Carryforward with
No Expiration |
| Balanced Retirement Fund* | | $ 21,130,730 | | $ 4,688,636 |
| Global Real Asset Fund (consolidated)* | | 12,043,701 | | 93,177,117 |
| * | Future utilization of losses are subject to limitation under current tax laws. |
Hartford Multi-Strategy Funds
Notes to Financial Statements – (continued)
October 31, 2021
The Balanced Income Fund, Checks and Balances Fund, Conservative Allocation Fund, Growth Allocation Fund, Moderate Allocation Fund, and Multi-Asset Income Fund had no capital loss carryforwards for U.S. income tax purposes at October 31, 2021.
During the year ended October 31, 2021 Balanced Retirement Fund utilized $2,176,854, Conservative Allocation Fund utilized $734,854, Global Real Asset Fund utilized $16,850,246, and Multi-Asset Income Fund utilized $14,260,897 of prior capital loss carryforwards.
| f) | Tax Basis of Investments – The aggregate cost of investments for federal income tax purposes at October 31, 2021 is different from book purposes primarily due to wash sale loss deferrals, passive foreign investment company (PFIC) mark-to-market adjustments, partnership adjustments and non-taxable distributions from underlying investments. The net unrealized appreciation/(depreciation) on investments for tax purposes, which consists of gross unrealized appreciation and depreciation, was also different from book purposes primarily due to wash sale loss deferrals and mark-to-market adjustments on swaps, forwards, futures, options, PFICs, partnership adjustments and nontaxable distributions from underlying investments. Both the cost and unrealized appreciation and depreciation for federal income tax purposes are disclosed below: |
| | |
| Fund | | Tax Cost | | Gross Unrealized
Appreciation | | Gross Unrealized
(Depreciation) | | Net Unrealized
Appreciation
(Depreciation) |
| Balanced Income Fund | | $ 13,311,813,268 | | $ 2,579,281,837 | | $ (140,611,160) | | $ 2,438,670,677 |
| Balanced Retirement Fund | | 91,668,528 | | 11,560,083 | | (2,174,289) | | 9,385,794 |
| Checks and Balances Fund | | 1,392,554,199 | | 330,525,908 | | — | | 330,525,908 |
| Conservative Allocation Fund | | 125,685,757 | | 13,359,949 | | (696,575) | | 12,663,374 |
| Global Real Asset Fund (consolidated) | | 82,991,361 | | 14,912,126 | | (634,863) | | 14,277,263 |
| Growth Allocation Fund | | 509,793,778 | | 139,941,764 | | (869,383) | | 139,072,381 |
| Moderate Allocation Fund | | 351,884,419 | | 69,411,674 | | (1,106,037) | | 68,305,637 |
| Multi-Asset Income Fund | | 810,693,240 | | 72,060,061 | | (10,224,417) | | 61,835,644 |
| g) | Accounting for Uncertainty in Income Taxes – Pursuant to provisions set forth by U.S. GAAP, Hartford Funds Management Company, LLC ("HFMC") reviews each Fund’s tax positions for all open tax years. As of October 31, 2021, HFMC had reviewed the open tax years and concluded that there was no reason to record a liability for net unrecognized tax obligations relating to uncertain income tax positions. Each Fund files U.S. tax returns. Although the statute of limitations for examining a Fund’s U.S. tax returns remains open for 3 years, no examination is currently in progress. The Funds recognize interest and penalties, if any, related to unrecognized tax benefits as income tax expense on the Statements of Operations. During the year ended October 31, 2021, the Funds did not incur any interest or penalties. HFMC is not aware of any tax positions for which it is reasonably possible that the total amounts of unrecognized tax obligations will significantly change in the next twelve months. |
| a) | Investment Management Agreement – HFMC serves as each Fund’s investment manager pursuant to an Investment Management Agreement with the Company. HFMC is an indirect subsidiary of The Hartford Financial Services Group, Inc. (“The Hartford”). HFMC has overall investment supervisory responsibility for each Fund. In addition, HFMC provides administrative personnel, services, equipment, facilities and office space for proper operation of each Fund. HFMC has contracted with Wellington Management Company LLP (“Wellington Management”) under a sub-advisory agreement and Wellington Management performs the daily investment of the assets of each Fund, except Checks and Balances Fund, Conservative Allocation Fund, Growth Allocation Fund and Moderate Allocation Fund, in accordance with the Fund’s investment objective and policies. Each Fund, except Checks and Balances Fund, pays a fee to HFMC under the Investment Management Agreement. With respect to each of Balanced Income Fund, Balanced Retirement Fund, Global Real Asset Fund and Multi-Asset Income Fund, HFMC pays a sub-advisory fee to Wellington Management out of its management fee. HFMC is responsible for the day-to-day management of Checks and Balances Fund, Conservative Allocation Fund, Growth Allocation Fund and Moderate Allocation Fund. |
| | The schedule below reflects the rates of compensation paid to HFMC for investment management services rendered as of October 31, 2021; the rates are accrued daily and paid monthly based on each Fund’s average daily net assets, at the following annual rates: |
| | |
Hartford Multi-Strategy Funds
Notes to Financial Statements – (continued)
October 31, 2021
| Fund | | Management Fee Rates |
| Balanced Income Fund | | 0.7000% on first $250 million and; |
| | | 0.6300% on next $250 million and; |
| | | 0.6000% on next $500 million and; |
| | | 0.5700% on next $1.5 billion and; |
| | | 0.5500% on next $2.5 billion and; |
| | | 0.5300% on next $5 billion and; |
| | | 0.4500% on next $2 billion and; |
| | | 0.3900% over $12 billion |
| Balanced Retirement Fund (Excluding assets invested in investment companies for which HFMC or its affiliates serves as investment manager (“Affiliated Funds”)) | | 0.3900% on first $1 billion and; |
| | | 0.3800% on next $4 billion and; |
| | | 0.3750% over $5 billion |
| Balanced Retirement Fund (Invested in Affiliated Funds) | | 0.0000% on all assets invested in Affiliated Funds |
| Checks and Balances Fund | | N/A |
| Conservative Allocation Fund, Growth Allocation Fund and Moderate Allocation Fund | | 0.1000% on first $500 million and; |
| | | 0.0950% on next $500 million and; |
| | | 0.0900% on next $1.5 billion and; |
| | | 0.0800% on next $2.5 billion and; |
| | | 0.0700% on next $2.5 billion and; |
| | | 0.0600% on next $2.5 billion and; |
| | | 0.0500% over $10 billion |
| Global Real Asset Fund | | 0.7950% on first $500 million and; |
| | | 0.7600% on next $500 million and; |
| | | 0.7300% on next $1.5 billion and; |
| | | 0.7000% on next $2.5 billion and; |
| | | 0.6600% over $5 billion |
| Multi-Asset Income Fund | | 0.5900% on first $500 million and; |
| | | 0.5500% on next $250 million and; |
| | | 0.5000% on next $250 million and; |
| | | 0.4750% on next $4 billion and; |
| | | 0.4725% on next $5 billion and; |
| | | 0.4700% over $10 billion |
HFMC has contractually agreed to waive the management fee it receives from the Global Real Asset Fund in an amount equal to the management fee paid to it by the Subsidiary. This waiver will remain in effect for as long as the Global Real Asset Fund remains invested in the Subsidiary.
| b) | Accounting Services Agreement – HFMC provides the Funds with accounting services pursuant to a fund accounting agreement by and between the Company, on behalf of each Fund, and HFMC. HFMC has delegated certain accounting and administrative service functions to State Street Bank and Trust Company (“State Street”). In consideration of services rendered and expenses assumed pursuant to the fund accounting agreement, each Fund pays HFMC a fee. Effective May 1, 2021, the fund accounting fee schedule as set forth in the fund accounting agreement by and between the Company, on behalf of the Funds, and HFMC, was revised. Effective May 1, 2021, the fund accounting fee for each Fund is equal to the greater of: (A) the sum of (i) the sub-accounting fee payable by HFMC with respect to the Fund; (ii) the fee payable for tax preparation services for the Fund; and (iii) the amount of expenses that HFMC allocates for providing the fund accounting services to the Fund; plus a target profit margin; or (B) $40,000 per year; provided, however, that to the extent the annual amount of the fund accounting fee exceeds 0.02% of the Fund’s average net assets (calculated during its current fiscal year), HFMC shall waive such portion of the fund accounting fee. For the period November 1, 2020 through April 30, 2021, HFMC received the following fee with respect to each Fund: any sub-accounting fee payable by HFMC plus the amount of expenses that HFMC allocates for providing the fund accounting services. |
| c) | Operating Expenses – Allocable expenses incurred by the Company are allocated to each series within the Company, and allocated to classes within each such series, in proportion to the average daily net assets of such series and classes, except where allocation of certain expenses is more fairly made directly to a Fund or to specific classes within a Fund. As of October 31, 2021, HFMC contractually agreed to limit the total annual fund operating expenses through February 28, 2022 (unless the Board of Directors approves its earlier termination) |
Hartford Multi-Strategy Funds
Notes to Financial Statements – (continued)
October 31, 2021
| | as follows for each of the following Funds: |
| | |
| | | Expense Limit as a Percentage of Average Daily Net Assets |
| Fund | | Class A | | Class C | | Class I | | Class R3 | | Class R4 | | Class R5 | | Class R6 | | Class Y | | Class F |
| Balanced Retirement Fund(1) | | 0.96% | | 1.71% | | 0.66% | | 1.18% | | 0.88% | | 0.55% | | 0.45% | | 0.55% | | 0.45% |
| Conservative Allocation Fund(2) | | 1.19% | | 1.94% | | 0.94% | | 1.44% | | 1.14% | | 0.84% | | N/A | | N/A | | 0.84% |
| Global Real Asset Fund(3) | | 1.25% | | 2.00% | | 1.00% | | 1.50% | | 1.20% | | 0.95% | | N/A | | 0.90% | | 0.90% |
| (1) | HFMC has contractually agreed to reimburse expenses excluding taxes, interest expenses, brokerage commissions, acquired fund fees and expenses resulting from the Fund’s investments in investment companies other than Affiliated Funds, and extraordinary expenses. |
| (2) | HFMC has contractually agreed to reimburse expenses excluding taxes, interest expenses, brokerage commissions and extraordinary expenses. |
| (3) | HFMC has contractually agreed to reimburse expenses excluding taxes, interest expenses, brokerage commissions, acquired fund fees and expenses and extraordinary expenses. |
| d) | Fees Paid Indirectly – Certain Funds have entered into agreements with State Street Global Markets, LLC and Russell Implementation Services, Inc. to partially recapture non-discounted trade commissions. Such rebates are used to pay a portion of a Fund's expenses. For the year ended October 31, 2021, these amounts, if any, are included in the Statements of Operations. |
| | The ratio of expenses to average net assets in the accompanying financial highlights excludes the reduction in expenses related to fees paid indirectly. The annualized expense ratio after waivers reflecting the reduction for fees paid indirectly for the period is as follows: |
| | |
| Fund | | Class A | | Class C | | Class I | | Class R3 | | Class R4 | | Class R5 | | Class R6 | | Class Y | | Class F |
| Balanced Income Fund | | 0.86% | | 1.61% | | 0.61% | | 1.24% | | 0.94% | | 0.64% | | 0.54% | | 0.64% | | 0.53% |
| Balanced Retirement Fund | | 0.83% | | 1.58% | | 0.53% | | 1.07% | | 0.77% | | 0.45% | | 0.34% | | 0.45% | | 0.35% |
| Checks and Balances Fund | | 0.37% | | 1.15% | | 0.13% | | 0.75% | | 0.45% | | 0.15% | | N/A | | N/A | | 0.04% |
| Conservative Allocation Fund | | 0.58% | | 1.37% | | 0.32% | | 0.95% | | 0.64% | | 0.35% | | N/A | | N/A | | 0.23% |
| Global Real Asset Fund (consolidated) | | 1.25% | | 2.00% | | 0.99% | | 1.50% | | 1.20% | | 0.95% | | N/A | | 0.90% | | 0.90% |
| Growth Allocation Fund | | 0.52% | | 1.33% | | 0.29% | | 0.87% | | 0.57% | | 0.26% | | N/A | | N/A | | 0.15% |
| Moderate Allocation Fund | | 0.52% | | 1.31% | | 0.26% | | 0.87% | | 0.58% | | 0.27% | | N/A | | N/A | | 0.17% |
| Multi-Asset Income Fund | | 1.00% | | 1.73% | | 0.70% | | 1.26% | | 1.04% | | 0.74% | | 0.63% | | 0.73% | | 0.63% |
| e) | Sales Charges and Distribution and Service Plan for Class A, C, R3 and R4 Shares – Hartford Funds Distributors, LLC (“HFD”), an indirect subsidiary of The Hartford, is the principal underwriter and distributor of each Fund. For the year ended October 31, 2021, HFD received front-end sales charges and contingent deferred sales charges for each Fund as follows: |
| | |
| Fund | | Front-End
Sales Charges | | Contingent Deferred
Sales Charges |
| Balanced Income Fund | | $ 7,546,843 | | $ 176,829 |
| Balanced Retirement Fund | | 10,767 | | 469 |
| Checks and Balances Fund | | 1,486,949 | | 8,778 |
| Conservative Allocation Fund | | 156,189 | | 259 |
| Global Real Asset Fund (consolidated) | | 133,550 | | 17 |
| Growth Allocation Fund | | 404,965 | | 4,969 |
| Moderate Allocation Fund | | 318,789 | | 3,042 |
| Multi-Asset Income Fund | | 334,819 | | 6,807 |
The Board of Directors of the Company has approved the adoption of a separate distribution plan (each a “Plan”) pursuant to Rule 12b-1 under the 1940 Act for each of Class A, C, R3 and R4 shares. Under a Plan, Class A, Class C, Class R3 and Class R4 shares of a Fund, as applicable, bear distribution and/or service fees paid to HFD, some or all of which may be paid to select broker-dealers. Pursuant to the Class A Plan, a Fund may pay HFD a fee of up to 0.25% of the average daily net assets attributable to Class A shares for distribution financing activities and shareholder account servicing activities. The entire amount of the fee may be used for shareholder servicing expenses and/or distribution expenses. Pursuant to the Class C Plan, a Fund may pay HFD a fee of up to 1.00% of the average daily net assets attributable to Class C shares for distribution financing activities, and up to 0.25% may be used for shareholder account servicing activities. The Class C Plan also provides that HFD will receive all contingent deferred sales charges attributable to Class C shares. Pursuant to the Class R3 Plan, a Fund may pay HFD a fee of up to 0.50% of the average daily net assets attributable to Class R3 shares for distribution financing activities, and up to 0.25% may be used for shareholder account servicing activities. Pursuant to the Class R4 Plan, a Fund may pay HFD a fee of up to 0.25% of the average daily net assets attributable to Class R4 shares for distribution financing activities. The entire amount of the fee may be used for shareholder account servicing activities. Each Fund’s 12b-1 fees are accrued daily and paid monthly or at such other intervals as the Company’s Board of Directors may determine. Any 12b-1 fees attributable to assets held in an account held directly with the Funds’ transfer agent for which there is not a third-party listed as the broker-dealer of record (or HFD does not otherwise have a payment obligation) are generally reimbursed to the applicable Fund. Such amounts are reflected as “Distribution fee reimbursements” on the Statements of Operations.
Hartford Multi-Strategy Funds
Notes to Financial Statements – (continued)
October 31, 2021
| f) | Other Related Party Transactions – Certain officers of the Company are directors and/or officers of HFMC and/or The Hartford or its subsidiaries. For the year ended October 31, 2021, a portion of the Company’s Chief Compliance Officer’s (“CCO”) compensation was paid by all of the investment companies in the Hartford fund complex. The portion allocated to each Fund, as represented in other expenses on the Statements of Operations, is outlined in the table below. |
| | |
| Fund | | CCO Compensation
Paid by Fund |
| Balanced Income Fund | | $ 26,449 |
| Balanced Retirement Fund | | 180 |
| Checks and Balances Fund | | 2,901 |
| Conservative Allocation Fund | | 240 |
| Global Real Asset Fund (consolidated) | | 206 |
| Growth Allocation Fund | | 1,108 |
| Moderate Allocation Fund | | 720 |
| Multi-Asset Income Fund | | 1,533 |
Hartford Administrative Services Company (“HASCO”), an indirect subsidiary of The Hartford, provides transfer agent services to each Fund. Each Fund pays HASCO a transfer agency fee payable monthly based on the lesser of (i) the costs of providing or overseeing transfer agency services provided to each share class of such Fund plus a target profit margin or (ii) a Specified Amount (as defined in the table below). Such fee is intended to compensate HASCO for: (i) fees payable by HASCO to DST Asset Manager Solutions, Inc. (“DST”) (and any other designated sub-agent) according to the agreed-upon fee schedule under the sub-transfer agency agreement between HASCO and DST (or between HASCO and any other designated sub-agent, as applicable); (ii) sub-transfer agency fees payable by HASCO to financial intermediaries, according to the agreed-upon terms between HASCO and the financial intermediaries, provided that such payments are within certain limits approved by the Company’s Board of Directors; (iii) certain expenses that HASCO’s parent company, Hartford Funds Management Group, Inc., allocates to HASCO that relate to HASCO’s transfer agency services provided to the Fund; and (iv) a target profit margin.
| Share Class | | Specified Amount
(as a percentage
average daily
net assets) |
| Class A | | 0.25% |
| Class C | | 0.25% |
| Class I | | 0.20% |
| Class R3 | | 0.22% |
| Class R4 | | 0.17% |
| Class R5 | | 0.12% |
| Class R6 | | 0.004% |
| Class Y | | 0.11% |
| Class F | | 0.004% |
From November 1, 2020 through February 28, 2021, HASCO contractually agreed to waive and/or reimburse a portion of the transfer agency fees for the share classes of the Funds listed below to the extent necessary to limit the transfer agency fees as follows:
| Fund | | Class Y |
| Balanced Income Fund | | 0.10% |
| Multi-Asset Income Fund | | 0.09% |
Pursuant to a sub-transfer agency agreement between HASCO and DST, HASCO has delegated certain transfer agent, dividend disbursing agent and shareholder servicing agent functions to DST. Each Fund does not pay any fee directly to DST; rather, HASCO makes all such payments to DST. The accrued amount shown in the Statements of Operations reflects the amounts charged by HASCO. These fees are accrued daily and paid monthly.
Hartford Multi-Strategy Funds
Notes to Financial Statements – (continued)
October 31, 2021
For the year ended October 31, 2021, the effective rate of compensation paid to HASCO for transfer agency services as a percentage of each Class' average daily net assets is as follows:
| Fund | | Class A | | Class C | | Class I | | Class R3 | | Class R4 | | Class R5 | | Class R6 | | Class Y | | Class F |
| Balanced Income Fund | | 0.07% | | 0.08% | | 0.08% | | 0.20% | | 0.15% | | 0.11% | | 0.00% * | | 0.11% | | 0.00%* |
| Balanced Retirement Fund | | 0.14% | | 0.15% | | 0.10% | | 0.22% | | 0.17% | | 0.12% | | 0.00% * | | 0.10% | | 0.00%* |
| Checks and Balances Fund | | 0.09% | | 0.11% | | 0.09% | | 0.22% | | 0.17% | | 0.12% | | N/A | | N/A | | 0.00%* |
| Conservative Allocation Fund | | 0.10% | | 0.14% | | 0.10% | | 0.22% | | 0.17% | | 0.12% | | N/A | | N/A | | 0.00%* |
| Global Real Asset Fund (consolidated) | | 0.18% | | 0.25% | | 0.09% | | 0.22% | | 0.17% | | 0.12% | | N/A | | 0.08% | | 0.00%* |
| Growth Allocation Fund | | 0.13% | | 0.18% | | 0.14% | | 0.22% | | 0.17% | | 0.11% | | N/A | | N/A | | 0.00%* |
| Moderate Allocation Fund | | 0.11% | | 0.15% | | 0.10% | | 0.21% | | 0.17% | | 0.11% | | N/A | | N/A | | 0.00%* |
| Multi-Asset Income Fund | | 0.14% | | 0.11% | | 0.08% | | 0.22% | | 0.17% | | 0.12% | | 0.00% * | | 0.10% | | 0.00%* |
| 8. | Securities Lending: |
| | The Company has entered into a securities lending agency agreement (“lending agreement”) with Citibank, N.A. (“Citibank”). A Fund may lend portfolio securities to certain borrowers in U.S. and non-U.S. markets in an amount not to exceed one-third (33 1/3%) of the value of its total assets. A Fund may lend portfolio securities, provided that the borrower provides collateral that is maintained in an amount at least equal to the current market value of the securities loaned. Cash collateral is invested for the benefit of a Fund by the Fund’s lending agent pursuant to collateral investment guidelines. The collateral is marked to market daily, in an amount at least equal to the current market value of the securities loaned. Each of Checks and Balances Fund, Conservative Allocation Fund, Growth Allocation Fund, and Moderate Allocation Fund do not currently engage in securities lending. |
| | A Fund is subject to certain risks while its securities are on loan, including the following: (i) the risk that the borrower defaults on the loan and the collateral is inadequate to cover the Fund’s loss; (ii) the risk that the earnings on the collateral invested are not sufficient to pay fees incurred in connection with the loan; (iii) the Fund could lose money in the event of a decline in the value of the collateral provided for loaned securities or a decline in the value of any investments made with cash collateral; (iv) the risk that the borrower may use the loaned securities to cover a short sale, which may in turn place downward pressure on the market prices of the loaned securities; (v) the risk that return of loaned securities could be delayed and interfere with portfolio management decisions; and (vi) the risk that any efforts to restrict or recall the securities for purposes of voting may not be effective. These events could also trigger adverse tax consequences for the Fund. |
| | A Fund retains loan fees and the interest on cash collateral investments but is required to pay the borrower a rebate for the use of cash collateral. In cases where the lent security is of high value to borrowers, there may be a negative rebate (i.e., a net payment from the borrower to the applicable Fund). Upon termination of a loan, a Fund is required to return to the borrower an amount equal to the cash collateral, plus any rebate owed to the borrowers. |
| | The net income earned on the securities lending (after payment of rebates and Citibank’s fee) is included on the Statements of Operations as Investment Income from securities lending. A Fund also receives payments from the borrower during the period of the loan, equivalent to dividends and interest earned on the securities loaned, which are recorded as Investment Income from dividends or interest, respectively, on the Statements of Operations. |
| | The following table presents for each Fund that lends its portfolio securities the market value of the securities on loan; the collateral posted by the borrower; and the net amount, if any, due from the borrower in the event of default as of October 31, 2021. |
| | |
| Fund | | Investment Securities on Loan, at market value,
Presented on the Statements of Assets and Liabilities | | Collateral Posted by Borrower(1) | | Net Amount(2) |
| Balanced Income Fund | | $ 80,483,013 | | $ (80,483,013) | | $ — |
| Balanced Retirement Fund | | 463,842 | | (463,842) | | — |
| Global Real Asset Fund (consolidated) | | 964,188 | | (964,188) (3) | | — |
| Multi-Asset Income Fund | | 1,659,385 | | (1,659,385) (3) | | — |
| (1) | It is each Fund’s policy to obtain additional collateral from, or return excess collateral to, the borrower by the end of the next business day following the valuation date of the securities loaned. Therefore, the value of the collateral held may be temporarily less than that required under the lending contract due to timing. Pursuant to the lending agreement, the borrower will provide collateral in an amount at least equal to the current market value of securities loaned. Collateral received in excess or in deficit of the market value is not presented in this table. |
| (2) | Net amount represents the net amount receivable due from the borrower in the event of default. |
| (3) | Includes non-cash collateral of $242 and $1,056,173 for Global Real Asset Fund and Multi-Asset Income Fund, respectively. |
Hartford Multi-Strategy Funds
Notes to Financial Statements – (continued)
October 31, 2021
| 9. | Secured Borrowings: |
| | The following tables reflect a breakdown of transactions accounted for as secured borrowings, the gross obligation by the type of collateral pledged, and the remaining contractual maturity of those transactions as of October 31, 2021. |
| | Certain Transfers Accounted For As Secured Borrowings |
| | Remaining Contractual Maturity of the Agreements |
| | |
| | Overnight and
Continuous | | < 30 days | | Between
30 & 90 days | | > 90 days | | Total |
| Balanced Income Fund | | | | | | | | | |
| Securities Lending Transactions(1) | | | | | | | | | |
| Common Stocks | $ 71,778,304 | | $ — | | $ — | | $ — | | $ 71,778,304 |
| Corporate Bonds | 1,100,558 | | — | | — | | — | | 1,100,558 |
| Escrows | 2,026,755 | | — | | — | | — | | 2,026,755 |
| Preferred Stocks | 8,638,232 | | — | | — | | — | | 8,638,232 |
| Total Borrowings | $ 83,543,849 | | $ — | | $ — | | $ — | | $ 83,543,849 |
| Gross amount of recognized liabilities for securities lending transactions | | $ 83,543,849 |
| Balanced Retirement Fund | | | | | | | | | |
| Securities Lending Transactions(1) | | | | | | | | | |
| Common Stocks | $ 412,044 | | $ — | | $ — | | $ — | | $ 412,044 |
| Corporate Bonds | 61,068 | | — | | — | | — | | 61,068 |
| Total Borrowings | $ 473,112 | | $ — | | $ — | | $ — | | $ 473,112 |
| Gross amount of recognized liabilities for securities lending transactions | | $ 473,112 |
| Global Real Asset Fund (consolidated) | | | | | | | | | |
| Securities Lending Transactions(1) | | | | | | | | | |
| Common Stocks | $ 967,269 | | $ — | | $ — | | $ — | | $ 967,269 |
| Exchange-Traded Funds | 22,076 | | — | | — | | — | | 22,076 |
| Total Borrowings | $ 989,345 | | $ — | | $ — | | $ — | | $ 989,345 |
| Gross amount of recognized liabilities for securities lending transactions | | $ 989,345 |
| Multi-Asset Income Fund | | | | | | | | | |
| Securities Lending Transactions(1) | | | | | | | | | |
| Common Stocks | $ 427,451 | | $ — | | $ — | | $ — | | $ 427,451 |
| Convertible Preferred Stocks | 461,362 | | — | | — | | — | | 461,362 |
| Corporate Bonds | 1,301 | | — | | — | | — | | 1,301 |
| Total Borrowings | $ 890,114 | | $ — | | $ — | | $ — | | $ 890,114 |
| Gross amount of recognized liabilities for securities lending transactions | | $ 890,114 |
| (1) | Amount represents the payable for cash collateral received on securities on loan. This will generally be in the “Overnight and Continuous” column as the securities are typically callable on demand. |
| 10. | Affiliate Fund Transactions: |
| | A summary of affiliate fund transactions for the Balanced Retirement Fund, Checks and Balances Fund, Conservative Allocation Fund, Growth Allocation Fund and Moderate Allocation Fund for the year ended October 31, 2021 is as follows: |
| | |
| Affiliated Investment Companies | | Beginning
Value as of
November 1, 2020 | | Purchases
at Cost | | Proceeds
from Sales | | Net
Realized
Gain/(Loss)
on Sales | | Change in
Unrealized
Appreciation/
(Depreciation) | | Ending
Value as of
October 31, 2021 | | Shares as of
October 31, 2021 | | Dividend
Income | | Capital Gains
Distribution |
| Balanced Retirement Fund |
| Hartford Multifactor Developed Markets (ex-US) ETF | | $ 5,567,000 | | $ — | | $ 1,920,250 | | $ 105,240 | | $ 1,084,519 | | $ 4,836,509 | | 157,541 | | $ 179,136 | | $ — |
| Hartford Multifactor Emerging Markets ETF | | 4,645,995 | | 1,092,427 | | 2,025,354 | | 46,509 | | 1,067,903 | | 4,827,480 | | 196,795 | | 148,223 | | — |
Hartford Multi-Strategy Funds
Notes to Financial Statements – (continued)
October 31, 2021
| Affiliated Investment Companies | | Beginning
Value as of
November 1, 2020 | | Purchases
at Cost | | Proceeds
from Sales | | Net
Realized
Gain/(Loss)
on Sales | | Change in
Unrealized
Appreciation/
(Depreciation) | | Ending
Value as of
October 31, 2021 | | Shares as of
October 31, 2021 | | Dividend
Income | | Capital Gains
Distribution |
| Balanced Retirement Fund – (continued) |
| Hartford Multifactor US Equity ETF | | $ 5,682,523 | | $ — | | $ 4,250,779 | | $ 587,231 | | $ 909,776 | | $ 2,928,751 | | 69,517 | | $ 82,613 | | $ — |
| The Hartford World Bond Fund, Class F | | 8,981,083 | | 3,925,855 | | 2,349,803 | | (14,722) | | (126,557) | | 10,415,856 | | 987,285 | | 112,285 | | — |
| Total | | $ 24,876,601 | | $ 5,018,282 | | $ 10,546,186 | | $ 724,258 | | $ 2,935,641 | | $ 23,008,596 | | 1,411,138 | | $ 522,257 | | $ — |
| Checks and Balances Fund |
| Hartford Total Return Bond ETF | | $ 504,816,492 | | $ 75,392,885 | | $ — | | $ — | | $ (6,799,581) | | $ 573,409,796 | | 14,109,493 | | $ 12,067,327 | | $ 1,345,663 |
| The Hartford Capital Appreciation Fund, Class F | | 476,230,437 | | 33,898,270 | | 68,008,528 | | 10,032,762 | | 119,851,628 | | 572,004,569 | | 11,611,948 | | 3,614,135 | | 24,024,846 |
| The Hartford Dividend and Growth Fund, Class F | | 482,551,309 | | 24,489,509 | | 121,643,137 | | 17,813,669 | | 171,182,980 | | 574,394,330 | | 16,844,409 | | 8,014,849 | | 10,877,946 |
| Total | | $ 1,463,598,238 | | $ 133,780,664 | | $189,651,665 | | $27,846,431 | | $ 284,235,027 | | $ 1,719,808,695 | | 42,565,850 | | $ 23,696,311 | | $ 36,248,455 |
| Conservative Allocation Fund |
| Hartford Core Bond ETF | | $ 27,852,061 | | $ 2,666,490 | | $ 1,160,229 | | $ (26,494) | | $ (626,522) | | $ 28,705,306 | | 700,743 | | $ 317,740 | | $ 217,061 |
| Hartford Core Equity Fund, Class F | | 10,659,674 | | 187,081 | | 2,642,063 | | 1,078,499 | | 2,670,703 | | 11,953,894 | | 240,763 | | 97,972 | | — |
| Hartford Emerging Markets Equity Fund, Class F | | 992,582 | | — | | 1,059,857 | | 93,063 | | (25,788) | | — | | — | | — | | — |
| Hartford Multifactor Developed Markets (ex-US) ETF | | 3,514,134 | | 713,639 | | — | | — | | 835,210 | | 5,062,983 | | 164,918 | | 153,545 | | — |
| Hartford Multifactor US Equity ETF | | 5,168,676 | | — | | 276,069 | | 40,794 | | 1,763,710 | | 6,697,111 | | 158,963 | | 107,001 | | — |
| Hartford Schroders Emerging Markets Equity Fund, Class F | | — | | 1,216,670 | | 268,285 | | 20,386 | | 55,487 | | 1,024,258 | | 50,806 | | 10,187 | | — |
| Hartford Schroders International Multi-Cap Value Fund, Class F | | 1,629,945 | | 411,786 | | 477,259 | | 46,786 | | 470,896 | | 2,082,154 | | 201,955 | | 51,426 | | — |
| Hartford Short Duration ETF | | 12,697,482 | | — | | — | | — | | (51,212) | | 12,646,270 | | 310,376 | | 266,818 | | — |
| Hartford Small Cap Value Fund, Class F | | 2,197,699 | | 1,293,180 | | 1,256,007 | | 97,476 | | 1,107,198 | | 3,439,546 | | 256,683 | | 32,897 | | — |
| The Hartford Equity Income Fund, Class F | | 6,128,690 | | 657,688 | | 1,686,986 | | 175,585 | | 1,911,405 | | 7,186,382 | | 303,479 | | 132,869 | | 68,969 |
Hartford Multi-Strategy Funds
Notes to Financial Statements – (continued)
October 31, 2021
| Affiliated Investment Companies | | Beginning
Value as of
November 1, 2020 | | Purchases
at Cost | | Proceeds
from Sales | | Net
Realized
Gain/(Loss)
on Sales | | Change in
Unrealized
Appreciation/
(Depreciation) | | Ending
Value as of
October 31, 2021 | | Shares as of
October 31, 2021 | | Dividend
Income | | Capital Gains
Distribution |
| Conservative Allocation Fund – (continued) |
| The Hartford Growth Opportunities Fund, Class F | | $ 3,408,915 | | $ 1,414,625 | | $ 1,614,671 | | $ 685,543 | | $ (84,890) | | $ 3,809,522 | | 56,279 | | $ — | | $ 457,899 |
| The Hartford Inflation Plus Fund, Class F | | 6,604,939 | | 2,512,013 | | 836,188 | | 41,490 | | 314,727 | | 8,636,981 | | 727,631 | | 174,935 | | — |
| The Hartford International Growth Fund, Class F | | 1,619,699 | | 976,689 | | 498,553 | | 71,379 | | 280,894 | | 2,450,108 | | 126,621 | | 5,656 | | 57,626 |
| The Hartford International Opportunities Fund, Class F | | 2,942,389 | | 1,649,110 | | 930,255 | | 234,030 | | 638,535 | | 4,533,809 | | 214,364 | | 24,012 | | — |
| The Hartford MidCap Fund, Class F | | 2,510,642 | | 318,011 | | 3,292,277 | | 673,453 | | (209,829) | | — | | — | | — | | 291,544 |
| The Hartford Small Company Fund, Class F | | 2,839,671 | | 1,718,789 | | 1,743,053 | | 587,086 | | 107,485 | | 3,509,978 | | 106,492 | | — | | 270,182 |
| The Hartford Strategic Income Fund, Class F | | 10,896,884 | | 1,002,534 | | 1,034,977 | | 58,642 | | 128,262 | | 11,051,345 | | 1,202,540 | | 346,265 | | 121,125 |
| The Hartford World Bond Fund, Class F | | 26,522,531 | | 2,690,016 | | 3,695,995 | | 126,400 | | (483,240) | | 25,159,712 | | 2,384,807 | | 302,602 | | — |
| Total | | $ 128,186,613 | | $ 19,428,321 | | $ 22,472,724 | | $ 4,004,118 | | $ 8,803,031 | | $ 137,949,359 | | 7,207,420 | | $ 2,023,925 | | $ 1,484,406 |
| Growth Allocation Fund |
| Hartford Core Bond ETF | | $ 40,287,337 | | $ — | | $ 2,076,199 | | $ (47,410) | | $ (834,864) | | $ 37,328,864 | | 911,258 | | $ 423,712 | | $ 313,975 |
| Hartford Core Equity Fund, Class F | | 102,508,093 | | 956,784 | | 17,791,922 | | 7,568,428 | | 29,664,709 | | 122,906,092 | | 2,475,450 | | 956,784 | | — |
| Hartford Emerging Markets Equity Fund, Class F | | 11,268,832 | | — | | 12,032,608 | | 1,187,277 | | (423,501) | | — | | — | | — | | — |
| Hartford Multifactor Developed Markets (ex-US) ETF | | 39,151,871 | | 11,486,556 | | — | | — | | 9,490,225 | | 60,128,652 | | 1,958,588 | | 1,783,337 | | — |
| Hartford Multifactor US Equity ETF | | 50,464,789 | | — | | 3,680,919 | | 479,919 | | 16,996,047 | | 64,259,836 | | 1,525,275 | | 1,033,904 | | — |
| Hartford Schroders Emerging Markets Equity Fund, Class F | | — | | 12,224,756 | | 1,209,676 | | 156,842 | | 748,449 | | 11,920,371 | | 591,288 | | 121,246 | | — |
| Hartford Schroders International Multi-Cap Value Fund, Class F | | 18,717,025 | | 2,179,451 | | 5,055,956 | | 213,578 | | 5,701,319 | | 21,755,417 | | 2,110,128 | | 560,266 | | — |
| Hartford Short Duration ETF | | 17,973,972 | | — | | 6,179,863 | | 170,620 | | (175,001) | | 11,789,728 | | 289,354 | | 288,093 | | — |
Hartford Multi-Strategy Funds
Notes to Financial Statements – (continued)
October 31, 2021
| Affiliated Investment Companies | | Beginning
Value as of
November 1, 2020 | | Purchases
at Cost | | Proceeds
from Sales | | Net
Realized
Gain/(Loss)
on Sales | | Change in
Unrealized
Appreciation/
(Depreciation) | | Ending
Value as of
October 31, 2021 | | Shares as of
October 31, 2021 | | Dividend
Income | | Capital Gains
Distribution |
| Growth Allocation Fund – (continued) |
| Hartford Small Cap Value Fund, Class F | | $ 23,106,271 | | $ 12,481,973 | | $ 9,327,745 | | $ (1,177,927) | | $ 13,958,980 | | $ 39,041,552 | | 2,913,549 | | $ 360,692 | | $ — |
| The Hartford Equity Income Fund, Class F | | 58,280,383 | | 2,012,846 | | 3,428,221 | | 357,956 | | 20,407,841 | | 77,630,805 | | 3,278,328 | | 1,353,174 | | 658,922 |
| The Hartford Growth Opportunities Fund, Class F | | 31,136,442 | | 7,851,657 | | 8,768,764 | | 2,812,725 | | 2,527,269 | | 35,559,329 | | 525,326 | | — | | 4,189,565 |
| The Hartford Inflation Plus Fund, Class F | | 8,438,177 | | 3,836,303 | | 1,622,633 | | 79,658 | | 345,264 | | 11,076,769 | | 933,174 | | 222,870 | | — |
| The Hartford International Growth Fund, Class F | | 16,560,817 | | 4,796,488 | | — | | — | | 3,509,023 | | 24,866,328 | | 1,285,081 | | 60,464 | | 602,420 |
| The Hartford International Opportunities Fund, Class F | | 34,515,631 | | 10,261,290 | | 3,582,854 | | 874,400 | | 9,097,373 | | 51,165,840 | | 2,419,189 | | 293,219 | | — |
| The Hartford MidCap Fund, Class F | | 26,270,528 | | 3,152,980 | | 34,446,900 | | 8,734,315 | | (3,710,923) | | — | | — | | — | | 3,152,980 |
| The Hartford Small Company Fund, Class F | | 29,006,089 | | 14,079,991 | | 11,145,894 | | 3,957,773 | | 3,074,881 | | 38,972,840 | | 1,182,428 | | — | | 2,869,277 |
| The Hartford Strategic Income Fund, Class F | | 10,069,134 | | 2,259,290 | | — | | — | | 133,319 | | 12,461,743 | | 1,356,011 | | 363,222 | | 113,038 |
| The Hartford World Bond Fund, Class F | | 32,790,952 | | 2,851,168 | | 8,912,710 | | 314,914 | | (677,395) | | 26,366,929 | | 2,499,235 | | 336,996 | | — |
| Total | | $ 550,546,343 | | $ 90,431,533 | | $129,262,864 | | $25,683,068 | | $ 109,833,015 | | $ 647,231,095 | | 26,253,662 | | $ 8,157,979 | | $ 11,900,177 |
| Moderate Allocation Fund |
| Hartford Core Bond ETF | | $ 55,559,554 | | $ 7,742,509 | | $ 2,870,040 | | $ (65,537) | | $ (1,274,420) | | $ 59,092,066 | | 1,442,533 | | $ 651,523 | | $ 432,995 |
| Hartford Core Equity Fund, Class F | | 50,417,978 | | 469,462 | | 9,390,002 | | 4,018,177 | | 14,038,134 | | 59,553,749 | | 1,199,471 | | 469,462 | | — |
| Hartford Emerging Markets Equity Fund, Class F | | 6,764,123 | | — | | 7,222,580 | | 722,478 | | (264,021) | | — | | — | | — | | — |
| Hartford Multifactor Developed Markets (ex-US) ETF | | 21,631,266 | | 3,843,704 | | — | | — | | 5,112,330 | | 30,587,300 | | 996,329 | | 933,866 | | — |
| Hartford Multifactor US Equity ETF | | 22,730,028 | | — | | 644,161 | | 95,186 | | 7,922,770 | | 30,103,823 | | 714,546 | | 476,802 | | — |
| Hartford Schroders Emerging Markets Equity Fund, Class F | | — | | 7,414,155 | | 2,017,528 | | 211,614 | | 368,777 | | 5,977,018 | | 296,479 | | 72,234 | | — |
Hartford Multi-Strategy Funds
Notes to Financial Statements – (continued)
October 31, 2021
| Affiliated Investment Companies | | Beginning
Value as of
November 1, 2020 | | Purchases
at Cost | | Proceeds
from Sales | | Net
Realized
Gain/(Loss)
on Sales | | Change in
Unrealized
Appreciation/
(Depreciation) | | Ending
Value as of
October 31, 2021 | | Shares as of
October 31, 2021 | | Dividend
Income | | Capital Gains
Distribution |
| Moderate Allocation Fund – (continued) |
| Hartford Schroders International Multi-Cap Value Fund, Class F | | $ 9,465,921 | | $ 1,225,723 | | $ 1,582,602 | | $ (29,567) | | $ 3,058,257 | | $ 12,137,732 | | 1,177,278 | | $ 299,933 | | $ — |
| Hartford Short Duration ETF | | 20,302,038 | | — | | — | | — | | (81,883) | | 20,220,155 | | 496,261 | | 426,617 | | — |
| Hartford Small Cap Value Fund, Class F | | 10,565,923 | | 5,662,656 | | 3,524,080 | | (646,813) | | 6,429,632 | | 18,487,318 | | 1,379,650 | | 165,395 | | — |
| The Hartford Equity Income Fund, Class F | | 30,564,060 | | 1,408,590 | | 6,363,084 | | 595,833 | | 9,724,832 | | 35,930,231 | | 1,517,324 | | 657,337 | | 340,015 |
| The Hartford Growth Opportunities Fund, Class F | | 15,494,172 | | 3,581,719 | | 4,894,768 | | 2,064,791 | | 485,810 | | 16,731,724 | | 247,182 | | — | | 2,081,685 |
| The Hartford Inflation Plus Fund, Class F | | 10,687,691 | | 4,950,974 | | 910,842 | | 32,137 | | 567,790 | | 15,327,750 | | 1,291,301 | | 297,861 | | — |
| The Hartford International Growth Fund, Class F | | 9,147,986 | | 3,063,819 | | — | | — | | 1,938,371 | | 14,150,176 | | 731,275 | | 33,398 | | 332,770 |
| The Hartford International Opportunities Fund, Class F | | 19,290,492 | | 5,631,903 | | 3,434,746 | | 765,654 | | 4,636,757 | | 26,890,060 | | 1,271,398 | | 155,328 | | — |
| The Hartford MidCap Fund, Class F | | 13,052,732 | | 1,545,692 | | 16,945,390 | | 4,221,091 | | (1,874,125) | | — | | — | | — | | 1,545,692 |
| The Hartford Small Company Fund, Class F | | 13,895,862 | | 5,143,892 | | 5,434,156 | | 1,870,483 | | 1,309,229 | | 16,785,310 | | 509,263 | | — | | 1,367,953 |
| The Hartford Strategic Income Fund, Class F | | 17,757,936 | | 1,461,878 | | 1,070,878 | | 44,768 | | 246,736 | | 18,440,440 | | 2,006,577 | | 570,171 | | 199,154 |
| The Hartford World Bond Fund, Class F | | 44,286,532 | | 3,397,312 | | 8,494,239 | | 261,154 | | (802,597) | | 38,648,162 | | 3,663,333 | | 482,981 | | — |
| Total | | $ 371,614,294 | | $ 56,543,988 | | $ 74,799,096 | | $14,161,449 | | $ 51,542,379 | | $ 419,063,014 | | 18,940,200 | | $ 5,692,908 | | $ 6,300,264 |
| 11. | Affiliate Holdings: |
| | As of October 31, 2021, affiliates of The Hartford had ownership of shares in each Fund as follows: |
| | |
| Percentage of a Class: | | | | | | | | | | | | | | | | | | |
| Fund | | Class A | | Class C | | Class I | | Class R3 | | Class R4 | | Class R5 | | Class R6 | | Class Y | | Class F |
| Balanced Retirement Fund | | — | | — | | — | | — | | — | | 0%* | | 91% | | — | | — |
| Conservative Allocation Fund | | — | | — | | — | | — | | — | | — | | N/A | | N/A | | 8% |
| Global Real Asset Fund (consolidated) | | — | | — | | — | | — | | 11% | | 4% | | N/A | | — | | — |
| * | Percentage rounds to zero. |
Hartford Multi-Strategy Funds
Notes to Financial Statements – (continued)
October 31, 2021
| Percentage of Fund by Class: | | | | | | | | | | | | | | | | | | |
| Fund | | Class A | | Class C | | Class I | | Class R3 | | Class R4 | | Class R5 | | Class R6 | | Class Y | | Class F |
| Balanced Retirement Fund | | — | | — | | — | | — | | — | | 0%* | | 0%* | | — | | — |
| Conservative Allocation Fund | | — | | — | | — | | — | | — | | — | | N/A | | N/A | | 0%* |
| Global Real Asset Fund (consolidated) | | — | | — | | — | | — | | 0%* | | 0%* | | N/A | | — | | — |
| * | Percentage rounds to zero. |
As of October 31, 2021, affiliated funds of funds and the 529 plan for which HFMC serves as the program manager (the “529 plan”) in the aggregate owned a portion of the Fund identified below. Therefore, this Fund may experience relatively large purchases or redemptions of their shares as a result of purchase and sale activity from these affiliated funds of funds and the 529 plan. Affiliated funds of funds and the 529 plan owned shares in the Fund listed below as follows:
| Fund | | Percentage
of Fund* |
| Balanced Income Fund | | 0% (1) |
| * | As of October 31, 2021, affiliated funds of funds and the 529 plan were invested in Class F shares. |
| (1) | Percentage rounds to zero. |
| 12. | Investment Transactions: |
| | For the year ended October 31, 2021, the cost of purchases and proceeds from sales of investment securities (excluding short-term investments) were as follows: |
| | |
| Fund | | Cost of Purchases
Excluding U.S.
Government
Obligations | | Sales Proceeds
Excluding U.S.
Government
Obligations | | Cost of Purchases
For U.S. Government
Obligations | | Sales Proceeds
For U.S. Government
Obligations | | Total Cost of
Purchases | | Total Sales
Proceeds |
| Balanced Income Fund | | $ 6,054,302,689 | | $ 5,838,145,885 | | $ 574,429,477 | | $ 427,407,662 | | $ 6,628,732,166 | | $ 6,265,553,547 |
| Balanced Retirement Fund | | 23,173,386 | | 40,143,732 | | 276,228 | | 4,701,199 | | 23,449,614 | | 44,844,931 |
| Checks and Balances Fund | | 133,780,664 | | 189,651,665 | | — | | — | | 133,780,664 | | 189,651,665 |
| Conservative Allocation Fund | | 19,428,321 | | 22,472,724 | | — | | — | | 19,428,321 | | 22,472,724 |
| Global Real Asset Fund (consolidated) | | 173,067,321 | | 241,101,541 | | 75,216,947 | | 94,235,581 | | 248,284,268 | | 335,337,122 |
| Growth Allocation Fund | | 90,431,533 | | 129,262,864 | | — | | — | | 90,431,533 | | 129,262,864 |
| Moderate Allocation Fund | | 56,543,988 | | 74,799,096 | | — | | — | | 56,543,988 | | 74,799,096 |
| Multi-Asset Income Fund | | 408,583,522 | | 452,338,908 | | 76,155,254 | | 101,967,616 | | 484,738,776 | | 554,306,524 |
| 13. | Capital Share Transactions: |
| | The following information is for the years ended October 31, 2021 and October 31, 2020: |
| | |
| | For the Year Ended
October 31, 2021 | | For the Year Ended
October 31, 2020 |
| | Shares | | Amount | | Shares | | Amount |
| Balanced Income Fund | | | | | | | |
| Class A | | | | | | | |
| Shares Sold | 56,638,399 | | $ 912,410,505 | | 55,154,686 | | $ 805,163,802 |
| Shares Issued for Reinvested Dividends | 6,337,681 | | 100,994,661 | | 7,936,617 | | 113,564,659 |
| Shares Redeemed | (36,941,791) | | (592,465,028) | | (43,400,316) | | (620,795,570) |
| Net Increase (Decrease) | 26,034,289 | | 420,940,138 | | 19,690,987 | | 297,932,891 |
| Class C | | | | | | | |
| Shares Sold | 19,296,475 | | $ 305,053,113 | | 32,640,521 | | $ 469,055,916 |
| Shares Issued for Reinvested Dividends | 3,297,597 | | 51,414,604 | | 5,488,230 | | 77,575,527 |
| Shares Redeemed | (58,220,767) | | (919,838,821) | | (60,265,630) | | (854,563,325) |
| Net Increase (Decrease) | (35,626,695) | | (563,371,104) | | (22,136,879) | | (307,931,882) |
| Class I | | | | | | | |
| Shares Sold | 69,948,705 | | $ 1,120,430,747 | | 92,488,693 | | $ 1,341,737,959 |
| Shares Issued for Reinvested Dividends | 6,707,399 | | 106,925,758 | | 7,950,893 | | 113,702,614 |
| Shares Redeemed | (58,657,625) | | (938,978,342) | | (76,433,649) | | (1,077,602,824) |
| Net Increase (Decrease) | 17,998,479 | | 288,378,163 | | 24,005,937 | | 377,837,749 |
Hartford Multi-Strategy Funds
Notes to Financial Statements – (continued)
October 31, 2021
| | For the Year Ended
October 31, 2021 | | For the Year Ended
October 31, 2020 |
| | Shares | | Amount | | Shares | | Amount |
| Class R3 | | | | | | | |
| Shares Sold | 1,063,857 | | $ 17,216,888 | | 1,268,147 | | $ 18,504,352 |
| Shares Issued for Reinvested Dividends | 207,440 | | 3,308,544 | | 348,715 | | 5,023,457 |
| Shares Redeemed | (2,777,225) | | (44,675,246) | | (3,872,565) | | (55,251,531) |
| Net Increase (Decrease) | (1,505,928) | | (24,149,814) | | (2,255,703) | | (31,723,722) |
| Class R4 | | | | | | | |
| Shares Sold | 887,004 | | $ 14,282,673 | | 1,364,794 | | $ 19,757,615 |
| Shares Issued for Reinvested Dividends | 138,662 | | 2,216,344 | | 208,288 | | 2,998,525 |
| Shares Redeemed | (1,561,079) | | (25,135,399) | | (2,445,432) | | (35,519,890) |
| Net Increase (Decrease) | (535,413) | | (8,636,382) | | (872,350) | | (12,763,750) |
| Class R5 | | | | | | | |
| Shares Sold | 579,974 | | $ 9,384,291 | | 959,413 | | $ 14,271,312 |
| Shares Issued for Reinvested Dividends | 66,159 | | 1,060,329 | | 81,136 | | 1,163,782 |
| Shares Redeemed | (950,639) | | (15,369,058) | | (1,098,983) | | (15,820,053) |
| Net Increase (Decrease) | (304,506) | | (4,924,438) | | (58,434) | | (384,959) |
| Class R6 | | | | | | | |
| Shares Sold | 3,594,984 | | $ 58,587,631 | | 10,859,156 | | $ 158,149,459 |
| Shares Issued for Reinvested Dividends | 432,819 | | 6,981,019 | | 384,810 | | 5,565,783 |
| Shares Redeemed | (3,532,741) | | (57,073,871) | | (7,732,607) | | (115,016,307) |
| Net Increase (Decrease) | 495,062 | | 8,494,779 | | 3,511,359 | | 48,698,935 |
| Class Y | | | | | | | |
| Shares Sold | 1,484,827 | | $ 24,021,575 | | 3,162,755 | | $ 46,541,926 |
| Shares Issued for Reinvested Dividends | 217,135 | | 3,497,580 | | 367,928 | | 5,319,103 |
| Shares Redeemed | (4,383,419) | | (69,378,275) | | (3,116,033) | | (45,084,145) |
| Net Increase (Decrease) | (2,681,457) | | (41,859,120) | | 414,650 | | 6,776,884 |
| Class F | | | | | | | |
| Shares Sold | 34,844,131 | | $ 559,715,613 | | 41,616,883 | | $ 606,292,789 |
| Shares Issued for Reinvested Dividends | 4,304,296 | | 68,676,058 | | 4,870,726 | | 69,613,828 |
| Shares Redeemed | (23,220,269) | | (373,176,674) | | (22,742,871) | | (325,987,947) |
| Net Increase (Decrease) | 15,928,158 | | 255,214,997 | | 23,744,738 | | 349,918,670 |
| Total Net Increase (Decrease) | 19,801,989 | | $ 330,087,219 | | 46,044,305 | | $ 728,360,816 |
| Balanced Retirement Fund | | | | | | | |
| Class A | | | | | | | |
| Shares Sold | 1,280,845 | | $ 12,522,777 | | 829,270 | | $ 7,602,976 |
| Shares Issued for Reinvested Dividends | 148,787 | | 1,460,156 | | 162,227 | | 1,478,434 |
| Shares Redeemed | (1,694,231) | | (16,578,048) | | (2,278,169) | | (20,637,828) |
| Net Increase (Decrease) | (264,599) | | (2,595,115) | | (1,286,672) | | (11,556,418) |
| Class C | | | | | | | |
| Shares Sold | 24,636 | | $ 240,647 | | 78,083 | | $ 722,298 |
| Shares Issued for Reinvested Dividends | 20,436 | | 199,103 | | 40,417 | | 370,718 |
| Shares Redeemed | (1,748,401) | | (17,089,916) | | (1,828,624) | | (16,709,913) |
| Net Increase (Decrease) | (1,703,329) | | (16,650,166) | | (1,710,124) | | (15,616,897) |
| Class I | | | | | | | |
| Shares Sold | 132,592 | | $ 1,303,454 | | 182,682 | | $ 1,637,754 |
| Shares Issued for Reinvested Dividends | 28,029 | | 274,228 | | 45,459 | | 414,252 |
| Shares Redeemed | (447,124) | | (4,372,091) | | (1,694,859) | | (15,377,224) |
| Net Increase (Decrease) | (286,503) | | (2,794,409) | | (1,466,718) | | (13,325,218) |
| Class R3 | | | | | | | |
| Shares Sold | 6,521 | | $ 64,293 | | 9,782 | | $ 88,977 |
| Shares Issued for Reinvested Dividends | 1,478 | | 14,497 | | 1,630 | | 14,895 |
| Shares Redeemed | (16,557) | | (160,487) | | (63,318) | | (580,754) |
| Net Increase (Decrease) | (8,558) | | (81,697) | | (51,906) | | (476,882) |
| Class R4 | | | | | | | |
| Shares Sold | 2,211 | | $ 21,497 | | 4,368 | | $ 39,430 |
| Shares Issued for Reinvested Dividends | 451 | | 4,407 | | 736 | | 6,666 |
| Shares Redeemed | (20,753) | | (197,627) | | (232) | | (2,082) |
| Net Increase (Decrease) | (18,091) | | (171,723) | | 4,872 | | 44,014 |
Hartford Multi-Strategy Funds
Notes to Financial Statements – (continued)
October 31, 2021
| | For the Year Ended
October 31, 2021 | | For the Year Ended
October 31, 2020 |
| | Shares | | Amount | | Shares | | Amount |
| Class R5 | | | | | | | |
| Shares Sold | 15,106 | | $ 149,168 | | 4,185 | | $ 37,826 |
| Shares Issued for Reinvested Dividends | 1,573 | | 15,361 | | 1,727 | | 15,682 |
| Shares Redeemed | (10,903) | | (105,554) | | (26,426) | | (242,776) |
| Net Increase (Decrease) | 5,776 | | 58,975 | | (20,514) | | (189,268) |
| Class R6 | | | | | | | |
| Shares Sold | 116 | | $ 1,150 | | — | | $ — |
| Shares Issued for Reinvested Dividends | 32 | | 309 | | 29 | | 261 |
| Shares Redeemed | (1) | | (6) | | — | | — |
| Net Increase (Decrease) | 147 | | 1,453 | | 29 | | 261 |
| Class Y | | | | | | | |
| Shares Sold | 65,767 | | $ 625,085 | | 28,372 | | $ 261,410 |
| Shares Issued for Reinvested Dividends | 3,741 | | 36,383 | | 4,584 | | 41,554 |
| Shares Redeemed | (100,663) | | (972,575) | | (215,860) | | (1,978,491) |
| Net Increase (Decrease) | (31,155) | | (311,107) | | (182,904) | | (1,675,527) |
| Class F | | | | | | | |
| Shares Sold | 4,427 | | $ 42,532 | | 10,728 | | $ 95,263 |
| Shares Issued for Reinvested Dividends | 484 | | 4,686 | | 2,445 | | 22,042 |
| Shares Redeemed | (12,344) | | (119,433) | | (196,982) | | (1,798,423) |
| Net Increase (Decrease) | (7,433) | | (72,215) | | (183,809) | | (1,681,118) |
| Total Net Increase (Decrease) | (2,313,745) | | $ (22,616,004) | | (4,897,746) | | $ (44,477,053) |
| Checks and Balances Fund | | | | | | | |
| Class A | | | | | | | |
| Shares Sold | 9,563,346 | | $ 101,897,212 | | 10,156,353 | | $ 92,300,349 |
| Shares Issued for Reinvested Dividends | 5,644,458 | | 58,040,207 | | 9,873,823 | | 92,559,754 |
| Shares Redeemed | (16,847,483) | | (180,252,796) | | (22,587,605) | | (205,625,638) |
| Net Increase (Decrease) | (1,639,679) | | (20,315,377) | | (2,557,429) | | (20,765,535) |
| Class C | | | | | | | |
| Shares Sold | 1,174,907 | | $ 12,383,383 | | 2,105,788 | | $ 19,175,545 |
| Shares Issued for Reinvested Dividends | 452,569 | | 4,582,397 | | 1,125,820 | | 10,530,364 |
| Shares Redeemed | (5,515,612) | | (58,167,014) | | (7,044,277) | | (64,072,525) |
| Net Increase (Decrease) | (3,888,136) | | (41,201,234) | | (3,812,669) | | (34,366,616) |
| Class I | | | | | | | |
| Shares Sold | 3,706,452 | | $ 40,310,852 | | 2,679,014 | | $ 25,021,261 |
| Shares Issued for Reinvested Dividends | 313,362 | | 3,236,969 | | 502,985 | | 4,714,597 |
| Shares Redeemed | (1,915,183) | | (20,546,580) | | (3,278,078) | | (29,498,058) |
| Net Increase (Decrease) | 2,104,631 | | 23,001,241 | | (96,079) | | 237,800 |
| Class R3 | | | | | | | |
| Shares Sold | 191,192 | | $ 2,003,683 | | 205,061 | | $ 1,897,830 |
| Shares Issued for Reinvested Dividends | 49,697 | | 506,109 | | 114,350 | | 1,069,179 |
| Shares Redeemed | (542,623) | | (5,833,566) | | (678,196) | | (6,002,020) |
| Net Increase (Decrease) | (301,734) | | (3,323,774) | | (358,785) | | (3,035,011) |
| Class R4 | | | | | | | |
| Shares Sold | 26,224 | | $ 279,913 | | 34,552 | | $ 312,513 |
| Shares Issued for Reinvested Dividends | 12,954 | | 132,561 | | 43,768 | | 409,168 |
| Shares Redeemed | (58,304) | | (592,123) | | (357,476) | | (3,067,692) |
| Net Increase (Decrease) | (19,126) | | (179,649) | | (279,156) | | (2,346,011) |
| Class R5 | | | | | | | |
| Shares Sold | 22,472 | | $ 241,324 | | 9,953 | | $ 87,599 |
| Shares Issued for Reinvested Dividends | 1,945 | | 19,782 | | 2,656 | | 24,459 |
| Shares Redeemed | (4,192) | | (45,527) | | (8,150) | | (76,799) |
| Net Increase (Decrease) | 20,225 | | 215,579 | | 4,459 | | 35,259 |
| Class F | | | | | | | |
| Shares Sold | 23,033 | | $ 236,246 | | 234,727 | | $ 2,034,553 |
| Shares Issued for Reinvested Dividends | 10,357 | | 106,910 | | 45,118 | | 422,013 |
| Shares Redeemed | (31,081) | | (337,152) | | (728,964) | | (7,058,907) |
| Net Increase (Decrease) | 2,309 | | 6,004 | | (449,119) | | (4,602,341) |
| Total Net Increase (Decrease) | (3,721,510) | | $ (41,797,210) | | (7,548,778) | | $ (64,842,455) |
Hartford Multi-Strategy Funds
Notes to Financial Statements – (continued)
October 31, 2021
| | For the Year Ended
October 31, 2021 | | For the Year Ended
October 31, 2020 |
| | Shares | | Amount | | Shares | | Amount |
| Conservative Allocation Fund | | | | | | | |
| Class A | | | | | | | |
| Shares Sold | 1,430,178 | | $ 16,976,189 | | 1,927,539 | | $ 20,597,317 |
| Shares Issued for Reinvested Dividends | 147,813 | | 1,707,235 | | 247,687 | | 2,675,018 |
| Shares Redeemed | (1,468,623) | | (17,460,347) | | (1,877,308) | | (19,807,169) |
| Net Increase (Decrease) | 109,368 | | 1,223,077 | | 297,918 | | 3,465,166 |
| Class C | | | | | | | |
| Shares Sold | 141,485 | | $ 1,670,539 | | 209,412 | | $ 2,213,734 |
| Shares Issued for Reinvested Dividends | 7,232 | | 83,318 | | 18,786 | | 202,330 |
| Shares Redeemed | (488,360) | | (5,754,588) | | (602,780) | | (6,406,625) |
| Net Increase (Decrease) | (339,643) | | (4,000,731) | | (374,582) | | (3,990,561) |
| Class I | | | | | | | |
| Shares Sold | 61,083 | | $ 723,947 | | 88,733 | | $ 945,899 |
| Shares Issued for Reinvested Dividends | 2,902 | | 33,517 | | 3,272 | | 35,338 |
| Shares Redeemed | (53,321) | | (627,085) | | (38,336) | | (406,988) |
| Net Increase (Decrease) | 10,664 | | 130,379 | | 53,669 | | 574,249 |
| Class R3 | | | | | | | |
| Shares Sold | 54,925 | | $ 654,224 | | 43,777 | | $ 470,582 |
| Shares Issued for Reinvested Dividends | 2,692 | | 31,199 | | 6,034 | | 65,407 |
| Shares Redeemed | (113,848) | | (1,346,415) | | (122,210) | | (1,330,140) |
| Net Increase (Decrease) | (56,231) | | (660,992) | | (72,399) | | (794,151) |
| Class R4 | | | | | | | |
| Shares Sold | 8,511 | | $ 100,790 | | 54,323 | | $ 583,081 |
| Shares Issued for Reinvested Dividends | 1,517 | | 17,531 | | 4,695 | | 50,805 |
| Shares Redeemed | (54,409) | | (640,616) | | (151,530) | | (1,543,673) |
| Net Increase (Decrease) | (44,381) | | (522,295) | | (92,512) | | (909,787) |
| Class R5 | | | | | | | |
| Shares Sold | 8,708 | | $ 103,762 | | 18,006 | | $ 195,139 |
| Shares Issued for Reinvested Dividends | 2,384 | | 27,577 | | 5,129 | | 55,546 |
| Shares Redeemed | (25,760) | | (303,431) | | (74,415) | | (805,682) |
| Net Increase (Decrease) | (14,668) | | (172,092) | | (51,280) | | (554,997) |
| Class F | | | | | | | |
| Shares Sold | 12,653 | | $ 145,252 | | — | | $ — |
| Shares Issued for Reinvested Dividends | 256 | | 2,956 | | 31 | | 329 |
| Shares Redeemed | (161) | | (1,935) | | — | | — |
| Net Increase (Decrease) | 12,748 | | 146,273 | | 31 | | 329 |
| Total Net Increase (Decrease) | (322,143) | | $ (3,856,381) | | (239,155) | | $ (2,209,752) |
| Global Real Asset Fund (consolidated) | | | | | | | |
| Class A | | | | | | | |
| Shares Sold | 632,001 | | $ 6,105,184 | | 252,055 | | $ 1,992,769 |
| Shares Issued for Reinvested Dividends | 37,483 | | 323,853 | | 43,022 | | 388,488 |
| Shares Redeemed | (377,711) | | (3,418,339) | | (408,300) | | (3,196,028) |
| Net Increase (Decrease) | 291,773 | | 3,010,698 | | (113,223) | | (814,771) |
| Class C | | | | | | | |
| Shares Sold | 6,073 | | $ 56,136 | | 5,809 | | $ 45,323 |
| Shares Issued for Reinvested Dividends | 4,242 | | 36,145 | | 5,829 | | 51,874 |
| Shares Redeemed | (173,662) | | (1,579,032) | | (135,100) | | (1,065,726) |
| Net Increase (Decrease) | (163,347) | | (1,486,751) | | (123,462) | | (968,529) |
| Class I | | | | | | | |
| Shares Sold | 431,701 | | $ 4,154,256 | | 796,224 | | $ 6,104,654 |
| Shares Issued for Reinvested Dividends | 47,677 | | 411,455 | | 121,069 | | 1,089,622 |
| Shares Redeemed | (537,784) | | (4,848,567) | | (3,529,140) | | (26,279,225) |
| Net Increase (Decrease) | (58,406) | | (282,856) | | (2,611,847) | | (19,084,949) |
| Class R3 | | | | | | | |
| Shares Sold | 673 | | $ 6,406 | | 2,403 | | $ 19,783 |
| Shares Issued for Reinvested Dividends | 260 | | 2,264 | | 218 | | 1,983 |
| Shares Redeemed | (9) | | (85) | | (13) | | (92) |
| Net Increase (Decrease) | 924 | | 8,585 | | 2,608 | | 21,674 |
Hartford Multi-Strategy Funds
Notes to Financial Statements – (continued)
October 31, 2021
| | For the Year Ended
October 31, 2021 | | For the Year Ended
October 31, 2020 |
| | Shares | | Amount | | Shares | | Amount |
| Class R4 | | | | | | | |
| Shares Sold | 191 | | $ 1,703 | | 396 | | $ 3,188 |
| Shares Issued for Reinvested Dividends | 52 | | 448 | | 146 | | 1,324 |
| Shares Redeemed | (1,887) | | (18,709) | | (4,349) | | (29,596) |
| Net Increase (Decrease) | (1,644) | | (16,558) | | (3,807) | | (25,084) |
| Class R5 | | | | | | | |
| Shares Sold | 17,762 | | $ 171,995 | | 13,903 | | $ 110,089 |
| Shares Issued for Reinvested Dividends | 562 | | 4,816 | | 174 | | 1,553 |
| Shares Redeemed | (3,283) | | (31,829) | | (3,561) | | (28,525) |
| Net Increase (Decrease) | 15,041 | | 144,982 | | 10,516 | | 83,117 |
| Class Y | | | | | | | |
| Shares Sold | 1,434,228 | | $ 13,837,961 | | 813,785 | | $ 6,350,078 |
| Shares Issued for Reinvested Dividends | 172,713 | | 1,488,786 | | 284,846 | | 2,563,617 |
| Shares Redeemed | (1,839,416) | | (17,989,119) | | (5,965,482) | | (47,653,015) |
| Net Increase (Decrease) | (232,475) | | (2,662,372) | | (4,866,851) | | (38,739,320) |
| Class F | | | | | | | |
| Shares Sold | 482,965 | | $ 4,511,387 | | 2,727,251 | | $ 19,813,540 |
| Shares Issued for Reinvested Dividends | 281,762 | | 2,428,791 | | 381,092 | | 3,429,830 |
| Shares Redeemed | (9,875,282) | | (96,716,600) | | (6,350,386) | | (48,449,993) |
| Net Increase (Decrease) | (9,110,555) | | (89,776,422) | | (3,242,043) | | (25,206,623) |
| Total Net Increase (Decrease) | (9,258,689) | | $ (91,060,694) | | (10,948,109) | | $ (84,734,485) |
| Growth Allocation Fund | | | | | | | |
| Class A | | | | | | | |
| Shares Sold | 2,198,117 | | $ 32,736,327 | | 2,605,135 | | $ 31,316,296 |
| Shares Issued for Reinvested Dividends | 1,530,798 | | 21,488,512 | | 1,739,403 | | 22,480,250 |
| Shares Redeemed | (4,629,236) | | (68,691,484) | | (6,553,260) | | (80,282,451) |
| Net Increase (Decrease) | (900,321) | | (14,466,645) | | (2,208,722) | | (26,485,905) |
| Class C | | | | | | | |
| Shares Sold | 161,540 | | $ 2,384,415 | | 258,776 | | $ 3,095,460 |
| Shares Issued for Reinvested Dividends | 92,142 | | 1,284,917 | | 133,984 | | 1,718,571 |
| Shares Redeemed | (1,343,444) | | (19,873,369) | | (1,406,749) | | (17,134,642) |
| Net Increase (Decrease) | (1,089,762) | | (16,204,037) | | (1,013,989) | | (12,320,611) |
| Class I | | | | | | | |
| Shares Sold | 228,634 | | $ 3,402,607 | | 210,536 | | $ 2,637,036 |
| Shares Issued for Reinvested Dividends | 30,751 | | 429,140 | | 39,326 | | 505,226 |
| Shares Redeemed | (203,045) | | (3,005,602) | | (420,882) | | (5,034,993) |
| Net Increase (Decrease) | 56,340 | | 826,145 | | (171,020) | | (1,892,731) |
| Class R3 | | | | | | | |
| Shares Sold | 38,149 | | $ 557,111 | | 34,446 | | $ 416,310 |
| Shares Issued for Reinvested Dividends | 17,304 | | 237,006 | | 21,335 | | 269,072 |
| Shares Redeemed | (62,255) | | (875,349) | | (156,043) | | (1,866,269) |
| Net Increase (Decrease) | (6,802) | | (81,232) | | (100,262) | | (1,180,887) |
| Class R4 | | | | | | | |
| Shares Sold | 17,781 | | $ 260,868 | | 27,491 | | $ 332,935 |
| Shares Issued for Reinvested Dividends | 7,781 | | 108,753 | | 19,377 | | 249,170 |
| Shares Redeemed | (31,358) | | (449,413) | | (288,874) | | (3,155,199) |
| Net Increase (Decrease) | (5,796) | | (79,792) | | (242,006) | | (2,573,094) |
| Class R5 | | | | | | | |
| Shares Sold | 23,340 | | $ 348,904 | | 36,125 | | $ 448,386 |
| Shares Issued for Reinvested Dividends | 16,140 | | 226,949 | | 19,070 | | 246,703 |
| Shares Redeemed | (131,577) | | (1,924,710) | | (102,221) | | (1,280,880) |
| Net Increase (Decrease) | (92,097) | | (1,348,857) | | (47,026) | | (585,791) |
| Class F | | | | | | | |
| Shares Sold | 30,095 | | $ 436,509 | | 11,277 | | $ 146,213 |
| Shares Issued for Reinvested Dividends | 1,255 | | 17,525 | | 920 | | 11,830 |
| Shares Redeemed | (4,755) | | (68,049) | | (5,650) | | (69,262) |
| Net Increase (Decrease) | 26,595 | | 385,985 | | 6,547 | | 88,781 |
| Total Net Increase (Decrease) | (2,011,843) | | $ (30,968,433) | | (3,776,478) | | $ (44,950,238) |
Hartford Multi-Strategy Funds
Notes to Financial Statements – (continued)
October 31, 2021
| | For the Year Ended
October 31, 2021 | | For the Year Ended
October 31, 2020 |
| | Shares | | Amount | | Shares | | Amount |
| Moderate Allocation Fund | | | | | | | |
| Class A | | | | | | | |
| Shares Sold | 2,304,152 | | $ 30,673,658 | | 2,213,094 | | $ 25,119,083 |
| Shares Issued for Reinvested Dividends | 966,673 | | 12,373,503 | | 946,724 | | 11,319,607 |
| Shares Redeemed | (3,310,751) | | (43,913,064) | | (4,455,322) | | (51,125,001) |
| Net Increase (Decrease) | (39,926) | | (865,903) | | (1,295,504) | | (14,686,311) |
| Class C | | | | | | | |
| Shares Sold | 127,973 | | $ 1,669,688 | | 218,756 | | $ 2,466,597 |
| Shares Issued for Reinvested Dividends | 64,013 | | 811,133 | | 75,547 | | 895,700 |
| Shares Redeemed | (1,230,405) | | (16,307,803) | | (1,069,017) | | (12,186,501) |
| Net Increase (Decrease) | (1,038,419) | | (13,826,982) | | (774,714) | | (8,824,204) |
| Class I | | | | | | | |
| Shares Sold | 160,514 | | $ 2,182,008 | | 191,976 | | $ 2,197,635 |
| Shares Issued for Reinvested Dividends | 29,926 | | 384,587 | | 30,578 | | 366,848 |
| Shares Redeemed | (161,011) | | (2,153,670) | | (284,155) | | (3,265,648) |
| Net Increase (Decrease) | 29,429 | | 412,925 | | (61,601) | | (701,165) |
| Class R3 | | | | | | | |
| Shares Sold | 198,750 | | $ 2,606,040 | | 164,710 | | $ 1,872,373 |
| Shares Issued for Reinvested Dividends | 35,693 | | 449,855 | | 38,859 | | 457,905 |
| Shares Redeemed | (229,056) | | (2,922,939) | | (327,044) | | (3,696,079) |
| Net Increase (Decrease) | 5,387 | | 132,956 | | (123,475) | | (1,365,801) |
| Class R4 | | | | | | | |
| Shares Sold | 20,481 | | $ 271,238 | | 47,208 | | $ 517,301 |
| Shares Issued for Reinvested Dividends | 9,396 | | 120,555 | | 8,928 | | 106,871 |
| Shares Redeemed | (85,165) | | (1,099,707) | | (43,047) | | (506,036) |
| Net Increase (Decrease) | (55,288) | | (707,914) | | 13,089 | | 118,136 |
| Class R5 | | | | | | | |
| Shares Sold | 148,015 | | $ 2,014,951 | | 73,474 | | $ 874,480 |
| Shares Issued for Reinvested Dividends | 17,571 | | 225,988 | | 18,509 | | 222,154 |
| Shares Redeemed | (75,210) | | (996,458) | | (116,121) | | (1,298,307) |
| Net Increase (Decrease) | 90,376 | | 1,244,481 | | (24,138) | | (201,673) |
| Class F | | | | | | | |
| Shares Sold | 14,275 | | $ 186,229 | | 10,903 | | $ 130,772 |
| Shares Issued for Reinvested Dividends | 1,409 | | 18,110 | | 814 | | 9,766 |
| Shares Redeemed | (4,789) | | (64,627) | | (3,870) | | (43,869) |
| Net Increase (Decrease) | 10,895 | | 139,712 | | 7,847 | | 96,669 |
| Total Net Increase (Decrease) | (997,546) | | $ (13,470,725) | | (2,258,496) | | $ (25,564,349) |
| Multi-Asset Income Fund | | | | | | | |
| Class A | | | | | | | |
| Shares Sold | 1,642,544 | | $ 35,033,996 | | 2,309,231 | | $ 45,748,122 |
| Shares Issued for Reinvested Dividends | 760,112 | | 16,325,324 | | 5,162,076 | | 105,163,342 |
| Shares Redeemed | (3,910,820) | | (83,435,688) | | (5,962,080) | | (119,878,398) |
| Net Increase (Decrease) | (1,508,164) | | (32,076,368) | | 1,509,227 | | 31,033,066 |
| Class C | | | | | | | |
| Shares Sold | 171,219 | | $ 3,661,331 | | 558,821 | | $ 11,029,593 |
| Shares Issued for Reinvested Dividends | 57,024 | | 1,227,512 | | 749,180 | | 15,305,211 |
| Shares Redeemed | (1,453,690) | | (31,214,774) | | (1,928,016) | | (38,667,340) |
| Net Increase (Decrease) | (1,225,447) | | (26,325,931) | | (620,015) | | (12,332,536) |
| Class I | | | | | | | |
| Shares Sold | 2,091,608 | | $ 44,166,780 | | 3,343,049 | | $ 65,779,871 |
| Shares Issued for Reinvested Dividends | 146,982 | | 3,149,601 | | 823,015 | | 16,753,953 |
| Shares Redeemed | (2,683,106) | | (56,912,453) | | (3,594,786) | | (71,808,671) |
| Net Increase (Decrease) | (444,516) | | (9,596,072) | | 571,278 | | 10,725,153 |
| Class R3 | | | | | | | |
| Shares Sold | 8,257 | | $ 176,649 | | 12,295 | | $ 247,049 |
| Shares Issued for Reinvested Dividends | 1,166 | | 25,363 | | 12,405 | | 256,187 |
| Shares Redeemed | (22,675) | | (493,439) | | (42,290) | | (880,822) |
| Net Increase (Decrease) | (13,252) | | (291,427) | | (17,590) | | (377,586) |
Hartford Multi-Strategy Funds
Notes to Financial Statements – (continued)
October 31, 2021
| | For the Year Ended
October 31, 2021 | | For the Year Ended
October 31, 2020 |
| | Shares | | Amount | | Shares | | Amount |
| Class R4 | | | | | | | |
| Shares Sold | 17,809 | | $ 387,821 | | 7,784 | | $ 154,029 |
| Shares Issued for Reinvested Dividends | 894 | | 19,586 | | 9,038 | | 187,742 |
| Shares Redeemed | (1,293) | | (28,202) | | (45,347) | | (848,704) |
| Net Increase (Decrease) | 17,410 | | 379,205 | | (28,525) | | (506,933) |
| Class R5 | | | | | | | |
| Shares Sold | 556 | | $ 12,118 | | 652 | | $ 13,298 |
| Shares Issued for Reinvested Dividends | 197 | | 4,297 | | 2,694 | | 55,805 |
| Shares Redeemed | (866) | | (18,911) | | (11,045) | | (220,418) |
| Net Increase (Decrease) | (113) | | (2,496) | | (7,699) | | (151,315) |
| Class R6 | | | | | | | |
| Shares Sold | 525 | | $ 11,454 | | 9,119 | | $ 175,383 |
| Shares Issued for Reinvested Dividends | 467 | | 10,192 | | 1,274 | | 26,195 |
| Shares Redeemed | (898) | | (19,564) | | (563) | | (10,960) |
| Net Increase (Decrease) | 94 | | 2,082 | | 9,830 | | 190,618 |
| Class Y | | | | | | | |
| Shares Sold | 80,414 | | $ 1,735,149 | | 297,672 | | $ 5,965,954 |
| Shares Issued for Reinvested Dividends | 9,867 | | 215,698 | | 95,278 | | 1,976,308 |
| Shares Redeemed | (305,520) | | (6,406,869) | | (407,803) | | (7,910,063) |
| Net Increase (Decrease) | (215,239) | | (4,456,022) | | (14,853) | | 32,199 |
| Class F | | | | | | | |
| Shares Sold | 603,702 | | $ 12,874,204 | | 742,416 | | $ 14,754,381 |
| Shares Issued for Reinvested Dividends | 122,848 | | 2,631,335 | | 791,234 | | 16,091,496 |
| Shares Redeemed | (1,104,412) | | (23,556,052) | | (1,471,329) | | (29,233,282) |
| Net Increase (Decrease) | (377,862) | | (8,050,513) | | 62,321 | | 1,612,595 |
| Total Net Increase (Decrease) | (3,767,089) | | $ (80,417,542) | | 1,463,974 | | $ 30,225,261 |
| 14. | Line of Credit: |
| | Each Fund participates in a committed line of credit pursuant to a credit agreement dated March 4, 2021. Each Fund may borrow under the line of credit for temporary or emergency purposes. The Funds (together with certain other Hartford Funds) may borrow up to $350 million in the aggregate, subject to asset coverage and other limitations specified in the credit agreement. The interest rate on borrowings varies depending on the nature of the loan. The facility also charges certain fees, such as an upfront fee and a commitment fee. From November 1, 2020 through March 4, 2021, the Funds (together with certain other Hartford Funds) had a similar agreement that enabled them to participate in a $350 million committed line of credit. The fees incurred by the Funds in connection with the committed lines of credit during the period appear in the Statements of Operations under “Other expenses.” During and as of the year ended October 31, 2021, none of the Funds had borrowings under this facility. |
| 15. | Indemnifications: |
| | Under the Company’s organizational documents, the Company shall indemnify its officers and directors to the full extent required or permitted under Maryland General Corporation Law and federal securities laws. In addition, the Company, on behalf of each Fund, may enter into contracts that contain a variety of indemnifications. The Company’s maximum exposure under these arrangements is unknown. However, as of the date of these financial statements, the Company has not had prior claims or losses pursuant to these contracts and expects the risk of loss to be remote. |
| 16. | Recent Accounting Pronouncement: |
| | In March 2020, FASB issued Accounting Standards Update (“ASU”) No. 2020-04, Reference Rate Reform (Topic 848); Facilitation of the Effects of Reference Rate Reform on Financial Reporting, which provides optional guidance for a limited period of time to ease the potential burden in accounting for (or recognizing the effects of) reference rate reform. The guidance is applicable to contracts referencing LIBOR or another reference rate that is expected to be discontinued due to reference rate reform. The ASU is effective as of March 12, 2020 and generally can be applied through December 31, 2022. Management is evaluating the underlying securities referencing LIBOR or another reference rate that is expected to be discontinued over the period of time the ASU is effective. |
Hartford Multi-Strategy Funds
Notes to Financial Statements – (continued)
October 31, 2021
| 17. | Change in Independent Registered Public Accounting Firm: |
| | On November 6, 2019, the Company, on behalf of the Funds, dismissed Ernst & Young LLP (“EY”) as the Funds’ independent registered public accounting firm effective upon the issuance of EY’s report on the Funds’ financial statements as of and for the fiscal year ended October 31, 2019. EY’s report on the Funds’ financial statements for the fiscal years October 31, 2018 and October 31, 2019 contained no adverse opinion or disclaimer of opinion nor was EY’s report qualified or modified as to uncertainty, audit scope or accounting principles. During the Funds’ fiscal periods ended on October 31, 2018 and October 31, 2019 and through December 30, 2019 (the “Covered Period”), (i) there were no disagreements with EY on any matter of accounting principles or practices, financial statement disclosure or auditing scope or procedure, which disagreements, if not resolved to the satisfaction of EY, would have caused it to make reference to the subject matter of the disagreements in connection with its reports on the Funds’ financial statements for the Covered Period, and (ii) there were no “reportable events” of the kind described in Item 304(a)(1)(v) of Regulation S-K under the Securities Exchange Act of 1934, as amended. |
| | On November 6, 2019, the Audit Committee of the Company’s Board of Directors participated in and approved the decision to engage PricewaterhouseCoopers LLP (“PwC”) as the independent registered public accounting firm for the Funds for the fiscal year ended October 31, 2020. The selection of PwC does not reflect any disagreements with or dissatisfaction by the Company or the Board of Directors with the performance of the Funds’ prior independent registered public accounting firm, EY. During the Covered Period, neither the Funds, nor anyone on their behalf, consulted with PwC on items which: (i) concerned the application of accounting principles to a specified transaction, either completed or proposed, or the type of audit opinion that might be rendered on the Funds’ financial statements; or (ii) concerned the subject of a disagreement (as defined in paragraph (a)(1)(iv) of Item 304 of Regulation S-K) or reportable events (as described in paragraph (a)(1)(v) of Item 304 of Regulation S-K). |
| 18. | Subsequent Events: |
| | In connection with the preparation of the financial statements of the Funds as of and for the year ended October 31, 2021, events and transactions subsequent to October 31, 2021, through the date the financial statements were issued have been evaluated by the Funds’ management for possible adjustment and/or disclosure. |
Report of Independent Registered Public Accounting Firm
To the Board of Directors of The Hartford Mutual Funds, Inc. and Shareholders of The Hartford Balanced Income Fund, Hartford AARP Balanced Retirement Fund, The Hartford Checks and Balances Fund, The Hartford Conservative Allocation Fund, The Hartford Global Real Asset Fund, The Hartford Growth Allocation Fund, Hartford Moderate Allocation Fund and Hartford Multi-Asset Income Fund.
Opinion on the Financial Statements
We have audited the accompanying statements of assets and liabilities, including the schedules of investments, of The Hartford Balanced Income Fund, Hartford AARP Balanced Retirement Fund, The Hartford Checks and Balances Fund, The Hartford Conservative Allocation Fund, The Hartford Global Real Asset Fund, The Hartford Growth Allocation Fund, Hartford Moderate Allocation Fund and Hartford Multi-Asset Income Fund (eight of the funds constituting The Hartford Mutual Funds, Inc., hereafter collectively referred to as the "Funds") as of October 31, 2021, the related statements of operations for the year ended October 31, 2021, the statements of changes in net assets for each of the two years in the period ended October 31, 2021, including the related notes, and the financial highlights for each of the two years in the period ended October 31, 2021 (collectively referred to as the “financial statements”). In our opinion, the financial statements present fairly, in all material respects, the financial position of each of the Funds as of October 31, 2021, the results of each of their operations for the year then ended, the changes in each of their net assets for each of the two years in the period ended October 31, 2021 and each of the financial highlights for each of the two years in the period ended October 31, 2021 in conformity with accounting principles generally accepted in the United States of America.
The financial statements of the Funds as of and for the year ended October 31, 2019 and the financial highlights for each of the periods ended on or prior to October 31, 2019 (not presented herein, other than the financial highlights) were audited by other auditors whose report dated December 30, 2019 expressed an unqualified opinion on those financial statements and financial highlights.
Basis for Opinion
These financial statements are the responsibility of the Funds’ management. Our responsibility is to express an opinion on the Funds’ financial statements based on our audits. We are a public accounting firm registered with the Public Company Accounting Oversight Board (United States) (PCAOB) and are required to be independent with respect to the Funds in accordance with the U.S. federal securities laws and the applicable rules and regulations of the Securities and Exchange Commission and the PCAOB.
We conducted our audits of these financial statements in accordance with the standards of the PCAOB. Those standards require that we plan and perform the audit to obtain reasonable assurance about whether the financial statements are free of material misstatement, whether due to error or fraud.
Our audits included performing procedures to assess the risks of material misstatement of the financial statements, whether due to error or fraud, and performing procedures that respond to those risks. Such procedures included examining, on a test basis, evidence regarding the amounts and disclosures in the financial statements. Our audits also included evaluating the accounting principles used and significant estimates made by management, as well as evaluating the overall presentation of the financial statements. Our procedures included confirmation of securities owned as of October 31, 2021 by correspondence with the custodian, transfer agent, agent banks and brokers; when replies were not received from brokers, we performed other auditing procedures. We believe that our audits provide a reasonable basis for our opinions.
/s/ PricewaterhouseCoopers LLP
Philadelphia, Pennsylvania
December 28, 2021
We have served as the auditor of one or more investment companies in the Hartford Funds group of investment companies since 2020.
Hartford Multi-Strategy Funds
Operation of the Liquidity Risk Management Program (Unaudited)
This section describes the operation and effectiveness of the Liquidity Risk Management Program (“LRM Program”) established in accordance with Rule 22e-4 under the Investment Company Act of 1940, as amended (the “Liquidity Rule”). The LRM Program seeks to assess and manage each Fund’s liquidity risk. The Liquidity Rule generally defines liquidity risk as the risk that a Fund could not meet its obligation to redeem shares without significant dilution of the non-redeeming investors’ interests in the Fund. The Board of Directors (“Board”) of The Hartford Mutual Funds, Inc. has appointed Hartford Funds Management Company, LLC (“HFMC”) to serve as the administrator of the LRM Program with respect to each of the Funds, subject to the oversight of the Board. In order to efficiently and effectively administer the LRM Program, HFMC established a Liquidity Risk Oversight Committee.
The LRM Program is comprised of various components designed to support the assessment and/or management of liquidity risk, including: (1) the assessment and periodic review (no less frequently than annually) of certain factors that influence each Fund’s liquidity risk; (2) the classification and periodic review (no less frequently than monthly) of each Fund’s investments into one of four liquidity categories that reflect an estimate of their liquidity under current market conditions; (3) a 15% limit on the acquisition of “illiquid investments” (as defined under the Liquidity Rule); (4) the determination of a minimum percentage of each Fund’s assets that generally will be invested in highly liquid investments (“HLIM”); (5) the periodic review (no less frequently than annually) of the HLIM and the adoption and implementation of policies and procedures for responding to a shortfall of a Fund’s highly liquid investments below its HLIM; and (6) periodic reporting to the Board.
At a meeting of the Board held May 11-13, 2021, HFMC provided an annual written report to the Board covering the period from April 1, 2020 through March 31, 2021. The annual report addressed important aspects of the LRM Program, including, but not limited to:
| • | the operation of the LRM Program (and related policies and procedures utilized in connection with management of the Funds’ liquidity risk); |
| • | an assessment of the adequacy and effectiveness of the LRM Program’s (and related policies and procedures’) implementation; |
| • | the operation, and assessment of the adequacy and effectiveness, of each Fund’s HLIM; |
| • | whether the third-party liquidity vendor’s (“LRM Program Vendor”) processes for determining preliminary liquidity classifications, including the particular methodologies or factors used and metrics analyzed by the LRM Program Vendor, are sufficient under the Liquidity Rule and appropriate in light of each Fund’s specific circumstances; and |
| • | any material changes to the LRM Program. |
In addition, HFMC provides a quarterly report on the LRM Program at each quarterly meeting of the Board’s Compliance and Risk Oversight Committee. The quarterly report included information regarding the Funds’ liquidity as measured by established parameters, a summary of developments within the capital markets that may impact liquidity, and other factors that may impact liquidity. Among other things, HFMC reports any changes to a Fund’s HLIM.
From April 1, 2020 through March 31, 2021, HFMC did not increase or reduce the HLIM for any Fund.
Based on its review and assessment, HFMC has concluded that the LRM Program is operating effectively to assess and manage the liquidity risk of each Fund and that the LRM Program has been and continues to be adequately and effectively implemented with respect to each Fund. Because liquidity in the capital markets in which the Funds invest is beyond the control of the Funds, there can be no assurance that the LRM Program will ensure liquidity under all circumstances and does not protect against the risk of loss.
Hartford Multi-Strategy Funds
Directors and Officers of the Company (Unaudited)
The Hartford Mutual Funds, Inc. (the “Company”) is governed by a Board of Directors (the “Directors”). The following tables present certain information regarding the Directors and officers of the Company as of October 31, 2021. For more information regarding the Directors and officers, please refer to the Statement of Additional Information, which is available, without charge, upon request by calling 1-888-843-7824.
NAME, YEAR OF BIRTH
AND ADDRESS(1) | | POSITION
HELD WITH
THE COMPANY | | TERM OF
OFFICE(2) AND
LENGTH OF
TIME SERVED | | PRINCIPAL OCCUPATION(S)
DURING PAST 5 YEARS | | NUMBER OF
PORTFOLIOS
IN FUND
COMPLEX(3)
OVERSEEN
BY DIRECTOR | | OTHER DIRECTORSHIPS
FOR PUBLIC COMPANIES
AND OTHER REGISTERED
INVESTMENT COMPANIES
BY DIRECTOR |
| NON-INTERESTED DIRECTORS |
HILARY E. ACKERMANN
(1956) | | Director | | Since 2014 | | Ms. Ackermann served as Chief Risk Officer at Goldman Sachs Bank USA from October 2008 to November 2011. | | 75 | | Ms. Ackermann served as a Director of Dynegy, Inc. from October 2012 until its acquisition by Vistra Energy Corporation (“Vistra”) in 2018, and since that time she has served as a Director of Vistra. Ms. Ackermann serves as a Director of Credit Suisse Holdings (USA), Inc. from January 2017 to present. |
ROBIN C. BEERY
(1967) | | Director | | Since 2017 | | Ms. Beery has served as a consultant to ArrowMark Partners (an alternative asset manager) since March of 2015 and since November 2018 has been employed by ArrowMark Partners as a Senior Advisor. Previously, she was Executive Vice President, Head of Distribution, for Janus Capital Group, and Chief Executive Officer and President of the Janus Mutual Funds (a global asset manager) from September 2009 to August 2014. | | 75 | | Ms. Beery serves as an independent Director of UMB Financial Corporation (January 2015 to present), has chaired the Compensation Committee since April 2017, and serves on the Audit Committee and the Risk Committee. |
LYNN S. BIRDSONG(4), (5)
(1946) | | Director and Chair of the Board | | Director since 2003; Chair of the Board since 2019 | | From January 1981 through December 2013, Mr. Birdsong was a partner in Birdsong Company, an advertising specialty firm. From 1979 to 2002, Mr. Birdsong was a Managing Director of Zurich Scudder Investments, an investment management firm. | | 75 | | None |
DERRICK D. CEPHAS
(1952) | | Director | | Since 2020 | | Mr. Cephas currently serves as Of Counsel to Squire Patton Boggs LLP, an international law firm with 45 offices in 20 countries. Until his retirement in October 2020, Mr. Cephas was a Partner of Weil, Gotshal & Manges LLP, an international law firm headquartered in New York, where he served as the Head of the Financial Institutions Practice (April 2011 to October 2020). | | 75 | | Mr. Cephas currently serves as a Director of Signature Bank, a New York-based commercial bank, and is a member of the Credit Committee, Examining Committee and Risk Committee. Mr. Cephas currently serves as a Director of Claros Mortgage Trust, Inc., a real estate investment trust. |
CHRISTINE R. DETRICK(5)
(1958) | | Director | | Since 2016 | | Ms. Detrick served as a Senior Partner/Advisor at Bain & Company (a management consulting firm) from September 2002 to December 2012. | | 75 | | Ms. Detrick serves as a Director and Chair of the Nominating and Governance Committee of Reinsurance Group of America (from January 2014 to present). She also serves as a Director of Charles River Associates (May 2020 to present). |
Hartford Multi-Strategy Funds
Directors and Officers of the Company (Unaudited) – (continued)
NAME, YEAR OF BIRTH
AND ADDRESS(1) | | POSITION
HELD WITH
THE COMPANY | | TERM OF
OFFICE(2) AND
LENGTH OF
TIME SERVED | | PRINCIPAL OCCUPATION(S)
DURING PAST 5 YEARS | | NUMBER OF
PORTFOLIOS
IN FUND
COMPLEX(3)
OVERSEEN
BY DIRECTOR | | OTHER DIRECTORSHIPS
FOR PUBLIC COMPANIES
AND OTHER REGISTERED
INVESTMENT COMPANIES
BY DIRECTOR |
ANDREW A. JOHNSON
(1962) | | Director | | Since 2020 | | Mr. Johnson currently serves as a Diversity and Inclusion Advisor at Neuberger Berman, a private, global investment management firm. Prior to his current role, Mr. Johnson served as Chief Investment Officer and Head of Global Investment Grade Fixed Income at Neuberger Berman (January 2009 to December 2018). | | 75 | | Mr. Johnson currently serves as a Director of AGNC Investment Corp., a real estate investment trust. |
PAUL L. ROSENBERG
(1953) | | Director | | Since 2020 | | Mr. Rosenberg is a Partner of The Bridgespan Group, a global nonprofit consulting firm that is a social impact advisor to nonprofits, non-governmental organizations, philanthropists and institutional investors (October 2007 to present). | | 75 | | None |
LEMMA W. SENBET(4)
(1946) | | Director | | Since 2005 | | Dr. Senbet currently serves as the William E. Mayer Chair Professor of Finance in the Robert H. Smith School of Business at the University of Maryland, where he was chair of the Finance Department from 1998 to 2006. In June 2013, he began a sabbatical from the University to serve as Executive Director of the African Economic Research Consortium which focuses on economic policy research and training, which he completed in 2018. | | 75 | | None |
DAVID SUNG
(1953) | | Director | | Since 2017 | | Mr. Sung was a Partner at Ernst & Young LLP from October 1995 to July 2014. | | 75 | | Mr. Sung serves as a Trustee of Ironwood Institutional Multi-Strategy Fund, LLC and Ironwood Multi-Strategy Fund, LLC (October 2015 to present). |
| OFFICERS AND INTERESTED DIRECTORS |
JAMES E. DAVEY(6)
(1964) | | Director, President and Chief Executive Officer | | President and Chief Executive Officer since 2010; Director since 2012 | | Mr. Davey serves as Executive Vice President of The Hartford Financial Services Group, Inc. Mr. Davey has served in various positions within The Hartford and its subsidiaries and joined The Hartford in 2002. Additionally, Mr. Davey serves as Director, Chairman, President, and Senior Managing Director for Hartford Funds Management Group, Inc. ("HFMG"). Mr. Davey also serves as President, Manager, Chairman of the Board, and Senior Managing Director for Hartford Funds Management Company, LLC (“HFMC”); Manager, Chairman of the Board, and President of Lattice Strategies LLC (“Lattice”); Chairman of the Board, Manager, and Senior Managing Director of Hartford Funds Distributors, LLC (“HFD”); and Chairman of the Board, President and Senior Managing Director of Hartford Administrative Services Company (“HASCO”), each of which is an affiliate of HFMG. | | 75 | | None |
ANDREW S. DECKER
(1963) | | AML Compliance Officer | | Since 2015 | | Mr. Decker serves as Chief Compliance Officer and AML Compliance Officer of HASCO (since April 2015) and Vice President of HASCO (since April 2018). Mr. Decker serves as AML Officer of HFD (since May 2015). Mr. Decker also serves as Vice President of HFMG (since April 2018). Prior to joining The Hartford, Mr. Decker served as Vice President and AML Officer at Janney Montgomery Scott (a broker dealer) from April 2011 to January 2015. | | N/A | | N/A |
AMY N. FURLONG
(1979) | | Vice President | | Since 2018 | | Ms. Furlong serves as Vice President and Assistant Treasurer of HFMC (since September 2019). From 2018 through March 15, 2021, Ms. Furlong served as the Treasurer of the Company. Ms. Furlong has served in various positions within The Hartford and its subsidiaries in connection with the operation of the Hartford funds. Ms. Furlong joined The Hartford in 2004. | | N/A | | N/A |
Hartford Multi-Strategy Funds
Directors and Officers of the Company (Unaudited) – (continued)
NAME, YEAR OF BIRTH
AND ADDRESS(1) | | POSITION
HELD WITH
THE COMPANY | | TERM OF
OFFICE(2) AND
LENGTH OF
TIME SERVED | | PRINCIPAL OCCUPATION(S)
DURING PAST 5 YEARS | | NUMBER OF
PORTFOLIOS
IN FUND
COMPLEX(3)
OVERSEEN
BY DIRECTOR | | OTHER DIRECTORSHIPS
FOR PUBLIC COMPANIES
AND OTHER REGISTERED
INVESTMENT COMPANIES
BY DIRECTOR |
WALTER F. GARGER
(1965) | | Vice President and Chief Legal Officer | | Since 2016 | | Mr. Garger serves as Secretary, Managing Director and General Counsel of HFMG, HFMC, HFD, and HASCO (since 2013). Mr. Garger also serves as Secretary and General Counsel of Lattice (since July 2016). Mr. Garger has served in various positions within The Hartford and its subsidiaries in connection with the operation of the Hartford funds. Mr. Garger joined The Hartford in 1995. | | N/A | | N/A |
THEODORE J. LUCAS
(1966) | | Vice President | | Since 2017 | | Mr. Lucas serves as Executive Vice President of HFMG (since July 2016) and as Executive Vice President of Lattice (since June 2017). Previously, Mr. Lucas served as Managing Partner of Lattice (2003 to 2016). | | N/A | | N/A |
JOSEPH G. MELCHER
(1973) | | Vice President and Chief Compliance Officer | | Since 2013 | | Mr. Melcher serves as Executive Vice President of HFMG and HASCO (since December 2013). Mr. Melcher also serves as Executive Vice President (since December 2013) and Chief Compliance Officer (since December 2012) of HFMC, serves as Executive Vice President and Chief Compliance Officer of Lattice (since July 2016), serves as Executive Vice President of HFD (since December 2013), and served as President and Chief Executive Officer of HFD (from April 2018 to June 2019). | | N/A | | N/A |
VERNON J. MEYER
(1964) | | Vice President | | Since 2006 | | Mr. Meyer serves as Managing Director and Chief Investment Officer of HFMC and Managing Director of HFMG (since 2013). Mr. Meyer also serves as Senior Vice President-Investments of Lattice (since March 2019). Mr. Meyer has served in various positions within The Hartford and its subsidiaries in connection with the operation of the Hartford funds. Mr. Meyer joined The Hartford in 2004. | | N/A | | N/A |
DAVID A. NAAB
(1985) | | Vice President and Treasurer | | Since March 15, 2021 | | Mr. Naab serves as Vice President and Assistant Treasurer of HFMC (since June 2021). Prior to joining HFMC in 2021, Mr. Naab served in various positions as an associate, senior associate, manager, senior manager, and director within the investment management, financial services, and asset & wealth management practice groups of PricewaterhouseCoopers, LLP from 2007 to 2020. | | N/A | | N/A |
ALICE A. PELLEGRINO
(1960) | | Vice President and Assistant Secretary | | Since 2016 | | Ms. Pellegrino serves as Vice President of HFMG (since December 2013). Ms. Pellegrino also serves as Vice President and Assistant Secretary of Lattice (since June 2017). Ms. Pellegrino is a Senior Counsel and has served in various positions within The Hartford and its subsidiaries in connection with the operation of the Hartford funds. Ms. Pellegrino joined The Hartford in 2007. | | N/A | | N/A |
THOMAS R. PHILLIPS
(1960) | | Vice President and Secretary | | Since 2017 | | Mr. Phillips is Deputy General Counsel for HFMG and currently serves as a Senior Vice President (since June 2021) and Assistant Secretary (since June 2017) for HFMG. Mr. Phillips also serves as Vice President of HFMC (since June 2021). Prior to joining HFMG in 2017, Mr. Phillips was a Director and Chief Legal Officer of Saturna Capital Corporation from 2014–2016. Prior to that, Mr. Phillips was a Partner and Deputy General Counsel of Lord, Abbett & Co. LLC. | | N/A | | N/A |
Hartford Multi-Strategy Funds
Directors and Officers of the Company (Unaudited) – (continued)
| (1) | The address for each officer and Director is c/o Hartford Funds 690 Lee Road, Wayne, Pennsylvania 19087. |
| (2) | Term of Office: Each Director holds an indefinite term until his or her retirement, resignation, removal, or death. Directors generally must retire no later than December 31 of the year in which the Director turns 75 years of age. Each Fund officer generally serves until his or her resignation, removal, or death. |
| (3) | The portfolios of the “Fund Complex” are operational series of The Hartford Mutual Funds, Inc., The Hartford Mutual Funds II, Inc., Hartford Series Fund, Inc., Hartford HLS Series Fund II, Inc., Lattice Strategies Trust, and Hartford Funds Exchange-Traded Trust. |
| (4) | Effective as of December 31, 2021, Messrs. Birdsong and Senbet will retire as Directors. |
| (5) | Mr. Birdsong will retire effective December 31, 2021. Anticipating Mr. Birdsong's retirement, the Board has elected Christine R. Detrick to serve as Chair of the Board effective November 4, 2021. Accordingly, effective November 4, 2021, Mr. Birdsong will no longer serve as Chair of the Board. Effective November 5, 2021, Ms. Detrick also will serve as a Director of Capital One Financial Corporation. |
| (6) | “Interested person,” as defined in the 1940 Act, of the Company because of the person’s affiliation with, or equity ownership of, HFMC, HFD or affiliated companies. |
Hartford Multi-Strategy Funds
HOW TO OBTAIN A COPY OF EACH FUND’S PROXY VOTING POLICIES AND VOTING RECORDS (UNAUDITED)
A description of the policies and procedures that each Fund uses to determine how to vote proxies relating to portfolio securities and information about how each Fund voted proxies relating to portfolio securities during the most recent twelve-month period ended June 30 are available (1) without charge, upon request, by calling 888-843-7824 and (2) on the SEC’s website at http://www.sec.gov.
QUARTERLY PORTFOLIO HOLDINGS INFORMATION (UNAUDITED)
Each Fund files its complete schedule of portfolio holdings with the SEC for the first and third quarters of each fiscal year as an exhibit to its reports on Form N-PORT. Each Fund’s portfolio holdings filed as an exhibit to Form N-PORT for the most recent first and third quarter of the Fund’s fiscal year are available (1) without charge, upon request, by calling 888-843-7824, (2) on the Funds’ website, hartfordfunds.com, and (3) on the SEC’s website at http://www.sec.gov.
Hartford Multi-Strategy Funds
Approval of Investment Management and Investment Sub-Advisory Agreements (Unaudited)
The Hartford Mutual Funds, Inc.
Hartford AARP Balanced Retirement Fund
The Hartford Balanced Income Fund
The Hartford Checks and Balances Fund
The Hartford Conservative Allocation Fund
The Hartford Global Real Asset Fund
The Hartford Growth Allocation Fund
Hartford Moderate Allocation Fund
Hartford Multi-Asset Income Fund (formerly, Hartford Multi-Asset Income and Growth Fund)
(each, a “Fund” and collectively, the “Funds”)
Section 15(c) of the Investment Company Act of 1940, as amended (the “1940 Act”), requires that each mutual fund’s board of directors, including a majority of those directors who are not “interested persons” of the mutual fund, as defined in the 1940 Act (the “Independent Directors”), annually review and consider the continuation of the mutual fund’s investment advisory and sub-advisory agreements. At its meeting held on August 3-4, 2021, the Board of Directors (the “Board”) of The Hartford Mutual Funds, Inc. (“HMF”), including each of the Independent Directors, unanimously voted to approve (i) the continuation of an investment management agreement by and between Hartford Funds Management Company, LLC (“HFMC”) and each of HMF, on behalf of each of the Funds, and The Hartford Mutual Funds II, Inc. (“HMF II”), on behalf of its series (the “Management Agreement”); and (ii) with respect to each of the Hartford AARP Balanced Retirement Fund, The Hartford Balanced Income Fund, The Hartford Global Real Asset Fund, and the Hartford Multi-Asset Income Fund (each, a “Sub-Advised Fund” and collectively, the “Sub-Advised Funds”), the continuation of an investment sub-advisory agreement (the “Sub-Advisory Agreement,” and together with the Management Agreement, the “Agreements”) between HFMC and Wellington Management Company LLP (the “Sub-adviser,” and together with HFMC, the “Advisers”).
In the months preceding the August 3-4, 2021 meeting, the Board requested and reviewed written responses from the Advisers to questions posed to the Advisers on behalf of the Independent Directors and supporting materials relating to those questions and responses. In addition, the Board considered such additional information as it deemed reasonably necessary to evaluate the Agreements, as applicable, with respect to each Fund, which included information furnished to the Board and its committees at their meetings throughout the year and in between regularly scheduled meetings on particular matters as the need arose, as well as information specifically prepared in connection with the approval of the continuation of the Agreements that was presented at the Board’s meetings held on June 15-16, 2021 and August 3-4, 2021. Information provided to the Board and its committees at their meetings throughout the year included, among other things, reports on Fund performance, legal, compliance and risk management matters, sales and marketing activity, shareholder services, and the other services provided to each Fund by the Advisers and their affiliates. The members of the Board also considered the materials and presentations by Fund officers and representatives of HFMC received at the Board’s meetings on June 15-16, 2021 and August 3-4, 2021 concerning the Agreements and at the special meeting of the Board’s Investment Committee on May 18, 2021 concerning Fund performance and other investment-related matters.
The Independent Directors, advised by independent legal counsel throughout the evaluation process, engaged service providers to assist them with evaluating the Agreements with respect to each Fund, as applicable. Broadridge Financial Solutions, Inc. (“Broadridge”), an independent provider of investment company data, was retained to provide the Board with reports on how each Fund’s contractual management fees, actual management fees, total expense ratios and investment performance compared to those of comparable mutual funds with similar investment objectives. The Independent Directors also engaged an independent financial services consultant (the “Consultant”) to assist them in evaluating each Fund’s contractual management fees and actual management fees, if any, total expense ratios and investment performance. In addition, the Consultant reviewed the profitability methodologies utilized by HFMC in connection with the continuation of the Management Agreement.
In determining whether to approve the continuation of the Agreements for a Fund, the members of the Board reviewed and evaluated information and factors they believed to be relevant and appropriate through the exercise of their reasonable business judgment. While individual members of the Board may have weighed certain factors differently, the Board’s determination to approve the continuation of the Agreements was based on a comprehensive consideration of all information provided to the Board throughout the year and specifically with respect to the continuation of the Agreements. The Board was also furnished with an analysis of its fiduciary obligations in connection with its evaluation of the Agreements. Throughout the evaluation process, the Board was assisted by counsel for the Funds and the Independent Directors were also separately assisted by independent legal counsel. In connection with their deliberations, the Independent Directors met separately with independent legal counsel and the Consultant on June 11, 2021 and in executive session on several occasions to consider their responsibilities under relevant laws and regulations and to discuss the materials presented and other matters deemed relevant to their consideration of the approval of the continuation of the Agreements. As a result of the discussions that occurred during the June 11, 2021 and June 15-16, 2021 meetings, the Independent Directors presented HFMC
Hartford Multi-Strategy Funds
Approval of Investment Management and Investment Sub-Advisory Agreements (Unaudited) – (continued)
with requests for additional information on certain topics. HFMC responded to these requests with additional information in connection with the August 3-4, 2021 meeting. A more detailed summary of the important, but not necessarily all, factors the Board considered with respect to its approval of the continuation of the Agreements is provided below.
Nature, Extent and Quality of Services Provided by the Advisers
The Board requested and considered information concerning the nature, extent and quality of the services provided to each Fund by the Advisers. The Board considered, among other things, the terms of the Agreements and the range of services provided by the Advisers. The Board considered the Advisers’ professional personnel who provide services to the Funds, including each Adviser’s ability and experience in attracting and retaining qualified personnel to service the Funds. The Board considered each Adviser’s reputation and overall financial strength, as well as each Adviser’s willingness to consider and implement organizational and operational changes designed to enhance services to the funds managed by HFMC and its affiliates (the “Hartford funds”). In addition, the Board considered the quality of each Adviser’s communications with the Board and responsiveness to Board inquiries and requests made from time to time with respect to the Funds and other Hartford funds. In this regard, the Board took into account the Advisers’ communications with the Board in light of the coronavirus (“COVID-19”) pandemic.
The Board also requested and evaluated information concerning each Adviser’s regulatory and compliance environment. In this regard, the Board requested and reviewed information about each Adviser’s compliance policies and procedures and compliance history, and a report from the Funds’ Chief Compliance Officer about each Adviser’s compliance with applicable laws and regulations, including responses to regulatory developments and any compliance or other issues raised by regulators. The Board also noted the Advisers’ support of the Funds’ compliance control structure, as applicable, and, including the resources devoted by the Advisers in support of the Funds’ obligations pursuant to Rule 38a-1 under the 1940 Act and the Funds’ liquidity risk management program, as well as the efforts of the Advisers to combat cybersecurity risks. The Board also considered HFMC’s investments in business continuity planning designed to benefit the Funds, and the implementation of HFMC’s business continuity plans due to the COVID-19 pandemic. The Board also noted HFMC’s commitment to maintaining high quality systems and expending substantial resources to prepare for and respond to ongoing changes to the market, regulatory and control environments in which the Funds and their service providers operate, including changes associated with the COVID-19 pandemic.
With respect to HFMC, the Board noted that, under the Management Agreement, HFMC is responsible for the management of the Funds, including oversight of fund operations and service providers, and the provision of administrative and investment advisory services in connection with selecting, monitoring and supervising the Sub-adviser for the Sub-Advised Funds. In this regard, the Board evaluated information about the nature and extent of responsibilities retained and risks assumed by HFMC that were not delegated to or assumed by the Sub-adviser. The Board noted that HFMC directly manages The Hartford Checks and Balances Fund, The Hartford Conservative Allocation Fund, The Hartford Growth Allocation Fund, and Hartford Moderate Allocation Fund (collectively, the “Allocation Funds”), which do not employ a sub-adviser. The Board considered HFMC’s ongoing monitoring of people, process and performance, including its quarterly reviews of each of the Hartford funds, semi-annual meetings with the leaders of each Fund’s portfolio management team, and oversight of the Hartford funds’ portfolio managers. The Board noted that HFMC has demonstrated a record of initiating changes to the portfolio management and/or investment strategies of the Hartford funds when warranted. The Board considered HFMC’s periodic due diligence reviews of the Sub-adviser and ongoing oversight of the Sub-adviser’s investment approach and results, process for monitoring best execution of portfolio trades and other trading operations by the Sub-adviser, and approach to risk management with respect to the Funds and the service providers to the Funds. The Board considered HFMC’s oversight of the securities lending program for the Funds that engage in securities lending and noted the income earned by the Funds that participate in such program. The Board also considered HFMC’s day-to-day oversight of each Fund’s compliance with its investment objective and policies as well as with applicable laws and regulations, noting that regulatory and other developments had over time led to an increase in the scope of HFMC’s oversight in this regard. Moreover, the Board considered HFMC’s oversight of potential conflicts of interest between the Funds’ investments and those of other funds or accounts managed by the Funds’ portfolio management personnel.
In addition, the Board considered HFMC’s ongoing commitment to review and rationalize the Hartford funds product line-up. The Board also considered the expenses that HFMC had incurred, as well as the risks HFMC had assumed, in connection with the launch of new funds and changes to existing Hartford funds in recent years. The Board considered that HFMC is responsible for providing the Funds’ officers.
With respect to the Sub-adviser, which provides certain day-to-day portfolio management services for the Sub-Advised Funds, subject to oversight by HFMC, and HFMC, which provides the day-to-day portfolio management services for the Allocation Funds, the Board considered, among other things, the Sub-adviser’s investment personnel, investment philosophy and process, investment research capabilities and resources, performance record, trade execution capabilities and experience, including with respect to sustainable investing and environmental, social and/or governance (ESG) criteria. With respect to The Hartford Global Real Asset Fund, the Board also considered the Sub-adviser’s flexibility in implementing the inflation
Hartford Multi-Strategy Funds
Approval of Investment Management and Investment Sub-Advisory Agreements (Unaudited) – (continued)
hedge overlay in a low inflation environment. The Board considered the experience of each Fund’s portfolio manager(s), the number of accounts managed by the portfolio manager(s), and the Sub-adviser’s method for compensating the portfolio manager(s). The Board also considered the Sub-adviser’s succession planning practices to ensure continuity of portfolio management services provided to the Funds.
The Board considered the benefits to shareholders of being part of the family of Hartford funds, including, with respect to certain share classes, the right to exchange investments between the same class of shares without a sales charge, the ability to reinvest Fund dividends into other Hartford funds (excluding the Hartford funds that are exchange-traded funds or an interval fund), and the ability to combine holdings in a Fund with holdings in other Hartford funds (excluding the Hartford funds that are exchange-traded funds or an interval fund) and 529 plans for which HFMC serves as the program manager to obtain a reduced sales charge. The Board considered HFMC’s efforts to provide investors in the Hartford funds with a broad range of investment styles and asset classes and the assumption of entrepreneurial and other risks by HFMC in sponsoring and providing ongoing services to new funds to expand these opportunities for shareholders. In addition, the Board observed that in the marketplace there are a range of investment options available to each Fund’s shareholders and such shareholders, having had the opportunity to consider other investment options, have chosen to invest in the Fund.
Based on these considerations, the Board concluded that it was satisfied with the nature, extent and quality of the services provided to each Fund by HFMC and, as applicable, the Sub-adviser.
Performance of each Fund and the Advisers
The Board considered the investment performance of each Fund. In this regard, the Board reviewed the performance of each Fund over different time periods presented in the materials and evaluated HFMC’s analysis of the Fund’s performance for these time periods. The Board considered information and materials provided to the Board by the Advisers concerning Fund performance, as well as information from Broadridge comparing the investment performance of each Fund to an appropriate universe of peer funds. The Board noted that while it found the comparative data provided by Broadridge generally useful in evaluating a Hartford fund’s investment performance, the Board recognized the limitations of such data, including that notable differences may exist between a Hartford fund and its peers. The Board also noted that, for the Hartford AARP Balanced Retirement Fund, The Hartford Global Real Asset Fund, and the Hartford Multi-Asset Income Fund, there existed no peer group with a strong correlation to each Fund’s investment strategy. For each of these Funds, the Board considered supplemental performance evaluation information. For details regarding each Fund’s performance, see the Fund-by-Fund synopsis below.
The Board considered the detailed investment analytics reports provided by HFMC’s Investment Advisory Group throughout the year, including in connection with the approval of the continuation of the Agreements. These reports included, among other things, information on each Fund’s gross returns and net returns, the Fund’s investment performance compared to one or more appropriate benchmarks and relevant groups or categories of peer funds, various statistics concerning the Fund’s portfolio, a narrative summary of various factors affecting Fund performance, and commentary on the effect of market conditions. The Board considered the Advisers’ work with the Investment Committee, which assists the Board in evaluating the performance of each Fund at periodic meetings throughout the year and specifically with respect to the approval of the continuation of the Agreements. The Board considered that the Investment Committee, in its evaluation of investment performance at meetings throughout the year, focused particular attention on information indicating less favorable performance of certain Hartford funds for specific time periods and discussed with the Advisers the reasons for such performance as well as any specific actions that the Advisers had taken, or had agreed to take, to seek to enhance Fund investment performance and the results of those actions. The Board also considered the analysis provided by the Consultant relating to each Fund’s performance track record.
Based on these considerations noted above, the Board concluded that it had continued confidence in HFMC’s and the Sub-adviser’s overall capabilities to manage the Funds.
Costs of the Services and Profitability of the Advisers
The Board reviewed information regarding HFMC’s cost to provide investment management and related services to each Fund and HFMC’s profitability, both overall and for each Fund, on a pre-tax basis without regard to distribution expenses. The Board also requested and reviewed information about the profitability to HFMC and its affiliates from all services provided to each Fund and all aspects of their relationship with the Fund, including information regarding profitability trends over time and information provided by Broadridge analyzing the profitability of managers to other fund complexes. In connection with these considerations, the Board took into account that the Hartford AARP Balanced Retirement Fund does not pay a management fee for the portion of the Fund’s assets invested in investment companies for which HFMC or its affiliates serve as investment manager. The Board also requested and received information relating to the operations and profitability of the Sub-adviser. The Board considered
Hartford Multi-Strategy Funds
Approval of Investment Management and Investment Sub-Advisory Agreements (Unaudited) – (continued)
representations from HFMC and the Sub-adviser that the Sub-adviser’s fees were negotiated at arm’s length on a Fund-by-Fund basis and that the sub-advisory fees are paid by HFMC and not the Sub-Advised Funds. Accordingly, the Board concluded that the profitability of the Sub-adviser is a less relevant factor with respect to the Board’s consideration of the Sub-Advisory Agreement.
The Board considered the Consultant’s review of the methodologies and estimates used by HFMC in calculating profitability in connection with the continuation of the Management Agreement, including a description of the methodology used to allocate certain expenses. The Board noted the Consultant’s view that HFMC’s process for calculating and reporting Fund profitability is reasonable and consistent with the process previously reviewed by the Consultant. The Board noted that the Consultant had previously performed a full review of this process and reported that such process is reasonable, sound and consistent with common industry practice.
Based on these considerations, the Board concluded that the profits realized by the Advisers and their affiliates from their relationships with each Fund were not excessive.
Comparison of Fees and Services Provided by the Advisers
The Board considered comparative information with respect to the services rendered to and the management fees to be paid by each Fund to HFMC and the total expense ratios of the Fund. The Board also considered comparative information with respect to the sub-advisory fees to be paid by HFMC to the Sub-adviser with respect to each Sub-Advised Fund. In this regard, the Board requested and reviewed information from HFMC and the Sub-adviser relating to the management and sub-advisory fees, including the sub-advisory fee schedule for each Sub-Advised Fund and the amount of the management fee retained by HFMC, and total operating expenses for each Fund. The Board also reviewed information from Broadridge comparing each Fund’s contractual management fees, actual management fees and total expense ratios relative to an appropriate group of funds selected by Broadridge. The Board considered such information from Broadridge in consultation with the Consultant. For details regarding each Fund’s expenses, see the Fund-by-Fund synopsis below.
The Board considered the methodology used by Broadridge to select the funds included in the expense groups. While the Board recognized that comparisons between a Fund and its peer funds may be imprecise given, among other differences, the different service levels and characteristics of mutual funds and the different business models and cost structures of the Advisers, the comparative information provided by Broadridge assisted the Board in evaluating the reasonableness of each Fund’s fees and total operating expenses. In addition, the Board considered the analysis and views of the Consultant relating to each Fund’s fees and total operating expenses and expense groups.
The Board received information regarding fees charged by the Sub-adviser to any other clients with investment strategies similar to those of the Funds, including institutional separate account clients and registered fund clients for which the Sub-adviser serves as either primary investment adviser or sub-adviser. The Board considered the explanations provided by the Sub-adviser about any differences between the Sub-adviser’s services to the Funds and the services the Sub-adviser provides to other types of clients. In this regard, the Board reviewed information about the generally broader scope of services and compliance, reporting and other legal burdens and risks of managing registered funds compared with those associated with managing assets of non-registered fund clients such as institutional separate accounts.
The Board also considered that the management fees paid by the Allocation Funds are for services provided in addition to, and are not duplicative of, services provided under the investment management agreement(s) of the underlying funds in which the Allocation Funds may invest.
Based on these considerations, the Board concluded that each Fund’s fees and total operating expenses, in conjunction with the information about quality of services, profitability, economies of scale, and other matters considered, were reasonable in light of the services provided.
Economies of Scale
The Board considered information regarding economies of scale, including the extent to which economies of scale may be realized as a Fund grows and whether fee levels reflect these economies of scale for the benefit of shareholders of the Fund. The Board reviewed the breakpoints in the management fee schedule for each Fund, if any, which reduce fee rates as the Fund’s assets grow over time. The Board recognized that a Fund with assets beyond the highest breakpoint level will continue to benefit from economies of scale because additional assets are charged the lowest breakpoint fee resulting in lower effective management fee rates. The Board also recognized that a fee schedule that reaches a breakpoint at a lower asset level provides shareholders with the benefit of anticipated or potential economies of scale. The Board considered that expense limitations and fee waivers that reduce a Fund’s expenses at all asset levels can have the same effect as breakpoints in sharing economies of scale with shareholders and provide protection from an increase in expenses if the Fund’s assets decline. In addition, the Board considered that initially setting competitive fee rates, pricing a Fund to scale at inception and making additional investments intended to enhance services available to shareholders are other
Hartford Multi-Strategy Funds
Approval of Investment Management and Investment Sub-Advisory Agreements (Unaudited) – (continued)
means of sharing anticipated or potential economies of scale with shareholders. The Board also considered that HFMC has been active in managing expenses, which has resulted in benefits being realized by shareholders. The Board also noted that, for each of the Hartford AARP Balanced Retirement Fund and The Hartford Global Real Asset Fund, the Fund’s current low asset levels have kept the Fund from fully realizing the benefits of anticipated or potential economies of scale.
The Board reviewed and evaluated materials from Broadridge and the Consultant showing how management fee schedules of peer funds reflect economies of scale for the benefit of shareholders as a peer fund’s assets hypothetically increase over time. Based on information provided by HFMC, Broadridge, and the Consultant, the Board recognized that there is no uniform methodology for establishing breakpoints or uniform pattern in asset levels that trigger breakpoints or the amounts of breakpoints triggered.
After considering all of the information available to it, the Board concluded that it was satisfied with the extent to which economies of scale would be shared for the benefit of each Fund’s shareholders based on currently available information and the effective management fees and total expense ratios for the Fund at its current and reasonably anticipated asset levels. The Board noted, however, that it would continue to monitor any future growth in each Fund’s assets and the appropriateness of additional management fee breakpoints or other methods to share benefits from economies of scale as part of its future review of the Agreements.
Other Benefits
The Board considered other benefits to the Advisers and their affiliates from their relationships with the Funds.
The Board noted that HFMC receives fees for fund accounting and related services from the Funds, and the Board considered information on the profitability to HFMC from providing such services to the Funds. The Board also considered that each Fund pays a transfer agency fee to Hartford Administrative Services Company (“HASCO”), an affiliate of HFMC, equal to the lesser of: (i) the actual costs incurred by HASCO in connection with the provisions of transfer agency services, including payments made to sub-transfer agents, plus a reasonable target profit margin; or (ii) a specified amount as set forth in the Transfer Agency and Service Agreement by and between HMF, on behalf of its Funds, HMF II, on behalf of its series, and HASCO. The Board reviewed information about the profitability to HASCO of the Funds’ transfer agency function. The Board considered information provided by HFMC indicating that the transfer agency fees charged by HASCO to the Funds were fair and reasonable based on available data about fees charged by transfer agents to other mutual funds. The Board also noted that HFMC and HASCO had delegated certain fund accounting services and transfer agency services, respectively, to external service providers.
The Board also considered that Hartford Funds Distributors, LLC (“HFD”), an affiliate of HFMC, serves as principal underwriter of the Funds. The Board noted that, as principal underwriter, HFD receives distribution and service fees from the Funds and receives all or a portion of the sales charges on sales or redemptions of certain classes of shares.
The Board considered the benefits, if any, to the Sub-adviser from any use of a Fund’s brokerage commissions to obtain soft dollar research.
Fund-by-Fund Factors
For purposes of the Fund-by-Fund discussion below, Fund performance is referred to as “in line with” a Fund’s benchmark where it was 0.5% above or below the benchmark return, and each Fund’s performance relative to its primary benchmark reflects the net performance of the Fund’s Class I shares as of March 31, 2021.
Hartford AARP Balanced Retirement Fund
| • | The Board noted that the Fund’s performance was in the 5th quintile of its performance universe for the 1-year period and the 4th quintile for the 3-and 5-year periods. The Board also noted that the Fund’s performance was above its custom blended benchmark for the 1-year period and below its benchmark for the 3- and 5-year periods. The Board noted recent changes to the Fund’s portfolio management team. |
| • | The Board noted that the Fund’s contractual management fee, actual management fee, and total expenses (less 12b-1 and shareholder service fees) were in the 1st quintile of its expense group. The Board noted that Class A shares of the Fund have a contractual expense cap of 0.96% through February 28, 2022, which resulted in HFMC reimbursing the Fund for certain expenses. |
Hartford Multi-Strategy Funds
Approval of Investment Management and Investment Sub-Advisory Agreements (Unaudited) – (continued)
The Hartford Balanced Income Fund
| • | The Board noted that the Fund’s performance was in the 5th quintile of its performance universe for the 1-year period, the 3rd quintile for the 3-year period, and the 4th quintile for the 5-year period. The Board also noted that the Fund’s performance was below its custom blended benchmark for the 1-year period and in line with its custom blended benchmark for the 3- and 5-year periods. |
| • | The Board noted that the Fund’s contractual management fee and actual management fee were in the 3rd quintile of its expense group and its total expenses (less 12b-1 and shareholder service fees) were in the 1st quintile. |
The Hartford Checks and Balances Fund
| • | The Board noted that the Fund’s performance was in the 4th quintile of its performance universe for the 1-year period, the 1st quintile for the 3-year period, and the 2nd quintile for the 5-year period. The Board also noted that the Fund’s performance was above its custom blended benchmark for the 1-year period and below its custom blended benchmark for the 3- and 5-year periods. |
| • | The Board noted that the Fund’s total expenses (less 12b-1 and shareholder service fees) were in the 1st quintile of its expense group. |
The Hartford Conservative Allocation Fund
| • | The Board noted that the Fund’s performance was in the 3rd quintile of its performance universe for the 1-, 3-, and 5- year periods. The Board also noted that the Fund’s performance was above its custom blended benchmark for the 1-year period, below its custom blended benchmark for the 3-year period, and in line with its custom blended benchmark for the 5-year period. |
| • | The Board noted that the Fund’s total expenses (less 12b-1 and shareholder service fees) were in the 4th quintile of its expense group. The Board noted that Class A shares of the Fund have a contractual expense cap of 1.19% through February 28, 2022. |
The Hartford Global Real Asset Fund
| • | The Board noted that the Fund’s performance was in the 1st quintile of its performance universe for the 1-year period, the 5th quintile for the 3-year period, and the 2nd quintile for the 5-year period. The Board also noted that the Fund’s performance was above its benchmark for the 1-, 3-, and 5-year periods. The Board noted recent changes to the Fund’s portfolio management team. |
| • | The Board noted that the Fund’s contractual management fee and its total expenses (less 12b-1 and shareholder service fees) were in the 3rd quintile of its expense group, while its actual management fee was in the 2nd quintile. The Board noted that Class A shares of the Fund have a contractual expense cap of 1.25% through February 28, 2022, which resulted in HFMC reimbursing the Fund for certain expenses. |
The Hartford Growth Allocation Fund
| • | The Board noted that the Fund’s performance was in the 1st quintile of its performance universe for the 1-year period, the 3rd quintile for the 3-year period, and the 2nd quintile for the 5-year period. The Board also noted that the Fund’s performance was above its custom blended benchmark for the 1-year period and below its custom blended benchmark for the 3- and 5-year periods. |
| • | The Board noted that the Fund’s total expenses (less 12b-1 and shareholder service fees) were in the 4th quintile of its expense group. |
Hartford Moderate Allocation Fund
| • | The Board noted that the Fund’s performance was in the 2nd quintile of its performance universe for the 1-year period and the 3rd quintile for the 3- and 5-year periods. The Board also noted that the Fund’s performance was above its custom blended benchmark for the 1-year period and below its custom blended benchmark for the 3- and 5-year periods. |
| • | The Board noted that the Fund’s total expenses (less 12b-1 and shareholder service fees) were in the 3rd quintile of its expense group. |
Hartford Multi-Strategy Funds
Approval of Investment Management and Investment Sub-Advisory Agreements (Unaudited) – (continued)
Hartford Multi-Asset Income Fund
| • | The Board noted that the Fund’s performance was in the 5th quintile of its performance universe for the 1-, 3-, and 5-year periods. The Board also noted that the Fund’s performance was below its custom blended benchmark for the 1-, 3-, and 5-year periods. The Board noted recent changes to the Fund’s portfolio management team. |
| • | The Board noted that the Fund’s contractual management fee, actual management fee, and total expenses (less 12b-1 and shareholder service fees) were in the 3rd quintile of its expense group. |
* * * *
Based upon the review of the factors summarized above, among others, the Board concluded that it is in the best interests of each Fund and its shareholders for the Board to approve the continuation of the Agreements for an additional year. In reaching this decision, the Board did not assign relative weights to the factors discussed above or deem any one or group of them to be controlling in and of themselves.
THIS PRIVACY POLICY IS NOT PART OF THIS REPORT
CUSTOMER PRIVACY NOTICE
The Hartford Financial Services Group, Inc. and Affiliates*
(herein called “we, our, and us”)
This Privacy Policy applies to our United States Operations
We value your trust. We are committed to the responsible:
| a) | management; |
| b) | use; and |
| c) | protection; |
of Personal Information.
This notice describes how we collect, disclose, and protect Personal Information.
We collect Personal Information to:
| a) | service your Transactions with us; and |
| b) | support our business functions. |
We may obtain Personal Information from:
| a) | You; |
| b) | your Transactions with us; and |
| c) | third parties such as a consumer-reporting agency. |
Based on the type of product or service You apply for or get from us, Personal Information such as:
| a) | your name; |
| b) | your address; |
| c) | your income; |
| d) | your payment; or |
| e) | your credit history; |
may be gathered from sources such as applications, Transactions, and consumer reports.
To serve You and service our business, we may share certain Personal Information. We will share Personal Information, only as allowed by law, with affiliates such as:
| a) | our insurance companies; |
| b) | our employee agents; |
| c) | our brokerage firms; and |
| d) | our administrators. |
As allowed by law, we may share Personal Financial Information with our affiliates to:
| a) | market our products; or |
| b) | market our services; |
to You without providing You with an option to prevent these disclosures.
We may also share Personal Information, only as allowed by law, with unaffiliated third parties including:
| a) | independent agents; |
| b) | brokerage firms; |
| c) | insurance companies; |
| d) | administrators; and |
| e) | service providers; |
who help us serve You and service our business.
When allowed by law, we may share certain Personal Financial Information with other unaffiliated third parties who assist us by performing services or functions such as:
| a) | taking surveys; |
| b) | marketing our products or services; or |
| c) | offering financial products or services under a joint agreement |
between us and one or more financial institutions.
We, and third parties we partner with, may track some of the pages You visit through the use of:
| a) | cookies; |
| b) | pixel tagging; or |
| c) | other technologies; |
and currently do not process or comply with any web browser’s “do not track” signal or other similar mechanism that indicates a request to disable online tracking of individual users who visit our websites or use our services.
For more information, our Online Privacy Policy, which governs information we collect on our website and our affiliate websites, is available at https://www.thehartford.com/online-privacy-policy.
We will not sell or share your Personal Financial Information with anyone for purposes unrelated to our business functions without offering You the opportunity to:
| a) | “opt-out;” or |
| b) | “opt-in;” |
as required by law.
We only disclose Personal Health Information with:
| a) | your authorization; or |
| b) | as otherwise allowed or required by law. |
Our employees have access to Personal Information in the course of doing their jobs, such as:
| a) | underwriting policies; |
| b) | paying claims; |
| c) | developing new products; or |
| d) | advising customers of our products and services. |
We use manual and electronic security procedures to maintain:
| a) | the confidentiality; and |
Personal Information that we have. We use these procedures to guard against unauthorized access.
Some techniques we use to protect Personal Information include:
| d) | firewall technology; and |
| e) | the use of detection software. |
We are responsible for and must:
| a) | identify information to be protected; |
| b) | provide an adequate level of protection for that data; and |
| c) | grant access to protected data only to those people who must use |
it in the performance of their job-related duties.
Employees who violate our privacy policies and procedures may be subject to discipline, which may include termination of their employment with us.
We will continue to follow our Privacy Policy regarding Personal Information even when a business relationship no longer exists between us.
As used in this Privacy Notice:
Application means your request for our product or service.
Personal Financial Information means financial information such as:
| d) | policy or claim information. |
Personal Financial Information may include Social Security Numbers, Driver’s license numbers, or other government-issued identification numbers, or credit, debit card, or bank account numbers.
Personal Health Information means health information such as:
| a) | your medical records; or |
| b) | information about your illness, disability or injury. |
Personal Information means information that identifies You personally and is not otherwise available to the public. It includes:
| a) | Personal Financial Information; and |
| b) | Personal Health Information. |
Transaction means your business dealings with us, such as:
| b) | your request for us to pay a claim; and |
| c) | your request for us to take an action on your account. |
You means an individual who has given us Personal Information in conjunction with:
a financial product or service from us if the product or service is used mainly for personal, family, or household purposes.
If you have any questions or comments about this privacy notice, please feel free to contact us at The Hartford – Consumer Rights and Privacy Compliance Unit, One Hartford Plaza, Mail Drop: T 04.180, Hartford, CT 06155, or at ConsumerPrivacyInquiriesMailbox@thehartford.com.
This Customer Privacy Notice is being provided on behalf of The Hartford Financial Services Group, Inc. and its affiliates (including the following as of February 2021), to the extent required by the Gramm-Leach-Bliley Act and implementing regulations:
1stAGChoice, Inc.; Access CoverageCorp, Inc.; Access CoverageCorp Technologies, Inc.; Assurances Continentales Continentale Verzekeringen N.V; Bracht, Deckers & Mackelbert N.V.; Business Management Group, Inc.; Canal Re S.A.; Cervus Claim Solutions, LLC; First State Insurance Company; FTC Resolution Company LLC; Hart Re Group L.L.C.; Hartford Accident and Indemnity Company; Hartford Administrative Services Company; Hartford Casualty General Agency, Inc.; Hartford Casualty Insurance Company; Hartford Fire General Agency, Inc.; Hartford Fire Insurance Company; Hartford Funds Distributors, LLC; Hartford Funds Management Company, LLC; Hartford Funds Management Group, Inc.; Hartford Holdings, Inc.; Hartford Insurance Company of Illinois; Hartford Insurance Company of the Midwest; Hartford Insurance Company of the Southeast; Hartford Insurance, Ltd.; Hartford Integrated Technologies, Inc.; Hartford Investment Management Company; Hartford Life and Accident Insurance Company; Hartford Lloyd’s Corporation; Hartford Lloyd’s Insurance Company; Hartford Management, Ltd.; Hartford Productivity Services LLC; Hartford of Texas General Agency, Inc.; Hartford Residual Market, L.C.C.; Hartford Specialty Insurance Services of Texas, LLC; Hartford STAG Ventures LLC; Hartford Strategic Investments, LLC; Hartford Underwriters General Agency, Inc.; Hartford Underwriters Insurance Company; Heritage Holdings, Inc.; Heritage Reinsurance Company, Ltd.; HLA LLC; HL Investment Advisors, LLC; Horizon Management Group, LLC; HRA Brokerage Services, Inc.; Lattice Strategies LLC; Maxum Casualty Insurance Company; Maxum Indemnity Company; Maxum Specialty Services Corporation; Millennium Underwriting Limited; MPC Resolution Company LLC; Navigators (Asia) Limited; Navigators Corporate Underwriters Limited; Navigators Holdings (Europe) N.V.; Navigators Holdings (UK) Limited; Navigators Insurance Company; Navigators International Insurance Company Ltd.; Navigators Management Company, Inc.; Navigators Management (UK) Limited; Navigators N.V.; Navigators Specialty Insurance Company; Navigators Underwriting Agency Limited; Navigators Underwriting Limited; New BDM NV; New England Insurance Company; New England Reinsurance Corporation; New Ocean Insurance Co., Ltd.; NIC Investments (Chile) SpA; Nutmeg Insurance Agency, Inc.; Nutmeg Insurance Company; Pacific Insurance Company, Limited; Property and Casualty Insurance Company of Hartford; Sentinel Insurance Company, Ltd; The Navigators Group, Inc.; Trumbull Flood Management, L.L.C.; Trumbull Insurance Company; Twin City Fire Insurance Company; Y-Risk, LLC.
Revised February 2021
[This page is intentionally left blank]
[This page is intentionally left blank]
This report is submitted for the general information of the shareholders of the Funds referenced in this report. It is not authorized for distribution to persons who are not shareholders of one or more Funds referenced in this report unless preceded or accompanied by a current prospectus for the relevant Funds. Nothing herein contained is to be considered an offer of sale or a solicitation of an offer to buy shares of any Fund listed in this report.
The information cannot be used or relied upon for the purpose of avoiding IRS penalties. These materials are not intended to provide tax, accounting or legal advice. As with all matters of a tax or legal nature, you should consult your own tax or legal counsel for advice.
Investors should carefully consider a fund’s investment objectives, risks, charges and expenses. This and other important information is contained in the fund’s prospectus and summary prospectus, which can be obtained by visiting hartfordfunds.com. Please read it carefully before investing.
The Funds are distributed by Hartford Funds Distributors, LLC (HFD), Member FINRA. Hartford Funds Management Company, LLC (HFMC) is the Funds’ investment manager. The Hartford Balanced Income Fund, Hartford AARP Balanced Retirement Fund, The Hartford Global Real Asset Fund and Hartford Multi-Asset Income Fund are sub-advised by Wellington Management Company LLP (Wellington). HFD and HFMC are not affiliated with Wellington.
MFAR-MS21 12/21 226050 Printed in the U.S.A.
Item 2. Code of Ethics.
The registrant, as of the end of the period covered by this report, has adopted a code of ethics that applies to the registrant’s principal executive officer, principal financial officer, principal accounting officer or controller, or persons performing similar functions, regardless of whether these individuals are employed by the registrant or a third party. There have been no amendments, during the period covered by this report, to a provision of the code of ethics that applies to the registrant’s principal executive officer, principal financial officer, principal accounting officer or controller, or persons performing similar functions, regardless of whether these individuals are employed by the registrant or a third party, and that relates to any element of the code of ethics description. The registrant has not granted any waivers, including an implicit waiver, from a provision of the code of ethics that applies to the registrant’s principal executive officer, principal financial officer, principal accounting officer or controller, or persons performing similar functions, regardless of whether these individuals are employed by the registrant or a third party, that relates to one or more of the items set forth in paragraph (b) of this item’s instructions. A copy of the code of ethics is filed herewith.
Item 3. Audit Committee Financial Expert.
The Board of Directors of the registrant (the “Board”) has designated David Sung as an Audit Committee Financial Expert. Mr. Sung is considered by the Board to be an independent director.
Item 4. Principal Accountant Fees and Services.
| | (a) | Audit Fees: The aggregate fees billed for each of the last two fiscal years for professional services rendered by the principal accountant for the audit of the registrant’s annual financial statements or services that are normally provided by the accountant in connection with statutory and regulatory filings or engagements for those fiscal years were: |
$834,000 for the fiscal year ended October 31, 2020; $869,045 for the fiscal year ended October 31, 2021.
| | (b) | Audit Related Fees: The aggregate fees billed in each of the last two fiscal years for assurance and related services by the principal accountant that are reasonably related to the performance of the audit of the registrant’s financial statements and are not reported under paragraph (a) of this Item were: |
$20,000 for the fiscal year ended October 31, 2020; $7,000 for the fiscal year ended October 31, 2021. Audit-related services were principally in connection with consents for the registration statements relating to Fund mergers.
| | (c) | Tax Fees: The aggregate fees billed in each of the last two fiscal years for professional services rendered by the principal accountant for tax compliance, tax advice, and tax planning were: |
$226,305 for the fiscal year ended October 31, 2020; $162,926 for the fiscal year ended October 31, 2021. Tax-related services were principally in connection with, but not limited to, general tax services and excise tax services.
| | (d) | All Other Fees: The aggregate fees billed in each of the last two fiscal years for products and services provided by the principal accountant, other than the services reported in paragraphs (a) through (c) of this Item were: |
$0 for the fiscal year ended October 31, 2020; $43,931 for the fiscal year ended October 31, 2021. These fees were principally in connection with, but not limited to, general audit related products and services and an accounting research tool subscription.
| | (e) (1) | The Pre-Approval Policies and Procedures (the “Policy”) adopted by the Audit Committee of the registrant (also, the “Fund”) sets forth the procedures pursuant to which services performed by the independent registered public accounting firm for the registrant may be pre-approved. The following summarizes the pre-approval requirements under the Policy. |
| | a) | The Audit Committee must pre-approve all audit services and non-audit services that the independent registered public accounting firm provides to the Fund. |
| | b) | The Audit Committee must pre-approve any engagement of the independent registered public accounting firm to provide non-audit services to any Service Affiliate (which is defined to include any entity controlling, controlled by, or under common control with the investment adviser that provides ongoing services to the Fund) during the period of the independent registered public accounting firm’s engagement to provide audit services to the Fund, if the non-audit services to the Service Affiliate directly impact the Fund’s operations and financial reporting. |
| | c) | The Audit Committee, from time to time, may designate one or more of its members who are Independent Directors (each a “Designated Member”) to consider, on the Audit Committee’s behalf, any non-audit services, whether to the Fund or to any Service Affiliate, that have not been pre-approved by the Audit Committee. The Designated Member also shall review, on the Audit Committee’s behalf, any proposed material change in the nature or extent of any non-audit services previously approved. In considering any requested non-audit services or proposed material change in such services, the Designated Member shall not authorize services which would exceed $50,000 in fees for such services. |
| | d) | The independent registered public accounting firm may not provide specified prohibited non-audit services set forth in the Policy to the Fund, the Fund’s investment adviser, the Service Affiliates or any other member of the investment company complex. |
| | (e) (2) | One hundred percent of the services described in items 4(b) through 4(d) were approved in accordance with the Audit Committee’s Pre-Approval Policy. As a result, none of such services was approved pursuant to paragraph (c)(7)(i)(C) of Rule 2-01 of Regulation S-X. |
| | (f) | None of the hours expended on the principal accountant’s engagement to audit the registrant’s financial statements for the year ended October 31, 2021, were attributed to work performed by persons other than the principal accountant’s full-time, permanent employees. |
| | (g) | The aggregate non-audit fees billed by the registrant’s accountant for services rendered to the registrant, and rendered to the registrant’s investment adviser (not including any sub-adviser whose role is primarily portfolio management and is subcontracted with or overseen by another investment adviser), and any entity controlling, controlled by, or under common control with the adviser that provides ongoing services to the registrant for each of the last two fiscal years of the registrant were: |
The aggregate non-audit fees billed by the registrant’s accountant for services rendered to the registrant: $246,305 for the fiscal year ended October 31, 2020; $213,857 for the fiscal year ended October 31, 2021.
The aggregate non-audit fees billed by the registrant’s accountant for services rendered to the registrant’s investment adviser (not including any sub-adviser whose role is primarily portfolio management and is subcontracted with or overseen by another investment adviser), and any entity controlling, controlled by, or under common control with the adviser was $0 for the fiscal year ended October 31, 2020 and $325,000 for the fiscal year ended October 31, 2021.
| | (h) | The registrant’s audit committee of the board of directors has considered whether the provision of non-audit services that were rendered to the registrant’s investment adviser (not including any sub-adviser whose role is primarily portfolio management and is subcontracted with or overseen by another investment adviser), and any entity controlling, controlled by, or under common control with the investment adviser that provides ongoing services to the registrant that were not pre-approved pursuant to paragraph (c)(7)(ii) of Rule 2-01 of Regulation S-X is compatible with maintaining the principal accountant’s independence. |
Item 5. Audit Committee of Listed Registrants.
Not applicable.
Item 6. Investments.
| | (a) | The Schedule of Investments in securities of unaffiliated issuers as of the close of the reporting period is included as part of the annual report filed under Item 1 of this form. |
Item 7. Disclosure of Proxy Voting Policies and Procedures for Closed-End Management Investment Companies.
Not applicable.
Item 8. Portfolio Managers of Closed-End Management Investment Companies.
Not applicable.
Item 9. Purchases of Equity Securities by Closed-End Management Investment Company and Affiliated Purchasers.
Not applicable.
Item 10. Submission of Matters to a Vote of Security Holders.
There have been no material changes to the procedures by which the shareholders may recommend nominees to the registrant’s board of directors, where those changes were implemented after the registrant last provided disclosure in response to the requirements of Item 407(c)(2)(iv) of Regulation S-K (17 CFR 229.407) (as required by Item 22(b)(15) of Schedule 14A (17 CFR 240.14a-101)), or this Item.
Item 11. Controls and Procedures.
| | (a) | The registrant’s principal executive and principal financial officers, or persons performing similar functions, have concluded that the registrant’s disclosure controls and procedures (as defined in Rule 30a-3(c) under the Investment Company Act of 1940, as amended (the “1940 Act”) (17 CFR 270.30a-3(c))) are generally effective to provide reasonable |
| | assurance, as of a date within 90 days of the filing date of the report that includes the disclosure required by this paragraph, based on their evaluation of these controls and procedures required by Rule 30a-3(b) under the 1940 Act (17 CFR 270.30a-3(b)) and Rules 13a-15(b) or 15d-15(b) under the Securities Exchange Act of 1934, as amended (17 CFR 240.13a-15(b) or 240.15d-15(b)). |
| | (b) | There were no changes in the registrant’s internal control over financial reporting (as defined in Rule 30a-3(d) under the 1940 Act (17 CFR 270.30a-3(d)) that occurred during the period covered by this report that have materially affected, or are reasonably likely to materially affect, the registrant’s internal control over financial reporting. |
Item 12. Disclosure of Securities Lending Activities for Closed-End Management Investment Companies.
Not applicable.
Item 13. Exhibits.
SIGNATURES
Pursuant to the requirements of the Securities Exchange Act of 1934 and the Investment Company Act of 1940, the registrant has duly caused this report to be signed on its behalf by the undersigned, thereunto duly authorized.
| | | | | | |
| | | | THE HARTFORD MUTUAL FUNDS, INC. |
| | | |
Date: January 6, 2022 | | | | By: | | /s/ James E. Davey |
| | | | | | James E. Davey |
| | | | | | President and Chief Executive Officer |
Pursuant to the requirements of the Securities Exchange Act of 1934 and the Investment Company Act of 1940, this report has been signed below by the following persons on behalf of the registrant and in the capacities and on the dates indicated.
| | | | | | |
Date: January 6, 2022 | | | | By: | | /s/ James E. Davey |
| | | | | | James E. Davey |
| | | | | | President and Chief Executive Officer |
| | | |
Date: January 6, 2022 | | | | By: | | /s/ David A. Naab |
| | | | | | David A. Naab |
| | | | | | Treasurer |
| | | | | | (Principal Financial Officer and Principal Accounting Officer) |