0001006415 hmfi:C000035183Member 2023-11-01 2024-10-31 0001006415 hmfi:C000185725Member us-gaap:HealthcareSectorMember 2024-10-31
UNITED STATES
SECURITIES AND EXCHANGE COMMISSION
Washington, D.C. 20549
FORM N-CSR
CERTIFIED SHAREHOLDER REPORT OF REGISTERED MANAGEMENT INVESTMENT COMPANIES
Investment Company Act file number
The Hartford Mutual Funds, Inc.
(Exact name of registrant as specified in charter)
690 Lee Road, Wayne, Pennsylvania 19087
(Address of Principal Executive Offices) (Zip Code)
Thomas R. Phillips, Esquire
Hartford Funds Management Company, LLC
690 Lee Road
Wayne, Pennsylvania 19087
(Name and Address of Agent for Service)
Copy to:
John V. O’Hanlon, Esquire
Dechert LLP
One International Place, 40th Floor
100 Oliver Street
Boston, Massachusetts 02110-2605
Registrant's telephone number, including area code:
Date of reporting period:
Form N-CSR is to be used by management investment companies to file reports with the Commission not later than 10 days after the transmission to stockholders of any report that is required to be transmitted to stockholders under Rule 30e-1 under the Investment Company Act of 1940 (17 CFR 270.30e-1). The Commission may use the information provided on Form N-CSR in its regulatory, disclosure review, inspection, and policymaking roles.
A registrant is required to disclose the information specified by Form N-CSR, and the Commission will make this information public. A registrant is not required to respond to the collection of information contained in Form N-CSR unless the Form displays a currently valid Office of Management and Budget (“OMB”) control number. Please direct comments concerning the accuracy of the information collection burden estimate and any suggestions for reducing the burden to Secretary, Securities and Exchange Commission, 100 F Street, NE, Washington, DC 20549-1090. The OMB has reviewed this collection of information under the clearance requirements of 44 U.S.C. § 3507.
Item 1. Reports to Stockholders.
(a) The Annual Shareholder Reports for each of The Capital Appreciation Fund, Hartford Core Equity Fund, The Hartford Dividend and Growth Fund, The Hartford Equity Income Fund, The Hartford Healthcare Fund, The Hartford MidCap Fund, The Hartford MidCap Value Fund, Hartford Small Cap Value Fund, The Hartford Small Company Fund, The Hartford Balanced Income Fund, The Hartford Checks and Balances Fund, The Hartford Conservative Allocation Fund, The Hartford Growth Allocation Fund, Hartford Moderate Allocation Fund, Hartford Multi-Asset Income Fund and Hartford Real Asset Fund are filed herewith.
Annual Shareholder Report
October 31, 2024
The Hartford Capital Appreciation Fund
Class A/ITHAX
This annual shareholder report contains important information about The Hartford Capital Appreciation Fund (the "Fund") for the period of November 1, 2023 to October 31, 2024. You can find additional information about the Fund at hartfordfunds.com/reports-hmf. You can also request this information by contacting us by calling 1‑888‑843‑7824.
What were the Fund costs for the last year?
(Based on a hypothetical $10,000 investment)
| Class Name | Costs of a $10,000 investment | Costs paid as a percentage
of a $10,000 investment |
| Class A | $122 | 1.04% |
How did the Fund perform last year and what impacted its performance?
Management's Discussion of Fund Performance
United States (U.S.) equities, as measured by the Russell 3000 Index, rose over the trailing twelve-month period ending October 31, 2024. During the second half of the period, the rally in U.S. stocks considerably broadened beyond a concentrated group of mega-cap technology companies that powered the market in the first half of the period. The labor market continued to cool, primarily through fewer job openings and reduced hiring rather than widespread layoffs. Fund performance described below is relative to the Russell 3000 Index for the trailing twelve-month period ended October 31, 2024.
Top Contributors to Performance
Sector allocation, a result of our bottom-up stock selection process, contributed positively to relative performance during the period due to the Fund’s underweight allocations to the Energy and Healthcare sectors.
Security selection within the Information Technology, Communication Services, and Energy sectors contributed positively to relative performance.
The Fund’s exposure to companies that we believe are higher quality contributed to relative results.
Top individual contributors over the period were an underweight position in Apple (Information Technology), an overweight position in American Express (Financials), and an out-of-benchmark position in ARM (Information Technology).
Top Detractors to Performance
Security selection was the primary detractor to relative performance during the period, driven by weak selection within the Industrials, Consumer Discretionary, and Healthcare sectors.
From a style perspective, the Fund’s underweight exposure to higher-momentum names detracted from relative performance.
The largest individual detractors over the period were an underweight position in NVIDIA (Information Technology), as well as overweight positions in Nike (Consumer Discretionary) and LKQ (Consumer Discretionary).
The views expressed in this section reflect the opinions of the Fund's sub-adviser, Wellington Management Company LLP, as of the date of this report and are subject to change based on changes in market, economic or other conditions. These views are not intended to be a forecast of future events and are no guarantee of future results.
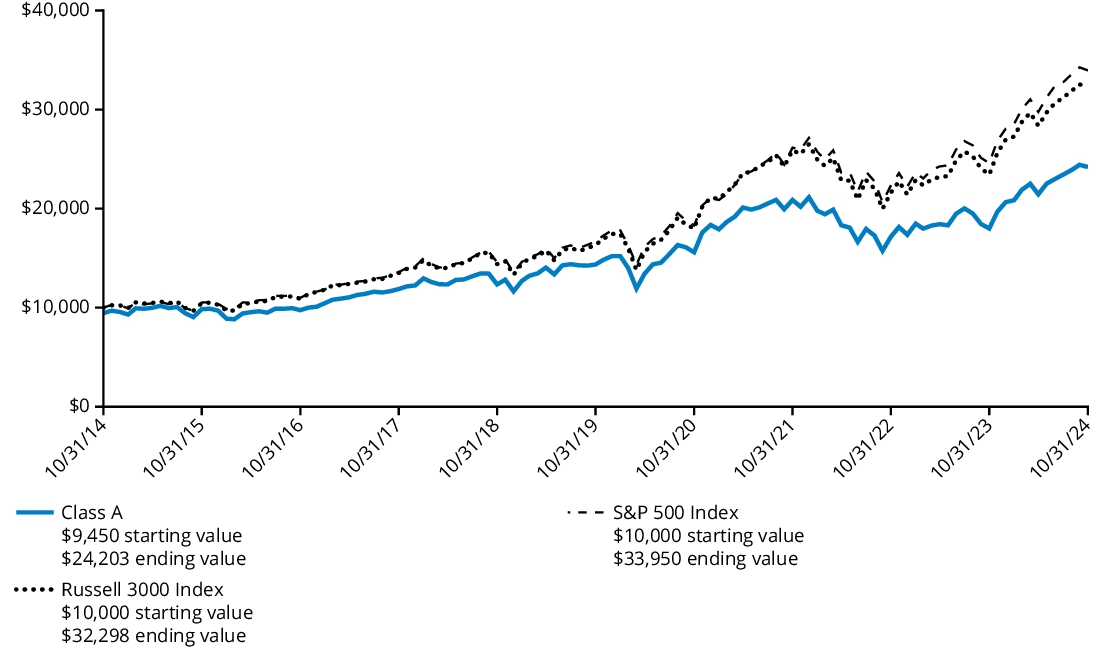
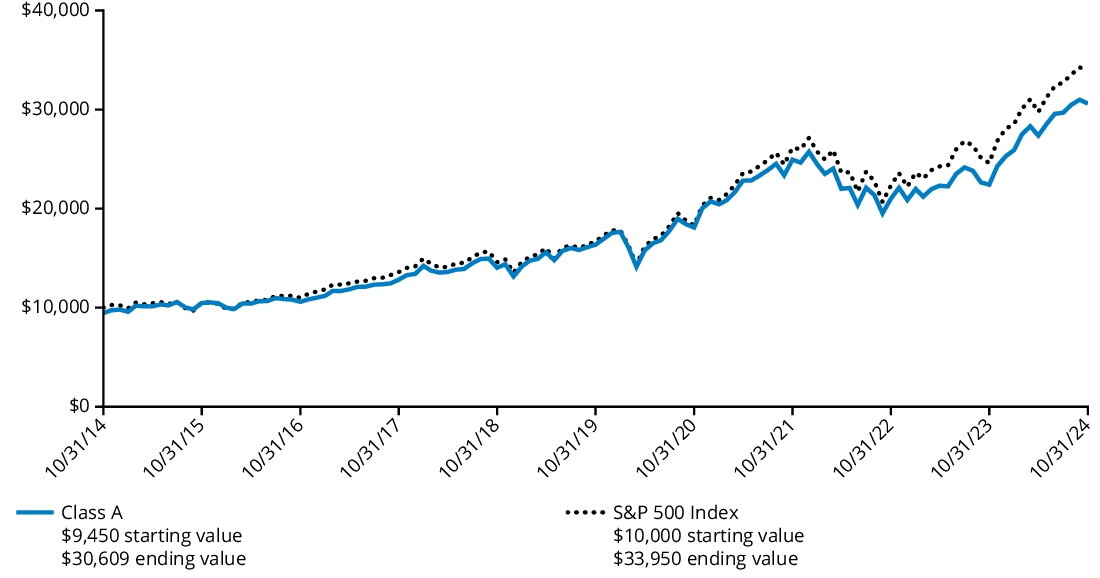
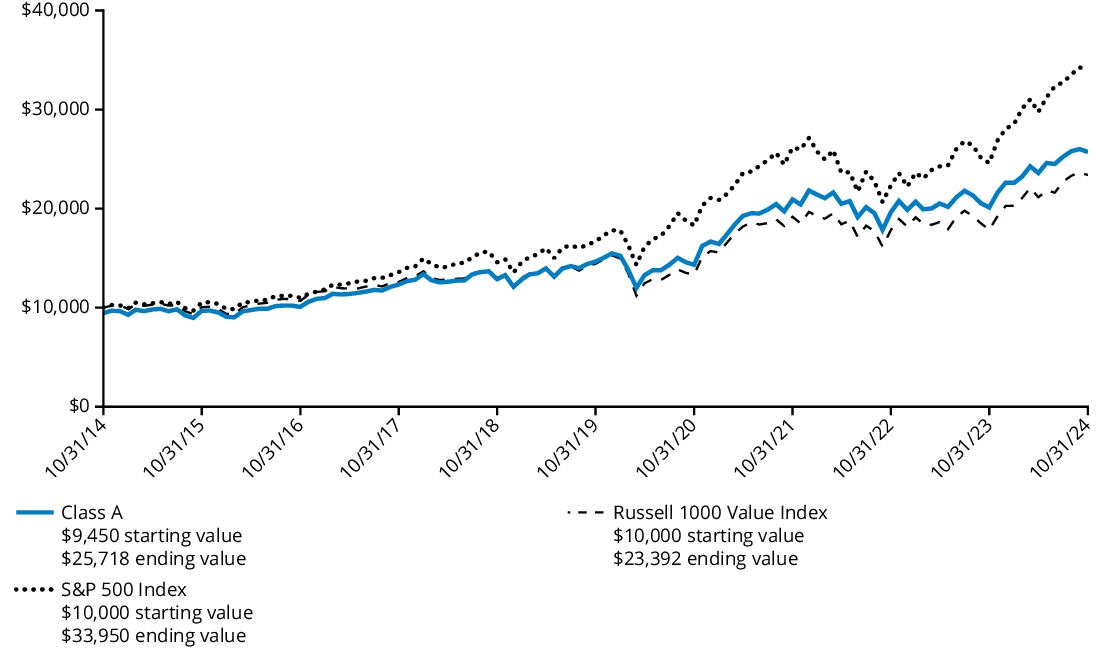
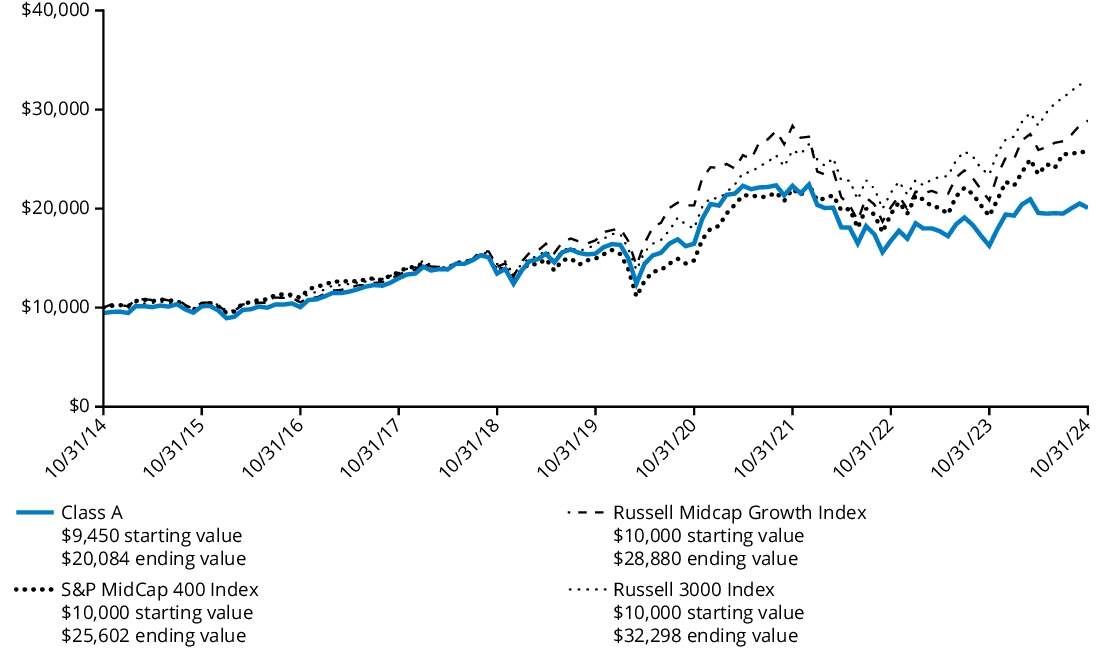
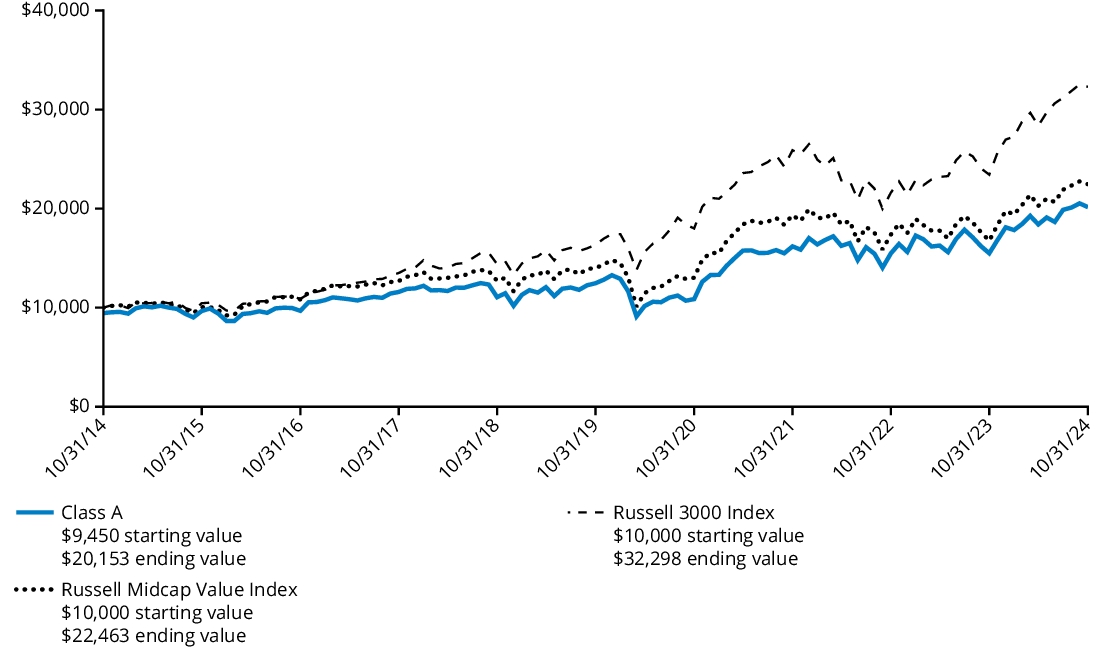
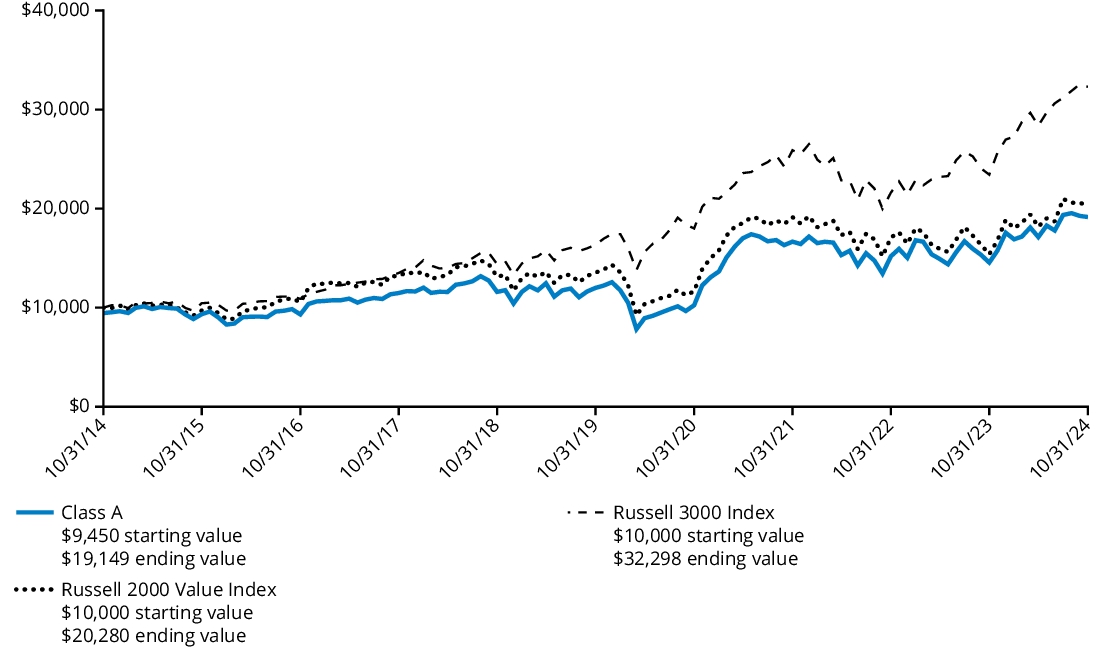
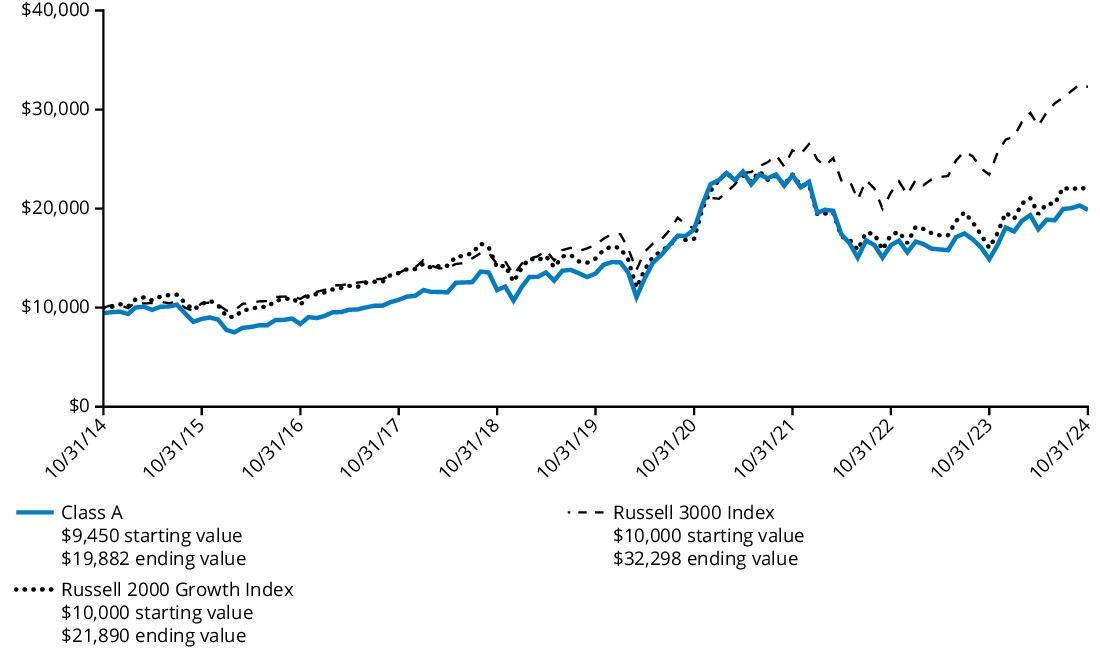
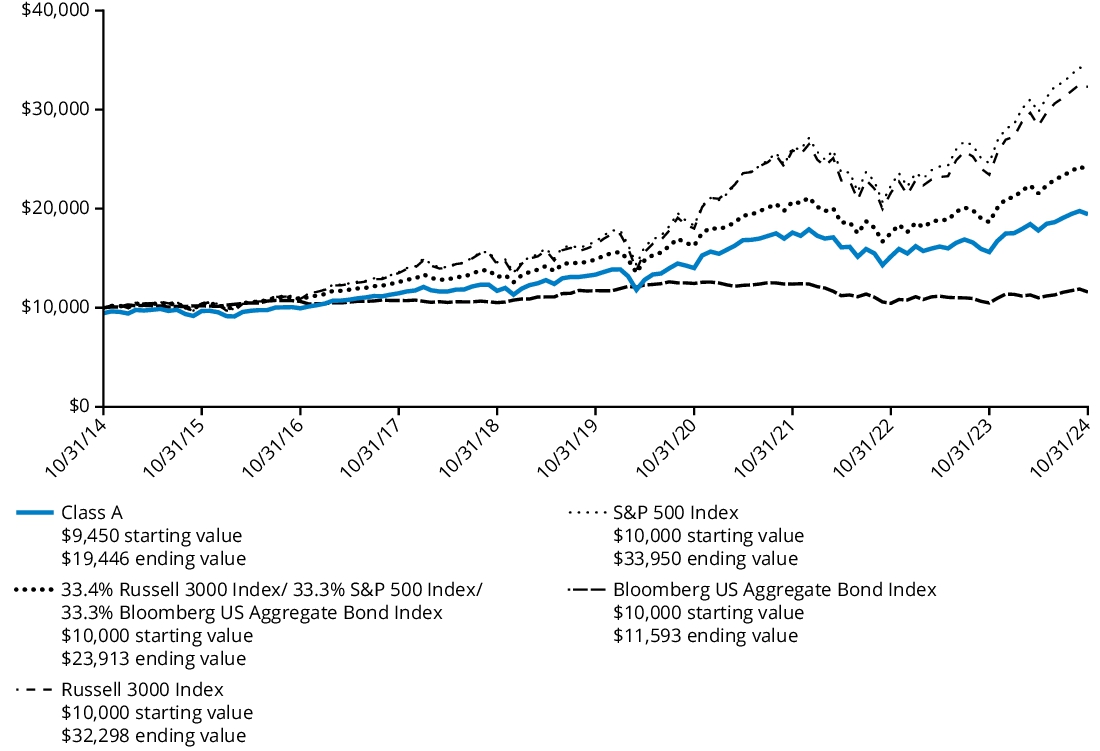
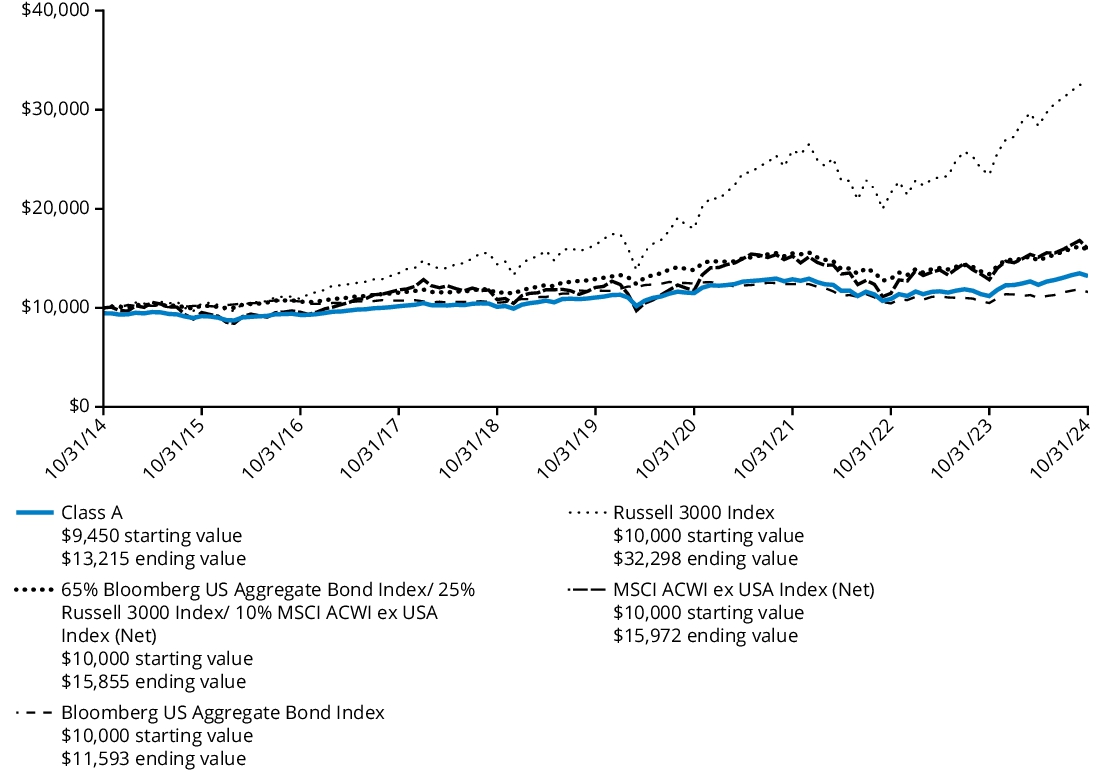
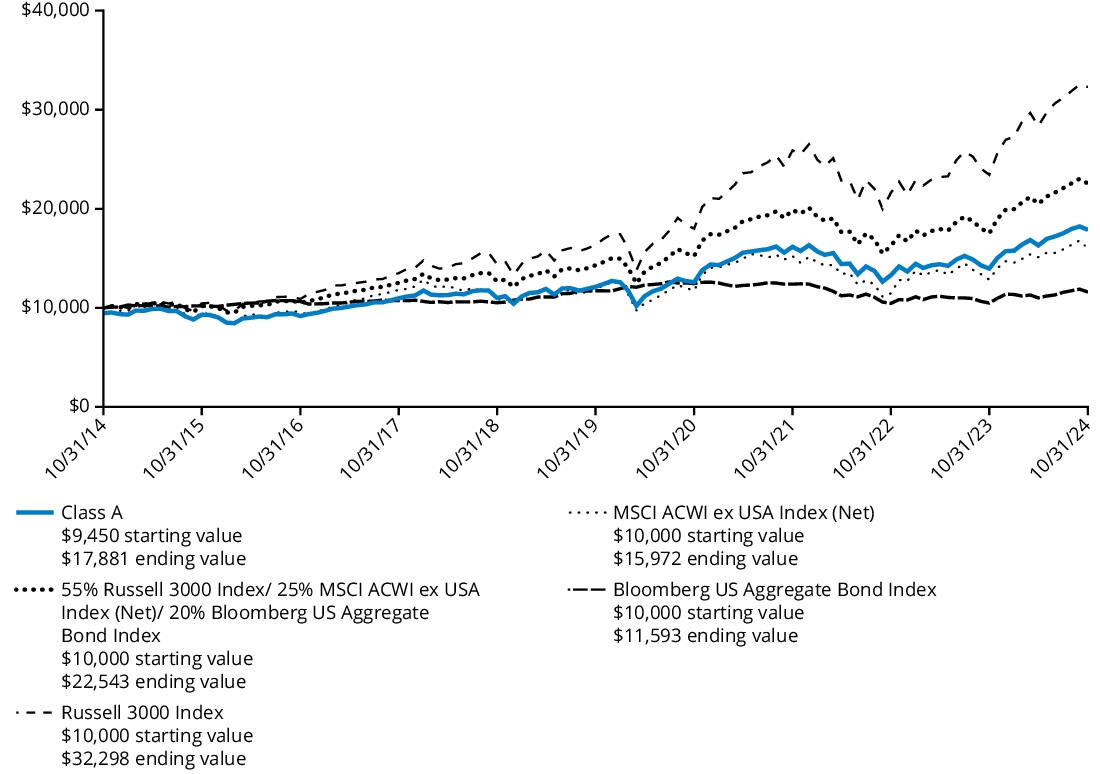
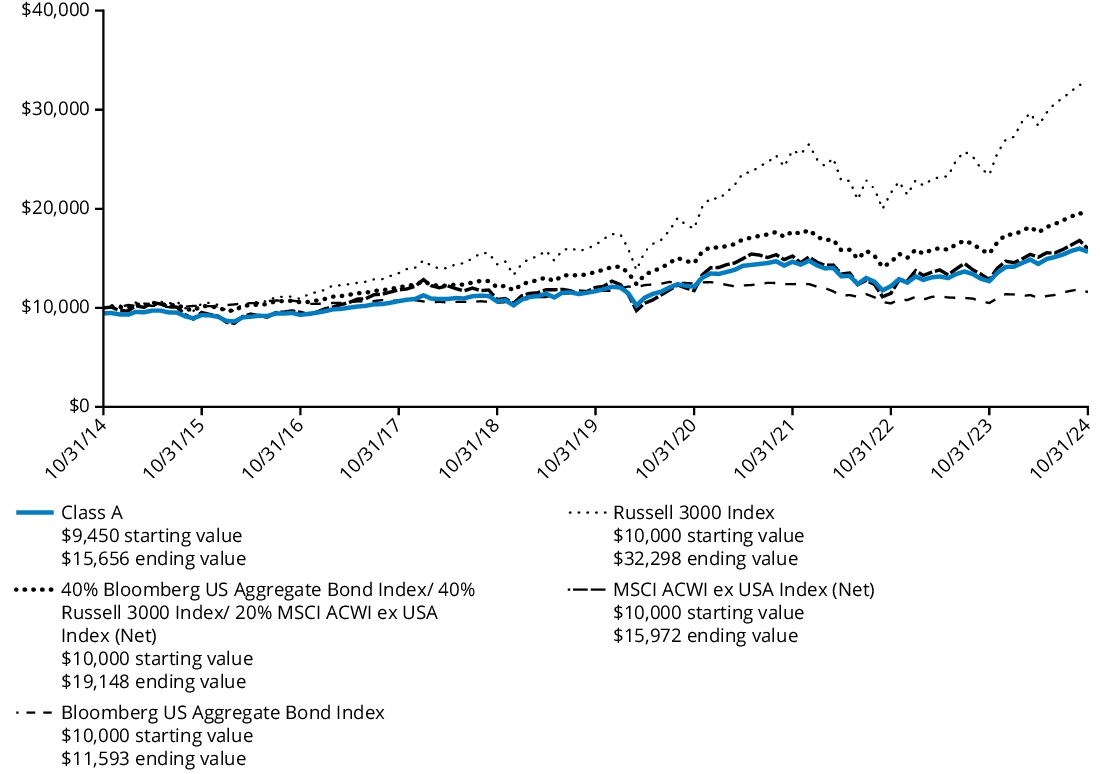
Comparison of Change in Value of $ 10,000 Investment
The graph below represents the hypothetical growth of a $10,000 investment in Class A shares and the comparative indices. The returns for Class A shares include the maximum front-end sales charge applicable to Class A shares.
Average Annual Total Returns
For the Periods Ended October 31, 2024 | 1 Year | 5 Years | 10 Years |
| Class A (with 5.50% maximum front-end sales charge) | 27.11% | 9.76% | 9.24% |
| Class A (without 5.50% maximum front-end sales charge) | 34.51% | 11.01% | 9.86% |
| Russell 3000 Index | 37.86% | 14.60% | 12.44% |
| S&P 500 Index | 38.02% | 15.27% | 13.00% |
The Fund’s past performance is not a good predictor of the Fund’s future performance. The graph and table do not reflect the deduction of taxes that a shareholder would pay on Fund distributions or redemption of Fund shares. Performance information reflects fee waivers and/or expense limitation arrangements, if any. Absent any applicable fee waivers and/or expense limitation arrangements, performance would have been lower. Visit hartfordfunds.com for the most recent performance information.
Key Fund Statistics as of October 31, 2024
| Fund's net assets | $6,255,800,025% |
| Total number of portfolio holdings (excluding derivatives, if any) | $144% |
| Total investment management fees paid | $40,293,822% |
| Portfolio turnover rate | $85% |
Graphical Representation of Holdings as of October 31, 2024
The table below shows the investment makeup of the Fund, representing the percentage of net assets of the Fund.
| Information Technology | 27.0 | % |
| Financials | 14.6 | % |
| Industrials | 10.7 | % |
| Consumer Discretionary | 10.5 | % |
| Communication Services | 9.5 | % |
| Health Care | 8.8 | % |
| Consumer Staples | 4.7 | % |
| Materials | 4.2 | % |
| Real Estate | 3.5 | % |
| Energy | 2.6 | % |
| Utilities | 1.9 | % |
| Short-Term Investments | 0.4 | % |
| Other Assets & Liabilities | 1.6 | % |
| Total | 100.0 | % |
* | For Fund compliance purposes, the Fund may not use the same classification system. These classifications are used for financial reporting purposes. |
Availability of Additional Information
For additional information about the Fund, including its prospectus, financial information, holdings, and proxy voting information, please visit the Fund’s website at the website address included at the beginning of this report.
The Fund is distributed by Hartford Funds Distributors, LLC (HFD).
Annual Shareholder Report
October 31, 2024
The Hartford Capital Appreciation Fund
Class C/HCACX
This annual shareholder report contains important information about The Hartford Capital Appreciation Fund (the "Fund") for the period of November 1, 2023 to October 31, 2024. You can find additional information about the Fund at hartfordfunds.com/reports-hmf. You can also request this information by contacting us by calling 1‑888‑843‑7824.
What were the Fund costs for the last year?
(Based on a hypothetical $10,000 investment)
| Class Name | Costs of a $10,000 investment | Costs paid as a percentage
of a $10,000 investment |
| Class C | $216 | 1.85% |
How did the Fund perform last year and what impacted its performance?
Management's Discussion of Fund Performance
United States (U.S.) equities, as measured by the Russell 3000 Index, rose over the trailing twelve-month period ending October 31, 2024. During the second half of the period, the rally in U.S. stocks considerably broadened beyond a concentrated group of mega-cap technology companies that powered the market in the first half of the period. The labor market continued to cool, primarily through fewer job openings and reduced hiring rather than widespread layoffs. Fund performance described below is relative to the Russell 3000 Index for the trailing twelve-month period ended October 31, 2024.
Top Contributors to Performance
Sector allocation, a result of our bottom-up stock selection process, contributed positively to relative performance during the period due to the Fund’s underweight allocations to the Energy and Healthcare sectors.
Security selection within the Information Technology, Communication Services, and Energy sectors contributed positively to relative performance.
The Fund’s exposure to companies that we believe are higher quality contributed to relative results.
Top individual contributors over the period were an underweight position in Apple (Information Technology), an overweight position in American Express (Financials), and an out-of-benchmark position in ARM (Information Technology).
Top Detractors to Performance
Security selection was the primary detractor to relative performance during the period, driven by weak selection within the Industrials, Consumer Discretionary, and Healthcare sectors.
From a style perspective, the Fund’s underweight exposure to higher-momentum names detracted from relative performance.
The largest individual detractors over the period were an underweight position in NVIDIA (Information Technology), as well as overweight positions in Nike (Consumer Discretionary) and LKQ (Consumer Discretionary).
The views expressed in this section reflect the opinions of the Fund's sub-adviser, Wellington Management Company LLP, as of the date of this report and are subject to change based on changes in market, economic or other conditions. These views are not intended to be a forecast of future events and are no guarantee of future results.
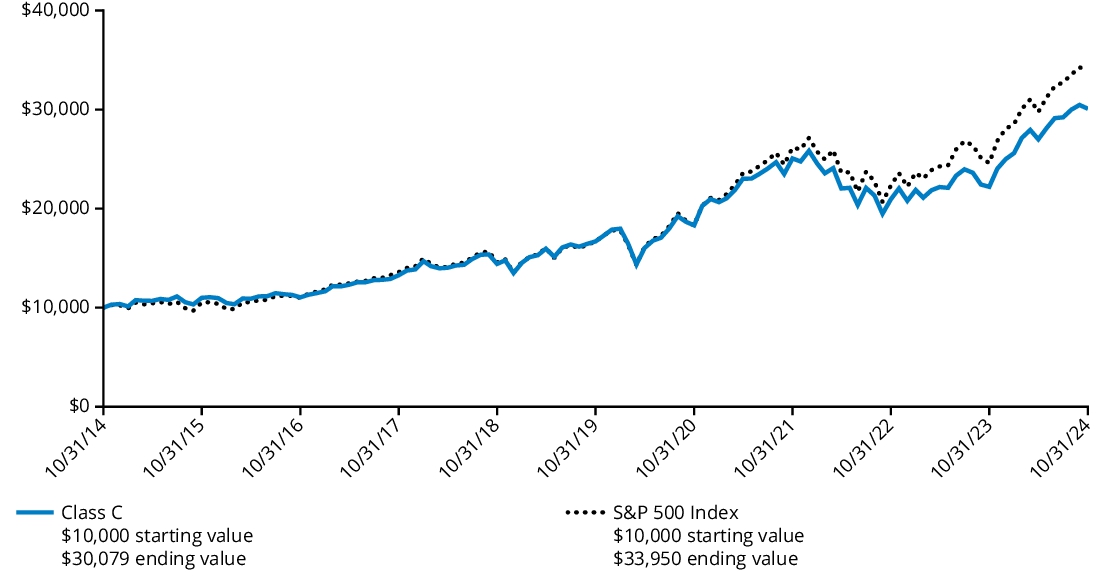
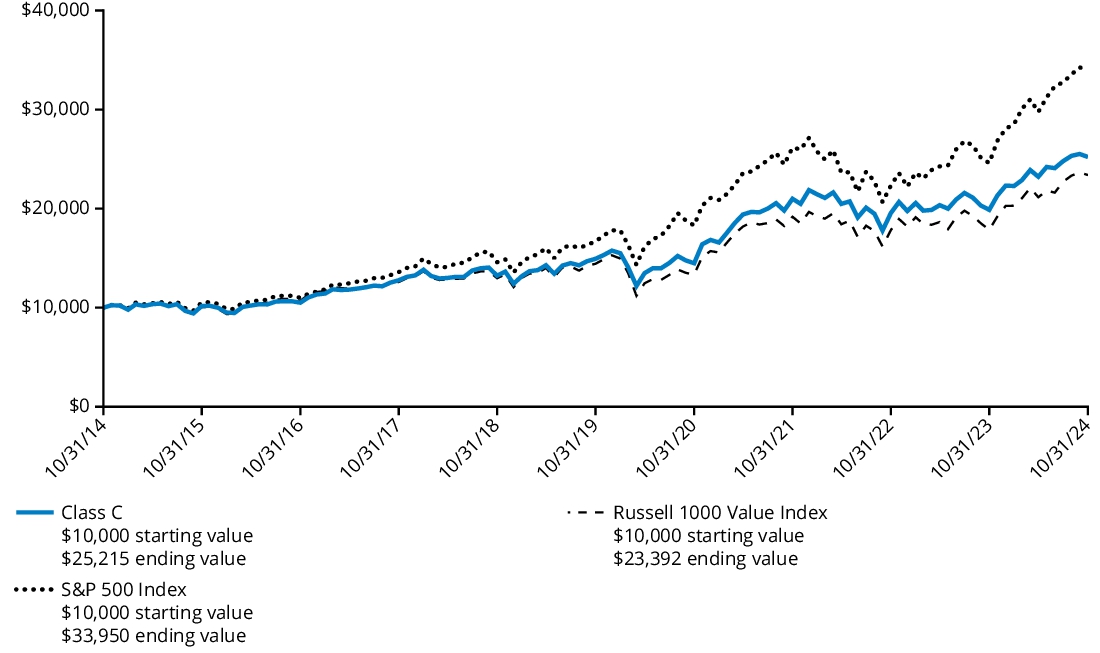
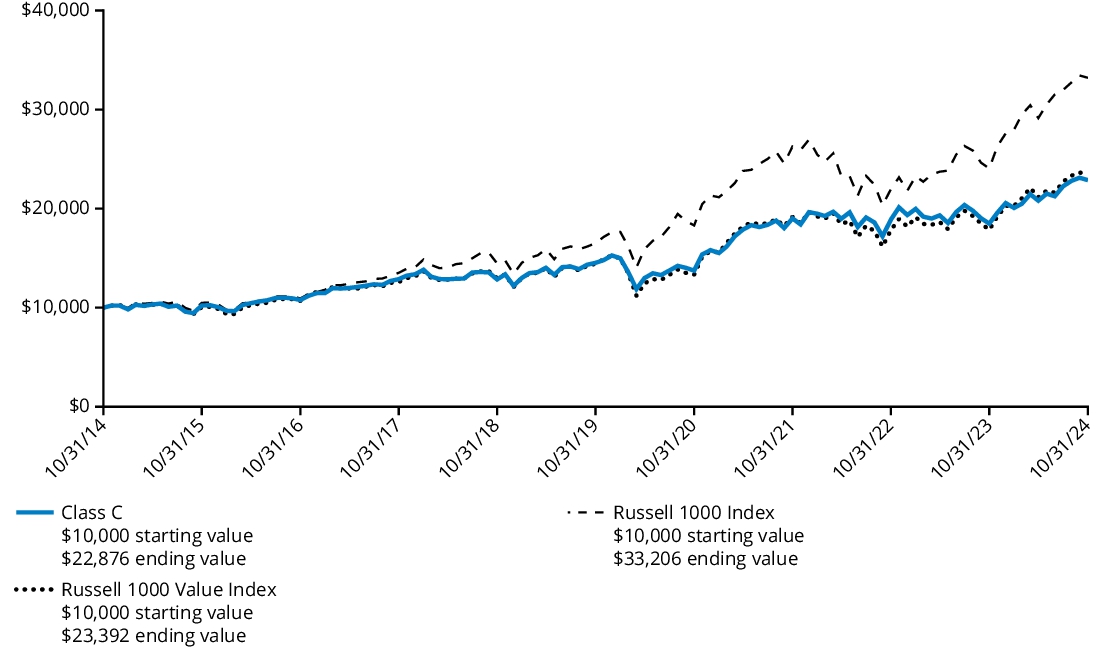
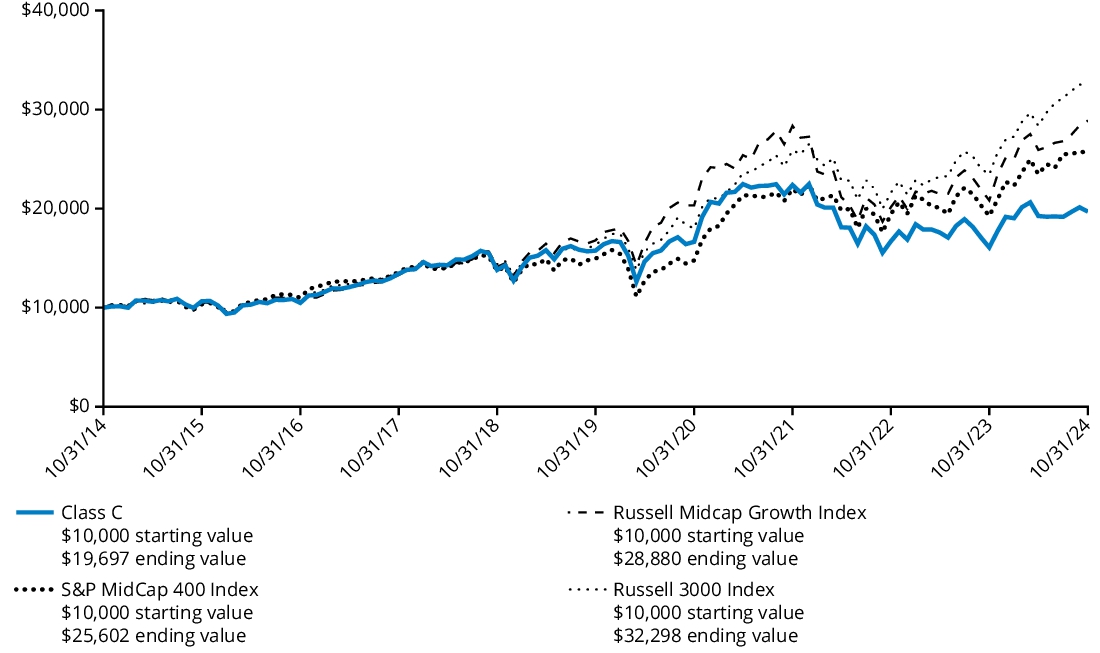
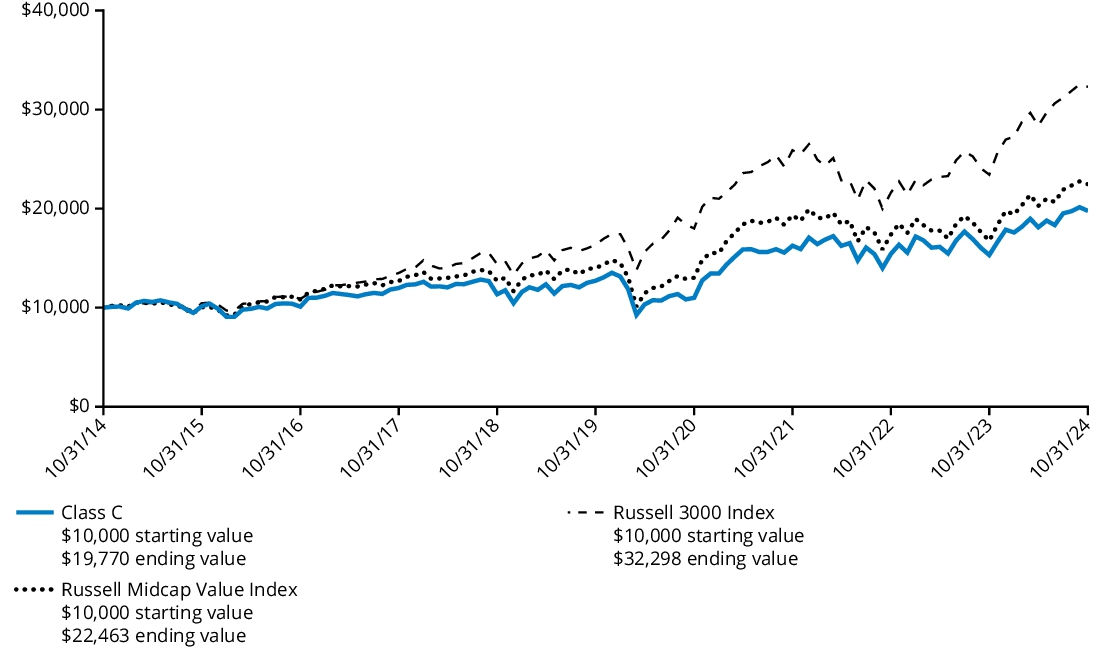
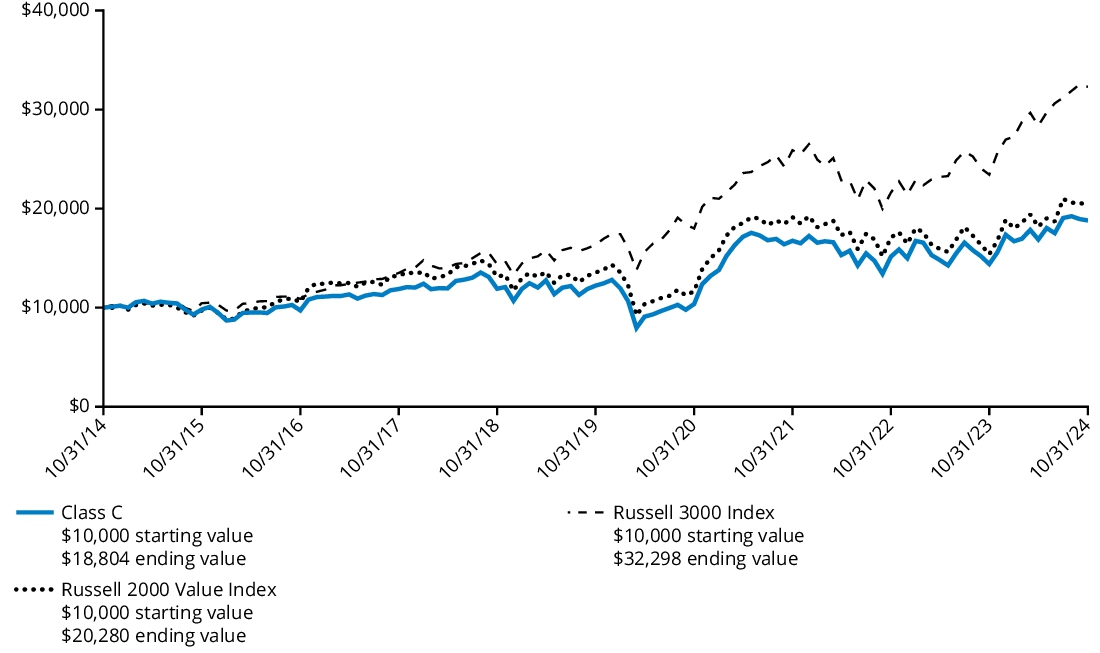
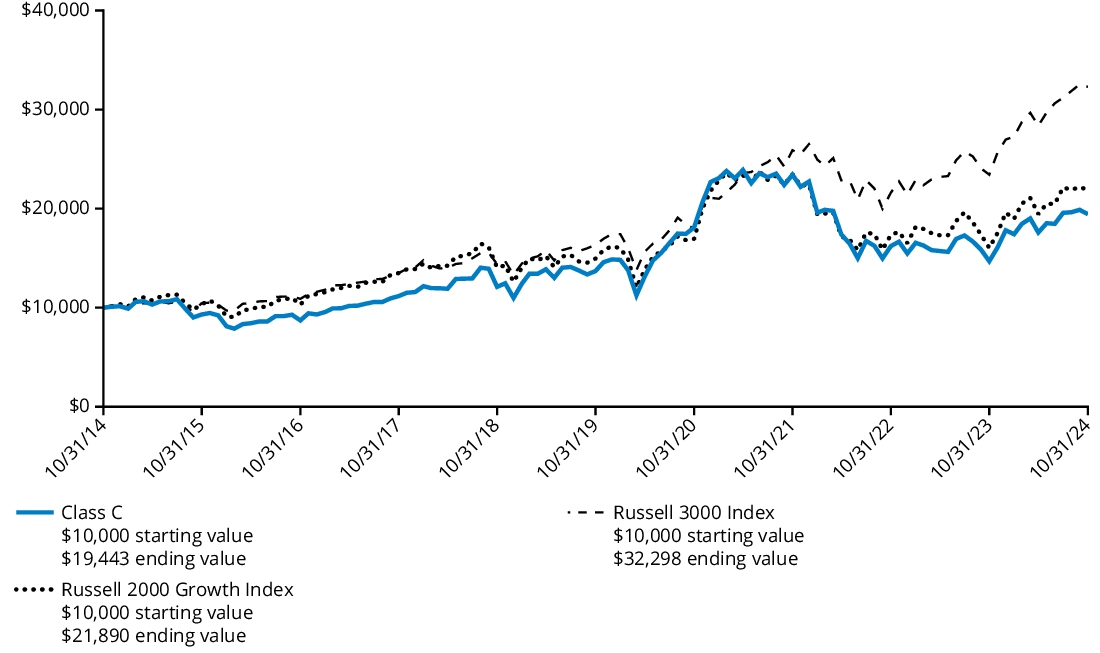
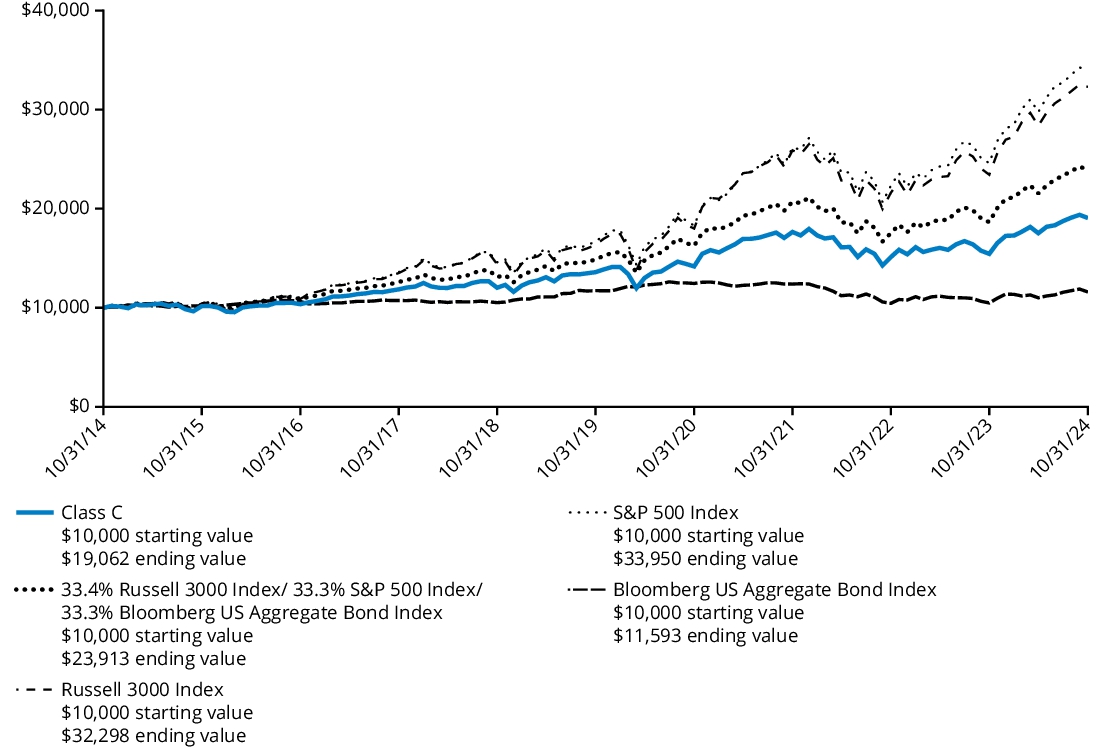
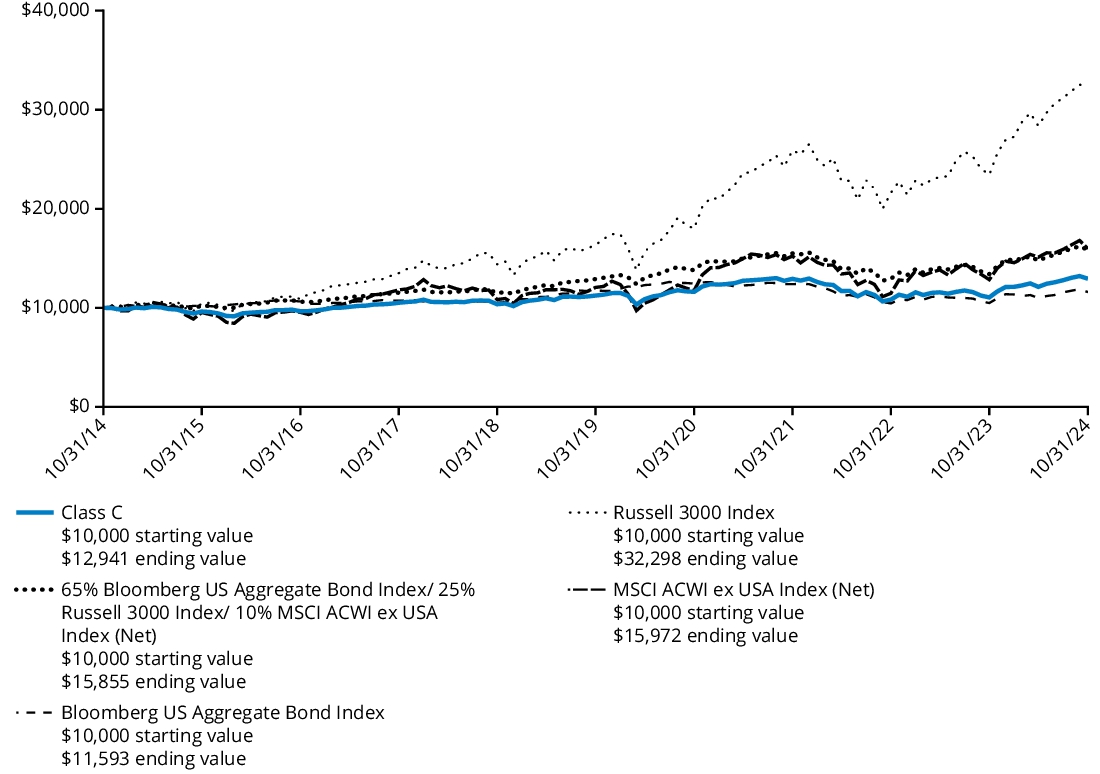
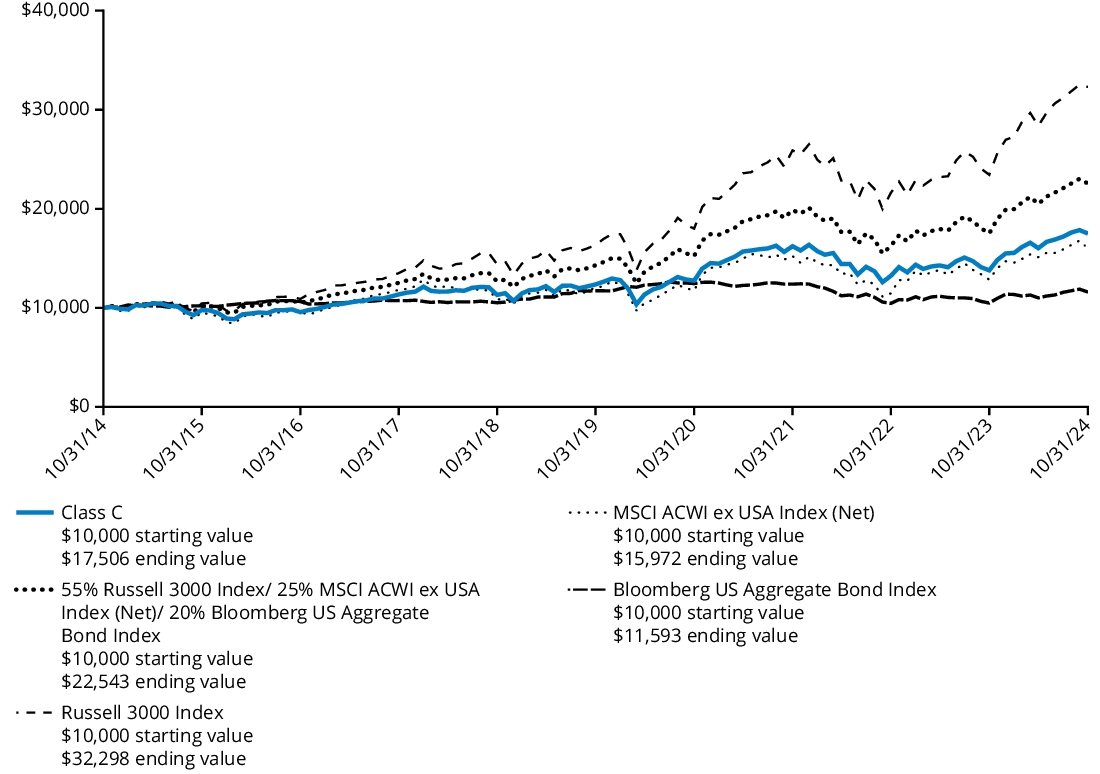
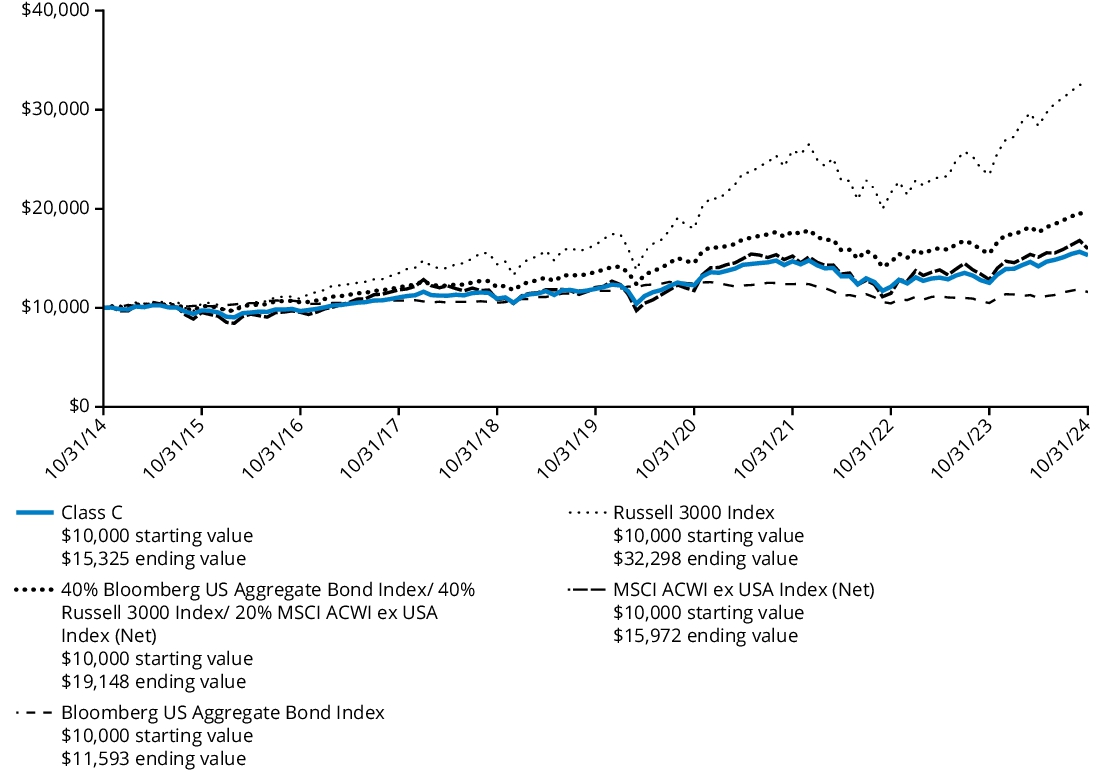
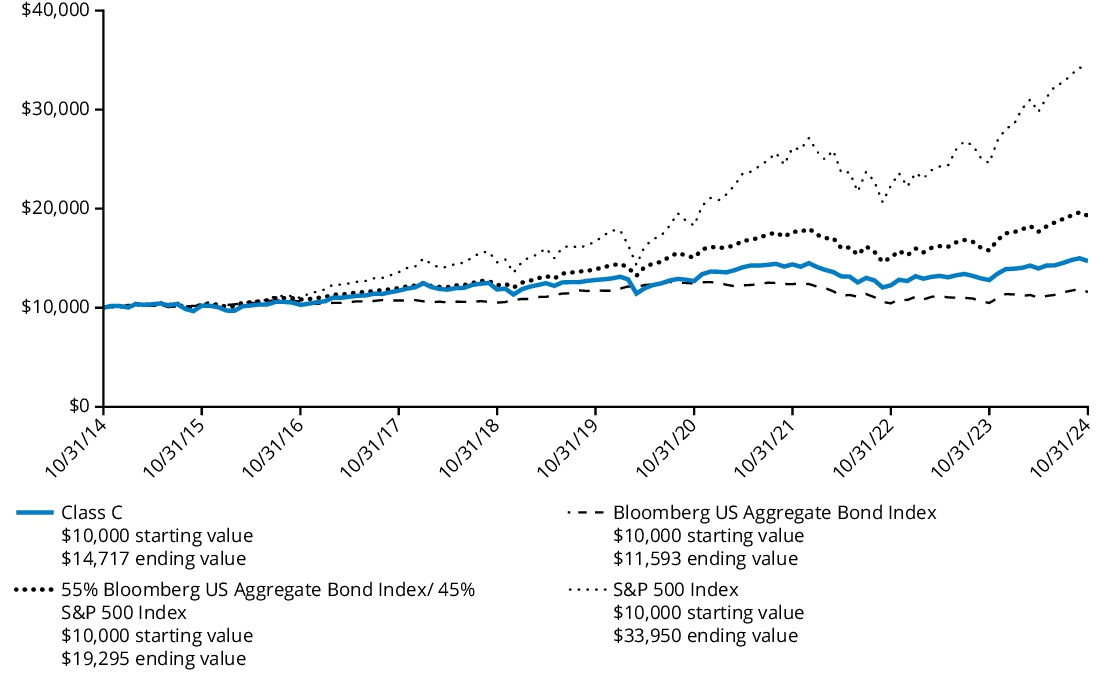
Comparison of Change in Value of $ 10,000 Investment
The graph below represents the hypothetical growth of a $10,000 investment in Class C shares (excluding sales charges) and the comparative indices. If sales charges had been included, the value would have been lower.
Average Annual Total Returns
For the Periods Ended October 31, 2024 | 1 Year | 5 Years | 10 Years |
| Class C (with 1.00% contingent deferred sales charge) | 32.45% | 10.13% | 9.03% |
| Class C (without 1.00% contingent deferred sales charge) | 33.45% | 10.13% | 9.03% |
| Russell 3000 Index | 37.86% | 14.60% | 12.44% |
| S&P 500 Index | 38.02% | 15.27% | 13.00% |
The Fund’s past performance is not a good predictor of the Fund’s future performance. The graph and table do not reflect the deduction of taxes that a shareholder would pay on Fund distributions or redemption of Fund shares. Performance information reflects fee waivers and/or expense limitation arrangements, if any. Absent any applicable fee waivers and/or expense limitation arrangements, performance would have been lower. Visit hartfordfunds.com for the most recent performance information.
Key Fund Statistics as of October 31, 2024
| Fund's net assets | $6,255,800,025% |
| Total number of portfolio holdings (excluding derivatives, if any) | $144% |
| Total investment management fees paid | $40,293,822% |
| Portfolio turnover rate | $85% |
Graphical Representation of Holdings as of October 31, 2024
The table below shows the investment makeup of the Fund, representing the percentage of net assets of the Fund.
| Information Technology | 27.0 | % |
| Financials | 14.6 | % |
| Industrials | 10.7 | % |
| Consumer Discretionary | 10.5 | % |
| Communication Services | 9.5 | % |
| Health Care | 8.8 | % |
| Consumer Staples | 4.7 | % |
| Materials | 4.2 | % |
| Real Estate | 3.5 | % |
| Energy | 2.6 | % |
| Utilities | 1.9 | % |
| Short-Term Investments | 0.4 | % |
| Other Assets & Liabilities | 1.6 | % |
| Total | 100.0 | % |
* | For Fund compliance purposes, the Fund may not use the same classification system. These classifications are used for financial reporting purposes. |
Availability of Additional Information
For additional information about the Fund, including its prospectus, financial information, holdings, and proxy voting information, please visit the Fund’s website at the website address included at the beginning of this report.
The Fund is distributed by Hartford Funds Distributors, LLC (HFD).
Annual Shareholder Report
October 31, 2024
The Hartford Capital Appreciation Fund
Class I/ITHIX
This annual shareholder report contains important information about The Hartford Capital Appreciation Fund (the "Fund") for the period of November 1, 2023 to October 31, 2024. You can find additional information about the Fund at hartfordfunds.com/reports-hmf. You can also request this information by contacting us by calling 1‑888‑843‑7824.
What were the Fund costs for the last year?
(Based on a hypothetical $10,000 investment)
| Class Name | Costs of a $10,000 investment | Costs paid as a percentage
of a $10,000 investment |
| Class I | $92 | 0.78% |
How did the Fund perform last year and what impacted its performance?
Management's Discussion of Fund Performance
United States (U.S.) equities, as measured by the Russell 3000 Index, rose over the trailing twelve-month period ending October 31, 2024. During the second half of the period, the rally in U.S. stocks considerably broadened beyond a concentrated group of mega-cap technology companies that powered the market in the first half of the period. The labor market continued to cool, primarily through fewer job openings and reduced hiring rather than widespread layoffs. Fund performance described below is relative to the Russell 3000 Index for the trailing twelve-month period ended October 31, 2024.
Top Contributors to Performance
Sector allocation, a result of our bottom-up stock selection process, contributed positively to relative performance during the period due to the Fund’s underweight allocations to the Energy and Healthcare sectors.
Security selection within the Information Technology, Communication Services, and Energy sectors contributed positively to relative performance.
The Fund’s exposure to companies that we believe are higher quality contributed to relative results.
Top individual contributors over the period were an underweight position in Apple (Information Technology), an overweight position in American Express (Financials), and an out-of-benchmark position in ARM (Information Technology).
Top Detractors to Performance
Security selection was the primary detractor to relative performance during the period, driven by weak selection within the Industrials, Consumer Discretionary, and Healthcare sectors.
From a style perspective, the Fund’s underweight exposure to higher-momentum names detracted from relative performance.
The largest individual detractors over the period were an underweight position in NVIDIA (Information Technology), as well as overweight positions in Nike (Consumer Discretionary) and LKQ (Consumer Discretionary).
The views expressed in this section reflect the opinions of the Fund's sub-adviser, Wellington Management Company LLP, as of the date of this report and are subject to change based on changes in market, economic or other conditions. These views are not intended to be a forecast of future events and are no guarantee of future results.
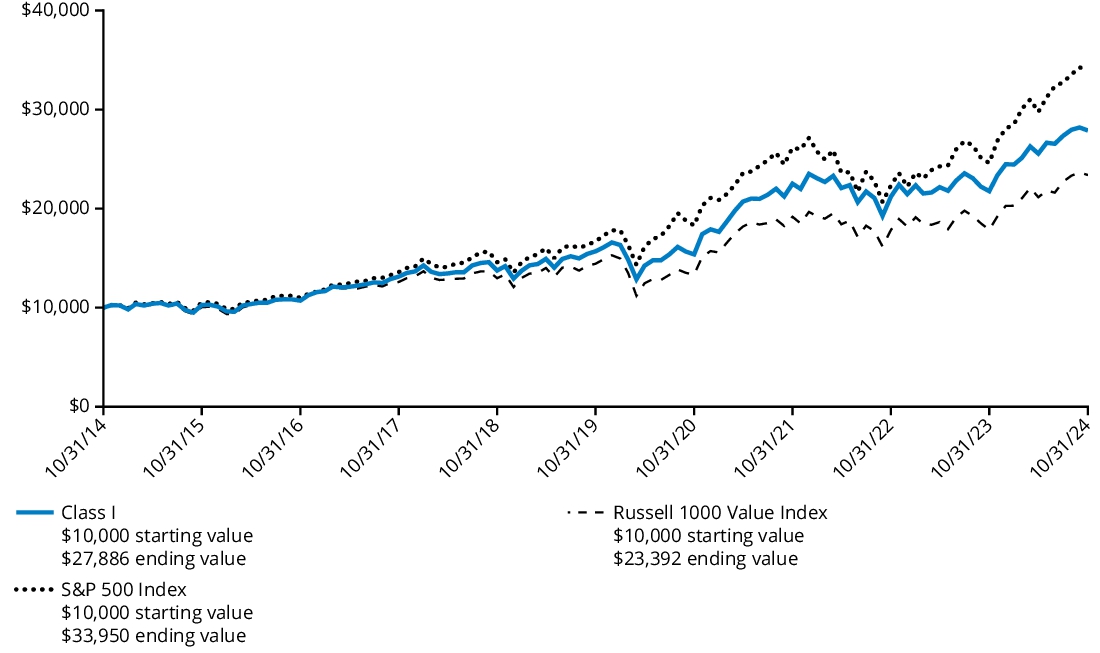
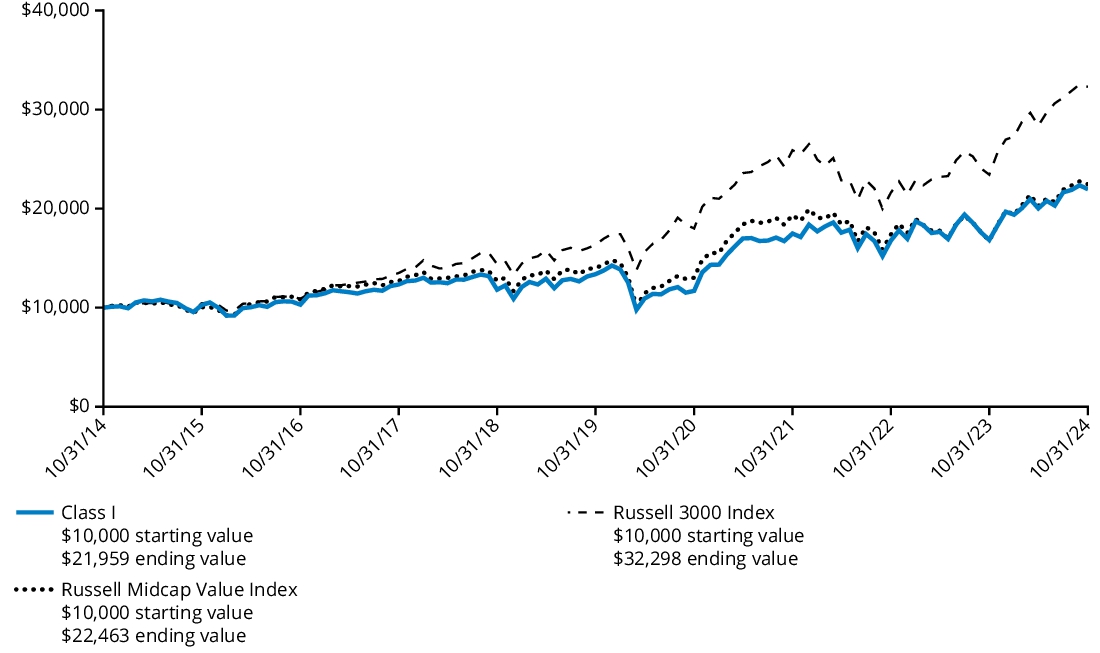
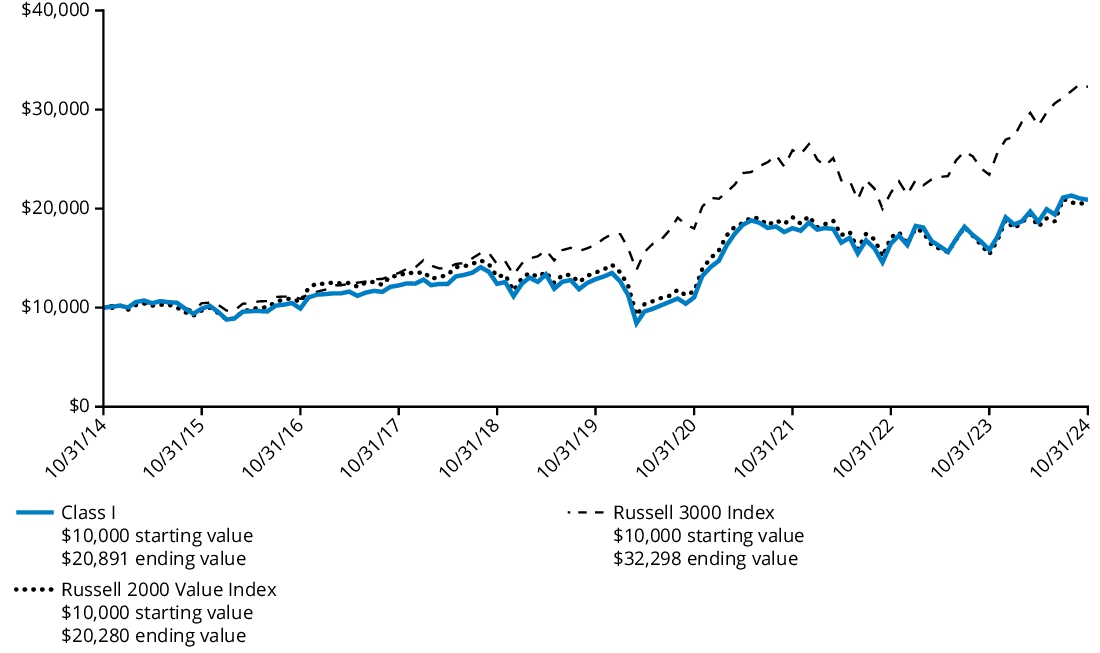
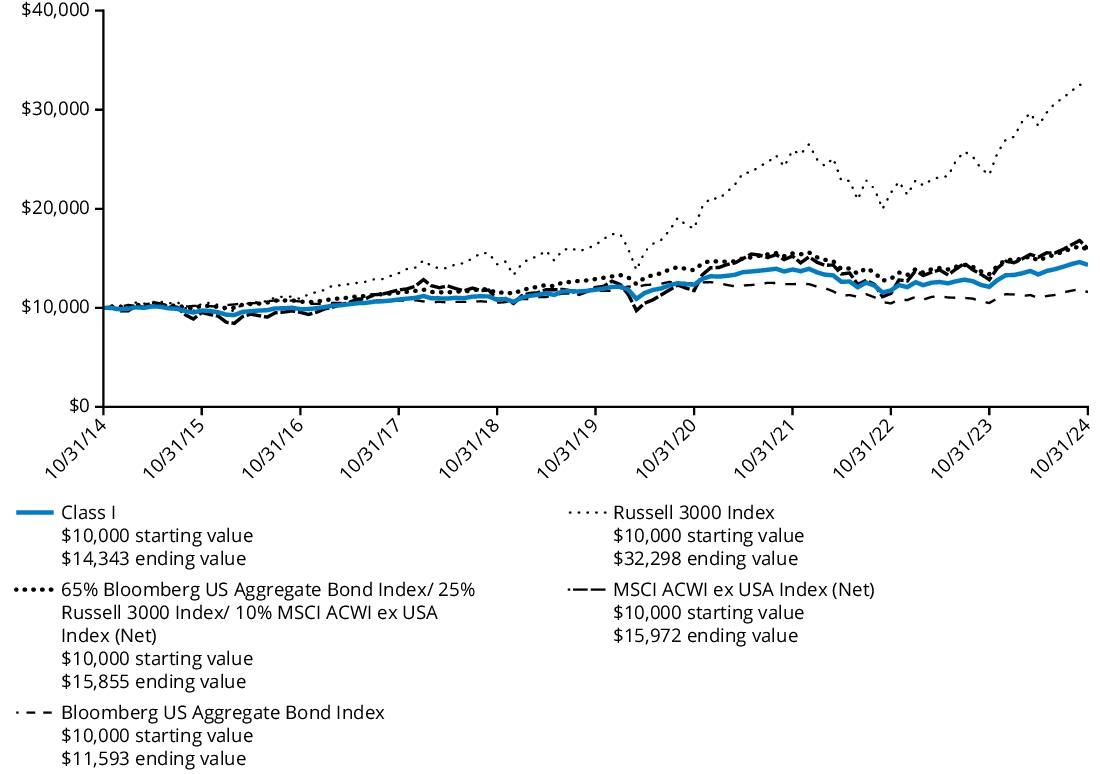
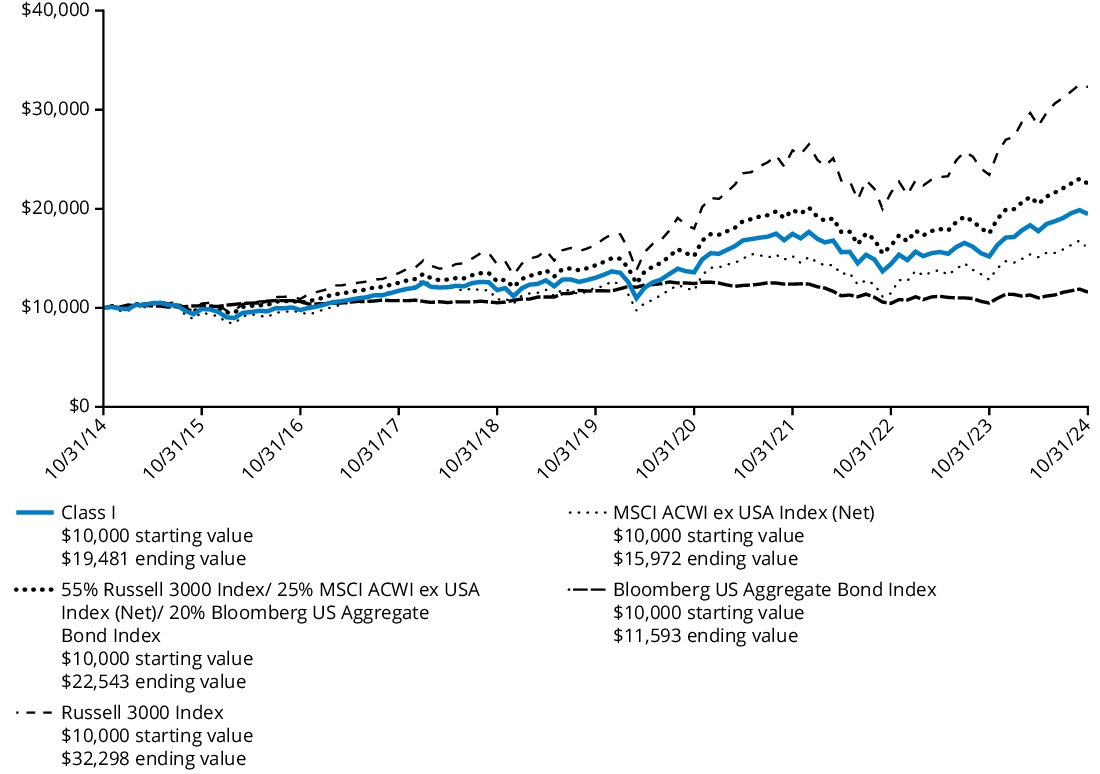
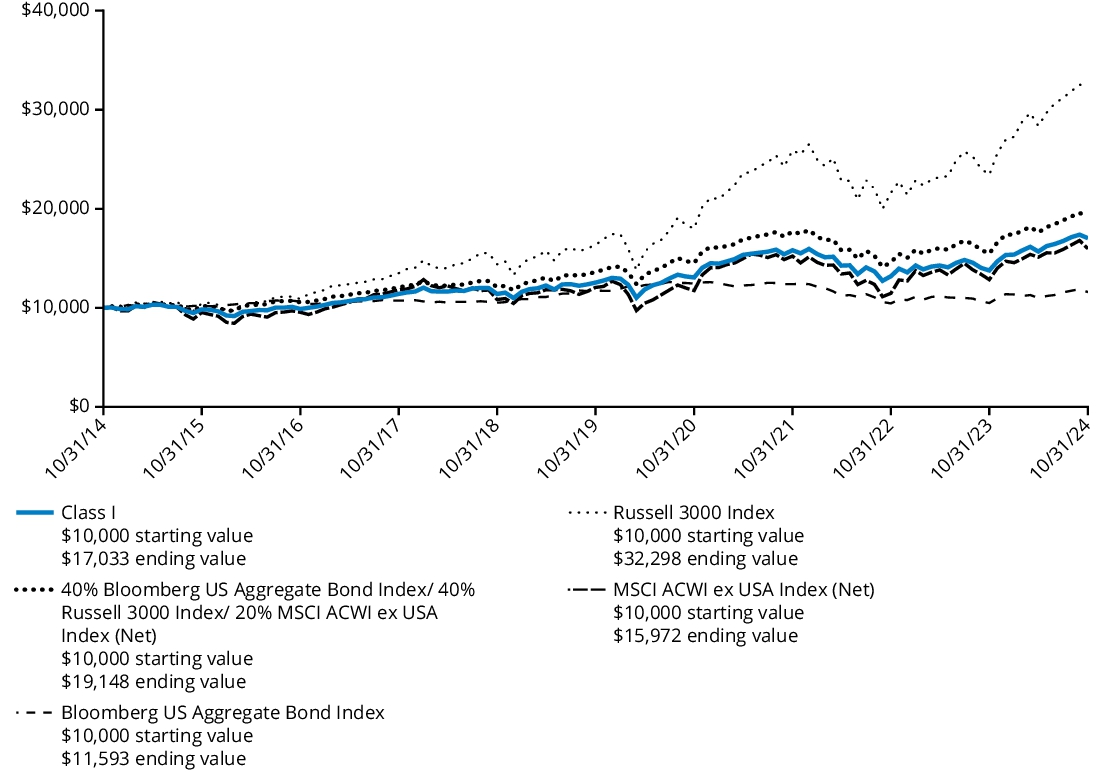
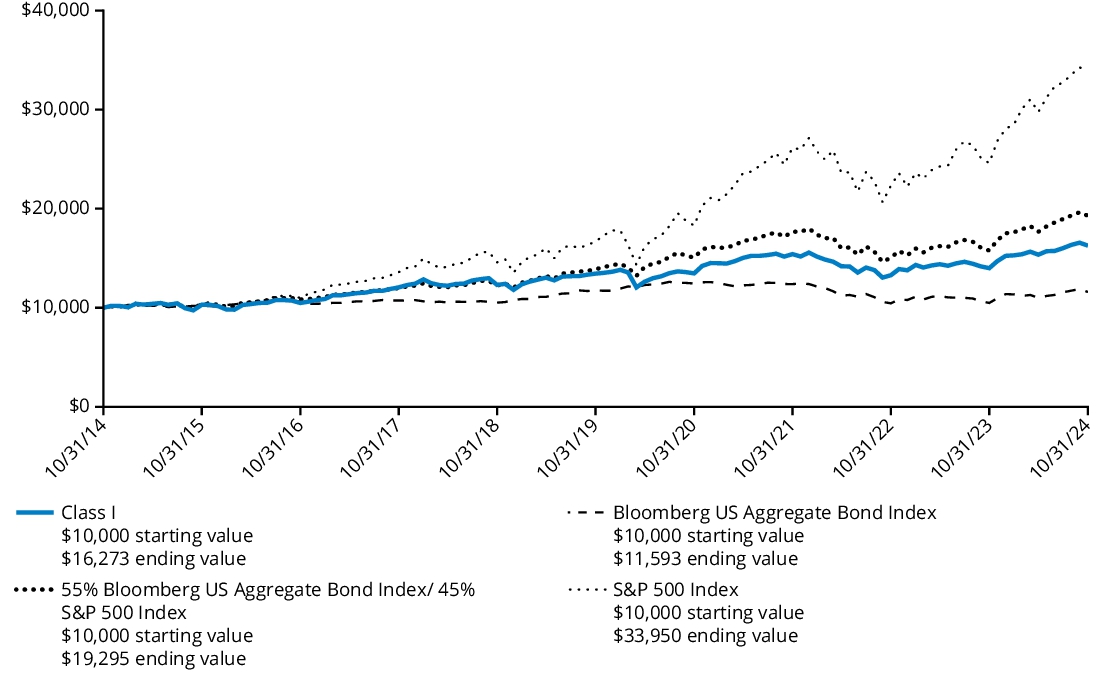
Comparison of Change in Value of $ 10,000 Investment
The graph below represents the hypothetical growth of a $10,000 investment in Class I shares and the comparative indices.
Average Annual Total Returns
For the Periods Ended October 31, 2024 | 1 Year | 5 Years | 10 Years |
| Class I | 34.85% | 11.30% | 10.17% |
| Russell 3000 Index | 37.86% | 14.60% | 12.44% |
| S&P 500 Index | 38.02% | 15.27% | 13.00% |
The Fund’s past performance is not a good predictor of the Fund’s future performance. The graph and table do not reflect the deduction of taxes that a shareholder would pay on Fund distributions or redemption of Fund shares. Performance information reflects fee waivers and/or expense limitation arrangements, if any. Absent any applicable fee waivers and/or expense limitation arrangements, performance would have been lower. Visit hartfordfunds.com for the most recent performance information.
Key Fund Statistics as of October 31, 2024
| Fund's net assets | $6,255,800,025% |
| Total number of portfolio holdings (excluding derivatives, if any) | $144% |
| Total investment management fees paid | $40,293,822% |
| Portfolio turnover rate | $85% |
Graphical Representation of Holdings as of October 31, 2024
The table below shows the investment makeup of the Fund, representing the percentage of net assets of the Fund.
| Information Technology | 27.0 | % |
| Financials | 14.6 | % |
| Industrials | 10.7 | % |
| Consumer Discretionary | 10.5 | % |
| Communication Services | 9.5 | % |
| Health Care | 8.8 | % |
| Consumer Staples | 4.7 | % |
| Materials | 4.2 | % |
| Real Estate | 3.5 | % |
| Energy | 2.6 | % |
| Utilities | 1.9 | % |
| Short-Term Investments | 0.4 | % |
| Other Assets & Liabilities | 1.6 | % |
| Total | 100.0 | % |
* | For Fund compliance purposes, the Fund may not use the same classification system. These classifications are used for financial reporting purposes. |
Availability of Additional Information
For additional information about the Fund, including its prospectus, financial information, holdings, and proxy voting information, please visit the Fund’s website at the website address included at the beginning of this report.
The Fund is distributed by Hartford Funds Distributors, LLC (HFD).
Annual Shareholder Report
October 31, 2024
The Hartford Capital Appreciation Fund
Class R3/ITHRX
This annual shareholder report contains important information about The Hartford Capital Appreciation Fund (the "Fund") for the period of November 1, 2023 to October 31, 2024. You can find additional information about the Fund at hartfordfunds.com/reports-hmf. You can also request this information by contacting us by calling 1‑888‑843‑7824.
What were the Fund costs for the last year?
(Based on a hypothetical $10,000 investment)
| Class Name | Costs of a $10,000 investment | Costs paid as a percentage
of a $10,000 investment |
| Class R3 | $165 | 1.41% |
How did the Fund perform last year and what impacted its performance?
Management's Discussion of Fund Performance
United States (U.S.) equities, as measured by the Russell 3000 Index, rose over the trailing twelve-month period ending October 31, 2024. During the second half of the period, the rally in U.S. stocks considerably broadened beyond a concentrated group of mega-cap technology companies that powered the market in the first half of the period. The labor market continued to cool, primarily through fewer job openings and reduced hiring rather than widespread layoffs. Fund performance described below is relative to the Russell 3000 Index for the trailing twelve-month period ended October 31, 2024.
Top Contributors to Performance
Sector allocation, a result of our bottom-up stock selection process, contributed positively to relative performance during the period due to the Fund’s underweight allocations to the Energy and Healthcare sectors.
Security selection within the Information Technology, Communication Services, and Energy sectors contributed positively to relative performance.
The Fund’s exposure to companies that we believe are higher quality contributed to relative results.
Top individual contributors over the period were an underweight position in Apple (Information Technology), an overweight position in American Express (Financials), and an out-of-benchmark position in ARM (Information Technology).
Top Detractors to Performance
Security selection was the primary detractor to relative performance during the period, driven by weak selection within the Industrials, Consumer Discretionary, and Healthcare sectors.
From a style perspective, the Fund’s underweight exposure to higher-momentum names detracted from relative performance.
The largest individual detractors over the period were an underweight position in NVIDIA (Information Technology), as well as overweight positions in Nike (Consumer Discretionary) and LKQ (Consumer Discretionary).
The views expressed in this section reflect the opinions of the Fund's sub-adviser, Wellington Management Company LLP, as of the date of this report and are subject to change based on changes in market, economic or other conditions. These views are not intended to be a forecast of future events and are no guarantee of future results.
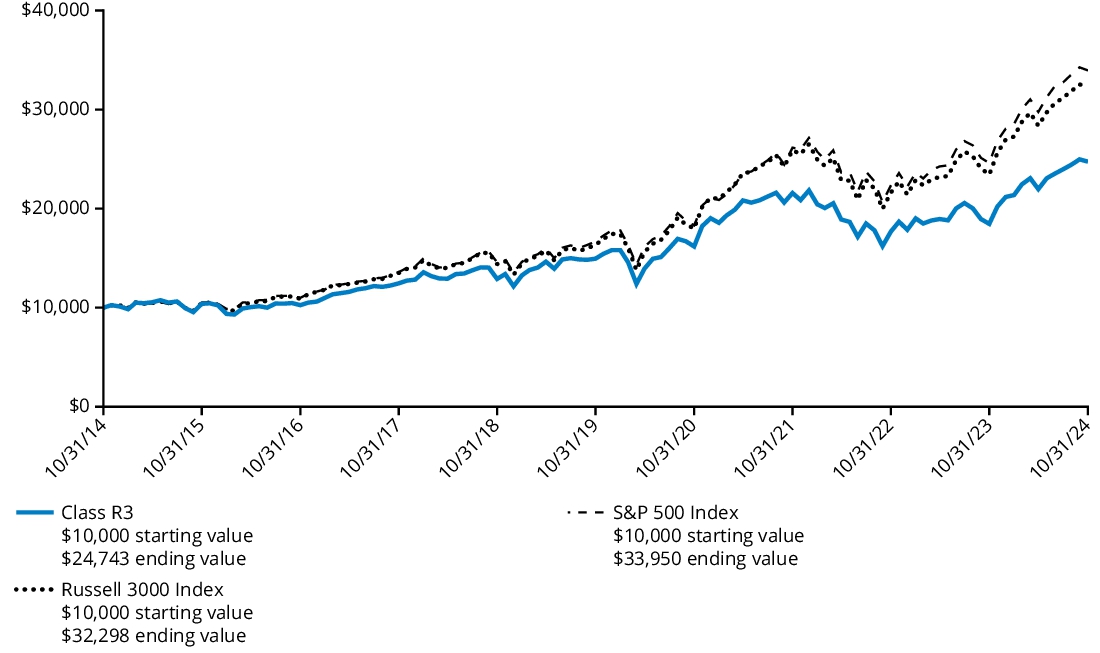
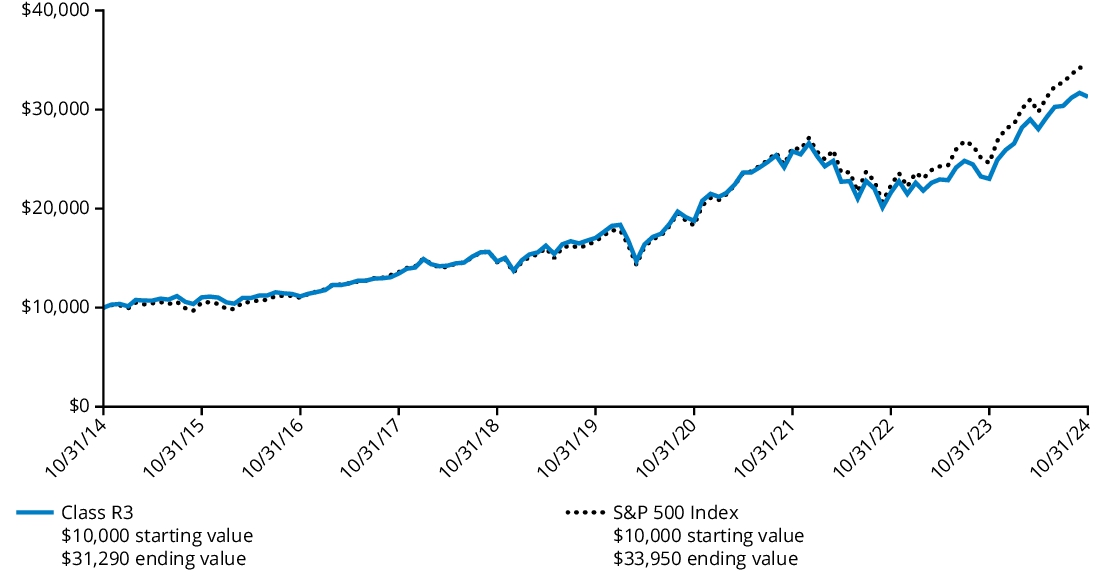
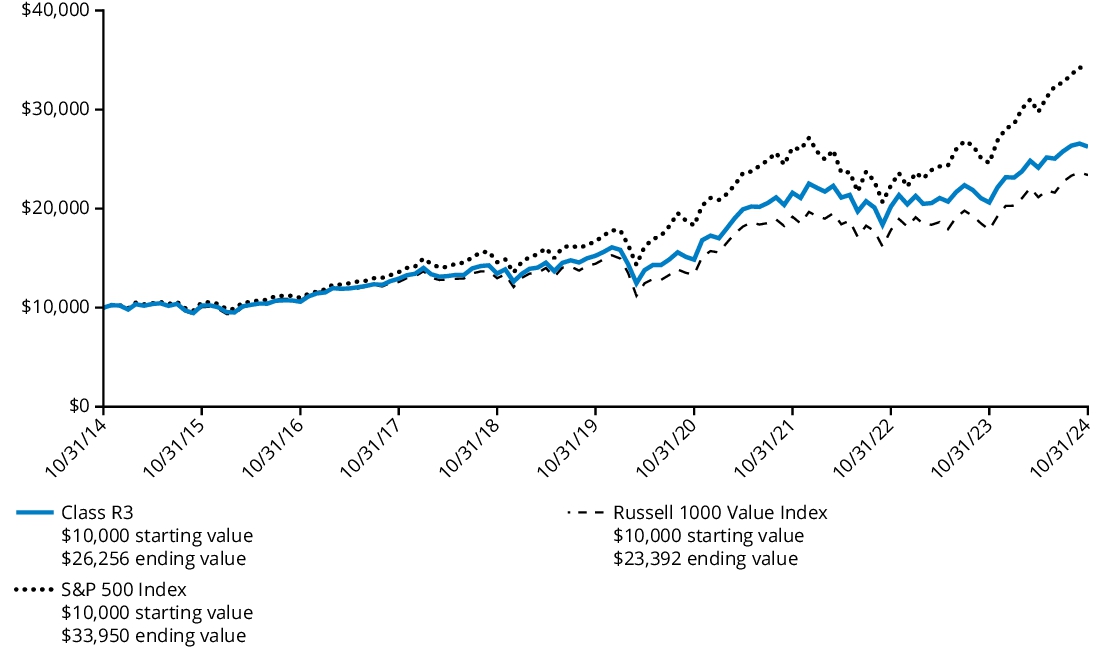
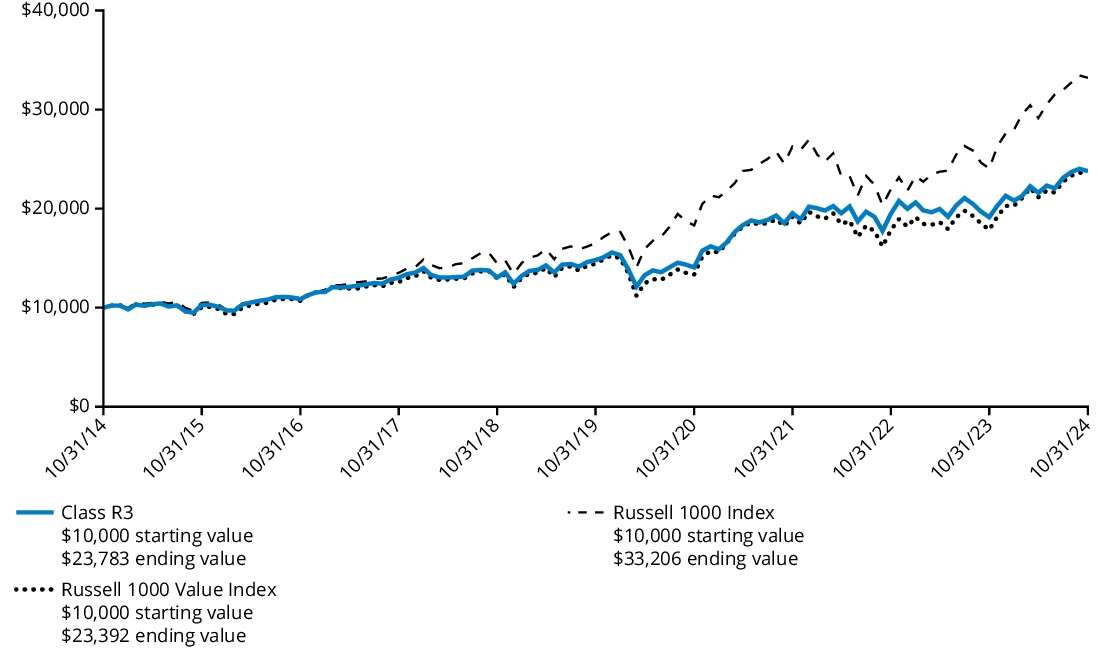
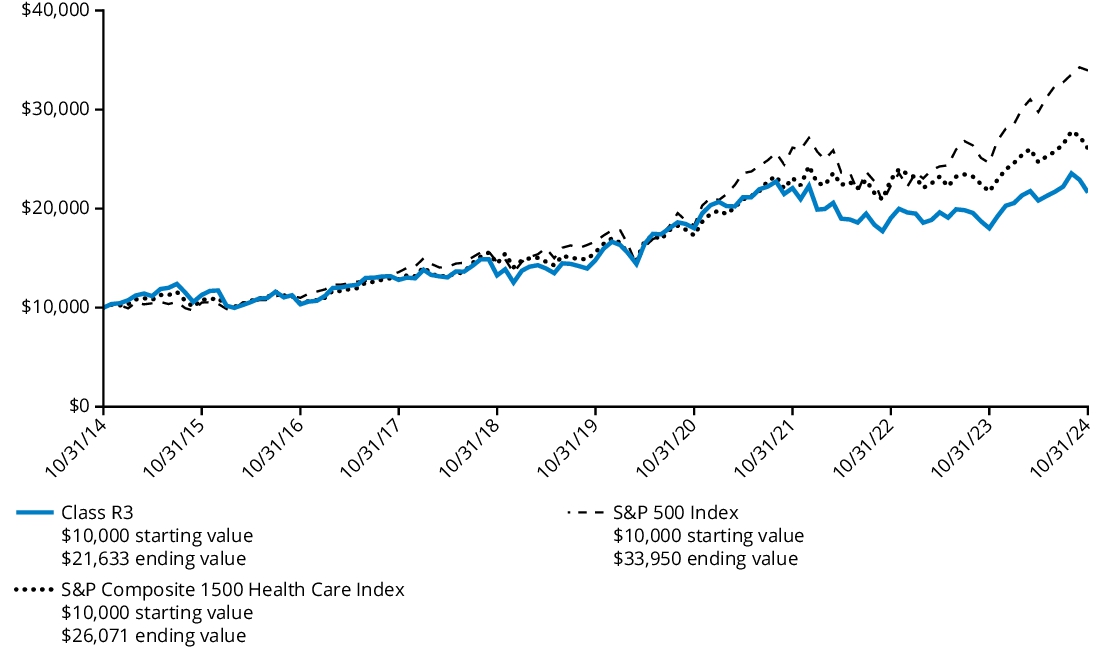
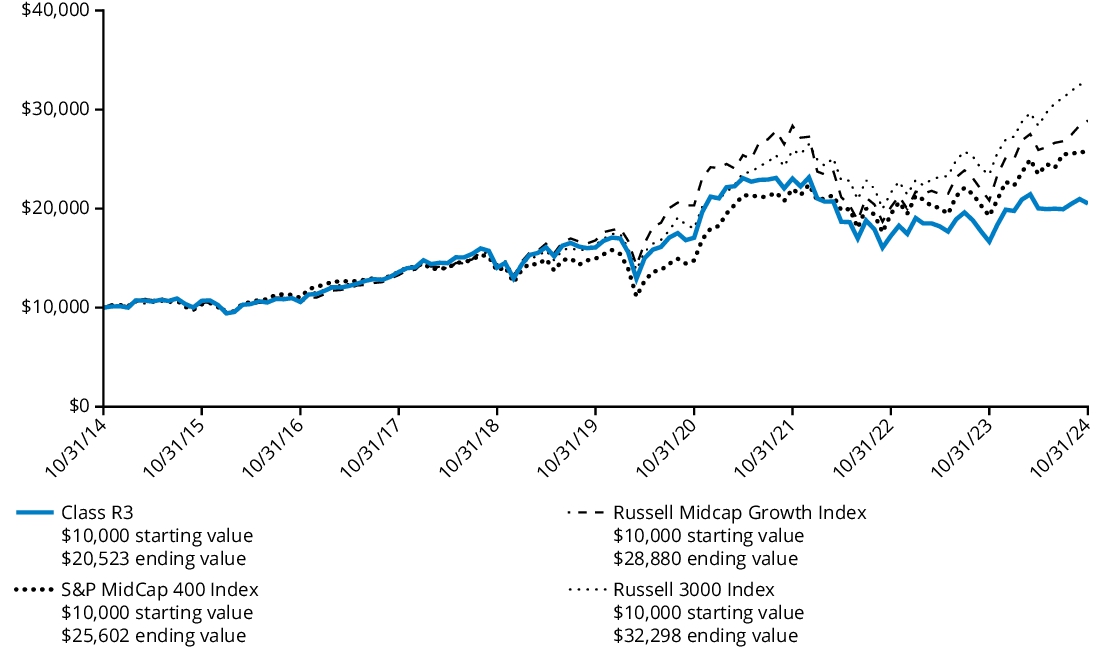
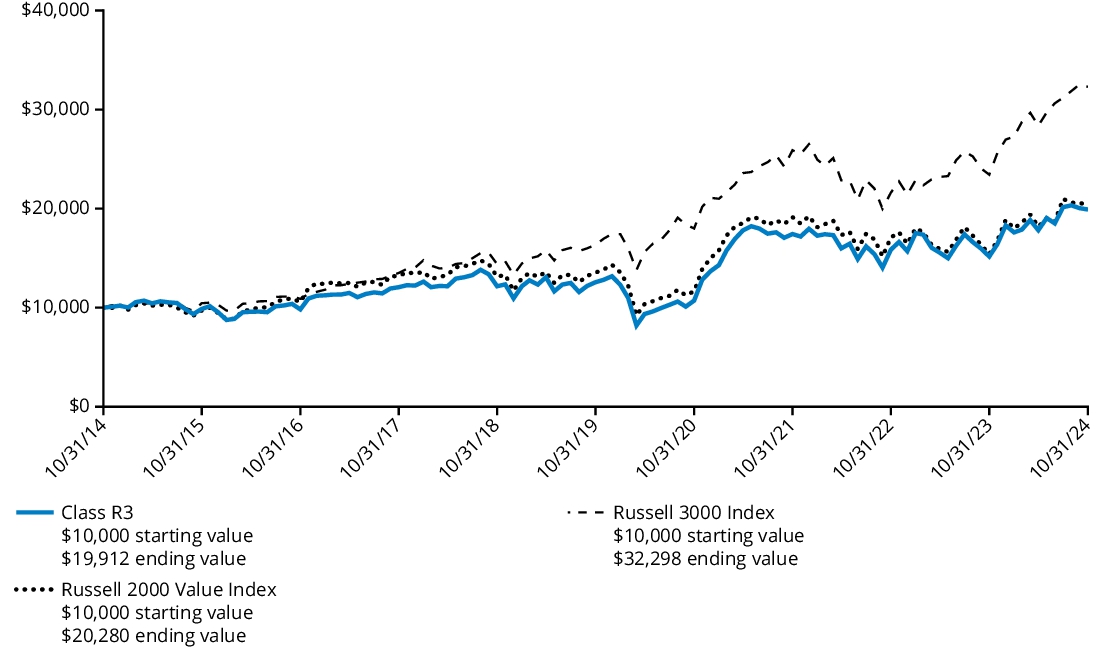
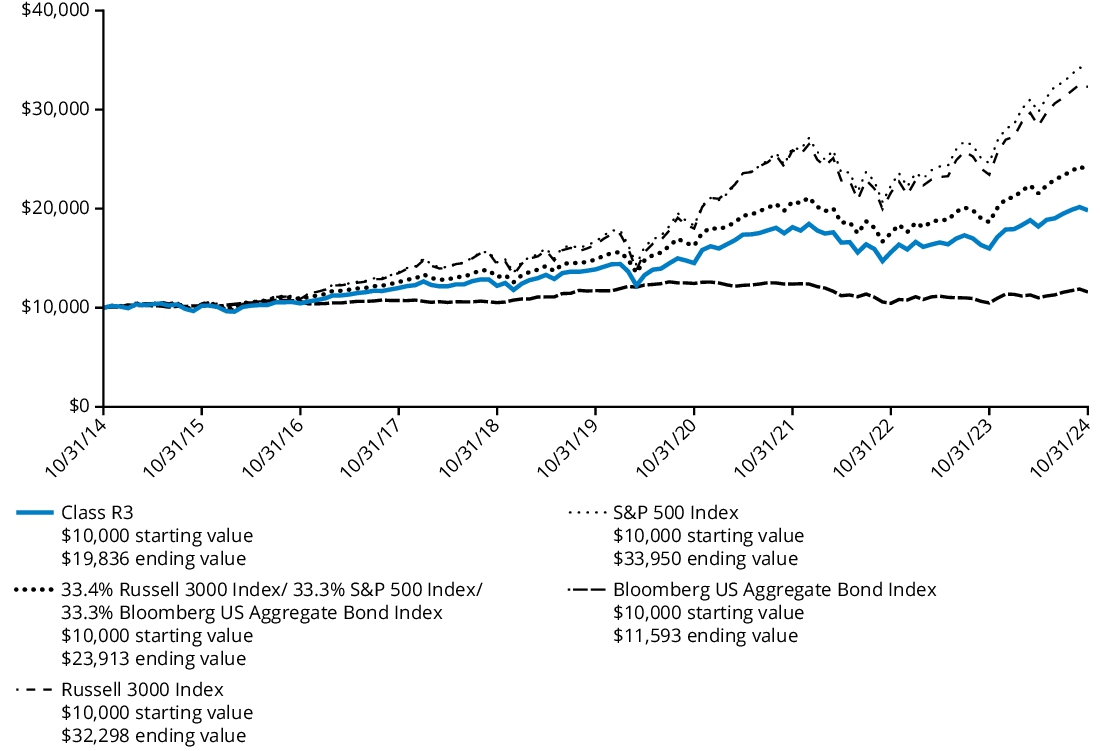
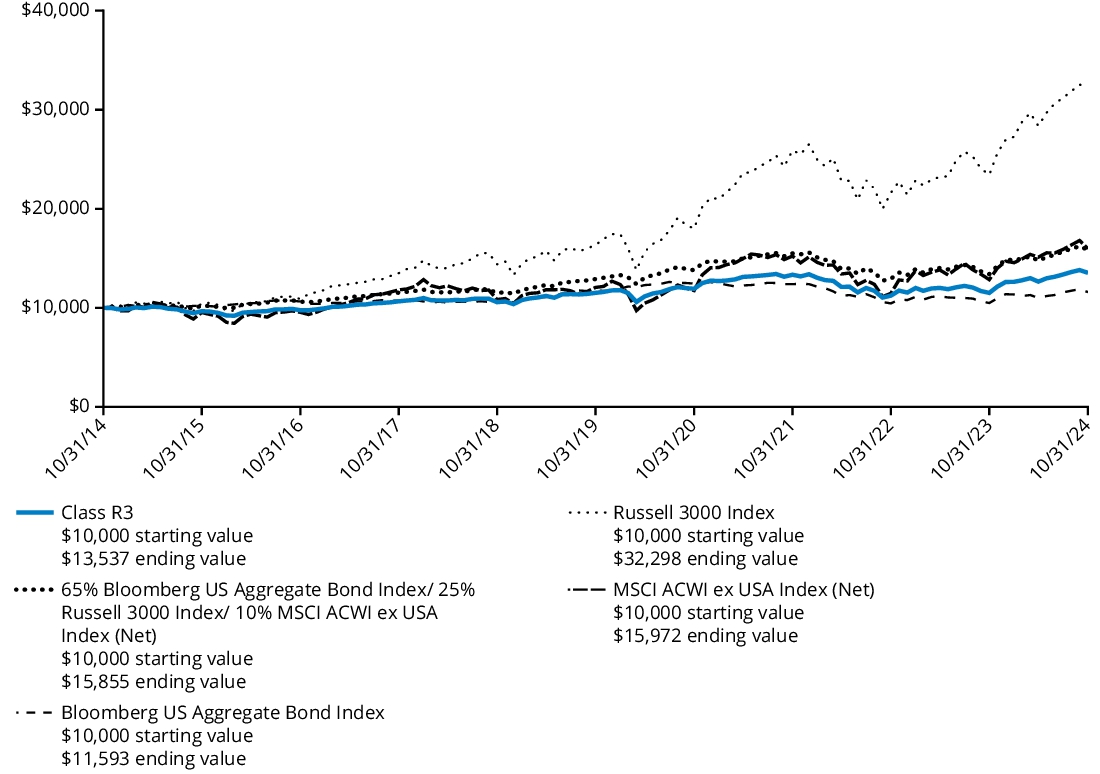
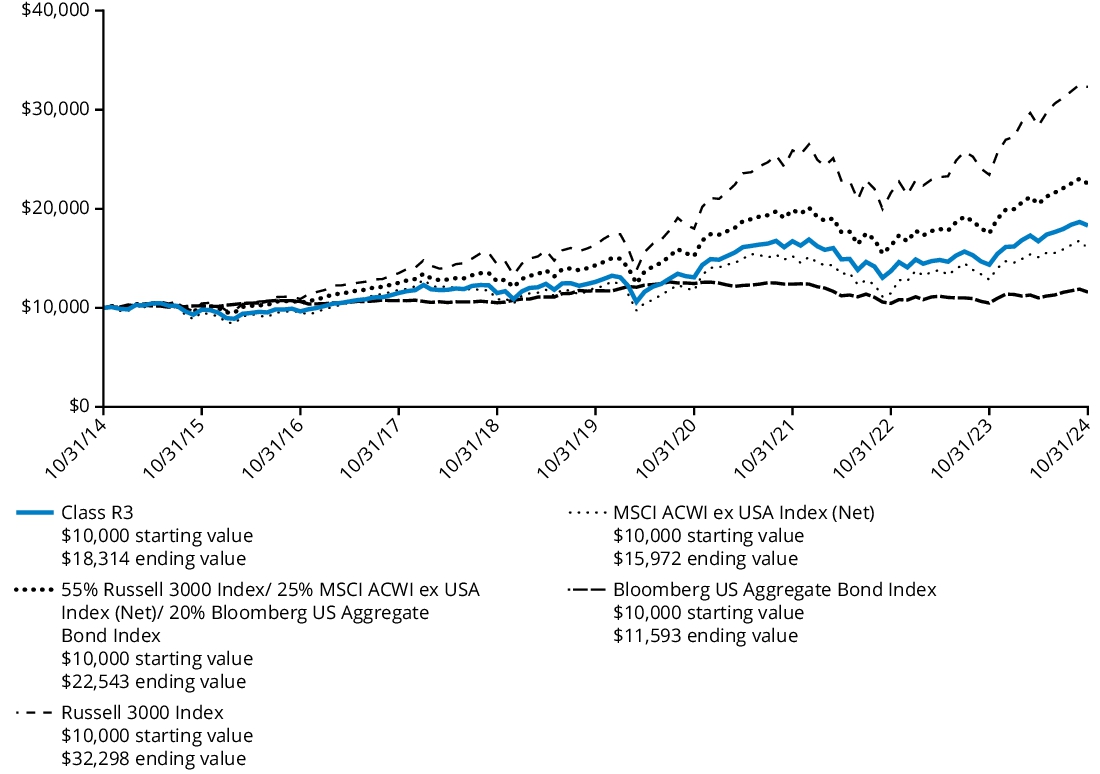
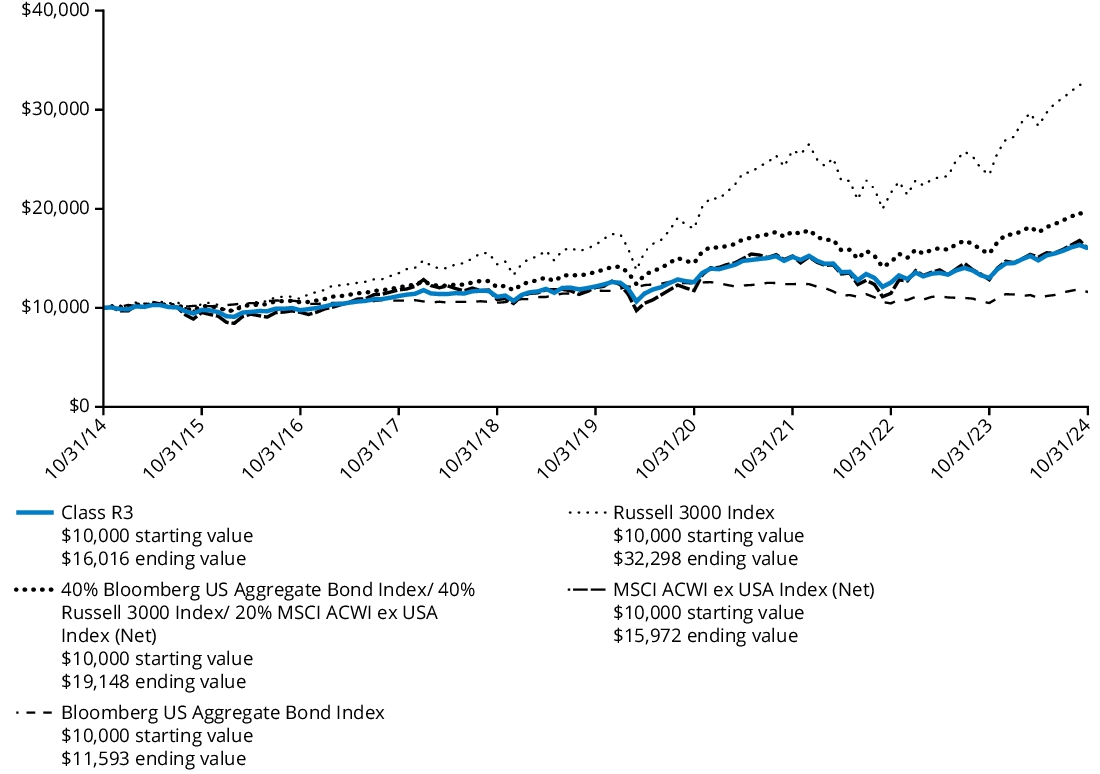
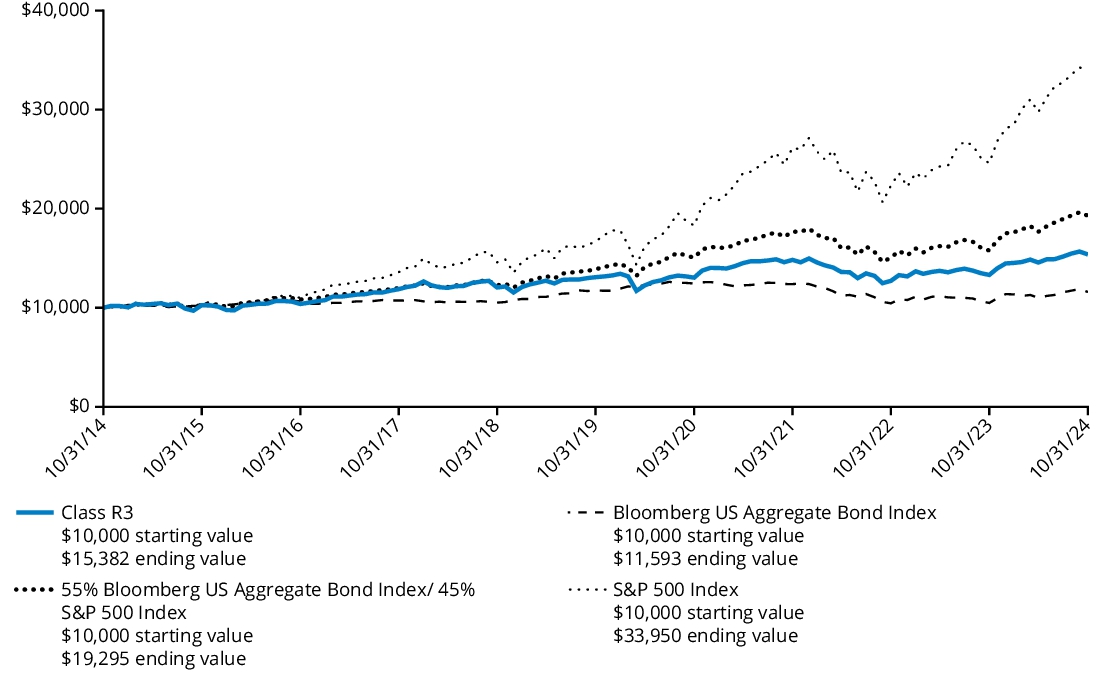
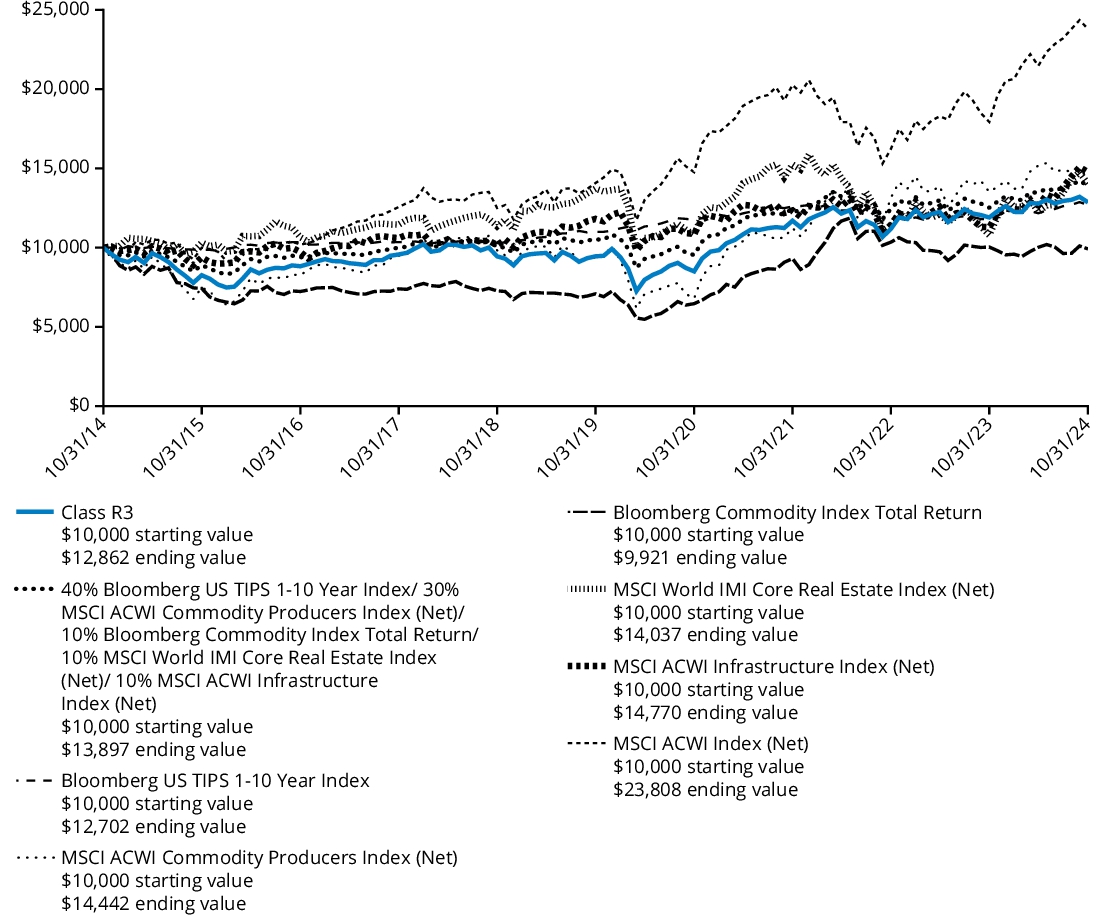
Comparison of Change in Value of $ 10,000 Investment
The graph below represents the hypothetical growth of a $10,000 investment in Class R3 shares and the comparative indices.
Average Annual Total Returns
For the Periods Ended October 31, 2024 | 1 Year | 5 Years | 10 Years |
| Class R3 | 34.03% | 10.61% | 9.48% |
| Russell 3000 Index | 37.86% | 14.60% | 12.44% |
| S&P 500 Index | 38.02% | 15.27% | 13.00% |
The Fund’s past performance is not a good predictor of the Fund’s future performance. The graph and table do not reflect the deduction of taxes that a shareholder would pay on Fund distributions or redemption of Fund shares. Performance information reflects fee waivers and/or expense limitation arrangements, if any. Absent any applicable fee waivers and/or expense limitation arrangements, performance would have been lower. Visit hartfordfunds.com for the most recent performance information.
Key Fund Statistics as of October 31, 2024
| Fund's net assets | $6,255,800,025% |
| Total number of portfolio holdings (excluding derivatives, if any) | $144% |
| Total investment management fees paid | $40,293,822% |
| Portfolio turnover rate | $85% |
Graphical Representation of Holdings as of October 31, 2024
The table below shows the investment makeup of the Fund, representing the percentage of net assets of the Fund.
| Information Technology | 27.0 | % |
| Financials | 14.6 | % |
| Industrials | 10.7 | % |
| Consumer Discretionary | 10.5 | % |
| Communication Services | 9.5 | % |
| Health Care | 8.8 | % |
| Consumer Staples | 4.7 | % |
| Materials | 4.2 | % |
| Real Estate | 3.5 | % |
| Energy | 2.6 | % |
| Utilities | 1.9 | % |
| Short-Term Investments | 0.4 | % |
| Other Assets & Liabilities | 1.6 | % |
| Total | 100.0 | % |
* | For Fund compliance purposes, the Fund may not use the same classification system. These classifications are used for financial reporting purposes. |
Availability of Additional Information
For additional information about the Fund, including its prospectus, financial information, holdings, and proxy voting information, please visit the Fund’s website at the website address included at the beginning of this report.
The Fund is distributed by Hartford Funds Distributors, LLC (HFD).
Annual Shareholder Report
October 31, 2024
The Hartford Capital Appreciation Fund
Class R4/ITHSX
This annual shareholder report contains important information about The Hartford Capital Appreciation Fund (the "Fund") for the period of November 1, 2023 to October 31, 2024. You can find additional information about the Fund at hartfordfunds.com/reports-hmf. You can also request this information by contacting us by calling 1‑888‑843‑7824.
What were the Fund costs for the last year?
(Based on a hypothetical $10,000 investment)
| Class Name | Costs of a $10,000 investment | Costs paid as a percentage
of a $10,000 investment |
| Class R4 | $129 | 1.10% |
How did the Fund perform last year and what impacted its performance?
Management's Discussion of Fund Performance
United States (U.S.) equities, as measured by the Russell 3000 Index, rose over the trailing twelve-month period ending October 31, 2024. During the second half of the period, the rally in U.S. stocks considerably broadened beyond a concentrated group of mega-cap technology companies that powered the market in the first half of the period. The labor market continued to cool, primarily through fewer job openings and reduced hiring rather than widespread layoffs. Fund performance described below is relative to the Russell 3000 Index for the trailing twelve-month period ended October 31, 2024.
Top Contributors to Performance
Sector allocation, a result of our bottom-up stock selection process, contributed positively to relative performance during the period due to the Fund’s underweight allocations to the Energy and Healthcare sectors.
Security selection within the Information Technology, Communication Services, and Energy sectors contributed positively to relative performance.
The Fund’s exposure to companies that we believe are higher quality contributed to relative results.
Top individual contributors over the period were an underweight position in Apple (Information Technology), an overweight position in American Express (Financials), and an out-of-benchmark position in ARM (Information Technology).
Top Detractors to Performance
Security selection was the primary detractor to relative performance during the period, driven by weak selection within the Industrials, Consumer Discretionary, and Healthcare sectors.
From a style perspective, the Fund’s underweight exposure to higher-momentum names detracted from relative performance.
The largest individual detractors over the period were an underweight position in NVIDIA (Information Technology), as well as overweight positions in Nike (Consumer Discretionary) and LKQ (Consumer Discretionary).
The views expressed in this section reflect the opinions of the Fund's sub-adviser, Wellington Management Company LLP, as of the date of this report and are subject to change based on changes in market, economic or other conditions. These views are not intended to be a forecast of future events and are no guarantee of future results.
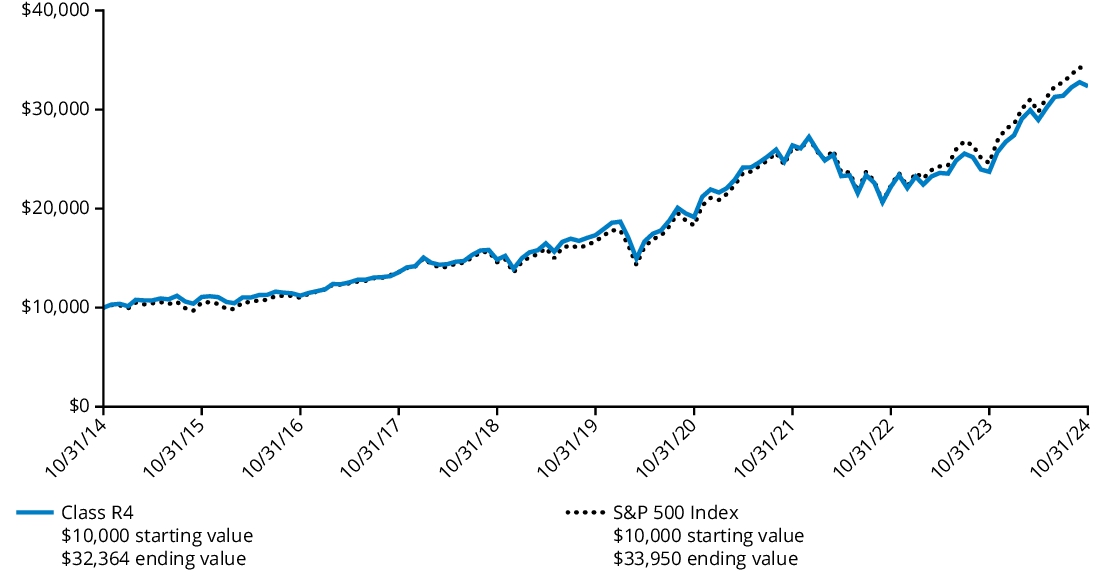
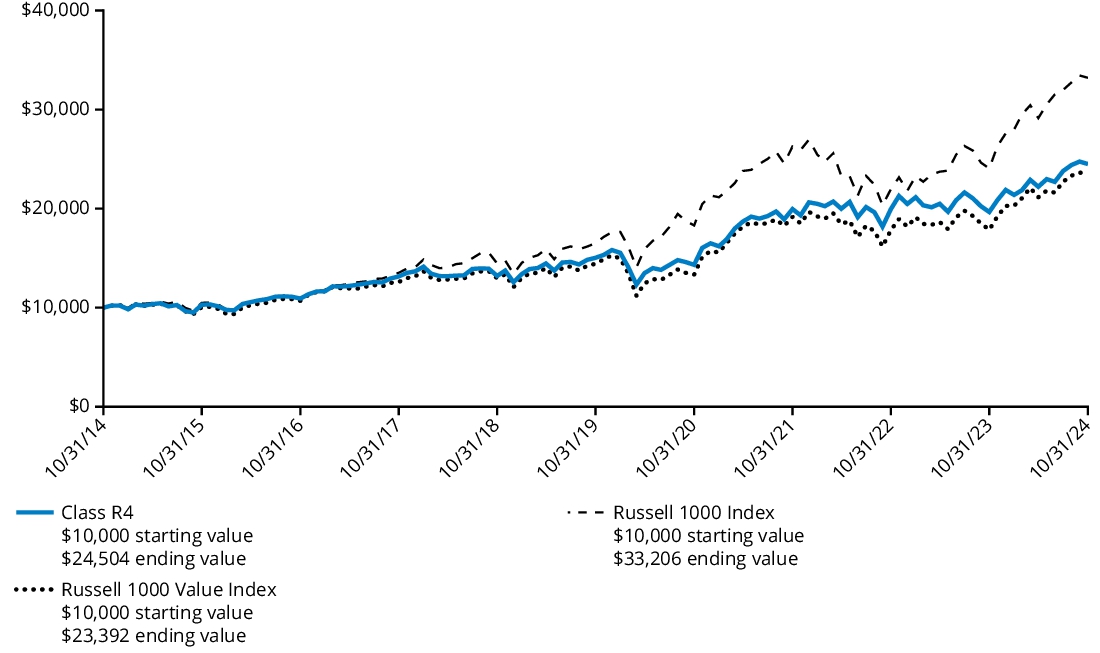
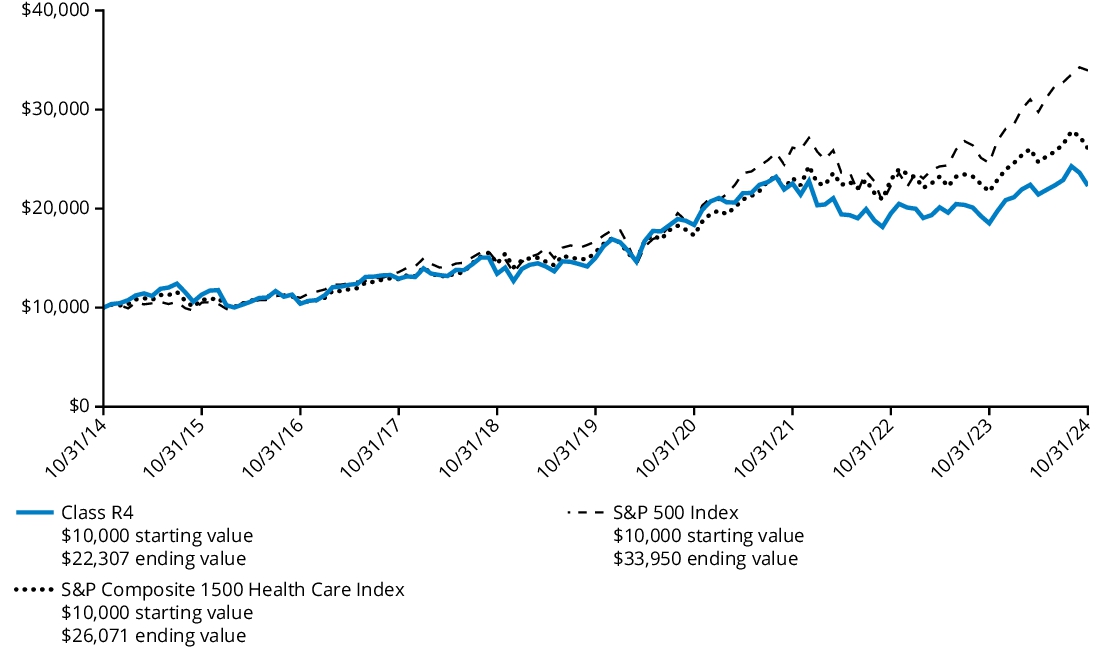
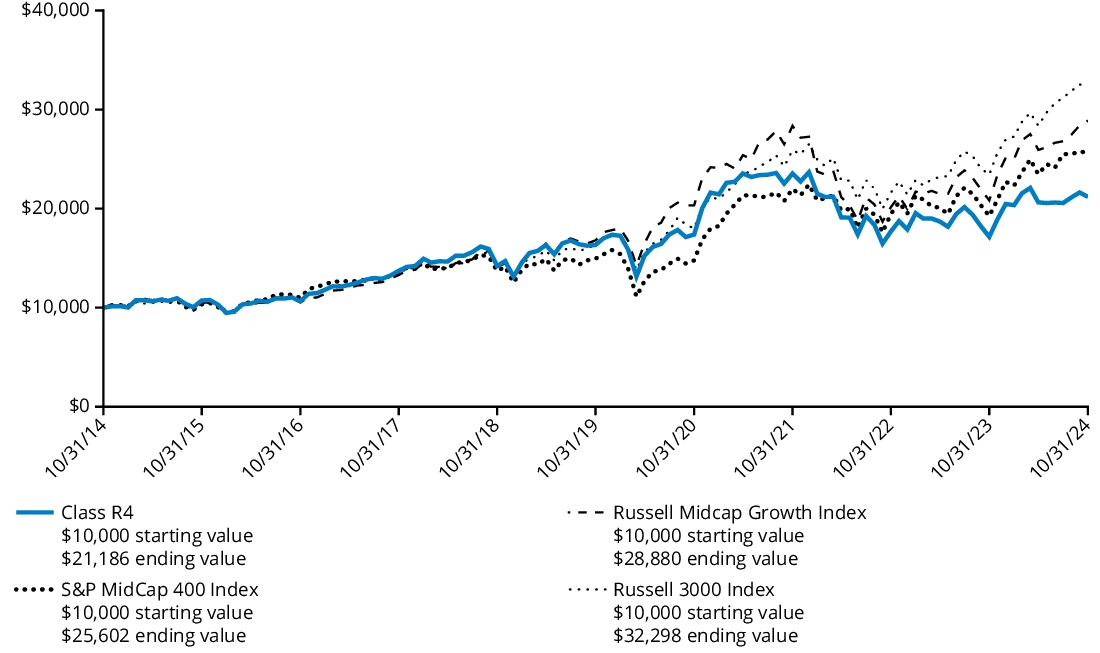
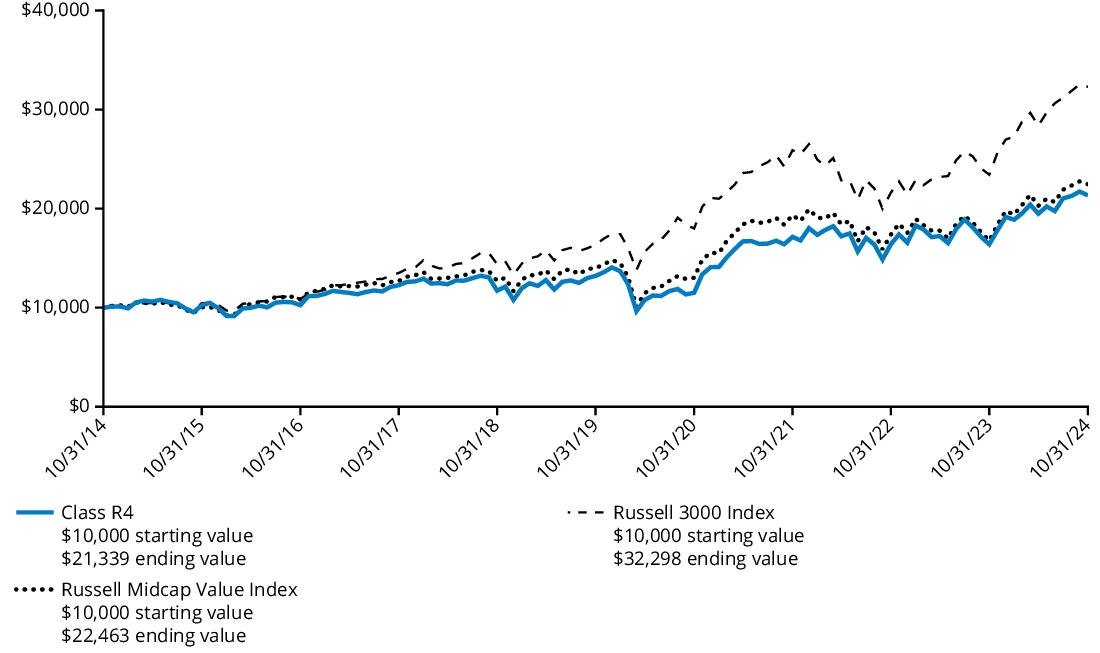
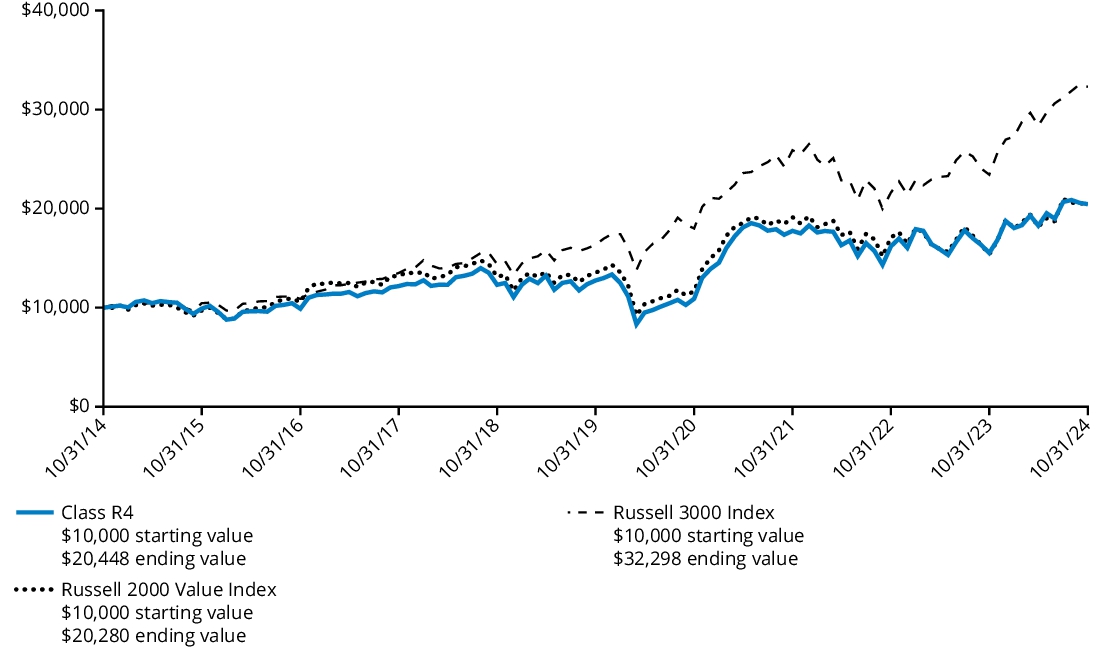
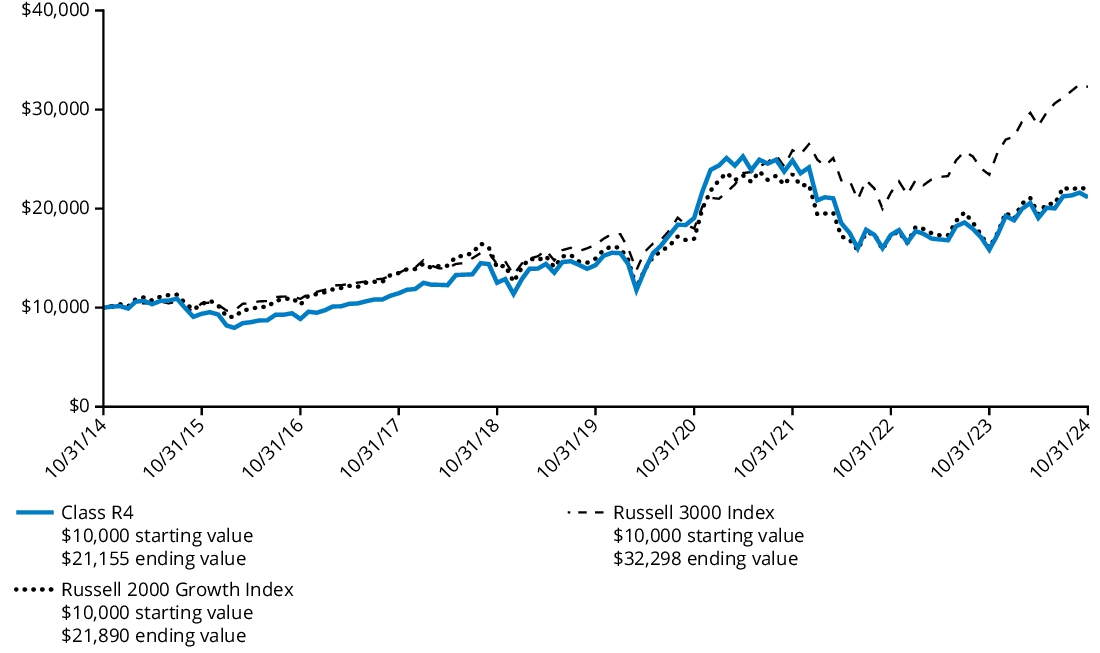
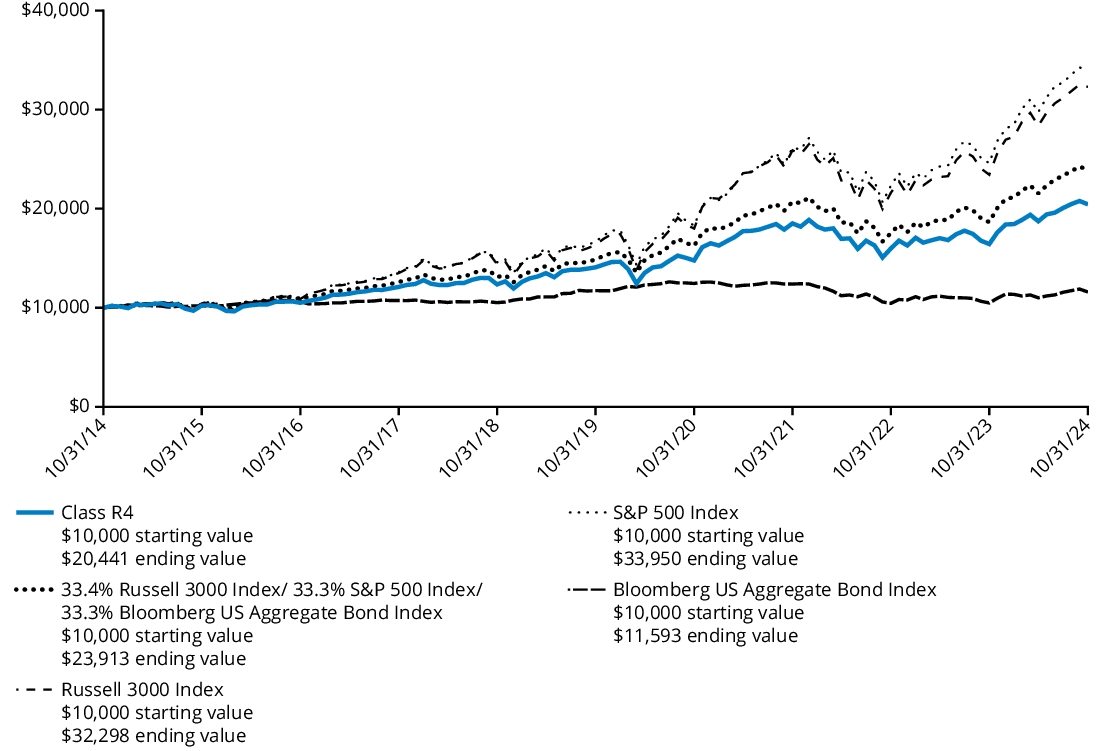
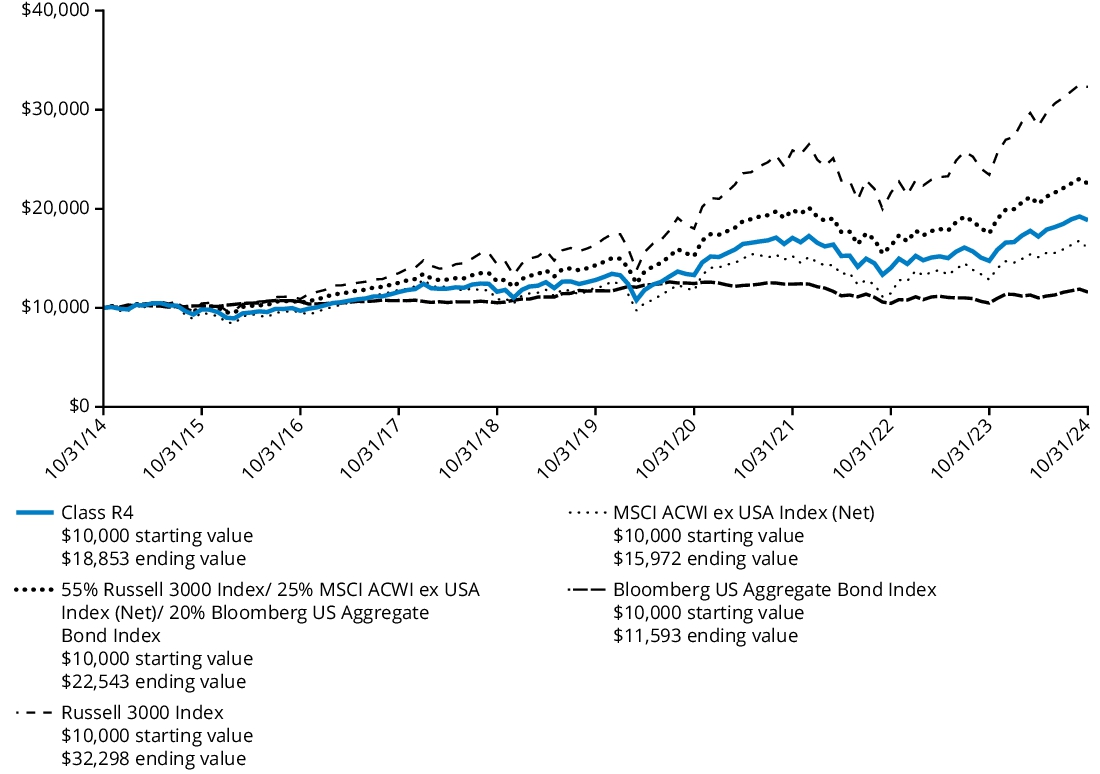
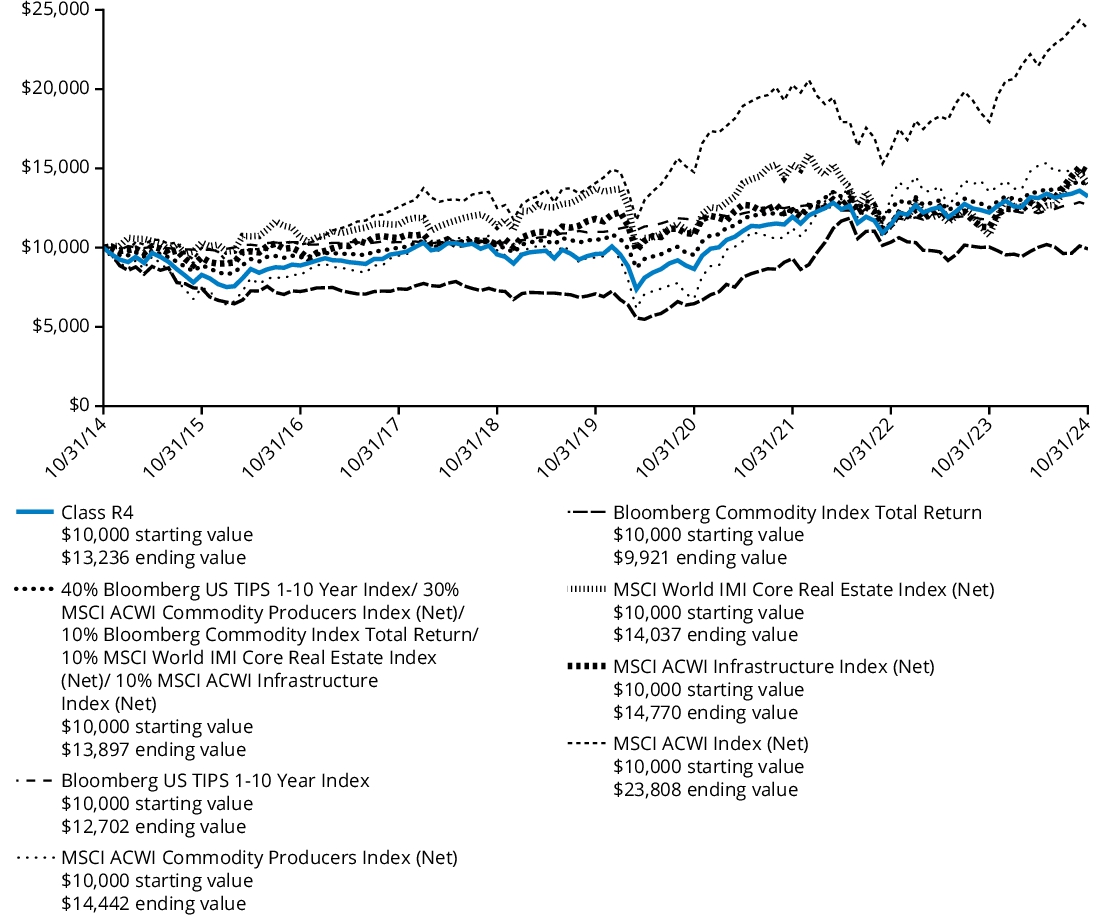
Comparison of Change in Value of $ 10,000 Investment
The graph below represents the hypothetical growth of a $10,000 investment in Class R4 shares and the comparative indices.
Average Annual Total Returns
For the Periods Ended October 31, 2024 | 1 Year | 5 Years | 10 Years |
| Class R4 | 34.45% | 10.95% | 9.82% |
| Russell 3000 Index | 37.86% | 14.60% | 12.44% |
| S&P 500 Index | 38.02% | 15.27% | 13.00% |
The Fund’s past performance is not a good predictor of the Fund’s future performance. The graph and table do not reflect the deduction of taxes that a shareholder would pay on Fund distributions or redemption of Fund shares. Performance information reflects fee waivers and/or expense limitation arrangements, if any. Absent any applicable fee waivers and/or expense limitation arrangements, performance would have been lower. Visit hartfordfunds.com for the most recent performance information.
Key Fund Statistics as of October 31, 2024
| Fund's net assets | $6,255,800,025% |
| Total number of portfolio holdings (excluding derivatives, if any) | $144% |
| Total investment management fees paid | $40,293,822% |
| Portfolio turnover rate | $85% |
Graphical Representation of Holdings as of October 31, 2024
The table below shows the investment makeup of the Fund, representing the percentage of net assets of the Fund.
| Information Technology | 27.0 | % |
| Financials | 14.6 | % |
| Industrials | 10.7 | % |
| Consumer Discretionary | 10.5 | % |
| Communication Services | 9.5 | % |
| Health Care | 8.8 | % |
| Consumer Staples | 4.7 | % |
| Materials | 4.2 | % |
| Real Estate | 3.5 | % |
| Energy | 2.6 | % |
| Utilities | 1.9 | % |
| Short-Term Investments | 0.4 | % |
| Other Assets & Liabilities | 1.6 | % |
| Total | 100.0 | % |
* | For Fund compliance purposes, the Fund may not use the same classification system. These classifications are used for financial reporting purposes. |
Availability of Additional Information
For additional information about the Fund, including its prospectus, financial information, holdings, and proxy voting information, please visit the Fund’s website at the website address included at the beginning of this report.
The Fund is distributed by Hartford Funds Distributors, LLC (HFD).
Annual Shareholder Report
October 31, 2024
The Hartford Capital Appreciation Fund
Class R5/ITHTX
This annual shareholder report contains important information about The Hartford Capital Appreciation Fund (the "Fund") for the period of November 1, 2023 to October 31, 2024. You can find additional information about the Fund at hartfordfunds.com/reports-hmf. You can also request this information by contacting us by calling 1‑888‑843‑7824.
What were the Fund costs for the last year?
(Based on a hypothetical $10,000 investment)
| Class Name | Costs of a $10,000 investment | Costs paid as a percentage
of a $10,000 investment |
| Class R5 | $94 | 0.80% |
How did the Fund perform last year and what impacted its performance?
Management's Discussion of Fund Performance
United States (U.S.) equities, as measured by the Russell 3000 Index, rose over the trailing twelve-month period ending October 31, 2024. During the second half of the period, the rally in U.S. stocks considerably broadened beyond a concentrated group of mega-cap technology companies that powered the market in the first half of the period. The labor market continued to cool, primarily through fewer job openings and reduced hiring rather than widespread layoffs. Fund performance described below is relative to the Russell 3000 Index for the trailing twelve-month period ended October 31, 2024.
Top Contributors to Performance
Sector allocation, a result of our bottom-up stock selection process, contributed positively to relative performance during the period due to the Fund’s underweight allocations to the Energy and Healthcare sectors.
Security selection within the Information Technology, Communication Services, and Energy sectors contributed positively to relative performance.
The Fund’s exposure to companies that we believe are higher quality contributed to relative results.
Top individual contributors over the period were an underweight position in Apple (Information Technology), an overweight position in American Express (Financials), and an out-of-benchmark position in ARM (Information Technology).
Top Detractors to Performance
Security selection was the primary detractor to relative performance during the period, driven by weak selection within the Industrials, Consumer Discretionary, and Healthcare sectors.
From a style perspective, the Fund’s underweight exposure to higher-momentum names detracted from relative performance.
The largest individual detractors over the period were an underweight position in NVIDIA (Information Technology), as well as overweight positions in Nike (Consumer Discretionary) and LKQ (Consumer Discretionary).
The views expressed in this section reflect the opinions of the Fund's sub-adviser, Wellington Management Company LLP, as of the date of this report and are subject to change based on changes in market, economic or other conditions. These views are not intended to be a forecast of future events and are no guarantee of future results.
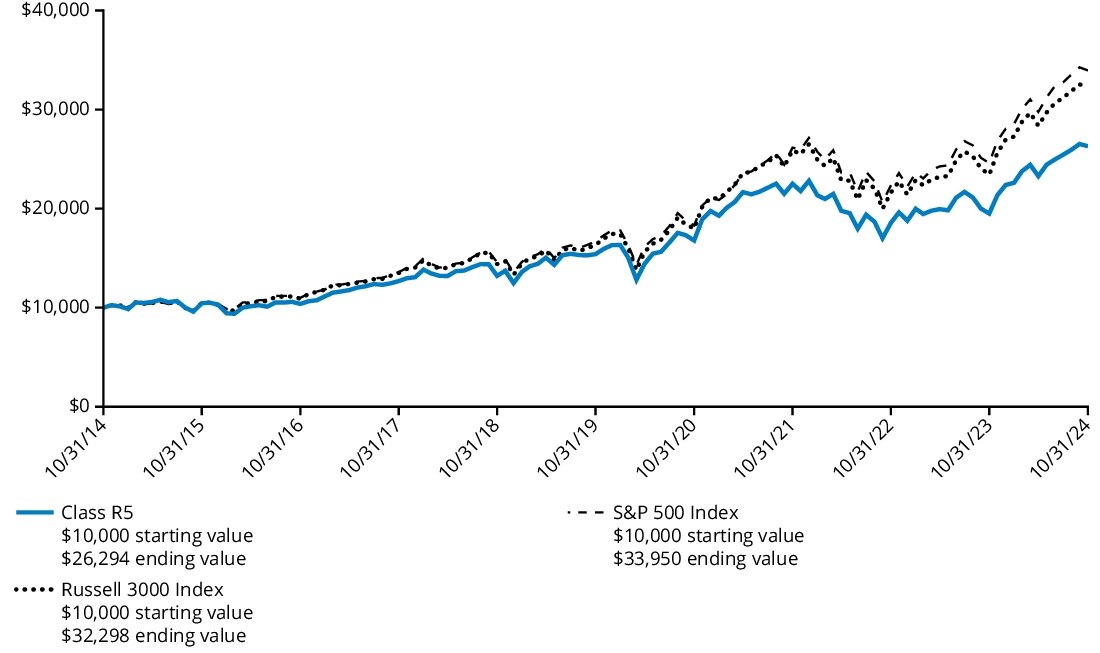
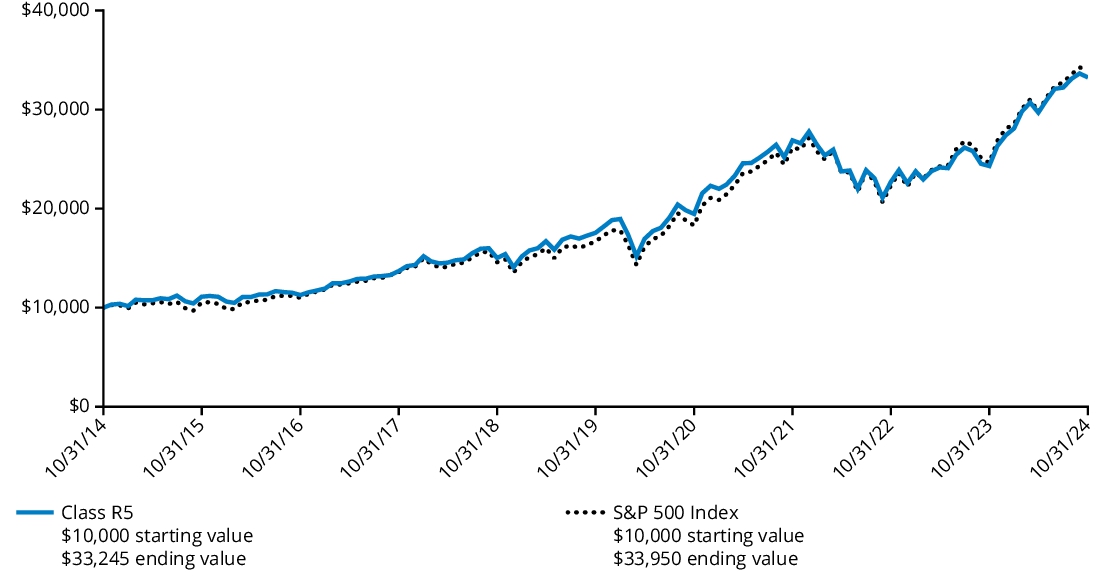
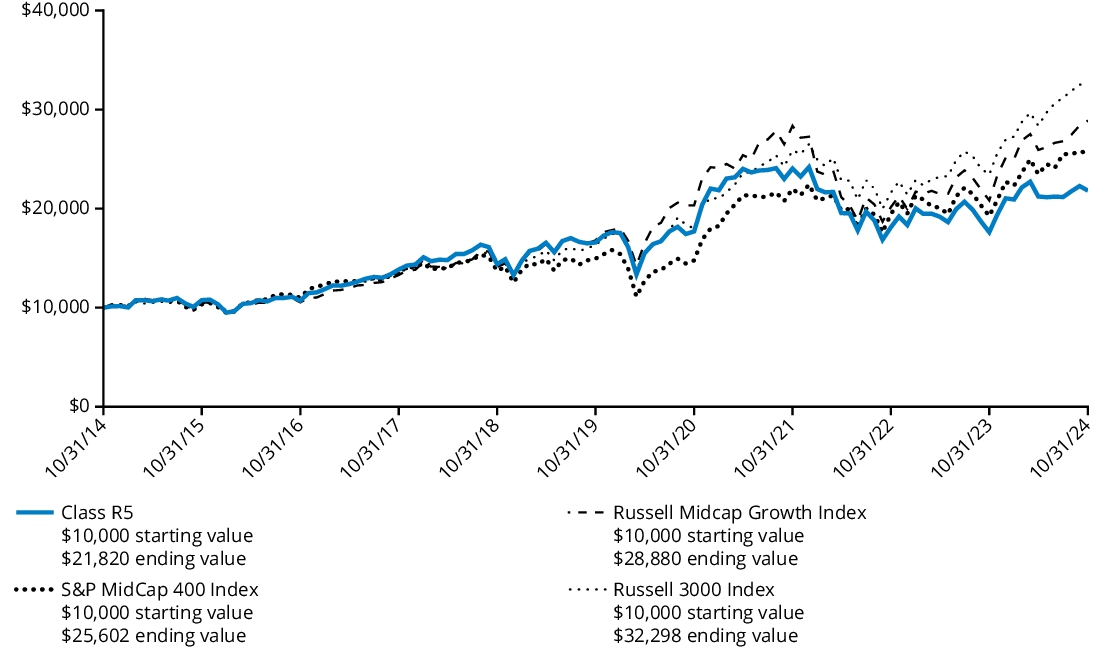
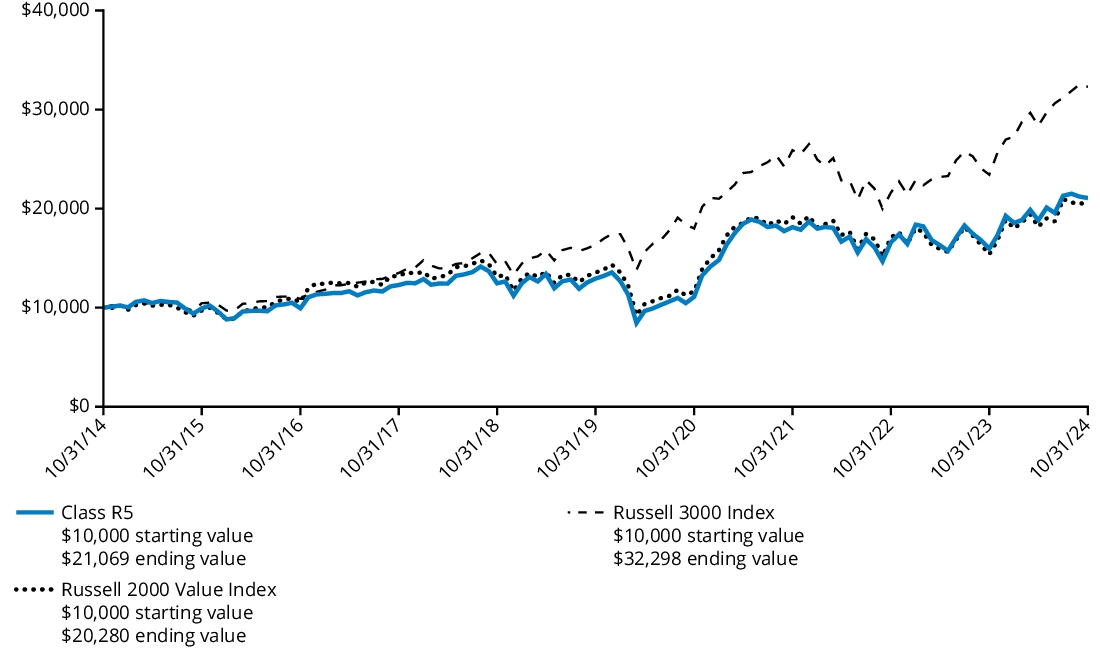
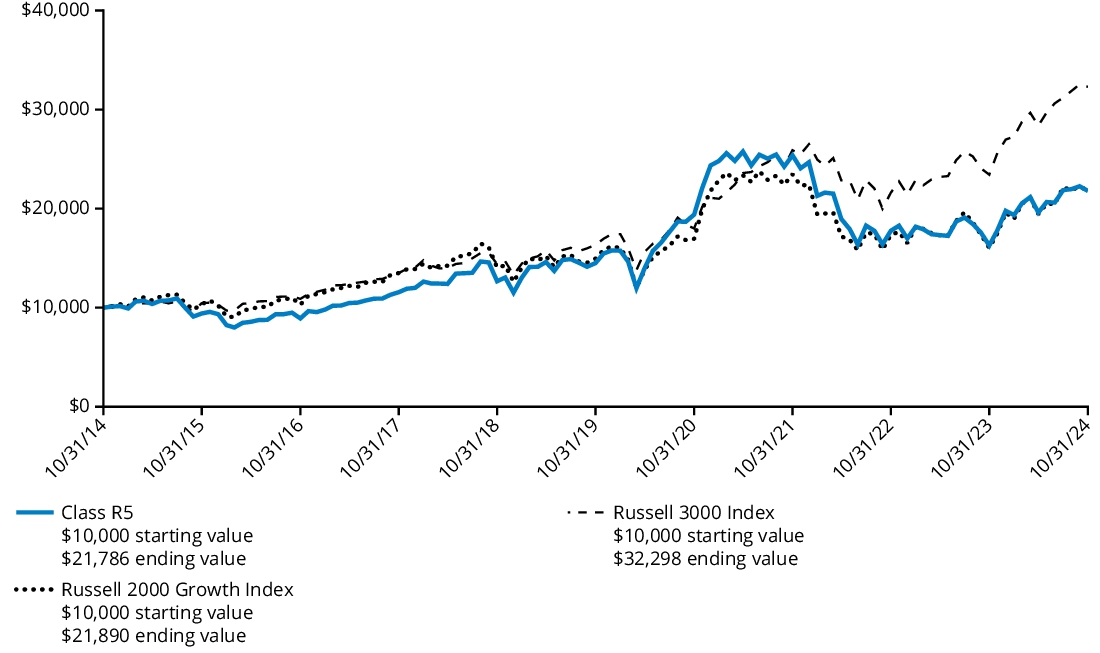
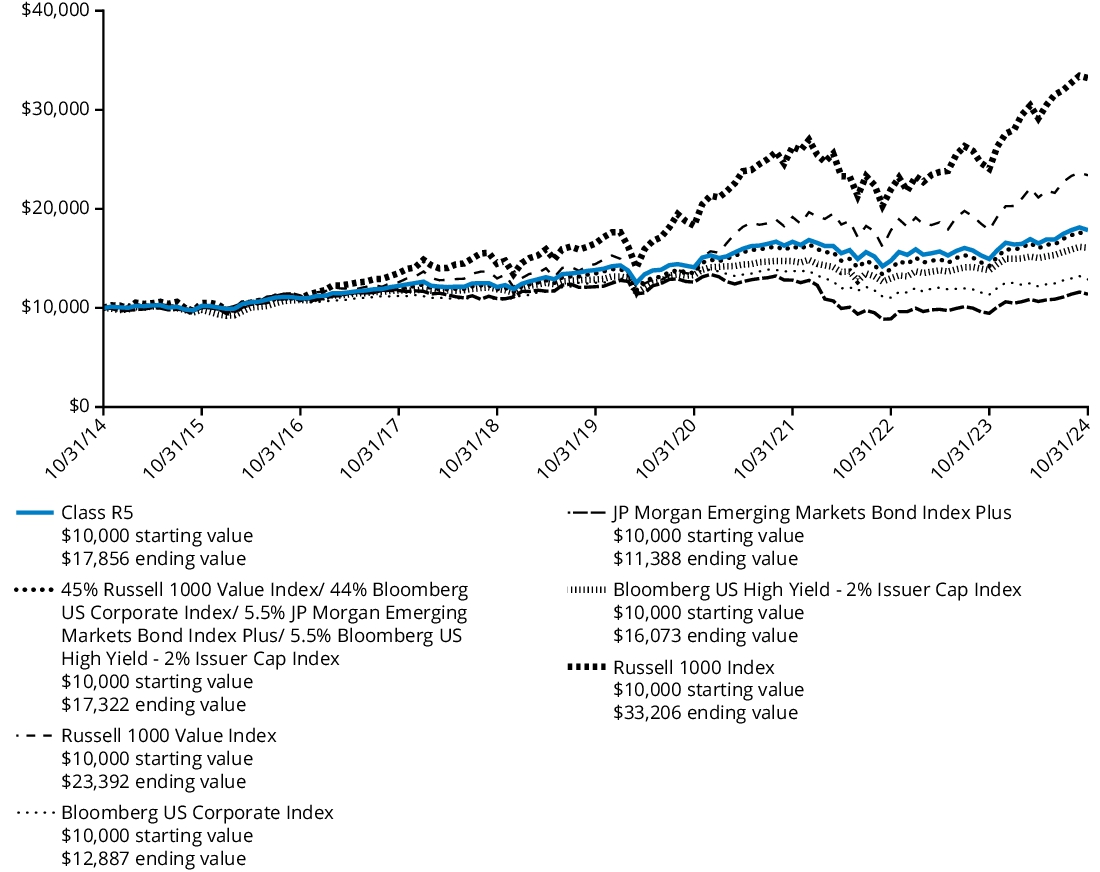
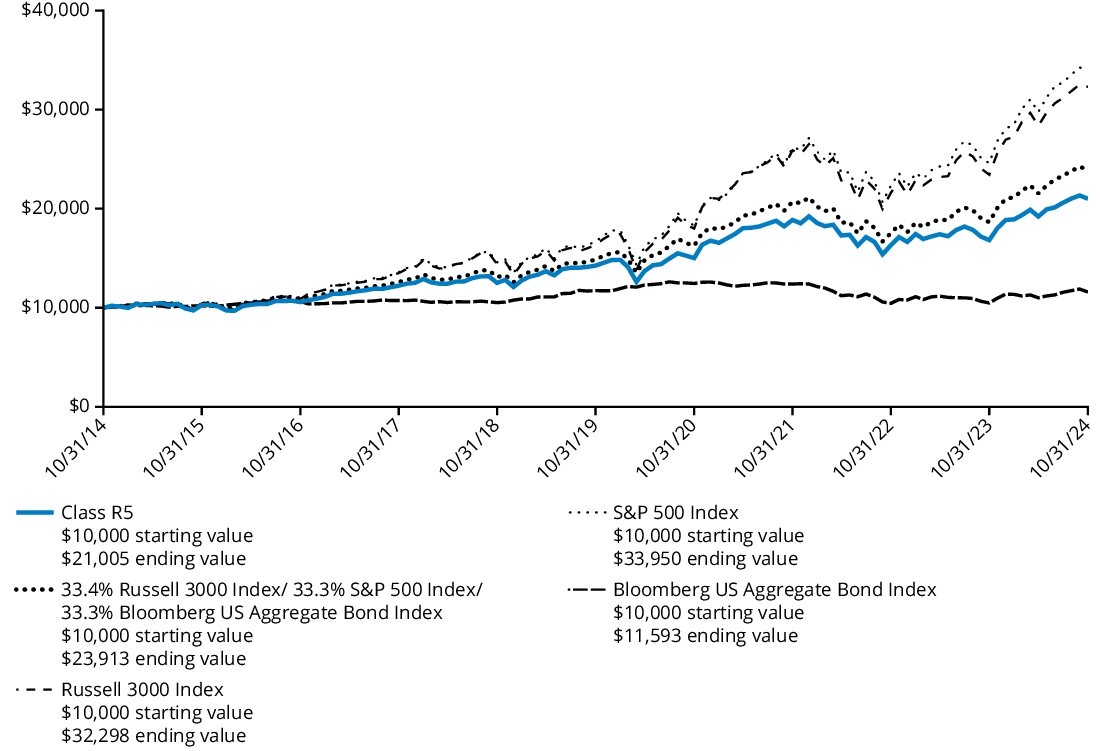
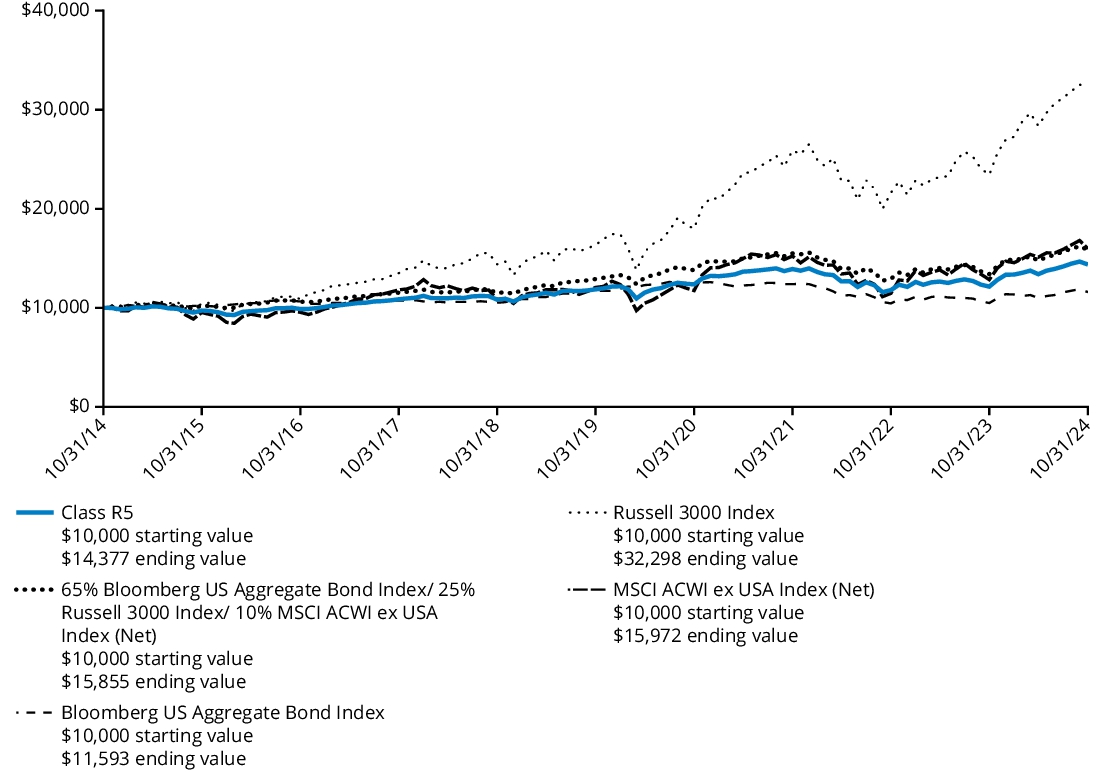
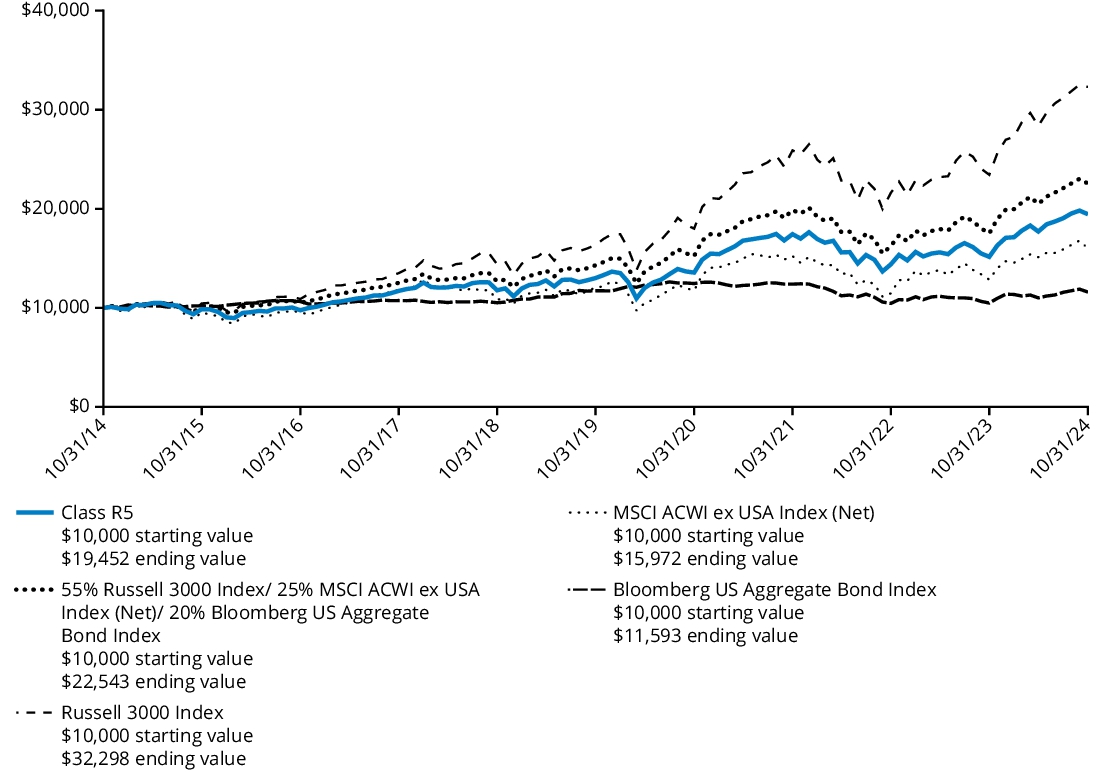
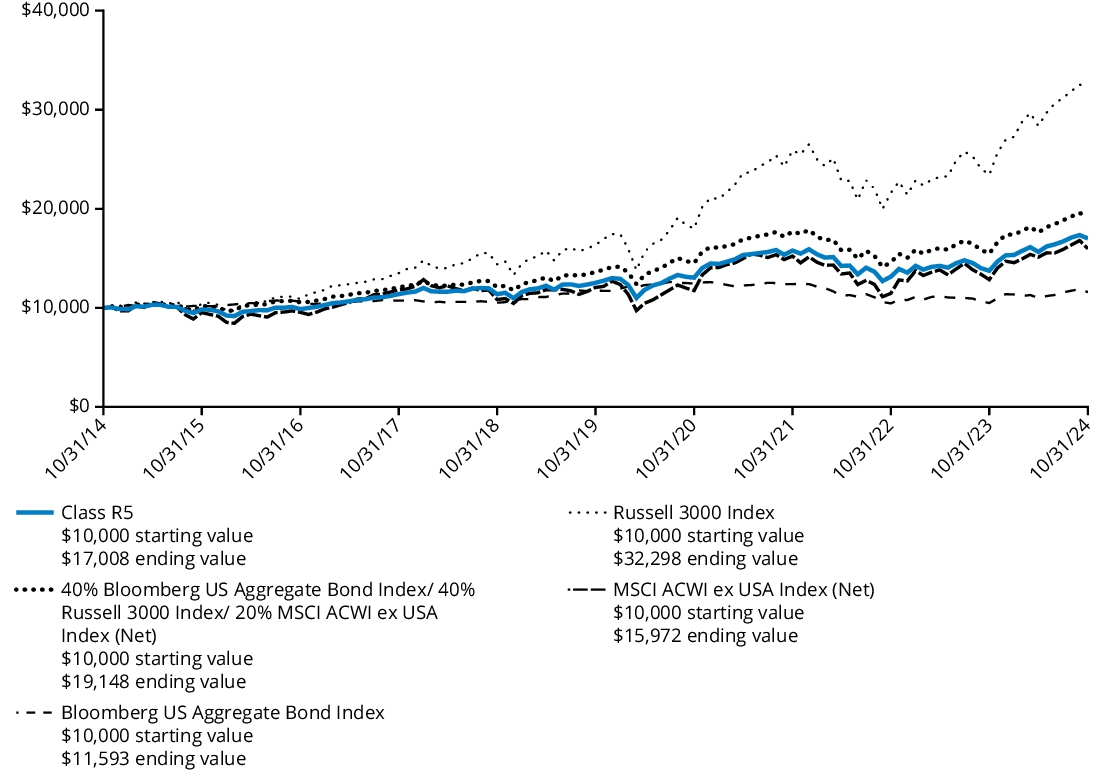
Comparison of Change in Value of $ 10,000 Investment
The graph below represents the hypothetical growth of a $10,000 investment in Class R5 shares and the comparative indices.
Average Annual Total Returns
For the Periods Ended October 31, 2024 | 1 Year | 5 Years | 10 Years |
| Class R5 | 34.82% | 11.28% | 10.15% |
| Russell 3000 Index | 37.86% | 14.60% | 12.44% |
| S&P 500 Index | 38.02% | 15.27% | 13.00% |
The Fund’s past performance is not a good predictor of the Fund’s future performance. The graph and table do not reflect the deduction of taxes that a shareholder would pay on Fund distributions or redemption of Fund shares. Performance information reflects fee waivers and/or expense limitation arrangements, if any. Absent any applicable fee waivers and/or expense limitation arrangements, performance would have been lower. Visit hartfordfunds.com for the most recent performance information.
Key Fund Statistics as of October 31, 2024
| Fund's net assets | $6,255,800,025% |
| Total number of portfolio holdings (excluding derivatives, if any) | $144% |
| Total investment management fees paid | $40,293,822% |
| Portfolio turnover rate | $85% |
Graphical Representation of Holdings as of October 31, 2024
The table below shows the investment makeup of the Fund, representing the percentage of net assets of the Fund.
| Information Technology | 27.0 | % |
| Financials | 14.6 | % |
| Industrials | 10.7 | % |
| Consumer Discretionary | 10.5 | % |
| Communication Services | 9.5 | % |
| Health Care | 8.8 | % |
| Consumer Staples | 4.7 | % |
| Materials | 4.2 | % |
| Real Estate | 3.5 | % |
| Energy | 2.6 | % |
| Utilities | 1.9 | % |
| Short-Term Investments | 0.4 | % |
| Other Assets & Liabilities | 1.6 | % |
| Total | 100.0 | % |
* | For Fund compliance purposes, the Fund may not use the same classification system. These classifications are used for financial reporting purposes. |
Availability of Additional Information
For additional information about the Fund, including its prospectus, financial information, holdings, and proxy voting information, please visit the Fund’s website at the website address included at the beginning of this report.
The Fund is distributed by Hartford Funds Distributors, LLC (HFD).
Annual Shareholder Report
October 31, 2024
The Hartford Capital Appreciation Fund
Class R6/ITHVX
This annual shareholder report contains important information about The Hartford Capital Appreciation Fund (the "Fund") for the period of November 1, 2023 to October 31, 2024. You can find additional information about the Fund at hartfordfunds.com/reports-hmf. You can also request this information by contacting us by calling 1‑888‑843‑7824.
What were the Fund costs for the last year?
(Based on a hypothetical $10,000 investment)
| Class Name | Costs of a $10,000 investment | Costs paid as a percentage
of a $10,000 investment |
| Class R6 | $82 | 0.70% |
How did the Fund perform last year and what impacted its performance?
Management's Discussion of Fund Performance
United States (U.S.) equities, as measured by the Russell 3000 Index, rose over the trailing twelve-month period ending October 31, 2024. During the second half of the period, the rally in U.S. stocks considerably broadened beyond a concentrated group of mega-cap technology companies that powered the market in the first half of the period. The labor market continued to cool, primarily through fewer job openings and reduced hiring rather than widespread layoffs. Fund performance described below is relative to the Russell 3000 Index for the trailing twelve-month period ended October 31, 2024.
Top Contributors to Performance
Sector allocation, a result of our bottom-up stock selection process, contributed positively to relative performance during the period due to the Fund’s underweight allocations to the Energy and Healthcare sectors.
Security selection within the Information Technology, Communication Services, and Energy sectors contributed positively to relative performance.
The Fund’s exposure to companies that we believe are higher quality contributed to relative results.
Top individual contributors over the period were an underweight position in Apple (Information Technology), an overweight position in American Express (Financials), and an out-of-benchmark position in ARM (Information Technology).
Top Detractors to Performance
Security selection was the primary detractor to relative performance during the period, driven by weak selection within the Industrials, Consumer Discretionary, and Healthcare sectors.
From a style perspective, the Fund’s underweight exposure to higher-momentum names detracted from relative performance.
The largest individual detractors over the period were an underweight position in NVIDIA (Information Technology), as well as overweight positions in Nike (Consumer Discretionary) and LKQ (Consumer Discretionary).
The views expressed in this section reflect the opinions of the Fund's sub-adviser, Wellington Management Company LLP, as of the date of this report and are subject to change based on changes in market, economic or other conditions. These views are not intended to be a forecast of future events and are no guarantee of future results.
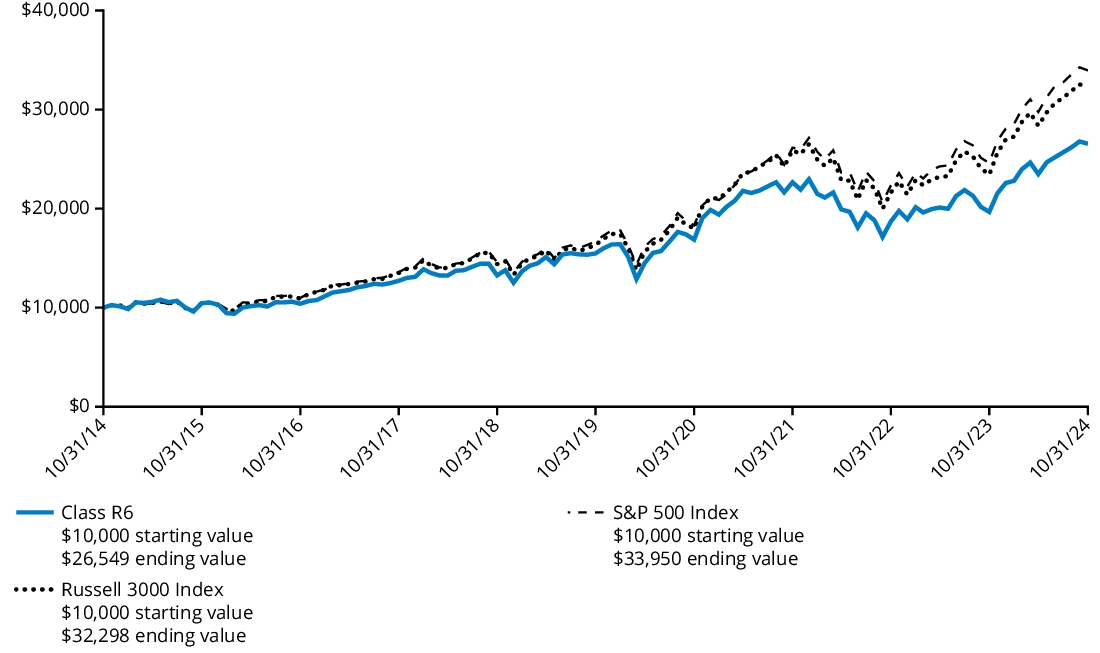
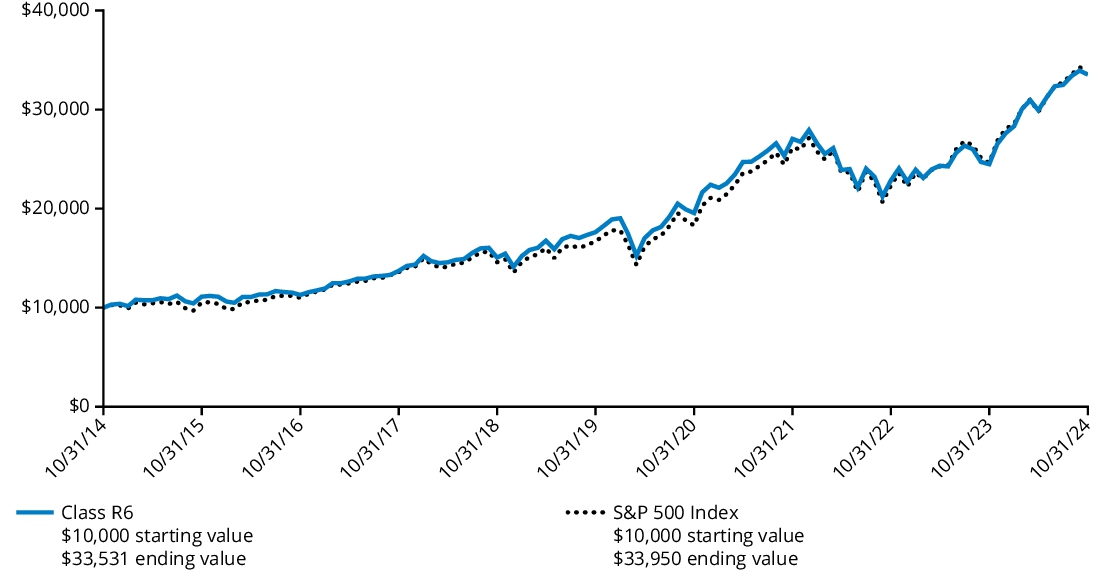
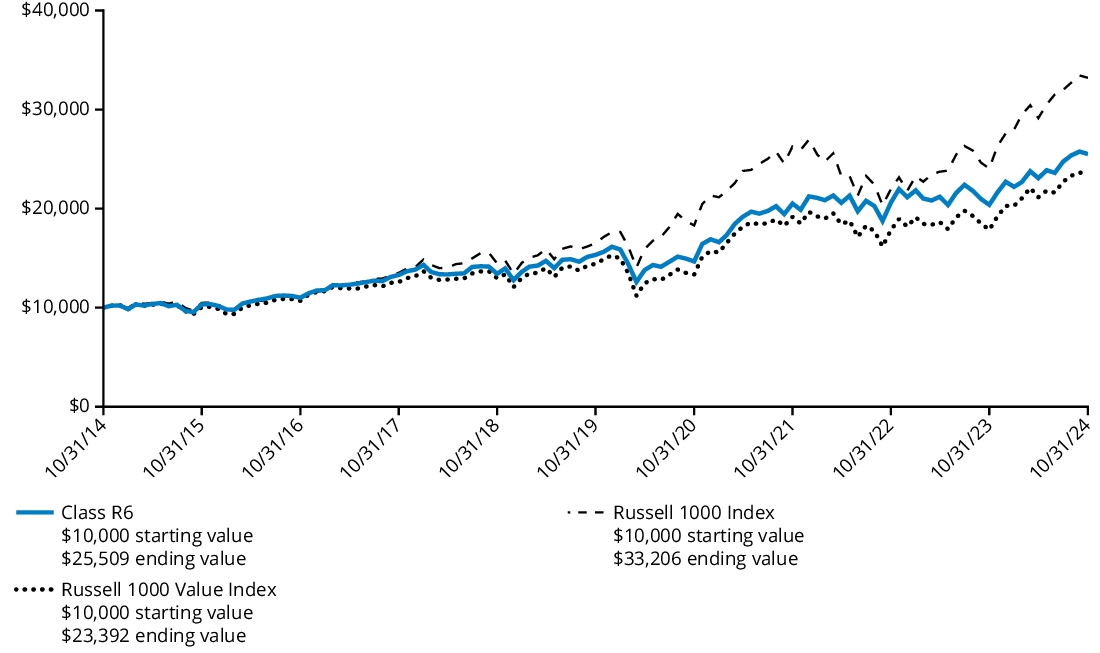
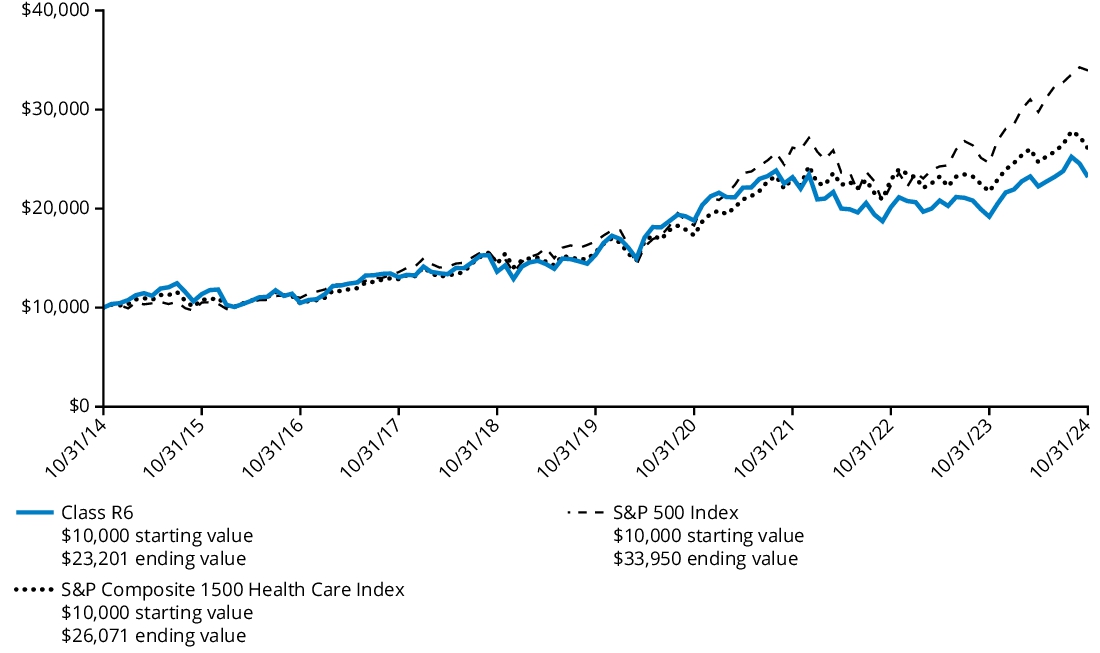
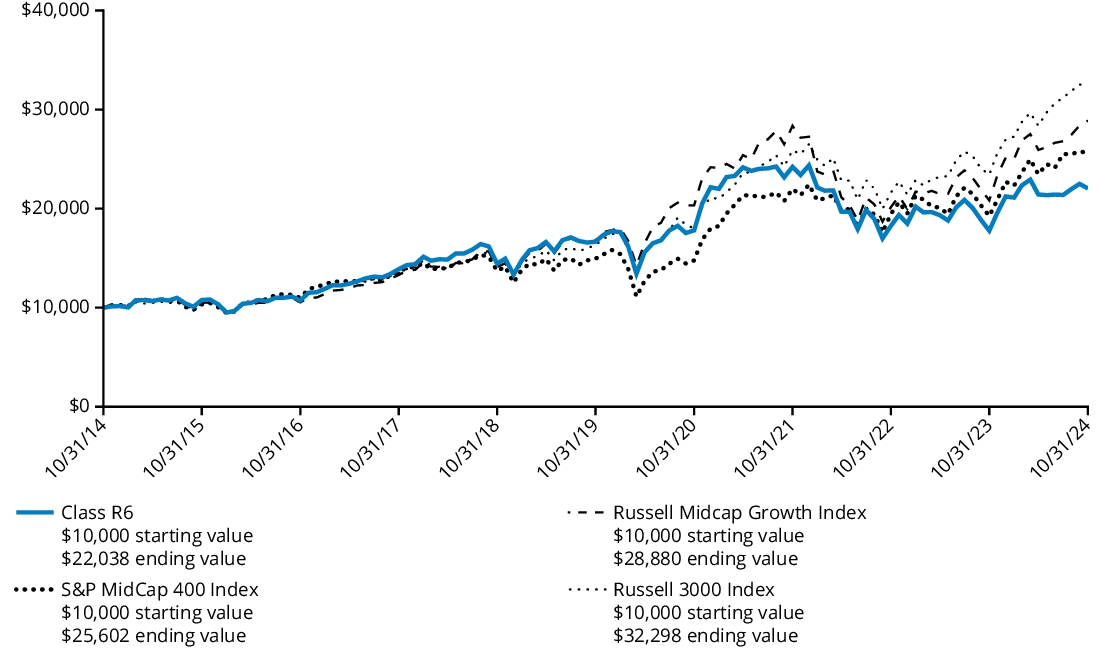
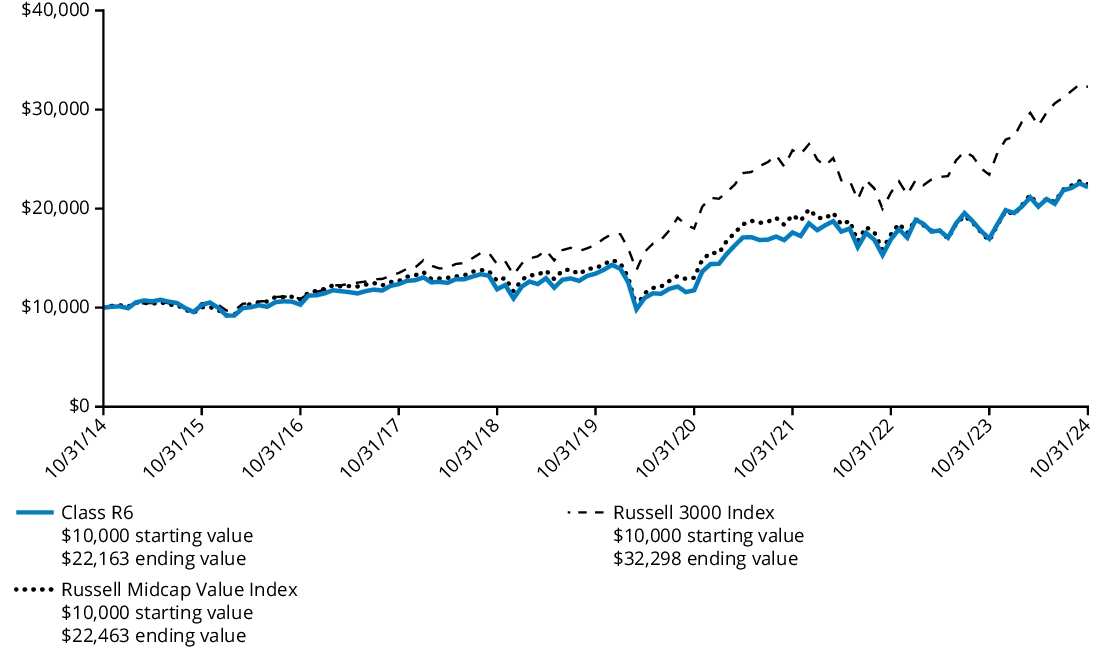
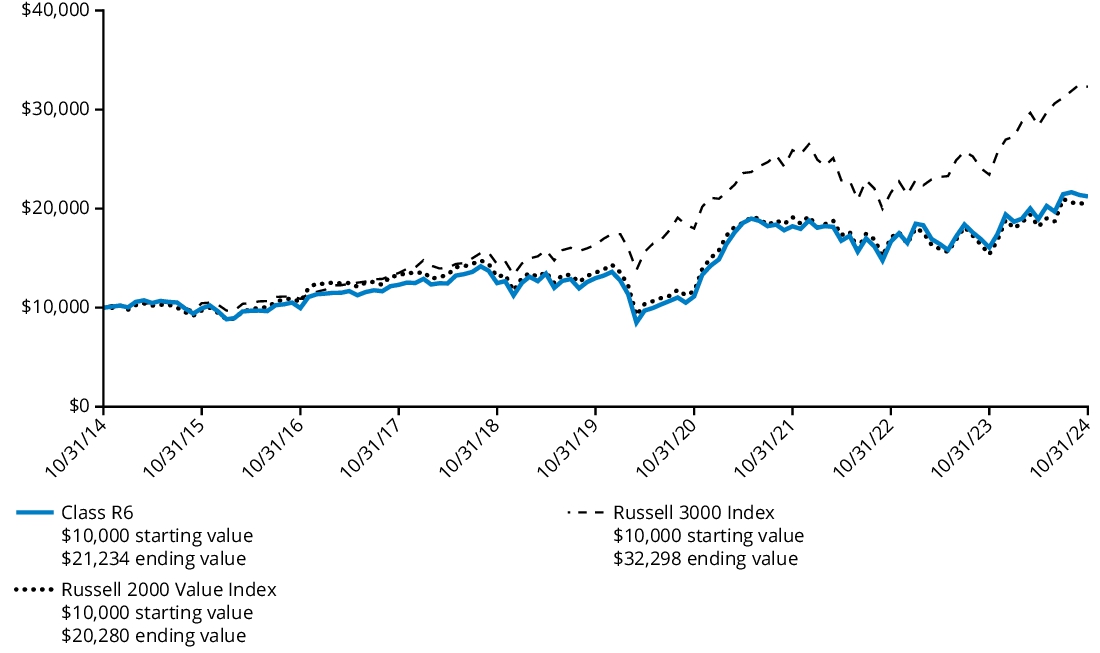
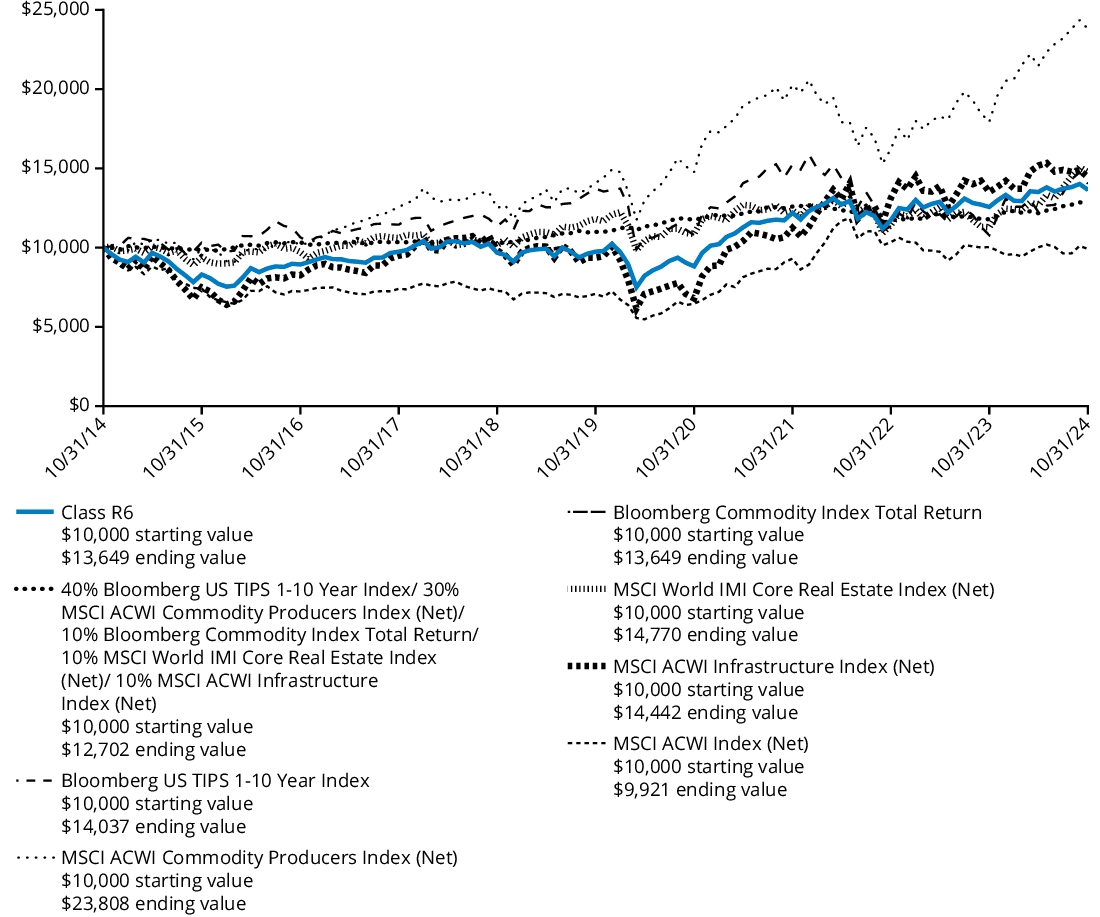
Comparison of Change in Value of $ 10,000 Investment
The graph below represents the hypothetical growth of a $10,000 investment in Class R6 shares and the comparative indices.
Average Annual Total Returns
For the Periods Ended October 31, 2024 | 1 Year | 5 Years | 10 Years |
| Class R6 | 34.99% | 11.40% | 10.26% |
| Russell 3000 Index | 37.86% | 14.60% | 12.44% |
| S&P 500 Index | 38.02% | 15.27% | 13.00% |
Class R6 shares commenced operations on November 7, 2014 and performance prior to that date is that of the Fund’s Class Y shares. Performance prior to the inception date of the class has not been adjusted to reflect the operating expenses of the class.
The Fund’s past performance is not a good predictor of the Fund’s future performance. The graph and table do not reflect the deduction of taxes that a shareholder would pay on Fund distributions or redemption of Fund shares. Performance information reflects fee waivers and/or expense limitation arrangements, if any. Absent any applicable fee waivers and/or expense limitation arrangements, performance would have been lower. Visit hartfordfunds.com for the most recent performance information.
Key Fund Statistics as of October 31, 2024
| Fund's net assets | $6,255,800,025% |
| Total number of portfolio holdings (excluding derivatives, if any) | $144% |
| Total investment management fees paid | $40,293,822% |
| Portfolio turnover rate | $85% |
Graphical Representation of Holdings as of October 31, 2024
The table below shows the investment makeup of the Fund, representing the percentage of net assets of the Fund.
| Information Technology | 27.0 | % |
| Financials | 14.6 | % |
| Industrials | 10.7 | % |
| Consumer Discretionary | 10.5 | % |
| Communication Services | 9.5 | % |
| Health Care | 8.8 | % |
| Consumer Staples | 4.7 | % |
| Materials | 4.2 | % |
| Real Estate | 3.5 | % |
| Energy | 2.6 | % |
| Utilities | 1.9 | % |
| Short-Term Investments | 0.4 | % |
| Other Assets & Liabilities | 1.6 | % |
| Total | 100.0 | % |
* | For Fund compliance purposes, the Fund may not use the same classification system. These classifications are used for financial reporting purposes. |
Availability of Additional Information
For additional information about the Fund, including its prospectus, financial information, holdings, and proxy voting information, please visit the Fund’s website at the website address included at the beginning of this report.
The Fund is distributed by Hartford Funds Distributors, LLC (HFD).
Annual Shareholder Report
October 31, 2024
The Hartford Capital Appreciation Fund
Class Y/HCAYX
This annual shareholder report contains important information about The Hartford Capital Appreciation Fund (the "Fund") for the period of November 1, 2023 to October 31, 2024. You can find additional information about the Fund at hartfordfunds.com/reports-hmf. You can also request this information by contacting us by calling 1‑888‑843‑7824.
What were the Fund costs for the last year?
(Based on a hypothetical $10,000 investment)
| Class Name | Costs of a $10,000 investment | Costs paid as a percentage
of a $10,000 investment |
| Class Y | $94 | 0.80% |
How did the Fund perform last year and what impacted its performance?
Management's Discussion of Fund Performance
United States (U.S.) equities, as measured by the Russell 3000 Index, rose over the trailing twelve-month period ending October 31, 2024. During the second half of the period, the rally in U.S. stocks considerably broadened beyond a concentrated group of mega-cap technology companies that powered the market in the first half of the period. The labor market continued to cool, primarily through fewer job openings and reduced hiring rather than widespread layoffs. Fund performance described below is relative to the Russell 3000 Index for the trailing twelve-month period ended October 31, 2024.
Top Contributors to Performance
Sector allocation, a result of our bottom-up stock selection process, contributed positively to relative performance during the period due to the Fund’s underweight allocations to the Energy and Healthcare sectors.
Security selection within the Information Technology, Communication Services, and Energy sectors contributed positively to relative performance.
The Fund’s exposure to companies that we believe are higher quality contributed to relative results.
Top individual contributors over the period were an underweight position in Apple (Information Technology), an overweight position in American Express (Financials), and an out-of-benchmark position in ARM (Information Technology).
Top Detractors to Performance
Security selection was the primary detractor to relative performance during the period, driven by weak selection within the Industrials, Consumer Discretionary, and Healthcare sectors.
From a style perspective, the Fund’s underweight exposure to higher-momentum names detracted from relative performance.
The largest individual detractors over the period were an underweight position in NVIDIA (Information Technology), as well as overweight positions in Nike (Consumer Discretionary) and LKQ (Consumer Discretionary).
The views expressed in this section reflect the opinions of the Fund's sub-adviser, Wellington Management Company LLP, as of the date of this report and are subject to change based on changes in market, economic or other conditions. These views are not intended to be a forecast of future events and are no guarantee of future results.
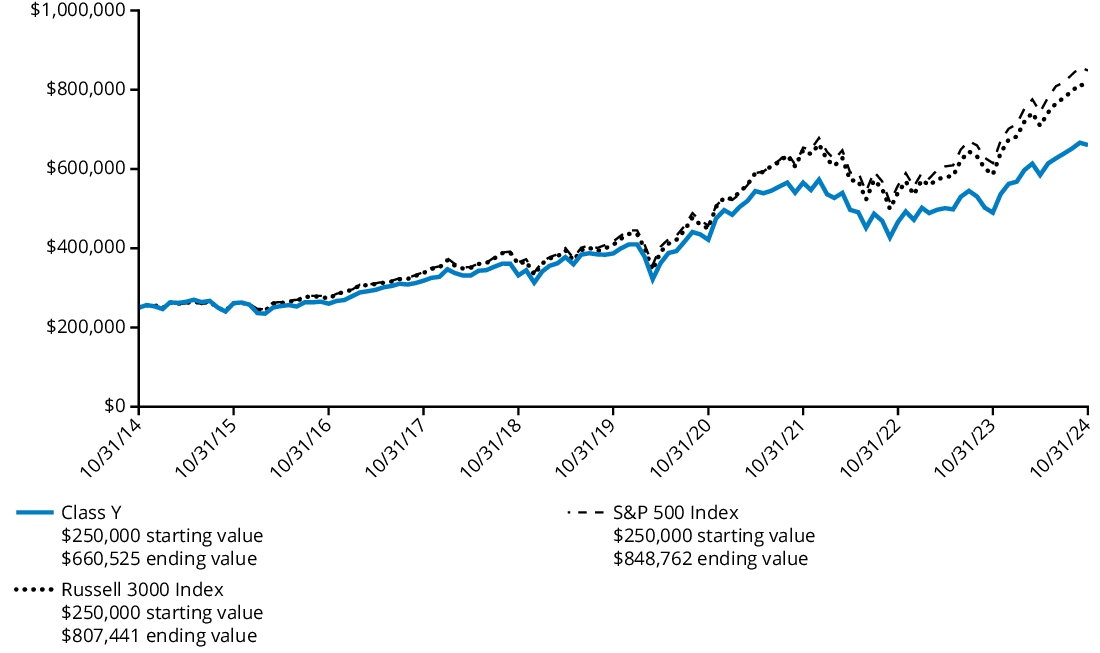
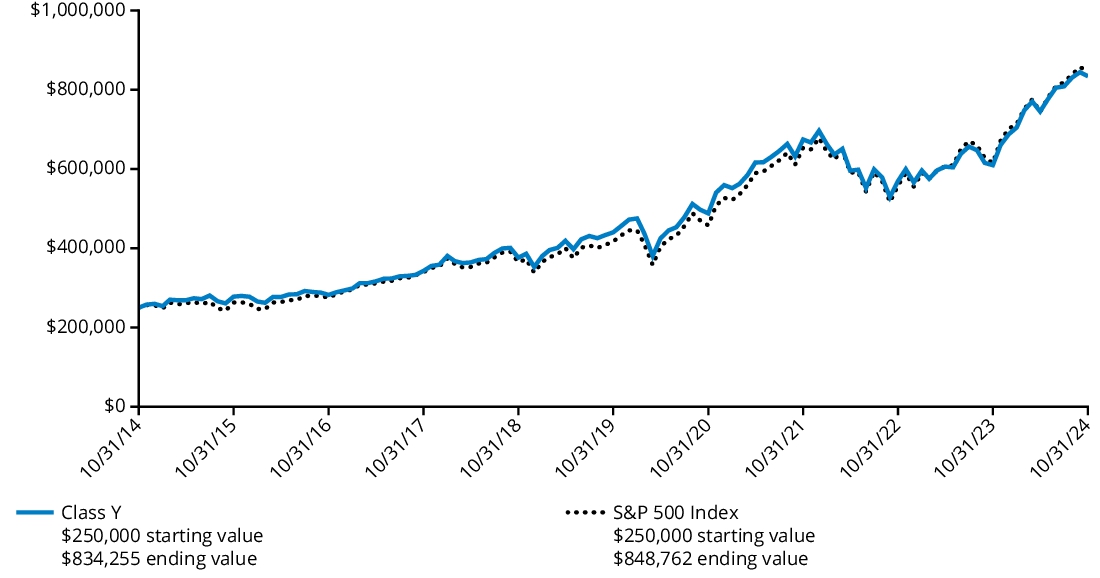
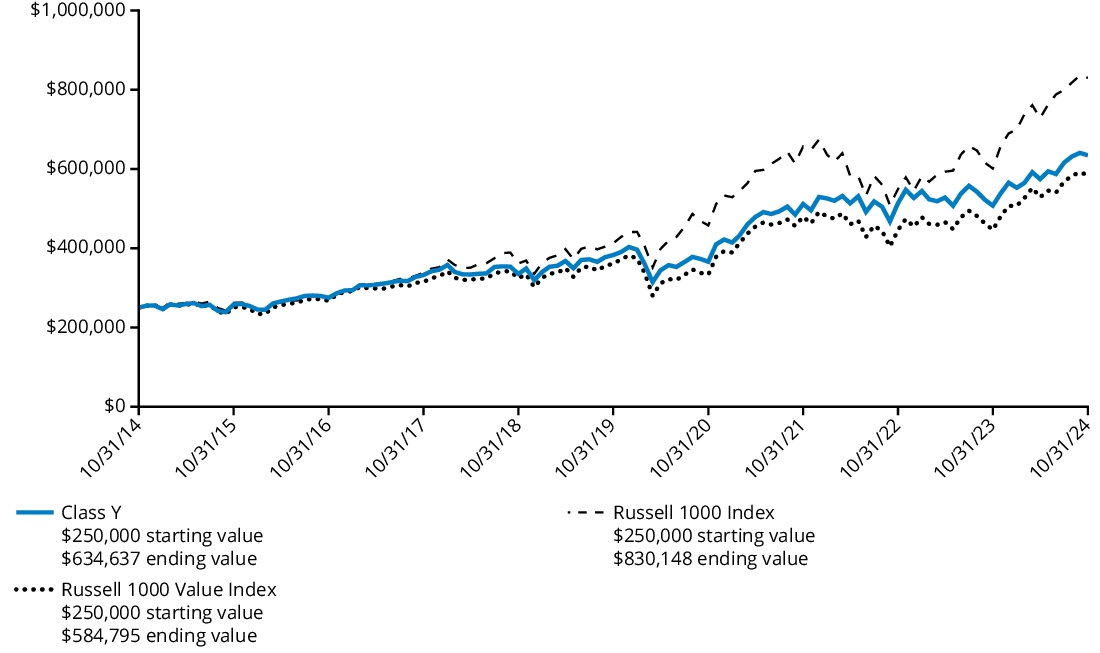
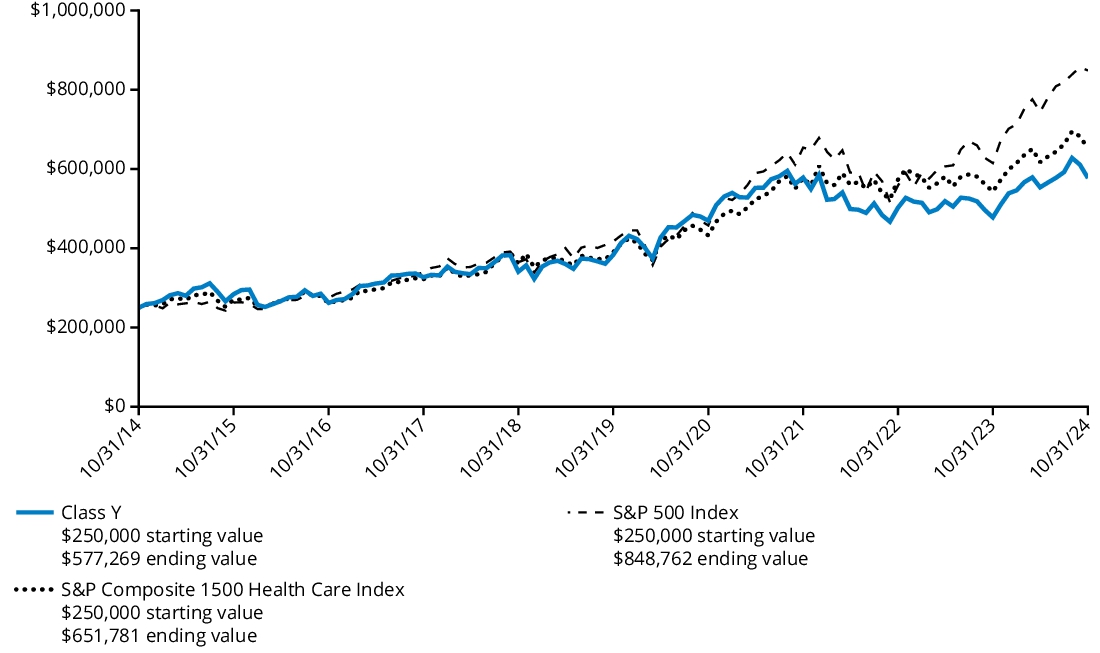
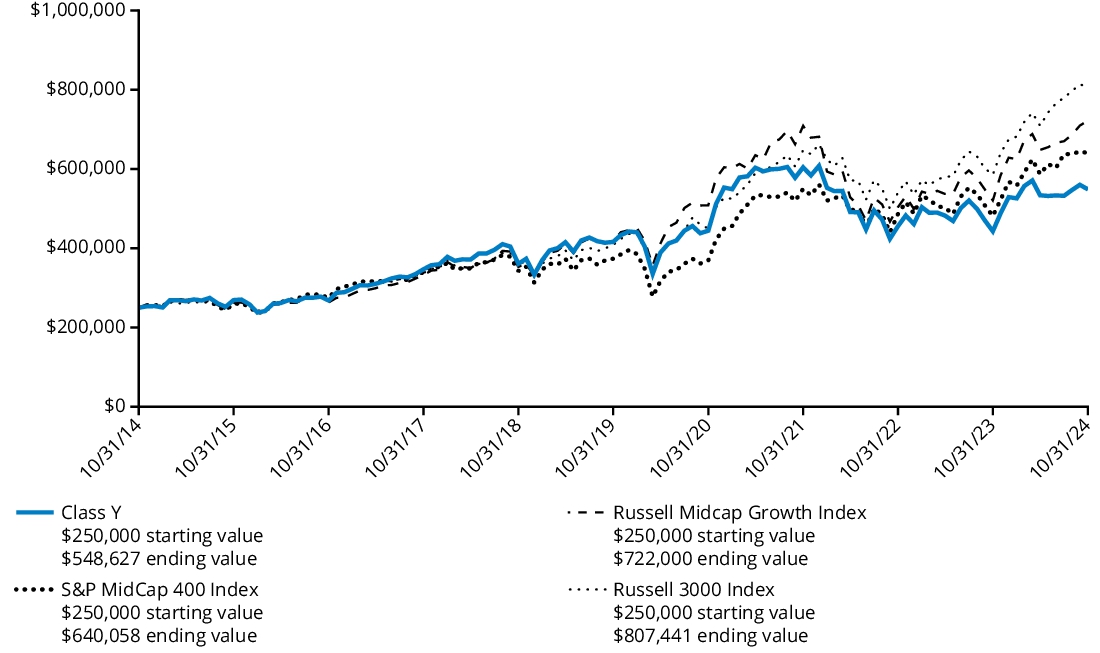
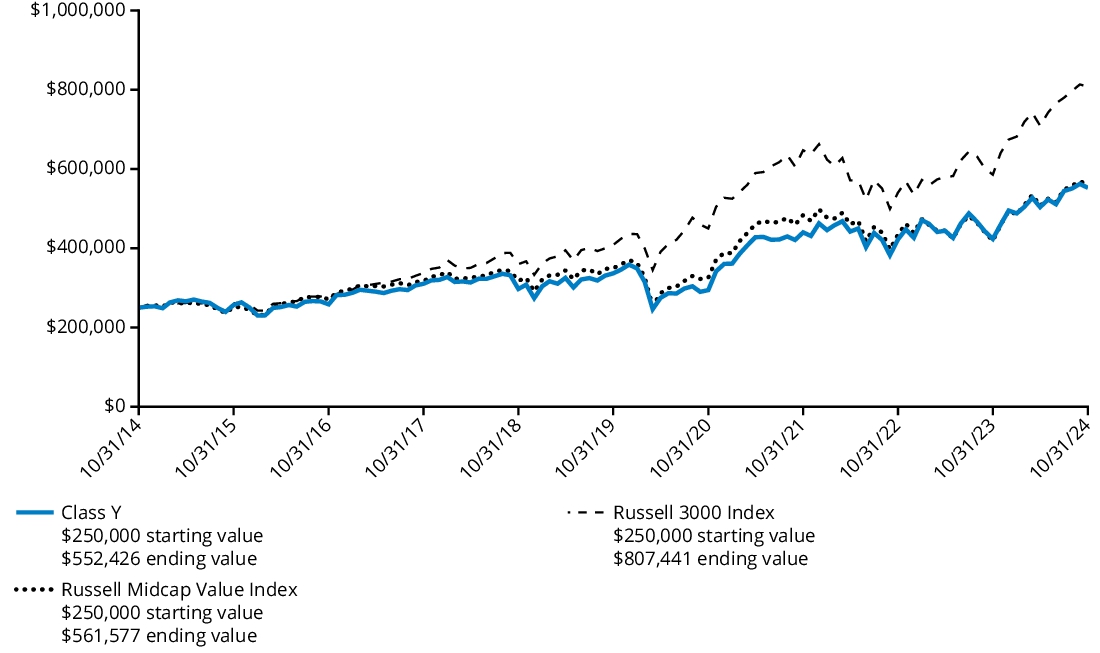
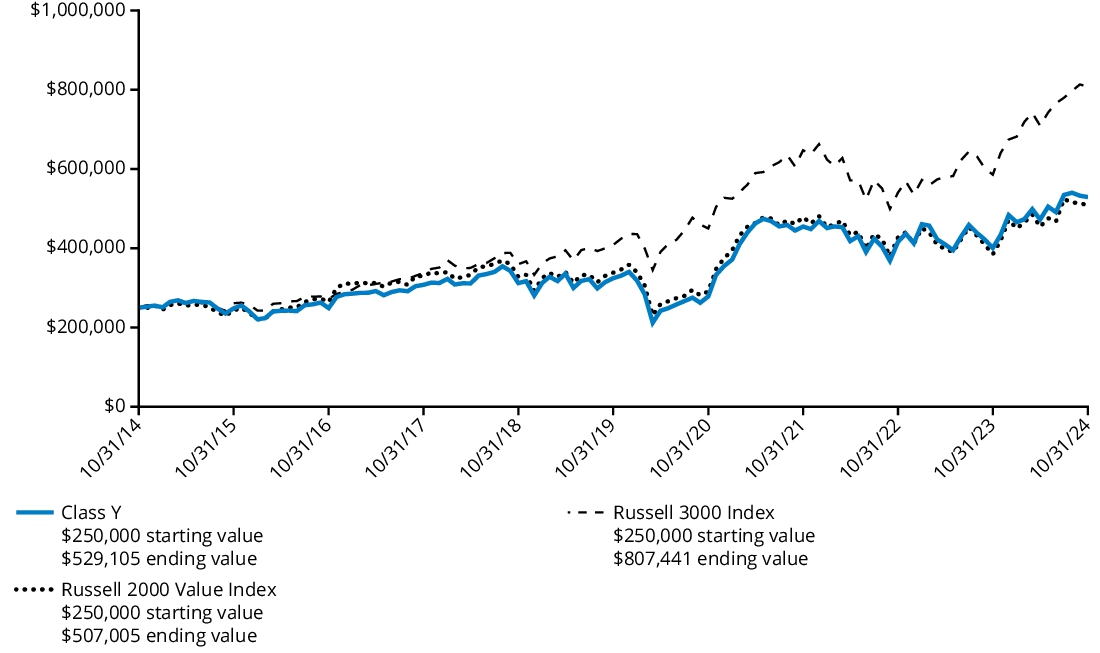
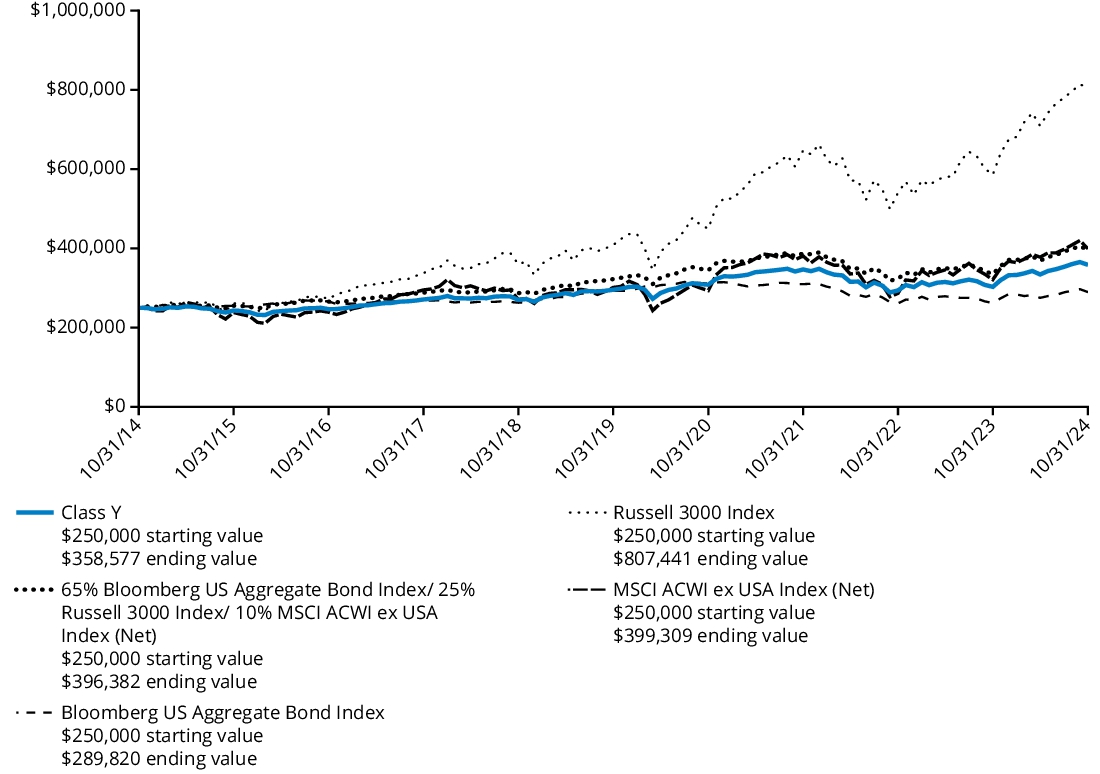
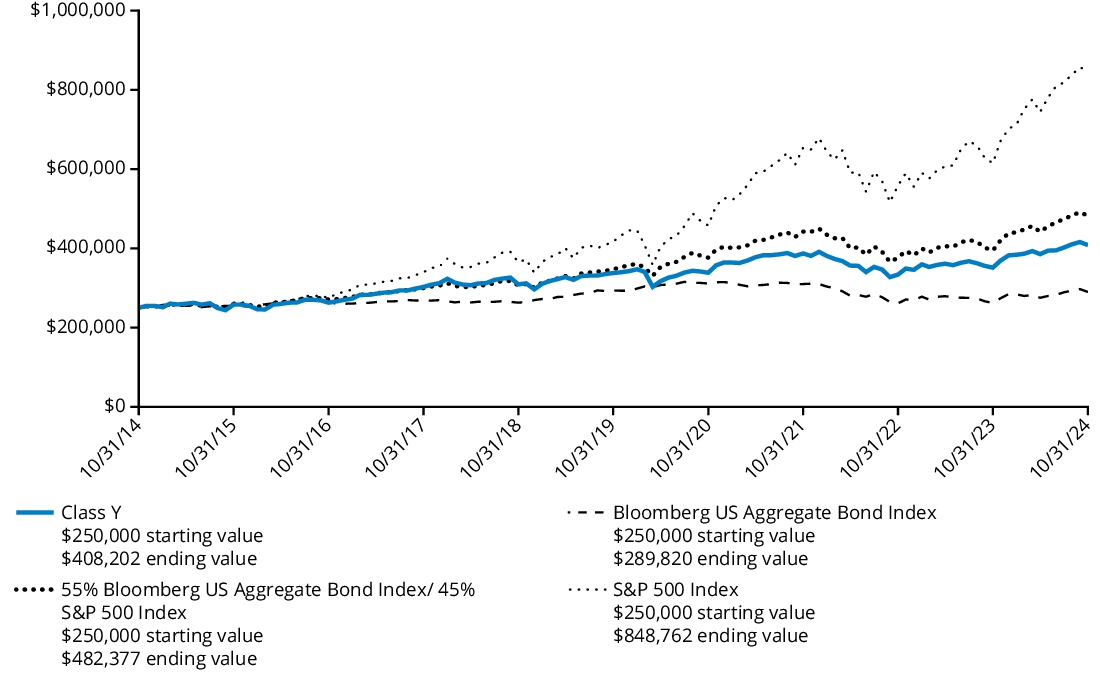
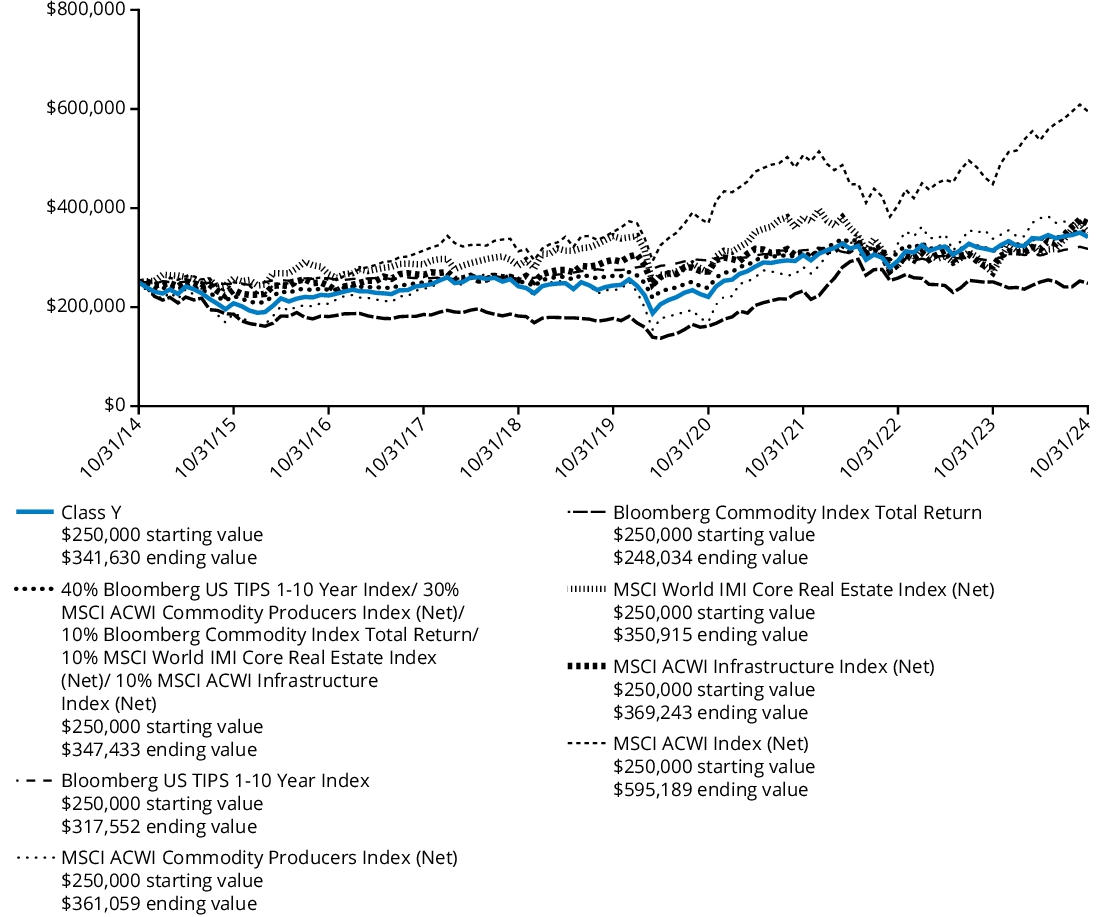
Comparison of Change in Value of $ 250,000 Investment
The graph below represents the hypothetical growth of a $250,000 investment in Class Y shares and the comparative indices.
Average Annual Total Returns
For the Periods Ended October 31, 2024 | 1 Year | 5 Years | 10 Years |
| Class Y | 34.85% | 11.30% | 10.20% |
| Russell 3000 Index | 37.86% | 14.60% | 12.44% |
| S&P 500 Index | 38.02% | 15.27% | 13.00% |
The Fund’s past performance is not a good predictor of the Fund’s future performance. The graph and table do not reflect the deduction of taxes that a shareholder would pay on Fund distributions or redemption of Fund shares. Performance information reflects fee waivers and/or expense limitation arrangements, if any. Absent any applicable fee waivers and/or expense limitation arrangements, performance would have been lower. Visit hartfordfunds.com for the most recent performance information.
Key Fund Statistics as of October 31, 2024
| Fund's net assets | $6,255,800,025% |
| Total number of portfolio holdings (excluding derivatives, if any) | $144% |
| Total investment management fees paid | $40,293,822% |
| Portfolio turnover rate | $85% |
Graphical Representation of Holdings as of October 31, 2024
The table below shows the investment makeup of the Fund, representing the percentage of net assets of the Fund.
| Information Technology | 27.0 | % |
| Financials | 14.6 | % |
| Industrials | 10.7 | % |
| Consumer Discretionary | 10.5 | % |
| Communication Services | 9.5 | % |
| Health Care | 8.8 | % |
| Consumer Staples | 4.7 | % |
| Materials | 4.2 | % |
| Real Estate | 3.5 | % |
| Energy | 2.6 | % |
| Utilities | 1.9 | % |
| Short-Term Investments | 0.4 | % |
| Other Assets & Liabilities | 1.6 | % |
| Total | 100.0 | % |
* | For Fund compliance purposes, the Fund may not use the same classification system. These classifications are used for financial reporting purposes. |
Availability of Additional Information
For additional information about the Fund, including its prospectus, financial information, holdings, and proxy voting information, please visit the Fund’s website at the website address included at the beginning of this report.
The Fund is distributed by Hartford Funds Distributors, LLC (HFD).
Annual Shareholder Report
October 31, 2024
The Hartford Capital Appreciation Fund
Class F/HCAFX
This annual shareholder report contains important information about The Hartford Capital Appreciation Fund (the "Fund") for the period of November 1, 2023 to October 31, 2024. You can find additional information about the Fund at hartfordfunds.com/reports-hmf. You can also request this information by contacting us by calling 1‑888‑843‑7824.
What were the Fund costs for the last year?
(Based on a hypothetical $10,000 investment)
| Class Name | Costs of a $10,000 investment | Costs paid as a percentage
of a $10,000 investment |
| Class F | $82 | 0.70% |
How did the Fund perform last year and what impacted its performance?
Management's Discussion of Fund Performance
United States (U.S.) equities, as measured by the Russell 3000 Index, rose over the trailing twelve-month period ending October 31, 2024. During the second half of the period, the rally in U.S. stocks considerably broadened beyond a concentrated group of mega-cap technology companies that powered the market in the first half of the period. The labor market continued to cool, primarily through fewer job openings and reduced hiring rather than widespread layoffs. Fund performance described below is relative to the Russell 3000 Index for the trailing twelve-month period ended October 31, 2024.
Top Contributors to Performance
Sector allocation, a result of our bottom-up stock selection process, contributed positively to relative performance during the period due to the Fund’s underweight allocations to the Energy and Healthcare sectors.
Security selection within the Information Technology, Communication Services, and Energy sectors contributed positively to relative performance.
The Fund’s exposure to companies that we believe are higher quality contributed to relative results.
Top individual contributors over the period were an underweight position in Apple (Information Technology), an overweight position in American Express (Financials), and an out-of-benchmark position in ARM (Information Technology).
Top Detractors to Performance
Security selection was the primary detractor to relative performance during the period, driven by weak selection within the Industrials, Consumer Discretionary, and Healthcare sectors.
From a style perspective, the Fund’s underweight exposure to higher-momentum names detracted from relative performance.
The largest individual detractors over the period were an underweight position in NVIDIA (Information Technology), as well as overweight positions in Nike (Consumer Discretionary) and LKQ (Consumer Discretionary).
The views expressed in this section reflect the opinions of the Fund's sub-adviser, Wellington Management Company LLP, as of the date of this report and are subject to change based on changes in market, economic or other conditions. These views are not intended to be a forecast of future events and are no guarantee of future results.
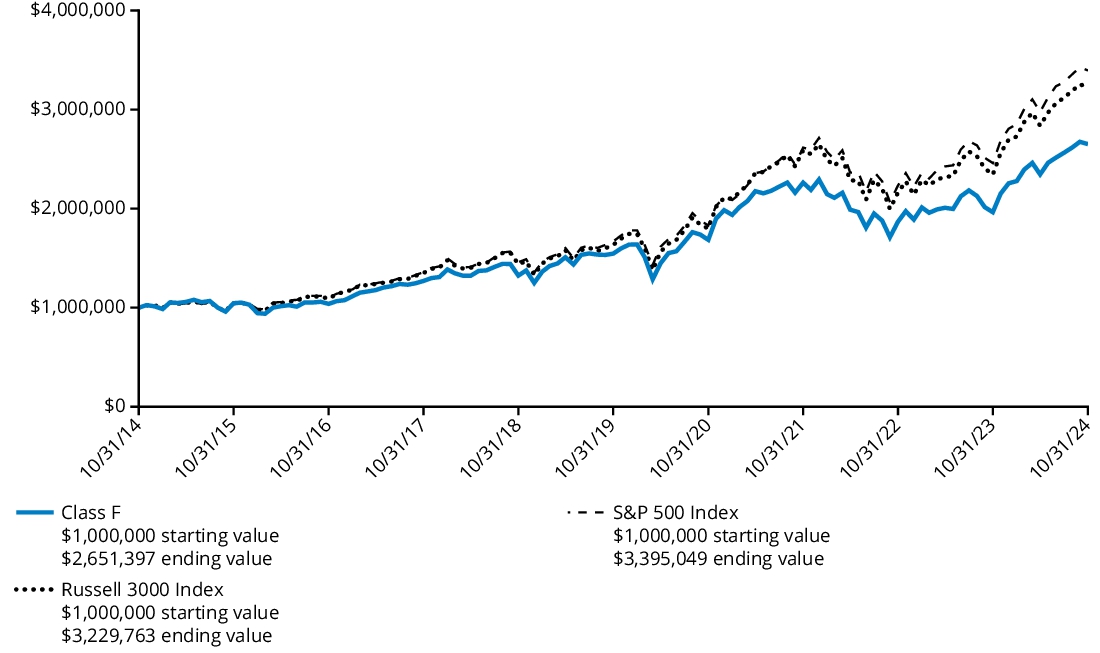
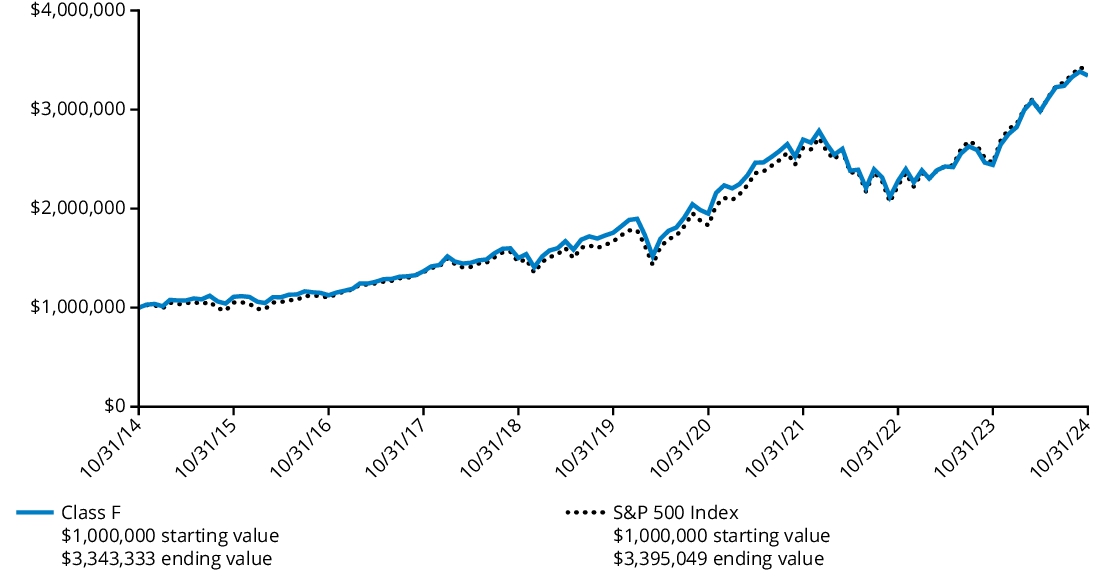
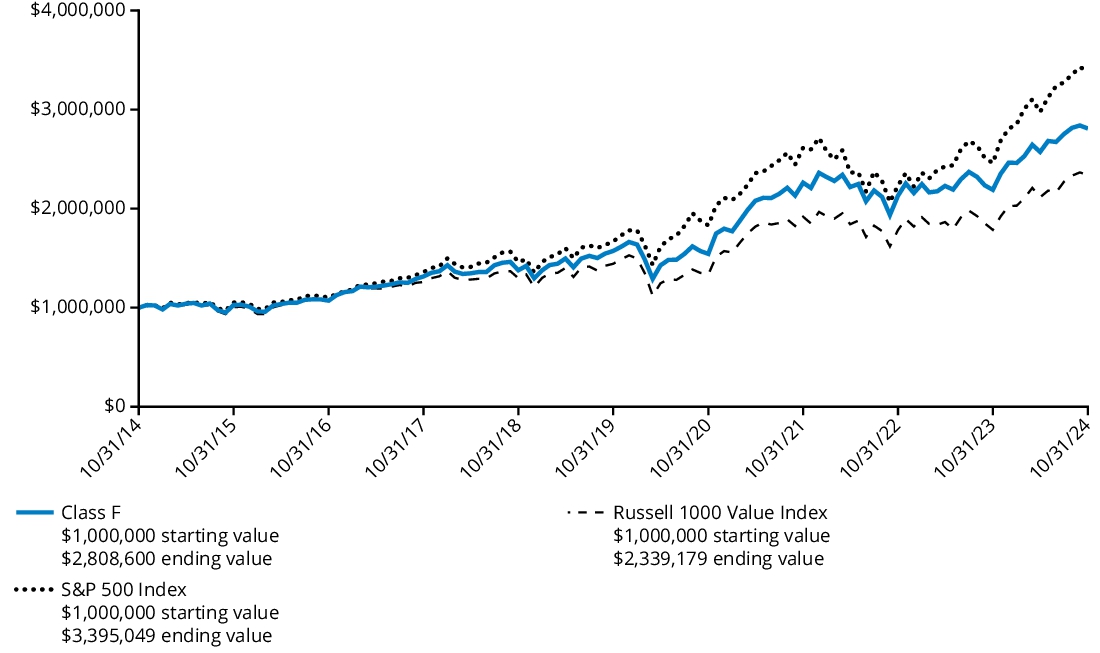
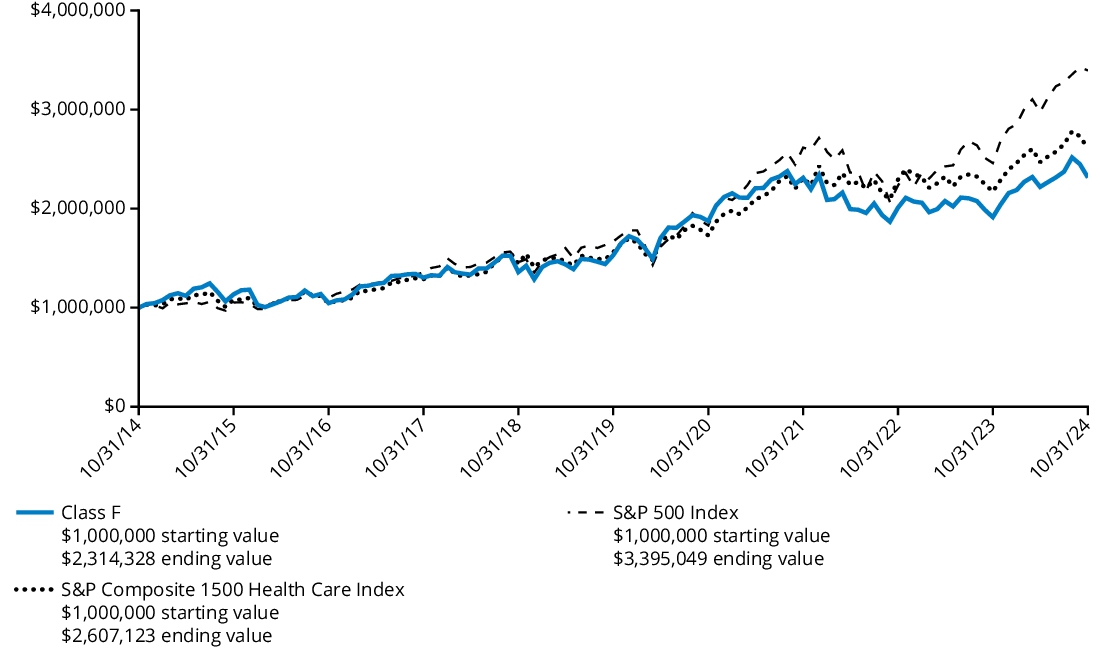
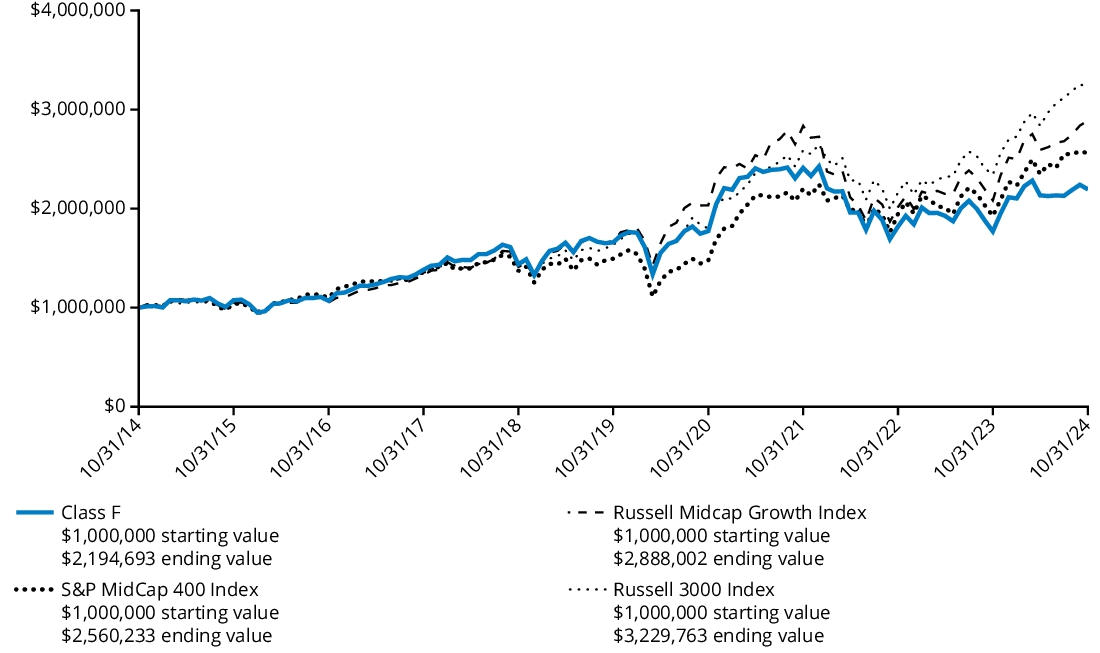
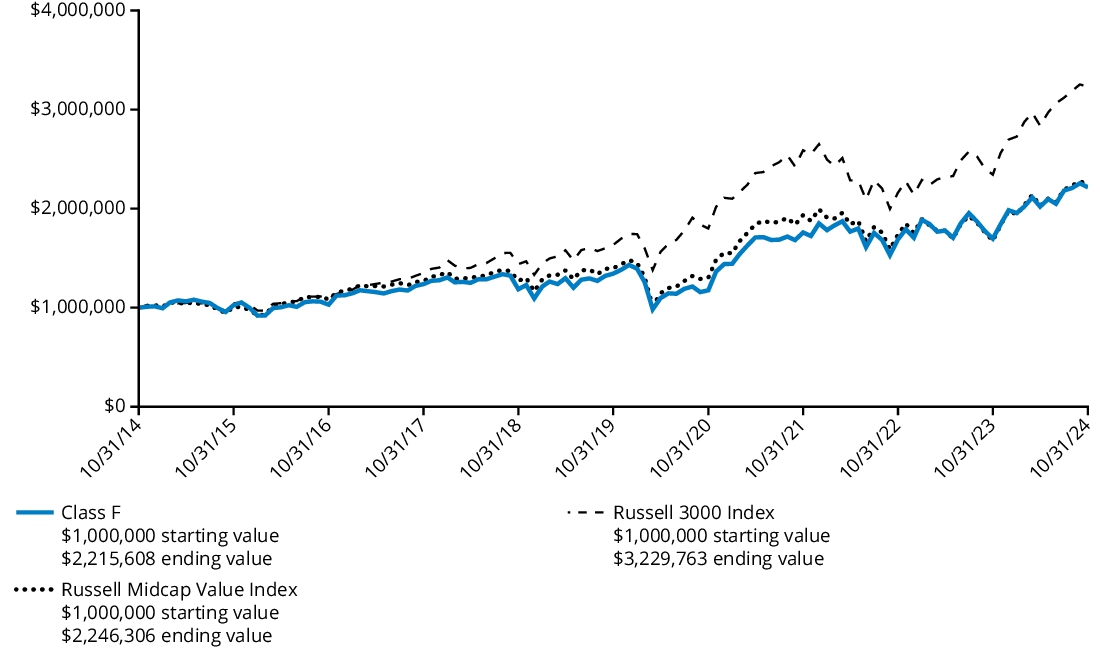
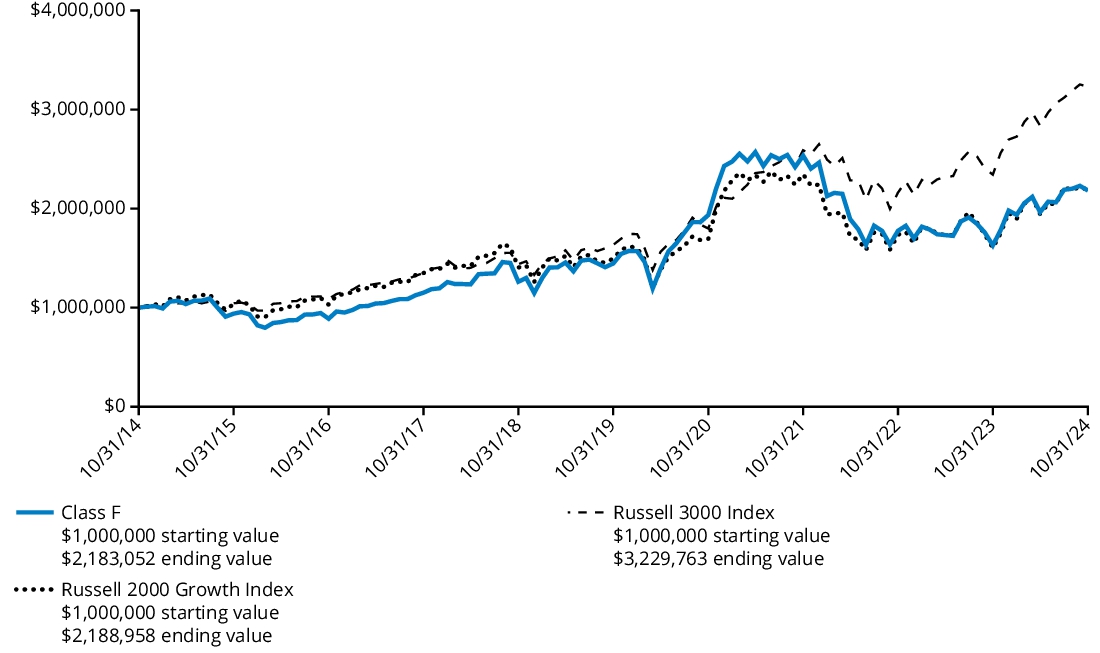
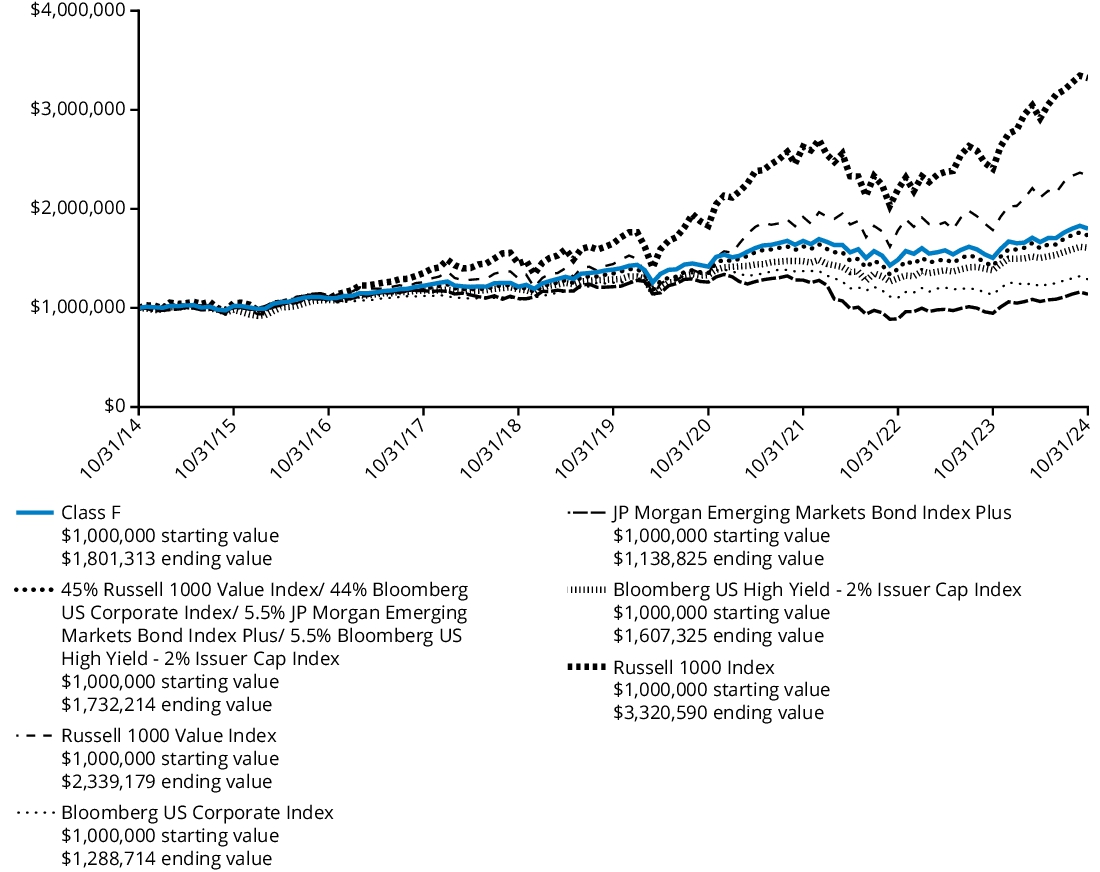
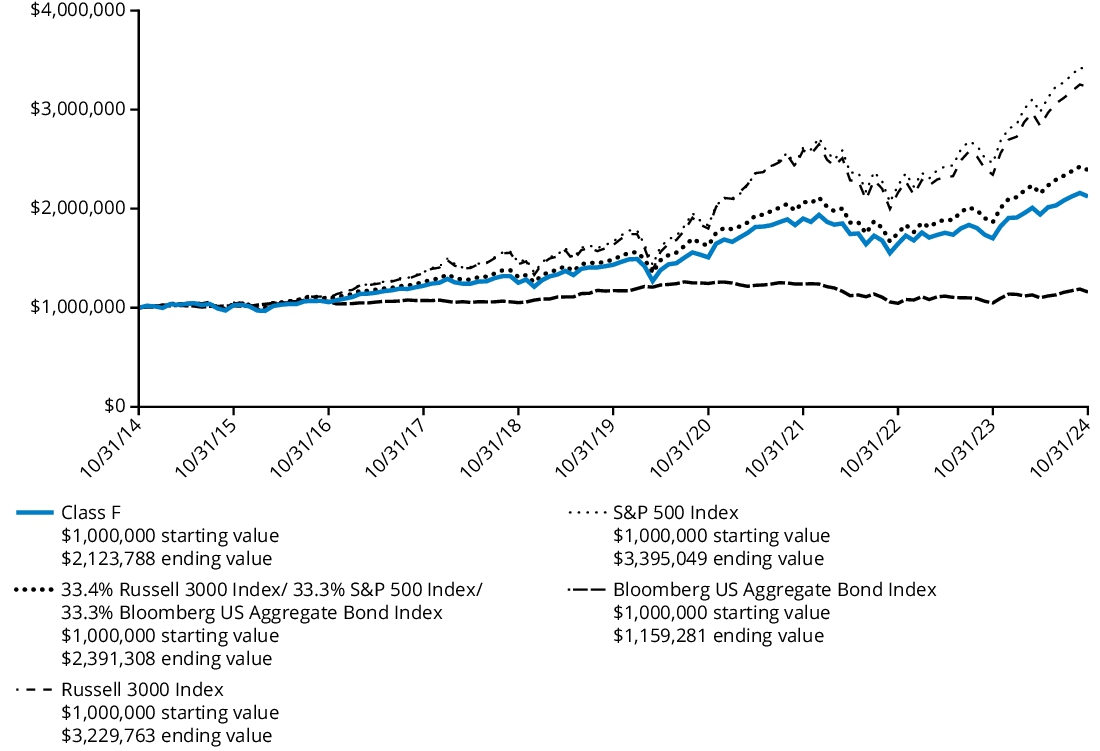
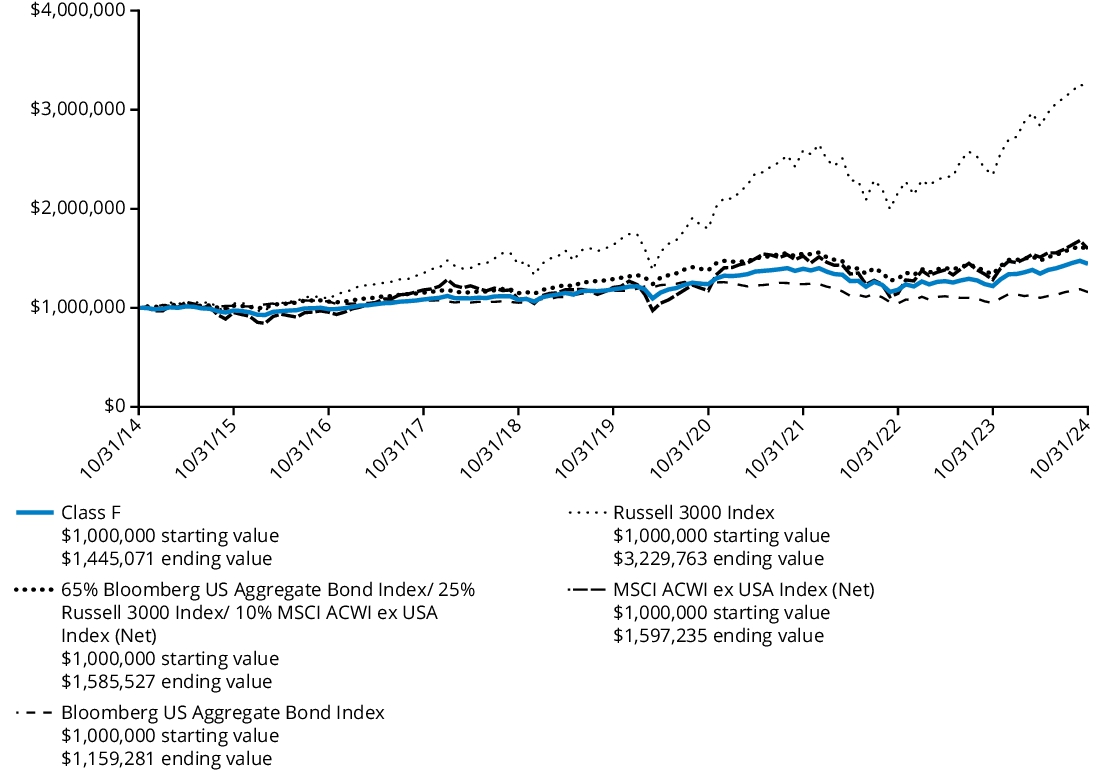
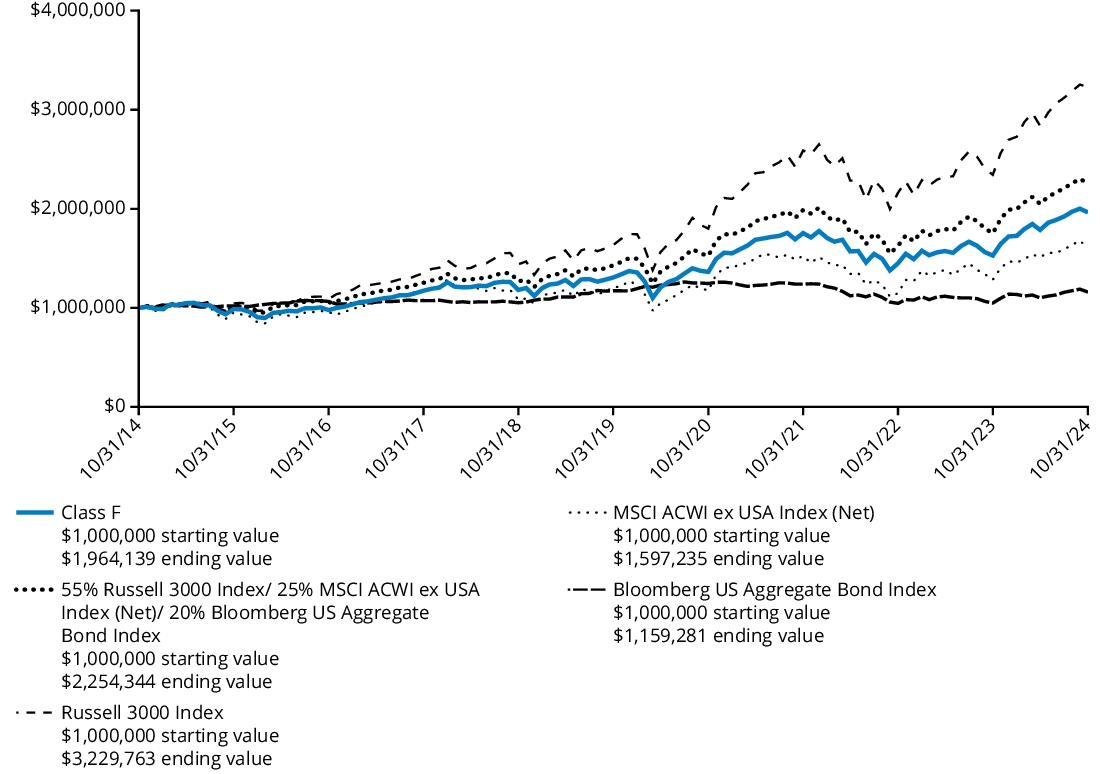
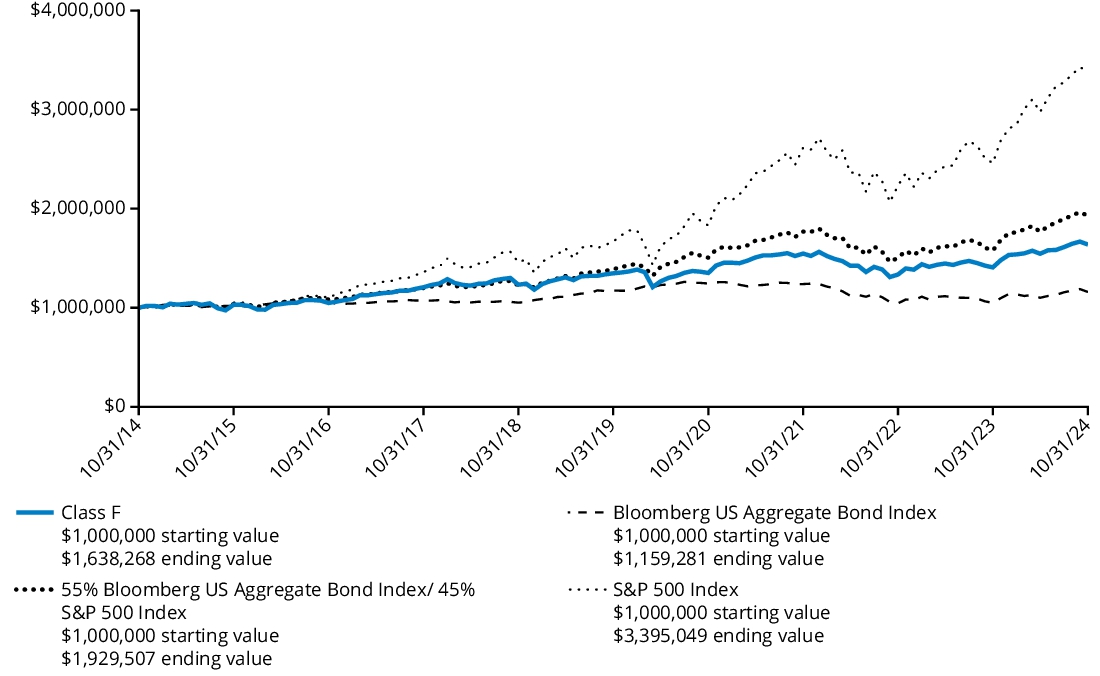
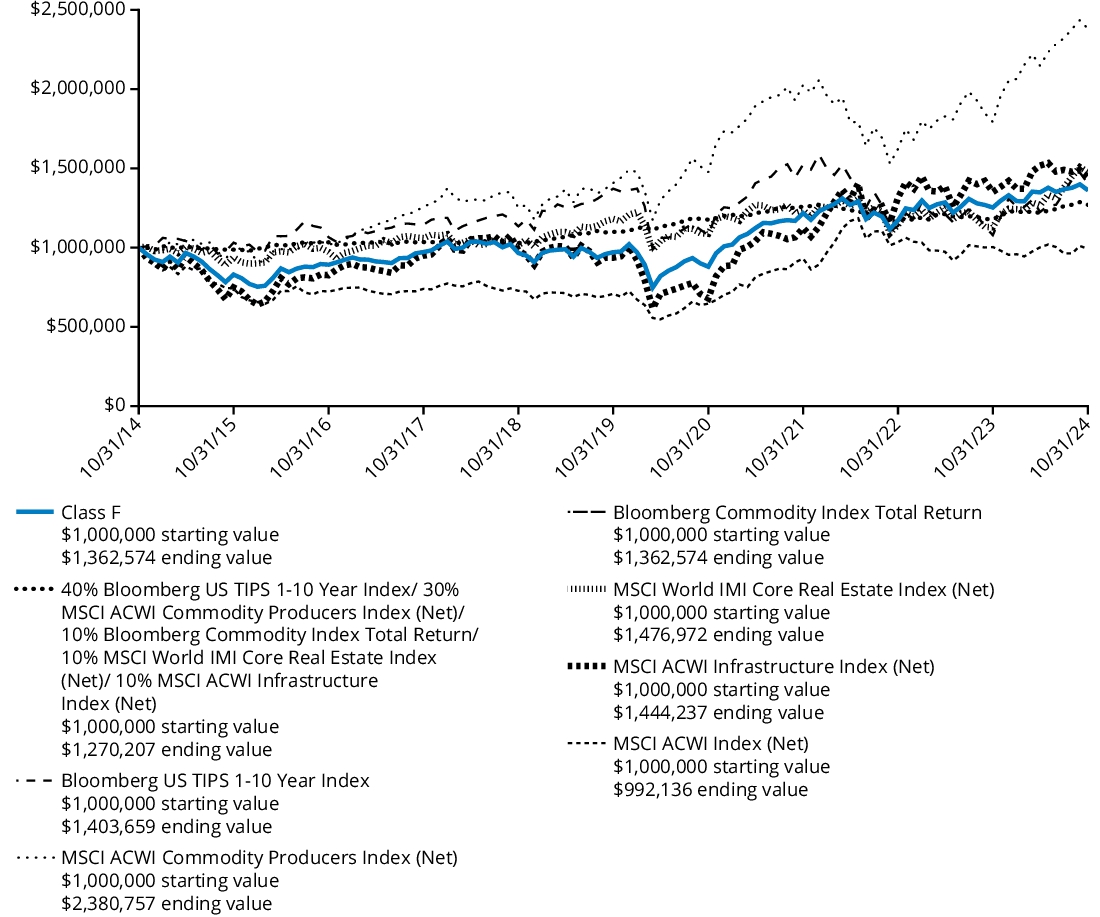
Comparison of Change in Value of $ 1,000,000 Investment
The graph below represents the hypothetical growth of a $1,000,000 investment in Class F shares and the comparative indices.
Average Annual Total Returns
For the Periods Ended October 31, 2024 | 1 Year | 5 Years | 10 Years |
| Class F | 35.00% | 11.40% | 10.24% |
| Russell 3000 Index | 37.86% | 14.60% | 12.44% |
| S&P 500 Index | 38.02% | 15.27% | 13.00% |
Class F shares commenced operations on February 28, 2017 and performance prior to that date is that of the Fund’s Class I shares. Performance prior to the inception date of the class has not been adjusted to reflect the operating expenses of the class.
The Fund’s past performance is not a good predictor of the Fund’s future performance. The graph and table do not reflect the deduction of taxes that a shareholder would pay on Fund distributions or redemption of Fund shares. Performance information reflects fee waivers and/or expense limitation arrangements, if any. Absent any applicable fee waivers and/or expense limitation arrangements, performance would have been lower. Visit hartfordfunds.com for the most recent performance information.
Key Fund Statistics as of October 31, 2024
| Fund's net assets | $6,255,800,025% |
| Total number of portfolio holdings (excluding derivatives, if any) | $144% |
| Total investment management fees paid | $40,293,822% |
| Portfolio turnover rate | $85% |
Graphical Representation of Holdings as of October 31, 2024
The table below shows the investment makeup of the Fund, representing the percentage of net assets of the Fund.
| Information Technology | 27.0 | % |
| Financials | 14.6 | % |
| Industrials | 10.7 | % |
| Consumer Discretionary | 10.5 | % |
| Communication Services | 9.5 | % |
| Health Care | 8.8 | % |
| Consumer Staples | 4.7 | % |
| Materials | 4.2 | % |
| Real Estate | 3.5 | % |
| Energy | 2.6 | % |
| Utilities | 1.9 | % |
| Short-Term Investments | 0.4 | % |
| Other Assets & Liabilities | 1.6 | % |
| Total | 100.0 | % |
* | For Fund compliance purposes, the Fund may not use the same classification system. These classifications are used for financial reporting purposes. |
Availability of Additional Information
For additional information about the Fund, including its prospectus, financial information, holdings, and proxy voting information, please visit the Fund’s website at the website address included at the beginning of this report.
The Fund is distributed by Hartford Funds Distributors, LLC (HFD).
Annual Shareholder Report
October 31, 2024
Hartford Core Equity Fund
Class A/HAIAX
This annual shareholder report contains important information about the Hartford Core Equity Fund (the "Fund") for the period of November 1, 2023 to October 31, 2024. You can find additional information about the Fund at hartfordfunds.com/reports-hmf. You can also request this information by contacting us by calling 1‑888‑843‑7824.
What were the Fund costs for the last year?
(Based on a hypothetical $10,000 investment)
| Class Name | Costs of a $10,000 investment | Costs paid as a percentage
of a $10,000 investment |
| Class A | $83 | 0.70% |
How did the Fund perform last year and what impacted its performance?
Management's Discussion of Fund Performance
United States (U.S.) equities, as measured by the S&P 500 Index, rose over the trailing twelve-month period ending October 31, 2024, with the S&P 500 Index surging to a record high that was driven by performance in a select group of mega-cap technology companies. The U.S. Federal Reserve (Fed) began easing monetary policy with an interest-rate cut of 50 basis points in September 2024 in an effort to generate a soft landing for the economy. Markets were also kept on edge in the third quarter of 2024 due to the anticipated extremely close presidential race between Vice President Kamala Harris and former President Donald Trump. Fund performance described below is relative to the S&P 500 Index for the trailing twelve-month period ended October 31, 2024.
Top Contributors to Performance
Underweight allocations to the Energy, Materials, and Consumer Staples sectors contributed positively to relative performance.
Security selection within the Information Technology, Communication Services, and Health Care sectors contributed positively to performance.
Top individual contributors over the period were an underweight position in GE Vernova (Industrials) and overweight positions in Broadcom (Information Technology) and American Express (Financials).
Top Detractors to Performance
Sector allocation, a result of our bottom-up stock selection process, was the main detractor from relative performance during the period, due to overweight allocations to the Healthcare and Financials sectors and an underweight to the Information Technology sector.
Security selection slightly detracted from relative performance during the period, driven by weak selection within the Consumer Staples, Consumer Discretionary, and Energy sectors.
The largest individual detractors over the period were overweight positions in Estee Lauder (Consumer Staples), UnitedHealth Group (Healthcare), and EOG Resources (Energy).
The views expressed in this section reflect the opinions of the Fund's sub-adviser, Wellington Management Company LLP, as of the date of this report and are subject to change based on changes in market, economic or other conditions. These views are not intended to be a forecast of future events and are no guarantee of future results.
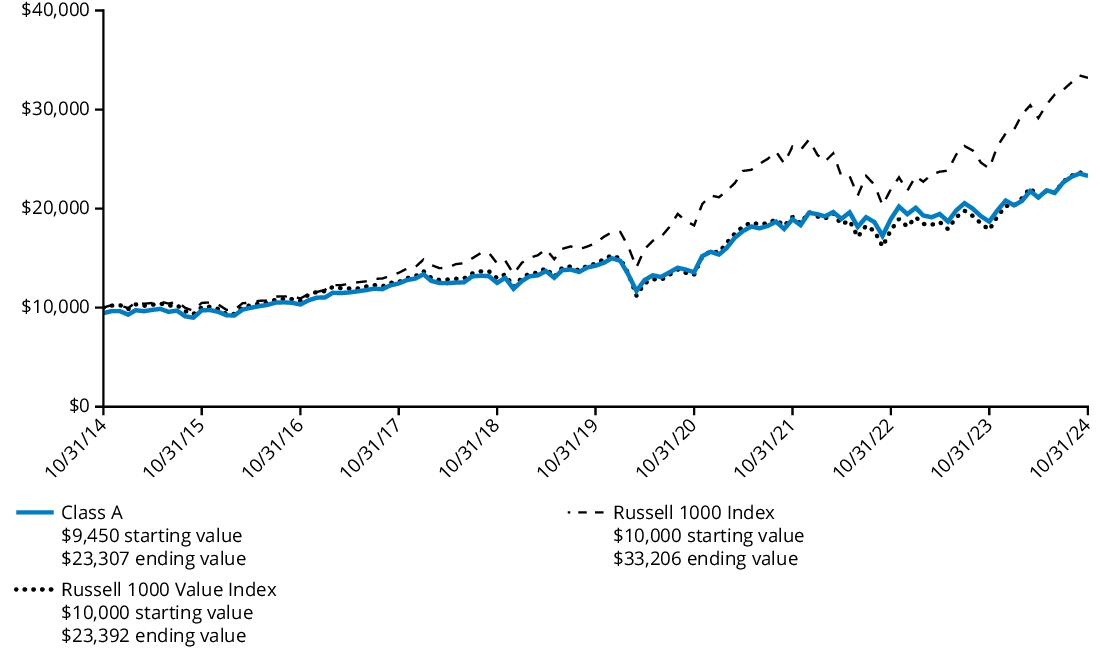
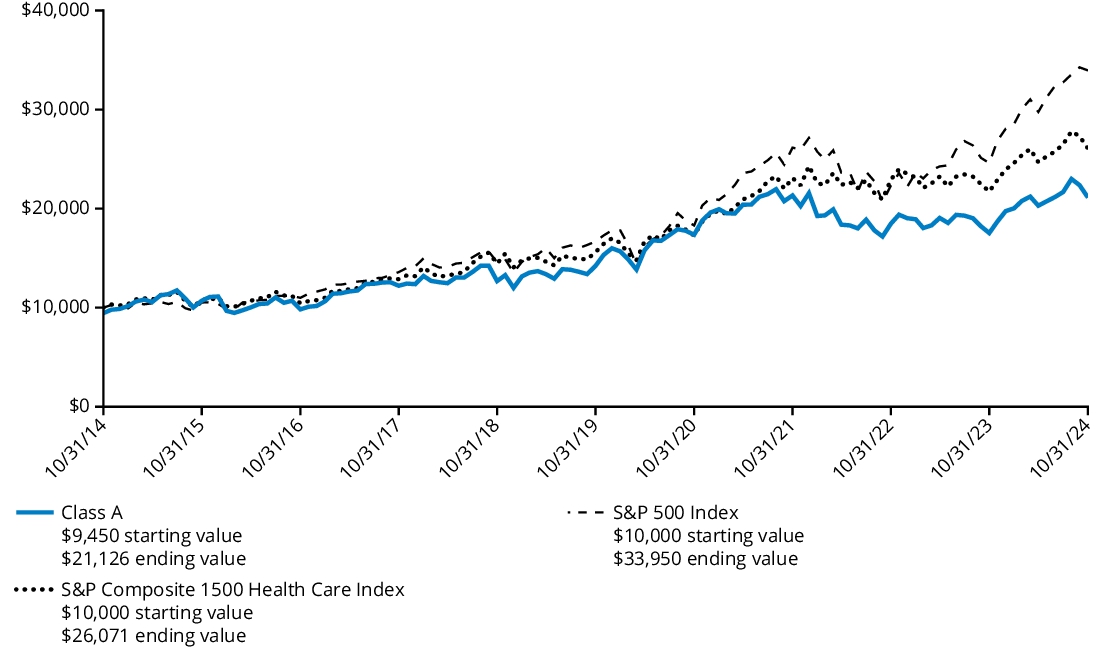
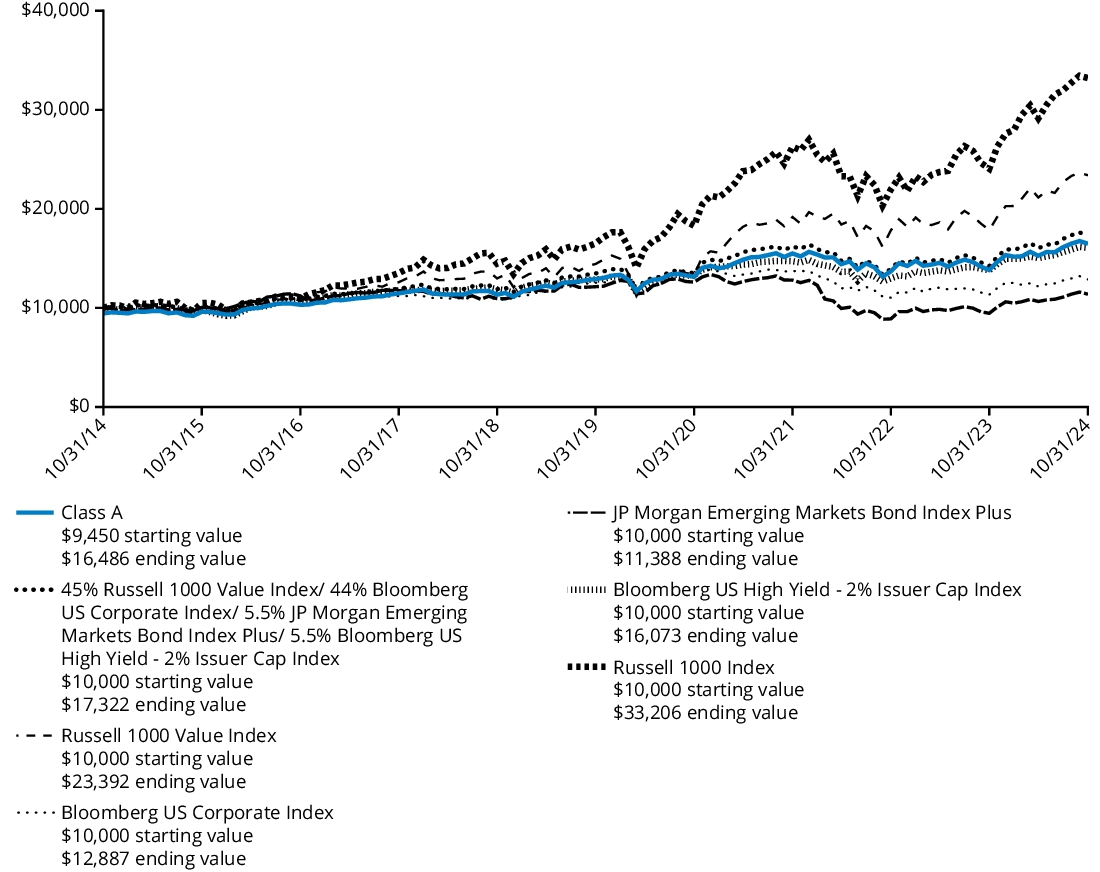
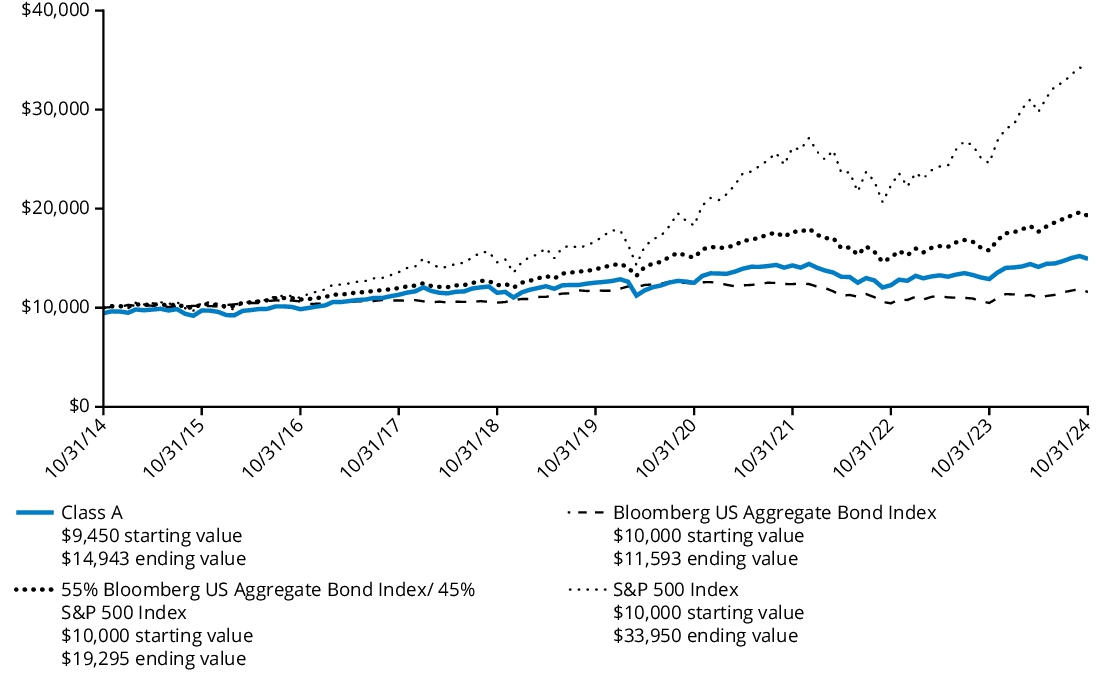
Comparison of Change in Value of $ 10,000 Investment
The graph below represents the hypothetical growth of a $10,000 investment in Class A shares and the comparative index. The returns for Class A shares include the maximum front-end sales charge applicable to Class A shares.
Average Annual Total Returns
For the Periods Ended October 31, 2024 | 1 Year | 5 Years | 10 Years |
| Class A (with 5.50% maximum front-end sales charge) | 29.01% | 12.07% | 11.84% |
| Class A (without 5.50% maximum front-end sales charge) | 36.51% | 13.35% | 12.47% |
| S&P 500 Index | 38.02% | 15.27% | 13.00% |
The Fund’s past performance is not a good predictor of the Fund’s future performance. The graph and table do not reflect the deduction of taxes that a shareholder would pay on Fund distributions or redemption of Fund shares. Performance information reflects fee waivers and/or expense limitation arrangements, if any. Absent any applicable fee waivers and/or expense limitation arrangements, performance would have been lower. Visit hartfordfunds.com for the most recent performance information.
Key Fund Statistics as of October 31, 2024
| Fund's net assets | $10,526,102,511% |
| Total number of portfolio holdings (excluding derivatives, if any) | $71% |
| Total investment management fees paid | $33,189,460% |
| Portfolio turnover rate | $27% |
Graphical Representation of Holdings as of October 31, 2024
The table below shows the investment makeup of the Fund, representing the percentage of net assets of the Fund.
| Information Technology | 31.8 | % |
| Financials | 12.9 | % |
| Health Care | 12.6 | % |
| Consumer Discretionary | 10.3 | % |
| Industrials | 9.4 | % |
| Communication Services | 8.5 | % |
| Consumer Staples | 4.0 | % |
| Utilities | 3.2 | % |
| Energy | 2.8 | % |
| Real Estate | 2.4 | % |
| Materials | 1.6 | % |
| Short-Term Investments | 0.1 | % |
| Other Assets & Liabilities | 0.4 | % |
| Total | 100.0 | % |
* | For Fund compliance purposes, the Fund may not use the same classification system. These classifications are used for financial reporting purposes. |
Availability of Additional Information
For additional information about the Fund, including its prospectus, financial information, holdings, and proxy voting information, please visit the Fund’s website at the website address included at the beginning of this report.
The Fund is distributed by Hartford Funds Distributors, LLC (HFD).
Annual Shareholder Report
October 31, 2024
Hartford Core Equity Fund
Class C/HGICX
This annual shareholder report contains important information about the Hartford Core Equity Fund (the "Fund") for the period of November 1, 2023 to October 31, 2024. You can find additional information about the Fund at hartfordfunds.com/reports-hmf. You can also request this information by contacting us by calling 1‑888‑843‑7824.
What were the Fund costs for the last year?
(Based on a hypothetical $10,000 investment)
| Class Name | Costs of a $10,000 investment | Costs paid as a percentage
of a $10,000 investment |
| Class C | $171 | 1.45% |
How did the Fund perform last year and what impacted its performance?
Management's Discussion of Fund Performance
United States (U.S.) equities, as measured by the S&P 500 Index, rose over the trailing twelve-month period ending October 31, 2024, with the S&P 500 Index surging to a record high that was driven by performance in a select group of mega-cap technology companies. The U.S. Federal Reserve (Fed) began easing monetary policy with an interest-rate cut of 50 basis points in September 2024 in an effort to generate a soft landing for the economy. Markets were also kept on edge in the third quarter of 2024 due to the anticipated extremely close presidential race between Vice President Kamala Harris and former President Donald Trump. Fund performance described below is relative to the S&P 500 Index for the trailing twelve-month period ended October 31, 2024.
Top Contributors to Performance
Underweight allocations to the Energy, Materials, and Consumer Staples sectors contributed positively to relative performance.
Security selection within the Information Technology, Communication Services, and Health Care sectors contributed positively to performance.
Top individual contributors over the period were an underweight position in GE Vernova (Industrials) and overweight positions in Broadcom (Information Technology) and American Express (Financials).
Top Detractors to Performance
Sector allocation, a result of our bottom-up stock selection process, was the main detractor from relative performance during the period, due to overweight allocations to the Healthcare and Financials sectors and an underweight to the Information Technology sector.
Security selection slightly detracted from relative performance during the period, driven by weak selection within the Consumer Staples, Consumer Discretionary, and Energy sectors.
The largest individual detractors over the period were overweight positions in Estee Lauder (Consumer Staples), UnitedHealth Group (Healthcare), and EOG Resources (Energy).
The views expressed in this section reflect the opinions of the Fund's sub-adviser, Wellington Management Company LLP, as of the date of this report and are subject to change based on changes in market, economic or other conditions. These views are not intended to be a forecast of future events and are no guarantee of future results.
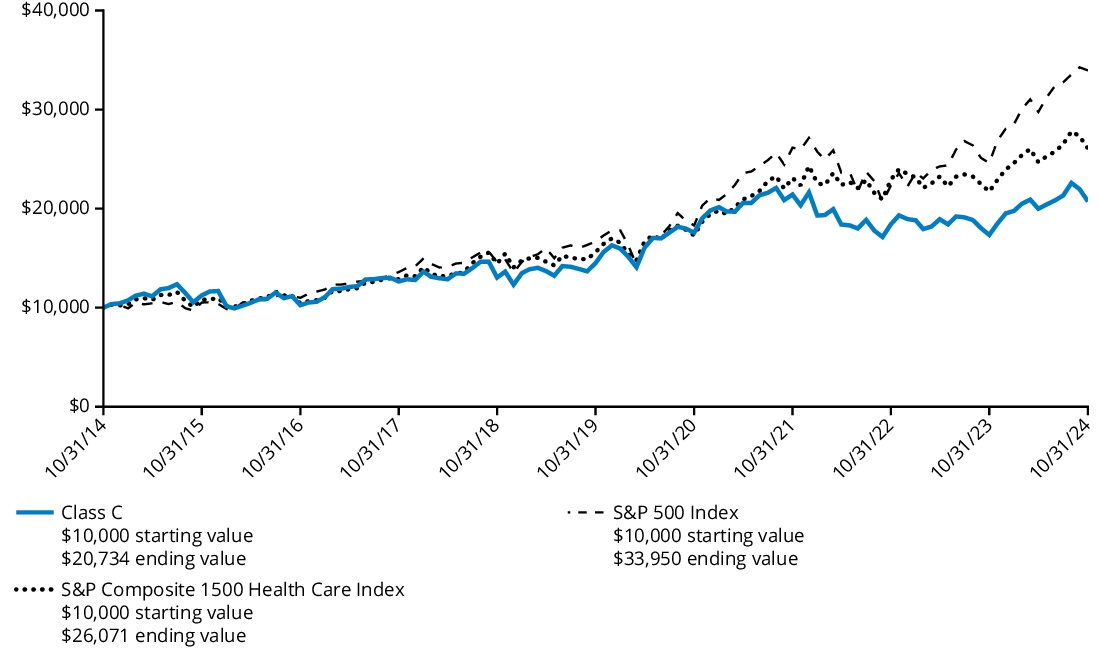
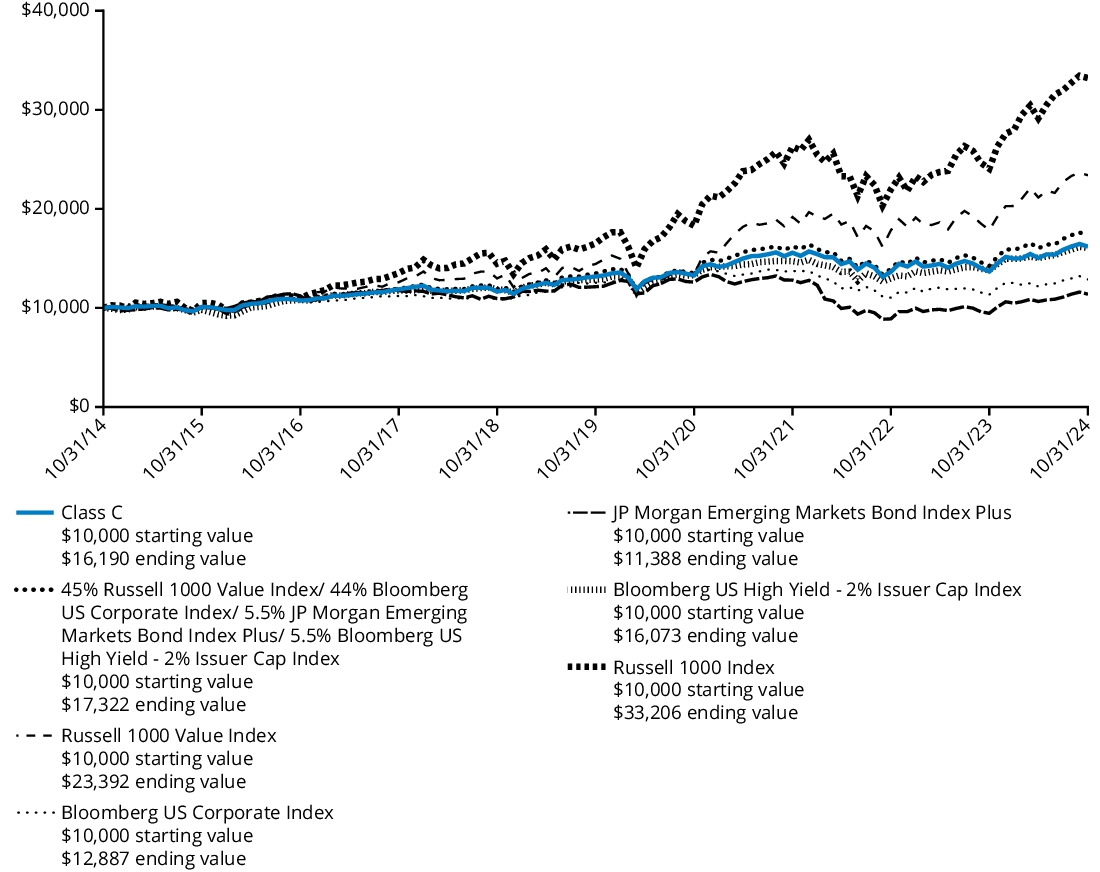
Comparison of Change in Value of $ 10,000 Investment
The graph below represents the hypothetical growth of a $10,000 investment in Class C shares (excluding sales charges) and the comparative index. If sales charges had been included, the value would have been lower.
Average Annual Total Returns
For the Periods Ended October 31, 2024 | 1 Year | 5 Years | 10 Years |
| Class C (with 1.00% contingent deferred sales charge) | 34.49% | 12.50% | 11.64% |
| Class C (without 1.00% contingent deferred sales charge) | 35.49% | 12.50% | 11.64% |
| S&P 500 Index | 38.02% | 15.27% | 13.00% |
The Fund’s past performance is not a good predictor of the Fund’s future performance. The graph and table do not reflect the deduction of taxes that a shareholder would pay on Fund distributions or redemption of Fund shares. Performance information reflects fee waivers and/or expense limitation arrangements, if any. Absent any applicable fee waivers and/or expense limitation arrangements, performance would have been lower. Visit hartfordfunds.com for the most recent performance information.
Key Fund Statistics as of October 31, 2024
| Fund's net assets | $10,526,102,511% |
| Total number of portfolio holdings (excluding derivatives, if any) | $71% |
| Total investment management fees paid | $33,189,460% |
| Portfolio turnover rate | $27% |
Graphical Representation of Holdings as of October 31, 2024
The table below shows the investment makeup of the Fund, representing the percentage of net assets of the Fund.
| Information Technology | 31.8 | % |
| Financials | 12.9 | % |
| Health Care | 12.6 | % |
| Consumer Discretionary | 10.3 | % |
| Industrials | 9.4 | % |
| Communication Services | 8.5 | % |
| Consumer Staples | 4.0 | % |
| Utilities | 3.2 | % |
| Energy | 2.8 | % |
| Real Estate | 2.4 | % |
| Materials | 1.6 | % |
| Short-Term Investments | 0.1 | % |
| Other Assets & Liabilities | 0.4 | % |
| Total | 100.0 | % |
* | For Fund compliance purposes, the Fund may not use the same classification system. These classifications are used for financial reporting purposes. |
Availability of Additional Information
For additional information about the Fund, including its prospectus, financial information, holdings, and proxy voting information, please visit the Fund’s website at the website address included at the beginning of this report.
The Fund is distributed by Hartford Funds Distributors, LLC (HFD).
Annual Shareholder Report
October 31, 2024
Hartford Core Equity Fund
Class I/HGIIX
This annual shareholder report contains important information about the Hartford Core Equity Fund (the "Fund") for the period of November 1, 2023 to October 31, 2024. You can find additional information about the Fund at hartfordfunds.com/reports-hmf. You can also request this information by contacting us by calling 1‑888‑843‑7824.
This report describes changes to the Fund that occurred during the reporting period.
What were the Fund costs for the last year?
(Based on a hypothetical $10,000 investment)
| Class Name | Costs of a $10,000 investment | Costs paid as a percentage
of a $10,000 investment |
| Class I | $54 | 0.46% |
How did the Fund perform last year and what impacted its performance?
Management's Discussion of Fund Performance
United States (U.S.) equities, as measured by the S&P 500 Index, rose over the trailing twelve-month period ending October 31, 2024, with the S&P 500 Index surging to a record high that was driven by performance in a select group of mega-cap technology companies. The U.S. Federal Reserve (Fed) began easing monetary policy with an interest-rate cut of 50 basis points in September 2024 in an effort to generate a soft landing for the economy. Markets were also kept on edge in the third quarter of 2024 due to the anticipated extremely close presidential race between Vice President Kamala Harris and former President Donald Trump. Fund performance described below is relative to the S&P 500 Index for the trailing twelve-month period ended October 31, 2024.
Top Contributors to Performance
Underweight allocations to the Energy, Materials, and Consumer Staples sectors contributed positively to relative performance.
Security selection within the Information Technology, Communication Services, and Health Care sectors contributed positively to performance.
Top individual contributors over the period were an underweight position in GE Vernova (Industrials) and overweight positions in Broadcom (Information Technology) and American Express (Financials).
Top Detractors to Performance
Sector allocation, a result of our bottom-up stock selection process, was the main detractor from relative performance during the period, due to overweight allocations to the Healthcare and Financials sectors and an underweight to the Information Technology sector.
Security selection slightly detracted from relative performance during the period, driven by weak selection within the Consumer Staples, Consumer Discretionary, and Energy sectors.
The largest individual detractors over the period were overweight positions in Estee Lauder (Consumer Staples), UnitedHealth Group (Healthcare), and EOG Resources (Energy).
The views expressed in this section reflect the opinions of the Fund's sub-adviser, Wellington Management Company LLP, as of the date of this report and are subject to change based on changes in market, economic or other conditions. These views are not intended to be a forecast of future events and are no guarantee of future results.
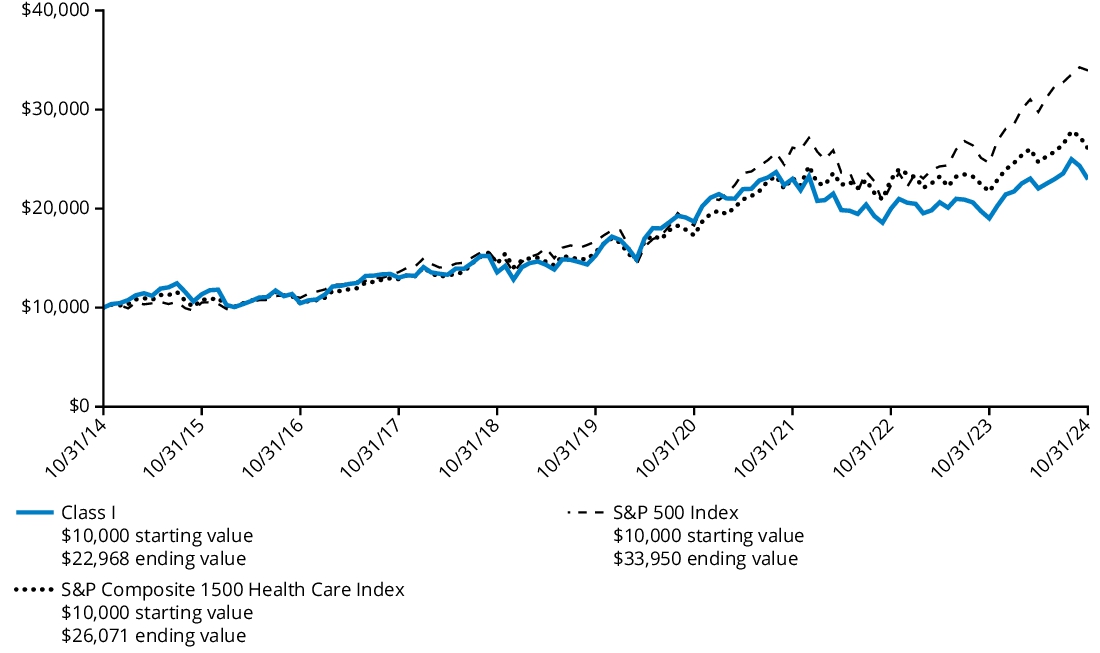
Comparison of Change in Value of $ 10,000 Investment
The graph below represents the hypothetical growth of a $10,000 investment in Class I shares and the comparative index.
Average Annual Total Returns
For the Periods Ended October 31, 2024 | 1 Year | 5 Years | 10 Years |
| Class I | 36.85% | 13.63% | 12.75% |
| S&P 500 Index | 38.02% | 15.27% | 13.00% |
Class I shares commenced operations on March 31, 2015 and performance prior to that date is that of the Fund’s Class A shares (excluding sales charges). Performance prior to the inception date of the class has not been adjusted to reflect the operating expenses of the class.
The Fund’s past performance is not a good predictor of the Fund’s future performance. The graph and table do not reflect the deduction of taxes that a shareholder would pay on Fund distributions or redemption of Fund shares. Performance information reflects fee waivers and/or expense limitation arrangements, if any. Absent any applicable fee waivers and/or expense limitation arrangements, performance would have been lower. Visit hartfordfunds.com for the most recent performance information.
Key Fund Statistics as of October 31, 2024
| Fund's net assets | $10,526,102,511% |
| Total number of portfolio holdings (excluding derivatives, if any) | $71% |
| Total investment management fees paid | $33,189,460% |
| Portfolio turnover rate | $27% |
Graphical Representation of Holdings as of October 31, 2024
The table below shows the investment makeup of the Fund, representing the percentage of net assets of the Fund.
| Information Technology | 31.8 | % |
| Financials | 12.9 | % |
| Health Care | 12.6 | % |
| Consumer Discretionary | 10.3 | % |
| Industrials | 9.4 | % |
| Communication Services | 8.5 | % |
| Consumer Staples | 4.0 | % |
| Utilities | 3.2 | % |
| Energy | 2.8 | % |
| Real Estate | 2.4 | % |
| Materials | 1.6 | % |
| Short-Term Investments | 0.1 | % |
| Other Assets & Liabilities | 0.4 | % |
| Total | 100.0 | % |
* | For Fund compliance purposes, the Fund may not use the same classification system. These classifications are used for financial reporting purposes. |
Material Fund Changes
This is a summary of certain changes to the Fund since the beginning of the reporting period.
Effective July 1, 2024, Hartford Administrative Services Company, the Fund’s transfer agent, contractually agreed to waive its transfer agency fee and/or reimburse transfer agency-related expenses to the extent necessary to limit the transfer agency fee for Class I of the Fund as follows: 0.104% of the average daily net assets attributable to the class. This contractual arrangement will remain in effect until February 28, 2025 unless the Board of Directors of the Fund approves its earlier termination.
Availability of Additional Information
For additional information about the Fund, including its prospectus, financial information, holdings, and proxy voting information, please visit the Fund’s website at the website address included at the beginning of this report.
The Fund is distributed by Hartford Funds Distributors, LLC (HFD).
Annual Shareholder Report
October 31, 2024
Hartford Core Equity Fund
Class R3/HGIRX
This annual shareholder report contains important information about the Hartford Core Equity Fund (the "Fund") for the period of November 1, 2023 to October 31, 2024. You can find additional information about the Fund at hartfordfunds.com/reports-hmf. You can also request this information by contacting us by calling 1‑888‑843‑7824.
What were the Fund costs for the last year?
(Based on a hypothetical $10,000 investment)
| Class Name | Costs of a $10,000 investment | Costs paid as a percentage
of a $10,000 investment |
| Class R3 | $127 | 1.08% |
How did the Fund perform last year and what impacted its performance?
Management's Discussion of Fund Performance
United States (U.S.) equities, as measured by the S&P 500 Index, rose over the trailing twelve-month period ending October 31, 2024, with the S&P 500 Index surging to a record high that was driven by performance in a select group of mega-cap technology companies. The U.S. Federal Reserve (Fed) began easing monetary policy with an interest-rate cut of 50 basis points in September 2024 in an effort to generate a soft landing for the economy. Markets were also kept on edge in the third quarter of 2024 due to the anticipated extremely close presidential race between Vice President Kamala Harris and former President Donald Trump. Fund performance described below is relative to the S&P 500 Index for the trailing twelve-month period ended October 31, 2024.
Top Contributors to Performance
Underweight allocations to the Energy, Materials, and Consumer Staples sectors contributed positively to relative performance.
Security selection within the Information Technology, Communication Services, and Health Care sectors contributed positively to performance.
Top individual contributors over the period were an underweight position in GE Vernova (Industrials) and overweight positions in Broadcom (Information Technology) and American Express (Financials).
Top Detractors to Performance
Sector allocation, a result of our bottom-up stock selection process, was the main detractor from relative performance during the period, due to overweight allocations to the Healthcare and Financials sectors and an underweight to the Information Technology sector.
Security selection slightly detracted from relative performance during the period, driven by weak selection within the Consumer Staples, Consumer Discretionary, and Energy sectors.
The largest individual detractors over the period were overweight positions in Estee Lauder (Consumer Staples), UnitedHealth Group (Healthcare), and EOG Resources (Energy).
The views expressed in this section reflect the opinions of the Fund's sub-adviser, Wellington Management Company LLP, as of the date of this report and are subject to change based on changes in market, economic or other conditions. These views are not intended to be a forecast of future events and are no guarantee of future results.
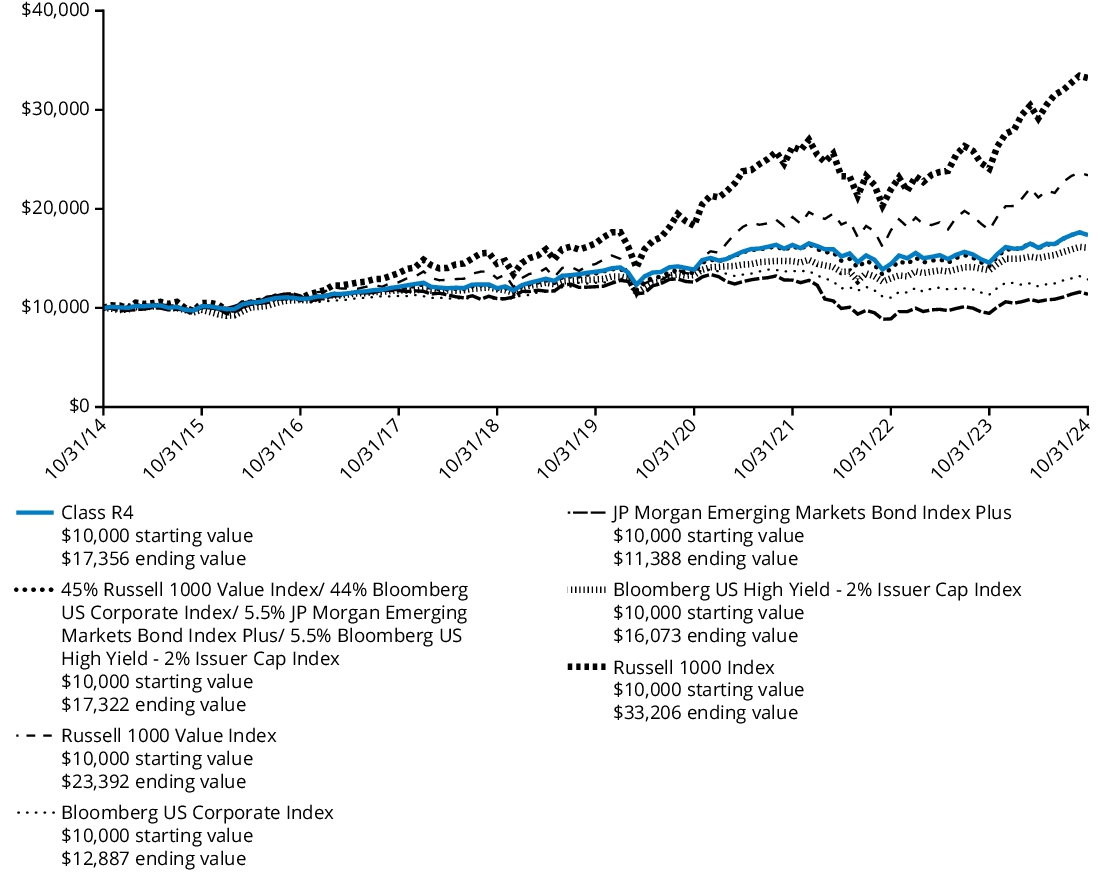
Comparison of Change in Value of $ 10,000 Investment
The graph below represents the hypothetical growth of a $10,000 investment in Class R3 shares and the comparative index.
Average Annual Total Returns
For the Periods Ended October 31, 2024 | 1 Year | 5 Years | 10 Years |
| Class R3 | 35.99% | 12.93% | 12.08% |
| S&P 500 Index | 38.02% | 15.27% | 13.00% |
The Fund’s past performance is not a good predictor of the Fund’s future performance. The graph and table do not reflect the deduction of taxes that a shareholder would pay on Fund distributions or redemption of Fund shares. Performance information reflects fee waivers and/or expense limitation arrangements, if any. Absent any applicable fee waivers and/or expense limitation arrangements, performance would have been lower. Visit hartfordfunds.com for the most recent performance information.
Key Fund Statistics as of October 31, 2024
| Fund's net assets | $10,526,102,511% |
| Total number of portfolio holdings (excluding derivatives, if any) | $71% |
| Total investment management fees paid | $33,189,460% |
| Portfolio turnover rate | $27% |
Graphical Representation of Holdings as of October 31, 2024
The table below shows the investment makeup of the Fund, representing the percentage of net assets of the Fund.
| Information Technology | 31.8 | % |
| Financials | 12.9 | % |
| Health Care | 12.6 | % |
| Consumer Discretionary | 10.3 | % |
| Industrials | 9.4 | % |
| Communication Services | 8.5 | % |
| Consumer Staples | 4.0 | % |
| Utilities | 3.2 | % |
| Energy | 2.8 | % |
| Real Estate | 2.4 | % |
| Materials | 1.6 | % |
| Short-Term Investments | 0.1 | % |
| Other Assets & Liabilities | 0.4 | % |
| Total | 100.0 | % |
* | For Fund compliance purposes, the Fund may not use the same classification system. These classifications are used for financial reporting purposes. |
Availability of Additional Information
For additional information about the Fund, including its prospectus, financial information, holdings, and proxy voting information, please visit the Fund’s website at the website address included at the beginning of this report.
The Fund is distributed by Hartford Funds Distributors, LLC (HFD).
Annual Shareholder Report
October 31, 2024
Hartford Core Equity Fund
Class R4/HGISX
This annual shareholder report contains important information about the Hartford Core Equity Fund (the "Fund") for the period of November 1, 2023 to October 31, 2024. You can find additional information about the Fund at hartfordfunds.com/reports-hmf. You can also request this information by contacting us by calling 1‑888‑843‑7824.
What were the Fund costs for the last year?
(Based on a hypothetical $10,000 investment)
| Class Name | Costs of a $10,000 investment | Costs paid as a percentage
of a $10,000 investment |
| Class R4 | $85 | 0.72% |
Costs paid include the impact of certain non-contractual waivers and/or reimbursements. In the absence of such waivers and reimbursements, the expense ratio would be higher.
How did the Fund perform last year and what impacted its performance?
Management's Discussion of Fund Performance
United States (U.S.) equities, as measured by the S&P 500 Index, rose over the trailing twelve-month period ending October 31, 2024, with the S&P 500 Index surging to a record high that was driven by performance in a select group of mega-cap technology companies. The U.S. Federal Reserve (Fed) began easing monetary policy with an interest-rate cut of 50 basis points in September 2024 in an effort to generate a soft landing for the economy. Markets were also kept on edge in the third quarter of 2024 due to the anticipated extremely close presidential race between Vice President Kamala Harris and former President Donald Trump. Fund performance described below is relative to the S&P 500 Index for the trailing twelve-month period ended October 31, 2024.
Top Contributors to Performance
Underweight allocations to the Energy, Materials, and Consumer Staples sectors contributed positively to relative performance.
Security selection within the Information Technology, Communication Services, and Health Care sectors contributed positively to performance.
Top individual contributors over the period were an underweight position in GE Vernova (Industrials) and overweight positions in Broadcom (Information Technology) and American Express (Financials).
Top Detractors to Performance
Sector allocation, a result of our bottom-up stock selection process, was the main detractor from relative performance during the period, due to overweight allocations to the Healthcare and Financials sectors and an underweight to the Information Technology sector.
Security selection slightly detracted from relative performance during the period, driven by weak selection within the Consumer Staples, Consumer Discretionary, and Energy sectors.
The largest individual detractors over the period were overweight positions in Estee Lauder (Consumer Staples), UnitedHealth Group (Healthcare), and EOG Resources (Energy).
The views expressed in this section reflect the opinions of the Fund's sub-adviser, Wellington Management Company LLP, as of the date of this report and are subject to change based on changes in market, economic or other conditions. These views are not intended to be a forecast of future events and are no guarantee of future results.
Comparison of Change in Value of $ 10,000 Investment
The graph below represents the hypothetical growth of a $10,000 investment in Class R4 shares and the comparative index.
Average Annual Total Returns
For the Periods Ended October 31, 2024 | 1 Year | 5 Years | 10 Years |
| Class R4 | 36.44% | 13.33% | 12.46% |
| S&P 500 Index | 38.02% | 15.27% | 13.00% |
The Fund’s past performance is not a good predictor of the Fund’s future performance. The graph and table do not reflect the deduction of taxes that a shareholder would pay on Fund distributions or redemption of Fund shares. Performance information reflects fee waivers and/or expense limitation arrangements, if any. Absent any applicable fee waivers and/or expense limitation arrangements, performance would have been lower. Visit hartfordfunds.com for the most recent performance information.
Key Fund Statistics as of October 31, 2024
| Fund's net assets | $10,526,102,511% |
| Total number of portfolio holdings (excluding derivatives, if any) | $71% |
| Total investment management fees paid | $33,189,460% |
| Portfolio turnover rate | $27% |
Graphical Representation of Holdings as of October 31, 2024
The table below shows the investment makeup of the Fund, representing the percentage of net assets of the Fund.
| Information Technology | 31.8 | % |
| Financials | 12.9 | % |
| Health Care | 12.6 | % |
| Consumer Discretionary | 10.3 | % |
| Industrials | 9.4 | % |
| Communication Services | 8.5 | % |
| Consumer Staples | 4.0 | % |
| Utilities | 3.2 | % |
| Energy | 2.8 | % |
| Real Estate | 2.4 | % |
| Materials | 1.6 | % |
| Short-Term Investments | 0.1 | % |
| Other Assets & Liabilities | 0.4 | % |
| Total | 100.0 | % |
* | For Fund compliance purposes, the Fund may not use the same classification system. These classifications are used for financial reporting purposes. |
Availability of Additional Information
For additional information about the Fund, including its prospectus, financial information, holdings, and proxy voting information, please visit the Fund’s website at the website address included at the beginning of this report.
The Fund is distributed by Hartford Funds Distributors, LLC (HFD).
Annual Shareholder Report
October 31, 2024
Hartford Core Equity Fund
Class R5/HGITX
This annual shareholder report contains important information about the Hartford Core Equity Fund (the "Fund") for the period of November 1, 2023 to October 31, 2024. You can find additional information about the Fund at hartfordfunds.com/reports-hmf. You can also request this information by contacting us by calling 1‑888‑843‑7824.
What were the Fund costs for the last year?
(Based on a hypothetical $10,000 investment)
| Class Name | Costs of a $10,000 investment | Costs paid as a percentage
of a $10,000 investment |
| Class R5 | $54 | 0.46% |
How did the Fund perform last year and what impacted its performance?
Management's Discussion of Fund Performance
United States (U.S.) equities, as measured by the S&P 500 Index, rose over the trailing twelve-month period ending October 31, 2024, with the S&P 500 Index surging to a record high that was driven by performance in a select group of mega-cap technology companies. The U.S. Federal Reserve (Fed) began easing monetary policy with an interest-rate cut of 50 basis points in September 2024 in an effort to generate a soft landing for the economy. Markets were also kept on edge in the third quarter of 2024 due to the anticipated extremely close presidential race between Vice President Kamala Harris and former President Donald Trump. Fund performance described below is relative to the S&P 500 Index for the trailing twelve-month period ended October 31, 2024.
Top Contributors to Performance
Underweight allocations to the Energy, Materials, and Consumer Staples sectors contributed positively to relative performance.
Security selection within the Information Technology, Communication Services, and Health Care sectors contributed positively to performance.
Top individual contributors over the period were an underweight position in GE Vernova (Industrials) and overweight positions in Broadcom (Information Technology) and American Express (Financials).
Top Detractors to Performance
Sector allocation, a result of our bottom-up stock selection process, was the main detractor from relative performance during the period, due to overweight allocations to the Healthcare and Financials sectors and an underweight to the Information Technology sector.
Security selection slightly detracted from relative performance during the period, driven by weak selection within the Consumer Staples, Consumer Discretionary, and Energy sectors.
The largest individual detractors over the period were overweight positions in Estee Lauder (Consumer Staples), UnitedHealth Group (Healthcare), and EOG Resources (Energy).
The views expressed in this section reflect the opinions of the Fund's sub-adviser, Wellington Management Company LLP, as of the date of this report and are subject to change based on changes in market, economic or other conditions. These views are not intended to be a forecast of future events and are no guarantee of future results.
Comparison of Change in Value of $ 10,000 Investment
The graph below represents the hypothetical growth of a $10,000 investment in Class R5 shares and the comparative index.
Average Annual Total Returns
For the Periods Ended October 31, 2024 | 1 Year | 5 Years | 10 Years |
| Class R5 | 36.82% | 13.62% | 12.76% |
| S&P 500 Index | 38.02% | 15.27% | 13.00% |
The Fund’s past performance is not a good predictor of the Fund’s future performance. The graph and table do not reflect the deduction of taxes that a shareholder would pay on Fund distributions or redemption of Fund shares. Performance information reflects fee waivers and/or expense limitation arrangements, if any. Absent any applicable fee waivers and/or expense limitation arrangements, performance would have been lower. Visit hartfordfunds.com for the most recent performance information.
Key Fund Statistics as of October 31, 2024
| Fund's net assets | $10,526,102,511% |
| Total number of portfolio holdings (excluding derivatives, if any) | $71% |
| Total investment management fees paid | $33,189,460% |
| Portfolio turnover rate | $27% |
Graphical Representation of Holdings as of October 31, 2024
The table below shows the investment makeup of the Fund, representing the percentage of net assets of the Fund.
| Information Technology | 31.8 | % |
| Financials | 12.9 | % |
| Health Care | 12.6 | % |
| Consumer Discretionary | 10.3 | % |
| Industrials | 9.4 | % |
| Communication Services | 8.5 | % |
| Consumer Staples | 4.0 | % |
| Utilities | 3.2 | % |
| Energy | 2.8 | % |
| Real Estate | 2.4 | % |
| Materials | 1.6 | % |
| Short-Term Investments | 0.1 | % |
| Other Assets & Liabilities | 0.4 | % |
| Total | 100.0 | % |
* | For Fund compliance purposes, the Fund may not use the same classification system. These classifications are used for financial reporting purposes. |
Availability of Additional Information
For additional information about the Fund, including its prospectus, financial information, holdings, and proxy voting information, please visit the Fund’s website at the website address included at the beginning of this report.
The Fund is distributed by Hartford Funds Distributors, LLC (HFD).
Annual Shareholder Report
October 31, 2024
Hartford Core Equity Fund
Class R6/HAITX
This annual shareholder report contains important information about the Hartford Core Equity Fund (the "Fund") for the period of November 1, 2023 to October 31, 2024. You can find additional information about the Fund at hartfordfunds.com/reports-hmf. You can also request this information by contacting us by calling 1‑888‑843‑7824.
What were the Fund costs for the last year?
(Based on a hypothetical $10,000 investment)
| Class Name | Costs of a $10,000 investment | Costs paid as a percentage
of a $10,000 investment |
| Class R6 | $43 | 0.36% |
How did the Fund perform last year and what impacted its performance?
Management's Discussion of Fund Performance
United States (U.S.) equities, as measured by the S&P 500 Index, rose over the trailing twelve-month period ending October 31, 2024, with the S&P 500 Index surging to a record high that was driven by performance in a select group of mega-cap technology companies. The U.S. Federal Reserve (Fed) began easing monetary policy with an interest-rate cut of 50 basis points in September 2024 in an effort to generate a soft landing for the economy. Markets were also kept on edge in the third quarter of 2024 due to the anticipated extremely close presidential race between Vice President Kamala Harris and former President Donald Trump. Fund performance described below is relative to the S&P 500 Index for the trailing twelve-month period ended October 31, 2024.
Top Contributors to Performance
Underweight allocations to the Energy, Materials, and Consumer Staples sectors contributed positively to relative performance.
Security selection within the Information Technology, Communication Services, and Health Care sectors contributed positively to performance.
Top individual contributors over the period were an underweight position in GE Vernova (Industrials) and overweight positions in Broadcom (Information Technology) and American Express (Financials).
Top Detractors to Performance
Sector allocation, a result of our bottom-up stock selection process, was the main detractor from relative performance during the period, due to overweight allocations to the Healthcare and Financials sectors and an underweight to the Information Technology sector.
Security selection slightly detracted from relative performance during the period, driven by weak selection within the Consumer Staples, Consumer Discretionary, and Energy sectors.
The largest individual detractors over the period were overweight positions in Estee Lauder (Consumer Staples), UnitedHealth Group (Healthcare), and EOG Resources (Energy).
The views expressed in this section reflect the opinions of the Fund's sub-adviser, Wellington Management Company LLP, as of the date of this report and are subject to change based on changes in market, economic or other conditions. These views are not intended to be a forecast of future events and are no guarantee of future results.
Comparison of Change in Value of $ 10,000 Investment
The graph below represents the hypothetical growth of a $10,000 investment in Class R6 shares and the comparative index.
Average Annual Total Returns
For the Periods Ended October 31, 2024 | 1 Year | 5 Years | 10 Years |
| Class R6 | 36.96% | 13.73% | 12.86% |
| S&P 500 Index | 38.02% | 15.27% | 13.00% |
Class R6 shares commenced operations on March 31, 2015 and performance prior to that date is that of the Fund’s Class Y shares. Performance prior to the inception date of the class has not been adjusted to reflect the operating expenses of the class.
The Fund’s past performance is not a good predictor of the Fund’s future performance. The graph and table do not reflect the deduction of taxes that a shareholder would pay on Fund distributions or redemption of Fund shares. Performance information reflects fee waivers and/or expense limitation arrangements, if any. Absent any applicable fee waivers and/or expense limitation arrangements, performance would have been lower. Visit hartfordfunds.com for the most recent performance information.
Key Fund Statistics as of October 31, 2024
| Fund's net assets | $10,526,102,511% |
| Total number of portfolio holdings (excluding derivatives, if any) | $71% |
| Total investment management fees paid | $33,189,460% |
| Portfolio turnover rate | $27% |
Graphical Representation of Holdings as of October 31, 2024
The table below shows the investment makeup of the Fund, representing the percentage of net assets of the Fund.
| Information Technology | 31.8 | % |
| Financials | 12.9 | % |
| Health Care | 12.6 | % |
| Consumer Discretionary | 10.3 | % |
| Industrials | 9.4 | % |
| Communication Services | 8.5 | % |
| Consumer Staples | 4.0 | % |
| Utilities | 3.2 | % |
| Energy | 2.8 | % |
| Real Estate | 2.4 | % |
| Materials | 1.6 | % |
| Short-Term Investments | 0.1 | % |
| Other Assets & Liabilities | 0.4 | % |
| Total | 100.0 | % |
* | For Fund compliance purposes, the Fund may not use the same classification system. These classifications are used for financial reporting purposes. |
Availability of Additional Information
For additional information about the Fund, including its prospectus, financial information, holdings, and proxy voting information, please visit the Fund’s website at the website address included at the beginning of this report.
The Fund is distributed by Hartford Funds Distributors, LLC (HFD).
Annual Shareholder Report
October 31, 2024
Hartford Core Equity Fund
Class Y/HGIYX
This annual shareholder report contains important information about the Hartford Core Equity Fund (the "Fund") for the period of November 1, 2023 to October 31, 2024. You can find additional information about the Fund at hartfordfunds.com/reports-hmf. You can also request this information by contacting us by calling 1‑888‑843‑7824.
What were the Fund costs for the last year?
(Based on a hypothetical $10,000 investment)
| Class Name | Costs of a $10,000 investment | Costs paid as a percentage
of a $10,000 investment |
| Class Y | $53 | 0.45% |
How did the Fund perform last year and what impacted its performance?
Management's Discussion of Fund Performance
United States (U.S.) equities, as measured by the S&P 500 Index, rose over the trailing twelve-month period ending October 31, 2024, with the S&P 500 Index surging to a record high that was driven by performance in a select group of mega-cap technology companies. The U.S. Federal Reserve (Fed) began easing monetary policy with an interest-rate cut of 50 basis points in September 2024 in an effort to generate a soft landing for the economy. Markets were also kept on edge in the third quarter of 2024 due to the anticipated extremely close presidential race between Vice President Kamala Harris and former President Donald Trump. Fund performance described below is relative to the S&P 500 Index for the trailing twelve-month period ended October 31, 2024.
Top Contributors to Performance
Underweight allocations to the Energy, Materials, and Consumer Staples sectors contributed positively to relative performance.
Security selection within the Information Technology, Communication Services, and Health Care sectors contributed positively to performance.
Top individual contributors over the period were an underweight position in GE Vernova (Industrials) and overweight positions in Broadcom (Information Technology) and American Express (Financials).
Top Detractors to Performance
Sector allocation, a result of our bottom-up stock selection process, was the main detractor from relative performance during the period, due to overweight allocations to the Healthcare and Financials sectors and an underweight to the Information Technology sector.
Security selection slightly detracted from relative performance during the period, driven by weak selection within the Consumer Staples, Consumer Discretionary, and Energy sectors.
The largest individual detractors over the period were overweight positions in Estee Lauder (Consumer Staples), UnitedHealth Group (Healthcare), and EOG Resources (Energy).
The views expressed in this section reflect the opinions of the Fund's sub-adviser, Wellington Management Company LLP, as of the date of this report and are subject to change based on changes in market, economic or other conditions. These views are not intended to be a forecast of future events and are no guarantee of future results.
Comparison of Change in Value of $ 250,000 Investment
The graph below represents the hypothetical growth of a $250,000 investment in Class Y shares and the comparative index.
Average Annual Total Returns
For the Periods Ended October 31, 2024 | 1 Year | 5 Years | 10 Years |
| Class Y | 36.84% | 13.64% | 12.81% |
| S&P 500 Index | 38.02% | 15.27% | 13.00% |
The Fund’s past performance is not a good predictor of the Fund’s future performance. The graph and table do not reflect the deduction of taxes that a shareholder would pay on Fund distributions or redemption of Fund shares. Performance information reflects fee waivers and/or expense limitation arrangements, if any. Absent any applicable fee waivers and/or expense limitation arrangements, performance would have been lower. Visit hartfordfunds.com for the most recent performance information.
Key Fund Statistics as of October 31, 2024
| Fund's net assets | $10,526,102,511% |
| Total number of portfolio holdings (excluding derivatives, if any) | $71% |
| Total investment management fees paid | $33,189,460% |
| Portfolio turnover rate | $27% |
Graphical Representation of Holdings as of October 31, 2024
The table below shows the investment makeup of the Fund, representing the percentage of net assets of the Fund.
| Information Technology | 31.8 | % |
| Financials | 12.9 | % |
| Health Care | 12.6 | % |
| Consumer Discretionary | 10.3 | % |
| Industrials | 9.4 | % |
| Communication Services | 8.5 | % |
| Consumer Staples | 4.0 | % |
| Utilities | 3.2 | % |
| Energy | 2.8 | % |
| Real Estate | 2.4 | % |
| Materials | 1.6 | % |
| Short-Term Investments | 0.1 | % |
| Other Assets & Liabilities | 0.4 | % |
| Total | 100.0 | % |
* | For Fund compliance purposes, the Fund may not use the same classification system. These classifications are used for financial reporting purposes. |
Availability of Additional Information
For additional information about the Fund, including its prospectus, financial information, holdings, and proxy voting information, please visit the Fund’s website at the website address included at the beginning of this report.
The Fund is distributed by Hartford Funds Distributors, LLC (HFD).
Annual Shareholder Report
October 31, 2024
Hartford Core Equity Fund
Class F/HGIFX
This annual shareholder report contains important information about the Hartford Core Equity Fund (the "Fund") for the period of November 1, 2023 to October 31, 2024. You can find additional information about the Fund at hartfordfunds.com/reports-hmf. You can also request this information by contacting us by calling 1‑888‑843‑7824.
What were the Fund costs for the last year?
(Based on a hypothetical $10,000 investment)
| Class Name | Costs of a $10,000 investment | Costs paid as a percentage
of a $10,000 investment |
| Class F | $43 | 0.36% |
How did the Fund perform last year and what impacted its performance?
Management's Discussion of Fund Performance
United States (U.S.) equities, as measured by the S&P 500 Index, rose over the trailing twelve-month period ending October 31, 2024, with the S&P 500 Index surging to a record high that was driven by performance in a select group of mega-cap technology companies. The U.S. Federal Reserve (Fed) began easing monetary policy with an interest-rate cut of 50 basis points in September 2024 in an effort to generate a soft landing for the economy. Markets were also kept on edge in the third quarter of 2024 due to the anticipated extremely close presidential race between Vice President Kamala Harris and former President Donald Trump. Fund performance described below is relative to the S&P 500 Index for the trailing twelve-month period ended October 31, 2024.
Top Contributors to Performance
Underweight allocations to the Energy, Materials, and Consumer Staples sectors contributed positively to relative performance.
Security selection within the Information Technology, Communication Services, and Health Care sectors contributed positively to performance.
Top individual contributors over the period were an underweight position in GE Vernova (Industrials) and overweight positions in Broadcom (Information Technology) and American Express (Financials).
Top Detractors to Performance
Sector allocation, a result of our bottom-up stock selection process, was the main detractor from relative performance during the period, due to overweight allocations to the Healthcare and Financials sectors and an underweight to the Information Technology sector.
Security selection slightly detracted from relative performance during the period, driven by weak selection within the Consumer Staples, Consumer Discretionary, and Energy sectors.
The largest individual detractors over the period were overweight positions in Estee Lauder (Consumer Staples), UnitedHealth Group (Healthcare), and EOG Resources (Energy).
The views expressed in this section reflect the opinions of the Fund's sub-adviser, Wellington Management Company LLP, as of the date of this report and are subject to change based on changes in market, economic or other conditions. These views are not intended to be a forecast of future events and are no guarantee of future results.
Comparison of Change in Value of $ 1,000,000 Investment
The graph below represents the hypothetical growth of a $1,000,000 investment in Class F shares and the comparative index.
Average Annual Total Returns
For the Periods Ended October 31, 2024 | 1 Year | 5 Years | 10 Years |
| Class F | 36.96% | 13.73% | 12.83% |
| S&P 500 Index | 38.02% | 15.27% | 13.00% |
Class F shares commenced operations on February 28, 2017 and performance prior to February 28, 2017 reflects the performance of the Fund's Class I shares from March 31, 2015 through February 27, 2017 and the Fund's Class A shares (excluding sales charges) prior to March 31, 2015. Performance prior to the inception date of the class has not been adjusted to reflect the operating expenses of the class.
The Fund’s past performance is not a good predictor of the Fund’s future performance. The graph and table do not reflect the deduction of taxes that a shareholder would pay on Fund distributions or redemption of Fund shares. Performance information reflects fee waivers and/or expense limitation arrangements, if any. Absent any applicable fee waivers and/or expense limitation arrangements, performance would have been lower. Visit hartfordfunds.com for the most recent performance information.
Key Fund Statistics as of October 31, 2024
| Fund's net assets | $10,526,102,511% |
| Total number of portfolio holdings (excluding derivatives, if any) | $71% |
| Total investment management fees paid | $33,189,460% |
| Portfolio turnover rate | $27% |
Graphical Representation of Holdings as of October 31, 2024
The table below shows the investment makeup of the Fund, representing the percentage of net assets of the Fund.
| Information Technology | 31.8 | % |
| Financials | 12.9 | % |
| Health Care | 12.6 | % |
| Consumer Discretionary | 10.3 | % |
| Industrials | 9.4 | % |
| Communication Services | 8.5 | % |
| Consumer Staples | 4.0 | % |
| Utilities | 3.2 | % |
| Energy | 2.8 | % |
| Real Estate | 2.4 | % |
| Materials | 1.6 | % |
| Short-Term Investments | 0.1 | % |
| Other Assets & Liabilities | 0.4 | % |
| Total | 100.0 | % |
* | For Fund compliance purposes, the Fund may not use the same classification system. These classifications are used for financial reporting purposes. |
Availability of Additional Information
For additional information about the Fund, including its prospectus, financial information, holdings, and proxy voting information, please visit the Fund’s website at the website address included at the beginning of this report.
The Fund is distributed by Hartford Funds Distributors, LLC (HFD).
Annual Shareholder Report
October 31, 2024
The Hartford Dividend and Growth Fund
Class A/IHGIX
This annual shareholder report contains important information about The Hartford Dividend and Growth Fund (the "Fund") for the period of November 1, 2023 to October 31, 2024. You can find additional information about the Fund at hartfordfunds.com/reports-hmf. You can also request this information by contacting us by calling 1‑888‑843‑7824.
What were the Fund costs for the last year?
(Based on a hypothetical $10,000 investment)
| Class Name | Costs of a $10,000 investment | Costs paid as a percentage
of a $10,000 investment |
| Class A | $108 | 0.95% |
How did the Fund perform last year and what impacted its performance?
Management's Discussion of Fund Performance
United States (U.S.) equities, as measured by the S&P 500 Index, rose over the trailing twelve-month period ending October 31, 2024, with the S&P 500 Index surging to a record high that was driven by performance in a select group of mega-cap technology companies. The U.S. Federal Reserve (Fed) began easing monetary policy with an interest-rate cut of 50 basis points in September in an effort to generate a soft landing for the economy. Markets were also kept on edge in the third quarter of 2024 due to the anticipated extremely close presidential race between Vice President Kamala Harris and former President Donald Trump. Fund performance described below is relative to the S&P 500 Index for the trailing twelve-month period ended October 31, 2024.
Top Contributors to Performance
Security selection within the Financials, Consumer Staples, and Consumer Discretionary sectors contributed positively to relative performance.
The Fund’s underweight allocation to the Consumer Discretionary sector and overweight to the Financials sector also contributed to relative performance.
Top individual contributors over the period were overweight positions in Micron Technology (Information Technology), Wells Fargo (Financials), and American Express (Financials).
Top Detractors to Performance
Security selection was the primary detractor to relative performance during the period, driven by weak selection within the Information Technology, Communication Services, and Healthcare sectors.
The largest individual detractors over the period were not owning NVIDIA (Information Technology), Meta Platforms (Communication Services), and an out-of-benchmark position in TotalEnergies (Energy).
Sector allocation, a result of our bottom-up stock selection process, was also a detractor to relative performance during the period due to the Fund’s underweight allocation to the Information Technology sector and overweight allocation to the Energy sector.
The views expressed in this section reflect the opinions of the Fund's sub-adviser, Wellington Management Company LLP, as of the date of this report and are subject to change based on changes in market, economic or other conditions. These views are not intended to be a forecast of future events and are no guarantee of future results.
Comparison of Change in Value of $ 10,000 Investment
The graph below represents the hypothetical growth of a $10,000 investment in Class A shares and the comparative indices. The returns for Class A shares include the maximum front-end sales charge applicable to Class A shares.
Average Annual Total Returns
For the Periods Ended October 31, 2024 | 1 Year | 5 Years | 10 Years |
| Class A (with 5.50% maximum front-end sales charge) | 20.81% | 10.65% | 9.91% |
| Class A (without 5.50% maximum front-end sales charge) | 27.84% | 11.91% | 10.53% |
| S&P 500 Index | 38.02% | 15.27% | 13.00% |
| Russell 1000 Value Index | 30.98% | 10.14% | 8.87% |
The S&P 500 Index serves as the Fund’s performance and regulatory index and provides a broad measure of market performance. The Russell 1000 Value Index serves as the Fund’s secondary performance index.
The Fund’s past performance is not a good predictor of the Fund’s future performance. The graph and table do not reflect the deduction of taxes that a shareholder would pay on Fund distributions or redemption of Fund shares. Performance information reflects fee waivers and/or expense limitation arrangements, if any. Absent any applicable fee waivers and/or expense limitation arrangements, performance would have been lower. Visit hartfordfunds.com for the most recent performance information.
Key Fund Statistics as of October 31, 2024
| Fund's net assets | $18,445,872,719% |
| Total number of portfolio holdings (excluding derivatives, if any) | $78% |
| Total investment management fees paid | $102,749,122% |
| Portfolio turnover rate | $28% |
Graphical Representation of Holdings as of October 31, 2024
The table below shows the investment makeup of the Fund, representing the percentage of net assets of the Fund.
| Information Technology | 17.5 | % |
| Financials | 16.7 | % |
| Health Care | 13.8 | % |
| Industrials | 9.8 | % |
| Communication Services | 7.2 | % |
| Energy | 7.2 | % |
| Consumer Staples | 7.1 | % |
| Utilities | 5.8 | % |
| Consumer Discretionary | 4.4 | % |
| Materials | 4.3 | % |
| Real Estate | 2.6 | % |
| Short-Term Investments | 1.1 | % |
| Other Assets & Liabilities | 2.5 | % |
| Total | 100.0 | % |
* | For Fund compliance purposes, the Fund may not use the same classification system. These classifications are used for financial reporting purposes. |
Availability of Additional Information
For additional information about the Fund, including its prospectus, financial information, holdings, and proxy voting information, please visit the Fund’s website at the website address included at the beginning of this report.
The Fund is distributed by Hartford Funds Distributors, LLC (HFD).
Annual Shareholder Report
October 31, 2024
The Hartford Dividend and Growth Fund
Class C/HDGCX
This annual shareholder report contains important information about The Hartford Dividend and Growth Fund (the "Fund") for the period of November 1, 2023 to October 31, 2024. You can find additional information about the Fund at hartfordfunds.com/reports-hmf. You can also request this information by contacting us by calling 1‑888‑843‑7824.
What were the Fund costs for the last year?
(Based on a hypothetical $10,000 investment)
| Class Name | Costs of a $10,000 investment | Costs paid as a percentage
of a $10,000 investment |
| Class C | $196 | 1.73% |
How did the Fund perform last year and what impacted its performance?
Management's Discussion of Fund Performance
United States (U.S.) equities, as measured by the S&P 500 Index, rose over the trailing twelve-month period ending October 31, 2024, with the S&P 500 Index surging to a record high that was driven by performance in a select group of mega-cap technology companies. The U.S. Federal Reserve (Fed) began easing monetary policy with an interest-rate cut of 50 basis points in September in an effort to generate a soft landing for the economy. Markets were also kept on edge in the third quarter of 2024 due to the anticipated extremely close presidential race between Vice President Kamala Harris and former President Donald Trump. Fund performance described below is relative to the S&P 500 Index for the trailing twelve-month period ended October 31, 2024.
Top Contributors to Performance
Security selection within the Financials, Consumer Staples, and Consumer Discretionary sectors contributed positively to relative performance.
The Fund’s underweight allocation to the Consumer Discretionary sector and overweight to the Financials sector also contributed to relative performance.
Top individual contributors over the period were overweight positions in Micron Technology (Information Technology), Wells Fargo (Financials), and American Express (Financials).
Top Detractors to Performance
Security selection was the primary detractor to relative performance during the period, driven by weak selection within the Information Technology, Communication Services, and Healthcare sectors.
The largest individual detractors over the period were not owning NVIDIA (Information Technology), Meta Platforms (Communication Services), and an out-of-benchmark position in TotalEnergies (Energy).
Sector allocation, a result of our bottom-up stock selection process, was also a detractor to relative performance during the period due to the Fund’s underweight allocation to the Information Technology sector and overweight allocation to the Energy sector.
The views expressed in this section reflect the opinions of the Fund's sub-adviser, Wellington Management Company LLP, as of the date of this report and are subject to change based on changes in market, economic or other conditions. These views are not intended to be a forecast of future events and are no guarantee of future results.
Comparison of Change in Value of $ 10,000 Investment
The graph below represents the hypothetical growth of a $10,000 investment in Class C shares (excluding sales charges) and the comparative indices. If sales charges had been included, the value would have been lower.
Average Annual Total Returns
For the Periods Ended October 31, 2024 | 1 Year | 5 Years | 10 Years |
| Class C (with 1.00% contingent deferred sales charge) | 25.84% | 11.04% | 9.69% |
| Class C (without 1.00% contingent deferred sales charge) | 26.84% | 11.04% | 9.69% |
| S&P 500 Index | 38.02% | 15.27% | 13.00% |
| Russell 1000 Value Index | 30.98% | 10.14% | 8.87% |
The S&P 500 Index serves as the Fund’s performance and regulatory index and provides a broad measure of market performance. The Russell 1000 Value Index serves as the Fund’s secondary performance index.
The Fund’s past performance is not a good predictor of the Fund’s future performance. The graph and table do not reflect the deduction of taxes that a shareholder would pay on Fund distributions or redemption of Fund shares. Performance information reflects fee waivers and/or expense limitation arrangements, if any. Absent any applicable fee waivers and/or expense limitation arrangements, performance would have been lower. Visit hartfordfunds.com for the most recent performance information.
Key Fund Statistics as of October 31, 2024
| Fund's net assets | $18,445,872,719% |
| Total number of portfolio holdings (excluding derivatives, if any) | $78% |
| Total investment management fees paid | $102,749,122% |
| Portfolio turnover rate | $28% |
Graphical Representation of Holdings as of October 31, 2024
The table below shows the investment makeup of the Fund, representing the percentage of net assets of the Fund.
| Information Technology | 17.5 | % |
| Financials | 16.7 | % |
| Health Care | 13.8 | % |
| Industrials | 9.8 | % |
| Communication Services | 7.2 | % |
| Energy | 7.2 | % |
| Consumer Staples | 7.1 | % |
| Utilities | 5.8 | % |
| Consumer Discretionary | 4.4 | % |
| Materials | 4.3 | % |
| Real Estate | 2.6 | % |
| Short-Term Investments | 1.1 | % |
| Other Assets & Liabilities | 2.5 | % |
| Total | 100.0 | % |
* | For Fund compliance purposes, the Fund may not use the same classification system. These classifications are used for financial reporting purposes. |
Availability of Additional Information
For additional information about the Fund, including its prospectus, financial information, holdings, and proxy voting information, please visit the Fund’s website at the website address included at the beginning of this report.
The Fund is distributed by Hartford Funds Distributors, LLC (HFD).
Annual Shareholder Report
October 31, 2024
The Hartford Dividend and Growth Fund
Class I/HDGIX
This annual shareholder report contains important information about The Hartford Dividend and Growth Fund (the "Fund") for the period of November 1, 2023 to October 31, 2024. You can find additional information about the Fund at hartfordfunds.com/reports-hmf. You can also request this information by contacting us by calling 1‑888‑843‑7824.
This report describes changes to the Fund that occurred during the reporting period.
What were the Fund costs for the last year?
(Based on a hypothetical $10,000 investment)
| Class Name | Costs of a $10,000 investment | Costs paid as a percentage
of a $10,000 investment |
| Class I | $82 | 0.72% |
How did the Fund perform last year and what impacted its performance?
Management's Discussion of Fund Performance
United States (U.S.) equities, as measured by the S&P 500 Index, rose over the trailing twelve-month period ending October 31, 2024, with the S&P 500 Index surging to a record high that was driven by performance in a select group of mega-cap technology companies. The U.S. Federal Reserve (Fed) began easing monetary policy with an interest-rate cut of 50 basis points in September in an effort to generate a soft landing for the economy. Markets were also kept on edge in the third quarter of 2024 due to the anticipated extremely close presidential race between Vice President Kamala Harris and former President Donald Trump. Fund performance described below is relative to the S&P 500 Index for the trailing twelve-month period ended October 31, 2024.
Top Contributors to Performance
Security selection within the Financials, Consumer Staples, and Consumer Discretionary sectors contributed positively to relative performance.
The Fund’s underweight allocation to the Consumer Discretionary sector and overweight to the Financials sector also contributed to relative performance.
Top individual contributors over the period were overweight positions in Micron Technology (Information Technology), Wells Fargo (Financials), and American Express (Financials).
Top Detractors to Performance
Security selection was the primary detractor to relative performance during the period, driven by weak selection within the Information Technology, Communication Services, and Healthcare sectors.
The largest individual detractors over the period were not owning NVIDIA (Information Technology), Meta Platforms (Communication Services), and an out-of-benchmark position in TotalEnergies (Energy).
Sector allocation, a result of our bottom-up stock selection process, was also a detractor to relative performance during the period due to the Fund’s underweight allocation to the Information Technology sector and overweight allocation to the Energy sector.
The views expressed in this section reflect the opinions of the Fund's sub-adviser, Wellington Management Company LLP, as of the date of this report and are subject to change based on changes in market, economic or other conditions. These views are not intended to be a forecast of future events and are no guarantee of future results.
Comparison of Change in Value of $ 10,000 Investment
The graph below represents the hypothetical growth of a $10,000 investment in Class I shares and the comparative indices.
Average Annual Total Returns
For the Periods Ended October 31, 2024 | 1 Year | 5 Years | 10 Years |
| Class I | 28.15% | 12.19% | 10.80% |
| S&P 500 Index | 38.02% | 15.27% | 13.00% |
| Russell 1000 Value Index | 30.98% | 10.14% | 8.87% |
The S&P 500 Index serves as the Fund’s performance and regulatory index and provides a broad measure of market performance. The Russell 1000 Value Index serves as the Fund’s secondary performance index.
The Fund’s past performance is not a good predictor of the Fund’s future performance. The graph and table do not reflect the deduction of taxes that a shareholder would pay on Fund distributions or redemption of Fund shares. Performance information reflects fee waivers and/or expense limitation arrangements, if any. Absent any applicable fee waivers and/or expense limitation arrangements, performance would have been lower. Visit hartfordfunds.com for the most recent performance information.
Key Fund Statistics as of October 31, 2024
| Fund's net assets | $18,445,872,719% |
| Total number of portfolio holdings (excluding derivatives, if any) | $78% |
| Total investment management fees paid | $102,749,122% |
| Portfolio turnover rate | $28% |
Graphical Representation of Holdings as of October 31, 2024
The table below shows the investment makeup of the Fund, representing the percentage of net assets of the Fund.
| Information Technology | 17.5 | % |
| Financials | 16.7 | % |
| Health Care | 13.8 | % |
| Industrials | 9.8 | % |
| Communication Services | 7.2 | % |
| Energy | 7.2 | % |
| Consumer Staples | 7.1 | % |
| Utilities | 5.8 | % |
| Consumer Discretionary | 4.4 | % |
| Materials | 4.3 | % |
| Real Estate | 2.6 | % |
| Short-Term Investments | 1.1 | % |
| Other Assets & Liabilities | 2.5 | % |
| Total | 100.0 | % |
* | For Fund compliance purposes, the Fund may not use the same classification system. These classifications are used for financial reporting purposes. |
Material Fund Changes
This is a summary of certain changes to the Fund since the beginning of the reporting period.
Effective July 1, 2024, Hartford Administrative Services Company, the Fund’s transfer agent, contractually agreed to waive its transfer agency fee and/or reimburse transfer agency-related expenses to the extent necessary to limit the transfer agency fee for Class I of the Fund as follows: 0.105% of the average daily net assets attributable to the class. This contractual arrangement will remain in effect until February 28, 2025 unless the Board of Directors of the Fund approves its earlier termination.
Availability of Additional Information
For additional information about the Fund, including its prospectus, financial information, holdings, and proxy voting information, please visit the Fund’s website at the website address included at the beginning of this report.
The Fund is distributed by Hartford Funds Distributors, LLC (HFD).
Annual Shareholder Report
October 31, 2024
The Hartford Dividend and Growth Fund
Class R3/HDGRX
This annual shareholder report contains important information about The Hartford Dividend and Growth Fund (the "Fund") for the period of November 1, 2023 to October 31, 2024. You can find additional information about the Fund at hartfordfunds.com/reports-hmf. You can also request this information by contacting us by calling 1‑888‑843‑7824.
What were the Fund costs for the last year?
(Based on a hypothetical $10,000 investment)
| Class Name | Costs of a $10,000 investment | Costs paid as a percentage
of a $10,000 investment |
| Class R3 | $152 | 1.34% |
How did the Fund perform last year and what impacted its performance?
Management's Discussion of Fund Performance
United States (U.S.) equities, as measured by the S&P 500 Index, rose over the trailing twelve-month period ending October 31, 2024, with the S&P 500 Index surging to a record high that was driven by performance in a select group of mega-cap technology companies. The U.S. Federal Reserve (Fed) began easing monetary policy with an interest-rate cut of 50 basis points in September in an effort to generate a soft landing for the economy. Markets were also kept on edge in the third quarter of 2024 due to the anticipated extremely close presidential race between Vice President Kamala Harris and former President Donald Trump. Fund performance described below is relative to the S&P 500 Index for the trailing twelve-month period ended October 31, 2024.
Top Contributors to Performance
Security selection within the Financials, Consumer Staples, and Consumer Discretionary sectors contributed positively to relative performance.
The Fund’s underweight allocation to the Consumer Discretionary sector and overweight to the Financials sector also contributed to relative performance.
Top individual contributors over the period were overweight positions in Micron Technology (Information Technology), Wells Fargo (Financials), and American Express (Financials).
Top Detractors to Performance
Security selection was the primary detractor to relative performance during the period, driven by weak selection within the Information Technology, Communication Services, and Healthcare sectors.
The largest individual detractors over the period were not owning NVIDIA (Information Technology), Meta Platforms (Communication Services), and an out-of-benchmark position in TotalEnergies (Energy).
Sector allocation, a result of our bottom-up stock selection process, was also a detractor to relative performance during the period due to the Fund’s underweight allocation to the Information Technology sector and overweight allocation to the Energy sector.
The views expressed in this section reflect the opinions of the Fund's sub-adviser, Wellington Management Company LLP, as of the date of this report and are subject to change based on changes in market, economic or other conditions. These views are not intended to be a forecast of future events and are no guarantee of future results.
Comparison of Change in Value of $ 10,000 Investment
The graph below represents the hypothetical growth of a $10,000 investment in Class R3 shares and the comparative indices.
Average Annual Total Returns
For the Periods Ended October 31, 2024 | 1 Year | 5 Years | 10 Years |
| Class R3 | 27.34% | 11.49% | 10.13% |
| S&P 500 Index | 38.02% | 15.27% | 13.00% |
| Russell 1000 Value Index | 30.98% | 10.14% | 8.87% |
The S&P 500 Index serves as the Fund’s performance and regulatory index and provides a broad measure of market performance. The Russell 1000 Value Index serves as the Fund’s secondary performance index.
The Fund’s past performance is not a good predictor of the Fund’s future performance. The graph and table do not reflect the deduction of taxes that a shareholder would pay on Fund distributions or redemption of Fund shares. Performance information reflects fee waivers and/or expense limitation arrangements, if any. Absent any applicable fee waivers and/or expense limitation arrangements, performance would have been lower. Visit hartfordfunds.com for the most recent performance information.
Key Fund Statistics as of October 31, 2024
| Fund's net assets | $18,445,872,719% |
| Total number of portfolio holdings (excluding derivatives, if any) | $78% |
| Total investment management fees paid | $102,749,122% |
| Portfolio turnover rate | $28% |
Graphical Representation of Holdings as of October 31, 2024
The table below shows the investment makeup of the Fund, representing the percentage of net assets of the Fund.
| Information Technology | 17.5 | % |
| Financials | 16.7 | % |
| Health Care | 13.8 | % |
| Industrials | 9.8 | % |
| Communication Services | 7.2 | % |
| Energy | 7.2 | % |
| Consumer Staples | 7.1 | % |
| Utilities | 5.8 | % |
| Consumer Discretionary | 4.4 | % |
| Materials | 4.3 | % |
| Real Estate | 2.6 | % |
| Short-Term Investments | 1.1 | % |
| Other Assets & Liabilities | 2.5 | % |
| Total | 100.0 | % |
* | For Fund compliance purposes, the Fund may not use the same classification system. These classifications are used for financial reporting purposes. |
Availability of Additional Information
For additional information about the Fund, including its prospectus, financial information, holdings, and proxy voting information, please visit the Fund’s website at the website address included at the beginning of this report.
The Fund is distributed by Hartford Funds Distributors, LLC (HFD).
Annual Shareholder Report
October 31, 2024
The Hartford Dividend and Growth Fund
Class R4/HDGSX
This annual shareholder report contains important information about The Hartford Dividend and Growth Fund (the "Fund") for the period of November 1, 2023 to October 31, 2024. You can find additional information about the Fund at hartfordfunds.com/reports-hmf. You can also request this information by contacting us by calling 1‑888‑843‑7824.
What were the Fund costs for the last year?
(Based on a hypothetical $10,000 investment)
| Class Name | Costs of a $10,000 investment | Costs paid as a percentage
of a $10,000 investment |
| Class R4 | $117 | 1.03% |
How did the Fund perform last year and what impacted its performance?
Management's Discussion of Fund Performance
United States (U.S.) equities, as measured by the S&P 500 Index, rose over the trailing twelve-month period ending October 31, 2024, with the S&P 500 Index surging to a record high that was driven by performance in a select group of mega-cap technology companies. The U.S. Federal Reserve (Fed) began easing monetary policy with an interest-rate cut of 50 basis points in September in an effort to generate a soft landing for the economy. Markets were also kept on edge in the third quarter of 2024 due to the anticipated extremely close presidential race between Vice President Kamala Harris and former President Donald Trump. Fund performance described below is relative to the S&P 500 Index for the trailing twelve-month period ended October 31, 2024.
Top Contributors to Performance
Security selection within the Financials, Consumer Staples, and Consumer Discretionary sectors contributed positively to relative performance.
The Fund’s underweight allocation to the Consumer Discretionary sector and overweight to the Financials sector also contributed to relative performance.
Top individual contributors over the period were overweight positions in Micron Technology (Information Technology), Wells Fargo (Financials), and American Express (Financials).
Top Detractors to Performance
Security selection was the primary detractor to relative performance during the period, driven by weak selection within the Information Technology, Communication Services, and Healthcare sectors.
The largest individual detractors over the period were not owning NVIDIA (Information Technology), Meta Platforms (Communication Services), and an out-of-benchmark position in TotalEnergies (Energy).
Sector allocation, a result of our bottom-up stock selection process, was also a detractor to relative performance during the period due to the Fund’s underweight allocation to the Information Technology sector and overweight allocation to the Energy sector.
The views expressed in this section reflect the opinions of the Fund's sub-adviser, Wellington Management Company LLP, as of the date of this report and are subject to change based on changes in market, economic or other conditions. These views are not intended to be a forecast of future events and are no guarantee of future results.
Comparison of Change in Value of $ 10,000 Investment
The graph below represents the hypothetical growth of a $10,000 investment in Class R4 shares and the comparative indices.
Average Annual Total Returns
For the Periods Ended October 31, 2024 | 1 Year | 5 Years | 10 Years |
| Class R4 | 27.73% | 11.83% | 10.47% |
| S&P 500 Index | 38.02% | 15.27% | 13.00% |
| Russell 1000 Value Index | 30.98% | 10.14% | 8.87% |
The S&P 500 Index serves as the Fund’s performance and regulatory index and provides a broad measure of market performance. The Russell 1000 Value Index serves as the Fund’s secondary performance index.
The Fund’s past performance is not a good predictor of the Fund’s future performance. The graph and table do not reflect the deduction of taxes that a shareholder would pay on Fund distributions or redemption of Fund shares. Performance information reflects fee waivers and/or expense limitation arrangements, if any. Absent any applicable fee waivers and/or expense limitation arrangements, performance would have been lower. Visit hartfordfunds.com for the most recent performance information.
Key Fund Statistics as of October 31, 2024
| Fund's net assets | $18,445,872,719% |
| Total number of portfolio holdings (excluding derivatives, if any) | $78% |
| Total investment management fees paid | $102,749,122% |
| Portfolio turnover rate | $28% |
Graphical Representation of Holdings as of October 31, 2024
The table below shows the investment makeup of the Fund, representing the percentage of net assets of the Fund.
| Information Technology | 17.5 | % |
| Financials | 16.7 | % |
| Health Care | 13.8 | % |
| Industrials | 9.8 | % |
| Communication Services | 7.2 | % |
| Energy | 7.2 | % |
| Consumer Staples | 7.1 | % |
| Utilities | 5.8 | % |
| Consumer Discretionary | 4.4 | % |
| Materials | 4.3 | % |
| Real Estate | 2.6 | % |
| Short-Term Investments | 1.1 | % |
| Other Assets & Liabilities | 2.5 | % |
| Total | 100.0 | % |
* | For Fund compliance purposes, the Fund may not use the same classification system. These classifications are used for financial reporting purposes. |
Availability of Additional Information
For additional information about the Fund, including its prospectus, financial information, holdings, and proxy voting information, please visit the Fund’s website at the website address included at the beginning of this report.
The Fund is distributed by Hartford Funds Distributors, LLC (HFD).
Annual Shareholder Report
October 31, 2024
The Hartford Dividend and Growth Fund
Class R5/HDGTX
This annual shareholder report contains important information about The Hartford Dividend and Growth Fund (the "Fund") for the period of November 1, 2023 to October 31, 2024. You can find additional information about the Fund at hartfordfunds.com/reports-hmf. You can also request this information by contacting us by calling 1‑888‑843‑7824.
What were the Fund costs for the last year?
(Based on a hypothetical $10,000 investment)
| Class Name | Costs of a $10,000 investment | Costs paid as a percentage
of a $10,000 investment |
| Class R5 | $83 | 0.73% |
How did the Fund perform last year and what impacted its performance?
Management's Discussion of Fund Performance
United States (U.S.) equities, as measured by the S&P 500 Index, rose over the trailing twelve-month period ending October 31, 2024, with the S&P 500 Index surging to a record high that was driven by performance in a select group of mega-cap technology companies. The U.S. Federal Reserve (Fed) began easing monetary policy with an interest-rate cut of 50 basis points in September in an effort to generate a soft landing for the economy. Markets were also kept on edge in the third quarter of 2024 due to the anticipated extremely close presidential race between Vice President Kamala Harris and former President Donald Trump. Fund performance described below is relative to the S&P 500 Index for the trailing twelve-month period ended October 31, 2024.
Top Contributors to Performance
Security selection within the Financials, Consumer Staples, and Consumer Discretionary sectors contributed positively to relative performance.
The Fund’s underweight allocation to the Consumer Discretionary sector and overweight to the Financials sector also contributed to relative performance.
Top individual contributors over the period were overweight positions in Micron Technology (Information Technology), Wells Fargo (Financials), and American Express (Financials).
Top Detractors to Performance
Security selection was the primary detractor to relative performance during the period, driven by weak selection within the Information Technology, Communication Services, and Healthcare sectors.
The largest individual detractors over the period were not owning NVIDIA (Information Technology), Meta Platforms (Communication Services), and an out-of-benchmark position in TotalEnergies (Energy).
Sector allocation, a result of our bottom-up stock selection process, was also a detractor to relative performance during the period due to the Fund’s underweight allocation to the Information Technology sector and overweight allocation to the Energy sector.
The views expressed in this section reflect the opinions of the Fund's sub-adviser, Wellington Management Company LLP, as of the date of this report and are subject to change based on changes in market, economic or other conditions. These views are not intended to be a forecast of future events and are no guarantee of future results.
Comparison of Change in Value of $ 10,000 Investment
The graph below represents the hypothetical growth of a $10,000 investment in Class R5 shares and the comparative indices.
Average Annual Total Returns
For the Periods Ended October 31, 2024 | 1 Year | 5 Years | 10 Years |
| Class R5 | 28.09% | 12.17% | 10.81% |
| S&P 500 Index | 38.02% | 15.27% | 13.00% |
| Russell 1000 Value Index | 30.98% | 10.14% | 8.87% |
The S&P 500 Index serves as the Fund’s performance and regulatory index and provides a broad measure of market performance. The Russell 1000 Value Index serves as the Fund’s secondary performance index.
The Fund’s past performance is not a good predictor of the Fund’s future performance. The graph and table do not reflect the deduction of taxes that a shareholder would pay on Fund distributions or redemption of Fund shares. Performance information reflects fee waivers and/or expense limitation arrangements, if any. Absent any applicable fee waivers and/or expense limitation arrangements, performance would have been lower. Visit hartfordfunds.com for the most recent performance information.
Key Fund Statistics as of October 31, 2024
| Fund's net assets | $18,445,872,719% |
| Total number of portfolio holdings (excluding derivatives, if any) | $78% |
| Total investment management fees paid | $102,749,122% |
| Portfolio turnover rate | $28% |
Graphical Representation of Holdings as of October 31, 2024
The table below shows the investment makeup of the Fund, representing the percentage of net assets of the Fund.
| Information Technology | 17.5 | % |
| Financials | 16.7 | % |
| Health Care | 13.8 | % |
| Industrials | 9.8 | % |
| Communication Services | 7.2 | % |
| Energy | 7.2 | % |
| Consumer Staples | 7.1 | % |
| Utilities | 5.8 | % |
| Consumer Discretionary | 4.4 | % |
| Materials | 4.3 | % |
| Real Estate | 2.6 | % |
| Short-Term Investments | 1.1 | % |
| Other Assets & Liabilities | 2.5 | % |
| Total | 100.0 | % |
* | For Fund compliance purposes, the Fund may not use the same classification system. These classifications are used for financial reporting purposes. |
Availability of Additional Information
For additional information about the Fund, including its prospectus, financial information, holdings, and proxy voting information, please visit the Fund’s website at the website address included at the beginning of this report.
The Fund is distributed by Hartford Funds Distributors, LLC (HFD).
Annual Shareholder Report
October 31, 2024
The Hartford Dividend and Growth Fund
Class R6/HDGVX
This annual shareholder report contains important information about The Hartford Dividend and Growth Fund (the "Fund") for the period of November 1, 2023 to October 31, 2024. You can find additional information about the Fund at hartfordfunds.com/reports-hmf. You can also request this information by contacting us by calling 1‑888‑843‑7824.
What were the Fund costs for the last year?
(Based on a hypothetical $10,000 investment)
| Class Name | Costs of a $10,000 investment | Costs paid as a percentage
of a $10,000 investment |
| Class R6 | $72 | 0.63% |
How did the Fund perform last year and what impacted its performance?
Management's Discussion of Fund Performance
United States (U.S.) equities, as measured by the S&P 500 Index, rose over the trailing twelve-month period ending October 31, 2024, with the S&P 500 Index surging to a record high that was driven by performance in a select group of mega-cap technology companies. The U.S. Federal Reserve (Fed) began easing monetary policy with an interest-rate cut of 50 basis points in September in an effort to generate a soft landing for the economy. Markets were also kept on edge in the third quarter of 2024 due to the anticipated extremely close presidential race between Vice President Kamala Harris and former President Donald Trump. Fund performance described below is relative to the S&P 500 Index for the trailing twelve-month period ended October 31, 2024.
Top Contributors to Performance
Security selection within the Financials, Consumer Staples, and Consumer Discretionary sectors contributed positively to relative performance.
The Fund’s underweight allocation to the Consumer Discretionary sector and overweight to the Financials sector also contributed to relative performance.
Top individual contributors over the period were overweight positions in Micron Technology (Information Technology), Wells Fargo (Financials), and American Express (Financials).
Top Detractors to Performance
Security selection was the primary detractor to relative performance during the period, driven by weak selection within the Information Technology, Communication Services, and Healthcare sectors.
The largest individual detractors over the period were not owning NVIDIA (Information Technology), Meta Platforms (Communication Services), and an out-of-benchmark position in TotalEnergies (Energy).
Sector allocation, a result of our bottom-up stock selection process, was also a detractor to relative performance during the period due to the Fund’s underweight allocation to the Information Technology sector and overweight allocation to the Energy sector.
The views expressed in this section reflect the opinions of the Fund's sub-adviser, Wellington Management Company LLP, as of the date of this report and are subject to change based on changes in market, economic or other conditions. These views are not intended to be a forecast of future events and are no guarantee of future results.
Comparison of Change in Value of $ 10,000 Investment
The graph below represents the hypothetical growth of a $10,000 investment in Class R6 shares and the comparative indices.
Average Annual Total Returns
For the Periods Ended October 31, 2024 | 1 Year | 5 Years | 10 Years |
| Class R6 | 28.21% | 12.29% | 10.91% |
| S&P 500 Index | 38.02% | 15.27% | 13.00% |
| Russell 1000 Value Index | 30.98% | 10.14% | 8.87% |
Class R6 shares commenced operations on November 7, 2014 and performance prior to that date is that of the Fund’s Class Y shares. Performance prior to the inception date of the class has not been adjusted to reflect the operating expenses of the class.
The S&P 500 Index serves as the Fund’s performance and regulatory index and provides a broad measure of market performance. The Russell 1000 Value Index serves as the Fund’s secondary performance index.
The Fund’s past performance is not a good predictor of the Fund’s future performance. The graph and table do not reflect the deduction of taxes that a shareholder would pay on Fund distributions or redemption of Fund shares. Performance information reflects fee waivers and/or expense limitation arrangements, if any. Absent any applicable fee waivers and/or expense limitation arrangements, performance would have been lower. Visit hartfordfunds.com for the most recent performance information.
Key Fund Statistics as of October 31, 2024
| Fund's net assets | $18,445,872,719% |
| Total number of portfolio holdings (excluding derivatives, if any) | $78% |
| Total investment management fees paid | $102,749,122% |
| Portfolio turnover rate | $28% |
Graphical Representation of Holdings as of October 31, 2024
The table below shows the investment makeup of the Fund, representing the percentage of net assets of the Fund.
| Information Technology | 17.5 | % |
| Financials | 16.7 | % |
| Health Care | 13.8 | % |
| Industrials | 9.8 | % |
| Communication Services | 7.2 | % |
| Energy | 7.2 | % |
| Consumer Staples | 7.1 | % |
| Utilities | 5.8 | % |
| Consumer Discretionary | 4.4 | % |
| Materials | 4.3 | % |
| Real Estate | 2.6 | % |
| Short-Term Investments | 1.1 | % |
| Other Assets & Liabilities | 2.5 | % |
| Total | 100.0 | % |
* | For Fund compliance purposes, the Fund may not use the same classification system. These classifications are used for financial reporting purposes. |
Availability of Additional Information
For additional information about the Fund, including its prospectus, financial information, holdings, and proxy voting information, please visit the Fund’s website at the website address included at the beginning of this report.
The Fund is distributed by Hartford Funds Distributors, LLC (HFD).
Annual Shareholder Report
October 31, 2024
The Hartford Dividend and Growth Fund
Class Y/HDGYX
This annual shareholder report contains important information about The Hartford Dividend and Growth Fund (the "Fund") for the period of November 1, 2023 to October 31, 2024. You can find additional information about the Fund at hartfordfunds.com/reports-hmf. You can also request this information by contacting us by calling 1‑888‑843‑7824.
What were the Fund costs for the last year?
(Based on a hypothetical $10,000 investment)
| Class Name | Costs of a $10,000 investment | Costs paid as a percentage
of a $10,000 investment |
| Class Y | $83 | 0.73% |
How did the Fund perform last year and what impacted its performance?
Management's Discussion of Fund Performance
United States (U.S.) equities, as measured by the S&P 500 Index, rose over the trailing twelve-month period ending October 31, 2024, with the S&P 500 Index surging to a record high that was driven by performance in a select group of mega-cap technology companies. The U.S. Federal Reserve (Fed) began easing monetary policy with an interest-rate cut of 50 basis points in September in an effort to generate a soft landing for the economy. Markets were also kept on edge in the third quarter of 2024 due to the anticipated extremely close presidential race between Vice President Kamala Harris and former President Donald Trump. Fund performance described below is relative to the S&P 500 Index for the trailing twelve-month period ended October 31, 2024.
Top Contributors to Performance
Security selection within the Financials, Consumer Staples, and Consumer Discretionary sectors contributed positively to relative performance.
The Fund’s underweight allocation to the Consumer Discretionary sector and overweight to the Financials sector also contributed to relative performance.
Top individual contributors over the period were overweight positions in Micron Technology (Information Technology), Wells Fargo (Financials), and American Express (Financials).
Top Detractors to Performance
Security selection was the primary detractor to relative performance during the period, driven by weak selection within the Information Technology, Communication Services, and Healthcare sectors.
The largest individual detractors over the period were not owning NVIDIA (Information Technology), Meta Platforms (Communication Services), and an out-of-benchmark position in TotalEnergies (Energy).
Sector allocation, a result of our bottom-up stock selection process, was also a detractor to relative performance during the period due to the Fund’s underweight allocation to the Information Technology sector and overweight allocation to the Energy sector.
The views expressed in this section reflect the opinions of the Fund's sub-adviser, Wellington Management Company LLP, as of the date of this report and are subject to change based on changes in market, economic or other conditions. These views are not intended to be a forecast of future events and are no guarantee of future results.
Comparison of Change in Value of $ 250,000 Investment
The graph below represents the hypothetical growth of a $250,000 investment in Class Y shares and the comparative indices.
Average Annual Total Returns
For the Periods Ended October 31, 2024 | 1 Year | 5 Years | 10 Years |
| Class Y | 28.12% | 12.22% | 10.87% |
| S&P 500 Index | 38.02% | 15.27% | 13.00% |
| Russell 1000 Value Index | 30.98% | 10.14% | 8.87% |
The S&P 500 Index serves as the Fund’s performance and regulatory index and provides a broad measure of market performance. The Russell 1000 Value Index serves as the Fund’s secondary performance index.
The Fund’s past performance is not a good predictor of the Fund’s future performance. The graph and table do not reflect the deduction of taxes that a shareholder would pay on Fund distributions or redemption of Fund shares. Performance information reflects fee waivers and/or expense limitation arrangements, if any. Absent any applicable fee waivers and/or expense limitation arrangements, performance would have been lower. Visit hartfordfunds.com for the most recent performance information.
Key Fund Statistics as of October 31, 2024
| Fund's net assets | $18,445,872,719% |
| Total number of portfolio holdings (excluding derivatives, if any) | $78% |
| Total investment management fees paid | $102,749,122% |
| Portfolio turnover rate | $28% |
Graphical Representation of Holdings as of October 31, 2024
The table below shows the investment makeup of the Fund, representing the percentage of net assets of the Fund.
| Information Technology | 17.5 | % |
| Financials | 16.7 | % |
| Health Care | 13.8 | % |
| Industrials | 9.8 | % |
| Communication Services | 7.2 | % |
| Energy | 7.2 | % |
| Consumer Staples | 7.1 | % |
| Utilities | 5.8 | % |
| Consumer Discretionary | 4.4 | % |
| Materials | 4.3 | % |
| Real Estate | 2.6 | % |
| Short-Term Investments | 1.1 | % |
| Other Assets & Liabilities | 2.5 | % |
| Total | 100.0 | % |
* | For Fund compliance purposes, the Fund may not use the same classification system. These classifications are used for financial reporting purposes. |
Availability of Additional Information
For additional information about the Fund, including its prospectus, financial information, holdings, and proxy voting information, please visit the Fund’s website at the website address included at the beginning of this report.
The Fund is distributed by Hartford Funds Distributors, LLC (HFD).
Annual Shareholder Report
October 31, 2024
The Hartford Dividend and Growth Fund
Class F/HDGFX
This annual shareholder report contains important information about The Hartford Dividend and Growth Fund (the "Fund") for the period of November 1, 2023 to October 31, 2024. You can find additional information about the Fund at hartfordfunds.com/reports-hmf. You can also request this information by contacting us by calling 1‑888‑843‑7824.
What were the Fund costs for the last year?
(Based on a hypothetical $10,000 investment)
| Class Name | Costs of a $10,000 investment | Costs paid as a percentage
of a $10,000 investment |
| Class F | $72 | 0.63% |
How did the Fund perform last year and what impacted its performance?
Management's Discussion of Fund Performance
United States (U.S.) equities, as measured by the S&P 500 Index, rose over the trailing twelve-month period ending October 31, 2024, with the S&P 500 Index surging to a record high that was driven by performance in a select group of mega-cap technology companies. The U.S. Federal Reserve (Fed) began easing monetary policy with an interest-rate cut of 50 basis points in September in an effort to generate a soft landing for the economy. Markets were also kept on edge in the third quarter of 2024 due to the anticipated extremely close presidential race between Vice President Kamala Harris and former President Donald Trump. Fund performance described below is relative to the S&P 500 Index for the trailing twelve-month period ended October 31, 2024.
Top Contributors to Performance
Security selection within the Financials, Consumer Staples, and Consumer Discretionary sectors contributed positively to relative performance.
The Fund’s underweight allocation to the Consumer Discretionary sector and overweight to the Financials sector also contributed to relative performance.
Top individual contributors over the period were overweight positions in Micron Technology (Information Technology), Wells Fargo (Financials), and American Express (Financials).
Top Detractors to Performance
Security selection was the primary detractor to relative performance during the period, driven by weak selection within the Information Technology, Communication Services, and Healthcare sectors.
The largest individual detractors over the period were not owning NVIDIA (Information Technology), Meta Platforms (Communication Services), and an out-of-benchmark position in TotalEnergies (Energy).
Sector allocation, a result of our bottom-up stock selection process, was also a detractor to relative performance during the period due to the Fund’s underweight allocation to the Information Technology sector and overweight allocation to the Energy sector.
The views expressed in this section reflect the opinions of the Fund's sub-adviser, Wellington Management Company LLP, as of the date of this report and are subject to change based on changes in market, economic or other conditions. These views are not intended to be a forecast of future events and are no guarantee of future results.
Comparison of Change in Value of $ 1,000,000 Investment
The graph below represents the hypothetical growth of a $1,000,000 investment in Class F shares and the comparative indices.
Average Annual Total Returns
For the Periods Ended October 31, 2024 | 1 Year | 5 Years | 10 Years |
| Class F | 28.25% | 12.29% | 10.88% |
| S&P 500 Index | 38.02% | 15.27% | 13.00% |
| Russell 1000 Value Index | 30.98% | 10.14% | 8.87% |
Class F shares commenced operations on February 28, 2017 and performance prior to that date is that of the Fund’s Class I shares. Performance prior to the inception date of the class has not been adjusted to reflect the operating expenses of the class.
The S&P 500 Index serves as the Fund’s performance and regulatory index and provides a broad measure of market performance. The Russell 1000 Value Index serves as the Fund’s secondary performance index.
The Fund’s past performance is not a good predictor of the Fund’s future performance. The graph and table do not reflect the deduction of taxes that a shareholder would pay on Fund distributions or redemption of Fund shares. Performance information reflects fee waivers and/or expense limitation arrangements, if any. Absent any applicable fee waivers and/or expense limitation arrangements, performance would have been lower. Visit hartfordfunds.com for the most recent performance information.
Key Fund Statistics as of October 31, 2024
| Fund's net assets | $18,445,872,719% |
| Total number of portfolio holdings (excluding derivatives, if any) | $78% |
| Total investment management fees paid | $102,749,122% |
| Portfolio turnover rate | $28% |
Graphical Representation of Holdings as of October 31, 2024
The table below shows the investment makeup of the Fund, representing the percentage of net assets of the Fund.
| Information Technology | 17.5 | % |
| Financials | 16.7 | % |
| Health Care | 13.8 | % |
| Industrials | 9.8 | % |
| Communication Services | 7.2 | % |
| Energy | 7.2 | % |
| Consumer Staples | 7.1 | % |
| Utilities | 5.8 | % |
| Consumer Discretionary | 4.4 | % |
| Materials | 4.3 | % |
| Real Estate | 2.6 | % |
| Short-Term Investments | 1.1 | % |
| Other Assets & Liabilities | 2.5 | % |
| Total | 100.0 | % |
* | For Fund compliance purposes, the Fund may not use the same classification system. These classifications are used for financial reporting purposes. |
Availability of Additional Information
For additional information about the Fund, including its prospectus, financial information, holdings, and proxy voting information, please visit the Fund’s website at the website address included at the beginning of this report.
The Fund is distributed by Hartford Funds Distributors, LLC (HFD).
Annual Shareholder Report
October 31, 2024
The Hartford Equity Income Fund
Class A/HQIAX
This annual shareholder report contains important information about The Hartford Equity Income Fund (the "Fund") for the period of November 1, 2023 to October 31, 2024. You can find additional information about the Fund at hartfordfunds.com/reports-hmf. You can also request this information by contacting us by calling 1‑888‑843‑7824.
What were the Fund costs for the last year?
(Based on a hypothetical $10,000 investment)
| Class Name | Costs of a $10,000 investment | Costs paid as a percentage
of a $10,000 investment |
| Class A | $109 | 0.97% |
How did the Fund perform last year and what impacted its performance?
Management's Discussion of Fund Performance
United States (U.S.) equities, as measured by the S&P 500 Index, rose over the trailing twelve-month period ending October 31, 2024, with the S&P 500 Index surging to a record high that was driven by performance in a select group of mega-cap technology companies. The U.S. Federal Reserve (Fed) began easing monetary policy with an interest-rate cut of 50 basis points in September 2024 in an effort to generate a soft landing for the economy. Markets were also kept on edge in the third quarter due to the anticipated extremely close presidential race between Vice President Kamala Harris and former President Donald Trump. Fund performance described below is relative to the Fund’s performance index, the Russell 1000 Value Index, for the trailing twelve-month period ended October 31, 2024.
Top Contributors to Performance
Security selection within the Information Technology, Consumer Discretionary, and Financials sectors contributed to relative performance.
An overweight allocation to the Utilities sector and an underweight allocation to the Communication Services sector contributed to relative performance.
Top individual contributors over the period were an out-of-benchmark position in Broadcom (Information Technology), not holding a position in Intel (Information Technology), and an overweight position in Corning (Information Technology).
Top Detractors to Performance
Security selection detracted from relative results during the period, driven by weak selection within the Industrials, Healthcare, and Real Estate sectors.
Sector allocation, a result of our bottom-up stock selection process, also detracted from relative performance mainly driven by the Fund’s underweight allocations to the Financials and Industrials sectors as well as the Fund’s overweight to the Healthcare sector.
The largest individual detractors over the period were an out-of-benchmark position in Pernod Ricard (Consumer Staples) and overweight positions in Pfizer (Healthcare) and ConocoPhillips (Energy).
The views expressed in this section reflect the opinions of the Fund's sub-adviser, Wellington Management Company LLP, as of the date of this report and are subject to change based on changes in market, economic or other conditions. These views are not intended to be a forecast of future events and are no guarantee of future results.
Comparison of Change in Value of $ 10,000 Investment
The graph below represents the hypothetical growth of a $10,000 investment in Class A shares and the comparative indices. The returns for Class A shares include the maximum front-end sales charge applicable to Class A shares.
Average Annual Total Returns
For the Periods Ended October 31, 2024 | 1 Year | 5 Years | 10 Years |
| Class A (with 5.50% maximum front-end sales charge) | 17.85% | 9.11% | 8.83% |
| Class A (without 5.50% maximum front-end sales charge) | 24.71% | 10.35% | 9.45% |
| Russell 1000 Value Index | 30.98% | 10.14% | 8.87% |
| Russell 1000 Index | 38.07% | 15.00% | 12.75% |
The Russell 1000 Value Index serves as the Fund’s performance index because the Fund’s investment manager believes it is more representative of the Fund’s investment strategy. The Russell 1000 Index serves as the Fund’s regulatory index and provides a broad measure of market performance.
The Fund’s past performance is not a good predictor of the Fund’s future performance. The graph and table do not reflect the deduction of taxes that a shareholder would pay on Fund distributions or redemption of Fund shares. Performance information reflects fee waivers and/or expense limitation arrangements, if any. Absent any applicable fee waivers and/or expense limitation arrangements, performance would have been lower. Visit hartfordfunds.com for the most recent performance information.
Key Fund Statistics as of October 31, 2024
| Fund's net assets | $5,177,432,916% |
| Total number of portfolio holdings (excluding derivatives, if any) | $77% |
| Total investment management fees paid | $31,393,286% |
| Portfolio turnover rate | $35% |
Graphical Representation of Holdings as of October 31, 2024
The table below shows the investment makeup of the Fund, representing the percentage of net assets of the Fund.
| Financials | 18.1 | % |
| Health Care | 16.1 | % |
| Industrials | 13.6 | % |
| Utilities | 8.8 | % |
| Information Technology | 8.6 | % |
| Consumer Staples | 8.4 | % |
| Energy | 8.0 | % |
| Real Estate | 6.4 | % |
| Materials | 4.4 | % |
| Consumer Discretionary | 3.3 | % |
| Communication Services | 2.1 | % |
| Short-Term Investments | 0.5 | % |
| Other Assets & Liabilities | 1.7 | % |
| Total | 100.0 | % |
* | For Fund compliance purposes, the Fund may not use the same classification system. These classifications are used for financial reporting purposes. |
Availability of Additional Information
For additional information about the Fund, including its prospectus, financial information, holdings, and proxy voting information, please visit the Fund’s website at the website address included at the beginning of this report.
The Fund is distributed by Hartford Funds Distributors, LLC (HFD).
Annual Shareholder Report
October 31, 2024
The Hartford Equity Income Fund
Class C/HQICX
This annual shareholder report contains important information about The Hartford Equity Income Fund (the "Fund") for the period of November 1, 2023 to October 31, 2024. You can find additional information about the Fund at hartfordfunds.com/reports-hmf. You can also request this information by contacting us by calling 1‑888‑843‑7824.
What were the Fund costs for the last year?
(Based on a hypothetical $10,000 investment)
| Class Name | Costs of a $10,000 investment | Costs paid as a percentage
of a $10,000 investment |
| Class C | $195 | 1.74% |
How did the Fund perform last year and what impacted its performance?
Management's Discussion of Fund Performance
United States (U.S.) equities, as measured by the S&P 500 Index, rose over the trailing twelve-month period ending October 31, 2024, with the S&P 500 Index surging to a record high that was driven by performance in a select group of mega-cap technology companies. The U.S. Federal Reserve (Fed) began easing monetary policy with an interest-rate cut of 50 basis points in September 2024 in an effort to generate a soft landing for the economy. Markets were also kept on edge in the third quarter due to the anticipated extremely close presidential race between Vice President Kamala Harris and former President Donald Trump. Fund performance described below is relative to the Fund’s performance index, the Russell 1000 Value Index, for the trailing twelve-month period ended October 31, 2024.
Top Contributors to Performance
Security selection within the Information Technology, Consumer Discretionary, and Financials sectors contributed to relative performance.
An overweight allocation to the Utilities sector and an underweight allocation to the Communication Services sector contributed to relative performance.
Top individual contributors over the period were an out-of-benchmark position in Broadcom (Information Technology), not holding a position in Intel (Information Technology), and an overweight position in Corning (Information Technology).
Top Detractors to Performance
Security selection detracted from relative results during the period, driven by weak selection within the Industrials, Healthcare, and Real Estate sectors.
Sector allocation, a result of our bottom-up stock selection process, also detracted from relative performance mainly driven by the Fund’s underweight allocations to the Financials and Industrials sectors as well as the Fund’s overweight to the Healthcare sector.
The largest individual detractors over the period were an out-of-benchmark position in Pernod Ricard (Consumer Staples) and overweight positions in Pfizer (Healthcare) and ConocoPhillips (Energy).
The views expressed in this section reflect the opinions of the Fund's sub-adviser, Wellington Management Company LLP, as of the date of this report and are subject to change based on changes in market, economic or other conditions. These views are not intended to be a forecast of future events and are no guarantee of future results.
Comparison of Change in Value of $ 10,000 Investment
The graph below represents the hypothetical growth of a $10,000 investment in Class C shares (excluding sales charges) and the comparative indices. If sales charges had been included, the value would have been lower.
Average Annual Total Returns
For the Periods Ended October 31, 2024 | 1 Year | 5 Years | 10 Years |
| Class C (with 1.00% contingent deferred sales charge) | 22.77% | 9.51% | 8.63% |
| Class C (without 1.00% contingent deferred sales charge) | 23.77% | 9.51% | 8.63% |
| Russell 1000 Value Index | 30.98% | 10.14% | 8.87% |
| Russell 1000 Index | 38.07% | 15.00% | 12.75% |
The Russell 1000 Value Index serves as the Fund’s performance index because the Fund’s investment manager believes it is more representative of the Fund’s investment strategy. The Russell 1000 Index serves as the Fund’s regulatory index and provides a broad measure of market performance.
The Fund’s past performance is not a good predictor of the Fund’s future performance. The graph and table do not reflect the deduction of taxes that a shareholder would pay on Fund distributions or redemption of Fund shares. Performance information reflects fee waivers and/or expense limitation arrangements, if any. Absent any applicable fee waivers and/or expense limitation arrangements, performance would have been lower. Visit hartfordfunds.com for the most recent performance information.
Key Fund Statistics as of October 31, 2024
| Fund's net assets | $5,177,432,916% |
| Total number of portfolio holdings (excluding derivatives, if any) | $77% |
| Total investment management fees paid | $31,393,286% |
| Portfolio turnover rate | $35% |
Graphical Representation of Holdings as of October 31, 2024
The table below shows the investment makeup of the Fund, representing the percentage of net assets of the Fund.
| Financials | 18.1 | % |
| Health Care | 16.1 | % |
| Industrials | 13.6 | % |
| Utilities | 8.8 | % |
| Information Technology | 8.6 | % |
| Consumer Staples | 8.4 | % |
| Energy | 8.0 | % |
| Real Estate | 6.4 | % |
| Materials | 4.4 | % |
| Consumer Discretionary | 3.3 | % |
| Communication Services | 2.1 | % |
| Short-Term Investments | 0.5 | % |
| Other Assets & Liabilities | 1.7 | % |
| Total | 100.0 | % |
* | For Fund compliance purposes, the Fund may not use the same classification system. These classifications are used for financial reporting purposes. |
Availability of Additional Information
For additional information about the Fund, including its prospectus, financial information, holdings, and proxy voting information, please visit the Fund’s website at the website address included at the beginning of this report.
The Fund is distributed by Hartford Funds Distributors, LLC (HFD).
Annual Shareholder Report
October 31, 2024
The Hartford Equity Income Fund
Class I/HQIIX
This annual shareholder report contains important information about The Hartford Equity Income Fund (the "Fund") for the period of November 1, 2023 to October 31, 2024. You can find additional information about the Fund at hartfordfunds.com/reports-hmf. You can also request this information by contacting us by calling 1‑888‑843‑7824.
This report describes changes to the Fund that occurred during the reporting period.
What were the Fund costs for the last year?
(Based on a hypothetical $10,000 investment)
| Class Name | Costs of a $10,000 investment | Costs paid as a percentage
of a $10,000 investment |
| Class I | $84 | 0.75% |
How did the Fund perform last year and what impacted its performance?
Management's Discussion of Fund Performance
United States (U.S.) equities, as measured by the S&P 500 Index, rose over the trailing twelve-month period ending October 31, 2024, with the S&P 500 Index surging to a record high that was driven by performance in a select group of mega-cap technology companies. The U.S. Federal Reserve (Fed) began easing monetary policy with an interest-rate cut of 50 basis points in September 2024 in an effort to generate a soft landing for the economy. Markets were also kept on edge in the third quarter due to the anticipated extremely close presidential race between Vice President Kamala Harris and former President Donald Trump. Fund performance described below is relative to the Fund’s performance index, the Russell 1000 Value Index, for the trailing twelve-month period ended October 31, 2024.
Top Contributors to Performance
Security selection within the Information Technology, Consumer Discretionary, and Financials sectors contributed to relative performance.
An overweight allocation to the Utilities sector and an underweight allocation to the Communication Services sector contributed to relative performance.
Top individual contributors over the period were an out-of-benchmark position in Broadcom (Information Technology), not holding a position in Intel (Information Technology), and an overweight position in Corning (Information Technology).
Top Detractors to Performance
Security selection detracted from relative results during the period, driven by weak selection within the Industrials, Healthcare, and Real Estate sectors.
Sector allocation, a result of our bottom-up stock selection process, also detracted from relative performance mainly driven by the Fund’s underweight allocations to the Financials and Industrials sectors as well as the Fund’s overweight to the Healthcare sector.
The largest individual detractors over the period were an out-of-benchmark position in Pernod Ricard (Consumer Staples) and overweight positions in Pfizer (Healthcare) and ConocoPhillips (Energy).
The views expressed in this section reflect the opinions of the Fund's sub-adviser, Wellington Management Company LLP, as of the date of this report and are subject to change based on changes in market, economic or other conditions. These views are not intended to be a forecast of future events and are no guarantee of future results.
Comparison of Change in Value of $ 10,000 Investment
The graph below represents the hypothetical growth of a $10,000 investment in Class I shares and the comparative indices.
Average Annual Total Returns
For the Periods Ended October 31, 2024 | 1 Year | 5 Years | 10 Years |
| Class I | 25.05% | 10.61% | 9.71% |
| Russell 1000 Value Index | 30.98% | 10.14% | 8.87% |
| Russell 1000 Index | 38.07% | 15.00% | 12.75% |
The Russell 1000 Value Index serves as the Fund’s performance index because the Fund’s investment manager believes it is more representative of the Fund’s investment strategy. The Russell 1000 Index serves as the Fund’s regulatory index and provides a broad measure of market performance.
The Fund’s past performance is not a good predictor of the Fund’s future performance. The graph and table do not reflect the deduction of taxes that a shareholder would pay on Fund distributions or redemption of Fund shares. Performance information reflects fee waivers and/or expense limitation arrangements, if any. Absent any applicable fee waivers and/or expense limitation arrangements, performance would have been lower. Visit hartfordfunds.com for the most recent performance information.
Key Fund Statistics as of October 31, 2024
| Fund's net assets | $5,177,432,916% |
| Total number of portfolio holdings (excluding derivatives, if any) | $77% |
| Total investment management fees paid | $31,393,286% |
| Portfolio turnover rate | $35% |
Graphical Representation of Holdings as of October 31, 2024
The table below shows the investment makeup of the Fund, representing the percentage of net assets of the Fund.
| Financials | 18.1 | % |
| Health Care | 16.1 | % |
| Industrials | 13.6 | % |
| Utilities | 8.8 | % |
| Information Technology | 8.6 | % |
| Consumer Staples | 8.4 | % |
| Energy | 8.0 | % |
| Real Estate | 6.4 | % |
| Materials | 4.4 | % |
| Consumer Discretionary | 3.3 | % |
| Communication Services | 2.1 | % |
| Short-Term Investments | 0.5 | % |
| Other Assets & Liabilities | 1.7 | % |
| Total | 100.0 | % |
* | For Fund compliance purposes, the Fund may not use the same classification system. These classifications are used for financial reporting purposes. |
Material Fund Changes
This is a summary of certain changes to the Fund since the beginning of the reporting period.
Effective July 1, 2024, Hartford Administrative Services Company, the Fund’s transfer agent, contractually agreed to waive its transfer agency fee and/or reimburse transfer agency-related expenses to the extent necessary to limit the transfer agency fee for Class I of the Fund as follows: 0.108% of the average daily net assets attributable to the class. This contractual arrangement will remain in effect until February 28, 2025 unless the Board of Directors of the Fund approves its earlier termination.
Availability of Additional Information
For additional information about the Fund, including its prospectus, financial information, holdings, and proxy voting information, please visit the Fund’s website at the website address included at the beginning of this report.
The Fund is distributed by Hartford Funds Distributors, LLC (HFD).
Annual Shareholder Report
October 31, 2024
The Hartford Equity Income Fund
Class R3/HQIRX
This annual shareholder report contains important information about The Hartford Equity Income Fund (the "Fund") for the period of November 1, 2023 to October 31, 2024. You can find additional information about the Fund at hartfordfunds.com/reports-hmf. You can also request this information by contacting us by calling 1‑888‑843‑7824.
What were the Fund costs for the last year?
(Based on a hypothetical $10,000 investment)
| Class Name | Costs of a $10,000 investment | Costs paid as a percentage
of a $10,000 investment |
| Class R3 | $153 | 1.36% |
How did the Fund perform last year and what impacted its performance?
Management's Discussion of Fund Performance
United States (U.S.) equities, as measured by the S&P 500 Index, rose over the trailing twelve-month period ending October 31, 2024, with the S&P 500 Index surging to a record high that was driven by performance in a select group of mega-cap technology companies. The U.S. Federal Reserve (Fed) began easing monetary policy with an interest-rate cut of 50 basis points in September 2024 in an effort to generate a soft landing for the economy. Markets were also kept on edge in the third quarter due to the anticipated extremely close presidential race between Vice President Kamala Harris and former President Donald Trump. Fund performance described below is relative to the Fund’s performance index, the Russell 1000 Value Index, for the trailing twelve-month period ended October 31, 2024.
Top Contributors to Performance
Security selection within the Information Technology, Consumer Discretionary, and Financials sectors contributed to relative performance.
An overweight allocation to the Utilities sector and an underweight allocation to the Communication Services sector contributed to relative performance.
Top individual contributors over the period were an out-of-benchmark position in Broadcom (Information Technology), not holding a position in Intel (Information Technology), and an overweight position in Corning (Information Technology).
Top Detractors to Performance
Security selection detracted from relative results during the period, driven by weak selection within the Industrials, Healthcare, and Real Estate sectors.
Sector allocation, a result of our bottom-up stock selection process, also detracted from relative performance mainly driven by the Fund’s underweight allocations to the Financials and Industrials sectors as well as the Fund’s overweight to the Healthcare sector.
The largest individual detractors over the period were an out-of-benchmark position in Pernod Ricard (Consumer Staples) and overweight positions in Pfizer (Healthcare) and ConocoPhillips (Energy).
The views expressed in this section reflect the opinions of the Fund's sub-adviser, Wellington Management Company LLP, as of the date of this report and are subject to change based on changes in market, economic or other conditions. These views are not intended to be a forecast of future events and are no guarantee of future results.
Comparison of Change in Value of $ 10,000 Investment
The graph below represents the hypothetical growth of a $10,000 investment in Class R3 shares and the comparative indices.
Average Annual Total Returns
For the Periods Ended October 31, 2024 | 1 Year | 5 Years | 10 Years |
| Class R3 | 24.27% | 9.94% | 9.05% |
| Russell 1000 Value Index | 30.98% | 10.14% | 8.87% |
| Russell 1000 Index | 38.07% | 15.00% | 12.75% |
The Russell 1000 Value Index serves as the Fund’s performance index because the Fund’s investment manager believes it is more representative of the Fund’s investment strategy. The Russell 1000 Index serves as the Fund’s regulatory index and provides a broad measure of market performance.
The Fund’s past performance is not a good predictor of the Fund’s future performance. The graph and table do not reflect the deduction of taxes that a shareholder would pay on Fund distributions or redemption of Fund shares. Performance information reflects fee waivers and/or expense limitation arrangements, if any. Absent any applicable fee waivers and/or expense limitation arrangements, performance would have been lower. Visit hartfordfunds.com for the most recent performance information.
Key Fund Statistics as of October 31, 2024
| Fund's net assets | $5,177,432,916% |
| Total number of portfolio holdings (excluding derivatives, if any) | $77% |
| Total investment management fees paid | $31,393,286% |
| Portfolio turnover rate | $35% |
Graphical Representation of Holdings as of October 31, 2024
The table below shows the investment makeup of the Fund, representing the percentage of net assets of the Fund.
| Financials | 18.1 | % |
| Health Care | 16.1 | % |
| Industrials | 13.6 | % |
| Utilities | 8.8 | % |
| Information Technology | 8.6 | % |
| Consumer Staples | 8.4 | % |
| Energy | 8.0 | % |
| Real Estate | 6.4 | % |
| Materials | 4.4 | % |
| Consumer Discretionary | 3.3 | % |
| Communication Services | 2.1 | % |
| Short-Term Investments | 0.5 | % |
| Other Assets & Liabilities | 1.7 | % |
| Total | 100.0 | % |
* | For Fund compliance purposes, the Fund may not use the same classification system. These classifications are used for financial reporting purposes. |
Availability of Additional Information
For additional information about the Fund, including its prospectus, financial information, holdings, and proxy voting information, please visit the Fund’s website at the website address included at the beginning of this report.
The Fund is distributed by Hartford Funds Distributors, LLC (HFD).
Annual Shareholder Report
October 31, 2024
The Hartford Equity Income Fund
Class R4/HQISX
This annual shareholder report contains important information about The Hartford Equity Income Fund (the "Fund") for the period of November 1, 2023 to October 31, 2024. You can find additional information about the Fund at hartfordfunds.com/reports-hmf. You can also request this information by contacting us by calling 1‑888‑843‑7824.
What were the Fund costs for the last year?
(Based on a hypothetical $10,000 investment)
| Class Name | Costs of a $10,000 investment | Costs paid as a percentage
of a $10,000 investment |
| Class R4 | $119 | 1.06% |
How did the Fund perform last year and what impacted its performance?
Management's Discussion of Fund Performance
United States (U.S.) equities, as measured by the S&P 500 Index, rose over the trailing twelve-month period ending October 31, 2024, with the S&P 500 Index surging to a record high that was driven by performance in a select group of mega-cap technology companies. The U.S. Federal Reserve (Fed) began easing monetary policy with an interest-rate cut of 50 basis points in September 2024 in an effort to generate a soft landing for the economy. Markets were also kept on edge in the third quarter due to the anticipated extremely close presidential race between Vice President Kamala Harris and former President Donald Trump. Fund performance described below is relative to the Fund’s performance index, the Russell 1000 Value Index, for the trailing twelve-month period ended October 31, 2024.
Top Contributors to Performance
Security selection within the Information Technology, Consumer Discretionary, and Financials sectors contributed to relative performance.
An overweight allocation to the Utilities sector and an underweight allocation to the Communication Services sector contributed to relative performance.
Top individual contributors over the period were an out-of-benchmark position in Broadcom (Information Technology), not holding a position in Intel (Information Technology), and an overweight position in Corning (Information Technology).
Top Detractors to Performance
Security selection detracted from relative results during the period, driven by weak selection within the Industrials, Healthcare, and Real Estate sectors.
Sector allocation, a result of our bottom-up stock selection process, also detracted from relative performance mainly driven by the Fund’s underweight allocations to the Financials and Industrials sectors as well as the Fund’s overweight to the Healthcare sector.
The largest individual detractors over the period were an out-of-benchmark position in Pernod Ricard (Consumer Staples) and overweight positions in Pfizer (Healthcare) and ConocoPhillips (Energy).
The views expressed in this section reflect the opinions of the Fund's sub-adviser, Wellington Management Company LLP, as of the date of this report and are subject to change based on changes in market, economic or other conditions. These views are not intended to be a forecast of future events and are no guarantee of future results.
Comparison of Change in Value of $ 10,000 Investment
The graph below represents the hypothetical growth of a $10,000 investment in Class R4 shares and the comparative indices.
Average Annual Total Returns
For the Periods Ended October 31, 2024 | 1 Year | 5 Years | 10 Years |
| Class R4 | 24.64% | 10.26% | 9.38% |
| Russell 1000 Value Index | 30.98% | 10.14% | 8.87% |
| Russell 1000 Index | 38.07% | 15.00% | 12.75% |
The Russell 1000 Value Index serves as the Fund’s performance index because the Fund’s investment manager believes it is more representative of the Fund’s investment strategy. The Russell 1000 Index serves as the Fund’s regulatory index and provides a broad measure of market performance.
The Fund’s past performance is not a good predictor of the Fund’s future performance. The graph and table do not reflect the deduction of taxes that a shareholder would pay on Fund distributions or redemption of Fund shares. Performance information reflects fee waivers and/or expense limitation arrangements, if any. Absent any applicable fee waivers and/or expense limitation arrangements, performance would have been lower. Visit hartfordfunds.com for the most recent performance information.
Key Fund Statistics as of October 31, 2024
| Fund's net assets | $5,177,432,916% |
| Total number of portfolio holdings (excluding derivatives, if any) | $77% |
| Total investment management fees paid | $31,393,286% |
| Portfolio turnover rate | $35% |
Graphical Representation of Holdings as of October 31, 2024
The table below shows the investment makeup of the Fund, representing the percentage of net assets of the Fund.
| Financials | 18.1 | % |
| Health Care | 16.1 | % |
| Industrials | 13.6 | % |
| Utilities | 8.8 | % |
| Information Technology | 8.6 | % |
| Consumer Staples | 8.4 | % |
| Energy | 8.0 | % |
| Real Estate | 6.4 | % |
| Materials | 4.4 | % |
| Consumer Discretionary | 3.3 | % |
| Communication Services | 2.1 | % |
| Short-Term Investments | 0.5 | % |
| Other Assets & Liabilities | 1.7 | % |
| Total | 100.0 | % |
* | For Fund compliance purposes, the Fund may not use the same classification system. These classifications are used for financial reporting purposes. |
Availability of Additional Information
For additional information about the Fund, including its prospectus, financial information, holdings, and proxy voting information, please visit the Fund’s website at the website address included at the beginning of this report.
The Fund is distributed by Hartford Funds Distributors, LLC (HFD).
Annual Shareholder Report
October 31, 2024
The Hartford Equity Income Fund
Class R5/HQITX
This annual shareholder report contains important information about The Hartford Equity Income Fund (the "Fund") for the period of November 1, 2023 to October 31, 2024. You can find additional information about the Fund at hartfordfunds.com/reports-hmf. You can also request this information by contacting us by calling 1‑888‑843‑7824.
What were the Fund costs for the last year?
(Based on a hypothetical $10,000 investment)
| Class Name | Costs of a $10,000 investment | Costs paid as a percentage
of a $10,000 investment |
| Class R5 | $84 | 0.75% |
How did the Fund perform last year and what impacted its performance?
Management's Discussion of Fund Performance
United States (U.S.) equities, as measured by the S&P 500 Index, rose over the trailing twelve-month period ending October 31, 2024, with the S&P 500 Index surging to a record high that was driven by performance in a select group of mega-cap technology companies. The U.S. Federal Reserve (Fed) began easing monetary policy with an interest-rate cut of 50 basis points in September 2024 in an effort to generate a soft landing for the economy. Markets were also kept on edge in the third quarter due to the anticipated extremely close presidential race between Vice President Kamala Harris and former President Donald Trump. Fund performance described below is relative to the Fund’s performance index, the Russell 1000 Value Index, for the trailing twelve-month period ended October 31, 2024.
Top Contributors to Performance
Security selection within the Information Technology, Consumer Discretionary, and Financials sectors contributed to relative performance.
An overweight allocation to the Utilities sector and an underweight allocation to the Communication Services sector contributed to relative performance.
Top individual contributors over the period were an out-of-benchmark position in Broadcom (Information Technology), not holding a position in Intel (Information Technology), and an overweight position in Corning (Information Technology).
Top Detractors to Performance
Security selection detracted from relative results during the period, driven by weak selection within the Industrials, Healthcare, and Real Estate sectors.
Sector allocation, a result of our bottom-up stock selection process, also detracted from relative performance mainly driven by the Fund’s underweight allocations to the Financials and Industrials sectors as well as the Fund’s overweight to the Healthcare sector.
The largest individual detractors over the period were an out-of-benchmark position in Pernod Ricard (Consumer Staples) and overweight positions in Pfizer (Healthcare) and ConocoPhillips (Energy).
The views expressed in this section reflect the opinions of the Fund's sub-adviser, Wellington Management Company LLP, as of the date of this report and are subject to change based on changes in market, economic or other conditions. These views are not intended to be a forecast of future events and are no guarantee of future results.
Comparison of Change in Value of $ 10,000 Investment
The graph below represents the hypothetical growth of a $10,000 investment in Class R5 shares and the comparative indices.
Average Annual Total Returns
For the Periods Ended October 31, 2024 | 1 Year | 5 Years | 10 Years |
| Class R5 | 25.06% | 10.61% | 9.71% |
| Russell 1000 Value Index | 30.98% | 10.14% | 8.87% |
| Russell 1000 Index | 38.07% | 15.00% | 12.75% |
The Russell 1000 Value Index serves as the Fund’s performance index because the Fund’s investment manager believes it is more representative of the Fund’s investment strategy. The Russell 1000 Index serves as the Fund’s regulatory index and provides a broad measure of market performance.
The Fund’s past performance is not a good predictor of the Fund’s future performance. The graph and table do not reflect the deduction of taxes that a shareholder would pay on Fund distributions or redemption of Fund shares. Performance information reflects fee waivers and/or expense limitation arrangements, if any. Absent any applicable fee waivers and/or expense limitation arrangements, performance would have been lower. Visit hartfordfunds.com for the most recent performance information.
Key Fund Statistics as of October 31, 2024
| Fund's net assets | $5,177,432,916% |
| Total number of portfolio holdings (excluding derivatives, if any) | $77% |
| Total investment management fees paid | $31,393,286% |
| Portfolio turnover rate | $35% |
Graphical Representation of Holdings as of October 31, 2024
The table below shows the investment makeup of the Fund, representing the percentage of net assets of the Fund.
| Financials | 18.1 | % |
| Health Care | 16.1 | % |
| Industrials | 13.6 | % |
| Utilities | 8.8 | % |
| Information Technology | 8.6 | % |
| Consumer Staples | 8.4 | % |
| Energy | 8.0 | % |
| Real Estate | 6.4 | % |
| Materials | 4.4 | % |
| Consumer Discretionary | 3.3 | % |
| Communication Services | 2.1 | % |
| Short-Term Investments | 0.5 | % |
| Other Assets & Liabilities | 1.7 | % |
| Total | 100.0 | % |
* | For Fund compliance purposes, the Fund may not use the same classification system. These classifications are used for financial reporting purposes. |
Availability of Additional Information
For additional information about the Fund, including its prospectus, financial information, holdings, and proxy voting information, please visit the Fund’s website at the website address included at the beginning of this report.
The Fund is distributed by Hartford Funds Distributors, LLC (HFD).
Annual Shareholder Report
October 31, 2024
The Hartford Equity Income Fund
Class R6/HQIVX
This annual shareholder report contains important information about The Hartford Equity Income Fund (the "Fund") for the period of November 1, 2023 to October 31, 2024. You can find additional information about the Fund at hartfordfunds.com/reports-hmf. You can also request this information by contacting us by calling 1‑888‑843‑7824.
What were the Fund costs for the last year?
(Based on a hypothetical $10,000 investment)
| Class Name | Costs of a $10,000 investment | Costs paid as a percentage
of a $10,000 investment |
| Class R6 | $73 | 0.65% |
How did the Fund perform last year and what impacted its performance?
Management's Discussion of Fund Performance
United States (U.S.) equities, as measured by the S&P 500 Index, rose over the trailing twelve-month period ending October 31, 2024, with the S&P 500 Index surging to a record high that was driven by performance in a select group of mega-cap technology companies. The U.S. Federal Reserve (Fed) began easing monetary policy with an interest-rate cut of 50 basis points in September 2024 in an effort to generate a soft landing for the economy. Markets were also kept on edge in the third quarter due to the anticipated extremely close presidential race between Vice President Kamala Harris and former President Donald Trump. Fund performance described below is relative to the Fund’s performance index, the Russell 1000 Value Index, for the trailing twelve-month period ended October 31, 2024.
Top Contributors to Performance
Security selection within the Information Technology, Consumer Discretionary, and Financials sectors contributed to relative performance.
An overweight allocation to the Utilities sector and an underweight allocation to the Communication Services sector contributed to relative performance.
Top individual contributors over the period were an out-of-benchmark position in Broadcom (Information Technology), not holding a position in Intel (Information Technology), and an overweight position in Corning (Information Technology).
Top Detractors to Performance
Security selection detracted from relative results during the period, driven by weak selection within the Industrials, Healthcare, and Real Estate sectors.
Sector allocation, a result of our bottom-up stock selection process, also detracted from relative performance mainly driven by the Fund’s underweight allocations to the Financials and Industrials sectors as well as the Fund’s overweight to the Healthcare sector.
The largest individual detractors over the period were an out-of-benchmark position in Pernod Ricard (Consumer Staples) and overweight positions in Pfizer (Healthcare) and ConocoPhillips (Energy).
The views expressed in this section reflect the opinions of the Fund's sub-adviser, Wellington Management Company LLP, as of the date of this report and are subject to change based on changes in market, economic or other conditions. These views are not intended to be a forecast of future events and are no guarantee of future results.
Comparison of Change in Value of $ 10,000 Investment
The graph below represents the hypothetical growth of a $10,000 investment in Class R6 shares and the comparative indices.
Average Annual Total Returns
For the Periods Ended October 31, 2024 | 1 Year | 5 Years | 10 Years |
| Class R6 | 25.15% | 10.72% | 9.82% |
| Russell 1000 Value Index | 30.98% | 10.14% | 8.87% |
| Russell 1000 Index | 38.07% | 15.00% | 12.75% |
Class R6 shares commenced operations on November 7, 2014 and performance prior to that date is that of the Fund’s Class Y shares. Performance prior to the inception date of the class has not been adjusted to reflect the operating expenses of the class.
The Russell 1000 Value Index serves as the Fund’s performance index because the Fund’s investment manager believes it is more representative of the Fund’s investment strategy. The Russell 1000 Index serves as the Fund’s regulatory index and provides a broad measure of market performance.
The Fund’s past performance is not a good predictor of the Fund’s future performance. The graph and table do not reflect the deduction of taxes that a shareholder would pay on Fund distributions or redemption of Fund shares. Performance information reflects fee waivers and/or expense limitation arrangements, if any. Absent any applicable fee waivers and/or expense limitation arrangements, performance would have been lower. Visit hartfordfunds.com for the most recent performance information.
Key Fund Statistics as of October 31, 2024
| Fund's net assets | $5,177,432,916% |
| Total number of portfolio holdings (excluding derivatives, if any) | $77% |
| Total investment management fees paid | $31,393,286% |
| Portfolio turnover rate | $35% |
Graphical Representation of Holdings as of October 31, 2024
The table below shows the investment makeup of the Fund, representing the percentage of net assets of the Fund.
| Financials | 18.1 | % |
| Health Care | 16.1 | % |
| Industrials | 13.6 | % |
| Utilities | 8.8 | % |
| Information Technology | 8.6 | % |
| Consumer Staples | 8.4 | % |
| Energy | 8.0 | % |
| Real Estate | 6.4 | % |
| Materials | 4.4 | % |
| Consumer Discretionary | 3.3 | % |
| Communication Services | 2.1 | % |
| Short-Term Investments | 0.5 | % |
| Other Assets & Liabilities | 1.7 | % |
| Total | 100.0 | % |
* | For Fund compliance purposes, the Fund may not use the same classification system. These classifications are used for financial reporting purposes. |
Availability of Additional Information
For additional information about the Fund, including its prospectus, financial information, holdings, and proxy voting information, please visit the Fund’s website at the website address included at the beginning of this report.
The Fund is distributed by Hartford Funds Distributors, LLC (HFD).
Annual Shareholder Report
October 31, 2024
The Hartford Equity Income Fund
Class Y/HQIYX
This annual shareholder report contains important information about The Hartford Equity Income Fund (the "Fund") for the period of November 1, 2023 to October 31, 2024. You can find additional information about the Fund at hartfordfunds.com/reports-hmf. You can also request this information by contacting us by calling 1‑888‑843‑7824.
What were the Fund costs for the last year?
(Based on a hypothetical $10,000 investment)
| Class Name | Costs of a $10,000 investment | Costs paid as a percentage
of a $10,000 investment |
| Class Y | $82 | 0.73% |
How did the Fund perform last year and what impacted its performance?
Management's Discussion of Fund Performance
United States (U.S.) equities, as measured by the S&P 500 Index, rose over the trailing twelve-month period ending October 31, 2024, with the S&P 500 Index surging to a record high that was driven by performance in a select group of mega-cap technology companies. The U.S. Federal Reserve (Fed) began easing monetary policy with an interest-rate cut of 50 basis points in September 2024 in an effort to generate a soft landing for the economy. Markets were also kept on edge in the third quarter due to the anticipated extremely close presidential race between Vice President Kamala Harris and former President Donald Trump. Fund performance described below is relative to the Fund’s performance index, the Russell 1000 Value Index, for the trailing twelve-month period ended October 31, 2024.
Top Contributors to Performance
Security selection within the Information Technology, Consumer Discretionary, and Financials sectors contributed to relative performance.
An overweight allocation to the Utilities sector and an underweight allocation to the Communication Services sector contributed to relative performance.
Top individual contributors over the period were an out-of-benchmark position in Broadcom (Information Technology), not holding a position in Intel (Information Technology), and an overweight position in Corning (Information Technology).
Top Detractors to Performance
Security selection detracted from relative results during the period, driven by weak selection within the Industrials, Healthcare, and Real Estate sectors.
Sector allocation, a result of our bottom-up stock selection process, also detracted from relative performance mainly driven by the Fund’s underweight allocations to the Financials and Industrials sectors as well as the Fund’s overweight to the Healthcare sector.
The largest individual detractors over the period were an out-of-benchmark position in Pernod Ricard (Consumer Staples) and overweight positions in Pfizer (Healthcare) and ConocoPhillips (Energy).
The views expressed in this section reflect the opinions of the Fund's sub-adviser, Wellington Management Company LLP, as of the date of this report and are subject to change based on changes in market, economic or other conditions. These views are not intended to be a forecast of future events and are no guarantee of future results.
Comparison of Change in Value of $ 250,000 Investment
The graph below represents the hypothetical growth of a $250,000 investment in Class Y shares and the comparative indices.
Average Annual Total Returns
For the Periods Ended October 31, 2024 | 1 Year | 5 Years | 10 Years |
| Class Y | 25.04% | 10.64% | 9.76% |
| Russell 1000 Value Index | 30.98% | 10.14% | 8.87% |
| Russell 1000 Index | 38.07% | 15.00% | 12.75% |
The Russell 1000 Value Index serves as the Fund’s performance index because the Fund’s investment manager believes it is more representative of the Fund’s investment strategy. The Russell 1000 Index serves as the Fund’s regulatory index and provides a broad measure of market performance.
The Fund’s past performance is not a good predictor of the Fund’s future performance. The graph and table do not reflect the deduction of taxes that a shareholder would pay on Fund distributions or redemption of Fund shares. Performance information reflects fee waivers and/or expense limitation arrangements, if any. Absent any applicable fee waivers and/or expense limitation arrangements, performance would have been lower. Visit hartfordfunds.com for the most recent performance information.
Key Fund Statistics as of October 31, 2024
| Fund's net assets | $5,177,432,916% |
| Total number of portfolio holdings (excluding derivatives, if any) | $77% |
| Total investment management fees paid | $31,393,286% |
| Portfolio turnover rate | $35% |
Graphical Representation of Holdings as of October 31, 2024
The table below shows the investment makeup of the Fund, representing the percentage of net assets of the Fund.
| Financials | 18.1 | % |
| Health Care | 16.1 | % |
| Industrials | 13.6 | % |
| Utilities | 8.8 | % |
| Information Technology | 8.6 | % |
| Consumer Staples | 8.4 | % |
| Energy | 8.0 | % |
| Real Estate | 6.4 | % |
| Materials | 4.4 | % |
| Consumer Discretionary | 3.3 | % |
| Communication Services | 2.1 | % |
| Short-Term Investments | 0.5 | % |
| Other Assets & Liabilities | 1.7 | % |
| Total | 100.0 | % |
* | For Fund compliance purposes, the Fund may not use the same classification system. These classifications are used for financial reporting purposes. |
Availability of Additional Information
For additional information about the Fund, including its prospectus, financial information, holdings, and proxy voting information, please visit the Fund’s website at the website address included at the beginning of this report.
The Fund is distributed by Hartford Funds Distributors, LLC (HFD).
Annual Shareholder Report
October 31, 2024
The Hartford Equity Income Fund
Class F/HQIFX
This annual shareholder report contains important information about The Hartford Equity Income Fund (the "Fund") for the period of November 1, 2023 to October 31, 2024. You can find additional information about the Fund at hartfordfunds.com/reports-hmf. You can also request this information by contacting us by calling 1‑888‑843‑7824.
What were the Fund costs for the last year?
(Based on a hypothetical $10,000 investment)
| Class Name | Costs of a $10,000 investment | Costs paid as a percentage
of a $10,000 investment |
| Class F | $73 | 0.65% |
How did the Fund perform last year and what impacted its performance?
Management's Discussion of Fund Performance
United States (U.S.) equities, as measured by the S&P 500 Index, rose over the trailing twelve-month period ending October 31, 2024, with the S&P 500 Index surging to a record high that was driven by performance in a select group of mega-cap technology companies. The U.S. Federal Reserve (Fed) began easing monetary policy with an interest-rate cut of 50 basis points in September 2024 in an effort to generate a soft landing for the economy. Markets were also kept on edge in the third quarter due to the anticipated extremely close presidential race between Vice President Kamala Harris and former President Donald Trump. Fund performance described below is relative to the Fund’s performance index, the Russell 1000 Value Index, for the trailing twelve-month period ended October 31, 2024.
Top Contributors to Performance
Security selection within the Information Technology, Consumer Discretionary, and Financials sectors contributed to relative performance.
An overweight allocation to the Utilities sector and an underweight allocation to the Communication Services sector contributed to relative performance.
Top individual contributors over the period were an out-of-benchmark position in Broadcom (Information Technology), not holding a position in Intel (Information Technology), and an overweight position in Corning (Information Technology).
Top Detractors to Performance
Security selection detracted from relative results during the period, driven by weak selection within the Industrials, Healthcare, and Real Estate sectors.
Sector allocation, a result of our bottom-up stock selection process, also detracted from relative performance mainly driven by the Fund’s underweight allocations to the Financials and Industrials sectors as well as the Fund’s overweight to the Healthcare sector.
The largest individual detractors over the period were an out-of-benchmark position in Pernod Ricard (Consumer Staples) and overweight positions in Pfizer (Healthcare) and ConocoPhillips (Energy).
The views expressed in this section reflect the opinions of the Fund's sub-adviser, Wellington Management Company LLP, as of the date of this report and are subject to change based on changes in market, economic or other conditions. These views are not intended to be a forecast of future events and are no guarantee of future results.
Comparison of Change in Value of $ 1,000,000 Investment
The graph below represents the hypothetical growth of a $1,000,000 investment in Class F shares and the comparative indices.
Average Annual Total Returns
For the Periods Ended October 31, 2024 | 1 Year | 5 Years | 10 Years |
| Class F | 25.17% | 10.72% | 9.79% |
| Russell 1000 Value Index | 30.98% | 10.14% | 8.87% |
| Russell 1000 Index | 38.07% | 15.00% | 12.75% |
Class F shares commenced operations on February 28, 2017 and performance prior to that date is that of the Fund’s Class I shares. Performance prior to the inception date of the class has not been adjusted to reflect the operating expenses of the class.
The Russell 1000 Value Index serves as the Fund’s performance index because the Fund’s investment manager believes it is more representative of the Fund’s investment strategy. The Russell 1000 Index serves as the Fund’s regulatory index and provides a broad measure of market performance.
The Fund’s past performance is not a good predictor of the Fund’s future performance. The graph and table do not reflect the deduction of taxes that a shareholder would pay on Fund distributions or redemption of Fund shares. Performance information reflects fee waivers and/or expense limitation arrangements, if any. Absent any applicable fee waivers and/or expense limitation arrangements, performance would have been lower. Visit hartfordfunds.com for the most recent performance information.
Key Fund Statistics as of October 31, 2024
| Fund's net assets | $5,177,432,916% |
| Total number of portfolio holdings (excluding derivatives, if any) | $77% |
| Total investment management fees paid | $31,393,286% |
| Portfolio turnover rate | $35% |
Graphical Representation of Holdings as of October 31, 2024
The table below shows the investment makeup of the Fund, representing the percentage of net assets of the Fund.
| Financials | 18.1 | % |
| Health Care | 16.1 | % |
| Industrials | 13.6 | % |
| Utilities | 8.8 | % |
| Information Technology | 8.6 | % |
| Consumer Staples | 8.4 | % |
| Energy | 8.0 | % |
| Real Estate | 6.4 | % |
| Materials | 4.4 | % |
| Consumer Discretionary | 3.3 | % |
| Communication Services | 2.1 | % |
| Short-Term Investments | 0.5 | % |
| Other Assets & Liabilities | 1.7 | % |
| Total | 100.0 | % |
* | For Fund compliance purposes, the Fund may not use the same classification system. These classifications are used for financial reporting purposes. |
Availability of Additional Information
For additional information about the Fund, including its prospectus, financial information, holdings, and proxy voting information, please visit the Fund’s website at the website address included at the beginning of this report.
The Fund is distributed by Hartford Funds Distributors, LLC (HFD).
Annual Shareholder Report
October 31, 2024
The Hartford Healthcare Fund
Class A/HGHAX
This annual shareholder report contains important information about The Hartford Healthcare Fund (the "Fund") for the period of November 1, 2023 to October 31, 2024. You can find additional information about the Fund at hartfordfunds.com/reports-hmf. You can also request this information by contacting us by calling 1‑888‑843‑7824.
What were the Fund costs for the last year?
(Based on a hypothetical $10,000 investment)
| Class Name | Costs of a $10,000 investment | Costs paid as a percentage
of a $10,000 investment |
| Class A | $141 | 1.28% |
How did the Fund perform last year and what impacted its performance?
Management's Discussion of Fund Performance
United States (U.S.) equities, as measured by the S&P 500 Index, rose over the trailing twelve-month period ending October 31, 2024, with the S&P 500 Index surging to a record high that was driven by performance in a select group of mega-cap technology companies. The U.S. Federal Reserve (Fed) began easing monetary policy with an interest-rate cut of 50 basis points in September 2024 in an effort to generate a soft landing for the economy. Markets were also kept on edge in the third quarter of 2024 due to the anticipated extremely close presidential race between Vice President Kamala Harris and former President Donald Trump. Fund performance described below is relative to the Fund’s performance index, the S&P Composite 1500 Health Care Index, for the trailing twelve-month period ended October 31, 2024.
Top Contributors to Performance
Security selection was the primary contributor to relative performance during the period, driven by strong selection within the small-cap Biopharma, mid-cap Biopharma, and large-cap Biopharma sub-sectors.
Top individual contributors over the period were underweight positions in Johnson & Johnson (large-cap Biopharma), CVS Health (Health Care Services) and the Fund’s out-of-benchmark position in UCB (large-cap Biopharma).
An overweight allocation to mid-cap Biopharma contributed positively to relative performance.
Top Detractors to Performance
Sector allocation, a result of the team’s bottom-up stock selection process, was a detractor to relative performance during the period due to the Fund’s overweight allocation to the Healthcare Services sub-sector.
Security selection within the Healthcare Services and Medical Technology sub-sectors contributed negatively to relative performance.
The largest individual detractors over the period were an underweight position in AbbVie (large-cap Biopharma), overweight to Humana (Healthcare Services), and the Fund’s out-of-benchmark position in agilon health (Healthcare Services).
The views expressed in this section reflect the opinions of the Fund's sub-adviser, Wellington Management Company LLP, as of the date of this report and are subject to change based on changes in market, economic or other conditions. These views are not intended to be a forecast of future events and are no guarantee of future results.
Comparison of Change in Value of $ 10,000 Investment
The graph below represents the hypothetical growth of a $10,000 investment in Class A shares and the comparative indices. The returns for Class A shares include the maximum front-end sales charge applicable to Class A shares.
Average Annual Total Returns
For the Periods Ended October 31, 2024 | 1 Year | 5 Years | 10 Years |
| Class A (with 5.50% maximum front-end sales charge) | 13.85% | 7.03% | 7.77% |
| Class A (without 5.50% maximum front-end sales charge) | 20.48% | 8.25% | 8.38% |
| S&P Composite 1500 Health Care Index | 20.04% | 10.81% | 10.06% |
| S&P 500 Index | 38.02% | 15.27% | 13.00% |
The S&P Composite 1500 Health Care Index serves as the Fund’s performance index because the Fund’s investment manager believes it is more representative of the Fund’s investment strategy. The S&P 500 Index serves as the Fund’s regulatory index and provides a broad measure of market performance.
The Fund’s past performance is not a good predictor of the Fund’s future performance. The graph and table do not reflect the deduction of taxes that a shareholder would pay on Fund distributions or redemption of Fund shares. Performance information reflects fee waivers and/or expense limitation arrangements, if any. Absent any applicable fee waivers and/or expense limitation arrangements, performance would have been lower. Visit hartfordfunds.com for the most recent performance information.
Key Fund Statistics as of October 31, 2024
| Fund's net assets | $1,042,223,289% |
| Total number of portfolio holdings (excluding derivatives, if any) | $106% |
| Total investment management fees paid | $9,690,767% |
| Portfolio turnover rate | $40% |
Graphical Representation of Holdings as of October 31, 2024
The table below shows the investment makeup of the Fund, representing the percentage of net assets of the Fund.
Composition by subsector *
| Pharmaceuticals | 28.6 | % |
| Health Care Providers & Services | 23.8 | % |
| Biotechnology | 20.9 | % |
| Health Care Equipment & Services & Supplies | 14.3 | % |
| Life Sciences Tools & Services | 9.8 | % |
| Health Care Technology | 0.6 | % |
| Short-Term Investments | 0.4 | % |
| Other Assets & Liabilities | 1.6 | % |
| Total | 100.0 | % |
* | For Fund compliance purposes, the Fund may not use the same classification system. These classifications are used for financial reporting purposes. |
Availability of Additional Information
For additional information about the Fund, including its prospectus, financial information, holdings, and proxy voting information, please visit the Fund’s website at the website address included at the beginning of this report.
The Fund is distributed by Hartford Funds Distributors, LLC (HFD).
Annual Shareholder Report
October 31, 2024
The Hartford Healthcare Fund
Class C/HGHCX
This annual shareholder report contains important information about The Hartford Healthcare Fund (the "Fund") for the period of November 1, 2023 to October 31, 2024. You can find additional information about the Fund at hartfordfunds.com/reports-hmf. You can also request this information by contacting us by calling 1‑888‑843‑7824.
What were the Fund costs for the last year?
(Based on a hypothetical $10,000 investment)
| Class Name | Costs of a $10,000 investment | Costs paid as a percentage
of a $10,000 investment |
| Class C | $227 | 2.07% |
How did the Fund perform last year and what impacted its performance?
Management's Discussion of Fund Performance
United States (U.S.) equities, as measured by the S&P 500 Index, rose over the trailing twelve-month period ending October 31, 2024, with the S&P 500 Index surging to a record high that was driven by performance in a select group of mega-cap technology companies. The U.S. Federal Reserve (Fed) began easing monetary policy with an interest-rate cut of 50 basis points in September 2024 in an effort to generate a soft landing for the economy. Markets were also kept on edge in the third quarter of 2024 due to the anticipated extremely close presidential race between Vice President Kamala Harris and former President Donald Trump. Fund performance described below is relative to the Fund’s performance index, the S&P Composite 1500 Health Care Index, for the trailing twelve-month period ended October 31, 2024.
Top Contributors to Performance
Security selection was the primary contributor to relative performance during the period, driven by strong selection within the small-cap Biopharma, mid-cap Biopharma, and large-cap Biopharma sub-sectors.
Top individual contributors over the period were underweight positions in Johnson & Johnson (large-cap Biopharma), CVS Health (Health Care Services) and the Fund’s out-of-benchmark position in UCB (large-cap Biopharma).
An overweight allocation to mid-cap Biopharma contributed positively to relative performance.
Top Detractors to Performance
Sector allocation, a result of the team’s bottom-up stock selection process, was a detractor to relative performance during the period due to the Fund’s overweight allocation to the Healthcare Services sub-sector.
Security selection within the Healthcare Services and Medical Technology sub-sectors contributed negatively to relative performance.
The largest individual detractors over the period were an underweight position in AbbVie (large-cap Biopharma), overweight to Humana (Healthcare Services), and the Fund’s out-of-benchmark position in agilon health (Healthcare Services).
The views expressed in this section reflect the opinions of the Fund's sub-adviser, Wellington Management Company LLP, as of the date of this report and are subject to change based on changes in market, economic or other conditions. These views are not intended to be a forecast of future events and are no guarantee of future results.
Comparison of Change in Value of $ 10,000 Investment
The graph below represents the hypothetical growth of a $10,000 investment in Class C shares (excluding sales charges) and the comparative indices. If sales charges had been included, the value would have been lower.
Average Annual Total Returns
For the Periods Ended October 31, 2024 | 1 Year | 5 Years | 10 Years |
| Class C (with 1.00% contingent deferred sales charge) | 18.52% | 7.42% | 7.56% |
| Class C (without 1.00% contingent deferred sales charge) | 19.52% | 7.42% | 7.56% |
| S&P Composite 1500 Health Care Index | 20.04% | 10.81% | 10.06% |
| S&P 500 Index | 38.02% | 15.27% | 13.00% |
The S&P Composite 1500 Health Care Index serves as the Fund’s performance index because the Fund’s investment manager believes it is more representative of the Fund’s investment strategy. The S&P 500 Index serves as the Fund’s regulatory index and provides a broad measure of market performance.
The Fund’s past performance is not a good predictor of the Fund’s future performance. The graph and table do not reflect the deduction of taxes that a shareholder would pay on Fund distributions or redemption of Fund shares. Performance information reflects fee waivers and/or expense limitation arrangements, if any. Absent any applicable fee waivers and/or expense limitation arrangements, performance would have been lower. Visit hartfordfunds.com for the most recent performance information.
Key Fund Statistics as of October 31, 2024
| Fund's net assets | $1,042,223,289% |
| Total number of portfolio holdings (excluding derivatives, if any) | $106% |
| Total investment management fees paid | $9,690,767% |
| Portfolio turnover rate | $40% |
Graphical Representation of Holdings as of October 31, 2024
The table below shows the investment makeup of the Fund, representing the percentage of net assets of the Fund.
Composition by subsector *
| Pharmaceuticals | 28.6 | % |
| Health Care Providers & Services | 23.8 | % |
| Biotechnology | 20.9 | % |
| Health Care Equipment & Services & Supplies | 14.3 | % |
| Life Sciences Tools & Services | 9.8 | % |
| Health Care Technology | 0.6 | % |
| Short-Term Investments | 0.4 | % |
| Other Assets & Liabilities | 1.6 | % |
| Total | 100.0 | % |
* | For Fund compliance purposes, the Fund may not use the same classification system. These classifications are used for financial reporting purposes. |
Availability of Additional Information
For additional information about the Fund, including its prospectus, financial information, holdings, and proxy voting information, please visit the Fund’s website at the website address included at the beginning of this report.
The Fund is distributed by Hartford Funds Distributors, LLC (HFD).
Annual Shareholder Report
October 31, 2024
The Hartford Healthcare Fund
Class I/HGHIX
This annual shareholder report contains important information about The Hartford Healthcare Fund (the "Fund") for the period of November 1, 2023 to October 31, 2024. You can find additional information about the Fund at hartfordfunds.com/reports-hmf. You can also request this information by contacting us by calling 1‑888‑843‑7824.
What were the Fund costs for the last year?
(Based on a hypothetical $10,000 investment)
| Class Name | Costs of a $10,000 investment | Costs paid as a percentage
of a $10,000 investment |
| Class I | $113 | 1.02% |
How did the Fund perform last year and what impacted its performance?
Management's Discussion of Fund Performance
United States (U.S.) equities, as measured by the S&P 500 Index, rose over the trailing twelve-month period ending October 31, 2024, with the S&P 500 Index surging to a record high that was driven by performance in a select group of mega-cap technology companies. The U.S. Federal Reserve (Fed) began easing monetary policy with an interest-rate cut of 50 basis points in September 2024 in an effort to generate a soft landing for the economy. Markets were also kept on edge in the third quarter of 2024 due to the anticipated extremely close presidential race between Vice President Kamala Harris and former President Donald Trump. Fund performance described below is relative to the Fund’s performance index, the S&P Composite 1500 Health Care Index, for the trailing twelve-month period ended October 31, 2024.
Top Contributors to Performance
Security selection was the primary contributor to relative performance during the period, driven by strong selection within the small-cap Biopharma, mid-cap Biopharma, and large-cap Biopharma sub-sectors.
Top individual contributors over the period were underweight positions in Johnson & Johnson (large-cap Biopharma), CVS Health (Health Care Services) and the Fund’s out-of-benchmark position in UCB (large-cap Biopharma).
An overweight allocation to mid-cap Biopharma contributed positively to relative performance.
Top Detractors to Performance
Sector allocation, a result of the team’s bottom-up stock selection process, was a detractor to relative performance during the period due to the Fund’s overweight allocation to the Healthcare Services sub-sector.
Security selection within the Healthcare Services and Medical Technology sub-sectors contributed negatively to relative performance.
The largest individual detractors over the period were an underweight position in AbbVie (large-cap Biopharma), overweight to Humana (Healthcare Services), and the Fund’s out-of-benchmark position in agilon health (Healthcare Services).
The views expressed in this section reflect the opinions of the Fund's sub-adviser, Wellington Management Company LLP, as of the date of this report and are subject to change based on changes in market, economic or other conditions. These views are not intended to be a forecast of future events and are no guarantee of future results.
Comparison of Change in Value of $ 10,000 Investment
The graph below represents the hypothetical growth of a $10,000 investment in Class I shares and the comparative indices.
Average Annual Total Returns
For the Periods Ended October 31, 2024 | 1 Year | 5 Years | 10 Years |
| Class I | 20.78% | 8.54% | 8.67% |
| S&P Composite 1500 Health Care Index | 20.04% | 10.81% | 10.06% |
| S&P 500 Index | 38.02% | 15.27% | 13.00% |
The S&P Composite 1500 Health Care Index serves as the Fund’s performance index because the Fund’s investment manager believes it is more representative of the Fund’s investment strategy. The S&P 500 Index serves as the Fund’s regulatory index and provides a broad measure of market performance.
The Fund’s past performance is not a good predictor of the Fund’s future performance. The graph and table do not reflect the deduction of taxes that a shareholder would pay on Fund distributions or redemption of Fund shares. Performance information reflects fee waivers and/or expense limitation arrangements, if any. Absent any applicable fee waivers and/or expense limitation arrangements, performance would have been lower. Visit hartfordfunds.com for the most recent performance information.
Key Fund Statistics as of October 31, 2024
| Fund's net assets | $1,042,223,289% |
| Total number of portfolio holdings (excluding derivatives, if any) | $106% |
| Total investment management fees paid | $9,690,767% |
| Portfolio turnover rate | $40% |
Graphical Representation of Holdings as of October 31, 2024
The table below shows the investment makeup of the Fund, representing the percentage of net assets of the Fund.
Composition by subsector *
| Pharmaceuticals | 28.6 | % |
| Health Care Providers & Services | 23.8 | % |
| Biotechnology | 20.9 | % |
| Health Care Equipment & Services & Supplies | 14.3 | % |
| Life Sciences Tools & Services | 9.8 | % |
| Health Care Technology | 0.6 | % |
| Short-Term Investments | 0.4 | % |
| Other Assets & Liabilities | 1.6 | % |
| Total | 100.0 | % |
* | For Fund compliance purposes, the Fund may not use the same classification system. These classifications are used for financial reporting purposes. |
Availability of Additional Information
For additional information about the Fund, including its prospectus, financial information, holdings, and proxy voting information, please visit the Fund’s website at the website address included at the beginning of this report.
The Fund is distributed by Hartford Funds Distributors, LLC (HFD).
Annual Shareholder Report
October 31, 2024
The Hartford Healthcare Fund
Class R3/HGHRX
This annual shareholder report contains important information about The Hartford Healthcare Fund (the "Fund") for the period of November 1, 2023 to October 31, 2024. You can find additional information about the Fund at hartfordfunds.com/reports-hmf. You can also request this information by contacting us by calling 1‑888‑843‑7824.
What were the Fund costs for the last year?
(Based on a hypothetical $10,000 investment)
| Class Name | Costs of a $10,000 investment | Costs paid as a percentage
of a $10,000 investment |
| Class R3 | $178 | 1.62% |
How did the Fund perform last year and what impacted its performance?
Management's Discussion of Fund Performance
United States (U.S.) equities, as measured by the S&P 500 Index, rose over the trailing twelve-month period ending October 31, 2024, with the S&P 500 Index surging to a record high that was driven by performance in a select group of mega-cap technology companies. The U.S. Federal Reserve (Fed) began easing monetary policy with an interest-rate cut of 50 basis points in September 2024 in an effort to generate a soft landing for the economy. Markets were also kept on edge in the third quarter of 2024 due to the anticipated extremely close presidential race between Vice President Kamala Harris and former President Donald Trump. Fund performance described below is relative to the Fund’s performance index, the S&P Composite 1500 Health Care Index, for the trailing twelve-month period ended October 31, 2024.
Top Contributors to Performance
Security selection was the primary contributor to relative performance during the period, driven by strong selection within the small-cap Biopharma, mid-cap Biopharma, and large-cap Biopharma sub-sectors.
Top individual contributors over the period were underweight positions in Johnson & Johnson (large-cap Biopharma), CVS Health (Health Care Services) and the Fund’s out-of-benchmark position in UCB (large-cap Biopharma).
An overweight allocation to mid-cap Biopharma contributed positively to relative performance.
Top Detractors to Performance
Sector allocation, a result of the team’s bottom-up stock selection process, was a detractor to relative performance during the period due to the Fund’s overweight allocation to the Healthcare Services sub-sector.
Security selection within the Healthcare Services and Medical Technology sub-sectors contributed negatively to relative performance.
The largest individual detractors over the period were an underweight position in AbbVie (large-cap Biopharma), overweight to Humana (Healthcare Services), and the Fund’s out-of-benchmark position in agilon health (Healthcare Services).
The views expressed in this section reflect the opinions of the Fund's sub-adviser, Wellington Management Company LLP, as of the date of this report and are subject to change based on changes in market, economic or other conditions. These views are not intended to be a forecast of future events and are no guarantee of future results.
Comparison of Change in Value of $ 10,000 Investment
The graph below represents the hypothetical growth of a $10,000 investment in Class R3 shares and the comparative indices.
Average Annual Total Returns
For the Periods Ended October 31, 2024 | 1 Year | 5 Years | 10 Years |
| Class R3 | 20.05% | 7.88% | 8.02% |
| S&P Composite 1500 Health Care Index | 20.04% | 10.81% | 10.06% |
| S&P 500 Index | 38.02% | 15.27% | 13.00% |
The S&P Composite 1500 Health Care Index serves as the Fund’s performance index because the Fund’s investment manager believes it is more representative of the Fund’s investment strategy. The S&P 500 Index serves as the Fund’s regulatory index and provides a broad measure of market performance.
The Fund’s past performance is not a good predictor of the Fund’s future performance. The graph and table do not reflect the deduction of taxes that a shareholder would pay on Fund distributions or redemption of Fund shares. Performance information reflects fee waivers and/or expense limitation arrangements, if any. Absent any applicable fee waivers and/or expense limitation arrangements, performance would have been lower. Visit hartfordfunds.com for the most recent performance information.
Key Fund Statistics as of October 31, 2024
| Fund's net assets | $1,042,223,289% |
| Total number of portfolio holdings (excluding derivatives, if any) | $106% |
| Total investment management fees paid | $9,690,767% |
| Portfolio turnover rate | $40% |
Graphical Representation of Holdings as of October 31, 2024
The table below shows the investment makeup of the Fund, representing the percentage of net assets of the Fund.
Composition by subsector *
| Pharmaceuticals | 28.6 | % |
| Health Care Providers & Services | 23.8 | % |
| Biotechnology | 20.9 | % |
| Health Care Equipment & Services & Supplies | 14.3 | % |
| Life Sciences Tools & Services | 9.8 | % |
| Health Care Technology | 0.6 | % |
| Short-Term Investments | 0.4 | % |
| Other Assets & Liabilities | 1.6 | % |
| Total | 100.0 | % |
* | For Fund compliance purposes, the Fund may not use the same classification system. These classifications are used for financial reporting purposes. |
Availability of Additional Information
For additional information about the Fund, including its prospectus, financial information, holdings, and proxy voting information, please visit the Fund’s website at the website address included at the beginning of this report.
The Fund is distributed by Hartford Funds Distributors, LLC (HFD).
Annual Shareholder Report
October 31, 2024
The Hartford Healthcare Fund
Class R4/HGHSX
This annual shareholder report contains important information about The Hartford Healthcare Fund (the "Fund") for the period of November 1, 2023 to October 31, 2024. You can find additional information about the Fund at hartfordfunds.com/reports-hmf. You can also request this information by contacting us by calling 1‑888‑843‑7824.
What were the Fund costs for the last year?
(Based on a hypothetical $10,000 investment)
| Class Name | Costs of a $10,000 investment | Costs paid as a percentage
of a $10,000 investment |
| Class R4 | $144 | 1.31% |
How did the Fund perform last year and what impacted its performance?
Management's Discussion of Fund Performance
United States (U.S.) equities, as measured by the S&P 500 Index, rose over the trailing twelve-month period ending October 31, 2024, with the S&P 500 Index surging to a record high that was driven by performance in a select group of mega-cap technology companies. The U.S. Federal Reserve (Fed) began easing monetary policy with an interest-rate cut of 50 basis points in September 2024 in an effort to generate a soft landing for the economy. Markets were also kept on edge in the third quarter of 2024 due to the anticipated extremely close presidential race between Vice President Kamala Harris and former President Donald Trump. Fund performance described below is relative to the Fund’s performance index, the S&P Composite 1500 Health Care Index, for the trailing twelve-month period ended October 31, 2024.
Top Contributors to Performance
Security selection was the primary contributor to relative performance during the period, driven by strong selection within the small-cap Biopharma, mid-cap Biopharma, and large-cap Biopharma sub-sectors.
Top individual contributors over the period were underweight positions in Johnson & Johnson (large-cap Biopharma), CVS Health (Health Care Services) and the Fund’s out-of-benchmark position in UCB (large-cap Biopharma).
An overweight allocation to mid-cap Biopharma contributed positively to relative performance.
Top Detractors to Performance
Sector allocation, a result of the team’s bottom-up stock selection process, was a detractor to relative performance during the period due to the Fund’s overweight allocation to the Healthcare Services sub-sector.
Security selection within the Healthcare Services and Medical Technology sub-sectors contributed negatively to relative performance.
The largest individual detractors over the period were an underweight position in AbbVie (large-cap Biopharma), overweight to Humana (Healthcare Services), and the Fund’s out-of-benchmark position in agilon health (Healthcare Services).
The views expressed in this section reflect the opinions of the Fund's sub-adviser, Wellington Management Company LLP, as of the date of this report and are subject to change based on changes in market, economic or other conditions. These views are not intended to be a forecast of future events and are no guarantee of future results.
Comparison of Change in Value of $ 10,000 Investment
The graph below represents the hypothetical growth of a $10,000 investment in Class R4 shares and the comparative indices.
Average Annual Total Returns
For the Periods Ended October 31, 2024 | 1 Year | 5 Years | 10 Years |
| Class R4 | 20.45% | 8.21% | 8.35% |
| S&P Composite 1500 Health Care Index | 20.04% | 10.81% | 10.06% |
| S&P 500 Index | 38.02% | 15.27% | 13.00% |
The S&P Composite 1500 Health Care Index serves as the Fund’s performance index because the Fund’s investment manager believes it is more representative of the Fund’s investment strategy. The S&P 500 Index serves as the Fund’s regulatory index and provides a broad measure of market performance.
The Fund’s past performance is not a good predictor of the Fund’s future performance. The graph and table do not reflect the deduction of taxes that a shareholder would pay on Fund distributions or redemption of Fund shares. Performance information reflects fee waivers and/or expense limitation arrangements, if any. Absent any applicable fee waivers and/or expense limitation arrangements, performance would have been lower. Visit hartfordfunds.com for the most recent performance information.
Key Fund Statistics as of October 31, 2024
| Fund's net assets | $1,042,223,289% |
| Total number of portfolio holdings (excluding derivatives, if any) | $106% |
| Total investment management fees paid | $9,690,767% |
| Portfolio turnover rate | $40% |
Graphical Representation of Holdings as of October 31, 2024
The table below shows the investment makeup of the Fund, representing the percentage of net assets of the Fund.
Composition by subsector *
| Pharmaceuticals | 28.6 | % |
| Health Care Providers & Services | 23.8 | % |
| Biotechnology | 20.9 | % |
| Health Care Equipment & Services & Supplies | 14.3 | % |
| Life Sciences Tools & Services | 9.8 | % |
| Health Care Technology | 0.6 | % |
| Short-Term Investments | 0.4 | % |
| Other Assets & Liabilities | 1.6 | % |
| Total | 100.0 | % |
* | For Fund compliance purposes, the Fund may not use the same classification system. These classifications are used for financial reporting purposes. |
Availability of Additional Information
For additional information about the Fund, including its prospectus, financial information, holdings, and proxy voting information, please visit the Fund’s website at the website address included at the beginning of this report.
The Fund is distributed by Hartford Funds Distributors, LLC (HFD).
Annual Shareholder Report
October 31, 2024
The Hartford Healthcare Fund
Class R5/HGHTX
This annual shareholder report contains important information about The Hartford Healthcare Fund (the "Fund") for the period of November 1, 2023 to October 31, 2024. You can find additional information about the Fund at hartfordfunds.com/reports-hmf. You can also request this information by contacting us by calling 1‑888‑843‑7824.
What were the Fund costs for the last year?
(Based on a hypothetical $10,000 investment)
| Class Name | Costs of a $10,000 investment | Costs paid as a percentage
of a $10,000 investment |
| Class R5 | $114 | 1.03% |
How did the Fund perform last year and what impacted its performance?
Management's Discussion of Fund Performance
United States (U.S.) equities, as measured by the S&P 500 Index, rose over the trailing twelve-month period ending October 31, 2024, with the S&P 500 Index surging to a record high that was driven by performance in a select group of mega-cap technology companies. The U.S. Federal Reserve (Fed) began easing monetary policy with an interest-rate cut of 50 basis points in September 2024 in an effort to generate a soft landing for the economy. Markets were also kept on edge in the third quarter of 2024 due to the anticipated extremely close presidential race between Vice President Kamala Harris and former President Donald Trump. Fund performance described below is relative to the Fund’s performance index, the S&P Composite 1500 Health Care Index, for the trailing twelve-month period ended October 31, 2024.
Top Contributors to Performance
Security selection was the primary contributor to relative performance during the period, driven by strong selection within the small-cap Biopharma, mid-cap Biopharma, and large-cap Biopharma sub-sectors.
Top individual contributors over the period were underweight positions in Johnson & Johnson (large-cap Biopharma), CVS Health (Health Care Services) and the Fund’s out-of-benchmark position in UCB (large-cap Biopharma).
An overweight allocation to mid-cap Biopharma contributed positively to relative performance.
Top Detractors to Performance
Sector allocation, a result of the team’s bottom-up stock selection process, was a detractor to relative performance during the period due to the Fund’s overweight allocation to the Healthcare Services sub-sector.
Security selection within the Healthcare Services and Medical Technology sub-sectors contributed negatively to relative performance.
The largest individual detractors over the period were an underweight position in AbbVie (large-cap Biopharma), overweight to Humana (Healthcare Services), and the Fund’s out-of-benchmark position in agilon health (Healthcare Services).
The views expressed in this section reflect the opinions of the Fund's sub-adviser, Wellington Management Company LLP, as of the date of this report and are subject to change based on changes in market, economic or other conditions. These views are not intended to be a forecast of future events and are no guarantee of future results.
Comparison of Change in Value of $ 10,000 Investment
The graph below represents the hypothetical growth of a $10,000 investment in Class R5 shares and the comparative indices.
Average Annual Total Returns
For the Periods Ended October 31, 2024 | 1 Year | 5 Years | 10 Years |
| Class R5 | 20.78% | 8.52% | 8.67% |
| S&P Composite 1500 Health Care Index | 20.04% | 10.81% | 10.06% |
| S&P 500 Index | 38.02% | 15.27% | 13.00% |
The S&P Composite 1500 Health Care Index serves as the Fund’s performance index because the Fund’s investment manager believes it is more representative of the Fund’s investment strategy. The S&P 500 Index serves as the Fund’s regulatory index and provides a broad measure of market performance.
The Fund’s past performance is not a good predictor of the Fund’s future performance. The graph and table do not reflect the deduction of taxes that a shareholder would pay on Fund distributions or redemption of Fund shares. Performance information reflects fee waivers and/or expense limitation arrangements, if any. Absent any applicable fee waivers and/or expense limitation arrangements, performance would have been lower. Visit hartfordfunds.com for the most recent performance information.
Key Fund Statistics as of October 31, 2024
| Fund's net assets | $1,042,223,289% |
| Total number of portfolio holdings (excluding derivatives, if any) | $106% |
| Total investment management fees paid | $9,690,767% |
| Portfolio turnover rate | $40% |
Graphical Representation of Holdings as of October 31, 2024
The table below shows the investment makeup of the Fund, representing the percentage of net assets of the Fund.
Composition by subsector *
| Pharmaceuticals | 28.6 | % |
| Health Care Providers & Services | 23.8 | % |
| Biotechnology | 20.9 | % |
| Health Care Equipment & Services & Supplies | 14.3 | % |
| Life Sciences Tools & Services | 9.8 | % |
| Health Care Technology | 0.6 | % |
| Short-Term Investments | 0.4 | % |
| Other Assets & Liabilities | 1.6 | % |
| Total | 100.0 | % |
* | For Fund compliance purposes, the Fund may not use the same classification system. These classifications are used for financial reporting purposes. |
Availability of Additional Information
For additional information about the Fund, including its prospectus, financial information, holdings, and proxy voting information, please visit the Fund’s website at the website address included at the beginning of this report.
The Fund is distributed by Hartford Funds Distributors, LLC (HFD).
Annual Shareholder Report
October 31, 2024
The Hartford Healthcare Fund
Class R6/HGHVX
This annual shareholder report contains important information about The Hartford Healthcare Fund (the "Fund") for the period of November 1, 2023 to October 31, 2024. You can find additional information about the Fund at hartfordfunds.com/reports-hmf. You can also request this information by contacting us by calling 1‑888‑843‑7824.
What were the Fund costs for the last year?
(Based on a hypothetical $10,000 investment)
| Class Name | Costs of a $10,000 investment | Costs paid as a percentage
of a $10,000 investment |
| Class R6 | $102 | 0.92% |
How did the Fund perform last year and what impacted its performance?
Management's Discussion of Fund Performance
United States (U.S.) equities, as measured by the S&P 500 Index, rose over the trailing twelve-month period ending October 31, 2024, with the S&P 500 Index surging to a record high that was driven by performance in a select group of mega-cap technology companies. The U.S. Federal Reserve (Fed) began easing monetary policy with an interest-rate cut of 50 basis points in September 2024 in an effort to generate a soft landing for the economy. Markets were also kept on edge in the third quarter of 2024 due to the anticipated extremely close presidential race between Vice President Kamala Harris and former President Donald Trump. Fund performance described below is relative to the Fund’s performance index, the S&P Composite 1500 Health Care Index, for the trailing twelve-month period ended October 31, 2024.
Top Contributors to Performance
Security selection was the primary contributor to relative performance during the period, driven by strong selection within the small-cap Biopharma, mid-cap Biopharma, and large-cap Biopharma sub-sectors.
Top individual contributors over the period were underweight positions in Johnson & Johnson (large-cap Biopharma), CVS Health (Health Care Services) and the Fund’s out-of-benchmark position in UCB (large-cap Biopharma).
An overweight allocation to mid-cap Biopharma contributed positively to relative performance.
Top Detractors to Performance
Sector allocation, a result of the team’s bottom-up stock selection process, was a detractor to relative performance during the period due to the Fund’s overweight allocation to the Healthcare Services sub-sector.
Security selection within the Healthcare Services and Medical Technology sub-sectors contributed negatively to relative performance.
The largest individual detractors over the period were an underweight position in AbbVie (large-cap Biopharma), overweight to Humana (Healthcare Services), and the Fund’s out-of-benchmark position in agilon health (Healthcare Services).
The views expressed in this section reflect the opinions of the Fund's sub-adviser, Wellington Management Company LLP, as of the date of this report and are subject to change based on changes in market, economic or other conditions. These views are not intended to be a forecast of future events and are no guarantee of future results.
Comparison of Change in Value of $ 10,000 Investment
The graph below represents the hypothetical growth of a $10,000 investment in Class R6 shares and the comparative indices.
Average Annual Total Returns
For the Periods Ended October 31, 2024 | 1 Year | 5 Years | 10 Years |
| Class R6 | 20.88% | 8.64% | 8.78% |
| S&P Composite 1500 Health Care Index | 20.04% | 10.81% | 10.06% |
| S&P 500 Index | 38.02% | 15.27% | 13.00% |
Class R6 shares commenced operations on February 28, 2019 and performance prior to that date is that of the Fund’s Class Y shares. Performance prior to the inception date of the class has not been adjusted to reflect the operating expenses of the class.
The S&P Composite 1500 Health Care Index serves as the Fund’s performance index because the Fund’s investment manager believes it is more representative of the Fund’s investment strategy. The S&P 500 Index serves as the Fund’s regulatory index and provides a broad measure of market performance.
The Fund’s past performance is not a good predictor of the Fund’s future performance. The graph and table do not reflect the deduction of taxes that a shareholder would pay on Fund distributions or redemption of Fund shares. Performance information reflects fee waivers and/or expense limitation arrangements, if any. Absent any applicable fee waivers and/or expense limitation arrangements, performance would have been lower. Visit hartfordfunds.com for the most recent performance information.
Key Fund Statistics as of October 31, 2024
| Fund's net assets | $1,042,223,289% |
| Total number of portfolio holdings (excluding derivatives, if any) | $106% |
| Total investment management fees paid | $9,690,767% |
| Portfolio turnover rate | $40% |
Graphical Representation of Holdings as of October 31, 2024
The table below shows the investment makeup of the Fund, representing the percentage of net assets of the Fund.
Composition by subsector *
| Pharmaceuticals | 28.6 | % |
| Health Care Providers & Services | 23.8 | % |
| Biotechnology | 20.9 | % |
| Health Care Equipment & Services & Supplies | 14.3 | % |
| Life Sciences Tools & Services | 9.8 | % |
| Health Care Technology | 0.6 | % |
| Short-Term Investments | 0.4 | % |
| Other Assets & Liabilities | 1.6 | % |
| Total | 100.0 | % |
* | For Fund compliance purposes, the Fund may not use the same classification system. These classifications are used for financial reporting purposes. |
Availability of Additional Information
For additional information about the Fund, including its prospectus, financial information, holdings, and proxy voting information, please visit the Fund’s website at the website address included at the beginning of this report.
The Fund is distributed by Hartford Funds Distributors, LLC (HFD).
Annual Shareholder Report
October 31, 2024
The Hartford Healthcare Fund
Class Y/HGHYX
This annual shareholder report contains important information about The Hartford Healthcare Fund (the "Fund") for the period of November 1, 2023 to October 31, 2024. You can find additional information about the Fund at hartfordfunds.com/reports-hmf. You can also request this information by contacting us by calling 1‑888‑843‑7824.
What were the Fund costs for the last year?
(Based on a hypothetical $10,000 investment)
| Class Name | Costs of a $10,000 investment | Costs paid as a percentage
of a $10,000 investment |
| Class Y | $114 | 1.03% |
How did the Fund perform last year and what impacted its performance?
Management's Discussion of Fund Performance
United States (U.S.) equities, as measured by the S&P 500 Index, rose over the trailing twelve-month period ending October 31, 2024, with the S&P 500 Index surging to a record high that was driven by performance in a select group of mega-cap technology companies. The U.S. Federal Reserve (Fed) began easing monetary policy with an interest-rate cut of 50 basis points in September 2024 in an effort to generate a soft landing for the economy. Markets were also kept on edge in the third quarter of 2024 due to the anticipated extremely close presidential race between Vice President Kamala Harris and former President Donald Trump. Fund performance described below is relative to the Fund’s performance index, the S&P Composite 1500 Health Care Index, for the trailing twelve-month period ended October 31, 2024.
Top Contributors to Performance
Security selection was the primary contributor to relative performance during the period, driven by strong selection within the small-cap Biopharma, mid-cap Biopharma, and large-cap Biopharma sub-sectors.
Top individual contributors over the period were underweight positions in Johnson & Johnson (large-cap Biopharma), CVS Health (Health Care Services) and the Fund’s out-of-benchmark position in UCB (large-cap Biopharma).
An overweight allocation to mid-cap Biopharma contributed positively to relative performance.
Top Detractors to Performance
Sector allocation, a result of the team’s bottom-up stock selection process, was a detractor to relative performance during the period due to the Fund’s overweight allocation to the Healthcare Services sub-sector.
Security selection within the Healthcare Services and Medical Technology sub-sectors contributed negatively to relative performance.
The largest individual detractors over the period were an underweight position in AbbVie (large-cap Biopharma), overweight to Humana (Healthcare Services), and the Fund’s out-of-benchmark position in agilon health (Healthcare Services).
The views expressed in this section reflect the opinions of the Fund's sub-adviser, Wellington Management Company LLP, as of the date of this report and are subject to change based on changes in market, economic or other conditions. These views are not intended to be a forecast of future events and are no guarantee of future results.
Comparison of Change in Value of $ 250,000 Investment
The graph below represents the hypothetical growth of a $250,000 investment in Class Y shares and the comparative indices.
Average Annual Total Returns
For the Periods Ended October 31, 2024 | 1 Year | 5 Years | 10 Years |
| Class Y | 20.79% | 8.54% | 8.73% |
| S&P Composite 1500 Health Care Index | 20.04% | 10.81% | 10.06% |
| S&P 500 Index | 38.02% | 15.27% | 13.00% |
The S&P Composite 1500 Health Care Index serves as the Fund’s performance index because the Fund’s investment manager believes it is more representative of the Fund’s investment strategy. The S&P 500 Index serves as the Fund’s regulatory index and provides a broad measure of market performance.
The Fund’s past performance is not a good predictor of the Fund’s future performance. The graph and table do not reflect the deduction of taxes that a shareholder would pay on Fund distributions or redemption of Fund shares. Performance information reflects fee waivers and/or expense limitation arrangements, if any. Absent any applicable fee waivers and/or expense limitation arrangements, performance would have been lower. Visit hartfordfunds.com for the most recent performance information.
Key Fund Statistics as of October 31, 2024
| Fund's net assets | $1,042,223,289% |
| Total number of portfolio holdings (excluding derivatives, if any) | $106% |
| Total investment management fees paid | $9,690,767% |
| Portfolio turnover rate | $40% |
Graphical Representation of Holdings as of October 31, 2024
The table below shows the investment makeup of the Fund, representing the percentage of net assets of the Fund.
Composition by subsector *
| Pharmaceuticals | 28.6 | % |
| Health Care Providers & Services | 23.8 | % |
| Biotechnology | 20.9 | % |
| Health Care Equipment & Services & Supplies | 14.3 | % |
| Life Sciences Tools & Services | 9.8 | % |
| Health Care Technology | 0.6 | % |
| Short-Term Investments | 0.4 | % |
| Other Assets & Liabilities | 1.6 | % |
| Total | 100.0 | % |
* | For Fund compliance purposes, the Fund may not use the same classification system. These classifications are used for financial reporting purposes. |
Availability of Additional Information
For additional information about the Fund, including its prospectus, financial information, holdings, and proxy voting information, please visit the Fund’s website at the website address included at the beginning of this report.
The Fund is distributed by Hartford Funds Distributors, LLC (HFD).
Annual Shareholder Report
October 31, 2024
The Hartford Healthcare Fund
Class F/HGHFX
This annual shareholder report contains important information about The Hartford Healthcare Fund (the "Fund") for the period of November 1, 2023 to October 31, 2024. You can find additional information about the Fund at hartfordfunds.com/reports-hmf. You can also request this information by contacting us by calling 1‑888‑843‑7824.
What were the Fund costs for the last year?
(Based on a hypothetical $10,000 investment)
| Class Name | Costs of a $10,000 investment | Costs paid as a percentage
of a $10,000 investment |
| Class F | $102 | 0.92% |
How did the Fund perform last year and what impacted its performance?
Management's Discussion of Fund Performance
United States (U.S.) equities, as measured by the S&P 500 Index, rose over the trailing twelve-month period ending October 31, 2024, with the S&P 500 Index surging to a record high that was driven by performance in a select group of mega-cap technology companies. The U.S. Federal Reserve (Fed) began easing monetary policy with an interest-rate cut of 50 basis points in September 2024 in an effort to generate a soft landing for the economy. Markets were also kept on edge in the third quarter of 2024 due to the anticipated extremely close presidential race between Vice President Kamala Harris and former President Donald Trump. Fund performance described below is relative to the Fund’s performance index, the S&P Composite 1500 Health Care Index, for the trailing twelve-month period ended October 31, 2024.
Top Contributors to Performance
Security selection was the primary contributor to relative performance during the period, driven by strong selection within the small-cap Biopharma, mid-cap Biopharma, and large-cap Biopharma sub-sectors.
Top individual contributors over the period were underweight positions in Johnson & Johnson (large-cap Biopharma), CVS Health (Health Care Services) and the Fund’s out-of-benchmark position in UCB (large-cap Biopharma).
An overweight allocation to mid-cap Biopharma contributed positively to relative performance.
Top Detractors to Performance
Sector allocation, a result of the team’s bottom-up stock selection process, was a detractor to relative performance during the period due to the Fund’s overweight allocation to the Healthcare Services sub-sector.
Security selection within the Healthcare Services and Medical Technology sub-sectors contributed negatively to relative performance.
The largest individual detractors over the period were an underweight position in AbbVie (large-cap Biopharma), overweight to Humana (Healthcare Services), and the Fund’s out-of-benchmark position in agilon health (Healthcare Services).
The views expressed in this section reflect the opinions of the Fund's sub-adviser, Wellington Management Company LLP, as of the date of this report and are subject to change based on changes in market, economic or other conditions. These views are not intended to be a forecast of future events and are no guarantee of future results.
Comparison of Change in Value of $ 1,000,000 Investment
The graph below represents the hypothetical growth of a $1,000,000 investment in Class F shares and the comparative indices.
Average Annual Total Returns
For the Periods Ended October 31, 2024 | 1 Year | 5 Years | 10 Years |
| Class F | 20.92% | 8.64% | 8.75% |
| S&P Composite 1500 Health Care Index | 20.04% | 10.81% | 10.06% |
| S&P 500 Index | 38.02% | 15.27% | 13.00% |
Class F shares commenced operations on February 28, 2017 and performance prior to that date is that of the Fund’s Class I shares. Performance prior to the inception date of the class has not been adjusted to reflect the operating expenses of the class.
The S&P Composite 1500 Health Care Index serves as the Fund’s performance index because the Fund’s investment manager believes it is more representative of the Fund’s investment strategy. The S&P 500 Index serves as the Fund’s regulatory index and provides a broad measure of market performance.
The Fund’s past performance is not a good predictor of the Fund’s future performance. The graph and table do not reflect the deduction of taxes that a shareholder would pay on Fund distributions or redemption of Fund shares. Performance information reflects fee waivers and/or expense limitation arrangements, if any. Absent any applicable fee waivers and/or expense limitation arrangements, performance would have been lower. Visit hartfordfunds.com for the most recent performance information.
Key Fund Statistics as of October 31, 2024
| Fund's net assets | $1,042,223,289% |
| Total number of portfolio holdings (excluding derivatives, if any) | $106% |
| Total investment management fees paid | $9,690,767% |
| Portfolio turnover rate | $40% |
Graphical Representation of Holdings as of October 31, 2024
The table below shows the investment makeup of the Fund, representing the percentage of net assets of the Fund.
Composition by subsector *
| Pharmaceuticals | 28.6 | % |
| Health Care Providers & Services | 23.8 | % |
| Biotechnology | 20.9 | % |
| Health Care Equipment & Services & Supplies | 14.3 | % |
| Life Sciences Tools & Services | 9.8 | % |
| Health Care Technology | 0.6 | % |
| Short-Term Investments | 0.4 | % |
| Other Assets & Liabilities | 1.6 | % |
| Total | 100.0 | % |
* | For Fund compliance purposes, the Fund may not use the same classification system. These classifications are used for financial reporting purposes. |
Availability of Additional Information
For additional information about the Fund, including its prospectus, financial information, holdings, and proxy voting information, please visit the Fund’s website at the website address included at the beginning of this report.
The Fund is distributed by Hartford Funds Distributors, LLC (HFD).
Annual Shareholder Report
October 31, 2024
The Hartford MidCap Fund
Class A/HFMCX
This annual shareholder report contains important information about The Hartford MidCap Fund (the "Fund") for the period of November 1, 2023 to October 31, 2024. You can find additional information about the Fund at hartfordfunds.com/reports-hmf. You can also request this information by contacting us by calling 1‑888‑843‑7824.
This report describes changes to the Fund that occurred during the reporting period.
What were the Fund costs for the last year?
(Based on a hypothetical $10,000 investment)
| Class Name | Costs of a $10,000 investment | Costs paid as a percentage
of a $10,000 investment |
| Class A | $124 | 1.11% |
How did the Fund perform last year and what impacted its performance?
Management's Discussion of Fund Performance
United States (U.S.) equities rose, as measured by the S&P 500 Index, over the trailing twelve-month period ending October 31, 2024, with the S&P 500 Index surging to a record high that was driven by performance in a select group of mega-cap technology companies. The U.S. Federal Reserve (Fed) began easing monetary policy with an interest-rate cut of 50 basis points in September 2024 in an effort to generate a soft landing for the economy. Markets were also kept on edge in the third quarter of 2024 due to the anticipated extremely close presidential race between Vice President Kamala Harris and former President Donald Trump. Fund performance described below is relative to the Fund’s performance index, the S&P MidCap 400 Index, for the trailing twelve-month period ended October 31, 2024.
Top Contributors to Performance
Security selection within the Energy, Utilities, and Real Estate sectors contributed positively to relative performance.
Top individual contributors over the period were out-of-benchmark positions in Fair Isaac (Information Technology), Targa Resources (Energy), and Nuvei (Financials).
Top Detractors to Performance
Security selection was the primary detractor to relative performance during the period, driven by weak selection within the Healthcare, Information Technology, and Consumer Staples sectors.
The largest individual detractors over the period were out-of-benchmark positions in agilon health (Healthcare) and Dexcom (Healthcare), and not holding Super Micro Computers (Information Technology).
Sector allocation, a result of the team’s bottom-up stock selection process, was also a detractor to relative performance during the period due to an overweight allocation to the Healthcare sector and an underweight to the Financials sector.
The views expressed in this section reflect the opinions of the Fund's sub-adviser, Wellington Management Company LLP, as of the date of this report and are subject to change based on changes in market, economic or other conditions. These views are not intended to be a forecast of future events and are no guarantee of future results.
Comparison of Change in Value of $ 10,000 Investment
The graph below represents the hypothetical growth of a $10,000 investment in Class A shares and the comparative indices. The returns for Class A shares include the maximum front-end sales charge applicable to Class A shares.
Average Annual Total Returns
For the Periods Ended October 31, 2024 | 1 Year | 5 Years | 10 Years |
| Class A (with 5.50% maximum front-end sales charge) | 16.77% | 4.19% | 7.22% |
| Class A (without 5.50% maximum front-end sales charge) | 23.56% | 5.38% | 7.83% |
| S&P MidCap 400 Index | 32.99% | 11.37% | 9.86% |
| Russell Midcap Growth Index | 38.67% | 11.46% | 11.19% |
| Russell 3000 Index | 37.86% | 14.60% | 12.44% |
The S&P MidCap 400 Index serves as the Fund’s performance index. The Russell Midcap Growth Index serves as the Fund’s secondary performance index. The Russell 3000 Index serves as the Fund’s regulatory index and provides a broad measure of market performance. Effective December 31, 2024, the Russell Midcap Growth Index will replace the S&P MidCap 400 Index as the Fund’s performance index because the Fund’s investment manager believes it is more representative of the Fund’s investment strategy.
The Fund’s past performance is not a good predictor of the Fund’s future performance. The graph and table do not reflect the deduction of taxes that a shareholder would pay on Fund distributions or redemption of Fund shares. Performance information reflects fee waivers and/or expense limitation arrangements, if any. Absent any applicable fee waivers and/or expense limitation arrangements, performance would have been lower. Visit hartfordfunds.com for the most recent performance information.
Key Fund Statistics as of October 31, 2024
| Fund's net assets | $5,411,536,635% |
| Total number of portfolio holdings (excluding derivatives, if any) | $92% |
| Total investment management fees paid | $42,893,347% |
| Portfolio turnover rate | $51% |
Graphical Representation of Holdings as of October 31, 2024
The table below shows the investment makeup of the Fund, representing the percentage of net assets of the Fund.
| Information Technology | 24.3 | % |
| Industrials | 17.6 | % |
| Consumer Discretionary | 15.3 | % |
| Health Care | 13.9 | % |
| Financials | 13.6 | % |
| Energy | 4.2 | % |
| Utilities | 3.5 | % |
| Communication Services | 2.9 | % |
| Consumer Staples | 2.5 | % |
| Real Estate | 1.2 | % |
| Materials | 0.8 | % |
| Short-Term Investments | 1.2 | % |
| Other Assets & Liabilities | (1.0 | )% |
| Total | 100.0 | % |
* | For Fund compliance purposes, the Fund may not use the same classification system. These classifications are used for financial reporting purposes. |
Material Fund Changes
This is a summary of certain changes to the Fund since the beginning of the reporting period.
Effective December 31, 2024, the Fund’s principal investment strategy and principal risks will be modified to reflect the investment team’s focus on quality companies with sustainable growth potential. These changes were announced in supplements to the Fund’s summary prospectus and statutory prospectus dated September 24, 2024.
For more complete information, you may review the Fund’s current prospectus dated March 1, 2024, as may be amended, supplemented or restated, and the Fund’s next prospectus, which we expect to be available by March 1, 2025, at hartfordfunds.com/reports‑hmf, upon request by calling 1-888-843-7824 or sending an e-mail to orders@mysummaryprospectus.com.
Availability of Additional Information
For additional information about the Fund, including its prospectus, financial information, holdings, and proxy voting information, please visit the Fund’s website at the website address included at the beginning of this report.
The Fund is distributed by Hartford Funds Distributors, LLC (HFD).
Annual Shareholder Report
October 31, 2024
The Hartford MidCap Fund
Class C/HMDCX
This annual shareholder report contains important information about The Hartford MidCap Fund (the "Fund") for the period of November 1, 2023 to October 31, 2024. You can find additional information about the Fund at hartfordfunds.com/reports-hmf. You can also request this information by contacting us by calling 1‑888‑843‑7824.
This report describes changes to the Fund that occurred during the reporting period.
What were the Fund costs for the last year?
(Based on a hypothetical $10,000 investment)
| Class Name | Costs of a $10,000 investment | Costs paid as a percentage
of a $10,000 investment |
| Class C | $214 | 1.92% |
How did the Fund perform last year and what impacted its performance?
Management's Discussion of Fund Performance
United States (U.S.) equities rose, as measured by the S&P 500 Index, over the trailing twelve-month period ending October 31, 2024, with the S&P 500 Index surging to a record high that was driven by performance in a select group of mega-cap technology companies. The U.S. Federal Reserve (Fed) began easing monetary policy with an interest-rate cut of 50 basis points in September 2024 in an effort to generate a soft landing for the economy. Markets were also kept on edge in the third quarter of 2024 due to the anticipated extremely close presidential race between Vice President Kamala Harris and former President Donald Trump. Fund performance described below is relative to the Fund’s performance index, the S&P MidCap 400 Index, for the trailing twelve-month period ended October 31, 2024.
Top Contributors to Performance
Security selection within the Energy, Utilities, and Real Estate sectors contributed positively to relative performance.
Top individual contributors over the period were out-of-benchmark positions in Fair Isaac (Information Technology), Targa Resources (Energy), and Nuvei (Financials).
Top Detractors to Performance
Security selection was the primary detractor to relative performance during the period, driven by weak selection within the Healthcare, Information Technology, and Consumer Staples sectors.
The largest individual detractors over the period were out-of-benchmark positions in agilon health (Healthcare) and Dexcom (Healthcare), and not holding Super Micro Computers (Information Technology).
Sector allocation, a result of the team’s bottom-up stock selection process, was also a detractor to relative performance during the period due to an overweight allocation to the Healthcare sector and an underweight to the Financials sector.
The views expressed in this section reflect the opinions of the Fund's sub-adviser, Wellington Management Company LLP, as of the date of this report and are subject to change based on changes in market, economic or other conditions. These views are not intended to be a forecast of future events and are no guarantee of future results.
Comparison of Change in Value of $ 10,000 Investment
The graph below represents the hypothetical growth of a $10,000 investment in Class C shares (excluding sales charges) and the comparative indices. If sales charges had been included, the value would have been lower.
Average Annual Total Returns
For the Periods Ended October 31, 2024 | 1 Year | 5 Years | 10 Years |
| Class C (with 1.00% contingent deferred sales charge) | 21.49% | 4.56% | 7.01% |
| Class C (without 1.00% contingent deferred sales charge) | 22.49% | 4.56% | 7.01% |
| S&P MidCap 400 Index | 32.99% | 11.37% | 9.86% |
| Russell Midcap Growth Index | 38.67% | 11.46% | 11.19% |
| Russell 3000 Index | 37.86% | 14.60% | 12.44% |
The S&P MidCap 400 Index serves as the Fund’s performance index. The Russell Midcap Growth Index serves as the Fund’s secondary performance index. The Russell 3000 Index serves as the Fund’s regulatory index and provides a broad measure of market performance. Effective December 31, 2024, the Russell Midcap Growth Index will replace the S&P MidCap 400 Index as the Fund’s performance index because the Fund’s investment manager believes it is more representative of the Fund’s investment strategy.
The Fund’s past performance is not a good predictor of the Fund’s future performance. The graph and table do not reflect the deduction of taxes that a shareholder would pay on Fund distributions or redemption of Fund shares. Performance information reflects fee waivers and/or expense limitation arrangements, if any. Absent any applicable fee waivers and/or expense limitation arrangements, performance would have been lower. Visit hartfordfunds.com for the most recent performance information.
Key Fund Statistics as of October 31, 2024
| Fund's net assets | $5,411,536,635% |
| Total number of portfolio holdings (excluding derivatives, if any) | $92% |
| Total investment management fees paid | $42,893,347% |
| Portfolio turnover rate | $51% |
Graphical Representation of Holdings as of October 31, 2024
The table below shows the investment makeup of the Fund, representing the percentage of net assets of the Fund.
| Information Technology | 24.3 | % |
| Industrials | 17.6 | % |
| Consumer Discretionary | 15.3 | % |
| Health Care | 13.9 | % |
| Financials | 13.6 | % |
| Energy | 4.2 | % |
| Utilities | 3.5 | % |
| Communication Services | 2.9 | % |
| Consumer Staples | 2.5 | % |
| Real Estate | 1.2 | % |
| Materials | 0.8 | % |
| Short-Term Investments | 1.2 | % |
| Other Assets & Liabilities | (1.0 | )% |
| Total | 100.0 | % |
* | For Fund compliance purposes, the Fund may not use the same classification system. These classifications are used for financial reporting purposes. |
Material Fund Changes
This is a summary of certain changes to the Fund since the beginning of the reporting period.
Effective December 31, 2024, the Fund’s principal investment strategy and principal risks will be modified to reflect the investment team’s focus on quality companies with sustainable growth potential. These changes were announced in supplements to the Fund’s summary prospectus and statutory prospectus dated September 24, 2024.
The expense ratio materially changed from the prior fiscal year due to changes in operating expenses.
For more complete information, you may review the Fund’s current prospectus dated March 1, 2024, as may be amended, supplemented or restated, and the Fund’s next prospectus, which we expect to be available by March 1, 2025, at hartfordfunds.com/reports‑hmf, upon request by calling 1-888-843-7824 or sending an e-mail to orders@mysummaryprospectus.com.
Availability of Additional Information
For additional information about the Fund, including its prospectus, financial information, holdings, and proxy voting information, please visit the Fund’s website at the website address included at the beginning of this report.
The Fund is distributed by Hartford Funds Distributors, LLC (HFD).
Annual Shareholder Report
October 31, 2024
The Hartford MidCap Fund
Class I/HFMIX
This annual shareholder report contains important information about The Hartford MidCap Fund (the "Fund") for the period of November 1, 2023 to October 31, 2024. You can find additional information about the Fund at hartfordfunds.com/reports-hmf. You can also request this information by contacting us by calling 1‑888‑843‑7824.
This report describes changes to the Fund that occurred during the reporting period.
What were the Fund costs for the last year?
(Based on a hypothetical $10,000 investment)
| Class Name | Costs of a $10,000 investment | Costs paid as a percentage
of a $10,000 investment |
| Class I | $94 | 0.84% |
How did the Fund perform last year and what impacted its performance?
Management's Discussion of Fund Performance
United States (U.S.) equities rose, as measured by the S&P 500 Index, over the trailing twelve-month period ending October 31, 2024, with the S&P 500 Index surging to a record high that was driven by performance in a select group of mega-cap technology companies. The U.S. Federal Reserve (Fed) began easing monetary policy with an interest-rate cut of 50 basis points in September 2024 in an effort to generate a soft landing for the economy. Markets were also kept on edge in the third quarter of 2024 due to the anticipated extremely close presidential race between Vice President Kamala Harris and former President Donald Trump. Fund performance described below is relative to the Fund’s performance index, the S&P MidCap 400 Index, for the trailing twelve-month period ended October 31, 2024.
Top Contributors to Performance
Security selection within the Energy, Utilities, and Real Estate sectors contributed positively to relative performance.
Top individual contributors over the period were out-of-benchmark positions in Fair Isaac (Information Technology), Targa Resources (Energy), and Nuvei (Financials).
Top Detractors to Performance
Security selection was the primary detractor to relative performance during the period, driven by weak selection within the Healthcare, Information Technology, and Consumer Staples sectors.
The largest individual detractors over the period were out-of-benchmark positions in agilon health (Healthcare) and Dexcom (Healthcare), and not holding Super Micro Computers (Information Technology).
Sector allocation, a result of the team’s bottom-up stock selection process, was also a detractor to relative performance during the period due to an overweight allocation to the Healthcare sector and an underweight to the Financials sector.
The views expressed in this section reflect the opinions of the Fund's sub-adviser, Wellington Management Company LLP, as of the date of this report and are subject to change based on changes in market, economic or other conditions. These views are not intended to be a forecast of future events and are no guarantee of future results.
Comparison of Change in Value of $ 10,000 Investment
The graph below represents the hypothetical growth of a $10,000 investment in Class I shares and the comparative indices.
Average Annual Total Returns
For the Periods Ended October 31, 2024 | 1 Year | 5 Years | 10 Years |
| Class I | 23.86% | 5.64% | 8.09% |
| S&P MidCap 400 Index | 32.99% | 11.37% | 9.86% |
| Russell Midcap Growth Index | 38.67% | 11.46% | 11.19% |
| Russell 3000 Index | 37.86% | 14.60% | 12.44% |
The S&P MidCap 400 Index serves as the Fund’s performance index. The Russell Midcap Growth Index serves as the Fund’s secondary performance index. The Russell 3000 Index serves as the Fund’s regulatory index and provides a broad measure of market performance. Effective December 31, 2024, the Russell Midcap Growth Index will replace the S&P MidCap 400 Index as the Fund’s performance index because the Fund’s investment manager believes it is more representative of the Fund’s investment strategy.
The Fund’s past performance is not a good predictor of the Fund’s future performance. The graph and table do not reflect the deduction of taxes that a shareholder would pay on Fund distributions or redemption of Fund shares. Performance information reflects fee waivers and/or expense limitation arrangements, if any. Absent any applicable fee waivers and/or expense limitation arrangements, performance would have been lower. Visit hartfordfunds.com for the most recent performance information.
Key Fund Statistics as of October 31, 2024
| Fund's net assets | $5,411,536,635% |
| Total number of portfolio holdings (excluding derivatives, if any) | $92% |
| Total investment management fees paid | $42,893,347% |
| Portfolio turnover rate | $51% |
Graphical Representation of Holdings as of October 31, 2024
The table below shows the investment makeup of the Fund, representing the percentage of net assets of the Fund.
| Information Technology | 24.3 | % |
| Industrials | 17.6 | % |
| Consumer Discretionary | 15.3 | % |
| Health Care | 13.9 | % |
| Financials | 13.6 | % |
| Energy | 4.2 | % |
| Utilities | 3.5 | % |
| Communication Services | 2.9 | % |
| Consumer Staples | 2.5 | % |
| Real Estate | 1.2 | % |
| Materials | 0.8 | % |
| Short-Term Investments | 1.2 | % |
| Other Assets & Liabilities | (1.0 | )% |
| Total | 100.0 | % |
* | For Fund compliance purposes, the Fund may not use the same classification system. These classifications are used for financial reporting purposes. |
Material Fund Changes
This is a summary of certain changes to the Fund since the beginning of the reporting period.
Effective December 31, 2024, the Fund’s principal investment strategy and principal risks will be modified to reflect the investment team’s focus on quality companies with sustainable growth potential. These changes were announced in supplements to the Fund’s summary prospectus and statutory prospectus dated September 24, 2024.
For more complete information, you may review the Fund’s current prospectus dated March 1, 2024, as may be amended, supplemented or restated, and the Fund’s next prospectus, which we expect to be available by March 1, 2025, at hartfordfunds.com/reports‑hmf, upon request by calling 1-888-843-7824 or sending an e-mail to orders@mysummaryprospectus.com.
Availability of Additional Information
For additional information about the Fund, including its prospectus, financial information, holdings, and proxy voting information, please visit the Fund’s website at the website address included at the beginning of this report.
The Fund is distributed by Hartford Funds Distributors, LLC (HFD).
Annual Shareholder Report
October 31, 2024
The Hartford MidCap Fund
Class R3/HFMRX
This annual shareholder report contains important information about The Hartford MidCap Fund (the "Fund") for the period of November 1, 2023 to October 31, 2024. You can find additional information about the Fund at hartfordfunds.com/reports-hmf. You can also request this information by contacting us by calling 1‑888‑843‑7824.
This report describes changes to the Fund that occurred during the reporting period.
What were the Fund costs for the last year?
(Based on a hypothetical $10,000 investment)
| Class Name | Costs of a $10,000 investment | Costs paid as a percentage
of a $10,000 investment |
| Class R3 | $164 | 1.47% |
How did the Fund perform last year and what impacted its performance?
Management's Discussion of Fund Performance
United States (U.S.) equities rose, as measured by the S&P 500 Index, over the trailing twelve-month period ending October 31, 2024, with the S&P 500 Index surging to a record high that was driven by performance in a select group of mega-cap technology companies. The U.S. Federal Reserve (Fed) began easing monetary policy with an interest-rate cut of 50 basis points in September 2024 in an effort to generate a soft landing for the economy. Markets were also kept on edge in the third quarter of 2024 due to the anticipated extremely close presidential race between Vice President Kamala Harris and former President Donald Trump. Fund performance described below is relative to the Fund’s performance index, the S&P MidCap 400 Index, for the trailing twelve-month period ended October 31, 2024.
Top Contributors to Performance
Security selection within the Energy, Utilities, and Real Estate sectors contributed positively to relative performance.
Top individual contributors over the period were out-of-benchmark positions in Fair Isaac (Information Technology), Targa Resources (Energy), and Nuvei (Financials).
Top Detractors to Performance
Security selection was the primary detractor to relative performance during the period, driven by weak selection within the Healthcare, Information Technology, and Consumer Staples sectors.
The largest individual detractors over the period were out-of-benchmark positions in agilon health (Healthcare) and Dexcom (Healthcare), and not holding Super Micro Computers (Information Technology).
Sector allocation, a result of the team’s bottom-up stock selection process, was also a detractor to relative performance during the period due to an overweight allocation to the Healthcare sector and an underweight to the Financials sector.
The views expressed in this section reflect the opinions of the Fund's sub-adviser, Wellington Management Company LLP, as of the date of this report and are subject to change based on changes in market, economic or other conditions. These views are not intended to be a forecast of future events and are no guarantee of future results.
Comparison of Change in Value of $ 10,000 Investment
The graph below represents the hypothetical growth of a $10,000 investment in Class R3 shares and the comparative indices.
Average Annual Total Returns
For the Periods Ended October 31, 2024 | 1 Year | 5 Years | 10 Years |
| Class R3 | 23.12% | 5.00% | 7.45% |
| S&P MidCap 400 Index | 32.99% | 11.37% | 9.86% |
| Russell Midcap Growth Index | 38.67% | 11.46% | 11.19% |
| Russell 3000 Index | 37.86% | 14.60% | 12.44% |
The S&P MidCap 400 Index serves as the Fund’s performance index. The Russell Midcap Growth Index serves as the Fund’s secondary performance index. The Russell 3000 Index serves as the Fund’s regulatory index and provides a broad measure of market performance. Effective December 31, 2024, the Russell Midcap Growth Index will replace the S&P MidCap 400 Index as the Fund’s performance index because the Fund’s investment manager believes it is more representative of the Fund’s investment strategy.
The Fund’s past performance is not a good predictor of the Fund’s future performance. The graph and table do not reflect the deduction of taxes that a shareholder would pay on Fund distributions or redemption of Fund shares. Performance information reflects fee waivers and/or expense limitation arrangements, if any. Absent any applicable fee waivers and/or expense limitation arrangements, performance would have been lower. Visit hartfordfunds.com for the most recent performance information.
Key Fund Statistics as of October 31, 2024
| Fund's net assets | $5,411,536,635% |
| Total number of portfolio holdings (excluding derivatives, if any) | $92% |
| Total investment management fees paid | $42,893,347% |
| Portfolio turnover rate | $51% |
Graphical Representation of Holdings as of October 31, 2024
The table below shows the investment makeup of the Fund, representing the percentage of net assets of the Fund.
| Information Technology | 24.3 | % |
| Industrials | 17.6 | % |
| Consumer Discretionary | 15.3 | % |
| Health Care | 13.9 | % |
| Financials | 13.6 | % |
| Energy | 4.2 | % |
| Utilities | 3.5 | % |
| Communication Services | 2.9 | % |
| Consumer Staples | 2.5 | % |
| Real Estate | 1.2 | % |
| Materials | 0.8 | % |
| Short-Term Investments | 1.2 | % |
| Other Assets & Liabilities | (1.0 | )% |
| Total | 100.0 | % |
* | For Fund compliance purposes, the Fund may not use the same classification system. These classifications are used for financial reporting purposes. |
Material Fund Changes
This is a summary of certain changes to the Fund since the beginning of the reporting period.
Effective December 31, 2024, the Fund’s principal investment strategy and principal risks will be modified to reflect the investment team’s focus on quality companies with sustainable growth potential. These changes were announced in supplements to the Fund’s summary prospectus and statutory prospectus dated September 24, 2024.
For more complete information, you may review the Fund’s current prospectus dated March 1, 2024, as may be amended, supplemented or restated, and the Fund’s next prospectus, which we expect to be available by March 1, 2025, at hartfordfunds.com/reports‑hmf, upon request by calling 1-888-843-7824 or sending an e-mail to orders@mysummaryprospectus.com.
Availability of Additional Information
For additional information about the Fund, including its prospectus, financial information, holdings, and proxy voting information, please visit the Fund’s website at the website address included at the beginning of this report.
The Fund is distributed by Hartford Funds Distributors, LLC (HFD).
Annual Shareholder Report
October 31, 2024
The Hartford MidCap Fund
Class R4/HFMSX
This annual shareholder report contains important information about The Hartford MidCap Fund (the "Fund") for the period of November 1, 2023 to October 31, 2024. You can find additional information about the Fund at hartfordfunds.com/reports-hmf. You can also request this information by contacting us by calling 1‑888‑843‑7824.
This report describes changes to the Fund that occurred during the reporting period.
What were the Fund costs for the last year?
(Based on a hypothetical $10,000 investment)
| Class Name | Costs of a $10,000 investment | Costs paid as a percentage
of a $10,000 investment |
| Class R4 | $127 | 1.14% |
How did the Fund perform last year and what impacted its performance?
Management's Discussion of Fund Performance
United States (U.S.) equities rose, as measured by the S&P 500 Index, over the trailing twelve-month period ending October 31, 2024, with the S&P 500 Index surging to a record high that was driven by performance in a select group of mega-cap technology companies. The U.S. Federal Reserve (Fed) began easing monetary policy with an interest-rate cut of 50 basis points in September 2024 in an effort to generate a soft landing for the economy. Markets were also kept on edge in the third quarter of 2024 due to the anticipated extremely close presidential race between Vice President Kamala Harris and former President Donald Trump. Fund performance described below is relative to the Fund’s performance index, the S&P MidCap 400 Index, for the trailing twelve-month period ended October 31, 2024.
Top Contributors to Performance
Security selection within the Energy, Utilities, and Real Estate sectors contributed positively to relative performance.
Top individual contributors over the period were out-of-benchmark positions in Fair Isaac (Information Technology), Targa Resources (Energy), and Nuvei (Financials).
Top Detractors to Performance
Security selection was the primary detractor to relative performance during the period, driven by weak selection within the Healthcare, Information Technology, and Consumer Staples sectors.
The largest individual detractors over the period were out-of-benchmark positions in agilon health (Healthcare) and Dexcom (Healthcare), and not holding Super Micro Computers (Information Technology).
Sector allocation, a result of the team’s bottom-up stock selection process, was also a detractor to relative performance during the period due to an overweight allocation to the Healthcare sector and an underweight to the Financials sector.
The views expressed in this section reflect the opinions of the Fund's sub-adviser, Wellington Management Company LLP, as of the date of this report and are subject to change based on changes in market, economic or other conditions. These views are not intended to be a forecast of future events and are no guarantee of future results.
Comparison of Change in Value of $ 10,000 Investment
The graph below represents the hypothetical growth of a $10,000 investment in Class R4 shares and the comparative indices.
Average Annual Total Returns
For the Periods Ended October 31, 2024 | 1 Year | 5 Years | 10 Years |
| Class R4 | 23.50% | 5.33% | 7.79% |
| S&P MidCap 400 Index | 32.99% | 11.37% | 9.86% |
| Russell Midcap Growth Index | 38.67% | 11.46% | 11.19% |
| Russell 3000 Index | 37.86% | 14.60% | 12.44% |
The S&P MidCap 400 Index serves as the Fund’s performance index. The Russell Midcap Growth Index serves as the Fund’s secondary performance index. The Russell 3000 Index serves as the Fund’s regulatory index and provides a broad measure of market performance. Effective December 31, 2024, the Russell Midcap Growth Index will replace the S&P MidCap 400 Index as the Fund’s performance index because the Fund’s investment manager believes it is more representative of the Fund’s investment strategy.
The Fund’s past performance is not a good predictor of the Fund’s future performance. The graph and table do not reflect the deduction of taxes that a shareholder would pay on Fund distributions or redemption of Fund shares. Performance information reflects fee waivers and/or expense limitation arrangements, if any. Absent any applicable fee waivers and/or expense limitation arrangements, performance would have been lower. Visit hartfordfunds.com for the most recent performance information.
Key Fund Statistics as of October 31, 2024
| Fund's net assets | $5,411,536,635% |
| Total number of portfolio holdings (excluding derivatives, if any) | $92% |
| Total investment management fees paid | $42,893,347% |
| Portfolio turnover rate | $51% |
Graphical Representation of Holdings as of October 31, 2024
The table below shows the investment makeup of the Fund, representing the percentage of net assets of the Fund.
| Information Technology | 24.3 | % |
| Industrials | 17.6 | % |
| Consumer Discretionary | 15.3 | % |
| Health Care | 13.9 | % |
| Financials | 13.6 | % |
| Energy | 4.2 | % |
| Utilities | 3.5 | % |
| Communication Services | 2.9 | % |
| Consumer Staples | 2.5 | % |
| Real Estate | 1.2 | % |
| Materials | 0.8 | % |
| Short-Term Investments | 1.2 | % |
| Other Assets & Liabilities | (1.0 | )% |
| Total | 100.0 | % |
* | For Fund compliance purposes, the Fund may not use the same classification system. These classifications are used for financial reporting purposes. |
Material Fund Changes
This is a summary of certain changes to the Fund since the beginning of the reporting period.
Effective December 31, 2024, the Fund’s principal investment strategy and principal risks will be modified to reflect the investment team’s focus on quality companies with sustainable growth potential. These changes were announced in supplements to the Fund’s summary prospectus and statutory prospectus dated September 24, 2024.
For more complete information, you may review the Fund’s current prospectus dated March 1, 2024, as may be amended, supplemented or restated, and the Fund’s next prospectus, which we expect to be available by March 1, 2025, at hartfordfunds.com/reports‑hmf, upon request by calling 1-888-843-7824 or sending an e-mail to orders@mysummaryprospectus.com.
Availability of Additional Information
For additional information about the Fund, including its prospectus, financial information, holdings, and proxy voting information, please visit the Fund’s website at the website address included at the beginning of this report.
The Fund is distributed by Hartford Funds Distributors, LLC (HFD).
Annual Shareholder Report
October 31, 2024
The Hartford MidCap Fund
Class R5/HFMTX
This annual shareholder report contains important information about The Hartford MidCap Fund (the "Fund") for the period of November 1, 2023 to October 31, 2024. You can find additional information about the Fund at hartfordfunds.com/reports-hmf. You can also request this information by contacting us by calling 1‑888‑843‑7824.
This report describes changes to the Fund that occurred during the reporting period.
What were the Fund costs for the last year?
(Based on a hypothetical $10,000 investment)
| Class Name | Costs of a $10,000 investment | Costs paid as a percentage
of a $10,000 investment |
| Class R5 | $96 | 0.86% |
How did the Fund perform last year and what impacted its performance?
Management's Discussion of Fund Performance
United States (U.S.) equities rose, as measured by the S&P 500 Index, over the trailing twelve-month period ending October 31, 2024, with the S&P 500 Index surging to a record high that was driven by performance in a select group of mega-cap technology companies. The U.S. Federal Reserve (Fed) began easing monetary policy with an interest-rate cut of 50 basis points in September 2024 in an effort to generate a soft landing for the economy. Markets were also kept on edge in the third quarter of 2024 due to the anticipated extremely close presidential race between Vice President Kamala Harris and former President Donald Trump. Fund performance described below is relative to the Fund’s performance index, the S&P MidCap 400 Index, for the trailing twelve-month period ended October 31, 2024.
Top Contributors to Performance
Security selection within the Energy, Utilities, and Real Estate sectors contributed positively to relative performance.
Top individual contributors over the period were out-of-benchmark positions in Fair Isaac (Information Technology), Targa Resources (Energy), and Nuvei (Financials).
Top Detractors to Performance
Security selection was the primary detractor to relative performance during the period, driven by weak selection within the Healthcare, Information Technology, and Consumer Staples sectors.
The largest individual detractors over the period were out-of-benchmark positions in agilon health (Healthcare) and Dexcom (Healthcare), and not holding Super Micro Computers (Information Technology).
Sector allocation, a result of the team’s bottom-up stock selection process, was also a detractor to relative performance during the period due to an overweight allocation to the Healthcare sector and an underweight to the Financials sector.
The views expressed in this section reflect the opinions of the Fund's sub-adviser, Wellington Management Company LLP, as of the date of this report and are subject to change based on changes in market, economic or other conditions. These views are not intended to be a forecast of future events and are no guarantee of future results.
Comparison of Change in Value of $ 10,000 Investment
The graph below represents the hypothetical growth of a $10,000 investment in Class R5 shares and the comparative indices.
Average Annual Total Returns
For the Periods Ended October 31, 2024 | 1 Year | 5 Years | 10 Years |
| Class R5 | 23.83% | 5.65% | 8.11% |
| S&P MidCap 400 Index | 32.99% | 11.37% | 9.86% |
| Russell Midcap Growth Index | 38.67% | 11.46% | 11.19% |
| Russell 3000 Index | 37.86% | 14.60% | 12.44% |
The S&P MidCap 400 Index serves as the Fund’s performance index. The Russell Midcap Growth Index serves as the Fund’s secondary performance index. The Russell 3000 Index serves as the Fund’s regulatory index and provides a broad measure of market performance. Effective December 31, 2024, the Russell Midcap Growth Index will replace the S&P MidCap 400 Index as the Fund’s performance index because the Fund’s investment manager believes it is more representative of the Fund’s investment strategy.
The Fund’s past performance is not a good predictor of the Fund’s future performance. The graph and table do not reflect the deduction of taxes that a shareholder would pay on Fund distributions or redemption of Fund shares. Performance information reflects fee waivers and/or expense limitation arrangements, if any. Absent any applicable fee waivers and/or expense limitation arrangements, performance would have been lower. Visit hartfordfunds.com for the most recent performance information.
Key Fund Statistics as of October 31, 2024
| Fund's net assets | $5,411,536,635% |
| Total number of portfolio holdings (excluding derivatives, if any) | $92% |
| Total investment management fees paid | $42,893,347% |
| Portfolio turnover rate | $51% |
Graphical Representation of Holdings as of October 31, 2024
The table below shows the investment makeup of the Fund, representing the percentage of net assets of the Fund.
| Information Technology | 24.3 | % |
| Industrials | 17.6 | % |
| Consumer Discretionary | 15.3 | % |
| Health Care | 13.9 | % |
| Financials | 13.6 | % |
| Energy | 4.2 | % |
| Utilities | 3.5 | % |
| Communication Services | 2.9 | % |
| Consumer Staples | 2.5 | % |
| Real Estate | 1.2 | % |
| Materials | 0.8 | % |
| Short-Term Investments | 1.2 | % |
| Other Assets & Liabilities | (1.0 | )% |
| Total | 100.0 | % |
* | For Fund compliance purposes, the Fund may not use the same classification system. These classifications are used for financial reporting purposes. |
Material Fund Changes
This is a summary of certain changes to the Fund since the beginning of the reporting period.
Effective December 31, 2024, the Fund’s principal investment strategy and principal risks will be modified to reflect the investment team’s focus on quality companies with sustainable growth potential. These changes were announced in supplements to the Fund’s summary prospectus and statutory prospectus dated September 24, 2024.
For more complete information, you may review the Fund’s current prospectus dated March 1, 2024, as may be amended, supplemented or restated, and the Fund’s next prospectus, which we expect to be available by March 1, 2025, at hartfordfunds.com/reports‑hmf, upon request by calling 1-888-843-7824 or sending an e-mail to orders@mysummaryprospectus.com.
Availability of Additional Information
For additional information about the Fund, including its prospectus, financial information, holdings, and proxy voting information, please visit the Fund’s website at the website address included at the beginning of this report.
The Fund is distributed by Hartford Funds Distributors, LLC (HFD).
Annual Shareholder Report
October 31, 2024
The Hartford MidCap Fund
Class R6/HFMVX
This annual shareholder report contains important information about The Hartford MidCap Fund (the "Fund") for the period of November 1, 2023 to October 31, 2024. You can find additional information about the Fund at hartfordfunds.com/reports-hmf. You can also request this information by contacting us by calling 1‑888‑843‑7824.
This report describes changes to the Fund that occurred during the reporting period.
What were the Fund costs for the last year?
(Based on a hypothetical $10,000 investment)
| Class Name | Costs of a $10,000 investment | Costs paid as a percentage
of a $10,000 investment |
| Class R6 | $84 | 0.75% |
How did the Fund perform last year and what impacted its performance?
Management's Discussion of Fund Performance
United States (U.S.) equities rose, as measured by the S&P 500 Index, over the trailing twelve-month period ending October 31, 2024, with the S&P 500 Index surging to a record high that was driven by performance in a select group of mega-cap technology companies. The U.S. Federal Reserve (Fed) began easing monetary policy with an interest-rate cut of 50 basis points in September 2024 in an effort to generate a soft landing for the economy. Markets were also kept on edge in the third quarter of 2024 due to the anticipated extremely close presidential race between Vice President Kamala Harris and former President Donald Trump. Fund performance described below is relative to the Fund’s performance index, the S&P MidCap 400 Index, for the trailing twelve-month period ended October 31, 2024.
Top Contributors to Performance
Security selection within the Energy, Utilities, and Real Estate sectors contributed positively to relative performance.
Top individual contributors over the period were out-of-benchmark positions in Fair Isaac (Information Technology), Targa Resources (Energy), and Nuvei (Financials).
Top Detractors to Performance
Security selection was the primary detractor to relative performance during the period, driven by weak selection within the Healthcare, Information Technology, and Consumer Staples sectors.
The largest individual detractors over the period were out-of-benchmark positions in agilon health (Healthcare) and Dexcom (Healthcare), and not holding Super Micro Computers (Information Technology).
Sector allocation, a result of the team’s bottom-up stock selection process, was also a detractor to relative performance during the period due to an overweight allocation to the Healthcare sector and an underweight to the Financials sector.
The views expressed in this section reflect the opinions of the Fund's sub-adviser, Wellington Management Company LLP, as of the date of this report and are subject to change based on changes in market, economic or other conditions. These views are not intended to be a forecast of future events and are no guarantee of future results.
Comparison of Change in Value of $ 10,000 Investment
The graph below represents the hypothetical growth of a $10,000 investment in Class R6 shares and the comparative indices.
Average Annual Total Returns
For the Periods Ended October 31, 2024 | 1 Year | 5 Years | 10 Years |
| Class R6 | 23.99% | 5.75% | 8.22% |
| S&P MidCap 400 Index | 32.99% | 11.37% | 9.86% |
| Russell Midcap Growth Index | 38.67% | 11.46% | 11.19% |
| Russell 3000 Index | 37.86% | 14.60% | 12.44% |
Class R6 shares commenced operations on November 7, 2014 and performance prior to that date is that of the Fund’s Class Y shares. Performance prior to the inception date of the class has not been adjusted to reflect the operating expenses of the class.
The S&P MidCap 400 Index serves as the Fund’s performance index. The Russell Midcap Growth Index serves as the Fund’s secondary performance index. The Russell 3000 Index serves as the Fund’s regulatory index and provides a broad measure of market performance. Effective December 31, 2024, the Russell Midcap Growth Index will replace the S&P MidCap 400 Index as the Fund’s performance index because the Fund’s investment manager believes it is more representative of the Fund’s investment strategy.
The Fund’s past performance is not a good predictor of the Fund’s future performance. The graph and table do not reflect the deduction of taxes that a shareholder would pay on Fund distributions or redemption of Fund shares. Performance information reflects fee waivers and/or expense limitation arrangements, if any. Absent any applicable fee waivers and/or expense limitation arrangements, performance would have been lower. Visit hartfordfunds.com for the most recent performance information.
Key Fund Statistics as of October 31, 2024
| Fund's net assets | $5,411,536,635% |
| Total number of portfolio holdings (excluding derivatives, if any) | $92% |
| Total investment management fees paid | $42,893,347% |
| Portfolio turnover rate | $51% |
Graphical Representation of Holdings as of October 31, 2024
The table below shows the investment makeup of the Fund, representing the percentage of net assets of the Fund.
| Information Technology | 24.3 | % |
| Industrials | 17.6 | % |
| Consumer Discretionary | 15.3 | % |
| Health Care | 13.9 | % |
| Financials | 13.6 | % |
| Energy | 4.2 | % |
| Utilities | 3.5 | % |
| Communication Services | 2.9 | % |
| Consumer Staples | 2.5 | % |
| Real Estate | 1.2 | % |
| Materials | 0.8 | % |
| Short-Term Investments | 1.2 | % |
| Other Assets & Liabilities | (1.0 | )% |
| Total | 100.0 | % |
* | For Fund compliance purposes, the Fund may not use the same classification system. These classifications are used for financial reporting purposes. |
Material Fund Changes
This is a summary of certain changes to the Fund since the beginning of the reporting period.
Effective December 31, 2024, the Fund’s principal investment strategy and principal risks will be modified to reflect the investment team’s focus on quality companies with sustainable growth potential. These changes were announced in supplements to the Fund’s summary prospectus and statutory prospectus dated September 24, 2024.
For more complete information, you may review the Fund’s current prospectus dated March 1, 2024, as may be amended, supplemented or restated, and the Fund’s next prospectus, which we expect to be available by March 1, 2025, at hartfordfunds.com/reports‑hmf, upon request by calling 1-888-843-7824 or sending an e-mail to orders@mysummaryprospectus.com.
Availability of Additional Information
For additional information about the Fund, including its prospectus, financial information, holdings, and proxy voting information, please visit the Fund’s website at the website address included at the beginning of this report.
The Fund is distributed by Hartford Funds Distributors, LLC (HFD).
Annual Shareholder Report
October 31, 2024
The Hartford MidCap Fund
Class Y/HMDYX
This annual shareholder report contains important information about The Hartford MidCap Fund (the "Fund") for the period of November 1, 2023 to October 31, 2024. You can find additional information about the Fund at hartfordfunds.com/reports-hmf. You can also request this information by contacting us by calling 1‑888‑843‑7824.
This report describes changes to the Fund that occurred during the reporting period.
What were the Fund costs for the last year?
(Based on a hypothetical $10,000 investment)
| Class Name | Costs of a $10,000 investment | Costs paid as a percentage
of a $10,000 investment |
| Class Y | $96 | 0.86% |
How did the Fund perform last year and what impacted its performance?
Management's Discussion of Fund Performance
United States (U.S.) equities rose, as measured by the S&P 500 Index, over the trailing twelve-month period ending October 31, 2024, with the S&P 500 Index surging to a record high that was driven by performance in a select group of mega-cap technology companies. The U.S. Federal Reserve (Fed) began easing monetary policy with an interest-rate cut of 50 basis points in September 2024 in an effort to generate a soft landing for the economy. Markets were also kept on edge in the third quarter of 2024 due to the anticipated extremely close presidential race between Vice President Kamala Harris and former President Donald Trump. Fund performance described below is relative to the Fund’s performance index, the S&P MidCap 400 Index, for the trailing twelve-month period ended October 31, 2024.
Top Contributors to Performance
Security selection within the Energy, Utilities, and Real Estate sectors contributed positively to relative performance.
Top individual contributors over the period were out-of-benchmark positions in Fair Isaac (Information Technology), Targa Resources (Energy), and Nuvei (Financials).
Top Detractors to Performance
Security selection was the primary detractor to relative performance during the period, driven by weak selection within the Healthcare, Information Technology, and Consumer Staples sectors.
The largest individual detractors over the period were out-of-benchmark positions in agilon health (Healthcare) and Dexcom (Healthcare), and not holding Super Micro Computers (Information Technology).
Sector allocation, a result of the team’s bottom-up stock selection process, was also a detractor to relative performance during the period due to an overweight allocation to the Healthcare sector and an underweight to the Financials sector.
The views expressed in this section reflect the opinions of the Fund's sub-adviser, Wellington Management Company LLP, as of the date of this report and are subject to change based on changes in market, economic or other conditions. These views are not intended to be a forecast of future events and are no guarantee of future results.
Comparison of Change in Value of $ 250,000 Investment
The graph below represents the hypothetical growth of a $250,000 investment in Class Y shares and the comparative indices.
Average Annual Total Returns
For the Periods Ended October 31, 2024 | 1 Year | 5 Years | 10 Years |
| Class Y | 23.87% | 5.69% | 8.18% |
| S&P MidCap 400 Index | 32.99% | 11.37% | 9.86% |
| Russell Midcap Growth Index | 38.67% | 11.46% | 11.19% |
| Russell 3000 Index | 37.86% | 14.60% | 12.44% |
The S&P MidCap 400 Index serves as the Fund’s performance index. The Russell Midcap Growth Index serves as the Fund’s secondary performance index. The Russell 3000 Index serves as the Fund’s regulatory index and provides a broad measure of market performance. Effective December 31, 2024, the Russell Midcap Growth Index will replace the S&P MidCap 400 Index as the Fund’s performance index because the Fund’s investment manager believes it is more representative of the Fund’s investment strategy.
The Fund’s past performance is not a good predictor of the Fund’s future performance. The graph and table do not reflect the deduction of taxes that a shareholder would pay on Fund distributions or redemption of Fund shares. Performance information reflects fee waivers and/or expense limitation arrangements, if any. Absent any applicable fee waivers and/or expense limitation arrangements, performance would have been lower. Visit hartfordfunds.com for the most recent performance information.
Key Fund Statistics as of October 31, 2024
| Fund's net assets | $5,411,536,635% |
| Total number of portfolio holdings (excluding derivatives, if any) | $92% |
| Total investment management fees paid | $42,893,347% |
| Portfolio turnover rate | $51% |
Graphical Representation of Holdings as of October 31, 2024
The table below shows the investment makeup of the Fund, representing the percentage of net assets of the Fund.
| Information Technology | 24.3 | % |
| Industrials | 17.6 | % |
| Consumer Discretionary | 15.3 | % |
| Health Care | 13.9 | % |
| Financials | 13.6 | % |
| Energy | 4.2 | % |
| Utilities | 3.5 | % |
| Communication Services | 2.9 | % |
| Consumer Staples | 2.5 | % |
| Real Estate | 1.2 | % |
| Materials | 0.8 | % |
| Short-Term Investments | 1.2 | % |
| Other Assets & Liabilities | (1.0 | )% |
| Total | 100.0 | % |
* | For Fund compliance purposes, the Fund may not use the same classification system. These classifications are used for financial reporting purposes. |
Material Fund Changes
This is a summary of certain changes to the Fund since the beginning of the reporting period.
Effective December 31, 2024, the Fund’s principal investment strategy and principal risks will be modified to reflect the investment team’s focus on quality companies with sustainable growth potential. These changes were announced in supplements to the Fund’s summary prospectus and statutory prospectus dated September 24, 2024.
The expense ratio materially changed from the prior fiscal year due to changes in operating expenses.
For more complete information, you may review the Fund’s current prospectus dated March 1, 2024, as may be amended, supplemented or restated, and the Fund’s next prospectus, which we expect to be available by March 1, 2025, at hartfordfunds.com/reports‑hmf, upon request by calling 1-888-843-7824 or sending an e-mail to orders@mysummaryprospectus.com.
Availability of Additional Information
For additional information about the Fund, including its prospectus, financial information, holdings, and proxy voting information, please visit the Fund’s website at the website address included at the beginning of this report.
The Fund is distributed by Hartford Funds Distributors, LLC (HFD).
Annual Shareholder Report
October 31, 2024
The Hartford MidCap Fund
Class F/HMDFX
This annual shareholder report contains important information about The Hartford MidCap Fund (the "Fund") for the period of November 1, 2023 to October 31, 2024. You can find additional information about the Fund at hartfordfunds.com/reports-hmf. You can also request this information by contacting us by calling 1‑888‑843‑7824.
This report describes changes to the Fund that occurred during the reporting period.
What were the Fund costs for the last year?
(Based on a hypothetical $10,000 investment)
| Class Name | Costs of a $10,000 investment | Costs paid as a percentage
of a $10,000 investment |
| Class F | $84 | 0.75% |
How did the Fund perform last year and what impacted its performance?
Management's Discussion of Fund Performance
United States (U.S.) equities rose, as measured by the S&P 500 Index, over the trailing twelve-month period ending October 31, 2024, with the S&P 500 Index surging to a record high that was driven by performance in a select group of mega-cap technology companies. The U.S. Federal Reserve (Fed) began easing monetary policy with an interest-rate cut of 50 basis points in September 2024 in an effort to generate a soft landing for the economy. Markets were also kept on edge in the third quarter of 2024 due to the anticipated extremely close presidential race between Vice President Kamala Harris and former President Donald Trump. Fund performance described below is relative to the Fund’s performance index, the S&P MidCap 400 Index, for the trailing twelve-month period ended October 31, 2024.
Top Contributors to Performance
Security selection within the Energy, Utilities, and Real Estate sectors contributed positively to relative performance.
Top individual contributors over the period were out-of-benchmark positions in Fair Isaac (Information Technology), Targa Resources (Energy), and Nuvei (Financials).
Top Detractors to Performance
Security selection was the primary detractor to relative performance during the period, driven by weak selection within the Healthcare, Information Technology, and Consumer Staples sectors.
The largest individual detractors over the period were out-of-benchmark positions in agilon health (Healthcare) and Dexcom (Healthcare), and not holding Super Micro Computers (Information Technology).
Sector allocation, a result of the team’s bottom-up stock selection process, was also a detractor to relative performance during the period due to an overweight allocation to the Healthcare sector and an underweight to the Financials sector.
The views expressed in this section reflect the opinions of the Fund's sub-adviser, Wellington Management Company LLP, as of the date of this report and are subject to change based on changes in market, economic or other conditions. These views are not intended to be a forecast of future events and are no guarantee of future results.
Comparison of Change in Value of $ 1,000,000 Investment
The graph below represents the hypothetical growth of a $1,000,000 investment in Class F shares and the comparative indices.
Average Annual Total Returns
For the Periods Ended October 31, 2024 | 1 Year | 5 Years | 10 Years |
| Class F | 23.98% | 5.75% | 8.18% |
| S&P MidCap 400 Index | 32.99% | 11.37% | 9.86% |
| Russell Midcap Growth Index | 38.67% | 11.46% | 11.19% |
| Russell 3000 Index | 37.86% | 14.60% | 12.44% |
Class F shares commenced operations on February 28, 2017 and performance prior to that date is that of the Fund’s Class I shares. Performance prior to the inception date of the class has not been adjusted to reflect the operating expenses of the class.
The S&P MidCap 400 Index serves as the Fund’s performance index. The Russell Midcap Growth Index serves as the Fund’s secondary performance index. The Russell 3000 Index serves as the Fund’s regulatory index and provides a broad measure of market performance. Effective December 31, 2024, the Russell Midcap Growth Index will replace the S&P MidCap 400 Index as the Fund’s performance index because the Fund’s investment manager believes it is more representative of the Fund’s investment strategy.
The Fund’s past performance is not a good predictor of the Fund’s future performance. The graph and table do not reflect the deduction of taxes that a shareholder would pay on Fund distributions or redemption of Fund shares. Performance information reflects fee waivers and/or expense limitation arrangements, if any. Absent any applicable fee waivers and/or expense limitation arrangements, performance would have been lower. Visit hartfordfunds.com for the most recent performance information.
Key Fund Statistics as of October 31, 2024
| Fund's net assets | $5,411,536,635% |
| Total number of portfolio holdings (excluding derivatives, if any) | $92% |
| Total investment management fees paid | $42,893,347% |
| Portfolio turnover rate | $51% |
Graphical Representation of Holdings as of October 31, 2024
The table below shows the investment makeup of the Fund, representing the percentage of net assets of the Fund.
| Information Technology | 24.3 | % |
| Industrials | 17.6 | % |
| Consumer Discretionary | 15.3 | % |
| Health Care | 13.9 | % |
| Financials | 13.6 | % |
| Energy | 4.2 | % |
| Utilities | 3.5 | % |
| Communication Services | 2.9 | % |
| Consumer Staples | 2.5 | % |
| Real Estate | 1.2 | % |
| Materials | 0.8 | % |
| Short-Term Investments | 1.2 | % |
| Other Assets & Liabilities | (1.0 | )% |
| Total | 100.0 | % |
* | For Fund compliance purposes, the Fund may not use the same classification system. These classifications are used for financial reporting purposes. |
Material Fund Changes
This is a summary of certain changes to the Fund since the beginning of the reporting period.
Effective December 31, 2024, the Fund’s principal investment strategy and principal risks will be modified to reflect the investment team’s focus on quality companies with sustainable growth potential. These changes were announced in supplements to the Fund’s summary prospectus and statutory prospectus dated September 24, 2024.
For more complete information, you may review the Fund’s current prospectus dated March 1, 2024, as may be amended, supplemented or restated, and the Fund’s next prospectus, which we expect to be available by March 1, 2025, at hartfordfunds.com/reports‑hmf, upon request by calling 1-888-843-7824 or sending an e-mail to orders@mysummaryprospectus.com.
Availability of Additional Information
For additional information about the Fund, including its prospectus, financial information, holdings, and proxy voting information, please visit the Fund’s website at the website address included at the beginning of this report.
The Fund is distributed by Hartford Funds Distributors, LLC (HFD).
Annual Shareholder Report
October 31, 2024
The Hartford MidCap Value Fund
Class A/HMVAX
This annual shareholder report contains important information about The Hartford MidCap Value Fund (the "Fund") for the period of November 1, 2023 to October 31, 2024. You can find additional information about the Fund at hartfordfunds.com/reports-hmf. You can also request this information by contacting us by calling 1‑888‑843‑7824.
What were the Fund costs for the last year?
(Based on a hypothetical $10,000 investment)
| Class Name | Costs of a $10,000 investment | Costs paid as a percentage
of a $10,000 investment |
| Class A | $131 | 1.14% |
How did the Fund perform last year and what impacted its performance?
Management's Discussion of Fund Performance
United States (U.S.) equities, as measured by the S&P 500 Index, rose over the trailing twelve-month period ending October 31, 2024, with the S&P 500 Index surging to a record high that was driven by performance in a select group of mega-cap technology companies. The U.S. Federal Reserve (Fed) began easing monetary policy with an interest-rate cut of 50 basis points in September 2024 in an effort to generate a soft landing for the economy. Markets were also kept on edge in the third quarter of 2024 due to the anticipated extremely close presidential race between Vice President Kamala Harris and former President Donald Trump. Fund performance described below is relative to the Fund’s performance index, the Russell Midcap Value Index, for the trailing twelve-month period ended October 31, 2024.
Top Contributors to Performance
Sector allocation, a result of the team’s bottom-up stock selection process, was a contributor to relative performance during the period due to the Fund’s overweight allocations to the Financials and Consumer Discretionary sectors, and underweight allocation to the Utilities sector.
Security selection within the Consumer Staples, Information Technology, and Communication Services sectors also contributed positively to relative performance.
Top individual contributors over the period were overweight positions in Coherent (Information Technology), Synovus Financial (Financials), and Flex (Information Technology).
Top Detractors to Performance
Security selection was the primary detractor to relative performance during the period, driven by weak selection within the Consumer Discretionary, Healthcare, and Energy sectors.
The Fund’s underweight allocations to the Real Estate and Industrials sectors and overweight to the Consumer Staples sector also detracted from relative results.
The largest individual detractors over the period were overweight positions in Flagstar Financial (Financials), Integra LifeSciences Holdings (Healthcare), and an out-of-benchmark position in Goodyear Tire&Rubber (Consumer Discretionary).
The views expressed in this section reflect the opinions of the Fund's sub-adviser, Wellington Management Company LLP, as of the date of this report and are subject to change based on changes in market, economic or other conditions. These views are not intended to be a forecast of future events and are no guarantee of future results.
Comparison of Change in Value of $ 10,000 Investment
The graph below represents the hypothetical growth of a $10,000 investment in Class A shares and the comparative indices. The returns for Class A shares include the maximum front-end sales charge applicable to Class A shares.
Average Annual Total Returns
For the Periods Ended October 31, 2024 | 1 Year | 5 Years | 10 Years |
| Class A (with 5.50% maximum front-end sales charge) | 22.93% | 8.84% | 7.26% |
| Class A (without 5.50% maximum front-end sales charge) | 30.09% | 10.08% | 7.87% |
| Russell Midcap Value Index | 34.03% | 9.93% | 8.43% |
| Russell 3000 Index | 37.86% | 14.60% | 12.44% |
The Russell Midcap Value Index serves as the Fund’s performance index because the Fund’s investment manager believes it is more representative of the Fund’s investment strategy. The Russell 3000 Index serves as the Fund’s regulatory index and provides a broad measure of market performance.
The Fund’s past performance is not a good predictor of the Fund’s future performance. The graph and table do not reflect the deduction of taxes that a shareholder would pay on Fund distributions or redemption of Fund shares. Performance information reflects fee waivers and/or expense limitation arrangements, if any. Absent any applicable fee waivers and/or expense limitation arrangements, performance would have been lower. Visit hartfordfunds.com for the most recent performance information.
Key Fund Statistics as of October 31, 2024
| Fund's net assets | $1,054,982,771% |
| Total number of portfolio holdings (excluding derivatives, if any) | $81% |
| Total investment management fees paid | $7,075,306% |
| Portfolio turnover rate | $132% |
Graphical Representation of Holdings as of October 31, 2024
The table below shows the investment makeup of the Fund, representing the percentage of net assets of the Fund.
| Financials | 20.9 | % |
| Industrials | 19.0 | % |
| Utilities | 9.6 | % |
| Consumer Discretionary | 8.9 | % |
| Health Care | 8.6 | % |
| Real Estate | 7.1 | % |
| Energy | 6.1 | % |
| Materials | 6.1 | % |
| Information Technology | 5.6 | % |
| Communication Services | 3.4 | % |
| Consumer Staples | 3.3 | % |
| Short-Term Investments | 0.2 | % |
| Other Assets & Liabilities | 1.2 | % |
| Total | 100.0 | % |
* | For Fund compliance purposes, the Fund may not use the same classification system. These classifications are used for financial reporting purposes. |
Availability of Additional Information
For additional information about the Fund, including its prospectus, financial information, holdings, and proxy voting information, please visit the Fund’s website at the website address included at the beginning of this report.
The Fund is distributed by Hartford Funds Distributors, LLC (HFD).
Annual Shareholder Report
October 31, 2024
The Hartford MidCap Value Fund
Class C/HMVCX
This annual shareholder report contains important information about The Hartford MidCap Value Fund (the "Fund") for the period of November 1, 2023 to October 31, 2024. You can find additional information about the Fund at hartfordfunds.com/reports-hmf. You can also request this information by contacting us by calling 1‑888‑843‑7824.
What were the Fund costs for the last year?
(Based on a hypothetical $10,000 investment)
| Class Name | Costs of a $10,000 investment | Costs paid as a percentage
of a $10,000 investment |
| Class C | $223 | 1.95% |
How did the Fund perform last year and what impacted its performance?
Management's Discussion of Fund Performance
United States (U.S.) equities, as measured by the S&P 500 Index, rose over the trailing twelve-month period ending October 31, 2024, with the S&P 500 Index surging to a record high that was driven by performance in a select group of mega-cap technology companies. The U.S. Federal Reserve (Fed) began easing monetary policy with an interest-rate cut of 50 basis points in September 2024 in an effort to generate a soft landing for the economy. Markets were also kept on edge in the third quarter of 2024 due to the anticipated extremely close presidential race between Vice President Kamala Harris and former President Donald Trump. Fund performance described below is relative to the Fund’s performance index, the Russell Midcap Value Index, for the trailing twelve-month period ended October 31, 2024.
Top Contributors to Performance
Sector allocation, a result of the team’s bottom-up stock selection process, was a contributor to relative performance during the period due to the Fund’s overweight allocations to the Financials and Consumer Discretionary sectors, and underweight allocation to the Utilities sector.
Security selection within the Consumer Staples, Information Technology, and Communication Services sectors also contributed positively to relative performance.
Top individual contributors over the period were overweight positions in Coherent (Information Technology), Synovus Financial (Financials), and Flex (Information Technology).
Top Detractors to Performance
Security selection was the primary detractor to relative performance during the period, driven by weak selection within the Consumer Discretionary, Healthcare, and Energy sectors.
The Fund’s underweight allocations to the Real Estate and Industrials sectors and overweight to the Consumer Staples sector also detracted from relative results.
The largest individual detractors over the period were overweight positions in Flagstar Financial (Financials), Integra LifeSciences Holdings (Healthcare), and an out-of-benchmark position in Goodyear Tire&Rubber (Consumer Discretionary).
The views expressed in this section reflect the opinions of the Fund's sub-adviser, Wellington Management Company LLP, as of the date of this report and are subject to change based on changes in market, economic or other conditions. These views are not intended to be a forecast of future events and are no guarantee of future results.
Comparison of Change in Value of $ 10,000 Investment
The graph below represents the hypothetical growth of a $10,000 investment in Class C shares (excluding sales charges) and the comparative indices. If sales charges had been included, the value would have been lower.
Average Annual Total Returns
For the Periods Ended October 31, 2024 | 1 Year | 5 Years | 10 Years |
| Class C (with 1.00% contingent deferred sales charge) | 28.09% | 9.22% | 7.05% |
| Class C (without 1.00% contingent deferred sales charge) | 29.09% | 9.22% | 7.05% |
| Russell Midcap Value Index | 34.03% | 9.93% | 8.43% |
| Russell 3000 Index | 37.86% | 14.60% | 12.44% |
The Russell Midcap Value Index serves as the Fund’s performance index because the Fund’s investment manager believes it is more representative of the Fund’s investment strategy. The Russell 3000 Index serves as the Fund’s regulatory index and provides a broad measure of market performance.
The Fund’s past performance is not a good predictor of the Fund’s future performance. The graph and table do not reflect the deduction of taxes that a shareholder would pay on Fund distributions or redemption of Fund shares. Performance information reflects fee waivers and/or expense limitation arrangements, if any. Absent any applicable fee waivers and/or expense limitation arrangements, performance would have been lower. Visit hartfordfunds.com for the most recent performance information.
Key Fund Statistics as of October 31, 2024
| Fund's net assets | $1,054,982,771% |
| Total number of portfolio holdings (excluding derivatives, if any) | $81% |
| Total investment management fees paid | $7,075,306% |
| Portfolio turnover rate | $132% |
Graphical Representation of Holdings as of October 31, 2024
The table below shows the investment makeup of the Fund, representing the percentage of net assets of the Fund.
| Financials | 20.9 | % |
| Industrials | 19.0 | % |
| Utilities | 9.6 | % |
| Consumer Discretionary | 8.9 | % |
| Health Care | 8.6 | % |
| Real Estate | 7.1 | % |
| Energy | 6.1 | % |
| Materials | 6.1 | % |
| Information Technology | 5.6 | % |
| Communication Services | 3.4 | % |
| Consumer Staples | 3.3 | % |
| Short-Term Investments | 0.2 | % |
| Other Assets & Liabilities | 1.2 | % |
| Total | 100.0 | % |
* | For Fund compliance purposes, the Fund may not use the same classification system. These classifications are used for financial reporting purposes. |
Availability of Additional Information
For additional information about the Fund, including its prospectus, financial information, holdings, and proxy voting information, please visit the Fund’s website at the website address included at the beginning of this report.
The Fund is distributed by Hartford Funds Distributors, LLC (HFD).
Annual Shareholder Report
October 31, 2024
The Hartford MidCap Value Fund
Class I/HMVJX
This annual shareholder report contains important information about The Hartford MidCap Value Fund (the "Fund") for the period of November 1, 2023 to October 31, 2024. You can find additional information about the Fund at hartfordfunds.com/reports-hmf. You can also request this information by contacting us by calling 1‑888‑843‑7824.
What were the Fund costs for the last year?
(Based on a hypothetical $10,000 investment)
| Class Name | Costs of a $10,000 investment | Costs paid as a percentage
of a $10,000 investment |
| Class I | $100 | 0.87% |
How did the Fund perform last year and what impacted its performance?
Management's Discussion of Fund Performance
United States (U.S.) equities, as measured by the S&P 500 Index, rose over the trailing twelve-month period ending October 31, 2024, with the S&P 500 Index surging to a record high that was driven by performance in a select group of mega-cap technology companies. The U.S. Federal Reserve (Fed) began easing monetary policy with an interest-rate cut of 50 basis points in September 2024 in an effort to generate a soft landing for the economy. Markets were also kept on edge in the third quarter of 2024 due to the anticipated extremely close presidential race between Vice President Kamala Harris and former President Donald Trump. Fund performance described below is relative to the Fund’s performance index, the Russell Midcap Value Index, for the trailing twelve-month period ended October 31, 2024.
Top Contributors to Performance
Sector allocation, a result of the team’s bottom-up stock selection process, was a contributor to relative performance during the period due to the Fund’s overweight allocations to the Financials and Consumer Discretionary sectors, and underweight allocation to the Utilities sector.
Security selection within the Consumer Staples, Information Technology, and Communication Services sectors also contributed positively to relative performance.
Top individual contributors over the period were overweight positions in Coherent (Information Technology), Synovus Financial (Financials), and Flex (Information Technology).
Top Detractors to Performance
Security selection was the primary detractor to relative performance during the period, driven by weak selection within the Consumer Discretionary, Healthcare, and Energy sectors.
The Fund’s underweight allocations to the Real Estate and Industrials sectors and overweight to the Consumer Staples sector also detracted from relative results.
The largest individual detractors over the period were overweight positions in Flagstar Financial (Financials), Integra LifeSciences Holdings (Healthcare), and an out-of-benchmark position in Goodyear Tire&Rubber (Consumer Discretionary).
The views expressed in this section reflect the opinions of the Fund's sub-adviser, Wellington Management Company LLP, as of the date of this report and are subject to change based on changes in market, economic or other conditions. These views are not intended to be a forecast of future events and are no guarantee of future results.
Comparison of Change in Value of $ 10,000 Investment
The graph below represents the hypothetical growth of a $10,000 investment in Class I shares and the comparative indices.
Average Annual Total Returns
For the Periods Ended October 31, 2024 | 1 Year | 5 Years | 10 Years |
| Class I | 30.46% | 10.41% | 8.18% |
| Russell Midcap Value Index | 34.03% | 9.93% | 8.43% |
| Russell 3000 Index | 37.86% | 14.60% | 12.44% |
The Russell Midcap Value Index serves as the Fund’s performance index because the Fund’s investment manager believes it is more representative of the Fund’s investment strategy. The Russell 3000 Index serves as the Fund’s regulatory index and provides a broad measure of market performance.
The Fund’s past performance is not a good predictor of the Fund’s future performance. The graph and table do not reflect the deduction of taxes that a shareholder would pay on Fund distributions or redemption of Fund shares. Performance information reflects fee waivers and/or expense limitation arrangements, if any. Absent any applicable fee waivers and/or expense limitation arrangements, performance would have been lower. Visit hartfordfunds.com for the most recent performance information.
Key Fund Statistics as of October 31, 2024
| Fund's net assets | $1,054,982,771% |
| Total number of portfolio holdings (excluding derivatives, if any) | $81% |
| Total investment management fees paid | $7,075,306% |
| Portfolio turnover rate | $132% |
Graphical Representation of Holdings as of October 31, 2024
The table below shows the investment makeup of the Fund, representing the percentage of net assets of the Fund.
| Financials | 20.9 | % |
| Industrials | 19.0 | % |
| Utilities | 9.6 | % |
| Consumer Discretionary | 8.9 | % |
| Health Care | 8.6 | % |
| Real Estate | 7.1 | % |
| Energy | 6.1 | % |
| Materials | 6.1 | % |
| Information Technology | 5.6 | % |
| Communication Services | 3.4 | % |
| Consumer Staples | 3.3 | % |
| Short-Term Investments | 0.2 | % |
| Other Assets & Liabilities | 1.2 | % |
| Total | 100.0 | % |
* | For Fund compliance purposes, the Fund may not use the same classification system. These classifications are used for financial reporting purposes. |
Availability of Additional Information
For additional information about the Fund, including its prospectus, financial information, holdings, and proxy voting information, please visit the Fund’s website at the website address included at the beginning of this report.
The Fund is distributed by Hartford Funds Distributors, LLC (HFD).
Annual Shareholder Report
October 31, 2024
The Hartford MidCap Value Fund
Class R3/HMVRX
This annual shareholder report contains important information about The Hartford MidCap Value Fund (the "Fund") for the period of November 1, 2023 to October 31, 2024. You can find additional information about the Fund at hartfordfunds.com/reports-hmf. You can also request this information by contacting us by calling 1‑888‑843‑7824.
What were the Fund costs for the last year?
(Based on a hypothetical $10,000 investment)
| Class Name | Costs of a $10,000 investment | Costs paid as a percentage
of a $10,000 investment |
| Class R3 | $170 | 1.48% |
How did the Fund perform last year and what impacted its performance?
Management's Discussion of Fund Performance
United States (U.S.) equities, as measured by the S&P 500 Index, rose over the trailing twelve-month period ending October 31, 2024, with the S&P 500 Index surging to a record high that was driven by performance in a select group of mega-cap technology companies. The U.S. Federal Reserve (Fed) began easing monetary policy with an interest-rate cut of 50 basis points in September 2024 in an effort to generate a soft landing for the economy. Markets were also kept on edge in the third quarter of 2024 due to the anticipated extremely close presidential race between Vice President Kamala Harris and former President Donald Trump. Fund performance described below is relative to the Fund’s performance index, the Russell Midcap Value Index, for the trailing twelve-month period ended October 31, 2024.
Top Contributors to Performance
Sector allocation, a result of the team’s bottom-up stock selection process, was a contributor to relative performance during the period due to the Fund’s overweight allocations to the Financials and Consumer Discretionary sectors, and underweight allocation to the Utilities sector.
Security selection within the Consumer Staples, Information Technology, and Communication Services sectors also contributed positively to relative performance.
Top individual contributors over the period were overweight positions in Coherent (Information Technology), Synovus Financial (Financials), and Flex (Information Technology).
Top Detractors to Performance
Security selection was the primary detractor to relative performance during the period, driven by weak selection within the Consumer Discretionary, Healthcare, and Energy sectors.
The Fund’s underweight allocations to the Real Estate and Industrials sectors and overweight to the Consumer Staples sector also detracted from relative results.
The largest individual detractors over the period were overweight positions in Flagstar Financial (Financials), Integra LifeSciences Holdings (Healthcare), and an out-of-benchmark position in Goodyear Tire&Rubber (Consumer Discretionary).
The views expressed in this section reflect the opinions of the Fund's sub-adviser, Wellington Management Company LLP, as of the date of this report and are subject to change based on changes in market, economic or other conditions. These views are not intended to be a forecast of future events and are no guarantee of future results.
Comparison of Change in Value of $ 10,000 Investment
The graph below represents the hypothetical growth of a $10,000 investment in Class R3 shares and the comparative indices.
Average Annual Total Returns
For the Periods Ended October 31, 2024 | 1 Year | 5 Years | 10 Years |
| Class R3 | 29.70% | 9.75% | 7.55% |
| Russell Midcap Value Index | 34.03% | 9.93% | 8.43% |
| Russell 3000 Index | 37.86% | 14.60% | 12.44% |
The Russell Midcap Value Index serves as the Fund’s performance index because the Fund’s investment manager believes it is more representative of the Fund’s investment strategy. The Russell 3000 Index serves as the Fund’s regulatory index and provides a broad measure of market performance.
The Fund’s past performance is not a good predictor of the Fund’s future performance. The graph and table do not reflect the deduction of taxes that a shareholder would pay on Fund distributions or redemption of Fund shares. Performance information reflects fee waivers and/or expense limitation arrangements, if any. Absent any applicable fee waivers and/or expense limitation arrangements, performance would have been lower. Visit hartfordfunds.com for the most recent performance information.
Key Fund Statistics as of October 31, 2024
| Fund's net assets | $1,054,982,771% |
| Total number of portfolio holdings (excluding derivatives, if any) | $81% |
| Total investment management fees paid | $7,075,306% |
| Portfolio turnover rate | $132% |
Graphical Representation of Holdings as of October 31, 2024
The table below shows the investment makeup of the Fund, representing the percentage of net assets of the Fund.
| Financials | 20.9 | % |
| Industrials | 19.0 | % |
| Utilities | 9.6 | % |
| Consumer Discretionary | 8.9 | % |
| Health Care | 8.6 | % |
| Real Estate | 7.1 | % |
| Energy | 6.1 | % |
| Materials | 6.1 | % |
| Information Technology | 5.6 | % |
| Communication Services | 3.4 | % |
| Consumer Staples | 3.3 | % |
| Short-Term Investments | 0.2 | % |
| Other Assets & Liabilities | 1.2 | % |
| Total | 100.0 | % |
* | For Fund compliance purposes, the Fund may not use the same classification system. These classifications are used for financial reporting purposes. |
Availability of Additional Information
For additional information about the Fund, including its prospectus, financial information, holdings, and proxy voting information, please visit the Fund’s website at the website address included at the beginning of this report.
The Fund is distributed by Hartford Funds Distributors, LLC (HFD).
Annual Shareholder Report
October 31, 2024
The Hartford MidCap Value Fund
Class R4/HMVSX
This annual shareholder report contains important information about The Hartford MidCap Value Fund (the "Fund") for the period of November 1, 2023 to October 31, 2024. You can find additional information about the Fund at hartfordfunds.com/reports-hmf. You can also request this information by contacting us by calling 1‑888‑843‑7824.
What were the Fund costs for the last year?
(Based on a hypothetical $10,000 investment)
| Class Name | Costs of a $10,000 investment | Costs paid as a percentage
of a $10,000 investment |
| Class R4 | $136 | 1.18% |
How did the Fund perform last year and what impacted its performance?
Management's Discussion of Fund Performance
United States (U.S.) equities, as measured by the S&P 500 Index, rose over the trailing twelve-month period ending October 31, 2024, with the S&P 500 Index surging to a record high that was driven by performance in a select group of mega-cap technology companies. The U.S. Federal Reserve (Fed) began easing monetary policy with an interest-rate cut of 50 basis points in September 2024 in an effort to generate a soft landing for the economy. Markets were also kept on edge in the third quarter of 2024 due to the anticipated extremely close presidential race between Vice President Kamala Harris and former President Donald Trump. Fund performance described below is relative to the Fund’s performance index, the Russell Midcap Value Index, for the trailing twelve-month period ended October 31, 2024.
Top Contributors to Performance
Sector allocation, a result of the team’s bottom-up stock selection process, was a contributor to relative performance during the period due to the Fund’s overweight allocations to the Financials and Consumer Discretionary sectors, and underweight allocation to the Utilities sector.
Security selection within the Consumer Staples, Information Technology, and Communication Services sectors also contributed positively to relative performance.
Top individual contributors over the period were overweight positions in Coherent (Information Technology), Synovus Financial (Financials), and Flex (Information Technology).
Top Detractors to Performance
Security selection was the primary detractor to relative performance during the period, driven by weak selection within the Consumer Discretionary, Healthcare, and Energy sectors.
The Fund’s underweight allocations to the Real Estate and Industrials sectors and overweight to the Consumer Staples sector also detracted from relative results.
The largest individual detractors over the period were overweight positions in Flagstar Financial (Financials), Integra LifeSciences Holdings (Healthcare), and an out-of-benchmark position in Goodyear Tire&Rubber (Consumer Discretionary).
The views expressed in this section reflect the opinions of the Fund's sub-adviser, Wellington Management Company LLP, as of the date of this report and are subject to change based on changes in market, economic or other conditions. These views are not intended to be a forecast of future events and are no guarantee of future results.
Comparison of Change in Value of $ 10,000 Investment
The graph below represents the hypothetical growth of a $10,000 investment in Class R4 shares and the comparative indices.
Average Annual Total Returns
For the Periods Ended October 31, 2024 | 1 Year | 5 Years | 10 Years |
| Class R4 | 30.13% | 10.07% | 7.87% |
| Russell Midcap Value Index | 34.03% | 9.93% | 8.43% |
| Russell 3000 Index | 37.86% | 14.60% | 12.44% |
The Russell Midcap Value Index serves as the Fund’s performance index because the Fund’s investment manager believes it is more representative of the Fund’s investment strategy. The Russell 3000 Index serves as the Fund’s regulatory index and provides a broad measure of market performance.
The Fund’s past performance is not a good predictor of the Fund’s future performance. The graph and table do not reflect the deduction of taxes that a shareholder would pay on Fund distributions or redemption of Fund shares. Performance information reflects fee waivers and/or expense limitation arrangements, if any. Absent any applicable fee waivers and/or expense limitation arrangements, performance would have been lower. Visit hartfordfunds.com for the most recent performance information.
Key Fund Statistics as of October 31, 2024
| Fund's net assets | $1,054,982,771% |
| Total number of portfolio holdings (excluding derivatives, if any) | $81% |
| Total investment management fees paid | $7,075,306% |
| Portfolio turnover rate | $132% |
Graphical Representation of Holdings as of October 31, 2024
The table below shows the investment makeup of the Fund, representing the percentage of net assets of the Fund.
| Financials | 20.9 | % |
| Industrials | 19.0 | % |
| Utilities | 9.6 | % |
| Consumer Discretionary | 8.9 | % |
| Health Care | 8.6 | % |
| Real Estate | 7.1 | % |
| Energy | 6.1 | % |
| Materials | 6.1 | % |
| Information Technology | 5.6 | % |
| Communication Services | 3.4 | % |
| Consumer Staples | 3.3 | % |
| Short-Term Investments | 0.2 | % |
| Other Assets & Liabilities | 1.2 | % |
| Total | 100.0 | % |
* | For Fund compliance purposes, the Fund may not use the same classification system. These classifications are used for financial reporting purposes. |
Availability of Additional Information
For additional information about the Fund, including its prospectus, financial information, holdings, and proxy voting information, please visit the Fund’s website at the website address included at the beginning of this report.
The Fund is distributed by Hartford Funds Distributors, LLC (HFD).
Annual Shareholder Report
October 31, 2024
The Hartford MidCap Value Fund
Class R5/HMVTX
This annual shareholder report contains important information about The Hartford MidCap Value Fund (the "Fund") for the period of November 1, 2023 to October 31, 2024. You can find additional information about the Fund at hartfordfunds.com/reports-hmf. You can also request this information by contacting us by calling 1‑888‑843‑7824.
What were the Fund costs for the last year?
(Based on a hypothetical $10,000 investment)
| Class Name | Costs of a $10,000 investment | Costs paid as a percentage
of a $10,000 investment |
| Class R5 | $101 | 0.88% |
How did the Fund perform last year and what impacted its performance?
Management's Discussion of Fund Performance
United States (U.S.) equities, as measured by the S&P 500 Index, rose over the trailing twelve-month period ending October 31, 2024, with the S&P 500 Index surging to a record high that was driven by performance in a select group of mega-cap technology companies. The U.S. Federal Reserve (Fed) began easing monetary policy with an interest-rate cut of 50 basis points in September 2024 in an effort to generate a soft landing for the economy. Markets were also kept on edge in the third quarter of 2024 due to the anticipated extremely close presidential race between Vice President Kamala Harris and former President Donald Trump. Fund performance described below is relative to the Fund’s performance index, the Russell Midcap Value Index, for the trailing twelve-month period ended October 31, 2024.
Top Contributors to Performance
Sector allocation, a result of the team’s bottom-up stock selection process, was a contributor to relative performance during the period due to the Fund’s overweight allocations to the Financials and Consumer Discretionary sectors, and underweight allocation to the Utilities sector.
Security selection within the Consumer Staples, Information Technology, and Communication Services sectors also contributed positively to relative performance.
Top individual contributors over the period were overweight positions in Coherent (Information Technology), Synovus Financial (Financials), and Flex (Information Technology).
Top Detractors to Performance
Security selection was the primary detractor to relative performance during the period, driven by weak selection within the Consumer Discretionary, Healthcare, and Energy sectors.
The Fund’s underweight allocations to the Real Estate and Industrials sectors and overweight to the Consumer Staples sector also detracted from relative results.
The largest individual detractors over the period were overweight positions in Flagstar Financial (Financials), Integra LifeSciences Holdings (Healthcare), and an out-of-benchmark position in Goodyear Tire&Rubber (Consumer Discretionary).
The views expressed in this section reflect the opinions of the Fund's sub-adviser, Wellington Management Company LLP, as of the date of this report and are subject to change based on changes in market, economic or other conditions. These views are not intended to be a forecast of future events and are no guarantee of future results.
Comparison of Change in Value of $ 10,000 Investment
The graph below represents the hypothetical growth of a $10,000 investment in Class R5 shares and the comparative indices.
Average Annual Total Returns
For the Periods Ended October 31, 2024 | 1 Year | 5 Years | 10 Years |
| Class R5 | 30.46% | 10.40% | 8.20% |
| Russell Midcap Value Index | 34.03% | 9.93% | 8.43% |
| Russell 3000 Index | 37.86% | 14.60% | 12.44% |
The Russell Midcap Value Index serves as the Fund’s performance index because the Fund’s investment manager believes it is more representative of the Fund’s investment strategy. The Russell 3000 Index serves as the Fund’s regulatory index and provides a broad measure of market performance.
The Fund’s past performance is not a good predictor of the Fund’s future performance. The graph and table do not reflect the deduction of taxes that a shareholder would pay on Fund distributions or redemption of Fund shares. Performance information reflects fee waivers and/or expense limitation arrangements, if any. Absent any applicable fee waivers and/or expense limitation arrangements, performance would have been lower. Visit hartfordfunds.com for the most recent performance information.
Key Fund Statistics as of October 31, 2024
| Fund's net assets | $1,054,982,771% |
| Total number of portfolio holdings (excluding derivatives, if any) | $81% |
| Total investment management fees paid | $7,075,306% |
| Portfolio turnover rate | $132% |
Graphical Representation of Holdings as of October 31, 2024
The table below shows the investment makeup of the Fund, representing the percentage of net assets of the Fund.
| Financials | 20.9 | % |
| Industrials | 19.0 | % |
| Utilities | 9.6 | % |
| Consumer Discretionary | 8.9 | % |
| Health Care | 8.6 | % |
| Real Estate | 7.1 | % |
| Energy | 6.1 | % |
| Materials | 6.1 | % |
| Information Technology | 5.6 | % |
| Communication Services | 3.4 | % |
| Consumer Staples | 3.3 | % |
| Short-Term Investments | 0.2 | % |
| Other Assets & Liabilities | 1.2 | % |
| Total | 100.0 | % |
* | For Fund compliance purposes, the Fund may not use the same classification system. These classifications are used for financial reporting purposes. |
Availability of Additional Information
For additional information about the Fund, including its prospectus, financial information, holdings, and proxy voting information, please visit the Fund’s website at the website address included at the beginning of this report.
The Fund is distributed by Hartford Funds Distributors, LLC (HFD).
Annual Shareholder Report
October 31, 2024
The Hartford MidCap Value Fund
Class R6/HMVUX
This annual shareholder report contains important information about The Hartford MidCap Value Fund (the "Fund") for the period of November 1, 2023 to October 31, 2024. You can find additional information about the Fund at hartfordfunds.com/reports-hmf. You can also request this information by contacting us by calling 1‑888‑843‑7824.
What were the Fund costs for the last year?
(Based on a hypothetical $10,000 investment)
| Class Name | Costs of a $10,000 investment | Costs paid as a percentage
of a $10,000 investment |
| Class R6 | $88 | 0.76% |
How did the Fund perform last year and what impacted its performance?
Management's Discussion of Fund Performance
United States (U.S.) equities, as measured by the S&P 500 Index, rose over the trailing twelve-month period ending October 31, 2024, with the S&P 500 Index surging to a record high that was driven by performance in a select group of mega-cap technology companies. The U.S. Federal Reserve (Fed) began easing monetary policy with an interest-rate cut of 50 basis points in September 2024 in an effort to generate a soft landing for the economy. Markets were also kept on edge in the third quarter of 2024 due to the anticipated extremely close presidential race between Vice President Kamala Harris and former President Donald Trump. Fund performance described below is relative to the Fund’s performance index, the Russell Midcap Value Index, for the trailing twelve-month period ended October 31, 2024.
Top Contributors to Performance
Sector allocation, a result of the team’s bottom-up stock selection process, was a contributor to relative performance during the period due to the Fund’s overweight allocations to the Financials and Consumer Discretionary sectors, and underweight allocation to the Utilities sector.
Security selection within the Consumer Staples, Information Technology, and Communication Services sectors also contributed positively to relative performance.
Top individual contributors over the period were overweight positions in Coherent (Information Technology), Synovus Financial (Financials), and Flex (Information Technology).
Top Detractors to Performance
Security selection was the primary detractor to relative performance during the period, driven by weak selection within the Consumer Discretionary, Healthcare, and Energy sectors.
The Fund’s underweight allocations to the Real Estate and Industrials sectors and overweight to the Consumer Staples sector also detracted from relative results.
The largest individual detractors over the period were overweight positions in Flagstar Financial (Financials), Integra LifeSciences Holdings (Healthcare), and an out-of-benchmark position in Goodyear Tire&Rubber (Consumer Discretionary).
The views expressed in this section reflect the opinions of the Fund's sub-adviser, Wellington Management Company LLP, as of the date of this report and are subject to change based on changes in market, economic or other conditions. These views are not intended to be a forecast of future events and are no guarantee of future results.
Comparison of Change in Value of $ 10,000 Investment
The graph below represents the hypothetical growth of a $10,000 investment in Class R6 shares and the comparative indices.
Average Annual Total Returns
For the Periods Ended October 31, 2024 | 1 Year | 5 Years | 10 Years |
| Class R6 | 30.56% | 10.53% | 8.28% |
| Russell Midcap Value Index | 34.03% | 9.93% | 8.43% |
| Russell 3000 Index | 37.86% | 14.60% | 12.44% |
Class R6 shares commenced operations on June 22, 2022 and performance for Class R6 shares prior to this date reflects the performance of the Fund's Class F shares from February 28, 2017 through June 21, 2022 and the Fund's Class I shares prior to February 28, 2017. Performance prior to the inception date of the class has not been adjusted to reflect the operating expenses of the class.
The Russell Midcap Value Index serves as the Fund’s performance index because the Fund’s investment manager believes it is more representative of the Fund’s investment strategy. The Russell 3000 Index serves as the Fund’s regulatory index and provides a broad measure of market performance.
The Fund’s past performance is not a good predictor of the Fund’s future performance. The graph and table do not reflect the deduction of taxes that a shareholder would pay on Fund distributions or redemption of Fund shares. Performance information reflects fee waivers and/or expense limitation arrangements, if any. Absent any applicable fee waivers and/or expense limitation arrangements, performance would have been lower. Visit hartfordfunds.com for the most recent performance information.
Key Fund Statistics as of October 31, 2024
| Fund's net assets | $1,054,982,771% |
| Total number of portfolio holdings (excluding derivatives, if any) | $81% |
| Total investment management fees paid | $7,075,306% |
| Portfolio turnover rate | $132% |
Graphical Representation of Holdings as of October 31, 2024
The table below shows the investment makeup of the Fund, representing the percentage of net assets of the Fund.
| Financials | 20.9 | % |
| Industrials | 19.0 | % |
| Utilities | 9.6 | % |
| Consumer Discretionary | 8.9 | % |
| Health Care | 8.6 | % |
| Real Estate | 7.1 | % |
| Energy | 6.1 | % |
| Materials | 6.1 | % |
| Information Technology | 5.6 | % |
| Communication Services | 3.4 | % |
| Consumer Staples | 3.3 | % |
| Short-Term Investments | 0.2 | % |
| Other Assets & Liabilities | 1.2 | % |
| Total | 100.0 | % |
* | For Fund compliance purposes, the Fund may not use the same classification system. These classifications are used for financial reporting purposes. |
Availability of Additional Information
For additional information about the Fund, including its prospectus, financial information, holdings, and proxy voting information, please visit the Fund’s website at the website address included at the beginning of this report.
The Fund is distributed by Hartford Funds Distributors, LLC (HFD).
Annual Shareholder Report
October 31, 2024
The Hartford MidCap Value Fund
Class Y/HMVYX
This annual shareholder report contains important information about The Hartford MidCap Value Fund (the "Fund") for the period of November 1, 2023 to October 31, 2024. You can find additional information about the Fund at hartfordfunds.com/reports-hmf. You can also request this information by contacting us by calling 1‑888‑843‑7824.
What were the Fund costs for the last year?
(Based on a hypothetical $10,000 investment)
| Class Name | Costs of a $10,000 investment | Costs paid as a percentage
of a $10,000 investment |
| Class Y | $100 | 0.87% |
How did the Fund perform last year and what impacted its performance?
Management's Discussion of Fund Performance
United States (U.S.) equities, as measured by the S&P 500 Index, rose over the trailing twelve-month period ending October 31, 2024, with the S&P 500 Index surging to a record high that was driven by performance in a select group of mega-cap technology companies. The U.S. Federal Reserve (Fed) began easing monetary policy with an interest-rate cut of 50 basis points in September 2024 in an effort to generate a soft landing for the economy. Markets were also kept on edge in the third quarter of 2024 due to the anticipated extremely close presidential race between Vice President Kamala Harris and former President Donald Trump. Fund performance described below is relative to the Fund’s performance index, the Russell Midcap Value Index, for the trailing twelve-month period ended October 31, 2024.
Top Contributors to Performance
Sector allocation, a result of the team’s bottom-up stock selection process, was a contributor to relative performance during the period due to the Fund’s overweight allocations to the Financials and Consumer Discretionary sectors, and underweight allocation to the Utilities sector.
Security selection within the Consumer Staples, Information Technology, and Communication Services sectors also contributed positively to relative performance.
Top individual contributors over the period were overweight positions in Coherent (Information Technology), Synovus Financial (Financials), and Flex (Information Technology).
Top Detractors to Performance
Security selection was the primary detractor to relative performance during the period, driven by weak selection within the Consumer Discretionary, Healthcare, and Energy sectors.
The Fund’s underweight allocations to the Real Estate and Industrials sectors and overweight to the Consumer Staples sector also detracted from relative results.
The largest individual detractors over the period were overweight positions in Flagstar Financial (Financials), Integra LifeSciences Holdings (Healthcare), and an out-of-benchmark position in Goodyear Tire&Rubber (Consumer Discretionary).
The views expressed in this section reflect the opinions of the Fund's sub-adviser, Wellington Management Company LLP, as of the date of this report and are subject to change based on changes in market, economic or other conditions. These views are not intended to be a forecast of future events and are no guarantee of future results.
Comparison of Change in Value of $ 250,000 Investment
The graph below represents the hypothetical growth of a $250,000 investment in Class Y shares and the comparative indices.
Average Annual Total Returns
For the Periods Ended October 31, 2024 | 1 Year | 5 Years | 10 Years |
| Class Y | 30.42% | 10.41% | 8.25% |
| Russell Midcap Value Index | 34.03% | 9.93% | 8.43% |
| Russell 3000 Index | 37.86% | 14.60% | 12.44% |
The Russell Midcap Value Index serves as the Fund’s performance index because the Fund’s investment manager believes it is more representative of the Fund’s investment strategy. The Russell 3000 Index serves as the Fund’s regulatory index and provides a broad measure of market performance.
The Fund’s past performance is not a good predictor of the Fund’s future performance. The graph and table do not reflect the deduction of taxes that a shareholder would pay on Fund distributions or redemption of Fund shares. Performance information reflects fee waivers and/or expense limitation arrangements, if any. Absent any applicable fee waivers and/or expense limitation arrangements, performance would have been lower. Visit hartfordfunds.com for the most recent performance information.
Key Fund Statistics as of October 31, 2024
| Fund's net assets | $1,054,982,771% |
| Total number of portfolio holdings (excluding derivatives, if any) | $81% |
| Total investment management fees paid | $7,075,306% |
| Portfolio turnover rate | $132% |
Graphical Representation of Holdings as of October 31, 2024
The table below shows the investment makeup of the Fund, representing the percentage of net assets of the Fund.
| Financials | 20.9 | % |
| Industrials | 19.0 | % |
| Utilities | 9.6 | % |
| Consumer Discretionary | 8.9 | % |
| Health Care | 8.6 | % |
| Real Estate | 7.1 | % |
| Energy | 6.1 | % |
| Materials | 6.1 | % |
| Information Technology | 5.6 | % |
| Communication Services | 3.4 | % |
| Consumer Staples | 3.3 | % |
| Short-Term Investments | 0.2 | % |
| Other Assets & Liabilities | 1.2 | % |
| Total | 100.0 | % |
* | For Fund compliance purposes, the Fund may not use the same classification system. These classifications are used for financial reporting purposes. |
Availability of Additional Information
For additional information about the Fund, including its prospectus, financial information, holdings, and proxy voting information, please visit the Fund’s website at the website address included at the beginning of this report.
The Fund is distributed by Hartford Funds Distributors, LLC (HFD).
Annual Shareholder Report
October 31, 2024
The Hartford MidCap Value Fund
Class F/HMVFX
This annual shareholder report contains important information about The Hartford MidCap Value Fund (the "Fund") for the period of November 1, 2023 to October 31, 2024. You can find additional information about the Fund at hartfordfunds.com/reports-hmf. You can also request this information by contacting us by calling 1‑888‑843‑7824.
What were the Fund costs for the last year?
(Based on a hypothetical $10,000 investment)
| Class Name | Costs of a $10,000 investment | Costs paid as a percentage
of a $10,000 investment |
| Class F | $88 | 0.76% |
How did the Fund perform last year and what impacted its performance?
Management's Discussion of Fund Performance
United States (U.S.) equities, as measured by the S&P 500 Index, rose over the trailing twelve-month period ending October 31, 2024, with the S&P 500 Index surging to a record high that was driven by performance in a select group of mega-cap technology companies. The U.S. Federal Reserve (Fed) began easing monetary policy with an interest-rate cut of 50 basis points in September 2024 in an effort to generate a soft landing for the economy. Markets were also kept on edge in the third quarter of 2024 due to the anticipated extremely close presidential race between Vice President Kamala Harris and former President Donald Trump. Fund performance described below is relative to the Fund’s performance index, the Russell Midcap Value Index, for the trailing twelve-month period ended October 31, 2024.
Top Contributors to Performance
Sector allocation, a result of the team’s bottom-up stock selection process, was a contributor to relative performance during the period due to the Fund’s overweight allocations to the Financials and Consumer Discretionary sectors, and underweight allocation to the Utilities sector.
Security selection within the Consumer Staples, Information Technology, and Communication Services sectors also contributed positively to relative performance.
Top individual contributors over the period were overweight positions in Coherent (Information Technology), Synovus Financial (Financials), and Flex (Information Technology).
Top Detractors to Performance
Security selection was the primary detractor to relative performance during the period, driven by weak selection within the Consumer Discretionary, Healthcare, and Energy sectors.
The Fund’s underweight allocations to the Real Estate and Industrials sectors and overweight to the Consumer Staples sector also detracted from relative results.
The largest individual detractors over the period were overweight positions in Flagstar Financial (Financials), Integra LifeSciences Holdings (Healthcare), and an out-of-benchmark position in Goodyear Tire&Rubber (Consumer Discretionary).
The views expressed in this section reflect the opinions of the Fund's sub-adviser, Wellington Management Company LLP, as of the date of this report and are subject to change based on changes in market, economic or other conditions. These views are not intended to be a forecast of future events and are no guarantee of future results.
Comparison of Change in Value of $ 1,000,000 Investment
The graph below represents the hypothetical growth of a $1,000,000 investment in Class F shares and the comparative indices.
Average Annual Total Returns
For the Periods Ended October 31, 2024 | 1 Year | 5 Years | 10 Years |
| Class F | 30.56% | 10.52% | 8.28% |
| Russell Midcap Value Index | 34.03% | 9.93% | 8.43% |
| Russell 3000 Index | 37.86% | 14.60% | 12.44% |
Class F shares commenced operations on February 28, 2017 and performance for Class F shares prior to February 28, 2017 reflects the performance of the Fund's Class I shares. Performance prior to the inception date of the class has not been adjusted to reflect the operating expenses of the class.
The Russell Midcap Value Index serves as the Fund’s performance index because the Fund’s investment manager believes it is more representative of the Fund’s investment strategy. The Russell 3000 Index serves as the Fund’s regulatory index and provides a broad measure of market performance.
The Fund’s past performance is not a good predictor of the Fund’s future performance. The graph and table do not reflect the deduction of taxes that a shareholder would pay on Fund distributions or redemption of Fund shares. Performance information reflects fee waivers and/or expense limitation arrangements, if any. Absent any applicable fee waivers and/or expense limitation arrangements, performance would have been lower. Visit hartfordfunds.com for the most recent performance information.
Key Fund Statistics as of October 31, 2024
| Fund's net assets | $1,054,982,771% |
| Total number of portfolio holdings (excluding derivatives, if any) | $81% |
| Total investment management fees paid | $7,075,306% |
| Portfolio turnover rate | $132% |
Graphical Representation of Holdings as of October 31, 2024
The table below shows the investment makeup of the Fund, representing the percentage of net assets of the Fund.
| Financials | 20.9 | % |
| Industrials | 19.0 | % |
| Utilities | 9.6 | % |
| Consumer Discretionary | 8.9 | % |
| Health Care | 8.6 | % |
| Real Estate | 7.1 | % |
| Energy | 6.1 | % |
| Materials | 6.1 | % |
| Information Technology | 5.6 | % |
| Communication Services | 3.4 | % |
| Consumer Staples | 3.3 | % |
| Short-Term Investments | 0.2 | % |
| Other Assets & Liabilities | 1.2 | % |
| Total | 100.0 | % |
* | For Fund compliance purposes, the Fund may not use the same classification system. These classifications are used for financial reporting purposes. |
Availability of Additional Information
For additional information about the Fund, including its prospectus, financial information, holdings, and proxy voting information, please visit the Fund’s website at the website address included at the beginning of this report.
The Fund is distributed by Hartford Funds Distributors, LLC (HFD).
Annual Shareholder Report
October 31, 2024
Hartford Small Cap Value Fund
Class A/HSMAX
This annual shareholder report contains important information about the Hartford Small Cap Value Fund (the "Fund") for the period of November 1, 2023 to October 31, 2024. You can find additional information about the Fund at hartfordfunds.com/reports-hmf. You can also request this information by contacting us by calling 1‑888‑843‑7824.
What were the Fund costs for the last year?
(Based on a hypothetical $10,000 investment)
| Class Name | Costs of a $10,000 investment | Costs paid as a percentage
of a $10,000 investment |
| Class A | $151 | 1.30% |
Costs paid excludes fees and expenses incurred indirectly as a result of investments in other investment companies.
How did the Fund perform last year and what impacted its performance?
Management's Discussion of Fund Performance
United States (U.S.) equities, as measured by the S&P 500 Index, rose over the trailing twelve-month period ending October 31, 2024, with the S&P 500 Index surging to a record high that was driven by performance in a select group of mega-cap technology companies. The U.S. Federal Reserve (Fed) began easing monetary policy with an interest-rate cut of 50 basis points in September 2024 in an effort to generate a soft landing for the economy. Markets were also kept on edge in the third quarter of 2024 due to the anticipated extremely close presidential race between Vice President Kamala Harris and former President Donald Trump. Fund performance described below is relative to the Fund’s performance index, the Russell 2000 Value Index, for the trailing twelve-month period ended October 31, 2024.
Top Contributors to Performance
Security selection within the Information Technology, Communication Services, Real Estate and Energy sectors contributed positively to relative performance.
Sector allocation, a result of our bottom-up stock selection process, contributed to relative performance mainly driven by the Fund’s underweight allocation to the Energy sector and overweight to the Financials sector.
Top individual contributors over the period were overweight positions in REV Group (Industrials) and Piedmont Office Realty Trust (Real Estate) and an out-of-benchmark position in InterDigital (Information Technology).
Top Detractors to Performance
Security selection detracted from relative results during the period, driven by weak selection within the Healthcare, Materials, and Consumer Staples sectors.
Underweight allocations to the Real Estate and Materials sectors detracted from relative performance.
The largest individual detractors over the period were overweight positions in Helen of Troy (Consumer Discretionary), Veradigm (Information Technology) and Pacira Biosciences (Healthcare).
The views expressed in this section reflect the opinions of the Fund's sub-adviser, Wellington Management Company LLP, as of the date of this report and are subject to change based on changes in market, economic or other conditions. These views are not intended to be a forecast of future events and are no guarantee of future results.
Comparison of Change in Value of $ 10,000 Investment
The graph below represents the hypothetical growth of a $10,000 investment in Class A shares and the comparative indices. The returns for Class A shares include the maximum front-end sales charge applicable to Class A shares.
Average Annual Total Returns
For the Periods Ended October 31, 2024 | 1 Year | 5 Years | 10 Years |
| Class A (with 5.50% maximum front-end sales charge) | 24.32% | 8.57% | 6.71% |
| Class A (without 5.50% maximum front-end sales charge) | 31.56% | 9.80% | 7.32% |
| Russell 2000 Value Index | 31.77% | 8.42% | 7.33% |
| Russell 3000 Index | 37.86% | 14.60% | 12.44% |
Performance for the Fund prior to November 1, 2018 reflects when the Fund pursued different strategies.
The Russell 2000 Value Index serves as the Fund’s performance index because the Fund’s investment manager believes it is more representative of the Fund’s investment strategy. The Russell 3000 Index serves as the Fund’s regulatory index and provides a broad measure of market performance.
The Fund’s past performance is not a good predictor of the Fund’s future performance. The graph and table do not reflect the deduction of taxes that a shareholder would pay on Fund distributions or redemption of Fund shares. Performance information reflects fee waivers and/or expense limitation arrangements, if any. Absent any applicable fee waivers and/or expense limitation arrangements, performance would have been lower. Visit hartfordfunds.com for the most recent performance information.
Key Fund Statistics as of October 31, 2024
| Fund's net assets | $124,682,872% |
| Total number of portfolio holdings (excluding derivatives, if any) | $67% |
| Total investment management fees paid | $836,971% |
| Portfolio turnover rate | $46% |
Graphical Representation of Holdings as of October 31, 2024
The table below shows the investment makeup of the Fund, representing the percentage of net assets of the Fund.
| Financials | 38.1 | % |
| Consumer Discretionary | 17.6 | % |
| Industrials | 11.3 | % |
| Information Technology | 9.0 | % |
| Health Care | 7.2 | % |
| Energy | 3.1 | % |
| Utilities | 3.1 | % |
| Real Estate | 3.0 | % |
| Consumer Staples | 2.8 | % |
| Materials | 2.8 | % |
| Communication Services | 1.9 | % |
| Short-Term Investments | 0.1 | % |
| Other Assets & Liabilities | 0.0 | %† |
| Total | 100.0 | % |
* | For Fund compliance purposes, the Fund may not use the same classification system. These classifications are used for financial reporting purposes. |
† | Percentage rounds to zero. |
Availability of Additional Information
For additional information about the Fund, including its prospectus, financial information, holdings, and proxy voting information, please visit the Fund’s website at the website address included at the beginning of this report.
The Fund is distributed by Hartford Funds Distributors, LLC (HFD).
Annual Shareholder Report
October 31, 2024
Hartford Small Cap Value Fund
Class C/HTSCX
This annual shareholder report contains important information about the Hartford Small Cap Value Fund (the "Fund") for the period of November 1, 2023 to October 31, 2024. You can find additional information about the Fund at hartfordfunds.com/reports-hmf. You can also request this information by contacting us by calling 1‑888‑843‑7824.
What were the Fund costs for the last year?
(Based on a hypothetical $10,000 investment)
| Class Name | Costs of a $10,000 investment | Costs paid as a percentage
of a $10,000 investment |
| Class C | $236 | 2.05% |
Costs paid excludes fees and expenses incurred indirectly as a result of investments in other investment companies.
How did the Fund perform last year and what impacted its performance?
Management's Discussion of Fund Performance
United States (U.S.) equities, as measured by the S&P 500 Index, rose over the trailing twelve-month period ending October 31, 2024, with the S&P 500 Index surging to a record high that was driven by performance in a select group of mega-cap technology companies. The U.S. Federal Reserve (Fed) began easing monetary policy with an interest-rate cut of 50 basis points in September 2024 in an effort to generate a soft landing for the economy. Markets were also kept on edge in the third quarter of 2024 due to the anticipated extremely close presidential race between Vice President Kamala Harris and former President Donald Trump. Fund performance described below is relative to the Fund’s performance index, the Russell 2000 Value Index, for the trailing twelve-month period ended October 31, 2024.
Top Contributors to Performance
Security selection within the Information Technology, Communication Services, Real Estate and Energy sectors contributed positively to relative performance.
Sector allocation, a result of our bottom-up stock selection process, contributed to relative performance mainly driven by the Fund’s underweight allocation to the Energy sector and overweight to the Financials sector.
Top individual contributors over the period were overweight positions in REV Group (Industrials) and Piedmont Office Realty Trust (Real Estate) and an out-of-benchmark position in InterDigital (Information Technology).
Top Detractors to Performance
Security selection detracted from relative results during the period, driven by weak selection within the Healthcare, Materials, and Consumer Staples sectors.
Underweight allocations to the Real Estate and Materials sectors detracted from relative performance.
The largest individual detractors over the period were overweight positions in Helen of Troy (Consumer Discretionary), Veradigm (Information Technology) and Pacira Biosciences (Healthcare).
The views expressed in this section reflect the opinions of the Fund's sub-adviser, Wellington Management Company LLP, as of the date of this report and are subject to change based on changes in market, economic or other conditions. These views are not intended to be a forecast of future events and are no guarantee of future results.
Comparison of Change in Value of $ 10,000 Investment
The graph below represents the hypothetical growth of a $10,000 investment in Class C shares (excluding sales charges) and the comparative indices. If sales charges had been included, the value would have been lower.
Average Annual Total Returns
For the Periods Ended October 31, 2024 | 1 Year | 5 Years | 10 Years |
| Class C (with 1.00% contingent deferred sales charge) | 29.54% | 8.99% | 6.52% |
| Class C (without 1.00% contingent deferred sales charge) | 30.54% | 8.99% | 6.52% |
| Russell 2000 Value Index | 31.77% | 8.42% | 7.33% |
| Russell 3000 Index | 37.86% | 14.60% | 12.44% |
Performance for the Fund prior to November 1, 2018 reflects when the Fund pursued different strategies.
The Russell 2000 Value Index serves as the Fund’s performance index because the Fund’s investment manager believes it is more representative of the Fund’s investment strategy. The Russell 3000 Index serves as the Fund’s regulatory index and provides a broad measure of market performance.
The Fund’s past performance is not a good predictor of the Fund’s future performance. The graph and table do not reflect the deduction of taxes that a shareholder would pay on Fund distributions or redemption of Fund shares. Performance information reflects fee waivers and/or expense limitation arrangements, if any. Absent any applicable fee waivers and/or expense limitation arrangements, performance would have been lower. Visit hartfordfunds.com for the most recent performance information.
Key Fund Statistics as of October 31, 2024
| Fund's net assets | $124,682,872% |
| Total number of portfolio holdings (excluding derivatives, if any) | $67% |
| Total investment management fees paid | $836,971% |
| Portfolio turnover rate | $46% |
Graphical Representation of Holdings as of October 31, 2024
The table below shows the investment makeup of the Fund, representing the percentage of net assets of the Fund.
| Financials | 38.1 | % |
| Consumer Discretionary | 17.6 | % |
| Industrials | 11.3 | % |
| Information Technology | 9.0 | % |
| Health Care | 7.2 | % |
| Energy | 3.1 | % |
| Utilities | 3.1 | % |
| Real Estate | 3.0 | % |
| Consumer Staples | 2.8 | % |
| Materials | 2.8 | % |
| Communication Services | 1.9 | % |
| Short-Term Investments | 0.1 | % |
| Other Assets & Liabilities | 0.0 | %† |
| Total | 100.0 | % |
* | For Fund compliance purposes, the Fund may not use the same classification system. These classifications are used for financial reporting purposes. |
† | Percentage rounds to zero. |
Availability of Additional Information
For additional information about the Fund, including its prospectus, financial information, holdings, and proxy voting information, please visit the Fund’s website at the website address included at the beginning of this report.
The Fund is distributed by Hartford Funds Distributors, LLC (HFD).
Annual Shareholder Report
October 31, 2024
Hartford Small Cap Value Fund
Class I/HSEIX
This annual shareholder report contains important information about the Hartford Small Cap Value Fund (the "Fund") for the period of November 1, 2023 to October 31, 2024. You can find additional information about the Fund at hartfordfunds.com/reports-hmf. You can also request this information by contacting us by calling 1‑888‑843‑7824.
What were the Fund costs for the last year?
(Based on a hypothetical $10,000 investment)
| Class Name | Costs of a $10,000 investment | Costs paid as a percentage
of a $10,000 investment |
| Class I | $116 | 1.00% |
Costs paid excludes fees and expenses incurred indirectly as a result of investments in other investment companies.
How did the Fund perform last year and what impacted its performance?
Management's Discussion of Fund Performance
United States (U.S.) equities, as measured by the S&P 500 Index, rose over the trailing twelve-month period ending October 31, 2024, with the S&P 500 Index surging to a record high that was driven by performance in a select group of mega-cap technology companies. The U.S. Federal Reserve (Fed) began easing monetary policy with an interest-rate cut of 50 basis points in September 2024 in an effort to generate a soft landing for the economy. Markets were also kept on edge in the third quarter of 2024 due to the anticipated extremely close presidential race between Vice President Kamala Harris and former President Donald Trump. Fund performance described below is relative to the Fund’s performance index, the Russell 2000 Value Index, for the trailing twelve-month period ended October 31, 2024.
Top Contributors to Performance
Security selection within the Information Technology, Communication Services, Real Estate and Energy sectors contributed positively to relative performance.
Sector allocation, a result of our bottom-up stock selection process, contributed to relative performance mainly driven by the Fund’s underweight allocation to the Energy sector and overweight to the Financials sector.
Top individual contributors over the period were overweight positions in REV Group (Industrials) and Piedmont Office Realty Trust (Real Estate) and an out-of-benchmark position in InterDigital (Information Technology).
Top Detractors to Performance
Security selection detracted from relative results during the period, driven by weak selection within the Healthcare, Materials, and Consumer Staples sectors.
Underweight allocations to the Real Estate and Materials sectors detracted from relative performance.
The largest individual detractors over the period were overweight positions in Helen of Troy (Consumer Discretionary), Veradigm (Information Technology) and Pacira Biosciences (Healthcare).
The views expressed in this section reflect the opinions of the Fund's sub-adviser, Wellington Management Company LLP, as of the date of this report and are subject to change based on changes in market, economic or other conditions. These views are not intended to be a forecast of future events and are no guarantee of future results.
Comparison of Change in Value of $ 10,000 Investment
The graph below represents the hypothetical growth of a $10,000 investment in Class I shares and the comparative indices.
Average Annual Total Returns
For the Periods Ended October 31, 2024 | 1 Year | 5 Years | 10 Years |
| Class I | 31.96% | 10.16% | 7.65% |
| Russell 2000 Value Index | 31.77% | 8.42% | 7.33% |
| Russell 3000 Index | 37.86% | 14.60% | 12.44% |
Class I shares commenced operations on March 31, 2015 and performance prior to that date is that of the Fund’s Class A shares (excluding sales charges). Performance prior to the inception date of the class has not been adjusted to reflect the operating expenses of the class.
Performance for the Fund prior to November 1, 2018 reflects when the Fund pursued different strategies.
The Russell 2000 Value Index serves as the Fund’s performance index because the Fund’s investment manager believes it is more representative of the Fund’s investment strategy. The Russell 3000 Index serves as the Fund’s regulatory index and provides a broad measure of market performance.
The Fund’s past performance is not a good predictor of the Fund’s future performance. The graph and table do not reflect the deduction of taxes that a shareholder would pay on Fund distributions or redemption of Fund shares. Performance information reflects fee waivers and/or expense limitation arrangements, if any. Absent any applicable fee waivers and/or expense limitation arrangements, performance would have been lower. Visit hartfordfunds.com for the most recent performance information.
Key Fund Statistics as of October 31, 2024
| Fund's net assets | $124,682,872% |
| Total number of portfolio holdings (excluding derivatives, if any) | $67% |
| Total investment management fees paid | $836,971% |
| Portfolio turnover rate | $46% |
Graphical Representation of Holdings as of October 31, 2024
The table below shows the investment makeup of the Fund, representing the percentage of net assets of the Fund.
| Financials | 38.1 | % |
| Consumer Discretionary | 17.6 | % |
| Industrials | 11.3 | % |
| Information Technology | 9.0 | % |
| Health Care | 7.2 | % |
| Energy | 3.1 | % |
| Utilities | 3.1 | % |
| Real Estate | 3.0 | % |
| Consumer Staples | 2.8 | % |
| Materials | 2.8 | % |
| Communication Services | 1.9 | % |
| Short-Term Investments | 0.1 | % |
| Other Assets & Liabilities | 0.0 | %† |
| Total | 100.0 | % |
* | For Fund compliance purposes, the Fund may not use the same classification system. These classifications are used for financial reporting purposes. |
† | Percentage rounds to zero. |
Availability of Additional Information
For additional information about the Fund, including its prospectus, financial information, holdings, and proxy voting information, please visit the Fund’s website at the website address included at the beginning of this report.
The Fund is distributed by Hartford Funds Distributors, LLC (HFD).
Annual Shareholder Report
October 31, 2024
Hartford Small Cap Value Fund
Class R3/HSMRX
This annual shareholder report contains important information about the Hartford Small Cap Value Fund (the "Fund") for the period of November 1, 2023 to October 31, 2024. You can find additional information about the Fund at hartfordfunds.com/reports-hmf. You can also request this information by contacting us by calling 1‑888‑843‑7824.
What were the Fund costs for the last year?
(Based on a hypothetical $10,000 investment)
| Class Name | Costs of a $10,000 investment | Costs paid as a percentage
of a $10,000 investment |
| Class R3 | $173 | 1.50% |
Costs paid excludes fees and expenses incurred indirectly as a result of investments in other investment companies.
How did the Fund perform last year and what impacted its performance?
Management's Discussion of Fund Performance
United States (U.S.) equities, as measured by the S&P 500 Index, rose over the trailing twelve-month period ending October 31, 2024, with the S&P 500 Index surging to a record high that was driven by performance in a select group of mega-cap technology companies. The U.S. Federal Reserve (Fed) began easing monetary policy with an interest-rate cut of 50 basis points in September 2024 in an effort to generate a soft landing for the economy. Markets were also kept on edge in the third quarter of 2024 due to the anticipated extremely close presidential race between Vice President Kamala Harris and former President Donald Trump. Fund performance described below is relative to the Fund’s performance index, the Russell 2000 Value Index, for the trailing twelve-month period ended October 31, 2024.
Top Contributors to Performance
Security selection within the Information Technology, Communication Services, Real Estate and Energy sectors contributed positively to relative performance.
Sector allocation, a result of our bottom-up stock selection process, contributed to relative performance mainly driven by the Fund’s underweight allocation to the Energy sector and overweight to the Financials sector.
Top individual contributors over the period were overweight positions in REV Group (Industrials) and Piedmont Office Realty Trust (Real Estate) and an out-of-benchmark position in InterDigital (Information Technology).
Top Detractors to Performance
Security selection detracted from relative results during the period, driven by weak selection within the Healthcare, Materials, and Consumer Staples sectors.
Underweight allocations to the Real Estate and Materials sectors detracted from relative performance.
The largest individual detractors over the period were overweight positions in Helen of Troy (Consumer Discretionary), Veradigm (Information Technology) and Pacira Biosciences (Healthcare).
The views expressed in this section reflect the opinions of the Fund's sub-adviser, Wellington Management Company LLP, as of the date of this report and are subject to change based on changes in market, economic or other conditions. These views are not intended to be a forecast of future events and are no guarantee of future results.
Comparison of Change in Value of $ 10,000 Investment
The graph below represents the hypothetical growth of a $10,000 investment in Class R3 shares and the comparative indices.
Average Annual Total Returns
For the Periods Ended October 31, 2024 | 1 Year | 5 Years | 10 Years |
| Class R3 | 31.29% | 9.64% | 7.13% |
| Russell 2000 Value Index | 31.77% | 8.42% | 7.33% |
| Russell 3000 Index | 37.86% | 14.60% | 12.44% |
Performance for the Fund prior to November 1, 2018 reflects when the Fund pursued different strategies.
The Russell 2000 Value Index serves as the Fund’s performance index because the Fund’s investment manager believes it is more representative of the Fund’s investment strategy. The Russell 3000 Index serves as the Fund’s regulatory index and provides a broad measure of market performance.
The Fund’s past performance is not a good predictor of the Fund’s future performance. The graph and table do not reflect the deduction of taxes that a shareholder would pay on Fund distributions or redemption of Fund shares. Performance information reflects fee waivers and/or expense limitation arrangements, if any. Absent any applicable fee waivers and/or expense limitation arrangements, performance would have been lower. Visit hartfordfunds.com for the most recent performance information.
Key Fund Statistics as of October 31, 2024
| Fund's net assets | $124,682,872% |
| Total number of portfolio holdings (excluding derivatives, if any) | $67% |
| Total investment management fees paid | $836,971% |
| Portfolio turnover rate | $46% |
Graphical Representation of Holdings as of October 31, 2024
The table below shows the investment makeup of the Fund, representing the percentage of net assets of the Fund.
| Financials | 38.1 | % |
| Consumer Discretionary | 17.6 | % |
| Industrials | 11.3 | % |
| Information Technology | 9.0 | % |
| Health Care | 7.2 | % |
| Energy | 3.1 | % |
| Utilities | 3.1 | % |
| Real Estate | 3.0 | % |
| Consumer Staples | 2.8 | % |
| Materials | 2.8 | % |
| Communication Services | 1.9 | % |
| Short-Term Investments | 0.1 | % |
| Other Assets & Liabilities | 0.0 | %† |
| Total | 100.0 | % |
* | For Fund compliance purposes, the Fund may not use the same classification system. These classifications are used for financial reporting purposes. |
† | Percentage rounds to zero. |
Availability of Additional Information
For additional information about the Fund, including its prospectus, financial information, holdings, and proxy voting information, please visit the Fund’s website at the website address included at the beginning of this report.
The Fund is distributed by Hartford Funds Distributors, LLC (HFD).
Annual Shareholder Report
October 31, 2024
Hartford Small Cap Value Fund
Class R4/HSMSX
This annual shareholder report contains important information about the Hartford Small Cap Value Fund (the "Fund") for the period of November 1, 2023 to October 31, 2024. You can find additional information about the Fund at hartfordfunds.com/reports-hmf. You can also request this information by contacting us by calling 1‑888‑843‑7824.
What were the Fund costs for the last year?
(Based on a hypothetical $10,000 investment)
| Class Name | Costs of a $10,000 investment | Costs paid as a percentage
of a $10,000 investment |
| Class R4 | $139 | 1.20% |
Costs paid excludes fees and expenses incurred indirectly as a result of investments in other investment companies.
How did the Fund perform last year and what impacted its performance?
Management's Discussion of Fund Performance
United States (U.S.) equities, as measured by the S&P 500 Index, rose over the trailing twelve-month period ending October 31, 2024, with the S&P 500 Index surging to a record high that was driven by performance in a select group of mega-cap technology companies. The U.S. Federal Reserve (Fed) began easing monetary policy with an interest-rate cut of 50 basis points in September 2024 in an effort to generate a soft landing for the economy. Markets were also kept on edge in the third quarter of 2024 due to the anticipated extremely close presidential race between Vice President Kamala Harris and former President Donald Trump. Fund performance described below is relative to the Fund’s performance index, the Russell 2000 Value Index, for the trailing twelve-month period ended October 31, 2024.
Top Contributors to Performance
Security selection within the Information Technology, Communication Services, Real Estate and Energy sectors contributed positively to relative performance.
Sector allocation, a result of our bottom-up stock selection process, contributed to relative performance mainly driven by the Fund’s underweight allocation to the Energy sector and overweight to the Financials sector.
Top individual contributors over the period were overweight positions in REV Group (Industrials) and Piedmont Office Realty Trust (Real Estate) and an out-of-benchmark position in InterDigital (Information Technology).
Top Detractors to Performance
Security selection detracted from relative results during the period, driven by weak selection within the Healthcare, Materials, and Consumer Staples sectors.
Underweight allocations to the Real Estate and Materials sectors detracted from relative performance.
The largest individual detractors over the period were overweight positions in Helen of Troy (Consumer Discretionary), Veradigm (Information Technology) and Pacira Biosciences (Healthcare).
The views expressed in this section reflect the opinions of the Fund's sub-adviser, Wellington Management Company LLP, as of the date of this report and are subject to change based on changes in market, economic or other conditions. These views are not intended to be a forecast of future events and are no guarantee of future results.
Comparison of Change in Value of $ 10,000 Investment
The graph below represents the hypothetical growth of a $10,000 investment in Class R4 shares and the comparative indices.
Average Annual Total Returns
For the Periods Ended October 31, 2024 | 1 Year | 5 Years | 10 Years |
| Class R4 | 31.67% | 9.92% | 7.42% |
| Russell 2000 Value Index | 31.77% | 8.42% | 7.33% |
| Russell 3000 Index | 37.86% | 14.60% | 12.44% |
Performance for the Fund prior to November 1, 2018 reflects when the Fund pursued different strategies.
The Russell 2000 Value Index serves as the Fund’s performance index because the Fund’s investment manager believes it is more representative of the Fund’s investment strategy. The Russell 3000 Index serves as the Fund’s regulatory index and provides a broad measure of market performance.
The Fund’s past performance is not a good predictor of the Fund’s future performance. The graph and table do not reflect the deduction of taxes that a shareholder would pay on Fund distributions or redemption of Fund shares. Performance information reflects fee waivers and/or expense limitation arrangements, if any. Absent any applicable fee waivers and/or expense limitation arrangements, performance would have been lower. Visit hartfordfunds.com for the most recent performance information.
Key Fund Statistics as of October 31, 2024
| Fund's net assets | $124,682,872% |
| Total number of portfolio holdings (excluding derivatives, if any) | $67% |
| Total investment management fees paid | $836,971% |
| Portfolio turnover rate | $46% |
Graphical Representation of Holdings as of October 31, 2024
The table below shows the investment makeup of the Fund, representing the percentage of net assets of the Fund.
| Financials | 38.1 | % |
| Consumer Discretionary | 17.6 | % |
| Industrials | 11.3 | % |
| Information Technology | 9.0 | % |
| Health Care | 7.2 | % |
| Energy | 3.1 | % |
| Utilities | 3.1 | % |
| Real Estate | 3.0 | % |
| Consumer Staples | 2.8 | % |
| Materials | 2.8 | % |
| Communication Services | 1.9 | % |
| Short-Term Investments | 0.1 | % |
| Other Assets & Liabilities | 0.0 | %† |
| Total | 100.0 | % |
* | For Fund compliance purposes, the Fund may not use the same classification system. These classifications are used for financial reporting purposes. |
† | Percentage rounds to zero. |
Availability of Additional Information
For additional information about the Fund, including its prospectus, financial information, holdings, and proxy voting information, please visit the Fund’s website at the website address included at the beginning of this report.
The Fund is distributed by Hartford Funds Distributors, LLC (HFD).
Annual Shareholder Report
October 31, 2024
Hartford Small Cap Value Fund
Class R5/HSMTX
This annual shareholder report contains important information about the Hartford Small Cap Value Fund (the "Fund") for the period of November 1, 2023 to October 31, 2024. You can find additional information about the Fund at hartfordfunds.com/reports-hmf. You can also request this information by contacting us by calling 1‑888‑843‑7824.
What were the Fund costs for the last year?
(Based on a hypothetical $10,000 investment)
| Class Name | Costs of a $10,000 investment | Costs paid as a percentage
of a $10,000 investment |
| Class R5 | $104 | 0.90% |
Costs paid excludes fees and expenses incurred indirectly as a result of investments in other investment companies.
How did the Fund perform last year and what impacted its performance?
Management's Discussion of Fund Performance
United States (U.S.) equities, as measured by the S&P 500 Index, rose over the trailing twelve-month period ending October 31, 2024, with the S&P 500 Index surging to a record high that was driven by performance in a select group of mega-cap technology companies. The U.S. Federal Reserve (Fed) began easing monetary policy with an interest-rate cut of 50 basis points in September 2024 in an effort to generate a soft landing for the economy. Markets were also kept on edge in the third quarter of 2024 due to the anticipated extremely close presidential race between Vice President Kamala Harris and former President Donald Trump. Fund performance described below is relative to the Fund’s performance index, the Russell 2000 Value Index, for the trailing twelve-month period ended October 31, 2024.
Top Contributors to Performance
Security selection within the Information Technology, Communication Services, Real Estate and Energy sectors contributed positively to relative performance.
Sector allocation, a result of our bottom-up stock selection process, contributed to relative performance mainly driven by the Fund’s underweight allocation to the Energy sector and overweight to the Financials sector.
Top individual contributors over the period were overweight positions in REV Group (Industrials) and Piedmont Office Realty Trust (Real Estate) and an out-of-benchmark position in InterDigital (Information Technology).
Top Detractors to Performance
Security selection detracted from relative results during the period, driven by weak selection within the Healthcare, Materials, and Consumer Staples sectors.
Underweight allocations to the Real Estate and Materials sectors detracted from relative performance.
The largest individual detractors over the period were overweight positions in Helen of Troy (Consumer Discretionary), Veradigm (Information Technology) and Pacira Biosciences (Healthcare).
The views expressed in this section reflect the opinions of the Fund's sub-adviser, Wellington Management Company LLP, as of the date of this report and are subject to change based on changes in market, economic or other conditions. These views are not intended to be a forecast of future events and are no guarantee of future results.
Comparison of Change in Value of $ 10,000 Investment
The graph below represents the hypothetical growth of a $10,000 investment in Class R5 shares and the comparative indices.
Average Annual Total Returns
For the Periods Ended October 31, 2024 | 1 Year | 5 Years | 10 Years |
| Class R5 | 32.01% | 10.25% | 7.74% |
| Russell 2000 Value Index | 31.77% | 8.42% | 7.33% |
| Russell 3000 Index | 37.86% | 14.60% | 12.44% |
Performance for the Fund prior to November 1, 2018 reflects when the Fund pursued different strategies.
The Russell 2000 Value Index serves as the Fund’s performance index because the Fund’s investment manager believes it is more representative of the Fund’s investment strategy. The Russell 3000 Index serves as the Fund’s regulatory index and provides a broad measure of market performance.
The Fund’s past performance is not a good predictor of the Fund’s future performance. The graph and table do not reflect the deduction of taxes that a shareholder would pay on Fund distributions or redemption of Fund shares. Performance information reflects fee waivers and/or expense limitation arrangements, if any. Absent any applicable fee waivers and/or expense limitation arrangements, performance would have been lower. Visit hartfordfunds.com for the most recent performance information.
Key Fund Statistics as of October 31, 2024
| Fund's net assets | $124,682,872% |
| Total number of portfolio holdings (excluding derivatives, if any) | $67% |
| Total investment management fees paid | $836,971% |
| Portfolio turnover rate | $46% |
Graphical Representation of Holdings as of October 31, 2024
The table below shows the investment makeup of the Fund, representing the percentage of net assets of the Fund.
| Financials | 38.1 | % |
| Consumer Discretionary | 17.6 | % |
| Industrials | 11.3 | % |
| Information Technology | 9.0 | % |
| Health Care | 7.2 | % |
| Energy | 3.1 | % |
| Utilities | 3.1 | % |
| Real Estate | 3.0 | % |
| Consumer Staples | 2.8 | % |
| Materials | 2.8 | % |
| Communication Services | 1.9 | % |
| Short-Term Investments | 0.1 | % |
| Other Assets & Liabilities | 0.0 | %† |
| Total | 100.0 | % |
* | For Fund compliance purposes, the Fund may not use the same classification system. These classifications are used for financial reporting purposes. |
† | Percentage rounds to zero. |
Availability of Additional Information
For additional information about the Fund, including its prospectus, financial information, holdings, and proxy voting information, please visit the Fund’s website at the website address included at the beginning of this report.
The Fund is distributed by Hartford Funds Distributors, LLC (HFD).
Annual Shareholder Report
October 31, 2024
Hartford Small Cap Value Fund
Class R6/HSMVX
This annual shareholder report contains important information about the Hartford Small Cap Value Fund (the "Fund") for the period of November 1, 2023 to October 31, 2024. You can find additional information about the Fund at hartfordfunds.com/reports-hmf. You can also request this information by contacting us by calling 1‑888‑843‑7824.
What were the Fund costs for the last year?
(Based on a hypothetical $10,000 investment)
| Class Name | Costs of a $10,000 investment | Costs paid as a percentage
of a $10,000 investment |
| Class R6 | $93 | 0.80% |
Costs paid excludes fees and expenses incurred indirectly as a result of investments in other investment companies.
How did the Fund perform last year and what impacted its performance?
Management's Discussion of Fund Performance
United States (U.S.) equities, as measured by the S&P 500 Index, rose over the trailing twelve-month period ending October 31, 2024, with the S&P 500 Index surging to a record high that was driven by performance in a select group of mega-cap technology companies. The U.S. Federal Reserve (Fed) began easing monetary policy with an interest-rate cut of 50 basis points in September 2024 in an effort to generate a soft landing for the economy. Markets were also kept on edge in the third quarter of 2024 due to the anticipated extremely close presidential race between Vice President Kamala Harris and former President Donald Trump. Fund performance described below is relative to the Fund’s performance index, the Russell 2000 Value Index, for the trailing twelve-month period ended October 31, 2024.
Top Contributors to Performance
Security selection within the Information Technology, Communication Services, Real Estate and Energy sectors contributed positively to relative performance.
Sector allocation, a result of our bottom-up stock selection process, contributed to relative performance mainly driven by the Fund’s underweight allocation to the Energy sector and overweight to the Financials sector.
Top individual contributors over the period were overweight positions in REV Group (Industrials) and Piedmont Office Realty Trust (Real Estate) and an out-of-benchmark position in InterDigital (Information Technology).
Top Detractors to Performance
Security selection detracted from relative results during the period, driven by weak selection within the Healthcare, Materials, and Consumer Staples sectors.
Underweight allocations to the Real Estate and Materials sectors detracted from relative performance.
The largest individual detractors over the period were overweight positions in Helen of Troy (Consumer Discretionary), Veradigm (Information Technology) and Pacira Biosciences (Healthcare).
The views expressed in this section reflect the opinions of the Fund's sub-adviser, Wellington Management Company LLP, as of the date of this report and are subject to change based on changes in market, economic or other conditions. These views are not intended to be a forecast of future events and are no guarantee of future results.
Comparison of Change in Value of $ 10,000 Investment
The graph below represents the hypothetical growth of a $10,000 investment in Class R6 shares and the comparative indices.
Average Annual Total Returns
For the Periods Ended October 31, 2024 | 1 Year | 5 Years | 10 Years |
| Class R6 | 32.14% | 10.34% | 7.82% |
| Russell 2000 Value Index | 31.77% | 8.42% | 7.33% |
| Russell 3000 Index | 37.86% | 14.60% | 12.44% |
Class R6 shares commenced operations on February 28, 2018 and performance prior to that date is that of the Fund’s Class Y shares. Performance prior to the inception date of the class has not been adjusted to reflect the operating expenses of the class.
Performance for the Fund prior to November 1, 2018 reflects when the Fund pursued different strategies.
The Russell 2000 Value Index serves as the Fund’s performance index because the Fund’s investment manager believes it is more representative of the Fund’s investment strategy. The Russell 3000 Index serves as the Fund’s regulatory index and provides a broad measure of market performance.
The Fund’s past performance is not a good predictor of the Fund’s future performance. The graph and table do not reflect the deduction of taxes that a shareholder would pay on Fund distributions or redemption of Fund shares. Performance information reflects fee waivers and/or expense limitation arrangements, if any. Absent any applicable fee waivers and/or expense limitation arrangements, performance would have been lower. Visit hartfordfunds.com for the most recent performance information.
Key Fund Statistics as of October 31, 2024
| Fund's net assets | $124,682,872% |
| Total number of portfolio holdings (excluding derivatives, if any) | $67% |
| Total investment management fees paid | $836,971% |
| Portfolio turnover rate | $46% |
Graphical Representation of Holdings as of October 31, 2024
The table below shows the investment makeup of the Fund, representing the percentage of net assets of the Fund.
| Financials | 38.1 | % |
| Consumer Discretionary | 17.6 | % |
| Industrials | 11.3 | % |
| Information Technology | 9.0 | % |
| Health Care | 7.2 | % |
| Energy | 3.1 | % |
| Utilities | 3.1 | % |
| Real Estate | 3.0 | % |
| Consumer Staples | 2.8 | % |
| Materials | 2.8 | % |
| Communication Services | 1.9 | % |
| Short-Term Investments | 0.1 | % |
| Other Assets & Liabilities | 0.0 | %† |
| Total | 100.0 | % |
* | For Fund compliance purposes, the Fund may not use the same classification system. These classifications are used for financial reporting purposes. |
† | Percentage rounds to zero. |
Availability of Additional Information
For additional information about the Fund, including its prospectus, financial information, holdings, and proxy voting information, please visit the Fund’s website at the website address included at the beginning of this report.
The Fund is distributed by Hartford Funds Distributors, LLC (HFD).
Annual Shareholder Report
October 31, 2024
Hartford Small Cap Value Fund
Class Y/HSMYX
This annual shareholder report contains important information about the Hartford Small Cap Value Fund (the "Fund") for the period of November 1, 2023 to October 31, 2024. You can find additional information about the Fund at hartfordfunds.com/reports-hmf. You can also request this information by contacting us by calling 1‑888‑843‑7824.
What were the Fund costs for the last year?
(Based on a hypothetical $10,000 investment)
| Class Name | Costs of a $10,000 investment | Costs paid as a percentage
of a $10,000 investment |
| Class Y | $99 | 0.85% |
Costs paid excludes fees and expenses incurred indirectly as a result of investments in other investment companies.
How did the Fund perform last year and what impacted its performance?
Management's Discussion of Fund Performance
United States (U.S.) equities, as measured by the S&P 500 Index, rose over the trailing twelve-month period ending October 31, 2024, with the S&P 500 Index surging to a record high that was driven by performance in a select group of mega-cap technology companies. The U.S. Federal Reserve (Fed) began easing monetary policy with an interest-rate cut of 50 basis points in September 2024 in an effort to generate a soft landing for the economy. Markets were also kept on edge in the third quarter of 2024 due to the anticipated extremely close presidential race between Vice President Kamala Harris and former President Donald Trump. Fund performance described below is relative to the Fund’s performance index, the Russell 2000 Value Index, for the trailing twelve-month period ended October 31, 2024.
Top Contributors to Performance
Security selection within the Information Technology, Communication Services, Real Estate and Energy sectors contributed positively to relative performance.
Sector allocation, a result of our bottom-up stock selection process, contributed to relative performance mainly driven by the Fund’s underweight allocation to the Energy sector and overweight to the Financials sector.
Top individual contributors over the period were overweight positions in REV Group (Industrials) and Piedmont Office Realty Trust (Real Estate) and an out-of-benchmark position in InterDigital (Information Technology).
Top Detractors to Performance
Security selection detracted from relative results during the period, driven by weak selection within the Healthcare, Materials, and Consumer Staples sectors.
Underweight allocations to the Real Estate and Materials sectors detracted from relative performance.
The largest individual detractors over the period were overweight positions in Helen of Troy (Consumer Discretionary), Veradigm (Information Technology) and Pacira Biosciences (Healthcare).
The views expressed in this section reflect the opinions of the Fund's sub-adviser, Wellington Management Company LLP, as of the date of this report and are subject to change based on changes in market, economic or other conditions. These views are not intended to be a forecast of future events and are no guarantee of future results.
Comparison of Change in Value of $ 250,000 Investment
The graph below represents the hypothetical growth of a $250,000 investment in Class Y shares and the comparative indices.
Average Annual Total Returns
For the Periods Ended October 31, 2024 | 1 Year | 5 Years | 10 Years |
| Class Y | 32.04% | 10.28% | 7.79% |
| Russell 2000 Value Index | 31.77% | 8.42% | 7.33% |
| Russell 3000 Index | 37.86% | 14.60% | 12.44% |
Performance for the Fund prior to November 1, 2018 reflects when the Fund pursued different strategies.
The Russell 2000 Value Index serves as the Fund’s performance index because the Fund’s investment manager believes it is more representative of the Fund’s investment strategy. The Russell 3000 Index serves as the Fund’s regulatory index and provides a broad measure of market performance.
The Fund’s past performance is not a good predictor of the Fund’s future performance. The graph and table do not reflect the deduction of taxes that a shareholder would pay on Fund distributions or redemption of Fund shares. Performance information reflects fee waivers and/or expense limitation arrangements, if any. Absent any applicable fee waivers and/or expense limitation arrangements, performance would have been lower. Visit hartfordfunds.com for the most recent performance information.
Key Fund Statistics as of October 31, 2024
| Fund's net assets | $124,682,872% |
| Total number of portfolio holdings (excluding derivatives, if any) | $67% |
| Total investment management fees paid | $836,971% |
| Portfolio turnover rate | $46% |
Graphical Representation of Holdings as of October 31, 2024
The table below shows the investment makeup of the Fund, representing the percentage of net assets of the Fund.
| Financials | 38.1 | % |
| Consumer Discretionary | 17.6 | % |
| Industrials | 11.3 | % |
| Information Technology | 9.0 | % |
| Health Care | 7.2 | % |
| Energy | 3.1 | % |
| Utilities | 3.1 | % |
| Real Estate | 3.0 | % |
| Consumer Staples | 2.8 | % |
| Materials | 2.8 | % |
| Communication Services | 1.9 | % |
| Short-Term Investments | 0.1 | % |
| Other Assets & Liabilities | 0.0 | %† |
| Total | 100.0 | % |
* | For Fund compliance purposes, the Fund may not use the same classification system. These classifications are used for financial reporting purposes. |
† | Percentage rounds to zero. |
Availability of Additional Information
For additional information about the Fund, including its prospectus, financial information, holdings, and proxy voting information, please visit the Fund’s website at the website address included at the beginning of this report.
The Fund is distributed by Hartford Funds Distributors, LLC (HFD).
Annual Shareholder Report
October 31, 2024
Hartford Small Cap Value Fund
Class F/HSMFX
This annual shareholder report contains important information about the Hartford Small Cap Value Fund (the "Fund") for the period of November 1, 2023 to October 31, 2024. You can find additional information about the Fund at hartfordfunds.com/reports-hmf. You can also request this information by contacting us by calling 1‑888‑843‑7824.
What were the Fund costs for the last year?
(Based on a hypothetical $10,000 investment)
| Class Name | Costs of a $10,000 investment | Costs paid as a percentage
of a $10,000 investment |
| Class F | $93 | 0.80% |
Costs paid excludes fees and expenses incurred indirectly as a result of investments in other investment companies.
How did the Fund perform last year and what impacted its performance?
Management's Discussion of Fund Performance
United States (U.S.) equities, as measured by the S&P 500 Index, rose over the trailing twelve-month period ending October 31, 2024, with the S&P 500 Index surging to a record high that was driven by performance in a select group of mega-cap technology companies. The U.S. Federal Reserve (Fed) began easing monetary policy with an interest-rate cut of 50 basis points in September 2024 in an effort to generate a soft landing for the economy. Markets were also kept on edge in the third quarter of 2024 due to the anticipated extremely close presidential race between Vice President Kamala Harris and former President Donald Trump. Fund performance described below is relative to the Fund’s performance index, the Russell 2000 Value Index, for the trailing twelve-month period ended October 31, 2024.
Top Contributors to Performance
Security selection within the Information Technology, Communication Services, Real Estate and Energy sectors contributed positively to relative performance.
Sector allocation, a result of our bottom-up stock selection process, contributed to relative performance mainly driven by the Fund’s underweight allocation to the Energy sector and overweight to the Financials sector.
Top individual contributors over the period were overweight positions in REV Group (Industrials) and Piedmont Office Realty Trust (Real Estate) and an out-of-benchmark position in InterDigital (Information Technology).
Top Detractors to Performance
Security selection detracted from relative results during the period, driven by weak selection within the Healthcare, Materials, and Consumer Staples sectors.
Underweight allocations to the Real Estate and Materials sectors detracted from relative performance.
The largest individual detractors over the period were overweight positions in Helen of Troy (Consumer Discretionary), Veradigm (Information Technology) and Pacira Biosciences (Healthcare).
The views expressed in this section reflect the opinions of the Fund's sub-adviser, Wellington Management Company LLP, as of the date of this report and are subject to change based on changes in market, economic or other conditions. These views are not intended to be a forecast of future events and are no guarantee of future results.
Comparison of Change in Value of $ 1,000,000 Investment
The graph below represents the hypothetical growth of a $1,000,000 investment in Class F shares and the comparative indices.
Average Annual Total Returns
For the Periods Ended October 31, 2024 | 1 Year | 5 Years | 10 Years |
| Class F | 32.23% | 10.34% | 7.77% |
| Russell 2000 Value Index | 31.77% | 8.42% | 7.33% |
| Russell 3000 Index | 37.86% | 14.60% | 12.44% |
Class F shares commenced operations on February 28, 2017. Performance for Class F shares prior to February 28, 2017 reflects the performance of the Fund's Class I shares from March 31, 2015 through February 27, 2017 and the Fund's Class A shares (excluding sales charges) prior to March 31, 2015. Performance prior to the inception date of the class has not been adjusted to reflect the operating expenses of the class.
Performance for the Fund prior to November 1, 2018 reflects when the Fund pursued different strategies.
The Russell 2000 Value Index serves as the Fund’s performance index because the Fund’s investment manager believes it is more representative of the Fund’s investment strategy. The Russell 3000 Index serves as the Fund’s regulatory index and provides a broad measure of market performance.
The Fund’s past performance is not a good predictor of the Fund’s future performance. The graph and table do not reflect the deduction of taxes that a shareholder would pay on Fund distributions or redemption of Fund shares. Performance information reflects fee waivers and/or expense limitation arrangements, if any. Absent any applicable fee waivers and/or expense limitation arrangements, performance would have been lower. Visit hartfordfunds.com for the most recent performance information.
Key Fund Statistics as of October 31, 2024
| Fund's net assets | $124,682,872% |
| Total number of portfolio holdings (excluding derivatives, if any) | $67% |
| Total investment management fees paid | $836,971% |
| Portfolio turnover rate | $46% |
Graphical Representation of Holdings as of October 31, 2024
The table below shows the investment makeup of the Fund, representing the percentage of net assets of the Fund.
| Financials | 38.1 | % |
| Consumer Discretionary | 17.6 | % |
| Industrials | 11.3 | % |
| Information Technology | 9.0 | % |
| Health Care | 7.2 | % |
| Energy | 3.1 | % |
| Utilities | 3.1 | % |
| Real Estate | 3.0 | % |
| Consumer Staples | 2.8 | % |
| Materials | 2.8 | % |
| Communication Services | 1.9 | % |
| Short-Term Investments | 0.1 | % |
| Other Assets & Liabilities | 0.0 | %† |
| Total | 100.0 | % |
* | For Fund compliance purposes, the Fund may not use the same classification system. These classifications are used for financial reporting purposes. |
† | Percentage rounds to zero. |
Availability of Additional Information
For additional information about the Fund, including its prospectus, financial information, holdings, and proxy voting information, please visit the Fund’s website at the website address included at the beginning of this report.
The Fund is distributed by Hartford Funds Distributors, LLC (HFD).
Annual Shareholder Report
October 31, 2024
The Hartford Small Company Fund
Class A/IHSAX
This annual shareholder report contains important information about The Hartford Small Company Fund (the "Fund") for the period of November 1, 2023 to October 31, 2024. You can find additional information about the Fund at hartfordfunds.com/reports-hmf. You can also request this information by contacting us by calling 1‑888‑843‑7824.
What were the Fund costs for the last year?
(Based on a hypothetical $10,000 investment)
| Class Name | Costs of a $10,000 investment | Costs paid as a percentage
of a $10,000 investment |
| Class A | $151 | 1.29% |
Costs paid excludes fees and expenses incurred indirectly as a result of investments in other investment companies.
How did the Fund perform last year and what impacted its performance?
Management's Discussion of Fund Performance
United States (U.S.) equities, as measured by the S&P 500 Index, rose over the trailing twelve-month period ending October 31, 2024, with the S&P 500 Index surging to a record high that was driven by performance in a select group of mega-cap technology companies. The U.S. Federal Reserve (Fed) began easing monetary policy with an interest-rate cut of 50 basis points in September 2024 in an effort to generate a soft landing for the economy. Markets were also kept on edge in the third quarter of 2024 due to the expected close presidential race between Vice President Kamala Harris and former President Donald Trump. Fund performance described below is relative to the Fund’s performance index, the Russell 2000 Growth Index, for the trailing twelve-month period ended October 31, 2024.
Top Contributors to Performance
Security selection within the Energy, Healthcare, and Financials sectors contributed positively to relative performance.
Not holding securities in the Utilities sector, an underweight allocation to the Materials sector and an overweight to the Industrials sector contributed to relative performance.
Top individual contributors over the period were an overweight position in PROCEPT BioRobotics (Healthcare) and out-of-benchmark positions in Viper Energy (Energy) and Wingstop (Consumer Discretionary).
Top Detractors to Performance
Sector allocation, a result of the team’s bottom-up stock selection process, detracted from relative performance mainly driven by the Fund’s overweight to the Energy sector and underweight allocations to the Information Technology and Consumer Staples sectors.
Security selection within Information Technology, Communication Services, and Consumer Discretionary detracted from relative results during the period.
The largest individual detractors over the period were not holding Super Micro Computer (Information Technology), an overweight position in Eventbrite (Communication Services), and an out-of-benchmark position in DoubleVerify Holdings (Information Technology).
The views expressed in this section reflect the opinions of the Fund's sub-adviser, Wellington Management Company LLP, as of the date of this report and are subject to change based on changes in market, economic or other conditions. These views are not intended to be a forecast of future events and are no guarantee of future results.
Comparison of Change in Value of $ 10,000 Investment
The graph below represents the hypothetical growth of a $10,000 investment in Class A shares and the comparative indices. The returns for Class A shares include the maximum front-end sales charge applicable to Class A shares.
Average Annual Total Returns
For the Periods Ended October 31, 2024 | 1 Year | 5 Years | 10 Years |
| Class A (with 5.50% maximum front-end sales charge) | 26.11% | 6.94% | 7.11% |
| Class A (without 5.50% maximum front-end sales charge) | 33.45% | 8.15% | 7.72% |
| Russell 2000 Growth Index | 36.49% | 7.92% | 8.15% |
| Russell 3000 Index | 37.86% | 14.60% | 12.44% |
The Russell 2000 Growth Index serves as the Fund’s performance index because the Fund’s investment manager believes it is more representative of the Fund’s investment strategy. The Russell 3000 Index serves as the Fund’s regulatory index and provides a broad measure of market performance.
The Fund’s past performance is not a good predictor of the Fund’s future performance. The graph and table do not reflect the deduction of taxes that a shareholder would pay on Fund distributions or redemption of Fund shares. Performance information reflects fee waivers and/or expense limitation arrangements, if any. Absent any applicable fee waivers and/or expense limitation arrangements, performance would have been lower. Visit hartfordfunds.com for the most recent performance information.
Key Fund Statistics as of October 31, 2024
| Fund's net assets | $645,935,232% |
| Total number of portfolio holdings (excluding derivatives, if any) | $113% |
| Total investment management fees paid | $5,142,443% |
| Portfolio turnover rate | $37% |
Graphical Representation of Holdings as of October 31, 2024
The table below shows the investment makeup of the Fund, representing the percentage of net assets of the Fund.
| Health Care | 28.3 | % |
| Industrials | 26.4 | % |
| Information Technology | 15.7 | % |
| Consumer Discretionary | 8.8 | % |
| Financials | 7.4 | % |
| Energy | 4.0 | % |
| Real Estate | 3.2 | % |
| Materials | 2.6 | % |
| Communication Services | 2.5 | % |
| Consumer Staples | 1.1 | % |
| Short-Term Investments | 0.6 | % |
| Other Assets & Liabilities | (0.6 | )% |
| Total | 100.0 | % |
* | For Fund compliance purposes, the Fund may not use the same classification system. These classifications are used for financial reporting purposes. |
Availability of Additional Information
For additional information about the Fund, including its prospectus, financial information, holdings, and proxy voting information, please visit the Fund’s website at the website address included at the beginning of this report.
The Fund is distributed by Hartford Funds Distributors, LLC (HFD).
Annual Shareholder Report
October 31, 2024
The Hartford Small Company Fund
Class C/HSMCX
This annual shareholder report contains important information about The Hartford Small Company Fund (the "Fund") for the period of November 1, 2023 to October 31, 2024. You can find additional information about the Fund at hartfordfunds.com/reports-hmf. You can also request this information by contacting us by calling 1‑888‑843‑7824.
What were the Fund costs for the last year?
(Based on a hypothetical $10,000 investment)
| Class Name | Costs of a $10,000 investment | Costs paid as a percentage
of a $10,000 investment |
| Class C | $251 | 2.16% |
Costs paid excludes fees and expenses incurred indirectly as a result of investments in other investment companies.
How did the Fund perform last year and what impacted its performance?
Management's Discussion of Fund Performance
United States (U.S.) equities, as measured by the S&P 500 Index, rose over the trailing twelve-month period ending October 31, 2024, with the S&P 500 Index surging to a record high that was driven by performance in a select group of mega-cap technology companies. The U.S. Federal Reserve (Fed) began easing monetary policy with an interest-rate cut of 50 basis points in September 2024 in an effort to generate a soft landing for the economy. Markets were also kept on edge in the third quarter of 2024 due to the expected close presidential race between Vice President Kamala Harris and former President Donald Trump. Fund performance described below is relative to the Fund’s performance index, the Russell 2000 Growth Index, for the trailing twelve-month period ended October 31, 2024.
Top Contributors to Performance
Security selection within the Energy, Healthcare, and Financials sectors contributed positively to relative performance.
Not holding securities in the Utilities sector, an underweight allocation to the Materials sector and an overweight to the Industrials sector contributed to relative performance.
Top individual contributors over the period were an overweight position in PROCEPT BioRobotics (Healthcare) and out-of-benchmark positions in Viper Energy (Energy) and Wingstop (Consumer Discretionary).
Top Detractors to Performance
Sector allocation, a result of the team’s bottom-up stock selection process, detracted from relative performance mainly driven by the Fund’s overweight to the Energy sector and underweight allocations to the Information Technology and Consumer Staples sectors.
Security selection within Information Technology, Communication Services, and Consumer Discretionary detracted from relative results during the period.
The largest individual detractors over the period were not holding Super Micro Computer (Information Technology), an overweight position in Eventbrite (Communication Services), and an out-of-benchmark position in DoubleVerify Holdings (Information Technology).
The views expressed in this section reflect the opinions of the Fund's sub-adviser, Wellington Management Company LLP, as of the date of this report and are subject to change based on changes in market, economic or other conditions. These views are not intended to be a forecast of future events and are no guarantee of future results.
Comparison of Change in Value of $ 10,000 Investment
The graph below represents the hypothetical growth of a $10,000 investment in Class C shares (excluding sales charges) and the comparative indices. If sales charges had been included, the value would have been lower.
Average Annual Total Returns
For the Periods Ended October 31, 2024 | 1 Year | 5 Years | 10 Years |
| Class C (with 1.00% contingent deferred sales charge) | 31.30% | 7.26% | 6.88% |
| Class C (without 1.00% contingent deferred sales charge) | 32.30% | 7.26% | 6.88% |
| Russell 2000 Growth Index | 36.49% | 7.92% | 8.15% |
| Russell 3000 Index | 37.86% | 14.60% | 12.44% |
The Russell 2000 Growth Index serves as the Fund’s performance index because the Fund’s investment manager believes it is more representative of the Fund’s investment strategy. The Russell 3000 Index serves as the Fund’s regulatory index and provides a broad measure of market performance.
The Fund’s past performance is not a good predictor of the Fund’s future performance. The graph and table do not reflect the deduction of taxes that a shareholder would pay on Fund distributions or redemption of Fund shares. Performance information reflects fee waivers and/or expense limitation arrangements, if any. Absent any applicable fee waivers and/or expense limitation arrangements, performance would have been lower. Visit hartfordfunds.com for the most recent performance information.
Key Fund Statistics as of October 31, 2024
| Fund's net assets | $645,935,232% |
| Total number of portfolio holdings (excluding derivatives, if any) | $113% |
| Total investment management fees paid | $5,142,443% |
| Portfolio turnover rate | $37% |
Graphical Representation of Holdings as of October 31, 2024
The table below shows the investment makeup of the Fund, representing the percentage of net assets of the Fund.
| Health Care | 28.3 | % |
| Industrials | 26.4 | % |
| Information Technology | 15.7 | % |
| Consumer Discretionary | 8.8 | % |
| Financials | 7.4 | % |
| Energy | 4.0 | % |
| Real Estate | 3.2 | % |
| Materials | 2.6 | % |
| Communication Services | 2.5 | % |
| Consumer Staples | 1.1 | % |
| Short-Term Investments | 0.6 | % |
| Other Assets & Liabilities | (0.6 | )% |
| Total | 100.0 | % |
* | For Fund compliance purposes, the Fund may not use the same classification system. These classifications are used for financial reporting purposes. |
Availability of Additional Information
For additional information about the Fund, including its prospectus, financial information, holdings, and proxy voting information, please visit the Fund’s website at the website address included at the beginning of this report.
The Fund is distributed by Hartford Funds Distributors, LLC (HFD).
Annual Shareholder Report
October 31, 2024
The Hartford Small Company Fund
Class I/IHSIX
This annual shareholder report contains important information about The Hartford Small Company Fund (the "Fund") for the period of November 1, 2023 to October 31, 2024. You can find additional information about the Fund at hartfordfunds.com/reports-hmf. You can also request this information by contacting us by calling 1‑888‑843‑7824.
What were the Fund costs for the last year?
(Based on a hypothetical $10,000 investment)
| Class Name | Costs of a $10,000 investment | Costs paid as a percentage
of a $10,000 investment |
| Class I | $115 | 0.98% |
Costs paid excludes fees and expenses incurred indirectly as a result of investments in other investment companies.
How did the Fund perform last year and what impacted its performance?
Management's Discussion of Fund Performance
United States (U.S.) equities, as measured by the S&P 500 Index, rose over the trailing twelve-month period ending October 31, 2024, with the S&P 500 Index surging to a record high that was driven by performance in a select group of mega-cap technology companies. The U.S. Federal Reserve (Fed) began easing monetary policy with an interest-rate cut of 50 basis points in September 2024 in an effort to generate a soft landing for the economy. Markets were also kept on edge in the third quarter of 2024 due to the expected close presidential race between Vice President Kamala Harris and former President Donald Trump. Fund performance described below is relative to the Fund’s performance index, the Russell 2000 Growth Index, for the trailing twelve-month period ended October 31, 2024.
Top Contributors to Performance
Security selection within the Energy, Healthcare, and Financials sectors contributed positively to relative performance.
Not holding securities in the Utilities sector, an underweight allocation to the Materials sector and an overweight to the Industrials sector contributed to relative performance.
Top individual contributors over the period were an overweight position in PROCEPT BioRobotics (Healthcare) and out-of-benchmark positions in Viper Energy (Energy) and Wingstop (Consumer Discretionary).
Top Detractors to Performance
Sector allocation, a result of the team’s bottom-up stock selection process, detracted from relative performance mainly driven by the Fund’s overweight to the Energy sector and underweight allocations to the Information Technology and Consumer Staples sectors.
Security selection within Information Technology, Communication Services, and Consumer Discretionary detracted from relative results during the period.
The largest individual detractors over the period were not holding Super Micro Computer (Information Technology), an overweight position in Eventbrite (Communication Services), and an out-of-benchmark position in DoubleVerify Holdings (Information Technology).
The views expressed in this section reflect the opinions of the Fund's sub-adviser, Wellington Management Company LLP, as of the date of this report and are subject to change based on changes in market, economic or other conditions. These views are not intended to be a forecast of future events and are no guarantee of future results.
Comparison of Change in Value of $ 10,000 Investment
The graph below represents the hypothetical growth of a $10,000 investment in Class I shares and the comparative indices.
Average Annual Total Returns
For the Periods Ended October 31, 2024 | 1 Year | 5 Years | 10 Years |
| Class I | 33.90% | 8.47% | 8.02% |
| Russell 2000 Growth Index | 36.49% | 7.92% | 8.15% |
| Russell 3000 Index | 37.86% | 14.60% | 12.44% |
The Russell 2000 Growth Index serves as the Fund’s performance index because the Fund’s investment manager believes it is more representative of the Fund’s investment strategy. The Russell 3000 Index serves as the Fund’s regulatory index and provides a broad measure of market performance.
The Fund’s past performance is not a good predictor of the Fund’s future performance. The graph and table do not reflect the deduction of taxes that a shareholder would pay on Fund distributions or redemption of Fund shares. Performance information reflects fee waivers and/or expense limitation arrangements, if any. Absent any applicable fee waivers and/or expense limitation arrangements, performance would have been lower. Visit hartfordfunds.com for the most recent performance information.
Key Fund Statistics as of October 31, 2024
| Fund's net assets | $645,935,232% |
| Total number of portfolio holdings (excluding derivatives, if any) | $113% |
| Total investment management fees paid | $5,142,443% |
| Portfolio turnover rate | $37% |
Graphical Representation of Holdings as of October 31, 2024
The table below shows the investment makeup of the Fund, representing the percentage of net assets of the Fund.
| Health Care | 28.3 | % |
| Industrials | 26.4 | % |
| Information Technology | 15.7 | % |
| Consumer Discretionary | 8.8 | % |
| Financials | 7.4 | % |
| Energy | 4.0 | % |
| Real Estate | 3.2 | % |
| Materials | 2.6 | % |
| Communication Services | 2.5 | % |
| Consumer Staples | 1.1 | % |
| Short-Term Investments | 0.6 | % |
| Other Assets & Liabilities | (0.6 | )% |
| Total | 100.0 | % |
* | For Fund compliance purposes, the Fund may not use the same classification system. These classifications are used for financial reporting purposes. |
Availability of Additional Information
For additional information about the Fund, including its prospectus, financial information, holdings, and proxy voting information, please visit the Fund’s website at the website address included at the beginning of this report.
The Fund is distributed by Hartford Funds Distributors, LLC (HFD).
Annual Shareholder Report
October 31, 2024
The Hartford Small Company Fund
Class R3/IHSRX
This annual shareholder report contains important information about The Hartford Small Company Fund (the "Fund") for the period of November 1, 2023 to October 31, 2024. You can find additional information about the Fund at hartfordfunds.com/reports-hmf. You can also request this information by contacting us by calling 1‑888‑843‑7824.
What were the Fund costs for the last year?
(Based on a hypothetical $10,000 investment)
| Class Name | Costs of a $10,000 investment | Costs paid as a percentage
of a $10,000 investment |
| Class R3 | $186 | 1.60% |
Costs paid excludes fees and expenses incurred indirectly as a result of investments in other investment companies.
How did the Fund perform last year and what impacted its performance?
Management's Discussion of Fund Performance
United States (U.S.) equities, as measured by the S&P 500 Index, rose over the trailing twelve-month period ending October 31, 2024, with the S&P 500 Index surging to a record high that was driven by performance in a select group of mega-cap technology companies. The U.S. Federal Reserve (Fed) began easing monetary policy with an interest-rate cut of 50 basis points in September 2024 in an effort to generate a soft landing for the economy. Markets were also kept on edge in the third quarter of 2024 due to the expected close presidential race between Vice President Kamala Harris and former President Donald Trump. Fund performance described below is relative to the Fund’s performance index, the Russell 2000 Growth Index, for the trailing twelve-month period ended October 31, 2024.
Top Contributors to Performance
Security selection within the Energy, Healthcare, and Financials sectors contributed positively to relative performance.
Not holding securities in the Utilities sector, an underweight allocation to the Materials sector and an overweight to the Industrials sector contributed to relative performance.
Top individual contributors over the period were an overweight position in PROCEPT BioRobotics (Healthcare) and out-of-benchmark positions in Viper Energy (Energy) and Wingstop (Consumer Discretionary).
Top Detractors to Performance
Sector allocation, a result of the team’s bottom-up stock selection process, detracted from relative performance mainly driven by the Fund’s overweight to the Energy sector and underweight allocations to the Information Technology and Consumer Staples sectors.
Security selection within Information Technology, Communication Services, and Consumer Discretionary detracted from relative results during the period.
The largest individual detractors over the period were not holding Super Micro Computer (Information Technology), an overweight position in Eventbrite (Communication Services), and an out-of-benchmark position in DoubleVerify Holdings (Information Technology).
The views expressed in this section reflect the opinions of the Fund's sub-adviser, Wellington Management Company LLP, as of the date of this report and are subject to change based on changes in market, economic or other conditions. These views are not intended to be a forecast of future events and are no guarantee of future results.
Comparison of Change in Value of $ 10,000 Investment
The graph below represents the hypothetical growth of a $10,000 investment in Class R3 shares and the comparative indices.
Average Annual Total Returns
For the Periods Ended October 31, 2024 | 1 Year | 5 Years | 10 Years |
| Class R3 | 33.10% | 7.83% | 7.45% |
| Russell 2000 Growth Index | 36.49% | 7.92% | 8.15% |
| Russell 3000 Index | 37.86% | 14.60% | 12.44% |
The Russell 2000 Growth Index serves as the Fund’s performance index because the Fund’s investment manager believes it is more representative of the Fund’s investment strategy. The Russell 3000 Index serves as the Fund’s regulatory index and provides a broad measure of market performance.
The Fund’s past performance is not a good predictor of the Fund’s future performance. The graph and table do not reflect the deduction of taxes that a shareholder would pay on Fund distributions or redemption of Fund shares. Performance information reflects fee waivers and/or expense limitation arrangements, if any. Absent any applicable fee waivers and/or expense limitation arrangements, performance would have been lower. Visit hartfordfunds.com for the most recent performance information.
Key Fund Statistics as of October 31, 2024
| Fund's net assets | $645,935,232% |
| Total number of portfolio holdings (excluding derivatives, if any) | $113% |
| Total investment management fees paid | $5,142,443% |
| Portfolio turnover rate | $37% |
Graphical Representation of Holdings as of October 31, 2024
The table below shows the investment makeup of the Fund, representing the percentage of net assets of the Fund.
| Health Care | 28.3 | % |
| Industrials | 26.4 | % |
| Information Technology | 15.7 | % |
| Consumer Discretionary | 8.8 | % |
| Financials | 7.4 | % |
| Energy | 4.0 | % |
| Real Estate | 3.2 | % |
| Materials | 2.6 | % |
| Communication Services | 2.5 | % |
| Consumer Staples | 1.1 | % |
| Short-Term Investments | 0.6 | % |
| Other Assets & Liabilities | (0.6 | )% |
| Total | 100.0 | % |
* | For Fund compliance purposes, the Fund may not use the same classification system. These classifications are used for financial reporting purposes. |
Availability of Additional Information
For additional information about the Fund, including its prospectus, financial information, holdings, and proxy voting information, please visit the Fund’s website at the website address included at the beginning of this report.
The Fund is distributed by Hartford Funds Distributors, LLC (HFD).
Annual Shareholder Report
October 31, 2024
The Hartford Small Company Fund
Class R4/IHSSX
This annual shareholder report contains important information about The Hartford Small Company Fund (the "Fund") for the period of November 1, 2023 to October 31, 2024. You can find additional information about the Fund at hartfordfunds.com/reports-hmf. You can also request this information by contacting us by calling 1‑888‑843‑7824.
What were the Fund costs for the last year?
(Based on a hypothetical $10,000 investment)
| Class Name | Costs of a $10,000 investment | Costs paid as a percentage
of a $10,000 investment |
| Class R4 | $151 | 1.29% |
Costs paid excludes fees and expenses incurred indirectly as a result of investments in other investment companies.
How did the Fund perform last year and what impacted its performance?
Management's Discussion of Fund Performance
United States (U.S.) equities, as measured by the S&P 500 Index, rose over the trailing twelve-month period ending October 31, 2024, with the S&P 500 Index surging to a record high that was driven by performance in a select group of mega-cap technology companies. The U.S. Federal Reserve (Fed) began easing monetary policy with an interest-rate cut of 50 basis points in September 2024 in an effort to generate a soft landing for the economy. Markets were also kept on edge in the third quarter of 2024 due to the expected close presidential race between Vice President Kamala Harris and former President Donald Trump. Fund performance described below is relative to the Fund’s performance index, the Russell 2000 Growth Index, for the trailing twelve-month period ended October 31, 2024.
Top Contributors to Performance
Security selection within the Energy, Healthcare, and Financials sectors contributed positively to relative performance.
Not holding securities in the Utilities sector, an underweight allocation to the Materials sector and an overweight to the Industrials sector contributed to relative performance.
Top individual contributors over the period were an overweight position in PROCEPT BioRobotics (Healthcare) and out-of-benchmark positions in Viper Energy (Energy) and Wingstop (Consumer Discretionary).
Top Detractors to Performance
Sector allocation, a result of the team’s bottom-up stock selection process, detracted from relative performance mainly driven by the Fund’s overweight to the Energy sector and underweight allocations to the Information Technology and Consumer Staples sectors.
Security selection within Information Technology, Communication Services, and Consumer Discretionary detracted from relative results during the period.
The largest individual detractors over the period were not holding Super Micro Computer (Information Technology), an overweight position in Eventbrite (Communication Services), and an out-of-benchmark position in DoubleVerify Holdings (Information Technology).
The views expressed in this section reflect the opinions of the Fund's sub-adviser, Wellington Management Company LLP, as of the date of this report and are subject to change based on changes in market, economic or other conditions. These views are not intended to be a forecast of future events and are no guarantee of future results.
Comparison of Change in Value of $ 10,000 Investment
The graph below represents the hypothetical growth of a $10,000 investment in Class R4 shares and the comparative indices.
Average Annual Total Returns
For the Periods Ended October 31, 2024 | 1 Year | 5 Years | 10 Years |
| Class R4 | 33.49% | 8.16% | 7.78% |
| Russell 2000 Growth Index | 36.49% | 7.92% | 8.15% |
| Russell 3000 Index | 37.86% | 14.60% | 12.44% |
The Russell 2000 Growth Index serves as the Fund’s performance index because the Fund’s investment manager believes it is more representative of the Fund’s investment strategy. The Russell 3000 Index serves as the Fund’s regulatory index and provides a broad measure of market performance.
The Fund’s past performance is not a good predictor of the Fund’s future performance. The graph and table do not reflect the deduction of taxes that a shareholder would pay on Fund distributions or redemption of Fund shares. Performance information reflects fee waivers and/or expense limitation arrangements, if any. Absent any applicable fee waivers and/or expense limitation arrangements, performance would have been lower. Visit hartfordfunds.com for the most recent performance information.
Key Fund Statistics as of October 31, 2024
| Fund's net assets | $645,935,232% |
| Total number of portfolio holdings (excluding derivatives, if any) | $113% |
| Total investment management fees paid | $5,142,443% |
| Portfolio turnover rate | $37% |
Graphical Representation of Holdings as of October 31, 2024
The table below shows the investment makeup of the Fund, representing the percentage of net assets of the Fund.
| Health Care | 28.3 | % |
| Industrials | 26.4 | % |
| Information Technology | 15.7 | % |
| Consumer Discretionary | 8.8 | % |
| Financials | 7.4 | % |
| Energy | 4.0 | % |
| Real Estate | 3.2 | % |
| Materials | 2.6 | % |
| Communication Services | 2.5 | % |
| Consumer Staples | 1.1 | % |
| Short-Term Investments | 0.6 | % |
| Other Assets & Liabilities | (0.6 | )% |
| Total | 100.0 | % |
* | For Fund compliance purposes, the Fund may not use the same classification system. These classifications are used for financial reporting purposes. |
Availability of Additional Information
For additional information about the Fund, including its prospectus, financial information, holdings, and proxy voting information, please visit the Fund’s website at the website address included at the beginning of this report.
The Fund is distributed by Hartford Funds Distributors, LLC (HFD).
Annual Shareholder Report
October 31, 2024
The Hartford Small Company Fund
Class R5/IHSUX
This annual shareholder report contains important information about The Hartford Small Company Fund (the "Fund") for the period of November 1, 2023 to October 31, 2024. You can find additional information about the Fund at hartfordfunds.com/reports-hmf. You can also request this information by contacting us by calling 1‑888‑843‑7824.
What were the Fund costs for the last year?
(Based on a hypothetical $10,000 investment)
| Class Name | Costs of a $10,000 investment | Costs paid as a percentage
of a $10,000 investment |
| Class R5 | $117 | 1.00% |
Costs paid excludes fees and expenses incurred indirectly as a result of investments in other investment companies.
How did the Fund perform last year and what impacted its performance?
Management's Discussion of Fund Performance
United States (U.S.) equities, as measured by the S&P 500 Index, rose over the trailing twelve-month period ending October 31, 2024, with the S&P 500 Index surging to a record high that was driven by performance in a select group of mega-cap technology companies. The U.S. Federal Reserve (Fed) began easing monetary policy with an interest-rate cut of 50 basis points in September 2024 in an effort to generate a soft landing for the economy. Markets were also kept on edge in the third quarter of 2024 due to the expected close presidential race between Vice President Kamala Harris and former President Donald Trump. Fund performance described below is relative to the Fund’s performance index, the Russell 2000 Growth Index, for the trailing twelve-month period ended October 31, 2024.
Top Contributors to Performance
Security selection within the Energy, Healthcare, and Financials sectors contributed positively to relative performance.
Not holding securities in the Utilities sector, an underweight allocation to the Materials sector and an overweight to the Industrials sector contributed to relative performance.
Top individual contributors over the period were an overweight position in PROCEPT BioRobotics (Healthcare) and out-of-benchmark positions in Viper Energy (Energy) and Wingstop (Consumer Discretionary).
Top Detractors to Performance
Sector allocation, a result of the team’s bottom-up stock selection process, detracted from relative performance mainly driven by the Fund’s overweight to the Energy sector and underweight allocations to the Information Technology and Consumer Staples sectors.
Security selection within Information Technology, Communication Services, and Consumer Discretionary detracted from relative results during the period.
The largest individual detractors over the period were not holding Super Micro Computer (Information Technology), an overweight position in Eventbrite (Communication Services), and an out-of-benchmark position in DoubleVerify Holdings (Information Technology).
The views expressed in this section reflect the opinions of the Fund's sub-adviser, Wellington Management Company LLP, as of the date of this report and are subject to change based on changes in market, economic or other conditions. These views are not intended to be a forecast of future events and are no guarantee of future results.
Comparison of Change in Value of $ 10,000 Investment
The graph below represents the hypothetical growth of a $10,000 investment in Class R5 shares and the comparative indices.
Average Annual Total Returns
For the Periods Ended October 31, 2024 | 1 Year | 5 Years | 10 Years |
| Class R5 | 33.86% | 8.48% | 8.10% |
| Russell 2000 Growth Index | 36.49% | 7.92% | 8.15% |
| Russell 3000 Index | 37.86% | 14.60% | 12.44% |
The Russell 2000 Growth Index serves as the Fund’s performance index because the Fund’s investment manager believes it is more representative of the Fund’s investment strategy. The Russell 3000 Index serves as the Fund’s regulatory index and provides a broad measure of market performance.
The Fund’s past performance is not a good predictor of the Fund’s future performance. The graph and table do not reflect the deduction of taxes that a shareholder would pay on Fund distributions or redemption of Fund shares. Performance information reflects fee waivers and/or expense limitation arrangements, if any. Absent any applicable fee waivers and/or expense limitation arrangements, performance would have been lower. Visit hartfordfunds.com for the most recent performance information.
Key Fund Statistics as of October 31, 2024
| Fund's net assets | $645,935,232% |
| Total number of portfolio holdings (excluding derivatives, if any) | $113% |
| Total investment management fees paid | $5,142,443% |
| Portfolio turnover rate | $37% |
Graphical Representation of Holdings as of October 31, 2024
The table below shows the investment makeup of the Fund, representing the percentage of net assets of the Fund.
| Health Care | 28.3 | % |
| Industrials | 26.4 | % |
| Information Technology | 15.7 | % |
| Consumer Discretionary | 8.8 | % |
| Financials | 7.4 | % |
| Energy | 4.0 | % |
| Real Estate | 3.2 | % |
| Materials | 2.6 | % |
| Communication Services | 2.5 | % |
| Consumer Staples | 1.1 | % |
| Short-Term Investments | 0.6 | % |
| Other Assets & Liabilities | (0.6 | )% |
| Total | 100.0 | % |
* | For Fund compliance purposes, the Fund may not use the same classification system. These classifications are used for financial reporting purposes. |
Availability of Additional Information
For additional information about the Fund, including its prospectus, financial information, holdings, and proxy voting information, please visit the Fund’s website at the website address included at the beginning of this report.
The Fund is distributed by Hartford Funds Distributors, LLC (HFD).
Annual Shareholder Report
October 31, 2024
The Hartford Small Company Fund
Class R6/IHSVX
This annual shareholder report contains important information about The Hartford Small Company Fund (the "Fund") for the period of November 1, 2023 to October 31, 2024. You can find additional information about the Fund at hartfordfunds.com/reports-hmf. You can also request this information by contacting us by calling 1‑888‑843‑7824.
What were the Fund costs for the last year?
(Based on a hypothetical $10,000 investment)
| Class Name | Costs of a $10,000 investment | Costs paid as a percentage
of a $10,000 investment |
| Class R6 | $103 | 0.88% |
Costs paid excludes fees and expenses incurred indirectly as a result of investments in other investment companies.
How did the Fund perform last year and what impacted its performance?
Management's Discussion of Fund Performance
United States (U.S.) equities, as measured by the S&P 500 Index, rose over the trailing twelve-month period ending October 31, 2024, with the S&P 500 Index surging to a record high that was driven by performance in a select group of mega-cap technology companies. The U.S. Federal Reserve (Fed) began easing monetary policy with an interest-rate cut of 50 basis points in September 2024 in an effort to generate a soft landing for the economy. Markets were also kept on edge in the third quarter of 2024 due to the expected close presidential race between Vice President Kamala Harris and former President Donald Trump. Fund performance described below is relative to the Fund’s performance index, the Russell 2000 Growth Index, for the trailing twelve-month period ended October 31, 2024.
Top Contributors to Performance
Security selection within the Energy, Healthcare, and Financials sectors contributed positively to relative performance.
Not holding securities in the Utilities sector, an underweight allocation to the Materials sector and an overweight to the Industrials sector contributed to relative performance.
Top individual contributors over the period were an overweight position in PROCEPT BioRobotics (Healthcare) and out-of-benchmark positions in Viper Energy (Energy) and Wingstop (Consumer Discretionary).
Top Detractors to Performance
Sector allocation, a result of the team’s bottom-up stock selection process, detracted from relative performance mainly driven by the Fund’s overweight to the Energy sector and underweight allocations to the Information Technology and Consumer Staples sectors.
Security selection within Information Technology, Communication Services, and Consumer Discretionary detracted from relative results during the period.
The largest individual detractors over the period were not holding Super Micro Computer (Information Technology), an overweight position in Eventbrite (Communication Services), and an out-of-benchmark position in DoubleVerify Holdings (Information Technology).
The views expressed in this section reflect the opinions of the Fund's sub-adviser, Wellington Management Company LLP, as of the date of this report and are subject to change based on changes in market, economic or other conditions. These views are not intended to be a forecast of future events and are no guarantee of future results.
Comparison of Change in Value of $ 10,000 Investment
The graph below represents the hypothetical growth of a $10,000 investment in Class R6 shares and the comparative indices.
Average Annual Total Returns
For the Periods Ended October 31, 2024 | 1 Year | 5 Years | 10 Years |
| Class R6 | 34.05% | 8.60% | 8.20% |
| Russell 2000 Growth Index | 36.49% | 7.92% | 8.15% |
| Russell 3000 Index | 37.86% | 14.60% | 12.44% |
Class R6 shares commenced operations on November 7, 2014 and performance prior to that date is that of the Fund's Class Y shares. Performance prior to the inception date of the class has not been adjusted to reflect the operating expenses of the class.
The Russell 2000 Growth Index serves as the Fund’s performance index because the Fund’s investment manager believes it is more representative of the Fund’s investment strategy. The Russell 3000 Index serves as the Fund’s regulatory index and provides a broad measure of market performance.
The Fund’s past performance is not a good predictor of the Fund’s future performance. The graph and table do not reflect the deduction of taxes that a shareholder would pay on Fund distributions or redemption of Fund shares. Performance information reflects fee waivers and/or expense limitation arrangements, if any. Absent any applicable fee waivers and/or expense limitation arrangements, performance would have been lower. Visit hartfordfunds.com for the most recent performance information.
Key Fund Statistics as of October 31, 2024
| Fund's net assets | $645,935,232% |
| Total number of portfolio holdings (excluding derivatives, if any) | $113% |
| Total investment management fees paid | $5,142,443% |
| Portfolio turnover rate | $37% |
Graphical Representation of Holdings as of October 31, 2024
The table below shows the investment makeup of the Fund, representing the percentage of net assets of the Fund.
| Health Care | 28.3 | % |
| Industrials | 26.4 | % |
| Information Technology | 15.7 | % |
| Consumer Discretionary | 8.8 | % |
| Financials | 7.4 | % |
| Energy | 4.0 | % |
| Real Estate | 3.2 | % |
| Materials | 2.6 | % |
| Communication Services | 2.5 | % |
| Consumer Staples | 1.1 | % |
| Short-Term Investments | 0.6 | % |
| Other Assets & Liabilities | (0.6 | )% |
| Total | 100.0 | % |
* | For Fund compliance purposes, the Fund may not use the same classification system. These classifications are used for financial reporting purposes. |
Availability of Additional Information
For additional information about the Fund, including its prospectus, financial information, holdings, and proxy voting information, please visit the Fund’s website at the website address included at the beginning of this report.
The Fund is distributed by Hartford Funds Distributors, LLC (HFD).
Annual Shareholder Report
October 31, 2024
The Hartford Small Company Fund
Class Y/HSCYX
This annual shareholder report contains important information about The Hartford Small Company Fund (the "Fund") for the period of November 1, 2023 to October 31, 2024. You can find additional information about the Fund at hartfordfunds.com/reports-hmf. You can also request this information by contacting us by calling 1‑888‑843‑7824.
What were the Fund costs for the last year?
(Based on a hypothetical $10,000 investment)
| Class Name | Costs of a $10,000 investment | Costs paid as a percentage
of a $10,000 investment |
| Class Y | $116 | 0.99% |
Costs paid excludes fees and expenses incurred indirectly as a result of investments in other investment companies.
How did the Fund perform last year and what impacted its performance?
Management's Discussion of Fund Performance
United States (U.S.) equities, as measured by the S&P 500 Index, rose over the trailing twelve-month period ending October 31, 2024, with the S&P 500 Index surging to a record high that was driven by performance in a select group of mega-cap technology companies. The U.S. Federal Reserve (Fed) began easing monetary policy with an interest-rate cut of 50 basis points in September 2024 in an effort to generate a soft landing for the economy. Markets were also kept on edge in the third quarter of 2024 due to the expected close presidential race between Vice President Kamala Harris and former President Donald Trump. Fund performance described below is relative to the Fund’s performance index, the Russell 2000 Growth Index, for the trailing twelve-month period ended October 31, 2024.
Top Contributors to Performance
Security selection within the Energy, Healthcare, and Financials sectors contributed positively to relative performance.
Not holding securities in the Utilities sector, an underweight allocation to the Materials sector and an overweight to the Industrials sector contributed to relative performance.
Top individual contributors over the period were an overweight position in PROCEPT BioRobotics (Healthcare) and out-of-benchmark positions in Viper Energy (Energy) and Wingstop (Consumer Discretionary).
Top Detractors to Performance
Sector allocation, a result of the team’s bottom-up stock selection process, detracted from relative performance mainly driven by the Fund’s overweight to the Energy sector and underweight allocations to the Information Technology and Consumer Staples sectors.
Security selection within Information Technology, Communication Services, and Consumer Discretionary detracted from relative results during the period.
The largest individual detractors over the period were not holding Super Micro Computer (Information Technology), an overweight position in Eventbrite (Communication Services), and an out-of-benchmark position in DoubleVerify Holdings (Information Technology).
The views expressed in this section reflect the opinions of the Fund's sub-adviser, Wellington Management Company LLP, as of the date of this report and are subject to change based on changes in market, economic or other conditions. These views are not intended to be a forecast of future events and are no guarantee of future results.
Comparison of Change in Value of $ 250,000 Investment
The graph below represents the hypothetical growth of a $250,000 investment in Class Y shares and the comparative indices.
Average Annual Total Returns
For the Periods Ended October 31, 2024 | 1 Year | 5 Years | 10 Years |
| Class Y | 33.96% | 8.48% | 8.13% |
| Russell 2000 Growth Index | 36.49% | 7.92% | 8.15% |
| Russell 3000 Index | 37.86% | 14.60% | 12.44% |
The Russell 2000 Growth Index serves as the Fund’s performance index because the Fund’s investment manager believes it is more representative of the Fund’s investment strategy. The Russell 3000 Index serves as the Fund’s regulatory index and provides a broad measure of market performance.
The Fund’s past performance is not a good predictor of the Fund’s future performance. The graph and table do not reflect the deduction of taxes that a shareholder would pay on Fund distributions or redemption of Fund shares. Performance information reflects fee waivers and/or expense limitation arrangements, if any. Absent any applicable fee waivers and/or expense limitation arrangements, performance would have been lower. Visit hartfordfunds.com for the most recent performance information.
Key Fund Statistics as of October 31, 2024
| Fund's net assets | $645,935,232% |
| Total number of portfolio holdings (excluding derivatives, if any) | $113% |
| Total investment management fees paid | $5,142,443% |
| Portfolio turnover rate | $37% |
Graphical Representation of Holdings as of October 31, 2024
The table below shows the investment makeup of the Fund, representing the percentage of net assets of the Fund.
| Health Care | 28.3 | % |
| Industrials | 26.4 | % |
| Information Technology | 15.7 | % |
| Consumer Discretionary | 8.8 | % |
| Financials | 7.4 | % |
| Energy | 4.0 | % |
| Real Estate | 3.2 | % |
| Materials | 2.6 | % |
| Communication Services | 2.5 | % |
| Consumer Staples | 1.1 | % |
| Short-Term Investments | 0.6 | % |
| Other Assets & Liabilities | (0.6 | )% |
| Total | 100.0 | % |
* | For Fund compliance purposes, the Fund may not use the same classification system. These classifications are used for financial reporting purposes. |
Availability of Additional Information
For additional information about the Fund, including its prospectus, financial information, holdings, and proxy voting information, please visit the Fund’s website at the website address included at the beginning of this report.
The Fund is distributed by Hartford Funds Distributors, LLC (HFD).
Annual Shareholder Report
October 31, 2024
The Hartford Small Company Fund
Class F/IHSFX
This annual shareholder report contains important information about The Hartford Small Company Fund (the "Fund") for the period of November 1, 2023 to October 31, 2024. You can find additional information about the Fund at hartfordfunds.com/reports-hmf. You can also request this information by contacting us by calling 1‑888‑843‑7824.
What were the Fund costs for the last year?
(Based on a hypothetical $10,000 investment)
| Class Name | Costs of a $10,000 investment | Costs paid as a percentage
of a $10,000 investment |
| Class F | $103 | 0.88% |
Costs paid excludes fees and expenses incurred indirectly as a result of investments in other investment companies.
How did the Fund perform last year and what impacted its performance?
Management's Discussion of Fund Performance
United States (U.S.) equities, as measured by the S&P 500 Index, rose over the trailing twelve-month period ending October 31, 2024, with the S&P 500 Index surging to a record high that was driven by performance in a select group of mega-cap technology companies. The U.S. Federal Reserve (Fed) began easing monetary policy with an interest-rate cut of 50 basis points in September 2024 in an effort to generate a soft landing for the economy. Markets were also kept on edge in the third quarter of 2024 due to the expected close presidential race between Vice President Kamala Harris and former President Donald Trump. Fund performance described below is relative to the Fund’s performance index, the Russell 2000 Growth Index, for the trailing twelve-month period ended October 31, 2024.
Top Contributors to Performance
Security selection within the Energy, Healthcare, and Financials sectors contributed positively to relative performance.
Not holding securities in the Utilities sector, an underweight allocation to the Materials sector and an overweight to the Industrials sector contributed to relative performance.
Top individual contributors over the period were an overweight position in PROCEPT BioRobotics (Healthcare) and out-of-benchmark positions in Viper Energy (Energy) and Wingstop (Consumer Discretionary).
Top Detractors to Performance
Sector allocation, a result of the team’s bottom-up stock selection process, detracted from relative performance mainly driven by the Fund’s overweight to the Energy sector and underweight allocations to the Information Technology and Consumer Staples sectors.
Security selection within Information Technology, Communication Services, and Consumer Discretionary detracted from relative results during the period.
The largest individual detractors over the period were not holding Super Micro Computer (Information Technology), an overweight position in Eventbrite (Communication Services), and an out-of-benchmark position in DoubleVerify Holdings (Information Technology).
The views expressed in this section reflect the opinions of the Fund's sub-adviser, Wellington Management Company LLP, as of the date of this report and are subject to change based on changes in market, economic or other conditions. These views are not intended to be a forecast of future events and are no guarantee of future results.
Comparison of Change in Value of $ 1,000,000 Investment
The graph below represents the hypothetical growth of a $1,000,000 investment in Class F shares and the comparative indices.
Average Annual Total Returns
For the Periods Ended October 31, 2024 | 1 Year | 5 Years | 10 Years |
| Class F | 34.01% | 8.59% | 8.12% |
| Russell 2000 Growth Index | 36.49% | 7.92% | 8.15% |
| Russell 3000 Index | 37.86% | 14.60% | 12.44% |
Class F shares commenced operations on February 28, 2017 and performance prior to that date is that of the Fund’s Class I shares. Performance prior to the inception date of the class has not been adjusted to reflect the operating expenses of the class.
The Russell 2000 Growth Index serves as the Fund’s performance index because the Fund’s investment manager believes it is more representative of the Fund’s investment strategy. The Russell 3000 Index serves as the Fund’s regulatory index and provides a broad measure of market performance.
The Fund’s past performance is not a good predictor of the Fund’s future performance. The graph and table do not reflect the deduction of taxes that a shareholder would pay on Fund distributions or redemption of Fund shares. Performance information reflects fee waivers and/or expense limitation arrangements, if any. Absent any applicable fee waivers and/or expense limitation arrangements, performance would have been lower. Visit hartfordfunds.com for the most recent performance information.
Key Fund Statistics as of October 31, 2024
| Fund's net assets | $645,935,232% |
| Total number of portfolio holdings (excluding derivatives, if any) | $113% |
| Total investment management fees paid | $5,142,443% |
| Portfolio turnover rate | $37% |
Graphical Representation of Holdings as of October 31, 2024
The table below shows the investment makeup of the Fund, representing the percentage of net assets of the Fund.
| Health Care | 28.3 | % |
| Industrials | 26.4 | % |
| Information Technology | 15.7 | % |
| Consumer Discretionary | 8.8 | % |
| Financials | 7.4 | % |
| Energy | 4.0 | % |
| Real Estate | 3.2 | % |
| Materials | 2.6 | % |
| Communication Services | 2.5 | % |
| Consumer Staples | 1.1 | % |
| Short-Term Investments | 0.6 | % |
| Other Assets & Liabilities | (0.6 | )% |
| Total | 100.0 | % |
* | For Fund compliance purposes, the Fund may not use the same classification system. These classifications are used for financial reporting purposes. |
Availability of Additional Information
For additional information about the Fund, including its prospectus, financial information, holdings, and proxy voting information, please visit the Fund’s website at the website address included at the beginning of this report.
The Fund is distributed by Hartford Funds Distributors, LLC (HFD).
Annual Shareholder Report
October 31, 2024
The Hartford Balanced Income Fund
Class A/HBLAX
This annual shareholder report contains important information about The Hartford Balanced Income Fund (the "Fund") for the period of November 1, 2023 to October 31, 2024. You can find additional information about the Fund at hartfordfunds.com/reports-hmf. You can also request this information by contacting us by calling 1‑888‑843‑7824.
What were the Fund costs for the last year?
(Based on a hypothetical $10,000 investment)
| Class Name | Costs of a $10,000 investment | Costs paid as a percentage
of a $10,000 investment |
| Class A | $96 | 0.88% |
How did the Fund perform last year and what impacted its performance?
Management's Discussion of Fund Performance
United States (U.S.) fixed income sectors generated positive total returns during the trailing twelve-month period ended October 31, 2024 as measured by the Bloomberg US Aggregate Bond Index. U.S. Treasury yields ended broadly lower, geopolitical uncertainty rose in Europe and the Middle East, and major banks’ monetary policy paths diverged. Most spread sectors generated positive excess returns over duration-equivalent government bonds as spreads narrowed, supported by more accommodative central bank policies. Equity markets made significant gains in the twelve-month period ending October 31, 2024. Performance was positive across all sectors, led by Financials and Industrials. Fund performance described below is relative to the Fund’s blended benchmark, 45% Russell 1000 Value Index/ 44% Bloomberg US Corporate Index/ 5.5% JP Morgan Emerging Markets Bond Index Plus/ 5.5% Bloomberg US High Yield - 2% Issuer Cap Index (the "Blended Benchmark"), for the trailing twelve-month period ended October 31, 2024.
Top Contributors to Performance
At the Fund level, the fixed income portion contributed to performance.
The Fund’s security selection in investment grade credit was the primary contributor to benchmark relative returns over the trailing twelve months.
The Fund’s overweight to high yield credit contributed as this sector broadly outperformed duration-equivalent Treasuries during the period.
The Fund’s duration and yield curve positioning was modestly additive to benchmark-relative returns as we employed small, tactical changes to the Fund’s posture during the period.
The Fund’s equity security selection in the Financials and Technology sectors contributed to benchmark-relative returns during the period.
Top Detractors to Performance
At the Fund level, the equity portion detracted from performance.
The primary detractor to relative performance over the period was equity security selection within the Industrials, Real Estate, and Materials sectors.
Sector allocation within equities also detracted from relative performance, particularly the underweight in the Financials and Industrials sectors, and overweight in the Energy sector.
The Fund’s underweight allocation to investment grade credit detracted from benchmark-relative returns as credit spreads tightened over the period.
The Fund’s security selection in high yield credit modestly detracted as the Fund owned higher-quality issuers while over this period, lower-quality high yield companies outperformed their higher-quality counterparts.
The Fund used derivatives, such as currency forwards, interest rate futures, and credit default swap index positions, on a limited basis during the period for risk management purposes and/or to gain exposure to certain markets. Overall, the use of derivatives had a negligible impact on the Fund’s benchmark-relative returns during the period.
The views expressed in this section reflect the opinions of the Fund's sub-adviser, Wellington Management Company LLP, as of the date of this report and are subject to change based on changes in market, economic or other conditions. These views are not intended to be a forecast of future events and are no guarantee of future results.
Comparison of Change in Value of $ 10,000 Investment
The graph below represents the hypothetical growth of a $10,000 investment in Class A shares and the comparative indices. The returns for Class A shares include the maximum front-end sales charge applicable to Class A shares.
Average Annual Total Returns
For the Periods Ended October 31, 2024 | 1 Year | 5 Years | 10 Years |
| Class A (with 5.50% maximum front-end sales charge) | 12.68% | 3.83%) | 5.13% |
| Class A (without 5.50% maximum front-end sales charge) | 19.24% | 5.01%) | 5.72% |
| Blended Benchmark | 21.77% | 5.15%) | 5.65% |
| Russell 1000 Value Index | 30.98% | 10.14%) | 8.87% |
| Bloomberg US Corporate Index | 13.63% | 0.54%) | 2.57% |
| JP Morgan Emerging Markets Bond Index Plus | 20.36% | (1.28)% | 1.31% |
| Bloomberg US High Yield - 2% Issuer Cap Index | 16.47% | 4.53%) | 4.86% |
| Russell 1000 Index | 38.07% | 15.00%) | 12.75% |
The Blended Benchmark serves as the Fund’s performance index because the Fund’s investment manager believes it is more representative of the Fund’s investment strategy. The Blended Benchmark is calculated by Hartford Funds Management Company, LLC. The Russell 1000 Index serves as the Fund’s regulatory index and provides a broad measure of market performance.
The Fund’s past performance is not a good predictor of the Fund’s future performance. The graph and table do not reflect the deduction of taxes that a shareholder would pay on Fund distributions or redemption of Fund shares. Performance information reflects fee waivers and/or expense limitation arrangements, if any. Absent any applicable fee waivers and/or expense limitation arrangements, performance would have been lower. Visit hartfordfunds.com for the most recent performance information.
Key Fund Statistics as of October 31, 2024
| Fund's net assets | $12,406,097,305% |
| Total number of portfolio holdings | $1,537% |
| Total investment management fees paid | $66,230,375% |
| Portfolio turnover rate | $61% |
Graphical Representation of Holdings as of October 31, 2024
The table below shows the investment makeup of the Fund, representing the percentage of net assets of the Fund.
Composition by Security Type
| Corporate Bonds | 46.3 | % |
| Common Stocks | 43.4 | % |
| Foreign Government Obligations | 3.3 | % |
| U.S. Government Securities | 2.4 | % |
| Municipal Bonds | 0.3 | % |
| Convertible Bonds | 0.1 | % |
| Preferred Stocks | 0.1 | % |
| Senior Floating Rate Interests | 0.1 | % |
| Short-Term Investments | 1.4 | % |
| Other Assets & Liabilities | 2.6 | % |
| Total | 100.0 | % |
Availability of Additional Information
For additional information about the Fund, including its prospectus, financial information, holdings, and proxy voting information, please visit the Fund’s website at the website address included at the beginning of this report.
The Fund is distributed by Hartford Funds Distributors, LLC (HFD).
Annual Shareholder Report
October 31, 2024
The Hartford Balanced Income Fund
Class C/HBLCX
This annual shareholder report contains important information about The Hartford Balanced Income Fund (the "Fund") for the period of November 1, 2023 to October 31, 2024. You can find additional information about the Fund at hartfordfunds.com/reports-hmf. You can also request this information by contacting us by calling 1‑888‑843‑7824.
What were the Fund costs for the last year?
(Based on a hypothetical $10,000 investment)
| Class Name | Costs of a $10,000 investment | Costs paid as a percentage
of a $10,000 investment |
| Class C | $179 | 1.64% |
How did the Fund perform last year and what impacted its performance?
Management's Discussion of Fund Performance
United States (U.S.) fixed income sectors generated positive total returns during the trailing twelve-month period ended October 31, 2024 as measured by the Bloomberg US Aggregate Bond Index. U.S. Treasury yields ended broadly lower, geopolitical uncertainty rose in Europe and the Middle East, and major banks’ monetary policy paths diverged. Most spread sectors generated positive excess returns over duration-equivalent government bonds as spreads narrowed, supported by more accommodative central bank policies. Equity markets made significant gains in the twelve-month period ending October 31, 2024. Performance was positive across all sectors, led by Financials and Industrials. Fund performance described below is relative to the Fund’s blended benchmark, 45% Russell 1000 Value Index/ 44% Bloomberg US Corporate Index/ 5.5% JP Morgan Emerging Markets Bond Index Plus/ 5.5% Bloomberg US High Yield - 2% Issuer Cap Index (the "Blended Benchmark"), for the trailing twelve-month period ended October 31, 2024.
Top Contributors to Performance
At the Fund level, the fixed income portion contributed to performance.
The Fund’s security selection in investment grade credit was the primary contributor to benchmark relative returns over the trailing twelve months.
The Fund’s overweight to high yield credit contributed as this sector broadly outperformed duration-equivalent Treasuries during the period.
The Fund’s duration and yield curve positioning was modestly additive to benchmark-relative returns as we employed small, tactical changes to the Fund’s posture during the period.
The Fund’s equity security selection in the Financials and Technology sectors contributed to benchmark-relative returns during the period.
Top Detractors to Performance
At the Fund level, the equity portion detracted from performance.
The primary detractor to relative performance over the period was equity security selection within the Industrials, Real Estate, and Materials sectors.
Sector allocation within equities also detracted from relative performance, particularly the underweight in the Financials and Industrials sectors, and overweight in the Energy sector.
The Fund’s underweight allocation to investment grade credit detracted from benchmark-relative returns as credit spreads tightened over the period.
The Fund’s security selection in high yield credit modestly detracted as the Fund owned higher-quality issuers while over this period, lower-quality high yield companies outperformed their higher-quality counterparts.
The Fund used derivatives, such as currency forwards, interest rate futures, and credit default swap index positions, on a limited basis during the period for risk management purposes and/or to gain exposure to certain markets. Overall, the use of derivatives had a negligible impact on the Fund’s benchmark-relative returns during the period.
The views expressed in this section reflect the opinions of the Fund's sub-adviser, Wellington Management Company LLP, as of the date of this report and are subject to change based on changes in market, economic or other conditions. These views are not intended to be a forecast of future events and are no guarantee of future results.
Comparison of Change in Value of $ 10,000 Investment
The graph below represents the hypothetical growth of a $10,000 investment in Class C shares (excluding sales charges) and the comparative indices. If sales charges had been included, the value would have been lower.
Average Annual Total Returns
For the Periods Ended October 31, 2024 | 1 Year | 5 Years | 10 Years |
| Class C (with 1.00% contingent deferred sales charge) | 17.34% | 4.22%) | 4.94% |
| Class C (without 1.00% contingent deferred sales charge) | 18.34% | 4.22%) | 4.94% |
| Blended Benchmark | 21.77% | 5.15%) | 5.65% |
| Russell 1000 Value Index | 30.98% | 10.14%) | 8.87% |
| Bloomberg US Corporate Index | 13.63% | 0.54%) | 2.57% |
| JP Morgan Emerging Markets Bond Index Plus | 20.36% | (1.28)% | 1.31% |
| Bloomberg US High Yield - 2% Issuer Cap Index | 16.47% | 4.53%) | 4.86% |
| Russell 1000 Index | 38.07% | 15.00%) | 12.75% |
The Blended Benchmark serves as the Fund’s performance index because the Fund’s investment manager believes it is more representative of the Fund’s investment strategy. The Blended Benchmark is calculated by Hartford Funds Management Company, LLC. The Russell 1000 Index serves as the Fund’s regulatory index and provides a broad measure of market performance.
The Fund’s past performance is not a good predictor of the Fund’s future performance. The graph and table do not reflect the deduction of taxes that a shareholder would pay on Fund distributions or redemption of Fund shares. Performance information reflects fee waivers and/or expense limitation arrangements, if any. Absent any applicable fee waivers and/or expense limitation arrangements, performance would have been lower. Visit hartfordfunds.com for the most recent performance information.
Key Fund Statistics as of October 31, 2024
| Fund's net assets | $12,406,097,305% |
| Total number of portfolio holdings | $1,537% |
| Total investment management fees paid | $66,230,375% |
| Portfolio turnover rate | $61% |
Graphical Representation of Holdings as of October 31, 2024
The table below shows the investment makeup of the Fund, representing the percentage of net assets of the Fund.
Composition by Security Type
| Corporate Bonds | 46.3 | % |
| Common Stocks | 43.4 | % |
| Foreign Government Obligations | 3.3 | % |
| U.S. Government Securities | 2.4 | % |
| Municipal Bonds | 0.3 | % |
| Convertible Bonds | 0.1 | % |
| Preferred Stocks | 0.1 | % |
| Senior Floating Rate Interests | 0.1 | % |
| Short-Term Investments | 1.4 | % |
| Other Assets & Liabilities | 2.6 | % |
| Total | 100.0 | % |
Availability of Additional Information
For additional information about the Fund, including its prospectus, financial information, holdings, and proxy voting information, please visit the Fund’s website at the website address included at the beginning of this report.
The Fund is distributed by Hartford Funds Distributors, LLC (HFD).
Annual Shareholder Report
October 31, 2024
The Hartford Balanced Income Fund
Class I/HBLIX
This annual shareholder report contains important information about The Hartford Balanced Income Fund (the "Fund") for the period of November 1, 2023 to October 31, 2024. You can find additional information about the Fund at hartfordfunds.com/reports-hmf. You can also request this information by contacting us by calling 1‑888‑843‑7824.
This report describes changes to the Fund that occurred during the reporting period.
What were the Fund costs for the last year?
(Based on a hypothetical $10,000 investment)
| Class Name | Costs of a $10,000 investment | Costs paid as a percentage
of a $10,000 investment |
| Class I | $70 | 0.64% |
How did the Fund perform last year and what impacted its performance?
Management's Discussion of Fund Performance
United States (U.S.) fixed income sectors generated positive total returns during the trailing twelve-month period ended October 31, 2024 as measured by the Bloomberg US Aggregate Bond Index. U.S. Treasury yields ended broadly lower, geopolitical uncertainty rose in Europe and the Middle East, and major banks’ monetary policy paths diverged. Most spread sectors generated positive excess returns over duration-equivalent government bonds as spreads narrowed, supported by more accommodative central bank policies. Equity markets made significant gains in the twelve-month period ending October 31, 2024. Performance was positive across all sectors, led by Financials and Industrials. Fund performance described below is relative to the Fund’s blended benchmark, 45% Russell 1000 Value Index/ 44% Bloomberg US Corporate Index/ 5.5% JP Morgan Emerging Markets Bond Index Plus/ 5.5% Bloomberg US High Yield - 2% Issuer Cap Index (the "Blended Benchmark"), for the trailing twelve-month period ended October 31, 2024.
Top Contributors to Performance
At the Fund level, the fixed income portion contributed to performance.
The Fund’s security selection in investment grade credit was the primary contributor to benchmark relative returns over the trailing twelve months.
The Fund’s overweight to high yield credit contributed as this sector broadly outperformed duration-equivalent Treasuries during the period.
The Fund’s duration and yield curve positioning was modestly additive to benchmark-relative returns as we employed small, tactical changes to the Fund’s posture during the period.
The Fund’s equity security selection in the Financials and Technology sectors contributed to benchmark-relative returns during the period.
Top Detractors to Performance
At the Fund level, the equity portion detracted from performance.
The primary detractor to relative performance over the period was equity security selection within the Industrials, Real Estate, and Materials sectors.
Sector allocation within equities also detracted from relative performance, particularly the underweight in the Financials and Industrials sectors, and overweight in the Energy sector.
The Fund’s underweight allocation to investment grade credit detracted from benchmark-relative returns as credit spreads tightened over the period.
The Fund’s security selection in high yield credit modestly detracted as the Fund owned higher-quality issuers while over this period, lower-quality high yield companies outperformed their higher-quality counterparts.
The Fund used derivatives, such as currency forwards, interest rate futures, and credit default swap index positions, on a limited basis during the period for risk management purposes and/or to gain exposure to certain markets. Overall, the use of derivatives had a negligible impact on the Fund’s benchmark-relative returns during the period.
The views expressed in this section reflect the opinions of the Fund's sub-adviser, Wellington Management Company LLP, as of the date of this report and are subject to change based on changes in market, economic or other conditions. These views are not intended to be a forecast of future events and are no guarantee of future results.
Comparison of Change in Value of $ 10,000 Investment
The graph below represents the hypothetical growth of a $10,000 investment in Class I shares and the comparative indices.
Average Annual Total Returns
For the Periods Ended October 31, 2024 | 1 Year | 5 Years | 10 Years |
| Class I | 19.60% | 5.26%) | 5.99% |
| Blended Benchmark | 21.77% | 5.15%) | 5.65% |
| Russell 1000 Value Index | 30.98% | 10.14%) | 8.87% |
| Bloomberg US Corporate Index | 13.63% | 0.54%) | 2.57% |
| JP Morgan Emerging Markets Bond Index Plus | 20.36% | (1.28)% | 1.31% |
| Bloomberg US High Yield - 2% Issuer Cap Index | 16.47% | 4.53%) | 4.86% |
| Russell 1000 Index | 38.07% | 15.00%) | 12.75% |
The Blended Benchmark serves as the Fund’s performance index because the Fund’s investment manager believes it is more representative of the Fund’s investment strategy. The Blended Benchmark is calculated by Hartford Funds Management Company, LLC. The Russell 1000 Index serves as the Fund’s regulatory index and provides a broad measure of market performance.
The Fund’s past performance is not a good predictor of the Fund’s future performance. The graph and table do not reflect the deduction of taxes that a shareholder would pay on Fund distributions or redemption of Fund shares. Performance information reflects fee waivers and/or expense limitation arrangements, if any. Absent any applicable fee waivers and/or expense limitation arrangements, performance would have been lower. Visit hartfordfunds.com for the most recent performance information.
Key Fund Statistics as of October 31, 2024
| Fund's net assets | $12,406,097,305% |
| Total number of portfolio holdings | $1,537% |
| Total investment management fees paid | $66,230,375% |
| Portfolio turnover rate | $61% |
Graphical Representation of Holdings as of October 31, 2024
The table below shows the investment makeup of the Fund, representing the percentage of net assets of the Fund.
Composition by Security Type
| Corporate Bonds | 46.3 | % |
| Common Stocks | 43.4 | % |
| Foreign Government Obligations | 3.3 | % |
| U.S. Government Securities | 2.4 | % |
| Municipal Bonds | 0.3 | % |
| Convertible Bonds | 0.1 | % |
| Preferred Stocks | 0.1 | % |
| Senior Floating Rate Interests | 0.1 | % |
| Short-Term Investments | 1.4 | % |
| Other Assets & Liabilities | 2.6 | % |
| Total | 100.0 | % |
Material Fund Changes
This is a summary of certain changes to the Fund since the beginning of the reporting period.
Effective July 1, 2024, Hartford Administrative Services Company, the Fund’s transfer agent, contractually agreed to waive its transfer agency fee and/or reimburse transfer agency-related expenses to the extent necessary to limit the transfer agency fee for Class I of the Fund as follows: 0.082% of the average daily net assets attributable to the class. This contractual arrangement will remain in effect until February 28, 2025 unless the Board of Directors of the Fund approves its earlier termination.
Availability of Additional Information
For additional information about the Fund, including its prospectus, financial information, holdings, and proxy voting information, please visit the Fund’s website at the website address included at the beginning of this report.
The Fund is distributed by Hartford Funds Distributors, LLC (HFD).
Annual Shareholder Report
October 31, 2024
The Hartford Balanced Income Fund
Class R3/HBLRX
This annual shareholder report contains important information about The Hartford Balanced Income Fund (the "Fund") for the period of November 1, 2023 to October 31, 2024. You can find additional information about the Fund at hartfordfunds.com/reports-hmf. You can also request this information by contacting us by calling 1‑888‑843‑7824.
This report describes changes to the Fund that occurred during the reporting period.
What were the Fund costs for the last year?
(Based on a hypothetical $10,000 investment)
| Class Name | Costs of a $10,000 investment | Costs paid as a percentage
of a $10,000 investment |
| Class R3 | $139 | 1.27% |
How did the Fund perform last year and what impacted its performance?
Management's Discussion of Fund Performance
United States (U.S.) fixed income sectors generated positive total returns during the trailing twelve-month period ended October 31, 2024 as measured by the Bloomberg US Aggregate Bond Index. U.S. Treasury yields ended broadly lower, geopolitical uncertainty rose in Europe and the Middle East, and major banks’ monetary policy paths diverged. Most spread sectors generated positive excess returns over duration-equivalent government bonds as spreads narrowed, supported by more accommodative central bank policies. Equity markets made significant gains in the twelve-month period ending October 31, 2024. Performance was positive across all sectors, led by Financials and Industrials. Fund performance described below is relative to the Fund’s blended benchmark, 45% Russell 1000 Value Index/ 44% Bloomberg US Corporate Index/ 5.5% JP Morgan Emerging Markets Bond Index Plus/ 5.5% Bloomberg US High Yield - 2% Issuer Cap Index (the "Blended Benchmark"), for the trailing twelve-month period ended October 31, 2024.
Top Contributors to Performance
At the Fund level, the fixed income portion contributed to performance.
The Fund’s security selection in investment grade credit was the primary contributor to benchmark relative returns over the trailing twelve months.
The Fund’s overweight to high yield credit contributed as this sector broadly outperformed duration-equivalent Treasuries during the period.
The Fund’s duration and yield curve positioning was modestly additive to benchmark-relative returns as we employed small, tactical changes to the Fund’s posture during the period.
The Fund’s equity security selection in the Financials and Technology sectors contributed to benchmark-relative returns during the period.
Top Detractors to Performance
At the Fund level, the equity portion detracted from performance.
The primary detractor to relative performance over the period was equity security selection within the Industrials, Real Estate, and Materials sectors.
Sector allocation within equities also detracted from relative performance, particularly the underweight in the Financials and Industrials sectors, and overweight in the Energy sector.
The Fund’s underweight allocation to investment grade credit detracted from benchmark-relative returns as credit spreads tightened over the period.
The Fund’s security selection in high yield credit modestly detracted as the Fund owned higher-quality issuers while over this period, lower-quality high yield companies outperformed their higher-quality counterparts.
The Fund used derivatives, such as currency forwards, interest rate futures, and credit default swap index positions, on a limited basis during the period for risk management purposes and/or to gain exposure to certain markets. Overall, the use of derivatives had a negligible impact on the Fund’s benchmark-relative returns during the period.
The views expressed in this section reflect the opinions of the Fund's sub-adviser, Wellington Management Company LLP, as of the date of this report and are subject to change based on changes in market, economic or other conditions. These views are not intended to be a forecast of future events and are no guarantee of future results.
Comparison of Change in Value of $ 10,000 Investment
The graph below represents the hypothetical growth of a $10,000 investment in Class R3 shares and the comparative indices.
Average Annual Total Returns
For the Periods Ended October 31, 2024 | 1 Year | 5 Years | 10 Years |
| Class R3 | 18.85% | 4.62%) | 5.35% |
| Blended Benchmark | 21.77% | 5.15%) | 5.65% |
| Russell 1000 Value Index | 30.98% | 10.14%) | 8.87% |
| Bloomberg US Corporate Index | 13.63% | 0.54%) | 2.57% |
| JP Morgan Emerging Markets Bond Index Plus | 20.36% | (1.28)% | 1.31% |
| Bloomberg US High Yield - 2% Issuer Cap Index | 16.47% | 4.53%) | 4.86% |
| Russell 1000 Index | 38.07% | 15.00%) | 12.75% |
The Blended Benchmark serves as the Fund’s performance index because the Fund’s investment manager believes it is more representative of the Fund’s investment strategy. The Blended Benchmark is calculated by Hartford Funds Management Company, LLC. The Russell 1000 Index serves as the Fund’s regulatory index and provides a broad measure of market performance.
The Fund’s past performance is not a good predictor of the Fund’s future performance. The graph and table do not reflect the deduction of taxes that a shareholder would pay on Fund distributions or redemption of Fund shares. Performance information reflects fee waivers and/or expense limitation arrangements, if any. Absent any applicable fee waivers and/or expense limitation arrangements, performance would have been lower. Visit hartfordfunds.com for the most recent performance information.
Key Fund Statistics as of October 31, 2024
| Fund's net assets | $12,406,097,305% |
| Total number of portfolio holdings | $1,537% |
| Total investment management fees paid | $66,230,375% |
| Portfolio turnover rate | $61% |
Graphical Representation of Holdings as of October 31, 2024
The table below shows the investment makeup of the Fund, representing the percentage of net assets of the Fund.
Composition by Security Type
| Corporate Bonds | 46.3 | % |
| Common Stocks | 43.4 | % |
| Foreign Government Obligations | 3.3 | % |
| U.S. Government Securities | 2.4 | % |
| Municipal Bonds | 0.3 | % |
| Convertible Bonds | 0.1 | % |
| Preferred Stocks | 0.1 | % |
| Senior Floating Rate Interests | 0.1 | % |
| Short-Term Investments | 1.4 | % |
| Other Assets & Liabilities | 2.6 | % |
| Total | 100.0 | % |
Material Fund Changes
This is a summary of certain changes to the Fund since the beginning of the reporting period.
The expense ratio materially changed from the prior fiscal year due to changes in operating expenses.
For more complete information, you may review the Fund’s next prospectus, which we expect to be available by March 1, 2025, at hartfordfunds.com/reports‑hmf, upon request by calling 1-888-843-7824 or sending an e-mail to orders@mysummaryprospectus.com.
Availability of Additional Information
For additional information about the Fund, including its prospectus, financial information, holdings, and proxy voting information, please visit the Fund’s website at the website address included at the beginning of this report.
The Fund is distributed by Hartford Funds Distributors, LLC (HFD).
Annual Shareholder Report
October 31, 2024
The Hartford Balanced Income Fund
Class R4/HBLSX
This annual shareholder report contains important information about The Hartford Balanced Income Fund (the "Fund") for the period of November 1, 2023 to October 31, 2024. You can find additional information about the Fund at hartfordfunds.com/reports-hmf. You can also request this information by contacting us by calling 1‑888‑843‑7824.
What were the Fund costs for the last year?
(Based on a hypothetical $10,000 investment)
| Class Name | Costs of a $10,000 investment | Costs paid as a percentage
of a $10,000 investment |
| Class R4 | $105 | 0.96% |
How did the Fund perform last year and what impacted its performance?
Management's Discussion of Fund Performance
United States (U.S.) fixed income sectors generated positive total returns during the trailing twelve-month period ended October 31, 2024 as measured by the Bloomberg US Aggregate Bond Index. U.S. Treasury yields ended broadly lower, geopolitical uncertainty rose in Europe and the Middle East, and major banks’ monetary policy paths diverged. Most spread sectors generated positive excess returns over duration-equivalent government bonds as spreads narrowed, supported by more accommodative central bank policies. Equity markets made significant gains in the twelve-month period ending October 31, 2024. Performance was positive across all sectors, led by Financials and Industrials. Fund performance described below is relative to the Fund’s blended benchmark, 45% Russell 1000 Value Index/ 44% Bloomberg US Corporate Index/ 5.5% JP Morgan Emerging Markets Bond Index Plus/ 5.5% Bloomberg US High Yield - 2% Issuer Cap Index (the "Blended Benchmark"), for the trailing twelve-month period ended October 31, 2024.
Top Contributors to Performance
At the Fund level, the fixed income portion contributed to performance.
The Fund’s security selection in investment grade credit was the primary contributor to benchmark relative returns over the trailing twelve months.
The Fund’s overweight to high yield credit contributed as this sector broadly outperformed duration-equivalent Treasuries during the period.
The Fund’s duration and yield curve positioning was modestly additive to benchmark-relative returns as we employed small, tactical changes to the Fund’s posture during the period.
The Fund’s equity security selection in the Financials and Technology sectors contributed to benchmark-relative returns during the period.
Top Detractors to Performance
At the Fund level, the equity portion detracted from performance.
The primary detractor to relative performance over the period was equity security selection within the Industrials, Real Estate, and Materials sectors.
Sector allocation within equities also detracted from relative performance, particularly the underweight in the Financials and Industrials sectors, and overweight in the Energy sector.
The Fund’s underweight allocation to investment grade credit detracted from benchmark-relative returns as credit spreads tightened over the period.
The Fund’s security selection in high yield credit modestly detracted as the Fund owned higher-quality issuers while over this period, lower-quality high yield companies outperformed their higher-quality counterparts.
The Fund used derivatives, such as currency forwards, interest rate futures, and credit default swap index positions, on a limited basis during the period for risk management purposes and/or to gain exposure to certain markets. Overall, the use of derivatives had a negligible impact on the Fund’s benchmark-relative returns during the period.
The views expressed in this section reflect the opinions of the Fund's sub-adviser, Wellington Management Company LLP, as of the date of this report and are subject to change based on changes in market, economic or other conditions. These views are not intended to be a forecast of future events and are no guarantee of future results.
Comparison of Change in Value of $ 10,000 Investment
The graph below represents the hypothetical growth of a $10,000 investment in Class R4 shares and the comparative indices.
Average Annual Total Returns
For the Periods Ended October 31, 2024 | 1 Year | 5 Years | 10 Years |
| Class R4 | 19.19% | 4.92%) | 5.67% |
| Blended Benchmark | 21.77% | 5.15%) | 5.65% |
| Russell 1000 Value Index | 30.98% | 10.14%) | 8.87% |
| Bloomberg US Corporate Index | 13.63% | 0.54%) | 2.57% |
| JP Morgan Emerging Markets Bond Index Plus | 20.36% | (1.28)% | 1.31% |
| Bloomberg US High Yield - 2% Issuer Cap Index | 16.47% | 4.53%) | 4.86% |
| Russell 1000 Index | 38.07% | 15.00%) | 12.75% |
The Blended Benchmark serves as the Fund’s performance index because the Fund’s investment manager believes it is more representative of the Fund’s investment strategy. The Blended Benchmark is calculated by Hartford Funds Management Company, LLC. The Russell 1000 Index serves as the Fund’s regulatory index and provides a broad measure of market performance.
The Fund’s past performance is not a good predictor of the Fund’s future performance. The graph and table do not reflect the deduction of taxes that a shareholder would pay on Fund distributions or redemption of Fund shares. Performance information reflects fee waivers and/or expense limitation arrangements, if any. Absent any applicable fee waivers and/or expense limitation arrangements, performance would have been lower. Visit hartfordfunds.com for the most recent performance information.
Key Fund Statistics as of October 31, 2024
| Fund's net assets | $12,406,097,305% |
| Total number of portfolio holdings | $1,537% |
| Total investment management fees paid | $66,230,375% |
| Portfolio turnover rate | $61% |
Graphical Representation of Holdings as of October 31, 2024
The table below shows the investment makeup of the Fund, representing the percentage of net assets of the Fund.
Composition by Security Type
| Corporate Bonds | 46.3 | % |
| Common Stocks | 43.4 | % |
| Foreign Government Obligations | 3.3 | % |
| U.S. Government Securities | 2.4 | % |
| Municipal Bonds | 0.3 | % |
| Convertible Bonds | 0.1 | % |
| Preferred Stocks | 0.1 | % |
| Senior Floating Rate Interests | 0.1 | % |
| Short-Term Investments | 1.4 | % |
| Other Assets & Liabilities | 2.6 | % |
| Total | 100.0 | % |
Availability of Additional Information
For additional information about the Fund, including its prospectus, financial information, holdings, and proxy voting information, please visit the Fund’s website at the website address included at the beginning of this report.
The Fund is distributed by Hartford Funds Distributors, LLC (HFD).
Annual Shareholder Report
October 31, 2024
The Hartford Balanced Income Fund
Class R5/HBLTX
This annual shareholder report contains important information about The Hartford Balanced Income Fund (the "Fund") for the period of November 1, 2023 to October 31, 2024. You can find additional information about the Fund at hartfordfunds.com/reports-hmf. You can also request this information by contacting us by calling 1‑888‑843‑7824.
What were the Fund costs for the last year?
(Based on a hypothetical $10,000 investment)
| Class Name | Costs of a $10,000 investment | Costs paid as a percentage
of a $10,000 investment |
| Class R5 | $72 | 0.66% |
How did the Fund perform last year and what impacted its performance?
Management's Discussion of Fund Performance
United States (U.S.) fixed income sectors generated positive total returns during the trailing twelve-month period ended October 31, 2024 as measured by the Bloomberg US Aggregate Bond Index. U.S. Treasury yields ended broadly lower, geopolitical uncertainty rose in Europe and the Middle East, and major banks’ monetary policy paths diverged. Most spread sectors generated positive excess returns over duration-equivalent government bonds as spreads narrowed, supported by more accommodative central bank policies. Equity markets made significant gains in the twelve-month period ending October 31, 2024. Performance was positive across all sectors, led by Financials and Industrials. Fund performance described below is relative to the Fund’s blended benchmark, 45% Russell 1000 Value Index/ 44% Bloomberg US Corporate Index/ 5.5% JP Morgan Emerging Markets Bond Index Plus/ 5.5% Bloomberg US High Yield - 2% Issuer Cap Index (the "Blended Benchmark"), for the trailing twelve-month period ended October 31, 2024.
Top Contributors to Performance
At the Fund level, the fixed income portion contributed to performance.
The Fund’s security selection in investment grade credit was the primary contributor to benchmark relative returns over the trailing twelve months.
The Fund’s overweight to high yield credit contributed as this sector broadly outperformed duration-equivalent Treasuries during the period.
The Fund’s duration and yield curve positioning was modestly additive to benchmark-relative returns as we employed small, tactical changes to the Fund’s posture during the period.
The Fund’s equity security selection in the Financials and Technology sectors contributed to benchmark-relative returns during the period.
Top Detractors to Performance
At the Fund level, the equity portion detracted from performance.
The primary detractor to relative performance over the period was equity security selection within the Industrials, Real Estate, and Materials sectors.
Sector allocation within equities also detracted from relative performance, particularly the underweight in the Financials and Industrials sectors, and overweight in the Energy sector.
The Fund’s underweight allocation to investment grade credit detracted from benchmark-relative returns as credit spreads tightened over the period.
The Fund’s security selection in high yield credit modestly detracted as the Fund owned higher-quality issuers while over this period, lower-quality high yield companies outperformed their higher-quality counterparts.
The Fund used derivatives, such as currency forwards, interest rate futures, and credit default swap index positions, on a limited basis during the period for risk management purposes and/or to gain exposure to certain markets. Overall, the use of derivatives had a negligible impact on the Fund’s benchmark-relative returns during the period.
The views expressed in this section reflect the opinions of the Fund's sub-adviser, Wellington Management Company LLP, as of the date of this report and are subject to change based on changes in market, economic or other conditions. These views are not intended to be a forecast of future events and are no guarantee of future results.
Comparison of Change in Value of $ 10,000 Investment
The graph below represents the hypothetical growth of a $10,000 investment in Class R5 shares and the comparative indices.
Average Annual Total Returns
For the Periods Ended October 31, 2024 | 1 Year | 5 Years | 10 Years |
| Class R5 | 19.51% | 5.25%) | 5.97% |
| Blended Benchmark | 21.77% | 5.15%) | 5.65% |
| Russell 1000 Value Index | 30.98% | 10.14%) | 8.87% |
| Bloomberg US Corporate Index | 13.63% | 0.54%) | 2.57% |
| JP Morgan Emerging Markets Bond Index Plus | 20.36% | (1.28)% | 1.31% |
| Bloomberg US High Yield - 2% Issuer Cap Index | 16.47% | 4.53%) | 4.86% |
| Russell 1000 Index | 38.07% | 15.00%) | 12.75% |
The Blended Benchmark serves as the Fund’s performance index because the Fund’s investment manager believes it is more representative of the Fund’s investment strategy. The Blended Benchmark is calculated by Hartford Funds Management Company, LLC. The Russell 1000 Index serves as the Fund’s regulatory index and provides a broad measure of market performance.
The Fund’s past performance is not a good predictor of the Fund’s future performance. The graph and table do not reflect the deduction of taxes that a shareholder would pay on Fund distributions or redemption of Fund shares. Performance information reflects fee waivers and/or expense limitation arrangements, if any. Absent any applicable fee waivers and/or expense limitation arrangements, performance would have been lower. Visit hartfordfunds.com for the most recent performance information.
Key Fund Statistics as of October 31, 2024
| Fund's net assets | $12,406,097,305% |
| Total number of portfolio holdings | $1,537% |
| Total investment management fees paid | $66,230,375% |
| Portfolio turnover rate | $61% |
Graphical Representation of Holdings as of October 31, 2024
The table below shows the investment makeup of the Fund, representing the percentage of net assets of the Fund.
Composition by Security Type
| Corporate Bonds | 46.3 | % |
| Common Stocks | 43.4 | % |
| Foreign Government Obligations | 3.3 | % |
| U.S. Government Securities | 2.4 | % |
| Municipal Bonds | 0.3 | % |
| Convertible Bonds | 0.1 | % |
| Preferred Stocks | 0.1 | % |
| Senior Floating Rate Interests | 0.1 | % |
| Short-Term Investments | 1.4 | % |
| Other Assets & Liabilities | 2.6 | % |
| Total | 100.0 | % |
Availability of Additional Information
For additional information about the Fund, including its prospectus, financial information, holdings, and proxy voting information, please visit the Fund’s website at the website address included at the beginning of this report.
The Fund is distributed by Hartford Funds Distributors, LLC (HFD).
Annual Shareholder Report
October 31, 2024
The Hartford Balanced Income Fund
Class R6/HBLVX
This annual shareholder report contains important information about The Hartford Balanced Income Fund (the "Fund") for the period of November 1, 2023 to October 31, 2024. You can find additional information about the Fund at hartfordfunds.com/reports-hmf. You can also request this information by contacting us by calling 1‑888‑843‑7824.
What were the Fund costs for the last year?
(Based on a hypothetical $10,000 investment)
| Class Name | Costs of a $10,000 investment | Costs paid as a percentage
of a $10,000 investment |
| Class R6 | $62 | 0.56% |
How did the Fund perform last year and what impacted its performance?
Management's Discussion of Fund Performance
United States (U.S.) fixed income sectors generated positive total returns during the trailing twelve-month period ended October 31, 2024 as measured by the Bloomberg US Aggregate Bond Index. U.S. Treasury yields ended broadly lower, geopolitical uncertainty rose in Europe and the Middle East, and major banks’ monetary policy paths diverged. Most spread sectors generated positive excess returns over duration-equivalent government bonds as spreads narrowed, supported by more accommodative central bank policies. Equity markets made significant gains in the twelve-month period ending October 31, 2024. Performance was positive across all sectors, led by Financials and Industrials. Fund performance described below is relative to the Fund’s blended benchmark, 45% Russell 1000 Value Index/ 44% Bloomberg US Corporate Index/ 5.5% JP Morgan Emerging Markets Bond Index Plus/ 5.5% Bloomberg US High Yield - 2% Issuer Cap Index (the "Blended Benchmark"), for the trailing twelve-month period ended October 31, 2024.
Top Contributors to Performance
At the Fund level, the fixed income portion contributed to performance.
The Fund’s security selection in investment grade credit was the primary contributor to benchmark relative returns over the trailing twelve months.
The Fund’s overweight to high yield credit contributed as this sector broadly outperformed duration-equivalent Treasuries during the period.
The Fund’s duration and yield curve positioning was modestly additive to benchmark-relative returns as we employed small, tactical changes to the Fund’s posture during the period.
The Fund’s equity security selection in the Financials and Technology sectors contributed to benchmark-relative returns during the period.
Top Detractors to Performance
At the Fund level, the equity portion detracted from performance.
The primary detractor to relative performance over the period was equity security selection within the Industrials, Real Estate, and Materials sectors.
Sector allocation within equities also detracted from relative performance, particularly the underweight in the Financials and Industrials sectors, and overweight in the Energy sector.
The Fund’s underweight allocation to investment grade credit detracted from benchmark-relative returns as credit spreads tightened over the period.
The Fund’s security selection in high yield credit modestly detracted as the Fund owned higher-quality issuers while over this period, lower-quality high yield companies outperformed their higher-quality counterparts.
The Fund used derivatives, such as currency forwards, interest rate futures, and credit default swap index positions, on a limited basis during the period for risk management purposes and/or to gain exposure to certain markets. Overall, the use of derivatives had a negligible impact on the Fund’s benchmark-relative returns during the period.
The views expressed in this section reflect the opinions of the Fund's sub-adviser, Wellington Management Company LLP, as of the date of this report and are subject to change based on changes in market, economic or other conditions. These views are not intended to be a forecast of future events and are no guarantee of future results.
Comparison of Change in Value of $ 10,000 Investment
The graph below represents the hypothetical growth of a $10,000 investment in Class R6 shares and the comparative indices.
Average Annual Total Returns
For the Periods Ended October 31, 2024 | 1 Year | 5 Years | 10 Years |
| Class R6 | 19.65% | 5.35%) | 6.07% |
| Blended Benchmark | 21.77% | 5.15%) | 5.65% |
| Russell 1000 Value Index | 30.98% | 10.14%) | 8.87% |
| Bloomberg US Corporate Index | 13.63% | 0.54%) | 2.57% |
| JP Morgan Emerging Markets Bond Index Plus | 20.36% | (1.28)% | 1.31% |
| Bloomberg US High Yield - 2% Issuer Cap Index | 16.47% | 4.53%) | 4.86% |
| Russell 1000 Index | 38.07% | 15.00%) | 12.75% |
Class R6 shares commenced operations on November 7, 2014 and performance prior to that date is that of the Fund’s Class Y shares. Performance prior to the inception date of the class has not been adjusted to reflect the operating expenses of the class.
The Blended Benchmark serves as the Fund’s performance index because the Fund’s investment manager believes it is more representative of the Fund’s investment strategy. The Blended Benchmark is calculated by Hartford Funds Management Company, LLC. The Russell 1000 Index serves as the Fund’s regulatory index and provides a broad measure of market performance.
The Fund’s past performance is not a good predictor of the Fund’s future performance. The graph and table do not reflect the deduction of taxes that a shareholder would pay on Fund distributions or redemption of Fund shares. Performance information reflects fee waivers and/or expense limitation arrangements, if any. Absent any applicable fee waivers and/or expense limitation arrangements, performance would have been lower. Visit hartfordfunds.com for the most recent performance information.
Key Fund Statistics as of October 31, 2024
| Fund's net assets | $12,406,097,305% |
| Total number of portfolio holdings | $1,537% |
| Total investment management fees paid | $66,230,375% |
| Portfolio turnover rate | $61% |
Graphical Representation of Holdings as of October 31, 2024
The table below shows the investment makeup of the Fund, representing the percentage of net assets of the Fund.
Composition by Security Type
| Corporate Bonds | 46.3 | % |
| Common Stocks | 43.4 | % |
| Foreign Government Obligations | 3.3 | % |
| U.S. Government Securities | 2.4 | % |
| Municipal Bonds | 0.3 | % |
| Convertible Bonds | 0.1 | % |
| Preferred Stocks | 0.1 | % |
| Senior Floating Rate Interests | 0.1 | % |
| Short-Term Investments | 1.4 | % |
| Other Assets & Liabilities | 2.6 | % |
| Total | 100.0 | % |
Availability of Additional Information
For additional information about the Fund, including its prospectus, financial information, holdings, and proxy voting information, please visit the Fund’s website at the website address included at the beginning of this report.
The Fund is distributed by Hartford Funds Distributors, LLC (HFD).
Annual Shareholder Report
October 31, 2024
The Hartford Balanced Income Fund
Class Y/HBLYX
This annual shareholder report contains important information about The Hartford Balanced Income Fund (the "Fund") for the period of November 1, 2023 to October 31, 2024. You can find additional information about the Fund at hartfordfunds.com/reports-hmf. You can also request this information by contacting us by calling 1‑888‑843‑7824.
What were the Fund costs for the last year?
(Based on a hypothetical $10,000 investment)
| Class Name | Costs of a $10,000 investment | Costs paid as a percentage
of a $10,000 investment |
| Class Y | $74 | 0.67% |
How did the Fund perform last year and what impacted its performance?
Management's Discussion of Fund Performance
United States (U.S.) fixed income sectors generated positive total returns during the trailing twelve-month period ended October 31, 2024 as measured by the Bloomberg US Aggregate Bond Index. U.S. Treasury yields ended broadly lower, geopolitical uncertainty rose in Europe and the Middle East, and major banks’ monetary policy paths diverged. Most spread sectors generated positive excess returns over duration-equivalent government bonds as spreads narrowed, supported by more accommodative central bank policies. Equity markets made significant gains in the twelve-month period ending October 31, 2024. Performance was positive across all sectors, led by Financials and Industrials. Fund performance described below is relative to the Fund’s blended benchmark, 45% Russell 1000 Value Index/ 44% Bloomberg US Corporate Index/ 5.5% JP Morgan Emerging Markets Bond Index Plus/ 5.5% Bloomberg US High Yield - 2% Issuer Cap Index (the "Blended Benchmark"), for the trailing twelve-month period ended October 31, 2024.
Top Contributors to Performance
At the Fund level, the fixed income portion contributed to performance.
The Fund’s security selection in investment grade credit was the primary contributor to benchmark relative returns over the trailing twelve months.
The Fund’s overweight to high yield credit contributed as this sector broadly outperformed duration-equivalent Treasuries during the period.
The Fund’s duration and yield curve positioning was modestly additive to benchmark-relative returns as we employed small, tactical changes to the Fund’s posture during the period.
The Fund’s equity security selection in the Financials and Technology sectors contributed to benchmark-relative returns during the period.
Top Detractors to Performance
At the Fund level, the equity portion detracted from performance.
The primary detractor to relative performance over the period was equity security selection within the Industrials, Real Estate, and Materials sectors.
Sector allocation within equities also detracted from relative performance, particularly the underweight in the Financials and Industrials sectors, and overweight in the Energy sector.
The Fund’s underweight allocation to investment grade credit detracted from benchmark-relative returns as credit spreads tightened over the period.
The Fund’s security selection in high yield credit modestly detracted as the Fund owned higher-quality issuers while over this period, lower-quality high yield companies outperformed their higher-quality counterparts.
The Fund used derivatives, such as currency forwards, interest rate futures, and credit default swap index positions, on a limited basis during the period for risk management purposes and/or to gain exposure to certain markets. Overall, the use of derivatives had a negligible impact on the Fund’s benchmark-relative returns during the period.
The views expressed in this section reflect the opinions of the Fund's sub-adviser, Wellington Management Company LLP, as of the date of this report and are subject to change based on changes in market, economic or other conditions. These views are not intended to be a forecast of future events and are no guarantee of future results.
Comparison of Change in Value of $ 250,000 Investment
The graph below represents the hypothetical growth of a $250,000 investment in Class Y shares and the comparative indices.
Average Annual Total Returns
For the Periods Ended October 31, 2024 | 1 Year | 5 Years | 10 Years |
| Class Y | 19.51% | 5.25%) | 6.00% |
| Blended Benchmark | 21.77% | 5.15%) | 5.65% |
| Russell 1000 Value Index | 30.98% | 10.14%) | 8.87% |
| Bloomberg US Corporate Index | 13.63% | 0.54%) | 2.57% |
| JP Morgan Emerging Markets Bond Index Plus | 20.36% | (1.28)% | 1.31% |
| Bloomberg US High Yield - 2% Issuer Cap Index | 16.47% | 4.53%) | 4.86% |
| Russell 1000 Index | 38.07% | 15.00%) | 12.75% |
The Blended Benchmark serves as the Fund’s performance index because the Fund’s investment manager believes it is more representative of the Fund’s investment strategy. The Blended Benchmark is calculated by Hartford Funds Management Company, LLC. The Russell 1000 Index serves as the Fund’s regulatory index and provides a broad measure of market performance.
The Fund’s past performance is not a good predictor of the Fund’s future performance. The graph and table do not reflect the deduction of taxes that a shareholder would pay on Fund distributions or redemption of Fund shares. Performance information reflects fee waivers and/or expense limitation arrangements, if any. Absent any applicable fee waivers and/or expense limitation arrangements, performance would have been lower. Visit hartfordfunds.com for the most recent performance information.
Key Fund Statistics as of October 31, 2024
| Fund's net assets | $12,406,097,305% |
| Total number of portfolio holdings | $1,537% |
| Total investment management fees paid | $66,230,375% |
| Portfolio turnover rate | $61% |
Graphical Representation of Holdings as of October 31, 2024
The table below shows the investment makeup of the Fund, representing the percentage of net assets of the Fund.
Composition by Security Type
| Corporate Bonds | 46.3 | % |
| Common Stocks | 43.4 | % |
| Foreign Government Obligations | 3.3 | % |
| U.S. Government Securities | 2.4 | % |
| Municipal Bonds | 0.3 | % |
| Convertible Bonds | 0.1 | % |
| Preferred Stocks | 0.1 | % |
| Senior Floating Rate Interests | 0.1 | % |
| Short-Term Investments | 1.4 | % |
| Other Assets & Liabilities | 2.6 | % |
| Total | 100.0 | % |
Availability of Additional Information
For additional information about the Fund, including its prospectus, financial information, holdings, and proxy voting information, please visit the Fund’s website at the website address included at the beginning of this report.
The Fund is distributed by Hartford Funds Distributors, LLC (HFD).
Annual Shareholder Report
October 31, 2024
The Hartford Balanced Income Fund
Class F/HBLFX
This annual shareholder report contains important information about The Hartford Balanced Income Fund (the "Fund") for the period of November 1, 2023 to October 31, 2024. You can find additional information about the Fund at hartfordfunds.com/reports-hmf. You can also request this information by contacting us by calling 1‑888‑843‑7824.
What were the Fund costs for the last year?
(Based on a hypothetical $10,000 investment)
| Class Name | Costs of a $10,000 investment | Costs paid as a percentage
of a $10,000 investment |
| Class F | $62 | 0.56% |
How did the Fund perform last year and what impacted its performance?
Management's Discussion of Fund Performance
United States (U.S.) fixed income sectors generated positive total returns during the trailing twelve-month period ended October 31, 2024 as measured by the Bloomberg US Aggregate Bond Index. U.S. Treasury yields ended broadly lower, geopolitical uncertainty rose in Europe and the Middle East, and major banks’ monetary policy paths diverged. Most spread sectors generated positive excess returns over duration-equivalent government bonds as spreads narrowed, supported by more accommodative central bank policies. Equity markets made significant gains in the twelve-month period ending October 31, 2024. Performance was positive across all sectors, led by Financials and Industrials. Fund performance described below is relative to the Fund’s blended benchmark, 45% Russell 1000 Value Index/ 44% Bloomberg US Corporate Index/ 5.5% JP Morgan Emerging Markets Bond Index Plus/ 5.5% Bloomberg US High Yield - 2% Issuer Cap Index (the "Blended Benchmark"), for the trailing twelve-month period ended October 31, 2024.
Top Contributors to Performance
At the Fund level, the fixed income portion contributed to performance.
The Fund’s security selection in investment grade credit was the primary contributor to benchmark relative returns over the trailing twelve months.
The Fund’s overweight to high yield credit contributed as this sector broadly outperformed duration-equivalent Treasuries during the period.
The Fund’s duration and yield curve positioning was modestly additive to benchmark-relative returns as we employed small, tactical changes to the Fund’s posture during the period.
The Fund’s equity security selection in the Financials and Technology sectors contributed to benchmark-relative returns during the period.
Top Detractors to Performance
At the Fund level, the equity portion detracted from performance.
The primary detractor to relative performance over the period was equity security selection within the Industrials, Real Estate, and Materials sectors.
Sector allocation within equities also detracted from relative performance, particularly the underweight in the Financials and Industrials sectors, and overweight in the Energy sector.
The Fund’s underweight allocation to investment grade credit detracted from benchmark-relative returns as credit spreads tightened over the period.
The Fund’s security selection in high yield credit modestly detracted as the Fund owned higher-quality issuers while over this period, lower-quality high yield companies outperformed their higher-quality counterparts.
The Fund used derivatives, such as currency forwards, interest rate futures, and credit default swap index positions, on a limited basis during the period for risk management purposes and/or to gain exposure to certain markets. Overall, the use of derivatives had a negligible impact on the Fund’s benchmark-relative returns during the period.
The views expressed in this section reflect the opinions of the Fund's sub-adviser, Wellington Management Company LLP, as of the date of this report and are subject to change based on changes in market, economic or other conditions. These views are not intended to be a forecast of future events and are no guarantee of future results.
Comparison of Change in Value of $ 1,000,000 Investment
The graph below represents the hypothetical growth of a $1,000,000 investment in Class F shares and the comparative indices.
Average Annual Total Returns
For the Periods Ended October 31, 2024 | 1 Year | 5 Years | 10 Years |
| Class F | 19.68% | 5.36%) | 6.06% |
| Blended Benchmark | 21.77% | 5.15%) | 5.65% |
| Russell 1000 Value Index | 30.98% | 10.14%) | 8.87% |
| Bloomberg US Corporate Index | 13.63% | 0.54%) | 2.57% |
| JP Morgan Emerging Markets Bond Index Plus | 20.36% | (1.28)% | 1.31% |
| Bloomberg US High Yield - 2% Issuer Cap Index | 16.47% | 4.53%) | 4.86% |
| Russell 1000 Index | 38.07% | 15.00%) | 12.75% |
Class F shares commenced operations on February 28, 2017 and performance prior to that date is that of the Fund’s Class I shares. Performance prior to the inception date of the class has not been adjusted to reflect the operating expenses of the class.
The Blended Benchmark serves as the Fund’s performance index because the Fund’s investment manager believes it is more representative of the Fund’s investment strategy. The Blended Benchmark is calculated by Hartford Funds Management Company, LLC. The Russell 1000 Index serves as the Fund’s regulatory index and provides a broad measure of market performance.
The Fund’s past performance is not a good predictor of the Fund’s future performance. The graph and table do not reflect the deduction of taxes that a shareholder would pay on Fund distributions or redemption of Fund shares. Performance information reflects fee waivers and/or expense limitation arrangements, if any. Absent any applicable fee waivers and/or expense limitation arrangements, performance would have been lower. Visit hartfordfunds.com for the most recent performance information.
Key Fund Statistics as of October 31, 2024
| Fund's net assets | $12,406,097,305% |
| Total number of portfolio holdings | $1,537% |
| Total investment management fees paid | $66,230,375% |
| Portfolio turnover rate | $61% |
Graphical Representation of Holdings as of October 31, 2024
The table below shows the investment makeup of the Fund, representing the percentage of net assets of the Fund.
Composition by Security Type
| Corporate Bonds | 46.3 | % |
| Common Stocks | 43.4 | % |
| Foreign Government Obligations | 3.3 | % |
| U.S. Government Securities | 2.4 | % |
| Municipal Bonds | 0.3 | % |
| Convertible Bonds | 0.1 | % |
| Preferred Stocks | 0.1 | % |
| Senior Floating Rate Interests | 0.1 | % |
| Short-Term Investments | 1.4 | % |
| Other Assets & Liabilities | 2.6 | % |
| Total | 100.0 | % |
Availability of Additional Information
For additional information about the Fund, including its prospectus, financial information, holdings, and proxy voting information, please visit the Fund’s website at the website address included at the beginning of this report.
The Fund is distributed by Hartford Funds Distributors, LLC (HFD).
Annual Shareholder Report
October 31, 2024
The Hartford Checks and Balances Fund
Class A/HCKAX
This annual shareholder report contains important information about The Hartford Checks and Balances Fund (the "Fund") for the period of November 1, 2023 to October 31, 2024. You can find additional information about the Fund at hartfordfunds.com/reports-hmf. You can also request this information by contacting us by calling 1‑888‑843‑7824.
What were the Fund costs for the last year?
(Based on a hypothetical $10,000 investment)
| Class Name | Costs of a $10,000 investment | Costs paid as a percentage
of a $10,000 investment |
| Class A | $43 | 0.38% |
Costs paid excludes fees and expenses incurred indirectly as a result of investments in other investment companies.
How did the Fund perform last year and what impacted its performance?
Management's Discussion of Fund Performance
Equities outperformed fixed income securities for the trailing one-year period ending October 31, 2024 led by domestic stocks. Both the S&P 500 Index and Russell 3000 Index generated strong returns supported by easing inflation and interest rate cuts. Bonds lagged but still posted strong positive returns for the trailing one-year period as measured by the Bloomberg US Aggregate Bond Index. Treasury yields ended broadly lower and most spread sectors generated positive excess returns over duration-equivalent government bonds as spreads narrowed, supported by more accommodative central bank policies. Fund performance described below is relative to the Fund’s blended benchmark, 33.4% Russell 3000 Index/ 33.3% S&P 500 Index/ 33.3% Bloomberg US Aggregate Bond Index (the "Blended Benchmark"), for the trailing twelve-month period ended October 31, 2024.
Top Contributors to Performance
Performance relative to the Blended Benchmark was helped from the Fund’s position in the Hartford Total Return Bond ETF, which outperformed its benchmark, the Bloomberg US Aggregate Bond Index, during the period.
Top Detractors to Performance
Performance relative to the Blended Benchmark was hurt from the Fund’s position in The Hartford Dividend and Growth Fund, which underperformed its benchmark, the S&P 500 Index, during the period.
The Fund’s investment in The Hartford Capital Appreciation Fund also detracted from performance relative to the Blended Benchmark. The Hartford Capital Appreciation Fund lagged its benchmark, the Russell 3000 Index, during the period.
The views expressed in this section reflect the opinions of the Fund's investment manager, Hartford Funds Management Company, LLC, as of the date of this report and are subject to change based on changes in market, economic or other conditions. These views are not intended to be a forecast of future events and are no guarantee of future results.
Comparison of Change in Value of $ 10,000 Investment
The graph below represents the hypothetical growth of a $10,000 investment in Class A shares and the comparative indices. The returns for Class A shares include the maximum front-end sales charge applicable to Class A shares.
Average Annual Total Returns
For the Periods Ended October 31, 2024 | 1 Year | 5 Years | 10 Years |
| Class A (with 5.50% maximum front-end sales charge) | 17.64% | 6.61%) | 6.88% |
| Class A (without 5.50% maximum front-end sales charge) | 24.48% | 7.82%) | 7.48% |
| Blended Benchmark | 28.27% | 9.97%) | 9.11% |
| Russell 3000 Index | 37.86% | 14.60%) | 12.44% |
| S&P 500 Index | 38.02% | 15.27%) | 13.00% |
| Bloomberg US Aggregate Bond Index | 10.55% | (0.23)% | 1.49% |
The Blended Benchmark is calculated by Hartford Funds Management Company, LLC.
The Fund’s past performance is not a good predictor of the Fund’s future performance. The graph and table do not reflect the deduction of taxes that a shareholder would pay on Fund distributions or redemption of Fund shares. Performance information reflects fee waivers and/or expense limitation arrangements, if any. Absent any applicable fee waivers and/or expense limitation arrangements, performance would have been lower. Visit hartfordfunds.com for the most recent performance information.
Key Fund Statistics as of October 31, 2024
| Fund's net assets | $1,403,957,177% |
| Total number of portfolio holdings | $5% |
| Total investment management fees paid | $0% |
| Portfolio turnover rate | $7% |
Graphical Representation of Holdings as of October 31, 2024
The table below shows the investment makeup of the Fund, representing the percentage of net assets of the Fund.
Composition by Asset Allocation
| Domestic Equity Funds | 66.7 | % |
| Taxable Fixed Income Fund | 33.0 | % |
| Short-Term Investments | 0.2 | % |
| Other Assets & Liabilities | 0.1 | % |
| Total | 100.0 | % |
Availability of Additional Information
For additional information about the Fund, including its prospectus, financial information, holdings, and proxy voting information, please visit the Fund’s website at the website address included at the beginning of this report.
The Fund is distributed by Hartford Funds Distributors, LLC (HFD).
Annual Shareholder Report
October 31, 2024
The Hartford Checks and Balances Fund
Class C/HCKCX
This annual shareholder report contains important information about The Hartford Checks and Balances Fund (the "Fund") for the period of November 1, 2023 to October 31, 2024. You can find additional information about the Fund at hartfordfunds.com/reports-hmf. You can also request this information by contacting us by calling 1‑888‑843‑7824.
What were the Fund costs for the last year?
(Based on a hypothetical $10,000 investment)
| Class Name | Costs of a $10,000 investment | Costs paid as a percentage
of a $10,000 investment |
| Class C | $130 | 1.16% |
Costs paid excludes fees and expenses incurred indirectly as a result of investments in other investment companies.
How did the Fund perform last year and what impacted its performance?
Management's Discussion of Fund Performance
Equities outperformed fixed income securities for the trailing one-year period ending October 31, 2024 led by domestic stocks. Both the S&P 500 Index and Russell 3000 Index generated strong returns supported by easing inflation and interest rate cuts. Bonds lagged but still posted strong positive returns for the trailing one-year period as measured by the Bloomberg US Aggregate Bond Index. Treasury yields ended broadly lower and most spread sectors generated positive excess returns over duration-equivalent government bonds as spreads narrowed, supported by more accommodative central bank policies. Fund performance described below is relative to the Fund’s blended benchmark, 33.4% Russell 3000 Index/ 33.3% S&P 500 Index/ 33.3% Bloomberg US Aggregate Bond Index (the "Blended Benchmark"), for the trailing twelve-month period ended October 31, 2024.
Top Contributors to Performance
Performance relative to the Blended Benchmark was helped from the Fund’s position in the Hartford Total Return Bond ETF, which outperformed its benchmark, the Bloomberg US Aggregate Bond Index, during the period.
Top Detractors to Performance
Performance relative to the Blended Benchmark was hurt from the Fund’s position in The Hartford Dividend and Growth Fund, which underperformed its benchmark, the S&P 500 Index, during the period.
The Fund’s investment in The Hartford Capital Appreciation Fund also detracted from performance relative to the Blended Benchmark. The Hartford Capital Appreciation Fund lagged its benchmark, the Russell 3000 Index, during the period.
The views expressed in this section reflect the opinions of the Fund's investment manager, Hartford Funds Management Company, LLC, as of the date of this report and are subject to change based on changes in market, economic or other conditions. These views are not intended to be a forecast of future events and are no guarantee of future results.
Comparison of Change in Value of $ 10,000 Investment
The graph below represents the hypothetical growth of a $10,000 investment in Class C shares (excluding sales charges) and the comparative indices. If sales charges had been included, the value would have been lower.
Average Annual Total Returns
For the Periods Ended October 31, 2024 | 1 Year | 5 Years | 10 Years |
| Class C (with 1.00% contingent deferred sales charge) | 22.44% | 7.00%) | 6.66% |
| Class C (without 1.00% contingent deferred sales charge) | 23.44% | 7.00%) | 6.66% |
| Blended Benchmark | 28.27% | 9.97%) | 9.11% |
| Russell 3000 Index | 37.86% | 14.60%) | 12.44% |
| S&P 500 Index | 38.02% | 15.27%) | 13.00% |
| Bloomberg US Aggregate Bond Index | 10.55% | (0.23)% | 1.49% |
The Blended Benchmark is calculated by Hartford Funds Management Company, LLC.
The Fund’s past performance is not a good predictor of the Fund’s future performance. The graph and table do not reflect the deduction of taxes that a shareholder would pay on Fund distributions or redemption of Fund shares. Performance information reflects fee waivers and/or expense limitation arrangements, if any. Absent any applicable fee waivers and/or expense limitation arrangements, performance would have been lower. Visit hartfordfunds.com for the most recent performance information.
Key Fund Statistics as of October 31, 2024
| Fund's net assets | $1,403,957,177% |
| Total number of portfolio holdings | $5% |
| Total investment management fees paid | $0% |
| Portfolio turnover rate | $7% |
Graphical Representation of Holdings as of October 31, 2024
The table below shows the investment makeup of the Fund, representing the percentage of net assets of the Fund.
Composition by Asset Allocation
| Domestic Equity Funds | 66.7 | % |
| Taxable Fixed Income Fund | 33.0 | % |
| Short-Term Investments | 0.2 | % |
| Other Assets & Liabilities | 0.1 | % |
| Total | 100.0 | % |
Availability of Additional Information
For additional information about the Fund, including its prospectus, financial information, holdings, and proxy voting information, please visit the Fund’s website at the website address included at the beginning of this report.
The Fund is distributed by Hartford Funds Distributors, LLC (HFD).
Annual Shareholder Report
October 31, 2024
The Hartford Checks and Balances Fund
Class I/HCKIX
This annual shareholder report contains important information about The Hartford Checks and Balances Fund (the "Fund") for the period of November 1, 2023 to October 31, 2024. You can find additional information about the Fund at hartfordfunds.com/reports-hmf. You can also request this information by contacting us by calling 1‑888‑843‑7824.
What were the Fund costs for the last year?
(Based on a hypothetical $10,000 investment)
| Class Name | Costs of a $10,000 investment | Costs paid as a percentage
of a $10,000 investment |
| Class I | $17 | 0.15% |
Costs paid excludes fees and expenses incurred indirectly as a result of investments in other investment companies.
How did the Fund perform last year and what impacted its performance?
Management's Discussion of Fund Performance
Equities outperformed fixed income securities for the trailing one-year period ending October 31, 2024 led by domestic stocks. Both the S&P 500 Index and Russell 3000 Index generated strong returns supported by easing inflation and interest rate cuts. Bonds lagged but still posted strong positive returns for the trailing one-year period as measured by the Bloomberg US Aggregate Bond Index. Treasury yields ended broadly lower and most spread sectors generated positive excess returns over duration-equivalent government bonds as spreads narrowed, supported by more accommodative central bank policies. Fund performance described below is relative to the Fund’s blended benchmark, 33.4% Russell 3000 Index/ 33.3% S&P 500 Index/ 33.3% Bloomberg US Aggregate Bond Index (the "Blended Benchmark"), for the trailing twelve-month period ended October 31, 2024.
Top Contributors to Performance
Performance relative to the Blended Benchmark was helped from the Fund’s position in the Hartford Total Return Bond ETF, which outperformed its benchmark, the Bloomberg US Aggregate Bond Index, during the period.
Top Detractors to Performance
Performance relative to the Blended Benchmark was hurt from the Fund’s position in The Hartford Dividend and Growth Fund, which underperformed its benchmark, the S&P 500 Index, during the period.
The Fund’s investment in The Hartford Capital Appreciation Fund also detracted from performance relative to the Blended Benchmark. The Hartford Capital Appreciation Fund lagged its benchmark, the Russell 3000 Index, during the period.
The views expressed in this section reflect the opinions of the Fund's investment manager, Hartford Funds Management Company, LLC, as of the date of this report and are subject to change based on changes in market, economic or other conditions. These views are not intended to be a forecast of future events and are no guarantee of future results.
Comparison of Change in Value of $ 10,000 Investment
The graph below represents the hypothetical growth of a $10,000 investment in Class I shares and the comparative indices.
Average Annual Total Returns
For the Periods Ended October 31, 2024 | 1 Year | 5 Years | 10 Years |
| Class I | 24.70% | 8.07%) | 7.74% |
| Blended Benchmark | 28.27% | 9.97%) | 9.11% |
| Russell 3000 Index | 37.86% | 14.60%) | 12.44% |
| S&P 500 Index | 38.02% | 15.27%) | 13.00% |
| Bloomberg US Aggregate Bond Index | 10.55% | (0.23)% | 1.49% |
The Blended Benchmark is calculated by Hartford Funds Management Company, LLC.
The Fund’s past performance is not a good predictor of the Fund’s future performance. The graph and table do not reflect the deduction of taxes that a shareholder would pay on Fund distributions or redemption of Fund shares. Performance information reflects fee waivers and/or expense limitation arrangements, if any. Absent any applicable fee waivers and/or expense limitation arrangements, performance would have been lower. Visit hartfordfunds.com for the most recent performance information.
Key Fund Statistics as of October 31, 2024
| Fund's net assets | $1,403,957,177% |
| Total number of portfolio holdings | $5% |
| Total investment management fees paid | $0% |
| Portfolio turnover rate | $7% |
Graphical Representation of Holdings as of October 31, 2024
The table below shows the investment makeup of the Fund, representing the percentage of net assets of the Fund.
Composition by Asset Allocation
| Domestic Equity Funds | 66.7 | % |
| Taxable Fixed Income Fund | 33.0 | % |
| Short-Term Investments | 0.2 | % |
| Other Assets & Liabilities | 0.1 | % |
| Total | 100.0 | % |
Availability of Additional Information
For additional information about the Fund, including its prospectus, financial information, holdings, and proxy voting information, please visit the Fund’s website at the website address included at the beginning of this report.
The Fund is distributed by Hartford Funds Distributors, LLC (HFD).
Annual Shareholder Report
October 31, 2024
The Hartford Checks and Balances Fund
Class R3/HCKRX
This annual shareholder report contains important information about The Hartford Checks and Balances Fund (the "Fund") for the period of November 1, 2023 to October 31, 2024. You can find additional information about the Fund at hartfordfunds.com/reports-hmf. You can also request this information by contacting us by calling 1‑888‑843‑7824.
What were the Fund costs for the last year?
(Based on a hypothetical $10,000 investment)
| Class Name | Costs of a $10,000 investment | Costs paid as a percentage
of a $10,000 investment |
| Class R3 | $84 | 0.75% |
Costs paid excludes fees and expenses incurred indirectly as a result of investments in other investment companies.
How did the Fund perform last year and what impacted its performance?
Management's Discussion of Fund Performance
Equities outperformed fixed income securities for the trailing one-year period ending October 31, 2024 led by domestic stocks. Both the S&P 500 Index and Russell 3000 Index generated strong returns supported by easing inflation and interest rate cuts. Bonds lagged but still posted strong positive returns for the trailing one-year period as measured by the Bloomberg US Aggregate Bond Index. Treasury yields ended broadly lower and most spread sectors generated positive excess returns over duration-equivalent government bonds as spreads narrowed, supported by more accommodative central bank policies. Fund performance described below is relative to the Fund’s blended benchmark, 33.4% Russell 3000 Index/ 33.3% S&P 500 Index/ 33.3% Bloomberg US Aggregate Bond Index (the "Blended Benchmark"), for the trailing twelve-month period ended October 31, 2024.
Top Contributors to Performance
Performance relative to the Blended Benchmark was helped from the Fund’s position in the Hartford Total Return Bond ETF, which outperformed its benchmark, the Bloomberg US Aggregate Bond Index, during the period.
Top Detractors to Performance
Performance relative to the Blended Benchmark was hurt from the Fund’s position in The Hartford Dividend and Growth Fund, which underperformed its benchmark, the S&P 500 Index, during the period.
The Fund’s investment in The Hartford Capital Appreciation Fund also detracted from performance relative to the Blended Benchmark. The Hartford Capital Appreciation Fund lagged its benchmark, the Russell 3000 Index, during the period.
The views expressed in this section reflect the opinions of the Fund's investment manager, Hartford Funds Management Company, LLC, as of the date of this report and are subject to change based on changes in market, economic or other conditions. These views are not intended to be a forecast of future events and are no guarantee of future results.
Comparison of Change in Value of $ 10,000 Investment
The graph below represents the hypothetical growth of a $10,000 investment in Class R3 shares and the comparative indices.
Average Annual Total Returns
For the Periods Ended October 31, 2024 | 1 Year | 5 Years | 10 Years |
| Class R3 | 24.06% | 7.42%) | 7.09% |
| Blended Benchmark | 28.27% | 9.97%) | 9.11% |
| Russell 3000 Index | 37.86% | 14.60%) | 12.44% |
| S&P 500 Index | 38.02% | 15.27%) | 13.00% |
| Bloomberg US Aggregate Bond Index | 10.55% | (0.23)% | 1.49% |
The Blended Benchmark is calculated by Hartford Funds Management Company, LLC.
The Fund’s past performance is not a good predictor of the Fund’s future performance. The graph and table do not reflect the deduction of taxes that a shareholder would pay on Fund distributions or redemption of Fund shares. Performance information reflects fee waivers and/or expense limitation arrangements, if any. Absent any applicable fee waivers and/or expense limitation arrangements, performance would have been lower. Visit hartfordfunds.com for the most recent performance information.
Key Fund Statistics as of October 31, 2024
| Fund's net assets | $1,403,957,177% |
| Total number of portfolio holdings | $5% |
| Total investment management fees paid | $0% |
| Portfolio turnover rate | $7% |
Graphical Representation of Holdings as of October 31, 2024
The table below shows the investment makeup of the Fund, representing the percentage of net assets of the Fund.
Composition by Asset Allocation
| Domestic Equity Funds | 66.7 | % |
| Taxable Fixed Income Fund | 33.0 | % |
| Short-Term Investments | 0.2 | % |
| Other Assets & Liabilities | 0.1 | % |
| Total | 100.0 | % |
Availability of Additional Information
For additional information about the Fund, including its prospectus, financial information, holdings, and proxy voting information, please visit the Fund’s website at the website address included at the beginning of this report.
The Fund is distributed by Hartford Funds Distributors, LLC (HFD).
Annual Shareholder Report
October 31, 2024
The Hartford Checks and Balances Fund
Class R4/HCKSX
This annual shareholder report contains important information about The Hartford Checks and Balances Fund (the "Fund") for the period of November 1, 2023 to October 31, 2024. You can find additional information about the Fund at hartfordfunds.com/reports-hmf. You can also request this information by contacting us by calling 1‑888‑843‑7824.
What were the Fund costs for the last year?
(Based on a hypothetical $10,000 investment)
| Class Name | Costs of a $10,000 investment | Costs paid as a percentage
of a $10,000 investment |
| Class R4 | $50 | 0.45% |
Costs paid excludes fees and expenses incurred indirectly as a result of investments in other investment companies.
How did the Fund perform last year and what impacted its performance?
Management's Discussion of Fund Performance
Equities outperformed fixed income securities for the trailing one-year period ending October 31, 2024 led by domestic stocks. Both the S&P 500 Index and Russell 3000 Index generated strong returns supported by easing inflation and interest rate cuts. Bonds lagged but still posted strong positive returns for the trailing one-year period as measured by the Bloomberg US Aggregate Bond Index. Treasury yields ended broadly lower and most spread sectors generated positive excess returns over duration-equivalent government bonds as spreads narrowed, supported by more accommodative central bank policies. Fund performance described below is relative to the Fund’s blended benchmark, 33.4% Russell 3000 Index/ 33.3% S&P 500 Index/ 33.3% Bloomberg US Aggregate Bond Index (the "Blended Benchmark"), for the trailing twelve-month period ended October 31, 2024.
Top Contributors to Performance
Performance relative to the Blended Benchmark was helped from the Fund’s position in the Hartford Total Return Bond ETF, which outperformed its benchmark, the Bloomberg US Aggregate Bond Index, during the period.
Top Detractors to Performance
Performance relative to the Blended Benchmark was hurt from the Fund’s position in The Hartford Dividend and Growth Fund, which underperformed its benchmark, the S&P 500 Index, during the period.
The Fund’s investment in The Hartford Capital Appreciation Fund also detracted from performance relative to the Blended Benchmark. The Hartford Capital Appreciation Fund lagged its benchmark, the Russell 3000 Index, during the period.
The views expressed in this section reflect the opinions of the Fund's investment manager, Hartford Funds Management Company, LLC, as of the date of this report and are subject to change based on changes in market, economic or other conditions. These views are not intended to be a forecast of future events and are no guarantee of future results.
Comparison of Change in Value of $ 10,000 Investment
The graph below represents the hypothetical growth of a $10,000 investment in Class R4 shares and the comparative indices.
Average Annual Total Returns
For the Periods Ended October 31, 2024 | 1 Year | 5 Years | 10 Years |
| Class R4 | 24.40% | 7.74%) | 7.41% |
| Blended Benchmark | 28.27% | 9.97%) | 9.11% |
| Russell 3000 Index | 37.86% | 14.60%) | 12.44% |
| S&P 500 Index | 38.02% | 15.27%) | 13.00% |
| Bloomberg US Aggregate Bond Index | 10.55% | (0.23)% | 1.49% |
The Blended Benchmark is calculated by Hartford Funds Management Company, LLC.
The Fund’s past performance is not a good predictor of the Fund’s future performance. The graph and table do not reflect the deduction of taxes that a shareholder would pay on Fund distributions or redemption of Fund shares. Performance information reflects fee waivers and/or expense limitation arrangements, if any. Absent any applicable fee waivers and/or expense limitation arrangements, performance would have been lower. Visit hartfordfunds.com for the most recent performance information.
Key Fund Statistics as of October 31, 2024
| Fund's net assets | $1,403,957,177% |
| Total number of portfolio holdings | $5% |
| Total investment management fees paid | $0% |
| Portfolio turnover rate | $7% |
Graphical Representation of Holdings as of October 31, 2024
The table below shows the investment makeup of the Fund, representing the percentage of net assets of the Fund.
Composition by Asset Allocation
| Domestic Equity Funds | 66.7 | % |
| Taxable Fixed Income Fund | 33.0 | % |
| Short-Term Investments | 0.2 | % |
| Other Assets & Liabilities | 0.1 | % |
| Total | 100.0 | % |
Availability of Additional Information
For additional information about the Fund, including its prospectus, financial information, holdings, and proxy voting information, please visit the Fund’s website at the website address included at the beginning of this report.
The Fund is distributed by Hartford Funds Distributors, LLC (HFD).
Annual Shareholder Report
October 31, 2024
The Hartford Checks and Balances Fund
Class R5/HCKTX
This annual shareholder report contains important information about The Hartford Checks and Balances Fund (the "Fund") for the period of November 1, 2023 to October 31, 2024. You can find additional information about the Fund at hartfordfunds.com/reports-hmf. You can also request this information by contacting us by calling 1‑888‑843‑7824.
What were the Fund costs for the last year?
(Based on a hypothetical $10,000 investment)
| Class Name | Costs of a $10,000 investment | Costs paid as a percentage
of a $10,000 investment |
| Class R5 | $16 | 0.14% |
Costs paid excludes fees and expenses incurred indirectly as a result of investments in other investment companies.
How did the Fund perform last year and what impacted its performance?
Management's Discussion of Fund Performance
Equities outperformed fixed income securities for the trailing one-year period ending October 31, 2024 led by domestic stocks. Both the S&P 500 Index and Russell 3000 Index generated strong returns supported by easing inflation and interest rate cuts. Bonds lagged but still posted strong positive returns for the trailing one-year period as measured by the Bloomberg US Aggregate Bond Index. Treasury yields ended broadly lower and most spread sectors generated positive excess returns over duration-equivalent government bonds as spreads narrowed, supported by more accommodative central bank policies. Fund performance described below is relative to the Fund’s blended benchmark, 33.4% Russell 3000 Index/ 33.3% S&P 500 Index/ 33.3% Bloomberg US Aggregate Bond Index (the "Blended Benchmark"), for the trailing twelve-month period ended October 31, 2024.
Top Contributors to Performance
Performance relative to the Blended Benchmark was helped from the Fund’s position in the Hartford Total Return Bond ETF, which outperformed its benchmark, the Bloomberg US Aggregate Bond Index, during the period.
Top Detractors to Performance
Performance relative to the Blended Benchmark was hurt from the Fund’s position in The Hartford Dividend and Growth Fund, which underperformed its benchmark, the S&P 500 Index, during the period.
The Fund’s investment in The Hartford Capital Appreciation Fund also detracted from performance relative to the Blended Benchmark. The Hartford Capital Appreciation Fund lagged its benchmark, the Russell 3000 Index, during the period.
The views expressed in this section reflect the opinions of the Fund's investment manager, Hartford Funds Management Company, LLC, as of the date of this report and are subject to change based on changes in market, economic or other conditions. These views are not intended to be a forecast of future events and are no guarantee of future results.
Comparison of Change in Value of $ 10,000 Investment
The graph below represents the hypothetical growth of a $10,000 investment in Class R5 shares and the comparative indices.
Average Annual Total Returns
For the Periods Ended October 31, 2024 | 1 Year | 5 Years | 10 Years |
| Class R5 | 24.82% | 8.06%) | 7.70% |
| Blended Benchmark | 28.27% | 9.97%) | 9.11% |
| Russell 3000 Index | 37.86% | 14.60%) | 12.44% |
| S&P 500 Index | 38.02% | 15.27%) | 13.00% |
| Bloomberg US Aggregate Bond Index | 10.55% | (0.23)% | 1.49% |
The Blended Benchmark is calculated by Hartford Funds Management Company, LLC.
The Fund’s past performance is not a good predictor of the Fund’s future performance. The graph and table do not reflect the deduction of taxes that a shareholder would pay on Fund distributions or redemption of Fund shares. Performance information reflects fee waivers and/or expense limitation arrangements, if any. Absent any applicable fee waivers and/or expense limitation arrangements, performance would have been lower. Visit hartfordfunds.com for the most recent performance information.
Key Fund Statistics as of October 31, 2024
| Fund's net assets | $1,403,957,177% |
| Total number of portfolio holdings | $5% |
| Total investment management fees paid | $0% |
| Portfolio turnover rate | $7% |
Graphical Representation of Holdings as of October 31, 2024
The table below shows the investment makeup of the Fund, representing the percentage of net assets of the Fund.
Composition by Asset Allocation
| Domestic Equity Funds | 66.7 | % |
| Taxable Fixed Income Fund | 33.0 | % |
| Short-Term Investments | 0.2 | % |
| Other Assets & Liabilities | 0.1 | % |
| Total | 100.0 | % |
Availability of Additional Information
For additional information about the Fund, including its prospectus, financial information, holdings, and proxy voting information, please visit the Fund’s website at the website address included at the beginning of this report.
The Fund is distributed by Hartford Funds Distributors, LLC (HFD).
Annual Shareholder Report
October 31, 2024
The Hartford Checks and Balances Fund
Class F/HCKFX
This annual shareholder report contains important information about The Hartford Checks and Balances Fund (the "Fund") for the period of November 1, 2023 to October 31, 2024. You can find additional information about the Fund at hartfordfunds.com/reports-hmf. You can also request this information by contacting us by calling 1‑888‑843‑7824.
What were the Fund costs for the last year?
(Based on a hypothetical $10,000 investment)
| Class Name | Costs of a $10,000 investment | Costs paid as a percentage
of a $10,000 investment |
| Class F | $5 | 0.04% |
Costs paid excludes fees and expenses incurred indirectly as a result of investments in other investment companies.
How did the Fund perform last year and what impacted its performance?
Management's Discussion of Fund Performance
Equities outperformed fixed income securities for the trailing one-year period ending October 31, 2024 led by domestic stocks. Both the S&P 500 Index and Russell 3000 Index generated strong returns supported by easing inflation and interest rate cuts. Bonds lagged but still posted strong positive returns for the trailing one-year period as measured by the Bloomberg US Aggregate Bond Index. Treasury yields ended broadly lower and most spread sectors generated positive excess returns over duration-equivalent government bonds as spreads narrowed, supported by more accommodative central bank policies. Fund performance described below is relative to the Fund’s blended benchmark, 33.4% Russell 3000 Index/ 33.3% S&P 500 Index/ 33.3% Bloomberg US Aggregate Bond Index (the "Blended Benchmark"), for the trailing twelve-month period ended October 31, 2024.
Top Contributors to Performance
Performance relative to the Blended Benchmark was helped from the Fund’s position in the Hartford Total Return Bond ETF, which outperformed its benchmark, the Bloomberg US Aggregate Bond Index, during the period.
Top Detractors to Performance
Performance relative to the Blended Benchmark was hurt from the Fund’s position in The Hartford Dividend and Growth Fund, which underperformed its benchmark, the S&P 500 Index, during the period.
The Fund’s investment in The Hartford Capital Appreciation Fund also detracted from performance relative to the Blended Benchmark. The Hartford Capital Appreciation Fund lagged its benchmark, the Russell 3000 Index, during the period.
The views expressed in this section reflect the opinions of the Fund's investment manager, Hartford Funds Management Company, LLC, as of the date of this report and are subject to change based on changes in market, economic or other conditions. These views are not intended to be a forecast of future events and are no guarantee of future results.
Comparison of Change in Value of $ 1,000,000 Investment
The graph below represents the hypothetical growth of a $1,000,000 investment in Class F shares and the comparative indices.
Average Annual Total Returns
For the Periods Ended October 31, 2024 | 1 Year | 5 Years | 10 Years |
| Class F | 24.83% | 8.17%) | 7.82% |
| Blended Benchmark | 28.27% | 9.97%) | 9.11% |
| Russell 3000 Index | 37.86% | 14.60%) | 12.44% |
| S&P 500 Index | 38.02% | 15.27%) | 13.00% |
| Bloomberg US Aggregate Bond Index | 10.55% | (0.23)% | 1.49% |
Class F shares commenced operations on February 28, 2017 and performance prior to that date reflects the performance of the Fund's Class I shares. Performance prior to the inception date of the class has not been adjusted to reflect the operating expenses of the class.
The Blended Benchmark is calculated by Hartford Funds Management Company, LLC.
The Fund’s past performance is not a good predictor of the Fund’s future performance. The graph and table do not reflect the deduction of taxes that a shareholder would pay on Fund distributions or redemption of Fund shares. Performance information reflects fee waivers and/or expense limitation arrangements, if any. Absent any applicable fee waivers and/or expense limitation arrangements, performance would have been lower. Visit hartfordfunds.com for the most recent performance information.
Key Fund Statistics as of October 31, 2024
| Fund's net assets | $1,403,957,177% |
| Total number of portfolio holdings | $5% |
| Total investment management fees paid | $0% |
| Portfolio turnover rate | $7% |
Graphical Representation of Holdings as of October 31, 2024
The table below shows the investment makeup of the Fund, representing the percentage of net assets of the Fund.
Composition by Asset Allocation
| Domestic Equity Funds | 66.7 | % |
| Taxable Fixed Income Fund | 33.0 | % |
| Short-Term Investments | 0.2 | % |
| Other Assets & Liabilities | 0.1 | % |
| Total | 100.0 | % |
Availability of Additional Information
For additional information about the Fund, including its prospectus, financial information, holdings, and proxy voting information, please visit the Fund’s website at the website address included at the beginning of this report.
The Fund is distributed by Hartford Funds Distributors, LLC (HFD).
Annual Shareholder Report
October 31, 2024
The Hartford Conservative Allocation Fund
Class A/HCVAX
This annual shareholder report contains important information about The Hartford Conservative Allocation Fund (the "Fund") for the period of November 1, 2023 to October 31, 2024. You can find additional information about the Fund at hartfordfunds.com/reports-hmf. You can also request this information by contacting us by calling 1‑888‑843‑7824.
This report describes changes to the Fund that occurred during the reporting period.
What were the Fund costs for the last year?
(Based on a hypothetical $10,000 investment)
| Class Name | Costs of a $10,000 investment | Costs paid as a percentage
of a $10,000 investment |
| Class A | $69 | 0.63% |
Costs paid excludes fees and expenses incurred indirectly as a result of investments in other investment companies.
How did the Fund perform last year and what impacted its performance?
Management's Discussion of Fund Performance
Equities outperformed fixed income securities for the trailing one-year period ending October 31, 2024 led by domestic stocks. United States (U.S.) equities generated strong returns as measured by the Russell 3000 Index. International equities also had strong performance for the trailing one-year period as measured by the MSCI ACWI ex USA Index (Net) supported by easing inflation and interest rate cuts. Bonds lagged but still posted strong positive returns for the trailing one-year period as measured by the Bloomberg US Aggregate Bond Index. Treasury yields ended broadly lower and most spread sectors generated positive excess returns over duration-equivalent government bonds as spreads narrowed, supported by more accommodative central bank policies. Fund performance described below is relative to the Fund’s blended benchmark, 65% Bloomberg US Aggregate Bond Index/ 25% Russell 3000 Index/ 10% MSCI ACWI ex USA Index (Net) (the "Blended Benchmark"), for the trailing twelve-month period ended October 31, 2024.
Top Contributors to Performance
The Fund’s investment in the Hartford Large Cap Growth ETF was the top contributor to relative performance for the trailing twelve-month period as large-cap growth stocks had strong performance and the Hartford Large Cap Growth ETF outperformed its benchmark during the period.
In fixed income, performance was helped from the Fund’s position in the Hartford Core Bond ETF, which outperformed its benchmark during the period.
Asset allocation also contributed to results helped from the overweight to underlying funds with high yield exposure as high yield performed well during the period.
Top Detractors to Performance
The Fund’s investments in The Hartford Equity Income Fund and Hartford Multifactor US Equity ETF were top detractors to performance as value stocks underperformed during the trailing twelve-month period.
Performance was also hurt from the Fund’s position in The Hartford World Bond Fund, which underperformed its benchmark during the period.
The views expressed in this section reflect the opinions of the Fund's investment manager, Hartford Funds Management Company, LLC, as of the date of this report and are subject to change based on changes in market, economic or other conditions. These views are not intended to be a forecast of future events and are no guarantee of future results.
Comparison of Change in Value of $ 10,000 Investment
The graph below represents the hypothetical growth of a $10,000 investment in Class A shares and the comparative indices. The returns for Class A shares include the maximum front-end sales charge applicable to Class A shares.
Average Annual Total Returns
For the Periods Ended October 31, 2024 | 1 Year | 5 Years | 10 Years |
| Class A (with 5.50% maximum front-end sales charge) | 11.60% | 2.49%) | 2.83% |
| Class A (without 5.50% maximum front-end sales charge) | 18.10% | 3.66%) | 3.41% |
| Blended Benchmark | 18.32% | 4.20%) | 4.72% |
| Bloomberg US Aggregate Bond Index | 10.55% | (0.23)% | 1.49% |
| Russell 3000 Index | 37.86% | 14.60%) | 12.44% |
| MSCI ACWI ex USA Index (Net) | 24.33% | 5.78%) | 4.79% |
The Blended Benchmark is calculated by Hartford Funds Management Company, LLC.
Performance information for the Fund prior to December 1, 2015 includes performance when the Fund was sub-advised by Wellington Management Company LLP using a modified strategy.
The Fund’s past performance is not a good predictor of the Fund’s future performance. The graph and table do not reflect the deduction of taxes that a shareholder would pay on Fund distributions or redemption of Fund shares. Performance information reflects fee waivers and/or expense limitation arrangements, if any. Absent any applicable fee waivers and/or expense limitation arrangements, performance would have been lower. Visit hartfordfunds.com for the most recent performance information.
Key Fund Statistics as of October 31, 2024
| Fund's net assets | $152,987,326% |
| Total number of portfolio holdings | $19% |
| Total investment management fees paid | $93,231% |
| Portfolio turnover rate | $29% |
Graphical Representation of Holdings as of October 31, 2024
The table below shows the investment makeup of the Fund, representing the percentage of net assets of the Fund.
Composition by Asset Allocation
| Taxable Fixed Income Funds | 62.7 | % |
| Domestic Equity Funds | 26.6 | % |
| International/Global Equity Funds | 10.4 | % |
| Short-Term Investments | 0.2 | % |
| Other Assets & Liabilities | 0.1 | % |
| Total | 100.0 | % |
Material Fund Changes
This is a summary of certain changes to the Fund since the beginning of the reporting period.
Effective as of the close of business on October 25, 2024, the Fund’s contractual investment management fee was eliminated and certain of the Fund’s expense limitation arrangements were reduced. The expense limitation arrangement remains in effect until February 28, 2026 unless the Board of Directors of The Hartford Mutual Funds, Inc. approves its earlier termination. These changes were announced in supplements to the Fund’s statutory prospectus dated June 20, 2024 and October 28, 2024 and reflected in the Fund’s summary prospectus dated March 1, 2024, as restated October 28, 2024.
For more complete information, you may review the Fund’s current prospectus dated March 1, 2024, as may be amended, supplemented or restated, and the Fund’s next prospectus, which we expect to be available by March 1, 2025, at hartfordfunds.com/reports‑hmf, upon request by calling 1-888-843-7824 or sending an e-mail to orders@mysummaryprospectus.com.
Availability of Additional Information
For additional information about the Fund, including its prospectus, financial information, holdings, and proxy voting information, please visit the Fund’s website at the website address included at the beginning of this report.
The Fund is distributed by Hartford Funds Distributors, LLC (HFD).
Annual Shareholder Report
October 31, 2024
The Hartford Conservative Allocation Fund
Class C/HCVCX
This annual shareholder report contains important information about The Hartford Conservative Allocation Fund (the "Fund") for the period of November 1, 2023 to October 31, 2024. You can find additional information about the Fund at hartfordfunds.com/reports-hmf. You can also request this information by contacting us by calling 1‑888‑843‑7824.
This report describes changes to the Fund that occurred during the reporting period.
What were the Fund costs for the last year?
(Based on a hypothetical $10,000 investment)
| Class Name | Costs of a $10,000 investment | Costs paid as a percentage
of a $10,000 investment |
| Class C | $156 | 1.44% |
Costs paid excludes fees and expenses incurred indirectly as a result of investments in other investment companies.
How did the Fund perform last year and what impacted its performance?
Management's Discussion of Fund Performance
Equities outperformed fixed income securities for the trailing one-year period ending October 31, 2024 led by domestic stocks. United States (U.S.) equities generated strong returns as measured by the Russell 3000 Index. International equities also had strong performance for the trailing one-year period as measured by the MSCI ACWI ex USA Index (Net) supported by easing inflation and interest rate cuts. Bonds lagged but still posted strong positive returns for the trailing one-year period as measured by the Bloomberg US Aggregate Bond Index. Treasury yields ended broadly lower and most spread sectors generated positive excess returns over duration-equivalent government bonds as spreads narrowed, supported by more accommodative central bank policies. Fund performance described below is relative to the Fund’s blended benchmark, 65% Bloomberg US Aggregate Bond Index/ 25% Russell 3000 Index/ 10% MSCI ACWI ex USA Index (Net) (the "Blended Benchmark"), for the trailing twelve-month period ended October 31, 2024.
Top Contributors to Performance
The Fund’s investment in the Hartford Large Cap Growth ETF was the top contributor to relative performance for the trailing twelve-month period as large-cap growth stocks had strong performance and the Hartford Large Cap Growth ETF outperformed its benchmark during the period.
In fixed income, performance was helped from the Fund’s position in the Hartford Core Bond ETF, which outperformed its benchmark during the period.
Asset allocation also contributed to results helped from the overweight to underlying funds with high yield exposure as high yield performed well during the period.
Top Detractors to Performance
The Fund’s investments in The Hartford Equity Income Fund and Hartford Multifactor US Equity ETF were top detractors to performance as value stocks underperformed during the trailing twelve-month period.
Performance was also hurt from the Fund’s position in The Hartford World Bond Fund, which underperformed its benchmark during the period.
The views expressed in this section reflect the opinions of the Fund's investment manager, Hartford Funds Management Company, LLC, as of the date of this report and are subject to change based on changes in market, economic or other conditions. These views are not intended to be a forecast of future events and are no guarantee of future results.
Comparison of Change in Value of $ 10,000 Investment
The graph below represents the hypothetical growth of a $10,000 investment in Class C shares (excluding sales charges) and the comparative indices. If sales charges had been included, the value would have been lower.
Average Annual Total Returns
For the Periods Ended October 31, 2024 | 1 Year | 5 Years | 10 Years |
| Class C (with 1.00% contingent deferred sales charge) | 16.05% | 2.86%) | 2.61% |
| Class C (without 1.00% contingent deferred sales charge) | 17.05% | 2.86%) | 2.61% |
| Blended Benchmark | 18.32% | 4.20%) | 4.72% |
| Bloomberg US Aggregate Bond Index | 10.55% | (0.23)% | 1.49% |
| Russell 3000 Index | 37.86% | 14.60%) | 12.44% |
| MSCI ACWI ex USA Index (Net) | 24.33% | 5.78%) | 4.79% |
The Blended Benchmark is calculated by Hartford Funds Management Company, LLC.
Performance information for the Fund prior to December 1, 2015 includes performance when the Fund was sub-advised by Wellington Management Company LLP using a modified strategy.
The Fund’s past performance is not a good predictor of the Fund’s future performance. The graph and table do not reflect the deduction of taxes that a shareholder would pay on Fund distributions or redemption of Fund shares. Performance information reflects fee waivers and/or expense limitation arrangements, if any. Absent any applicable fee waivers and/or expense limitation arrangements, performance would have been lower. Visit hartfordfunds.com for the most recent performance information.
Key Fund Statistics as of October 31, 2024
| Fund's net assets | $152,987,326% |
| Total number of portfolio holdings | $19% |
| Total investment management fees paid | $93,231% |
| Portfolio turnover rate | $29% |
Graphical Representation of Holdings as of October 31, 2024
The table below shows the investment makeup of the Fund, representing the percentage of net assets of the Fund.
Composition by Asset Allocation
| Taxable Fixed Income Funds | 62.7 | % |
| Domestic Equity Funds | 26.6 | % |
| International/Global Equity Funds | 10.4 | % |
| Short-Term Investments | 0.2 | % |
| Other Assets & Liabilities | 0.1 | % |
| Total | 100.0 | % |
Material Fund Changes
This is a summary of certain changes to the Fund since the beginning of the reporting period.
Effective as of the close of business on October 25, 2024, the Fund’s contractual investment management fee was eliminated and certain of the Fund’s expense limitation arrangements were reduced. The expense limitation arrangement remains in effect until February 28, 2026 unless the Board of Directors of The Hartford Mutual Funds, Inc. approves its earlier termination. These changes were announced in supplements to the Fund’s statutory prospectus dated June 20, 2024 and October 28, 2024 and reflected in the Fund’s summary prospectus dated March 1, 2024, as restated October 28, 2024.
For more complete information, you may review the Fund’s current prospectus dated March 1, 2024, as may be amended, supplemented or restated, and the Fund’s next prospectus, which we expect to be available by March 1, 2025, at hartfordfunds.com/reports‑hmf, upon request by calling 1-888-843-7824 or sending an e-mail to orders@mysummaryprospectus.com.
Availability of Additional Information
For additional information about the Fund, including its prospectus, financial information, holdings, and proxy voting information, please visit the Fund’s website at the website address included at the beginning of this report.
The Fund is distributed by Hartford Funds Distributors, LLC (HFD).
Annual Shareholder Report
October 31, 2024
The Hartford Conservative Allocation Fund
Class I/HCVIX
This annual shareholder report contains important information about The Hartford Conservative Allocation Fund (the "Fund") for the period of November 1, 2023 to October 31, 2024. You can find additional information about the Fund at hartfordfunds.com/reports-hmf. You can also request this information by contacting us by calling 1‑888‑843‑7824.
This report describes changes to the Fund that occurred during the reporting period.
What were the Fund costs for the last year?
(Based on a hypothetical $10,000 investment)
| Class Name | Costs of a $10,000 investment | Costs paid as a percentage
of a $10,000 investment |
| Class I | $41 | 0.38% |
Costs paid excludes fees and expenses incurred indirectly as a result of investments in other investment companies.
How did the Fund perform last year and what impacted its performance?
Management's Discussion of Fund Performance
Equities outperformed fixed income securities for the trailing one-year period ending October 31, 2024 led by domestic stocks. United States (U.S.) equities generated strong returns as measured by the Russell 3000 Index. International equities also had strong performance for the trailing one-year period as measured by the MSCI ACWI ex USA Index (Net) supported by easing inflation and interest rate cuts. Bonds lagged but still posted strong positive returns for the trailing one-year period as measured by the Bloomberg US Aggregate Bond Index. Treasury yields ended broadly lower and most spread sectors generated positive excess returns over duration-equivalent government bonds as spreads narrowed, supported by more accommodative central bank policies. Fund performance described below is relative to the Fund’s blended benchmark, 65% Bloomberg US Aggregate Bond Index/ 25% Russell 3000 Index/ 10% MSCI ACWI ex USA Index (Net) (the "Blended Benchmark"), for the trailing twelve-month period ended October 31, 2024.
Top Contributors to Performance
The Fund’s investment in the Hartford Large Cap Growth ETF was the top contributor to relative performance for the trailing twelve-month period as large-cap growth stocks had strong performance and the Hartford Large Cap Growth ETF outperformed its benchmark during the period.
In fixed income, performance was helped from the Fund’s position in the Hartford Core Bond ETF, which outperformed its benchmark during the period.
Asset allocation also contributed to results helped from the overweight to underlying funds with high yield exposure as high yield performed well during the period.
Top Detractors to Performance
The Fund’s investments in The Hartford Equity Income Fund and Hartford Multifactor US Equity ETF were top detractors to performance as value stocks underperformed during the trailing twelve-month period.
Performance was also hurt from the Fund’s position in The Hartford World Bond Fund, which underperformed its benchmark during the period.
The views expressed in this section reflect the opinions of the Fund's investment manager, Hartford Funds Management Company, LLC, as of the date of this report and are subject to change based on changes in market, economic or other conditions. These views are not intended to be a forecast of future events and are no guarantee of future results.
Comparison of Change in Value of $ 10,000 Investment
The graph below represents the hypothetical growth of a $10,000 investment in Class I shares and the comparative indices.
Average Annual Total Returns
For the Periods Ended October 31, 2024 | 1 Year | 5 Years | 10 Years |
| Class I | 18.35% | 3.93%) | 3.67% |
| Blended Benchmark | 18.32% | 4.20%) | 4.72% |
| Bloomberg US Aggregate Bond Index | 10.55% | (0.23)% | 1.49% |
| Russell 3000 Index | 37.86% | 14.60%) | 12.44% |
| MSCI ACWI ex USA Index (Net) | 24.33% | 5.78%) | 4.79% |
The Blended Benchmark is calculated by Hartford Funds Management Company, LLC.
Performance information for the Fund prior to December 1, 2015 includes performance when the Fund was sub-advised by Wellington Management Company LLP using a modified strategy.
The Fund’s past performance is not a good predictor of the Fund’s future performance. The graph and table do not reflect the deduction of taxes that a shareholder would pay on Fund distributions or redemption of Fund shares. Performance information reflects fee waivers and/or expense limitation arrangements, if any. Absent any applicable fee waivers and/or expense limitation arrangements, performance would have been lower. Visit hartfordfunds.com for the most recent performance information.
Key Fund Statistics as of October 31, 2024
| Fund's net assets | $152,987,326% |
| Total number of portfolio holdings | $19% |
| Total investment management fees paid | $93,231% |
| Portfolio turnover rate | $29% |
Graphical Representation of Holdings as of October 31, 2024
The table below shows the investment makeup of the Fund, representing the percentage of net assets of the Fund.
Composition by Asset Allocation
| Taxable Fixed Income Funds | 62.7 | % |
| Domestic Equity Funds | 26.6 | % |
| International/Global Equity Funds | 10.4 | % |
| Short-Term Investments | 0.2 | % |
| Other Assets & Liabilities | 0.1 | % |
| Total | 100.0 | % |
Material Fund Changes
This is a summary of certain changes to the Fund since the beginning of the reporting period.
Effective as of the close of business on October 25, 2024, the Fund’s contractual investment management fee was eliminated and certain of the Fund’s expense limitation arrangements were reduced. The expense limitation arrangement remains in effect until February 28, 2026 unless the Board of Directors of The Hartford Mutual Funds, Inc. approves its earlier termination. These changes were announced in supplements to the Fund’s statutory prospectus dated June 20, 2024 and October 28, 2024 and reflected in the Fund’s summary prospectus dated March 1, 2024, as restated October 28, 2024.
For more complete information, you may review the Fund’s current prospectus dated March 1, 2024, as may be amended, supplemented or restated, and the Fund’s next prospectus, which we expect to be available by March 1, 2025, at hartfordfunds.com/reports‑hmf, upon request by calling 1-888-843-7824 or sending an e-mail to orders@mysummaryprospectus.com.
Availability of Additional Information
For additional information about the Fund, including its prospectus, financial information, holdings, and proxy voting information, please visit the Fund’s website at the website address included at the beginning of this report.
The Fund is distributed by Hartford Funds Distributors, LLC (HFD).
Annual Shareholder Report
October 31, 2024
The Hartford Conservative Allocation Fund
Class R3/HCVRX
This annual shareholder report contains important information about The Hartford Conservative Allocation Fund (the "Fund") for the period of November 1, 2023 to October 31, 2024. You can find additional information about the Fund at hartfordfunds.com/reports-hmf. You can also request this information by contacting us by calling 1‑888‑843‑7824.
This report describes changes to the Fund that occurred during the reporting period.
What were the Fund costs for the last year?
(Based on a hypothetical $10,000 investment)
| Class Name | Costs of a $10,000 investment | Costs paid as a percentage
of a $10,000 investment |
| Class R3 | $107 | 0.98% |
Costs paid excludes fees and expenses incurred indirectly as a result of investments in other investment companies.
How did the Fund perform last year and what impacted its performance?
Management's Discussion of Fund Performance
Equities outperformed fixed income securities for the trailing one-year period ending October 31, 2024 led by domestic stocks. United States (U.S.) equities generated strong returns as measured by the Russell 3000 Index. International equities also had strong performance for the trailing one-year period as measured by the MSCI ACWI ex USA Index (Net) supported by easing inflation and interest rate cuts. Bonds lagged but still posted strong positive returns for the trailing one-year period as measured by the Bloomberg US Aggregate Bond Index. Treasury yields ended broadly lower and most spread sectors generated positive excess returns over duration-equivalent government bonds as spreads narrowed, supported by more accommodative central bank policies. Fund performance described below is relative to the Fund’s blended benchmark, 65% Bloomberg US Aggregate Bond Index/ 25% Russell 3000 Index/ 10% MSCI ACWI ex USA Index (Net) (the "Blended Benchmark"), for the trailing twelve-month period ended October 31, 2024.
Top Contributors to Performance
The Fund’s investment in the Hartford Large Cap Growth ETF was the top contributor to relative performance for the trailing twelve-month period as large-cap growth stocks had strong performance and the Hartford Large Cap Growth ETF outperformed its benchmark during the period.
In fixed income, performance was helped from the Fund’s position in the Hartford Core Bond ETF, which outperformed its benchmark during the period.
Asset allocation also contributed to results helped from the overweight to underlying funds with high yield exposure as high yield performed well during the period.
Top Detractors to Performance
The Fund’s investments in The Hartford Equity Income Fund and Hartford Multifactor US Equity ETF were top detractors to performance as value stocks underperformed during the trailing twelve-month period.
Performance was also hurt from the Fund’s position in The Hartford World Bond Fund, which underperformed its benchmark during the period.
The views expressed in this section reflect the opinions of the Fund's investment manager, Hartford Funds Management Company, LLC, as of the date of this report and are subject to change based on changes in market, economic or other conditions. These views are not intended to be a forecast of future events and are no guarantee of future results.
Comparison of Change in Value of $ 10,000 Investment
The graph below represents the hypothetical growth of a $10,000 investment in Class R3 shares and the comparative indices.
Average Annual Total Returns
For the Periods Ended October 31, 2024 | 1 Year | 5 Years | 10 Years |
| Class R3 | 17.61% | 3.29%) | 3.07% |
| Blended Benchmark | 18.32% | 4.20%) | 4.72% |
| Bloomberg US Aggregate Bond Index | 10.55% | (0.23)% | 1.49% |
| Russell 3000 Index | 37.86% | 14.60%) | 12.44% |
| MSCI ACWI ex USA Index (Net) | 24.33% | 5.78%) | 4.79% |
The Blended Benchmark is calculated by Hartford Funds Management Company, LLC.
Performance information for the Fund prior to December 1, 2015 includes performance when the Fund was sub-advised by Wellington Management Company LLP using a modified strategy.
The Fund’s past performance is not a good predictor of the Fund’s future performance. The graph and table do not reflect the deduction of taxes that a shareholder would pay on Fund distributions or redemption of Fund shares. Performance information reflects fee waivers and/or expense limitation arrangements, if any. Absent any applicable fee waivers and/or expense limitation arrangements, performance would have been lower. Visit hartfordfunds.com for the most recent performance information.
Key Fund Statistics as of October 31, 2024
| Fund's net assets | $152,987,326% |
| Total number of portfolio holdings | $19% |
| Total investment management fees paid | $93,231% |
| Portfolio turnover rate | $29% |
Graphical Representation of Holdings as of October 31, 2024
The table below shows the investment makeup of the Fund, representing the percentage of net assets of the Fund.
Composition by Asset Allocation
| Taxable Fixed Income Funds | 62.7 | % |
| Domestic Equity Funds | 26.6 | % |
| International/Global Equity Funds | 10.4 | % |
| Short-Term Investments | 0.2 | % |
| Other Assets & Liabilities | 0.1 | % |
| Total | 100.0 | % |
Material Fund Changes
This is a summary of certain changes to the Fund since the beginning of the reporting period.
Effective as of the close of business on October 25, 2024, the Fund’s contractual investment management fee was eliminated and certain of the Fund’s expense limitation arrangements were reduced. The expense limitation arrangement remains in effect until February 28, 2026 unless the Board of Directors of The Hartford Mutual Funds, Inc. approves its earlier termination. These changes were announced in supplements to the Fund’s statutory prospectus dated June 20, 2024 and October 28, 2024 and reflected in the Fund’s summary prospectus dated March 1, 2024, as restated October 28, 2024.
For more complete information, you may review the Fund’s current prospectus dated March 1, 2024, as may be amended, supplemented or restated, and the Fund’s next prospectus, which we expect to be available by March 1, 2025, at hartfordfunds.com/reports‑hmf, upon request by calling 1-888-843-7824 or sending an e-mail to orders@mysummaryprospectus.com.
Availability of Additional Information
For additional information about the Fund, including its prospectus, financial information, holdings, and proxy voting information, please visit the Fund’s website at the website address included at the beginning of this report.
The Fund is distributed by Hartford Funds Distributors, LLC (HFD).
Annual Shareholder Report
October 31, 2024
The Hartford Conservative Allocation Fund
Class R4/HCVSX
This annual shareholder report contains important information about The Hartford Conservative Allocation Fund (the "Fund") for the period of November 1, 2023 to October 31, 2024. You can find additional information about the Fund at hartfordfunds.com/reports-hmf. You can also request this information by contacting us by calling 1‑888‑843‑7824.
This report describes changes to the Fund that occurred during the reporting period.
What were the Fund costs for the last year?
(Based on a hypothetical $10,000 investment)
| Class Name | Costs of a $10,000 investment | Costs paid as a percentage
of a $10,000 investment |
| Class R4 | $74 | 0.68% |
Costs paid excludes fees and expenses incurred indirectly as a result of investments in other investment companies.
How did the Fund perform last year and what impacted its performance?
Management's Discussion of Fund Performance
Equities outperformed fixed income securities for the trailing one-year period ending October 31, 2024 led by domestic stocks. United States (U.S.) equities generated strong returns as measured by the Russell 3000 Index. International equities also had strong performance for the trailing one-year period as measured by the MSCI ACWI ex USA Index (Net) supported by easing inflation and interest rate cuts. Bonds lagged but still posted strong positive returns for the trailing one-year period as measured by the Bloomberg US Aggregate Bond Index. Treasury yields ended broadly lower and most spread sectors generated positive excess returns over duration-equivalent government bonds as spreads narrowed, supported by more accommodative central bank policies. Fund performance described below is relative to the Fund’s blended benchmark, 65% Bloomberg US Aggregate Bond Index/ 25% Russell 3000 Index/ 10% MSCI ACWI ex USA Index (Net) (the "Blended Benchmark"), for the trailing twelve-month period ended October 31, 2024.
Top Contributors to Performance
The Fund’s investment in the Hartford Large Cap Growth ETF was the top contributor to relative performance for the trailing twelve-month period as large-cap growth stocks had strong performance and the Hartford Large Cap Growth ETF outperformed its benchmark during the period.
In fixed income, performance was helped from the Fund’s position in the Hartford Core Bond ETF, which outperformed its benchmark during the period.
Asset allocation also contributed to results helped from the overweight to underlying funds with high yield exposure as high yield performed well during the period.
Top Detractors to Performance
The Fund’s investments in The Hartford Equity Income Fund and Hartford Multifactor US Equity ETF were top detractors to performance as value stocks underperformed during the trailing twelve-month period.
Performance was also hurt from the Fund’s position in The Hartford World Bond Fund, which underperformed its benchmark during the period.
The views expressed in this section reflect the opinions of the Fund's investment manager, Hartford Funds Management Company, LLC, as of the date of this report and are subject to change based on changes in market, economic or other conditions. These views are not intended to be a forecast of future events and are no guarantee of future results.
Comparison of Change in Value of $ 10,000 Investment
The graph below represents the hypothetical growth of a $10,000 investment in Class R4 shares and the comparative indices.
Average Annual Total Returns
For the Periods Ended October 31, 2024 | 1 Year | 5 Years | 10 Years |
| Class R4 | 17.99% | 3.59%) | 3.39% |
| Blended Benchmark | 18.32% | 4.20%) | 4.72% |
| Bloomberg US Aggregate Bond Index | 10.55% | (0.23)% | 1.49% |
| Russell 3000 Index | 37.86% | 14.60%) | 12.44% |
| MSCI ACWI ex USA Index (Net) | 24.33% | 5.78%) | 4.79% |
The Blended Benchmark is calculated by Hartford Funds Management Company, LLC.
Performance information for the Fund prior to December 1, 2015 includes performance when the Fund was sub-advised by Wellington Management Company LLP using a modified strategy.
The Fund’s past performance is not a good predictor of the Fund’s future performance. The graph and table do not reflect the deduction of taxes that a shareholder would pay on Fund distributions or redemption of Fund shares. Performance information reflects fee waivers and/or expense limitation arrangements, if any. Absent any applicable fee waivers and/or expense limitation arrangements, performance would have been lower. Visit hartfordfunds.com for the most recent performance information.
Key Fund Statistics as of October 31, 2024
| Fund's net assets | $152,987,326% |
| Total number of portfolio holdings | $19% |
| Total investment management fees paid | $93,231% |
| Portfolio turnover rate | $29% |
Graphical Representation of Holdings as of October 31, 2024
The table below shows the investment makeup of the Fund, representing the percentage of net assets of the Fund.
Composition by Asset Allocation
| Taxable Fixed Income Funds | 62.7 | % |
| Domestic Equity Funds | 26.6 | % |
| International/Global Equity Funds | 10.4 | % |
| Short-Term Investments | 0.2 | % |
| Other Assets & Liabilities | 0.1 | % |
| Total | 100.0 | % |
Material Fund Changes
This is a summary of certain changes to the Fund since the beginning of the reporting period.
Effective as of the close of business on October 25, 2024, the Fund’s contractual investment management fee was eliminated and certain of the Fund’s expense limitation arrangements were reduced. The expense limitation arrangement remains in effect until February 28, 2026 unless the Board of Directors of The Hartford Mutual Funds, Inc. approves its earlier termination. These changes were announced in supplements to the Fund’s statutory prospectus dated June 20, 2024 and October 28, 2024 and reflected in the Fund’s summary prospectus dated March 1, 2024, as restated October 28, 2024.
For more complete information, you may review the Fund’s current prospectus dated March 1, 2024, as may be amended, supplemented or restated, and the Fund’s next prospectus, which we expect to be available by March 1, 2025, at hartfordfunds.com/reports‑hmf, upon request by calling 1-888-843-7824 or sending an e-mail to orders@mysummaryprospectus.com.
Availability of Additional Information
For additional information about the Fund, including its prospectus, financial information, holdings, and proxy voting information, please visit the Fund’s website at the website address included at the beginning of this report.
The Fund is distributed by Hartford Funds Distributors, LLC (HFD).
Annual Shareholder Report
October 31, 2024
The Hartford Conservative Allocation Fund
Class R5/HCVTX
This annual shareholder report contains important information about The Hartford Conservative Allocation Fund (the "Fund") for the period of November 1, 2023 to October 31, 2024. You can find additional information about the Fund at hartfordfunds.com/reports-hmf. You can also request this information by contacting us by calling 1‑888‑843‑7824.
This report describes changes to the Fund that occurred during the reporting period.
What were the Fund costs for the last year?
(Based on a hypothetical $10,000 investment)
| Class Name | Costs of a $10,000 investment | Costs paid as a percentage
of a $10,000 investment |
| Class R5 | $41 | 0.38% |
Costs paid excludes fees and expenses incurred indirectly as a result of investments in other investment companies.
How did the Fund perform last year and what impacted its performance?
Management's Discussion of Fund Performance
Equities outperformed fixed income securities for the trailing one-year period ending October 31, 2024 led by domestic stocks. United States (U.S.) equities generated strong returns as measured by the Russell 3000 Index. International equities also had strong performance for the trailing one-year period as measured by the MSCI ACWI ex USA Index (Net) supported by easing inflation and interest rate cuts. Bonds lagged but still posted strong positive returns for the trailing one-year period as measured by the Bloomberg US Aggregate Bond Index. Treasury yields ended broadly lower and most spread sectors generated positive excess returns over duration-equivalent government bonds as spreads narrowed, supported by more accommodative central bank policies. Fund performance described below is relative to the Fund’s blended benchmark, 65% Bloomberg US Aggregate Bond Index/ 25% Russell 3000 Index/ 10% MSCI ACWI ex USA Index (Net) (the "Blended Benchmark"), for the trailing twelve-month period ended October 31, 2024.
Top Contributors to Performance
The Fund’s investment in the Hartford Large Cap Growth ETF was the top contributor to relative performance for the trailing twelve-month period as large-cap growth stocks had strong performance and the Hartford Large Cap Growth ETF outperformed its benchmark during the period.
In fixed income, performance was helped from the Fund’s position in the Hartford Core Bond ETF, which outperformed its benchmark during the period.
Asset allocation also contributed to results helped from the overweight to underlying funds with high yield exposure as high yield performed well during the period.
Top Detractors to Performance
The Fund’s investments in The Hartford Equity Income Fund and Hartford Multifactor US Equity ETF were top detractors to performance as value stocks underperformed during the trailing twelve-month period.
Performance was also hurt from the Fund’s position in The Hartford World Bond Fund, which underperformed its benchmark during the period.
The views expressed in this section reflect the opinions of the Fund's investment manager, Hartford Funds Management Company, LLC, as of the date of this report and are subject to change based on changes in market, economic or other conditions. These views are not intended to be a forecast of future events and are no guarantee of future results.
Comparison of Change in Value of $ 10,000 Investment
The graph below represents the hypothetical growth of a $10,000 investment in Class R5 shares and the comparative indices.
Average Annual Total Returns
For the Periods Ended October 31, 2024 | 1 Year | 5 Years | 10 Years |
| Class R5 | 18.38% | 3.91%) | 3.70% |
| Blended Benchmark | 18.32% | 4.20%) | 4.72% |
| Bloomberg US Aggregate Bond Index | 10.55% | (0.23)% | 1.49% |
| Russell 3000 Index | 37.86% | 14.60%) | 12.44% |
| MSCI ACWI ex USA Index (Net) | 24.33% | 5.78%) | 4.79% |
The Blended Benchmark is calculated by Hartford Funds Management Company, LLC.
Performance information for the Fund prior to December 1, 2015 includes performance when the Fund was sub-advised by Wellington Management Company LLP using a modified strategy.
The Fund’s past performance is not a good predictor of the Fund’s future performance. The graph and table do not reflect the deduction of taxes that a shareholder would pay on Fund distributions or redemption of Fund shares. Performance information reflects fee waivers and/or expense limitation arrangements, if any. Absent any applicable fee waivers and/or expense limitation arrangements, performance would have been lower. Visit hartfordfunds.com for the most recent performance information.
Key Fund Statistics as of October 31, 2024
| Fund's net assets | $152,987,326% |
| Total number of portfolio holdings | $19% |
| Total investment management fees paid | $93,231% |
| Portfolio turnover rate | $29% |
Graphical Representation of Holdings as of October 31, 2024
The table below shows the investment makeup of the Fund, representing the percentage of net assets of the Fund.
Composition by Asset Allocation
| Taxable Fixed Income Funds | 62.7 | % |
| Domestic Equity Funds | 26.6 | % |
| International/Global Equity Funds | 10.4 | % |
| Short-Term Investments | 0.2 | % |
| Other Assets & Liabilities | 0.1 | % |
| Total | 100.0 | % |
Material Fund Changes
This is a summary of certain changes to the Fund since the beginning of the reporting period.
Effective as of the close of business on October 25, 2024, the Fund’s contractual investment management fee was eliminated and certain of the Fund’s expense limitation arrangements were reduced. The expense limitation arrangement remains in effect until February 28, 2026 unless the Board of Directors of The Hartford Mutual Funds, Inc. approves its earlier termination. These changes were announced in supplements to the Fund’s statutory prospectus dated June 20, 2024 and October 28, 2024 and reflected in the Fund’s summary prospectus dated March 1, 2024, as restated October 28, 2024.
For more complete information, you may review the Fund’s current prospectus dated March 1, 2024, as may be amended, supplemented or restated, and the Fund’s next prospectus, which we expect to be available by March 1, 2025, at hartfordfunds.com/reports‑hmf, upon request by calling 1-888-843-7824 or sending an e-mail to orders@mysummaryprospectus.com.
Availability of Additional Information
For additional information about the Fund, including its prospectus, financial information, holdings, and proxy voting information, please visit the Fund’s website at the website address included at the beginning of this report.
The Fund is distributed by Hartford Funds Distributors, LLC (HFD).
Annual Shareholder Report
October 31, 2024
The Hartford Conservative Allocation Fund
Class Y/HCVYX
This annual shareholder report contains important information about The Hartford Conservative Allocation Fund (the "Fund") for the period of November 1, 2023 to October 31, 2024. You can find additional information about the Fund at hartfordfunds.com/reports-hmf. You can also request this information by contacting us by calling 1‑888‑843‑7824.
This report describes changes to the Fund that occurred during the reporting period.
What were the Fund costs for the last year?
(Based on a hypothetical $10,000 investment)
| Class Name | Costs of a $10,000 investment* | Costs paid as a percentage
of a $10,000 investment^ |
| Class Y | $0 | 0.16% |
| * | Reflects information for the period of October 25, 2024 (commencement of operations of Class Y shares) through October 31, 2024. Expenses for the full reporting period would be higher. |
| ^ | Annualized. |
Costs paid excludes fees and expenses incurred indirectly as a result of investments in other investment companies.
How did the Fund perform last year and what impacted its performance?
Management's Discussion of Fund Performance
Equities outperformed fixed income securities for the trailing one-year period ending October 31, 2024 led by domestic stocks. United States (U.S.) equities generated strong returns as measured by the Russell 3000 Index. International equities also had strong performance for the trailing one-year period as measured by the MSCI ACWI ex USA Index (Net) supported by easing inflation and interest rate cuts. Bonds lagged but still posted strong positive returns for the trailing one-year period as measured by the Bloomberg US Aggregate Bond Index. Treasury yields ended broadly lower and most spread sectors generated positive excess returns over duration-equivalent government bonds as spreads narrowed, supported by more accommodative central bank policies. Fund performance described below is relative to the Fund’s blended benchmark, 65% Bloomberg US Aggregate Bond Index/ 25% Russell 3000 Index/ 10% MSCI ACWI ex USA Index (Net) (the "Blended Benchmark"), for the trailing twelve-month period ended October 31, 2024.
Top Contributors to Performance
The Fund’s investment in the Hartford Large Cap Growth ETF was the top contributor to relative performance for the trailing twelve-month period as large-cap growth stocks had strong performance and the Hartford Large Cap Growth ETF outperformed its benchmark during the period.
In fixed income, performance was helped from the Fund’s position in the Hartford Core Bond ETF, which outperformed its benchmark during the period.
Asset allocation also contributed to results helped from the overweight to underlying funds with high yield exposure as high yield performed well during the period.
Top Detractors to Performance
The Fund’s investments in The Hartford Equity Income Fund and Hartford Multifactor US Equity ETF were top detractors to performance as value stocks underperformed during the trailing twelve-month period.
Performance was also hurt from the Fund’s position in The Hartford World Bond Fund, which underperformed its benchmark during the period.
The views expressed in this section reflect the opinions of the Fund's investment manager, Hartford Funds Management Company, LLC, as of the date of this report and are subject to change based on changes in market, economic or other conditions. These views are not intended to be a forecast of future events and are no guarantee of future results.
Comparison of Change in Value of $ 250,000 Investment
The graph below represents the hypothetical growth of a $250,000 investment in Class Y shares and the comparative indices.
Average Annual Total Returns
For the Period Ended October 31, 2024 | 1 Year | 5 Years | 10 Years |
| Class Y | (0.61)% | 3.93%) | 3.67% |
| Blended Benchmark | 18.32%) | 4.20%) | 4.72% |
| Bloomberg US Aggregate Bond Index | 10.55%) | (0.23)% | 1.49% |
| Russell 3000 Index | 37.86%) | 14.60%) | 12.44% |
| MSCI ACWI ex USA Index (Net) | 24.33%) | 5.78%) | 4.79% |
Class Y shares commenced operations on October 25, 2024 and performance prior to that date is that of the Fund's Class I shares.
The Blended Benchmark is calculated by Hartford Funds Management Company, LLC.
Performance information for the Fund prior to December 1, 2015 includes performance when the Fund was sub-advised by Wellington Management Company LLP using a modified strategy.
The Fund’s past performance is not a good predictor of the Fund’s future performance. The graph and table do not reflect the deduction of taxes that a shareholder would pay on Fund distributions or redemption of Fund shares. Performance information reflects fee waivers and/or expense limitation arrangements, if any. Absent any applicable fee waivers and/or expense limitation arrangements, performance would have been lower. Visit hartfordfunds.com for the most recent performance information.
Key Fund Statistics as of October 31, 2024
| Fund's net assets | $152,987,326% |
| Total number of portfolio holdings | $19% |
| Total investment management fees paid | $93,231% |
| Portfolio turnover rate | $29% |
Graphical Representation of Holdings as of October 31, 2024
The table below shows the investment makeup of the Fund, representing the percentage of net assets of the Fund.
Composition by Asset Allocation
| Taxable Fixed Income Funds | 62.7 | % |
| Domestic Equity Funds | 26.6 | % |
| International/Global Equity Funds | 10.4 | % |
| Short-Term Investments | 0.2 | % |
| Other Assets & Liabilities | 0.1 | % |
| Total | 100.0 | % |
Material Fund Changes
This is a summary of certain changes to the Fund since the beginning of the reporting period.
Effective as of the close of business on October 25, 2024, the Fund’s contractual investment management fee was eliminated and certain of the Fund’s expense limitation arrangements were reduced. The expense limitation arrangement remains in effect until February 28, 2026 unless the Board of Directors of The Hartford Mutual Funds, Inc. approves its earlier termination. These changes were announced in supplements to the Fund’s statutory prospectus dated June 20, 2024 and October 28, 2024 and reflected in the Fund’s summary prospectus dated March 1, 2024, as restated October 28, 2024.
For more complete information, you may review the Fund’s current prospectus dated March 1, 2024, as may be amended, supplemented or restated, and the Fund’s next prospectus, which we expect to be available by March 1, 2025, at hartfordfunds.com/reports‑hmf, upon request by calling 1-888-843-7824 or sending an e-mail to orders@mysummaryprospectus.com.
Availability of Additional Information
For additional information about the Fund, including its prospectus, financial information, holdings, and proxy voting information, please visit the Fund’s website at the website address included at the beginning of this report.
The Fund is distributed by Hartford Funds Distributors, LLC (HFD).
Annual Shareholder Report
October 31, 2024
The Hartford Conservative Allocation Fund
Class F/HCVFX
This annual shareholder report contains important information about The Hartford Conservative Allocation Fund (the "Fund") for the period of November 1, 2023 to October 31, 2024. You can find additional information about the Fund at hartfordfunds.com/reports-hmf. You can also request this information by contacting us by calling 1‑888‑843‑7824.
This report describes changes to the Fund that occurred during the reporting period.
What were the Fund costs for the last year?
(Based on a hypothetical $10,000 investment)
| Class Name | Costs of a $10,000 investment | Costs paid as a percentage
of a $10,000 investment |
| Class F | $29 | 0.27% |
Costs paid excludes fees and expenses incurred indirectly as a result of investments in other investment companies.
How did the Fund perform last year and what impacted its performance?
Management's Discussion of Fund Performance
Equities outperformed fixed income securities for the trailing one-year period ending October 31, 2024 led by domestic stocks. United States (U.S.) equities generated strong returns as measured by the Russell 3000 Index. International equities also had strong performance for the trailing one-year period as measured by the MSCI ACWI ex USA Index (Net) supported by easing inflation and interest rate cuts. Bonds lagged but still posted strong positive returns for the trailing one-year period as measured by the Bloomberg US Aggregate Bond Index. Treasury yields ended broadly lower and most spread sectors generated positive excess returns over duration-equivalent government bonds as spreads narrowed, supported by more accommodative central bank policies. Fund performance described below is relative to the Fund’s blended benchmark, 65% Bloomberg US Aggregate Bond Index/ 25% Russell 3000 Index/ 10% MSCI ACWI ex USA Index (Net) (the "Blended Benchmark"), for the trailing twelve-month period ended October 31, 2024.
Top Contributors to Performance
The Fund’s investment in the Hartford Large Cap Growth ETF was the top contributor to relative performance for the trailing twelve-month period as large-cap growth stocks had strong performance and the Hartford Large Cap Growth ETF outperformed its benchmark during the period.
In fixed income, performance was helped from the Fund’s position in the Hartford Core Bond ETF, which outperformed its benchmark during the period.
Asset allocation also contributed to results helped from the overweight to underlying funds with high yield exposure as high yield performed well during the period.
Top Detractors to Performance
The Fund’s investments in The Hartford Equity Income Fund and Hartford Multifactor US Equity ETF were top detractors to performance as value stocks underperformed during the trailing twelve-month period.
Performance was also hurt from the Fund’s position in The Hartford World Bond Fund, which underperformed its benchmark during the period.
The views expressed in this section reflect the opinions of the Fund's investment manager, Hartford Funds Management Company, LLC, as of the date of this report and are subject to change based on changes in market, economic or other conditions. These views are not intended to be a forecast of future events and are no guarantee of future results.
Comparison of Change in Value of $ 1,000,000 Investment
The graph below represents the hypothetical growth of a $1,000,000 investment in Class F shares and the comparative indices.
Average Annual Total Returns
For the Periods Ended October 31, 2024 | 1 Year | 5 Years | 10 Years |
| Class F | 18.45% | 4.03%) | 3.75% |
| Blended Benchmark | 18.32% | 4.20%) | 4.72% |
| Bloomberg US Aggregate Bond Index | 10.55% | (0.23)% | 1.49% |
| Russell 3000 Index | 37.86% | 14.60%) | 12.44% |
| MSCI ACWI ex USA Index (Net) | 24.33% | 5.78%) | 4.79% |
Class F shares commenced operations on February 28, 2017 and performance prior to that date is that of the Fund’s Class I shares. Performance prior to the inception date of the class has not been adjusted to reflect the operating expenses of the class.
The Blended Benchmark is calculated by Hartford Funds Management Company, LLC.
Performance information for the Fund prior to December 1, 2015 includes performance when the Fund was sub-advised by Wellington Management Company LLP using a modified strategy.
The Fund’s past performance is not a good predictor of the Fund’s future performance. The graph and table do not reflect the deduction of taxes that a shareholder would pay on Fund distributions or redemption of Fund shares. Performance information reflects fee waivers and/or expense limitation arrangements, if any. Absent any applicable fee waivers and/or expense limitation arrangements, performance would have been lower. Visit hartfordfunds.com for the most recent performance information.
Key Fund Statistics as of October 31, 2024
| Fund's net assets | $152,987,326% |
| Total number of portfolio holdings | $19% |
| Total investment management fees paid | $93,231% |
| Portfolio turnover rate | $29% |
Graphical Representation of Holdings as of October 31, 2024
The table below shows the investment makeup of the Fund, representing the percentage of net assets of the Fund.
Composition by Asset Allocation
| Taxable Fixed Income Funds | 62.7 | % |
| Domestic Equity Funds | 26.6 | % |
| International/Global Equity Funds | 10.4 | % |
| Short-Term Investments | 0.2 | % |
| Other Assets & Liabilities | 0.1 | % |
| Total | 100.0 | % |
Material Fund Changes
This is a summary of certain changes to the Fund since the beginning of the reporting period.
Effective as of the close of business on October 25, 2024, the Fund’s contractual investment management fee was eliminated and certain of the Fund’s expense limitation arrangements were reduced. The expense limitation arrangement remains in effect until February 28, 2026 unless the Board of Directors of The Hartford Mutual Funds, Inc. approves its earlier termination. These changes were announced in supplements to the Fund’s statutory prospectus dated June 20, 2024 and October 28, 2024 and reflected in the Fund’s summary prospectus dated March 1, 2024, as restated October 28, 2024.
For more complete information, you may review the Fund’s current prospectus dated March 1, 2024, as may be amended, supplemented or restated, and the Fund’s next prospectus, which we expect to be available by March 1, 2025, at hartfordfunds.com/reports‑hmf, upon request by calling 1-888-843-7824 or sending an e-mail to orders@mysummaryprospectus.com.
Availability of Additional Information
For additional information about the Fund, including its prospectus, financial information, holdings, and proxy voting information, please visit the Fund’s website at the website address included at the beginning of this report.
The Fund is distributed by Hartford Funds Distributors, LLC (HFD).
Annual Shareholder Report
October 31, 2024
The Hartford Growth Allocation Fund
Class A/HRAAX
This annual shareholder report contains important information about The Hartford Growth Allocation Fund (the "Fund") for the period of November 1, 2023 to October 31, 2024. You can find additional information about the Fund at hartfordfunds.com/reports-hmf. You can also request this information by contacting us by calling 1‑888‑843‑7824.
What were the Fund costs for the last year?
(Based on a hypothetical $10,000 investment)
| Class Name | Costs of a $10,000 investment | Costs paid as a percentage
of a $10,000 investment |
| Class A | $60 | 0.53% |
Costs paid excludes fees and expenses incurred indirectly as a result of investments in other investment companies.
How did the Fund perform last year and what impacted its performance?
Management's Discussion of Fund Performance
Equities outperformed fixed income securities for the trailing one-year period ending October 31, 2024 led by domestic stocks. United States (U.S.) equities generated strong returns as measured by the Russell 3000 Index. International equities also had strong performance for the trailing one-year period as measured by the MSCI ACWI ex USA Index (Net) supported by easing inflation and interest rate cuts. Bonds lagged but still posted strong positive returns for the trailing one-year period as measured by the Bloomberg US Aggregate Bond Index. Treasury yields ended broadly lower and most spread sectors generated positive excess returns over duration-equivalent government bonds as spreads narrowed, supported by more accommodative central bank policies. Fund performance described below is relative to the Fund’s blended benchmark, 55% Russell 3000 Index/ 25% MSCI ACWI ex USA Index (Net)/ 20% Bloomberg US Aggregate Bond Index (the "Blended Benchmark"), for the trailing twelve-month period ended October 31, 2024.
Top Contributors to Performance
The Fund’s investments in the Hartford Large Cap Growth ETF and The Hartford Growth Opportunities Fund were the top contributors to performance for the trailing twelve-month period as large-cap growth stocks had strong performance and these underlying funds outperformed their benchmarks during the period.
In fixed income, performance was helped from the Fund’s position in the Hartford Core Bond ETF, which outperformed its benchmark during the period.
Asset allocation also contributed to performance as the overweight to equities was beneficial.
Top Detractors to Performance
The Fund’s investment in The Hartford Equity Income Fund and Hartford Multifactor US Equity ETF were top detractors to performance as value stocks underperformed during the trailing twelve-month period.
Performance was also hurt from the Fund’s position in the Hartford Core Equity Fund, which underperformed its benchmark during the period.
The Fund’s investments in the Hartford Schroders International Multi-Cap Value Fund and The Hartford International Opportunities Fund also detracted.
The views expressed in this section reflect the opinions of the Fund's investment manager, Hartford Funds Management Company, LLC, as of the date of this report and are subject to change based on changes in market, economic or other conditions. These views are not intended to be a forecast of future events and are no guarantee of future results.
Comparison of Change in Value of $ 10,000 Investment
The graph below represents the hypothetical growth of a $10,000 investment in Class A shares and the comparative indices. The returns for Class A shares include the maximum front-end sales charge applicable to Class A shares.
Average Annual Total Returns
For the Periods Ended October 31, 2024 | 1 Year | 5 Years | 10 Years |
| Class A (with 5.50% maximum front-end sales charge) | 20.98% | 6.87%) | 5.98% |
| Class A (without 5.50% maximum front-end sales charge) | 28.02% | 8.08%) | 6.58% |
| Blended Benchmark | 28.67% | 9.54%) | 8.47% |
| Russell 3000 Index | 37.86% | 14.60%) | 12.44% |
| MSCI ACWI ex USA Index (Net) | 24.33% | 5.78%) | 4.79% |
| Bloomberg US Aggregate Bond Index | 10.55% | (0.23)% | 1.49% |
The Blended Benchmark is calculated by Hartford Funds Management Company, LLC.
The Fund’s past performance is not a good predictor of the Fund’s future performance. The graph and table do not reflect the deduction of taxes that a shareholder would pay on Fund distributions or redemption of Fund shares. Performance information reflects fee waivers and/or expense limitation arrangements, if any. Absent any applicable fee waivers and/or expense limitation arrangements, performance would have been lower. Visit hartfordfunds.com for the most recent performance information.
Key Fund Statistics as of October 31, 2024
| Fund's net assets | $541,344,687% |
| Total number of portfolio holdings | $19% |
| Total investment management fees paid | $529,226% |
| Portfolio turnover rate | $9% |
Graphical Representation of Holdings as of October 31, 2024
The table below shows the investment makeup of the Fund, representing the percentage of net assets of the Fund.
Composition by Asset Allocation
| Domestic Equity Funds | 59.2 | % |
| International/Global Equity Funds | 25.8 | % |
| Taxable Fixed Income Funds | 14.8 | % |
| Short-Term Investments | 0.2 | % |
| Other Assets & Liabilities | 0.0 | % |
| Total | 100.0 | % |
Availability of Additional Information
For additional information about the Fund, including its prospectus, financial information, holdings, and proxy voting information, please visit the Fund’s website at the website address included at the beginning of this report.
The Fund is distributed by Hartford Funds Distributors, LLC (HFD).
Annual Shareholder Report
October 31, 2024
The Hartford Growth Allocation Fund
Class C/HRACX
This annual shareholder report contains important information about The Hartford Growth Allocation Fund (the "Fund") for the period of November 1, 2023 to October 31, 2024. You can find additional information about the Fund at hartfordfunds.com/reports-hmf. You can also request this information by contacting us by calling 1‑888‑843‑7824.
What were the Fund costs for the last year?
(Based on a hypothetical $10,000 investment)
| Class Name | Costs of a $10,000 investment | Costs paid as a percentage
of a $10,000 investment |
| Class C | $157 | 1.38% |
Costs paid excludes fees and expenses incurred indirectly as a result of investments in other investment companies.
How did the Fund perform last year and what impacted its performance?
Management's Discussion of Fund Performance
Equities outperformed fixed income securities for the trailing one-year period ending October 31, 2024 led by domestic stocks. United States (U.S.) equities generated strong returns as measured by the Russell 3000 Index. International equities also had strong performance for the trailing one-year period as measured by the MSCI ACWI ex USA Index (Net) supported by easing inflation and interest rate cuts. Bonds lagged but still posted strong positive returns for the trailing one-year period as measured by the Bloomberg US Aggregate Bond Index. Treasury yields ended broadly lower and most spread sectors generated positive excess returns over duration-equivalent government bonds as spreads narrowed, supported by more accommodative central bank policies. Fund performance described below is relative to the Fund’s blended benchmark, 55% Russell 3000 Index/ 25% MSCI ACWI ex USA Index (Net)/ 20% Bloomberg US Aggregate Bond Index (the "Blended Benchmark"), for the trailing twelve-month period ended October 31, 2024.
Top Contributors to Performance
The Fund’s investments in the Hartford Large Cap Growth ETF and The Hartford Growth Opportunities Fund were the top contributors to performance for the trailing twelve-month period as large-cap growth stocks had strong performance and these underlying funds outperformed their benchmarks during the period.
In fixed income, performance was helped from the Fund’s position in the Hartford Core Bond ETF, which outperformed its benchmark during the period.
Asset allocation also contributed to performance as the overweight to equities was beneficial.
Top Detractors to Performance
The Fund’s investment in The Hartford Equity Income Fund and Hartford Multifactor US Equity ETF were top detractors to performance as value stocks underperformed during the trailing twelve-month period.
Performance was also hurt from the Fund’s position in the Hartford Core Equity Fund, which underperformed its benchmark during the period.
The Fund’s investments in the Hartford Schroders International Multi-Cap Value Fund and The Hartford International Opportunities Fund also detracted.
The views expressed in this section reflect the opinions of the Fund's investment manager, Hartford Funds Management Company, LLC, as of the date of this report and are subject to change based on changes in market, economic or other conditions. These views are not intended to be a forecast of future events and are no guarantee of future results.
Comparison of Change in Value of $ 10,000 Investment
The graph below represents the hypothetical growth of a $10,000 investment in Class C shares (excluding sales charges) and the comparative indices. If sales charges had been included, the value would have been lower.
Average Annual Total Returns
For the Periods Ended October 31, 2024 | 1 Year | 5 Years | 10 Years |
| Class C (with 1.00% contingent deferred sales charge) | 25.98% | 7.20%) | 5.76% |
| Class C (without 1.00% contingent deferred sales charge) | 26.98% | 7.20%) | 5.76% |
| Blended Benchmark | 28.67% | 9.54%) | 8.47% |
| Russell 3000 Index | 37.86% | 14.60%) | 12.44% |
| MSCI ACWI ex USA Index (Net) | 24.33% | 5.78%) | 4.79% |
| Bloomberg US Aggregate Bond Index | 10.55% | (0.23)% | 1.49% |
The Blended Benchmark is calculated by Hartford Funds Management Company, LLC.
The Fund’s past performance is not a good predictor of the Fund’s future performance. The graph and table do not reflect the deduction of taxes that a shareholder would pay on Fund distributions or redemption of Fund shares. Performance information reflects fee waivers and/or expense limitation arrangements, if any. Absent any applicable fee waivers and/or expense limitation arrangements, performance would have been lower. Visit hartfordfunds.com for the most recent performance information.
Key Fund Statistics as of October 31, 2024
| Fund's net assets | $541,344,687% |
| Total number of portfolio holdings | $19% |
| Total investment management fees paid | $529,226% |
| Portfolio turnover rate | $9% |
Graphical Representation of Holdings as of October 31, 2024
The table below shows the investment makeup of the Fund, representing the percentage of net assets of the Fund.
Composition by Asset Allocation
| Domestic Equity Funds | 59.2 | % |
| International/Global Equity Funds | 25.8 | % |
| Taxable Fixed Income Funds | 14.8 | % |
| Short-Term Investments | 0.2 | % |
| Other Assets & Liabilities | 0.0 | % |
| Total | 100.0 | % |
Availability of Additional Information
For additional information about the Fund, including its prospectus, financial information, holdings, and proxy voting information, please visit the Fund’s website at the website address included at the beginning of this report.
The Fund is distributed by Hartford Funds Distributors, LLC (HFD).
Annual Shareholder Report
October 31, 2024
The Hartford Growth Allocation Fund
Class I/HRAIX
This annual shareholder report contains important information about The Hartford Growth Allocation Fund (the "Fund") for the period of November 1, 2023 to October 31, 2024. You can find additional information about the Fund at hartfordfunds.com/reports-hmf. You can also request this information by contacting us by calling 1‑888‑843‑7824.
What were the Fund costs for the last year?
(Based on a hypothetical $10,000 investment)
| Class Name | Costs of a $10,000 investment | Costs paid as a percentage
of a $10,000 investment |
| Class I | $30 | 0.26% |
Costs paid excludes fees and expenses incurred indirectly as a result of investments in other investment companies.
How did the Fund perform last year and what impacted its performance?
Management's Discussion of Fund Performance
Equities outperformed fixed income securities for the trailing one-year period ending October 31, 2024 led by domestic stocks. United States (U.S.) equities generated strong returns as measured by the Russell 3000 Index. International equities also had strong performance for the trailing one-year period as measured by the MSCI ACWI ex USA Index (Net) supported by easing inflation and interest rate cuts. Bonds lagged but still posted strong positive returns for the trailing one-year period as measured by the Bloomberg US Aggregate Bond Index. Treasury yields ended broadly lower and most spread sectors generated positive excess returns over duration-equivalent government bonds as spreads narrowed, supported by more accommodative central bank policies. Fund performance described below is relative to the Fund’s blended benchmark, 55% Russell 3000 Index/ 25% MSCI ACWI ex USA Index (Net)/ 20% Bloomberg US Aggregate Bond Index (the "Blended Benchmark"), for the trailing twelve-month period ended October 31, 2024.
Top Contributors to Performance
The Fund’s investments in the Hartford Large Cap Growth ETF and The Hartford Growth Opportunities Fund were the top contributors to performance for the trailing twelve-month period as large-cap growth stocks had strong performance and these underlying funds outperformed their benchmarks during the period.
In fixed income, performance was helped from the Fund’s position in the Hartford Core Bond ETF, which outperformed its benchmark during the period.
Asset allocation also contributed to performance as the overweight to equities was beneficial.
Top Detractors to Performance
The Fund’s investment in The Hartford Equity Income Fund and Hartford Multifactor US Equity ETF were top detractors to performance as value stocks underperformed during the trailing twelve-month period.
Performance was also hurt from the Fund’s position in the Hartford Core Equity Fund, which underperformed its benchmark during the period.
The Fund’s investments in the Hartford Schroders International Multi-Cap Value Fund and The Hartford International Opportunities Fund also detracted.
The views expressed in this section reflect the opinions of the Fund's investment manager, Hartford Funds Management Company, LLC, as of the date of this report and are subject to change based on changes in market, economic or other conditions. These views are not intended to be a forecast of future events and are no guarantee of future results.
Comparison of Change in Value of $ 10,000 Investment
The graph below represents the hypothetical growth of a $10,000 investment in Class I shares and the comparative indices.
Average Annual Total Returns
For the Periods Ended October 31, 2024 | 1 Year | 5 Years | 10 Years |
| Class I | 28.29% | 8.37%) | 6.90% |
| Blended Benchmark | 28.67% | 9.54%) | 8.47% |
| Russell 3000 Index | 37.86% | 14.60%) | 12.44% |
| MSCI ACWI ex USA Index (Net) | 24.33% | 5.78%) | 4.79% |
| Bloomberg US Aggregate Bond Index | 10.55% | (0.23)% | 1.49% |
The Blended Benchmark is calculated by Hartford Funds Management Company, LLC.
The Fund’s past performance is not a good predictor of the Fund’s future performance. The graph and table do not reflect the deduction of taxes that a shareholder would pay on Fund distributions or redemption of Fund shares. Performance information reflects fee waivers and/or expense limitation arrangements, if any. Absent any applicable fee waivers and/or expense limitation arrangements, performance would have been lower. Visit hartfordfunds.com for the most recent performance information.
Key Fund Statistics as of October 31, 2024
| Fund's net assets | $541,344,687% |
| Total number of portfolio holdings | $19% |
| Total investment management fees paid | $529,226% |
| Portfolio turnover rate | $9% |
Graphical Representation of Holdings as of October 31, 2024
The table below shows the investment makeup of the Fund, representing the percentage of net assets of the Fund.
Composition by Asset Allocation
| Domestic Equity Funds | 59.2 | % |
| International/Global Equity Funds | 25.8 | % |
| Taxable Fixed Income Funds | 14.8 | % |
| Short-Term Investments | 0.2 | % |
| Other Assets & Liabilities | 0.0 | % |
| Total | 100.0 | % |
Availability of Additional Information
For additional information about the Fund, including its prospectus, financial information, holdings, and proxy voting information, please visit the Fund’s website at the website address included at the beginning of this report.
The Fund is distributed by Hartford Funds Distributors, LLC (HFD).
Annual Shareholder Report
October 31, 2024
The Hartford Growth Allocation Fund
Class R3/HRARX
This annual shareholder report contains important information about The Hartford Growth Allocation Fund (the "Fund") for the period of November 1, 2023 to October 31, 2024. You can find additional information about the Fund at hartfordfunds.com/reports-hmf. You can also request this information by contacting us by calling 1‑888‑843‑7824.
What were the Fund costs for the last year?
(Based on a hypothetical $10,000 investment)
| Class Name | Costs of a $10,000 investment | Costs paid as a percentage
of a $10,000 investment |
| Class R3 | $100 | 0.88% |
Costs paid excludes fees and expenses incurred indirectly as a result of investments in other investment companies.
How did the Fund perform last year and what impacted its performance?
Management's Discussion of Fund Performance
Equities outperformed fixed income securities for the trailing one-year period ending October 31, 2024 led by domestic stocks. United States (U.S.) equities generated strong returns as measured by the Russell 3000 Index. International equities also had strong performance for the trailing one-year period as measured by the MSCI ACWI ex USA Index (Net) supported by easing inflation and interest rate cuts. Bonds lagged but still posted strong positive returns for the trailing one-year period as measured by the Bloomberg US Aggregate Bond Index. Treasury yields ended broadly lower and most spread sectors generated positive excess returns over duration-equivalent government bonds as spreads narrowed, supported by more accommodative central bank policies. Fund performance described below is relative to the Fund’s blended benchmark, 55% Russell 3000 Index/ 25% MSCI ACWI ex USA Index (Net)/ 20% Bloomberg US Aggregate Bond Index (the "Blended Benchmark"), for the trailing twelve-month period ended October 31, 2024.
Top Contributors to Performance
The Fund’s investments in the Hartford Large Cap Growth ETF and The Hartford Growth Opportunities Fund were the top contributors to performance for the trailing twelve-month period as large-cap growth stocks had strong performance and these underlying funds outperformed their benchmarks during the period.
In fixed income, performance was helped from the Fund’s position in the Hartford Core Bond ETF, which outperformed its benchmark during the period.
Asset allocation also contributed to performance as the overweight to equities was beneficial.
Top Detractors to Performance
The Fund’s investment in The Hartford Equity Income Fund and Hartford Multifactor US Equity ETF were top detractors to performance as value stocks underperformed during the trailing twelve-month period.
Performance was also hurt from the Fund’s position in the Hartford Core Equity Fund, which underperformed its benchmark during the period.
The Fund’s investments in the Hartford Schroders International Multi-Cap Value Fund and The Hartford International Opportunities Fund also detracted.
The views expressed in this section reflect the opinions of the Fund's investment manager, Hartford Funds Management Company, LLC, as of the date of this report and are subject to change based on changes in market, economic or other conditions. These views are not intended to be a forecast of future events and are no guarantee of future results.
Comparison of Change in Value of $ 10,000 Investment
The graph below represents the hypothetical growth of a $10,000 investment in Class R3 shares and the comparative indices.
Average Annual Total Returns
For the Periods Ended October 31, 2024 | 1 Year | 5 Years | 10 Years |
| Class R3 | 27.58% | 7.73%) | 6.24% |
| Blended Benchmark | 28.67% | 9.54%) | 8.47% |
| Russell 3000 Index | 37.86% | 14.60%) | 12.44% |
| MSCI ACWI ex USA Index (Net) | 24.33% | 5.78%) | 4.79% |
| Bloomberg US Aggregate Bond Index | 10.55% | (0.23)% | 1.49% |
The Blended Benchmark is calculated by Hartford Funds Management Company, LLC.
The Fund’s past performance is not a good predictor of the Fund’s future performance. The graph and table do not reflect the deduction of taxes that a shareholder would pay on Fund distributions or redemption of Fund shares. Performance information reflects fee waivers and/or expense limitation arrangements, if any. Absent any applicable fee waivers and/or expense limitation arrangements, performance would have been lower. Visit hartfordfunds.com for the most recent performance information.
Key Fund Statistics as of October 31, 2024
| Fund's net assets | $541,344,687% |
| Total number of portfolio holdings | $19% |
| Total investment management fees paid | $529,226% |
| Portfolio turnover rate | $9% |
Graphical Representation of Holdings as of October 31, 2024
The table below shows the investment makeup of the Fund, representing the percentage of net assets of the Fund.
Composition by Asset Allocation
| Domestic Equity Funds | 59.2 | % |
| International/Global Equity Funds | 25.8 | % |
| Taxable Fixed Income Funds | 14.8 | % |
| Short-Term Investments | 0.2 | % |
| Other Assets & Liabilities | 0.0 | % |
| Total | 100.0 | % |
Availability of Additional Information
For additional information about the Fund, including its prospectus, financial information, holdings, and proxy voting information, please visit the Fund’s website at the website address included at the beginning of this report.
The Fund is distributed by Hartford Funds Distributors, LLC (HFD).
Annual Shareholder Report
October 31, 2024
The Hartford Growth Allocation Fund
Class R4/HRASX
This annual shareholder report contains important information about The Hartford Growth Allocation Fund (the "Fund") for the period of November 1, 2023 to October 31, 2024. You can find additional information about the Fund at hartfordfunds.com/reports-hmf. You can also request this information by contacting us by calling 1‑888‑843‑7824.
What were the Fund costs for the last year?
(Based on a hypothetical $10,000 investment)
| Class Name | Costs of a $10,000 investment | Costs paid as a percentage
of a $10,000 investment |
| Class R4 | $65 | 0.57% |
Costs paid excludes fees and expenses incurred indirectly as a result of investments in other investment companies.
How did the Fund perform last year and what impacted its performance?
Management's Discussion of Fund Performance
Equities outperformed fixed income securities for the trailing one-year period ending October 31, 2024 led by domestic stocks. United States (U.S.) equities generated strong returns as measured by the Russell 3000 Index. International equities also had strong performance for the trailing one-year period as measured by the MSCI ACWI ex USA Index (Net) supported by easing inflation and interest rate cuts. Bonds lagged but still posted strong positive returns for the trailing one-year period as measured by the Bloomberg US Aggregate Bond Index. Treasury yields ended broadly lower and most spread sectors generated positive excess returns over duration-equivalent government bonds as spreads narrowed, supported by more accommodative central bank policies. Fund performance described below is relative to the Fund’s blended benchmark, 55% Russell 3000 Index/ 25% MSCI ACWI ex USA Index (Net)/ 20% Bloomberg US Aggregate Bond Index (the "Blended Benchmark"), for the trailing twelve-month period ended October 31, 2024.
Top Contributors to Performance
The Fund’s investments in the Hartford Large Cap Growth ETF and The Hartford Growth Opportunities Fund were the top contributors to performance for the trailing twelve-month period as large-cap growth stocks had strong performance and these underlying funds outperformed their benchmarks during the period.
In fixed income, performance was helped from the Fund’s position in the Hartford Core Bond ETF, which outperformed its benchmark during the period.
Asset allocation also contributed to performance as the overweight to equities was beneficial.
Top Detractors to Performance
The Fund’s investment in The Hartford Equity Income Fund and Hartford Multifactor US Equity ETF were top detractors to performance as value stocks underperformed during the trailing twelve-month period.
Performance was also hurt from the Fund’s position in the Hartford Core Equity Fund, which underperformed its benchmark during the period.
The Fund’s investments in the Hartford Schroders International Multi-Cap Value Fund and The Hartford International Opportunities Fund also detracted.
The views expressed in this section reflect the opinions of the Fund's investment manager, Hartford Funds Management Company, LLC, as of the date of this report and are subject to change based on changes in market, economic or other conditions. These views are not intended to be a forecast of future events and are no guarantee of future results.
Comparison of Change in Value of $ 10,000 Investment
The graph below represents the hypothetical growth of a $10,000 investment in Class R4 shares and the comparative indices.
Average Annual Total Returns
For the Periods Ended October 31, 2024 | 1 Year | 5 Years | 10 Years |
| Class R4 | 27.86% | 8.04%) | 6.55% |
| Blended Benchmark | 28.67% | 9.54%) | 8.47% |
| Russell 3000 Index | 37.86% | 14.60%) | 12.44% |
| MSCI ACWI ex USA Index (Net) | 24.33% | 5.78%) | 4.79% |
| Bloomberg US Aggregate Bond Index | 10.55% | (0.23)% | 1.49% |
The Blended Benchmark is calculated by Hartford Funds Management Company, LLC.
The Fund’s past performance is not a good predictor of the Fund’s future performance. The graph and table do not reflect the deduction of taxes that a shareholder would pay on Fund distributions or redemption of Fund shares. Performance information reflects fee waivers and/or expense limitation arrangements, if any. Absent any applicable fee waivers and/or expense limitation arrangements, performance would have been lower. Visit hartfordfunds.com for the most recent performance information.
Key Fund Statistics as of October 31, 2024
| Fund's net assets | $541,344,687% |
| Total number of portfolio holdings | $19% |
| Total investment management fees paid | $529,226% |
| Portfolio turnover rate | $9% |
Graphical Representation of Holdings as of October 31, 2024
The table below shows the investment makeup of the Fund, representing the percentage of net assets of the Fund.
Composition by Asset Allocation
| Domestic Equity Funds | 59.2 | % |
| International/Global Equity Funds | 25.8 | % |
| Taxable Fixed Income Funds | 14.8 | % |
| Short-Term Investments | 0.2 | % |
| Other Assets & Liabilities | 0.0 | % |
| Total | 100.0 | % |
Availability of Additional Information
For additional information about the Fund, including its prospectus, financial information, holdings, and proxy voting information, please visit the Fund’s website at the website address included at the beginning of this report.
The Fund is distributed by Hartford Funds Distributors, LLC (HFD).
Annual Shareholder Report
October 31, 2024
The Hartford Growth Allocation Fund
Class R5/HRATX
This annual shareholder report contains important information about The Hartford Growth Allocation Fund (the "Fund") for the period of November 1, 2023 to October 31, 2024. You can find additional information about the Fund at hartfordfunds.com/reports-hmf. You can also request this information by contacting us by calling 1‑888‑843‑7824.
What were the Fund costs for the last year?
(Based on a hypothetical $10,000 investment)
| Class Name | Costs of a $10,000 investment | Costs paid as a percentage
of a $10,000 investment |
| Class R5 | $30 | 0.26% |
Costs paid excludes fees and expenses incurred indirectly as a result of investments in other investment companies.
How did the Fund perform last year and what impacted its performance?
Management's Discussion of Fund Performance
Equities outperformed fixed income securities for the trailing one-year period ending October 31, 2024 led by domestic stocks. United States (U.S.) equities generated strong returns as measured by the Russell 3000 Index. International equities also had strong performance for the trailing one-year period as measured by the MSCI ACWI ex USA Index (Net) supported by easing inflation and interest rate cuts. Bonds lagged but still posted strong positive returns for the trailing one-year period as measured by the Bloomberg US Aggregate Bond Index. Treasury yields ended broadly lower and most spread sectors generated positive excess returns over duration-equivalent government bonds as spreads narrowed, supported by more accommodative central bank policies. Fund performance described below is relative to the Fund’s blended benchmark, 55% Russell 3000 Index/ 25% MSCI ACWI ex USA Index (Net)/ 20% Bloomberg US Aggregate Bond Index (the "Blended Benchmark"), for the trailing twelve-month period ended October 31, 2024.
Top Contributors to Performance
The Fund’s investments in the Hartford Large Cap Growth ETF and The Hartford Growth Opportunities Fund were the top contributors to performance for the trailing twelve-month period as large-cap growth stocks had strong performance and these underlying funds outperformed their benchmarks during the period.
In fixed income, performance was helped from the Fund’s position in the Hartford Core Bond ETF, which outperformed its benchmark during the period.
Asset allocation also contributed to performance as the overweight to equities was beneficial.
Top Detractors to Performance
The Fund’s investment in The Hartford Equity Income Fund and Hartford Multifactor US Equity ETF were top detractors to performance as value stocks underperformed during the trailing twelve-month period.
Performance was also hurt from the Fund’s position in the Hartford Core Equity Fund, which underperformed its benchmark during the period.
The Fund’s investments in the Hartford Schroders International Multi-Cap Value Fund and The Hartford International Opportunities Fund also detracted.
The views expressed in this section reflect the opinions of the Fund's investment manager, Hartford Funds Management Company, LLC, as of the date of this report and are subject to change based on changes in market, economic or other conditions. These views are not intended to be a forecast of future events and are no guarantee of future results.
Comparison of Change in Value of $ 10,000 Investment
The graph below represents the hypothetical growth of a $10,000 investment in Class R5 shares and the comparative indices.
Average Annual Total Returns
For the Periods Ended October 31, 2024 | 1 Year | 5 Years | 10 Years |
| Class R5 | 28.38% | 8.38%) | 6.88% |
| Blended Benchmark | 28.67% | 9.54%) | 8.47% |
| Russell 3000 Index | 37.86% | 14.60%) | 12.44% |
| MSCI ACWI ex USA Index (Net) | 24.33% | 5.78%) | 4.79% |
| Bloomberg US Aggregate Bond Index | 10.55% | (0.23)% | 1.49% |
The Blended Benchmark is calculated by Hartford Funds Management Company, LLC.
The Fund’s past performance is not a good predictor of the Fund’s future performance. The graph and table do not reflect the deduction of taxes that a shareholder would pay on Fund distributions or redemption of Fund shares. Performance information reflects fee waivers and/or expense limitation arrangements, if any. Absent any applicable fee waivers and/or expense limitation arrangements, performance would have been lower. Visit hartfordfunds.com for the most recent performance information.
Key Fund Statistics as of October 31, 2024
| Fund's net assets | $541,344,687% |
| Total number of portfolio holdings | $19% |
| Total investment management fees paid | $529,226% |
| Portfolio turnover rate | $9% |
Graphical Representation of Holdings as of October 31, 2024
The table below shows the investment makeup of the Fund, representing the percentage of net assets of the Fund.
Composition by Asset Allocation
| Domestic Equity Funds | 59.2 | % |
| International/Global Equity Funds | 25.8 | % |
| Taxable Fixed Income Funds | 14.8 | % |
| Short-Term Investments | 0.2 | % |
| Other Assets & Liabilities | 0.0 | % |
| Total | 100.0 | % |
Availability of Additional Information
For additional information about the Fund, including its prospectus, financial information, holdings, and proxy voting information, please visit the Fund’s website at the website address included at the beginning of this report.
The Fund is distributed by Hartford Funds Distributors, LLC (HFD).
Annual Shareholder Report
October 31, 2024
The Hartford Growth Allocation Fund
Class F/HRAFX
This annual shareholder report contains important information about The Hartford Growth Allocation Fund (the "Fund") for the period of November 1, 2023 to October 31, 2024. You can find additional information about the Fund at hartfordfunds.com/reports-hmf. You can also request this information by contacting us by calling 1‑888‑843‑7824.
What were the Fund costs for the last year?
(Based on a hypothetical $10,000 investment)
| Class Name | Costs of a $10,000 investment | Costs paid as a percentage
of a $10,000 investment |
| Class F | $18 | 0.16% |
Costs paid excludes fees and expenses incurred indirectly as a result of investments in other investment companies.
How did the Fund perform last year and what impacted its performance?
Management's Discussion of Fund Performance
Equities outperformed fixed income securities for the trailing one-year period ending October 31, 2024 led by domestic stocks. United States (U.S.) equities generated strong returns as measured by the Russell 3000 Index. International equities also had strong performance for the trailing one-year period as measured by the MSCI ACWI ex USA Index (Net) supported by easing inflation and interest rate cuts. Bonds lagged but still posted strong positive returns for the trailing one-year period as measured by the Bloomberg US Aggregate Bond Index. Treasury yields ended broadly lower and most spread sectors generated positive excess returns over duration-equivalent government bonds as spreads narrowed, supported by more accommodative central bank policies. Fund performance described below is relative to the Fund’s blended benchmark, 55% Russell 3000 Index/ 25% MSCI ACWI ex USA Index (Net)/ 20% Bloomberg US Aggregate Bond Index (the "Blended Benchmark"), for the trailing twelve-month period ended October 31, 2024.
Top Contributors to Performance
The Fund’s investments in the Hartford Large Cap Growth ETF and The Hartford Growth Opportunities Fund were the top contributors to performance for the trailing twelve-month period as large-cap growth stocks had strong performance and these underlying funds outperformed their benchmarks during the period.
In fixed income, performance was helped from the Fund’s position in the Hartford Core Bond ETF, which outperformed its benchmark during the period.
Asset allocation also contributed to performance as the overweight to equities was beneficial.
Top Detractors to Performance
The Fund’s investment in The Hartford Equity Income Fund and Hartford Multifactor US Equity ETF were top detractors to performance as value stocks underperformed during the trailing twelve-month period.
Performance was also hurt from the Fund’s position in the Hartford Core Equity Fund, which underperformed its benchmark during the period.
The Fund’s investments in the Hartford Schroders International Multi-Cap Value Fund and The Hartford International Opportunities Fund also detracted.
The views expressed in this section reflect the opinions of the Fund's investment manager, Hartford Funds Management Company, LLC, as of the date of this report and are subject to change based on changes in market, economic or other conditions. These views are not intended to be a forecast of future events and are no guarantee of future results.
Comparison of Change in Value of $ 1,000,000 Investment
The graph below represents the hypothetical growth of a $1,000,000 investment in Class F shares and the comparative indices.
Average Annual Total Returns
For the Periods Ended October 31, 2024 | 1 Year | 5 Years | 10 Years |
| Class F | 28.55% | 8.50%) | 6.98% |
| Blended Benchmark | 28.67% | 9.54%) | 8.47% |
| Russell 3000 Index | 37.86% | 14.60%) | 12.44% |
| MSCI ACWI ex USA Index (Net) | 24.33% | 5.78%) | 4.79% |
| Bloomberg US Aggregate Bond Index | 10.55% | (0.23)% | 1.49% |
Class F shares commenced operations on February 28, 2017 and performance prior to that date is that of the Fund’s Class I shares. Performance prior to the inception date of the class has not been adjusted to reflect the operating expenses of the class.
The Blended Benchmark is calculated by Hartford Funds Management Company, LLC.
The Fund’s past performance is not a good predictor of the Fund’s future performance. The graph and table do not reflect the deduction of taxes that a shareholder would pay on Fund distributions or redemption of Fund shares. Performance information reflects fee waivers and/or expense limitation arrangements, if any. Absent any applicable fee waivers and/or expense limitation arrangements, performance would have been lower. Visit hartfordfunds.com for the most recent performance information.
Key Fund Statistics as of October 31, 2024
| Fund's net assets | $541,344,687% |
| Total number of portfolio holdings | $19% |
| Total investment management fees paid | $529,226% |
| Portfolio turnover rate | $9% |
Graphical Representation of Holdings as of October 31, 2024
The table below shows the investment makeup of the Fund, representing the percentage of net assets of the Fund.
Composition by Asset Allocation
| Domestic Equity Funds | 59.2 | % |
| International/Global Equity Funds | 25.8 | % |
| Taxable Fixed Income Funds | 14.8 | % |
| Short-Term Investments | 0.2 | % |
| Other Assets & Liabilities | 0.0 | % |
| Total | 100.0 | % |
Availability of Additional Information
For additional information about the Fund, including its prospectus, financial information, holdings, and proxy voting information, please visit the Fund’s website at the website address included at the beginning of this report.
The Fund is distributed by Hartford Funds Distributors, LLC (HFD).
Annual Shareholder Report
October 31, 2024
Hartford Moderate Allocation Fund
Class A/HBAAX
This annual shareholder report contains important information about the Hartford Moderate Allocation Fund (the "Fund") for the period of November 1, 2023 to October 31, 2024. You can find additional information about the Fund at hartfordfunds.com/reports-hmf. You can also request this information by contacting us by calling 1‑888‑843‑7824.
What were the Fund costs for the last year?
(Based on a hypothetical $10,000 investment)
| Class Name | Costs of a $10,000 investment | Costs paid as a percentage
of a $10,000 investment |
| Class A | $60 | 0.54% |
Costs paid excludes fees and expenses incurred indirectly as a result of investments in other investment companies.
How did the Fund perform last year and what impacted its performance?
Management's Discussion of Fund Performance
Equities outperformed fixed income securities for the trailing one-year period ending October 31, 2024 led by domestic stocks. United States (U.S.) equities generated strong returns as measured by the Russell 3000 Index. International equities also had strong performance for the trailing one-year period as measured by the MSCI ACWI ex USA Index (Net) supported by easing inflation and interest rate cuts. Bonds lagged but still posted strong positive returns for the trailing one-year period as measured by the Bloomberg US Aggregate Bond Index. Treasury yields ended broadly lower and most spread sectors generated positive excess returns over duration-equivalent government bonds as spreads narrowed, supported by more accommodative central bank policies. Fund performance described below is relative to the Fund’s blended benchmark, 40% Bloomberg US Aggregate Bond Index/ 40% Russell 3000 Index/ 20% MSCI ACWI ex USA Index (Net) (the "Blended Benchmark"), for the trailing twelve-month period ended October 31, 2024.
Top Contributors to Performance
The Fund’s investment in the Hartford Large Cap Growth ETF was the top contributor to performance for the trailing twelve-month period as large-cap growth stocks had strong performance and the Hartford Large Cap Growth ETF outperformed its benchmark during the period.
In fixed income, performance was helped from the Fund’s position in the Hartford Core Bond ETF, which outperformed its benchmark during the period.
Asset allocation also contributed to performance as the overweight to equities was beneficial along with the overweight to underlying funds with high yield exposure as high yield performed well during the period.
Top Detractors to Performance
The Fund’s investments in The Hartford Equity Income Fund and Hartford Multifactor US Equity ETF were top detractors to performance as value stocks underperformed during the trailing twelve-month period.
Performance was also hurt from the Fund’s positions in The Hartford World Bond Fund and the Hartford Core Equity Fund and these underlying funds underperformed their benchmarks during the period.
The views expressed in this section reflect the opinions of the Fund's investment manager, Hartford Funds Management Company, LLC, as of the date of this report and are subject to change based on changes in market, economic or other conditions. These views are not intended to be a forecast of future events and are no guarantee of future results.
Comparison of Change in Value of $ 10,000 Investment
The graph below represents the hypothetical growth of a $10,000 investment in Class A shares and the comparative indices. The returns for Class A shares include the maximum front-end sales charge applicable to Class A shares.
Average Annual Total Returns
For the Periods Ended October 31, 2024 | 1 Year | 5 Years | 10 Years |
| Class A (with 5.50% maximum front-end sales charge) | 16.60% | 4.83%) | 4.58% |
| Class A (without 5.50% maximum front-end sales charge) | 23.38% | 6.03%) | 5.18% |
| Blended Benchmark | 23.77% | 7.05%) | 6.71% |
| Bloomberg US Aggregate Bond Index | 10.55% | (0.23)% | 1.49% |
| Russell 3000 Index | 37.86% | 14.60%) | 12.44% |
| MSCI ACWI ex USA Index (Net) | 24.33% | 5.78%) | 4.79% |
The Blended Benchmark is calculated by Hartford Funds Management Company, LLC.
Performance information for the Fund prior to December 1, 2015 includes performance when the Fund was sub-advised by Wellington Management Company LLP using a modified strategy.
The Fund’s past performance is not a good predictor of the Fund’s future performance. The graph and table do not reflect the deduction of taxes that a shareholder would pay on Fund distributions or redemption of Fund shares. Performance information reflects fee waivers and/or expense limitation arrangements, if any. Absent any applicable fee waivers and/or expense limitation arrangements, performance would have been lower. Visit hartfordfunds.com for the most recent performance information.
Key Fund Statistics as of October 31, 2024
| Fund's net assets | $317,535,414% |
| Total number of portfolio holdings | $17% |
| Total investment management fees paid | $314,674% |
| Portfolio turnover rate | $11% |
Graphical Representation of Holdings as of October 31, 2024
The table below shows the investment makeup of the Fund, representing the percentage of net assets of the Fund.
Composition by Asset Allocation
| Domestic Equity Funds | 43.0 | % |
| Taxable Fixed Income Funds | 36.3 | % |
| International/Global Equity Funds | 20.5 | % |
| Short-Term Investments | 0.2 | % |
| Other Assets & Liabilities | 0.0 | % |
| Total | 100.0 | % |
Availability of Additional Information
For additional information about the Fund, including its prospectus, financial information, holdings, and proxy voting information, please visit the Fund’s website at the website address included at the beginning of this report.
The Fund is distributed by Hartford Funds Distributors, LLC (HFD).
Annual Shareholder Report
October 31, 2024
Hartford Moderate Allocation Fund
Class C/HBACX
This annual shareholder report contains important information about the Hartford Moderate Allocation Fund (the "Fund") for the period of November 1, 2023 to October 31, 2024. You can find additional information about the Fund at hartfordfunds.com/reports-hmf. You can also request this information by contacting us by calling 1‑888‑843‑7824.
What were the Fund costs for the last year?
(Based on a hypothetical $10,000 investment)
| Class Name | Costs of a $10,000 investment | Costs paid as a percentage
of a $10,000 investment |
| Class C | $153 | 1.38% |
Costs paid excludes fees and expenses incurred indirectly as a result of investments in other investment companies.
How did the Fund perform last year and what impacted its performance?
Management's Discussion of Fund Performance
Equities outperformed fixed income securities for the trailing one-year period ending October 31, 2024 led by domestic stocks. United States (U.S.) equities generated strong returns as measured by the Russell 3000 Index. International equities also had strong performance for the trailing one-year period as measured by the MSCI ACWI ex USA Index (Net) supported by easing inflation and interest rate cuts. Bonds lagged but still posted strong positive returns for the trailing one-year period as measured by the Bloomberg US Aggregate Bond Index. Treasury yields ended broadly lower and most spread sectors generated positive excess returns over duration-equivalent government bonds as spreads narrowed, supported by more accommodative central bank policies. Fund performance described below is relative to the Fund’s blended benchmark, 40% Bloomberg US Aggregate Bond Index/ 40% Russell 3000 Index/ 20% MSCI ACWI ex USA Index (Net) (the "Blended Benchmark"), for the trailing twelve-month period ended October 31, 2024.
Top Contributors to Performance
The Fund’s investment in the Hartford Large Cap Growth ETF was the top contributor to performance for the trailing twelve-month period as large-cap growth stocks had strong performance and the Hartford Large Cap Growth ETF outperformed its benchmark during the period.
In fixed income, performance was helped from the Fund’s position in the Hartford Core Bond ETF, which outperformed its benchmark during the period.
Asset allocation also contributed to performance as the overweight to equities was beneficial along with the overweight to underlying funds with high yield exposure as high yield performed well during the period.
Top Detractors to Performance
The Fund’s investments in The Hartford Equity Income Fund and Hartford Multifactor US Equity ETF were top detractors to performance as value stocks underperformed during the trailing twelve-month period.
Performance was also hurt from the Fund’s positions in The Hartford World Bond Fund and the Hartford Core Equity Fund and these underlying funds underperformed their benchmarks during the period.
The views expressed in this section reflect the opinions of the Fund's investment manager, Hartford Funds Management Company, LLC, as of the date of this report and are subject to change based on changes in market, economic or other conditions. These views are not intended to be a forecast of future events and are no guarantee of future results.
Comparison of Change in Value of $ 10,000 Investment
The graph below represents the hypothetical growth of a $10,000 investment in Class C shares (excluding sales charges) and the comparative indices. If sales charges had been included, the value would have been lower.
Average Annual Total Returns
For the Periods Ended October 31, 2024 | 1 Year | 5 Years | 10 Years |
| Class C (with 1.00% contingent deferred sales charge) | 21.32% | 5.17%) | 4.36% |
| Class C (without 1.00% contingent deferred sales charge) | 22.32% | 5.17%) | 4.36% |
| Blended Benchmark | 23.77% | 7.05%) | 6.71% |
| Bloomberg US Aggregate Bond Index | 10.55% | (0.23)% | 1.49% |
| Russell 3000 Index | 37.86% | 14.60%) | 12.44% |
| MSCI ACWI ex USA Index (Net) | 24.33% | 5.78%) | 4.79% |
The Blended Benchmark is calculated by Hartford Funds Management Company, LLC.
Performance information for the Fund prior to December 1, 2015 includes performance when the Fund was sub-advised by Wellington Management Company LLP using a modified strategy.
The Fund’s past performance is not a good predictor of the Fund’s future performance. The graph and table do not reflect the deduction of taxes that a shareholder would pay on Fund distributions or redemption of Fund shares. Performance information reflects fee waivers and/or expense limitation arrangements, if any. Absent any applicable fee waivers and/or expense limitation arrangements, performance would have been lower. Visit hartfordfunds.com for the most recent performance information.
Key Fund Statistics as of October 31, 2024
| Fund's net assets | $317,535,414% |
| Total number of portfolio holdings | $17% |
| Total investment management fees paid | $314,674% |
| Portfolio turnover rate | $11% |
Graphical Representation of Holdings as of October 31, 2024
The table below shows the investment makeup of the Fund, representing the percentage of net assets of the Fund.
Composition by Asset Allocation
| Domestic Equity Funds | 43.0 | % |
| Taxable Fixed Income Funds | 36.3 | % |
| International/Global Equity Funds | 20.5 | % |
| Short-Term Investments | 0.2 | % |
| Other Assets & Liabilities | 0.0 | % |
| Total | 100.0 | % |
Availability of Additional Information
For additional information about the Fund, including its prospectus, financial information, holdings, and proxy voting information, please visit the Fund’s website at the website address included at the beginning of this report.
The Fund is distributed by Hartford Funds Distributors, LLC (HFD).
Annual Shareholder Report
October 31, 2024
Hartford Moderate Allocation Fund
Class I/HBAIX
This annual shareholder report contains important information about the Hartford Moderate Allocation Fund (the "Fund") for the period of November 1, 2023 to October 31, 2024. You can find additional information about the Fund at hartfordfunds.com/reports-hmf. You can also request this information by contacting us by calling 1‑888‑843‑7824.
What were the Fund costs for the last year?
(Based on a hypothetical $10,000 investment)
| Class Name | Costs of a $10,000 investment | Costs paid as a percentage
of a $10,000 investment |
| Class I | $30 | 0.27% |
Costs paid excludes fees and expenses incurred indirectly as a result of investments in other investment companies.
How did the Fund perform last year and what impacted its performance?
Management's Discussion of Fund Performance
Equities outperformed fixed income securities for the trailing one-year period ending October 31, 2024 led by domestic stocks. United States (U.S.) equities generated strong returns as measured by the Russell 3000 Index. International equities also had strong performance for the trailing one-year period as measured by the MSCI ACWI ex USA Index (Net) supported by easing inflation and interest rate cuts. Bonds lagged but still posted strong positive returns for the trailing one-year period as measured by the Bloomberg US Aggregate Bond Index. Treasury yields ended broadly lower and most spread sectors generated positive excess returns over duration-equivalent government bonds as spreads narrowed, supported by more accommodative central bank policies. Fund performance described below is relative to the Fund’s blended benchmark, 40% Bloomberg US Aggregate Bond Index/ 40% Russell 3000 Index/ 20% MSCI ACWI ex USA Index (Net) (the "Blended Benchmark"), for the trailing twelve-month period ended October 31, 2024.
Top Contributors to Performance
The Fund’s investment in the Hartford Large Cap Growth ETF was the top contributor to performance for the trailing twelve-month period as large-cap growth stocks had strong performance and the Hartford Large Cap Growth ETF outperformed its benchmark during the period.
In fixed income, performance was helped from the Fund’s position in the Hartford Core Bond ETF, which outperformed its benchmark during the period.
Asset allocation also contributed to performance as the overweight to equities was beneficial along with the overweight to underlying funds with high yield exposure as high yield performed well during the period.
Top Detractors to Performance
The Fund’s investments in The Hartford Equity Income Fund and Hartford Multifactor US Equity ETF were top detractors to performance as value stocks underperformed during the trailing twelve-month period.
Performance was also hurt from the Fund’s positions in The Hartford World Bond Fund and the Hartford Core Equity Fund and these underlying funds underperformed their benchmarks during the period.
The views expressed in this section reflect the opinions of the Fund's investment manager, Hartford Funds Management Company, LLC, as of the date of this report and are subject to change based on changes in market, economic or other conditions. These views are not intended to be a forecast of future events and are no guarantee of future results.
Comparison of Change in Value of $ 10,000 Investment
The graph below represents the hypothetical growth of a $10,000 investment in Class I shares and the comparative indices.
Average Annual Total Returns
For the Periods Ended October 31, 2024 | 1 Year | 5 Years | 10 Years |
| Class I | 23.67% | 6.30%) | 5.47% |
| Blended Benchmark | 23.77% | 7.05%) | 6.71% |
| Bloomberg US Aggregate Bond Index | 10.55% | (0.23)% | 1.49% |
| Russell 3000 Index | 37.86% | 14.60%) | 12.44% |
| MSCI ACWI ex USA Index (Net) | 24.33% | 5.78%) | 4.79% |
The Blended Benchmark is calculated by Hartford Funds Management Company, LLC.
Performance information for the Fund prior to December 1, 2015 includes performance when the Fund was sub-advised by Wellington Management Company LLP using a modified strategy.
The Fund’s past performance is not a good predictor of the Fund’s future performance. The graph and table do not reflect the deduction of taxes that a shareholder would pay on Fund distributions or redemption of Fund shares. Performance information reflects fee waivers and/or expense limitation arrangements, if any. Absent any applicable fee waivers and/or expense limitation arrangements, performance would have been lower. Visit hartfordfunds.com for the most recent performance information.
Key Fund Statistics as of October 31, 2024
| Fund's net assets | $317,535,414% |
| Total number of portfolio holdings | $17% |
| Total investment management fees paid | $314,674% |
| Portfolio turnover rate | $11% |
Graphical Representation of Holdings as of October 31, 2024
The table below shows the investment makeup of the Fund, representing the percentage of net assets of the Fund.
Composition by Asset Allocation
| Domestic Equity Funds | 43.0 | % |
| Taxable Fixed Income Funds | 36.3 | % |
| International/Global Equity Funds | 20.5 | % |
| Short-Term Investments | 0.2 | % |
| Other Assets & Liabilities | 0.0 | % |
| Total | 100.0 | % |
Availability of Additional Information
For additional information about the Fund, including its prospectus, financial information, holdings, and proxy voting information, please visit the Fund’s website at the website address included at the beginning of this report.
The Fund is distributed by Hartford Funds Distributors, LLC (HFD).
Annual Shareholder Report
October 31, 2024
Hartford Moderate Allocation Fund
Class R3/HBARX
This annual shareholder report contains important information about the Hartford Moderate Allocation Fund (the "Fund") for the period of November 1, 2023 to October 31, 2024. You can find additional information about the Fund at hartfordfunds.com/reports-hmf. You can also request this information by contacting us by calling 1‑888‑843‑7824.
What were the Fund costs for the last year?
(Based on a hypothetical $10,000 investment)
| Class Name | Costs of a $10,000 investment | Costs paid as a percentage
of a $10,000 investment |
| Class R3 | $97 | 0.87% |
Costs paid excludes fees and expenses incurred indirectly as a result of investments in other investment companies.
How did the Fund perform last year and what impacted its performance?
Management's Discussion of Fund Performance
Equities outperformed fixed income securities for the trailing one-year period ending October 31, 2024 led by domestic stocks. United States (U.S.) equities generated strong returns as measured by the Russell 3000 Index. International equities also had strong performance for the trailing one-year period as measured by the MSCI ACWI ex USA Index (Net) supported by easing inflation and interest rate cuts. Bonds lagged but still posted strong positive returns for the trailing one-year period as measured by the Bloomberg US Aggregate Bond Index. Treasury yields ended broadly lower and most spread sectors generated positive excess returns over duration-equivalent government bonds as spreads narrowed, supported by more accommodative central bank policies. Fund performance described below is relative to the Fund’s blended benchmark, 40% Bloomberg US Aggregate Bond Index/ 40% Russell 3000 Index/ 20% MSCI ACWI ex USA Index (Net) (the "Blended Benchmark"), for the trailing twelve-month period ended October 31, 2024.
Top Contributors to Performance
The Fund’s investment in the Hartford Large Cap Growth ETF was the top contributor to performance for the trailing twelve-month period as large-cap growth stocks had strong performance and the Hartford Large Cap Growth ETF outperformed its benchmark during the period.
In fixed income, performance was helped from the Fund’s position in the Hartford Core Bond ETF, which outperformed its benchmark during the period.
Asset allocation also contributed to performance as the overweight to equities was beneficial along with the overweight to underlying funds with high yield exposure as high yield performed well during the period.
Top Detractors to Performance
The Fund’s investments in The Hartford Equity Income Fund and Hartford Multifactor US Equity ETF were top detractors to performance as value stocks underperformed during the trailing twelve-month period.
Performance was also hurt from the Fund’s positions in The Hartford World Bond Fund and the Hartford Core Equity Fund and these underlying funds underperformed their benchmarks during the period.
The views expressed in this section reflect the opinions of the Fund's investment manager, Hartford Funds Management Company, LLC, as of the date of this report and are subject to change based on changes in market, economic or other conditions. These views are not intended to be a forecast of future events and are no guarantee of future results.
Comparison of Change in Value of $ 10,000 Investment
The graph below represents the hypothetical growth of a $10,000 investment in Class R3 shares and the comparative indices.
Average Annual Total Returns
For the Periods Ended October 31, 2024 | 1 Year | 5 Years | 10 Years |
| Class R3 | 22.98% | 5.67%) | 4.82% |
| Blended Benchmark | 23.77% | 7.05%) | 6.71% |
| Bloomberg US Aggregate Bond Index | 10.55% | (0.23)% | 1.49% |
| Russell 3000 Index | 37.86% | 14.60%) | 12.44% |
| MSCI ACWI ex USA Index (Net) | 24.33% | 5.78%) | 4.79% |
The Blended Benchmark is calculated by Hartford Funds Management Company, LLC.
Performance information for the Fund prior to December 1, 2015 includes performance when the Fund was sub-advised by Wellington Management Company LLP using a modified strategy.
The Fund’s past performance is not a good predictor of the Fund’s future performance. The graph and table do not reflect the deduction of taxes that a shareholder would pay on Fund distributions or redemption of Fund shares. Performance information reflects fee waivers and/or expense limitation arrangements, if any. Absent any applicable fee waivers and/or expense limitation arrangements, performance would have been lower. Visit hartfordfunds.com for the most recent performance information.
Key Fund Statistics as of October 31, 2024
| Fund's net assets | $317,535,414% |
| Total number of portfolio holdings | $17% |
| Total investment management fees paid | $314,674% |
| Portfolio turnover rate | $11% |
Graphical Representation of Holdings as of October 31, 2024
The table below shows the investment makeup of the Fund, representing the percentage of net assets of the Fund.
Composition by Asset Allocation
| Domestic Equity Funds | 43.0 | % |
| Taxable Fixed Income Funds | 36.3 | % |
| International/Global Equity Funds | 20.5 | % |
| Short-Term Investments | 0.2 | % |
| Other Assets & Liabilities | 0.0 | % |
| Total | 100.0 | % |
Availability of Additional Information
For additional information about the Fund, including its prospectus, financial information, holdings, and proxy voting information, please visit the Fund’s website at the website address included at the beginning of this report.
The Fund is distributed by Hartford Funds Distributors, LLC (HFD).
Annual Shareholder Report
October 31, 2024
Hartford Moderate Allocation Fund
Class R4/HBASX
This annual shareholder report contains important information about the Hartford Moderate Allocation Fund (the "Fund") for the period of November 1, 2023 to October 31, 2024. You can find additional information about the Fund at hartfordfunds.com/reports-hmf. You can also request this information by contacting us by calling 1‑888‑843‑7824.
What were the Fund costs for the last year?
(Based on a hypothetical $10,000 investment)
| Class Name | Costs of a $10,000 investment | Costs paid as a percentage
of a $10,000 investment |
| Class R4 | $65 | 0.58% |
Costs paid excludes fees and expenses incurred indirectly as a result of investments in other investment companies.
How did the Fund perform last year and what impacted its performance?
Management's Discussion of Fund Performance
Equities outperformed fixed income securities for the trailing one-year period ending October 31, 2024 led by domestic stocks. United States (U.S.) equities generated strong returns as measured by the Russell 3000 Index. International equities also had strong performance for the trailing one-year period as measured by the MSCI ACWI ex USA Index (Net) supported by easing inflation and interest rate cuts. Bonds lagged but still posted strong positive returns for the trailing one-year period as measured by the Bloomberg US Aggregate Bond Index. Treasury yields ended broadly lower and most spread sectors generated positive excess returns over duration-equivalent government bonds as spreads narrowed, supported by more accommodative central bank policies. Fund performance described below is relative to the Fund’s blended benchmark, 40% Bloomberg US Aggregate Bond Index/ 40% Russell 3000 Index/ 20% MSCI ACWI ex USA Index (Net) (the "Blended Benchmark"), for the trailing twelve-month period ended October 31, 2024.
Top Contributors to Performance
The Fund’s investment in the Hartford Large Cap Growth ETF was the top contributor to performance for the trailing twelve-month period as large-cap growth stocks had strong performance and the Hartford Large Cap Growth ETF outperformed its benchmark during the period.
In fixed income, performance was helped from the Fund’s position in the Hartford Core Bond ETF, which outperformed its benchmark during the period.
Asset allocation also contributed to performance as the overweight to equities was beneficial along with the overweight to underlying funds with high yield exposure as high yield performed well during the period.
Top Detractors to Performance
The Fund’s investments in The Hartford Equity Income Fund and Hartford Multifactor US Equity ETF were top detractors to performance as value stocks underperformed during the trailing twelve-month period.
Performance was also hurt from the Fund’s positions in The Hartford World Bond Fund and the Hartford Core Equity Fund and these underlying funds underperformed their benchmarks during the period.
The views expressed in this section reflect the opinions of the Fund's investment manager, Hartford Funds Management Company, LLC, as of the date of this report and are subject to change based on changes in market, economic or other conditions. These views are not intended to be a forecast of future events and are no guarantee of future results.
Comparison of Change in Value of $ 10,000 Investment
The graph below represents the hypothetical growth of a $10,000 investment in Class R4 shares and the comparative indices.
Average Annual Total Returns
For the Periods Ended October 31, 2024 | 1 Year | 5 Years | 10 Years |
| Class R4 | 23.42% | 5.98%) | 5.13% |
| Blended Benchmark | 23.77% | 7.05%) | 6.71% |
| Bloomberg US Aggregate Bond Index | 10.55% | (0.23)% | 1.49% |
| Russell 3000 Index | 37.86% | 14.60%) | 12.44% |
| MSCI ACWI ex USA Index (Net) | 24.33% | 5.78%) | 4.79% |
The Blended Benchmark is calculated by Hartford Funds Management Company, LLC.
Performance information for the Fund prior to December 1, 2015 includes performance when the Fund was sub-advised by Wellington Management Company LLP using a modified strategy.
The Fund’s past performance is not a good predictor of the Fund’s future performance. The graph and table do not reflect the deduction of taxes that a shareholder would pay on Fund distributions or redemption of Fund shares. Performance information reflects fee waivers and/or expense limitation arrangements, if any. Absent any applicable fee waivers and/or expense limitation arrangements, performance would have been lower. Visit hartfordfunds.com for the most recent performance information.
Key Fund Statistics as of October 31, 2024
| Fund's net assets | $317,535,414% |
| Total number of portfolio holdings | $17% |
| Total investment management fees paid | $314,674% |
| Portfolio turnover rate | $11% |
Graphical Representation of Holdings as of October 31, 2024
The table below shows the investment makeup of the Fund, representing the percentage of net assets of the Fund.
Composition by Asset Allocation
| Domestic Equity Funds | 43.0 | % |
| Taxable Fixed Income Funds | 36.3 | % |
| International/Global Equity Funds | 20.5 | % |
| Short-Term Investments | 0.2 | % |
| Other Assets & Liabilities | 0.0 | % |
| Total | 100.0 | % |
Availability of Additional Information
For additional information about the Fund, including its prospectus, financial information, holdings, and proxy voting information, please visit the Fund’s website at the website address included at the beginning of this report.
The Fund is distributed by Hartford Funds Distributors, LLC (HFD).
Annual Shareholder Report
October 31, 2024
Hartford Moderate Allocation Fund
Class R5/HBATX
This annual shareholder report contains important information about the Hartford Moderate Allocation Fund (the "Fund") for the period of November 1, 2023 to October 31, 2024. You can find additional information about the Fund at hartfordfunds.com/reports-hmf. You can also request this information by contacting us by calling 1‑888‑843‑7824.
What were the Fund costs for the last year?
(Based on a hypothetical $10,000 investment)
| Class Name | Costs of a $10,000 investment | Costs paid as a percentage
of a $10,000 investment |
| Class R5 | $31 | 0.28% |
Costs paid excludes fees and expenses incurred indirectly as a result of investments in other investment companies.
How did the Fund perform last year and what impacted its performance?
Management's Discussion of Fund Performance
Equities outperformed fixed income securities for the trailing one-year period ending October 31, 2024 led by domestic stocks. United States (U.S.) equities generated strong returns as measured by the Russell 3000 Index. International equities also had strong performance for the trailing one-year period as measured by the MSCI ACWI ex USA Index (Net) supported by easing inflation and interest rate cuts. Bonds lagged but still posted strong positive returns for the trailing one-year period as measured by the Bloomberg US Aggregate Bond Index. Treasury yields ended broadly lower and most spread sectors generated positive excess returns over duration-equivalent government bonds as spreads narrowed, supported by more accommodative central bank policies. Fund performance described below is relative to the Fund’s blended benchmark, 40% Bloomberg US Aggregate Bond Index/ 40% Russell 3000 Index/ 20% MSCI ACWI ex USA Index (Net) (the "Blended Benchmark"), for the trailing twelve-month period ended October 31, 2024.
Top Contributors to Performance
The Fund’s investment in the Hartford Large Cap Growth ETF was the top contributor to performance for the trailing twelve-month period as large-cap growth stocks had strong performance and the Hartford Large Cap Growth ETF outperformed its benchmark during the period.
In fixed income, performance was helped from the Fund’s position in the Hartford Core Bond ETF, which outperformed its benchmark during the period.
Asset allocation also contributed to performance as the overweight to equities was beneficial along with the overweight to underlying funds with high yield exposure as high yield performed well during the period.
Top Detractors to Performance
The Fund’s investments in The Hartford Equity Income Fund and Hartford Multifactor US Equity ETF were top detractors to performance as value stocks underperformed during the trailing twelve-month period.
Performance was also hurt from the Fund’s positions in The Hartford World Bond Fund and the Hartford Core Equity Fund and these underlying funds underperformed their benchmarks during the period.
The views expressed in this section reflect the opinions of the Fund's investment manager, Hartford Funds Management Company, LLC, as of the date of this report and are subject to change based on changes in market, economic or other conditions. These views are not intended to be a forecast of future events and are no guarantee of future results.
Comparison of Change in Value of $ 10,000 Investment
The graph below represents the hypothetical growth of a $10,000 investment in Class R5 shares and the comparative indices.
Average Annual Total Returns
For the Periods Ended October 31, 2024 | 1 Year | 5 Years | 10 Years |
| Class R5 | 23.75% | 6.31%) | 5.45% |
| Blended Benchmark | 23.77% | 7.05%) | 6.71% |
| Bloomberg US Aggregate Bond Index | 10.55% | (0.23)% | 1.49% |
| Russell 3000 Index | 37.86% | 14.60%) | 12.44% |
| MSCI ACWI ex USA Index (Net) | 24.33% | 5.78%) | 4.79% |
The Blended Benchmark is calculated by Hartford Funds Management Company, LLC.
Performance information for the Fund prior to December 1, 2015 includes performance when the Fund was sub-advised by Wellington Management Company LLP using a modified strategy.
The Fund’s past performance is not a good predictor of the Fund’s future performance. The graph and table do not reflect the deduction of taxes that a shareholder would pay on Fund distributions or redemption of Fund shares. Performance information reflects fee waivers and/or expense limitation arrangements, if any. Absent any applicable fee waivers and/or expense limitation arrangements, performance would have been lower. Visit hartfordfunds.com for the most recent performance information.
Key Fund Statistics as of October 31, 2024
| Fund's net assets | $317,535,414% |
| Total number of portfolio holdings | $17% |
| Total investment management fees paid | $314,674% |
| Portfolio turnover rate | $11% |
Graphical Representation of Holdings as of October 31, 2024
The table below shows the investment makeup of the Fund, representing the percentage of net assets of the Fund.
Composition by Asset Allocation
| Domestic Equity Funds | 43.0 | % |
| Taxable Fixed Income Funds | 36.3 | % |
| International/Global Equity Funds | 20.5 | % |
| Short-Term Investments | 0.2 | % |
| Other Assets & Liabilities | 0.0 | % |
| Total | 100.0 | % |
Availability of Additional Information
For additional information about the Fund, including its prospectus, financial information, holdings, and proxy voting information, please visit the Fund’s website at the website address included at the beginning of this report.
The Fund is distributed by Hartford Funds Distributors, LLC (HFD).
Annual Shareholder Report
October 31, 2024
Hartford Moderate Allocation Fund
Class F/HBADX
This annual shareholder report contains important information about the Hartford Moderate Allocation Fund (the "Fund") for the period of November 1, 2023 to October 31, 2024. You can find additional information about the Fund at hartfordfunds.com/reports-hmf. You can also request this information by contacting us by calling 1‑888‑843‑7824.
What were the Fund costs for the last year?
(Based on a hypothetical $10,000 investment)
| Class Name | Costs of a $10,000 investment | Costs paid as a percentage
of a $10,000 investment |
| Class F | $20 | 0.18% |
Costs paid excludes fees and expenses incurred indirectly as a result of investments in other investment companies.
How did the Fund perform last year and what impacted its performance?
Management's Discussion of Fund Performance
Equities outperformed fixed income securities for the trailing one-year period ending October 31, 2024 led by domestic stocks. United States (U.S.) equities generated strong returns as measured by the Russell 3000 Index. International equities also had strong performance for the trailing one-year period as measured by the MSCI ACWI ex USA Index (Net) supported by easing inflation and interest rate cuts. Bonds lagged but still posted strong positive returns for the trailing one-year period as measured by the Bloomberg US Aggregate Bond Index. Treasury yields ended broadly lower and most spread sectors generated positive excess returns over duration-equivalent government bonds as spreads narrowed, supported by more accommodative central bank policies. Fund performance described below is relative to the Fund’s blended benchmark, 40% Bloomberg US Aggregate Bond Index/ 40% Russell 3000 Index/ 20% MSCI ACWI ex USA Index (Net) (the "Blended Benchmark"), for the trailing twelve-month period ended October 31, 2024.
Top Contributors to Performance
The Fund’s investment in the Hartford Large Cap Growth ETF was the top contributor to performance for the trailing twelve-month period as large-cap growth stocks had strong performance and the Hartford Large Cap Growth ETF outperformed its benchmark during the period.
In fixed income, performance was helped from the Fund’s position in the Hartford Core Bond ETF, which outperformed its benchmark during the period.
Asset allocation also contributed to performance as the overweight to equities was beneficial along with the overweight to underlying funds with high yield exposure as high yield performed well during the period.
Top Detractors to Performance
The Fund’s investments in The Hartford Equity Income Fund and Hartford Multifactor US Equity ETF were top detractors to performance as value stocks underperformed during the trailing twelve-month period.
Performance was also hurt from the Fund’s positions in The Hartford World Bond Fund and the Hartford Core Equity Fund and these underlying funds underperformed their benchmarks during the period.
The views expressed in this section reflect the opinions of the Fund's investment manager, Hartford Funds Management Company, LLC, as of the date of this report and are subject to change based on changes in market, economic or other conditions. These views are not intended to be a forecast of future events and are no guarantee of future results.
Comparison of Change in Value of $ 1,000,000 Investment
The graph below represents the hypothetical growth of a $1,000,000 investment in Class F shares and the comparative indices.
Average Annual Total Returns
For the Periods Ended October 31, 2024 | 1 Year | 5 Years | 10 Years |
| Class F | 23.88% | 6.41%) | 5.54% |
| Blended Benchmark | 23.77% | 7.05%) | 6.71% |
| Bloomberg US Aggregate Bond Index | 10.55% | (0.23)% | 1.49% |
| Russell 3000 Index | 37.86% | 14.60%) | 12.44% |
| MSCI ACWI ex USA Index (Net) | 24.33% | 5.78%) | 4.79% |
Class F shares commenced operations on February 28, 2017 and performance prior to that date is that of the Fund’s Class I shares. Performance prior to the inception date of the class has not been adjusted to reflect the operating expenses of the class.
The Blended Benchmark is calculated by Hartford Funds Management Company, LLC.
Performance information for the Fund prior to December 1, 2015 includes performance when the Fund was sub-advised by Wellington Management Company LLP using a modified strategy.
The Fund’s past performance is not a good predictor of the Fund’s future performance. The graph and table do not reflect the deduction of taxes that a shareholder would pay on Fund distributions or redemption of Fund shares. Performance information reflects fee waivers and/or expense limitation arrangements, if any. Absent any applicable fee waivers and/or expense limitation arrangements, performance would have been lower. Visit hartfordfunds.com for the most recent performance information.
Key Fund Statistics as of October 31, 2024
| Fund's net assets | $317,535,414% |
| Total number of portfolio holdings | $17% |
| Total investment management fees paid | $314,674% |
| Portfolio turnover rate | $11% |
Graphical Representation of Holdings as of October 31, 2024
The table below shows the investment makeup of the Fund, representing the percentage of net assets of the Fund.
Composition by Asset Allocation
| Domestic Equity Funds | 43.0 | % |
| Taxable Fixed Income Funds | 36.3 | % |
| International/Global Equity Funds | 20.5 | % |
| Short-Term Investments | 0.2 | % |
| Other Assets & Liabilities | 0.0 | % |
| Total | 100.0 | % |
Availability of Additional Information
For additional information about the Fund, including its prospectus, financial information, holdings, and proxy voting information, please visit the Fund’s website at the website address included at the beginning of this report.
The Fund is distributed by Hartford Funds Distributors, LLC (HFD).
Annual Shareholder Report
October 31, 2024
Hartford Multi-Asset Income Fund
Class A/ITTAX
This annual shareholder report contains important information about the Hartford Multi-Asset Income Fund (the "Fund") for the period of November 1, 2023 to October 31, 2024. You can find additional information about the Fund at hartfordfunds.com/reports-hmf. You can also request this information by contacting us by calling 1‑888‑843‑7824.
What were the Fund costs for the last year?
(Based on a hypothetical $10,000 investment)
| Class Name | Costs of a $10,000 investment | Costs paid as a percentage
of a $10,000 investment |
| Class A | $113 | 1.05% |
Costs paid excludes fees and expenses incurred indirectly as a result of investments in other investment companies.
How did the Fund perform last year and what impacted its performance?
Management's Discussion of Fund Performance
Global equities, as measured by the MSCI World Index (Net), rose over the trailing twelve-month period ending October 31, 2024, supported by easing inflation and interest rate cuts. Despite mixed economic indicators and geopolitical tensions, such as leadership changes in major countries and ongoing conflict in the Middle East, resilient labor markets and lower energy prices bolstered market sentiment. Fund performance described below is relative to the Fund’s blended benchmark, 55% Bloomberg US Aggregate Bond Index/ 45% S&P 500 Index (the "Blended Benchmark"), for the trailing twelve-month period ended October 31, 2024.
Top Contributors to Performance
Fixed income allocations contributed positively to relative performance over the period. This was primarily driven by positive relative returns from our allocation to active strategies (such as, strategic income allocation).
Within equity, United States housing equities, equity securities that promote environmental sustainability in our view, global defensive equities, and global cyclicals contributed to the relative performance. Volatility management also added to performance.
The Fund’s tactical positioning implemented through our active allocation process also generated positive results.
Top Detractors to Performance
Equities delivered positive total returns but sub-strategy selection, the underweight asset allocation, and security selection detracted from relative performance.
Equity allocations detracted from relative performance, driven by exposure to global dividend growth equities and North Asian equities.
The Fund’s use of call options, which sought to hedge market exposure, detracted from relative returns.
During the period, the Fund’s use of derivatives, such as equity futures, interest rate futures, and total return swaps, to seek tactical exposures to equity and fixed-income markets, was additive to relative performance. Over the period, the Fund’s use of equity and interest rate futures for risk management purposes, contributed slightly positively to relative performance.
The views expressed in this section reflect the opinions of the Fund's sub-adviser, Wellington Management Company LLP, as of the date of this report and are subject to change based on changes in market, economic or other conditions. These views are not intended to be a forecast of future events and are no guarantee of future results.
Comparison of Change in Value of $ 10,000 Investment
The graph below represents the hypothetical growth of a $10,000 investment in Class A shares and the comparative indices. The returns for Class A shares include the maximum front-end sales charge applicable to Class A shares.
Average Annual Total Returns
For the Periods Ended October 31, 2024 | 1 Year | 5 Years | 10 Years |
| Class A (with 5.50% maximum front-end sales charge) | 9.50% | 2.41%) | 4.10% |
| Class A (without 5.50% maximum front-end sales charge) | 15.87% | 3.57%) | 4.69% |
| Blended Benchmark | 22.30% | 6.81%) | 6.79% |
| Bloomberg US Aggregate Bond Index | 10.55% | (0.23)% | 1.49% |
| S&P 500 Index | 38.02% | 15.27%) | 13.00% |
The Blended Benchmark is calculated by Hartford Funds Management Company, LLC.
Performance for the Fund prior to May 1, 2019, reflects the Fund’s performance while it pursued its prior investment objective and was managed in accordance with its prior investment strategy.
The Fund’s past performance is not a good predictor of the Fund’s future performance. The graph and table do not reflect the deduction of taxes that a shareholder would pay on Fund distributions or redemption of Fund shares. Performance information reflects fee waivers and/or expense limitation arrangements, if any. Absent any applicable fee waivers and/or expense limitation arrangements, performance would have been lower. Visit hartfordfunds.com for the most recent performance information.
Key Fund Statistics as of October 31, 2024
| Fund's net assets | $586,610,484% |
| Total number of portfolio holdings | $1,068% |
| Total investment management fees paid | $3,512,866% |
| Portfolio turnover rate (excludes to be announced (TBA) roll transactions) | $187% |
Graphical Representation of Holdings as of October 31, 2024
The table below shows the investment makeup of the Fund, representing the percentage of net assets of the Fund.
Composition by Security Type
| Common Stocks | 23.9 | % |
| Corporate Bonds | 21.2 | % |
| Asset & Commercial Mortgage-Backed Securities | 14.3 | % |
| Equity Linked Securities | 10.3 | % |
| Senior Floating Rate Interests | 9.3 | % |
| U.S. Government Securities | 6.2 | % |
| U.S. Government Agencies | 5.7 | % |
| Convertible Bonds | 4.8 | % |
| Foreign Government Obligations | 3.5 | % |
| Exchange-Traded Funds | 1.0 | % |
| Preferred Stocks | 1.0 | % |
| Municipal Bonds | 0.1 | % |
| Short-Term Investments | 0.9 | % |
| Other Assets & Liabilities | (2.2 | )% |
| Total | 100.0 | % |
Availability of Additional Information
For additional information about the Fund, including its prospectus, financial information, holdings, and proxy voting information, please visit the Fund’s website at the website address included at the beginning of this report.
The Fund is distributed by Hartford Funds Distributors, LLC (HFD).
Annual Shareholder Report
October 31, 2024
Hartford Multi-Asset Income Fund
Class C/HAFCX
This annual shareholder report contains important information about the Hartford Multi-Asset Income Fund (the "Fund") for the period of November 1, 2023 to October 31, 2024. You can find additional information about the Fund at hartfordfunds.com/reports-hmf. You can also request this information by contacting us by calling 1‑888‑843‑7824.
What were the Fund costs for the last year?
(Based on a hypothetical $10,000 investment)
| Class Name | Costs of a $10,000 investment | Costs paid as a percentage
of a $10,000 investment |
| Class C | $192 | 1.79% |
Costs paid excludes fees and expenses incurred indirectly as a result of investments in other investment companies.
How did the Fund perform last year and what impacted its performance?
Management's Discussion of Fund Performance
Global equities, as measured by the MSCI World Index (Net), rose over the trailing twelve-month period ending October 31, 2024, supported by easing inflation and interest rate cuts. Despite mixed economic indicators and geopolitical tensions, such as leadership changes in major countries and ongoing conflict in the Middle East, resilient labor markets and lower energy prices bolstered market sentiment. Fund performance described below is relative to the Fund’s blended benchmark, 55% Bloomberg US Aggregate Bond Index/ 45% S&P 500 Index (the "Blended Benchmark"), for the trailing twelve-month period ended October 31, 2024.
Top Contributors to Performance
Fixed income allocations contributed positively to relative performance over the period. This was primarily driven by positive relative returns from our allocation to active strategies (such as, strategic income allocation).
Within equity, United States housing equities, equity securities that promote environmental sustainability in our view, global defensive equities, and global cyclicals contributed to the relative performance. Volatility management also added to performance.
The Fund’s tactical positioning implemented through our active allocation process also generated positive results.
Top Detractors to Performance
Equities delivered positive total returns but sub-strategy selection, the underweight asset allocation, and security selection detracted from relative performance.
Equity allocations detracted from relative performance, driven by exposure to global dividend growth equities and North Asian equities.
The Fund’s use of call options, which sought to hedge market exposure, detracted from relative returns.
During the period, the Fund’s use of derivatives, such as equity futures, interest rate futures, and total return swaps, to seek tactical exposures to equity and fixed-income markets, was additive to relative performance. Over the period, the Fund’s use of equity and interest rate futures for risk management purposes, contributed slightly positively to relative performance.
The views expressed in this section reflect the opinions of the Fund's sub-adviser, Wellington Management Company LLP, as of the date of this report and are subject to change based on changes in market, economic or other conditions. These views are not intended to be a forecast of future events and are no guarantee of future results.
Comparison of Change in Value of $ 10,000 Investment
The graph below represents the hypothetical growth of a $10,000 investment in Class C shares (excluding sales charges) and the comparative indices. If sales charges had been included, the value would have been lower.
Average Annual Total Returns
For the Periods Ended October 31, 2024 | 1 Year | 5 Years | 10 Years |
| Class C (with 1.00% contingent deferred sales charge) | 14.01% | 2.82%) | 3.94% |
| Class C (without 1.00% contingent deferred sales charge) | 15.01% | 2.82%) | 3.94% |
| Blended Benchmark | 22.30% | 6.81%) | 6.79% |
| Bloomberg US Aggregate Bond Index | 10.55% | (0.23)% | 1.49% |
| S&P 500 Index | 38.02% | 15.27%) | 13.00% |
The Blended Benchmark is calculated by Hartford Funds Management Company, LLC.
Performance for the Fund prior to May 1, 2019, reflects the Fund’s performance while it pursued its prior investment objective and was managed in accordance with its prior investment strategy.
The Fund’s past performance is not a good predictor of the Fund’s future performance. The graph and table do not reflect the deduction of taxes that a shareholder would pay on Fund distributions or redemption of Fund shares. Performance information reflects fee waivers and/or expense limitation arrangements, if any. Absent any applicable fee waivers and/or expense limitation arrangements, performance would have been lower. Visit hartfordfunds.com for the most recent performance information.
Key Fund Statistics as of October 31, 2024
| Fund's net assets | $586,610,484% |
| Total number of portfolio holdings | $1,068% |
| Total investment management fees paid | $3,512,866% |
| Portfolio turnover rate (excludes to be announced (TBA) roll transactions) | $187% |
Graphical Representation of Holdings as of October 31, 2024
The table below shows the investment makeup of the Fund, representing the percentage of net assets of the Fund.
Composition by Security Type
| Common Stocks | 23.9 | % |
| Corporate Bonds | 21.2 | % |
| Asset & Commercial Mortgage-Backed Securities | 14.3 | % |
| Equity Linked Securities | 10.3 | % |
| Senior Floating Rate Interests | 9.3 | % |
| U.S. Government Securities | 6.2 | % |
| U.S. Government Agencies | 5.7 | % |
| Convertible Bonds | 4.8 | % |
| Foreign Government Obligations | 3.5 | % |
| Exchange-Traded Funds | 1.0 | % |
| Preferred Stocks | 1.0 | % |
| Municipal Bonds | 0.1 | % |
| Short-Term Investments | 0.9 | % |
| Other Assets & Liabilities | (2.2 | )% |
| Total | 100.0 | % |
Availability of Additional Information
For additional information about the Fund, including its prospectus, financial information, holdings, and proxy voting information, please visit the Fund’s website at the website address included at the beginning of this report.
The Fund is distributed by Hartford Funds Distributors, LLC (HFD).
Annual Shareholder Report
October 31, 2024
Hartford Multi-Asset Income Fund
Class I/ITTIX
This annual shareholder report contains important information about the Hartford Multi-Asset Income Fund (the "Fund") for the period of November 1, 2023 to October 31, 2024. You can find additional information about the Fund at hartfordfunds.com/reports-hmf. You can also request this information by contacting us by calling 1‑888‑843‑7824.
What were the Fund costs for the last year?
(Based on a hypothetical $10,000 investment)
| Class Name | Costs of a $10,000 investment | Costs paid as a percentage
of a $10,000 investment |
| Class I | $82 | 0.76% |
Costs paid excludes fees and expenses incurred indirectly as a result of investments in other investment companies.
How did the Fund perform last year and what impacted its performance?
Management's Discussion of Fund Performance
Global equities, as measured by the MSCI World Index (Net), rose over the trailing twelve-month period ending October 31, 2024, supported by easing inflation and interest rate cuts. Despite mixed economic indicators and geopolitical tensions, such as leadership changes in major countries and ongoing conflict in the Middle East, resilient labor markets and lower energy prices bolstered market sentiment. Fund performance described below is relative to the Fund’s blended benchmark, 55% Bloomberg US Aggregate Bond Index/ 45% S&P 500 Index (the "Blended Benchmark"), for the trailing twelve-month period ended October 31, 2024.
Top Contributors to Performance
Fixed income allocations contributed positively to relative performance over the period. This was primarily driven by positive relative returns from our allocation to active strategies (such as, strategic income allocation).
Within equity, United States housing equities, equity securities that promote environmental sustainability in our view, global defensive equities, and global cyclicals contributed to the relative performance. Volatility management also added to performance.
The Fund’s tactical positioning implemented through our active allocation process also generated positive results.
Top Detractors to Performance
Equities delivered positive total returns but sub-strategy selection, the underweight asset allocation, and security selection detracted from relative performance.
Equity allocations detracted from relative performance, driven by exposure to global dividend growth equities and North Asian equities.
The Fund’s use of call options, which sought to hedge market exposure, detracted from relative returns.
During the period, the Fund’s use of derivatives, such as equity futures, interest rate futures, and total return swaps, to seek tactical exposures to equity and fixed-income markets, was additive to relative performance. Over the period, the Fund’s use of equity and interest rate futures for risk management purposes, contributed slightly positively to relative performance.
The views expressed in this section reflect the opinions of the Fund's sub-adviser, Wellington Management Company LLP, as of the date of this report and are subject to change based on changes in market, economic or other conditions. These views are not intended to be a forecast of future events and are no guarantee of future results.
Comparison of Change in Value of $ 10,000 Investment
The graph below represents the hypothetical growth of a $10,000 investment in Class I shares and the comparative indices.
Average Annual Total Returns
For the Periods Ended October 31, 2024 | 1 Year | 5 Years | 10 Years |
| Class I | 16.24% | 3.89%) | 4.99% |
| Blended Benchmark | 22.30% | 6.81%) | 6.79% |
| Bloomberg US Aggregate Bond Index | 10.55% | (0.23)% | 1.49% |
| S&P 500 Index | 38.02% | 15.27%) | 13.00% |
Class I shares commenced operations on March 31, 2015 and performance prior to that date is that of the Fund’s Class A shares (excluding sales charges). Performance prior to the inception date of the class has not been adjusted to reflect the operating expenses of the class.
The Blended Benchmark is calculated by Hartford Funds Management Company, LLC.
Performance for the Fund prior to May 1, 2019, reflects the Fund’s performance while it pursued its prior investment objective and was managed in accordance with its prior investment strategy.
The Fund’s past performance is not a good predictor of the Fund’s future performance. The graph and table do not reflect the deduction of taxes that a shareholder would pay on Fund distributions or redemption of Fund shares. Performance information reflects fee waivers and/or expense limitation arrangements, if any. Absent any applicable fee waivers and/or expense limitation arrangements, performance would have been lower. Visit hartfordfunds.com for the most recent performance information.
Key Fund Statistics as of October 31, 2024
| Fund's net assets | $586,610,484% |
| Total number of portfolio holdings | $1,068% |
| Total investment management fees paid | $3,512,866% |
| Portfolio turnover rate (excludes to be announced (TBA) roll transactions) | $187% |
Graphical Representation of Holdings as of October 31, 2024
The table below shows the investment makeup of the Fund, representing the percentage of net assets of the Fund.
Composition by Security Type
| Common Stocks | 23.9 | % |
| Corporate Bonds | 21.2 | % |
| Asset & Commercial Mortgage-Backed Securities | 14.3 | % |
| Equity Linked Securities | 10.3 | % |
| Senior Floating Rate Interests | 9.3 | % |
| U.S. Government Securities | 6.2 | % |
| U.S. Government Agencies | 5.7 | % |
| Convertible Bonds | 4.8 | % |
| Foreign Government Obligations | 3.5 | % |
| Exchange-Traded Funds | 1.0 | % |
| Preferred Stocks | 1.0 | % |
| Municipal Bonds | 0.1 | % |
| Short-Term Investments | 0.9 | % |
| Other Assets & Liabilities | (2.2 | )% |
| Total | 100.0 | % |
Availability of Additional Information
For additional information about the Fund, including its prospectus, financial information, holdings, and proxy voting information, please visit the Fund’s website at the website address included at the beginning of this report.
The Fund is distributed by Hartford Funds Distributors, LLC (HFD).
Annual Shareholder Report
October 31, 2024
Hartford Multi-Asset Income Fund
Class R3/ITTRX
This annual shareholder report contains important information about the Hartford Multi-Asset Income Fund (the "Fund") for the period of November 1, 2023 to October 31, 2024. You can find additional information about the Fund at hartfordfunds.com/reports-hmf. You can also request this information by contacting us by calling 1‑888‑843‑7824.
What were the Fund costs for the last year?
(Based on a hypothetical $10,000 investment)
| Class Name | Costs of a $10,000 investment | Costs paid as a percentage
of a $10,000 investment |
| Class R3 | $144 | 1.34% |
Costs paid include the impact of certain non-contractual waivers and/or reimbursements. In the absence of such waivers and reimbursements, the expense ratio would be higher. Costs paid excludes fees and expenses incurred indirectly as a result of investments in other investment companies.
How did the Fund perform last year and what impacted its performance?
Management's Discussion of Fund Performance
Global equities, as measured by the MSCI World Index (Net), rose over the trailing twelve-month period ending October 31, 2024, supported by easing inflation and interest rate cuts. Despite mixed economic indicators and geopolitical tensions, such as leadership changes in major countries and ongoing conflict in the Middle East, resilient labor markets and lower energy prices bolstered market sentiment. Fund performance described below is relative to the Fund’s blended benchmark, 55% Bloomberg US Aggregate Bond Index/ 45% S&P 500 Index (the "Blended Benchmark"), for the trailing twelve-month period ended October 31, 2024.
Top Contributors to Performance
Fixed income allocations contributed positively to relative performance over the period. This was primarily driven by positive relative returns from our allocation to active strategies (such as, strategic income allocation).
Within equity, United States housing equities, equity securities that promote environmental sustainability in our view, global defensive equities, and global cyclicals contributed to the relative performance. Volatility management also added to performance.
The Fund’s tactical positioning implemented through our active allocation process also generated positive results.
Top Detractors to Performance
Equities delivered positive total returns but sub-strategy selection, the underweight asset allocation, and security selection detracted from relative performance.
Equity allocations detracted from relative performance, driven by exposure to global dividend growth equities and North Asian equities.
The Fund’s use of call options, which sought to hedge market exposure, detracted from relative returns.
During the period, the Fund’s use of derivatives, such as equity futures, interest rate futures, and total return swaps, to seek tactical exposures to equity and fixed-income markets, was additive to relative performance. Over the period, the Fund’s use of equity and interest rate futures for risk management purposes, contributed slightly positively to relative performance.
The views expressed in this section reflect the opinions of the Fund's sub-adviser, Wellington Management Company LLP, as of the date of this report and are subject to change based on changes in market, economic or other conditions. These views are not intended to be a forecast of future events and are no guarantee of future results.
Comparison of Change in Value of $ 10,000 Investment
The graph below represents the hypothetical growth of a $10,000 investment in Class R3 shares and the comparative indices.
Average Annual Total Returns
For the Periods Ended October 31, 2024 | 1 Year | 5 Years | 10 Years |
| Class R3 | 15.52% | 3.28%) | 4.40% |
| Blended Benchmark | 22.30% | 6.81%) | 6.79% |
| Bloomberg US Aggregate Bond Index | 10.55% | (0.23)% | 1.49% |
| S&P 500 Index | 38.02% | 15.27%) | 13.00% |
The Blended Benchmark is calculated by Hartford Funds Management Company, LLC.
Performance for the Fund prior to May 1, 2019, reflects the Fund’s performance while it pursued its prior investment objective and was managed in accordance with its prior investment strategy.
The Fund’s past performance is not a good predictor of the Fund’s future performance. The graph and table do not reflect the deduction of taxes that a shareholder would pay on Fund distributions or redemption of Fund shares. Performance information reflects fee waivers and/or expense limitation arrangements, if any. Absent any applicable fee waivers and/or expense limitation arrangements, performance would have been lower. Visit hartfordfunds.com for the most recent performance information.
Key Fund Statistics as of October 31, 2024
| Fund's net assets | $586,610,484% |
| Total number of portfolio holdings | $1,068% |
| Total investment management fees paid | $3,512,866% |
| Portfolio turnover rate (excludes to be announced (TBA) roll transactions) | $187% |
Graphical Representation of Holdings as of October 31, 2024
The table below shows the investment makeup of the Fund, representing the percentage of net assets of the Fund.
Composition by Security Type
| Common Stocks | 23.9 | % |
| Corporate Bonds | 21.2 | % |
| Asset & Commercial Mortgage-Backed Securities | 14.3 | % |
| Equity Linked Securities | 10.3 | % |
| Senior Floating Rate Interests | 9.3 | % |
| U.S. Government Securities | 6.2 | % |
| U.S. Government Agencies | 5.7 | % |
| Convertible Bonds | 4.8 | % |
| Foreign Government Obligations | 3.5 | % |
| Exchange-Traded Funds | 1.0 | % |
| Preferred Stocks | 1.0 | % |
| Municipal Bonds | 0.1 | % |
| Short-Term Investments | 0.9 | % |
| Other Assets & Liabilities | (2.2 | )% |
| Total | 100.0 | % |
Availability of Additional Information
For additional information about the Fund, including its prospectus, financial information, holdings, and proxy voting information, please visit the Fund’s website at the website address included at the beginning of this report.
The Fund is distributed by Hartford Funds Distributors, LLC (HFD).
Annual Shareholder Report
October 31, 2024
Hartford Multi-Asset Income Fund
Class R4/ITTSX
This annual shareholder report contains important information about the Hartford Multi-Asset Income Fund (the "Fund") for the period of November 1, 2023 to October 31, 2024. You can find additional information about the Fund at hartfordfunds.com/reports-hmf. You can also request this information by contacting us by calling 1‑888‑843‑7824.
What were the Fund costs for the last year?
(Based on a hypothetical $10,000 investment)
| Class Name | Costs of a $10,000 investment | Costs paid as a percentage
of a $10,000 investment |
| Class R4 | $117 | 1.08% |
Costs paid excludes fees and expenses incurred indirectly as a result of investments in other investment companies.
How did the Fund perform last year and what impacted its performance?
Management's Discussion of Fund Performance
Global equities, as measured by the MSCI World Index (Net), rose over the trailing twelve-month period ending October 31, 2024, supported by easing inflation and interest rate cuts. Despite mixed economic indicators and geopolitical tensions, such as leadership changes in major countries and ongoing conflict in the Middle East, resilient labor markets and lower energy prices bolstered market sentiment. Fund performance described below is relative to the Fund’s blended benchmark, 55% Bloomberg US Aggregate Bond Index/ 45% S&P 500 Index (the "Blended Benchmark"), for the trailing twelve-month period ended October 31, 2024.
Top Contributors to Performance
Fixed income allocations contributed positively to relative performance over the period. This was primarily driven by positive relative returns from our allocation to active strategies (such as, strategic income allocation).
Within equity, United States housing equities, equity securities that promote environmental sustainability in our view, global defensive equities, and global cyclicals contributed to the relative performance. Volatility management also added to performance.
The Fund’s tactical positioning implemented through our active allocation process also generated positive results.
Top Detractors to Performance
Equities delivered positive total returns but sub-strategy selection, the underweight asset allocation, and security selection detracted from relative performance.
Equity allocations detracted from relative performance, driven by exposure to global dividend growth equities and North Asian equities.
The Fund’s use of call options, which sought to hedge market exposure, detracted from relative returns.
During the period, the Fund’s use of derivatives, such as equity futures, interest rate futures, and total return swaps, to seek tactical exposures to equity and fixed-income markets, was additive to relative performance. Over the period, the Fund’s use of equity and interest rate futures for risk management purposes, contributed slightly positively to relative performance.
The views expressed in this section reflect the opinions of the Fund's sub-adviser, Wellington Management Company LLP, as of the date of this report and are subject to change based on changes in market, economic or other conditions. These views are not intended to be a forecast of future events and are no guarantee of future results.
Comparison of Change in Value of $ 10,000 Investment
The graph below represents the hypothetical growth of a $10,000 investment in Class R4 shares and the comparative indices.
Average Annual Total Returns
For the Periods Ended October 31, 2024 | 1 Year | 5 Years | 10 Years |
| Class R4 | 15.85% | 3.54%) | 4.68% |
| Blended Benchmark | 22.30% | 6.81%) | 6.79% |
| Bloomberg US Aggregate Bond Index | 10.55% | (0.23)% | 1.49% |
| S&P 500 Index | 38.02% | 15.27%) | 13.00% |
The Blended Benchmark is calculated by Hartford Funds Management Company, LLC.
Performance for the Fund prior to May 1, 2019, reflects the Fund’s performance while it pursued its prior investment objective and was managed in accordance with its prior investment strategy.
The Fund’s past performance is not a good predictor of the Fund’s future performance. The graph and table do not reflect the deduction of taxes that a shareholder would pay on Fund distributions or redemption of Fund shares. Performance information reflects fee waivers and/or expense limitation arrangements, if any. Absent any applicable fee waivers and/or expense limitation arrangements, performance would have been lower. Visit hartfordfunds.com for the most recent performance information.
Key Fund Statistics as of October 31, 2024
| Fund's net assets | $586,610,484% |
| Total number of portfolio holdings | $1,068% |
| Total investment management fees paid | $3,512,866% |
| Portfolio turnover rate (excludes to be announced (TBA) roll transactions) | $187% |
Graphical Representation of Holdings as of October 31, 2024
The table below shows the investment makeup of the Fund, representing the percentage of net assets of the Fund.
Composition by Security Type
| Common Stocks | 23.9 | % |
| Corporate Bonds | 21.2 | % |
| Asset & Commercial Mortgage-Backed Securities | 14.3 | % |
| Equity Linked Securities | 10.3 | % |
| Senior Floating Rate Interests | 9.3 | % |
| U.S. Government Securities | 6.2 | % |
| U.S. Government Agencies | 5.7 | % |
| Convertible Bonds | 4.8 | % |
| Foreign Government Obligations | 3.5 | % |
| Exchange-Traded Funds | 1.0 | % |
| Preferred Stocks | 1.0 | % |
| Municipal Bonds | 0.1 | % |
| Short-Term Investments | 0.9 | % |
| Other Assets & Liabilities | (2.2 | )% |
| Total | 100.0 | % |
Availability of Additional Information
For additional information about the Fund, including its prospectus, financial information, holdings, and proxy voting information, please visit the Fund’s website at the website address included at the beginning of this report.
The Fund is distributed by Hartford Funds Distributors, LLC (HFD).
Annual Shareholder Report
October 31, 2024
Hartford Multi-Asset Income Fund
Class R5/ITTTX
This annual shareholder report contains important information about the Hartford Multi-Asset Income Fund (the "Fund") for the period of November 1, 2023 to October 31, 2024. You can find additional information about the Fund at hartfordfunds.com/reports-hmf. You can also request this information by contacting us by calling 1‑888‑843‑7824.
What were the Fund costs for the last year?
(Based on a hypothetical $10,000 investment)
| Class Name | Costs of a $10,000 investment | Costs paid as a percentage
of a $10,000 investment |
| Class R5 | $84 | 0.78% |
Costs paid excludes fees and expenses incurred indirectly as a result of investments in other investment companies.
How did the Fund perform last year and what impacted its performance?
Management's Discussion of Fund Performance
Global equities, as measured by the MSCI World Index (Net), rose over the trailing twelve-month period ending October 31, 2024, supported by easing inflation and interest rate cuts. Despite mixed economic indicators and geopolitical tensions, such as leadership changes in major countries and ongoing conflict in the Middle East, resilient labor markets and lower energy prices bolstered market sentiment. Fund performance described below is relative to the Fund’s blended benchmark, 55% Bloomberg US Aggregate Bond Index/ 45% S&P 500 Index (the "Blended Benchmark"), for the trailing twelve-month period ended October 31, 2024.
Top Contributors to Performance
Fixed income allocations contributed positively to relative performance over the period. This was primarily driven by positive relative returns from our allocation to active strategies (such as, strategic income allocation).
Within equity, United States housing equities, equity securities that promote environmental sustainability in our view, global defensive equities, and global cyclicals contributed to the relative performance. Volatility management also added to performance.
The Fund’s tactical positioning implemented through our active allocation process also generated positive results.
Top Detractors to Performance
Equities delivered positive total returns but sub-strategy selection, the underweight asset allocation, and security selection detracted from relative performance.
Equity allocations detracted from relative performance, driven by exposure to global dividend growth equities and North Asian equities.
The Fund’s use of call options, which sought to hedge market exposure, detracted from relative returns.
During the period, the Fund’s use of derivatives, such as equity futures, interest rate futures, and total return swaps, to seek tactical exposures to equity and fixed-income markets, was additive to relative performance. Over the period, the Fund’s use of equity and interest rate futures for risk management purposes, contributed slightly positively to relative performance.
The views expressed in this section reflect the opinions of the Fund's sub-adviser, Wellington Management Company LLP, as of the date of this report and are subject to change based on changes in market, economic or other conditions. These views are not intended to be a forecast of future events and are no guarantee of future results.
Comparison of Change in Value of $ 10,000 Investment
The graph below represents the hypothetical growth of a $10,000 investment in Class R5 shares and the comparative indices.
Average Annual Total Returns
For the Periods Ended October 31, 2024 | 1 Year | 5 Years | 10 Years |
| Class R5 | 16.20% | 3.84%) | 4.99% |
| Blended Benchmark | 22.30% | 6.81%) | 6.79% |
| Bloomberg US Aggregate Bond Index | 10.55% | (0.23)% | 1.49% |
| S&P 500 Index | 38.02% | 15.27%) | 13.00% |
The Blended Benchmark is calculated by Hartford Funds Management Company, LLC.
Performance for the Fund prior to May 1, 2019, reflects the Fund’s performance while it pursued its prior investment objective and was managed in accordance with its prior investment strategy.
The Fund’s past performance is not a good predictor of the Fund’s future performance. The graph and table do not reflect the deduction of taxes that a shareholder would pay on Fund distributions or redemption of Fund shares. Performance information reflects fee waivers and/or expense limitation arrangements, if any. Absent any applicable fee waivers and/or expense limitation arrangements, performance would have been lower. Visit hartfordfunds.com for the most recent performance information.
Key Fund Statistics as of October 31, 2024
| Fund's net assets | $586,610,484% |
| Total number of portfolio holdings | $1,068% |
| Total investment management fees paid | $3,512,866% |
| Portfolio turnover rate (excludes to be announced (TBA) roll transactions) | $187% |
Graphical Representation of Holdings as of October 31, 2024
The table below shows the investment makeup of the Fund, representing the percentage of net assets of the Fund.
Composition by Security Type
| Common Stocks | 23.9 | % |
| Corporate Bonds | 21.2 | % |
| Asset & Commercial Mortgage-Backed Securities | 14.3 | % |
| Equity Linked Securities | 10.3 | % |
| Senior Floating Rate Interests | 9.3 | % |
| U.S. Government Securities | 6.2 | % |
| U.S. Government Agencies | 5.7 | % |
| Convertible Bonds | 4.8 | % |
| Foreign Government Obligations | 3.5 | % |
| Exchange-Traded Funds | 1.0 | % |
| Preferred Stocks | 1.0 | % |
| Municipal Bonds | 0.1 | % |
| Short-Term Investments | 0.9 | % |
| Other Assets & Liabilities | (2.2 | )% |
| Total | 100.0 | % |
Availability of Additional Information
For additional information about the Fund, including its prospectus, financial information, holdings, and proxy voting information, please visit the Fund’s website at the website address included at the beginning of this report.
The Fund is distributed by Hartford Funds Distributors, LLC (HFD).
Annual Shareholder Report
October 31, 2024
Hartford Multi-Asset Income Fund
Class R6/ITTVX
This annual shareholder report contains important information about the Hartford Multi-Asset Income Fund (the "Fund") for the period of November 1, 2023 to October 31, 2024. You can find additional information about the Fund at hartfordfunds.com/reports-hmf. You can also request this information by contacting us by calling 1‑888‑843‑7824.
What were the Fund costs for the last year?
(Based on a hypothetical $10,000 investment)
| Class Name | Costs of a $10,000 investment | Costs paid as a percentage
of a $10,000 investment |
| Class R6 | $71 | 0.66% |
Costs paid excludes fees and expenses incurred indirectly as a result of investments in other investment companies.
How did the Fund perform last year and what impacted its performance?
Management's Discussion of Fund Performance
Global equities, as measured by the MSCI World Index (Net), rose over the trailing twelve-month period ending October 31, 2024, supported by easing inflation and interest rate cuts. Despite mixed economic indicators and geopolitical tensions, such as leadership changes in major countries and ongoing conflict in the Middle East, resilient labor markets and lower energy prices bolstered market sentiment. Fund performance described below is relative to the Fund’s blended benchmark, 55% Bloomberg US Aggregate Bond Index/ 45% S&P 500 Index (the "Blended Benchmark"), for the trailing twelve-month period ended October 31, 2024.
Top Contributors to Performance
Fixed income allocations contributed positively to relative performance over the period. This was primarily driven by positive relative returns from our allocation to active strategies (such as, strategic income allocation).
Within equity, United States housing equities, equity securities that promote environmental sustainability in our view, global defensive equities, and global cyclicals contributed to the relative performance. Volatility management also added to performance.
The Fund’s tactical positioning implemented through our active allocation process also generated positive results.
Top Detractors to Performance
Equities delivered positive total returns but sub-strategy selection, the underweight asset allocation, and security selection detracted from relative performance.
Equity allocations detracted from relative performance, driven by exposure to global dividend growth equities and North Asian equities.
The Fund’s use of call options, which sought to hedge market exposure, detracted from relative returns.
During the period, the Fund’s use of derivatives, such as equity futures, interest rate futures, and total return swaps, to seek tactical exposures to equity and fixed-income markets, was additive to relative performance. Over the period, the Fund’s use of equity and interest rate futures for risk management purposes, contributed slightly positively to relative performance.
The views expressed in this section reflect the opinions of the Fund's sub-adviser, Wellington Management Company LLP, as of the date of this report and are subject to change based on changes in market, economic or other conditions. These views are not intended to be a forecast of future events and are no guarantee of future results.
Comparison of Change in Value of $ 10,000 Investment
The graph below represents the hypothetical growth of a $10,000 investment in Class R6 shares and the comparative indices.
Average Annual Total Returns
For the Periods Ended October 31, 2024 | 1 Year | 5 Years | 10 Years |
| Class R6 | 16.29% | 3.96%) | 5.08% |
| Blended Benchmark | 22.30% | 6.81%) | 6.79% |
| Bloomberg US Aggregate Bond Index | 10.55% | (0.23)% | 1.49% |
| S&P 500 Index | 38.02% | 15.27%) | 13.00% |
Class R6 shares commenced operations on February 28, 2018 and performance prior to that date is that of the Fund’s Class Y shares. Performance prior to the inception date of the class has not been adjusted to reflect the operating expenses of the class.
The Blended Benchmark is calculated by Hartford Funds Management Company, LLC.
Performance for the Fund prior to May 1, 2019, reflects the Fund’s performance while it pursued its prior investment objective and was managed in accordance with its prior investment strategy.
The Fund’s past performance is not a good predictor of the Fund’s future performance. The graph and table do not reflect the deduction of taxes that a shareholder would pay on Fund distributions or redemption of Fund shares. Performance information reflects fee waivers and/or expense limitation arrangements, if any. Absent any applicable fee waivers and/or expense limitation arrangements, performance would have been lower. Visit hartfordfunds.com for the most recent performance information.
Key Fund Statistics as of October 31, 2024
| Fund's net assets | $586,610,484% |
| Total number of portfolio holdings | $1,068% |
| Total investment management fees paid | $3,512,866% |
| Portfolio turnover rate (excludes to be announced (TBA) roll transactions) | $187% |
Graphical Representation of Holdings as of October 31, 2024
The table below shows the investment makeup of the Fund, representing the percentage of net assets of the Fund.
Composition by Security Type
| Common Stocks | 23.9 | % |
| Corporate Bonds | 21.2 | % |
| Asset & Commercial Mortgage-Backed Securities | 14.3 | % |
| Equity Linked Securities | 10.3 | % |
| Senior Floating Rate Interests | 9.3 | % |
| U.S. Government Securities | 6.2 | % |
| U.S. Government Agencies | 5.7 | % |
| Convertible Bonds | 4.8 | % |
| Foreign Government Obligations | 3.5 | % |
| Exchange-Traded Funds | 1.0 | % |
| Preferred Stocks | 1.0 | % |
| Municipal Bonds | 0.1 | % |
| Short-Term Investments | 0.9 | % |
| Other Assets & Liabilities | (2.2 | )% |
| Total | 100.0 | % |
Availability of Additional Information
For additional information about the Fund, including its prospectus, financial information, holdings, and proxy voting information, please visit the Fund’s website at the website address included at the beginning of this report.
The Fund is distributed by Hartford Funds Distributors, LLC (HFD).
Annual Shareholder Report
October 31, 2024
Hartford Multi-Asset Income Fund
Class Y/IHAYX
This annual shareholder report contains important information about the Hartford Multi-Asset Income Fund (the "Fund") for the period of November 1, 2023 to October 31, 2024. You can find additional information about the Fund at hartfordfunds.com/reports-hmf. You can also request this information by contacting us by calling 1‑888‑843‑7824.
What were the Fund costs for the last year?
(Based on a hypothetical $10,000 investment)
| Class Name | Costs of a $10,000 investment | Costs paid as a percentage
of a $10,000 investment |
| Class Y | $83 | 0.77% |
Costs paid excludes fees and expenses incurred indirectly as a result of investments in other investment companies.
How did the Fund perform last year and what impacted its performance?
Management's Discussion of Fund Performance
Global equities, as measured by the MSCI World Index (Net), rose over the trailing twelve-month period ending October 31, 2024, supported by easing inflation and interest rate cuts. Despite mixed economic indicators and geopolitical tensions, such as leadership changes in major countries and ongoing conflict in the Middle East, resilient labor markets and lower energy prices bolstered market sentiment. Fund performance described below is relative to the Fund’s blended benchmark, 55% Bloomberg US Aggregate Bond Index/ 45% S&P 500 Index (the "Blended Benchmark"), for the trailing twelve-month period ended October 31, 2024.
Top Contributors to Performance
Fixed income allocations contributed positively to relative performance over the period. This was primarily driven by positive relative returns from our allocation to active strategies (such as, strategic income allocation).
Within equity, United States housing equities, equity securities that promote environmental sustainability in our view, global defensive equities, and global cyclicals contributed to the relative performance. Volatility management also added to performance.
The Fund’s tactical positioning implemented through our active allocation process also generated positive results.
Top Detractors to Performance
Equities delivered positive total returns but sub-strategy selection, the underweight asset allocation, and security selection detracted from relative performance.
Equity allocations detracted from relative performance, driven by exposure to global dividend growth equities and North Asian equities.
The Fund’s use of call options, which sought to hedge market exposure, detracted from relative returns.
During the period, the Fund’s use of derivatives, such as equity futures, interest rate futures, and total return swaps, to seek tactical exposures to equity and fixed-income markets, was additive to relative performance. Over the period, the Fund’s use of equity and interest rate futures for risk management purposes, contributed slightly positively to relative performance.
The views expressed in this section reflect the opinions of the Fund's sub-adviser, Wellington Management Company LLP, as of the date of this report and are subject to change based on changes in market, economic or other conditions. These views are not intended to be a forecast of future events and are no guarantee of future results.
Comparison of Change in Value of $ 250,000 Investment
The graph below represents the hypothetical growth of a $250,000 investment in Class Y shares and the comparative indices.
Average Annual Total Returns
For the Periods Ended October 31, 2024 | 1 Year | 5 Years | 10 Years |
| Class Y | 16.20% | 3.87%) | 5.03% |
| Blended Benchmark | 22.30% | 6.81%) | 6.79% |
| Bloomberg US Aggregate Bond Index | 10.55% | (0.23)% | 1.49% |
| S&P 500 Index | 38.02% | 15.27%) | 13.00% |
The Blended Benchmark is calculated by Hartford Funds Management Company, LLC.
Performance for the Fund prior to May 1, 2019, reflects the Fund’s performance while it pursued its prior investment objective and was managed in accordance with its prior investment strategy.
The Fund’s past performance is not a good predictor of the Fund’s future performance. The graph and table do not reflect the deduction of taxes that a shareholder would pay on Fund distributions or redemption of Fund shares. Performance information reflects fee waivers and/or expense limitation arrangements, if any. Absent any applicable fee waivers and/or expense limitation arrangements, performance would have been lower. Visit hartfordfunds.com for the most recent performance information.
Key Fund Statistics as of October 31, 2024
| Fund's net assets | $586,610,484% |
| Total number of portfolio holdings | $1,068% |
| Total investment management fees paid | $3,512,866% |
| Portfolio turnover rate (excludes to be announced (TBA) roll transactions) | $187% |
Graphical Representation of Holdings as of October 31, 2024
The table below shows the investment makeup of the Fund, representing the percentage of net assets of the Fund.
Composition by Security Type
| Common Stocks | 23.9 | % |
| Corporate Bonds | 21.2 | % |
| Asset & Commercial Mortgage-Backed Securities | 14.3 | % |
| Equity Linked Securities | 10.3 | % |
| Senior Floating Rate Interests | 9.3 | % |
| U.S. Government Securities | 6.2 | % |
| U.S. Government Agencies | 5.7 | % |
| Convertible Bonds | 4.8 | % |
| Foreign Government Obligations | 3.5 | % |
| Exchange-Traded Funds | 1.0 | % |
| Preferred Stocks | 1.0 | % |
| Municipal Bonds | 0.1 | % |
| Short-Term Investments | 0.9 | % |
| Other Assets & Liabilities | (2.2 | )% |
| Total | 100.0 | % |
Availability of Additional Information
For additional information about the Fund, including its prospectus, financial information, holdings, and proxy voting information, please visit the Fund’s website at the website address included at the beginning of this report.
The Fund is distributed by Hartford Funds Distributors, LLC (HFD).
Annual Shareholder Report
October 31, 2024
Hartford Multi-Asset Income Fund
Class F/ITTFX
This annual shareholder report contains important information about the Hartford Multi-Asset Income Fund (the "Fund") for the period of November 1, 2023 to October 31, 2024. You can find additional information about the Fund at hartfordfunds.com/reports-hmf. You can also request this information by contacting us by calling 1‑888‑843‑7824.
What were the Fund costs for the last year?
(Based on a hypothetical $10,000 investment)
| Class Name | Costs of a $10,000 investment | Costs paid as a percentage
of a $10,000 investment |
| Class F | $71 | 0.66% |
Costs paid excludes fees and expenses incurred indirectly as a result of investments in other investment companies.
How did the Fund perform last year and what impacted its performance?
Management's Discussion of Fund Performance
Global equities, as measured by the MSCI World Index (Net), rose over the trailing twelve-month period ending October 31, 2024, supported by easing inflation and interest rate cuts. Despite mixed economic indicators and geopolitical tensions, such as leadership changes in major countries and ongoing conflict in the Middle East, resilient labor markets and lower energy prices bolstered market sentiment. Fund performance described below is relative to the Fund’s blended benchmark, 55% Bloomberg US Aggregate Bond Index/ 45% S&P 500 Index (the "Blended Benchmark"), for the trailing twelve-month period ended October 31, 2024.
Top Contributors to Performance
Fixed income allocations contributed positively to relative performance over the period. This was primarily driven by positive relative returns from our allocation to active strategies (such as, strategic income allocation).
Within equity, United States housing equities, equity securities that promote environmental sustainability in our view, global defensive equities, and global cyclicals contributed to the relative performance. Volatility management also added to performance.
The Fund’s tactical positioning implemented through our active allocation process also generated positive results.
Top Detractors to Performance
Equities delivered positive total returns but sub-strategy selection, the underweight asset allocation, and security selection detracted from relative performance.
Equity allocations detracted from relative performance, driven by exposure to global dividend growth equities and North Asian equities.
The Fund’s use of call options, which sought to hedge market exposure, detracted from relative returns.
During the period, the Fund’s use of derivatives, such as equity futures, interest rate futures, and total return swaps, to seek tactical exposures to equity and fixed-income markets, was additive to relative performance. Over the period, the Fund’s use of equity and interest rate futures for risk management purposes, contributed slightly positively to relative performance.
The views expressed in this section reflect the opinions of the Fund's sub-adviser, Wellington Management Company LLP, as of the date of this report and are subject to change based on changes in market, economic or other conditions. These views are not intended to be a forecast of future events and are no guarantee of future results.
Comparison of Change in Value of $ 1,000,000 Investment
The graph below represents the hypothetical growth of a $1,000,000 investment in Class F shares and the comparative indices.
Average Annual Total Returns
For the Periods Ended October 31, 2024 | 1 Year | 5 Years | 10 Years |
| Class F | 16.32% | 3.98%) | 5.06% |
| Blended Benchmark | 22.30% | 6.81%) | 6.79% |
| Bloomberg US Aggregate Bond Index | 10.55% | (0.23)% | 1.49% |
| S&P 500 Index | 38.02% | 15.27%) | 13.00% |
Class F shares commenced operations on February 28, 2017. Performance for Class F shares prior to February 28, 2017 reflects the performance of the Fund's Class I shares from March 31, 2015 through February 27, 2017 and the Fund's Class A shares (excluding sales charges) prior to March 31, 2015. Performance prior to the inception date of the class has not been adjusted to reflect the operating expenses of the class.
The Blended Benchmark is calculated by Hartford Funds Management Company, LLC.
Performance for the Fund prior to May 1, 2019, reflects the Fund’s performance while it pursued its prior investment objective and was managed in accordance with its prior investment strategy.
The Fund’s past performance is not a good predictor of the Fund’s future performance. The graph and table do not reflect the deduction of taxes that a shareholder would pay on Fund distributions or redemption of Fund shares. Performance information reflects fee waivers and/or expense limitation arrangements, if any. Absent any applicable fee waivers and/or expense limitation arrangements, performance would have been lower. Visit hartfordfunds.com for the most recent performance information.
Key Fund Statistics as of October 31, 2024
| Fund's net assets | $586,610,484% |
| Total number of portfolio holdings | $1,068% |
| Total investment management fees paid | $3,512,866% |
| Portfolio turnover rate (excludes to be announced (TBA) roll transactions) | $187% |
Graphical Representation of Holdings as of October 31, 2024
The table below shows the investment makeup of the Fund, representing the percentage of net assets of the Fund.
Composition by Security Type
| Common Stocks | 23.9 | % |
| Corporate Bonds | 21.2 | % |
| Asset & Commercial Mortgage-Backed Securities | 14.3 | % |
| Equity Linked Securities | 10.3 | % |
| Senior Floating Rate Interests | 9.3 | % |
| U.S. Government Securities | 6.2 | % |
| U.S. Government Agencies | 5.7 | % |
| Convertible Bonds | 4.8 | % |
| Foreign Government Obligations | 3.5 | % |
| Exchange-Traded Funds | 1.0 | % |
| Preferred Stocks | 1.0 | % |
| Municipal Bonds | 0.1 | % |
| Short-Term Investments | 0.9 | % |
| Other Assets & Liabilities | (2.2 | )% |
| Total | 100.0 | % |
Availability of Additional Information
For additional information about the Fund, including its prospectus, financial information, holdings, and proxy voting information, please visit the Fund’s website at the website address included at the beginning of this report.
The Fund is distributed by Hartford Funds Distributors, LLC (HFD).
Annual Shareholder Report
October 31, 2024
Hartford Real Asset Fund (Consolidated)
Class A/HRLAX
This annual shareholder report contains important information about the Hartford Real Asset Fund (the "Fund") for the period of November 1, 2023 to October 31, 2024. You can find additional information about the Fund at hartfordfunds.com/reports-hmf. You can also request this information by contacting us by calling 1‑888‑843‑7824.
What were the Fund costs for the last year?
(Based on a hypothetical $10,000 investment)
| Class Name | Costs of a $10,000 investment | Costs paid as a percentage
of a $10,000 investment |
| Class A | $130 | 1.25% |
Costs paid excludes fees and expenses incurred indirectly as a result of investments in other investment companies.
How did the Fund perform last year and what impacted its performance?
Management's Discussion of Fund Performance
Global equities, as measured by the MSCI ACWI Index (Net), rose over the trailing twelve-month period ending October 31, 2024, due to strong earnings from select mega-cap tech companies and an improved economic outlook. The European Central Bank began easing rates, while the United States (U.S.) Federal Reserve (Fed) cut its benchmark rate by 50 basis points. The European Union (EU) saw healthy consumption growth. Japan faced economic challenges, and China’s rebound was limited by its property sector. Political developments garnered greater prominence amid an anticipated extremely close U.S. presidential race and leadership changes in many countries. Fund performance described below is relative to the Fund’s blended benchmark, 40% Bloomberg US TIPS 1-10 Year Index/ 30% MSCI ACWI Commodity Producers Index (Net)/ 10% Bloomberg Commodity Index Total Return/ 10% MSCI World IMI Core Real Estate Index (Net)/ 10% MSCI ACWI Infrastructure Index (Net) (the "Blended Benchmark"), for the trailing twelve-month period ended October 31, 2024.
Top Contributors to Performance
Allocation decisions were modestly additive across the major asset classes, helped by an overweight to equities and an underweight to fixed income.
Within fixed income, positive effects from security selection were driven by strong selection within Treasury Inflation-Protected Securities (TIPS).
Within Commodities, positive effects from security selection were driven by an overweight to natural gas and a non-benchmark position in carbon emissions within the Energy sector.
Top Detractors to Performance
Negative relative results within equities were driven by weak security selection within the Energy, Real Estate, Infrastructure, and Industrial Metals sectors. Sector allocation decisions contributed, driven by an underweight to the Industrial Metals sector and an overweight to the Real Estate sector which more than offset the negative impacts from an overweight to the Agriculture sector and an underweight to the Infrastructure sector.
Within Commodities, sector allocation was negative during the period, driven by the negative impacts from an overweight to precious metals.
Within fixed income, sector allocation was negative, driven by a non-benchmark position in Mexican inflation-linked bonds.
During the period, the Fund gained commodity exposure through derivatives, primarily futures. While an overweight to the commodities asset class had a negative impact over the period, this was offset by positive relative results within the asset class. An overweight to the Industrial Metals sector and an overweight to natural gas within the Energy sector both contributed.
The views expressed in this section reflect the opinions of the Fund's sub-adviser, Wellington Management Company LLP, as of the date of this report and are subject to change based on changes in market, economic or other conditions. These views are not intended to be a forecast of future events and are no guarantee of future results.
Comparison of Change in Value of $ 10,000 Investment
The graph below represents the hypothetical growth of a $10,000 investment in Class A shares and the comparative indices. The returns for Class A shares include the maximum front-end sales charge applicable to Class A shares.
Average Annual Total Returns
For the Periods Ended October 31, 2024 | 1 Year | 5 Years | 10 Years |
| Class A (with 5.50% maximum front-end sales charge) | 2.28%) | 5.39% | 2.22%) |
| Class A (without 5.50% maximum front-end sales charge) | 8.23%) | 6.59% | 2.80%) |
| Blended Benchmark | 11.01%) | 5.72% | 3.35%) |
| Bloomberg US TIPS 1-10 Year Index | 7.70%) | 2.93% | 2.42%) |
| MSCI ACWI Commodity Producers Index (Net) | 6.88%) | 9.04% | 3.74%) |
| Bloomberg Commodity Index Total Return | (1.18)% | 6.96% | (0.08)% |
| MSCI World IMI Core Real Estate Index (Net) | 30.10%) | 0.46% | 3.45%) |
| MSCI ACWI Infrastructure Index (Net) | 30.84%) | 4.57% | 3.98%) |
| MSCI ACWI Index (Net) | 32.79%) | 11.08% | 9.06%) |
The Blended Benchmark serves as the Fund’s performance index because the Fund’s investment manager believes it is more representative of the Fund’s investment strategy. The Blended Benchmark is calculated by Hartford Funds Management Company, LLC. The MSCI ACWI Index (Net) serves as the Fund’s regulatory index and provides a broad measure of market performance.
The Fund’s past performance is not a good predictor of the Fund’s future performance. The graph and table do not reflect the deduction of taxes that a shareholder would pay on Fund distributions or redemption of Fund shares. Performance information reflects fee waivers and/or expense limitation arrangements, if any. Absent any applicable fee waivers and/or expense limitation arrangements, performance would have been lower. Visit hartfordfunds.com for the most recent performance information.
Key Fund Statistics as of October 31, 2024
| Fund's net assets | $79,409,714% |
| Total number of portfolio holdings | $217% |
| Total investment management fees paid | $800,743% |
| Portfolio turnover rate | $198% |
Graphical Representation of Holdings as of October 31, 2024
The table below shows the investment makeup of the Fund, representing the percentage of net assets of the Fund.
Composition by Security Type
| Common Stocks | 52.1 | % |
| U.S. Government Securities | 32.8 | % |
| Foreign Government Obligations | 1.3 | % |
| Exchange-Traded Funds | 0.5 | % |
| Closed End Funds | 0.4 | % |
| Short-Term Investments | 10.1 | % |
| Other Assets & Liabilities | 2.8 | % |
| Total | 100.0 | % |
Availability of Additional Information
For additional information about the Fund, including its prospectus, financial information, holdings, and proxy voting information, please visit the Fund’s website at the website address included at the beginning of this report.
The Fund is distributed by Hartford Funds Distributors, LLC (HFD).
Annual Shareholder Report
October 31, 2024
Hartford Real Asset Fund (Consolidated)
Class C/HRLCX
This annual shareholder report contains important information about the Hartford Real Asset Fund (the "Fund") for the period of November 1, 2023 to October 31, 2024. You can find additional information about the Fund at hartfordfunds.com/reports-hmf. You can also request this information by contacting us by calling 1‑888‑843‑7824.
What were the Fund costs for the last year?
(Based on a hypothetical $10,000 investment)
| Class Name | Costs of a $10,000 investment | Costs paid as a percentage
of a $10,000 investment |
| Class C | $208 | 2.00% |
Costs paid excludes fees and expenses incurred indirectly as a result of investments in other investment companies.
How did the Fund perform last year and what impacted its performance?
Management's Discussion of Fund Performance
Global equities, as measured by the MSCI ACWI Index (Net), rose over the trailing twelve-month period ending October 31, 2024, due to strong earnings from select mega-cap tech companies and an improved economic outlook. The European Central Bank began easing rates, while the United States (U.S.) Federal Reserve (Fed) cut its benchmark rate by 50 basis points. The European Union (EU) saw healthy consumption growth. Japan faced economic challenges, and China’s rebound was limited by its property sector. Political developments garnered greater prominence amid an anticipated extremely close U.S. presidential race and leadership changes in many countries. Fund performance described below is relative to the Fund’s blended benchmark, 40% Bloomberg US TIPS 1-10 Year Index/ 30% MSCI ACWI Commodity Producers Index (Net)/ 10% Bloomberg Commodity Index Total Return/ 10% MSCI World IMI Core Real Estate Index (Net)/ 10% MSCI ACWI Infrastructure Index (Net) (the "Blended Benchmark"), for the trailing twelve-month period ended October 31, 2024.
Top Contributors to Performance
Allocation decisions were modestly additive across the major asset classes, helped by an overweight to equities and an underweight to fixed income.
Within fixed income, positive effects from security selection were driven by strong selection within Treasury Inflation-Protected Securities (TIPS).
Within Commodities, positive effects from security selection were driven by an overweight to natural gas and a non-benchmark position in carbon emissions within the Energy sector.
Top Detractors to Performance
Negative relative results within equities were driven by weak security selection within the Energy, Real Estate, Infrastructure, and Industrial Metals sectors. Sector allocation decisions contributed, driven by an underweight to the Industrial Metals sector and an overweight to the Real Estate sector which more than offset the negative impacts from an overweight to the Agriculture sector and an underweight to the Infrastructure sector.
Within Commodities, sector allocation was negative during the period, driven by the negative impacts from an overweight to precious metals.
Within fixed income, sector allocation was negative, driven by a non-benchmark position in Mexican inflation-linked bonds.
During the period, the Fund gained commodity exposure through derivatives, primarily futures. While an overweight to the commodities asset class had a negative impact over the period, this was offset by positive relative results within the asset class. An overweight to the Industrial Metals sector and an overweight to natural gas within the Energy sector both contributed.
The views expressed in this section reflect the opinions of the Fund's sub-adviser, Wellington Management Company LLP, as of the date of this report and are subject to change based on changes in market, economic or other conditions. These views are not intended to be a forecast of future events and are no guarantee of future results.
Comparison of Change in Value of $ 10,000 Investment
The graph below represents the hypothetical growth of a $10,000 investment in Class C shares (excluding sales charges) and the comparative indices. If sales charges had been included, the value would have been lower.
Average Annual Total Returns
For the Periods Ended October 31, 2024 | 1 Year | 5 Years | 10 Years |
| Class C (with 1.00% contingent deferred sales charge) | 6.52%) | 5.80% | 2.04%) |
| Class C (without 1.00% contingent deferred sales charge) | 7.52%) | 5.80% | 2.04%) |
| Blended Benchmark | 11.01%) | 5.72% | 3.35%) |
| Bloomberg US TIPS 1-10 Year Index | 7.70%) | 2.93% | 2.42%) |
| MSCI ACWI Commodity Producers Index (Net) | 6.88%) | 9.04% | 3.74%) |
| Bloomberg Commodity Index Total Return | (1.18)% | 6.96% | (0.08)% |
| MSCI World IMI Core Real Estate Index (Net) | 30.10%) | 0.46% | 3.45%) |
| MSCI ACWI Infrastructure Index (Net) | 30.84%) | 4.57% | 3.98%) |
| MSCI ACWI Index (Net) | 32.79%) | 11.08% | 9.06%) |
The Blended Benchmark serves as the Fund’s performance index because the Fund’s investment manager believes it is more representative of the Fund’s investment strategy. The Blended Benchmark is calculated by Hartford Funds Management Company, LLC. The MSCI ACWI Index (Net) serves as the Fund’s regulatory index and provides a broad measure of market performance.
The Fund’s past performance is not a good predictor of the Fund’s future performance. The graph and table do not reflect the deduction of taxes that a shareholder would pay on Fund distributions or redemption of Fund shares. Performance information reflects fee waivers and/or expense limitation arrangements, if any. Absent any applicable fee waivers and/or expense limitation arrangements, performance would have been lower. Visit hartfordfunds.com for the most recent performance information.
Key Fund Statistics as of October 31, 2024
| Fund's net assets | $79,409,714% |
| Total number of portfolio holdings | $217% |
| Total investment management fees paid | $800,743% |
| Portfolio turnover rate | $198% |
Graphical Representation of Holdings as of October 31, 2024
The table below shows the investment makeup of the Fund, representing the percentage of net assets of the Fund.
Composition by Security Type
| Common Stocks | 52.1 | % |
| U.S. Government Securities | 32.8 | % |
| Foreign Government Obligations | 1.3 | % |
| Exchange-Traded Funds | 0.5 | % |
| Closed End Funds | 0.4 | % |
| Short-Term Investments | 10.1 | % |
| Other Assets & Liabilities | 2.8 | % |
| Total | 100.0 | % |
Availability of Additional Information
For additional information about the Fund, including its prospectus, financial information, holdings, and proxy voting information, please visit the Fund’s website at the website address included at the beginning of this report.
The Fund is distributed by Hartford Funds Distributors, LLC (HFD).
Annual Shareholder Report
October 31, 2024
Hartford Real Asset Fund (Consolidated)
Class I/HRLIX
This annual shareholder report contains important information about the Hartford Real Asset Fund (the "Fund") for the period of November 1, 2023 to October 31, 2024. You can find additional information about the Fund at hartfordfunds.com/reports-hmf. You can also request this information by contacting us by calling 1‑888‑843‑7824.
What were the Fund costs for the last year?
(Based on a hypothetical $10,000 investment)
| Class Name | Costs of a $10,000 investment | Costs paid as a percentage
of a $10,000 investment |
| Class I | $104 | 1.00% |
Costs paid excludes fees and expenses incurred indirectly as a result of investments in other investment companies.
How did the Fund perform last year and what impacted its performance?
Management's Discussion of Fund Performance
Global equities, as measured by the MSCI ACWI Index (Net), rose over the trailing twelve-month period ending October 31, 2024, due to strong earnings from select mega-cap tech companies and an improved economic outlook. The European Central Bank began easing rates, while the United States (U.S.) Federal Reserve (Fed) cut its benchmark rate by 50 basis points. The European Union (EU) saw healthy consumption growth. Japan faced economic challenges, and China’s rebound was limited by its property sector. Political developments garnered greater prominence amid an anticipated extremely close U.S. presidential race and leadership changes in many countries. Fund performance described below is relative to the Fund’s blended benchmark, 40% Bloomberg US TIPS 1-10 Year Index/ 30% MSCI ACWI Commodity Producers Index (Net)/ 10% Bloomberg Commodity Index Total Return/ 10% MSCI World IMI Core Real Estate Index (Net)/ 10% MSCI ACWI Infrastructure Index (Net) (the "Blended Benchmark"), for the trailing twelve-month period ended October 31, 2024.
Top Contributors to Performance
Allocation decisions were modestly additive across the major asset classes, helped by an overweight to equities and an underweight to fixed income.
Within fixed income, positive effects from security selection were driven by strong selection within Treasury Inflation-Protected Securities (TIPS).
Within Commodities, positive effects from security selection were driven by an overweight to natural gas and a non-benchmark position in carbon emissions within the Energy sector.
Top Detractors to Performance
Negative relative results within equities were driven by weak security selection within the Energy, Real Estate, Infrastructure, and Industrial Metals sectors. Sector allocation decisions contributed, driven by an underweight to the Industrial Metals sector and an overweight to the Real Estate sector which more than offset the negative impacts from an overweight to the Agriculture sector and an underweight to the Infrastructure sector.
Within Commodities, sector allocation was negative during the period, driven by the negative impacts from an overweight to precious metals.
Within fixed income, sector allocation was negative, driven by a non-benchmark position in Mexican inflation-linked bonds.
During the period, the Fund gained commodity exposure through derivatives, primarily futures. While an overweight to the commodities asset class had a negative impact over the period, this was offset by positive relative results within the asset class. An overweight to the Industrial Metals sector and an overweight to natural gas within the Energy sector both contributed.
The views expressed in this section reflect the opinions of the Fund's sub-adviser, Wellington Management Company LLP, as of the date of this report and are subject to change based on changes in market, economic or other conditions. These views are not intended to be a forecast of future events and are no guarantee of future results.
Comparison of Change in Value of $ 10,000 Investment
The graph below represents the hypothetical growth of a $10,000 investment in Class I shares and the comparative indices.
Average Annual Total Returns
For the Periods Ended October 31, 2024 | 1 Year | 5 Years | 10 Years |
| Class I | 8.49%) | 6.89% | 3.07%) |
| Blended Benchmark | 11.01%) | 5.72% | 3.35%) |
| Bloomberg US TIPS 1-10 Year Index | 7.70%) | 2.93% | 2.42%) |
| MSCI ACWI Commodity Producers Index (Net) | 6.88%) | 9.04% | 3.74%) |
| Bloomberg Commodity Index Total Return | (1.18)% | 6.96% | (0.08)% |
| MSCI World IMI Core Real Estate Index (Net) | 30.10%) | 0.46% | 3.45%) |
| MSCI ACWI Infrastructure Index (Net) | 30.84%) | 4.57% | 3.98%) |
| MSCI ACWI Index (Net) | 32.79%) | 11.08% | 9.06%) |
The Blended Benchmark serves as the Fund’s performance index because the Fund’s investment manager believes it is more representative of the Fund’s investment strategy. The Blended Benchmark is calculated by Hartford Funds Management Company, LLC. The MSCI ACWI Index (Net) serves as the Fund’s regulatory index and provides a broad measure of market performance.
The Fund’s past performance is not a good predictor of the Fund’s future performance. The graph and table do not reflect the deduction of taxes that a shareholder would pay on Fund distributions or redemption of Fund shares. Performance information reflects fee waivers and/or expense limitation arrangements, if any. Absent any applicable fee waivers and/or expense limitation arrangements, performance would have been lower. Visit hartfordfunds.com for the most recent performance information.
Key Fund Statistics as of October 31, 2024
| Fund's net assets | $79,409,714% |
| Total number of portfolio holdings | $217% |
| Total investment management fees paid | $800,743% |
| Portfolio turnover rate | $198% |
Graphical Representation of Holdings as of October 31, 2024
The table below shows the investment makeup of the Fund, representing the percentage of net assets of the Fund.
Composition by Security Type
| Common Stocks | 52.1 | % |
| U.S. Government Securities | 32.8 | % |
| Foreign Government Obligations | 1.3 | % |
| Exchange-Traded Funds | 0.5 | % |
| Closed End Funds | 0.4 | % |
| Short-Term Investments | 10.1 | % |
| Other Assets & Liabilities | 2.8 | % |
| Total | 100.0 | % |
Availability of Additional Information
For additional information about the Fund, including its prospectus, financial information, holdings, and proxy voting information, please visit the Fund’s website at the website address included at the beginning of this report.
The Fund is distributed by Hartford Funds Distributors, LLC (HFD).
Annual Shareholder Report
October 31, 2024
Hartford Real Asset Fund (Consolidated)
Class R3/HRLRX
This annual shareholder report contains important information about the Hartford Real Asset Fund (the "Fund") for the period of November 1, 2023 to October 31, 2024. You can find additional information about the Fund at hartfordfunds.com/reports-hmf. You can also request this information by contacting us by calling 1‑888‑843‑7824.
What were the Fund costs for the last year?
(Based on a hypothetical $10,000 investment)
| Class Name | Costs of a $10,000 investment | Costs paid as a percentage
of a $10,000 investment |
| Class R3 | $156 | 1.50% |
Costs paid excludes fees and expenses incurred indirectly as a result of investments in other investment companies.
How did the Fund perform last year and what impacted its performance?
Management's Discussion of Fund Performance
Global equities, as measured by the MSCI ACWI Index (Net), rose over the trailing twelve-month period ending October 31, 2024, due to strong earnings from select mega-cap tech companies and an improved economic outlook. The European Central Bank began easing rates, while the United States (U.S.) Federal Reserve (Fed) cut its benchmark rate by 50 basis points. The European Union (EU) saw healthy consumption growth. Japan faced economic challenges, and China’s rebound was limited by its property sector. Political developments garnered greater prominence amid an anticipated extremely close U.S. presidential race and leadership changes in many countries. Fund performance described below is relative to the Fund’s blended benchmark, 40% Bloomberg US TIPS 1-10 Year Index/ 30% MSCI ACWI Commodity Producers Index (Net)/ 10% Bloomberg Commodity Index Total Return/ 10% MSCI World IMI Core Real Estate Index (Net)/ 10% MSCI ACWI Infrastructure Index (Net) (the "Blended Benchmark"), for the trailing twelve-month period ended October 31, 2024.
Top Contributors to Performance
Allocation decisions were modestly additive across the major asset classes, helped by an overweight to equities and an underweight to fixed income.
Within fixed income, positive effects from security selection were driven by strong selection within Treasury Inflation-Protected Securities (TIPS).
Within Commodities, positive effects from security selection were driven by an overweight to natural gas and a non-benchmark position in carbon emissions within the Energy sector.
Top Detractors to Performance
Negative relative results within equities were driven by weak security selection within the Energy, Real Estate, Infrastructure, and Industrial Metals sectors. Sector allocation decisions contributed, driven by an underweight to the Industrial Metals sector and an overweight to the Real Estate sector which more than offset the negative impacts from an overweight to the Agriculture sector and an underweight to the Infrastructure sector.
Within Commodities, sector allocation was negative during the period, driven by the negative impacts from an overweight to precious metals.
Within fixed income, sector allocation was negative, driven by a non-benchmark position in Mexican inflation-linked bonds.
During the period, the Fund gained commodity exposure through derivatives, primarily futures. While an overweight to the commodities asset class had a negative impact over the period, this was offset by positive relative results within the asset class. An overweight to the Industrial Metals sector and an overweight to natural gas within the Energy sector both contributed.
The views expressed in this section reflect the opinions of the Fund's sub-adviser, Wellington Management Company LLP, as of the date of this report and are subject to change based on changes in market, economic or other conditions. These views are not intended to be a forecast of future events and are no guarantee of future results.
Comparison of Change in Value of $ 10,000 Investment
The graph below represents the hypothetical growth of a $10,000 investment in Class R3 shares and the comparative indices.
Average Annual Total Returns
For the Periods Ended October 31, 2024 | 1 Year | 5 Years | 10 Years |
| Class R3 | 8.04%) | 6.35% | 2.55%) |
| Blended Benchmark | 11.01%) | 5.72% | 3.35%) |
| Bloomberg US TIPS 1-10 Year Index | 7.70%) | 2.93% | 2.42%) |
| MSCI ACWI Commodity Producers Index (Net) | 6.88%) | 9.04% | 3.74%) |
| Bloomberg Commodity Index Total Return | (1.18)% | 6.96% | (0.08)% |
| MSCI World IMI Core Real Estate Index (Net) | 30.10%) | 0.46% | 3.45%) |
| MSCI ACWI Infrastructure Index (Net) | 30.84%) | 4.57% | 3.98%) |
| MSCI ACWI Index (Net) | 32.79%) | 11.08% | 9.06%) |
The Blended Benchmark serves as the Fund’s performance index because the Fund’s investment manager believes it is more representative of the Fund’s investment strategy. The Blended Benchmark is calculated by Hartford Funds Management Company, LLC. The MSCI ACWI Index (Net) serves as the Fund’s regulatory index and provides a broad measure of market performance.
The Fund’s past performance is not a good predictor of the Fund’s future performance. The graph and table do not reflect the deduction of taxes that a shareholder would pay on Fund distributions or redemption of Fund shares. Performance information reflects fee waivers and/or expense limitation arrangements, if any. Absent any applicable fee waivers and/or expense limitation arrangements, performance would have been lower. Visit hartfordfunds.com for the most recent performance information.
Key Fund Statistics as of October 31, 2024
| Fund's net assets | $79,409,714% |
| Total number of portfolio holdings | $217% |
| Total investment management fees paid | $800,743% |
| Portfolio turnover rate | $198% |
Graphical Representation of Holdings as of October 31, 2024
The table below shows the investment makeup of the Fund, representing the percentage of net assets of the Fund.
Composition by Security Type
| Common Stocks | 52.1 | % |
| U.S. Government Securities | 32.8 | % |
| Foreign Government Obligations | 1.3 | % |
| Exchange-Traded Funds | 0.5 | % |
| Closed End Funds | 0.4 | % |
| Short-Term Investments | 10.1 | % |
| Other Assets & Liabilities | 2.8 | % |
| Total | 100.0 | % |
Availability of Additional Information
For additional information about the Fund, including its prospectus, financial information, holdings, and proxy voting information, please visit the Fund’s website at the website address included at the beginning of this report.
The Fund is distributed by Hartford Funds Distributors, LLC (HFD).
Annual Shareholder Report
October 31, 2024
Hartford Real Asset Fund (Consolidated)
Class R4/HRLSX
This annual shareholder report contains important information about the Hartford Real Asset Fund (the "Fund") for the period of November 1, 2023 to October 31, 2024. You can find additional information about the Fund at hartfordfunds.com/reports-hmf. You can also request this information by contacting us by calling 1‑888‑843‑7824.
What were the Fund costs for the last year?
(Based on a hypothetical $10,000 investment)
| Class Name | Costs of a $10,000 investment | Costs paid as a percentage
of a $10,000 investment |
| Class R4 | $125 | 1.20% |
Costs paid excludes fees and expenses incurred indirectly as a result of investments in other investment companies.
How did the Fund perform last year and what impacted its performance?
Management's Discussion of Fund Performance
Global equities, as measured by the MSCI ACWI Index (Net), rose over the trailing twelve-month period ending October 31, 2024, due to strong earnings from select mega-cap tech companies and an improved economic outlook. The European Central Bank began easing rates, while the United States (U.S.) Federal Reserve (Fed) cut its benchmark rate by 50 basis points. The European Union (EU) saw healthy consumption growth. Japan faced economic challenges, and China’s rebound was limited by its property sector. Political developments garnered greater prominence amid an anticipated extremely close U.S. presidential race and leadership changes in many countries. Fund performance described below is relative to the Fund’s blended benchmark, 40% Bloomberg US TIPS 1-10 Year Index/ 30% MSCI ACWI Commodity Producers Index (Net)/ 10% Bloomberg Commodity Index Total Return/ 10% MSCI World IMI Core Real Estate Index (Net)/ 10% MSCI ACWI Infrastructure Index (Net) (the "Blended Benchmark"), for the trailing twelve-month period ended October 31, 2024.
Top Contributors to Performance
Allocation decisions were modestly additive across the major asset classes, helped by an overweight to equities and an underweight to fixed income.
Within fixed income, positive effects from security selection were driven by strong selection within Treasury Inflation-Protected Securities (TIPS).
Within Commodities, positive effects from security selection were driven by an overweight to natural gas and a non-benchmark position in carbon emissions within the Energy sector.
Top Detractors to Performance
Negative relative results within equities were driven by weak security selection within the Energy, Real Estate, Infrastructure, and Industrial Metals sectors. Sector allocation decisions contributed, driven by an underweight to the Industrial Metals sector and an overweight to the Real Estate sector which more than offset the negative impacts from an overweight to the Agriculture sector and an underweight to the Infrastructure sector.
Within Commodities, sector allocation was negative during the period, driven by the negative impacts from an overweight to precious metals.
Within fixed income, sector allocation was negative, driven by a non-benchmark position in Mexican inflation-linked bonds.
During the period, the Fund gained commodity exposure through derivatives, primarily futures. While an overweight to the commodities asset class had a negative impact over the period, this was offset by positive relative results within the asset class. An overweight to the Industrial Metals sector and an overweight to natural gas within the Energy sector both contributed.
The views expressed in this section reflect the opinions of the Fund's sub-adviser, Wellington Management Company LLP, as of the date of this report and are subject to change based on changes in market, economic or other conditions. These views are not intended to be a forecast of future events and are no guarantee of future results.
Comparison of Change in Value of $ 10,000 Investment
The graph below represents the hypothetical growth of a $10,000 investment in Class R4 shares and the comparative indices.
Average Annual Total Returns
For the Periods Ended October 31, 2024 | 1 Year | 5 Years | 10 Years |
| Class R4 | 8.36%) | 6.64% | 2.84%) |
| Blended Benchmark | 11.01%) | 5.72% | 3.35%) |
| Bloomberg US TIPS 1-10 Year Index | 7.70%) | 2.93% | 2.42%) |
| MSCI ACWI Commodity Producers Index (Net) | 6.88%) | 9.04% | 3.74%) |
| Bloomberg Commodity Index Total Return | (1.18)% | 6.96% | (0.08)% |
| MSCI World IMI Core Real Estate Index (Net) | 30.10%) | 0.46% | 3.45%) |
| MSCI ACWI Infrastructure Index (Net) | 30.84%) | 4.57% | 3.98%) |
| MSCI ACWI Index (Net) | 32.79%) | 11.08% | 9.06%) |
The Blended Benchmark serves as the Fund’s performance index because the Fund’s investment manager believes it is more representative of the Fund’s investment strategy. The Blended Benchmark is calculated by Hartford Funds Management Company, LLC. The MSCI ACWI Index (Net) serves as the Fund’s regulatory index and provides a broad measure of market performance.
The Fund’s past performance is not a good predictor of the Fund’s future performance. The graph and table do not reflect the deduction of taxes that a shareholder would pay on Fund distributions or redemption of Fund shares. Performance information reflects fee waivers and/or expense limitation arrangements, if any. Absent any applicable fee waivers and/or expense limitation arrangements, performance would have been lower. Visit hartfordfunds.com for the most recent performance information.
Key Fund Statistics as of October 31, 2024
| Fund's net assets | $79,409,714% |
| Total number of portfolio holdings | $217% |
| Total investment management fees paid | $800,743% |
| Portfolio turnover rate | $198% |
Graphical Representation of Holdings as of October 31, 2024
The table below shows the investment makeup of the Fund, representing the percentage of net assets of the Fund.
Composition by Security Type
| Common Stocks | 52.1 | % |
| U.S. Government Securities | 32.8 | % |
| Foreign Government Obligations | 1.3 | % |
| Exchange-Traded Funds | 0.5 | % |
| Closed End Funds | 0.4 | % |
| Short-Term Investments | 10.1 | % |
| Other Assets & Liabilities | 2.8 | % |
| Total | 100.0 | % |
Availability of Additional Information
For additional information about the Fund, including its prospectus, financial information, holdings, and proxy voting information, please visit the Fund’s website at the website address included at the beginning of this report.
The Fund is distributed by Hartford Funds Distributors, LLC (HFD).
Annual Shareholder Report
October 31, 2024
Hartford Real Asset Fund (Consolidated)
Class R5/HRLTX
This annual shareholder report contains important information about the Hartford Real Asset Fund (the "Fund") for the period of November 1, 2023 to October 31, 2024. You can find additional information about the Fund at hartfordfunds.com/reports-hmf. You can also request this information by contacting us by calling 1‑888‑843‑7824.
What were the Fund costs for the last year?
(Based on a hypothetical $10,000 investment)
| Class Name | Costs of a $10,000 investment | Costs paid as a percentage
of a $10,000 investment |
| Class R5 | $99 | 0.95% |
Costs paid excludes fees and expenses incurred indirectly as a result of investments in other investment companies.
How did the Fund perform last year and what impacted its performance?
Management's Discussion of Fund Performance
Global equities, as measured by the MSCI ACWI Index (Net), rose over the trailing twelve-month period ending October 31, 2024, due to strong earnings from select mega-cap tech companies and an improved economic outlook. The European Central Bank began easing rates, while the United States (U.S.) Federal Reserve (Fed) cut its benchmark rate by 50 basis points. The European Union (EU) saw healthy consumption growth. Japan faced economic challenges, and China’s rebound was limited by its property sector. Political developments garnered greater prominence amid an anticipated extremely close U.S. presidential race and leadership changes in many countries. Fund performance described below is relative to the Fund’s blended benchmark, 40% Bloomberg US TIPS 1-10 Year Index/ 30% MSCI ACWI Commodity Producers Index (Net)/ 10% Bloomberg Commodity Index Total Return/ 10% MSCI World IMI Core Real Estate Index (Net)/ 10% MSCI ACWI Infrastructure Index (Net) (the "Blended Benchmark"), for the trailing twelve-month period ended October 31, 2024.
Top Contributors to Performance
Allocation decisions were modestly additive across the major asset classes, helped by an overweight to equities and an underweight to fixed income.
Within fixed income, positive effects from security selection were driven by strong selection within Treasury Inflation-Protected Securities (TIPS).
Within Commodities, positive effects from security selection were driven by an overweight to natural gas and a non-benchmark position in carbon emissions within the Energy sector.
Top Detractors to Performance
Negative relative results within equities were driven by weak security selection within the Energy, Real Estate, Infrastructure, and Industrial Metals sectors. Sector allocation decisions contributed, driven by an underweight to the Industrial Metals sector and an overweight to the Real Estate sector which more than offset the negative impacts from an overweight to the Agriculture sector and an underweight to the Infrastructure sector.
Within Commodities, sector allocation was negative during the period, driven by the negative impacts from an overweight to precious metals.
Within fixed income, sector allocation was negative, driven by a non-benchmark position in Mexican inflation-linked bonds.
During the period, the Fund gained commodity exposure through derivatives, primarily futures. While an overweight to the commodities asset class had a negative impact over the period, this was offset by positive relative results within the asset class. An overweight to the Industrial Metals sector and an overweight to natural gas within the Energy sector both contributed.
The views expressed in this section reflect the opinions of the Fund's sub-adviser, Wellington Management Company LLP, as of the date of this report and are subject to change based on changes in market, economic or other conditions. These views are not intended to be a forecast of future events and are no guarantee of future results.
Comparison of Change in Value of $ 10,000 Investment
The graph below represents the hypothetical growth of a $10,000 investment in Class R5 shares and the comparative indices.
Average Annual Total Returns
For the Periods Ended October 31, 2024 | 1 Year | 5 Years | 10 Years |
| Class R5 | 8.62%) | 6.92% | 3.11%) |
| Blended Benchmark | 11.01%) | 5.72% | 3.35%) |
| Bloomberg US TIPS 1-10 Year Index | 7.70%) | 2.93% | 2.42%) |
| MSCI ACWI Commodity Producers Index (Net) | 6.88%) | 9.04% | 3.74%) |
| Bloomberg Commodity Index Total Return | (1.18)% | 6.96% | (0.08)% |
| MSCI World IMI Core Real Estate Index (Net) | 30.10%) | 0.46% | 3.45%) |
| MSCI ACWI Infrastructure Index (Net) | 30.84%) | 4.57% | 3.98%) |
| MSCI ACWI Index (Net) | 32.79%) | 11.08% | 9.06%) |
The Blended Benchmark serves as the Fund’s performance index because the Fund’s investment manager believes it is more representative of the Fund’s investment strategy. The Blended Benchmark is calculated by Hartford Funds Management Company, LLC. The MSCI ACWI Index (Net) serves as the Fund’s regulatory index and provides a broad measure of market performance.
The Fund’s past performance is not a good predictor of the Fund’s future performance. The graph and table do not reflect the deduction of taxes that a shareholder would pay on Fund distributions or redemption of Fund shares. Performance information reflects fee waivers and/or expense limitation arrangements, if any. Absent any applicable fee waivers and/or expense limitation arrangements, performance would have been lower. Visit hartfordfunds.com for the most recent performance information.
Key Fund Statistics as of October 31, 2024
| Fund's net assets | $79,409,714% |
| Total number of portfolio holdings | $217% |
| Total investment management fees paid | $800,743% |
| Portfolio turnover rate | $198% |
Graphical Representation of Holdings as of October 31, 2024
The table below shows the investment makeup of the Fund, representing the percentage of net assets of the Fund.
Composition by Security Type
| Common Stocks | 52.1 | % |
| U.S. Government Securities | 32.8 | % |
| Foreign Government Obligations | 1.3 | % |
| Exchange-Traded Funds | 0.5 | % |
| Closed End Funds | 0.4 | % |
| Short-Term Investments | 10.1 | % |
| Other Assets & Liabilities | 2.8 | % |
| Total | 100.0 | % |
Availability of Additional Information
For additional information about the Fund, including its prospectus, financial information, holdings, and proxy voting information, please visit the Fund’s website at the website address included at the beginning of this report.
The Fund is distributed by Hartford Funds Distributors, LLC (HFD).
Annual Shareholder Report
October 31, 2024
Hartford Real Asset Fund (Consolidated)
Class R6/HRLZX
This annual shareholder report contains important information about the Hartford Real Asset Fund (the "Fund") for the period of November 1, 2023 to October 31, 2024. You can find additional information about the Fund at hartfordfunds.com/reports-hmf. You can also request this information by contacting us by calling 1‑888‑843‑7824.
What were the Fund costs for the last year?
(Based on a hypothetical $10,000 investment)
| Class Name | Costs of a $10,000 investment | Costs paid as a percentage
of a $10,000 investment |
| Class R6 | $94 | 0.90% |
Costs paid excludes fees and expenses incurred indirectly as a result of investments in other investment companies.
How did the Fund perform last year and what impacted its performance?
Management's Discussion of Fund Performance
Global equities, as measured by the MSCI ACWI Index (Net), rose over the trailing twelve-month period ending October 31, 2024, due to strong earnings from select mega-cap tech companies and an improved economic outlook. The European Central Bank began easing rates, while the United States (U.S.) Federal Reserve (Fed) cut its benchmark rate by 50 basis points. The European Union (EU) saw healthy consumption growth. Japan faced economic challenges, and China’s rebound was limited by its property sector. Political developments garnered greater prominence amid an anticipated extremely close U.S. presidential race and leadership changes in many countries. Fund performance described below is relative to the Fund’s blended benchmark, 40% Bloomberg US TIPS 1-10 Year Index/ 30% MSCI ACWI Commodity Producers Index (Net)/ 10% Bloomberg Commodity Index Total Return/ 10% MSCI World IMI Core Real Estate Index (Net)/ 10% MSCI ACWI Infrastructure Index (Net) (the "Blended Benchmark"), for the trailing twelve-month period ended October 31, 2024.
Top Contributors to Performance
Allocation decisions were modestly additive across the major asset classes, helped by an overweight to equities and an underweight to fixed income.
Within fixed income, positive effects from security selection were driven by strong selection within Treasury Inflation-Protected Securities (TIPS).
Within Commodities, positive effects from security selection were driven by an overweight to natural gas and a non-benchmark position in carbon emissions within the Energy sector.
Top Detractors to Performance
Negative relative results within equities were driven by weak security selection within the Energy, Real Estate, Infrastructure, and Industrial Metals sectors. Sector allocation decisions contributed, driven by an underweight to the Industrial Metals sector and an overweight to the Real Estate sector which more than offset the negative impacts from an overweight to the Agriculture sector and an underweight to the Infrastructure sector.
Within Commodities, sector allocation was negative during the period, driven by the negative impacts from an overweight to precious metals.
Within fixed income, sector allocation was negative, driven by a non-benchmark position in Mexican inflation-linked bonds.
During the period, the Fund gained commodity exposure through derivatives, primarily futures. While an overweight to the commodities asset class had a negative impact over the period, this was offset by positive relative results within the asset class. An overweight to the Industrial Metals sector and an overweight to natural gas within the Energy sector both contributed.
The views expressed in this section reflect the opinions of the Fund's sub-adviser, Wellington Management Company LLP, as of the date of this report and are subject to change based on changes in market, economic or other conditions. These views are not intended to be a forecast of future events and are no guarantee of future results.
Comparison of Change in Value of $ 10,000 Investment
The graph below represents the hypothetical growth of a $10,000 investment in Class R6 shares and the comparative indices.
Average Annual Total Returns
For the Periods Ended October 31, 2024 | 1 Year | 5 Years | 10 Years |
| Class R6 | 8.60%) | 6.97% | 3.16%) |
| Blended Benchmark | 11.01%) | 5.72% | 3.35%) |
| Bloomberg US TIPS 1-10 Year Index | 7.70%) | 2.93% | 2.42%) |
| MSCI ACWI Commodity Producers Index (Net) | 6.88%) | 9.04% | 3.74%) |
| Bloomberg Commodity Index Total Return | (1.18)% | 6.96% | (0.08)% |
| MSCI World IMI Core Real Estate Index (Net) | 30.10%) | 0.46% | 3.45%) |
| MSCI ACWI Infrastructure Index (Net) | 30.84%) | 4.57% | 3.98%) |
| MSCI ACWI Index (Net) | 32.79%) | 11.08% | 9.06%) |
Class R6 shares commenced operations on February 28, 2022 and performance prior to that date is that of the Fund’s Class Y shares. Performance prior to the inception date of the class has not been adjusted to reflect the operating expenses of the class.
The Blended Benchmark serves as the Fund’s performance index because the Fund’s investment manager believes it is more representative of the Fund’s investment strategy. The Blended Benchmark is calculated by Hartford Funds Management Company, LLC. The MSCI ACWI Index (Net) serves as the Fund’s regulatory index and provides a broad measure of market performance.
The Fund’s past performance is not a good predictor of the Fund’s future performance. The graph and table do not reflect the deduction of taxes that a shareholder would pay on Fund distributions or redemption of Fund shares. Performance information reflects fee waivers and/or expense limitation arrangements, if any. Absent any applicable fee waivers and/or expense limitation arrangements, performance would have been lower. Visit hartfordfunds.com for the most recent performance information.
Key Fund Statistics as of October 31, 2024
| Fund's net assets | $79,409,714% |
| Total number of portfolio holdings | $217% |
| Total investment management fees paid | $800,743% |
| Portfolio turnover rate | $198% |
Graphical Representation of Holdings as of October 31, 2024
The table below shows the investment makeup of the Fund, representing the percentage of net assets of the Fund.
Composition by Security Type
| Common Stocks | 52.1 | % |
| U.S. Government Securities | 32.8 | % |
| Foreign Government Obligations | 1.3 | % |
| Exchange-Traded Funds | 0.5 | % |
| Closed End Funds | 0.4 | % |
| Short-Term Investments | 10.1 | % |
| Other Assets & Liabilities | 2.8 | % |
| Total | 100.0 | % |
Availability of Additional Information
For additional information about the Fund, including its prospectus, financial information, holdings, and proxy voting information, please visit the Fund’s website at the website address included at the beginning of this report.
The Fund is distributed by Hartford Funds Distributors, LLC (HFD).
Annual Shareholder Report
October 31, 2024
Hartford Real Asset Fund (Consolidated)
Class Y/HRLYX
This annual shareholder report contains important information about the Hartford Real Asset Fund (the "Fund") for the period of November 1, 2023 to October 31, 2024. You can find additional information about the Fund at hartfordfunds.com/reports-hmf. You can also request this information by contacting us by calling 1‑888‑843‑7824.
What were the Fund costs for the last year?
(Based on a hypothetical $10,000 investment)
| Class Name | Costs of a $10,000 investment | Costs paid as a percentage
of a $10,000 investment |
| Class Y | $94 | 0.90% |
Costs paid excludes fees and expenses incurred indirectly as a result of investments in other investment companies.
How did the Fund perform last year and what impacted its performance?
Management's Discussion of Fund Performance
Global equities, as measured by the MSCI ACWI Index (Net), rose over the trailing twelve-month period ending October 31, 2024, due to strong earnings from select mega-cap tech companies and an improved economic outlook. The European Central Bank began easing rates, while the United States (U.S.) Federal Reserve (Fed) cut its benchmark rate by 50 basis points. The European Union (EU) saw healthy consumption growth. Japan faced economic challenges, and China’s rebound was limited by its property sector. Political developments garnered greater prominence amid an anticipated extremely close U.S. presidential race and leadership changes in many countries. Fund performance described below is relative to the Fund’s blended benchmark, 40% Bloomberg US TIPS 1-10 Year Index/ 30% MSCI ACWI Commodity Producers Index (Net)/ 10% Bloomberg Commodity Index Total Return/ 10% MSCI World IMI Core Real Estate Index (Net)/ 10% MSCI ACWI Infrastructure Index (Net) (the "Blended Benchmark"), for the trailing twelve-month period ended October 31, 2024.
Top Contributors to Performance
Allocation decisions were modestly additive across the major asset classes, helped by an overweight to equities and an underweight to fixed income.
Within fixed income, positive effects from security selection were driven by strong selection within Treasury Inflation-Protected Securities (TIPS).
Within Commodities, positive effects from security selection were driven by an overweight to natural gas and a non-benchmark position in carbon emissions within the Energy sector.
Top Detractors to Performance
Negative relative results within equities were driven by weak security selection within the Energy, Real Estate, Infrastructure, and Industrial Metals sectors. Sector allocation decisions contributed, driven by an underweight to the Industrial Metals sector and an overweight to the Real Estate sector which more than offset the negative impacts from an overweight to the Agriculture sector and an underweight to the Infrastructure sector.
Within Commodities, sector allocation was negative during the period, driven by the negative impacts from an overweight to precious metals.
Within fixed income, sector allocation was negative, driven by a non-benchmark position in Mexican inflation-linked bonds.
During the period, the Fund gained commodity exposure through derivatives, primarily futures. While an overweight to the commodities asset class had a negative impact over the period, this was offset by positive relative results within the asset class. An overweight to the Industrial Metals sector and an overweight to natural gas within the Energy sector both contributed.
The views expressed in this section reflect the opinions of the Fund's sub-adviser, Wellington Management Company LLP, as of the date of this report and are subject to change based on changes in market, economic or other conditions. These views are not intended to be a forecast of future events and are no guarantee of future results.
Comparison of Change in Value of $ 250,000 Investment
The graph below represents the hypothetical growth of a $250,000 investment in Class Y shares and the comparative indices.
Average Annual Total Returns
For the Periods Ended October 31, 2024 | 1 Year | 5 Years | 10 Years |
| Class Y | 8.72%) | 6.99% | 3.17%) |
| Blended Benchmark | 11.01%) | 5.72% | 3.35%) |
| Bloomberg US TIPS 1-10 Year Index | 7.70%) | 2.93% | 2.42%) |
| MSCI ACWI Commodity Producers Index (Net) | 6.88%) | 9.04% | 3.74%) |
| Bloomberg Commodity Index Total Return | (1.18)% | 6.96% | (0.08)% |
| MSCI World IMI Core Real Estate Index (Net) | 30.10%) | 0.46% | 3.45%) |
| MSCI ACWI Infrastructure Index (Net) | 30.84%) | 4.57% | 3.98%) |
| MSCI ACWI Index (Net) | 32.79%) | 11.08% | 9.06%) |
The Blended Benchmark serves as the Fund’s performance index because the Fund’s investment manager believes it is more representative of the Fund’s investment strategy. The Blended Benchmark is calculated by Hartford Funds Management Company, LLC. The MSCI ACWI Index (Net) serves as the Fund’s regulatory index and provides a broad measure of market performance.
The Fund’s past performance is not a good predictor of the Fund’s future performance. The graph and table do not reflect the deduction of taxes that a shareholder would pay on Fund distributions or redemption of Fund shares. Performance information reflects fee waivers and/or expense limitation arrangements, if any. Absent any applicable fee waivers and/or expense limitation arrangements, performance would have been lower. Visit hartfordfunds.com for the most recent performance information.
Key Fund Statistics as of October 31, 2024
| Fund's net assets | $79,409,714% |
| Total number of portfolio holdings | $217% |
| Total investment management fees paid | $800,743% |
| Portfolio turnover rate | $198% |
Graphical Representation of Holdings as of October 31, 2024
The table below shows the investment makeup of the Fund, representing the percentage of net assets of the Fund.
Composition by Security Type
| Common Stocks | 52.1 | % |
| U.S. Government Securities | 32.8 | % |
| Foreign Government Obligations | 1.3 | % |
| Exchange-Traded Funds | 0.5 | % |
| Closed End Funds | 0.4 | % |
| Short-Term Investments | 10.1 | % |
| Other Assets & Liabilities | 2.8 | % |
| Total | 100.0 | % |
Availability of Additional Information
For additional information about the Fund, including its prospectus, financial information, holdings, and proxy voting information, please visit the Fund’s website at the website address included at the beginning of this report.
The Fund is distributed by Hartford Funds Distributors, LLC (HFD).
Annual Shareholder Report
October 31, 2024
Hartford Real Asset Fund (Consolidated)
Class F/HRLFX
This annual shareholder report contains important information about the Hartford Real Asset Fund (the "Fund") for the period of November 1, 2023 to October 31, 2024. You can find additional information about the Fund at hartfordfunds.com/reports-hmf. You can also request this information by contacting us by calling 1‑888‑843‑7824.
What were the Fund costs for the last year?
(Based on a hypothetical $10,000 investment)
| Class Name | Costs of a $10,000 investment | Costs paid as a percentage
of a $10,000 investment |
| Class F | $94 | 0.90% |
Costs paid excludes fees and expenses incurred indirectly as a result of investments in other investment companies.
How did the Fund perform last year and what impacted its performance?
Management's Discussion of Fund Performance
Global equities, as measured by the MSCI ACWI Index (Net), rose over the trailing twelve-month period ending October 31, 2024, due to strong earnings from select mega-cap tech companies and an improved economic outlook. The European Central Bank began easing rates, while the United States (U.S.) Federal Reserve (Fed) cut its benchmark rate by 50 basis points. The European Union (EU) saw healthy consumption growth. Japan faced economic challenges, and China’s rebound was limited by its property sector. Political developments garnered greater prominence amid an anticipated extremely close U.S. presidential race and leadership changes in many countries. Fund performance described below is relative to the Fund’s blended benchmark, 40% Bloomberg US TIPS 1-10 Year Index/ 30% MSCI ACWI Commodity Producers Index (Net)/ 10% Bloomberg Commodity Index Total Return/ 10% MSCI World IMI Core Real Estate Index (Net)/ 10% MSCI ACWI Infrastructure Index (Net) (the "Blended Benchmark"), for the trailing twelve-month period ended October 31, 2024.
Top Contributors to Performance
Allocation decisions were modestly additive across the major asset classes, helped by an overweight to equities and an underweight to fixed income.
Within fixed income, positive effects from security selection were driven by strong selection within Treasury Inflation-Protected Securities (TIPS).
Within Commodities, positive effects from security selection were driven by an overweight to natural gas and a non-benchmark position in carbon emissions within the Energy sector.
Top Detractors to Performance
Negative relative results within equities were driven by weak security selection within the Energy, Real Estate, Infrastructure, and Industrial Metals sectors. Sector allocation decisions contributed, driven by an underweight to the Industrial Metals sector and an overweight to the Real Estate sector which more than offset the negative impacts from an overweight to the Agriculture sector and an underweight to the Infrastructure sector.
Within Commodities, sector allocation was negative during the period, driven by the negative impacts from an overweight to precious metals.
Within fixed income, sector allocation was negative, driven by a non-benchmark position in Mexican inflation-linked bonds.
During the period, the Fund gained commodity exposure through derivatives, primarily futures. While an overweight to the commodities asset class had a negative impact over the period, this was offset by positive relative results within the asset class. An overweight to the Industrial Metals sector and an overweight to natural gas within the Energy sector both contributed.
The views expressed in this section reflect the opinions of the Fund's sub-adviser, Wellington Management Company LLP, as of the date of this report and are subject to change based on changes in market, economic or other conditions. These views are not intended to be a forecast of future events and are no guarantee of future results.
Comparison of Change in Value of $ 1,000,000 Investment
The graph below represents the hypothetical growth of a $1,000,000 investment in Class F shares and the comparative indices.
Average Annual Total Returns
For the Periods Ended October 31, 2024 | 1 Year | 5 Years | 10 Years |
| Class F | 8.72%) | 7.00% | 3.14%) |
| Blended Benchmark | 11.01%) | 5.72% | 3.35%) |
| Bloomberg US TIPS 1-10 Year Index | 7.70%) | 2.93% | 2.42%) |
| MSCI ACWI Commodity Producers Index (Net) | 6.88%) | 9.04% | 3.74%) |
| Bloomberg Commodity Index Total Return | (1.18)% | 6.96% | (0.08)% |
| MSCI World IMI Core Real Estate Index (Net) | 30.10%) | 0.46% | 3.45%) |
| MSCI ACWI Infrastructure Index (Net) | 30.84%) | 4.57% | 3.98%) |
| MSCI ACWI Index (Net) | 32.79%) | 11.08% | 9.06%) |
Class F shares commenced operations on February 28, 2017 and performance prior to that date is that of the Fund’s Class I shares. Performance prior to the inception date of the class has not been adjusted to reflect the operating expenses of the class.
The Blended Benchmark serves as the Fund’s performance index because the Fund’s investment manager believes it is more representative of the Fund’s investment strategy. The Blended Benchmark is calculated by Hartford Funds Management Company, LLC. The MSCI ACWI Index (Net) serves as the Fund’s regulatory index and provides a broad measure of market performance.
The Fund’s past performance is not a good predictor of the Fund’s future performance. The graph and table do not reflect the deduction of taxes that a shareholder would pay on Fund distributions or redemption of Fund shares. Performance information reflects fee waivers and/or expense limitation arrangements, if any. Absent any applicable fee waivers and/or expense limitation arrangements, performance would have been lower. Visit hartfordfunds.com for the most recent performance information.
Key Fund Statistics as of October 31, 2024
| Fund's net assets | $79,409,714% |
| Total number of portfolio holdings | $217% |
| Total investment management fees paid | $800,743% |
| Portfolio turnover rate | $198% |
Graphical Representation of Holdings as of October 31, 2024
The table below shows the investment makeup of the Fund, representing the percentage of net assets of the Fund.
Composition by Security Type
| Common Stocks | 52.1 | % |
| U.S. Government Securities | 32.8 | % |
| Foreign Government Obligations | 1.3 | % |
| Exchange-Traded Funds | 0.5 | % |
| Closed End Funds | 0.4 | % |
| Short-Term Investments | 10.1 | % |
| Other Assets & Liabilities | 2.8 | % |
| Total | 100.0 | % |
Availability of Additional Information
For additional information about the Fund, including its prospectus, financial information, holdings, and proxy voting information, please visit the Fund’s website at the website address included at the beginning of this report.
The Fund is distributed by Hartford Funds Distributors, LLC (HFD).
Item 2. Code of Ethics.
The registrant, as of the end of the period covered by this report, has adopted a code of ethics that applies to the registrant’s principal executive officer, principal financial officer, principal accounting officer or controller, or persons performing similar functions, regardless of whether these individuals are employed by the registrant or a third party. There have been no amendments, during the period covered by this report, to a provision of the code of ethics that applies to the registrant’s principal executive officer, principal financial officer, principal accounting officer or controller, or persons performing similar functions, regardless of whether these individuals are employed by the registrant or a third party, and that relates to any element of the code of ethics description. The registrant has not granted any waivers, including an implicit waiver, from a provision of the code of ethics that applies to the registrant’s principal executive officer, principal financial officer, principal accounting officer or controller, or persons performing similar functions, regardless of whether these individuals are employed by the registrant or a third party, that relates to one or more of the items set forth in paragraph (b) of this item’s instructions. A copy of the code of ethics is filed herewith.
Item 3. Audit Committee Financial Expert.
The Board of Directors of the registrant (the “Board”) has designated David Sung as an Audit Committee Financial Expert. Mr. Sung is considered by the Board to be an independent director.
Item 4. Principal Accountant Fees and Services.
The fees below reflect the aggregate fees billed by all of the series of The Hartford Mutual Funds, Inc., which includes the series of The Hartford Mutual Funds, Inc. to which this certified shareholder report relates.
| | (a) | Audit Fees: The aggregate fees billed for each of the last two fiscal years for professional services rendered by the principal accountant for the audit of the registrant’s annual financial statements or services that are normally provided by the accountant in connection with statutory and regulatory filings or engagements for those fiscal years were: |
$1,107,993 for the fiscal year ended October 31, 2024; $1,100,079 for the fiscal year ended October 31, 2023.
| | (b) | Audit Related Fees: The aggregate fees billed in each of the last two fiscal years for assurance and related services by the principal accountant that are reasonably related to the performance of the audit of the registrant’s financial statements and are not reported under paragraph (a) of this Item were: |
$16,000 for the fiscal year ended October 31, 2024; $0 for the fiscal year ended October 31, 2023. Audit-related services were principally in connection with consents for additional registration statements.
| | (c) | Tax Fees: The aggregate fees billed in each of the last two fiscal years for professional services rendered by the principal accountant for tax compliance, tax advice, and tax planning were: |
$171,084 for the fiscal year ended October 31, 2024; $162,926 for the fiscal year ended October 31, 2023. Tax-related services were principally in connection with, but not limited to, general tax services and excise tax services.
| | (d) | All Other Fees: The aggregate fees billed in each of the last two fiscal years for products and services provided by the principal accountant, other than the services reported in paragraphs (a) through (c) of this Item were: |
$983 for the fiscal year ended October 31, 2024; $2,758 for the fiscal year ended October 31, 2023. These fees were principally in connection with, but not limited to, general audit related products and services and an accounting research tool subscription.
| | (e) (1) | The Pre-Approval Policies and Procedures (the “Policy”) adopted by the Audit Committee of the registrant (also, the “Fund”) sets forth the procedures pursuant to which services performed by the independent registered public accounting firm for the registrant may be pre-approved. The following summarizes the pre-approval requirements under the Policy. |
| | a) | The Audit Committee must pre-approve all audit services and non-audit services that the independent registered public accounting firm provides to the Fund. |
| | b) | The Audit Committee must pre-approve any engagement of the independent registered public accounting firm to provide non-audit services to any Service Affiliate (which is defined to include any entity controlling, controlled by, or under common control with the investment adviser that provides ongoing services to the Fund) during the period of the independent registered public accounting firm’s engagement to provide audit services to the Fund, if the non-audit services to the Service Affiliate directly impact the Fund’s operations and financial reporting. |
| | c) | The Audit Committee, from time to time, may designate one or more of its members who are Independent Directors (each a “Designated Member”) to consider, on the Audit Committee’s behalf, any non-audit services, whether to the Fund or to any Service Affiliate, that have not been pre-approved by the Audit Committee. The Designated Member also shall review, on the Audit Committee’s behalf, any proposed material change in the nature or extent of any non-audit services previously approved. In considering any requested non-audit services or proposed material change in such services, the Designated Member shall not authorize services which would exceed $50,000 in fees for such services. |
| | d) | The independent registered public accounting firm may not provide specified prohibited non-audit services set forth in the Policy to the Fund, the Fund’s investment adviser, the Service Affiliates or any other member of the investment company complex. |
| | (e) (2) | One hundred percent of the services described in items 4(b) through 4(d) were approved in accordance with the Audit Committee’s Pre-Approval Policy. As a result, none of such services was approved pursuant to paragraph (c)(7)(i)(C) of Rule 2-01 of Regulation S-X. |
| | (f) | Less than 50% of the hours expended on the principal accountant’s engagement to audit the registrant’s financial statements for the year ended October 31, 2024, were attributed to work performed by persons other than the principal accountant’s full-time, permanent employees. |
| | (g) | The aggregate non-audit fees billed by the registrant’s accountant for services rendered to the registrant, and rendered to the registrant’s investment adviser (not including any sub-adviser whose role is primarily portfolio management and is subcontracted with or overseen by another investment adviser), and any entity controlling, controlled by, or under common control with the adviser that provides ongoing services to the registrant for each of the last two fiscal years of the registrant were: |
The aggregate non-audit fees billed by the registrant’s accountant for services rendered to the registrant: $172,067 for the fiscal year ended October 31, 2024; $165,684 for the fiscal year ended October 31, 2023.
The aggregate non-audit fees billed by the registrant’s accountant for services rendered to the registrant’s investment adviser (not including any sub-adviser whose role is primarily portfolio management and is subcontracted with or overseen by another investment adviser), and any entity controlling, controlled by, or under common control with the adviser was $121,199 for the fiscal year ended October 31, 2024 and $121,199 for the fiscal year ended October 31, 2023.
| | (h) | The registrant’s audit committee of the board of directors has considered whether the provision of non-audit services that were rendered to the registrant’s investment adviser (not including any sub-adviser whose role is primarily portfolio management and is subcontracted with or overseen by another investment adviser), and any entity controlling, controlled by, or under common control with the investment adviser that provides ongoing services to the registrant that were not pre-approved pursuant to paragraph (c)(7)(ii) of Rule 2-01 of Regulation S-X is compatible with maintaining the principal accountant’s independence. |
Item 5. Audit Committee of Listed Registrants.
Not applicable.
Item 6. Investments.
| | (a) | The Schedule of Investments in securities of unaffiliated issuers as of the close of the reporting period is included in the Annual Financial Statements and Other Information filed under Item 7 of this form. |
Item 7. Financial Statements and Financial Highlights for Open-End Management Investment Companies.
Item 8. Changes in and Disagreements with Accountants for Open-End Management Investment Companies.
Item 9. Proxy Disclosures for Open-End Management Investment Companies.
Item 10. Remuneration Paid to Directors, Officers, and Others of Open-End Management Investment Companies.
Item 11. Statement Regarding Basis for Approval of Investment Advisory Contract.
Hartford Domestic
Equity Funds
Annual Financial Statements
and Other Information
◼The Hartford Capital Appreciation Fund |
◼Hartford Core Equity Fund |
◼The Hartford Dividend and Growth Fund |
◼The Hartford Equity Income Fund |
◼The Hartford Growth Opportunities Fund |
◼The Hartford Healthcare Fund |
◼The Hartford MidCap Fund |
◼The Hartford MidCap Value Fund |
◼The Hartford Small Cap Growth Fund |
◼Hartford Small Cap Value Fund |
◼The Hartford Small Company Fund |
Hartford Domestic Equity Funds
Table of Contents
| |
Please note that this report includes responses to Items 7-11 of Form N-CSR, which is a reporting form filed with the U.S. Securities and Exchange Commission by mutual funds and exchange traded funds. Certain Form N-CSR items listed below may not be applicable. | |
| |
| |
| |
| |
| |
| |
| |
| |
| |
| |
| |
| |
| |
| |
| |
| |
| |
| |
| |
| |
| |
| |
| |
| |
| |
| |
| |
| |
| |
| |
| |
| |
| |
| |
| |
| |
| |
| |
| |
| |
| |
Hartford Domestic Equity Funds
Item 7. Financial Statements and Financial Highlights for Open-End Management Investment Companies.
The Hartford Capital Appreciation Fund
Schedule of InvestmentsOctober 31, 2024
Shares or Principal Amount | | |
|
| Automobiles & Components - 0.5% |
| | |
| |
| | |
| | |
| | |
| | |
| | |
| | |
| | |
| | | |
| |
| | |
| | |
| | |
| | |
| Fortune Brands Innovations, Inc. | |
| | |
| | |
| | |
| Honeywell International, Inc. | |
| John Bean Technologies Corp. | |
| | |
| | |
| | |
| | |
| | | |
| Commercial & Professional Services - 0.5% |
| | |
| Consumer Discretionary Distribution & Retail - 5.2% |
| | |
| | |
| O'Reilly Automotive, Inc.* | |
| | |
| | |
| | | |
| Consumer Durables & Apparel - 2.0% |
| | |
| | |
| | |
| Tempur Sealy International, Inc. | |
| | | |
| |
| | |
| DraftKings, Inc. Class A* | |
| | |
| Royal Caribbean Cruises Ltd. | |
| | |
| Wyndham Hotels & Resorts, Inc. | |
| | | |
| Consumer Staples Distribution & Retail - 0.6% |
| U.S. Foods Holding Corp.* | |
| |
| | |
| | |
| | |
| | |
| | |
| | | |
Shares or Principal Amount | | |
COMMON STOCKS - 98.0% - (continued) |
| Equity Real Estate Investment Trusts (REITs) - 3.4% |
| American Healthcare, Inc. REIT | |
| American Tower Corp. REIT | |
| AvalonBay Communities, Inc. REIT | |
| Brixmor Property Group, Inc. REIT | |
| Camden Property Trust REIT | |
| Simon Property Group, Inc. REIT | |
| | | |
| Financial Services - 7.5% |
| | |
| | |
| | |
| | |
| | |
| | |
| StepStone Group, Inc. Class A | |
| | |
| | |
| Tradeweb Markets, Inc. Class A | |
| | |
| | |
| | | |
| Food, Beverage & Tobacco - 3.2% |
| | |
| | |
| Philip Morris International, Inc. | |
| Tyson Foods, Inc. Class A | |
| | | |
| Health Care Equipment & Services - 4.7% |
| | |
| | |
| Integra LifeSciences Holdings Corp.* | |
| Intuitive Surgical, Inc.* | |
| | |
| | |
| | |
| | | |
| Household & Personal Products - 0.9% |
| | |
| |
| | |
| | |
| Marsh & McLennan Cos., Inc. | |
| Principal Financial Group, Inc. | |
| | | |
| |
| | |
| | |
| | |
| | |
| | |
| | |
| | |
| | | |
| Media & Entertainment - 9.3% |
| | |
| | |
| | |
| Liberty Media Corp.-Liberty Formula One | |
| Live Nation Entertainment, Inc.* | |
The accompanying notes are an integral part of these financial statements.
The Hartford Capital Appreciation Fund
Schedule of Investments – (continued)October 31, 2024
Shares or Principal Amount | | |
COMMON STOCKS - 98.0% - (continued) |
| Media & Entertainment - 9.3% - (continued) |
| Meta Platforms, Inc. Class A | |
| | |
| | |
| | |
| | |
| | |
| | | |
| Pharmaceuticals, Biotechnology & Life Sciences - 4.1% |
| Charles River Laboratories International, Inc.* | |
| | |
| | |
| | |
| | |
| | |
| | |
| | |
| Vertex Pharmaceuticals, Inc.* | |
| | | |
| Semiconductors & Semiconductor Equipment - 9.4% |
| Allegro MicroSystems, Inc.* | |
| | |
| | |
| | |
| | |
| | |
| | |
| | |
| | | |
| Software & Services - 8.4% |
| | |
| Cognizant Technology Solutions Corp. Class A | |
| | |
| Informatica, Inc. Class A* | |
| | |
| | |
| Rubicon Earnout Shares*(1)(2) | |
| Rubicon TRA Placeholder*(1)(2) | |
| | |
| | |
| | | |
| Technology Hardware & Equipment - 9.2% |
| | |
| | |
| | |
| | |
| Dell Technologies, Inc. Class C | |
| | |
| | | |
| Telecommunication Services - 0.3% |
| | |
| |
| | |
| Knight-Swift Transportation Holdings, Inc. | |
| | |
| | |
| | | |
| |
| | |
Shares or Principal Amount | | |
COMMON STOCKS - 98.0% - (continued) |
| Utilities - 1.9% - (continued) |
| | |
| | |
| | | |
| Total Common Stocks
(cost $4,412,954,314) | | |
CONVERTIBLE PREFERRED STOCKS - 0.0% |
| Health Care Equipment & Services - 0.0% |
| Lumeris Group Holdings Corp.*(1)(2)(4) | |
| Software & Services - 0.0% |
| Lookout, Inc. Series F*(1)(2)(4) | |
| Total Convertible Preferred Stocks
(cost $1,783,654) | | |
| Total Long-Term Investments
(cost $4,414,737,968) | | |
SHORT-TERM INVESTMENTS - 0.4% |
| Repurchase Agreements - 0.4% |
| Fixed Income Clearing Corp. Repurchase Agreement dated 10/31/2024 at 4.85%, due on 11/01/2024 with a maturity value of $25,069,758; collateralized by U.S. Treasury Note at 4.63%, maturing 06/30/2026, with a market value of $25,567,863 | |
| Securities Lending Collateral - 0.0% |
| Goldman Sachs Financial Square Funds, Government Fund, Institutional Class, | |
| HSBC U.S. Government Money Market Fund, Institutional Class, 4.78%(5) | |
| Invesco Government & Agency Portfolio, Institutional Class, 4.76%(5) | |
| Morgan Stanley Institutional Liquidity Funds, Government Portfolio, Institutional Class, 4.78%(5) | |
| | | |
| Total Short-Term Investments
(cost $26,742,086) | |
| Total Investments
(cost $4,441,480,054) | | |
| Other Assets and Liabilities | | |
| | | |
Note:
Percentage of investments as shown is the ratio of the total market value to net assets.
Prices of foreign equities that are principally traded on certain foreign markets will generally be adjusted daily pursuant to a fair value pricing service approved by Hartford Funds Management Company, LLC in order to reflect an adjustment for factors occurring after the close of certain foreign markets but before the close of the New York Stock Exchange.
Equity industry classifications used in this report are the Global Industry Classification Standard, which was developed by and is the exclusive property and service mark of MSCI, Inc. and Standard & Poor’s.
For Fund compliance purposes, the Fund may not use the same classification system. These classifications are used for financial reporting purposes.
The accompanying notes are an integral part of these financial statements.
The Hartford Capital Appreciation Fund
Schedule of Investments – (continued)October 31, 2024
See “Glossary” for abbreviation descriptions.
| |
| Investment in securities not registered under the Securities Act of 1933 (excluding securities acquired pursuant to Rule 144A and Regulation S). At the end of the period, the value of such restricted securities amounted to $35,038,760 or 0.6% of net assets. |
| | | | |
| | | | |
| Lookout, Inc. Series F Convertible Preferred | | | |
| Lumeris Group Holdings Corp. Convertible Preferred | | | |
| | | | |
| | | | |
| | | | |
| | | | |
| Investment valued using significant unobservable inputs. |
| Represents entire or partial securities on loan. See Note 8 in the accompanying Notes to Financial Statements for securities lending information. |
| Currently no rate available. |
| Current yield as of period end. |
Futures Contracts Outstanding at October 31, 2024 |
| | | | Value and
Unrealized
Appreciation/
(Depreciation) |
|
| | | | |
| |
† See Significant Accounting Policies of accompanying Notes to Financial Statements regarding valuation of investments.
The accompanying notes are an integral part of these financial statements.
The Hartford Capital Appreciation Fund
Schedule of Investments – (continued)October 31, 2024
Fair Value Summary
The following is a summary of the fair valuations according to the inputs used as of October 31, 2024 in valuing the Fund’s investments.
| | | | |
| | | | |
| | | | |
| | | | |
| | | | |
| | | | |
Commercial & Professional Services | | | | |
Consumer Discretionary Distribution & Retail | | | | |
Consumer Durables & Apparel | | | | |
| | | | |
Consumer Staples Distribution & Retail | | | | |
| | | | |
Equity Real Estate Investment Trusts (REITs) | | | | |
| | | | |
| | | | |
Health Care Equipment & Services | | | | |
Household & Personal Products | | | | |
| | | | |
| | | | |
| | | | |
Pharmaceuticals, Biotechnology & Life Sciences | | | | |
Semiconductors & Semiconductor Equipment | | | | |
| | | | |
Technology Hardware & Equipment | | | | |
Telecommunication Services | | | | |
| | | | |
| | | | |
Convertible Preferred Stocks | | | | |
| | | | |
| | | | |
| | | | |
| | | | |
| | | | |
| For the year ended October 31, 2024, there were no transfers in and out of Level 3. |
| Derivative instruments (excluding purchased and written options, if applicable) are valued at the unrealized appreciation/(depreciation) on the investments. |
Level 3 investments at the beginning and/or end of the period in relation to net assets were not significant and accordingly, a reconciliation of Level 3 assets for the year ended October 31, 2024 is not presented.
The accompanying notes are an integral part of these financial statements.
Hartford Core Equity Fund
Schedule of InvestmentsOctober 31, 2024
Shares or Principal Amount | | |
|
| Automobiles & Components - 0.4% |
| | |
| |
| | |
| | |
| | |
| | | |
| |
| | |
| Builders FirstSource, Inc.* | |
| | |
| | |
| | |
| | |
| | |
| | |
| | |
| | | |
| Commercial & Professional Services - 0.9% |
| | |
| Consumer Discretionary Distribution & Retail - 6.5% |
| | |
| | |
| | |
| | | |
| Consumer Durables & Apparel - 1.3% |
| | |
| | |
| | | |
| |
| Marriott International, Inc. Class A | |
| | |
| | | |
| |
| | |
| | |
| | |
| | |
| | | |
| Equity Real Estate Investment Trusts (REITs) - 2.4% |
| | |
| | |
| | |
| | | |
| Financial Services - 5.4% |
| | |
| | |
| | |
| | |
| | | |
| Food, Beverage & Tobacco - 2.1% |
| Brown-Forman Corp. Class B | |
| Constellation Brands, Inc. Class A | |
| | |
| | | |
| Health Care Equipment & Services - 5.8% |
| | |
| | |
Shares or Principal Amount | | |
COMMON STOCKS - 99.5% - (continued) |
| Health Care Equipment & Services - 5.8% - (continued) |
| | |
| | |
| | | |
| Household & Personal Products - 1.9% |
| Estee Lauder Cos., Inc. Class A | |
| | |
| | | |
| |
| | |
| | |
| | |
| | | |
| |
| | |
| | |
| | | |
| Media & Entertainment - 8.5% |
| | |
| Meta Platforms, Inc. Class A | |
| | |
| | | |
| Pharmaceuticals, Biotechnology & Life Sciences - 6.8% |
| | |
| | |
| | |
| Thermo Fisher Scientific, Inc. | |
| Vertex Pharmaceuticals, Inc.* | |
| | | |
| Semiconductors & Semiconductor Equipment - 11.5% |
| | |
| | |
| | |
| | |
| | | |
| Software & Services - 10.5% |
| | |
| | |
| | |
| | |
| | |
| | | |
| Technology Hardware & Equipment - 9.8% |
| | |
| | |
| | |
| | | |
| |
| | |
| |
| | |
| | |
| | |
| | | |
| Total Common Stocks
(cost $5,477,257,499) | | |
The accompanying notes are an integral part of these financial statements.
Hartford Core Equity Fund
Schedule of Investments – (continued)October 31, 2024
Shares or Principal Amount | | |
SHORT-TERM INVESTMENTS - 0.1% |
| Repurchase Agreements - 0.1% |
| Fixed Income Clearing Corp. Repurchase Agreement dated 10/31/2024 at 4.85%, due on 11/01/2024 with a maturity value of $11,675,186; collateralized by U.S. Treasury Note at 0.88%, maturing 06/30/2026, with a market value of $11,907,181 | |
| Total Short-Term Investments
(cost $11,673,613) | |
| Total Investments
(cost $5,488,931,112) | | |
| Other Assets and Liabilities | | |
| | | |
Note:
Percentage of investments as shown is the ratio of the total market value to net assets.
Equity industry classifications used in this report are the Global Industry Classification Standard, which was developed by and is the exclusive property and service mark of MSCI, Inc. and Standard & Poor’s.
For Fund compliance purposes, the Fund may not use the same classification system. These classifications are used for financial reporting purposes.
See “Glossary” for abbreviation descriptions.
| |
| See Significant Accounting Policies of accompanying Notes to Financial Statements regarding valuation of investments. |
The following is a summary of the fair valuations according to the inputs used as of October 31, 2024 in valuing the Fund’s investments.
| | | | |
| | | | |
| | | | |
| | | | |
| | | | |
| | | | |
Commercial & Professional Services | | | | |
Consumer Discretionary Distribution & Retail | | | | |
Consumer Durables & Apparel | | | | |
| | | | |
| | | | |
Equity Real Estate Investment Trusts (REITs) | | | | |
| | | | |
| | | | |
Health Care Equipment & Services | | | | |
Household & Personal Products | | | | |
| | | | |
| | | | |
| | | | |
Pharmaceuticals, Biotechnology & Life Sciences | | | | |
Semiconductors & Semiconductor Equipment | | | | |
| | | | |
Technology Hardware & Equipment | | | | |
| | | | |
| | | | |
| | | | |
| | | | |
| For the year ended October 31, 2024, there were no transfers in and out of Level 3. |
The accompanying notes are an integral part of these financial statements.
The Hartford Dividend and Growth Fund
Schedule of InvestmentsOctober 31, 2024
Shares or Principal Amount | | |
|
| |
| | |
| | |
| | |
| | | |
| |
| | |
| | |
| | |
| Honeywell International, Inc. | |
| | |
| | |
| Westinghouse Air Brake Technologies Corp. | |
| | | |
| Consumer Discretionary Distribution & Retail - 3.6% |
| | |
| | |
| | |
| | | |
| |
| | |
| | |
| | | |
| Consumer Staples Distribution & Retail - 0.5% |
| | |
| |
| | |
| | |
| | |
| | |
| | |
| | |
| | | |
| Equity Real Estate Investment Trusts (REITs) - 2.6% |
| American Tower Corp. REIT | |
| | |
| | | |
| Financial Services - 6.4% |
| | |
| | |
| | |
| | |
| | |
| | | |
| Food, Beverage & Tobacco - 4.4% |
| | |
| Mondelez International, Inc. Class A | |
| Philip Morris International, Inc. | |
| Tyson Foods, Inc. Class A | |
| | | |
| Health Care Equipment & Services - 6.8% |
| | |
| | |
| | |
| | |
| | |
| | | |
| Household & Personal Products - 2.1% |
| | |
| | |
| | | |
Shares or Principal Amount | | |
COMMON STOCKS - 96.4% - (continued) |
| |
| American International Group, Inc. | |
| | |
| Principal Financial Group, Inc. | |
| | | |
| |
| | |
| | |
| | |
| | |
| | | |
| Media & Entertainment - 7.0% |
| | |
| | |
| | |
| | |
| | | |
| Pharmaceuticals, Biotechnology & Life Sciences - 7.1% |
| Agilent Technologies, Inc. | |
| | |
| | |
| | |
| | |
| | |
| | | |
| Semiconductors & Semiconductor Equipment - 4.6% |
| | |
| | |
| | |
| | | |
| Software & Services - 7.4% |
| | |
| Cognizant Technology Solutions Corp. Class A | |
| | |
| | |
| | | |
| Technology Hardware & Equipment - 5.3% |
| | |
| | |
| | | |
| Telecommunication Services - 0.2% |
| | |
| |
| | |
| JB Hunt Transport Services, Inc. | |
| | | |
| |
| American Electric Power Co., Inc. | |
| | |
| | |
| | |
| | | |
| Total Common Stocks
(cost $11,712,585,847) | | |
The accompanying notes are an integral part of these financial statements.
The Hartford Dividend and Growth Fund
Schedule of Investments – (continued)October 31, 2024
Shares or Principal Amount | | |
SHORT-TERM INVESTMENTS - 1.1% |
| Repurchase Agreements - 0.7% |
| Fixed Income Clearing Corp. Repurchase Agreement dated 10/31/2024 at 4.85%, due on 11/01/2024 with a maturity value of $123,107,924; collateralized by U.S. Treasury Note at 4.63%, maturing 06/30/2026, with a market value of $125,553,337 | |
| Securities Lending Collateral - 0.4% |
| Goldman Sachs Financial Square Funds, Government Fund, Institutional Class, | |
| HSBC U.S. Government Money Market Fund, Institutional Class, 4.78%(2) | |
| Invesco Government & Agency Portfolio, Institutional Class, 4.76%(2) | |
| Morgan Stanley Institutional Liquidity Funds, Government Portfolio, Institutional Class, 4.78%(2) | |
| | | |
| Total Short-Term Investments
(cost $199,220,510) | |
| Total Investments
(cost $11,911,806,357) | | |
| Other Assets and Liabilities | | |
| | | |
Note:
Percentage of investments as shown is the ratio of the total market value to net assets.
Prices of foreign equities that are principally traded on certain foreign markets will generally be adjusted daily pursuant to a fair value pricing service approved by Hartford Funds Management Company, LLC in order to reflect an adjustment for factors occurring after the close of certain foreign markets but before the close of the New York Stock Exchange.
Equity industry classifications used in this report are the Global Industry Classification Standard, which was developed by and is the exclusive property and service mark of MSCI, Inc. and Standard & Poor’s.
For Fund compliance purposes, the Fund may not use the same classification system. These classifications are used for financial reporting purposes.
See “Glossary” for abbreviation descriptions.
| |
| Represents entire or partial securities on loan. See Note 8 in the accompanying Notes to Financial Statements for securities lending information. |
| Current yield as of period end. |
| See Significant Accounting Policies of accompanying Notes to Financial Statements regarding valuation of investments. |
The following is a summary of the fair valuations according to the inputs used as of October 31, 2024 in valuing the Fund’s investments.
| | | | |
| | | | |
| | | | |
| | | | |
| | | | |
Consumer Discretionary Distribution & Retail | | | | |
| | | | |
Consumer Staples Distribution & Retail | | | | |
| | | | |
Equity Real Estate Investment Trusts (REITs) | | | | |
| | | | |
| | | | |
Health Care Equipment & Services | | | | |
Household & Personal Products | | | | |
| | | | |
| | | | |
| | | | |
Pharmaceuticals, Biotechnology & Life Sciences | | | | |
Semiconductors & Semiconductor Equipment | | | | |
| | | | |
Technology Hardware & Equipment | | | | |
Telecommunication Services | | | | |
| | | | |
| | | | |
| | | | |
| | | | |
| For the year ended October 31, 2024, there were no transfers in and out of Level 3. |
The accompanying notes are an integral part of these financial statements.
The Hartford Equity Income Fund
Schedule of InvestmentsOctober 31, 2024
Shares or Principal Amount | | |
|
| |
| | |
| | |
| | |
| | |
| | |
| | | |
| |
| | |
| | |
| | |
| | |
| Honeywell International, Inc. | |
| | |
| Johnson Controls International PLC | |
| L3Harris Technologies, Inc. | |
| | |
| | |
| | | |
| Consumer Discretionary Distribution & Retail - 1.5% |
| Industria de Diseno Textil SA | |
| | |
| | | |
| Consumer Durables & Apparel - 0.2% |
| | |
| |
| | |
| | |
| | | |
| |
| | |
| | |
| | |
| | |
| | |
| | | |
| Equity Real Estate Investment Trusts (REITs) - 6.4% |
| | |
| Gaming & Leisure Properties, Inc. REIT | |
| Host Hotels & Resorts, Inc. REIT | |
| Lamar Advertising Co. Class A, REIT | |
| | |
| | | |
| Financial Services - 7.2% |
| Ares Management Corp. Class A | |
| Capital One Financial Corp. | |
| Intercontinental Exchange, Inc. | |
| | |
| | |
| Raymond James Financial, Inc. | |
| | | |
| Food, Beverage & Tobacco - 5.6% |
| Archer-Daniels-Midland Co. | |
| | |
| | |
| Philip Morris International, Inc. | |
| | | |
| Health Care Equipment & Services - 4.1% |
| | |
| | |
| | | |
Shares or Principal Amount | | |
COMMON STOCKS - 97.8% - (continued) |
| Household & Personal Products - 2.8% |
| | |
| | |
| | | |
| |
| American International Group, Inc. | |
| | |
| | | |
| |
| | |
| | |
| | |
| | |
| | | |
| Media & Entertainment - 0.7% |
| | |
| Pharmaceuticals, Biotechnology & Life Sciences - 12.0% |
| | |
| | |
| | |
| | |
| | |
| | |
| | | |
| Semiconductors & Semiconductor Equipment - 3.0% |
| | |
| | |
| | |
| | | |
| Software & Services - 1.0% |
| | |
| Technology Hardware & Equipment - 4.6% |
| | |
| | |
| | |
| | | |
| Telecommunication Services - 1.4% |
| | |
| |
| Canadian National Railway Co. | |
| Knight-Swift Transportation Holdings, Inc. | |
| United Parcel Service, Inc. Class B | |
| | | |
| |
| American Electric Power Co., Inc. | |
| | |
| | |
| | |
| | |
| | |
| | |
| | |
| | | |
| Total Common Stocks
(cost $3,944,822,745) | | |
The accompanying notes are an integral part of these financial statements.
The Hartford Equity Income Fund
Schedule of Investments – (continued)October 31, 2024
Shares or Principal Amount | | |
SHORT-TERM INVESTMENTS - 0.5% |
| Repurchase Agreements - 0.5% |
| Fixed Income Clearing Corp. Repurchase Agreement dated 10/31/2024 at 4.85%, due on 11/01/2024 with a maturity value of $22,983,690; collateralized by U.S. Treasury Note at 0.88%, maturing 06/30/2026, with a market value of $23,440,325 | |
| Total Short-Term Investments
(cost $22,980,594) | |
| Total Investments
(cost $3,967,803,339) | | |
| Other Assets and Liabilities | | |
| | | |
Note:
Percentage of investments as shown is the ratio of the total market value to net assets.
Prices of foreign equities that are principally traded on certain foreign markets will generally be adjusted daily pursuant to a fair value pricing service approved by Hartford Funds Management Company, LLC in order to reflect an adjustment for factors occurring after the close of certain foreign markets but before the close of the New York Stock Exchange.
Equity industry classifications used in this report are the Global Industry Classification Standard, which was developed by and is the exclusive property and service mark of MSCI, Inc. and Standard & Poor’s.
For Fund compliance purposes, the Fund may not use the same classification system. These classifications are used for financial reporting purposes.
See “Glossary” for abbreviation descriptions.
† See Significant Accounting Policies of accompanying Notes to Financial Statements regarding valuation of investments.
The following is a summary of the fair valuations according to the inputs used as of October 31, 2024 in valuing the Fund’s investments.
| | | | |
| | | | |
| | | | |
| | | | |
| | | | |
Consumer Discretionary Distribution & Retail | | | | |
Consumer Durables & Apparel | | | | |
| | | | |
| | | | |
Equity Real Estate Investment Trusts (REITs) | | | | |
| | | | |
| | | | |
Health Care Equipment & Services | | | | |
Household & Personal Products | | | | |
| | | | |
| | | | |
| | | | |
Pharmaceuticals, Biotechnology & Life Sciences | | | | |
Semiconductors & Semiconductor Equipment | | | | |
| | | | |
Technology Hardware & Equipment | | | | |
Telecommunication Services | | | | |
| | | | |
| | | | |
| | | | |
| | | | |
| For the year ended October 31, 2024, there were no transfers in and out of Level 3. |
The accompanying notes are an integral part of these financial statements.
The Hartford Growth Opportunities Fund
Schedule of InvestmentsOctober 31, 2024
Shares or Principal Amount | | |
|
| |
| | |
| | |
| | |
| | |
| | | |
| Consumer Discretionary Distribution & Retail - 6.1% |
| | |
| O'Reilly Automotive, Inc.* | |
| | |
| | | |
| Consumer Durables & Apparel - 1.4% |
| | |
| |
| DraftKings, Inc. Class A* | |
| Royal Caribbean Cruises Ltd. | |
| | |
| | | |
| |
| | |
| Equity Real Estate Investment Trusts (REITs) - 1.3% |
| American Tower Corp. REIT | |
| AvalonBay Communities, Inc. REIT | |
| | | |
| Financial Services - 4.7% |
| | |
| | |
| Tradeweb Markets, Inc. Class A | |
| | | |
| Health Care Equipment & Services - 2.9% |
| | |
| | |
| Intuitive Surgical, Inc.* | |
| | | |
| Media & Entertainment - 17.5% |
| | |
| Liberty Media Corp.-Liberty Formula One | |
| Live Nation Entertainment, Inc.* | |
| Meta Platforms, Inc. Class A | |
| | |
| | |
| | |
| | | |
| Pharmaceuticals, Biotechnology & Life Sciences - 7.0% |
| | |
| | |
| | |
| | |
| Vertex Pharmaceuticals, Inc.* | |
| | | |
| Semiconductors & Semiconductor Equipment - 19.7% |
| | |
| | |
| | |
| | |
| | |
| | | |
| Software & Services - 7.5% |
| | |
| | |
| Rubicon Earnout Shares*(1)(2) | |
Shares or Principal Amount | | |
COMMON STOCKS - 98.0% - (continued) |
| Software & Services - 7.5% - (continued) |
| Rubicon TRA Placeholder*(1)(2) | |
| | |
| | |
| | | |
| Technology Hardware & Equipment - 17.2% |
| | |
| | |
| Dell Technologies, Inc. Class C | |
| | |
| | | |
| Telecommunication Services - 1.2% |
| | |
| |
| | |
| | |
| | | |
| Total Common Stocks
(cost $3,542,760,748) | | |
CONVERTIBLE PREFERRED STOCKS - 0.3% |
| Health Care Equipment & Services - 0.2% |
| Lumeris Group Holdings Corp.*(1)(2)(3) | |
| Software & Services - 0.1% |
| Lookout, Inc. Series F*(1)(2)(3) | |
| Total Convertible Preferred Stocks
(cost $17,456,734) | | |
EXCHANGE-TRADED FUNDS - 0.8% |
| Other Investment Pools & Funds - 0.8% |
| iShares Russell 1000 Growth ETF | |
| Total Exchange-Traded Funds
(cost $42,365,250) | | |
| Total Long-Term Investments
(cost $3,602,582,732) | | |
SHORT-TERM INVESTMENTS - 0.2% |
| Repurchase Agreements - 0.2% |
| Fixed Income Clearing Corp. Repurchase Agreement dated 10/31/2024 at 4.85%, due on 11/01/2024 with a maturity value of $10,208,488; collateralized by U.S. Treasury Note at 0.88%, maturing 06/30/2026, with a market value of $10,411,388 | |
| Total Short-Term Investments
(cost $10,207,113) | |
| Total Investments
(cost $3,612,789,845) | | |
| Other Assets and Liabilities | | |
| | | |
Note:
Percentage of investments as shown is the ratio of the total market value to net assets.
Prices of foreign equities that are principally traded on certain foreign markets will generally be adjusted daily pursuant to a fair value pricing service approved by Hartford Funds Management Company, LLC in order to reflect an adjustment for factors occurring after the close of certain foreign markets but before the close of the New York Stock Exchange.
The accompanying notes are an integral part of these financial statements.
The Hartford Growth Opportunities Fund
Schedule of Investments – (continued)October 31, 2024
Equity industry classifications used in this report are the Global Industry Classification Standard, which was developed by and is the exclusive property and service mark of MSCI, Inc. and Standard & Poor’s.
For Fund compliance purposes, the Fund may not use the same classification system. These classifications are used for financial reporting purposes.
See “Glossary” for abbreviation descriptions.
| |
| Investment in securities not registered under the Securities Act of 1933 (excluding securities acquired pursuant to Rule 144A and Regulation S). At the end of the period, the value of such restricted securities amounted to $25,261,554 or 0.5% of net assets. |
| | | | |
| Lookout, Inc. Series F Convertible Preferred | | | |
| Lumeris Group Holdings Corp. Convertible Preferred | | | |
| | | | |
| | | | |
| | | | |
| | | | |
| Investment valued using significant unobservable inputs. |
| Currently no rate available. |
| See Significant Accounting Policies of accompanying Notes to Financial Statements regarding valuation of investments. |
The following is a summary of the fair valuations according to the inputs used as of October 31, 2024 in valuing the Fund’s investments.
| | | | |
| | | | |
| | | | |
| | | | |
Consumer Discretionary Distribution & Retail | | | | |
Consumer Durables & Apparel | | | | |
| | | | |
| | | | |
Equity Real Estate Investment Trusts (REITs) | | | | |
| | | | |
Health Care Equipment & Services | | | | |
| | | | |
Pharmaceuticals, Biotechnology & Life Sciences | | | | |
Semiconductors & Semiconductor Equipment | | | | |
| | | | |
Technology Hardware & Equipment | | | | |
Telecommunication Services | | | | |
| | | | |
Convertible Preferred Stocks | | | | |
| | | | |
| | | | |
| | | | |
| For the year ended October 31, 2024, there were no transfers in and out of Level 3. |
Level 3 investments at the beginning and/or end of the period in relation to net assets were not significant and accordingly, a reconciliation of Level 3 assets for the year ended October 31, 2024 is not presented.
The accompanying notes are an integral part of these financial statements.
The Hartford Healthcare Fund
Schedule of InvestmentsOctober 31, 2024
Shares or Principal Amount | | |
|
| |
| | |
| Akero Therapeutics, Inc.* | |
| Alnylam Pharmaceuticals, Inc.* | |
| | |
| Amicus Therapeutics, Inc.* | |
| Apellis Pharmaceuticals, Inc.* | |
| Apogee Therapeutics, Inc.* | |
| | |
| | |
| Autolus Therapeutics PLC ADR* | |
| Avidity Biosciences, Inc.* | |
| | |
| Blueprint Medicines Corp.* | |
| Celldex Therapeutics, Inc.* | |
| Crinetics Pharmaceuticals, Inc.* | |
| | |
| | |
| | |
| | |
| | |
| Immunocore Holdings PLC ADR* | |
| Ionis Pharmaceuticals, Inc.* | |
| Kymera Therapeutics, Inc.* | |
| Legend Biotech Corp. ADR* | |
| | |
| | |
| MoonLake Immunotherapeutics* | |
| | |
| Nurix Therapeutics, Inc.* | |
| | |
| | |
| Regeneron Pharmaceuticals, Inc.* | |
| REVOLUTION Medicines, Inc.* | |
| Rocket Pharmaceuticals, Inc.* | |
| Sarepta Therapeutics, Inc.* | |
| | |
| Scholar Rock Holding Corp.* | |
| Sichuan Kelun-Biotech Biopharmaceutical Co. | |
| Soleno Therapeutics, Inc.* | |
| Ultragenyx Pharmaceutical, Inc.* | |
| United Therapeutics Corp.* | |
| | |
| Vertex Pharmaceuticals, Inc.* | |
| Xenon Pharmaceuticals, Inc.* | |
| | |
| | | |
| Health Care Distributors - 2.0% |
| | |
| Health Care Equipment - 13.9% |
| | |
| | |
| | |
| Edwards Lifesciences Corp.* | |
| | |
| | |
| Inspire Medical Systems, Inc.* | |
| | |
| Intuitive Surgical, Inc.* | |
| | |
| | | |
Shares or Principal Amount | | |
COMMON STOCKS - 98.0% - (continued) |
| Health Care Facilities - 5.4% |
| Acadia Healthcare Co., Inc.* | |
| Ardent Health Partners, Inc.* | |
| | |
| | |
| | |
| | |
| | | |
| Health Care Services - 3.1% |
| | |
| | |
| | |
| LifeStance Health Group, Inc.* | |
| Option Care Health, Inc.* | |
| Privia Health Group, Inc.* | |
| | | |
| Health Care Supplies - 0.4% |
| | |
| Health Care Technology - 0.6% |
| Evolent Health, Inc. Class A* | |
| Life Sciences Tools & Services - 9.8% |
| Agilent Technologies, Inc. | |
| | |
| | |
| | |
| | |
| | |
| Thermo Fisher Scientific, Inc. | |
| | | |
| Managed Health Care - 13.4% |
| Alignment Healthcare, Inc.* | |
| | |
| | |
| | |
| | |
| | |
| | | |
| |
| | |
| | |
| Chugai Pharmaceutical Co. Ltd. | |
| | |
| | |
| Elanco Animal Health, Inc.* | |
| | |
| | |
| | |
| | |
| | |
| | |
| | |
| Structure Therapeutics, Inc. ADR* | |
| | |
| | |
| | |
| | | |
| Total Common Stocks
(cost $700,966,362) | | |
The accompanying notes are an integral part of these financial statements.
The Hartford Healthcare Fund
Schedule of Investments – (continued)October 31, 2024
Shares or Principal Amount | | |
|
| Health Care Equipment - 0.0% |
| Abiomed, Inc. CVR*(2)(3)(4) | |
| Total Rights
(cost $7,564) | | |
| Total Long-Term Investments
(cost $700,973,926) | | |
SHORT-TERM INVESTMENTS - 0.4% |
| Repurchase Agreements - 0.2% |
| Fixed Income Clearing Corp. Repurchase Agreement dated 10/31/2024 at 4.85%, due on 11/01/2024 with a maturity value of $2,384,973; collateralized by U.S. Treasury Note at 0.88%, maturing 06/30/2026, with a market value of $2,432,508 | |
| Securities Lending Collateral - 0.2% |
| Goldman Sachs Financial Square Funds, Government Fund, Institutional Class, | |
| HSBC U.S. Government Money Market Fund, Institutional Class, 4.78%(5) | |
| Invesco Government & Agency Portfolio, Institutional Class, 4.76%(5) | |
| Morgan Stanley Institutional Liquidity Funds, Government Portfolio, Institutional Class, | |
| | | |
| Total Short-Term Investments
(cost $4,588,655) | |
| Total Investments
(cost $705,562,581) | | |
| Other Assets and Liabilities | | |
| | | |
Note:
Percentage of investments as shown is the ratio of the total market value to net assets.
Prices of foreign equities that are principally traded on certain foreign markets will generally be adjusted daily pursuant to a fair value pricing service approved by Hartford Funds Management Company, LLC in order to reflect an adjustment for factors occurring after the close of certain foreign markets but before the close of the New York Stock Exchange.
Equity industry classifications used in this report are the Global Industry Classification Standard, which was developed by and is the exclusive property and service mark of MSCI, Inc. and Standard & Poor’s.
For Fund compliance purposes, the Fund may not use the same classification system. These classifications are used for financial reporting purposes.
See “Glossary” for abbreviation descriptions.
| |
| Represents entire or partial securities on loan. See Note 8 in the accompanying Notes to Financial Statements for securities lending information. |
| Investment in securities not registered under the Securities Act of 1933 (excluding securities acquired pursuant to Rule 144A and Regulation S). At the end of the period, the value of such restricted securities amounted to $7,564 or 0.0% of net assets. |
| Investment valued using significant unobservable inputs. |
| Currently no expiration date available. |
| Current yield as of period end. |
| See Significant Accounting Policies of accompanying Notes to Financial Statements regarding valuation of investments. |
The following is a summary of the fair valuations according to the inputs used as of October 31, 2024 in valuing the Fund’s investments.
| | | | |
| | | | |
| | | | |
| | | | |
| | | | |
| | | | |
| | | | |
| | | | |
| | | | |
| | | | |
Life Sciences Tools & Services | | | | |
| | | | |
| | | | |
| | | | |
| | | | |
| | | | |
| For the year ended October 31, 2024, there were no transfers in and out of Level 3. |
Level 3 investments at the beginning and/or end of the period in relation to net assets were not significant and accordingly, a reconciliation of Level 3 assets for the year ended October 31, 2024 is not presented.
The accompanying notes are an integral part of these financial statements.
Schedule of InvestmentsOctober 31, 2024
Shares or Principal Amount | | |
|
| |
| | |
| |
| | |
| | |
| | |
| | |
| | |
| | |
| Lennox International, Inc. | |
| Lincoln Electric Holdings, Inc. | |
| Vertiv Holdings Co. Class A | |
| | |
| Westinghouse Air Brake Technologies Corp. | |
| | | |
| Commercial & Professional Services - 2.6% |
| | |
| | |
| | |
| | | |
| Consumer Discretionary Distribution & Retail - 5.1% |
| | |
| Floor & Decor Holdings, Inc. Class A* | |
| O'Reilly Automotive, Inc.* | |
| | |
| | |
| | | |
| Consumer Durables & Apparel - 3.6% |
| | |
| | |
| | | |
| |
| Choice Hotels International, Inc.(1) | |
| | |
| | |
| DraftKings, Inc. Class A* | |
| Hyatt Hotels Corp. Class A | |
| | | |
| Consumer Staples Distribution & Retail - 0.5% |
| Casey's General Stores, Inc. | |
| |
| | |
| | |
| | |
| | | |
| Equity Real Estate Investment Trusts (REITs) - 1.2% |
| Lamar Advertising Co. Class A, REIT | |
| Financial Services - 10.5% |
| | |
| Hamilton Lane, Inc. Class A | |
| | |
| Rocket Cos., Inc. Class A* | |
| Tradeweb Markets, Inc. Class A | |
| | |
| | | |
| Food, Beverage & Tobacco - 1.2% |
| | |
| | |
| | | |
Shares or Principal Amount | | |
COMMON STOCKS - 99.8% - (continued) |
| Health Care Equipment & Services - 4.6% |
| Inspire Medical Systems, Inc.* | |
| | |
| Veeva Systems, Inc. Class A* | |
| | | |
| Household & Personal Products - 0.8% |
| | |
| |
| | |
| | |
| White Mountains Insurance Group Ltd. | |
| | | |
| |
| | |
| | |
| | | |
| Media & Entertainment - 2.9% |
| | |
| Trade Desk, Inc. Class A* | |
| | | |
| Pharmaceuticals, Biotechnology & Life Sciences - 9.3% |
| | |
| | |
| | |
| Mettler-Toledo International, Inc.* | |
| Neurocrine Biosciences, Inc.* | |
| Sarepta Therapeutics, Inc.* | |
| Ultragenyx Pharmaceutical, Inc.* | |
| United Therapeutics Corp.* | |
| | |
| | | |
| Semiconductors & Semiconductor Equipment - 6.0% |
| | |
| | |
| | |
| Monolithic Power Systems, Inc. | |
| | |
| | | |
| Software & Services - 17.3% |
| | |
| | |
| | |
| | |
| Guidewire Software, Inc.* | |
| | |
| Informatica, Inc. Class A* | |
| | |
| Procore Technologies, Inc.* | |
| | |
| Tyler Technologies, Inc.* | |
| | |
| | |
| | | |
| Technology Hardware & Equipment - 1.0% |
| | |
| | |
| | | |
| |
| Expeditors International of Washington, Inc. | |
The accompanying notes are an integral part of these financial statements.
Schedule of Investments – (continued)October 31, 2024
Shares or Principal Amount | | |
COMMON STOCKS - 99.8% - (continued) |
| Transportation - 3.2% - (continued) |
| | |
| | |
| | | |
| |
| | |
| | |
| | |
| | |
| | | |
| Total Common Stocks
(cost $3,812,877,530) | | |
SHORT-TERM INVESTMENTS - 1.2% |
| Repurchase Agreements - 0.1% |
| Fixed Income Clearing Corp. Repurchase Agreement dated 10/31/2024 at 4.85%, due on 11/01/2024 with a maturity value of $4,014,920; collateralized by U.S. Treasury Note at 4.63%, maturing 06/30/2026, with a market value of $4,094,775 | |
| Securities Lending Collateral - 1.1% |
| Goldman Sachs Financial Square Funds, Government Fund, Institutional Class, | |
| HSBC U.S. Government Money Market Fund, Institutional Class, 4.78%(2) | |
| Invesco Government & Agency Portfolio, Institutional Class, 4.76%(2) | |
| Morgan Stanley Institutional Liquidity Funds, Government Portfolio, Institutional Class, 4.78%(2) | |
| | | |
| Total Short-Term Investments
(cost $62,179,962) | |
| Total Investments
(cost $3,875,057,492) | | |
| Other Assets and Liabilities | | |
| | | |
Note:
Percentage of investments as shown is the ratio of the total market value to net assets.
Prices of foreign equities that are principally traded on certain foreign markets will generally be adjusted daily pursuant to a fair value pricing service approved by Hartford Funds Management Company, LLC in order to reflect an adjustment for factors occurring after the close of certain foreign markets but before the close of the New York Stock Exchange.
Equity industry classifications used in this report are the Global Industry Classification Standard, which was developed by and is the exclusive property and service mark of MSCI, Inc. and Standard & Poor’s.
For Fund compliance purposes, the Fund may not use the same classification system. These classifications are used for financial reporting purposes.
See “Glossary” for abbreviation descriptions.
| |
| Represents entire or partial securities on loan. See Note 8 in the accompanying Notes to Financial Statements for securities lending information. |
| Current yield as of period end. |
| See Significant Accounting Policies of accompanying Notes to Financial Statements regarding valuation of investments. |
The accompanying notes are an integral part of these financial statements.
Schedule of Investments – (continued)October 31, 2024
Fair Value Summary
The following is a summary of the fair valuations according to the inputs used as of October 31, 2024 in valuing the Fund’s investments.
| | | | |
| | | | |
| | | | |
| | | | |
| | | | |
Commercial & Professional Services | | | | |
Consumer Discretionary Distribution & Retail | | | | |
Consumer Durables & Apparel | | | | |
| | | | |
Consumer Staples Distribution & Retail | | | | |
| | | | |
Equity Real Estate Investment Trusts (REITs) | | | | |
| | | | |
| | | | |
Health Care Equipment & Services | | | | |
Household & Personal Products | | | | |
| | | | |
| | | | |
| | | | |
Pharmaceuticals, Biotechnology & Life Sciences | | | | |
Semiconductors & Semiconductor Equipment | | | | |
| | | | |
Technology Hardware & Equipment | | | | |
| | | | |
| | | | |
| | | | |
| | | | |
| For the year ended October 31, 2024, there were no transfers in and out of Level 3. |
The accompanying notes are an integral part of these financial statements.
The Hartford MidCap Value Fund
Schedule of InvestmentsOctober 31, 2024
Shares or Principal Amount | | |
|
| Automobiles & Components - 1.4% |
| | |
| |
| Columbia Banking System, Inc. | |
| First Citizens BancShares, Inc. Class A | |
| | |
| | |
| | | |
| |
| | |
| | |
| | |
| | |
| Fortune Brands Innovations, Inc. | |
| John Bean Technologies Corp. | |
| L3Harris Technologies, Inc. | |
| | |
| WESCO International, Inc. | |
| Westinghouse Air Brake Technologies Corp. | |
| | | |
| Commercial & Professional Services - 3.4% |
| Science Applications International Corp. | |
| | |
| | | |
| Consumer Discretionary Distribution & Retail - 1.1% |
| | |
| Consumer Durables & Apparel - 3.5% |
| | |
| Skechers USA, Inc. Class A* | |
| | |
| Tempur Sealy International, Inc. | |
| | | |
| |
| International Game Technology PLC | |
| Wyndham Hotels & Resorts, Inc. | |
| | | |
| Consumer Staples Distribution & Retail - 1.8% |
| U.S. Foods Holding Corp.* | |
| |
| | |
| | |
| | |
| | |
| | | |
| Equity Real Estate Investment Trusts (REITs) - 7.1% |
| Camden Property Trust REIT | |
| Essential Properties Realty Trust, Inc. REIT | |
| Gaming & Leisure Properties, Inc. REIT | |
| | |
| | |
| | |
| | | |
| Financial Services - 8.0% |
| Ares Management Corp. Class A | |
| | |
| | |
| | |
| | |
| | |
| | | |
| Food, Beverage & Tobacco - 1.4% |
| | |
Shares or Principal Amount | | |
COMMON STOCKS - 98.6% - (continued) |
| Health Care Equipment & Services - 4.2% |
| Acadia Healthcare Co., Inc.* | |
| | |
| Edwards Lifesciences Corp.* | |
| Integra LifeSciences Holdings Corp.* | |
| | |
| | | |
| |
| | |
| | |
| American International Group, Inc. | |
| | |
| | |
| | |
| | | |
| |
| | |
| | |
| | |
| | |
| | |
| | | |
| Media & Entertainment - 3.4% |
| | |
| | |
| Live Nation Entertainment, Inc.* | |
| | | |
| Pharmaceuticals, Biotechnology & Life Sciences - 4.4% |
| Agilent Technologies, Inc. | |
| Charles River Laboratories International, Inc.* | |
| | |
| | |
| | | |
| Semiconductors & Semiconductor Equipment - 2.9% |
| Allegro MicroSystems, Inc.* | |
| | |
| | |
| | |
| | | |
| Technology Hardware & Equipment - 2.7% |
| | |
| | |
| | |
| | | |
| |
| | |
| Knight-Swift Transportation Holdings, Inc. | |
| | | |
| |
| | |
| | |
| | |
| | |
| | |
| | |
| | | |
| Total Common Stocks
(cost $872,416,594) | | |
The accompanying notes are an integral part of these financial statements.
The Hartford MidCap Value Fund
Schedule of Investments – (continued)October 31, 2024
Shares or Principal Amount | | |
SHORT-TERM INVESTMENTS - 0.2% |
| Repurchase Agreements - 0.2% |
| Fixed Income Clearing Corp. Repurchase Agreement dated 10/31/2024 at 4.85%, due on 11/01/2024 with a maturity value of $2,318,815; collateralized by U.S. Treasury Note at 0.88%, maturing 06/30/2026, with a market value of $2,364,930 | |
| Total Short-Term Investments
(cost $2,318,503) | |
| Total Investments
(cost $874,735,097) | | |
| Other Assets and Liabilities | | |
| | | |
Note:
Percentage of investments as shown is the ratio of the total market value to net assets.
Prices of foreign equities that are principally traded on certain foreign markets will generally be adjusted daily pursuant to a fair value pricing service approved by Hartford Funds Management Company, LLC in order to reflect an adjustment for factors occurring after the close of certain foreign markets but before the close of the New York Stock Exchange.
Equity industry classifications used in this report are the Global Industry Classification Standard, which was developed by and is the exclusive property and service mark of MSCI, Inc. and Standard & Poor’s.
For Fund compliance purposes, the Fund may not use the same classification system. These classifications are used for financial reporting purposes.
See “Glossary” for abbreviation descriptions.
| |
| See Significant Accounting Policies of accompanying Notes to Financial Statements regarding valuation of investments. |
The following is a summary of the fair valuations according to the inputs used as of October 31, 2024 in valuing the Fund’s investments.
| | | | |
| | | | |
| | | | |
| | | | |
| | | | |
| | | | |
Commercial & Professional Services | | | | |
Consumer Discretionary Distribution & Retail | | | | |
Consumer Durables & Apparel | | | | |
| | | | |
Consumer Staples Distribution & Retail | | | | |
| | | | |
Equity Real Estate Investment Trusts (REITs) | | | | |
| | | | |
| | | | |
Health Care Equipment & Services | | | | |
| | | | |
| | | | |
| | | | |
Pharmaceuticals, Biotechnology & Life Sciences | | | | |
Semiconductors & Semiconductor Equipment | | | | |
Technology Hardware & Equipment | | | | |
| | | | |
| | | | |
| | | | |
| | | | |
| For the year ended October 31, 2024, there were no transfers in and out of Level 3. |
The accompanying notes are an integral part of these financial statements.
The Hartford Small Cap Growth Fund
Schedule of InvestmentsOctober 31, 2024
Shares or Principal Amount | | |
|
| Automobiles & Components - 1.5% |
| Modine Manufacturing Co.* | |
| | |
| | | |
| |
| | |
| | |
| | | |
| |
| Applied Industrial Technologies, Inc. | |
| | |
| | |
| | |
| | |
| | |
| | |
| John Bean Technologies Corp. | |
| | |
| NEXTracker, Inc. Class A* | |
| | |
| Rush Enterprises, Inc. Class A | |
| | |
| | |
| | |
| | |
| Zurn Elkay Water Solutions Corp. | |
| | | |
| Commercial & Professional Services - 6.1% |
| ACV Auctions, Inc. Class A* | |
| CACI International, Inc. Class A* | |
| Casella Waste Systems, Inc. Class A* | |
| | |
| | |
| | |
| Huron Consulting Group, Inc.* | |
| | |
| | |
| | | |
| Consumer Discretionary Distribution & Retail - 2.7% |
| Abercrombie & Fitch Co. Class A* | |
| Boot Barn Holdings, Inc.* | |
| | |
| | |
| | |
| | | |
| Consumer Durables & Apparel - 3.8% |
| | |
| Century Communities, Inc. | |
| Installed Building Products, Inc. | |
| | |
| Smith Douglas Homes Corp.* | |
| | |
| | |
| | | |
| |
| Sweetgreen, Inc. Class A* | |
| | |
| Wyndham Hotels & Resorts, Inc. | |
| | | |
| |
| | |
| | |
| Kodiak Gas Services, Inc. | |
Shares or Principal Amount | | |
COMMON STOCKS - 98.3% - (continued) |
| Energy - 2.4% - (continued) |
| | |
| Weatherford International PLC | |
| | | |
| Equity Real Estate Investment Trusts (REITs) - 2.2% |
| | |
| Phillips Edison & Co., Inc. REIT | |
| Ryman Hospitality Properties, Inc. REIT | |
| | | |
| Financial Services - 5.6% |
| | |
| Hamilton Lane, Inc. Class A | |
| | |
| StepStone Group, Inc. Class A | |
| | |
| | |
| | | |
| Food, Beverage & Tobacco - 0.8% |
| | |
| Health Care Equipment & Services - 9.5% |
| | |
| | |
| | |
| | |
| | |
| | |
| Hims & Hers Health, Inc.* | |
| iRhythm Technologies, Inc.* | |
| Merit Medical Systems, Inc.* | |
| Option Care Health, Inc.* | |
| PROCEPT BioRobotics Corp.* | |
| | |
| | |
| | | |
| Household & Personal Products - 2.0% |
| | |
| | |
| | | |
| |
| White Mountains Insurance Group Ltd. | |
| |
| | |
| Axalta Coating Systems Ltd.* | |
| | |
| | |
| | |
| | |
| | | |
| Pharmaceuticals, Biotechnology & Life Sciences - 17.0% |
| Akero Therapeutics, Inc.* | |
| Amicus Therapeutics, Inc.* | |
| Apellis Pharmaceuticals, Inc.* | |
| Apogee Therapeutics, Inc.* | |
| Avidity Biosciences, Inc.* | |
| Axsome Therapeutics, Inc.* | |
| Bicara Therapeutics, Inc.*(1) | |
| | |
| Blueprint Medicines Corp.* | |
| Celldex Therapeutics, Inc.* | |
| Crinetics Pharmaceuticals, Inc.* | |
| | |
| | |
| Denali Therapeutics, Inc.* | |
| | |
The accompanying notes are an integral part of these financial statements.
The Hartford Small Cap Growth Fund
Schedule of Investments – (continued)October 31, 2024
Shares or Principal Amount | | |
COMMON STOCKS - 98.3% - (continued) |
| Pharmaceuticals, Biotechnology & Life Sciences - 17.0% - (continued) |
| | |
| | |
| | |
| Ionis Pharmaceuticals, Inc.* | |
| Kymera Therapeutics, Inc.* | |
| | |
| Nurix Therapeutics, Inc.* | |
| | |
| Protagonist Therapeutics, Inc.* | |
| | |
| | |
| REVOLUTION Medicines, Inc.* | |
| Rocket Pharmaceuticals, Inc.* | |
| | |
| Scholar Rock Holding Corp.* | |
| Soleno Therapeutics, Inc.* | |
| Spyre Therapeutics, Inc.* | |
| Structure Therapeutics, Inc. ADR* | |
| | |
| Ultragenyx Pharmaceutical, Inc.* | |
| | |
| | |
| | |
| | |
| | |
| | | |
| Semiconductors & Semiconductor Equipment - 4.1% |
| | |
| Credo Technology Group Holding Ltd.* | |
| | |
| | |
| | |
| | |
| | | |
| Software & Services - 11.5% |
| | |
| Altair Engineering, Inc. Class A* | |
| | |
| | |
| | |
| | |
| CCC Intelligent Solutions Holdings, Inc.* | |
| Clearwater Analytics Holdings, Inc. Class A* | |
| Grid Dynamics Holdings, Inc.* | |
| Guidewire Software, Inc.* | |
| Informatica, Inc. Class A* | |
| | |
| | |
| | |
| Sprout Social, Inc. Class A* | |
| | |
| | |
| | | |
| Technology Hardware & Equipment - 3.9% |
| | |
| | |
| Insight Enterprises, Inc.* | |
| Napco Security Technologies, Inc. | |
| | |
| | |
| | | |
Shares or Principal Amount | | |
COMMON STOCKS - 98.3% - (continued) |
| |
| Knight-Swift Transportation Holdings, Inc. | |
| Total Common Stocks
(cost $260,293,378) | | |
EXCHANGE-TRADED FUNDS - 1.5% |
| Other Investment Pools & Funds - 1.5% |
| iShares Russell 2000 Growth ETF (1) | |
| Total Exchange-Traded Funds
(cost $5,351,559) | | |
| Total Long-Term Investments
(cost $265,644,937) | | |
SHORT-TERM INVESTMENTS - 0.7% |
| Repurchase Agreements - 0.1% |
| Fixed Income Clearing Corp. Repurchase Agreement dated 10/31/2024 at 4.85%, due on 11/01/2024 with a maturity value of $421,444; collateralized by U.S. Treasury Note at 0.88%, maturing 06/30/2026, with a market value of $429,873 | |
| Securities Lending Collateral - 0.6% |
| Goldman Sachs Financial Square Funds, Government Fund, Institutional Class, | |
| HSBC U.S. Government Money Market Fund, Institutional Class, 4.78%(2) | |
| Invesco Government & Agency Portfolio, Institutional Class, 4.76%(2) | |
| Morgan Stanley Institutional Liquidity Funds, Government Portfolio, Institutional Class, | |
| | | |
| Total Short-Term Investments
(cost $2,612,593) | |
| Total Investments
(cost $268,257,530) | | |
| Other Assets and Liabilities | | |
| | | |
Note:
Percentage of investments as shown is the ratio of the total market value to net assets.
Equity industry classifications used in this report are the Global Industry Classification Standard, which was developed by and is the exclusive property and service mark of MSCI, Inc. and Standard & Poor’s.
For Fund compliance purposes, the Fund may not use the same classification system. These classifications are used for financial reporting purposes.
See “Glossary” for abbreviation descriptions.
| |
| Represents entire or partial securities on loan. See Note 8 in the accompanying Notes to Financial Statements for securities lending information. |
| Current yield as of period end. |
| See Significant Accounting Policies of accompanying Notes to Financial Statements regarding valuation of investments. |
The accompanying notes are an integral part of these financial statements.
The Hartford Small Cap Growth Fund
Schedule of Investments – (continued)October 31, 2024
Fair Value Summary
The following is a summary of the fair valuations according to the inputs used as of October 31, 2024 in valuing the Fund’s investments.
| | | | |
| | | | |
| | | | |
| | | | |
| | | | |
| | | | |
Commercial & Professional Services | | | | |
Consumer Discretionary Distribution & Retail | | | | |
Consumer Durables & Apparel | | | | |
| | | | |
| | | | |
Equity Real Estate Investment Trusts (REITs) | | | | |
| | | | |
| | | | |
Health Care Equipment & Services | | | | |
Household & Personal Products | | | | |
| | | | |
| | | | |
Pharmaceuticals, Biotechnology & Life Sciences | | | | |
Semiconductors & Semiconductor Equipment | | | | |
| | | | |
Technology Hardware & Equipment | | | | |
| | | | |
| | | | |
| | | | |
| | | | |
| For the year ended October 31, 2024, there were no transfers in and out of Level 3. |
The accompanying notes are an integral part of these financial statements.
Hartford Small Cap Value Fund
Schedule of InvestmentsOctober 31, 2024
Shares or Principal Amount | | |
|
| Automobiles & Components - 1.6% |
| | |
| |
| | |
| | |
| Columbia Banking System, Inc. | |
| | |
| | |
| First Interstate BancSystem, Inc. Class A | |
| | |
| | |
| Pacific Premier Bancorp, Inc. | |
| Sandy Spring Bancorp, Inc. | |
| | | |
| |
| | |
| | |
| | |
| Spirit AeroSystems Holdings, Inc. Class A* | |
| | | |
| Commercial & Professional Services - 5.0% |
| | |
| | |
| | |
| | | |
| Consumer Durables & Apparel - 11.0% |
| | |
| | |
| | |
| | |
| Malibu Boats, Inc. Class A* | |
| | |
| | |
| | | |
| |
| Adtalem Global Education, Inc.* | |
| Cracker Barrel Old Country Store, Inc. | |
| Monarch Casino & Resort, Inc. | |
| | | |
| |
| | |
| Select Water Solutions, Inc. | |
| | | |
| Equity Real Estate Investment Trusts (REITs) - 3.0% |
| Pebblebrook Hotel Trust REIT | |
| Piedmont Office Realty Trust, Inc. Class A, REIT | |
| | | |
| Financial Services - 10.8% |
| Bread Financial Holdings, Inc. | |
| Encore Capital Group, Inc.* | |
| | |
| | |
| | |
| | |
| | |
| | | |
| Health Care Equipment & Services - 6.4% |
| Integra LifeSciences Holdings Corp.* | |
| | |
| | |
| | |
| | | |
Shares or Principal Amount | | |
COMMON STOCKS - 97.7% - (continued) |
| Household & Personal Products - 2.8% |
| Edgewell Personal Care Co. | |
| | |
| | | |
| |
| | |
| | |
| | |
| | |
| | | |
| |
| | |
| | |
| | | |
| Media & Entertainment - 1.9% |
| National CineMedia, Inc.*(1) | |
| Pharmaceuticals, Biotechnology & Life Sciences - 0.8% |
| Pacira BioSciences, Inc.* | |
| Semiconductors & Semiconductor Equipment - 2.4% |
| | |
| Silicon Motion Technology Corp. ADR | |
| | | |
| Software & Services - 6.6% |
| | |
| | |
| | |
| | |
| | | |
| |
| | |
| | |
| | | |
| Total Common Stocks
(cost $100,213,292) | | |
EXCHANGE-TRADED FUNDS - 2.2% |
| Other Investment Pools & Funds - 2.2% |
| iShares Russell 2000 Value ETF | |
| Total Exchange-Traded Funds
(cost $2,532,418) | | |
| Total Long-Term Investments
(cost $102,745,710) | | |
SHORT-TERM INVESTMENTS - 0.1% |
| Repurchase Agreements - 0.1% |
| Fixed Income Clearing Corp. Repurchase Agreement dated 10/31/2024 at 4.85%, due on 11/01/2024 with a maturity value of $157,990; collateralized by U.S. Treasury Note at 0.88%, maturing 06/30/2026, with a market value of $161,207 | |
| Securities Lending Collateral - 0.0% |
| Goldman Sachs Financial Square Funds, Government Fund, Institutional Class, | |
| HSBC U.S. Government Money Market Fund, Institutional Class, 4.78%(2) | |
The accompanying notes are an integral part of these financial statements.
Hartford Small Cap Value Fund
Schedule of Investments – (continued)October 31, 2024
Shares or Principal Amount | | |
SHORT-TERM INVESTMENTS - 0.1% - (continued) |
| Securities Lending Collateral - 0.0% - (continued) |
| Invesco Government & Agency Portfolio, Institutional Class, 4.76%(2) | |
| Morgan Stanley Institutional Liquidity Funds, Government Portfolio, Institutional Class, | |
| | | |
| Total Short-Term Investments
(cost $160,819) | |
| Total Investments
(cost $102,906,529) | | |
| Other Assets and Liabilities | | |
| | | |
Note:
Percentage of investments as shown is the ratio of the total market value to net assets.
Prices of foreign equities that are principally traded on certain foreign markets will generally be adjusted daily pursuant to a fair value pricing service approved by Hartford Funds Management Company, LLC in order to reflect an adjustment for factors occurring after the close of certain foreign markets but before the close of the New York Stock Exchange.
Equity industry classifications used in this report are the Global Industry Classification Standard, which was developed by and is the exclusive property and service mark of MSCI, Inc. and Standard & Poor’s.
For Fund compliance purposes, the Fund may not use the same classification system. These classifications are used for financial reporting purposes.
See “Glossary” for abbreviation descriptions.
| |
| Represents entire or partial securities on loan. See Note 8 in the accompanying Notes to Financial Statements for securities lending information. |
| Current yield as of period end. |
| See Significant Accounting Policies of accompanying Notes to Financial Statements regarding valuation of investments. |
The following is a summary of the fair valuations according to the inputs used as of October 31, 2024 in valuing the Fund’s investments.
| | | | |
| | | | |
| | | | |
| | | | |
| | | | |
| | | | |
Commercial & Professional Services | | | | |
Consumer Durables & Apparel | | | | |
| | | | |
| | | | |
Equity Real Estate Investment Trusts (REITs) | | | | |
| | | | |
Health Care Equipment & Services | | | | |
Household & Personal Products | | | | |
| | | | |
| | | | |
| | | | |
Pharmaceuticals, Biotechnology & Life Sciences | | | | |
Semiconductors & Semiconductor Equipment | | | | |
| | | | |
| | | | |
| | | | |
| | | | |
| | | | |
| For the year ended October 31, 2024, there were no transfers in and out of Level 3. |
The accompanying notes are an integral part of these financial statements.
The Hartford Small Company Fund
Schedule of InvestmentsOctober 31, 2024
Shares or Principal Amount | | |
|
| Automobiles & Components - 0.6% |
| | |
| |
| | |
| |
| | |
| | |
| Applied Industrial Technologies, Inc. | |
| | |
| Comfort Systems USA, Inc. | |
| | |
| | |
| | |
| NEXTracker, Inc. Class A* | |
| Rush Enterprises, Inc. Class A | |
| Shoals Technologies Group, Inc. Class A* | |
| | |
| Zurn Elkay Water Solutions Corp. | |
| | | |
| Commercial & Professional Services - 7.6% |
| Aris Water Solutions, Inc. Class A | |
| Casella Waste Systems, Inc. Class A* | |
| ExlService Holdings, Inc.* | |
| | |
| | |
| | | |
| Consumer Discretionary Distribution & Retail - 2.6% |
| Abercrombie & Fitch Co. Class A* | |
| Boot Barn Holdings, Inc.* | |
| | |
| | |
| | | |
| Consumer Durables & Apparel - 1.7% |
| | |
| |
| | |
| | |
| | |
| Sweetgreen, Inc. Class A* | |
| | |
| | | |
| |
| | |
| | |
| | | |
| Equity Real Estate Investment Trusts (REITs) - 3.2% |
| American Healthcare, Inc. REIT | |
| Phillips Edison & Co., Inc. REIT | |
| Ryman Hospitality Properties, Inc. REIT | |
| | | |
| Financial Services - 3.9% |
| HA Sustainable Infrastructure Capital, Inc. | |
| Hamilton Lane, Inc. Class A | |
| PJT Partners, Inc. Class A | |
| | | |
| Health Care Equipment & Services - 10.7% |
| Acadia Healthcare Co., Inc.* | |
| Alignment Healthcare, Inc.* | |
| | |
| | |
| | |
| Hims & Hers Health, Inc.* | |
Shares or Principal Amount | | |
COMMON STOCKS - 98.6% - (continued) |
| Health Care Equipment & Services - 10.7% - (continued) |
| Inspire Medical Systems, Inc.* | |
| | |
| PROCEPT BioRobotics Corp.* | |
| | |
| | | |
| Household & Personal Products - 1.1% |
| | |
| |
| | |
| |
| | |
| Media & Entertainment - 2.5% |
| | |
| | |
| | |
| | | |
| Pharmaceuticals, Biotechnology & Life Sciences - 17.4% |
| Akero Therapeutics, Inc.* | |
| Amicus Therapeutics, Inc.* | |
| Apellis Pharmaceuticals, Inc.* | |
| Apogee Therapeutics, Inc.* | |
| Avidity Biosciences, Inc.* | |
| | |
| Blueprint Medicines Corp.* | |
| Celldex Therapeutics, Inc.* | |
| Crinetics Pharmaceuticals, Inc.* | |
| | |
| | |
| | |
| | |
| Immunocore Holdings PLC ADR* | |
| | |
| Intellia Therapeutics, Inc.* | |
| Intra-Cellular Therapies, Inc.* | |
| Kymera Therapeutics, Inc.* | |
| | |
| Nurix Therapeutics, Inc.* | |
| | |
| Protagonist Therapeutics, Inc.* | |
| | |
| | |
| REVOLUTION Medicines, Inc.* | |
| Rocket Pharmaceuticals, Inc.* | |
| | |
| Scholar Rock Holding Corp.* | |
| Soleno Therapeutics, Inc.* | |
| Structure Therapeutics, Inc. ADR* | |
| Syndax Pharmaceuticals, Inc.* | |
| | |
| | |
| | |
| | | |
| Semiconductors & Semiconductor Equipment - 3.5% |
| Credo Technology Group Holding Ltd.* | |
| | |
| | |
| | |
| | |
| | | |
| Software & Services - 8.1% |
| | |
| Clearwater Analytics Holdings, Inc. Class A* | |
| | |
The accompanying notes are an integral part of these financial statements.
The Hartford Small Company Fund
Schedule of Investments – (continued)October 31, 2024
Shares or Principal Amount | | |
COMMON STOCKS - 98.6% - (continued) |
| Software & Services - 8.1% - (continued) |
| DoubleVerify Holdings, Inc.* | |
| Ingram Micro Holding Corp.*(3) | |
| | |
| | |
| SentinelOne, Inc. Class A* | |
| Sprout Social, Inc. Class A* | |
| | | |
| Technology Hardware & Equipment - 4.2% |
| | |
| | |
| | |
| | |
| | |
| | | |
| Total Common Stocks
(cost $501,265,113) | | |
EXCHANGE-TRADED FUNDS - 1.4% |
| Other Investment Pools & Funds - 1.4% |
| iShares Russell 2000 Growth ETF (3) | |
| Total Exchange-Traded Funds
(cost $8,956,853) | | |
| Total Long-Term Investments
(cost $510,221,966) | | |
SHORT-TERM INVESTMENTS - 0.6% |
| Repurchase Agreements - 0.0% |
| Fixed Income Clearing Corp. Repurchase Agreement dated 10/31/2024 at 4.85%, due on 11/01/2024 with a maturity value of $427,436; collateralized by U.S. Treasury Note at 4.63%, maturing 06/30/2026, with a market value of $435,996 | |
| Securities Lending Collateral - 0.6% |
| Goldman Sachs Financial Square Funds, Government Fund, Institutional Class, | |
| HSBC U.S. Government Money Market Fund, Institutional Class, 4.78%(4) | |
| Invesco Government & Agency Portfolio, Institutional Class, 4.76%(4) | |
| Morgan Stanley Institutional Liquidity Funds, Government Portfolio, Institutional Class, | |
| | | |
| Total Short-Term Investments
(cost $4,177,435) | |
| Total Investments
(cost $514,399,401) | | |
| Other Assets and Liabilities | | |
| | | |
Note:
Percentage of investments as shown is the ratio of the total market value to net assets.
Prices of foreign equities that are principally traded on certain foreign markets will generally be adjusted daily pursuant to a fair value pricing service approved by Hartford Funds Management Company, LLC in order to reflect an adjustment for factors occurring after the close of certain foreign markets but before the close of the New York Stock Exchange.
Equity industry classifications used in this report are the Global Industry Classification Standard, which was developed by and is the exclusive property and service mark of MSCI, Inc. and Standard & Poor’s.
For Fund compliance purposes, the Fund may not use the same classification system. These classifications are used for financial reporting purposes.
See “Glossary” for abbreviation descriptions.
| |
| Investment in securities not registered under the Securities Act of 1933 (excluding securities acquired pursuant to Rule 144A and Regulation S). At the end of the period, the value of such restricted securities amounted to $1,451,926 or 0.2% of net assets. |
| Investment valued using significant unobservable inputs. |
| Represents entire or partial securities on loan. See Note 8 in the accompanying Notes to Financial Statements for securities lending information. |
| Current yield as of period end. |
| See Significant Accounting Policies of accompanying Notes to Financial Statements regarding valuation of investments. |
The accompanying notes are an integral part of these financial statements.
The Hartford Small Company Fund
Schedule of Investments – (continued)October 31, 2024
Fair Value Summary
The following is a summary of the fair valuations according to the inputs used as of October 31, 2024 in valuing the Fund’s investments.
| | | | |
| | | | |
| | | | |
| | | | |
| | | | |
| | | | |
Commercial & Professional Services | | | | |
Consumer Discretionary Distribution & Retail | | | | |
Consumer Durables & Apparel | | | | |
| | | | |
| | | | |
Equity Real Estate Investment Trusts (REITs) | | | | |
| | | | |
Health Care Equipment & Services | | | | |
Household & Personal Products | | | | |
| | | | |
| | | | |
| | | | |
Pharmaceuticals, Biotechnology & Life Sciences | | | | |
Semiconductors & Semiconductor Equipment | | | | |
| | | | |
Technology Hardware & Equipment | | | | |
| | | | |
| | | | |
| | | | |
| For the year ended October 31, 2024, there were no transfers in and out of Level 3. |
Level 3 investments at the beginning and/or end of the period in relation to net assets were not significant and accordingly, a reconciliation of Level 3 assets for the year ended October 31, 2024 is not presented.
The accompanying notes are an integral part of these financial statements.
Hartford Domestic Equity Funds
GLOSSARY: (abbreviations used in preceding Schedules of Investments)
|
| |
|
| American Depositary Receipt |
| |
| |
| Real Estate Investment Trust |
Hartford Domestic Equity Funds
Statements of Assets and LiabilitiesOctober 31, 2024
| The Hartford
Capital
Appreciation
Fund | | The Hartford
Dividend and
Growth Fund | The Hartford
Equity Income
Fund | The Hartford
Growth
Opportunities
Fund | The Hartford
Healthcare Fund |
| | | | | | |
Investments in securities, at market value(1) | | | | | | |
| | | | | | |
| | | | | | |
Cash collateral due from broker on futures contracts | | | | | | |
Cash collateral held for securities on loan | | | | | | |
| | | | | | |
| | | | | | |
Investment securities sold | | | | | | |
| | | | | | |
| | | | | | |
Securities lending income | | | | | | |
| | | | | | |
| | | | | | |
| | | | | | |
| | | | | | |
Obligation to return securities lending collateral | | | | | | |
| | | | | | |
Investment securities purchased | | | | | | |
| | | | | | |
Investment management fees | | | | | | |
| | | | | | |
| | | | | | |
Chief Compliance Officer fees | | | | | | |
| | | | | | |
Variation margin on futures contracts | | | | | | |
| | | | | | |
| | | | | | |
| | | | | | |
| | | | | | |
| | | | | | |
Capital stock and paid-in-capital | | | | | | |
Distributable earnings (loss) | | | | | | |
| | | | | | |
| | | | | | |
| | | | | | |
Class A:Net asset value per share | | | | | | |
Maximum offering price per share | | | | | | |
| | | | | | |
| | | | | | |
Class C:Net asset value per share | | | | | | |
| | | | | | |
| | | | | | |
Class I:Net asset value per share | | | | | | |
| | | | | | |
| | | | | | |
Class R3:Net asset value per share | | | | | | |
| | | | | | |
| | | | | | |
Class R4:Net asset value per share | | | | | | |
| | | | | | |
| | | | | | |
The accompanying notes are an integral part of these financial statements.
Hartford Domestic Equity Funds
Statements of Assets and Liabilities – (continued)October 31, 2024
| The Hartford Capital Appreciation Fund | | The Hartford Dividend and Growth Fund | The Hartford Equity Income Fund | The Hartford Growth Opportunities Fund | The Hartford Healthcare Fund |
Class R5:Net asset value per share | | | | | | |
| | | | | | |
| | | | | | |
Class R6:Net asset value per share | | | | | | |
| | | | | | |
| | | | | | |
Class Y:Net asset value per share | | | | | | |
| | | | | | |
| | | | | | |
Class F:Net asset value per share | | | | | | |
| | | | | | |
| | | | | | |
| | | | | | |
| | | | | | |
(1) Includes Investment in securities on loan, at market value | | | | | | |
The accompanying notes are an integral part of these financial statements.
Hartford Domestic Equity Funds
Statements of Assets and Liabilities – (continued)October 31, 2024
| | The Hartford
MidCap Value
Fund | The Hartford
Small Cap
Growth Fund | Hartford
Small Cap
Value Fund | The Hartford
Small Company
Fund |
| | | | | |
Investments in securities, at market value(1) | | | | | |
| | | | | |
| | | | | |
Cash collateral held for securities on loan | | | | | |
| | | | | |
| | | | | |
Investment securities sold | | | | | |
| | | | | |
| | | | | |
Securities lending income | | | | | |
| | | | | |
| | | | | |
| | | | | |
Obligation to return securities lending collateral | | | | | |
| | | | | |
Investment securities purchased | | | | | |
| | | | | |
Investment management fees | | | | | |
| | | | | |
| | | | | |
Chief Compliance Officer fees | | | | | |
| | | | | |
| | | | | |
| | | | | |
| | | | | |
| | | | | |
| | | | | |
Capital stock and paid-in-capital | | | | | |
Distributable earnings (loss) | | | | | |
| | | | | |
| | | | | |
| | | | | |
Class A:Net asset value per share | | | | | |
Maximum offering price per share | | | | | |
| | | | | |
| | | | | |
Class C:Net asset value per share | | | | | |
| | | | | |
| | | | | |
Class I:Net asset value per share | | | | | |
| | | | | |
| | | | | |
Class R3:Net asset value per share | | | | | |
| | | | | |
| | | | | |
Class R4:Net asset value per share | | | | | |
| | | | | |
| | | | | |
Class R5:Net asset value per share | | | | | |
| | | | | |
| | | | | |
Class R6:Net asset value per share | | | | | |
| | | | | |
| | | | | |
The accompanying notes are an integral part of these financial statements.
Hartford Domestic Equity Funds
Statements of Assets and Liabilities – (continued)October 31, 2024
| | The Hartford MidCap Value Fund | The Hartford Small Cap Growth Fund | Hartford Small Cap Value Fund | The Hartford Small Company Fund |
Class Y:Net asset value per share | | | | | |
| | | | | |
| | | | | |
Class F:Net asset value per share | | | | | |
| | | | | |
| | | | | |
| | | | | |
(1) Includes Investment in securities on loan, at market value | | | | | |
The accompanying notes are an integral part of these financial statements.
Hartford Domestic Equity Funds
Statements of OperationsFor the Year Ended October 31, 2024
| The Hartford
Capital
Appreciation
Fund | | The Hartford
Dividend and
Growth Fund | The Hartford
Equity Income
Fund | The Hartford
Growth
Opportunities
Fund | The Hartford
Healthcare Fund |
| | | | | | |
| | | | | | |
| | | | | | |
| | | | | | |
Foreign withholding tax reclaims | | | | | | |
Less: Foreign tax withheld | | | | | | |
Total investment income, net | | | | | | |
| | | | | | |
Investment management fees | | | | | | |
| | | | | | |
| | | | | | |
| | | | | | |
| | | | | | |
| | | | | | |
| | | | | | |
| | | | | | |
| | | | | | |
| | | | | | |
| | | | | | |
| | | | | | |
| | | | | | |
| | | | | | |
| | | | | | |
| | | | | | |
| | | | | | |
Registration and filing fees | | | | | | |
| | | | | | |
| | | | | | |
Chief Compliance Officer fees | | | | | | |
| | | | | | |
| | | | | | |
Total expenses (before waivers, reimbursements and fees paid indirectly) | | | | | | |
Transfer agent fee waivers | | | | | | |
Distribution fee reimbursements | | | | | | |
| | | | | | |
Total waivers, reimbursements and fees paid indirectly | | | | | | |
| | | | | | |
Net Investment Income (Loss) | | | | | | |
Net Realized Gain (Loss) on Investments, Other Financial Instruments and Foreign Currency Transactions on: | | | | | | |
| | | | | | |
| | | | | | |
Other foreign currency transactions | | | | | | |
Net Realized Gain (Loss) on Investments, Other Financial Instruments and Foreign Currency Transactions | | | | | | |
Net Changes in Unrealized Appreciation (Depreciation) of Investments, Other Financial Instruments and Foreign Currency Transactions of: | | | | | | |
| | | | | | |
| | | | | | |
Translation of other assets and liabilities in foreign currencies | | | | | | |
The accompanying notes are an integral part of these financial statements.
Hartford Domestic Equity Funds
Statements of Operations – (continued)For the Year Ended October 31, 2024
| The Hartford Capital Appreciation Fund | | The Hartford Dividend and Growth Fund | The Hartford Equity Income Fund | The Hartford Growth Opportunities Fund | The Hartford Healthcare Fund |
Net Changes in Unrealized Appreciation (Depreciation) of Investments, Other Financial Instruments and Foreign Currency Transactions | | | | | | |
Net Gain (Loss) on Investments, Other Financial Instruments and Foreign Currency Transactions | | | | | | |
Net Increase (Decrease) in Net Assets Resulting from Operations | | | | | | |
The accompanying notes are an integral part of these financial statements.
Hartford Domestic Equity Funds
Statements of Operations – (continued)For the Year Ended October 31, 2024
| | The Hartford
MidCap Value
Fund | The Hartford
Small Cap
Growth Fund | Hartford
Small Cap
Value Fund | The Hartford
Small Company
Fund |
| | | | | |
| | | | | |
| | | | | |
| | | | | |
Less: Foreign tax withheld | | | | | |
Total investment income, net | | | | | |
| | | | | |
Investment management fees | | | | | |
| | | | | |
| | | | | |
| | | | | |
| | | | | |
| | | | | |
| | | | | |
| | | | | |
| | | | | |
| | | | | |
| | | | | |
| | | | | |
| | | | | |
| | | | | |
| | | | | |
| | | | | |
| | | | | |
Registration and filing fees | | | | | |
| | | | | |
| | | | | |
Chief Compliance Officer fees | | | | | |
| | | | | |
| | | | | |
Total expenses (before waivers, reimbursements and fees paid indirectly) | | | | | |
| | | | | |
Transfer agent fee waivers | | | | | |
Distribution fee reimbursements | | | | | |
| | | | | |
Total waivers, reimbursements and fees paid indirectly | | | | | |
| | | | | |
Net Investment Income (Loss) | | | | | |
Net Realized Gain (Loss) on Investments and Foreign Currency Transactions on: | | | | | |
| | | | | |
Other foreign currency transactions | | | | | |
Net Realized Gain (Loss) on Investments and Foreign Currency Transactions | | | | | |
Net Changes in Unrealized Appreciation (Depreciation) of: | | | | | |
| | | | | |
Investments in affiliated investments | | | | | |
Net Changes in Unrealized Appreciation (Depreciation) | | | | | |
Net Gain (Loss) on Investments and Foreign Currency Transactions | | | | | |
Net Increase (Decrease) in Net Assets Resulting from Operations | | | | | |
The accompanying notes are an integral part of these financial statements.
Hartford Domestic Equity Funds
Statements of Changes in Net Assets
| The Hartford
Capital Appreciation Fund | |
| For the
Year Ended
October 31,
2024 | For the
Year Ended
October 31,
2023 | For the
Year Ended
October 31,
2024 | For the
Year Ended
October 31,
2023 |
| | | | |
Net investment income (loss) | | | | |
Net realized gain (loss) on investments, other financial instruments and foreign currency transactions | | | | |
Net changes in unrealized appreciation (depreciation) of investments, other financial instruments and foreign currency transactions | | | | |
Net Increase (Decrease) in Net Assets Resulting from Operations | | | | |
Distributions to Shareholders: | | | | |
| | | | |
| | | | |
| | | | |
| | | | |
| | | | |
| | | | |
| | | | |
| | | | |
| | | | |
| | | | |
Capital Share Transactions: | | | | |
| | | | |
Issued on reinvestment of distributions | | | | |
| | | | |
Net increase (decrease) from capital share transactions | | | | |
Net Increase (Decrease) in Net Assets | | | | |
| | | | |
| | | | |
| | | | |
The accompanying notes are an integral part of these financial statements.
Hartford Domestic Equity Funds
Statements of Changes in Net Assets – (continued)
| The Hartford
Dividend and Growth Fund | The Hartford
Equity Income Fund |
| For the
Year Ended
October 31,
2024 | For the
Year Ended
October 31,
2023 | For the
Year Ended
October 31,
2024 | For the
Year Ended
October 31,
2023 |
| | | | |
Net investment income (loss) | | | | |
Net realized gain (loss) on investments and foreign currency transactions | | | | |
Net changes in unrealized appreciation (depreciation) of investments and foreign currency transactions | | | | |
Net Increase (Decrease) in Net Assets Resulting from Operations | | | | |
Distributions to Shareholders: | | | | |
| | | | |
| | | | |
| | | | |
| | | | |
| | | | |
| | | | |
| | | | |
| | | | |
| | | | |
| | | | |
Capital Share Transactions: | | | | |
| | | | |
Issued on reinvestment of distributions | | | | |
| | | | |
Net increase (decrease) from capital share transactions | | | | |
Net Increase (Decrease) in Net Assets | | | | |
| | | | |
| | | | |
| | | | |
The accompanying notes are an integral part of these financial statements.
Hartford Domestic Equity Funds
Statements of Changes in Net Assets – (continued)
| The Hartford
Growth Opportunities Fund | The Hartford
Healthcare Fund |
| For the
Year Ended
October 31,
2024 | For the
Year Ended
October 31,
2023 | For the
Year Ended
October 31,
2024 | For the
Year Ended
October 31,
2023 |
| | | | |
Net investment income (loss) | | | | |
Net realized gain (loss) on investments and foreign currency transactions | | | | |
Net changes in unrealized appreciation (depreciation) of investments and foreign currency transactions | | | | |
Net Increase (Decrease) in Net Assets Resulting from Operations | | | | |
Distributions to Shareholders: | | | | |
| | | | |
| | | | |
| | | | |
| | | | |
| | | | |
| | | | |
| | | | |
| | | | |
| | | | |
| | | | |
Capital Share Transactions: | | | | |
| | | | |
Issued on reinvestment of distributions | | | | |
| | | | |
Net increase (decrease) from capital share transactions | | | | |
Net Increase (Decrease) in Net Assets | | | | |
| | | | |
| | | | |
| | | | |
The accompanying notes are an integral part of these financial statements.
Hartford Domestic Equity Funds
Statements of Changes in Net Assets – (continued)
| | The Hartford
MidCap Value Fund |
| For the
Year Ended
October 31,
2024 | For the
Year Ended
October 31,
2023 | For the
Year Ended
October 31,
2024 | For the
Year Ended
October 31,
2023 |
| | | | |
Net investment income (loss) | | | | |
Net realized gain (loss) on investments and foreign currency transactions | | | | |
Net changes in unrealized appreciation (depreciation) of investments | | | | |
Net Increase (Decrease) in Net Assets Resulting from Operations | | | | |
Distributions to Shareholders: | | | | |
| | | | |
| | | | |
| | | | |
| | | | |
| | | | |
| | | | |
| | | | |
| | | | |
| | | | |
| | | | |
Capital Share Transactions: | | | | |
| | | | |
Issued on reinvestment of distributions | | | | |
| | | | |
Net increase (decrease) from capital share transactions | | | | |
Net Increase (Decrease) in Net Assets | | | | |
| | | | |
| | | | |
| | | | |
The accompanying notes are an integral part of these financial statements.
Hartford Domestic Equity Funds
Statements of Changes in Net Assets – (continued)
| The Hartford
Small Cap Growth Fund | Hartford
Small Cap Value Fund |
| For the
Year Ended
October 31,
2024 | For the
Year Ended
October 31,
2023 | For the
Year Ended
October 31,
2024 | For the
Year Ended
October 31,
2023 |
| | | | |
Net investment income (loss) | | | | |
Net realized gain (loss) on investments and foreign currency transactions | | | | |
Net changes in unrealized appreciation (depreciation) of investments | | | | |
Net Increase (Decrease) in Net Assets Resulting from Operations | | | | |
Distributions to Shareholders: | | | | |
| | | | |
| | | | |
| | | | |
| | | | |
| | | | |
| | | | |
| | | | |
| | | | |
| | | | |
| | | | |
Capital Share Transactions: | | | | |
| | | | |
Issued on reinvestment of distributions | | | | |
| | | | |
Net increase (decrease) from capital share transactions | | | | |
Net Increase (Decrease) in Net Assets | | | | |
| | | | |
| | | | |
| | | | |
The accompanying notes are an integral part of these financial statements.
Hartford Domestic Equity Funds
Statements of Changes in Net Assets – (continued)
| The Hartford
Small Company Fund |
| For the
Year Ended
October 31,
2024 | For the
Year Ended
October 31,
2023 |
| | |
Net investment income (loss) | | |
Net realized gain (loss) on investments | | |
Net changes in unrealized appreciation (depreciation) of investments | | |
Net Increase (Decrease) in Net Assets Resulting from Operations | | |
Capital Share Transactions: | | |
| | |
| | |
Net increase (decrease) from capital share transactions | | |
Net Increase (Decrease) in Net Assets | | |
| | |
| | |
| | |
The accompanying notes are an integral part of these financial statements.
Hartford Domestic Equity Funds
| — Selected Per-Share Data(1) — | — Ratios and Supplemental Data — |
| Net
Asset
Value at
Beginning
of Period | Net
Investment
Income
(Loss) | Net
Realized
and
Unrealized
Gain (Loss)
on
Investments | Total from
Investment
Operations | Dividends
from Net
Investment
Income | Distributions
from
Capital
Gains | Total
Dividends
and
Distributions | Net
Asset
Value at
End of
Period | | Net
Assets
at End
of Period
(000s) | Ratio of
Expenses
to
Average
Net
Assets
Before
Adjust-
| Ratio of
Expenses
to
Average
Net
Assets
After
Adjust-
| Ratio of
Net
Investment
Income
(Loss) to
Average
Net Assets | |
The Hartford Capital Appreciation Fund |
For the Year Ended October 31, 2024 |
| | | | | | | | | | | | | | |
| | | | | | | | | | | | | | |
| | | | | | | | | | | | | | |
| | | | | | | | | | | | | | |
| | | | | | | | | | | | | | |
| | | | | | | | | | | | | | |
| | | | | | | | | | | | | | |
| | | | | | | | | | | | | | |
| | | | | | | | | | | | | | |
For the Year Ended October 31, 2023 |
| | | | | | | | | | | | | | |
| | | | | | | | | | | | | | |
| | | | | | | | | | | | | | |
| | | | | | | | | | | | | | |
| | | | | | | | | | | | | | |
| | | | | | | | | | | | | | |
| | | | | | | | | | | | | | |
| | | | | | | | | | | | | | |
| | | | | | | | | | | | | | |
For the Year Ended October 31, 2022 |
| | | | | | | | | | | | | | |
| | | | | | | | | | | | | | |
| | | | | | | | | | | | | | |
| | | | | | | | | | | | | | |
| | | | | | | | | | | | | | |
| | | | | | | | | | | | | | |
| | | | | | | | | | | | | | |
| | | | | | | | | | | | | | |
| | | | | | | | | | | | | | |
For the Year Ended October 31, 2021 |
| | | | | | | | | | | | | | |
| | | | | | | | | | | | | | |
| | | | | | | | | | | | | | |
| | | | | | | | | | | | | | |
| | | | | | | | | | | | | | |
| | | | | | | | | | | | | | |
| | | | | | | | | | | | | | |
| | | | | | | | | | | | | | |
| | | | | | | | | | | | | | |
The accompanying notes are an integral part of these financial statements.
Hartford Domestic Equity Funds
Financial Highlights – (continued)
| — Selected Per-Share Data(1) — | — Ratios and Supplemental Data — |
| Net Asset Value at Beginning of Period | Net Investment Income (Loss) | Net Realized and Unrealized Gain (Loss) on Investments | Total from Investment Operations | Dividends from Net Investment Income | Distributions from Capital Gains | Total Dividends and Distributions | Net Asset Value at End of Period | | Net Assets at End of Period (000s) | Ratio of Expenses to Average Net Assets Before Adjust- ments(3) | Ratio of Expenses to Average Net Assets After Adjust- ments(3) | Ratio of Net Investment Income (Loss) to Average Net Assets | |
The Hartford Capital Appreciation Fund – (continued) |
For the Year Ended October 31, 2020 |
| | | | | | | | | | | | | | |
| | | | | | | | | | | | | | |
| | | | | | | | | | | | | | |
| | | | | | | | | | | | | | |
| | | | | | | | | | | | | | |
| | | | | | | | | | | | | | |
| | | | | | | | | | | | | | |
| | | | | | | | | | | | | | |
| | | | | | | | | | | | | | |
Hartford Core Equity Fund |
For the Year Ended October 31, 2024 |
| | | | | | | | | | | | | | |
| | | | | | | | | | | | | | |
| | | | | | | | | | | | | | |
| | | | | | | | | | | | | | |
| | | | | | | | | | | | | | |
| | | | | | | | | | | | | | |
| | | | | | | | | | | | | | |
| | | | | | | | | | | | | | |
| | | | | | | | | | | | | | |
For the Year Ended October 31, 2023 |
| | | | | | | | | | | | | | |
| | | | | | | | | | | | | | |
| | | | | | | | | | | | | | |
| | | | | | | | | | | | | | |
| | | | | | | | | | | | | | |
| | | | | | | | | | | | | | |
| | | | | | | | | | | | | | |
| | | | | | | | | | | | | | |
| | | | | | | | | | | | | | |
For the Year Ended October 31, 2022 |
| | | | | | | | | | | | | | |
| | | | | | | | | | | | | | |
| | | | | | | | | | | | | | |
| | | | | | | | | | | | | | |
| | | | | | | | | | | | | | |
| | | | | | | | | | | | | | |
| | | | | | | | | | | | | | |
| | | | | | | | | | | | | | |
| | | | | | | | | | | | | | |
The accompanying notes are an integral part of these financial statements.
Hartford Domestic Equity Funds
Financial Highlights – (continued)
| — Selected Per-Share Data(1) — | — Ratios and Supplemental Data — |
| Net Asset Value at Beginning of Period | Net Investment Income (Loss) | Net Realized and Unrealized Gain (Loss) on Investments | Total from Investment Operations | Dividends from Net Investment Income | Distributions from Capital Gains | Total Dividends and Distributions | Net Asset Value at End of Period | | Net Assets at End of Period (000s) | Ratio of Expenses to Average Net Assets Before Adjust- ments(3) | Ratio of Expenses to Average Net Assets After Adjust- ments(3) | Ratio of Net Investment Income (Loss) to Average Net Assets | |
Hartford Core Equity Fund – (continued) |
For the Year Ended October 31, 2021 |
| | | | | | | | | | | | | | |
| | | | | | | | | | | | | | |
| | | | | | | | | | | | | | |
| | | | | | | | | | | | | | |
| | | | | | | | | | | | | | |
| | | | | | | | | | | | | | |
| | | | | | | | | | | | | | |
| | | | | | | | | | | | | | |
| | | | | | | | | | | | | | |
For the Year Ended October 31, 2020 |
| | | | | | | | | | | | | | |
| | | | | | | | | | | | | | |
| | | | | | | | | | | | | | |
| | | | | | | | | | | | | | |
| | | | | | | | | | | | | | |
| | | | | | | | | | | | | | |
| | | | | | | | | | | | | | |
| | | | | | | | | | | | | | |
| | | | | | | | | | | | | | |
The Hartford Dividend and Growth Fund |
For the Year Ended October 31, 2024 |
| | | | | | | | | | | | | | |
| | | | | | | | | | | | | | |
| | | | | | | | | | | | | | |
| | | | | | | | | | | | | | |
| | | | | | | | | | | | | | |
| | | | | | | | | | | | | | |
| | | | | | | | | | | | | | |
| | | | | | | | | | | | | | |
| | | | | | | | | | | | | | |
For the Year Ended October 31, 2023 |
| | | | | | | | | | | | | | |
| | | | | | | | | | | | | | |
| | | | | | | | | | | | | | |
| | | | | | | | | | | | | | |
| | | | | | | | | | | | | | |
| | | | | | | | | | | | | | |
| | | | | | | | | | | | | | |
| | | | | | | | | | | | | | |
| | | | | | | | | | | | | | |
The accompanying notes are an integral part of these financial statements.
Hartford Domestic Equity Funds
Financial Highlights – (continued)
| — Selected Per-Share Data(1) — | — Ratios and Supplemental Data — |
| Net Asset Value at Beginning of Period | Net Investment Income (Loss) | Net Realized and Unrealized Gain (Loss) on Investments | Total from Investment Operations | Dividends from Net Investment Income | Distributions from Capital Gains | Total Dividends and Distributions | Net Asset Value at End of Period | | Net Assets at End of Period (000s) | Ratio of Expenses to Average Net Assets Before Adjust- ments(3) | Ratio of Expenses to Average Net Assets After Adjust- ments(3) | Ratio of Net Investment Income (Loss) to Average Net Assets | |
The Hartford Dividend and Growth Fund – (continued) |
For the Year Ended October 31, 2022 |
| | | | | | | | | | | | | | |
| | | | | | | | | | | | | | |
| | | | | | | | | | | | | | |
| | | | | | | | | | | | | | |
| | | | | | | | | | | | | | |
| | | | | | | | | | | | | | |
| | | | | | | | | | | | | | |
| | | | | | | | | | | | | | |
| | | | | | | | | | | | | | |
For the Year Ended October 31, 2021 |
| | | | | | | | | | | | | | |
| | | | | | | | | | | | | | |
| | | | | | | | | | | | | | |
| | | | | | | | | | | | | | |
| | | | | | | | | | | | | | |
| | | | | | | | | | | | | | |
| | | | | | | | | | | | | | |
| | | | | | | | | | | | | | |
| | | | | | | | | | | | | | |
For the Year Ended October 31, 2020 |
| | | | | | | | | | | | | | |
| | | | | | | | | | | | | | |
| | | | | | | | | | | | | | |
| | | | | | | | | | | | | | |
| | | | | | | | | | | | | | |
| | | | | | | | | | | | | | |
| | | | | | | | | | | | | | |
| | | | | | | | | | | | | | |
| | | | | | | | | | | | | | |
The Hartford Equity Income Fund |
For the Year Ended October 31, 2024 |
| | | | | | | | | | | | | | |
| | | | | | | | | | | | | | |
| | | | | | | | | | | | | | |
| | | | | | | | | | | | | | |
| | | | | | | | | | | | | | |
| | | | | | | | | | | | | | |
| | | | | | | | | | | | | | |
| | | | | | | | | | | | | | |
| | | | | | | | | | | | | | |
The accompanying notes are an integral part of these financial statements.
Hartford Domestic Equity Funds
Financial Highlights – (continued)
| — Selected Per-Share Data(1) — | — Ratios and Supplemental Data — |
| Net Asset Value at Beginning of Period | Net Investment Income (Loss) | Net Realized and Unrealized Gain (Loss) on Investments | Total from Investment Operations | Dividends from Net Investment Income | Distributions from Capital Gains | Total Dividends and Distributions | Net Asset Value at End of Period | | Net Assets at End of Period (000s) | Ratio of Expenses to Average Net Assets Before Adjust- ments(3) | Ratio of Expenses to Average Net Assets After Adjust- ments(3) | Ratio of Net Investment Income (Loss) to Average Net Assets | |
The Hartford Equity Income Fund – (continued) |
For the Year Ended October 31, 2023 |
| | | | | | | | | | | | | | |
| | | | | | | | | | | | | | |
| | | | | | | | | | | | | | |
| | | | | | | | | | | | | | |
| | | | | | | | | | | | | | |
| | | | | | | | | | | | | | |
| | | | | | | | | | | | | | |
| | | | | | | | | | | | | | |
| | | | | | | | | | | | | | |
For the Year Ended October 31, 2022 |
| | | | | | | | | | | | | | |
| | | | | | | | | | | | | | |
| | | | | | | | | | | | | | |
| | | | | | | | | | | | | | |
| | | | | | | | | | | | | | |
| | | | | | | | | | | | | | |
| | | | | | | | | | | | | | |
| | | | | | | | | | | | | | |
| | | | | | | | | | | | | | |
For the Year Ended October 31, 2021 |
| | | | | | | | | | | | | | |
| | | | | | | | | | | | | | |
| | | | | | | | | | | | | | |
| | | | | | | | | | | | | | |
| | | | | | | | | | | | | | |
| | | | | | | | | | | | | | |
| | | | | | | | | | | | | | |
| | | | | | | | | | | | | | |
| | | | | | | | | | | | | | |
For the Year Ended October 31, 2020 |
| | | | | | | | | | | | | | |
| | | | | | | | | | | | | | |
| | | | | | | | | | | | | | |
| | | | | | | | | | | | | | |
| | | | | | | | | | | | | | |
| | | | | | | | | | | | | | |
| | | | | | | | | | | | | | |
| | | | | | | | | | | | | | |
| | | | | | | | | | | | | | |
The accompanying notes are an integral part of these financial statements.
Hartford Domestic Equity Funds
Financial Highlights – (continued)
| — Selected Per-Share Data(1) — | — Ratios and Supplemental Data — |
| Net Asset Value at Beginning of Period | Net Investment Income (Loss) | Net Realized and Unrealized Gain (Loss) on Investments | Total from Investment Operations | Dividends from Net Investment Income | Distributions from Capital Gains | Total Dividends and Distributions | Net Asset Value at End of Period | | Net Assets at End of Period (000s) | Ratio of Expenses to Average Net Assets Before Adjust- ments(3) | Ratio of Expenses to Average Net Assets After Adjust- ments(3) | Ratio of Net Investment Income (Loss) to Average Net Assets | |
The Hartford Growth Opportunities Fund |
For the Year Ended October 31, 2024 |
| | | | | | | | | | | | | | |
| | | | | | | | | | | | | | |
| | | | | | | | | | | | | | |
| | | | | | | | | | | | | | |
| | | | | | | | | | | | | | |
| | | | | | | | | | | | | | |
| | | | | | | | | | | | | | |
| | | | | | | | | | | | | | |
| | | | | | | | | | | | | | |
For the Year Ended October 31, 2023 |
| | | | | | | | | | | | | | |
| | | | | | | | | | | | | | |
| | | | | | | | | | | | | | |
| | | | | | | | | | | | | | |
| | | | | | | | | | | | | | |
| | | | | | | | | | | | | | |
| | | | | | | | | | | | | | |
| | | | | | | | | | | | | | |
| | | | | | | | | | | | | | |
For the Year Ended October 31, 2022 |
| | | | | | | | | | | | | | |
| | | | | | | | | | | | | | |
| | | | | | | | | | | | | | |
| | | | | | | | | | | | | | |
| | | | | | | | | | | | | | |
| | | | | | | | | | | | | | |
| | | | | | | | | | | | | | |
| | | | | | | | | | | | | | |
| | | | | | | | | | | | | | |
For the Year Ended October 31, 2021 |
| | | | | | | | | | | | | | |
| | | | | | | | | | | | | | |
| | | | | | | | | | | | | | |
| | | | | | | | | | | | | | |
| | | | | | | | | | | | | | |
| | | | | | | | | | | | | | |
| | | | | | | | | | | | | | |
| | | | | | | | | | | | | | |
| | | | | | | | | | | | | | |
The accompanying notes are an integral part of these financial statements.
Hartford Domestic Equity Funds
Financial Highlights – (continued)
| — Selected Per-Share Data(1) — | — Ratios and Supplemental Data — |
| Net Asset Value at Beginning of Period | Net Investment Income (Loss) | Net Realized and Unrealized Gain (Loss) on Investments | Total from Investment Operations | Dividends from Net Investment Income | Distributions from Capital Gains | Total Dividends and Distributions | Net Asset Value at End of Period | | Net Assets at End of Period (000s) | Ratio of Expenses to Average Net Assets Before Adjust- ments(3) | Ratio of Expenses to Average Net Assets After Adjust- ments(3) | Ratio of Net Investment Income (Loss) to Average Net Assets | |
The Hartford Growth Opportunities Fund – (continued) |
For the Year Ended October 31, 2020 |
| | | | | | | | | | | | | | |
| | | | | | | | | | | | | | |
| | | | | | | | | | | | | | |
| | | | | | | | | | | | | | |
| | | | | | | | | | | | | | |
| | | | | | | | | | | | | | |
| | | | | | | | | | | | | | |
| | | | | | | | | | | | | | |
| | | | | | | | | | | | | | |
The Hartford Healthcare Fund |
For the Year Ended October 31, 2024 |
| | | | | | | | | | | | | | |
| | | | | | | | | | | | | | |
| | | | | | | | | | | | | | |
| | | | | | | | | | | | | | |
| | | | | | | | | | | | | | |
| | | | | | | | | | | | | | |
| | | | | | | | | | | | | | |
| | | | | | | | | | | | | | |
| | | | | | | | | | | | | | |
For the Year Ended October 31, 2023 |
| | | | | | | | | | | | | | |
| | | | | | | | | | | | | | |
| | | | | | | | | | | | | | |
| | | | | | | | | | | | | | |
| | | | | | | | | | | | | | |
| | | | | | | | | | | | | | |
| | | | | | | | | | | | | | |
| | | | | | | | | | | | | | |
| | | | | | | | | | | | | | |
For the Year Ended October 31, 2022 |
| | | | | | | | | | | | | | |
| | | | | | | | | | | | | | |
| | | | | | | | | | | | | | |
| | | | | | | | | | | | | | |
| | | | | | | | | | | | | | |
| | | | | | | | | | | | | | |
| | | | | | | | | | | | | | |
| | | | | | | | | | | | | | |
| | | | | | | | | | | | | | |
The accompanying notes are an integral part of these financial statements.
Hartford Domestic Equity Funds
Financial Highlights – (continued)
| — Selected Per-Share Data(1) — | — Ratios and Supplemental Data — |
| Net Asset Value at Beginning of Period | Net Investment Income (Loss) | Net Realized and Unrealized Gain (Loss) on Investments | Total from Investment Operations | Dividends from Net Investment Income | Distributions from Capital Gains | Total Dividends and Distributions | Net Asset Value at End of Period | | Net Assets at End of Period (000s) | Ratio of Expenses to Average Net Assets Before Adjust- ments(3) | Ratio of Expenses to Average Net Assets After Adjust- ments(3) | Ratio of Net Investment Income (Loss) to Average Net Assets | |
The Hartford Healthcare Fund – (continued) |
For the Year Ended October 31, 2021 |
| | | | | | | | | | | | | | |
| | | | | | | | | | | | | | |
| | | | | | | | | | | | | | |
| | | | | | | | | | | | | | |
| | | | | | | | | | | | | | |
| | | | | | | | | | | | | | |
| | | | | | | | | | | | | | |
| | | | | | | | | | | | | | |
| | | | | | | | | | | | | | |
For the Year Ended October 31, 2020 |
| | | | | | | | | | | | | | |
| | | | | | | | | | | | | | |
| | | | | | | | | | | | | | |
| | | | | | | | | | | | | | |
| | | | | | | | | | | | | | |
| | | | | | | | | | | | | | |
| | | | | | | | | | | | | | |
| | | | | | | | | | | | | | |
| | | | | | | | | | | | | | |
|
For the Year Ended October 31, 2024 |
| | | | | | | | | | | | | | |
| | | | | | | | | | | | | | |
| | | | | | | | | | | | | | |
| | | | | | | | | | | | | | |
| | | | | | | | | | | | | | |
| | | | | | | | | | | | | | |
| | | | | | | | | | | | | | |
| | | | | | | | | | | | | | |
| | | | | | | | | | | | | | |
For the Year Ended October 31, 2023 |
| | | | | | | | | | | | | | |
| | | | | | | | | | | | | | |
| | | | | | | | | | | | | | |
| | | | | | | | | | | | | | |
| | | | | | | | | | | | | | |
| | | | | | | | | | | | | | |
| | | | | | | | | | | | | | |
| | | | | | | | | | | | | | |
| | | | | | | | | | | | | | |
The accompanying notes are an integral part of these financial statements.
Hartford Domestic Equity Funds
Financial Highlights – (continued)
| — Selected Per-Share Data(1) — | — Ratios and Supplemental Data — |
| Net Asset Value at Beginning of Period | Net Investment Income (Loss) | Net Realized and Unrealized Gain (Loss) on Investments | Total from Investment Operations | Dividends from Net Investment Income | Distributions from Capital Gains | Total Dividends and Distributions | Net Asset Value at End of Period | | Net Assets at End of Period (000s) | Ratio of Expenses to Average Net Assets Before Adjust- ments(3) | Ratio of Expenses to Average Net Assets After Adjust- ments(3) | Ratio of Net Investment Income (Loss) to Average Net Assets | |
The Hartford MidCap Fund – (continued) |
For the Year Ended October 31, 2022 |
| | | | | | | | | | | | | | |
| | | | | | | | | | | | | | |
| | | | | | | | | | | | | | |
| | | | | | | | | | | | | | |
| | | | | | | | | | | | | | |
| | | | | | | | | | | | | | |
| | | | | | | | | | | | | | |
| | | | | | | | | | | | | | |
| | | | | | | | | | | | | | |
For the Year Ended October 31, 2021 |
| | | | | | | | | | | | | | |
| | | | | | | | | | | | | | |
| | | | | | | | | | | | | | |
| | | | | | | | | | | | | | |
| | | | | | | | | | | | | | |
| | | | | | | | | | | | | | |
| | | | | | | | | | | | | | |
| | | | | | | | | | | | | | |
| | | | | | | | | | | | | | |
For the Year Ended October 31, 2020 |
| | | | | | | | | | | | | | |
| | | | | | | | | | | | | | |
| | | | | | | | | | | | | | |
| | | | | | | | | | | | | | |
| | | | | | | | | | | | | | |
| | | | | | | | | | | | | | |
| | | | | | | | | | | | | | |
| | | | | | | | | | | | | | |
| | | | | | | | | | | | | | |
The Hartford MidCap Value Fund |
For the Year Ended October 31, 2024 |
| | | | | | | | | | | | | | |
| | | | | | | | | | | | | | |
| | | | | | | | | | | | | | |
| | | | | | | | | | | | | | |
| | | | | | | | | | | | | | |
| | | | | | | | | | | | | | |
| | | | | | | | | | | | | | |
| | | | | | | | | | | | | | |
| | | | | | | | | | | | | | |
The accompanying notes are an integral part of these financial statements.
Hartford Domestic Equity Funds
Financial Highlights – (continued)
| — Selected Per-Share Data(1) — | — Ratios and Supplemental Data — |
| Net Asset Value at Beginning of Period | Net Investment Income (Loss) | Net Realized and Unrealized Gain (Loss) on Investments | Total from Investment Operations | Dividends from Net Investment Income | Distributions from Capital Gains | Total Dividends and Distributions | Net Asset Value at End of Period | | Net Assets at End of Period (000s) | Ratio of Expenses to Average Net Assets Before Adjust- ments(3) | Ratio of Expenses to Average Net Assets After Adjust- ments(3) | Ratio of Net Investment Income (Loss) to Average Net Assets | |
The Hartford MidCap Value Fund – (continued) |
For the Year Ended October 31, 2023 |
| | | | | | | | | | | | | | |
| | | | | | | | | | | | | | |
| | | | | | | | | | | | | | |
| | | | | | | | | | | | | | |
| | | | | | | | | | | | | | |
| | | | | | | | | | | | | | |
| | | | | | | | | | | | | | |
| | | | | | | | | | | | | | |
| | | | | | | | | | | | | | |
For the Year Ended October 31, 2022 |
| | | | | | | | | | | | | | |
| | | | | | | | | | | | | | |
| | | | | | | | | | | | | | |
| | | | | | | | | | | | | | |
| | | | | | | | | | | | | | |
| | | | | | | | | | | | | | |
| | | | | | | | | | | | | | |
| | | | | | | | | | | | | | |
| | | | | | | | | | | | | | |
For the Year Ended October 31, 2021 |
| | | | | | | | | | | | | | |
| | | | | | | | | | | | | | |
| | | | | | | | | | | | | | |
| | | | | | | | | | | | | | |
| | | | | | | | | | | | | | |
| | | | | | | | | | | | | | |
| | | | | | | | | | | | | | |
| | | | | | | | | | | | | | |
For the Year Ended October 31, 2020 |
| | | | | | | | | | | | | | |
| | | | | | | | | | | | | | |
| | | | | | | | | | | | | | |
| | | | | | | | | | | | | | |
| | | | | | | | | | | | | | |
| | | | | | | | | | | | | | |
| | | | | | | | | | | | | | |
| | | | | | | | | | | | | | |
The Hartford Small Cap Growth Fund |
For the Year Ended October 31, 2024 |
| | | | | | | | | | | | | | |
| | | | | | | | | | | | | | |
| | | | | | | | | | | | | | |
| | | | | | | | | | | | | | |
| | | | | | | | | | | | | | |
| | | | | | | | | | | | | | |
| | | | | | | | | | | | | | |
| | | | | | | | | | | | | | |
| | | | | | | | | | | | | | |
The accompanying notes are an integral part of these financial statements.
Hartford Domestic Equity Funds
Financial Highlights – (continued)
| — Selected Per-Share Data(1) — | — Ratios and Supplemental Data — |
| Net Asset Value at Beginning of Period | Net Investment Income (Loss) | Net Realized and Unrealized Gain (Loss) on Investments | Total from Investment Operations | Dividends from Net Investment Income | Distributions from Capital Gains | Total Dividends and Distributions | Net Asset Value at End of Period | | Net Assets at End of Period (000s) | Ratio of Expenses to Average Net Assets Before Adjust- ments(3) | Ratio of Expenses to Average Net Assets After Adjust- ments(3) | Ratio of Net Investment Income (Loss) to Average Net Assets | |
The Hartford Small Cap Growth Fund – (continued) |
For the Year Ended October 31, 2023 |
| | | | | | | | | | | | | | |
| | | | | | | | | | | | | | |
| | | | | | | | | | | | | | |
| | | | | | | | | | | | | | |
| | | | | | | | | | | | | | |
| | | | | | | | | | | | | | |
| | | | | | | | | | | | | | |
| | | | | | | | | | | | | | |
| | | | | | | | | | | | | | |
For the Year Ended October 31, 2022 |
| | | | | | | | | | | | | | |
| | | | | | | | | | | | | | |
| | | | | | | | | | | | | | |
| | | | | | | | | | | | | | |
| | | | | | | | | | | | | | |
| | | | | | | | | | | | | | |
| | | | | | | | | | | | | | |
| | | | | | | | | | | | | | |
| | | | | | | | | | | | | | |
For the Year Ended October 31, 2021 |
| | | | | | | | | | | | | | |
| | | | | | | | | | | | | | |
| | | | | | | | | | | | | | |
| | | | | | | | | | | | | | |
| | | | | | | | | | | | | | |
| | | | | | | | | | | | | | |
| | | | | | | | | | | | | | |
| | | | | | | | | | | | | | |
| | | | | | | | | | | | | | |
For the Year Ended October 31, 2020 |
| | | | | | | | | | | | | | |
| | | | | | | | | | | | | | |
| | | | | | | | | | | | | | |
| | | | | | | | | | | | | | |
| | | | | | | | | | | | | | |
| | | | | | | | | | | | | | |
| | | | | | | | | | | | | | |
| | | | | | | | | | | | | | |
| | | | | | | | | | | | | | |
The accompanying notes are an integral part of these financial statements.
Hartford Domestic Equity Funds
Financial Highlights – (continued)
| — Selected Per-Share Data(1) — | — Ratios and Supplemental Data — |
| Net Asset Value at Beginning of Period | Net Investment Income (Loss) | Net Realized and Unrealized Gain (Loss) on Investments | Total from Investment Operations | Dividends from Net Investment Income | Distributions from Capital Gains | Total Dividends and Distributions | Net Asset Value at End of Period | | Net Assets at End of Period (000s) | Ratio of Expenses to Average Net Assets Before Adjust- ments(3) | Ratio of Expenses to Average Net Assets After Adjust- ments(3) | Ratio of Net Investment Income (Loss) to Average Net Assets | |
Hartford Small Cap Value Fund |
For the Year Ended October 31, 2024 |
| | | | | | | | | | | | | | |
| | | | | | | | | | | | | | |
| | | | | | | | | | | | | | |
| | | | | | | | | | | | | | |
| | | | | | | | | | | | | | |
| | | | | | | | | | | | | | |
| | | | | | | | | | | | | | |
| | | | | | | | | | | | | | |
| | | | | | | | | | | | | | |
For the Year Ended October 31, 2023 |
| | | | | | | | | | | | | | |
| | | | | | | | | | | | | | |
| | | | | | | | | | | | | | |
| | | | | | | | | | | | | | |
| | | | | | | | | | | | | | |
| | | | | | | | | | | | | | |
| | | | | | | | | | | | | | |
| | | | | | | | | | | | | | |
| | | | | | | | | | | | | | |
For the Year Ended October 31, 2022 |
| | | | | | | | | | | | | | |
| | | | | | | | | | | | | | |
| | | | | | | | | | | | | | |
| | | | | | | | | | | | | | |
| | | | | | | | | | | | | | |
| | | | | | | | | | | | | | |
| | | | | | | | | | | | | | |
| | | | | | | | | | | | | | |
| | | | | | | | | | | | | | |
For the Year Ended October 31, 2021 |
| | | | | | | | | | | | | | |
| | | | | | | | | | | | | | |
| | | | | | | | | | | | | | |
| | | | | | | | | | | | | | |
| | | | | | | | | | | | | | |
| | | | | | | | | | | | | | |
| | | | | | | | | | | | | | |
| | | | | | | | | | | | | | |
| | | | | | | | | | | | | | |
The accompanying notes are an integral part of these financial statements.
Hartford Domestic Equity Funds
Financial Highlights – (continued)
| — Selected Per-Share Data(1) — | — Ratios and Supplemental Data — |
| Net Asset Value at Beginning of Period | Net Investment Income (Loss) | Net Realized and Unrealized Gain (Loss) on Investments | Total from Investment Operations | Dividends from Net Investment Income | Distributions from Capital Gains | Total Dividends and Distributions | Net Asset Value at End of Period | | Net Assets at End of Period (000s) | Ratio of Expenses to Average Net Assets Before Adjust- ments(3) | Ratio of Expenses to Average Net Assets After Adjust- ments(3) | Ratio of Net Investment Income (Loss) to Average Net Assets | |
Hartford Small Cap Value Fund – (continued) |
For the Year Ended October 31, 2020 |
| | | | | | | | | | | | | | |
| | | | | | | | | | | | | | |
| | | | | | | | | | | | | | |
| | | | | | | | | | | | | | |
| | | | | | | | | | | | | | |
| | | | | | | | | | | | | | |
| | | | | | | | | | | | | | |
| | | | | | | | | | | | | | |
| | | | | | | | | | | | | | |
The Hartford Small Company Fund |
For the Year Ended October 31, 2024 |
| | | | | | | | | | | | | | |
| | | | | | | | | | | | | | |
| | | | | | | | | | | | | | |
| | | | | | | | | | | | | | |
| | | | | | | | | | | | | | |
| | | | | | | | | | | | | | |
| | | | | | | | | | | | | | |
| | | | | | | | | | | | | | |
| | | | | | | | | | | | | | |
For the Year Ended October 31, 2023 |
| | | | | | | | | | | | | | |
| | | | | | | | | | | | | | |
| | | | | | | | | | | | | | |
| | | | | | | | | | | | | | |
| | | | | | | | | | | | | | |
| | | | | | | | | | | | | | |
| | | | | | | | | | | | | | |
| | | | | | | | | | | | | | |
| | | | | | | | | | | | | | |
For the Year Ended October 31, 2022 |
| | | | | | | | | | | | | | |
| | | | | | | | | | | | | | |
| | | | | | | | | | | | | | |
| | | | | | | | | | | | | | |
| | | | | | | | | | | | | | |
| | | | | | | | | | | | | | |
| | | | | | | | | | | | | | |
| | | | | | | | | | | | | | |
| | | | | | | | | | | | | | |
The accompanying notes are an integral part of these financial statements.
Hartford Domestic Equity Funds
Financial Highlights – (continued)
| — Selected Per-Share Data(1) — | — Ratios and Supplemental Data — |
| Net Asset Value at Beginning of Period | Net Investment Income (Loss) | Net Realized and Unrealized Gain (Loss) on Investments | Total from Investment Operations | Dividends from Net Investment Income | Distributions from Capital Gains | Total Dividends and Distributions | Net Asset Value at End of Period | | Net Assets at End of Period (000s) | Ratio of Expenses to Average Net Assets Before Adjust- ments(3) | Ratio of Expenses to Average Net Assets After Adjust- ments(3) | Ratio of Net Investment Income (Loss) to Average Net Assets | |
The Hartford Small Company Fund – (continued) |
For the Year Ended October 31, 2021 |
| | | | | | | | | | | | | | |
| | | | | | | | | | | | | | |
| | | | | | | | | | | | | | |
| | | | | | | | | | | | | | |
| | | | | | | | | | | | | | |
| | | | | | | | | | | | | | |
| | | | | | | | | | | | | | |
| | | | | | | | | | | | | | |
| | | | | | | | | | | | | | |
For the Year Ended October 31, 2020 |
| | | | | | | | | | | | | | |
| | | | | | | | | | | | | | |
| | | | | | | | | | | | | | |
| | | | | | | | | | | | | | |
| | | | | | | | | | | | | | |
| | | | | | | | | | | | | | |
| | | | | | | | | | | | | | |
| | | | | | | | | | | | | | |
| | | | | | | | | | | | | | |
FINANCIAL HIGHLIGHTS FOOTNOTES |
| Information presented relates to a share outstanding throughout the indicated period. Net investment income (loss) per share amounts are calculated based on average shares outstanding unless otherwise noted. |
| Assumes initial investment at net asset value at the beginning of each period, reinvestment of all distributions, the complete redemption of the investment at net asset value at the end of each period and no sales charge. Total return would be reduced if sales charges were taken into account. |
| Adjustments include waivers and reimbursements, if applicable. Ratios do not include fees paid indirectly (see Expenses in the accompanying Notes to Financial Statements). |
| The “Net Realized and Unrealized Gain (Loss) on Investments” and “Total from Net Investment Income” for Classes I, R4 and R5 shares have been updated since the October 31, 2021 Annual Report to reflect a non-material change of $0.01 to these amounts. |
| Amount is less than $0.01 per share. |
| Amount is less than (0.01)%. |
| The expense ratio includes expenses associated with The Hartford Growth Opportunities Fund’s shareholder meeting held on December 13, 2023, which was ultimately adjourned until January 23, 2024. If these expenses were excluded, the ratios would have been as follows: 1.07% (Class A), 1.89% (Class C), 0.83% (Class I), 1.44% (Class R3), 1.13% (Class R4), 0.83% (Class R5), 0.73% (Class R6), 0.81% (Class Y) and 0.73% (Class F). |
| Per share amounts have been adjusted for a 4 for 1 reverse share split on September 13, 2024 (See Note 16 in the Notes to Financial Statements). |
| Per share amounts have been adjusted for a 2 for 1 reverse share split on September 13, 2024 (See Note 16 in the Notes to Financial Statements). |
| Commenced operations on June 22, 2022. |
| Per share amount was not in accord with the net realized and unrealized gain (loss) for the period because of the timing of transactions in shares of the Fund and the amount and timing of per-share net realized and unrealized gain (loss) on such shares. |
| |
| |
The accompanying notes are an integral part of these financial statements.
Hartford Domestic Equity Funds
Notes to Financial Statements October 31, 2024
The Hartford Mutual Funds, Inc. and The Hartford Mutual Funds II, Inc. (each, a "Company" and collectively, the "Companies") are each an open-end registered management investment company comprised of thirty-six and fifteen series, respectively, as of October 31, 2024. Financial statements for the series of each Company listed below (each, a "Fund" and collectively, the "Funds") are included in this report.
The Hartford Mutual Funds, Inc.: |
The Hartford Capital Appreciation Fund (the "Capital Appreciation Fund") |
Hartford Core Equity Fund (the "Core Equity Fund") |
The Hartford Dividend and Growth Fund (the "Dividend and Growth Fund") |
The Hartford Equity Income Fund (the "Equity Income Fund") |
The Hartford Healthcare Fund (the "Healthcare Fund") |
The Hartford MidCap Fund (the "MidCap Fund") |
The Hartford MidCap Value Fund (the "MidCap Value Fund") |
Hartford Small Cap Value Fund (the "Small Cap Value Fund") |
The Hartford Small Company Fund (the "Small Company Fund") |
The Hartford Mutual Funds II, Inc.: |
The Hartford Growth Opportunities Fund (the "Growth Opportunities Fund") |
The Hartford Small Cap Growth Fund (the "Small Cap Growth Fund") |
The assets of each Fund are separate, and a shareholder's interest is limited to the Fund in which shares are held. Each Company is organized under the laws of the State of Maryland and is registered with the U.S. Securities and Exchange Commission (the "SEC") under the Investment Company Act of 1940, as amended (the "1940 Act"). Each Fund is a diversified open-end management investment company. Each Fund applies specialized accounting and reporting standards under Accounting Standards Codification Topic 946, "Financial Services – Investment Companies".
Each Fund has registered for sale Class A, Class C, Class I, Class R3, Class R4, Class R5, Class R6, Class Y and Class F shares. Class A shares of each Fund are sold with a front-end sales charge of up to 5.50%. Class C shares of each Fund are sold with a contingent deferred sales charge of up to 1.00% on shares redeemed within twelve months of purchase. Class C shares automatically convert to Class A shares of the same Fund after eight years provided that the Fund or the financial intermediary has records verifying that the Class C shares have been held for at least eight years. Classes I, R3, R4, R5, R6, Y and F shares do not have a sales charge.
2.
Significant Accounting Policies:
The following is a summary of significant accounting policies of each Fund used in the preparation of its financial statements, which are in accordance with United States Generally Accepted Accounting Principles ("U.S. GAAP"). The preparation of financial statements in accordance with U.S. GAAP may require management to make estimates and assumptions that affect the reported amounts of assets and liabilities and disclosure of contingent assets and liabilities at the date of the financial statements and the reported amounts of increases and decreases in net assets from operations during the reporting period. Actual results could differ from those estimates.
a)
Determination of Net Asset Value – The net asset value ("NAV") of each class of each Fund’s shares is determined as of the close of regular trading on the New York Stock Exchange (the "Exchange") (normally 4:00 p.m. Eastern Time) (the "NYSE Close") on each day that the Exchange is open ("Valuation Date"). If the Exchange is closed due to weather or other extraordinary circumstances on a day it would typically be open for business, each Fund may treat such day as a typical business day and accept purchase and redemption orders and calculate each Fund’s NAV in accordance with applicable law. The NAV of each class of each Fund's shares is determined by dividing the value of the Fund’s net assets attributable to the class of shares by the number of shares outstanding for that class. Information that becomes known to the Funds after the NAV has been calculated on a particular day will not generally be used to retroactively adjust the NAV determined earlier that day.
b)
Investment Valuation and Fair Value Measurements – For purposes of calculating the NAV of each class of each Fund, portfolio securities and other assets held in the Fund’s portfolio for which market prices are readily available are valued at market value. Market value is generally determined on the basis of official close price or last reported trade price. If no trades were reported, market value is based on prices obtained from a quotation reporting system, established market makers (including evaluated prices), or independent pricing services. Pricing vendors may use matrix pricing or valuation models that utilize certain inputs and assumptions to derive values, including transaction data, credit quality information, general market conditions, news, and other factors and assumptions.
Hartford Domestic Equity Funds
Notes to Financial Statements – (continued) October 31, 2024
With respect to a Fund's investments that do not have readily available market prices, each Company's Board of Directors (the "Board") has designated Hartford Funds Management Company, LLC (the "Investment Manager" or "HFMC") as its valuation designee to perform fair valuations pursuant to Rule 2a-5 under the 1940 Act (the "Valuation Designee").
If market prices are not readily available or deemed unreliable, the Valuation Designee determines the fair value of the security or other instrument in good faith under policies and procedures approved by and under the supervision of the Board ("Valuation Procedures").
The Valuation Designee has delegated the day-to-day responsibility for implementing the Valuation Procedures to the Valuation Committee (the "Valuation Committee"). The Valuation Committee will consider all available relevant factors in determining an investment’s fair value. The Valuation Designee reports fair value matters to the Audit Committee of the Board.
Prices of foreign equities that are principally traded on certain foreign markets will generally be adjusted daily pursuant to a fair value pricing service in order to reflect an adjustment for the factors occurring after the close of certain foreign markets but before the NYSE Close. Securities and other instruments that are primarily traded on foreign markets may trade on days that are not business days of the Funds. The value of the foreign securities or other instruments in which a Fund invests may change on days when a shareholder will not be able to purchase, redeem or exchange shares of the Fund.
Fixed income investments (other than short-term obligations) and non-exchange traded derivatives held by a Fund are normally valued at prices supplied by independent pricing services in accordance with the Valuation Procedures. Short-term investments maturing in 60 days or less are generally valued at amortized cost, which approximates fair value.
Exchange-traded derivatives, such as options, futures and options on futures, are valued at the last sale price determined by the exchange where such instruments principally trade as of the close of such exchange ("Exchange Close"). If a last sale price is not available, the value will be the mean of the most recently quoted bid and ask prices as of the Exchange Close. If a mean of the bid and ask prices cannot be calculated for the day, the value will be the most recently quoted bid price as of the Exchange Close. Over-the-counter derivatives are normally valued based on prices supplied by independent pricing services in accordance with the Valuation Procedures.
Investments valued in currencies other than U.S. dollars are converted to U.S. dollars using the prevailing spot currency exchange rates obtained from independent pricing services for calculation of the NAV. As a result, the NAV of a Fund’s shares may be affected by changes in the value of currencies in relation to the U.S. dollar. The value of securities or other instruments traded in markets outside the United States or denominated in currencies other than the U.S. dollar may be affected significantly on a day that the Exchange is closed and the market value may change on days when an investor is not able to purchase, redeem or exchange shares of a Fund.
Foreign currency contracts represent agreements to exchange currencies on specific future dates at predetermined rates. Foreign currency contracts are valued using foreign currency exchange rates and forward rates as provided by an independent pricing service on the Valuation Date.
Shares of investment companies listed and traded on an exchange are valued in the same manner as any exchange-listed equity security. Investments in investment companies that are not listed or traded on an exchange ("Non-Traded Funds"), if any, are valued at the respective NAV of each Non-Traded Fund on the Valuation Date. Such Non-Traded Funds and listed investment companies may use fair value pricing as disclosed in their prospectuses.
Financial instruments for which prices are not available from an independent pricing service may be valued using quotations obtained from one or more dealers that make markets in the respective financial instrument in accordance with the Valuation Procedures.
U.S. GAAP defines fair value as the price that a Fund would receive to sell an asset or pay to transfer a liability in an orderly transaction between market participants. The U.S. GAAP fair value measurement standards require disclosure of a fair value hierarchy for each major category of assets and liabilities. Various inputs are used in determining the fair value of each Fund’s investments. These inputs are summarized into three broad hierarchy levels. This hierarchy is based on whether the valuation inputs are observable or unobservable. These levels are:
•
Level 1 – Quoted prices in active markets for identical investments. Level 1 may include exchange traded instruments, such as domestic equities, some foreign equities, options, futures, mutual funds, exchange traded funds, rights and warrants.
•
Level 2 – Observable inputs other than Level 1 prices, such as quoted prices for similar investments; quoted prices in markets that are not active; or other inputs that are observable or can be corroborated by observable market data. Level 2 may include debt investments that are traded less frequently than exchange traded instruments and which are valued using independent pricing services; foreign equities, which are principally traded on certain foreign markets and are adjusted daily pursuant to a fair value pricing service in order
Hartford Domestic Equity Funds
Notes to Financial Statements – (continued) October 31, 2024
to reflect an adjustment for the factors occurring after the close of certain foreign markets but before the NYSE Close; senior floating rate interests, which are valued using an aggregate of dealer bids; short-term investments, which are valued at amortized cost; and swaps, which are valued based upon the terms of each swap contract.
•
Level 3 – Significant unobservable inputs that are supported by limited or no market activity. Level 3 may include financial instruments whose values are determined using indicative market quotes or require significant management judgment or estimation. These unobservable valuation inputs may include estimates for current yields, maturity/duration, prepayment speed, and indicative market quotes for comparable investments along with other assumptions relating to credit quality, collateral value, complexity of the investment structure, general market conditions and liquidity. This category may include investments where trading has been halted or there are certain restrictions on trading. While these investments are priced using unobservable inputs, the valuation of these investments reflects the best available data and management believes the prices are a reasonable representation of exit price.
Valuation levels are not necessarily indicative of the risk associated with investing in such investments. Individual investments within any of the above mentioned asset classes may be assigned a different hierarchical level than those presented above, as individual circumstances dictate.
For additional information, refer to the Fair Value Summary and the Level 3 roll-forward reconciliation, if applicable, which follows each Fund's Schedule of Investments.
c)
Investment Transactions and Investment Income – Investment transactions are recorded as of the trade date (the date the order to buy or sell is executed) for financial reporting purposes. Investments purchased or sold on a when-issued or delayed-delivery basis may be settled a month or more after the trade date. Realized gains and losses are determined on the basis of identified cost.
Dividend income from domestic securities is accrued on the ex-dividend date. In general, dividend income from foreign securities is recorded on the ex-date; however, dividend notifications in certain foreign jurisdictions may not be available in a timely manner and as a result, a Fund will record the dividend as soon as the relevant details (i.e., rate per share, payment date, shareholders of record, etc.) are publicly available. Interest income, including amortization of premium, accretion of discounts and additional principal received in-kind in lieu of cash, is accrued on a daily basis.
The Dividend and Growth Fund filed claims to recover taxes withheld on prior year reclaims (EU reclaims) related to French taxes withheld on dividend income from 2009, 2010 and 2011. The Dividend and Growth Fund received EU reclaims with related interest in the amount of $427,032, which is recorded on the Statement of Operations as Foreign withholding tax reclaims.
Idle cash and currency balances may be swept into overnight sweep accounts held in a demand deposit account at State Street Bank and Trust Company ("State Street") that earn interest, which are classified as interest income on the Statements of Operations.
Please refer to Note 8 for Securities Lending information.
d)
Taxes – A Fund may be subject to taxes imposed on realized gains on securities of certain foreign countries in which such Fund invests. A Fund may also be subject to taxes withheld on foreign dividends and interest from securities in which a Fund invests. The amount of any foreign taxes withheld and foreign tax expense is included on the accompanying Statements of Operations as a reduction to net investment income or net realized or unrealized gain (loss) on investments in these securities, if applicable.
e)
Foreign Currency Transactions – Assets and liabilities denominated in currencies other than U.S. dollars are translated into U.S. dollars at the exchange rates in effect on the Valuation Date. Purchases and sales of investments, income and expenses are translated into U.S. dollars at the exchange rates on the dates of such transactions.
A Fund does not isolate that portion of portfolio investment valuation resulting from fluctuations in the foreign currency exchange rates from the fluctuations arising from changes in the market prices of investments held. Exchange rate fluctuations are included with the net realized and unrealized gain or loss on investments in the accompanying financial statements.
Net realized foreign exchange gains or losses arise from sales of foreign currencies and the difference between asset and liability amounts initially stated in foreign currencies and the U.S. dollar value of the amounts actually received or paid. Net unrealized foreign exchange gains or losses arise from changes in the value of other assets and liabilities at the end of the reporting period, resulting from changes in the exchange rates.
f)
Joint Trading Account – A Fund may invest cash balances into a joint trading account that may be invested in one or more repurchase agreements.
g)
Fund Share Valuation and Dividend Distributions to Shareholders – Orders for each class of each Fund’s shares are executed in accordance with the investment instructions of the shareholders. The NAV of each class of each Fund’s shares is determined as of the close of business on each business day of the Exchange (see Note 2(a)). The NAV is determined separately for each class of shares of a Fund by dividing
Hartford Domestic Equity Funds
Notes to Financial Statements – (continued) October 31, 2024
the Fund's net assets attributable to that class by the number of shares of the class outstanding. Each class of shares offered by a Fund has equal rights as to assets and voting privileges (except that shareholders of a class have exclusive voting rights regarding any matter relating solely to that class of shares). Income and non-class specific expenses are allocated daily to each class on the basis of the relative net assets of the class of the Fund. Realized and unrealized gains and losses are allocated daily based on the relative net assets of each class of shares of each Fund.
Orders for the purchase of a Fund's shares received prior to the close of the Exchange on any day the Exchange is open for business are priced at the NAV determined as of the close of the Exchange. Orders received after the close of the Exchange, or on a day on which the Exchange and/or the Funds are not open for business, are priced at the next determined NAV.
Dividends are declared pursuant to a policy adopted by the respective Company's Board of Directors. Dividends and/or distributions to shareholders are recorded on ex-date. The policy of each Fund, except Dividend and Growth Fund and Equity Income Fund, is to pay dividends from net investment income and realized gains, if any, at least once a year. The policy of Dividend and Growth Fund and Equity Income Fund is to pay dividends from net investment income, if any, quarterly and realized gains, if any, at least once a year.
Income dividends and capital gains distributions are determined in accordance with federal income tax regulations, which may differ from U.S. GAAP with respect to character and timing (see Federal Income Taxes: Distributions and Components of Distributable Earnings and
Reclassification of Capital Accounts notes).
3.
Securities and Other Investments:
a)
Restricted Securities – Each Fund may invest in securities that are subject to legal or contractual restrictions on resale. These securities generally may be resold in transactions exempt from registration or to the public if the securities are registered. Disposal of these securities may involve time-consuming negotiations and expense, and prompt sale at an acceptable price may be difficult. Information regarding restricted securities, if applicable, is included at the end of each Fund's Schedule of Investments.
b)
Repurchase Agreements – A repurchase agreement is an agreement between two parties whereby one party sells the other a security at a specified price with a commitment to repurchase the security later at an agreed-upon price, date and interest payment. Each Fund is permitted to enter into fully collateralized repurchase agreements. Each Company's Board of Directors has delegated to the sub-adviser(s), as applicable, the responsibility of evaluating the creditworthiness of the banks and securities dealers with which the Funds will engage in repurchase agreements. The sub-adviser(s) will monitor such transactions to ensure that the value of underlying collateral will be at least equal to the total amount of the repurchase obligation as required by the valuation provision of the repurchase agreement, including the accrued interest. Repurchase agreements carry the risk that the market value of the securities declines below the repurchase price. A Fund could also lose money if it is unable to recover the securities and the value of any collateral held. In the event the borrower commences bankruptcy proceedings, a court may characterize the transaction as a loan. If a Fund has not perfected a security interest in the underlying collateral, the Fund may be required to return the underlying collateral to the borrower’s estate and be treated as an unsecured creditor. As an unsecured creditor, the Fund could lose some or all of the principal and interest involved in the transaction. See each Fund's Schedule of Investments, if applicable, for repurchase agreements as of October 31, 2024.
4.
Financial Derivative Instruments:
The following disclosures contain information on the derivative instruments used by a Fund during the period, the credit-risk-related contingent features in certain derivative instruments, and how such derivative instruments affect the financial position and results of operations of the applicable Fund. The location and fair value amounts of these instruments on the Statements of Assets and Liabilities and the realized gains and losses and changes in unrealized gains and losses on the Statements of Operations, each categorized by type of derivative contract, are included in the following Additional Derivative Instrument Information footnote. The derivative instruments outstanding as of period-end are disclosed in the notes to the Schedules of Investments, if applicable. The amounts of realized gains and losses and changes in unrealized gains and losses on derivative instruments during the period are disclosed in the Statements of Operations.
a)
Futures Contracts – A Fund may enter into futures contracts. A futures contract is an agreement between two parties to buy or sell an asset at a set price on a future date. A Fund may use futures contracts to manage risk or obtain exposure to the investment markets, commodities, or movements in interest rates and currency values. The primary risks associated with the use of futures contracts are the imperfect correlation between the change in market value of the investments held by a Fund and the prices of futures contracts and the possibility of an illiquid market. Upon entering into a futures contract, a Fund is required to deposit with a futures commission merchant ("FCM") an amount of cash or U.S. Government or Agency Obligations in accordance with the initial margin requirements of the broker or exchange. Futures contracts are marked to market daily and an appropriate amount equal to the change in value ("variation margin") is paid or received by a Fund. Gains or losses are recognized but not considered realized until the contracts expire or are closed. Futures contracts involve, to varying degrees, risk of loss in excess of the variation margin disclosed on the Statements of Assets and Liabilities.
Hartford Domestic Equity Funds
Notes to Financial Statements – (continued) October 31, 2024
During the year ended October 31, 2024, the Capital Appreciation Fund had used futures contracts.
b)
Additional Derivative Instrument Information:
Capital Appreciation Fund
The Effect of Derivative Instruments on the Statement of Assets and Liabilities as of October 31, 2024: |
| |
| | | | | | |
| | | | | | |
Unrealized depreciation on futures contracts(1) | | | | | | |
| | | | | | |
| Amount represents the cumulative appreciation and depreciation on futures contracts as disclosed within the Schedule of Investments under the open “Futures Contracts” section. Only current day’s variation margin, if any, is reported within the Statement of Assets and Liabilities. |
The Effect of Derivative Instruments on the Statement of Operations for the year ended October 31, 2024: |
| |
| | | | | | |
Realized Gain (Loss) on Derivatives Recognized as a Result of Operations: | | | | | | |
Net realized gain (loss) on futures contracts | | | | | | |
| | | | | | |
Net Change in Unrealized Appreciation (Depreciation) on Derivatives Recognized as a Result of Operations: | | | | | | |
Net change in unrealized appreciation (depreciation) of futures contracts | | | | | | |
| | | | | | |
For the year ended October 31, 2024, the average monthly amount or number per contract outstanding for each derivative type was as follows:
| Average Notional
Par, Contracts
or Face Amount |
Futures Contracts Number of Long Contracts | |
c)
Balance Sheet Offsetting Information – Set forth below are tables which disclose both gross information and net information about instruments and transactions eligible for offset in the financial statements, and instruments and transactions that are subject to a master netting arrangement, as well as amounts related to margin, reflected as financial collateral (including cash collateral), held at clearing brokers, counterparties and a Fund's custodian. The master netting arrangements allow the clearing brokers to net any collateral held in or on behalf of a Fund, or liabilities or payment obligations of the clearing brokers to a Fund, against any liabilities or payment obligations of a Fund to the clearing brokers. A Fund is required to deposit financial collateral (including cash collateral) at the Fund's custodian on behalf of clearing brokers and counterparties to continually meet the original and maintenance requirements established by the clearing brokers and counterparties. Such requirements are specific to the respective clearing broker or counterparty. Certain master netting arrangements may not be enforceable in a bankruptcy.
Hartford Domestic Equity Funds
Notes to Financial Statements – (continued) October 31, 2024
The following tables present a Fund's derivative assets and liabilities, presented on a gross basis as no amounts are netted within the Statements of Assets and Liabilities, by counterparty net of amounts available for offset under a master netting agreement or similar agreement ("MNA") and net of the related collateral received/pledged by a Fund as of October 31, 2024:
Capital Appreciation Fund | | |
Derivative Financial Instruments: | | |
| | |
Total gross amount of derivative assets and liabilities in the Statement of Assets and Liabilities | | |
Derivatives not subject to a MNA | | |
Total gross amount of assets and liabilities subject to MNA or similar agreements | | |
A Fund’s investments expose it to various types of risks associated with financial instruments and the markets. A Fund may be exposed to the risks described below. Each Fund’s prospectus provides details of its principal risks.
The market values of equity securities, such as common stocks and preferred stocks, or equity related derivative investments, such as futures and options, may decline due to general market conditions which are not specifically related to a particular company, such as real or perceived adverse economic conditions, changes in the general outlook for corporate earnings, changes in interest or currency rates or adverse investor sentiment generally. The market value of equity securities may also decline due to factors which affect a particular industry or industries, such as labor shortages or increased production costs and competitive conditions within an industry. Equity securities and equity related investments generally have greater market price volatility than fixed income securities.
Investing in the securities of non-U.S. issuers, whether directly or indirectly, involves certain considerations and risks not typically associated with securities of U.S. issuers. Such risks include, but are not limited to: generally less liquid and less efficient securities markets; generally greater price volatility; exchange rate fluctuations; imposition of restrictions on the expatriation of funds or other protectionist measures; less publicly available information about issuers; the imposition of withholding or other taxes; higher transaction and custody costs; settlement delays and risk of loss attendant in settlement procedures; difficulties in enforcing contractual obligations; less regulation of securities markets; different accounting, disclosure and reporting requirements; more substantial governmental involvement in the economy; higher inflation rates; and greater social, economic and political uncertainties. Non-U.S. issuers may also be affected by political, social, economic or diplomatic developments in a foreign country or region or the U.S. (including the imposition of sanctions, tariffs, or other governmental restrictions). These risks are heightened for investments in issuers from countries with less developed markets.
A widespread health crisis, such as a global pandemic, could cause substantial market volatility, exchange trading suspensions or restrictions and closures of securities exchanges and businesses, impact the ability to complete redemptions, and adversely impact Fund performance.
a)
Each Fund intends to continue to qualify as a Regulated Investment Company ("RIC") under Subchapter M of the Internal Revenue Code ("IRC") by distributing substantially all of its taxable net investment income and net realized capital gains to its shareholders each year. Each Fund has distributed substantially all of its income and capital gains in prior years, if applicable, and intends to distribute substantially all of its income and capital gains during the calendar year ending December 31, 2024. Accordingly, no provision for federal income or excise taxes has been made in the accompanying financial statements. Distributions from short-term capital gains are treated as ordinary income distributions for federal income tax purposes.
b)
Net Investment Income (Loss), Net Realized Gains (Losses) and Distributions – Net investment income (loss) and net realized gains (losses) may differ for financial statement and tax purposes primarily because of losses deferred due to wash sale adjustments, foreign currency gains and losses, adjustments related to Passive Foreign Investment Companies ("PFICs"), reclasification of dividend income, RICs, certain derivatives and partnerships. The character of distributions made during the year from net investment income or net realized gains may differ from their ultimate characterization for federal income tax purposes. Also, due to the timing of dividend distributions, the fiscal year in which amounts are distributed may differ from the year that the income or realized gains (losses) were recorded by each Fund.
Hartford Domestic Equity Funds
Notes to Financial Statements – (continued) October 31, 2024
c)
Distributions and Components of Distributable Earnings – The tax character of distributions paid by each Fund for the years ended October 31, 2024 and October 31, 2023 are as follows:
| For the Year Ended
October 31, 2024 | For the Year Ended
October 31, 2023 |
| | | | |
Capital Appreciation Fund | | | | |
| | | | |
| | | | |
| | | | |
Growth Opportunities Fund | | | | |
| | | | |
| | | | |
| | | | |
| | | | |
| | | | |
| | | | |
| | | | |
| The Funds designate these distributions as long-term capital gains dividends pursuant to IRC Sec 852(b)(3)(c). |
As of October 31, 2024, the components of total accumulated earnings (deficit) for each Fund on a tax basis are as follows:
| Undistributed
Ordinary
Income | Undistributed
Long-Term
Capital Gains | Accumulated
Capital and
Other Losses | Other
Temporary
Differences | Unrealized
Appreciation
(Depreciation)
on Investments | Total
Accumulated
Earnings
(Deficit) |
Capital Appreciation Fund | | | | | | |
| | | | | | |
| | | | | | |
| | | | | | |
Growth Opportunities Fund | | | | | | |
| | | | | | |
| | | | | | |
| | | | | | |
| | | | | | |
| | | | | | |
| | | | | | |
d)
Reclassification of Capital Accounts – The Funds may record reclassifications in their capital accounts. These reclassifications have no impact on the total net assets of the Funds. The reclassifications are a result of permanent differences between U.S. GAAP and tax accounting for such items as earnings and profits distributed to shareholders on the redemption of shares, net operating loss, reclassification of dividend income and subsequent adjustments to wash sales. Adjustments are made to reflect the impact these items have on the current and future earnings distributions to shareholders. Therefore, the source of the Funds' distributions may be shown in the accompanying Statements of Changes in Net Assets as from distributable earnings or from capital depending on the type of book and tax differences that exist. For the year ended October 31, 2024, the Funds recorded reclassifications to increase (decrease) the accounts listed below:
| | Distributable
Earnings (Loss) |
Capital Appreciation Fund | | |
| | |
| | |
| | |
Growth Opportunities Fund | | |
| | |
| | |
| | |
| | |
| | |
e)
Capital Loss Carryforward – Under the Regulated Investment Company Modernization Act of 2010, funds are permitted to carry forward capital losses for an unlimited period.
Hartford Domestic Equity Funds
Notes to Financial Statements – (continued) October 31, 2024
At October 31, 2024 (tax year end), each Fund's capital loss carryforwards for U.S. federal income tax purposes were as follows:
| Short-Term
Capital Loss
Carryforward with
No Expiration | Long-Term
Capital Loss
Carryforward with
No Expiration |
Growth Opportunities Fund | | |
| | |
During the year ended October 31, 2024, Capital Appreciation Fund utilized $15,319,634, Growth Opportunities Fund utilized $741,880,605, Healthcare Fund utilized $15,112,871 and Small Company Fund utilized $26,900,521 of prior year capital loss carryforwards.
The Capital Appreciation Fund, Core Equity Fund, Dividend and Growth Fund, Equity Income Fund, Healthcare Fund, MidCap Fund, MidCap Value Fund, Small Cap Growth Fund and Small Cap Value Fund had no capital loss carryforwards for U.S. federal tax purposes as of October 31, 2024.
During the year ended October 31, 2024, Growth Opportunities Fund deferred $27,225,639, MidCap Fund deferred $23,895,735 and Small Company Fund deferred $1,993,590 late year ordinary losses.
f)
Tax Basis of Investments – The aggregate cost of investments for federal income tax purposes at October 31, 2024 is different from book purposes primarily due to wash sale loss deferrals, PFIC mark to market adjustments, partnerships and reclassification of dividend income. The net unrealized appreciation/(depreciation) on investments for tax purposes, which consists of gross unrealized appreciation and depreciation, was also different from book purposes primarily due to wash sale loss deferrals, mark-to-market adjustments on futures, PFICs, partnership adjustments and reclassification of dividend income. Both the cost and unrealized appreciation and depreciation for federal income tax purposes are disclosed below:
| | Gross Unrealized
Appreciation | Gross Unrealized
(Depreciation) | Net Unrealized
Appreciation
(Depreciation) |
Capital Appreciation Fund | | | | |
| | | | |
| | | | |
| | | | |
Growth Opportunities Fund | | | | |
| | | | |
| | | | |
| | | | |
| | | | |
| | | | |
| | | | |
g)
Accounting for Uncertainty in Income Taxes – Pursuant to provisions set forth by U.S. GAAP, HFMC reviews each Fund’s tax positions for all open tax years. As of October 31, 2024, HFMC had reviewed the open tax years and concluded that there was no reason to record a liability for net unrecognized tax obligations relating to uncertain income tax positions. Each Fund files U.S. tax returns. Although the statute of limitations for examining a Fund’s U.S. tax returns remains open for three years, no examination is currently in progress. The Funds recognize interest and penalties, if any, related to unrecognized tax benefits as income tax expense on the Statements of Operations. During the year ended October 31, 2024, the Funds did not incur any interest or penalties. HFMC is not aware of any tax positions for which it is reasonably possible that the total amounts of unrecognized tax obligations will significantly change in the next twelve months.
a)
Investment Management Agreement – HFMC serves as each Fund’s investment manager. Each Company, on behalf of its respective Funds, has entered into an Investment Management Agreement with HFMC. HFMC is an indirect subsidiary of The Hartford Financial Services Group, Inc. ("The Hartford"). HFMC has overall investment supervisory responsibility for each Fund. In addition, HFMC provides administrative personnel, services, equipment, facilities and office space for proper operation of each Fund. HFMC has contracted with Wellington Management Company LLP ("Wellington Management") under a sub-advisory agreement and Wellington Management performs the daily investment of the assets of each Fund in accordance with the Fund’s investment objective and policies. Each Fund pays a fee to HFMC. HFMC pays a sub-advisory fee to Wellington Management out of its management fee.
The schedule below reflects the rates of compensation paid to HFMC for investment management services rendered as of October 31, 2024; the rates are accrued daily and paid monthly based on each Fund’s average daily net assets, at the following annual rates:
Hartford Domestic Equity Funds
Notes to Financial Statements – (continued) October 31, 2024
| |
Capital Appreciation Fund | 0.8000% on first $500 million and; |
| 0.7000% on next $500 million and; |
| 0.6500% on next $4 billion and; |
| 0.6475% on next $5 billion and; |
| |
| 0.4500% on first $500 million and; |
| 0.3500% on next $500 million and; |
| 0.3300% on next $1.5 billion and; |
| 0.3250% on next $2.5 billion and; |
| |
| 0.7500% on first $500 million and; |
| 0.6500% on next $500 million and; |
| 0.6000% on next $1.5 billion and; |
| 0.5950% on next $2.5 billion and; |
| 0.5900% on next $5 billion and; |
| |
| 0.7500% on first $250 million and; |
| 0.7000% on next $250 million and; |
| 0.6500% on next $500 million and; |
| 0.6000% on next $1.5 billion and; |
| 0.5900% on next $2.5 billion and; |
| |
Growth Opportunities Fund | 0.8000% on first $250 million and; |
| 0.7000% on next $4.75 billion and; |
| 0.6975% on next $5 billion and; |
| |
| 0.9000% on first $500 million and; |
| 0.8500% on next $500 million and; |
| 0.8000% on next $4 billion and; |
| 0.7975% on next $5 billion and; |
| |
| 0.8500% on first $500 million and; |
| 0.7500% on next $500 million and; |
| 0.7000% on next $4 billion and; |
| 0.6975% on next $5 billion and; |
| |
| 0.7500% on first $500 million and; |
| 0.6500% on next $500 million and; |
| 0.6000% on next $1.5 billion and; |
| 0.5950% on next $2.5 billion and; |
| 0.5900% on next $5 billion and; |
| |
| 0.9000% on first $100 million and; |
| 0.8000% on next $150 million and; |
| 0.7000% on next $250 million and; |
| 0.6500% on next $4.5 billion and; |
| 0.6300% on next $5 billion and; |
| |
| 0.7000% on first $500 million and; |
| 0.6500% on next $500 million and; |
| 0.6000% on next $2 billion and; |
| 0.5900% on next $2 billion and; |
| 0.5800% on next $5 billion and; |
| |
| 0.8500% on first $250 million and; |
| 0.8000% on next $250 million and; |
| 0.7500% on next $500 million and; |
| 0.7000% on next $500 million and; |
| 0.6500% on next $3.5 billion and; |
| 0.6300% on next $5 billion and; |
| |
Hartford Domestic Equity Funds
Notes to Financial Statements – (continued) October 31, 2024
b)
Accounting Services Agreement – HFMC provides the Funds with accounting services pursuant to a fund accounting agreement by and between each Company, on behalf of its respective Funds, and HFMC. HFMC has delegated certain accounting and administrative service functions to State Street Bank and Trust Company ("State Street"). In consideration of services rendered and expenses assumed pursuant to the fund accounting agreement, each Fund pays HFMC a fee. The fund accounting fee for each Fund is equal to the greater of: (A) the sum of (i) the sub-accounting fee payable by HFMC with respect to the Fund; (ii) the fee payable for tax preparation services for the Fund; and (iii) the amount of expenses that HFMC allocates for providing the fund accounting services to the Fund; plus a target profit margin; or (B) $40,000 per year; provided, however, that to the extent the annual amount of the fund accounting fee exceeds 0.02% of the Fund’s average net assets (calculated during its current fiscal year), HFMC shall waive such portion of the fund accounting fee.
c)
Operating Expenses – Allocable expenses incurred by each Company are allocated to each series within such Company, and allocated to classes within each such series, in proportion to the average daily net assets of such series and classes, except where allocation of certain expenses is more fairly made directly to a Fund or to specific classes within a Fund. As of October 31, 2024, HFMC contractually agreed to limit the total annual fund operating expenses (exclusive of taxes, interest expenses, brokerage commissions, acquired fund fees and expenses, and extraordinary expenses), until February 28, 2025 (unless the applicable Board of Directors approves its earlier termination) as follows for the following Fund:
| Expense Limit as a Percentage of Average Daily Net Assets |
| | | | | | | | | |
| | | | | | | | | |
d)
Fees Paid Indirectly – Certain Funds have entered into agreements with State Street Global Markets, LLC and Russell Implementation Services, Inc. to partially recapture non-discounted trade commissions. Such rebates are used to pay a portion of a Fund's expenses. For the year ended October 31, 2024, these amounts, if any, are included in the Statements of Operations.
The ratio of expenses to average net assets in the accompanying financial highlights excludes the reduction in expenses related to fees paid indirectly. The impacted annualized expense ratio after waivers reflecting the reduction for fees paid indirectly for the period is as follows: Capital Appreciation Fund Class F (0.69%), Core Equity Fund Class A (0.69%), and Class I (0.45%), Dividend and Growth Fund Class F (0.62%), Class Y (0.72%), and Class R5 (0.72%), Equity Income Fund Class F (0.64%), Growth Opportunities Fund Class R5 (0.86%), MidCap Value Fund Class Y (0.86%), Class R3 (1.47%), Class R4 (1.17%), and Class R5 (0.87%), Small Cap Growth Fund Class C (2.12%), and Class R6 (0.86%). The amount of fees recaptured by the other funds did not impact the ratio of expenses to average net assets in the financial highlights.
e)
Sales Charges and Distribution and Service Plan for Class A, C, R3 and R4 Shares – Hartford Funds Distributors, LLC ("HFD"), an indirect subsidiary of The Hartford, is the principal underwriter and distributor of each Fund. For the year ended October 31, 2024, HFD received front-end sales charges and contingent deferred sales charges for each Fund as follows:
| | Contingent Deferred
Sales Charges |
Capital Appreciation Fund | | |
| | |
| | |
| | |
Growth Opportunities Fund | | |
| | |
| | |
| | |
| | |
| | |
| | |
The Board of Directors of each Company has approved the adoption of a separate distribution plan (each a "Plan") pursuant to Rule 12b-1 under the 1940 Act for each of Class A, C, R3 and R4 shares. Under a Plan, Class A, Class C, Class R3 and Class R4 shares of a Fund, as applicable, bear distribution and/or service fees paid to HFD, some or all of which may be paid to select broker-dealers. Pursuant to the Class A Plan, a Fund may pay HFD a fee of up to 0.25% of the average daily net assets attributable to Class A shares for distribution financing activities and shareholder account servicing activities. The entire amount of the fee may be used for shareholder servicing expenses and/or distribution expenses. Pursuant to the Class C Plan, a Fund may pay HFD a fee of up to 1.00% of the average daily net assets attributable to Class C shares for distribution financing activities, and up to 0.25% may be used for shareholder account servicing activities. The Class C Plan also provides that HFD will receive all contingent deferred sales charges attributable to Class C shares. Pursuant to the Class R3 Plan, a Fund may pay HFD a fee of up to 0.50% of the average daily net assets attributable to Class R3 shares for distribution financing activities, and up to 0.25% may be used for shareholder account servicing activities. Pursuant to the Class R4 Plan, a Fund may pay HFD a fee of up to 0.25% of the average daily net assets attributable to Class R4 shares for distribution financing activities.
Hartford Domestic Equity Funds
Notes to Financial Statements – (continued) October 31, 2024
The entire amount of the fee may be used for shareholder account servicing activities. Each Fund’s 12b-1 fees are accrued daily and paid monthly or at such other intervals as the respective Company’s Board of Directors may determine. Any 12b-1 fees attributable to assets held in an account held directly with the Funds’ transfer agent for which there is not a third-party listed as the broker-dealer of record (or HFD does not otherwise have a payment obligation) are generally reimbursed to the applicable share class of the applicable Fund. Such amounts are reflected as "Distribution fee reimbursements" on the Statements of Operations.
f)
Remuneration Paid to Directors, Officers, and others – Certain officers of each Company are directors and/or officers of HFMC and/or The Hartford or its subsidiaries. For the year ended October 31, 2024, a portion of each Company’s Chief Compliance Officer’s ("CCO") compensation was paid by each Fund, which is included on the Statement of Operations as Chief Compliance Officer fees.
g)
Hartford Administrative Services Company ("HASCO"), an indirect subsidiary of The Hartford, provides transfer agent services to each Fund. Each Fund pays HASCO a transfer agency fee payable monthly based on the lesser of (i) the costs of providing or overseeing transfer agency services provided to each share class of such Fund plus a target profit margin or (ii) a Specified Amount (as defined in the table below). Such fee is intended to compensate HASCO for: (i) fees payable by HASCO to SS&C GIDS, Inc. ("SS&C") (and any other designated sub-agent) according to the agreed-upon fee schedule under the sub-transfer agency agreement between HASCO and SS&C (or between HASCO and any other designated sub-agent, as applicable); (ii) sub-transfer agency fees payable by HASCO to financial intermediaries, according to the agreed-upon terms between HASCO and the financial intermediaries, provided that such payments are within certain limits approved by the applicable Company’s Board of Directors; (iii) certain expenses that HASCO’s parent company, Hartford Funds Management Group, Inc., allocates to HASCO that relate to HASCO’s transfer agency services provided to the Fund; and (iv) a target profit margin.
| Specified Amount
(as a percentage
average daily
net assets) |
| |
| |
| |
| |
| |
| |
| |
| |
| |
Effective March 1, 2024, HASCO has contractually agreed to waive its transfer agency fee and/or reimburse transfer agency-related expenses to the extent necessary to limit the transfer agency fee for Class Y of the Fund listed below until February 28, 2025, unless the applicable Board of Directors approves its earlier termination.
From November 1, 2023 through February 29, 2024, HASCO contractually agreed to waive and/or reimburse a portion of the transfer agency fees for Class Y of the Funds listed below to the extent necessary to limit the transfer agency fees as follows:
Effective July 1, 2024, HASCO has contractually agreed to waive its transfer agency fee and/or reimburse transfer agency-related expenses to the extent necessary to limit the transfer agency fee for Class I of the Funds listed below until February 28, 2025, unless the Board of Directors approves its earlier termination as follows:
| | |
| | |
| | |
| | |
Growth Opportunities Fund | | |
| | |
Hartford Domestic Equity Funds
Notes to Financial Statements – (continued) October 31, 2024
Pursuant to a sub-transfer agency agreement between HASCO and SS&C, HASCO has delegated certain transfer agent, dividend disbursing agent and shareholder servicing agent functions to SS&C. Each Fund does not pay any fee directly to SS&C; rather, HASCO makes all such payments to SS&C. The accrued amount shown in the Statements of Operations reflects the amounts charged by HASCO. These fees are accrued daily and paid monthly.
For the year ended October 31, 2024, the effective rate of compensation paid to HASCO for transfer agency services as a percentage of each Class' average daily net assets is as follows:
| | | | | | | | | |
Capital Appreciation Fund | | | | | | | | | |
| | | | | | | | | |
| | | | | | | | | |
| | | | | | | | | |
Growth Opportunities Fund | | | | | | | | | |
| | | | | | | | | |
| | | | | | | | | |
| | | | | | | | | |
| | | | | | | | | |
| | | | | | | | | |
| | | | | | | | | |
| Percentage rounds to zero. |
Each Company has entered into a securities lending agency agreement ("lending agreement") with Citibank, N.A. ("Citibank"). A Fund may lend portfolio securities to certain borrowers in U.S. and non-U.S. markets in an amount not to exceed one-third (33 1/3%) of the value of its total assets. A Fund may lend portfolio securities, provided that the borrower provides collateral that is maintained in an amount at least equal to the current market value of the securities loaned. Cash collateral is invested for the benefit of a Fund by the Fund’s lending agent pursuant to collateral investment guidelines. The collateral is marked to market daily, in an amount at least equal to the current market value of the securities loaned. The contractual maturities of the securities lending transactions are considered overnight and continuous.
A Fund is subject to certain risks while its securities are on loan, including the following: (i) the risk that the borrower defaults on the loan and the collateral is inadequate to cover the Fund’s loss; (ii) the risk that the earnings on the collateral invested are not sufficient to pay fees incurred in connection with the loan; (iii) the Fund could lose money in the event of a decline in the value of the collateral provided for loaned securities or a decline in the value of any investments made with cash collateral; (iv) the risk that the borrower may use the loaned securities to cover a short sale, which may in turn place downward pressure on the market prices of the loaned securities; (v) the risk that return of loaned securities could be delayed and interfere with portfolio management decisions; (vi) the risk that any efforts to restrict or recall the securities for purposes of voting may not be effective; and (vii) operational risks (i.e., the risk of losses resulting from problems in the settlement and accounting process especially so in certain international markets). These events could also trigger adverse tax consequences for a Fund.
A Fund retains loan fees and the interest on cash collateral investments but is required to pay the borrower a rebate for the use of cash collateral. In cases where the lent security is of high value to borrowers, there may be a negative rebate (i.e., a net payment from the borrower to the applicable Fund). Upon termination of a loan, a Fund is required to return to the borrower an amount equal to the cash collateral, plus any rebate owed to the borrowers.
The net income earned on the securities lending (after payment of rebates and Citibank’s fee) is included on the Statements of Operations as Investment Income from securities lending. A Fund also receives payments from the borrower during the period of the loan, equivalent to dividends and interest earned on the securities loaned, which are recorded as Investment Income from dividends or interest, respectively, on the Statements of Operations.
Hartford Domestic Equity Funds
Notes to Financial Statements – (continued) October 31, 2024
The following table presents for each Fund that lends its portfolio securities the market value of the securities on loan and the cash and non-cash collateral posted by the borrower as of October 31, 2024.
| Investment Securities on Loan, at market value,
Presented on the Statements of Assets and Liabilities | | |
Capital Appreciation Fund | | | |
| | | |
| | | |
| | | |
Growth Opportunities Fund | | | |
| | | |
| | | |
| | | |
| | | |
| | | |
| | | |
| It is each Fund’s policy to obtain additional collateral from, or return excess collateral to, the borrower by the end of the next business day following the valuation date of the securities loaned. Therefore, the value of the collateral held may be temporarily less than that required under the lending contract due to timing. Pursuant to the lending agreement, the borrower will provide collateral in an amount at least equal to the current market value of securities loaned. |
9.
Affiliated Security Transactions:
If a Fund owns 5% or more of the outstanding voting securities, either directly or indirectly, of a particular issuer, the 1940 Act deems such an issuer to be an "affiliate" of the Fund. As of and during the year ended October 31, 2024, the MidCap Fund owned 5% or more of the outstanding voting securities of the issuer identified in the table below.
A summary of affiliated security transactions for the year ended October 31, 2024 follows:
| Beginning
Value as of
November 1, 2023 | | | Net
Realized
Gain/(Loss)
on Sales | | Change in
Unrealized
Appreciation/
(Depreciation) | Ending
Value as of
October 31,
2024 | Shares as of
October 31,
2024 | | Capital Gains
Distribution |
|
| | | | | | | | | | |
| Not an affiliate as of October 31, 2024. |
As of October 31, 2024, affiliates of The Hartford had ownership of shares in certain Funds as follows:
| Percentage rounds to zero. |
Percentage of Fund by Class: | | | | | | | | | |
| | | | | | | | | |
| | | | | | | | | |
| | | | | | | | | |
| Percentage rounds to zero. |
Hartford Domestic Equity Funds
Notes to Financial Statements – (continued) October 31, 2024
As of October 31, 2024, affiliated funds of funds and the 529 plan for which HFMC serves as the program manager (the "529 plan") in the aggregate owned a portion of the Funds identified below. Therefore, these Funds may experience relatively large purchases or redemptions of their shares as a result of purchase and sale activity from these affiliated funds of funds and the 529 plan. Affiliated funds of funds and the 529 plan owned shares in the Funds listed below as follows:
| |
Capital Appreciation Fund | |
| |
| |
| |
Growth Opportunities Fund | |
| |
| |
| |
| |
| |
| As of October 31, 2024, affiliated funds of funds and the 529 plan were invested in Class F shares. |
11.
Investment Transactions:
For the year ended October 31, 2024, the cost of purchases and proceeds from sales of investment securities (excluding short-term investments) were as follows:
| Cost of Purchases
Excluding U.S.
Government
Obligations | Sales Proceeds
Excluding U.S.
Government
Obligations | | |
Capital Appreciation Fund | | | | |
| | | | |
| | | | |
| | | | |
Growth Opportunities Fund | | | | |
| | | | |
| | | | |
| | | | |
| | | | |
| | | | |
| | | | |
12.
Capital Share Transactions:
The following information is for the years ended October 31, 2024 and October 31, 2023:
| For the Year Ended
October 31, 2024 | For the Year Ended
October 31, 2023 |
| | | | |
Capital Appreciation Fund | | | | |
| | | | |
| | | | |
Shares Issued for Reinvested Dividends | | | | |
| | | | |
| | | | |
| | | | |
| | | | |
Shares Issued for Reinvested Dividends | | | | |
| | | | |
| | | | |
| | | | |
| | | | |
Shares Issued for Reinvested Dividends | | | | |
| | | | |
| | | | |
Hartford Domestic Equity Funds
Notes to Financial Statements – (continued) October 31, 2024
| For the Year Ended October 31, 2024 | For the Year Ended October 31, 2023 |
| | | | |
| | | | |
| | | | |
Shares Issued for Reinvested Dividends | | | | |
| | | | |
| | | | |
| | | | |
| | | | |
Shares Issued for Reinvested Dividends | | | | |
| | | | |
| | | | |
| | | | |
| | | | |
Shares Issued for Reinvested Dividends | | | | |
| | | | |
| | | | |
| | | | |
| | | | |
Shares Issued for Reinvested Dividends | | | | |
| | | | |
| | | | |
| | | | |
| | | | |
Shares Issued for Reinvested Dividends | | | | |
| | | | |
| | | | |
| | | | |
| | | | |
Shares Issued for Reinvested Dividends | | | | |
| | | | |
| | | | |
Total Net Increase (Decrease) | | | | |
| | | | |
| | | | |
| | | | |
Shares Issued for Reinvested Dividends | | | | |
| | | | |
| | | | |
| | | | |
| | | | |
Shares Issued for Reinvested Dividends | | | | |
| | | | |
| | | | |
| | | | |
| | | | |
Shares Issued for Reinvested Dividends | | | | |
| | | | |
| | | | |
| | | | |
| | | | |
Shares Issued for Reinvested Dividends | | | | |
| | | | |
| | | | |
| | | | |
| | | | |
Shares Issued for Reinvested Dividends | | | | |
| | | | |
| | | | |
Hartford Domestic Equity Funds
Notes to Financial Statements – (continued) October 31, 2024
| For the Year Ended October 31, 2024 | For the Year Ended October 31, 2023 |
| | | | |
| | | | |
| | | | |
Shares Issued for Reinvested Dividends | | | | |
| | | | |
| | | | |
| | | | |
| | | | |
Shares Issued for Reinvested Dividends | | | | |
| | | | |
| | | | |
| | | | |
| | | | |
Shares Issued for Reinvested Dividends | | | | |
| | | | |
| | | | |
| | | | |
| | | | |
Shares Issued for Reinvested Dividends | | | | |
| | | | |
| | | | |
Total Net Increase (Decrease) | | | | |
Dividend and Growth Fund(1) | | | | |
| | | | |
| | | | |
Shares Issued for Reinvested Dividends | | | | |
| | | | |
| | | | |
| | | | |
| | | | |
Shares Issued for Reinvested Dividends | | | | |
| | | | |
| | | | |
| | | | |
| | | | |
Shares Issued for Reinvested Dividends | | | | |
| | | | |
| | | | |
| | | | |
| | | | |
Shares Issued for Reinvested Dividends | | | | |
| | | | |
| | | | |
| | | | |
| | | | |
Shares Issued for Reinvested Dividends | | | | |
| | | | |
| | | | |
| | | | |
| | | | |
Shares Issued for Reinvested Dividends | | | | |
| | | | |
| | | | |
| | | | |
| | | | |
Shares Issued for Reinvested Dividends | | | | |
| | | | |
| | | | |
Hartford Domestic Equity Funds
Notes to Financial Statements – (continued) October 31, 2024
| For the Year Ended October 31, 2024 | For the Year Ended October 31, 2023 |
| | | | |
| | | | |
| | | | |
Shares Issued for Reinvested Dividends | | | | |
| | | | |
| | | | |
| | | | |
| | | | |
Shares Issued for Reinvested Dividends | | | | |
| | | | |
| | | | |
Total Net Increase (Decrease) | | | | |
| | | | |
| | | | |
| | | | |
Shares Issued for Reinvested Dividends | | | | |
| | | | |
| | | | |
| | | | |
| | | | |
Shares Issued for Reinvested Dividends | | | | |
| | | | |
| | | | |
| | | | |
| | | | |
Shares Issued for Reinvested Dividends | | | | |
| | | | |
| | | | |
| | | | |
| | | | |
Shares Issued for Reinvested Dividends | | | | |
| | | | |
| | | | |
| | | | |
| | | | |
Shares Issued for Reinvested Dividends | | | | |
| | | | |
| | | | |
| | | | |
| | | | |
Shares Issued for Reinvested Dividends | | | | |
| | | | |
| | | | |
| | | | |
| | | | |
Shares Issued for Reinvested Dividends | | | | |
| | | | |
| | | | |
| | | | |
| | | | |
Shares Issued for Reinvested Dividends | | | | |
| | | | |
| | | | |
| | | | |
| | | | |
Shares Issued for Reinvested Dividends | | | | |
| | | | |
| | | | |
Total Net Increase (Decrease) | | | | |
Hartford Domestic Equity Funds
Notes to Financial Statements – (continued) October 31, 2024
| For the Year Ended October 31, 2024 | For the Year Ended October 31, 2023 |
| | | | |
Growth Opportunities Fund(1) | | | | |
| | | | |
| | | | |
| | | | |
| | | | |
| | | | |
| | | | |
| | | | |
| | | | |
| | | | |
| | | | |
| | | | |
| | | | |
| | | | |
| | | | |
| | | | |
| | | | |
| | | | |
| | | | |
| | | | |
| | | | |
| | | | |
| | | | |
| | | | |
| | | | |
| | | | |
| | | | |
| | | | |
| | | | |
| | | | |
| | | | |
| | | | |
| | | | |
| | | | |
| | | | |
| | | | |
| | | | |
Total Net Increase (Decrease) | | | | |
| | | | |
| | | | |
| | | | |
Shares Issued for Reinvested Dividends | | | | |
| | | | |
| | | | |
| | | | |
| | | | |
Shares Issued for Reinvested Dividends | | | | |
| | | | |
| | | | |
| | | | |
| | | | |
Shares Issued for Reinvested Dividends | | | | |
| | | | |
| | | | |
Hartford Domestic Equity Funds
Notes to Financial Statements – (continued) October 31, 2024
| For the Year Ended October 31, 2024 | For the Year Ended October 31, 2023 |
| | | | |
| | | | |
| | | | |
Shares Issued for Reinvested Dividends | | | | |
| | | | |
| | | | |
| | | | |
| | | | |
Shares Issued for Reinvested Dividends | | | | |
| | | | |
| | | | |
| | | | |
| | | | |
Shares Issued for Reinvested Dividends | | | | |
| | | | |
| | | | |
| | | | |
| | | | |
Shares Issued for Reinvested Dividends | | | | |
| | | | |
| | | | |
| | | | |
| | | | |
Shares Issued for Reinvested Dividends | | | | |
| | | | |
| | | | |
| | | | |
| | | | |
Shares Issued for Reinvested Dividends | | | | |
| | | | |
| | | | |
Total Net Increase (Decrease) | | | | |
| | | | |
| | | | |
| | | | |
Shares Issued for Reinvested Dividends | | | | |
| | | | |
| | | | |
| | | | |
| | | | |
Shares Issued for Reinvested Dividends | | | | |
| | | | |
| | | | |
| | | | |
| | | | |
Shares Issued for Reinvested Dividends | | | | |
| | | | |
| | | | |
| | | | |
| | | | |
Shares Issued for Reinvested Dividends | | | | |
| | | | |
| | | | |
| | | | |
| | | | |
Shares Issued for Reinvested Dividends | | | | |
| | | | |
| | | | |
Hartford Domestic Equity Funds
Notes to Financial Statements – (continued) October 31, 2024
| For the Year Ended October 31, 2024 | For the Year Ended October 31, 2023 |
| | | | |
| | | | |
| | | | |
Shares Issued for Reinvested Dividends | | | | |
| | | | |
| | | | |
| | | | |
| | | | |
Shares Issued for Reinvested Dividends | | | | |
| | | | |
| | | | |
| | | | |
| | | | |
Shares Issued for Reinvested Dividends | | | | |
| | | | |
| | | | |
| | | | |
| | | | |
Shares Issued for Reinvested Dividends | | | | |
| | | | |
| | | | |
Total Net Increase (Decrease) | | | | |
| | | | |
| | | | |
| | | | |
Shares Issued for Reinvested Dividends | | | | |
| | | | |
| | | | |
| | | | |
| | | | |
Shares Issued for Reinvested Dividends | | | | |
| | | | |
| | | | |
| | | | |
| | | | |
Shares Issued for Reinvested Dividends | | | | |
| | | | |
| | | | |
| | | | |
| | | | |
Shares Issued for Reinvested Dividends | | | | |
| | | | |
| | | | |
| | | | |
| | | | |
Shares Issued for Reinvested Dividends | | | | |
| | | | |
| | | | |
| | | | |
| | | | |
Shares Issued for Reinvested Dividends | | | | |
| | | | |
| | | | |
| | | | |
| | | | |
Shares Issued for Reinvested Dividends | | | | |
| | | | |
| | | | |
Hartford Domestic Equity Funds
Notes to Financial Statements – (continued) October 31, 2024
| For the Year Ended October 31, 2024 | For the Year Ended October 31, 2023 |
| | | | |
| | | | |
| | | | |
Shares Issued for Reinvested Dividends | | | | |
| | | | |
| | | | |
| | | | |
| | | | |
Shares Issued for Reinvested Dividends | | | | |
| | | | |
| | | | |
Total Net Increase (Decrease) | | | | |
| | | | |
| | | | |
| | | | |
Shares Issued for Reinvested Dividends | | | | |
| | | | |
| | | | |
| | | | |
| | | | |
Shares Issued for Reinvested Dividends | | | | |
| | | | |
| | | | |
| | | | |
| | | | |
Shares Issued for Reinvested Dividends | | | | |
| | | | |
| | | | |
| | | | |
| | | | |
Shares Issued for Reinvested Dividends | | | | |
| | | | |
| | | | |
| | | | |
| | | | |
Shares Issued for Reinvested Dividends | | | | |
| | | | |
| | | | |
| | | | |
| | | | |
Shares Issued for Reinvested Dividends | | | | |
| | | | |
| | | | |
| | | | |
| | | | |
Shares Issued for Reinvested Dividends | | | | |
| | | | |
| | | | |
| | | | |
| | | | |
Shares Issued for Reinvested Dividends | | | | |
| | | | |
| | | | |
| | | | |
| | | | |
Shares Issued for Reinvested Dividends | | | | |
| | | | |
| | | | |
Total Net Increase (Decrease) | | | | |
Hartford Domestic Equity Funds
Notes to Financial Statements – (continued) October 31, 2024
| For the Year Ended October 31, 2024 | For the Year Ended October 31, 2023 |
| | | | |
| | | | |
| | | | |
| | | | |
Shares Issued for Reinvested Dividends | | | | |
| | | | |
| | | | |
| | | | |
| | | | |
Shares Issued for Reinvested Dividends | | | | |
| | | | |
| | | | |
| | | | |
| | | | |
Shares Issued for Reinvested Dividends | | | | |
| | | | |
| | | | |
| | | | |
| | | | |
Shares Issued for Reinvested Dividends | | | | |
| | | | |
| | | | |
| | | | |
| | | | |
Shares Issued for Reinvested Dividends | | | | |
| | | | |
| | | | |
| | | | |
| | | | |
Shares Issued for Reinvested Dividends | | | | |
| | | | |
| | | | |
| | | | |
| | | | |
Shares Issued for Reinvested Dividends | | | | |
| | | | |
| | | | |
| | | | |
| | | | |
Shares Issued for Reinvested Dividends | | | | |
| | | | |
| | | | |
| | | | |
| | | | |
Shares Issued for Reinvested Dividends | | | | |
| | | | |
| | | | |
Total Net Increase (Decrease) | | | | |
| | | | |
| | | | |
| | | | |
| | | | |
| | | | |
| | | | |
| | | | |
| | | | |
| | | | |
Hartford Domestic Equity Funds
Notes to Financial Statements – (continued) October 31, 2024
| For the Year Ended October 31, 2024 | For the Year Ended October 31, 2023 |
| | | | |
| | | | |
| | | | |
| | | | |
| | | | |
| | | | |
| | | | |
| | | | |
| | | | |
| | | | |
| | | | |
| | | | |
| | | | |
| | | | |
| | | | |
| | | | |
| | | | |
| | | | |
| | | | |
| | | | |
| | | | |
| | | | |
| | | | |
| | | | |
| | | | |
| | | | |
| | | | |
| | | | |
| | | | |
Total Net Increase (Decrease) | | | | |
| Includes In-Kind Redemptions during the year ended October 31, 2023. |
| Share transactions have been adjusted to reflect the effect of a 4 for 1 reverse share split on September 13, 2024 (See Note 16 of the Notes to Financial Statements). |
| Share transactions have been adjusted to reflect the effect of a 2 for 1 reverse share split on September 13, 2024 (See Note 16 of the Notes to Financial Statements). |
In certain circumstances, a Fund may distribute portfolio securities as payment for redemption of Fund shares (redemption in-kind). For financial reporting purposes, a Fund will recognize a gain on in-kind redemptions to the extent the value of the distributed securities on the date of redemption exceeds the cost of those securities; a Fund will recognize a loss if the cost exceeds value. Gains and losses realized on redemptions in-kind are not recognized for tax purposes, and are re-classified from realized gain (loss) to paid-in-capital.
During the year ended October 31, 2023, 8,428,087 and 5,854,664 shares of the Dividend and Growth Fund and Growth Opportunities Fund, respectively, were redeemed in-kind. A net realized gain (loss) of ($7,936,735) and ($32,684,108) on investments for the Dividend and Growth Fund and Growth Opportunities Fund, respectively, delivered through the in-kind redemptions.
Each Fund participates in a committed line of credit pursuant to a credit agreement dated February 29, 2024. Each Fund may borrow under the line of credit for temporary or emergency purposes. The Funds (together with certain other Hartford Funds) may borrow up to $350 million in the aggregate, subject to asset coverage and other limitations specified in the credit agreement. The interest rate on borrowings varies depending on the nature of the loan. The facility also charges certain fees, such as a commitment fee. From November 1, 2023 through February 29, 2024, the Funds (together with certain other Hartford Funds) had a similar agreement that enabled them to participate in a $350 million committed line of credit. The fees incurred by the Funds in connection with the committed lines of credit during the period appear in the Statements of Operations under "Other expenses." During and as of the year ended October 31, 2024, none of the Funds had borrowings under these facilities.
Hartford Domestic Equity Funds
Notes to Financial Statements – (continued) October 31, 2024
Under each Company’s organizational documents, the Company shall indemnify its officers and directors to the full extent required or permitted under Maryland General Corporation Law and federal securities laws. In addition, each Company, on behalf of its respective Funds, may enter into contracts that contain a variety of indemnifications. Each Company’s maximum exposure under these arrangements is unknown. However, as of the date of these financial statements, each Company has not had prior claims or losses pursuant to these contracts and expects the risk of loss to be remote.
16.
Reverse Stock Split for Class C shares of the Growth Opportunities Fund, the MidCap Fund, the Small Cap Growth Fund, and the Small Company Fund:
The Board of Directors of The Hartford Mutual Funds, Inc. and The Hartford Mutual Funds II, Inc. approved a reverse stock split of the issued and outstanding Class C shares (the “Reverse Stock Split”) of each of the Growth Opportunities Fund, the MidCap Fund, the Small Cap Growth Fund, and the Small Company Fund. References to a "Fund" in this section refer only to the Growth Opportunities Fund, the MidCap Fund, the Small Cap Growth Fund, and the Small Company Fund. The Reverse Stock Split was completed after the close of business on September 13, 2024 (the “Effective Date”). As a result of the Reverse Stock Split, for each Class C share of a Fund that a shareholder owned as of the Effective Date, the shareholder received a proportional number of Class C shares of the same Fund with the same aggregate dollar value. Thus, the total dollar value of an investment in Class C shares of a Fund was unchanged and each shareholder continues to own the same percentage (by value) of the class of the same Fund immediately following the Reverse Stock Split as the shareholder owned immediately prior to the Reverse Stock Split. The Reverse Stock Split was not a taxable event, nor did it impact the net assets, operational results or total return of the Funds. The Reverse Stock Split was carried out in accordance with a stock split ratio set forth below, calculated to result in a net asset value per share that better aligns the share class prices of such Fund. The shares outstanding, NAV per share and other per share information have been updated in the accompanying financial statements and the financial highlights to reflect the effect of the Reverse Stock Split.
| |
Growth Opportunities Fund | |
| |
| |
| |
17.
Recent Accounting Pronouncement:
In November 2023, the Financial Accounting Standards Board issued Accounting Standards Update No. 2023-07 (“ASU 2023-07”), “Segment Reporting (“Topic 280”). ASU 2023-07 clarifies the guidance in Topic 280, which requires public entities to provide disclosures of significant segment expenses and other segment items. The guidance requires public entities to provide in interim periods all disclosures about a reportable segment’s profit or loss and assets that are currently required annually and also applies to public entities with a single reportable segment. Entities are permitted to disclose more than one measure of a segment’s profit or loss if such measures are used by the Chief Operating Decision Maker to allocate resources and assess performance, as long as at least one of those measures is determined in a way that is most consistent with the measurement principles used to measure the corresponding amounts in the consolidated financial statements. The amendments in this update are effective for fiscal years beginning after December 15, 2023, and interim periods within fiscal years beginning after December 15, 2024. Early adoption is permitted. Management is currently evaluating the implications, if any, of the additional requirements and their impact on the Funds' financial statements.
Management has evaluated all subsequent transactions and events through the date on which these financial statements were issued and has determined that no additional items require disclosure in these financial statements.
Report of Independent Registered Public Accounting Firm
To the Board of Directors of The Hartford Mutual Funds, Inc. and The Hartford Mutual Funds II, Inc. and Shareholders of The Hartford Capital Appreciation Fund, Hartford Core Equity Fund, The Hartford Dividend and Growth Fund, The Hartford Equity Income Fund, The Hartford Growth Opportunities Fund, The Hartford Healthcare Fund, The Hartford MidCap Fund, The Hartford MidCap Value Fund, The Hartford Small Cap Growth Fund, Hartford Small Cap Value Fund and The Hartford Small Company Fund
Opinions on the Financial Statements
We have audited the accompanying statements of assets and liabilities, including the schedules of investments, of The Hartford Capital Appreciation Fund, Hartford Core Equity Fund, The Hartford Dividend and Growth Fund, The Hartford Equity Income Fund, The Hartford Healthcare Fund, The Hartford MidCap Fund, The Hartford MidCap Value Fund, Hartford Small Cap Value Fund and The Hartford Small Company Fund (nine of the funds constituting The Hartford Mutual Funds, Inc.) and The Hartford Growth Opportunities Fund, and The Hartford Small Cap Growth Fund (two of the funds constituting The Hartford Mutual Funds II, Inc.) (hereafter collectively referred to as the “Funds”) as of October 31, 2024, the related statements of operations for the year ended October 31, 2024, the statements of changes in net assets for each of the two years in the period ended October 31, 2024, including the related notes, and the financial highlights for each of the periods indicated therein (collectively referred to as the “financial statements”). In our opinion, the financial statements present fairly, in all material respects, the financial position of each of the Funds as of October 31, 2024, the results of each of their operations for the year then ended, the changes in each of their net assets for each of the two years in the period ended October 31, 2024 and each of the financial highlights for each of the periods indicated therein, in conformity with accounting principles generally accepted in the United States of America.
These financial statements are the responsibility of the Funds’ management. Our responsibility is to express an opinion on the Funds’ financial statements based on our audits. We are a public accounting firm registered with the Public Company Accounting Oversight Board (United States) (PCAOB) and are required to be independent with respect to the Funds in accordance with the U.S. federal securities laws and the applicable rules and regulations of the Securities and Exchange Commission and the PCAOB.
We conducted our audits of these financial statements in accordance with the standards of the PCAOB. Those standards require that we plan and perform the audit to obtain reasonable assurance about whether the financial statements are free of material misstatement, whether due to error or fraud.
Our audits included performing procedures to assess the risks of material misstatement of the financial statements, whether due to error or fraud, and performing procedures that respond to those risks. Such procedures included examining, on a test basis, evidence regarding the amounts and disclosures in the financial statements. Our audits also included evaluating the accounting principles used and significant estimates made by management, as well as evaluating the overall presentation of the financial statements. Our procedures included confirmation of securities owned as of October 31, 2024 by correspondence with the custodian, transfer agents and brokers; when replies were not received from brokers, we performed other auditing procedures. We believe that our audits provide a reasonable basis for our opinions.
/s/PricewaterhouseCoopers LLP
Philadelphia, Pennsylvania
December 26, 2024
We have served as the auditor of one or more investment companies in the Hartford Funds group of investment companies since 2020.
Hartford Domestic Equity Funds
Item 8. Changes in and Disagreements with Accountants for Open-End Management Investment Companies.
Not applicable. There were no changes in or disagreements with accountants during the period.
Hartford Domestic Equity Funds
Item 9. Proxy Disclosures for Open-End Management Investment Companies.
A special meeting of shareholders of The Hartford Growth Opportunities Fund (the "Fund") was held on December 13, 2023, which was ultimately adjourned until January 23, 2024 (“Shareholder Meeting”). At the Shareholder Meeting, shareholders of the Fund did not achieve the necessary quorum under the Investment Company Act of 1940, as amended, to approve the proposal to reclassify the Fund from a diversified investment company to a non-diversified investment company and eliminate a related fundamental diversification policy. As a result, the Fund remains diversified and remains subject to its related fundamental diversification policy. The final results of the Shareholder Meeting are below:
|
Shares Outstanding (as of Record Date (September 25, 2023)): 116,143,369 |
Total Shares Voted: 55,586,848 |
Percentage of Shares Voted: 47.86% |
|
Percentage of Shares For: 70.67% |
|
Percentage of Shares Against: 14.95% |
Votes Abstained: 7,991,916 |
Percentage of Shares Abstained: 14.38% |
Hartford Domestic Equity Funds
Item 10. Remuneration Paid to Directors, Officers, and Others of Open-End Management Investment Companies.
The response to this item is included under Item 7 of this form.
Hartford Domestic Equity Funds
Item 11. Statement Regarding Basis for Approval of Investment Advisory Contract.Approval of Investment Management and Investment Sub-Advisory Agreements (Unaudited)
The Hartford Mutual Funds, Inc.
The Hartford Mutual Funds II, Inc.
The Hartford Capital Appreciation Fund
Hartford Core Equity Fund
The Hartford Dividend and Growth Fund
The Hartford Equity Income Fund
The Hartford Growth Opportunities Fund
The Hartford Healthcare Fund
The Hartford MidCap Fund
The Hartford MidCap Value Fund
The Hartford Small Cap Growth Fund
Hartford Small Cap Value Fund
The Hartford Small Company Fund
(each, a “Fund” and collectively, the “Funds”)
Section 15(c) of the Investment Company Act of 1940, as amended (the “1940 Act”), requires that each mutual fund’s board of directors, including a majority of those directors who are not “interested persons” of the mutual fund, as defined in the 1940 Act (the “Independent Directors”), annually review and consider the continuation of the mutual fund’s investment advisory and sub-advisory agreements. At their meeting held on September 11-12, 2024, the Boards of Directors (collectively, the “Board”) of The Hartford Mutual Funds, Inc. (“HMF”) and The Hartford Mutual Funds II, Inc. (“HMF II”), including the Independent Directors, unanimously voted to approve (i) the continuation of an investment management agreement by and between Hartford Funds Management Company, LLC (“HFMC”) and each of HMF, on behalf of each of The Hartford Capital Appreciation Fund, Hartford Core Equity Fund, The Hartford Dividend and Growth Fund, The Hartford Equity Income Fund, The Hartford MidCap Fund, The Hartford MidCap Value Fund, and Hartford Small Cap Value Fund and HMF II, on behalf of each of The Hartford Growth Opportunities Fund and The Hartford Small Cap Growth Fund (the “Management Agreement”); (ii) the continuation of a separate investment management agreement by and between HFMC and HMF, on behalf of each of The Hartford Healthcare Fund and The Hartford Small Company Fund (the “2013 Investment Management Agreement” and together with the Management Agreement, the “Management Agreements”); and (iii) the continuation of investment sub-advisory agreements (each, a “Sub-Advisory Agreement,” and together with the Management Agreements, the “Agreements”) between HFMC and each Fund’s sub-adviser, Wellington Management Company LLP (the “Sub-adviser” and together with HFMC, the “Advisers”), with respect to each Fund.
In the months preceding the September 11-12, 2024 meeting, the Board requested and reviewed written responses from the Advisers to questions posed to the Advisers on behalf of the Independent Directors and supporting materials relating to those questions and responses. In addition, the Board considered such additional information as it deemed reasonably necessary to evaluate the Agreements, as applicable, with respect to each Fund, which included information furnished to the Board and its committees at their meetings throughout the year and in between regularly scheduled meetings on particular matters as the need arose, as well as information specifically prepared in connection with the approval of the continuation of the Agreements that was presented at the Board’s meetings held on June 11, 2024 and September 11-12, 2024. Information provided to the Board and its committees at their meetings throughout the year included, among other things, reports on Fund performance, legal, compliance and risk management matters, sales and marketing activity, shareholder services, and the other services provided to each Fund by the Advisers and their affiliates. The members of the Board also considered the materials and presentations by Fund officers and representatives of HFMC received at the Board’s meetings on June 11, 2024 and September 11-12, 2024 concerning the Agreements and at the special meeting of the Board’s Investment Committee on May 23, 2024 concerning Fund performance and other investment-related matters.
The Independent Directors engaged service providers to assist them with evaluating the Agreements with respect to each Fund, as applicable. Broadridge Financial Solutions, Inc. (“Broadridge”), an independent provider of investment company data, was retained to provide the Board with reports on how each Fund’s contractual management fees, actual management fees, total expense ratios and investment performance compared to those of an appropriate group of investment companies selected by Broadridge. The Independent Directors also engaged an independent consultant (the “Consultant”) to assist them in evaluating each Fund’s fees and expenses.
In determining whether to approve the continuation of the Agreements for a Fund, the members of the Board reviewed and evaluated information and factors they believed to be relevant and appropriate through the exercise of their reasonable business judgment. While individual members of the Board may have weighed certain factors differently, the Board’s determination to approve the continuation of the Agreements was based on a comprehensive consideration of all information provided to the Board throughout the year and specifically with respect to the continuation of the Agreements. The Board was also furnished with an analysis of its fiduciary obligations in connection with its evaluation of the Agreements. Throughout the evaluation process, the Board was assisted by counsel for the Funds and the Independent Directors were also separately assisted by
Hartford Domestic Equity Funds
Item 11. Statement Regarding Basis for Approval of Investment Advisory Contract.Approval of Investment Management and Investment Sub-Advisory Agreements (Unaudited) – (continued)
independent legal counsel. In connection with their deliberations, the Independent Directors met separately with independent legal counsel and the Consultant on June 7, 2024 and in executive session on several occasions to consider their responsibilities under relevant laws and regulations and to discuss the materials presented and other matters deemed relevant to their consideration of the approval of the continuation of the Agreements. As a result of the discussions that occurred during the June 7, 2024 and June 11, 2024 meetings, the Independent Directors presented HFMC and its affiliates with requests for additional information on certain topics. HFMC responded to these requests with additional information in connection with the September 11-12, 2024 meeting. A more detailed summary of the important, but not necessarily all, factors the Board considered with respect to its approval of the continuation of the Agreements is provided below.
Nature, Extent and Quality of Services Provided by the Advisers
The Board requested and considered information concerning the nature, extent and quality of the services provided to each Fund by the Advisers. The Board considered, among other things, the terms of the Agreements and the range of services provided by the Advisers. The Board considered the Advisers’ professional personnel who provide services to the Funds, including each Adviser’s ability and experience in attracting and retaining qualified personnel to service the Funds. The Board considered each Adviser’s reputation and overall financial strength, as well as each Adviser’s willingness to consider and implement organizational and operational changes designed to enhance services to the funds managed by HFMC and its affiliates (the “Hartford funds”). In addition, the Board considered the quality of each Adviser’s communications with the Board and responsiveness to Board inquiries and requests made from time to time with respect to the Funds and other Hartford funds.
The Board also requested and evaluated information concerning each Adviser’s regulatory and compliance environment. In this regard, the Board reviewed information about each Adviser’s compliance policies and procedures and compliance history, and a report from the Funds’ Chief Compliance Officer about each Adviser’s compliance with applicable laws and regulations, including responses to regulatory developments and any compliance or other issues raised by regulators. The Board also noted the Advisers’ support of the Funds’ compliance control structure, as applicable, including the resources devoted by the Advisers in support of the Funds’ obligations pursuant to Rule 38a-1 under the 1940 Act and the Funds’ risk management programs, as well as the efforts of the Advisers to address cybersecurity risks. The Board also considered HFMC’s investments in business continuity planning designed to benefit the Funds. The Board also noted HFMC’s commitment to maintaining high quality systems and expending substantial resources to prepare for and respond to ongoing changes to the market, regulatory and control environments in which the Funds and their service providers operate.
With respect to HFMC, the Board noted that, under the Management Agreements, HFMC is responsible for the management of the Funds, including oversight of fund operations and service providers, and the provision of investment advisory and administrative services in connection with selecting, monitoring and supervising the Sub-adviser. In this regard, the Board evaluated information about the nature and extent of responsibilities retained and risks assumed by HFMC that were not delegated to or assumed by the Sub-adviser. The Board considered HFMC’s ongoing monitoring of people, process and performance, including its quarterly reviews of each of the Hartford funds, semi-annual meetings with the leaders of each Fund’s portfolio management team, and ongoing oversight of the Hartford funds’ portfolio managers. The Board noted that HFMC has demonstrated a record of initiating changes to the portfolio management and/or investment strategies of the Hartford funds when warranted. The Board considered HFMC’s periodic due diligence reviews of the Sub-adviser and ongoing oversight of the Sub-adviser’s investment approach and results, process for monitoring best execution of portfolio trades and other trading operations by the Sub-adviser, and approach to risk management with respect to the Funds. The Board considered HFMC’s oversight of the securities lending program for the Funds that engage in securities lending and noted the income earned by the Funds that participate in such program. The Board also considered HFMC’s day-to-day oversight of each Fund’s compliance with its investment objective and policies as well as with applicable laws and regulations, noting that regulatory and other developments had over time led to an increase in the scope of HFMC’s oversight in this regard. Moreover, the Board considered HFMC’s oversight of potential conflicts of interest between the Funds’ investments and those of other funds or accounts, if any, managed by the Funds’ portfolio management personnel.
In addition, the Board considered HFMC’s overall strategic plan for, and ongoing commitment to review and re-assess, the Hartford funds product line-up. The Board also considered the expenses that HFMC had incurred, as well as the risks HFMC had assumed, in connection with the launch of new funds and changes to existing Hartford funds in recent years. The Board considered that HFMC is responsible for providing the Funds’ officers.
With respect to the Sub-adviser, which provides certain day-to-day portfolio management services for the Funds, subject to oversight by HFMC, the Board considered, among other things, the Sub-adviser’s investment personnel, investment philosophy and process, investment research capabilities and resources, performance record, trade execution capabilities and experience. The Board considered the experience of each Fund’s portfolio manager(s), the number of accounts managed by the portfolio manager(s), and the Sub-adviser’s method for compensating the portfolio manager(s). The Board also considered the Sub-adviser’s succession planning practices to ensure continuity of portfolio management services provided to the Funds and HFMC’s oversight of these practices.
Hartford Domestic Equity Funds
Item 11. Statement Regarding Basis for Approval of Investment Advisory Contract.Approval of Investment Management and Investment Sub-Advisory Agreements (Unaudited) – (continued)
The Board considered the benefits to shareholders of being part of the family of Hartford funds, including, with respect to certain share classes, the right to exchange investments between the same class of shares without a sales charge, the ability to reinvest Fund dividends into other Hartford funds (excluding the Hartford funds that are either an exchange-traded fund or a closed-end fund), and the ability to combine holdings in a Fund with holdings in other Hartford funds (excluding the Hartford funds that are either an exchange-traded fund or a closed-end fund) and 529 plans for which HFMC serves as the program manager to obtain a reduced sales charge. The Board considered HFMC’s efforts to provide investors in the Hartford funds with a broad range of investment styles and asset classes and the assumption of entrepreneurial and other risks by HFMC in sponsoring and providing ongoing services to new funds to expand these opportunities for shareholders. In addition, the Board observed that in the marketplace there are a range of investment options available to each Fund’s shareholders and such shareholders, having had the opportunity to consider other investment options, have chosen to invest in the Fund.
Based on these considerations, the Board concluded that it was satisfied with the nature, extent and quality of the services provided to each Fund by HFMC and the Sub-adviser.
Performance of each Fund and the Advisers
The Board considered the investment performance of each Fund. In this regard, the Board reviewed the performance of each Fund over different time periods and evaluated HFMC’s analysis of each Fund’s performance for these time periods. The Board considered information and materials provided to the Board by the Advisers concerning Fund performance, as well as information from Broadridge comparing the investment performance of each Fund to an appropriate universe of peer funds. The Board noted that while it found the comparative data provided by Broadridge generally useful in evaluating a Hartford fund’s investment performance, the Board recognized the limitations of such data, including that notable differences may exist between a Hartford fund and its peers. For details regarding each Fund’s performance, see the Fund-by-Fund synopsis below.
The Board considered the detailed investment analytics reports provided by HFMC’s Investment Advisory Group throughout the year, including in connection with the approval of the continuation of the Agreements. These reports included, among other things, information on each Fund’s gross returns and net returns, the Fund’s investment performance compared to one or more appropriate benchmarks and relevant groups or categories of peer funds, various statistics concerning the Fund’s portfolio, a narrative summary of various factors affecting Fund performance, and commentary on the effect of current and recent market conditions. The Board also noted that, for The Hartford Capital Appreciation Fund, the Fund utilizes a multiple sleeve structure whereby each sleeve uses a different investment style and considered the performance attributions of the underlying portfolio managers. The Board considered the Advisers’ work with the Investment Committee, which assists the Board in evaluating the performance of each Fund at periodic meetings throughout the year and specifically with respect to the approval of the continuation of the Agreements. The Board considered that the Investment Committee, in its evaluation of investment performance at meetings throughout the year, focused particular attention on information indicating less favorable performance of certain Hartford funds for specific time periods and discussed with HFMC’s Investment Advisory Group the reasons for such performance as well as any specific actions that the Advisers had taken, or had agreed to take, to seek to enhance Fund investment performance and the results of those actions. The Board also considered information provided by the Consultant relating to each Fund’s performance track record.
Based on these considerations, the Board concluded that it had continued confidence in HFMC’s and the Sub-adviser’s overall capabilities to manage the Funds.
Costs of the Services and Profitability of the Advisers
The Board reviewed information regarding HFMC’s cost to provide investment management and related services to each Fund and HFMC’s profitability, both overall and for each Fund, on a pre-tax basis without regard to distribution expenses. The Board also requested and reviewed information about the profitability to HFMC and its affiliates from all services provided to each Fund and all aspects of their relationship with the Fund, including information regarding profitability trends over time and information provided by Broadridge analyzing the profitability of investment managers to other fund complexes. The Board also requested and received information relating to the operations and profitability of the Sub-adviser. The Board considered representations from HFMC and the Sub-adviser that the Sub-adviser’s fees were negotiated at arm’s length on a Fund-by-Fund basis and that the sub-advisory fees are paid by HFMC and not the Funds. Accordingly, the Board concluded that the profitability of the Sub-adviser is a less relevant factor with respect to the Board’s consideration of the Sub-Advisory Agreements.
Hartford Domestic Equity Funds
Item 11. Statement Regarding Basis for Approval of Investment Advisory Contract.Approval of Investment Management and Investment Sub-Advisory Agreements (Unaudited) – (continued)
The Board considered that the Independent Directors’ prior independent consultant had previously reviewed the methodologies and estimates used by HFMC in calculating profitability in connection with the continuation of the Management Agreements, including a description of the methodology used to allocate certain expenses. The Board noted that the prior independent consultant previously reported that such process is reasonable, sound and consistent with common industry practice. The Board noted that HFMC’s process for calculating and reporting Fund profitability is consistent with the process previously reviewed by the prior independent consultant.
Based on these considerations, the Board concluded that the profits realized by HFMC and its affiliates from their relationships with each Fund were not excessive.
Comparison of Fees and Services Provided by the Advisers
The Board considered comparative information with respect to the services rendered to and the management fees to be paid by each Fund to HFMC and the total expense ratios of the Fund. The Board also considered comparative information with respect to the sub-advisory fees to be paid by HFMC to the Sub-adviser with respect to each Fund. In this regard, the Board requested and reviewed information from HFMC and the Sub-adviser relating to the management and sub-advisory fees, including the sub-advisory fee schedule for each Fund and the amount of the management fee retained by HFMC, and total operating expenses for each Fund. The Board also reviewed information from Broadridge comparing each Fund’s contractual management fees, actual management fees and total expense ratios relative to an appropriate group of funds selected by Broadridge. For details regarding each Fund’s fees and expenses, see the Fund-by-Fund synopsis below.
The Board considered the methodology used by Broadridge to select the funds included in the expense groups. While the Board recognized that comparisons between a Fund and its peer funds may be imprecise given, among other differences, the different service levels and characteristics of mutual funds and the different business models and cost structures of the Advisers, the comparative information provided by Broadridge assisted the Board in evaluating the reasonableness of each Fund’s fees and total operating expenses. In addition, the Board considered the independent analysis and views of the Consultant regarding each Fund’s fees and total operating expenses in the context of the Fund’s investment performance.
The Board also considered that HFMC provides nondiscretionary investment advisory services to model portfolios that pursue investment objectives and investment strategies similar to those of the Hartford Core Equity Fund and The Hartford Dividend and Growth Fund. The Board also received information regarding fees charged by the Sub-adviser to any other clients with investment strategies similar to those of the Funds, including any institutional separate account clients and registered fund clients for which the Sub-adviser serves as either primary investment adviser or sub-adviser. The Board considered the explanations provided by the Sub-adviser about any differences between the Sub-adviser’s services to the Funds and the services the Sub-adviser provides to other types of clients. In this regard, the Board reviewed information about the generally broader scope of services and compliance, reporting and other legal burdens and risks of managing registered funds compared with those associated with managing assets of non-registered fund clients such as institutional separate accounts.
Based on these considerations, the Board concluded that each Fund’s fees and total operating expenses, in conjunction with the information about quality of services, profitability, economies of scale, and other matters considered, were reasonable in light of the services provided.
The Board considered information regarding economies of scale, including the extent to which economies of scale may be realized as a Fund grows and whether fee levels reflect these economies of scale for the benefit of shareholders of the Fund. The Board reviewed the breakpoints in the management fee schedule for each Fund, if any, which reduce fee rates as the Fund’s assets grow over time. The Board recognized that a Fund with assets beyond the highest breakpoint level will continue to benefit from economies of scale because additional assets are charged the lowest breakpoint fee resulting in lower effective management fee rates. The Board also recognized that a fee schedule that reaches a breakpoint at a lower asset level provides shareholders with the benefit of anticipated or potential economies of scale. The Board considered that expense limitations and fee waivers that reduce a Fund’s expenses at all asset levels can have the same effect as breakpoints in sharing economies of scale with shareholders and provide protection from an increase in expenses if the Fund’s assets decline. In addition, the Board considered that initially setting competitive fee rates, pricing a Fund to scale at inception, and making additional investments intended to enhance services available to shareholders are other means of sharing anticipated or potential economies of scale with shareholders. The Board also considered that HFMC has been active in managing expenses of the Hartford funds in recent years, which has resulted in benefits being realized by shareholders. The Board also noted that, for Hartford Small Cap Value Fund, the Fund’s current low asset levels have kept the Fund from fully realizing the benefits of anticipated or potential economies of scale. The Board considered HFMC’s assessment of the low asset levels for the Hartford Small Cap Value Fund.
Hartford Domestic Equity Funds
Item 11. Statement Regarding Basis for Approval of Investment Advisory Contract.Approval of Investment Management and Investment Sub-Advisory Agreements (Unaudited) – (continued)
The Board reviewed and evaluated materials from Broadridge showing how management fee schedules of peer funds reflect economies of scale for the benefit of shareholders as a peer fund’s assets hypothetically increase over time. Based on information provided by HFMC and Broadridge, the Board recognized that there is no uniform methodology for establishing breakpoints or uniform pattern in asset levels that trigger breakpoints or the amounts of breakpoints triggered.
After considering all of the information available to it, the Board concluded that it was satisfied with the extent to which economies of scale, if any, would be shared for the benefit of each Fund’s shareholders based on currently available information and the effective management fees and total expense ratios for the Fund at its current and reasonably anticipated asset levels. The Board noted, however, that it would continue to monitor any future growth in each Fund’s assets and the appropriateness of additional management fee breakpoints or other methods to share benefits from economies of scale as part of its future review of the Agreements.
The Board considered other benefits to the Advisers and their affiliates from their relationships with the Funds.
The Board noted that HFMC receives fees for fund accounting and related services from the Funds, and the Board considered information on the profitability to HFMC from providing such services to the Funds. The Board also considered that each Fund pays a transfer agency fee to Hartford Administrative Services Company (“HASCO”), an affiliate of HFMC, equal to the lesser of: (i) the actual costs incurred by HASCO in connection with the provisions of transfer agency services, including payments made to sub-transfer agents, plus a reasonable target profit margin; or (ii) a specified amount as set forth in the Transfer Agency and Service Agreement by and between HMF and HMF II, on behalf of their respective Funds, and HASCO. The Board reviewed information about the profitability to HASCO of the Funds’ transfer agency function. The Board considered information provided by HFMC indicating that the transfer agency fees charged by HASCO to the Funds were fair and reasonable based on available industry data about fees charged by transfer agents to other mutual funds. The Board also noted that HFMC and HASCO had delegated certain fund accounting services and transfer agency services, respectively, to external service providers, subject to oversight.
The Board also considered that Hartford Funds Distributors, LLC (“HFD”), an affiliate of HFMC, serves as principal underwriter of the Funds. The Board noted that, as principal underwriter, HFD receives distribution and service fees from the Funds and receives all or a portion of the sales charges on sales or redemptions of certain classes of shares. The Board considered that HFD has entered into an agreement with Wellington and Wellington Trust Company NA to provide certain marketing support services in connection with certain collective investment trust vehicles managed by Wellington.
The Board considered the benefits, if any, to the Sub-adviser from any use of a Fund’s brokerage commissions to obtain soft dollar research.
For purposes of evaluating a Fund’s performance, the Board considered the Fund’s performance relative to similarly managed funds and the Fund’s performance relative to its benchmark. In particular, the Board considered the Fund’s performance of its Class A shares (net of all fees and expenses), as of March 31, 2024, and compared that performance to the Fund’s peer universe, which includes all funds within the same classification or category, as determined by Broadridge. The Board considered the Fund’s performance relative to its peer universe by evaluating its quintile ranking, with the 1st quintile representing the top performing funds within a peer universe and the 5th quintile representing the lowest performing funds. For purposes of evaluating the Fund’s performance relative to its benchmark, the Board considered the Fund’s performance of its Class I shares (net of all fees and expenses) as of March 31, 2024. The Board considered Fund performance to be “in line with” a Fund’s benchmark where it was 50 basis points above or below the benchmark return. With respect to fees and expenses, the Board considered the Fund’s contractual management fee, actual management fee, and total operating expenses of its Class A shares, as compared to the Fund’s expense peer group, which includes a group of similarly sized funds selected by Broadridge.
The Hartford Capital Appreciation Fund
•
The Board noted that the Fund’s performance was in the 4th quintile versus its peer universe for the 1-, 3- and 5-year periods. The Board also noted that the Fund’s performance was below its benchmark for the 1-, 3- and 5-year periods. The Board noted recent changes to the Fund’s portfolio management team.
•
The Board noted that the Fund’s contractual management fee, actual management fee and total expenses were in the 4th quintile of its expense group.
Hartford Domestic Equity Funds
Item 11. Statement Regarding Basis for Approval of Investment Advisory Contract.Approval of Investment Management and Investment Sub-Advisory Agreements (Unaudited) – (continued)
Hartford Core Equity Fund
•
The Board noted that the Fund’s performance was in the 3rd quintile versus its peer universe for the 1-year period and the 4th quintile for the 3- and 5-year periods. The Board also noted that the Fund’s performance was below its benchmark for the 1-, 3- and 5-year periods. The Board noted upcoming changes to the Fund’s portfolio management team.
•
The Board noted that the Fund’s contractual management fee, actual management fee and total expenses were in the 1st quintile of its expense group.
The Hartford Dividend and Growth Fund
•
The Board noted that the Fund’s performance was in the 2nd quintile versus its peer universe for the 1-, 3- and 5-year periods. The Board also noted that the Fund’s performance was below its benchmark for the 1-, 3- and 5-year periods.
•
The Board noted that the Fund’s contractual management fee, actual management fee and its total expenses were in the 3rd quintile.
The Hartford Equity Income Fund
•
The Board noted that the Fund’s performance was in the 5th quintile versus its peer universe for the 1-year period and the 3rd quintile for the 3- and 5-year periods. The Board also noted that the Fund’s performance was below its benchmark for the 1-year period and in line with its benchmark for the 3- and 5-year periods.
•
The Board noted that the Fund’s contractual management fee, actual management fee and total expenses were in the 3rd quintile of its expense group.
The Hartford Growth Opportunities Fund
•
The Board noted that the Fund’s performance was in the 1st quintile versus its peer universe for the 1-year period and the 3rd quintile for the 3- and 5-year periods. The Board also noted that the Fund’s performance was above its benchmark for the 1-year period and below its benchmark for the 3- and 5-year periods.
•
The Board noted that the Fund’s contractual management fee, actual management fee and total expenses were in the 3rd quintile of its expense group.
The Hartford Healthcare Fund
•
The Board noted that the Fund’s performance was in the 5th quintile versus its peer universe for the 1- and 3-year periods and the 4th quintile for the 5-year period. The Board also noted that the Fund’s performance was in line with its benchmark for the 1-year period and below its benchmark for the 3- and 5-year periods. The Board noted recent changes to the Fund’s portfolio management team.
•
The Board noted that the Fund’s contractual management fee, actual management fee and total expenses were in the 5th quintile of its expense group.
•
The Board noted that the Fund’s performance was in the 5th quintile versus its peer universe for the 1- and 5-year periods and the 4th quintile for the 3-year period. The Board also noted that the Fund’s performance was below its benchmark for the 1-, 3- and 5-year periods. The Board noted upcoming changes to the Fund’s portfolio management team.
•
The Board noted that the Fund’s contractual management fee and actual management fee were in the 3rd quintile and its total expenses were in the 4th quintile.
Hartford Domestic Equity Funds
Item 11. Statement Regarding Basis for Approval of Investment Advisory Contract.Approval of Investment Management and Investment Sub-Advisory Agreements (Unaudited) – (continued)
The Hartford MidCap Value Fund
•
The Board noted that the Fund’s performance was in the 3rd quintile versus its peer universe for the 1-year period and the 2nd quintile for the 3- and 5-year periods. The Board also noted that the Fund’s performance was below its benchmark for the 1-year period and above its benchmark for the 3- and 5-year periods. The Board noted recent changes to the Fund’s portfolio management team.
•
The Board noted that the Fund’s contractual management fee and total expenses were in the 3rd quintile of its expense group, while its actual management fee was in the 4th quintile.
The Hartford Small Cap Growth Fund
•
The Board noted that the Fund’s performance was in the 2nd quintile versus its peer universe for the 1-year period, the 4th quintile for the 3-year period, and the 5th quintile for the 5-year period. The Board also noted that the Fund’s performance was above its benchmark for the 1-year period, in line with its benchmark for the 3-year period, and below its benchmark for the 5-year period. The Board noted upcoming changes to the Fund’s portfolio management team.
•
The Board noted that the Fund’s contractual management fee was in the 2nd quintile of its expense group, while its actual management fee was in the 3rd quintile and its total expenses were in the 4th quintile. The Board also noted that HASCO had contractually agreed to limit its transfer agency fee for Class Y shares of the Fund.
Hartford Small Cap Value Fund
•
The Board noted that the Fund’s performance was in the 4th quintile versus its peer universe for the 1- and 5-year periods and the 5th quintile for the 3-year period. The Board also noted that the Fund’s performance was below its benchmark for the 1-year period and above its benchmark for the 3- and 5-year periods.
•
The Board noted that the Fund’s contractual management fee was in the 2nd quintile of its expense group, while its actual management fee and total expenses were in the 3rd quintile. The Board also noted that HFMC had contractually agreed to limit the expenses (exclusive of certain specified expenses) for the Fund.
The Hartford Small Company Fund
•
The Board noted that the Fund’s performance was in the 3rd quintile versus its peer universe for the 1- and 5-year periods and the 5th quintile for the 3-year period. The Board also noted that the Fund’s performance was above its benchmark for the 1- and 5-year periods and below its benchmark for the 3-year period.
•
The Board noted that the Fund’s contractual management fee was in the 2nd quintile of its expense group, while its actual management fee was in the 3rd quintile and its total expenses were in the 4th quintile.
Based upon the review of the factors summarized above, among others, the Board concluded that it is in the best interests of each Fund and its shareholders for the Board to approve the continuation of the Agreements for an additional year. In reaching this decision, the Board did not assign relative weights to the factors discussed above or deem any one or group of them to be controlling in and of themselves.
Hartford Domestic Equity Funds
Index Glossary for Indices Included in the Annual Shareholder Reports (Unaudited)
Russell 1000 Growth Index (reflects no deduction for fees, expenses or taxes) is designed to measure the performance of those Russell 1000 Index companies with higher price-to-book ratios and higher forecasted growth values. The Russell 1000 Index is designed to measure the performance of the 1,000 largest companies in the Russell 3000 Index based on their market capitalization and current index membership. |
Russell 1000 Index (reflects no deduction for fees, expenses or taxes) is designed to measure the performance of the 1,000 largest companies in the Russell 3000 Index. The Russell 3000 Index is designed to measure the performance of the 3,000 largest US companies based on total market capitalizations. |
Russell Midcap Growth Index (reflects no deduction for fees, expenses or taxes) is designed to measure the performance of the mid-cap growth segment of the US equity universe. It includes those Russell Midcap Index companies with relatively higher price-to-book ratios, higher I/B/E/S forecast medium term (2 year) growth and higher sales per share historical growth (5 years). |
Russell 1000 Value Index (reflects no deduction for fees, expenses or taxes) is designed to measure the performance of those Russell 1000 Index companies with lower price-to-book ratios and lower forecasted growth values. The Russell 1000 Index is designed to measure the performance of the 1,000 largest companies in the Russell 3000 Index based on their market capitalization and current index membership. |
Russell 2000 Growth Index (reflects no deduction for fees, expenses or taxes) is designed to measure the performance of those Russell 2000 Index companies with higher price-to-book ratios and higher forecasted growth values. The Russell 2000 Index is an index comprised of 2,000 of the smallest US-domiciled company common stocks based on a combination of their market capitalization and current index membership. |
Russell 2000 Value Index (reflects no deduction for fees, expenses or taxes) is designed to measure the performance of those Russell 2000 Index companies with lower price-to-book ratios and lower forecasted growth values. The Russell 2000 Index is an index comprised of 2,000 of the smallest US-domiciled company common stocks based on a combination of their market capitalization and current index membership. |
Russell 3000 Growth Index (reflects no deduction for fees, expenses or taxes) is designed to measure the performance of those Russell 3000 Index companies with higher price-to-book ratios and higher forecasted growth values. The Russell 3000 Index is designed to measure the performance of the 3,000 largest US companies based on their market capitalization. |
Russell 3000 Index (reflects no deduction for fees, expenses or taxes) is designed to measure the performance of the 3,000 largest US companies based on total market capitalization. |
Russell Midcap Value Index (reflects no deduction for fees, expenses or taxes) is designed to measure the performance of the mid-cap value segment of the US equity universe. It includes those Russell Midcap Index companies with lower price-to-book ratios and lower forecasted growth values. |
S&P 500 Index (reflects no deduction for fees, expenses or taxes) is a float-adjusted market capitalization-weighted index composed of 500 widely held common stocks. |
S&P Composite 1500 Health Care Index (reflects no deduction for fees, expenses or taxes) is a float-adjusted market capitalization-weighted index comprised of those companies included in the S&P Composite 1500 that are classified as members of the Global Industry Classification Standard (GICS®) health care sector. |
S&P MidCap 400 Index (reflects no deduction for fees, expenses or taxes) is a float-adjusted market capitalization-weighted index designed to measure the performance of the mid-cap segment of the market. The index is composed of 400 constituent companies. |
This report is submitted for the general information of the shareholders of the Funds referenced in this report. It is not authorized for distribution to persons who are not shareholders of one or more Funds referenced in this report unless preceded or accompanied by a current prospectus for the relevant Funds. Nothing herein contained is to be considered an offer of sale or a solicitation of an offer to buy shares of any Fund listed in this report.
The information cannot be used or relied upon for the purpose of avoiding IRS penalties. These materials are not intended to provide tax, accounting or legal advice. As with all matters of a tax or legal nature, you should consult your own tax or legal counsel for advice.
Investors should carefully consider a Fund’s investment objectives, risks, charges and expenses. This and other important information is contained in the Fund’s prospectus and summary prospectus, which can be obtained by visiting hartfordfunds.com. Please read it carefully before investing.
The Funds are distributed by Hartford Funds Distributors, LLC.
MFAR-DE24 12/24 Printed in the U.S.A.
Hartford Multi-Strategy Funds
Annual Financial Statements
and Other Information
◼The Hartford Balanced Income Fund |
◼The Hartford Checks and Balances Fund |
◼The Hartford Conservative Allocation Fund |
◼The Hartford Growth Allocation Fund |
◼Hartford Moderate Allocation Fund |
◼Hartford Multi-Asset Income Fund |
◼Hartford Real Asset Fund |
Hartford Multi-Strategy Funds
Table of Contents
| |
Please note that this report includes responses to Items 7-11 of Form N-CSR, which is a reporting form filed with the U.S. Securities and Exchange Commission by mutual funds and exchange traded funds. Certain Form N-CSR items listed below may not be applicable. | |
| |
| |
| |
| |
| |
| |
| |
| |
| |
| |
| |
| |
| |
| |
| |
| |
| |
| |
| |
| |
| |
| |
| |
| |
| |
| |
| |
| |
| |
| |
| |
| |
| |
| |
| |
| |
| |
| |
| |
| |
| |
Hartford Multi-Strategy Funds
Item 7. Financial Statements and Financial Highlights for Open-End Management Investment Companies.
The Hartford Balanced Income Fund
Schedule of InvestmentsOctober 31, 2024
Shares or Principal Amount | | |
|
| Commercial Services - 0.0% |
| Global Payments, Inc. 1.50%, | |
| Healthcare - Products - 0.0% |
| Insulet Corp. 0.38%, 09/01/2026 | |
| |
| Meritage Homes Corp. 1.75%, | |
| |
| Uber Technologies, Inc. 0.88%, | |
| |
| Carnival Corp. 5.75%, 12/01/2027 | |
| Machinery-Diversified - 0.0% |
| Middleby Corp. 1.00%, 09/01/2025 | |
| |
| Northern Oil & Gas, Inc. 3.63%, 04/15/2029 | |
| Real Estate Investment Trusts - 0.1% |
| Rexford Industrial Realty LP | |
| | |
| | |
| | | |
| |
| Microchip Technology, Inc. 0.75%, | |
| ON Semiconductor Corp. 0.50%, 03/01/2029 | |
| | | |
| Total Convertible Bonds
(cost $16,374,717) | |
|
| |
| Clear Channel Outdoor Holdings, Inc. | |
| | |
| | |
| | |
| Lamar Media Corp. 3.75%, 02/15/2028 | |
| | | |
| |
| | |
| | |
| | |
| | |
| | |
| | |
| | |
| | |
| | |
| | |
| | |
| | |
| HEICO Corp. 5.25%, 08/01/2028 | |
| L3Harris Technologies, Inc. | |
| | |
| | |
Shares or Principal Amount | | |
CORPORATE BONDS - 46.2% - (continued) |
| Aerospace/Defense - 1.2% - (continued) |
| | |
| | |
| | |
| | |
| | |
| | |
| | |
| | |
| | |
| Spirit AeroSystems, Inc. 9.38%, | |
| | |
| | |
| | |
| | |
| | |
| | |
| | | |
| |
| Archer-Daniels-Midland Co. 4.50%, 08/15/2033 | |
| | |
| | |
| | |
| Cargill, Inc. 2.13%, 11/10/2031(1) | |
| Darling Ingredients, Inc. 6.00%, | |
| | |
| | |
| | |
| Philip Morris International, Inc. | |
| | |
| | |
| | |
| | |
| | |
| | |
| | | |
| |
| JetBlue Airways Corp./JetBlue Loyalty LP 9.88%, 09/20/2031(1) | |
| |
| | |
| | |
| | |
| | | |
| Auto Manufacturers - 0.3% |
| Ford Motor Credit Co. LLC | |
| | |
| | |
| | |
| General Motors Financial Co., Inc. 1.50%, 06/10/2026 | |
| Mercedes-Benz Finance North America LLC 5.20%, 08/03/2026(1) | |
| | | |
The accompanying notes are an integral part of these financial statements.
The Hartford Balanced Income Fund
Schedule of Investments – (continued)October 31, 2024
Shares or Principal Amount | | |
CORPORATE BONDS - 46.2% - (continued) |
| Auto Parts & Equipment - 0.0% |
| Clarios Global LP/Clarios U.S. Finance Co. 6.75%, | |
| | |
| | | |
| |
| Anheuser-Busch Cos. LLC/Anheuser-Busch InBev Worldwide, Inc. | |
| | |
| | |
| Anheuser-Busch InBev Worldwide, Inc. | |
| | |
| | |
| | |
| | |
| | |
| | |
| | |
| | |
| Bacardi Ltd./Bacardi-Martini BV | |
| | |
| | |
| | |
| Central American Bottling Corp./CBC Bottling Holdco SL/Beliv Holdco SL | |
| | |
| | |
| | |
| | |
| | |
| | |
| | |
| Pernod Ricard International Finance LLC 1.63%, 04/01/2031(1) | |
| | | |
| |
| Amgen, Inc. 5.60%, 03/02/2043 | |
| Gilead Sciences, Inc. 2.60%, 10/01/2040 | |
| Illumina, Inc. 5.75%, 12/13/2027 | |
| | |
| | |
| | |
| | |
| | |
| | |
| | | |
| |
| | |
| | |
| | |
| Axalta Coating Systems Dutch Holding B BV 7.25%, 02/15/2031(1) | |
| Braskem Netherlands Finance BV | |
| | |
| | |
| | |
| | |
Shares or Principal Amount | | |
CORPORATE BONDS - 46.2% - (continued) |
| Chemicals - 0.6% - (continued) |
| Celanese U.S. Holdings LLC | |
| | |
| | |
| | |
| | |
| | |
| | |
| | |
| Hanwha Totalenergies Petrochemical Co. Ltd. 5.50%, 07/18/2029(3) | |
| Mativ Holdings, Inc. 8.00%, | |
| NOVA Chemicals Corp. 8.50%, | |
| | |
| | |
| | |
| Olympus Water U.S. Holding Corp. | |
| Sasol Financing USA LLC 5.50%, 03/18/2031 | |
| Sherwin-Williams Co. 2.90%, | |
| Tronox, Inc. 4.63%, 03/15/2029(1)(2) | |
| | |
| | |
| | |
| | | |
| |
| Banca Comerciala Romana SA 7.63%, 05/19/2027, (7.63% fixed rate until 05/19/2026; 3 mo. EURIBOR + 4.54% thereafter)(3)(4) | |
| | |
| 7.25%, 12/07/2028, (7.25% fixed rate until 12/07/2027; 1 yr. EURIBOR ICE Swap + 4.29% | |
| 8.88%, 04/27/2027, (8.88% fixed rate until 04/27/2026; 1 yr. EURIBOR ICE Swap + 5.58% | |
| Banco de Credito del Peru SA | |
| 3.13%, 07/01/2030, (3.13% fixed rate until 07/01/2025; 5 yr. USD CMT + 3.00% thereafter)(1)(4) | |
| 3.13%, 07/01/2030, (3.13% fixed rate until 07/01/2025; 5 yr. USD CMT + 3.00% thereafter)(3)(4) | |
| 3.25%, 09/30/2031, (3.25% fixed rate until 09/30/2026; 5 yr. USD CMT + 2.45% thereafter)(3)(4) | |
| | |
| Banco de Credito e Inversiones SA | |
| Banco Santander SA 5.54%, 03/14/2030, (5.54% fixed rate until 03/14/2029; 1 yr. USD CMT + | |
| Bancolombia SA 4.63%, 12/18/2029, (4.63% fixed rate until 12/18/2024; 5 yr. USD CMT + 2.94% | |
The accompanying notes are an integral part of these financial statements.
The Hartford Balanced Income Fund
Schedule of Investments – (continued)October 31, 2024
Shares or Principal Amount | | |
CORPORATE BONDS - 46.2% - (continued) |
| Commercial Banks - 9.5% - (continued) |
| | |
| 2.48%, 09/21/2036, (2.48% fixed rate until 09/21/2031; 5 yr. USD CMT + 1.20% thereafter)(4) | |
| 2.50%, 02/13/2031, (2.50% fixed rate until 02/13/2030; 3 mo. USD Term SOFR + 1.25% | |
| 2.68%, 06/19/2041, (2.68% fixed rate until 06/19/2040; 6 mo. USD SOFR + 1.93% thereafter)(4) | |
| 3.71%, 04/24/2028, (3.71% fixed rate until 04/24/2027; 3 mo. USD Term SOFR + 1.77% | |
| 3.82%, 01/20/2028, (3.82% fixed rate until 01/20/2027; 3 mo. USD Term SOFR + 1.84% | |
| 3.97%, 02/07/2030, (3.97% fixed rate until 02/07/2029; 3 mo. USD Term SOFR + 1.47% | |
| 4.08%, 03/20/2051, (4.08% fixed rate until 03/20/2050; 3 mo. USD Term SOFR + 3.41% | |
| 4.24%, 04/24/2038, (4.24% fixed rate until 04/24/2037; 3 mo. USD Term SOFR + 2.08% | |
| 4.33%, 03/15/2050, (4.33% fixed rate until 03/15/2049; 3 mo. USD Term SOFR + 1.78% | |
| 5.52%, 10/25/2035, (5.52% fixed rate until 10/25/2034; 6 mo. USD SOFR + 1.74% thereafter)(4) | |
| 5.93%, 09/15/2027, (5.93% fixed rate until 09/15/2026; 6 mo. USD SOFR + 1.34% thereafter)(4) | |
| Bank of New York Mellon Corp. | |
| 5.06%, 07/22/2032, (5.06% fixed rate until 07/22/2031; 6 mo. USD SOFR + 1.23% thereafter)(4) | |
| 6.32%, 10/25/2029, (6.32% fixed rate until 10/25/2028; 6 mo. USD SOFR + 1.60% thereafter)(4) | |
| 6.47%, 10/25/2034, (6.47% fixed rate until 10/25/2033; 6 mo. USD SOFR + 1.85% thereafter)(4) | |
| Bank Polska Kasa Opieki SA 5.50%, 11/23/2027, (5.50% fixed rate until 11/23/2026; 3 mo. EURIBOR + | |
| | |
| 4.84%, 09/10/2028, (4.84% fixed rate until 09/10/2027; 6 mo. USD SOFR + 1.34% thereafter)(4) | |
| 4.94%, 09/10/2030, (4.94% fixed rate until 09/10/2029; 6 mo. USD SOFR + 1.56% thereafter)(4) | |
Shares or Principal Amount | | |
CORPORATE BONDS - 46.2% - (continued) |
| Commercial Banks - 9.5% - (continued) |
| 5.69%, 03/12/2030, (5.69% fixed rate until 03/12/2029; 6 mo. USD SOFR + 1.74% thereafter)(4) | |
| 5.83%, 05/09/2027, (5.83% fixed rate until 05/09/2026; 6 mo. USD SOFR + 2.21% thereafter)(4) | |
| 7.39%, 11/02/2028, (7.39% fixed rate until 11/02/2027; 1 yr. USD CMT + 3.30% thereafter)(4) | |
| 9.63%, 12/15/2029, (9.63% fixed rate until 12/15/2029; 5 yr. USD ICE Swap + 5.78% | |
| | |
| 8.13%, 01/08/2039, (8.13% fixed rate until 01/08/2034; 5 yr. USD CMT + 4.21% thereafter)(1)(4) | |
| 8.45%, 06/29/2038, (8.45% fixed rate until 06/29/2033; 5 yr. USD CMT + 4.66% thereafter)(1)(4) | |
| | |
| 1.90%, 09/30/2028, (1.90% fixed rate until 09/30/2027; 6 mo. USD SOFR + 1.61% thereafter)(1)(4) | |
| 7.38%, 09/10/2034, (7.38% fixed rate until 09/10/2034; 5 yr. USD CMT + 3.54% thereafter)(1)(4)(5) | |
| | |
| 2.05%, 10/19/2027, (2.05% fixed rate until 10/19/2026; 6 mo. USD SOFR + 1.09% thereafter)(1)(4) | |
| | |
| 6.71%, 10/19/2029, (6.71% fixed rate until 10/19/2028; 6 mo. USD SOFR + 2.27% thereafter)(1)(4) | |
| | |
| 0.50%, 09/13/2028, (0.50% fixed rate until 09/13/2027; 3 mo. EURIBOR + 0.78% | |
| 4.82%, 01/15/2030, (4.82% fixed rate until 01/15/2029; 3 mo. EURIBOR + 2.25% | |
| | |
| 3.07%, 02/24/2028, (3.07% fixed rate until 02/24/2027; 6 mo. USD SOFR + 1.28% thereafter)(2)(4) | |
| 4.66%, 05/24/2028, (4.66% fixed rate until 05/24/2027; 6 mo. USD SOFR + 1.89% thereafter)(4) | |
| 6.17%, 05/25/2034, (6.17% fixed rate until 05/25/2033; 6 mo. USD SOFR + 2.66% thereafter)(4) | |
| Citizens Financial Group, Inc. | |
| 5.72%, 07/23/2032, (5.72% fixed rate until 07/23/2031; 6 mo. USD SOFR + 1.91% thereafter)(4) | |
| 5.84%, 01/23/2030, (5.84% fixed rate until 01/23/2029; 6 mo. USD SOFR + 2.01% thereafter)(4) | |
The accompanying notes are an integral part of these financial statements.
The Hartford Balanced Income Fund
Schedule of Investments – (continued)October 31, 2024
Shares or Principal Amount | | |
CORPORATE BONDS - 46.2% - (continued) |
| Commercial Banks - 9.5% - (continued) |
| | |
| 1.91%, 06/16/2026, (1.91% fixed rate until 06/16/2025; 6 mo. USD SOFR + 1.68% thereafter)(1)(4) | |
| 6.32%, 10/03/2029, (6.32% fixed rate until 10/03/2028; 6 mo. USD SOFR + 1.86% thereafter)(1)(4) | |
| | |
| 1.62%, 09/11/2026, (1.62% fixed rate until 09/11/2025; 1 yr. USD CMT + 1.35% thereafter)(1)(4) | |
| 5.71%, 03/01/2030, (5.71% fixed rate until 03/01/2029; 1 yr. USD CMT + 1.40% thereafter)(1)(4) | |
| | |
| 2.13%, 11/24/2026, (2.13% fixed rate until 11/24/2025; 6 mo. USD SOFR + 1.87% thereafter)(4) | |
| 2.31%, 11/16/2027, (2.31% fixed rate until 11/16/2026; 6 mo. USD SOFR + 1.22% thereafter)(4) | |
| 2.55%, 01/07/2028, (2.55% fixed rate until 01/07/2027; 6 mo. USD SOFR + 1.32% thereafter)(4) | |
| 3.55%, 09/18/2031, (3.55% fixed rate until 09/18/2030; 6 mo. USD SOFR + 3.04% thereafter)(4) | |
| 5.00%, 09/11/2030, (5.00% fixed rate until 09/11/2029; 6 mo. USD SOFR + 1.70% thereafter)(4) | |
| | |
| 6.72%, 01/18/2029, (6.72% fixed rate until 01/18/2028; 6 mo. USD SOFR + 3.18% thereafter)(4) | |
| Erste & Steiermaerkische Banka DD 4.88%, 01/31/2029, (4.88% fixed rate until 01/31/2028; 3 mo. EURIBOR + 2.20% thereafter)(3)(4) | |
| First Abu Dhabi Bank PJSC 6.32%, 04/04/2034, (6.32% fixed rate until 10/04/2028; 5 yr. USD CMT + | |
| | |
| | |
| | |
| | |
| Goldman Sachs Group, Inc. | |
| 1.09%, 12/09/2026, (1.09% fixed rate until 12/09/2025; 6 mo. USD SOFR + 0.79% thereafter)(4) | |
| 3.44%, 02/24/2043, (3.44% fixed rate until 02/24/2042; 6 mo. USD SOFR + 1.63% thereafter)(4) | |
| 4.02%, 10/31/2038, (4.02% fixed rate until 10/31/2037; 3 mo. USD Term SOFR + 1.63% | |
| 4.69%, 10/23/2030, (4.69% fixed rate until 10/23/2029; 6 mo. USD SOFR + 1.14% thereafter)(4) | |
| 5.02%, 10/23/2035, (5.02% fixed rate until 10/23/2034; 6 mo. USD SOFR + 1.42% thereafter)(4) | |
Shares or Principal Amount | | |
CORPORATE BONDS - 46.2% - (continued) |
| Commercial Banks - 9.5% - (continued) |
| 5.05%, 07/23/2030, (5.05% fixed rate until 07/23/2029; 6 mo. USD SOFR + 1.21% thereafter)(4) | |
| 5.73%, 04/25/2030, (5.73% fixed rate until 04/25/2029; 6 mo. USD SOFR + 1.27% thereafter)(4) | |
| 6.48%, 10/24/2029, (6.48% fixed rate until 10/24/2028; 6 mo. USD SOFR + 1.77% thereafter)(4) | |
| | |
| | |
| | |
| | |
| 3.97%, 05/22/2030, (3.97% fixed rate until 05/22/2029; 3 mo. USD Term SOFR + 1.87% | |
| 4.76%, 06/09/2028, (4.76% fixed rate until 06/09/2027; 6 mo. USD SOFR + 2.11% thereafter)(4) | |
| 5.60%, 05/17/2028, (5.60% fixed rate until 05/17/2027; 6 mo. USD SOFR + 1.06% thereafter)(4) | |
| 5.73%, 05/17/2032, (5.73% fixed rate until 05/17/2031; 6 mo. USD SOFR + 1.52% thereafter)(4) | |
| 6.33%, 03/09/2044, (6.33% fixed rate until 03/09/2043; 6 mo. USD SOFR + 2.65% thereafter)(4) | |
| 6.95%, 03/11/2034, (6.95% fixed rate until 03/11/2034; 5 year USD CMT + 3.19% | |
| 8.00%, 03/07/2028, (8.00% fixed rate until 03/07/2028; 5 yr. USD CMT + 3.86% thereafter)(4)(5) | |
| Huntington Bancshares, Inc. 5.71%, 02/02/2035, (5.71% fixed rate until 02/02/2034; 6 mo. USD SOFR + | |
| Intesa Sanpaolo SpA 4.95%, 06/01/2042, (4.95% fixed rate until 06/01/2041; 1 yr. USD CMT + | |
| | |
| 2.52%, 04/22/2031, (2.52% fixed rate until 04/22/2030; 6 mo. USD SOFR + 2.04% thereafter)(4) | |
| 2.96%, 05/13/2031, (2.96% fixed rate until 05/13/2030; 3 mo. USD Term SOFR + 2.52% | |
| 3.11%, 04/22/2041, (3.11% fixed rate until 04/22/2040; 3 mo. USD Term SOFR + 2.46% | |
| 3.88%, 07/24/2038, (3.88% fixed rate until 07/24/2037; 3 mo. USD Term SOFR + 1.62% | |
| 4.32%, 04/26/2028, (4.32% fixed rate until 04/26/2027; 6 mo. USD SOFR + 1.56% thereafter)(4) | |
The accompanying notes are an integral part of these financial statements.
The Hartford Balanced Income Fund
Schedule of Investments – (continued)October 31, 2024
Shares or Principal Amount | | |
CORPORATE BONDS - 46.2% - (continued) |
| Commercial Banks - 9.5% - (continued) |
| 4.57%, 06/14/2030, (4.57% fixed rate until 06/14/2029; 6 mo. USD SOFR + 1.75% thereafter)(4) | |
| 4.60%, 10/22/2030, (4.60% fixed rate until 10/22/2029; 6 mo. USD SOFR + 1.04% thereafter)(4) | |
| 4.95%, 10/22/2035, (4.95% fixed rate until 10/22/2034; 6 mo. USD SOFR + 1.34% thereafter)(4) | |
| 5.00%, 07/22/2030, (5.00% fixed rate until 07/22/2029; 6 mo. USD SOFR + 1.13% thereafter)(4) | |
| 5.29%, 07/22/2035, (5.29% fixed rate until 07/22/2034; 6 mo. USD SOFR + 1.46% thereafter)(4) | |
| 5.30%, 07/24/2029, (5.30% fixed rate until 07/24/2028; 6 mo. USD SOFR + 1.45% thereafter)(4) | |
| 5.34%, 01/23/2035, (5.34% fixed rate until 01/23/2034; 6 mo. USD SOFR + 1.62% thereafter)(4) | |
| 5.77%, 04/22/2035, (5.77% fixed rate until 04/22/2034; 6 mo. USD SOFR + 1.49% thereafter)(4) | |
| 6.07%, 10/22/2027, (6.07% fixed rate until 10/22/2026; 6 mo. USD SOFR + 1.33% thereafter)(4) | |
| 6.09%, 10/23/2029, (6.09% fixed rate until 10/23/2028; 6 mo. USD SOFR + 1.57% thereafter)(4) | |
| 6.88%, 06/01/2029, (6.88% fixed rate until 06/01/2029; 5 yr. USD CMT + 2.74% thereafter)(4)(5) | |
| Lloyds Banking Group PLC 5.72%, 06/05/2030, (5.72% fixed rate until 06/05/2029; 1 yr. USD CMT + | |
| M&T Bank Corp. 7.41%, 10/30/2029, (7.41% fixed rate until 10/30/2028; 6 mo. USD SOFR + 2.80% | |
| Macquarie Group Ltd. 1.63%, 09/23/2027, (1.63% fixed rate until 09/23/2026; 6 mo. USD SOFR + | |
| Manufacturers & Traders Trust Co. | |
| | |
| | |
| mBank SA 0.97%, 09/21/2027, (0.97% fixed rate until 09/21/2026; 3 mo. EURIBOR + 1.25% | |
| | |
| 1.79%, 02/13/2032, (1.79% fixed rate until 02/13/2031; 6 mo. USD SOFR + 1.03% thereafter)(4) | |
| 1.93%, 04/28/2032, (1.93% fixed rate until 04/28/2031; 6 mo. USD SOFR + 1.02% thereafter)(4) | |
| 2.48%, 09/16/2036, (2.48% fixed rate until 09/16/2031; 6 mo. USD SOFR + 1.36% thereafter)(4) | |
Shares or Principal Amount | | |
CORPORATE BONDS - 46.2% - (continued) |
| Commercial Banks - 9.5% - (continued) |
| 4.46%, 04/22/2039, (4.46% fixed rate until 04/22/2038; 3 mo. USD Term SOFR + 1.69% | |
| 5.04%, 07/19/2030, (5.04% fixed rate until 07/19/2029; 6 mo. USD SOFR + 1.22% thereafter)(4) | |
| 5.17%, 01/16/2030, (5.17% fixed rate until 01/16/2029; 6 mo. USD SOFR + 1.45% thereafter)(4) | |
| 5.45%, 07/20/2029, (5.45% fixed rate until 07/20/2028; 6 mo. USD SOFR + 1.63% thereafter)(4) | |
| 5.94%, 02/07/2039, (5.94% fixed rate until 02/07/2034; 5 yr. USD CMT + 1.80% thereafter)(4) | |
| 5.95%, 01/19/2038, (5.95% fixed rate until 01/19/2033; 5 yr. USD CMT + 2.43% thereafter)(4) | |
| 6.41%, 11/01/2029, (6.41% fixed rate until 11/01/2028; 6 mo. USD SOFR + 1.83% thereafter)(4) | |
| NatWest Group PLC 1.64%, 06/14/2027, (1.64% fixed rate until 06/14/2026; 1 yr. USD CMT + | |
| NBK SPC Ltd. 5.50%, 06/06/2030, (5.50% fixed rate until 06/06/2029; 6 mo. USD SOFR + 1.16% | |
| Nova Ljubljanska Banka DD | |
| 4.50%, 05/29/2030, (4.50% fixed rate until 05/29/2029; 1 yr. EURIBOR ICE Swap + 1.65% | |
| 6.88%, 01/24/2034, (6.88% fixed rate until 01/24/2029; 5 yr. EURIBOR ICE Swap + 4.23% | |
| | |
| 5.00%, 01/31/2029, (5.00% fixed rate until 01/31/2028; 3 mo. EURIBOR + 2.30% | |
| 8.75%, 05/15/2033, (8.75% fixed rate until 02/15/2028; 5 yr. USD CMT + 5.06% thereafter)(3)(4) | |
| OTP Banka DD 4.75%, 04/03/2028, (4.75% fixed rate until 04/03/2027; 3 mo. EURIBOR + 1.90% | |
| PNC Financial Services Group, Inc. 4.81%, 10/21/2032, (4.81% fixed rate until 10/21/2031; 6 mo. USD SOFR + 1.26% thereafter)(4) | |
| | |
| | |
| | |
| Societe Generale SA 1.79%, 06/09/2027, (1.79% fixed rate until 06/09/2026; 1 yr. USD CMT + | |
The accompanying notes are an integral part of these financial statements.
The Hartford Balanced Income Fund
Schedule of Investments – (continued)October 31, 2024
Shares or Principal Amount | | |
CORPORATE BONDS - 46.2% - (continued) |
| Commercial Banks - 9.5% - (continued) |
| | |
| 5.69%, 05/14/2028, (5.69% fixed rate until 05/14/2027; 1 yr. USD CMT + 1.05% thereafter)(1)(4) | |
| 7.02%, 02/08/2030, (7.02% fixed rate until 02/08/2029; 1 yr. USD CMT + 2.20% thereafter)(1)(4) | |
| 7.88%, 03/08/2030, (7.88% fixed rate until 03/08/2030; 5 yr. USD CMT + 3.57% | |
| | |
| 5.16%, 05/18/2034, (5.16% fixed rate until 05/18/2033; 6 mo. USD SOFR + 1.89% thereafter)(2)(4) | |
| 5.82%, 11/04/2028, (5.82% fixed rate until 11/04/2027; 6 mo. USD SOFR + 1.72% thereafter)(4) | |
| 6.12%, 11/21/2034, (6.12% fixed rate until 11/21/2033; 6 mo. USD SOFR + 1.96% thereafter)(4) | |
| Truist Financial Corp. 5.44%, 01/24/2030, (5.44% fixed rate until 01/24/2029; 6 mo. USD SOFR + | |
| | |
| 1.31%, 02/02/2027, (1.31% fixed rate until 02/02/2026; 6 mo. USD SOFR + 0.98% thereafter)(1)(4) | |
| 3.09%, 05/14/2032, (3.09% fixed rate until 05/14/2031; 6 mo. USD SOFR + 1.73% thereafter)(1)(4) | |
| 4.19%, 04/01/2031, (4.19% fixed rate until 04/01/2030; 6 mo. USD SOFR + 3.73% thereafter)(1)(4) | |
| 5.70%, 02/08/2035, (5.70% fixed rate until 02/08/2034; 1 yr. USD CMT + 1.77% thereafter)(1)(4) | |
| 6.25%, 09/22/2029, (6.25% fixed rate until 09/22/2028; 1 yr. USD CMT + 1.80% thereafter)(1)(4) | |
| 6.30%, 09/22/2034, (6.30% fixed rate until 09/22/2033; 1 yr. USD CMT + 2.00% thereafter)(1)(4) | |
| 6.44%, 08/11/2028, (6.44% fixed rate until 08/11/2027; 6 mo. USD SOFR + 3.70% thereafter)(1)(4) | |
| 6.85%, 09/10/2029, (6.85% fixed rate until 09/10/2029; 5 yr. USD ICE Swap + 3.63% | |
| 9.25%, 11/13/2033, (9.25% fixed rate until 11/13/2033; 5 yr. USD CMT + 4.76% thereafter)(1)(4)(5) | |
| UniCredit SpA 1.98%, 06/03/2027, (1.98% fixed rate until 06/03/2026; 1 yr. USD CMT + 1.20% | |
| United Overseas Bank Ltd. 3.86%, 10/07/2032, (3.86% fixed rate until 10/07/2027; 5 yr. USD CMT + | |
| Wachovia Corp. 5.50%, 08/01/2035 | |
Shares or Principal Amount | | |
CORPORATE BONDS - 46.2% - (continued) |
| Commercial Banks - 9.5% - (continued) |
| | |
| 3.07%, 04/30/2041, (3.07% fixed rate until 04/30/2040; 6 mo. USD SOFR + 2.53% thereafter)(4) | |
| 3.53%, 03/24/2028, (3.53% fixed rate until 03/24/2027; 6 mo. USD SOFR + 1.51% thereafter)(4) | |
| 3.58%, 05/22/2028, (3.58% fixed rate until 05/22/2027; 3 mo. USD Term SOFR + 1.57% | |
| 3.91%, 04/25/2026, (3.91% fixed rate until 04/25/2025; 6 mo. USD SOFR + 1.32% thereafter)(4) | |
| 4.61%, 04/25/2053, (4.61% fixed rate until 04/25/2052; 6 mo. USD SOFR + 2.13% thereafter)(4) | |
| | |
| 4.90%, 07/25/2033, (4.90% fixed rate until 07/25/2032; 6 mo. USD SOFR + 2.10% thereafter)(4) | |
| | |
| 5.01%, 04/04/2051, (5.01% fixed rate until 04/04/2050; 3 mo. USD Term SOFR + 4.50% | |
| 5.20%, 01/23/2030, (5.20% fixed rate until 01/22/2029; 6 mo. USD SOFR + 1.50% thereafter)(4) | |
| 5.50%, 01/23/2035, (5.50% fixed rate until 01/23/2034; 6 mo. USD SOFR + 1.78% thereafter)(4) | |
| 5.56%, 07/25/2034, (5.56% fixed rate until 07/25/2033; 6 mo. USD SOFR + 1.99% thereafter)(4) | |
| 5.57%, 07/25/2029, (5.57% fixed rate until 07/25/2028; 6 mo. USD SOFR + 1.74% thereafter)(4) | |
| | |
| 6.30%, 10/23/2029, (6.30% fixed rate until 10/23/2028; 6 mo. USD SOFR + 1.79% thereafter)(4) | |
| 6.49%, 10/23/2034, (6.49% fixed rate until 10/23/2033; 6 mo. USD SOFR + 2.06% thereafter)(4) | |
| | | |
| Commercial Services - 0.6% |
| Adani Ports & Special Economic Zone Ltd. | |
| | |
| | |
| | |
| | |
| Allied Universal Holdco LLC 7.88%, | |
| Allied Universal Holdco LLC/Allied Universal Finance Corp. 9.75%, | |
| Allied Universal Holdco LLC/Allied Universal Finance Corp./Atlas Luxco 4 SARL | |
| | |
| | |
The accompanying notes are an integral part of these financial statements.
The Hartford Balanced Income Fund
Schedule of Investments – (continued)October 31, 2024
Shares or Principal Amount | | |
CORPORATE BONDS - 46.2% - (continued) |
| Commercial Services - 0.6% - (continued) |
| | |
| | |
| | |
| | |
| | |
| Belron U.K. Finance PLC 5.75%, | |
| Boost Newco Borrower LLC 7.50%, | |
| Cornell University 4.84%, | |
| DP World Salaam 6.00%, 10/01/2025, (6.00% fixed rate until 10/01/2025; 5 yr. USD CMT + 5.75% | |
| Duke University 2.83%, 10/01/2055 | |
| Garda World Security Corp. | |
| | |
| | |
| Georgetown University 2.25%, 04/01/2030 | |
| | |
| | |
| | |
| Raven Acquisition Holdings LLC | |
| Service Corp. International | |
| | |
| | |
| Shift4 Payments LLC/Shift4 Payments Finance Sub, Inc. 6.75%, | |
| TriNet Group, Inc. 7.13%, | |
| United Rentals North America, Inc. | |
| | |
| | |
| | |
| Williams Scotsman, Inc. 4.63%, | |
| | | |
| Construction Materials - 0.3% |
| Builders FirstSource, Inc. | |
| | |
| | |
| Cemex SAB de CV 9.13%, 03/14/2028, (9.13% fixed rate until 03/14/2028; 5 yr. USD CMT + 5.16% thereafter)(1)(4)(5) | |
| CP Atlas Buyer, Inc. 7.00%, | |
| Emerald Borrower LP/Emerald Co.-Issuer, Inc. 6.63%, | |
| Lennox International, Inc. 1.70%, 08/01/2027 | |
| | |
| | |
| | |
| Standard Industries, Inc. | |
| | |
| | |
Shares or Principal Amount | | |
CORPORATE BONDS - 46.2% - (continued) |
| Construction Materials - 0.3% - (continued) |
| Trane Technologies Financing Ltd. | |
| | |
| | |
| | |
| | | |
| Distribution/Wholesale - 0.1% |
| American Builders & Contractors Supply Co., Inc. 4.00%, | |
| Telecommunications Co. Telekom Srbija AD Belgrade 7.00%, | |
| Windsor Holdings III LLC 8.50%, | |
| | | |
| Diversified Financial Services - 1.8% |
| AGFC Capital Trust I 6.67%, 01/15/2067, 3 mo. USD Term | |
| Aircastle Ltd./Aircastle Ireland DAC | |
| American Express Co. 5.28%, 07/27/2029, (5.28% fixed rate until 07/27/2028; 6 mo. USD SOFR + | |
| | |
| | |
| | |
| Capital One Financial Corp. | |
| 4.99%, 07/24/2026, (4.99% fixed rate until 07/24/2025; 6 mo. USD SOFR + 2.16% thereafter)(4) | |
| 5.25%, 07/26/2030, (5.25% fixed rate until 07/26/2029; 6 mo. USD SOFR + 2.60% thereafter)(4) | |
| 5.46%, 07/26/2030, (5.46% fixed rate until 07/26/2029; 6 mo. USD SOFR + 1.56% thereafter)(4) | |
| 5.47%, 02/01/2029, (5.47% fixed rate until 02/01/2028; 6 mo. USD SOFR + 2.08% thereafter)(4) | |
| 6.31%, 06/08/2029, (6.31% fixed rate until 06/08/2028; 6 mo. USD SOFR + 2.64% thereafter)(4) | |
| 7.62%, 10/30/2031, (7.62% fixed rate until 10/30/2030; 6 mo. USD SOFR + 3.07% thereafter)(4) | |
| Credit Acceptance Corp. 9.25%, | |
| Discover Financial Services 7.96%, 11/02/2034, (7.96% fixed rate until 11/02/2033; 6 mo. USD SOFR + | |
| | |
| | |
| | |
| Freedom Mortgage Holdings LLC | |
| GTLK Europe Capital DAC 4.80%, | |
| Hightower Holding LLC 9.13%, | |
The accompanying notes are an integral part of these financial statements.
The Hartford Balanced Income Fund
Schedule of Investments – (continued)October 31, 2024
Shares or Principal Amount | | |
CORPORATE BONDS - 46.2% - (continued) |
| Diversified Financial Services - 1.8% - (continued) |
| Intercontinental Exchange, Inc. | |
| | |
| | |
| | |
| | |
| Lseg U.S. Fin Corp. 5.30%, | |
| | |
| | |
| | |
| Macquarie Airfinance Holdings Ltd. | |
| Manappuram Finance Ltd. 7.38%, | |
| | |
| | |
| | |
| | |
| | |
| | |
| Nationstar Mortgage Holdings, Inc. | |
| | |
| | |
| | |
| | |
| | |
| | |
| | |
| | |
| | |
| PennyMac Financial Services, Inc. | |
| | |
| | |
| | |
| | |
| Power Finance Corp. Ltd. 1.84%, | |
| Radian Group, Inc. 6.20%, 05/15/2029 | |
| | |
| | |
| | |
| | |
| | |
| | |
| | |
| United Wholesale Mortgage LLC | |
| | | |
| |
| AES Andes SA 6.30%, 03/15/2029(1) | |
| AES Corp. 3.30%, 07/15/2025(1) | |
| AES Panama Generation Holdings | |
| Alfa Desarrollo SpA 4.55%, | |
| Appalachian Power Co. 4.50%, 03/01/2049 | |
| Berkshire Hathaway Energy Co. 6.13%, 04/01/2036 | |
Shares or Principal Amount | | |
CORPORATE BONDS - 46.2% - (continued) |
| Electric - 3.7% - (continued) |
| Buffalo Energy Mexico Holdings/Buffalo Energy Infrastructure/Buffalo Energy | |
| Bulgarian Energy Holding EAD | |
| CenterPoint Energy, Inc. 5.40%, 06/01/2029 | |
| Clearway Energy Operating LLC | |
| | |
| | |
| | |
| Cleco Corporate Holdings LLC 3.38%, 09/15/2029 | |
| Consolidated Edison Co. of New York, Inc. | |
| | |
| | |
| | |
| | |
| | |
| | |
| | |
| | |
| Duke Energy Carolinas LLC | |
| | |
| | |
| | |
| | |
| | |
| | |
| | |
| 6.45%, 09/01/2054, (6.45% fixed rate until 06/03/2034; 5 yr. USD CMT + 2.59% thereafter)(4) | |
| | |
| | |
| | |
| Duquesne Light Holdings, Inc. | |
| | |
| | |
| | |
| | |
| | |
| Emera U.S. Finance LP 2.64%, 06/15/2031 | |
| Energo-Pro AS 11.00%, 11/02/2028(1) | |
| EUSHI Finance, Inc. 7.63%, 12/15/2054, (7.63% fixed rate until 09/15/2029; 5 yr. USD CMT + | |
| Eversource Energy 5.50%, 01/01/2034 | |
| FirstEnergy Pennsylvania Electric Co. | |
| FirstEnergy Transmission LLC | |
| | |
| | |
| Fortis, Inc. 3.06%, 10/04/2026 | |
| GDZ Elektrik Dagitim AS 9.00%, | |
| Georgia Power Co. 4.30%, 03/15/2043 | |
The accompanying notes are an integral part of these financial statements.
The Hartford Balanced Income Fund
Schedule of Investments – (continued)October 31, 2024
Shares or Principal Amount | | |
CORPORATE BONDS - 46.2% - (continued) |
| Electric - 3.7% - (continued) |
| India Clean Energy Holdings | |
| | |
| | |
| ITC Holdings Corp. 4.95%, | |
| | |
| | |
| | |
| Lamar Funding Ltd. 3.96%, | |
| MidAmerican Energy Co. 4.40%, 10/15/2044 | |
| National Grid PLC 5.42%, 01/11/2034 | |
| Niagara Energy SAC 5.75%, | |
| | |
| | |
| | |
| Oglethorpe Power Corp. 5.05%, 10/01/2048 | |
| Ohio Edison Co. 5.50%, 01/15/2033(1) | |
| OmGrid Funding Ltd. 5.20%, | |
| | |
| Pacific Gas & Electric Co. | |
| | |
| | |
| | |
| | |
| | |
| | |
| | |
| | |
| | |
| | |
| | |
| PG&E Corp. 7.38%, 03/15/2055, (7.38% fixed rate until 12/15/2029; 5 yr. USD CMT + 3.88% | |
| | |
| | |
| | |
| ReNew Wind Energy AP2/ReNew Power Pvt Ltd. other 9 Subsidiaries | |
| Rochester Gas & Electric Corp. | |
| SAEL/SPREPL/SSSPL/JGPEPL/SKREPL/UBEPL | |
| | |
| Southern California Edison Co. | |
| | |
| | |
| | |
| | |
| | |
| | |
| Southern Co. 4.85%, 03/15/2035 | |
| Star Energy Geothermal Darajat II/Star Energy Geothermal Salak | |
Shares or Principal Amount | | |
CORPORATE BONDS - 46.2% - (continued) |
| Electric - 3.7% - (continued) |
| Termocandelaria Power SA 7.75%, | |
| Virginia Electric & Power Co. | |
| | |
| | |
| | |
| | |
| | |
| | |
| Zorlu Enerji Elektrik Uretim AS | |
| | | |
| |
| Honeywell International, Inc. | |
| | |
| | |
| Imola Merger Corp. 4.75%, | |
| | |
| | |
| | |
| | | |
| Energy-Alternate Sources - 0.0% |
| | |
| | |
| | |
| | |
| Greenko Power II Ltd. 4.30%, | |
| Vena Energy Capital Pte. Ltd. 3.13%, | |
| | | |
| Engineering & Construction - 0.1% |
| Aeropuerto Internacional de Tocumen SA | |
| | |
| | |
| | |
| | |
| | |
| IRB Infrastructure Developers Ltd. | |
| Sitios Latinoamerica SAB de CV | |
| | | |
| |
| Caesars Entertainment, Inc. | |
| | |
| | |
| | |
| | |
| | |
| | |
| Cirsa Finance International SARL | |
| | |
| | |
| Great Canadian Gaming Corp. 8.75%, | |
| Resorts World Las Vegas LLC/RWLV Capital, Inc. | |
| | |
The accompanying notes are an integral part of these financial statements.
The Hartford Balanced Income Fund
Schedule of Investments – (continued)October 31, 2024
Shares or Principal Amount | | |
CORPORATE BONDS - 46.2% - (continued) |
| Entertainment - 0.4% - (continued) |
| | |
| Speedway Motorsports LLC/Speedway Funding II, Inc. 4.88%, | |
| Warnermedia Holdings, Inc. | |
| | |
| | |
| | |
| Wynn Resorts Finance LLC/Wynn Resorts Capital Corp. | |
| | |
| | |
| | | |
| Environmental Control - 0.6% |
| Republic Services, Inc. 5.20%, 11/15/2034 | |
| | |
| | |
| | |
| Veralto Corp. 5.50%, 09/18/2026 | |
| | |
| | |
| | |
| | | |
| |
| | |
| | |
| | |
| | |
| | |
| | |
| | |
| BRF SA 5.75%, 09/21/2050(3) | |
| Cencosud SA 5.95%, 05/28/2031(1) | |
| | |
| | |
| | |
| | |
| | |
| JBS USA Holding Lux SARL/JBS USA Food Co./JBS Lux Co. SARL 2.50%, 01/15/2027 | |
| | |
| | |
| | |
| | |
| | |
| | |
| | |
| Performance Food Group, Inc. | |
| | |
| | |
| | |
| | |
| | |
| | |
| | |
| | |
| | |
| | |
| | | |
Shares or Principal Amount | | |
CORPORATE BONDS - 46.2% - (continued) |
| Forest Products & Paper - 0.0% |
| LD Celulose International GmbH | |
| Suzano Austria GmbH 3.75%, 01/15/2031 | |
| | | |
| |
| AltaGas Ltd. 7.20%, 10/15/2054, (7.20% fixed rate until 07/17/2034; 5 yr. USD CMT + 3.57% | |
| AmeriGas Partners LP/AmeriGas Finance Corp. 5.75%, 05/20/2027 | |
| | |
| | |
| | |
| | |
| | |
| | |
| | |
| Southern California Gas Co. 5.05%, 09/01/2034 | |
| | | |
| Hand/Machine Tools - 0.1% |
| | |
| | |
| | |
| | |
| | | |
| Healthcare - Products - 1.0% |
| Agilent Technologies, Inc. 4.75%, 09/09/2034 | |
| Alcon Finance Corp. 2.60%, | |
| Avantor Funding, Inc. 4.63%, | |
| Baxter International, Inc. | |
| | |
| | |
| GE HealthCare Technologies, Inc. | |
| | |
| | |
| | |
| | |
| | |
| | |
| | |
| | |
| | |
| | |
| | |
| | |
| | | |
| Healthcare - Services - 1.4% |
| | |
| | |
| | |
| CHS/Community Health Systems, Inc. | |
| | |
| | |
| | |
| | |
| | |
The accompanying notes are an integral part of these financial statements.
The Hartford Balanced Income Fund
Schedule of Investments – (continued)October 31, 2024
Shares or Principal Amount | | |
CORPORATE BONDS - 46.2% - (continued) |
| Healthcare - Services - 1.4% - (continued) |
| | |
| | |
| | |
| | |
| | |
| | |
| | |
| | |
| | |
| Health Care Service Corp. A Mutual Legal Reserve Co. 5.20%, | |
| IQVIA, Inc. 2.25%, 01/15/2028(1) | |
| Kaiser Foundation Hospitals 2.81%, 06/01/2041 | |
| Laboratory Corp. of America Holdings 4.55%, 04/01/2032 | |
| Quest Diagnostics, Inc. 4.63%, 12/15/2029 | |
| Surgery Center Holdings, Inc. 7.25%, | |
| | |
| | |
| | |
| Tenet Healthcare Corp. 6.13%, 06/15/2030 | |
| | |
| | |
| | |
| | |
| | |
| | |
| | |
| | |
| | | |
| |
| Ashton Woods USA LLC/Ashton Woods Finance Co. | |
| | |
| | |
| | |
| Century Communities, Inc. 3.88%, | |
| KB Home 4.80%, 11/15/2029 | |
| | |
| | |
| | |
| STL Holding Co. LLC 8.75%, | |
| Taylor Morrison Communities, Inc. | |
| | |
| | |
| | | |
| Household Products - 0.2% |
| | |
| | |
| | |
| | |
| | |
| | |
| | | |
Shares or Principal Amount | | |
CORPORATE BONDS - 46.2% - (continued) |
| |
| | |
| | |
| | |
| | | |
| |
| ACE Capital Trust II 9.70%, 04/01/2030 | |
| Acrisure LLC/Acrisure Finance, Inc. | |
| | |
| | |
| American International Group, Inc. | |
| | |
| | |
| American National Group, Inc. 5.75%, 10/01/2029 | |
| Aon Global Ltd. 4.25%, 12/12/2042 | |
| Aon North America, Inc. 5.30%, 03/01/2031 | |
| | |
| | |
| | |
| | |
| | |
| | |
| | |
| CNO Global Funding 2.65%, | |
| Corebridge Financial, Inc. 3.85%, 04/05/2029 | |
| Corebridge Global Funding 5.90%, | |
| Equitable Financial Life Global Funding | |
| | |
| | |
| Equitable Holdings, Inc. 4.35%, 04/20/2028 | |
| | |
| | |
| | |
| Jackson National Life Global Funding | |
| | |
| | |
| Liberty Mutual Group, Inc. | |
| 4.13%, 12/15/2051, (4.13% fixed rate until 09/15/2026; 5 yr. USD CMT + 3.32% thereafter)(1)(4) | |
| | |
| Marsh & McLennan Cos., Inc. | |
| | |
| | |
| | |
| | |
| MGIC Investment Corp. 5.25%, 08/15/2028 | |
| Nationwide Mutual Insurance Co. | |
| | |
| | |
| Northwestern Mutual Global Funding | |
| Protective Life Global Funding 5.47%, | |
The accompanying notes are an integral part of these financial statements.
The Hartford Balanced Income Fund
Schedule of Investments – (continued)October 31, 2024
Shares or Principal Amount | | |
CORPORATE BONDS - 46.2% - (continued) |
| Insurance - 1.9% - (continued) |
| SBL Holdings, Inc. 7.20%, | |
| Willis North America, Inc. 4.65%, 06/15/2027 | |
| | | |
| |
| Amazon.com, Inc. 3.95%, 04/13/2052 | |
| | |
| | |
| | |
| | |
| Go Daddy Operating Co. LLC/GD Finance Co., Inc. 3.50%, | |
| | |
| | |
| | |
| | |
| | |
| Newfold Digital Holdings Group, Inc. | |
| | |
| | |
| Rakuten Group, Inc. 9.75%, | |
| | |
| | |
| | |
| | | |
| Investment Company Security - 0.1% |
| Abu Dhabi Developmental Holding Co. PJSC | |
| | |
| | |
| Ares Capital Corp. 5.95%, 07/15/2029 | |
| Ares Strategic Income Fund 6.35%, | |
| Carlyle Secured Lending, Inc. 6.75%, | |
| Huarong Finance 2017 Co. Ltd. | |
| Huarong Finance II Co. Ltd. 4.63%, | |
| | |
| | | |
| |
| ArcelorMittal SA 6.55%, 11/29/2027 | |
| | |
| | |
| | |
| Cleveland-Cliffs, Inc. 4.63%, | |
| | |
| | |
| | |
| JSW Steel Ltd. 5.05%, 04/05/2032(3) | |
| | |
| | | |
Shares or Principal Amount | | |
CORPORATE BONDS - 46.2% - (continued) |
| |
| Amentum Holdings, Inc. 7.25%, | |
| | |
| | |
| | |
| | |
| | |
| | |
| Fortress Intermediate 3, Inc. 7.50%, | |
| Hewlett Packard Enterprise Co. | |
| | |
| | |
| IBM International Capital Pte. Ltd. | |
| | |
| | |
| | |
| Insight Enterprises, Inc. 6.63%, | |
| International Business Machines Corp. 4.15%, 05/15/2039 | |
| McAfee Corp. 7.38%, 02/15/2030(1) | |
| | | |
| |
| | |
| | |
| | |
| | |
| | |
| | |
| | |
| Royal Caribbean Cruises Ltd. | |
| | |
| | |
| | |
| | |
| | |
| | |
| | | |
| |
| | |
| | |
| | |
| Las Vegas Sands Corp. 3.50%, 08/18/2026 | |
| Melco Resorts Finance Ltd. | |
| | |
| | |
| | |
| | |
| Station Casinos LLC 6.63%, | |
| Studio City Finance Ltd. 5.00%, | |
| Sugarhouse HSP Gaming Prop Mezz LP/Sugarhouse HSP Gaming Finance Corp. 5.88%, | |
| Wynn Las Vegas LLC/Wynn Las Vegas Capital Corp. 5.25%, | |
| | | |
The accompanying notes are an integral part of these financial statements.
The Hartford Balanced Income Fund
Schedule of Investments – (continued)October 31, 2024
Shares or Principal Amount | | |
CORPORATE BONDS - 46.2% - (continued) |
| Machinery-Diversified - 0.2% |
| | |
| | |
| | |
| | |
| | |
| | |
| TK Elevator Holdco GmbH 7.63%, | |
| TK Elevator U.S. Newco, Inc. 5.25%, | |
| Westinghouse Air Brake Technologies Corp. | |
| | |
| | |
| | | |
| |
| AMC Networks, Inc. 10.25%, | |
| CCO Holdings LLC/CCO Holdings Capital Corp. | |
| | |
| | |
| | |
| | |
| | |
| | |
| Charter Communications Operating LLC/Charter Communications Operating Capital | |
| | |
| | |
| | |
| | |
| | |
| | |
| | |
| | |
| | |
| | |
| | |
| | |
| | |
| | |
| | |
| | |
| | |
| | |
| | |
| Discovery Communications LLC 3.95%, 06/15/2025 | |
| | |
| | |
| | |
| | |
| | |
| Scripps Escrow, Inc. 5.88%, | |
| | |
| | |
| | |
| Sunrise FinCo I BV 4.88%, | |
Shares or Principal Amount | | |
CORPORATE BONDS - 46.2% - (continued) |
| Media - 1.6% - (continued) |
| Time Warner Cable Enterprises LLC 8.38%, 07/15/2033 | |
| | |
| | |
| | |
| Univision Communications, Inc. | |
| | |
| | |
| Virgin Media Secured Finance PLC | |
| | |
| | |
| | |
| | |
| | |
| VZ Secured Financing BV 5.00%, | |
| Ziggo BV 4.88%, 01/15/2030(1) | |
| | | |
| Metal Fabricate/Hardware - 0.0% |
| Advanced Drainage Systems, Inc. | |
| | |
| | |
| | | |
| |
| Anglo American Capital PLC | |
| | |
| | |
| | |
| | |
| AngloGold Ashanti Holdings PLC 3.75%, 10/01/2030 | |
| | |
| | |
| | |
| First Quantum Minerals Ltd. 8.63%, | |
| FMG Resources August 2006 Pty. Ltd. | |
| | |
| | |
| | |
| | |
| | |
| | |
| | |
| | |
| | |
| | |
| | |
| | |
| Navoi Mining & Metallurgical Combinat | |
| | |
| | |
| | |
| | |
| | |
| Rio Tinto Finance USA Ltd. 2.75%, 11/02/2051 | |
| | |
| | |
| | |
The accompanying notes are an integral part of these financial statements.
The Hartford Balanced Income Fund
Schedule of Investments – (continued)October 31, 2024
Shares or Principal Amount | | |
CORPORATE BONDS - 46.2% - (continued) |
| Mining - 1.2% - (continued) |
| WE Soda Investments Holding PLC | |
| | |
| | |
| | | |
| Office/Business Equipment - 0.1% |
| CDW LLC/CDW Finance Corp. | |
| | |
| | |
| | | |
| |
| Adnoc Murban Rsc Ltd. 5.13%, | |
| | |
| | |
| | |
| | |
| | |
| | |
| BP Capital Markets America, Inc. | |
| | |
| | |
| | |
| | |
| | |
| | |
| | |
| Diamond Foreign Asset Co./Diamond Finance LLC 8.50%, 10/01/2030(1) | |
| | |
| | |
| | |
| | |
| | |
| | |
| | |
| | |
| | |
| Empresa Nacional del Petroleo | |
| Eni SpA 5.50%, 05/15/2034(1) | |
| Equinor ASA 3.63%, 04/06/2040 | |
| | |
| | |
| | |
| Hilcorp Energy I LP/Hilcorp Finance | |
| | |
| | |
| | |
| | |
| Nabors Industries, Inc. 9.13%, | |
| Noble Finance II LLC 8.00%, | |
| Northern Oil & Gas, Inc. 8.75%, | |
| Ovintiv, Inc. 7.38%, 11/01/2031 | |
| Patterson-UTI Energy, Inc. | |
| | |
| | |
| Permian Resources Operating LLC | |
| | |
| | |
Shares or Principal Amount | | |
CORPORATE BONDS - 46.2% - (continued) |
| Oil & Gas - 2.1% - (continued) |
| Petroleos de Venezuela SA 6.00%, | |
| Petroleos Mexicanos 7.69%, 01/23/2050 | |
| Phillips 66 Co. 5.25%, 06/15/2031 | |
| Pluspetrol Camisea SA/Pluspetrol Lote 56 SA 6.24%, 07/03/2036(1) | |
| Range Resources Corp. 4.75%, | |
| | |
| | |
| | |
| | |
| | |
| | |
| | |
| Shell International Finance BV | |
| | |
| | |
| | |
| | |
| | |
| | |
| State Oil Co. of the Azerbaijan Republic 6.95%, 03/18/2030(3) | |
| Suncor Energy, Inc. 4.00%, | |
| | |
| | |
| | |
| | |
| | |
| | |
| | |
| | |
| | |
| | |
| | |
| | |
| | |
| | |
| | |
| | |
| | |
| | |
| YPF SA 6.95%, 07/21/2027(3) | |
| | | |
| Oil & Gas Services - 0.1% |
| Enerflex Ltd. 9.00%, 10/15/2027(1) | |
| USA Compression Partners LP/USA Compression Finance Corp. | |
| Weatherford International Ltd. 8.63%, | |
| | | |
| Packaging & Containers - 0.3% |
| Ardagh Packaging Finance PLC/Ardagh Holdings USA, Inc. | |
| | |
| | |
| Clydesdale Acquisition Holdings, Inc. | |
| | |
| | |
The accompanying notes are an integral part of these financial statements.
The Hartford Balanced Income Fund
Schedule of Investments – (continued)October 31, 2024
Shares or Principal Amount | | |
CORPORATE BONDS - 46.2% - (continued) |
| Packaging & Containers - 0.3% - (continued) |
| Graphic Packaging International LLC | |
| | |
| | |
| LABL, Inc. 8.63%, 10/01/2031(1) | |
| Mauser Packaging Solutions Holding Co. | |
| | |
| | |
| Owens-Brockway Glass Container, Inc. | |
| | |
| | |
| SAN Miguel Industrias Pet SA/NG PET R&P Latin America SA 3.75%, | |
| Sealed Air Corp. 1.57%, 10/15/2026(1) | |
| | | |
| |
| | |
| | |
| | |
| | |
| AstraZeneca Finance LLC 4.90%, 02/26/2031 | |
| AstraZeneca PLC 4.00%, 09/18/2042 | |
| Becton Dickinson & Co. 4.69%, 02/13/2028 | |
| | |
| | |
| | |
| | |
| | |
| Cardinal Health, Inc. 5.13%, 02/15/2029 | |
| | |
| | |
| | |
| | |
| | |
| | |
| | |
| | |
| | |
| Novartis Capital Corp. 4.00%, 09/18/2031 | |
| Pfizer Investment Enterprises Pte. Ltd. | |
| | |
| | |
| | |
| Takeda Pharmaceutical Co. Ltd. 5.30%, 07/05/2034 | |
| Teva Pharmaceutical Finance Netherlands II BV 7.88%, 09/15/2031 | |
| Teva Pharmaceutical Finance Netherlands III BV | |
| | |
| | |
| Viatris, Inc. 2.70%, 06/22/2030 | |
| | | |
Shares or Principal Amount | | |
CORPORATE BONDS - 46.2% - (continued) |
| |
| AL Candelaria -spain- SA 5.75%, | |
| Antero Midstream Partners LP/Antero Midstream Finance Corp. | |
| | |
| | |
| Blue Racer Midstream LLC/Blue Racer Finance Corp. 7.25%, | |
| | |
| | |
| | |
| | |
| | |
| | |
| Columbia Pipelines Holding Co. LLC | |
| | |
| | |
| Columbia Pipelines Operating Co. LLC | |
| | |
| | |
| | |
| DT Midstream, Inc. 4.13%, | |
| | |
| | |
| | |
| | |
| | |
| 5.75%, 07/15/2080, (5.75% fixed rate until 04/15/2030; 5 yr. USD CMT + 5.31% thereafter)(4) | |
| | |
| | |
| | |
| | |
| | |
| | |
| | |
| 8.00%, 05/15/2054, (8.00% fixed rate until 02/15/2029; 5 yr. USD CMT + 4.02% thereafter)(4) | |
| EQM Midstream Partners LP | |
| | |
| | |
| | |
| Galaxy Pipeline Assets Bidco Ltd. | |
| | |
| | |
| | |
| Greensaif Pipelines Bidco SARL | |
| | |
| | |
| | |
| | |
| Hess Midstream Operations LP | |
| | |
| | |
| | |
| | |
| | |
| ONEOK Partners LP 6.13%, 02/01/2041 | |
The accompanying notes are an integral part of these financial statements.
The Hartford Balanced Income Fund
Schedule of Investments – (continued)October 31, 2024
Shares or Principal Amount | | |
CORPORATE BONDS - 46.2% - (continued) |
| Pipelines - 1.9% - (continued) |
| | |
| | |
| | |
| | |
| | |
| | |
| | |
| South Bow Canadian Infrastructure Holdings Ltd. 7.50%, 03/01/2055, (7.50% fixed rate until 12/01/2034; 5 yr. USD CMT + 3.67% | |
| | |
| | |
| | |
| | |
| Transcanada Trust 5.60%, 03/07/2082, (5.60% fixed rate until 12/07/2031; 5 yr. USD CMT + | |
| | |
| | |
| | |
| Williams Cos., Inc. 5.10%, 09/15/2045 | |
| | | |
| |
| Canary Wharf Group Investment Holdings PLC 3.38%, 04/23/2028(3) | |
| Country Garden Holdings Co. Ltd. | |
| | |
| | |
| | |
| Elect Global Investments Ltd. 4.10%, 06/03/2025, (4.10% fixed rate until 06/03/2025; 5 yr. USD CMT + 2.89% thereafter)(3)(4)(5) | |
| Esic Sukuk Ltd. 5.83%, 02/14/2029(3) | |
| Fuqing Investment Management Ltd. | |
| GLP Pte. Ltd. 3.88%, 06/04/2025(3) | |
| NWD Finance BVI Ltd. 4.13%, 03/10/2028, (4.13% fixed rate until 03/10/2028; 5 yr. USD CMT + 5.86% thereafter)(3)(4)(5) | |
| Pingan Real Estate Capital Ltd. | |
| | | |
| Real Estate Investment Trusts - 1.8% |
| American Assets Trust LP 6.15%, 10/01/2034 | |
| | |
| | |
| | |
| American Tower Trust I 5.49%, | |
| Brandywine Operating Partnership LP | |
| Brixmor Operating Partnership LP | |
| | |
| | |
| Cousins Properties LP 5.88%, 10/01/2034 | |
Shares or Principal Amount | | |
CORPORATE BONDS - 46.2% - (continued) |
| Real Estate Investment Trusts - 1.8% - (continued) |
| | |
| | |
| | |
| | |
| | |
| | |
| Equinix, Inc. 3.20%, 11/18/2029 | |
| GLP Capital LP/GLP Financing II, Inc. | |
| | |
| | |
| | |
| | |
| Healthpeak OP LLC 5.25%, 12/15/2032 | |
| Hudson Pacific Properties LP | |
| | |
| | |
| | |
| | |
| | |
| Pebblebrook Hotel LP/PEB Finance Corp. 6.38%, 10/15/2029(1) | |
| Piedmont Operating Partnership LP 6.88%, 07/15/2029 | |
| Realty Income Corp. 4.85%, 03/15/2030 | |
| Regency Centers LP 5.25%, 01/15/2034 | |
| RHP Hotel Properties LP/RHP Finance Corp. | |
| | |
| | |
| | |
| | |
| | |
| | |
| | |
| | |
| | |
| | |
| UDR, Inc. 2.10%, 08/01/2032 | |
| Welltower OP LLC 2.75%, 01/15/2032 | |
| | | |
| |
| 1011778 BC ULC/New Red Finance, Inc. | |
| | |
| | |
| | |
| Asbury Automotive Group, Inc. | |
| | |
| | |
| | |
| | |
| | |
| | |
| | |
| BCPE Ulysses Intermediate, Inc. | |
| Cougar JV Subsidiary LLC 8.00%, | |
| FirstCash, Inc. 4.63%, 09/01/2028(1) | |
The accompanying notes are an integral part of these financial statements.
The Hartford Balanced Income Fund
Schedule of Investments – (continued)October 31, 2024
Shares or Principal Amount | | |
CORPORATE BONDS - 46.2% - (continued) |
| Retail - 0.7% - (continued) |
| Foundation Building Materials, Inc. | |
| Home Depot, Inc. 4.50%, 12/06/2048 | |
| LBM Acquisition LLC 6.25%, | |
| Lowe's Cos., Inc. 2.80%, 09/15/2041 | |
| | |
| | |
| | |
| | |
| Michaels Cos., Inc. 5.25%, | |
| O'Reilly Automotive, Inc. 5.00%, 08/19/2034 | |
| PetSmart, Inc./PetSmart Finance Corp. | |
| | |
| | |
| Specialty Building Products Holdings LLC/SBP Finance Corp. | |
| Staples, Inc. 10.75%, 09/01/2029(1) | |
| | |
| | |
| | |
| | |
| Zhongsheng Group Holdings Ltd. | |
| | | |
| |
| | |
| | |
| | |
| | |
| Entegris, Inc. 4.75%, 04/15/2029(1)(10) | |
| | |
| | |
| | |
| | |
| | |
| | |
| | |
| | |
| | |
| | |
| | |
| | |
| Marvell Technology, Inc. 5.75%, 02/15/2029 | |
| | |
| | |
| | |
| | |
| | |
| | |
| | |
| | |
| | |
| | |
| | |
| Skyworks Solutions, Inc. 1.80%, 06/01/2026 | |
| | | |
Shares or Principal Amount | | |
CORPORATE BONDS - 46.2% - (continued) |
| |
| AthenaHealth Group, Inc. 6.50%, | |
| Dun & Bradstreet Corp. 5.00%, | |
| Fiserv, Inc. 4.75%, 03/15/2030 | |
| Microsoft Corp. 2.92%, 03/17/2052 | |
| | |
| | |
| | |
| | |
| | |
| | |
| | |
| | |
| | |
| | |
| | |
| | |
| | |
| | |
| | |
| | |
| | |
| | |
| | |
| | |
| | |
| | |
| ROBLOX Corp. 3.88%, 05/01/2030(1) | |
| Rocket Software, Inc. 6.50%, | |
| UKG, Inc. 6.88%, 02/01/2031(1) | |
| | | |
| Telecommunications - 1.5% |
| Altice Financing SA 5.75%, | |
| Altice France Holding SA 10.50%, | |
| | |
| | |
| | |
| | |
| America Movil SAB de CV 9.50%, 01/27/2031 | |
| | |
| | |
| | |
| | |
| | |
| CAS Capital No. 1 Ltd. 4.00%, 07/12/2026, (4.00% fixed rate until 07/12/2026; 5 yr. USD CMT + 3.64% thereafter)(3)(4)(5) | |
| | |
| | |
| | |
| Empresa Nacional de Telecomunicaciones SA | |
| | |
| | |
| Frontier Communications Holdings LLC | |
| | |
The accompanying notes are an integral part of these financial statements.
The Hartford Balanced Income Fund
Schedule of Investments – (continued)October 31, 2024
Shares or Principal Amount | | |
CORPORATE BONDS - 46.2% - (continued) |
| Telecommunications - 1.5% - (continued) |
| | |
| | |
| | |
| 4.20%, 08/02/2026, (4.20% fixed rate until 08/02/2026; 5 yr. USD CMT + 5.53% thereafter)(3)(4)(5) | |
| | |
| | |
| | |
| | |
| Kaixo Bondco Telecom SA 5.13%, | |
| | |
| | |
| | |
| | |
| | |
| Millicom International Cellular SA | |
| | |
| | |
| | |
| | |
| Network i2i Ltd. 5.65%, 01/15/2025, (5.65% fixed rate until 01/15/2025; 5 yr. USD CMT + 4.27% | |
| | |
| | |
| | |
| | |
| Rogers Communications, Inc. 5.00%, 02/15/2029 | |
| Silknet JSC 8.38%, 01/31/2027(3) | |
| Sprint Spectrum Co. LLC/Sprint Spectrum Co. II LLC/Sprint Spectrum Co. III LLC 5.15%, | |
| Telecom Italia Capital SA | |
| | |
| | |
| | |
| | |
| | |
| | |
| | |
| | |
| | |
| | |
| Tower Bersama Infrastructure Tbk. PT | |
| | |
| | |
| | |
| Verizon Communications, Inc. | |
| | |
| | |
| VF Ukraine PAT via VFU Funding PLC | |
| Vmed O2 U.K. Financing I PLC | |
Shares or Principal Amount | | |
CORPORATE BONDS - 46.2% - (continued) |
| Telecommunications - 1.5% - (continued) |
| | |
| 5.13%, 06/04/2081, (5.13% fixed rate until 12/04/2050; 5 yr. USD CMT + 3.07% thereafter)(4) | |
| | |
| | | |
| |
| Burlington Northern Santa Fe LLC 4.55%, 09/01/2044 | |
| CSX Corp. 4.90%, 03/15/2055 | |
| Lima Metro Line 2 Finance Ltd. | |
| | |
| | |
| | |
| Rumo Luxembourg SARL 5.25%, | |
| Russian Railways Via RZD Capital PLC 5.70%, 04/05/2022(7)(8) | |
| Ryder System, Inc. 4.90%, 12/01/2029 | |
| | | |
| Trucking & Leasing - 0.4% |
| Penske Truck Leasing Co. LP/PTL Finance Corp. | |
| | |
| | |
| | |
| | |
| SMBC Aviation Capital Finance DAC | |
| | | |
| |
| Aegea Finance SARL 9.00%, | |
| Total Corporate Bonds
(cost $5,900,223,499) | |
FOREIGN GOVERNMENT OBLIGATIONS - 3.3% |
| |
| Angola Government International Bonds | |
| | |
| | |
| | | |
| |
| Argentina Republic Government International Bonds | |
| | |
| | |
| | |
| | |
| | | |
| |
| Republic of Azerbaijan International Bonds 3.50%, 09/01/2032(3) | |
The accompanying notes are an integral part of these financial statements.
The Hartford Balanced Income Fund
Schedule of Investments – (continued)October 31, 2024
Shares or Principal Amount | | |
FOREIGN GOVERNMENT OBLIGATIONS - 3.3% - (continued) |
| |
| Benin Government International Bonds | |
| | |
| | |
| | | |
| |
| Bermuda Government International Bonds 5.00%, 07/15/2032(3) | |
| |
| Brazil Government International Bonds | |
| | |
| | |
| | | |
| |
| Bulgaria Government International Bonds | |
| | |
| | |
| | |
| | |
| | | |
| |
| Chile Government International Bonds 3.10%, 01/22/2061 | |
| |
| Colombia Government International Bonds | |
| | |
| | |
| | |
| | |
| | |
| | |
| | |
| | |
| | |
| | |
| Colombia TES 7.25%, 10/18/2034 | |
| | | |
| |
| Costa Rica Government International Bonds | |
| | |
| | |
| | |
| | |
| | | |
| |
| Czech Republic Government Bonds | |
| Dominican Republic - 0.2% |
| Dominican Republic International Bonds | |
| | |
| | |
| | |
| | |
| | |
Shares or Principal Amount | | |
FOREIGN GOVERNMENT OBLIGATIONS - 3.3% - (continued) |
| Dominican Republic - 0.2% - (continued) |
| | |
| | |
| | |
| | | |
| |
| Ecuador Government International Bonds | |
| | |
| | |
| | |
| | | |
| |
| Egypt Government International Bonds | |
| | |
| | |
| | |
| | |
| | |
| | |
| | |
| | |
| | |
| | |
| | |
| | | |
| |
| El Salvador Government International Bonds 7.12%, 01/20/2050(3) | |
| |
| Gabon Government International Bonds | |
| | |
| | |
| | |
| | |
| | | |
| |
| Guatemala Government Bonds | |
| | |
| | |
| | |
| | |
| | |
| | |
| | |
| | |
| | | |
| |
| | |
| | |
| | |
| Hungary Government International Bonds | |
| | |
| | |
| | |
| | |
| | |
| | |
| | |
The accompanying notes are an integral part of these financial statements.
The Hartford Balanced Income Fund
Schedule of Investments – (continued)October 31, 2024
Shares or Principal Amount | | |
FOREIGN GOVERNMENT OBLIGATIONS - 3.3% - (continued) |
| Hungary - 0.2% - (continued) |
| | |
| | |
| | |
| Magyar Export-Import Bank Zrt | |
| | |
| | |
| | | |
| |
| Ivory Coast Government International Bonds | |
| | |
| | |
| | |
| | | |
| |
| Jordan Government International Bonds | |
| | |
| | |
| | |
| | | |
| |
| Mexico Cetes 0.00%, 06/11/2026(13) | |
| Mexico Government International Bonds | |
| | |
| | |
| | |
| | |
| | |
| | |
| | |
| | |
| | |
| | |
| | |
| | | |
| |
| Mongolia Government International Bonds | |
| | |
| | |
| | | |
| |
| Morocco Government International Bonds 1.38%, 03/30/2026(3) | |
| |
| North Macedonia Government International Bonds | |
| | |
| | |
| | |
| | |
| | | |
| |
| Oman Government International Bonds | |
| | |
Shares or Principal Amount | | |
FOREIGN GOVERNMENT OBLIGATIONS - 3.3% - (continued) |
| Oman - 0.0% - (continued) |
| | |
| | |
| | | |
| |
| Pakistan Government International Bonds | |
| | |
| | |
| | |
| | |
| | | |
| |
| Panama Government International Bonds | |
| | |
| | |
| | |
| | |
| | | |
| |
| Peru Government International Bonds | |
| | |
| | |
| | |
| | |
| | |
| | | |
| |
| Bank Gospodarstwa Krajowego | |
| Republic of Poland Government International Bonds 5.50%, 04/04/2053 | |
| | | |
| |
| Romania Government International Bonds | |
| | |
| | |
| | |
| | |
| | |
| | |
| | |
| | |
| | |
| | |
| | |
| | |
| | | |
| |
| KSA Sukuk Ltd. 5.25%, 06/04/2034(1) | |
| Saudi Government International Bonds | |
| | |
| | |
| | |
| | |
| | |
The accompanying notes are an integral part of these financial statements.
The Hartford Balanced Income Fund
Schedule of Investments – (continued)October 31, 2024
Shares or Principal Amount | | |
FOREIGN GOVERNMENT OBLIGATIONS - 3.3% - (continued) |
| Saudi Arabia - 0.2% - (continued) |
| | |
| | |
| | | |
| |
| Senegal Government International Bonds 4.75%, 03/13/2028(3) | |
| |
| Serbia International Bonds | |
| | |
| | |
| | | |
| |
| Republic of South Africa Government Bonds | |
| | |
| | |
| | |
| | |
| Republic of South Africa Government International Bonds 5.75%, 09/30/2049 | |
| | | |
| |
| Sri Lanka Government International Bonds | |
| | |
| | |
| | |
| | |
| | | |
| |
| Asian Infrastructure Investment Bank | |
| Inter-American Development Bank 7.35%, 10/06/2030 | |
| | | |
| |
| Hazine Mustesarligi Varlik Kiralama | |
| Turkiye Government International Bonds | |
| | |
| | |
| | |
| | |
| | |
| | |
| | |
| | |
| | |
| | | |
| |
| Ukraine Government International Bonds | |
| | |
| | |
| | |
| | |
| | |
| | |
Shares or Principal Amount | | |
FOREIGN GOVERNMENT OBLIGATIONS - 3.3% - (continued) |
| Ukraine - 0.1% - (continued) |
| | |
| | |
| | | |
| United Arab Emirates - 0.0% |
| Abu Dhabi Government International Bonds 5.50%, 04/30/2054(1) | |
| Emirate of Dubai Government International Bonds 3.90%, | |
| Finance Department Government of Sharjah 4.63%, 01/17/2031(1) | |
| | | |
| |
| Uruguay Government International Bonds 9.75%, 07/20/2033 | |
| |
| Venezuela Government International Bonds | |
| | |
| | |
| | |
| | |
| | |
| | | |
| Total Foreign Government Obligations
(cost $401,859,485) | | |
|
| |
| Sales Tax Securitization Corp., IL, Rev 4.64%, 01/01/2040 | |
| General Obligation - 0.2% |
| City of New York, NY, GO 4.61%, 09/01/2037 | |
| State of Illinois, IL, GO 5.10%, 06/01/2033 | |
| | | |
| |
| Rutgers The State University of New Jersey, NJ, Rev 3.92%, 05/01/2119 | |
| Total Municipal Bonds
(cost $44,259,363) | | |
SENIOR FLOATING RATE INTERESTS - 0.1%(14) |
| Construction Materials - 0.0% |
| CP Atlas Buyer, Inc. 8.54%, 11/23/2027, 1 mo. USD Term SOFR + 3.75% | |
| |
| HUB International Ltd. 7.37%, 06/20/2030, 3 mo. USD Term SOFR + 2.75% | |
The accompanying notes are an integral part of these financial statements.
The Hartford Balanced Income Fund
Schedule of Investments – (continued)October 31, 2024
Shares or Principal Amount | | |
SENIOR FLOATING RATE INTERESTS - 0.1%(14) - (continued) |
| |
| Fortress Intermediate 3, Inc. 8.44%, 06/27/2031, 1 mo. USD Term SOFR + 3.75% | |
| McAfee LLC 8.10%, 03/01/2029, 1 mo. USD Term SOFR + 3.25% | |
| | | |
| Packaging & Containers - 0.0% |
| Clydesdale Acquisition Holdings, Inc. 7.86%, 04/13/2029, 1 mo. USD Term SOFR + 3.18% | |
| |
| Specialty Building Products Holdings LLC 8.54%, 10/15/2028, 1 mo. USD Term SOFR + 3.75% | |
| |
| Dun & Bradstreet Corp. 7.47%, 01/18/2029, 1 mo. USD Term SOFR + 2.75% | |
| Total Senior Floating Rate Interests
(cost $15,366,520) | |
U.S. GOVERNMENT SECURITIES - 2.4% |
| U.S. Treasury Securities - 2.4% |
| U.S. Treasury Bonds - 1.3% |
| | |
| | |
| | |
| | |
| | |
| | |
| | |
| | |
| | |
| | |
| | |
| | |
| | |
| | | |
| U.S. Treasury Notes - 1.1% |
| | |
| | |
| | |
| | |
| | |
| | |
| | |
| | |
| | |
| | |
| | |
| | | |
| Total U.S. Government Securities
(cost $303,023,423) | | |
|
| |
| | |
| | |
| | |
Shares or Principal Amount | | |
COMMON STOCKS - 43.4% - (continued) |
| Banks - 3.6% - (continued) |
| | |
| | |
| | | |
| |
| | |
| | |
| | |
| | |
| Honeywell International, Inc. | |
| Johnson Controls International PLC | |
| L3Harris Technologies, Inc. | |
| | |
| | |
| | | |
| Consumer Discretionary Distribution & Retail - 0.7% |
| Industria de Diseno Textil SA | |
| | |
| | | |
| Consumer Durables & Apparel - 0.1% |
| | |
| |
| | |
| | |
| | | |
| |
| | |
| | |
| | |
| | |
| | |
| | | |
| Equity Real Estate Investment Trusts (REITs) - 2.9% |
| | |
| Gaming & Leisure Properties, Inc. REIT | |
| Host Hotels & Resorts, Inc. REIT | |
| Lamar Advertising Co. Class A, REIT | |
| | |
| | | |
| Financial Services - 2.7% |
| Ares Management Corp. Class A | |
| Capital One Financial Corp. | |
| | |
| Raymond James Financial, Inc. | |
| | |
| | | |
| Food, Beverage & Tobacco - 2.5% |
| Archer-Daniels-Midland Co. | |
| | |
| | |
| Philip Morris International, Inc. | |
| | | |
| Health Care Equipment & Services - 1.8% |
| | |
| | |
| | | |
The accompanying notes are an integral part of these financial statements.
The Hartford Balanced Income Fund
Schedule of Investments – (continued)October 31, 2024
Shares or Principal Amount | | |
COMMON STOCKS - 43.4% - (continued) |
| Household & Personal Products - 1.2% |
| | |
| | |
| | | |
| |
| American International Group, Inc. | |
| | |
| | | |
| |
| | |
| | |
| LyondellBasell Industries NV Class A | |
| | |
| | |
| | | |
| Media & Entertainment - 0.3% |
| | |
| Pharmaceuticals, Biotechnology & Life Sciences - 5.5% |
| | |
| | |
| | |
| | |
| | |
| | |
| | | |
| Semiconductors & Semiconductor Equipment - 1.3% |
| | |
| | |
| | |
| | | |
| Software & Services - 0.5% |
| | |
| Technology Hardware & Equipment - 2.0% |
| | |
| | |
| | |
| | | |
| Telecommunication Services - 0.6% |
| | |
| |
| Canadian National Railway Co. | |
| United Parcel Service, Inc. Class B | |
| | | |
| |
| American Electric Power Co., Inc. | |
| | |
| | |
| | |
| | |
| | |
| | |
| | |
| | | |
| Total Common Stocks
(cost $4,261,375,348) | | |
Shares or Principal Amount | | |
|
| |
| Bank of America Corp. Series PP, | |
| Total Preferred Stocks
(cost $19,250,000) | | |
| Total Long-Term Investments
(cost $10,961,732,355) | | |
SHORT-TERM INVESTMENTS - 1.4% |
| Repurchase Agreements - 0.7% |
| Fixed Income Clearing Corp. Repurchase Agreement dated 10/31/2024 at 4.85%, due on 11/01/2024 with a maturity value of $88,832,469; collateralized by U.S. Treasury Note at 4.63%, maturing 06/30/2026, with a market value of $90,597,045 | |
| Securities Lending Collateral - 0.3% |
| Goldman Sachs Financial Square Funds, Government Fund, Institutional Class, 4.77%(18) | |
| HSBC U.S. Government Money Market Fund, Institutional Class, | |
| Invesco Government & Agency Portfolio, Institutional Class, | |
| Morgan Stanley Institutional Liquidity Funds, Government Portfolio, Institutional Class, | |
| | | |
| U.S. Treasury Securities - 0.4% |
| U.S. Treasury Bills - 0.4% |
| | |
| | |
| | |
| | |
| | |
| | | |
| Total Short-Term Investments
(cost $167,804,852) | |
| Total Investments
(cost $11,129,537,207) | | |
| Other Assets and Liabilities | | |
| | | |
Note:
Percentage of investments as shown is the ratio of the total market value to net assets.
Prices of foreign equities that are principally traded on certain foreign markets will generally be adjusted daily pursuant to a fair value pricing service approved by Hartford Funds Management Company, LLC in order to reflect an adjustment for factors occurring after the close of certain foreign markets but before the close of the New York Stock Exchange.
The Fund may refer to any one or more of the industry classifications used by one or more widely recognized market indices, ratings group and/or as defined by Fund management. Industry classifications may not be identical across all security types.
The accompanying notes are an integral part of these financial statements.
The Hartford Balanced Income Fund
Schedule of Investments – (continued)October 31, 2024
Equity industry classifications used in this report are the Global Industry Classification Standard, which was developed by and is the exclusive property and service mark of MSCI, Inc. and Standard & Poor’s.
For Fund compliance purposes, the Fund may not use the same classification system. These classifications are used for financial reporting purposes.
See “Glossary” for abbreviation descriptions.
| Security was purchased pursuant to Rule 144A under the Securities Act of 1933 and may be sold in transactions that are exempt from registration (typically only to qualified institutional buyers) or in a public offering registered under the Securities Act of 1933. At October 31, 2024, the aggregate value of these securities was $1,622,441,961, representing 13.1% of net assets. |
| Represents entire or partial securities on loan. See Note 8 in the accompanying Notes to Financial Statements for securities lending information. |
| Security is exempt from registration under Regulation S under the Securities Act of 1933, which exempts from registration securities offered and sold outside of the United States. Security may not be offered or sold in the United States except pursuant to an exemption from, or in a transaction not subject to, the registration requirements of the Securities Act of 1933. At October 31, 2024, the aggregate value of these securities was $297,658,149, representing 2.4% of net assets. |
| Fixed to variable rate investment. The rate shown reflects the fixed rate in effect at October 31, 2024. Rate will reset at a future date. Base lending rates may be subject to a floor or cap. |
| Perpetual maturity security. Maturity date shown is the next call date or final legal maturity date, whichever comes first. |
| Variable or floating rate security, which interest rate adjusts periodically based on changes in current interest rates and prepayments on the underlying pool of assets. Rate shown is the rate in effect as of period end. |
| Non-income producing. For long-term debt securities, items identified are in default as to payment of interest and/or principal. |
| Investment valued using significant unobservable inputs. |
| Variable rate security; the rate reported is the coupon rate in effect at October 31, 2024. Base lending rates may be subject to a floor or cap. |
| Share amount represents shares of the issuer previously held that resulted in receipt of the escrow. |
| Security is a “step-up” bond where coupon increases or steps up at a predetermined date. Rate shown is current coupon rate. |
| Security has the ability to pay in kind (“PIK”) or pay income in cash. When applicable, separate rates of such payments are disclosed. |
| Security is a zero-coupon bond. |
| Senior floating rate interests generally pay interest rates which are periodically adjusted by reference to a base short-term, floating lending rate plus a premium. The base lending rates are primarily the Secured Overnight Financing Rate ("SOFR") and secondarily, the prime rate offered by one or more major United States banks (the "Prime Rate"). Senior floating rate interests often require prepayments from excess cash flows or permit the borrower to repay at its election. The rate at which the borrower repays cannot be predicted with accuracy. As a result, the actual remaining maturity may be substantially less than the stated maturities shown. Base lending rates may be subject to a floor or cap. Unless otherwise noted, the interest rate disclosed for these securities represents the rate in effect as of October 31, 2024. |
| All, or a portion of the security, was pledged as collateral in connection with futures contracts. As of October 31, 2024, the market value of securities pledged was $7,805,984. |
| All, or a portion of the security, was pledged as collateral in connection with centrally cleared swap contracts. As of October 31, 2024, the market value of securities pledged was $2,189,663. |
| Perpetual security with no stated maturity date. |
| Current yield as of period end. |
| The rate shown represents current yield to maturity. |
Futures Contracts Outstanding at October 31, 2024 |
| | | | Value and
Unrealized
Appreciation/
(Depreciation) |
|
U.S. Treasury 2-Year Note Future | | | | |
U.S. Treasury 10-Year Note Future | | | | |
U.S. Treasury Ultra Bond Future | | | | |
| | | | |
Short position contracts: |
Euro BUXL 30-Year Bond Future | | | | |
| | | | |
| | | | |
| | | | |
U.S. Treasury 5-Year Note Future | | | | |
U.S. Treasury 10-Year Ultra Future | | | | |
U.S. Treasury Long Bond Future | | | | |
| | | | |
| |
The accompanying notes are an integral part of these financial statements.
The Hartford Balanced Income Fund
Schedule of Investments – (continued)October 31, 2024
Centrally Cleared Credit Default Swap Contracts Outstanding at October 31, 2024 |
| | | | | | | | Unrealized
Appreciation/
(Depreciation) |
Credit default swaps on indices: | |
| |
| | | | | | | | | |
| | | | | | | | | |
iTraxx-Asia ex-Japan.IG.S41 | | | | | | | | | |
| | | | |
Credit default swaps on single-name | | | | | | | | | |
| |
| | | | | | | | | |
| |
| | | | | | | | | |
| | | | | | | | | |
Total centrally cleared credit default swap contracts | | | | |
| The maximum potential amount the Fund could be required to pay as a seller of credit protection or receive as a buyer of credit protection if a credit event occurs as defined under the terms of that particular swap agreement. |
Foreign Currency Contracts Outstanding at October 31, 2024 |
Amount and Description of
Currency to be Purchased | Amount and Description of
Currency to be Sold | | | Appreciation/
(Depreciation) |
| | | | | | |
| | | | | | |
| | | | | | |
| | | | | | |
| | | | | | |
| | | | | | |
| | | | | | |
| | | | | | |
| | | | | | |
| | | | | | |
| | | | | | |
| | | | | | |
| | | | | | |
| | | | | | |
| | | | | | |
| | | | | | |
| | | | | | |
| | | | | | |
| | | | | | |
| | | | | | |
| | | | | | |
| | | | | | |
| | | | | | |
| | | | | | |
| | | | | | |
| | | | | | |
| | | | | | |
| | | | | | |
| | | | | | |
| | | | | | |
| | | | | | |
| | | | | | |
| | | | | | |
| | | | | | |
| | | | | | |
| | | | | | |
| | | | | | |
The accompanying notes are an integral part of these financial statements.
The Hartford Balanced Income Fund
Schedule of Investments – (continued)October 31, 2024
Foreign Currency Contracts Outstanding at October 31, 2024 – (continued) |
Amount and Description of Currency to be Purchased | Amount and Description of Currency to be Sold | | | Appreciation/ (Depreciation) |
| | | | | | |
| | | | | | |
| | | | | | |
| | | | | | |
| | | | | | |
| | | | | | |
| | | | | | |
| | | | | | |
| | | | | | |
| | | | | | |
| | | | | | |
| | | | | | |
| | | | | | |
Total foreign currency contracts | |
† See Significant Accounting Policies of accompanying Notes to Financial Statements regarding valuation of investments.
The accompanying notes are an integral part of these financial statements.
The Hartford Balanced Income Fund
Schedule of Investments – (continued)October 31, 2024
Fair Value Summary
The following is a summary of the fair valuations according to the inputs used as of October 31, 2024 in valuing the Fund’s investments.
| | | | |
| | | | |
| | | | |
| | | | |
Foreign Government Obligations | | | | |
| | | | |
Senior Floating Rate Interests | | | | |
U.S. Government Securities | | | | |
| | | | |
| | | | |
| | | | |
Consumer Discretionary Distribution & Retail | | | | |
Consumer Durables & Apparel | | | | |
| | | | |
| | | | |
Equity Real Estate Investment Trusts (REITs) | | | | |
| | | | |
| | | | |
Health Care Equipment & Services | | | | |
Household & Personal Products | | | | |
| | | | |
| | | | |
| | | | |
Pharmaceuticals, Biotechnology & Life Sciences | | | | |
Semiconductors & Semiconductor Equipment | | | | |
| | | | |
Technology Hardware & Equipment | | | | |
Telecommunication Services | | | | |
| | | | |
| | | | |
| | | | |
| | | | |
Foreign Currency Contracts(2) | | | | |
| | | | |
Swaps - Credit Default(2) | | | | |
| | | | |
| | | | |
Foreign Currency Contracts(2) | | | | |
| | | | |
Swaps - Credit Default(2) | | | | |
| | | | |
| For the year ended October 31, 2024, investments valued at $33,750 were transferred into Level 3 due to the unavailability of active market pricing. There were no transfers out of Level 3. |
| Derivative instruments (excluding purchased and written options, if applicable) are valued at the unrealized appreciation/(depreciation) on the investments. |
Level 3 investments at the beginning and/or end of the period in relation to net assets were not significant and accordingly, a reconciliation of Level 3 assets for the year ended October 31, 2024 is not presented.
The accompanying notes are an integral part of these financial statements.
The Hartford Checks and Balances Fund
Schedule of InvestmentsOctober 31, 2024
Shares or Principal Amount | | |
AFFILIATED INVESTMENT COMPANIES - 99.7% |
| Domestic Equity Funds - 66.7% |
| The Hartford Capital Appreciation Fund, Class F | |
| The Hartford Dividend and Growth Fund, Class F | |
| Total Domestic Equity Funds
(cost $641,967,973) | |
| Taxable Fixed Income Funds - 33.0% |
| Hartford Total Return Bond ETF | |
| Total Affiliated Investment Companies
(cost $1,159,714,871) | |
SHORT-TERM INVESTMENTS - 0.2% |
| Other Investment Pools & Funds - 0.2% |
| BlackRock Liquidity Funds, FedFund Portfolio, Institutional Class, 4.75%(1) | |
| Total Short-Term Investments
(cost $3,145,353) | |
| Total Investments
(cost $1,162,860,224) | | |
| Other Assets and Liabilities | | |
| | | |
Note:
Percentage of investments as shown is the ratio of the total market value to net assets.
For Fund compliance purposes, the Fund may not use the same classification system. These classifications are used for financial reporting purposes.
See “Glossary” for abbreviation descriptions.
| Current yield as of period end. |
| See Significant Accounting Policies of accompanying Notes to Financial Statements regarding valuation of investments. |
The following is a summary of the fair valuations according to the inputs used as of October 31, 2024 in valuing the Fund’s investments.
| | | | |
| | | | |
Affiliated Investment Companies | | | | |
| | | | |
| | | | |
| For the year ended October 31, 2024, there were no transfers in and out of Level 3. |
The accompanying notes are an integral part of these financial statements.
The Hartford Conservative Allocation Fund
Schedule of InvestmentsOctober 31, 2024
Shares or Principal Amount | | |
AFFILIATED INVESTMENT COMPANIES - 99.7% |
| Domestic Equity Funds - 26.6% |
| Hartford Core Equity Fund, Class F | |
| Hartford Large Cap Growth ETF* | |
| Hartford Small Cap Value Fund, Class F | |
| Hartford US Quality Growth ETF | |
| | |
| The Hartford Equity Income Fund, Class F | |
| The Hartford Small Company Fund, Class F* | |
| Total Domestic Equity Funds
(cost $33,019,774) | |
| International/Global Equity Funds - 10.4% |
| Hartford Multifactor Developed Markets (ex-US) ETF | |
| Hartford Schroders Emerging Markets Equity Fund, Class F | |
| Hartford Schroders International Contrarian Value Fund | |
| The Hartford International Growth Fund, Class F | |
| The Hartford International Opportunities Fund, Class F | |
| Total International/Global Equity Funds
(cost $15,081,653) | |
| Taxable Fixed Income Funds - 62.7% |
| | |
| Hartford Schroders Core Fixed Income Fund, Class F | |
| Hartford Strategic Income ETF | |
| The Hartford Inflation Plus Fund, Class F | |
| The Hartford Strategic Income Fund, Class F | |
| The Hartford World Bond Fund, Class F | |
| Total Taxable Fixed Income Funds
(cost $100,128,590) | |
| Total Affiliated Investment Companies
(cost $148,230,017) | |
Shares or Principal Amount | | |
SHORT-TERM INVESTMENTS - 0.2% |
| Other Investment Pools & Funds - 0.2% |
| BlackRock Liquidity Funds, FedFund Portfolio, Institutional Class, 4.75%(1) | |
| Total Short-Term Investments
(cost $319,437) | |
| Total Investments
(cost $148,549,454) | | |
| Other Assets and Liabilities | | |
| | | |
Note:
Percentage of investments as shown is the ratio of the total market value to net assets.
For Fund compliance purposes, the Fund may not use the same classification system. These classifications are used for financial reporting purposes.
See “Glossary” for abbreviation descriptions.
| |
| Current yield as of period end. |
| See Significant Accounting Policies of accompanying Notes to Financial Statements regarding valuation of investments. |
The following is a summary of the fair valuations according to the inputs used as of October 31, 2024 in valuing the Fund’s investments.
| | | | |
| | | | |
Affiliated Investment Companies | | | | |
| | | | |
| | | | |
| For the year ended October 31, 2024, there were no transfers in and out of Level 3. |
The accompanying notes are an integral part of these financial statements.
The Hartford Growth Allocation Fund
Schedule of InvestmentsOctober 31, 2024
Shares or Principal Amount | | |
AFFILIATED INVESTMENT COMPANIES - 99.8% |
| Domestic Equity Funds - 59.2% |
| Hartford Core Equity Fund, Class F | |
| Hartford Large Cap Growth ETF* | |
| Hartford Multifactor US Equity ETF | |
| Hartford Small Cap Value Fund, Class F | |
| The Hartford Equity Income Fund, Class F | |
| The Hartford Growth Opportunities Fund, Class F* | |
| The Hartford Small Company Fund, Class F* | |
| Total Domestic Equity Funds
(cost $210,924,993) | |
| International/Global Equity Funds - 25.8% |
| Hartford Multifactor Developed Markets (ex-US) ETF | |
| Hartford Schroders Emerging Markets Equity Fund, Class F | |
| Hartford Schroders International Multi-Cap Value Fund, Class F | |
| The Hartford International Growth Fund, Class F | |
| The Hartford International Opportunities Fund, Class F | |
| Total International/Global Equity Funds
(cost $122,259,055) | |
| Taxable Fixed Income Funds - 14.8% |
| | |
| Hartford Schroders Core Fixed Income Fund, Class F | |
| The Hartford Strategic Income Fund, Class F | |
| The Hartford World Bond Fund, Class F | |
| Total Taxable Fixed Income Funds
(cost $82,948,461) | |
| Total Affiliated Investment Companies
(cost $416,132,509) | |
Shares or Principal Amount | | |
SHORT-TERM INVESTMENTS - 0.2% |
| Other Investment Pools & Funds - 0.2% |
| BlackRock Liquidity Funds, FedFund Portfolio, Institutional Class, 4.75%(1) | |
| Total Short-Term Investments
(cost $1,143,057) | |
| Total Investments
(cost $417,275,566) | | |
| Other Assets and Liabilities | | |
| | | |
Note:
Percentage of investments as shown is the ratio of the total market value to net assets.
For Fund compliance purposes, the Fund may not use the same classification system. These classifications are used for financial reporting purposes.
See “Glossary” for abbreviation descriptions.
| |
| Current yield as of period end. |
| See Significant Accounting Policies of accompanying Notes to Financial Statements regarding valuation of investments. |
The following is a summary of the fair valuations according to the inputs used as of October 31, 2024 in valuing the Fund’s investments.
| | | | |
| | | | |
Affiliated Investment Companies | | | | |
| | | | |
| | | | |
| For the year ended October 31, 2024, there were no transfers in and out of Level 3. |
The accompanying notes are an integral part of these financial statements.
Hartford Moderate Allocation Fund
Schedule of InvestmentsOctober 31, 2024
Shares or Principal Amount | | |
AFFILIATED INVESTMENT COMPANIES - 99.8% |
| Domestic Equity Funds - 43.0% |
| Hartford Core Equity Fund, Class F | |
| Hartford Large Cap Growth ETF* | |
| Hartford Multifactor US Equity ETF | |
| Hartford Small Cap Value Fund, Class F | |
| The Hartford Equity Income Fund, Class F | |
| The Hartford Small Company Fund, Class F* | |
| Total Domestic Equity Funds
(cost $86,585,541) | |
| International/Global Equity Funds - 20.5% |
| Hartford Multifactor Developed Markets (ex-US) ETF | |
| Hartford Schroders Emerging Markets Equity Fund, Class F | |
| Hartford Schroders International Multi-Cap Value Fund, Class F | |
| The Hartford International Growth Fund, Class F | |
| The Hartford International Opportunities Fund, Class F | |
| Total International/Global Equity Funds
(cost $56,230,771) | |
| Taxable Fixed Income Funds - 36.3% |
| | |
| Hartford Schroders Core Fixed Income Fund, Class F | |
| The Hartford Strategic Income Fund, Class F | |
| The Hartford World Bond Fund, Class F | |
| Total Taxable Fixed Income Funds
(cost $121,955,514) | |
| Total Affiliated Investment Companies
(cost $264,771,826) | |
Shares or Principal Amount | | |
SHORT-TERM INVESTMENTS - 0.2% |
| Other Investment Pools & Funds - 0.2% |
| BlackRock Liquidity Funds, FedFund Portfolio, Institutional Class, 4.75%(1) | |
| Total Short-Term Investments
(cost $669,254) | |
| Total Investments
(cost $265,441,080) | | |
| Other Assets and Liabilities | | |
| | | |
Note:
Percentage of investments as shown is the ratio of the total market value to net assets.
For Fund compliance purposes, the Fund may not use the same classification system. These classifications are used for financial reporting purposes.
See “Glossary” for abbreviation descriptions.
| |
| Current yield as of period end. |
| See Significant Accounting Policies of accompanying Notes to Financial Statements regarding valuation of investments. |
The following is a summary of the fair valuations according to the inputs used as of October 31, 2024 in valuing the Fund’s investments.
| | | | |
| | | | |
Affiliated Investment Companies | | | | |
| | | | |
| | | | |
| For the year ended October 31, 2024, there were no transfers in and out of Level 3. |
The accompanying notes are an integral part of these financial statements.
Hartford Multi-Asset Income Fund
Schedule of InvestmentsOctober 31, 2024
Shares or Principal Amount | | |
ASSET & COMMERCIAL MORTGAGE-BACKED SECURITIES - 14.3% |
| Asset-Backed - Automobile - 2.3% |
| Ally Bank Auto Credit-Linked Notes | |
| ARI Fleet Lease Trust 5.41%, | |
| Avis Budget Rental Car Funding AESOP LLC 5.85%, 06/20/2030(1) | |
| Bridgecrest Lending Auto Securitization Trust 4.72%, 09/15/2028 | |
| CFMT LLC 1.39%, 09/22/2031(1) | |
| Enterprise Fleet Financing LLC 6.40%, | |
| Ford Credit Auto Lease Trust 5.29%, 06/15/2026 | |
| GLS Auto Receivables Issuer Trust | |
| Hyundai Auto Lease Securitization Trust | |
| Nissan Auto Lease Trust 4.91%, 01/15/2026 | |
| Prestige Auto Receivables Trust 6.75%, | |
| SFS Auto Receivables Securitization Trust | |
| | |
| | |
| | |
| Wheels Fleet Lease Funding 1 LLC | |
| | |
| | |
| | | |
| Asset-Backed - Credit Card - 0.3% |
| American Express Credit Account Master Trust 5.23%, 04/15/2029 | |
| Trillium Credit Card Trust II 5.99%, | |
| | | |
| Commercial Mortgage-Backed Securities - 2.2% |
| BOCA Commercial Mortgage Trust 9.24%, 08/15/2041, 1 mo. USD Term | |
| BPR Trust 5.85%, 11/05/2029(1)(3) | |
| Commercial Mortgage Trust 4.35%, | |
| DC Trust 8.48%, 04/13/2040(1)(3) | |
| FS Trust 8.24%, 08/15/2039, 1 mo. USD | |
| HIH Trust 9.14%, 10/15/2041, 1 mo. USD | |
| JP Morgan Chase Commercial Mortgage Securities Trust 5.80%, | |
| JPMBB Commercial Mortgage Securities Trust 4.05%, 09/15/2047(1)(3) | |
| MF1 LLC 8.05%, 03/19/2039, 1 mo. USD | |
| MF1 Trust 7.72%, 08/18/2041, 1 mo. USD Term SOFR + 2.94%(1)(2) | |
| Morgan Stanley Bank of America Merrill Lynch Trust 3.81%, 05/15/2046(1)(3) | |
| Morgan Stanley Capital I Trust 3.91%, | |
| NXPT Commercial Mortgage Trust | |
| ONE Mortgage Trust 6.67%, 03/15/2036, 1 mo. USD Term SOFR + 1.86%(1)(2) | |
Shares or Principal Amount | | |
ASSET & COMMERCIAL MORTGAGE-BACKED SECURITIES - 14.3% - (continued) |
| Commercial Mortgage-Backed Securities - 2.2% - (continued) |
| ROCK Trust 8.82%, 11/13/2041(1) | |
| SFAVE Commercial Mortgage Securities Trust 4.14%, 01/05/2043(1)(3) | |
| SHR Trust 9.25%, 10/15/2041, 1 mo. USD Term SOFR + 4.45%(1)(2) | |
| Worldwide Plaza Trust 3.53%, | |
| | | |
| Other Asset-Backed Securities - 5.2% |
| AASET Trust 3.84%, 05/15/2039(1) | |
| Affirm Asset Securitization Trust 7.35%, | |
| Apidos CLO XXXIII Ltd. 6.80%, 10/24/2034, 3 mo. USD Term SOFR + | |
| Apidos CLO XXXIV Ltd. 11.38%, 01/20/2035, 3 mo. USD Term SOFR + | |
| Apidos CLO XXXVI Ltd. 7.78%, 07/20/2034, 3 mo. USD Term SOFR + | |
| | |
| 6.83%, 10/20/2031, 3 mo. USD Term | |
| 7.83%, 10/20/2031, 3 mo. USD Term | |
| Barings CLO Ltd. 11.06%, 07/15/2037, 3 mo. USD Term SOFR + 6.40%(1)(2) | |
| Benefit Street Partners CLO XXVII Ltd. 10.77%, 10/20/2037, 3 mo. USD Term | |
| Castlelake Aircraft Structured Trust | |
| | |
| | |
| | |
| | |
| Cologix Data Centers U.S. Issuer LLC | |
| Dell Equipment Finance Trust 5.65%, | |
| DLLAD LLC 4.79%, 01/20/2028(1) | |
| Hamlin Park CLO Ltd. 0.00%, | |
| | |
| 9.46%, 10/25/2033, 30 day USD SOFR Average + 4.60%(1)(2) | |
| 10.36%, 10/25/2034, 30 day USD SOFR Average + 5.50%(1)(2) | |
| Horizon Aircraft Finance I Ltd. 4.46%, | |
| Horizon Aircraft Finance III Ltd. 3.43%, | |
| Hotwire Funding LLC 2.31%, | |
| Kubota Credit Owner Trust | |
| | |
| | |
| LCM XXV Ltd. 7.18%, 07/20/2030, 3 mo. USD Term SOFR + 2.56%(1)(2) | |
| Lewey Park CLO Ltd. 0.00%, | |
| Magnetite XXVIII Ltd. 6.78%, 01/20/2035, 3 mo. USD Term SOFR + | |
The accompanying notes are an integral part of these financial statements.
Hartford Multi-Asset Income Fund
Schedule of Investments – (continued)October 31, 2024
Shares or Principal Amount | | |
ASSET & COMMERCIAL MORTGAGE-BACKED SECURITIES - 14.3% - (continued) |
| Other Asset-Backed Securities - 5.2% - (continued) |
| MMAF Equipment Finance LLC 4.95%, | |
| Mosaic Solar Loan Trust 6.25%, | |
| Neuberger Berman CLO XVI-S Ltd. 11.17%, 04/15/2034, 3 mo. USD Term | |
| Neuberger Berman Loan Advisers CLO 57 Ltd. 7.50%, 10/24/2038, 3 mo. USD | |
| New Economy Assets Phase 1 Sponsor LLC | |
| | |
| | |
| OCP CLO Ltd. 10.46%, 10/25/2037, 3 mo. USD Term SOFR + 5.90%(1)(2) | |
| Progress Residential Trust 4.25%, | |
| Sapphire Aviation Finance II Ltd. 3.23%, | |
| Stack Infrastructure Issuer LLC | |
| | |
| | |
| Start II Ltd. 4.09%, 03/15/2044(1) | |
| Verizon Master Trust 4.17%, 08/20/2030 | |
| Voya CLO Ltd. 7.01%, 07/14/2031, 3 mo. USD Term SOFR + 2.35%(1)(2) | |
| Voya Ltd. 6.87%, 10/15/2030, 3 mo. USD | |
| | | |
| Whole Loan Collateral CMO - 4.3% |
| | |
| | |
| | |
| Bellemeade Re Ltd. 8.06%, 08/25/2034, 30 day USD SOFR Average + | |
| COLT Mortgage Loan Trust 5.25%, | |
| Deephaven Residential Mortgage Trust | |
| Federal Home Loan Mortgage Corp. Seasoned Credit Risk Transfer Trust 3.50%, 10/25/2058 | |
| Federal National Mortgage Association Connecticut Avenue Securities Trust | |
| 10.36%, 12/25/2041, 30 day USD SOFR Average + 5.50%(1)(2) | |
| 10.86%, 10/25/2041, 30 day USD SOFR Average + 6.00%(1)(2) | |
| 10.86%, 12/25/2041, 30 day USD SOFR Average + 6.00%(1)(2) | |
| 11.06%, 11/25/2041, 30 day USD SOFR Average + 6.20%(1)(2) | |
| 11.86%, 04/25/2042, 30 day USD SOFR Average + 7.00%(1)(2) | |
| 12.51%, 01/25/2042, 30 day USD SOFR Average + 7.65%(1)(2) | |
| 14.36%, 03/25/2042, 30 day USD SOFR Average + 9.50%(1)(2) | |
| 14.71%, 03/25/2042, 30 day USD SOFR Average + 9.85%(1)(2) | |
| | |
| | |
| | |
Shares or Principal Amount | | |
ASSET & COMMERCIAL MORTGAGE-BACKED SECURITIES - 14.3% - (continued) |
| Whole Loan Collateral CMO - 4.3% - (continued) |
| Imperial Fund Mortgage Trust 4.10%, | |
| MetLife Securitization Trust 3.00%, | |
| Mill City Mortgage Loan Trust 2.75%, | |
| | |
| | |
| | |
| | |
| | |
| | |
| | |
| | |
| | |
| | |
| 8.60%, 11/25/2029(1)(4)(5) | |
| | |
| Radnor Re Ltd. 7.76%, 09/25/2034, 30 day USD SOFR Average + 2.90%(1)(2) | |
| Towd Point Mortgage Trust | |
| | |
| | |
| Verus Securitization Trust 3.04%, | |
| | | |
| Total Asset & Commercial Mortgage-Backed Securities
(cost $84,604,669) | |
|
| |
| Southwest Airlines Co. 1.25%, 05/01/2025 | |
| Auto Manufacturers - 0.1% |
| Ford Motor Co. 0.00%, 03/15/2026(6) | |
| Rivian Automotive, Inc. 3.63%, 10/15/2030 | |
| | | |
| |
| Alnylam Pharmaceuticals, Inc. 1.00%, 09/15/2027 | |
| Immunocore Holdings PLC 2.50%, | |
| Ionis Pharmaceuticals, Inc. 1.75%, 06/15/2028 | |
| | | |
| Commercial Services - 0.4% |
| | |
| | |
| | |
| Global Payments, Inc. 1.50%, | |
| | |
| | |
| | |
| | | |
| |
| PG&E Corp. 4.25%, 12/01/2027(1) | |
| Southern Co. 3.88%, 12/15/2025 | |
| | | |
The accompanying notes are an integral part of these financial statements.
Hartford Multi-Asset Income Fund
Schedule of Investments – (continued)October 31, 2024
Shares or Principal Amount | | |
CONVERTIBLE BONDS - 4.8% - (continued) |
| Energy-Alternate Sources - 0.1% |
| Enphase Energy, Inc. 0.00%, | |
| Engineering & Construction - 0.5% |
| Cellnex Telecom SA 0.75%, | |
| Fluor Corp. 1.13%, 08/15/2029(8) | |
| | | |
| |
| DraftKings Holdings, Inc. 0.00%, | |
| Live Nation Entertainment, Inc. 3.13%, | |
| | | |
| Healthcare - Products - 0.2% |
| Exact Sciences Corp. 2.00%, | |
| Insulet Corp. 0.38%, 09/01/2026 | |
| Integra LifeSciences Holdings Corp. 0.50%, 08/15/2025 | |
| | | |
| |
| Meritage Homes Corp. 1.75%, | |
| |
| Alibaba Group Holding Ltd. 0.50%, | |
| Etsy, Inc. 0.25%, 06/15/2028 | |
| JD.com, Inc. 0.25%, 06/01/2029(1) | |
| Meituan 0.00%, 04/27/2028(6)(7) | |
| | |
| | |
| | |
| Snap, Inc. 0.13%, 03/01/2028 | |
| Uber Technologies, Inc. 0.88%, | |
| Zillow Group, Inc. 1.38%, 09/01/2026 | |
| | | |
| |
| Rapid7, Inc. 0.25%, 03/15/2027 | |
| Seagate HDD Cayman 3.50%, 06/01/2028 | |
| Zscaler, Inc. 0.13%, 07/01/2025 | |
| | | |
| |
| Carnival Corp. 5.75%, 12/01/2027 | |
| |
| Wynn Macau Ltd. 4.50%, 03/07/2029(1) | |
| Machinery-Diversified - 0.1% |
| Middleby Corp. 1.00%, 09/01/2025 | |
| Miscellaneous Manufacturing - 0.1% |
| Axon Enterprise, Inc. 0.50%, 12/15/2027 | |
| John Bean Technologies Corp. 0.25%, 05/15/2026 | |
| | | |
| |
| Dexcom, Inc. 0.38%, 05/15/2028 | |
| Real Estate Investment Trusts - 0.4% |
| Federal Realty OP LP 3.25%, | |
Shares or Principal Amount | | |
CONVERTIBLE BONDS - 4.8% - (continued) |
| Real Estate Investment Trusts - 0.4% - (continued) |
| HAT Holdings I LLC/HAT Holdings II LLC | |
| Rexford Industrial Realty LP | |
| | |
| | |
| Welltower OP LLC 2.75%, 05/15/2028(1) | |
| | | |
| |
| Microchip Technology, Inc. 0.75%, | |
| ON Semiconductor Corp. 0.50%, 03/01/2029 | |
| | | |
| |
| Datadog, Inc. 0.13%, 06/15/2025 | |
| Dayforce, Inc. 0.25%, 03/15/2026 | |
| Guidewire Software, Inc. 1.25%, | |
| MongoDB, Inc. 0.25%, 01/15/2026 | |
| Snowflake, Inc. 0.00%, 10/01/2029(1)(6) | |
| | | |
| Total Convertible Bonds
(cost $27,603,905) | |
|
| |
| Clear Channel Outdoor Holdings, Inc. | |
| |
| MHP Lux SA 6.25%, 09/19/2029(7) | |
| |
| JetBlue Airways Corp./JetBlue Loyalty LP | |
| VistaJet Malta Finance PLC/Vista Management Holding, Inc. 6.38%, | |
| | | |
| |
| S&S Holdings LLC 8.38%, 10/01/2031(1) | |
| Auto Manufacturers - 0.1% |
| General Motors Financial Co., Inc. 5.70%, 09/30/2030, (5.70% fixed rate until 09/30/2030; 5 yr. USD CMT + 5.00% thereafter)(8)(9)(10) | |
| Auto Parts & Equipment - 0.2% |
| | |
| | |
| | |
| | |
| | | |
| |
| Braskem Netherlands Finance BV | |
| Mativ Holdings, Inc. 8.00%, 10/01/2029(1) | |
| | |
| | |
| | |
| | |
| | |
The accompanying notes are an integral part of these financial statements.
Hartford Multi-Asset Income Fund
Schedule of Investments – (continued)October 31, 2024
Shares or Principal Amount | | |
CORPORATE BONDS - 21.2% - (continued) |
| Chemicals - 0.4% - (continued) |
| | |
| 5.25%, 02/27/2025, (5.25% fixed rate until 02/27/2025; 5 yr. USD CMT + 3.87% thereafter)(7)(9)(10) | |
| | | |
| |
| Abanca Corp. Bancaria SA 10.63%, 07/14/2028, (10.63% fixed rate until 07/14/2028; 5 yr. EUR Swap + 7.64% | |
| AIB Group PLC 5.87%, 03/28/2035, (5.87% fixed rate until 03/28/2034; 6 mo. USD SOFR + 1.91% | |
| Banca Monte dei Paschi di Siena SpA | |
| 4.75%, 03/15/2029, (4.75% fixed rate until 03/15/2028; 3 mo. EURIBOR + | |
| 7.71%, 01/18/2028, (7.71% fixed rate until 01/18/2027; 5 yr. EURIBOR ICE Swap + 5.01% thereafter)(7)(9) | |
| Banca Transilvania SA 7.25%, 12/07/2028, (7.25% fixed rate until 12/07/2027; 1 yr. EURIBOR ICE Swap + 4.29% thereafter)(7)(9) | |
| Banco de Sabadell SA 5.00%, 05/19/2027, (5.00% fixed rate until 05/19/2027; 5 yr. EUR Swap + 5.17% | |
| | |
| 2.48%, 09/21/2036, (2.48% fixed rate until 09/21/2031; 5 yr. USD CMT + | |
| 5.52%, 10/25/2035, (5.52% fixed rate until 10/25/2034; 6 mo. USD SOFR | |
| Bank of Cyprus Holdings PLC 11.88%, 12/21/2028, (11.88% fixed rate until 12/21/2028; 5 yr. EURIBOR ICE Swap + 9.13% thereafter)(7)(9)(10) | |
| Bank of Cyprus PCL 5.00%, 05/02/2029, (5.00% fixed rate until 05/02/2028; 3 mo. EURIBOR + 1.97% | |
| Bank of New York Mellon Corp. 4.98%, 03/14/2030, (4.98% fixed rate until 03/14/2029; 6 mo. USD SOFR + | |
| BAWAG Group AG 7.25%, 09/18/2029, (7.25% fixed rate until 09/18/2029; 5 yr. EURIBOR ICE Swap + 5.05% | |
| BBVA Bancomer SA 8.45%, 06/29/2038, (8.45% fixed rate until 06/29/2033; 5 yr. USD CMT + 4.66% thereafter)(7)(9) | |
| | |
| 7.38%, 09/10/2034, (7.38% fixed rate until 09/10/2034; 5 yr. USD CMT + 3.54% thereafter)(1)(9)(10) | |
| 7.38%, 06/11/2030, (7.38% fixed rate until 06/11/2030; 5 yr. EURIBOR ICE Swap + 4.63% | |
Shares or Principal Amount | | |
CORPORATE BONDS - 21.2% - (continued) |
| Commercial Banks - 3.9% - (continued) |
| BPCE SA 1.50%, 01/13/2042, (1.50% fixed rate until 10/13/2026; 5 yr. EUR Swap + 1.75% thereafter)(7)(9) | |
| Caixa Economica Montepio Geral Caixa Economica Bancaria SA | |
| 5.63%, 05/29/2028, (5.63% fixed rate until 05/29/2027; 3 mo. EURIBOR + | |
| 8.50%, 06/12/2034, (8.50% fixed rate until 03/12/2029; 5 yr. EURIBOR ICE Swap + 5.82% thereafter)(7)(9) | |
| | |
| 6.04%, 06/15/2035, (6.04% fixed rate until 06/15/2034; 6 mo. USD SOFR + 2.26% thereafter)(1)(9) | |
| 6.84%, 09/13/2034, (6.84% fixed rate until 09/13/2033; 6 mo. USD SOFR + 2.77% thereafter)(1)(9) | |
| 7.50%, 01/16/2030, (7.50% fixed rate until 01/16/2030; 5 yr. EURIBOR ICE Swap + 5.30% | |
| CCF Holding SAS 9.25%, 06/12/2029, (9.25% fixed rate until 06/12/2029; 5 yr. EUR Swap + 6.63% | |
| | |
| 4.00%, 12/10/2025, (4.00% fixed rate until 12/10/2025; 5 yr. USD CMT + | |
| 7.38%, 05/15/2028, (7.38% fixed rate until 05/15/2028; 5 yr. USD CMT + | |
| | |
| 4.00%, 07/16/2032, (4.00% fixed rate until 07/16/2031; 3 mo. EURIBOR + | |
| 7.88%, 10/09/2031, (7.88% fixed rate until 10/09/2031; 5 yr. EURIBOR ICE Swap + 5.13% | |
| Commonwealth Bank of Australia 5.07%, | |
| Credit Agricole SA 6.50%, 09/23/2029, (6.50% fixed rate until 09/23/2029; 5 yr. EURIBOR ICE Swap + 4.21% | |
| Crelan SA 5.25%, 01/23/2032, (5.25% fixed rate until 01/23/2031; 1 yr. EURIBOR ICE Swap + 2.75% | |
| | |
| 1.38%, 02/17/2032, (1.38% fixed rate until 02/17/2031; 3 mo. EURIBOR + | |
| 4.50%, 11/30/2026, (4.50% fixed rate until 11/30/2026; 5 yr. EURIBOR ICE Swap + 4.55% | |
| Erste Group Bank AG 7.00%, 04/15/2031, (7.00% fixed rate until 04/15/2031; 5 yr. EURIBOR ICE Swap + 4.41 % thereafter)(7)(9)(10) | |
| Freedom Mortgage Corp. 12.25%, | |
The accompanying notes are an integral part of these financial statements.
Hartford Multi-Asset Income Fund
Schedule of Investments – (continued)October 31, 2024
Shares or Principal Amount | | |
CORPORATE BONDS - 21.2% - (continued) |
| Commercial Banks - 3.9% - (continued) |
| Goldman Sachs Group, Inc. 7.50%, 02/10/2029, (7.50% fixed rate until 02/10/2029; 5 yr. USD CMT + 3.16% | |
| Golomt Bank 11.00%, 05/20/2027(7) | |
| Hellenic Bank PCL 10.25%, 06/14/2033, (10.25% fixed rate until 03/14/2028; 5 yr. EUR Swap + 6.85% thereafter)(7)(9) | |
| | |
| 6.88%, 09/11/2029, (6.88% fixed rate until 09/11/2029; 5 yr. USD CMT + | |
| 7.40%, 11/13/2034, (7.40% fixed rate until 11/13/2033; 6 mo. USD SOFR | |
| | |
| 4.20%, 06/01/2032, (4.20% fixed rate until 06/01/2031; 1 yr. USD CMT + | |
| | |
| | |
| 9.13%, 09/07/2029, (9.13% fixed rate until 09/07/2029; 5 yr. EURIBOR ICE Swap + 6.26% | |
| | |
| 2.58%, 04/22/2032, (2.58% fixed rate until 04/22/2031; 3 mo. USD Term SOFR + 1.25% thereafter)(9) | |
| 3.11%, 04/22/2041, (3.11% fixed rate until 04/22/2040; 3 mo. USD Term SOFR + 2.46% thereafter)(9) | |
| 4.51%, 10/22/2028, (4.51% fixed rate until 10/22/2027; 6 mo. USD SOFR | |
| 4.60%, 10/22/2030, (4.60% fixed rate until 10/22/2029; 6 mo. USD SOFR | |
| Jyske Bank AS 5.13%, 05/01/2035, (5.13% fixed rate until 02/01/2030; 5 yr. EURIBOR ICE Swap + 2.50% | |
| La Banque Postale SA 3.88%, 05/20/2026, (3.88% fixed rate until 05/20/2026; 5 yr. EURIBOR ICE Swap + 4.01% thereafter)(7)(9)(10) | |
| Lloyds Banking Group PLC 8.50%, 03/27/2028, (8.50% fixed rate until 03/27/2028; 5 yr. U.K. Government Bond + 5.14% thereafter)(9)(10) | |
| National Bank of Greece SA 5.88%, 06/28/2035, (5.88% fixed rate until 03/28/2030; 5 yr. EURIBOR ICE Swap + 3.15% thereafter)(7)(9) | |
| Nova Ljubljanska Banka DD | |
| 6.88%, 01/24/2034, (6.88% fixed rate until 01/24/2029; 5 yr. EURIBOR ICE Swap + 4.23% thereafter)(7)(9) | |
| 7.13%, 06/27/2027, (7.13% fixed rate until 06/27/2026; 1 yr. EUR Swap + | |
| Novo Banco SA 9.88%, 12/01/2033, (9.88% fixed rate until 06/01/2028; 5 yr. EUR Swap + 6.71% thereafter)(7)(9) | |
Shares or Principal Amount | | |
CORPORATE BONDS - 21.2% - (continued) |
| Commercial Banks - 3.9% - (continued) |
| OTP Bank Nyrt 8.75%, 05/15/2033, (8.75% fixed rate until 02/15/2028; 5 yr. USD CMT + 5.06% thereafter)(7)(9) | |
| Piraeus Financial Holdings SA | |
| 7.25%, 04/17/2034, (7.25% fixed rate until 01/17/2029; 5 yr. EUR Swap + | |
| 8.75%, 06/16/2026, (8.75% fixed rate until 06/16/2026; 5 yr. EUR Swap + 9.20% thereafter)(7)(9)(10) | |
| | |
| 4.75%, 05/26/2026, (4.75% fixed rate until 05/26/2026; 5 yr. USD CMT + 3.93% thereafter)(1)(9)(10) | |
| 10.00%, 11/14/2028, (10.00% fixed rate until 11/14/2028; 5 yr. USD CMT + 5.45% thereafter)(1)(9)(10) | |
| | |
| 5.38%, 09/06/2045, (5.38% fixed rate until 09/06/2044; 1 yr. USD SOFR ICE Swap Rate + 1.86% | |
| 9.02%, 11/15/2033, (9.02% fixed rate until 11/15/2032; 6 mo. USD SOFR + 5.02% thereafter)(1)(9) | |
| 9.25%, 11/13/2033, (9.25% fixed rate until 11/13/2033; 5 yr. USD CMT + 4.76% thereafter)(1)(9)(10) | |
| 9.25%, 11/13/2033, (9.25% fixed rate until 11/13/2033; 5 yr. USD CMT + 4.76% thereafter)(7)(9)(10) | |
| Virgin Money U.K. PLC 11.00%, 12/08/2028, (11.00% fixed rate until 12/08/2028; 5 yr. U.K. Government Bond + 6.99% thereafter)(7)(9)(10) | |
| | | |
| Commercial Services - 0.5% |
| Adani Ports & Special Economic Zone Ltd. 4.00%, 07/30/2027(7) | |
| Allied Universal Holdco LLC 7.88%, | |
| House of HR Group BV 9.00%, | |
| Nexi SpA 1.63%, 04/30/2026(7) | |
| Shift4 Payments LLC/Shift4 Payments Finance Sub, Inc. 6.75%, | |
| Verisure Holding AB 3.25%, | |
| Verisure Midholding AB 5.25%, | |
| | | |
| Construction Materials - 0.2% |
| Sisecam U.K. PLC 8.63%, 05/02/2032(7) | |
| Trane Technologies Financing Ltd. 5.10%, 06/13/2034 | |
| | | |
| Distribution/Wholesale - 0.1% |
| Telecommunications Co. Telekom Srbija AD Belgrade 7.00%, 10/28/2029(1) | |
The accompanying notes are an integral part of these financial statements.
Hartford Multi-Asset Income Fund
Schedule of Investments – (continued)October 31, 2024
Shares or Principal Amount | | |
CORPORATE BONDS - 21.2% - (continued) |
| Diversified Financial Services - 1.4% |
| Air Lease Corp. 4.13%, 12/15/2026, (4.13% fixed rate until 12/15/2026; 5 yr. USD CMT + 3.15% thereafter)(9)(10) | |
| Aircastle Ltd. 5.25%, 06/15/2026, (5.25% fixed rate until 06/15/2026; 5 yr. USD CMT + 4.41% thereafter)(1)(9)(10) | |
| Ares Finance Co. III LLC 4.13%, 06/30/2051, (4.13% fixed rate until 06/30/2026; 5 yr. USD CMT + 3.24% | |
| Bread Financial Holdings, Inc. 9.75%, | |
| Capital One Financial Corp. | |
| 5.88%, 07/26/2035, (5.88% fixed rate until 07/26/2034; 6 mo. USD SOFR | |
| 6.31%, 06/08/2029, (6.31% fixed rate until 06/08/2028; 6 mo. USD SOFR | |
| 7.62%, 10/30/2031, (7.62% fixed rate until 10/30/2030; 6 mo. USD SOFR | |
| Charles Schwab Corp. 4.00%, 06/01/2026, (4.00% fixed rate until 06/01/2026; 5 yr. USD CMT + 3.17% | |
| Discover Financial Services | |
| 6.13%, 06/23/2025, (6.13% fixed rate until 06/23/2025; 5 yr. USD CMT + | |
| 7.96%, 11/02/2034, (7.96% fixed rate until 11/02/2033; 6 mo. USD SOFR | |
| Focus Financial Partners LLC 6.75%, | |
| Freedom Mortgage Holdings LLC | |
| | |
| | |
| goeasy Ltd. 7.63%, 07/01/2029(1) | |
| Hightower Holding LLC 9.13%, | |
| Jane Street Group/JSG Finance, Inc. | |
| LFS Topco LLC 5.88%, 10/15/2026(1) | |
| Manappuram Finance Ltd. 7.38%, | |
| Midcap Financial Issuer Trust 6.50%, | |
| Muthoot Finance Ltd. 7.13%, | |
| United Wholesale Mortgage LLC 5.50%, | |
| | | |
| |
| AES Andes SA 6.35%, 10/07/2079, (6.35% fixed rate until 01/07/2025; 5 yr. USD CMT + 4.92% thereafter)(7)(9) | |
| AES Panama Generation Holdings SRL | |
| Buffalo Energy Mexico Holdings/Buffalo Energy Infrastructure/Buffalo Energy | |
| Bulgarian Energy Holding EAD 2.45%, | |
Shares or Principal Amount | | |
CORPORATE BONDS - 21.2% - (continued) |
| Electric - 2.0% - (continued) |
| CenterPoint Energy, Inc. 6.70%, 05/15/2055, (6.70% fixed rate until 02/15/2030; 5 yr. USD CMT + 2.59% | |
| CMS Energy Corp. 3.75%, 12/01/2050, (3.75% fixed rate until 09/01/2030; 5 yr. USD CMT + 2.90% thereafter)(9) | |
| | |
| 6.88%, 02/01/2055, (6.88% fixed rate until 11/03/2029; 5 yr. USD CMT + | |
| 7.00%, 06/01/2054, (7.00% fixed rate until 03/03/2034; 5 yr. USD CMT + | |
| Emera, Inc. 6.75%, 06/15/2076 | |
| Energo-Pro AS 11.00%, 11/02/2028(7) | |
| EUSHI Finance, Inc. 7.63%, 12/15/2054, (7.63% fixed rate until 09/15/2029; 5 yr. USD CMT + 3.14% thereafter)(1)(9) | |
| GDZ Elektrik Dagitim AS 9.00%, | |
| Johnsonville Aeroderivative Combustion Turbine Generation LLC 5.08%, 10/01/2054 | |
| Pacific Gas & Electric Co. | |
| | |
| | |
| PG&E Corp. 7.38%, 03/15/2055, (7.38% fixed rate until 12/15/2029; 5 yr. USD CMT + 3.88% thereafter)(9) | |
| SAEL/SPREPL/SSSPL/JGPEPL/SKREPL/UBEPL | |
| Termocandelaria Power SA 7.75%, | |
| Virginia Electric & Power Co. 5.55%, 08/15/2054 | |
| Zorlu Enerji Elektrik Uretim AS 11.00%, | |
| | | |
| Energy-Alternate Sources - 0.3% |
| FS Luxembourg SARL 8.88%, | |
| Engineering & Construction - 0.4% |
| IHS Holding Ltd. 6.25%, 11/29/2028(7) | |
| International Airport Finance SA 12.00%, | |
| IRB Infrastructure Developers Ltd. | |
| | | |
| |
| Caesars Entertainment, Inc. 6.00%, | |
| Great Canadian Gaming Corp. 8.75%, | |
| Warnermedia Holdings, Inc. 5.14%, 03/15/2052 | |
| | | |
| Environmental Control - 0.1% |
| Reworld Holding Corp. 4.88%, | |
| |
| Minerva Luxembourg SA 8.88%, | |
The accompanying notes are an integral part of these financial statements.
Hartford Multi-Asset Income Fund
Schedule of Investments – (continued)October 31, 2024
Shares or Principal Amount | | |
CORPORATE BONDS - 21.2% - (continued) |
| Food - 0.3% - (continued) |
| | |
| | |
| | |
| | | |
| |
| Elior Group SA 3.75%, 07/15/2026(7) | |
| Forest Products & Paper - 0.2% |
| LD Celulose International GmbH 7.95%, | |
| Mercer International, Inc. 12.88%, | |
| | | |
| |
| AltaGas Ltd. 7.20%, 10/15/2054, (7.20% fixed rate until 07/17/2034; 5 yr. USD CMT + 3.57% thereafter)(1)(9) | |
| Hand/Machine Tools - 0.1% |
| IMA Industria Macchine Automatiche | |
| |
| Achmea BV 5.63%, 11/02/2044, (5.63% fixed rate until 05/02/2034; 5 yr. EURIBOR ICE Swap + 3.85% | |
| Acrisure LLC/Acrisure Finance, Inc. | |
| | |
| | |
| Admiral Group PLC 8.50%, 01/06/2034(7) | |
| Alliant Holdings Intermediate LLC/Alliant Holdings Co-Issuer 7.38%, | |
| Ardonagh Group Finance Ltd. 8.88%, | |
| AssuredPartners, Inc. 5.63%, | |
| | |
| | |
| | |
| Atradius Credito y Caucion SA de Seguros y Reaseguros 5.00%, | |
| Enstar Finance LLC 5.50%, 01/15/2042, (5.50% fixed rate until 01/15/2027; 5 yr. USD CMT + 4.01% thereafter)(9) | |
| | |
| 4.70%, 10/15/2051, (4.70% fixed rate until 07/15/2026; 5 yr. USD CMT + | |
| 7.95%, 10/15/2054, (7.95% fixed rate until 07/15/2029; 5 yr. USD CMT + | |
| Howden U.K. Refinance PLC/Howden U.K. Refinance 2 PLC/Howden U.S. Refinance LLC 8.13%, | |
| Liberty Mutual Group, Inc. 4.13%, 12/15/2051, (4.13% fixed rate until 09/15/2026; 5 yr. USD CMT + 3.32% | |
| | |
| 7.72%, 05/17/2066, 3 mo. USD Term | |
Shares or Principal Amount | | |
CORPORATE BONDS - 21.2% - (continued) |
| Insurance - 1.0% - (continued) |
| 9.25%, 12/01/2027, (9.25% fixed rate until 12/01/2027; 5 yr. USD CMT + 5.32% thereafter)(8)(9)(10) | |
| SBL Holdings, Inc. 7.20%, 10/30/2034(1) | |
| Zurich Finance Ireland Designated Activity Co. 3.00%, 04/19/2051, (3.00% fixed rate until 01/19/2031; 5 yr. USD CMT + 2.78% thereafter)(7)(9) | |
| | | |
| |
| | |
| | |
| | |
| 8.73%, 02/15/2029, 3 mo. EURIBOR + | |
| 8.73%, 02/15/2029, 3 mo. EURIBOR + | |
| Meta Platforms, Inc. 5.55%, 08/15/2064 | |
| Rakuten Group, Inc. 9.75%, | |
| Wayfair LLC 7.25%, 10/31/2029(1) | |
| | | |
| Investment Company Security - 0.1% |
| Antares Holdings LP 6.35%, | |
| Huarong Finance 2017 Co. Ltd. 3.80%, | |
| New Mountain Finance Corp. 6.20%, 10/15/2027 | |
| | | |
| |
| CSN Resources SA 4.63%, 06/10/2031(7) | |
| |
| MajorDrive Holdings IV LLC 6.38%, | |
| |
| | |
| | |
| | |
| Melco Resorts Finance Ltd. 5.38%, | |
| Studio City Finance Ltd. 5.00%, | |
| | | |
| |
| Charter Communications Operating LLC/Charter Communications Operating Capital 6.83%, 10/23/2055 | |
| Scripps Escrow II, Inc. 3.88%, | |
| Scripps Escrow, Inc. 5.88%, | |
| VTR Comunicaciones SpA 5.13%, | |
| | | |
| |
| First Quantum Minerals Ltd. 8.63%, | |
| | |
| | |
| | |
The accompanying notes are an integral part of these financial statements.
Hartford Multi-Asset Income Fund
Schedule of Investments – (continued)October 31, 2024
Shares or Principal Amount | | |
CORPORATE BONDS - 21.2% - (continued) |
| Mining - 0.9% - (continued) |
| Navoi Mining & Metallurgical Combinat | |
| | |
| | |
| Stillwater Mining Co. 4.50%, | |
| Vedanta Resources Finance II PLC | |
| WE Soda Investments Holding PLC | |
| | | |
| |
| | |
| | |
| | |
| | |
| | |
| | |
| Energean Israel Finance Ltd. | |
| | |
| | |
| Leviathan Bond Ltd. 6.75%, | |
| Tullow Oil PLC 10.25%, 05/15/2026(7) | |
| YPF SA 6.95%, 07/21/2027(7) | |
| | | |
| Packaging & Containers - 0.3% |
| Ardagh Packaging Finance PLC/Ardagh Holdings USA, Inc. 2.13%, | |
| Clydesdale Acquisition Holdings, Inc. | |
| Owens-Brockway Glass Container, Inc. | |
| SAN Miguel Industrias Pet SA/NG PET R&P Latin America SA 3.75%, | |
| | | |
| |
| Teva Pharmaceutical Finance Netherlands II BV | |
| | |
| | |
| | | |
| |
| AL Candelaria -spain- SA 5.75%, | |
| | |
| 5.75%, 07/15/2080, (5.75% fixed rate until 04/15/2030; 5 yr. USD CMT + | |
| 8.50%, 01/15/2084, (8.50% fixed rate until 10/15/2033; 5 yr. USD CMT + | |
| Energy Transfer LP 8.00%, 05/15/2054, (8.00% fixed rate until 02/15/2029; 5 yr. USD CMT + 4.02% thereafter)(9) | |
| Galaxy Pipeline Assets Bidco Ltd. | |
| | |
| | |
| | |
Shares or Principal Amount | | |
CORPORATE BONDS - 21.2% - (continued) |
| Pipelines - 0.4% - (continued) |
| South Bow Canadian Infrastructure Holdings Ltd. 7.63%, 03/01/2055, (7.63% fixed rate until 12/01/2029; 5 yr. USD CMT + 3.95% thereafter)(1)(9) | |
| | |
| 5.60%, 03/07/2082, (5.60% fixed rate until 12/07/2031; 5 yr. USD CMT + | |
| 5.88%, 08/15/2076, (5.88% fixed rate until 08/15/2026; 3 mo. USD SOFR | |
| | | |
| |
| Canary Wharf Group Investment Holdings PLC | |
| | |
| | |
| | |
| Castellum AB 3.13%, 12/02/2026, (3.13% fixed rate until 12/02/2026; 5 yr. EUR Swap + 3.45% | |
| Elect Global Investments Ltd. 4.10%, 06/03/2025, (4.10% fixed rate until 06/03/2025; 5 yr. USD CMT + 2.89% | |
| Fuqing Investment Management Ltd. | |
| Neinor Homes SLU 5.88%, 02/15/2030 | |
| NWD Finance BVI Ltd. 4.13%, 03/10/2028, (4.13% fixed rate until 03/10/2028; 5 yr. USD CMT + 5.86% | |
| Peach Property Finance GmbH 4.38%, | |
| Pingan Real Estate Capital Ltd. 3.45%, | |
| Samhallsbyggnadsbolaget i Norden AB | |
| | | |
| Real Estate Investment Trusts - 1.1% |
| Alexandrite Monnet U.K. Holdco PLC | |
| | |
| | |
| American Assets Trust LP 6.15%, 10/01/2034 | |
| Hudson Pacific Properties LP 4.65%, | |
| Kite Realty Group LP 5.50%, 03/01/2034 | |
| Trust Fibra Uno 7.38%, 02/13/2034(7) | |
| | | |
| |
| | |
| | |
| | |
| BCPE Ulysses Intermediate, Inc. 7.75%, | |
| Cougar JV Subsidiary LLC 8.00%, | |
| Foundation Building Materials, Inc. | |
| Goldstory SAS 6.75%, 02/01/2030(7) | |
| Macy's Retail Holdings LLC 5.13%, 01/15/2042 | |
The accompanying notes are an integral part of these financial statements.
Hartford Multi-Asset Income Fund
Schedule of Investments – (continued)October 31, 2024
Shares or Principal Amount | | |
CORPORATE BONDS - 21.2% - (continued) |
| Retail - 0.4% - (continued) |
| | |
| Staples, Inc. 10.75%, 09/01/2029(1) | |
| Victra Holdings LLC/Victra Finance Corp. | |
| Walgreens Boots Alliance, Inc. 8.13%, 08/15/2029 | |
| | | |
| |
| Foundry JV Holdco LLC 6.15%, | |
| |
| Rocket Software, Inc. 9.00%, | |
| | |
| 6.68%, 07/31/2031, 3 mo. EURIBOR + | |
| 6.68%, 07/31/2031, 3 mo. EURIBOR + | |
| | | |
| |
| CoBank ACB 6.25%, 10/01/2026, (6.25% fixed rate until 10/01/2026; 3 mo. USD SOFR + 4.66% thereafter)(9)(10) | |
| Telecommunications - 2.0% |
| Africell Holding Ltd. 10.50%, | |
| Altice France SA 5.13%, 07/15/2029(1) | |
| | |
| | |
| | |
| Axian Telecom 7.38%, 02/16/2027(7) | |
| CAS Capital No. 1 Ltd. 4.00%, 07/12/2026, (4.00% fixed rate until 07/12/2026; 5 yr. USD CMT + 3.64% | |
| Connect Finco SARL/Connect U.S. Finco | |
| Eolo SpA 4.88%, 10/21/2028(7) | |
| Eutelsat SA 9.75%, 04/13/2029(7) | |
| Iliad Holding SASU 6.88%, 04/15/2031(7) | |
| Kaixo Bondco Telecom SA 5.13%, | |
| | |
| | |
| | |
| Lorca Telecom Bondco SA 5.75%, | |
| Millicom International Cellular SA 4.50%, | |
| Network i2i Ltd. 5.65%, 01/15/2025, (5.65% fixed rate until 01/15/2025; 5 yr. USD CMT + 4.27% | |
| Odido Holding BV 3.75%, 01/15/2029(7) | |
| Silknet JSC 8.38%, 01/31/2027(7) | |
| VEON Holdings BV 3.38%, 11/25/2027(7) | |
| VF Ukraine PAT via VFU Funding PLC | |
| | | |
| Trucking & Leasing - 0.0% |
| Penske Truck Leasing Co. LP/PTL Finance Corp. 5.88%, 11/15/2027(1) | |
Shares or Principal Amount | | |
CORPORATE BONDS - 21.2% - (continued) |
| |
| Aegea Finance SARL 9.00%, | |
| Total Corporate Bonds
(cost $123,922,837) | |
FOREIGN GOVERNMENT OBLIGATIONS - 3.5% |
| |
| Benin Government International Bonds | |
| |
| Bermuda Government International Bonds 3.38%, 08/20/2050(7) | |
| |
| Brazil Notas do Tesouro Nacional | |
| | |
| | |
| | |
| | |
| | | |
| |
| | |
| | |
| | |
| | | |
| |
| Colombia Government International Bonds 5.00%, 06/15/2045 | |
| | |
| | |
| | |
| | | |
| |
| Czech Republic Government Bonds | |
| Dominican Republic - 0.0% |
| Dominican Republic International Bonds | |
| |
| Gabon Government International Bonds | |
| |
| Hungary Government Bonds 3.00%, 08/21/2030 | |
| |
| | |
| | |
| | |
| | |
| | | |
| |
| Indonesia Treasury Bonds 7.00%, 09/15/2030 | |
| |
| Israel Government International Bonds 5.75%, 03/12/2054 | |
| |
| Ivory Coast Government International Bonds 4.88%, 01/30/2032(7) | |
The accompanying notes are an integral part of these financial statements.
Hartford Multi-Asset Income Fund
Schedule of Investments – (continued)October 31, 2024
Shares or Principal Amount | | |
FOREIGN GOVERNMENT OBLIGATIONS - 3.5% - (continued) |
| |
| Jordan Government International Bonds | |
| |
| Malaysia Government Bonds | |
| | |
| | |
| | |
| | | |
| |
| Mexico Bonos 7.75%, 05/29/2031 | |
| |
| North Macedonia Government International Bonds 6.96%, | |
| |
| | |
| | |
| | |
| | |
| | | |
| |
| Philippines Government Bonds 6.25%, 03/22/2028 | |
| |
| Republic of Poland Government Bonds 3.75%, 05/25/2027 | |
| |
| | |
| | |
| | |
| | |
| Romania Government International Bonds | |
| | |
| | |
| | |
| | | |
| |
| Republic of South Africa Government Bonds | |
| | |
| | |
| | |
| | | |
| |
| European Bank for Reconstruction & Development 4.60%, 12/09/2025 | |
| |
| Thailand Government Bonds | |
| | |
| | |
| | | |
| |
| Uruguay Government International Bonds 9.75%, 07/20/2033 | |
| Total Foreign Government Obligations
(cost $20,677,988) | | |
Shares or Principal Amount | | |
|
| |
| Chicago Transit Auth Sales & Transfer Tax Receipts, IL, Rev 6.90%, 12/01/2040 | |
| |
| Golden State Tobacco Securitization Corp., CA, Rev 3.00%, 06/01/2046 | |
| |
| Metropolitan Transportation Auth, NY, Rev | |
| | |
| | |
| | |
| | | |
| |
| Texas Natural Gas Securitization Finance Corp., TX, Rev 5.10%, 04/01/2035 | |
| Total Municipal Bonds
(cost $564,288) | | |
SENIOR FLOATING RATE INTERESTS - 9.3%(13) |
| |
| Barnes Group, Inc. 7.19%, 09/03/2030, 1 mo. USD Term SOFR + 2.50% | |
| | |
| 7.10%, 02/28/2031, 3 mo. USD Term SOFR + 2.50% | |
| 7.32%, 01/19/2032, U.S. (Fed) Prime Rate + 1.50% | |
| | | |
| |
| AS Mileage Plan IP Ltd. 6.66%, 10/15/2031, 3 mo. USD Term SOFR + 2.00% | |
| JetBlue Airways Corp. 10.52%, 08/27/2029, 3 mo. USD Term SOFR + 5.50% | |
| | | |
| |
| ABG Intermediate Holdings 2 LLC 7.45%, 12/21/2028, 1 mo. USD Term SOFR + 2.75% | |
| Hanesbrands, Inc. 8.44%, 03/08/2030, 1 mo. USD Term SOFR + 3.75% | |
| Varsity Brands, Inc. 8.82%, 08/26/2031, 3 mo. USD Term SOFR + 3.75% | |
| | | |
| Auto Parts & Equipment - 0.1% |
| | |
| 9.85%, 03/30/2027, 3 mo. USD Term SOFR + 5.00% | |
| 13.35%, 03/30/2028, 3 mo. USD Term SOFR + 8.50% | |
| | | |
| |
| Pegasus Bidco BV 7.85%, 07/12/2029, 3 mo. USD Term SOFR + 3.25% | |
| |
| A-AP Buyer, Inc. 7.85%, 09/09/2031, 3 mo. USD Term SOFR + 3.25% | |
The accompanying notes are an integral part of these financial statements.
Hartford Multi-Asset Income Fund
Schedule of Investments – (continued)October 31, 2024
Shares or Principal Amount | | |
SENIOR FLOATING RATE INTERESTS - 9.3%(13) - (continued) |
| Chemicals - 0.2% - (continued) |
| INEOS U.S. Finance LLC 8.44%, 02/07/2031, 1 mo. USD Term SOFR + 3.75% | |
| Nouryon Finance BV 8.63%, 04/03/2028, 3 mo. USD Term SOFR + 3.50% | |
| | |
| 0.00%, 09/17/2031, 1 mo. USD Term | |
| 8.69%, 09/17/2031, 1 mo. USD Term SOFR + 4.00% | |
| | | |
| Commercial Services - 0.9% |
| Allied Universal Holdco LLC 8.54%, 05/12/2028, 1 mo. USD Term SOFR + 3.75% | |
| Belron Finance 2019 LLC 7.49%, 10/16/2031, 1 mo. USD Term SOFR + 2.75% | |
| Boost Newco Borrower LLC 7.10%, 01/31/2031, 3 mo. USD Term SOFR + 2.50% | |
| BrightView Landscapes LLC 7.09%, 04/20/2029, 3 mo. USD Term SOFR + 2.50% | |
| Camelot U.S. Acquisition LLC 7.44%, 01/31/2031, 1 mo. USD Term SOFR + 2.75% | |
| Cimpress PLC 7.69%, 05/17/2028, 1 mo. USD Term SOFR + 3.00% | |
| Creative Artists Agency LLC 7.44%, 10/01/2031, 1 mo. USD Term SOFR + 2.75% | |
| Ensemble RCM LLC 7.59%, 08/01/2029, 3 mo. USD Term SOFR + 3.00% | |
| First Advantage Holdings LLC 7.94%, 09/19/2031, 1 mo. USD Term SOFR + 3.25% | |
| Garda World Security Corp. 8.29%, 02/01/2029, 1 mo. USD Term SOFR + 3.50% | |
| OMNIA Partners LLC 7.87%, 07/25/2030, 3 mo. USD Term SOFR + 3.25% | |
| Ryan LLC 8.19%, 11/14/2030, 1 mo. USD Term SOFR + 3.50% | |
| Trans Union LLC 6.69%, 12/01/2028, 1 mo. USD Term SOFR + 2.00% | |
| TTF Holdings LLC 8.44%, 07/18/2031, 1 mo. USD Term SOFR + 3.75% | |
| Wand NewCo 3, Inc. 7.91%, 01/30/2031, 1 mo. USD Term SOFR + 3.25% | |
| | | |
| Construction Materials - 0.4% |
| Chamberlain Group, Inc. 8.04%, 11/03/2028, 1 mo. USD Term SOFR + 3.25% | |
| Cornerstone Building Brands, Inc. 8.15%, 04/12/2028, 1 mo. USD Term SOFR + 3.25% | |
| CP Atlas Buyer, Inc. 8.54%, 11/23/2027, 1 mo. USD Term SOFR + 3.75% | |
| Emerald Borrower LP 7.56%, 08/04/2031, 3 mo. USD Term SOFR + 2.50% | |
Shares or Principal Amount | | |
SENIOR FLOATING RATE INTERESTS - 9.3%(13) - (continued) |
| Construction Materials - 0.4% - (continued) |
| Nvent Electric PLC 0.00%, 09/12/2031, 1 mo. USD Term SOFR + 3.50%(14) | |
| Quikrete Holdings, Inc. 7.19%, 04/14/2031, 1 mo. USD Term SOFR + 2.50% | |
| Wilsonart LLC 8.85%, 08/05/2031, U.S. (Fed) Prime Rate + 4.25% | |
| | | |
| Distribution/Wholesale - 0.2% |
| American Builders & Contractors Supply Co., Inc. 6.44%, 01/31/2031, 1 mo. USD Term SOFR + 1.75% | |
| Core & Main LP 6.72%, 07/27/2028, 1 mo. USD Term SOFR + 2.00% | |
| Windsor Holdings III LLC 8.26%, 08/01/2030, 1 mo. USD Term SOFR + 3.50% | |
| | | |
| Diversified Financial Services - 0.2% |
| Blackhawk Network Holdings, Inc. 9.69%, 03/12/2029, 1 mo. USD Term SOFR + 5.00% | |
| Focus Financial Partners LLC | |
| 0.00%, 09/15/2031, 1 mo. USD Term | |
| 7.94%, 09/15/2031, 1 mo. USD Term SOFR + 3.25% | |
| Hightower Holding LLC 8.75%, 04/21/2028, 3 mo. USD Term SOFR + 3.50% | |
| | | |
| |
| II-VI, Inc. 7.19%, 07/02/2029, 1 mo. USD Term SOFR + 2.50% | |
| Lsf12 Crown U.S. Commercial Bidco LLC 0.00%, 10/10/2031, 1 mo. USD Term | |
| | | |
| Engineering & Construction - 0.1% |
| Brown Group Holding LLC 7.47%, 07/01/2031, 3 mo. USD Term SOFR + 2.75% | |
| KKR Apple Bidco LLC 7.55%, 09/22/2028, 1 mo. USD Term SOFR + 2.75% | |
| | | |
| |
| Banijay Entertainment SAS 8.20%, 03/01/2028, 1 mo. USD Term SOFR + 3.25% | |
| Caesars Entertainment, Inc. 7.44%, 02/06/2031, 1 mo. USD Term SOFR + 2.75% | |
| Cinemark USA, Inc. 7.91%, 05/24/2030, 3 mo. USD Term SOFR + 3.25% | |
| Light & Wonder International, Inc. 7.03%, 04/14/2029, 1 mo. USD Term SOFR + 2.25% | |
| Ontario Gaming GTA LP 8.89%, 08/01/2030, 3 mo. USD Term SOFR + 4.25% | |
| | | |
The accompanying notes are an integral part of these financial statements.
Hartford Multi-Asset Income Fund
Schedule of Investments – (continued)October 31, 2024
Shares or Principal Amount | | |
SENIOR FLOATING RATE INTERESTS - 9.3%(13) - (continued) |
| Environmental Control - 0.2% |
| | |
| 7.36%, 11/30/2028, 1 mo. USD Term SOFR + 2.50% | |
| 7.54%, 11/30/2028, 1 mo. USD Term SOFR + 2.75% | |
| Filtration Group Corp. 8.30%, 10/21/2028, 1 mo. USD Term SOFR + 3.50% | |
| | | |
| |
| Aspire Bakeries Holdings LLC 8.97%, 12/13/2030, 1 mo. USD Term SOFR + 4.25% | |
| B&G Foods, Inc. 8.56%, 10/10/2029, 3 mo. USD Term SOFR + 3.50% | |
| CHG PPC Parent LLC 7.55%, 12/08/2028, 1 mo. USD Term SOFR + 2.75% | |
| U.S. Foods, Inc. 6.44%, 11/22/2028, 1 mo. USD Term SOFR + 1.75% | |
| | | |
| |
| Golden State Foods LLC 0.00%, 10/07/2031, 1 mo. USD Term SOFR + | |
| Hand/Machine Tools - 0.1% |
| Alliance Laundry Systems LLC 8.19%, 08/19/2031, 1 mo. USD Term SOFR + 3.50% | |
| Madison Safety & Flow LLC 7.97%, 09/26/2031, 1 mo. USD Term SOFR + 3.25% | |
| | | |
| Healthcare - Products - 0.2% |
| Bausch & Lomb Corp. 8.09%, 05/10/2027, 1 mo. USD Term SOFR + 3.25% | |
| Insulet Corp. 7.19%, 08/04/2031, 1 mo. USD Term SOFR + 2.50% | |
| Medline Borrower LP 6.94%, 10/23/2028, 1 mo. USD Term SOFR + 2.25% | |
| | | |
| Healthcare - Services - 0.1% |
| ADMI Corp. 8.17%, 12/23/2027, 1 mo. USD Term SOFR + 3.38% | |
| Heartland Dental LLC 9.19%, 04/28/2028, 1 mo. USD Term SOFR + 4.50% | |
| | | |
| |
| Tecta America Corp. 8.80%, 04/10/2028, 1 mo. USD Term SOFR + 4.00% | |
| |
| AI Aqua Merger Sub, Inc. 8.36%, 07/31/2028, 1 mo. USD Term SOFR + 3.50% | |
Shares or Principal Amount | | |
SENIOR FLOATING RATE INTERESTS - 9.3%(13) - (continued) |
| Home Furnishings - 0.3% - (continued) |
| Mattress Firm, Inc. 8.92%, 09/25/2028, 6 mo. USD Term SOFR + 4.25% | |
| Tempur Sealy International, Inc. 7.24%, 10/03/2031, 1 mo. USD Term SOFR + 2.50% | |
| | | |
| |
| Acrisure LLC 8.01%, 11/06/2030, 1 mo. USD Term SOFR + 3.25% | |
| Alliant Holdings Intermediate LLC 7.76%, 09/19/2031, 1 mo. USD Term SOFR + 3.00% | |
| AssuredPartners, Inc. 8.19%, 02/14/2031, 1 mo. USD Term SOFR + 3.50% | |
| | |
| 8.79%, 08/19/2028, 1 mo. USD Term SOFR + 4.00% | |
| 10.05%, 01/20/2029, 1 mo. USD Term SOFR + 5.25% | |
| BroadStreet Partners, Inc. 7.94%, 06/13/2031, 1 mo. USD Term SOFR + 3.25% | |
| HUB International Ltd. 7.37%, 06/20/2030, 3 mo. USD Term SOFR + 2.75% | |
| Ryan Specialty Group LLC 6.94%, 09/15/2031, 1 mo. USD Term SOFR + 2.25% | |
| Sedgwick Claims Management Services, Inc. 7.59%, 07/31/2031, 3 mo. USD Term SOFR + 3.00% | |
| Truist Insurance Holdings LLC 7.85%, 05/06/2031, 3 mo. USD Term SOFR + 3.25% | |
| USI, Inc. 7.35%, 11/22/2029, 3 mo. USD Term SOFR + 2.75% | |
| | | |
| |
| Endure Digital, Inc. 8.47%, 02/10/2028, 1 mo. USD Term SOFR + 3.50% | |
| Getty Images, Inc. 8.85%, 02/19/2026, 6 mo. USD Term SOFR + 4.50% | |
| MH Sub I LLC 8.94%, 05/03/2028, 1 mo. USD Term SOFR + 4.25% | |
| Plano HoldCo, Inc. 8.09%, 10/02/2031, U.S. (Fed) Prime Rate + 3.50% | |
| | | |
| Investment Company Security - 0.0% |
| Dragon Buyer, Inc. 7.90%, 09/30/2031, 3 mo. USD Term SOFR + 3.25% | |
| |
| Fortress Intermediate 3, Inc. 8.44%, 06/27/2031, 1 mo. USD Term SOFR + 3.75% | |
| McAfee LLC 8.10%, 03/01/2029, 1 mo. USD Term SOFR + 3.25% | |
| NCR Atleos LLC 8.40%, 03/27/2029, 3 mo. USD Term SOFR + 3.75% | |
| Peraton Corp. 8.54%, 02/01/2028, 1 mo. USD Term SOFR + 3.75% | |
| | | |
The accompanying notes are an integral part of these financial statements.
Hartford Multi-Asset Income Fund
Schedule of Investments – (continued)October 31, 2024
Shares or Principal Amount | | |
SENIOR FLOATING RATE INTERESTS - 9.3%(13) - (continued) |
| |
| MajorDrive Holdings IV LLC 8.87%, 06/01/2028, 3 mo. USD Term SOFR + 4.00% | |
| Recess Holdings, Inc. 9.09%, 02/20/2030, 3 mo. USD Term SOFR + 4.50% | |
| | | |
| Machinery - Construction & Mining - 0.0% |
| Terex Corp. 6.69%, 10/08/2031, 1 mo. USD Term SOFR + 2.00% | |
| Machinery-Diversified - 0.1% |
| TK Elevator U.S. Newco, Inc. 8.59%, 04/30/2030, 6 mo. USD Term SOFR + 3.50% | |
| |
| Century DE Buyer LLC 8.60%, 10/30/2030, 3 mo. USD Term SOFR + 4.00% | |
| EW Scripps Co. 7.80%, 01/07/2028, 1 mo. USD Term SOFR + 3.00% | |
| NEP Group, Inc. 8.12%, 08/19/2026, 1 mo. USD Term SOFR + 3.25% | |
| | | |
| |
| Arsenal AIC Parent LLC 7.94%, 08/18/2030, 1 mo. USD Term SOFR + 3.25% | |
| Miscellaneous Manufacturing - 0.1% |
| LTI Holdings, Inc. 9.44%, 07/19/2029, 1 mo. USD Term SOFR + 4.75% | |
| Packaging & Containers - 0.3% |
| Berlin Packaging LLC 8.58%, 06/09/2031, 3 mo. USD Term SOFR + 3.75% | |
| Clydesdale Acquisition Holdings, Inc. 7.86%, 04/13/2029, 1 mo. USD Term SOFR + 3.18% | |
| TricorBraun Holdings, Inc. 8.05%, 03/03/2028, 1 mo. USD Term SOFR + 3.25% | |
| | | |
| |
| CPPIB Capital, Inc. 7.85%, 08/20/2031, 3 mo. USD Term SOFR + 3.25% | |
| NGP XI Midstream Holdings LLC 8.60%, 07/25/2031, 3 mo. USD Term SOFR + 4.00% | |
| Oryx Midstream Services Permian Basin LLC 7.92%, 10/05/2028, 1 mo. USD Term SOFR + 3.00% | |
| Rockpoint Gas Storage Partners LP 8.36%, 09/12/2031, 3 mo. USD Term SOFR + 3.50% | |
| Traverse Midstream Partners LLC 8.09%, 02/16/2028, 3 mo. USD Term SOFR + 3.50% | |
| | | |
| |
| Cushman & Wakefield U.S. Borrower LLC 7.94%, 01/31/2030, 1 mo. USD Term SOFR + 3.25% | |
Shares or Principal Amount | | |
SENIOR FLOATING RATE INTERESTS - 9.3%(13) - (continued) |
| |
| Iron Mountain, Inc. 6.69%, 01/31/2031, 1 mo. USD Term SOFR + 2.00% | |
| |
| 1011778 BC Unlimited Liability Co. 6.44%, 09/20/2030, 1 mo. USD Term SOFR + 1.75% | |
| Beacon Roofing Supply, Inc. 6.69%, 05/19/2028, 1 mo. USD Term SOFR + 2.00% | |
| Foundation Building Materials Holding Co. LLC 8.78%, 01/29/2031, 3 mo. USD Term SOFR + 4.65% | |
| Great Outdoors Group LLC 8.55%, 03/06/2028, 1 mo. USD Term SOFR + 3.75% | |
| IRB Holding Corp. 7.54%, 12/15/2027, 1 mo. USD Term SOFR + 2.75% | |
| Johnstone Supply LLC 7.85%, 06/09/2031, 1 mo. USD Term SOFR + 3.00% | |
| LBM Acquisition LLC 8.67%, 06/06/2031, 1 mo. USD Term SOFR + 3.75% | |
| White Cap Buyer LLC 7.94%, 10/19/2029, 1 mo. USD Term SOFR + 3.25% | |
| | | |
| |
| Ascend Learning LLC 8.29%, 12/11/2028, 1 mo. USD Term SOFR + 3.50% | |
| AthenaHealth Group, Inc. 7.94%, 02/15/2029, 1 mo. USD Term SOFR + 3.25% | |
| Banff Merger Sub, Inc. 8.34%, 07/30/2031, 3 mo. USD Term SOFR + 3.75% | |
| BCPE Pequod Buyer, Inc. 0.00%, 09/19/2031, 1 mo. USD Term SOFR + | |
| Cast & Crew Payroll LLC 8.44%, 12/29/2028, 1 mo. USD Term SOFR + 3.75% | |
| Cotiviti Corp. 8.09%, 05/01/2031, 1 mo. USD Term SOFR + 3.25% | |
| DCert Buyer, Inc. 8.69%, 10/16/2026, 1 mo. USD Term SOFR + 4.00% | |
| Dun & Bradstreet Corp. 7.47%, 01/18/2029, 1 mo. USD Term SOFR + 2.75% | |
| EP Purchaser LLC 8.37%, 11/06/2028, 3 mo. USD Term SOFR + 3.50% | |
| | |
| 7.94%, 05/30/2031, 1 mo. USD Term SOFR + 3.25% | |
| 8.10%, 05/30/2031, 1 mo. USD Term SOFR + 3.25% | |
| Evertec Group LLC 7.94%, 10/30/2030, 1 mo. USD Term SOFR + 3.25% | |
| Genesys Cloud Services Holdings II LLC 7.69%, 12/01/2027, 1 mo. USD Term SOFR + 3.00% | |
| Polaris Newco LLC 8.85%, 06/02/2028, 3 mo. USD Term SOFR + 4.00% | |
The accompanying notes are an integral part of these financial statements.
Hartford Multi-Asset Income Fund
Schedule of Investments – (continued)October 31, 2024
Shares or Principal Amount | | |
SENIOR FLOATING RATE INTERESTS - 9.3%(13) - (continued) |
| Software - 1.2% - (continued) |
| Rocket Software, Inc. 9.44%, 11/28/2028, 1 mo. USD Term SOFR + 4.75% | |
| SS&C Technologies, Inc. 6.69%, 05/09/2031, 1 mo. USD Term SOFR + 2.00% | |
| Thunder Generation Funding LLC 7.61%, 10/03/2031, 3 mo. USD Term SOFR + 3.00% | |
| UKG, Inc. 7.62%, 02/10/2031, 3 mo. USD Term SOFR + 3.00% | |
| Zelis Payments Buyer, Inc. 7.44%, 09/28/2029, 1 mo. USD Term SOFR + 2.75% | |
| | | |
| Telecommunications - 0.3% |
| Crown Subsea Communications Holding, Inc. 8.69%, 01/30/2031, 1 mo. USD Term SOFR + 4.00% | |
| Frontier Communications Corp. 8.76%, 07/01/2031, 3 mo. USD Term SOFR + 3.50% | |
| Venga Finance SARL 9.31%, 06/28/2029, 3 mo. USD Term SOFR + 4.25% | |
| Zacapa SARL 8.60%, 03/22/2029, 3 mo. USD Term SOFR + 4.00% | |
| | | |
| |
| First Student Bidco, Inc. 7.87%, 07/21/2028, 3 mo. USD Term SOFR + 3.00% | |
| Genesee & Wyoming, Inc. 6.60%, 04/10/2031, 3 mo. USD Term SOFR + 2.00% | |
| Savage Enterprises LLC 7.69%, 09/15/2028, 1 mo. USD Term SOFR + 3.00% | |
| Third Coast Infrastructure LLC 8.94%, 09/25/2030, 1 mo. USD Term SOFR + 4.25% | |
| | | |
| Total Senior Floating Rate Interests
(cost $54,766,685) | |
U.S. GOVERNMENT AGENCIES - 5.7% |
| Mortgage-Backed Agencies - 5.7% |
| Farm Credit Bank of Texas - 0.1% |
| 7.75%, 06/15/2029, 5 yr. USD CMT + | |
| Federal Home Loan Mortgage Corp. - 2.1% |
| | |
| | |
| | |
| | |
| | |
| | |
| | |
| | |
| | |
| 11.96%, 01/25/2042, 30 day USD SOFR Average + 7.10%(1)(2) | |
Shares or Principal Amount | | |
U.S. GOVERNMENT AGENCIES - 5.7% - (continued) |
| Mortgage-Backed Agencies - 5.7% - (continued) |
| Federal Home Loan Mortgage Corp. - 2.1% - (continued) |
| 12.57%, 03/25/2050, 30 day USD SOFR Average + 7.71%(1)(2) | |
| 12.66%, 11/25/2041, 30 day USD SOFR Average + 7.80%(1)(2) | |
| | | |
| Federal National Mortgage Association - 0.0% |
| | |
| Government National Mortgage Association - 0.1% |
| | |
| | |
| | |
| | |
| | |
| | |
| | |
| | |
| | |
| | |
| | |
| | |
| | |
| | |
| | |
| | |
| | |
| | |
| | |
| | |
| | |
| | |
| | |
| | |
| | |
| | |
| | |
| | |
| | |
| | |
| | |
| | |
| | |
| | |
| | |
| | |
| | |
| | |
| | |
| | |
| | |
| | | |
| Uniform Mortgage-Backed Security - 3.4% |
| | |
| | |
| | | |
| Total U.S. Government Agencies
(cost $33,641,233) | | |
U.S. GOVERNMENT SECURITIES - 6.2% |
| U.S. Treasury Securities - 6.2% |
| U.S. Treasury Bonds - 3.8% |
| | |
| | |
| | |
The accompanying notes are an integral part of these financial statements.
Hartford Multi-Asset Income Fund
Schedule of Investments – (continued)October 31, 2024
Shares or Principal Amount | | |
U.S. GOVERNMENT SECURITIES - 6.2% - (continued) |
| U.S. Treasury Securities - 6.2% - (continued) |
| U.S. Treasury Bonds - 3.8% - (continued) |
| | |
| | |
| | |
| | |
| | |
| | |
| | |
| | |
| | |
| | |
| | |
| | |
| | |
| | |
| | |
| | | |
| U.S. Treasury Inflation-Indexed Bonds - 0.5% |
| | |
| U.S. Treasury Inflation-Indexed Notes - 0.6% |
| | |
| U.S. Treasury Notes - 1.3% |
| | |
| 4.25%, 02/28/2029(17)(18) | |
| | | |
| Total U.S. Government Securities
(cost $37,873,040) | | |
|
| Automobiles & Components - 0.2% |
| Bayerische Motoren Werke AG | |
| Great Wall Motor Co. Ltd. Class H | |
| | |
| | |
| | | |
| |
| Banco Bilbao Vizcaya Argentaria SA | |
| | |
| Bank Mandiri Persero Tbk. PT | |
| Bank of Beijing Co. Ltd. Class A | |
| Bank of Chengdu Co. Ltd. Class A | |
| Bank of Jiangsu Co. Ltd. Class A | |
| Bank of the Philippine Islands | |
| | |
| Huntington Bancshares, Inc. | |
| | |
| | |
| | |
| Mitsubishi UFJ Financial Group, Inc. | |
| Mizuho Financial Group, Inc. | |
| National Australia Bank Ltd. | |
| | |
| Sumitomo Mitsui Financial Group, Inc. | |
| | |
| | |
| | | |
| |
| | |
| | |
| | |
| | |
| | |
| | |
Shares or Principal Amount | | |
COMMON STOCKS - 23.9% - (continued) |
| Capital Goods - 0.9% - (continued) |
| | |
| Stanley Black & Decker, Inc. | |
| | |
| | | |
| Commercial & Professional Services - 0.1% |
| | |
| Consumer Discretionary Distribution & Retail - 0.6% |
| | |
| Industria de Diseno Textil SA | |
| | |
| | |
| | | |
| Consumer Durables & Apparel - 0.8% |
| | |
| | |
| | |
| | |
| | |
| | |
| | | |
| |
| | |
| | |
| | | |
| Consumer Staples Distribution & Retail - 0.4% |
| | |
| | |
| Walgreens Boots Alliance, Inc. | |
| | | |
| |
| | |
| | |
| | |
| | |
| | |
| | |
| | |
| | |
| | |
| Oil & Natural Gas Corp. Ltd. | |
| | |
| | |
| | |
| | |
| | |
| Woodside Energy Group Ltd. | |
| | | |
| Equity Real Estate Investment Trusts (REITs) - 0.8% |
| Alexandria Real Estate Equities, Inc. REIT | |
| | |
| Digital Realty Trust, Inc. REIT | |
| Gaming & Leisure Properties, Inc. REIT | |
| Simon Property Group, Inc. REIT | |
| | |
| | |
| | | |
| Financial Services - 1.5% |
| Annaly Capital Management, Inc. REIT | |
| Ares Management Corp. Class A | |
| | |
| | |
| | |
The accompanying notes are an integral part of these financial statements.
Hartford Multi-Asset Income Fund
Schedule of Investments – (continued)October 31, 2024
Shares or Principal Amount | | |
COMMON STOCKS - 23.9% - (continued) |
| Financial Services - 1.5% - (continued) |
| | |
| | |
| | |
| | |
| Qifu Technology, Inc. ADR | |
| | | |
| Food, Beverage & Tobacco - 1.4% |
| | |
| British American Tobacco PLC | |
| | |
| | |
| | |
| | |
| | |
| | |
| | |
| Philip Morris International, Inc. | |
| | | |
| Health Care Equipment & Services - 0.1% |
| | |
| | |
| | | |
| Household & Personal Products - 0.4% |
| | |
| | |
| | |
| | |
| | | |
| |
| | |
| | |
| American Financial Group, Inc. | |
| | |
| | |
| | |
| | |
| Legal & General Group PLC | |
| Muenchener Rueckversicherungs-Gesellschaft AG in Muenchen | |
| | |
| Phoenix Group Holdings PLC | |
| | |
| | |
| | |
| Tokio Marine Holdings, Inc. | |
| | |
| Zurich Insurance Group AG | |
| | | |
| |
| African Rainbow Minerals Ltd. | |
| Aluminum Corp. of China Ltd. Class H | |
| | |
| | |
| | |
| | |
| | |
| | |
| | |
| Grupo Mexico SAB de CV Class B | |
| LyondellBasell Industries NV Class A | |
| | |
| | |
| | |
Shares or Principal Amount | | |
COMMON STOCKS - 23.9% - (continued) |
| Materials - 1.3% - (continued) |
| | |
| | |
| Zijin Mining Group Co. Ltd. Class H | |
| | | |
| Media & Entertainment - 0.3% |
| | |
| | |
| | | |
| Pharmaceuticals, Biotechnology & Life Sciences - 1.6% |
| | |
| | |
| | |
| | |
| | |
| | |
| | |
| | |
| | |
| | | |
| Real Estate Management & Development - 0.0% |
| Daito Trust Construction Co. Ltd. | |
| Semiconductors & Semiconductor Equipment - 0.9% |
| | |
| | |
| Flat Glass Group Co. Ltd. Class H(8) | |
| | |
| Microchip Technology, Inc. | |
| | |
| | |
| | |
| | | |
| Software & Services - 1.0% |
| | |
| | |
| International Business Machines Corp. | |
| | |
| | |
| | |
| | |
| | |
| | |
| Shanghai Baosight Software Co. Ltd. Class A | |
| | |
| | | |
| Technology Hardware & Equipment - 1.6% |
| | |
| | |
| BYD Electronic International Co. Ltd. | |
| | |
| Catcher Technology Co. Ltd. | |
| Chicony Electronics Co. Ltd. | |
| | |
| | |
| | |
| | |
| | |
| Samsung Electronics Co. Ltd. | |
| Seagate Technology Holdings PLC | |
| | |
| Sunny Optical Technology Group Co. Ltd. | |
The accompanying notes are an integral part of these financial statements.
Hartford Multi-Asset Income Fund
Schedule of Investments – (continued)October 31, 2024
Shares or Principal Amount | | |
COMMON STOCKS - 23.9% - (continued) |
| Technology Hardware & Equipment - 1.6% - (continued) |
| Telefonaktiebolaget LM Ericsson Class B | |
| | |
| | | |
| Telecommunication Services - 0.6% |
| | |
| | |
| | |
| | |
| Verizon Communications, Inc. | |
| | |
| | | |
| |
| | |
| United Parcel Service, Inc. Class B | |
| | | |
| |
| American Electric Power Co., Inc. | |
| | |
| | |
| | |
| | |
| | |
| | |
| GD Power Development Co. Ltd. Class A | |
| | |
| | |
| Power Grid Corp. of India Ltd. | |
| | |
| | |
| Terna - Rete Elettrica Nazionale | |
| | | |
| Total Common Stocks
(cost $137,533,306) | | |
EQUITY LINKED SECURITIES - 10.3% |
| |
| Citizens Financial Group, Inc. (BNP Paribas Securities Corp.) 12.00%, 11/20/2024 | |
| Eli Lilly & Co. (BNP Paribas Issuance BV) 12.00%, 12/26/2024(1) | |
| | | |
| |
| Caterpillar, Inc. (Canadian Imperial Bank of Commerce) 12.00%, 12/26/2024 | |
| Textron, Inc. (BNP Paribas Issuance BV) 12.00%, 01/23/2025*(1) | |
| | | |
| Consumer Discretionary Distribution & Retail - 1.1% |
| Amazon.com, Inc. (Mizuho Securities) 12.00%, 11/20/2024 | |
| TJX Cos, Inc. (BNP Paribas Securities Corp.) 12.00%, 11/20/2024 | |
| | | |
| Consumer Staples Distribution & Retail - 0.5% |
| Costco Wholesale Corp. (Mizuho Markets Cayman LP)
12.00%, 12/26/2024 | |
Shares or Principal Amount | | |
EQUITY LINKED SECURITIES - 10.3% - (continued) |
| |
| Salesforce.com, Inc. (Royal Bank of Canada)
| |
| Financial Services - 1.0% |
| Intercontinental Exchange, Inc. (Mizuho Markets Cayman LP) | |
| S&P Global, Inc. (HSBC Bank PLC) 12.00%, 12/26/2024 | |
| | | |
| Health Care Equipment & Services - 0.9% |
| Boston Scientific Corp. (Mizuho Securities) 12.00%, 11/20/2024 | |
| UnitedHealth Group, Inc. (Mizuho Markets Cayman LP) 12.00%, | |
| | | |
| Media & Entertainment - 1.0% |
| Meta Platforms, Inc. (BNP Paribas Issuance BV) 12.00%, | |
| Netflix, Inc. (Mizuho Markets Cayman LP) 12.00%, 01/23/2025* | |
| | | |
| Semiconductors & Semiconductor Equipment - 0.7% |
| Nvidia Corp. (Mizuho Markets Cayman LP)
| |
| Software & Services - 1.5% |
| Conocophillips (Royal Bank of Canada) 12.00%, 01/23/2025*(1) | |
| Intl Business Machines Corp. (HSBC Bank PLC) 12.00%, 12/26/2024 | |
| Microsoft Corp. (RBC Capital Markets) | |
| | | |
| Technology Hardware & Equipment - 1.1% |
| Apple, Inc. (RBC Capital Markets) | |
| Corning, Inc. (Mizuho Markets Cayman LP) 12.00%, 12/26/2024 | |
| | | |
| Total Equity Linked Securities
(cost $60,222,319) | | |
EXCHANGE-TRADED FUNDS - 1.0% |
| Other Investment Pools & Funds - 1.0% |
| | |
| SPDR Blackstone Senior Loan ETF | |
| Vanguard High Dividend Yield ETF | |
| Total Exchange-Traded Funds
(cost $5,626,222) | | |
|
| Automobiles & Components - 0.2% |
| Bayerische Motoren Werke AG | |
The accompanying notes are an integral part of these financial statements.
Hartford Multi-Asset Income Fund
Schedule of Investments – (continued)October 31, 2024
Shares or Principal Amount | | |
PREFERRED STOCKS - 1.0% - (continued) |
| Automobiles & Components - 0.2% - (continued) |
| Hyundai Motor Co. (Preference | |
| Hyundai Motor Co. (Preference | |
| | | |
| |
| Bank of America Corp. Series L, | |
| |
| Boeing Co. (Preference Shares), 6.00% | |
| Financial Services - 0.2% |
| Ares Management Corp. Series B, 6.75% | |
| Morgan Stanley Series Q, 6.63%(21) | |
| Synchrony Financial Series B, 8.25%(21) | |
| | | |
| |
| American National Group, Inc. Series B, | |
| Enstar Group Ltd. Series D, 7.00%(21) | |
| Samsung Fire & Marine Insurance Co. Ltd. (Preference Shares)(20) | |
| | | |
| Technology Hardware & Equipment - 0.1% |
| Samsung Electronics Co. Ltd. | |
| Telecommunication Services - 0.1% |
| AT&T, Inc. Series A, 5.00%(21) | |
| U.S. Cellular Corp. (Preference Shares), 6.25% | |
| U.S. Cellular Corp. (Preference Shares), 5.50% | |
| U.S. Cellular Corp. (Preference Shares), 5.50% | |
| | | |
| |
| NextEra Energy, Inc. (Preference Shares), 6.93% | |
| Total Preferred Stocks
(cost $6,442,645) | | |
| Total Long-Term Investments
(cost $593,479,137) | | |
SHORT-TERM INVESTMENTS - 0.9% |
| Repurchase Agreements - 0.4% |
| Fixed Income Clearing Corp. Repurchase Agreement dated 10/31/2024 at 4.85%, due on 11/01/2024 with a maturity value of $2,446,544; collateralized by U.S. Treasury Note at 4.63%, maturing 06/30/2026, with a market value of $2,495,213 | |
| Securities Lending Collateral - 0.5% |
| Goldman Sachs Financial Square Funds, Government Fund, Institutional Class, 4.77%(22) | |
| HSBC U.S. Government Money Market Fund, Institutional Class, | |
Shares or Principal Amount | | |
SHORT-TERM INVESTMENTS - 0.9% - (continued) |
| Securities Lending Collateral - 0.5% - (continued) |
| Invesco Government & Agency Portfolio, Institutional Class, | |
| Morgan Stanley Institutional Liquidity Funds, Government Portfolio, Institutional Class, 4.78%(22) | |
| | | |
| Total Short-Term Investments
(cost $5,426,283) | |
| Total Investments
(cost $598,905,420) | | |
| Other Assets and Liabilities | | |
| | | |
Note:
Percentage of investments as shown is the ratio of the total market value to net assets.
Prices of foreign equities that are principally traded on certain foreign markets will generally be adjusted daily pursuant to a fair value pricing service approved by Hartford Funds Management Company, LLC in order to reflect an adjustment for factors occurring after the close of certain foreign markets but before the close of the New York Stock Exchange.
The Fund may refer to any one or more of the industry classifications used by one or more widely recognized market indices, ratings group and/or as defined by Fund management. Industry classifications may not be identical across all security types.
Equity industry classifications used in this report are the Global Industry Classification Standard, which was developed by and is the exclusive property and service mark of MSCI, Inc. and Standard & Poor’s.
For Fund compliance purposes, the Fund may not use the same classification system. These classifications are used for financial reporting purposes.
See “Glossary” for abbreviation descriptions.
| |
| Security was purchased pursuant to Rule 144A under the Securities Act of 1933 and may be sold in transactions that are exempt from registration (typically only to qualified institutional buyers) or in a public offering registered under the Securities Act of 1933. At October 31, 2024, the aggregate value of these securities was $144,492,091, representing 24.6% of net assets. |
| Variable rate securities; the rate reported is the coupon rate in effect at October 31, 2024. Base lending rates may be subject to a floor or cap. |
| Variable or floating rate security, which interest rate adjusts periodically based on changes in current interest rates and prepayments on the underlying pool of assets. Rate shown is the rate in effect as of period end. |
| Investment valued using significant unobservable inputs. |
| Security is a “step-up” bond where coupon increases or steps up at a predetermined date. Rate shown is current coupon rate. |
| Security is a zero-coupon bond. |
| Security is exempt from registration under Regulation S under the Securities Act of 1933, which exempts from registration securities offered and sold outside of the United States. Security may not be offered or sold in the United States except pursuant to an exemption from, or in a transaction not subject to, the registration requirements of the Securities Act of 1933. At October 31, 2024, the aggregate value of these securities was $85,019,378, representing 14.5% of net assets. |
The accompanying notes are an integral part of these financial statements.
Hartford Multi-Asset Income Fund
Schedule of Investments – (continued)October 31, 2024
| Represents entire or partial securities on loan. See Note 8 in the accompanying Notes to Financial Statements for securities lending information. |
| Fixed to variable rate investment. The rate shown reflects the fixed rate in effect at October 31, 2024. Rate will reset at a future date. Base lending rates may be subject to a floor or cap. |
| Perpetual maturity security. Maturity date shown is the next call date or final legal maturity date, whichever comes first. |
| Share amount represents shares of the issuer previously held that resulted in receipt of the escrow. |
| Security has the ability to pay in kind (“PIK”) or pay income in cash. When applicable, separate rates of such payments are disclosed. |
| Senior floating rate interests generally pay interest rates which are periodically adjusted by reference to a base short-term, floating lending rate plus a premium. The base lending rates are primarily the Secured Overnight Financing Rate ("SOFR") and secondarily, the prime rate offered by one or more major United States banks (the "Prime Rate"). Senior floating rate interests often require prepayments from excess cash flows or permit the borrower to repay at its election. The rate at which the borrower repays cannot be predicted with accuracy. As a result, the actual remaining maturity may be substantially less than the stated maturities shown. Base lending rates may be subject to a floor or cap. Unless otherwise noted, the interest rate disclosed for these securities represents the rate in effect as of October 31, 2024. |
| Represents an unsettled loan commitment. The coupon rate will be determined at time of settlement. |
| This security, or a portion of this security, has unfunded loan commitments. As of October 31, 2024, the aggregate value of the unfunded commitment was $41,817, which represents to 0.0% of total net assets. |
| Represents or includes a TBA transaction. |
| All, or a portion of the security, was pledged as collateral in connection with futures contracts. As of October 31, 2024, the market value of securities pledged was $4,826,585. |
| All, or a portion of the security, was pledged as collateral in connection with centrally cleared swap contracts. As of October 31, 2024, the market value of securities pledged was $3,076,106. |
| The principal amount for these securities are adjusted for inflation and the interest payments equal a fixed percentage of the inflation-adjusted principal amount. |
| Currently no rate available. |
| Perpetual security with no stated maturity date. |
| Current yield as of period end. |
Futures Contracts Outstanding at October 31, 2024 |
| | | | Value and
Unrealized
Appreciation/
(Depreciation) |
|
Australian 10-Year Bond Future | | | | |
MSCI Emerging Markets Index Future | | | | |
MSCI Singapore Index Future | | | | |
| | | | |
| | | | |
| | | | |
U.S. Treasury 2-Year Note Future | | | | |
U.S. Treasury 10-Year Note Future | | | | |
U.S. Treasury Long Bond Future | | | | |
U.S. Treasury Ultra Bond Future | | | | |
| | | | |
Short position contracts: |
| | | | |
| | | | |
Euro BUXL 30-Year Bond Future | | | | |
| | | | |
| | | | |
| | | | |
| | | | |
French Government Bond Future | | | | |
| | | | |
| | | | |
| | | | |
| | | | |
Stockholm OMXS30 Index Future | | | | |
U.S. Treasury 5-Year Note Future | | | | |
U.S. Treasury 10-Year Ultra Future | | | | |
| | | | |
| |
The accompanying notes are an integral part of these financial statements.
Hartford Multi-Asset Income Fund
Schedule of Investments – (continued)October 31, 2024
OTC Credit Default Swap Contracts Outstanding at October 31, 2024 |
| | | | | | | | | Unrealized
Appreciation/
(Depreciation) |
Credit default swaps on indices: |
|
| | | | | | | | | | |
Total OTC credit default swap contracts | | | | |
| The maximum potential amount the Fund could be required to pay as a seller of credit protection or receive as a buyer of credit protection if a credit event occurs as defined under the terms of that particular swap agreement. |
OTC Total Return Swap Contracts Outstanding at October 31, 2024 |
| | | Payments
received (paid)
by the Fund | | | | | | Unrealized
Appreciation/
Depreciation |
Russell 1000 Growth Total Return Index | | | | | | | | | | |
Russell 1000 Value Total Return Index | | | | | | | | | | |
S&P 500 Consumer Discretionary Index | | | | | | | | | | |
S&P 500 Consumer Staples Index | | | | | | | | | | |
S&P 500 Energy Sector Total Return Index | | | | | | | | | | |
| | | | | | | | | | |
| | | | | | | | | | |
S&P 500 Industrials Index | | | | | | | | | | |
S&P 500 Telecommunication Services Index | | | | | | | | | | |
S&P 500 Utilities Sector Total Return Index | | | | | | | | | | |
Total OTC total return swap contracts | | | | |
Centrally Cleared Credit Default Swap Contracts Outstanding at October 31, 2024 |
| | | | | | | | Unrealized
Appreciation/
(Depreciation) |
Credit default swaps on indices: | |
| |
| | | | | | | | | |
| |
| | | | | | | | | |
Credit default swaps on single-name | | | | | | | | | |
| |
Mediobanca Banca di Credito Finanziario SpA | | | | | | | | | |
| | | | | | | | | |
Total centrally cleared credit default swap contracts | | | | |
| The maximum potential amount the Fund could be required to pay as a seller of credit protection or receive as a buyer of credit protection if a credit event occurs as defined under the terms of that particular swap agreement. |
Centrally Cleared Interest Rate Swap Contracts Outstanding at October 31, 2024 |
| | | | | | | | Unrealized
Appreciation/
(Depreciation) |
| | | | | | | | | |
Total centrally cleared interest rate swaps contracts | | | | |
The accompanying notes are an integral part of these financial statements.
Hartford Multi-Asset Income Fund
Schedule of Investments – (continued)October 31, 2024
Foreign Currency Contracts Outstanding at October 31, 2024 |
Amount and Description of
Currency to be Purchased | Amount and Description of
Currency to be Sold | | | Appreciation/
(Depreciation) |
| | | | | | |
| | | | | | |
| | | | | | |
| | | | | | |
| | | | | | |
| | | | | | |
| | | | | | |
| | | | | | |
| | | | | | |
| | | | | | |
| | | | | | |
| | | | | | |
| | | | | | |
| | | | | | |
| | | | | | |
| | | | | | |
| | | | | | |
| | | | | | |
| | | | | | |
| | | | | | |
| | | | | | |
| | | | | | |
| | | | | | |
| | | | | | |
| | | | | | |
| | | | | | |
| | | | | | |
| | | | | | |
| | | | | | |
| | | | | | |
| | | | | | |
| | | | | | |
| | | | | | |
| | | | | | |
| | | | | | |
| | | | | | |
| | | | | | |
| | | | | | |
| | | | | | |
| | | | | | |
| | | | | | |
| | | | | | |
| | | | | | |
| | | | | | |
Total foreign currency contracts | |
Foreign Cross Currency Contracts Outstanding at October 31, 2024 |
| | | | Unrealized
Appreciation/
Depreciation |
| | | | | | |
† See Significant Accounting Policies of accompanying Notes to Financial Statements regarding valuation of investments.
The accompanying notes are an integral part of these financial statements.
Hartford Multi-Asset Income Fund
Schedule of Investments – (continued)October 31, 2024
Fair Value Summary
The following is a summary of the fair valuations according to the inputs used as of October 31, 2024 in valuing the Fund’s investments.
| | | | |
| | | | |
Asset & Commercial Mortgage-Backed Securities | | | | |
| | | | |
| | | | |
Foreign Government Obligations | | | | |
| | | | |
Senior Floating Rate Interests | | | | |
| | | | |
U.S. Government Securities | | | | |
| | | | |
| | | | |
| | | | |
| | | | |
Commercial & Professional Services | | | | |
Consumer Discretionary Distribution & Retail | | | | |
Consumer Durables & Apparel | | | | |
| | | | |
Consumer Staples Distribution & Retail | | | | |
| | | | |
Equity Real Estate Investment Trusts (REITs) | | | | |
| | | | |
| | | | |
Health Care Equipment & Services | | | | |
Household & Personal Products | | | | |
| | | | |
| | | | |
| | | | |
Pharmaceuticals, Biotechnology & Life Sciences | | | | |
Real Estate Management & Development | | | | |
Semiconductors & Semiconductor Equipment | | | | |
| | | | |
Technology Hardware & Equipment | | | | |
Telecommunication Services | | | | |
| | | | |
| | | | |
| | | | |
| | | | |
| | | | |
| | | | |
Foreign Currency Contracts(2) | | | | |
| | | | |
Swaps - Credit Default(2) | | | | |
| | | | |
| | | | |
| | | | |
| | | | |
Foreign Currency Contracts(2) | | | | |
| | | | |
Swaps - Credit Default(2) | | | | |
| | | | |
| | | | |
| For the year ended October 31, 2024, there were no transfers in and out of Level 3. |
| Derivative instruments (excluding purchased and written options, if applicable) are valued at the unrealized appreciation/(depreciation) on the investments. |
Level 3 investments at the beginning and/or end of the period in relation to net assets were not significant and accordingly, a reconciliation of Level 3 assets for the year ended October 31, 2024 is not presented.
The accompanying notes are an integral part of these financial statements.
Hartford Real Asset Fund (Consolidated)
Schedule of InvestmentsOctober 31, 2024
Shares or Principal Amount | | |
FOREIGN GOVERNMENT OBLIGATIONS - 1.3% |
| |
| Brazil Notas do Tesouro Nacional 6.00%, | |
| |
| Mexico Udibonos 4.00%, 11/03/2050(1) | |
| Total Foreign Government Obligations
(cost $1,231,538) | | |
U.S. GOVERNMENT SECURITIES - 32.8% |
| U.S. Treasury Securities - 32.8% |
| U.S. Treasury Inflation-Indexed Bonds - 3.3% |
| | |
| | |
| | |
| | |
| | |
| | |
| | |
| | | |
| U.S. Treasury Inflation-Indexed Notes - 29.5% |
| | |
| | |
| | |
| | |
| | |
| | |
| | |
| | |
| | |
| | |
| | |
| | |
| | |
| | |
| | |
| | |
| | |
| | |
| | |
| | |
| | |
| | |
| | |
| | |
| | |
| | |
| | | |
| Total U.S. Government Securities
(cost $25,756,239) | | |
|
| Consumer Staples Distribution & Retail - 0.1% |
| | |
| |
| | |
| | |
| | |
| | |
| | |
| | |
| | |
Shares or Principal Amount | | |
COMMON STOCKS - 52.1% - (continued) |
| Energy - 15.7% - (continued) |
| | |
| | |
| | |
| | |
| | |
| | |
| | |
| | |
| | |
| Petroleo Brasileiro SA ADR | |
| | |
| | |
| | |
| Surgutneftegas PJSC ADR*(2) | |
| | |
| | |
| | | |
| Equity Real Estate Investment Trusts (REITs) - 11.6% |
| American Assets Trust, Inc. REIT | |
| Camden Property Trust REIT | |
| | |
| | |
| | |
| DiamondRock Hospitality Co. REIT | |
| Empire State Realty Trust, Inc. Class A, REIT | |
| | |
| Essex Property Trust, Inc. REIT | |
| Fibra Uno Administracion SA de CV REIT | |
| Gaming & Leisure Properties, Inc. REIT | |
| Host Hotels & Resorts, Inc. REIT | |
| Independence Realty Trust, Inc. REIT | |
| | |
| Land Securities Group PLC REIT | |
| | |
| Nippon Building Fund, Inc. REIT | |
| Omega Healthcare Investors, Inc. REIT | |
| | |
| Ryman Hospitality Properties, Inc. REIT | |
| Sabra Health Care, Inc. REIT | |
| | |
| | |
| Unibail-Rodamco-Westfield REIT* | |
| | |
| | |
| | |
| | | |
| Food, Beverage & Tobacco - 2.4% |
| Archer-Daniels-Midland Co. | |
| | |
| | |
| | |
| | | |
| |
| | |
| Alpha Metallurgical Resources, Inc. | |
| | |
| Anglo American Platinum Ltd. | |
| | |
| | |
| | |
| | |
| | |
The accompanying notes are an integral part of these financial statements.
Hartford Real Asset Fund (Consolidated)
Schedule of Investments – (continued)October 31, 2024
Shares or Principal Amount | | |
COMMON STOCKS - 52.1% - (continued) |
| Materials - 14.7% - (continued) |
| CF Industries Holdings, Inc. | |
| | |
| Dundee Precious Metals, Inc. | |
| | |
| | |
| | |
| | |
| | |
| | |
| | |
| | |
| | |
| | |
| | |
| MMC Norilsk Nickel PJSC ADR*(2) | |
| | |
| | |
| | |
| | |
| | |
| | |
| | |
| | |
| | |
| | |
| | |
| | | |
| Real Estate Management & Development - 2.5% |
| China Jinmao Holdings Group Ltd. | |
| China Overseas Land & Investment Ltd. | |
| | |
| Mitsubishi Estate Co. Ltd. | |
| | |
| | |
| | |
| | |
| Tokyu Fudosan Holdings Corp. | |
| | |
| | | |
| Telecommunication Services - 0.2% |
| | |
| | |
| | | |
| |
| Canadian National Railway Co. | |
| |
| | |
| | |
| | |
| | |
| Kansai Electric Power Co., Inc. | |
| | |
| | |
| | | |
| Total Common Stocks
(cost $39,823,211) | | |
Shares or Principal Amount | | |
|
| Investment Company Securities - 0.4% |
| Sprott Physical Uranium Trust* | |
| Total Closed End Funds
(cost $335,242) | |
EXCHANGE-TRADED FUNDS - 0.5% |
| Other Investment Pools & Funds - 0.5% |
| iShares MSCI Global Metals & Mining | |
| VanEck Agribusiness ETF (3) | |
| Total Exchange-Traded Funds
(cost $397,542) | | |
| Total Long-Term Investments
(cost $67,543,772) | | |
SHORT-TERM INVESTMENTS - 10.1% |
| Other Investment Pools & Funds - 9.9% |
| Morgan Stanley Institutional Liquidity Funds, Government Portfolio, Institutional Class, | |
| Securities Lending Collateral - 0.2% |
| Goldman Sachs Financial Square Funds, Government Fund, Institutional Class, | |
| HSBC U.S. Government Money Market Fund, Institutional Class, 4.78%(4) | |
| Invesco Government & Agency Portfolio, Institutional Class, 4.76%(4) | |
| Morgan Stanley Institutional Liquidity Funds, Government Portfolio, Institutional Class, | |
| | | |
| Total Short-Term Investments
(cost $8,072,832) | |
| Total Investments
(cost $75,616,604) | | |
| Other Assets and Liabilities | | |
| | | |
Note:
Percentage of investments as shown is the ratio of the total market value to net assets.
Prices of foreign equities that are principally traded on certain foreign markets will generally be adjusted daily pursuant to a fair value pricing service approved by Hartford Funds Management Company, LLC in order to reflect an adjustment for factors occurring after the close of certain foreign markets but before the close of the New York Stock Exchange.
The Fund may refer to any one or more of the industry classifications used by one or more widely recognized market indices, ratings group and/or as defined by Fund management. Industry classifications may not be identical across all security types.
Equity industry classifications used in this report are the Global Industry Classification Standard, which was developed by and is the exclusive property and service mark of MSCI, Inc. and Standard & Poor’s.
The Consolidated Schedule of Investments includes investments held by Hartford Cayman Real Asset Fund, Ltd. (the “Subsidiary”), a wholly owned subsidiary of the Fund, which primarily invests in commodity-related
The accompanying notes are an integral part of these financial statements.
Hartford Real Asset Fund (Consolidated)
Schedule of Investments – (continued)October 31, 2024
instruments. The Fund may invest up to 25% of its total assets in the Subsidiary. As of October 31, 2024, the Fund invested 20.9% of its total assets in the Subsidiary.
For Fund compliance purposes, the Fund may not use the same classification system. These classifications are used for financial reporting purposes.
See “Glossary” for abbreviation descriptions.
| The principal amount for these securities are adjusted for inflation and the interest payments equal a fixed percentage of the inflation-adjusted principal amount. |
| Investment valued using significant unobservable inputs. |
| Represents entire or partial securities on loan. See Note 8 in the accompanying Notes to Financial Statements for securities lending information. |
| Current yield as of period end. |
Futures Contracts Outstanding at October 31, 2024 |
| | | | Value and
Unrealized
Appreciation/
(Depreciation) |
|
| | | | |
| | | | |
California Carbon Allowance Vintage Future | | | | |
Chicago Ethanol Platts Swap Futures | | | | |
| | | | |
| | | | |
| | | | |
| | | | |
| | | | |
| | | | |
| | | | |
| | | | |
| | | | |
| | | | |
| | | | |
| | | | |
| | | | |
| | | | |
| | | | |
| | | | |
LME Primary Aluminum Future | | | | |
LME Primary Aluminum Future | | | | |
| | | | |
| | | | |
| | | | |
| | | | |
| | | | |
| | | | |
| | | | |
| | | | |
| | | | |
| | | | |
| | | | |
| | | | |
| | | | |
| | | | |
| | | | |
| | | | |
| | | | |
| | | | |
World Sugar No. 11 Future | | | | |
| | | | |
Short position contracts: |
| | | | |
| | | | |
| | | | |
| | | | |
| | | | |
The accompanying notes are an integral part of these financial statements.
Hartford Real Asset Fund (Consolidated)
Schedule of Investments – (continued)October 31, 2024
Futures Contracts Outstanding at October 31, 2024 – (continued) |
| | | | Value and Unrealized Appreciation/ (Depreciation) |
Short position contracts – (continued): |
KC Hard Red Winter Wheat Future | | | | |
| | | | |
| | | | |
| | | | |
| | | | |
| | | | |
| | | | |
LME Primary Aluminum Future | | | | |
LME Primary Aluminum Future | | | | |
| | | | |
| | | | |
| | | | |
| | | | |
| | | | |
| | | | |
| | | | |
| | | | |
| |
† See Significant Accounting Policies of accompanying Notes to Financial Statements regarding valuation of investments.
The following is a summary of the fair valuations according to the inputs used as of October 31, 2024 in valuing the Fund’s investments.
| | | | |
| | | | |
Foreign Government Obligations | | | | |
U.S. Government Securities | | | | |
| | | | |
Consumer Staples Distribution & Retail | | | | |
| | | | |
Equity Real Estate Investment Trusts (REITs) | | | | |
| | | | |
| | | | |
Real Estate Management & Development | | | | |
Telecommunication Services | | | | |
| | | | |
| | | | |
| | | | |
| | | | |
| | | | |
| | | | |
| | | | |
| | | | |
| | | | |
| | | | |
| For the year ended October 31, 2024, there were no transfers in and out of Level 3. |
| Derivative instruments (excluding purchased and written options, if applicable) are valued at the unrealized appreciation/(depreciation) on the investments. |
Level 3 investments at the beginning and/or end of the period in relation to net assets were not significant and accordingly, a reconciliation of Level 3 assets for the year ended October 31, 2024 is not presented.
The accompanying notes are an integral part of these financial statements.
Hartford Multi-Strategy Funds
GLOSSARY: (abbreviations used in preceding Schedules of Investments)
Counterparty Abbreviations: |
| |
| |
| BNP Paribas Securities Services |
| Bank of America Securities LLC |
| |
| Deutsche Bank Securities, Inc. |
| |
| Hongkong and Shanghai Banking Corporation |
| |
| |
| |
| RBC Dominion Securities, Inc. |
| |
| |
| State Street Global Markets LLC |
| |
| |
| |
|
| |
| |
| |
| |
| |
| |
| |
| |
| |
| |
| |
| |
| |
| |
| |
| |
| |
| |
| |
| |
| |
| |
| |
| |
| |
| |
| |
| |
| |
| |
| |
|
| Cotation Assistee en Continu |
| Credit Derivatives Emerging Markets |
| Markit Commercial Mortgage-Backed North American |
| Constant Maturity Treasury Index |
| |
| Financial Times and Stock Exchange |
| |
| Intercontinental Exchange, Inc. |
| |
| |
| |
| |
| |
| |
| |
|
| |
| |
| |
|
| American Depositary Receipt |
| |
| Chess Depositary Interest |
| Collateralized Loan Obligation |
| Collateralized Mortgage Obligation |
| |
| Euro Interbank Offered Rate |
| Global Depositary Receipt |
| |
| |
| |
| Morgan Stanley Capital International |
| |
| Private Joint Stock Company |
| |
| Reformulated Blendstock for Oxygenate Blending |
| Real Estate Investment Trust |
| Secured Overnight Financing Rate |
| Standard & Poor's Depositary Receipt |
| |
| |
| |
| |
Hartford Multi-Strategy Funds
Statements of Assets and LiabilitiesOctober 31, 2024
| The Hartford
Balanced
Income Fund | The Hartford
Checks and
Balances Fund | The Hartford
Conservative
Allocation Fund | The Hartford
Growth
Allocation Fund |
| | | | |
Investments in securities, at market value(1) | | | | |
| | | | |
Investments in affiliated investment companies, at market value | | | | |
| | | | |
Cash collateral held for securities on loan | | | | |
| | | | |
Unrealized appreciation on foreign currency contracts | | | | |
| | | | |
| | | | |
Investment securities sold | | | | |
| | | | |
| | | | |
Securities lending income | | | | |
Variation margin on futures contracts | | | | |
Variation margin on centrally cleared swap contracts | | | | |
| | | | |
| | | | |
| | | | |
| | | | |
| | | | |
Unrealized depreciation on foreign currency contracts | | | | |
Obligation to return securities lending collateral | | | | |
| | | | |
Investment securities purchased | | | | |
| | | | |
Investment management fees | | | | |
| | | | |
| | | | |
Chief Compliance Officer fees | | | | |
| | | | |
| | | | |
| | | | |
| | | | |
| | | | |
| | | | |
| | | | |
Capital stock and paid-in-capital | | | | |
Distributable earnings (loss) | | | | |
| | | | |
| | | | |
| | | | |
Class A:Net asset value per share | | | | |
Maximum offering price per share | | | | |
| | | | |
| | | | |
Class C:Net asset value per share | | | | |
| | | | |
| | | | |
Class I:Net asset value per share | | | | |
| | | | |
| | | | |
Class R3:Net asset value per share | | | | |
| | | | |
| | | | |
The accompanying notes are an integral part of these financial statements.
Hartford Multi-Strategy Funds
Statements of Assets and Liabilities – (continued)October 31, 2024
| The Hartford Balanced Income Fund | The Hartford Checks and Balances Fund | The Hartford Conservative Allocation Fund | The Hartford Growth Allocation Fund |
Class R4:Net asset value per share | | | | |
| | | | |
| | | | |
Class R5:Net asset value per share | | | | |
| | | | |
| | | | |
Class R6:Net asset value per share | | | | |
| | | | |
| | | | |
Class Y:Net asset value per share | | | | |
| | | | |
| | | | |
Class F:Net asset value per share | | | | |
| | | | |
| | | | |
| | | | |
Cost of investments in affiliated investments | | | | |
| | | | |
(1) Includes Investment in securities on loan, at market value | | | | |
The accompanying notes are an integral part of these financial statements.
Hartford Multi-Strategy Funds
Statements of Assets and Liabilities – (continued)October 31, 2024
| Hartford
Moderate
Allocation Fund | Hartford
Multi-Asset
Income Fund | Hartford
Real
Asset Fund
(Consolidated) |
| | | |
Investments in securities, at market value(1) | | | |
| | | |
Investments in affiliated investment companies, at market value | | | |
| | | |
Cash collateral due from broker on futures contracts | | | |
Cash collateral held for securities on loan | | | |
| | | |
Unrealized appreciation on OTC swap contracts | | | |
Unrealized appreciation on foreign currency contracts | | | |
| | | |
| | | |
Investment securities sold | | | |
| | | |
| | | |
Securities lending income | | | |
| | | |
| | | |
| | | |
| | | |
Unrealized depreciation on foreign currency contracts | | | |
Obligation to return securities lending collateral | | | |
Unrealized depreciation on OTC swap contracts | | | |
Cash collateral due to broker on swap contracts | | | |
Unfunded loan commitments | | | |
| | | |
Investment securities purchased | | | |
| | | |
Investment management fees | | | |
| | | |
| | | |
Chief Compliance Officer fees | | | |
| | | |
Variation margin on futures contracts | | | |
Variation margin on centrally cleared swap contracts | | | |
| | | |
| | | |
OTC swap contracts premiums received | | | |
| | | |
| | | |
| | | |
| | | |
Capital stock and paid-in-capital | | | |
Distributable earnings (loss) | | | |
| | | |
| | | |
| | | |
Class A:Net asset value per share | | | |
Maximum offering price per share | | | |
| | | |
| | | |
Class C:Net asset value per share | | | |
| | | |
| | | |
Class I:Net asset value per share | | | |
| | | |
| | | |
The accompanying notes are an integral part of these financial statements.
Hartford Multi-Strategy Funds
Statements of Assets and Liabilities – (continued)October 31, 2024
| Hartford Moderate Allocation Fund | Hartford Multi-Asset Income Fund | Hartford Real Asset Fund (Consolidated) |
Class R3:Net asset value per share | | | |
| | | |
| | | |
Class R4:Net asset value per share | | | |
| | | |
| | | |
Class R5:Net asset value per share | | | |
| | | |
| | | |
Class R6:Net asset value per share | | | |
| | | |
| | | |
Class Y:Net asset value per share | | | |
| | | |
| | | |
Class F:Net asset value per share | | | |
| | | |
| | | |
| | | |
Cost of investments in affiliated investments | | | |
| | | |
(1) Includes Investment in securities on loan, at market value | | | |
The accompanying notes are an integral part of these financial statements.
Hartford Multi-Strategy Funds
Statements of OperationsFor the Year Ended October 31, 2024
| The Hartford
Balanced
Income Fund | The Hartford
Checks and
Balances Fund | The Hartford
Conservative
Allocation Fund | The Hartford
Growth
Allocation Fund |
| | | | |
| | | | |
Dividends from affiliated investment companies | | | | |
| | | | |
| | | | |
Less: Foreign tax withheld | | | | |
Total investment income, net | | | | |
| | | | |
Investment management fees | | | | |
| | | | |
| | | | |
| | | | |
| | | | |
| | | | |
| | | | |
| | | | |
| | | | |
| | | | |
| | | | |
| | | | |
| | | | |
| | | | |
| | | | |
| | | | |
| | | | |
Registration and filing fees | | | | |
| | | | |
| | | | |
Chief Compliance Officer fees | | | | |
| | | | |
| | | | |
Total expenses (before waivers, reimbursements and fees paid indirectly) | | | | |
| | | | |
Transfer agent fee waivers | | | | |
Distribution fee reimbursements | | | | |
| | | | |
Total waivers, reimbursements and fees paid indirectly | | | | |
| | | | |
Net Investment Income (Loss) | | | | |
Net Realized Gain (Loss) on Investments, Other Financial Instruments and Foreign Currency Transactions on: | | | | |
Capital gain distributions received from affiliated investment companies | | | | |
| | | | |
Less: Foreign taxes paid on realized capital gains | | | | |
Investments in affiliated investment companies | | | | |
| | | | |
| | | | |
Foreign currency contracts | | | | |
Other foreign currency transactions | | | | |
Net Realized Gain (Loss) on Investments, Other Financial Instruments and Foreign Currency Transactions | | | | |
Net Changes in Unrealized Appreciation (Depreciation) of Investments, Other Financial Instruments and Foreign Currency Transactions of: | | | | |
| | | | |
Investments in affiliated investment companies | | | | |
| | | | |
| | | | |
Foreign currency contracts | | | | |
Translation of other assets and liabilities in foreign currencies | | | | |
Net Changes in Unrealized Appreciation (Depreciation) of Investments, Other Financial Instruments and Foreign Currency Transactions | | | | |
The accompanying notes are an integral part of these financial statements.
Hartford Multi-Strategy Funds
Statements of Operations – (continued)For the Year Ended October 31, 2024
| The Hartford Balanced Income Fund | The Hartford Checks and Balances Fund | The Hartford Conservative Allocation Fund | The Hartford Growth Allocation Fund |
Net Gain (Loss) on Investments, Other Financial Instruments and Foreign Currency Transactions | | | | |
Net Increase (Decrease) in Net Assets Resulting from Operations | | | | |
* Includes change in unrealized appreciation (depreciation) on deferred capital gains tax | | | | |
The accompanying notes are an integral part of these financial statements.
Hartford Multi-Strategy Funds
Statements of Operations – (continued)For the Year Ended October 31, 2024
| Hartford
Moderate
Allocation Fund | Hartford
Multi-Asset
Income Fund | Hartford
Real
Asset Fund
(Consolidated) |
| | | |
| | | |
Dividends from affiliated investment companies | | | |
| | | |
| | | |
Less: Foreign tax withheld | | | |
Total investment income, net | | | |
| | | |
Investment management fees | | | |
| | | |
| | | |
| | | |
| | | |
| | | |
| | | |
| | | |
| | | |
| | | |
| | | |
| | | |
| | | |
| | | |
| | | |
| | | |
| | | |
Registration and filing fees | | | |
| | | |
| | | |
Chief Compliance Officer fees | | | |
| | | |
| | | |
Total expenses (before waivers, reimbursements and fees paid indirectly) | | | |
| | | |
| | | |
Distribution fee reimbursements | | | |
| | | |
Total waivers, reimbursements and fees paid indirectly | | | |
| | | |
Net Investment Income (Loss) | | | |
Net Realized Gain (Loss) on Investments, Other Financial Instruments and Foreign Currency Transactions on: | | | |
Capital gain distributions received from affiliated investment companies | | | |
| | | |
Less: Foreign taxes paid on realized capital gains | | | |
Investments in affiliated investment companies | | | |
Purchased options contracts | | | |
| | | |
| | | |
Foreign currency contracts | | | |
Other foreign currency transactions | | | |
Cash contribution from sub-adviser(1) | | | |
Net Realized Gain (Loss) on Investments, Other Financial Instruments and Foreign Currency Transactions | | | |
Net Changes in Unrealized Appreciation (Depreciation) of Investments, Other Financial Instruments and Foreign Currency Transactions of: | | | |
| | | |
Investments in affiliated investment companies | | | |
| | | |
| | | |
Foreign currency contracts | | | |
Translation of other assets and liabilities in foreign currencies | | | |
The accompanying notes are an integral part of these financial statements.
Hartford Multi-Strategy Funds
Statements of Operations – (continued)For the Year Ended October 31, 2024
| Hartford Moderate Allocation Fund | Hartford Multi-Asset Income Fund | Hartford Real Asset Fund (Consolidated) |
Net Changes in Unrealized Appreciation (Depreciation) of Investments, Other Financial Instruments and Foreign Currency Transactions | | | |
Net Gain (Loss) on Investments, Other Financial Instruments and Foreign Currency Transactions | | | |
Net Increase (Decrease) in Net Assets Resulting from Operations | | | |
* Includes change in unrealized appreciation (depreciation) on deferred capital gains tax | | | |
| See Note 7 in the Notes to Financial Statements. |
The accompanying notes are an integral part of these financial statements.
Hartford Multi-Strategy Funds
Statements of Changes in Net Assets
| The Hartford
Balanced Income Fund | The Hartford
Checks and Balances Fund |
| For the
Year Ended
October 31,
2024 | For the
Year Ended
October 31,
2023 | For the
Year Ended
October 31,
2024 | For the
Year Ended
October 31,
2023 |
| | | | |
Net investment income (loss) | | | | |
Net realized gain (loss) on investments, other financial instruments and foreign currency transactions | | | | |
Net changes in unrealized appreciation (depreciation) of investments, other financial instruments and foreign currency transactions | | | | |
Net Increase (Decrease) in Net Assets Resulting from Operations | | | | |
Distributions to Shareholders: | | | | |
| | | | |
| | | | |
| | | | |
| | | | |
| | | | |
| | | | |
| | | | |
| | | | |
| | | | |
| | | | |
Capital Share Transactions: | | | | |
| | | | |
Issued on reinvestment of distributions | | | | |
| | | | |
Net increase (decrease) from capital share transactions | | | | |
Net Increase (Decrease) in Net Assets | | | | |
| | | | |
| | | | |
| | | | |
The accompanying notes are an integral part of these financial statements.
Hartford Multi-Strategy Funds
Statements of Changes in Net Assets – (continued)
| The Hartford
Conservative Allocation Fund | The Hartford
Growth Allocation Fund |
| For the
Year Ended
October 31,
2024 | For the
Year Ended
October 31,
2023 | For the
Year Ended
October 31,
2024 | For the
Year Ended
October 31,
2023 |
| | | | |
Net investment income (loss) | | | | |
Net realized gain (loss) on investments | | | | |
Net changes in unrealized appreciation (depreciation) of investments and foreign currency transactions | | | | |
Net Increase (Decrease) in Net Assets Resulting from Operations | | | | |
Distributions to Shareholders: | | | | |
| | | | |
| | | | |
| | | | |
| | | | |
| | | | |
| | | | |
| | | | |
| | | | |
Capital Share Transactions: | | | | |
| | | | |
| | | | |
Issued on reinvestment of distributions | | | | |
| | | | |
Net increase (decrease) from capital share transactions | | | | |
Net Increase (Decrease) in Net Assets | | | | |
| | | | |
| | | | |
| | | | |
The accompanying notes are an integral part of these financial statements.
Hartford Multi-Strategy Funds
Statements of Changes in Net Assets – (continued)
| Hartford
Moderate Allocation Fund | Hartford
Multi-Asset Income Fund |
| For the
Year Ended
October 31,
2024 | For the
Year Ended
October 31,
2023 | For the
Year Ended
October 31,
2024 | For the
Year Ended
October 31,
2023 |
| | | | |
Net investment income (loss) | | | | |
Net realized gain (loss) on investments, other financial instruments and foreign currency transactions | | | | |
Net changes in unrealized appreciation (depreciation) of investments, other financial instruments and foreign currency transactions | | | | |
Net Increase (Decrease) in Net Assets Resulting from Operations | | | | |
Distributions to Shareholders: | | | | |
| | | | |
| | | | |
| | | | |
| | | | |
| | | | |
| | | | |
| | | | |
| | | | |
| | | | |
| | | | |
| | | | |
| | | | |
| | | | |
| | | | |
| | | | |
| | | | |
| | | | |
| | | | |
| | | | |
| | | | |
Capital Share Transactions: | | | | |
| | | | |
Issued on reinvestment of distributions | | | | |
| | | | |
Net increase (decrease) from capital share transactions | | | | |
Net Increase (Decrease) in Net Assets | | | | |
| | | | |
| | | | |
| | | | |
The accompanying notes are an integral part of these financial statements.
Hartford Multi-Strategy Funds
Statements of Changes in Net Assets – (continued)
| Hartford
Real Asset Fund
(Consolidated) |
| For the
Year Ended
October 31,
2024 | For the
Year Ended
October 31,
2023 |
| | |
Net investment income (loss) | | |
Net realized gain (loss) on investments, other financial instruments and foreign currency transactions | | |
Net changes in unrealized appreciation (depreciation) of investments, other financial instruments and foreign currency transactions | | |
Net Increase (Decrease) in Net Assets Resulting from Operations | | |
Distributions to Shareholders: | | |
| | |
| | |
| | |
| | |
| | |
| | |
| | |
| | |
| | |
| | |
Capital Share Transactions: | | |
| | |
Issued on reinvestment of distributions | | |
| | |
Net increase (decrease) from capital share transactions | | |
Net Increase (Decrease) in Net Assets | | |
| | |
| | |
| | |
The accompanying notes are an integral part of these financial statements.
Hartford Multi-Strategy Funds
| — Selected Per-Share Data(1) — | — Ratios and Supplemental Data — |
| Net
Asset
Value at
Beginning
of Period | Net
Investment
Income
(Loss) | Net
Realized
and
Unrealized
Gain (Loss)
on
Investments | Total from
Investment
Operations | Dividends
from Net
Investment
Income | Distributions
from
Capital
Gains | | Total
Dividends
and
Distributions | Net
Asset
Value at
End of
Period | | Net
Assets
at End
of Period
(000s) | Ratio of
Expenses
to
Average
Net
Assets
Before
Adjust-
| Ratio of
Expenses
to
Average
Net
Assets
After
Adjust-
| Ratio of
Net
Investment
Income
(Loss) to
Average
| |
The Hartford Balanced Income Fund |
For the Year Ended October 31, 2024 |
| | | | | | | | | | | | | | | |
| | | | | | | | | | | | | | | |
| | | | | | | | | | | | | | | |
| | | | | | | | | | | | | | | |
| | | | | | | | | | | | | | | |
| | | | | | | | | | | | | | | |
| | | | | | | | | | | | | | | |
| | | | | | | | | | | | | | | |
| | | | | | | | | | | | | | | |
For the Year Ended October 31, 2023 |
| | | | | | | | | | | | | | | |
| | | | | | | | | | | | | | | |
| | | | | | | | | | | | | | | |
| | | | | | | | | | | | | | | |
| | | | | | | | | | | | | | | |
| | | | | | | | | | | | | | | |
| | | | | | | | | | | | | | | |
| | | | | | | | | | | | | | | |
| | | | | | | | | | | | | | | |
For the Year Ended October 31, 2022 |
| | | | | | | | | | | | | | | |
| | | | | | | | | | | | | | | |
| | | | | | | | | | | | | | | |
| | | | | | | | | | | | | | | |
| | | | | | | | | | | | | | | |
| | | | | | | | | | | | | | | |
| | | | | | | | | | | | | | | |
| | | | | | | | | | | | | | | |
| | | | | | | | | | | | | | | |
For the Year Ended October 31, 2021 |
| | | | | | | | | | | | | | | |
| | | | | | | | | | | | | | | |
| | | | | | | | | | | | | | | |
| | | | | | | | | | | | | | | |
| | | | | | | | | | | | | | | |
| | | | | | | | | | | | | | | |
| | | | | | | | | | | | | | | |
| | | | | | | | | | | | | | | |
| | | | | | | | | | | | | | | |
The accompanying notes are an integral part of these financial statements.
Hartford Multi-Strategy Funds
Financial Highlights – (continued)
| — Selected Per-Share Data(1) — | — Ratios and Supplemental Data — |
| Net Asset Value at Beginning of Period | Net Investment Income (Loss) | Net Realized and Unrealized Gain (Loss) on Investments | Total from Investment Operations | Dividends from Net Investment Income | Distributions from Capital Gains | | Total Dividends and Distributions | Net Asset Value at End of Period | | Net Assets at End of Period (000s) | Ratio of Expenses to Average Net Assets Before Adjust- ments(3)(4) | Ratio of Expenses to Average Net Assets After Adjust- ments(3)(4) | Ratio of Net Investment Income (Loss) to Average Net Assets(4) | |
The Hartford Balanced Income Fund – (continued) |
For the Year Ended October 31, 2020 |
| | | | | | | | | | | | | | | |
| | | | | | | | | | | | | | | |
| | | | | | | | | | | | | | | |
| | | | | | | | | | | | | | | |
| | | | | | | | | | | | | | | |
| | | | | | | | | | | | | | | |
| | | | | | | | | | | | | | | |
| | | | | | | | | | | | | | | |
| | | | | | | | | | | | | | | |
The Hartford Checks and Balances Fund |
For the Year Ended October 31, 2024 |
| | | | | | | | | | | | | | | |
| | | | | | | | | | | | | | | |
| | | | | | | | | | | | | | | |
| | | | | | | | | | | | | | | |
| | | | | | | | | | | | | | | |
| | | | | | | | | | | | | | | |
| | | | | | | | | | | | | | | |
For the Year Ended October 31, 2023 |
| | | | | | | | | | | | | | | |
| | | | | | | | | | | | | | | |
| | | | | | | | | | | | | | | |
| | | | | | | | | | | | | | | |
| | | | | | | | | | | | | | | |
| | | | | | | | | | | | | | | |
| | | | | | | | | | | | | | | |
For the Year Ended October 31, 2022 |
| | | | | | | | | | | | | | | |
| | | | | | | | | | | | | | | |
| | | | | | | | | | | | | | | |
| | | | | | | | | | | | | | | |
| | | | | | | | | | | | | | | |
| | | | | | | | | | | | | | | |
| | | | | | | | | | | | | | | |
For the Year Ended October 31, 2021 |
| | | | | | | | | | | | | | | |
| | | | | | | | | | | | | | | |
| | | | | | | | | | | | | | | |
| | | | | | | | | | | | | | | |
| | | | | | | | | | | | | | | |
| | | | | | | | | | | | | | | |
| | | | | | | | | | | | | | | |
The accompanying notes are an integral part of these financial statements.
Hartford Multi-Strategy Funds
Financial Highlights – (continued)
| — Selected Per-Share Data(1) — | — Ratios and Supplemental Data — |
| Net Asset Value at Beginning of Period | Net Investment Income (Loss) | Net Realized and Unrealized Gain (Loss) on Investments | Total from Investment Operations | Dividends from Net Investment Income | Distributions from Capital Gains | | Total Dividends and Distributions | Net Asset Value at End of Period | | Net Assets at End of Period (000s) | Ratio of Expenses to Average Net Assets Before Adjust- ments(3)(4) | Ratio of Expenses to Average Net Assets After Adjust- ments(3)(4) | Ratio of Net Investment Income (Loss) to Average Net Assets(4) | |
The Hartford Checks and Balances Fund – (continued) |
For the Year Ended October 31, 2020 |
| | | | | | | | | | | | | | | |
| | | | | | | | | | | | | | | |
| | | | | | | | | | | | | | | |
| | | | | | | | | | | | | | | |
| | | | | | | | | | | | | | | |
| | | | | | | | | | | | | | | |
| | | | | | | | | | | | | | | |
The Hartford Conservative Allocation Fund |
For the Year Ended October 31, 2024 |
| | | | | | | | | | | | | | | |
| | | | | | | | | | | | | | | |
| | | | | | | | | | | | | | | |
| | | | | | | | | | | | | | | |
| | | | | | | | | | | | | | | |
| | | | | | | | | | | | | | | |
| | | | | | | | | | | | | | | |
| | | | | | | | | | | | | | | |
For the Year Ended October 31, 2023 |
| | | | | | | | | | | | | | | |
| | | | | | | | | | | | | | | |
| | | | | | | | | | | | | | | |
| | | | | | | | | | | | | | | |
| | | | | | | | | | | | | | | |
| | | | | | | | | | | | | | | |
| | | | | | | | | | | | | | | |
For the Year Ended October 31, 2022 |
| | | | | | | | | | | | | | | |
| | | | | | | | | | | | | | | |
| | | | | | | | | | | | | | | |
| | | | | | | | | | | | | | | |
| | | | | | | | | | | | | | | |
| | | | | | | | | | | | | | | |
| | | | | | | | | | | | | | | |
For the Year Ended October 31, 2021 |
| | | | | | | | | | | | | | | |
| | | | | | | | | | | | | | | |
| | | | | | | | | | | | | | | |
| | | | | | | | | | | | | | | |
| | | | | | | | | | | | | | | |
| | | | | | | | | | | | | | | |
| | | | | | | | | | | | | | | |
The accompanying notes are an integral part of these financial statements.
Hartford Multi-Strategy Funds
Financial Highlights – (continued)
| — Selected Per-Share Data(1) — | — Ratios and Supplemental Data — |
| Net Asset Value at Beginning of Period | Net Investment Income (Loss) | Net Realized and Unrealized Gain (Loss) on Investments | Total from Investment Operations | Dividends from Net Investment Income | Distributions from Capital Gains | | Total Dividends and Distributions | Net Asset Value at End of Period | | Net Assets at End of Period (000s) | Ratio of Expenses to Average Net Assets Before Adjust- ments(3)(4) | Ratio of Expenses to Average Net Assets After Adjust- ments(3)(4) | Ratio of Net Investment Income (Loss) to Average Net Assets(4) | |
The Hartford Conservative Allocation Fund – (continued) |
For the Year Ended October 31, 2020 |
| | | | | | | | | | | | | | | |
| | | | | | | | | | | | | | | |
| | | | | | | | | | | | | | | |
| | | | | | | | | | | | | | | |
| | | | | | | | | | | | | | | |
| | | | | | | | | | | | | | | |
| | | | | | | | | | | | | | | |
The Hartford Growth Allocation Fund |
For the Year Ended October 31, 2024 |
| | | | | | | | | | | | | | | |
| | | | | | | | | | | | | | | |
| | | | | | | | | | | | | | | |
| | | | | | | | | | | | | | | |
| | | | | | | | | | | | | | | |
| | | | | | | | | | | | | | | |
| | | | | | | | | | | | | | | |
For the Year Ended October 31, 2023 |
| | | | | | | | | | | | | | | |
| | | | | | | | | | | | | | | |
| | | | | | | | | | | | | | | |
| | | | | | | | | | | | | | | |
| | | | | | | | | | | | | | | |
| | | | | | | | | | | | | | | |
| | | | | | | | | | | | | | | |
For the Year Ended October 31, 2022 |
| | | | | | | | | | | | | | | |
| | | | | | | | | | | | | | | |
| | | | | | | | | | | | | | | |
| | | | | | | | | | | | | | | |
| | | | | | | | | | | | | | | |
| | | | | | | | | | | | | | | |
| | | | | | | | | | | | | | | |
For the Year Ended October 31, 2021 |
| | | | | | | | | | | | | | | |
| | | | | | | | | | | | | | | |
| | | | | | | | | | | | | | | |
| | | | | | | | | | | | | | | |
| | | | | | | | | | | | | | | |
| | | | | | | | | | | | | | | |
| | | | | | | | | | | | | | | |
The accompanying notes are an integral part of these financial statements.
Hartford Multi-Strategy Funds
Financial Highlights – (continued)
| — Selected Per-Share Data(1) — | — Ratios and Supplemental Data — |
| Net Asset Value at Beginning of Period | Net Investment Income (Loss) | Net Realized and Unrealized Gain (Loss) on Investments | Total from Investment Operations | Dividends from Net Investment Income | Distributions from Capital Gains | | Total Dividends and Distributions | Net Asset Value at End of Period | | Net Assets at End of Period (000s) | Ratio of Expenses to Average Net Assets Before Adjust- ments(3)(4) | Ratio of Expenses to Average Net Assets After Adjust- ments(3)(4) | Ratio of Net Investment Income (Loss) to Average Net Assets(4) | |
The Hartford Growth Allocation Fund – (continued) |
For the Year Ended October 31, 2020 |
| | | | | | | | | | | | | | | |
| | | | | | | | | | | | | | | |
| | | | | | | | | | | | | | | |
| | | | | | | | | | | | | | | |
| | | | | | | | | | | | | | | |
| | | | | | | | | | | | | | | |
| | | | | | | | | | | | | | | |
Hartford Moderate Allocation Fund |
For the Year Ended October 31, 2024 |
| | | | | | | | | | | | | | | |
| | | | | | | | | | | | | | | |
| | | | | | | | | | | | | | | |
| | | | | | | | | | | | | | | |
| | | | | | | | | | | | | | | |
| | | | | | | | | | | | | | | |
| | | | | | | | | | | | | | | |
For the Year Ended October 31, 2023 |
| | | | | | | | | | | | | | | |
| | | | | | | | | | | | | | | |
| | | | | | | | | | | | | | | |
| | | | | | | | | | | | | | | |
| | | | | | | | | | | | | | | |
| | | | | | | | | | | | | | | |
| | | | | | | | | | | | | | | |
For the Year Ended October 31, 2022 |
| | | | | | | | | | | | | | | |
| | | | | | | | | | | | | | | |
| | | | | | | | | | | | | | | |
| | | | | | | | | | | | | | | |
| | | | | | | | | | | | | | | |
| | | | | | | | | | | | | | | |
| | | | | | | | | | | | | | | |
For the Year Ended October 31, 2021 |
| | | | | | | | | | | | | | | |
| | | | | | | | | | | | | | | |
| | | | | | | | | | | | | | | |
| | | | | | | | | | | | | | | |
| | | | | | | | | | | | | | | |
| | | | | | | | | | | | | | | |
| | | | | | | | | | | | | | | |
The accompanying notes are an integral part of these financial statements.
Hartford Multi-Strategy Funds
Financial Highlights – (continued)
| — Selected Per-Share Data(1) — | — Ratios and Supplemental Data — |
| Net Asset Value at Beginning of Period | Net Investment Income (Loss) | Net Realized and Unrealized Gain (Loss) on Investments | Total from Investment Operations | Dividends from Net Investment Income | Distributions from Capital Gains | | Total Dividends and Distributions | Net Asset Value at End of Period | | Net Assets at End of Period (000s) | Ratio of Expenses to Average Net Assets Before Adjust- ments(3)(4) | Ratio of Expenses to Average Net Assets After Adjust- ments(3)(4) | Ratio of Net Investment Income (Loss) to Average Net Assets(4) | |
Hartford Moderate Allocation Fund – (continued) |
For the Year Ended October 31, 2020 |
| | | | | | | | | | | | | | | |
| | | | | | | | | | | | | | | |
| | | | | | | | | | | | | | | |
| | | | | | | | | | | | | | | |
| | | | | | | | | | | | | | | |
| | | | | | | | | | | | | | | |
| | | | | | | | | | | | | | | |
Hartford Multi-Asset Income Fund |
For the Year Ended October 31, 2024 |
| | | | | | | | | | | | | | | |
| | | | | | | | | | | | | | | |
| | | | | | | | | | | | | | | |
| | | | | | | | | | | | | | | |
| | | | | | | | | | | | | | | |
| | | | | | | | | | | | | | | |
| | | | | | | | | | | | | | | |
| | | | | | | | | | | | | | | |
| | | | | | | | | | | | | | | |
For the Year Ended October 31, 2023 |
| | | | | | | | | | | | | | | |
| | | | | | | | | | | | | | | |
| | | | | | | | | | | | | | | |
| | | | | | | | | | | | | | | |
| | | | | | | | | | | | | | | |
| | | | | | | | | | | | | | | |
| | | | | | | | | | | | | | | |
| | | | | | | | | | | | | | | |
| | | | | | | | | | | | | | | |
For the Year Ended October 31, 2022 |
| | | | | | | | | | | | | | | |
| | | | | | | | | | | | | | | |
| | | | | | | | | | | | | | | |
| | | | | | | | | | | | | | | |
| | | | | | | | | | | | | | | |
| | | | | | | | | | | | | | | |
| | | | | | | | | | | | | | | |
| | | | | | | | | | | | | | | |
| | | | | | | | | | | | | | | |
For the Year Ended October 31, 2021 |
| | | | | | | | | | | | | | | |
| | | | | | | | | | | | | | | |
| | | | | | | | | | | | | | | |
| | | | | | | | | | | | | | | |
| | | | | | | | | | | | | | | |
| | | | | | | | | | | | | | | |
| | | | | | | | | | | | | | | |
| | | | | | | | | | | | | | | |
| | | | | | | | | | | | | | | |
The accompanying notes are an integral part of these financial statements.
Hartford Multi-Strategy Funds
Financial Highlights – (continued)
| — Selected Per-Share Data(1) — | — Ratios and Supplemental Data — |
| Net Asset Value at Beginning of Period | Net Investment Income (Loss) | Net Realized and Unrealized Gain (Loss) on Investments | Total from Investment Operations | Dividends from Net Investment Income | Distributions from Capital Gains | | Total Dividends and Distributions | Net Asset Value at End of Period | | Net Assets at End of Period (000s) | Ratio of Expenses to Average Net Assets Before Adjust- ments(3)(4) | Ratio of Expenses to Average Net Assets After Adjust- ments(3)(4) | Ratio of Net Investment Income (Loss) to Average Net Assets(4) | |
Hartford Multi-Asset Income Fund – (continued) |
For the Year Ended October 31, 2020 |
| | | | | | | | | | | | | | | |
| | | | | | | | | | | | | | | |
| | | | | | | | | | | | | | | |
| | | | | | | | | | | | | | | |
| | | | | | | | | | | | | | | |
| | | | | | | | | | | | | | | |
| | | | | | | | | | | | | | | |
| | | | | | | | | | | | | | | |
| | | | | | | | | | | | | | | |
Hartford Real Asset Fund (Consolidated) |
For the Year Ended October 31, 2024 |
| | | | | | | | | | | | | | | |
| | | | | | | | | | | | | | | |
| | | | | | | | | | | | | | | |
| | | | | | | | | | | | | | | |
| | | | | | | | | | | | | | | |
| | | | | | | | | | | | | | | |
| | | | | | | | | | | | | | | |
| | | | | | | | | | | | | | | |
| | | | | | | | | | | | | | | |
For the Year Ended October 31, 2023 |
| | | | | | | | | | | | | | | |
| | | | | | | | | | | | | | | |
| | | | | | | | | | | | | | | |
| | | | | | | | | | | | | | | |
| | | | | | | | | | | | | | | |
| | | | | | | | | | | | | | | |
| | | | | | | | | | | | | | | |
| | | | | | | | | | | | | | | |
| | | | | | | | | | | | | | | |
For the Year Ended October 31, 2022 |
| | | | | | | | | | | | | | | |
| | | | | | | | | | | | | | | |
| | | | | | | | | | | | | | | |
| | | | | | | | | | | | | | | |
| | | | | | | | | | | | | | | |
| | | | | | | | | | | | | | | |
| | | | | | | | | | | | | | | |
| | | | | | | | | | | | | | | |
| | | | | | | | | | | | | | | |
The accompanying notes are an integral part of these financial statements.
Hartford Multi-Strategy Funds
Financial Highlights – (continued)
| — Selected Per-Share Data(1) — | — Ratios and Supplemental Data — |
| Net Asset Value at Beginning of Period | Net Investment Income (Loss) | Net Realized and Unrealized Gain (Loss) on Investments | Total from Investment Operations | Dividends from Net Investment Income | Distributions from Capital Gains | | Total Dividends and Distributions | Net Asset Value at End of Period | | Net Assets at End of Period (000s) | Ratio of Expenses to Average Net Assets Before Adjust- ments(3)(4) | Ratio of Expenses to Average Net Assets After Adjust- ments(3)(4) | Ratio of Net Investment Income (Loss) to Average Net Assets(4) | |
Hartford Real Asset Fund (Consolidated) – (continued) |
For the Year Ended October 31, 2021 |
| | | | | | | | | | | | | | | |
| | | | | | | | | | | | | | | |
| | | | | | | | | | | | | | | |
| | | | | | | | | | | | | | | |
| | | | | | | | | | | | | | | |
| | | | | | | | | | | | | | | |
| | | | | | | | | | | | | | | |
| | | | | | | | | | | | | | | |
For the Year Ended October 31, 2020 |
| | | | | | | | | | | | | | | |
| | | | | | | | | | | | | | | |
| | | | | | | | | | | | | | | |
| | | | | | | | | | | | | | | |
| | | | | | | | | | | | | | | |
| | | | | | | | | | | | | | | |
| | | | | | | | | | | | | | | |
| | | | | | | | | | | | | | | |
FINANCIAL HIGHLIGHTS FOOTNOTES |
| Information presented relates to a share outstanding throughout the indicated period. Net investment income (loss) per share amounts are calculated based on average shares outstanding unless otherwise noted. |
| Assumes initial investment at net asset value at the beginning of each period, reinvestment of all distributions, the complete redemption of the investment at net asset value at the end of each period and no sales charge. Total return would be reduced if sales charges were taken into account. |
| Adjustments include waivers and reimbursements, if applicable. Ratios do not include fees paid indirectly (see Expenses in the accompanying Notes to Financial Statements). |
| Ratios do not include expenses of the Underlying Funds and/or other investment companies, if applicable. |
| Commenced operations as of the close of business on October 25, 2024. |
| Per share amount was not in accord with the net realized and unrealized gain (loss) for the period because of the timing of transactions in shares of the Fund and the amount and timing of per-share net realized and unrealized gain (loss) on such shares. |
| |
| Ratios reflect the impact of a shorter period and may not be indicative of the ratio for a full year. |
| |
| Per share amount is less than $0.005. |
| Includes reimbursement from sub-adviser due to trade error. Without the reimbursement, the Fund’s total return for Class A, Class C, Class I, Class R3, Class R4, Class R5, Class R6, Class Y and Class F would have been 15.75%, 14.95%, 16.18%, 15.47%, 15.74%, 16.14%, 16.23%, 16.14% and 16.20%, respectively (See Note 7 in the Notes to Financial Statements). |
| Portfolio turnover excludes TBA roll transactions. Had TBA roll transactions been included, the portfolio turnover rate would have been 209%, 70%, 62%, 63% and 91% for the fiscal years ended October 31, 2024, October 31, 2023, October 31, 2022, October 31, 2021 and October 31, 2020, respectively. |
| Commenced operations on February 28, 2022. |
| Portfolio turnover excludes TBA roll transactions. Had TBA roll transactions been included, the portfolio turnover rate would have been 202% and 319% for the fiscal years ended October 31, 2021 and October 31, 2020, respectively. |
The accompanying notes are an integral part of these financial statements.
Hartford Multi-Strategy Funds
Notes to Financial Statements October 31, 2024
The Hartford Mutual Funds, Inc. (the "Company") is an open-end registered management investment company comprised of thirty-six series, as of October 31, 2024. Financial statements for the series of the Company listed below (each a "Fund" and collectively, the "Funds") are included in this report.
The Hartford Mutual Funds, Inc.: |
The Hartford Balanced Income Fund (the "Balanced Income Fund") |
The Hartford Checks and Balances Fund (the "Checks and Balances Fund") |
The Hartford Conservative Allocation Fund (the "Conservative Allocation Fund") |
The Hartford Growth Allocation Fund (the "Growth Allocation Fund") |
Hartford Moderate Allocation Fund (the "Moderate Allocation Fund") |
Hartford Multi-Asset Income Fund (the "Multi-Asset Income Fund") |
Hartford Real Asset Fund (the "Real Asset Fund") |
The assets of each Fund are separate, and a shareholder's interest is limited to the Fund in which shares are held. The Company is organized under the laws of the State of Maryland and is registered with the U.S. Securities and Exchange Commission (the "SEC") under the Investment Company Act of 1940, as amended (the "1940 Act"). Each Fund is a diversified open-end management investment company. Each Fund applies specialized accounting and reporting standards under Accounting Standards Codification Topic 946, "Financial Services – Investment Companies".
Each Fund has registered for sale Class A, Class C, Class I, Class R3, Class R4, Class R5 and Class F shares. Each Fund, except Checks and Balances Fund, Growth Allocation Fund and Moderate Allocation Fund, has registered for sale Class R6 and Class Y shares. As of October 31, 2024, Class R6 shares of the Conservative Allocation Fund have not commenced operations and as a result, are not included in this report. Class Y shares of the Conservative Allocation Fund commenced operations as of the close of business on October 25, 2024. Class A shares of each Fund are sold with a front-end sales charge of up to 5.50%. Class C shares of each Fund are sold with a contingent deferred sales charge of up to 1.00% on shares redeemed within twelve months of purchase. Class C shares automatically convert to Class A shares of the same Fund after eight years provided that the Fund or the financial intermediary has records verifying that the Class C shares have been held for at least eight years. Classes I, R3, R4, R5, R6, Y and F shares do not have a sales charge.
Each of the Checks and Balances Fund, Conservative Allocation Fund, Growth Allocation Fund and Moderate Allocation Fund invested in affiliated mutual funds and affiliated exchange-traded funds ("Affiliated Investment Companies" or "Underlying Funds") during the year ended October 31, 2024. Each of the Growth Allocation Fund, Moderate Allocation Fund and Conservative Allocation Fund are referred to as the "Asset Allocation Funds."
Hartford Funds Management Company, LLC ("HFMC" or the "Investment Manager") serves as the investment manager to each Fund.
2.
Significant Accounting Policies:
The following is a summary of significant accounting policies of each Fund used in the preparation of its financial statements, which are in accordance with United States Generally Accepted Accounting Principles ("U.S. GAAP"). The preparation of financial statements in accordance with U.S. GAAP may require management to make estimates and assumptions that affect the reported amounts of assets and liabilities and disclosure of contingent assets and liabilities at the date of the financial statements and the reported amounts of increases and decreases in net assets from operations during the reporting period. Actual results could differ from those estimates.
a)
Determination of Net Asset Value – The net asset value ("NAV") of each class of each Fund’s shares is determined as of the close of regular trading on the New York Stock Exchange (the "Exchange") (normally 4:00 p.m. Eastern Time) (the "NYSE Close") on each day that the Exchange is open ("Valuation Date"). If the Exchange is closed due to weather or other extraordinary circumstances on a day it would typically be open for business, each Fund may treat such day as a typical business day and accept purchase and redemption orders and calculate each Fund’s NAV in accordance with applicable law. The NAV of each class of each Fund's shares is determined by dividing the value of the Fund’s net assets attributable to the class of shares by the number of shares outstanding for that class. Information that becomes known to the Funds after the NAV has been calculated on a particular day will not generally be used to retroactively adjust the NAV determined earlier that day.
b)
Investment Valuation and Fair Value Measurements – For purposes of calculating the NAV of each class of each Fund, portfolio securities and other assets held in a Fund’s portfolio for which market prices are readily available are valued at market value. Market value is generally determined on the basis of official close price or last reported trade price. If no trades were reported, market value is based on prices
Hartford Multi-Strategy Funds
Notes to Financial Statements – (continued) October 31, 2024
obtained from a quotation reporting system, established market makers (including evaluated prices), or independent pricing services. Pricing vendors may use matrix pricing or valuation models that utilize certain inputs and assumptions to derive values, including transaction data, credit quality information, general market conditions, news, and other factors and assumptions.
With respect to a Fund's investments that do not have readily available market prices, the Company's Board of Directors (the "Board") has designated Hartford Funds Management Company, LLC (the "Investment Manager" or "HFMC") as its valuation designee to perform fair valuations pursuant to Rule 2a-5 under the 1940 Act (the "Valuation Designee").
If market prices are not readily available or deemed unreliable, the Valuation Designee determines the fair value of the security or other instrument in good faith under policies and procedures approved by and under the supervision of the Board ("Valuation Procedures").
The Valuation Designee has delegated the day-to-day responsibility for implementing the Valuation Procedures to the Valuation Committee (the "Valuation Committee"). The Valuation Committee will consider all available relevant factors in determining an investment’s fair value. The Valuation Designee reports fair value matters to the Audit Committee of the Board.
Prices of foreign equities that are principally traded on certain foreign markets will generally be adjusted daily pursuant to a fair value pricing service in order to reflect an adjustment for the factors occurring after the close of certain foreign markets but before the NYSE Close. Securities and other instruments that are primarily traded on foreign markets may trade on days that are not business days of the Funds. The value of the foreign securities or other instruments in which a Fund invests may change on days when a shareholder will not be able to purchase, redeem or exchange shares of the Fund.
Fixed income investments (other than short-term obligations) and non-exchange traded derivatives held by a Fund are normally valued at prices supplied by independent pricing services in accordance with the Valuation Procedures. Short-term investments maturing in 60 days or less are generally valued at amortized cost, which approximates fair value.
Exchange-traded derivatives, such as options, futures and options on futures, are valued at the last sale price determined by the exchange where such instruments principally trade as of the close of such exchange ("Exchange Close"). If a last sale price is not available, the value will be the mean of the most recently quoted bid and ask prices as of the Exchange Close. If a mean of the bid and ask prices cannot be calculated for the day, the value will be the most recently quoted bid price as of the Exchange Close. Over-the-counter derivatives are normally valued based on prices supplied by independent pricing services in accordance with the Valuation Procedures.
Investments valued in currencies other than U.S. dollars are converted to U.S. dollars using the prevailing spot currency exchange rates obtained from independent pricing services for calculation of the NAV. As a result, the NAV of each Fund’s shares may be affected by changes in the value of currencies in relation to the U.S. dollar. The value of securities or other instruments traded in markets outside the United States or denominated in currencies other than the U.S. dollar may be affected significantly on a day that the Exchange is closed and the market value may change on days when an investor is not able to purchase, redeem or exchange shares of each Fund.
Foreign currency contracts represent agreements to exchange currencies on specific future dates at predetermined rates. Foreign currency contracts are valued using foreign currency exchange rates and forward rates as provided by an independent pricing service on the Valuation Date.
Shares of investment companies listed and traded on an exchange are valued in the same manner as any exchange-listed equity security. Investments in investment companies that are not listed or traded on an exchange ("Non-Traded Funds"), if any, are valued at the respective NAV of each Non-Traded Fund on the Valuation Date. Such Non-Traded Funds and listed investment companies may use fair value pricing as disclosed in their prospectuses.
Financial instruments for which prices are not available from an independent pricing service may be valued using quotations obtained from one or more dealers that make markets in the respective financial instrument in accordance with the Valuation Procedures.
U.S. GAAP defines fair value as the price that a Fund would receive to sell an asset or pay to transfer a liability in an orderly transaction between market participants. The U.S. GAAP fair value measurement standards require disclosure of a fair value hierarchy for each major category of assets and liabilities. Various inputs are used in determining the fair value of each Fund’s investments. These inputs are summarized into three broad hierarchy levels. This hierarchy is based on whether the valuation inputs are observable or unobservable. These levels are:
•
Level 1 – Quoted prices in active markets for identical investments. Level 1 may include exchange traded instruments, such as domestic equities, some foreign equities, options, futures, mutual funds, exchange traded funds, rights and warrants.
•
Level 2 – Observable inputs other than Level 1 prices, such as quoted prices for similar investments; quoted prices in markets that are not active; or other inputs that are observable or can be corroborated by observable market data. Level 2 may include debt investments that are traded less frequently than exchange traded instruments and which are valued using independent pricing services; foreign
Hartford Multi-Strategy Funds
Notes to Financial Statements – (continued) October 31, 2024
equities, which are principally traded on certain foreign markets and are adjusted daily pursuant to a fair value pricing service in order to reflect an adjustment for the factors occurring after the close of certain foreign markets but before the NYSE Close; senior floating rate interests, which are valued using an aggregate of dealer bids; short-term investments, which are valued at amortized cost; and swaps, which are valued based upon the terms of each swap contract.
•
Level 3 – Significant unobservable inputs that are supported by limited or no market activity. Level 3 may include financial instruments whose values are determined using indicative market quotes or require significant management judgment or estimation. These unobservable valuation inputs may include estimates for current yields, maturity/duration, prepayment speed, and indicative market quotes for comparable investments along with other assumptions relating to credit quality, collateral value, complexity of the investment structure, general market conditions and liquidity. This category may include investments where trading has been halted or there are certain restrictions on trading. While these investments are priced using unobservable inputs, the valuation of these investments reflects the best available data and management believes the prices are a reasonable representation of exit price.
Valuation levels are not necessarily indicative of the risk associated with investing in such investments. Individual investments within any of the above mentioned asset classes may be assigned a different hierarchical level than those presented above, as individual circumstances dictate.
For additional information, refer to the Fair Value Summary and the Level 3 roll-forward reconciliation, if applicable, which follows each Fund's Schedule of Investments.
c)
Investment Transactions and Investment Income – Investment transactions are recorded as of the trade date (the date the order to buy or sell is executed) for financial reporting purposes. Investments purchased or sold on a when-issued or delayed-delivery basis may be settled a month or more after the trade date. Realized gains and losses are determined on the basis of identified cost.
The trade date for senior floating rate interests purchased in the primary loan market is considered the date on which the loan allocations are determined. The trade date for senior floating rate interests purchased in the secondary loan market is the date on which the transaction is entered into.
Dividend income from domestic securities is accrued on the ex-dividend date. In general, dividend income from foreign securities is recorded on the ex-date; however, dividend notifications in certain foreign jurisdictions may not be available in a timely manner and as a result, a Fund will record the dividend as soon as the relevant details (i.e., rate per share, payment date, shareholders of record, etc.) are publicly available. Interest income, including amortization of premium, accretion of discounts, inflation adjustments and additional principal received in-kind in lieu of cash, is accrued on a daily basis. Paydown gains and losses on mortgage-related and other asset-backed securities are included in interest income in the Statements of Operations, as applicable.
Idle cash and currency balances may be swept into overnight sweep accounts held in a demand deposit account at State Street Bank and Trust Company ("State Street") that earn interest, which are classified as interest income on the Statements of Operations.
Please refer to Note 8 for Securities Lending information.
d)
Taxes – A Fund may be subject to taxes imposed on realized gains on securities of certain foreign countries in which such Fund invests. A Fund may also be subject to taxes withheld on foreign dividends and interest from securities in which a Fund invests. The amount of any foreign taxes withheld and foreign tax expense is included on the accompanying Statements of Operations as a reduction to net investment income or net realized or unrealized gain (loss) on investments in these securities, if applicable.
e)
Foreign Currency Transactions – Assets and liabilities denominated in currencies other than U.S. dollars are translated into U.S. dollars at the exchange rates in effect on the Valuation Date. Purchases and sales of investments, income and expenses are translated into U.S. dollars at the exchange rates on the dates of such transactions.
A Fund does not isolate that portion of portfolio investment valuation resulting from fluctuations in the foreign currency exchange rates from the fluctuations arising from changes in the market prices of investments held. Exchange rate fluctuations are included with the net realized and unrealized gain or loss on investments in the accompanying financial statements.
Net realized foreign exchange gains or losses arise from sales of foreign currencies and the difference between asset and liability amounts initially stated in foreign currencies and the U.S. dollar value of the amounts actually received or paid. Net unrealized foreign exchange gains or losses arise from changes in the value of other assets and liabilities at the end of the reporting period, resulting from changes in the exchange rates.
f)
Joint Trading Account – A Fund may invest cash balances into a joint trading account that may be invested in one or more repurchase agreements.
Hartford Multi-Strategy Funds
Notes to Financial Statements – (continued) October 31, 2024
g)
Fund Share Valuation and Dividend Distributions to Shareholders – Orders for each class of each Fund’s shares are executed in accordance with the investment instructions of the shareholders. The NAV of each class of each Fund’s shares is determined as of the close of business on each business day of the Exchange (see Note 2(a)). The NAV is determined separately for each class of shares of each Fund by dividing the Fund's net assets attributable to that class by the number of shares of the class outstanding. Each class of shares offered by each Fund has equal rights as to assets and voting privileges (except that shareholders of a class have exclusive voting rights regarding any matter relating solely to that class of shares). Income and non-class specific expenses are allocated daily to each class on the basis of the relative net assets of the class of the Fund. Realized and unrealized gains and losses are allocated daily based on the relative net assets of each class of shares of each Fund.
Orders for the purchase of each Fund's shares received prior to the close of the Exchange on any day the Exchange is open for business are priced at the NAV determined as of the close of the Exchange. Orders received after the close of the Exchange, or on a day on which the Exchange and/or the Funds are not open for business, are priced at the next determined NAV.
Dividends are declared pursuant to a policy adopted by the Company’s Board of Directors. Dividends and/or distributions to shareholders are recorded on ex-date. The policy of each of Balanced Income Fund and Checks and Balances Fund is to pay dividends from net investment income, if any, quarterly and realized gains, if any, at least once a year. The policy of each of Conservative Allocation Fund, Growth Allocation Fund, Moderate Allocation Fund and Real Asset Fund is to pay dividends from net investment income and realized gains, if any; at least once a year. Normally, dividends from net investment income of Multi-Asset Income Fund are declared and paid monthly and dividends from realized gains, if any, are paid at least once a year.
Long-term capital gains distributions received from Underlying Funds, if applicable, are distributed at least annually, when required. Unless shareholders specify otherwise, all dividends and distributions from a Fund will be automatically reinvested in additional full or fractional shares of the Fund.
Income dividends and capital gains distributions are determined in accordance with federal income tax regulations, which may differ from U.S. GAAP with respect to character and timing (see Federal Income Taxes: Distributions and Components of Distributable Earnings and
Reclassification of Capital Accounts notes).
h)
Basis for Consolidation – The Real Asset Fund may invest up to 25% of its total assets in a wholly-owned subsidiary of the Real Asset Fund (the "Subsidiary"). The Subsidiary is organized under the laws of the Cayman Islands and is consolidated in the Real Asset Fund’s financial statements. All intercompany balances, revenues, and expenses have been eliminated in consolidation. The Subsidiary acts as an investment vehicle in order to enter into certain investments (primarily commodities) for the Real Asset Fund consistent with the investment objectives and policies specified in the Prospectus and Statement of Additional Information.
3.
Securities and Other Investments:
The following sets forth a description of securities and other investments for each Fund, except the Asset Allocation Funds and the Checks and Balances Fund.
a)
Restricted Securities – Each Fund may invest in securities that are subject to legal or contractual restrictions on resale. These securities generally may be resold in transactions exempt from registration or to the public if the securities are registered. Disposal of these securities may involve time-consuming negotiations and expense, and prompt sale at an acceptable price may be difficult. Information regarding restricted securities, if applicable, is included at the end of each Fund's Schedule of Investments.
b)
Investments Purchased on a When-Issued or Delayed-Delivery Basis – Delivery and payment for investments that have been purchased by a Fund on a forward commitment, or when-issued or delayed-delivery basis, take place beyond the customary settlement period. A Fund may dispose of or renegotiate a delayed-delivery transaction after it is entered into, and may sell delayed-delivery investments before they are delivered, which may result in a realized gain or loss. During this period, such investments are subject to market fluctuations. See each Fund’s Schedule of Investments, if applicable, for when-issued or delayed-delivery investments as of October 31, 2024.
A Fund may enter into to-be announced ("TBA") commitments. TBA commitments are forward agreements for the purchase or sale of mortgage-backed securities for a fixed price, with payment and delivery on an agreed-upon future settlement date. The specific securities to be delivered are not identified at the trade date; however, delivered securities must meet specified terms, including issuer, rate and mortgage terms. Although each Fund may enter into TBA commitments with the intention of acquiring or delivering securities for its portfolio, the Fund can extend the settlement date, roll the transaction, or dispose of a commitment prior to settlement if deemed appropriate to do so. If the TBA commitment is closed through the acquisition of an offsetting TBA commitment, each Fund realizes a gain or loss. In a TBA roll transaction, each Fund generally purchases or sells the initial TBA commitment prior to the agreed upon settlement date and enters into
Hartford Multi-Strategy Funds
Notes to Financial Statements – (continued) October 31, 2024
a new TBA commitment for future delivery or receipt of the mortgage-backed securities. TBA commitments involve a risk of loss if the value of the security to be purchased or sold declines or increases, respectively, prior to settlement date. See each Fund's Schedule of Investments, if applicable, for TBA commitments as of October 31, 2024.
c)
Senior Floating Rate Interests – A Fund may invest in senior floating rate interests. Senior floating rate interests generally hold the most senior position in the capital structure of a business entity (the "Borrower"), are typically secured by specific collateral and have a claim on the assets and/or stock of the Borrower that is senior to that held by subordinated debt holders and stockholders of the Borrower. Senior floating rate interests are typically structured and administered by a financial institution that acts as the agent of the lenders participating in the senior floating rate interest. A Fund may invest in multiple series or tranches of a senior floating rate interest, which may have varying terms and carry different associated risks. A Fund may also enter into unfunded loan commitments, which are contractual obligations for future funding. Unfunded loan commitments may include revolving credit facilities, which may obligate the Fund to supply additional cash to the Borrower on demand. Unfunded loan commitments represent a future obligation in full. A Fund may receive a commitment fee based on the undrawn portion of the underlying line of credit portion of a senior floating rate interest. In certain circumstances, a Fund may receive various fees upon the restructure of a senior floating rate interest by a borrower. Fees earned/paid may be recorded as a component of income or realized gain/loss in the Statements of Operations.
Senior floating rate interests are typically rated below-investment-grade, which suggests they are more likely to default and generally pay higher interest rates than investment-grade loans. A default could lead to non-payment of income, which would result in a reduction of income to a Fund, and there can be no assurance that the liquidation of any collateral would satisfy the Borrower’s obligation in the event of non-payment of scheduled interest or principal payments, or that such collateral could be readily liquidated. See each Fund's Schedule of Investments, if applicable, for outstanding senior floating rate interests as of October 31, 2024.
d)
Mortgage-Related and Other Asset-Backed Securities – A Fund may invest in mortgage-related and other asset-backed securities. These securities include mortgage pass-through securities, collateralized mortgage obligations, commercial mortgage-backed securities, stripped mortgage-backed securities, asset-backed securities, collateralized debt obligations and other securities that directly or indirectly represent a participation in, or are secured by and payable from, mortgage loans on real property. Mortgage-related securities are created from pools of residential or commercial mortgage loans, including mortgage loans made by savings and loan institutions, mortgage bankers, commercial banks and others. Asset-backed securities are created from many types of assets, including auto loans, credit card receivables, home equity loans, and student loans. These securities provide a monthly payment that consists of both interest and principal payments. Interest payments may be determined by fixed or adjustable rates. The rate of prepayments on underlying mortgages will affect the price and volatility of a mortgage-related security, and may have the effect of shortening or extending the effective duration of the security relative to what was anticipated at the time of purchase. The timely payment of principal and interest of certain mortgage-related securities is guaranteed by the full faith and credit of the United States Government. Mortgage-related and other asset-backed securities created and guaranteed by non-governmental issuers, including government-sponsored corporations, may be supported by various forms of insurance or guarantees, but there can be no assurance that the private insurers or guarantors can meet their obligations under the insurance policies or guarantee arrangements. See each Fund's Schedule of Investments, if applicable, for mortgage-related and other asset-backed securities as of October 31, 2024.
e)
Inflation-Indexed Bonds – A Fund may invest in inflation-indexed bonds. Inflation-indexed bonds are fixed income investments whose principal value is periodically adjusted to the rate of inflation. The interest rate on these bonds is generally fixed at issuance at a rate lower than typical bonds. Over the life of an inflation-indexed bond, however, interest will be paid based on a principal value, which is adjusted for inflation. Any increase or decrease in the principal amount of an inflation-indexed bond will be included as interest income on the Statements of Operations, even though investors do not receive the principal amount until maturity. See each Fund's Schedule of Investments, if applicable, for inflation-indexed bonds as of October 31, 2024.
f)
Equity Linked Securities – A Fund may invest in equity linked securities, which usually convert into common stock at a date predetermined by the issuer. These securities generally offer a higher dividend yield than that of the common stock to which the security is linked. These instruments are issued by a company other than the one to which the security is linked and carry the credit of the issuer, not that of the underlying common stock. The securities’ appreciation is limited based on a predetermined final cap price at the date of the conversion. Risks of investing in these securities include, but are not limited to, a set time to capture the yield advantage, limited appreciation potential, decline in value of the underlying stock, and failure of the issuer to pay dividends or to deliver common stock at maturity. Since equity linked securities are in note form, equity linked securities are also subject to certain debt securities risks. Investments in equity linked securities are also subject to liquidity risk, which may make equity linked securities difficult to sell and value. See each Fund's Schedule of Investments, if applicable, for equity linked securities as of October 31, 2024.
g)
Repurchase Agreements – A repurchase agreement is an agreement between two parties whereby one party sells the other a security at a specified price with a commitment to repurchase the security later at an agreed-upon price, date and interest payment. Each Fund is permitted to enter into fully collateralized repurchase agreements. The Company's Board of Directors has delegated to the sub-adviser(s), as applicable, the responsibility of evaluating the creditworthiness of the banks and securities dealers with which the Funds will engage in
Hartford Multi-Strategy Funds
Notes to Financial Statements – (continued) October 31, 2024
repurchase agreements. The sub-adviser(s) will monitor such transactions to ensure that the value of underlying collateral will be at least equal to the total amount of the repurchase obligation as required by the valuation provision of the repurchase agreement, including the accrued interest. Repurchase agreements carry the risk that the market value of the securities declines below the repurchase price. A Fund could also lose money if it is unable to recover the securities and the value of any collateral held. In the event the borrower commences bankruptcy proceedings, a court may characterize the transaction as a loan. If a Fund has not perfected a security interest in the underlying collateral, the Fund may be required to return the underlying collateral to the borrower’s estate and be treated as an unsecured creditor. As an unsecured creditor, the Fund could lose some or all of the principal and interest involved in the transaction. See each Fund's Schedule of Investments, if applicable, for repurchase agreements as of October 31, 2024.
4.
Financial Derivative Instruments:
The following disclosures contain information on the derivative instruments used by each of Balanced Income Fund, Multi-Asset Income Fund and Real Asset Fund during the period, the credit-risk-related contingent features in certain derivative instruments, and how such derivative instruments affect the financial position and results of operations of the applicable Fund. The location and fair value amounts of these instruments on the Statements of Assets and Liabilities and the realized gains and losses and changes in unrealized gains and losses on the Statements of Operations, each categorized by type of derivative contract, are included in the following Additional Derivative Instrument Information footnote. The derivative instruments outstanding as of period-end are disclosed in the notes to the Schedules of Investments, if applicable. The amounts of realized gains and losses and changes in unrealized gains and losses on derivative instruments during the period are disclosed in the Statements of Operations.
a)
Futures Contracts – A Fund may enter into futures contracts. A futures contract is an agreement between two parties to buy or sell an asset at a set price on a future date. A Fund may use futures contracts to manage risk or obtain exposure to the investment markets, commodities, or movements in interest rates and currency values. The primary risks associated with the use of futures contracts are the imperfect correlation between the change in market value of the investments held by a Fund and the prices of futures contracts and the possibility of an illiquid market. Upon entering into a futures contract, a Fund is required to deposit with a futures commission merchant ("FCM") an amount of cash or U.S. Government or Agency Obligations in accordance with the initial margin requirements of the broker or exchange. Futures contracts are marked to market daily and an appropriate amount equal to the change in value ("variation margin") is paid or received by a Fund. Gains or losses are recognized but not considered realized until the contracts expire or are closed. Futures contracts involve, to varying degrees, risk of loss in excess of the variation margin disclosed on the Statements of Assets and Liabilities.
During the year ended October 31, 2024, each of Balanced Income Fund, Multi-Asset Income Fund and Real Asset Fund had used Futures Contracts.
b)
Foreign Currency Contracts – A Fund may enter into foreign currency contracts that obligate the Fund to purchase or sell currencies at specified future dates. Foreign currency contracts may be used in connection with settling purchases or sales of securities to hedge the currency exposure associated with some or all of a Fund’s investments and/or as part of an investment strategy. Foreign currency contracts are marked to market daily and the change in value is recorded by a Fund as an unrealized gain or loss. A Fund will record a realized gain or loss when the foreign currency contract is settled.
Foreign currency contracts involve elements of market risk in excess of the amounts reflected in the Statements of Assets and Liabilities. In addition, risks may arise upon entering into these contracts from the potential inability of the counterparties to meet the terms of the contracts and from unanticipated movements in the value of the foreign currencies relative to the U.S. dollar. Upon entering into a foreign currency contract, a Fund may be required to post margin equal to its outstanding exposure thereunder.
During the year ended October 31, 2024, each of Balanced Income Fund, Multi-Asset Income Fund and Real Asset Fund had used Foreign Currency Contracts.
c)
Options Contracts – An option contract is a contract sold by one party to another party that offers the buyer the right, but not the obligation, to buy (call) or sell (put) an investment or other financial asset at an agreed-upon price during a specific period of time or on a specific date. Option contracts are either over-the-counter ("OTC") options or executed in a registered exchange ("exchange-traded options"). A Fund may write (sell) covered call and put options on futures, swaps ("swaptions"), securities, commodities or currencies. Writing put options may increase a Fund’s exposure to the underlying instrument. Writing call options may decrease a Fund’s exposure to the underlying instrument. Premiums received from writing options that expire are treated as realized gains. Premiums received from writing options that are exercised or closed are added to the proceeds or offset amounts paid on the underlying futures, swaps, investments or currency transactions to determine the realized gain or loss. A Fund, as a writer of an option, has no control over whether the underlying instrument may be sold (call) or purchased (put) and as a result bears the market risk of an unfavorable change in the price of the instrument underlying the written option. There is the risk a Fund may not be able to enter into a closing transaction because of an illiquid market. A Fund may also purchase put and call options. Purchasing call options may increase a Fund’s exposure to the underlying instrument. Purchasing put options may decrease a Fund’s exposure to the underlying instrument. A Fund pays a premium, which is included on the Fund’s Statements of Assets and
Hartford Multi-Strategy Funds
Notes to Financial Statements – (continued) October 31, 2024
Liabilities as an investment and is subsequently marked to market to reflect the current value of the option. Premiums paid for purchasing options that expire are treated as realized losses. Certain options may be purchased with premiums to be determined on a future date. The premiums for these options are based upon implied volatility parameters at specified terms. The risk associated with purchasing put and call options is generally limited to the premium paid. Premiums paid for purchasing options that are exercised or closed are added to the amounts paid or offset against the proceeds on the underlying investment transaction to determine the realized gain or loss. Entering into OTC options also exposes a Fund to counterparty risk. Counterparty risk is the possibility that the counterparty to the agreements may default on its obligation to perform or disagree as to the meaning of the contractual terms in the agreements.
During the year ended October 31, 2024, the Multi-Asset Income Fund had used Options Contracts.
d)
Swap Contracts – A Fund may invest in swap contracts. Swap contracts are agreements to exchange or swap investment cash flows, assets, foreign currencies or market-linked returns at specified future intervals. Swap contracts are either privately negotiated in the over-the-counter market ("OTC swaps") or cleared through a central counterparty or derivatives clearing organization ("centrally cleared swaps"). A Fund may enter into credit default, total return, cross-currency, interest rate, inflation and other forms of swap contracts to manage its exposure to credit, currency, interest rate, commodity and inflation risk. Swap contracts are also used to gain exposure to certain markets. In connection with these contracts, investments or cash may be identified as collateral or margin in accordance with the terms of the respective swap contracts and/or master netting arrangement to provide assets of value and recourse in the event of default or bankruptcy/insolvency.
Swaps are valued in accordance with the Valuation Procedures. Changes in market value, if any, are reflected as a component of net changes in unrealized appreciation or depreciation on the Statements of Operations. Daily changes in valuation of centrally cleared swaps, if any, are recorded as a receivable or payable for the change in value ("variation margin") on the Statements of Assets and Liabilities. Realized gains or losses on centrally cleared swaps are recorded upon the termination of the swaps. OTC swap payments received or paid at the beginning of the measurement period are reflected as such on the Statements of Assets and Liabilities and represent premiums paid or received upon entering into the swap contract to compensate for differences between the stated terms of the swap contract and prevailing market conditions (credit spreads, currency exchange rates, interest rates and other relevant factors). These upfront premiums are recorded as realized gains or losses on the Statements of Operations upon termination or maturity of the swap. A liquidation payment received or made at the termination or maturity of the swap is recorded as a realized gain or loss on the Statements of Operations. Net periodic payments received or paid by a Fund are included as part of realized gains or losses on the Statements of Operations.
Entering into these contracts involves, to varying degrees, elements of liquidation, counterparty, credit and market risk in excess of the amounts recognized on the Statements of Assets and Liabilities. Such risks involve the possibility that there will be no liquid market for these contracts, that the counterparty to the contracts may default on its obligation to perform or disagree as to the meaning of contractual terms in the contracts, and that there may be unfavorable changes in market conditions (credit spreads, currency exchange rates, interest rates and other relevant factors).
A Fund’s maximum risk of loss from counterparty risk for OTC swaps is the net value of the discounted cash flows to be received from the counterparty over the contract’s remaining life, and current market value, to the extent that amount is positive. The risk is mitigated by having a master netting arrangement between a Fund and the counterparty, which allows for the netting of payments made or received (although such amounts are presented on a gross basis within the Statements of Assets and Liabilities, as applicable) as well as the posting of collateral to a Fund to cover the Fund’s exposure to the counterparty. In a centrally cleared swap, while a Fund enters into an agreement with a clearing broker to execute contracts with a counterparty, the performance of the swap is guaranteed by the central clearinghouse, which reduces the Fund’s exposure to counterparty risk. However, the Fund is still exposed to a certain amount of counterparty risk through the clearing broker and clearinghouse. The clearinghouse attempts to minimize this risk to its participants through the use of mandatory margin requirements, daily cash settlements and other procedures. Likewise, the clearing broker reduces its risk through margin requirements and required segregation of customer balances.
Credit Default Swap Contracts – The credit default swap market allows a Fund to manage credit risk through buying and selling credit protection on a specific issuer, asset or basket of assets. Certain credit default swaps involve the exchange of a fixed rate premium for protection against the loss in value of an underlying investment or index in the event of a credit event, such as payment default or bankruptcy.
Under a credit default swap contract, one party acts as guarantor by receiving the fixed periodic payment in exchange for the commitment to purchase the underlying investment at par if the defined credit event occurs. Upon the occurrence of a defined credit event, the difference between the value of the reference obligation and the swap’s notional amount is recorded as realized gain or loss on swap transactions in the Statements of Operations. A "buyer" of credit protection agrees to pay a counterparty to assume the credit risk of an issuer upon the occurrence of certain events. The "seller" of the protection receives periodic payments and agrees to assume the credit risk of an issuer upon the occurrence of certain events. Although specified events are contract specific, credit events are generally defined as bankruptcy,
Hartford Multi-Strategy Funds
Notes to Financial Statements – (continued) October 31, 2024
failure to pay, restructuring, obligation acceleration, obligation default or repudiation/moratorium. A "seller’s" exposure is limited to the total notional amount of the credit default swap contract. These potential amounts would be partially offset by any recovery values of the respective referenced obligations or upfront payments received upon entering into the contract.
Implied credit spreads, represented in absolute terms, utilized in determining the market value of credit default swap contracts on corporate issues, sovereign government issues or U.S. municipal issues as of year-end are disclosed in the notes to the Schedules of Investments, as applicable, and serve as an indicator of the current status of the payment/performance risk and represent the likelihood or risk of default for the credit derivative. The implied credit spread of a particular referenced entity reflects the cost of buying/selling protection and there may also be upfront payments required to be made to enter into the contract. Wider credit spreads represent a deterioration of the referenced entity’s credit soundness and a greater likelihood or risk of default or other credit event occurring as defined under the terms of the contract. For credit default swap contracts on credit indices, the quoted market prices and resulting values serve as the indicator of the current status of the payment/performance risk. Increasing market values, in absolute terms when compared to the notional amount of the swap, represent a deterioration of the referenced equity’s credit soundness and a greater likelihood or risk of default or other credit event occurring as defined under the terms of the contract.
During the year ended October 31, 2024, each of Balanced Income Fund and Multi-Asset Income Fund had used Credit Default Swap Contracts.
Interest Rate Swap Contracts – A Fund may use interest rate swaps to hedge interest rate and duration risk. In a typical interest rate swap, one party agrees to make regular payments equal to a floating interest rate, based on a specified interest rate or benchmark (e.g. Secured Overnight Financing Rate (“SOFR”)), multiplied by a notional amount, in return for payments equal to a fixed rate multiplied by the same amount, for a specific period of time. The net interest received or paid on interest rate swap contracts is recorded as a realized gain or loss. Interest rate swaps are marked to market daily and the change, if any, is recorded as an unrealized gain or loss in the Statements of Operations. When the interest rate swap contract is terminated early, a Fund records a realized gain or loss equal to the difference between the current market value and the upfront premium or cost.
If an interest rate swap contract provides for payments in different currencies, the parties might agree to exchange the notional amount as well. Interest rate swaps may also depend on other prices or rates, such as the value of an index. The risks of interest rate swaps include changes in market conditions, which will affect the value of the contract or the cash flows and the possible inability of the counterparty to fulfill its obligations under the contract. A Fund’s maximum risk of loss from counterparty credit risk is the discounted net value of the cash flows to be received from the counterparty over the contract’s remaining life, to the extent that amount is positive.
During the year ended October 31, 2024, the Multi-Asset Income Fund had used Interest Rate Swap Contracts.
Total Return Swap Contracts – Certain Funds may invest in total return swap contracts in pursuit of the Fund's investment objective or for hedging purposes. An investment in a total return swap allows a Fund to gain or mitigate exposure to underlying reference assets. Total return swap contracts involve commitments where cash flows are exchanged based on the price of underlying reference assets and based on a fixed or variable interest rate. One party receives payments based on the price appreciation or depreciation of the underlying reference asset, in exchange for paying to or receiving from the counterparty seller an agreed-upon interest rate. A variable interest rate may be correlated to a base rate, such as SOFR, and is adjusted each reset period, which is defined at the beginning of the contract. Therefore, if interest rates increase over the term of the swap contract, the party paying the rate may be required to pay a higher rate at each swap reset date.
Total return swap contracts on indices involve commitments to pay interest in exchange for a market-linked return. One party pays out the total return of a specific reference asset, which may be an equity, index, or bond, and in return receives a regular stream of payments. To the extent the total return of the security or index underlying the transaction exceeds or falls short of the offsetting interest rate obligation, a Fund will receive a payment from or make a payment to the counterparty. If the Fund is a payer in a total return swap, it may be subject to unlimited losses. A Fund is also subject to counterparty risk. If the counterparty fails to meet its obligations, the Fund may lose money.
During the year ended October 31, 2024, the Multi-Asset Income Fund had used Total Return Swap Contracts.
Hartford Multi-Strategy Funds
Notes to Financial Statements – (continued) October 31, 2024
e)
Additional Derivative Instrument Information:
The Effect of Derivative Instruments on the Statement of Assets and Liabilities as of October 31, 2024: |
| |
| | | | | | |
| | | | | | |
Unrealized appreciation on futures contracts(1) | | | | | | |
Unrealized appreciation on foreign currency contracts | | | | | | |
Unrealized appreciation on swap contracts(2) | | | | | | |
| | | | | | |
| | | | | | |
Unrealized depreciation on futures contracts(1) | | | | | | |
Unrealized depreciation on foreign currency contracts | | | | | | |
Unrealized depreciation on swap contracts(2) | | | | | | |
| | | | | | |
| Amount represents the cumulative appreciation and depreciation on futures contracts as disclosed within the Schedule of Investments under the open “Futures Contracts” section. Only current day’s variation margin, if any, is reported within the Statement of Assets and Liabilities. |
| Amount represents the cumulative appreciation and depreciation on centrally cleared swaps, if applicable, as disclosed within the Schedule of Investments. Only the current day’s variation margin, if any, is reported within the Statements of Assets and Liabilities. OTC swaps are reported within the Statement of Assets and Liabilities within Unrealized appreciation and depreciation on OTC swap contracts, if applicable. |
The Effect of Derivative Instruments on the Statement of Operations for the year ended October 31, 2024: |
| |
| | | | | | |
Realized Gain (Loss) on Derivatives Recognized as a Result of Operations: | | | | | | |
Net realized gain (loss) on futures contracts | | | | | | |
Net realized gain (loss) on swap contracts | | | | | | |
Net realized gain (loss) on foreign currency contracts | | | | | | |
| | | | | | |
Net Change in Unrealized Appreciation (Depreciation) on Derivatives Recognized as a Result of Operations: | | | | | | |
Net change in unrealized appreciation (depreciation) of futures contracts | | | | | | |
Net change in unrealized appreciation (depreciation) of swap contracts | | | | | | |
Net change in unrealized appreciation (depreciation) of foreign currency contracts | | | | | | |
| | | | | | |
For the year ended October 31, 2024, the average monthly amount or number per contract outstanding for each derivative type was as follows:
| Average Notional
Par, Contracts
or Face Amount |
Futures Contracts Number of Long Contracts | |
Futures Contracts Number of Short Contracts | |
Swap Contracts at Notional Amount | |
Foreign Currency Contracts Purchased at Contract Amount | |
Foreign Currency Contracts Sold at Contract Amount | |
Hartford Multi-Strategy Funds
Notes to Financial Statements – (continued) October 31, 2024
Multi-Asset Income Fund
The Effect of Derivative Instruments on the Statement of Assets and Liabilities as of October 31, 2024: |
| |
| | | | | | |
| | | | | | |
Unrealized appreciation on futures contracts(1) | | | | | | |
Unrealized appreciation on foreign currency contracts | | | | | | |
Unrealized appreciation on swap contracts(2) | | | | | | |
| | | | | | |
| | | | | | |
Unrealized depreciation on futures contracts(1) | | | | | | |
Unrealized depreciation on foreign currency contracts | | | | | | |
Unrealized depreciation on swap contracts(2) | | | | | | |
| | | | | | |
| Amount represents the cumulative appreciation and depreciation on futures contracts as disclosed within the Schedule of Investments under the open “Futures Contracts” section. Only current day’s variation margin, if any, is reported within the Statement of Assets and Liabilities. |
| Amount represents the cumulative appreciation and depreciation on centrally cleared swaps, if applicable, as disclosed within the Schedule of Investments. Only the current day’s variation margin, if any, is reported within the Statements of Assets and Liabilities. OTC swaps are reported within the Statement of Assets and Liabilities within Unrealized appreciation and depreciation on OTC swap contracts, if applicable. |
The Effect of Derivative Instruments on the Statement of Operations for the year ended October 31, 2024: |
| |
| | | | | | |
Realized Gain (Loss) on Derivatives Recognized as a Result of Operations: | | | | | | |
Net realized gain (loss) on purchased options contracts | | | | | | |
Net realized gain (loss) on futures contracts | | | | | | |
Net realized gain (loss) on swap contracts | | | | | | |
Net realized gain (loss) on foreign currency contracts | | | | | | |
| | | | | | |
Net Change in Unrealized Appreciation (Depreciation) on Derivatives Recognized as a Result of Operations: | | | | | | |
Net change in unrealized appreciation (depreciation) of futures contracts | | | | | | |
Net change in unrealized appreciation (depreciation) of swap contracts | | | | | | |
Net change in unrealized appreciation (depreciation) of foreign currency contracts | | | | | | |
| | | | | | |
For the year ended October 31, 2024, the average monthly amount or number per contract outstanding for each derivative type was as follows:
| Average Notional
Par, Contracts
or Face Amount |
Purchased Options at Notional Amount | |
Futures Contracts Number of Long Contracts | |
Futures Contracts Number of Short Contracts | |
Swap Contracts at Notional Amount | |
Foreign Currency Contracts Purchased at Contract Amount | |
Foreign Currency Contracts Sold at Contract Amount | |
Hartford Multi-Strategy Funds
Notes to Financial Statements – (continued) October 31, 2024
Real Asset Fund (Consolidated)
The Effect of Derivative Instruments on the Statement of Assets and Liabilities as of October 31, 2024: |
| |
| | | | | | |
| | | | | | |
Unrealized appreciation on futures contracts(1) | | | | | | |
| | | | | | |
| | | | | | |
Unrealized depreciation on futures contracts(1) | | | | | | |
| | | | | | |
| Amount represents the cumulative appreciation and depreciation on futures contracts as disclosed within the Schedule of Investments under the open “Futures Contracts” section. Only current day’s variation margin, if any, is reported within the Statement of Assets and Liabilities. |
The Effect of Derivative Instruments on the Statement of Operations for the year ended October 31, 2024: |
| |
| | | | | | |
Realized Gain (Loss) on Derivatives Recognized as a Result of Operations: | | | | | | |
Net realized gain (loss) on futures contracts | | | | | | |
Net realized gain (loss) on foreign currency contracts | | | | | | |
| | | | | | |
Net Change in Unrealized Appreciation (Depreciation) on Derivatives Recognized as a Result of Operations: | | | | | | |
Net change in unrealized appreciation (depreciation) of futures contracts | | | | | | |
Net change in unrealized appreciation (depreciation) of foreign currency contracts | | | | | | |
| | | | | | |
For the year ended October 31, 2024, the average monthly amount or number per contract outstanding for each derivative type was as follows:
| Average Notional
Par, Contracts
or Face Amount |
Futures Contracts Number of Long Contracts | |
Futures Contracts Number of Short Contracts | |
Foreign Currency Contracts Purchased at Contract Amount | |
Foreign Currency Contracts Sold at Contract Amount | |
f)
Balance Sheet Offsetting Information – Set forth below are tables which disclose both gross information and net information about instruments and transactions eligible for offset in the financial statements, and instruments and transactions that are subject to a master netting arrangement, as well as amounts related to margin, reflected as financial collateral (including cash collateral), held at clearing brokers, counterparties and a Fund's custodian. The master netting arrangements allow the clearing brokers to net any collateral held in or on behalf of a Fund, or liabilities or payment obligations of the clearing brokers to a Fund, against any liabilities or payment obligations of the Fund to the clearing brokers. A Fund is required to deposit financial collateral (including cash collateral) at the Fund's custodian on behalf of clearing brokers and counterparties to continually meet the original and maintenance requirements established by the clearing brokers and counterparties. Such requirements are specific to the respective clearing broker or counterparty. Certain master netting arrangements may not be enforceable in a bankruptcy.
Hartford Multi-Strategy Funds
Notes to Financial Statements – (continued) October 31, 2024
The following tables present a Fund's derivative assets and liabilities, presented on a gross basis as no amounts are netted within the Statements of Assets and Liabilities, by counterparty net of amounts available for offset under a master netting agreement or similar agreement ("MNA") and net of the related collateral received/pledged by a Fund as of October 31, 2024:
| | |
Derivative Financial Instruments: | | |
Foreign currency contracts | | |
| | |
| | |
Total gross amount of derivative assets and liabilities in the Statement of Assets and Liabilities | | |
Derivatives not subject to a MNA | | |
Total gross amount of assets and liabilities subject to MNA or similar agreements | | |
| | Financial
Instruments
and Derivatives
Available
for Offset | | | |
| | | | | |
BNP Paribas Securities Services | | | | | |
| | | | | |
Deutsche Bank Securities, Inc. | | | | | |
| | | | | |
| | | | | |
| | | | | |
RBC Dominion Securities, Inc. | | | | | |
State Street Global Markets LLC | | | | | |
| | | | | |
| | | | | |
| | | | | |
| | | | | |
| | | | | |
| | | | | |
| Gross Amount
of Liabilities | Financial
Instruments
and Derivatives
Available
for Offset | | | |
Bank of America Securities LLC | | | | | |
| | | | | |
Deutsche Bank Securities, Inc. | | | | | |
| | | | | |
| | | | | |
| | | | | |
| | | | | |
State Street Global Markets LLC | | | | | |
| | | | | |
| In some instances, the actual collateral received and/or pledged may be more than the amount shown. |
| | |
Derivative Financial Instruments: | | |
Foreign currency contracts | | |
| | |
| | |
Total gross amount of derivative assets and liabilities in the Statement of Assets and Liabilities | | |
Derivatives not subject to a MNA | | |
Total gross amount of assets and liabilities subject to MNA or similar agreements | | |
Hartford Multi-Strategy Funds
Notes to Financial Statements – (continued) October 31, 2024
| | Financial
Instruments
and Derivatives
Available
for Offset | | | |
| | | | | |
| | | | | |
BNP Paribas Securities Services | | | | | |
| | | | | |
Deutsche Bank Securities, Inc. | | | | | |
| | | | | |
| | | | | |
| | | | | |
| | | | | |
RBC Dominion Securities, Inc. | | | | | |
| | | | | |
| | | | | |
State Street Global Markets LLC | | | | | |
| | | | | |
| | | | | |
| | | | | |
| | | | | |
| Gross Amount
of Liabilities | Financial
Instruments
and Derivatives
Available
for Offset | | | |
Bank of America Securities LLC | | | | | |
BNP Paribas Securities Services | | | | | |
| | | | | |
Deutsche Bank Securities, Inc. | | | | | |
| | | | | |
| | | | | |
| | | | | |
State Street Global Markets LLC | | | | | |
| | | | | |
| | | | | |
| In some instances, the actual collateral received and/or pledged may be more than the amount shown. |
Real Asset Fund (Consolidated) | | |
Derivative Financial Instruments: | | |
| | |
Total gross amount of derivative assets and liabilities in the Statement of Assets and Liabilities | | |
Derivatives not subject to a MNA | | |
Total gross amount of assets and liabilities subject to MNA or similar agreements | | |
A Fund’s investments expose it to various types of risks associated with financial instruments and the markets. A Fund may be exposed to the risks described below. Each Fund’s prospectus provides details of its principal risks. References to "Fund" in this section include the Fund or an Underlying Fund, as applicable.
The market values of equity securities, such as common stocks and preferred stocks, or equity related derivative investments, such as futures and options, may decline due to general market conditions which are not specifically related to a particular company, such as real or perceived adverse economic conditions, changes in the general outlook for corporate earnings, changes in interest or currency rates or adverse investor sentiment generally. The market value of equity securities may also decline due to factors which affect a particular industry or industries, such as labor shortages or increased production costs and competitive conditions within an industry. Equity securities and equity related investments generally have greater market price volatility than fixed income securities.
Certain Funds are exposed to the risks of the Underlying Funds and/or other investment companies in direct proportion to the amount of assets those Funds allocate to each Underlying Fund and/or other investment companies. The market values of the Underlying Funds and/or other investment companies may decline due to general market conditions which are not specifically related to a particular company in which the
Hartford Multi-Strategy Funds
Notes to Financial Statements – (continued) October 31, 2024
Underlying Fund and/or other investment companies invested, such as real or perceived adverse economic conditions, changes in the general outlook for corporate earnings, changes in interest or currency rates or adverse investor sentiment generally. The market value of equity securities in which the Underlying Funds and/or other investment companies invest may also decline due to factors which affect a particular industry or industries, such as labor shortages or increased production costs and competitive conditions within an industry.
Certain investments held by a Fund expose the Fund to various risks which may include, but are not limited to, interest rate, prepayment, and extension risks. Interest rate risk is the risk that fixed income securities will decline in value because of changes in interest rates. As nominal interest rates rise, the values of certain fixed income securities held by a Fund are likely to decrease. A nominal interest rate can be described as the sum of a real interest rate and an expected inflation rate. Fixed income securities with longer durations tend to be more sensitive to changes in interest rates, usually making them more volatile than securities with shorter durations. Duration is useful primarily as a measure of the sensitivity of a fixed income security’s market price to interest rate (i.e., yield) movements. Senior floating rate interests and securities subject to prepayment and extension risk generally offer less potential for gains when interest rates decline. Rising interest rates may cause prepayments to occur at a slower than expected rate, thereby effectively lengthening the maturity of the security and making the security more sensitive to interest rate changes. Prepayment and extension risk are major risks of mortgage-backed securities, senior floating rate interests and certain asset-backed securities. For certain asset-backed securities, the actual maturity may be less than the stated maturity shown in the Schedule of Investments, if applicable. As a result, the timing of income recognition relating to these securities may vary based upon the actual maturity.
Investing in the securities of non-U.S. issuers, whether directly or indirectly, involves certain considerations and risks not typically associated with securities of U.S. issuers. Such risks include, but are not limited to: generally less liquid and less efficient securities markets; generally greater price volatility; exchange rate fluctuations; imposition of restrictions on the expatriation of funds or other protectionist measures; less publicly available information about issuers; the imposition of withholding or other taxes; higher transaction and custody costs; settlement delays and risk of loss attendant in settlement procedures; difficulties in enforcing contractual obligations; less regulation of securities markets; different accounting, disclosure and reporting requirements; more substantial governmental involvement in the economy; higher inflation rates; and greater social, economic and political uncertainties. Non-U.S. issuers may also be affected by political, social, economic or diplomatic developments in a foreign country or region or the U.S. (including the imposition of sanctions, tariffs, or other governmental restrictions). These risks are heightened for investments in issuers from countries with less developed markets.
Credit risk depends largely on the perceived financial health of bond issuers. In general, the credit rating is inversely related to the credit risk of the issuer. Higher rated bonds generally are deemed to have less credit risk, while lower or unrated bonds are deemed to have higher risk of default. The share price, yield and total return of a fund that holds securities with higher credit risk may be more volatile than those of a fund that holds bonds with lower credit risk. A Fund may be exposed to counterparty risk, or the risk that an institution or other entity with which a Fund has unsettled or open transactions will default.
Geopolitical events, including the invasion of Ukraine by Russia and conflict between Israel and Hamas, have injected uncertainty into the global financial markets. One or more of the Funds hold positions in securities or other instruments that are economically tied to Russia. Investments in Russia are subject to political, economic, legal, market and currency risks, as well as the risks related to the economic sanctions on Russia imposed by the United States and/or other countries. Such sanctions which affect companies in many sectors, including energy, financial services and defense, among others, have adversely affected and could continue to adversely affect the global energy and financial markets and, thus, have adversely affected and could continue to adversely affect the value of a Fund’s investments, even beyond any direct exposure the Fund may have to Russian issuers or the adjoining geographic regions. In addition, certain transactions have or may be prohibited and/or existing investments have or may become illiquid (e.g., because transacting in certain existing investments is prohibited), which could cause a Fund to sell other portfolio holdings at a disadvantageous time or price in order to meet redemptions.
A widespread health crisis, such as a global pandemic, could cause substantial market volatility, exchange trading suspensions or restrictions and closures of securities exchanges and businesses, impact the ability to complete redemptions, and adversely impact Fund performance.
a)
Each Fund intends to continue to qualify as a Regulated Investment Company ("RIC") under Subchapter M of the Internal Revenue Code ("IRC") by distributing substantially all of its taxable net investment income and net realized capital gains to its shareholders each year. Each Fund has distributed substantially all of its income and capital gains in prior years, if applicable, and intends to distribute substantially all of its income and capital gains during the calendar year ending December 31, 2024. Accordingly, no provision for federal income or excise taxes has been made in the accompanying financial statements. Distributions from short-term capital gains are treated as ordinary income distributions for federal income tax purposes.
b)
Net Investment Income (Loss), Net Realized Gains (Losses) and Distributions – Net investment income (loss) and net realized gains (losses) may differ for financial statement and tax purposes primarily because of losses deferred due to wash sale adjustments, foreign currency gains and losses, adjustments related to Passive Foreign Investment Companies ("PFICs"), reclassification of dividend income, RICs, certain derivatives and the treatment of income from the Subsidiary. The character of distributions made during the year from net investment
Hartford Multi-Strategy Funds
Notes to Financial Statements – (continued) October 31, 2024
income or net realized gains may differ from their ultimate characterization for federal income tax purposes. Also, due to the timing of dividend distributions, the fiscal year in which amounts are distributed may differ from the year that the income or realized gains (losses) were recorded by each Fund.
c)
Distributions and Components of Distributable Earnings – The tax character of distributions paid by each Fund for the years ended October 31, 2024 and October 31, 2023 are as follows:
| For the Year Ended
October 31, 2024 | For the Year Ended
October 31, 2023 |
| | | | | |
| | | | | |
| | | | | |
Conservative Allocation Fund | | | | | |
| | | | | |
| | | | | |
| | | | | |
Real Asset Fund (Consolidated) | | | | | |
| | | | | |
| The Funds designate these distributions as long-term capital gains dividends pursuant to IRC Sec 852(b)(3)(c). |
As of October 31, 2024, the components of total accumulated earnings (deficit) for each Fund on a tax basis are as follows:
| Undistributed
Ordinary
Income | Undistributed
Long-Term
Capital Gains | Accumulated
Capital and
Other Losses | Other
Temporary
Differences | Unrealized
Appreciation
(Depreciation)
on Investments | Total
Accumulated
Earnings
(Deficit) |
| | | | | | |
| | | | | | |
Conservative Allocation Fund | | | | | | |
| | | | | | |
| | | | | | |
| | | | | | |
Real Asset Fund (Consolidated) | | | | | | |
d)
Reclassification of Capital Accounts – The Funds may record reclassifications in their capital accounts. These reclassifications have no impact on the total net assets of the Funds. The reclassifications are a result of permanent differences between U.S. GAAP and for tax accounting for such items as book income loss from the subsidiary, adjustments related to a reorganization and reclassification of dividend income. Adjustments are made to reflect the impact these items have on the current and future earnings distributions to shareholders. Therefore, the source of the Funds' distributions may be shown in the accompanying Statements of Changes in Net Assets as from distributable earnings or from capital depending on the type of book and tax differences that exist. For the year ended October 31, 2024, the Funds recorded reclassifications to increase (decrease) the accounts listed below:
| | Distributable
Earnings (Loss) |
Conservative Allocation Fund | | |
| | |
Real Asset Fund (Consolidated) | | |
e)
Capital Loss Carryforward – Under the Regulated Investment Company Modernization Act of 2010, funds are permitted to carry forward capital losses for an unlimited period.
Hartford Multi-Strategy Funds
Notes to Financial Statements – (continued) October 31, 2024
At October 31, 2024 (tax year end), each Fund's capital loss carryforwards for U.S. federal income tax purposes were as follows:
| Short-Term
Capital Loss
Carryforward with
No Expiration | Long-Term
Capital Loss
Carryforward with
No Expiration |
Conservative Allocation Fund* | | |
| | |
| | |
Real Asset Fund (Consolidated)* | | |
| Future utilization of losses are subject to limitation under current tax laws. |
During the year ended October 31, 2024, Balanced Income Fund utilized $15,071,029, Conservative Allocation Fund utilized $1,733,006, Growth Allocation Fund utilized $3,980,862, Moderate Allocation Fund utilized $4,752,433, Multi-Asset Income Fund utilized $28,473,303 and Real Asset Fund utilized $5,782,576 of prior year capital loss carryforwards.
Balanced Income Fund, Checks and Balances Fund and Growth Allocation Fund had no capital loss carryforwards for U.S. income tax purposes at October 31, 2024.
f)
Tax Basis of Investments – The aggregate cost of investments for federal income tax purposes at October 31, 2024 is different from book purposes primarily due to wash sale loss deferrals and adjustments related to PFICs. The net unrealized appreciation/(depreciation) on investments for tax purposes, which consists of gross unrealized appreciation and depreciation, was also different from book purposes primarily due to wash sale loss deferrals, mark-to-market adjustments on derivatives, mark-to-market adjustments on PFICs, partnership adjustments, reclassification of dividend income and investment in the Subsidiary. Both the cost and unrealized appreciation and depreciation for federal income tax purposes are disclosed below:
| | Gross Unrealized
Appreciation | Gross Unrealized
(Depreciation) | Net Unrealized
Appreciation
(Depreciation) |
| | | | |
| | | | |
Conservative Allocation Fund | | | | |
| | | | |
| | | | |
| | | | |
Real Asset Fund (Consolidated) | | | | |
g)
Accounting for Uncertainty in Income Taxes – Pursuant to provisions set forth by U.S. GAAP, HFMC reviews each Fund’s tax positions for all open tax years. As of October 31, 2024, HFMC had reviewed the open tax years and concluded that there was no reason to record a liability for net unrecognized tax obligations relating to uncertain income tax positions. Each Fund files U.S. tax returns. Although the statute of limitations for examining a Fund’s U.S. tax returns remains open for three years, no examination is currently in progress. The Funds recognize interest and penalties, if any, related to unrecognized tax benefits as income tax expense on the Statements of Operations. During the year ended October 31, 2024, the Funds did not incur any interest or penalties. HFMC is not aware of any tax positions for which it is reasonably possible that the total amounts of unrecognized tax obligations will significantly change in the next twelve months.
a)
Investment Management Agreement – HFMC serves as each Fund’s investment manager. The Company, on behalf of each Fund, has entered into an Investment Management Agreement with HFMC. HFMC is an indirect subsidiary of The Hartford Financial Services Group, Inc. ("The Hartford"). HFMC has overall investment supervisory responsibility for each Fund. In addition, HFMC provides administrative personnel, services, equipment, facilities and office space for proper operation of each Fund. HFMC has contracted with Wellington Management Company LLP ("Wellington Management") under a sub-advisory agreement and Wellington Management performs the daily investment of the assets of each Fund, except Checks and Balances Fund, Conservative Allocation Fund, Growth Allocation Fund and Moderate Allocation Fund, in accordance with the Fund’s investment objective and policies. As of October 31, 2024, each Fund, except Checks and Balances Fund and Conservative Allocation Fund, pays a fee to HFMC under the Investment Management Agreement. With respect to each of Balanced Income Fund, Multi-Asset Income Fund and Real Asset Fund, HFMC pays a sub-advisory fee to Wellington Management out of its management fee. HFMC is responsible for the day-to-day management of Checks and Balances Fund, Conservative Allocation Fund, Growth Allocation Fund and Moderate Allocation Fund.
On August 2, 2024, Wellington Management reimbursed the Multi-Asset Income Fund in the amount of $423,638 due to a trade error.
Hartford Multi-Strategy Funds
Notes to Financial Statements – (continued) October 31, 2024
The schedule below reflects the rates of compensation paid to HFMC for investment management services rendered as of October 31, 2024; the rates are accrued daily and paid monthly based on each Fund’s average daily net assets, at the following annual rates:
| |
| 0.7000% on first $250 million and; |
| 0.6300% on next $250 million and; |
| 0.6000% on next $500 million and; |
| 0.5700% on next $1.5 billion and; |
| 0.5500% on next $2.5 billion and; |
| 0.5300% on next $5 billion and; |
| 0.4500% on next $2 billion and; |
| |
Checks and Balances Fund and Conservative Allocation Fund | |
Growth Allocation Fund and Moderate Allocation Fund | 0.1000% on first $500 million and; |
| 0.0950% on next $500 million and; |
| 0.0900% on next $1.5 billion and; |
| 0.0800% on next $2.5 billion and; |
| 0.0700% on next $2.5 billion and; |
| 0.0600% on next $2.5 billion and; |
| |
| 0.5900% on first $500 million and; |
| 0.5500% on next $250 million and; |
| 0.5000% on next $250 million and; |
| 0.4750% on next $4 billion and; |
| 0.4725% on next $5 billion and; |
| |
| 0.7950% on first $500 million and; |
| 0.7600% on next $500 million and; |
| 0.7300% on next $1.5 billion and; |
| 0.7000% on next $2.5 billion and; |
| |
*
HFMC has contractually agreed to waive a portion of the management fee it receives from the Real Asset Fund in an amount equal to the management fee paid to it by the Subsidiary. This waiver will remain in effect for as long as the Real Asset Fund remains invested in the Subsidiary.
Prior to the close of business on October 25, 2024, the rates of compensation paid to HFMC for investment management services were as follows:
| |
Conservative Allocation Fund | 0.1000% on first $500 million and; |
| 0.0950% on next $500 million and; |
| 0.0900% on next $1.5 billion and; |
| 0.0800% on next $2.5 billion and; |
| 0.0700% on next $2.5 billion and; |
| 0.0600% on next $2.5 billion and; |
| |
b)
Accounting Services Agreement – HFMC provides the Funds with accounting services pursuant to a fund accounting agreement by and between the Company, on behalf of each Fund, and HFMC. HFMC has delegated certain accounting and administrative service functions to State Street Bank and Trust Company ("State Street"). In consideration of services rendered and expenses assumed pursuant to the fund accounting agreement, each Fund pays HFMC a fee. The fund accounting fee for each Fund is equal to the greater of: (A) the sum of (i) the sub-accounting fee payable by HFMC with respect to the Fund; (ii) the fee payable for tax preparation services for the Fund; and (iii) the amount of expenses that HFMC allocates for providing the fund accounting services to the Fund; plus a target profit margin; or (B) $40,000 per year; provided, however, that to the extent the annual amount of the fund accounting fee exceeds 0.02% of the Fund’s average net assets (calculated during its current fiscal year), HFMC shall waive such portion of the fund accounting fee.
c)
Operating Expenses – Allocable expenses incurred by the Company are allocated to each series within the Company, and allocated to classes within each such series, in proportion to the average daily net assets of such series and classes, except where allocation of certain expenses is more fairly made directly to a Fund or to specific classes within a Fund. As of October 31, 2024, HFMC contractually agreed
Hartford Multi-Strategy Funds
Notes to Financial Statements – (continued) October 31, 2024
to limit the total annual fund operating expenses until the dates stated in the footnotes to the table below (unless the Board of Directors approves its earlier termination) as follows for each of the following Funds:
| Expense Limit as a Percentage of Average Daily Net Assets |
| | | | | | | | | |
Conservative Allocation Fund(1) | | | | | | | | | |
Real Asset Fund (Consolidated)(2) | | | | | | | | | |
| HFMC has contractually agreed to reimburse expenses excluding taxes, interest expenses, brokerage commissions and extraordinary expenses until February 28, 2026. |
| HFMC has contractually agreed to reimburse expenses excluding taxes, interest expenses, brokerage commissions, acquired fund fees and expenses and extraordinary expenses until February 28, 2025. |
From February 29, 2024 through October 25, 2024, HFMC contractually agreed to limit the total annual fund operating expenses (exclusive of taxes, interest expenses, brokerage commissions and extraordinary expenses) as follows for the following Fund:
| Expense Limit as a Percentage of Average Daily Net Assets |
| | | | | | | | |
Conservative Allocation Fund | | | | | | | | |
d)
Fees Paid Indirectly – Certain Funds have entered into agreements with State Street Global Markets, LLC and Russell Implementation Services, Inc. to partially recapture non-discounted trade commissions. Such rebates are used to pay a portion of a Fund's expenses. For the year ended October 31, 2024, these amounts, if any, are included in the Statements of Operations.
The ratio of expenses to average net assets in the accompanying financial highlights excludes the reduction in expenses related to fees paid indirectly. For the year ended October 31, 2024, the amount of fees recaptured did not impact the ratio of expenses to average net assets in the financial highlights.
e)
Sales Charges and Distribution and Service Plan for Class A, C, R3 and R4 Shares – Hartford Funds Distributors, LLC ("HFD"), an indirect subsidiary of The Hartford, is the principal underwriter and distributor of each Fund. For the year ended October 31, 2024, HFD received front-end sales charges and contingent deferred sales charges for each Fund as follows:
| | Contingent Deferred
Sales Charges |
| | |
| | |
Conservative Allocation Fund | | |
| | |
| | |
| | |
Real Asset Fund (Consolidated) | | |
The Board of Directors of the Company has approved the adoption of a separate distribution plan (each a "Plan") pursuant to Rule 12b-1 under the 1940 Act for each of Class A, C, R3 and R4 shares. Under a Plan, Class A, Class C, Class R3 and Class R4 shares of a Fund, as applicable, bear distribution and/or service fees paid to HFD, some or all of which may be paid to select broker-dealers. Pursuant to the Class A Plan, a Fund may pay HFD a fee of up to 0.25% of the average daily net assets attributable to Class A shares for distribution financing activities and shareholder account servicing activities. The entire amount of the fee may be used for shareholder servicing expenses and/or distribution expenses. Pursuant to the Class C Plan, a Fund may pay HFD a fee of up to 1.00% of the average daily net assets attributable to Class C shares for distribution financing activities, and up to 0.25% may be used for shareholder account servicing activities. The Class C Plan also provides that HFD will receive all contingent deferred sales charges attributable to Class C shares. Pursuant to the Class R3 Plan, a Fund may pay HFD a fee of up to 0.50% of the average daily net assets attributable to Class R3 shares for distribution financing activities, and up to 0.25% may be used for shareholder account servicing activities. Pursuant to the Class R4 Plan, a Fund may pay HFD a fee of up to 0.25% of the average daily net assets attributable to Class R4 shares for distribution financing activities. The entire amount of the fee may be used for shareholder account servicing activities. Each Fund’s 12b-1 fees are accrued daily and paid monthly or at such other intervals as the Company’s Board of Directors may determine. Any 12b-1 fees attributable to assets held in an account held directly with the Funds’ transfer agent for which there is not a third-party listed as the broker-dealer of record (or HFD does not otherwise have a payment obligation) are generally reimbursed to the applicable Fund. Such amounts are reflected as "Distribution fee reimbursements" on the Statements of Operations.
f)
Remuneration Paid to Directors, Officers, and others – Certain officers of the Company are directors and/or officers of HFMC and/or The Hartford or its subsidiaries. For the year ended October 31, 2024, a portion of the Company’s Chief Compliance Officer’s ("CCO") compensation was paid by each Fund, which is included on the Statement of Operations as Chief Compliance Officer fees.
Hartford Multi-Strategy Funds
Notes to Financial Statements – (continued) October 31, 2024
g)
Hartford Administrative Services Company ("HASCO"), an indirect subsidiary of The Hartford, provides transfer agent services to each Fund. Each Fund pays HASCO a transfer agency fee payable monthly based on the lesser of (i) the costs of providing or overseeing transfer agency services provided to each share class of such Fund plus a target profit margin or (ii) a Specified Amount (as defined in the table below). Such fee is intended to compensate HASCO for: (i) fees payable by HASCO to SS&C GIDS, Inc. ("SS&C") (and any other designated sub-agent) according to the agreed-upon fee schedule under the sub-transfer agency agreement between HASCO and SS&C (or between HASCO and any other designated sub-agent, as applicable); (ii) sub-transfer agency fees payable by HASCO to financial intermediaries, according to the agreed-upon terms between HASCO and the financial intermediaries, provided that such payments are within certain limits approved by the Company’s Board of Directors; (iii) certain expenses that HASCO’s parent company, Hartford Funds Management Group, Inc., allocates to HASCO that relate to HASCO’s transfer agency services provided to the Fund; and (iv) a target profit margin.
| Specified Amount
(as a percentage
average daily
net assets) |
| |
| |
| |
| |
| |
| |
| |
| |
| |
Effective July 1, 2024, HASCO has contractually agreed to waive its transfer agency fee and/or reimburse transfer agency-related expenses to the extent necessary to limit the transfer agency fee for Class I of the Fund listed below until February 28, 2025, unless the Board of Directors approves its earlier termination as follows:
Pursuant to a sub-transfer agency agreement between HASCO and SS&C, HASCO has delegated certain transfer agent, dividend disbursing agent and shareholder servicing agent functions to SS&C. Each Fund does not pay any fee directly to SS&C; rather, HASCO makes all such payments to SS&C. The accrued amount shown in the Statements of Operations reflects the amounts charged by HASCO. These fees are accrued daily and paid monthly.
For the year ended October 31, 2024, the effective rate of compensation paid to HASCO for transfer agency services as a percentage of each Class' average daily net assets is as follows:
| | | | | | | | | |
| | | | | | | | | |
| | | | | | | | | |
Conservative Allocation Fund | | | | | | | | | |
| | | | | | | | | |
| | | | | | | | | |
| | | | | | | | | |
Real Asset Fund (Consolidated) | | | | | | | | | |
| Percentage rounds to zero. |
The Company has entered into a securities lending agency agreement ("lending agreement") with Citibank, N.A. ("Citibank"). A Fund may lend portfolio securities to certain borrowers in U.S. and non-U.S. markets in an amount not to exceed one-third (33 1/3%) of the value of its total assets. A Fund may lend portfolio securities, provided that the borrower provides collateral that is maintained in an amount at least equal to the current market value of the securities loaned. Cash collateral is invested for the benefit of a Fund by the Fund’s lending agent pursuant to collateral investment guidelines. The collateral is marked to market daily, in an amount at least equal to the current market value of the securities loaned. The contractual maturities of the securities lending transactions are considered overnight and continuous. Each of Checks and Balances Fund, Conservative Allocation Fund, Growth Allocation Fund, and Moderate Allocation Fund do not currently engage in securities lending.
Hartford Multi-Strategy Funds
Notes to Financial Statements – (continued) October 31, 2024
A Fund is subject to certain risks while its securities are on loan, including the following: (i) the risk that the borrower defaults on the loan and the collateral is inadequate to cover the Fund’s loss; (ii) the risk that the earnings on the collateral invested are not sufficient to pay fees incurred in connection with the loan; (iii) the Fund could lose money in the event of a decline in the value of the collateral provided for loaned securities or a decline in the value of any investments made with cash collateral; (iv) the risk that the borrower may use the loaned securities to cover a short sale, which may in turn place downward pressure on the market prices of the loaned securities; (v) the risk that return of loaned securities could be delayed and interfere with portfolio management decisions; (vi) the risk that any efforts to restrict or recall the securities for purposes of voting may not be effective; and (vii) operational risks (i.e., the risk of losses resulting from problems in the settlement and accounting process especially so in certain international markets). These events could also trigger adverse tax consequences for a Fund.
A Fund retains loan fees and the interest on cash collateral investments but is required to pay the borrower a rebate for the use of cash collateral. In cases where the lent security is of high value to borrowers, there may be a negative rebate (i.e., a net payment from the borrower to the applicable Fund). Upon termination of a loan, a Fund is required to return to the borrower an amount equal to the cash collateral, plus any rebate owed to the borrowers.
The net income earned on the securities lending (after payment of rebates and Citibank’s fee) is included on the Statements of Operations as Investment Income from securities lending. A Fund also receives payments from the borrower during the period of the loan, equivalent to dividends and interest earned on the securities loaned, which are recorded as Investment Income from dividends or interest, respectively, on the Statements of Operations.
The following table presents for each Fund that lends its portfolio securities the market value of the securities on loan and the cash and non-cash collateral posted by the borrower as of October 31, 2024.
| Investment Securities on Loan, at market value,
Presented on the Statements of Assets and Liabilities | | |
| | | |
| | | |
Real Asset Fund (Consolidated) | | | |
| It is each Fund’s policy to obtain additional collateral from, or return excess collateral to, the borrower by the end of the next business day following the valuation date of the securities loaned. Therefore, the value of the collateral held may be temporarily less than that required under the lending contract due to timing. Pursuant to the lending agreement, the borrower will provide collateral in an amount at least equal to the current market value of securities loaned. |
9.
Affiliate Fund Transactions:
A summary of affiliated investment companies transactions for the Checks and Balances Fund, Conservative Allocation Fund, Growth Allocation Fund and Moderate Allocation Fund for the year ended October 31, 2024 is as follows:
Affiliated Investment Companies | Beginning
Value as of
November 1, 2023 | | | Net
Realized
Gain/(Loss)
on Sales | Change in
Unrealized
Appreciation/
(Depreciation) | Ending
Value as of
October 31, 2024 | Shares as of
October 31, 2024 | | Capital Gains
Distribution |
|
Hartford Total Return Bond ETF | | | | | | | | | |
The Hartford Capital Appreciation Fund, Class F | | | | | | | | | |
The Hartford Dividend and Growth Fund, Class F | | | | | | | | | |
| | | | | | | | | |
Conservative Allocation Fund |
| | | | | | | | | |
Hartford Core Equity Fund, Class F | | | | | | | | | |
Hartford Multi-Strategy Funds
Notes to Financial Statements – (continued) October 31, 2024
Affiliated Investment Companies | Beginning Value as of November 1, 2023 | | | Net Realized Gain/(Loss) on Sales | Change in Unrealized Appreciation/ (Depreciation) | Ending Value as of October 31, 2024 | Shares as of October 31, 2024 | | Capital Gains Distribution |
Conservative Allocation Fund – (continued) |
Hartford Large Cap Growth ETF | | | | | | | | | |
Hartford Multifactor Developed Markets (ex-US) ETF | | | | | | | | | |
Hartford Multifactor US Equity ETF | | | | | | | | | |
Hartford Schroders Core Fixed Income Fund, Class F | | | | | | | | | |
Hartford Schroders Emerging Markets Equity Fund, Class F | | | | | | | | | |
Hartford Schroders International Contrarian Value Fund | | | | | | | | | |
Hartford Schroders International Multi-Cap Value Fund, Class F | | | | | | | | | |
Hartford Small Cap Value Fund, Class F | | | | | | | | | |
Hartford Strategic Income ETF | | | | | | | | | |
Hartford US Quality Growth ETF | | | | | | | | | |
| | | | | | | | | |
The Hartford Equity Income Fund, Class F | | | | | | | | | |
The Hartford Growth Opportunities Fund, Class F | | | | | | | | | |
Hartford Multi-Strategy Funds
Notes to Financial Statements – (continued) October 31, 2024
Affiliated Investment Companies | Beginning Value as of November 1, 2023 | | | Net Realized Gain/(Loss) on Sales | Change in Unrealized Appreciation/ (Depreciation) | Ending Value as of October 31, 2024 | Shares as of October 31, 2024 | | Capital Gains Distribution |
Conservative Allocation Fund – (continued) |
The Hartford Inflation Plus Fund, Class F | | | | | | | | | |
The Hartford International Growth Fund, Class F | | | | | | | | | |
The Hartford International Opportunities Fund, Class F | | | | | | | | | |
The Hartford Small Company Fund, Class F | | | | | | | | | |
The Hartford Strategic Income Fund, Class F | | | | | | | | | |
The Hartford World Bond Fund, Class F | | | | | | | | | |
| | | | | | | | | |
|
| | | | | | | | | |
Hartford Core Equity Fund, Class F | | | | | | | | | |
Hartford Large Cap Growth ETF | | | | | | | | | |
Hartford Multifactor Developed Markets (ex-US) ETF | | | | | | | | | |
Hartford Multifactor US Equity ETF | | | | | | | | | |
Hartford Schroders Core Fixed Income Fund, Class F | | | | | | | | | |
Hartford Schroders Emerging Markets Equity Fund, Class F | | | | | | | | | |
Hartford Multi-Strategy Funds
Notes to Financial Statements – (continued) October 31, 2024
Affiliated Investment Companies | Beginning Value as of November 1, 2023 | | | Net Realized Gain/(Loss) on Sales | Change in Unrealized Appreciation/ (Depreciation) | Ending Value as of October 31, 2024 | Shares as of October 31, 2024 | | Capital Gains Distribution |
Growth Allocation Fund – (continued) |
Hartford Schroders International Multi-Cap Value Fund, Class F | | | | | | | | | |
Hartford Small Cap Value Fund, Class F | | | | | | | | | |
The Hartford Equity Income Fund, Class F | | | | | | | | | |
The Hartford Growth Opportunities Fund, Class F | | | | | | | | | |
The Hartford International Growth Fund, Class F | | | | | | | | | |
The Hartford International Opportunities Fund, Class F | | | | | | | | | |
The Hartford Small Company Fund, Class F | | | | | | | | | |
The Hartford Strategic Income Fund, Class F | | | | | | | | | |
The Hartford World Bond Fund, Class F | | | | | | | | | |
| | | | | | | | | |
|
| | | | | | | | | |
Hartford Core Equity Fund, Class F | | | | | | | | | |
Hartford Large Cap Growth ETF | | | | | | | | | |
Hartford Multifactor Developed Markets (ex-US) ETF | | | | | | | | | |
Hartford Multi-Strategy Funds
Notes to Financial Statements – (continued) October 31, 2024
Affiliated Investment Companies | Beginning Value as of November 1, 2023 | | | Net Realized Gain/(Loss) on Sales | Change in Unrealized Appreciation/ (Depreciation) | Ending Value as of October 31, 2024 | Shares as of October 31, 2024 | | Capital Gains Distribution |
Moderate Allocation Fund – (continued) |
Hartford Multifactor US Equity ETF | | | | | | | | | |
Hartford Schroders Core Fixed Income Fund, Class F | | | | | | | | | |
Hartford Schroders Emerging Markets Equity Fund, Class F | | | | | | | | | |
Hartford Schroders International Multi-Cap Value Fund, Class F | | | | | | | | | |
Hartford Small Cap Value Fund, Class F | | | | | | | | | |
The Hartford Equity Income Fund, Class F | | | | | | | | | |
The Hartford Growth Opportunities Fund, Class F | | | | | | | | | |
The Hartford International Growth Fund, Class F | | | | | | | | | |
The Hartford International Opportunities Fund, Class F | | | | | | | | | |
The Hartford Small Company Fund, Class F | | | | | | | | | |
The Hartford Strategic Income Fund, Class F | | | | | | | | | |
The Hartford World Bond Fund, Class F | | | | | | | | | |
| | | | | | | | | |
Hartford Multi-Strategy Funds
Notes to Financial Statements – (continued) October 31, 2024
As of October 31, 2024, affiliates of The Hartford had ownership of shares in certain Funds as follows:
| | | | | | | | | |
| | | | | | | | | |
Conservative Allocation Fund | | | | | | | | | |
| | | | | | | | | |
Real Asset Fund (Consolidated) | | | | | | | | | |
| Percentage rounds to zero. |
Percentage of Fund by Class: | | | | | | | | | |
| | | | | | | | | |
Conservative Allocation Fund | | | | | | | | | |
| | | | | | | | | |
Real Asset Fund (Consolidated) | | | | | | | | | |
| Percentage rounds to zero. |
As of October 31, 2024, the 529 plan for which HFMC serves as the program manager (the "529 plan") in the aggregate owned a portion of the Fund identified below. The 529 plan owned shares in the Fund listed below as follows:
| As of October 31, 2024, the 529 plan was invested in Class F shares. |
| Percentage rounds to zero. |
11.
Investment Transactions:
For the year ended October 31, 2024, the cost of purchases and proceeds from sales of investment securities (excluding short-term investments) were as follows:
| Cost of Purchases
Excluding U.S.
Government
Obligations | Sales Proceeds
Excluding U.S.
Government
Obligations | Cost of Purchases
For U.S. Government
Obligations | Sales Proceeds
For U.S. Government
Obligations | | |
| | | | | | |
| | | | | | |
Conservative Allocation Fund | | | | | | |
| | | | | | |
| | | | | | |
| | | | | | |
Real Asset Fund (Consolidated) | | | | | | |
12.
Capital Share Transactions:
The following information is for the years ended October 31, 2024 and October 31, 2023:
| For the Year or Period Ended
October 31, 2024 | For the Year Ended
October 31, 2023 |
| | | | |
| | | | |
| | | | |
| | | | |
Shares Issued for Reinvested Dividends | | | | |
| | | | |
| | | | |
Hartford Multi-Strategy Funds
Notes to Financial Statements – (continued) October 31, 2024
| For the Year or Period Ended October 31, 2024 | For the Year Ended October 31, 2023 |
| | | | |
| | | | |
| | | | |
Shares Issued for Reinvested Dividends | | | | |
| | | | |
| | | | |
| | | | |
| | | | |
Shares Issued for Reinvested Dividends | | | | |
| | | | |
| | | | |
| | | | |
| | | | |
Shares Issued for Reinvested Dividends | | | | |
| | | | |
| | | | |
| | | | |
| | | | |
Shares Issued for Reinvested Dividends | | | | |
| | | | |
| | | | |
| | | | |
| | | | |
Shares Issued for Reinvested Dividends | | | | |
| | | | |
| | | | |
| | | | |
| | | | |
Shares Issued for Reinvested Dividends | | | | |
| | | | |
| | | | |
| | | | |
| | | | |
Shares Issued for Reinvested Dividends | | | | |
| | | | |
| | | | |
| | | | |
| | | | |
Shares Issued for Reinvested Dividends | | | | |
| | | | |
| | | | |
Total Net Increase (Decrease) | | | | |
| | | | |
| | | | |
| | | | |
Shares Issued for Reinvested Dividends | | | | |
| | | | |
| | | | |
| | | | |
| | | | |
Shares Issued for Reinvested Dividends | | | | |
| | | | |
| | | | |
| | | | |
| | | | |
Shares Issued for Reinvested Dividends | | | | |
| | | | |
| | | | |
Hartford Multi-Strategy Funds
Notes to Financial Statements – (continued) October 31, 2024
| For the Year or Period Ended October 31, 2024 | For the Year Ended October 31, 2023 |
| | | | |
| | | | |
| | | | |
Shares Issued for Reinvested Dividends | | | | |
| | | | |
| | | | |
| | | | |
| | | | |
Shares Issued for Reinvested Dividends | | | | |
| | | | |
| | | | |
| | | | |
| | | | |
Shares Issued for Reinvested Dividends | | | | |
| | | | |
| | | | |
| | | | |
| | | | |
Shares Issued for Reinvested Dividends | | | | |
| | | | |
| | | | |
Total Net Increase (Decrease) | | | | |
Conservative Allocation Fund | | | | |
| | | | |
| | | | |
| | | | |
Shares Issued for Reinvested Dividends | | | | |
| | | | |
| | | | |
| | | | |
| | | | |
| | | | |
Shares Issued for Reinvested Dividends | | | | |
| | | | |
| | | | |
| | | | |
| | | | |
| | | | |
Shares Issued for Reinvested Dividends | | | | |
| | | | |
| | | | |
| | | | |
| | | | |
| | | | |
Shares Issued for Reinvested Dividends | | | | |
| | | | |
| | | | |
| | | | |
| | | | |
| | | | |
Shares Issued for Reinvested Dividends | | | | |
| | | | |
| | | | |
| | | | |
| | | | |
| | | | |
Shares Issued for Reinvested Dividends | | | | |
| | | | |
| | | | |
Hartford Multi-Strategy Funds
Notes to Financial Statements – (continued) October 31, 2024
| For the Year or Period Ended October 31, 2024 | For the Year Ended October 31, 2023 |
| | | | |
| | | | |
| | | | |
| | | | |
| | | | |
| | | | |
| | | | |
Shares Issued for Reinvested Dividends | | | | |
| | | | |
| | | | |
Total Net Increase (Decrease) | | | | |
| | | | |
| | | | |
| | | | |
Shares Issued for Reinvested Dividends | | | | |
| | | | |
| | | | |
| | | | |
| | | | |
Shares Issued for Reinvested Dividends | | | | |
| | | | |
| | | | |
| | | | |
| | | | |
Shares Issued for Reinvested Dividends | | | | |
| | | | |
| | | | |
| | | | |
| | | | |
Shares Issued for Reinvested Dividends | | | | |
| | | | |
| | | | |
| | | | |
| | | | |
Shares Issued for Reinvested Dividends | | | | |
| | | | |
| | | | |
| | | | |
| | | | |
Shares Issued for Reinvested Dividends | | | | |
| | | | |
| | | | |
| | | | |
| | | | |
Shares Issued for Reinvested Dividends | | | | |
| | | | |
| | | | |
Total Net Increase (Decrease) | | | | |
| | | | |
| | | | |
| | | | |
Shares Issued for Reinvested Dividends | | | | |
| | | | |
| | | | |
Hartford Multi-Strategy Funds
Notes to Financial Statements – (continued) October 31, 2024
| For the Year or Period Ended October 31, 2024 | For the Year Ended October 31, 2023 |
| | | | |
| | | | |
| | | | |
Shares Issued for Reinvested Dividends | | | | |
| | | | |
| | | | |
| | | | |
| | | | |
Shares Issued for Reinvested Dividends | | | | |
| | | | |
| | | | |
| | | | |
| | | | |
Shares Issued for Reinvested Dividends | | | | |
| | | | |
| | | | |
| | | | |
| | | | |
Shares Issued for Reinvested Dividends | | | | |
| | | | |
| | | | |
| | | | |
| | | | |
Shares Issued for Reinvested Dividends | | | | |
| | | | |
| | | | |
| | | | |
| | | | |
Shares Issued for Reinvested Dividends | | | | |
| | | | |
| | | | |
Total Net Increase (Decrease) | | | | |
| | | | |
| | | | |
| | | | |
Shares Issued for Reinvested Dividends | | | | |
| | | | |
| | | | |
| | | | |
| | | | |
Shares Issued for Reinvested Dividends | | | | |
| | | | |
| | | | |
| | | | |
| | | | |
Shares Issued for Reinvested Dividends | | | | |
| | | | |
| | | | |
| | | | |
| | | | |
Shares Issued for Reinvested Dividends | | | | |
| | | | |
| | | | |
| | | | |
| | | | |
Shares Issued for Reinvested Dividends | | | | |
| | | | |
| | | | |
Hartford Multi-Strategy Funds
Notes to Financial Statements – (continued) October 31, 2024
| For the Year or Period Ended October 31, 2024 | For the Year Ended October 31, 2023 |
| | | | |
| | | | |
| | | | |
Shares Issued for Reinvested Dividends | | | | |
| | | | |
| | | | |
| | | | |
| | | | |
Shares Issued for Reinvested Dividends | | | | |
| | | | |
| | | | |
| | | | |
| | | | |
Shares Issued for Reinvested Dividends | | | | |
| | | | |
| | | | |
| | | | |
| | | | |
Shares Issued for Reinvested Dividends | | | | |
| | | | |
| | | | |
Total Net Increase (Decrease) | | | | |
Real Asset Fund (Consolidated) | | | | |
| | | | |
| | | | |
Shares Issued for Reinvested Dividends | | | | |
| | | | |
| | | | |
| | | | |
| | | | |
Shares Issued for Reinvested Dividends | | | | |
| | | | |
| | | | |
| | | | |
| | | | |
Shares Issued for Reinvested Dividends | | | | |
| | | | |
| | | | |
| | | | |
| | | | |
Shares Issued for Reinvested Dividends | | | | |
| | | | |
| | | | |
| | | | |
Shares Issued for Reinvested Dividends | | | | |
| | | | |
| | | | |
| | | | |
Shares Issued for Reinvested Dividends | | | | |
| | | | |
| | | | |
| | | | |
| | | | |
Shares Issued for Reinvested Dividends | | | | |
| | | | |
| | | | |
Hartford Multi-Strategy Funds
Notes to Financial Statements – (continued) October 31, 2024
| For the Year or Period Ended October 31, 2024 | For the Year Ended October 31, 2023 |
| | | | |
| | | | |
| | | | |
Shares Issued for Reinvested Dividends | | | | |
| | | | |
| | | | |
| | | | |
| | | | |
Shares Issued for Reinvested Dividends | | | | |
| | | | |
| | | | |
Total Net Increase (Decrease) | | | | |
| Commenced operations at the close of business on October 25, 2024. |
At a meeting held on June 11, 2024, the Board of the Company approved an Agreement and Plan of Reorganization (the “Plan”) that provided for the reorganization of the Hartford AARP Balanced Retirement Fund ("Balanced Retirement Fund" or the “Acquired Fund”), a series of the Company, into Conservative Allocation Fund (the “Acquiring Fund”), a separate series of the Company (the “Reorganization”).
Pursuant to the terms of the Plan, after the close of business on October 25, 2024 (the "Closing Date"), the Acquired Fund transferred all of its assets to the Acquiring Fund, in exchange for shares of the Acquiring Fund, the assumption of all of the liabilities of the Acquired Fund by the Acquiring Fund, and the distribution of shares of the Acquiring Fund to the shareholders of the Acquired Fund in complete liquidation of the Acquired Fund.
Prior to the Reorganization, the Acquired Fund engaged in transition management techniques, such as selling portfolio investments, for the purpose of complying with the anticipated investment policies or limitations of the Acquiring Fund after the Reorganization.
After the close of business on October 25, 2024, the consummation of the Reorganization was accomplished by a tax-free exchange of shares of the Balanced Retirement Fund in the following amounts:
| Net Assets of the
Balanced Retirement Fund
as of the close of
business on
October 25, 2024
("Closing Date") | Shares of the
Balanced Retirement Fund
as of the
Closing Date | Value of Shares
Issued by the
Conservative Allocation Fund | Shares Issued by the
Conservative Allocation Fund | Net Assets
of the
Conservative Allocation Fund
immediately after
the Reorganization |
| | | | | |
| | | | | |
| | | | | |
| | | | | |
| | | | | |
| | | | | |
| | | | | |
| | | | | |
| | | | | |
As of the Closing Date, the Acquired Fund and the Conservative Allocation Fund had investments (excluding cash and cash equivalents) valued at $5,570,910 and $96,617,944 with a cost basis of $5,679,069 and $88,948,712, respectively. For financial reporting purposes, assets received, liabilities assumed and shares issued by the Conservative Allocation Fund were recorded at fair value; however, the cost basis of the investments received by the Conservative Allocation Fund from the Acquired Fund was carried forward to align ongoing reporting of the Conservative Allocation Fund’s realized and unrealized gains and losses with amounts distributable to shareholders for tax purposes.
The aggregate net assets of the Conservative Allocation Fund immediately after the acquisition were $154,289,830 which included $108,159 of acquired unrealized depreciation.
Hartford Multi-Strategy Funds
Notes to Financial Statements – (continued) October 31, 2024
Assuming the Reorganization had been completed on November 1, 2023, the Conservative Allocation Fund’s pro-forma results of operations for the year ended October 31, 2024 are as follows:
| |
Net realized and unrealized gain (loss) on investments | |
Net increase (decrease) in net assets from operations | |
Because the combined investment portfolios have been managed as a single integrated portfolio since the Reorganization was completed, it is not practicable to separate the amounts of revenue and earnings of the Acquired Fund that have been included in the Conservative Allocation Fund’s Statement of Operations since the Closing Date.
Each Fund participates in a committed line of credit pursuant to a credit agreement dated February 29, 2024. Each Fund may borrow under the line of credit for temporary or emergency purposes. The Funds (together with certain other Hartford Funds) may borrow up to $350 million in the aggregate, subject to asset coverage and other limitations specified in the credit agreement. The interest rate on borrowings varies depending on the nature of the loan. The facility also charges certain fees, such as a commitment fee. From November 1, 2023 through February 29, 2024, the Funds (together with certain other Hartford Funds) had a similar agreement that enabled them to participate in a $350 million committed line of credit. The fees incurred by the Funds in connection with the committed lines of credit during the period appear in the Statements of Operations under "Other expenses." During and as of the year ended October 31, 2024, none of the Funds had borrowings under these facilities.
Under the Company’s organizational documents, the Company shall indemnify its officers and directors to the full extent required or permitted under Maryland General Corporation Law and federal securities laws. In addition, the Company, on behalf of each Fund, may enter into contracts that contain a variety of indemnifications. The Company’s maximum exposure under these arrangements is unknown. However, as of the date of these financial statements, the Company has not had prior claims or losses pursuant to these contracts and expects the risk of loss to be remote.
16.
Recent Accounting Pronouncement:
In November 2023, the Financial Accounting Standards Board issued Accounting Standards Update No. 2023-07 (“ASU 2023-07”), “Segment Reporting (“Topic 280”). ASU 2023-07 clarifies the guidance in Topic 280, which requires public entities to provide disclosures of significant segment expenses and other segment items. The guidance requires public entities to provide in interim periods all disclosures about a reportable segment’s profit or loss and assets that are currently required annually and also applies to public entities with a single reportable segment. Entities are permitted to disclose more than one measure of a segment’s profit or loss if such measures are used by the Chief Operating Decision Maker to allocate resources and assess performance, as long as at least one of those measures is determined in a way that is most consistent with the measurement principles used to measure the corresponding amounts in the consolidated financial statements. The amendments in this update are effective for fiscal years beginning after December 15, 2023, and interim periods within fiscal years beginning after December 15, 2024. Early adoption is permitted. Management is currently evaluating the implications, if any, of the additional requirements and their impact on the Funds' financial statements.
Management has evaluated all subsequent transactions and events through the date on which these financial statements were issued and has determined that no additional items require disclosure in these financial statements.
Report of Independent Registered Public Accounting Firm
To the Board of Directors of The Hartford Mutual Funds, Inc. and Shareholders of The Hartford Balanced Income Fund, The Hartford Checks and Balances Fund, The Hartford Conservative Allocation Fund, The Hartford Growth Allocation Fund, Hartford Moderate Allocation Fund, Hartford Multi-Asset Income Fund and Hartford Real Asset Fund
Opinions on the Financial Statements
We have audited the accompanying statements of assets and liabilities, including the schedules of investments, of each of the funds indicated in the table below (seven of the funds constituting The Hartford Mutual Funds, Inc., hereafter collectively referred to as the "Funds") as of October 31, 2024, and the related statements of operations and changes in net assets for each of the periods indicated in the table below, including the related notes, and the financial highlights for each of the periods indicated in the table below (collectively referred to as the “financial statements”). In our opinion, the financial statements present fairly, in all material respects, the financial position of each of the Funds as of October 31, 2024, the results of each of their operations and the changes in each of their net assets, and each of the financial highlights for each of the periods indicated in the table below, in conformity with accounting principles generally accepted in the United States of America.
|
The Hartford Balanced Income Fund(1) |
The Hartford Checks and Balances Fund(1) |
The Hartford Conservative Allocation Fund(1) |
The Hartford Growth Allocation Fund(1) |
Hartford Moderate Allocation Fund(1) |
Hartford Multi-Asset Income Fund(1) |
Hartford Real Asset Fund(2) |
| Statement of assets and liabilities, including the schedule of investments, as of October 31, 2024, the related statement of operations for the year ended October 31, 2024, the statements of changes in net assets for each of the two years in the period ended October 31, 2024 and financial highlights for each of the periods indicated therein. |
| Consolidated statement of assets and liabilities, including the consolidated schedule of investments, as of October 31, 2024, the related consolidated statement of operations for the year ended October 31, 2024, the consolidated statements of changes in net assets for each of the two years in the period ended October 31, 2024, and the consolidated financial highlights for each of the periods indicated therein. |
These financial statements are the responsibility of the Funds’ management. Our responsibility is to express an opinion on the Funds’ financial statements based on our audits. We are a public accounting firm registered with the Public Company Accounting Oversight Board (United States) (PCAOB) and are required to be independent with respect to the Funds in accordance with the U.S. federal securities laws and the applicable rules and regulations of the Securities and Exchange Commission and the PCAOB.
We conducted our audits of these financial statements in accordance with the standards of the PCAOB. Those standards require that we plan and perform the audit to obtain reasonable assurance about whether the financial statements are free of material misstatement, whether due to error or fraud.
Our audits included performing procedures to assess the risks of material misstatement of the financial statements, whether due to error or fraud, and performing procedures that respond to those risks. Such procedures included examining, on a test basis, evidence regarding the amounts and disclosures in the financial statements. Our audits also included evaluating the accounting principles used and significant estimates made by management, as well as evaluating the overall presentation of the financial statements. Our procedures included confirmation of securities owned as of October 31, 2024 by correspondence with the custodian, transfer agents, agent banks and brokers; when replies were not received from agent banks and brokers, we performed other auditing procedures. We believe that our audits provide a reasonable basis for our opinions.
/s/PricewaterhouseCoopers LLP
Philadelphia, Pennsylvania
December 26, 2024
We have served as the auditor of one or more investment companies in the Hartford Funds group of investment companies since 2020.
Hartford Multi-Strategy Funds
Item 8. Changes in and Disagreements with Accountants for Open-End Management Investment Companies.
Not applicable. There were no changes in or disagreements with accountants during the period.
Hartford Multi-Strategy Funds
Item 9. Proxy Disclosures for Open-End Management Investment Companies.
Not applicable. There were no matters submitted to a vote of shareholders during the period.
Hartford Multi-Strategy Funds
Item 10. Remuneration Paid to Directors, Officers, and Others of Open-End Management Investment Companies.
The response to this item is included under Item 7 of this form.
Hartford Multi-Strategy Funds
Item 11. Statement Regarding Basis for Approval of Investment Advisory Contract.Approval of Investment Management and Investment Sub-Advisory Agreements (Unaudited)
The Hartford Mutual Funds, Inc.
The Hartford Balanced Income Fund
The Hartford Checks and Balances Fund
The Hartford Conservative Allocation Fund
Hartford Real Asset Fund
The Hartford Growth Allocation Fund
Hartford Moderate Allocation Fund
Hartford Multi-Asset Income Fund
(each, a “Fund” and collectively, the “Funds”)
Section 15(c) of the Investment Company Act of 1940, as amended (the “1940 Act”), requires that each mutual fund’s board of directors, including a majority of those directors who are not “interested persons” of the mutual fund, as defined in the 1940 Act (the “Independent Directors”), annually review and consider the continuation of the mutual fund’s investment advisory and sub-advisory agreements. At its meeting held on September 11-12, 2024, the Board of Directors (the “Board”) of The Hartford Mutual Funds, Inc. (“HMF”), including the Independent Directors, unanimously voted to approve (i) the continuation of an investment management agreement by and between Hartford Funds Management Company, LLC (“HFMC”) and each of HMF, on behalf of each of the Funds, and The Hartford Mutual Funds II, Inc. (“HMF II”), on behalf of each of its series (the “Management Agreement”); and (ii) with respect to each of The Hartford Balanced Income Fund, Hartford Real Asset Fund, and Hartford Multi-Asset Income Fund (each, a “Sub-Advised Fund” and collectively, the “Sub-Advised Funds”), the continuation of an investment sub-advisory agreement (the “Sub-Advisory Agreement” and together with the Management Agreement, the “Agreements”) between HFMC and Wellington Management Company LLP (the “Sub-adviser,” and together with HFMC, the “Advisers”).
In the months preceding the September 11-12, 2024 meeting, the Board requested and reviewed written responses from the Advisers to questions posed to the Advisers on behalf of the Independent Directors and supporting materials relating to those questions and responses. In addition, the Board considered such additional information as it deemed reasonably necessary to evaluate the Agreements, as applicable, with respect to each Fund, which included information furnished to the Board and its committees at their meetings throughout the year and in between regularly scheduled meetings on particular matters as the need arose, as well as information specifically prepared in connection with the approval of the continuation of the Agreements that was presented at the Board’s meetings held on June 11, 2024 and September 11-12, 2024. Information provided to the Board and its committees at their meetings throughout the year included, among other things, reports on Fund performance, legal, compliance and risk management matters, sales and marketing activity, shareholder services, and the other services provided to each Fund by the Advisers and their affiliates. The members of the Board also considered the materials and presentations by Fund officers and representatives of HFMC received at the Board’s meetings on June 11, 2024 and September 11-12, 2024 concerning the Agreements and at the special meeting of the Board’s Investment Committee on May 23, 2024 concerning Fund-by-Fund performance and other investment-related matters.
The Independent Directors engaged service providers to assist them with evaluating the Agreements with respect to each Fund, as applicable. Broadridge Financial Solutions, Inc. (“Broadridge”), an independent provider of investment company data, was retained to provide the Board with reports on how each Fund’s contractual management fees, actual management fees, total expense ratios and investment performance compared to those of an appropriate group of investment companies selected by Broadridge. The Independent Directors also engaged an independent consultant (the “Consultant”) to assist them in evaluating each Fund’s fees and expenses.
In determining whether to approve the continuation of the Agreements for a Fund, the members of the Board reviewed and evaluated information and factors they believed to be relevant and appropriate through the exercise of their reasonable business judgment. While individual members of the Board may have weighed certain factors differently, the Board’s determination to approve the continuation of the Agreements was based on a comprehensive consideration of all information provided to the Board throughout the year and specifically with respect to the continuation of the Agreements. The Board was also furnished with an analysis of its fiduciary obligations in connection with its evaluation of the Agreements. Throughout the evaluation process, the Board was assisted by counsel for the Funds and the Independent Directors were also separately assisted by independent legal counsel. In connection with their deliberations, the Independent Directors met separately with independent legal counsel and the Consultant on June 7, 2024 and in executive session on several occasions to consider their responsibilities under relevant laws and regulations and to discuss the materials presented and other matters deemed relevant to their consideration of the approval of the continuation of the Agreements. As a result of the discussions that occurred during the June 7, 2024 and June 11, 2024 meetings, the Independent Directors presented HFMC and its affiliates with requests for additional information on certain topics. HFMC responded to these requests with additional information in connection with the September 11-12, 2024 meeting. A more detailed summary of the important, but not necessarily all, factors the Board considered with respect to its approval of the continuation of the Agreements is provided below.
Hartford Multi-Strategy Funds
Item 11. Statement Regarding Basis for Approval of Investment Advisory Contract.Approval of Investment Management and Investment Sub-Advisory Agreements (Unaudited) – (continued)
Nature, Extent and Quality of Services Provided by the Advisers
The Board requested and considered information concerning the nature, extent and quality of the services provided to each Fund by the Advisers. The Board considered, among other things, the terms of the Agreements and the range of services provided by the Advisers. The Board considered the Advisers’ professional personnel who provide services to the Funds, including each Adviser’s ability and experience in attracting and retaining qualified personnel to service the Funds. The Board considered each Adviser’s reputation and overall financial strength, as well as each Adviser’s willingness to consider and implement organizational and operational changes designed to enhance services to the funds managed by HFMC and its affiliates (the “Hartford funds”). In addition, the Board considered the quality of each Adviser’s communications with the Board and responsiveness to Board inquiries and requests made from time to time with respect to the Funds and other Hartford funds.
The Board also requested and evaluated information concerning each Adviser’s regulatory and compliance environment. In this regard, the Board reviewed information about each Adviser’s compliance policies and procedures and compliance history, and a report from the Funds’ Chief Compliance Officer about each Adviser’s compliance with applicable laws and regulations, including responses to regulatory developments and any compliance or other issues raised by regulators. The Board also noted the Advisers’ support of the Funds’ compliance control structure, as applicable, including the resources devoted by the Advisers in support of the Funds’ obligations pursuant to Rule 38a-1 under the 1940 Act and the Funds’ risk management programs, as well as the efforts of the Advisers to address cybersecurity risks. The Board also considered HFMC’s investments in business continuity planning designed to benefit the Funds. The Board also noted HFMC’s commitment to maintaining high quality systems and expending substantial resources to prepare for and respond to ongoing changes to the market, regulatory and control environments in which the Funds and their service providers operate.
With respect to HFMC, the Board noted that, under the Management Agreement, HFMC is responsible for the management of the Funds, including oversight of fund operations and service providers, and the provision of investment advisory and administrative services in connection with selecting, monitoring and supervising the Sub-adviser for the Sub-Advised Funds. In this regard, the Board evaluated information about the nature and extent of responsibilities retained and risks assumed by HFMC that were not delegated to or assumed by the Sub-adviser. The Board noted that HFMC directly manages the investment portfolios for The Hartford Checks and Balances Fund, The Hartford Conservative Allocation Fund, The Hartford Growth Allocation Fund, and Hartford Moderate Allocation Fund (collectively, the “Allocation Funds”), which do not employ a sub-adviser. The Board considered HFMC’s ongoing monitoring of people, process and performance, including its quarterly reviews of each of the Hartford funds, semi-annual meetings with the leaders of each Fund’s portfolio management team, and ongoing oversight of the Hartford funds’ portfolio managers. The Board noted that HFMC has demonstrated a record of initiating changes to the portfolio management and/or investment strategies of the Hartford funds when warranted. The Board considered HFMC’s periodic due diligence reviews of the Sub-adviser and ongoing oversight of the Sub-adviser’s investment approach and results, process for monitoring best execution of portfolio trades and other trading operations by the Sub-adviser, and approach to risk management with respect to the Funds. The Board considered HFMC’s oversight of the securities lending program for the Funds that engage in securities lending and noted the income earned by the Funds that participate in such program. The Board also considered HFMC’s day-to-day oversight of each Fund’s compliance with its investment objective and policies as well as with applicable laws and regulations, noting that regulatory and other developments had over time led to an increase in the scope of HFMC’s oversight in this regard. Moreover, the Board considered HFMC’s oversight of potential conflicts of interest between the Funds’ investments and those of other funds or accounts, if any, managed by the Funds’ portfolio management personnel.
In addition, the Board considered HFMC’s overall strategic plan for, and ongoing commitment to review and re-assess, the Hartford funds product line-up. The Board also considered the expenses that HFMC had incurred, as well as the risks HFMC had assumed, in connection with the launch of new funds and changes to existing Hartford funds in recent years. The Board considered that HFMC is responsible for providing the Funds’ officers.
With respect to the Sub-adviser, which provides certain day-to-day portfolio management services for the Sub-Advised Funds subject to oversight by HFMC, and HFMC, which provides the day-to-day portfolio management services for the Allocation Funds, the Board considered, among other things, the Sub-adviser’s investment personnel, investment philosophy and process, investment research capabilities and resources, performance record, trade execution capabilities and experience. With respect to the Hartford Real Asset Fund, the Board also considered the Sub-adviser’s flexibility in implementing the inflation hedge overlay in the current inflation environment. The Board considered the experience of each Fund’s portfolio manager(s), the number of accounts managed by the portfolio manager(s), and the Sub-adviser’s method for compensating the portfolio manager(s). The Board also considered the Sub-adviser’s succession planning practices to ensure continuity of portfolio management services provided to the Funds and HFMC’s oversight of these practices.
The Board considered the benefits to shareholders of being part of the family of Hartford funds, including, with respect to certain share classes, the right to exchange investments between the same class of shares without a sales charge, the ability to reinvest Fund dividends into other Hartford funds (excluding the Hartford funds that are either an exchange-traded fund or a closed-end fund), and the ability to combine holdings in a Fund with holdings
Hartford Multi-Strategy Funds
Item 11. Statement Regarding Basis for Approval of Investment Advisory Contract.Approval of Investment Management and Investment Sub-Advisory Agreements (Unaudited) – (continued)
in other Hartford funds (excluding the Hartford funds that are either an exchange-traded fund or a closed-end fund) and 529 plans for which HFMC serves as the program manager to obtain a reduced sales charge. The Board considered HFMC’s efforts to provide investors in the Hartford funds with a broad range of investment styles and asset classes and the assumption of entrepreneurial and other risks by HFMC in sponsoring and providing ongoing services to new funds to expand these opportunities for shareholders. In addition, the Board observed that in the marketplace there are a range of investment options available to each Fund’s shareholders and such shareholders, having had the opportunity to consider other investment options, have chosen to invest in the Fund.
Based on these considerations, the Board concluded that it was satisfied with the nature, extent and quality of the services provided to each Fund by HFMC and, as applicable, the Sub-adviser.
Performance of each Fund and the Advisers
The Board considered the investment performance of each Fund. In this regard, the Board reviewed the performance of each Fund over different time periods and evaluated HFMC’s analysis of each Fund’s performance for these time periods. The Board considered information and materials provided to the Board by the Advisers concerning Fund performance, as well as information from Broadridge comparing the investment performance of each Fund to an appropriate universe of peer funds. The Board noted that while it found the comparative data provided by Broadridge generally useful in evaluating a Hartford fund’s investment performance, the Board recognized the limitations of such data, including that notable differences may exist between a Hartford fund and its peers. The Board also noted that, for Hartford Multi-Asset Income Fund, there existed no peer group with a strong correlation to the Fund’s investment strategy. For that Fund, the Board considered supplemental performance evaluation information. For details regarding each Fund’s performance, see the Fund-by-Fund synopsis below.
The Board considered the detailed investment analytics reports provided by HFMC’s Investment Advisory Group throughout the year, including in connection with the approval of the continuation of the Agreements. These reports included, among other things, information on each Fund’s gross returns and net returns, the Fund’s investment performance compared to one or more appropriate benchmarks and relevant groups or categories of peer funds, various statistics concerning the Fund’s portfolio, a narrative summary of various factors affecting Fund performance, and commentary on the effect of current and recent market conditions. The Board considered the Advisers’ work with the Investment Committee, which assists the Board in evaluating the performance of each Fund at periodic meetings throughout the year and specifically with respect to the approval of the continuation of the Agreements. The Board considered that the Investment Committee, in its evaluation of investment performance at meetings throughout the year, focused particular attention on information indicating less favorable performance of certain Hartford funds for specific time periods and discussed with HFMC’s Investment Advisory Group the reasons for such performance as well as any specific actions that the Advisers had taken, or had agreed to take, to seek to enhance Fund investment performance and the results of those actions. The Board also considered information provided by the Consultant relating to each Fund’s performance track record.
Based on these considerations, the Board concluded that it had continued confidence in HFMC’s overall capabilities to manage the Funds and the Sub-adviser’s overall capabilities to manage the Sub-Advised Funds.
Costs of the Services and Profitability of the Advisers
The Board reviewed information regarding HFMC’s cost to provide investment management and related services to each Fund and HFMC’s profitability, both overall and for each Fund, on a pre-tax basis without regard to distribution expenses. The Board also requested and reviewed information about the profitability to HFMC and its affiliates from all services provided to each Fund and all aspects of their relationship with the Fund, including information regarding profitability trends over time and information provided by Broadridge analyzing the profitability of investment managers to other fund complexes. The Board also requested and received information relating to the operations and profitability of the Sub-adviser. The Board considered representations from HFMC and the Sub-adviser that the Sub-adviser’s fees were negotiated at arm’s length on a Fund-by-Fund basis and that the sub-advisory fees are paid by HFMC and not the Sub-Advised Funds. Accordingly, the Board concluded that the profitability of the Sub-adviser is a less relevant factor with respect to the Board’s consideration of the Sub-Advisory Agreement.
The Board considered that the Independent Directors’ prior independent consultant had previously reviewed the methodologies and estimates used by HFMC in calculating profitability in connection with the continuation of the Management Agreement, including a description of the methodology used to allocate certain expenses. The Board noted that the prior independent consultant previously reported that such process is reasonable, sound and consistent with common industry practice. The Board noted that HFMC’s process for calculating and reporting Fund profitability is consistent with the process previously reviewed by the prior independent consultant.
Hartford Multi-Strategy Funds
Item 11. Statement Regarding Basis for Approval of Investment Advisory Contract.Approval of Investment Management and Investment Sub-Advisory Agreements (Unaudited) – (continued)
Based on these considerations, the Board concluded that the profits realized by HFMC and its affiliates from their relationships with each Fund were not excessive.
Comparison of Fees and Services Provided by the Advisers
The Board considered comparative information with respect to the services rendered to and the management fees to be paid by each Fund to HFMC and the total expense ratios of the Fund. The Board also considered comparative information with respect to the sub-advisory fees to be paid by HFMC to the Sub-adviser with respect to each Sub-Advised Fund. In this regard, the Board requested and reviewed information from HFMC and the Sub-adviser relating to the management and sub-advisory fees, including the sub-advisory fee schedule for each Sub-Advised Fund and the amount of the management fee retained by HFMC, and total operating expenses for each Fund. The Board also reviewed information from Broadridge comparing each Fund’s contractual management fees, actual management fees and total expense ratios relative to an appropriate group of funds selected by Broadridge. For details regarding each Fund’s fees and expenses, see the Fund-by-Fund synopsis below.
The Board considered the methodology used by Broadridge to select the funds included in the expense groups. While the Board recognized that comparisons between a Fund and its peer funds may be imprecise given, among other differences, the different service levels and characteristics of mutual funds and the different business models and cost structures of the Advisers, the comparative information provided by Broadridge assisted the Board in evaluating the reasonableness of each Fund’s fees and total operating expenses. In addition, the Board considered the independent analysis and views of the Consultant regarding each Fund’s fees and total operating expenses in the context of the Fund’s investment performance.
The Board received information regarding fees charged by the Sub-adviser to any other clients with investment strategies similar to those of the Funds, including any institutional separate account clients and registered fund clients for which the Sub-adviser serves as either primary investment adviser or sub-adviser. The Board considered the explanations provided by the Sub-adviser about any differences between the Sub-adviser’s services to the Funds and the services the Sub-adviser provides to other types of clients. In this regard, the Board reviewed information about the generally broader scope of services and compliance, reporting and other legal burdens and risks of managing registered funds compared with those associated with managing assets of non-registered fund clients such as institutional separate accounts.
The Board also considered that the management fees paid by The Hartford Conservative Allocation Fund, The Hartford Growth Allocation Fund, and Hartford Moderate Allocation Fund are for services provided in addition to, and are not duplicative of, services provided under the investment management agreement(s) of the underlying funds in which these Allocation Funds may invest.
Based on these considerations, the Board concluded that each Fund’s fees and total operating expenses, in conjunction with the information about quality of services, profitability, economies of scale, and other matters considered, were reasonable in light of the services provided.
The Board considered information regarding economies of scale, including the extent to which economies of scale may be realized as a Fund grows and whether fee levels reflect these economies of scale for the benefit of shareholders of the Fund. The Board reviewed the breakpoints in the management fee schedule for each Fund, if any, which reduce fee rates as the Fund’s assets grow over time. The Board recognized that a Fund with assets beyond the highest breakpoint level will continue to benefit from economies of scale because additional assets are charged the lowest breakpoint fee resulting in lower effective management fee rates. The Board also recognized that a fee schedule that reaches a breakpoint at a lower asset level provides shareholders with the benefit of anticipated or potential economies of scale. The Board considered that expense limitations and fee waivers that reduce a Fund’s expenses at all asset levels can have the same effect as breakpoints in sharing economies of scale with shareholders and provide protection from an increase in expenses if the Fund’s assets decline. In addition, the Board considered that initially setting competitive fee rates, pricing a Fund to scale at inception, and making additional investments intended to enhance services available to shareholders are other means of sharing anticipated or potential economies of scale with shareholders. The Board also considered that HFMC has been active in managing expenses of the Hartford funds in recent years, which has resulted in benefits being realized by shareholders. The Board also noted that, for Hartford Real Asset Fund, the Fund’s current low asset levels have kept the Fund from fully realizing the benefits of anticipated or potential economies of scale. The Board considered HFMC’s assessment of the low asset levels for the Hartford Real Asset Fund.
The Board reviewed and evaluated materials from Broadridge showing how management fee schedules of peer funds reflect economies of scale for the benefit of shareholders as a peer fund’s assets hypothetically increase over time. Based on information provided by HFMC and Broadridge the Board recognized that there is no uniform methodology for establishing breakpoints or uniform pattern in asset levels that trigger breakpoints or the amounts of breakpoints triggered.
Hartford Multi-Strategy Funds
Item 11. Statement Regarding Basis for Approval of Investment Advisory Contract.Approval of Investment Management and Investment Sub-Advisory Agreements (Unaudited) – (continued)
After considering all of the information available to it, the Board concluded that it was satisfied with the extent to which economies of scale, if any, would be shared for the benefit of each Fund’s shareholders based on currently available information and the effective management fees and total expense ratios for the Fund at its current and reasonably anticipated asset levels. The Board noted, however, that it would continue to monitor any future growth in each Fund’s assets and the appropriateness of additional management fee breakpoints or other methods to share benefits from economies of scale as part of its future review of the Agreements.
The Board considered other benefits to the Advisers and their affiliates from their relationships with the Funds.
The Board noted that HFMC receives fees for fund accounting and related services from the Funds, and the Board considered information on the profitability to HFMC from providing such services to the Funds. The Board also considered that each Fund pays a transfer agency fee to Hartford Administrative Services Company (“HASCO”), an affiliate of HFMC, equal to the lesser of: (i) the actual costs incurred by HASCO in connection with the provisions of transfer agency services, including payments made to sub-transfer agents, plus a reasonable target profit margin; or (ii) a specified amount as set forth in the Transfer Agency and Service Agreement by and between HMF, on behalf of its Funds, HMF II, on behalf of its series, and HASCO. The Board reviewed information about the profitability to HASCO of the Funds’ transfer agency function. The Board considered information provided by HFMC indicating that the transfer agency fees charged by HASCO to the Funds were fair and reasonable based on available industry data about fees charged by transfer agents to other mutual funds. The Board also noted that HFMC and HASCO had delegated certain fund accounting services and transfer agency services, respectively, to external service providers, subject to oversight.
The Board also considered that Hartford Funds Distributors, LLC (“HFD”), an affiliate of HFMC, serves as principal underwriter of the Funds. The Board noted that, as principal underwriter, HFD receives distribution and service fees from the Funds and receives all or a portion of the sales charges on sales or redemptions of certain classes of shares. The Board considered that HFD has entered into an agreement with Wellington and Wellington Trust Company NA to provide certain marketing support services in connection with certain collective investment trust vehicles managed by Wellington.
The Board considered the benefits, if any, to the Sub-adviser from any use of a Fund’s brokerage commissions to obtain soft dollar research.
For purposes of evaluating a Fund’s performance, the Board considered the Fund’s performance relative to similarly managed funds and the Fund’s performance relative to its benchmark. In particular, the Board considered the Fund’s performance of its Class A shares (net of all fees and expenses), as of March 31, 2024, and compared that performance to the Fund’s peer universe, which includes all funds within the same classification or category, as determined by Broadridge. The Board considered the Fund’s performance relative to its peer universe by evaluating its quintile ranking, with the 1st quintile representing the top performing funds within a peer universe and the 5th quintile representing the lowest performing funds. For purposes of evaluating the Fund’s performance relative to its benchmark, the Board considered the Fund’s performance of its Class I shares (net of all fees and expenses) as of March 31, 2024. The Board considered Fund performance to be “in line with” a Fund’s benchmark where it was 50 basis points above or below the benchmark return. With respect to fees and expenses, the Board considered the Fund’s contractual management fee, actual management fee, and total operating expenses of its Class A shares, as compared to the Fund’s expense peer group, which includes a group of similarly sized funds selected by Broadridge.
The Hartford Balanced Income Fund
•
The Board noted that the Fund’s performance was in the 5th quintile versus its peer universe for the 1-year period, the 3rd quintile for the 3-year period, and the 4th quintile for the 5-year period. The Board also noted that the Fund’s performance was below its custom blended benchmark for the 1-year period and in line with its benchmark for the 3- and 5-year periods.
•
The Board noted that the Fund’s contractual management fee was in the 5th quintile of its expense group, while its actual management fee and total expenses were in the 2nd quintile.
The Hartford Checks and Balances Fund
•
The Board noted that the Fund’s performance was in the 4th quintile versus its peer universe for the 1-year period and the 3rd quintile for the 3- and 5-year periods. The Board also noted that the Fund’s performance was below its custom blended benchmark for the 1-, 3- and 5-year periods.
Hartford Multi-Strategy Funds
Item 11. Statement Regarding Basis for Approval of Investment Advisory Contract.Approval of Investment Management and Investment Sub-Advisory Agreements (Unaudited) – (continued)
•
The Board noted that the Fund’s total expenses were in the 2nd quintile of its expense group and that the Fund is not directly charged a management fee by HFMC.
The Hartford Conservative Allocation Fund
•
The Board noted that the Fund’s performance was in the 2nd quintile versus its peer universe for the 1-year period, the 4th quintile for the 3-year period, and the 3rd quintile for the 5-year period. The Board also noted that the Fund’s performance was in line with its custom blended benchmark for the 1- and 3-year periods and below its benchmark for the 5-year period.
•
The Board noted that the Fund’s contractual management fee was in the 1st quintile of its expense group, while its actual management fee was in the 3rd quintile and its total expenses were in the 4th quintile. In considering the Fund’s expenses, the Board noted the shareholder savings expected to result from a management fee reduction to be implemented in 2024. The Board also noted that HFMC had contractually agreed to limit the expenses (exclusive of certain specified expenses) for the Fund.
•
The Board noted that the Fund’s performance was in the 3rd quintile versus its peer universe for the 1-year period, the 1st quintile for the 3-year period, and the 2nd quintile for the 5-year period. The Board also noted that the Fund’s performance was above its benchmark, which included a combination the Fund’s prior custom blended benchmark performance through April 2020 and the current custom blended benchmark performance from May 2020 through March 31, 2024, for the 1-, 3- and 5-year periods.
•
The Board noted that the Fund’s contractual management fee and total expenses were in the 4th quintile of its expense group, while its actual management fee was in the 3rd quintile. The Board also noted that HFMC had contractually agreed to limit the expenses (exclusive of certain specified expenses) for the Fund.
The Hartford Growth Allocation Fund
•
The Board noted that the Fund’s performance was in the 3rd quintile versus its peer universe for the 1-year period and the 4th quintile for the 3- and 5-year periods. The Board also noted that the Fund’s performance was below its custom blended benchmark for the 1-, 3- and 5-year periods.
•
The Board noted that the Fund’s contractual management fee was in the 1st quintile of its expense group, while its actual management fee was in the 3rd quintile and its total expenses were in the 4th quintile.
Hartford Moderate Allocation Fund
•
The Board noted that the Fund’s performance was in the 2nd quintile versus its peer universe for the 1-year period and the 4th quintile for the 3- and 5-year periods. The Board also noted that the Fund’s performance was below its custom blended benchmark for the 1-, 3- and 5-year periods.
•
The Board noted that the Fund’s contractual management fee was in the 1st quintile of its expense group, while its actual management fee and total expenses were in the 3rd quintile.
Hartford Multi-Asset Income Fund
•
The Board noted that the Fund’s performance was in the 5th quintile versus its peer universe for the 1- and 5-year periods and the 4th quintile for the 3-year period. The Board also noted that the Fund’s performance was below its custom blended benchmark for the 1-, 3- and 5-year periods. The Board also noted upcoming changes to the Fund’s portfolio management team.
•
The Board noted that the Fund’s contractual management fee was in the 3rd quintile of its expense group, while its actual management fee and total expenses were in the 5th quintile.
Hartford Multi-Strategy Funds
Item 11. Statement Regarding Basis for Approval of Investment Advisory Contract.Approval of Investment Management and Investment Sub-Advisory Agreements (Unaudited) – (continued)
Based upon the review of the factors summarized above, among others, the Board concluded that it is in the best interests of each Fund and its shareholders for the Board to approve the continuation of the Agreements for an additional year. In reaching this decision, the Board did not assign relative weights to the factors discussed above or deem any one or group of them to be controlling in and of themselves.
Hartford Multi-Strategy Funds
Index Glossary for Indices Included in the Annual Shareholder Reports (Unaudited)
Bloomberg US Corporate Index (reflects no deduction for fees, expenses or taxes) is the Corporate component of the US Credit Index within the Bloomberg US Aggregate Bond Index. |
Bloomberg US Aggregate Bond Index (reflects no deduction for fees, expenses or taxes) is composed of securities that cover the US investment grade fixed rate bond market, with index components for government and corporate securities, mortgage pass-through securities, and asset-backed securities. |
Bloomberg US High Yield - 2% Issuer Cap Index (reflects no deduction for fees, expenses or taxes) is the 2% issuer cap component of the Bloomberg US High Yield Index, which is an unmanaged broad-based market value-weighted index that tracks the total return performance of non-investment grade, fixed-rate, publicly placed, dollar denominated and non convertible debt registered with the Securities and Exchange Commission. |
Bloomberg US TIPS 1-10 Year Index (reflects no deduction for fees, expenses or taxes) represents US Treasury inflation-protected securities having a maturity of at least 1 year and less than 10 years. |
Bloomberg Commodity Index Total Return (reflects no deduction for fees, expenses or taxes) is composed of futures contracts and reflects the returns on a fully collateralized investment in the Bloomberg Commodity Index ("BCOM"). This combines the returns of the BCOM with the returns on cash collateral invested in 13 week (3 Month) US Treasury Bills. |
JP Morgan Emerging Markets Bond Index Plus (reflects no deduction for fees, expenses or taxes) is a market capitalization-weighted index that tracks returns for actively traded external debt instruments in emerging markets. |
MSCI ACWI Commodity Producers Index (Net) (reflects reinvested dividends net of withholding taxes but reflects no deduction for fees, expenses or other taxes) is designed to capture the global opportunity set of commodity producers in the energy, metal and agricultural sectors. Constituents are selected from the equity universe of MSCI ACWI Index, the parent index, which covers mid and large cap securities across developed market and emerging market countries. |
MSCI ACWI ex USA Index (Net) (reflects reinvested dividends net of withholding taxes but reflects no deduction for fees, expenses or other taxes) is designed to capture large and mid cap securities across developed markets (excluding the US) and emerging market countries. |
MSCI ACWI Index (Net) (reflects reinvested dividends net of withholding taxes but reflects no deduction for fees, expenses or other taxes) is designed to capture large and mid cap securities across developed markets and emerging markets countries. |
MSCI ACWI Infrastructure Index (Net) (reflects reinvested dividends net of withholding taxes but reflects no deduction for fees, expenses or other taxes) is designed to capture the global opportunity set of companies that are owners or operators of infrastructure assets. |
MSCI World IMI Core Real Estate Index (Net) (reflects reinvested dividends net of withholding taxes but reflects no deduction for fees, expenses or other taxes) is designed to capture large, mid and small cap stocks across developed countries engaged in the ownership, development and management of specific core property type real estate. |
Russell 1000 Index (reflects no deduction for fees, expenses or taxes) is designed to measure the performance of the 1,000 largest companies in the Russell 3000 Index. The Russell 3000 Index is designed to measure the performance of the 3,000 largest US companies based on total market capitalizations. |
Russell 1000 Value Index (reflects no deduction for fees, expenses or taxes) is designed to measure the performance of those Russell 1000 Index companies with lower price-to-book ratios and lower forecasted growth values. The Russell 1000 Index is designed to measure the performance of the 1,000 largest companies in the Russell 3000 Index based on their market capitalization and current index membership. |
Russell 3000 Index (reflects no deduction for fees, expenses or taxes) is designed to measure the performance of the 3,000 largest US companies based on total market capitalization. |
S&P 500 Index (reflects no deduction for fees, expenses or taxes) is a float-adjusted market capitalization-weighted index composed of 500 widely held common stocks. |
Additional Information Regarding Bloomberg Index(es). “Bloomberg®” and the above referenced Bloomberg index(es) are service marks of Bloomberg Finance L.P. and its affiliates, including Bloomberg Index Services Limited (“BISL”), the administrator of the index (collectively, “Bloomberg”), and have been licensed for use for certain purposes by Hartford Funds Management Company, LLC ("HFMC"). The Funds are not sponsored, endorsed, sold or promoted by Bloomberg. Bloomberg does not make any representation or warranty, express or implied, to the owners of or counterparties to the Funds or any member of the public regarding the advisability of investing in securities generally or in the Funds particularly. The only relationship of Bloomberg to HFMC is the licensing of certain trademarks, trade names and service marks and of the above referenced Bloomberg index(es), which is determined, composed and calculated by BISL without regard to HFMC or the Funds. Bloomberg has no obligation to take the needs of HFMC or the owners of the Funds into consideration in determining, composing or calculating the above referenced Bloomberg index(es). Bloomberg is not responsible for and has not participated in the determination of the timing of, prices at, or quantities of the Funds to be issued. Bloomberg shall not have any obligation or liability, including, without limitation, to the Funds' customers, in connection with the administration, marketing or trading of the Funds. |
BLOOMBERG DOES NOT GUARANTEE THE ACCURACY AND/OR THE COMPLETENESS OF THE ABOVE REFERENCED BLOOMBERG INDEX(ES) OR ANY DATA RELATED THERETO AND SHALL HAVE NO LIABILITY FOR ANY ERRORS, OMISSIONS OR INTERRUPTIONS THEREIN. BLOOMBERG DOES NOT MAKE ANY WARRANTY, EXPRESS OR IMPLIED, AS TO RESULTS TO BE OBTAINED BY HFMC, OWNERS OF THE FUNDS OR ANY OTHER PERSON OR |
Hartford Multi-Strategy Funds
Index Glossary for Indices Included in the Annual Shareholder Reports (Unaudited) – (continued)
ENTITY FROM THE USE OF THE ABOVE REFERENCED BLOOMBERG INDEX(ES) OR ANY DATA RELATED THERETO. BLOOMBERG DOES NOT MAKE ANY EXPRESS OR IMPLIED WARRANTIES AND EXPRESSLY DISCLAIMS ALL WARRANTIES OF MERCHANTABILITY OR FITNESS FOR A PARTICULAR PURPOSE OR USE WITH RESPECT TO THE ABOVE REFERENCED BLOOMBERG INDEX(ES) OR ANY DATA RELATED THERETO. WITHOUT LIMITING ANY OF THE FOREGOING, TO THE MAXIMUM EXTENT ALLOWED BY LAW, BLOOMBERG, ITS LICENSORS, AND ITS AND THEIR RESPECTIVE EMPLOYEES, CONTRACTORS, AGENTS, SUPPLIERS, AND VENDORS SHALL HAVE NO LIABILITY OR RESPONSIBILITY WHATSOEVER FOR ANY INJURY OR DAMAGES --WHETHER DIRECT, INDIRECT, CONSEQUENTIAL, INCIDENTAL, PUNITIVE OR OTHERWISE --ARISING IN CONNECTION WITH THE ABOVE REFERENCED BLOOMBERG INDEX(ES) OR ANY DATA OR VALUES RELATING THERETO --WHETHER ARISING FROM THEIR NEGLIGENCE OR OTHERWISE, EVEN IF NOTIFIED OF THE POSSIBILITY THEREOF. |
Additional Information Regarding Blended Benchmarks that Include an MSCI Index. The blended returns are calculated by HFMC and include, among other index provider data, end of day index level values licensed from MSCI (“MSCI Data”). For the avoidance of doubt, MSCI is not the benchmark “administrator” for, or a “contributor”, “submitter” or “supervised contributor” to, the blended returns, and the MSCI Data is not considered a “contribution” or “submission” in relation to the blended returns, as those terms may be defined in any rules, laws, regulations, legislation or international standards. MSCI Data is provided “AS IS” without warranty or liability and no copying or distribution is permitted. MSCI does not make any representation regarding the advisability of any investment or strategy and does not sponsor, promote, issue, sell or otherwise recommend or endorse any investment or strategy, including any financial products or strategies based on, tracking or otherwise utilizing any MSCI Data, models, analytics or other materials or information. |
Additional Information Regarding MSCI Indices.
Neither MSCI nor any other party involved in or related to compiling, computing or creating the MSCI data makes any express or implied warranties or representations with respect to such data (or the results to be obtained by the use thereof), and all such parties hereby expressly disclaim all warranties of originality, accuracy, completeness, merchantability or fitness for a particular purpose with respect to any of such data. Without limiting any of the foregoing, in no event shall MSCI, any of its affiliates or any third party involved in or related to compiling, computing or creating the data have any liability for any direct, indirect, special, punitive, consequential or any other damages (including lost profits) even if notified of the possibility of such damages. No further distribution or dissemination of the MSCI data is permitted without MSCI’s express written consent. |
This report is submitted for the general information of the shareholders of the Funds referenced in this report. It is not authorized for distribution to persons who are not shareholders of one or more Funds referenced in this report unless preceded or accompanied by a current prospectus for the relevant Funds. Nothing herein contained is to be considered an offer of sale or a solicitation of an offer to buy shares of any Fund listed in this report.
The information cannot be used or relied upon for the purpose of avoiding IRS penalties. These materials are not intended to provide tax, accounting or legal advice. As with all matters of a tax or legal nature, you should consult your own tax or legal counsel for advice.
Investors should carefully consider a Fund’s investment objectives, risks, charges and expenses. This and other important information is contained in the Fund’s prospectus and summary prospectus, which can be obtained by visiting hartfordfunds.com. Please read it carefully before investing.
The Funds are distributed by Hartford Funds Distributors, LLC.
MFAR-MS24 12/24 Printed in the U.S.A.
Item 12. Disclosure of Proxy Voting Policies and Procedures for Closed-End Management Investment Companies.
Not applicable.
Item 13. Portfolio Managers of Closed-End Management Investment Companies.
Not applicable.
Item 14. Purchases of Equity Securities by Closed-End Management Investment Company and Affiliated Purchasers.
Not applicable.
Item 15. Submission of Matters to a Vote of Security Holders.
There have been no material changes to the procedures by which the shareholders may recommend nominees to the registrant’s board of directors, where those changes were implemented after the registrant last provided disclosure in response to the requirements of Item 407(c)(2)(iv) of Regulation S-K (17 CFR 229.407) (as required by Item 22(b)(15) of Schedule 14A (17 CFR 240.14a-101)), or this Item.
Item 16. Controls and Procedures.
| | (a) | The registrant’s principal executive and principal financial officers, or persons performing similar functions, have concluded that the registrant’s disclosure controls and procedures (as defined in Rule 30a-3(c) under the Investment Company Act of 1940, as amended (the “1940 Act”) (17 CFR 270.30a-3(c))) are generally effective to provide reasonable assurance, as of a date within 90 days of the filing date of the report that includes the disclosure required by this paragraph, based on their evaluation of these controls and procedures required by Rule 30a-3(b) under the 1940 Act (17 CFR 270.30a-3(b)) and Rules 13a-15(b) or 15d-15(b) under the Securities Exchange Act of 1934, as amended (17 CFR 240.13a-15(b) or 240.15d-15(b)). |
| | (b) | There were no changes in the registrant’s internal control over financial reporting (as defined in Rule 30a-3(d) under the 1940 Act (17 CFR 270.30a-3(d)) that occurred during the period covered by this report that have materially affected, or are reasonably likely to materially affect, the registrant’s internal control over financial reporting. |
Item 17. Disclosure of Securities Lending Activities for Closed-End Management Investment Companies.
Not applicable.
Item 18. Recovery of Erroneously Awarded Compensation.
Not applicable.
Item 19. Exhibits.
SIGNATURES
Pursuant to the requirements of the Securities Exchange Act of 1934 and the Investment Company Act of 1940, the registrant has duly caused this report to be signed on its behalf by the undersigned, thereunto duly authorized.
| | | | | | |
| | | | THE HARTFORD MUTUAL FUNDS, INC. |
| | | |
| Date: January 6, 2025 | | | | By: | | /s/ Gregory A. Frost |
| | | | | | Gregory A. Frost |
| | | | | | President and Chief Executive Officer |
Pursuant to the requirements of the Securities Exchange Act of 1934 and the Investment Company Act of 1940, this report has been signed below by the following persons on behalf of the registrant and in the capacities and on the dates indicated.
| | | | | | |
| Date: January 6, 2025 | | | | By: | | /s/ Gregory A. Frost |
| | | | | | Gregory A. Frost |
| | | | | | President and Chief Executive Officer |
| | | | | | |
| Date: January 6, 2025 | | | | By: | | /s/ Ankit Puri |
| | | | | | Ankit Puri |
| | | | | | Treasurer |
| | | | | | (Principal Financial Officer and Principal Accounting Officer) |