Exhibit 99.2

Salix Pharmaceuticals Investor Presentation
December 2013
We have a
One Tract
mind.
Table of Contents
Transaction Overview 5
Salix & Santarus Overview 7
Key Credit Highlights 12
Combined Company Overview 16
Historical Financial Overview 29
Appendix 33
2
Disclaimer
Forward-Looking Statements
This document contains forward-looking statements, which relate to matters such as the Company’s acquisition of Santarus, Inc. (“Santarus”) and the Company’s industry, business strategy, goals and expectations concerning its market position, future operations, margins, profitability, capital expenditures, liquidity and capital resources, other financial and operating information and peak revenue potential. When used in this presentation, the words “will,” “believes,” “intends,” “anticipates,” “plans”, “projects”, “estimates”, “expects” and similar expressions (including negatives thereof) are intended to identify forward-looking statements. Such statements are based on management’s current expectations and assumptions regarding the Company’s business and performance, the economy and other future conditions and forecasts of future events, circumstances and results. As with any projection or forecast, forward-looking statements are inherently susceptible to uncertainty and changes in circumstances. Actual results could differ materially from those expressed in, or implied by, such forward-looking statements.
Factors that could cause our actual results to differ materially from the Company’s projected results include, among others, those set forth in the section entitled “Risk Factors” in the Company’s and Santarus’ filings with the Securities and Exchange Commission. The Company makes no representations or warranties as to the accuracy or completeness of such statements, estimates and projections and there can be no assurance that the third party or publicly available information on which the Company’s forward-looking statements are based is complete or accurate.
Non-GAAP Financial Measures
Some of the financial metrics presented in this document represent non-GAAP financial measures. A reconciliation of the non-GAAP financial metrics to GAAP is presented in the Appendix. However, these non-GAAP financial metrics should not be considered as an alternative to other performance or liquidity measures derived in accordance with GAAP.
Pro Forma Information
This document contains certain pro forma information that reflects our current expectations and assumptions regarding the effect that our pending acquisition of Santarus would have had if it has been completed at an earlier date. This pro forma information does not purport to present the results that would have actually occurred had the acquisition been completed on the assumed date, or which may be realized in the future.
Trademark Disclaimer
The following are trademarks or registered trademarks of Salix in the United States and/or other countries: APRISO®, COLAZAL®, FULYZAQ™, GIAZO®, OSMOPREP®, METOZOLV®, PROCTOCORT®, and RELISTOR®.
The following are registered trademarks of Santarus in the United States and/or other countries: FENOGLIDE®, UCERIS®, and ZEGERID®.
There may be other company names and products mentioned in this document, and such company names and/or products may be trademarks or registered trademarks of other companies. The use of these company names and/or products herein is not intended to imply a relationship or endorsement of Salix or Santarus by such company.
3
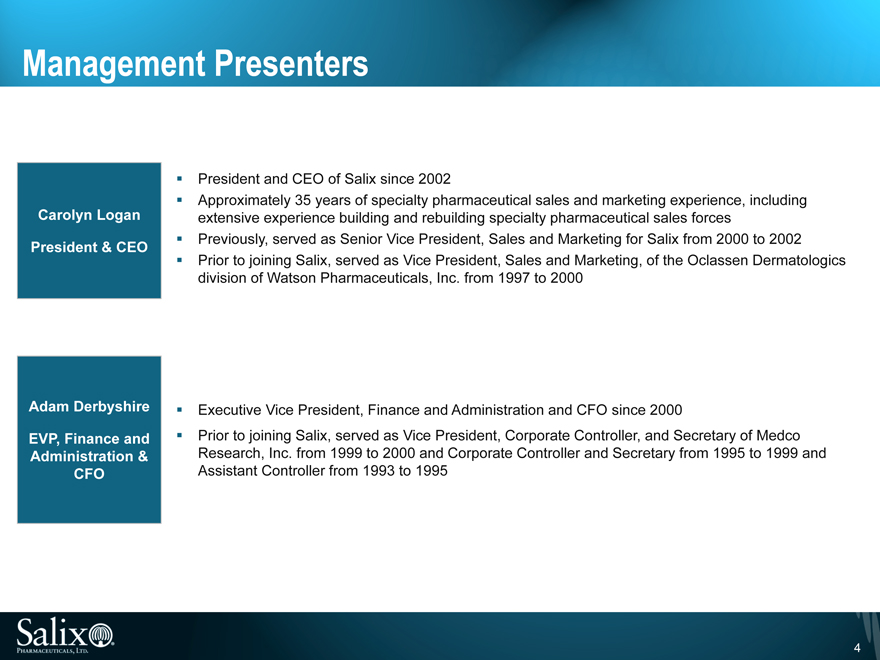
Management Presenters
Carolyn Logan
President & CEO
President and CEO of Salix since 2002
Approximately 35 years of specialty pharmaceutical sales and marketing experience, including extensive experience building and rebuilding specialty pharmaceutical sales forces Previously, served as Senior Vice President, Sales and Marketing for Salix from 2000 to 2002 Prior to joining Salix, served as Vice President, Sales and Marketing, of the Oclassen Dermatologics division of Watson Pharmaceuticals, Inc. from 1997 to 2000
Adam Derbyshire
EVP, Finance and Administration & CFO
Executive Vice President, Finance and Administration and CFO since 2000
Prior to joining Salix, served as Vice President, Corporate Controller, and Secretary of Medco Research, Inc. from 1999 to 2000 and Corporate Controller and Secretary from 1995 to 1999 and Assistant Controller from 1993 to 1995
4
Transaction Overview
5
Introduction
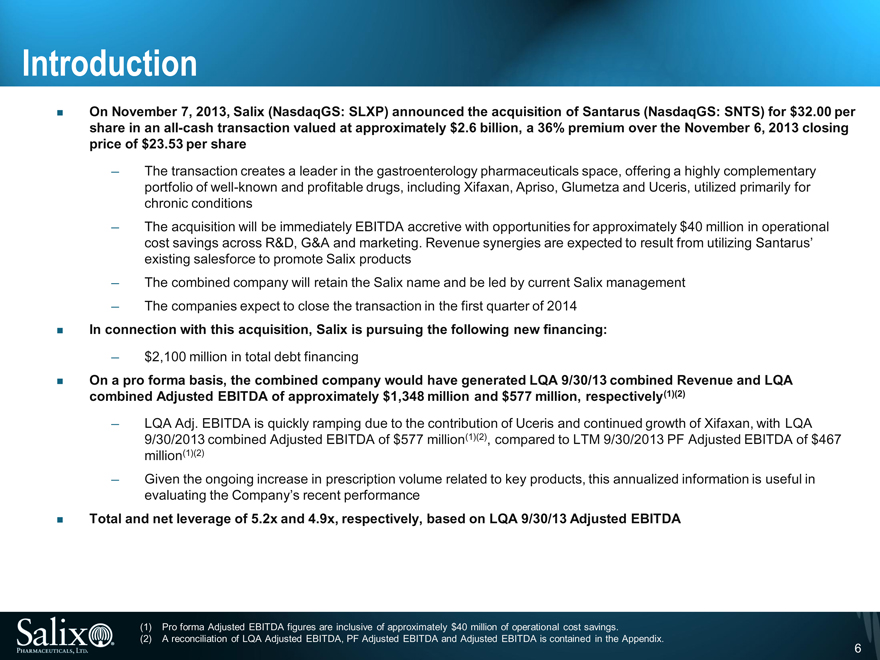
On November 7, 2013, Salix (NasdaqGS: SLXP) announced the acquisition of Santarus (NasdaqGS: SNTS) for $32.00 per share in an all-cash transaction valued at approximately $2.6 billion, a 36% premium over the November 6, 2013 closing price of $23.53 per share
The transaction creates a leader in the gastroenterology pharmaceuticals space, offering a highly complementary portfolio of well-known and profitable drugs, including Xifaxan, Apriso, Glumetza and Uceris, utilized primarily for chronic conditions
The acquisition will be immediately EBITDA accretive with opportunities for approximately $40 million in operational cost savings across R&D, G&A and marketing. Revenue synergies are expected to result from utilizing Santarus’ existing salesforce to promote Salix products
The combined company will retain the Salix name and be led by current Salix management
The companies expect to close the transaction in the first quarter of 2014
In connection with this acquisition, Salix is pursuing the following new financing:
$2,100 million in total debt financing
On a pro forma basis, the combined company would have generated LQA 9/30/13 combined Revenue and LQA combined Adjusted EBITDA of approximately $1,348 million and $577 million, respectively(1)(2)
LQA Adj. EBITDA is quickly ramping due to the contribution of Uceris and continued growth of Xifaxan, with LQA 9/30/2013 combined Adjusted EBITDA of $577 million(1)(2), compared to LTM 9/30/2013 PF Adjusted EBITDA of $467 million(1)(2)
Given the ongoing increase in prescription volume related to key products, this annualized information is useful in evaluating the Company’s recent performance
Total and net leverage of 5.2x and 4.9x, respectively, based on LQA 9/30/13 Adjusted EBITDA
(1) Pro forma Adjusted EBITDA figures are inclusive of approximately $40 million of operational cost savings.
(2) A reconciliation of LQA Adjusted EBITDA, PF Adjusted EBITDA and Adjusted EBITDA is contained in the Appendix.
6

Salix & Santarus Overview
7
Salix Overview
Company Description
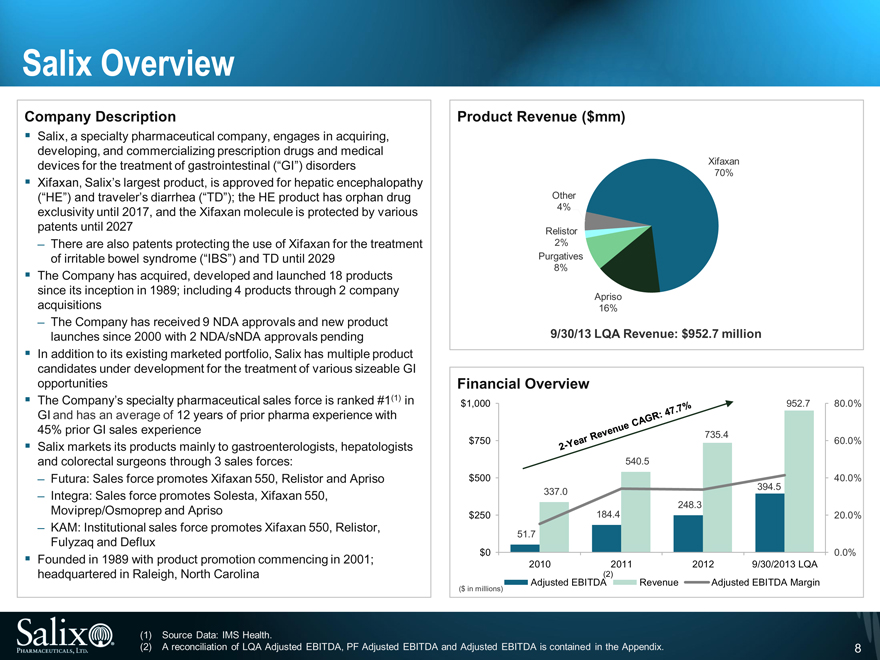
Salix, a specialty pharmaceutical company, engages in acquiring, developing, and commercializing prescription drugs and medical devices for the treatment of gastrointestinal (“GI”) disorders
Xifaxan, Salix’s largest product, is approved for hepatic encephalopathy (“HE”) and traveler’s diarrhea (“TD”); the HE product has orphan drug exclusivity until 2017, and the Xifaxan molecule is protected by various patents until 2027
There are also patents protecting the use of Xifaxan for the treatment of irritable bowel syndrome (“IBS”) and TD until 2029
The Company has acquired, developed and launched 18 products since its inception in 1989; including 4 products through 2 company acquisitions
The Company has received 9 NDA approvals and new product launches since 2000 with 2 NDA/sNDA approvals pending
In addition to its existing marketed portfolio, Salix has multiple product candidates under development for the treatment of various sizeable GI opportunities
The Company’s specialty pharmaceutical sales force is ranked #1(1) in GI and has an average of 12 years of prior pharma experience with 45% prior GI sales experience
Salix markets its products mainly to gastroenterologists, hepatologists and colorectal surgeons through 3 sales forces:
Futura: Sales force promotes Xifaxan 550, Relistor and Apriso
Integra: Sales force promotes Solesta, Xifaxan 550,
Moviprep/Osmoprep and Apriso
KAM: Institutional sales force promotes Xifaxan 550, Relistor, Fulyzaq and Deflux
Founded in 1989 with product promotion commencing in 2001; headquartered in Raleigh, North Carolina
Product Revenue ($mm)
Xifaxan
70%
Other
4%
Relistor
2%
Purgatives
8%
Apriso
16%
9/30/13 LQA Revenue: $952.7 million
Financial Overview
$1,000
952.7
80.0%
735.4
$750
60.0%
540.5
$500
40.0%
337.0
394.5
248.3
$250
184.4
20.0%
51.7
$0
0.0%
2010
2011
2012
9/30/2013 LQA
2-Year Revenue CAGR: 47.7%
(2)
Adjusted EBITDA
Revenue
Adjusted EBITDA Margin
($ in millions)
(1)
Source Data: IMS Health.
(2)
A reconciliation of LQA Adjusted EBITDA, PF Adjusted EBITDA and Adjusted EBITDA is contained in the Appendix.
8
Santarus Overview
Company Description
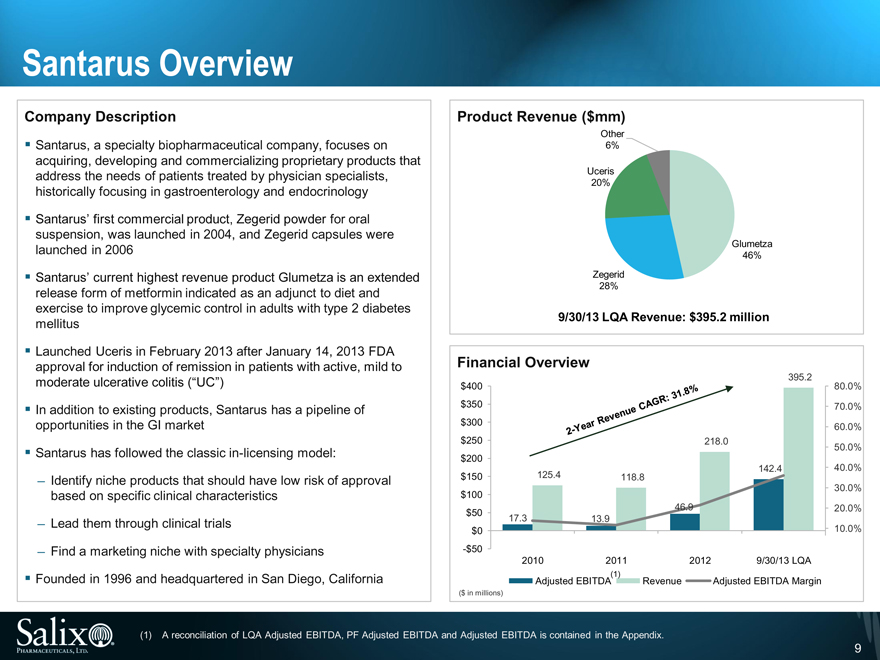
Santarus, a specialty biopharmaceutical company, focuses on acquiring, developing and commercializing proprietary products that address the needs of patients treated by physician specialists, historically focusing in gastroenterology and endocrinology
Santarus’ first commercial product, Zegerid powder for oral suspension, was launched in 2004, and Zegerid capsules were launched in 2006
Santarus’ current highest revenue product Glumetza is an extended release form of metformin indicated as an adjunct to diet and exercise to improve glycemic control in adults with type 2 diabetes mellitus
Launched Uceris in February 2013 after January 14, 2013 FDA approval for induction of remission in patients with active, mild to moderate ulcerative colitis (“UC”)
In addition to existing products, Santarus has a pipeline of opportunities in the GI market
Santarus has followed the classic in-licensing model:
Identify niche products that should have low risk of approval based on specific clinical characteristics
Lead them through clinical trials
Find a marketing niche with specialty physicians
Founded in 1996 and headquartered in San Diego, California
Product Revenue ($mm)
Other
6%
Uceris
20%
Glumetza
46%
Zegerid
28%
9/30/13 LQA Revenue: $395.2 million
Financial Overview
395.2
$400
80.0%
$350
70.0%
$300
60.0%
$250
218.0
50.0%
$200
142.4
40.0%
$150
125.4
118.8
30.0%
$100
$50
46.9
20.0%
17.3
13.9
$0
10.0%
-$50
2010
2011
2012
9/30/13 LQA
Adjusted EBITDA(1)
Revenue
Adjusted EBITDA Margin
($ in millions)
(1) A reconciliation of LQA Adjusted EBITDA, PF Adjusted EBITDA and Adjusted EBITDA is contained in the Appendix.
9
Summary Business Comparison
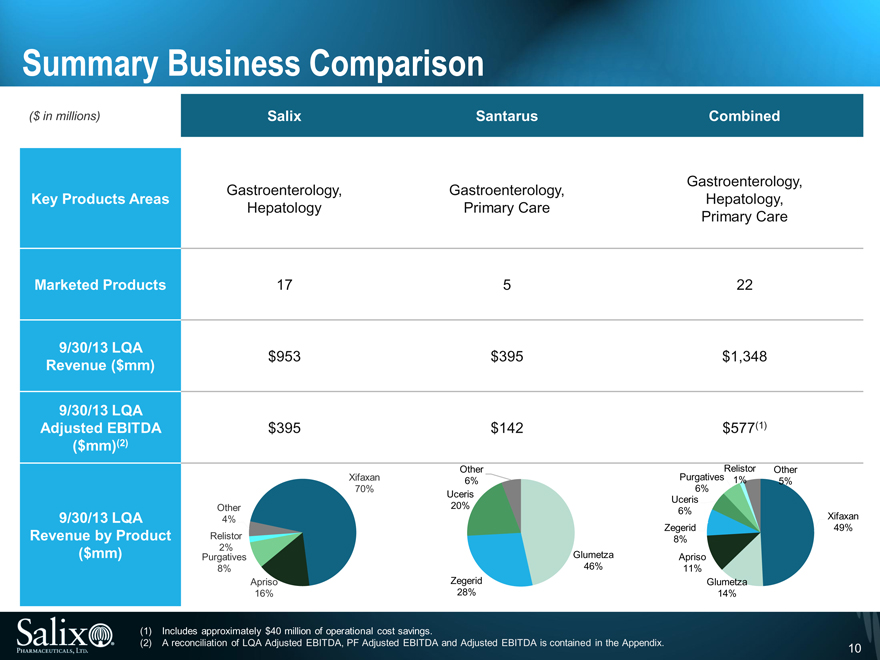
($ in millions) Salix Santarus Combined
Gastroenterology, Gastroenterology, Gastroenterology,
Key Products Areas Hepatology,
Hepatology Primary Care Primary Care
Marketed Products 17 5 22
9/30/13 LQA
Revenue ($mm) $953 $ 395 $1,348
9/30/13 LQA
Adjusted EBITDA $395 $ 142 $577(1)
($mm)(2)
Other Relistor Other
Xifaxan 6% Purgatives 1% 5%
70% 6%
Uceris Uceris
Other 20% 6%
9/30/13 LQA 4% Xifaxan
Zegerid 49%
Revenue by Product Relistor 8%
($mm) Purgatives 2% Glumetza Apriso
8% 46% 11%
Apriso Zegerid Glumetza
16% 28% 14%
(1) Includes approximately $40 million of operational cost savings.
(2) A reconciliation of LQA Adjusted EBITDA, PF Adjusted EBITDA and Adjusted EBITDA is contained in the Appendix. 10
Transaction Rationale
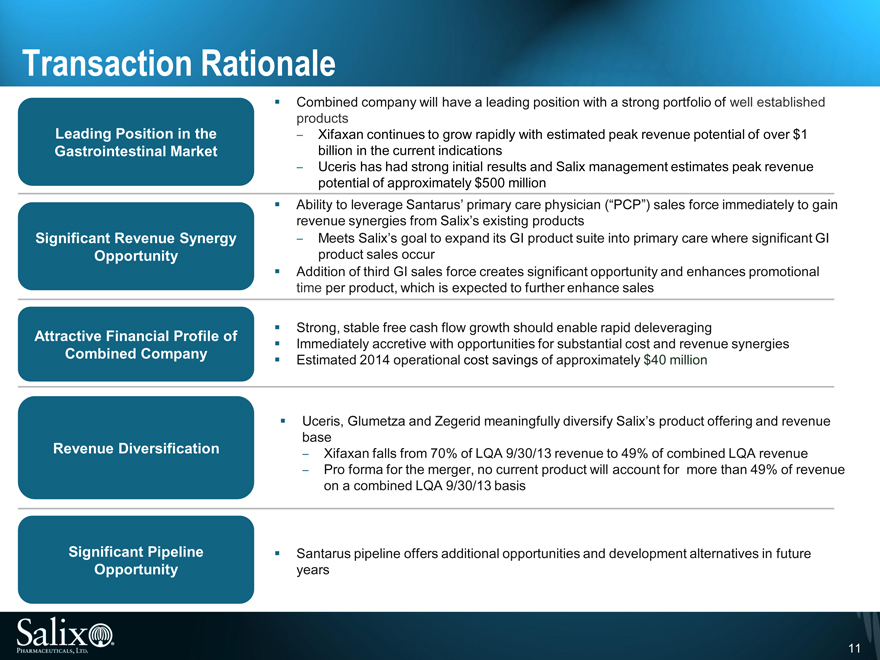
Combined company will have a leading position with a strong portfolio of well established
products
Leading Position in the Xifaxan continues to grow rapidly with estimated peak revenue potential of over $1
Gastrointestinal Market billion in the current indications
Uceris has had strong initial results and Salix management estimates peak revenue
potential of approximately $500 million
Ability to leverage Santarus’ primary care physician (“PCP”) sales force immediately to gain
revenue synergies from Salix’s existing products
Significant Revenue Synergy Meets Salix’s goal to expand its GI product suite into primary care where significant GI
Opportunity product sales occur
Addition of third GI sales force creates significant opportunity and enhances promotional
time per product, which is expected to further enhance sales
Strong, stable free cash flow growth should enable rapid deleveraging
Attractive Financial Profile of Immediately accretive with opportunities for substantial cost and revenue synergies
Combined Company Estimated 2014 operational cost savings of approximately $40 million
Significant Pipeline Santarus pipeline offers additional opportunities and development alternatives in future
Opportunity years Uceris, Glumetza and Zegerid meaningfully diversify Salix’s product offering and revenue
base
Revenue Diversification Xifaxan falls from 70% of LQA 9/30/13 revenue to 49% of combined LQA revenue
Pro forma for the merger, no current product will account for more than 49% of revenue
on a combined LQA 9/30/13 basis
11

Key Credit Highlights
12
Summary of Key Credit Highlights
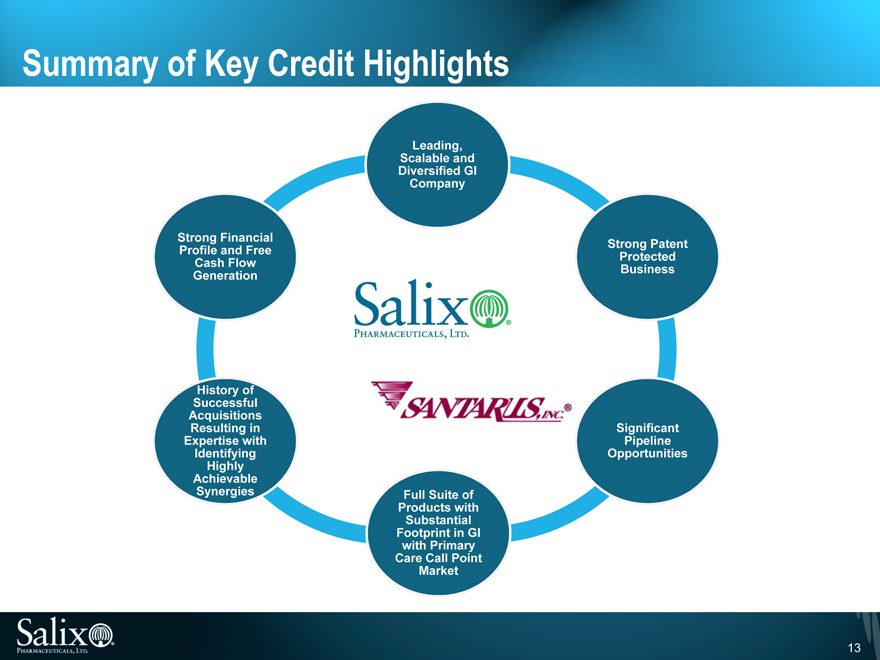
Leading, Scalable and Diversified GI
Company
Strong Patent Protected Business
Significant Pipeline Opportunities
Full Suite of Products with Substantial Footprint in GI with Primary Care Call Point Market
History of Successful Acquisitions Resulting in Expertise with Identifying Highly Achievable Synergies
Strong Financial Profile and Free Cash Flow Generation
13
Key Highlights
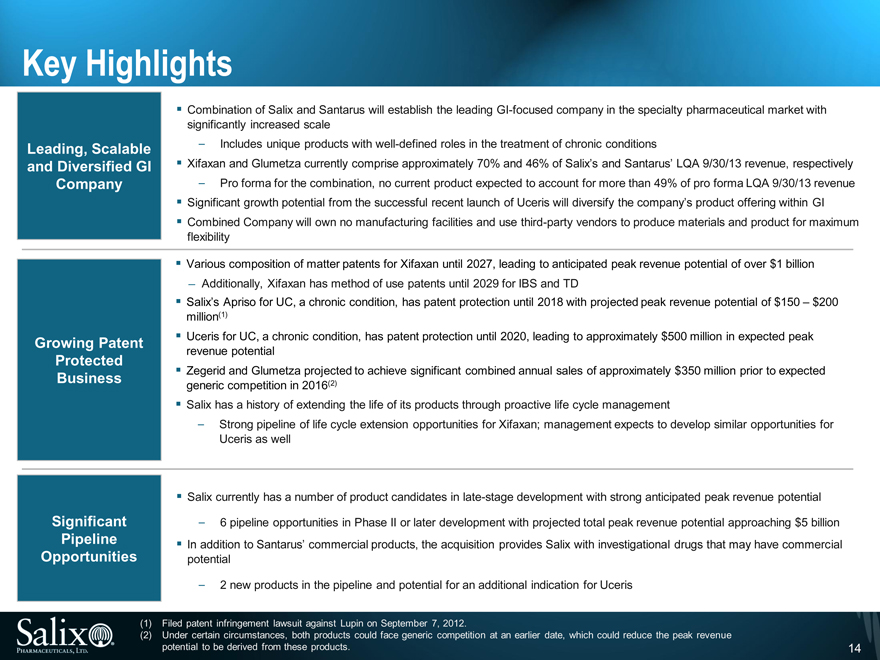
Combination of Salix and Santarus will establish the leading GI-focused company in the specialty pharmaceutical market with
significantly increased scale
Leading, Scalable Includes unique products with well-defined roles in the treatment of chronic conditions
and Diversified GI Xifaxan and Glumetza currently comprise approximately 70% and 46% of Salix’s and Santarus’ LQA 9/30/13 revenue, respectively
Company Pro forma for the combination, no current product expected to account for more than 49% of pro forma LQA 9/30/13 revenue
Significant growth potential from the successful recent launch of Uceris will diversify the company’s product offering within GI
Combined Company will own no manufacturing facilities and use third-party vendors to produce materials and product for maximum
flexibility
Various composition of matter patents for Xifaxan until 2027, leading to anticipated peak revenue potential of over $1 billion
Additionally, Xifaxan has method of use patents until 2029 for IBS and TD
Salix’s Apriso for UC, a chronic condition, has patent protection until 2018 with projected peak revenue potential of $150 – $200
million(1)
Growing Patent Uceris for UC, a chronic condition, has patent protection until 2020, leading to approximately $500 million in expected peak
revenue potential
Protected
Business Zegerid and Glumetza projected to achieve significant combined annual sales of approximately $350 million prior to expected
generic competition in 2016(2)
Salix has a history of extending the life of its products through proactive life cycle management
Strong pipeline of life cycle extension opportunities for Xifaxan; management expects to develop similar opportunities for
Uceris as well
Salix currently has a number of product candidates in late-stage development with strong anticipated peak revenue potential
Significant 6 pipeline opportunities in Phase II or later development with projected total peak revenue potential approaching $5 billion
Pipeline In addition to Santarus’ commercial products, the acquisition provides Salix with investigational drugs that may have commercial
Opportunities potential
2 new products in the pipeline and potential for an additional indication for Uceris
(1) Filed patent infringement lawsuit against Lupin on September 7, 2012.
(2) Under certain circumstances, both products could face generic competition at an earlier date, which could reduce the peak revenue
potential to be derived from these products. 14
Key Highlights (cont’d)
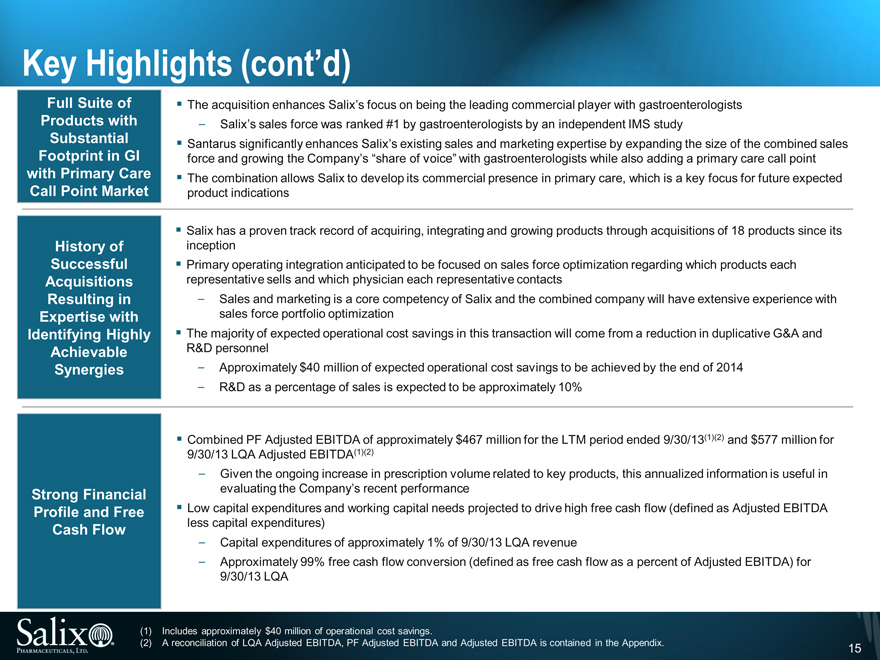
Full Suite of The acquisition enhances Salix’s focus on being the leading commercial player with gastroenterologists
Products with Salix’s sales force was ranked #1 by gastroenterologists by an independent IMS study
Substantial Santarus significantly enhances Salix’s existing sales and marketing expertise by expanding the size of the combined sales
Footprint in GI force and growing the Company’s “share of voice” with gastroenterologists while also adding a primary care call point
with Primary Care The combination allows Salix to develop its commercial presence in primary care, which is a key focus for future expected
Call Point Market product indications
Salix has a proven track record of acquiring, integrating and growing products through acquisitions of 18 products since its
History of inception
Successful Primary operating integration anticipated to be focused on sales force optimization regarding which products each
Acquisitions representative sells and which physician each representative contacts
Resulting in Sales and marketing is a core competency of Salix and the combined company will have extensive experience with
Expertise with sales force portfolio optimization
Identifying Highly The majority of expected operational cost savings in this transaction will come from a reduction in duplicative G&A and
Achievable R&D personnel
Synergies Approximately $40 million of expected operational cost savings to be achieved by the end of 2014
R&D as a percentage of sales is expected to be approximately 10%
Combined PF Adjusted EBITDA of approximately $467 million for the LTM period ended 9/30/13(1)(2) and $577 million for
9/30/13 LQA Adjusted EBITDA(1)(2)
Given the ongoing increase in prescription volume related to key products, this annualized information is useful in
Strong Financial evaluating the Company’s recent performance
Profile and Free Low capital expenditures and working capital needs projected to drive high free cash flow (defined as Adjusted EBITDA
Cash Flow less capital expenditures)
Capital expenditures of approximately 1% of 9/30/13 LQA revenue
Approximately 99% free cash flow conversion (defined as free cash flow as a percent of Adjusted EBITDA) for
9/30/13 LQA
(1) Includes approximately $40 million of operational cost savings.
(2) A reconciliation of LQA Adjusted EBITDA, PF Adjusted EBITDA and Adjusted EBITDA is contained in the Appendix. 15
Combined Company Overview
16
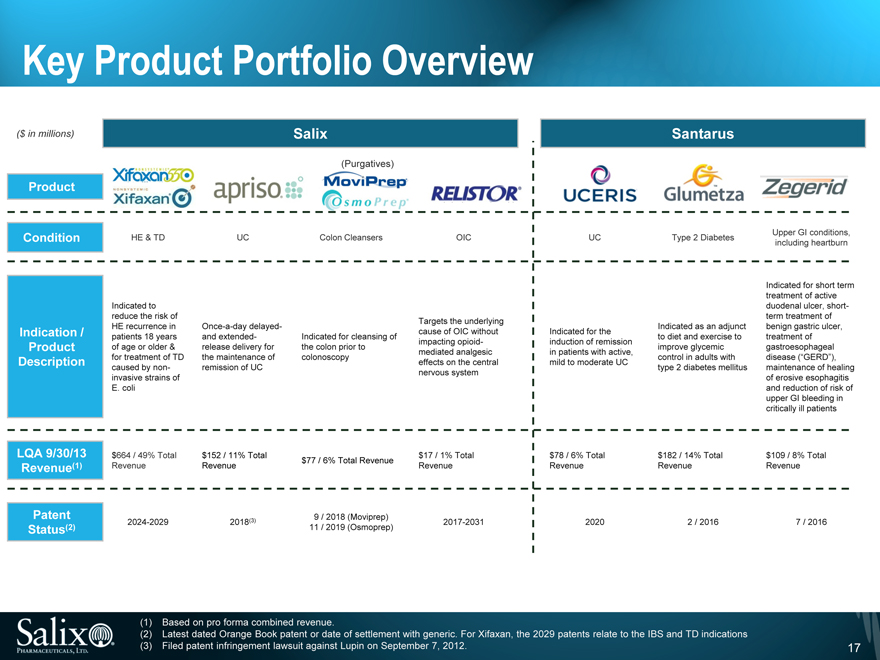
Key Product Portfolio Overview
($ in millions) Salix Santarus
(Purgatives)
Product
Condition HE & TD UC Colon Cleansers OIC UC Type 2 Diabetes
Indicated to reduce the risk of
Targets the underlying
HE recurrence in Once-a-day delayed - Indicated as an adjunct Indication / cause of OIC without Indicated for the patients 18 years and extended - Indicated for cleansing of to diet and exercise to impacting opioid- induction of remission Product of age or older & release delivery for the colon prior to improve glycemic mediated analgesic in patients with active, for treatment of TD the maintenance of colonoscopy control in adults with Description effects on the central mild to moderate UC caused by non- remission of UC type 2 diabetes mellitus nervous system invasive strains of E. coli
LQA 9/30/13 $664 / 49% Total $152 / 11% Total $17 / 1% Total $78 / 6% Total $182 / 14% Total $77 / 6% Total Revenue Revenue (1) Revenue Revenue Revenue Revenue Revenue
Patent 9 / 2018 (Moviprep)
Status (2) 2024-2029 2018(3) 11 / 2019 (Osmoprep) 2017-2031 2020 2 / 2016
(1) Based on pro forma combined revenue.
(2) Latest dated Orange Book patent or date of settlement with generic. For Xifaxan, the 2029 patents relate to the IBS and TD indications (3) Filed patent infringement lawsuit against Lupin on September 7, 2012.
Upper GI conditions, including heartburn
Indicated for short term treatment of active duodenal ulcer, short-term treatment of benign gastric ulcer, treatment of gastroesophageal disease (_GERD_), maintenance of healing of erosive esophagitis and reduction of risk of upper GI bleeding in critically ill patients
$109 / 8% Total Revenue
7 / 2016
17
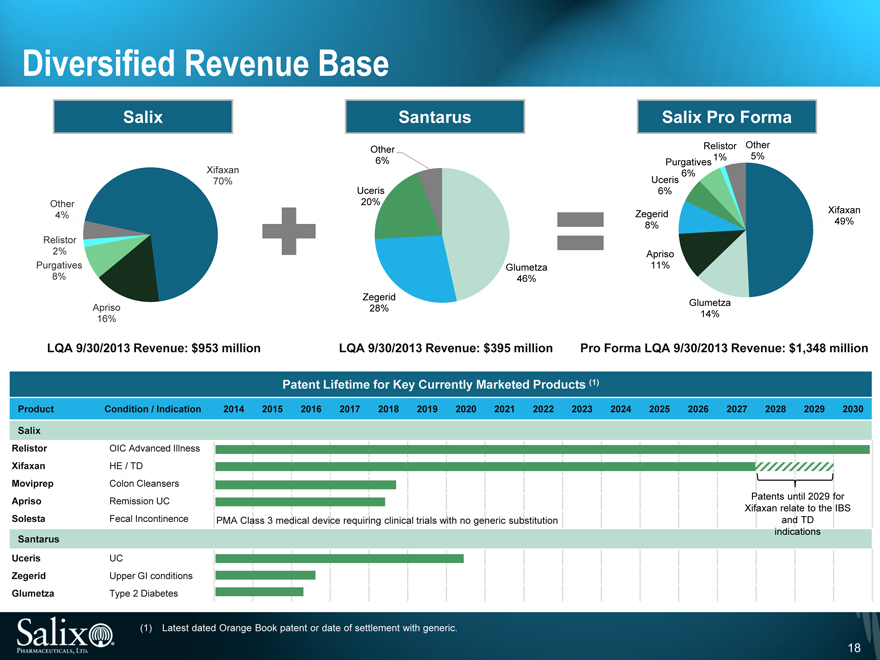
Diversified Revenue Base
Salix
Other 4%
Relistor 2%
Purgatives 8%
Apriso 16%
Xifaxan 70%
Santarus
Other 6%
Uceris 20%
Zegerid 28%
Glumetza 46%
Salix Pro Forma
Other 5%
Relistor 1%
Purgatives 6%
Uceris 6%
Zegerid 8%
Apriso 11%
Glumetza 14%
Xifaxan 49%
LQA 9/30/2013 Revenue: $953 million
LQA 9/30/2013 Revenue: $395 million
Pro Forma LQA 9/30/2013 Revenue: $1,348 million
Patent Lifetime for Key Currently Marketed Products (1)
Product Condition / Indication 2014 2015 2016 2017 2018 2019 2020 2021 2022 2023 2024 2025 2026 2027 2028 2029 2030
Salix
Relistor OIC Advanced Illness
Xifaxan HE / TD
Moviprep Colon Cleansers
Apriso Remission UC Patents until 2029 for
Xifaxan relate to the IBS
Solesta Fecal Incontinence PMA Class 3 medical device requiring clinical trials with no generic substitution and TD
indications
Santarus
Uceris UC
Zegerid Upper GI conditions
Glumetza Type 2 Diabetes
(1) Latest dated Orange Book patent or date of settlement with generic.
18
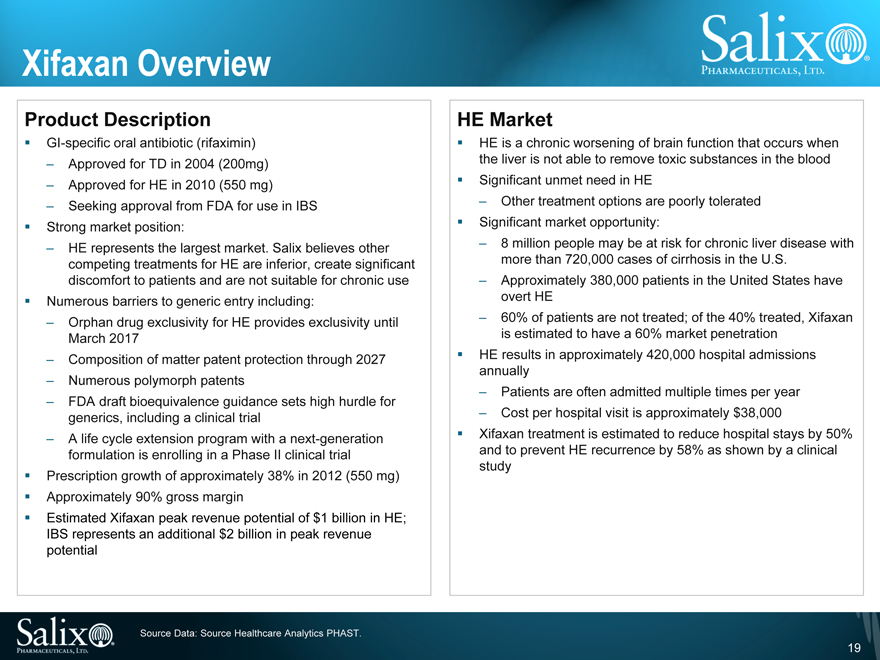
Xifaxan Overview
Product Description
GI-specific oral antibiotic (rifaximin)
Approved for TD in 2004 (200mg)
Approved for HE in 2010 (550 mg)
Seeking approval from FDA for use in IBS
Strong market position:
HE represents the largest market. Salix believes other competing treatments for HE are inferior, create significant discomfort to patients and are not suitable for chronic use Numerous barriers to generic entry including:
Orphan drug exclusivity for HE provides exclusivity until March 2017
Composition of matter patent protection through 2027
Numerous polymorph patents
FDA draft bioequivalence guidance sets high hurdle for generics, including a clinical trial
A life cycle extension program with a next-generation formulation is enrolling in a Phase II clinical trial Prescription growth of approximately 38% in 2012 (550 mg) Approximately 90% gross margin Estimated Xifaxan peak revenue potential of $1 billion in HE; IBS represents an additional $2 billion in peak revenue potential
Source Data: Source Healthcare Analytics PHAST.
HE Market
HE is a chronic worsening of brain function that occurs when the liver is not able to remove toxic substances in the blood Significant unmet need in HE
Other treatment options are poorly tolerated Significant market opportunity:
8 million people may be at risk for chronic liver disease with more than 720,000 cases of cirrhosis in the U.S.
Approximately 380,000 patients in the United States have overt HE
60% of patients are not treated; of the 40% treated, Xifaxan is estimated to have a 60% market penetrationHE results in approximately 420,000 hospital admissions annually
Patients are often admitted multiple times per year
Cost per hospital visit is approximately $38,000
Xifaxan treatment is estimated to reduce hospital stays by 50% and to prevent HE recurrence by 58% as shown by a clinical study
19
Xifaxan Overview (cont’d)
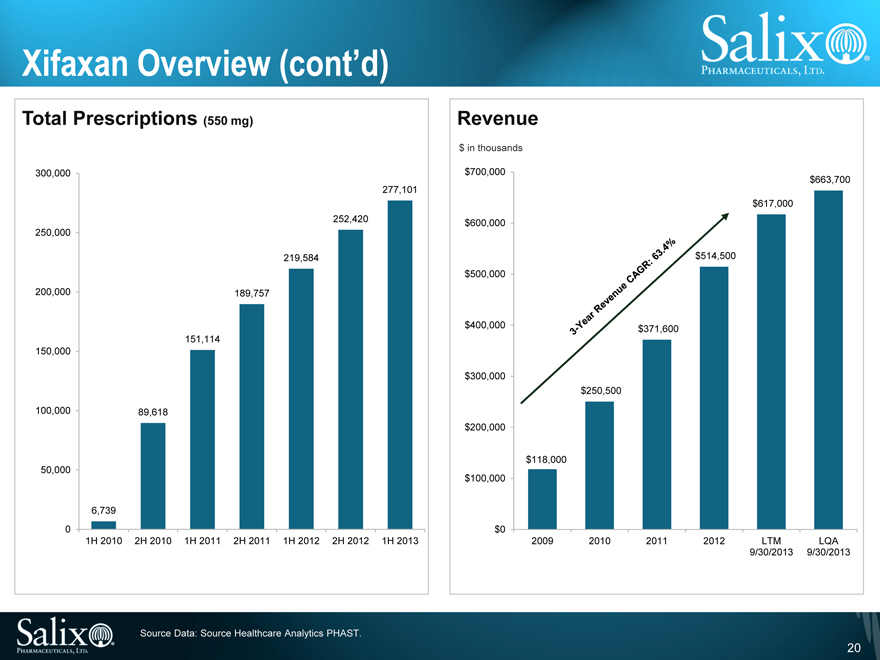
Total Prescriptions (550 mg)
300,000 250,000 200,000 150,000 100,000 50,000 0
6,739
89,618
151,114
189,757
219,584
252,420
277,101
1H 2010
2H 2010
1H 2011
2H 2011
1H 2012
2H 2012
1H 2013
Revenue
$ in thousands
$700,000 $600,000 $500,000 $400,000 $300,000 $200,000 $100,000 $0
$118,000
$250,500
$371,600
$514,500
$617,000
$663,700
2009
2010
2011
2012
LTM 9/30/2013
LQA 9/30/2013
3-Year Revenue CAGR: 63.4%
Source Data: Source Healthcare Analytics PHAST.
20
Uceris Overview
Product Description
UC Market
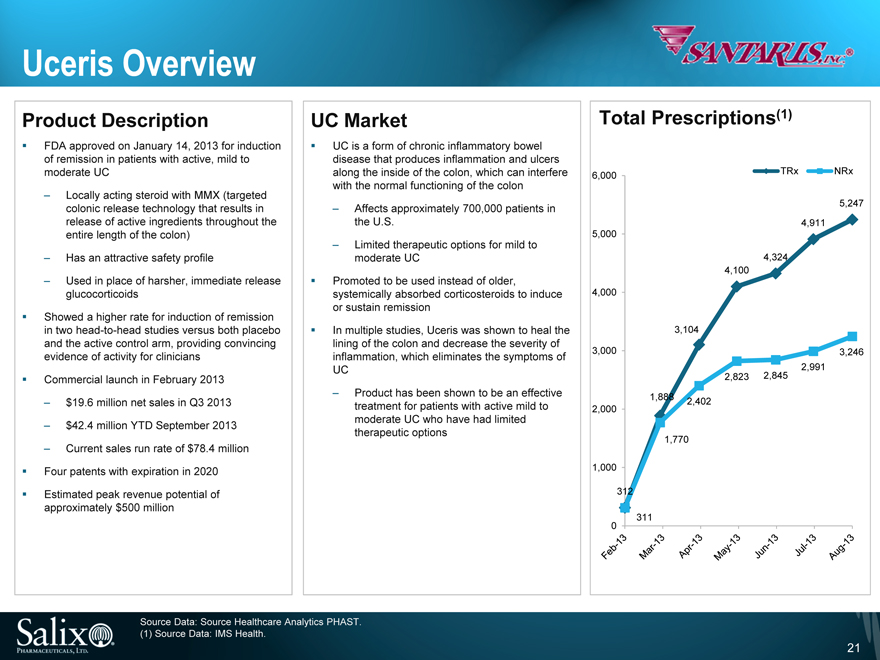
FDA approved on January 14, 2013 for induction of remission in patients with active, mild to moderate UC
Locally acting steroid with MMX (targeted colonic release technology that results in release of active ingredients throughout the entire length of the colon)
Has an attractive safety profile
Used in place of harsher, immediate release glucocorticoids
Showed a higher rate for induction of remission in two head-to-head studies versus both placebo and the active control arm, providing convincing evidence of activity for clinicians
Commercial launch in February 2013 $19.6 million net sales in Q3 2013 $42.4 million YTD September 2013
Current sales run rate of $78.4 million Four patents with expiration in 2020
Estimated peak revenue potential of approximately $500 million
UC is a form of chronic inflammatory bowel disease that produces inflammation and ulcers along the inside of the colon, which can interfere with the normal functioning of the colon
Affects approximately 700,000 patients in the U.S.
Limited therapeutic options for mild to moderate UC
Promoted to be used instead of older, systemically absorbed corticosteroids to induce or sustain remission
In multiple studies, Uceris was shown to heal the lining of the colon and decrease the severity of inflammation, which eliminates the symptoms of UC
Product has been shown to be an effective treatment for patients with active mild to moderate UC who have had limited therapeutic options
Source Data: Source Healthcare Analytics PHAST. (1) Source Data: IMS Health.
Total Prescriptions (1)
TRx NRx 6,000
5,247 4,911 5,000
4,324 4,100
4,000
3,104
3,000 3,246 2,845 2,991 2,823
1,888 2,402 2,000
1,770
1,000
312
0 311
Feb-13
Mar-13
Apr-13
May-13
Jun-13
Jul-13
Aug-13
21
Apriso Overview
Product & Market Description
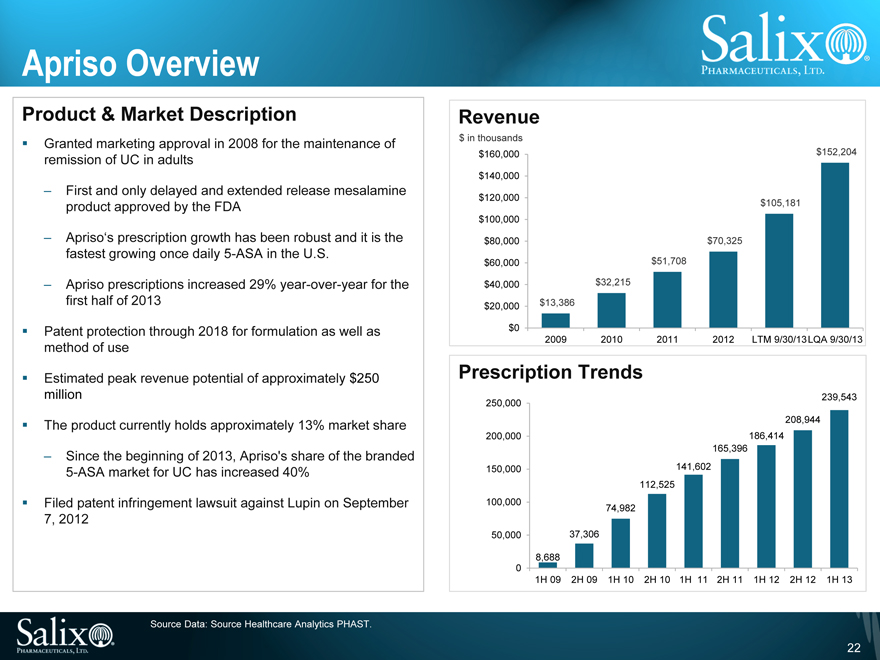
Granted marketing approval in 2008 for the maintenance of remission of UC in adults
First and only delayed and extended release mesalamine product approved by the FDA
Apriso’s prescription growth has been robust and it is the fastest growing once daily 5-ASA in the U.S.
Apriso prescriptions increased 29% year-over-year for the first half of 2013
Patent protection through 2018 for formulation as well as method of use
Estimated peak revenue potential of approximately $250 million
The product currently holds approximately 13% market share
Since the beginning of 2013, Apriso’s share of the branded 5-ASA market for UC has increased 40%
Filed patent infringement lawsuit against Lupin on September 7, 2012
Source Data: Source Healthcare Analytics PHAST.
Revenue
$ in thousands
$160,000 $152,204 $140,000
$120,000
$105,181 $100,000
$80,000 $70,325 $60,000 $51,708 $40,000 $32,215 $20,000 $13,386 $0
2009 2010 2011 2012 LTM 9/30/13LQA 9/30/13
Prescription Trends
239,543 250,000 208,944 200,000 186,414 165,396 150,000 141,602 112,525 100,000 74,982
50,000 37,306
8,688 0
1H 09 2H 09 1H 10 2H 10 1H 11 2H 11 1H 12 2H 12 1H 13
22
Glumetza Overview
Product & Market Description
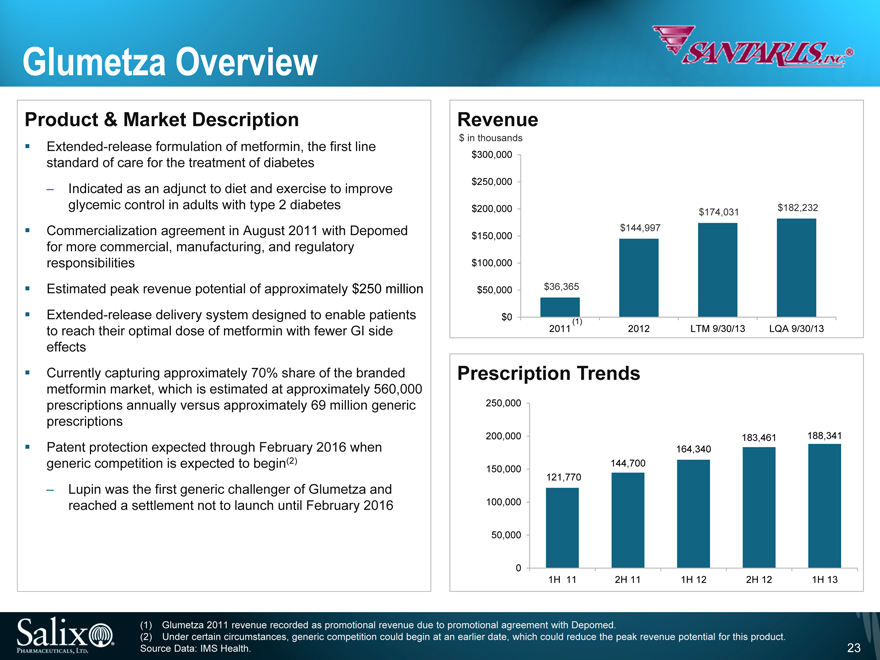
Extended -release formulation of metformin, the first line standard of care for the treatment of diabetes
Indicated as an adjunct to diet and exercise to improve glycemic control in adults with type 2 diabetes
Commercialization agreement in August 2011 with Depomed for more commercial, manufacturing, and regulatory responsibilities
Estimated peak revenue potential of approximately $250 million
Extended -release delivery system designed to enable patients to reach their optimal dose of metformin with fewer GI side effects
Currently capturing approximately 70% share of the branded metformin market, which is estimated at approximately 560,000 prescriptions annually versus approximately 69 million generic prescriptions
Patent protection expected through February 2016 when generic competition is expected to begin(2)
Lupin was the first generic challenger of Glumetza and reached a settlement not to launch until February 2016
Revenue
$ in thousands
$300,000
$250,000
$200,000 $174,031 $182,232
$144,997 $150,000
$100,000
$50,000 $36,365
$0
(1)
2011 2012 LTM 9/30/13 LQA 9/30/13
Prescription Trends
250,000
200,000 183,461 188,341 164,340 144,700 150,000 121,770
100,000
50,000
0
1H 11 2H 11 1H 12 2H 12 1H 13
(1) Glumetza 2011 revenue recorded as promotional revenue due to promotional agreement with Depomed.
(2) Under certain circumstances, generic competition could begin at an earlier date, which could reduce the peak revenue potential for this product.
Source Data: IMS Health.
23
Zegerid Overview
Product & Market Description
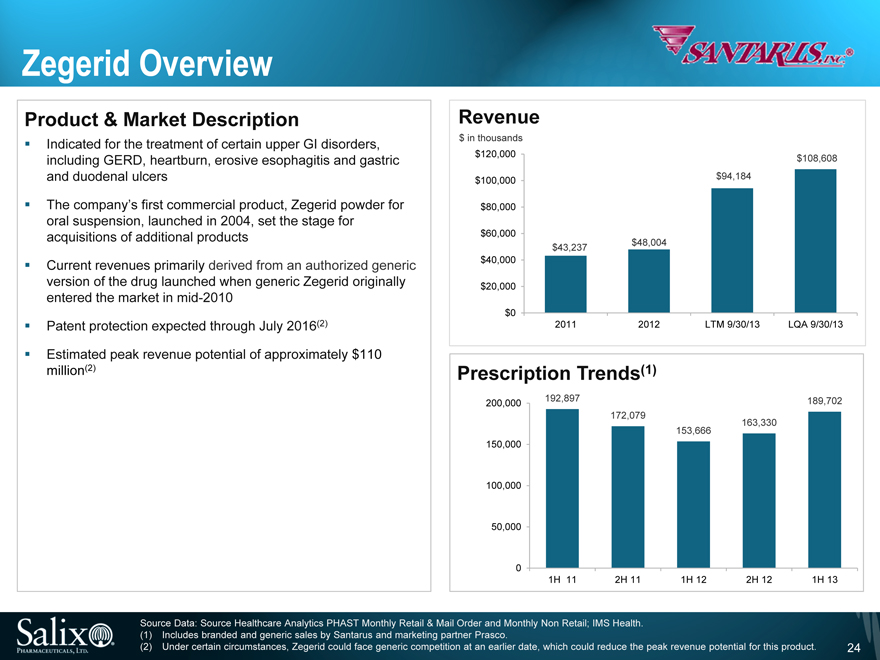
Indicated for the treatment of certain upper GI disorders, including GERD, heartburn, erosive esophagitis and gastric and duodenal ulcers
The company’s first commercial product, Zegerid powder for oral suspension, launched in 2004, set the stage for acquisitions of additional products
Current revenues primarily derived from an authorized generic version of the drug launched when generic Zegerid originally entered the market in mid-2010
Patent protection expected through July 2016(2)
Estimated peak revenue potential of approximately $110 million(2)
Revenue
$ in thousands
$120,000
$100,000
$80,000
$60,000
$40,000
$20,000
$0
$43,237
$48,004
$94,184
$108,608
2011
2012
LTM 9/30/13
LQA 9/30/13
Prescription Trends(1)
200,000
150,000
100,000
50,000
0
192,897
172,079
153,666
163,330
189,702
1H 11
2H 11
1H 12
2H 12
1H 13
Source Data: Source Healthcare Analytics PHAST Monthly Retail & Mail Order and Monthly Non Retail; IMS Health. (1) Includes branded and generic sales by Santarus and marketing partner Prasco.
(2) Under certain circumstances, Zegerid could face generic competition at an earlier date, which could reduce the peak revenue potential for this product.
24
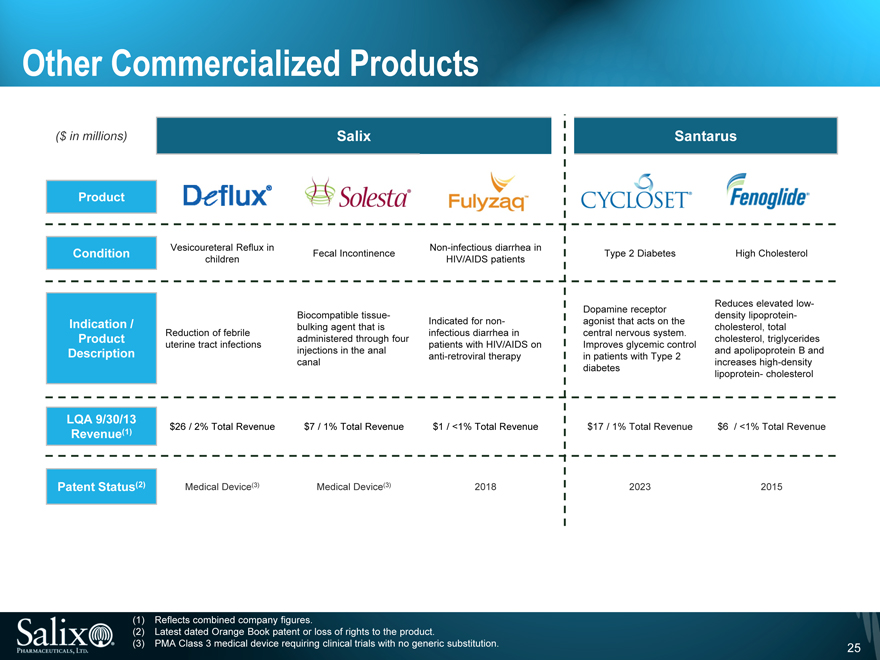
Other Commercialized Products
($ in millions)
Salix
Product
Vesicoureteral Reflux in Non-infectious diarrhea in Condition Fecal Incontinence children HIV/AIDS patients
Biocompatible tissue-
Indication / Indicated for non-bulking agent that is Reduction of febrile infectious diarrhea in Product administered through four uterine tract infections patients with HIV/AIDS on Description injections in the anal anti-retroviral therapy canal
LQA 9/30/13
$26 / 2% Total Revenue $7 / 1% Total Revenue $1 / <1% Total Revenue
Revenue (1)
Patent Status (2) Medical Device (3) Medical Device (3) 2018
Santarus
Type 2 Diabetes High Cholesterol
Reduces elevated low-Dopamine receptor density lipoprotein -agonist that acts on the cholesterol, total central nervous system. cholesterol, triglycerides Improves glycemic control and apolipoprotein B and in patients with Type 2 increases high-density diabetes lipoprotein - cholesterol
$17 / 1% Total Revenue $6 / <1% Total Revenue
2023
2015
(1) Reflects combined company figures.
(2) Latest dated Orange Book patent or loss of rights to the product.
(3) PMA Class 3 medical device requiring clinical trials with no generic substitution.
25
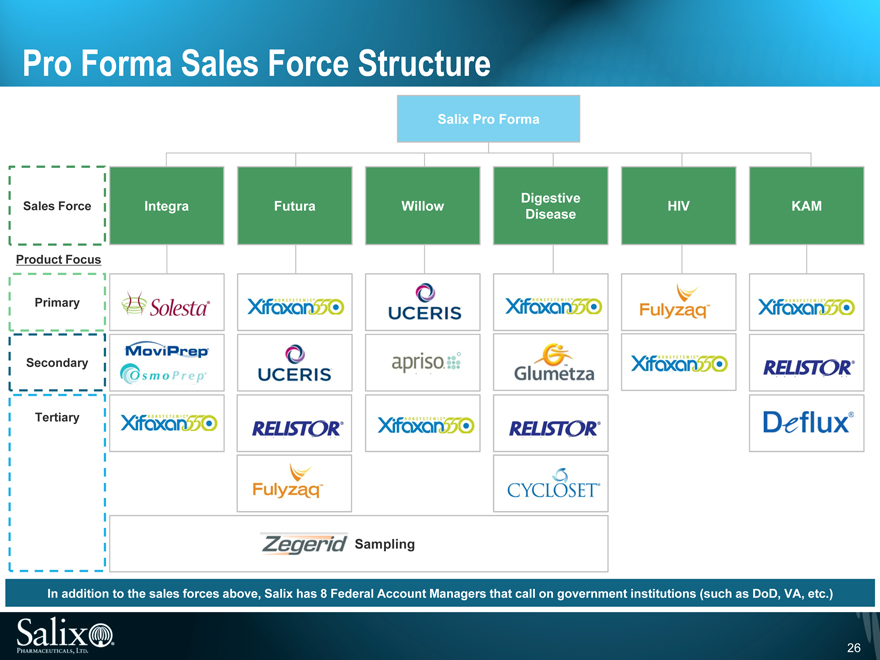
Pro Forma Sales Force Structure
Salix Pro Forma
Sales Force
Product Focus
Primary
Secondary
Tertiary
Integra
Futura
Willow
Digestive Disease
HIV
KAM
In addition to the sales forces above, Salix has 8 Federal Account Managers that call on government institutions (such as DoD, VA, etc.)
26
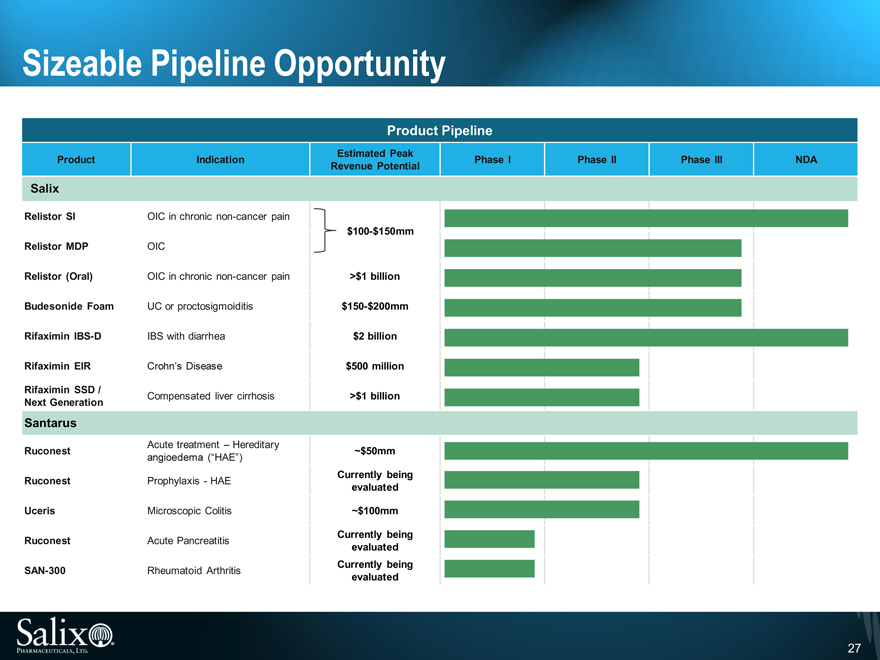
Sizeable Pipeline Opportunity
Product Pipeline
Estimated Peak
Product Indication Phase I Phase II Phase III NDA
Revenue Potential
Salix
Relistor SI OIC in chronic non-cancer pain
$100-$150mm
Relistor MDP OIC
Relistor (Oral) OIC in chronic non-cancer pain >$1 billion
Budesonide Foam UC or proctosigmoiditis $150-$200mm
Rifaximin IBS-D IBS with diarrhea $2 billion
Rifaximin EIR Crohn’s Disease $500 million
Rifaximin SSD / Compensated liver cirrhosis >$1 billion
Next Generation
Santarus
Acute treatment – Hereditary
Ruconest ~$50mm
angioedema (“HAE”)
Ruconest Prophylaxis - HAE Currently being
evaluated
Uceris Microscopic Colitis ~$100mm
Ruconest Acute Pancreatitis Currently being
evaluated
SAN-300 Rheumatoid Arthritis Currently being
evaluated
27
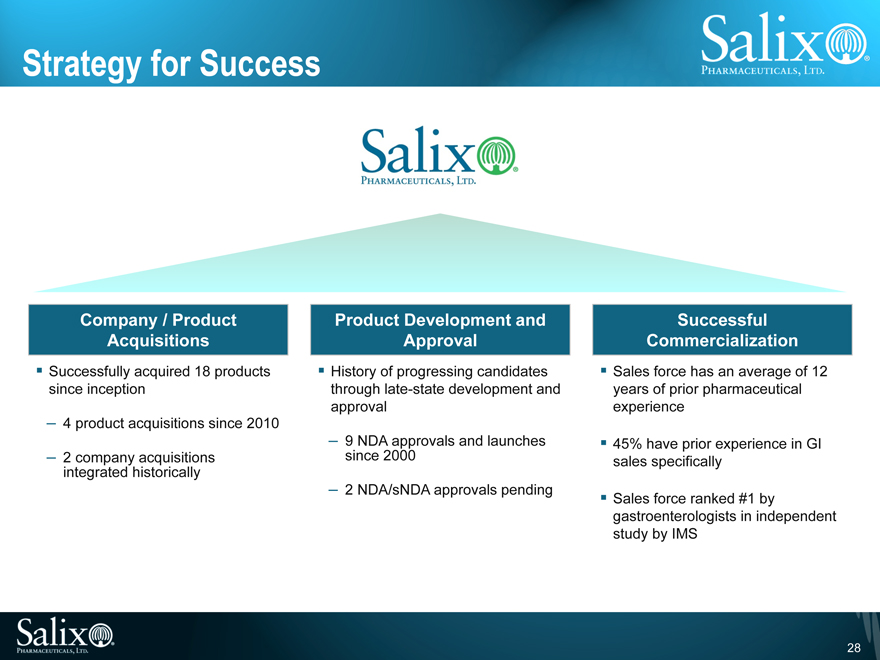
Strategy for Success
Company / Product Acquisitions
Successfully acquired 18 products since inception
4 product acquisitions since 2010
2 company acquisitions integrated historically
Product Development and Approval
History of progressing candidates through late-state development and approval
9 NDA approvals and launches since 2000
2 NDA/sNDA approvals pending
Successful Commercialization
Sales force has an average of 12 years of prior pharmaceutical experience
45% have prior experience in GI sales specifically
Sales force ranked #1 by gastroenterologists in independent study by IMS
28

Historical Financial Overview
29
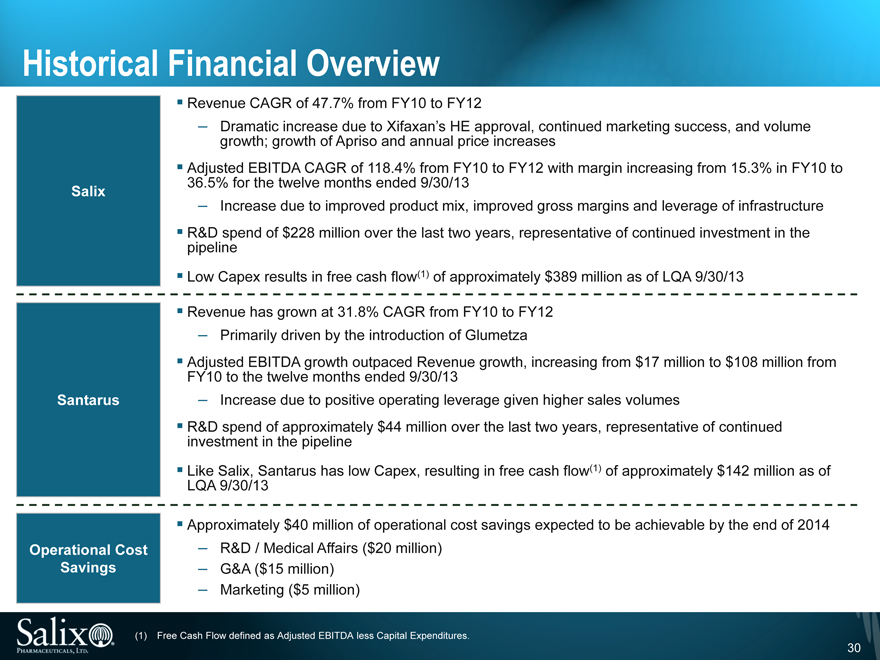
Historical Financial Overview
Revenue CAGR of 47.7% from FY10 to FY12
Dramatic increase due to Xifaxan’s HE approval, continued marketing success, and volume growth; growth of Apriso and annual price increases
Adjusted EBITDA CAGR of 118.4% from FY10 to FY12 with margin increasing from 15.3% in FY10 to 36.5% for the twelve months ended 9/30/13
Salix
Increase due to improved product mix, improved gross margins and leverage of infrastructure
R&D spend of $228 million over the last two years, representative of continued investment in the pipeline
Low Capex results in free cash flow(1) of approximately $389 million as of LQA 9/30/13
Revenue has grown at 31.8% CAGR from FY10 to FY12
Primarily driven by the introduction of Glumetza
Adjusted EBITDA growth outpaced Revenue growth, increasing from $17 million to $108 million from FY10 to the twelve months ended 9/30/13 Santarus Increase due to positive operating leverage given higher sales volumes
R&D spend of approximately $44 million over the last two years, representative of continued investment in the pipeline
Like Salix, Santarus has low Capex, resulting in free cash flow(1) of approximately $142 million as of LQA 9/30/13
Approximately $40 million of operational cost savings expected to be achievable by the end of 2014 Operational Cost R&D / Medical Affairs ($20 million) Savings G&A ($15 million)
Marketing ($5 million)
(1) Free Cash Flow defined as Adjusted EBITDA less Capital Expenditures.
30
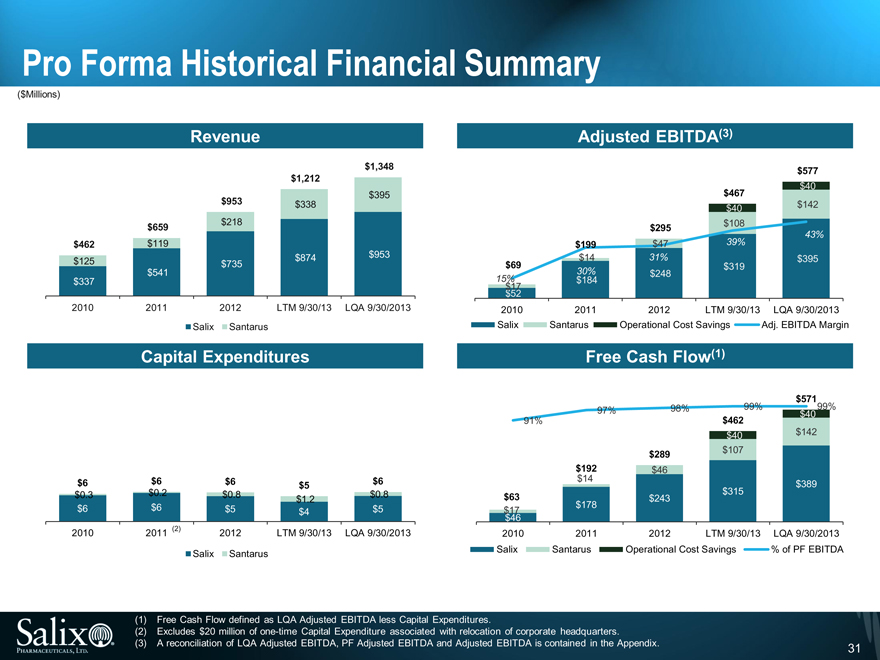
Pro Forma Historical Financial Summary
($Millions)
Revenue
$1,348
$1,212
$395
$953 $338
$659 $218
$462 $119
$953
$125 $735 $874
$541
$337
2010 2011 2012 LTM 9/30/13 LQA 9/30/2013
Salix Santarus
Capital Expenditures
$6 $6 $6 $5 $6
$0.3 $0.2 $0.8 $0.8
$1.2
$6 $6 $5 $4 $5
2010 2011 (2) 2012 LTM 9/30/13 LQA 9/30/2013
Salix Santarus
Adjusted EBITDA(3)
$577
$40
$467
$40 $142
$295 $108
43%
$199 $47 39%
$14 31% $395
$69 $319
30% $248
15% $184
$17
$52
2010 2011 2012 LTM 9/30/13 LQA 9/30/2013
Salix Santarus Operational Cost Savings Adj. EBITDA Margin
Free Cash Flow(1)
$571
97% 98% 99% $40 99%
91% $462
$40 $142
$289 $107
$192 $46
$14 $389
$63 $243 $315
$17 $178
$46
2010 2011 2012 LTM 9/30/13 LQA 9/30/2013
Salix Santarus Operational Cost Savings % of PF EBITDA
(1) Free Cash Flow defined as LQA Adjusted EBITDA less Capital Expenditures.
(2) Excludes $20 million of one-time Capital Expenditure associated with relocation of corporate headquarters.
(3) A reconciliation of LQA Adjusted EBITDA, PF Adjusted EBITDA and Adjusted EBITDA is contained in the Appendix.
31
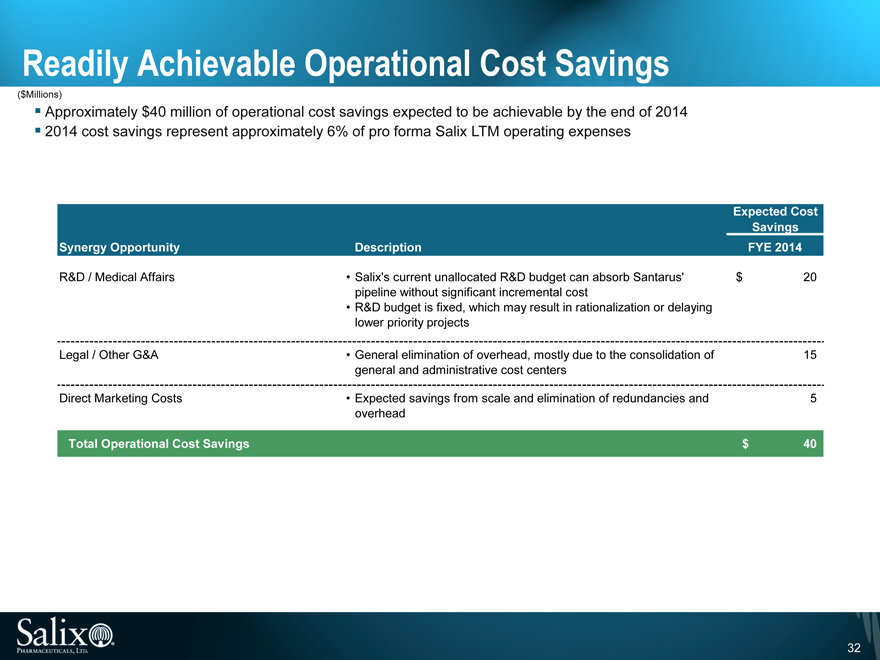
Readily Achievable Operational Cost Savings
($Millions)
Approximately $40 million of operational cost savings expected to be achievable by the end of 2014 2014 cost savings represent approximately 6% of pro forma Salix LTM operating expenses
Expected Cost
Savings
Synergy Opportunity Description FYE 2014
R&D / Medical Affairs Salix’s current unallocated R&D budget can absorb Santarus’ $ 20
pipeline without significant incremental cost
R&D budget is fixed, which may result in rationalization or delaying
lower priority projects
Legal / Other G&A General elimination of overhead, mostly due to the consolidation of 15
general and administrative cost centers
Direct Marketing Costs Expected savings from scale and elimination of redundancies and 5
overhead
Total Operational Cost Savings $ 40
32

Appendix
33
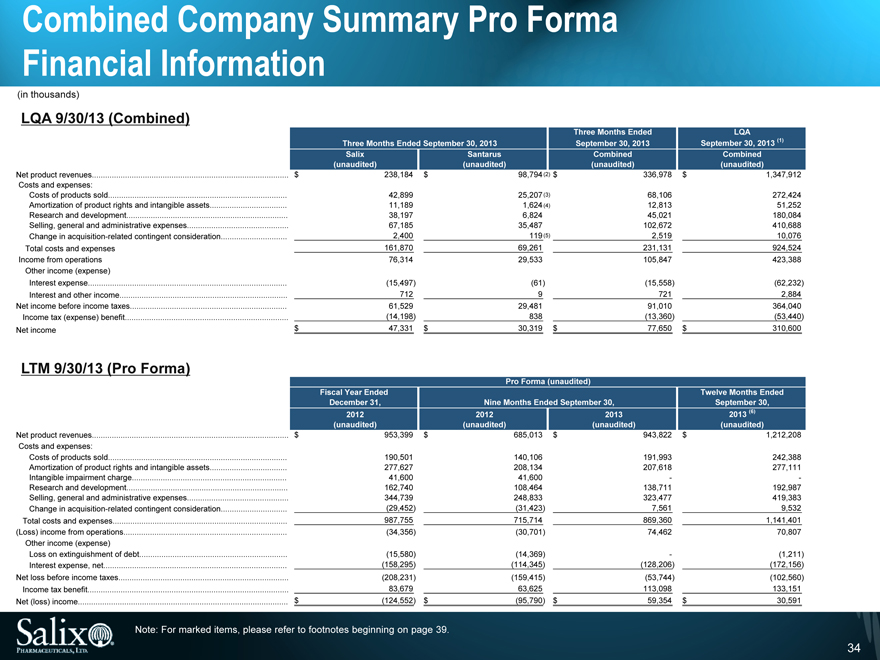
Combined Company Summary Pro Forma
Financial Information
(in thousands)
LQA 9/30/13 (Combined)
Three Months Ended September 30, 2013 Three Months Ended September 30, 2013 LQA September 30, 2013 (1)
Salix Santarus Combined Combined
(unaudited) (unaudited) (unaudited) (unaudited)
Net product revenues $ 238,184 $ 98,794 (2) $336,978 $ 1,347,912
Costs and expenses:
Costs of products sold 42,899 25,207 (3) 68,106 272,424
Amortization of product rights and intangible assets 11,189 1,624 (4) 12,813 51,252
Research and development 38,197 6,824 45,021 180,084
Selling, general and administrative expenses 67,185 35,487 102,672 410,688
Change in acquisition-related contingent consideration 2,400 119 (5) 2,519 10,076
Total costs and expenses 161,870 69,261 231,131 924,524
Income from operations 76,314 29,533 105,847 423,388
Other income (expense)
Interest expense (15,497) (61) (15,558) (62,232)
Interest and other income 712 9 721 2,884
Net income before income taxes 61,529 29,481 91,010 364,040
Income tax (expense) benefit (14,198) 838 (13,360) (53,440)
Net income $47,331 $ 30,319 $ 77,650 $ 310,600
LTM 9/30/13 (Pro Forma)
Pro Forma (unaudited)
Fiscal Year Ended December 31, Nine Months Ended September 30, Twelve Months Ended September 30,
2012 2012 2013 2013 (6)
(unaudited) (unaudited) (unaudited) (unaudited)
Net product revenues $ 953,399 $ 685,013 $ 943,822 $ 1,212,208
Costs and expenses:
Costs of products sold 190,501 140,106 191,993 242,388
Amortization of product rights and intangible assets 277,627 208,134 207,618 277,111
Intangible impairment charge 41,600 41,600 - -
Research and development 162,740 108,464 138,711 192,987
Selling, general and administrative expenses 344,739 248,833 323,477 419,383
Change in acquisition-related contingent consideration (29,452) (31,423) 7,561 9,532
Total costs and expenses 987,755 715,714 869,360 1,141,401
(Loss) income from operations (34,356) (30,701) 74,462 70,807
Other income (expense)
Loss on extinguishment of debt (15,580) (14,369) - (1,211)
Interest expense, net (158,295) (114,345) (128,206) (172,156)
Net loss before income taxes (208,231) (159,415) (53,744) (102,560)
Income tax benefit 83,679 63,625 113,098 133,151
Net (loss) income $ (124,552) $ (95,790) $ 59,354 $ 30,591
Note: For marked items, please refer to footnotes beginning on page 39.
34
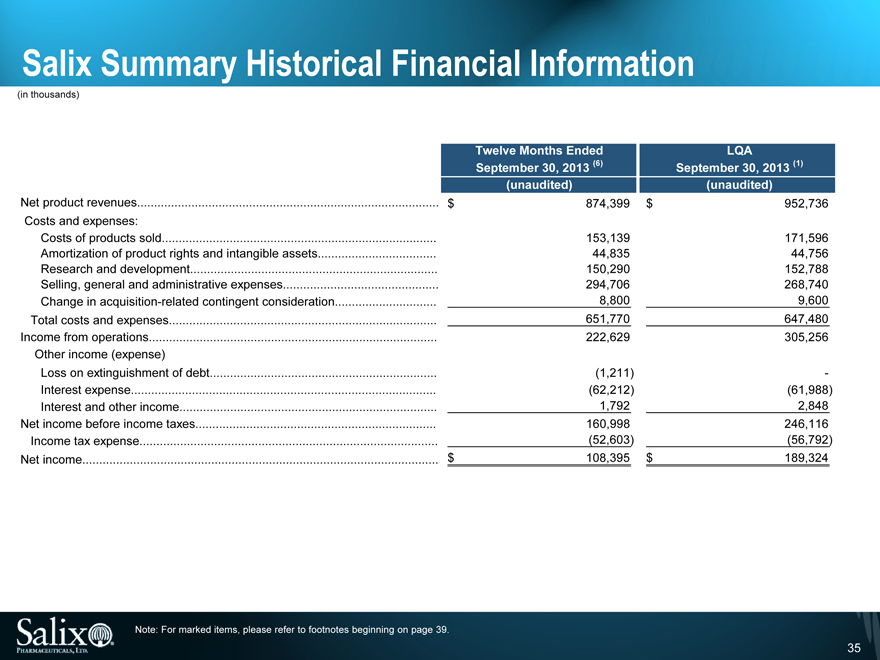
Salix Summary Historical Financial Information
(in thousands)
Twelve Months Ended LQA
September 30, 2013 (6) September 30, 2013 (1)
(unaudited) (unaudited)
Net product revenues $ 874,399 $ 952,736
Costs and expenses:
Costs of products sold 153,139 171,596
Amortization of product rights and intangible assets 44,835 44,756
Research and development 150,290 152,788
Selling, general and administrative expenses 294,706 268,740
Change in acquisition-related contingent consideration 8,800 9,600
Total costs and expenses 651,770 647,480
Income from operations 222,629 305,256
Other income (expense)
Loss on extinguishment of debt (1,211) -
Interest expense (62,212) (61,988)
Interest and other income 1,792 2,848
Net income before income taxes 160,998 246,116
Income tax expense (52,603) (56,792)
Net income $ 108,395 $ 189,324
Note: For marked items, please refer to footnotes beginning on page 39.
35
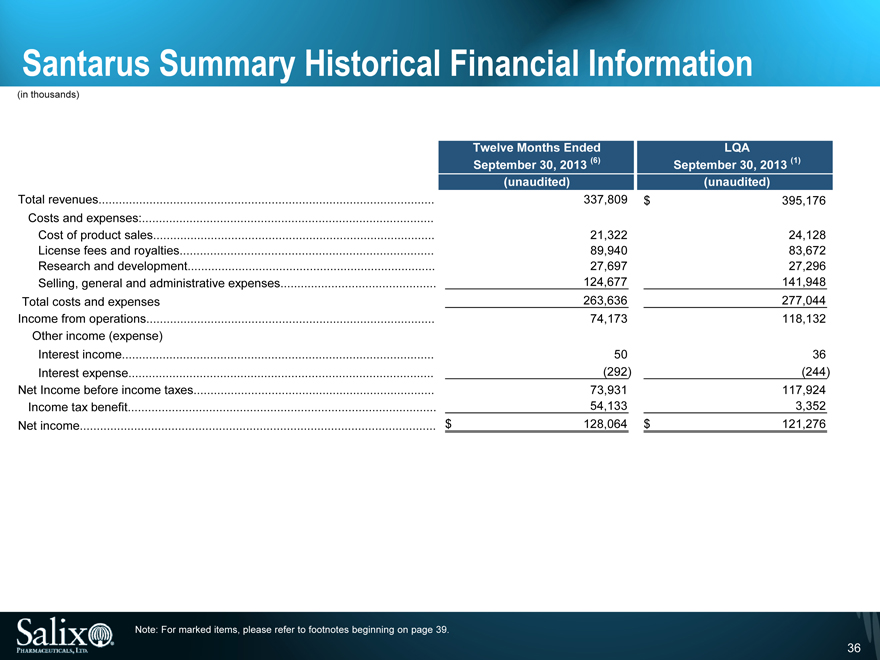
Santarus Summary Historical Financial Information
(in thousands)
Total revenues
Costs and expenses:
Cost of product sales
License fees and royalties
Research and development
Selling, general and administrative expenses
Total costs and expenses
Income from operations
Other income (expense)
Interest income
Interest expense
Net Income before income taxes
Income tax benefit
Net income
Twelve Months Ended
September 30, 2013 (6)
(unaudited)
337,809
21,322
89,940
27,697
124,677
263,636
74,173
50
(292)
73,931
54,133
$ 128,064
LQA
September 30, 2013 (1)
(unaudited)
$ 395,176
24,128
83,672
27,296
141,948
277,044
118,132
36
(244)
117,924
3,352
$ 121,276
Note: For marked items, please refer to footnotes beginning on page 39.
36
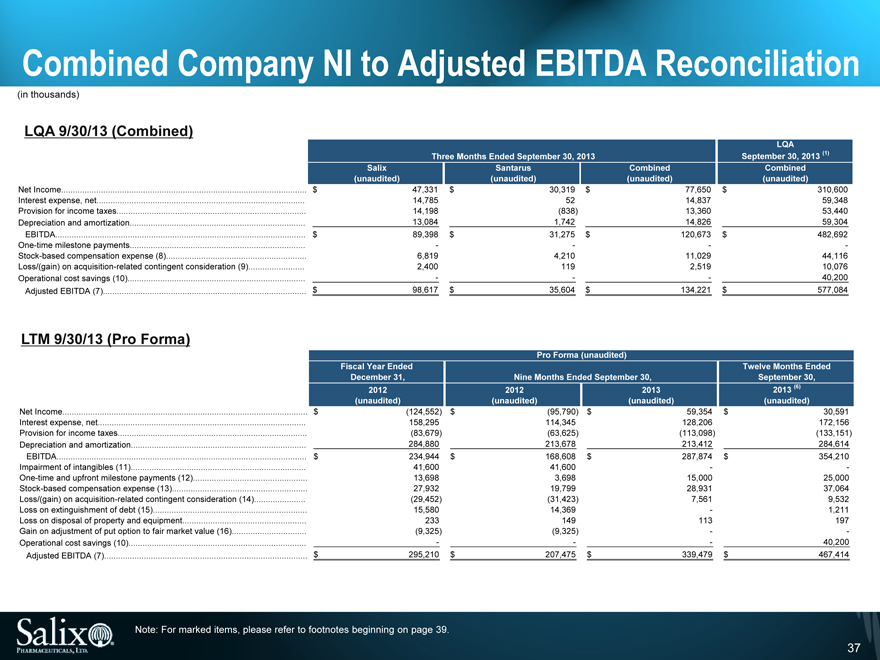
Combined Company NI to Adjusted EBITDA Reconciliation
(in thousands)
LQA 9/30/13 (Combined)
Three Months Ended September 30, 2013 LQA September 30, 2013 (1)
Net Income
Interest expense, net
Provision for income taxes
Depreciation and amortization
EBITDA
One-time milestone payments
Stock-based compensation expense (8)
Loss/(gain) on acquisition-related contingent consideration (9)
Operational cost savings (10)
Adjusted EBITDA (7)
Salix
(unaudited)
$ 47,331
14,785
14,198
13,084
$ 89,398
-
6,819
2,400
-
$ 98,617
Santarus
(unaudited)
$ 30,319 $
52
(838)
1,742
$ 31,275 $
-
4,210
119
-
$ 35,604 $
Combined
(unaudited)
77,650
14,837
13,360
14,826
120,673
-
11,029
2,519
-
134,221
Combined
(unaudited)
$ 310,600
59,348
53,440
59,304
$ 482,692
-
44,116
10,076
40,200
$ 577,084
LTM 9/30/13 (Pro Forma)
Pro Forma (unaudited)
Fiscal Year Ended December 31, Nine Months Ended September 30, Twelve Months Ended September 30,
Net Income
Interest expense, net
Provision for income taxes
Depreciation and amortization
EBITDA
Impairment of intangibles (11)
One-time and upfront milestone payments (12)
Stock-based compensation expense (13)
Loss/(gain) on acquisition-related contingent consideration (14)
Loss on extinguishment of debt (15)
Loss on disposal of property and equipment
Gain on adjustment of put option to fair market value (16)
Operational cost savings (10)
Adjusted EBITDA (7)
2012
(unaudited)
$ (124,552)
158,295
(83,679)
284,880
$ 234,944
41,600
13,698
27,932
(29,452)
15,580
233
(9,325)
-
$ 295,210
2012
(unaudited)
$ (95,790) $
114,345
(63,625)
213,678
$ 168,608 $
41,600
3,698
19,799
(31,423)
14,369
149
(9,325)
-
$ 207,475 $
2013
(unaudited)
59,354
128,206
(113,098)
213,412
287,874
-
15,000
28,931
7,561
-
113
-
-
339,479
2013 (6)
(unaudited)
$ 30,591
172,156
(133,151)
284,614
$ 354,210
-
25,000
37,064
9,532
1,211
197
-
40,200
$ 467,414
Note: For marked items, please refer to footnotes beginning on page 39.
37
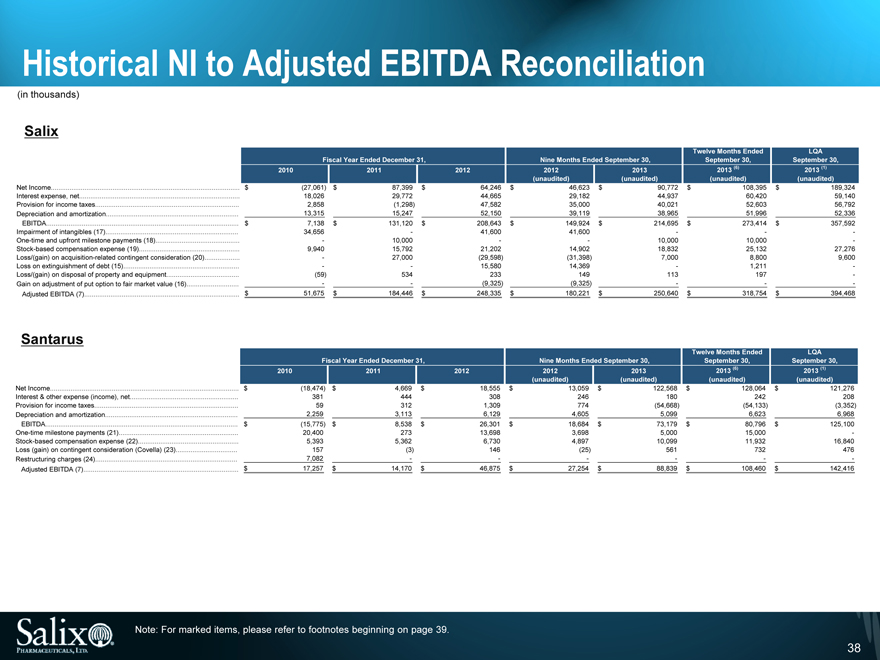
Historical NI to Adjusted EBITDA Reconciliation
(in thousands)
Salix
Fiscal Year Ended December 31, Nine Months Ended September 30, Twelve Months Ended September 30, LQA September 30,
Net Income
Interest expense, net
Provision for income taxes
Depreciation and amortization
EBITDA
Impairment of intangibles (17)
One-time and upfront milestone payments (18)
Stock-based compensation expense (19)
Loss/(gain) on acquisition-related contingent consideration (20)
Loss on extinguishment of debt (15)
Loss/(gain) on disposal of property and equipment
Gain on adjustment of put option to fair market value (16)
Adjusted EBITDA (7)
2010
$ (27,061)
18,026
2,858
13,315
$ 7,138
34,656
-
9,940
-
-
(59)
-
$ 51,675
2011
$87,399
29,772
(1,298)
15,247
$131,120
-
10,000
15,792
27,000
-
534
-
$184,446
2012
$ 64,246
44,665
47,582
52,150
$ 208,643
41,600
-
21,202
(29,598)
15,580
233
(9,325)
$ 248,335
2012
(unaudited)
$ 46,623
29,182
35,000
39,119
$ 149,924
41,600
-
14,902
(31,398)
14,369
149
(9,325)
$ 180,221
2013
(unaudited)
$ 90,772
44,937
40,021
38,965
$ 214,695
-
10,000
18,832
7,000
-
113
-
$ 250,640
2013 (6)
(unaudited)
$ 108,395
60,420
52,603
51,996
$ 273,414
-
10,000
25,132
8,800
1,211
197
-
$ 318,754
2013 (1)
(unaudited)
$ 189,324
59,140
56,792
52,336
$ 357,592
-
-
27,276
9,600
-
-
-
$ 394,468
Santarus
Fiscal Year Ended December 31, Nine Months Ended September 30, Twelve Months Ended September 30, LQA September 30,
Net Income
Interest & other expense (income), net
Provision for income taxes
Depreciation and amortization
EBITDA
One-time milestone payments (21)
Stock-based compensation expense (22)
Loss (gain) on contingent consideration (Covella) (23)
Restructuring charges (24)
Adjusted EBITDA (7)
2010
$ (18,474)
381
59
2,259
$ (15,775)
20,400
5,393
157
7,082
$ 17,257
2011
$4,669
444
312
3,113
$8,538
273
5,362
(3)
-
$14,170
2012
$ 18,555
308
1,309
6,129
$ 26,301
13,698
6,730
146
-
$ 46,875
2012
(unaudited)
$ 13,059
246
774
4,605
$ 18,684
3,698
4,897
(25)
-
$ 27,254
2013
(unaudited)
$ 122,568
180
(54,668)
5,099
$ 73,179
5,000
10,099
561
-
$ 88,839
2013 (6)
(unaudited)
$ 128,064
242
(54,133)
6,623
$ 80,796
15,000
11,932
732
-
$ 108,460
2013 (1)
(unaudited)
$ 121,276
208
(3,352)
6,968
$ 125,100
-
16,840
476
-
$ 142,416
Note: For marked items, please refer to footnotes beginning on page 39.
38
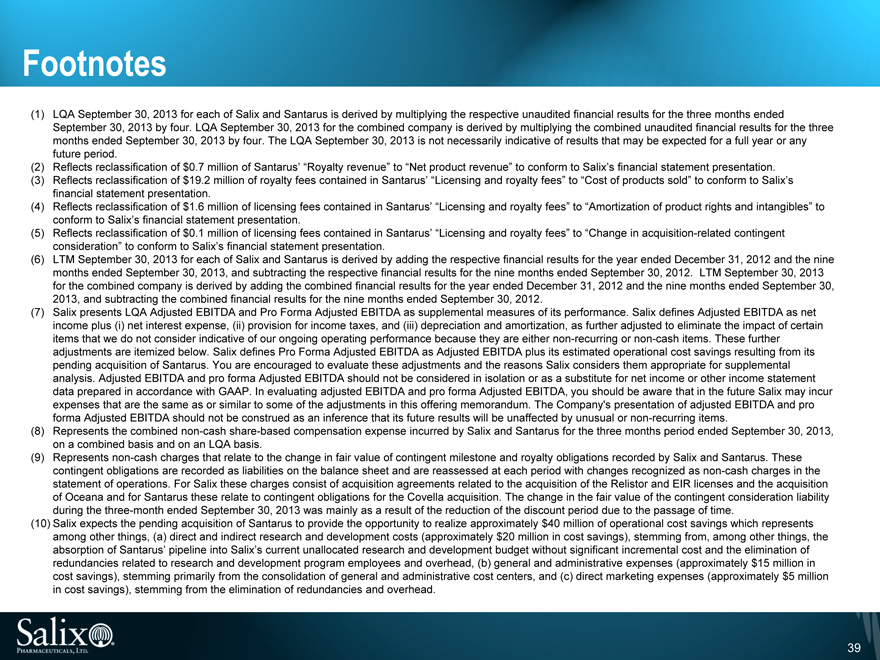
Footnotes
(1) LQA September 30, 2013 for each of Salix and Santarus is derived by multiplying the respective unaudited financial results for the three months ended September 30, 2013 by four. LQA September 30, 2013 for the combined company is derived by multiplying the combined unaudited financial results for the three months ended September 30, 2013 by four. The LQA September 30, 2013 is not necessarily indicative of results that may be expected for a full year or any future period.
(2) Reflects reclassification of $0.7 million of Santarus’ “Royalty revenue” to “Net product revenue” to conform to Salix’s financial statement presentation. (6) (1)
(3) Reflects reclassification of $19.2 million of royalty fees contained in Santarus’ “Licensing and royalty fees” to “Cost of products sold” to conform to Salix’s financial statement presentation.
(4) Reflects reclassification of $1.6 million of licensing fees contained in Santarus’ “Licensing and royalty fees” to “Amortization of product rights and intangibles” to conform to Salix’s financial statement presentation.
(5) Reflects reclassification of $0.1 million of licensing fees contained in Santarus’ “Licensing and royalty fees” to “Change in acquisition-related contingent consideration” to conform to Salix’s financial statement presentation.
(6) LTM September 30, 2013 for each of Salix and Santarus is derived by adding the respective financial results for the year ended December 31, 2012 and the nine months ended September 30, 2013, and subtracting the respective financial results for the nine months ended September 30, 2012. LTM September 30, 2013 for the combined company is derived by adding the combined financial results for the year ended December 31, 2012 and the nine months ended September 30, 2013, and subtracting the combined financial results for the nine months ended September 30, 2012.
(7) Salix presents LQA Adjusted EBITDA and Pro Forma Adjusted EBITDA as supplemental measures of its performance. Salix defines Adjusted EBITDA as net income plus (i) net interest expense, (ii) provision for income taxes, and (iii) depreciation and amortization, as further adjusted to eliminate the impact of certain items that we do not consider indicative of our ongoing operating performance because they are either non-recurring or non-cash items. These further adjustments are itemized below. Salix defines Pro Forma Adjusted EBITDA as Adjusted EBITDA plus its estimated operational cost savings resulting from its pending acquisition of Santarus. You are encouraged to evaluate these adjustments and the reasons Salix considers them appropriate for supplemental (1)
(6) analysis. Adjusted EBITDA and pro forma Adjusted EBITDA should not be considered in isolation or as a substitute for net income or other income statement data prepared in accordance with GAAP. In evaluating adjusted EBITDA and pro forma Adjusted EBITDA, you should be aware that in the future Salix may incur expenses that are the same as or similar to some of the adjustments in this offering memorandum. The Company’s presentation of adjusted EBITDA and pro forma Adjusted EBITDA should not be construed as an inference that its future results will be unaffected by unusual or non-recurring items.
(8) Represents the combined non-cash share-based compensation expense incurred by Salix and Santarus for the three months period ended September 30, 2013, on a combined basis and on an LQA basis.
(9) Represents non-cash charges that relate to the change in fair value of contingent milestone and royalty obligations recorded by Salix and Santarus. These contingent obligations are recorded as liabilities on the balance sheet and are reassessed at each period with changes recognized as non-cash charges in the statement of operations. For Salix these charges consist of acquisition agreements related to the acquisition of the Relistor and EIR licenses and the acquisition of Oceana and for Santarus these relate to contingent obligations for the Covella acquisition. The change in the fair value of the contingent consideration liability during the three-month ended September 30, 2013 was mainly as a result of the reduction of the discount period due to the passage of time.
(10) Salix expects the pending acquisition of Santarus to provide the opportunity to realize approximately $40 million of operational cost savings which represents among other things, (a) direct and indirect research and development costs (approximately $20 million in cost savings), stemming from, among other things, the absorption of Santarus’ pipeline into Salix’s current unallocated research and development budget without significant incremental cost and the elimination of redundancies related to research and development program employees and overhead, (b) general and administrative expenses (approximately $15 million in cost savings), stemming primarily from the consolidation of general and administrative cost centers, and (c) direct marketing expenses (approximately $5 million in cost savings), stemming from the elimination of redundancies and overhead.
39
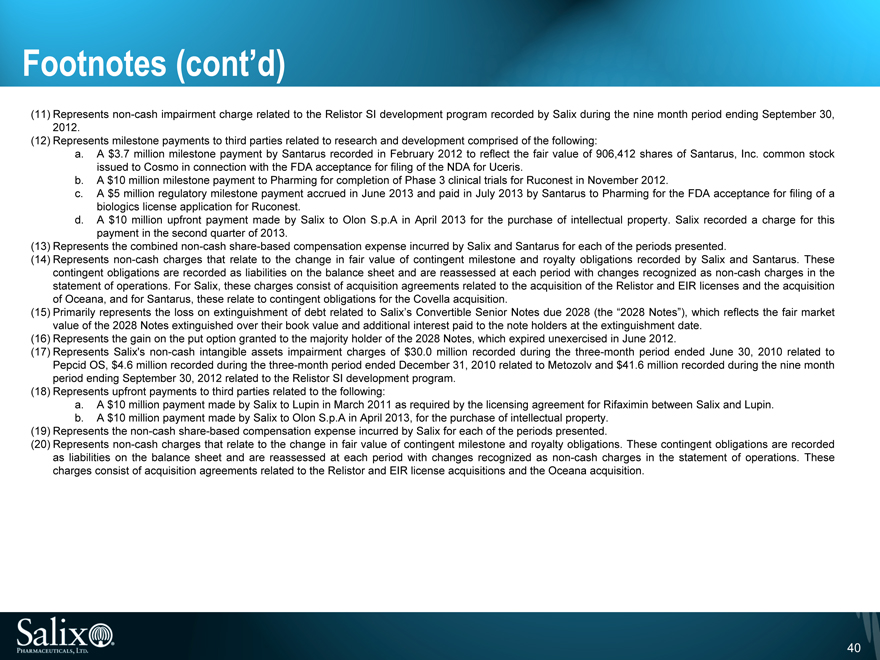
Footnotes (cont’d)
(11) Represents non-cash impairment charge related to the Relistor SI development program recorded by Salix during the nine month period ending September 30, 2012.
(12) Represents milestone payments to third parties related to research and development comprised of the following:
a. A $3.7 million milestone payment by Santarus recorded in February 2012 to reflect the fair value of 906,412 shares of Santarus, Inc. common stock issued to Cosmo in connection with the FDA acceptance for filing of the NDA for Uceris.
b. A $10 million milestone payment to Pharming for completion of Phase 3 clinical trials for Ruconest in November 2012.
c. A $5 million regulatory milestone payment accrued in June 2013 and paid in July 2013 by Santarus to Pharming for the FDA acceptance for filing of a biologics license application for Ruconest.
d. A $10 million upfront payment made by Salix to Olon S.p.A in April 2013 for the purchase of intellectual property. Salix recorded a charge for this payment in the second quarter of 2013.
(13) Represents the combined non-cash share-based compensation expense incurred by Salix and Santarus for each of the periods presented.
(14) Represents non-cash charges that relate to the change in fair value of contingent milestone and royalty obligations recorded by Salix and Santarus. These contingent obligations are recorded as liabilities on the balance sheet and are reassessed at each period with changes recognized as non-cash charges in the statement of operations. For Salix, these charges consist of acquisition agreements related to the acquisition of the Relistor and EIR licenses and the acquisition of Oceana, and for Santarus, these relate to contingent obligations for the Covella acquisition.
(15) Primarily represents the loss on extinguishment of debt related to Salix’s Convertible Senior Notes due 2028 (the “2028 Notes”), which reflects the fair market value of the 2028 Notes extinguished over their book value and additional interest paid to the note holders at the extinguishment date.
(16) Represents the gain on the put option granted to the majority holder of the 2028 Notes, which expired unexercised in June 2012.
(17) Represents Salix’s non-cash intangible assets impairment charges of $30.0 million recorded during the three-month period ended June 30, 2010 related to Pepcid OS, $4.6 million recorded during the three-month period ended December 31, 2010 related to Metozolv and $41.6 million recorded during the nine month (1) (6) period ending September 30, 2012 related to the Relistor SI development program.
(18) Represents upfront payments to third parties related to the following:
a. A $10 million payment made by Salix to Lupin in March 2011 as required by the licensing agreement for Rifaximin between Salix and Lupin.
b. A $10 million payment made by Salix to Olon S.p.A in April 2013, for the purchase of intellectual property.
(19) Represents the non-cash share-based compensation expense incurred by Salix for each of the periods presented.
(20) Represents non-cash charges that relate to the change in fair value of contingent milestone and royalty obligations. These contingent obligations are recorded as liabilities on the balance sheet and are reassessed at each period with changes recognized as non-cash charges in the statement of operations. These charges consist of acquisition agreements related to the Relistor and EIR license acquisitions and the Oceana acquisition.
40
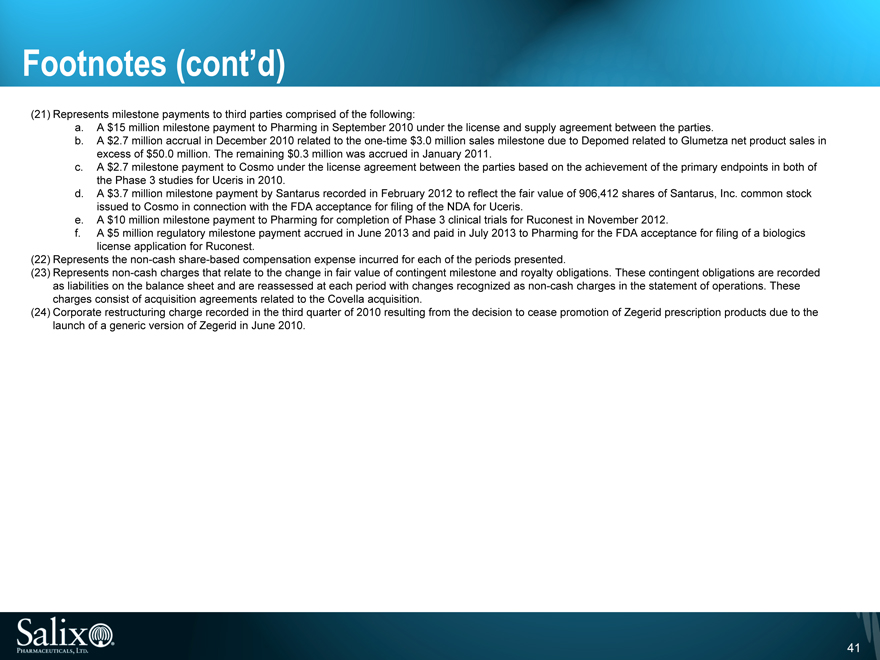
Footnotes (cont’d)
(21) Represents milestone payments to third parties comprised of the following:
a. A $15 million milestone payment to Pharming in September 2010 under the license and supply agreement between the parties.
b. A $2.7 million accrual in December 2010 related to the one-time $3.0 million sales milestone due to Depomed related to Glumetza net product sales in excess of $50.0 million. The remaining $0.3 million was accrued in January 2011.
c. A $2.7 milestone payment to Cosmo under the license agreement between the parties based on the achievement of the primary endpoints (6) in both of (1) the Phase 3 studies for Uceris in 2010.
d. A $3.7 million milestone payment by Santarus recorded in February 2012 to reflect the fair value of 906,412 shares of Santarus, Inc. common stock issued to Cosmo in connection with the FDA acceptance for filing of the NDA for Uceris.
e. A $10 million milestone payment to Pharming for completion of Phase 3 clinical trials for Ruconest in November 2012.
f. A $5 million regulatory milestone payment accrued in June 2013 and paid in July 2013 to Pharming for the FDA acceptance for filing of a biologics license application for Ruconest.
(22) Represents the non-cash share-based compensation expense incurred for each of the periods presented.
(23) Represents non-cash charges that relate to the change in fair value of contingent milestone and royalty obligations. These contingent obligations are recorded as liabilities on the balance sheet and are reassessed at each period with changes recognized as non-cash charges in the statement of operations. These charges consist of acquisition agreements related to the Covella acquisition.
(24) Corporate restructuring charge recorded in the third quarter of 2010 resulting from the decision to cease promotion of Zegerid prescription products due to the launch of a generic version of Zegerid in June 2010.
41