EXHIBIT 13
2014 Annual Report to Stockholders
2014 Annual Report
Message From the Chairman
Dear Shareholders:
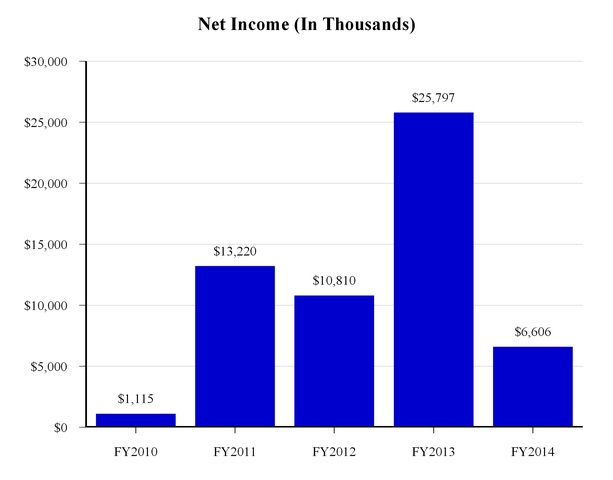
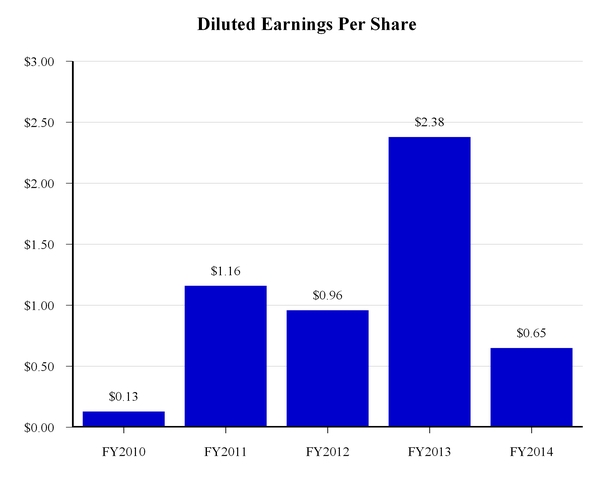
It is my pleasure to forward our Annual Report for fiscal 2014. We reported net income of $6.6 million, or $0.65 per diluted share, and a return on equity of 4.3%, which is lower than expected, but not unreasonable given the decline in mortgage banking revenues. As I described in my message last year, we expected fiscal 2014 to be a year of transition for our company. We understood at that time that the elevated earnings in fiscal 2013 from our mortgage banking business would be difficult to replicate in fiscal 2014. In fact, we spent the first three quarters of fiscal 2014 adjusting our mortgage banking business model to compensate for the poorer mortgage banking fundamentals. At the same time, we were investing in our community banking business to increase our loan origination capacity to support growth in our multi-family, commercial real estate and construction loan portfolios. By the end of fiscal 2014 each of these initiatives were largely complete and, as a result, we are better positioned today than we were last year at this time to take advantage of better general economic conditions and stabilized mortgage origination markets.
In addition to the initiatives described above, our fiscal 2014 Business Plan outlined our multi-year objectives to lower the balance of cash and cash equivalents; to decrease the percentage of single-family loans to loans held for investment; to change our funding mix by reducing borrowings, time deposits, and brokered deposits; to improve asset quality; and to return a meaningful amount of capital to our shareholders in the form of cash dividends and stock repurchases while maintaining sound regulatory capital ratios. More specifically, the fiscal 2014 Business Plan for Provident Bank forecast growth in loans held for investment, growth in retail deposits (primarily core deposits), control of operating expenses, and sound capital management decisions. For Provident Bank Mortgage, we established goals to change our product offerings consistent with the changing market, to increase the percentage of purchase money origination volume, to lower our operating expenses and to update our systems, policies and practices consistent with the regulatory changes scheduled to take effect in January 2014.
I am pleased to report that we have made progress in all of these specific initiatives. Loan originations and purchases for the held for investment portfolio were $168.0 million in fiscal 2014, a 79% increase from $94.1 million in fiscal 2013, resulting in an increase in loans held for investment for the first time in six years; we increased the core deposits balance by 1% at June 30, 2014 from the same date last year, less than intended but making progress nonetheless; operating expenses declined by $13.2 million or 20% from the prior year; and, we paid a quarterly cash dividend of $0.10 per share while repurchasing 1.13 million shares of our common stock.
Additionally, in fiscal 2014, Provident Bank Mortgage originated $2.0 billion of loans held for sale, with 58% originated from purchase money transactions and 42% from refinance transactions. Also, we decreased the operating expenses in our mortgage banking business by $10.4 million or 25% in comparison to the prior year and we successfully implemented the changes in regulatory requirements within the January 2014 deadline.
Provident Bank
We remain committed to the strategies implemented in prior years that we believe will improve our fundamental performance. For example, the percentage of investment securities to total assets continues to decline, the percentage of loans held for investment to total assets continues to increase and the percentage of preferred loans (multi-family, commercial real estate, construction and commercial business) to loans held for investment continues to grow. We intend to grow the Company with more aggressive goals this year but will remain disciplined in our growth execution, returning capital to shareholders in the form of cash dividends and common stock repurchases to the extent our opportunities are limited by overly aggressive competitors or languishing improvement in general economic conditions. We will continue to invest in our preferred loan origination capabilities and retail deposit platform primarily within our geographic footprint.
Similar to last year, during the course of fiscal 2015, we will emphasize prudent increases in loans held for investment; the growth of retail deposits (primarily transaction accounts); diligent control of operating expenses; and sound capital management decisions. We believe that successful execution of these strategies will enhance our franchise value while limiting our risk profile.
Provident Bank Mortgage
We have made significant progress in adjusting our mortgage banking business model to current market fundamentals. During the course of fiscal 2014, we closed four mortgage banking retail offices and reduced the total number of mortgage banking employees by 19%. In fiscal 2015, we will plan to: change our product offerings commensurate with the changing market; continue our focus on purchase money originations versus refinance originations; make changes to our operating expenses consistent with the changing market; and respond to the significant changes in regulatory requirements currently scheduled to take effect in August 2015.
A Final Word
There is no doubt that fiscal 2014 was a year of transition for our Company but not unlike many transitions we have successfully overcome in the past; and, it seems to me, that it is unrealistic to believe that the path to success does not contain some bumps along the way. In fact, I’m reminded of a quote attributed to David Brinkley, the Emmy-award winning broadcast journalist who once said, “Lay a firm foundation with the bricks that others throw at you.” Well, we positioned a few bricks and reinforced our foundation during fiscal 2014 and I am confident that the effort will result in better future performance. The Company is well positioned for future growth and will be able to capitalize on opportunities very quickly as they arise.
In closing, I wish to thank our staff of banking professionals for their ongoing commitment and dedication; and express my appreciation for the support we receive from our customers in the communities we serve and the trust bestowed upon us by our shareholders. We recognize that our Company is inextricably linked to each of you and we will make every effort to earn your respect and loyalty.
Sincerely,
Craig G. Blunden
Chairman and Chief Executive Officer
Financial Highlights
The following tables set forth information concerning the consolidated financial position and results of operations of the Corporation and its subsidiary at the dates and for the periods indicated.
|
| | | | | | | | | | | | | | | | | | | | |
| | | At or For The Year Ended June 30, |
| | | 2014 | | 2013 | | 2012 | | 2011 | | 2010 |
| (In Thousands, Except Per Share Information ) | | | | | | | | |
| FINANCIAL CONDITION DATA: | | | | | | | | | | |
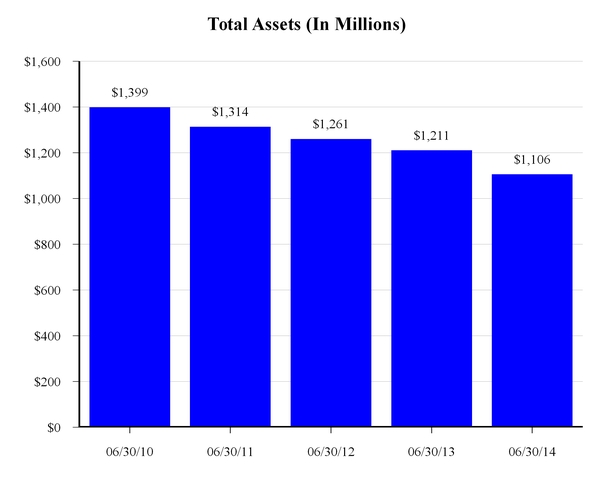
| Total assets | | $ | 1,105,629 |
| | $ | 1,211,041 |
| | $ | 1,260,917 |
| | $ | 1,313,724 |
| | $ | 1,398,576 |
|
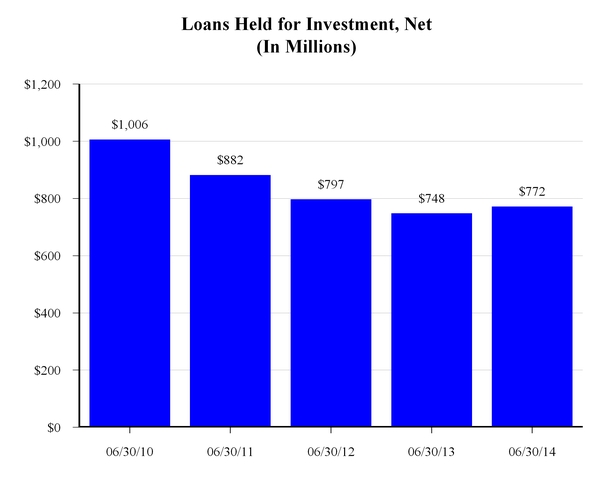
| Loans held for investment, net | | 772,141 |
| | 748,397 |
| | 796,836 |
| | 881,610 |
| | 1,006,260 |
|
| Loans held for sale, at fair value | | 158,883 |
| | 188,050 |
| | 231,639 |
| | 191,678 |
| | 170,255 |
|
| Cash and cash equivalents | | 118,937 |
| | 193,839 |
| | 145,136 |
| | 142,550 |
| | 96,201 |
|
| Investment securities | | 17,147 |
| | 19,510 |
| | 22,898 |
| | 26,193 |
| | 35,003 |
|
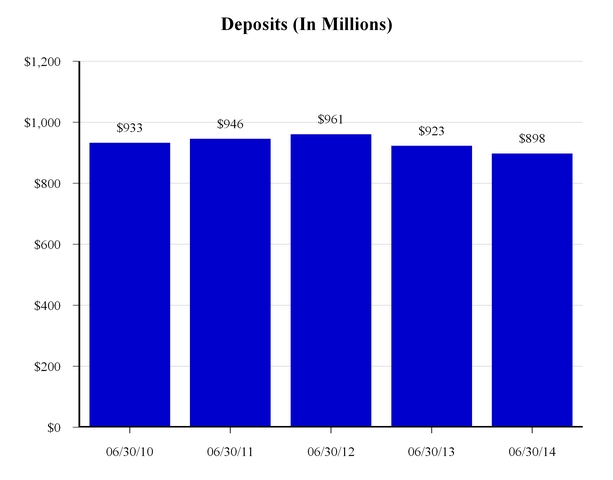
| Deposits | | 897,870 |
| | 923,010 |
| | 961,411 |
| | 945,767 |
| | 932,933 |
|
| Borrowings | | 41,431 |
| | 106,491 |
| | 126,546 |
| | 206,598 |
| | 309,647 |
|
| Stockholders’ equity | | 145,862 |
| | 159,974 |
| | 144,777 |
| | 140,918 |
| | 126,919 |
|
| Book value per share | | 15.66 |
| | 15.40 |
| | 13.34 |
| | 12.34 |
| | 11.13 |
|
| OPERATING DATA: | | |
| | |
| | |
| | |
| | |
|
| Interest income | | $ | 38,059 |
| | $ | 44,161 |
| | $ | 51,435 |
| | $ | 58,689 |
| | $ | 70,163 |
|
| Interest expense | | 7,336 |
| | 10,804 |
| | 14,705 |
| | 20,940 |
| | 30,585 |
|
| Net interest income | | 30,723 |
| | 33,357 |
| | 36,730 |
| | 37,749 |
| | 39,578 |
|
| (Recovery) provision for loan losses | | (3,380 | ) | | (1,499 | ) | | 5,777 |
| | 5,465 |
| | 21,843 |
|
| Net interest income after (recovery) provision for loan losses | | 34,103 |
| | 34,856 |
| | 30,953 |
| | 32,284 |
| | 17,735 |
|
| Loan servicing and other fees | | 1,077 |
| | 1,093 |
| | 733 |
| | 892 |
| | 797 |
|
| Gain on sale of loans, net | | 25,799 |
| | 68,493 |
| | 38,017 |
| | 31,194 |
| | 14,338 |
|
| Deposit account fees | | 2,469 |
| | 2,449 |
| | 2,438 |
| | 2,504 |
| | 2,823 |
|
| Net gain on sale of investment securities | | — |
| | — |
| | — |
| | — |
| | 2,290 |
|
Gain (loss) on sale and operations of real estate owned acquired in the settlement of loans, net | | 18 |
| | 916 |
| | (120 | ) | | (1,351 | ) | | 16 |
|
| Gain on sale of premises and equipment | | — |
| | — |
| | — |
| | 1,089 |
| | — |
|
| Card and processing fees | | 1,370 |
| | 1,292 |
| | 1,282 |
| | 1,274 |
| | 1,110 |
|
| Other non-interest income | | 942 |
| | 957 |
| | 800 |
| | 755 |
| | 885 |
|
| Operating expenses | | 54,168 |
| | 67,343 |
| | 55,365 |
| | 45,372 |
| | 38,139 |
|
| Income before income taxes | | 11,610 |
| | 42,713 |
| | 18,738 |
| | 23,269 |
| | 1,855 |
|
| Provision for income taxes | | 5,004 |
| | 16,916 |
| | 7,928 |
| | 10,049 |
| | 740 |
|
| Net income | | $ | 6,606 |
| | $ | 25,797 |
| | $ | 10,810 |
| | $ | 13,220 |
| | $ | 1,115 |
|
| Basic earnings per share | | $ | 0.67 |
| | $ | 2.43 |
| | $ | 0.96 |
| | $ | 1.16 |
| | $ | 0.13 |
|
| Diluted earnings per share | | $ | 0.65 |
| | $ | 2.38 |
| | $ | 0.96 |
| | $ | 1.16 |
| | $ | 0.13 |
|
| Cash dividend per share | | $ | 0.40 |
| | $ | 0.24 |
| | $ | 0.14 |
| | $ | 0.04 |
| | $ | 0.04 |
|
Financial Highlights
|
| | | | | | | | | | | | | | | |
| | | At or For The Year Ended June 30, |
| | | 2014 | | 2013 | | 2012 | | 2011 | | 2010 |
| KEY OPERATING RATIOS: | | | | | | | | | | |
| Performance Ratios | | | | | | | | | | |
| Return on average assets | | 0.58 | % | | 2.09 | % | | 0.84 | % | | 0.97 | % | | 0.08 | % |
| Return on average stockholders’ equity | | 4.31 |
| | 16.80 |
| | 7.58 |
| | 9.80 |
| | 0.94 |
|
| Interest rate spread | | 2.69 |
| | 2.69 |
| | 2.83 |
| | 2.76 |
| | 2.71 |
|
| Net interest margin | | 2.79 |
| | 2.80 |
| | 2.95 |
| | 2.90 |
| | 2.83 |
|
| Average interest-earning assets to average interest-bearing liabilities | | 113.54 |
| | 112.46 |
| | 110.53 |
| | 108.31 |
| | 105.68 |
|
| Operating and administrative expenses as a percentage of average total assets | | 4.75 |
| | 5.44 |
| | 4.29 |
| | 3.33 |
| | 2.61 |
|
Efficiency ratio (1) | | 86.81 |
| | 62.03 |
| | 69.31 |
| | 61.23 |
| | 61.68 |
|
| Stockholders’ equity to total assets ratio | | 13.19 |
| | 13.21 |
| | 11.48 |
| | 10.73 |
| | 9.07 |
|
| Dividend payout ratio | | 61.54 |
| | 10.08 |
| | 14.58 |
| | 3.45 |
| | 30.77 |
|
| Regulatory Capital Ratios | | |
| | |
| | |
| | |
| | |
|
| Tier 1 leverage capital ratio | | 12.53 | % | | 13.12 | % | | 11.26 | % | | 10.47 | % | | 8.77 | % |
| Tier 1 risk-based capital ratio | | 18.72 |
| | 21.36 |
| | 17.53 |
| | 16.22 |
| | 11.83 |
|
| Total risk-based capital ratio | | 19.98 |
| | 22.64 |
| | 18.79 |
| | 17.48 |
| | 13.10 |
|
| Asset Quality Ratios | | |
| | |
| | |
| | |
| | |
|
| Non-performing loans as a percentage of loans held for investment, net | | 2.06 | % | | 2.90 | % | | 4.33 | % | | 4.21 | % | | 5.84 | % |
| Non-performing assets as a percentage of total assets | | 1.66 |
| | 1.98 |
| | 3.17 |
| | 3.46 |
| | 5.25 |
|
| Allowance for loan losses as a percentage of gross loans held for investment | | 1.25 |
| | 1.96 |
| | 2.63 |
| | 3.34 |
| | 4.14 |
|
| Allowance for loan losses as a percentage of gross non-performing loans | | 55.73 |
| | 58.77 |
| | 52.45 |
| | 59.49 |
| | 56.78 |
|
| Net charge-offs to average loans receivable, net | | 0.21 |
| | 0.51 |
| | 1.38 |
| | 1.67 |
| | 1.96 |
|
| |
(1) | Non-interest expense as a percentage of net interest income and non-interest income. |
Shareholder Information
ANNUAL MEETING
The annual meeting of shareholders will be held at the Riverside Art Museum at 3425 Mission Inn Avenue, Riverside, California on Tuesday, November 25, 2014 at 11:00 a.m. (Pacific). A formal notice of the meeting, together with a proxy statement and proxy form, will be mailed to shareholders.
CORPORATE OFFICE
Provident Financial Holdings, Inc.
3756 Central Avenue
Riverside, CA 92506
(951) 686-6060
INTERNET ADDRESS
www.myprovident.com
SPECIAL COUNSEL
Breyer & Associates PC
8180 Greensboro Drive, Suite 785
McLean, VA 22102
(703) 883-1100
INDEPENDENT REGISTERED PUBLIC ACCOUNTING FIRM
Deloitte & Touche LLP
695 Town Center Drive, Suite 1200
Costa Mesa, CA 92626-7188
(714) 436-7100
TRANSFER AGENT
Registrar and Transfer Company
10 Commerce Drive
Cranford, NJ 07016
(908) 497-2300
MARKET INFORMATION
Provident Financial Holdings, Inc. is traded on the NASDAQ Global Select Market under the symbol PROV.
FINANCIAL INFORMATION
Requests for copies of the Form 10-K and Forms 10-Q filed with the Securities and Exchange Commission should be directed in writing to:
Donavon P. Ternes
President, COO and CFO
Provident Financial Holdings, Inc.
3756 Central Avenue
Riverside, CA 92506
CORPORATE PROFILE
Provident Financial Holdings, Inc. (the “Corporation”), a Delaware corporation, was organized in January 1996 for the purpose of becoming the holding company for Provident Savings Bank, F.S.B. (the “Bank”) upon the Bank’s conversion from a federal mutual to a federal stock savings bank (“Conversion”). The Conversion was completed on June 27, 1996. The Corporation does not engage in any significant activity other than holding the stock of the Bank. The Bank serves the banking needs of select communities in Riverside and San Bernardino Counties and has mortgage lending operations in Southern and Northern California.
Board of Directors and Senior Officers
|
| | |
| Board of Directors | | Senior Officers |
| | | |
| Joseph P. Barr, CPA | | Provident Financial Holdings, Inc. |
| Principal | | |
| Swenson Accountancy Corporation | | Craig G. Blunden |
| | | Chairman |
| Bruce W. Bennett | | Chief Executive Officer |
| Retired Health Care Executive | | |
| Private Investor | | Donavon P. Ternes |
| | | President |
| Craig G. Blunden | | Chief Operating Officer |
| Chairman and Chief Executive Officer | | Chief Financial Officer |
| Provident Financial Holdings, Inc. | | Corporate Secretary |
| Provident Bank | | |
| | | Provident Bank |
| Judy A. Carpenter | | |
| President and Chief Operating Officer | | Craig G. Blunden |
| Riverside Medical Clinic | | Chairman |
| | | Chief Executive Officer |
| Debbi H. Guthrie | | |
| Senior Vice President and Managing Director | | Richard L. Gale |
| Raincross Hospitality Corporation | | Senior Vice President |
| | | Provident Bank Mortgage |
| Roy H. Taylor | | |
| Chief Executive Officer | | Deborah L. Hill |
| Hub International of California, Inc. | | Senior Vice President |
| Insurance Services, Inc. | | Chief Human Resources and |
| | | Administrative Officer |
| William E. Thomas, Esq. | | |
| Principal | | Lilian Salter |
| William E. Thomas, Inc., | | Senior Vice President |
| A Professional Law Corporation | | Chief Information Officer |
| | | |
| | | Donavon P. Ternes |
| | | President |
| | | Chief Operating Officer |
| | | Chief Financial Officer |
| | | Corporate Secretary |
| | | |
| | | David S. Weiant |
| | | Senior Vice President |
| | | Chief Lending Officer |
| | | |
| | | Gwendolyn L. Wertz |
| | | Senior Vice President |
| | | Retail Banking |
Provident Locations
|
| | |
| | |
| | | |
| RETAIL BANKING CENTERS | | WHOLESALE MORTGAGE OFFICES |
| | | |
| Blythe | | Pleasanton |
| 350 E. Hobson Way | | 5934 Gibraltar Drive, Suite 102 |
| Blythe, CA 92225 | | Pleasanton, CA 94588 |
| | | |
| Canyon Crest | | Rancho Cucamonga |
| 5225 Canyon Crest Drive, Suite 86 | | 10370 Commerce Center Drive, Suite 200 |
| Riverside, CA 92507 | | Rancho Cucamonga, CA 91730 |
| | | |
| Corona | | |
| 487 Magnolia Avenue, Suite 101 | | RETAIL MORTGAGE OFFICES |
| Corona, CA 92879 | | |
| | | City of Industry |
| Corporate Office | | 18725 East Gale Avenue, Suite 100 |
| 3756 Central Avenue | | City of Industry, CA 91748 |
| Riverside CA 92506 | | |
| | | Elk Grove |
| Downtown Business Center | | 9245 Laguna Springs Drive, Suite 130 |
| 4001 Main Street | | Elk Grove, CA 95758 |
| Riverside, CA 92501 | | |
| | | Escondido |
| Hemet | | 362 West Mission Avenue, Suite 200 |
| 1690 E. Florida Avenue | | Escondido, CA 92025 |
| Hemet, CA 92544 | | |
| | | Glendora |
| Iris Plaza | | 1200 East Route 66, Suite 102 |
| 16110 Perris Boulevard, Suite K | | Glendora, CA 91740 |
| Moreno Valley, CA 92551 | | |
| | | Livermore |
| La Quinta | | 2578 Old First Street |
| 78752 Highway 111 | | Livermore, CA 94550 |
| La Quinta, CA 92253 | | |
| | | Rancho Cucamonga |
| La Sierra | | 10370 Commerce Center Drive, Suite 110 |
| 3312 La Sierra Avenue, Suite 105 | | Rancho Cucamonga, CA 91730 |
| Riverside, CA 92503 | | |
| | | Redding |
| Moreno Valley | | 1619 Hilltop Drive, Suite E |
| 12460 Heacock Street | | Redding, CA 96002 |
| Moreno Valley, CA 92553 | | |
|
| | |
| | | Riverside, Canyon Crest Drive |
| Orangecrest | | 5225 Canyon Crest Drive, Suite 86 |
| 19348 Van Buren Boulevard, Suite 119 | | Riverside, CA 92507 |
| Riverside, CA 92508 | | |
| | | Riverside, Indiana Avenue |
| Rancho Mirage | | 7111 Indiana Avenue, Suite 200 |
| 71991 Highway 111 | | Riverside, CA 92504 |
| Ranch Mirage, CA 92270 | | |
| | | Riverside, Riverside Avenue |
| Redlands | | 6529 Riverside Avenue, Suite 160 |
| 125 E. Citrus Avenue | | Riverside, CA 92506 |
| Redlands, CA 92373 | | |
| | | Roseville |
| Sun City | | 2998 Douglas Boulevard, Suite 105 |
| 27010 Sun City Boulevard | | Roseville, CA 95661 |
| Sun City, CA 92586 | | |
| | | San Rafael |
| Temecula | | 899 Northgate Drive, Suite 304 |
| 40705 Winchester Road, Suite 6 | | San Rafael, CA 94903 |
| Temecula, CA 92591 | | |
| | | Santa Barbara |
| | | 3710 State Street, Suite B
|
| | | Santa Barbara, CA 93105 |
| | | |
| | | Westlake Village |
| | | 2659 Townsgate Road, Suite 105 |
| | | Westlake Village, CA 91361 |
| | | |
| | | |
| | | |
| | | |
| | | |
| | | |
| | | |
| | | |
| | | |
| | | |
Customer Information 1-800-442-5201 or www.myprovident.com |
Corporate Office
3756 Central Avenue, Riverside, CA 92506
(951) 686-6060
www.myprovident.com
NASDAQ Global Select Market - PROV