EXHIBIT 13
2015 Annual Report to Stockholders
2015 Annual Report
Message From the Chairman
Dear Shareholders:
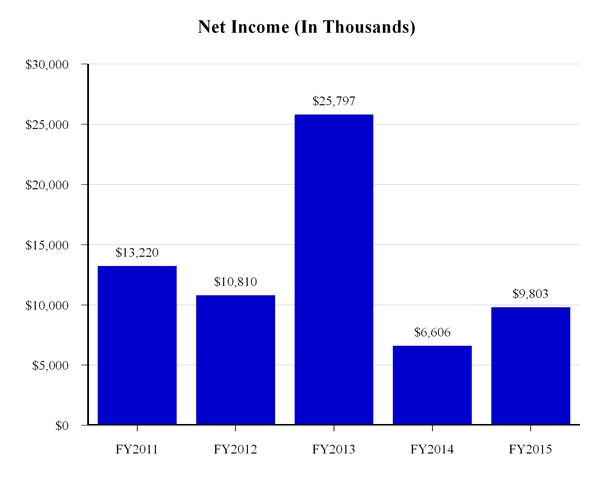
It is my pleasure to forward our Annual Report for fiscal 2015. We reported net income of $9.8 million, or $1.07 per diluted share, and a return on equity of 6.8%, which is significantly better than last year. As I described in my message last year, we were well-positioned to execute on our corporate strategies and our improved financial results reflect our ability to monetize a combination of generally better economic conditions and improved mortgage banking fundamentals during fiscal 2015. In fact, our pre-tax income was much more evenly distributed between our operating segments with community banking contributing $9.1 million and mortgage banking contributing $8.0 million in fiscal 2015. We are pleased with the progress we are making to improve the financial results of each operating segment and believe more progress can be made by executing on our multi-year objectives.
The fiscal 2015 Business Plan for Provident Bank forecast growth in loans held for investment, growth in retail deposits (primarily core deposits), control of operating expenses, and sound capital management decisions. For Provident Bank Mortgage, we established goals to change our product offerings consistent with the changing market, to increase the percentage of purchase money origination volume, to lower our operating expenses and to update our systems, policies and practices consistent with the regulatory changes scheduled to take effect in October 2015.
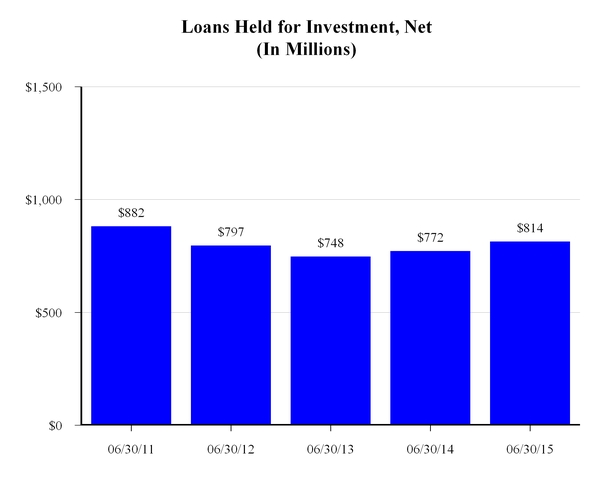
I am pleased to report that we have made progress in all of these specific initiatives. For Provident Bank, loan originations and purchases for the held for investment portfolio were $175.1 million in fiscal 2015, a four percent increase from $168.0 million in fiscal 2014, resulting in a five percent increase in loans held for investment; the core deposits balance increased by $51.4 million or 10% at June 30, 2015 from the same date last year; operating expenses increased by $3.8 million or seven percent from the prior year but our efficiency ratio improved to 79% in fiscal 2015 from 87% last year denoting that the growth in revenue outpaced the rise in operating expenses; finally, we paid a quarterly cash dividend of $0.11 per share in the first three quarters and $0.12 per share in the fourth quarter of fiscal 2015 while repurchasing approximately 785,000 shares of our common stock.
Additionally, in fiscal 2015, Provident Bank Mortgage originated $2.5 billion of loans held for sale a 26% increase from fiscal 2014, with 43% originated from purchase money transactions and 57% from refinance transactions. Also, while the operating expenses in our mortgage banking business were essentially unchanged from the prior year, revenue increased by approximately $9.9 million reversing the prior year’s pre-tax loss. We are also well on our way to the successful implementation of the changes needed to comply with the regulatory requirements by the October 2015 deadline.
Provident Bank
We remain committed to the long-term strategies implemented in prior years that we believe will improve our fundamental performance. For example, the percentage of investment securities to total assets continues to decline, the percentage of loans held for investment to total assets continues to increase and the percentage of preferred loans (multi-family, commercial real estate, construction and commercial business) to loans held for investment continues to grow. We intend to grow the Company with more aggressive goals this year but will remain disciplined in our execution, returning capital to shareholders in the form of cash dividends and common stock repurchases to the extent our opportunities are limited by overly aggressive competitors.
Similar to last year, during the course of fiscal 2016, we will emphasize prudent increases in loans held for investment; the growth of retail deposits (primarily transaction accounts); diligent control of operating expenses; and sound capital management decisions. We believe that successful execution of these strategies will enhance our franchise value while limiting our risk profile.
Provident Bank Mortgage
We have made significant progress in adjusting our mortgage banking business model to current market fundamentals. During the course of fiscal 2015, we opened one and closed two mortgage banking retail offices and kept the total number of mortgage banking employees essentially unchanged from the prior year. In fiscal 2016, we plan to: change our product offerings commensurate with the changing market; continue our focus on purchase money originations versus refinance originations; make changes to our operating expenses consistent with the changing market; and respond to the significant changes in regulatory requirements scheduled to take effect in October 2015.
A Final Word
In less than one year we will be celebrating the 60th Anniversary of our Company. As I reflect on the history of the Company, I can recall many important milestones such as, exceeding one billion dollars in total assets, becoming a publicly traded company, growing to over 500 employees, and successfully navigating through the Great Recession, among many others. But one thing stands out to me during our entire 60 year history: first and foremost we are a community bank and we have never forgotten that our success comes from fulfilling the needs of the businesses and families in the communities we serve. As I think about our community bank heritage, I’m reminded of a quote I once heard, “Write this on a rock…small businesses and community banks are the twin pillars of America’s Main Street economy.” A bit dramatic but I believe it to be true nonetheless. We differentiate our Company from the Wall Street banks and other interlopers by making local decisions and standing shoulder-to-shoulder with local leaders and residents to build a better community. I can describe many instances where our Company, directors, officers and staff have been instrumental in helping a particular project come to fruition for the betterment of the community. Why does it matter? Here’s what I know, engaging the community generates goodwill and a loyal customer base with diverse needs and preferences. Our goal is to meet those diverse needs and preferences when indifferent Wall Street banks can’t or won’t. By doing so, we will enhance and strengthen the franchise value of our Company along the way.
In closing, I wish to thank our staff of banking professionals for their ongoing commitment and dedication; and express my appreciation for the support we receive from customers and shareholders.
Sincerely,
Craig G. Blunden
Chairman and Chief Executive Officer
Financial Highlights
The following tables set forth information concerning the consolidated financial position and results of operations of the Corporation and its subsidiary at the dates and for the periods indicated.
|
| | | | | | | | | | | | | | | | | | | | |
| | | At or For The Year Ended June 30, |
| (In Thousands, Except Per Share Information) | | 2015 | | 2014 | | 2013 | | 2012 | | 2011 |
| | | | | | | | | |
| FINANCIAL CONDITION DATA: | | | | | | | | | | |
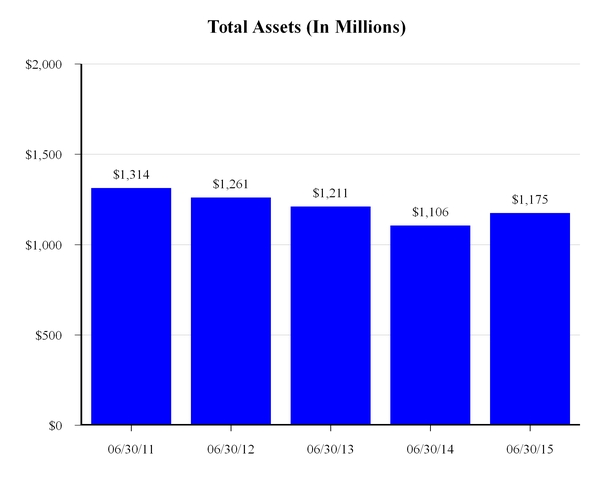
| Total assets | | $ | 1,174,555 |
| | $ | 1,105,629 |
| | $ | 1,211,041 |
| | $ | 1,260,917 |
| | $ | 1,313,724 |
|
| Loans held for investment, net | | 814,234 |
| | 772,141 |
| | 748,397 |
| | 796,836 |
| | 881,610 |
|
| Loans held for sale, at fair value | | 224,715 |
| | 158,883 |
| | 188,050 |
| | 231,639 |
| | 191,678 |
|
| Cash and cash equivalents | | 81,403 |
| | 118,937 |
| | 193,839 |
| | 145,136 |
| | 142,550 |
|
| Investment securities | | 14,961 |
| | 17,147 |
| | 19,510 |
| | 22,898 |
| | 26,193 |
|
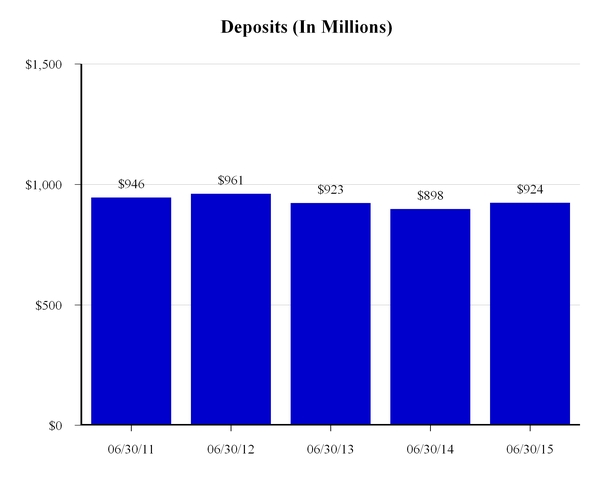
| Deposits | | 924,086 |
| | 897,870 |
| | 923,010 |
| | 961,411 |
| | 945,767 |
|
| Borrowings | | 91,367 |
| | 41,431 |
| | 106,491 |
| | 126,546 |
| | 206,598 |
|
| Stockholders’ equity | | 141,137 |
| | 145,862 |
| | 159,974 |
| | 144,777 |
| | 140,918 |
|
| Book value per share | | 16.35 |
| | 15.66 |
| | 15.40 |
| | 13.34 |
| | 12.34 |
|
| | | | | | | | | | | |
| OPERATING DATA: | | |
| | |
| | |
| | |
| | |
|
| Interest income | | $ | 39,696 |
| | $ | 38,059 |
| | $ | 44,161 |
| | $ | 51,435 |
| | $ | 58,689 |
|
| Interest expense | | 6,421 |
| | 7,336 |
| | 10,804 |
| | 14,705 |
| | 20,940 |
|
| Net interest income | | 33,275 |
| | 30,723 |
| | 33,357 |
| | 36,730 |
| | 37,749 |
|
| (Recovery) provision for loan losses | | (1,387 | ) | | (3,380 | ) | | (1,499 | ) | | 5,777 |
| | 5,465 |
|
| Net interest income after (recovery) provision for loan losses | | 34,662 |
| | 34,103 |
| | 34,856 |
| | 30,953 |
| | 32,284 |
|
| Loan servicing and other fees | | 1,085 |
| | 1,077 |
| | 1,093 |
| | 733 |
| | 892 |
|
| Gain on sale of loans, net | | 34,210 |
| | 25,799 |
| | 68,493 |
| | 38,017 |
| | 31,194 |
|
| Deposit account fees | | 2,412 |
| | 2,469 |
| | 2,449 |
| | 2,438 |
| | 2,504 |
|
Gain (loss) on sale and operations of real estate owned acquired in the settlement of loans, net | | 282 |
| | 18 |
| | 916 |
| | (120 | ) | | (1,351 | ) |
| Gain on sale of premises and equipment | | — |
| | — |
| | — |
| | — |
| | 1,089 |
|
| Card and processing fees | | 1,406 |
| | 1,370 |
| | 1,292 |
| | 1,282 |
| | 1,274 |
|
| Other non-interest income | | 992 |
| | 942 |
| | 957 |
| | 800 |
| | 755 |
|
| Operating expenses | | 57,969 |
| | 54,168 |
| | 67,343 |
| | 55,365 |
| | 45,372 |
|
| Income before income taxes | | 17,080 |
| | 11,610 |
| | 42,713 |
| | 18,738 |
| | 23,269 |
|
| Provision for income taxes | | 7,277 |
| | 5,004 |
| | 16,916 |
| | 7,928 |
| | 10,049 |
|
| Net income | | $ | 9,803 |
| | $ | 6,606 |
| | $ | 25,797 |
| | $ | 10,810 |
| | $ | 13,220 |
|
| Basic earnings per share | | $ | 1.09 |
| | $ | 0.67 |
| | $ | 2.43 |
| | $ | 0.96 |
| | $ | 1.16 |
|
| Diluted earnings per share | | $ | 1.07 |
| | $ | 0.65 |
| | $ | 2.38 |
| | $ | 0.96 |
| | $ | 1.16 |
|
| Cash dividend per share | | $ | 0.45 |
| | $ | 0.40 |
| | $ | 0.24 |
| | $ | 0.14 |
| | $ | 0.04 |
|
Financial Highlights
|
| | | | | | | | | | | | | | | |
| | | At or For The Year Ended June 30, |
| | | 2015 | | 2014 | | 2013 | | 2012 | | 2011 |
| | | | | | | | | | | |
| KEY OPERATING RATIOS: | | | | | | | | | | |
| | | | | | | | | | | |
| Performance Ratios | | | | | | | | | | |
| Return on average assets | | 0.87 | % | | 0.58 | % | | 2.09 | % | | 0.84 | % | | 0.97 | % |
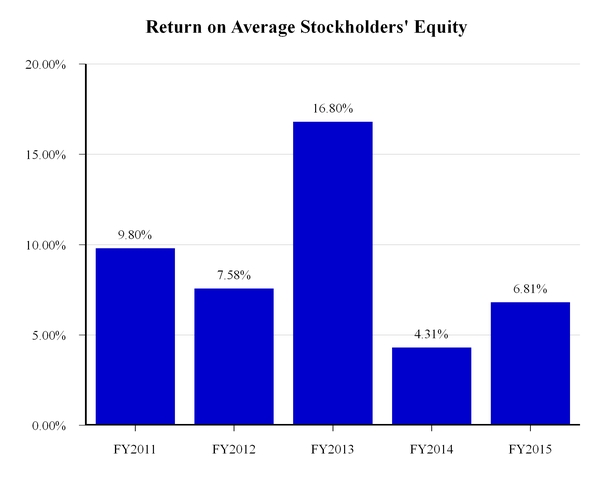
| Return on average stockholders’ equity | | 6.81 |
| | 4.31 |
| | 16.80 |
| | 7.58 |
| | 9.80 |
|
| Interest rate spread | | 2.96 |
| | 2.69 |
| | 2.69 |
| | 2.83 |
| | 2.76 |
|
| Net interest margin | | 3.03 |
| | 2.79 |
| | 2.80 |
| | 2.95 |
| | 2.90 |
|
| Average interest-earning assets to average interest-bearing liabilities | | 113.02 |
| | 113.54 |
| | 112.46 |
| | 110.53 |
| | 108.31 |
|
| Operating and administrative expenses as a percentage of average total assets | | 5.12 |
| | 4.75 |
| | 5.44 |
| | 4.29 |
| | 3.33 |
|
Efficiency ratio(1) | | 78.70 |
| | 86.81 |
| | 62.03 |
| | 69.31 |
| | 61.23 |
|
| Stockholders’ equity to total assets ratio | | 12.02 |
| | 13.19 |
| | 13.21 |
| | 11.48 |
| | 10.73 |
|
| Dividend payout ratio | | 42.06 |
| | 61.54 |
| | 10.08 |
| | 14.58 |
| | 3.45 |
|
| | | | | | | | | | | |
The Corporation's Regulatory Capital Ratios(2) | | |
| | |
| | |
| | |
| | |
|
| Tier 1 leverage capital (to adjusted average assets) | | 11.94 | % | | N/A | | N/A | | N/A | | N/A |
| CET1 capital (to risk-weighted assets) | | 19.24 |
| | N/A | | N/A | | N/A | | N/A |
| Tier 1 capital (to risk-weighted assets) | | 19.24 |
| | N/A | | N/A | | N/A | | N/A |
| Total capital (to risk-weighted assets) | | 20.49 |
| | N/A | | N/A | | N/A | | N/A |
| | | | | | | | | | | |
The Bank's Regulatory Capital Ratios(2) | | |
| | |
| | |
| | |
| | |
|
| Tier 1 leverage capital (to adjusted average assets) | | 10.68 | % | | 12.53 | % | | 13.12 | % | | 11.26 | % | | 10.47 | % |
| CET1 capital (to risk-weighted assets) | | 17.22 |
| | N/A | | N/A | | N/A | | N/A |
| Tier 1 capital (to risk-weighted assets) | | 17.22 |
| | 18.72 |
| | 21.36 |
| | 17.53 |
| | 16.22 |
|
| Total capital (to risk-weighted assets) | | 18.47 |
| | 19.98 |
| | 22.64 |
| | 18.79 |
| | 17.48 |
|
| | | | | | | | | | | |
| Asset Quality Ratios | | |
| | |
| | |
| | |
| | |
|
| Non-performing loans as a percentage of loans held for investment, net | | 1.71 | % | | 2.06 | % | | 2.90 | % | | 4.33 | % | | 4.21 | % |
| Non-performing assets as a percentage of total assets | | 1.39 |
| | 1.66 |
| | 1.98 |
| | 3.17 |
| | 3.46 |
|
| Allowance for loan losses as a percentage of gross loans held for investment | | 1.06 |
| | 1.25 |
| | 1.96 |
| | 2.63 |
| | 3.34 |
|
| Allowance for loan losses as a percentage of gross non-performing loans | | 59.77 |
| | 55.73 |
| | 58.77 |
| | 52.45 |
| | 59.49 |
|
| Net (recoveries) charge-offs to average loans receivable, net | | (0.04 | ) | | 0.21 |
| | 0.51 |
| | 1.38 |
| | 1.67 |
|
| |
(1) | Non-interest expense as a percentage of net interest income and non-interest income. |
| |
(2) | On January 1, 2015 the Corporation and the Bank implemented the Basel III capital protocol consistent with regulatory requirements which were not applicable in prior periods. |
Shareholder Information
ANNUAL MEETING
The annual meeting of shareholders will be held at the Riverside Art Museum at 3425 Mission Inn Avenue, Riverside, California on Thursday, November 19, 2015 at 11:00 a.m. (Pacific). A formal notice of the meeting, together with a proxy statement and proxy form, will be mailed to shareholders.
CORPORATE OFFICE
Provident Financial Holdings, Inc.
3756 Central Avenue
Riverside, CA 92506
(951) 686-6060
INTERNET ADDRESS
www.myprovident.com
SPECIAL COUNSEL
Breyer & Associates PC
8180 Greensboro Drive, Suite 785
McLean, VA 22102
(703) 883-1100
INDEPENDENT REGISTERED PUBLIC ACCOUNTING FIRM
Deloitte & Touche LLP
695 Town Center Drive, Suite 1200
Costa Mesa, CA 92626-7188
(714) 436-7100
TRANSFER AGENT
Computershare, Inc.
P.O. Box 43078
Providence, RI 02940
(800) 942-5909
MARKET INFORMATION
Provident Financial Holdings, Inc. is traded on the NASDAQ Global Select Market under the symbol PROV.
FINANCIAL INFORMATION
Requests for copies of the Form 10-K and Forms 10-Q filed with the Securities and Exchange Commission should be directed in writing to:
Donavon P. Ternes
President, COO and CFO
Provident Financial Holdings, Inc.
3756 Central Avenue
Riverside, CA 92506
CORPORATE PROFILE
Provident Financial Holdings, Inc. (the “Corporation”), a Delaware corporation, was organized in January 1996 for the purpose of becoming the holding company for Provident Savings Bank, F.S.B. (the “Bank”) upon the Bank’s conversion from a federal mutual to a federal stock savings bank (“Conversion”). The Conversion was completed on June 27, 1996. The Corporation does not engage in any significant activity other than holding the stock of the Bank. The Bank serves the banking needs of select communities in Riverside and San Bernardino Counties and has mortgage lending operations in Southern and Northern California.
Board of Directors and Senior Officers
|
| | |
| Board of Directors | | Senior Officers |
| | | |
| Joseph P. Barr, CPA | | Provident Financial Holdings, Inc. |
| Principal | | |
| Swenson Accountancy Corporation | | Craig G. Blunden |
| | | Chairman and Chief Executive Officer |
| Bruce W. Bennett | | |
| Retired Health Care Executive | | Donavon P. Ternes |
| Private Investor | | President, Chief Operating Officer and |
| | | Chief Financial Officer |
| Craig G. Blunden | | Corporate Secretary |
| Chairman and Chief Executive Officer | | |
| Provident Financial Holdings, Inc. | | Provident Bank |
| Provident Bank | | |
| | | Craig G. Blunden |
| Judy A. Carpenter | | Chairman and Chief Executive Officer |
| President and Chief Operating Officer | | |
| Riverside Medical Clinic | | Richard L. Gale |
| | | Senior Vice President |
| Debbi H. Guthrie | | Provident Bank Mortgage |
| Executive Vice President, | | |
| Chief Financial Officer and | | Deborah L. Hill |
| Chief Operations Officer | | Senior Vice President |
| Raincross Hospitality Corporation | | Chief Human Resources and |
| | | Administrative Officer |
| Roy H. Taylor | | |
| Chief Executive Officer | | Lilian Salter |
| Hub International of California, Inc. | | Senior Vice President |
| | | Chief Information Officer |
| William E. Thomas, Esq. | | |
| Principal | | Donavon P. Ternes |
| William E. Thomas, Inc., | | President, Chief Operating Officer and |
| A Professional Law Corporation | | Chief Financial Officer |
| | | Corporate Secretary |
| | | |
| | | David S. Weiant |
| | | Senior Vice President |
| | | Chief Lending Officer |
| | | |
| | | Gwendolyn L. Wertz |
| | | Senior Vice President |
| | | Retail Banking |
| | | |
| | | |
| | | |
| | | |
Provident Locations
|
| | |
| | |
| | | |
| RETAIL BANKING CENTERS | | WHOLESALE MORTGAGE OFFICES |
| | | |
| Blythe | | Pleasanton |
| 350 E. Hobson Way | | 5934 Gibraltar Drive, Suite 102 |
| Blythe, CA 92225 | | Pleasanton, CA 94588 |
| | | |
| Canyon Crest | | Rancho Cucamonga |
| 5225 Canyon Crest Drive, Suite 86 | | 10370 Commerce Center Drive, Suite 200 |
| Riverside, CA 92507 | | Rancho Cucamonga, CA 91730 |
| | | |
| Corona | | |
| 487 Magnolia Avenue, Suite 101 | | RETAIL MORTGAGE OFFICES |
| Corona, CA 92879 | | |
| | | Carlsbad |
| Corporate Office | | 2888 Loker Avenue East, Suite 202 |
| 3756 Central Avenue | | Carlsbad, CA 92010 |
| Riverside, CA 92506 | | |
| | | City of Industry |
| Downtown Business Center | | 18725 East Gale Avenue, Suite 100 |
| 4001 Main Street | | City of Industry, CA 91748 |
| Riverside, CA 92501 | | |
| | | Elk Grove |
| Hemet | | 9245 Laguna Springs Drive, Suite 130 |
| 1690 E. Florida Avenue | | Elk Grove, CA 95758 |
| Hemet, CA 92544 | | |
| | | Escondido |
| Iris Plaza | | 362 West Mission Avenue, Suite 200 |
| 16110 Perris Boulevard, Suite K | | Escondido, CA 92025 |
| Moreno Valley, CA 92551 | | |
| | | Glendora |
| La Quinta | | 1200 East Route 66, Suite 102 |
| 78752 Highway 111 | | Glendora, CA 91740 |
| La Quinta, CA 92253 | | |
| | | Livermore |
| La Sierra | | 2578 Old First Street |
| 3312 La Sierra Avenue, Suite 105 | | Livermore, CA 94550 |
| Riverside, CA 92503 | | |
| | | Rancho Cucamonga |
| Moreno Valley | | 10370 Commerce Center Drive, Suite 110 |
| 12460 Heacock Street | | Rancho Cucamonga, CA 91730 |
| Moreno Valley, CA 92553 | | |
|
| | |
| | | Riverside, Canyon Crest Drive |
| Orangecrest | | 5225 Canyon Crest Drive, Suite 86 |
| 19348 Van Buren Boulevard, Suite 119 | | Riverside, CA 92507 |
| Riverside, CA 92508 | | |
| | | Riverside, Indiana Avenue |
| Rancho Mirage | | 7111 Indiana Avenue, Suite 200 |
| 71991 Highway 111 | | Riverside, CA 92504 |
| Ranch Mirage, CA 92270 | | |
| | | Riverside, Riverside Avenue |
| Redlands | | 6529 Riverside Avenue, Suite 160 |
| 125 E. Citrus Avenue | | Riverside, CA 92506 |
| Redlands, CA 92373 | | |
| | | Roseville |
| Sun City | | 2998 Douglas Boulevard, Suite 105 |
| 27010 Sun City Boulevard | | Roseville, CA 95661 |
| Sun City, CA 92586 | | |
| | | Santa Barbara |
| Temecula | | 3710 State Street, Suite B
|
| 40705 Winchester Road, Suite 6 | | Santa Barbara, CA 93105 |
| Temecula, CA 92591 | | |
| | | Westlake Village |
| | | 2659 Townsgate Road, Suite 105 |
| | | Westlake Village, CA 91361 |
| | | |
| | | |
| | | |
| | | |
| | | |
| | | |
| | | |
| | | |
| | | |
| | | |
| | | |
| | | |
| | | |
| | | |
Customer Information 1-800-442-5201 or www.myprovident.com |
Corporate Office
3756 Central Avenue, Riverside, CA 92506
(951) 686-6060
www.myprovident.com
NASDAQ Global Select Market - PROV