EXHIBIT 13
2017 Annual Report to Stockholders
2017 Annual Report
Message From the Chairman
Dear Shareholders:
I am pleased to forward our Annual Report for fiscal 2017. You will note that it has been a mixed year for the Company. A year where we have demonstrated meaningful improvement in our community banking business, improving profitability by 11% in comparison to last year, but a year where we have also experienced challenges in our mortgage banking business, recording a small loss for the year. We have navigated similar waters in the past and are confident that we can continue to improve our community banking results by capitalizing on better general economic conditions through high quality growth while simultaneously adjusting our mortgage banking business to compensate for the poorer mortgage banking environment.
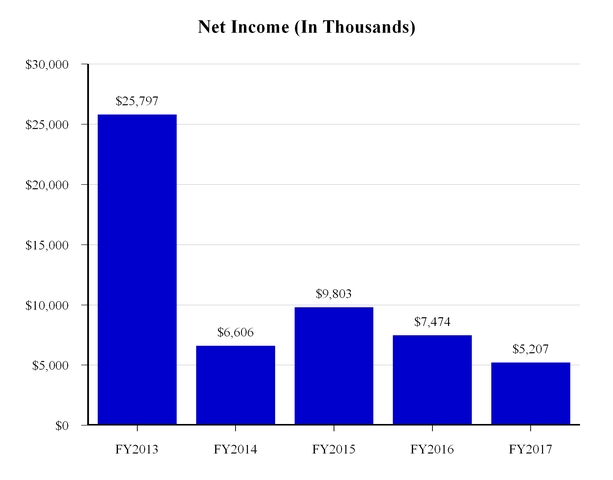
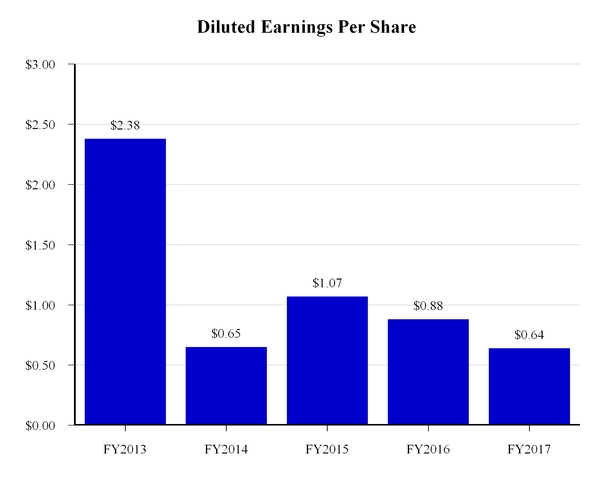
Overall, our fiscal 2017 financial results, net income of $5.2 million or $0.64 per share, deteriorated from last year and was largely the result of mortgage interest rate volatility resulting in a compressed loan sale margin as mortgage loan competitors responded with more aggressive pricing in an effort to stabilize their declining volume. When the downturn became evident, we spent the final two quarters of the fiscal year adjusting our mortgage banking business to compensate for the weaker mortgage banking fundamentals. As a result, we are better positioned today than we were last year at this time to better compete with what we believe will be lower overall mortgage volumes for fiscal 2018 in comparison to recent prior years.
The fiscal 2017 Business Plan for Provident Bank forecast growth in loans held for investment, growth in retail deposits (primarily core deposits), control of operating expenses, and sound capital management decisions. For Provident Bank Mortgage, we established goals to change our product offerings consistent with the changing market, to increase the percentage of purchase money origination volume, and to lower our operating expenses consistent with changes in market opportunities.
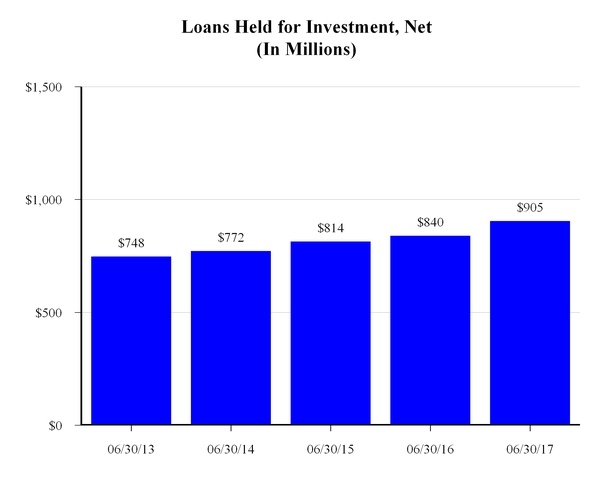
I am pleased to report that we have made progress. For Provident Bank, loan originations and purchases for the held for investment portfolio were $253.7 million in fiscal 2017, a 17 percent increase from $216.1 million in fiscal 2016, unfortunately the increased origination volume was tempered by loan prepayments. Nevertheless, loans held for investment grew eight percent this year, a higher growth rate than last year, and consistent with the moderate growth rate of the past four years; the core deposits balance increased by $41.1 million or seven percent at June 30, 2017 from the same date last year; operating expenses for fiscal 2017 increased by just three percent from the prior year; and finally, we paid a quarterly cash dividend of $0.13 per share in fiscal 2017 while repurchasing approximately 425,000 shares of our common stock.
Additionally, in fiscal 2017, Provident Bank Mortgage originated approximately $1.9 billion of loans held for sale, a decline of approximately 3% from fiscal 2016, with 51 percent originated for purchase money transactions and 49 percent originated for refinance transactions. Provident Bank Mortgage also originated $76.5 million of loans held for investment in fiscal 2017, a 109 percent increase from the $36.6 million originated last year. Also, operating expenses in our mortgage banking business were lower by one percent from the prior year, however, our loan sale margin declined to 140 basis points in fiscal 2017 from 157 basis points in fiscal 2016 as a result of the more competitive situation this year. To put this in perspective, 17 basis points less in loan sale margin on $1.9 billion of production volume reduces revenues by $3.2 million which, for us, was the difference between a profitable year or an unprofitable year for mortgage banking. Unfortunately, we experienced the latter.
Provident Bank
We remain committed to the long-term strategies implemented in prior years that we believe will improve our fundamental performance. For example, the percentage of investment securities to total assets remains at very low levels and the percentage of loans held for investment to total assets continues to increase. We intend to grow the Company with similar goals this year in comparison to last year but will remain disciplined in our execution, returning capital to shareholders in the form of cash dividends and common stock repurchases to the extent our opportunities are limited by overly aggressive competitors. We will not pursue growth at any cost.
Similar to last year, during the course of fiscal 2018, we plan to emphasize prudent increases in loans held for investment; the growth of retail deposits; diligent control of operating expenses; and sound capital management decisions. We believe that successful execution of these strategies will enhance our franchise value while limiting our risk profile.
Provident Bank Mortgage
We continue to adjust our mortgage banking business model to current market fundamentals. During the course of fiscal 2017, we opened one and closed three mortgage banking retail offices and reduced the total number of mortgage banking personnel from the end of the prior year by approximately 16%. In fiscal 2018, we plan to: change our product offerings commensurate with the shifting market; continue our focus on purchase money originations versus refinance originations; make changes to our operating expenses consistent with market opportunities; and complete the implementation of our new loan operating system.
A Final Word
As I reflect on the performance of our Company during fiscal 2017, it would be easy to focus on the disappointing financial results while ignoring the heavy-lifting of our day-to-day activities that builds the franchise value of the Company without
embedding excessive risk in the balance sheet. We strive for long-term viability and try not to be unduly obsessed with short-term profitability. That is not to say, however, that we are satisfied with our recent financial performance, we are not. But, we also have long memories filled with past economic instability and the resultant stress on the financial services industry and financial and real estate markets; and in particular, individual banks that overextended themselves by entering new business lines they did not fully understand or expanded their risk appetite beyond prudent levels. We stick to our knitting; we have been serving the needs of consumers and businesses of Inland Southern California for many years and have grown to become the largest community bank headquartered in Riverside County. Over time, this approach has served our constituencies well.
In closing, I wish to recognize our staff of banking professionals and the Board of Directors for their endless commitment and dedication; and express my appreciation for the support we receive from our customers and shareholders. We recognize that our long-term success is conditioned upon your ongoing goodwill. Thank you.
Sincerely,
Craig G. Blunden
Chairman and Chief Executive Officer
Financial Highlights
The following tables set forth information concerning the consolidated financial position and results of operations of the Corporation and its subsidiary at the dates and for the periods indicated.
|
| | | | | | | | | | | | | | | | | | | | |
| | | At or For The Year Ended June 30, |
| (In Thousands, Except Per Share Information) | | 2017 | | 2016 | | 2015 | | 2014 | | 2013 |
| | | | | | | | | |
| FINANCIAL CONDITION DATA: | | | | | | | | | | |
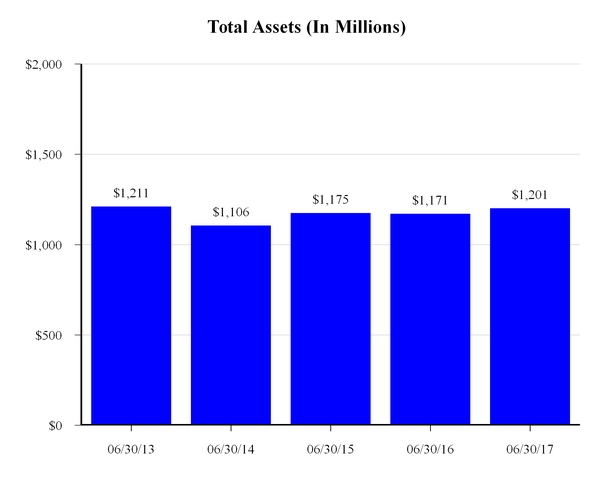
| Total assets | | $ | 1,200,633 |
| | $ | 1,171,381 |
| | $ | 1,174,555 |
| | $ | 1,105,629 |
| | $ | 1,211,041 |
|
| Loans held for investment, net | | 904,919 |
| | 840,022 |
| | 814,234 |
| | 772,141 |
| | 748,397 |
|
| Loans held for sale, at fair value | | 116,548 |
| | 189,458 |
| | 224,715 |
| | 158,883 |
| | 188,050 |
|
| Cash and cash equivalents | | 72,826 |
| | 51,206 |
| | 81,403 |
| | 118,937 |
| | 193,839 |
|
| Investment securities | | 69,759 |
| | 51,522 |
| | 14,961 |
| | 17,147 |
| | 19,510 |
|
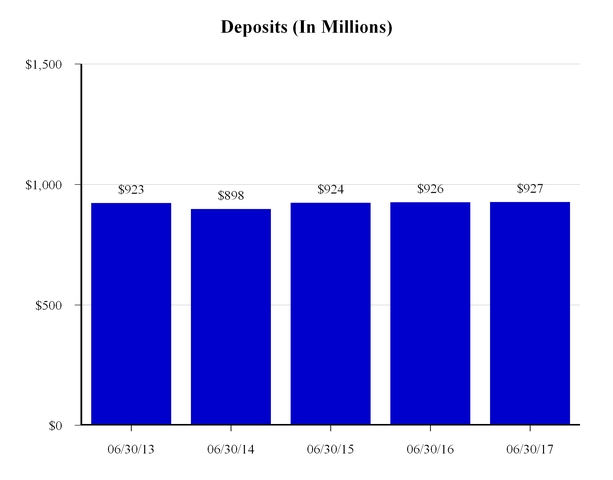
| Deposits | | 926,521 |
| | 926,384 |
| | 924,086 |
| | 897,870 |
| | 923,010 |
|
| Borrowings | | 126,226 |
| | 91,299 |
| | 91,367 |
| | 41,431 |
| | 106,491 |
|
| Stockholders’ equity | | 128,230 |
| | 133,451 |
| | 141,137 |
| | 145,862 |
| | 159,974 |
|
| Book value per share | | 16.62 |
| | 16.73 |
| | 16.35 |
| | 15.66 |
| | 15.40 |
|
| | | | | | | | | | | |
| OPERATING DATA: | | |
| | |
| | |
| | |
| | |
|
| Interest income | | $ | 42,417 |
| | $ | 39,304 |
| | $ | 39,696 |
| | $ | 38,059 |
| | $ | 44,161 |
|
| Interest expense | | 6,679 |
| | 6,975 |
| | 6,421 |
| | 7,336 |
| | 10,804 |
|
| Net interest income | | 35,738 |
| | 32,329 |
| | 33,275 |
| | 30,723 |
| | 33,357 |
|
| Recovery from the allowance for loan losses | | (1,042 | ) | | (1,715 | ) | | (1,387 | ) | | (3,380 | ) | | (1,499 | ) |
| Net interest income after recovery from the allowance for loan losses | | 36,780 |
| | 34,044 |
| | 34,662 |
| | 34,103 |
| | 34,856 |
|
| Loan servicing and other fees | | 1,251 |
| | 1,068 |
| | 1,085 |
| | 1,077 |
| | 1,093 |
|
| Gain on sale of loans, net | | 25,680 |
| | 31,521 |
| | 34,210 |
| | 25,799 |
| | 68,493 |
|
| Deposit account fees | | 2,194 |
| | 2,319 |
| | 2,412 |
| | 2,469 |
| | 2,449 |
|
(Loss) gain on sale and operations of real estate owned acquired in the settlement of loans, net | | (557 | ) | | (95 | ) | | 282 |
| | 18 |
| | 916 |
|
| Card and processing fees | | 1,451 |
| | 1,448 |
| | 1,406 |
| | 1,370 |
| | 1,292 |
|
| Other non-interest income | | 802 |
| | 800 |
| | 992 |
| | 942 |
| | 957 |
|
| Operating expenses | | 58,785 |
| | 58,259 |
| | 57,969 |
| | 54,168 |
| | 67,343 |
|
| Income before income taxes | | 8,816 |
| | 12,846 |
| | 17,080 |
| | 11,610 |
| | 42,713 |
|
| Provision for income taxes | | 3,609 |
| | 5,372 |
| | 7,277 |
| | 5,004 |
| | 16,916 |
|
| Net income | | $ | 5,207 |
| | $ | 7,474 |
| | $ | 9,803 |
| | $ | 6,606 |
| | $ | 25,797 |
|
| Basic earnings per share | | $ | 0.66 |
| | $ | 0.90 |
| | $ | 1.09 |
| | $ | 0.67 |
| | $ | 2.43 |
|
| Diluted earnings per share | | $ | 0.64 |
| | $ | 0.88 |
| | $ | 1.07 |
| | $ | 0.65 |
| | $ | 2.38 |
|
| Cash dividend per share | | $ | 0.52 |
| | $ | 0.48 |
| | $ | 0.45 |
| | $ | 0.40 |
| | $ | 0.24 |
|
Financial Highlights
|
| | | | | | | | | | | | | | | |
| | | At or For The Year Ended June 30, |
| | | 2017 | | 2016 | | 2015 | | 2014 | | 2013 |
| | | | | | | | | | | |
| KEY OPERATING RATIOS: | | | | | | | | | | |
| | | | | | | | | | | |
| Performance Ratios | | | | | | | | | | |
| Return on average assets | | 0.43 | % | | 0.64 | % | | 0.87 | % | | 0.58 | % | | 2.09 | % |
| Return on average stockholders’ equity | | 3.94 |
| | 5.43 |
| | 6.81 |
| | 4.31 |
| | 16.80 |
|
| Interest rate spread | | 3.00 |
| | 2.78 |
| | 2.96 |
| | 2.69 |
| | 2.69 |
|
| Net interest margin | | 3.06 |
| | 2.85 |
| | 3.03 |
| | 2.79 |
| | 2.80 |
|
| Average interest-earning assets to average interest-bearing liabilities | | 111.16 |
| | 111.75 |
| | 113.02 |
| | 113.54 |
| | 112.46 |
|
| Operating and administrative expenses as a percentage of average total assets | | 4.90 |
| | 4.98 |
| | 5.12 |
| | 4.75 |
| | 5.44 |
|
Efficiency ratio(1) | | 88.32 |
| | 83.96 |
| | 78.70 |
| | 86.81 |
| | 62.03 |
|
| Stockholders’ equity to total assets ratio | | 10.68 |
| | 11.39 |
| | 12.02 |
| | 13.19 |
| | 13.21 |
|
| Dividend payout ratio | | 81.25 |
| | 54.55 |
| | 42.06 |
| | 61.54 |
| | 10.08 |
|
| | | | | | | | | | | |
The Corporation's Regulatory Capital Ratios(2) | | |
| | |
| | |
| | |
| | |
|
| Tier 1 leverage capital (to adjusted average assets) | | 10.77 | % | | 11.40 | % | | 11.94 | % | | N/A | | N/A |
| CET1 capital (to risk-weighted assets) | | 17.57 |
| | 17.89 |
| | 19.24 |
| | N/A | | N/A |
| Tier 1 capital (to risk-weighted assets) | | 17.57 |
| | 17.89 |
| | 19.24 |
| | N/A | | N/A |
| Total capital (to risk-weighted assets) | | 18.71 |
| | 19.09 |
| | 20.49 |
| | N/A | | N/A |
| | | | | | | | | | | |
The Bank's Regulatory Capital Ratios(2) | | |
| | |
| | |
| | |
| | |
|
| Tier 1 leverage capital (to adjusted average assets) | | 9.90 | % | | 10.29 | % | | 10.68 | % | | 12.53 | % | | 13.12 | % |
| CET1 capital (to risk-weighted assets) | | 16.14 |
| | 16.16 |
| | 17.22 |
| | N/A | | N/A |
| Tier 1 capital (to risk-weighted assets) | | 16.14 |
| | 16.16 |
| | 17.22 |
| | 18.72 |
| | 21.36 |
|
| Total capital (to risk-weighted assets) | | 17.28 |
| | 17.36 |
| | 18.47 |
| | 19.98 |
| | 22.64 |
|
| | | | | | | | | | | |
| Asset Quality Ratios | | |
| | |
| | |
| | |
| | |
|
| Non-performing loans as a percentage of loans held for investment, net | | 0.88 | % | | 1.23 | % | | 1.71 | % | | 2.06 | % | | 2.90 | % |
| Non-performing assets as a percentage of total assets | | 0.80 |
| | 1.11 |
| | 1.39 |
| | 1.66 |
| | 1.98 |
|
| Allowance for loan losses as a percentage of gross loans held for investment | | 0.88 |
| | 1.02 |
| | 1.06 |
| | 1.25 |
| | 1.96 |
|
| Net (recoveries) charge-offs to average loans receivable, net | | (0.04 | ) | | (0.17 | ) | | (0.04 | ) | | 0.21 |
| | 0.51 |
|
| |
(1) | Non-interest expense as a percentage of net interest income and non-interest income. |
| |
(2) | On January 1, 2015 the Corporation and the Bank implemented the Basel III capital protocol consistent with regulatory requirements which were not applicable in prior periods. |
Shareholder Information
ANNUAL MEETING
The annual meeting of shareholders will be held at the Riverside Art Museum at 3425 Mission Inn Avenue, Riverside, California on Tuesday, November 28, 2017 at 11:00 a.m. (Pacific). A formal notice of the meeting, together with a proxy statement and proxy form, will be mailed to shareholders.
CORPORATE OFFICE
Provident Financial Holdings, Inc.
3756 Central Avenue
Riverside, CA 92506
(951) 686-6060
INTERNET ADDRESS
www.myprovident.com
SPECIAL COUNSEL
Breyer & Associates PC
8180 Greensboro Drive, Suite 785
McLean, VA 22102
(703) 883-1100
INDEPENDENT REGISTERED PUBLIC ACCOUNTING FIRM
Deloitte & Touche LLP
695 Town Center Drive, Suite 1000
Costa Mesa, CA 92626-7188
(714) 436-7100
TRANSFER AGENT
Computershare, Inc.
P.O. Box 43078
Providence, RI 02940
(800) 942-5909
MARKET INFORMATION
Provident Financial Holdings, Inc. is traded on the NASDAQ Global Select Market under the symbol PROV.
FINANCIAL INFORMATION
Requests for copies of the Form 10-K and Forms 10-Q filed with the Securities and Exchange Commission should be directed in writing to:
Donavon P. Ternes
President, COO and CFO
Provident Financial Holdings, Inc.
3756 Central Avenue
Riverside, CA 92506
CORPORATE PROFILE
Provident Financial Holdings, Inc. (the “Corporation”), a Delaware corporation, was organized in January 1996 for the purpose of becoming the holding company for Provident Savings Bank, F.S.B. (the “Bank”) upon the Bank’s conversion from a federal mutual to a federal stock savings bank (“Conversion”). The Conversion was completed on June 27, 1996. The Corporation does not engage in any significant activity other than holding the stock of the Bank. The Bank serves the banking needs of select communities in Riverside and San Bernardino Counties and has mortgage lending operations in Southern and Northern California.
Board of Directors and Senior Officers
|
| | |
| Board of Directors | | Senior Officers |
| | | |
| Joseph P. Barr, CPA | | Provident Financial Holdings, Inc. |
| Partner Emeritus | | |
| Swenson Accountancy Corporation | | Craig G. Blunden |
| | | Chairman and Chief Executive Officer |
| Bruce W. Bennett | | |
| Retired Health Care Executive | | Donavon P. Ternes |
| Private Investor | | President, Chief Operating Officer, |
| | | Chief Financial Officer, and |
| Craig G. Blunden | | Corporate Secretary |
| Chairman and Chief Executive Officer | | |
| Provident Financial Holdings, Inc. | | Provident Bank |
| Provident Bank | | |
| | | Craig G. Blunden |
| Judy A. Carpenter | | Chairman and Chief Executive Officer |
| President and Chief Operating Officer | | |
| Riverside Medical Clinic | | Deborah L. Hill |
| | | Senior Vice President |
| Debbi H. Guthrie | | Chief Human Resources and |
| Retired Executive | | Administrative Officer |
| Raincross Hospitality Corporation | | |
| | | Robert "Scott" Ritter |
| Roy H. Taylor | | Senior Vice President |
| Chief Executive Officer | | Provident Bank Mortgage |
| Hub International of California, Inc. | | |
| | | Lilian Salter |
| William E. Thomas, Esq. | | Senior Vice President |
| Principal | | Chief Information Officer |
| William E. Thomas, Inc., | | |
| a Professional Law Corporation | | Donavon P. Ternes |
| | | President, Chief Operating Officer, |
| | | Chief Financial Officer, and |
| | | Corporate Secretary |
| | | |
| | | David S. Weiant |
| | | Senior Vice President |
| | | Chief Lending Officer |
| | | |
| | | Gwendolyn L. Wertz |
| | | Senior Vice President |
| | | Retail Banking |
| | | |
| | | |
| | | |
| | | |
Provident Locations
|
| | |
| | |
| | | |
| RETAIL BANKING CENTERS | | WHOLESALE MORTGAGE OFFICES |
| | | |
| Blythe | | Pleasanton |
| 350 E. Hobson Way | | 5934 Gibraltar Drive, Suite 102 |
| Blythe, CA 92225 | | Pleasanton, CA 94588 |
| | | |
| Canyon Crest | | Rancho Cucamonga |
| 5225 Canyon Crest Drive, Suite 86 | | 10370 Commerce Center Drive, Suite 200 |
| Riverside, CA 92507 | | Rancho Cucamonga, CA 91730 |
| | | |
| Corona | | |
| 487 Magnolia Avenue, Suite 101 | | RETAIL MORTGAGE OFFICES |
| Corona, CA 92879 | | |
| | | Atascadero |
| Downtown Business Center | | 7480 El Camino Real, 2nd Floor |
| 4001 Main Street | | Atascadero, CA 93422 |
| Riverside, CA 92501 | | |
| | | Brea |
| Hemet | | 3010 Saturn Street, Suite 101 |
| 1690 E. Florida Avenue | | Brea, CA 92821 |
| Hemet, CA 92544 | | |
| | | Escondido |
| Home Office | | 221 West Crest Street, Suite 100 |
| 6570 Magnolia Avenue | | Escondido, CA 92025 |
| Riverside, CA 92506 | | |
| | | Glendora |
| La Quinta | | 1200 East Route 66, Suite 102 |
| 78752 Highway 111 | | Glendora, CA 91740 |
| La Quinta, CA 92253 | | |
| | | Rancho Cucamonga |
| La Sierra | | 10370 Commerce Center Drive, Suite 110 |
| 3312 La Sierra Avenue, Suite 105 | | Rancho Cucamonga, CA 91730 |
| Riverside, CA 92503 | | |
| | | Riverside, Canyon Crest Drive |
| Moreno Valley | | 5225 Canyon Crest Drive, Suite 86 |
| 12460 Heacock Street | | Riverside, CA 92507 |
| Moreno Valley, CA 92553 | | |
| | | Riverside, Indiana Avenue |
| Orangecrest | | 7111 Indiana Avenue, Suite 200 |
| 19348 Van Buren Boulevard, Suite 119 | | Riverside, CA 92504 |
| Riverside, CA 92508 | | |
|
| | |
| | | Riverside, Riverside Avenue |
| Rancho Mirage | | 6529 Riverside Avenue, Suite 160 |
| 71991 Highway 111 | | Riverside, CA 92506 |
| Ranch Mirage, CA 92270 | | |
| | | Roseville |
| Redlands | | 2998 Douglas Boulevard, Suite 105 |
| 125 E. Citrus Avenue | | Roseville, CA 95661 |
| Redlands, CA 92373 | | |
| | | |
| Sun City | | |
| 27010 Sun City Boulevard | | |
| Sun City, CA 92586 | | |
| | | |
| Temecula | | |
| 40705 Winchester Road, Suite 6 | | |
| Temecula, CA 92591 | | |
| | | |
| | | |
Customer Information 1-800-442-5201 or www.myprovident.com |
Corporate Office
3756 Central Avenue, Riverside, CA 92506
(951) 686-6060
www.myprovident.com
NASDAQ Global Select Market - PROV