UNITED STATES
SECURITIES AND EXCHANGE COMMISSION
Washington, D.C. 20549
FORM N-CSR
CERTIFIED SHAREHOLDER REPORT OF REGISTERED
MANAGEMENT INVESTMENT COMPANIES
Investment Company Act file number: 811-07607
Morgan Stanley Variable Insurance Fund, Inc.
(Exact name of registrant as specified in charter)
| 522 Fifth Avenue, New York, New York | | 10036 |
| (Address of principal executive offices) | | (Zip code) |
John H. Gernon
522 Fifth Avenue, New York, New York 10036
(Name and address of agent for service)
Registrant's telephone number, including area code: 212-296-0289
Date of fiscal year end: December 31,
Date of reporting period: December 31, 2021
Item 1 - Report to Shareholders

Morgan Stanley Variable Insurance Fund, Inc.
Annual Report – December 31, 2021
Core Plus Fixed Income Portfolio
The Fund is intended to be a funding vehicle for variable annuity contracts and variable life insurance policies offered by the separate accounts of certain life insurance companies.
Morgan Stanley Variable Insurance Fund, Inc.
Annual Report – December 31, 2021
Expense Example | | | 2 | | |
Investment Overview | | | 3 | | |
Portfolio of Investments | | | 5 | | |
Statement of Assets and Liabilities | | | 15 | | |
Statement of Operations | | | 16 | | |
Statements of Changes in Net Assets | | | 17 | | |
Financial Highlights | | | 18 | | |
Notes to Financial Statements | | | 20 | | |
Report of Independent Registered Public Accounting Firm | | | 30 | | |
Liquidity Risk Management Program | | | 31 | | |
Federal Tax Notice | | | 32 | | |
Director and Officer Information | | | 33 | | |
1
Morgan Stanley Variable Insurance Fund, Inc.
Annual Report – December 31, 2021
Expense Example (unaudited)
Core Plus Fixed Income Portfolio
As a shareholder of the Core Plus Fixed Income Portfolio (the "Fund"), you incur two types of costs: (1) insurance company charges; and (2) ongoing costs, which may include advisory fees, administration fees, distribution (12b-1) fees and other Fund expenses. This example is intended to help you understand your ongoing costs (in dollars) of investing in the Fund and to compare these costs with the ongoing costs of investing in other mutual funds.
This example is based on an investment of $1,000 invested at the beginning of the six-month period ended December 31, 2021 and held for the entire six-month period.
Actual Expenses
The table below provides information about actual account values and actual expenses. You may use the information in this table, together with the amount you invested, to estimate the expenses that you paid over the period. Simply divide your account value by $1,000 (for example, an $8,600 account value divided by $1,000 = 8.6), then multiply the result by the number in the table under the heading entitled "Actual Expenses Paid During Period" to estimate the expenses you paid on your account during this period.
Hypothetical Example for Comparison Purposes
The table below provides information about hypothetical account values and hypothetical expenses based on the Fund's actual expense ratio and an assumed rate of return of 5% per year before expenses, which is not the Fund's actual return. The hypothetical account values and expenses may not be used to estimate the actual ending account balance or expenses you paid for the period. You may use this information to compare the ongoing costs of investing in the Fund and other funds. To do so, compare this 5% hypothetical example with the 5% hypothetical examples that appear in the shareholder reports of the other funds.
Please note that the expenses shown in the table are meant to highlight your ongoing costs only and do not reflect any insurance company charges. Therefore, the table below is useful in comparing ongoing costs, but will not help you determine the relative total cost of owning different funds. In addition, if these insurance company charges were included, your costs would have been higher.
| | | Beginning
Account Value
7/1/21 | | Actual Ending
Account Value
12/31/21 | | Hypothetical
Ending
Account Value | | Actual
Expenses Paid
During Period* | | Hypothetical
Expenses Paid
During Period* | | Net Expense
Ratio During
Period** | |
Core Plus Fixed Income Portfolio Class I | | $ | 1,000.00 | | | $ | 1,001.90 | | | $ | 1,021.93 | | | $ | 3.28 | | | $ | 3.31 | | | | 0.65 | % | |
Core Plus Fixed Income Portfolio Class II | | | 1,000.00 | | | | 1,000.60 | | | | 1,020.67 | | | | 4.54 | | | | 4.58 | | | | 0.90 | | |
* Expenses are calculated using each Fund Class' annualized net expense ratio (as disclosed), multiplied by the average account value over the period and multiplied by 184/365 (to reflect the most recent one-half year period).
** Annualized.
2
Morgan Stanley Variable Insurance Fund, Inc.
Annual Report – December 31, 2021
Investment Overview (unaudited)
Core Plus Fixed Income Portfolio
The Fund seeks above-average total return over a market cycle of three to five years by investing primarily in a diversified portfolio of fixed income securities.
Performance
For the fiscal year ended December 31, 2021, the Fund's Class I shares had a total return based on net asset value and reinvestment of distributions per share of –0.32%, net of fees, and –0.54%, net of fees, for Class II shares. The Fund's Class I and Class II shares outperformed the Fund's benchmark, the Bloomberg U.S. Aggregate Index (the "Index"), which returned –1.54%.
Factors Affecting Performance
• Over the 12-month period ending December 31, 2021, U.S. Treasury yields rose across the curve as the market maneuvered the threats of supply-side bottlenecks, rising inflation, as well as new strains of COVID-19 — first delta and later omicron. Over the year, 10-year U.S. Treasury yields rose 60 basis points, ending the year at 1.51%. Yields rose outside the U.S. as well, in both the developed and emerging markets, as central banks reduced easy policy programs put in place in response to the coronavirus and, in some cases, began quantitative tightening to mitigate rapidly rising inflation.
• The allocation to securitized credit was the largest contributor to the Fund's performance for the year. The sector benefited from strong yield advantages and easy monetary policy, as well as the strength of the housing market and healthy household balance sheets. Outperformance was driven by the portfolio's exposure to non-agency commercial mortgage-backed securities (CMBS), asset-backed securities and non-agency residential mortgage-backed securities (RMBS), as spreads narrowed throughout the year. The portfolio's underweight agency RMBS position also marginally contributed to relative performance, as did the portfolio's overweight to agency CMBS.
• Also contributing to performance was the allocation to high yield corporate bonds. The high yield sector performed well in tandem with other risk assets as the U.S. economy reopened and lower credit quality bonds (which generally offer higher yields) outperformed as investors continued to search for yield.
• The largest detractor from performance for the year was emerging market currency risk. The portfolio was long emerging market currencies versus the U.S. dollar, which hurt performance as the dollar strengthened over the year.
Management Strategies
• Throughout the period, we maintained an overweight position to spread (non-government) sectors that we believe have strong or improving fundamentals, as well as areas that we think can be more resilient given the market impacts caused by the coronavirus and rising inflation. The overweight spread position was predominantly versus an underweight to U.S. Treasuries.
• The Fund maintains an out-of-benchmark allocation to securitized credit, notably non-agency RMBS and CMBS. Throughout the year, the Fund increased the exposure to non-agency RMBS. We like their short duration profile, and the credit fundamentals are strong, in our view. The Fund also increased the allocation to CMBS, but has pared it back more recently, based on tight valuations and credit fundamentals in the retail and hotel subsectors.
• The Fund modestly increased the allocation to high yield corporate bonds, focused in industrials, during the year. A significant amount of optimism on the economy and pandemic is priced into spreads. But we believe default risks look low, both absolutely and relative to history.
• The Fund was positioned with an overweight to investment grade corporate bonds. Favorable monetary and fiscal policies as well as economic reopenings continue to anchor a supportive backdrop for credit. Fundamentals remain strong, despite headwinds from supply chains and inflationary pressures. Technicals remain supportive, driven by the continued demand for yield in an income-starved world.
• With regard to interest rate strategy, the Fund moved to an underweight duration position during the year, focused in the U.S.
3
Morgan Stanley Variable Insurance Fund, Inc.
Annual Report – December 31, 2021
Investment Overview (unaudited)
Core Plus Fixed Income Portfolio

In accordance with SEC regulations, the Fund's performance shown assumes that all recurring fees (including management fees) were deducted and all dividends and distributions were reinvested. The performance of Class II shares will vary from the performance of Class I shares based upon its different inception date and will be negatively impacted by additional fees assessed to that class.
Performance Compared to the Bloomberg U.S. Aggregate Index(1)
| | | Period Ended December 31, 2021 | |
| | | Total Returns(2) | |
| | | | | Average Annual | |
| | | One
Year | | Five
Years | | Ten
Years | | Since
Inception(5) | |
Fund – Class I(3) | | | –0.32 | % | | | 4.69 | % | | | 4.55 | % | | | 4.88 | % | |
Bloomberg U.S. Aggregate Index | | | –1.54 | | | | 3.57 | | | | 2.90 | | | | 4.96 | | |
Fund – Class II(4) | | | –0.54 | | | | 4.42 | | | | 4.29 | | | | 3.84 | | |
Bloomberg U.S. Aggregate Index | | | –1.54 | | | | 3.57 | | | | 2.90 | | | | 3.97 | | |
Performance data quoted represents past performance, which is no guarantee of future results, and current performance may be lower or higher than the figures shown. Performance assumes that all dividends and distributions, if any, were reinvested. For the most recent month-end performance figures, please contact the issuing insurance company or speak with your financial advisor. Investment return and principal value will fluctuate so that Fund shares, when redeemed, may be worth more or less than their original cost. Total returns do not reflect the deduction of taxes that a shareholder would pay on Fund distributions or the redemption of Fund shares. Performance shown does not reflect fees and expenses imposed by your insurance company's separate account. If performance information included the effect of these additional charges, the total returns would be lower.
(1) The Bloomberg U.S. Aggregate Index tracks the performance of U.S. government agency and Treasury securities, investment-grade corporate debt securities, agency mortgage-backed securities, asset-backed securities and commercial mortgage-backed securities. The Index is unmanaged and its returns do not include any sales charges or fees. Such costs would lower performance. It is not possible to invest directly in an index.
(2) Total returns for the Fund reflect fees waived and expenses reimbursed, if applicable, by the Adviser (as defined herein). Without such waivers and reimbursements, total returns would have been lower.
(3) Commenced operations on January 2, 1997.
(4) Commenced offering on May 1, 2003.
(5) For comparative purposes, average annual since inception returns listed for the Index refers to the inception date or initial offering of the respective share class of the Fund, not the inception of the Index.
4
Morgan Stanley Variable Insurance Fund, Inc.
Annual Report – December 31, 2021
Portfolio of Investments
Core Plus Fixed Income Portfolio
| | | Face Amount
(000) | | Value
(000) | |
Fixed Income Securities (98.8%) | |
Agency Adjustable Rate Mortgages (0.0%) (a) | |
Federal Home Loan Mortgage Corporation,
Conventional Pool:
12 Month USD LIBOR + 1.63%,
1.94%, 7/1/45 | | $ | 27 | | | $ | 28 | | |
Federal National Mortgage Association,
Conventional Pool: | |
12 Month USD LIBOR + 1.59%,
1.84%, 12/1/45 | | | 11 | | | | 11 | | |
| | | | 39 | | |
Agency Fixed Rate Mortgages (12.0%) | |
Federal Home Loan Mortgage Corporation,
Gold Pools: | |
3.50%, 1/1/44 | | | 328 | | | | 354 | | |
4.00%, 12/1/41 - 10/1/44 | | | 359 | | | | 394 | | |
5.41%, 7/1/37 - 8/1/37 | | | 11 | | | | 13 | | |
5.44%, 1/1/37 - 2/1/38 | | | 46 | | | | 51 | | |
5.46%, 5/1/37 - 1/1/38 | | | 41 | | | | 44 | | |
5.48%, 8/1/37 | | | 11 | | | | 12 | | |
5.50%, 8/1/37 - 11/1/37 | | | 48 | | | | 53 | | |
5.52%, 10/1/37 | | | 5 | | | | 5 | | |
5.62%, 12/1/36 - 8/1/37 | | | 47 | | | | 52 | | |
6.00%, 8/1/37 - 5/1/38 | | | 14 | | | | 15 | | |
6.50%, 9/1/32 | | | 1 | | | | 1 | | |
7.50%, 5/1/35 | | | 20 | | | | 23 | | |
8.00%, 8/1/32 | | | 12 | | | | 14 | | |
8.50%, 8/1/31 | | | 17 | | | | 20 | | |
Federal National Mortgage Association,
Conventional Pools: | |
2.50%, 2/1/50 | | | 224 | | | | 229 | | |
3.00%, 7/1/49 | | | 66 | | | | 67 | | |
3.50%, 7/1/46 - 7/1/49 | | | 761 | | | | 798 | | |
4.00%, 11/1/41 - 8/1/49 | | | 726 | | | | 791 | | |
4.50%, 8/1/40 - 9/1/48 | | | 245 | | | | 263 | | |
5.00%, 7/1/40 | | | 46 | | | | 52 | | |
5.62%, 12/1/36 | | | 18 | | | | 19 | | |
6.00%, 12/1/38 | | | 150 | | | | 169 | | |
6.50%, 11/1/27 - 10/1/38 | | | 12 | | | | 13 | | |
7.00%, 6/1/29 | | | 5 | | | | 5 | | |
7.50%, 8/1/37 | | | 34 | | | | 40 | | |
8.00%, 4/1/33 | | | 27 | | | | 32 | | |
8.50%, 10/1/32 | | | 27 | | | | 33 | | |
9.50%, 4/1/30 | | | 2 | | | | 2 | | |
February TBA:
2.50%, 2/1/52 (b) | | | 6,250 | | | | 6,361 | | |
January TBA:
2.00%, 1/1/52 (b) | | | 850 | | | | 847 | | |
| | | Face Amount
(000) | | Value
(000) | |
Government National Mortgage Association,
January TBA:
3.00%, 1/20/52 (b) | | $ | 1,000 | | | $ | 1,035 | | |
Various Pools:
3.50%, 11/20/40 - 7/20/46 | | | 276 | | | | 291 | | |
4.00%, 7/15/44 | | | 102 | | | | 111 | | |
5.00%, 12/20/48 - 2/20/49 | | | 27 | | | | 29 | | |
| | | | 12,238 | | |
Asset-Backed Securities (10.4%) | |
AIMCO CLO,
Series 2018-B
3 Month USD LIBOR + 1.10%,
1.22%, 1/15/32 (c)(d) | | | 625 | | | | 625 | | |
American Homes 4 Rent Trust,
6.07%, 10/17/52 (c) | | | 490 | | | | 537 | | |
Aqua Finance Trust,
1.54%, 7/17/46 (c) | | | 149 | | | | 148 | | |
Benefit Street Partners CLO XX Ltd.,
3 Month USD LIBOR + 1.17%,
1.31%, 7/15/34 (c)(d) | | | 390 | | | | 390 | | |
Blackbird Capital Aircraft Lease
Securitization Ltd.,
5.68%, 12/16/41 (c) | | | 357 | | | | 339 | | |
Cologix Data Centers US Issuer LLC,
3.30%, 12/26/51 (c) | | | 225 | | | | 225 | | |
Conn's Receivables Funding 2021-A LLC,
2.87%, 5/15/26 (c) | | | 125 | | | | 125 | | |
CWABS Asset-Backed Certificates Trust,
1 Month USD LIBOR + 1.58%,
1.67%, 12/25/34 (d) | | | 644 | | | | 644 | | |
Falcon Aerospace Ltd.,
3.60%, 9/15/39 (c) | | | 201 | | | | 196 | | |
Foundation Finance Trust,
3.86%, 11/15/34 (c) | | | 138 | | | | 141 | | |
FREED ABS Trust,
0.62%, 11/20/28 (c) | | | 297 | | | | 296 | | |
GAIA Aviation Ltd.,
7.00%, 12/15/44 (c) | | | 326 | | | | 263 | | |
Goodgreen Trust,
5.53%, 4/15/55 (c) | | | 477 | | | | 495 | | |
JOL Air Ltd.,
4.95%, 4/15/44 (c) | | | 227 | | | | 214 | | |
Lunar 2021-1 Structured Aircraft
Portfolio Notes,
2.64%, 10/15/46 (c) | | | 344 | | | | 343 | | |
Lunar Aircraft Ltd.,
3.38%, 2/15/45 (c) | | | 117 | | | | 114 | | |
Mosaic Solar Loan Trust,
1.92%, 6/20/52 (c) | | | 224 | | | | 219 | | |
New Residential Mortgage LLC,
5.44%, 6/25/25 - 7/25/25 (c) | | | 829 | | | | 840 | | |
NovaStar Mortgage Funding Trust,
1 Month USD LIBOR + 1.06%,
1.16%, 12/25/33 (d) | | | 202 | | | | 202 | | |
NRZ Excess Spread-Collateralized Notes,
Class A
3.47%, 11/25/26 (c) | | | 288 | | | | 288 | | |
The accompanying notes are an integral part of the financial statements.
5
Morgan Stanley Variable Insurance Fund, Inc.
Annual Report – December 31, 2021
Portfolio of Investments (cont'd)
Core Plus Fixed Income Portfolio
| | | Face Amount
(000) | | Value
(000) | |
Asset-Backed Securities (cont'd) | |
Octagon Investment Partners 51 Ltd.,
3 Month USD LIBOR + 1.15%,
1.28%, 7/20/34 (c)(d) | | $ | 900 | | | $ | 900 | | |
Oxford Finance Funding LLC,
5.44%, 2/15/27 (c) | | | 232 | | | | 237 | | |
PMT FMSR Issuer Trust,
1 Month USD LIBOR + 3.00%,
3.09%, 3/25/26 (c)(d) | | | 650 | | | | 652 | | |
PNMAC GMSR Issuer Trust,
1 Month USD LIBOR + 2.85%,
2.95%, 2/25/23 (c)(d) | | | 300 | | | | 301 | | |
PRET 2021-NPL6 LLC,
2.49%, 7/25/51 (c) | | | 225 | | | | 227 | | |
Sculptor CLO XXVI Ltd.,
3 Month USD LIBOR + 1.27%,
0.00%, 7/20/34 (c)(d) | | | 840 | | | | 844 | | |
SFS Asset Securitization LLC,
4.24%, 6/10/25 (c) | | | 509 | | | | 509 | | |
Sprite Ltd.,
4.25%, 12/15/37 (c) | | | 205 | | | | 203 | | |
START Ireland,
4.09%, 3/15/44 (c) | | | 147 | | | | 147 | | |
| | | | 10,664 | | |
Collateralized Mortgage Obligations —
Agency Collateral Series (1.9%) | |
Federal Home Loan Mortgage Corporation,
1 Month USD LIBOR + 4.35%,
4.44%, 12/25/26 (c)(d) | | | 59 | | | | 59 | | |
1 Month USD LIBOR + 5.25%,
5.34%, 7/25/26 (c)(d) | | | 43 | | | | 43 | | |
IO
2.63%, 1/25/49 (d) | | | 715 | | | | 139 | | |
2.65%, 2/25/49 (d) | | | 1,635 | | | | 330 | | |
2.66%, 1/25/49 (d) | | | 2,950 | | | | 592 | | |
3.07%, 11/25/36 (d) | | | 475 | | | | 156 | | |
3.46%, 10/25/38 (d) | | | 800 | | | | 285 | | |
IO REMIC
6.00% - 1 Month USD LIBOR,
5.89%, 11/15/43 - 6/15/44 (e) | | | 1,030 | | | | 167 | | |
IO STRIPS
7.50%, 12/15/29 | | | 2 | | | | — | @ | |
Federal National Mortgage Association,
IO REMIC
6.00%, 5/25/33 - 7/25/33 | | | 133 | | | | 25 | | |
IO STRIPS
8.00%, 4/25/24 | | | — | @ | | | — | @ | |
8.00%, 6/25/35 (d) | | | 7 | | | | 1 | | |
9.00%, 11/25/26 | | | — | @ | | | — | @ | |
REMIC
7.00%, 9/25/32 | | | 19 | | | | 23 | | |
| | | Face Amount
(000) | | Value
(000) | |
Government National Mortgage Association,
IO
0.76%, 8/20/58 (d) | | $ | 3,290 | | | $ | 60 | | |
5.00%, 2/16/41 | | | 50 | | | | 9 | | |
IO PAC
6.15% - 1 Month USD LIBOR,
6.06%, 10/20/41 (e) | | | 16 | | | | — | @ | |
| | | | 1,889 | | |
Commercial Mortgage-Backed Securities (6.3%) | |
Bancorp Commercial Mortgage Trust,
SOFR30A + 2.41%,
2.46%, 9/15/36 (c)(d) | | | 450 | | | | 449 | | |
BANK 2019-BNK21,
IO
0.87%, 10/17/52 (d) | | | 3,968 | | | | 225 | | |
BANK 2020-BNK30,
2.92%, 12/15/53 (d) | | | 725 | | | | 667 | | |
Citigroup Commercial Mortgage Trust,
3.50%, 12/10/41 (c)(d) | | | 300 | | | | 237 | | |
IO
0.72%, 11/10/48 (d) | | | 2,300 | | | | 56 | | |
0.88%, 9/10/58 (d) | | | 4,340 | | | | 123 | | |
Commercial Mortgage Trust,
IO
0.06%, 7/10/45 (d) | | | 7,958 | | | | 4 | | |
0.70%, 10/10/47 (d) | | | 2,485 | | | | 40 | | |
1.00%, 7/15/47 (d) | | | 2,535 | | | | 52 | | |
GS Mortgage Securities Trust,
4.74%, 8/10/46 (c)(d) | | | 500 | | | | 490 | | |
IO
0.71%, 9/10/47 (d) | | | 4,305 | | | | 70 | | |
1.22%, 10/10/48 (d) | | | 4,693 | | | | 180 | | |
Highways 2021 PLC,
1 Month GBP SONIA + 1.35%,
0.00%, 11/18/26 (c)(d) | | GBP | 300 | | | | 407 | | |
Jackson Park Trust LIC,
3.24%, 10/14/39 (c)(d) | | $ | 400 | | | | 366 | | |
JP Morgan Chase Commercial
Mortgage Securities Trust,
IO
0.51%, 4/15/46 (d) | | | 6,000 | | | | 40 | | |
0.59%, 12/15/49 (d) | | | 2,616 | | | | 60 | | |
0.86%, 7/15/47 (d) | | | 5,066 | | | | 68 | | |
JPMBB Commercial Mortgage
Securities Trust,
IO
0.96%, 8/15/47 (d) | | | 3,184 | | | | 67 | | |
Last Mile Logistics Pan Euro Finance DAC,
1.90%, 8/17/33 | | EUR | 100 | | | | 114 | | |
MF1 2021-W10X,
SOFR + 2.82%,
2.87%, 12/15/34 (c)(d) | | $ | 475 | | | | 475 | | |
MFT Trust,
3.48%, 2/10/42 (c)(d) | | | 200 | | | | 188 | | |
MKT 2020-525M Mortgage Trust,
2.94%, 2/12/40 (c)(d) | | | 200 | | | | 184 | | |
The accompanying notes are an integral part of the financial statements.
6
Morgan Stanley Variable Insurance Fund, Inc.
Annual Report – December 31, 2021
Portfolio of Investments (cont'd)
Core Plus Fixed Income Portfolio
| | | Face Amount
(000) | | Value
(000) | |
Commercial Mortgage-Backed Securities (cont'd) | |
Multifamily Connecticut Avenue
Securities Trust,
1 Month USD LIBOR + 1.95%,
2.05%, 3/25/50 (c)(d) | | $ | 131 | | | $ | 132 | | |
Natixis Commercial Mortgage Securities Trust,
1 Month USD LIBOR + 2.20%,
2.31%, 7/15/36 (c)(d) | | | 500 | | | | 500 | | |
4.32%, 1/15/43 (c)(d) | | | 200 | | | | 202 | | |
Real Estate Asset Liquidity Trust,
IO
1.15%, 2/12/31 (c)(d) | | CAD | 3,525 | | | | 157 | | |
SG Commercial Mortgage Securities Trust,
3.73%, 3/15/37 (c)(d) | | $ | 450 | | | | 446 | | |
SLG Office Trust,
IO
0.26%, 7/15/41 (c)(d) | | | 3,650 | | | | 74 | | |
WFRBS Commercial Mortgage Trust,
4.14%, 5/15/45 (c)(d) | | | 385 | | | | 379 | | |
| | | | 6,452 | | |
Corporate Bonds (37.9%) | |
Finance (13.1%) | |
AerCap Ireland Capital DAC/AerCap
Global Aviation Trust,
3.00%, 10/29/28 | | | 150 | | | | 152 | | |
4.13%, 7/3/23 | | | 325 | | | | 338 | | |
American International Group, Inc.
4.50%, 7/16/44 | | | 75 | | | | 93 | | |
Anthem, Inc.
2.25%, 5/15/30 | | | 75 | | | | 75 | | |
AON Corp./AON Global Holdings PLC
2.60%, 12/2/31 | | | 100 | | | | 102 | | |
Australia & New Zealand Banking Group Ltd.
2.57%, 11/25/35 (c) | | | 200 | | | | 192 | | |
Avolon Holdings Funding Ltd.
2.88%, 2/15/25 (c) | | | 275 | | | | 281 | | |
Banco de Credito e Inversiones SA
2.88%, 10/14/31 (c) | | | 225 | | | | 222 | | |
Banco Santander Chile
2.70%, 1/10/25 (c) | | | 150 | | | | 153 | | |
Bank Hapoalim BM
3.26%, 1/21/32 (c) | | | 225 | | | | 224 | | |
Bank of America Corp.,
2.57%, 10/20/32 | | | 25 | | | | 25 | | |
2.68%, 6/19/41 | | | 275 | | | | 265 | | |
2.69%, 4/22/32 | | | 175 | | | | 178 | | |
MTN
4.00%, 1/22/25 | | | 610 | | | | 652 | | |
Bank of Ireland Group PLC
2.03%, 9/30/27 (c) | | | 250 | | | | 246 | | |
Bank of Montreal
3.80%, 12/15/32 | | | 250 | | | | 268 | | |
Belrose Funding Trust
2.33%, 8/15/30 (c) | | | 100 | | | | 98 | | |
BNP Paribas SA
4.40%, 8/14/28 (c) | | | 300 | | | | 336 | | |
Boston Properties LP
3.80%, 2/1/24 | | | 70 | | | | 73 | | |
| | | Face Amount
(000) | | Value
(000) | |
BPCE SA,
3.12%, 10/19/32 (c) | | $ | 250 | | | $ | 251 | | |
5.15%, 7/21/24 (c) | | | 300 | | | | 325 | | |
Brookfield Finance LLC
3.45%, 4/15/50 | | | 150 | | | | 157 | | |
Brown & Brown, Inc.
2.38%, 3/15/31 | | | 100 | | | | 98 | | |
Capital One Financial Corp.
3.30%, 10/30/24 | | | 400 | | | | 421 | | |
Citigroup, Inc.,
2.52%, 11/3/32 | | | 100 | | | | 100 | | |
5.50%, 9/13/25 | | | 150 | | | | 170 | | |
CNO Financial Group, Inc.
5.25%, 5/30/29 | | | 95 | | | | 109 | | |
Coinbase Global, Inc.
3.38%, 10/1/28 (c)(f) | | | 110 | | | | 103 | | |
Credit Agricole SA
3.25%, 10/4/24 (c) | | | 250 | | | | 262 | | |
Credit Suisse Group AG
2.59%, 9/11/25 (c) | | | 400 | | | | 409 | | |
Danske Bank A/S
5.00%, 1/12/23 (c) | | | 200 | | | | 200 | | |
Deutsche Bank AG,
2.22%, 9/18/24 | | | 150 | | | | 152 | | |
3.95%, 2/27/23 | | | 250 | | | | 258 | | |
GA Global Funding Trust
1.00%, 4/8/24 (c) | | | 175 | | | | 173 | | |
Global Atlantic Fin Co.
3.13%, 6/15/31 (c) | | | 125 | | | | 124 | | |
Goldman Sachs Group, Inc. (The),
2.65%, 10/21/32 | | | 250 | | | | 252 | | |
MTN
4.80%, 7/8/44 | | | 100 | | | | 128 | | |
Grupo Aval Ltd.
4.38%, 2/4/30 (c) | | | 200 | | | | 192 | | |
Howard Hughes Corp. (The)
4.38%, 2/1/31 (c) | | | 150 | | | | 152 | | |
HSBC Holdings PLC
4.25%, 3/14/24 | | | 425 | | | | 449 | | |
Intercontinental Exchange, Inc.
1.85%, 9/15/32 | | | 300 | | | | 288 | | |
JPMorgan Chase & Co.,
1.95%, 2/4/32 | | | 125 | | | | 120 | | |
2.55%, 11/8/32 | | | 400 | | | | 403 | | |
4.13%, 12/15/26 | | | 300 | | | | 331 | | |
Life Storage LP
2.40%, 10/15/31 | | | 125 | | | | 123 | | |
Lloyds Banking Group PLC
4.38%, 3/22/28 | | | 300 | | | | 337 | | |
Macquarie Bank Ltd.
2.30%, 1/22/25 (c) | | | 250 | | | | 256 | | |
Macquarie Group Ltd.
2.87%, 1/14/33 (c) | | | 125 | | | | 125 | | |
Marsh & McLennan Cos., Inc.
5.88%, 8/1/33 | | | 150 | | | | 200 | | |
MassMutual Global Funding II
3.40%, 3/8/26 (c) | | | 200 | | | | 214 | | |
MPT Operating Partnership LP/
MPT Finance Corp.
5.00%, 10/15/27 | | | 100 | | | | 105 | | |
The accompanying notes are an integral part of the financial statements.
7
Morgan Stanley Variable Insurance Fund, Inc.
Annual Report – December 31, 2021
Portfolio of Investments (cont'd)
Core Plus Fixed Income Portfolio
| | | Face Amount
(000) | | Value
(000) | |
Finance (cont'd) | |
Nationwide Building Society
4.30%, 3/8/29 (c) | | $ | 375 | | | $ | 414 | | |
Oversea-Chinese Banking Corp. Ltd.
1.83%, 9/10/30 (c) | | | 200 | | | | 199 | | |
Pine Street Trust I
4.57%, 2/15/29 (c) | | | 150 | | | | 169 | | |
Progressive Corp. (The)
3.20%, 3/26/30 | | | 50 | | | | 54 | | |
Realty Income Corp.
0.75%, 3/15/26 | | | 152 | | | | 146 | | |
Rocket Mortgage LLC/Rocket
Mortgage Co-Issuer, Inc.
3.88%, 3/1/31 (c) | | | 145 | | | | 147 | | |
Societe Generale SA
2.63%, 1/22/25 (c) | | | 225 | | | | 231 | | |
SVB Financial Group,
1.80%, 2/2/31 | | | 275 | | | | 261 | | |
4.10%, 12/31/99 (g) | | | 100 | | | | 99 | | |
Travelers Cos., Inc. (The)
3.75%, 5/15/46 | | | 125 | | | | 144 | | |
USAA Capital Corp.
2.13%, 5/1/30 (c) | | | 150 | | | | 150 | | |
Wells Fargo & Co.,
2.88%, 10/30/30 | | | 200 | | | | 208 | | |
3.07%, 4/30/41 | | | 125 | | | | 128 | | |
Westpac Banking Corp.
2.67%, 11/15/35 | | | 75 | | | | 73 | | |
| | | | 13,383 | | |
Industrials (22.7%) | |
7-Eleven, Inc.
2.50%, 2/10/41 (c) | | | 125 | | | | 116 | | |
AbbVie, Inc.
4.25%, 11/21/49 | | | 125 | | | | 151 | | |
Adobe, Inc.
2.30%, 2/1/30 | | | 175 | | | | 179 | | |
Airbnb, Inc.
0.00%, 3/15/26 (c) | | | 130 | | | | 128 | | |
Alibaba Group Holding Ltd.
2.13%, 2/9/31 (f) | | | 200 | | | | 193 | | |
Altria Group, Inc.
3.40%, 2/4/41 | | | 125 | | | | 116 | | |
Amazon.com, Inc.
2.70%, 6/3/60 | | | 175 | | | | 169 | | |
American Airlines Inc/AAdvantage Loyalty IP Ltd.
5.75%, 4/20/29 (c) | | | 145 | | | | 155 | | |
Amgen, Inc.
2.80%, 8/15/41 | | | 100 | | | | 96 | | |
Anheuser-Busch InBev Worldwide, Inc.,
3.50%, 6/1/30 | | | 75 | | | | 82 | | |
4.60%, 4/15/48 | | | 275 | | | | 337 | | |
Apple, Inc.,
2.65%, 5/11/50 | | | 150 | | | | 148 | | |
2.70%, 8/5/51 | | | 175 | | | | 173 | | |
Arches Buyer, Inc.
4.25%, 6/1/28 (c) | | | 123 | | | | 123 | | |
| | | Face Amount
(000) | | Value
(000) | |
AT&T, Inc.,
2.55%, 12/1/33 | | $ | 225 | | | $ | 220 | | |
3.55%, 9/15/55 | | | 300 | | | | 302 | | |
Baidu, Inc.
1.72%, 4/9/26 | | | 275 | | | | 272 | | |
BAT Capital Corp.
3.56%, 8/15/27 | | | 300 | | | | 315 | | |
Boeing Co. (The),
2.95%, 2/1/30 | | | 100 | | | | 102 | | |
3.95%, 8/1/59 | | | 100 | | | | 104 | | |
BP Capital Markets PLC,
4.38%, 12/31/99 (g) | | | 75 | | | | 79 | | |
4.88%, 12/31/99 (g) | | | 75 | | | | 81 | | |
Burlington Northern Santa Fe LLC
3.30%, 9/15/51 | | | 100 | | | | 109 | | |
Canadian Pacific Railway Co.
3.10%, 12/2/51 | | | 75 | | | | 77 | | |
CDW LLC/CDW Finance Corp.
2.67%, 12/1/26 | | | 75 | | | | 77 | | |
Charter Communications Operating LLC/
Charter Communications Operating Capital,
2.30%, 2/1/32 | | | 50 | | | | 48 | | |
2.80%, 4/1/31 | | | 100 | | | | 99 | | |
3.50%, 3/1/42 | | | 375 | | | | 364 | | |
Children's Health System of Texas
2.51%, 8/15/50 | | | 175 | | | | 166 | | |
Cigna Corp.,
3.05%, 10/15/27 | | | 100 | | | | 106 | | |
3.40%, 3/15/51 | | | 75 | | | | 79 | | |
Comcast Corp.,
1.95%, 1/15/31 | | | 375 | | | | 368 | | |
2.94%, 11/1/56 (c) | | | 150 | | | | 143 | | |
Crown Castle International Corp.
3.30%, 7/1/30 | | | 150 | | | | 158 | | |
CVS Health Corp.,
1.88%, 2/28/31 | | | 300 | | | | 288 | | |
5.13%, 7/20/45 | | | 50 | | | | 65 | | |
Daimler Trucks Finance North America LLC,
1.13%, 12/14/23 (c) | | | 150 | | | | 150 | | |
2.00%, 12/14/26 (c) | | | 150 | | | | 151 | | |
Deere & Co.
3.10%, 4/15/30 | | | 75 | | | | 81 | | |
Dell International LLC/EMC Corp.,
3.45%, 12/15/51 (c) | | | 175 | | | | 168 | | |
6.02%, 6/15/26 | | | 375 | | | | 434 | | |
Delta Air Lines Pass Through Trust,
Series AA
3.20%, 10/25/25 | | | 150 | | | | 155 | | |
Dexcom, Inc.
0.25%, 11/15/25 (f) | | | 200 | | | | 238 | | |
Diamond Sports Group LLC/
Diamond Sports Finance Co.
6.63%, 8/15/27 (c) | | | 250 | | | | 71 | | |
Diamondback Energy, Inc.
3.25%, 12/1/26 | | | 250 | | | | 264 | | |
DT Midstream, Inc.
4.13%, 6/15/29 (c) | | | 105 | | | | 108 | | |
The accompanying notes are an integral part of the financial statements.
8
Morgan Stanley Variable Insurance Fund, Inc.
Annual Report – December 31, 2021
Portfolio of Investments (cont'd)
Core Plus Fixed Income Portfolio
| | | Face Amount
(000) | | Value
(000) | |
Industrials (cont'd) | |
DXC Technology Co.
1.80%, 9/15/26 | | $ | 350 | | | $ | 346 | | |
Enbridge, Inc.,
2.50%, 1/15/25 (f) | | | 150 | | | | 154 | | |
2.50%, 8/1/33 | | | 275 | | | | 270 | | |
Energy Transfer LP,
2.90%, 5/15/25 | | | 250 | | | | 259 | | |
4.75%, 1/15/26 | | | 75 | | | | 82 | | |
Enterprise Products Operating LLC
3.30%, 2/15/53 | | | 200 | | | | 199 | | |
Equinix, Inc.
1.00%, 9/15/25 | | | 300 | | | | 291 | | |
Exxon Mobil Corp.
3.45%, 4/15/51 | | | 150 | | | | 163 | | |
Ford Motor Credit Co., LLC
4.39%, 1/8/26 | | | 200 | | | | 216 | | |
Fox Corp.
5.48%, 1/25/39 | | | 175 | | | | 226 | | |
Galaxy Pipeline Assets Bidco Ltd.
1.75%, 9/30/27 (c) | | | 318 | | | | 319 | | |
Garda World Security Corp.
4.63%, 2/15/27 (c) | | | 350 | | | | 349 | | |
General Motors Co.
6.60%, 4/1/36 | | | 75 | | | | 102 | | |
General Motors Financial Co., Inc.
4.35%, 1/17/27 | | | 275 | | | | 303 | | |
Georgia-Pacific LLC
2.30%, 4/30/30 (c) | | | 175 | | | | 175 | | |
Gilead Sciences, Inc.
2.80%, 10/1/50 | | EUR | 100 | | | | 97 | | |
Glencore Funding LLC
4.13%, 3/12/24 (c) | | $ | 250 | | | | 263 | | |
GLP Capital LP/GLP Financing II, Inc.,
3.25%, 1/15/32 | | | 50 | | | | 50 | | |
5.38%, 4/15/26 | | | 125 | | | | 139 | | |
Grifols SA
2.25%, 11/15/27 (c) | | | 100 | | | | 114 | | |
GSK Finance No 3 PLC
0.00%, 6/22/23 (c) | | | 250 | | | | 246 | | |
HCA, Inc.
5.25%, 6/15/49 | | | 75 | | | | 97 | | |
Hyatt Hotels Corp.
1.80%, 10/1/24 | | | 150 | | | | 150 | | |
Hyundai Capital America
1.80%, 1/10/28 (c) | | | 250 | | | | 242 | | |
Imperial Brands Finance PLC
3.13%, 7/26/24 (c) | | | 350 | | | | 362 | | |
JBS Finance Luxembourg Sarl
2.50%, 1/15/27 (c) | | | 225 | | | | 223 | | |
Johns Hopkins University,
Series A
2.81%, 1/1/60 | | | 145 | | | | 149 | | |
Las Vegas Sands Corp.
3.20%, 8/8/24 | | | 100 | | | | 102 | | |
Level 3 Financing, Inc.
3.40%, 3/1/27 (c) | | | 175 | | | | 181 | | |
| | | Face Amount
(000) | | Value
(000) | |
Lions Gate Capital Holdings LLC
5.50%, 4/15/29 (c) | | $ | 145 | | | $ | 148 | | |
LYB International Finance III LLC
4.20%, 5/1/50 | | | 100 | | | | 116 | | |
MARB BondCo PLC
3.95%, 1/29/31 (c) | | | 200 | | | | 191 | | |
Mauser Packaging Solutions Holding Co.
7.25%, 4/15/25 (c) | | | 220 | | | | 221 | | |
McDonald's Corp.
4.45%, 9/1/48 | | | 50 | | | | 62 | | |
McLaren Health Care Corp.,
Series A
4.39%, 5/15/48 | | | 150 | | | | 186 | | |
NBN Co. Ltd.
2.63%, 5/5/31 (c) | | | 225 | | | | 226 | | |
Newcastle Coal Infrastructure Group Pty Ltd.
4.40%, 9/29/27 (c) | | | 275 | | | | 275 | | |
NIKE, Inc.
3.25%, 3/27/40 | | | 100 | | | | 109 | | |
Nissan Motor Co. Ltd.
3.04%, 9/15/23 (c) | | | 275 | | | | 282 | | |
NOVA Chemicals Corp.
4.25%, 5/15/29 (c)(f) | | | 165 | | | | 166 | | |
NTT Finance Corp.
1.59%, 4/3/28 (c) | | | 375 | | | | 367 | | |
NuStar Logistics LP
6.38%, 10/1/30 | | | 225 | | | | 250 | | |
NVIDIA Corp.
2.00%, 6/15/31 | | | 150 | | | | 149 | | |
Occidental Petroleum Corp.
3.50%, 8/15/29 | | | 275 | | | | 283 | | |
ONEOK, Inc.
3.10%, 3/15/30 | | | 175 | | | | 178 | | |
Peloton Interactive, Inc.
0.00%, 2/15/26 (c) | | | 235 | | | | 200 | | |
Pertamina Persero PT
2.30%, 2/9/31 | | | 650 | | | | 622 | | |
Raytheon Technologies Corp.
4.05%, 5/4/47 | | | 75 | | | | 87 | | |
Resorts World Las Vegas LLC/
RWLV Capital, Inc.
4.63%, 4/16/29 (c) | | | 200 | | | | 201 | | |
RingCentral, Inc.
0.00%, 3/15/26 | | | 125 | | | | 111 | | |
Rockies Express Pipeline LLC
3.60%, 5/15/25 (c) | | | 275 | | | | 283 | | |
Royalty Pharma PLC
3.55%, 9/2/50 | | | 50 | | | | 50 | | |
SBA Communications Corp.
3.13%, 2/1/29 (c) | | | 145 | | | | 139 | | |
Sealed Air Corp.
1.57%, 10/15/26 (c) | | | 75 | | | | 73 | | |
Sherwin-Williams Co. (The)
2.30%, 5/15/30 | | | 150 | | | | 150 | | |
Silgan Holdings, Inc.
1.40%, 4/1/26 (c) | | | 200 | | | | 195 | | |
Splunk, Inc.
1.13%, 6/15/27 | | | 200 | | | | 188 | | |
The accompanying notes are an integral part of the financial statements.
9
Morgan Stanley Variable Insurance Fund, Inc.
Annual Report – December 31, 2021
Portfolio of Investments (cont'd)
Core Plus Fixed Income Portfolio
| | | Face Amount
(000) | | Value
(000) | |
Industrials (cont'd) | |
Spotify USA, Inc.
0.00%, 3/15/26 (c) | | $ | 140 | | | $ | 127 | | |
Standard Industries, Inc.
2.25%, 11/21/26 (c) | | EUR | 125 | | | | 140 | | |
Syngenta Finance N.V.
4.89%, 4/24/25 (c) | | $ | 300 | | | | 322 | | |
T-Mobile USA, Inc.,
2.25%, 11/15/31 (f) | | | 200 | | | | 194 | | |
3.60%, 11/15/60 | | | 50 | | | | 50 | | |
Telefonica Emisiones SA
4.10%, 3/8/27 | | | 300 | | | | 331 | | |
TotalEnergies SE,
Series FP
0.50%, 12/2/22 | | | 200 | | | | 204 | | |
Trimble, Inc.
4.15%, 6/15/23 | | | 350 | | | | 364 | | |
Uber Technologies, Inc.
0.00%, 12/15/25 | | | 190 | | | | 187 | | |
Univision Communications, Inc.
4.50%, 5/1/29 (c) | | | 245 | | | | 248 | | |
US Foods, Inc.
4.75%, 2/15/29 (c) | | | 250 | | | | 255 | | |
Verizon Communications, Inc.,
2.65%, 11/20/40 | | | 250 | | | | 238 | | |
2.99%, 10/30/56 | | | 150 | | | | 142 | | |
Volkswagen Group of America Finance LLC
4.75%, 11/13/28 (c) | | | 275 | | | | 317 | | |
Vontier Corp.
2.40%, 4/1/28 (c) | | | 250 | | | | 242 | | |
VTR Finance N.V.
6.38%, 7/15/28 (c) | | | 200 | | | | 208 | | |
Walt Disney Co. (The)
2.75%, 9/1/49 | | | 247 | | | | 240 | | |
Western Digital Corp.
1.50%, 2/1/24 | | | 125 | | | | 127 | | |
Williams Cos., Inc. (The)
3.50%, 10/15/51 | | | 50 | | | | 51 | | |
Ziff Davis, Inc.
4.63%, 10/15/30 (c) | | | 131 | | | | 135 | | |
ZYNGA, Inc.
0.00%, 12/15/26 | | | 130 | | | | 119 | | |
| | | | 23,226 | | |
Utilities (2.1%) | |
Calpine Corp.
4.50%, 2/15/28 (c) | | | 200 | | | | 208 | | |
DTE Electric Co.
2.95%, 3/1/50 | | | 50 | | | | 50 | | |
Duke Energy Indiana LLC
2.75%, 4/1/50 | | | 83 | | | | 81 | | |
Entergy Louisiana LLC
1.60%, 12/15/30 | | | 125 | | | | 118 | | |
Jersey Central Power & Light Co.
2.75%, 3/1/32 (c) | | | 150 | | | | 152 | | |
Mississippi Power Co.
3.95%, 3/30/28 | | | 275 | | | | 302 | | |
NextEra Energy Capital Holdings, Inc.
3.00%, 1/15/52 | | | 150 | | | | 150 | | |
| | | Face Amount
(000) | | Value
(000) | |
Northern States Power Co.
2.90%, 3/1/50 | | $ | 150 | | | $ | 152 | | |
NRG Energy, Inc.
3.63%, 2/15/31 (c) | | | 160 | | | | 156 | | |
Pacific Gas and Electric Co.
3.30%, 8/1/40 | | | 75 | | | | 70 | | |
Piedmont Natural Gas Co., Inc.
2.50%, 3/15/31 | | | 125 | | | | 125 | | |
Public Service Enterprise Group, Inc.
2.45%, 11/15/31 | | | 300 | | | | 296 | | |
Virginia Electric and Power Co.
2.95%, 11/15/51 | | | 125 | | | | 126 | | |
Xcel Energy, Inc.
2.60%, 12/1/29 | | | 175 | | | | 179 | | |
| | | | 2,165 | | |
| | | | 38,774 | | |
Mortgages — Other (23.4%) | |
Alternative Loan Trust,
1 Month USD LIBOR + 0.36%,
0.46%, 5/25/47 (d) | | | 87 | | | | 84 | | |
5.50%, 2/25/36 | | | 5 | | | | 4 | | |
6.00%, 7/25/37 | | | 43 | | | | 35 | | |
PAC
5.50%, 2/25/36 | | | 3 | | | | 2 | | |
6.00%, 4/25/36 | | | 12 | | | | 8 | | |
Banc of America Alternative Loan Trust,
1 Month USD LIBOR + 0.65%,
0.75%, 7/25/46 (d) | | | 110 | | | | 89 | | |
6.36%, 10/25/36 | | | 267 | | | | 111 | | |
Banc of America Funding Trust,
5.25%, 7/25/37 | | | 20 | | | | 20 | | |
6.00%, 7/25/37 | | | 16 | | | | 16 | | |
Bayview MSR Opportunity Master Fund Trust,
3.00%, 11/25/51 (c)(d) | | | 244 | | | | 250 | | |
Brean Asset Backed Securities Trust,
1.40%, 10/25/63 (c)(d) | | | 287 | | | | 274 | | |
1.75%, 10/25/61 (c)(d) | | | 278 | | | | 270 | | |
CFMT 2021-HB7 LLC,
3.85%, 10/27/31 (c)(d) | | | 350 | | | | 348 | | |
ChaseFlex Trust,
6.00%, 2/25/37 | | | 321 | | | | 178 | | |
CIM Trust,
2.50%, 7/1/51 (c)(d) | | | 402 | | | | 404 | | |
2.57%, 7/25/55 (c) | | | 488 | | | | 487 | | |
2.82%, 10/25/61 (c) | | | 291 | | | | 291 | | |
Citigroup Mortgage Loan Trust,
2.50%, 9/25/51 (c)(d) | | | 486 | | | | 486 | | |
COLT 2021-RPL1 Trust,
1.67%, 9/25/61 (c)(d) | | | 192 | | | | 191 | | |
Credit Suisse Mortgage Capital Certificates,
1 Month USD LIBOR + 3.97%,
4.08%, 4/15/23 (c)(d) | | | 591 | | | | 593 | | |
CSFB Mortgage-Backed Pass-Through
Certificates,
6.50%, 11/25/35 | | | 746 | | | | 223 | | |
The accompanying notes are an integral part of the financial statements.
10
Morgan Stanley Variable Insurance Fund, Inc.
Annual Report – December 31, 2021
Portfolio of Investments (cont'd)
Core Plus Fixed Income Portfolio
| | | Face Amount
(000) | | Value
(000) | |
Mortgages — Other (cont'd) | |
Eurosail BV,
3 Month EURIBOR + 1.80%,
1.25%, 10/17/40 (c) | | EUR | 300 | | | $ | 342 | | |
Farringdon Mortgages No. 2 PLC,
3 Month LIBOR + 1.50%,
1.63%, 7/15/47 (d) | | GBP | 209 | | | | 283 | | |
Federal Home Loan Mortgage Corporation,
0.00%, 5/25/45 (c)(d) | | $ | 3 | | | | 3 | | |
3.00%, 9/25/45 - 5/25/47 | | | 606 | | | | 605 | | |
3.50%, 5/25/45 - 5/25/47 | | | 393 | | | | 399 | | |
4.00%, 5/25/45 | | | 10 | | | | 11 | | |
Flagstar Mortgage Trust,
2.50%, 9/25/51 (c)(d) | | | 412 | | | | 412 | | |
FMC GMSR Issuer Trust,
3.85%, 10/25/26 (c)(d) | | | 300 | | | | 298 | | |
Glenbeigh 2 Issuer 2021-2 DAC,
3 Month EURIBOR + 0.75%,
0.21%, 6/24/50 (c) | | EUR | 460 | | | | 525 | | |
GSR Mortgage Loan Trust,
5.75%, 1/25/37 | | $ | 89 | | | | 74 | | |
HarborView Mortgage Loan Trust,
1 Month USD LIBOR + 0.19%,
0.29%, 1/19/38 (d) | | | 228 | | | | 222 | | |
Headlands Residential 2021-RPL1 LLC,
2.49%, 9/25/26 (c)(d) | | | 350 | | | | 350 | | |
Hundred Acre Wood Trust,
2.50%, 10/25/51 (c) | | | 521 | | | | 521 | | |
2.50%, 10/25/51 (c)(d) | | | 438 | | | | 437 | | |
Imperial Fund Mortgage Trust,
2.09%, 1/25/57 (c)(d) | | | 523 | | | | 522 | | |
JP Morgan Alternative Loan Trust,
6.00%, 12/25/35 | | | 37 | | | | 33 | | |
JP Morgan Mortgage Trust,
3.03%, 6/25/37 (d) | | | 32 | | | | 28 | | |
6.00%, 6/25/37 | | | 18 | | | | 22 | | |
Legacy Mortgage Asset Trust,
3.25%, 2/25/60 (c) | | | 429 | | | | 431 | | |
Lehman Mortgage Trust,
6.50%, 9/25/37 | | | 626 | | | | 311 | | |
LHOME Mortgage Trust,
3.23%, 10/25/24 (c) | | | 170 | | | | 171 | | |
Mello Mortgage Capital Acceptance,
2.50%, 8/25/51 (c)(d) | | | 488 | | | | 488 | | |
Natixis Commercial Mortgage
Securities Trust,
1 Month USD LIBOR + 1.70%,
1.81%, 8/15/38 (c)(d) | | | 325 | | | | 325 | | |
Preston Ridge Partners LLC,
1.74%, 9/25/26 (c)(d) | | | 265 | | | | 262 | | |
2.36%, 10/25/26 (c)(d) | | | 278 | | | | 276 | | |
2.49%, 10/25/26 - 11/25/26 (c) | | | 665 | | | | 664 | | |
RALI Trust,
6.00%, 4/25/36 - 1/25/37 | | | 27 | | | | 26 | | |
Rate Mortgage Trust,
2.50%, 11/25/51 (c)(d) | | | 546 | | | | 544 | | |
Residential Asset Securitization Trust,
6.00%, 7/25/36 | | | 22 | | | | 17 | | |
| | | Face Amount
(000) | | Value
(000) | |
Sage AR Funding PLC (SGSHR) No. 1,
0.16%, 11/17/51 | | GBP | 400 | | | $ | 542 | | |
Seasoned Credit Risk Transfer Trust,
3.00%, 7/25/56 - 5/25/60 | | $ | 4,537 | | | | 4,733 | | |
4.00%, 7/25/56 (d) | | | 300 | | | | 303 | | |
4.00%, 8/25/58 - 2/25/59 | | | 401 | | | | 426 | | |
4.25%, 5/25/60 (c)(d) | | | 600 | | | | 621 | | |
4.50%, 6/25/57 | | | 709 | | | | 766 | | |
4.75%, 7/25/56 - 6/25/57 (c)(d) | | | 700 | | | | 720 | | |
Stanwich Mortgage Loan Co. LLC,
2.74%, 10/16/26 (c) | | | 381 | | | | 381 | | |
Structured Asset Securities Corp.
Reverse Mortgage Loan Trust,
1 Month USD LIBOR + 1.85%,
1.95%, 5/25/47 (c)(d) | | | 859 | | | | 807 | | |
TVC Mortgage Trust,
3.47%, 9/25/24 (c) | | | 200 | | | | 201 | | |
United Wholesale Mortgage Trust,
2.50%, 8/25/51 (c)(d) | | | 510 | | | | 513 | | |
UWM Mortgage Trust,
2.50%, 11/25/51 (c)(d) | | | 371 | | | | 371 | | |
VMC Finance LLC,
1 Month USD LIBOR + 1.65%,
1.75%, 1/18/37 (c)(d) | | | 350 | | | | 350 | | |
VOLT CV LLC,
2.49%, 11/27/51 (c) | | | 191 | | | | 191 | | |
| | | | 23,891 | | |
Municipal Bonds (1.4%) | |
Chicago O'Hare International Airport, IL,
O'Hare International Airport Revenue
Series 2010B
6.40%, 1/1/40 | | | 115 | | | | 172 | | |
City of New York, NY,
Series G-1
5.97%, 3/1/36 | | | 245 | | | | 330 | | |
Illinois State Toll Highway Authority, IL,
Highway Revenue, Build America Bonds
Series A
6.18%, 1/1/34 | | | 705 | | | | 965 | | |
| | | | 1,467 | | |
Sovereign (5.1%) | |
Australia Government Bond,
3.25%, 4/21/25 | | AUD | 600 | | | | 467 | | |
China Government Bond,
3.13%, 11/21/29 | | CNY | 4,600 | | | | 736 | | |
Dominican Republic International Bond,
5.88%, 1/30/60 (c) | | $ | 225 | | | | 217 | | |
Ecuador Government International Bond,
0.50%, 7/31/40 (c)(h) | | | 62 | | | | 37 | | |
Egypt Government Bond,
13.77%, 1/5/24 | | EGP | 1,475 | | | | 94 | | |
Egypt Government International Bond,
6.38%, 4/11/31 (c) | | $ | 200 | | | | 211 | | |
7.50%, 2/16/61 (c) | | | 200 | | | | 164 | | |
Export-Import Bank of India,
3.25%, 1/15/30 (c) | | | 200 | | | | 204 | | |
Honduras Government International Bond,
5.63%, 6/24/30 (c) | | | 150 | | | | 156 | | |
The accompanying notes are an integral part of the financial statements.
11
Morgan Stanley Variable Insurance Fund, Inc.
Annual Report – December 31, 2021
Portfolio of Investments (cont'd)
Core Plus Fixed Income Portfolio
| | | Face Amount
(000) | | Value
(000) | |
Sovereign (cont'd) | |
Italy Buoni Poliennali Del Tesoro,
0.65%, 10/28/27 (c) | | EUR | 603 | | | $ | 735 | | |
Ivory Coast Government
International Bond,
4.88%, 1/30/32 (c) | | $ | 125 | | | | 137 | | |
Mexican Bonos,
Series M
7.75%, 5/29/31 | | MXN | 5,500 | | | | 272 | | |
Morocco Government International Bond,
4.00%, 12/15/50 (c) | | $ | 200 | | | | 182 | | |
Nigeria Government International Bond,
9.25%, 1/21/49 (c) | | | 200 | | | | 204 | | |
North Macedonia Government
International Bond,
1.63%, 3/10/28 (c) | | EUR | 160 | | | | 171 | | |
Petroleos Mexicanos,
6.70%, 2/16/32 (c) | | $ | 388 | | | | 393 | | |
6.95%, 1/28/60 | | | 55 | | | | 49 | | |
Republic of Italy Government
International Bond,
0.88%, 5/6/24 | | | 200 | | | | 198 | | |
Republic of South Africa Government Bond,
8.25%, 3/31/32 | | ZAR | 4,158 | | | | 236 | | |
Republic of Uzbekistan International Bond,
3.70%, 11/25/30 (c) | | $ | 200 | | | | 192 | | |
Senegal Government International Bond,
6.25%, 5/23/33 (c) | | | 200 | | | | 206 | | |
| | | | 5,261 | | |
Supranational (0.4%) | |
Banque Ouest Africaine de Developpement
4.70%, 10/22/31 (c) | | | 350 | | | | 383 | | |
Total Fixed Income Securities (Cost $100,072) | | | 101,058 | | |
| | | Shares | | | |
Short-Term Investments (9.2%) | |
Investment Company (7.6%) | |
Morgan Stanley Institutional Liquidity
Funds — Government Portfolio —
Institutional Class (See Note H)
(Cost $7,798) | | | 7,797958 | | | | 7,798 | | |
Securities held as Collateral on Loaned Securities (0.8%) | |
Investment Company (0.8%) | |
Morgan Stanley Institutional Liquidity
Funds — Government Portfolio —
Institutional Class (See Note H)
(Cost $757) | | | 756,575 | | | | 757 | | |
| | | Face Amount
(000) | | Value
(000) | |
U.S. Treasury Security (0.8%) | |
U.S. Treasury Bill
0.06%, 7/14/22 (i)
(Cost $833) | | $ | 833 | | | $ | 832 | | |
Total Short-Term Investments (Cost $9,388) | | | 9,387 | | |
Total Investments (108.0%) (Cost $109,460)
Including $978 of Securities Loaned (j)(k) | | | 110,445 | | |
Liabilities in Excess of Other Assets (–8.0%) | | | (8,190 | ) | |
Net Assets (100.0%) | | $ | 102,255 | | |
(a) Amount is less than 0.05%.
(b) Security is subject to delayed delivery.
(c) 144A security — Certain conditions for public sale may exist. Unless otherwise noted, these securities are deemed to be liquid.
(d) Floating or variable rate securities: The rates disclosed are as of December 31, 2021. For securities based on a published reference rate and spread, the reference rate and spread are indicated in the description in the Portfolio of Investments. Certain variable rate securities may not be based on a published reference rate and spread but are determined by the issuer or agent and are based on current market conditions. These securities do not indicate a reference rate and spread in their description in the Portfolio of Investments.
(e) Inverse Floating Rate Security — Interest rate fluctuates with an inverse relationship to an associated interest rate. Indicated rate is the effective rate at December 31, 2021.
(f) All or a portion of this security was on loan at December 31, 2021.
(g) Perpetual — One or more securities do not have a predetermined maturity date. Rates for these securities are fixed for a period of time, after which they revert to a floating rate. Interest rates in effect are as of December 31, 2021.
(h) Multi-step — Coupon rate changes in predetermined increments to maturity. Rate disclosed is as of December 31, 2021. Maturity date disclosed is the ultimate maturity date.
(i) Rate shown is the yield to maturity at December 31, 2021.
(j) Securities are available for collateral in connection with securities purchased on a forward commitment basis, open foreign currency exchange contracts and futures contracts.
(k) At December 31, 2021, the aggregate cost for federal income tax purposes is approximately $109,467,000. The aggregate gross unrealized appreciation is approximately $2,886,000 and the aggregate gross unrealized depreciation is approximately $1,913,000, resulting in net unrealized appreciation of approximately $973,000.
@ Value is less than $500.
CLO Collateralized Loan Obligation.
EURIBOR Euro Interbank Offered Rate.
IO Interest Only.
LIBOR London Interbank Offered Rate.
MTN Medium Term Note.
PAC Planned Amortization Class.
REMIC Real Estate Mortgage Investment Conduit.
SOFR Secured Overnight Financing Rate.
SONIA Sterling Over Night Indexed Average.
STRIPS Separate Trading of Registered Interest and Principal of Securities.
TBA To Be Announced.
The accompanying notes are an integral part of the financial statements.
12
Morgan Stanley Variable Insurance Fund, Inc.
Annual Report – December 31, 2021
Portfolio of Investments (cont'd)
Core Plus Fixed Income Portfolio
Foreign Currency Forward Exchange Contracts:
The Fund had the following foreign currency forward exchange contracts open at December 31, 2021:
Counterparty | | Contracts to
Deliver
(000) | | In
Exchange
For
(000) | | Delivery
Date | | Unrealized
Appreciation
(Depreciation)
(000) | |
Bank of America NA | | CNY | 4,698 | | | $ | 733 | | | 2/18/22 | | $ | (1 | ) | |
Bank of America NA | | GBP | 300 | | | $ | 398 | | | 2/18/22 | | | (8 | ) | |
Bank of America NA | | $ | 28 | | | ZAR | 453 | | | 2/18/22 | | | — | @ | �� |
Barclays Bank PLC | | GBP | 623 | | | $ | 838 | | | 2/18/22 | | | (5 | ) | |
BNP Paribas SA | | EUR | 2,271 | | | $ | 2,589 | | | 2/18/22 | | | 1 | | |
BNP Paribas SA | | $ | 262 | | | CNY | 1,684 | | | 2/18/22 | | | 1 | | |
BNP Paribas SA | | $ | 262 | | | PLN | 1,073 | | | 2/18/22 | | | 3 | | |
BNP Paribas SA | | $ | 10 | | | RUB | 771 | | | 2/18/22 | | | (— | @) | |
Citibank NA | | $ | 2 | | | HUF | 705 | | | 2/18/22 | | | (— | @) | |
Citibank NA | | $ | 61 | | | EGP | 980 | | | 2/17/22 | | | 1 | | |
Goldman Sachs International | | SEK | 2,354 | | | $ | 261 | | | 2/18/22 | | | (— | @) | |
Goldman Sachs International | | $ | 260 | | | CZK | 5,858 | | | 2/18/22 | | | 7 | | |
JPMorgan Chase Bank NA | | EUR | 405 | | | $ | 459 | | | 2/18/22 | | | (2 | ) | |
JPMorgan Chase Bank NA | | $ | 3 | | | CAD | 3 | | | 2/18/22 | | | — | @ | |
JPMorgan Chase Bank NA | | $ | 259 | | | HUF | 83,472 | | | 2/18/22 | | | (3 | ) | |
JPMorgan Chase Bank NA | | $ | 214 | | | MXN | 4,462 | | | 2/18/22 | | | 2 | | |
JPMorgan Chase Bank NA | | $ | 256 | | | RUB | 18,930 | | | 2/18/22 | | | (6 | ) | |
Royal Bank of Canada | | GBP | — | @ | | $ | — | @ | | 2/18/22 | | | (— | @) | |
State Street Bank and Trust Co. | | $ | 248 | | | JPY | 28,290 | | | 2/18/22 | | | (2 | ) | |
UBS AG | | AUD | 655 | | | $ | 480 | | | 2/18/22 | | | 4 | | |
UBS AG | | CAD | 201 | | | $ | 160 | | | 2/18/22 | | | 1 | | |
UBS AG | | $ | 3 | | | CHF | 3 | | | 2/18/22 | | | — | @ | |
UBS AG | | $ | 46 | | | MXN | 986 | | | 2/18/22 | | | 2 | | |
UBS AG | | $ | 10 | | | MXN | 215 | | | 2/18/22 | | | — | @ | |
| | | | | | | | | $ | (5 | ) | |
Futures Contracts:
The Fund had the following futures contracts open at December 31, 2021:
| | | Number
of
Contracts | | Expiration
Date | | Notional
Amount
(000) | | Value
(000) | | Unrealized
Appreciation
(Depreciation)
(000) | |
Long: | |
U.S. Treasury 2 yr. Note | | | 30 | | | Mar-22 | | $ | 6,000 | | | $ | 6,545 | | | $ | (9 | ) | |
U.S. Treasury 5 yr. Note | | | 32 | | | Mar-22 | | | 3,200 | | | | 3,871 | | | | 8 | | |
U.S. Treasury Long Bond | | | 29 | | | Mar-22 | | | 2,900 | | | | 4,653 | | | | 5 | | |
U.S. Treasury Ultra Bond | | | 31 | | | Mar-22 | | | 3,100 | | | | 6,111 | | | | 84 | | |
Short: | |
Euro OAT | | | 2 | | | Mar-22 | | EUR | (200 | ) | | | (372 | ) | | | 4 | | |
German Euro 30 yr. Bond | | | 1 | | | Mar-22 | | | (100 | ) | | | (235 | ) | | | 7 | | |
German Euro BTP | | | 3 | | | Mar-22 | | | (300 | ) | | | (502 | ) | | | 7 | | |
German Euro Bund | | | 1 | | | Mar-22 | | | (100 | ) | | | (195 | ) | | | 3 | | |
U.S. Treasury Ultra Long Bond | | | 35 | | | Mar-22 | | $ | (3,500 | ) | | | (5,125 | ) | | | (82 | ) | |
US Treasury10 yr. Note | | | 2 | | | Mar-22 | | | (200 | ) | | | (261 | ) | | | 2 | | |
| | | $ | 29 | | |
The accompanying notes are an integral part of the financial statements.
13
Morgan Stanley Variable Insurance Fund, Inc.
Annual Report – December 31, 2021
Portfolio of Investments (cont'd)
Core Plus Fixed Income Portfolio
@ Value is less than $500.
BTP Buoni del Tesoro Poliennali.
OAT Obligations Assimilables du Trésor (Treasury Obligation).
AUD — Australian Dollar
CAD — Canadian Dollar
CHF — Swiss Franc
CNY — Chinese Yuan Renminbi
CZK — Czech Koruna
EGP — Egyptian Pound
EUR — Euro
GBP — British Pound
HUF — Hungarian Forint
JPY — Japanese Yen
MXN — Mexican Peso
PLN — Polish Zloty
RUB — Russian Ruble
SEK — Swedish Krona
USD — United States Dollar
ZAR — South African Rand
Portfolio Composition*
Classification | | Percentage of
Total Investments | |
Mortgages — Other | | | 21.8 | % | |
Industrials | | | 21.2 | | |
Finance | | | 12.2 | | |
Agency Fixed Rate Mortgages | | | 11.1 | | |
Other** | | | 10.2 | | |
Asset-Backed Securities | | | 9.7 | | |
Short-Term Investments | | | 7.9 | | |
Commercial Mortgage-Backed Securities | | | 5.9 | | |
Total Investments | | | 100.0 | %*** | |
* Percentages indicated are based upon total investments (excluding Securities held as Collateral on Loaned Securities) as of December 31, 2021.
** Industries and/or investment types representing less than 5% of total investments.
*** Does not include open long/short futures contracts with a value of approximately $27,870,000 and net unrealized appreciation of approximately $29,000. Does not include open foreign currency forward exchange contracts with net unrealized depreciation of approximately $5,000.
The accompanying notes are an integral part of the financial statements.
14
Morgan Stanley Variable Insurance Fund, Inc.
Annual Report – December 31, 2021
Core Plus Fixed Income Portfolio
Statement of Assets and Liabilities | | December 31, 2021
(000) | |
Assets: | |
Investments in Securities of Unaffiliated Issuers, at Value(1) (Cost $100,905) | | $ | 101,890 | | |
Investment in Security of Affiliated Issuer, at Value (Cost $8,555) | | | 8,555 | | |
Total Investments in Securities, at Value (Cost $109,460) | | | 110,445 | | |
Foreign Currency, at Value (Cost $22) | | | 22 | | |
Receivable for Investments Sold | | | 9,192 | | |
Interest Receivable | | | 595 | | |
Receivable for Variation Margin on Futures Contracts | | | 422 | | |
Receivable for Fund Shares Sold | | | 76 | | |
Unrealized Appreciation on Foreign Currency Forward Exchange Contracts | | | 22 | | |
Tax Reclaim Receivable | | | 4 | | |
Receivable from Affiliate | | | — | @ | |
Receivable from Securities Lending Income | | | — | @ | |
Other Assets | | | 19 | | |
Total Assets | | | 120,797 | | |
Liabilities: | |
Payable for Investments Purchased | | | 17,464 | | |
Collateral on Securities Loaned, at Value | | | 757 | | |
Payable for Professional Fees | | | 54 | | |
Payable for Servicing Fees | | | 52 | | |
Payable for Custodian Fees | | | 40 | | |
Deferred Capital Gain Country Tax | | | 33 | | |
Unrealized Depreciation on Foreign Currency Forward Exchange Contracts | | | 27 | | |
Payable for Advisory Fees | | | 25 | | |
Payable for Fund Shares Redeemed | | | 11 | | |
Payable for Administration Fees | | | 7 | | |
Payable for Distribution Fees — Class II Shares | | | 2 | | |
Payable for Transfer Agency Fees | | | 2 | | |
Other Liabilities | | | 68 | | |
Total Liabilities | | | 18,542 | | |
NET ASSETS | | $ | 102,255 | | |
Net Assets Consist of: | |
Paid-in-Capital | | $ | 96,547 | | |
Total Distributable Earnings | | | 5,708 | | |
Net Assets | | $ | 102,255 | | |
CLASS I: | |
Net Assets | | $ | 85,556 | | |
Net Asset Value, Offering and Redemption Price Per Share Applicable to 8,169,967 Outstanding
$0.001 Par Value Shares (Authorized 500,000,000 Shares) | | $ | 10.47 | | |
CLASS II: | |
Net Assets | | $ | 16,699 | | |
Net Asset Value, Offering and Redemption Price Per Share Applicable to 1,581,570 Outstanding
$0.001 Par Value Shares (Authorized 500,000,000 Shares) | | $ | 10.56 | | |
(1) Including: | |
Securities on Loan, at Value: | | $ | 978 | | |
@ Amount is less than $500.
The accompanying notes are an integral part of the financial statements.
15
Morgan Stanley Variable Insurance Fund, Inc.
Annual Report – December 31, 2021
Core Plus Fixed Income Portfolio
Statement of Operations | | Year Ended
December 31, 2021
(000) | |
Investment Income: | |
Interest from Securities of Unaffiliated Issuers (Net of $12 of Foreign Taxes Withheld) | | $ | 4,242 | | |
Dividends from Security of Affiliated Issuer (Note H) | | | 5 | | |
Income from Securities Loaned — Net | | | 3 | | |
Total Investment Income | | | 4,250 | | |
Expenses: | |
Advisory Fees (Note B) | | | 528 | | |
Professional Fees | | | 172 | | |
Servicing Fees (Note D) | | | 159 | | |
Distribution Fees — Class II Shares (Note E) | | | 136 | | |
Administration Fees (Note C) | | | 113 | | |
Pricing Fees | | | 56 | | |
Custodian Fees (Note G) | | | 55 | | |
Shareholder Reporting Fees | | | 29 | | |
Transfer Agency Fees (Note F) | | | 11 | | |
Directors' Fees and Expenses | | | 6 | | |
Other Expenses | | | 20 | | |
Total Expenses | | | 1,285 | | |
Waiver of Advisory Fees (Note B) | | | (190 | ) | |
Rebate from Morgan Stanley Affiliate (Note H) | | | (10 | ) | |
Net Expenses | | | 1,085 | | |
Net Investment Income | | | 3,165 | | |
Realized Gain (Loss): | |
Investments Sold (Net of $24 of Capital Gain Country Tax) | | | 2,533 | | |
Foreign Currency Forward Exchange Contracts | | | (181 | ) | |
Foreign Currency Translation | | | (11 | ) | |
Futures Contracts | | | (488 | ) | |
Net Realized Gain | | | 1,853 | | |
Change in Unrealized Appreciation (Depreciation): | |
Investments (Net of Decrease in Deferred Capital Gain Country Tax of $80) | | | (6,525 | ) | |
Foreign Currency Forward Exchange Contracts | | | 344 | | |
Foreign Currency Translation | | | (7 | ) | |
Futures Contracts | | | 127 | | |
Net Change in Unrealized Appreciation (Depreciation) | | | (6,061 | ) | |
Net Realized Gain and Change in Unrealized Appreciation (Depreciation) | | | (4,208 | ) | |
Net Decrease in Net Assets Resulting from Operations | | $ | (1,043 | ) | |
The accompanying notes are an integral part of the financial statements.
16
Morgan Stanley Variable Insurance Fund, Inc.
Annual Report – December 31, 2021
Core Plus Fixed Income Portfolio
Statements of Changes in Net Assets | | Year Ended
December 31, 2021
(000) | | Year Ended
December 31, 2020
(000) | |
Increase (Decrease) in Net Assets: | |
Operations: | |
Net Investment Income | | $ | 3,165 | | | $ | 4,226 | | |
Net Realized Gain | | | 1,853 | | | | 6,708 | | |
Net Change in Unrealized Appreciation (Depreciation) | | | (6,061 | ) | | | 1,570 | | |
Net Increase (Decrease) in Net Assets Resulting from Operations | | | (1,043 | ) | | | 12,504 | | |
Dividends and Distributions to Shareholders: | |
Class I | | | (8,987 | ) | | | (3,273 | ) | |
Class II | | | (1,617 | ) | | | (3,366 | ) | |
Total Dividends and Distributions to Shareholders | | | (10,604 | ) | | | (6,639 | ) | |
Capital Share Transactions:(1) | |
Class I: | |
Subscribed | | | 18,715 | | | | 19,076 | | |
Distributions Reinvested | | | 8,987 | | | | 3,273 | | |
Redeemed | | | (19,863 | ) | | | (30,207 | ) | |
Class II: | |
Subscribed | | | 13,539 | | | | 22,491 | | |
Distributions Reinvested | | | 1,617 | | | | 3,366 | | |
Redeemed | | | (90,146 | ) | | | (30,920 | ) | |
Net Decrease in Net Assets Resulting from Capital Share Transactions | | | (67,151 | ) | | | (12,921 | ) | |
Total Decrease in Net Assets | | | (78,798 | ) | | | (7,056 | ) | |
Net Assets: | |
Beginning of Period | | | 181,053 | | | | 188,109 | | |
End of Period | | $ | 102,255 | | | $ | 181,053 | | |
(1) Capital Share Transactions: | |
Class I: | |
Shares Subscribed | | | 1,680 | | | | 1,662 | | |
Shares Issued on Distributions Reinvested | | | 855 | | | | 289 | | |
Shares Redeemed | | | (1,788 | ) | | | (2,677 | ) | |
Net Increase (Decrease) in Class I Shares Outstanding | | | 747 | | | | (726 | ) | |
Class II: | |
Shares Subscribed | | | 1,183 | | | | 1,965 | | |
Shares Issued on Distributions Reinvested | | | 152 | | | | 297 | | |
Shares Redeemed | | | (7,806 | ) | | | (2,722 | ) | |
Net Decrease in Class II Shares Outstanding | | | (6,471 | ) | | | (460 | ) | |
The accompanying notes are an integral part of the financial statements.
17
Morgan Stanley Variable Insurance Fund, Inc.
Annual Report – December 31, 2021
Financial Highlights
Core Plus Fixed Income Portfolio
| | | Class I | |
| | | Year Ended December 31, | |
Selected Per Share Data and Ratios | | 2021 | | 2020 | | 2019 | | 2018 | | 2017 | |
Net Asset Value, Beginning of Period | | $ | 11.72 | | | $ | 11.31 | | | $ | 10.63 | | | $ | 10.98 | | | $ | 10.67 | | |
Income (Loss) from Investment Operations: | |
Net Investment Income(1) | | | 0.26 | | | | 0.28 | | | | 0.35 | | | | 0.34 | | | | 0.34 | | |
Net Realized and Unrealized Gain (Loss) | | | (0.29 | ) | | | 0.58 | | | | 0.79 | | | | (0.41 | ) | | | 0.32 | | |
Total from Investment Operations | | | (0.03 | ) | | | 0.86 | | | | 1.14 | | | | (0.07 | ) | | | 0.66 | | |
Distributions from and/or in Excess of: | |
Net Investment Income | | | (0.46 | ) | | | (0.33 | ) | | | (0.46 | ) | | | (0.28 | ) | | | (0.35 | ) | |
Net Realized Gain | | | (0.76 | ) | | | (0.12 | ) | | | — | | | | — | | | | — | | |
Total Distributions | | | (1.22 | ) | | | (0.45 | ) | | | (0.46 | ) | | | (0.28 | ) | | | (0.35 | ) | |
Net Asset Value, End of Period | | $ | 10.47 | | | $ | 11.72 | | | $ | 11.31 | | | $ | 10.63 | | | $ | 10.98 | | |
Total Return(2) | | | (0.32 | )% | | | 7.80 | % | | | 10.88 | %(3) | | | (0.65 | )% | | | 6.24 | % | |
Ratios to Average Net Assets and Supplemental Data: | |
Net Assets, End of Period (Thousands) | | $ | 85,556 | | | $ | 86,993 | | | $ | 92,157 | | | $ | 70,476 | | | $ | 79,752 | | |
Ratio of Expenses Before Expense Limitation | | | 0.82 | % | | | 0.75 | % | | | 0.77 | % | | | 0.76 | % | | | 0.76 | % | |
Ratio of Expenses After Expense Limitation | | | 0.67 | %(4)(5) | | | 0.68 | %(4) | | | 0.69 | %(4) | | | 0.68 | %(4) | | | 0.68 | %(4) | |
Ratio of Expenses After Expense Limitation Excluding Interest Expenses | | | N/A | | | | 0.68 | %(4) | | | N/A | | | | N/A | | | | N/A | | |
Ratio of Net Investment Income | | | 2.35 | %(4) | | | 2.47 | %(4) | | | 3.16 | %(4) | | | 3.12 | %(4) | | | 3.10 | %(4) | |
Ratio of Rebate from Morgan Stanley Affiliates | | | 0.01 | % | | | 0.02 | % | | | 0.01 | % | | | 0.02 | % | | | 0.02 | % | |
Portfolio Turnover Rate | | | 399 | % | | | 296 | % | | | 231 | % | | | 220 | % | | | 277 | % | |
(1) Per share amount is based on average shares outstanding.
(2) Calculated based on the net asset value as of the last business day of the period. Performance does not reflect fees and expenses imposed by your insurance company's separate account. If performance information included the effect of these additional charges, the total return would be lower.
(3) Performance was positively impacted by approximately 0.10% due to the receipt of proceeds from the settlement of class action suit involving the Fund's past holdings. This was a one-time settlement, and as a result, the impact on the NAV and consequently the performance will not likely be repeated in the future. Had this settlement not occurred, the total return for Class I shares would have been approximately 10.78%.
(4) The Ratio of Expenses After Expense Limitation and Ratio of Net Investment Income reflect the rebate of certain Fund expenses in connection with the investments in Morgan Stanley affiliates during the period. The effect of the rebate on the ratios is disclosed in the above table as "Ratio of Rebate from Morgan Stanley Affiliates."
(5) Effective July 1, 2021, the Adviser has agreed to limit the ratio of expenses to average net assets to the maximum ratio of 0.65% for Class I shares. Prior to July 1, 2021, the maximum ratio was 0.70% for Class I shares.
The accompanying notes are an integral part of the financial statements.
18
Morgan Stanley Variable Insurance Fund, Inc.
Annual Report – December 31, 2021
Financial Highlights
Core Plus Fixed Income Portfolio
| | | Class II | |
| | | Year Ended December 31, | |
Selected Per Share Data and Ratios | | 2021 | | 2020 | | 2019 | | 2018 | | 2017 | |
Net Asset Value, Beginning of Period | | $ | 11.68 | | | $ | 11.27 | | | $ | 10.59 | | | $ | 10.94 | | | $ | 10.64 | | |
Income (Loss) from Investment Operations: | |
Net Investment Income(1) | | | 0.24 | | | | 0.25 | | | | 0.32 | | | | 0.31 | | | | 0.31 | | |
Net Realized and Unrealized Gain (Loss) | | | (0.30 | ) | | | 0.58 | | | | 0.79 | | | | (0.41 | ) | | | 0.31 | | |
Total from Investment Operations | | | (0.06 | ) | | | 0.83 | | | | 1.11 | | | | (0.10 | ) | | | 0.62 | | |
Distributions from and/or in Excess of: | |
Net Investment Income | | | (0.30 | ) | | | (0.30 | ) | | | (0.43 | ) | | | (0.25 | ) | | | (0.32 | ) | |
Net Realized Gain | | | (0.76 | ) | | | (0.12 | ) | | | — | | | | — | | | | — | | |
Total Distributions | | | (1.06 | ) | | | (0.42 | ) | | | (0.43 | ) | | | (0.25 | ) | | | (0.32 | ) | |
Net Asset Value, End of Period | | $ | 10.56 | | | $ | 11.68 | | | $ | 11.27 | | | $ | 10.59 | | | $ | 10.94 | | |
Total Return(2) | | | (0.54 | )% | | | 7.55 | % | | | 10.61 | %(3) | | | (0.91 | )% | | | 5.89 | % | |
Ratios to Average Net Assets and Supplemental Data: | |
Net Assets, End of Period (Thousands) | | $ | 16,699 | | | $ | 94,060 | | | $ | 95,952 | | | $ | 91,733 | | | $ | 111,585 | | |
Ratio of Expenses Before Expense Limitation | | | 1.07 | % | | | 1.00 | % | | | 1.02 | % | | | 1.01 | % | | | 1.01 | % | |
Ratio of Expenses After Expense Limitation | | | 0.92 | %(4)(5) | | | 0.93 | %(4) | | | 0.94 | %(4) | | | 0.93 | %(4) | | | 0.93 | %(4) | |
Ratio of Expenses After Expense Limitation Excluding Interest Expenses | | | N/A | | | | 0.93 | %(4) | | | N/A | | | | N/A | | | | N/A | | |
Ratio of Net Investment Income | | | 2.10 | %(4) | | | 2.22 | %(4) | | | 2.91 | %(4) | | | 2.87 | %(4) | | | 2.85 | %(4) | |
Ratio of Rebate from Morgan Stanley Affiliates | | | 0.01 | % | | | 0.02 | % | | | 0.01 | % | | | 0.02 | % | | | 0.02 | % | |
Portfolio Turnover Rate | | | 399 | % | | | 296 | % | | | 231 | % | | | 220 | % | | | 277 | % | |
(1) Per share amount is based on average shares outstanding.
(2) Calculated based on the net asset value as of the last business day of the period. Performance does not reflect fees and expenses imposed by your insurance company's separate account. If performance information included the effect of these additional charges, the total return would be lower.
(3) Performance was positively impacted by approximately 0.10% due to the receipt of proceeds from the settlement of class action suit involving the Fund's past holdings. This was a one-time settlement, and as a result, the impact on the NAV and consequently the performance will not likely be repeated in the future. Had this settlement not occurred, the total return for Class II shares would have been approximately 10.51%.
(4) The Ratio of Expenses After Expense Limitation and Ratio of Net Investment Income reflect the rebate of certain Fund expenses in connection with the investments in Morgan Stanley affiliates during the period. The effect of the rebate on the ratios is disclosed in the above table as "Ratio of Rebate from Morgan Stanley Affiliates."
(5) Effective July 1, 2021, the Adviser has agreed to limit the ratio of expenses to average net assets to the maximum ratio of 0.90% for Class II shares. Prior to July 1, 2021, the maximum ratio was 0.95% for Class II shares.
The accompanying notes are an integral part of the financial statements.
19
Morgan Stanley Variable Insurance Fund, Inc.
Annual Report – December 31, 2021
Notes to Financial Statements
Morgan Stanley Variable Insurance Fund, Inc. (the "Company") is registered under the Investment Company Act of 1940, as amended (the "Act"), as an open-end management investment company. The Company is comprised of ten separate active, diversified and non-diversified funds (individually referred to as a "Fund," collectively as the "Funds"). The Company applies investment company accounting and reporting guidance.
The accompanying financial statements relate to the Core Plus Fixed Income Portfolio. The Fund seeks above-average total return over a market cycle of three to five years by investing primarily in a diversified portfolio of fixed income securities. The Fund offers two classes of shares — Class I and Class II. Both classes of shares have identical voting rights (except that shareholders of a Class have exclusive voting rights regarding any matter relating solely to that Class of shares), dividend, liquidation and other rights.
The Company is intended to be a funding vehicle for variable annuity contracts and variable life insurance policies offered by the separate accounts of certain life insurance companies.
A. Significant Accounting Policies: The following significant accounting policies are in conformity with U.S. generally accepted accounting principles ("GAAP"). Such policies are consistently followed by the Company in the preparation of its financial statements. GAAP may require management to make estimates and assumptions that affect the reported amounts and disclosures in the financial statements. Actual results may differ from those estimates.
In March 2020, the Financial Accounting Standards Board ("FASB") issued an Accounting Standard Update, ASU 2020-04, Reference Rate Reform (Topic 848) — Facilitation of the Effects of Reference Rate Reform on Financial Reporting ("ASU 2020-04"), which provides optional, temporary relief with respect to the financial reporting of contracts subject to certain types of modifications due to the planned discontinuation of the London Interbank Offered Rate ("LIBOR") and other Interbank Offered Rate ("IBOR") based reference rates at the end of 2021. The temporary relief provided by ASU 2020-04 is effective for certain reference rate-related contract modifications that occur during the period from March 12, 2020 through December 31, 2022. Management evaluated the impact of ASU 2020-04 on the Fund's investments, derivatives, debt and other contracts that will undergo reference rate-related modifications as a result of the reference rate reform and does not expect there will be any significant impact to the Fund.
1. Security Valuation: (1) Certain portfolio securities may be valued by an outside pricing service/vendor approved by the Company's Board of Directors (the
"Directors"). The pricing service/vendor may employ a pricing model that takes into account, among other things, bids, yield spreads and/or other market data and specific security characteristics. Alternatively, if a valuation is not available from an outside pricing service/vendor, and the security trades on an exchange, the security may be valued at its latest reported sale price (or at the exchange official closing price if such exchange reports an official closing price), prior to the time when assets are valued. If there are no sales on a given day and if there is no official exchange closing price for that day, the security is valued at the mean between the last reported bid and asked prices if such bid and asked prices are available in the relevant exchanges. If only bid prices are available then the latest bid price may be used. If Morgan Stanley Investment Management Inc. (the "Adviser"), a wholly-owned subsidiary of Morgan Stanley, determines that the price provided by the outside pricing service/vendor or exchange does not reflect the security's fair value or is unable to provide a price, prices from brokers or dealers may also be utilized. In these circumstances, the value of the security will be the mean of bid and asked prices obtained from brokers or dealers; (2) futures are valued at the settlement price on the exchange on which they trade or, if a settlement price is unavailable, at the last sale price on the exchange; (3) when market quotations are not readily available, including circumstances under which the Adviser determines that the closing price, last sale price or the mean between the last reported bid and asked prices are not reflective of a security's market value, portfolio securities are valued at their fair value as determined in good faith under procedures established by and under the general supervision of the Directors. Occasionally, developments affecting the closing prices of securities and other assets may occur between the times at which valuations of such securities are determined (that is, close of the foreign market on which the securities trade) and the close of business of the New York Stock Exchange ("NYSE"). If developments occur during such periods that are expected to materially affect the value of such securities, such valuations may be adjusted to reflect the estimated fair value of such securities as of the close of the NYSE, as determined in good faith by the Directors or by the Adviser using a pricing service and/or procedures approved by the Directors; (4) quotations of foreign portfolio securities, other assets and liabilities and forward contracts stated in foreign currency are translated into U.S. dollar equivalents at the prevailing market rates prior to the close of the NYSE; and (5) investments in mutual funds, including the Morgan Stanley Institutional Liquidity Funds, are valued at the net asset value ("NAV") as of the close of each business day.
20
Morgan Stanley Variable Insurance Fund, Inc.
Annual Report – December 31, 2021
Notes to Financial Statements (cont'd)
The Directors have responsibility for determining in good faith the fair value of the investments, and the Directors may appoint others, such as the Company's Adviser or a valuation committee, to assist the Directors in determining fair value and to make the actual calculations pursuant to the fair valuation methodologies previously approved by the Directors. Under procedures approved by the Directors, the Company's Adviser has formed a Valuation Committee whose members are approved by the Directors. The Valuation Committee provides administration and oversight of the Company's valuation policies and procedures, which are reviewed at least annually by the Directors. These procedures allow the Company to utilize independent pricing services, quotations from securities and financial instrument dealers and other market sources to determine fair value.
2. Fair Value Measurement: FASB Accounting Standards CodificationTM ("ASC") 820, "Fair Value Measurement" ("ASC 820"), defines fair value as the value that the Fund would receive to sell an investment or pay to transfer a liability in a timely transaction with an independent buyer in the principal market, or in the absence of a principal market, the most advantageous market for the investment or liability. ASC 820 establishes a three-tier hierarchy to distinguish between (1) inputs that reflect the assumptions market participants would use in valuing an asset or liability developed based on market data obtained from sources independent of the reporting entity (observable inputs) and (2) inputs that reflect the reporting entity's own assumptions about the assumptions market participants would use in valuing an asset or liability developed based on the best information available in the circumstances (unobservable inputs) and to establish classification of fair value measurements for disclosure purposes. Various inputs are used in determining the value of the Fund's investments. The inputs are summarized in the three broad levels listed below:
• Level 1 – unadjusted quoted prices in active markets for identical investments
• Level 2 – other significant observable inputs (including quoted prices for similar investments, interest rates, prepayment speeds, credit risk, etc.)
• Level 3 – significant unobservable inputs including the Fund's own assumptions in determining the fair value of investments. Factors considered in making this determination may include, but are not limited to, information obtained by contacting the issuer, analysts, or the appropriate stock exchange (for exchange-traded securities), analysis of the issuer's
financial statements or other available documents and, if necessary, available information concerning other securities in similar circumstances.
The inputs or methodology used for valuing securities are not necessarily an indication of the risk associated with investing in those securities and the determination of the significance of a particular input to the fair value measurement in its entirety requires judgment and considers factors specific to each security.
The following is a summary of the inputs used to value the Fund's investments as of December 31, 2021:
Investment Type | | Level 1
Unadjusted
quoted
prices
(000) | | Level 2
Other
significant
observable
inputs
(000) | | Level 3
Significant
unobservable
inputs
(000) | | Total
(000) | |
Assets: | |
Fixed Income Securities | |
Agency Adjustable Rate
Mortgages | | $ | — | | | $ | 39 | | | $ | — | | | $ | 39 | | |
Agency Fixed Rate
Mortgages | | | — | | | | 12,238 | | | | — | | | | 12,238 | | |
Asset-Backed Securities | | | — | | | | 10,664 | | | | — | | | | 10,664 | | |
Collateralized Mortgage
Obligations — Agency
Collateral Series | | | — | | | | 1,889 | | | | — | | | | 1,889 | | |
Commercial
Mortgage-Backed
Securities | | | — | | | | 6,452 | | | | — | | | | 6,452 | | |
Corporate Bonds | | | — | | | | 38,774 | | | | — | | | | 38,774 | | |
Mortgages — Other | | | — | | | | 23,891 | | | | — | | | | 23,891 | | |
Municipal Bonds | | | — | | | | 1,467 | | | | — | | | | 1,467 | | |
Sovereign | | | — | | | | 5,261 | | | | — | | | | 5,261 | | |
Supranational | | | — | | | | 383 | | | | — | | | | 383 | | |
Total Fixed Income
Securities | | | — | | | | 101,058 | | | | — | | | | 101,058 | | |
Short-Term Investments | |
Investment Company | | | 8,555 | | | | — | | | | — | | | | 8,555 | | |
U.S. Treasury Securities | | | — | | | | 832 | | | | — | | | | 832 | | |
Total Short-Term
Investments | | | 8,555 | | | | 832 | | | | — | | | | 9,387 | | |
Foreign Currency
Forward Exchange
Contracts | | | — | | | | 22 | | | | — | | | | 22 | | |
Futures Contracts | | | 120 | | | | — | | | | — | | | | 120 | | |
Total Assets | | | 8,675 | | | | 101,912 | | | | — | | | | 110,587 | | |
Liabilities: | |
Foreign Currency
Forward Exchange
Contracts | | | — | | | | (27 | ) | | | — | | | | (27 | ) | |
Futures Contracts | | | (91 | ) | | | — | | | | — | | | | (91 | ) | |
Total Liabilities | | | (91 | ) | | | (27 | ) | | | — | | | | (118 | ) | |
Total | | $ | 8,584 | | | $ | 101,885 | | | $ | — | | | $ | 110,469 | | |
21
Morgan Stanley Variable Insurance Fund, Inc.
Annual Report – December 31, 2021
Notes to Financial Statements (cont'd)
Transfers between investment levels may occur as the markets fluctuate and/or the availability of data used in an investment's valuation changes.
Following is a reconciliation of investments in which significant unobservable inputs (Level 3) were used in determining fair value:
| | | Corporate
Bond
(000) | |
Beginning Balance | | $ | — | † | |
Purchases | | | — | | |
Sales | | | (— | )† | |
Amortization of discount | | | — | | |
Transfers in | | | — | | |
Transfers out | | | — | | |
Corporate actions | | | — | | |
Change in unrealized appreciation (depreciation) | | | — | | |
Realized gains (losses) | | | — | | |
Ending Balance | | $ | — | | |
Net change in unrealized appreciation
(depreciation) from investments still
held as of December 31, 2021 | | $ | — | | |
† Includes a security valued at zero.
3. Foreign Currency Translation and Foreign Investments: The books and records of the Fund are maintained in U.S. dollars. Foreign currency amounts are translated into U.S. dollars as follows:
— investments, other assets and liabilities at the prevailing rate of exchange on the valuation date;
— investment transactions and investment income at the prevailing rates of exchange on the dates of such transactions.
Although the net assets of the Fund are presented at the foreign exchange rates and market values at the close of the period, the Fund does not isolate that portion of the results of operations arising as a result of changes in the foreign exchange rates from the fluctuations arising from changes in the market prices of securities held at period end. Similarly, the Fund does not isolate the effect of changes in foreign exchange rates from the fluctuations arising from changes in the market prices of securities sold during the period. Accordingly, realized and unrealized foreign currency gains (losses) on investments in securities are included in the reported net realized and unrealized gains (losses) on investment transactions and balances. However, pursuant to U.S. federal income tax regulations, gains and losses from certain foreign currency transactions and the foreign currency portion of gains and losses realized on sales and maturities of foreign
denominated debt securities are treated as ordinary income for U.S. federal income tax purposes.
Net realized gains (losses) on foreign currency transactions represent net foreign exchange gains (losses) from sales and maturities of foreign currency forward exchange contracts, disposition of foreign currencies, currency gains (losses) realized between the trade and settlement dates on securities transactions, and the difference between the amount of investment income and foreign withholding taxes recorded on the Fund's books and the U.S. dollar equivalent amounts actually received or paid. The change in unrealized currency gains (losses) on foreign currency transactions for the period is reflected in the Statement of Operations.
Foreign security and currency transactions may involve certain considerations and risks not typically associated with those of U.S. dollar denominated transactions as a result of, among other factors, fluctuations of exchange rates in relation to the U.S. dollar, the possibility of lower levels of governmental supervision and regulation of foreign securities markets and the possibility of political or economic instability.
Governmental approval for foreign investments may be required in advance of making an investment under certain circumstances in some countries, and the extent of foreign investments in domestic companies may be subject to limitation in other countries. Foreign ownership limitations also may be imposed by the charters of individual companies to prevent, among other concerns, violations of foreign investment limitations. As a result, an additional class of shares (identified as "Foreign" in the Portfolio of Investments) may be created and offered for investment. The "local" and "foreign shares" market values may differ. In the absence of trading of the foreign shares in such markets, the Fund values the foreign shares at the closing exchange price of the local shares.
4. Derivatives: The Fund may, but is not required to, use derivative instruments for a variety of purposes, including hedging, risk management, portfolio management or to earn income. Derivatives are financial instruments whose value is based, in part, on the value of an underlying asset, interest rate, index or financial instrument. Prevailing interest rates and volatility levels, among other things, also affect the value of derivative instruments. A derivative instrument often has risks similar to its underlying asset and may have additional risks, including imperfect correlation between the value of the derivative and the underlying asset, risks of default by the counterparty to certain transactions, magnification of losses incurred due
22
Morgan Stanley Variable Insurance Fund, Inc.
Annual Report – December 31, 2021
Notes to Financial Statements (cont'd)
to changes in the market value of the securities, instruments, indices or interest rates to which the derivative instrument relates, risks that the transactions may not be liquid and risks arising from margin requirements. The use of derivatives involves risks that are different from, and possibly greater than, the risks associated with other portfolio investments. Derivatives may involve the use of highly specialized instruments that require investment techniques and risk analyses different from those associated with other portfolio investments. All of the Fund's holdings, including derivative instruments, are marked-to-market each day with the change in value reflected in unrealized appreciation (depreciation). Upon disposition, a realized gain or loss is recognized.
Certain derivative transactions may give rise to a form of leverage. Leverage magnifies the potential for gain and the risk of loss. Leverage associated with derivative transactions may cause the Fund to liquidate portfolio positions when it may not be advantageous to do so to satisfy its obligations or to meet earmarking or segregation requirements, pursuant to applicable Securities and Exchange Commission ("SEC") rules and regulations, or may cause the Fund to be more volatile than if the Fund had not been leveraged. Although the Adviser seeks to use derivatives to further the Fund's investment objectives, there is no assurance that the use of derivatives will achieve this result.
Following is a description of the derivative instruments and techniques that the Fund used during the period and their associated risks:
Foreign Currency Forward Exchange Contracts: In connection with its investments in foreign securities, the Fund also entered into contracts with banks, brokers or dealers to purchase or sell securities or foreign currencies at a future date. A foreign currency forward exchange contract ("currency contract") is a negotiated agreement between the contracting parties to exchange a specified amount of currency at a specified future time at a specified rate. The rate can be higher or lower than the spot rate between the currencies that are the subject of the contract. Currency contracts may be used to protect against uncertainty in the level of future foreign currency exchange rates or to gain or modify exposure to a particular currency. In addition, the Fund may use cross currency hedging or proxy hedging with respect to currencies in which the Fund has or expects to have portfolio or currency exposure. Cross currency hedges involve the sale of one currency against the positive exposure to a different currency and may be used for hedging purposes
or to establish an active exposure to the exchange rate between any two currencies. To the extent hedged by the use of currency contracts, the precise matching of the currency contract amounts and the value of the securities involved will not generally be possible because the future value of such securities in foreign currencies will change as a consequence of market movements in the value of those securities between the date on which the contract is entered into and the date it matures. Furthermore, such transactions may reduce or preclude the opportunity for gain if the value of the currency should move in the direction opposite to the position taken. There is additional risk to the extent that currency contracts create exposure to currencies in which the Fund's securities are not denominated. Unanticipated changes in currency prices may result in poorer overall performance for the Fund than if it had not entered into such contracts. The use of currency contracts involves the risk of loss from the insolvency or bankruptcy of the counterparty to the contract or the failure of the counterparty to make payments or otherwise comply with the terms of the contract. A currency contract is marked-to-market daily and the change in market value is recorded by the Fund as unrealized gain or loss. The Fund records realized gains (losses) when the currency contract is closed equal to the difference between the value of the currency contract at the time it was opened and the value at the time it was closed.
Futures: A futures contract is a standardized, exchange-traded agreement to buy or sell a specific quantity of an underlying asset, reference rate or index at a specific price at a specific future time. The value of a futures contract tends to increase and decrease in tandem with the value of the underlying instrument. Depending on the terms of the particular contract, futures contracts are settled through either physical delivery of the underlying instrument on the settlement date or by payment of a cash settlement amount on the settlement date. During the period the futures contract is open, payments are received from or made to the broker based upon changes in the value of the contract (the variation margin). A decision as to whether, when and how to use futures contracts involves the exercise of skill and judgment and even a well-conceived futures transaction may be unsuccessful because of market behavior or unexpected events. In addition to the derivatives risks discussed above, the prices of futures contracts can be highly volatile, using futures contracts can lower total return and the potential loss from futures contracts can exceed the Fund's initial investment in such contracts. No assurance can be given
23
Morgan Stanley Variable Insurance Fund, Inc.
Annual Report – December 31, 2021
Notes to Financial Statements (cont'd)
that a liquid market will exist for any particular futures contract at any particular time. There is also the risk of loss by the Fund of margin deposits in the event of bankruptcy of a broker with which the Fund has open positions in the futures contract.
FASB ASC 815, "Derivatives and Hedging" ("ASC 815"), is intended to improve financial reporting about derivative instruments by requiring enhanced disclosures to enable investors to better understand how and why the Fund uses derivative instruments, how these derivative instruments are accounted for and their effects on the Fund's financial position and results of operations.
The following tables set forth the fair value of the Fund's derivative contracts by primary risk exposure as of December 31, 2021:
| | | Asset Derivatives
Statement of Assets
and Liabilities
Location | | Primary Risk
Exposure | | Value
(000) | |
Foreign Currency
Forward
Exchange
Contracts | | Unrealized Appreciation
on Foreign Currency
Forward Exchange
Contracts | | Currency Risk | | $ | 22 | | |
Futures
Contracts | | Variation Margin on
Futures Contracts | | Interest
Rate Risk | | | 120 | (a) | |
Total | | | | | | $ | 142 | | |
| | | Liability Derivatives
Statement of Assets
and Liabilities
Location | | Primary Risk
Exposure | | Value
(000) | |
Foreign Currency
Forward
Exchange
Contracts | | Unrealized Depreciation
on Foreign Currency
Forward Exchange
Contracts | | Currency Risk | | $ | (27 | ) | |
Futures
Contracts | | Variation Margin on
Futures Contracts | | Interest
Rate Risk | | | (91 | )(a) | |
Total | | | | | | $ | (118 | ) | |
(a) This amount represents the cumulative appreciation (depreciation) as reported in the Portfolio of Investments. The Statement of Assets and Liabilities only reflects the current day's net variation margin.
The following tables set forth by primary risk exposure the Fund's realized gains (losses) and change in unrealized appreciation (depreciation) by type of derivative contract for the year ended December 31, 2021 in accordance with ASC 815:
Realized Gain (Loss) | |
Primary Risk Exposure | | Derivative
Type | | Value
(000) | |
Currency Risk | | Foreign Currency Forward
Exchange Contracts | | $ | (181 | ) | |
Interest Rate Risk | | Futures Contracts | | | (488 | ) | |
Total | | | | $ | (669 | ) | |
Change in Unrealized Appreciation (Depreciation) | |
Primary Risk Exposure | | Derivative
Type | | Value
(000) | |
Currency Risk | | Foreign Currency Forward
Exchange Contracts | | $ | 344 | | |
Interest Rate Risk | | Futures Contracts | | | 127 | | |
Total | | | | $ | 471 | | |
At December 31, 2021, the Fund's derivative assets and liabilities are as follows:
Gross Amounts of Assets and Liabilities Presented in the
Statement of Assets and Liabilities | |
Derivatives(b) | | Assets(c)
(000) | | Liabilities(c)
(000) | |
Foreign Currency Forward
Exchange Contracts | | $ | 22 | | | $ | (27 | ) | |
(b) Excludes exchange-traded derivatives.
(c) Absent an event of default or early termination, OTC derivative assets and liabilities are presented gross and not offset in the Statement of Assets and Liabilities.
The Fund typically enters into International Swaps and Derivatives Association, Inc. Master Agreements ("ISDA Master Agreements") or similar master agreements (collectively, "Master Agreements") with its contract counterparties for certain OTC derivatives in order to, among other things, reduce its credit risk to counterparties. ISDA Master Agreements include provisions for general obligations, representations, collateral and events of default or termination. Under an ISDA Master Agreement, the Fund typically may offset with the counterparty certain OTC derivative financial instruments' payables and/or receivables with collateral held and/or posted and create one single net payment (close-out netting) in the event of default, termination and/or potential deterioration in the credit quality of the counterparty. Various Master Agreements govern the terms of certain transactions with counterparties, including transactions such as swap, forward, repurchase and reverse repurchase agreements. These Master Agreements typically attempt to reduce the counterparty risk associated with such transactions by specifying credit protection mechanisms and providing standardization that improves legal certainty. Cross-termination provisions under Master Agreements typically provide that a default in connection with one transaction between the Fund and a counterparty gives the non-defaulting party the right to terminate any other transactions in place with the defaulting party to create one single net payment due to/due from the defaulting party and may be a feature in certain Master Agreements. In the event the Fund exercises its right to terminate a Master Agreement after a counterparty experiences a termination event as defined in the Master Agreement, the return of collateral with market value in
24
Morgan Stanley Variable Insurance Fund, Inc.
Annual Report – December 31, 2021
Notes to Financial Statements (cont'd)
excess of the Fund's net liability may be delayed or denied.
The following tables present derivative financial instruments that are subject to enforceable netting arrangements as of December 31, 2021:
Gross Amounts Not Offset in the Statement of
Assets and Liabilities | |
Counterparty | | Gross Asset
Derivatives
Presented in
the Statement
of Assets and
Liabilities
(000) | | Financial
Instrument
(000) | | Collateral
Received
(000) | | Net
Amount
(not less
than $0)
(000) | |
Bank of America NA | | $ | — | @ | | $ | (— | @) | | $ | — | | | $ | 0 | | |
BNP Paribas SA | | | 5 | | | | (— | @) | | | — | | | | 5 | | |
Citibank NA | | | 1 | | | | (— | @) | | | — | | | | 1 | | |
Goldman Sachs
International | | | 7 | | | | (— | @) | | | — | | | | 7 | | |
JPMorgan Chase
Bank NA | | | 2 | | | | (2 | ) | | | — | | | | 0 | | |
UBS AG | | | 7 | | | | — | | | | — | | | | 7 | | |
Total | | $ | 22 | | | $ | (2 | ) | | $ | — | | | $ | 20 | | |
Gross Amounts Not Offset in the Statement of
Assets and Liabilities | |
Counterparty | | Gross Liability
Derivatives
Presented in
the Statement
of Assets and
Liabilities
(000) | | Financial
Instrument
(000) | | Collateral
Pledged
(000) | | Net
Amount
(not less
than $0)
(000) | |
Bank of
America NA | | $ | 9 | | | $ | (— | @) | | $ | — | | | $ | 9 | | |
Barclays
Bank PLC | | | 5 | | | | — | | | | — | | | | 5 | | |
BNP Paribas
SA | | | — | @ | | | (— | @) | | | — | | | | 0 | | |
Citibank NA | | | — | @ | | | (— | @) | | | — | | | | 0 | | |
Goldman Sachs
International | | | — | @ | | | (— | @) | | | — | | | | 0 | | |
JPMorgan Chase
Bank NA | | | 11 | | | | (2 | ) | | | — | | | | 9 | | |
Royal Bank Of
Canada (UK) | | | — | @ | | | — | | | | — | | | | — | @ | |
State Street Bank
and Trust Co. | | | 2 | | | | — | | | | — | | | | 2 | | |
Total | | $ | 27 | | | $ | (2 | ) | | $ | — | | | $ | 25 | | |
@ Amount is less than $500.
For the year ended December 31, 2021, the approximate average monthly amount outstanding for each derivative type is as follows:
Foreign Currency Forward Exchange Contracts: | |
Average monthly principal amount | | $ | 15,470,000 | | |
Futures Contracts: | |
Average monthly notional value | | $ | 51,241,000 | | |
5. When-Issued/Delayed Delivery Securities: The Fund purchases and sells when-issued and delayed delivery securities. Securities purchased on a when-issued or delayed delivery basis are purchased for delivery beyond the normal settlement date at a stated price and yield, and no income accrues to the Fund on such securities prior to delivery date. Payment and delivery for when-issued and delayed delivery securities can take place a month or more after the date of the transaction. When the Fund enters into a purchase transaction on a when-issued or delayed delivery basis, securities are available for collateral in an amount at least equal in value to the Fund's commitments to purchase such securities. Purchasing securities on a when-issued or delayed delivery basis may involve a risk that the market price at the time of delivery may be lower than the agreed upon purchase price, in which case there could be an unrealized loss at the time of delivery. Purchasing investments on a when-issued or delayed delivery basis may be considered a form of leverage which may increase the impact that gains (losses) may have on the Fund.
6. Securities Lending: The Fund lends securities to qualified financial institutions, such as broker-dealers, to earn additional income. Any increase or decrease in the fair value of the securities loaned that might occur and any interest earned or dividends declared on those securities during the term of the loan would remain in the Fund. The Fund would receive cash or securities as collateral in an amount equal to or exceeding 100% of the current fair value of the loaned securities. The collateral is marked-to-market daily by State Street Bank and Trust Company ("State Street"), the securities lending agent, to ensure that a minimum of 100% collateral coverage is maintained.
Based on pre-established guidelines, the securities lending agent invests any cash collateral that is received in an affiliated money market portfolio and repurchase agreements. Securities lending income is generated from the earnings on the invested collateral and borrowing fees, less any rebates owed to the borrowers and compensation to the lending agent, and is recorded as "Income from Securities Loaned — Net" in the Fund's Statement of Operations. Risks in securities lending transactions are that a borrower may not provide additional collateral when required or return the securities when due, and that the value of the short-term investments will be less than the amount of cash collateral plus any rebate that is required to be returned to the borrower.
25
Morgan Stanley Variable Insurance Fund, Inc.
Annual Report – December 31, 2021
Notes to Financial Statements (cont'd)
The Fund has the right under the securities lending agreement to recover the securities from the borrower on demand.
The following table presents financial instruments that are subject to enforceable netting arrangements as of December 31, 2021:
Gross Amounts Not Offset in the Statement of Assets and Liabilities | |
Gross Asset
Amounts
Presented
in the
Statement of
Assets and
Liabilities
(000) | | Financial
Instrument
(000) | | Collateral
Received
(000) | | Net Amount
(not less
than $0)
(000) | |
| $ | 978 | (d) | | $ | — | | | $ | (978 | )(e)(f) | | $ | 0 | | |
(d) Represents market value of loaned securities at year end.
(e) The Fund received cash collateral of approximately $757,000, which was subsequently invested in Morgan Stanley Institutional Liquidity Funds as reported in the Portfolio of Investments. In addition, the Fund received non-cash collateral of approximately $244,000 in the form of U.S. Government obligations, which the Fund cannot sell or repledge, and accordingly are not reflected in the Portfolio of Investments.
(f) The actual collateral received is greater than the amount shown here due to overcollateralization.
FASB ASC 860, "Transfers & Servicing: Repurchase-to-Maturity Transactions, Repurchase Financings, and Disclosures", is intended to provide increased transparency about the types of collateral pledged in securities lending transactions and other similar transactions that are accounted for as secured borrowing.
The following table displays a breakdown of transactions accounted for as secured borrowings, the gross obligations by class of collateral pledged and the remaining contractual maturity of those transactions as of December 31, 2021:
Remaining Contractual Maturity of the Agreements | |
| | | Overnight and
Continuous
(000) | | <30 days
(000) | | Between
30 &
90 days
(000) | | >90 days
(000) | | Total
(000) | |
Securities Lending
Transactions | |
Corporate Bonds | | $ | 757 | | | $ | — | | | $ | — | | | $ | — | | | $ | 757 | | |
Total Borrowings | | $ | 757 | | | $ | — | | | $ | — | | | $ | — | | | $ | 757 | | |
Gross amount of
recognized liabilities
for securities lending
transactions | | $ | 757 | | |
7. Indemnifications: The Company enters into contracts that contain a variety of indemnifications. The Company's maximum exposure under these arrangements is unknown. However, the Company has not had prior
claims or losses pursuant to these contracts and expects the risk of loss to be remote.
8. Security Transactions, Income and Expenses: Security transactions are accounted for on the trade date (date the order to buy or sell is executed). Realized gains and losses on the sale of investment securities are determined on the specific identified cost method. Dividend income and other distributions are recorded on the ex-dividend date net of applicable withholding taxes. Interest income is recognized on the accrual basis net of applicable withholding taxes except where collection is in doubt. Discounts are accreted and premiums are amortized over the life of the respective securities. Most expenses of the Company can be directly attributed to a particular Fund. Expenses which cannot be directly attributed are apportioned among the Funds based upon relative net assets or other appropriate methods. Income, expenses (other than class specific expenses) and realized and unrealized gains or losses are allocated to each class of shares based upon their relative net assets.
Settlement and registration of foreign securities transactions may be subject to significant risks not normally associated with investments in the United States. In certain markets, ownership of shares is defined according to entries in the issuer's share register. It is possible that a Fund holding these securities could lose its share registration through fraud, negligence or even mere oversight. In addition, shares being delivered for sales and cash being paid for purchases may be delivered before the exchange is complete. This may subject the Fund to further risk of loss in the event of a failure to complete the transaction by the counterparty.
9. Dividends and Distributions to Shareholders: Dividends and distributions to shareholders are recorded on the ex-dividend date. Dividends from net investment income, if any, are declared and paid annually. Net realized capital gains, if any, are distributed at least annually.
B. Advisory Fees: The Adviser, a wholly-owned subsidiary of Morgan Stanley, provides the Fund with advisory services under the terms of an Investment Advisory Agreement, paid quarterly, at the annual rate based on the daily net assets as follows:
First $1
billion | | Over $1
billion | |
| | 0.375 | % | | | 0.30 | % | |
For the year ended December 31, 2021, the advisory fee rate (net of waiver/rebate) was equivalent to an annual effective rate of 0.23% of the Fund's average daily net assets.
26
Morgan Stanley Variable Insurance Fund, Inc.
Annual Report – December 31, 2021
Notes to Financial Statements (cont'd)
The Adviser has agreed to reduce its advisory fee and/or reimburse the Fund so that total annual Fund operating expenses, excluding certain investment related expenses, taxes, interest and other extraordinary expenses (including litigation), will not exceed 0.70% for Class I shares and 0.95% for Class II shares. Effective July 1, 2021, the Adviser has agreed to reduce its advisory fee and/or reimburse the Fund so that the total annual Fund operating expenses will not exceed 0.65% for Class I shares and 0.90% for Class II shares. The fee waivers and/or expense reimbursements will continue for at least one year from the date of the Fund's prospectus or until such time as the Directors act to discontinue all or a portion of such waivers and/or reimbursements when they deem such action is appropriate. For the year ended December 31, 2021, approximately $190,000 of advisory fees were waived pursuant to this arrangement.
C. Administration Fees: The Adviser also serves as Administrator to the Company and provides administrative services pursuant to an Administration Agreement for an annual fee, accrued daily and paid monthly, of 0.08% of the Fund's average daily net assets.
Under a Sub-Administration Agreement between the Administrator and State Street, State Street provides certain administrative services to the Company. For such services, the Administrator pays State Street a portion of the fee the Administrator receives from the Fund.
D. Servicing Fees: The Company accrues daily and pays quarterly a servicing fee of up to 0.17% of the average daily value of shares of the Fund held in an insurance company's account. Certain insurance companies have entered into a servicing agreement with the Company to provide administrative and other contract-owner related services on behalf of the Fund.
E. Distribution Fees: Morgan Stanley Distribution, Inc. ("MSDI" or the "Distributor"), a wholly-owned subsidiary of the Adviser and an indirect subsidiary of Morgan Stanley, serves as the Distributor of the Fund and provides the Fund's Class II shareholders with distribution services pursuant to a Distribution Plan (the "Plan") in accordance with Rule 12b-1 under the Act. Under the Plan, the Fund is authorized to pay the Distributor a distribution fee, which is accrued daily and paid monthly, at an annual rate of 0.25% of the Fund's average daily net assets attributable to Class II shares.
F. Dividend Disbursing and Transfer Agent: The Company's dividend disbursing and transfer agent is DST Asset Manager Solutions, Inc. ("DST"). Pursuant to a Transfer Agency Agreement, the Company pays DST a fee based on
the number of classes, accounts and transactions relating to the Funds of the Company.
G. Custodian Fees: State Street (the "Custodian") also serves as Custodian for the Company in accordance with a Custodian Agreement. The Custodian holds cash, securities and other assets of the Company as required by the Act. Custody fees are payable monthly based on assets held in custody, investment purchases and sales activity and account maintenance fees, plus reimbursement for certain out-of-pocket expenses.
H. Security Transactions and Transactions with Affiliates: For the year ended December 31, 2021, purchases and sales of investment securities for the Fund, other than long-term U.S. Government securities and short-term investments were approximately $75,706,000 and $122,633,000, respectively. For the year ended December 31, 2021, purchases and sales of long-term U.S. Government securities were approximately $466,332,000 and $491,831,000, respectively.
The Fund invests in the Institutional Class of the Morgan Stanley Institutional Liquidity Funds (the "Liquidity Funds"), an open-end management investment company managed by the Adviser, both directly and as a portion of the securities held as collateral on loaned securities. Advisory fees paid by the Fund are reduced by an amount equal to its pro-rata share of the advisory and administration fees paid by the Fund due to its investment in the Liquidity Funds. For the year ended December 31, 2021, advisory fees paid were reduced by approximately $10,000 relating to the Fund's investment in the Liquidity Funds.
A summary of the Fund's transactions in shares of affiliated investments during the year ended December 31, 2021 is as follows:
Affiliated
Investment
Company | | Value
December 31,
2020
(000) | | Purchases
at Cost
(000) | | Proceeds
from Sales
(000) | | Dividend
Income
(000) | |
Liquidity Funds | | $ | 26,737 | | | $ | 127,672 | | | $ | 145,854 | | | $ | 5 | | |
Affiliated
Investment
Company (cont'd) | | Realized
Gain (Loss)
(000) | | Change in
Unrealized
Appreciation
(Depreciation)
(000) | | Value
December 31,
2021
(000) | |
Liquidity Funds | | $ | — | | | $ | — | | | $ | 8,555 | | |
The Fund is permitted to purchase and sell securities ("cross-trade") from and to other Morgan Stanley funds as well as other funds and client accounts for which the Adviser or an affiliate of the Adviser serves as investment adviser, pursuant
27
Morgan Stanley Variable Insurance Fund, Inc.
Annual Report – December 31, 2021
Notes to Financial Statements (cont'd)
to procedures approved by the Directors in compliance with Rule 17a-7 under the Act (the "Rule"). Each cross-trade is executed at the current market price in compliance with provisions of the Rule. For the year ended December 31, 2021, the Fund did not engage in any cross-trade transactions.
The Fund has an unfunded Deferred Compensation Plan (the "Compensation Plan"), which allows each independent Director to defer payment of all, or a portion, of the fees he or she receives for serving on the Board of Directors. Each eligible Director generally may elect to have the deferred amounts credited with a return equal to the total return on one or more of the Morgan Stanley funds that are offered as investment options under the Compensation Plan. Appreciation/depreciation and distributions received from these investments are recorded with an offsetting increase/decrease in the deferred compensation obligation and do not affect the NAV of the Fund.
I. Federal Income Taxes: It is the Fund's intention to continue to qualify as a regulated investment company and distribute all of its taxable and tax-exempt income. Accordingly, no provision for federal income taxes is required in the financial statements.
The Fund may be subject to taxes imposed by countries in which it invests. Such taxes are generally based on income and/or capital gains earned or repatriated. Taxes are accrued based on net investment income, net realized gains and net unrealized appreciation as such income and/or gains are earned. Taxes may also be based on transactions in foreign currency and are accrued based on the value of investments denominated in such currency.
FASB ASC 740-10, "Income Taxes — Overall", sets forth a minimum threshold for financial statement recognition of the benefit of a tax position taken or expected to be taken in a tax return. Management has concluded there are no significant uncertain tax positions that would require recognition in the financial statements. If applicable, the Fund recognizes interest accrued related to unrecognized tax benefits in "Interest Expense" and penalties in "Other Expenses" in the Statement of Operations. The Fund files tax returns with the U.S. Internal Revenue Service, New York and various states. Generally, each of the tax years in the four-year period ended December 31, 2021 remains subject to examination by taxing authorities.
The tax character of distributions paid may differ from the character of distributions shown for GAAP purposes due to short-term capital gains being treated as ordinary income for
tax purposes. The tax character of distributions paid during fiscal years 2021 and 2020 was as follows:
2021 Distributions
Paid From: | | 2020 Distributions
Paid From: | |
Ordinary
Income
(000) | | Long-Term
Capital Gain
(000) | | Ordinary
Income
(000) | | Long-Term
Capital Gain
(000) | |
| $ | 8,540 | | | $ | 2,064 | | | $ | 6,132 | | | $ | 507 | | |
The amount and character of income and gains to be distributed are determined in accordance with income tax regulations which may differ from GAAP. These book/tax differences are either considered temporary or permanent in nature.
Temporary differences are attributable to differing book and tax treatments for the timing of the recognition of gains (losses) on certain investment transactions and the timing of the deductibility of certain expenses.
The Fund had no permanent differences causing reclassifications among the components of net assets for the year ended December 31, 2021.
At December 31, 2021, the components of distributable earnings for the Fund on a tax basis were as follows:
Undistributed
Ordinary
Income
(000) | | Undistributed
Long-Term
Capital Gain
(000) | |
| $ | 3,240 | | | $ | 1,507 | | |
J. Credit Facility: The Company and other Morgan Stanley funds participated in a $300,000,000 committed, unsecured revolving line of credit facility (the "Facility") with State Street. This Facility is to be used for temporary emergency purposes or funding of shareholder redemption requests. The interest rate on borrowings is based on the federal funds rate or 1 month LIBOR rate plus a spread. Effective April 19, 2021, the interest rate on borrowings is based on the federal funds effective rate or overnight bank funding rate plus a spread. The Facility also has a commitment fee of 0.25% per annum based on the unused portion of the Facility. During the year ended December 31, 2021, the Fund did not have any borrowings under the Facility.
K. Other: At December 31, 2021, the Fund had record owners of 10% or greater. Investment activities of these shareholders could have a material impact on the Fund. The aggregate percentage of such owners was 34.9%.
L. Market Risk: The outbreak of the coronavirus ("COVID-19") and the recovery responses could adversely impact the operations of the Fund and its service providers
28
Morgan Stanley Variable Insurance Fund, Inc.
Annual Report – December 31, 2021
Notes to Financial Statements (cont'd)
and financial performance of the Fund and the Fund's investments. The extent of such impact depends on future developments, including (i) the duration and spread of the outbreak, (ii) the restrictions and advisories, (iii) the effects on the financial markets, (iv) government and regulatory responses, and (v) the effects on the economy overall as a result of developments such as disruption to consumer demand, economic output and supply chains. The duration and extent of COVID-19 and associated economic and market conditions and uncertainty over the long term cannot be reasonably estimated at this time. The ultimate impact of COVID-19 and the extent to which the associated conditions impact the Fund will also depend on future developments, which are highly uncertain, difficult to accurately predict and subject to change at any time. If the financial performance of the Fund's investments is impacted because of these factors for an extended period, the Fund's investment results may be adversely affected.
M. LIBOR Discontinuance or Unavailability Risk: LIBOR is intended to represent the rate at which contributing banks may obtain short-term borrowings from each other in the London interbank market. The regulatory authority that oversees financial services firms and financial markets in the U.K. has announced that, after the end of 2021, it would no longer persuade or compel contributing banks to make rate submissions for purposes of determining the LIBOR rate. However, subsequent announcements by the Financial Conduct Authority, the LIBOR administrator and other regulators indicate that it is possible that the most widely used tenors of U.S. Dollar LIBOR may continue to be provided on a representative basis until mid-2023. However, in connection with supervisory guidance from regulators, some regulated entities will cease to enter into most new LIBOR-based contracts after January 1, 2022. As a result, it is possible that commencing in 2022 (or a later date, if a particular reference rate is expected to continue beyond 2021), LIBOR may no longer be available or no longer deemed an appropriate reference rate upon which to determine the interest rate on or impacting certain derivatives and other instruments or investments comprising some or all of the Fund's portfolio. In light of this eventuality, public and private sector industry initiatives are currently underway to establish new or alternative reference rates to be used in place of LIBOR. There is no assurance that the composition or characteristics of any such alternative reference rate will be similar to or produce the same value or economic equivalence as LIBOR or that it will have the same volume or liquidity as did LIBOR prior to its discontinuance or unavailability, which may affect the value or
liquidity or return on certain of the Fund's investments and result in costs incurred in connection with closing out positions and entering into new trades.
Neither the effect of the LIBOR transition process nor its ultimate success can yet be known. The transition process might lead to increased volatility and illiquidity in markets for, and reduce the effectiveness of new hedges placed against, instruments whose terms currently include LIBOR. While some existing LIBOR-based instruments may contemplate a scenario where LIBOR is no longer available by providing for an alternative rate-setting methodology, there may be significant uncertainty regarding the effectiveness of any such alternative methodologies to replicate LIBOR. Not all existing LIBOR-based instruments may have alternative rate-setting provisions and there remains uncertainty regarding the willingness and ability of issuers to add alternative rate-setting provisions in certain existing instruments. In addition, a liquid market for newly-issued instruments that use a reference rate other than LIBOR still may be developing. There may also be challenges for the Fund to enter into hedging transactions against such newly-issued instruments until a market for such hedging transactions develops. All of the aforementioned may adversely affect the Fund's performance or net asset value.
29
Morgan Stanley Variable Insurance Fund, Inc.
Annual Report – December 31, 2021
Report of Independent Registered Public Accounting Firm
To the Shareholders and Board of Directors of
Morgan Stanley Variable Insurance Fund, Inc. —
Core Plus Fixed Income Portfolio
Opinion on the Financial Statements
We have audited the accompanying statement of assets and liabilities of Core Plus Fixed Income Portfolio (the "Fund") (one of the funds constituting Morgan Stanley Variable Insurance Fund, Inc. (the "Company")), including the portfolio of investments, as of December 31, 2021, and the related statement of operations for the year then ended, the statements of changes in net assets for each of the two years in the period then ended, the financial highlights for each of the five years in the period then ended and the related notes (collectively referred to as the "financial statements"). In our opinion, the financial statements present fairly, in all material respects, the financial position of Core Plus Fixed Income Portfolio (one of the funds constituting Morgan Stanley Variable Insurance Fund, Inc.) at December 31, 2021, the results of its operations for the year then ended, the changes in its net assets for each of the two years in the period then ended and its financial highlights for each of the five years in the period then ended, in conformity with U.S. generally accepted accounting principles.
Basis for Opinion
These financial statements are the responsibility of the Company's management. Our responsibility is to express an opinion on the Fund's financial statements based on our audits. We are a public accounting firm registered with the Public Company Accounting Oversight Board (United States) ("PCAOB") and are required to be independent with respect to the Company in accordance with the U.S. federal securities law and the applicable rules and regulations of the Securities and Exchange Commission and the PCAOB.
We conducted our audits in accordance with the standards of the PCAOB. Those standards require that we plan and perform the audit to obtain reasonable assurance about whether the financial statements are free of material misstatement, whether due to error or fraud. The Company is not required to have, nor were we engaged to perform, an audit of the Company's internal control over financial reporting. As part of our audits, we are required to obtain an understanding of internal control over financial reporting, but not for the purpose of expressing an opinion on the effectiveness of the Company's internal control over financial reporting. Accordingly, we express no such opinion.
Our audits included performing procedures to assess the risks of material misstatement of the financial statements, whether due to error or fraud, and performing procedures that respond to those risks. Such procedures included examining, on a test basis, evidence regarding the amounts and disclosures in the financial statements. Our procedures included confirmation of securities owned as of December 31, 2021 by correspondence with the custodian and others or by other appropriate auditing procedures where replies from others were not received. Our audits also included evaluating the accounting principles used and significant estimates made by management, as well as evaluating the overall presentation of the financial statements. We believe that our audits provide a reasonable basis for our opinion.

We have served as the auditor of one or more Morgan Stanley investment companies since 2000.
Boston, Massachusetts
February 18, 2022
30
Morgan Stanley Variable Insurance Fund, Inc.
Annual Report – December 31, 2021
Liquidity Risk Management Program (unaudited)
In compliance with Rule 22e-4 under the Investment Company Act of 1940, as amended (the "Liquidity Rule"), the Fund has adopted and implemented a liquidity risk management program (the "Program"), which is reasonably designed to assess and manage the risk that the Fund could not meet requests to redeem shares issued by the Fund without significant dilution of remaining investors' interests in the Fund (i.e., liquidity risk). The Fund's Board of Directors (the "Board") previously approved the designation of the Liquidity Risk Subcommittee (the "LRS") as Program administrator. The LRS is comprised of representatives from various divisions within Morgan Stanley Investment Management.
At a meeting held on March 3-4, 2021, the Board reviewed a written report prepared by the LRS that addressed the Program's operation and assessed its adequacy, and effectiveness of implementation for the period from January 1, 2020, through December 31, 2020, as required under the Liquidity Rule, and discussed the impact of the COVID-19 pandemic on liquidity and the LRS's assessment of liquidity risk during the reporting period, including during the distressed market environment caused by the onset of the COVID-19 pandemic. The report concluded that the Program operated effectively and was adequately and effectively implemented in all material aspects, and that the relevant controls and safeguards were appropriately designed to enable the LRS to administer the Program in compliance with the Liquidity Rule.
In accordance with the Program, the LRS assessed each Fund's liquidity risk no less frequently than annually taking into consideration certain factors, as applicable, such as (i) investment strategy and liquidity of portfolio investments, (ii) short-term and long-term cash flow projections and (iii) holdings of cash and cash equivalents and borrowing arrangements and other funding sources. Certain factors are considered under both normal and reasonably foreseeable stressed conditions.
Each Fund portfolio investment is classified into one of four liquidity categories, which classification is assessed at least monthly by the LRS. The classification is based on a determination of the number of days it is reasonably expected to take to convert the investment into cash, or sell or dispose of the investment, in current market conditions without significantly changing the market value of the investment. Liquidity classification determinations take into account various market, trading and investment-specific considerations, as well as market depth, and in some cases utilize third-party vendor data.
The Liquidity Rule limits a fund's investments in illiquid investments to 15% of its net assets and requires funds that do not primarily hold assets that are highly liquid investments to determine and maintain a minimum percentage of the fund's net assets to be invested in highly liquid investments (highly liquid investment minimum or "HLIM"). The LRS believes that the Program includes provisions reasonably designed to review, monitor and comply with the 15% limit on illiquid investments and for determining, periodically reviewing and complying with the HLIM requirement, as applicable.
There can be no assurance that the Program will achieve its objectives under all circumstances in the future. Please refer to the Fund's prospectus for more information regarding the Fund's exposure to liquidity risk and other risks to which it may be subject.
31
Morgan Stanley Variable Insurance Fund, Inc.
Annual Report – December 31, 2021
Federal Tax Notice (unaudited)
For federal income tax purposes, the following information is furnished with respect to the distributions paid by the Fund during its taxable year ended December 31, 2021.
The Fund designated and paid approximately $2,064,000 as a long-term capital gain distribution.
In January, the Fund provides tax information to shareholders for the preceding calendar year.
32
Morgan Stanley Variable Insurance Fund, Inc.
Annual Report – December 31, 2021
Director and Officer Information (unaudited)
Independent Directors:
Name, Address and Birth
Year of Independent Director | | Position(s)
Held with
Registrant | | Length of
Time
Served* | | Principal Occupation(s) During Past 5 Years and
Other Relevant Professional Experience | | Number of
Funds
in Fund
Complex
Overseen
by
Independent
Director** | | Other Directorships Held by Independent
Director During Past 5 Years*** | |
Frank L. Bowman
c/o Perkins Coie LLP
Counsel to the Independent Directors
1155 Avenue of the Americas
22nd Floor
New York, NY 10036
Birth Year: 1944 | | Director | | Since August 2006 | | President, Strategic Decisions, LLC (consulting) (since February 2009); Director or Trustee of various Morgan Stanley Funds (since August 2006); Chairperson of the Compliance and Insurance Committee (since October 2015); formerly, Chairperson of the Insurance Sub-Committee of the Compliance and Insurance Committee (2007-2015); served as President and Chief Executive Officer of the Nuclear Energy Institute (policy organization) (February 2005-November 2008); retired as Admiral, U.S. Navy after serving over 38 years on active duty including 8 years as Director of the Naval Nuclear Propulsion Program in the Department of the Navy and the U.S. Department of Energy (1996-2004); served as Chief of Naval Personnel (July 1994-September 1996) and on the Joint Staff as Director of Political Military Affairs (June 1992-July 1994); knighted as Honorary Knight Commander of the Most Excellent Order of the British Empire; awarded the Officier de l'Orde National du Mérite by the French Government; elected to the National Academy of Engineering (2009). | | | 77 | | | Director of Naval and Nuclear Technologies LLP; Director Emeritus of the Armed Services YMCA; Member of the National Security Advisory Council of the Center for U.S. Global Engagement and a member of the CNA Military Advisory Board; Chairman of Fairhaven United Methodist Church; Member of the Board of Advisors of the Dolphin Scholarship Foundation; Director of other various nonprofit organizations; formerly, Director of BP, plc (November 2010-May 2019). | |
Kathleen A. Dennis
c/o Perkins Coie LLP
Counsel to the Independent Directors
1155 Avenue of the Americas
22nd Floor
New York, NY 10036
Birth Year: 1953 | | Director | | Since August 2006 | | Chairperson of the Governance Committee (since January 2021), Chairperson of the Liquidity and Alternatives Sub-Committee of the Investment Committee (2006-2020) and Director or Trustee of various Morgan Stanley Funds (since August 2006); President, Cedarwood Associates (mutual fund and investment management consulting) (since July 2006); formerly, Senior Managing Director of Victory Capital Management (1993-2006). | | | 77 | | | Board Member, University of Albany Foundation (2012-present); Board Member, Mutual Funds Directors Forum (2014-present); Director of various non-profit organizations. | |
Nancy C. Everett
c/o Perkins Coie LLP
Counsel to the Independent
Directors
1155 Avenue of the Americas
22nd Floor
New York, NY 10036
Birth Year: 1955 | | Director | | Since January 2015 | | Chairperson of the Equity Investment Committee (since January 2021); Director or Trustee of various Morgan Stanley Funds (since January 2015); Chief Executive Officer, Virginia Commonwealth University Investment Company (since November 2015); Owner, OBIR, LLC (institutional investment management consulting) (since June 2014); formerly, Managing Director, BlackRock, Inc. (February 2011-December 2013) and Chief Executive Officer, General Motors Asset Management (a/k/a Promark Global Advisors, Inc.) (June 2005-May 2010). | | | 78 | | | Formerly, Member of Virginia Commonwealth University School of Business Foundation (2005-2016); Member of Virginia Commonwealth University Board of Visitors (2013-2015); Member of Committee on Directors for Emerging Markets Growth Fund, Inc. (2007-2010); Chairperson of Performance Equity Management, LLC (2006-2010); and Chairperson, GMAM Absolute Return Strategies Fund, LLC (2006-2010). | |
33
Morgan Stanley Variable Insurance Fund, Inc.
Annual Report – December 31, 2021
Director and Officer Information (unaudited) (cont'd)
Independent Directors (cont'd):
Name, Address and Birth
Year of Independent Director | | Position(s)
Held with
Registrant | | Length of
Time
Served* | | Principal Occupation(s) During Past 5 Years and
Other Relevant Professional Experience | | Number of
Funds
in Fund
Complex
Overseen
by
Independent
Director** | | Other Directorships Held by Independent
Director During Past 5 Years*** | |
Jakki L. Haussler
c/o Perkins Coie LLP
Counsel to the Independent
Directors
1155 Avenue of the Americas
22nd Floor
New York, NY 10036
Birth Year: 1957 | | Director | | Since January 2015 | | Director or Trustee of various Morgan Stanley Funds (since January 2015); Chairman, Opus Capital Group (since 1996); formerly, Chief Executive Officer, Opus Capital Group (1996-2019); Director, Capvest Venture Fund, LP (May 2000-December 2011); Partner, Adena Ventures, LP (July 1999-December 2010); Director, The Victory Funds (February 2005-July 2008). | | | 78 | | | Director, Barnes Group Inc. (since July 2021); Director of Cincinnati Bell Inc. and Member, Audit Committee and Chairman, Governance and Nominating Committee; Director of Service Corporation International and Member, Audit Committee and Investment Committee; Director of Northern Kentucky University Foundation and Member, Investment Committee; Member of Chase College of Law Transactional Law Practice Center Board of Advisors; Director of Best Transport; Director of Chase College of Law Board of Visitors; formerly, Member, University of Cincinnati Foundation Investment Committee; Member, Miami University Board of Visitors (2008-2011); Trustee of Victory Funds (2005-2008) and Chairman, Investment Committee (2007-2008) and Member, Service Provider Committee (2005-2008). | |
Dr. Manuel H. Johnson
c/o Johnson Smick
International, Inc.
220 I Street, NE Suite 200
Washington, D.C. 20002
Birth Year: 1949 | | Director | | Since July 1991 | | Senior Partner, Johnson Smick International, Inc. (consulting firm); Chairperson of the Fixed Income, Liquidity and Alternatives Investment Committee (since January 2021), Chairperson of the Investment Committee (2006-2020) and Director or Trustee of various Morgan Stanley Funds (since July 1991); Co-Chairman and a founder of the Group of Seven Council (G7C) (international economic commission); formerly, Chairperson of the Audit Committee (July 1991-September 2006); Vice Chairman of the Board of Governors of the Federal Reserve System and Assistant Secretary of the U.S. Treasury. | | | 77 | | | Director of NVR, Inc. (home construction). | |
Joseph J. Kearns
c/o Perkins Coie LLP
Counsel to the Independent
Directors
1155 Avenue of the Americas
22nd Floor
New York, NY 10036
Birth Year: 1942 | | Director | | Since August 1994 | | Senior Adviser, Kearns & Associates LLC (investment consulting); Chairperson of the Audit Committee (since October 2006) and Director or Trustee of various Morgan Stanley Funds (since August 1994); formerly, Deputy Chairperson of the Audit Committee (July 2003-September 2006) and Chairperson of the Audit Committee of various Morgan Stanley Funds (since August 1994); CFO of the J. Paul Getty Trust (1982-1999). | | | 78 | | | Director, Rubicon Investments (since February 2019); Prior to August 2016, Director of Electro Rent Corporation (equipment leasing); Prior to December 31, 2013, Director of The Ford Family Foundation. | |
Michael F. Klein
c/o Perkins Coie LLP
Counsel to the Independent
Directors
1155 Avenue of the Americas
22nd Floor
New York, NY 10036
Birth Year: 1958 | | Director | | Since August 2006 | | Chairperson of the Risk Committee (since January 2021); Managing Director, Aetos Alternatives Management, LP (since March 2000); Co-President, Aetos Alternatives Management, LP (since January 2004) and Co-Chief Executive Officer of Aetos Alternatives Management, LP (since August 2013); Chairperson of the Fixed Income Sub-Committee of the Investment Committee (2006-2020) and Director or Trustee of various Morgan Stanley Funds (since August 2006); formerly, Managing Director, Morgan Stanley & Co. Inc. and Morgan Stanley Dean Witter Investment Management and President, various Morgan Stanley Funds (June 1998-March 2000); Principal, Morgan Stanley & Co. Inc. and Morgan Stanley Dean Witter Investment Management (August 1997-December 1999). | | | 77 | | | Director of certain investment funds managed or sponsored by Aetos Alternatives Management, LP; Director of Sanitized AG and Sanitized Marketing AG (specialty chemicals). | |
34
Morgan Stanley Variable Insurance Fund, Inc.
Annual Report – December 31, 2021
Director and Officer Information (unaudited) (cont'd)
Independent Directors (cont'd):
Name, Address and Birth
Year of Independent Director | | Position(s)
Held with
Registrant | | Length of
Time
Served* | | Principal Occupation(s) During Past 5 Years and
Other Relevant Professional Experience | | Number of
Funds
in Fund
Complex
Overseen
by
Independent
Director** | | Other Directorships Held by Independent
Director During Past 5 Years*** | |
Patricia A. Maleski
c/o Perkins Coie LLP
Counsel to the Independent
Directors
1155 Avenue of the Americas
22nd Floor
New York, NY 10036
Birth Year: 1960 | | Director | | Since January 2017 | | Director or Trustee of various Morgan Stanley Funds (since January 2017); Managing Director, JPMorgan Asset Management (2004-2016); Oversight and Control Head of Fiduciary and Conflicts of Interest Program (2015-2016); Chief Control Officer — Global Asset Management (2013-2015); President, JPMorgan Funds (2010-2013); Chief Administrative Officer (2004-2013); various other positions including Treasurer and Board Liaison (since 2001). | | | 78 | | | Trustee, Nutley Family Service Bureau, Inc. (since January 2022). | |
W. Allen Reed
c/o Perkins Coie LLP
Counsel to the Independent
Directors
1155 Avenue of the Americas
22nd Floor
New York, NY 10036
Birth Year: 1947 | | Chair of the Board and Director | | Chair of the Board since August 2020 and Director since August 2006 | | Chair of the Boards of various Morgan Stanley Funds (since August 2020); Director or Trustee of various Morgan Stanley Funds (since August 2006); formerly, Vice Chair of the Boards of various Morgan Stanley Funds (January 2020-August 2020); President and Chief Executive Officer of General Motors Asset Management; Chairman and Chief Executive Officer of the GM Trust Bank and Corporate Vice President of General Motors Corporation (August 1994-December 2005). | | | 77 | | | Formerly, Director of Legg Mason, Inc. (2006-2019); and Director of the Auburn University Foundation (2010-2015). | |
Frances L. Cashman
c/o Perkins Coie LLP
Counsel to the Independent
Directors
1155 Avenue of the Americas
22nd Floor
New York, NY 10036
Birth Year: 1961 | | Advisory Board Member | | Advisory Board Member Since January 2022 | | Chief Executive Officer, Asset Management Division, Euromoney Institutional Investor PLC (financial information) (May 2021-Present); Executive Vice President and various other roles, Legg Mason & Co. (asset management) (2010-2020); Managing Director, Stifel Nicolaus (2005-2010). | | | 78 | | | Trustee and Investment Committee Member, Georgia Tech Foundation (Since June 2019); Trustee and Chair of Marketing Committee, Loyola Blakefield (Since September 2017); Trustee, MMI Gateway Foundation (since September 2017); Director and Investment Committee Member, Catholic Community Foundation Board (2012-2018); Director and Investment Committee Member, St. Ignatius Loyola Academy (2011-2017). | |
Eddie A. Grier
c/o Perkins Coie LLP
Counsel to the Independent
Directors
1155 Avenue of the Americas
22nd Floor
New York, NY 10036
Birth Year: 1955 | | Advisory Board Member | | Advisory Board Member Since January 2022 | | Dean, Santa Clara University Leavey School of Business (since April 2021); Dean, Virginia Commonwealth University School of Business (2010-2021); President and various other roles, Walt Disney Company (entertainment and media) (1981-2010). | | | 78 | | | Director, Witt/Keiffer, Inc. (executive search) (since 2016); Director, NuStar GP, LLC (energy) (since August 2021); Director, Sonida Senior Living, Inc. (residential community operator) (2016-2021); Director, NVR, Inc. (homebuilding) (2013-2020); Director, Middleburg Trust Company (wealth management) (2014-2019); Director, Colonial Williamsburg Company (since 2012); Regent, University of Massachusetts Global (since 2021); Director and Chair, ChildFund International (2012-2021); Trustee, Brandman University (2010-2021); Director, Richmond Forum (2012-2019). | |
* This is the earliest date the Director began serving the Morgan Stanley Funds. Each Director serves an indefinite term, until his or her successor is elected.
** The Fund Complex includes (as of December 31, 2021) all open-end and closed-end funds (including all of their portfolios) advised by Morgan Stanley Investment Management Inc. (the "Adviser") and any funds that have an adviser that is an affiliated person of the Adviser (including, but not limited to, Morgan Stanley AIP GP LP).
*** This includes any directorships at public companies and registered investment companies held by the Director at any time during the past five years.
35
Morgan Stanley Variable Insurance Fund, Inc.
Annual Report – December 31, 2021
Director and Officer Information (unaudited) (cont'd)
Executive Officers:
Name, Address and Birth Year of
Executive Officer | | Position(s)
Held with
Registrant | | Length of
Time Served* | | Principal Occupation(s) During Past 5 Years | |
John H. Gernon
522 Fifth Avenue
New York, NY 10036
Birth Year: 1963 | | President and Principal Executive Officer | | Since September 2013 | | President and Principal Executive Officer of the Equity and Fixed Income Funds and the Morgan Stanley AIP Funds (since September 2013) and the Liquidity Funds and various money market funds (since May 2014) in the Fund Complex; Managing Director of the Adviser. | |
Deidre A. Downes
1633 Broadway
New York, NY 10019
Birth Year: 1977 | | Chief Compliance Officer | | Since November 2021 | | Executive Director of the Adviser (since January 2021) and Chief Compliance Officer of various Morgan Stanley Funds (since November 2021). Formerly, Vice President and Corporate Counsel at PGIM and Prudential Financial (October 2016-December 2020). | |
Francis J. Smith
522 Fifth Avenue
New York, NY 10036
Birth Year: 1965 | | Treasurer and Principal Financial Officer | | Treasurer since July 2003 and Principal Financial Officer since September 2002 | | Managing Director of the Adviser and various entities affiliated with the Adviser; Treasurer (since July 2003) and Principal Financial Officer of various Morgan Stanley Funds (since September 2002). | |
Mary E. Mullin
1633 Broadway
New York, NY 10019
Birth Year: 1967 | | Secretary | | Since June 1999 | | Managing Director of the Adviser; Secretary of various Morgan Stanley Funds (since June 1999). | |
Michael J. Key
522 Fifth Avenue
New York, NY 10036
Birth Year: 1979 | | Vice President | | Since June 2017 | | Vice President of the Equity and Fixed Income Funds, Liquidity Funds, various money market funds and the Morgan Stanley AIP Funds in the Fund Complex (since June 2017); Executive Director of the Adviser; Head of Product Development for Equity and Fixed Income Funds (since August 2013). | |
* This is the earliest date the officer began serving the Morgan Stanley Funds. Each officer serves an indefinite term, until his or her successor is elected.
36
Morgan Stanley Variable Insurance Fund, Inc.
Annual Report – December 31, 2021
Adviser and Administrator
Morgan Stanley Investment Management Inc.
522 Fifth Avenue
New York, New York 10036
Distributor
Morgan Stanley Distribution, Inc.
522 Fifth Avenue
New York, New York 10036
Dividend Disbursing and Transfer Agent
DST Asset Manager Solutions, Inc.
2000 Crown Colony Drive
Quincy, Massachusetts 02169
Custodian
State Street Bank and Trust Company
One Lincoln Street
Boston, Massachusetts 02111
Legal Counsel
Dechert LLP
1095 Avenue of the Americas
New York, New York 10036
Counsel to the Independent Directors
Perkins Coie LLP
1155 Avenue of the Americas,
22nd Floor
New York, New York 10036
Independent Registered Public Accounting Firm
Ernst & Young LLP
200 Clarendon Street
Boston, Massachusetts 02116
Reporting to Shareholders
Each Morgan Stanley fund provides a complete schedule of portfolio holdings in its Semi-Annual and the Annual Reports within 60 days of the end of the fund's second and fourth fiscal quarters. The Semi-Annual and Annual Reports are filed electronically with the Securities and Exchange Commission ("SEC") on Form N-CSRS and Form N-CSR, respectively. Morgan Stanley also delivers the Semi-Annual and Annual Reports to fund shareholders and makes these reports available on its public website, www.morganstanley.com/im/shareholderreports. Each Morgan Stanley non-money market fund also files a complete schedule of portfolio holdings with the SEC for the fund's first and third fiscal quarters as an attachment to Form N-PORT. Morgan Stanley does not deliver the reports for the first and third fiscal quarters to shareholders, but makes the complete schedule of portfolio holdings for the fund's first and third fiscal quarters available on its public website. The holdings for each money market fund are also posted to the Morgan Stanley public website. You may obtain the Form N-PORT filings (as well as the Form N-CSR and N-CSRS filings) by accessing the SEC's website, www.sec.gov. You can also request copies of these materials, upon payment of a duplicating fee, by electronic request at the SEC's email address (publicinfo@sec.gov).
Proxy Voting Policies and Procedures and Proxy Voting Record
You may obtain a copy of the Company's Proxy Voting Policy and Procedures and information regarding how the Company voted proxies relating to portfolio securities during the most recent twelve-month period ended June 30, without charge, upon request, by calling toll free 1 (800) 548-7786 or by visiting our website at www.morganstanley.com/im/shareholderreports. This information is also available on the SEC's website at www.sec.gov.
This report is submitted for the general information of the shareholders of the Fund. For more detailed information about the Fund, its fees and expenses and other pertinent information, please read its Prospectus. The Company's Statement of Additional Information contains additional information about the Fund, including its Directors. It is available, without charge, by calling 1 (800) 548-7786.
Householding Notice
To reduce printing and mailing costs, the Fund attempts to eliminate duplicate mailings to the same address. The Fund delivers a single copy of certain shareholder documents, including shareholder reports, prospectuses and proxy materials, to investors with the same last name who reside at the same address. Your participation in this program will continue for an unlimited period of time unless you instruct us otherwise. You can request multiple copies of these documents by calling (800) 548-7786, 8:00 a.m. to 6:00 p.m., ET. Once our Customer Service Center has received your instructions, we will begin sending individual copies for each account within 30 days.
This report is not authorized for distribution to prospective investors in the Fund unless preceded or accompanied by an effective Prospectus. Read the Prospectus carefully before investing.
UIFCPFIANN
3997585 EXP 02.28.23

Morgan Stanley Variable Insurance Fund, Inc.
Annual Report – December 31, 2021
The Fund is intended to be a funding vehicle for variable annuity contracts and variable life insurance policies offered by the separate accounts of certain life insurance companies.
Morgan Stanley Variable Insurance Fund, Inc.
Annual Report – December 31, 2021
Consolidated Expense Example | | | 2 | | |
Investment Overview | | | 3 | | |
Consolidated Portfolio of Investments | | | 5 | | |
Consolidated Statement of Assets and Liabilities | | | 8 | | |
Consolidated Statement of Operations | | | 9 | | |
Consolidated Statements of Changes in Net Assets | | | 10 | | |
Consolidated Financial Highlights | | | 11 | | |
Notes to Consolidated Financial Statements | | | 13 | | |
Report of Independent Registered Public Accounting Firm | | | 25 | | |
Liquidity Risk Management Program | | | 26 | | |
Federal Tax Notice | | | 27 | | |
Director and Officer Information | | | 28 | | |
1
Morgan Stanley Variable Insurance Fund, Inc.
Annual Report – December 31, 2021
Consolidated Expense Example (unaudited)
Discovery Portfolio
As a shareholder of the Discovery Portfolio (the "Fund"), you incur two types of costs: (1) insurance company charges; and (2) ongoing costs, which may include advisory fees, administration fees, distribution (12b-1) fees and other Fund expenses. This example is intended to help you understand your ongoing costs (in dollars) of investing in the Fund and to compare these costs with the ongoing costs of investing in other mutual funds.
This example is based on an investment of $1,000 invested at the beginning of the six-month period ended December 31, 2021 and held for the entire six-month period.
Actual Expenses
The table below provides information about actual account values and actual expenses. You may use the information in this table, together with the amount you invested, to estimate the expenses that you paid over the period. Simply divide your account value by $1,000 (for example, an $8,600 account value divided by $1,000 = 8.6), then multiply the result by the number in the table under the heading entitled "Actual Expenses Paid During Period" to estimate the expenses you paid on your account during this period.
Hypothetical Example for Comparison Purposes
The table below provides information about hypothetical account values and hypothetical expenses based on the Fund's actual expense ratio and an assumed rate of return of 5% per year before expenses, which is not the Fund's actual return. The hypothetical account values and expenses may not be used to estimate the actual ending account balance or expenses you paid for the period. You may use this information to compare the ongoing costs of investing in the Fund and other funds. To do so, compare this 5% hypothetical example with the 5% hypothetical examples that appear in the shareholder reports of the other funds.
Please note that the expenses shown in the table are meant to highlight your ongoing costs only and do not reflect any insurance company charges. Therefore, the table below is useful in comparing ongoing costs, but will not help you determine the relative total cost of owning different funds. In addition, if these insurance company charges were included, your costs would have been higher.
| | | Beginning
Account Value
7/1/21 | | Actual Ending
Account Value
12/31/21 | | Hypothetical
Ending
Account Value | | Actual
Expenses Paid
During Period* | | Hypothetical
Expenses Paid
During Period* | | Net Expense
Ratio During
Period** | |
Discovery Portfolio Class I | | $ | 1,000.00 | | | $ | 822.20 | | | $ | 1,020.42 | | | $ | 4.36 | | | $ | 4.84 | | | | 0.95 | % | |
Discovery Portfolio Class II | | | 1,000.00 | | | | 821.30 | | | | 1,019.91 | | | | 4.82 | | | | 5.35 | | | | 1.05 | | |
* Expenses are calculated using each Fund Class' annualized net expense ratio (as disclosed), multiplied by the average account value over the period and multiplied by 184/365 (to reflect the most recent one-half year period).
** Annualized.
2
Morgan Stanley Variable Insurance Fund, Inc.
Annual Report – December 31, 2021
Investment Overview (unaudited)
Discovery Portfolio
The Fund seeks long term capital growth by investing primarily in common stocks and other equity securities.
On April 5, 2021 the Fund suspended offering Class I and Class II shares to new investors.
Performance
For the fiscal year ended December 31, 2021, the Fund's Class I shares had a total return based on net asset value and reinvestment of distributions per share of –11.06%, net of fees, and –11.19%, net of fees, for Class II shares. The Fund's Class I and Class II shares underperformed the Fund's benchmark, the Russell Midcap® Growth Index (the "Index"), which returned 12.73%.
Factors Affecting Performance
• U.S. equity markets saw increased short-term volatility in 2021 but ultimately overcame concerns about new COVID-19 variants, inflation, and fiscal and monetary policy uncertainties to end the year higher. The economic recovery progressed due to easing restrictions and increasing vaccinations, along with support from the federal government's pandemic relief and accommodative monetary policy. Inflation persisted longer than expected, in part due to pandemic-related supply-side disruptions and labor shortages, leading the U.S. Federal Reserve and other central banks around the world to begin withdrawing monetary stimulus measures. The clarity on monetary policy and early evidence that the highly contagious omicron variant could be less deadly led markets to rally at year-end.
• Mid-cap growth equities, as measured by the Index, advanced over the period. Eight of the Index's 11 sectors posted double-digit gains, led by energy, real estate and industrials. Communication services and consumer staples were the only sectors with negative performance in the Index and the greatest relative laggards in the Index in the period.
• Counterpoint Global seeks high quality companies, which we define primarily as those with sustainable competitive advantages. We manage concentrated portfolios that are highly differentiated from the benchmark, with securities weighted on our assessment of the quality of the company and our conviction. The value added or detracted in any period of time will result from stock selection, given our philosophy and process. For the year, the Fund underperformed the Index.
• The long-term investment horizon and conviction-weighted investment approach embraced by the team since 1998 can result in periods of performance deviation from the benchmark and peers. The Fund underperformed the Index in this reporting period mainly due to adverse stock selection, with sector allocations detracting to a lesser extent.
• Greater market volatility and a widespread sell-off in high growth and high multiple equities was a significant headwind to portfolio performance through much of 2021. We believe the sell-off was driven by a broad rotation out of such names and not due to company-specific fundamentals, which, across most of the portfolio, remained largely robust.
• The main detractors from relative performance were consumer discretionary, health care and information technology due to mixed stock selection. A company that operates an edge cloud platform for processing, serving and securing customers' applications was the largest detractor within these sectors and across the whole portfolio. It saw its shares underperform due to a network outage which led to difficulties with some customers, and resulted in financial results and an outlook that fell short of investor expectations. Holdings in a leading online retailer of home furnishings, an online luxury goods marketplace and a biotechnology company focused on the development of therapeutics using messenger RNA technology (sold prior to the end of the reporting period) were also among the largest detractors in these sectors and across the whole portfolio for the period.
• Although a diverse set of holdings among these areas weighed on relative results, it was partly offset by strength in a large and fast-growing business in the U.S. food delivery logistics area, with leading market share in suburban markets. The company was the top contributor within these sectors and across the whole portfolio. Its shares outperformed due to continued solid execution and market share gains within the restaurant category, as well as investor optimism around the company's planned expansion into non-restaurant verticals and additional markets internationally. The stock was sold prior to the end of the reporting period.
• An overweight allocation to communication services was also a larger detractor from relative performance, but the negative impact was partially offset by favorable stock selection.
• A zero weight allocation to consumer staples was also advantageous to relative performance.
3
Morgan Stanley Variable Insurance Fund, Inc.
Annual Report – December 31, 2021
Investment Overview (unaudited) (cont'd)
Discovery Portfolio
Management Strategies
• As a team, we believe having a market outlook can be an anchor. Our focus is on assessing company prospects over a five-year horizon, and owning a portfolio of unique companies whose market value we believe can increase significantly for underlying fundamental reasons.

In accordance with SEC regulations, the Fund's performance shown assumes that all recurring fees (including management fees) were deducted and all dividends and distributions were reinvested. The performance of Class II shares will vary from the performance of Class I shares based upon its different inception date and will be negatively impacted by additional fees assessed to that class.
Performance Compared to the Russell Midcap® Growth Index(1)
| | | Period Ended December 31, 2021 | |
| | | Total Returns(2) | |
| | | | | Average Annual | |
| | | One
Year | | Five
Years | | Ten
Years | | Since
Inception(5) | |
Fund – Class I(3) | | | –11.06 | % | | | 37.01 | % | | | 20.23 | % | | | 11.42 | % | |
Russell Midcap® Growth Index | | | 12.73 | | | | 19.83 | | | | 16.63 | | | | 9.80 | | |
Fund – Class II(4) | | | –11.19 | | | | 36.85 | | | | 20.11 | | | | 15.94 | | |
Russell Midcap® Growth Index | | | 12.73 | | | | 19.83 | | | | 16.63 | | | | 13.01 | | |
Performance data quoted represents past performance, which is no guarantee of future results, and current performance may be lower or higher than the figures shown. Performance assumes that all dividends and distributions, if any, were reinvested. For the most recent month-end performance figures, please contact the issuing insurance company or speak with your financial advisor. Investment return and principal value will fluctuate so that Fund shares, when redeemed, may be worth more or less than their original cost. Total returns do not reflect the deduction of taxes that a shareholder would pay on Fund distributions or the redemption of Fund shares. Performance shown does not reflect fees and expenses imposed by your insurance company's separate account. If performance information included the effect of these additional charges, the total returns would be lower.
(1) The Russell Midcap® Growth Index measures the performance of the mid-cap growth segment of the U.S. equity universe. It includes those Russell Midcap® Index companies with higher price-to-book ratios and higher forecasted growth values. The Russell Midcap® Index is a subset of the Russell 1000® Index and includes approximately 800 of the smallest securities in the Russell 1000® Index, which in turn consists of approximately 1,000 of the largest U.S. securities based on a combination of market capitalization and current index membership. The Index is unmanaged and its returns do not include any sales charges or fees. Such costs would lower performance. It is not possible to invest directly in an index.
(2) Total returns for the Fund reflect fees waived and expenses reimbursed, if applicable, by the Adviser (as defined herein). Without such waivers and reimbursements, total returns would have been lower.
(3) Commenced operations on October 18, 1999.
(4) Commenced offering on May 5, 2003.
(5) For comparative purposes, average annual since inception returns listed for the Index refers to the inception date or initial offering of the respective share class of the Fund, not the inception of the Index.
4
Morgan Stanley Variable Insurance Fund, Inc.
Annual Report – December 31, 2021
Consolidated Portfolio of Investments
Discovery Portfolio
| | | Shares | | Value
(000) | |
Common Stocks (91.1%) | |
Biotechnology (1.1%) | |
Alnylam Pharmaceuticals, Inc. (a) | | | 8,296 | | | $ | 1,407 | | |
Ginkgo Bioworks Holdings, Inc. (a)(b) | | | 82,077 | | | | 682 | | |
Intellia Therapeutics, Inc. (a) | | | 13,526 | | | | 1,599 | | |
| | | | 3,688 | | |
Consumer Finance (1.0%) | |
Upstart Holdings, Inc. (a) | | | 21,390 | | | | 3,236 | | |
Entertainment (5.4%) | |
ROBLOX Corp., Class A (a) | | | 170,125 | | | | 17,550 | | |
Equity Real Estate Investment Trusts (REITs) (0.6%) | |
WeWork, Inc., Class A REIT (a) | | | 216,035 | | | | 1,858 | | |
Health Care Providers & Services (2.8%) | |
Agilon Health, Inc. (a) | | | 215,297 | | | | 5,813 | | |
Guardant Health, Inc. (a) | | | 31,502 | | | | 3,151 | | |
| | | | 8,964 | | |
Health Care Technology (7.3%) | |
Doximity, Inc., Class A (a) | | | 142,648 | | | | 7,151 | | |
GoodRx Holdings, Inc., Class A (a) | | | 231,307 | | | | 7,559 | | |
Teladoc Health, Inc. (a) | | | 8,627 | | | | 792 | | |
Veeva Systems, Inc., Class A (a) | | | 31,947 | | | | 8,162 | | |
| | | | 23,664 | | |
Information Technology Services (26.4%) | |
Affirm Holdings, Inc. (a) | | | 165,858 | | | | 16,679 | | |
Cloudflare, Inc., Class A (a) | | | 160,719 | | | | 21,135 | | |
Fastly, Inc., Class A (a) | | | 238,374 | | | | 8,450 | | |
Marqeta, Inc., Class A (a) | | | 148,098 | | | | 2,543 | | |
MongoDB, Inc. (a) | | | 39,335 | | | | 20,822 | | |
Okta, Inc. (a) | | | 69,743 | | | | 15,634 | | |
| | | | 85,263 | | |
Interactive Media & Services (7.8%) | |
Pinterest, Inc., Class A (a) | | | 220,927 | | | | 8,031 | | |
Twitter, Inc. (a) | | | 266,151 | | | | 11,503 | | |
ZoomInfo Technologies, Inc., Class A (a) | | | 86,378 | | | | 5,545 | | |
| | | | 25,079 | | |
Internet & Direct Marketing Retail (5.4%) | |
Chewy, Inc., Class A (a) | | | 32,349 | | | | 1,907 | | |
Farfetch Ltd., Class A (a) | | | 131,945 | | | | 4,411 | | |
Grab Holdings Ltd., Class A (a) | | | 328,484 | | | | 2,342 | | |
Wayfair, Inc., Class A (a) | | | 46,975 | | | | 8,924 | | |
| | | | 17,584 | | |
Leisure Products (2.2%) | |
Peloton Interactive, Inc., Class A (a) | | | 199,378 | | | | 7,130 | | |
Life Sciences Tools & Services (1.1%) | |
10X Genomics, Inc., Class A (a) | | | 22,824 | | | | 3,400 | | |
Pharmaceuticals (3.0%) | |
Royalty Pharma PLC, Class A (United Kingdom) | | | 239,415 | | | | 9,541 | | |
| | | Shares | | Value
(000) | |
Real Estate Management & Development (1.9%) | |
Opendoor Technologies, Inc. (a) | | | 190,420 | | | $ | 2,782 | | |
Redfin Corp. (a) | | | 86,482 | | | | 3,320 | | |
| | | | 6,102 | | |
Software (21.9%) | |
Aurora Innovation, Inc. (a)(c) | | | 129,934 | | | | 1,383 | | |
Bill.Com Holdings, Inc. (a) | | | 48,889 | | | | 12,181 | | |
Cipher Mining, Inc. (a) | | | 202,446 | | | | 937 | | |
Confluent, Inc., Class A (a) | | | 75,782 | | | | 5,778 | | |
Gitlab, Inc., Class A (a) | | | 21,514 | | | | 1,872 | | |
HashiCorp, Inc., Class A (a) | | | 26,967 | | | | 2,455 | | |
HubSpot, Inc. (a) | | | 4,707 | | | | 3,103 | | |
IronSource Ltd., Class A (Israel) (a)(c) | | | 378,379 | | | | 2,665 | | |
IronSource Ltd., Class A (Israel) (a) | | | 99,041 | | | | 766 | | |
MicroStrategy, Inc., Class A (a) | | | 2,554 | | | | 1,391 | | |
Monday.com Ltd. (Israel) (a) | | | 15,798 | | | | 4,877 | | |
Procore Technologies, Inc. (a) | | | 41,992 | | | | 3,358 | | |
Qualtrics International, Inc., Class A (a) | | | 66,227 | | | | 2,344 | | |
Samsara, Inc., Class A (a) | | | 91,743 | | | | 2,579 | | |
Trade Desk, Inc. (The), Class A (a) | | | 126,877 | | | | 11,627 | | |
UiPath, Inc., Class A (a) | | | 32,406 | | | | 1,398 | | |
Unity Software, Inc. (a) | | | 85,631 | | | | 12,244 | | |
| | | | 70,958 | | |
Specialty Retail (3.2%) | |
Carvana Co. (a) | | | 44,127 | | | | 10,228 | | |
Total Common Stocks (Cost $284,836) | | | 294,245 | | |
Preferred Stocks (0.9%) | |
Internet & Direct Marketing Retail (0.1%) | |
Overstock.com, Inc. Series A-1 | | | 3,472 | | | | 163 | | |
Software (0.8%) | |
Databricks, Inc. (a)(c)(d) (acquisition
cost — $2,666; acquired 8/31/21) | | | 12,093 | | | | 2,729 | | |
Total Preferred Stocks (Cost $2,688) | | | 2,892 | | |
Investment Company (0.9%) | |
| Grayscale Bitcoin Trust (a) (Cost $3,807) | | | 85,120 | | | | 2,915 | | |
| | | No. of
Warrants | | | |
Warrant (0.0%) (e) | |
Biotechnology (0.0%) (e) | |
Ginkgo Bioworks Holdings, Inc.
expires 12/31/27 (a) (Cost $55) | | | 16,415 | | | | 37 | | |
| | | Shares | | | |
Short-Term Investments (7.6%) | |
Securities held as Collateral on Loaned Securities (0.2%) | |
Investment Company (0.2%) | |
Morgan Stanley Institutional Liquidity Funds —
Treasury Securities Portfolio — Institutional
Class (See Note H) | | | 637,218 | | | | 637 | | |
The accompanying notes are an integral part of the consolidated financial statements.
5
Morgan Stanley Variable Insurance Fund, Inc.
Annual Report – December 31, 2021
Consolidated Portfolio of Investments (cont'd)
Discovery Portfolio
| | | Face Amount
(000) | | Value
(000) | |
Repurchase Agreements (0.0%) (e) | |
HSBC Securities USA, Inc., (0.05%, dated
12/31/21, due 1/3/22; proceeds $6;
fully collateralized by U.S. Government
obligations; 0.00% due
5/15/25 - 11/15/28; valued at $6) | | $ | 6 | | | $ | 6 | | |
Merrill Lynch & Co., Inc., (0.05%, dated
12/31/21, due 1/3/22; proceeds $115;
fully collateralized by U.S. Government
obligations; 0.13% - 2.88% due
7/31/23 - 7/31/25; valued at $117) | | | 115 | | | | 115 | | |
| | | | 121 | | |
Total Securities held as Collateral on
Loaned Securities (Cost $758) | | | 758 | | |
| | | Shares | | | |
Investment Company (7.4%) | |
Morgan Stanley Institutional Liquidity
Funds — Treasury Securities Portfolio —
Institutional Class (See Note H)
(Cost $23,946) | | | 23,946,333 | | | | 23,946 | | |
Total Short-Term Investments
(Cost $24,704) | | | 24,704 | | |
Total Investments Excluding Purchased
Options (100.5%) (Cost $316,090) | | | | | 324,793 | | |
Total Purchased Options Outstanding (0.1%)
(Cost $1,967) | | | 445 | | |
Total Investments (100.6%)
(Cost $318,057) Including $682 of
Securities Loaned (f)(g) | | | 325,238 | | |
Liabilities in Excess of Other Assets (–0.6%) | | | (1,921 | ) | |
Net Assets (100.0%) | | $ | 323,317 | | |
(a) Non-income producing security.
(b) All or a portion of this security was on loan at December 31, 2021.
(c) Security cannot be offered for public resale without first being registered under the Securities Act of 1933 and related rules ("restricted security"). Acquisition date represents the day on which an enforceable right to acquire such security is obtained and is presented along with related cost in the security description. The Fund has registration rights for certain restricted securities. Any costs related to such registration are borne by the issuer. The aggregate value of restricted securities (excluding 144A holdings) at December 31, 2021 amounts to approximately $6,777,000 and represents 2.1% of net assets.
(d) At December 31, 2021, the Fund held a fair valued security valued at approximately $2,729,000, representing 0.8% of net assets. This security has been fair valued as determined in good faith under procedures established by and under the general supervision of the Company's (as defined herein) Directors.
(e) Amount is less than 0.05%.
(f) Securities are available for collateral in connection with purchased options.
(g) At December 31, 2021, the aggregate cost for federal income tax purposes is approximately $321,014,000. The aggregate gross unrealized appreciation is approximately $62,094,000 and the aggregate gross unrealized depreciation is approximately $57,877,000, resulting in net unrealized appreciation of approximately $4,217,000.
REIT Real Estate Investment Trust.
The accompanying notes are an integral part of the consolidated financial statements.
6
Morgan Stanley Variable Insurance Fund, Inc.
Annual Report – December 31, 2021
Consolidated Portfolio of Investments (cont'd)
Discovery Portfolio
Call Options Purchased:
The Fund had the following call options purchased open at December 31, 2021:
Counterparty | | Description | | Strike
Price | | Expiration
Date | | Number of
Contracts | | Notional
Amount
(000) | | Value
(000) | | Premiums
Paid
(000) | | Unrealized
Depreciation
(000) | |
BNP Paribas | | USD/CNH | | CNH | 7.45 | | | Jan-22 | | | 75,453,606 | | | | 75,454 | | | $ | — | @ | | $ | 403 | | | $ | (403 | ) | |
Goldman Sachs International | | USD/CNH | | CNH | 7.27 | | | Nov-22 | | | 85,198,084 | | | | 85,198 | | | | 257 | | | | 409 | | | | (152 | ) | |
Goldman Sachs International | | USD/CNH | | CNH | 7.57 | | | Mar-22 | | | 75,023,260 | | | | 75,023 | | | | 4 | | | | 373 | | | | (369 | ) | |
JP Morgan Chase Bank NA | | USD/CNH | | CNH | 7.28 | | | Jul-22 | | | 85,091,612 | | | | 85,092 | | | | 106 | | | | 396 | | | | (290 | ) | |
JP Morgan Chase Bank NA | | USD/CNH | | CNH | 7.31 | | | Aug-22 | | | 37,813,460 | | | | 37,813 | | | | 51 | | | | 257 | | | | (206 | ) | |
JP Morgan Chase Bank NA | | USD/CNH | | CNH | 7.38 | | | Jul-22 | | | 24,370,551 | | | | 24,371 | | | | 27 | | | | 129 | | | | (102 | ) | |
| | | | | | | | | | | | | $ | 445 | | | $ | 1,967 | | | $ | (1,522 | ) | |
@ Value is less than $500.
CNH — Chinese Yuan Renminbi Offshore
USD — United States Dollar
Portfolio Composition*
Classification | | Percentage of
Total Investments | |
Information Technology Services | | | 26.3 | % | |
Software | | | 22.8 | | |
Other** | | | 17.6 | | |
Interactive Media & Services | | | 7.7 | | |
Short-Term Investments | | | 7.4 | | |
Health Care Technology | | | 7.3 | | |
Internet & Direct Marketing Retail | | | 5.5 | | |
Entertainment | | | 5.4 | | |
Total Investments | | | 100.0 | % | |
* Percentages indicated are based upon total investments (excluding Securities held as Collateral on Loaned Securities) as of December 31, 2021.
** Industries and/or investment types representing less than 5% of total investments.
The accompanying notes are an integral part of the consolidated financial statements.
7
Morgan Stanley Variable Insurance Fund, Inc.
Annual Report – December 31, 2021
Consolidated Statement of Assets and Liabilities | | December 31, 2021
(000) | |
Assets: | |
Investments in Securities of Unaffiliated Issuers, at Value(1) (Cost $293,474) | | $ | 300,655 | | |
Investment in Security of Affiliated Issuer, at Value (Cost $24,583) | | | 24,583 | | |
Total Investments in Securities, at Value (Cost $318,057) | | | 325,238 | | |
Foreign Currency, at Value (Cost $1) | | | 1 | | |
Cash from Securities Lending | | | 1 | | |
Receivable for Fund Shares Sold | | | 314 | | |
Receivable for Investments Sold | | | 27 | | |
Receivable from Securities Lending Income | | | 5 | | |
Receivable from Affiliate | | | — | @ | |
Other Assets | | | 16 | | |
Total Assets | | | 325,602 | | |
Liabilities: | |
Collateral on Securities Loaned, at Value | | | 759 | | |
Due to Broker | | | 580 | | |
Payable for Advisory Fees | | | 543 | | |
Payable for Servicing Fees | | | 145 | | |
Payable for Investments Purchased | | | 60 | | |
Payable for Professional Fees | | | 60 | | |
Payable for Fund Shares Redeemed | | | 28 | | |
Payable for Custodian Fees | | | 26 | | |
Payable for Distribution Fees — Class II Shares | | | 23 | | |
Payable for Administration Fees | | | 23 | | |
Payable for Organization Costs for Subsidiary | | | 2 | | |
Payable for Transfer Agency Fees | | | 2 | | |
Other Liabilities | | | 34 | | |
Total Liabilities | | | 2,285 | | |
NET ASSETS | | $ | 323,317 | | |
Net Assets Consist of: | |
Paid-in-Capital | | $ | 235,980 | | |
Total Distributable Earnings | | | 87,337 | | |
Net Assets | | $ | 323,317 | | |
CLASS I: | |
Net Assets | | $ | 56,135 | | |
Net Asset Value, Offering and Redemption Price Per Share Applicable to 3,295,033 Outstanding
$0.001 Par Value Shares (Authorized 500,000,000 Shares) | | $ | 17.04 | | |
CLASS II: | |
Net Assets | | $ | 267,182 | | |
Net Asset Value, Offering and Redemption Price Per Share Applicable to 16,653,038 Outstanding
$0.001 Par Value Shares (Authorized 500,000,000 Shares) | | $ | 16.04 | | |
(1) Including: | |
Securities on Loan, at Value: | | $ | 682 | | |
@ Amount is less than $500.
The accompanying notes are an integral part of the financial statements.
8
Morgan Stanley Variable Insurance Fund, Inc.
Annual Report – December 31, 2021
Consolidated Statement of Operations | | Year Ended
December 31, 2021
(000) | |
Investment Income: | |
Income from Securities Loaned — Net | | $ | 423 | | |
Dividends from Securities of Unaffiliated Issuers | | | 244 | | |
Dividends from Security of Affiliated Issuer (Note H) | | | 2 | | |
Total Investment Income | | | 669 | | |
Expenses: | |
Advisory Fees (Note B) | | | 2,944 | | |
Distribution Fees — Class II Shares (Note E) | | | 817 | | |
Servicing Fees (Note D) | | | 604 | | |
Administration Fees (Note C) | | | 314 | | |
Professional Fees | | | 169 | | |
Shareholder Reporting Fees | | | 51 | | |
Custodian Fees (Note G) | | | 38 | | |
Transfer Agency Fees (Note F) | | | 10 | | |
Directors' Fees and Expenses | | | 9 | | |
Pricing Fees | | | 5 | | |
Organization Costs for Subsidiary | | | 3 | | |
Interest Expenses | | | 1 | | |
Other Expenses | | | 23 | | |
Total Expenses | | | 4,988 | | |
Waiver of Distribution Fees — Class II Shares (Note E) | | | (490 | ) | |
Waiver of Advisory Fees (Note B) | | | (441 | ) | |
Rebate from Morgan Stanley Affiliate (Note H) | | | (9 | ) | |
Net Expenses | | | 4,048 | | |
Net Investment Loss | | | (3,379 | ) | |
Realized Gain (Loss): | |
Investments Sold | | | 87,821 | | |
Foreign Currency Translation | | | (5 | ) | |
Net Realized Gain | | | 87,816 | | |
Change in Unrealized Appreciation (Depreciation): | |
Investments | | | (124,504 | ) | |
Foreign Currency Translation | | | (— | @) | |
Net Change in Unrealized Appreciation (Depreciation) | | | (124,504 | ) | |
Net Realized Gain and Change in Unrealized Appreciation (Depreciation) | | | (36,688 | ) | |
Net Decrease in Net Assets Resulting from Operations | | $ | (40,067 | ) | |
@ Amount is less than $500.
The accompanying notes are an integral part of the financial statements.
9
Morgan Stanley Variable Insurance Fund, Inc.
Annual Report – December 31, 2021
Consolidated Statements of
Changes in Net Assets | | Year Ended
December 31, 2021
(000) | | Year Ended
December 31, 2020*
(000) | |
Increase (Decrease) in Net Assets: | |
Operations: | |
Net Investment Loss | | $ | (3,379 | ) | | $ | (2,395 | ) | |
Net Realized Gain | | | 87,816 | | | | 147,230 | | |
Net Change in Unrealized Appreciation (Depreciation) | | | (124,504 | ) | | | 100,669 | | |
Net Increase (Decrease) in Net Assets Resulting from Operations | | | (40,067 | ) | | | 245,504 | | |
Dividends and Distributions to Shareholders: | |
Class I | | | (23,695 | ) | | | (5,068 | ) | |
Class II | | | (124,612 | ) | | | (24,283 | ) | |
Total Dividends and Distributions to Shareholders | | | (148,307 | ) | | | (29,351 | ) | |
Capital Share Transactions:(1) | |
Class I: | |
Subscribed | | | 19,984 | | | | 15,457 | | |
Distributions Reinvested | | | 23,695 | | | | 5,068 | | |
Redeemed | | | (25,575 | ) | | | (20,658 | ) | |
Class II: | |
Subscribed | | | 32,347 | | | | 44,075 | | |
Distributions Reinvested | | | 124,612 | | | | 24,283 | | |
Redeemed | | | (64,212 | ) | | | (47,501 | ) | |
Net Increase in Net Assets Resulting from Capital Share Transactions | | | 110,851 | | | | 20,724 | | |
Total Increase (Decrease) in Net Assets | | | (77,523 | ) | | | 236,877 | | |
Net Assets: | |
Beginning of Period | | | 400,840 | | | | 163,963 | | |
End of Period | | $ | 323,317 | | | $ | 400,840 | | |
(1) Capital Share Transactions: | |
Class I: | |
Shares Subscribed | | | 837 | | | | 783 | | |
Shares Issued on Distributions Reinvested | | | 1,162 | | | | 253 | | |
Shares Redeemed | | | (1,019 | ) | | | (1,076 | ) | |
Net Increase (Decrease) in Class I Shares Outstanding | | | 980 | | | | (40 | ) | |
Class II: | |
Shares Subscribed | | | 1,279 | | | | 2,362 | | |
Shares Issued on Distributions Reinvested | | | 6,487 | | | | 1,256 | | |
Shares Redeemed | | | (2,819 | ) | | | (2,462 | ) | |
Net Increase in Class II Shares Outstanding | | | 4,947 | | | | 1,156 | | |
* Not consolidated.
The accompanying notes are an integral part of the financial statements.
10
Morgan Stanley Variable Insurance Fund, Inc.
Annual Report – December 31, 2021
Consolidated Financial Highlights
Discovery Portfolio
| | | Class I | |
| | | Year Ended December 31, | |
Selected Per Share Data and Ratios | | 2021 | | 2020(1) | | 2019(1) | | 2018(1) | | 2017(1) | |
Net Asset Value, Beginning of Period | | $ | 29.50 | | | $ | 13.05 | | | $ | 10.71 | | | $ | 12.10 | | | $ | 8.72 | | |
Income (Loss) from Investment Operations: | |
Net Investment Loss(2) | | | (0.19 | ) | | | (0.17 | ) | | | (0.07 | ) | | | (0.08 | ) | | | (0.05 | ) | |
Net Realized and Unrealized Gain (Loss) | | | (1.27 | ) | | | 18.96 | | | | 4.45 | | | | 1.69 | | | | 3.43 | | |
Total from Investment Operations | | | (1.46 | ) | | | 18.79 | | | | 4.38 | | | | 1.61 | | | | 3.38 | | |
Distributions from and/or in Excess of: | |
Net Realized Gain | | | (11.00 | ) | | | (2.34 | ) | | | (2.04 | ) | | | (3.00 | ) | | | — | | |
Net Asset Value, End of Period | | $ | 17.04 | | | $ | 29.50 | | | $ | 13.05 | | | $ | 10.71 | | | $ | 12.10 | | |
Total Return(3) | | | (11.06 | )% | | | 152.30 | % | | | 40.11 | % | | | 10.65 | % | | | 38.76 | % | |
Ratios to Average Net Assets and Supplemental Data: | |
Net Assets, End of Period (Thousands) | | $ | 56,135 | | | $ | 68,299 | | | $ | 30,739 | | | $ | 27,630 | | | $ | 28,747 | | |
Ratio of Expenses Before Expense Limitation | | | 1.06 | % | | | 1.08 | % | | | 1.11 | % | | | 1.15 | % | | | 1.17 | % | |
Ratio of Expenses After Expense Limitation | | | 0.95 | %(4) | | | 0.95 | %(4) | | | 0.94 | %(4) | | | 0.94 | %(4) | | | 0.99 | %(4)(5) | |
Ratio of Expenses After Expense Limitation Excluding Interest Expenses | | | 0.95 | %(4) | | | N/A | | | | N/A | | | | N/A | | | | N/A | | |
Ratio of Net Investment Loss | | | (0.78 | )%(4) | | | (0.86 | )%(4) | | | (0.49 | )%(4) | | | (0.59 | )%(4) | | | (0.45 | )%(4) | |
Ratio of Rebate from Morgan Stanley Affiliates | | | 0.00 | %(6) | | | 0.00 | %(6) | | | 0.01 | % | | | 0.01 | % | | | 0.00 | %(6) | |
Portfolio Turnover Rate | | | 95 | % | | | 112 | % | | | 101 | % | | | 89 | % | | | 64 | % | |
(1) Not consolidated.
(2) Per share amount is based on average shares outstanding.
(3) Calculated based on the net asset value as of the last business day of the period. Performance does not reflect fees and expenses imposed by your insurance company's separate account. If performance information included the effect of these additional charges, the total return would be lower.
(4) The Ratio of Expenses After Expense Limitation and Ratio of Net Investment Loss reflect the rebate of certain Fund expenses in connection with the investments in Morgan Stanley affiliates during the period. The effect of the rebate on the ratios is disclosed in the above table as "Ratio of Rebate from Morgan Stanley Affiliates."
(5) Effective July 1, 2017, the Adviser has agreed to limit the ratio of expenses to average net assets to the maximum ratio of 0.95% for Class I shares. Prior to July 1, 2017, the maximum ratio was 1.05% for Class I shares.
(6) Amount is less than 0.005%.
The accompanying notes are an integral part of the consolidated financial statements.
11
Morgan Stanley Variable Insurance Fund, Inc.
Annual Report – December 31, 2021
Consolidated Financial Highlights
Discovery Portfolio
| | | Class II | |
| | | Year Ended December 31, | |
Selected Per Share Data and Ratios | | 2021 | | 2020(1) | | 2019(1) | | 2018(1) | | 2017(1) | |
Net Asset Value, Beginning of Period | | $ | 28.41 | | | $ | 12.63 | | | $ | 10.42 | | | $ | 11.85 | | | $ | 8.55 | | |
Income (Loss) from Investment Operations: | |
Net Investment Loss(2) | | | (0.20 | ) | | | (0.18 | ) | | | (0.08 | ) | | | (0.09 | ) | | | (0.06 | ) | |
Net Realized and Unrealized Gain (Loss) | | | (1.17 | ) | | | 18.30 | | | | 4.33 | | | | 1.66 | | | | 3.36 | | |
Total from Investment Operations | | | (1.37 | ) | | | 18.12 | | | | 4.25 | | | | 1.57 | | | | 3.30 | | |
Distributions from and/or in Excess of: | |
Net Realized Gain | | | (11.00 | ) | | | (2.34 | ) | | | (2.04 | ) | | | (3.00 | ) | | | — | | |
Net Asset Value, End of Period | | $ | 16.04 | | | $ | 28.41 | | | $ | 12.63 | | | $ | 10.42 | | | $ | 11.85 | | |
Total Return(3) | | | (11.19 | )% | | | 152.04 | % | | | 39.97 | % | | | 10.53 | % | | | 38.60 | % | |
Ratios to Average Net Assets and Supplemental Data: | |
Net Assets, End of Period (Thousands) | | $ | 267,182 | | | $ | 332,541 | | | $ | 133,224 | | | $ | 100,030 | | | $ | 89,140 | | |
Ratio of Expenses Before Expense Limitation | | | 1.31 | % | | | 1.33 | % | | | 1.36 | % | | | 1.40 | % | | | 1.42 | % | |
Ratio of Expenses After Expense Limitation | | | 1.05 | %(4) | | | 1.05 | %(4) | | | 1.04 | %(4) | | | 1.04 | %(4) | | | 1.09 | %(4)(5) | |
Ratio of Expenses After Expense Limitation Excluding Interest Expenses | | | 1.05 | %(4) | | | N/A | | | | N/A | | | | N/A | | | | N/A | | |
Ratio of Net Investment Loss | | | (0.88 | )%(4) | | | (0.96 | )%(4) | | | (0.59 | )%(4) | | | (0.69 | )%(4) | | | (0.55 | )%(4) | |
Ratio of Rebate from Morgan Stanley Affiliates | | | 0.00 | %(6) | | | 0.00 | %(6) | | | 0.01 | % | | | 0.01 | % | | | 0.00 | %(6) | |
Portfolio Turnover Rate | | | 95 | % | | | 112 | % | | | 101 | % | | | 89 | % | | | 64 | % | |
(1) Not consolidated.
(2) Per share amount is based on average shares outstanding.
(3) Calculated based on the net asset value as of the last business day of the period. Performance does not reflect fees and expenses imposed by your insurance company's separate account. If performance information included the effect of these additional charges, the total return would be lower.
(4) The Ratio of Expenses After Expense Limitation and Ratio of Net Investment Loss reflect the rebate of certain Fund expenses in connection with the investments in Morgan Stanley affiliates during the period. The effect of the rebate on the ratios is disclosed in the above table as "Ratio of Rebate from Morgan Stanley Affiliates."
(5) Effective July 1, 2017, the Adviser has agreed to limit the ratio of expenses to average net assets to the maximum ratio of 1.05% for Class II shares. Prior to July 1, 2017, the maximum ratio was 1.15% for Class II shares.
(6) Amount is less than 0.005%.
The accompanying notes are an integral part of the consolidated financial statements.
12
Morgan Stanley Variable Insurance Fund, Inc.
Annual Report – December 31, 2021
Notes to Consolidated Financial Statements
Morgan Stanley Variable Insurance Fund, Inc. (the "Company") is registered under the Investment Company Act of 1940, as amended (the "Act"), as an open-end management investment company. The Company is comprised of ten separate active, diversified and non-diversified funds (individually referred to as a "Fund," collectively as the "Funds"). The Company applies investment company accounting and reporting guidance.
The accompanying consolidated financial statements relate to the Discovery Portfolio. The Fund seeks long-term capital growth by investing primarily in common stocks and other equity securities. The Fund offers two classes of shares — Class I and Class II. Both classes of shares have identical voting rights (except that shareholders of a Class have exclusive voting rights regarding any matter relating solely to that Class of shares), dividend, liquidation and other rights. Effective April 5, 2021, the Fund suspended offering of Class I and Class II shares to new investors.
The Company is intended to be a funding vehicle for variable annuity contracts and variable life insurance policies offered by the separate accounts of certain life insurance companies.
A. Significant Accounting Policies: The following significant accounting policies are in conformity with U.S. generally accepted accounting principles ("GAAP"). Such policies are consistently followed by the Company in the preparation of its consolidated financial statements. GAAP may require management to make estimates and assumptions that affect the reported amounts and disclosures in the consolidated financial statements. Actual results may differ from those estimates.
The Fund may, consistent with its principal investment strategies, invest up to 25% of its total assets in a wholly-owned subsidiary of the Fund organized as a company under the laws of the Cayman Islands, VIF Discovery Cayman Portfolio, Ltd. (the "Subsidiary"). The Subsidiary may invest in bitcoin indirectly through cash settled futures or indirectly through investments in Grayscale Bitcoin Trust (BTC) ("GBTC"), a privately offered investment vehicle that invests in bitcoin. The Fund is the sole shareholder of the Subsidiary, and it is not currently expected that shares of the Subsidiary will be sold or offered to other investors. The consolidated portfolio of investments and consolidated financial statements include the positions and accounts of the Fund and the Subsidiary. All intercompany accounts and transactions of the Fund and the Subsidiary have been eliminated in consolidation and all accounting policies of the Subsidiary are consistent with those of the Fund. As of December 31, 2021, the Subsidiary represented approximately $3,094,000 or approximately 0.96% of the total net assets of the Fund.
Investments in the Subsidiary are expected to provide the Fund with exposure to bitcoin within the limitations of Subchapter M of the Code and recent Internal Revenue Service ("IRS") revenue rulings, which require that a mutual fund receive no more than ten percent of its gross income from such investments in order to receive favorable tax treatment as a regulated investment company ("RIC"). Tax treatment of the income received from the Subsidiary may potentially be affected by changes in legislation, regulations or other legally binding authority, which could affect the character, timing and amount of the Fund's taxable income and distributions. If such changes occur, the Fund may need to significantly change its investment strategy and recognize unrealized gains in order to remain qualified for taxation as a RIC, which could adversely affect the Fund.
1. Security Valuation: (1) An equity portfolio security listed or traded on an exchange is valued at its latest reported sales price (or at the exchange official closing price if such exchange reports an official closing price), and if there were no sales on a given day and if there is no official exchange closing price for that day, the security is valued at the mean between the last reported bid and asked prices if such bid and asked prices are available on the relevant exchanges. If only bid prices are available then the latest bid price may be used. Listed equity securities not traded on the valuation date with no reported bid and asked prices available on the exchange are valued at the mean between the current bid and asked prices obtained from one or more reputable brokers or dealers. In cases where a security is traded on more than one exchange, the security is valued on the exchange designated as the primary market; (2) all other equity portfolio securities for which over-the-counter ("OTC") market quotations are readily available are valued at the latest reported sales price (or at the market official closing price if such market reports an official closing price), and if there was no trading in the security on a given day and if there is no official closing price from relevant markets for that day, the security is valued at the mean between the last reported bid and asked prices if such bid and asked prices are available on the relevant markets. An unlisted equity security that does not trade on the valuation date and for which bid and asked prices from the relevant markets are unavailable is valued at the mean between the current bid and asked prices obtained from one or more reputable brokers or dealers; (3) listed options are valued at the last reported sales price on the exchange on which they are listed (or at the exchange official closing price if such exchange reports an official closing price). If an official closing price or last reported sales price is unavailable, the
13
Morgan Stanley Variable Insurance Fund, Inc.
Annual Report – December 31, 2021
Notes to Consolidated Financial Statements (cont'd)
listed option should be fair valued at the mean between its latest bid and ask prices. Unlisted options are valued at the mean between their latest bid and ask prices from a broker/dealer or valued by a pricing service/vendor; (4) certain portfolio securities may be valued by an outside pricing service/vendor approved by the Company's Board of Directors (the "Directors"). The pricing service/vendor may employ a pricing model that takes into account, among other things, bids, yield spreads and/or other market data and specific security characteristics. Alternatively, if a valuation is not available from an outside pricing service/vendor, and the security trades on an exchange, the security may be valued at its latest reported sale price (or at the exchange official closing price if such exchange reports an official closing price), prior to the time when assets are valued. If there are no sales on a given day and if there is no official exchange closing price for that day, the security is valued at the mean between the last reported bid and asked prices if such bid and asked prices are available in the relevant exchanges. If only bid prices are available then the latest bid price may be used. If Morgan Stanley Investment Management Inc. (the "Adviser"), a wholly-owned subsidiary of Morgan Stanley, determines that the price provided by the outside pricing service/vendor or exchange does not reflect the security's fair value or is unable to provide a price, prices from brokers or dealers may also be utilized. In these circumstances, the value of the security will be the mean of bid and asked prices obtained from brokers or dealers; (5) when market quotations are not readily available, including circumstances under which the Adviser determines that the closing price, last sale price or the mean between the last reported bid and asked prices are not reflective of a security's market value, portfolio securities are valued at their fair value as determined in good faith under procedures established by and under the general supervision of the Directors. Occasionally, developments affecting the closing prices of securities and other assets may occur between the times at which valuations of such securities are determined (that is, close of the foreign market on which the securities trade) and the close of business of the New York Stock Exchange ("NYSE"). If developments occur during such periods that are expected to materially affect the value of such securities, such valuations may be adjusted to reflect the estimated fair value of such securities as of the close of the NYSE, as determined in good faith by the Directors or by the Adviser using a pricing service and/or procedures approved by the Directors; (6) Private Investment in Public Equity ("PIPE") investments may be valued based on the
underlying stock price less a discount until the commitment is fulfilled and shares are registered; and (7) investments in mutual funds, including the Morgan Stanley Institutional Liquidity Funds, are valued at the net asset value ("NAV") as of the close of each business day.
The Directors have responsibility for determining in good faith the fair value of the investments, and the Directors may appoint others, such as the Company's Adviser or a valuation committee, to assist the Directors in determining fair value and to make the actual calculations pursuant to the fair valuation methodologies previously approved by the Directors. Under procedures approved by the Directors, the Company's Adviser has formed a Valuation Committee whose members are approved by the Directors. The Valuation Committee provides administration and oversight of the Company's valuation policies and procedures, which are reviewed at least annually by the Directors. These procedures allow the Company to utilize independent pricing services, quotations from securities and financial instrument dealers and other market sources to determine fair value.
2. Fair Value Measurement: Financial Accounting Standards Board ("FASB") Accounting Standards CodificationTM ("ASC") 820, "Fair Value Measurement" ("ASC 820"), defines fair value as the value that the Fund would receive to sell an investment or pay to transfer a liability in a timely transaction with an independent buyer in the principal market, or in the absence of a principal market, the most advantageous market for the investment or liability. ASC 820 establishes a three-tier hierarchy to distinguish between (1) inputs that reflect the assumptions market participants would use in valuing an asset or liability developed based on market data obtained from sources independent of the reporting entity (observable inputs) and (2) inputs that reflect the reporting entity's own assumptions about the assumptions market participants would use in valuing an asset or liability developed based on the best information available in the circumstances (unobservable inputs) and to establish classification of fair value measurements for disclosure purposes. Various inputs are used in determining the value of the Fund's investments. The inputs are summarized in the three broad levels listed below:
• Level 1 – unadjusted quoted prices in active markets for identical investments
• Level 2 – other significant observable inputs (including quoted prices for similar investments, interest rates, prepayment speeds, credit risk, etc.)
14
Morgan Stanley Variable Insurance Fund, Inc.
Annual Report – December 31, 2021
Notes to Consolidated Financial Statements (cont'd)
• Level 3 – significant unobservable inputs including the Fund's own assumptions in determining the fair value of investments. Factors considered in making this determination may include, but are not limited to, information obtained by contacting the issuer, analysts, or the appropriate stock exchange (for exchange-traded securities), analysis of the issuer's financial statements or other available documents and, if necessary, available information concerning other securities in similar circumstances.
The inputs or methodology used for valuing securities are not necessarily an indication of the risk associated with investing in those securities and the determination of the significance of a particular input to the fair value measurement in its entirety requires judgment and considers factors specific to each security.
The following is a summary of the inputs used to value the Fund's investments as of December 31, 2021:
| Investment Type | | Level 1
Unadjusted
quoted
prices
(000) | | Level 2
Other
significant
observable
inputs
(000) | | Level 3
Significant
unobservable
inputs
(000) | | Total
(000) | |
Assets: | |
Common Stocks | |
Biotechnology | | $ | 3,688 | | | $ | — | | | $ | — | | | $ | 3,688 | | |
Consumer Finance | | | 3,236 | | | | — | | | | — | | | | 3,236 | | |
Entertainment | | | 17,550 | | | | — | | | | — | | | | 17,550 | | |
Equity Real Estate
Investment Trusts
(REITs) | | | 1,858 | | | | — | | | | — | | | | 1,858 | | |
Health Care Providers &
Services | | | 8,964 | | | | — | | | | — | | | | 8,964 | | |
Health Care Technology | | | 23,664 | | | | — | | | | — | | | | 23,664 | | |
Information Technology
Services | | | 85,263 | | | | — | | | | — | | | | 85,263 | | |
Interactive Media &
Services | | | 25,079 | | | | — | | | | — | | | | 25,079 | | |
Internet & Direct
Marketing Retail | | | 17,584 | | | | — | | | | — | | | | 17,584 | | |
Leisure Products | | | 7,130 | | | | — | | | | — | | | | 7,130 | | |
Life Sciences Tools &
Services | | | 3,400 | | | | — | | | | — | | | | 3,400 | | |
Pharmaceuticals | | | 9,541 | | | | — | | | | — | | | | 9,541 | | |
Real Estate
Management &
Development | | | 6,102 | | | | — | | | | — | | | | 6,102 | | |
Software | | | 66,910 | | | | 4,048 | | | | — | | | | 70,958 | | |
Specialty Retail | | | 10,228 | | | | — | | | | — | | | | 10,228 | | |
Total Common Stocks | | | 290,197 | | | | 4,048 | | | | — | | | | 294,245 | | |
Investment Type | | Level 1
Unadjusted
quoted
prices
(000) | | Level 2
Other
significant
observable
inputs
(000) | | Level 3
Significant
unobservable
inputs
(000) | | Total
(000) | |
Preferred Stocks | |
Internet & Direct
Marketing Retail | | $ | 163 | | | $ | — | | | $ | — | | | $ | 163 | | |
Software | | | — | | | | — | | | | 2,729 | | | | 2,729 | | |
Total Preferred Stocks | | | 163 | | | | — | | | | 2,729 | | | | 2,892 | | |
Investment Company | | | 2,915 | | | | — | | | | — | | | | 2,915 | | |
Warrant | | | 37 | | | | — | | | | — | | | | 37 | | |
Call Options Purchased | | | — | | | | 445 | | | | — | | | | 445 | | |
Short-Term Investments | |
Investment Company | | | 24,583 | | | | — | | | | — | | | | 24,583 | | |
Repurchase Agreements | | | — | | | | 121 | | | | — | | | | 121 | | |
Total Short-Term
Investments | | | 24,583 | | | | 121 | | | | — | | | | 24,704 | | |
Total Assets | | $ | 317,895 | | | $ | 4,614 | | | $ | 2,729 | | | $ | 325,238 | | |
Transfers between investment levels may occur as the markets fluctuate and/or the availability of data used in an investment's valuation changes.
Following is a reconciliation of investments in which significant unobservable inputs (Level 3) were used in determining fair value:
| | | Common
Stock
(000) | | Preferred
Stock
(000) | |
Beginning Balance | | $ | 929 | | | $ | — | | |
Purchases | | | — | | | | 2,666 | | |
Sales | | | — | | | | — | | |
Amortization of discount | | | — | | | | — | | |
Transfers in | | | — | | | | — | | |
Transfers out | | | (929 | )† | | | — | | |
Corporate actions | | | — | | | | — | | |
Change in unrealized appreciation (depreciation) | | | — | | | | 63 | | |
Realized gains (losses) | | | — | | | | — | | |
Ending Balance | | $ | — | | | $ | 2,729 | | |
Net change in unrealized appreciation
(depreciation) from investments still
held as of December 31, 2021 | | $ | — | | | $ | 63 | | |
† A security transferred out of level 3 due to an Initial Public Offering.
15
Morgan Stanley Variable Insurance Fund, Inc.
Annual Report – December 31, 2021
Notes to Consolidated Financial Statements (cont'd)
The following table presents additional information about valuation techniques and inputs used for investments that are measured at fair value and categorized within Level 3 as of December 31, 2021. Various valuation techniques were used in the valuation of certain investments and weighted based on the level of significance. The Fund calculated the weighted averages of the unobservable inputs relative to each investment's fair value as of December 31, 2021.
| | | Fair Value at
December 31, 2021
(000) | | Valuation
Technique | | Unobservable
Input | | Amount* | | Impact to
Valuation from an
Increase in Input** | |
Preferred Stock | | $ | 2,729 | | | Market Transaction Method | | Precedent Transaction | | $ | 220.45 | | | Increase | |
| | | | | Discounted Cash Flow | | Weighted Average
Cost of Capital | | | 11.0 | % | | Decrease | |
| | | | | | | Perpetual Growth Rate | | | 3.5 | % | | Increase | |
| | | | | Market Comparable Companies | | Enterprise
Value/Revenue | | | 38.5 | x | | Increase | |
| | | | | | | Discount for Lack
of Marketability | | | 12.0 | % | | Decrease | |
* Amount is indicative of the weighted average.
** Represents the expected directional change in the fair value of the Level 3 investments that would result from an increase in the corresponding input. A decrease to the unobservable input would have the opposite effect. Significant changes in these inputs could result in significantly higher or lower fair value measurements.
3. Repurchase Agreements: The Fund may enter into repurchase agreements under which the Fund lends cash and takes possession of securities with an agreement that the counterparty will repurchase such securities. In connection with transactions in repurchase agreements, a bank as custodian for the Fund takes possession of the underlying securities which are held as collateral, with a market value at least equal to the amount of the repurchase transaction, including principal and accrued interest. To the extent that any repurchase transaction exceeds one business day, the value of the collateral is marked-to-market on a daily basis to determine that the value of the collateral does not decrease below the repurchase price plus accrued interest as earned. If such a decrease occurs, additional collateral will be requested and, when received, will be added to the account to maintain full collateralization. In the event of default on the obligation to repurchase, the Fund has the right to liquidate the collateral and apply the proceeds in satisfaction of the obligation. In the event of default or bankruptcy by the counterparty to the agreement, realization of the collateral proceeds may be subject to cost and delays. The Fund, along with other affiliated investment companies, may utilize a joint trading account for the purpose of entering into repurchase agreements.
4. Foreign Currency Translation and Foreign Investments: The books and records of the Fund are
maintained in U.S. dollars. Foreign currency amounts are translated into U.S. dollars as follows:
— investments, other assets and liabilities at the prevailing rate of exchange on the valuation date;
— investment transactions and investment income at the prevailing rates of exchange on the dates of such transactions.
Although the net assets of the Fund are presented at the foreign exchange rates and market values at the close of the period, the Fund does not isolate that portion of the results of operations arising as a result of changes in the foreign exchange rates from the fluctuations arising from changes in the market prices of securities held at period end. Similarly, the Fund does not isolate the effect of changes in foreign exchange rates from the fluctuations arising from changes in the market prices of securities sold during the period. Accordingly, realized and unrealized foreign currency gains (losses) on investments in securities are included in the reported net realized and unrealized gains (losses) on investment transactions and balances. However, pursuant to U.S. federal income tax regulations, gains and losses from certain foreign currency transactions and the foreign currency portion of gains and losses realized on sales and maturities of foreign denominated debt securities are treated as ordinary income for U.S. federal income tax purposes.
Net realized gains (losses) on foreign currency transactions represent net foreign exchange gains (losses) from foreign currency forward exchange contracts, disposition of foreign currencies, currency gains (losses) realized between the trade and settlement dates on securities transactions,
16
Morgan Stanley Variable Insurance Fund, Inc.
Annual Report – December 31, 2021
Notes to Consolidated Financial Statements (cont'd)
and the difference between the amount of investment income and foreign withholding taxes recorded on the Fund's books and the U.S. dollar equivalent amounts actually received or paid. The change in unrealized currency gains (losses) on foreign currency transactions for the period is reflected in the Consolidated Statement of Operations.
Foreign security and currency transactions may involve certain considerations and risks not typically associated with those of U.S. dollar denominated transactions as a result of, among other factors, fluctuations of exchange rates in relation to the U.S. dollar, the possibility of lower levels of governmental supervision and regulation of foreign securities markets and the possibility of political or economic instability.
Governmental approval for foreign investments may be required in advance of making an investment under certain circumstances in some countries, and the extent of foreign investments in domestic companies may be subject to limitation in other countries. Foreign ownership limitations also may be imposed by the charters of individual companies to prevent, among other concerns, violations of foreign investment limitations. As a result, an additional class of shares (identified as "Foreign" in the Consolidated Portfolio of Investments) may be created and offered for investment. The "local" and "foreign shares" market values may differ. In the absence of trading of the foreign shares in such markets, the Fund values the foreign shares at the closing exchange price of the local shares.
5. Derivatives: The Fund may, but is not required to, use derivative instruments for a variety of purposes, including hedging, risk management, portfolio management or to earn income. Derivatives are financial instruments whose value is based, in part, on the value of an underlying asset, interest rate, index or financial instrument. Prevailing interest rates and volatility levels, among other things, also affect the value of derivative instruments. A derivative instrument often has risks similar to its underlying asset and may have additional risks, including imperfect correlation between the value of the derivative and the underlying asset, risks of default by the counterparty to certain transactions, magnification of losses incurred due to changes in the market value of the securities, instruments, indices or interest rates to which the derivative instrument relates, risks that the transactions may not be liquid and risks arising from margin requirements. The use of derivatives involves risks that are different from, and possibly greater than, the risks associated with other portfolio investments. Derivatives may involve the use of
highly specialized instruments that require investment techniques and risk analyses different from those associated with other portfolio investments. All of the Fund's holdings, including derivative instruments, are marked-to-market each day with the change in value reflected in unrealized appreciation (depreciation). Upon disposition, a realized gain or loss is recognized.
Certain derivative transactions may give rise to a form of leverage. Leverage magnifies the potential for gain and the risk of loss. Leverage associated with derivative transactions may cause the Fund to liquidate portfolio positions when it may not be advantageous to do so to satisfy its obligations or to meet earmarking or segregation requirements, pursuant to applicable Securities and Exchange Commission ("SEC") rules and regulations, or may cause the Fund to be more volatile than if the Fund had not been leveraged. Although the Adviser seeks to use derivatives to further the Fund's investment objectives, there is no assurance that the use of derivatives will achieve this result.
Following is a description of the derivative instruments and techniques that the Fund used during the period and their associated risks:
Options: With respect to options, the Fund is subject to equity risk, interest rate risk and foreign currency exchange risk in the normal course of pursuing its investment objectives. If the Fund buys an option, it buys a legal contract giving it the right to buy or sell a specific amount of the underlying instrument or foreign currency, or futures contract on the underlying instrument or foreign currency, at an agreed-upon price during a period of time or on a specified date typically in exchange for a premium paid by the Fund. The Fund may purchase and/or sell put and call options. Purchasing call options tends to increase the Fund's exposure to the underlying (or similar) instrument. Purchasing put options tends to decrease the Fund's exposure to the underlying (or similar) instrument. When entering into purchased option contracts, the Fund bears the risk of interest or exchange rates or securities prices moving unexpectedly, in which case, the Fund may not achieve the anticipated benefits of the purchased option contracts; however the risk of loss is limited to the premium paid. Purchased options are reported as part of "Total Investments in Securities" in the Consolidated Statement of Assets and Liabilities. Premiums paid for purchasing options which expired are treated as realized losses. If the Fund sells an option, it sells to another party the right to buy from or sell to the Fund a specific amount of the underlying instrument or foreign currency, or futures contract on the underlying instrument or for-
17
Morgan Stanley Variable Insurance Fund, Inc.
Annual Report – December 31, 2021
Notes to Consolidated Financial Statements (cont'd)
eign currency, at an agreed-upon price during a period of time or on a specified date typically in exchange for a premium received by the Fund. When options are purchased OTC, the Fund bears the risk that the counterparty that wrote the option will be unable or unwilling to perform its obligations under the option contract. Options may also be illiquid and the Fund may have difficulty closing out its position. A decision as to whether, when and how to use options involves the exercise of skill and judgment and even a well-conceived option transaction may be unsuccessful because of market behavior or unexpected events. The prices of options can be highly volatile and the use of options can lower total returns.
Private Investment in Public Equity: The Fund may acquire equity securities of an issuer that are issued through a private investment in public equity transaction, including on a when-issued basis. PIPE transactions typically involve the purchase of securities directly from a publicly traded company or its affiliates in a private placement transaction, typically at a discount to the market price of the company's securities. The Fund's PIPE investment represents an unfunded subscription agreement in a private investment in public equity. The Fund will earmark or segregate cash or liquid assets or establish a segregated account on the Fund's books in which it will continually maintain cash or cash equivalents or other liquid portfolio securities equal in value to commitments to purchase securities on a forward commitment basis.
As of December 31, 2021, the Fund did not have any open PIPE contract.
FASB ASC 815, "Derivatives and Hedging" ("ASC 815"), is intended to improve financial reporting about derivative instruments by requiring enhanced disclosures to enable investors to better understand how and why the Fund uses derivative instruments, how these derivative instruments are accounted for and their effects on the Fund's financial position and results of operations.
The following table sets forth the fair value of the Fund's derivative contracts by primary risk exposure as of December 31, 2021:
| | | Asset Derivatives
Consolidated
Statement of Assets
and Liabilities
Location | | Primary Risk
Exposure | | Value
(000) | |
Purchased Options
| | Investments, at Value
(Purchased Options) | | Currency Risk | | $ | 445 | (a) | |
(a) Amounts are included in Investments in Securities in the Consolidated Statement of Assets and Liabilities.
The following tables set forth by primary risk exposure the Fund's realized gains (losses) and change in unrealized appreciation (depreciation) by type of derivative contract for the year ended December 31, 2021 in accordance with ASC 815:
Realized Gain (Loss) | |
Primary Risk Exposure | | Derivative
Type | | Value
(000) | |
Currency Risk | | Investments
(Purchased Options) | | $ | (1,295 | )(b) | |
(b) Amounts are included in Realized Gain (Loss) on Investments Sold in the Consolidated Statement of Operations.
Change in Unrealized Appreciation (Depreciation) | |
Primary Risk Exposure | | Derivative
Type | | Value
(000) | |
Currency Risk | | Investments
(Purchased Options) | | $ | (475 | )(c) | |
(c) Amounts are included in Change in Unrealized Appreciation (Depreciation) on Investments in the Consolidated Statement of Operations.
At December 31, 2021, the Fund's derivative assets and liabilities are as follows:
Gross Amounts of Assets and Liabilities Presented in the
Consolidated Statement of Assets and Liabilities | |
Derivatives | | Assets(d)
(000) | | Liabilities(d)
(000) | |
Purchased Options | | $ | 445 | (a) | | $ | — | | |
(a) Amounts are included in Investments in Securities in the Consolidated Statement of Assets and Liabilities.
(d) Absent an event of default or early termination, OTC derivative assets and liabilities are presented gross and not offset in the Consolidated Statement of Assets and Liabilities.
The Fund typically enters into International Swaps and Derivatives Association, Inc. Master Agreements ("ISDA Master Agreements") or similar master agreements (collectively, "Master Agreements") with its contract counterparties for certain OTC derivatives in order to, among other things, reduce its credit risk to counterparties. ISDA Master Agreements include provisions for general obligations, representations, collateral and events of default or termination. Under an ISDA Master Agreement, the Fund typically may offset with the counterparty certain OTC derivative financial instruments' payables and/or receivables with collateral held and/or posted and create one single net payment (close-out netting) in the event of default, termination and/or potential deterioration in the credit quality of the counterparty. Various Master Agreements govern the terms of certain transactions with counterparties, including transactions such as swap, forward, repurchase and reverse repurchase agreements. These Master Agreements typically attempt to reduce the counterparty risk associated with such
18
Morgan Stanley Variable Insurance Fund, Inc.
Annual Report – December 31, 2021
Notes to Consolidated Financial Statements (cont'd)
transactions by specifying credit protection mechanisms and providing standardization that improves legal certainty. Cross-termination provisions under Master Agreements typically provide that a default in connection with one transaction between the Fund and a counterparty gives the non-defaulting party the right to terminate any other transactions in place with the defaulting party to create one single net payment due to/due from the defaulting party and may be a feature in certain Master Agreements. In the event the Fund exercises its right to terminate a Master Agreement after a counterparty experiences a termination event as defined in the Master Agreement, the return of collateral with market value in excess of the Fund's net liability may be delayed or denied.
The following table presents derivative financial instruments that are subject to enforceable netting arrangements as of December 31, 2021:
Gross Amounts Not Offset in the Consolidated Statement of Assets and Liabilities | |
Counterparty | | Gross Asset
Derivatives
Presented
in the
Consolidated
Statement of
Assets and
Liabilities(a)
(000) | | Financial
Instrument
(000) | | Collateral
Received(e)
(000) | | Net
Amount
(not less
than $0)
(000) | |
BNP Paribas | | $ | — | @ | | $ | — | | | $ | — | | | $ | — | @ | |
Goldman Sachs
International | | | 261 | | | | — | | | | (261 | ) | | | 0 | | |
JP Morgan
Chase
Bank NA | | | 184 | | | | — | | | | (184 | ) | | | 0 | | |
Total | | $ | 445 | | | $ | — | | | $ | (445 | ) | | $ | — | @ | |
@ Value is less than $500.
(a) Amounts are included in Investments in Securities in the Consolidated Statement of Assets and Liabilities.
(e) In some instances, the actual collateral received may be more than the amount shown here due to overcollateralization.
For the year ended December 31, 2021, the approximate average monthly amount outstanding for each derivative type is as follows:
Purchased Options: | |
Average monthly notional amount | | | 343,796,000 | | |
Derivative Contract — PIPE: | |
Average monthly notional amount | | $ | 2,667,000 | | |
6. Securities Lending: The Fund lends securities to qualified financial institutions, such as broker-dealers, to earn additional income. Any increase or decrease in the fair value of the securities loaned that might occur and any interest earned or dividends declared on those securi-
ties during the term of the loan would remain in the Fund. The Fund would receive cash or securities as collateral in an amount equal to or exceeding 100% of the current fair value of the loaned securities. The collateral is marked-to-market daily by State Street Bank and Trust Company ("State Street"), the securities lending agent, to ensure that a minimum of 100% collateral coverage is maintained.
Based on pre-established guidelines, the securities lending agent invests any cash collateral that is received in an affiliated money market portfolio and repurchase agreements. Securities lending income is generated from the earnings on the invested collateral and borrowing fees, less any rebates owed to the borrowers and compensation to the lending agent, and is recorded as "Income from Securities Loaned — Net" in the Fund's Consolidated Statement of Operations. Risks in securities lending transactions are that a borrower may not provide additional collateral when required or return the securities when due, and that the value of the short-term investments will be less than the amount of cash collateral plus any rebate that is required to be returned to the borrower.
The Fund has the right under the securities lending agreement to recover the securities from the borrower on demand.
The following table presents financial instruments that are subject to enforceable netting arrangements as of December 31, 2021:
Gross Amounts Not Offset in the Consolidated Statement of
Assets and Liabilities | |
Gross Asset
Amounts
Presented
in the
Consolidated
Statement of
Assets and
Liabilities
(000) | | Financial
Instrument
(000) | | Collateral
Received
(000) | | Net Amount
(not less
than $0)
(000) | |
$ | 682 | (f) | | $ | — | | | $ | (682 | )(g)(h) | | $ | 0 | | |
(f) Represents market value of loaned securities at year end.
(g) The Fund received cash collateral of approximately $759,000, of which approximately $758,000 was subsequently invested in Repurchase Agreements and Morgan Stanley Institutional Liquidity Funds as reported in the Portfolio of Investments. As of December 31, 2021, there was uninvested cash of approximately $1,000, which is not reflected in the Consolidated Portfolio of Investments.
(h) The actual collateral received is greater than the amount shown here due to overcollateralization.
FASB ASC 860, "Transfers & Servicing: Repurchase-to-Maturity Transactions, Repurchase Financings, and Disclosures", is intended to provide increased transparency
19
Morgan Stanley Variable Insurance Fund, Inc.
Annual Report – December 31, 2021
Notes to Consolidated Financial Statements (cont'd)
about the types of collateral pledged in securities lending transactions and other similar transactions that are accounted for as secured borrowing.
The following table displays a breakdown of transactions accounted for as secured borrowings, the gross obligations by class of collateral pledged and the remaining contractual maturity of those transactions as of December 31, 2021:
| | | Remaining Contractual Maturity of the Agreements | |
| | | Overnight and
Continuous
(000) | | <30 days
(000) | | Between
30 &
90 days
(000) | | >90 days
(000) | | Total
(000) | |
Securities Lending
Transactions | |
Common Stock | | $ | 759 | | | $ | — | | | $ | — | | | $ | — | | | $ | 759 | | |
Total Borrowings | | $ | 759 | | | $ | — | | | $ | — | | | $ | — | | | $ | 759 | | |
Gross amount of
recognized liabilities
for securities lending
transactions | | $ | 759 | | |
7. Restricted Securities: The Fund invests in unregistered or otherwise restricted securities. The term "restricted securities" refers to securities that are unregistered or are held by control persons of the issuer and securities that are subject to contractual restrictions on their resale. As a result, restricted securities may be more difficult to value and the Fund may have difficulty disposing of such assets either in a timely manner or for a reasonable price. In order to dispose of an unregistered security, the Fund, where it has contractual rights to do so, may have to cause such security to be registered. A considerable period may elapse between the time the decision is made to sell the security and the time the security is registered so that the Fund can sell it. Contractual restrictions on the resale of securities vary in length and scope and are generally the result of a negotiation between the issuer and the acquirer of the securities. The Fund would, in either case, bear market risks during that period.
Restricted securities are identified in the Consolidated Portfolio of Investments.
8. Indemnifications: The Company enters into contracts that contain a variety of indemnifications. The Company's maximum exposure under these arrangements is unknown. However, the Company has not had prior claims or losses pursuant to these contracts and expects the risk of loss to be remote.
9. Security Transactions, Income and Expenses: Security transactions are accounted for on the trade date (date the order to buy or sell is executed). Realized gains and losses on the sale of investment securities are deter-
mined on the specific identified cost method. Dividend income and other distributions are recorded on the ex-dividend date (except for certain foreign dividends which may be recorded as soon as the Fund is informed of such dividends) net of applicable withholding taxes. Interest income is recognized on the accrual basis net of applicable withholding taxes except where collection is in doubt. Discounts are accreted and premiums are amortized over the life of the respective securities. Most expenses of the Company can be directly attributed to a particular Fund. Expenses which cannot be directly attributed are apportioned among the Funds based upon relative net assets or other appropriate methods. Income, expenses (other than class specific expenses) and realized and unrealized gains or losses are allocated to each class of shares based upon their relative net assets.
10. Dividends and Distributions to Shareholders: Dividends and distributions to shareholders are recorded on the ex-dividend date. Dividends from net investment income, if any, are declared and paid annually. Net realized capital gains, if any, are distributed at least annually.
B. Advisory Fees: The Adviser, a wholly-owned subsidiary of Morgan Stanley, provides the Fund with advisory services under the terms of an Investment Advisory Agreement, paid quarterly, at the annual rate based on the daily net assets as follows:
First $500
million | | Next $500
million | | Over $1
billion | |
| | 0.75 | % | | | 0.70 | % | | | 0.65 | % | |
For the year ended December 31, 2021, the advisory fee rate (net of waiver/rebate) was equivalent to an annual effective rate of 0.64% of the Fund's average daily net assets.
The Adviser has agreed to reduce its advisory fee and/or reimburse the Fund so that total annual Fund operating expenses, excluding certain investment related expenses, taxes, interest and other extraordinary expenses (including litigation), will not exceed 0.95% for Class I shares and 1.05% for Class II shares. The fee waivers and/or expense reimbursements will continue for at least one year from the date of the Fund's prospectus or until such time as the Directors act to discontinue all or a portion of such waivers and/or reimbursements when they deem such action is appropriate. For the year ended December 31, 2021, approximately $441,000 of advisory fees were waived pursuant to this arrangement.
The Adviser provides investment advisory services to the Subsidiary pursuant to the Subsidiary Investment Management Agreement (the "Agreement"). Under the Agreement, the Subsidiary will pay the Adviser at the end of each fiscal quarter, calculated by applying a quarterly rate, based on the an-
20
Morgan Stanley Variable Insurance Fund, Inc.
Annual Report – December 31, 2021
Notes to Consolidated Financial Statements (cont'd)
nual rate of 0.05%, to the average daily net assets of the Subsidiary.
The Adviser has agreed to waive its advisory fees by the amount of advisory fees it receives from the Subsidiary.
C. Administration Fees: The Adviser also serves as Administrator to the Company and provides administrative services pursuant to an Administration Agreement for an annual fee, accrued daily and paid monthly, of 0.08% of the Fund's average daily net assets.
Under a Sub-Administration Agreement between the Administrator and State Street, State Street provides certain administrative services to the Company. For such services, the Administrator pays State Street a portion of the fee the Administrator receives from the Fund.
D. Servicing Fees: The Company accrues daily and pays quarterly a servicing fee of up to 0.17% of the average daily value of shares of the Fund held in an insurance company's account. Certain insurance companies have entered into a servicing agreement with the Company to provide administrative and other contract-owner related services on behalf of the Fund.
E. Distribution Fees: Morgan Stanley Distribution, Inc. ("MSDI" or the "Distributor"), a wholly-owned subsidiary of the Adviser and an indirect subsidiary of Morgan Stanley, serves as the Distributor of the Fund and provides the Fund's Class II shareholders with distribution services pursuant to a Distribution Plan (the "Plan") in accordance with Rule 12b-1 under the Act. Under the Plan, the Fund is authorized to pay the Distributor a distribution fee, which is accrued daily and paid monthly, at an annual rate of 0.25% of the Fund's average daily net assets attributable to Class II shares. The Distributor has agreed to waive 0.15% of the 0.25% distribution fee that it may receive. This fee waiver will continue for at least one year from the date of the Fund's prospectus or until such time as the Directors act to discontinue all or a portion of such waiver when they deem such action is appropriate. For the year ended December 31, 2021, this waiver amounted to approximately $490,000.
F. Dividend Disbursing and Transfer Agent: The Company's dividend disbursing and transfer agent is DST Asset Manager Solutions, Inc. ("DST"). Pursuant to a Transfer Agency Agreement, the Company pays DST a fee based on the number of classes, accounts and transactions relating to the Funds of the Company.
G. Custodian Fees: State Street (the "Custodian") also serves as Custodian for the Company in accordance with a Custodian Agreement. The Custodian holds cash, securities
and other assets of the Company as required by the Act. Custody fees are payable monthly based on assets held in custody, investment purchases and sales activity and account maintenance fees, plus reimbursement for certain out-of-pocket expenses.
H. Security Transactions and Transactions with Affiliates: For the year ended December 31, 2021, purchases and sales of investment securities for the Fund, other than long-term U.S. Government securities and short-term investments were approximately $352,161,000 and $390,741,000, respectively. There were no purchases and sales of long-term U.S. Government securities for the year ended December 31, 2021.
The Fund invests in the Institutional Class of the Morgan Stanley Institutional Liquidity Funds — Treasury Securities Portfolio (the "Liquidity Funds"), an open-end management investment company managed by the Adviser, both directly and as a portion of the securities held as collateral on loaned securities. Advisory fees paid by the Fund are reduced by an amount equal to its pro-rata share of the advisory and administration fees paid by the Fund due to its investment in the Liquidity Funds. For the year ended December 31, 2021, advisory fees paid were reduced by approximately $9,000 relating to the Fund's investment in the Liquidity Funds.
A summary of the Fund's transactions in shares of affiliated investments during the year ended December 31, 2021 is as follows:
Affiliated
Investment
Company | | Value
December 31,
2020
(000) | | Purchases
at Cost
(000) | | Proceeds
from Sales
(000) | | Dividend
Income
(000) | |
Liquidity Funds | | $ | 24,612 | | | $ | 221,817 | | | $ | 221,846 | | | $ | 2 | | |
Affiliated
Investment
Company (cont'd) | | Realized
Gain (Loss)
(000) | | Change in
Unrealized
Appreciation
(Depreciation)
(000) | | Value
December 31,
2021
(000) | |
Liquidity Funds | | $ | — | | | $ | — | | | $ | 24,583 | | |
The Fund is permitted to purchase and sell securities ("cross-trade") from and to other Morgan Stanley funds as well as other funds and client accounts for which the Adviser or an affiliate of the Adviser serves as investment adviser, pursuant to procedures approved by the Directors in compliance with Rule 17a-7 under the Act (the "Rule"). Each cross-trade is executed at the current market price in compliance with provisions of the Rule. For the year ended December 31, 2021, the Fund did not engage in any cross-trade transactions.
21
Morgan Stanley Variable Insurance Fund, Inc.
Annual Report – December 31, 2021
Notes to Consolidated Financial Statements (cont'd)
The Fund has an unfunded Deferred Compensation Plan (the "Compensation Plan"), which allows each independent Director to defer payment of all, or a portion, of the fees he or she receives for serving on the Board of Directors. Each eligible Director generally may elect to have the deferred amounts credited with a return equal to the total return on one or more of the Morgan Stanley funds that are offered as investment options under the Compensation Plan. Appreciation/depreciation and distributions received from these investments are recorded with an offsetting increase/decrease in the deferred compensation obligation and do not affect the NAV of the Fund.
I. Federal Income Taxes: It is the Fund's intention to continue to qualify as a regulated investment company and distribute all of its taxable and tax-exempt income. Accordingly, no provision for federal income taxes is required in the consolidated financial statements.
The Fund may be subject to taxes imposed by countries in which it invests. Such taxes are generally based on income and/or capital gains earned or repatriated. Taxes are accrued based on net investment income, net realized gains and net unrealized appreciation as such income and/or gains are earned. Taxes may also be based on transactions in foreign currency and are accrued based on the value of investments denominated in such currency.
FASB ASC 740-10, "Income Taxes — Overall", sets forth a minimum threshold for consolidated financial statement recognition of the benefit of a tax position taken or expected to be taken in a tax return. Management has concluded there are no significant uncertain tax positions that would require recognition in the consolidated financial statements. If applicable, the Fund recognizes interest accrued related to unrecognized tax benefits in "Interest Expense" and penalties in "Other Expenses" in the Consolidated Statement of Operations. The Fund files tax returns with the U.S. Internal Revenue Service, New York and various states. Generally, each of the tax years in the four-year period ended December 31, 2021 remains subject to examination by taxing authorities.
The tax character of distributions paid may differ from the character of distributions shown for GAAP purposes due to short-term capital gains being treated as ordinary income for tax purposes. The tax character of distributions paid during fiscal years 2021 and 2020 was as follows:
2021 Distributions
Paid From: | | 2020 Distributions
Paid From: | |
Ordinary
Income
(000) | | Long-Term
Capital Gain
(000) | | Ordinary
Income
(000) | | Long-Term
Capital Gain
(000) | |
$ | 32,577 | | | $ | 115,730 | | | $ | 6,331 | | | $ | 23,020 | | |
The amount and character of income and gains to be distributed are determined in accordance with income tax regulations which may differ from GAAP. These book/tax differences are either considered temporary or permanent in nature.
Temporary differences are attributable to differing book and tax treatments for the timing of the recognition of gains (losses) on certain investment transactions and the timing of the deductibility of certain expenses.
Permanent differences, due to nondeductible offering costs related to the Subsidiary, resulted in the following reclassifications among the compoents of net assets at December 31, 2021:
Total
Distributable
Earnings
(000) | | Paid-in-
Capital
(000) | |
$ | 3 | | | $ | (3 | ) | |
At December 31, 2021, the components of distributable earnings for the Fund on a tax basis were as follows:
Undistributed
Ordinary
Income
(000) | | Undistributed
Long-Term
Capital Gain
(000) | |
$ | 5,485 | | | $ | 77,635 | | |
J. Credit Facility: The Company and other Morgan Stanley funds participated in a $300,000,000 committed, unsecured revolving line of credit facility (the "Facility") with State Street. This Facility is to be used for temporary emergency purposes or funding of shareholder redemption requests. The interest rate on borrowings is based on the federal funds rate or 1 month LIBOR rate plus a spread. Effective April 19, 2021, the interest rate on borrowings is based on the federal funds effective rate or overnight bank funding rate plus a spread. The Facility also has a commitment fee of 0.25% per annum based on the unused portion of the Facility. During the year ended December 31, 2021, the Fund did not have any borrowings under the Facility.
K. Other: At December 31, 2021, the Fund had record owners of 10% or greater. Investment activities of these shareholders could have a material impact on the Fund. The aggregate percentage of such owners was 54.6%.
L. Market Risk and Risks Relating to Certain Financial Instruments:
22
Morgan Stanley Variable Insurance Fund, Inc.
Annual Report – December 31, 2021
Notes to Consolidated Financial Statements (cont'd)
Bitcoin: The Fund may have exposure to bitcoin indirectly through investments in GBTC, a privately offered investment vehicle that invests in bitcoin. Cryptocurrencies (also referred to as "virtual currencies" and "digital currencies") are digital assets designed to act as a medium of exchange. Although cryptocurrency is an emerging asset class, there are thousands of cryptocurrencies, the most well-known of which is bitcoin. Cryptocurrency facilitates decentralized, peer-to-peer financial exchange and value storage that is used like money, without the oversight of a central authority or banks. The value of cryptocurrency is not backed by any government, corporation, or other identified body. Similar to fiat currencies (i.e., a currency that is backed by a central bank or a national, supra-national or quasi-national organization), cryptocurrencies are susceptible to theft, loss and destruction. For example, the bitcoin held by GBTC (and the Fund's indirect exposure to such bitcoin) is also susceptible to these risks. The value of the GBTC investments in cryptocurrency is subject to fluctuations in the value of the cryptocurrency, which have been and may in the future be highly volatile. The value of cryptocurrencies is determined by the supply and demand for cryptocurrency in the global market for the trading of cryptocurrency, which consists primarily of transactions on electronic exchanges. The price of bitcoin could drop precipitously (including to zero) for a variety of reasons, including, but not limited to, regulatory changes, a crisis of confidence, flaw or operational issue in the bitcoin network or a change in user preference to competing cryptocurrencies. The GBTC exposure to cryptocurrency could result in substantial losses to the Fund.
Market: The outbreak of the coronavirus ("COVID-19") and the recovery responses could adversely impact the operations of the Fund and its service providers and financial performance of the Fund and the Fund's investments. The extent of such impact depends on future developments, including (i) the duration and spread of the outbreak, (ii) the restrictions and advisories, (iii) the effects on the financial markets, (iv) government and regulatory responses, and (v) the effects on the economy overall as a result of developments such as disruption to consumer demand, economic output and supply chains. The duration and extent of COVID-19 and associated economic and market conditions and uncertainty over the long term cannot be reasonably estimated at this time. The ultimate impact of COVID-19 and the extent to which the associated conditions impact the Fund will also depend on future developments, which are highly uncertain, difficult to accurately predict and subject to change at any time. If the financial performance of the Fund's investments is impacted because of these factors for an extended period, the Fund's investment results may be adversely affected.
Special Purpose Acquisition Companies ("SPAC"): The Fund may invest in stock, warrants, and other securities of SPACs or similar special purpose entities. A SPAC is typically a publicly traded company that raises investment capital via an initial public offering ("IPO") for the purpose of acquiring the equity securities of one or more existing companies (or interests therein) via merger, combination, acquisition or other similar transactions. The Fund may acquire an interest in a SPAC in an IPO or a secondary market transaction.
Unless and until an acquisition is completed, a SPAC generally invests its assets (less a portion retained to cover expenses) in U.S. government securities, money market securities and cash. To the extent the SPAC is invested in cash or similar securities, this may negatively affect the Fund's performance. Because SPACs and similar entities are in essence blank check companies without operating history or ongoing business other than seeking acquisitions, the value of their securities is particularly dependent on the ability of the entity's management to identify and complete a profitable acquisition. There is no guarantee that the SPACs in which the Fund invests will complete an acquisition or that any acquisitions that are completed will be profitable. Some SPACs may pursue acquisitions only within certain industries or regions, which may increase the volatility of their prices. In addition, these securities, which are typically traded in the over-the-counter market, may be considered illiquid and/or be subject to restrictions on resale.
Other risks of investing in SPACs include that a significant portion of the monies raised by the SPAC may be expended during the search for a target transaction; an attractive transaction may not be identified at all (or any requisite approvals may not be obtained) and the SPAC may dissolve and be required to return any remaining monies to shareholders, causing the Fund to incur the opportunity cost of missed investment opportunities the Fund otherwise could have benefited from; a transaction once identified or effected may prove unsuccessful and an investment in the SPAC may lose value; the warrants or other rights with respect to the SPAC held by the Fund may expire worthless or may be repurchased or retired by the SPAC at an unfavorable price; and an investment in a SPAC may be diluted by additional later offerings of interests in the SPAC or by other investors exercising existing rights to purchase shares of the SPAC. In addition, a SPAC target company may have limited operating experience, a smaller size, limited product lines, markets, distribution channels and financial and managerial resources. Investing in the securities of smaller companies involves greater risk, and portfolio price volatility.
23
Morgan Stanley Variable Insurance Fund, Inc.
Annual Report – December 31, 2021
Notes to Consolidated Financial Statements (cont'd)
Private Investment in Public Equity: The Fund may acquire equity securities of an issuer that are issued through a PIPE transaction, including on a when-issued basis. The Fund will generally earmark an amount of cash or high quality securities equal (on a daily mark to market basis) to the amount of its commitment to purchase the when-issued securities. PIPE transactions typically involve the purchase of securities directly from a publicly traded company or its affiliates in a private placement transaction, including through a SPAC, typically at a discount to the market price of the company's securities. There is a risk that if the market price of the securities drops below a set threshold, the company may have to issue additional stock at a significantly reduced price, which may dilute the value of the Fund's investment. Shares in PIPEs generally are not registered with the SEC until after a certain time period from the date the private sale is completed. This restricted period can last many months. Until the public registration process is completed, PIPEs are restricted as to resale and the Fund cannot freely trade the securities. Generally, such restrictions cause the PIPEs to be illiquid during this time. PIPEs may contain provisions that the issuer will pay specified financial penalties to the holder if the issuer does not publicly register the restricted equity securities within a specified period of time, but there is no assurance that the restricted equity securities will be publicly registered, or that the registration will remain in effect.
24
Morgan Stanley Variable Insurance Fund, Inc.
Annual Report – December 31, 2021
Report of Independent Registered Public Accounting Firm
To the Shareholders and Board of Directors of
Morgan Stanley Variable Insurance Fund, Inc. —
Discovery Portfolio
Opinion on the Financial Statements
We have audited the accompanying consolidated statement of assets and liabilities of Discovery Portfolio (the "Fund") (one of the funds constituting the Morgan Stanley Variable Insurance Fund, Inc. (the "Company")), including the consolidated portfolio of investments, as of December 31, 2021, and the related consolidated statements of operations and changes in net assets for the year then ended and the statement of changes in net assets for the year ended December 31, 2020, the consolidated financial highlights for the year ended December 31, 2021 and the financial highlights for each of the four years in the period ended December 31, 2020 and the related notes (collectively referred to as the "financial statements"). In our opinion, the financial statements present fairly, in all material respects, the consolidated financial position of Discovery Portfolio (one of the funds constituting the Morgan Stanley Variable Insurance Fund, Inc.) at December 31, 2021, the consolidated results of its operations and the consolidated changes in its net assets for the year then ended and the changes in its net assets for the year ended December 31, 2020 and its consolidated financial highlights for the year ended December 31, 2021 and its financial highlights for each of the four years in the period ended December 31, 2020, in conformity with U.S. generally accepted accounting principles.
Basis for Opinion
These consolidated financial statements are the responsibility of the Company's management. Our responsibility is to express an opinion on the Fund's consolidated financial statements based on our audits. We are a public accounting firm registered with the Public Company Accounting Oversight Board (United States) ("PCAOB") and are required to be independent with respect to the Company in accordance with the U.S. federal securities law and the applicable rules and regulations of the Securities and Exchange Commission and the PCAOB.
We conducted our audits in accordance with the standards of the PCAOB. Those standards require that we plan and perform the audit to obtain reasonable assurance about whether the financial statements are free of material misstatement, whether due to error or fraud. The Company is not required to have, nor were we engaged to perform, an audit of the Company's internal control over financial reporting. As part of our audits, we are required to obtain an understanding of internal control over financial reporting, but not for the purpose of expressing an opinion on the effectiveness of the Company's internal control over financial reporting. Accordingly, we express no such opinion.
Our audits included performing procedures to assess the risks of material misstatement of the consolidated financial statements, whether due to error or fraud, and performing procedures that respond to those risks. Such procedures included examining, on a test basis, evidence regarding the amounts and disclosures in the consolidated financial statements. Our procedures included confirmation of securities owned as of December 31, 2021 by correspondence with the custodian and others or by other appropriate auditing procedures where replies from others were not received. Our audits also included evaluating the accounting principles used and significant estimates made by management, as well as evaluating the overall presentation of the consolidated financial statements. We believe that our audits provide a reasonable basis for our opinion.

We have served as the auditor of one or more Morgan Stanley investment companies since 2000.
Boston, Massachusetts
February 18, 2022
25
Morgan Stanley Variable Insurance Fund, Inc.
Annual Report – December 31, 2021
Liquidity Risk Management Program (unaudited)
In compliance with Rule 22e-4 under the Investment Company Act of 1940, as amended (the "Liquidity Rule"), the Fund has adopted and implemented a liquidity risk management program (the "Program"), which is reasonably designed to assess and manage the risk that the Fund could not meet requests to redeem shares issued by the Fund without significant dilution of remaining investors' interests in the Fund (i.e., liquidity risk). The Fund's Board of Directors (the "Board") previously approved the designation of the Liquidity Risk Subcommittee (the "LRS") as Program administrator. The LRS is comprised of representatives from various divisions within Morgan Stanley Investment Management.
At a meeting held on March 3-4, 2021, the Board reviewed a written report prepared by the LRS that addressed the Program's operation and assessed its adequacy, and effectiveness of implementation for the period from January 1, 2020, through December 31, 2020, as required under the Liquidity Rule, and discussed the impact of the COVID-19 pandemic on liquidity and the LRS's assessment of liquidity risk during the reporting period, including during the distressed market environment caused by the onset of the COVID-19 pandemic. The report concluded that the Program operated effectively and was adequately and effectively implemented in all material aspects, and that the relevant controls and safeguards were appropriately designed to enable the LRS to administer the Program in compliance with the Liquidity Rule.
In accordance with the Program, the LRS assessed each Fund's liquidity risk no less frequently than annually taking into consideration certain factors, as applicable, such as (i) investment strategy and liquidity of portfolio investments, (ii) short-term and long-term cash flow projections and (iii) holdings of cash and cash equivalents and borrowing arrangements and other funding sources. Certain factors are considered under both normal and reasonably foreseeable stressed conditions.
Each Fund portfolio investment is classified into one of four liquidity categories, which classification is assessed at least monthly by the LRS. The classification is based on a determination of the number of days it is reasonably expected to take to convert the investment into cash, or sell or dispose of the investment, in current market conditions without significantly changing the market value of the investment. Liquidity classification determinations take into account various market, trading and investment-specific considerations, as well as market depth, and in some cases utilize third-party vendor data.
The Liquidity Rule limits a fund's investments in illiquid investments to 15% of its net assets and requires funds that do not primarily hold assets that are highly liquid investments to determine and maintain a minimum percentage of the fund's net assets to be invested in highly liquid investments (highly liquid investment minimum or "HLIM"). The LRS believes that the Program includes provisions reasonably designed to review, monitor and comply with the 15% limit on illiquid investments and for determining, periodically reviewing and complying with the HLIM requirement, as applicable.
There can be no assurance that the Program will achieve its objectives under all circumstances in the future. Please refer to the Fund's prospectus for more information regarding the Fund's exposure to liquidity risk and other risks to which it may be subject.
26
Morgan Stanley Variable Insurance Fund, Inc.
Annual Report – December 31, 2021
Federal Tax Notice (unaudited)
For federal income tax purposes, the following information is furnished with respect to the distributions paid by the Fund during its taxable year ended December 31, 2021.
The Fund designated and paid approximately $115,730,000 as a long-term capital gain distribution.
In January, the Fund provides tax information to shareholders for the preceding calendar year.
27
Morgan Stanley Variable Insurance Fund, Inc.
Annual Report – December 31, 2021
Director and Officer Information (unaudited)
Independent Directors:
Name, Address and Birth
Year of Independent Director | | Position(s)
Held with
Registrant | | Length of
Time
Served* | | Principal Occupation(s) During Past 5 Years and
Other Relevant Professional Experience | | Number of
Funds
in Fund
Complex
Overseen
by
Independent
Director** | | Other Directorships Held by Independent
Director During Past 5 Years*** | |
Frank L. Bowman
c/o Perkins Coie LLP
Counsel to the Independent Directors
1155 Avenue of the Americas
22nd Floor
New York, NY 10036
Birth Year: 1944 | | Director | | Since August 2006 | | President, Strategic Decisions, LLC (consulting) (since February 2009); Director or Trustee of various Morgan Stanley Funds (since August 2006); Chairperson of the Compliance and Insurance Committee (since October 2015); formerly, Chairperson of the Insurance Sub-Committee of the Compliance and Insurance Committee (2007-2015); served as President and Chief Executive Officer of the Nuclear Energy Institute (policy organization) (February 2005-November 2008); retired as Admiral, U.S. Navy after serving over 38 years on active duty including 8 years as Director of the Naval Nuclear Propulsion Program in the Department of the Navy and the U.S. Department of Energy (1996-2004); served as Chief of Naval Personnel (July 1994-September 1996) and on the Joint Staff as Director of Political Military Affairs (June 1992-July 1994); knighted as Honorary Knight Commander of the Most Excellent Order of the British Empire; awarded the Officier de l'Orde National du Mérite by the French Government; elected to the National Academy of Engineering (2009). | | | 77 | | | Director of Naval and Nuclear Technologies LLP; Director Emeritus of the Armed Services YMCA; Member of the National Security Advisory Council of the Center for U.S. Global Engagement and a member of the CNA Military Advisory Board; Chairman of Fairhaven United Methodist Church; Member of the Board of Advisors of the Dolphin Scholarship Foundation; Director of other various nonprofit organizations; formerly, Director of BP, plc (November 2010-May 2019). | |
Kathleen A. Dennis
c/o Perkins Coie LLP
Counsel to the Independent Directors
1155 Avenue of the Americas
22nd Floor
New York, NY 10036
Birth Year: 1953 | | Director | | Since August 2006 | | Chairperson of the Governance Committee (since January 2021), Chairperson of the Liquidity and Alternatives Sub-Committee of the Investment Committee (2006-2020) and Director or Trustee of various Morgan Stanley Funds (since August 2006); President, Cedarwood Associates (mutual fund and investment management consulting) (since July 2006); formerly, Senior Managing Director of Victory Capital Management (1993-2006). | | | 77 | | | Board Member, University of Albany Foundation (2012-present); Board Member, Mutual Funds Directors Forum (2014-present); Director of various non-profit organizations. | |
Nancy C. Everett
c/o Perkins Coie LLP
Counsel to the Independent
Directors
1155 Avenue of the Americas
22nd Floor
New York, NY 10036
Birth Year: 1955 | | Director | | Since January 2015 | | Chairperson of the Equity Investment Committee (since January 2021); Director or Trustee of various Morgan Stanley Funds (since January 2015); Chief Executive Officer, Virginia Commonwealth University Investment Company (since November 2015); Owner, OBIR, LLC (institutional investment management consulting) (since June 2014); formerly, Managing Director, BlackRock, Inc. (February 2011-December 2013) and Chief Executive Officer, General Motors Asset Management (a/k/a Promark Global Advisors, Inc.) (June 2005-May 2010). | | | 78 | | | Formerly, Member of Virginia Commonwealth University School of Business Foundation (2005-2016); Member of Virginia Commonwealth University Board of Visitors (2013-2015); Member of Committee on Directors for Emerging Markets Growth Fund, Inc. (2007-2010); Chairperson of Performance Equity Management, LLC (2006-2010); and Chairperson, GMAM Absolute Return Strategies Fund, LLC (2006-2010). | |
28
Morgan Stanley Variable Insurance Fund, Inc.
Annual Report – December 31, 2021
Director and Officer Information (unaudited) (cont'd)
Independent Directors (cont'd):
Name, Address and Birth
Year of Independent Director | | Position(s)
Held with
Registrant | | Length of
Time
Served* | | Principal Occupation(s) During Past 5 Years and
Other Relevant Professional Experience | | Number of
Funds
in Fund
Complex
Overseen
by
Independent
Director** | | Other Directorships Held by Independent
Director During Past 5 Years*** | |
Jakki L. Haussler
c/o Perkins Coie LLP
Counsel to the Independent
Directors
1155 Avenue of the Americas
22nd Floor
New York, NY 10036
Birth Year: 1957 | | Director | | Since January 2015 | | Director or Trustee of various Morgan Stanley Funds (since January 2015); Chairman, Opus Capital Group (since 1996); formerly, Chief Executive Officer, Opus Capital Group (1996-2019); Director, Capvest Venture Fund, LP (May 2000-December 2011); Partner, Adena Ventures, LP (July 1999-December 2010); Director, The Victory Funds (February 2005-July 2008). | | | 78 | | | Director, Barnes Group Inc. (since July 2021); Director of Cincinnati Bell Inc. and Member, Audit Committee and Chairman, Governance and Nominating Committee; Director of Service Corporation International and Member, Audit Committee and Investment Committee; Director of Northern Kentucky University Foundation and Member, Investment Committee; Member of Chase College of Law Transactional Law Practice Center Board of Advisors; Director of Best Transport; Director of Chase College of Law Board of Visitors; formerly, Member, University of Cincinnati Foundation Investment Committee; Member, Miami University Board of Visitors (2008-2011); Trustee of Victory Funds (2005-2008) and Chairman, Investment Committee (2007-2008) and Member, Service Provider Committee (2005-2008). | |
Dr. Manuel H. Johnson
c/o Johnson Smick
International, Inc.
220 I Street, NE Suite 200
Washington, D.C. 20002
Birth Year: 1949 | | Director | | Since July 1991 | | Senior Partner, Johnson Smick International, Inc. (consulting firm); Chairperson of the Fixed Income, Liquidity and Alternatives Investment Committee (since January 2021), Chairperson of the Investment Committee (2006-2020) and Director or Trustee of various Morgan Stanley Funds (since July 1991); Co-Chairman and a founder of the Group of Seven Council (G7C) (international economic commission); formerly, Chairperson of the Audit Committee (July 1991-September 2006); Vice Chairman of the Board of Governors of the Federal Reserve System and Assistant Secretary of the U.S. Treasury. | | | 77 | | | Director of NVR, Inc. (home construction). | |
Joseph J. Kearns
c/o Perkins Coie LLP
Counsel to the Independent
Directors
1155 Avenue of the Americas
22nd Floor
New York, NY 10036
Birth Year: 1942 | | Director | | Since August 1994 | | Senior Adviser, Kearns & Associates LLC (investment consulting); Chairperson of the Audit Committee (since October 2006) and Director or Trustee of various Morgan Stanley Funds (since August 1994); formerly, Deputy Chairperson of the Audit Committee (July 2003-September 2006) and Chairperson of the Audit Committee of various Morgan Stanley Funds (since August 1994); CFO of the J. Paul Getty Trust (1982-1999). | | | 78 | | | Director, Rubicon Investments (since February 2019); Prior to August 2016, Director of Electro Rent Corporation (equipment leasing); Prior to December 31, 2013, Director of The Ford Family Foundation. | |
Michael F. Klein
c/o Perkins Coie LLP
Counsel to the Independent
Directors
1155 Avenue of the Americas
22nd Floor
New York, NY 10036
Birth Year: 1958 | | Director | | Since August 2006 | | Chairperson of the Risk Committee (since January 2021); Managing Director, Aetos Alternatives Management, LP (since March 2000); Co-President, Aetos Alternatives Management, LP (since January 2004) and Co-Chief Executive Officer of Aetos Alternatives Management, LP (since August 2013); Chairperson of the Fixed Income Sub-Committee of the Investment Committee (2006-2020) and Director or Trustee of various Morgan Stanley Funds (since August 2006); formerly, Managing Director, Morgan Stanley & Co. Inc. and Morgan Stanley Dean Witter Investment Management and President, various Morgan Stanley Funds (June 1998-March 2000); Principal, Morgan Stanley & Co. Inc. and Morgan Stanley Dean Witter Investment Management (August 1997-December 1999). | | | 77 | | | Director of certain investment funds managed or sponsored by Aetos Alternatives Management, LP; Director of Sanitized AG and Sanitized Marketing AG (specialty chemicals). | |
29
Morgan Stanley Variable Insurance Fund, Inc.
Annual Report – December 31, 2021
Director and Officer Information (unaudited) (cont'd)
Independent Directors (cont'd):
Name, Address and Birth
Year of Independent Director | | Position(s)
Held with
Registrant | | Length of
Time
Served* | | Principal Occupation(s) During Past 5 Years and
Other Relevant Professional Experience | | Number of
Funds
in Fund
Complex
Overseen
by
Independent
Director** | | Other Directorships Held by Independent
Director During Past 5 Years*** | |
Patricia A. Maleski
c/o Perkins Coie LLP
Counsel to the Independent
Directors
1155 Avenue of the Americas
22nd Floor
New York, NY 10036
Birth Year: 1960 | | Director | | Since January 2017 | | Director or Trustee of various Morgan Stanley Funds (since January 2017); Managing Director, JPMorgan Asset Management (2004-2016); Oversight and Control Head of Fiduciary and Conflicts of Interest Program (2015-2016); Chief Control Officer — Global Asset Management (2013-2015); President, JPMorgan Funds (2010-2013); Chief Administrative Officer (2004-2013); various other positions including Treasurer and Board Liaison (since 2001). | | | 78 | | | Trustee, Nutley Family Service Bureau, Inc. (since January 2022). | |
W. Allen Reed
c/o Perkins Coie LLP
Counsel to the Independent
Directors
1155 Avenue of the Americas
22nd Floor
New York, NY 10036
Birth Year: 1947 | | Chair of the Board and Director | | Chair of the Board since August 2020 and Director since August 2006 | | Chair of the Boards of various Morgan Stanley Funds (since August 2020); Director or Trustee of various Morgan Stanley Funds (since August 2006); formerly, Vice Chair of the Boards of various Morgan Stanley Funds (January 2020-August 2020); President and Chief Executive Officer of General Motors Asset Management; Chairman and Chief Executive Officer of the GM Trust Bank and Corporate Vice President of General Motors Corporation (August 1994-December 2005). | | | 77 | | | Formerly, Director of Legg Mason, Inc. (2006-2019); and Director of the Auburn University Foundation (2010-2015). | |
Frances L. Cashman
c/o Perkins Coie LLP
Counsel to the Independent
Directors
1155 Avenue of the Americas
22nd Floor
New York, NY 10036
Birth Year: 1961 | | Advisory Board Member | | Advisory Board Member Since January 2022 | | Chief Executive Officer, Asset Management Division, Euromoney Institutional Investor PLC (financial information) (May 2021-Present); Executive Vice President and various other roles, Legg Mason & Co. (asset management) (2010-2020); Managing Director, Stifel Nicolaus (2005-2010). | | | 78 | | | Trustee and Investment Committee Member, Georgia Tech Foundation (Since June 2019); Trustee and Chair of Marketing Committee, Loyola Blakefield (Since September 2017); Trustee, MMI Gateway Foundation (since September 2017); Director and Investment Committee Member, Catholic Community Foundation Board (2012-2018); Director and Investment Committee Member, St. Ignatius Loyola Academy (2011-2017). | |
Eddie A. Grier
c/o Perkins Coie LLP
Counsel to the Independent
Directors
1155 Avenue of the Americas
22nd Floor
New York, NY 10036
Birth Year: 1955 | | Advisory Board Member | | Advisory Board Member Since January 2022 | | Dean, Santa Clara University Leavey School of Business (since April 2021); Dean, Virginia Commonwealth University School of Business (2010-2021); President and various other roles, Walt Disney Company (entertainment and media) (1981-2010). | | | 78 | | | Director, Witt/Keiffer, Inc. (executive search) (since 2016); Director, NuStar GP, LLC (energy) (since August 2021); Director, Sonida Senior Living, Inc. (residential community operator) (2016-2021); Director, NVR, Inc. (homebuilding) (2013-2020); Director, Middleburg Trust Company (wealth management) (2014-2019); Director Colonial Williamsburg Company (since 2012); Regent, University of Massachusetts Global (since 2021); Director and Chair, ChildFund International (2012-2021); Trustee, Brandman University (2010-2021); Director, Richmond Forum (2012-2019). | |
* This is the earliest date the Director began serving the Morgan Stanley Funds. Each Director serves an indefinite term, until his or her successor is elected.
** The Fund Complex includes (as of December 31, 2021) all open-end and closed-end funds (including all of their portfolios) advised by Morgan Stanley Investment Management Inc. (the "Adviser") and any funds that have an adviser that is an affiliated person of the Adviser (including, but not limited to, Morgan Stanley AIP GP LP).
*** This includes any directorships at public companies and registered investment companies held by the Director at any time during the past five years.
30
Morgan Stanley Variable Insurance Fund, Inc.
Annual Report – December 31, 2021
Director and Officer Information (unaudited) (cont'd)
Executive Officers:
Name, Address and Birth Year of
Executive Officer | | Position(s)
Held with
Registrant | | Length of
Time Served* | | Principal Occupation(s) During Past 5 Years | |
John H. Gernon
522 Fifth Avenue
New York, NY 10036
Birth Year: 1963 | | President and Principal Executive Officer | | Since September 2013 | | President and Principal Executive Officer of the Equity and Fixed Income Funds and the Morgan Stanley AIP Funds (since September 2013) and the Liquidity Funds and various money market funds (since May 2014) in the Fund Complex; Managing Director of the Adviser. | |
Deidre A. Downes
1633 Broadway
New York, NY 10019
Birth Year: 1977 | | Chief Compliance Officer | | Since November 2021 | | Executive Director of the Adviser (since January 2021) and Chief Compliance Officer of various Morgan Stanley Funds (since November 2021). Formerly, Vice President and Corporate Counsel at PGIM and Prudential Financial (October 2016 -December 2020). | |
Francis J. Smith
522 Fifth Avenue
New York, NY 10036
Birth Year: 1965 | | Treasurer and Principal Financial Officer | | Treasurer since July 2003 and Principal Financial Officer since September 2002 | | Managing Director of the Adviser and various entities affiliated with the Adviser; Treasurer (since July 2003) and Principal Financial Officer of various Morgan Stanley Funds (since September 2002). | |
Mary E. Mullin
1633 Broadway
New York, NY 10019
Birth Year: 1967 | | Secretary | | Since June 1999 | | Managing Director of the Adviser; Secretary of various Morgan Stanley Funds (since June 1999). | |
Michael J. Key
522 Fifth Avenue
New York, NY 10036
Birth Year: 1979 | | Vice President | | Since June 2017 | | Vice President of the Equity and Fixed Income Funds, Liquidity Funds, various money market funds and the Morgan Stanley AIP Funds in the Fund Complex (since June 2017); Executive Director of the Adviser; Head of Product Development for Equity and Fixed Income Funds (since August 2013). | |
* This is the earliest date the officer began serving the Morgan Stanley Funds. Each officer serves an indefinite term, until his or her successor is elected.
31
Morgan Stanley Variable Insurance Fund, Inc.
Annual Report – December 31, 2021
Adviser and Administrator
Morgan Stanley Investment Management Inc.
522 Fifth Avenue
New York, New York 10036
Distributor
Morgan Stanley Distribution, Inc.
522 Fifth Avenue
New York, New York 10036
Dividend Disbursing and Transfer Agent
DST Asset Manager Solutions, Inc.
2000 Crown Colony Drive
Quincy, Massachusetts 02169
Custodian
State Street Bank and Trust Company
One Lincoln Street
Boston, Massachusetts 02111
Legal Counsel
Dechert LLP
1095 Avenue of the Americas
New York, New York 10036
Counsel to the Independent Directors
Perkins Coie LLP
1155 Avenue of the Americas,
22nd Floor
New York, New York 10036
Independent Registered Public Accounting Firm
Ernst & Young LLP
200 Clarendon Street
Boston, Massachusetts 02116
Reporting to Shareholders
Each Morgan Stanley fund provides a complete schedule of portfolio holdings in its Semi-Annual and the Annual Reports within 60 days of the end of the fund's second and fourth fiscal quarters. The Semi-Annual and Annual Reports are filed electronically with the Securities and Exchange Commission ("SEC") on Form N-CSRS and Form N-CSR, respectively. Morgan Stanley also delivers the Semi-Annual and Annual Reports to fund shareholders and makes these reports available on its public website, www.morganstanley.com/im/shareholderreports. Each Morgan Stanley non-money market fund also files a complete schedule of portfolio holdings with the SEC for the fund's first and third fiscal quarters as an attachment to Form N-PORT. Morgan Stanley does not deliver the reports for the first and third fiscal quarters to shareholders, but makes the complete schedule of portfolio holdings for the fund's first and third fiscal quarters available on its public website. The holdings for each money market fund are also posted to the Morgan Stanley public website. You may obtain the Form N-PORT filings (as well as the Form N-CSR and N-CSRS filings) by accessing the SEC's website, www.sec.gov. You can also request copies of these materials, upon payment of a duplicating fee, by electronic request at the SEC's email address (publicinfo@sec.gov).
Proxy Voting Policies and Procedures and Proxy Voting Record
You may obtain a copy of the Company's Proxy Voting Policy and Procedures and information regarding how the Company voted proxies relating to portfolio securities during the most recent twelve-month period ended June 30, without charge, upon request, by calling toll free 1 (800) 548-7786 or by visiting our website at www.morganstanley.com/im/shareholderreports. This information is also available on the SEC's website at www.sec.gov.
This report is submitted for the general information of the shareholders of the Fund. For more detailed information about the Fund, its fees and expenses and other pertinent information, please read its Prospectus. The Company's Statement of Additional Information contains additional information about the Fund, including its Directors. It is available, without charge, by calling 1 (800) 548-7786.
Householding Notice
To reduce printing and mailing costs, the Fund attempts to eliminate duplicate mailings to the same address. The Fund delivers a single copy of certain shareholder documents, including shareholder reports, prospectuses and proxy materials, to investors with the same last name who reside at the same address. Your participation in this program will continue for an unlimited period of time unless you instruct us otherwise. You can request multiple copies of these documents by calling (800) 548-7786, 8:00 a.m. to 6:00 p.m., ET. Once our Customer Service Center has received your instructions, we will begin sending individual copies for each account within 30 days.
This report is not authorized for distribution to prospective investors in the Fund unless preceded or accompanied by an effective Prospectus. Read the Prospectus carefully before investing.
UIFMCGANN
3997594 EXP 02.28.23

Morgan Stanley Variable Insurance Fund, Inc.
Annual Report – December 31, 2021
Emerging Markets Debt Portfolio
The Fund is intended to be a funding vehicle for variable annuity contracts and variable life insurance policies offered by the separate accounts of certain life insurance companies.
Morgan Stanley Variable Insurance Fund, Inc.
Annual Report – December 31, 2021
Expense Example | | | 2 | | |
Investment Overview | | | 3 | | |
Portfolio of Investments | | | 5 | | |
Statement of Assets and Liabilities | | | 11 | | |
Statement of Operations | | | 12 | | |
Statements of Changes in Net Assets | | | 13 | | |
Financial Highlights | | | 14 | | |
Notes to Financial Statements | | | 16 | | |
Report of Independent Registered Public Accounting Firm | | | 25 | | |
Liquidity Risk Management Program | | | 26 | | |
Director and Officer Information | | | 27 | | |
1
Morgan Stanley Variable Insurance Fund, Inc.
Annual Report – December 31, 2021
Expense Example (unaudited)
Emerging Markets Debt Portfolio
As a shareholder of the Emerging Markets Debt Portfolio (the "Fund"), you incur two types of costs: (1) insurance company charges; and (2) ongoing costs, which may include advisory fees, administration fees, distribution (12b-1) fees and other Fund expenses. This example is intended to help you understand your ongoing costs (in dollars) of investing in the Fund and to compare these costs with the ongoing costs of investing in other mutual funds.
This example is based on an investment of $1,000 invested at the beginning of the six-month period ended December 31, 2021 and held for the entire six-month period.
Actual Expenses
The table below provides information about actual account values and actual expenses. You may use the information in this table, together with the amount you invested, to estimate the expenses that you paid over the period. Simply divide your account value by $1,000 (for example, an $8,600 account value divided by $1,000 = 8.6), then multiply the result by the number in the table under the heading entitled "Actual Expenses Paid During Period" to estimate the expenses you paid on your account during this period.
Hypothetical Example for Comparison Purposes
The table below provides information about hypothetical account values and hypothetical expenses based on the Fund's actual expense ratio and an assumed rate of return of 5% per year before expenses, which is not the Fund's actual return. The hypothetical account values and expenses may not be used to estimate the actual ending account balance or expenses you paid for the period. You may use this information to compare the ongoing costs of investing in the Fund and other funds. To do so, compare this 5% hypothetical example with the 5% hypothetical examples that appear in the shareholder reports of the other funds.
Please note that the expenses shown in the table are meant to highlight your ongoing costs only and do not reflect any insurance company charges. Therefore, the table below is useful in comparing ongoing costs, but will not help you determine the relative total cost of owning different funds. In addition, if these insurance company charges were included, your costs would have been higher.
| | | Beginning
Account Value
7/1/21 | | Actual Ending
Account Value
12/31/21 | | Hypothetical
Ending
Account Value | | Actual
Expenses Paid
During Period* | | Hypothetical
Expenses Paid
During Period* | | Net Expense
Ratio During
Period** | |
Emerging Markets Debt Portfolio Class I | | $ | 1,000.00 | | | $ | 986.10 | | | $ | 1,019.66 | | | $ | 5.51 | | | $ | 5.60 | | | | 1.10 | % | |
Emerging Markets Debt Portfolio Class II | | | 1,000.00 | | | | 986.80 | | | | 1,019.41 | | | | 5.76 | | | | 5.85 | | | | 1.15 | | |
* Expenses are calculated using each Fund Class' annualized net expense ratio (as disclosed), multiplied by the average account value over the period and multiplied by 184/365 (to reflect the most recent one-half year period).
** Annualized.
2
Morgan Stanley Variable Insurance Fund, Inc.
Annual Report – December 31, 2021
Investment Overview (unaudited)
Emerging Markets Debt Portfolio
The Fund seeks high total return by investing primarily in fixed income securities of government and government related issuers and, to a lesser extent, of corporate issuers in emerging market countries.
Performance
For the fiscal year ended December 31, 2021, the Fund's Class I shares had a total return based on net asset value and reinvestment of distributions per share of –2.02%, net of fees, and –1.96%, net of fees, for Class II shares. The Fund's Class I and Class II shares underperformed the Fund's benchmark, the J.P. Morgan Emerging Markets Bond Global Diversified Index (the "Index"), which returned –1.80%.
Factors Affecting Performance
• The upward move in U.S. Treasury yields during the first quarter of 2021 was driven mainly by higher inflation expectations, as the market focused on the "the reflation trade/commodity super cycle," supported by expectations of a booming economic rebound as some economies exit lockdown with pent-up demand, the larger-than-expected $1.9 billion U.S. fiscal relief package, and prospects of further expenditure in the form of President Biden's infrastructure program. However, the U.S. Treasury sell-off experienced in the first quarter reversed itself in the second quarter. At its policy meeting in June 2021, the Federal Reserve (Fed) surprised the market by signaling two rate hikes in 2023 (as opposed to expectations of no hike until 2024). Equity markets made new highs, amid a global macroeconomic backdrop that was also generally supportive for emerging markets. Risk appetite then receded later in the year, which was challenging for emerging markets assets, particularly in November when there was increased uncertainty around the omicron variant of COVID-19 and the prospects of Fed tightening.
• In the 12-month period, bonds from countries in Asia and the Middle East led the way, while those from Latin America and Europe lagged. In particular, bonds from Zambia, Ecuador and Belize outperformed the most, while bonds from El Salvador, Ethiopia and Venezuela lagged.
• For the Fund, overweight positions in El Salvador, Oman and Ecuador, along with overall positioning in Turkey, added to relative performance in the year overall. Security selection was additive to relative returns, particularly in Mexico and Venezuela. Conversely, overall positioning in Sri Lanka and Zambia detracted from relative performance, as did security selection in Egypt and Bahrain.
Management Strategies
• We have adopted an opportunistic stance toward emerging market debt at the beginning of 2022. Though tighter global monetary policy, elevated inflation and uncertainty over the omicron variant may limit the scope for a sizable rally in risky assets, global growth has remained solid and commodity prices recovered in December 2021. Against such a backdrop, we believe there is room for high yield emerging markets credit to outperform investment grade credit. On the local debt side, even though emerging market currencies may face near-term challenges if dollar strength persists in early 2022, we believe some currencies look substantially undervalued (mainly in Latin America) and could outperform in a scenario where uncertainty subsides. In local rates, we prefer yield curves that are already pricing in aggressive monetary policy tightening.
• Potential developments that could turn our cautious stance more bullish include the prospects of growth-supportive policies in China, confirmation that the omicron variant is less severe than previously thought and/or that existing vaccines remain effective against it, and an easing of supply bottlenecks that could provide a respite to rising inflationary pressures globally, thereby reducing the need for tighter monetary policy. In addition, we continue to monitor idiosyncratic issues, including monetary policy developments in Turkey, the status of negotiations between Argentina and the International Monetary Fund over a new program, as well as geopolitical risks involving Russia and Ukraine.
3
Morgan Stanley Variable Insurance Fund, Inc.
Annual Report – December 31, 2021
Investment Overview (unaudited) (cont'd)
Emerging Markets Debt Portfolio

In accordance with SEC regulations, the Fund's performance shown assumes that all recurring fees (including management fees) were deducted and all dividends and distributions were reinvested. The performance of Class II shares will vary from the performance of Class I shares based upon its different inception date and will be negatively impacted by additional fees assessed to that class.
Performance Compared to the J.P. Morgan Emerging Markets Bond Global Diversified Index(1) and the Emerging Markets Debt Blended Index(2)
| | | Period Ended December 31, 2021 | |
| | | Total Returns(3) | |
| | | | | Average Annual | |
| | | One
Year | | Five
Years | | Ten
Years | | Since
Inception(6) | |
Fund – Class I(4) | | | –2.02 | % | | | 3.82 | % | | | 3.86 | % | | | 6.25 | % | |
J.P. Morgan Emerging Markets
Bond Global Diversified Index | | | –1.80 | | | | 4.65 | | | | 5.28 | | | | 7.76 | | |
Emerging Markets Debt Blended
Index | | | –1.80 | | | | 4.28 | | | | 4.86 | | | | 7.50 | | |
Fund – Class II(5) | | | –1.96 | | | | 3.77 | | | | 3.82 | | | | 6.82 | | |
J.P. Morgan Emerging Markets
Bond Global Diversified Index | | | –1.80 | | | | 4.65 | | | | 5.28 | | | | 7.64 | | |
Emerging Markets Debt Blended
Index | | | –1.80 | | | | 4.28 | | | | 4.86 | | | | 7.66 | | |
Performance data quoted represents past performance, which is no guarantee of future results, and current performance may be lower or higher than the figures shown. Performance assumes that all dividends and distributions, if any, were reinvested. For the most recent month-end performance figures, please contact the issuing insurance company or speak with your financial advisor. Investment return and principal value will fluctuate so that Fund shares, when redeemed, may be worth more or less than their original cost. Total returns do not reflect the deduction of taxes that a shareholder would pay on Fund distributions or the redemption of Fund shares. Performance shown does not reflect fees and expenses imposed by your insurance company's separate account. If performance information included the effect of these additional charges, the total returns would be lower.
(1) The J.P. Morgan Emerging Markets Bond Global Diversified Index tracks total returns for U.S. dollar-denominated debt instruments issued by emerging markets sovereign and quasi-sovereign entities: Brady Bonds, loans, Eurobonds and local market instruments for emerging market countries but limits the weights of countries with larger debt stocks by only including a specified portion of these countries' eligible current face amounts of debt outstanding. The Index is unmanaged and its returns do not include any sales charges or fees. Such costs would lower performance. It is not possible to invest directly in an index.
(2) The Emerging Markets Debts Blended Index is a performance linked benchmark of old and new benchmark of the Fund. Old benchmark represented by J.P. Morgan Emerging Markets Bond Global Index (benchmark that tracks total returns for U.S. dollar-denominated debt instruments issued by emerging markets sovereign and quasi-sovereign entities) from the Fund's inception to December 31, 2019 and the new benchmark represented by J.P. Morgan Emerging Markets Bond Global Diversified Index for periods thereafter. The Index is unmanaged and its returns do not include any sales charges or fees. Such costs would lower performance. It is not possible to invest directly in an index.
(3) Total returns for the Fund reflect fees waived and expenses reimbursed, if applicable, by the Adviser (as defined herein). Without such waivers and reimbursements, total returns would have been lower.
(4) Commenced operations on June 16, 1997.
(5) Commenced offering on December 19, 2002.
(6) For comparative purposes, average annual since inception returns listed for the Index refers to the inception date or initial offering of the respective share class of the Fund, not the inception of the Index.
4
Morgan Stanley Variable Insurance Fund, Inc.
Annual Report – December 31, 2021
Portfolio of Investments
Emerging Markets Debt Portfolio
| | | Face Amount
(000) | | Value
(000) | |
Fixed Income Securities (97.6%) | |
Angola (1.6%) | |
Sovereign (1.6%) | |
Angolan Government International Bond,
8.00%, 11/26/29 | | $ | 695 | | | $ | 687 | | |
8.00%, 11/26/29 (a) | | | 790 | | | | 782 | | |
9.38%, 5/8/48 (a) | | | 890 | | | | 874 | | |
| | | | 2,343 | | |
Argentina (1.2%) | |
Sovereign (1.2%) | |
Argentine Republic Government
International Bond,
0.50%, 7/9/30 (b) | | | 786 | | | | 277 | | |
1.00%, 7/9/29 | | | 148 | | | | 54 | | |
1.13%, 7/9/35 (b) | | | 690 | | | | 222 | | |
2.00%, 1/9/38 (b) | | | 3,150 | | | | 1,197 | | |
| | | | 1,750 | | |
Armenia (0.5%) | |
Sovereign (0.5%) | |
Republic of Armenia International Bond,
3.60%, 2/2/31 | | | 250 | | | | 234 | | |
3.95%, 9/26/29 | | | 460 | | | | 448 | | |
| | | | 682 | | |
Azerbaijan (1.0%) | |
Sovereign (1.0%) | |
Republic of Azerbaijan International Bond,
3.50%, 1/9/32 | | | 1,460 | | | | 1,481 | | |
Bahrain (0.7%) | |
Sovereign (0.7%) | |
Bahrain Government International Bond,
7.50%, 9/20/47 | | | 1,050 | | | | 1,065 | | |
Belarus (0.4%) | |
Sovereign (0.4%) | |
Republic of Belarus International Bond,
6.20%, 2/28/30 (a) | | | 720 | | | | 574 | | |
Brazil (3.6%) | |
Corporate Bonds (1.2%) | |
Braskem Netherlands Finance BV,
4.50%, 1/31/30 (a) | | | 1,030 | | | | 1,098 | | |
MARB BondCo PLC,
3.95%, 1/29/31 (a) | | | 480 | | | | 459 | | |
Suzano Austria GmbH,
3.75%, 1/15/31 | | | 175 | | | | 178 | | |
| | | | 1,735 | | |
Sovereign (2.4%) | |
Brazilian Government International Bond,
3.88%, 6/12/30 | | | 200 | | | | 194 | | |
4.50%, 5/30/29 | | | 420 | | | | 431 | | |
5.00%, 1/27/45 | | | 1,639 | | | | 1,542 | | |
6.00%, 4/7/26 | | | 1,250 | | | | 1,403 | | |
| | | | 3,570 | | |
| | | | 5,305 | | |
| | | Face Amount
(000) | | Value
(000) | |
Chile (1.5%) | |
Corporate Bond (0.7%) | |
Colbun SA,
3.15%, 6/3/30 (a) | | $ | 990 | | | $ | 992 | | |
Sovereign (0.8%) | |
Chile Government International Bond,
3.50%, 1/25/50 | | | 900 | | | | 934 | | |
3.86%, 6/21/47 | | | 230 | | | | 255 | | |
| | | | 1,189 | | |
| | | | 2,181 | | |
China (3.0%) | |
Sovereign (3.0%) | |
Sinopec Group Overseas
Development 2012 Ltd.,
4.88%, 5/17/42 | | | 390 | | | | 482 | | |
Sinopec Group Overseas
Development 2013 Ltd.,
4.38%, 10/17/23 | | | 650 | | | | 687 | | |
Sinopec Group Overseas
Development 2018 Ltd.,
2.95%, 12/11/29 (a)(c) | | | 1,600 | | | | 1,667 | | |
Three Gorges Finance I Cayman
Islands Ltd.,
3.70%, 6/10/25 | | | 750 | | | | 800 | | |
3.70%, 6/10/25 (a) | | | 838 | | | | 894 | | |
| | | | 4,530 | | |
Colombia (2.5%) | |
Corporate Bonds (0.4%) | |
Millicom International Cellular SA,
4.50%, 4/27/31 (a) | | | 357 | | | | 360 | | |
Termocandelaria Power Ltd.,
7.88%, 1/30/29 (a) | | | 268 | | | | 269 | | |
| | | | 629 | | |
Sovereign (2.1%) | |
Colombia Government International Bond,
3.00%, 1/30/30 (c) | | | 816 | | | | 747 | | |
4.13%, 5/15/51 | | | 1,100 | | | | 897 | | |
5.00%, 6/15/45 | | | 1,740 | | | | 1,577 | | |
| | | | 3,221 | | |
| | | | 3,850 | | |
Costa Rica (0.8%) | |
Sovereign (0.8%) | |
Costa Rica Government International Bond,
6.13%, 2/19/31 (a) | | | 380 | | | | 384 | | |
7.00%, 4/4/44 | | | 260 | | | | 256 | | |
7.16%, 3/12/45 | | | 540 | | | | 536 | | |
| | | | 1,176 | | |
Croatia (0.3%) | |
Sovereign (0.3%) | |
Croatia Government International Bond,
6.00%, 1/26/24 | | | 400 | | | | 439 | | |
The accompanying notes are an integral part of the financial statements.
5
Morgan Stanley Variable Insurance Fund, Inc.
Annual Report – December 31, 2021
Portfolio of Investments (cont'd)
Emerging Markets Debt Portfolio
| | | Face Amount
(000) | | Value
(000) | |
Dominican Republic (4.3%) | |
Sovereign (4.3%) | |
Dominican Republic International Bond,
4.88%, 9/23/32 (a) | | $ | 230 | | | $ | 234 | | |
5.30%, 1/21/41 (a) | | | 710 | | | | 703 | | |
5.88%, 1/30/60 (a) | | | 1,360 | | | | 1,311 | | |
6.00%, 7/19/28 (a) | | | 570 | | | | 638 | | |
6.85%, 1/27/45 (a) | | | 740 | | | | 818 | | |
6.88%, 1/29/26 (a) | | | 820 | | | | 936 | | |
7.45%, 4/30/44 (a) | | | 739 | | | | 876 | | |
9.75%, 6/5/26 (a) | | DOP | 44,050 | | | | 855 | | |
| | | | 6,371 | | |
Ecuador (2.1%) | |
Sovereign (2.1%) | |
Ecuador Government International Bond,
0.00%, 7/31/30 (a) | | $ | 273 | | | | 155 | | |
0.50%, 7/31/40 (b) | | | 265 | | | | 156 | | |
0.50%, 7/31/40 (a)(b) | | | 1,126 | | | | 662 | | |
1.00%, 7/31/35 (b) | | | 440 | | | | 291 | | |
1.00%, 7/31/35 (a)(b) | | | 1,707 | | | | 1,129 | | |
5.00%, 7/31/30 (a)(b) | | | 937 | | | | 779 | | |
| | | | 3,172 | | |
Egypt (4.4%) | |
Sovereign (4.4%) | |
Egypt Government Bond,
13.77%, 1/5/24 | | EGP | 20,850 | | | | 1,322 | | |
14.06%, 1/12/26 | | | 14,260 | | | | 905 | | |
Egypt Government International Bond,
4.75%, 4/16/26 | | EUR | 210 | | | | 231 | | |
5.25%, 10/6/25 (a) | | $ | 200 | | | | 202 | | |
5.80%, 9/30/27 (a) | | EUR | 880 | | | | 848 | | |
6.38%, 4/11/31 (a) | | | 1,050 | | | | 1,107 | | |
6.59%, 2/21/28 | | $ | 330 | | | | 322 | | |
7.50%, 2/16/61 (a) | | | 770 | | | | 631 | | |
8.15%, 11/20/59 (a) | | | 840 | | | | 720 | | |
8.88%, 5/29/50 (a) | | | 340 | | | | 310 | | |
| | | | 6,598 | | |
El Salvador (0.6%) | |
Sovereign (0.6%) | |
El Salvador Government International Bond,
6.38%, 1/18/27 | | | 1,141 | | | | 699 | | |
8.63%, 2/28/29 (a) | | | 370 | | | | 229 | | |
| | | | 928 | | |
Gabon (0.4%) | |
Sovereign (0.4%) | |
Republic of Gabon,
6.95%, 6/16/25 (a) | | | 610 | | | | 635 | | |
Ghana (1.9%) | |
Sovereign (1.9%) | |
Ghana Government International Bond,
7.75%, 4/7/29 | | | 950 | | | | 798 | | |
7.88%, 2/11/35 | | | 345 | | | | 272 | | |
| | | Face Amount
(000) | | Value
(000) | |
8.63%, 6/16/49 (a) | | $ | 460 | | | $ | 366 | | |
8.88%, 5/7/42 (a) | | | 680 | | | | 553 | | |
8.95%, 3/26/51 (a) | | | 1,070 | | | | 860 | | |
| | | | 2,849 | | |
Guatemala (0.9%) | |
Sovereign (0.9%) | |
Guatemala Government Bond,
4.88%, 2/13/28 | | | 687 | | | | 741 | | |
6.13%, 6/1/50 (a) | | | 320 | | | | 368 | | |
Republic of Guatemala,
4.65%, 7/10/41 (a) | | | 310 | | | | 310 | | |
| | | | 1,419 | | |
Honduras (0.1%) | |
Sovereign (0.1%) | |
Honduras Government International Bond,
5.63%, 6/24/30 (a) | | | 180 | | | | 188 | | |
Hungary (1.1%) | |
Sovereign (1.1%) | |
Hungary Government International Bond,
5.38%, 3/25/24 | | | 1,250 | | | | 1,359 | | |
7.63%, 3/29/41 | | | 220 | | | | 361 | | |
| | | | 1,720 | | |
India (0.6%) | |
Sovereign (0.6%) | |
Export-Import Bank of India,
3.38%, 5/8/26 (a) | | | 790 | | | | 829 | | |
Indonesia (5.8%) | |
Sovereign (5.8%) | |
Indonesia Government International Bond,
3.85%, 7/18/27 | | | 400 | | | | 439 | | |
4.13%, 1/15/25 | | | 1,484 | | | | 1,603 | | |
4.45%, 4/15/70 | | | 960 | | | | 1,141 | | |
4.75%, 1/8/26 (a) | | | 830 | | | | 928 | | |
4.75%, 1/8/26 | | | 990 | | | | 1,107 | | |
5.35%, 2/11/49 (c) | | | 200 | | | | 263 | | |
5.88%, 1/15/24 | | | 1,250 | | | | 1,371 | | |
Pertamina Persero PT,
6.45%, 5/30/44 (a) | | | 680 | | | | 890 | | |
6.50%, 11/7/48 (a) | | | 660 | | | | 883 | | |
| | | | 8,625 | | |
Ivory Coast (0.4%) | |
Sovereign (0.4%) | |
Ivory Coast Government
International Bond,
4.88%, 1/30/32 (a) | | EUR | 590 | | | | 648 | | |
Jamaica (0.8%) | |
Sovereign (0.8%) | |
Jamaica Government International Bond,
7.88%, 7/28/45 | | $ | 720 | | | | 1,000 | | |
8.00%, 3/15/39 | | | 150 | | | | 208 | | |
| | | | 1,208 | | |
The accompanying notes are an integral part of the financial statements.
6
Morgan Stanley Variable Insurance Fund, Inc.
Annual Report – December 31, 2021
Portfolio of Investments (cont'd)
Emerging Markets Debt Portfolio
| | | Face Amount
(000) | | Value
(000) | |
Jordan (0.6%) | |
Sovereign (0.6%) | |
Jordan Government International Bond,
7.38%, 10/10/47 (a) | | $ | 840 | | | $ | 851 | | |
Kazakhstan (2.3%) | |
Sovereign (2.3%) | |
Kazakhstan Government International Bond,
5.13%, 7/21/25 (a) | | | 200 | | | | 225 | | |
5.13%, 7/21/25 | | | 1,000 | | | | 1,128 | | |
6.50%, 7/21/45 | | | 520 | | | | 747 | | |
KazMunayGas National Co., JSC,
6.38%, 10/24/48 (a) | | | 980 | | | | 1,291 | | |
| | | | 3,391 | | |
Kenya (0.8%) | |
Sovereign (0.8%) | |
Kenya Government International Bond,
8.00%, 5/22/32 (a) | | | 1,110 | | | | 1,215 | | |
Lebanon (0.2%) | |
Sovereign (0.2%) | |
Lebanon Government International Bond,
6.85%, 3/23/27 - 5/25/29 (d)(e) | | | 2,940 | | | | 318 | | |
Malaysia (1.4%) | |
Sovereign (1.4%) | |
Petronas Capital Ltd.,
3.50%, 3/18/25 - 4/21/30 | | | 1,970 | | | | 2,117 | | |
Mexico (7.5%) | |
Corporate Bond (0.3%) | |
Cemex SAB de CV,
5.13%, 8/6/26 (a)(f) | | | 400 | | | | 415 | | |
Sovereign (7.2%) | |
Banco Nacional de Comercio Exterior SNC,
2.72%, 8/11/31 (a) | | | 600 | | | | 594 | | |
Mexican BonosSeries M,
7.75%, 5/29/31 | | MXN | 29,597 | | | | 1,462 | | |
Mexico Government International Bond,
4.15%, 3/28/27 | | $ | 706 | | | | 781 | | |
4.50%, 4/22/29 | | | 410 | | | | 457 | | |
Petroleos Mexicanos,
6.35%, 2/12/48 | | | 1,250 | | | | 1,072 | | |
6.70%, 2/16/32 (a)(c) | | | 2,294 | | | | 2,322 | | |
6.95%, 1/28/60 | | | 470 | | | | 420 | | |
7.69%, 1/23/50 | | | 3,738 | | | | 3,615 | | |
| | | | 10,723 | | |
| | | | 11,138 | | |
Mongolia (0.7%) | |
Sovereign (0.7%) | |
Mongolia Government International Bond,
4.45%, 7/7/31 (a) | | | 380 | | | | 361 | | |
5.13%, 4/7/26 (a) | | | 240 | | | | 246 | | |
5.63%, 5/1/23 | | | 399 | | | | 411 | | |
| | | | 1,018 | | |
Morocco (0.4%) | |
Sovereign (0.4%) | |
Morocco Government International Bond,
4.00%, 12/15/50 (a) | | | 610 | | | | 555 | | |
| | | Face Amount
(000) | | Value
(000) | |
Nigeria (2.8%) | |
Corporate Bond (0.7%) | |
IHS Netherlands Holdco BV,
8.00%, 9/18/27 (a) | | $ | 950 | | | $ | 1,008 | | |
Sovereign (2.1%) | |
Nigeria Government International Bond,
6.38%, 7/12/23 | | | 270 | | | | 280 | | |
6.50%, 11/28/27 (a) | | | 590 | | | | 590 | | |
7.14%, 2/23/30 (a) | | | 860 | | | | 848 | | |
7.38%, 9/28/33 (a) | | | 200 | | | | 191 | | |
8.25%, 9/28/51 (a) | | | 360 | | | | 338 | | |
9.25%, 1/21/49 (a) | | | 900 | | | | 919 | | |
| | | | 3,166 | | |
| | | | 4,174 | | |
Oman (3.3%) | |
Sovereign (3.3%) | |
Oman Government International Bond,
6.00%, 8/1/29 (a) | | | 2,200 | | | | 2,373 | | |
6.25%, 1/25/31 (a) | | | 2,370 | | | | 2,596 | | |
| | | | 4,969 | | |
Panama (2.3%) | |
Corporate Bond (0.3%) | |
AES Panama Generation Holdings SRL,
4.38%, 5/31/30 (a) | | | 375 | | | | 391 | | |
Sovereign (2.0%) | |
Panama Government International Bond,
3.87%, 7/23/60 | | | 470 | | | | 472 | | |
4.00%, 9/22/24 | | | 914 | | | | 972 | | |
4.50%, 4/1/56 | | | 450 | | | | 497 | | |
8.88%, 9/30/27 | | | 763 | | | | 1,030 | | |
| | | | 2,971 | | |
| | | | 3,362 | | |
Paraguay (0.9%) | |
Sovereign (0.9%) | |
Paraguay Government International Bond,
4.95%, 4/28/31 (a) | | | 600 | | | | 676 | | |
5.40%, 3/30/50 (a) | | | 550 | | | | 630 | | |
| | | | 1,306 | | |
Peru (2.8%) | |
Corporate Bond (0.2%) | |
Intercorp Peru Ltd.,
3.88%, 8/15/29 | | | 320 | | | | 312 | | |
Sovereign (2.6%) | |
Corporación Financiera de Desarrollo SA,
5.25%, 7/15/29 (a) | | | 998 | | | | 1,033 | | |
Peruvian Government
International Bond,
5.63%, 11/18/50 | | | 890 | | | | 1,254 | | |
6.55%, 3/14/37 | | | 1,150 | | | | 1,572 | | |
| | | | 3,859 | | |
| | | | 4,171 | | |
The accompanying notes are an integral part of the financial statements.
7
Morgan Stanley Variable Insurance Fund, Inc.
Annual Report – December 31, 2021
Portfolio of Investments (cont'd)
Emerging Markets Debt Portfolio
| | | Face Amount
(000) | | Value
(000) | |
Philippines (2.1%) | |
Sovereign (2.1%) | |
Philippine Government International Bond,
3.95%, 1/20/40 | | $ | 386 | | | $ | 432 | | |
9.50%, 2/2/30 | | | 1,749 | | | | 2,718 | | |
| | | | 3,150 | | |
Poland (0.6%) | |
Sovereign (0.6%) | |
Republic of Poland Government
International Bond,
3.00%, 3/17/23 | | | 940 | | | | 966 | | |
Qatar (4.3%) | |
Sovereign (4.3%) | |
Qatar Government International Bond,
3.75%, 4/16/30 (a) | | | 1,300 | | | | 1,461 | | |
4.00%, 3/14/29 | | | 1,080 | | | | 1,219 | | |
4.82%, 3/14/49 (a) | | | 2,870 | | | | 3,771 | | |
| | | | 6,451 | | |
Romania (1.4%) | |
Sovereign (1.4%) | |
Romanian Government International Bond,
1.75%, 7/13/30 (a) | | EUR | 315 | | | | 336 | | |
2.00%, 4/14/33 | | | 330 | | | | 343 | | |
4.00%, 2/14/51 | | $ | 830 | | | | 833 | | |
4.38%, 8/22/23 | | | 94 | | | | 99 | | |
4.88%, 1/22/24 | | | 500 | | | | 533 | | |
| | | | 2,144 | | |
Russia (4.0%) | |
Sovereign (4.0%) | |
Russian Foreign Bond — Eurobond,
4.50%, 4/4/22 | | | 1,800 | | | | 1,815 | | |
5.63%, 4/4/42 | | | 3,200 | | | | 4,180 | | |
| | | | 5,995 | | |
Saudi Arabia (2.5%) | |
Corporate Bond (0.5%) | |
SA Global Sukuk Ltd.,
2.69%, 6/17/31 (a) | | | 780 | | | | 786 | | |
Sovereign (2.0%) | |
Saudi Government International Bond,
3.45%, 2/2/61 (a) | | | 1,000 | | | | 1,012 | | |
4.38%, 4/16/29 | | | 440 | | | | 506 | | |
5.25%, 1/16/50 (a) | | | 1,080 | | | | 1,424 | | |
| | | | 2,942 | | |
| | | | 3,728 | | |
Senegal (0.8%) | |
Sovereign (0.8%) | |
Senegal Government International Bond,
6.25%, 5/23/33 (a) | | | 1,220 | | | | 1,259 | | |
Serbia (0.2%) | |
Sovereign (0.2%) | |
Serbia International Bond,
2.13%, 12/1/30 (a) | | | 310 | | | | 291 | | |
| | | Face Amount
(000) | | Value
(000) | |
South Africa (1.6%) | |
Sovereign (1.6%) | |
Eskom Holdings SOC Ltd.,
8.45%, 8/10/28 | | $ | 710 | | | $ | 767 | | |
Republic of South Africa Government
International Bond,
4.30%, 10/12/28 | | | 1,540 | | | | 1,566 | | |
| | | | 2,333 | | |
Sri Lanka (1.3%) | |
Sovereign (1.3%) | |
Sri Lanka Government International Bond,
6.20%, 5/11/27 | | | 1,800 | | | | 923 | | |
7.55%, 3/28/30 | | | 1,900 | | | | 955 | | |
| | | | 1,878 | | |
Turkey (2.9%) | |
Sovereign (2.9%) | |
Turkey Government International Bond,
4.88%, 4/16/43 | | | 630 | | | | 484 | | |
5.25%, 3/13/30 | | | 760 | | | | 656 | | |
5.75%, 3/22/24 | | | 1,580 | | | | 1,548 | | |
5.88%, 6/26/31 | | | 1,080 | | | | 962 | | |
6.88%, 3/17/36 | | | 700 | | | | 659 | | |
| | | | 4,309 | | |
Ukraine (3.2%) | |
Corporate Bond (0.3%) | |
NPC Ukrenergo,
6.88%, 11/9/26 (a) | | | 510 | | | | 448 | | |
Sovereign (2.9%) | |
Ukraine Government International Bond,
6.88%, 5/21/29 | | | 1,000 | | | | 889 | | |
7.75%, 9/1/23 - 9/1/26 | | | 3,550 | | | | 3,448 | | |
| | | | 4,337 | | |
| | | | 4,785 | | |
United Arab Emirates (3.5%) | |
Corporate Bond (0.6%) | |
Galaxy Pipeline Assets Bidco Ltd.,
3.25%, 9/30/40 (a) | | | 965 | | | | 978 | | |
Sovereign (2.9%) | |
Abu Dhabi Government
International Bond,
2.50%, 9/30/29 (a) | | | 1,750 | | | | 1,819 | | |
2.70%, 9/2/70 (a) | | | 820 | | | | 748 | | |
3.13%, 5/3/26 | | | 938 | | | | 1,000 | | |
DP World Crescent Ltd.,
4.85%, 9/26/28 | | | 740 | | | | 832 | | |
| | | | 4,399 | | |
| | | | 5,377 | | |
Uruguay (1.7%) | |
Sovereign (1.7%) | |
Uruguay Government International Bond,
4.38%, 10/27/27 | | | 1,100 | | | | 1,239 | | |
5.10%, 6/18/50 | | | 1,020 | | | | 1,351 | | |
| | | | 2,590 | | |
The accompanying notes are an integral part of the financial statements.
8
Morgan Stanley Variable Insurance Fund, Inc.
Annual Report – December 31, 2021
Portfolio of Investments (cont'd)
Emerging Markets Debt Portfolio
| | | Face Amount
(000) | | Value
(000) | |
Uzbekistan (0.3%) | |
Sovereign (0.3%) | |
Republic of Uzbekistan Bond,
3.70%, 11/25/30 (a) | | $ | 410 | | | $ | 394 | | |
Venezuela (0.4%) | |
Sovereign (0.4%) | |
Petroleos de Venezuela SA,
6.00%, 11/15/26 (d)(e) | | | 15,740 | | | | 650 | | |
Zambia (0.3%) | |
Sovereign (0.3%) | |
Zambia Government International Bond,
5.38%, 9/20/22 | | | 650 | | | | 489 | | |
Total Fixed Income Securities (Cost $155,411) | | | 145,940 | | |
| | | No. of
Warrants | | | |
Warrant (0.0%) (g) | |
Venezuela (0.0%) (g) | |
Venezuela Government International Bond,
Oil-Linked Payment Obligation, expires
4/15/20 (h) (Cost $—) | | | 3,750 | | | | 8 | | |
| | | Shares | | | |
Short-Term Investments (2.8%) | |
Securities held as Collateral on Loaned Securities (1.5%) | |
Investment Company (1.3%) | |
Morgan Stanley Institutional Liquidity Funds —
Treasury Securities Portfolio — Institutional
Class (See Note H) | | | 1,871,185 | | | | 1,871 | | |
| | | Face Amount
(000) | | | |
Repurchase Agreements (0.2%) | |
HSBC Securities USA, Inc., (0.05%, dated
12/31/21, due 1/3/22; proceeds $19;
fully collateralized by U.S. Government
obligations; 0.00% due
5/15/25 - 11/15/28; valued at $19) | | $ | 19 | | | | 19 | | |
Merrill Lynch & Co., Inc., (0.05%, dated
12/31/21, due 1/3/22; proceeds $337;
fully collateralized by U.S. Government
obligations; 0.13% - 2.88% due
7/31/23 - 7/31/25; valued at $344) | | | 337 | | | | 337 | | |
| | | | 356 | | |
Total Securities held as Collateral on
Loaned Securities (Cost $2,227) | | | 2,227 | | |
| | | Shares | | | |
Investment Company (0.6%) | |
Morgan Stanley Institutional Liquidity Funds —
Treasury Securities Portfolio — Institutional
Class (See Note H) (Cost $960) | | | 959,944 | | | | 960 | | |
| | | Face Amount
(000) | | Value
(000) | |
Egypt (0.7%) | |
Sovereign (0.7%) | |
Egypt Treasury Bills,
12.95%, 9/13/22 (Cost $984) | | EGP | 16,800 | | | $ | 986 | | |
Total Short-Term Investments (Cost $4,171) | | | 4,173 | | |
Total Investments (100.4%) (Cost $159,582)
Including $2,938 of Securities Loaned (i)(j) | | | 150,121 | | |
Liabilities in Excess of Other Assets (–0.4%) | | | (527 | ) | |
Net Assets (100.0%) | | $ | 149,594 | | |
Country assignments and aggregations are based generally on third party vendor classifications and information, and may be different from the assignments and aggregations under the policies set forth in the Fund's prospectus and/or statement of additional information relating to geographic classifications.
(a) 144A security — Certain conditions for public sale may exist. Unless otherwise noted, these securities are deemed to be liquid.
(b) Multi-step — Coupon rate changes in predetermined increments to maturity. Rate disclosed is as of December 31, 2021. Maturity date disclosed is the ultimate maturity date.
(c) All or a portion of this security was on loan at December 31, 2021.
(d) Non-income producing security; bond in default.
(e) Issuer in bankruptcy.
(f) Perpetual — One or more securities do not have a predetermined maturity date. Rates for these securities are fixed for a period of time, after which they revert to a floating rate. Interest rates in effect are as of December 31, 2021.
(g) Amount is less than 0.05%.
(h) Perpetual maturity date. Date disclosed is the last expiration date.
(i) Securities are available for collateral in connection with an open foreign currency forward exchange contracts.
(j) At December 31, 2021, the aggregate cost for federal income tax purposes is approximately $160,206,000. The aggregate gross unrealized appreciation is approximately $7,377,000 and the aggregate gross unrealized depreciation is approximately $17,488,000, resulting in net unrealized depreciation of approximately $10,111,000.
Foreign Currency Forward Exchange Contracts:
The Fund had the following foreign currency forward exchange contracts open at December 31, 2021:
Counterparty | | Contracts
to
Deliver
(000) | | In
Exchange
For
(000) | | Delivery
Date | | Unrealized
Appreciation
(Depreciation)
(000) | |
Barclays Bank PLC | | EUR | 2,790 | | | $ | 3,165 | | | 2/18/22 | | $ | (14 | ) | |
JPMorgan Chase
Bank NA | | MXN | 16,000 | | | $ | 761 | | | 2/18/22 | | | (15 | ) | |
UBS AG | | $ | 337 | | | EUR | 298 | | | 2/18/22 | | | 3 | | |
| | | $ | (26 | ) | |
DOP — Dominican Peso
EGP — Egyptian Pound
EUR — Euro
MXN — Mexican Peso
The accompanying notes are an integral part of the financial statements.
9
Morgan Stanley Variable Insurance Fund, Inc.
Annual Report – December 31, 2021
Portfolio of Investments (cont'd)
Emerging Markets Debt Portfolio
Portfolio Composition*
Classification | | Percentage of
Total Investments | |
Sovereign | | | 93.5 | % | |
Corporate Bonds | | | 5.2 | | |
Other** | | | 1.3 | | |
Total Investments | | | 100.0 | %*** | |
* Percentages indicated are based upon total investments (excluding Securities held as Collateral on Loaned Securities) as of December 31, 2021.
** Industries and/or investment types representing less than 5% of total investments.
*** Does not include open foreign currency forward exchange contracts with net unrealized depreciation of approximately $26,000.
The accompanying notes are an integral part of the financial statements.
10
Morgan Stanley Variable Insurance Fund, Inc.
Annual Report – December 31, 2021
Emerging Markets Debt Portfolio
Statement of Assets and Liabilities | | December 31, 2021
(000) | |
Assets: | |
Investments in Securities of Unaffiliated Issuers, at Value(1) (Cost $156,751) | | $ | 147,290 | | |
Investment in Security of Affiliated Issuer, at Value (Cost $2,831) | | | 2,831 | | |
Total Investments in Securities, at Value (Cost $159,582) | | | 150,121 | | |
Foreign Currency, at Value (Cost $33) | | | 18 | | |
Cash from Securities Lending | | | 2 | | |
Interest Receivable | | | 2,319 | | |
Receivable for Fund Shares Sold | | | 79 | | |
Unrealized Appreciation on Foreign Currency Forward Exchange Contracts | | | 3 | | |
Receivable from Securities Lending Income | | | 1 | | |
Receivable from Affiliate | | | — | @ | |
Other Assets | | | 21 | | |
Total Assets | | | 152,564 | | |
Liabilities: | |
Collateral on Securities Loaned, at Value | | | 2,229 | | |
Deferred Capital Gain Country Tax | | | 293 | | |
Payable for Advisory Fees | | | 238 | | |
Payable for Professional Fees | | | 56 | | |
Payable for Servicing Fees | | | 37 | | |
Unrealized Depreciation on Foreign Currency Forward Exchange Contracts | | | 29 | | |
Payable for Custodian Fees | | | 17 | | |
Payable for Fund Shares Redeemed | | | 16 | | |
Payable for Administration Fees | | | 10 | | |
Payable for Transfer Agency Fees | | | 2 | | |
Payable for Distribution Fees — Class II Shares | | | 1 | | |
Other Liabilities | | | 42 | | |
Total Liabilities | | | 2,970 | | |
NET ASSETS | | $ | 149,594 | | |
Net Assets Consist of: | |
Paid-in-Capital | | $ | 175,694 | | |
Total Accumulated Loss | | | (26,100 | ) | |
Net Assets | | $ | 149,594 | | |
CLASS I: | |
Net Assets | | $ | 133,413 | | |
Net Asset Value, Offering and Redemption Price Per Share Applicable to 18,531,397 Outstanding
$0.001 Par Value Shares (Authorized 500,000,000 Shares) | | $ | 7.20 | | |
CLASS II: | |
Net Assets | | $ | 16,181 | | |
Net Asset Value, Offering and Redemption Price Per Share Applicable to 2,267,647 Outstanding
$0.001 Par Value Shares (Authorized 500,000,000 Shares) | | $ | 7.14 | | |
(1) Including: | |
Securities on Loan, at Value: | | $ | 2,938 | | |
@ Amount is less than $500.
The accompanying notes are an integral part of the financial statements.
11
Morgan Stanley Variable Insurance Fund, Inc.
Annual Report – December 31, 2021
Emerging Markets Debt Portfolio
Statement of Operations | | Year Ended
December 31, 2021
(000) | |
Investment Income: | |
Interest from Securities of Unaffiliated Issuers (Net of $85 of Foreign Taxes Withheld) | | $ | 8,889 | | |
Income from Securities Loaned — Net | | | 10 | | |
Dividends from Security of Affiliated Issuer (Note H) | | | — | @ | |
Total Investment Income | | | 8,899 | | |
Expenses: | |
Advisory Fees (Note B) | | | 1,168 | | |
Servicing Fees (Note D) | | | 250 | | |
Professional Fees | | | 168 | | |
Administration Fees (Note C) | | | 125 | | |
Distribution Fees — Class II Shares (Note E) | | | 42 | | |
Shareholder Reporting Fees | | | 26 | | |
Custodian Fees (Note G) | | | 24 | | |
Pricing Fees | | | 18 | | |
Transfer Agency Fees (Note F) | | | 10 | | |
Directors' Fees and Expenses | | | 6 | | |
Other Expenses | | | 22 | | |
Total Expenses | | | 1,859 | | |
Waiver of Advisory Fees (Note B) | | | (72 | ) | |
Waiver of Distribution Fees — Class II Shares (Note E) | | | (34 | ) | |
Rebate from Morgan Stanley Affiliate (Note H) | | | (1 | ) | |
Net Expenses | | | 1,752 | | |
Net Investment Income | | | 7,147 | | |
Realized Gain (Loss): | |
Investments Sold | | | 455 | | |
Foreign Currency Forward Exchange Contracts | | | 257 | | |
Foreign Currency Translation | | | (6 | ) | |
Net Realized Gain | | | 706 | | |
Change in Unrealized Appreciation (Depreciation): | |
Investments (Net of Decrease in Deferred Capital Gain Country Tax of $399) | | | (11,022 | ) | |
Foreign Currency Forward Exchange Contracts | | | (15 | ) | |
Foreign Currency Translation | | | (12 | ) | |
Net Change in Unrealized Appreciation (Depreciation) | | | (11,049 | ) | |
Net Realized Gain and Change in Unrealized Appreciation (Depreciation) | | | (10,343 | ) | |
Net Decrease in Net Assets Resulting from Operations | | $ | (3,196 | ) | |
@ Amount is less than $500.
The accompanying notes are an integral part of the financial statements.
12
Morgan Stanley Variable Insurance Fund, Inc.
Annual Report – December 31, 2021
Emerging Markets Debt Portfolio
Statements of Changes in Net Assets | | Year Ended
December 31, 2021
(000) | | Year Ended
December 31, 2020
(000) | |
Increase (Decrease) in Net Assets: | |
Operations: | |
Net Investment Income | | $ | 7,147 | | | $ | 7,207 | | |
Net Realized Gain | | | 706 | | | | 1,881 | | |
Net Change in Unrealized Appreciation (Depreciation) | | | (11,049 | ) | | | (3,725 | ) | |
Net Increase (Decrease) in Net Assets Resulting from Operations | | | (3,196 | ) | | | 5,363 | | |
Dividends and Distributions to Shareholders: | |
Class I | | | (7,092 | ) | | | (6,350 | ) | |
Class II | | | (875 | ) | | | (839 | ) | |
Total Dividends and Distributions to Shareholders | | | (7,967 | ) | | | (7,189 | ) | |
Capital Share Transactions:(1) | |
Class I: | |
Subscribed | | | 10,446 | | | | 10,537 | | |
Distributions Reinvested | | | 7,092 | | | | 6,350 | | |
Redeemed | | | (19,503 | ) | | | (40,250 | ) | |
Class II: | |
Subscribed | | | 1,399 | | | | 1,915 | | |
Distributions Reinvested | | | 875 | | | | 839 | | |
Redeemed | | | (2,626 | ) | | | (6,036 | ) | |
Net Decrease in Net Assets Resulting from Capital Share Transactions | | | (2,317 | ) | | | (26,645 | ) | |
Total Decrease in Net Assets | | | (13,480 | ) | | | (28,471 | ) | |
Net Assets: | |
Beginning of Period | | | 163,074 | | | | 191,545 | | |
End of Period | | $ | 149,594 | | | $ | 163,074 | | |
(1) Capital Share Transactions: | |
Class I: | |
Shares Subscribed | | | 1,399 | | | | 1,449 | | |
Shares Issued on Distributions Reinvested | | | 969 | | | | 886 | | |
Shares Redeemed | | | (2,616 | ) | | | (5,739 | ) | |
Net Decrease in Class I Shares Outstanding | | | (248 | ) | | | (3,404 | ) | |
Class II: | |
Shares Subscribed | | | 190 | | | | 259 | | |
Shares Issued on Distributions Reinvested | | | 120 | | | | 118 | | |
Shares Redeemed | | | (357 | ) | | | (840 | ) | |
Net Decrease in Class II Shares Outstanding | | | (47 | ) | | | (463 | ) | |
The accompanying notes are an integral part of the financial statements.
13
Morgan Stanley Variable Insurance Fund, Inc.
Annual Report – December 31, 2021
Financial Highlights
Emerging Markets Debt Portfolio
| | | Class I | |
| | | Year Ended December 31, | |
Selected Per Share Data and Ratios | | 2021 | | 2020 | | 2019 | | 2018 | | 2017 | |
Net Asset Value, Beginning of Period | | $ | 7.74 | | | $ | 7.68 | | | $ | 7.09 | | | $ | 8.08 | | | $ | 7.79 | | |
Income (Loss) from Investment Operations: | |
Net Investment Income(1) | | | 0.34 | | | | 0.32 | | | | 0.38 | | | | 0.36 | | | | 0.42 | | |
Net Realized and Unrealized Gain (Loss) | | | (0.49 | ) | | | 0.08 | | | | 0.62 | | | | (0.92 | ) | | | 0.32 | | |
Total from Investment Operations | | | (0.15 | ) | | | 0.40 | | | | 1.00 | | | | (0.56 | ) | | | 0.74 | | |
Distributions from and/or in Excess of: | |
Net Investment Income | | | (0.39 | ) | | | (0.34 | ) | | | (0.41 | ) | | | (0.43 | ) | | | (0.45 | ) | |
Net Asset Value, End of Period | | $ | 7.20 | | | $ | 7.74 | | | $ | 7.68 | | | $ | 7.09 | | | $ | 8.08 | | |
Total Return(2) | | | (2.02 | )% | | | 5.55 | % | | | 14.25 | % | | | (6.94 | )% | | | 9.71 | % | |
Ratios to Average Net Assets and Supplemental Data: | |
Net Assets, End of Period (Thousands) | | $ | 133,413 | | | $ | 145,312 | | | $ | 170,382 | | | $ | 165,582 | | | $ | 219,994 | | |
Ratio of Expenses Before Expense Limitation | | | 1.17 | % | | | N/A | | | | N/A | | | | N/A | | | | N/A | | |
Ratio of Expenses After Expense Limitation | | | 1.12 | %(3)(4) | | | 1.15 | %(3) | | | 1.11 | %(3) | | | 1.11 | %(3) | | | 1.10 | %(3) | |
Ratio of Expenses After Expense Limitation Excluding Interest Expenses | | | N/A | | | | N/A | | | | N/A | | | | 1.11 | %(3) | | | N/A | | |
Ratio of Net Investment Income | | | 4.59 | %(3) | | | 4.34 | %(3) | | | 5.04 | %(3) | | | 4.83 | %(3) | | | 5.22 | %(3) | |
Ratio of Rebate from Morgan Stanley Affiliates | | | 0.00 | %(5) | | | 0.00 | %(5) | | | 0.01 | % | | | 0.00 | %(5) | | | 0.01 | % | |
Portfolio Turnover Rate | | | 28 | % | | | 40 | % | | | 40 | % | | | 32 | % | | | 46 | % | |
(1) Per share amount is based on average shares outstanding.
(2) Calculated based on the net asset value as of the last business day of the period. Performance does not reflect fees and expenses imposed by your insurance company's separate account. If performance information included the effect of these additional charges, the total return would be lower.
(3) The Ratio of Expenses After Expense Limitation and Ratio of Net Investment Income reflect the rebate of certain Fund expenses in connection with the investments in Morgan Stanley affiliates during the period. The effect of the rebate on the ratios is disclosed in the above table as "Ratio of Rebate from Morgan Stanley Affiliates."
(4) Effective July 1, 2021, the Adviser has agreed to limit the ratio of expenses to average net assets to the maximum ratio of 1.10% for Class I shares. Prior to July 1, 2021, the maximum ratio was 1.30% for Class I shares.
(5) Amount is less than 0.005%.
The accompanying notes are an integral part of the financial statements.
14
Morgan Stanley Variable Insurance Fund, Inc.
Annual Report – December 31, 2021
Financial Highlights
Emerging Markets Debt Portfolio
| | | Class II | |
| | | Year Ended December 31, | |
Selected Per Share Data and Ratios | | 2021 | | 2020 | | 2019 | | 2018 | | 2017 | |
Net Asset Value, Beginning of Period | | $ | 7.67 | | | $ | 7.61 | | | $ | 7.03 | | | $ | 8.02 | | | $ | 7.74 | | |
Income (Loss) from Investment Operations: | |
Net Investment Income(1) | | | 0.34 | | | | 0.31 | | | | 0.37 | | | | 0.36 | | | | 0.41 | | |
Net Realized and Unrealized Gain (Loss) | | | (0.48 | ) | | | 0.08 | | | | 0.62 | | | | (0.92 | ) | | | 0.32 | | |
Total from Investment Operations | | | (0.14 | ) | | | 0.39 | | | | 0.99 | | | | (0.56 | ) | | | 0.73 | | |
Distributions from and/or in Excess of: | |
Net Investment Income | | | (0.39 | ) | | | (0.33 | ) | | | (0.41 | ) | | | (0.43 | ) | | | (0.45 | ) | |
Net Asset Value, End of Period | | $ | 7.14 | | | $ | 7.67 | | | $ | 7.61 | | | $ | 7.03 | | | $ | 8.02 | | |
Total Return(2) | | | (1.96 | )% | | | 5.53 | % | | | 14.17 | % | | | (7.04 | )% | | | 9.58 | % | |
Ratios to Average Net Assets and Supplemental Data: | |
Net Assets, End of Period (Thousands) | | $ | 16,181 | | | $ | 17,762 | | | $ | 21,163 | | | $ | 19,502 | | | $ | 22,144 | | |
Ratio of Expenses Before Expense Limitation | | | 1.42 | % | | | 1.40 | % | | | 1.37 | % | | | 1.36 | % | | | 1.36 | % | |
Ratio of Expenses After Expense Limitation | | | 1.17 | %(3)(4) | | | 1.20 | %(3) | | | 1.16 | %(3) | | | 1.16 | %(3) | | | 1.15 | %(3) | |
Ratio of Expenses After Expense Limitation Excluding Interest Expenses | | | N/A | | | | N/A | | | | N/A | | | | 1.16 | %(3) | | | N/A | | |
Ratio of Net Investment Income | | | 4.54 | %(3) | | | 4.29 | %(3) | | | 4.99 | %(3) | | | 4.78 | %(3) | | | 5.17 | %(3) | |
Ratio of Rebate from Morgan Stanley Affiliates | | | 0.00 | %(5) | | | 0.00 | %(5) | | | 0.01 | % | | | 0.00 | %(5) | | | 0.01 | % | |
Portfolio Turnover Rate | | | 28 | % | | | 40 | % | | | 40 | % | | | 32 | % | | | 46 | % | |
(1) Per share amount is based on average shares outstanding.
(2) Calculated based on the net asset value as of the last business day of the period. Performance does not reflect fees and expenses imposed by your insurance company's separate account. If performance information included the effect of these additional charges, the total return would be lower.
(3) The Ratio of Expenses After Expense Limitation and Ratio of Net Investment Income reflect the rebate of certain Fund expenses in connection with the investments in Morgan Stanley affiliates during the period. The effect of the rebate on the ratios is disclosed in the above table as "Ratio of Rebate from Morgan Stanley Affiliates."
(4) Effective July 1, 2021, the Adviser has agreed to limit the ratio of expenses to average net assets to the maximum ratio of 1.15% for Class II shares. Prior to July 1, 2021, the maximum ratio was 1.35% for Class II shares.
(5) Amount is less than 0.005%.
The accompanying notes are an integral part of the financial statements.
15
Morgan Stanley Variable Insurance Fund, Inc.
Annual Report – December 31, 2021
Notes to Financial Statements
Morgan Stanley Variable Insurance Fund, Inc. (the "Company") is registered under the Investment Company Act of 1940, as amended (the "Act"), as an open-end management investment company. The Company is comprised of ten separate active, diversified and non-diversified funds (individually referred to as a "Fund," collectively as the "Funds"). The Company applies investment company accounting and reporting guidance.
The accompanying financial statements relate to the Emerging Markets Debt Portfolio. The Fund seeks high total return by investing primarily in fixed income securities of government and government-related issuers and, to a lesser extent, of corporate issuers in emerging market countries. The Fund offers two classes of shares — Class I and Class II. Both classes of shares have identical voting rights (except that shareholders of a Class have exclusive voting rights regarding any matter relating solely to that Class of shares), dividend, liquidation and other rights.
The Company is intended to be a funding vehicle for variable annuity contracts and variable life insurance policies offered by the separate accounts of certain life insurance companies.
A. Significant Accounting Policies: The following significant accounting policies are in conformity with U.S. generally accepted accounting principles ("GAAP"). Such policies are consistently followed by the Company in the preparation of its financial statements. GAAP may require management to make estimates and assumptions that affect the reported amounts and disclosures in the financial statements. Actual results may differ from those estimates.
1. Security Valuation: (1) Certain portfolio securities may be valued by an outside pricing service/vendor approved by the Company's Board of Directors (the "Directors"). The pricing service/vendor may employ a pricing model that takes into account, among other things, bids, yield spreads and/or other market data and specific security characteristics. Alternatively, if a valuation is not available from an outside pricing service/vendor, and the security trades on an exchange, the security may be valued at its latest reported sale price (or at the exchange official closing price if such exchange reports an official closing price), prior to the time when assets are valued. If there are no sales on a given day and if there is no official exchange closing price for that day, the security is valued at the mean between the last reported bid and asked prices if such bid and asked prices are available in the relevant exchanges. If only bid prices are available then the latest bid price may be used. If Morgan Stanley Investment Management Inc. (the "Adviser") or Morgan Stanley Investment Management Limited ("MSIM Limited")
(the "Sub-Adviser"), each a wholly-owned subsidiary of Morgan Stanley, determines that the price provided by the outside pricing service/vendor or exchange does not reflect the security's fair value or is unable to provide a price, prices from brokers or dealers may also be utilized. In these circumstances, the value of the security will be the mean of bid and asked prices obtained from brokers or dealers; (2) when market quotations are not readily available, including circumstances under which the Adviser or the Sub-Adviser determines that the closing price, last sale price or the mean between the last reported bid and asked prices are not reflective of a security's market value, portfolio securities are valued at their fair value as determined in good faith under procedures established by and under the general supervision of the Directors. Occasionally, developments affecting the closing prices of securities and other assets may occur between the times at which valuations of such securities are determined (that is, close of the foreign market on which the securities trade) and the close of business of the New York Stock Exchange ("NYSE"). If developments occur during such periods that are expected to materially affect the value of such securities, such valuations may be adjusted to reflect the estimated fair value of such securities as of the close of the NYSE, as determined in good faith by the Directors or by the Adviser using a pricing service and/or procedures approved by the Directors; (3) quotations of foreign portfolio securities, other assets and liabilities and forward contracts stated in foreign currency are translated into U.S. dollar equivalents at the prevailing market rates prior to the close of the NYSE; and (4) investments in mutual funds, including the Morgan Stanley Institutional Liquidity Funds, are valued at the net asset value ("NAV") as of the close of each business day.
The Directors have responsibility for determining in good faith the fair value of the investments, and the Directors may appoint others, such as the Company's Adviser or a valuation committee, to assist the Directors in determining fair value and to make the actual calculations pursuant to the fair valuation methodologies previously approved by the Directors. Under procedures approved by the Directors, the Company's Adviser has formed a Valuation Committee whose members are approved by the Directors. The Valuation Committee provides administration and oversight of the Company's valuation policies and procedures, which are reviewed at least annually by the Directors. These procedures allow the Company to utilize independent pricing services, quotations from securities and financial instrument dealers and other market sources to determine fair value.
16
Morgan Stanley Variable Insurance Fund, Inc.
Annual Report – December 31, 2021
Notes to Financial Statements (cont'd)
2. Fair Value Measurement: Financial Accounting Standards Board ("FASB") Accounting Standards CodificationTM ("ASC") 820, "Fair Value Measurement" ("ASC 820"), defines fair value as the value that the Fund would receive to sell an investment or pay to transfer a liability in a timely transaction with an independent buyer in the principal market, or in the absence of a principal market, the most advantageous market for the investment or liability. ASC 820 establishes a three-tier hierarchy to distinguish between (1) inputs that reflect the assumptions market participants would use in valuing an asset or liability developed based on market data obtained from sources independent of the reporting entity (observable inputs) and (2) inputs that reflect the reporting entity's own assumptions about the assumptions market participants would use in valuing an asset or liability developed based on the best information available in the circumstances (unobservable inputs) and to establish classification of fair value measurements for disclosure purposes. Various inputs are used in determining the value of the Fund's investments. The inputs are summarized in the three broad levels listed below:
• Level 1 – unadjusted quoted prices in active markets for identical investments
• Level 2 – other significant observable inputs (including quoted prices for similar investments, interest rates, prepayment speeds, credit risk, etc.)
• Level 3 – significant unobservable inputs including the Fund's own assumptions in determining the fair value of investments. Factors considered in making this determination may include, but are not limited to, information obtained by contacting the issuer, analysts, or the appropriate stock exchange (for exchange-traded securities), analysis of the issuer's financial statements or other available documents and, if necessary, available information concerning other securities in similar circumstances.
The inputs or methodology used for valuing securities are not necessarily an indication of the risk associated with investing in those securities and the determination of the significance of a particular input to the fair value measurement in its entirety requires judgment and considers factors specific to each security.
The following is a summary of the inputs used to value the Fund's investments as of December 31, 2021:
Investment Type | | Level 1
Unadjusted
quoted
prices
(000) | | Level 2
Other
significant
observable
inputs
(000) | | Level 3
Significant
unobservable
inputs
(000) | | Total
(000) | |
Assets: | |
Fixed Income Securities | |
Corporate Bonds | | $ | — | | | $ | 7,694 | | | $ | — | | | $ | 7,694 | | |
Sovereign | | | — | | | | 138,246 | | | | — | | | | 138,246 | | |
Total Fixed Income
Securities | | | — | | | | 145,940 | | | | — | | | | 145,940 | | |
Warrant | | | — | | | | 8 | | | | — | | | | 8 | | |
Short-Term Investments | |
Investment Company | | | 2,831 | | | | — | | | | — | | | | 2,831 | | |
Repurchase Agreements | | | — | | | | 356 | | | | — | | | | 356 | | |
Sovereign | | | — | | | | 986 | | | | — | | | | 986 | | |
Total Short-Term
Investments | | | 2,831 | | | | 1,342 | | | | — | | | | 4,173 | | |
Foreign Currency
Forward Exchange
Contract | | | — | | | | 3 | | | | — | | | | 3 | | |
Total Assets | | | 2,831 | | | | 147,293 | | | | — | | | | 150,124 | | |
Liabilities: | |
Foreign Currency
Forward Exchange
Contracts | | | — | | | | (29 | ) | | | — | | | | (29 | ) | |
Total | | $ | 2,831 | | | $ | 147,264 | | | $ | — | | | $ | 150,095 | | |
Transfers between investment levels may occur as the markets fluctuate and/or the availability of data used in an investment's valuation changes.
3. Repurchase Agreements: The Fund may enter into repurchase agreements under which the Fund lends cash and takes possession of securities with an agreement that the counterparty will repurchase such securities. In connection with transactions in repurchase agreements, a bank as custodian for the Fund takes possession of the underlying securities which are held as collateral, with a market value at least equal to the amount of the repurchase transaction, including principal and accrued interest. To the extent that any repurchase transaction exceeds one business day, the value of the collateral is marked-to-market on a daily basis to determine that the value of the collateral does not decrease below the repurchase price plus accrued interest as earned. If such a decrease occurs, additional collateral will be requested and, when received, will be added to the account to maintain full collateralization. In the event of default on the obligation to repurchase, the Fund has the right to liquidate the collateral and apply the proceeds in satisfaction of the obligation.
17
Morgan Stanley Variable Insurance Fund, Inc.
Annual Report – December 31, 2021
Notes to Financial Statements (cont'd)
In the event of default or bankruptcy by the counterparty to the agreement, realization of the collateral proceeds may be subject to cost and delays. The Fund, along with other affiliated investment companies, may utilize a joint trading account for the purpose of entering into repurchase agreements.
4. Foreign Currency Translation and Foreign Investments: The books and records of the Fund are maintained in U.S. dollars. Foreign currency amounts are translated into U.S. dollars as follows:
— investments, other assets and liabilities at the prevailing rate of exchange on the valuation date;
— investment transactions and investment income at the prevailing rates of exchange on the dates of such transactions.
Although the net assets of the Fund are presented at the foreign exchange rates and market values at the close of the period, the Fund does not isolate that portion of the results of operations arising as a result of changes in the foreign exchange rates from the fluctuations arising from changes in the market prices of securities held at period end. Similarly, the Fund does not isolate the effect of changes in foreign exchange rates from the fluctuations arising from changes in the market prices of securities sold during the period. Accordingly, realized and unrealized foreign currency gains (losses) on investments in securities are included in the reported net realized and unrealized gains (losses) on investment transactions and balances. However, pursuant to U.S. federal income tax regulations, gains and losses from certain foreign currency transactions and the foreign currency portion of gains and losses realized on sales and maturities of foreign denominated debt securities are treated as ordinary income for U.S. federal income tax purposes.
Net realized gains (losses) on foreign currency transactions represent net foreign exchange gains (losses) from foreign currency forward exchange contracts, disposition of foreign currencies, currency gains (losses) realized between the trade and settlement dates on securities transactions, and the difference between the amount of investment income and foreign withholding taxes recorded on the Fund's books and the U.S. dollar equivalent amounts actually received or paid. The change in unrealized currency gains (losses) on foreign currency transactions for the period is reflected in the Statement of Operations.
Foreign security and currency transactions may involve certain considerations and risks not typically associated with those of U.S. dollar denominated transactions as a
result of, among other factors, fluctuations of exchange rates in relation to the U.S. dollar, the possibility of lower levels of governmental supervision and regulation of foreign securities markets and the possibility of political or economic instability.
Governmental approval for foreign investments may be required in advance of making an investment under certain circumstances in some countries, and the extent of foreign investments in domestic companies may be subject to limitation in other countries. Foreign ownership limitations also may be imposed by the charters of individual companies to prevent, among other concerns, violations of foreign investment limitations. As a result, an additional class of shares (identified as "Foreign" in the Portfolio of Investments) may be created and offered for investment. The "local" and "foreign shares" market values may differ. In the absence of trading of the foreign shares in such markets, the Fund values the foreign shares at the closing exchange price of the local shares.
5. Structured Investments: The Fund invested a portion of its assets in structured investments. A structured investment is a derivative security designed to offer a return linked to a particular underlying security, currency, commodity or market. Structured investments may come in various forms including notes (such as exchange-traded notes), warrants and options to purchase securities. The Fund will typically use structured investments to gain exposure to a permitted underlying security, currency, commodity or market when direct access to a market is limited or inefficient from a tax or cost standpoint. There can be no assurance that structured investments will trade at the same price or have the same value as the underlying security, currency, commodity or market. Investments in structured investments involve risks including issuer risk, counterparty risk and market risk. Holders of structured investments bear risks of the underlying investment and are subject to issuer or counterparty risk because the Fund is relying on the creditworthiness of such issuer or counterparty and has no rights with respect to the underlying investment. Certain structured investments may be thinly traded or have a limited trading market and may have the effect of increasing the Fund's illiquidity to the extent that the Fund, at a particular time, may be unable to find qualified buyers for these securities.
6. Derivatives: The Fund may, but is not required to, use derivative instruments for a variety of purposes, including hedging, risk management, portfolio management or to earn income. Derivatives are financial instruments whose value is based, in part, on the value of an underlying asset, interest rate, index or financial instrument. Prevailing
18
Morgan Stanley Variable Insurance Fund, Inc.
Annual Report – December 31, 2021
Notes to Financial Statements (cont'd)
interest rates and volatility levels, among other things, also affect the value of derivative instruments. A derivative instrument often has risks similar to its underlying asset and may have additional risks, including imperfect correlation between the value of the derivative and the underlying asset, risks of default by the counterparty to certain transactions, magnification of losses incurred due to changes in the market value of the securities, instruments, indices or interest rates to which the derivative instrument relates, risks that the transactions may not be liquid and risks arising from margin requirements. The use of derivatives involves risks that are different from, and possibly greater than, the risks associated with other portfolio investments. Derivatives may involve the use of highly specialized instruments that require investment techniques and risk analyses different from those associated with other portfolio investments. All of the Fund's holdings, including derivative instruments, are marked-to-market each day with the change in value reflected in unrealized appreciation (depreciation). Upon disposition, a realized gain or loss is recognized.
Certain derivative transactions may give rise to a form of leverage. Leverage magnifies the potential for gain and the risk of loss. Leverage associated with derivative transactions may cause the Fund to liquidate portfolio positions when it may not be advantageous to do so to satisfy its obligations or to meet earmarking or segregation requirements, pursuant to applicable Securities and Exchange Commission ("SEC") rules and regulations, or may cause the Fund to be more volatile than if the Fund had not been leveraged. Although the Adviser seeks to use derivatives to further the Fund's investment objectives, there is no assurance that the use of derivatives will achieve this result.
Following is a description of the derivative instruments and techniques that the Fund used during the period and their associated risks:
Foreign Currency Forward Exchange Contracts: In connection with its investments in foreign securities, the Fund also entered into contracts with banks, brokers or dealers to purchase or sell securities or foreign currencies at a future date. A foreign currency forward exchange contract ("currency contract") is a negotiated agreement between the contracting parties to exchange a specified amount of currency at a specified future time at a specified rate. The rate can be higher or lower than the spot rate between the currencies that are the subject of the contract. Currency contracts may be used to protect against uncertainty in the level of future foreign currency exchange rates or to gain or modify exposure to a
particular currency. To the extent hedged by the use of currency contracts, the precise matching of the currency contract amounts and the value of the securities involved will not generally be possible because the future value of such securities in foreign currencies will change as a consequence of market movements in the value of those securities between the date on which the contract is entered into and the date it matures. Furthermore, such transactions may reduce or preclude the opportunity for gain if the value of the currency should move in the direction opposite to the position taken. There is additional risk to the extent that currency contracts create exposure to currencies in which the Fund's securities are not denominated. Unanticipated changes in currency prices may result in poorer overall performance for the Fund than if it had not entered into such contracts. The use of currency contracts involves the risk of loss from the insolvency or bankruptcy of the counterparty to the contract or the failure of the counterparty to make payments or otherwise comply with the terms of the contract. A currency contract is marked-to-market daily and the change in market value is recorded by the Fund as unrealized gain or loss. The Fund records realized gains (losses) when the currency contract is closed equal to the difference between the value of the currency contract at the time it was opened and the value at the time it was closed.
FASB ASC 815, "Derivatives and Hedging" ("ASC 815"), is intended to improve financial reporting about derivative instruments by requiring enhanced disclosures to enable investors to better understand how and why the Fund uses derivative instruments, how these derivative instruments are accounted for and their effects on the Fund's financial position and results of operations.
The following tables set forth the fair value of the Fund's derivative contracts by primary risk exposure as of December 31, 2021:
| | | Asset Derivatives
Statement of Assets
and Liabilities
Location | | Primary Risk
Exposure | | Value
(000) | |
Foreign Currency
Forward
Exchange
Contract | | Unrealized Appreciation
on Foreign Currency
Forward Exchange
Contract | | Currency Risk | | $ | 3 | | |
| | | Liability Derivatives
Statement of Assets
and Liabilities
Location | | Primary Risk
Exposure | | Value
(000) | |
Foreign Currency
Forward
Exchange
Contracts | | Unrealized Depreciation
on Foreign Currency
Forward Exchange
Contracts | | Currency Risk | | $ | (29 | ) | |
19
Morgan Stanley Variable Insurance Fund, Inc.
Annual Report – December 31, 2021
Notes to Financial Statements (cont'd)
The following tables set forth by primary risk exposure the Fund's realized gains (losses) and change in unrealized appreciation (depreciation) by type of derivative contract for the year ended December 31, 2021 in accordance with ASC 815:
Realized Gain (Loss) | |
Primary Risk Exposure | | Derivative
Type | | Value
(000) | |
Currency Risk | | Foreign Currency
Forward Exchange
Contracts | | $ | 257 | | |
Change in Unrealized Appreciation (Depreciation) | |
Primary Risk Exposure | | Derivative
Type | | Value
(000) | |
Currency Risk | | Foreign Currency
Forward Exchange
Contracts | | $ | (15 | ) | |
At December 31, 2021, the Fund's derivative assets and liabilities are as follows:
Gross Amounts of Assets and Liabilities Presented in the
Statement of Assets and Liabilities | |
Derivatives | | Assets(a)
(000) | | Liabilities(a)
(000) | |
Foreign Currency Forward
Exchange Contracts | | | $3 | | | | $(29) | | |
(a) Absent an event of default or early termination, OTC derivative assets and liabilities are presented gross and not offset in the Statement of Assets and Liabilities.
The Fund typically enters into International Swaps and Derivatives Association, Inc. Master Agreements ("ISDA Master Agreements") or similar master agreements (collectively, "Master Agreements") with its contract counterparties for certain OTC derivatives in order to, among other things, reduce its credit risk to counterparties. ISDA Master Agreements include provisions for general obligations, representations, collateral and events of default or termination. Under an ISDA Master Agreement, the Fund typically may offset with the counterparty certain OTC derivative financial instruments' payables and/or receivables with collateral held and/or posted and create one single net payment (close-out netting) in the event of default, termination and/or potential deterioration in the credit quality of the counterparty. Various Master Agreements govern the terms of certain transactions with counterparties, including transactions such as swap, forward, repurchase and reverse repurchase agreements. These Master Agreements typically attempt to reduce the counterparty risk associated with such transactions by specifying credit protection mechanisms and providing standardization that improves legal certainty. Cross-termination provisions under Master Agreements typically provide that a default in connection with
one transaction between the Fund and a counterparty gives the non-defaulting party the right to terminate any other transactions in place with the defaulting party to create one single net payment due to/due from the defaulting party and may be a feature in certain Master Agreements. In the event the Fund exercises its right to terminate a Master Agreement after a counterparty experiences a termination event as defined in the Master Agreement, the return of collateral with market value in excess of the Fund's net liability may be delayed or denied.
The following table presents derivative financial instruments that are subject to enforceable netting arrangements as of December 31, 2021:
Gross Amounts Not Offset in the Statement of
Assets and Liabilities | |
Counterparty | | Gross Asset
Derivatives
Presented in the
Statement of
Assets and
Liabilities
(000) | | Financial
Instrument
(000) | | Collateral
Received
(000) | | Net
Amount
(not less
than $0)
(000) | |
UBS AG | | $ | 3 | | | $ | — | | | $ | — | | | $ | 3 | | |
Gross Amounts Not Offset in the Statement of
Assets and Liabilities | |
Counterparty | | Gross Liability
Derivatives
Presented in the
Statement of
Assets and
Liabilities
(000) | | Financial
Instrument
(000) | | Collateral
Pledged
(000) | | Net
Amount
(not less
than $0)
(000) | |
Barclays Bank PLC | | $ | 14 | | | $ | — | | | $ | — | | | $ | 14 | | |
JPMorgan Chase
Bank NA | | | 15 | | | | — | | | | — | | | | 15 | | |
Total | | $ | 29 | | | $ | — | | | $ | — | | | $ | 29 | | |
For the year ended December 31, 2021, the approximate average monthly amount outstanding for each derivative type is as follows:
Foreign Currency Forward Exchange Contracts: | |
Average monthly principal amount | | $ | 3,969,000 | | |
7. Securities Lending: The Fund lends securities to qualified financial institutions, such as broker-dealers, to earn additional income. Any increase or decrease in the fair value of the securities loaned that might occur and any interest earned or dividends declared on those securities during the term of the loan would remain in the Fund. The Fund would receive cash or securities as collateral in an amount equal to or exceeding 100% of the current fair value of the loaned securities. The collateral is marked-to-market daily by State Street Bank and Trust Company ("State Street"), the securities lending agent, to ensure that a minimum of 100% collateral coverage is maintained.
20
Morgan Stanley Variable Insurance Fund, Inc.
Annual Report – December 31, 2021
Notes to Financial Statements (cont'd)
Based on pre-established guidelines, the securities lending agent invests any cash collateral that is received in an affiliated money market portfolio and repurchase agreements. Securities lending income is generated from the earnings on the invested collateral and borrowing fees, less any rebates owed to the borrowers and compensation to the lending agent, and is recorded as "Income from Securities Loaned — Net" in the Fund's Statement of Operations. Risks in securities lending transactions are that a borrower may not provide additional collateral when required or return the securities when due, and that the value of the short-term investments will be less than the amount of cash collateral plus any rebate that is required to be returned to the borrower.
The Fund has the right under the securities lending agreement to recover the securities from the borrower on demand.
The following table presents financial instruments that are subject to enforceable netting arrangements as of December 31, 2021:
Gross Amounts Not Offset in the Statement of Assets and Liabilities | |
Gross Asset
Amounts
Presented
in the
Statement of
Assets and
Liabilities
(000) | | Financial
Instrument
(000) | | Collateral
Received
(000) | | Net Amount
(not less
than $0)
(000) | |
| $ | 2,938 | (b) | | $ | — | | | $ | (2,938 | )(c)(d) | | $ | 0 | | |
(b) Represents market value of loaned securities at year end.
(c) The Fund received cash collateral of approximately $2,229,000, of which approximately $2,227,000 was subsequently invested in Repurchase Agreements and Morgan Stanley Institutional Liquidity Funds as reported in the Portfolio of Investments. As of December 31, 2021, there was uninvested cash of approximately $2,000, which is not reflected in the Portfolio of Investments. In addition, the Fund received non-cash collateral of approximately $768,000 in the form of U.S. Government obligations, which the Fund cannot sell or repledge, and accordingly are not reflected in the Portfolio of Investments.
(d) The actual collateral received is greater than the amount shown here due to overcollateralization.
FASB ASC 860, "Transfers & Servicing: Repurchase-to-Maturity Transactions, Repurchase Financings, and Disclosures", is intended to provide increased transparency about the types of collateral pledged in securities lending transactions and other similar transactions that are accounted for as secured borrowing.
The following table displays a breakdown of transactions accounted for as secured borrowings, the gross obligations by class of collateral pledged and the remaining
contractual maturity of those transactions as of December 31, 2021:
| | | Remaining Contractual Maturity of the Agreements | |
| | | Overnight and
Continuous
(000) | | <30 days
(000) | | Between
30 &
90 days
(000) | | >90 days
(000) | | Total
(000) | |
Securities Lending
Transactions | |
Sovereign | | $ | 2,229 | | | $ | — | | | $ | — | | | $ | — | | | $ | 2,229 | | |
Total Borrowings | | $ | 2,229 | | | $ | — | | | $ | — | | | $ | — | | | $ | 2,229 | | |
Gross amount of
recognized liabilities
for securities lending
transactions | | $ | 2,229 | | |
8. Indemnifications: The Company enters into contracts that contain a variety of indemnifications. The Company's maximum exposure under these arrangements is unknown. However, the Company has not had prior claims or losses pursuant to these contracts and expects the risk of loss to be remote.
9. Security Transactions, Income and Expenses: Security transactions are accounted for on the trade date (date the order to buy or sell is executed). Realized gains and losses on the sale of investment securities are determined on the specific identified cost method. Dividend income and other distributions are recorded on the ex-dividend date (except for certain foreign dividends which may be recorded as soon as the Fund is informed of such dividends) net of applicable withholding taxes. Interest income is recognized on the accrual basis net of applicable withholding taxes, except where collection is in doubt. Discounts are accreted and premiums are amortized over the life of the respective securities. Most expenses of the Company can be directly attributed to a particular Fund. Expenses which cannot be directly attributed are apportioned among the Funds based upon relative net assets or other appropriate methods. Income, expenses (other than class specific expenses) and realized and unrealized gains or losses are allocated to each class of shares based upon their relative net assets.
Settlement and registration of foreign securities transactions may be subject to significant risks not normally associated with investments in the United States. In certain markets, ownership of shares is defined according to entries in the issuer's share register. It is possible that a Fund holding these securities could lose its share registration through fraud, negligence or even mere oversight. In addition, shares being delivered for sales and cash being paid for purchases may be delivered before the exchange is complete. This may subject the Fund to further risk of loss in the event of a failure to complete the transaction by the counterparty.
21
Morgan Stanley Variable Insurance Fund, Inc.
Annual Report – December 31, 2021
Notes to Financial Statements (cont'd)
10. Dividends and Distributions to Shareholders: Dividends and distributions to shareholders are recorded on the ex-dividend date. Dividends from net investment income, if any, are declared and paid annually. Net realized capital gains, if any, are distributed at least annually.
B. Advisory/Sub-Advisory Fees: The Adviser, a wholly-owned subsidiary of Morgan Stanley, provides the Fund with advisory services under the terms of an Investment Advisory Agreement, paid quarterly, at the annual rate based on the daily net assets as follows:
First $500
million | | Next $500
million | | Over $1
billion | |
| | 0.75 | % | | | 0.70 | % | | | 0.65 | % | |
For the year ended December 31, 2021, the advisory fee rate (net of waiver/rebate) was equivalent to an annual effective rate of 0.70% of the Fund's average daily net assets.
The Adviser has agreed to reduce its advisory fee and/or reimburse the Fund so that total annual Fund operating expenses, excluding certain investment related expenses, taxes, interest and other extraordinary expenses (including litigation), will not exceed 1.30% for Class I shares and 1.35% for Class II shares. Effective July 1, 2021, the Adviser has agreed to reduce its advisory fee and/or reimburse the Fund so that the total annual Fund operating expenses will not exceed 1.10% for Class I shares and 1.15% for Class II shares. The fee waivers and/or expense reimbursements will continue for at least one year from the date of the Fund's prospectus or until such time as the Directors act to discontinue all or a portion of such waivers and/or reimbursements when they deem such action is appropriate. For the year ended December 31, 2021, approximately $72,000 of advisory fees were waived pursuant to this arrangement.
The Adviser has entered into a Sub-Advisory Agreement with the Sub-Adviser, a wholly-owned subsidiary of Morgan Stanley. The Sub-Adviser provides the Fund with advisory services subject to the overall supervision of the Adviser and the Fund's Officers and Directors. The Adviser pays the Sub-Adviser on a monthly basis a portion of the net advisory fees the Adviser receives from the Fund.
C. Administration Fees: The Adviser also serves as Administrator to the Company and provides administrative services pursuant to an Administration Agreement for an annual fee, accrued daily and paid monthly, of 0.08% of the Fund's average daily net assets.
Under a Sub-Administration Agreement between the Administrator and State Street, State Street provides certain administrative services to the Company. For such services, the Administrator pays State Street a portion of the fee the Administrator receives from the Fund.
D. Servicing Fees: The Company accrues daily and pays quarterly a servicing fee of up to 0.17% of the average daily value of shares of the Fund held in an insurance company's account. Certain insurance companies have entered into a servicing agreement with the Company to provide administrative and other contract-owner related services on behalf of the Fund.
E. Distribution Fees: Morgan Stanley Distribution, Inc. ("MSDI" or the "Distributor"), a wholly-owned subsidiary of the Adviser and an indirect subsidiary of Morgan Stanley, serves as the Distributor of the Fund and provides the Fund's Class II shareholders with distribution services pursuant to a Distribution Plan (the "Plan") in accordance with Rule 12b-1 under the Act. Under the Plan, the Fund is authorized to pay the Distributor a distribution fee, which is accrued daily and paid monthly, at an annual rate of 0.25% of the Fund's average daily net assets attributable to Class II shares. The Distributor has agreed to waive 0.20% of the 0.25% distribution fee that it may receive. This fee waiver will continue for at least one year from the date of the Fund's prospectus or until such time as the Directors act to discontinue all or a portion of such waiver when they deem such action is appropriate. For the year ended December 31, 2021, this waiver amounted to approximately $34,000.
F. Dividend Disbursing and Transfer Agent: The Company's dividend disbursing and transfer agent is DST Asset Manager Solutions, Inc. ("DST"). Pursuant to a Transfer Agency Agreement, the Company pays DST a fee based on the number of classes, accounts and transactions relating to the Funds of the Company.
G. Custodian Fees: State Street (the "Custodian") also serves as Custodian for the Company in accordance with a Custodian Agreement. The Custodian holds cash, securities and other assets of the Company as required by the Act. Custody fees are payable monthly based on assets held in custody, investment purchases and sales activity and account maintenance fees, plus reimbursement for certain out-of-pocket expenses.
H. Security Transactions and Transactions with Affiliates: For the year ended December 31, 2021, purchases and sales of investment securities for the Fund, other than long-term U.S. Government securities and short-term investments were approximately $41,995,000 and $43,657,000, respectively. There were no purchases and sales of long-term U.S. Government securities for the year ended December 31, 2021.
The Fund invests in the Institutional Class of the Morgan Stanley Institutional Liquidity Funds — Treasury Securities Portfolio (the "Liquidity Funds"), an open-end management
22
Morgan Stanley Variable Insurance Fund, Inc.
Annual Report – December 31, 2021
Notes to Financial Statements (cont'd)
investment company managed by the Adviser, both directly and as a portion of the securities held as collateral on loaned securities. Advisory fees paid by the Fund are reduced by an amount equal to its pro-rata share of the advisory and administration fees paid by the Fund due to its investment in the Liquidity Funds. For the year ended December 31, 2021, advisory fees paid were reduced by approximately $1,000 relating to the Fund's investment in the Liquidity Funds.
A summary of the Fund's transactions in shares of affiliated investments during the year ended December 31, 2021 is as follows:
Affiliated
Investment
Company | | Value
December 31,
2020
(000) | | Purchases
at Cost
(000) | | Proceeds
from Sales
(000) | | Dividend
Income
(000) | |
Liquidity Funds | | $ | 5,574 | | | $ | 36,129 | | | $ | 38,872 | | | $ | — | @ | |
Affiliated
Investment
Company (cont'd) | | Realized
Gain (Loss)
(000) | | Change in
Unrealized
Appreciation
(Depreciation)
(000) | | Value
December 31,
2021
(000) | |
Liquidity Funds | | $ | — | | | $ | — | | | $ | 2,831 | | |
@ Amount is less than $500.
The Fund is permitted to purchase and sell securities ("cross-trade") from and to other Morgan Stanley funds as well as other funds and client accounts for which the Adviser or an affiliate of the Adviser serves as investment adviser, pursuant to procedures approved by the Directors in compliance with Rule 17a-7 under the Act (the "Rule"). Each cross-trade is executed at the current market price in compliance with provisions of the Rule. For the year ended December 31, 2021, the Fund did not engage in any cross-trade transactions.
The Fund has an unfunded Deferred Compensation Plan (the "Compensation Plan"), which allows each independent Director to defer payment of all, or a portion, of the fees he or she receives for serving on the Board of Directors. Each eligible Director generally may elect to have the deferred amounts credited with a return equal to the total return on one or more of the Morgan Stanley funds that are offered as investment options under the Compensation Plan. Appreciation/depreciation and distributions received from these investments are recorded with an offsetting increase/decrease in the deferred compensation obligation and do not affect the NAV of the Fund.
I. Federal Income Taxes: It is the Fund's intention to continue to qualify as a regulated investment company and distribute all of its taxable and tax-exempt income. Accordingly, no provision for federal income taxes is required in the financial statements.
The Fund may be subject to taxes imposed by countries in which it invests. Such taxes are generally based on income and/or capital gains earned or repatriated. Taxes are accrued based on net investment income, net realized gains and net unrealized appreciation as such income and/or gains are earned. Taxes may also be based on transactions in foreign currency and are accrued based on the value of investments denominated in such currency.
FASB ASC 740-10, "Income Taxes — Overall", sets forth a minimum threshold for financial statement recognition of the benefit of a tax position taken or expected to be taken in a tax return. Management has concluded there are no significant uncertain tax positions that would require recognition in the financial statements. If applicable, the Fund recognizes interest accrued related to unrecognized tax benefits in "Interest Expense" and penalties in "Other Expenses" in the Statement of Operations. The Fund files tax returns with the U.S. Internal Revenue Service, New York and various states. Generally, each of the tax years in the four-year period ended December 31, 2021 remains subject to examination by taxing authorities.
The tax character of distributions paid may differ from the character of distributions shown for GAAP purposes due to short-term capital gains being treated as ordinary income for tax purposes. The tax character of distributions paid during fiscal years 2021 and 2020 was as follows:
2021 Distributions
Paid From: | | 2020 Distributions
Paid From: | |
Ordinary
Income
(000) | | Ordinary
Income
(000) | |
| $ | 7,967 | | | $ | 7,189 | | |
The amount and character of income and gains to be distributed are determined in accordance with income tax regulations which may differ from GAAP. These book/tax differences are either considered temporary or permanent in nature.
Temporary differences are attributable to differing book and tax treatments for the timing of the recognition of gains (losses) on certain investment transactions and the timing of the deductibility of certain expenses.
The Fund had no permanent differences causing reclassifications among the components of net assets for the year ended December 31, 2021.
At December 31, 2021, the components of distributable earnings for the Fund on a tax basis were as follows:
Undistributed
Ordinary
Income
(000) | | Undistributed
Long-Term
Capital Gain
(000) | |
| $ | 8,544 | | | $ | — | | |
23
Morgan Stanley Variable Insurance Fund, Inc.
Annual Report – December 31, 2021
Notes to Financial Statements (cont'd)
At December 31, 2021, the Fund had available for federal income tax purposes unused short-term and long-term capital losses of approximately $1,883,000 and $19,504,000, respectively, that do not have an expiration date.
To the extent that capital loss carryforwards are used to offset any future capital gains realized, no capital gains tax liability will be incurred by the Fund for gains realized and not distributed. To the extent that capital gains are offset, such gains will not be distributed to the shareholders. During the year ended December 31, 2021, the Fund utilized capital loss carryforwards for U.S. federal income tax purposes of approximately $300,000.
J. Credit Facility: The Company and other Morgan Stanley funds participated in a $300,000,000 committed, unsecured revolving line of credit facility (the "Facility") with State Street. This Facility is to be used for temporary emergency purposes or funding of shareholder redemption requests. The interest rate on borrowings is based on the federal funds rate or 1 month LIBOR rate plus a spread. Effective April 19, 2021, the interest rate on borrowings is based on the federal funds effective rate or overnight bank funding rate plus a spread. The Facility also has a commitment fee of 0.25% per annum based on the unused portion of the Facility. During the year ended December 31, 2021, the Fund did not have any borrowings under the Facility.
K. Other: At December 31, 2021, the Fund had record owners of 10% or greater. Investment activities of these shareholders could have a material impact on the Fund. The aggregate percentage of such owners was 63.1%.
L. Market Risk: The outbreak of the coronavirus ("COVID-19") and the recovery responses could adversely impact the operations of the Fund and its service providers and financial performance of the Fund and the Fund's investments. The extent of such impact depends on future developments, including (i) the duration and spread of the outbreak, (ii) the restrictions and advisories, (iii) the effects on the financial markets, (iv) government and regulatory responses, and (v) the effects on the economy overall as a result of developments such as disruption to consumer demand, economic output and supply chains. The duration and extent of COVID-19 and associated economic and market conditions and uncertainty over the long term cannot be reasonably estimated at this time. The ultimate impact of COVID-19 and the extent to which the associated conditions impact the Fund will also depend on future developments, which are highly uncertain, difficult to accurately predict and subject to change at any time. If the financial performance of the Fund's
investments is impacted because of these factors for an extended period, the Fund's investment results may be adversely affected.
24
Morgan Stanley Variable Insurance Fund, Inc.
Annual Report – December 31, 2021
Report of Independent Registered Public Accounting Firm
To the Shareholders and Board of Directors of
Morgan Stanley Variable Insurance Fund, Inc. —
Emerging Markets Debt Portfolio
Opinion on the Financial Statements
We have audited the accompanying statement of assets and liabilities of Emerging Markets Debt Portfolio (the "Fund") (one of the funds constituting Morgan Stanley Variable Insurance Fund, Inc. (the "Company")), including the portfolio of investments, as of December 31, 2021, and the related statement of operations for the year then ended, the statements of changes in net assets for each of the two years in the period then ended, the financial highlights for each of the five years in the period then ended and the related notes (collectively referred to as the "financial statements"). In our opinion, the financial statements present fairly, in all material respects, the financial position of Emerging Markets Debt Portfolio (one of the funds constituting Morgan Stanley Variable Insurance Fund, Inc.) at December 31, 2021, the results of its operations for the year then ended, the changes in its net assets for each of the two years in the period then ended and its financial highlights for each of the five years in the period then ended, in conformity with U.S. generally accepted accounting principles.
Basis for Opinion
These financial statements are the responsibility of the Company's management. Our responsibility is to express an opinion on the Fund's financial statements based on our audits. We are a public accounting firm registered with the Public Company Accounting Oversight Board (United States) ("PCAOB") and are required to be independent with respect to the Company in accordance with the U.S. federal securities law and the applicable rules and regulations of the Securities and Exchange Commission and the PCAOB.
We conducted our audits in accordance with the standards of the PCAOB. Those standards require that we plan and perform the audit to obtain reasonable assurance about whether the financial statements are free of material misstatement, whether due to error or fraud. The Company is not required to have, nor were we engaged to perform, an audit of the Company's internal control over financial reporting. As part of our audits, we are required to obtain an understanding of internal control over financial reporting, but not for the purpose of expressing an opinion on the effectiveness of the Company's internal control over financial reporting. Accordingly, we express no such opinion.
Our audits included performing procedures to assess the risks of material misstatement of the financial statements, whether due to error or fraud, and performing procedures that respond to those risks. Such procedures included examining, on a test basis, evidence regarding the amounts and disclosures in the financial statements. Our procedures included confirmation of securities owned as of December 31, 2021 by correspondence with the custodian and others or by other appropriate auditing procedures where replies from others were not received. Our audits also included evaluating the accounting principles used and significant estimates made by management, as well as evaluating the overall presentation of the financial statements. We believe that our audits provide a reasonable basis for our opinion.

We have served as the auditor of one or more Morgan Stanley investment companies since 2000.
Boston, Massachusetts
February 18, 2022
25
Morgan Stanley Variable Insurance Fund, Inc.
Annual Report – December 31, 2021
Liquidity Risk Management Program (unaudited)
In compliance with Rule 22e-4 under the Investment Company Act of 1940, as amended (the "Liquidity Rule"), the Fund has adopted and implemented a liquidity risk management program (the "Program"), which is reasonably designed to assess and manage the risk that the Fund could not meet requests to redeem shares issued by the Fund without significant dilution of remaining investors' interests in the Fund (i.e., liquidity risk). The Fund's Board of Directors (the "Board") previously approved the designation of the Liquidity Risk Subcommittee (the "LRS") as Program administrator. The LRS is comprised of representatives from various divisions within Morgan Stanley Investment Management.
At a meeting held on March 3-4, 2021, the Board reviewed a written report prepared by the LRS that addressed the Program's operation and assessed its adequacy, and effectiveness of implementation for the period from January 1, 2020, through December 31, 2020, as required under the Liquidity Rule, and discussed the impact of the COVID-19 pandemic on liquidity and the LRS's assessment of liquidity risk during the reporting period, including during the distressed market environment caused by the onset of the COVID-19 pandemic. The report concluded that the Program operated effectively and was adequately and effectively implemented in all material aspects, and that the relevant controls and safeguards were appropriately designed to enable the LRS to administer the Program in compliance with the Liquidity Rule.
In accordance with the Program, the LRS assessed each Fund's liquidity risk no less frequently than annually taking into consideration certain factors, as applicable, such as (i) investment strategy and liquidity of portfolio investments, (ii) short-term and long-term cash flow projections and (iii) holdings of cash and cash equivalents and borrowing arrangements and other funding sources. Certain factors are considered under both normal and reasonably foreseeable stressed conditions.
Each Fund portfolio investment is classified into one of four liquidity categories, which classification is assessed at least monthly by the LRS. The classification is based on a determination of the number of days it is reasonably expected to take to convert the investment into cash, or sell or dispose of the investment, in current market conditions without significantly changing the market value of the investment. Liquidity classification determinations take into account various market, trading and investment-specific considerations, as well as market depth, and in some cases utilize third-party vendor data.
The Liquidity Rule limits a fund's investments in illiquid investments to 15% of its net assets and requires funds that do not primarily hold assets that are highly liquid investments to determine and maintain a minimum percentage of the fund's net assets to be invested in highly liquid investments (highly liquid investment minimum or "HLIM"). The LRS believes that the Program includes provisions reasonably designed to review, monitor and comply with the 15% limit on illiquid investments and for determining, periodically reviewing and complying with the HLIM requirement, as applicable.
There can be no assurance that the Program will achieve its objectives under all circumstances in the future. Please refer to the Fund's prospectus for more information regarding the Fund's exposure to liquidity risk and other risks to which it may be subject.
26
Morgan Stanley Variable Insurance Fund, Inc.
Annual Report – December 31, 2021
Director and Officer Information (unaudited)
Independent Directors:
Name, Address and Birth
Year of Independent Director | | Position(s)
Held with
Registrant | | Length of
Time
Served* | | Principal Occupation(s) During Past 5 Years and
Other Relevant Professional Experience | | Number of
Funds
in Fund
Complex
Overseen
by
Independent
Director** | | Other Directorships Held by Independent
Director During Past 5 Years*** | |
Frank L. Bowman
c/o Perkins Coie LLP
Counsel to the Independent Directors
1155 Avenue of the Americas
22nd Floor
New York, NY 10036
Birth Year: 1944 | | Director | | Since August 2006 | | President, Strategic Decisions, LLC (consulting) (since February 2009); Director or Trustee of various Morgan Stanley Funds (since August 2006); Chairperson of the Compliance and Insurance Committee (since October 2015); formerly, Chairperson of the Insurance Sub-Committee of the Compliance and Insurance Committee (2007-2015); served as President and Chief Executive Officer of the Nuclear Energy Institute (policy organization) (February 2005-November 2008); retired as Admiral, U.S. Navy after serving over 38 years on active duty including 8 years as Director of the Naval Nuclear Propulsion Program in the Department of the Navy and the U.S. Department of Energy (1996-2004); served as Chief of Naval Personnel (July 1994-September 1996) and on the Joint Staff as Director of Political Military Affairs (June 1992-July 1994); knighted as Honorary Knight Commander of the Most Excellent Order of the British Empire; awarded the Officier de l'Orde National du Mérite by the French Government; elected to the National Academy of Engineering (2009). | | | 77 | | | Director of Naval and Nuclear Technologies LLP; Director Emeritus of the Armed Services YMCA; Member of the National Security Advisory Council of the Center for U.S. Global Engagement and a member of the CNA Military Advisory Board; Chairman of Fairhaven United Methodist Church; Member of the Board of Advisors of the Dolphin Scholarship Foundation; Director of other various nonprofit organizations; formerly, Director of BP, plc (November 2010-May 2019). | |
Kathleen A. Dennis
c/o Perkins Coie LLP
Counsel to the Independent Directors
1155 Avenue of the Americas
22nd Floor
New York, NY 10036
Birth Year: 1953 | | Director | | Since August 2006 | | Chairperson of the Governance Committee (since January 2021), Chairperson of the Liquidity and Alternatives Sub-Committee of the Investment Committee (2006-2020) and Director or Trustee of various Morgan Stanley Funds (since August 2006); President, Cedarwood Associates (mutual fund and investment management consulting) (since July 2006); formerly, Senior Managing Director of Victory Capital Management (1993-2006). | | | 77 | | | Board Member, University of Albany Foundation (2012-present); Board Member, Mutual Funds Directors Forum (2014-present); Director of various non-profit organizations. | |
Nancy C. Everett
c/o Perkins Coie LLP
Counsel to the Independent Directors
1155 Avenue of the Americas
22nd Floor
New York, NY 10036
Birth Year: 1955 | | Director | | Since January 2015 | | Chairperson of the Equity Investment Committee (since January 2021); Director or Trustee of various Morgan Stanley Funds (since January 2015); Chief Executive Officer, Virginia Commonwealth University Investment Company (since November 2015); Owner, OBIR, LLC (institutional investment management consulting) (since June 2014); formerly, Managing Director, BlackRock, Inc. (February 2011-December 2013) and Chief Executive Officer, General Motors Asset Management (a/k/a Promark Global Advisors, Inc.) (June 2005-May 2010). | | | 78 | | | Formerly, Member of Virginia Commonwealth University School of Business Foundation (2005-2016); Member of Virginia Commonwealth University Board of Visitors (2013-2015); Member of Committee on Directors for Emerging Markets Growth Fund, Inc. (2007-2010); Chairperson of Performance Equity Management, LLC (2006-2010); and Chairperson, GMAM Absolute Return Strategies Fund, LLC (2006-2010). | |
27
Morgan Stanley Variable Insurance Fund, Inc.
Annual Report – December 31, 2021
Director and Officer Information (unaudited) (cont'd)
Independent Directors (cont'd):
Name, Address and Birth
Year of Independent Director | | Position(s)
Held with
Registrant | | Length of
Time
Served* | | Principal Occupation(s) During Past 5 Years and
Other Relevant Professional Experience | | Number of
Funds
in Fund
Complex
Overseen
by
Independent
Director** | | Other Directorships Held by Independent
Director During Past 5 Years*** | |
Jakki L. Haussler
c/o Perkins Coie LLP
Counsel to the Independent Directors
1155 Avenue of the Americas
22nd Floor
New York, NY 10036
Birth Year: 1957 | | Director | | Since January 2015 | | Director or Trustee of various Morgan Stanley Funds (since January 2015); Chairman, Opus Capital Group (since 1996); formerly, Chief Executive Officer, Opus Capital Group (1996-2019); Director, Capvest Venture Fund, LP (May 2000-December 2011); Partner, Adena Ventures, LP (July 1999-December 2010); Director, The Victory Funds (February 2005-July 2008). | | | 78 | | | Director, Barnes Group Inc. (since July 2021); Director of Cincinnati Bell Inc. and Member, Audit Committee and Chairman, Governance and Nominating Committee; Director of Service Corporation International and Member, Audit Committee and Investment Committee; Director of Northern Kentucky University Foundation and Member, Investment Committee; Member of Chase College of Law Transactional Law Practice Center Board of Advisors; Director of Best Transport; Director of Chase College of Law Board of Visitors; formerly, Member, University of Cincinnati Foundation Investment Committee; Member, Miami University Board of Visitors (2008-2011); Trustee of Victory Funds (2005-2008) and Chairman, Investment Committee (2007-2008) and Member, Service Provider Committee (2005-2008). | |
Dr. Manuel H. Johnson
c/o Johnson Smick
International, Inc.
220 I Street, NE Suite 200
Washington, D.C. 20002
Birth Year: 1949 | | Director | | Since
July
1991 | | Senior Partner, Johnson Smick International, Inc. (consulting firm); Chairperson of the Fixed Income, Liquidity and Alternatives Investment Committee (since January 2021), Chairperson of the Investment Committee (2006-2020) and Director or Trustee of various Morgan Stanley Funds (since July 1991); Co-Chairman and a founder of the Group of Seven Council (G7C) (international economic commission); formerly, Chairperson of the Audit Committee (July 1991-September 2006); Vice Chairman of the Board of Governors of the Federal Reserve System and Assistant Secretary of the U.S. Treasury. | | | 77 | | | Director of NVR, Inc. (home construction). | |
Joseph J. Kearns
c/o Perkins Coie LLP
Counsel to the Independent Directors
1155 Avenue of the Americas
22nd Floor
New York, NY 10036
Birth Year: 1942 | | Director | | Since
August 1994 | | Senior Adviser, Kearns & Associates LLC (investment consulting); Chairperson of the Audit Committee (since October 2006) and Director or Trustee of various Morgan Stanley Funds (since August 1994); formerly, Deputy Chairperson of the Audit Committee (July 2003-September 2006) and Chairperson of the Audit Committee of various Morgan Stanley Funds (since August 1994); CFO of the J. Paul Getty Trust (1982-1999). | | | 78 | | | Director, Rubicon Investments (since February 2019); Prior to August 2016, Director of Electro Rent Corporation (equipment leasing); Prior to December 31, 2013, Director of The Ford Family Foundation. | |
Michael F. Klein
c/o Perkins Coie LLP
Counsel to the Independent Directors
1155 Avenue of the Americas
22nd Floor
New York, NY 10036
Birth Year: 1958 | | Director | | Since
August 2006 | | Chairperson of the Risk Committee (since January 2021); Managing Director, Aetos Alternatives Management, LP (since March 2000); Co-President, Aetos Alternatives Management, LP (since January 2004) and Co-Chief Executive Officer of Aetos Alternatives Management, LP (since August 2013); Chairperson of the Fixed Income Sub-Committee of the Investment Committee (2006-2020) and Director or Trustee of various Morgan Stanley Funds (since August 2006); formerly, Managing Director, Morgan Stanley & Co. Inc. and Morgan Stanley Dean Witter Investment Management and President, various Morgan Stanley Funds (June 1998-March 2000); Principal, Morgan Stanley & Co. Inc. and Morgan Stanley Dean Witter Investment Management (August 1997-December 1999). | | | 77 | | | Director of certain investment funds managed or sponsored by Aetos Alternatives Management, LP; Director of Sanitized AG and Sanitized Marketing AG (specialty chemicals). | |
28
Morgan Stanley Variable Insurance Fund, Inc.
Annual Report – December 31, 2021
Director and Officer Information (unaudited) (cont'd)
Independent Directors (cont'd):
Name, Address and Birth
Year of Independent Director | | Position(s)
Held with
Registrant | | Length of
Time
Served* | | Principal Occupation(s) During Past 5 Years and
Other Relevant Professional Experience | | Number of
Funds
in Fund
Complex
Overseen
by
Independent
Director** | | Other Directorships Held by Independent
Director During Past 5 Years*** | |
Patricia A. Maleski
c/o Perkins Coie LLP
Counsel to the Independent Directors
1155 Avenue of the Americas
22nd Floor
New York, NY 10036
Birth Year: 1960 | | Director | | Since
January 2017 | | Director or Trustee of various Morgan Stanley Funds (since January 2017); Managing Director, JPMorgan Asset Management (2004-2016); Oversight and Control Head of Fiduciary and Conflicts of Interest Program (2015-2016); Chief Control Officer — Global Asset Management (2013-2015); President, JPMorgan Funds (2010-2013); Chief Administrative Officer (2004-2013); various other positions including Treasurer and Board Liaison (since 2001). | | | 78 | | | Trustee, Nutley Family Service Bureau, Inc. (since January 2022). | |
W. Allen Reed
c/o Perkins Coie LLP
Counsel to the Independent Directors
1155 Avenue of the Americas
22nd Floor
New York, NY 10036
Birth Year: 1947 | | Chair of the Board and Director | | Chair of the Board since August 2020 and Director since August 2006 | | Chair of the Boards of various Morgan Stanley Funds (since August 2020); Director or Trustee of various Morgan Stanley Funds (since August 2006); formerly, Vice Chair of the Boards of various Morgan Stanley Funds (January 2020-August 2020); President and Chief Executive Officer of General Motors Asset Management; Chairman and Chief Executive Officer of the GM Trust Bank and Corporate Vice President of General Motors Corporation (August 1994-December 2005). | | | 77 | | | Formerly, Director of Legg Mason, Inc. (2006-2019); and Director of the Auburn University Foundation (2010-2015). | |
Frances L. Cashman
c/o Perkins Coie LLP
Counsel to the Independent Directors
1155 Avenue of the Americas
22nd Floor
New York, NY 10036
Birth Year: 1961 | | Advisory Board Member | | Advisory Board Member Since January 2022 | | Chief Executive Officer, Asset Management Division, Euromoney Institutional Investor PLC (financial information) (May 2021-Present); Executive Vice President and various other roles, Legg Mason & Co. (asset management) (2010-2020); Managing Director, Stifel Nicolaus (2005-2010). | | | 78 | | | Trustee and Investment Committee Member, Georgia Tech Foundation (Since June 2019); Trustee and Chair of Marketing Committee, Loyola Blakefield (Since September 2017); Trustee, MMI Gateway Foundation (since September 2017); Director and Investment Committee Member, Catholic Community Foundation Board (2012-2018); Director and Investment Committee Member, St. Ignatius Loyola Academy (2011-2017). | |
Eddie A. Grier
c/o Perkins Coie LLP
Counsel to the Independent Directors
1155 Avenue of the Americas
22nd Floor
New York, NY 10036
Birth Year: 1955 | | Advisory Board Member | | Advisory Board Member Since January 2022 | | Dean, Santa Clara University Leavey School of Business (since April 2021); Dean, Virginia Commonwealth University School of Business (2010-2021); President and various other roles, Walt Disney Company (entertainment and media) (1981-2010). | | | 78 | | | Director, Witt/Keiffer, Inc. (executive search) (since 2016); Director, NuStar GP, LLC (energy) (since August 2021); Director, Sonida Senior Living, Inc. (residential community operator) (2016-2021); Director, NVR, Inc. (homebuilding) (2013-2020); Director, Middleburg Trust Company (wealth management) (2014-2019); Director, Colonial Williamsburg Company (since 2012); Regent, University of Massachusetts Global (since 2021); Director and Chair, ChildFund International (2012-2021); Trustee, Brandman University (2010-2021); Director, Richmond Forum (2012-2019). | |
* This is the earliest date the Director began serving the Morgan Stanley Funds. Each Director serves an indefinite term, until his or her successor is elected.
** The Fund Complex includes (as of December 31, 2021) all open-end and closed-end funds (including all of their portfolios) advised by Morgan Stanley Investment Management Inc. (the "Adviser") and any funds that have an adviser that is an affiliated person of the Adviser (including, but not limited to, Morgan Stanley AIP GP LP).
*** This includes any directorships at public companies and registered investment companies held by the Director at any time during the past five years.
29
Morgan Stanley Variable Insurance Fund, Inc.
Annual Report – December 31, 2021
Director and Officer Information (unaudited) (cont'd)
Executive Officers:
Name, Address and Birth Year of
Executive Officer | | Position(s)
Held with
Registrant | | Length of
Time Served* | | Principal Occupation(s) During Past 5 Years | |
John H. Gernon
522 Fifth Avenue
New York, NY 10036
Birth Year: 1963 | | President and Principal Executive Officer | | Since September 2013 | | President and Principal Executive Officer of the Equity and Fixed Income Funds and the Morgan Stanley AIP Funds (since September 2013) and the Liquidity Funds and various money market funds (since May 2014) in the Fund Complex; Managing Director of the Adviser. | |
Deidre A. Downes
1633 Broadway
New York, NY 10019
Birth Year: 1977 | | Chief Compliance Officer | | Since November 2021 | | Executive Director of the Adviser (since January 2021) and Chief Compliance Officer of various Morgan Stanley Funds (since November 2021). Formerly, Vice President and Corporate Counsel at PGIM and Prudential Financial (October 2016 -December 2020). | |
Francis J. Smith
522 Fifth Avenue
New York, NY 10036
Birth Year: 1965 | | Treasurer and Principal Financial Officer | | Treasurer since July 2003 and Principal Financial Officer since September 2002 | | Managing Director of the Adviser and various entities affiliated with the Adviser; Treasurer (since July 2003) and Principal Financial Officer of various Morgan Stanley Funds (since September 2002). | |
Mary E. Mullin
1633 Broadway
New York, NY 10019
Birth Year: 1967 | | Secretary | | Since June 1999 | | Managing Director of the Adviser; Secretary of various Morgan Stanley Funds (since June 1999). | |
Michael J. Key
522 Fifth Avenue
New York, NY 10036
Birth Year: 1979 | | Vice President | | Since June 2017 | | Vice President of the Equity and Fixed Income Funds, Liquidity Funds, various money market funds and the Morgan Stanley AIP Funds in the Fund Complex (since June 2017); Executive Director of the Adviser; Head of Product Development for Equity and Fixed Income Funds (since August 2013). | |
* This is the earliest date the officer began serving the Morgan Stanley Funds. Each officer serves an indefinite term, until his or her successor is elected.
30
Morgan Stanley Variable Insurance Fund, Inc.
Annual Report – December 31, 2021
Adviser and Administrator
Morgan Stanley Investment Management Inc.
522 Fifth Avenue
New York, New York 10036
Sub-Adviser
Morgan Stanley Investment Management Limited
25 Cabot Square, Canary Wharf
London, E14 4QA, England
Distributor
Morgan Stanley Distribution, Inc.
522 Fifth Avenue
New York, New York 10036
Dividend Disbursing and Transfer Agent
DST Asset Manager Solutions, Inc.
2000 Crown Colony Drive
Quincy, Massachusetts 02169
Custodian
State Street Bank and Trust Company
One Lincoln Street
Boston, Massachusetts 02111
Legal Counsel
Dechert LLP
1095 Avenue of the Americas
New York, New York 10036
Counsel to the Independent Directors
Perkins Coie LLP
1155 Avenue of the Americas,
22nd Floor
New York, New York 10036
Independent Registered Public Accounting Firm
Ernst & Young LLP
200 Clarendon Street
Boston, Massachusetts 02116
Reporting to Shareholders
Each Morgan Stanley fund provides a complete schedule of portfolio holdings in its Semi-Annual and the Annual Reports within 60 days of the end of the fund's second and fourth fiscal quarters. The Semi-Annual and Annual Reports are filed electronically with the Securities and Exchange Commission ("SEC") on Form N-CSRS and Form N-CSR, respectively. Morgan Stanley also delivers the Semi-Annual and Annual Reports to fund shareholders and makes these reports available on its public website, www.morganstanley.com/im/shareholderreports. Each Morgan Stanley non-money market fund also files a complete schedule of portfolio holdings with the SEC for the fund's first and third fiscal quarters as an attachment to Form N-PORT. Morgan Stanley does not deliver the reports for the first and third fiscal quarters to shareholders, but makes the complete schedule of portfolio holdings for the fund's first and third fiscal quarters available on its public website. The holdings for each money market fund are also posted to the Morgan Stanley public website. You may obtain the Form N-PORT filings (as well as the Form N-CSR and N-CSRS filings) by accessing the SEC's website, www.sec.gov. You can also request copies of these materials, upon payment of a duplicating fee, by electronic request at the SEC's email address (publicinfo@sec.gov).
Proxy Voting Policies and Procedures and Proxy Voting Record
You may obtain a copy of the Company's Proxy Voting Policy and Procedures and information regarding how the Company voted proxies relating to portfolio securities during the most recent twelve-month period ended June 30, without charge, upon request, by calling toll free 1 (800) 548-7786 or by visiting our website at www.morganstanley.com/im/shareholderreports. This information is also available on the SEC's website at www.sec.gov.
This report is submitted for the general information of the shareholders of the Fund. For more detailed information about the Fund, its fees and expenses and other pertinent information, please read its Prospectus. The Company's Statement of Additional Information contains additional information about the Fund, including its Directors. It is available, without charge, by calling 1 (800) 548-7786.
Householding Notice
To reduce printing and mailing costs, the Fund attempts to eliminate duplicate mailings to the same address. The Fund delivers a single copy of certain shareholder documents, including shareholder reports, prospectuses and proxy materials, to investors with the same last name who reside at the same address. Your participation in this program will continue for an unlimited period of time unless you instruct us otherwise. You can request multiple copies of these documents by calling (800) 548-7786, 8:00 a.m. to 6:00 p.m., ET. Once our Customer Service Center has received your instructions, we will begin sending individual copies for each account within 30 days.
This report is not authorized for distribution to prospective investors in the Fund unless preceded or accompanied by an effective Prospectus. Read the Prospectus carefully before investing.
UIFEMDANN
3997599 EXP 02.28.23

Morgan Stanley Variable Insurance Fund, Inc.
Annual Report – December 31, 2021
Emerging Markets Equity Portfolio
The Fund is intended to be a funding vehicle for variable annuity contracts and variable life insurance policies offered by the separate accounts of certain life insurance companies.
Morgan Stanley Variable Insurance Fund, Inc.
Annual Report – December 31, 2021
Expense Example | | | 2 | | |
Investment Overview | | | 3 | | |
Portfolio of Investments | | | 6 | | |
Statement of Assets and Liabilities | | | 8 | | |
Statement of Operations | | | 9 | | |
Statements of Changes in Net Assets | | | 10 | | |
Financial Highlights | | | 11 | | |
Notes to Financial Statements | | | 13 | | |
Report of Independent Registered Public Accounting Firm | | | 20 | | |
Liquidity Risk Management Program | | | 21 | | |
Federal Tax Notice | | | 22 | | |
Director and Officer Information | | | 23 | | |
1
Morgan Stanley Variable Insurance Fund, Inc.
Annual Report – December 31, 2021
Expense Example (unaudited)
Emerging Markets Equity Portfolio
As a shareholder of the Emerging Markets Equity Portfolio (the "Fund"), you incur two types of costs: (1) insurance company charges; and (2) ongoing costs, which may include advisory fees, administration fees, distribution (12b-1) fees and other Fund expenses. This example is intended to help you understand your ongoing costs (in dollars) of investing in the Fund and to compare these costs with the ongoing costs of investing in other mutual funds.
This example is based on an investment of $1,000 invested at the beginning of the six-month period ended December 31, 2021 and held for the entire six-month period.
Actual Expenses
The table below provides information about actual account values and actual expenses. You may use the information in this table, together with the amount you invested, to estimate the expenses that you paid over the period. Simply divide your account value by $1,000 (for example, an $8,600 account value divided by $1,000 = 8.6), then multiply the result by the number in the table under the heading entitled "Actual Expenses Paid During Period" to estimate the expenses you paid on your account during this period.
Hypothetical Example for Comparison Purposes
The table below provides information about hypothetical account values and hypothetical expenses based on the Fund's actual expense ratio and an assumed rate of return of 5% per year before expenses, which is not the Fund's actual return. The hypothetical account values and expenses may not be used to estimate the actual ending account balance or expenses you paid for the period. You may use this information to compare the ongoing costs of investing in the Fund and other funds. To do so, compare this 5% hypothetical example with the 5% hypothetical examples that appear in the shareholder reports of the other funds.
Please note that the expenses shown in the table are meant to highlight your ongoing costs only and do not reflect any insurance company charges. Therefore, the table below is useful in comparing ongoing costs, but will not help you determine the relative total cost of owning different funds. In addition, if these insurance company charges were included, your costs would have been higher.
| | | Beginning
Account Value
7/1/21 | | Actual Ending
Account Value
12/31/21 | | Hypothetical
Ending
Account Value | | Actual
Expenses Paid
During Period* | | Hypothetical
Expenses Paid
During Period* | | Net Expense
Ratio During
Period** | |
Emerging Markets Equity Portfolio Class I | | $ | 1,000.00 | | | $ | 946.60 | | | $ | 1,018.80 | | | $ | 6.23 | | | $ | 6.46 | | | | 1.27 | % | |
Emerging Markets Equity Portfolio Class II | | | 1,000.00 | | | | 946.50 | | | | 1,018.55 | | | | 6.48 | | | | 6.72 | | | | 1.32 | | |
* Expenses are calculated using each Fund Class' annualized net expense ratio (as disclosed), multiplied by the average account value over the period and multiplied by 184/365 (to reflect the most recent one-half year period).
** Annualized.
2
Morgan Stanley Variable Insurance Fund, Inc.
Annual Report – December 31, 2021
Investment Overview (unaudited)
Emerging Markets Equity Portfolio
The Fund seeks long-term capital appreciation by investing primarily in growth-oriented equity securities of issuers in emerging market countries.
Performance
For the fiscal year ended December 31, 2021, the Fund's Class I shares had a total return based on net asset value and reinvestment of distributions per share of 2.99%, net of fees, and 2.95%, net of fees, for Class II shares. The Fund's Class I and Class II shares outperformed the Fund's benchmark, the MSCI Emerging Markets Index (the "Index"), which returned –2.54%.
Factors Affecting Performance
• In the volatility of 2021, our emerging markets (EM) portfolio helped preserve capital during some of the large downward market moves and delivered positive absolute returns. We achieved this by remaining disciplined in managing an active portfolio of quality growth stocks that are informed by our thematic research and assessment of macro drivers and risks. Some of the key drivers supporting our performance included identifying and allocating for: economic recovery and/or improving policy reform prospects in South Africa, Central Europe and Mexico; rising demand for the select materials needed in the green technology critical to carbon reduction; recovery in demand for transportation and select consumer staples and services as societies adjusted to the COVID-19 pandemic; greater demand for credit, particularly in countries that have avoided or cleaned up past debt problems, as in Poland and India.
• Our aggregate country allocation — which is informed by our thematic research, high conviction in select stocks and an assessment of macro drivers — contributed to excess returns, led by the underweight allocation to China. While we have been underweight China for several years, we increased our underweight in early 2021 primarily to reduce our exposure to the internet and e-commerce industries, where we assessed that earnings growth prospects were likely to slow down. As a risk consideration, we had also expressed concern about how dominant China's weight had become in the Index (peaking at 43%).
• From a sector perspective, our stock selection was also particularly well rewarded in information technology (IT) and materials — which we added to selectively over the year. We see robust future growth likely being driven by specific sub-sectors of digitization and technology; while the pandemic accelerated certain consumer and business
consumption patterns, many of these trends will likely remain permanent even after the pandemic wanes. The materials companies we have chosen meet our high-quality criteria with earnings that we believe can be sustained longer term by greater demand linked to the "green economy." In addition, we had strong stock selection among financials, which we steadily added later in the year, particularly in countries where central banks were raising rates.
• Allocations to an IT services company and two semiconductor equipment companies contributed. We believe there may be short-term volatility in the semiconductor space as chip supply normalizes. Longer term, the Fund is invested in companies that we believe are poised to benefit from a structural up-cycle.
• The overweight allocation to and stock selection in Russia contributed, through allocations to a digital consumer bank and two low-cost energy producers.
• Stock selection in South Africa contributed strongly to returns, led by allocations to a global metals and minerals mining company, a leading platinum group metals producer and a large retail bank.
• Stock selection in China, India and Brazil detracted. In China, the Fund's allocations to an internet platform company and two after-school tutoring companies detracted. However, changes we made to the China portfolio over the course of the year were constructive, as China stock selection contributed positively to returns in the second half of 2021.
• Zero allocations to Saudi Arabia, the United Arab Emirates, Qatar and Kuwait also detracted as these were among the best performing markets in EM during the year. We have not been invested in Saudi Arabia given concerns that growth in the non-oil economy has lagged, its fiscal deficit has widened and its pegged currency is likely unsustainable longer term.
Management Strategies
• The portfolio remains focused on the themes, stocks and countries that we believe can thrive, even if growth levels are lower than they were in the first decade of the 2000s, when EM boomed as an asset class. We continue to be overweight secular growth winners in themes such as digitization and technology and media, consumer plays that are supported by economic recovery and rising disposable income, and select cyclical recovery plays in
3
Morgan Stanley Variable Insurance Fund, Inc.
Annual Report – December 31, 2021
Investment Overview (unaudited) (cont'd)
Emerging Markets Equity Portfolio
those energy and materials companies that meet our high quality criteria with earnings that can be sustained longer term by greater demand linked to the "green economy."
• In Russia, many of the quality names we own are supported by the country's conservative macro policies, which have built up a fairly strong resilience to external shocks, including years of economic sanctions by the U.S. and European Union. We remain constructive and overweight South Africa as President Ramaphosa appears to be wisely allowing the justice system to run its course with former President Zuma, and the economy is supported by tailwinds from demand for metals, such as platinum, that are linked to electric vehicles and other green-friendly production. We strongly believe that paper and packaging, as provided by a company the Fund is invested in, are part of the gradual but increasing move away from plastics, and that there will likely be long-term earnings benefits from this trend.
• Eastern Europe — and Poland in particular — remain an engine room of innovation and entrepreneurship in regard to tech companies providing solutions for cybersecurity and other IT services, as well as growing global demand for gaming, which remains robust across EM despite the blunt crackdown in China. In software and IT services, e-commerce platforms, and payments, some of the most innovative growth companies are located in Brazil, Russia and Indonesia, and we remain positive on earnings growth in this area.
• Select financials are beginning to benefit from the rise in interest rates in certain countries; banks with effective fintech strategies will likely be the beneficiaries of rising demand for credit at greater profitability. We remain positive not only on names we own in South Africa and India, but also select quality names we own in China.
• Overarching our high conviction in these individual names driven by these themes are broader macro factors that we believe can help shift investor demand in favor of EM as an asset class. Key among the catalysts to trigger improved returns for EM equities are an eventual weakening of the U.S. dollar on the back of historic fiscal deficits and debt buildup; the sustainable earnings for select commodities (platinum, aluminum, copper) linked to carbon emissions reduction goals; the economic benefits from reforms in countries such as Indonesia and India; and continuing digital innovations emanating from many EM countries. We believe EM valuations overall are at compelling valuations relative to the U.S. equity market, which is likely to be helpful in catalyzing asset allocation shifts.
4
Morgan Stanley Variable Insurance Fund, Inc.
Annual Report – December 31, 2021
Investment Overview (unaudited) (cont'd)
Emerging Markets Equity Portfolio
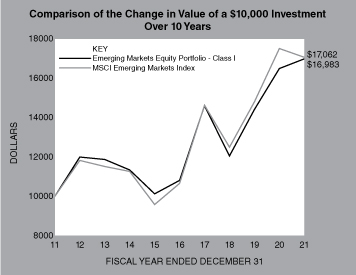
In accordance with SEC regulations, the Fund's performance shown assumes that all recurring fees (including management fees) were deducted and all dividends and distributions were reinvested. The performance of Class II shares will vary from the performance of Class I shares based upon its different inception date and will be negatively impacted by additional fees assessed to that class.
Performance Compared to the MSCI Emerging Markets Index(1)
| | | Period Ended December 31, 2021 | |
| | | Total Returns(2) | |
| | | | | Average Annual | |
| | | One
Year | | Five
Years | | Ten
Years | | Since
Inception(5) | |
Fund – Class I(3) | | | 2.99 | % | | | 9.46 | % | | | 5.44 | % | | | 6.01 | % | |
MSCI Emerging Markets Index | | | –2.54 | | | | 9.87 | | | | 5.49 | | | | 6.22 | | |
Fund – Class II(4) | | | 2.95 | | | | 9.41 | | | | 5.38 | | | | 9.47 | | |
MSCI Emerging Markets Index | | | –2.54 | | | | 9.87 | | | | 5.49 | | | | 10.29 | | |
Performance data quoted represents past performance, which is no guarantee of future results, and current performance may be lower or higher than the figures shown. Performance assumes that all dividends and distributions, if any, were reinvested. For the most recent month-end performance figures, please contact the issuing insurance company or speak with your financial advisor. Investment return and principal value will fluctuate so that Fund shares, when redeemed, may be worth more or less than their original cost. Total returns do not reflect the deduction of taxes that a shareholder would pay on Fund distributions or the redemption of Fund shares. Performance shown does not reflect fees and expenses imposed by your insurance company's separate account. If performance information included the effect of these additional charges, the total returns would be lower.
(1) The MSCI Emerging Markets Index is a free float-adjusted market capitalization weighted index that is designed to measure equity market performance of emerging markets. The term "free float" represents the portion of shares outstanding that are deemed to be available for purchase in the public equity markets by investors. The MSCI Emerging Markets Index currently consists of 25 emerging market country indices. The performance of the Index is listed in U.S. dollars and assumes reinvestment of net dividends. Returns, including periods prior to January 1, 2001, are calculated using the return data of the MSCI Emerging Markets Index (gross dividends) through December 31, 2000 and the return data of the MSCI Emerging Markets Net Index (net dividends) after December 31, 2000. Net total return indices reinvest dividends after the deduction of withholding taxes, using (for international indices) a tax rate applicable to non-resident institutional investors who do not benefit from double taxation treaties. The Index is unmanaged and its returns do not include any sales charges or fees. Such costs would lower performance. It is not possible to invest directly in an index.
(2) Total returns for the Fund reflect fees waived and expenses reimbursed, if applicable, by the Adviser (as defined herein). Without such waivers and reimbursements, total returns would have been lower.
(3) Commenced operations on October 1, 1996.
(4) Commenced offering on January 10, 2003.
(5) For comparative purposes, average annual since inception returns listed for the Index refers to the inception date or initial offering of the respective share class of the Fund, not the inception of the Index.
5
Morgan Stanley Variable Insurance Fund, Inc.
Annual Report – December 31, 2021
Portfolio of Investments
Emerging Markets Equity Portfolio
| | | Shares | | Value
(000) | |
Common Stocks (99.5%) | |
Argentina (1.6%) | |
Globant SA (a) | | | 11,564 | | | $ | 3,632 | | |
Brazil (0.8%) | |
Lojas Renner SA | | | 408,470 | | | | 1,768 | | |
China (16.6%) | |
China Construction Bank Corp. H Shares (b) | | | 5,687,230 | | | | 3,938 | | |
China Mengniu Dairy Co., Ltd. (b) | | | 520,000 | | | | 2,948 | | |
China Merchants Bank Co., Ltd. H Shares (b) | | | 526,000 | | | | 4,084 | | |
China Resources Beer Holdings Co., Ltd. (b) | | | 396,000 | | | | 3,243 | | |
China Tourism Group Duty Free Corp. Ltd.,
Class A | | | 16,300 | | | | 561 | | |
Jiangsu Hengrui Medicine Co., Ltd., Class A | | | 145,909 | | | | 1,161 | | |
Kweichow Moutai Co., Ltd., Class A | | | 7,291 | | | | 2,345 | | |
Li Ning Co., Ltd. (b) | | | 124,500 | | | | 1,363 | | |
Meituan, Class B (a)(b) | | | 122,400 | | | | 3,538 | | |
Proya Cosmetics Co. Ltd., Class A | | | 22,800 | | | | 745 | | |
Shenzhou International Group Holdings Ltd. (b) | | | 173,200 | | | | 3,330 | | |
Tencent Holdings Ltd. (b) | | | 171,800 | | | | 10,064 | | |
Wuxi Biologics Cayman, Inc. (a)(b) | | | 49,000 | | | | 582 | | |
| | | | 37,902 | | |
Czech Republic (0.9%) | |
Komercni Banka AS | | | 48,193 | | | | 2,061 | | |
Germany (1.2%) | |
Infineon Technologies AG | | | 61,624 | | | | 2,837 | | |
Hong Kong (1.1%) | |
Hong Kong Exchanges & Clearing Ltd. | | | 42,400 | | | | 2,476 | | |
India (13.6%) | |
Asian Paints Ltd. | | | 39,678 | | | | 1,806 | | |
Eicher Motors Ltd. | | | 26,499 | | | | 924 | | |
Gland Pharma Ltd. (a) | | | 12,677 | | | | 659 | | |
HDFC Bank Ltd. ADR | | | 56,213 | | | | 3,658 | | |
Hindalco Industries Ltd. | | | 316,246 | | | | 2,023 | | |
Housing Development Finance Corp., Ltd. | | | 121,273 | | | | 4,220 | | |
ICICI Bank Ltd. | | | 424,093 | | | | 4,223 | | |
ICICI Prudential Life Insurance Co., Ltd. | | | 195,242 | | | | 1,473 | | |
Infosys Ltd. | | | 117,334 | | | | 2,980 | | |
Infosys Ltd. ADR | | | 34,407 | | | | 871 | | |
Mahindra & Mahindra Financial Services Ltd. | | | 411,319 | | | | 824 | | |
Mahindra & Mahindra Ltd. | | | 130,720 | | | | 1,472 | | |
MakeMyTrip Ltd. (a) | | | 23,060 | | | | 639 | | |
Reliance Industries Ltd. | | | 131,376 | | | | 4,185 | | |
Shree Cement Ltd. | | | 2,940 | | | | 1,067 | | |
| | | | 31,024 | | |
Indonesia (1.9%) | |
Bank Central Asia Tbk PT | | | 4,788,500 | | | | 2,452 | | |
Bank Mandiri Persero Tbk PT | | | 2,930,100 | | | | 1,447 | | |
Bukalapak.com PT Tbk (a) | | | 11,127,600 | | | | 337 | | |
| | | | 4,236 | | |
Korea, Republic of (10.6%) | |
Hyundai Motor Co. | | | 4,922 | | | | 864 | | |
| | | Shares | | Value
(000) | |
Kakao Corp. (a) | | | 14,079 | | | $ | 1,330 | | |
KakaoBank Corp. (a) | | | 3,227 | | | | 160 | | |
KB Financial Group, Inc. | | | 37,161 | | | | 1,718 | | |
Kia Corp. | | | 12,388 | | | | 855 | | |
LG Chem Ltd. | | | 2,395 | | | | 1,238 | | |
NAVER Corp. | | | 4,009 | | | | 1,273 | | |
Samsung Electronics Co., Ltd. | | | 208,378 | | | | 13,685 | | |
Samsung SDI Co., Ltd. (a) | | | 3,208 | | | | 1,764 | | |
SK Hynix, Inc. (a) | | | 11,639 | | | | 1,278 | | |
| | | | 24,165 | | |
Mexico (4.7%) | |
Grupo Aeroportuario del Sureste SAB de CV,
Class B | | | 169,200 | | | | 3,488 | | |
Grupo Financiero Banorte SAB de CV Series O | | | 620,666 | | | | 4,037 | | |
Wal-Mart de Mexico SAB de CV | | | 885,453 | | | | 3,296 | | |
| | | | 10,821 | | |
Netherlands (2.1%) | |
ASML Holding N.V. | | | 5,992 | | | | 4,771 | | |
Panama (1.5%) | |
Copa Holdings SA, Class A (a) | | | 40,300 | | | | 3,331 | | |
Poland (3.1%) | |
Bank Polska Kasa Opieki SA | | | 96,233 | | | | 2,905 | | |
LPP SA | | | 997 | | | | 4,238 | | |
| | | | 7,143 | | |
Russia (8.0%) | |
Fix Price Group Ltd. GDR (Euroclear) | | | 181,926 | | | | 1,373 | | |
Fix Price Group Ltd. GDR | | | 96,387 | | | | 728 | | |
LUKOIL PJSC ADR | | | 38,925 | | | | 3,484 | | �� |
Novatek PJSC (Registered GDR) | | | 16,636 | | | | 3,896 | | |
Ozon Holdings PLC ADR (a) | | | 32,454 | | | | 961 | | |
Sberbank of Russia PJSC ADR | | | 115,107 | | | | 1,847 | | |
TCS Group Holding PLC GDR | | | 34,937 | | | | 2,946 | | |
Yandex N.V., Class A (a) | | | 50,952 | | | | 3,083 | | |
| | | | 18,318 | | |
Singapore (1.5%) | |
Sea Ltd. ADR (a) | | | 15,020 | | | | 3,360 | | |
South Africa (5.5%) | |
Anglo American Platinum Ltd. | | | 18,978 | | | | 2,164 | | |
Anglo American PLC | | | 145,539 | | | | 5,952 | | |
Capitec Bank Holdings Ltd. | | | 24,703 | | | | 3,162 | | |
Mr Price Group Ltd. | | | 104,723 | | | | 1,311 | | |
| | | | 12,589 | | |
Taiwan (16.5%) | |
Airtac International Group | | | 87,901 | | | | 3,228 | | |
ASE Technology Holding Co., Ltd. | | | 923,738 | | | | 3,569 | | |
Delta Electronics, Inc. | | | 477,000 | | | | 4,733 | | |
MediaTek, Inc. | | | 20,000 | | | | 858 | | |
Novatek Microelectronics Corp. | | | 102,000 | | | | 1,981 | | |
Silergy Corp. | | | 17,000 | | | | 3,077 | | |
Taiwan Semiconductor Manufacturing Co., Ltd. | | | 913,000 | | | | 20,196 | | |
| | | | 37,642 | | |
The accompanying notes are an integral part of the financial statements.
6
Morgan Stanley Variable Insurance Fund, Inc.
Annual Report – December 31, 2021
Portfolio of Investments (cont'd)
Emerging Markets Equity Portfolio
| | | Shares | | Value
(000) | |
Thailand (0.5%) | |
Ngern Tid Lor PCL (a) | | | 1,010,000 | | | $ | 1,104 | | |
United Kingdom (1.9%) | |
Mondi PLC | | | 172,178 | | | | 4,270 | | |
United States (5.9%) | |
Applied Materials, Inc. | | | 17,275 | | | | 2,718 | | |
EPAM Systems, Inc. (a) | | | 4,858 | | | | 3,247 | | |
MercadoLibre, Inc. (a) | | | 2,301 | | | | 3,103 | | |
NIKE, Inc., Class B | | | 15,394 | | | | 2,566 | | |
NVIDIA Corp. | | | 6,014 | | | | 1,769 | | |
| | | | 13,403 | | |
Total Common Stocks (Cost $151,107) | | | 226,853 | | |
Short-Term Investment (0.9%) | |
Investment Company (0.9%) | |
Morgan Stanley Institutional Liquidity
Funds — Government Portfolio —
Institutional Class (See Note H)
(Cost $2,032) | | | 2,032,383 | | | | 2,032 | | |
Total Investments (100.4%)
(Cost $153,139) (c)(d) | | | 228,885 | | |
Liabilities in Excess of Other Assets (–0.4%) | | | (924 | ) | |
Net Assets (100.0%) | | $ | 227,961 | | |
Country assignments and aggregations are based generally on third party vendor classifications and information, and may be different from the assignments and aggregations under the policies set forth in the Fund's prospectus and/or statement of additional information relating to geographic classifications.
(a) Non-income producing security.
(b) Security trades on the Hong Kong exchange.
(c) The approximate fair value and percentage of net assets, $80,956,000 and 35.5%, respectively, represent the securities that have been fair valued under the fair valuation policy for international investments as described in Note A-1 within the Notes to the Financial Statements.
(d) At December 31, 2021, the aggregate cost for federal income tax purposes is approximately $153,963,000. The aggregate gross unrealized appreciation is approximately $84,271,000 and the aggregate gross unrealized depreciation is approximately $9,360,000, resulting in net unrealized appreciation of approximately $74,911,000.
ADR American Depositary Receipt.
GDR Global Depositary Receipt.
PJSC Public Joint Stock Company.
Portfolio Composition
Classification | | Percentage of
Total Investments | |
Other* | | | 41.3 | % | |
Semiconductors & Semiconductor Equipment | | | 18.8 | | |
Banks | | | 16.9 | | |
Interactive Media & Services | | | 6.9 | | |
Tech Hardware, Storage & Peripherals | | | 6.0 | | |
Oil, Gas & Consumable Fuels | | | 5.1 | | |
Textiles, Apparel & Luxury Goods | | | 5.0 | | |
Total Investments | | | 100.0 | % | |
* Industries and/or investment types representing less than 5% of total investments.
The accompanying notes are an integral part of the financial statements.
7
Morgan Stanley Variable Insurance Fund, Inc.
Annual Report – December 31, 2021
Emerging Markets Equity Portfolio
Statement of Assets and Liabilities | | December 31, 2021
(000) | |
Assets: | |
Investments in Securities of Unaffiliated Issuers, at Value (Cost $151,107) | | $ | 226,853 | | |
Investment in Security of Affiliated Issuer, at Value (Cost $2,032) | | | 2,032 | | |
Total Investments in Securities, at Value (Cost $153,139) | | | 228,885 | | |
Foreign Currency, at Value (Cost $32) | | | 32 | | |
Dividends Receivable | | | 394 | | |
Receivable for Fund Shares Sold | | | 133 | | |
Tax Reclaim Receivable | | | 55 | | |
Receivable for Investments Sold | | | — | @ | |
Receivable from Affiliate | | | — | @ | |
Receivable from Securities Lending Income | | | — | @ | |
Other Assets | | | 28 | | |
Total Assets | | | 229,527 | | |
Liabilities: | |
Deferred Capital Gain Country Tax | | | 681 | | |
Payable for Advisory Fees | | | 489 | | |
Payable for Custodian Fees | | | 114 | | |
Payable for Servicing Fees | | | 83 | | |
Payable for Professional Fees | | | 62 | | |
Payable for Fund Shares Redeemed | | | 38 | | |
Payable for Investments Purchased | | | 34 | | |
Payable for Administration Fees | | | 15 | | |
Payable for Transfer Agency Fees | | | 3 | | |
Payable for Distribution Fees — Class II Shares | | | 1 | | |
Other Liabilities | | | 46 | | |
Total Liabilities | | | 1,566 | | |
NET ASSETS | | $ | 227,961 | | |
Net Assets Consist of: | |
Paid-in-Capital | | $ | 134,303 | | |
Total Distributable Earnings | | | 93,658 | | |
Net Assets | | $ | 227,961 | | |
CLASS I: | |
Net Assets | | $ | 160,661 | | |
Net Asset Value, Offering and Redemption Price Per Share Applicable to 8,870,682 Outstanding
$0.001 Par Value Shares (Authorized 500,000,000 Shares) | | $ | 18.11 | | |
CLASS II: | |
Net Assets | | $ | 67,300 | | |
Net Asset Value, Offering and Redemption Price Per Share Applicable to 3,729,999 Outstanding
$0.001 Par Value Shares (Authorized 500,000,000 Shares) | | $ | 18.04 | | |
@ Amount is less than $500.
The accompanying notes are an integral part of the financial statements.
8
Morgan Stanley Variable Insurance Fund, Inc.
Annual Report – December 31, 2021
Emerging Markets Equity Portfolio
Statement of Operations | | Year Ended
December 31, 2021
(000) | |
Investment Income: | |
Dividends from Securities of Unaffiliated Issuers (Net of $565 of Foreign Taxes Withheld) | | $ | 4,114 | | |
Income from Securities Loaned — Net | | | 10 | | |
Dividends from Security of Affiliated Issuer (Note H) | | | 1 | | |
Total Investment Income | | | 4,125 | | |
Expenses: | |
Advisory Fees (Note B) | | | 2,071 | | |
Servicing Fees (Note D) | | | 375 | | |
Administration Fees (Note C) | | | 195 | | |
Distribution Fees — Class II Shares (Note E) | | | 179 | | |
Professional Fees | | | 173 | | |
Custodian Fees (Note G) | | | 150 | | |
Shareholder Reporting Fees | | | 40 | | |
Transfer Agency Fees (Note F) | | | 15 | | |
Directors' Fees and Expenses | | | 7 | | |
Pricing Fees | | | 5 | | |
Other Expenses | | | 14 | | |
Total Expenses | | | 3,224 | | |
Waiver of Distribution Fees — Class II Shares (Note E) | | | (143 | ) | |
Rebate from Morgan Stanley Affiliate (Note H) | | | (1 | ) | |
Net Expenses | | | 3,080 | | |
Net Investment Income | | | 1,045 | | |
Realized Gain (Loss): | |
Investments Sold (Net of $234 of Capital Gain Country Tax) | | | 37,681 | | |
Foreign Currency Translation | | | (244 | ) | |
Net Realized Gain | | | 37,437 | | |
Change in Unrealized Appreciation (Depreciation): | |
Investments (Net of Increase in Deferred Capital Gain Country Tax of $263) | | | (30,849 | ) | |
Foreign Currency Translation | | | 2 | | |
Net Change in Unrealized Appreciation (Depreciation) | | | (30,847 | ) | |
Net Realized Gain and Change in Unrealized Appreciation (Depreciation) | | | 6,590 | | |
Net Increase in Net Assets Resulting from Operations | | $ | 7,635 | | |
The accompanying notes are an integral part of the financial statements.
9
Morgan Stanley Variable Insurance Fund, Inc.
Annual Report – December 31, 2021
Emerging Markets Equity Portfolio
Statements of Changes in Net Assets | | Year Ended
December 31, 2021
(000) | | Year Ended
December 31, 2020
(000) | |
Increase (Decrease) in Net Assets: | |
Operations: | |
Net Investment Income | | $ | 1,045 | | | $ | 694 | | |
Net Realized Gain (Loss) | | | 37,437 | | | | (17,974 | ) | |
Net Change in Unrealized Appreciation (Depreciation) | | | (30,847 | ) | | | 45,717 | | |
Net Increase in Net Assets Resulting from Operations | | | 7,635 | | | | 28,437 | | |
Dividends and Distributions to Shareholders: | |
Class I | | | (1,446 | ) | | | (4,365 | ) | |
Class II | | | (557 | ) | | | (1,886 | ) | |
Total Dividends and Distributions to Shareholders | | | (2,003 | ) | | | (6,251 | ) | |
Capital Share Transactions:(1) | |
Class I: | |
Subscribed | | | 17,164 | | | | 14,816 | | |
Distributions Reinvested | | | 1,446 | | | | 4,365 | | |
Redeemed | | | (28,766 | ) | | | (31,140 | ) | |
Class II: | |
Subscribed | | | 6,350 | | | | 9,684 | | |
Distributions Reinvested | | | 557 | | | | 1,886 | | |
Redeemed | | | (14,697 | ) | | | (16,978 | ) | |
Net Decrease in Net Assets Resulting from Capital Share Transactions | | | (17,946 | ) | | | (17,367 | ) | |
Total Increase (Decrease) in Net Assets | | | (12,314 | ) | | | 4,819 | | |
Net Assets: | |
Beginning of Period | | | 240,275 | | | | 235,456 | | |
End of Period | | $ | 227,961 | | | $ | 240,275 | | |
(1) Capital Share Transactions: | |
Class I: | |
Shares Subscribed | | | 918 | | | | 1,016 | | |
Shares Issued on Distributions Reinvested | | | 77 | | | | 307 | | |
Shares Redeemed | | | (1,544 | ) | | | (2,148 | ) | |
Net Decrease in Class I Shares Outstanding | | | (549 | ) | | | (825 | ) | |
Class II: | |
Shares Subscribed | | | 341 | | | | 682 | | |
Shares Issued on Distributions Reinvested | | | 30 | | | | 133 | | |
Shares Redeemed | | | (790 | ) | | | (1,164 | ) | |
Net Decrease in Class II Shares Outstanding | | | (419 | ) | | | (349 | ) | |
The accompanying notes are an integral part of the financial statements.
10
Morgan Stanley Variable Insurance Fund, Inc.
Annual Report – December 31, 2021
Financial Highlights
Emerging Markets Equity Portfolio
| | | Class I | |
| | | Year Ended December 31, | |
Selected Per Share Data and Ratios | | 2021 | | 2020 | | 2019 | | 2018 | | 2017 | |
Net Asset Value, Beginning of Period | | $ | 17.73 | | | $ | 15.99 | | | $ | 14.48 | | | $ | 17.65 | | | $ | 13.16 | | |
Income (Loss) from Investment Operations: | |
Net Investment Income(1) | | | 0.08 | | | | 0.05 | | | | 0.20 | | | | 0.14 | | | | 0.09 | | |
Net Realized and Unrealized Gain (Loss) | | | 0.46 | | | | 2.15 | | | | 2.56 | | | | (3.23 | ) | | | 4.52 | | |
Total from Investment Operations | | | 0.54 | | | | 2.20 | | | | 2.76 | | | | (3.09 | ) | | | 4.61 | | |
Distributions from and/or in Excess of: | |
Net Investment Income | | | (0.16 | ) | | | (0.21 | ) | | | (0.17 | ) | | | (0.08 | ) | | | (0.12 | ) | |
Net Realized Gain | | | — | | | | (0.25 | ) | | | (1.08 | ) | | | — | | | | — | | |
Total Distributions | | | (0.16 | ) | | | (0.46 | ) | | | (1.25 | ) | | | (0.08 | ) | | | (0.12 | ) | |
Net Asset Value, End of Period | | $ | 18.11 | | | $ | 17.73 | | | $ | 15.99 | | | $ | 14.48 | | | $ | 17.65 | | |
Total Return(2) | | | 2.99 | % | | | 14.44 | % | | | 19.59 | % | | | (17.47 | )% | | | 35.06 | % | |
Ratios to Average Net Assets and Supplemental Data: | |
Net Assets, End of Period (Thousands) | | $ | 160,661 | | | $ | 166,989 | | | $ | 163,794 | | | $ | 175,300 | | | $ | 238,026 | | |
Ratio of Expenses Before Expense Limitation | | | 1.25 | % | | | 1.30 | % | | | 1.27 | % | | | N/A | | | | 1.32 | % | |
Ratio of Expenses After Expense Limitation | | | 1.25 | %(3) | | | 1.25 | %(3) | | | 1.25 | %(3) | | | 1.22 | %(3) | | | 1.25 | %(3) | |
Ratio of Expenses After Expense Limitation Excluding Interest Expenses | | | N/A | | | | 1.25 | %(3) | | | 1.25 | %(3) | | | 1.22 | %(3) | | | N/A | | |
Ratio of Net Investment Income | | | 0.44 | %(3) | | | 0.35 | %(3) | | | 1.33 | %(3) | | | 0.86 | %(3) | | | 0.56 | %(3) | |
Ratio of Rebate from Morgan Stanley Affiliates | | | 0.00 | %(4) | | | 0.00 | %(4) | | | 0.00 | %(4) | | | 0.01 | % | | | 0.00 | %(4) | |
Portfolio Turnover Rate | | | 39 | % | | | 52 | % | | | 36 | % | | | 42 | % | | | 37 | % | |
(1) Per share amount is based on average shares outstanding.
(2) Calculated based on the net asset value as of the last business day of the period. Performance does not reflect fees and expenses imposed by your insurance company's separate account. If performance information included the effect of these additional charges, the total return would be lower.
(3) The Ratio of Expenses After Expense Limitation and Ratio of Net Investment Income reflect the rebate of certain Fund expenses in connection with the investments in Morgan Stanley affiliates during the period. The effect of the rebate on the ratios is disclosed in the above table as "Ratio of Rebate from Morgan Stanley Affiliates."
(4) Amount is less than 0.005%.
The accompanying notes are an integral part of the financial statements.
11
Morgan Stanley Variable Insurance Fund, Inc.
Annual Report – December 31, 2021
Financial Highlights
Emerging Markets Equity Portfolio
| | | Class II | |
| | | Year Ended December 31, | |
Selected Per Share Data and Ratios | | 2021 | | 2020 | | 2019 | | 2018 | | 2017 | |
Net Asset Value, Beginning of Period | | $ | 17.66 | | | $ | 15.93 | | | $ | 14.44 | | | $ | 17.59 | | | $ | 13.11 | | |
Income (Loss) from Investment Operations: | |
Net Investment Income(1) | | | 0.07 | | | | 0.04 | | | | 0.19 | | | | 0.13 | | | | 0.08 | | |
Net Realized and Unrealized Gain (Loss) | | | 0.46 | | | | 2.14 | | | | 2.54 | | | | (3.21 | ) | | | 4.51 | | |
Total from Investment Operations | | | 0.53 | | | | 2.18 | | | | 2.73 | | | | (3.08 | ) | | | 4.59 | | |
Distributions from and/or in Excess of: | |
Net Investment Income | | | (0.15 | ) | | | (0.20 | ) | | | (0.16 | ) | | | (0.07 | ) | | | (0.11 | ) | |
Net Realized Gain | | | — | | | | (0.25 | ) | | | (1.08 | ) | | | — | | | | — | | |
Total Distributions | | | (0.15 | ) | | | (0.45 | ) | | | (1.24 | ) | | | (0.07 | ) | | | (0.11 | ) | |
Net Asset Value, End of Period | | $ | 18.04 | | | $ | 17.66 | | | $ | 15.93 | | | $ | 14.44 | | | $ | 17.59 | | |
Total Return(2) | | | 2.95 | % | | | 14.36 | % | | | 19.51 | % | | | (17.51 | )% | | | 35.06 | % | |
Ratios to Average Net Assets and Supplemental Data: | |
Net Assets, End of Period (Thousands) | | $ | 67,300 | | | $ | 73,286 | | | $ | 71,662 | | | $ | 68,404 | | | $ | 89,249 | | |
Ratio of Expenses Before Expense Limitation | | | 1.50 | % | | | 1.55 | % | | | 1.52 | % | | | 1.48 | % | | | 1.57 | % | |
Ratio of Expenses After Expense Limitation | | | 1.30 | %(3) | | | 1.30 | %(3) | | | 1.30 | %(3) | | | 1.27 | %(3) | | | 1.30 | %(3) | |
Ratio of Expenses After Expense Limitation Excluding Interest Expenses | | | N/A | | | | 1.30 | %(3) | | | 1.30 | %(3) | | | 1.27 | %(3) | | | N/A | | |
Ratio of Net Investment Income | | | 0.39 | %(3) | | | 0.30 | %(3) | | | 1.28 | %(3) | | | 0.81 | %(3) | | | 0.51 | %(3) | |
Ratio of Rebate from Morgan Stanley Affiliates | | | 0.00 | %(4) | | | 0.00 | %(4) | | | 0.00 | %(4) | | | 0.01 | % | | | 0.00 | %(4) | |
Portfolio Turnover Rate | | | 39 | % | | | 52 | % | | | 36 | % | | | 42 | % | | | 37 | % | |
(1) Per share amount is based on average shares outstanding.
(2) Calculated based on the net asset value as of the last business day of the period. Performance does not reflect fees and expenses imposed by your insurance company's separate account. If performance information included the effect of these additional charges, the total return would be lower.
(3) The Ratio of Expenses After Expense Limitation and Ratio of Net Investment Income reflect the rebate of certain Fund expenses in connection with the investments in Morgan Stanley affiliates during the period. The effect of the rebate on the ratios is disclosed in the above table as "Ratio of Rebate from Morgan Stanley Affiliates."
(4) Amount is less than 0.005%.
The accompanying notes are an integral part of the financial statements.
12
Morgan Stanley Variable Insurance Fund, Inc.
Annual Report – December 31, 2021
Notes to Financial Statements
Morgan Stanley Variable Insurance Fund, Inc. (the "Company") is registered under the Investment Company Act of 1940, as amended (the "Act"), as an open-end management investment company. The Company is comprised of ten separate active, diversified and non-diversified funds (individually referred to as a "Fund," collectively as the "Funds"). The Company applies investment company accounting and reporting guidance.
The accompanying financial statements relate to the Emerging Markets Equity Portfolio. The Fund seeks long-term capital appreciation by investing primarily in growth-oriented equity securities of issuers in emerging market countries. The Fund offers two classes of shares — Class I and Class II. Both classes of shares have identical voting rights (except that shareholders of a Class have exclusive voting rights regarding any matter relating solely to that Class of shares), dividend, liquidation and other rights.
The Company is intended to be a funding vehicle for variable annuity contracts and variable life insurance policies offered by the separate accounts of certain life insurance companies.
A. Significant Accounting Policies: The following significant accounting policies are in conformity with U.S. generally accepted accounting principles ("GAAP"). Such policies are consistently followed by the Company in the preparation of its financial statements. GAAP may require management to make estimates and assumptions that affect the reported amounts and disclosures in the financial statements. Actual results may differ from those estimates.
1. Security Valuation: (1) An equity portfolio security listed or traded on an exchange is valued at its latest reported sales price (or at the exchange official closing price if such exchange reports an official closing price), and if there were no sales on a given day and if there is no official exchange closing price for that day, the security is valued at the mean between the last reported bid and asked prices if such bid and asked prices are available on the relevant exchanges. If only bid prices are available then the latest bid price may be used. Listed equity securities not traded on the valuation date with no reported bid and asked prices available on the exchange are valued at the mean between the current bid and asked prices obtained from one or more reputable brokers or dealers. In cases where a security is traded on more than one exchange, the security is valued on the exchange designated as the primary market; (2) all other equity portfolio securities for which over-the-counter ("OTC") market quotations are readily available are valued at the latest reported sales price (or at the market official closing price if such market reports an official closing price), and if there was no
trading in the security on a given day and if there is no official closing price from relevant markets for that day, the security is valued at the mean between the last reported bid and asked prices if such bid and asked prices are available on the relevant markets. An unlisted equity security that does not trade on the valuation date and for which bid and asked prices from the relevant markets are unavailable is valued at the mean between the current bid and asked prices obtained from one or more reputable brokers or dealers; (3) certain portfolio securities may be valued by an outside pricing service/vendor approved by the Company's Board of Directors (the "Directors"). The pricing service/vendor may employ a pricing model that takes into account, among other things, bids, yield spreads and/or other market data and specific security characteristics. Alternatively, if a valuation is not available from an outside pricing service/vendor, and the security trades on an exchange, the security may be valued at its latest reported sale price (or at the exchange official closing price if such exchange reports an official closing price), prior to the time when assets are valued. If there are no sales on a given day and if there is no official exchange closing price for that day, the security is valued at the mean between the last reported bid and asked prices if such bid and asked prices are available in the relevant exchanges. If only bid prices are available then the latest bid price may be used. If Morgan Stanley Investment Management Inc. (the "Adviser") or Morgan Stanley Investment Management Company ("MSIM Company") (the "Sub-Adviser"), each a wholly-owned subsidiary of Morgan Stanley, determines that the price provided by the outside pricing service/vendor or exchange does not reflect the security's fair value or is unable to provide a price, prices from brokers or dealers may also be utilized. In these circumstances, the value of the security will be the mean of bid and asked prices obtained from brokers or dealers; (4) when market quotations are not readily available, including circumstances under which the Adviser or the Sub-Adviser determines that the closing price, last sale price or the mean between the last reported bid and asked prices are not reflective of a security's market value, portfolio securities are valued at their fair value as determined in good faith under procedures established by and under the general supervision of the Directors. Occasionally, developments affecting the closing prices of securities and other assets may occur between the times at which valuations of such securities are determined (that is, close of the foreign market on which the securities trade) and the close of business of the New York Stock Exchange ("NYSE"). If developments occur during such periods that are expected to materially affect the value of
13
Morgan Stanley Variable Insurance Fund, Inc.
Annual Report – December 31, 2021
Notes to Financial Statements (cont'd)
such securities, such valuations may be adjusted to reflect the estimated fair value of such securities as of the close of the NYSE, as determined in good faith by the Directors or by the Adviser using a pricing service and/or procedures approved by the Directors; (5) quotations of foreign portfolio securities, other assets and liabilities and forward contracts stated in foreign currency are translated into U.S. dollar equivalents at the prevailing market rates prior to the close of the NYSE; and (6) investments in mutual funds, including the Morgan Stanley Institutional Liquidity Funds, are valued at the net asset value ("NAV") as of the close of each business day.
The Directors have responsibility for determining in good faith the fair value of the investments, and the Directors may appoint others, such as the Company's Adviser or a valuation committee, to assist the Directors in determining fair value and to make the actual calculations pursuant to the fair valuation methodologies previously approved by the Directors. Under procedures approved by the Directors, the Company's Adviser has formed a Valuation Committee whose members are approved by the Directors. The Valuation Committee provides administration and oversight of the Company's valuation policies and procedures, which are reviewed at least annually by the Directors. These procedures allow the Company to utilize independent pricing services, quotations from securities and financial instrument dealers and other market sources to determine fair value.
2. Fair Value Measurement: Financial Accounting Standards Board ("FASB") Accounting Standards CodificationTM ("ASC") 820, "Fair Value Measurement" ("ASC 820"), defines fair value as the value that the Fund would receive to sell an investment or pay to transfer a liability in a timely transaction with an independent buyer in the principal market, or in the absence of a principal market, the most advantageous market for the investment or liability. ASC 820 establishes a three-tier hierarchy to distinguish between (1) inputs that reflect the assumptions market participants would use in valuing an asset or liability developed based on market data obtained from sources independent of the reporting entity (observable inputs) and (2) inputs that reflect the reporting entity's own assumptions about the assumptions market participants would use in valuing an asset or liability developed based on the best information available in the circumstances (unobservable inputs) and to establish classification of fair value measurements for disclosure purposes. Various inputs are used in determining the value of the
Fund's investments. The inputs are summarized in the three broad levels listed below:
• Level 1 – unadjusted quoted prices in active markets for identical investments
• Level 2 – other significant observable inputs (including quoted prices for similar investments, interest rates, prepayment speeds, credit risk, etc.)
• Level 3 – significant unobservable inputs including the Fund's own assumptions in determining the fair value of investments. Factors considered in making this determination may include, but are not limited to, information obtained by contacting the issuer, analysts, or the appropriate stock exchange (for exchange-traded securities), analysis of the issuer's financial statements or other available documents and, if necessary, available information concerning other securities in similar circumstances.
The inputs or methodology used for valuing securities are not necessarily an indication of the risk associated with investing in those securities and the determination of the significance of a particular input to the fair value measurement in its entirety requires judgment and considers factors specific to each security.
The following is a summary of the inputs used to value the Fund's investments as of December 31, 2021:
Investment Type | | Level 1
Unadjusted
quoted
prices
(000) | | Level 2
Other
significant
observable
inputs
(000) | | Level 3
Significant
unobservable
inputs
(000) | | Total
(000) | |
Assets: | |
Common Stocks | |
Airlines | | $ | 3,331 | | | $ | — | | | $ | — | | | $ | 3,331 | | |
Automobiles | | | 2,396 | | | | 1,719 | | | | — | | | | 4,115 | | |
Banks | | | 27,895 | | | | 10,743 | | | | — | | | | 38,638 | | |
Beverages | | | 5,588 | | | | — | | | | — | | | | 5,588 | | |
Capital Markets | | | 2,476 | | | | — | | | | — | | | | 2,476 | | |
Chemicals | | | 1,806 | | | | 1,238 | | | | — | | | | 3,044 | | |
Construction Materials | | | 1,067 | | | | — | | | | — | | | | 1,067 | | |
Consumer Finance | | | 824 | | | | 1,104 | | | | — | | | | 1,928 | | |
Electronic Equipment,
Instruments &
Components | | | — | | | | 6,497 | | | | — | | | | 6,497 | | |
Entertainment | | | 3,360 | | | | — | | | | — | | | | 3,360 | | |
Food & Staples Retailing | | | 3,296 | | | | — | | | | — | | | | 3,296 | | |
Food Products | | | 2,948 | | | | — | | | | — | | | | 2,948 | | |
Hotels, Restaurants &
Leisure | | | 639 | | | | — | | | | — | | | | 639 | | |
Information Technology
Services | | | 10,730 | | | | — | | | | — | | | | 10,730 | | |
Insurance | | | 1,473 | | | | — | | | | — | | | | 1,473 | | |
14
Morgan Stanley Variable Insurance Fund, Inc.
Annual Report – December 31, 2021
Notes to Financial Statements (cont'd)
Investment Type | | Level 1
Unadjusted
quoted
prices
(000) | | Level 2
Other
significant
observable
inputs
(000) | | Level 3
Significant
unobservable
inputs
(000) | | Total
(000) | |
Common Stocks (cont'd) | |
Interactive Media &
Services | | $ | 13,147 | | | $ | 2,603 | | | $ | — | | | $ | 15,750 | | |
Internet & Direct
Marketing Retail | | | 7,602 | | | | 337 | | | | — | | | | 7,939 | | |
Life Sciences Tools &
Services | | | 582 | | | | — | | | | — | | | | 582 | | |
Machinery | | | — | | | | 3,228 | | | | — | | | | 3,228 | | |
Metals & Mining | | | 10,139 | | | | — | | | | — | | | | 10,139 | | |
Multi-Line Retail | | | 1,373 | | | | 2,496 | | | | — | | | | 3,869 | | |
Oil, Gas & Consumable
Fuels | | | 11,565 | | | | — | | | | — | | | | 11,565 | | |
Paper & Forest Products | | | 4,270 | | | | — | | | | — | | | | 4,270 | | |
Personal Products | | | 745 | | | | — | | | | — | | | | 745 | | |
Pharmaceuticals | | | 1,820 | | | | — | | | | — | | | | 1,820 | | |
Semiconductors &
Semiconductor
Equipment | | | 9,258 | | | | 33,796 | | | | — | | | | 43,054 | | |
Specialty Retail | | | 1,872 | | | | — | | | | — | | | | 1,872 | | |
Tech Hardware,
Storage & Peripherals | | | — | | | | 13,685 | | | | — | | | | 13,685 | | |
Textiles, Apparel &
Luxury Goods | | | 7,259 | | | | 4,238 | | | | — | | | | 11,497 | | |
Thrifts & Mortgage
Finance | | | 4,220 | | | | — | | | | — | | | | 4,220 | | |
Transportation
Infrastructure | | | 3,488 | | | | — | | | | — | | | | 3,488 | | |
Total Common Stocks | | | 145,169 | | | | 81,684 | | | | — | | | | 226,853 | | |
Short-Term Investment | |
Investment Company | | | 2,032 | | | | — | | | | — | | | | 2,032 | | |
Total Assets | | $ | 147,201 | | | $ | 81,684 | | | $ | — | | | $ | 228,885 | | |
Transfers between investment levels may occur as the markets fluctuate and/or the availability of data used in an investment's valuation changes.
3. Foreign Currency Translation and Foreign Investments: The books and records of the Fund are maintained in U.S. dollars. Foreign currency amounts are translated into U.S. dollars as follows:
— investments, other assets and liabilities at the prevailing rate of exchange on the valuation date;
— investment transactions and investment income at the prevailing rates of exchange on the dates of such transactions.
Although the net assets of the Fund are presented at the foreign exchange rates and market values at the close of the period, the Fund does not isolate that portion of the results of operations arising as a result of changes in the foreign exchange rates from the fluctuations arising from
changes in the market prices of securities held at period end. Similarly, the Fund does not isolate the effect of changes in foreign exchange rates from the fluctuations arising from changes in the market prices of securities sold during the period. Accordingly, realized and unrealized foreign currency gains (losses) on investments in securities are included in the reported net realized and unrealized gains (losses) on investment transactions and balances. However, pursuant to U.S. federal income tax regulations, gains and losses from certain foreign currency transactions and the foreign currency portion of gains and losses realized on sales and maturities of foreign denominated debt securities are treated as ordinary income for U.S. federal income tax purposes.
Net realized gains (losses) on foreign currency transactions represent net foreign exchange gains (losses) from foreign currency forward exchange contracts, disposition of foreign currencies, currency gains (losses) realized between the trade and settlement dates on securities transactions, and the difference between the amount of investment income and foreign withholding taxes recorded on the Fund's books and the U.S. dollar equivalent amounts actually received or paid. The change in unrealized currency gains (losses) on foreign currency transactions for the period is reflected in the Statement of Operations.
Foreign security and currency transactions may involve certain considerations and risks not typically associated with those of U.S. dollar denominated transactions as a result of, among other factors, fluctuations of exchange rates in relation to the U.S. dollar, the possibility of lower levels of governmental supervision and regulation of foreign securities markets and the possibility of political or economic instability.
Governmental approval for foreign investments may be required in advance of making an investment under certain circumstances in some countries, and the extent of foreign investments in domestic companies may be subject to limitation in other countries. Foreign ownership limitations also may be imposed by the charters of individual companies to prevent, among other concerns, violations of foreign investment limitations. As a result, an additional class of shares (identified as "Foreign" in the Portfolio of Investments) may be created and offered for investment. The "local" and "foreign shares" market values may differ. In the absence of trading of the foreign shares in such markets, the Fund values the foreign shares at the closing exchange price of the local shares.
15
Morgan Stanley Variable Insurance Fund, Inc.
Annual Report – December 31, 2021
Notes to Financial Statements (cont'd)
4. Securities Lending: The Fund lends securities to qualified financial institutions, such as broker-dealers, to earn additional income. Any increase or decrease in the fair value of the securities loaned that might occur and any interest earned or dividends declared on those securities during the term of the loan would remain in the Fund. The Fund would receive cash or securities as collateral in an amount equal to or exceeding 100% of the current fair value of the loaned securities. The collateral is marked-to-market daily by State Street Bank and Trust Company ("State Street"), the securities lending agent, to ensure that a minimum of 100% collateral coverage is maintained.
Based on pre-established guidelines, the securities lending agent invests any cash collateral that is received in an affiliated money market portfolio and repurchase agreements. Securities lending income is generated from the earnings on the invested collateral and borrowing fees, less any rebates owed to the borrowers and compensation to the lending agent, and is recorded as "Income from Securities Loaned — Net" in the Fund's Statement of Operations. Risks in securities lending transactions are that a borrower may not provide additional collateral when required or return the securities when due, and that the value of the short-term investments will be less than the amount of cash collateral plus any rebate that is required to be returned to the borrower.
The Fund has the right under the securities lending agreement to recover the securities from the borrower on demand.
At December 31, 2021, the Fund did not have any outstanding securities on loan.
5. Indemnifications: The Company enters into contracts that contain a variety of indemnifications. The Company's maximum exposure under these arrangements is unknown. However, the Company has not had prior claims or losses pursuant to these contracts and expects the risk of loss to be remote.
6. Security Transactions, Income and Expenses: Security transactions are accounted for on the trade date (date the order to buy or sell is executed). Realized gains and losses on the sale of investment securities are determined on the specific identified cost method. Dividend income and other distributions are recorded on the ex-dividend date (except for certain foreign dividends which may be recorded as soon as the Fund is informed of such dividends) net of applicable withholding taxes. Interest income is recognized on the accrual basis net of applicable withholding taxes except where collection is in doubt.
Discounts are accreted and premiums are amortized over the life of the respective securities. Most expenses of the Company can be directly attributed to a particular Fund. Expenses which cannot be directly attributed are apportioned among the Funds based upon relative net assets or other appropriate methods. Income, expenses (other than class specific expenses) and realized and unrealized gains or losses are allocated to each class of shares based upon their relative net assets.
Settlement and registration of foreign securities transactions may be subject to significant risks not normally associated with investments in the United States. In certain markets, ownership of shares is defined according to entries in the issuer's share register. It is possible that a Fund holding these securities could lose its share registration through fraud, negligence or even mere oversight. In addition, shares being delivered for sales and cash being paid for purchases may be delivered before the exchange is complete. This may subject the Fund to further risk of loss in the event of a failure to complete the transaction by the counterparty.
7. Dividends and Distributions to Shareholders: Dividends and distributions to shareholders are recorded on the ex-dividend date. Dividends from net investment income, if any, are declared and paid annually. Net realized capital gains, if any, are distributed at least annually.
B. Advisory/Sub-Advisory Fees: The Adviser, a wholly-owned subsidiary of Morgan Stanley, provides the Fund with advisory services under the terms of an Investment Advisory Agreement, paid quarterly, at the annual rate based on the daily net assets as follows:
First $500
million | | Next $500
million | | Next $1.5
billion | | Over $2.5
billion | |
| | 0.85 | % | | | 0.75 | % | | | 0.70 | % | | | 0.65 | % | |
For the year ended December 31, 2021, the advisory fee rate (net of rebate) was equivalent to an annual effective rate of 0.85% of the Fund's average daily net assets.
The Adviser has agreed to reduce its advisory fee and/or reimburse the Fund so that total annual Fund operating expenses, excluding certain investment related expenses, taxes, interest and other extraordinary expenses (including litigation), will not exceed 1.25% for Class I shares and 1.30% for Class II shares. The fee waivers and/or expense reimbursements will continue for at least one year from the date of the Fund's prospectus or until such time as the Directors act to discontinue all or a portion of such waivers and/or reimbursements when they deem such action is appropriate. This arrangement had no effect for the year ended December 31, 2021.
16
Morgan Stanley Variable Insurance Fund, Inc.
Annual Report – December 31, 2021
Notes to Financial Statements (cont'd)
The Adviser has entered into a Sub-Advisory Agreement with the Sub-Adviser, a wholly-owned subsidiary of Morgan Stanley. The Sub-Adviser provides the Fund with advisory services subject to the overall supervision of the Adviser and the Fund's Officers and Directors. The Adviser pays the Sub-Adviser on a monthly basis a portion of the net advisory fees the Adviser receives from the Fund.
C. Administration Fees: The Adviser also serves as Administrator to the Company and provides administrative services pursuant to an Administration Agreement for an annual fee, accrued daily and paid monthly, of 0.08% of the Fund's average daily net assets.
Under a Sub-Administration Agreement between the Administrator and State Street, State Street provides certain administrative services to the Company. For such services, the Administrator pays State Street a portion of the fee the Administrator receives from the Fund.
D. Servicing Fees: The Company accrues daily and pays quarterly a servicing fee of up to 0.17% of the average daily value of shares of the Fund held in an insurance company's account. Certain insurance companies have entered into a servicing agreement with the Company to provide administrative and other contract-owner related services on behalf of the Fund.
E. Distribution Fees: Morgan Stanley Distribution, Inc. ("MSDI" or the "Distributor"), a wholly-owned subsidiary of the Adviser and an indirect subsidiary of Morgan Stanley, serves as the Distributor of the Fund and provides the Fund's Class II shareholders with distribution services pursuant to a Distribution Plan (the "Plan") in accordance with Rule 12b-1 under the Act. Under the Plan, the Fund is authorized to pay the Distributor a distribution fee, which is accrued daily and paid monthly, at an annual rate of 0.25% of the Fund's average daily net assets attributable to Class II shares. The Distributor has agreed to waive 0.20% of the 0.25% distribution fee that it may receive. This fee waiver will continue for at least one year from the date of the Fund's prospectus or until such time as the Directors act to discontinue all or a portion of such waiver when they deem such action is appropriate. For the year ended December 31, 2021, this waiver amounted to approximately $143,000.
F. Dividend Disbursing and Transfer Agent: The Company's dividend disbursing and transfer agent is DST Asset Manager Solutions, Inc. ("DST"). Pursuant to a Transfer Agency Agreement, the Company pays DST a fee based on the number of classes, accounts and transactions relating to the Funds of the Company.
G. Custodian Fees: State Street (the "Custodian") also serves as Custodian for the Company in accordance with a
Custodian Agreement. The Custodian holds cash, securities and other assets of the Company as required by the Act. Custody fees are payable monthly based on assets held in custody, investment purchases and sales activity and account maintenance fees, plus reimbursement for certain out-of-pocket expenses.
H. Security Transactions and Transactions with Affiliates: For the year ended December 31, 2021, purchases and sales of investment securities for the Fund, other than long-term U.S. Government securities and short-term investments were approximately $91,952,000 and $110,157,000, respectively. There were no purchases and sales of long-term U.S. Government securities for the year ended December 31, 2021.
The Fund invests in the Institutional Class of the Morgan Stanley Institutional Liquidity Funds — Government Portfolio (the "Liquidity Funds"), an open-end management investment company managed by the Adviser, both directly and as a portion of the securities held as collateral on loaned securities. Advisory fees paid by the Fund are reduced by an amount equal to its pro-rata share of the advisory and administration fees paid by the Fund due to its investment in the Liquidity Funds. For the year ended December 31, 2021, advisory fees paid were reduced by approximately $1,000 relating to the Fund's investment in the Liquidity Funds.
A summary of the Fund's transactions in shares of affiliated investments during the year ended December 31, 2021 is as follows:
Affiliated
Investment
Company | | Value
December 31,
2020
(000) | | Purchases
at Cost
(000) | | Proceeds
from
Sales
(000) | | Dividend
Income
(000) | |
Liquidity Funds | | $ | 3,203 | | | $ | 52,833 | | | $ | 54,004 | | | $ | 1 | | |
Affiliated
Investment
Company (cont'd) | | Realized
Gain (Loss)
(000) | | Change in
Unrealized
Appreciation
(Depreciation)
(000) | | Value
December 31,
2021
(000) | |
Liquidity Funds | | $ | — | | | $ | — | | | $ | 2,032 | | |
The Fund is permitted to purchase and sell securities ("cross-trade") from and to other Morgan Stanley funds as well as other funds and client accounts for which the Adviser or an affiliate of the Adviser serves as investment adviser, pursuant to procedures approved by the Directors in compliance with Rule 17a-7 under the Act (the "Rule"). Each cross-trade is executed at the current market price in compliance with provisions of the Rule. For the year ended December 31, 2021, the Fund did not engage in any cross-trade transactions.
17
Morgan Stanley Variable Insurance Fund, Inc.
Annual Report – December 31, 2021
Notes to Financial Statements (cont'd)
The Fund has an unfunded Deferred Compensation Plan (the "Compensation Plan"), which allows each independent Director to defer payment of all, or a portion, of the fees he or she receives for serving on the Board of Directors. Each eligible Director generally may elect to have the deferred amounts credited with a return equal to the total return on one or more of the Morgan Stanley funds that are offered as investment options under the Compensation Plan. Appreciation/depreciation and distributions received from these investments are recorded with an offsetting increase/decrease in the deferred compensation obligation and do not affect the NAV of the Fund.
I. Federal Income Taxes: It is the Fund's intention to continue to qualify as a regulated investment company and distribute all of its taxable and tax-exempt income. Accordingly, no provision for federal income taxes is required in the financial statements.
The Fund may be subject to taxes imposed by countries in which it invests. Such taxes are generally based on income and/or capital gains earned or repatriated. Taxes are accrued based on net investment income, net realized gains and net unrealized appreciation as such income and/or gains are earned. Taxes may also be based on transactions in foreign currency and are accrued based on the value of investments denominated in such currency.
FASB ASC 740-10, "Income Taxes — Overall", sets forth a minimum threshold for financial statement recognition of the benefit of a tax position taken or expected to be taken in a tax return. Management has concluded there are no significant uncertain tax positions that would require recognition in the financial statements. If applicable, the Fund recognizes interest accrued related to unrecognized tax benefits in "Interest Expense" and penalties in "Other Expenses" in the Statement of Operations. The Fund files tax returns with the U.S. Internal Revenue Service, New York and various states. Generally, each of the tax years in the four-year period ended December 31, 2021 remains subject to examination by taxing authorities.
The tax character of distributions paid may differ from the character of distributions shown for GAAP purposes due to short-term capital gains being treated as ordinary income for tax purposes. The tax character of distributions paid during fiscal years 2021 and 2020 was as follows:
2021 Distributions
Paid From: | | 2020 Distributions
Paid From: | |
Ordinary
Income
(000) | | Long-Term
Capital Gain
(000) | | Ordinary
Income
(000) | | Long-Term
Capital Gain
(000) | |
| $ | 2,003 | | | $ | — | | | $ | 2,804 | | | $ | 3,447 | | |
The amount and character of income and gains to be distributed are determined in accordance with income tax regulations which may differ from GAAP. These book/tax differences are either considered temporary or permanent in nature.
Temporary differences are attributable to differing book and tax treatments for the timing of the recognition of gains (losses) on certain investment transactions and the timing of the deductibility of certain expenses.
The Fund had no permanent differences causing reclassifications among the components of net assets for the year ended December 31, 2021.
At December 31, 2021, the components of distributable earnings for the Fund on a tax basis were as follows:
Undistributed
Ordinary
Income
(000) | | Undistributed
Long-Term
Capital Gain
(000) | |
| $ | 731 | | | $ | 18,524 | | |
During the year ended December 31, 2021, the Fund utilized capital loss carryforwards for U.S. federal income tax purposes of approximately $18,003,000.
J. Credit Facility: The Company and other Morgan Stanley funds participated in a $300,000,000 committed, unsecured revolving line of credit facility (the "Facility") with State Street. This Facility is to be used for temporary emergency purposes or funding of shareholder redemption requests. The interest rate on borrowings is based on the federal funds rate or 1 month LIBOR rate plus a spread. Effective April 19, 2021, the interest rate on borrowings is based on the federal funds effective rate or overnight bank funding rate plus a spread. The Facility also has a commitment fee of 0.25% per annum based on the unused portion of the Facility. During the year ended December 31, 2021, the Fund did not have any borrowings under the Facility.
K. Other: At December 31, 2021, the Fund had record owners of 10% or greater. Investment activities of these shareholders could have a material impact on the Fund. The aggregate percentage of such owners was 53.4%.
L. Market Risk: The outbreak of the coronavirus ("COVID-19") and the recovery responses could adversely impact the operations of the Fund and its service providers and financial performance of the Fund and the Fund's investments. The extent of such impact depends on future developments, including (i) the duration and spread of the outbreak, (ii) the restrictions and advisories, (iii) the effects on the financial markets, (iv) government and regulatory responses,
18
Morgan Stanley Variable Insurance Fund, Inc.
Annual Report – December 31, 2021
Notes to Financial Statements (cont'd)
and (v) the effects on the economy overall as a result of developments such as disruption to consumer demand, economic output and supply chains. The duration and extent of COVID-19 and associated economic and market conditions and uncertainty over the long term cannot be reasonably estimated at this time. The ultimate impact of COVID-19 and the extent to which the associated conditions impact the Fund will also depend on future developments, which are highly uncertain, difficult to accurately predict and subject to change at any time. If the financial performance of the Fund's investments is impacted because of these factors for an extended period, the Fund's investment results may be adversely affected.
19
Morgan Stanley Variable Insurance Fund, Inc.
Annual Report – December 31, 2021
Report of Independent Registered Public Accounting Firm
To the Shareholders and Board of Directors of
Morgan Stanley Variable Insurance Fund, Inc. —
Emerging Markets Equity Portfolio
Opinion on the Financial Statements
We have audited the accompanying statement of assets and liabilities of Emerging Markets Equity Portfolio (the "Fund") (one of the funds constituting Morgan Stanley Variable Insurance Fund, Inc. (the "Company")), including the portfolio of investments, as of December 31, 2021, and the related statement of operations for the year then ended, the statements of changes in net assets for each of the two years in the period then ended, the financial highlights for each of the five years in the period then ended and the related notes (collectively referred to as the "financial statements"). In our opinion, the financial statements present fairly, in all material respects, the financial position of Emerging Markets Equity Portfolio (one of the funds constituting Morgan Stanley Variable Insurance Fund, Inc.) at December 31, 2021, the results of its operations for the year then ended, the changes in its net assets for each of the two years in the period then ended and its financial highlights for each of the five years in the period then ended, in conformity with U.S. generally accepted accounting principles.
Basis for Opinion
These financial statements are the responsibility of the Company's management. Our responsibility is to express an opinion on the Fund's financial statements based on our audits. We are a public accounting firm registered with the Public Company Accounting Oversight Board (United States) ("PCAOB") and are required to be independent with respect to the Company in accordance with the U.S. federal securities law and the applicable rules and regulations of the Securities and Exchange Commission and the PCAOB.
We conducted our audits in accordance with the standards of the PCAOB. Those standards require that we plan and perform the audit to obtain reasonable assurance about whether the financial statements are free of material misstatement, whether due to error or fraud. The Company is not required to have, nor were we engaged to perform, an audit of the Company's internal control over financial reporting. As part of our audits, we are required to obtain an understanding of internal control over financial reporting, but not for the purpose of expressing an opinion on the effectiveness of the Company's internal control over financial reporting. Accordingly, we express no such opinion.
Our audits included performing procedures to assess the risks of material misstatement of the financial statements, whether due to error or fraud, and performing procedures that respond to those risks. Such procedures included examining, on a test basis, evidence regarding the amounts and disclosures in the financial statements. Our procedures included confirmation of securities owned as of December 31, 2021 by correspondence with the custodian and others or by other appropriate auditing procedures where replies from others were not received. Our audits also included evaluating the accounting principles used and significant estimates made by management, as well as evaluating the overall presentation of the financial statements. We believe that our audits provide a reasonable basis for our opinion.

We have served as the auditor of one or more Morgan Stanley investment companies since 2000.
Boston, Massachusetts
February 18, 2022
20
Morgan Stanley Variable Insurance Fund, Inc.
Annual Report – December 31, 2021
Liquidity Risk Management Program (unaudited)
In compliance with Rule 22e-4 under the Investment Company Act of 1940, as amended (the "Liquidity Rule"), the Fund has adopted and implemented a liquidity risk management program (the "Program"), which is reasonably designed to assess and manage the risk that the Fund could not meet requests to redeem shares issued by the Fund without significant dilution of remaining investors' interests in the Fund (i.e., liquidity risk). The Fund's Board of Directors (the "Board") previously approved the designation of the Liquidity Risk Subcommittee (the "LRS") as Program administrator. The LRS is comprised of representatives from various divisions within Morgan Stanley Investment Management.
At a meeting held on March 3-4, 2021, the Board reviewed a written report prepared by the LRS that addressed the Program's operation and assessed its adequacy, and effectiveness of implementation for the period from January 1, 2020, through December 31, 2020, as required under the Liquidity Rule, and discussed the impact of the COVID-19 pandemic on liquidity and the LRS's assessment of liquidity risk during the reporting period, including during the distressed market environment caused by the onset of the COVID-19 pandemic. The report concluded that the Program operated effectively and was adequately and effectively implemented in all material aspects, and that the relevant controls and safeguards were appropriately designed to enable the LRS to administer the Program in compliance with the Liquidity Rule.
In accordance with the Program, the LRS assessed each Fund's liquidity risk no less frequently than annually taking into consideration certain factors, as applicable, such as (i) investment strategy and liquidity of portfolio investments, (ii) short-term and long-term cash flow projections and (iii) holdings of cash and cash equivalents and borrowing arrangements and other funding sources. Certain factors are considered under both normal and reasonably foreseeable stressed conditions.
Each Fund portfolio investment is classified into one of four liquidity categories, which classification is assessed at least monthly by the LRS. The classification is based on a determination of the number of days it is reasonably expected to take to convert the investment into cash, or sell or dispose of the investment, in current market conditions without significantly changing the market value of the investment. Liquidity classification determinations take into account various market, trading and investment-specific considerations, as well as market depth, and in some cases utilize third-party vendor data.
The Liquidity Rule limits a fund's investments in illiquid investments to 15% of its net assets and requires funds that do not primarily hold assets that are highly liquid investments to determine and maintain a minimum percentage of the fund's net assets to be invested in highly liquid investments (highly liquid investment minimum or "HLIM"). The LRS believes that the Program includes provisions reasonably designed to review, monitor and comply with the 15% limit on illiquid investments and for determining, periodically reviewing and complying with the HLIM requirement, as applicable.
There can be no assurance that the Program will achieve its objectives under all circumstances in the future. Please refer to the Fund's prospectus for more information regarding the Fund's exposure to liquidity risk and other risks to which it may be subject.
21
Morgan Stanley Variable Insurance Fund, Inc.
Annual Report – December 31, 2021
Federal Tax Notice (unaudited)
For federal income tax purposes, the following information is furnished with respect to the distributions paid by the Fund during its taxable year ended December 31, 2021. For corporate shareholders 1.36% of the dividends qualified for the dividends received deduction.
For federal income tax purposes, the following information is furnished with respect to the Fund's earnings for its taxable year ended December 31, 2021. When distributed, certain earnings may be subject to a maximum tax rate of 15% as provided for by the Jobs and Growth Tax Relief Reconciliation Act of 2003. The Fund designated up to a maximum of approximately $2,403,000 as taxable at this lower rate.
The Fund intends to pass through foreign tax credits of approximately $565,000 and has derived net income from sources within foreign countries amounting to approximately $4,734,000.
In January, the Fund provides tax information to shareholders for the preceding calendar year.
22
Morgan Stanley Variable Insurance Fund, Inc.
Annual Report – December 31, 2021
Director and Officer Information (unaudited)
Independent Directors:
Name, Address and Birth
Year of Independent Director | | Position(s)
Held with
Registrant | | Length of
Time
Served* | | Principal Occupation(s) During Past 5 Years and
Other Relevant Professional Experience | | Number of
Funds
in Fund
Complex
Overseen
by
Independent
Director** | | Other Directorships Held by Independent
Director During Past 5 Years*** | |
Frank L. Bowman
c/o Perkins Coie LLP
Counsel to the Independent Directors
1155 Avenue of the Americas
22nd Floor
New York, NY 10036
Birth Year: 1944 | | Director | | Since August 2006 | | President, Strategic Decisions, LLC (consulting) (since February 2009); Director or Trustee of various Morgan Stanley Funds (since August 2006); Chairperson of the Compliance and Insurance Committee (since October 2015); formerly, Chairperson of the Insurance Sub-Committee of the Compliance and Insurance Committee (2007-2015); served as President and Chief Executive Officer of the Nuclear Energy Institute (policy organization) (February 2005-November 2008); retired as Admiral, U.S. Navy after serving over 38 years on active duty including 8 years as Director of the Naval Nuclear Propulsion Program in the Department of the Navy and the U.S. Department of Energy (1996-2004); served as Chief of Naval Personnel (July 1994-September 1996) and on the Joint Staff as Director of Political Military Affairs (June 1992-July 1994); knighted as Honorary Knight Commander of the Most Excellent Order of the British Empire; awarded the Officier de l'Orde National du Mérite by the French Government; elected to the National Academy of Engineering (2009). | | | 77 | | | Director of Naval and Nuclear Technologies LLP; Director Emeritus of the Armed Services YMCA; Member of the National Security Advisory Council of the Center for U.S. Global Engagement and a member of the CNA Military Advisory Board; Chairman of Fairhaven United Methodist Church; Member of the Board of Advisors of the Dolphin Scholarship Foundation; Director of other various nonprofit organizations; formerly, Director of BP, plc (November 2010-May 2019). | |
Kathleen A. Dennis
c/o Perkins Coie LLP
Counsel to the Independent Directors
1155 Avenue of the Americas
22nd Floor
New York, NY 10036
Birth Year: 1953 | | Director | | Since August 2006 | | Chairperson of the Governance Committee (since January 2021), Chairperson of the Liquidity and Alternatives Sub-Committee of the Investment Committee (2006-2020) and Director or Trustee of various Morgan Stanley Funds (since August 2006); President, Cedarwood Associates (mutual fund and investment management consulting) (since July 2006); formerly, Senior Managing Director of Victory Capital Management (1993-2006). | | | 77 | | | Board Member, University of Albany Foundation (2012-present); Board Member, Mutual Funds Directors Forum (2014-present); Director of various non-profit organizations. | |
Nancy C. Everett
c/o Perkins Coie LLP
Counsel to the Independent Directors
1155 Avenue of the Americas
22nd Floor
New York, NY 10036
Birth Year: 1955 | | Director | | Since January 2015 | | Chairperson of the Equity Investment Committee (since January 2021); Director or Trustee of various Morgan Stanley Funds (since January 2015); Chief Executive Officer, Virginia Commonwealth University Investment Company (since November 2015); Owner, OBIR, LLC (institutional investment management consulting) (since June 2014); formerly, Managing Director, BlackRock, Inc. (February 2011-December 2013) and Chief Executive Officer, General Motors Asset Management (a/k/a Promark Global Advisors, Inc.) (June 2005-May 2010). | | | 78 | | | Formerly, Member of Virginia Commonwealth University School of Business Foundation (2005-2016); Member of Virginia Commonwealth University Board of Visitors (2013-2015); Member of Committee on Directors for Emerging Markets Growth Fund, Inc. (2007-2010); Chairperson of Performance Equity Management, LLC (2006-2010); and Chairperson, GMAM Absolute Return Strategies Fund, LLC (2006-2010). | |
23
Morgan Stanley Variable Insurance Fund, Inc.
Annual Report – December 31, 2021
Director and Officer Information (unaudited) (cont'd)
Independent Directors (cont'd):
Name, Address and Birth
Year of Independent Director | | Position(s)
Held with
Registrant | | Length of
Time
Served* | | Principal Occupation(s) During Past 5 Years and
Other Relevant Professional Experience | | Number of
Funds
in Fund
Complex
Overseen
by
Independent
Director** | | Other Directorships Held by Independent
Director During Past 5 Years*** | |
Jakki L. Haussler
c/o Perkins Coie LLP
Counsel to the Independent Directors
1155 Avenue of the Americas
22nd Floor
New York, NY 10036
Birth Year: 1957 | | Director | | Since January 2015 | | Director or Trustee of various Morgan Stanley Funds (since January 2015); Chairman, Opus Capital Group (since 1996); formerly, Chief Executive Officer, Opus Capital Group (1996-2019); Director, Capvest Venture Fund, LP (May 2000-December 2011); Partner, Adena Ventures, LP (July 1999-December 2010); Director, The Victory Funds (February 2005-July 2008). | | | 78 | | | Director, Barnes Group Inc. (since July 2021); Director of Cincinnati Bell Inc. and Member, Audit Committee and Chairman, Governance and Nominating Committee; Director of Service Corporation International and Member, Audit Committee and Investment Committee; Director of Northern Kentucky University Foundation and Member, Investment Committee; Member of Chase College of Law Transactional Law Practice Center Board of Advisors; Director of Best Transport; Director of Chase College of Law Board of Visitors; formerly, Member, University of Cincinnati Foundation Investment Committee; Member, Miami University Board of Visitors (2008-2011); Trustee of Victory Funds (2005-2008) and Chairman, Investment Committee (2007-2008) and Member, Service Provider Committee (2005-2008). | |
Dr. Manuel H. Johnson
c/o Johnson Smick
International, Inc.
220 I Street, NE Suite 200
Washington, D.C. 20002
Birth Year: 1949 | | Director | | Since
July
1991 | | Senior Partner, Johnson Smick International, Inc. (consulting firm); Chairperson of the Fixed Income, Liquidity and Alternatives Investment Committee (since January 2021), Chairperson of the Investment Committee (2006-2020) and Director or Trustee of various Morgan Stanley Funds (since July 1991); Co-Chairman and a founder of the Group of Seven Council (G7C) (international economic commission); formerly, Chairperson of the Audit Committee (July 1991-September 2006); Vice Chairman of the Board of Governors of the Federal Reserve System and Assistant Secretary of the U.S. Treasury. | | | 77 | | | Director of NVR, Inc. (home construction). | |
Joseph J. Kearns
c/o Perkins Coie LLP
Counsel to the Independent Directors
1155 Avenue of the Americas
22nd Floor
New York, NY 10036
Birth Year: 1942 | | Director | | Since
August 1994 | | Senior Adviser, Kearns & Associates LLC (investment consulting); Chairperson of the Audit Committee (since October 2006) and Director or Trustee of various Morgan Stanley Funds (since August 1994); formerly, Deputy Chairperson of the Audit Committee (July 2003-September 2006) and Chairperson of the Audit Committee of various Morgan Stanley Funds (since August 1994); CFO of the J. Paul Getty Trust (1982-1999). | | | 78 | | | Director, Rubicon Investments (since February 2019); Prior to August 2016, Director of Electro Rent Corporation (equipment leasing); Prior to December 31, 2013, Director of The Ford Family Foundation. | |
Michael F. Klein
c/o Perkins Coie LLP
Counsel to the Independent Directors
1155 Avenue of the Americas
22nd Floor
New York, NY 10036
Birth Year: 1958 | | Director | | Since
August 2006 | | Chairperson of the Risk Committee (since January 2021); Managing Director, Aetos Alternatives Management, LP (since March 2000); Co-President, Aetos Alternatives Management, LP (since January 2004) and Co-Chief Executive Officer of Aetos Alternatives Management, LP (since August 2013); Chairperson of the Fixed Income Sub-Committee of the Investment Committee (2006-2020) and Director or Trustee of various Morgan Stanley Funds (since August 2006); formerly, Managing Director, Morgan Stanley & Co. Inc. and Morgan Stanley Dean Witter Investment Management and President, various Morgan Stanley Funds (June 1998-March 2000); Principal, Morgan Stanley & Co. Inc. and Morgan Stanley Dean Witter Investment Management (August 1997-December 1999). | | | 77 | | | Director of certain investment funds managed or sponsored by Aetos Alternatives Management, LP; Director of Sanitized AG and Sanitized Marketing AG (specialty chemicals). | |
24
Morgan Stanley Variable Insurance Fund, Inc.
Annual Report – December 31, 2021
Director and Officer Information (unaudited) (cont'd)
Independent Directors (cont'd):
Name, Address and Birth
Year of Independent Director | | Position(s)
Held with
Registrant | | Length of
Time
Served* | | Principal Occupation(s) During Past 5 Years and
Other Relevant Professional Experience | | Number of
Funds
in Fund
Complex
Overseen
by
Independent
Director** | | Other Directorships Held by Independent
Director During Past 5 Years*** | |
Patricia A. Maleski
c/o Perkins Coie LLP
Counsel to the Independent Directors
1155 Avenue of the Americas
22nd Floor
New York, NY 10036
Birth Year: 1960 | | Director | | Since
January 2017 | | Director or Trustee of various Morgan Stanley Funds (since January 2017); Managing Director, JPMorgan Asset Management (2004-2016); Oversight and Control Head of Fiduciary and Conflicts of Interest Program (2015-2016); Chief Control Officer — Global Asset Management (2013-2015); President, JPMorgan Funds (2010-2013); Chief Administrative Officer (2004-2013); various other positions including Treasurer and Board Liaison (since 2001). | | | 78 | | | Trustee, Nutley Family Service Bureau, Inc. (since January 2022). | |
W. Allen Reed
c/o Perkins Coie LLP
Counsel to the Independent Directors
1155 Avenue of the Americas
22nd Floor
New York, NY 10036
Birth Year: 1947 | | Chair of the Board and Director | | Chair of the Board since August 2020 and Director since August 2006 | | Chair of the Boards of various Morgan Stanley Funds (since August 2020); Director or Trustee of various Morgan Stanley Funds (since August 2006); formerly, Vice Chair of the Boards of various Morgan Stanley Funds (January 2020-August 2020); President and Chief Executive Officer of General Motors Asset Management; Chairman and Chief Executive Officer of the GM Trust Bank and Corporate Vice President of General Motors Corporation (August 1994-December 2005). | | | 77 | | | Formerly, Director of Legg Mason, Inc. (2006-2019); and Director of the Auburn University Foundation (2010-2015). | |
Frances L. Cashman
c/o Perkins Coie LLP
Counsel to the Independent Directors
1155 Avenue of the Americas
22nd Floor
New York, NY 10036
Birth Year: 1961 | | Advisory Board Member | | Advisory Board Member Since January 2022 | | Chief Executive Officer, Asset Management Division, Euromoney Institutional Investor PLC (financial information) (May 2021-Present); Executive Vice President and various other roles, Legg Mason & Co. (asset management) (2010-2020); Managing Director, Stifel Nicolaus (2005-2010). | | | 78 | | | Trustee and Investment Committee Member, Georgia Tech Foundation (Since June 2019); Trustee and Chair of Marketing Committee, Loyola Blakefield (Since September 2017); Trustee, MMI Gateway Foundation (since September 2017); Director and Investment Committee Member, Catholic Community Foundation Board (2012-2018); Director and Investment Committee Member, St. Ignatius Loyola Academy (2011-2017). | |
Eddie A. Grier
c/o Perkins Coie LLP
Counsel to the Independent Directors
1155 Avenue of the Americas
22nd Floor
New York, NY 10036
Birth Year: 1955 | | Advisory Board Member | | Advisory Board Member Since January 2022 | | Dean, Santa Clara University Leavey School of Business (since April 2021); Dean, Virginia Commonwealth University School of Business (2010-2021); President and various other roles, Walt Disney Company (entertainment and media) (1981-2010). | | | 78 | | | Director, Witt/Keiffer, Inc. (executive search) (since 2016); Director, NuStar GP, LLC (energy) (since August 2021); Director, Sonida Senior Living, Inc. (residential community operator) (2016-2021); Director, NVR, Inc. (homebuilding) (2013-2020); Director, Middleburg Trust Company (wealth management) (2014-2019); Director, Colonial Williamsburg Company (since 2012); Regent, University of Massachusetts Global (since 2021); Director and Chair, ChildFund International (2012-2021); Trustee, Brandman University (2010-2021); Director, Richmond Forum (2012-2019). | |
* This is the earliest date the Director began serving the Morgan Stanley Funds. Each Director serves an indefinite term, until his or her successor is elected.
** The Fund Complex includes (as of December 31, 2021) all open-end and closed-end funds (including all of their portfolios) advised by Morgan Stanley Investment Management Inc. (the "Adviser") and any funds that have an adviser that is an affiliated person of the Adviser (including, but not limited to, Morgan Stanley AIP GP LP).
*** This includes any directorships at public companies and registered investment companies held by the Director at any time during the past five years.
25
Morgan Stanley Variable Insurance Fund, Inc.
Annual Report – December 31, 2021
Director and Officer Information (unaudited) (cont'd)
Executive Officers:
Name, Address and Birth Year of
Executive Officer | | Position(s)
Held with
Registrant | | Length of
Time Served* | | Principal Occupation(s) During Past 5 Years | |
John H. Gernon
522 Fifth Avenue
New York, NY 10036
Birth Year: 1963 | | President and Principal Executive Officer | | Since September 2013 | | President and Principal Executive Officer of the Equity and Fixed Income Funds and the Morgan Stanley AIP Funds (since September 2013) and the Liquidity Funds and various money market funds (since May 2014) in the Fund Complex; Managing Director of the Adviser. | |
Deidre A. Downes
1633 Broadway
New York, NY 10019
Birth Year: 1977 | | Chief Compliance Officer | | Since November 2021 | | Executive Director of the Adviser (since January 2021) and Chief Compliance Officer of various Morgan Stanley Funds (since November 2021). Formerly, Vice President and Corporate Counsel at PGIM and Prudential Financial (October 2016 -December 2020). | |
Francis J. Smith
522 Fifth Avenue
New York, NY 10036
Birth Year: 1965 | | Treasurer and Principal Financial Officer | | Treasurer since July 2003 and Principal Financial Officer since September 2002 | | Managing Director of the Adviser and various entities affiliated with the Adviser; Treasurer (since July 2003) and Principal Financial Officer of various Morgan Stanley Funds (since September 2002). | |
Mary E. Mullin
1633 Broadway
New York, NY 10019
Birth Year: 1967 | | Secretary | | Since June 1999 | | Managing Director of the Adviser; Secretary of various Morgan Stanley Funds (since June 1999). | |
Michael J. Key
522 Fifth Avenue
New York, NY 10036
Birth Year: 1979 | | Vice President | | Since June 2017 | | Vice President of the Equity and Fixed Income Funds, Liquidity Funds, various money market funds and the Morgan Stanley AIP Funds in the Fund Complex (since June 2017); Executive Director of the Adviser; Head of Product Development for Equity and Fixed Income Funds (since August 2013). | |
* This is the earliest date the officer began serving the Morgan Stanley Funds. Each officer serves an indefinite term, until his or her successor is elected.
26
Morgan Stanley Variable Insurance Fund, Inc.
Annual Report – December 31, 2021
Adviser and Administrator
Morgan Stanley Investment Management Inc.
522 Fifth Avenue
New York, New York 10036
Sub-Adviser
Morgan Stanley Investment Management Company
23 Church Street
16-01 Capital Square, Singapore 049481
Distributor
Morgan Stanley Distribution, Inc.
522 Fifth Avenue
New York, New York 10036
Dividend Disbursing and Transfer Agent
DST Asset Manager Solutions, Inc.
2000 Crown Colony Drive
Quincy, Massachusetts 02169
Custodian
State Street Bank and Trust Company
One Lincoln Street
Boston, Massachusetts 02111
Legal Counsel
Dechert LLP
1095 Avenue of the Americas
New York, New York 10036
Counsel to the Independent Directors
Perkins Coie LLP
1155 Avenue of the Americas,
22nd Floor
New York, New York 10036
Independent Registered Public Accounting Firm
Ernst & Young LLP
200 Clarendon Street
Boston, Massachusetts 02116
Reporting to Shareholders
Each Morgan Stanley fund provides a complete schedule of portfolio holdings in its Semi-Annual and the Annual Reports within 60 days of the end of the fund's second and fourth fiscal quarters. The Semi-Annual and Annual Reports are filed electronically with the Securities and Exchange Commission ("SEC") on Form N-CSRS and Form N-CSR, respectively. Morgan Stanley also delivers the Semi-Annual and Annual Reports to fund shareholders and makes these reports available on its public website, www.morganstanley.com/im/shareholderreports. Each Morgan Stanley non-money market fund also files a complete schedule of portfolio holdings with the SEC for the fund's first and third fiscal quarters as an attachment to Form N-PORT. Morgan Stanley does not deliver the reports for the first and third fiscal quarters to shareholders, but makes the complete schedule of portfolio holdings for the fund's first and third fiscal quarters available on its public website. The holdings for each money market fund are also posted to the Morgan Stanley public website. You may obtain the Form N-PORT filings (as well as the Form N-CSR and N-CSRS filings) by accessing the SEC's website, www.sec.gov. You can also request copies of these materials, upon payment of a duplicating fee, by electronic request at the SEC's email address (publicinfo@sec.gov).
Proxy Voting Policies and Procedures and Proxy Voting Record
You may obtain a copy of the Company's Proxy Voting Policy and Procedures and information regarding how the Company voted proxies relating to portfolio securities during the most recent twelve-month period ended June 30, without charge, upon request, by calling toll free 1 (800) 548-7786 or by visiting our website at www.morganstanley.com/im/shareholderreports. This information is also available on the SEC's website at www.sec.gov.
This report is submitted for the general information of the shareholders of the Fund. For more detailed information about the Fund, its fees and expenses and other pertinent information, please read its Prospectus. The Company's Statement of Additional Information contains additional information about the Fund, including its Directors. It is available, without charge, by calling 1 (800) 548-7786.
Householding Notice
To reduce printing and mailing costs, the Fund attempts to eliminate duplicate mailings to the same address. The Fund delivers a single copy of certain shareholder documents, including shareholder reports, prospectuses and proxy materials, to investors with the same last name who reside at the same address. Your participation in this program will continue for an unlimited period of time unless you instruct us otherwise. You can request multiple copies of these documents by calling (800) 548-7786, 8:00 a.m. to 6:00 p.m., ET. Once our Customer Service Center has received your instructions, we will begin sending individual copies for each account within 30 days.
This report is not authorized for distribution to prospective investors in the Fund unless preceded or accompanied by an effective Prospectus. Read the Prospectus carefully before investing.
UIFEMEANN
3997606 EXP 02.28.23

Morgan Stanley Variable Insurance Fund, Inc.
Annual Report – December 31, 2021
Global Franchise Portfolio
The Fund is intended to be a funding vehicle for variable annuity contracts and variable life insurance policies offered by the separate accounts of certain life insurance companies.
Morgan Stanley Variable Insurance Fund, Inc.
Annual Report – December 31, 2021
Expense Example | | | 2 | | |
Investment Overview | | | 3 | | |
Portfolio of Investments | | | 7 | | |
Statement of Assets and Liabilities | | | 8 | | |
Statement of Operations | | | 9 | | |
Statements of Changes in Net Assets | | | 10 | | |
Financial Highlights | | | 11 | | |
Notes to Financial Statements | | | 12 | | |
Report of Independent Registered Public Accounting Firm | | | 18 | | |
Liquidity Risk Management Program | | | 19 | | |
Federal Tax Notice | | | 20 | | |
Director and Officer Information | | | 21 | | |
1
Morgan Stanley Variable Insurance Fund, Inc.
Annual Report – December 31, 2021
Expense Example (unaudited)
Global Franchise Portfolio
As a shareholder of the Global Franchise Portfolio (the "Fund"), you incur two types of costs: (1) insurance company charges; and (2) ongoing costs, which include advisory fees, administration fees, distribution (12b-1) fees and other Fund expenses. This example is intended to help you understand your ongoing costs (in dollars) of investing in the Fund and to compare these costs with the ongoing costs of investing in other mutual funds.
This example is based on an investment of $1,000 invested at the beginning of the six-month period ended December 31, 2021 and held for the entire six-month period.
Actual Expenses
The table below provides information about actual account values and actual expenses. You may use the information in this table, together with the amount you invested, to estimate the expenses that you paid over the period. Simply divide your account value by $1,000 (for example, an $8,600 account value divided by $1,000 = 8.6), then multiply the result by the number in the table under the heading entitled "Actual Expenses Paid During Period" to estimate the expenses you paid on your account during this period.
Hypothetical Example for Comparison Purposes
The table below provides information about hypothetical account values and hypothetical expenses based on the Fund's actual expense ratio and an assumed rate of return of 5% per year before expenses, which is not the Fund's actual return. The hypothetical account values and expenses may not be used to estimate the actual ending account balance or expenses you paid for the period. You may use this information to compare the ongoing costs of investing in the Fund and other funds. To do so, compare this 5% hypothetical example with the 5% hypothetical examples that appear in the shareholder reports of the other funds.
Please note that the expenses shown in the table are meant to highlight your ongoing costs only and do not reflect any insurance company charges. Therefore, the table below is useful in comparing ongoing costs, but will not help you determine the relative total cost of owning different funds. In addition, if these insurance company charges were included, your costs would have been higher.
| | | Beginning
Account Value
7/1/21 | | Actual Ending
Account Value
12/31/21 | | Hypothetical
Ending
Account Value | | Actual
Expenses Paid
During Period* | | Hypothetical
Expenses Paid
During Period* | | Net Expense
Ratio During
Period** | |
Global Franchise Portfolio Class II | | $ | 1,000.00 | | | $ | 1,109.80 | | | $ | 1,019.16 | | | $ | 6.38 | | | $ | 6.11 | | | | 1.20 | % | |
* Expenses are calculated using the Fund Class' annualized net expense ratio (as disclosed), multiplied by the average account value over the period and multiplied by 184/365 (to reflect the most recent one-half year period).
** Annualized.
2
Morgan Stanley Variable Insurance Fund, Inc.
Annual Report – December 31, 2021
Investment Overview (unaudited)
Global Franchise Portfolio
The Fund seeks long-term capital appreciation.
Performance
For the fiscal year ended December 31, 2021, the Fund's Class II shares had a total return based on net asset value and reinvestment of distributions per share of 21.67%, net of fees. The Fund's Class II shares underperformed the Fund's benchmark, the MSCI World Net Index (the "Index"), which returned 21.82%.
Factors Affecting Performance
• The Index delivered +21.8% in U.S. dollars (USD) for 2021 (+24.2% in local currency), on top of the +15.9% USD return in 2020. Cyclical sectors were among the leaders for the year, with energy returning +40%, information technology +30%, real estate +29% and financials +28%. As in the fourth quarter, the software & services subsector, important for the portfolio, was the weakest element of information technology, up only 20% versus +33% for hardware & equipment and +52% for semiconductors. The other key sectors, consumer staples (+13%) and health care (+20%), also lagged the overall index, making 2021 a tough environment for the Fund in relative terms. Utilities (+10%) and communication services (+14%) were also weak for the year. The U.S. (+26%) handily outperformed the Index, while Canada (+26% in USD, +25% in local) was the only other major market ahead. Asia was weak in 2021. Hong Kong was down 4% in USD (-3% local), while Japan was only up 2% (+13% local) and Singapore was +6% (+8% local). All were in the shadow of China, which fell 22% in USD and local currency. Within Europe, France (+20% USD, +29% local), Switzerland (+19%, +23%), the U.K. (+18%, +20%) and Italy (+15%, +24%) were far stronger than Spain (+1%, +9%) and Germany (+5%, +13%).
• For the Fund in 2021, positive stock selection outweighed the headwind from sector allocation, which was negative mainly due to the overweight in the lagging consumer staples sector. Outperformance in the health care, industrials and consumer staples sectors drove the positive stock selection.
• The largest absolute contributors for 2021 were Microsoft, Accenture, Danaher, PMI and Thermo Fisher. The three absolute detractors in the year were Fidelity National Information Services, Reckitt Benckiser and Unilever, which was exited in the first quarter of 2021, while Becton Dickinson and the fourth quarter 2021 acquisition of Steris both contributed.
Management Strategies
The Search for Better Outcomes
• What is a better outcome? As long-term investors, we seek to deliver better outcomes for our clients by producing attractive returns. In order to do that, we must invest with a conscious eye on whether companies can deliver better outcomes not just today, but five, 10 and even 20 years from now. We back companies that have the characteristics needed to lead in the long run, like recurring revenue, pricing power and strong management, and that importantly also have the awareness to invest in managing and improving their environmental, social and governance (ESG) impact.
• This logic is consistent with how humans have evolved. If we are to believe the latest neuroscience,(i) humans inherently seek "better outcomes" and, perhaps contrary to common belief, it is not the achievement that gives us satisfaction, but the journey itself. We do this because a "seeking system" gives us a feeling of reward and pleasure when we explore our surroundings and seek new information for survival. Similarly, companies seeking to deliver better outcomes and faced with a changing world must explore their surroundings and seek new information for survival.
A look back
• Looking back on 2021, companies had plenty of change to maneuver. Instead of a pure "return to normal," 2021 was a year of continued headwinds. Although we saw signs of a bounce back with the lifting of COVID-19 lockdown measures in the spring, plus sharp earnings growth, a number of economic challenges have lingered: from supply chain disruption and labor shortages to intensified China-U.S. trade and political tensions. Despite these issues, equity markets continued to boom, buoyed by positive vaccine rollout news, with growth stocks and more cyclical value stocks taking turns to drive the market forward, seemingly unfazed by peak earnings and peak margins or persistent inflation taking hold. The dangers of earnings and multiple correction grew larger, but always seemed just beyond the horizon. Investors started the year leaning into the cyclical rally, but ended the year looking for more defensive positioning, which may bode well for quality investors.
• We also saw ESG momentum continue to build in 2021, with $141 billion of flows(ii) going into ESG funds globally. In Europe, the most mature sustainable
3
Morgan Stanley Variable Insurance Fund, Inc.
Annual Report – December 31, 2021
Investment Overview (unaudited) (cont'd)
Global Franchise Portfolio
investment market, this shift to ESG funds has been via active management. This is not a surprise. It's hard to remain passive in the face of challenges like climate change; if you believe the world is going to change significantly as sustainability externalities start to be priced in, there will be winners and losers, creating investment risks and opportunities. As long-term investors, being on the right side of that change is key.
• Underlying the shift toward ESG is evidence that more and more countries are taking steps to create a more sustainable society and economy. Most of the actions in 2021 were linked to COP26 (the 26th United Nations Climate Change "Conference of Parties") that took place in Glasgow in November. The pressing urgency of the climate challenge brought a series of new commitments to tighten carbon targets, "phase down" coal, remove fossil fuel subsidies, tackle methane emissions and stop deforestation. Countries representing 70% of global emissions and gross domestic product have now committed to reaching net zero by 2050 or 2060, with massive implications for many corporates. Regulators acted too, and some have come a long way. In Europe, new sustainable regulations(iii) that aim to give clients more transparency around sustainable investment came into force, and the European Central Bank presented an action plan to include climate change considerations in its monetary policy strategy.(iv) The U.S. Securities and Exchange Commission has moved from throwing out investor proposals pushing companies like Exxon on climate change in 2019, to forcing companies to hold investor votes on emission targets in 2021.(v) Whether one believes the pace of change is too fast or too slow, the direction of change is clear.
Three trends for the year ahead
• For the year ahead, the environment remains uncertain, whether one looks at it through the lens of economics, health, politics or sustainability; but we believe there are three trends that will shape outcomes for companies, economies and societies.
• First, after a pandemic that has so far seen 230 million cases and nearly 5 million deaths, we expect a stronger push on social challenges, from diversity to inequality, as economies get back on their feet. COVID-19 has not only hit companies and economies, but has put the world back two decades in the fight against poverty, as vulnerable countries and groups of people have shouldered the brunt of the burden.(vi) The pressure on companies to play their part in tackling inequality is likely to continue, from
eliminating race and gender inequities to protecting the human rights of workers in the supply chain. In 2021, we already saw the introduction of Nasdaq's new rules(vii) requiring firms to disclose board-level diversity statistics and have, or explain why they do not have, at least two diverse directors. Similar diversity measures were also announced by the Hong Kong stock exchange, which made clear that "a single gender board is not considered to be a diverse board" and called on companies to appoint a director of a different gender.
• We are also seeing increased action from policymakers and investors. On human rights, the European Union (EU) is considering rules to make human rights due diligence mandatory, while the global responsible investor organization, the UN Principles for Responsible Investment, has announced a new worldwide collaborative platform to support investors in taking action on social issues.(viii) Together, these pressures are likely to lead to greater action on the S in ESG.
• Second, we believe work will turn from climate commitments to policy reality, resulting in an emergence of more laws, fiscal incentives, investor pressure and a continuation of rising climate litigations as the transition to low carbon continues. This will not only impact the fossil fuel industry. For example, in the case of the car industry — whether it's proposals to effectively ban new fossil fuel cars from as early as 2035 like in the EU, or suggesting new incentives for electric vehicles like in the U.S. — the economic rules of the game are changing. Every sector will need to change, and companies who want to stay ahead will need to adapt now or risk ending up in the company graveyard.
• Third, 2022 could prove to be the year of nature, as countries meet for the much less talked about COP15 (the 15th UN Biodiversity Conference) to address the depletion of planetary resources.(ix) Targets will be set in Kunming in China for the next decade, and commitments from both governments and the private sector have already emerged. A coalition of more than 50 countries has committed to protect almost a third of the planet by 2030.(x) We're also seeing the emergence of voluntary disclosure frameworks for companies (as produced by the Taskforce on Nature-related Financial Disclosures) and investors promising to eliminate agricultural commodity-driven deforestation risks across their investment portfolios and invest in nature-based solutions. Although new targets are unlikely to lead to an immediate price on free resources such as water, air, forests and the ocean, it should speed up
4
Morgan Stanley Variable Insurance Fund, Inc.
Annual Report – December 31, 2021
Investment Overview (unaudited) (cont'd)
Global Franchise Portfolio
government action, business decisions and investment allocations. Companies looking to future-proof their businesses will need to understand how dependent they are on planetary resources and how they are impacting nature through their products and services, so they can take action to manage the risks and explore opportunities. Long-term investors looking to future-proof their returns need to do the same.
• Whatever the pace of change in 2022, efforts to create a sustainable future is a game that's played out in decades, not months. Just like any journey, there will be bumps in the road; but as the transition takes place, we believe companies with a strong "seeking system" that helps them be alert to the world around them will help them stay on top of their game and deliver long-term returns for clients. As bottom-up stock pickers, and with the introduction of the new Head of Sustainable Outcomes for the International Equity team, we're determined to keep seeking better outcomes, to learn and improve our offering to you, and to keep pressing for progress from the world's best companies.
(i) Source: Quartz, "Neuroscience confirms that to be truly happy, you will always need something more," Olivia Goodhill, May 16, 2016.
(ii) Source: Morningstar. Data as of third quarter 2021.
(iii) A legislative package that is part of the EU's sustainable finance action plan, including the Sustainable Finance Disclosure Regulation and changes to the Markets in Financial Instruments Directive II and Undertakings for the Collective Investment in Transferable Securities Directive.
(iv) Source: European Central Bank press release, July 8, 2021.
(v) Source: Financial Times, "SEC forces oil companies to hold investor votes on emission targets," Myles McCormick, March 20, 2021.
(vi) Source: United Nations News, "More than half a billion pushed into extreme poverty due to health costs," December 12, 2021.
(vii) Source: Nasdaq, October 1, 2021.
(viii) Source: United Nations Principles for Responsible Investment.
(ix) Source: Stockholm Resilience Centre.
(x) Source: The Guardian, "More than 50 countries commit to protection of 30% of Earth's land and oceans," Patrick Greenfield and Fiona Harvey, January 11, 2021.
5
Morgan Stanley Variable Insurance Fund, Inc.
Annual Report – December 31, 2021
Investment Overview (unaudited) (cont'd)
Global Franchise Portfolio
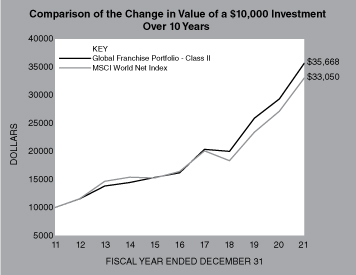
In accordance with SEC regulations, the Fund's performance shown assumes that all recurring fees (including management fees) were deducted and all dividends and distributions were reinvested.
Performance Compared to the MSCI World Net Index(1)
| | | Period Ended December 31, 2021 | |
| | | Total Returns(2) | |
| | | | | Average Annual | |
| | | One
Year | | Five
Years | | Ten
Years | | Since
Inception(4) | |
Fund – Class II(3) | | | 21.67 | % | | | 17.12 | % | | | 13.56 | % | | | 12.15 | % | |
MSCI World Net Index | | | 21.82 | | | | 15.03 | | | | 12.70 | | | | 9.76 | | |
Performance data quoted represents past performance, which is no guarantee of future results, and current performance may be lower or higher than the figures shown. Performance assumes that all dividends and distributions, if any, were reinvested. For the most recent month-end performance figures, please contact the issuing insurance company or speak with your financial advisor. Investment return and principal value will fluctuate so that Fund shares, when redeemed, may be worth more or less than their original cost. Total returns do not reflect the deduction of taxes that a shareholder would pay on Fund distributions or the redemption of Fund shares. Performance shown does not reflect fees and expenses imposed by your insurance company's separate account. If performance information included the effect of these additional charges, the total returns would be lower. Please keep in mind that double-digit returns for the Fund are highly unusual and cannot be sustained.
(1) The MSCI World Net Index is a free float-adjusted market capitalization weighted index that is designed to measure the global equity market performance of developed markets. The term "free float" represents the portion of shares outstanding that are deemed to be available for purchase in the public equity markets by investors. The MSCI World Net Index currently consists of 23 developed market country indices. The performance of the Index is listed in U.S. dollars and assumes reinvestment of net dividends. Net total return indices reinvest dividends after the deduction of withholding taxes, using (for international indices) a tax rate applicable to non-resident institutional investors who do not benefit from double taxation treaties. The Index is unmanaged and its returns do not include any sales charges or fees. Such costs would lower performance. It is not possible to invest directly in an index.
(2) Total returns for the Fund reflect fees waived and expenses reimbursed, if applicable, by the Adviser (as defined herein). Without such waivers and reimbursements, total returns would have been lower.
(3) Commenced operations on April 30, 2003.
(4) For comparative purposes, average annual since inception returns listed for the Index refers to the inception date or initial offering of the respective share class of the Fund, not the inception of the Index.
6
Morgan Stanley Variable Insurance Fund, Inc.
Annual Report – December 31, 2021
Portfolio of Investments
Global Franchise Portfolio
| | | Shares | | Value
(000) | |
Common Stocks (98.6%) | |
France (5.9%) | |
L'Oreal SA | | | 1,368 | | | $ | 650 | | |
LVMH Moet Hennessy Louis Vuitton SE | | | 789 | | | | 653 | | |
Pernod Ricard SA | | | 3,846 | | | | 926 | | |
| | | | 2,229 | | |
Germany (4.8%) | |
SAP SE | | | 12,914 | | | | 1,817 | | |
Italy (0.6%) | |
Davide Campari-Milano N.V. | | | 15,153 | | | | 221 | | |
Netherlands (2.0%) | |
Heineken N.V. | | | 6,919 | | | | 779 | | |
United Kingdom (10.2%) | |
Experian PLC | | | 9,156 | | | | 450 | | |
Reckitt Benckiser Group PLC | | | 28,721 | | | | 2,465 | | |
RELX PLC (Euronext N.V.) | | | 6,282 | | | | 204 | | |
RELX PLC (LSE) | | | 24,105 | | | | 784 | | |
| | | | 3,903 | | |
United States (75.1%) | |
Abbott Laboratories | | | 12,531 | | | | 1,764 | | |
Accenture PLC, Class A | | | 5,194 | | | | 2,153 | | |
Automatic Data Processing, Inc. | | | 6,272 | | | | 1,547 | | |
Baxter International, Inc. | | | 18,424 | | | | 1,582 | | |
Becton Dickinson & Co. | | | 5,805 | | | | 1,460 | | |
Broadridge Financial Solutions, Inc. | | | 2,030 | | | | 371 | | |
Coca-Cola Co. (The) | | | 11,352 | | | | 672 | | |
Danaher Corp. | | | 5,478 | | | | 1,802 | | |
Estee Lauder Cos., Inc. (The), Class A | | | 1,254 | | | | 464 | | |
Factset Research Systems, Inc. | | | 433 | | | | 210 | | |
Fidelity National Information Services, Inc. | | | 7,658 | | | | 836 | | |
Intercontinental Exchange, Inc. | | | 10,125 | | | | 1,385 | | |
Microsoft Corp. | | | 10,550 | | | | 3,548 | | |
Moody's Corp. | | | 1,183 | | | | 462 | | |
NIKE, Inc., Class B | | | 2,661 | | | | 443 | | |
Philip Morris International, Inc. | | | 30,167 | | | | 2,866 | | |
Procter & Gamble Co. (The) | | | 11,092 | | | | 1,814 | | |
Roper Technologies, Inc. | | | 1,627 | | | | 800 | | |
Steris PLC | | | 331 | | | | 81 | | |
Thermo Fisher Scientific, Inc. | | | 2,825 | | | | 1,885 | | |
Visa, Inc., Class A | | | 9,062 | | | | 1,964 | | |
Zoetis, Inc. | | | 2,115 | | | | 516 | | |
| | | | 28,625 | | |
Total Common Stocks (Cost $19,243) | | | 37,574 | | |
| | | Shares | | Value
(000) | |
Short-Term Investment (1.5%) | |
Investment Company (1.5%) | |
Morgan Stanley Institutional Liquidity Funds —
Treasury Securities Portfolio — Institutional
Class (See Note H) (Cost $590) | | | 589,725 | | | $ | 590 | | |
| Total Investments (100.1%) (Cost $19,833) (a)(b) | | | 38,164 | | |
Liabilities in Excess of Other Assets (–0.1%) | | | (30 | ) | |
Net Assets (100.0%) | | $ | 38,134 | | |
Country assignments and aggregations are based generally on third party vendor classifications and information, and may be different from the assignments and aggregations under the policies set forth in the Fund's prospectus and/or statement of additional information relating to geographic classifications.
(a) The approximate fair value and percentage of net assets, $2,038,000 and 5.3%, respectively, represent the securities that have been fair valued under the fair valuation policy for international investments as described in Note A-1 within the Notes to the Financial Statements.
(b) At December 31, 2021, the aggregate cost for federal income tax purposes is approximately $20,106,000. The aggregate gross unrealized appreciation is approximately $18,372,000 and the aggregate gross unrealized depreciation is approximately $315,000, resulting in net unrealized appreciation of approximately $18,057,000.
Euronext N.V. Euronext Amsterdam Stock Market.
LSE London Stock Exchange.
Portfolio Composition
Classification | | Percentage of
Total Investments | |
Information Technology Services | | | 18.0 | % | |
Other* | | | 14.5 | | |
Software | | | 14.1 | | |
Health Care Equipment & Supplies | | | 12.8 | | |
Household Products | | | 11.2 | | |
Life Sciences Tools & Services | | | 9.7 | | |
Tobacco | | | 7.5 | | |
Beverages | | | 6.8 | | |
Capital Markets | | | 5.4 | | |
Total Investments | | | 100.0 | % | |
* Industries and/or investment types representing less than 5% of total investments
The accompanying notes are an integral part of the financial statements.
7
Morgan Stanley Variable Insurance Fund, Inc.
Annual Report – December 31, 2021
Global Franchise Portfolio
Statement of Assets and Liabilities | | December 31, 2021
(000) | |
Assets: | |
Investments in Securities of Unaffiliated Issuers, at Value (Cost $19,243) | | $ | 37,574 | | |
Investment in Security of Affiliated Issuer, at Value (Cost $590) | | | 590 | | |
Total Investments in Securities, at Value (Cost $19,833) | | | 38,164 | | |
Foreign Currency, at Value (Cost —@) | | | — | @ | |
Dividends Receivable | | | 53 | | |
Tax Reclaim Receivable | | | 16 | | |
Receivable for Fund Shares Sold | | | 1 | | |
Receivable from Affiliate | | | — | @ | |
Other Assets | | | 9 | | |
Total Assets | | | 38,243 | | |
Liabilities: | |
Payable for Professional Fees | | | 42 | | |
Payable for Custodian Fees | | | 17 | | |
Payable for Servicing Fees | | | 17 | | |
Payable for Advisory Fees | | | 9 | | |
Payable for Distribution Fees — Class II Shares | | | 8 | | |
Payable for Fund Shares Redeemed | | | 3 | | |
Payable for Administration Fees | | | 3 | | |
Payable for Transfer Agency Fees | | | 1 | | |
Other Liabilities | | | 9 | | |
Total Liabilities | | | 109 | | |
NET ASSETS | | $ | 38,134 | | |
Net Assets Consist of: | |
Paid-in-Capital | | $ | 16,831 | | |
Total Distributable Earnings | | | 21,303 | | |
Net Assets | | $ | 38,134 | | |
CLASS II: | |
Net Asset Value, Offering and Redemption Price Per Share Applicable to 2,792,447 Outstanding
$0.001 Par Value Shares (Authorized 500,000,000 Shares) | | $ | 13.66 | | |
@ Amount is less than $500.
The accompanying notes are an integral part of the financial statements.
8
Morgan Stanley Variable Insurance Fund, Inc.
Annual Report – December 31, 2021
Global Franchise Portfolio
Statement of Operations | | Year Ended
December 31, 2021
(000) | |
Investment Income: | |
Dividends from Securities of Unaffiliated Issuers (Net of $10 of Foreign Taxes Withheld) | | $ | 617 | | |
Dividends from Security of Affiliated Issuer (Note H) | | | — | @ | |
Total Investment Income | | | 617 | | |
Expenses: | |
Advisory Fees (Note B) | | | 287 | | |
Professional Fees | | | 134 | | |
Distribution Fees — Class II Shares (Note E) | | | 90 | | |
Servicing Fees (Note D) | | | 48 | | |
Administration Fees (Note C) | | | 29 | | |
Custodian Fees (Note G) | | | 23 | | |
Shareholder Reporting Fees | | | 12 | | |
Directors' Fees and Expenses | | | 5 | | |
Transfer Agency Fees (Note F) | | | 4 | | |
Pricing Fees | | | 2 | | |
Other Expenses | | | 10 | | |
Total Expenses | | | 644 | | |
Waiver of Advisory Fees (Note B) | | | (214 | ) | |
Rebate from Morgan Stanley Affiliate (Note H) | | | (— | @) | |
Net Expenses | | | 430 | | |
Net Investment Income | | | 187 | | |
Realized Gain (Loss): | |
Investments Sold | | | 3,070 | | |
Foreign Currency Translation | | | (1 | ) | |
Net Realized Gain | | | 3,069 | | |
Change in Unrealized Appreciation (Depreciation): | |
Investments | | | 3,890 | | |
Foreign Currency Translation | | | (1 | ) | |
Net Change in Unrealized Appreciation (Depreciation) | | | 3,889 | | |
Net Realized Gain and Change in Unrealized Appreciation (Depreciation) | | | 6,958 | | |
Net Increase in Net Assets Resulting from Operations | | $ | 7,145 | | |
@ Amount is less than $500.
The accompanying notes are an integral part of the financial statements.
9
Morgan Stanley Variable Insurance Fund, Inc.
Annual Report – December 31, 2021
Global Franchise Portfolio
Statements of Changes in Net Assets | | Year Ended
December 31, 2021
(000) | | Year Ended
December 31, 2020
(000) | |
Increase (Decrease) in Net Assets: | |
Operations: | |
Net Investment Income | | $ | 187 | | | $ | 243 | | |
Net Realized Gain | | | 3,069 | | | | 3,679 | | |
Net Change in Unrealized Appreciation (Depreciation) | | | 3,889 | | | | 60 | | |
Net Increase in Net Assets Resulting from Operations | | | 7,145 | | | | 3,982 | | |
Dividends and Distributions to Shareholders: | |
Class II | | | (3,966 | ) | | | (3,630 | ) | |
Capital Share Transactions:(1) | |
Class II: | |
Subscribed | | | 2,741 | | | | 1,391 | | |
Distributions Reinvested | | | 3,966 | | | | 3,630 | | |
Redeemed | | | (5,940 | ) | | | (6,478 | ) | |
Net Increase (Decrease) in Net Assets Resulting from Capital Share Transactions | | | 767 | | | | (1,457 | ) | |
Total Increase (Decrease) in Net Assets | | | 3,946 | | | | (1,105 | ) | |
Net Assets: | |
Beginning of Period | | | 34,188 | | | | 35,293 | | |
End of Period | | $ | 38,134 | | | $ | 34,188 | | |
(1) Capital Share Transactions: | |
Class II: | |
Shares Subscribed | | | 216 | | | | 119 | | |
Shares Issued on Distributions Reinvested | | | 315 | | | | 320 | | |
Shares Redeemed | | | (461 | ) | | | (547 | ) | |
Net Increase (Decrease) in Class II Shares Outstanding | | | 70 | | | | (108 | ) | |
The accompanying notes are an integral part of the financial statements.
10
Morgan Stanley Variable Insurance Fund, Inc.
Annual Report – December 31, 2021
Financial Highlights
Global Franchise Portfolio
| | | Class II | |
| | | Year Ended December 31, | |
Selected Per Share Data and Ratios | | 2021 | | 2020 | | 2019 | | 2018 | | 2017 | |
Net Asset Value, Beginning of Period | | $ | 12.56 | | | $ | 12.47 | | | $ | 11.18 | | | $ | 13.73 | | | $ | 12.64 | | |
Income (Loss) from Investment Operations: | |
Net Investment Income(1) | | | 0.07 | | | | 0.09 | | | | 0.10 | | | | 0.11 | | | | 0.13 | | |
Net Realized and Unrealized Gain (Loss) | | | 2.52 | | | | 1.41 | | | | 3.09 | | | | (0.22 | ) | | | 2.96 | | |
Total from Investment Operations | | | 2.59 | | | | 1.50 | | | | 3.19 | | | | (0.11 | ) | | | 3.09 | | |
Distributions from and/or in Excess of: | |
Net Investment Income | | | (0.09 | ) | | | (0.11 | ) | | | (0.12 | ) | | | (0.15 | ) | | | (0.19 | ) | |
Net Realized Gain | | | (1.40 | ) | | | (1.30 | ) | | | (1.78 | ) | | | (2.29 | ) | | | (1.81 | ) | |
Total Distributions | | | (1.49 | ) | | | (1.41 | ) | | | (1.90 | ) | | | (2.44 | ) | | | (2.00 | ) | |
Net Asset Value, End of Period | | $ | 13.66 | | | $ | 12.56 | | | $ | 12.47 | | | $ | 11.18 | | | $ | 13.73 | | |
Total Return(2) | | | 21.67 | % | | | 13.21 | % | | | 29.53 | % | | | (1.77 | )% | | | 25.75 | % | |
Ratios to Average Net Assets and Supplemental Data: | |
Net Assets, End of Period (Thousands) | | $ | 38,134 | | | $ | 34,188 | | | $ | 35,293 | | | $ | 32,322 | | | $ | 39,318 | | |
Ratio of Expenses Before Expense Limitation | | | 1.80 | % | | | 1.80 | % | | | 1.69 | % | | | 1.77 | % | | | 1.73 | % | |
Ratio of Expenses After Expense Limitation | | | 1.20 | %(3) | | | 1.20 | %(3) | | | 1.20 | %(3) | | | 1.20 | %(3) | | | 1.20 | %(3) | |
Ratio of Net Investment Income | | | 0.52 | %(3) | | | 0.74 | %(3) | | | 0.82 | %(3) | | | 0.88 | %(3) | | | 0.96 | %(3) | |
Ratio of Rebate from Morgan Stanley Affiliates | | | 0.00 | %(4) | | | 0.00 | %(4) | | | 0.00 | %(4) | | | 0.00 | %(4) | | | 0.00 | %(4) | |
Portfolio Turnover Rate | | | 14 | % | | | 17 | % | | | 14 | % | | | 27 | % | | | 26 | % | |
(1) Per share amount is based on average shares outstanding.
(2) Calculated based on the net asset value as of the last business day of the period. Performance does not reflect fees and expenses imposed by your insurance company's separate account. If performance information included the effect of these additional charges, the total return would be lower.
(3) The Ratio of Expenses After Expense Limitation and Ratio of Net Investment Income reflect the rebate of certain Fund expenses in connection with the investments in Morgan Stanley affiliates during the period. The effect of the rebate on the ratios is disclosed in the above table as "Ratio of Rebate from Morgan Stanley Affiliates."
(4) Amount is less than 0.005%.
The accompanying notes are an integral part of the financial statements.
11
Morgan Stanley Variable Insurance Fund, Inc.
Annual Report – December 31, 2021
Notes to Financial Statements
Morgan Stanley Variable Insurance Fund, Inc. (the "Company") is registered under the Investment Company Act of 1940, as amended (the "Act"), as an open-end management investment company. The Company is comprised of ten separate active, diversified and non-diversified funds (individually referred to as a "Fund," collectively as the "Funds"). The Company applies investment company accounting and reporting guidance.
The accompanying financial statements relate to the Global Franchise Portfolio. The Company seeks long-term capital appreciation. The Fund currently offers Class II shares only, although Class I shares may be offered in the future.
The Company is intended to be a funding vehicle for variable annuity contracts and variable life insurance policies offered by the separate accounts of certain life insurance companies.
A. Significant Accounting Policies: The following significant accounting policies are in conformity with U.S. generally accepted accounting principles ("GAAP"). Such policies are consistently followed by the Company in the preparation of its financial statements. GAAP may require management to make estimates and assumptions that affect the reported amounts and disclosures in the financial statements. Actual results may differ from those estimates.
1. Security Valuation: (1) An equity portfolio security listed or traded on an exchange is valued at its latest reported sales price (or at the exchange official closing price if such exchange reports an official closing price), and if there were no sales on a given day and if there is no official exchange closing price for that day, the security is valued at the mean between the last reported bid and asked prices if such bid and asked prices are available on the relevant exchanges. If only bid prices are available then the latest bid price may be used. Listed equity securities not traded on the valuation date with no reported bid and asked prices available on the exchange are valued at the mean between the current bid and asked prices obtained from one or more reputable brokers or dealers. In cases where a security is traded on more than one exchange, the security is valued on the exchange designated as the primary market; (2) all other equity portfolio securities for which over-the-counter ("OTC") market quotations are readily available are valued at the latest reported sales price (or at the market official closing price if such market reports an official closing price), and if there was no trading in the security on a given day and if there is no official closing price from relevant markets for that day, the security is valued at the mean between the last reported bid and asked prices if such bid and asked prices are available on the relevant markets. An unlisted equity
security that does not trade on the valuation date and for which bid and asked prices from the relevant markets are unavailable is valued at the mean between the current bid and asked prices obtained from one or more reputable brokers or dealers; (3) certain portfolio securities may be valued by an outside pricing service/vendor approved by the Company's Board of Directors (the "Directors"). The pricing service/vendor may employ a pricing model that takes into account, among other things, bids, yield spreads and/or other market data and specific security characteristics. Alternatively, if a valuation is not available from an outside pricing service/vendor, and the security trades on an exchange, the security may be valued at its latest reported sale price (or at the exchange official closing price if such exchange reports an official closing price), prior to the time when assets are valued. If there are no sales on a given day and if there is no official exchange closing price for that day, the security is valued at the mean between the last reported bid and asked prices if such bid and asked prices are available in the relevant exchanges. If only bid prices are available then the latest bid price may be used. If Morgan Stanley Investment Management Inc. (the "Adviser") or Morgan Stanley Investment Management Limited ("MSIM Limited") (the "Sub-Adviser"), each a wholly-owned subsidiary of Morgan Stanley, determines that the price provided by the outside pricing service/vendor or exchange does not reflect the security's fair value or is unable to provide a price, prices from brokers or dealers may also be utilized. In these circumstances, the value of the security will be the mean of bid and asked prices obtained from brokers or dealers; (4) when market quotations are not readily available, including circumstances under which the Adviser or the Sub-Adviser determines that the closing price, last sale price or the mean between the last reported bid and asked prices are not reflective of a security's market value, portfolio securities are valued at their fair value as determined in good faith under procedures established by and under the general supervision of the Directors. Occasionally, developments affecting the closing prices of securities and other assets may occur between the times at which valuations of such securities are determined (that is, close of the foreign market on which the securities trade) and the close of business of the New York Stock Exchange ("NYSE"). If developments occur during such periods that are expected to materially affect the value of such securities, such valuations may be adjusted to reflect the estimated fair value of such securities as of the close of the NYSE, as determined in good faith by the Directors or by the Adviser using a pricing service and/or procedures approved by the Directors; (5) quotations of
12
Morgan Stanley Variable Insurance Fund, Inc.
Annual Report – December 31, 2021
Notes to Financial Statements (cont'd)
foreign portfolio securities, other assets and liabilities and forward contracts stated in foreign currency are translated into U.S. dollar equivalents at the prevailing market rates prior to the close of the NYSE; and (6) investments in mutual funds, including the Morgan Stanley Institutional Liquidity Funds, are valued at the net asset value ("NAV") as of the close of each business day.
The Directors have responsibility for determining in good faith the fair value of the investments, and the Directors may appoint others, such as the Company's Adviser or a valuation committee, to assist the Directors in determining fair value and to make the actual calculations pursuant to the fair valuation methodologies previously approved by the Directors. Under procedures approved by the Directors, the Company's Adviser has formed a Valuation Committee whose members are approved by the Directors. The Valuation Committee provides administration and oversight of the Company's valuation policies and procedures, which are reviewed at least annually by the Directors. These procedures allow the Company to utilize independent pricing services, quotations from securities and financial instrument dealers and other market sources to determine fair value.
2. Fair Value Measurement: Financial Accounting Standards Board ("FASB") Accounting Standards CodificationTM ("ASC") 820, "Fair Value Measurement" ("ASC 820"), defines fair value as the value that the Fund would receive to sell an investment or pay to transfer a liability in a timely transaction with an independent buyer in the principal market, or in the absence of a principal market, the most advantageous market for the investment or liability. ASC 820 establishes a three-tier hierarchy to distinguish between (1) inputs that reflect the assumptions market participants would use in valuing an asset or liability developed based on market data obtained from sources independent of the reporting entity (observable inputs) and (2) inputs that reflect the reporting entity's own assumptions about the assumptions market participants would use in valuing an asset or liability developed based on the best information available in the circumstances (unobservable inputs) and to establish classification of fair value measurements for disclosure purposes. Various inputs are used in determining the value of the Fund's investments. The inputs are summarized in the three broad levels listed below:
• Level 1 – unadjusted quoted prices in active markets for identical investments
• Level 2 – other significant observable inputs (including quoted prices for similar investments, interest rates, prepayment speeds, credit risk, etc.)
• Level 3 – significant unobservable inputs including the Fund's own assumptions in determining the fair value of investments. Factors considered in making this determination may include, but are not limited to, information obtained by contacting the issuer, analysts, or the appropriate stock exchange (for exchange-traded securities), analysis of the issuer's financial statements or other available documents and, if necessary, available information concerning other securities in similar circumstances.
The inputs or methodology used for valuing securities are not necessarily an indication of the risk associated with investing in those securities and the determination of the significance of a particular input to the fair value measurement in its entirety requires judgment and considers factors specific to each security.
The following is a summary of the inputs used to value the Fund's investments as of December 31, 2021:
Investment Type | | Level 1
Unadjusted
quoted
prices
(000) | | Level 2
Other
significant
observable
inputs
(000) | | Level 3
Significant
unobservable
inputs
(000) | | Total
(000) | |
Assets: | |
Common Stocks | |
Beverages | | $ | 2,377 | | | $ | 221 | | | $ | — | | | $ | 2,598 | | |
Capital Markets | | | 2,057 | | | | — | | | | — | | | | 2,057 | | |
Health Care Equipment &
Supplies | | | 4,887 | | | | — | | | | — | | | | 4,887 | | |
Household Products | | | 4,279 | | | | — | | | | — | | | | 4,279 | | |
Industrial Conglomerates | | | 800 | | | | — | | | | — | | | | 800 | | |
Information Technology
Services | | | 6,871 | | | | — | | | | — | | | | 6,871 | | |
Life Sciences Tools &
Services | | | 3,687 | | | | — | | | | — | | | | 3,687 | | |
Personal Products | | | 1,114 | | | | — | | | | — | | | | 1,114 | | |
Pharmaceuticals | | | 516 | | | | — | | | | — | | | | 516 | | |
Professional Services | | | 1,438 | | | | — | | | | — | | | | 1,438 | | |
Software | | | 3,548 | | | | 1,817 | | | | — | | | | 5,365 | | |
Textiles, Apparel &
Luxury Goods | | | 1,096 | | | | — | | | | — | | | | 1,096 | | |
Tobacco | | | 2,866 | | | | — | | | | — | | | | 2,866 | | |
Total Common Stocks | | | 35,536 | | | | 2,038 | | | | — | | | | 37,574 | | |
Short-Term Investment | |
Investment Company | | | 590 | | | | — | | | | — | | | | 590 | | |
Total Assets | | $ | 36,126 | | | $ | 2,038 | | | $ | — | | | $ | 38,164 | | |
13
Morgan Stanley Variable Insurance Fund, Inc.
Annual Report – December 31, 2021
Notes to Financial Statements (cont'd)
Transfers between investment levels may occur as the markets fluctuate and/or the availability of data used in an investment's valuation changes.
3. Foreign Currency Translation and Foreign Investments: The books and records of the Fund are maintained in U.S. dollars. Foreign currency amounts are translated into U.S. dollars as follows:
— investments, other assets and liabilities at the prevailing rate of exchange on the valuation date;
— investment transactions and investment income at the prevailing rates of exchange on the dates of such transactions.
Although the net assets of the Fund are presented at the foreign exchange rates and market values at the close of the period, the Fund does not isolate that portion of the results of operations arising as a result of changes in the foreign exchange rates from the fluctuations arising from changes in the market prices of securities held at period end. Similarly, the Fund does not isolate the effect of changes in foreign exchange rates from the fluctuations arising from changes in the market prices of securities sold during the period. Accordingly, realized and unrealized foreign currency gains (losses) on investments in securities are included in the reported net realized and unrealized gains (losses) on investment transactions and balances. However, pursuant to U.S. federal income tax regulations, gains and losses from certain foreign currency transactions and the foreign currency portion of gains and losses realized on sales and maturities of foreign denominated debt securities are treated as ordinary income for U.S. federal income tax purposes.
Net realized gains (losses) on foreign currency transactions represent net foreign exchange gains (losses) from foreign currency forward exchange contracts, disposition of foreign currencies, currency gains (losses) realized between the trade and settlement dates on securities transactions, and the difference between the amount of investment income and foreign withholding taxes recorded on the Fund's books and the U.S. dollar equivalent amounts actually received or paid. The change in unrealized currency gains (losses) on foreign currency transactions for the period is reflected in the Statement of Operations.
Foreign security and currency transactions may involve certain considerations and risks not typically associated with those of U.S. dollar denominated transactions as a result of, among other factors, fluctuations of exchange rates in relation to the U.S. dollar, the possibility of lower levels of governmental supervision and regulation of
foreign securities markets and the possibility of political or economic instability.
Governmental approval for foreign investments may be required in advance of making an investment under certain circumstances in some countries, and the extent of foreign investments in domestic companies may be subject to limitation in other countries. Foreign ownership limitations also may be imposed by the charters of individual companies to prevent, among other concerns, violations of foreign investment limitations. As a result, an additional class of shares (identified as "Foreign" in the Portfolio of Investments) may be created and offered for investment. The "local" and "foreign shares" market values may differ. In the absence of trading of the foreign shares in such markets, the Fund values the foreign shares at the closing exchange price of the local shares.
4. Indemnifications: The Company enters into contracts that contain a variety of indemnifications. The Company's maximum exposure under these arrangements is unknown. However, the Company has not had prior claims or losses pursuant to these contracts and expects the risk of loss to be remote.
5. Security Transactions, Income and Expenses: Security transactions are accounted for on the trade date (date the order to buy or sell is executed). Realized gains and losses on the sale of investment securities are determined on the specific identified cost method. Dividend income and other distributions are recorded on the ex-dividend date (except for certain foreign dividends which may be recorded as soon as the Fund is informed of such dividends) net of applicable withholding taxes. Interest income is recognized on the accrual basis net of applicable withholding taxes except where collection is in doubt. Discounts are accreted and premiums are amortized over the life of the respective securities. Most expenses of the Company can be directly attributed to a particular Fund. Expenses which cannot be directly attributed are apportioned among the Funds based upon relative net assets or other appropriate methods. Income, expenses (other than class specific expenses) and realized and unrealized gains or losses are allocated to each class of shares based upon their relative net assets.
Settlement and registration of foreign securities transactions may be subject to significant risks not normally associated with investments in the United States. In certain markets, ownership of shares is defined according to entries in the issuer's share register. It is possible that a Fund holding these securities could lose its share registration through fraud, negligence or even mere oversight. In
14
Morgan Stanley Variable Insurance Fund, Inc.
Annual Report – December 31, 2021
Notes to Financial Statements (cont'd)
addition, shares being delivered for sales and cash being paid for purchases may be delivered before the exchange is complete. This may subject the Fund to further risk of loss in the event of a failure to complete the transaction by the counterparty.
6. Dividends and Distributions to Shareholders: Dividends and distributions to shareholders are recorded on the ex-dividend date. Dividends from net investment income, if any, are declared and paid annually. Net realized capital gains, if any, are distributed at least annually.
B. Advisory/Sub-Advisory Fees: The Adviser, a wholly-owned subsidiary of Morgan Stanley, provides the Fund with advisory services under the terms of an Investment Advisory Agreement, paid quarterly, at the annual rate based on the daily net assets as follows:
First $500
million | | Next $500
million | | Over $1
billion | |
| | 0.80 | % | | | 0.75 | % | | | 0.70 | % | |
For the year ended December 31, 2021, the advisory fee rate (net of waiver/rebate) was equivalent to an annual effective rate of 0.20% of the Fund's average daily net assets.
The Adviser has agreed to reduce its advisory fee and/or reimburse the Fund so that the total annual Fund operating expenses, excluding certain investment related expenses, taxes, interest and other extraordinary expenses (including litigation), will not exceed 1.20% for Class II shares. The fee waivers and/or expense reimbursements will continue for at least one year from the date of the Fund's prospectus or until such time as the Directors act to discontinue all or a portion of such waivers and/or reimbursements when they deem such action is appropriate. For the year ended December 31, 2021, approximately $214,000 of advisory fees were waived pursuant to this arrangement.
The Adviser has entered into a Sub-Advisory Agreement with the Sub-Adviser, a wholly-owned subsidiary of Morgan Stanley. The Sub-Adviser provides the Fund with advisory services subject to the overall supervision of the Adviser and the Fund's Officers and Directors. The Adviser pays the Sub-Adviser on a monthly basis a portion of the net advisory fees the Adviser receives from the Fund.
C. Administration Fees: The Adviser also serves as Administrator to the Company and provides administrative services pursuant to an Administration Agreement for an annual fee, accrued daily and paid monthly, of 0.08% of the Fund's average daily net assets.
Under a Sub-Administration Agreement between the Administrator and State Street Bank and Trust Company ("State Street"), State Street provides certain administrative services to the Company. For such services, the Administrator pays State
Street a portion of the fee the Administrator receives from the Fund.
D. Servicing Fees: The Company accrues daily and pays quarterly a servicing fee of up to 0.17% of the average daily value of shares of the Fund held in an insurance company's account. Certain insurance companies have entered into a servicing agreement with the Company to provide administrative and other contract-owner related services on behalf of the Fund.
E. Distribution Fees: Morgan Stanley Distribution, Inc. ("MSDI" or the "Distributor"), a wholly-owned subsidiary of the Adviser and an indirect subsidiary of Morgan Stanley, serves as the Distributor of the Fund and provides the Fund's Class II shareholders with distribution services pursuant to a Distribution Plan (the "Plan") in accordance with Rule 12b-1 under the Act. Under the Plan, the Fund is authorized to pay the Distributor a distribution fee, which is accrued daily and paid monthly, at an annual rate of 0.25% of the Fund's average daily net assets attributable to Class II shares.
F. Dividend Disbursing and Transfer Agent: The Company's dividend disbursing and transfer agent is DST Asset Manager Solutions, Inc. ("DST"). Pursuant to a Transfer Agency Agreement, the Company pays DST a fee based on the number of classes, accounts and transactions relating to the Funds of the Company.
G. Custodian Fees: State Street (the "Custodian") also serves as Custodian for the Company in accordance with a Custodian Agreement. The Custodian holds cash, securities and other assets of the Company as required by the Act. Custody fees are payable monthly based on assets held in custody, investment purchases and sales activity and account maintenance fees, plus reimbursement for certain out-of-pocket expenses.
H. Security Transactions and Transactions with Affiliates: For the year ended December 31, 2021, purchases and sales of investment securities for the Fund, other than long-term U.S. Government securities and short-term investments were approximately $4,794,000 and $7,775,000, respectively. There were no purchases and sales of long-term U.S. Government securities for the year ended December 31, 2021.
The Fund invests in the Institutional Class of the Morgan Stanley Institutional Liquidity Funds — Treasury Securities Portfolio (the "Liquidity Funds"), an open-end management investment company managed by the Adviser. Advisory fees paid by the Fund are reduced by an amount equal to its pro-rata share of the advisory and administration fees paid by the Fund due to its investment in the Liquidity Funds. For the year ended December 31, 2021, advisory fees paid were
15
Morgan Stanley Variable Insurance Fund, Inc.
Annual Report – December 31, 2021
Notes to Financial Statements (cont'd)
reduced by less than $500 relating to the Fund's investment in the Liquidity Funds.
A summary of the Fund's transactions in shares of affiliated investments during the year ended December 31, 2021 is as follows:
Affiliated
Investment
Company | | Value
December 31,
2020
(000) | | Purchases
at Cost
(000) | | Proceeds
from Sales
(000) | | Dividend
Income
(000) | |
Liquidity Funds | | $ | 575 | | | $ | 6,323 | | | $ | 6,308 | | | $ | — | @ | |
Affiliated
Investment
Company (cont'd) | | Realized
Gain (Loss)
(000) | | Change in
Unrealized
Appreciation
(Depreciation)
(000) | | Value
December 31,
2021
(000) | |
Liquidity Funds | | $ | — | | | $ | — | | | $ | 590 | | |
@ Amount is less than $500.
The Fund is permitted to purchase and sell securities ("cross-trade") from and to other Morgan Stanley funds as well as other funds and client accounts for which the Adviser or an affiliate of the Adviser serves as investment adviser, pursuant to procedures approved by the Directors in compliance with Rule 17a-7 under the Act (the "Rule"). Each cross-trade is executed at the current market price in compliance with provisions of the Rule. For the year ended December 31, 2021, the Fund did not engage in any cross-trade transactions.
The Fund has an unfunded Deferred Compensation Plan (the "Compensation Plan"), which allows each independent Director to defer payment of all, or a portion, of the fees he or she receives for serving on the Board of Directors. Each eligible Director generally may elect to have the deferred amounts credited with a return equal to the total return on one or more of the Morgan Stanley funds that are offered as investment options under the Compensation Plan. Appreciation/depreciation and distributions received from these investments are recorded with an offsetting increase/decrease in the deferred compensation obligation and do not affect the NAV of the Fund.
I. Federal Income Taxes: It is the Fund's intention to continue to qualify as a regulated investment company and distribute all of its taxable and tax-exempt income. Accordingly, no provision for federal income taxes is required in the financial statements.
The Fund may be subject to taxes imposed by countries in which it invests. Such taxes are generally based on income and/or capital gains earned or repatriated. Taxes are accrued based on net investment income, net realized gains and net unrealized appreciation as such income and/or gains are earned. Taxes may also be based on transactions in foreign
currency and are accrued based on the value of investments denominated in such currency.
FASB ASC 740-10, "Income Taxes — Overall", sets forth a minimum threshold for financial statement recognition of the benefit of a tax position taken or expected to be taken in a tax return. Management has concluded there are no significant uncertain tax positions that would require recognition in the financial statements. If applicable, the Fund recognizes interest accrued related to unrecognized tax benefits in "Interest Expense" and penalties in "Other Expenses" in the Statement of Operations. The Fund files tax returns with the U.S. Internal Revenue Service, New York and various states. Generally, each of the tax years in the four-year period ended December 31, 2021 remains subject to examination by taxing authorities.
The tax character of distributions paid may differ from the character of distributions shown for GAAP purposes due to short-term capital gains being treated as ordinary income for tax purposes. The tax character of distributions paid during fiscal years 2021 and 2020 was as follows:
2021 Distributions
Paid From: | | 2020 Distributions
Paid From: | |
Ordinary
Income
(000) | | Long-Term
Capital Gain
(000) | | Ordinary
Income
(000) | | Long-Term
Capital Gain
(000) | |
| $ | 276 | | | $ | 3,690 | | | $ | 367 | | | $ | 3,263 | | |
The amount and character of income and gains to be distributed are determined in accordance with income tax regulations which may differ from GAAP. These book/tax differences are either considered temporary or permanent in nature.
Temporary differences are attributable to differing book and tax treatments for the timing of the recognition of gains (losses) on certain investment transactions and the timing of the deductibility of certain expenses.
The Fund had no permanent differences causing reclassifications among the components of net assets for the year ended December 31, 2021.
At December 31, 2021, the components of distributable earnings for the Fund on a tax basis were as follows:
Undistributed
Ordinary
Income
(000) | | Undistributed
Long-Term
Capital Gain
(000) | |
| $ | 188 | | | $ | 3,060 | | |
J. Credit Facility: The Company and other Morgan Stanley funds participated in a $300,000,000 committed, unsecured revolving line of credit facility (the "Facility") with State Street. This Facility is to be used for temporary emergency purposes or funding of shareholder redemption
16
Morgan Stanley Variable Insurance Fund, Inc.
Annual Report – December 31, 2021
Notes to Financial Statements (cont'd)
requests. The interest rate on borrowings is based on the federal funds rate or 1 month LIBOR rate plus a spread. Effective April 19, 2021, the interest rate on borrowings is based on the federal funds effective rate or overnight bank funding rate plus a spread. The Facility also has a commitment fee of 0.25% per annum based on the unused portion of the Facility. During the year ended December 31, 2021, the Fund did not have any borrowings under the Facility.
K. Other: At December 31, 2021, the Fund had record owners of 10% or greater. Investment activities of these shareholders could have a material impact on the Fund. The aggregate percentage of such owners was 81.6%.
L. Market Risk: The outbreak of the coronavirus ("COVID-19") and the recovery responses could adversely impact the operations of the Fund and its service providers and financial performance of the Fund and the Fund's investments. The extent of such impact depends on future developments, including (i) the duration and spread of the outbreak, (ii) the restrictions and advisories, (iii) the effects on the financial markets, (iv) government and regulatory responses, and (v) the effects on the economy overall as a result of developments such as disruption to consumer demand, economic output and supply chains. The duration and extent of COVID-19 and associated economic and market conditions and uncertainty over the long term cannot be reasonably estimated at this time. The ultimate impact of COVID-19 and the extent to which the associated conditions impact the Fund will also depend on future developments, which are highly uncertain, difficult to accurately predict and subject to change at any time. If the financial performance of the Fund's investments is impacted because of these factors for an extended period, the Fund's investment results may be adversely affected.
17
Morgan Stanley Variable Insurance Fund, Inc.
Annual Report – December 31, 2021
Report of Independent Registered Public Accounting Firm
To the Shareholders and Board of Directors of
Morgan Stanley Variable Insurance Fund, Inc. —
Global Franchise Portfolio
Opinion on the Financial Statements
We have audited the accompanying statement of assets and liabilities of Global Franchise Portfolio (the "Fund") (one of the funds constituting Morgan Stanley Variable Insurance Fund, Inc. (the "Company")), including the portfolio of investments, as of December 31, 2021, and the related statement of operations for the year then ended, the statements of changes in net assets for each of the two years in the period then ended, the financial highlights for each of the five years in the period then ended and the related notes (collectively referred to as the "financial statements"). In our opinion, the financial statements present fairly, in all material respects, the financial position of Global Franchise Portfolio (one of the funds constituting Morgan Stanley Variable Insurance Fund, Inc.) at December 31, 2021, the results of its operations for the year then ended, the changes in its net assets for each of the two years in the period then ended and its financial highlights for each of the five years in the period then ended, in conformity with U.S. generally accepted accounting principles.
Basis for Opinion
These financial statements are the responsibility of the Company's management. Our responsibility is to express an opinion on the Fund's financial statements based on our audits. We are a public accounting firm registered with the Public Company Accounting Oversight Board (United States) ("PCAOB") and are required to be independent with respect to the Company in accordance with the U.S. federal securities law and the applicable rules and regulations of the Securities and Exchange Commission and the PCAOB.
We conducted our audits in accordance with the standards of the PCAOB. Those standards require that we plan and perform the audit to obtain reasonable assurance about whether the financial statements are free of material misstatement, whether due to error or fraud. The Company is not required to have, nor were we engaged to perform, an audit of the Company's internal control over financial reporting. As part of our audits, we are required to obtain an understanding of internal control over financial reporting, but not for the purpose of expressing an opinion on the effectiveness of the Company's internal control over financial reporting. Accordingly, we express no such opinion.
Our audits included performing procedures to assess the risks of material misstatement of the financial statements, whether due to error or fraud, and performing procedures that respond to those risks. Such procedures included examining, on a test basis, evidence regarding the amounts and disclosures in the financial statements. Our procedures included confirmation of securities owned as of December 31, 2021by correspondence with the custodian and others or by other appropriate auditing procedures where replies from others were not received. Our audits also included evaluating the accounting principles used and significant estimates made by management, as well as evaluating the overall presentation of the financial statements. We believe that our audits provide a reasonable basis for our opinion.

We have served as the auditor of one or more Morgan Stanley investment companies since 2000.
Boston, Massachusetts
February 18, 2022
18
Morgan Stanley Variable Insurance Fund, Inc.
Annual Report – December 31, 2021
Liquidity Risk Management Program (unaudited)
In compliance with Rule 22e-4 under the Investment Company Act of 1940, as amended (the "Liquidity Rule"), the Fund has adopted and implemented a liquidity risk management program (the "Program"), which is reasonably designed to assess and manage the risk that the Fund could not meet requests to redeem shares issued by the Fund without significant dilution of remaining investors' interests in the Fund (i.e., liquidity risk). The Fund's Board of Directors (the "Board") previously approved the designation of the Liquidity Risk Subcommittee (the "LRS") as Program administrator. The LRS is comprised of representatives from various divisions within Morgan Stanley Investment Management.
At a meeting held on March 3-4, 2021, the Board reviewed a written report prepared by the LRS that addressed the Program's operation and assessed its adequacy, and effectiveness of implementation for the period from January 1, 2020, through December 31, 2020, as required under the Liquidity Rule, and discussed the impact of the COVID-19 pandemic on liquidity and the LRS's assessment of liquidity risk during the reporting period, including during the distressed market environment caused by the onset of the COVID-19 pandemic. The report concluded that the Program operated effectively and was adequately and effectively implemented in all material aspects, and that the relevant controls and safeguards were appropriately designed to enable the LRS to administer the Program in compliance with the Liquidity Rule.
In accordance with the Program, the LRS assessed each Fund's liquidity risk no less frequently than annually taking into consideration certain factors, as applicable, such as (i) investment strategy and liquidity of portfolio investments, (ii) short-term and long-term cash flow projections and (iii) holdings of cash and cash equivalents and borrowing arrangements and other funding sources. Certain factors are considered under both normal and reasonably foreseeable stressed conditions.
Each Fund portfolio investment is classified into one of four liquidity categories, which classification is assessed at least monthly by the LRS. The classification is based on a determination of the number of days it is reasonably expected to take to convert the investment into cash, or sell or dispose of the investment, in current market conditions without significantly changing the market value of the investment. Liquidity classification determinations take into account various market, trading and investment-specific considerations, as well as market depth, and in some cases utilize third-party vendor data.
The Liquidity Rule limits a fund's investments in illiquid investments to 15% of its net assets and requires funds that do not primarily hold assets that are highly liquid investments to determine and maintain a minimum percentage of the fund's net assets to be invested in highly liquid investments (highly liquid investment minimum or "HLIM"). The LRS believes that the Program includes provisions reasonably designed to review, monitor and comply with the 15% limit on illiquid investments and for determining, periodically reviewing and complying with the HLIM requirement, as applicable.
There can be no assurance that the Program will achieve its objectives under all circumstances in the future. Please refer to the Fund's prospectus for more information regarding the Fund's exposure to liquidity risk and other risks to which it may be subject.
19
Morgan Stanley Variable Insurance Fund, Inc.
Annual Report – December 31, 2021
Federal Tax Notice (unaudited)
For federal income tax purposes, the following information is furnished with respect to the distributions paid by the Fund during its taxable year ended December 31, 2021. For corporate shareholders 100.0% of the dividends qualified for the dividends received deduction.
The Fund designated and paid approximately $3,690,000 as a long-term capital gain distribution.
For federal income tax purposes, the following information is furnished with respect to the Fund's earnings for its taxable year ended December 31, 2021. When distributed, certain earnings may be subject to a maximum tax rate of 15% as provided for by the Jobs and Growth Tax Relief Reconciliation Act of 2003. The Fund designated up to a maximum of approximately $276,000 as taxable at this lower rate.
In January, the Fund provides tax information to shareholders for the preceding calendar year.
20
Morgan Stanley Variable Insurance Fund, Inc.
Annual Report – December 31, 2021
Director and Officer Information (unaudited)
Independent Directors:
Name, Address and Birth
Year of Independent Director | | Position(s)
Held with
Registrant | | Length of
Time
Served* | | Principal Occupation(s) During Past 5 Years and
Other Relevant Professional Experience | | Number of
Funds
in Fund
Complex
Overseen
by
Independent
Director** | | Other Directorships Held by Independent
Director During Past 5 Years*** | |
Frank L. Bowman
c/o Perkins Coie LLP
Counsel to the Independent Directors
1155 Avenue of the Americas
22nd Floor
New York, NY 10036
Birth Year: 1944 | | Director | | Since August 2006 | | President, Strategic Decisions, LLC (consulting) (since February 2009); Director or Trustee of various Morgan Stanley Funds (since August 2006); Chairperson of the Compliance and Insurance Committee (since October 2015); formerly, Chairperson of the Insurance Sub-Committee of the Compliance and Insurance Committee (2007-2015); served as President and Chief Executive Officer of the Nuclear Energy Institute (policy organization) (February 2005-November 2008); retired as Admiral, U.S. Navy after serving over 38 years on active duty including 8 years as Director of the Naval Nuclear Propulsion Program in the Department of the Navy and the U.S. Department of Energy (1996-2004); served as Chief of Naval Personnel (July 1994-September 1996) and on the Joint Staff as Director of Political Military Affairs (June 1992-July 1994); knighted as Honorary Knight Commander of the Most Excellent Order of the British Empire; awarded the Officier de l'Orde National du Mérite by the French Government; elected to the National Academy of Engineering (2009). | | | 77 | | | Director of Naval and Nuclear Technologies LLP; Director Emeritus of the Armed Services YMCA; Member of the National Security Advisory Council of the Center for U.S. Global Engagement and a member of the CNA Military Advisory Board; Chairman of Fairhaven United Methodist Church; Member of the Board of Advisors of the Dolphin Scholarship Foundation; Director of other various nonprofit organizations; formerly, Director of BP, plc (November 2010-May 2019). | |
Kathleen A. Dennis
c/o Perkins Coie LLP
Counsel to the Independent Directors
1155 Avenue of the Americas
22nd Floor
New York, NY 10036
Birth Year: 1953 | | Director | | Since August 2006 | | Chairperson of the Governance Committee (since January 2021), Chairperson of the Liquidity and Alternatives Sub-Committee of the Investment Committee (2006-2020) and Director or Trustee of various Morgan Stanley Funds (since August 2006); President, Cedarwood Associates (mutual fund and investment management consulting) (since July 2006); formerly, Senior Managing Director of Victory Capital Management (1993-2006). | | | 77 | | | Board Member, University of Albany Foundation (2012-present); Board Member, Mutual Funds Directors Forum (2014-present); Director of various non-profit organizations. | |
Nancy C. Everett
c/o Perkins Coie LLP
Counsel to the Independent Directors
1155 Avenue of the Americas
22nd Floor
New York, NY 10036
Birth Year: 1955 | | Director | | Since January 2015 | | Chairperson of the Equity Investment Committee (since January 2021); Director or Trustee of various Morgan Stanley Funds (since January 2015); Chief Executive Officer, Virginia Commonwealth University Investment Company (since November 2015); Owner, OBIR, LLC (institutional investment management consulting) (since June 2014); formerly, Managing Director, BlackRock, Inc. (February 2011-December 2013) and Chief Executive Officer, General Motors Asset Management (a/k/a Promark Global Advisors, Inc.) (June 2005-May 2010). | | | 78 | | | Formerly, Member of Virginia Commonwealth University School of Business Foundation (2005-2016); Member of Virginia Commonwealth University Board of Visitors (2013-2015); Member of Committee on Directors for Emerging Markets Growth Fund, Inc. (2007-2010); Chairperson of Performance Equity Management, LLC (2006-2010); and Chairperson, GMAM Absolute Return Strategies Fund, LLC (2006-2010). | |
21
Morgan Stanley Variable Insurance Fund, Inc.
Annual Report – December 31, 2021
Director and Officer Information (unaudited) (cont'd)
Independent Directors (cont'd):
Name, Address and Birth
Year of Independent Director | | Position(s)
Held with
Registrant | | Length of
Time
Served* | | Principal Occupation(s) During Past 5 Years and
Other Relevant Professional Experience | | Number of
Funds
in Fund
Complex
Overseen
by
Independent
Director** | | Other Directorships Held by Independent
Director During Past 5 Years*** | |
Jakki L. Haussler
c/o Perkins Coie LLP
Counsel to the Independent Directors
1155 Avenue of the Americas
22nd Floor
New York, NY 10036
Birth Year: 1957 | | Director | | Since January 2015 | | Director or Trustee of various Morgan Stanley Funds (since January 2015); Chairman, Opus Capital Group (since 1996); formerly, Chief Executive Officer, Opus Capital Group (1996-2019); Director, Capvest Venture Fund, LP (May 2000-December 2011); Partner, Adena Ventures, LP (July 1999-December 2010); Director, The Victory Funds (February 2005-July 2008). | | | 78 | | | Director, Barnes Group Inc. (since July 2021); Director of Cincinnati Bell Inc. and Member, Audit Committee and Chairman, Governance and Nominating Committee; Director of Service Corporation International and Member, Audit Committee and Investment Committee; Director of Northern Kentucky University Foundation and Member, Investment Committee; Member of Chase College of Law Transactional Law Practice Center Board of Advisors; Director of Best Transport; Director of Chase College of Law Board of Visitors; formerly, Member, University of Cincinnati Foundation Investment Committee; Member, Miami University Board of Visitors (2008-2011); Trustee of Victory Funds (2005-2008) and Chairman, Investment Committee (2007-2008) and Member, Service Provider Committee (2005-2008). | |
Dr. Manuel H. Johnson
c/o Johnson Smick
International, Inc.
220 I Street, NE Suite 200
Washington, D.C. 20002
Birth Year: 1949 | | Director | | Since
July
1991 | | Senior Partner, Johnson Smick International, Inc. (consulting firm); Chairperson of the Fixed Income, Liquidity and Alternatives Investment Committee (since January 2021), Chairperson of the Investment Committee (2006-2020) and Director or Trustee of various Morgan Stanley Funds (since July 1991); Co-Chairman and a founder of the Group of Seven Council (G7C) (international economic commission); formerly, Chairperson of the Audit Committee (July 1991-September 2006); Vice Chairman of the Board of Governors of the Federal Reserve System and Assistant Secretary of the U.S. Treasury. | | | 77 | | | Director of NVR, Inc. (home construction). | |
Joseph J. Kearns
c/o Perkins Coie LLP
Counsel to the Independent Directors
1155 Avenue of the Americas
22nd Floor
New York, NY 10036
Birth Year: 1942 | | Director | | Since
August 1994 | | Senior Adviser, Kearns & Associates LLC (investment consulting); Chairperson of the Audit Committee (since October 2006) and Director or Trustee of various Morgan Stanley Funds (since August 1994); formerly, Deputy Chairperson of the Audit Committee (July 2003-September 2006) and Chairperson of the Audit Committee of various Morgan Stanley Funds (since August 1994); CFO of the J. Paul Getty Trust (1982-1999). | | | 78 | | | Director, Rubicon Investments (since February 2019); Prior to August 2016, Director of Electro Rent Corporation (equipment leasing); Prior to December 31, 2013, Director of The Ford Family Foundation. | |
Michael F. Klein
c/o Perkins Coie LLP
Counsel to the Independent Directors
1155 Avenue of the Americas
22nd Floor
New York, NY 10036
Birth Year: 1958 | | Director | | Since
August 2006 | | Chairperson of the Risk Committee (since January 2021); Managing Director, Aetos Alternatives Management, LP (since March 2000); Co-President, Aetos Alternatives Management, LP (since January 2004) and Co-Chief Executive Officer of Aetos Alternatives Management, LP (since August 2013); Chairperson of the Fixed Income Sub-Committee of the Investment Committee (2006-2020) and Director or Trustee of various Morgan Stanley Funds (since August 2006); formerly, Managing Director, Morgan Stanley & Co. Inc. and Morgan Stanley Dean Witter Investment Management and President, various Morgan Stanley Funds (June 1998-March 2000); Principal, Morgan Stanley & Co. Inc. and Morgan Stanley Dean Witter Investment Management (August 1997-December 1999). | | | 77 | | | Director of certain investment funds managed or sponsored by Aetos Alternatives Management, LP; Director of Sanitized AG and Sanitized Marketing AG (specialty chemicals). | |
22
Morgan Stanley Variable Insurance Fund, Inc.
Annual Report – December 31, 2021
Director and Officer Information (unaudited) (cont'd)
Independent Directors (cont'd):
Name, Address and Birth
Year of Independent Director | | Position(s)
Held with
Registrant | | Length of
Time
Served* | | Principal Occupation(s) During Past 5 Years and
Other Relevant Professional Experience | | Number of
Funds
in Fund
Complex
Overseen
by
Independent
Director** | | Other Directorships Held by Independent
Director During Past 5 Years*** | |
Patricia A. Maleski
c/o Perkins Coie LLP
Counsel to the Independent Directors
1155 Avenue of the Americas
22nd Floor
New York, NY 10036
Birth Year: 1960 | | Director | | Since
January 2017 | | Director or Trustee of various Morgan Stanley Funds (since January 2017); Managing Director, JPMorgan Asset Management (2004-2016); Oversight and Control Head of Fiduciary and Conflicts of Interest Program (2015-2016); Chief Control Officer — Global Asset Management (2013-2015); President, JPMorgan Funds (2010-2013); Chief Administrative Officer (2004-2013); various other positions including Treasurer and Board Liaison (since 2001). | | | 78 | | | Trustee, Nutley Family Service Bureau, Inc. (since January 2022). | |
W. Allen Reed
c/o Perkins Coie LLP
Counsel to the Independent Directors
1155 Avenue of the Americas
22nd Floor
New York, NY 10036
Birth Year: 1947 | | Chair of the Board and Director | | Chair of the Board since August 2020 and Director since August 2006 | | Chair of the Boards of various Morgan Stanley Funds (since August 2020); Director or Trustee of various Morgan Stanley Funds (since August 2006); formerly, Vice Chair of the Boards of various Morgan Stanley Funds (January 2020-August 2020); President and Chief Executive Officer of General Motors Asset Management; Chairman and Chief Executive Officer of the GM Trust Bank and Corporate Vice President of General Motors Corporation (August 1994-December 2005). | | | 77 | | | Formerly, Director of Legg Mason, Inc. (2006-2019); and Director of the Auburn University Foundation (2010-2015). | |
Frances L. Cashman
c/o Perkins Coie LLP
Counsel to the Independent Directors
1155 Avenue of the Americas
22nd Floor
New York, NY 10036
Birth Year: 1961 | | Advisory Board Member | | Advisory Board Member Since January 2022 | | Chief Executive Officer, Asset Management Division, Euromoney Institutional Investor PLC (financial information) (May 2021-Present); Executive Vice President and various other roles, Legg Mason & Co. (asset management) (2010-2020); Managing Director, Stifel Nicolaus (2005-2010). | | | 78 | | | Trustee and Investment Committee Member, Georgia Tech Foundation (Since June 2019); Trustee and Chair of Marketing Committee, Loyola Blakefield (Since September 2017); Trustee, MMI Gateway Foundation (since September 2017); Director and Investment Committee Member, Catholic Community Foundation Board (2012-2018); Director and Investment Committee Member, St. Ignatius Loyola Academy (2011-2017). | |
Eddie A. Grier
c/o Perkins Coie LLP
Counsel to the Independent Directors
1155 Avenue of the Americas
22nd Floor
New York, NY 10036
Birth Year: 1955 | | Advisory Board Member | | Advisory Board Member Since January 2022 | | Dean, Santa Clara University Leavey School of Business (since April 2021); Dean, Virginia Commonwealth University School of Business (2010-2021); President and various other roles, Walt Disney Company (entertainment and media) (1981-2010). | | | 78 | | | Director, Witt/Keiffer, Inc. (executive search) (since 2016); Director, NuStar GP, LLC (energy) (since August 2021); Director, Sonida Senior Living, Inc. (residential community operator) (2016-2021); Director, NVR, Inc. (homebuilding) (2013-2020); Director, Middleburg Trust Company (wealth management) (2014-2019); Director, Colonial Williamsburg Company (since 2012); Regent, University of Massachusetts Global (since 2021); Director and Chair, ChildFund International (2012-2021); Trustee, Brandman University (2010-2021); Director, Richmond Forum (2012-2019). | |
* This is the earliest date the Director began serving the Morgan Stanley Funds. Each Director serves an indefinite term, until his or her successor is elected.
** The Fund Complex includes (as of December 31, 2021) all open-end and closed-end funds (including all of their portfolios) advised by Morgan Stanley Investment Management Inc. (the "Adviser") and any funds that have an adviser that is an affiliated person of the Adviser (including, but not limited to, Morgan Stanley AIP GP LP).
*** This includes any directorships at public companies and registered investment companies held by the Director at any time during the past five years.
23
Morgan Stanley Variable Insurance Fund, Inc.
Annual Report – December 31, 2021
Director and Officer Information (unaudited) (cont'd)
Executive Officers:
Name, Address and Birth Year of
Executive Officer | | Position(s)
Held with
Registrant | | Length of
Time Served* | | Principal Occupation(s) During Past 5 Years | |
John H. Gernon
522 Fifth Avenue
New York, NY 10036
Birth Year: 1963 | | President and Principal Executive Officer | | Since September 2013 | | President and Principal Executive Officer of the Equity and Fixed Income Funds and the Morgan Stanley AIP Funds (since September 2013) and the Liquidity Funds and various money market funds (since May 2014) in the Fund Complex; Managing Director of the Adviser. | |
Deidre A. Downes
1633 Broadway
New York, NY 10019
Birth Year: 1977 | | Chief Compliance Officer | | Since November 2021 | | Executive Director of the Adviser (since January 2021) and Chief Compliance Officer of various Morgan Stanley Funds (since November 2021). Formerly, Vice President and Corporate Counsel at PGIM and Prudential Financial (October 2016 -December 2020). | |
Francis J. Smith
522 Fifth Avenue
New York, NY 10036
Birth Year: 1965 | | Treasurer and Principal Financial Officer | | Treasurer since July 2003 and Principal Financial Officer since September 2002 | | Managing Director of the Adviser and various entities affiliated with the Adviser; Treasurer (since July 2003) and Principal Financial Officer of various Morgan Stanley Funds (since September 2002). | |
Mary E. Mullin
1633 Broadway
New York, NY 10019
Birth Year: 1967 | | Secretary | | Since June 1999 | | Managing Director of the Adviser; Secretary of various Morgan Stanley Funds (since June 1999). | |
Michael J. Key
522 Fifth Avenue
New York, NY 10036
Birth Year: 1979 | | Vice President | | Since June 2017 | | Vice President of the Equity and Fixed Income Funds, Liquidity Funds, various money market funds and the Morgan Stanley AIP Funds in the Fund Complex (since June 2017); Executive Director of the Adviser; Head of Product Development for Equity and Fixed Income Funds (since August 2013). | |
* This is the earliest date the officer began serving the Morgan Stanley Funds. Each officer serves an indefinite term, until his or her successor is elected.
24
Morgan Stanley Variable Insurance Fund, Inc.
Annual Report – December 31, 2021
Adviser and Administrator
Morgan Stanley Investment Management Inc.
522 Fifth Avenue
New York, New York 10036
Sub-Adviser
Morgan Stanley Investment Management Limited
25 Cabot Square, Canary Wharf
London, E14 4QA, England
Distributor
Morgan Stanley Distribution, Inc.
522 Fifth Avenue
New York, New York 10036
Dividend Disbursing and Transfer Agent
DST Asset Manager Solutions, Inc.
2000 Crown Colony Drive
Quincy, Massachusetts 02169
Custodian
State Street Bank and Trust Company
One Lincoln Street
Boston, Massachusetts 02111
Legal Counsel
Dechert LLP
1095 Avenue of the Americas
New York, New York 10036
Counsel to the Independent Directors
Perkins Coie LLP
1155 Avenue of the Americas,
22nd Floor
New York, New York 10036
Independent Registered Public Accounting Firm
Ernst & Young LLP
200 Clarendon Street
Boston, Massachusetts 02116
Reporting to Shareholders
Each Morgan Stanley fund provides a complete schedule of portfolio holdings in its Semi-Annual and the Annual Reports within 60 days of the end of the fund's second and fourth fiscal quarters. The Semi-Annual and Annual Reports are filed electronically with the Securities and Exchange Commission ("SEC") on Form N-CSRS and Form N-CSR, respectively. Morgan Stanley also delivers the Semi-Annual and Annual Reports to fund shareholders and makes these reports available on its public website, www.morganstanley.com/im/shareholderreports. Each Morgan Stanley non-money market fund also files a complete schedule of portfolio holdings with the SEC for the fund's first and third fiscal quarters as an attachment to Form N-PORT. Morgan Stanley does not deliver the reports for the first and third fiscal quarters to shareholders, but makes the complete schedule of portfolio holdings for the fund's first and third fiscal quarters available on its public website. The holdings for each money market fund are also posted to the Morgan Stanley public website. You may obtain the Form N-PORT filings (as well as the Form N-CSR and N-CSRS filings) by accessing the SEC's website, www.sec.gov. You can also request copies of these materials, upon payment of a duplicating fee, by electronic request at the SEC's email address (publicinfo@sec.gov).
Proxy Voting Policies and Procedures and Proxy Voting Record
You may obtain a copy of the Company's Proxy Voting Policy and Procedures and information regarding how the Company voted proxies relating to portfolio securities during the most recent twelve-month period ended June 30, without charge, upon request, by calling toll free 1 (800) 548-7786 or by visiting our website at www.morganstanley.com/im/shareholderreports. This information is also available on the SEC's website at www.sec.gov.
This report is submitted for the general information of the shareholders of the Fund. For more detailed information about the Fund, its fees and expenses and other pertinent information, please read its Prospectus. The Company's Statement of Additional Information contains additional information about the Fund, including its Directors. It is available, without charge, by calling 1 (800) 548-7786.
Householding Notice
To reduce printing and mailing costs, the Fund attempts to eliminate duplicate mailings to the same address. The Fund delivers a single copy of certain shareholder documents, including shareholder reports, prospectuses and proxy materials, to investors with the same last name who reside at the same address. Your participation in this program will continue for an unlimited period of time unless you instruct us otherwise. You can request multiple copies of these documents by calling (800) 548-7786, 8:00 a.m. to 6:00 p.m., ET. Once our Customer Service Center has received your instructions, we will begin sending individual copies for each account within 30 days.
This report is not authorized for distribution to prospective investors in the Fund unless preceded or accompanied by an effective Prospectus. Read the Prospectus carefully before investing.
UIFGFANN
3997771 EXP 02.28.23

Morgan Stanley Variable Insurance Fund, Inc.
Annual Report – December 31, 2021
Global Infrastructure Portfolio
The Fund is intended to be a funding vehicle for variable annuity contracts and variable life insurance policies offered by the separate accounts of certain life insurance companies.
Morgan Stanley Variable Insurance Fund, Inc.
Annual Report – December 31, 2021
Expense Example | | | 2 | | |
Investment Overview | | | 3 | | |
Portfolio of Investments | | | 6 | | |
Statement of Assets and Liabilities | | | 8 | | |
Statement of Operations | | | 9 | | |
Statements of Changes in Net Assets | | | 10 | | |
Financial Highlights | | | 11 | | |
Notes to Financial Statements | | | 13 | | |
Report of Independent Registered Public Accounting Firm | | | 19 | | |
Liquidity Risk Management Program | | | 20 | | |
Federal Tax Notice | | | 21 | | |
Director and Officer Information | | | 22 | | |
1
Morgan Stanley Variable Insurance Fund, Inc.
Annual Report – December 31, 2021
Expense Example (unaudited)
Global Infrastructure Portfolio
As a shareholder of the Global Infrastructure Portfolio (the "Fund"), you incur two types of costs: (1) insurance company charges; and (2) ongoing costs, which may include advisory fees, administration fees, distribution (12b-1) fees and other Fund expenses. This example is intended to help you understand your ongoing costs (in dollars) of investing in the Fund and to compare these costs with the ongoing costs of investing in other mutual funds.
This example is based on an investment of $1,000 invested at the beginning of the six-month period ended December 31, 2021 and held for the entire six-month period.
Actual Expenses
The table below provides information about actual account values and actual expenses. You may use the information in this table, together with the amount you invested, to estimate the expenses that you paid over the period. Simply divide your account value by $1,000 (for example, an $8,600 account value divided by $1,000 = 8.6), then multiply the result by the number in the table under the heading entitled "Actual Expenses Paid During Period" to estimate the expenses you paid on your account during this period.
Hypothetical Example for Comparison Purposes
The table below provides information about hypothetical account values and hypothetical expenses based on the Fund's actual expense ratio and an assumed rate of return of 5% per year before expenses, which is not the Fund's actual return. The hypothetical account values and expenses may not be used to estimate the actual ending account balance or expenses you paid for the period. You may use this information to compare the ongoing costs of investing in the Fund and other funds. To do so, compare this 5% hypothetical example with the 5% hypothetical examples that appear in the shareholder reports of the other funds.
Please note that the expenses shown in the table are meant to highlight your ongoing costs only and do not reflect any insurance company charges. Therefore, the table below is useful in comparing ongoing costs, but will not help you determine the relative total cost of owning different funds. In addition, if these insurance company charges were included, your costs would have been higher.
| | | Beginning
Account Value
7/1/21 | | Actual Ending
Account Value
12/31/21 | | Hypothetical
Ending
Account Value | | Actual
Expenses Paid
During Period* | | Hypothetical
Expenses Paid
During Period* | | Net Expense
Ratio During
Period** | |
Global Infrastructure Portfolio Class I | | $ | 1,000.00 | | | $ | 1,040.70 | | | $ | 1,020.82 | | | $ | 4.48 | | | $ | 4.43 | | | | 0.87 | % | |
Global Infrastructure Portfolio Class II | | | 1,000.00 | | | | 1,040.10 | | | | 1,019.56 | | | | 5.76 | | | | 5.70 | | | | 1.12 | | |
* Expenses are calculated using each Fund Class' annualized net expense ratio (as disclosed), multiplied by the average account value over the period and multiplied by 184/365 (to reflect the most recent one-half year period).
** Annualized.
2
Morgan Stanley Variable Insurance Fund, Inc.
Annual Report – December 31, 2021
Investment Overview (unaudited)
Global Infrastructure Portfolio
The Fund seeks both capital appreciation and current income.
Performance
For the fiscal year ended December 31, 2021, the Fund's Class I shares had a total return based on net asset value and reinvestment of distributions per share of 14.26%, net of fees, and 14.00%, net of fees, for Class II shares. The Fund's Class I and Class II shares underperformed the Fund's benchmark, the Dow Jones Brookfield Global Infrastructure IndexSM (the "Index"), which returned 19.87%, as well as the S&P Global BMI Index, a proxy for global equities, which returned 18.18%.
Factors Affecting Performance
• Infrastructure shares increased 19.87% in the year ending December 31, 2021, as measured by the Index. From a sector perspective, gas midstream, ports, communications, pipeline companies, European regulated utilities, and water & waste outperformed the Index, while airports, toll roads, gas distribution utilities, diversified, and electricity transmission & distribution underperformed. Despite the wide dispersion of performance across sectors, all sectors generated positive absolute returns on the year.
• Listed infrastructure's healthy 2021 performance, while welcomed, masked a turbulent and uneven year for the asset class beneath the surface. Return dispersion among subsectors ended 2021 at incredibly wide levels, with energy infrastructure and communications materially outpacing transportation and renewables. Even in areas with more stable fundamental operating environments like network utilities, we witnessed a wide dispersion of returns, with European (in particular U.K.) utilities meaningfully outperforming their U.S. and other regional counterparts.
• While some of this share price dispersion was warranted and can be attributed to very favorable fundamental recovery coming out of the pandemic — energy infrastructure's strong recovery off a difficult 2020 is a prime example — we view other discrepancies as unjustified. Most notably, we view the poor multi-year relative performance of U.S. utilities as purely thematic and not consistent with robust operating trends. Additionally, we view the poor performance of European tower operators relative to their U.S. peers as unwarranted and largely a function of passive U.S. real estate fund flows, given that fundamentals in both regions are similar.
• For the full-year 2021, the Fund underperformed the Index. From a bottom-up perspective, the Fund benefited
from favorable stock selection in the airports, gas midstream, and water & waste sectors, which was offset by adverse stock selection in the gas distribution utilities, communications, and toll roads sectors. From a top-down perspective, generally speaking the Fund was negatively impacted by our utilities positioning, with our positions in renewable power-exposed developers and "energy transition" network utilities suffering relative to those network companies not exposed to renewable development. In addition, but to a lesser extent, we were negatively impacted by our overweight positioning in transportation infrastructure.
Management Strategies
• We remain committed to our core investment philosophy as an infrastructure value investor. As value-oriented, bottom-up driven investors, our investment perspective is that over the medium and long term, the key factor in determining the performance of infrastructure securities will be underlying infrastructure asset values. Given the large and growing private infrastructure market, we believe that there are limits as to the level of premium or discount at which the public sector should trade relative to its underlying private infrastructure value. These limits can be viewed as the point at which the arbitrage opportunity between owning infrastructure in the private versus public markets becomes compelling. In aiming to achieve core infrastructure exposure in a cost-effective manner, we invest in equity securities of publicly listed infrastructure companies we believe offer the best value relative to their underlying infrastructure value and Net Asset Value growth prospects.
• Our research currently leads us to an overweighting in the Fund to a group of companies in the toll roads, gas distribution utilities, and airports sectors, and an underweighting to companies in the electricity transmission & distribution, pipeline companies, European regulated utilities, diversified, gas midstream, water & waste, and ports sectors. Our positioning in communications is relatively in line with the index. Finally, we continue to retain out-of-benchmark positions in renewables, railroads, and certain other utilities that are not contained in the Index.
• Given the dispersion of returns in 2021 and the discrepancies at the regional/stock level mentioned, what does this imply for 2022? Perhaps unsurprisingly, we view the opportunity set for listed infrastructure in 2022 to be solid. On the one hand, we expect areas with favorable to
3
Morgan Stanley Variable Insurance Fund, Inc.
Annual Report – December 31, 2021
Investment Overview (unaudited) (cont'd)
Global Infrastructure Portfolio
improving fundamental backdrops to continue to broadly perform well, in particular energy infrastructure (already favorable) and transportation (improving), as the global recovery expands. On the other hand, in areas like communications that are more mixed, we view certain stock-specific opportunities as particularly attractive. Finally, while we acknowledge there is currently an acute focus on interest rate levels and inflation trends, we continue to believe there are many utility companies trading at attractive valuation levels, in particular in the context of above historical average growth trends. Certainly, should the financial markets become more concerned about valuation (i.e., multiple) levels, such companies are likely to hold up well.

* Performance shown for the Fund's Class I shares reflects the performance of the Class X shares of VIS Global Infrastructure for periods prior to April 28, 2014.
In accordance with SEC regulations, the Fund's performance shown assumes that all recurring fees (including management fees) were deducted and all dividends and distributions were reinvested. The performance of Class II shares will vary from the performance of Class I shares based upon its different inception date and will be negatively impacted by additional fees assessed to that class.
4
Morgan Stanley Variable Insurance Fund, Inc.
Annual Report – December 31, 2021
Investment Overview (unaudited) (cont'd)
Global Infrastructure Portfolio
Performance Compared to the Dow Jones Brookfield Global Infrastructure IndexSM(1) and the S&P Global BMI Index(2)
| | | Period Ended December 31, 2021 | |
| | | Total Returns(3) | |
| | | | | Average Annual | |
| | | One
Year | | Five
Years | | Ten
Years | | Since
Inception(5) | |
Fund – Class I(4) | | | 14.26 | % | | | 8.57 | % | | | 9.27 | % | | | 8.21 | % | |
Dow Jones Brookfield Global
Infrastructure IndexSM | | | 19.87 | | | | 8.89 | | | | 8.72 | | | | 9.15 | | |
S&P Global BMI Index | | | 18.18 | | | | 14.53 | | | | 12.34 | | | | 8.69 | | |
Fund – Class II(4) | | | 14.00 | | | | 8.29 | | | | 9.00 | | | | 5.42 | | |
Dow Jones Brookfield Global
Infrastructure IndexSM | | | 19.87 | | | | 8.89 | | | | 8.72 | | | | 7.58 | | |
S&P Global BMI Index | | | 18.18 | | | | 14.53 | | | | 12.34 | | | | 6.91 | | |
Performance data quoted represents past performance, which is no guarantee of future results, and current performance may be lower or higher than the figures shown. Performance assumes that all dividends and distributions, if any, were reinvested. For the most recent month-end performance figures, please contact the issuing insurance company or speak with your financial advisor. Investment return and principal value will fluctuate so that Fund shares, when redeemed, may be worth more or less than their original cost. Total returns do not reflect the deduction of taxes that a shareholder would pay on Fund distributions or the redemption of Fund shares. Performance shown does not reflect fees and expenses imposed by your insurance company's separate account. If performance information included the effect of these additional charges, the total returns would be lower.
(1) The Dow Jones Brookfield Global Infrastructure IndexSM is a float-adjusted market capitalization weighted index that measures the stock performance of companies that exhibit strong infrastructure characteristics. The Index intends to measure all sectors of the infrastructure market. The Index was first published in July 2008; however, back-tested hypothetical performance information is available for this Index since December 31, 2002. Returns are calculated using the return data of the S&P Global BMI Index through December 31, 2002 and the return data of the Dow Jones Brookfield Global Infrastructure Index for periods thereafter. The Index is unmanaged and its returns do not include any sales charges or fees. Such costs would lower performance. It is not possible to invest directly in an index.
(2) The Standard & Poor's Global BMI Index (S&P Global BMI Index) is a broad market index designed to capture exposure to equities in all countries in the world that meet minimum size and liquidity requirements. The index members represent developed and emerging market countries. The Index is unmanaged and its returns do not include any sales charges or fees. Such costs would lower performance. It is not possible to invest directly in an index.
(3) Total returns for the Fund reflect fees waived and expenses reimbursed, if applicable, by the Adviser (as defined herein). Without such waivers and reimbursements, total returns would have been lower.
(4) On April 28, 2014, the Variable Insurance Fund, Inc. (formerly Universal Institutional Funds, Inc.,) on behalf of the Fund, acquired substantially all of the assets and liabilities of Morgan Stanley Select" Dimensions Investment Series — Global Infrastructure Portfolio ("SD Global Infrastructure") and Morgan Stanley Variable Investment Series — Global Infrastructure Portfolio ("VIS Global Infrastructure") in exchange for shares of the Fund. The Fund adopted the financial and performance history of VIS Global Infrastructure. As a result, performance shown for Class I shares and Class II shares reflects the performance history of VIS Global Infrastructure's Class X shares and Class Y shares, respectively, for periods prior to April 28, 2014. VIS Global Infrastructure's Class X shares commenced operations on March 1, 1990 and Class Y shares commenced operations on June 5, 2000.
(5) For comparative purposes, average annual since inception returns listed for the Indexes refer to the inception date or initial offering of the respective share class of the Fund, not the inception of the Index.
5
Morgan Stanley Variable Insurance Fund, Inc.
Annual Report – December 31, 2021
Portfolio of Investments
Global Infrastructure Portfolio
| | | Shares | | Value
(000) | |
Common Stocks (96.9%) | |
Australia (2.7%) | |
APA Group (Units) (a)(b) | | | 12,710 | | | $ | 93 | | |
Atlas Arteria Ltd. (Units) (a) | | | 76,652 | | | | 386 | | |
Transurban Group (Units) (a) | | | 196,627 | | | | 1,977 | | |
| | | | 2,456 | | |
Canada (10.5%) | |
Enbridge, Inc. | | | 69,480 | | | | 2,714 | | |
GFL Environmental, Inc. | | | 28,235 | | | | 1,069 | | |
Gibson Energy, Inc. | | | 134,763 | | | | 2,388 | | |
Pembina Pipeline Corp. | | | 39,493 | | | | 1,198 | | |
TC Energy Corp. | | | 46,404 | | | | 2,158 | | |
| | | | 9,527 | | |
China (8.5%) | |
China Gas Holdings Ltd. (c) | | | 3,020,000 | | | | 6,274 | | |
Jiangsu Expressway Co., Ltd., Class H (c) | | | 446,000 | | | | 457 | | |
Zhejiang Expressway Co., Ltd., Class H (c) | | | 1,064,000 | | | | 949 | | |
| | | | 7,680 | | |
Denmark (1.4%) | |
Orsted A/S | | | 9,691 | | | | 1,241 | | |
France (4.8%) | |
Getlink SE | | | 44,968 | | | | 746 | | |
Vinci SA | | | 34,027 | | | | 3,599 | | |
| | | | 4,345 | | |
Germany (1.0%) | |
Vantage Towers AG | | | 24,743 | | | | 906 | | |
Hong Kong (0.8%) | |
Power Assets Holdings Ltd. | | | 113,000 | | | | 704 | | |
Italy (5.4%) | |
Atlantia SpA (d) | | | 31,955 | | | | 634 | | |
Infrastrutture Wireless Italiane SpA | | | 224,212 | | | | 2,719 | | |
Terna SpA | | | 190,898 | | | | 1,544 | | |
| | | | 4,897 | | |
Japan (1.0%) | |
East Japan Railway Co. | | | 14,400 | | | | 885 | | |
Mexico (2.5%) | |
Grupo Aeroportuario del Pacifico SAB de CV,
Class B | | | 80,133 | | | | 1,106 | | |
Grupo Aeroportuario del Sureste SAB de CV,
Class B | | | 54,651 | | | | 1,127 | | |
| | | | 2,233 | | |
New Zealand (0.5%) | |
Auckland International Airport Ltd. (d) | | | 82,165 | | | | 433 | | |
Portugal (1.6%) | |
EDP Renovaveis SA | | | 57,945 | | | | 1,445 | | |
| | | Shares | | Value
(000) | |
Spain (6.1%) | |
Aena SME SA (d) | | | 3,416 | | | $ | 538 | | |
Cellnex Telecom SA | | | 28,861 | | | | 1,672 | | |
Ferrovial SA | | | 42,267 | | | | 1,322 | | |
Iberdrola SA | | | 167,839 | | | | 1,987 | | |
| | | | 5,519 | | |
Switzerland (0.7%) | |
Flughafen Zurich AG (Registered) (d) | | | 3,478 | | | | 625 | | |
United Kingdom (5.7%) | |
National Grid PLC | | | 245,430 | | | | 3,521 | | |
Pennon Group PLC | | | 40,570 | | | | 641 | | |
Severn Trent PLC | | | 26,184 | | | | 1,044 | | |
| | | | 5,206 | | |
United States (43.7%) | |
Ameren Corp. | | | 9,539 | | | | 849 | | |
American Electric Power Co., Inc. | | | 26,230 | | | | 2,334 | | |
American Tower Corp. REIT | | | 21,090 | | | | 6,169 | | |
American Water Works Co., Inc. | | | 12,541 | | | | 2,368 | | |
Atmos Energy Corp. | | | 10,771 | | | | 1,128 | | |
Avangrid, Inc. (b) | | | 6,136 | | | | 306 | | |
CenterPoint Energy, Inc. | | | 30,227 | | | | 844 | | |
Cheniere Energy, Inc. | | | 22,158 | | | | 2,247 | | |
Crown Castle International Corp. REIT | | | 32,758 | | | | 6,838 | | |
Edison International | | | 24,874 | | | | 1,698 | | |
Eversource Energy | | | 19,602 | | | | 1,783 | | |
NextEra Energy, Inc. | | | 17,226 | | | | 1,608 | | |
NiSource, Inc. | | | 29,174 | | | | 806 | | |
ONEOK, Inc. | | | 23,567 | | | | 1,385 | | |
PG&E Corp. (d) | | | 14,200 | | | | 172 | | |
SBA Communications Corp. REIT | | | 8,871 | | | | 3,451 | | |
Sempra Energy | | | 19,290 | | | | 2,552 | | |
Targa Resources Corp. | | | 28,675 | | | | 1,498 | | |
Williams Cos., Inc. (The) | | | 56,383 | | | | 1,468 | | |
| | | | 39,504 | | |
Total Common Stocks (Cost $68,627) | | | 87,606 | | |
Short-Term Investment (2.8%) | |
Investment Company (2.8%) | |
Morgan Stanley Institutional Liquidity
Funds — Treasury Portfolio —
Institutional Class Institutional Class
(See Note H) (Cost $2,577) | | | 2,576,953 | | | | 2,577 | | |
Total Investments (99.7%) (Cost $71,204)
Including $397 of Securities Loaned (e)(f) | | | 90,183 | | |
Other Assets in Excess of Liabilities (0.3%) | | | 247 | | |
Net Assets (100.0%) | | $ | 90,430 | | |
The accompanying notes are an integral part of the financial statements.
6
Morgan Stanley Variable Insurance Fund, Inc.
Annual Report – December 31, 2021
Portfolio of Investments (cont'd)
Global Infrastructure Portfolio
Country assignments and aggregations are based generally on third party vendor classifications and information, and may be different from the assignments and aggregations under the policies set forth in the Fund's prospectus and/or statement of additional information relating to geographic classifications.
(a) Consists of one or more classes of securities traded together as a unit; stocks with attached warrants.
(b) All or a portion of this security was on loan at December 31, 2021.
(c) Security trades on the Hong Kong exchange.
(d) Non-income producing security.
(e) The approximate fair value and percentage of net assets, $14,073,000 and 15.6%, respectively, represent the securities that have been fair valued under the fair valuation policy for international investments as described in Note A-1 within the Notes to the Financial Statements.
(f) At December 31, 2021, the aggregate cost for federal income tax purposes is approximately $73,070,000. The aggregate gross unrealized appreciation is approximately $21,368,000 and the aggregate gross unrealized depreciation is approximately $4,229,000, resulting in net unrealized appreciation of approximately $17,139,000.
REIT Real Estate Investment Trust.
Portfolio Composition
Classification | | Percentage of
Total Investments | |
Oil & Gas Storage & Transportation | | | 28.7 | % | |
Communications | | | 24.1 | | |
Other* | | | 17.7 | | |
Electricity Transmission & Distribution | | | 17.4 | | |
Diversified | | | 6.4 | | |
Toll Roads | | | 5.7 | | |
Total Investments | | | 100.0 | % | |
* Industries and/or investment types representing less than 5% of total investments.
The accompanying notes are an integral part of the financial statements.
7
Morgan Stanley Variable Insurance Fund, Inc.
Annual Report – December 31, 2021
Global Infrastructure Portfolio
Statement of Assets and Liabilities | | December 31, 2021
(000) | |
Assets: | |
Investments in Securities of Unaffiliated Issuers, at Value(1) (Cost $68,627) | | $ | 87,606 | | |
Investment in Security of Affiliated Issuer, at Value (Cost $2,577) | | | 2,577 | | |
Total Investments in Securities, at Value (Cost $71,204) | | | 90,183 | | |
Foreign Currency, at Value (Cost $18) | | | 18 | | |
Receivable for Investments Sold | | | 242 | | |
Dividends Receivable | | | 221 | | |
Tax Reclaim Receivable | | | 22 | | |
Receivable for Fund Shares Sold | | | 3 | | |
Receivable from Affiliate | | | — | @ | |
Receivable from Securities Lending Income | | | — | @ | |
Other Assets | | | 12 | | |
Total Assets | | | 90,701 | | |
Liabilities: | |
Payable for Fund Shares Redeemed | | | 55 | | |
Payable for Advisory Fees | | | 50 | | |
Payable for Professional Fees | | | 46 | | |
Payable for Servicing Fees | | | 45 | | |
Payable for Custodian Fees | | | 42 | | |
Payable for Distribution Fees — Class II Shares | | | 11 | | |
Payable for Administration Fees | | | 6 | | |
Payable for Transfer Agency Fees | | | 1 | | |
Other Liabilities | | | 15 | | |
Total Liabilities | | | 271 | | |
NET ASSETS | | $ | 90,430 | | |
Net Assets Consist of: | |
Paid-in-Capital | | $ | 65,925 | | |
Total Distributable Earnings | | | 24,505 | | |
Net Assets | | $ | 90,430 | | |
CLASS I: | |
Net Assets | | $ | 36,573 | | |
Net Asset Value, Offering and Redemption Price Per Share Applicable to 4,384,936 Outstanding
$0.001 Par Value Shares (Authorized 500,000,000 Shares) | | $ | 8.34 | | |
CLASS II: | |
Net Assets | | $ | 53,857 | | |
Net Asset Value, Offering and Redemption Price Per Share Applicable to 6,512,306 Outstanding
$0.001 Par Value Shares (Authorized 500,000,000 Shares) | | $ | 8.27 | | |
(1) Including: | |
Securities on Loan, at Value: | | $ | 397 | | |
@ Amount is less than $500.
The accompanying notes are an integral part of the financial statements.
8
Morgan Stanley Variable Insurance Fund, Inc.
Annual Report – December 31, 2021
Global Infrastructure Portfolio
Statement of Operations | | Year Ended
December 31, 2021
(000) | |
Investment Income: | |
Dividends from Securities of Unaffiliated Issuers (Net of $136 of Foreign Taxes Withheld) | | $ | 2,483 | | |
Income from Securities Loaned — Net | | | 8 | | |
Dividends from Security of Affiliated Issuer (Note H) | | | — | @ | |
Total Investment Income | | | 2,491 | | |
Expenses: | |
Advisory Fees (Note B) | | | 711 | | |
Professional Fees | | | 140 | | |
Distribution Fees — Class II Shares (Note E) | | | 119 | | |
Servicing Fees (Note D) | | | 118 | | |
Custodian Fees (Note G) | | | 68 | | |
Administration Fees (Note C) | | | 67 | | |
Shareholder Reporting Fees | | | 23 | | |
Transfer Agency Fees (Note F) | | | 6 | | |
Directors' Fees and Expenses | | | 6 | | |
Pricing Fees | | | 4 | | |
Other Expenses | | | 12 | | |
Total Expenses | | | 1,274 | | |
Waiver of Advisory Fees (Note B) | | | (428 | ) | |
Rebate from Morgan Stanley Affiliate (Note H) | | | (1 | ) | |
Net Expenses | | | 845 | | |
Net Investment Income | | | 1,646 | | |
Realized Gain (Loss): | |
Investments Sold | | | 6,026 | | |
Foreign Currency Translation | | | (2 | ) | |
Net Realized Gain | | | 6,024 | | |
Change in Unrealized Appreciation (Depreciation): | |
Investments | | | 3,186 | | |
Foreign Currency Translation | | | (1 | ) | |
Net Change in Unrealized Appreciation (Depreciation) | | | 3,185 | | |
Net Realized Gain and Change in Unrealized Appreciation (Depreciation) | | | 9,209 | | |
Net Increase in Net Assets Resulting from Operations | | $ | 10,855 | | |
@ Amount is less than $500.
The accompanying notes are an integral part of the financial statements.
9
Morgan Stanley Variable Insurance Fund, Inc.
Annual Report – December 31, 2021
Global Infrastructure Portfolio
Statements of Changes in Net Assets | | Year Ended
December 31, 2021
(000) | | Year Ended
December 31, 2020
(000) | |
Increase (Decrease) in Net Assets: | |
Operations: | |
Net Investment Income | | $ | 1,646 | | | $ | 1,471 | | |
Net Realized Gain | | | 6,024 | | | | 2,392 | | |
Net Change in Unrealized Appreciation (Depreciation) | | | 3,185 | | | | (5,625 | ) | |
Net Increase (Decrease) in Net Assets Resulting from Operations | | | 10,855 | | | | (1,762 | ) | |
Dividends and Distributions to Shareholders: | |
Class I | | | (2,180 | ) | | | (1,168 | ) | |
Class II | | | (2,860 | ) | | | (1,196 | ) | |
Total Dividends and Distributions to Shareholders | | | (5,040 | ) | | | (2,364 | ) | |
Capital Share Transactions:(1) | |
Class I: | |
Subscribed | | | 1,945 | | | | 1,652 | | |
Distributions Reinvested | | | 2,180 | | | | 1,168 | | |
Redeemed | | | (6,091 | ) | | | (7,202 | ) | |
Class II: | |
Subscribed | | | 14,755 | | | | 5,363 | | |
Distributions Reinvested | | | 2,860 | | | | 1,196 | | |
Redeemed | | | (8,179 | ) | | | (9,123 | ) | |
Net Increase (Decrease) in Net Assets Resulting from Capital Share Transactions | | | 7,470 | | | | (6,946 | ) | |
Total Increase (Decrease) in Net Assets | | | 13,285 | | | | (11,072 | ) | |
Net Assets: | |
Beginning of Period | | | 77,145 | | | | 88,217 | | |
End of Period | | $ | 90,430 | | | $ | 77,145 | | |
(1) Capital Share Transactions: | |
Class I: | |
Shares Subscribed | | | 241 | | | | 225 | | |
Shares Issued on Distributions Reinvested | | | 267 | | | | 164 | | |
Shares Redeemed | | | (745 | ) | | | (958 | ) | |
Net Decrease in Class I Shares Outstanding | | | (237 | ) | | | (569 | ) | |
Class II: | |
Shares Subscribed | | | 1,822 | | | | 714 | | |
Shares Issued on Distributions Reinvested | | | 354 | | | | 169 | | |
Shares Redeemed | | | (1,022 | ) | | | (1,237 | ) | |
Net Increase (Decrease) in Class II Shares Outstanding | | | 1,154 | | | | (354 | ) | |
The accompanying notes are an integral part of the financial statements.
10
Morgan Stanley Variable Insurance Fund, Inc.
Annual Report – December 31, 2021
Financial Highlights
Global Infrastructure Portfolio
| | | Class I | |
| | | Year Ended December 31, | |
Selected Per Share Data and Ratios | | 2021 | | 2020 | | 2019 | | 2018 | | 2017 | |
Net Asset Value, Beginning of Period | | $ | 7.76 | | | $ | 8.12 | | | $ | 6.80 | | | $ | 7.91 | | | $ | 7.53 | | |
Income (Loss) from Investment Operations: | |
Net Investment Income(1) | | | 0.17 | | | | 0.15 | | | | 0.20 | | | | 0.20 | | | | 0.23 | | |
Net Realized and Unrealized Gain (Loss) | | | 0.92 | | | | (0.26 | ) | | | 1.69 | | | | (0.79 | ) | | | 0.72 | | |
Total from Investment Operations | | | 1.09 | | | | (0.11 | ) | | | 1.89 | | | | (0.59 | ) | | | 0.95 | | |
Distributions from and/or in Excess of: | |
Net Investment Income | | | (0.21 | ) | | | (0.13 | ) | | | (0.22 | ) | | | (0.23 | ) | | | (0.19 | ) | |
Net Realized Gain | | | (0.30 | ) | | | (0.12 | ) | | | (0.35 | ) | | | (0.29 | ) | | | (0.38 | ) | |
Total Distributions | | | (0.51 | ) | | | (0.25 | ) | | | (0.57 | ) | | | (0.52 | ) | | | (0.57 | ) | |
Net Asset Value, End of Period | | $ | 8.34 | | | $ | 7.76 | | | $ | 8.12 | | | $ | 6.80 | | | $ | 7.91 | | |
Total Return(2) | | | 14.26 | % | | | (1.15 | )% | | | 28.30 | % | | | (7.85 | )% | | | 12.96 | % | |
Ratios to Average Net Assets and Supplemental Data: | |
Net Assets, End of Period (Thousands) | | $ | 36,573 | | | $ | 35,868 | | | $ | 42,162 | | | $ | 38,642 | | | $ | 50,116 | | |
Ratio of Expenses Before Expense Limitation | | | 1.38 | % | | | 1.36 | % | | | 1.33 | % | | | 1.34 | % | | | 1.34 | % | |
Ratio of Expenses After Expense Limitation | | | 0.87 | %(3) | | | 0.87 | %(3) | | | 0.87 | %(3) | | | 0.87 | %(3) | | | 0.86 | %(3) | |
Ratio of Net Investment Income | | | 2.11 | %(3) | | | 2.06 | %(3) | | | 2.58 | %(3) | | | 2.80 | %(3) | | | 2.98 | %(3) | |
Ratio of Rebate from Morgan Stanley Affiliates | | | 0.00 | %(4) | | | 0.00 | %(4) | | | 0.00 | %(4) | | | 0.00 | %(4) | | | 0.01 | % | |
Portfolio Turnover Rate | | | 59 | % | | | 62 | % | | | 30 | % | | | 44 | % | | | 43 | % | |
(1) Per share amount is based on average shares outstanding.
(2) Calculated based on the net asset value as of the last business day of the period. Performance does not reflect fees and expenses imposed by your insurance company's separate account. If performance information included the effect of these additional charges, the total return would be lower.
(3) The Ratio of Expenses After Expense Limitation and Ratio of Net Investment Income reflect the rebate of certain Fund expenses in connection with the investments in Morgan Stanley affiliates during the period. The effect of the rebate on the ratios is disclosed in the above table as "Ratio of Rebate from Morgan Stanley Affiliates."
(4) Amount is less than 0.005%.
The accompanying notes are an integral part of the financial statements.
11
Morgan Stanley Variable Insurance Fund, Inc.
Annual Report – December 31, 2021
Financial Highlights
Global Infrastructure Portfolio
| | | Class II | |
| | | Year Ended December 31, | |
Selected Per Share Data and Ratios | | 2021 | | 2020 | | 2019 | | 2018 | | 2017 | |
Net Asset Value, Beginning of Period | | $ | 7.70 | | | $ | 8.06 | | | $ | 6.76 | | | $ | 7.85 | | | $ | 7.49 | | |
Income (Loss) from Investment Operations: | |
Net Investment Income(1) | | | 0.15 | | | | 0.13 | | | | 0.18 | | | | 0.18 | | | | 0.21 | | |
Net Realized and Unrealized Gain (Loss) | | | 0.92 | | | | (0.26 | ) | | | 1.67 | | | | (0.77 | ) | | | 0.71 | | |
Total from Investment Operations | | | 1.07 | | | | (0.13 | ) | | | 1.85 | | | | (0.59 | ) | | | 0.92 | | |
Distributions from and/or in Excess of: | |
Net Investment Income | | | (0.20 | ) | | | (0.11 | ) | | | (0.20 | ) | | | (0.21 | ) | | | (0.18 | ) | |
Net Realized Gain | | | (0.30 | ) | | | (0.12 | ) | | | (0.35 | ) | | | (0.29 | ) | | | (0.38 | ) | |
Total Distributions | | | (0.50 | ) | | | (0.23 | ) | | | (0.55 | ) | | | (0.50 | ) | | | (0.56 | ) | |
Net Asset Value, End of Period | | $ | 8.27 | | | $ | 7.70 | | | $ | 8.06 | | | $ | 6.76 | | | $ | 7.85 | | |
Total Return(2) | | | 14.00 | % | | | (1.43 | )% | | | 27.87 | % | | | (7.89 | )% | | | 12.54 | % | |
Ratios to Average Net Assets and Supplemental Data: | |
Net Assets, End of Period (Thousands) | | $ | 53,857 | | | $ | 41,277 | | | $ | 46,055 | | | $ | 38,193 | | | $ | 45,234 | | |
Ratio of Expenses Before Expense Limitation | | | 1.63 | % | | | 1.61 | % | | | 1.58 | % | | | 1.59 | % | | | 1.59 | % | |
Ratio of Expenses After Expense Limitation | | | 1.12 | %(3) | | | 1.12 | %(3) | | | 1.12 | %(3) | | | 1.12 | %(3) | | | 1.11 | %(3) | |
Ratio of Net Investment Income | | | 1.86 | %(3) | | | 1.81 | %(3) | | | 2.33 | %(3) | | | 2.55 | %(3) | | | 2.73 | %(3) | |
Ratio of Rebate from Morgan Stanley Affiliates | | | 0.00 | %(4) | | | 0.00 | %(4) | | | 0.00 | %(4) | | | 0.00 | %(4) | | | 0.01 | % | |
Portfolio Turnover Rate | | | 59 | % | | | 62 | % | | | 30 | % | | | 44 | % | | | 43 | % | |
(1) Per share amount is based on average shares outstanding.
(2) Calculated based on the net asset value as of the last business day of the period. Performance does not reflect fees and expenses imposed by your insurance company's separate account. If performance information included the effect of these additional charges, the total return would be lower.
(3) The Ratio of Expenses After Expense Limitation and Ratio of Net Investment Income reflect the rebate of certain Fund expenses in connection with the investments in Morgan Stanley affiliates during the period. The effect of the rebate on the ratios is disclosed in the above table as "Ratio of Rebate from Morgan Stanley Affiliates."
(4) Amount is less than 0.005%.
The accompanying notes are an integral part of the financial statements.
12
Morgan Stanley Variable Insurance Fund, Inc.
Annual Report – December 31, 2021
Notes to Financial Statements
Morgan Stanley Variable Insurance Fund, Inc. (the "Company") is registered under the Investment Company Act of 1940, as amended (the "Act"), as an open-end management investment company. The Company is comprised of ten separate active, diversified and non-diversified funds (individually referred to as a "Fund," collectively as the "Funds"). The Company applies investment company accounting and reporting guidance.
The accompanying financial statements relate to the Global Infrastructure Portfolio. The Fund seeks both capital appreciation and current income. The Fund offers two classes of shares — Class I and Class II. Both classes of shares have identical voting rights (except that shareholders of a Class have exclusive voting rights regarding any matter relating solely to that Class of shares), dividend, liquidation and other rights.
The Company is intended to be a funding vehicle for variable annuity contracts and variable life insurance policies offered by the separate accounts of certain life insurance companies.
A. Significant Accounting Policies: The following significant accounting policies are in conformity with U.S. generally accepted accounting principles ("GAAP"). Such policies are consistently followed by the Company in the preparation of its financial statements. GAAP may require management to make estimates and assumptions that affect the reported amounts and disclosures in the financial statements. Actual results may differ from those estimates.
1. Security Valuation: (1) An equity portfolio security listed or traded on an exchange is valued at its latest reported sales price (or at the exchange official closing price if such exchange reports an official closing price), and if there were no sales on a given day and if there is no official exchange closing price for that day, the security is valued at the mean between the last reported bid and asked prices if such bid and asked prices are available on the relevant exchanges. If only bid prices are available then the latest bid price may be used. Listed equity securities not traded on the valuation date with no reported bid and asked prices available on the exchange are valued at the mean between the current bid and asked prices obtained from one or more reputable brokers or dealers. In cases where a security is traded on more than one exchange, the security is valued on the exchange designated as the primary market; (2) all other equity portfolio securities for which over-the-counter ("OTC") market quotations are readily available are valued at the latest reported sales price (or at the market official closing price if such market reports an official closing price), and if there was no trading in the security on a given day and if there is no
official closing price from relevant markets for that day, the security is valued at the mean between the last reported bid and asked prices if such bid and asked prices are available on the relevant markets. An unlisted equity security that does not trade on the valuation date and for which bid and asked prices from the relevant markets are unavailable is valued at the mean between the current bid and asked prices obtained from one or more reputable brokers or dealers; (3) certain portfolio securities may be valued by an outside pricing service/vendor approved by the Company's Board of Directors (the "Directors"). The pricing service/vendor may employ a pricing model that takes into account, among other things, bids, yield spreads and/or other market data and specific security characteristics. Alternatively, if a valuation is not available from an outside pricing service/vendor, and the security trades on an exchange, the security may be valued at its latest reported sale price (or at the exchange official closing price if such exchange reports an official closing price), prior to the time when assets are valued. If there are no sales on a given day and if there is no official exchange closing price for that day, the security is valued at the mean between the last reported bid and asked prices if such bid and asked prices are available in the relevant exchanges. If only bid prices are available then the latest bid price may be used. If Morgan Stanley Investment Management Inc. (the "Adviser"), a wholly-owned subsidiary of Morgan Stanley, determines that the price provided by the outside pricing service/vendor or exchange does not reflect the security's fair value or is unable to provide a price, prices from brokers or dealers may also be utilized. In these circumstances, the value of the security will be the mean of bid and asked prices obtained from brokers or dealers; (4) when market quotations are not readily available, including circumstances under which the Adviser determines that the closing price, last sale price or the mean between the last reported bid and asked prices are not reflective of a security's market value, portfolio securities are valued at their fair value as determined in good faith under procedures established by and under the general supervision of the Directors. Occasionally, developments affecting the closing prices of securities and other assets may occur between the times at which valuations of such securities are determined (that is, close of the foreign market on which the securities trade) and the close of business of the New York Stock Exchange ("NYSE"). If developments occur during such periods that are expected to materially affect the value of such securities, such valuations may be adjusted to reflect the estimated fair value of such securities as of the close of the NYSE, as determined in good faith by the Directors or
13
Morgan Stanley Variable Insurance Fund, Inc.
Annual Report – December 31, 2021
Notes to Financial Statements (cont'd)
by the Adviser using a pricing service and/or procedures approved by the Directors; (5) quotations of foreign portfolio securities, other assets and liabilities and forward contracts stated in foreign currency are translated into U.S. dollar equivalents at the prevailing market rates prior to the close of the NYSE; and (6) investments in mutual funds, including the Morgan Stanley Institutional Liquidity Funds, are valued at the net asset value ("NAV") as of the close of each business day.
The Directors have responsibility for determining in good faith the fair value of the investments, and the Directors may appoint others, such as the Company's Adviser or a valuation committee, to assist the Directors in determining fair value and to make the actual calculations pursuant to the fair valuation methodologies previously approved by the Directors. Under procedures approved by the Directors, the Company's Adviser has formed a Valuation Committee whose members are approved by the Directors. The Valuation Committee provides administration and oversight of the Company's valuation policies and procedures, which are reviewed at least annually by the Directors. These procedures allow the Company to utilize independent pricing services, quotations from securities and financial instrument dealers and other market sources to determine fair value.
2. Fair Value Measurement: Financial Accounting Standards Board ("FASB") Accounting Standards CodificationTM ("ASC") 820, "Fair Value Measurement" ("ASC 820"), defines fair value as the value that the Fund would receive to sell an investment or pay to transfer a liability in a timely transaction with an independent buyer in the principal market, or in the absence of a principal market, the most advantageous market for the investment or liability. ASC 820 establishes a three-tier hierarchy to distinguish between (1) inputs that reflect the assumptions market participants would use in valuing an asset or liability developed based on market data obtained from sources independent of the reporting entity (observable inputs) and (2) inputs that reflect the reporting entity's own assumptions about the assumptions market participants would use in valuing an asset or liability developed based on the best information available in the circumstances (unobservable inputs) and to establish classification of fair value measurements for disclosure purposes. Various inputs are used in determining the value of the Fund's investments. The inputs are summarized in the three broad levels listed below:
• Level 1 – unadjusted quoted prices in active markets for identical investments
• Level 2 – other significant observable inputs (including quoted prices for similar investments, interest rates, prepayment speeds, credit risk, etc.)
• Level 3 – significant unobservable inputs including the Fund's own assumptions in determining the fair value of investments. Factors considered in making this determination may include, but are not limited to, information obtained by contacting the issuer, analysts, or the appropriate stock exchange (for exchange-traded securities), analysis of the issuer's financial statements or other available documents and, if necessary, available information concerning other securities in similar circumstances.
The inputs or methodology used for valuing securities are not necessarily an indication of the risk associated with investing in those securities and the determination of the significance of a particular input to the fair value measurement in its entirety requires judgment and considers factors specific to each security.
The following is a summary of the inputs used to value the Fund's investments as of December 31, 2021:
Investment Type | | Level 1
Unadjusted
quoted
prices
(000) | | Level 2
Other
significant
observable
inputs
(000) | | Level 3
Significant
unobservable
inputs
(000) | | Total
(000) | |
Assets: | |
Common Stocks | |
Airports | | $ | 2,666 | | | $ | 1,163 | | | $ | — | | | $ | 3,829 | | |
Commercial Services &
Supplies | | | 1,069 | | | | — | | | | — | | | | 1,069 | | |
Communications | | | 16,458 | | | | 5,297 | | | | — | | | | 21,755 | | |
Diversified | | | 4,443 | | | | 1,322 | | | | — | | | | 5,765 | | |
Electricity Transmission &
Distribution | | | 12,126 | | | | 3,531 | | | | — | | | | 15,657 | | |
Oil & Gas Storage &
Transportation | | | 25,909 | | | | — | | | | — | | | | 25,909 | | |
Railroads | | | — | | | | 885 | | | | — | | | | 885 | | |
Renewables | | | 1,445 | | | | 1,241 | | | | — | | | | 2,686 | | |
Toll Roads | | | 4,515 | | | | 634 | | | | — | | | | 5,149 | | |
Utilities | | | 849 | | | | — | | | | — | | | | 849 | | |
Water | | | 4,053 | | | | — | | | | — | | | | 4,053 | | |
Total Common Stocks | | | 73,533 | | | | 14,073 | | | | — | | | | 87,606 | | |
Short-Term Investment | |
Investment Company | | | 2,577 | | | | — | | | | — | | | | 2,577 | | |
Total Assets | | $ | 76,110 | | | $ | 14,073 | | | $ | — | | | $ | 90,183 | | |
14
Morgan Stanley Variable Insurance Fund, Inc.
Annual Report – December 31, 2021
Notes to Financial Statements (cont'd)
Transfers between investment levels may occur as the markets fluctuate and/or the availability of data used in an investment's valuation changes.
3. Repurchase Agreements: The Fund may enter into repurchase agreements under which the Fund lends cash and takes possession of securities with an agreement that the counterparty will repurchase such securities. In connection with transactions in repurchase agreements, a bank as custodian for the Fund takes possession of the underlying securities which are held as collateral, with a market value at least equal to the amount of the repurchase transaction, including principal and accrued interest. To the extent that any repurchase transaction exceeds one business day, the value of the collateral is marked-to-market on a daily basis to determine that the value of the collateral does not decrease below the repurchase price plus accrued interest as earned. If such a decrease occurs, additional collateral will be requested and, when received, will be added to the account to maintain full collateralization. In the event of default on the obligation to repurchase, the Fund has the right to liquidate the collateral and apply the proceeds in satisfaction of the obligation. In the event of default or bankruptcy by the counterparty to the agreement, realization of the collateral proceeds may be subject to cost and delays. The Fund, along with other affiliated investment companies, may utilize a joint trading account for the purpose of entering into repurchase agreements.
4. Foreign Currency Translation and Foreign Investments: The books and records of the Fund are maintained in U.S. dollars. Foreign currency amounts are translated into U.S. dollars as follows:
— investments, other assets and liabilities at the prevailing rate of exchange on the valuation date;
— investment transactions and investment income at the prevailing rates of exchange on the dates of such transactions.
Although the net assets of the Fund are presented at the foreign exchange rates and market values at the close of the period, the Fund does not isolate that portion of the results of operations arising as a result of changes in the foreign exchange rates from the fluctuations arising from changes in the market prices of securities held at period end. Similarly, the Fund does not isolate the effect of changes in foreign exchange rates from the fluctuations arising from changes in the market prices of securities sold during the period. Accordingly, realized and unrealized foreign currency gains (losses) on investments in securities are included in the reported net realized and
unrealized gains (losses) on investment transactions and balances. However, pursuant to U.S. federal income tax regulations, gains and losses from certain foreign currency transactions and the foreign currency portion of gains and losses realized on sales and maturities of foreign denominated debt securities are treated as ordinary income for U.S. federal income tax purposes.
Net realized gains (losses) on foreign currency transactions represent net foreign exchange gains (losses) from foreign currency forward exchange contracts, disposition of foreign currencies, currency gains (losses) realized between the trade and settlement dates on securities transactions, and the difference between the amount of investment income and foreign withholding taxes recorded on the Fund's books and the U.S. dollar equivalent amounts actually received or paid. The change in unrealized currency gains (losses) on foreign currency transactions for the period is reflected in the Statement of Operations.
Foreign security and currency transactions may involve certain considerations and risks not typically associated with those of U.S. dollar denominated transactions as a result of, among other factors, fluctuations of exchange rates in relation to the U.S. dollar, the possibility of lower levels of governmental supervision and regulation of foreign securities markets and the possibility of political or economic instability.
Governmental approval for foreign investments may be required in advance of making an investment under certain circumstances in some countries, and the extent of foreign investments in domestic companies may be subject to limitation in other countries. Foreign ownership limitations also may be imposed by the charters of individual companies to prevent, among other concerns, violations of foreign investment limitations. As a result, an additional class of shares (identified as "Foreign" in the Portfolio of Investments) may be created and offered for investment. The "local" and "foreign shares" market values may differ. In the absence of trading of the foreign shares in such markets, the Fund values the foreign shares at the closing exchange price of the local shares.
5. Securities Lending: The Fund lends securities to qualified financial institutions, such as broker-dealers, to earn additional income. Any increase or decrease in the fair value of the securities loaned that might occur and any interest earned or dividends declared on those securities during the term of the loan would remain in the Fund. The Fund would receive cash or securities as collateral in an amount equal to or exceeding 100% of the
15
Morgan Stanley Variable Insurance Fund, Inc.
Annual Report – December 31, 2021
Notes to Financial Statements (cont'd)
current fair value of the loaned securities. The collateral is marked-to-market daily by State Street Bank and Trust Company ("State Street"), the securities lending agent, to ensure that a minimum of 100% collateral coverage is maintained.
Based on pre-established guidelines, the securities lending agent invests any cash collateral that is received in an affiliated money market portfolio and repurchase agreements. Securities lending income is generated from the earnings on the invested collateral and borrowing fees, less any rebates owed to the borrowers and compensation to the lending agent, and is recorded as "Income from Securities Loaned — Net" in the Fund's Statement of Operations. Risks in securities lending transactions are that a borrower may not provide additional collateral when required or return the securities when due, and that the value of the short-term investments will be less than the amount of cash collateral plus any rebate that is required to be returned to the borrower.
The Fund has the right under the securities lending agreement to recover the securities from the borrower on demand.
The following table presents financial instruments that are subject to enforceable netting arrangements as of December 31, 2021:
Gross Amounts Not Offset in the Statement of Assets and Liabilities | |
Gross Asset
Amounts
Presented in
the Statement
of Assets and
Liabilities
(000) | | Financial
Instrument
(000) | | Collateral
Received
(000) | | Net Amount
(not less
than $0)
(000) | |
| $ | 397 | (a) | | $ | — | | | $ | (397 | )(b)(c) | | $ | 0 | | |
(a) Represents market value of loaned securities at year end.
(b) The Fund received non-cash collateral of approximately $414,000 in the form of U.S. Government obligations, which the Fund cannot sell or repledge, and accordingly are not reflected in the Portfolio of Investments.
(c) The actual collateral received is greater than the amount shown here due to overcollateralization.
6. Indemnifications: The Company enters into contracts that contain a variety of indemnifications. The Company's maximum exposure under these arrangements is unknown. However, the Company has not had prior claims or losses pursuant to these contracts and expects the risk of loss to be remote.
7. Security Transactions, Income and Expenses: Security transactions are accounted for on the trade date (date the order to buy or sell is executed). Realized gains and losses on the sale of investment securities are
determined on the specific identified cost method. Dividend income and other distributions are recorded on the ex-dividend date (except for certain foreign dividends which may be recorded as soon as the Fund is informed of such dividends) net of applicable withholding taxes. Interest income is recognized on the accrual basis net of applicable withholding taxed except where collection is in doubt. Discounts are accreted and premiums are amortized over the life of the respective securities. Most expenses of the Company can be directly attributed to a particular Fund. Expenses which cannot be directly attributed are apportioned among the Funds based upon relative net assets or other appropriate methods. Income, expenses (other than class specific expenses) and realized and unrealized gains or losses are allocated to each class of shares based upon their relative net assets.
Settlement and registration of foreign securities transactions may be subject to significant risks not normally associated with investments in the United States. In certain markets, ownership of shares is defined according to entries in the issuer's share register. It is possible that a Fund holding these securities could lose its share registration through fraud, negligence or even mere oversight. In addition, shares being delivered for sales and cash being paid for purchases may be delivered before the exchange is complete. This may subject the Fund to further risk of loss in the event of a failure to complete the transaction by the counterparty.
8. Dividends and Distributions to Shareholders: Dividends and distributions to shareholders are recorded on the ex-dividend date. Dividends from net investment income, if any, are declared and paid annually. Net realized capital gains, if any, are distributed at least annually.
B. Advisory Fees: The Adviser, a wholly-owned subsidiary of Morgan Stanley, provides the Fund with advisory services under the terms of an Investment Advisory Agreement, paid quarterly, at an annual rate of 0.85% of the daily net assets of the Fund.
The Adviser has agreed to reduce its advisory fee and/or reimburse the Fund so that total annual Fund operating expenses, excluding certain investment related expenses, taxes, interest and other extraordinary expenses (including litigation), will not exceed 0.87% for Class I shares and 1.12% for Class II shares. The fee waivers and/or expense reimbursements will continue for at least one year from the date of the Fund's prospectus or until such time as the Directors act to discontinue all or a portion of such waivers and/or reimbursements when they deem such action is appropriate. For the year ended December 31, 2021, approximately $428,000 of advisory fees were waived pursuant to this arrangement.
16
Morgan Stanley Variable Insurance Fund, Inc.
Annual Report – December 31, 2021
Notes to Financial Statements (cont'd)
C. Administration Fees: The Adviser also serves as Administrator to the Company and provides administrative services pursuant to an Administration Agreement for an annual fee, accrued daily and paid monthly, of 0.08% of the Fund's average daily net assets.
Under a Sub-Administration Agreement between the Administrator and State Street, State Street provides certain administrative services to the Company. For such services, the Administrator pays State Street a portion of the fee the Administrator receives from the Fund.
D. Servicing Fees: The Company accrues daily and pays quarterly a servicing fee of up to 0.17% of the average daily value of shares of the Fund held in an insurance company's account. Certain insurance companies have entered into a servicing agreement with the Company to provide administrative and other contract-owner related services on behalf of the Fund.
E. Distribution Fees: Morgan Stanley Distribution, Inc. ("MSDI" or the "Distributor"), a wholly-owned subsidiary of the Adviser and an indirect subsidiary of Morgan Stanley, serves as the Distributor of the Fund and provides the Fund's Class II shareholders with distribution services pursuant to a Distribution Plan (the "Plan") in accordance with Rule 12b-1 under the Act. Under the Plan, the Fund is authorized to pay the Distributor a distribution fee, which is accrued daily and paid monthly, at an annual rate of 0.25% of the Fund's average daily net assets attributable to Class II shares.
F. Dividend Disbursing and Transfer Agent: The Company's dividend disbursing and transfer agent is DST Asset Manager Solutions, Inc. ("DST"). Pursuant to a Transfer Agency Agreement, the Company pays DST a fee based on the number of classes, accounts and transactions relating to the Funds of the Company.
G. Custodian Fees: State Street (the "Custodian") also serves as Custodian for the Company in accordance with a Custodian Agreement. The Custodian holds cash, securities and other assets of the Company as required by the Act. Custody fees are payable monthly based on assets held in custody, investment purchases and sales activity and account maintenance fees, plus reimbursement for certain out-of-pocket expenses.
H. Security Transactions and Transactions with Affiliates: For the year ended December 31, 2021, purchases and sales of investment securities for the Fund, other than long-term U.S. Government securities and short-term investments were approximately $52,572,000 and $47,681,000, respectively. There were no purchases and sales of long-term
U.S. Government securities for the year ended December 31, 2021.
The Fund invests in the Institutional Class of the Morgan Stanley Institutional Liquidity Funds (the "Liquidity Funds"), an open-end management investment company managed by the Adviser, both directly and as a portion of the securities held as collateral on loaned securities. Advisory fees paid by the Fund are reduced by an amount equal to its pro-rata share of the advisory and administration fees paid by the Fund due to its investment in the Liquidity Funds. For the year ended December 31, 2021, advisory fees paid were reduced by approximately $1,000 relating to the Fund's investment in the Liquidity Funds.
A summary of the Fund's transactions in shares of affiliated investments during the year ended December 31, 2021 is as follows:
Affiliated
Investment
Company | | Value
December 31,
2020
(000) | | Purchases
at Cost
(000) | | Proceeds
from Sales
(000) | | Dividend
Income
(000) | |
Liquidity Funds | | $ | 4,169 | | | $ | 29,951 | | | $ | 31,543 | | | $ | — | @ | |
Affiliated
Investment
Company (cont'd) | | Realized
Gain (Loss)
(000) | | Change in
Unrealized
Appreciation
(Depreciation)
(000) | | Value
December 31,
2021
(000) | |
Liquidity Funds | | $ | — | | | $ | — | | | $ | 2,577 | | |
@ Amount is less than $500.
The Fund is permitted to purchase and sell securities ("cross-trade") from and to other Morgan Stanley funds as well as other funds and client accounts for which the Adviser or an affiliate of the Adviser serves as investment adviser, pursuant to procedures approved by the Directors in compliance with Rule 17a-7 under the Act (the "Rule"). Each cross-trade is executed at the current market price in compliance with provisions of the Rule. For the year ended December 31, 2021, the Fund did not engage in any cross-trade transactions.
The Fund has an unfunded Deferred Compensation Plan (the "Compensation Plan"), which allows each independent Director to defer payment of all, or a portion, of the fees he or she receives for serving on the Board of Directors. Each eligible Director generally may elect to have the deferred amounts credited with a return equal to the total return on one or more of the Morgan Stanley funds that are offered as investment options under the Compensation Plan. Appreciation/depreciation and distributions received from these investments are recorded with an offsetting increase/decrease in the deferred compensation obligation and do not affect the NAV of the Fund.
17
Morgan Stanley Variable Insurance Fund, Inc.
Annual Report – December 31, 2021
Notes to Financial Statements (cont'd)
I. Federal Income Taxes: It is the Fund's intention to continue to qualify as a regulated investment company and distribute all of its taxable and tax-exempt income. Accordingly, no provision for federal income taxes is required in the financial statements.
The Fund may be subject to taxes imposed by countries in which it invests. Such taxes are generally based on income and/or capital gains earned or repatriated. Taxes are accrued based on net investment income, net realized gains and net unrealized appreciation as such income and/or gains are earned. Taxes may also be based on transactions in foreign currency and are accrued based on the value of investments denominated in such currency.
FASB ASC 740-10, "Income Taxes — Overall", sets forth a minimum threshold for financial statement recognition of the benefit of a tax position taken or expected to be taken in a tax return. Management has concluded there are no significant uncertain tax positions that would require recognition in the financial statements. If applicable, the Fund recognizes interest accrued related to unrecognized tax benefits in "Interest Expense" and penalties in "Other Expenses" in the Statement of Operations. The Fund files tax returns with the U.S. Internal Revenue Service, New York and various states. Generally, each of the tax years in the four-year period ended December 31, 2021 remains subject to examination by taxing authorities.
The tax character of distributions paid may differ from the character of distributions shown for GAAP purposes due to short-term capital gains being treated as ordinary income for tax purposes. The tax character of distributions paid during fiscal years 2021 and 2020 was as follows:
2021 Distributions
Paid From: | | 2020 Distributions
Paid From: | |
Ordinary
Income
(000) | | Long-Term
Capital Gain
(000) | | Ordinary
Income
(000) | | Long-Term
Capital Gain
(000) | |
| $ | 2,024 | | | $ | 3,016 | | | $ | 1,179 | | | $ | 1,185 | | |
The amount and character of income and gains to be distributed are determined in accordance with income tax regulations which may differ from GAAP. These book/tax differences are either considered temporary or permanent in nature.
Temporary differences are attributable to differing book and tax treatments for the timing of the recognition of gains (losses) on certain investment transactions and the timing of the deductibility of certain expenses.
The Fund had no permanent differences causing reclassifications among the components of net assets for the year ended December 31, 2021.
At December 31, 2021, the components of distributable earnings for the Fund on a tax basis were as follows:
Undistributed
Ordinary
Income
(000) | | Undistributed
Long-Term
Capital Gain
(000) | |
| $ | 3,323 | | | $ | 4,045 | | |
J. Credit Facility: The Company and other Morgan Stanley funds participated in a $300,000,000 committed, unsecured revolving line of credit facility (the "Facility") with State Street. This Facility is to be used for temporary emergency purposes or funding of shareholder redemption requests. The interest rate on borrowings is based on the federal funds rate or 1 month LIBOR rate plus a spread. Effective April 19, 2021, the interest rate on borrowings is based on the federal funds effective rate or overnight bank funding rate plus a spread. The Facility also has a commitment fee of 0.25% per annum based on the unused portion of the Facility. During the year ended December 31, 2021, the Fund did not have any borrowings under the Facility.
K. Other: At December 31, 2021, the Fund had record owners of 10% or greater. Investment activities of these shareholders could have a material impact on the Fund. The aggregate percentage of such owners was 59.8%.
L. Market Risk: The outbreak of the coronavirus ("COVID-19") and the recovery responses could adversely impact the operations of the Fund and its service providers and financial performance of the Fund and the Fund's investments. The extent of such impact depends on future developments, including (i) the duration and spread of the outbreak, (ii) the restrictions and advisories, (iii) the effects on the financial markets, (iv) government and regulatory responses, and (v) the effects on the economy overall as a result of developments such as disruption to consumer demand, economic output and supply chains. The duration and extent of COVID-19 and associated economic and market conditions and uncertainty over the long term cannot be reasonably estimated at this time. The ultimate impact of COVID-19 and the extent to which the associated conditions impact the Fund will also depend on future developments, which are highly uncertain, difficult to accurately predict and subject to change at any time. If the financial performance of the Fund's investments is impacted because of these factors for an extended period, the Fund's investment results may be adversely affected.
18
Morgan Stanley Variable Insurance Fund, Inc.
Annual Report – December 31, 2021
Report of Independent Registered Public Accounting Firm
To the Shareholders and Board of Directors of
Morgan Stanley Variable Insurance Fund, Inc. —
Global Infrastructure Portfolio
Opinion on the Financial Statements
We have audited the accompanying statement of assets and liabilities of Global Infrastructure Portfolio (the "Fund") (one of the funds constituting Morgan Stanley Variable Insurance Fund, Inc. (the "Company")), including the portfolio of investments, as of December 31, 2021, and the related statement of operations for the year then ended, the statements of changes in net assets for each of the two years in the period then ended, the financial highlights for each of the five years in the period then ended and the related notes (collectively referred to as the "financial statements"). In our opinion, the financial statements present fairly, in all material respects, the financial position of Global Infrastructure Portfolio (one of the funds constituting Morgan Stanley Variable Insurance Fund, Inc.) at December 31, 2021, the results of its operations for the year then ended, the changes in its net assets for each of the two years in the period then ended and its financial highlights for each of the five years in the period then ended, in conformity with U.S. generally accepted accounting principles.
Basis for Opinion
These financial statements are the responsibility of the Company's management. Our responsibility is to express an opinion on the Fund's financial statements based on our audits. We are a public accounting firm registered with the Public Company Accounting Oversight Board (United States) ("PCAOB") and are required to be independent with respect to the Company in accordance with the U.S. federal securities law and the applicable rules and regulations of the Securities and Exchange Commission and the PCAOB.
We conducted our audits in accordance with the standards of the PCAOB. Those standards require that we plan and perform the audit to obtain reasonable assurance about whether the financial statements are free of material misstatement, whether due to error or fraud. The Company is not required to have, nor were we engaged to perform, an audit of the Company's internal control over financial reporting. As part of our audits, we are required to obtain an understanding of internal control over financial reporting, but not for the purpose of expressing an opinion on the effectiveness of the Company's internal control over financial reporting. Accordingly, we express no such opinion.
Our audits included performing procedures to assess the risks of material misstatement of the financial statements, whether due to error or fraud, and performing procedures that respond to those risks. Such procedures included examining, on a test basis, evidence regarding the amounts and disclosures in the financial statements. Our procedures included confirmation of securities owned as of December 31, 2021by correspondence with the custodian and others or by other appropriate auditing procedures where replies from others were not received. Our audits also included evaluating the accounting principles used and significant estimates made by management, as well as evaluating the overall presentation of the financial statements. We believe that our audits provide a reasonable basis for our opinion.

We have served as the auditor of one or more Morgan Stanley investment companies since 2000.
Boston, Massachusetts
February 18, 2022
19
Morgan Stanley Variable Insurance Fund, Inc.
Annual Report – December 31, 2021
Liquidity Risk Management Program (unaudited)
In compliance with Rule 22e-4 under the Investment Company Act of 1940, as amended (the "Liquidity Rule"), the Fund has adopted and implemented a liquidity risk management program (the "Program"), which is reasonably designed to assess and manage the risk that the Fund could not meet requests to redeem shares issued by the Fund without significant dilution of remaining investors' interests in the Fund (i.e., liquidity risk). The Fund's Board of Directors (the "Board") previously approved the designation of the Liquidity Risk Subcommittee (the "LRS") as Program administrator. The LRS is comprised of representatives from various divisions within Morgan Stanley Investment Management.
At a meeting held on March 3-4, 2021, the Board reviewed a written report prepared by the LRS that addressed the Program's operation and assessed its adequacy, and effectiveness of implementation for the period from January 1, 2020, through December 31, 2020, as required under the Liquidity Rule, and discussed the impact of the COVID-19 pandemic on liquidity and the LRS's assessment of liquidity risk during the reporting period, including during the distressed market environment caused by the onset of the COVID-19 pandemic. The report concluded that the Program operated effectively and was adequately and effectively implemented in all material aspects, and that the relevant controls and safeguards were appropriately designed to enable the LRS to administer the Program in compliance with the Liquidity Rule.
In accordance with the Program, the LRS assessed each Fund's liquidity risk no less frequently than annually taking into consideration certain factors, as applicable, such as (i) investment strategy and liquidity of portfolio investments, (ii) short-term and long-term cash flow projections and (iii) holdings of cash and cash equivalents and borrowing arrangements and other funding sources. Certain factors are considered under both normal and reasonably foreseeable stressed conditions.
Each Fund portfolio investment is classified into one of four liquidity categories, which classification is assessed at least monthly by the LRS. The classification is based on a determination of the number of days it is reasonably expected to take to convert the investment into cash, or sell or dispose of the investment, in current market conditions without significantly changing the market value of the investment. Liquidity classification determinations take into account various market, trading and investment-specific considerations, as well as market depth, and in some cases utilize third-party vendor data.
The Liquidity Rule limits a fund's investments in illiquid investments to 15% of its net assets and requires funds that do not primarily hold assets that are highly liquid investments to determine and maintain a minimum percentage of the fund's net assets to be invested in highly liquid investments (highly liquid investment minimum or "HLIM"). The LRS believes that the Program includes provisions reasonably designed to review, monitor and comply with the 15% limit on illiquid investments and for determining, periodically reviewing and complying with the HLIM requirement, as applicable.
There can be no assurance that the Program will achieve its objectives under all circumstances in the future. Please refer to the Fund's prospectus for more information regarding the Fund's exposure to liquidity risk and other risks to which it may be subject.
20
Morgan Stanley Variable Insurance Fund, Inc.
Annual Report – December 31, 2021
Federal Tax Notice (unaudited)
For federal income tax purposes, the following information is furnished with respect to the distributions paid by the Fund during its taxable year ended December 31, 2021. For corporate shareholders 21.7% of the dividends qualified for the dividends received deduction.
The Fund designated and paid approximately $3,016,000 as a long-term capital gain distribution.
For federal income tax purposes, the following information is furnished with respect to the Fund's earnings for its taxable year ended December 31, 2021. When distributed, certain earnings may be subject to a maximum tax rate of 15% as provided for by the Jobs and Growth Tax Relief Reconciliation Act of 2003. The Fund designated up to a maximum of approximately $1,615,000 as taxable at this lower rate.
The Fund intends to pass through foreign tax credits of approximately $136,000 and has derived net income from sources within foreign countries amounting to approximately $1,740,000.
In January, the Fund provides tax information to shareholders for the preceding calendar year.
21
Morgan Stanley Variable Insurance Fund, Inc.
Annual Report – December 31, 2021
Director and Officer Information (unaudited)
Independent Directors:
Name, Address and Birth
Year of Independent Director | | Position(s)
Held with
Registrant | | Length of
Time
Served* | | Principal Occupation(s) During Past 5 Years and
Other Relevant Professional Experience | | Number of
Funds
in Fund
Complex
Overseen
by
Independent
Director** | | Other Directorships Held by Independent
Director During Past 5 Years*** | |
Frank L. Bowman
c/o Perkins Coie LLP
Counsel to the Independent
Directors
1155 Avenue of the Americas
22nd Floor
New York, NY 10036
Birth Year: 1944 | | Director | | Since August 2006 | | President, Strategic Decisions, LLC (consulting) (since February 2009); Director or Trustee of various Morgan Stanley Funds (since August 2006); Chairperson of the Compliance and Insurance Committee (since October 2015); formerly, Chairperson of the Insurance Sub-Committee of the Compliance and Insurance Committee (2007-2015); served as President and Chief Executive Officer of the Nuclear Energy Institute (policy organization) (February 2005-November 2008); retired as Admiral, U.S. Navy after serving over 38 years on active duty including 8 years as Director of the Naval Nuclear Propulsion Program in the Department of the Navy and the U.S. Department of Energy (1996-2004); served as Chief of Naval Personnel (July 1994-September 1996) and on the Joint Staff as Director of Political Military Affairs (June 1992-July 1994); knighted as Honorary Knight Commander of the Most Excellent Order of the British Empire; awarded the Officier de l'Orde National du Mérite by the French Government; elected to the National Academy of Engineering (2009). | | | 77 | | | Director of Naval and Nuclear Technologies LLP; Director Emeritus of the Armed Services YMCA; Member of the National Security Advisory Council of the Center for U.S. Global Engagement and a member of the CNA Military Advisory Board; Chairman of Fairhaven United Methodist Church; Member of the Board of Advisors of the Dolphin Scholarship Foundation; Director of other various nonprofit organizations; formerly, Director of BP, plc (November 2010-May 2019). | |
Kathleen A. Dennis
c/o Perkins Coie LLP
Counsel to the Independent Directors
1155 Avenue of the Americas
22nd Floor
New York, NY 10036
Birth Year: 1953 | | Director | | Since August 2006 | | Chairperson of the Governance Committee (since January 2021), Chairperson of the Liquidity and Alternatives Sub-Committee of the Investment Committee (2006-2020) and Director or Trustee of various Morgan Stanley Funds (since August 2006); President, Cedarwood Associates (mutual fund and investment management consulting) (since July 2006); formerly, Senior Managing Director of Victory Capital Management (1993-2006). | | | 77 | | | Board Member, University of Albany Foundation (2012-present); Board Member, Mutual Funds Directors Forum (2014-present); Director of various non-profit organizations. | |
Nancy C. Everett
c/o Perkins Coie LLP
Counsel to the Independent Directors
1155 Avenue of the Americas
22nd Floor
New York, NY 10036
Birth Year: 1955 | | Director | | Since January 2015 | | Chairperson of the Equity Investment Committee (since January 2021); Director or Trustee of various Morgan Stanley Funds (since January 2015); Chief Executive Officer, Virginia Commonwealth University Investment Company (since November 2015); Owner, OBIR, LLC (institutional investment management consulting) (since June 2014); formerly, Managing Director, BlackRock, Inc. (February 2011-December 2013) and Chief Executive Officer, General Motors Asset Management (a/k/a Promark Global Advisors, Inc.) (June 2005-May 2010). | | | 78 | | | Formerly, Member of Virginia Commonwealth University School of Business Foundation (2005-2016); Member of Virginia Commonwealth University Board of Visitors (2013-2015); Member of Committee on Directors for Emerging Markets Growth Fund, Inc. (2007-2010); Chairperson of Performance Equity Management, LLC (2006-2010); and Chairperson, GMAM Absolute Return Strategies Fund, LLC (2006-2010). | |
22
Morgan Stanley Variable Insurance Fund, Inc.
Annual Report – December 31, 2021
Director and Officer Information (unaudited) (cont'd)
Independent Directors (cont'd):
Name, Address and Birth
Year of Independent Director | | Position(s)
Held with
Registrant | | Length of
Time
Served* | | Principal Occupation(s) During Past 5 Years and
Other Relevant Professional Experience | | Number of
Funds
in Fund
Complex
Overseen
by
Independent
Director** | | Other Directorships Held by Independent
Director During Past 5 Years*** | |
Jakki L. Haussler
c/o Perkins Coie LLP
Counsel to the Independent Directors
1155 Avenue of the Americas
22nd Floor
New York, NY 10036
Birth Year: 1957 | | Director | | Since January
2015 | | Director or Trustee of various Morgan Stanley Funds (since January 2015); Chairman, Opus Capital Group (since 1996); formerly, Chief Executive Officer, Opus Capital Group (1996-2019); Director, Capvest Venture Fund, LP (May 2000-December 2011); Partner, Adena Ventures, LP (July 1999-December 2010); Director, The Victory Funds (February 2005-July 2008). | | | 78 | | | Director, Barnes Group Inc. (since July 2021); Director of Cincinnati Bell Inc. and Member, Audit Committee and Chairman, Governance and Nominating Committee; Director of Service Corporation International and Member, Audit Committee and Investment Committee; Director of Northern Kentucky University Foundation and Member, Investment Committee; Member of Chase College of Law Transactional Law Practice Center Board of Advisors; Director of Best Transport; Director of Chase College of Law Board of Visitors; formerly, Member, University of Cincinnati Foundation Investment Committee; Member, Miami University Board of Visitors (2008-2011); Trustee of Victory Funds (2005-2008) and Chairman, Investment Committee (2007-2008) and Member, Service Provider Committee (2005-2008). | |
Dr. Manuel H. Johnson
c/o Johnson Smick International, Inc.
220 I Street, NE Suite 200
Washington, D.C. 20002
Birth Year: 1949 | | Director | | Since July 1991 | | Senior Partner, Johnson Smick International, Inc. (consulting firm); Chairperson of the Fixed Income, Liquidity and Alternatives Investment Committee (since January 2021), Chairperson of the Investment Committee (2006-2020) and Director or Trustee of various Morgan Stanley Funds (since July 1991); Co-Chairman and a founder of the Group of Seven Council (G7C) (international economic commission); formerly, Chairperson of the Audit Committee (July 1991-September 2006); Vice Chairman of the Board of Governors of the Federal Reserve System and Assistant Secretary of the U.S. Treasury. | | | 77 | | | Director of NVR, Inc. (home construction). | |
Joseph J. Kearns
c/o Perkins Coie LLP
Counsel to the Independent Directors
1155 Avenue of the Americas
22nd Floor
New York, NY 10036
Birth Year: 1942 | | Director | | Since August 1994 | | Senior Adviser, Kearns & Associates LLC (investment consulting); Chairperson of the Audit Committee (since October 2006) and Director or Trustee of various Morgan Stanley Funds (since August 1994); formerly, Deputy Chairperson of the Audit Committee (July 2003-September 2006) and Chairperson of the Audit Committee of various Morgan Stanley Funds (since August 1994); CFO of the J. Paul Getty Trust (1982-1999). | | | 78 | | | Director, Rubicon Investments (since February 2019); Prior to August 2016, Director of Electro Rent Corporation (equipment leasing); Prior to December 31, 2013, Director of The Ford Family Foundation. | |
Michael F. Klein
c/o Perkins Coie LLP
Counsel to the Independent Directors
1155 Avenue of the Americas
22nd Floor
New York, NY 10036
Birth Year: 1958 | | Director | | Since August 2006 | | Chairperson of the Risk Committee (since January 2021); Managing Director, Aetos Alternatives Management, LP (since March 2000); Co-President, Aetos Alternatives Management, LP (since January 2004) and Co-Chief Executive Officer of Aetos Alternatives Management, LP (since August 2013); Chairperson of the Fixed Income Sub-Committee of the Investment Committee (2006-2020) and Director or Trustee of various Morgan Stanley Funds (since August 2006); formerly, Managing Director, Morgan Stanley & Co. Inc. and Morgan Stanley Dean Witter Investment Management and President, various Morgan Stanley Funds (June 1998-March 2000); Principal, Morgan Stanley & Co. Inc. and Morgan Stanley Dean Witter Investment Management (August 1997-December 1999). | | | 77 | | | Director of certain investment funds managed or sponsored by Aetos Alternatives Management, LP; Director of Sanitized AG and Sanitized Marketing AG (specialty chemicals). | |
23
Morgan Stanley Variable Insurance Fund, Inc.
Annual Report – December 31, 2021
Director and Officer Information (unaudited) (cont'd)
Independent Directors (cont'd):
Name, Address and Birth
Year of Independent Director | | Position(s)
Held with
Registrant | | Length of
Time
Served* | | Principal Occupation(s) During Past 5 Years and
Other Relevant Professional Experience | | Number of
Funds
in Fund
Complex
Overseen
by
Independent
Director** | | Other Directorships Held by Independent
Director During Past 5 Years*** | |
Patricia A. Maleski
c/o Perkins Coie LLP
Counsel to the Independent Directors
1155 Avenue of the Americas
22nd Floor
New York, NY 10036
Birth Year: 1960 | | Director | | Since January 2017 | | Director or Trustee of various Morgan Stanley Funds (since January 2017); Managing Director, JPMorgan Asset Management (2004-2016); Oversight and Control Head of Fiduciary and Conflicts of Interest Program (2015-2016); Chief Control Officer — Global Asset Management (2013-2015); President, JPMorgan Funds (2010-2013); Chief Administrative Officer (2004-2013); various other positions including Treasurer and Board Liaison (since 2001). | | | 78 | | | Trustee, Nutley Family Service Bureau, Inc. (since January 2022). | |
W. Allen Reed
c/o Perkins Coie LLP
Counsel to the Independent Directors
1155 Avenue of the Americas
22nd Floor
New York, NY 10036
Birth Year: 1947 | | Chair of the Board and Director | | Chair of the Board since August 2020 and Director since August 2006 | | Chair of the Boards of various Morgan Stanley Funds (since August 2020); Director or Trustee of various Morgan Stanley Funds (since August 2006); formerly, Vice Chair of the Boards of various Morgan Stanley Funds (January 2020-August 2020); President and Chief Executive Officer of General Motors Asset Management; Chairman and Chief Executive Officer of the GM Trust Bank and Corporate Vice President of General Motors Corporation (August 1994-December 2005). | | | 77 | | | Formerly, Director of Legg Mason, Inc. (2006-2019); and Director of the Auburn University Foundation (2010-2015). | |
Frances L. Cashman
c/o Perkins Coie LLP
Counsel to the Independent Directors
1155 Avenue of the Americas
22nd Floor
New York, NY 10036
Birth Year: 1961 | | Advisory Board Member | | Advisory Board Member Since January 2022 | | Chief Executive Officer, Asset Management Division, Euromoney Institutional Investor PLC (financial information) (May 2021-Present); Executive Vice President and various other roles, Legg Mason & Co. (asset management) (2010-2020); Managing Director, Stifel Nicolaus (2005-2010). | | | 78 | | | Trustee and Investment Committee Member, Georgia Tech Foundation (Since June 2019); Trustee and Chair of Marketing Committee, Loyola Blakefield (Since September 2017); Trustee, MMI Gateway Foundation (since September 2017); Director and Investment Committee Member, Catholic Community Foundation Board (2012-2018); Director and Investment Committee Member, St. Ignatius Loyola Academy (2011-2017). | |
Eddie A. Grier
c/o Perkins Coie LLP
Counsel to the Independent Directors
1155 Avenue of the Americas
22nd Floor
New York, NY 10036
Birth Year: 1955 | | Advisory Board Member | | Advisory Board Member Since January 2022 | | Dean, Santa Clara University Leavey School of Business (since April 2021); Dean, Virginia Commonwealth University School of Business (2010-2021); President and various other roles, Walt Disney Company (entertainment and media) (1981-2010). | | | 78 | | | Director, Witt/Keiffer, Inc. (executive search) (since 2016); Director, NuStar GP, LLC (energy) (since August 2021); Director, Sonida Senior Living, Inc. (residential community operator) (2016-2021); Director, NVR, Inc. (homebuilding) (2013-2020); Director, Middleburg Trust Company (wealth management) (2014-2019); Director, Colonial Williamsburg Company (since 2012); Regent, University of Massachusetts Global (since 2021); Director and Chair, ChildFund International (2012-2021); Trustee, Brandman University (2010-2021); Director, Richmond Forum (2012-2019). | |
* This is the earliest date the Director began serving the Morgan Stanley Funds. Each Director serves an indefinite term, until his or her successor is elected.
** The Fund Complex includes (as of December 31, 2021) all open-end and closed-end funds (including all of their portfolios) advised by Morgan Stanley Investment Management Inc. (the "Adviser") and any funds that have an adviser that is an affiliated person of the Adviser (including, but not limited to, Morgan Stanley AIP GP LP).
*** This includes any directorships at public companies and registered investment companies held by the Director at any time during the past five years.
24
Morgan Stanley Variable Insurance Fund, Inc.
Annual Report – December 31, 2021
Director and Officer Information (unaudited) (cont'd)
Executive Officers:
Name, Address and Birth Year of
Executive Officer | | Position(s)
Held with
Registrant | | Length of
Time Served* | | Principal Occupation(s) During Past 5 Years | |
John H. Gernon
522 Fifth Avenue
New York, NY 10036
Birth Year: 1963 | | President and Principal Executive Officer | | Since September 2013 | | President and Principal Executive Officer of the Equity and Fixed Income Funds and the Morgan Stanley AIP Funds (since September 2013) and the Liquidity Funds and various money market funds (since May 2014) in the Fund Complex; Managing Director of the Adviser. | |
Deidre A. Downes
1633 Broadway
New York, NY 10019
Birth Year: 1977 | | Chief Compliance Officer | | Since November 2021 | | Executive Director of the Adviser (since January 2021) and Chief Compliance Officer of various Morgan Stanley Funds (since November 2021). Formerly, Vice President and Corporate Counsel at PGIM and Prudential Financial (October 2016-December 2020). | |
Francis J. Smith
522 Fifth Avenue
New York, NY 10036
Birth Year: 1965 | | Treasurer and Principal Financial Officer | | Treasurer since July 2003 and Principal Financial Officer since September 2002 | | Managing Director of the Adviser and various entities affiliated with the Adviser; Treasurer (since July 2003) and Principal Financial Officer of various Morgan Stanley Funds (since September 2002). | |
Mary E. Mullin
1633 Broadway
New York, NY 10019
Birth Year: 1967 | | Secretary | | Since June 1999 | | Managing Director of the Adviser; Secretary of various Morgan Stanley Funds (since June 1999). | |
Michael J. Key
522 Fifth Avenue
New York, NY 10036
Birth Year: 1979 | | Vice President | | Since June 2017 | | Vice President of the Equity and Fixed Income Funds, Liquidity Funds, various money market funds and the Morgan Stanley AIP Funds in the Fund Complex (since June 2017); Executive Director of the Adviser; Head of Product Development for Equity and Fixed Income Funds (since August 2013). | |
* This is the earliest date the officer began serving the Morgan Stanley Funds. Each officer serves an indefinite term, until his or her successor is elected.
25
Morgan Stanley Variable Insurance Fund, Inc.
Annual Report – December 31, 2021
Adviser and Administrator
Morgan Stanley Investment Management Inc.
522 Fifth Avenue
New York, New York 10036
Distributor
Morgan Stanley Distribution, Inc.
522 Fifth Avenue
New York, New York 10036
Dividend Disbursing and Transfer Agent
DST Asset Manager Solutions, Inc.
2000 Crown Colony Drive
Quincy, Massachusetts 02169
Custodian
State Street Bank and Trust Company
One Lincoln Street
Boston, Massachusetts 02111
Legal Counsel
Dechert LLP
1095 Avenue of the Americas
New York, New York 10036
Counsel to the Independent Directors
Perkins Coie LLP
1155 Avenue of the Americas,
22nd Floor
New York, New York 10036
Independent Registered Public Accounting Firm
Ernst & Young LLP
200 Clarendon Street
Boston, Massachusetts 02116
Reporting to Shareholders
Each Morgan Stanley fund provides a complete schedule of portfolio holdings in its Semi-Annual and the Annual Reports within 60 days of the end of the fund's second and fourth fiscal quarters. The Semi-Annual and Annual Reports are filed electronically with the Securities and Exchange Commission ("SEC") on Form N-CSRS and Form N-CSR, respectively. Morgan Stanley also delivers the Semi-Annual and Annual Reports to fund shareholders and makes these reports available on its public website, www.morganstanley.com/im/shareholderreports. Each Morgan Stanley non-money market fund also files a complete schedule of portfolio holdings with the SEC for the fund's first and third fiscal quarters as an attachment to Form N-PORT. Morgan Stanley does not deliver the reports for the first and third fiscal quarters to shareholders, but makes the complete schedule of portfolio holdings for the fund's first and third fiscal quarters available on its public website. The holdings for each money market fund are also posted to the Morgan Stanley public website. You may obtain the Form N-PORT filings (as well as the Form N-CSR and N-CSRS filings) by accessing the SEC's website, www.sec.gov. You can also request copies of these materials, upon payment of a duplicating fee, by electronic request at the SEC's email address (publicinfo@sec.gov).
Proxy Voting Policies and Procedures and Proxy Voting Record
You may obtain a copy of the Company's Proxy Voting Policy and Procedures and information regarding how the Company voted proxies relating to portfolio securities during the most recent twelve-month period ended June 30, without charge, upon request, by calling toll free 1 (800) 548-7786 or by visiting our website at www.morganstanley.com/im/shareholderreports. This information is also available on the SEC's website at www.sec.gov.
This report is submitted for the general information of the shareholders of the Fund. For more detailed information about the Fund, its fees and expenses and other pertinent information, please read its Prospectus. The Company's Statement of Additional Information contains additional information about the Fund, including its Directors. It is available, without charge, by calling 1 (800) 548-7786.
Householding Notice
To reduce printing and mailing costs, the Fund attempts to eliminate duplicate mailings to the same address. The Fund delivers a single copy of certain shareholder documents, including shareholder reports, prospectuses and proxy materials, to investors with the same last name who reside at the same address. Your participation in this program will continue for an unlimited period of time unless you instruct us otherwise. You can request multiple copies of these documents by calling (800) 548-7786, 8:00 a.m. to 6:00 p.m., ET. Once our Customer Service Center has received your instructions, we will begin sending individual copies for each account within 30 days.
This report is not authorized for distribution to prospective investors in the Fund unless preceded or accompanied by an effective Prospectus. Read the Prospectus carefully before investing.
UIFGINANN
3997778 EXP 02.28.23

Morgan Stanley Variable Insurance Fund, Inc.
Annual Report – December 31, 2021
Global Real Estate Portfolio
The Fund is intended to be a funding vehicle for variable annuity contracts and variable life insurance policies offered by the separate accounts of certain life insurance companies.
Morgan Stanley Variable Insurance Fund, Inc.
Annual Report – December 31, 2021
Expense Example | | | 2 | | |
Investment Overview | | | 3 | | |
| Portfolio of Investments | | | 6 | | |
| Statement of Assets and Liabilities | | | 9 | | |
| Statement of Operations | | | 10 | | |
| Statements of Changes in Net Assets | | | 11 | | |
Financial Highlights | | | 12 | | |
Notes to Financial Statements | | | 13 | | |
| Report of Independent Registered Public Accounting Firm | | | 21 | | |
Liquidity Risk Management Program | | | 22 | | |
| Director and Officer Information | | | 23 | | |
1
Morgan Stanley Variable Insurance Fund, Inc.
Annual Report – December 31, 2021
Expense Example (unaudited)
Global Real Estate Portfolio
As a shareholder of the Global Real Estate Portfolio (the "Fund"), you incur two types of costs: (1) insurance company charges; and (2) ongoing costs, which include advisory fees, administration fees, distribution (12b-1) fees and other Fund expenses. This example is intended to help you understand your ongoing costs (in dollars) of investing in the Fund and to compare these costs with the ongoing costs of investing in other mutual funds.
This example is based on an investment of $1,000 invested at the beginning of the six-month period ended December 31, 2021 and held for the entire six-month period.
Actual Expenses
The table below provides information about actual account values and actual expenses. You may use the information in this table, together with the amount you invested, to estimate the expenses that you paid over the period. Simply divide your account value by $1,000 (for example, an $8,600 account value divided by $1,000 = 8.6), then multiply the result by the number in the table under the heading entitled "Actual Expenses Paid During Period" to estimate the expenses you paid on your account during this period.
Hypothetical Example for Comparison Purposes
The table below provides information about hypothetical account values and hypothetical expenses based on the Fund's actual expense ratio and an assumed rate of return of 5% per year before expenses, which is not the Fund's actual return. The hypothetical account values and expenses may not be used to estimate the actual ending account balance or expenses you paid for the period. You may use this information to compare the ongoing costs of investing in the Fund and other funds. To do so, compare this 5% hypothetical example with the 5% hypothetical examples that appear in the shareholder reports of the other funds.
Please note that the expenses shown in the table are meant to highlight your ongoing costs only and do not reflect any insurance company charges. Therefore, the table below is useful in comparing ongoing costs, but will not help you determine the relative total cost of owning different funds. In addition, if these insurance company charges were included, your costs would have been higher.
| | | Beginning
Account Value
7/1/21 | | Actual Ending
Account Value
12/31/21 | | Hypothetical
Ending
Account Value | | Actual
Expenses Paid
During Period* | | Hypothetical
Expenses Paid
During Period* | | Net Expense
Ratio During
Period** | |
Global Real Estate Portfolio Class II | | $ | 1,000.00 | | | $ | 1,068.60 | | | $ | 1,018.90 | | | $ | 6.52 | | | $ | 6.36 | | | | 1.25 | % | |
* Expenses are calculated using the Fund Class' annualized net expense ratio (as disclosed), multiplied by the average account value over the period and multiplied by 184/365 (to reflect the most recent one-half year period).
** Annualized.
2
Morgan Stanley Variable Insurance Fund, Inc.
Annual Report – December 31, 2021
Investment Overview (unaudited)
Global Real Estate Portfolio
The Fund seeks to provide current income and capital appreciation.
Performance
For the fiscal year ended December 31, 2021, the Fund's Class II shares had a total return based on net asset value and reinvestment of distributions per share of 23.83%, net of fees. The Fund's Class II shares underperformed the Fund's benchmark, the FTSE EPRA Nareit Developed Real Estate Index — Net Total Return to U.S. Investors (the "Index"), which returned 26.90%, and outperformed the MSCI World Net Index, which returned 21.82%.
Factors Affecting Performance
• Global real estate securities gained 26.9% during the 12-month period ending December 31, 2021, as measured by the Index. This growth was supported by several macro and fundamental factors, including monetary and fiscal stimulus, continued vaccine distribution, and the reopening — or anticipated reopening — of economies around the world. The real estate sector posted gains every quarter in 2021, except the third quarter when there were modest declines primarily due to the spread and impact of the delta variant and potential contagion concerns from the Evergrandei situation in China.
• North American property stocks gained 42.6% for the year as measured by the FTSE EPRA Nareit North America Index.ii
o The U.S. market outperformed the broader real estate universe. After a strong start to the year in more economically sensitive sectors such as office, lodging and retail, rising concerns regarding COVID-19 and the delta and omicron variants led to investors questioning the sustainability of economic growth and resulted in sector leadership rotation. Ultimately the more defensive and secularly favored sectors, such as storage, apartments, and industrial, outperformed and posted strong returns for the year. An exception to this sector leadership rotation was within retail, where regional malls posted the best returns for the year on continued strength in retail sales and robust discretionary spending. In contrast, health care and office companies underperformed.
o The Fund's overweight to storage and shopping centers, underweight to skilled nursing health care, and security selection in industrial and data centers were top relative contributors for the year. Key detractors included the
underweights to industrial, regional malls and data centers; security selection within and the underweight to apartments; and security selection in NYC office and shopping centers.
• Within Asia, property stocks returned 4.3% for the year, as measured by the FTSE EPRA Nareit Developed Asia Index.ii
o Asian real estate securities underperformed the broader real estate market amid a lagging vaccination rollout, lockdowns in the region from zero-COVID policies and the surge in COVID-19 cases due to the delta and omicron variants. Monetary policy tightening, a slowdown in Chinese economic data and continued worries about credit availability to Chinese property developers alongside the Evergrandei debt crisis also weighed on investor sentiment. Within the Index, Australia storage, Singapore health care and Japan real estate investment trust industrial were top performers due to their defensive characteristics and stronger secular growth prospects, while retail and hotel companies across most markets underperformed due to COVID-19 concerns.
o The Fund's underweights to Hong Kong residential and Australia and Singapore retail, and the out-of-Index position to Australia real estate services were relative contributors to performance. This was offset by the out-of-Index positions in China and Hong Kong real estate services, and the overweight to Singapore data centers.
• European property stocks returned 10.0% for the year, as measured by the FTSE EPRA Nareit Developed Europe Index.ii
o The European market underperformed the broader real estate universe. Similar to the U.S market, after initial outperformance in more economically cyclical sectors and countries, rising COVID-19 cases stemming from
i Not held in the portfolio as of December 31, 2021.
ii The FTSE EPRA Nareit North America Index is a subset of the FTSE EPRA Nareit Developed Index and is a free float-adjusted market capitalization weighted index composed of listed real estate securities in the North American (U.S. and Canada) real estate market. The FTSE EPRA Nareit Developed Asia Index is a subset of the FTSE EPRA Nareit Developed Index and is a free float-adjusted market capitalization weighted index composed of listed real estate securities in the Asian real estate markets. The FTSE EPRA Nareit Developed Europe Index is a subset of the FTSE EPRA Nareit Developed Index and is a free float-adjusted market capitalization weighted index composed of listed real estate securities in the European real estate markets. The performance of the indexes are listed in U.S. dollars and assume reinvestment of dividends. The indexes are unmanaged and their returns do not include any sales charges or fees. Such costs would lower performance. It is not possible to invest directly in an index. Data as of December 31, 2021.
3
Morgan Stanley Variable Insurance Fund, Inc.
Annual Report – December 31, 2021
Investment Overview (unaudited) (cont'd)
Global Real Estate Portfolio
the delta and omicron variants led investors to question the sustainability of macroeconomic growth. As a result, those sectors with more defensive and secularly favored demand that generated higher cash flow growth ultimately outperformed. Companies within the storage and industrial sectors throughout Europe, and those specifically within Belgium and Sweden outperformed, while the most notable underperformance was concentrated in German residential due to merger and acquisition (M&A) activity and regulatory concerns.
o An out-of-Index position in a U.K. homebuilder, the underweights to German residential and Switzerland, and security selection within Netherlands retail were top relative contributors to the Fund. This was offset by security selection in Sweden and the overweights to both U.K. and Continental office companies.
Management Strategies
• The team uses internal proprietary research to invest in public real estate companies that we believe offer the best value relative to their underlying assets and growth prospects. The team combines a bottom-up approach, assessing the intrinsic value, equity multiples and growth prospects of each security, with a top-down view that incorporates fundamental inflection points, macroeconomic considerations, and geopolitical and country risk. By incorporating both an equity market valuation and a more traditional real estate valuation with a top-down overlay, we believe the Fund will be better prepared to identify securities with the best expected total returns.
• Forecasted market strength in the asset class is supported by a number of macro and fundamental factors, including continued vaccine distribution, the reopening and/or anticipated reopening of economies around the world, and growing demand for real estate. We believe the relative valuation of real estate securities is attractive compared to investable alternatives, including the broader equity market, fixed income and direct property investment. Fundamental recovery and strength, coupled with attractive relative valuations, appear to be supportive of above-trend growth over the next several years. We believe continued M&A and privatizations are possible given discounts to private market valuations observed across sectors. Transaction volumes are expected to increase given the growing clarity on the recovery in fundamentals across most major sectors. However, an elevated risk premium
should be expected for assets with operational, leasing or repositioning risk.
• Rising inflation and related rising interest rates could dampen value appreciation in the near term. However, we believe inflation pressures will likely moderate throughout the year and interest rates are likely to remain low versus history. More important is the expectation for continued economic expansion and strong gross domestic product growth, coupled with an expectation for limited new supply additions, strong credit availability and increasing investor interest in the space, which could lead to above-trend levels of cash flow growth in the sector.
4
Morgan Stanley Variable Insurance Fund, Inc.
Annual Report – December 31, 2021
Investment Overview (unaudited) (cont'd)
Global Real Estate Portfolio
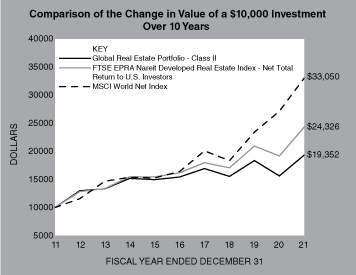
In accordance with SEC regulations, the Fund's performance shown assumes that all recurring fees (including management fees) were deducted and all dividends and distributions were reinvested.
Performance Compared to the FTSE EPRA Nareit Developed Real Estate Index – Net Total Return to U.S. Investors(1) and the MSCI World Net Index(2)
| | | Period Ended December 31, 2021 | |
| | | Total Returns(3) | |
| | | | | Average Annual | |
| | | One
Year | | Five
Years | | Ten
Years | | Since
Inception(5) | |
Fund – Class II(4) | | | 23.83 | % | | | 4.63 | % | | | 6.82 | % | | | 4.13 | % | |
FTSE EPRA Nareit Developed
Real Estate Index – Net
Total Return to U.S. Investors | | | 26.90 | | | | 8.50 | | | | 9.30 | | | | 5.41 | | |
MSCI World Net Index | | | 21.82 | | | | 15.03 | | | | 12.70 | | | | 7.71 | | |
Performance data quoted represents past performance, which is no guarantee of future results, and current performance may be lower or higher than the figures shown. Performance assumes that all dividends and distributions, if any, were reinvested. For the most recent month-end performance figures, please contact the issuing insurance company or speak with your financial advisor. Investment return and principal value will fluctuate so that Fund shares, when redeemed, may be worth more or less than their original cost. Total returns do not reflect the deduction of taxes that a shareholder would pay on Fund distributions or the redemption of Fund shares. Performance shown does not reflect fees and expenses imposed by your insurance company's separate account. If performance information included the effect of these additional charges, the total returns would be lower. Please keep in mind that double-digit returns for the Fund are highly unusual and cannot be sustained.
(1) The FTSE EPRA Nareit Developed Real Estate Index — Net Total Return to U.S. Investors is a free float-adjusted market capitalization weighted index designed to reflect the stock performance of companies engaged in specific aspects of the major real estate markets/regions of the developed world. The performance of the Index is listed in U.S. dollars and assumes reinvestment of dividends. "Net Total Return to U.S. Investors" reflects a reduction in total returns after taking into account the withholding tax on dividends by certain foreign countries represented in the Index. The Index is unmanaged and its returns do not include any sales charges or fees. Such costs would lower performance. It is not possible to invest directly in an index.
(2) The MSCI World Net Index is a free float-adjusted market capitalization weighted index that is designed to measure the global equity market performance of developed markets. The term "free float" represents the portion of shares outstanding that are deemed to be available for purchase in the public equity markets by investors. The MSCI World Net Index currently consists of 23 developed market country indices. The performance of the Index is listed in U.S. dollars and assumes reinvestment of net dividends. Net total return indices reinvest dividends after the deduction of withholding taxes, using (for international indices) a tax rate applicable to non-resident institutional investors who do not benefit from double taxation treaties. The Index is unmanaged and its returns do not include any sales charges or fees. Such costs would lower performance. It is not possible to invest directly in an index.
(3) Total returns for the Fund reflect fees waived and expenses reimbursed, if applicable, by the Adviser (as defined herein). Without such waivers and reimbursements, total returns would have been lower.
(4) Commenced operations on April 28, 2006.
(5) For comparative purposes, average annual since inception returns listed for the Indexes refer to the inception date or initial offering of the respective share class of the Fund, not the inception of the Index.
5
Morgan Stanley Variable Insurance Fund, Inc.
Annual Report – December 31, 2021
Portfolio of Investments
Global Real Estate Portfolio
| | | Shares | | Value
(000) | |
Common Stocks (99.4%) | |
Australia (3.9%) | |
Charter Hall Group REIT | | | 45,814 | | | $ | 686 | | |
Goodman Group REIT | | | 10,548 | | | | 203 | | |
GPT Group (The) REIT | | | 107,059 | | | | 422 | | |
Mirvac Group REIT | | | 58,293 | | | | 124 | | |
National Storage REIT | | | 189,672 | | | | 367 | | |
Stockland REIT | | | 145,923 | | | | 450 | | |
| | | | 2,252 | | |
Austria (0.4%) | |
CA Immobilien Anlagen AG | | | 5,576 | | | | 208 | | |
Canada (2.2%) | |
Dream Industrial REIT | | | 52,953 | | | | 721 | | |
Tricon Residential, Inc. | | | 37,638 | | | | 576 | | |
| | | | 1,297 | | |
China (1.0%) | |
China Resources Mixc Lifestyle
Services Ltd. (a) | | | 44,400 | | | | 207 | | |
GDS Holdings Ltd. ADR (b) | | | 3,089 | | | | 146 | | |
Longfor Group Holdings Ltd. (a) | | | 49,000 | | | | 230 | | |
| | | | 583 | | |
Finland (0.3%) | |
Kojamo Oyj | | | 7,382 | | | | 179 | | |
France (2.3%) | |
Gecina SA REIT | | | 4,098 | | | | 573 | | |
ICADE REIT | | | 4,102 | | | | 295 | | |
Klepierre SA REIT (b) | | | 3,533 | | | | 84 | | |
Mercialys SA REIT | | | 42,214 | | | | 412 | | |
| | | | 1,364 | | |
Germany (2.7%) | |
Deutsche EuroShop AG | | | 10,507 | | | | 175 | | |
Deutsche Wohnen SE | | | 2,294 | | | | 96 | | |
LEG Immobilien SE | | | 1,732 | | | | 242 | | |
Vonovia SE | | | 19,035 | | | | 1,049 | | |
| | | | 1,562 | | |
Hong Kong (5.0%) | |
ESR Cayman Ltd. (b) | | | 211,000 | | | | 713 | | |
Hongkong Land Holdings Ltd. | | | 92,100 | | | | 479 | | |
Link REIT | | | 69,660 | | | | 613 | | |
Sun Hung Kai Properties Ltd. | | | 51,893 | | | | 630 | | |
Wharf Real Estate Investment Co., Ltd. | | | 96,420 | | | | 490 | | |
| | | | 2,925 | | |
Ireland (0.6%) | |
Hibernia REIT PLC | | | 245,516 | | | | 363 | | |
Japan (8.2%) | |
Activia Properties, Inc. REIT | | | 45 | | | | 163 | | |
Daiwa Office Investment Corp. REIT | | | 30 | | | | 183 | | |
Daiwa Securities Living Investments Corp. REIT | | | 162 | | | | 167 | | |
GLP J-REIT | | | 199 | | | | 344 | | |
Hoshino Resorts, Inc. REIT | | | 39 | | | | 221 | | |
| | | Shares | | Value
(000) | |
Hulic Co., Ltd. | | | 10,300 | | | $ | 98 | | |
Japan Metropolitan Fund Investment Corp. REIT | | | 293 | | | | 252 | | |
Japan Real Estate Investment Corp. REIT | | | 86 | | | | 488 | | |
Mitsubishi Estate Co., Ltd. | | | 26,200 | | | | 364 | | |
Mitsui Fudosan Co., Ltd. | | | 45,300 | | | | 898 | | |
Nippon Building Fund, Inc. REIT | | | 95 | | | | 553 | | |
Nippon Prologis Inc. REIT | | | 145 | | | | 513 | | |
Orix, Inc. J-REIT | | | 157 | | | | 245 | | |
Sumitomo Realty & Development Co., Ltd. | | | 9,800 | | | | 289 | | |
| | | | 4,778 | | |
Malta (0.0%) (c) | |
BGP Holdings PLC (d) | | | 5,886,464 | | | | 20 | | |
Netherlands (1.2%) | |
Eurocommercial Properties N,V. REIT | | | 18,252 | | | | 397 | | |
NSI N.V. REIT | | | 7,691 | | | | 306 | | |
| | | | 703 | | |
Norway (0.1%) | |
Entra ASA | | | 1,976 | | | | 44 | | |
Singapore (1.9%) | |
Digital Core REIT | | | 191,800 | | | | 222 | | |
Digital Core Management Pte Ltd. REIT (b) | | | 97,000 | | | | 112 | | |
Frasers Logistics & Commercial Trust REIT | | | 252,500 | | | | 285 | | |
Keppel DC REIT | | | 198,500 | | | | 364 | | |
Mapletree Industrial Trust REIT | | | 45,657 | | | | 92 | | |
| | | | 1,075 | | |
Spain (1.3%) | |
Inmobiliaria Colonial Socimi SA REIT | | | 21,624 | | | | 202 | | |
Merlin Properties Socimi SA REIT | | | 51,499 | | | | 558 | | |
| | | | 760 | | |
Sweden (1.1%) | |
Castellum AB | | | 853 | | | | 23 | | |
Fabege AB | | | 18,282 | | | | 306 | | |
Hufvudstaden AB, Class A | | | 19,088 | | | | 285 | | |
| | | | 614 | | |
Switzerland (0.5%) | |
PSP Swiss Property AG (Registered) | | | 2,096 | | | | 261 | | |
United Kingdom (4.7%) | |
British Land Co., PLC (The) REIT | | | 77,394 | | | | 556 | | |
Derwent London PLC REIT | | | 4,986 | | | | 231 | | |
Empiric Student Property PLC REIT | | | 162,400 | | | | 189 | | |
Grainger PLC | | | 21,511 | | | | 92 | | |
Great Portland Estates PLC REIT | | | 19,481 | | | | 192 | | |
Hammerson PLC REIT (e) | | | 450,673 | | | | 200 | | |
Helical PLC | | | 25,381 | | | | 156 | | |
Land Securities Group PLC REIT | | | 55,615 | | | | 584 | | |
Segro PLC REIT | | | 19,658 | | | | 382 | | |
Workspace Group PLC REIT | | | 15,611 | | | | 171 | | |
| | | | 2,753 | | |
The accompanying notes are an integral part of the financial statements.
6
Morgan Stanley Variable Insurance Fund, Inc.
Annual Report – December 31, 2021
Portfolio of Investments (cont'd)
Global Real Estate Portfolio
| | | Shares | | Value
(000) | |
United States (62.0%) | |
Agree Realty Corp. REIT | | | 14,741 | | | $ | 1,052 | | |
Alexandria Real Estate Equities, Inc. REIT | | | 5,426 | | | | 1,210 | | |
Boyd Gaming Corp. (b) | | | 9,438 | | | | 619 | | |
Brixmor Property Group, Inc. REIT | | | 42,743 | | | | 1,086 | | |
Caesars Entertainment, Inc. (b) | | | 2,908 | | | | 272 | | |
Digital Realty Trust, Inc. REIT | | | 12,195 | | | | 2,157 | | |
Equity Residential REIT | | | 20,645 | | | | 1,868 | | |
Extra Space Storage, Inc. REIT | | | 6,070 | | | | 1,376 | | |
Healthcare Trust of America, Inc., Class A REIT | | | 13,551 | | | | 452 | | |
Healthpeak Properties, Inc. REIT | | | 31,147 | | | | 1,124 | | |
Invitation Homes, Inc. REIT | | | 21,342 | | | | 968 | | |
Kilroy Realty Corp. REIT | | | 10,392 | | | | 691 | | |
Kite Realty Group Trust REIT | | | 39,666 | | | | 864 | | |
Life Storage, Inc. REIT | | | 6,210 | | | | 951 | | |
Medical Properties Trust, Inc. REIT | | | 27,698 | | | | 655 | | |
Mid-America Apartment Communities, Inc. REIT | | | 7,423 | | | | 1,703 | | |
NETSTREIT Corp. REIT | | | 33,885 | | | | 776 | | |
Outfront Media, Inc. REIT | | | 24,165 | | | | 648 | | |
ProLogis, Inc. REIT | | | 28,514 | | | | 4,801 | | |
Public Storage REIT | | | 7,378 | | | | 2,764 | | |
Rexford Industrial Realty, Inc. REIT | | | 11,777 | | | | 955 | | |
| RPT Realty REIT | | | 40,318 | | | | 539 | | |
SBA Communications Corp. REIT | | | 979 | | | | 381 | | |
Simon Property Group, Inc. REIT | | | 5,827 | | | | 931 | | |
SITE Centers Corp. REIT | | | 60,602 | | | | 959 | | |
Sun Communities, Inc. REIT | | | 8,641 | | | | 1,814 | | |
UDR, Inc. REIT | | | 23,256 | | | | 1,395 | | |
VICI Properties, Inc. REIT | | | 22,600 | | | | 681 | | |
Welltower, Inc. REIT | | | 28,636 | | | | 2,456 | | |
| | | | 36,148 | | |
Total Common Stocks (Cost $48,586) | | | 57,889 | | |
Short-Term Investments (0.5%) | |
Securities held as Collateral on Loaned Securities (0.2%) | |
Investment Company (0.2%) | |
Morgan Stanley Institutional Liquidity
Funds — Treasury Securities Portfolio —
Institutional Class (See Note H) | | | 101,511 | | | | 102 | | |
| | | Face Amount
(000) | | Value
(000) | |
Repurchase Agreements (0.0%) (c) | |
HSBC Securities USA, Inc. (0.05%, dated
12/31/21, due 1/3/22; proceeds $1;
fully collateralized by U.S. Government
obligations; 0.00% due
5/15/25 - 11/15/28; valued at $1) | | $ | 1 | | | $ | 1 | | |
Merrill Lynch & Co., Inc. (0.05%, dated
12/31/21, due 1/3/22; proceeds $18;
fully collateralized by U.S. Government
obligations; 0.13% - 2.88% due
7/31/23 - 7/31/25; valued at $19) | | | 18 | | | | 18 | | |
| | | | 19 | | |
Total Securities held as Collateral on Loaned
Securities (Cost $121) | | | 121 | | |
| | | Shares | | | |
Investment Company (0.3%) | |
Morgan Stanley Institutional Liquidity Funds —
Treasury Securities Portfolio — Institutional
Class (See Note H) (Cost $196) | | | 195,921 | | | | 196 | | |
Total Short-Term Investments (Cost $317) | | | 317 | | |
Total Investments (99.9%) (Cost $48,903)
Including $188 of Securities Loaned (f)(g) | | | 58,206 | | |
Other Assets in Excess of Liabilities (0.1%) | | | 71 | | |
Net Assets (100.0%) | | $ | 58,277 | | |
Country assignments and aggregations are based generally on third party vendor classifications and information, and may be different from the assignments and aggregations under the policies set forth in the Fund's prospectus and/or statement of additional information relating to geographic classifications.
(a) Security trades on the Hong Kong exchange.
(b) Non-income producing security.
(c) Amount is less than 0.05%.
(d) At December 31, 2021, the Fund held a fair valued security valued at approximately $20,000, representing less than 0.05% of net assets. This security has been fair valued as determined in good faith under procedures established by and under the general supervision of the Company's (as defined herein) Directors.
(e) All or a portion of this security was on loan at December 31, 2021.
(f) The approximate fair value and percentage of net assets, $8,406,000 and 14.4%, respectively, represent the securities that have been fair valued under the fair valuation policy for international investments as described in Note A-1 within the Notes to the Financial Statements.
(g) At December 31, 2021, the aggregate cost for federal income tax purposes is approximately $50,323,000. The aggregate gross unrealized appreciation is approximately $10,266,000 and the aggregate gross unrealized depreciation is approximately $2,383,000, resulting in net unrealized appreciation of approximately $7,883,000.
ADR American Depositary Receipt.
REIT Real Estate Investment Trust.
The accompanying notes are an integral part of the financial statements.
7
Morgan Stanley Variable Insurance Fund, Inc.
Annual Report – December 31, 2021
Portfolio of Investments (cont'd)
Global Real Estate Portfolio
Portfolio Composition*
Classification | | Percentage of
Total Investments | |
Diversified | | | 20.6 | % | |
Residential | | | 17.5 | | |
Industrial | | | 14.9 | | |
Retail | | | 12.9 | | |
Office | | | 10.9 | | |
Self Storage | | | 9.4 | | |
Health Care | | | 8.1 | | |
Other** | | | 5.7 | | |
Total Investments | | | 100.0 | % | |
* Percentages indicated are based upon total investments (excluding Securities held as Collateral on Loaned Securities) as of December 31, 2021.
** Industries and/or investment types representing less than 5% of total investments.
The accompanying notes are an integral part of the financial statements.
8
Morgan Stanley Variable Insurance Fund, Inc.
Annual Report – December 31, 2021
Global Real Estate Portfolio
Statement of Assets and Liabilities | | December 31, 2021
(000) | |
Assets: | |
Investments in Securities of Unaffiliated Issuers, at Value(1) (Cost $48,605) | | $ | 57,908 | | |
Investment in Security of Affiliated Issuer, at Value (Cost $298) | | | 298 | | |
Total Investments in Securities, at Value (Cost $48,903) | | | 58,206 | | |
Foreign Currency, at Value (Cost $300) | | | 302 | | |
Cash from Securities Lending | | | — | @ | |
Dividends Receivable | | | 163 | | |
Tax Reclaim Receivable | | | 17 | | |
Receivable for Investments Sold | | | 2 | | |
Receivable from Securities Lending Income | | | 1 | | |
Receivable from Affiliate | | | — | @ | |
Receivable for Fund Shares Sold | | | — | @ | |
Other Assets | | | 12 | | |
Total Assets | | | 58,703 | | |
Liabilities: | |
Collateral on Securities Loaned, at Value | | | 121 | | |
Payable for Custodian Fees | | | 65 | | |
Payable for Fund Shares Redeemed | | | 62 | | |
Payable for Professional Fees | | | 48 | | |
Deferred Capital Gain Country Tax | | | 36 | | |
Payable for Advisory Fees | | | 22 | | |
Payable for Servicing Fees | | | 21 | | |
Payable for Investments Purchased | | | 13 | | |
Payable for Distribution Fees — Class II Shares | | | 12 | | |
Payable for Administration Fees | | | 4 | | |
Payable for Transfer Agency Fees | | | 1 | | |
Other Liabilities | | | 21 | | |
Total Liabilities | | | 426 | | |
NET ASSETS | | $ | 58,277 | | |
Net Assets Consist of: | |
Paid-in-Capital | | $ | 46,638 | | |
Total Distributable Earnings | | | 11,639 | | |
Net Assets | | $ | 58,277 | | |
CLASS II: | |
Net Asset Value, Offering and Redemption Price Per Share Applicable to 5,622,548 Outstanding
$0.001 Par Value Shares (Authorized 500,000,000 Shares) | | $ | 10.36 | | |
(1) Including: | |
Securities on Loan, at Value: | | $ | 188 | | |
@ Amount is less than $500.
The accompanying notes are an integral part of the financial statements.
9
Morgan Stanley Variable Insurance Fund, Inc.
Annual Report – December 31, 2021
Global Real Estate Portfolio
Statement of Operations | | Year Ended
December 31, 2021
(000) | |
Investment Income: | |
Dividends from Securities of Unaffiliated Issuers (Net of $69 of Foreign Taxes Withheld) | | $ | 1,648 | | |
Non-Cash Dividends from Securities of Unaffiliated Issuers | | | 119 | | |
Income from Securities Loaned — Net | | | 4 | | |
Dividends from Security of Affiliated Issuer (Note H) | | | — | @ | |
Total Investment Income | | | 1,771 | | |
Expenses: | |
Advisory Fees (Note B) | | | 451 | | |
Professional Fees | | | 145 | | |
Distribution Fees — Class II Shares (Note E) | | | 141 | | |
Custodian Fees (Note G) | | | 95 | | |
Servicing Fees (Note D) | | | 95 | | |
Administration Fees (Note C) | | | 45 | | |
Shareholder Reporting Fees | | | 22 | | |
Pricing Fees | | | 7 | | |
Transfer Agency Fees (Note F) | | | 5 | | |
Directors' Fees and Expenses | | | 5 | | |
Other Expenses | | | 12 | | |
Total Expenses | | | 1,023 | | |
Waiver of Advisory Fees (Note B) | | | (318 | ) | |
Rebate from Morgan Stanley Affiliate (Note H) | | | (— | @) | |
Net Expenses | | | 705 | | |
Net Investment Income | | | 1,066 | | |
Realized Gain (Loss): | |
Investments Sold (Net of $15 of Capital Gain Country Tax) | | | 12,087 | | |
Foreign Currency Translation | | | (19 | ) | |
Net Realized Gain | | | 12,068 | | |
Change in Unrealized Appreciation (Depreciation): | |
Investments (Net of Increase in Deferred Capital Gain Country Tax of $1) | | | (1,165 | ) | |
Foreign Currency Translation | | | (1 | ) | |
Net Change in Unrealized Appreciation (Depreciation) | | | (1,166 | ) | |
Net Realized Gain and Change in Unrealized Appreciation (Depreciation) | | | 10,902 | | |
Net Increase in Net Assets Resulting from Operations | | $ | 11,968 | | |
@ Amount is less than $500.
The accompanying notes are an integral part of the financial statements.
10
Morgan Stanley Variable Insurance Fund, Inc.
Annual Report – December 31, 2021
Global Real Estate Portfolio
Statements of Changes in Net Assets | | Year Ended
December 31, 2021
(000) | | Year Ended
December 31, 2020
(000) | |
Increase (Decrease) in Net Assets: | |
Operations: | |
Net Investment Income | | $ | 1,066 | | | $ | 999 | | |
Net Realized Gain (Loss) | | | 12,068 | | | | (5,615 | ) | |
Net Change in Unrealized Appreciation (Depreciation) | | | (1,166 | ) | | | (5,997 | ) | |
Net Increase (Decrease) in Net Assets Resulting from Operations | | | 11,968 | | | | (10,613 | ) | |
Dividends and Distributions to Shareholders: | |
Class II | | | (1,323 | ) | | | (3,403 | ) | |
Capital Share Transactions:(1) | |
Class II: | |
Subscribed | | | 4,667 | | | | 7,643 | | |
Distributions Reinvested | | | 1,323 | | | | 3,403 | | |
Redeemed | | | (11,612 | ) | | | (14,202 | ) | |
Net Decrease in Net Assets Resulting from Capital Share Transactions | | | (5,622 | ) | | | (3,156 | ) | |
Total Increase (Decrease) in Net Assets | | | 5,023 | | | | (17,172 | ) | |
Net Assets: | |
Beginning of Period | | | 53,254 | | | | 70,426 | | |
End of Period | | $ | 58,277 | | | $ | 53,254 | | |
(1) Capital Share Transactions: | |
Class II: | |
Shares Subscribed | | | 488 | | | | 974 | | |
Shares Issued on Distributions Reinvested | | | 135 | | | | 464 | | |
Shares Redeemed | | | (1,222 | ) | | | (1,735 | ) | |
Net Decrease in Class II Shares Outstanding | | | (599 | ) | | | (297 | ) | |
The accompanying notes are an integral part of the financial statements.
11
Morgan Stanley Variable Insurance Fund, Inc.
Annual Report – December 31, 2021
Financial Highlights
Global Real Estate Portfolio
| | | Class II | |
| | | Year Ended December 31, | |
Selected Per Share Data and Ratios | | 2021 | | 2020 | | 2019 | | 2018 | | 2017 | |
Net Asset Value, Beginning of Period | | $ | 8.56 | | | $ | 10.80 | | | $ | 9.87 | | | $ | 11.09 | | | $ | 10.36 | | |
Income (Loss) from Investment Operations: | |
Net Investment Income(1) | | | 0.18 | | | | 0.16 | | | | 0.18 | | | | 0.25 | | | | 0.24 | | |
Net Realized and Unrealized Gain (Loss) | | | 1.85 | | | | (1.86 | ) | | | 1.58 | | | | (1.13 | ) | | | 0.75 | | |
Total from Investment Operations | | | 2.03 | | | | (1.70 | ) | | | 1.76 | | | | (0.88 | ) | | | 0.99 | | |
Distributions from and/or in Excess of: | |
Net Investment Income | | | (0.23 | ) | | | (0.37 | ) | | | (0.29 | ) | | | (0.34 | ) | | | (0.26 | ) | |
Net Realized Gain | | | — | | | | (0.17 | ) | | | (0.54 | ) | | | — | | | | — | | |
Total Distributions | | | (0.23 | ) | | | (0.54 | ) | | | (0.83 | ) | | | (0.34 | ) | | | (0.26 | ) | |
Net Asset Value, End of Period | | $ | 10.36 | | | $ | 8.56 | | | $ | 10.80 | | | $ | 9.87 | | | $ | 11.09 | | |
Total Return(2) | | | 23.83 | % | | | (14.85 | )% | | | 18.06 | % | | | (8.20 | )% | | | 9.71 | % | |
Ratios to Average Net Assets and Supplemental Data: | |
Net Assets, End of Period (Thousands) | | $ | 58,277 | | | $ | 53,254 | | | $ | 70,426 | | | $ | 66,751 | | | $ | 83,625 | | |
Ratio of Expenses Before Expense Limitation | | | 1.81 | % | | | 1.81 | % | | | 1.64 | % | | | 1.66 | % | | | 1.69 | % | |
Ratio of Expenses After Expense Limitation | | | 1.25 | %(3) | | | 1.25 | %(3) | | | 1.25 | %(3) | | | 1.33 | %(3)(4) | | | 1.40 | %(3) | |
Ratio of Net Investment Income | | | 1.89 | %(3) | | | 1.89 | %(3) | | | 1.67 | %(3) | | | 2.37 | %(3) | | | 2.26 | %(3) | |
Ratio of Rebate from Morgan Stanley Affiliates | | | 0.00 | %(5) | | | 0.00 | %(5) | | | 0.00 | %(5) | | | 0.00 | %(5) | | | 0.00 | %(5) | |
Portfolio Turnover Rate | | | 123 | % | | | 53 | % | | | 24 | % | | | 36 | % | | | 34 | % | |
(1) Per share amount is based on average shares outstanding.
(2) Calculated based on the net asset value as of the last business day of the period. Performance does not reflect fees and expenses imposed by your insurance company's separate account. If performance information included the effect of these additional charges, the total return would be lower.
(3) The Ratio of Expenses After Expense Limitation and Ratio of Net Investment Income reflect the rebate of certain Fund expenses in connection with the investments in Morgan Stanley affiliates during the period. The effect of the rebate on the ratios is disclosed in the above table as "Ratio of Rebate from Morgan Stanley Affiliates."
(4) Effective July 1, 2018, the Adviser has agreed to limit the ratio of expenses to average net assets to the maximum ratio of 1.25% for Class II shares. Prior to July 1, 2018, the maximum ratio was 1.40% for Class II shares.
(5) Amount is less than 0.005%.
The accompanying notes are an integral part of the financial statements.
12
Morgan Stanley Variable Insurance Fund, Inc.
Annual Report – December 31, 2021
Notes to Financial Statements
Morgan Stanley Variable Insurance Fund, Inc. (the "Company") is registered under the Investment Company Act of 1940, as amended (the "Act"), as an open-end management investment company. The Company is comprised of ten separate active, diversified and non-diversified funds (individually referred to as a "Fund," collectively as the "Funds"). The Company applies investment company accounting and reporting guidance.
The accompanying financial statements relate to the Global Real Estate Portfolio. The Fund seeks to provide current income and capital appreciation. The Fund currently offers Class II shares only, although Class I shares may be offered in the future.
The Company is intended to be a funding vehicle for variable annuity contracts and variable life insurance policies offered by the separate accounts of certain life insurance companies.
A. Significant Accounting Policies: The following significant accounting policies are in conformity with U.S. generally accepted accounting principles ("GAAP"). Such policies are consistently followed by the Company in the preparation of its financial statements. GAAP may require management to make estimates and assumptions that affect the reported amounts and disclosures in the financial statements. Actual results may differ from those estimates.
1. Security Valuation: (1) An equity portfolio security listed or traded on an exchange is valued at its latest reported sales price (or at the exchange official closing price if such exchange reports an official closing price), and if there were no sales on a given day and if there is no official exchange closing price for that day, the security is valued at the mean between the last reported bid and asked prices if such bid and asked prices are available on the relevant exchanges. If only bid prices are available then the latest bid price may be used. Listed equity securities not traded on the valuation date with no reported bid and asked prices available on the exchange are valued at the mean between the current bid and asked prices obtained from one or more reputable brokers or dealers. In cases where a security is traded on more than one exchange, the security is valued on the exchange designated as the primary market; (2) all other equity portfolio securities for which over-the-counter ("OTC") market quotations are readily available are valued at the latest reported sales price (or at the market official closing price if such market reports an official closing price), and if there was no trading in the security on a given day and if there is no official closing price from relevant markets for that day, the security is valued at the mean between the last reported bid and asked prices if such bid and asked prices
are available on the relevant markets. An unlisted equity security that does not trade on the valuation date and for which bid and asked prices from the relevant markets are unavailable is valued at the mean between the current bid and asked prices obtained from one or more reputable brokers or dealers; (3) certain portfolio securities may be valued by an outside pricing service/vendor approved by the Company's Board of Directors (the "Directors"). The pricing service/vendor may employ a pricing model that takes into account, among other things, bids, yield spreads and/or other market data and specific security characteristics. Alternatively, if a valuation is not available from an outside pricing service/vendor, and the security trades on an exchange, the security may be valued at its latest reported sale price (or at the exchange official closing price if such exchange reports an official closing price), prior to the time when assets are valued. If there are no sales on a given day and if there is no official exchange closing price for that day, the security is valued at the mean between the last reported bid and asked prices if such bid and asked prices are available in the relevant exchanges. If only bid prices are available then the latest bid price may be used. If Morgan Stanley Investment Management Inc. (the "Adviser") or Morgan Stanley Investment Management Limited ("MSIM Limited") and Morgan Stanley Investment Management Company ("MSIM Company") (together, the "Sub-Advisers"), each a wholly-owned subsidiary of Morgan Stanley, determines that the price provided by the outside pricing service/vendor or exchange does not reflect the security's fair value or is unable to provide a price, prices from brokers or dealers may also be utilized. In these circumstances, the value of the security will be the mean of bid and asked prices obtained from brokers or dealers; (4) when market quotations are not readily available, including circumstances under which the Adviser or the Sub-Advisers determine that the closing price, last sale price or the mean between the last reported bid and asked prices are not reflective of a security's market value, portfolio securities are valued at their fair value as determined in good faith under procedures established by and under the general supervision of the Directors. Occasionally, developments affecting the closing prices of securities and other assets may occur between the times at which valuations of such securities are determined (that is, close of the foreign market on which the securities trade) and the close of business of the New York Stock Exchange ("NYSE"). If developments occur during such periods that are expected to materially affect the value of such securities, such valuations may be adjusted to reflect the estimated
13
Morgan Stanley Variable Insurance Fund, Inc.
Annual Report – December 31, 2021
Notes to Financial Statements (cont'd)
fair value of such securities as of the close of the NYSE, as determined in good faith by the Directors or by the Adviser using a pricing service and/or procedures approved by the Directors; (5) quotations of foreign portfolio securities, other assets and liabilities and forward contracts stated in foreign currency are translated into U.S. dollar equivalents at the prevailing market rates prior to the close of the NYSE; and (6) investments in mutual funds, including the Morgan Stanley Institutional Liquidity Funds, are valued at the net asset value ("NAV") as of the close of each business day.
The Directors have responsibility for determining in good faith the fair value of the investments, and the Directors may appoint others, such as the Company's Adviser or a valuation committee, to assist the Directors in determining fair value and to make the actual calculations pursuant to the fair valuation methodologies previously approved by the Directors. Under procedures approved by the Directors, the Company's Adviser has formed a Valuation Committee whose members are approved by the Directors. The Valuation Committee provides administration and oversight of the Company's valuation policies and procedures, which are reviewed at least annually by the Directors. These procedures allow the Company to utilize independent pricing services, quotations from securities and financial instrument dealers and other market sources to determine fair value.
The Fund invests a significant portion of its assets in securities of REITs. The market's perception of prospective declines in private real estate values and other financial assets may result in increased volatility of market prices that can negatively impact the valuation of certain issuers held by the Fund.
2. Fair Value Measurement: Financial Accounting Standards Board ("FASB") Accounting Standards CodificationTM ("ASC") 820, "Fair Value Measurement" ("ASC 820"), defines fair value as the value that the Fund would receive to sell an investment or pay to transfer a liability in a timely transaction with an independent buyer in the principal market, or in the absence of a principal market, the most advantageous market for the investment or liability. ASC 820 establishes a three-tier hierarchy to distinguish between (1) inputs that reflect the assumptions market participants would use in valuing an asset or liability developed based on market data obtained from sources independent of the reporting entity (observable inputs) and (2) inputs that reflect the reporting entity's own assumptions about the assumptions market
participants would use in valuing an asset or liability developed based on the best information available in the circumstances (unobservable inputs) and to establish classification of fair value measurements for disclosure purposes. Various inputs are used in determining the value of the Fund's investments. The inputs are summarized in the three broad levels listed below:
• Level 1 – unadjusted quoted prices in active markets for identical investments
• Level 2 – other significant observable inputs (including quoted prices for similar investments, interest rates, prepayment speeds, credit risk, etc.)
• Level 3 – significant unobservable inputs including the Fund's own assumptions in determining the fair value of investments. Factors considered in making this determination may include, but are not limited to, information obtained by contacting the issuer, analysts, or the appropriate stock exchange (for exchange-traded securities), analysis of the issuer's financial statements or other available documents and, if necessary, available information concerning other securities in similar circumstances.
The inputs or methodology used for valuing securities are not necessarily an indication of the risk associated with investing in those securities and the determination of the significance of a particular input to the fair value measurement in its entirety requires judgment and considers factors specific to each security.
The following is a summary of the inputs used to value the Fund's investments as of December 31, 2021:
Investment Type | | Level 1
Unadjusted
quoted
prices
(000) | | Level 2
Other
significant
observable
inputs
(000) | | Level 3
Significant
unobservable
inputs
(000) | | Total
(000) | |
Assets: | |
Common Stocks | |
Diversified | | $ | 8,380 | | | $ | 3,580 | | | $ | — | | | $ | 11,960 | | |
Health Care | | | 4,687 | | | | — | | | | — | | | | 4,687 | | |
Industrial | | | 7,775 | | | | 857 | | | | — | | | | 8,632 | | |
Industrial/Office Mixed | | | 285 | | | | 23 | | | | — | | | | 308 | | |
Lodging/Resorts | | | 891 | | | | 221 | | | | — | | | | 1,112 | | |
Office | | | 4,372 | | | | 1,984 | | | | — | | | | 6,356 | | |
Residential | | | 8,605 | | | | 1,566 | | | | 20 | | | | 10,191 | | |
Retail | | | 7,300 | | | | 175 | | | | — | | | | 7,475 | | |
Self Storage | | | 5,458 | | | | — | | | | — | | | | 5,458 | | |
Specialty | | | 1,710 | | | | — | | | | — | | | | 1,710 | | |
Total Common Stocks | | | 49,463 | | | | 8,406 | | | | 20 | | | | 57,889 | | |
14
Morgan Stanley Variable Insurance Fund, Inc.
Annual Report – December 31, 2021
Notes to Financial Statements (cont'd)
Investment Type | | Level 1
Unadjusted
quoted
prices
(000) | | Level 2
Other
significant
observable
inputs
(000) | | Level 3
Significant
unobservable
inputs
(000) | | Total
(000) | |
Short-Term Investments | |
Investment Company | | $ | 298 | | | $ | — | | | $ | — | | | $ | 298 | | |
Repurchase Agreements | | | — | | | | 19 | | | | — | | | | 19 | | |
Total Short-Term
Investments | | | 298 | | | | 19 | | | | — | | | | 317 | | |
Total Assets | | $ | 49,761 | | | $ | 8,425 | | | $ | 20 | | | $ | 58,206 | | |
Transfers between investment levels may occur as the markets fluctuate and/or the availability of data used in an investment's valuation changes.
Following is a reconciliation of investments in which significant unobservable inputs (Level 3) were used in determining fair value:
| | | Common
Stock
(000) | |
Beginning Balance | | $ | 9 | | |
Purchases | | | — | | |
Sales | | | — | | |
Amortization of discount | | | — | | |
Transfers in | | | — | | |
Transfers out | | | — | | |
Corporate actions | | | — | | |
Change in unrealized
appreciation (depreciation) | | | 11 | | |
Realized gains (losses) | | | — | | |
Ending Balance | | $ | 20 | | |
Net change in unrealized appreciation
(depreciation) from investments still
held as of December 31, 2021 | | $ | 11 | | |
The following table presents additional information about valuation techniques and inputs used for investments that are measured at fair value and categorized within Level 3 as of December 31, 2021:
| | | Fair Value at
December 31, 2021
(000) | | Valuation
Technique | | Unobservable
Input | | Amount* | | Impact to
Valuation from an
Increase in Input** | |
Common Stock | | $ | 20 | | | Market Transaction
Method | | Transaction Valuation | | $ | 0.003 | | | Increase | |
* Amount is indicative of the weighted average.
** Represents the expected directional change in the fair value of the Level 3 investments that would result from an increase in the corresponding input. A decrease to the unobservable input would have the opposite effect. Significant changes in these inputs could result in significantly higher or lower fair value measurements.
3. Repurchase Agreements: The Fund may enter into repurchase agreements under which the Fund lends cash and takes possession of securities with an agreement that the counterparty will repurchase such securities. In connection with transactions in repurchase agreements, a bank as custodian for the Fund takes possession of the underlying securities which are held as collateral, with a market value at least equal to the amount of the repurchase transaction, including principal and accrued interest. To the extent that any repurchase transaction exceeds one business day, the value of the collateral is marked-tomarket on a daily basis to determine that the value of the collateral does not decrease below the repurchase price plus accrued interest as earned. If such a decrease occurs, additional collateral will be requested and, when received, will be added to the account to maintain full collateralization. In the event of default on the obligation to repurchase, the Fund has the right to liquidate the collateral and apply the proceeds in satisfaction of the obligation. In the event of default or
bankruptcy by the counterparty to the agreement, realization of the collateral proceeds may be subject to cost and delays. The Fund, along with other affiliated investment companies, may utilize a joint trading account for the purpose of entering into repurchase agreements.
4. Foreign Currency Translation and Foreign Investments: The books and records of the Fund are maintained in U.S. dollars. Foreign currency amounts are translated into U.S. dollars as follows:
— investments, other assets and liabilities at the prevailing rate of exchange on the valuation date;
— investment transactions and investment income at the prevailing rates of exchange on the dates of such transactions.
Although the net assets of the Fund are presented at the foreign exchange rates and market values at the close of the period, the Fund does not isolate that portion of the results of operations arising as a result of changes in the
15
Morgan Stanley Variable Insurance Fund, Inc.
Annual Report – December 31, 2021
Notes to Financial Statements (cont'd)
foreign exchange rates from the fluctuations arising from changes in the market prices of securities held at period end. Similarly, the Fund does not isolate the effect of changes in foreign exchange rates from the fluctuations arising from changes in the market prices of securities sold during the period. Accordingly, realized and unrealized foreign currency gains (losses) on investments in securities are included in the reported net realized and unrealized gains (losses) on investment transactions and balances. However, pursuant to U.S. federal income tax regulations, gains and losses from certain foreign currency transactions and the foreign currency portion of gains and losses realized on sales and maturities of foreign denominated debt securities are treated as ordinary income for U.S. federal income tax purposes.
Net realized gains (losses) on foreign currency transactions represent net foreign exchange gains (losses) from foreign currency forward exchange contracts, disposition of foreign currencies, currency gains (losses) realized between the trade and settlement dates on securities transactions, and the difference between the amount of investment income and foreign withholding taxes recorded on the Fund's books and the U.S. dollar equivalent amounts actually received or paid. The change in unrealized currency gains (losses) on foreign currency transactions for the period is reflected in the Statement of Operations.
Foreign security and currency transactions may involve certain considerations and risks not typically associated with those of U.S. dollar denominated transactions as a result of, among other factors, fluctuations of exchange rates in relation to the U.S. dollar, the possibility of lower levels of governmental supervision and regulation of foreign securities markets and the possibility of political or economic instability.
Governmental approval for foreign investments may be required in advance of making an investment under certain circumstances in some countries, and the extent of foreign investments in domestic companies may be subject to limitation in other countries. Foreign ownership limitations also may be imposed by the charters of individual companies to prevent, among other concerns, violations of foreign investment limitations. As a result, an additional class of shares (identified as "Foreign" in the Portfolio of Investments) may be created and offered for investment. The "local" and "foreign shares" market values may differ. In the absence of trading of the foreign shares in such markets, the Fund values the foreign shares at the closing exchange price of the local shares.
5. Securities Lending: The Fund lends securities to qualified financial institutions, such as broker-dealers, to
earn additional income. Any increase or decrease in the fair value of the securities loaned that might occur and any interest earned or dividends declared on those securities during the term of the loan would remain in the Fund. The Fund would receive cash or securities as collateral in an amount equal to or exceeding 100% of the current fair value of the loaned securities. The collateral is marked-to-market daily by State Street Bank and Trust Company ("State Street"), the securities lending agent, to ensure that a minimum of 100% collateral coverage is maintained.
Based on pre-established guidelines, the securities lending agent invests any cash collateral that is received in an affiliated money market portfolio and repurchase agreements. Securities lending income is generated from the earnings on the invested collateral and borrowing fees, less any rebates owed to the borrowers and compensation to the lending agent, and is recorded as "Income from Securities Loaned — Net" in the Fund's Statement of Operations. Risks in securities lending transactions are that a borrower may not provide additional collateral when required or return the securities when due, and that the value of the short-term investments will be less than the amount of cash collateral plus any rebate that is required to be returned to the borrower.
The Fund has the right under the securities lending agreement to recover the securities from the borrower on demand.
The following table presents financial instruments that are subject to enforceable netting arrangements as of December 31, 2021:
Gross Amounts Not Offset in the Statement of Assets and Liabilities | |
Gross Asset
Amounts
Presented
in the
Statement of
Assets and
Liabilities
(000) | | Financial
Instrument
(000) | | Collateral
Received
(000) | | Net Amount
(not less
than $0)
(000) | |
| $ | 188 | (a) | | $ | — | | | $ | (188 | )(b)(c) | | $ | 0 | | |
(a) Represents market value of loaned securities at year end.
(b) The Fund received cash collateral of approximately $121,000, which was subsequently invested in Repurchase Agreements and Morgan Stanley Institutional Liquidity Funds as reported in the Portfolio of Investments. As of December 31, 2021, there was uninvested cash of less than $500, which is not reflected in the Portfolio of Investments. In addition, the Fund received non-cash collateral of approximately $91,000 in the form of U.S. Government obligations, which the Fund cannot sell or repledge, and accordingly are not reflected in the Portfolio of Investments.
(c) The actual collateral received is greater than the amount shown here due to overcollateralization.
16
Morgan Stanley Variable Insurance Fund, Inc.
Annual Report – December 31, 2021
Notes to Financial Statements (cont'd)
FASB ASC 860, "Transfers & Servicing: Repurchase-to-Maturity Transactions, Repurchase Financings, and Disclosures", is intended to provide increased transparency about the types of collateral pledged in securities lending transactions and other similar transactions that are accounted for as secured borrowing.
The following table displays a breakdown of transactions accounted for as secured borrowings, the gross obligations by class of collateral pledged and the remaining contractual maturity of those transactions as of December 31, 2021:
Remaining Contractual Maturity of the Agreements | |
| | | Overnight and
Continuous
(000) | | <30 days
(000) | | Between
30 &
90 days
(000) | | >90 days
(000) | | Total
(000) | |
Securities Lending
Transactions | |
Common Stocks | | $ | 121 | | | $ | — | | | $ | — | | | $ | — | | | $ | 121 | | |
Total Borrowings | | $ | 121 | | | $ | — | | | $ | — | | | $ | — | | | $ | 121 | | |
Gross amount of
recognized liabilities
for securities lending
transactions | | $ | 121 | | |
6. Indemnifications: The Company enters into contracts that contain a variety of indemnifications. The Company's maximum exposure under these arrangements is unknown. However, the Company has not had prior claims or losses pursuant to these contracts and expects the risk of loss to be remote.
7. Security Transactions, Income and Expenses: Security transactions are accounted for on the trade date (date the order to buy or sell is executed). Realized gains and losses on the sale of investment securities are determined on the specific identified cost method. Dividend income and other distributions are recorded on the ex-dividend date (except for certain foreign dividends which may be recorded as soon as the Fund is informed of such dividends) net of applicable withholding taxes. Non-cash dividends received in the form of stock, if any, are recognized on the ex-dividend date and recorded as non-cash dividend income at fair value. Interest income is recognized on the accrual basis net of applicable withholding taxes except where collection is in doubt. Discounts are accreted and premiums are amortized over the life of the respective securities. Most expenses of the Company can be directly attributed to a particular Fund. Expenses which cannot be directly attributed are apportioned among the Funds based upon relative net assets or other appropriate methods. Income, expenses (other than class specific expenses) and realized and unrealized gains or
losses are allocated to each class of shares based upon their relative net assets.
The Fund owns shares of REITs which report information on the source of their distributions annually in the following calendar year. A portion of distributions received from REITs during the year is estimated to be a return of capital and is recorded as a reduction of their cost.
Settlement and registration of foreign securities transactions may be subject to significant risks not normally associated with investments in the United States. In certain markets, ownership of shares is defined according to entries in the issuer's share register. It is possible that a Fund holding these securities could lose its share registration through fraud, negligence or even mere oversight. In addition, shares being delivered for sales and cash being paid for purchases may be delivered before the exchange is complete. This may subject the Fund to further risk of loss in the event of a failure to complete the transaction by the counterparty.
8. Dividends and Distributions to Shareholders: Dividends and distributions to shareholders are recorded on the ex-dividend date. Dividends from net investment income, if any, are declared and paid annually. Net realized capital gains, if any, are distributed at least annually.
B. Advisory/Sub-Advisory Fees: The Adviser, a wholly-owned subsidiary of Morgan Stanley, provides the Fund with advisory services under the terms of an Investment Advisory Agreement, paid quarterly, at an annual rate of 0.80% of the daily net assets of the Fund.
The Adviser has agreed to reduce its advisory fee and/or reimburse the Fund so that the total annual Fund operating expenses, excluding certain investment related expenses, taxes, interest and other extraordinary expenses (including litigation), will not exceed 1.25% for Class II shares. The fee waivers and/or expense reimbursements will continue for at least one year from the date of the Fund's prospectus or until such time as the Directors act to discontinue all or a portion of such waivers and/or reimbursements when they deem such action is appropriate. For the year ended December 31, 2021, approximately $318,000 of advisory fees were waived pursuant to this arrangement.
The Adviser has entered into Sub-Advisory Agreements with the Sub-Advisers, each a wholly-owned subsidiary of Morgan Stanley. The Sub-Advisers provide the Fund with advisory services subject to the overall supervision of the Adviser and the Company's Officers and Directors. The Adviser pays the Sub-Advisers on a monthly basis a portion of the net advisory fees the Adviser receives from the Fund.
17
Morgan Stanley Variable Insurance Fund, Inc.
Annual Report – December 31, 2021
Notes to Financial Statements (cont'd)
C. Administration Fees: The Adviser also serves as Administrator to the Company and provides administrative services pursuant to an Administration Agreement for an annual fee, accrued daily and paid monthly, of 0.08% of the Fund's average daily net assets.
Under a Sub-Administration Agreement between the Administrator and State Street, State Street provides certain administrative services to the Company. For such services, the Administrator pays State Street a portion of the fee the Administrator receives from the Fund.
D. Servicing Fees: The Company accrues daily and pays quarterly a servicing fee of up to 0.17% of the average daily value of shares of the Fund held in an insurance company's account. Certain insurance companies have entered into a servicing agreement with the Company to provide administrative and other contract-owner related services on behalf of the Fund.
E. Distribution Fees: Morgan Stanley Distribution, Inc. ("MSDI" or the "Distributor"), a wholly-owned subsidiary of the Adviser and an indirect subsidiary of Morgan Stanley, serves as the Distributor of the Fund and provides the Fund's Class II shareholders with distribution services pursuant to a Distribution Plan (the "Plan") in accordance with Rule 12b-1 under the Act. Under the Plan, the Fund is authorized to pay the Distributor a distribution fee, which is accrued daily and paid monthly, at an annual rate of 0.25% of the Fund's average daily net assets attributable to Class II shares.
F. Dividend Disbursing and Transfer Agent: The Company's dividend disbursing and transfer agent is DST Asset Manager Solutions, Inc. ("DST"). Pursuant to a Transfer Agency Agreement, the Company pays DST a fee based on the number of classes, accounts and transactions relating to the Funds of the Company.
G. Custodian Fees: State Street (the "Custodian") also serves as Custodian for the Company in accordance with a Custodian Agreement. The Custodian holds cash, securities and other assets of the Company as required by the Act. Custody fees are payable monthly based on assets held in custody, investment purchases and sales activity and account maintenance fees, plus reimbursement for certain out-of-pocket expenses.
H. Security Transactions and Transactions with Affiliates: For the year ended December 31, 2021, purchases and sales of investment securities for the Fund, other than long-term U.S. Government securities and short-term investments were approximately $68,190,000 and $74,182,000, respectively. There were no purchases and sales of long-term
U.S. Government securities for the year ended December 31, 2021.
The Fund invests in the Institutional Class of the Morgan Stanley Institutional Liquidity Funds — Treasury Portfolio (the "Liquidity Funds"), an open-end management investment company managed by the Adviser, both directly and as a portion of the securities held as collateral on loaned securities. Advisory fees paid by the Fund are reduced by an amount equal to its pro-rata share of the advisory and administration fees paid by the Fund due to its investment in the Liquidity Funds. For the year ended December 31, 2021, advisory fees paid were reduced by less than $500 relating to the Fund's investment in the Liquidity Funds.
A summary of the Fund's transactions in shares of affiliated investments during the year ended December 31, 2021 is as follows:
Affiliated
Investment
Company | | Value
December 31,
2020
(000) | | Purchases
at Cost
(000) | | Proceeds
from Sales
(000) | | Dividend
Income
(000) | |
Liquidity Funds | | $ | 618 | | | $ | 13,785 | | | $ | 14,105 | | | $ | — | @ | |
Affiliated
Investment
Company (cont'd) | | Realized
Gain (Loss)
(000) | | Change in
Unrealized
Appreciation
(Depreciation)
(000) | | Value
December 31,
2021
(000) | |
Liquidity Funds | | $ | — | | | $ | — | | | $ | 298 | | |
@ Amount is less than $500.
The Fund is permitted to purchase and sell securities ("cross-trade") from and to other Morgan Stanley funds as well as other funds and client accounts for which the Adviser or an affiliate of the Adviser serves as investment adviser, pursuant to procedures approved by the Directors in compliance with Rule 17a-7 under the Act (the "Rule"). Each cross-trade is executed at the current market price in compliance with provisions of the Rule. For the year ended December 31, 2021, the Fund did not engage in any cross-trade transactions.
The Fund has an unfunded Deferred Compensation Plan (the "Compensation Plan"), which allows each independent Director to defer payment of all, or a portion, of the fees he or she receives for serving on the Board of Directors. Each eligible Director generally may elect to have the deferred amounts credited with a return equal to the total return on one or more of the Morgan Stanley funds that are offered as investment options under the Compensation Plan. Appreciation/depreciation and distributions received from these investments are recorded with an offsetting increase/decrease in the
18
Morgan Stanley Variable Insurance Fund, Inc.
Annual Report – December 31, 2021
Notes to Financial Statements (cont'd)
deferred compensation obligation and do not affect the NAV of the Fund.
I. Federal Income Taxes: It is the Fund's intention to continue to qualify as a regulated investment company and distribute all of its taxable and tax-exempt income. Accordingly, no provision for federal income taxes is required in the financial statements.
The Fund may be subject to taxes imposed by countries in which it invests. Such taxes are generally based on income and/or capital gains earned or repatriated. Taxes are accrued based on net investment income, net realized gains and net unrealized appreciation as such income and/or gains are earned. Taxes may also be based on transactions in foreign currency and are accrued based on the value of investments denominated in such currency.
FASB ASC 740-10, "Income Taxes — Overall", sets forth a minimum threshold for financial statement recognition of the benefit of a tax position taken or expected to be taken in a tax return. Management has concluded there are no significant uncertain tax positions that would require recognition in the financial statements. If applicable, the Fund recognizes interest accrued related to unrecognized tax benefits in "Interest Expense" and penalties in "Other Expenses" in the Statement of Operations. The Fund files tax returns with the U.S. Internal Revenue Service, New York and various states. Generally, each of the tax years in the four-year period ended December 31, 2021 remains subject to examination by taxing authorities.
The tax character of distributions paid may differ from the character of distributions shown for GAAP purposes due to short-term capital gains being treated as ordinary income for tax purposes. The tax character of distributions paid during fiscal years 2021 and 2020 was as follows:
2021 Distributions
Paid From: | | 2020 Distributions
Paid From: | |
Ordinary
Income
(000) | | Long-Term
Capital Gain
(000) | | Ordinary
Income
(000) | | Long-Term
Capital Gain
(000) | |
$ | 1,323 | | | $ | — | | | $ | 2,346 | | | $ | 1,057 | | |
The amount and character of income and gains to be distributed are determined in accordance with income tax regulations which may differ from GAAP. These book/tax differences are either considered temporary or permanent in nature.
Temporary differences are attributable to differing book and tax treatments for the timing of the recognition of gains (losses) on certain investment transactions and the timing of the deductibility of certain expenses.
Permanent differences, due to equalization debits, resulted in the following reclassifications among the components of net assets at December 31, 2021:
Total
Distributable
Earnings
(000) | | Paid-in-
Capital
(000) | |
| $ | (347 | ) | | $ | 347 | | |
At December 31, 2021, the components of distributable earnings for the Fund on a tax basis were as follows:
Undistributed
Ordinary
Income
(000) | | Undistributed
Long-Term
Capital Gain
(000) | |
| $ | 3,600 | | | $ | 162 | | |
During the year ended December 31, 2021, the Fund utilized capital loss carryforwards for U.S. federal income tax purposes of approximately $6,764,000.
J. Credit Facility: The Company and other Morgan Stanley funds participated in a $300,000,000 committed, unsecured revolving line of credit facility (the "Facility") with State Street. This Facility is to be used for temporary emergency purposes or funding of shareholder redemption requests. The interest rate on borrowings is based on the federal funds rate or 1 month LIBOR rate plus a spread. Effective April 19, 2021, the interest rate on borrowings is based on the federal funds effective rate or overnight bank funding rate plus a spread. The Facility also has a commitment fee of 0.25% per annum based on the unused portion of the Facility. During the year ended December 31, 2021, the Fund did not have any borrowings under the Facility.
K. Other: At December 31, 2021, the Fund had record owners of 10% or greater. Investment activities of these shareholders could have a material impact on the Fund. The aggregate percentage of such owners was 85.3%.
L. Market Risk: The outbreak of the coronavirus ("COVID-19") and the recovery responses could adversely impact the operations of the Fund and its service providers and financial performance of the Fund and the Fund's investments. The extent of such impact depends on future developments, including (i) the duration and spread of the outbreak, (ii) the restrictions and advisories, (iii) the effects on the financial markets, (iv) government and regulatory responses, and (v) the effects on the economy overall as a result of developments such as disruption to consumer demand, economic output and supply chains. The duration and extent of COVID-19 and associated economic and market conditions and uncertainty over the long term cannot be reasonably estimated at this time. The ultimate impact of COVID-19
19
Morgan Stanley Variable Insurance Fund, Inc.
Annual Report – December 31, 2021
Notes to Financial Statements (cont'd)
and the extent to which the associated conditions impact the Fund will also depend on future developments, which are highly uncertain, difficult to accurately predict and subject to change at any time. If the financial performance of the Fund's investments is impacted because of these factors for an extended period, the Fund's investment results may be adversely affected.
20
Morgan Stanley Variable Insurance Fund, Inc.
Annual Report – December 31, 2021
Report of Independent Registered Public Accounting Firm
To the Shareholders and Board of Directors of
Morgan Stanley Variable Insurance Fund, Inc. —
Global Real Estate Portfolio
Opinion on the Financial Statements
We have audited the accompanying statement of assets and liabilities of Global Real Estate Portfolio (the "Fund") (one of the funds constituting Morgan Stanley Variable Insurance Fund, Inc. (the "Company")), including the portfolio of investments, as of December 31, 2021, and the related statement of operations for the year then ended, the statements of changes in net assets for each of the two years in the period then ended, the financial highlights for each of the five years in the period then ended and the related notes (collectively referred to as the "financial statements"). In our opinion, the financial statements present fairly, in all material respects, the financial position of Global Real Estate Portfolio (one of the funds constituting Morgan Stanley Variable Insurance Fund, Inc.) at December 31, 2021, the results of its operations for the year then ended, the changes in its net assets for each of the two years in the period then ended and its financial highlights for each of the five years in the period then ended, in conformity with U.S. generally accepted accounting principles.
Basis for Opinion
These financial statements are the responsibility of the Company's management. Our responsibility is to express an opinion on the Fund's financial statements based on our audits. We are a public accounting firm registered with the Public Company Accounting Oversight Board (United States) ("PCAOB") and are required to be independent with respect to the Company in accordance with the U.S. federal securities law and the applicable rules and regulations of the Securities and Exchange Commission and the PCAOB.
We conducted our audits in accordance with the standards of the PCAOB. Those standards require that we plan and perform the audit to obtain reasonable assurance about whether the financial statements are free of material misstatement, whether due to error or fraud. The Company is not required to have, nor were we engaged to perform, an audit of the Company's internal control over financial reporting. As part of our audits, we are required to obtain an understanding of internal control over financial reporting, but not for the purpose of expressing an opinion on the effectiveness of the Company's internal control over financial reporting. Accordingly, we express no such opinion.
Our audits included performing procedures to assess the risks of material misstatement of the financial statements, whether due to error or fraud, and performing procedures that respond to those risks. Such procedures included examining, on a test basis, evidence regarding the amounts and disclosures in the financial statements. Our procedures included confirmation of securities owned as of December 31, 2021 by correspondence with the custodian and others or by other appropriate auditing procedures where replies from others were not received. Our audits also included evaluating the accounting principles used and significant estimates made by management, as well as evaluating the overall presentation of the financial statements. We believe that our audits provide a reasonable basis for our opinion.

We have served as the auditor of one or more Morgan Stanley investment companies since 2000.
Boston, Massachusetts
February 18, 2022
21
Morgan Stanley Variable Insurance Fund, Inc.
Annual Report – December 31, 2021
Liquidity Risk Management Program (unaudited)
In compliance with Rule 22e-4 under the Investment Company Act of 1940, as amended (the "Liquidity Rule"), the Fund has adopted and implemented a liquidity risk management program (the "Program"), which is reasonably designed to assess and manage the risk that the Fund could not meet requests to redeem shares issued by the Fund without significant dilution of remaining investors' interests in the Fund (i.e., liquidity risk). The Fund's Board of Directors (the "Board") previously approved the designation of the Liquidity Risk Subcommittee (the "LRS") as Program administrator. The LRS is comprised of representatives from various divisions within Morgan Stanley Investment Management.
At a meeting held on March 3-4, 2021, the Board reviewed a written report prepared by the LRS that addressed the Program's operation and assessed its adequacy, and effectiveness of implementation for the period from January 1, 2020, through December 31, 2020, as required under the Liquidity Rule, and discussed the impact of the COVID-19 pandemic on liquidity and the LRS's assessment of liquidity risk during the reporting period, including during the distressed market environment caused by the onset of the COVID-19 pandemic. The report concluded that the Program operated effectively and was adequately and effectively implemented in all material aspects, and that the relevant controls and safeguards were appropriately designed to enable the LRS to administer the Program in compliance with the Liquidity Rule.
In accordance with the Program, the LRS assessed each Fund's liquidity risk no less frequently than annually taking into consideration certain factors, as applicable, such as (i) investment strategy and liquidity of portfolio investments, (ii) short-term and long-term cash flow projections and (iii) holdings of cash and cash equivalents and borrowing arrangements and other funding sources. Certain factors are considered under both normal and reasonably foreseeable stressed conditions.
Each Fund portfolio investment is classified into one of four liquidity categories, which classification is assessed at least monthly by the LRS. The classification is based on a determination of the number of days it is reasonably expected to take to convert the investment into cash, or sell or dispose of the investment, in current market conditions without significantly changing the market value of the investment. Liquidity classification determinations take into account various market, trading and investment-specific considerations, as well as market depth, and in some cases utilize third-party vendor data.
The Liquidity Rule limits a fund's investments in illiquid investments to 15% of its net assets and requires funds that do not primarily hold assets that are highly liquid investments to determine and maintain a minimum percentage of the fund's net assets to be invested in highly liquid investments (highly liquid investment minimum or "HLIM"). The LRS believes that the Program includes provisions reasonably designed to review, monitor and comply with the 15% limit on illiquid investments and for determining, periodically reviewing and complying with the HLIM requirement, as applicable.
There can be no assurance that the Program will achieve its objectives under all circumstances in the future. Please refer to the Fund's prospectus for more information regarding the Fund's exposure to liquidity risk and other risks to which it may be subject.
22
Morgan Stanley Variable Insurance Fund, Inc.
Annual Report – December 31, 2021
Director and Officer Information (unaudited)
Independent Directors:
Name, Address and Birth
Year of Independent Director | | Position(s)
Held with
Registrant | | Length of
Time
Served* | | Principal Occupation(s) During Past 5 Years and
Other Relevant Professional Experience | | Number of
Funds
in Fund
Complex
Overseen
by
Independent
Director** | | Other Directorships Held by Independent
Director During Past 5 Years*** | |
Frank L. Bowman
c/o Perkins Coie LLP
Counsel to the Independent Directors
1155 Avenue of the Americas
22nd Floor
New York, NY 10036
Birth Year: 1944 | | Director | | Since August 2006 | | President, Strategic Decisions, LLC (consulting) (since February 2009); Director or Trustee of various Morgan Stanley Funds (since August 2006); Chairperson of the Compliance and Insurance Committee (since October 2015); formerly, Chairperson of the Insurance Sub-Committee of the Compliance and Insurance Committee (2007-2015); served as President and Chief Executive Officer of the Nuclear Energy Institute (policy organization) (February 2005-November 2008); retired as Admiral, U.S. Navy after serving over 38 years on active duty including 8 years as Director of the Naval Nuclear Propulsion Program in the Department of the Navy and the U.S. Department of Energy (1996-2004); served as Chief of Naval Personnel (July 1994-September 1996) and on the Joint Staff as Director of Political Military Affairs (June 1992-July 1994); knighted as Honorary Knight Commander of the Most Excellent Order of the British Empire; awarded the Officier de l'Orde National du Mérite by the French Government; elected to the National Academy of Engineering (2009). | | | 77 | | | Director of Naval and Nuclear Technologies LLP; Director Emeritus of the Armed Services YMCA; Member of the National Security Advisory Council of the Center for U.S. Global Engagement and a member of the CNA Military Advisory Board; Chairman of Fairhaven United Methodist Church; Member of the Board of Advisors of the Dolphin Scholarship Foundation; Director of other various nonprofit organizations; formerly, Director of BP, plc (November 2010-May 2019). | |
Kathleen A. Dennis
c/o Perkins Coie LLP
Counsel to the Independent Directors
1155 Avenue of the Americas
22nd Floor
New York, NY 10036
Birth Year: 1953 | | Director | | Since August 2006 | | Chairperson of the Governance Committee (since January 2021), Chairperson of the Liquidity and Alternatives Sub-Committee of the Investment Committee (2006-2020) and Director or Trustee of various Morgan Stanley Funds (since August 2006); President, Cedarwood Associates (mutual fund and investment management consulting) (since July 2006); formerly, Senior Managing Director of Victory Capital Management (1993-2006). | | | 77 | | | Board Member, University of Albany Foundation (2012-present); Board Member, Mutual Funds Directors Forum (2014-present); Director of various non-profit organizations. | |
Nancy C. Everett
c/o Perkins Coie LLP
Counsel to the Independent Directors
1155 Avenue of the Americas
22nd Floor
New York, NY 10036
Birth Year: 1955 | | Director | | Since January 2015 | | Chairperson of the Equity Investment Committee (since January 2021); Director or Trustee of various Morgan Stanley Funds (since January 2015); Chief Executive Officer, Virginia Commonwealth University Investment Company (since November 2015); Owner, OBIR, LLC (institutional investment management consulting) (since June 2014); formerly, Managing Director, BlackRock, Inc. (February 2011-December 2013) and Chief Executive Officer, General Motors Asset Management (a/k/a Promark Global Advisors, Inc.) (June 2005-May 2010). | | | 78 | | | Formerly, Member of Virginia Commonwealth University School of Business Foundation (2005-2016); Member of Virginia Commonwealth University Board of Visitors (2013-2015); Member of Committee on Directors for Emerging Markets Growth Fund, Inc. (2007-2010); Chairperson of Performance Equity Management, LLC (2006-2010); and Chairperson, GMAM Absolute Return Strategies Fund, LLC (2006-2010). | |
23
Morgan Stanley Variable Insurance Fund, Inc.
Annual Report – December 31, 2021
Director and Officer Information (unaudited) (cont'd)
Independent Directors (cont'd):
Name, Address and Birth
Year of Independent Director | | Position(s)
Held with
Registrant | | Length of
Time
Served* | | Principal Occupation(s) During Past 5 Years and
Other Relevant Professional Experience | | Number of
Funds
in Fund
Complex
Overseen
by
Independent
Director** | | Other Directorships Held by Independent
Director During Past 5 Years*** | |
Jakki L. Haussler
c/o Perkins Coie LLP
Counsel to the Independent Directors
1155 Avenue of the Americas
22nd Floor
New York, NY 10036
Birth Year: 1957 | | Director | | Since January 2015 | | Director or Trustee of various Morgan Stanley Funds (since January 2015); Chairman, Opus Capital Group (since 1996); formerly, Chief Executive Officer, Opus Capital Group (1996-2019); Director, Capvest Venture Fund, LP (May 2000-December 2011); Partner, Adena Ventures, LP (July 1999-December 2010); Director, The Victory Funds (February 2005-July 2008). | | | 78 | | | Director, Barnes Group Inc. (since July 2021); Director of Cincinnati Bell Inc. and Member, Audit Committee and Chairman, Governance and Nominating Committee; Director of Service Corporation International and Member, Audit Committee and Investment Committee; Director of Northern Kentucky University Foundation and Member, Investment Committee; Member of Chase College of Law Transactional Law Practice Center Board of Advisors; Director of Best Transport; Director of Chase College of Law Board of Visitors; formerly, Member, University of Cincinnati Foundation Investment Committee; Member, Miami University Board of Visitors (2008-2011); Trustee of Victory Funds (2005-2008) and Chairman, Investment Committee (2007-2008) and Member, Service Provider Committee (2005-2008). | |
Dr. Manuel H. Johnson
c/o Johnson Smick
International, Inc.
220 I Street, NE Suite 200
Washington, D.C. 20002
Birth Year: 1949 | | Director | | Since
July
1991 | | Senior Partner, Johnson Smick International, Inc. (consulting firm); Chairperson of the Fixed Income, Liquidity and Alternatives Investment Committee (since January 2021), Chairperson of the Investment Committee (2006-2020) and Director or Trustee of various Morgan Stanley Funds (since July 1991); Co-Chairman and a founder of the Group of Seven Council (G7C) (international economic commission); formerly, Chairperson of the Audit Committee (July 1991-September 2006); Vice Chairman of the Board of Governors of the Federal Reserve System and Assistant Secretary of the U.S. Treasury. | | | 77 | | | Director of NVR, Inc. (home construction). | |
Joseph J. Kearns
c/o Perkins Coie LLP
Counsel to the Independent Directors
1155 Avenue of the Americas
22nd Floor
New York, NY 10036
Birth Year: 1942 | | Director | | Since
August 1994 | | Senior Adviser, Kearns & Associates LLC (investment consulting); Chairperson of the Audit Committee (since October 2006) and Director or Trustee of various Morgan Stanley Funds (since August 1994); formerly, Deputy Chairperson of the Audit Committee (July 2003-September 2006) and Chairperson of the Audit Committee of various Morgan Stanley Funds (since August 1994); CFO of the J. Paul Getty Trust (1982-1999). | | | 78 | | | Director, Rubicon Investments (since February 2019); Prior to August 2016, Director of Electro Rent Corporation (equipment leasing); Prior to December 31, 2013, Director of The Ford Family Foundation. | |
Michael F. Klein
c/o Perkins Coie LLP
Counsel to the Independent Directors
1155 Avenue of the Americas
22nd Floor
New York, NY 10036
Birth Year: 1958 | | Director | | Since
August 2006 | | Chairperson of the Risk Committee (since January 2021); Managing Director, Aetos Alternatives Management, LP (since March 2000); Co-President, Aetos Alternatives Management, LP (since January 2004) and Co-Chief Executive Officer of Aetos Alternatives Management, LP (since August 2013); Chairperson of the Fixed Income Sub-Committee of the Investment Committee (2006-2020) and Director or Trustee of various Morgan Stanley Funds (since August 2006); formerly, Managing Director, Morgan Stanley & Co. Inc. and Morgan Stanley Dean Witter Investment Management and President, various Morgan Stanley Funds (June 1998-March 2000); Principal, Morgan Stanley & Co. Inc. and Morgan Stanley Dean Witter Investment Management (August 1997-December 1999). | | | 77 | | | Director of certain investment funds managed or sponsored by Aetos Alternatives Management, LP; Director of Sanitized AG and Sanitized Marketing AG (specialty chemicals). | |
24
Morgan Stanley Variable Insurance Fund, Inc.
Annual Report – December 31, 2021
Director and Officer Information (unaudited) (cont'd)
Independent Directors (cont'd):
Name, Address and Birth
Year of Independent Director | | Position(s)
Held with
Registrant | | Length of
Time
Served* | | Principal Occupation(s) During Past 5 Years and
Other Relevant Professional Experience | | Number of
Funds
in Fund
Complex
Overseen
by
Independent
Director** | | Other Directorships Held by Independent
Director During Past 5 Years*** | |
Patricia A. Maleski
c/o Perkins Coie LLP
Counsel to the Independent Directors
1155 Avenue of the Americas
22nd Floor
New York, NY 10036
Birth Year: 1960 | | Director | | Since
January 2017 | | Director or Trustee of various Morgan Stanley Funds (since January 2017); Managing Director, JPMorgan Asset Management (2004-2016); Oversight and Control Head of Fiduciary and Conflicts of Interest Program (2015-2016); Chief Control Officer — Global Asset Management (2013-2015); President, JPMorgan Funds (2010-2013); Chief Administrative Officer (2004-2013); various other positions including Treasurer and Board Liaison (since 2001). | | | 78 | | | Trustee, Nutley Family Service Bureau, Inc. (since January 2022). | |
W. Allen Reed
c/o Perkins Coie LLP
Counsel to the Independent Directors
1155 Avenue of the Americas
22nd Floor
New York, NY 10036
Birth Year: 1947 | | Chair of the Board and Director | | Chair of the Board since August 2020 and Director since August 2006 | | Chair of the Boards of various Morgan Stanley Funds (since August 2020); Director or Trustee of various Morgan Stanley Funds (since August 2006); formerly, Vice Chair of the Boards of various Morgan Stanley Funds (January 2020-August 2020); President and Chief Executive Officer of General Motors Asset Management; Chairman and Chief Executive Officer of the GM Trust Bank and Corporate Vice President of General Motors Corporation (August 1994-December 2005). | | | 77 | | | Formerly, Director of Legg Mason, Inc. (2006-2019); and Director of the Auburn University Foundation (2010-2015). | |
Frances L. Cashman
c/o Perkins Coie LLP
Counsel to the Independent Directors
1155 Avenue of the Americas
22nd Floor
New York, NY 10036
Birth Year: 1961 | | Advisory Board Member | | Advisory Board Member Since January 2022 | | Chief Executive Officer, Asset Management Division, Euromoney Institutional Investor PLC (financial information) (May 2021-Present); Executive Vice President and various other roles, Legg Mason & Co. (asset management) (2010-2020); Managing Director, Stifel Nicolaus (2005-2010). | | | 78 | | | Trustee and Investment Committee Member, Georgia Tech Foundation (Since June 2019); Trustee and Chair of Marketing Committee, Loyola Blakefield (Since September 2017); Trustee, MMI Gateway Foundation (since September 2017); Director and Investment Committee Member, Catholic Community Foundation Board (2012-2018); Director and Investment Committee Member, St. Ignatius Loyola Academy (2011-2017). | |
Eddie A. Grier
c/o Perkins Coie LLP
Counsel to the Independent Directors
1155 Avenue of the Americas
22nd Floor
New York, NY 10036
Birth Year: 1955 | | Advisory Board Member | | Advisory Board Member Since January 2022 | | Dean, Santa Clara University Leavey School of Business (since April 2021); Dean, Virginia Commonwealth University School of Business (2010-2021); President and various other roles, Walt Disney Company (entertainment and media) (1981-2010). | | | 78 | | | Director, Witt/Keiffer, Inc. (executive search) (since 2016); Director, NuStar GP, LLC (energy) (since August 2021); Director, Sonida Senior Living, Inc. (residential community operator) (2016-2021); Director, NVR, Inc. (homebuilding) (2013-2020); Director, Middleburg Trust Company (wealth management) (2014-2019); Director, Colonial Williamsburg Company (since 2012); Regent, University of Massachusetts Global (since 2021); Director and Chair, ChildFund International (2012-2021); Trustee, Brandman University (2010-2021); Director, Richmond Forum (2012-2019). | |
* This is the earliest date the Director began serving the Morgan Stanley Funds. Each Director serves an indefinite term, until his or her successor is elected.
** The Fund Complex includes (as of December 31, 2021) all open-end and closed-end funds (including all of their portfolios) advised by Morgan Stanley Investment Management Inc. (the "Adviser") and any funds that have an adviser that is an affiliated person of the Adviser (including, but not limited to, Morgan Stanley AIP GP LP).
*** This includes any directorships at public companies and registered investment companies held by the Director at any time during the past five years.
25
Morgan Stanley Variable Insurance Fund, Inc.
Annual Report – December 31, 2021
Director and Officer Information (unaudited) (cont'd)
Executive Officers:
Name, Address and Birth Year of
Executive Officer | | Position(s)
Held with
Registrant | | Length of
Time Served* | | Principal Occupation(s) During Past 5 Years | |
John H. Gernon
522 Fifth Avenue
New York, NY 10036
Birth Year: 1963 | | President and Principal Executive Officer | | Since September 2013 | | President and Principal Executive Officer of the Equity and Fixed Income Funds and the Morgan Stanley AIP Funds (since September 2013) and the Liquidity Funds and various money market funds (since May 2014) in the Fund Complex; Managing Director of the Adviser. | |
Deidre A. Downes
1633 Broadway
New York, NY 10019
Birth Year: 1977 | | Chief Compliance Officer | | Since November 2021 | | Executive Director of the Adviser (since January 2021) and Chief Compliance Officer of various Morgan Stanley Funds (since November 2021). Formerly, Vice President and Corporate Counsel at PGIM and Prudential Financial (October 2016-December 2020). | |
Francis J. Smith
522 Fifth Avenue
New York, NY 10036
Birth Year: 1965 | | Treasurer and Principal Financial Officer | | Treasurer since July 2003 and Principal Financial Officer since September 2002 | | Managing Director of the Adviser and various entities affiliated with the Adviser; Treasurer (since July 2003) and Principal Financial Officer of various Morgan Stanley Funds (since September 2002). | |
Mary E. Mullin
1633 Broadway
New York, NY 10019
Birth Year: 1967 | | Secretary | | Since June 1999 | | Managing Director of the Adviser; Secretary of various Morgan Stanley Funds (since June 1999). | |
Michael J. Key
522 Fifth Avenue
New York, NY 10036
Birth Year: 1979 | | Vice President | | Since June 2017 | | Vice President of the Equity and Fixed Income Funds, Liquidity Funds, various money market funds and the Morgan Stanley AIP Funds in the Fund Complex (since June 2017); Executive Director of the Adviser; Head of Product Development for Equity and Fixed Income Funds (since August 2013). | |
* This is the earliest date the officer began serving the Morgan Stanley Funds. Each officer serves an indefinite term, until his or her successor is elected.
26
Morgan Stanley Variable Insurance Fund, Inc.
Annual Report – December 31, 2021
Adviser and Administrator
Morgan Stanley Investment Management Inc.
522 Fifth Avenue
New York, New York 10036
Sub-Advisers
Morgan Stanley Investment Management Limited
25 Cabot Square, Canary Wharf
London, E14 4QA, England
Morgan Stanley Investment Management Company
23 Church Street
16-01 Capital Square, Singapore 049481
Distributor
Morgan Stanley Distribution, Inc.
522 Fifth Avenue
New York, New York 10036
Dividend Disbursing and Transfer Agent
DST Asset Manager Solutions, Inc.
2000 Crown Colony Drive
Quincy, Massachusetts 02169
Custodian
State Street Bank and Trust Company
One Lincoln Street
Boston, Massachusetts 02111
Legal Counsel
Dechert LLP
1095 Avenue of the Americas
New York, New York 10036
Counsel to the Independent Directors
Perkins Coie LLP
1155 Avenue of the Americas,
22nd Floor
New York, New York 10036
Independent Registered Public Accounting Firm
Ernst & Young LLP
200 Clarendon Street
Boston, Massachusetts 02116
Reporting to Shareholders
Each Morgan Stanley fund provides a complete schedule of portfolio holdings in its Semi-Annual and the Annual Reports within 60 days of the end of the fund's second and fourth fiscal quarters. The Semi-Annual and Annual Reports are filed electronically with the Securities and Exchange Commission ("SEC") on Form N-CSRS and Form N-CSR, respectively. Morgan Stanley also delivers the Semi-Annual and Annual Reports to fund shareholders and makes these reports available on its public website, www.morganstanley.com/im/shareholderreports. Each Morgan Stanley non-money market fund also files a complete schedule of portfolio holdings with the SEC for the fund's first and third fiscal quarters as an attachment to Form N-PORT. Morgan Stanley does not deliver the reports for the first and third fiscal quarters to shareholders, but makes the complete schedule of portfolio holdings for the fund's first and third fiscal quarters available on its public website. The holdings for each money market fund are also posted to the Morgan Stanley public website. You may obtain the Form N-PORT filings (as well as the Form N-CSR and N-CSRS filings) by accessing the SEC's website, www.sec.gov. You can also request copies of these materials, upon payment of a duplicating fee, by electronic request at the SEC's email address (publicinfo@sec.gov).
Proxy Voting Policies and Procedures and Proxy Voting Record
You may obtain a copy of the Company's Proxy Voting Policy and Procedures and information regarding how the Company voted proxies relating to portfolio securities during the most recent twelve-month period ended June 30, without charge, upon request, by calling toll free 1 (800) 548-7786 or by visiting our website at www.morganstanley.com/im/shareholderreports. This information is also available on the SEC's website at www.sec.gov.
This report is submitted for the general information of the shareholders of the Fund. For more detailed information about the Fund, its fees and expenses and other pertinent information, please read its Prospectus. The Company's Statement of Additional Information contains additional information about the Fund, including its Directors. It is available, without charge, by calling 1 (800) 548-7786.
Householding Notice
To reduce printing and mailing costs, the Fund attempts to eliminate duplicate mailings to the same address. The Fund delivers a single copy of certain shareholder documents, including shareholder reports, prospectuses and proxy materials, to investors with the same last name who reside at the same address. Your participation in this program will continue for an unlimited period of time unless you instruct us otherwise. You can request multiple copies of these documents by calling (800) 548-7786, 8:00 a.m. to 6:00 p.m., ET. Once our Customer Service Center has received your instructions, we will begin sending individual copies for each account within 30 days.
This report is not authorized for distribution to prospective investors in the Fund unless preceded or accompanied by an effective Prospectus. Read the Prospectus carefully before investing.
UIFGREANN
3997785 EXP 02.28.23

Morgan Stanley Variable Insurance Fund, Inc.
Annual Report – December 31, 2021
Global Strategist Portfolio
The Fund is intended to be a funding vehicle for variable annuity contracts and variable life insurance policies offered by the separate accounts of certain life insurance companies.
Morgan Stanley Variable Insurance Fund, Inc.
Annual Report – December 31, 2021
Consolidated Expense Example | | | 2 | | |
Investment Overview | | | 3 | | |
Consolidated Portfolio of Investments | | | 9 | | |
Consolidated Statement of Assets and Liabilities | | | 36 | | |
Consolidated Statement of Operations | | | 37 | | |
Consolidated Statements of Changes in Net Assets | | | 38 | | |
Consolidated Financial Highlights | | | 39 | | |
Notes to Consolidated Financial Statements | | | 41 | | |
Report of Independent Registered Public Accounting Firm | | | 54 | | |
Liquidity Risk Management Program | | | 55 | | |
Federal Tax Notice | | | 56 | | |
Director and Officer Information | | | 57 | | |
1
Morgan Stanley Variable Insurance Fund, Inc.
Annual Report – December 31, 2021
Consolidated Expense Example (unaudited)
Global Strategist Portfolio
As a shareholder of the Global Strategist Portfolio (the "Fund"), you incur two types of costs: (1) insurance company charges; and (2) ongoing costs, which may include advisory fees, administration fees, distribution (12b-1) fees and other Fund expenses. This example is intended to help you understand your ongoing costs (in dollars) of investing in the Fund and to compare these costs with the ongoing costs of investing in other mutual funds.
This example is based on an investment of $1,000 invested at the beginning of the six-month period ended December 31, 2021 and held for the entire six-month period.
Actual Expenses
The table below provides information about actual account values and actual expenses. You may use the information in this table, together with the amount you invested, to estimate the expenses that you paid over the period. Simply divide your account value by $1,000 (for example, an $8,600 account value divided by $1,000 = 8.6), then multiply the result by the number in the table under the heading entitled "Actual Expenses Paid During Period" to estimate the expenses you paid on your account during this period.
Hypothetical Example for Comparison Purposes
The table below provides information about hypothetical account values and hypothetical expenses based on the Fund's actual expense ratio and an assumed rate of return of 5% per year before expenses, which is not the Fund's actual return. The hypothetical account values and expenses may not be used to estimate the actual ending account balance or expenses you paid for the period. You may use this information to compare the ongoing costs of investing in the Fund and other funds. To do so, compare this 5% hypothetical example with the 5% hypothetical examples that appear in the shareholder reports of the other funds.
Please note that the expenses shown in the table are meant to highlight your ongoing costs only and do not reflect any insurance company charges. Therefore, the table below is useful in comparing ongoing costs, but will not help you determine the relative total cost of owning different funds. In addition, if these insurance company charges were included, your costs would have been higher.
| | | Beginning
Account Value
7/1/21 | | Actual Ending
Account Value
12/31/21 | | Hypothetical
Ending
Account Value | | Actual
Expenses Paid
During Period* | | Hypothetical
Expenses Paid
During Period* | | Net Expense
Ratio During
Period** | |
Global Strategist Portfolio Class I | | $ | 1,000.00 | | | $ | 1,013.60 | | | $ | 1,020.67 | | | $ | 4.57 | | | $ | 4.58 | | | | 0.90 | % | |
Global Strategist Portfolio Class II | | | 1,000.00 | | | | 1,012.70 | | | | 1,020.16 | | | | 5.07 | | | | 5.09 | | | | 1.00 | | |
* Expenses are calculated using each Fund Class' annualized net expense ratio (as disclosed), multiplied by the average account value over the period and multiplied by 184/365 (to reflect the most recent one-half year period).
** Annualized.
2
Morgan Stanley Variable Insurance Fund, Inc.
Annual Report – December 31, 2021
Investment Overview (unaudited)
Global Strategist Portfolio
The Fund seeks total return.
Performance
For the fiscal year ended December 31, 2021, the Fund's Class I shares had a total return based on net asset value and reinvestment of distributions per share of 8.37%, net of fees, and 8.22%, net of fees, for Class II shares. The Fund's Class I and Class II shares underperformed the Fund's benchmark, the MSCI All Country World Index (the "Index"), which returned 18.54%, and underperformed the Customized MSIM Global Allocation Index (the "Customized Index"), which returned 8.78%. The Fund and benchmark index performance is in U.S. dollar ("USD") terms, unless otherwise noted.
Factors Affecting Performance*(i)
• Global markets were characterized by a broad reflation trade for most of 2021, aided by the deployment of vaccines and strong economic rebound in developed markets, along with record fiscal and monetary stimulus. However, optimism peaked in the first quarter of 2021, and as the summer progressed, concerns arose around the more contagious delta variant of COVID-19, moderating growth, higher rates, waning stimulus, and supply-chain bottlenecks causing inflation.
• Global equities returned +21% (the Index in local currencies) for the year. Developed markets led (MSCI World Index +24% in local currency), where vaccination and reopening campaigns were rolled out the earliest. U.S. markets were the strongest globally (S&P 500 Index +28.7%), supported by bold government stimulus and positive economic surprises. Emerging markets (EM) underperformed substantially (MSCI EM Index –2.5% in USD), held back by COVID-19 outbreaks and lack of vaccinations, higher rates and increased discussion of U.S. Federal Reserve (Fed) tapering, U.S. dollar strength (DXY Index +6.4%), and peaking growth in China amid regulatory activity, credit tightening, and a brewing property market crisis. Chinese equities were among the largest underperformers in the MSCI EM Index, declining by –21.7% (MSCI China Index in USD).
• Bond prices fell in the year as a whole. Relatively safe government bond yields surged higher in the first quarter of 2021 amid optimism around stimulus, economic reopening, and vaccinations. By the second quarter of 2021, market concerns over the prospect of peaking stimulus and growth, and the spread of the delta variant in emerging markets all conspired to cause the reflation trade
to pause and even reverse. Government bond yields bottomed in early August 2021 and began to rise again as it became increasingly clear that the temporary supply shortages associated with COVID-19 were having a durable impact on inflation, causing policymakers to accelerate withdrawal of accommodation. For the year, the J.P. Morgan Global Government Bond Index fell –2.5% in local currency. The U.S. 10-year Treasury yield rose +60 basis points (bps) to 1.51%. U.S. 10-year breakeven inflation rates reflected the increased expectations for inflation, rising +61 bps to 2.61%. Corporate bonds followed a similar pattern to equities, tightening amid the recovery in growth. The Bloomberg U.S. Corporate High Yield Index spread narrowed by –77 bps to 2.83%. Outside the U.S., relatively safe government bond yields also rose: U.K. 10-year gilt yields rose +77 bps to 0.97%, and German 10-year bund yields rose +39 bps to –0.18%.
* Certain of the Fund's investment themes may, in whole or part, be implemented through the use of derivatives, including the purchase and sale of futures, options, swaps, structured investments (including commodity-linked notes) and other related instruments and techniques. The Fund may also invest in foreign currency forward exchange contracts, which are also derivatives, in connection with its investments in foreign securities. The Fund may use derivative instruments for a variety of purposes, including hedging, risk management, portfolio management or to earn income. As a result, the use of derivatives had a material effect on the Fund's performance during the period.
(i) Source: Morgan Stanley Investment Management (MSIM) Global Multi-Asset Team analysis; market data sourced from Bloomberg. The MSCI World Net Index is a free float adjusted market capitalization weighted index that is designed to measure the global equity market performance of developed markets. The term "free float" represents the portion of shares outstanding that are deemed to be available for purchase in the public equity markets by investors. The performance of the Index is listed in U.S. dollars and assumes reinvestment of net dividends. The Standard & Poor's 500® Index (S&P 500® measures the performance of the large cap segment of the U.S. equities market, covering approximately 80% of the U.S. equities market. The Index includes 500 leading companies in leading industries of the U.S. economy. The MSCI Emerging Markets Net Index is a free float adjusted market capitalization weighted index that is designed to measure equity market performance of emerging markets. The MSCI Emerging Markets Index currently consists of 23 emerging-market country indices. The performance of the index is listed in U.S. dollars and assumes reinvestment of net dividends. The U.S. Dollar Index (DXY) is an index of the value of the United States dollar relative to a basket of foreign currencies, often referred to as a basket of US trade partners' currencies. The MSCI China Index is a free float-adjusted market capitalization index that captures large and mid cap representation across China A shares, H shares, B shares, Red chips, P chips and foreign listings (e.g. ADRs). The performance of the Index is listed in U.S. dollars and assumes reinvestment of net dividends. The J.P. Morgan Global Government Bond Index is a market value weighted fixed income index comprised of government bonds in developed countries. The Bloomberg U.S. Corporate High Yield Index measures the market of USD-denominated, non-investment grade, fixed rate, taxable corporate bonds. Securities are classified as high yield if the middle rating of Moody's, Fitch, and S&P is Ba1/BB+/BB+ or below. The Index excludes emerging market debt. The S&P GSCI Commodity Index is a composite index of commodity sector returns, representing an unleveraged, long only investment in commodity futures that is broadly diversified across the spectrum of commodities. The indexes do not include any expenses, fees or sales charges, which would lower performance. The indexes are unmanaged and should not be considered an investment. It is not possible to invest directly in an index. One basis point = 0.01%.
3
Morgan Stanley Variable Insurance Fund, Inc.
Annual Report – December 31, 2021
Investment Overview (unaudited) (cont'd)
Global Strategist Portfolio
• The U.S. dollar rose +6.4% in the year (DXY Index), bolstered by favorable rate and growth differentials, and early vaccine deployment and economic reopening. In addition, the Fed pivoted from its stated view that inflationary impacts would be temporary, announcing it would taper its asset purchases in November 2021, then doubling the rate of that taper at its December meeting, paving the way for interest rate hikes as soon as March 2022. The weakest currency was the Turkish lira, which fell by over –44% in 2021, as Turkish President Recep Erdogan removed the head of its central bank and continued to cut rates, despite surging inflation there. The largest gainer versus the dollar was the Chinese renminbi.
• Commodity prices surged by +40% (S&P GSCI Index) in 2021, led by a 50% rally in oil prices, as global demand improved amid still-constrained supply. The situation was exacerbated by supply shortages in energy markets which emerged in the third quarter of 2021 (e.g., a gas shortage and lack of wind power in Europe over the summer and power cuts in China, which caused spikes in energy prices). Growth-sensitive industrial metals also rose, with copper up +27% for the year.
• The Fund's asset allocation mix of an average overweight in equities and fixed income had a negative impact on performance.
• Active positions within equities contributed to performance. Contributors included an overweight in exploration & production stocks vs. U.S. equities as well as overweight positions in our Value Recovery theme, such as overweights in U.S. Value vs. Anti-Value and Low-Volatility stocks. Detractors included overweights in global equities (ex-China, ex-U.S.) vs. U.S. equities, in gold miner stocks vs. U.S. equities, in European Monetary Union (EMU) transport infrastructure stocks vs. developed market equities, and in Chinese internet stocks vs. global equities.
• Active positions within fixed income detracted from performance. Detractors included overweights in Brazil and Mexican bonds vs. U.S. Treasuries. Contributors included an overweight in U.S. inflation breakeven rates.
• Active positions within commodities had a negative impact on performance, as an overweight in gold and an underweight in copper detracted. An overweight in oil contributed to performance.
• Active currency positions detracted from performance. Detractors during the period included overweights in defensive currencies vs. the U.S. dollar, in the Turkish lira,
and in the Brazilian real vs. a basket of emerging market currencies (ex-China).
Management Strategies(ii)
Key 2022 Macroeconomic Issues
2022: COVID-19 Transitions From Pandemic to Endemic
• Our base case is that 2022 will be the year that COVID-19 transitions from pandemic to endemic, with 2023 likely the first full normal year since 2019.
• Two years after the first cases of COVID-19, the world still faces tsunamis of new infections with no apparent end in sight. And while COVID-19 continues to have an outsized impact on financial assets — for example, bond market performance in the past nine months has been better explained by infection numbers than inflation, growth, or the Fed — countries, populations, and governments are reacting more moderately to new waves of infections, with targeted measures such as vaccination campaigns and mandates, with masking and selective quarantines, thus reducing the economic impacts of each successive wave. Indeed, current data suggests omicron is twice as infectious as delta, though its deadliness is lower. And though 2022 may see a few more waves, each could be of lessening severity given the improvement in the availability of medical tools in the developed world such as triple-dose vaccines, antiviral therapeutics and treatment, as well as the protection afforded by prior natural infection. Of course, the uncertainty around this base case remains enormous and, as such, well reflected in the prices of direct plays on an end to COVID-19, working from home and on full reopening of the global economy.
From Overheating to Stagflation
• While we still expect above-trend growth for most of 2022, by the end of 2022, the economy will likely slow to or below trend.
• We believe the economy entered the Overheating phase in mid-2021. The Global Multi-Asset Team defines Overheating as above-trend growth, a closed output gap, and rising inflation. The global economy grew at 5.8% in 2021, more than double its trend growth rate, and the output gap is now nearly closed with labor markets in
(ii) Source: Morgan Stanley Investment Management (MSIM) Global Multi-Asset Team analysis; market data sourced from Bloomberg; consensus estimates sourced from Thomson Reuters I/B/E/S.
4
Morgan Stanley Variable Insurance Fund, Inc.
Annual Report – December 31, 2021
Investment Overview (unaudited) (cont'd)
Global Strategist Portfolio
many countries within the range of NAIRU (non-accelerating inflation rate of unemployment). Inflation is now above central bank targets virtually everywhere. We expect Overheating to persist before the Stagflationary phase takes over in the second half. We define Stagflation as an environment where growth has decelerated to or below potential, but where inflation is above target and rising. For the U.S., sub-2% growth and 2.5%-3.0% inflation, which we expect by year-end 2022, qualifies as Stagflation.
• Why the shift from Overheating in the first half to Stagflation by year-end 2022? In the first half of the year, we expect contributors to growth will win the tug-of-war against detractors, but by the end of the year detractors will gain the upper hand. The main boosts to economic growth include: continued reopening; the public to private sector hand-off as fiscal stimulus fades; still-easy monetary policy, with negative real rates everywhere in the developed world; easing supply shortages; and consumption, as approximately 15% of the $2.5 trillion of U.S. household excess savings will be spent in 2022 (with similarly large magnitudes across the world). Offsetting these growth boosts, the following are likely to detract from growth in the latter part of 2022: The U.S. fiscal cliff, which could detract –250 basis points from U.S. gross domestic product (GDP); the latest COVID-19 variant, omicron, which will hit growth in the first quarter and may delay the eventual economic normalization we expect over 2022 and into 2023; and the end of "free money", which will likely slow economic activity with a lag.
Inflation: Partially Transitory, Partially Structural
• After taking two steps forward in 2021, inflation will take a step back in 2022 as core goods prices normalize. However, structural forces have likely ended the disinflation cycle of the past 40 years as the world enters a more inflationary regime akin to the late 1960s (but not the 1970s).
• Core inflation has accelerated to 5%. But a very high proportion of current inflation is supply-shortage driven and thus likely to be temporary. For example, over half the acceleration in core inflation has been driven by car prices. On the other hand, inflation has broadened: median inflation, the best measure of the breadth of inflation, now points to an underlying trend in core CPI of 3.0% (from a low of 1.5% just a year ago).
• Many structural trends support a regime shift to higher inflation. Unlike in the prior cycle where printed money
accumulated as commercial banks' excess reserves at the Fed, in this cycle, the money printed was spent. In addition, improved bargaining power for workers, as well as changes in attitudes and demands of workers, point to higher inflation. There is also building evidence of "greenflation," with decarbonization (net-zero by 2050) adding as much 80-100 basis points to developed markets' consumer price inflation in each the next 10 years by some estimates. Importantly, unlike in the decade following the Global Financial Crisis (GFC), no deleveraging in the banking, household and corporate sectors is occurring, removing a significant source of deflation.
The End of "Free Money"
• Over the past two years, the Federal Reserve, the European Central Bank, the Bank of Japan and the Bank of England collectively printed over $11 trillion (about 26% of their GDP), more than double the amount which was printed after the GFC in half of the time. At the same time, these four central banks cut rates to (or below) zero. Money became literally free and enormous quantities of it were (and still are) floating around. Governments availed themselves of this "free money" and spent more in 2020-21 than at any time since World War II. The combination has been explosive for economies and markets, particularly because the Fed can print money but cannot control where it goes. All this is now reversing. Most central banks are already tapering their bond purchases or are about to. A few have started raising rates — most recently the Bank of England. For its part, the Fed has started tapering quantitative easing (QE) purchases, expects to raise rates three times in 2022, and is even starting to discuss QT (quantitative tightening, i.e., shrinking its enormous nearly $9 trillion balance sheet). "Free money" has been an elixir for markets. What happens when money is no longer free?
The End of China's Exceptionalism(iii)
• China has grown at an extraordinary pace of 9% for four decades. In fact, many predicted China would overtake the U.S. as the largest economy in the world by 2020. Though China has had an outsized impact on the global economy, driving approximately 38% of global growth in the past decade, its economy is still 23% smaller than that of the U.S. and its growth is likely to severely downshift to 4% or less for the following reasons: 1) China has "gotten old before getting rich," with its working age population estimated to have peaked in 2010, and its total population
(iii) Source for data presented in this section: Bloomberg L.P. and GMA Team proprietary research. Data as of December 31, 2021.
5
Morgan Stanley Variable Insurance Fund, Inc.
Annual Report – December 31, 2021
Investment Overview (unaudited) (cont'd)
Global Strategist Portfolio
likely starting to shrink outright in 2023; 2) China has already built out its infrastructure and housing and thus cannot keep investing at the same pace. Further capital deepening will become debt-funded malinvestment, as the property sector's recent troubles show; and 3) President Xi Jinping, in consolidating power around himself, is in the process strangling the golden goose responsible for the Chinese growth miracle of the past 40 years.
Key 2022 Investment Themes
Speculative Mania Bursts(iv)
• In the 10 years before COVID-19 hit, U.S. and global stocks rose in one of the biggest and longest bull markets of the past century. But interestingly stocks did not show signs of generalized frothiness usually associated with long bull markets. Then in the 18 months following the COVID-19 low in March 2020, from a near standstill, most market participants caught the bit in their teeth and pushed almost every measure of speculative enthusiasm to record levels: initial public offering funds raised went from $32 billion annually from 2009 to 2019 to a record $262 billion in 2021 (nearly four times the 2000 record of $65 billion). Merger and acquisition activity went from $1.25 trillion annually in the last decade to $2.75 trillion in 2021. Inflows into equity mutual funds and exchange-traded funds reached $1 trillion in 2021, more than the past 20 years combined and significantly exceeding 2000's $312 billion. Margin debt has doubled from the average of the past five years to reach more than 2% of GDP, much higher than the 2000's when it was 1.4% of GDP. The meme stock craze of early 2020 has ebbed with many stocks down –50% from their peaks, but their market caps are still 10 to 20 times higher than pre-COVID-19 levels in 2019 despite revenues down 20% to 50% and no profits.
• History shows that these speculative manias tend not to last much more than 18 months and are followed by market corrections greater than –40%, unwinding almost all of the bubble's gains. Highly speculative and expensive assets are most at risk: the crypto ecosystem, retail/meme stocks, no-profits stocks, hypergrowth high-multiple stocks and probably growth stocks in general.
• There are already indications that some of the bubbliest areas in the market have burst, though the overall market continues to make new highs, powered by an increasingly small number of mega-cap stocks. Possible catalysts for a more generalized market correction include The End of "Free Money", the fiscal cliff and Stagflation. Or it may
just be that stock market optimism and expectations are so high that they are very unlikely to ever be met.
The Value Bull Market Is Only Getting Started
• We believe value stocks in the U.S. and globally have entered a structural bull market, in which they could potentially outperform growth stocks over the next five to seven years.
• If one properly defines Value (the way the Global Multi-Asset team does: by removing sector/industry bias, equal weighting each stock, and focusing on the cheapest quintile of stocks), Value has outperformed Anti-Value (i.e. the most expensive quintile of stocks) by +26% since April 2020.(v) We believe this marks the beginning of an uptrend, which is mirrored by our global measures of Value: Value outside the U.S. has outperformed Anti-Value by +28% since its low in 2020.
• Nonetheless, Value remains nearly the cheapest it has ever been. Today, U.S. Value stocks trade at 11x forward earnings, with Anti-Value stocks at 37x. This is well below the average historical relative discount of Value stocks to Anti-Value. A normalization of relative multiples would result in a 69% re-rating for Value stocks. The likely catalyst for this normalization would be higher inflation and the end of quantitative easing and zero interest rates, which would be favorable for Value stocks' fundamentals as well as their valuations relative to longer-duration Anti-Value stocks.
The Rise of the Rest (of the World)
• For the past 10 years, the U.S. stock market benefited from the best of all worlds compared to its foreign peers and, as a result, has spectacularly outperformed. U.S. stocks rallied +428% since 2010 with non-U.S. stocks up only +96% in USD terms, a +332% outperformance.(vi) Non-U.S. developed
(iv) Source for all data presented in this section: Bloomberg L.P. and GMA Team proprietary research. Data as of December 31, 2021.
(v) The index performance is provided for illustrative purposes only and is not meant to depict the performance of a specific investment. Past performance is no guarantee of future results.
(vi) The U.S. stock market is represented by the S&P 500 Index; non-U.S. developed markets are represented by the MSCI All Country World ex U.S. Index; emerging markets ex China are represented by MSCI Emerging Markets ex China Index. The MSCI All Country World ex U.S. Index is a free float adjusted market capitalization weighted index designed to measure the equity market performance of developed and emerging markets, excluding the U.S. The performance of the Index is listed in U.S. dollars and assumes reinvestment of net dividends. The MSCI Emerging Markets ex China Index is a free float-adjusted market capitalization weighted index that is designed to measure equity market performance of emerging markets, excluding China. The performance of the index is listed in U.S. dollars and assumes reinvestment of net dividends. The index performance is provided for illustrative purposes only and is not meant to depict the performance of a specific investment. Past performance is no guarantee of future results.
6
Morgan Stanley Variable Insurance Fund, Inc.
Annual Report – December 31, 2021
Investment Overview (unaudited) (cont'd)
Global Strategist Portfolio
equities are now trading at a record –30% discount to U.S. equities, and emerging markets ex-China equities are trading at a –43% discount (approaching the Asian Crisis low of 47%), on relative forward price-to-earnings (P/E). Many factors supported U.S. outperformance, most of which are likely in the process of reversing.
• Back in 2010, U.S. equities stood near 15-year lows relative to the rest of the world on price-to-book valuations. In addition, the U.S. dollar was the cheapest it had been since the early 1970s. During the 2010s, U.S. economic growth was double that of emerging markets ex-China (in real U.S. dollar terms) and 50% faster than that of other developed economies (in real terms). Partially as a result, U.S. listed company profits were up +376%, massively outpacing Rest of World profits of +123% (in U.S. dollar terms). Non-U.S. regions were buffeted by economic and political crises such as the eurozone peripheral crisis, the Fragile Five emerging economies in 2013, the Oil Collapse of 2014, the China Devaluation in 2015, and Brexit in 2016, as well as various political crises in Brazil and other emerging markets, while the U.S. remained relatively stable. U.S. companies benefited from a corporate tax cut as well as its sector mix. U.S. tech and internet stocks made up of 19% of U.S. benchmarks in 2010 and ended at 40% in 2021. Meanwhile, in the rest of the world, tech and internet stocks were just 7% of market cap (in 2010 and now). This benefited U.S. stocks as tech and internet outperformed the rest of the U.S. market by +448%.
• Looking forward, most of the above factors are no longer as favorable: U.S. equities have the highest relative valuations in history vs. the rest of the world and the U.S. dollar is expensive (though not extreme). From their current record-high levels, U.S. corporate margins are more likely to suffer downside pressure from labor costs, taxes, regulation and the possible re-shoring of supply chains. Lastly, a high tech and internet index weighting was very helpful in one of the biggest Growth bull markets in history, but these sectors are likely to suffer from the end of the pandemic boost to digital and virtual activities, high valuations and excessive profits expectations, greater regulation and anti-trust enforcement, and the incipient signs of potential excessive capital investment. Economic prospects still may favor the U.S. over the rest of developed markets, but even there, the U.S. is starting to face many of the same problems as its peers (e.g. increasing size of government, expansion of the welfare safety net, slower population growth, etc.).
Commodities Still Beat Stocks and Bonds
• Commodities had a very strong year in 2021 — as is typical during the Overheating phase of the cycle — rallying +40% (S&P GSCI Index). As mentioned, we expect to remain in the Overheating phase for a few more quarters before transitioning to Stagflation. Historically commodities have been the best performing asset class during Stagflation.
• While commodities' financialization in the past two decades mean they are more sensitive to a risk-off environment even if fundamentals remain strong, and China (where growth is slowing) has become a bigger source of demand for most commodities than the U.S. except for oil, two structural factors should keep commodities well supported. First is the severe underinvestment in oil & gas, as well as in most other industrial metals and bulks. Oil investment globally peaked at $779 billion in 2014 and in 2020 fell as low as $328 billion, and global mining capex peaked at roughly $160 billion annually in 2012-2013 and has averaged roughly $80 billion annually from 2016-2020.(vii) Second, decarbonization might require enormous quantities of some commodities which current production (and future production at current investment levels) would be incapable of meeting, thus causing "greenflation" (inflation in commodities required for the electrification and greening of the global economy).
(vii) Source: Bloomberg L.P.
7
Morgan Stanley Variable Insurance Fund, Inc.
Annual Report – December 31, 2021
Investment Overview (unaudited) (cont'd)
Global Strategist Portfolio
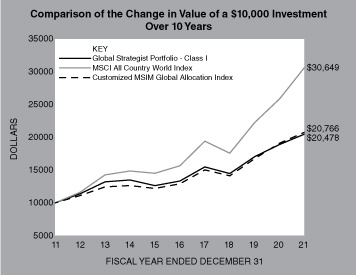
In accordance with SEC regulations, the Fund's performance shown assumes that all recurring fees (including management fees) were deducted and all dividends and distributions were reinvested. The performance of Class II shares will vary from the performance of Class I shares based upon its different inception date and will be negatively impacted by additional fees assessed to that class.
Performance Compared to the MSCI All Country World Index(1) and the Customized MSIM Global Allocation Index(2)
| | | Period Ended December 31, 2021 | |
| | | Total Returns(3) | |
| | | | | Average Annual | |
| | | One
Year | | Five
Years | | Ten
Years | | Since
Inception(6) | |
Fund – Class I(4) | | | 8.37 | % | | | 8.97 | % | | | 7.43 | % | | | 4.68 | % | |
MSCI All Country World Index | | | 18.54 | | | | 14.40 | | | | 11.85 | | | | 7.40 | | |
Customized MSIM Global
Allocation Index | | | 8.78 | | | | 9.99 | | | | 7.58 | | | | N/A | | |
Fund – Class II(5) | | | 8.22 | | | | 8.86 | | | | 7.30 | | | | 6.34 | | |
MSCI All Country World Index | | | 18.54 | | | | 14.40 | | | | 11.85 | | | | 10.25 | | |
Customized MSIM Global
Allocation Index | | | 8.78 | | | | 9.99 | | | | 7.58 | | | | 6.72 | | |
Performance data quoted represents past performance, which is no guarantee of future results, and current performance may be lower or higher than the figures shown. Performance assumes that all dividends and distributions, if any, were reinvested. For the most recent month-end performance figures, please contact the issuing insurance company or speak with your financial advisor. Investment return and principal value will fluctuate so that Fund shares, when redeemed, may be worth more or less than their original cost. Total returns do not reflect the deduction of taxes that a shareholder would pay on Fund distributions or the redemption of Fund shares. Performance shown does not reflect fees and expenses imposed by your insurance company's separate account. If performance information included the effect of these additional charges, the total returns would be lower.
(1) The MSCI All Country World Index is a free float-adjusted market capitalization weighted index designed to measure the equity market performance of developed and emerging markets. The term "free float" represents the portion of shares outstanding that are deemed to be available for purchase in the public equity markets by investors. The performance of the Index is listed in U.S. dollars and assumes reinvestment of net dividends. Net total return indices reinvest dividends after the deduction of withholding taxes, using (for international indices) a tax rate applicable to non-resident institutional investors who do not benefit from double taxation treaties. Returns, including periods prior to January 1, 2001, are calculated using the return data of the MSCI All Country World Index (gross dividends) through December 31, 2000 and the return data of the MSCI All Country World Index (net dividends) after December 31, 2000. The Index is unmanaged and its returns do not include any sales charges or fees. Such costs would lower performance. It is not possible to invest directly in an index.
(2) The Customized MSIM Global Allocation Index is a performance linked benchmark comprised of 60% MSCI All Country World Index and 40% Bloomberg Global Aggregate Index for periods after May 31, 2017. Prior to May 31, 2017, the Customized MSIM Global Allocation Index consisted of 60% MSCI All Country World Index (benchmark that measures the equity market performance of developed and emerging markets), 30% Bloomberg Global Aggregate Index (benchmark that provides a broadbased measure of the global investment grade fixed-rate debt markets), 5% S&P GSCI Light Energy Index (benchmark for investment performance in the energy commodity market) and 5% ICE BofA U.S. Dollar 1-Month LIBID Average Index (benchmark that tracks the performance of a basket of synthetic assets paying LIBID to a stated maturity). The Customized MSIM Global Allocation Index was added as the Fund benchmark on October 2, 2013 and is provided for comparative purposes only. The Index is unmanaged and its returns do not include any sales charges or fees. Such costs would lower performance. It is not possible to invest directly in an index.
(3) Total returns for the Fund reflect fees waived and expenses reimbursed, if applicable, by the Adviser (as defined herein). Without such waivers and reimbursements, total returns would have been lower.
(4) Commenced operations on January 2, 1997.
(5) Commenced offering on March 15, 2011.
(6) For comparative purposes, average annual since inception returns listed for the Indexes refer to the inception date or initial offering of the respective share class of the Fund, not the inception of the Index.
8
Morgan Stanley Variable Insurance Fund, Inc.
Annual Report – December 31, 2021
Consolidated Portfolio of Investments
Global Strategist Portfolio
| | | Face Amount
(000) | | Value
(000) | |
Fixed Income Securities (47.7%) | |
Agency Adjustable Rate Mortgage (0.0%) (a) | |
United States (0.0%) (a) | |
Federal Home Loan Mortgage Corporation,
Conventional Pool:
12 Month USD LIBOR + 1.63%,
1.94%, 7/1/45 (Cost $5) | | $ | 5 | | | $ | 5 | | |
Agency Fixed Rate Mortgages (2.7%) | |
United States (2.7%) | |
Federal Home Loan Mortgage Corporation,
Conventional Pool:
4.50%, 1/1/49 | | | 12 | | | | 13 | | |
Gold Pools:
3.50%, 2/1/45 - 6/1/45 | | | 206 | | | | 222 | | |
4.50%, 1/1/49 | | | 11 | | | | 12 | | |
Federal National Mortgage Association,
Conventional Pools:
3.50%, 1/1/51 | | | 624 | | | | 657 | | |
4.00%, 11/1/41 - 1/1/46 | | | 216 | | | | 237 | | |
4.50%, 3/1/41 - 11/1/44 | | | 94 | | | | 103 | | |
5.00%, 1/1/41 - 3/1/41 | | | 35 | | | | 39 | | |
6.00%, 1/1/38 | | | 7 | | | | 9 | | |
6.50%, 8/1/38 | | | 2 | | | | 2 | | |
February TBA:
2.50%, 2/1/52 (b) | | | 300 | | | | 305 | | |
January TBA:
2.00%, 1/1/52 (b) | | | 650 | | | | 648 | | |
3.00%, 1/1/52 (b) | | | 520 | | | | 539 | | |
Government National Mortgage Association,
Various Pools:
4.00%, 7/15/44 | | | 14 | | | | 15 | | |
5.00%, 2/20/49 | | | 5 | | | | 6 | | |
Total Agency Fixed Rate Mortgages (Cost $2,796) | | | 2,807 | | |
Asset-Backed Securities (0.4%) | |
United States (0.4%) | |
Freed ABS Trust,
3.06%, 3/18/27 (c) | | | 87 | | | | 88 | | |
New Century Home Equity Loan Trust,
1 Month USD LIBOR + 1.35%,
1.45%, 3/25/33 (d) | | | 73 | | | | 73 | | |
NovaStar Mortgage Funding Trust,
1 Month USD LIBOR + 1.58%,
1.68%, 12/25/34 (d) | | | 75 | | | | 75 | | |
Renaissance Home Equity Loan Trust,
1 Month USD LIBOR + 0.76%,
0.86%, 12/25/32 (d) | | | 78 | | | | 76 | | |
SLM Student Loan Trust,
3 Month EURIBOR + 0.55%,
0.01%, 7/25/39 (d) | | EUR | 91 | | | | 102 | | |
Total Asset-Backed Securities (Cost $407) | | | 414 | | |
Commercial Mortgage-Backed Securities (0.6%) | |
United Kingdom (0.1%) | |
Taurus 2018-2 UK DAC,
3 Month GBP LIBOR + 1.10%,
1.21%, 5/22/28 (d) | | GBP | 59 | | | | 79 | | |
| | | Face Amount
(000) | | Value
(000) | |
United States (0.5%) | |
COMM Mortgage Trust,
3.28%, 1/10/46 | | $ | 45 | | | $ | 46 | | |
3.96%, 3/10/47 | | | 144 | | | | 151 | | |
4.75%, 7/15/47 (c)(d) | | | 100 | | | | 100 | | |
Commercial Mortgage Pass-Through
Certificates,
4.24%, 2/10/47 (d) | | | 77 | | | | 81 | | |
UBS-Barclays Commercial Mortgage Trust,
3.53%, 5/10/63 | | | 40 | | | | 40 | | |
WFRBS Commercial Mortgage Trust,
5.00%, 9/15/46 (c)(d) | | | 140 | | | | 140 | | |
| | | | 558 | | |
Total Commercial Mortgage-Backed Securities (Cost $618) | | | 637 | | |
Corporate Bonds (13.3%) | |
Australia (0.5%) | |
Macquarie Group Ltd.,
4.15%, 3/27/24 (c) | | | 50 | | | | 52 | | |
NBN Co. Ltd.,
2.63%, 5/5/31 (c) | | | 200 | | | | 201 | | |
Transurban Finance Co. Pty Ltd.,
2.00%, 8/28/25 | | EUR | 100 | | | | 121 | | |
Westpac Banking Corp.,
2.67%, 11/15/35 | | $ | 125 | | | | 122 | | |
| | | | 496 | | |
Belgium (0.1%) | |
Anheuser-Busch InBev SA N.V.,
2.75%, 3/17/36 | | EUR | 75 | | | | 101 | | |
Brazil (0.2%) | |
JBS Finance Luxembourg Sarl,
2.50%, 1/15/27 (c) | | $ | 225 | | | | 223 | | |
Canada (0.5%) | |
Enbridge, Inc.,
2.50%, 1/15/25 | | | 125 | | | | 129 | | |
Province of Ontario Canada,
2.30%, 6/15/26 | | | 190 | | | | 197 | | |
Province of Quebec Canada,
1.35%, 5/28/30 | | | 240 | | | | 233 | | |
| | | | 559 | | |
China (0.2%) | |
Baidu, Inc.,
2.88%, 7/6/22 | | | 200 | | | | 202 | | |
Colombia (0.2%) | |
Ecopetrol SA,
5.88%, 9/18/23 | | | 140 | | | | 149 | | |
France (0.7%) | |
AXA SA,
3.25%, 5/28/49 | | EUR | 100 | | | | 128 | | |
BNP Paribas SA,
1.13%, 6/11/26 | | | 125 | | | | 147 | | |
BPCE SA,
5.15%, 7/21/24 (c) | | $ | 200 | | | | 217 | | |
The accompanying notes are an integral part of the consolidated financial statements.
9
Morgan Stanley Variable Insurance Fund, Inc.
Annual Report – December 31, 2021
Consolidated Portfolio of Investments (cont'd)
Global Strategist Portfolio
| | | Face Amount
(000) | | Value
(000) | |
Corporate Bonds (cont'd) | |
Orange SA,
5.00%, 1/10/26 (e) | | EUR | 100 | | | $ | 134 | | |
TotalEnergies SE,
3.88%, 5/18/22 (e) | | | 100 | | | | 115 | | |
| | | | 741 | | |
Germany (0.9%) | |
Bayer US Finance II LLC,
3.88%, 12/15/23 (c) | | $ | 200 | | | | 209 | | |
Deutsche Bank AG,
Series E
0.96%, 11/8/23 | | | 150 | | | | 150 | | |
Deutsche Telekom International
Finance BV,
4.38%, 6/21/28 (c) | | | 150 | | | | 168 | | |
Kreditanstalt fuer Wiederaufbau,
1.13%, 9/15/32 | | EUR | 190 | | | | 238 | | |
Volkswagen International
Finance N.V.,
Series 10Y
1.88%, 3/30/27 | | | 100 | | | | 122 | | |
| | | | 887 | | |
India (0.2%) | |
ONGC Videsh Vankorneft Pte Ltd.,
3.75%, 7/27/26 | | $ | 200 | | | | 210 | | |
Ireland (0.2%) | |
AerCap Ireland Capital DAC/AerCap
Global Aviation Trust,
2.45%, 10/29/26 | | | 175 | | | | 177 | | |
Avolon Holdings Funding Ltd.,
2.88%, 2/15/25 (c) | | | 50 | | | | 51 | | |
| | | | 228 | | |
Italy (0.1%) | |
Assicurazioni Generali SpA,
5.50%, 10/27/47 | | EUR | 100 | | | | 138 | | |
Japan (0.2%) | |
NTT Finance Corp.,
1.59%, 4/3/28 (c) | | $ | 200 | | | | 196 | | |
Korea, Republic of (0.6%) | |
Korea Electric Power Corp.,
2.50%, 6/24/24 (c) | | | 200 | | | | 207 | | |
Korea Hydro & Nuclear Power Co., Ltd.,
3.75%, 7/25/23 (c) | | | 200 | | | | 208 | | |
Korea Southern Power Co. Ltd.,
0.75%, 1/27/26 (c) | | | 200 | | | | 193 | | |
| | | | 608 | | |
Luxembourg (0.1%) | |
Blackstone Property Partners Europe
Holdings Sarl,
1.25%, 4/26/27 | | EUR | 100 | | | | 115 | | |
Mexico (0.1%) | |
Fomento Economico Mexicano
SAB de CV,
0.50%, 5/28/28 | | $ | 100 | | | | 113 | | |
| | | Face Amount
(000) | | Value
(000) | |
Netherlands (0.1%) | |
ASR Nederland N.V.,
5.00%, 9/30/24 (e) | | EUR | 100 | | | $ | 127 | | |
Qatar (0.2%) | |
Ooredoo International Finance Ltd.,
2.63%, 4/8/31 (c) | | $ | 200 | | | | 201 | | |
Saudi Arabia (0.2%) | |
Saudi Arabian Oil Co.,
3.50%, 4/16/29 | | | 200 | | | | 214 | | |
Spain (0.4%) | |
Banco Santander SA,
3.13%, 1/19/27 | | EUR | 100 | | | | 126 | | |
5.18%, 11/19/25 | | $ | 200 | | | | 223 | | |
CaixaBank SA,
0.75%, 4/18/23 | | EUR | 100 | | | | 115 | | |
| | | | 464 | | |
Sweden (0.1%) | |
Akelius Residential Property
Financing BV,
1.13%, 1/11/29 | | | 100 | | | | 112 | | |
Switzerland (0.9%) | |
Credit Suisse Group AG,
2.19%, 6/5/26 (c) | | $ | 500 | | | | 503 | | |
Syngenta Finance N.V.,
4.44%, 4/24/23 (c) | | | 200 | | | | 207 | | |
UBS Group AG,
3.49%, 5/23/23 (c) | | | 200 | | | | 202 | | |
| | | | 912 | | |
United Arab Emirates (0.4%) | |
ADCB Finance Cayman Ltd.,
4.00%, 3/29/23 (c) | | | 200 | | | | 207 | | |
Galaxy Pipeline Assets Bidco Ltd.,
2.63%, 3/31/36 (c) | | | 225 | | | | 220 | | |
| | | | 427 | | |
United Kingdom (1.2%) | |
BAT Capital Corp.,
3.56%, 8/15/27 | | | 125 | | | | 131 | | |
HSBC Holdings PLC,
2.26%, 11/13/26 | | GBP | 100 | | | | 137 | | |
4.25%, 3/14/24 | | $ | 200 | | | | 211 | | |
Lloyds Banking Group PLC,
1.75%, 9/7/28 | | EUR | 100 | | | | 117 | | |
2.25%, 10/16/24 | | GBP | 100 | | | | 138 | | |
Nationwide Building Society,
3.77%, 3/8/24 (c) | | $ | 200 | | | | 206 | | |
Natwest Group PLC,
3.88%, 9/12/23 | | | 200 | | | | 209 | | |
NGG Finance PLC,
5.63%, 6/18/73 | | GBP | 100 | | | | 147 | | |
| | | | 1,296 | | |
United States (5.0%) | |
7-Eleven, Inc.,
1.30%, 2/10/28 (c) | | $ | 100 | | | | 95 | | |
Altria Group, Inc.,
2.45%, 2/4/32 | | | 75 | | | | 71 | | |
The accompanying notes are an integral part of the consolidated financial statements.
10
Morgan Stanley Variable Insurance Fund, Inc.
Annual Report – December 31, 2021
Consolidated Portfolio of Investments (cont'd)
Global Strategist Portfolio
| | | Face Amount
(000) | | Value
(000) | |
Corporate Bonds (cont'd) | |
Amazon.com, Inc.,
2.70%, 6/3/60 | | $ | 50 | | | $ | 48 | | |
AT&T, Inc.,
1.80%, 9/5/26 | | EUR | 100 | | | | 121 | | |
2.90%, 12/4/26 | | GBP | 100 | | | | 143 | | |
Bank of America Corp.,
2.57%, 10/20/32 | | $ | 50 | | | | 50 | | |
2.69%, 4/22/32 | | | 50 | | | | 51 | | |
MTN
4.00%, 1/22/25 | | | 175 | | | | 187 | | |
Boeing Co. (The),
5.15%, 5/1/30 | | | 100 | | | | 117 | | |
CDW LLC/CDW Finance Corp.,
2.67%, 12/1/26 | | | 25 | | | | 26 | | |
Charter Communications Operating
LLC/Charter Communications
Operating Capital,
2.30%, 2/1/32 | | | 25 | | | | 24 | | |
2.80%, 4/1/31 | | | 75 | | | | 74 | | |
3.50%, 3/1/42 | | | 25 | | | | 24 | | |
5.13%, 7/1/49 | | | 25 | | | | 29 | | |
Chubb INA Holdings, Inc.,
0.88%, 6/15/27 | | EUR | 100 | | | | 117 | | |
Cigna Corp.,
2.38%, 3/15/31 | | $ | 25 | | | | 25 | | |
3.88%, 10/15/47 | | | 50 | | | | 56 | | |
Citigroup, Inc.,
5.50%, 9/13/25 | | | 75 | | | | 85 | | |
Comcast Corp.,
1.95%, 1/15/31 | | | 125 | | | | 123 | | |
CVS Health Corp.,
2.13%, 9/15/31 | | | 100 | | | | 98 | | |
Deere & Co.,
3.10%, 4/15/30 | | | 100 | | | | 108 | | |
Diamondback Energy, Inc.,
2.88%, 12/1/24 | | | 150 | | | | 156 | | |
Emerson Electric Co.,
1.25%, 10/15/25 | | EUR | 125 | | | | 148 | | |
Energy Transfer LP,
2.90%, 5/15/25 | | $ | 150 | | | | 155 | | |
Enterprise Products Operating LLC,
3.95%, 1/31/60 | | | 50 | | | | 54 | | |
Ford Motor Credit Co. LLC,
3.09%, 1/9/23 | | | 200 | | | | 204 | | |
Fox Corp.,
4.71%, 1/25/29 | | | 150 | | | | 171 | | |
Georgia-Pacific LLC,
2.30%, 4/30/30 (c) | | | 125 | | | | 125 | | |
HCA, Inc.,
5.25%, 6/15/49 | | | 50 | | | | 64 | | |
JPMorgan Chase & Co.,
1.95%, 2/4/32 | | | 250 | | | | 241 | | |
4.13%, 12/15/26 | | | 75 | | | | 83 | | |
Level 3 Financing, Inc.,
3.40%, 3/1/27 (c) | | | 100 | | | | 103 | | |
| | | Face Amount
(000) | | Value
(000) | |
Lowe's Cos., Inc.,
1.30%, 4/15/28 | | $ | 75 | | | $ | 72 | | |
1.70%, 10/15/30 | | | 100 | | | | 95 | | |
McDonald's Corp.,
MTN
3.38%, 5/26/25 | | | 100 | | | | 106 | | |
Metropolitan Life Global Funding I,
2.95%, 4/9/30 (c) | | | 150 | | | | 158 | | |
NextEra Energy Capital Holdings, Inc.,
2.75%, 11/1/29 | | | 175 | | | | 180 | | |
NVIDIA Corp.,
2.00%, 6/15/31 | | | 125 | | | | 125 | | |
Occidental Petroleum Corp.,
3.20%, 8/15/26 | | | 35 | | | | 36 | | |
5.55%, 3/15/26 | | | 75 | | | | 84 | | |
Pacific Gas and Electric Co.,
2.50%, 2/1/31 | | | 25 | | | | 24 | | |
PepsiCo, Inc.,
2.63%, 4/28/26 | | EUR | 100 | | | | 126 | | |
Prologis Euro Finance LLC,
1.88%, 1/5/29 | | | 100 | | | | 123 | | |
Synchrony Bank,
3.00%, 6/15/22 | | $ | 250 | | | | 252 | | |
Upjohn Finance BV,
1.91%, 6/23/32 | | EUR | 100 | | | | 119 | | |
Verizon Communications, Inc.,
1.13%, 11/3/28 | | $ | 100 | | | | 130 | | |
2.99%, 10/30/56 | | | 50 | | | | 48 | | |
3.40%, 3/22/41 | | | 100 | | | | 105 | | |
Vontier Corp.,
2.40%, 4/1/28 (c) | | | 50 | | | | 48 | | |
Walt Disney Co. (The),
2.65%, 1/13/31 | | | 100 | | | | 104 | | |
3.80%, 3/22/30 | | | 50 | | | | 56 | | |
Wells Fargo & Co.,
MTN
2.88%, 10/30/30 | | | 125 | | | | 130 | | |
| | | | 5,297 | | |
Total Corporate Bonds (Cost $13,858) | | | 14,016 | | |
Mortgages — Other (0.7%) | |
Germany (0.1%) | |
Berg Finance,
1.05%, 4/22/33 | | EUR | 79 | | | | 90 | | |
United Kingdom (0.1%) | |
Landmark Mortgage Securities
No. 3 PLC,
3 Month GBP LIBOR + 2.10%,
2.31%, 4/17/44 (d) | | GBP | 74 | | | | 100 | | |
United States (0.5%) | |
Federal Home Loan Mortgage
Corporation,
3.00%, 9/25/45 - 5/25/47 | | $ | 118 | | | | 118 | | |
3.50%, 5/25/45 - 7/25/46 | | | 45 | | | | 47 | | |
4.00%, 5/25/45 | | | 3 | | | | 3 | | |
The accompanying notes are an integral part of the consolidated financial statements.
11
Morgan Stanley Variable Insurance Fund, Inc.
Annual Report – December 31, 2021
Consolidated Portfolio of Investments (cont'd)
Global Strategist Portfolio
| | | Face Amount
(000) | | Value
(000) | |
Mortgages — Other (cont'd) | |
Hundred Acre Wood Trust,
2.50%, 10/25/51 (c)(d) | | $ | 99 | | | $ | 99 | | |
Seasoned Credit Risk Transfer Trust,
3.00%, 11/25/57 - 10/25/58 | | | 213 | | | | 224 | | |
4.00%, 10/25/58 | | | 17 | | | | 18 | | |
| | | | 509 | | |
Total Mortgages — Other (Cost $684) | | | 699 | | |
Sovereign (26.5%) | |
Australia (0.7%) | |
Australia Government Bond,
0.25%, 11/21/25 | | AUD | 450 | | | | 315 | | |
2.50%, 5/21/30 | | | 160 | | | | 124 | | |
2.75%, 11/21/29 | | | 150 | | | | 119 | | |
3.25%, 4/21/25 | | | 210 | | | | 164 | | |
| | | | 722 | | |
Austria (0.1%) | |
Republic of Austria Government Bond,
0.00%, 2/20/30 (c) | | EUR | 70 | | | | 80 | | |
Belgium (0.3%) | |
Kingdom of Belgium Government Bond,
0.90%, 6/22/29 (c) | | | 30 | | | | 37 | | |
1.70%, 6/22/50 (c) | | | 90 | | | | 122 | | |
1.90%, 6/22/38 (c) | | | 150 | | | | 208 | | |
| | | | 367 | | |
Canada (1.1%) | |
Canadian Government Bond,
1.25%, 6/1/30 | | CAD | 1,450 | | | | 1,138 | | |
2.00%, 12/1/51 | | | 20 | | | | 17 | | |
| | | | 1,155 | | |
China (9.2%) | |
Agricultural Development Bank of China,
2.25%, 4/22/25 | | CNY | 770 | | | | 119 | | |
3.79%, 10/26/30 | | | 740 | | | | 122 | | |
China Development Bank,
3.07%, 3/10/30 | | | 1,410 | | | | 220 | | |
3.34%, 7/14/25 | | | 740 | | | | 119 | | |
China Government Bond,
3.02%, 5/27/31 | | | 17,370 | | | | 2,770 | | |
3.13%, 11/21/29 | | | 4,990 | | | | 799 | | |
3.27%, 11/19/30 | | | 32,010 | | | | 5,196 | | |
3.81%, 9/14/50 | | | 300 | | | | 50 | | |
3.86%, 7/22/49 | | | 1,430 | | | | 242 | | |
Export-Import Bank of China (The),
2.93%, 3/2/25 | | | 740 | | | | 117 | | |
| | | | 9,754 | | |
Colombia (0.0%) (a) | |
Colombian TES,
Series B
7.75%, 9/18/30 | | COP | 122,600 | | | | 29 | | |
Denmark (0.1%) | |
Denmark Government Bond,
0.50%, 11/15/27 | | DKK | 630 | | | | 101 | | |
| | | Face Amount
(000) | | Value
(000) | |
Finland (0.1%) | |
Finland Government Bond,
1.13%, 4/15/34 (c) | | EUR | 70 | | | $ | 89 | | |
France (1.7%) | |
Agence Francaise de
Developpement EPIC,
1.50%, 10/31/34 | | $ | 100 | | | | 127 | | |
Banque Federative du Credit Mutuel SA,
1.25%, 12/5/25 | | GBP | 100 | | | | 134 | | |
French Republic Government Bond OAT,
0.00%, 11/25/29 | | EUR | 1,010 | | | | 1,151 | | |
2.00%, 5/25/48 (c) | | | 170 | | | | 249 | | |
SNCF Reseau,
1.88%, 3/30/34 | | | 100 | | | | 131 | | |
| | | | 1,792 | | |
Germany (0.5%) | |
Bundesrepublik Deutschland
Bundesanleihe,
0.00%, 5/15/36 | | | 70 | | | | 80 | | |
4.25%, 7/4/39 | | | 40 | | | | 80 | | |
State of North Rhine-Westphalia Germany,
1.65%, 2/22/38 | | | 290 | | | | 387 | | |
| | | | 547 | | |
Greece (2.7%) | |
Hellenic Republic Government Bond,
0.75%, 6/18/31 (c) | | | 2,589 | | | | 2,801 | | |
Hungary (0.0%) (a) | |
Hungary Government Bond,
3.00%, 8/21/30 | | HUF | 4,450 | | | | 12 | | |
Indonesia (0.3%) | |
Indonesia Government International Bond,
1.75%, 4/24/25 | | EUR | 130 | | | | 154 | | |
Indonesia Treasury Bond,
8.25%, 5/15/29 | | IDR | 839,000 | | | | 66 | | |
8.38%, 3/15/34 | | | 981,000 | | | | 77 | | |
| | | | 297 | | |
Ireland (0.1%) | |
Ireland Government Bond,
0.20%, 10/18/30 | | EUR | 80 | | | | 92 | | |
Italy (1.3%) | |
Italy Buoni Poliennali Del Tesoro,
0.00%, 8/1/26 | | | 230 | | | | 257 | | |
1.40%, 5/26/25 (c) | | | 101 | | | | 124 | | |
1.65%, 12/1/30 (c) | | | 40 | | | | 48 | | |
1.85%, 7/1/25 (c) | | | 390 | | | | 470 | | |
2.45%, 9/1/50 (c) | | | 240 | | | | 301 | | |
Republic of Italy Government International
Bond,
0.88%, 5/6/24 | | $ | 200 | | | | 198 | | |
| | | | 1,398 | | |
Japan (4.5%) | |
Japan Government Five-Year Bond,
0.10%, 6/20/24 | | JPY | 118,000 | | | | 1,031 | | |
Japan Government Ten-Year Bond,
0.10%, 6/20/26 - 6/20/29 | | | 200,000 | | | | 1,756 | | |
The accompanying notes are an integral part of the consolidated financial statements.
12
Morgan Stanley Variable Insurance Fund, Inc.
Annual Report – December 31, 2021
Consolidated Portfolio of Investments (cont'd)
Global Strategist Portfolio
| | | Face Amount
(000) | | Value
(000) | |
Sovereign (cont'd) | |
Japan Government Thirty-Year Bond,
0.30%, 6/20/46 | | JPY | 37,000 | | | $ | 302 | | |
0.40%, 9/20/49 | | | 26,000 | | | | 211 | | |
0.60%, 6/20/50 | | | 3,000 | | | | 26 | | |
1.70%, 6/20/33 | | | 75,000 | | | | 766 | | |
Japan Government Twenty-Year Bond,
0.40%, 6/20/41 | | | 80,000 | | | | 687 | | |
| | | | 4,779 | | |
Korea, Republic of (0.6%) | |
Export-Import Bank of Korea,
0.63%, 2/9/26 | | $ | 200 | | | | 194 | | |
Korea Development Bank (The),
0.80%, 7/19/26 | | | 200 | | | | 194 | | |
Korea International Bond,
2.00%, 6/19/24 | | | 200 | | | | 205 | | |
| | | | 593 | | |
Malaysia (0.3%) | |
Malaysia Government Bond,
3.89%, 8/15/29 | | MYR | 440 | | | | 108 | | |
Petronas Capital Ltd.,
3.50%, 3/18/25 (c) | | $ | 200 | | | | 212 | | |
| | | | 320 | | |
Mexico (0.3%) | |
Mexican Bonos,
Series M
7.50%, 6/3/27 | | MXN | 1,700 | | | | 83 | | |
8.50%, 5/31/29 | | | 800 | | | | 41 | | |
Mexico Government International Bond,
4.50%, 4/22/29 | | | 200 | | | | 223 | | |
Petroleos Mexicanos,
6.95%, 1/28/60 | | $ | 20 | | | | 18 | | |
| | | | 365 | | |
Netherlands (0.2%) | |
Netherlands Government Bond,
0.00%, 7/15/30 (c) | | EUR | 190 | | | | 219 | | |
2.75%, 1/15/47 (c) | | | 20 | | | | 37 | | |
| | | | 256 | | |
Norway (0.0%) (a) | |
Norway Government Bond,
1.38%, 8/19/30 (c) | | NOK | 220 | | | | 24 | | |
Poland (0.1%) | |
Republic of Poland Government Bond,
0.25%, 10/25/26 | | PLN | 300 | | | | 63 | | |
Russia (0.1%) | |
Russian Federal Bond — OFZ,
7.95%, 10/7/26 | | RUB | 6,010 | | | | 79 | | |
Spain (0.7%) | |
Spain Government Bond,
0.00%, 1/31/28 | | EUR | 110 | | | | 124 | | |
1.25%, 10/31/30 (c) | | | 410 | | | | 501 | | |
2.70%, 10/31/48 (c) | | | 40 | | | | 60 | | |
3.45%, 7/30/66 (c) | | | 21 | | | | 36 | | |
| | | | 721 | | |
| | | Face Amount
(000) | | Value
(000) | |
Sweden (0.1%) | |
Sweden Government Bond,
0.75%, 5/12/28 | | SEK | 740 | | | $ | 85 | | |
United Kingdom (1.4%) | |
United Kingdom Gilt,
0.38%, 10/22/30 | | GBP | 230 | | | | 297 | | |
0.63%, 10/22/50 | | | 170 | | | | 203 | | |
1.63%, 10/22/28 | | | 220 | | | | 314 | | |
3.50%, 1/22/45 | | | 180 | | | | 357 | | |
4.25%, 9/7/39 | | | 130 | | | | 263 | | |
| | | | 1,434 | | |
Total Sovereign (Cost $28,111) | | | 27,955 | | |
Supranational (1.2%) | |
Asian Development Bank,
2.13%, 5/19/31 | | NZD | 60 | | | | 38 | | |
European Investment Bank,
0.20%, 7/15/24 | | EUR | 220 | | | | 254 | | |
Series EARN
0.00%, 1/14/31 | | | 200 | | | | 226 | | |
International Bank for Reconstruction &
Development, SOFR + 0.43%,
0.48%, 8/19/27 (d) | | $ | 330 | | | | 334 | | |
2.20%, 2/27/24 | | AUD | 610 | | | | 456 | | |
Total Supranational (Cost $1,314) | | | 1,308 | | |
U.S. Treasury Securities (2.3%) | |
United States (2.3%) | |
U.S. Treasury Bonds,
1.13%, 5/15/40 | | $ | 980 | | | | 859 | | |
1.25%, 5/15/50 | | | 350 | | | | 297 | | |
2.50%, 2/15/45 | | | 590 | | | | 649 | | |
2.75%, 8/15/47 | | | 510 | | | | 594 | | |
Total U.S. Treasury Securities (Cost $2,403) | | | 2,399 | | |
Total Fixed Income Securities (Cost $50,196) | | | 50,240 | | |
| | | Shares | | | |
Common Stocks (38.0%) | |
Australia (0.5%) | |
Afterpay Ltd. (f) | | | 100 | | | | 6 | | |
Ampol Ltd. | | | 113 | | | | 2 | | |
APA Group | | | 512 | | | | 4 | | |
Aristocrat Leisure Ltd. | | | 266 | | | | 8 | | |
ASX Ltd. | | | 85 | | | | 6 | | |
Aurizon Holdings Ltd. | | | 862 | | | | 2 | | |
AusNet Services Ltd. | | | 897 | | | | 2 | | |
Australia & New Zealand Banking Group Ltd. | | | 1,287 | | | | 26 | | |
BHP Group Ltd. | | | 1,300 | | | | 39 | | |
BlueScope Steel Ltd. | | | 239 | | | | 4 | | |
Brambles Ltd. | | | 631 | | | | 5 | | |
Cochlear Ltd. | | | 29 | | | | 5 | | |
Coles Group Ltd. | | | 584 | | | | 8 | | |
Commonwealth Bank of Australia | | | 779 | | | | 57 | | |
Computershare Ltd. | | | 253 | | | | 4 | | |
Crown Resorts Ltd. (f) | | | 174 | | | | 1 | | |
The accompanying notes are an integral part of the consolidated financial statements.
13
Morgan Stanley Variable Insurance Fund, Inc.
Annual Report – December 31, 2021
Consolidated Portfolio of Investments (cont'd)
Global Strategist Portfolio
| | | Shares | | Value
(000) | |
Australia (cont'd) | |
CSL Ltd. | | | 204 | | | $ | 43 | | |
Dexus REIT | | | 477 | | | | 4 | | |
Domino's Pizza Enterprises Ltd. | | | 28 | | | | 2 | | |
Endeavour Group Ltd. (Australia) | | | 634 | | | | 3 | | |
Evolution Mining Ltd. | | | 850 | | | | 2 | | |
Fortescue Metals Group Ltd. | | | 748 | | | | 10 | | |
Goodman Group REIT | | | 729 | | | | 14 | | |
GPT Group (The) REIT | | | 906 | | | | 4 | | |
IDP Education Ltd. | | | 98 | | | | 2 | | |
Insurance Australia Group Ltd. | | | 1,179 | | | | 4 | | |
James Hardie Industries PLC CDI | | | 196 | | | | 8 | | |
Lendlease Corp Ltd. REIT | | | 329 | | | | 3 | | |
Macquarie Group Ltd. | | | 153 | | | | 23 | | |
Magellan Financial Group Ltd. | | | 64 | | | | 1 | | |
Medibank Pvt Ltd. | | | 1,322 | | | | 3 | | |
Mirvac Group REIT | | | 1,730 | | | | 4 | | |
National Australia Bank Ltd. | | | 1,482 | | | | 31 | | |
Newcrest Mining Ltd. | | | 365 | | | | 6 | | |
Northern Star Resources Ltd. | | | 538 | | | | 4 | | |
OneMarket Ltd. (f) | | | 137 | | | | — | | |
Orica Ltd. | | | 193 | | | | 2 | | |
Origin Energy Ltd. | | | 828 | | | | 3 | | |
Qantas Airways Ltd. (f) | | | 439 | | | | 2 | | |
QBE Insurance Group Ltd. | | | 662 | | | | 5 | | |
Ramsay Health Care Ltd. | | | 82 | | | | 4 | | |
REA Group Ltd. | | | 25 | | | | 3 | | |
Reece Ltd. | | | 136 | | | | 3 | | |
Rio Tinto Ltd. | | | 163 | | | | 12 | | |
Santos Ltd. | | | 1,438 | | | | 7 | | |
Scentre Group REIT | | | 2,267 | | | | 5 | | |
Seek Ltd. | | | 157 | | | | 4 | | |
Sonic Healthcare Ltd. | | | 203 | | | | 7 | | |
South32 Ltd. | | | 2,037 | | | | 6 | | |
Stockland REIT | | | 1,118 | | | | 3 | | |
Suncorp Group Ltd. | | | 563 | | | | 5 | | |
Sydney Airport (f) | | | 595 | | | | 4 | | |
Tabcorp Holdings Ltd. | | | 993 | | | | 4 | | |
Telstra Corp., Ltd. | | | 1,819 | | | | 6 | | |
Transurban Group | | | 1,337 | | | | 13 | | |
Treasury Wine Estates Ltd. | | | 337 | | | | 3 | | |
Vicinity Centres REIT | | | 1,823 | | | | 2 | | |
Washington H Soul Pattinson & Co. Ltd. | | | 103 | | | | 2 | | |
Wesfarmers Ltd. | | | 494 | | | | 21 | | |
Westpac Banking Corp. | | | 1,620 | | | | 25 | | |
WiseTech Global Ltd. | | | 67 | | | | 3 | | |
Woodside Petroleum Ltd. | | | 426 | | | | 7 | | |
Woolworths Group Ltd. | | | 555 | | | | 15 | | |
Xero Ltd. (f) | | | 59 | | | | 6 | | |
| | | | 532 | | |
Austria (0.0%) (a) | |
Erste Group Bank AG | | | 276 | | | | 13 | | |
OMV AG | | | 119 | | | | 7 | | |
| | | Shares | | Value
(000) | |
Raiffeisen Bank International AG | | | 118 | | | $ | 4 | | |
Verbund AG | | | 56 | | | | 6 | | |
voestalpine AG | | | 92 | | | | 3 | | |
| | | | 33 | | |
Belgium (0.1%) | |
Ageas SA N.V. | | | 157 | | | | 8 | | |
Anheuser-Busch InBev SA N.V. | | | 698 | | | | 42 | | |
Argenx SE (f) | | | 44 | | | | 16 | | |
Elia Group SA N.V. | | | 29 | | | | 4 | | |
Etablissements Franz Colruyt N.V. | | | 51 | | | | 2 | | |
Groupe Bruxelles Lambert SA | | | 105 | | | | 12 | | |
KBC Group N.V. | | | 232 | | | | 20 | | |
Proximus SADP | | | 145 | | | | 3 | | |
Sofina SA | | | 14 | | | | 7 | | |
Solvay SA | | | 69 | | | | 8 | | |
UCB SA | | | 118 | | | | 13 | | |
Umicore SA | | | 183 | | | | 7 | | |
| | | | 142 | | |
Canada (1.7%) | |
Agnico Eagle Mines Ltd. | | | 225 | | | | 12 | | |
Air Canada (f) | | | 161 | | | | 3 | | |
Algonquin Power & Utilities Corp. | | | 513 | | | | 7 | | |
Alimentation Couche-Tard, Inc. | | | 772 | | | | 32 | | |
AltaGas Ltd. | | | 256 | | | | 5 | | |
Ballard Power Systems, Inc. (f) | | | 221 | | | | 3 | | |
Bank of Montreal | | | 590 | | | | 63 | | |
Bank of Nova Scotia (The) | | | 1,106 | | | | 78 | | |
Barrick Gold Corp. (LSE) | | | 1,383 | | | | 26 | | |
Barrick Gold Corp. (NYSE) | | | 57 | | | | 1 | | |
Bausch Health Cos., Inc. (f) | | | 284 | | | | 8 | | |
BCE, Inc. | | | 66 | | | | 3 | | |
Blackberry Ltd. (f) | | | 506 | | | | 5 | | |
Brookfield Asset Management, Inc., Class A | | | 1,280 | | | | 77 | | |
Brookfield Renewable Corp., Class A | | | 120 | | | | 4 | | |
CAE, Inc. (f) | | | 293 | | | | 7 | | |
Cameco Corp. | | | 372 | | | | 8 | | |
Canadian Apartment Properties REIT | | | 77 | | | | 4 | | |
Canadian Imperial Bank of Commerce | | | 412 | | | | 48 | | |
Canadian National Railway Co. | | | 643 | | | | 79 | | |
Canadian Natural Resources Ltd. | | | 1,088 | | | | 46 | | |
Canadian Pacific Railway Ltd. (NYSE) | | | 135 | | | | 10 | | |
Canadian Pacific Railway Ltd. (TSX) | | | 611 | | | | 44 | | |
Canadian Tire Corp., Ltd., Class A | | | 53 | | | | 8 | | |
Canadian Utilities Ltd., Class A | | | 117 | | | | 3 | | |
Canopy Growth Corp. (f) | | | 224 | | | | 2 | | |
CCL Industries, Inc., Class B | | | 139 | | | | 7 | | |
Cenovus Energy, Inc. | | | 1,211 | | | | 15 | | |
CGI, Inc. (f) | | | 200 | | | | 18 | | |
Constellation Software, Inc. | | | 18 | | | | 33 | | |
Dollarama, Inc. | | | 265 | | | | 13 | | |
Emera, Inc. | | | 235 | | | | 12 | | |
Empire Co., Ltd., Class A | | | 154 | | | | 5 | | |
The accompanying notes are an integral part of the consolidated financial statements.
14
Morgan Stanley Variable Insurance Fund, Inc.
Annual Report – December 31, 2021
Consolidated Portfolio of Investments (cont'd)
Global Strategist Portfolio
| | | Shares | | Value
(000) | |
Canada (cont'd) | |
Enbridge, Inc. | | | 1,851 | | | $ | 72 | | |
Fairfax Financial Holdings Ltd. | | | 24 | | | | 12 | | |
First Quantum Minerals Ltd. | | | 556 | | | | 13 | | |
FirstService Corp. | | | 36 | | | | 7 | | |
Fortis, Inc. | | | 428 | | | | 21 | | |
Franco-Nevada Corp. | | | 175 | | | | 24 | | |
George Weston Ltd. | | | 69 | | | | 8 | | |
GFL Environmental, Inc. | | | 145 | | | | 5 | | |
Gildan Activewear, Inc. | | | 184 | | | | 8 | | |
Great-West Lifeco, Inc. | | | 255 | | | | 8 | | |
Hydro One Ltd. | | | 300 | | | | 8 | | |
IA Financial Corp., Inc. | | | 99 | | | | 6 | | |
IGM Financial, Inc. | | | 77 | | | | 3 | | |
Imperial Oil Ltd. | | | 227 | | | | 8 | | |
Intact Financial Corp. | | | 161 | | | | 21 | | |
Ivanhoe Mines Ltd., Class A (f) | | | 462 | | | | 4 | | |
Keyera Corp. | | | 204 | | | | 5 | | |
Kinross Gold Corp. | | | 1,145 | | | | 7 | | |
Kirkland Lake Gold Ltd. | | | 246 | | | | 10 | | |
Lightspeed Commerce, Inc. (f) | | | 102 | | | | 4 | | |
Loblaw Cos., Ltd. | | | 154 | | | | 13 | | |
Lundin Mining Corp. | | | 627 | | | | 5 | | |
Magna International, Inc. | | | 260 | | | | 21 | | |
Manulife Financial Corp. | | | 1,762 | | | | 34 | | |
Metro, Inc. | | | 224 | | | | 12 | | |
National Bank of Canada | | | 309 | | | | 24 | | |
Northland Power, Inc. | | | 207 | | | | 6 | | |
Nutrien Ltd. | | | 415 | | | | 31 | | |
Nuvei Corp. (f) | | | 54 | | | | 3 | | |
Onex Corp. | | | 69 | | | | 5 | | |
Open Text Corp. | | | 249 | | | | 12 | | |
Pan American Silver Corp. | | | 195 | | | | 5 | | |
Parkland Corp. | | | 138 | | | | 4 | | |
Pembina Pipeline Corp. | | | 507 | | | | 15 | | |
Power Corp. of Canada | | | 410 | | | | 14 | | |
Quebecor, Inc., Class B | | | 154 | | | | 3 | | |
Restaurant Brands International, Inc. | | | 261 | | | | 16 | | |
RioCan Real Estate Investment Trust | | | 142 | | | | 3 | | |
Ritchie Bros Auctioneers, Inc. | | | 102 | | | | 6 | | |
Rogers Communications, Inc., Class B | | | 326 | | | | 15 | | |
Royal Bank of Canada | | | 1,201 | | | | 127 | | |
Saputo, Inc. | | | 227 | | | | 5 | | |
Shaw Communications, Inc., Class B | | | 414 | | | | 13 | | |
Shopify, Inc., Class A (f) | | | 106 | | | | 146 | | |
Sun Life Financial, Inc. | | | 537 | | | | 30 | | |
Suncor Energy, Inc. | | | 1,358 | | | | 34 | | |
TC Energy Corp. | | | 797 | | | | 37 | | |
Teck Resources Ltd., Class B | | | 438 | | | | 13 | | |
TELUS Corp. | | | 407 | | | | 10 | | |
TFI International, Inc. | | | 76 | | | | 8 | | |
Thomson Reuters Corp. | | | 158 | | | | 19 | | |
TMX Group Ltd. | | | 51 | | | | 5 | | |
| | | Shares | | Value
(000) | |
Toromont Industries Ltd. | | | 75 | | | $ | 7 | | |
Toronto-Dominion Bank (The) | | | 1,665 | | | | 128 | | |
Tourmaline Oil Corp. | | | 284 | | | | 9 | | |
West Fraser Timber Co., Ltd. | | | 88 | | | | 8 | | |
Wheaton Precious Metals Corp. | | | 411 | | | | 18 | | |
WSP Global, Inc. | | | 108 | | | | 16 | | |
| | | | 1,823 | | |
China (0.0%) (a) | |
China Common Rich Renewable Energy
Investments Ltd. (f) | | | 18,000 | | | | — | | |
Wharf Holdings Ltd. (The) (g) | | | 1,400 | | | | 4 | | |
| | | | 4 | | |
Denmark (0.4%) | |
Ambu A/S Series B | | | 153 | | | | 4 | | |
AP Moller — Maersk A/S Series A | | | 3 | | | | 10 | | |
AP Moller — Maersk A/S Series B | | | 5 | | | | 18 | | |
Carlsberg A/S Series B | | | 89 | | | | 15 | | |
Chr Hansen Holding A/S | | | 95 | | | | 8 | | |
Coloplast A/S Series B | | | 107 | | | | 19 | | |
Danske Bank A/S | | | 610 | | | | 11 | | |
Demant A/S (f) | | | 102 | | | | 5 | | |
DSV Panalpina A/S | | | 182 | | | | 42 | | |
Genmab A/S (f) | | | 61 | | | | 24 | | |
GN Store Nord AS | | | 113 | | | | 7 | | |
Novo Nordisk A/S Series B | | | 1,499 | | | | 168 | | |
Novozymes A/S Series B | | | 183 | | | | 15 | | |
Orsted A/S | | | 171 | | | | 22 | | |
Pandora A/S | | | 89 | | | | 11 | | |
ROCKWOOL International A/S, Class B | | | 8 | | | | 4 | | |
Tryg A/S | | | 328 | | | | 8 | | |
Vestas Wind Systems A/S | | | 915 | | | | 28 | | |
| | | | 419 | | |
Finland (0.2%) | |
Elisa Oyj | | | 129 | | | | 8 | | |
Fortum Oyj | | | 412 | | | | 13 | | |
Kesko Oyj, Class B | | | 252 | | | | 8 | | |
Kone Oyj, Class B | | | 312 | | | | 22 | | |
Neste Oyj | | | 387 | | | | 19 | | |
Nokia Oyj (f) | | | 4,931 | | | | 31 | | |
Orion Oyj, Class B | | | 96 | | | | 4 | | |
Sampo Oyj, Class A | | | 452 | | | | 23 | | |
Stora Enso Oyj, Class R | | | 532 | | | | 10 | | |
UPM-Kymmene Oyj | | | 491 | | | | 19 | | |
Wartsila Oyj Abp | | | 433 | | | | 6 | | |
| | | | 163 | | |
France (2.4%) | |
Accor SA (f) | | | 1,086 | | | | 35 | | |
Aeroports de Paris (f) | | | 27 | | | | 4 | | |
Air Liquide SA | | | 435 | | | | 76 | | |
Airbus SE (f) | | | 536 | | | | 69 | | |
Alstom SA | | | 291 | | | | 10 | | |
Amundi SA | | | 57 | | | | 5 | | |
The accompanying notes are an integral part of the consolidated financial statements.
15
Morgan Stanley Variable Insurance Fund, Inc.
Annual Report – December 31, 2021
Consolidated Portfolio of Investments (cont'd)
Global Strategist Portfolio
| | | Shares | | Value
(000) | |
France (cont'd) | |
ArcelorMittal SA | | | 606 | | | $ | 19 | | |
Arkema SA | | | 56 | | | | 8 | | |
AXA SA | | | 1,772 | | | | 53 | | |
BioMerieux | | | 38 | | | | 5 | | |
BNP Paribas SA | | | 1,039 | | | | 72 | | |
Bollore SA | | | 825 | | | | 5 | | |
Bouygues SA | | | 208 | | | | 7 | | |
Bureau Veritas SA | | | 271 | | | | 9 | | |
Capgemini SE | | | 148 | | | | 36 | | |
Carrefour SA | | | 570 | | | | 10 | | |
Cie de Saint-Gobain | | | 468 | | | | 33 | | |
Cie Generale des Etablissements Michelin SCA | | | 154 | | | | 25 | | |
CNP Assurances | | | 161 | | | | 4 | | |
Covivio REIT | | | 49 | | | | 4 | | |
Credit Agricole SA | | | 1,136 | | | | 16 | | |
Danone SA | | | 598 | | | | 37 | | |
Dassault Aviation SA | | | 23 | | | | 3 | | |
Dassault Systemes SE | | | 619 | | | | 37 | | |
Edenred | | | 231 | | | | 11 | | |
Eiffage SA | | | 1,851 | | | | 191 | | |
Electricite de France SA | | | 434 | | | | 5 | | |
Engie SA | | | 1,691 | | | | 25 | | |
EssilorLuxottica SA | | | 264 | | | | 56 | | |
Eurazeo SE | | | 37 | | | | 3 | | |
Eurofins Scientific SE | | | 122 | | | | 15 | | |
Euronext N.V. | | | 79 | | | | 8 | | |
Faurecia SE | | | 106 | | | | 5 | | |
Gecina SA REIT | | | 42 | | | | 6 | | |
Getlink SE | | | 402 | | | | 7 | | |
Hermes International | | | 29 | | | | 51 | | |
Ipsen SA | | | 35 | | | | 3 | | |
Kering SA | | | 69 | | | | 56 | | |
Klepierre SA REIT (f) | | | 186 | | | | 4 | | |
L'Oreal SA | | | 229 | | | | 109 | | |
La Francaise des Jeux SAEM | | | 87 | | | | 4 | | |
Legrand SA | | | 246 | | | | 29 | | |
LVMH Moet Hennessy Louis Vuitton SE | | | 256 | | | | 212 | | |
Orange SA | | | 1,829 | | | | 20 | | |
Orpea SA | | | 47 | | | | 5 | | |
Pernod Ricard SA | | | 192 | | | | 46 | | |
Publicis Groupe SA | | | 210 | | | | 14 | | |
Remy Cointreau SA | | | 21 | | | | 5 | | |
Renault SA (f) | | | 175 | | | | 6 | | |
Safran SA | | | 315 | | | | 39 | | |
Sanofi | | | 1,028 | | | | 104 | | |
Sartorius Stedim Biotech | | | 26 | | | | 14 | | |
Schneider Electric SE | | | 498 | | | | 98 | | |
SEB SA | | | 25 | | | | 4 | | |
Societe Generale SA | | | 744 | | | | 26 | | |
Sodexo SA | | | 81 | | | | 7 | | |
STMicroelectronics N.V. | | | 624 | | | | 31 | | |
Suez SA | | | 322 | | | | 7 | | |
| | | Shares | | Value
(000) | |
Teleperformance | | | 54 | | | $ | 24 | | |
Thales SA | | | 99 | | | | 8 | | |
TotalEnergies SE | | | 2,284 | | | | 116 | | |
Ubisoft Entertainment SA (f) | | | 87 | | | | 4 | | |
Unibail-Rodamco-Westfield REIT (f) | | | 114 | | | | 8 | | |
Unibail-Rodamco-Westfield REIT CDI (f) | | | 1,000 | | | | 3 | | |
Valeo SA | | | 206 | | | | 6 | | |
Veolia Environnement SA | | | 602 | | | | 22 | | |
Vinci SA | | | 4,725 | | | | 500 | | |
Vivendi SE | | | 713 | | | | 10 | | |
Wendel SE | | | 25 | | | | 3 | | |
Worldline SA (f) | | | 222 | | | | 12 | | |
| | | | 2,524 | | |
Germany (1.3%) | |
Adidas AG | | | 176 | | | | 51 | | |
Allianz SE (Registered) | | | 377 | | | | 89 | | |
Aroundtown SA | | | 912 | | | | 6 | | |
BASF SE | | | 833 | | | | 58 | | |
Bayer AG (Registered) | | | 873 | | | | 47 | | |
Bayerische Motoren Werke AG | | | 303 | | | | 30 | | |
Bayerische Motoren Werke AG (Preference) | | | 53 | | | | 4 | | |
Bechtle AG | | | 78 | | | | 6 | | |
Beiersdorf AG | | | 91 | | | | 9 | | |
Brenntag SE | | | 142 | | | | 13 | | |
Carl Zeiss Meditec AG | | | 38 | | | | 8 | | |
Commerzbank AG (f) | | | 910 | | | | 7 | | |
Continental AG (f) | | | 98 | | | | 10 | | |
Covestro AG | | | 173 | | | | 11 | | |
Daimler AG (Registered) | | | 902 | | | | 69 | | |
Daimler Truck Holding AG (f) | | | 420 | | | | 15 | | |
Delivery Hero SE (f) | | | 152 | | | | 17 | | |
Deutsche Bank AG (Registered) (f) | | | 1,883 | | | | 23 | | |
Deutsche Boerse AG | | | 172 | | | | 29 | | |
Deutsche Lufthansa AG (Registered) (f) | | | 546 | | | | 4 | | |
Deutsche Post AG (Registered) | | | 902 | | | | 58 | | |
Deutsche Telekom AG (Registered) | | | 3,045 | | | | 56 | | |
E.ON SE | | | 2,038 | | | | 28 | | |
Evonik Industries AG | | | 191 | | | | 6 | | |
Fresenius Medical Care AG & Co., KGaA | | | 189 | | | | 12 | | |
Fresenius SE & Co., KGaA | | | 385 | | | | 16 | | |
Fuchs Petrolub SE (Preference) | | | 63 | | | | 3 | | |
GEA Group AG | | | 140 | | | | 8 | | |
Hannover Rueck SE (Registered) | | | 55 | | | | 10 | | |
HeidelbergCement AG | | | 135 | | | | 9 | | |
HelloFresh SE (f) | | | 158 | | | | 12 | | |
Henkel AG & Co., KGaA | | | 94 | | | | 7 | | |
Henkel AG & Co., KGaA (Preference) | | | 162 | | | | 13 | | |
Infineon Technologies AG | | | 1,198 | | | | 55 | | |
KION Group AG | | | 67 | | | | 7 | | |
Knorr-Bremse AG | | | 67 | | | | 7 | | |
Lanxess AG | | | 75 | | | | 5 | | |
LEG Immobilien SE | | | 66 | | | | 9 | | |
Merck KGaA | | | 118 | | | | 30 | | |
The accompanying notes are an integral part of the consolidated financial statements.
16
Morgan Stanley Variable Insurance Fund, Inc.
Annual Report – December 31, 2021
Consolidated Portfolio of Investments (cont'd)
Global Strategist Portfolio
| | | Shares | | Value
(000) | |
Germany (cont'd) | |
MTU Aero Engines AG | | | 49 | | | $ | 10 | | |
Muenchener Rueckversicherungs-Gesellschaft
AG in Muenchen (Registered) | | | 127 | | | | 38 | | |
Nemetschek SE | | | 55 | | | | 7 | | |
Porsche Automobil Holding SE (Preference) | | | 137 | | | | 13 | | |
Puma SE | | | 97 | | | | 12 | | |
QIAGEN N.V. (f) | | | 210 | | | | 12 | | |
Rational AG | | | 5 | | | | 5 | | |
RWE AG | | | 588 | | | | 24 | | |
SAP SE | | | 951 | | | | 134 | | |
Sartorius AG (Preference) | | | 25 | | | | 17 | | |
Scout24 AG | | | 78 | | | | 5 | | |
Siemens AG (Registered) | | | 699 | | | | 121 | | |
Siemens Energy AG (f) | | | 368 | | | | 9 | | |
Siemens Healthineers AG | | | 258 | | | | 19 | | |
Symrise AG | | | 116 | | | | 17 | | |
Telefonica Deutschland Holding AG | | | 956 | | | | 3 | | |
Uniper SE | | | 83 | | | | 4 | | |
United Internet AG (Registered) | | | 90 | | | | 4 | | |
Volkswagen AG | | | 30 | | | | 9 | | |
Volkswagen AG (Preference) | | | 168 | | | | 34 | | |
Vonovia SE | | | 674 | | | | 37 | | |
Zalando SE (f) | | | 211 | | | | 17 | | |
| | | | 1,408 | | |
Hong Kong (0.3%) | |
AIA Group Ltd. | | | 7,316 | | | | 74 | | |
BOC Hong Kong Holdings Ltd. | | | 2,217 | | | | 7 | | |
Budweiser Brewing Co., APAC Ltd. | | | 1,025 | | | | 3 | | |
Chow Tai Fook Jewellery Group Ltd. (f) | | | 1,221 | | | | 2 | | |
CK Asset Holdings Ltd. | | | 1,191 | | | | 8 | | |
CK Hutchison Holdings Ltd. | | | 1,622 | | | | 10 | | |
CK Infrastructure Holdings Ltd. | | | 392 | | | | 2 | | |
CLP Holdings Ltd. | | | 974 | | | | 10 | | |
ESR Cayman Ltd. (f) | | | 1,199 | | | | 4 | | |
Futu Holdings Ltd. ADR (f) | | | 31 | | | | 1 | | |
Galaxy Entertainment Group Ltd. (f) | | | 1,338 | | | | 7 | | |
Hang Lung Properties Ltd. | | | 1,214 | | | | 3 | | |
Hang Seng Bank Ltd. | | | 455 | | | | 8 | | |
Henderson Land Development Co., Ltd. | | | 878 | | | | 4 | | |
HK Electric Investments & HK Electric
Investments Ltd. | | | 1,576 | | | | 2 | | |
HKT Trust & HKT Ltd. | | | 2,269 | | | | 3 | | |
Hong Kong & China Gas Co., Ltd. | | | 6,693 | | | | 10 | | |
Hong Kong Exchanges & Clearing Ltd. | | | 723 | | | | 42 | | |
Hongkong Land Holdings Ltd. | | | 704 | | | | 4 | | |
Jardine Matheson Holdings Ltd. | | | 128 | | | | 7 | | |
Link REIT | | | 1,286 | | | | 11 | | |
Melco Resorts & Entertainment Ltd. ADR (f) | | | 131 | | | | 1 | | |
MTR Corp., Ltd. | | | 923 | | | | 5 | | |
New World Development Co. Ltd. | | | 916 | | | | 4 | | |
Power Assets Holdings Ltd. | | | 821 | | | | 5 | | |
Sands China Ltd. (f) | | | 1,503 | | | | 4 | | |
| | | Shares | | Value
(000) | |
Sino Land Co., Ltd. | | | 2,005 | | | $ | 2 | | |
SITC International Holdings Co. Ltd. | | | 804 | | | | 3 | | |
Sun Hung Kai Properties Ltd. | | | 780 | | | | 9 | | |
Swire Pacific Ltd., Class A | | | 284 | | | | 2 | | |
Swire Properties Ltd. | | | 718 | | | | 2 | | |
Techtronic Industries Co., Ltd. | | | 839 | | | | 17 | | |
WH Group Ltd. | | | 5,079 | | | | 3 | | |
Wharf Real Estate Investment Co., Ltd. | | | 1,006 | | | | 5 | | |
Xinyi Glass Holdings Ltd. | | | 1,124 | | | | 3 | | |
| | | | 287 | | |
Ireland (0.1%) | |
CRH PLC | | | 715 | | | | 38 | | |
Flutter Entertainment PLC (f) | | | 152 | | | | 24 | | |
Kerry Group PLC, Class A | | | 144 | | | | 19 | | |
Kingspan Group PLC | | | 144 | | | | 17 | | |
Smurfit Kappa Group PLC | | | 226 | | | | 12 | | |
| | | | 110 | | |
Israel (0.1%) | |
Azrieli Group Ltd. | | | 40 | | | | 4 | | |
Bank Hapoalim BM | | | 1,078 | | | | 11 | | |
Bank Leumi Le-Israel BM | | | 1,368 | | | | 15 | | |
Check Point Software Technologies Ltd. (f) | | | 100 | | | | 12 | | |
CyberArk Software Ltd. (f) | | | 37 | | | | 6 | | |
Elbit Systems Ltd. | | | 25 | | | | 4 | | |
Fiverr International Ltd. (f) | | | 28 | | | | 3 | | |
ICL Group Ltd. | | | 669 | | | | 7 | | |
Inmode Ltd. (f) | | | 47 | | | | 3 | | |
Israel Discount Bank Ltd., Class A | | | 1,105 | | | | 8 | | |
Kornit Digital Ltd. (f) | | | 44 | | | | 7 | | |
Mizrahi Tefahot Bank Ltd. | | | 133 | | | | 5 | | |
Nice Ltd. (f) | | | 59 | | | | 18 | | |
Teva Pharmaceutical Industries Ltd. ADR (f) | | | 1,039 | | | | 8 | | |
Wix.com Ltd. (f) | | | 53 | | | | 8 | | |
| | | | 119 | | |
Italy (0.5%) | |
Amplifon SpA | | | 113 | | | | 6 | | |
Assicurazioni Generali SpA | | | 1,006 | | | | 21 | | |
Atlantia SpA (f) | | | 8,020 | | | | 159 | | |
CNH Industrial N.V. | | | 934 | | | | 18 | | |
Davide Campari-Milano N.V. | | | 474 | | | | 7 | | |
DiaSorin SpA | | | 23 | | | | 4 | | |
Enel SpA | | | 7,372 | | | | 59 | | |
Eni SpA | | | 2,283 | | | | 32 | | |
EXOR N.V. | | | 99 | | | | 9 | | |
Ferrari N.V. | | | 116 | | | | 30 | | |
FinecoBank Banca Fineco SpA | | | 561 | | | | 10 | | |
Infrastrutture Wireless Italiane SpA | | | 302 | | | | 4 | | |
Intesa Sanpaolo SpA | | | 15,031 | | | | 39 | | |
Mediobanca Banca di Credito Finanziario SpA | | | 564 | | | | 6 | | |
Moncler SpA | | | 189 | | | | 14 | | |
Nexi SpA (f) | | | 432 | | | | 7 | | |
Poste Italiane SpA | | | 473 | | | | 6 | | |
The accompanying notes are an integral part of the consolidated financial statements.
17
Morgan Stanley Variable Insurance Fund, Inc.
Annual Report – December 31, 2021
Consolidated Portfolio of Investments (cont'd)
Global Strategist Portfolio
| | | Shares | | Value
(000) | |
Italy (cont'd) | |
Prysmian SpA | | | 230 | | | $ | 9 | | |
Recordati Industria Chimica e Farmaceutica SpA | | | 96 | | | | 6 | | |
Snam SpA | | | 1,836 | | | | 11 | | |
Stellantis N.V. | | | 1,829 | | | | 35 | | |
Telecom Italia SpA (Milano) | | | 9,001 | | | | 4 | | |
Tenaris SA | | | 426 | | | | 4 | | |
Terna SpA | | | 1,274 | | | | 10 | | |
UniCredit SpA | | | 1,918 | | | | 30 | | |
| | | | 540 | | |
Netherlands (0.8%) | |
ABN Amro Bank N.V. CVA | | | 384 | | | | 6 | | |
Adyen N.V. (f) | | | 19 | | | | 50 | | |
Aegon N.V. | | | 1,631 | | | | 8 | | |
Akzo Nobel N.V. | | | 171 | | | | 19 | | |
ASM International N.V. | | | 43 | | | | 19 | | |
ASML Holding N.V. | | | 382 | | | | 307 | | |
Basic-Fit N.V. (f) | | | 788 | | | | 38 | | |
Coca-Cola Europacific Partners PLC | | | 187 | | | | 10 | | |
Heineken Holding N.V. | | | 105 | | | | 10 | | |
Heineken N.V. | | | 236 | | | | 27 | | |
IMCD N.V. | | | 54 | | | | 12 | | |
ING Groep N.V. | | | 3,577 | | | | 50 | | |
InPost SA (f) | | | 189 | | | | 2 | | |
JDE Peet's N.V. | | | 91 | | | | 3 | | |
Just Eat Takeaway.com N.V (f) | | | 168 | | | | 9 | | |
Koninklijke Ahold Delhaize N.V. | | | 952 | | | | 33 | | |
Koninklijke DSM N.V. | | | 160 | | | | 36 | | |
Koninklijke KPN N.V. | | | 3,062 | | | | 9 | | |
Koninklijke Philips N.V. | | | 846 | | | | 32 | | |
NN Group N.V. | | | 246 | | | | 13 | | |
Prosus N.V. (f) | | | 865 | | | | 72 | | |
Randstad N.V. | | | 109 | | | | 7 | | |
Universal Music Group N.V. | | | 661 | | | | 19 | | |
Wolters Kluwer N.V. | | | 246 | | | | 29 | | |
| | | | 820 | | |
New Zealand (0.0%) (a) | |
Auckland International Airport Ltd. (f) | | | 1,200 | | | | 7 | | |
Fisher & Paykel Healthcare Corp., Ltd. | | | 543 | | | | 12 | | |
Mercury NZ Ltd. | | | 629 | | | | 3 | | |
Meridian Energy Ltd. | | | 1,230 | | | | 4 | | |
Ryman Healthcare Ltd. | | | 396 | | | | 3 | | |
Spark New Zealand Ltd. | | | 1,717 | | | | 5 | | |
| | | | 34 | | |
Norway (0.1%) | |
Adevinta ASA (f) | | | 246 | | | | 3 | | |
Aker BP ASA | | | 119 | | | | 4 | | |
DNB Bank ASA | | | 877 | | | | 20 | | |
Equinor ASA | | | 933 | | | | 25 | | |
Gjensidige Forsikring ASA | | | 189 | | | | 4 | | |
Mowi ASA | | | 415 | | | | 10 | | |
Norsk Hydro ASA | | | 1,270 | | | | 10 | | |
| | | Shares | | Value
(000) | |
Orkla ASA | | | 709 | | | $ | 7 | | |
Schibsted ASA, Class A | | | 70 | | | | 3 | | |
Schibsted ASA, Class B | | | 95 | | | | 3 | | |
Telenor ASA | | | 666 | | | | 10 | | |
Yara International ASA | | | 155 | | | | 8 | | |
| | | | 107 | | |
Portugal (0.0%) (a) | |
EDP — Energias de Portugal SA | | | 2,636 | | | | 14 | | |
EDP Renovaveis SA | | | 274 | | | | 7 | | |
Galp Energia SGPS SA | | | 471 | | | | 5 | | |
Jeronimo Martins SGPS SA | | | 265 | | | | 6 | | |
| | | | 32 | | |
Singapore (0.1%) | |
Ascendas REIT | | | 1,200 | | | | 3 | | |
CapitaLand Integrated Commercial Trust REIT | | | 1,792 | | | | 3 | | |
Capitaland Investment Ltd. (f) | | | 1,000 | | | | 2 | | |
City Developments Ltd. | | | 100 | | | | 1 | | |
DBS Group Holdings Ltd. | | | 600 | | | | 14 | | |
Genting Singapore Ltd. | | | 1,800 | | | | 1 | | |
Keppel Corp., Ltd. | | | 500 | | | | 2 | | |
Mapletree Commercial Trust REIT | | | 700 | | | | 1 | | |
Mapletree Logistics Trust REIT | | | 1,100 | | | | 2 | | |
Oversea-Chinese Banking Corp., Ltd. | | | 1,200 | | | | 10 | | |
Singapore Airlines Ltd. (f) | | | 500 | | | | 2 | | |
Singapore Exchange Ltd. | | | 200 | | | | 1 | | |
Singapore Technologies Engineering Ltd. | | | 600 | | | | 2 | | |
Singapore Telecommunications Ltd. | | | 3,100 | | | | 5 | | |
United Overseas Bank Ltd. | | | 500 | | | | 10 | | |
UOL Group Ltd. | | | 100 | | | | 1 | | |
Venture Corp. Ltd. | | | 100 | | | | 1 | | |
Wilmar International Ltd. | | | 700 | | | | 2 | | |
| | | | 63 | | |
South Africa (0.0%) (a) | |
Nedbank Group Ltd. | | | 249 | | | | 3 | | |
Old Mutual Ltd. | | | 7,755 | | | | 6 | | |
Thungela Resources Ltd. (f) | | | 132 | | | | 1 | | |
| | | | 10 | | |
Spain (0.4%) | |
ACS Actividades de Construccion y Servicios SA | | | 223 | | | | 6 | | |
Aena SME SA (f) | | | 68 | | | | 11 | | |
Amadeus IT Group SA (f) | | | 412 | | | | 28 | | |
Banco Bilbao Vizcaya Argentaria SA | | | 6,127 | | | | 36 | | |
Banco Santander SA | | | 15,867 | | | | 53 | | |
CaixaBank SA | | | 4,068 | | | | 11 | | |
Cellnex Telecom SA | | | 466 | | | | 27 | | |
Enagas SA | | | 227 | | | | 5 | | |
Endesa SA | | | 291 | | | | 7 | | |
Ferrovial SA | | | 3,614 | | | | 113 | | |
Grifols SA | | | 274 | | | | 5 | | |
Iberdrola SA | | | 5,303 | | | | 63 | | |
Industria de Diseno Textil SA | | | 984 | | | | 32 | | |
Melia Hotels International SA (f) | | | 782 | | | | 5 | | |
The accompanying notes are an integral part of the consolidated financial statements.
18
Morgan Stanley Variable Insurance Fund, Inc.
Annual Report – December 31, 2021
Consolidated Portfolio of Investments (cont'd)
Global Strategist Portfolio
| | | Shares | | Value
(000) | |
Spain (cont'd) | |
Naturgy Energy Group SA | | | 178 | | | $ | 6 | | |
Red Electrica Corp., SA | | | 394 | | | | 8 | | |
Repsol SA | | | 1,321 | | | | 16 | | |
Siemens Gamesa Renewable Energy SA (f) | | | 220 | | | | 5 | | |
Telefonica SA | | | 4,793 | | | | 21 | | |
| | | | 458 | | |
Sweden (0.6%) | |
Alfa Laval AB | | | 278 | | | | 11 | | |
Assa Abloy AB, Class B | | | 881 | | | | 27 | | |
Atlas Copco AB, Class A | | | 594 | | | | 41 | | |
Atlas Copco AB, Class B | | | 345 | | | | 20 | | |
Boliden AB | | | 242 | | | | 9 | | |
Electrolux AB (f) | | | 205 | | | | 5 | | |
Embracer Group AB (f) | | | 444 | | | | 5 | | |
Epiroc AB, Class A | | | 591 | | | | 15 | | |
Epiroc AB, Class B | | | 347 | | | | 7 | | |
EQT AB | | | 266 | | | | 14 | | |
Essity AB, Class B | | | 529 | | | | 17 | | |
Evolution AB | | | 153 | | | | 22 | | |
Fastighets AB Balder, Class B (f) | | | 94 | | | | 7 | | |
Getinge AB, Class B | | | 206 | | | | 9 | | |
Hennes & Mauritz AB, Class B | | | 641 | | | | 13 | | |
Hexagon AB, Class B | | | 1,780 | | | | 28 | | |
Husqvarna AB, Class B | | | 388 | | | | 6 | | |
ICA Gruppen AB | | | 92 | | | | 5 | | |
Industrivarden AB, Class A | | | 122 | | | | 4 | | |
Industrivarden AB, Class C | | | 145 | | | | 5 | | |
Investment AB Latour, Class B | | | 138 | | | | 6 | | |
Investor AB, Class A | | | 443 | | | | 12 | | |
Investor AB, Class B | | | 1,615 | | | | 41 | | |
Kinnevik AB, Class B (f) | | | 216 | | | | 8 | | |
L E Lundbergforetagen AB, Class B | | | 70 | | | | 4 | | |
Lifco AB, Class B | | | 216 | | | | 7 | | |
Lundin Energy AB | | | 180 | | | | 6 | | |
Nibe Industrier AB, Class B | | | 1,279 | | | | 19 | | |
Nordea Bank Abp | | | 2,857 | | | | 35 | | |
Sagax AB | | | 153 | | | | 5 | | |
Sandvik AB | | | 1,001 | | | | 28 | | |
Securitas AB, Class B | | | 287 | | | | 4 | | |
Sinch AB (f) | | | 497 | | | | 6 | | |
Skandinaviska Enskilda Banken AB, Class A | | | 1,431 | | | | 20 | | |
Skanska AB, Class B | | | 306 | | | | 8 | | |
| SKF AB, Class B | | | 339 | | | | 8 | | |
Svenska Cellulosa AB SCA, Class B | | | 532 | | | | 9 | | |
Svenska Handelsbanken AB, Class A | | | 1,294 | | | | 14 | | |
Swedbank AB, Class A | | | 799 | | | | 16 | | |
Swedish Match AB | | | 1,304 | | | | 10 | | |
Tele2 AB, Class B | | | 457 | | | | 7 | | |
Telefonaktiebolaget LM Ericsson, Class B | | | 2,566 | | | | 28 | | |
| | | Shares | | Value
(000) | |
Telia Co., AB | | | 2,339 | | | $ | 9 | | |
Volvo AB, Class A | | | 186 | | | | 4 | | |
Volvo AB, Class B | | | 1,276 | | | | 30 | | |
| | | | 614 | | |
Switzerland (1.6%) | |
ABB Ltd. (Registered) | | | 1,503 | | | | 57 | | |
Adecco Group AG (Registered) | | | 142 | | | | 7 | | |
Alcon, Inc. | | | 466 | | | | 41 | | |
Bachem Holding AG | | | 6 | | | | 5 | | |
Baloise Holding AG (Registered) | | | 42 | | | | 7 | | |
Barry Callebaut AG (Registered) | | | 3 | | | | 7 | | |
Chocoladefabriken Lindt & Sprungli AG | | | 1 | | | | 14 | | |
Cie Financiere Richemont SA (Registered) | | | 476 | | | | 71 | | |
Clariant AG (Registered) (f) | | | 196 | | | | 4 | | |
Credit Suisse Group AG (Registered) | | | 2,425 | | | | 23 | | |
EMS-Chemie Holding AG (Registered) | | | 6 | | | | 7 | | |
Geberit AG (Registered) | | | 33 | | | | 27 | | |
Givaudan SA (Registered) | | | 8 | | | | 42 | | |
Holcim Ltd. (Registered) (f) | | | 475 | | | | 24 | | |
Julius Baer Group Ltd. | | | 201 | | | | 13 | | |
Kuehne & Nagel International AG (Registered) | | | 50 | | | | 16 | | |
Logitech International SA (Registered) | | | 161 | | | | 13 | | |
Lonza Group AG (Registered) | | | 69 | | | | 57 | | |
Nestle SA (Registered) | | | 2,561 | | | | 358 | | |
Novartis AG (Registered) | | | 2,006 | | | | 176 | | |
Partners Group Holding AG | | | 21 | | | | 35 | | |
Roche Holding AG | | | 29 | | | | 13 | | |
Roche Holding AG (Genusschein) | | | 637 | | | | 264 | | |
Schindler Holding AG | | | 38 | | | | 10 | | |
Schindler Holding AG (Registered) | | | 18 | | | | 5 | | |
SGS SA (Registered) | | | 5 | | | | 17 | | |
Sika AG (Registered) | | | 129 | | | | 54 | | |
Sonova Holding AG (Registered) | | | 50 | | | | 20 | | |
Straumann Holding AG (Registered) | | | 9 | | | | 19 | | |
Swatch Group AG (The) | | | 27 | | | | 8 | | |
Swatch Group AG (The) (Registered) | | | 48 | | | | 3 | | |
Swiss Life Holding AG (Registered) | | | 29 | | | | 18 | | |
Swiss Prime Site AG (Registered) | | | 69 | | | | 7 | | |
Swiss Re AG | | | 275 | | | | 27 | | |
Swisscom AG (Registered) | | | 24 | | | | 14 | | |
Temenos AG (Registered) | | | 62 | | | | 9 | | |
UBS Group AG (Registered) | | | 3,220 | | | | 58 | | |
VAT Group AG | | | 25 | | | | 12 | | |
Vifor Pharma AG | | | 46 | | | | 8 | | |
Zurich Insurance Group AG | | | 137 | | | | 60 | | |
| | | | 1,630 | | |
United Kingdom (2.3%) | |
| 3i Group PLC | | | 914 | | | | 18 | | |
Aberdeen PLC | | | 1,989 | | | | 6 | | |
Admiral Group PLC | | | 176 | | | | 8 | | |
The accompanying notes are an integral part of the consolidated financial statements.
19
Morgan Stanley Variable Insurance Fund, Inc.
Annual Report – December 31, 2021
Consolidated Portfolio of Investments (cont'd)
Global Strategist Portfolio
| | | Shares | | Value
(000) | |
United Kingdom (cont'd) | |
Anglo American PLC | | | 1,220 | | | $ | 50 | | |
Antofagasta PLC | | | 364 | | | | 7 | | |
Ashtead Group PLC | | | 421 | | | | 34 | | |
Associated British Foods PLC | | | 324 | | | | 9 | | |
AstraZeneca PLC | | | 1,472 | | | | 173 | | |
Auto Trader Group PLC | | | 879 | | | | 9 | | |
AVEVA Group PLC | | | 112 | | | | 5 | | |
Aviva PLC | | | 3,628 | | | | 20 | | |
BAE Systems PLC | | | 2,998 | | | | 22 | | |
Barclays PLC | | | 15,669 | | | | 40 | | |
Barratt Developments PLC | | | 935 | | | | 9 | | |
Berkeley Group Holdings PLC | | | 102 | | | | 7 | | |
BHP Group PLC | | | 1,962 | | | | 58 | | |
| BP PLC | | | 18,615 | | | | 83 | | |
British American Tobacco PLC | | | 1,991 | | | | 74 | | |
British Land Co., PLC (The) REIT | | | 804 | | | | 6 | | |
BT Group PLC | | | 8,218 | | | | 19 | | |
Bunzl PLC | | | 315 | | | | 12 | | |
Burberry Group PLC | | | 369 | | | | 9 | | |
Coca-Cola HBC AG (f) | | | 184 | | | | 6 | | |
Compass Group PLC (f) | | | 1,687 | | | | 38 | | |
Croda International PLC | | | 130 | | | | 18 | | |
DCC PLC | | | 90 | | | | 7 | | |
Diageo PLC | | | 2,176 | | | | 119 | | |
Entain PLC (f) | | | 558 | | | | 13 | | |
Evraz PLC | | | 464 | | | | 4 | | |
Experian PLC | | | 872 | | | | 43 | | |
Ferguson PLC | | | 207 | | | | 37 | | |
G4S PLC | | | 2,164 | | | | 7 | | |
GlaxoSmithKline PLC | | | 4,692 | | | | 102 | | |
Glencore PLC (f) | | | 9,265 | | | | 47 | | |
Halma PLC | | | 355 | | | | 15 | | |
Hargreaves Lansdown PLC | | | 326 | | | | 6 | | |
Hikma Pharmaceuticals PLC | | | 160 | | | | 5 | | |
HSBC Holdings PLC | | | 19,078 | | | | 116 | | |
Imperial Brands PLC | | | 881 | | | | 19 | | |
Informa PLC (f) | | | 1,375 | | | | 10 | | |
InterContinental Hotels Group PLC (f) | | | 823 | | | | 53 | | |
Intertek Group PLC | | | 149 | | | | 11 | | |
Intu Properties PLC REIT (f) | | | 1,268 | | | | — | @ | |
J Sainsbury PLC | | | 1,610 | | | | 6 | | |
JD Sports Fashion PLC | | | 2,394 | | | | 7 | | |
Johnson Matthey PLC | | | 178 | | | | 5 | | |
Kingfisher PLC | | | 1,967 | | | | 9 | | |
Land Securities Group PLC REIT | | | 641 | | | | 7 | | |
Legal & General Group PLC | | | 5,557 | | | | 22 | | |
Lloyds Banking Group PLC | | | 66,253 | | | | 43 | | |
London Stock Exchange Group PLC | | | 304 | | | | 29 | | |
M&G PLC | | | 2,372 | | | | 6 | | |
Melrose Industries PLC | | | 4,072 | | | | 9 | | |
Mondi PLC | | | 444 | | | | 11 | | |
National Grid PLC | | | 3,373 | | | | 48 | | |
| | | Shares | | Value
(000) | |
Natwest Group PLC | | | 5,392 | | | $ | 16 | | |
Next PLC | | | 126 | | | | 14 | | |
Ocado Group PLC (f) | | | 449 | | | | 10 | | |
Paragon Offshore PLC (f) | | | 67 | | | | — | | |
Pearson PLC | | | 689 | | | | 6 | | |
Persimmon PLC | | | 293 | | | | 11 | | |
Phoenix Group Holdings PLC | | | 588 | | | | 5 | | |
Prudential PLC | | | 2,433 | | | | 42 | | |
Reckitt Benckiser Group PLC | | | 666 | | | | 57 | | |
RELX PLC | | | 1,822 | | | | 59 | | |
Rentokil Initial PLC | | | 1,757 | | | | 14 | | |
Rio Tinto PLC | | | 1,044 | | | | 69 | | |
Rolls-Royce Holdings PLC (f) | | | 7,822 | | | | 13 | | |
Royal Dutch Shell PLC, Class A | | | 3,808 | | | | 84 | | |
Royal Dutch Shell PLC, Class B | | | 3,411 | | | | 75 | | |
Sage Group PLC (The) | | | 956 | | | | 11 | | |
Schroders PLC | | | 114 | | | | 6 | | |
Segro PLC REIT | | | 1,129 | | | | 22 | | |
Severn Trent PLC | | | 230 | | | | 9 | | |
Smith & Nephew PLC | | | 826 | | | | 14 | | |
Smiths Group PLC | | | 363 | | | | 8 | | |
Spirax-Sarco Engineering PLC | | | 68 | | | | 15 | | |
SSE PLC | | | 981 | | | | 22 | | |
St. James's Place PLC | | | 492 | | | | 11 | | |
Standard Chartered PLC | | | 2,461 | | | | 15 | | |
Taylor Wimpey PLC | | | 3,359 | | | | 8 | | |
Tesco PLC | | | 7,184 | | | | 28 | | |
Unilever PLC CVA | | | 2,411 | | | | 129 | | |
United Utilities Group PLC | | | 626 | | | | 9 | | |
Virgin Money UK PLC (f) | | | 888 | | | | 2 | | |
Vodafone Group PLC | | | 25,817 | | | | 39 | | |
Whitbread PLC (f) | | | 910 | | | | 37 | | |
WPP PLC | | | 1,116 | | | | 17 | | |
| | | | 2,433 | | |
United States (24.5%) | |
10X Genomics, Inc., Class A (f) | | | 41 | | | | 6 | | |
3M Co. | | | 300 | | | | 53 | | |
Abbott Laboratories | | | 915 | | | | 129 | | |
AbbVie, Inc. | | | 906 | | | | 123 | | |
ABIOMED, Inc. (f) | | | 24 | | | | 9 | | |
Accenture PLC, Class A | | | 324 | | | | 134 | | |
Activision Blizzard, Inc. | | | 414 | | | | 28 | | |
Adobe, Inc. (f) | | | 240 | | | | 136 | | |
Advance Auto Parts, Inc. | | | 32 | | | | 8 | | |
Advanced Micro Devices, Inc. (f) | | | 634 | | | | 91 | | |
AES Corp. (The) | | | 349 | | | | 8 | | |
Affirm Holdings, Inc. (f) | | | 47 | | | | 5 | | |
Aflac, Inc. | | | 330 | | | | 19 | | |
Agilent Technologies, Inc. | | | 157 | | | | 25 | | |
AGNC Investment Corp. REIT | | | 276 | | | | 4 | | |
Air Products & Chemicals, Inc. | | | 115 | | | | 35 | | |
Airbnb, Inc., Class A (f) | | | 125 | | | | 21 | | |
Akamai Technologies, Inc. (f) | | | 84 | | | | 10 | | |
The accompanying notes are an integral part of the consolidated financial statements.
20
Morgan Stanley Variable Insurance Fund, Inc.
Annual Report – December 31, 2021
Consolidated Portfolio of Investments (cont'd)
Global Strategist Portfolio
| | | Shares | | Value
(000) | |
United States (cont'd) | |
Albemarle Corp. | | | 60 | | | $ | 14 | | |
Alexandria Real Estate Equities, Inc. REIT | | | 75 | | | | 17 | | |
Align Technology, Inc. (f) | | | 40 | | | | 26 | | |
Alleghany Corp. (f) | | | 7 | | | | 5 | | |
Allegion PLC | | | 46 | | | | 6 | | |
Alliant Energy Corp. | | | 129 | | | | 8 | | |
Allstate Corp. (The) | | | 153 | | | | 18 | | |
Ally Financial, Inc. | | | 187 | | | | 9 | | |
Alnylam Pharmaceuticals, Inc. (f) | | | 60 | | | | 10 | | |
Alphabet, Inc., Class A (f) | | | 156 | | | | 452 | | |
Alphabet, Inc., Class C (f) | | | 150 | | | | 434 | | |
Altria Group, Inc. | | | 945 | | | | 45 | | |
Amazon.com, Inc. (f) | | | 241 | | | | 804 | | |
AMC Entertainment Holdings, Inc., Class A (f) | | | 295 | | | | 8 | | |
Amcor PLC | | | 801 | | | | 10 | | |
AMERCO | | | 5 | | | | 4 | | |
Ameren Corp. | | | 133 | | | | 12 | | |
American Electric Power Co., Inc. | | | 259 | | | | 23 | | |
American Express Co. | | | 354 | | | | 58 | | |
American Financial Group, Inc. | | | 37 | | | | 5 | | |
American International Group, Inc. | | | 447 | | | | 25 | | |
American Tower Corp. REIT | | | 234 | | | | 68 | | |
American Water Works Co., Inc. | | | 94 | | | | 18 | | |
Ameriprise Financial, Inc. | | | 59 | | | | 18 | | |
AmerisourceBergen Corp. | | | 81 | | | | 11 | | |
AMETEK, Inc. | | | 119 | | | | 17 | | |
Amgen, Inc. | | | 298 | | | | 67 | | |
Amphenol Corp., Class A | | | 307 | | | | 27 | | |
Analog Devices, Inc. | | | 281 | | | | 49 | | |
Annaly Capital Management, Inc. REIT | | | 757 | | | | 6 | | |
ANSYS, Inc. (f) | | | 45 | | | | 18 | | |
Anthem, Inc. | | | 126 | | | | 58 | | |
AO Smith Corp. | | | 69 | | | | 6 | | |
Aon PLC, Class A | | | 118 | | | | 35 | | |
Apollo Global Management, Inc. | | | 92 | | | | 7 | | |
Apple, Inc. | | | 8,499 | | | | 1,509 | | |
Applied Materials, Inc. | | | 472 | | | | 74 | | |
Aptiv PLC (f) | | | 140 | | | | 23 | | |
Aramark | | | 2,699 | | | | 99 | | |
Arch Capital Group Ltd. (f) | | | 206 | | | | 9 | | |
Archer-Daniels-Midland Co. | | | 290 | | | | 20 | | |
Arista Networks, Inc. (f) | | | 118 | | | | 17 | | |
Arrow Electronics, Inc. (f) | | | 37 | | | | 5 | | |
Arthur J Gallagher & Co. | | | 107 | | | | 18 | | |
Asana, Inc., Class A (f) | | | 38 | | | | 3 | | |
Assurant, Inc. | | | 31 | | | | 5 | | |
AT&T, Inc. | | | 3,716 | | | | 91 | | |
Athene Holding Ltd., Class A (f) | | | 70 | | | | 6 | | |
Atmos Energy Corp. | | | 69 | | | | 7 | | |
Autodesk, Inc. (f) | | | 114 | | | | 32 | | |
Automatic Data Processing, Inc. | | | 218 | | | | 54 | | |
AutoZone, Inc. (f) | | | 11 | | | | 23 | | |
| | | Shares | | Value
(000) | |
Avalara, Inc. (f) | | | 46 | | | $ | 6 | | |
AvalonBay Communities, Inc. REIT | | | 72 | | | | 18 | | |
Avantor, Inc. (f) | | | 275 | | | | 12 | | |
Avery Dennison Corp. | | | 43 | | | | 9 | | |
Baker Hughes Co. | | | 426 | | | | 10 | | |
Ball Corp. | | | 169 | | | | 16 | | |
Bank of America Corp. | | | 3,951 | | | | 176 | | |
Bank of New York Mellon Corp. (The) | | | 427 | | | | 25 | | |
Bath & Body Works, Inc. | | | 136 | | | | 9 | | |
Baxter International, Inc. | | | 260 | | | | 22 | | |
Becton Dickinson & Co. | | | 150 | | | | 38 | | |
Bentley Systems, Inc., Class B | | | 90 | | | | 4 | | |
Berkshire Hathaway, Inc., Class B (f) | | | 684 | | | | 205 | | |
Best Buy Co., Inc. | | | 118 | | | | 12 | | |
Bill.Com Holdings, Inc. (f) | | | 39 | | | | 10 | | |
Bio-Rad Laboratories, Inc., Class A (f) | | | 12 | | | | 9 | | |
Bio-Techne Corp. | | | 20 | | | | 10 | | |
Biogen, Inc. (f) | | | 78 | | | | 19 | | |
BioMarin Pharmaceutical, Inc. (f) | | | 97 | | | | 9 | | |
Black Knight, Inc. (f) | | | 81 | | | | 7 | | |
BlackRock, Inc. | | | 79 | | | | 72 | | |
Blackstone Group, Inc. (The) | | | 357 | | | | 46 | | |
Bloomin' Brands, Inc. (f) | | | 899 | | | | 19 | | |
Boeing Co. (The) (f) | | | 294 | | | | 59 | | |
Booking Holdings, Inc. (f) | | | 21 | | | | 50 | | |
Booz Allen Hamilton Holding Corp. | | | 70 | | | | 6 | | |
BorgWarner, Inc. | | | 125 | | | | 6 | | |
Boston Properties, Inc. REIT | | | 78 | | | | 9 | | |
Boston Scientific Corp. (f) | | | 745 | | | | 32 | | |
Brinker International, Inc. (f) | | | 463 | | | | 17 | | |
Bristol-Myers Squibb Co. | | | 1,166 | | | | 73 | | |
Broadcom, Inc. | | | 198 | | | | 132 | | |
Broadridge Financial Solutions, Inc. | | | 60 | | | | 11 | | |
Brown & Brown, Inc. | | | 125 | | | | 9 | | |
Brown-Forman Corp., Class B | | | 160 | | | | 12 | | |
Bunge Ltd. | | | 73 | | | | 7 | | |
Burlington Stores, Inc. (f) | | | 35 | | | | 10 | | |
Cable One, Inc. | | | 3 | | | | 5 | | |
Cabot Oil & Gas Corp. | | | 5,975 | | | | 114 | | |
Cadence Design Systems, Inc. (f) | | | 141 | | | | 26 | | |
Caesars Entertainment, Inc. (f) | | | 112 | | | | 10 | | |
Camden Property Trust REIT | | | 52 | | | | 9 | | |
Campbell Soup Co. | | | 100 | | | | 4 | | |
Capital One Financial Corp. | | | 231 | | | | 34 | | |
Cardinal Health, Inc. | | | 152 | | | | 8 | | |
Carlyle Group, Inc. (The) | | | 83 | | | | 5 | | |
CarMax, Inc. (f) | | | 84 | | | | 11 | | |
Carnival Corp. (f) | | | 435 | | | | 9 | | |
Carrier Global Corp. | | | 433 | | | | 23 | | |
Carvana Co. (f) | | | 39 | | | | 9 | | |
Catalent, Inc. (f) | | | 90 | | | | 12 | | |
Caterpillar, Inc. | | | 286 | | | | 59 | | |
Cboe Global Markets, Inc. | | | 54 | | | | 7 | | |
The accompanying notes are an integral part of the consolidated financial statements.
21
Morgan Stanley Variable Insurance Fund, Inc.
Annual Report – December 31, 2021
Consolidated Portfolio of Investments (cont'd)
Global Strategist Portfolio
| | | Shares | | Value
(000) | |
United States (cont'd) | |
CBRE Group, Inc., Class A (f) | | | 174 | | | $ | 19 | | |
CDW Corp. | | | 72 | | | | 15 | | |
Celanese Corp. | | | 57 | | | | 10 | | |
Centene Corp. (f) | | | 290 | | | | 24 | | |
CenterPoint Energy, Inc. | | | 305 | | | | 9 | | |
Ceridian HCM Holding, Inc. (f) | | | 71 | | | | 7 | | |
Cerner Corp. | | | 156 | | | | 14 | | |
CF Industries Holdings, Inc. | | | 108 | | | | 8 | | |
CH Robinson Worldwide, Inc. | | | 67 | | | | 7 | | |
Charles River Laboratories International, Inc. (f) | | | 26 | | | | 10 | | |
Charles Schwab Corp. (The) | | | 757 | | | | 64 | | |
Charter Communications, Inc., Class A (f) | | | 67 | | | | 44 | | |
Cheesecake Factory, Inc. (The) (f) | | | 536 | | | | 21 | | |
Cheniere Energy, Inc. | | | 125 | | | | 13 | | |
Chevron Corp. | | | 1,011 | | | | 119 | | |
Chewy, Inc., Class A (f) | | | 51 | | | | 3 | | |
Chipotle Mexican Grill, Inc. (f) | | | 15 | | | | 26 | | |
Choice Hotels International, Inc. | | | 199 | | | | 31 | | |
Chubb Ltd. | | | 227 | | | | 44 | | |
Church & Dwight Co., Inc. | | | 128 | | | | 13 | | |
Cigna Corp. | | | 175 | | | | 40 | | |
Cincinnati Financial Corp. | | | 79 | | | | 9 | | |
Cintas Corp. | | | 48 | | | | 21 | | |
Cisco Systems, Inc. | | | 2,140 | | | | 136 | | |
Citigroup, Inc. | | | 1,084 | | | | 65 | | |
Citizens Financial Group, Inc. | | | 223 | | | | 11 | | |
Citrix Systems, Inc. | | | 65 | | | | 6 | | |
Clarivate PLC (f) | | | 182 | | | | 4 | | |
Clorox Co. (The) | | | 63 | | | | 11 | | |
Cloudflare, Inc., Class A (f) | | | 126 | | | | 17 | | |
CME Group, Inc. | | | 187 | | | | 43 | | |
CMS Energy Corp. | | | 149 | | | | 10 | | |
Coca-Cola Co. (The) | | | 2,095 | | | | 124 | | |
Cognex Corp. | | | 92 | | | | 7 | | |
Cognizant Technology Solutions Corp., Class A | | | 270 | | | | 24 | | |
Coinbase Global, Inc., Class A (f) | | | 20 | | | | 5 | | |
Colgate-Palmolive Co. | | | 410 | | | | 35 | | |
Comcast Corp., Class A | | | 2,365 | | | | 119 | | |
Conagra Brands, Inc. | | | 249 | | | | 8 | | |
ConocoPhillips | | | 9,771 | | | | 705 | | |
Consolidated Edison, Inc. | | | 182 | | | | 16 | | |
Constellation Brands, Inc., Class A | | | 87 | | | | 22 | | |
Cooper Cos., Inc. (The) | | | 26 | | | | 11 | | |
Copart, Inc. (f) | | | 111 | | | | 17 | | |
Corning, Inc. | | | 421 | | | | 16 | | |
Corteva, Inc. | | | 383 | | | | 18 | | |
CoStar Group, Inc. (f) | | | 207 | | | | 16 | | |
Costco Wholesale Corp. | | | 217 | | | | 123 | | |
Coupa Software, Inc. (f) | | | 40 | | | | 6 | | |
Cracker Barrel Old Country Store, Inc. | | | 234 | | | | 30 | | |
Crowdstrike Holdings, Inc., Class A (f) | | | 100 | | | | 20 | | |
Crown Castle International Corp. REIT | | | 221 | | | | 46 | | |
| | | Shares | | Value
(000) | |
Crown Holdings, Inc. | | | 66 | | | $ | 7 | | |
CSX Corp. | | | 1,170 | | | | 44 | | |
Cummins, Inc. | | | 75 | | | | 16 | | |
CVS Health Corp. | | | 678 | | | | 70 | | |
Danaher Corp. | | | 333 | | | | 110 | | |
Darden Restaurants, Inc. | | | 1,372 | | | | 207 | | |
Datadog, Inc., Class A (f) | | | 99 | | | | 18 | | |
Dave & Buster's Entertainment, Inc. (f) | | | 480 | | | | 18 | | |
DaVita, Inc. (f) | | | 35 | | | | 4 | | |
Deere & Co. | | | 154 | | | | 53 | | |
Dell Technologies, Inc., Class C (f) | | | 144 | | | | 8 | | |
Delta Air Lines, Inc. (f) | | | 84 | | | | 3 | | |
Denny's Corp. (f) | | | 639 | | | | 10 | | |
Dentsply Sirona, Inc. | | | 113 | | | | 6 | | |
Devon Energy Corp. | | | 4,802 | | | | 212 | | |
DexCom, Inc. (f) | | | 50 | | | | 27 | | |
Diamondback Energy, Inc. | | | 1,311 | | | | 141 | | |
Digital Realty Trust, Inc. REIT | | | 146 | | | | 26 | | |
Dine Brands Global, Inc. | | | 173 | | | | 13 | | |
Discover Financial Services | | | 154 | | | | 18 | | |
Discovery, Inc., Class A (f) | | | 88 | | | | 2 | | |
Discovery, Inc., Class C (f) | | | 165 | | | | 4 | | |
DISH Network Corp., Class A (f) | | | 128 | | | | 4 | | |
DocuSign, Inc. (f) | | | 104 | | | | 16 | | |
Dollar General Corp. | | | 121 | | | | 29 | | |
Dollar Tree, Inc. (f) | | | 115 | | | | 16 | | |
Dominion Energy, Inc. | | | 419 | | | | 33 | | |
Domino's Pizza, Inc. | | | 19 | | | | 11 | | |
DoorDash, Inc., Class A (f) | | | 57 | | | | 8 | | |
Dover Corp. | | | 75 | | | | 14 | | |
Dow, Inc. | | | 386 | | | | 22 | | |
DR Horton, Inc. | | | 2,726 | | | | 296 | | |
DraftKings, Inc., Class A (f) | | | 174 | | | | 5 | | |
Dropbox, Inc., Class A (f) | | | 164 | | | | 4 | | |
DTE Energy Co. | | | 100 | | | | 12 | | |
Duke Energy Corp. | | | 395 | | | | 41 | | |
Duke Realty Corp. REIT | | | 196 | | | | 13 | | |
DuPont de Nemours, Inc. | | | 269 | | | | 22 | | |
Dynatrace, Inc. (f) | | | 96 | | | | 6 | | |
Eastman Chemical Co. | | | 70 | | | | 8 | | |
Eaton Corp., PLC | | | 205 | | | | 35 | | |
eBay, Inc. | | | 338 | | | | 22 | | |
Ecolab, Inc. | | | 133 | | | | 31 | | |
Edison International | | | 195 | | | | 13 | | |
Edwards Lifesciences Corp. (f) | | | 322 | | | | 42 | | |
Elanco Animal Health, Inc. (f) | | | 223 | | | | 6 | | |
Electronic Arts, Inc. | | | 147 | | | | 19 | | |
Eli Lilly & Co. | | | 421 | | | | 116 | | |
Emerson Electric Co. | | | 310 | | | | 29 | | |
Enphase Energy, Inc. (f) | | | 66 | | | | 12 | | |
Entegris, Inc. | | | 71 | | | | 10 | | |
Entergy Corp. | | | 103 | | | | 12 | | |
EOG Resources, Inc. | | | 307 | | | | 27 | | |
The accompanying notes are an integral part of the consolidated financial statements.
22
Morgan Stanley Variable Insurance Fund, Inc.
Annual Report – December 31, 2021
Consolidated Portfolio of Investments (cont'd)
Global Strategist Portfolio
| | | Shares | | Value
(000) | |
United States (cont'd) | |
EPAM Systems, Inc. (f) | | | 29 | | | $ | 19 | | |
Equifax, Inc. | | | 63 | | | | 18 | | |
Equinix, Inc. REIT | | | 47 | | | | 40 | | |
Equitable Holdings, Inc. | | | 194 | | | | 6 | | |
Equity Lifestyle Properties, Inc. REIT | | | 90 | | | | 8 | | |
Equity Residential REIT | | | 185 | | | | 17 | | |
Erie Indemnity Co., Class A | | | 13 | | | | 3 | | |
Essential Utilities, Inc. | | | 121 | | | | 6 | | |
Essex Property Trust, Inc. REIT | | | 34 | | | | 12 | | |
Estee Lauder Cos., Inc. (The), Class A | | | 119 | | | | 44 | | |
Etsy, Inc. (f) | | | 68 | | | | 15 | | |
Everest Re Group Ltd. | | | 21 | | | | 6 | | |
Evergy, Inc. | | | 118 | | | | 8 | | |
Eversource Energy | | | 178 | | | | 16 | | |
Exact Sciences Corp. (f) | | | 90 | | | | 7 | | |
Exelon Corp. | | | 501 | | | | 29 | | |
Expedia Group, Inc. (f) | | | 77 | | | | 14 | | |
Expeditors International of Washington, Inc. | | | 87 | | | | 12 | | |
Extra Space Storage, Inc. REIT | | | 69 | | | | 16 | | |
Exxon Mobil Corp. | | | 2,205 | | | | 135 | | |
F5 Networks, Inc. (f) | | | 31 | | | | 8 | | |
Factset Research Systems, Inc. | | | 20 | | | | 10 | | |
Fair Isaac Corp. (f) | | | 15 | | | | 7 | | |
Fastenal Co. | | | 295 | | | | 19 | | |
FedEx Corp. | | | 131 | | | | 34 | | |
Fidelity National Financial, Inc. | | | 141 | | | | 7 | | |
Fidelity National Information Services, Inc. | | | 529 | | | | 58 | | |
Fifth Third Bancorp | | | 361 | | | | 16 | | |
First Republic Bank | | | 92 | | | | 19 | | |
FirstEnergy Corp. | | | 280 | | | | 12 | | |
Fiserv, Inc. (f) | | | 310 | | | | 32 | | |
FleetCor Technologies, Inc. (f) | | | 41 | | | | 9 | | |
FMC Corp. | | | 66 | | | | 7 | | |
Ford Motor Co. | | | 1,958 | | | | 41 | | |
Fortinet, Inc. (f) | | | 69 | | | | 25 | | |
Fortive Corp. | | | 177 | | | | 13 | | |
Fortune Brands Home & Security, Inc. | | | 72 | | | | 8 | | |
Fox Corp., Class A | | | 168 | | | | 6 | | |
Fox Corp., Class B | | | 79 | | | | 3 | | |
Franklin Resources, Inc. | | | 155 | | | | 5 | | |
Freeport-McMoRan, Inc. | | | 769 | | | | 32 | | |
Garmin Ltd. | | | 79 | | | | 11 | | |
Gartner, Inc. (f) | | | 43 | | | | 14 | | |
Generac Holdings, Inc. (f) | | | 33 | | | | 12 | | |
General Dynamics Corp. | | | 123 | | | | 26 | | |
General Electric Co. | | | 576 | | | | 54 | | |
General Mills, Inc. | | | 313 | | | | 21 | | |
General Motors Co. (f) | | | 657 | | | | 39 | | |
Genuine Parts Co. | | | 74 | | | | 10 | | |
Gilead Sciences, Inc. | | | 653 | | | | 47 | | |
Global Payments, Inc. | | | 155 | | | | 21 | | |
Globe Life, Inc. | | | 50 | | | | 5 | | |
| | | Shares | | Value
(000) | |
GoDaddy, Inc., Class A (f) | | | 87 | | | $ | 7 | | |
Goldman Sachs Group, Inc. (The) | | | 178 | | | | 68 | | |
Guidewire Software, Inc. (f) | | | 41 | | | | 5 | | |
Halliburton Co. | | | 464 | | | | 11 | | |
Hartford Financial Services Group, Inc. (The) | | | 180 | | | | 12 | | |
Hasbro, Inc. | | | 68 | | | | 7 | | |
HCA Healthcare, Inc. | | | 133 | | | | 34 | | |
Healthpeak Properties, Inc. REIT | | | 281 | | | | 10 | | |
HEICO Corp. | | | 22 | | | | 3 | | |
HEICO Corp., Class A | | | 38 | | | | 5 | | |
Henry Schein, Inc. (f) | | | 73 | | | | 6 | | |
Hershey Co. (The) | | | 75 | | | | 15 | | |
Hess Corp. | | | 146 | | | | 11 | | |
Hewlett Packard Enterprise Co. | | | 687 | | | | 11 | | |
Hilton Grand Vacations, Inc. (f) | | | 421 | | | | 22 | | |
Hilton Worldwide Holdings, Inc. (f) | | | 1,140 | | | | 178 | | |
Hologic, Inc. (f) | | | 132 | | | | 10 | | |
Home Depot, Inc. (The) | | | 546 | | | | 227 | | |
Honeywell International, Inc. | | | 354 | | | | 74 | | |
Horizon Therapeutics PLC (f) | | | 112 | | | | 12 | | |
Hormel Foods Corp. | | | 152 | | | | 7 | | |
Host Hotels & Resorts, Inc. REIT (f) | | | 376 | | | | 7 | | |
Howmet Aerospace, Inc. | | | 200 | | | | 6 | | |
HP, Inc. | | | 622 | | | | 23 | | |
HubSpot, Inc. (f) | | | 23 | | | | 15 | | |
Humana, Inc. | | | 66 | | | | 31 | | |
Huntington Bancshares, Inc. | | | 775 | | | | 12 | | |
Huntington Ingalls Industries, Inc. | | | 21 | | | | 4 | | |
Hyatt Hotels Corp., Class A (f) | | | 391 | | | | 37 | | |
IAC/InterActiveCorp (f) | | | 42 | | | | 5 | | |
IDEX Corp. | | | 39 | | | | 9 | | |
IDEXX Laboratories, Inc. (f) | | | 44 | | | | 29 | | |
IHS Markit Ltd. | | | 196 | | | | 26 | | |
Illinois Tool Works, Inc. | | | 163 | | | | 40 | | |
Illumina, Inc. (f) | | | 76 | | | | 29 | | |
Incyte Corp. (f) | | | 101 | | | | 7 | | |
Ingersoll Rand, Inc. | | | 211 | | | | 13 | | |
Insulet Corp. (f) | | | 37 | | | | 10 | | |
Intel Corp. | | | 2,112 | | | | 109 | | |
Intercontinental Exchange, Inc. | | | 291 | | | | 40 | | |
International Business Machines Corp. | | | 465 | | | | 62 | | |
International Flavors & Fragrances, Inc. | | | 130 | | | | 20 | | |
International Paper Co. | | | 194 | | | | 9 | | |
Interpublic Group of Cos., Inc. (The) | | | 202 | | | | 8 | | |
Intuit, Inc. | | | 141 | | | | 91 | | |
Intuitive Surgical, Inc. (f) | | | 184 | | | | 66 | | |
Invesco Ltd. | | | 181 | | | | 4 | | |
Invitation Homes, Inc. REIT | | | 298 | | | | 14 | | |
IPG Photonics Corp. (f) | | | 20 | | | | 3 | | |
IQVIA Holdings, Inc. (f) | | | 100 | | | | 28 | | |
Iron Mountain, Inc. REIT | | | 226 | | | | 12 | | |
Jack Henry & Associates, Inc. | | | 38 | | | | 6 | | |
Jackson Financial, Inc., Class A | | | 64 | | | | 3 | | |
The accompanying notes are an integral part of the consolidated financial statements.
23
Morgan Stanley Variable Insurance Fund, Inc.
Annual Report – December 31, 2021
Consolidated Portfolio of Investments (cont'd)
Global Strategist Portfolio
| | | Shares | | Value
(000) | |
United States (cont'd) | |
Jacobs Engineering Group, Inc. | | | 67 | | | $ | 9 | | |
Jazz Pharmaceuticals PLC (f) | | | 32 | | | | 4 | | |
JB Hunt Transport Services, Inc. | | | 43 | | | | 9 | | |
JM Smucker Co. (The) | | | 55 | | | | 7 | | |
Johnson & Johnson | | | 1,373 | | | | 235 | | |
Johnson Controls International PLC | | | 370 | | | | 30 | | |
JPMorgan Chase & Co. | | | 1,556 | | | | 246 | | |
Juniper Networks, Inc. | | | 164 | | | | 6 | | |
KB Home | | | 629 | | | | 28 | | |
Kellogg Co. | | | 132 | | | | 8 | | |
Keurig Dr Pepper, Inc. | | | 363 | | | | 13 | | |
KeyCorp | | | 498 | | | | 12 | | |
Keysight Technologies, Inc. (f) | | | 96 | | | | 20 | | |
Kimberly-Clark Corp. | | | 174 | | | | 25 | | |
Kinder Morgan, Inc. | | | 1,065 | | | | 17 | | |
KKR & Co., Inc. | | | 274 | | | | 20 | | |
KLA Corp. | | | 80 | | | | 34 | | |
Knight-Swift Transportation Holdings, Inc. | | | 81 | | | | 5 | | |
Kraft Heinz Co. (The) | | | 347 | | | | 12 | | |
Kroger Co. (The) | | | 362 | | | | 16 | | |
L3Harris Technologies, Inc. | | | 105 | | | | 22 | | |
Laboratory Corp. of America Holdings (f) | | | 48 | | | | 15 | | |
Lam Research Corp. | | | 73 | | | | 52 | | |
Las Vegas Sands Corp. (f) | | | 181 | | | | 7 | | |
Lear Corp. | | | 31 | | | | 6 | | |
Leidos Holdings, Inc. | | | 70 | | | | 6 | | |
Lennar Corp., Class A | | | 2,296 | | | | 267 | | |
Lennox International, Inc. | | | 17 | | | | 6 | | |
Liberty Broadband Corp., Class A (f) | | | 13 | | | | 2 | | |
Liberty Broadband Corp., Class C (f) | | | 76 | | | | 12 | | |
Liberty Global PLC, Class A (f) | | | 81 | | | | 2 | | |
Liberty Global PLC Series C (f) | | | 177 | | | | 5 | | |
Liberty Media Corp-Liberty SiriusXM,
Class A (f) | | | 43 | | | | 2 | | |
Liberty Media Corp-Liberty SiriusXM,
Class C (f) | | | 88 | | | | 4 | | |
Liberty Media Corp.-Liberty Formula One,
Class C (f) | | | 101 | | | | 6 | | |
Lincoln National Corp. | | | 94 | | | | 6 | | |
Linde PLC | | | 267 | | | | 92 | | |
Live Nation Entertainment, Inc. (f) | | | 85 | | | | 10 | | |
LKQ Corp. | | | 144 | | | | 9 | | |
Lockheed Martin Corp. | | | 129 | | | | 46 | | |
Loews Corp. | | | 113 | | | | 7 | | |
Lowe's Cos., Inc. | | | 358 | | | | 93 | | |
Lucid Group, Inc. (f) | | | 204 | | | | 8 | | |
Lululemon Athletica, Inc. (f) | | | 62 | | | | 24 | | |
Lumen Technologies, Inc. | | | 491 | | | | 6 | | |
Lyft, Inc., Class A (f) | | | 140 | | | | 6 | | |
LyondellBasell Industries N.V., Class A | | | 139 | | | | 13 | | |
M&T Bank Corp. | | | 67 | | | | 10 | | |
M/I Homes, Inc. (f) | | | 207 | | | | 13 | | |
Marathon Oil Corp. | | | 5,311 | | | | 87 | | |
| | | Shares | | Value
(000) | |
Marathon Petroleum Corp. | | | 333 | | | $ | 21 | | |
Markel Corp. (f) | | | 7 | | | | 9 | | |
MarketAxess Holdings, Inc. | | | 20 | | | | 8 | | |
Marriott International, Inc., Class A (f) | | | 1,301 | | | | 215 | | |
Marriott Vacations Worldwide Corp. | | | 151 | | | | 26 | | |
Marsh & McLennan Cos., Inc. | | | 261 | | | | 45 | | |
Martin Marietta Materials, Inc. | | | 32 | | | | 14 | | |
Marvell Technology, Inc. | | | 432 | | | | 38 | | |
Masco Corp. | | | 128 | | | | 9 | | |
Masimo Corp. (f) | | | 27 | | | | 8 | | |
Mastercard, Inc., Class A | | | 452 | | | | 162 | | |
Match Group, Inc. (f) | | | 137 | | | | 18 | | |
McCormick & Co., Inc. | | | 128 | | | | 12 | | |
McDonald's Corp. | | | 385 | | | | 103 | | |
McKesson Corp. | | | 80 | | | | 20 | | |
MDC Holdings, Inc. | | | 507 | | | | 28 | | |
Medical Properties Trust, Inc. REIT | | | 309 | | | | 7 | | |
Medtronic PLC | | | 703 | | | | 73 | | |
MercadoLibre, Inc. (f) | | | 23 | | | | 31 | | |
Merck & Co., Inc. | | | 1,323 | | | | 101 | | |
Meritage Homes Corp. (f) | | | 272 | | | | 33 | | |
Meta Platforms, Inc., Class A (f) | | | 1,238 | | | | 416 | | |
MetLife, Inc. | | | 379 | | | | 24 | | |
Mettler-Toledo International, Inc. (f) | | | 12 | | | | 20 | | |
MGM Resorts International | | | 202 | | | | 9 | | |
Microchip Technology, Inc. | | | 284 | | | | 25 | | |
Micron Technology, Inc. | | | 586 | | | | 55 | | |
Microsoft Corp. | | | 3,634 | | | | 1,222 | | |
Mid-America Apartment Communities, Inc. REIT | | | 60 | | | | 14 | | |
Moderna, Inc. (f) | | | 191 | | | | 49 | | |
Mohawk Industries, Inc. (f) | | | 31 | | | | 6 | | |
Molina Healthcare, Inc. (f) | | | 30 | | | | 10 | | |
Molson Coors Beverage Co., Class B | | | 98 | | | | 5 | | |
Mondelez International, Inc., Class A | | | 715 | | | | 47 | | |
MongoDB, Inc. (f) | | | 31 | | | | 16 | | |
Monolithic Power Systems, Inc. | | | 23 | | | | 11 | | |
Monster Beverage Corp. (f) | | | 204 | | | | 20 | | |
Moody's Corp. | | | 87 | | | | 34 | | |
Mosaic Co. (The) | | | 190 | | | | 7 | | |
Motorola Solutions, Inc. | | | 86 | | | | 23 | | |
MSCI, Inc. | | | 43 | | | | 26 | | |
Nasdaq, Inc. | | | 61 | | | | 13 | | |
NetApp, Inc. | | | 117 | | | | 11 | | |
Netflix, Inc. (f) | | | 231 | | | | 139 | | |
Neurocrine Biosciences, Inc. (f) | | | 51 | | | | 4 | | |
Newell Brands, Inc. | | | 201 | | | | 4 | | |
Newmont Corp. (NYSE) | | | 184 | | | | 11 | | |
Newmont Corp. (TSX) | | | 417 | | | | 26 | | |
News Corp., Class A | | | 204 | | | | 5 | | |
NextEra Energy, Inc. | | | 1,014 | | | | 95 | | |
NIKE, Inc., Class B | | | 661 | | | | 110 | | |
NiSource, Inc. | | | 203 | | | | 6 | | |
Nordson Corp. | | | 27 | | | | 7 | | |
The accompanying notes are an integral part of the consolidated financial statements.
24
Morgan Stanley Variable Insurance Fund, Inc.
Annual Report – December 31, 2021
Consolidated Portfolio of Investments (cont'd)
Global Strategist Portfolio
| | | Shares | | Value
(000) | |
United States (cont'd) | |
Norfolk Southern Corp. | | | 127 | | | $ | 38 | | |
Northern Trust Corp. | | | 103 | | | | 12 | | |
Northrop Grumman Corp. | | | 79 | | | | 31 | | |
NortonLifeLock, Inc. | | | 299 | | | | 8 | | |
Novavax, Inc. (f) | | | 39 | | | | 6 | | |
Novocure Ltd. (f) | | | 50 | | | | 4 | | |
NRG Energy, Inc. | | | 126 | | | | 5 | | |
Nuance Communications, Inc. (f) | | | 154 | | | | 9 | | |
Nucor Corp. | | | 153 | | | | 17 | | |
NVIDIA Corp. | | | 1,312 | | | | 386 | | |
NVR, Inc. (f) | | | 27 | | | | 160 | | |
NXP Semiconductors N.V. | | | 138 | | | | 31 | | |
O'Reilly Automotive, Inc. (f) | | | 35 | | | | 25 | | |
Oak Street Health, Inc. (f) | | | 52 | | | | 2 | | |
Occidental Petroleum Corp. | | | 490 | | | | 14 | | |
Okta, Inc. (f) | | | 66 | | | | 15 | | |
Old Dominion Freight Line, Inc. | | | 51 | | | | 18 | | |
Omnicom Group, Inc. | | | 111 | | | | 8 | | |
ON Semiconductor Corp. (f) | | | 220 | | | | 15 | | |
ONEOK, Inc. | | | 232 | | | | 14 | | |
Oracle Corp. | | | 749 | | | | 65 | | |
Otis Worldwide Corp. | | | 211 | | | | 18 | | |
Ovintiv, Inc. | | | 72 | | | | 2 | | |
Owens Corning | | | 54 | | | | 5 | | |
PACCAR, Inc. | | | 180 | | | | 16 | | |
Packaging Corp. of America | | | 50 | | | | 7 | | |
Palantir Technologies, Inc., Class A (f) | | | 842 | | | | 15 | | |
Palo Alto Networks, Inc. (f) | | | 50 | | | | 28 | | |
Parker Hannifin Corp. | | | 66 | | | | 21 | | |
Paychex, Inc. | | | 167 | | | | 23 | | |
Paycom Software, Inc. (f) | | | 27 | | | | 11 | | |
PayPal Holdings, Inc. (f) | | | 591 | | | | 111 | | |
PDC Energy, Inc. | | | 643 | | | | 31 | | |
Peloton Interactive, Inc., Class A (f) | | | 153 | | | | 5 | | |
Pentair PLC | | | 85 | | | | 6 | | |
PepsiCo, Inc. | | | 711 | | | | 124 | | |
PerkinElmer, Inc. | | | 58 | | | | 12 | | |
Pfizer, Inc. | | | 2,887 | | | | 170 | | |
PG&E Corp. (f) | | | 785 | | | | 10 | | |
Philip Morris International, Inc. | | | 803 | | | | 76 | | |
Phillips 66 | | | 229 | | | | 17 | | |
Pinterest, Inc., Class A (f) | | | 299 | | | | 11 | | |
Pioneer Natural Resources Co. | | | 1,813 | | | | 330 | | |
Plug Power, Inc. (f) | | | 277 | | | | 8 | | |
PNC Financial Services Group, Inc. (The) | | | 221 | | | | 44 | | |
Pool Corp. | | | 21 | | | | 12 | | |
PPG Industries, Inc. | | | 123 | | | | 21 | | |
PPL Corp. | | | 399 | | | | 12 | | |
Principal Financial Group, Inc. | | | 139 | | | | 10 | | |
Procter & Gamble Co. (The) | | | 1,250 | | | | 204 | | |
Progressive Corp. (The) | | | 304 | | | | 31 | | |
ProLogis, Inc. REIT | | | 382 | | | | 64 | | |
| | | Shares | | Value
(000) | |
Prudential Financial, Inc. | | | 200 | | | $ | 22 | | |
PTC, Inc. (f) | | | 58 | | | | 7 | | |
Public Service Enterprise Group, Inc. | | | 261 | | | | 17 | | |
Public Storage REIT | | | 81 | | | | 30 | | |
Pulte Group, Inc. | | | 1,966 | | | | 112 | | |
Qorvo, Inc. (f) | | | 59 | | | | 9 | | |
QUALCOMM, Inc. | | | 584 | | | | 107 | | |
Quest Diagnostics, Inc. | | | 63 | | | | 11 | | |
Raymond James Financial, Inc. | | | 97 | | | | 10 | | |
Raytheon Technologies Corp. | | | 786 | | | | 68 | | |
Realty Income Corp. REIT | | | 287 | | | | 21 | | |
Regency Centers Corp. REIT | | | 80 | | | | 6 | | |
Regeneron Pharmaceuticals, Inc. (f) | | | 54 | | | | 34 | | |
Regions Financial Corp. | | | 500 | | | | 11 | | |
Republic Services, Inc. | | | 115 | | | | 16 | | |
ResMed, Inc. | | | 77 | | | | 20 | | |
RingCentral, Inc., Class A (f) | | | 41 | | | | 8 | | |
Rivian Automotive, Inc., Class A (f) | | | 92 | | | | 10 | | |
Robert Half International, Inc. | | | 58 | | | | 6 | | |
Rockwell Automation, Inc. | | | 60 | | | | 21 | | |
Roku, Inc. (f) | | | 61 | | | | 14 | | |
Rollins, Inc. | | | 116 | | | | 4 | | |
Roper Technologies, Inc. | | | 55 | | | | 27 | | |
Ross Stores, Inc. | | | 185 | | | | 21 | | |
Royal Caribbean Cruises Ltd. (f) | | | 119 | | | | 9 | | |
Royalty Pharma PLC, Class A | | | 180 | | | | 7 | | |
RPM International, Inc. | | | 67 | | | | 7 | | |
S&P Global, Inc. | | | 125 | | | | 59 | | |
salesforce.com, Inc. (f) | | | 504 | | | | 128 | | |
SBA Communications Corp. REIT | | | 56 | | | | 22 | | |
Schlumberger N.V. | | | 726 | | | | 22 | | |
Seagate Technology Holdings PLC | | | 107 | | | | 12 | | |
Seagen, Inc. (f) | | | 72 | | | | 11 | | |
Sealed Air Corp. | | | 77 | | | | 5 | | |
SEI Investments Co. | | | 63 | | | | 4 | | |
Sempra Energy | | | 166 | | | | 22 | | |
Sensata Technologies Holding PLC (f) | | | 82 | | | | 5 | | |
ServiceNow, Inc. (f) | | | 102 | | | | 66 | | |
Sherwin-Williams Co. (The) | | | 129 | | | | 45 | | |
Signature Bank | | | 33 | | | | 11 | | |
Simon Property Group, Inc. REIT | | | 172 | | | | 27 | | |
Sirius XM Holdings, Inc. | | | 520 | | | | 3 | | |
Skyworks Solutions, Inc. | | | 85 | | | | 13 | | |
Snap, Inc., Class A (f) | | | 564 | | | | 27 | | |
Snap-On, Inc. | | | 28 | | | | 6 | | |
Snowflake, Inc., Class A (f) | | | 108 | | | | 37 | | |
SoFi Technologies, Inc. (f) | | | 278 | | | | 4 | | |
SolarEdge Technologies, Inc. (f) | | | 28 | | | | 8 | | |
Southern Co. (The) | | | 545 | | | | 37 | | |
Southwest Airlines Co. (f) | | | 81 | | | | 3 | | |
Splunk, Inc. (f) | | | 87 | | | | 10 | | |
Square, Inc., Class A (f) | | | 213 | | | | 34 | | |
SS&C Technologies Holdings, Inc. | | | 119 | | | | 10 | | |
The accompanying notes are an integral part of the consolidated financial statements.
25
Morgan Stanley Variable Insurance Fund, Inc.
Annual Report – December 31, 2021
Consolidated Portfolio of Investments (cont'd)
Global Strategist Portfolio
| | | Shares | | Value
(000) | |
United States (cont'd) | |
Stanley Black & Decker, Inc. | | | 83 | | | $ | 16 | | |
Starbucks Corp. | | | 607 | | | | 71 | | |
State Street Corp. | | | 192 | | | | 18 | | |
Steel Dynamics, Inc. | | | 108 | | | | 7 | | |
Steris PLC | | | 52 | | | | 13 | | |
Stryker Corp. | | | 177 | | | | 47 | | |
Sun Communities, Inc. REIT | | | 60 | | | | 13 | | |
Sunrun, Inc. (f) | | | 91 | | | | 3 | | |
SVB Financial Group (f) | | | 31 | | | | 21 | | |
Synchrony Financial | | | 297 | | | | 14 | | |
Synopsys, Inc. (f) | | | 78 | | | | 29 | | |
Sysco Corp. | | | 267 | | | | 21 | | |
T Rowe Price Group, Inc. | | | 121 | | | | 24 | | |
T-Mobile US, Inc. (f) | | | 322 | | | | 37 | | |
Take-Two Interactive Software, Inc. (f) | | | 61 | | | | 11 | | |
Target Corp. | | | 254 | | | | 59 | | |
TE Connectivity Ltd. | | | 167 | | | | 27 | | |
Teladoc Health, Inc. (f) | | | 74 | | | | 7 | | |
Teledyne Technologies, Inc. (f) | | | 24 | | | | 10 | | |
Teleflex, Inc. | | | 25 | | | | 8 | | |
Teradyne, Inc. | | | 86 | | | | 14 | | |
Tesla, Inc. (f) | | | 432 | | | | 457 | | |
Texas Instruments, Inc. | | | 479 | | | | 90 | | |
Texas Roadhouse, Inc. | | | 695 | | | | 62 | | |
Textron, Inc. | | | 115 | | | | 9 | | |
Thermo Fisher Scientific, Inc. | | | 203 | | | | 135 | | |
TJX Cos., Inc. (The) | | | 623 | | | | 47 | | |
Toll Brothers, Inc. | | | 861 | | | | 62 | | |
Tractor Supply Co. | | | 59 | | | | 14 | | |
Trade Desk, Inc. (The), Class A (f) | | | 227 | | | | 21 | | |
Tradeweb Markets, Inc., Class A | | | 54 | | | | 5 | | |
Trane Technologies PLC | | | 123 | | | | 25 | | |
TransDigm Group, Inc. (f) | | | 27 | | | | 17 | | |
TransUnion | | | 100 | | | | 12 | | |
Travelers Cos., Inc. (The) | | | 129 | | | | 20 | | |
Trimble, Inc. (f) | | | 132 | | | | 12 | | |
Truist Financial Corp. | | | 698 | | | | 41 | | |
Twilio, Inc., Class A (f) | | | 86 | | | | 23 | | |
Twitter, Inc. (f) | | | 426 | | | | 18 | | |
Tyler Technologies, Inc. (f) | | | 21 | | | | 11 | | |
Tyson Foods, Inc., Class A | | | 153 | | | | 13 | | |
Uber Technologies, Inc. (f) | | | 646 | | | | 27 | | |
UDR, Inc. REIT | | | 155 | | | | 9 | | |
UGI Corp. | | | 108 | | | | 5 | | |
Ulta Beauty, Inc. (f) | | | 27 | | | | 11 | | |
Union Pacific Corp. | | | 338 | | | | 85 | | |
United Parcel Service, Inc., Class B | | | 373 | | | | 80 | | |
United Rentals, Inc. (f) | | | 39 | | | | 13 | | |
UnitedHealth Group, Inc. | | | 491 | | | | 247 | | |
Unity Software, Inc. (f) | | | 29 | | | | 4 | | |
| | | Shares | | Value
(000) | |
Universal Health Services, Inc., Class B | | | 40 | | | $ | 5 | | |
Upstart Holdings, Inc. (f) | | | 11 | | | | 2 | | |
US Bancorp | | | 728 | | | | 41 | | |
Vail Resorts, Inc. | | | 21 | | | | 7 | | |
Valero Energy Corp. | | | 213 | | | | 16 | | |
Veeva Systems, Inc., Class A (f) | | | 72 | | | | 18 | | |
Ventas, Inc. REIT | | | 204 | | | | 10 | | |
VeriSign, Inc. (f) | | | 52 | | | | 13 | | |
Verisk Analytics, Inc. | | | 79 | | | | 18 | | |
Verizon Communications, Inc. | | | 4,185 | | | | 217 | | |
Vertex Pharmaceuticals, Inc. (f) | | | 135 | | | | 30 | | |
VF Corp. | | | 173 | | | | 13 | | |
ViacomCBS, Inc., Class B | | | 316 | | | | 10 | | |
Viatris, Inc. | | | 629 | | | | 9 | | |
VICI Properties, Inc. REIT | | | 319 | | | | 10 | | |
Visa, Inc., Class A | | | 870 | | | | 189 | | |
Vistra Corp. | | | 226 | | | | 5 | | |
VMware, Inc., Class A | | | 109 | | | | 13 | | |
Vornado Realty Trust REIT | | | 88 | | | | 4 | | |
Vulcan Materials Co. | | | 68 | | | | 14 | | |
Walgreens Boots Alliance, Inc. | | | 380 | | | | 20 | | |
Walmart, Inc. | | | 799 | | | | 116 | | |
Walt Disney Co. (The) (f) | | | 948 | | | | 147 | | |
Waste Connections, Inc. | | | 135 | | | | 18 | | |
Waste Management, Inc. | | | 216 | | | | 36 | | |
Waters Corp. (f) | | | 32 | | | | 12 | | |
Wayfair, Inc., Class A (f) | | | 42 | | | | 8 | | |
WEC Energy Group, Inc. | | | 163 | | | | 16 | | |
Wells Fargo & Co. | | | 2,125 | | | | 102 | | |
Welltower, Inc. REIT | | | 224 | | | | 19 | | |
West Pharmaceutical Services, Inc. | | | 38 | | | | 18 | | |
Western Digital Corp. (f) | | | 160 | | | | 10 | | |
Western Union Co. (The) | | | 210 | | | | 4 | | |
Westinghouse Air Brake Technologies Corp. | | | 94 | | | | 9 | | |
WestRock Co. | | | 140 | | | | 6 | | |
Weyerhaeuser Co. REIT | | | 388 | | | | 16 | | |
Whirlpool Corp. | | | 32 | | | | 8 | | |
Williams Cos., Inc. (The) | | | 637 | | | | 17 | | |
Willis Towers Watson PLC | | | 67 | | | | 16 | | |
Workday, Inc., Class A (f) | | | 99 | | | | 27 | | |
WP Carey, Inc. REIT | | | 95 | | | | 8 | | |
WR Berkley Corp. | | | 73 | | | | 6 | | |
WW Grainger, Inc. | | | 23 | | | | 12 | | |
Wyndham Hotels & Resorts, Inc. | | | 332 | | | | 30 | | |
Wynn Resorts Ltd. (f) | | | 54 | | | | 5 | | |
Xcel Energy, Inc. | | | 278 | | | | 19 | | |
Xilinx, Inc. | | | 128 | | | | 27 | | |
Xylem, Inc. | | | 94 | | | | 11 | | |
Yum! Brands, Inc. | | | 152 | | | | 21 | | |
Zebra Technologies Corp., Class A (f) | | | 27 | | | | 16 | | |
Zendesk, Inc. (f) | | | 63 | | | | 7 | | |
The accompanying notes are an integral part of the consolidated financial statements.
26
Morgan Stanley Variable Insurance Fund, Inc.
Annual Report – December 31, 2021
Consolidated Portfolio of Investments (cont'd)
Global Strategist Portfolio
| | | Shares | | Value
(000) | |
United States (cont'd) | |
Zillow Group, Inc., Class A (f) | | | 33 | | | $ | 2 | | |
Zillow Group, Inc., Class C (f) | | | 89 | | | | 6 | | |
Zimmer Biomet Holdings, Inc. | | | 110 | | | | 14 | | |
Zoetis, Inc. | | | 245 | | | | 60 | | |
Zoom Video Communications, Inc., Class A (f) | | | 114 | | | | 21 | | |
ZoomInfo Technologies, Inc., Class A (f) | | | 116 | | | | 7 | | |
Zscaler, Inc. (f) | | | 42 | | | | 13 | | |
| | | | 25,800 | | |
Total Common Stocks (Cost $31,777) | | | 40,105 | | |
Short-Term Investments (13.6%) | |
Investment Company (13.0%) | |
Morgan Stanley Institutional Liquidity
Funds — Government Portfolio —
Institutional Class (See Note H)
(Cost $13,700) | | | 13,699,609 | | | | 13,700 | | |
| | | Face Amount
(000) | | | |
U.S. Treasury Security (0.6%) | |
U.S. Treasury Bill
0.06%, 7/14/22 (h)(i) (Cost $676) | | $ | 676 | | | | 675 | | |
Total Short-Term Investments (Cost $14,376) | | | 14,375 | | |
| Total Investments (99.3%) (Cost $96,349) (j)(k)(l) | | | 104,720 | | |
Other Assets in Excess of Liabilities (0.7%) | | | 769 | | |
Net Assets (100.0%) | | $ | 105,489 | | |
Country assignments and aggregations are based generally on third party vendor classifications and information, and may be different from the assignments and aggregations under the policies set forth in the Fund's prospectus and/or statement of additional information relating to geographic classifications.
(a) Amount is less than 0.05%.
(b) Security is subject to delayed delivery.
(c) 144A security — Certain conditions for public sale may exist. Unless otherwise noted, these securities are deemed to be liquid.
(d) Floating or variable rate securities: The rates disclosed are as of December 31, 2021. For securities based on a published reference rate and spread, the reference rate and spread are indicated in the description in the Consolidated Portfolio of Investments. Certain variable rate securities may not be based on a published reference rate and spread but are determined by the issuer or agent and are based on current market conditions. These securities do not indicate a reference rate and spread in their description in the Consolidated Portfolio of Investments.
(e) Perpetual — One or more securities do not have a predetermined maturity date. Rates for these securities are fixed for a period of time, after which they revert to a floating rate. Interest rates in effect are as of December 31, 2021.
(f) Non-income producing security.
(g) Security trades on the Hong Kong exchange.
(h) Rate shown is the yield to maturity at December 31, 2021.
(i) All or a portion of the security was pledged to cover margin requirements for swap agreements.
(j) Securities are available for collateral in connection with securities purchased on a forward commitment basis, open foreign currency forward exchange contracts, futures contracts and swap agreements.
(k) The approximate fair value and percentage of net assets, $5,429,000 and 5.1%, respectively, represent the securities that have been fair valued under the fair valuation policy for international investments as described in Note A-1 within the Notes to the Consolidated Financial Statements.
(l) At December 31, 2021, the aggregate cost for federal income tax purposes is approximately $98,053,000. The aggregate gross unrealized appreciation is approximately $13,101,000 and the aggregate gross unrealized depreciation is approximately $5,183,000, resulting in net unrealized appreciation of approximately $7,918,000.
@ Value is less than $500.
ADR American Depositary Receipt.
CDI CHESS Depositary Interest.
CVA Certificaten Van Aandelen.
LIBOR London Interbank Offered Rate.
EURIBOR Euro Interbank Offered Rate.
LSE London Stock Exchange.
MTN Medium Term Note.
NYSE New York Stock Exchange.
OAT Obligations Assimilables du Trésor (Treasury Obligation).
OFZ Obilgatsyi Federal'novo Zaima (Russian Federal Loan Obligation).
REIT Real Estate Investment Trust.
SOFR Secured Overnight Financing Rate.
TBA To Be Announced.
TSX Toronto Stock Exchange.
The accompanying notes are an integral part of the consolidated financial statements.
27
Morgan Stanley Variable Insurance Fund, Inc.
Annual Report – December 31, 2021
Consolidated Portfolio of Investments (cont'd)
Global Strategist Portfolio
Foreign Currency Forward Exchange Contracts:
The Fund had the following foreign currency forward exchange contracts open at December 31, 2021:
Counterparty | |
Contracts
to Deliver
(000) | | In
Exchange
For
(000) | |
Delivery
Date | | Unrealized
Appreciation
(Depreciation)
(000) | |
Bank of America NA | | CNH | 2,390 | | | $ | 373 | | | 3/17/22 | | $ | (2 | ) | |
Bank of America NA | | PLN | 67 | | | $ | 16 | | | 3/17/22 | | | (— | @) | |
Bank of America NA | | $ | 212 | | | CHF | 194 | | | 2/18/22 | | | 2 | | |
Bank of America NA | | $ | 35 | | | ILS | 110 | | | 3/16/22 | | | — | @ | |
Bank of America NA | | $ | 35 | | | NZD | 51 | | | 3/17/22 | | | — | @ | |
Bank of Montreal | | $ | 75 | | | CAD | 96 | | | 3/17/22 | | | 1 | | |
Barclays Bank PLC | | GBP | 428 | | | $ | 575 | | | 2/18/22 | | | (3 | ) | |
Barclays Bank PLC | | $ | 66 | | | AUD | 93 | | | 3/17/22 | | | 2 | | |
Barclays Bank PLC | | $ | 36 | | | CAD | 46 | | | 3/17/22 | | | 1 | | |
Barclays Bank PLC | | $ | 79 | | | GBP | 59 | | | 2/18/22 | | | 1 | | |
Barclays Bank PLC | | $ | 91 | | | GBP | 68 | | | 3/17/22 | | | — | @ | |
Barclays Bank PLC | | $ | 38 | | | SEK | 345 | | | 3/17/22 | | | — | @ | |
BNP Paribas SA | | CNY | 44,913 | | | $ | 6,985 | | | 3/17/22 | | | (24 | ) | |
BNP Paribas SA | | DKK | 117 | | | $ | 18 | | | 3/17/22 | | | (— | @) | |
BNP Paribas SA | | EUR | 550 | | | $ | 625 | | | 3/17/22 | | | (3 | ) | |
BNP Paribas SA | | EUR | 204 | | | $ | 231 | | | 3/17/22 | | | (1 | ) | |
BNP Paribas SA | | JPY | 3,209 | | | $ | 28 | | | 3/17/22 | | | — | @ | |
BNP Paribas SA | | JPY | 607 | | | $ | 5 | | | 3/17/22 | | | — | @ | |
BNP Paribas SA | | $ | 162 | | | CAD | 208 | | | 3/17/22 | | | 2 | | |
BNP Paribas SA | | $ | 13 | | | CLP | 10,924 | | | 3/17/22 | | | (— | @) | |
BNP Paribas SA | | $ | 789 | | | CNH | 5,067 | | | 2/18/22 | | | 6 | | |
BNP Paribas SA | | $ | 13 | | | COP | 50,392 | | | 3/17/22 | | | (— | @) | |
BNP Paribas SA | | $ | 347 | | | EUR | 304 | | | 2/18/22 | | | (— | @) | |
BNP Paribas SA | | $ | 71 | | | HKD | 556 | | | 3/17/22 | | | — | @ | |
BNP Paribas SA | | $ | 26 | | | IDR | 375,000 | | | 3/17/22 | | | — | @ | |
BNP Paribas SA | | $ | 34 | | �� | JPY | 3,952 | | | 3/17/22 | | | — | @ | |
BNP Paribas SA | | $ | 593 | | | MXN | 12,784 | | | 3/17/22 | | | 23 | | |
BNP Paribas SA | | $ | 33 | | | PEN | 135 | | | 2/18/22 | | | — | @ | |
BNP Paribas SA | | $ | 117 | | | SGD | 161 | | | 3/17/22 | | | 2 | | |
BNP Paribas SA | | $ | 1 | | | TWD | 32 | | | 3/17/22 | | | (— | @) | |
Citibank NA | | $ | 7 | | | CZK | 168 | | | 3/17/22 | | | — | @ | |
Citibank NA | | $ | 32 | | | ILS | 100 | | | 3/16/22 | | | — | @ | |
Citibank NA | | $ | 75 | | | SGD | 101 | | | 2/18/22 | | | — | @ | |
Citibank NA | | $ | 124 | | | THB | 4,040 | | | 2/18/22 | | | (3 | ) | |
Citibank NA | | $ | 4 | | | THB | 145 | | | 3/17/22 | | | — | @ | |
Commonwealth Bank of Australia | | NZD | 13 | | | $ | 9 | | | 3/17/22 | | | (— | @) | |
Goldman Sachs International | | BRL | 254 | | | $ | 45 | | | 3/17/22 | | | (— | @) | |
Goldman Sachs International | | BRL | 677 | | | $ | 119 | | | 3/17/22 | | | — | @ | |
Goldman Sachs International | | CAD | 1,461 | | | $ | 1,143 | | | 3/17/22 | | | (12 | ) | |
Goldman Sachs International | | EUR | 362 | | | $ | 409 | | | 3/17/22 | | | (4 | ) | |
Goldman Sachs International | | JPY | 1,214 | | | $ | 11 | | | 3/17/22 | | | — | @ | |
Goldman Sachs International | | NOK | 5 | | | $ | 1 | | | 3/17/22 | | | (— | @) | |
Goldman Sachs International | | $ | 69 | | | AUD | 97 | | | 3/17/22 | | | 2 | | |
Goldman Sachs International | | $ | — | @ | | DKK | 3 | | | 2/18/22 | | | — | @ | |
Goldman Sachs International | | $ | 21 | | | HKD | 163 | | | 3/17/22 | | | — | @ | |
Goldman Sachs International | | $ | 428 | | | KRW | 505,579 | | | 2/18/22 | | | (3 | ) | |
Goldman Sachs International | | $ | 13 | | | KRW | 15,023 | | | 3/17/22 | | | (— | @) | |
Goldman Sachs International | | $ | 28 | | | RON | 122 | | | 2/18/22 | | | (— | @) | |
Goldman Sachs International | | $ | 1,298 | | | RUB | 97,548 | | | 3/17/22 | | | (18 | ) | |
JPMorgan Chase Bank NA | | CAD | 21 | | | $ | 16 | | | 2/18/22 | | | (— | @) | |
JPMorgan Chase Bank NA | | CAD | 22 | | | $ | 17 | | | 2/18/22 | | | (— | @) | |
JPMorgan Chase Bank NA | | DKK | 148 | | | $ | 23 | | | 2/18/22 | | | — | @ | |
The accompanying notes are an integral part of the consolidated financial statements.
28
Morgan Stanley Variable Insurance Fund, Inc.
Annual Report – December 31, 2021
Consolidated Portfolio of Investments (cont'd)
Global Strategist Portfolio
Foreign Currency Forward Exchange Contracts (cont'd):
Counterparty | |
Contracts
to Deliver
(000) | | In
Exchange
For
(000) | |
Delivery
Date | | Unrealized
Appreciation
(Depreciation)
(000) | |
JPMorgan Chase Bank NA | | JPY | 2,945 | | | $ | 26 | | | 2/18/22 | | $ | (— | @) | |
JPMorgan Chase Bank NA | | MXN | 727 | | | $ | 35 | | | 2/18/22 | | | (— | @) | |
JPMorgan Chase Bank NA | | RUB | 1,954 | | | $ | 26 | | | 2/18/22 | | | 1 | | |
JPMorgan Chase Bank NA | | SEK | 71 | | | $ | 8 | | | 3/17/22 | | | (— | @) | |
JPMorgan Chase Bank NA | | $ | 133 | | | AUD | 186 | | | 3/17/22 | | | 3 | | |
JPMorgan Chase Bank NA | | $ | 17 | | | CAD | 22 | | | 1/6/22 | | | — | @ | |
JPMorgan Chase Bank NA | | $ | 18 | | | HUF | 5,668 | | | 2/18/22 | | | (— | @) | |
JPMorgan Chase Bank NA | | $ | 26 | | | JPY | 2,945 | | | 1/6/22 | | | — | @ | |
JPMorgan Chase Bank NA | | $ | 14 | | | NOK | 122 | | | 2/18/22 | | | (— | @) | |
JPMorgan Chase Bank NA | | $ | 5 | | | PLN | 21 | | | 2/18/22 | | | — | @ | |
JPMorgan Chase Bank NA | | $ | 85 | | | SEK | 740 | | | 2/18/22 | | | (3 | ) | |
JPMorgan Chase Bank NA | | ZAR | 19 | | | $ | 1 | | | 3/17/22 | | | (— | @) | |
State Street Bank and Trust Co. | | $ | 3 | | | HKD | 20 | | | 3/17/22 | | | — | @ | |
State Street Bank and Trust Co. | | $ | 443 | | | JPY | 50,466 | | | 2/18/22 | | | (4 | ) | |
UBS AG | | AUD | 855 | | | $ | 627 | | | 2/18/22 | | | 5 | | |
UBS AG | | AUD | 5 | | | $ | 3 | | | 2/18/22 | | | (— | @) | |
UBS AG | | EUR | 107 | | | $ | 121 | | | 3/17/22 | | | (1 | ) | |
UBS AG | | EUR | 1,972 | | | $ | 2,228 | | | 3/17/22 | | | (20 | ) | |
UBS AG | | EUR | 8 | | | $ | 9 | | | 3/17/22 | | | (— | @) | |
UBS AG | | EUR | 16 | | | $ | 18 | | | 3/17/22 | | | (— | @) | |
UBS AG | | GBP | 37 | | | $ | 49 | | | 3/17/22 | | | (1 | ) | |
UBS AG | | JPY | 8,293 | | | $ | 73 | | | 3/17/22 | | | — | @ | |
UBS AG | | JPY | 42,231 | | | $ | 372 | | | 3/17/22 | | | 4 | | |
UBS AG | | JPY | 2,376 | | | $ | 21 | | | 2/18/22 | | | — | @ | |
UBS AG | | NOK | 6,034 | | | $ | 662 | | | 3/17/22 | | | (22 | ) | |
UBS AG | | SEK | 383 | | | $ | 42 | | | 3/17/22 | | | (— | @) | |
UBS AG | | $ | 3 | | | AUD | 5 | | | 2/18/22 | | | — | @ | |
UBS AG | | $ | 3 | | | AUD | 5 | | | 2/18/22 | | | — | @ | |
UBS AG | | $ | 204 | | | AUD | 287 | | | 3/17/22 | | | 5 | | |
UBS AG | | $ | 9 | | | CAD | 11 | | | 2/18/22 | | | (— | @) | |
UBS AG | | $ | 173 | | | CAD | 223 | | | 3/17/22 | | | 3 | | |
UBS AG | | $ | 45 | | | CZK | 1,001 | | | 2/18/22 | | | — | @ | |
UBS AG | | $ | 129 | | | EUR | 114 | | | 2/18/22 | | | — | @ | |
UBS AG | | $ | 1 | | | HUF | 419 | | | 3/17/22 | | | — | @ | |
UBS AG | | $ | 9 | | | JPY | 1,012 | | | 2/18/22 | | | (— | @) | |
UBS AG | | $ | 5 | | | MXN | 99 | | | 2/18/22 | | | — | @ | |
UBS AG | | $ | 855 | | | MXN | 18,420 | | | 3/17/22 | | | 34 | | |
UBS AG | | $ | 4 | | | TRY | 62 | | | 3/17/22 | | | — | @ | |
UBS AG | | ZAR | 327 | | | $ | 20 | | | 3/17/22 | | | (— | @) | |
| | | | | | | | | $ | (27 | ) | |
Futures Contracts:
The Fund had the following futures contracts open at December 31, 2021: | |
| | | Number
of
Contracts | | Expiration
Date | | Notional
Amount
(000) | | Value
(000) | | Unrealized
Appreciation
(Depreciation)
(000) | |
Long: | |
U.S. Treasury 10 yr. Note (United States) | | | 12 | | | Mar-22 | | $ | 1,200 | | | $ | 1,566 | | | $ | 9 | | |
SPI 200 Index (Australia) | | | 4 | | | Mar-22 | | AUD | — | @ | | | 535 | | | | 7 | | |
SGX MSCI Singapore (Singapore) | | | 5 | | | Jan-22 | | SGD | 1 | | | | 126 | | | | 1 | | |
South Korea 10 yr. Bond (Korea, Republic of) | | | 5 | | | Mar-22 | | KRW | 500,000 | | | | 523 | | | | (4 | ) | |
The accompanying notes are an integral part of the consolidated financial statements.
29
Morgan Stanley Variable Insurance Fund, Inc.
Annual Report – December 31, 2021
Consolidated Portfolio of Investments (cont'd)
Global Strategist Portfolio
Futures Contracts (cont'd):
| | | Number
of
Contracts | | Expiration
Date | | Notional
Amount
(000) | | Value
(000) | | Unrealized
Appreciation
(Depreciation)
(000) | |
IBEX 35 Index (Spain) | | | 1 | | | Jan-22 | | EUR | — | @ | | $ | 99 | | | $ | 3 | | |
Hang Seng Index (Hong Kong) | | | 1 | | | Jan-22 | | HKD | — | @ | | | 150 | | | | 1 | | |
Gold Futures (United States) | | | 6 | | | Feb-22 | | $ | 1 | | | | 1,097 | | | | 12 | | |
FTSE MIB Index (Italy) | | | 1 | | | Mar-22 | | EUR | — | @ | | | 155 | | | | 3 | | |
CAC 40 Index (France) | | | 1 | | | Jan-22 | | | — | @ | | | 81 | | | | 2 | | |
U.S. Treasury 5 yr. Note (United States) | | | 5 | | | Mar-22 | | $ | 500 | | | | 605 | | | | 2 | | |
Short: | |
NIKKEI 255 Index (Japan) | | | 6 | | | Mar-22 | | JPY | (3 | ) | | | (752 | ) | | | (6 | ) | |
U.S. Treasury 5 yr. Note (United States) | | | 59 | | | Mar-22 | | $ | (5,900 | ) | | | (7,138 | ) | | | (23 | ) | |
U.S. Treasury 2 yr. Note (United States) | | | 25 | | | Mar-22 | | | (5,000 | ) | | | (5,454 | ) | | | 1 | | |
S&P 500 E Mini Index (United States) | | | 39 | | | Mar-22 | | | (2 | ) | | | (9,279 | ) | | | (114 | ) | |
MSCI Emerging Market E Mini (United States) | | | 17 | | | Mar-22 | | | (1 | ) | | | (1,042 | ) | | | 10 | | |
FTSE 100 Index (United Kingdom) | | | 1 | | | Mar-22 | | GBP | (— | @) | | | (99 | ) | | | (1 | ) | |
Euro Stoxx 50 Index Dividend (Germany) | | | 30 | | | Mar-22 | | EUR | (— | @) | | | (1,464 | ) | | | (12 | ) | |
Copper High Grade Index (United States) | | | 9 | | | Mar-22 | | $ | (225 | ) | | | (1,004 | ) | | | (15 | ) | |
US Treasury10 yr. Note (United States) | | | 3 | | | Mar-22 | | | (300 | ) | | | (392 | ) | | | (3 | ) | |
U.S. Treasury Ultra Long Bond (United States) | | | 29 | | | Mar-22 | | | (2,900 | ) | | | (4,247 | ) | | | (70 | ) | |
German Euro Bund (Germany) | | | 2 | | | Mar-22 | | EUR | (200 | ) | | | (390 | ) | | | 6 | | |
German Euro BTP (Germany) | | | 18 | | | Mar-22 | | | (1,800 | ) | | | (3,013 | ) | | | 68 | | |
| | | $ | (123 | ) | |
Interest Rate Swap Agreements:
The Fund had the following interest rate swap agreements open at December 31, 2021:
Swap Counterparty | | Floating Rate
Index | | Pay/
Receive
Floating Rate | | Fixed Rate | | Payment
Frequency
Paid/
Received | | Maturity
Date | | Notional
Amount
(000) | | Value
(000) | | Upfront
Payment
Paid
(000) | | Unrealized
Appreciation
(Depreciation)
(000) | |
Morgan Stanley & Co. LLC* | | 1 Month TIIE | | Pay | | | 6.14 | % | | Quarterly/
Quarterly | | 7/3/23 | | MXN | 23,872 | | | $ | (18 | ) | | $ | — | | | $ | (18 | ) | |
Morgan Stanley & Co. LLC* | | 1 Month TIIE | | Pay | | | 6.14 | | | Quarterly/
Quarterly | | 7/3/23 | | | 23,872 | | | | (18 | ) | | | — | | | | (18 | ) | |
Morgan Stanley & Co. LLC* | | 1 Month TIIE | | Pay | | | 6.13 | | | Quarterly/
Quarterly | | 7/5/23 | | | 23,872 | | | | (18 | ) | | | — | | | | (18 | ) | |
Morgan Stanley & Co. LLC* | | 1 Month TIIE | | Pay | | | 7.30 | | | Quarterly/
Quarterly | | 12/26/23 | | | 23,778 | | | | (1 | ) | | | — | | | | (1 | ) | |
Morgan Stanley & Co. LLC* | | 1 Month TIIE | | Pay | | | 7.31 | | | Quarterly/
Quarterly | | 12/26/23 | | | 24,139 | | | | (1 | ) | | | — | | | | (1 | ) | |
Morgan Stanley & Co. LLC* | | 1 Month TIIE | | Pay | | | 7.30 | | | Quarterly/
Quarterly | | 12/27/23 | | | 24,139 | | | | (1 | ) | | | — | | | | (1 | ) | |
Morgan Stanley & Co. LLC* | | 1 Month TIIE | | Pay | | | 6.68 | | | Quarterly/
Quarterly | | 6/29/26 | | | 6,814 | | | | (10 | ) | | | — | | | | (10 | ) | |
Morgan Stanley & Co. LLC* | | 1 Month TIIE | | Pay | | | 6.68 | | | Quarterly/
Quarterly | | 6/29/26 | | | 6,814 | | | | (9 | ) | | | — | | | | (9 | ) | |
Morgan Stanley & Co. LLC* | | 1 Month TIIE | | Pay | | | 6.66 | | | Quarterly/
Quarterly | | 7/1/26 | | | 6,814 | | | | (10 | ) | | | — | | | | (10 | ) | |
Morgan Stanley & Co. LLC* | | 1 Month TIIE | | Pay | | | 7.36 | | | Quarterly/
Quarterly | | 12/22/26 | | | 10,395 | | | | (1 | ) | | | — | | | | (1 | ) | |
Morgan Stanley & Co. LLC* | | 1 Month TIIE | | Pay | | | 7.38 | | | Quarterly/
Quarterly | | 12/22/26 | | | 10,395 | | | | (1 | ) | | | — | | | | (1 | ) | |
Morgan Stanley & Co. LLC* | | BRL-CDI | | Pay | | | 10.55 | | | Semi-Annual/
Quarterly | | 1/2/25 | | BRL | 2,016 | | | | 1 | | | | — | | | | 1 | | |
Morgan Stanley & Co. LLC* | | BRL-CDI | | Pay | | | 10.55 | | | Semi-Annual/
Quarterly | | 1/2/25 | | | 2,016 | | | | 1 | | | | — | | | | 1 | | |
The accompanying notes are an integral part of the consolidated financial statements.
30
Morgan Stanley Variable Insurance Fund, Inc.
Annual Report – December 31, 2021
Consolidated Portfolio of Investments (cont'd)
Global Strategist Portfolio
Interest Rate Swap Agreements (cont'd):
Swap Counterparty | | Floating Rate
Index | | Pay/
Receive
Floating Rate | | Fixed Rate | | Payment
Frequency
Paid/
Received | | Maturity
Date | | Notional
Amount
(000) | | Value
(000) | | Upfront
Payment
Paid
(000) | | Unrealized
Appreciation
(Depreciation)
(000) | |
Morgan Stanley & Co. LLC* | | BRL-CDI | | Pay | | | 10.57 | % | | Semi-Annual/
Quarterly | | 1/2/25 | | BRL | 4,033 | | | $ | 1 | | | $ | — | | | $ | 1 | | |
Morgan Stanley & Co. LLC* | | BRL-CDI | | Pay | | | 11.63 | | | Semi-Annual/
Quarterly | | 1/2/25 | | | 4,755 | | | | 31 | | | | — | | | | 31 | | |
Morgan Stanley & Co. LLC* | | BRL-CDI | | Pay | | | 11.63 | | | Semi-Annual/
Quarterly | | 1/2/25 | | | 4,755 | | | | 31 | | | | — | | | | 31 | | |
Morgan Stanley & Co. LLC* | | BRL-CDI | | Pay | | | 11.69 | | | Semi-Annual/
Quarterly | | 1/2/25 | | | 4,684 | | | | 31 | | | | — | | | | 31 | | |
Morgan Stanley & Co. LLC* | | BRL-CDI | | Pay | | | 11.74 | | | Semi-Annual/
Quarterly | | 1/2/25 | | | 6,991 | | | | 49 | | | | — | | | | 49 | | |
Morgan Stanley & Co. LLC* | | BRL-CDI | | Pay | | | 11.80 | | | Semi-Annual/
Quarterly | | 1/2/25 | | | 3,995 | | | | 29 | | | | — | | | | 29 | | |
Morgan Stanley & Co. LLC* | | BRL-CDI | | Pay | | | 11.85 | | | Semi-Annual/
Quarterly | | 1/2/25 | | | 4,679 | | | | 35 | | | | — | | | | 35 | | |
Morgan Stanley & Co. LLC* | | BRL-CDI | | Pay | | | 11.90 | | | Semi-Annual/
Quarterly | | 1/2/25 | | | 4,680 | | | | 37 | | | | — | | | | 37 | | |
| | | | | | | | | | | | | | | $ | 158 | | | $ | — | | | $ | 158 | | |
Total Return Swap Agreements:
The Fund had the following total return swap agreements open at December 31, 2021:
Swap Counterparty | | Index | | Pay/
Receive
Total Return
of Referenced
Index | | Floating Rate | | Payment
Frequency | | Maturity
Date | | Notional
Amount
(000) | | Value
(000) | | Upfront
Payment
Paid
(000) | | Unrealized
Appreciation
(Depreciation)
(000) | |
BNP Paribas SA
| | BNP Custom
U.S. Banks Index†† | |
Receive | | 3 Month USD
LIBOR plus 0.40% | | Quarterly | | 9/16/22 | | $ | 180 | | | $ | (— | @) | | $ | — | | | $ | (— | @) | |
BNP Paribas SA
| | BNP Custom
U.S. Banks Index†† | |
Receive | | 3 Month USD
LIBOR plus 0.40% | | Quarterly | | 9/16/22 | | | 2,419 | | | | — | @ | | | — | | | | — | @ | |
BNP Paribas SA
| | MSCI Daily Total Return
Gross USA Index | |
Receive | | 3 Month USD
LIBOR plus 0.38% | | Quarterly | | 7/14/22 | | | 9,042 | | | | 798 | | | | — | | | | 798 | | |
BNP Paribas SA
| | MSCI Daily Total Return
Gross USA Index | |
Receive | | 3 Month USD
LIBOR plus 0.39% | | Quarterly | | 9/29/22 | | | 6,704 | | | | (39 | ) | | | — | | | | (39 | ) | |
BNP Paribas SA
| | MSCI Japan Net
Total Return Index | |
Receive | | 3 Month USD
LIBOR plus 0.18% | | Quarterly | | 2/10/22 | | | 4,274 | | | | (133 | ) | | | — | | | | (133 | ) | |
Goldman Sachs
International | | MSCI Daily Total Return
Gross USA Index | | Receive | | 3 Month USD
LIBOR plus 0.37% | | Quarterly | | 10/13/22 | | | 3,218 | | | | 281 | | | | — | | | | 281 | | |
Goldman Sachs
International | | MSCI Emerging Markets
Net Total Return Index | | Receive | | 3 Month USD
LIBOR plus 0.18% | | Quarterly | | 1/26/22 | | | 8,443 | | | | (377 | ) | | | — | | | | (377 | ) | |
JPMorgan Chase Bank NA
| | JPM SPX 1500
Anti-Value Index†† | | Pay | | 3 Month USD
LIBOR plus 0.20% | | Quarterly | | 12/7/22 | | | 858 | | | | (42 | ) | | | — | | | | (42 | ) | |
JPMorgan Chase Bank NA
| | JPM SPX 1500
Anti-Value Index†† | | Pay | | 3 Month USD
LIBOR plus 0.20% | | Quarterly | | 12/7/22 | | | 1,755 | | | | (47 | ) | | | — | | | | (47 | ) | |
JPMorgan Chase Bank NA
| | JPM SPX 1500
Anti-Value Index†† | | Pay | | 3 Month USD
LIBOR plus 0.20% | | Quarterly | | 12/7/22 | | | 1,707 | | | | (5 | ) | | | — | | | | (5 | ) | |
JPMorgan Chase Bank NA
| | JPM SPX 1500
Anti-Value Index†† | | Pay | | 3 Month USD
LIBOR plus 0.20% | | Quarterly | | 12/7/22 | | | 1,238 | | | | (50 | ) | | | — | | | | (50 | ) | |
JPMorgan Chase Bank NA
| | JPM SPX 1500
Anti-Value Index†† | | Pay | | 3 Month USD
LIBOR plus 0.20% | | Quarterly | | 12/7/22 | | | 1,234 | | | | (40 | ) | | | — | | | | (40 | ) | |
JPMorgan Chase Bank NA
| | JPM SPX 1500
Value Index†† | | Receive | | 3 Month USD
LIBOR plus 0.20% | | Quarterly | | 12/7/22 | | | 1,145 | | | | 64 | | | | — | | | | 64 | | |
JPMorgan Chase Bank NA
| | JPM SPX 1500
Value Index†† | | Receive | | 3 Month USD
LIBOR plus 0.20% | | Quarterly | | 12/7/22 | | | 2,353 | | | | 71 | | | | — | | | | 71 | | |
The accompanying notes are an integral part of the consolidated financial statements.
31
Morgan Stanley Variable Insurance Fund, Inc.
Annual Report – December 31, 2021
Consolidated Portfolio of Investments (cont'd)
Global Strategist Portfolio
Total Return Swap Agreements (cont'd):
Swap Counterparty | | Index | | Pay/
Receive
Total Return
of Referenced
Index | | Floating Rate | | Payment
Frequency | | Maturity
Date | | Notional
Amount
(000) | | Value
(000) | | Upfront
Payment
Paid
(000) | | Unrealized
Appreciation
(Depreciation)
(000) | |
JPMorgan Chase Bank NA
| | JPM SPX 1500
Value Index†† | |
Receive | | 3 Month USD
LIBOR plus 0.20% | | Quarterly | | 12/7/22 | | $ | 2,254 | | | $ | 32 | | | $ | — | | | $ | 32 | | |
JPMorgan Chase Bank NA
| | JPM SPX 1500
Value Index†† | | Receive | | 3 Month USD
LIBOR plus 0.20% | | Quarterly | | 12/7/22 | | | 530 | | | | 23 | | | | — | | | | 23 | | |
JPMorgan Chase Bank NA
| | JPM SPX 1500
Value Index†† | | Receive | | 3 Month USD
LIBOR plus 0.20% | | Quarterly | | 12/7/22 | | | 530 | | | | 16 | | | | — | | | | 16 | | |
JPMorgan Chase Bank NA
| | JPM SPX 500
Anti-Value Index†† | | Pay | | 3 Month USD
LIBOR plus 0.20% | | Quarterly | | 12/7/22 | | | 1,911 | | | | (113 | ) | | | — | | | | (113 | ) | |
JPMorgan Chase Bank NA
| | JPM SPX 500
Value Index†† | | Receive | | 3 Month USD
LIBOR plus 0.20% | | Quarterly | | 12/7/22 | | | 1,913 | | | | 111 | | | | — | | | | 111 | | |
| | | | | | | | | | | | | | | $ | 550 | | | $ | — | | | $ | 550 | | |
†† See tables below for details of the equity basket holdings underlying the swap.
The following table represents the equity basket holdings underlying the total return swap with BNP Custom U.S. Banks Index as of December 31, 2021:
Security Description | | Shares | | Value
(000) | | Index Weight | |
BNP Custom U.S. Banks Index | |
Bank of America Corp. | | | 308,343 | | | $ | 13,718 | | | | 22.47 | % | |
CIT Group, Inc. | | | 3,298 | | | | 169 | | | | 0.28 | | |
Citigroup, Inc. | | | 79,236 | | | | 4,785 | | | | 7.84 | | |
Citizens Financial Group | | | 15,687 | | | | 741 | | | | 1.21 | | |
Comerica, Inc. | | | 5,287 | | | | 460 | | | | 0.75 | | |
East West Bancorp, Inc. | | | 4,961 | | | | 390 | | | | 0.64 | | |
Fifth Third Bancorp | | | 25,079 | | | | 1,092 | | | | 1.79 | | |
First Republic Bank | | | 5,750 | | | | 1,187 | | | | 1.94 | | |
Huntington Bancshares, Inc. | | | 35,695 | | | | 550 | | | | 0.90 | | |
JPMorgan Chase & Co. | | | 110,953 | | | | 17,569 | | | | 28.78 | | |
Keycorp | | | 34,389 | | | | 795 | | | | 1.30 | | |
M&T Bank Corp. | | | 4,440 | | | | 682 | | | | 1.12 | | |
People's United Financial | | | 13,619 | | | | 243 | | | | 0.40 | | |
PNC Financial Services Group | | | 15,425 | | | | 3,093 | | | | 5.07 | | |
Regions Financial Corp. | | | 34,597 | | | | 754 | | | | 1.24 | | |
Signature Bank | | | 1,907 | | | | 617 | | | | 1.01 | | |
| SVB Financial Group | | | 1,793 | | | | 1,216 | | | | 1.99 | | |
Truist Financial Corp. | | | 45,852 | | | | 2,685 | | | | 4.40 | | |
US Bancorp | | | 51,605 | | | | 2,899 | | | | 4.75 | | |
Wells Fargo & Co. | | | 146,120 | | | | 7,011 | | | | 11.48 | | |
Zions Bancorp NA | | | 6,245 | | | | 394 | | | | 0.65 | | |
The following table represents the equity basket holdings underlying the total return swap with JPM SPX 1500 Anti-Value Index as of December 31, 2021:
Security Description | | Shares | | Value
(000) | | Index Weight | |
JPM SPX 1500 Anti-Value Index | |
Allegheny Technologies, Inc. | | | 3,489 | | | $ | 56 | | | | 0.53 | % | |
American Tower Corp. | | | 192 | | | | 56 | | | | 0.54 | | |
Apple, Inc. | | | 315 | | | | 56 | | | | 0.54 | | |
Arista Networks, Inc. | | | 422 | | | | 61 | | | | 0.58 | | |
Security Description | | Shares | | Value
(000) | | Index Weight | |
JPM SPX 1500 Anti-Value Index (cont'd) | |
| Arlo Technologies, Inc. | | | 6,556 | | | $ | 69 | | | | 0.66 | % | |
Celsius Holdings, Inc. | | | 808 | | | | 60 | | | | 0.58 | | |
Chesapeake Utilities, Corp. | | | 389 | | | | 57 | | | | 0.54 | | |
Corvel Corp. | | | 267 | | | | 56 | | | | 0.53 | | |
Crown Castle International Corp. | | | 275 | | | | 57 | | | | 0.55 | | |
Cytokinetics, Inc. | | | 1,425 | | | | 65 | | | | 0.62 | | |
Diamondrock Hospitality Co. | | | 5,951 | | | | 57 | | | | 0.55 | | |
DMC Global, Inc. | | | 1,410 | | | | 56 | | | | 0.53 | | |
Eastgroup Properties, Inc. | | | 245 | | | | 56 | | | | 0.53 | | |
Eli Lilly & Co. | | | 207 | | | | 57 | | | | 0.55 | | |
Estee Lauder Companies — Class A | | | 153 | | | | 57 | | | | 0.54 | | |
Fluor Corp. | | | 2,261 | | | | 56 | | | | 0.54 | | |
GCP Applied Technologies | | | 1,873 | | | | 59 | | | | 0.57 | | |
Glaukos Corp. | | | 1,267 | | | | 56 | | | | 0.54 | | |
Helmerich & Payne | | | 2,362 | | | | 56 | | | | 0.54 | | |
Hilton Worldwide Holdings, Inc. | | | 366 | | | | 57 | | | | 0.55 | | |
Host Hotels & Resorts, Inc. | | | 3,250 | | | | 57 | | | | 0.54 | | |
IDEXX Laboratories, Inc. | | | 88 | | | | 58 | | | | 0.55 | | |
Intuitive Surgical, Inc. | | | 161 | | | | 58 | | | | 0.55 | | |
Kinsale Capital Group, Inc. | | | 243 | | | | 58 | | | | 0.55 | | |
Lakeland Financial Corp. | | | 697 | | | | 56 | | | | 0.53 | | |
Lamb Weston Holdings, Inc. | | | 946 | | | | 60 | | | | 0.57 | | |
Lendingtree, Inc. | | | 477 | | | | 58 | | | | 0.56 | | |
Live Nation Entertainment, Inc. | | | 499 | | | | 60 | | | | 0.57 | | |
MarketAxess Holdings, Inc. | | | 146 | | | | 60 | | | | 0.57 | | |
Mastercard, Inc. — Class A | | | 159 | | | | 57 | | | | 0.55 | | |
Mccormick & Co. Non Vtg Shrs | | | 577 | | | | 56 | | | | 0.53 | | |
Motorola Solutions, Inc. | | | 205 | | | | 56 | | | | 0.53 | | |
Neogenomics, Inc. | | | 1,662 | | | | 57 | | | | 0.54 | | |
Nexpoint Residential | | | 664 | | | | 56 | | | | 0.53 | | |
Norwegian Cruise Line Holdings, Inc. | | | 2,767 | | | | 57 | | | | 0.55 | | |
PAR Pacific Holdings, Inc. | | | 3,819 | | | | 63 | | | | 0.60 | | |
Penumbra, Inc. | | | 216 | | | | 62 | | | | 0.59 | | |
The accompanying notes are an integral part of the consolidated financial statements.
32
Morgan Stanley Variable Insurance Fund, Inc.
Annual Report – December 31, 2021
Consolidated Portfolio of Investments (cont'd)
Global Strategist Portfolio
Security Description | | Shares | | Value
(000) | | Index Weight | |
JPM SPX 1500 Anti-Value Index (cont'd) | |
Rexford Industrial Realty, Inc. | | | 717 | | | $ | 58 | | | | 0.56 | % | |
Royal Caribbean Cruises Ltd. | | | 758 | | | | 58 | | | | 0.56 | | |
SBA Communications Corp. | | | 147 | | | | 57 | | | | 0.55 | | |
Servicenow, Inc. | | | 85 | | | | 55 | | | | 0.53 | | |
Simply Good Foods Co. (The) | | | 1,403 | | | | 58 | | | | 0.56 | | |
Tandem Diabetes Care, Inc. | | | 386 | | | | 58 | | | | 0.56 | | |
Tootsie Roll Industries | | | 1,528 | | | | 55 | | | | 0.53 | | |
Transdigm Group, Inc. | | | 88 | | | | 56 | | | | 0.54 | | |
Trupanion, Inc. | | | 459 | | | | 61 | | | | 0.58 | | |
Viavi Solutions, Inc. | | | 3,314 | | | | 58 | | | | 0.56 | | |
Wingstop, Inc. | | | 329 | | | | 57 | | | | 0.54 | | |
World Acceptance Corp. | | | 253 | | | | 62 | | | | 0.59 | | |
Zoetis, Inc. | | | 230 | | | | 56 | | | | 0.54 | | |
The following table represents the equity basket holdings underlying the total return swap with JPM SPX 1500 Value Index as of December 31, 2021:
Security Description | | Shares | | Value
(000) | | Index Weight | |
JPM SPX 1500 Value Index | |
AAR Corp. | | | 1,505 | | | $ | 59 | | | | 0.56 | % | |
ACI Worldwide, Inc. | | | 1,691 | | | | 59 | | | | 0.56 | | |
Activision Blizzard, Inc. | | | 891 | | | | 59 | | | | 0.56 | | |
Allstate Corp. | | | 465 | | | | 55 | | | | 0.52 | | |
Amkor Technology, Inc. | | | 2,252 | | | | 56 | | | | 0.53 | | |
Andersons, Inc. (The) | | | 1,511 | | | | 59 | | | | 0.56 | | |
Archer-Daniels-Midland Co. | | | 811 | | | | 55 | | | | 0.52 | | |
Atlas Air Worldwide Holdings | | | 584 | | | | 55 | | | | 0.52 | | |
Avanos Medical, Inc. | | | 1,697 | | | | 59 | | | | 0.56 | | |
Avnet, Inc. | | | 1,342 | | | | 55 | | | | 0.53 | | |
Bloomin' Brands, Inc. | | | 2,728 | | | | 57 | | | | 0.54 | | |
Boyd Gaming Corp. | | | 854 | | | | 56 | | | | 0.53 | | |
Cardinal Health, Inc. | | | 1,067 | | | | 55 | | | | 0.52 | | |
Caretrust REIT, Inc. | | | 2,416 | | | | 55 | | | | 0.52 | | |
Centene Corp. | | | 714 | | | | 59 | | | | 0.56 | | |
Cigna Corp. | | | 253 | | | | 58 | | | | 0.55 | | |
Cohu, Inc. | | | 1,593 | | | | 61 | | | | 0.58 | | |
Customers Bancorp, Inc. | | | 863 | | | | 56 | | | | 0.54 | | |
Dentsply Sirona, Inc. | | | 1,007 | | | | 56 | | | | 0.53 | | |
Enersys | | | 694 | | | | 55 | | | | 0.52 | | |
Envista Holdings Corp. | | | 1,290 | | | | 58 | | | | 0.55 | | |
Fresh Del Monte Produce, Inc. | | | 2,049 | | | | 57 | | | | 0.54 | | |
Hillenbrand, Inc. | | | 1,064 | | | | 55 | | | | 0.53 | | |
Industrial Logistics Properties Trust | | | 2,210 | | | | 55 | | | | 0.53 | | |
International Business Machines Corp. | | | 426 | | | | 57 | | | | 0.54 | | |
Jabil, Inc. | | | 854 | | | | 60 | | | | 0.57 | | |
Kimco Realty Corp. | | | 2,207 | | | | 54 | | | | 0.52 | | |
MDU Resources Group, Inc. | | | 1,802 | | | | 56 | | | | 0.53 | | |
Micron Technology, Inc. | | | 619 | | | | 58 | | | | 0.55 | | |
Moog, Inc. — Class A | | | 716 | | | | 58 | | | | 0.55 | | |
Mosaic Co. (The) | | | 1,467 | | | | 58 | | | | 0.55 | | |
Security Description | | Shares | | Value
(000) | | Index Weight | |
JPM SPX 1500 Value Index (cont'd) | |
Netscout Systems, Inc. | | | 1,718 | | | $ | 57 | | | | 0.54 | % | |
NRG Energy, Inc. | | | 1,389 | | | | 60 | | | | 0.57 | | |
Nu Skin Enterprises, Inc. — Class A | | | 1,147 | | | | 58 | | | | 0.55 | | |
OFG Bancorp | | | 2,063 | | | | 55 | | | | 0.52 | | |
OGE Energy Corp. | | | 1,421 | | | | 55 | | | | 0.52 | | |
Owens & Minor, Inc. | | | 1,274 | | | | 55 | | | | 0.53 | | |
Perdoceo Education Corp. | | | 4,899 | | | | 58 | | | | 0.55 | | |
Photronics, Inc. | | | 3,664 | | | | 69 | | | | 0.66 | | |
Plantronics, Inc. | | | 2,034 | | | | 60 | | | | 0.57 | | |
PVH Corp. | | | 513 | | | | 55 | | | | 0.52 | | |
Sanmina Corp. | | | 1,335 | | | | 55 | | | | 0.53 | | |
Scansource, Inc. | | | 1,587 | | | | 56 | | | | 0.53 | | |
Timkensteel Corp. | | | 3,538 | | | | 58 | | | | 0.55 | | |
Titan International, Inc. | | | 6,883 | | | | 75 | | | | 0.72 | | |
Unitil Corp. | | | 1,204 | | | | 55 | | | | 0.53 | | |
Viatris, Inc. | | | 4,151 | | | | 56 | | | | 0.53 | | |
Vista Outdoor, Inc. | | | 1,326 | | | | 61 | | | | 0.58 | | |
Weyerhaeuser Co. | | | 1,323 | | | | 54 | | | | 0.52 | | |
Xerox Holdings Corp. | | | 2,521 | | | | 57 | | | | 0.54 | | |
The following table represents the equity basket holdings underlying the total return swap with JPM SPX 500 Anti-Value Index Index as of December 31, 2021:
Security Description | | Shares | | Value
(000) | | Index Weight | |
JPM SPX 500 Anti-Value Index | |
Abiomed, Inc. | | | 143 | | | $ | 51 | | | | 1.11 | % | |
Agilent Technologies, Inc. | | | 288 | | | | 46 | | | | 1.00 | | |
American Tower Corp. | | | 161 | | | | 47 | | | | 1.02 | | |
American Water Works Co., Inc. | | | 250 | | | | 47 | | | | 1.02 | | |
Bio-Techne Corp. | | | 95 | | | | 49 | | | | 1.06 | | |
Brown & Brown, Inc. | | | 657 | | | | 46 | | | | 1.00 | | |
Carnival Corp. | | | 2,471 | | | | 50 | | | | 1.08 | | |
Chipotle Mexican Grill, Inc. | | | 27 | | | | 47 | | | | 1.02 | | |
Costco Wholesale Corp. | | | 81 | | | | 46 | | | | 0.99 | | |
Crown Castle International Corp. | | | 231 | | | | 48 | | | | 1.05 | | |
Domino's Pizza, Inc. | | | 81 | | | | 46 | | | | 1.00 | | |
Ecolab, Inc. | | | 194 | | | | 46 | | | | 0.99 | | |
Edwards Lifesciences Corp. | | | 397 | | | | 51 | | | | 1.11 | | |
Eli Lilly & Co. | | | 175 | | | | 48 | | | | 1.05 | | |
Equinix, Inc. | | | 54 | | | | 46 | | | | 0.99 | | |
Estee Lauder Companies — Class A | | | 128 | | | | 47 | | | | 1.03 | | |
Eversource Energy | | | 506 | | | | 46 | | | | 1.00 | | |
Fastenal Co. | | | 714 | | | | 46 | | | | 0.99 | | |
Fortinet, Inc. | | | 142 | | | | 51 | | | | 1.11 | | |
Hilton Worldwide Holdings, Inc. | | | 308 | | | | 48 | | | | 1.04 | | |
Host Hotels & Resorts, Inc. | | | 2,738 | | | | 48 | | | | 1.03 | | |
IDEXX Laboratories, Inc. | | | 73 | | | | 48 | | | | 1.05 | | |
Illumina, Inc. | | | 125 | | | | 48 | | | | 1.03 | | |
Intuitive Surgical, Inc. | | | 135 | | | | 48 | | | | 1.05 | | |
Lamb Weston Holdings, Inc. | | | 797 | | | | 51 | | | | 1.10 | | |
The accompanying notes are an integral part of the consolidated financial statements.
33
Morgan Stanley Variable Insurance Fund, Inc.
Annual Report – December 31, 2021
Consolidated Portfolio of Investments (cont'd)
Global Strategist Portfolio
Security Description | | Shares | | Value
(000) | | Index Weight | |
JPM SPX 500 Anti-Value Index (cont'd) | |
Las Vegas Sands Corp. | | | 1,244 | | | $ | 47 | | | | 1.01 | % | |
Live Nation Entertainment, Inc. | | | 420 | | | | 50 | | | | 1.09 | | |
MarketAxess Holdings, Inc. | | | 122 | | | | 50 | | | | 1.09 | | |
Martin Marietta Materials | | | 104 | | | | 46 | | | | 1.00 | | |
Match Group, Inc. | | | 345 | | | | 46 | | | | 0.99 | | |
Mettler-Toledo International | | | 28 | | | | 48 | | | | 1.04 | | |
Monster Beverage Corp. | | | 511 | | | | 49 | | | | 1.06 | | |
Nasdaq, Inc. | | | 216 | | | | 45 | | | | 0.98 | | |
Nextera Energy, Inc. | | | 488 | | | | 46 | | | | 0.99 | | |
Norwegian Cruise Line Holding, Inc. | | | 2,323 | | | | 48 | | | | 1.04 | | |
Rollins, Inc. | | | 1,347 | | | | 46 | | | | 1.00 | | |
Roper Technologies, Inc. | | | 92 | | | | 45 | | | | 0.99 | | |
Royal Caribbean Cruises Ltd. | | | 637 | | | | 49 | | | | 1.06 | | |
SBA Communications Corp. | | | 124 | | | | 48 | | | | 1.04 | | |
Schwab (Charles) Corp. | | | 543 | | | | 46 | | | | 0.99 | | |
Servicenow, Inc. | | | 71 | | | | 46 | | | | 1.00 | | |
Synopsys, Inc. | | | 124 | | | | 46 | | | | 0.99 | | |
Transdigm Group, Inc. | | | 74 | | | | 47 | | | | 1.02 | | |
Tyler Technologies, Inc. | | | 85 | | | | 46 | | | | 0.99 | | |
Verisign, Inc. | | | 179 | | | | 45 | | | | 0.99 | | |
Vulcan Materials Co. | | | 221 | | | | 46 | | | | 1.00 | | |
Walt Disney Co. (The) | | | 294 | | | | 46 | | | | 0.99 | | |
WEC Energy Group, Inc. | | | 470 | | | | 46 | | | | 0.99 | | |
West Pharmaceutical Services | | | 99 | | | | 47 | | | | 1.01 | | |
Zoetis, Inc. | | | 193 | | | | 47 | | | | 1.02 | | |
The following table represents the equity basket holdings underlying the total return swap with JPM SPX 500 Value Index as of December 31, 2021:
Security Description | | Shares | | Value
(000) | | Index Weight | |
JPM SPX 500 Value Index | |
Aflac, Inc. | | | 588 | | | $ | 34 | | | | 1.00 | % | |
Allstate Corp. | | | 295 | | | | 35 | | | | 1.01 | | |
American International Group | | | 597 | | | | 34 | | | | 0.98 | | |
Archer-Daniels-Midland Co. | | | 513 | | | | 35 | | | | 1.01 | | |
Bristol-Myers Squibb Co. | | | 568 | | | | 35 | | | | 1.03 | | |
C.H. Robinson Worldwide, Inc. | | | 332 | | | | 36 | | | | 1.04 | | |
Cardinal Health, Inc. | | | 678 | | | | 35 | | | | 1.01 | | |
CBRE Group, Inc. — Class A | | | 324 | | | | 35 | | | | 1.02 | | |
Centene Corp. | | | 451 | | | | 37 | | | | 1.08 | | |
Cigna Corp. | | | 160 | | | | 37 | | | | 1.07 | | |
Conagra Brands, Inc. | | | 1,017 | | | | 35 | | | | 1.01 | | |
CVS Health Corp. | | | 353 | | | | 36 | | | | 1.06 | | |
Davita, Inc. | | | 323 | | | | 37 | | | | 1.06 | | |
Dow, Inc. | | | 600 | | | | 34 | | | | 0.99 | | |
D.R. Horton, Inc. | | | 312 | | | | 34 | | | | 0.98 | | |
DXC Technology Co. | | | 1,059 | | | | 34 | | | | 0.99 | | |
Entergy Corp. | | | 312 | | | | 35 | | | | 1.02 | | |
Exelon Corp. | | | 610 | | | | 35 | | | | 1.02 | | |
Fedex Corp. | | | 133 | | | | 35 | | | | 1.00 | | |
Security Description | | Shares | | Value
(000) | | Index Weight | |
JPM SPX 500 Value Index (cont'd) | |
Ford Motor Co. | | | 1,661 | | | $ | 35 | | | | 1.00 | % | |
Gap, Inc. (The) | | | 1,934 | | | | 34 | | | | 0.99 | | |
General Dynamics Corp. | | | 163 | | | | 34 | | | | 0.98 | | |
Global Payments, Inc. | | | 268 | | | | 36 | | | | 1.05 | | |
Henry Schein, Inc. | | | 448 | | | | 35 | | | | 1.01 | | |
Intl Business Machines Corp. | | | 270 | | | | 36 | | | | 1.04 | | |
Iron Mountain, Inc. | | | 681 | | | | 36 | | | | 1.03 | | |
Juniper Networks, Inc. | | | 1,020 | | | | 36 | | | | 1.06 | | |
Kimco Realty Corp. | | | 1,401 | | | | 35 | | | | 1.00 | | |
Laboratory Corporation of America Holdings | | | 110 | | | | 35 | | | | 1.00 | | |
LyondellBasell Industries — Class A | | | 366 | | | | 34 | | | | 0.98 | | |
Micron Technology, Inc. | | | 394 | | | | 37 | | | | 1.06 | | |
Mosaic Co. (The) | | | 929 | | | | 36 | | | | 1.06 | | |
Northrop Grumman Corp. | | | 90 | | | | 35 | | | | 1.01 | | |
NRG Energy, Inc. | | | 875 | | | | 38 | | | | 1.09 | | |
Organon & Co. | | | 1,110 | | | | 34 | | | | 0.98 | | |
Pinnacle West Capital | | | 484 | | | | 34 | | | | 0.99 | | |
Pultegroup, Inc. | | | 614 | | | | 35 | | | | 1.02 | | |
PVH Corp. | | | 326 | | | | 35 | | | | 1.01 | | |
Quest Diagnostics, Inc. | | | 203 | | | | 35 | | | | 1.02 | | |
Regency Centers Corp. | | | 446 | | | | 34 | | | | 0.97 | | |
Seagate Technology Holdings | | | 303 | | | | 34 | | | | 0.99 | | |
Textron, Inc. | | | 443 | | | | 34 | | | | 0.99 | | |
Tyson Foods, Inc. — Class A | | | 387 | | | | 34 | | | | 0.98 | | |
Universal Health Services — Class B | | | 261 | | | | 34 | | | | 0.98 | | |
Ventas, Inc. | | | 679 | | | | 35 | | | | 1.01 | | |
Viatris, Inc. | | | 2,628 | | | | 36 | | | | 1.03 | | |
Walgreens Boots Alliance, Inc. | | | 710 | | | | 37 | | | | 1.07 | | |
Western Digital Corp. | | | 565 | | | | 37 | | | | 1.07 | | |
Weyerhaeuser Co. | | | 838 | | | | 35 | | | | 1.00 | | |
Whirlpool Corp. | | | 143 | | | | 34 | | | | 0.98 | | |
@ Value/Notional amount is less than $500.
* Cleared swap agreement, the broker is Morgan Stanley & Co. LLC.
BTP Buoni del Tesoro Poliennali.
CAC Cotation Assistée en Continu.
CDI Certificado de Depósito Interbancári.
FTSE Financial Times Stock Exchange.
IBEX Índice Bursátil Español.
MIB Milano Indice di Borsa.
MSCI Morgan Stanley Capital International.
SGX Singapore Exchange Ltd.
SPI Schedule Performance Index.
TIIE Interbank Equilibrium Interest Rate.
AUD — Australian Dollar
BRL — Brazilian Real
CAD — Canadian Dollar
CHF — Swiss Franc
CLP — Chilean Peso
CNH — Chinese Yuan Renminbi Offshore
CNY — Chinese Yuan Renminbi
COP — Colombian Peso
The accompanying notes are an integral part of the consolidated financial statements.
34
Morgan Stanley Variable Insurance Fund, Inc.
Annual Report – December 31, 2021
Consolidated Portfolio of Investments (cont'd)
Global Strategist Portfolio
CZK — Czech Koruna
DKK — Danish Krone
EUR — Euro
GBP — British Pound
HKD — Hong Kong Dollar
HUF — Hungarian Forint
IDR — Indonesian Rupiah
ILS — Israeli Shekel
JPY — Japanese Yen
KRW — South Korean Won
MXN — Mexican Peso
MYR — Malaysian Ringgit
NOK — Norwegian Krone
NZD — New Zealand Dollar
PEN — Peruvian Nuevo Sol
PLN — Polish Zloty
RON — Romanian New Leu
RUB — Russian Ruble
SEK — Swedish Krona
SGD — Singapore Dollar
THB — Thai Baht
TRY — Turkish Lira
TWD — Taiwan Dollar
USD — United States Dollar
ZAR — South African Rand
Portfolio Composition
Classification | | Percentage of
Total Investments | |
Fixed Income Securities | | | 48.0 | % | |
Common Stocks | | | 38.3 | | |
Short-Term Investments | | | 13.7 | | |
Total Investments | | | 100.0 | %** | |
** Does not include open long/short futures contracts with a value of approximately $39,211,000 and net unrealized depreciation of approximately $123,000. Does not include open foreign currency forward exchange contracts with net unrealized depreciation of approximately $27,000. Also does not include open swap agreements with net unrealized appreciation of approximately $708,000.
The accompanying notes are an integral part of the consolidated financial statements.
35
Morgan Stanley Variable Insurance Fund, Inc.
Annual Report – December 31, 2021
Global Strategist Portfolio
Consolidated Statement of Assets and Liabilities | | December 31, 2021
(000) | |
Assets: | |
Investments in Securities of Unaffiliated Issuers, at Value (Cost $82,649) | | $ | 91,020 | | |
Investment in Security of Affiliated Issuer, at Value (Cost $13,700) | | | 13,700 | | |
Total Investments in Securities, at Value (Cost $96,349) | | | 104,720 | | |
Foreign Currency, at Value (Cost $440) | | | 454 | | |
Cash | | | 1 | | |
Unrealized Appreciation on Swap Agreements | | | 1,396 | | |
Receivable for Variation Margin on Futures Contracts | | | 1,180 | | |
Due from Broker | | | 895 | | |
Receivable for Investments Sold | | | 728 | | |
Interest Receivable | | | 245 | | |
Unrealized Appreciation on Foreign Currency Forward Exchange Contracts | | | 97 | | |
Tax Reclaim Receivable | | | 50 | | |
Dividends Receivable | | | 27 | | |
Due from Adviser | | | 24 | | |
Receivable for Fund Shares Sold | | | 1 | | |
Receivable from Affiliate | | | — | @ | |
Other Assets | | | 14 | | |
Total Assets | | | 109,832 | | |
Liabilities: | |
Payable for Investments Purchased | | | 2,308 | | |
Unrealized Depreciation on Swap Agreements | | | 846 | | |
Due to Broker | | | 680 | | |
Payable for Custodian Fees | | | 135 | | |
Unrealized Depreciation on Foreign Currency Forward Exchange Contracts | | | 124 | | |
Payable for Professional Fees | | | 103 | | |
Payable for Servicing Fees | | | 32 | | |
Payable for Variation Margin on Swap Agreements | | | 15 | | |
Payable for Administration Fees | | | 7 | | |
Payable for Fund Shares Redeemed | | | 3 | | |
Payable for Transfer Agency Fees | | | 2 | | |
Payable for Distribution Fees — Class II Shares | | | 1 | | |
Deferred Capital Gain Country Tax | | | 1 | | |
Other Liabilities | | | 86 | | |
Total Liabilities | | | 4,343 | | |
NET ASSETS | | $ | 105,489 | | |
Net Assets Consist of: | |
Paid-in-Capital | | $ | 82,804 | | |
Total Distributable Earnings | | | 22,685 | | |
Net Assets | | $ | 105,489 | | |
CLASS I: | |
Net Assets | | $ | 88,704 | | |
Net Asset Value, Offering and Redemption Price Per Share Applicable to 7,848,608 Outstanding
$0.001 Par Value Shares (Authorized 500,000,000 Shares) | | $ | 11.30 | | |
CLASS II: | |
Net Assets | | $ | 16,785 | | |
Net Asset Value, Offering and Redemption Price Per Share Applicable to 1,494,459 Outstanding
$0.001 Par Value Shares (Authorized 500,000,000 Shares) | | $ | 11.23 | | |
@ Amount is less than $500.
The accompanying notes are an integral part of the consolidated financial statements.
36
Morgan Stanley Variable Insurance Fund, Inc.
Annual Report – December 31, 2021
Global Strategist Portfolio
Consolidated Statement of Operations | | Year Ended
December 31, 2021
(000) | |
Investment Income: | |
Interest from Securities of Unaffiliated Issuers (Net of $2 of Foreign Taxes Withheld) | | $ | 983 | | |
Dividends from Securities of Unaffiliated Issuers (Net of $49 of Foreign Taxes Withheld) | | | 930 | | |
Dividends from Security of Affiliated Issuer (Note H) | | | 2 | | |
Total Investment Income | | | 1,915 | | |
Expenses: | |
Advisory Fees (Note B) | | | 804 | | |
Professional Fees | | | 246 | | |
Custodian Fees (Note G) | | | 188 | | |
Servicing Fees (Note D) | | | 165 | | |
Pricing Fees | | | 95 | | |
Administration Fees (Note C) | | | 86 | | |
Distribution Fees — Class II Shares (Note E) | | | 42 | | |
Shareholder Reporting Fees | | | 19 | | |
Transfer Agency Fees (Note F) | | | 12 | | |
Directors' Fees and Expenses | | | 6 | | |
Other Expenses | | | 13 | | |
Total Expenses | | | 1,676 | | |
Waiver of Advisory Fees (Note B) | | | (668 | ) | |
Waiver of Distribution Fees — Class II Shares (Note E) | | | (25 | ) | |
Rebate from Morgan Stanley Affiliate (Note H) | | | (5 | ) | |
Net Expenses | | | 978 | | |
Net Investment Income | | | 937 | | |
Realized Gain (Loss): | |
Investments Sold | | | 12,665 | | |
Foreign Currency Forward Exchange Contracts | | | (148 | ) | |
Foreign Currency Translation | | | (32 | ) | |
Futures Contracts | | | (805 | ) | |
Swap Agreements | | | 4,335 | | |
Net Realized Gain | | | 16,015 | | |
Change in Unrealized Appreciation (Depreciation): | |
Investments (Net of Decrease in Deferred Capital Gain Country Tax of $1) | | | (6,597 | ) | |
Foreign Currency Forward Exchange Contracts | | | (221 | ) | |
Foreign Currency Translation | | | (2 | ) | |
Futures Contracts | | | (177 | ) | |
Swap Agreements | | | (1,419 | ) | |
Net Change in Unrealized Appreciation (Depreciation) | | | (8,416 | ) | |
Net Realized Gain and Change in Unrealized Appreciation (Depreciation) | | | 7,599 | | |
Net Increase in Net Assets Resulting from Operations | | $ | 8,536 | | |
The accompanying notes are an integral part of the consolidated financial statements.
37
Morgan Stanley Variable Insurance Fund, Inc.
Annual Report – December 31, 2021
Global Strategist Portfolio
Consolidated Statements of Changes in
Net Assets | | Year Ended
December 31, 2021
(000) | | Year Ended
December 31, 2020
(000) | |
Increase (Decrease) in Net Assets: | |
Operations: | |
Net Investment Income | | $ | 937 | | | $ | 847 | | |
Net Realized Gain | | | 16,015 | | | | 4,121 | | |
Net Change in Unrealized Appreciation (Depreciation) | | | (8,416 | ) | | | 4,760 | | |
Net Increase in Net Assets Resulting from Operations | | | 8,536 | | | | 9,728 | | |
Dividends and Distributions to Shareholders: | |
Class I | | | (4,709 | ) | | | (7,322 | ) | |
Class II | | | (855 | ) | | | (1,336 | ) | |
Total Dividends and Distributions to Shareholders | | | (5,564 | ) | | | (8,658 | ) | |
Capital Share Transactions:(1) | |
Class I: | |
Subscribed | | | 5,366 | | | | 3,399 | | |
Distributions Reinvested | | | 4,709 | | | | 7,322 | | |
Redeemed | | | (12,450 | ) | | | (12,642 | ) | |
Class II: | |
Subscribed | | | 1,095 | | | | 474 | | |
Distributions Reinvested | | | 855 | | | | 1,336 | | |
Redeemed | | | (1,825 | ) | | | (2,356 | ) | |
Net Decrease in Net Assets Resulting from Capital Share Transactions | | | (2,250 | ) | | | (2,467 | ) | |
Total Increase (Decrease) in Net Assets | | | 722 | | | | (1,397 | ) | |
Net Assets: | |
Beginning of Period | | | 104,767 | | | | 106,164 | | |
End of Period | | $ | 105,489 | | | $ | 104,767 | | |
(1) Capital Share Transactions: | |
Class I: | |
Shares Subscribed | | | 470 | | | | 329 | | |
Shares Issued on Distributions Reinvested | | | 421 | | | | 778 | | |
Shares Redeemed | | | (1,099 | ) | | | (1,260 | ) | |
Net Decrease in Class I Shares Outstanding | | | (208 | ) | | | (153 | ) | |
Class II: | |
Shares Subscribed | | | 97 | | | | 48 | | |
Shares Issued on Distributions Reinvested | | | 77 | | | | 143 | | |
Shares Redeemed | | | (162 | ) | | | (237 | ) | |
Net Increase (Decrease) in Class II Shares Outstanding | | | 12 | | | | (46 | ) | |
The accompanying notes are an integral part of the consolidated financial statements.
38
Morgan Stanley Variable Insurance Fund, Inc.
Annual Report – December 31, 2021
Consolidated Financial Highlights
Global Strategist Portfolio
| | | Class I | |
| | | Year Ended December 31, | |
Selected Per Share Data and Ratios | | 2021 | | 2020 | | 2019 | | 2018 | | 2017 | |
Net Asset Value, Beginning of Period | | $ | 10.99 | | | $ | 10.91 | | | $ | 9.85 | | | $ | 11.17 | | | $ | 9.87 | | |
Income (Loss) from Investment Operations: | |
Net Investment Income(1) | | | 0.10 | | | | 0.09 | | | | 0.16 | | | | 0.16 | | | | 0.20 | | |
Net Realized and Unrealized Gain (Loss) | | | 0.81 | | | | 0.95 | | | | 1.56 | | | | (0.86 | ) | | | 1.38 | | |
Total from Investment Operations | | | 0.91 | | | | 1.04 | | | | 1.72 | | | | (0.70 | ) | | | 1.58 | | |
Distributions from and/or in Excess of: | |
Net Investment Income | | | (0.21 | ) | | | (0.16 | ) | | | (0.20 | ) | | | (0.13 | ) | | | (0.12 | ) | |
Net Realized Gain | | | (0.39 | ) | | | (0.80 | ) | | | (0.46 | ) | | | (0.49 | ) | | | (0.16 | ) | |
Total Distributions | | | (0.60 | ) | | | (0.96 | ) | | | (0.66 | ) | | | (0.62 | ) | | | (0.28 | ) | |
Net Asset Value, End of Period | | $ | 11.30 | | | $ | 10.99 | | | $ | 10.91 | | | $ | 9.85 | | | $ | 11.17 | | |
Total Return(2) | | | 8.37 | % | | | 10.92 | % | | | 17.77 | % | | | (6.50 | )% | | | 16.11 | % | |
Ratios to Average Net Assets and Supplemental Data: | |
Net Assets, End of Period (Thousands) | | $ | 88,704 | | | $ | 88,563 | | | $ | 89,575 | | | $ | 87,675 | | | $ | 107,015 | | |
Ratio of Expenses Before Expense Limitation | | | 1.52 | % | | | 1.59 | % | | | 1.49 | % | | | 1.44 | % | | | 1.42 | % | |
Ratio of Expenses After Expense Limitation | | | 0.90 | %(3) | | | 0.88 | %(3) | | | 0.88 | %(3) | | | 0.89 | %(3) | | | 0.88 | %(3) | |
Ratio of Net Investment Income | | | 0.89 | %(3) | | | 0.89 | %(3) | | | 1.55 | %(3) | | | 1.48 | %(3) | | | 1.85 | %(3) | |
Ratio of Rebate from Morgan Stanley Affiliates | | | 0.00 | %(4) | | | 0.02 | % | | | 0.02 | % | | | 0.01 | % | | | 0.02 | % | |
Portfolio Turnover Rate | | | 111 | % | | | 114 | % | | | 124 | % | | | 85 | % | | | 99 | % | |
(1) Per share amount is based on average shares outstanding.
(2) Calculated based on the net asset value as of the last business day of the period. Performance does not reflect fees and expenses imposed by your insurance company's separate account. If performance information included the effect of these additional charges, the total return would be lower.
(3) The Ratio of Expenses After Expense Limitation and Ratio of Net Investment Income reflect the rebate of certain Fund expenses in connection with the investments in Morgan Stanley affiliates during the period. The effect of the rebate on the ratios is disclosed in the above table as "Ratio of Rebate from Morgan Stanley Affiliates."
(4) Amount is less than 0.005%.
The accompanying notes are an integral part of the consolidated financial statements.
39
Morgan Stanley Variable Insurance Fund, Inc.
Annual Report – December 31, 2021
Consolidated Financial Highlights
Global Strategist Portfolio
| | | Class II | |
| | | Year Ended December 31, | |
Selected Per Share Data and Ratios | | 2021 | | 2020 | | 2019 | | 2018 | | 2017 | |
Net Asset Value, Beginning of Period | | $ | 10.93 | | | $ | 10.85 | | | $ | 9.79 | | | $ | 11.11 | | | $ | 9.82 | | |
Income (Loss) from Investment Operations: | |
Net Investment Income(1) | | | 0.09 | | | | 0.08 | | | | 0.15 | | | | 0.15 | | | | 0.18 | | |
Net Realized and Unrealized Gain (Loss) | | | 0.80 | | | | 0.94 | | | | 1.56 | | | | (0.86 | ) | | | 1.38 | | |
Total from Investment Operations | | | 0.89 | | | | 1.02 | | | | 1.71 | | | | (0.71 | ) | | | 1.56 | | |
Distributions from and/or in Excess of: | |
Net Investment Income | | | (0.20 | ) | | | (0.14 | ) | | | (0.19 | ) | | | (0.12 | ) | | | (0.11 | ) | |
Net Realized Gain | | | (0.39 | ) | | | (0.80 | ) | | | (0.46 | ) | | | (0.49 | ) | | | (0.16 | ) | |
Total Distributions | | | (0.59 | ) | | | (0.94 | ) | | | (0.65 | ) | | | (0.61 | ) | | | (0.27 | ) | |
Net Asset Value, End of Period | | $ | 11.23 | | | $ | 10.93 | | | $ | 10.85 | | | $ | 9.79 | | | $ | 11.11 | | |
Total Return(2) | | | 8.22 | % | | | 10.85 | % | | | 17.74 | % | | | (6.65 | )% | | | 15.96 | % | |
Ratios to Average Net Assets and Supplemental Data: | |
Net Assets, End of Period (Thousands) | | $ | 16,785 | | | $ | 16,204 | | | $ | 16,589 | | | $ | 16,906 | | | $ | 21,700 | | |
Ratio of Expenses Before Expense Limitation | | | 1.77 | % | | | 1.84 | % | | | 1.74 | % | | | 1.69 | % | | | 1.67 | % | |
Ratio of Expenses After Expense Limitation | | | 1.00 | %(3) | | | 0.98 | %(3) | | | 0.98 | %(3) | | | 0.99 | %(3) | | | 0.98 | %(3) | |
Ratio of Net Investment Income | | | 0.79 | %(3) | | | 0.79 | %(3) | | | 1.45 | %(3) | | | 1.38 | %(3) | | | 1.75 | %(3) | |
Ratio of Rebate from Morgan Stanley Affiliates | | | 0.00 | %(4) | | | 0.02 | % | | | 0.02 | % | | | 0.01 | % | | | 0.02 | % | |
Portfolio Turnover Rate | | | 111 | % | | | 114 | % | | | 124 | % | | | 85 | % | | | 99 | % | |
(1) Per share amount is based on average shares outstanding.
(2) Calculated based on the net asset value as of the last business day of the period. Performance does not reflect fees and expenses imposed by your insurance company's separate account. If performance information included the effect of these additional charges, the total return would be lower.
(3) The Ratio of Expenses After Expense Limitation and Ratio of Net Investment Income reflect the rebate of certain Fund expenses in connection with the investments in Morgan Stanley affiliates during the period. The effect of the rebate on the ratios is disclosed in the above table as "Ratio of Rebate from Morgan Stanley Affiliates."
(4) Amount is less than 0.005%.
The accompanying notes are an integral part of the consolidated financial statements.
40
Morgan Stanley Variable Insurance Fund, Inc.
Annual Report – December 31, 2021
Notes to Consolidated Financial Statements
Morgan Stanley Variable Insurance Fund, Inc. (the "Company") is registered under the Investment Company Act of 1940, as amended (the "Act"), as an open-end management investment company. The Company is comprised of ten separate active, diversified and non-diversified funds (individually referred to as a "Fund," collectively as the "Funds"). The Company applies investment company accounting and reporting guidance.
The accompanying consolidated financial statements relate to the Global Strategist Portfolio. The Fund seeks total return and offers two classes of shares — Class I and Class II. Both classes of shares have identical voting rights (except that shareholders of a Class have exclusive voting rights regarding any matter relating solely to that Class of shares), dividend, liquidation and other rights.
The Company is intended to be a funding vehicle for variable annuity contracts and variable life insurance policies offered by the separate accounts of certain life insurance companies.
A. Significant Accounting Policies: The following significant accounting policies are in conformity with U.S. generally accepted accounting principles ("GAAP"). Such policies are consistently followed by the Company in the preparation of its consolidated financial statements. GAAP may require management to make estimates and assumptions that affect the reported amounts and disclosures in the consolidated financial statements. Actual results may differ from those estimates.
In March 2020, the Financial Accounting Standards Board ("FASB") issued an Accounting Standard Update, ASU 2020-04, Reference Rate Reform (Topic 848) — Facilitation of the Effects of Reference Rate Reform on Financial Reporting ("ASU 2020-04"), which provides optional, temporary relief with respect to the financial reporting of contracts subject to certain types of modifications due to the planned discontinuation of the London Interbank Offered Rate ("LIBOR") and other Interbank Offered Rate ("IBOR") based reference rates at the end of 2021. The temporary relief provided by ASU 2020-04 is effective for certain reference rate-related contract modifications that occur during the period from March 12, 2020 through December 31, 2022. Management evaluated the impact of ASU 2020-04 on the Fund's investments, derivatives, debt and other contracts that will undergo reference rate-related modifications as a result of the reference rate reform and does not expect there will be any significant impact to the Fund.
The Fund may, consistent with its principal investment strategies, invest up to 25% of its total assets in a wholly-owned subsidiary of the Fund organized as a company under the laws of the Cayman Islands, VIF Global Strategist Cayman Portfolio, Ltd. (the "Subsidiary"). The Subsidiary may invest, directly or indirectly through the use of derivatives, in
securities, commodities, commodity-related instruments and other investments, primarily futures, swaps and notes. The Fund is the sole shareholder of the Subsidiary, and it is not currently expected that shares of the Subsidiary will be sold or offered to other investors. The consolidated portfolio of investments and consolidated financial statements include the positions and accounts of the Fund and the Subsidiary. All intercompany accounts and transactions of the Fund and the Subsidiary have been eliminated in consolidation and all accounting policies of the Subsidiary are consistent with those of the Fund. As of December 31, 2021, the Subsidiary represented approximately $11,865,000 or approximately 11.25% of the total net assets of the Fund.
Investments in the Subsidiary are expected to provide the Fund with exposure to the commodity markets within the limitations of Subchapter M of the Code and recent Internal Revenue Service ("IRS") revenue rulings, which require that a mutual fund receive no more than ten percent of its gross income from such investments in order to receive favorable tax treatment as a regulated investment company ("RIC"). Tax treatment of the income received from the Subsidiary may potentially be affected by changes in legislation, regulations or other legally binding authority, which could affect the character, timing and amount of the Fund's taxable income and distributions. If such changes occur, the Fund may need to significantly change its investment strategy and recognize unrealized gains in order to remain qualified for taxation as a RIC, which could adversely affect the Fund.
1. Security Valuation: (1) An equity portfolio security listed or traded on an exchange is valued at its latest reported sales price (or at the exchange official closing price if such exchange reports an official closing price), and if there were no sales on a given day and if there is no official exchange closing price for that day, the security is valued at the mean between the last reported bid and asked prices if such bid and asked prices are available on the relevant exchanges. If only bid prices are available then the latest bid price may be used. Listed equity securities not traded on the valuation date with no reported bid and asked prices available on the exchange are valued at the mean between the current bid and asked prices obtained from one or more reputable brokers or dealers. In cases where a security is traded on more than one exchange, the security is valued on the exchange designated as the primary market; (2) all other equity portfolio securities for which over-the-counter ("OTC") market quotations are readily available are valued at the latest reported sales price (or at the market official closing price if such market reports an official closing price), and if there was no trading in the security on a given day and if there is no official closing price from relevant markets for that day,
41
Morgan Stanley Variable Insurance Fund, Inc.
Annual Report – December 31, 2021
Notes to Consolidated Financial Statements (cont'd)
the security is valued at the mean between the last reported bid and asked prices if such bid and asked prices are available on the relevant markets. An unlisted equity security that does not trade on the valuation date and for which bid and asked prices from the relevant markets are unavailable is valued at the mean between the current bid and asked prices obtained from one or more reputable brokers or dealers; (3) certain portfolio securities may be valued by an outside pricing service/vendor approved by the Company's Board of Directors (the "Directors"). The pricing service/vendor may employ a pricing model that takes into account, among other things, bids, yield spreads and/or other market data and specific security characteristics. Alternatively, if a valuation is not available from an outside pricing service/vendor, and the security trades on an exchange, the security may be valued at its latest reported sale price (or at the exchange official closing price if such exchange reports an official closing price), prior to the time when assets are valued. If there are no sales on a given day and if there is no official exchange closing price for that day, the security is valued at the mean between the last reported bid and asked prices if such bid and asked prices are available in the relevant exchanges. If only bid prices are available then the latest bid price may be used. If Morgan Stanley Investment Management Inc. (the "Adviser") or Morgan Stanley Investment Management Limited ("MSIM Limited") (the "Sub-Adviser"), each a wholly-owned subsidiary of Morgan Stanley, determines that the price provided by the outside pricing service/vendor or exchange does not reflect the security's fair value or is unable to provide a price, prices from brokers or dealers may also be utilized. In these circumstances, the value of the security will be the mean of bid and asked prices obtained from brokers or dealers; (4) futures are valued at the settlement price on the exchange on which they trade or, if a settlement price is unavailable, at the last sale price on the exchange; (5) OTC swaps may be valued by an outside pricing service approved by the Directors or quotes from a broker or dealer. Swaps cleared on a clearinghouse or exchange may be valued using the closing price provided by the clearinghouse or exchange. Total return swaps may also be fair valued using direct accrual/return calculations if prices on the reference asset on the total return leg of the swap are available from a pricing service/vendor for such instrument. In the event that the reference asset on the total return leg of the swap is a benchmark index, then price of such reference asset may be obtained from a pricing service provider or from the benchmark index sponsor; (6) when market quotations are not readily available, including circumstances under which the Adviser or the
Sub-Adviser determines that the closing price, last sale price or the mean between the last reported bid and asked prices are not reflective of a security's market value, portfolio securities are valued at their fair value as determined in good faith under procedures established by and under the general supervision of the Directors. Occasionally, developments affecting the closing prices of securities and other assets may occur between the times at which valuations of such securities are determined (that is, close of the foreign market on which the securities trade) and the close of business of the New York Stock Exchange ("NYSE"). If developments occur during such periods that are expected to materially affect the value of such securities, such valuations may be adjusted to reflect the estimated fair value of such securities as of the close of the NYSE, as determined in good faith by the Directors or by the Adviser using a pricing service and/or procedures approved by the Directors; (7) quotations of foreign portfolio securities, other assets and liabilities and forward contracts stated in foreign currency are translated into U.S. dollar equivalents at the prevailing market rates prior to the close of the NYSE; and (8) investments in mutual funds, including the Morgan Stanley Institutional Liquidity Funds, are valued at the net asset value ("NAV") as of the close of each business day.
The Directors have responsibility for determining in good faith the fair value of the investments, and the Directors may appoint others, such as the Company's Adviser or a valuation committee, to assist the Directors in determining fair value and to make the actual calculations pursuant to the fair valuation methodologies previously approved by the Directors. Under procedures approved by the Directors, the Company's Adviser has formed a Valuation Committee whose members are approved by the Directors. The Valuation Committee provides administration and oversight of the Company's valuation policies and procedures, which are reviewed at least annually by the Directors. These procedures allow the Company to utilize independent pricing services, quotations from securities and financial instrument dealers and other market sources to determine fair value.
2. Fair Value Measurement: FASB Accounting Standards CodificationTM ("ASC") 820, "Fair Value Measurement" ("ASC 820"), defines fair value as the value that the Fund would receive to sell an investment or pay to transfer a liability in a timely transaction with an independent buyer in the principal market, or in the absence of a principal market, the most advantageous market for the investment or liability. ASC 820 establishes a three-tier hierarchy to distinguish between (1) inputs that
42
Morgan Stanley Variable Insurance Fund, Inc.
Annual Report – December 31, 2021
Notes to Consolidated Financial Statements (cont'd)
reflect the assumptions market participants would use in valuing an asset or liability developed based on market data obtained from sources independent of the reporting entity (observable inputs) and (2) inputs that reflect the reporting entity's own assumptions about the assumptions market participants would use in valuing an asset or liability developed based on the best information available in the circumstances (unobservable inputs) and to establish classification of fair value measurements for disclosure purposes. Various inputs are used in determining the value of the Fund's investments. The inputs are summarized in the three broad levels listed below:
• Level 1 – unadjusted quoted prices in active markets for identical investments
• Level 2 – other significant observable inputs (including quoted prices for similar investments, interest rates, prepayment speeds, credit risk, etc.)
• Level 3 – significant unobservable inputs including the Fund's own assumptions in determining the fair value of investments. Factors considered in making this determination may include, but are not limited to, information obtained by contacting the issuer, analysts, or the appropriate stock exchange (for exchange-traded securities), analysis of the issuer's financial statements or other available documents and, if necessary, available information concerning other securities in similar circumstances.
The inputs or methodology used for valuing securities are not necessarily an indication of the risk associated with investing in those securities and the determination of the significance of a particular input to the fair value measurement in its entirety requires judgment and considers factors specific to each security.
The following is a summary of the inputs used to value the Fund's investments as of December 31, 2021:
Investment Type | | Level 1
Unadjusted
quoted
prices
(000) | | Level 2
Other
significant
observable
inputs
(000) | | Level 3
Significant
unobservable
inputs
(000) | | Total
(000) | |
Assets: | |
Fixed Income Securities | |
Agency Adjustable Rate
Mortgage | | $ | — | | | $ | 5 | | | $ | — | | | $ | 5 | | |
Agency Fixed Rate
Mortgages | | | — | | | | 2,807 | | | | — | | | | 2,807 | | |
Asset-Backed Securities | | | — | | | | 414 | | | | — | | | | 414 | | |
Commercial
Mortgage-Backed
Securities | | | — | | | | 637 | | | | — | | | | 637 | | |
Corporate Bonds | | | — | | | | 14,016 | | | | — | | | | 14,016 | | |
Investment Type | | Level 1
Unadjusted
quoted
prices
(000) | | Level 2
Other
significant
observable
inputs
(000) | | Level 3
Significant
unobservable
inputs
(000) | | Total
(000) | |
Fixed Income Securities (cont'd) | |
Mortgages - Other | | $ | — | | | $ | 699 | | | $ | — | | | $ | 699 | | |
Sovereign | | | — | | | | 27,955 | | | | — | | | | 27,955 | | |
Supranational | | | — | | | | 1,308 | | | | — | | | | 1,308 | | |
U.S. Treasury Securities | | | — | | | | 2,399 | | | | — | | | | 2,399 | | |
Total Fixed Income
Securities | | | — | | | | 50,240 | | | | — | | | | 50,240 | | |
Common Stocks | |
Aerospace & Defense | | | 459 | | | | 14 | | | | — | | | | 473 | | |
Air Freight & Logistics | | | 135 | | | | 100 | | | | — | | | | 235 | | |
Airlines | | | 13 | | | | 4 | | | | — | | | | 17 | | |
Auto Components | | | 92 | | | | 10 | | | | — | | | | 102 | | |
Automobiles | | | 561 | | | | 224 | | | | — | | | | 785 | | |
Banks | | | 1,919 | | | | 364 | | | | — | | | | 2,283 | | |
Beverages | | | 591 | | | | 22 | | | | — | | | | 613 | | |
Biotechnology | | | 494 | | | | 29 | | | | — | | | | 523 | | |
Building Products | | | 171 | | | | 77 | | | | — | | | | 248 | | |
Capital Markets | | | 905 | | | | 195 | | | | — | | | | 1,100 | | |
Chemicals | | | 590 | | | | 245 | | | | — | | | | 835 | | |
Commercial Services &
Supplies | | | 142 | | | | 11 | | | | — | | | | 153 | | |
Communications
Equipment | | | 190 | | | | 59 | | | | — | | | | 249 | | |
Construction &
Engineering | | | 714 | | | | 127 | | | | — | | | | 841 | | |
Construction Materials | | | 74 | | | | 33 | | | | — | | | | 107 | | |
Consumer Finance | | | 139 | | | | — | | | | — | | | | 139 | | |
Containers & Packaging | | | 88 | | | | — | | | | — | | | | 88 | | |
Distributors | | | 31 | | | | — | | | | — | | | | 31 | | |
Diversified Consumer
Services | | | 2 | | | | — | | | | — | | | | 2 | | |
Diversified Financial
Services | | | 245 | | | | 83 | | | | — | | | | 328 | | |
Diversified
Telecommunication
Services | | | 404 | | | | 160 | | | | — | | | | 564 | | |
Electric Utilities | | | 453 | | | | 188 | | | | — | | | | 641 | | |
Electrical Equipment | | | 260 | | | | 108 | | | | — | | | | 368 | | |
Electronic Equipment,
Instruments &
Components | | | 174 | | | | 28 | | | | — | | | | 202 | | |
Energy Equipment &
Services | | | 43 | | | | 4 | † | | | — | | | | 47 | † | |
Entertainment | | | 410 | | | | 5 | | | | — | | | | 415 | | |
Equity Real Estate
Investment Trusts
(REITs) | | | 754 | | | | 1 | | | | — | | | | 755 | | |
Food & Staples Retailing | | | 487 | | | | 25 | | | | — | | | | 512 | | |
Food Products | | | 259 | | | | 396 | | | | — | | | | 655 | | |
Gas Utilities | | | 31 | | | | 22 | | | | — | | | | 53 | | |
Health Care
Equipment & Supplies | | | 715 | | | | 172 | | | | — | | | | 887 | | |
43
Morgan Stanley Variable Insurance Fund, Inc.
Annual Report – December 31, 2021
Notes to Consolidated Financial Statements (cont'd)
Investment Type | | Level 1
Unadjusted
quoted
prices
(000) | | Level 2
Other
significant
observable
inputs
(000) | | Level 3
Significant
unobservable
inputs
(000) | | Total
(000) | |
Common Stocks (cont'd) | |
Health Care Providers &
Services | | $ | 615 | | | $ | 34 | | | $ | — | | | $ | 649 | | |
Health Care Technology | | | 39 | | | | — | | | | — | | | | 39 | | |
Hotels, Restaurants &
Leisure | | | 1,706 | | | | 27 | | | | — | | | | 1,733 | | |
Household Durables | | | 1,067 | | | | 5 | | | | — | | | | 1,072 | | |
Household Products | | | 345 | | | | 37 | | | | — | | | | 382 | | |
Independent Power
Producers & Energy
Traders | | | 34 | | | | 4 | | | | — | | | | 38 | | |
Industrial
Conglomerates | | | 251 | | | | 134 | | | | — | | | | 385 | | |
Information Technology
Services | | | 1,404 | | | | 41 | | | | — | | | | 1,445 | | |
Insurance | | | 841 | | | | 311 | | | | — | | | | 1,152 | | |
Interactive Media &
Services | | | 1,404 | | | | 8 | | | | — | | | | 1,412 | | |
Internet & Direct
Marketing Retail | | | 975 | | | | 34 | | | | — | | | | 1,009 | | |
Leisure Products | | | 12 | | | | — | | | | — | | | | 12 | | |
Life Sciences Tools &
Services | | | 465 | | | | 74 | | | | — | | | | 539 | | |
Machinery | | | 391 | | | | 270 | | | | — | | | | 661 | | |
Marine | | | 3 | | | | 44 | | | | — | | | | 47 | | |
Media | | | 314 | | | | 6 | | | | — | | | | 320 | | |
Metals & Mining | | | 568 | | | | 22 | | | | — | | | | 590 | | |
Multi-Line Retail | | | 160 | | | | — | | | | — | | | | 160 | | |
Multi-Utilities | | | 265 | | | | 52 | | | | — | | | | 317 | | |
Oil, Gas & Consumable
Fuels | | | 2,678 | | | | 109 | | | | — | | | | 2,787 | | |
Paper & Forest Products | | | 19 | | | | 38 | | | | — | | | | 57 | | |
Personal Products | | | 282 | | | | 9 | | | | — | | | | 291 | | |
Pharmaceuticals | | | 1,211 | | | | 716 | | | | — | | | | 1,927 | | |
Professional Services | | | 322 | | | | 24 | | | | — | | | | 346 | | |
Real Estate
Management &
Development | | | 92 | | | | 75 | | | | — | | | | 167 | | |
Road & Rail | | | 384 | | | | — | | | | — | | | | 384 | | |
Semiconductors &
Semiconductor
Equipment | | | 1,749 | | | | 55 | | | | — | | | | 1,804 | | |
Software | | | 2,335 | | | | 174 | † | | | — | | | | 2,509 | † | |
Specialty Retail | | | 538 | | | | 45 | | | | — | | | | 583 | | |
Tech Hardware,
Storage &
Peripherals | | | 1,584 | | | | 13 | | | | — | | | | 1,597 | | |
Textiles, Apparel &
Luxury Goods | | | 539 | | | | 170 | | | | — | | | | 709 | | |
Tobacco | | | 214 | | | | 10 | | | | — | | | | 224 | | |
Trading Companies &
Distributors | | | 149 | | | | 13 | | | | — | | | | 162 | | |
Transportation
Infrastructure | | | 35 | | | | 170 | | | | — | | | | 205 | | |
Investment Type | | Level 1
Unadjusted
quoted
prices
(000) | | Level 2
Other
significant
observable
inputs
(000) | | Level 3
Significant
unobservable
inputs
(000) | | Total
(000) | |
Common Stocks (cont'd) | |
Water Utilities | | $ | 42 | | | $ | — | | | $ | — | | | $ | 42 | | |
Wireless
Telecommunication
Services | | | 91 | | | | 7 | | | | — | | | | 98 | | |
Total Common Stocks | | | 34,668 | | | | 5,437 | † | | | — | | | | 40,105 | † | |
Short-Term Investments | |
Investment Company | | | 13,700 | | | | — | | | | — | | | | 13,700 | | |
U.S. Treasury Security | | | — | | | | 675 | | | | — | | | | 675 | | |
Total Short-Term
Investments | | | 13,700 | | | | 675 | | | | — | | | | 14,375 | | |
Foreign Currency
Forward Exchange
Contracts | | | — | | | | 97 | | | | — | | | | 97 | | |
Futures Contracts | | | 125 | | | | — | | | | — | | | | 125 | | |
Interest Rate Swap
Agreements | | | — | | | | 246 | | | | — | | | | 246 | | |
Total Return Swap
Agreements | | | — | | | | 1,396 | | | | — | | | | 1,396 | | |
Total Assets | | | 48,493 | | | | 58,091 | † | | | — | | | | 106,584 | † | |
Liabilities: | |
Foreign Currency
Forward Exchange
Contracts | | | — | | | | (124 | ) | | | — | | | | (124 | ) | |
Futures Contracts | | | (248 | ) | | | — | | | | — | | | | (248 | ) | |
Interest Rate Swap
Agreements | | | — | | | | (88 | ) | | | — | | | | (88 | ) | |
Total Return Swap
Agreements | | | — | | | | (846 | ) | | | — | | | | (846 | ) | |
Total Liabilities | | | (248 | ) | | | (1,058 | ) | | | — | | | | (1,306 | ) | |
Total | | $ | 48,245 | | | $ | 57,033 | † | | $ | — | | | $ | 105,278 | † | |
† Includes one or more securities valued at zero.
Transfers between investment levels may occur as the markets fluctuate and/or the availability of data used in an investment's valuation changes.
Following is a reconciliation of investments in which significant unobservable inputs (Level 3) were used in determining fair value:
| | | Common
Stock
(000) | |
Beginning Balance | | $ | — | † | |
Purchases | | | — | | |
Sales | | | — | | |
Amortization of discount | | | — | | |
Transfers in | | | — | | |
Transfers out | | | (— | )† | |
Corporate actions | | | — | | |
44
Morgan Stanley Variable Insurance Fund, Inc.
Annual Report – December 31, 2021
Notes to Consolidated Financial Statements (cont'd)
| | | Common
Stock
(000) | |
Change in unrealized
appreciation (depreciation) | | $ | — | | |
Realized gains (losses) | | | — | | |
Ending Balance | | $ | — | | |
Net change in unrealized appreciation
(depreciation) from investments still
held as of December 31, 2021 | | $ | — | | |
† Includes a security valued at zero.
3. Foreign Currency Translation and Foreign Investments: The books and records of the Fund are maintained in U.S. dollars. Foreign currency amounts are translated into U.S. dollars as follows:
— investments, other assets and liabilities at the prevailing rate of exchange on the valuation date;
— investment transactions and investment income at the prevailing rates of exchange on the dates of such transactions.
Although the net assets of the Fund are presented at the foreign exchange rates and market values at the close of the period, the Fund does not isolate that portion of the results of operations arising as a result of changes in the foreign exchange rates from the fluctuations arising from changes in the market prices of securities held at period end. Similarly, the Fund does not isolate the effect of changes in foreign exchange rates from the fluctuations arising from changes in the market prices of securities sold during the period. Accordingly, realized and unrealized foreign currency gains (losses) on investments in securities are included in the reported net realized and unrealized gains (losses) on investment transactions and balances. However, pursuant to U.S. federal income tax regulations, gains and losses from certain foreign currency transactions and the foreign currency portion of gains and losses realized on sales and maturities of foreign denominated debt securities are treated as ordinary income for U.S. federal income tax purposes.
Net realized gains (losses) on foreign currency transactions represent net foreign exchange gains (losses) from foreign currency forward exchange contracts, disposition of foreign currencies, currency gains (losses) realized between the trade and settlement dates on securities transactions, and the difference between the amount of investment income and foreign withholding taxes recorded on the Fund's books and the U.S. dollar equivalent amounts actually received or paid. The change in unrealized currency gains (losses) on foreign currency
transactions for the period is reflected in the Consolidated Statement of Operations.
Foreign security and currency transactions may involve certain considerations and risks not typically associated with those of U.S. dollar denominated transactions as a result of, among other factors, fluctuations of exchange rates in relation to the U.S. dollar, the possibility of lower levels of governmental supervision and regulation of foreign securities markets and the possibility of political or economic instability.
Governmental approval for foreign investments may be required in advance of making an investment under certain circumstances in some countries, and the extent of foreign investments in domestic companies may be subject to limitation in other countries. Foreign ownership limitations also may be imposed by the charters of individual companies to prevent, among other concerns, violations of foreign investment limitations. As a result, an additional class of shares (identified as "Foreign" in the Consolidated Portfolio of Investments) may be created and offered for investment. The "local" and "foreign shares" market values may differ. In the absence of trading of the foreign shares in such markets, the Fund values the foreign shares at the closing exchange price of the local shares.
4. Derivatives: The Fund may, but is not required to, use derivative instruments for a variety of purposes, including hedging, risk management, portfolio management or to earn income. Derivatives are financial instruments whose value is based, in part, on the value of an underlying asset, interest rate, index or financial instrument. Prevailing interest rates and volatility levels, among other things, also affect the value of derivative instruments. A derivative instrument often has risks similar to its underlying asset and may have additional risks, including imperfect correlation between the value of the derivative and the underlying asset, risks of default by the counterparty to certain transactions, magnification of losses incurred due to changes in the market value of the securities, instruments, indices or interest rates to which the derivative instrument relates, risks that the transactions may not be liquid and risks arising from margin requirements. The use of derivatives involves risks that are different from, and possibly greater than, the risks associated with other portfolio investments. Derivatives may involve the use of highly specialized instruments that require investment techniques and risk analyses different from those associated with other portfolio investments. All of the Fund's holdings, including derivative instruments, are marked-to-market each day with the change in value reflected in unrealized appreciation
45
Morgan Stanley Variable Insurance Fund, Inc.
Annual Report – December 31, 2021
Notes to Consolidated Financial Statements (cont'd)
(depreciation). Upon disposition, a realized gain or loss is recognized.
Certain derivative transactions may give rise to a form of leverage. Leverage magnifies the potential for gain and the risk of loss. Leverage associated with derivative transactions may cause the Fund to liquidate portfolio positions when it may not be advantageous to do so to satisfy its obligations or to meet earmarking or segregation requirements, pursuant to applicable Securities and Exchange Commission ("SEC") rules and regulations, or may cause the Fund to be more volatile than if the Fund had not been leveraged. Although the Adviser and/or Sub-Adviser seek to use derivatives to further the Fund's investment objectives, there is no assurance that the use of derivatives will achieve this result.
Following is a description of the derivative instruments and techniques that the Fund used during the period and their associated risks:
Foreign Currency Forward Exchange Contracts: In connection with its investments in foreign securities, the Fund also entered into contracts with banks, brokers or dealers to purchase or sell securities or foreign currencies at a future date. A foreign currency forward exchange contract ("currency contract") is a negotiated agreement between the contracting parties to exchange a specified amount of currency at a specified future time at a specified rate. The rate can be higher or lower than the spot rate between the currencies that are the subject of the contract. Currency contracts may be used to protect against uncertainty in the level of future foreign currency exchange rates or to gain or modify exposure to a particular currency. In addition, the Fund may use cross currency hedging or proxy hedging with respect to currencies in which the Fund has or expects to have portfolio or currency exposure. Cross currency hedges involve the sale of one currency against the positive exposure to a different currency and may be used for hedging purposes or to establish an active exposure to the exchange rate between any two currencies. To the extent hedged by the use of currency contracts, the precise matching of the currency contract amounts and the value of the securities involved will not generally be possible because the future value of such securities in foreign currencies will change as a consequence of market movements in the value of those securities between the date on which the contract is entered into and the date it matures. Furthermore, such transactions may reduce or preclude the opportunity for gain if the value of the currency should move in the direction opposite to the position taken. There is
additional risk to the extent that currency contracts create exposure to currencies in which the Fund's securities are not denominated. Unanticipated changes in currency prices may result in poorer overall performance for the Fund than if it had not entered into such contracts. The use of currency contracts involves the risk of loss from the insolvency or bankruptcy of the counterparty to the contract or the failure of the counterparty to make payments or otherwise comply with the terms of the contract. A currency contract is marked-to-market daily and the change in market value is recorded by the Fund as unrealized gain or loss. The Fund records realized gains (losses) when the currency contract is closed equal to the difference between the value of the currency contract at the time it was opened and the value at the time it was closed.
Futures: A futures contract is a standardized, exchange-traded agreement to buy or sell a specific quantity of an underlying asset, reference rate or index at a specific price at a specific future time. The value of a futures contract tends to increase and decrease in tandem with the value of the underlying instrument. Depending on the terms of the particular contract, futures contracts are settled through either physical delivery of the underlying instrument on the settlement date or by payment of a cash settlement amount on the settlement date. During the period the futures contract is open, payments are received from or made to the broker based upon changes in the value of the contract (the variation margin). A decision as to whether, when and how to use futures contracts involves the exercise of skill and judgment and even a well-conceived futures transaction may be unsuccessful because of market behavior or unexpected events. In addition to the derivatives risks discussed above, the prices of futures contracts can be highly volatile, using futures contracts can lower total return and the potential loss from futures contracts can exceed the Fund's initial investment in such contracts. No assurance can be given that a liquid market will exist for any particular futures contract at any particular time. There is also the risk of loss by the Fund of margin deposits in the event of bankruptcy of a broker with which the Fund has open positions in the futures contract.
Swaps: The Fund may enter into OTC swap contracts or cleared swap transactions. A swap contract is an agreement between two parties pursuant to which the parties exchange payments at specified dates on the basis of a specified notional amount, with the payments calculated by reference to specified securities, indices, reference
46
Morgan Stanley Variable Insurance Fund, Inc.
Annual Report – December 31, 2021
Notes to Consolidated Financial Statements (cont'd)
rates, currencies or other instruments. Typically swap agreements provide that when the period payment dates for both parties are the same, the payments are made on a net basis (i.e., the two payment streams are netted out, with only the net amount paid by one party to the other). The Fund's obligations or rights under a swap contract entered into on a net basis will generally be equal only to the net amount to be paid or received under the agreement, based on the relative values of the positions held by each party. Cleared swap transactions may help reduce counterparty credit risk. In a cleared swap, the Fund's ultimate counterparty is a clearinghouse rather than a swap dealer, bank or other financial institution. OTC swap agreements are not entered into or traded on exchanges and often there is no central clearing or guaranty function for OTC swaps. These OTC swaps are often subject to credit risk or the risk of default or non-performance by the counterparty. Both OTC and cleared swaps could result in losses if interest rates, foreign currency exchange rates or other factors are not correctly anticipated by the Fund or if the reference index, security or investments do not perform as expected. During the period swap agreements are open, payments are received from or made to the clearinghouse or counterparty based upon changes in the value of the contract (variation margin). The Dodd-Frank Wall Street Reform and Consumer Protection Act and related regulatory developments require the clearing and exchange-trading of certain standardized swap transactions. Mandatory exchange-trading and clearing is occurring on a phased-in basis based on the type of market participant and U.S. Commission ("CFTC") approval of contracts for central clearing and exchange trading.
The Fund may enter into total return swaps in which one party agrees to make periodic payments to another party based on the change in market value of the assets underlying the contract, which may include, but not be limited to, a specified security, basket of securities or securities indices during the specified period, in return for periodic payments based on a fixed or variable interest rate or the total return from other underlying assets. Total return swaps may be used to obtain long or short exposure to a security or market without owning or taking physical custody of such security or investing directly in such market. Total return swaps may effectively add leverage to the Fund's portfolio because, in addition to its total net assets, the Fund would be subject to investment exposure on the notional amount of the swap. Total return swaps are subject to the risk that a counterparty will default on its payment obligations to the Fund thereunder, and
conversely, that the Fund will not be able to meet its obligation to the counterparty.
The Fund may enter into interest rate swaps which is an agreement between two parties to exchange their respective commitments to pay or receive interest. Interest rate swaps are generally entered into on a net basis. Interest rate swaps do not involve the delivery of securities, other underlying assets, or principal. Accordingly, the risk of market loss with respect to interest rate swaps is typically limited to the net amount of interest payments that the Fund is contractually obligated to make.
When the Fund has an unrealized loss on a swap agreement, the Fund has instructed the custodian to pledge cash or liquid securities as collateral with a value approximately equal to the amount of the unrealized loss. Collateral pledges are monitored and subsequently adjusted if and when the swap valuations fluctuate. If applicable, cash collateral is included with "Due from (to) Broker" in the Consolidated Statement of Assets and Liabilities.
Upfront payments paid or received by the Fund will be reflected as an asset or liability, respectively, in the Consolidated Statement of Assets and Liabilities.
FASB ASC 815, "Derivatives and Hedging" ("ASC 815"), is intended to improve financial reporting about derivative instruments by requiring enhanced disclosures to enable investors to better understand how and why the Fund uses derivative instruments, how these derivative instruments are accounted for and their effects on the Fund's financial position and results of operations.
The following tables set forth the fair value of the Fund's derivative contracts by primary risk exposure as of December 31, 2021:
| | | Asset Derivatives
Consolidated
Statement of Assets
and Liabilities
Location | | Primary Risk
Exposure | |
Value
(000) | |
Foreign Currency
Forward
Exchange
Contracts | | Unrealized Appreciation
on Foreign Currency
Forward Exchange
Contracts | | Currency Risk | | $ | 97 | | |
Futures Contract | | Variation Margin on
Futures Contract | | Commodity
Risk | | | 12 | (a) | |
Futures Contracts | | Variation Margin on
Futures Contracts | | Equity Risk | | | 27 | (a) | |
Futures Contracts | | Variation Margin on
Futures Contracts | | Interest
Rate Risk | | | 86 | (a) | |
Swap Agreements | | Variation Margin on
Swap Agreements | | Interest
Rate Risk | | | 246 | (a) | |
Swap Agreement | | Unrealized Appreciation
on Swap Agreement | | Equity Risk | | | 1,396 | | |
Total | | | | | | $ | 1,864 | | |
47
Morgan Stanley Variable Insurance Fund, Inc.
Annual Report – December 31, 2021
Notes to Consolidated Financial Statements (cont'd)
| | | Liability Derivatives
Consolidated
Statement of Assets
and Liabilities
Location | | Primary Risk
Exposure | | Value
(000) | |
Foreign Currency
Forward
Exchange
Contracts | | Unrealized Depreciation
on Foreign Currency
Forward Exchange
Contracts | | Currency Risk | | $ | (124 | ) | |
Futures Contract | | Variation Margin on
Futures Contract | | Commodity
Risk | | | (15 | )(a) | |
Futures Contracts | | Variation Margin on
Futures Contracts | | Equity Risk | | | (133 | )(a) | |
Futures Contracts | | Variation Margin on
Futures Contracts | | Interest Rate
Risk | | | (100 | )(a) | |
Swap Agreements | | Variation Margin on
Swap Agreements | | Interest Rate
Risk | | | (88 | )(a) | |
Swap Agreements | | Unrealized Depreciation
on Swap Agreements | | Equity Risk | | | (846 | ) | |
Total | | | | | | $ | (1,306 | ) | |
(a) This amount represents the cumulative appreciation (depreciation) as reported in the Consolidated Portfolio of Investments. The Consolidated Statement of Assets and Liabilities only reflects the current day's net variation margin.
The following tables set forth by primary risk exposure the Fund's realized gains (losses) and change in unrealized appreciation (depreciation) by type of derivative contract for the year ended December 31, 2021 in accordance with ASC 815:
Realized Gain (Loss) | |
Primary Risk Exposure | | Derivative
Type | | Value
(000) | |
Currency Risk | | Foreign Currency Forward
Exchange Contracts | | $ | (148 | ) | |
Commodity Risk | | Futures Contracts | | | (51 | ) | |
Equity Risk | | Futures Contracts | | | (1,149 | ) | |
Interest Rate Risk | | Futures Contracts | | | 395 | | |
Equity Risk | | Swap Agreements | | | 6,620 | | |
Interest Rate Risk | | Swap Agreements | | | (2,285 | ) | |
Total | | | | $ | 3,382 | | |
Change in Unrealized Appreciation (Depreciation) | |
Primary Risk Exposure | | Derivative
Type | | Value
(000) | |
Currency Risk
| | Foreign Currency Forward
Exchange Contracts | | $ | (221 | ) | |
Commodity Risk | | Futures Contracts | | | (19 | ) | |
Equity Risk | | Futures Contracts | | | (120 | ) | |
Interest Rate Risk | | Futures Contracts | | | (38 | ) | |
Equity Risk | | Swap Agreements | | | (1,101 | ) | |
Interest Rate Risk | | Swap Agreements | | | (318 | ) | |
Total | | | | $ | (1,817 | ) | |
At December 31, 2021, the Fund's derivative assets and liabilities are as follows:
Gross Amounts of Assets and Liabilities Presented in the
Consolidated Statement of Assets and Liabilities | |
Derivatives(b) | | Assets(c)
(000) | | Liabilities(c)
(000) | |
Foreign Currency Forward
Exchange Contracts | | $ | 97 | | | $ | (124 | ) | |
Swap Agreements | | | 1,396 | | | | (846 | ) | |
Total | | $ | 1,493 | | | $ | (970 | ) | |
(b) Excludes exchange-traded derivatives.
(c) Absent an event of default or early termination, OTC derivative assets and liabilities are presented gross and not offset in the Consolidated Statement of Assets and Liabilities.
The Fund typically enters into International Swaps and Derivatives Association, Inc. Master Agreements ("ISDA Master Agreements") or similar master agreements (collectively, "Master Agreements") with its contract counterparties for certain OTC derivatives in order to, among other things, reduce its credit risk to counterparties. ISDA Master Agreements include provisions for general obligations, representations, collateral and events of default or termination. Under an ISDA Master Agreement, the Fund typically may offset with the counterparty certain OTC derivative financial instruments' payables and/or receivables with collateral held and/or posted and create one single net payment (close-out netting) in the event of default, termination and/or potential deterioration in the credit quality of the counterparty. Various Master Agreements govern the terms of certain transactions with counterparties, including transactions such as swap, forward, repurchase and reverse repurchase agreements. These Master Agreements typically attempt to reduce the counterparty risk associated with such transactions by specifying credit protection mechanisms and providing standardization that improves legal certainty. Cross-termination provisions under Master Agreements typically provide that a default in connection with one transaction between the Fund and a counterparty gives the non-defaulting party the right to terminate any other transactions in place with the defaulting party to create one single net payment due to/due from the defaulting party and may be a feature in certain Master Agreements. In the event the Fund exercises its right to terminate a Master Agreement after a counterparty experiences a termination event as defined in the Master Agreement, the return of collateral with market value in excess of the Fund's net liability may be delayed or denied.
48
Morgan Stanley Variable Insurance Fund, Inc.
Annual Report – December 31, 2021
Notes to Consolidated Financial Statements (cont'd)
The following tables present derivative financial instruments that are subject to enforceable netting arrangements as of December 31, 2021:
Gross Amounts Not Offset in the Consolidated Statement of Assets and Liabilities | |
Counterparty | | Gross Asset
Derivatives
Presented in the
Consolidated
Statement of
Assets and
Liabilities
(000) | | Financial
Instrument
(000) | | Collateral
Received(d)
(000) | | Net
Amount
(not less
than $0)
(000) | |
Bank of America NA | | $ | 2 | | | $ | (2 | ) | | $ | — | | | $ | 0 | | |
Bank of Montreal | | | 1 | | | | — | | | | — | | | | 1 | | |
Barclays Bank PLC | | | 4 | | | | (3 | ) | | | — | | | | 1 | | |
BNP Paribas SA | | | 831 | | | | (200 | ) | | | (631 | ) | | | 0 | | |
Citibank NA | | | — | @ | | | (— | @) | | | — | | | | 0 | | |
Goldman Sachs
International | | | 283 | | | | (283 | ) | | | — | | | | 0 | | |
JPMorgan Chase
Bank NA | | | 321 | | | | (300 | ) | | | — | | | | 21 | | |
State Street Bank
and Trust Co. | | | — | @ | | | (— | @) | | | — | | | | 0 | | |
UBS AG | | | 51 | | | | (44 | ) | | | — | | | | 7 | | |
Total | | $ | 1,493 | | | $ | (832 | ) | | $ | (631 | ) | | $ | 30 | | |
| Gross Amounts Not Offset in the Consolidated Statement of Assets and Liabilities | |
Counterparty | | Gross Liability
Derivatives
Presented in the
Consolidated
Statement of
Assets and
Liabilities
(000) | | Financial
Instrument
(000) | | Collateral
Pledged(d)
(000) | | Net
Amount
(not less
than $0)
(000) | |
Bank of America NA | | $ | 2 | | | $ | (2 | ) | | $ | — | | | $ | 0 | | |
Barclays Bank PLC | | | 3 | | | | (3 | ) | | | — | | | | 0 | | |
BNP Paribas SA | | | 200 | | | | (200 | ) | | | — | | | | 0 | | |
Citibank NA | | | 3 | | | | (— | @) | | | — | | | | 3 | | |
Commonwealth
Bank of Australia | | | — | @ | | | — | | | | — | | | | — | @ | |
Goldman Sachs
International | | | 414 | | | | (283 | ) | | | (131 | ) | | | 0 | | |
JPMorgan Chase
Bank NA | | | 300 | | | | (300 | ) | | | — | | | | 0 | | |
State Street Bank
and Trust Co. | | | 4 | | | | (— | @) | | | — | | | | 4 | | |
UBS AG | | | 44 | | | | (44 | ) | | | — | | | | 0 | | |
Total | | $ | 970 | | | $ | (832 | ) | | $ | (131 | ) | | $ | 7 | | |
@ Value is less than $500.
(d) In some instances, the actual collateral received or pledged may be more than the amount shown here due to overcollateralization.
For the year ended December 31, 2021, the approximate average monthly amount outstanding for each derivative type is as follows:
Foreign Currency Forward Exchange Contracts: | |
Average monthly principal amount | | $ | 32,999,000 | | |
Futures Contracts: | |
Average monthly notional value | | $ | 36,036,000 | | |
Swap Agreements: | |
Average monthly notional amount | | $ | 23,335,000 | | |
5. When-Issued/Delayed Delivery Securities: The Fund purchases and sells when-issued and delayed delivery securities. Securities purchased on a when-issued or delayed delivery basis are purchased for delivery beyond the normal settlement date at a stated price and yield, and no income accrues to the Fund on such securities prior to delivery date. Payment and delivery for when-issued and delayed delivery securities can take place a month or more after the date of the transaction. When the Fund enters into a purchase transaction on a when-issued or delayed delivery basis, securities are available for collateral in an amount at least equal in value to the Fund's commitments to purchase such securities. Purchasing securities on a when-issued or delayed delivery basis may involve a risk that the market price at the time of delivery may be lower than the agreed upon purchase price, in which case there could be an unrealized loss at the time of delivery. Purchasing investments on a when-issued or delayed delivery basis may be considered a form of leverage which may increase the impact that gains (losses) may have on the Fund.
6. Indemnifications: The Company enters into contracts that contain a variety of indemnifications. The Company's maximum exposure under these arrangements is unknown. However, the Company has not had prior claims or losses pursuant to these contracts and expects the risk of loss to be remote.
7. Security Transactions, Income and Expenses: Security transactions are accounted for on the trade date (date the order to buy or sell is executed). Realized gains and losses on the sale of investment securities are determined on the specific identified cost method. Dividend income and other distributions are recorded on the ex-dividend date (except for certain foreign dividends which may be recorded as soon as the Fund is informed of such dividends) net of applicable withholding taxes. Interest income is recognized on the accrual basis net of applicable withholding taxes except where collection is in doubt. Discounts are accreted and premiums are amortized over the life of the respective securities. Most expenses of the
49
Morgan Stanley Variable Insurance Fund, Inc.
Annual Report – December 31, 2021
Notes to Consolidated Financial Statements (cont'd)
Company can be directly attributed to a particular Fund. Expenses which cannot be directly attributed are apportioned among the Funds based upon relative net assets or other appropriate methods. Income, expenses (other than class specific expenses) and realized and unrealized gains or losses are allocated to each class of shares based upon their relative net assets.
Settlement and registration of foreign securities transactions may be subject to significant risks not normally associated with investments in the United States. In certain markets, ownership of shares is defined according to entries in the issuer's share register. It is possible that a Fund holding these securities could lose its share registration through fraud, negligence or even mere oversight. In addition, shares being delivered for sales and cash being paid for purchases may be delivered before the exchange is complete. This may subject the Fund to further risk of loss in the event of a failure to complete the transaction by the counterparty.
8. Dividends and Distributions to Shareholders: Dividends and distributions to shareholders are recorded on the ex-dividend date. Dividends from net investment income, if any, are declared and paid annually. Net realized capital gains, if any, are distributed at least annually.
B. Advisory/Sub-Advisory Fees: The Adviser, a wholly-owned subsidiary of Morgan Stanley, provides the Fund with advisory services under the terms of an Investment Advisory Agreement, paid quarterly, at the annual rate based on the daily net assets as follows:
First $500
million | | Next $500
million | | Over $1
billion | |
| | 0.75 | % | | | 0.70 | % | | | 0.65 | % | |
For the year ended December 31, 2021, the advisory fee rate (net of waiver/rebate) was equivalent to an annual effective rate of 0.12% of the Fund's average daily net assets.
The Adviser has agreed to reduce its advisory fee and/or reimburse the Fund so that total annual Fund operating expenses, excluding certain investment related expenses, taxes, interest and other extraordinary expenses (including litigation), will not exceed 0.90% for Class I shares and 1.00% for Class II shares. The fee waivers and/or expense reimbursements will continue for at least one year from the date of the Fund's prospectus or until such time as the Directors act to discontinue all or a portion of such waivers and/or reimbursements when they deem such action is appropriate. For the year ended December 31, 2021, approximately $668,000 of advisory fees were waived pursuant to this arrangement.
The Adviser has entered into a Sub-Advisory Agreement with the Sub-Adviser, a wholly-owned subsidiary of Morgan Stan-
ley. The Sub-Adviser provides the Fund with advisory services subject to the overall supervision of the Adviser and the Fund's Officers and Directors. The Adviser pays the Sub-Adviser on a monthly basis a portion of the net advisory fees the Adviser receives from the Fund.
The Adviser provides investment advisory services to the Subsidiary pursuant to the Subsidiary Investment Management Agreement (the "Agreement"). Under the Agreement, the Subsidiary will pay the Adviser at the end of each fiscal quarter, calculated by applying a quarterly rate, based on the annual rate of 0.05%, to the average daily net assets of the Subsidiary.
The Adviser has agreed to waive its advisory fees by the amount of advisory fees it receives from the Subsidiary.
C. Administration Fees: The Adviser also serves as Administrator to the Company and provides administrative services pursuant to an Administration Agreement for an annual fee, accrued daily and paid monthly, of 0.08% of the Fund's average daily net assets.
Under a Sub-Administration Agreement between the Administrator and State Street Bank and Trust Company ("State Street"), State Street provides certain administrative services to the Company. For such services, the Administrator pays State Street a portion of the fee the Administrator receives from the Fund.
D. Servicing Fees: The Company accrues daily and pays quarterly a servicing fee of up to 0.17% of the average daily value of shares of the Fund held in an insurance company's account. Certain insurance companies have entered into a servicing agreement with the Company to provide administrative and other contract-owner related services on behalf of the Fund.
E. Distribution Fees: Morgan Stanley Distribution, Inc. ("MSDI" or the "Distributor"), a wholly-owned subsidiary of the Adviser and an indirect subsidiary of Morgan Stanley, serves as the Distributor of the Fund and provides the Fund's Class II shareholders with distribution services pursuant to a Distribution Plan (the "Plan") in accordance with Rule 12b-1 under the Act. Under the Plan, the Fund is authorized to pay the Distributor a distribution fee, which is accrued daily and paid monthly, at an annual rate of 0.25% of the Fund's average daily net assets attributable to Class II shares. The Distributor has agreed to waive 0.15% of the 0.25% distribution fee that it may receive. This fee waiver will continue for at least one year from the date of the Fund's prospectus or until such time as the Directors act to discontinue all or a portion of such waiver when they deem such action is appropriate. For the year ended
50
Morgan Stanley Variable Insurance Fund, Inc.
Annual Report – December 31, 2021
Notes to Consolidated Financial Statements (cont'd)
December 31, 2021, this waiver amounted to approximately $25,000.
F. Dividend Disbursing and Transfer Agent: The Company's dividend disbursing and transfer agent is DST Asset Manager Solutions, Inc. ("DST"). Pursuant to a Transfer Agency Agreement, the Company pays DST a fee based on the number of classes, accounts and transactions relating to the Funds of the Company.
G. Custodian Fees: State Street (the "Custodian") also serves as Custodian for the Company in accordance with a Custodian Agreement. The Custodian holds cash, securities and other assets of the Company as required by the Act. Custody fees are payable monthly based on assets held in custody, investment purchases and sales activity and account maintenance fees, plus reimbursement for certain out-of-pocket expenses.
H. Security Transactions and Transactions with Affiliates: For the year ended December 31, 2021, purchases and sales of investment securities for the Fund, other than long-term U.S. Government securities and short-term investments were approximately $67,761,000 and $71,457,000, respectively. For the year ended December 31, 2021, purchases and sales of long-term U.S. Government securities were approximately $38,164,000 and $38,347,000, respectively.
The Fund invests in the Institutional Class of the Morgan Stanley Institutional Liquidity Funds — Government Portfolio (the "Liquidity Funds"), an open-end management investment company managed by the Adviser. Advisory fees paid by the Fund are reduced by an amount equal to its pro-rata share of the advisory and administration fees paid by the Fund due to its investment in the Liquidity Funds. For the year ended December 31, 2021, advisory fees paid were reduced by approximately $5,000 relating to the Fund's investment in the Liquidity Funds.
A summary of the Fund's transactions in shares of affiliated investments during the year ended December 31, 2021 is as follows:
Affiliated
Investment
Company | | Value
December 31,
2020
(000) | | Purchases
at Cost
(000) | | Proceeds
from Sales
(000) | | Dividend
Income
(000) | |
Liquidity Funds | | $ | 15,117 | | | $ | 91,673 | | | $ | 93,090 | | | $ | 2 | | |
Affiliated
Investment
Company (cont'd) | | Realized
Gain (Loss)
(000) | | Change in
Unrealized
Appreciation
(Depreciation)
(000) | | Value
December 31,
2021
(000) | |
Liquidity Funds | | $ | — | | | $ | — | | | $ | 13,700 | | |
During the year ended December 31, 2021, the Fund incurred less than $500 in brokerage commissions with Morgan Stanley & Co. LLC, an affiliate of the Adviser/Administrator, Sub-Adviser and Distributor, for portfolio transactions executed on behalf of the Fund.
The Fund is permitted to purchase and sell securities ("cross-trade") from and to other Morgan Stanley funds as well as other funds and client accounts for which the Adviser or an affiliate of the Adviser serves as investment adviser, pursuant to procedures approved by the Directors in compliance with Rule 17a-7 under the Act (the "Rule"). Each cross-trade is executed at the current market price in compliance with provisions of the Rule. For the year ended December 31, 2021, the Fund did not engage in any cross-trade transactions.
The Fund has an unfunded Deferred Compensation Plan (the "Compensation Plan"), which allows each independent Director to defer payment of all, or a portion, of the fees he or she receives for serving on the Board of Directors. Each eligible Director generally may elect to have the deferred amounts credited with a return equal to the total return on one or more of the Morgan Stanley funds that are offered as investment options under the Compensation Plan. Appreciation/depreciation and distributions received from these investments are recorded with an offsetting increase/decrease in the deferred compensation obligation and do not affect the NAV of the Fund.
I. Federal Income Taxes: It is the Fund's intention to continue to qualify as a regulated investment company and distribute all of its taxable and tax-exempt income. Accordingly, no provision for federal income taxes is required in the consolidated financial statements.
The Fund may be subject to taxes imposed by countries in which it invests. Such taxes are generally based on income and/or capital gains earned or repatriated. Taxes are accrued based on net investment income, net realized gains and net unrealized appreciation as such income and/or gains are earned. Taxes may also be based on transactions in foreign currency and are accrued based on the value of investments denominated in such currency.
FASB ASC 740-10, "Income Taxes — Overall", sets forth a minimum threshold for consolidated financial statement recognition of the benefit of a tax position taken or expected to be taken in a tax return. Management has concluded there are no significant uncertain tax positions that would require recognition in the consolidated financial statements. If applicable, the Fund recognizes interest accrued related to unrecognized tax benefits in "Interest Expense" and penalties in "Other Expenses" in the Consolidated Statement of
51
Morgan Stanley Variable Insurance Fund, Inc.
Annual Report – December 31, 2021
Notes to Consolidated Financial Statements (cont'd)
Operations. The Fund files tax returns with the U.S. Internal Revenue Service, New York and various states. Generally, each of the tax years in the four-year period ended December 31, 2021 remains subject to examination by taxing authorities.
The tax character of distributions paid may differ from the character of distributions shown for GAAP purposes due to short-term capital gains being treated as ordinary income for tax purposes. The tax character of distributions paid during fiscal years 2021 and 2020 was as follows:
2021 Distributions
Paid From: | | 2020 Distributions
Paid From: | |
Ordinary
Income
(000) | | Long-Term
Capital Gain
(000) | | Ordinary
Income
(000) | | Long-Term
Capital Gain
(000) | |
| $ | 4,054 | | | $ | 1,510 | | | $ | 4,575 | | | $ | 4,083 | | |
The amount and character of income and gains to be distributed are determined in accordance with income tax regulations which may differ from GAAP. These book/tax differences are either considered temporary or permanent in nature.
Temporary differences are attributable to differing book and tax treatments for the timing of the recognition of gains (losses) on certain investment transactions and the timing of the deductibility of certain expenses.
The Fund had no permanent differences causing reclassifications among the components of net assets for the year ended December 31, 2021.
At December 31, 2021, the components of distributable earnings for the Fund on a tax basis were as follows:
Undistributed
Ordinary
Income
(000) | | Undistributed
Long-Term
Capital Gain
(000) | |
| $ | 5,291 | | | $ | 9,927 | | |
J. Credit Facility: The Company and other Morgan Stanley funds participated in a $300,000,000 committed, unsecured revolving line of credit facility (the "Facility") with State Street. This Facility is to be used for temporary emergency purposes or funding of shareholder redemption requests. The interest rate on borrowings is based on the federal funds rate or 1 month LIBOR rate plus a spread. Effective April 19, 2021, the interest rate on borrowings is based on the federal funds effective rate or overnight bank funding rate plus a spread. The Facility also has a commitment fee of 0.25% per annum based on the unused portion of the Facility. During the year ended December 31, 2021, the Fund did not have any borrowings under the Facility.
K. Other: At December 31, 2021, the Fund had record owners of 10% or greater. Investment activities of these sharehold-
ers could have a material impact on the Fund. The aggregate percentage of such owners was 73.3%.
L. Market Risk: The outbreak of the coronavirus ("COVID-19") and the recovery responses could adversely impact the operations of the Fund and its service providers and financial performance of the Fund and the Fund's investments. The extent of such impact depends on future developments, including (i) the duration and spread of the outbreak, (ii) the restrictions and advisories, (iii) the effects on the financial markets, (iv) government and regulatory responses, and (v) the effects on the economy overall as a result of developments such as disruption to consumer demand, economic output and supply chains. The duration and extent of COVID-19 and associated economic and market conditions and uncertainty over the long term cannot be reasonably estimated at this time. The ultimate impact of COVID-19 and the extent to which the associated conditions impact the Fund will also depend on future developments, which are highly uncertain, difficult to accurately predict and subject to change at any time. If the financial performance of the Fund's investments is impacted because of these factors for an extended period, the Fund's investment results may be adversely affected.
M. LIBOR Discontinuance or Unavailability Risk: LIBOR is intended to represent the rate at which contributing banks may obtain short-term borrowings from each other in the London interbank market. The regulatory authority that oversees financial services firms and financial markets in the U.K. has announced that, after the end of 2021, it would no longer persuade or compel contributing banks to make rate submissions for purposes of determining the LIBOR rate. However, subsequent announcements by the Financial Conduct Authority, the LIBOR administrator and other regulators indicate that it is possible that the most widely used tenors of U.S. Dollar LIBOR may continue to be provided on a representative basis until mid-2023. However, in connection with supervisory guidance from regulators, some regulated entities will cease to enter into most new LIBOR-based contracts after January 1, 2022. As a result, it is possible that commencing in 2022 (or a later date, if a particular reference rate is expected to continue beyond 2021), LIBOR may no longer be available or no longer deemed an appropriate reference rate upon which to determine the interest rate on or impacting certain derivatives and other instruments or investments comprising some or all of the Fund's portfolio. In light of this eventuality, public and private sector industry initiatives are currently underway to establish new or alternative reference rates to be used in place of LIBOR. There is no assurance that the composition or characteristics of any such alternative reference rate will be similar to or produce the same
52
Morgan Stanley Variable Insurance Fund, Inc.
Annual Report – December 31, 2021
Notes to Consolidated Financial Statements (cont'd)
value or economic equivalence as LIBOR or that it will have the same volume or liquidity as did LIBOR prior to its discontinuance or unavailability, which may affect the value or liquidity or return on certain of the Fund's investments and result in costs incurred in connection with closing out positions and entering into new trades.
Neither the effect of the LIBOR transition process nor its ultimate success can yet be known. The transition process might lead to increased volatility and illiquidity in markets for, and reduce the effectiveness of new hedges placed against, instruments whose terms currently include LIBOR. While some existing LIBOR-based instruments may contemplate a scenario where LIBOR is no longer available by providing for an alternative rate-setting methodology, there may be significant uncertainty regarding the effectiveness of any such alternative methodologies to replicate LIBOR. Not all existing LIBOR-based instruments may have alternative rate-setting provisions and there remains uncertainty regarding the willingness and ability of issuers to add alternative rate-setting provisions in certain existing instruments. In addition, a liquid market for newly-issued instruments that use a reference rate other than LIBOR still may be developing. There may also be challenges for the Fund to enter into hedging transactions against such newly-issued instruments until a market for such hedging transactions develops. All of the aforementioned may adversely affect the Fund's performance or net asset value.
53
Morgan Stanley Variable Insurance Fund, Inc.
Annual Report – December 31, 2021
Report of Independent Registered Public Accounting Firm
To the Shareholders and Board of Directors of
Morgan Stanley Variable Insurance Fund, Inc. —
Global Strategist Portfolio
Opinion on the Financial Statements
We have audited the accompanying consolidated statement of assets and liabilities of Global Strategist Portfolio (the "Fund") (one of the funds constituting Morgan Stanley Variable Insurance Fund, Inc. (the "Company")), including the consolidated portfolio of investments, as of December 31, 2021, and the related consolidated statement of operations for the year then ended, the consolidated statements of changes in net assets for each of the two years in the period then ended, the consolidated financial highlights for each of the five years in the period then ended and the related notes (collectively referred to as the "financial statements"). In our opinion, the financial statements present fairly, in all material respects, the consolidated financial position of Global Strategist Portfolio (one of the funds constituting Morgan Stanley Variable Insurance Fund, Inc.) at December 31, 2021, the consolidated results of its operations for the year then ended, the consolidated changes in its net assets for each of the two years in the period then ended and its consolidated financial highlights for each of the five years in the period then ended, in conformity with U.S. generally accepted accounting principles.
Basis for Opinion
These financial statements are the responsibility of the Company's management. Our responsibility is to express an opinion on the Fund's consolidated financial statements based on our audits. We are a public accounting firm registered with the Public Company Accounting Oversight Board (United States) ("PCAOB") and are required to be independent with respect to the Company in accordance with the U.S. federal securities law and the applicable rules and regulations of the Securities and Exchange Commission and the PCAOB.
We conducted our audits in accordance with the standards of the PCAOB. Those standards require that we plan and perform the audit to obtain reasonable assurance about whether the financial statements are free of material misstatement, whether due to error or fraud. The Company is not required to have, nor were we engaged to perform, an audit of the Company's internal control over financial reporting. As part of our audits, we are required to obtain an understanding of internal control over financial reporting, but not for the purpose of expressing an opinion on the effectiveness of the Company's internal control over financial reporting. Accordingly, we express no such opinion.
Our audits included performing procedures to assess the risks of material misstatement of the consolidated financial statements, whether due to error or fraud, and performing procedures that respond to those risks. Such procedures included examining, on a test basis, evidence regarding the amounts and disclosures in the consolidated financial statements. Our procedures included confirmation of securities owned as of December 31, 2021 by correspondence with the custodian and others or by other appropriate auditing procedures where replies from others were not received. Our audits also included evaluating the accounting principles used and significant estimates made by management, as well as evaluating the overall presentation of the consolidated financial statements. We believe that our audits provide a reasonable basis for our opinion.

We have served as the auditor of one or more Morgan Stanley investment companies since 2000.
Boston, Massachusetts
February 18, 2022
54
Morgan Stanley Variable Insurance Fund, Inc.
Annual Report – December 31, 2021
Liquidity Risk Management Program (unaudited)
In compliance with Rule 22e-4 under the Investment Company Act of 1940, as amended (the "Liquidity Rule"), the Fund has adopted and implemented a liquidity risk management program (the "Program"), which is reasonably designed to assess and manage the risk that the Fund could not meet requests to redeem shares issued by the Fund without significant dilution of remaining investors' interests in the Fund (i.e., liquidity risk). The Fund's Board of Directors (the "Board") previously approved the designation of the Liquidity Risk Subcommittee (the "LRS") as Program administrator. The LRS is comprised of representatives from various divisions within Morgan Stanley Investment Management.
At a meeting held on March 3-4, 2021, the Board reviewed a written report prepared by the LRS that addressed the Program's operation and assessed its adequacy, and effectiveness of implementation for the period from January 1, 2020, through December 31, 2020, as required under the Liquidity Rule, and discussed the impact of the COVID-19 pandemic on liquidity and the LRS's assessment of liquidity risk during the reporting period, including during the distressed market environment caused by the onset of the COVID-19 pandemic. The report concluded that the Program operated effectively and was adequately and effectively implemented in all material aspects, and that the relevant controls and safeguards were appropriately designed to enable the LRS to administer the Program in compliance with the Liquidity Rule.
In accordance with the Program, the LRS assessed each Fund's liquidity risk no less frequently than annually taking into consideration certain factors, as applicable, such as (i) investment strategy and liquidity of portfolio investments, (ii) short-term and long-term cash flow projections and (iii) holdings of cash and cash equivalents and borrowing arrangements and other funding sources. Certain factors are considered under both normal and reasonably foreseeable stressed conditions.
Each Fund portfolio investment is classified into one of four liquidity categories, which classification is assessed at least monthly by the LRS. The classification is based on a determination of the number of days it is reasonably expected to take to convert the investment into cash, or sell or dispose of the investment, in current market conditions without significantly changing the market value of the investment. Liquidity classification determinations take into account various market, trading and investment-specific considerations, as well as market depth, and in some cases utilize third-party vendor data.
The Liquidity Rule limits a fund's investments in illiquid investments to 15% of its net assets and requires funds that do not primarily hold assets that are highly liquid investments to determine and maintain a minimum percentage of the fund's net assets to be invested in highly liquid investments (highly liquid investment minimum or "HLIM"). The LRS believes that the Program includes provisions reasonably designed to review, monitor and comply with the 15% limit on illiquid investments and for determining, periodically reviewing and complying with the HLIM requirement, as applicable.
There can be no assurance that the Program will achieve its objectives under all circumstances in the future. Please refer to the Fund's prospectus for more information regarding the Fund's exposure to liquidity risk and other risks to which it may be subject.
55
Morgan Stanley Variable Insurance Fund, Inc.
Annual Report – December 31, 2021
Federal Tax Notice (unaudited)
For federal income tax purposes, the following information is furnished with respect to the distributions paid by the Fund during its taxable year ended December 31, 2021. For corporate shareholders 18.34% of the dividends qualified for the dividends received deduction.
The Fund designated and paid approximately $1,510,000 as a long-term capital gain distribution.
In January, the Fund provides tax information to shareholders for the preceding calendar year.
56
Morgan Stanley Variable Insurance Fund, Inc.
Annual Report – December 31, 2021
Director and Officer Information (unaudited)
Independent Directors:
Name, Address and Birth
Year of Independent Director | | Position(s)
Held with
Registrant | | Length of
Time
Served* | | Principal Occupation(s) During Past 5 Years and
Other Relevant Professional Experience | | Number of
Funds
in Fund
Complex
Overseen
by
Independent
Director** | | Other Directorships Held by Independent
Director During Past 5 Years*** | |
Frank L. Bowman
c/o Perkins Coie LLP
Counsel to the Independent
Directors
1155 Avenue of the Americas
22nd Floor
New York, NY 10036
Birth Year: 1944 | | Director | | Since August 2006 | | President, Strategic Decisions, LLC (consulting) (since February 2009); Director or Trustee of various Morgan Stanley Funds (since August 2006); Chairperson of the Compliance and Insurance Committee (since October 2015); formerly, Chairperson of the Insurance Sub-Committee of the Compliance and Insurance Committee (2007-2015); served as President and Chief Executive Officer of the Nuclear Energy Institute (policy organization) (February 2005-November 2008); retired as Admiral, U.S. Navy after serving over 38 years on active duty including 8 years as Director of the Naval Nuclear Propulsion Program in the Department of the Navy and the U.S. Department of Energy (1996-2004); served as Chief of Naval Personnel (July 1994-September 1996) and on the Joint Staff as Director of Political Military Affairs (June 1992-July 1994); knighted as Honorary Knight Commander of the Most Excellent Order of the British Empire; awarded the Officier de l'Orde National du Mèrite by the French Government; elected to the National Academy of Engineering (2009). | | | 77 | | | Director of Naval and Nuclear Technologies LLP; Director Emeritus of the Armed Services YMCA; Member of the National Security Advisory Council of the Center for U.S. Global Engagement and a member of the CNA Military Advisory Board; Chairman of Fairhaven United Methodist Church; Member of the Board of Advisors of the Dolphin Scholarship Foundation; Director of other various nonprofit organizations; formerly, Director of BP, plc (November 2010-May 2019). | |
Kathleen A. Dennis
c/o Perkins Coie LLP
Counsel to the Independent
Directors
1155 Avenue of the Americas
22nd Floor
New York, NY 10036
Birth Year: 1953 | | Director | | Since August 2006 | | Chairperson of the Governance Committee (since January 2021), Chairperson of the Liquidity and Alternatives Sub-Committee of the Investment Committee (2006-2020) and Director or Trustee of various Morgan Stanley Funds (since August 2006); President, Cedarwood Associates (mutual fund and investment management consulting) (since July 2006); formerly, Senior Managing Director of Victory Capital Management (1993-2006). | | | 77 | | | Board Member, University of Albany Foundation (2012-present); Board Member, Mutual Funds Directors Forum (2014-present); Director of various non-profit organizations. | |
Nancy C. Everett
c/o Perkins Coie LLP
Counsel to the Independent
Directors
1155 Avenue of the Americas
22nd Floor
New York, NY 10036
Birth Year: 1955 | | Director | | Since January 2015 | | Chairperson of the Equity Investment Committee (since January 2021); Director or Trustee of various Morgan Stanley Funds (since January 2015); Chief Executive Officer, Virginia Commonwealth University Investment Company (since November 2015); Owner, OBIR, LLC (institutional investment management consulting) (since June 2014); formerly, Managing Director, BlackRock, Inc. (February 2011-December 2013) and Chief Executive Officer, General Motors Asset Management (a/k/a Promark Global Advisors, Inc.) (June 2005-May 2010). | | | 78 | | | Formerly, Member of Virginia Commonwealth University School of Business Foundation (2005-2016); Member of Virginia Commonwealth University Board of Visitors (2013-2015); Member of Committee on Directors for Emerging Markets Growth Fund, Inc. (2007-2010); Chairperson of Performance Equity Management, LLC (2006-2010); and Chairperson, GMAM Absolute Return Strategies Fund, LLC (2006-2010). | |
57
Morgan Stanley Variable Insurance Fund, Inc.
Annual Report – December 31, 2021
Director and Officer Information (unaudited) (cont'd)
Independent Directors (cont'd):
Name, Address and Birth
Year of Independent Director | | Position(s)
Held with
Registrant | | Length of
Time
Served* | | Principal Occupation(s) During Past 5 Years and
Other Relevant Professional Experience | | Number of
Funds
in Fund
Complex
Overseen
by
Independent
Director** | | Other Directorships Held by Independent
Director During Past 5 Years*** | |
Jakki L. Haussler
c/o Perkins Coie LLP
Counsel to the Independent
Directors
1155 Avenue of the Americas
22nd Floor
New York, NY 10036
Birth Year: 1957 | | Director | | Since January 2015 | | Director or Trustee of various Morgan Stanley Funds (since January 2015); Chairman, Opus Capital Group (since 1996); formerly, Chief Executive Officer, Opus Capital Group (1996-2019); Director, Capvest Venture Fund, LP (May 2000-December 2011); Partner, Adena Ventures, LP (July 1999-December 2010); Director, The Victory Funds (February 2005-July 2008). | | | 78 | | | Director, Barnes Group Inc. (since July 2021); Director of Cincinnati Bell Inc. and Member, Audit Committee and Chairman, Governance and Nominating Committee; Director of Service Corporation International and Member, Audit Committee and Investment Committee; Director of Northern Kentucky University Foundation and Member, Investment Committee; Member of Chase College of Law Transactional Law Practice Center Board of Advisors; Director of Best Transport; Director of Chase College of Law Board of Visitors; formerly, Member, University of Cincinnati Foundation Investment Committee; Member, Miami University Board of Visitors (2008-2011); Trustee of Victory Funds (2005-2008) and Chairman, Investment Committee (2007-2008) and Member, Service Provider Committee (2005-2008). | |
Dr. Manuel H. Johnson
c/o Johnson Smick
International, Inc.
220 I Street, NE Suite 200
Washington, D.C. 20002
Birth Year: 1949 | | Director | | Since July 1991 | | Senior Partner, Johnson Smick International, Inc. (consulting firm); Chairperson of the Fixed Income, Liquidity and Alternatives Investment Committee (since January 2021), Chairperson of the Investment Committee (2006-2020) and Director or Trustee of various Morgan Stanley Funds (since July 1991); Co-Chairman and a founder of the Group of Seven Council (G7C) (international economic commission); formerly, Chairperson of the Audit Committee (July 1991-September 2006); Vice Chairman of the Board of Governors of the Federal Reserve System and Assistant Secretary of the U.S. Treasury. | | | 77 | | | Director of NVR, Inc. (home construction). | |
Joseph J. Kearns
c/o Perkins Coie LLP
Counsel to the Independent
Directors
1155 Avenue of the Americas
22nd Floor
New York, NY 10036
Birth Year: 1942 | | Director | | Since August 1994 | | Senior Adviser, Kearns & Associates LLC (investment consulting); Chairperson of the Audit Committee (since October 2006) and Director or Trustee of various Morgan Stanley Funds (since August 1994); formerly, Deputy Chairperson of the Audit Committee (July 2003-September 2006) and Chairperson of the Audit Committee of various Morgan Stanley Funds (since August 1994); CFO of the J. Paul Getty Trust (1982-1999). | | | 78 | | | Director, Rubicon Investments (since February 2019); Prior to August 2016, Director of Electro Rent Corporation (equipment leasing); Prior to December 31, 2013, Director of The Ford Family Foundation. | |
Michael F. Klein
c/o Perkins Coie LLP
Counsel to the Independent
Directors
1155 Avenue of the Americas
22nd Floor
New York, NY 10036
Birth Year: 1958 | | Director | | Since August 2006 | | Chairperson of the Risk Committee (since January 2021); Managing Director, Aetos Alternatives Management, LP (since March 2000); Co-President, Aetos Alternatives Management, LP (since January 2004) and Co-Chief Executive Officer of Aetos Alternatives Management, LP (since August 2013); Chairperson of the Fixed Income Sub-Committee of the Investment Committee (2006-2020) and Director or Trustee of various Morgan Stanley Funds (since August 2006); formerly, Managing Director, Morgan Stanley & Co. Inc. and Morgan Stanley Dean Witter Investment Management and President, various Morgan Stanley Funds (June 1998-March 2000); Principal, Morgan Stanley & Co. Inc. and Morgan Stanley Dean Witter Investment Management (August 1997-December 1999). | | | 77 | | | Director of certain investment funds managed or sponsored by Aetos Alternatives Management, LP; Director of Sanitized AG and Sanitized Marketing AG (specialty chemicals). | |
58
Morgan Stanley Variable Insurance Fund, Inc.
Annual Report – December 31, 2021
Director and Officer Information (unaudited) (cont'd)
Independent Directors (cont'd):
Name, Address and Birth
Year of Independent Director | | Position(s)
Held with
Registrant | | Length of
Time
Served* | | Principal Occupation(s) During Past 5 Years and
Other Relevant Professional Experience | | Number of
Funds
in Fund
Complex
Overseen
by
Independent
Director** | | Other Directorships Held by Independent
Director During Past 5 Years*** | |
Patricia A. Maleski
c/o Perkins Coie LLP
Counsel to the Independent
Directors
1155 Avenue of the Americas
22nd Floor
New York, NY 10036
Birth Year: 1960 | | Director | | Since January 2017 | | Director or Trustee of various Morgan Stanley Funds (since January 2017); Managing Director, JPMorgan Asset Management (2004-2016); Oversight and Control Head of Fiduciary and Conflicts of Interest Program (2015-2016); Chief Control Officer — Global Asset Management (2013-2015); President, JPMorgan Funds (2010-2013); Chief Administrative Officer (2004-2013); various other positions including Treasurer and Board Liaison (since 2001). | | | 78 | | | Trustee, Nutley Family Service Bureau, Inc. (since January 2022). | |
W. Allen Reed
c/o Perkins Coie LLP
Counsel to the Independent
Directors
1155 Avenue of the Americas
22nd Floor
New York, NY 10036
Birth Year: 1947 | | Chair of the Board and Director | | Chair of the Board since August 2020 and Director since August 2006 | | Chair of the Boards of various Morgan Stanley Funds (since August 2020); Director or Trustee of various Morgan Stanley Funds (since August 2006); formerly, Vice Chair of the Boards of various Morgan Stanley Funds (January 2020-August 2020); President and Chief Executive Officer of General Motors Asset Management; Chairman and Chief Executive Officer of the GM Trust Bank and Corporate Vice President of General Motors Corporation (August 1994-December 2005). | | | 77 | | | Formerly, Director of Legg Mason, Inc. (2006-2019); and Director of the Auburn University Foundation (2010-2015). | |
Frances L. Cashman
c/o Perkins Coie LLP
Counsel to the Independent
Directors
1155 Avenue of the Americas
22nd Floor
New York, NY 10036
Birth Year: 1961 | | Advisory Board Member | | Advisory Board Member Since January 2022 | | Chief Executive Officer, Asset Management Division, Euromoney Institutional Investor PLC (financial information) (May 2021-Present); Executive Vice President and various other roles, Legg Mason & Co. (asset management) (2010-2020); Managing Director, Stifel Nicolaus (2005-2010). | | | 78 | | | Trustee and Investment Committee Member, Georgia Tech Foundation (Since June 2019); Trustee and Chair of Marketing Committee, Loyola Blakefield (Since September 2017); Trustee, MMI Gateway Foundation (since September 2017); Director and Investment Committee Member, Catholic Community Foundation Board (2012-2018); Director and Investment Committee Member, St. Ignatius Loyola Academy (2011-2017). | |
Eddie A. Grier
c/o Perkins Coie LLP
Counsel to the Independent
Directors
1155 Avenue of the Americas
22nd Floor
New York, NY 10036
Birth Year: 1955 | | Advisory Board Member | | Advisory Board Member Since January 2022 | | Dean, Santa Clara University Leavey School of Business (since April 2021); Dean, Virginia Commonwealth University School of Business (2010-2021); President and various other roles, Walt Disney Company (entertainment and media) (1981-2010). | | | 78 | | | Director, Witt/Keiffer, Inc. (executive search) (since 2016); Director, NuStar GP, LLC (energy) (since August 2021); Director, Sonida Senior Living, Inc. (residential community operator) (2016-2021); Director, NVR, Inc. (homebuilding) (2013-2020); Director, Middleburg Trust Company (wealth management) (2014-2019); Director, Colonial Williamsburg Company (since 2012); Regent, University of Massachusetts Global (since 2021); Director and Chair, ChildFund International (2012-2021); Trustee, Brandman University (2010-2021); Director, Richmond Forum (2012-2019). | |
* This is the earliest date the Director began serving the Morgan Stanley Funds. Each Director serves an indefinite term, until his or her successor is elected.
** The Fund Complex includes (as of December 31, 2021) all open-end and closed-end funds (including all of their portfolios) advised by Morgan Stanley Investment Management Inc. (the "Adviser") and any funds that have an adviser that is an affiliated person of the Adviser (including, but not limited to, Morgan Stanley AIP GP LP).
*** This includes any directorships at public companies and registered investment companies held by the Director at any time during the past five years.
59
Morgan Stanley Variable Insurance Fund, Inc.
Annual Report – December 31, 2021
Director and Officer Information (unaudited) (cont'd)
Executive Officers:
Name, Address and Birth Year of
Executive Officer | | Position(s)
Held with
Registrant | | Length of
Time Served* | | Principal Occupation(s) During Past 5 Years | |
John H. Gernon
522 Fifth Avenue
New York, NY 10036
Birth Year: 1963 | | President and Principal Executive Officer | | Since September 2013 | | President and Principal Executive Officer of the Equity and Fixed Income Funds and the Morgan Stanley AIP Funds (since September 2013) and the Liquidity Funds and various money market funds (since May 2014) in the Fund Complex; Managing Director of the Adviser. | |
Deidre A. Downes
1633 Broadway
New York, NY 10019
Birth Year: 1977 | | Chief Compliance Officer | | Since November 2021 | | Executive Director of the Adviser (since January 2021) and Chief Compliance Officer of various Morgan Stanley Funds (since November 2021). Formerly, Vice President and Corporate Counsel at PGIM and Prudential Financial (October 2016-December 2020). | |
Francis J. Smith
522 Fifth Avenue
New York, NY 10036
Birth Year: 1965 | | Treasurer and Principal Financial Officer | | Treasurer since July 2003 and Principal Financial Officer since September 2002 | | Managing Director of the Adviser and various entities affiliated with the Adviser; Treasurer (since July 2003) and Principal Financial Officer of various Morgan Stanley Funds (since September 2002). | |
Mary E. Mullin
1633 Broadway
New York, NY 10019
Birth Year: 1967 | | Secretary | | Since June 1999 | | Managing Director of the Adviser; Secretary of various Morgan Stanley Funds (since June 1999). | |
Michael J. Key
522 Fifth Avenue
New York, NY 10036
Birth Year: 1979 | | Vice President | | Since June 2017 | | Vice President of the Equity and Fixed Income Funds, Liquidity Funds, various money market funds and the Morgan Stanley AIP Funds in the Fund Complex (since June 2017); Executive Director of the Adviser; Head of Product Development for Equity and Fixed Income Funds (since August 2013). | |
* This is the earliest date the officer began serving the Morgan Stanley Funds. Each officer serves an indefinite term, until his or her successor is elected.
60
Morgan Stanley Variable Insurance Fund, Inc.
Annual Report – December 31, 2021
Adviser and Administrator
Morgan Stanley Investment Management Inc.
522 Fifth Avenue
New York, New York 10036
Sub-Adviser
Morgan Stanley Investment Management Limited
25 Cabot Square, Canary Wharf
London, E14 4QA, England
Distributor
Morgan Stanley Distribution, Inc.
522 Fifth Avenue
New York, New York 10036
Dividend Disbursing and Transfer Agent
DST Asset Manager Solutions, Inc.
2000 Crown Colony Drive
Quincy, Massachusetts 02169
Custodian
State Street Bank and Trust Company
One Lincoln Street
Boston, Massachusetts 02111
Legal Counsel
Dechert LLP
1095 Avenue of the Americas
New York, New York 10036
Counsel to the Independent Directors
Perkins Coie LLP
1155 Avenue of the Americas,
22nd Floor
New York, New York 10036
Independent Registered Public Accounting Firm
Ernst & Young LLP
200 Clarendon Street
Boston, Massachusetts 02116
Reporting to Shareholders
Each Morgan Stanley fund provides a complete schedule of portfolio holdings in its Semi-Annual and the Annual Reports within 60 days of the end of the fund's second and fourth fiscal quarters. The Semi-Annual and Annual Reports are filed electronically with the Securities and Exchange Commission ("SEC") on Form N-CSRS and Form N-CSR, respectively. Morgan Stanley also delivers the Semi-Annual and Annual Reports to fund shareholders and makes these reports available on its public website, www.morganstanley.com/im/shareholderreports. Each Morgan Stanley non-money market fund also files a complete schedule of portfolio holdings with the SEC for the fund's first and third fiscal quarters as an attachment to Form N-PORT. Morgan Stanley does not deliver the reports for the first and third fiscal quarters to shareholders, but makes the complete schedule of portfolio holdings for the fund's first and third fiscal quarters available on its public website. The holdings for each money market fund are also posted to the Morgan Stanley public website. You may obtain the Form N-PORT filings (as well as the Form N-CSR and N-CSRS filings) by accessing the SEC's website, www.sec.gov. You can also request copies of these materials, upon payment of a duplicating fee, by electronic request at the SEC's email address (publicinfo@sec.gov).
Proxy Voting Policies and Procedures and Proxy Voting Record
You may obtain a copy of the Company's Proxy Voting Policy and Procedures and information regarding how the Company voted proxies relating to portfolio securities during the most recent twelve-month period ended June 30, without charge, upon request, by calling toll free 1 (800) 548-7786 or by visiting our website at www.morganstanley.com/im/shareholderreports. This information is also available on the SEC's website at www.sec.gov.
This report is submitted for the general information of the shareholders of the Fund. For more detailed information about the Fund, its fees and expenses and other pertinent information, please read its Prospectus. The Company's Statement of Additional Information contains additional information about the Fund, including its Directors. It is available, without charge, by calling 1 (800) 548-7786.
Householding Notice
To reduce printing and mailing costs, the Fund attempts to eliminate duplicate mailings to the same address. The Fund delivers a single copy of certain shareholder documents, including shareholder reports, prospectuses and proxy materials, to investors with the same last name who reside at the same address. Your participation in this program will continue for an unlimited period of time unless you instruct us otherwise. You can request multiple copies of these documents by calling (800) 548-7786, 8:00 a.m. to 6:00 p.m., ET. Once our Customer Service Center has received your instructions, we will begin sending individual copies for each account within 30 days.
This report is not authorized for distribution to prospective investors in the Fund unless preceded or accompanied by an effective Prospectus. Read the Prospectus carefully before investing.
UIFIMANN
3997790 EXP 02.28.23

Morgan Stanley Variable Insurance Fund, Inc.
Annual Report – December 31, 2021
The Fund is intended to be a funding vehicle for variable annuity contracts and variable life insurance policies offered by the separate accounts of certain life insurance companies.
Morgan Stanley Variable Insurance Fund, Inc.
Annual Report – December 31, 2021
Consolidated Expense Example | | | 2 | | |
Investment Overview | | | 3 | | |
Consolidated Portfolio of Investments | | | 5 | | |
Consolidated Statement of Assets and Liabilities | | | 8 | | |
Consolidated Statement of Operations | | | 9 | | |
Consolidated Statements of Changes in Net Assets | | | 10 | | |
Consolidated Financial Highlights | | | 11 | | |
Notes to Consolidated Financial Statements | | | 13 | | |
Report of Independent Registered Public Accounting Firm | | | 25 | | |
Liquidity Risk Management Program | | | 26 | | |
Federal Tax Notice | | | 27 | | |
Director and Officer Information | | | 28 | | |
1
Morgan Stanley Variable Insurance Fund, Inc.
Annual Report – December 31, 2021
Consolidated Expense Example (unaudited)
Growth Portfolio
As a shareholder of the Growth Portfolio (the "Fund"), you incur two types of costs: (1) insurance company charges; and (2) ongoing costs, which may include advisory fees, administration fees, distribution (12b-1) fees and other Fund expenses. This example is intended to help you understand your ongoing costs (in dollars) of investing in the Fund and to compare these costs with the ongoing costs of investing in other mutual funds.
This example is based on an investment of $1,000 invested at the beginning of the six-month period ended December 31, 2021 and held for the entire six-month period.
Actual Expenses
The table below provides information about actual account values and actual expenses. You may use the information in this table, together with the amount you invested, to estimate the expenses that you paid over the period. Simply divide your account value by $1,000 (for example, an $8,600 account value divided by $1,000 = 8.6), then multiply the result by the number in the table under the heading entitled "Actual Expenses Paid During Period" to estimate the expenses you paid on your account during this period.
Hypothetical Example for Comparison Purposes
The table below provides information about hypothetical account values and hypothetical expenses based on the Fund's actual expense ratio and an assumed rate of return of 5% per year before expenses, which is not the Fund's actual return. The hypothetical account values and expenses may not be used to estimate the actual ending account balance or expenses you paid for the period. You may use this information to compare the ongoing costs of investing in the Fund and other funds. To do so, compare this 5% hypothetical example with the 5% hypothetical examples that appear in the shareholder reports of the other funds.
Please note that the expenses shown in the table are meant to highlight your ongoing costs only and do not reflect any insurance company charges. Therefore, the table below is useful in comparing ongoing costs, but will not help you determine the relative total cost of owning different funds. In addition, if these insurance company charges were included, your costs would have been higher.
| | | Beginning
Account Value
7/1/21 | | Actual Ending
Account Value
12/31/21 | | Hypothetical
Ending
Account Value | | Actual
Expenses Paid
During Period* | | Hypothetical
Expenses Paid
During Period* | | Net Expense
Ratio During
Period** | |
Growth Portfolio Class I | | $ | 1,000.00 | | | $ | 889.60 | | | $ | 1,022.33 | | | $ | 2.71 | | | $ | 2.91 | | | | 0.57 | % | |
Growth Portfolio Class II | | | 1,000.00 | | | | 888.40 | | | | 1,021.07 | | | | 3.90 | | | | 4.18 | | | | 0.82 | | |
* Expenses are calculated using each Fund Class' annualized net expense ratio (as disclosed), multiplied by the average account value over the period and multiplied by 184/365 (to reflect the most recent one-half year period).
** Annualized.
2
Morgan Stanley Variable Insurance Fund, Inc.
Annual Report – December 31, 2021
Investment Overview (unaudited)
Growth Portfolio
The Fund seeks long-term capital appreciation by investing primarily in growth-oriented equity securities of large capitalization companies.
On May 21, 2021, the Fund suspended offering Class I and Class II shares to new investors.
Performance
For the fiscal year ended December 31, 2021, the Fund's Class I shares had a total return based on net asset value and reinvestment of distributions per share of 0.10%, net of fees, and –0.15%, net of fees, for Class II shares. The Fund's Class I and Class II shares underperformed the Fund's benchmark, the Russell 1000® Growth Index (the "Index"), which returned 27.60%.
Factors Affecting Performance
• U.S. equity markets saw increased short-term volatility in 2021 but ultimately overcame concerns about new COVID-19 variants, inflation, and fiscal and monetary policy uncertainties to end the year higher. The economic recovery progressed due to easing restrictions and increasing vaccinations, along with support from the federal government's pandemic relief and accommodative monetary policy. Inflation persisted longer than expected, in part due to pandemic-related supply-side disruptions and labor shortages, leading the U.S. Federal Reserve and other central banks around the world to begin withdrawing monetary stimulus measures. The clarity on monetary policy and early evidence that the highly contagious omicron variant could be less deadly led markets to rally at year-end.
• Large-cap growth equities, as measured by the Index, advanced over the period. All sectors in the Index had positive performance, led by energy. Utilities had the smallest gain and was the largest relative underperformer in the Index.
• Counterpoint Global seeks high quality companies, which we define primarily as those with sustainable competitive advantages. We manage concentrated portfolios that are highly differentiated from the benchmark, with securities weighted on our assessment of the quality of the company and our conviction. The value added or detracted in any period of time will result from stock selection, given our philosophy and process. For the year, the Fund underperformed the Index.
• The long-term investment horizon and conviction-weighted investment approach embraced by the team since 1998 can result in periods of performance deviation from the benchmark and peers. The Fund underperformed the Index in this reporting period due to adverse stock selection.
• Greater market volatility and a widespread sell-off in high growth and high multiple equities was a significant headwind to portfolio performance through much of 2021. We believe the sell-off was driven by a broad rotation out of such names and not due to company-specific fundamentals, which, across most of the portfolio, remained largely robust.
• Mixed stock selection in the information technology sector was the largest detractor from relative performance. A proprietary cloud-based communications platform that connects users through frictionless video, voice, chat and content sharing was the top detractor in the sector and across the portfolio. The company recently reported overall healthy fundamentals, with robust customer growth, solid renewal trends, continued expansion of its customer footprint internationally and greater user adoption of its cloud-calling solution. However, the company experienced elevated customer churn with smaller customers, some of which have been returning to live interactions, and this weighed on investor sentiment. Within the sector, the underperformance of this and other holdings was partly offset by strength in a global cloud platform that provides security, performance and reliability services to the applications of its customers, which was the top contributor in the sector and across whole portfolio in the period.
• Stock selection in communication services was disadvantageous to relative performance. An audio streaming platform was the largest detractor in the sector and fourth greatest detractor across the portfolio, due to mixed reported results. The company recently reported strong advertising revenue growth and solid engagement trends with its expanding library of podcast content; however, this was offset by weaker-than-expected user growth resulting from the ongoing impact of COVID-19 in some markets as well as a user registration issue, which has since been resolved.
• Stock selection in consumer discretionary, real estate, health care and industrials modestly weighed on relative performance.
3
Morgan Stanley Variable Insurance Fund, Inc.
Annual Report – December 31, 2021
Investment Overview (unaudited) (cont'd)
Growth Portfolio
• Conversely, energy was the top contributor to relative performance, due to favorable stock selection and an average sector underweight. The Fund held only one energy company during the period, which was sold prior to the end of the reporting period. Its shares advanced on improving fundamentals, supported by a recovery in oil prices.
• An average sector underweight in consumer staples was modestly beneficial to relative performance. The Fund's sole holding in consumer staples was sold prior to the end of the reporting period.
Management Strategies
• As a team, we believe having a market outlook can be an anchor. Our focus is on assessing company prospects over a five-year horizon, and owning a portfolio of unique companies whose market value we believe can increase significantly for underlying fundamental reasons.
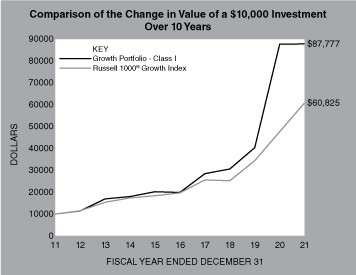
In accordance with SEC regulations, the Fund's performance shown assumes that all recurring fees (including management fees) were deducted and all dividends and distributions were reinvested. The performance of Class II shares will vary from the performance of Class I shares based upon its different inception date and will be negatively impacted by additional fees assessed to that class.
Performance Compared to the Russell 1000® Growth Index(1)
| | | Period Ended December 31, 2021 | |
| | | Total Returns(2) | |
| | | | | Average Annual | |
| | | One
Year | | Five
Years | | Ten
Years | | Since
Inception(5) | |
Fund – Class I(3) | | | 0.10 | % | | | 34.57 | % | | | 24.26 | % | | | 12.92 | % | |
Russell 1000® Growth Index | | | 27.60 | | | | 25.32 | | | | 19.79 | | | | 10.38 | | |
Fund – Class II(4) | | | –0.15 | | | | 34.25 | | | | 23.95 | | | | 15.85 | | |
Russell 1000® Growth Index | | | 27.60 | | | | 25.32 | | | | 19.79 | | | | 13.20 | | |
Performance data quoted represents past performance, which is no guarantee of future results, and current performance may be lower or higher than the figures shown. Performance assumes that all dividends and distributions, if any, were reinvested. For the most recent month-end performance figures, please contact the issuing insurance company or speak with your financial advisor. Investment return and principal value will fluctuate so that Fund shares, when redeemed, may be worth more or less than their original cost. Total returns do not reflect the deduction of taxes that a shareholder would pay on Fund distributions or the redemption of Fund shares. Performance shown does not reflect fees and expenses imposed by your insurance company's separate account. If performance information included the effect of these additional charges, the total returns would be lower.
(1) The Russell 1000® Growth Index measures the performance of the large-cap growth segment of the U.S. equity universe. It includes those Russell 1000® Index companies with higher price-to-book ratios and higher forecasted growth values. The Russell 1000® Index is an index of approximately 1,000 of the largest U.S. companies based on a combination of market capitalization and current index membership. The Index is unmanaged and its returns do not include any sales charges or fees. Such costs would lower performance. It is not possible to invest directly in an index.
(2) Total returns for the Fund reflect fees waived and expenses reimbursed, if applicable, by the Adviser (as defined herein). Without such waivers and reimbursements, total returns would have been lower.
(3) Commenced operations on January 2, 1997.
(4) Commenced offering on May 5, 2003.
(5) For comparative purposes, average annual since inception returns listed for the Index refers to the inception date or initial offering of the respective share class of the Fund, not the inception of the Index.
4
Morgan Stanley Variable Insurance Fund, Inc.
Annual Report – December 31, 2021
Consolidated Portfolio of Investments
Growth Portfolio
| | | Shares | | Value
(000) | |
Common Stocks (94.9%) | |
Automobiles (0.6%) | |
Rivian Automotive, Inc., Class A (a) | | | 61,252 | | | $ | 6,351 | | |
Biotechnology (0.8%) | |
Alnylam Pharmaceuticals, Inc. (a) | | | 12,850 | | | | 2,179 | | |
Ginkgo Bioworks Holdings, Inc. (a)(b) | | | 262,683 | | | | 2,183 | | |
Moderna, Inc. (a) | | | 13,766 | | | | 3,496 | | |
| | | | 7,858 | | |
Capital Markets (1.0%) | |
Coinbase Global, Inc., Class A (a) | | | 38,431 | | | | 9,699 | | |
Entertainment (8.4%) | |
ROBLOX Corp., Class A (a) | | | 530,887 | | | | 54,766 | | |
Sea Ltd. ADR (Singapore) (a) | | | 68,377 | | | | 15,297 | | |
Spotify Technology SA (a) | | | 62,294 | | | | 14,579 | | |
| | | | 84,642 | | |
Health Care Equipment & Supplies (0.5%) | |
DexCom, Inc. (a) | | | 8,912 | | | | 4,785 | | |
Health Care Providers & Services (2.2%) | |
Agilon health, Inc. (a) | | | 450,013 | | | | 12,150 | | |
Guardant Health, Inc. (a) | | | 97,108 | | | | 9,713 | | |
| | | | 21,863 | | |
Health Care Technology (3.4%) | |
Doximity, Inc., Class A (a) | | | 89,272 | | | | 4,475 | | |
GoodRx Holdings, Inc., Class A (a) | | | 143,036 | | | | 4,674 | | |
Veeva Systems, Inc., Class A (a) | | | 99,466 | | | | 25,412 | | |
| | | | 34,561 | | |
Hotels, Restaurants & Leisure (2.4%) | |
Airbnb, Inc., Class A (a) | | | 145,290 | | | | 24,190 | | |
Information Technology Services (31.9%) | |
Adyen N.V. (Netherlands) (a) | | | 6,884 | | | | 18,116 | | |
Cloudflare, Inc., Class A (a) | | | 478,668 | | | | 62,945 | | |
Fastly, Inc., Class A (a) | | | 109,254 | | | | 3,873 | | |
MongoDB, Inc. (a) | | | 32,477 | | | | 17,192 | | |
Okta, Inc. (a) | | | 48,020 | | | | 10,765 | | |
Shopify, Inc., Class A (Canada) (a) | | | 48,493 | | | | 66,794 | | |
Snowflake, Inc., Class A (a) | | | 214,998 | | | | 72,830 | | |
Square, Inc., Class A (a) | | | 244,139 | | | | 39,431 | | |
Twilio, Inc., Class A (a) | | | 108,746 | | | | 28,637 | | |
| | | | 320,583 | | |
Interactive Media & Services (9.0%) | |
Pinterest, Inc., Class A (a) | | | 414,641 | | | | 15,072 | | |
Snap, Inc., Class A (a) | | | 798,413 | | | | 37,549 | | |
Twitter, Inc. (a) | | | 875,417 | | | | 37,836 | | |
| | | | 90,457 | | |
| | | Shares | | Value
(000) | |
Internet & Direct Marketing Retail (9.6%) | |
Chewy, Inc., Class A (a) | | | 101,700 | | | $ | 5,997 | | |
DoorDash, Inc., Class A (a) | | | 310,757 | | | | 46,272 | | |
Grab Holdings Ltd., Class A (a) | | | 1,019,328 | | | | 7,268 | | |
MercadoLibre, Inc. (a) | | | 12,601 | | | | 16,991 | | |
Wayfair, Inc., Class A (a) | | | 105,106 | | | | 19,967 | | |
| | | | 96,495 | | |
Life Sciences Tools & Services (1.0%) | |
10X Genomics, Inc., Class A (a) | | | 71,484 | | | | 10,648 | | |
Pharmaceuticals (3.0%) | |
Royalty Pharma PLC, Class A | | | 749,869 | | | | 29,882 | | |
Real Estate Management & Development (1.6%) | |
Zillow Group, Inc., Class C (a) | | | 255,259 | | | | 16,298 | | |
Software (17.3%) | |
Aurora Innovation, Inc. (a)(c) | | | 371,870 | | | | 3,957 | | |
Bill.Com Holdings, Inc. (a) | | | 107,806 | | | | 26,860 | | |
Datadog, Inc., Class A (a) | | | 226,197 | | | | 40,288 | | |
Trade Desk, Inc. (The), Class A (a) | | | 400,943 | | | | 36,743 | | |
Unity Software, Inc. (a) | | | 269,942 | | | | 38,599 | | |
Zoom Video Communications, Inc., Class A (a) | | | 149,618 | | | | 27,516 | | |
| | | | 173,963 | | |
Specialty Retail (2.2%) | |
Carvana Co. (a) | | | 93,832 | | | | 21,749 | | |
Total Common Stocks (Cost $705,825) | | | 954,024 | | |
Preferred Stocks (0.9%) | |
Electronic Equipment, Instruments & Components (0.0%) | |
Magic Leap Series C (a)(c)(d)
(acquisition cost — $1,526;
acquired 12/22/15) | | | 66,235 | | | | — | | |
Software (0.9%) | |
Databricks, Inc. (a)(c)(d)
(acquisition cost — $8,310;
acquired 8/31/21) | | | 37,696 | | | | 8,505 | | |
Lookout, Inc. Series F (a)(c)(d)
(acquisition cost — $1,618;
acquired 6/17/14) | | | 141,612 | | | | 670 | | |
| | | | 9,175 | | |
Total Preferred Stocks (Cost $11,454) | | | 9,175 | | |
Investment Company (0.9%) | |
| Grayscale Bitcoin Trust (a) (Cost $11,528) | | | 261,759 | | | | 8,965 | | |
Short-Term Investments (3.5%) | |
Securities held as Collateral on Loaned Securities (0.3%) | |
Investment Company (0.2%) | |
Morgan Stanley Institutional Liquidity
Funds — Treasury Securities
Portfolio — Institutional Class
(See Note H) | | | 2,039,382 | | | | 2,039 | | |
The accompanying notes are an integral part of the consolidated financial statements.
5
Morgan Stanley Variable Insurance Fund, Inc.
Annual Report – December 31, 2021
Consolidated Portfolio of Investments (cont'd)
Growth Portfolio
| | | Face Amount
(000) | | Value
(000) | |
Repurchase Agreements (0.1%) | |
HSBC Securities USA, Inc., (0.05%, dated
12/31/21, due 1/3/22; proceeds $21;
fully collateralized by U.S. Government
obligations; 0.00% due
5/15/25 – 11/15/28; valued at $21) | | $ | 21 | | | $ | 21 | | |
Merrill Lynch & Co., Inc., (0.05%, dated
12/31/21, due 1/3/22; proceeds $367;
fully collateralized by U.S. Government
obligations; 0.13% – 2.88% due
7/31/23 – 7/31/25; valued at $374) | | | 367 | | | | 367 | | |
| | | | 388 | | |
Total Securities held as Collateral on
Loaned Securities (Cost $2,427) | | | 2,427 | | |
| | | Shares | | | |
Investment Company (3.2%) | |
Morgan Stanley Institutional Liquidity
Funds — Treasury Securities
Portfolio — Institutional Class
(See Note H) (Cost $31,856) | | | 31,855,814 | | | | 31,856 | | |
Total Short-Term Investments
(Cost $34,283) | | | 34,283 | | |
Total Investments Excluding Purchased
Options (100.2%) (Cost $763,090) | | | | | 1,006,447 | | |
Total Purchased Options Outstanding (0.1%)
(Cost $5,747) | | | 1,335 | | |
Total Investments (100.3%) (Cost $768,837)
Including $2,183 of Securities Loaned (e)(f) | | | 1,007,782 | | |
Liabilities in Excess of Other Assets (–0.3%) | | | (2,702 | ) | |
Net Assets (100.0%) | | $ | 1,005,080 | | |
(a) Non-income producing security.
(b) All or a portion of this security was on loan at December 31, 2021.
(c) Security cannot be offered for public resale without first being registered under the Securities Act of 1933 and related rules ("restricted security"). Acquisition date represents the day on which an enforceable right to acquire such security is obtained and is presented along with related cost in the security description. The Fund has registration rights for certain restricted securities. Any costs related to such registration are borne by the issuer. The aggregate value of restricted securities (excluding 144A holdings) at December 31, 2021 amounts to approximately $13,132,000 and represents 1.3% of net assets.
(d) At December 31, 2021, the Fund held fair valued securities valued at approximately $9,175,000, representing 0.9% of net assets. These securities have been fair valued as determined in good faith under procedures established by and under the general supervision of the Company's (as defined herein) Directors.
(e) Securities are available for collateral in connection with purchased options.
(f) At December 31, 2021, the aggregate cost for federal income tax purposes is approximately $773,429,000. The aggregate gross unrealized appreciation is approximately $324,858,000 and the aggregate gross unrealized depreciation is approximately $90,503,000, resulting in net unrealized appreciation of approximately $234,355,000.
ADR American Depositary Receipt.
Call Options Purchased:
The Fund had the following call options purchased open at December 31, 2021:
Counterparty | | Description | | Strike
Price | | Expiration
Date | | Number of
Contracts | | Notional
Amount
(000) | | Value
(000) | | Premiums
Paid
(000) | | Unrealized
Depreciation
(000) | |
BNP Paribas | | USD/CNH | | CNH | 7.45 | | | Jan-22 | | | 212,955,750 | | | $ | 212,956 | | | $ | — | @ | | $ | 1,137 | | | $ | (1,137 | ) | |
Goldman Sachs International | | USD/CNH | | CNH | 7.27 | | | Nov-22 | | | 255,980,426 | | | | 255,980 | | | | 773 | | | | 1,229 | | | | (456 | ) | |
Goldman Sachs International | | USD/CNH | | CNH | 7.57 | | | Mar-22 | | | 207,385,996 | | | | 207,386 | | | | 10 | | | | 1,030 | | | | (1,020 | ) | |
JP Morgan Chase Bank NA | | USD/CNH | | CNH | 7.28 | | | Jul-22 | | | 250,959,503 | | | | 250,960 | | | | 313 | | | | 1,169 | | | | (856 | ) | |
JP Morgan Chase Bank NA | | USD/CNH | | CNH | 7.31 | | | Aug-22 | | | 117,162,448 | | | | 117,162 | | | | 158 | | | | 796 | | | | (638 | ) | |
JP Morgan Chase Bank NA | | USD/CNH | | CNH | 7.38 | | | Jul-22 | | | 72,806,938 | | | | 72,807 | | | | 81 | | | | 386 | | | | (305 | ) | |
| | | | | | | | | | | | | $ | 1,335 | | | $ | 5,747 | | | $ | (4,412 | ) | |
@ Value is less than $500.
CNH — Chinese Yuan Renminbi Offshore
USD — United States Dollar
The accompanying notes are an integral part of the consolidated financial statements.
6
Morgan Stanley Variable Insurance Fund, Inc.
Annual Report – December 31, 2021
Consolidated Portfolio of Investments (cont'd)
Growth Portfolio
Portfolio Composition*
Classification | | Percentage of
Total Investments | |
Information Technology Services | | | 31.9 | % | |
Other** | | | 22.8 | | |
Software | | | 18.3 | | |
Internet & Direct Marketing Retail | | | 9.6 | | |
Interactive Media & Services | | | 9.0 | | |
Entertainment | | | 8.4 | | |
Total Investments | | | 100.0 | % | |
* Percentages indicated are based upon total investments (excluding Securities held as Collateral on Loaned Securities) as of December 31, 2021.
** Industries and/or investment types representing less than 5% of total investments.
The accompanying notes are an integral part of the consolidated financial statements.
7
Morgan Stanley Variable Insurance Fund, Inc.
Annual Report – December 31, 2021
Consolidated Statement of Assets and Liabilities | | December 31, 2021
(000) | |
Assets: | |
Investments in Securities of Unaffiliated Issuers, at Value(1) (Cost $734,942) | | $ | 973,887 | | |
Investment in Security of Affiliated Issuer, at Value (Cost $33,895) | | | 33,895 | | |
Total Investments in Securities, at Value (Cost $768,837) | | | 1,007,782 | | |
Foreign Currency, at Value (Cost $1) | | | 1 | | |
Cash from Securities Lending | | | 3 | | |
Receivable for Investments Sold | | | 2,877 | | |
Receivable for Fund Shares Sold | | | 1,088 | | |
Receivable from Securities Lending Income | | | 15 | | |
Receivable from Affiliate | | | — | @ | |
Other Assets | | | 41 | | |
Total Assets | | | 1,011,807 | | |
Liabilities: | |
Collateral on Securities Loaned, at Value | | | 2,430 | | |
Due to Broker | | | 1,550 | | |
Payable for Advisory Fees | | | 894 | | |
Payable for Fund Shares Redeemed | | | 877 | | |
Payable for Servicing Fees | | | 484 | | |
Payable for Investments Purchased | | | 183 | | |
Payable for Distribution Fees — Class II Shares | | | 78 | | |
Payable for Administration Fees | | | 70 | | |
Payable for Professional Fees | | | 53 | | |
Payable for Custodian Fees | | | 32 | | |
Payable for Directors' Fees and Expenses | | | 10 | | |
Payable for Organization Costs for Subsidiary | | | 6 | | |
Payable for Transfer Agency Fees | | | 3 | | |
Other Liabilities | | | 57 | | |
Total Liabilities | | | 6,727 | | |
NET ASSETS | | $ | 1,005,080 | | |
Net Assets Consist of: | |
Paid-in-Capital | | $ | 489,242 | | |
Total Distributable Earnings | | | 515,838 | | |
Net Assets | | $ | 1,005,080 | | |
CLASS I: | |
Net Assets | | $ | 645,473 | | |
Net Asset Value, Offering and Redemption Price Per Share Applicable to 12,015,304 Outstanding
$0.001 Par Value Shares (Authorized 500,000,000 Shares) | | $ | 53.72 | | |
CLASS II: | |
Net Assets | | $ | 359,607 | | |
Net Asset Value, Offering and Redemption Price Per Share Applicable to 7,426,451 Outstanding
$0.001 Par Value Shares (Authorized 500,000,000 Shares) | | $ | 48.42 | | |
(1) Including: | |
Securities on Loan, at Value: | | $ | 2,183 | | |
@ Amount is less than $500.
The accompanying notes are an integral part of the consolidated financial statements.
8
Morgan Stanley Variable Insurance Fund, Inc.
Annual Report – December 31, 2021
Consolidated Statement of Operations | | Year Ended
December 31, 2021
(000) | |
Investment Income: | |
Dividends from Securities of Unaffiliated Issuers | | $ | 514 | | |
Income from Securities Loaned — Net | | | 18 | | |
Dividends from Security of Affiliated Issuer (Note H) | | | 4 | | |
Total Investment Income | | | 536 | | |
Expenses: | |
Advisory Fees (Note B) | | | 5,618 | | |
Servicing Fees (Note D) | | | 1,551 | | |
Distribution Fees — Class II Shares (Note E) | | | 980 | | |
Administration Fees (Note C) | | | 910 | | |
Professional Fees | | | 162 | | |
Custodian Fees (Note G) | | | 47 | | |
Shareholder Reporting Fees | | | 35 | | |
Directors' Fees and Expenses | | | 16 | | |
Transfer Agency Fees (Note F) | | | 14 | | |
Organization Costs for Subsidiary | | | 8 | | |
Pricing Fees | | | 4 | | |
Other Expenses | | | 35 | | |
Total Expenses | | | 9,380 | | |
Waiver of Advisory Fees (Note B) | | | (1,917 | ) | |
Rebate from Morgan Stanley Affiliate (Note H) | | | (15 | ) | |
Net Expenses | | | 7,448 | | |
Net Investment Loss | | | (6,912 | ) | |
Realized Gain (Loss): | |
Investments Sold | | | 291,431 | | |
Foreign Currency Translation | | | (1 | ) | |
Net Realized Gain | | | 291,430 | | |
Change in Unrealized Appreciation (Depreciation): | |
Investments | | | (275,645 | ) | |
Foreign Currency Translation | | | — | @ | |
Net Change in Unrealized Appreciation (Depreciation) | | | (275,645 | ) | |
Net Realized Gain and Change in Unrealized Appreciation (Depreciation) | | | 15,785 | | |
Net Increase in Net Assets Resulting from Operations | | $ | 8,873 | | |
@ Amount is less than $500.
The accompanying notes are an integral part of the consolidated financial statements.
9
Morgan Stanley Variable Insurance Fund, Inc.
Annual Report – December 31, 2021
Consolidated Statements of Changes in Net Assets | | Year Ended
December 31,
2021
(000) | | Year Ended
December 31,
2020*
(000) | |
Increase (Decrease) in Net Assets: | |
Operations: | |
Net Investment Loss | | $ | (6,912 | ) | | $ | (5,363 | ) | |
Net Realized Gain | | | 291,430 | | | | 289,160 | | |
Net Change in Unrealized Appreciation (Depreciation) | | | (275,645 | ) | | | 368,104 | | |
Net Increase in Net Assets Resulting from Operations | | | 8,873 | | | | 651,901 | | |
Dividends and Distributions to Shareholders: | |
Class I | | | (182,572 | ) | | | (56,486 | ) | |
Class II | | | (102,441 | ) | | | (33,542 | ) | |
Total Dividends and Distributions to Shareholders | | | (285,013 | ) | | | (90,028 | ) | |
Capital Share Transactions:(1) | |
Class I: | |
Subscribed | | | 36,428 | | | | 19,685 | | |
Distributions Reinvested | | | 182,572 | | | | 56,486 | | |
Redeemed | | | (134,771 | ) | | | (89,600 | ) | |
Class II: | |
Subscribed | | | 119,731 | | | | 78,680 | | |
Distributions Reinvested | | | 102,441 | | | | 33,542 | | |
Redeemed | | | (150,916 | ) | | | (135,411 | ) | |
Net Increase (Decrease) in Net Assets Resulting from Capital Share Transactions | | | 155,485 | | | | (36,618 | ) | |
Total Increase (Decrease) in Net Assets | | | (120,655 | ) | | | 525,255 | | |
Net Assets: | |
Beginning of Period | | | 1,125,735 | | | | 600,480 | | |
End of Period | | $ | 1,005,080 | | | $ | 1,125,735 | | |
(1) Capital Share Transactions: | |
Class I: | |
Shares Subscribed | | | 535 | | | | 388 | | |
Shares Issued on Distributions Reinvested | | | 3,013 | | | | 1,087 | | |
Shares Redeemed | | | (2,028 | ) | | | (1,783 | ) | |
Net Increase (Decrease) in Class I Shares Outstanding | | | 1,520 | | | | (308 | ) | |
Class II: | |
Shares Subscribed | | | 2,052 | | | | 1,646 | | |
Shares Issued on Distributions Reinvested | | | 1,873 | | | | 696 | | |
Shares Redeemed | | | (2,469 | ) | | | (2,753 | ) | |
Net Increase (Decrease) in Class II Shares Outstanding | | | 1,456 | | | | (411 | ) | |
* Not consolidated.
The accompanying notes are an integral part of the consolidated financial statements.
10
Morgan Stanley Variable Insurance Fund, Inc.
Annual Report – December 31, 2021
Consolidated Financial Highlights
Growth Portfolio
| | | Class I | |
| | | Year Ended December 31, | |
Selected Per Share Data and Ratios | | 2021 | | 2020(1) | | 2019(1) | | 2018(1) | | 2017(1) | |
Net Asset Value, Beginning of Period | | $ | 70.24 | | | $ | 35.80 | | | $ | 28.62 | | | $ | 32.38 | | | $ | 24.65 | | |
Income (Loss) from Investment Operations: | |
Net Investment Loss(2) | | | (0.35 | ) | | | (0.28 | ) | | | (0.14 | ) | | | (0.14 | ) | | | (0.13 | ) | |
Net Realized and Unrealized Gain (Loss) | | | 2.53 | | | | 40.32 | | | | 9.23 | | | | 3.34 | | | | 10.44 | | |
Total from Investment Operations | | | 2.18 | | | | 40.04 | | | | 9.09 | | | | 3.20 | | | | 10.31 | | |
Distributions from and/or in Excess of: | |
Net Realized Gain | | | (18.70 | ) | | | (5.60 | ) | | | (1.91 | ) | | | (6.96 | ) | | | (2.58 | ) | |
Net Asset Value, End of Period | | $ | 53.72 | | | $ | 70.24 | | | $ | 35.80 | | | $ | 28.62 | | | $ | 32.38 | | |
Total Return(3) | | | 0.10 | % | | | 117.31 | % | | | 31.81 | % | | | 7.54 | % | | | 43.15 | % | |
Ratios to Average Net Assets and Supplemental Data: | |
Net Assets, End of Period (Thousands) | | $ | 645,473 | | | $ | 737,155 | | | $ | 386,720 | | | $ | 126,941 | | | $ | 133,745 | | |
Ratio of Expenses Before Expense Limitation | | | 0.74 | % | | | 0.74 | % | | | 0.78 | % | | | N/A | | | | 0.81 | % | |
Ratio of Expenses After Expense Limitation | | | 0.57 | %(4) | | | 0.56 | %(4) | | | 0.61 | %(4)(5) | | | 0.79 | %(4) | | | 0.79 | %(4) | |
Ratio of Net Investment Loss | | | (0.52 | )%(4) | | | (0.55 | )%(4) | | | (0.41 | )%(4) | | | (0.39 | )%(4) | | | (0.43 | )%(4) | |
Ratio of Rebate from Morgan Stanley Affiliates | | | 0.00 | %(6) | | | 0.01 | % | | | 0.01 | % | | | 0.00 | %(6) | | | 0.01 | % | |
Portfolio Turnover Rate | | | 59 | % | | | 55 | % | | | 95 | % | | | 56 | % | | | 54 | % | |
(1) Not consolidated.
(2) Per share amount is based on average shares outstanding.
(3) Calculated based on the net asset value as of the last business day of the period. Performance does not reflect fees and expenses imposed by your insurance company's separate account. If performance information included the effect of these additional charges, the total return would be lower.
(4) The Ratio of Expenses After Expense Limitation and Ratio of Net Investment Loss reflect the rebate of certain Fund expenses in connection with the investments in Morgan Stanley affiliates during the period. The effect of the rebate on the ratios is disclosed in the above table as "Ratio of Rebate from Morgan Stanley Affiliates."
(5) Effective April 29, 2019, the Adviser has agreed to limit the ratio of expenses to average net assets to the maximum ratio of 0.57% for Class I shares. Prior to April 29, 2019, the maximum ratio was 0.80% for Class I shares.
(6) Amount is less than 0.005%.
The accompanying notes are an integral part of the consolidated financial statements.
11
Morgan Stanley Variable Insurance Fund, Inc.
Annual Report – December 31, 2021
Consolidated Financial Highlights
Growth Portfolio
| | | Class II | |
| | | Year Ended December 31, | |
Selected Per Share Data and Ratios | | 2021 | | 2020(1) | | 2019(1) | | 2018(1) | | 2017(1) | |
Net Asset Value, Beginning of Period | | $ | 65.09 | | | $ | 33.51 | | | $ | 26.95 | | | $ | 30.89 | | | $ | 23.66 | | |
Income (Loss) from Investment Operations: | |
Net Investment Loss(2) | | | (0.46 | ) | | | (0.38 | ) | | | (0.21 | ) | | | (0.21 | ) | | | (0.19 | ) | |
Net Realized and Unrealized Gain (Loss) | | | 2.49 | | | | 37.56 | | | | 8.68 | | | | 3.23 | | | | 10.00 | | |
Total from Investment Operations | | | 2.03 | | | | 37.18 | | | | 8.47 | | | | 3.02 | | | | 9.81 | | |
Distributions from and/or in Excess of: | |
Net Realized Gain | | | (18.70 | ) | | | (5.60 | ) | | | (1.91 | ) | | | (6.96 | ) | | | (2.58 | ) | |
Net Asset Value, End of Period | | $ | 48.42 | | | $ | 65.09 | | | $ | 33.51 | | | $ | 26.95 | | | $ | 30.89 | | |
Total Return(3) | | | (0.15 | )% | | | 116.76 | % | | | 31.47 | % | | | 7.30 | % | | | 42.82 | % | |
Ratios to Average Net Assets and Supplemental Data: | |
Net Assets, End of Period (Thousands) | | $ | 359,607 | | | $ | 388,580 | | | $ | 213,760 | | | $ | 139,300 | | | $ | 124,268 | | |
Ratio of Expenses Before Expense Limitation | | | 0.99 | % | | | 0.99 | % | | | 1.03 | % | | | N/A | | | | 1.06 | % | |
Ratio of Expenses After Expense Limitation | | | 0.82 | %(4) | | | 0.81 | %(4) | | | 0.86 | %(4)(5) | | | 1.04 | %(4) | | | 1.04 | %(4) | |
Ratio of Net Investment Loss | | | (0.77 | )%(4) | | | (0.80 | )%(4) | | | (0.66 | )%(4) | | | (0.64 | )%(4) | | | (0.68 | )%(4) | |
Ratio of Rebate from Morgan Stanley Affiliates | | | 0.00 | %(6) | | | 0.01 | % | | | 0.01 | % | | | 0.00 | %(6) | | | 0.01 | % | |
Portfolio Turnover Rate | | | 59 | % | | | 55 | % | | | 95 | % | | | 56 | % | | | 54 | % | |
(1) Not consolidated.
(2) Per share amount is based on average shares outstanding.
(3) Calculated based on the net asset value as of the last business day of the period. Performance does not reflect fees and expenses imposed by your insurance company's separate account. If performance information included the effect of these additional charges, the total return would be lower.
(4) The Ratio of Expenses After Expense Limitation and Ratio of Net Investment Loss reflect the rebate of certain Fund expenses in connection with the investments in Morgan Stanley affiliates during the period. The effect of the rebate on the ratios is disclosed in the above table as "Ratio of Rebate from Morgan Stanley Affiliates."
(5) Effective April 29, 2019, the Adviser has agreed to limit the ratio of expenses to average net assets to the maximum ratio of 0.82% for Class II shares. Prior to April 29, 2019, the maximum ratio was 1.05% for Class II shares.
(6) Amount is less than 0.005%.
The accompanying notes are an integral part of the consolidated financial statements.
12
Morgan Stanley Variable Insurance Fund, Inc.
Annual Report – December 31, 2021
Notes to Consolidated Financial Statements
Morgan Stanley Variable Insurance Fund, Inc. (the "Company") is registered under the Investment Company Act of 1940, as amended (the "Act"), as an open-end management investment company. The Company is comprised of ten separate active, diversified and non-diversified funds (individually referred to as a "Fund," collectively as the "Funds"). The Company applies investment company accounting and reporting guidance.
The accompanying consolidated financial statements relate to the Growth Portfolio. The Fund seeks long-term capital appreciation by investing primarily in growth-oriented equity securities of large capitalization companies. The Fund offers two classes of shares — Class I and Class II. Both classes of shares have identical voting rights (except that shareholders of a Class have exclusive voting rights regarding any matter relating solely to that Class of shares), dividend, liquidation and other rights. Effective May 21, 2021, the Fund suspended offering of Class I and Class II shares to new investors.
The Company is intended to be a funding vehicle for variable annuity contracts and variable life insurance policies offered by the separate accounts of certain life insurance companies.
A. Significant Accounting Policies: The following significant accounting policies are in conformity with U.S. generally accepted accounting principles ("GAAP"). Such policies are consistently followed by the Company in the preparation of its consolidated financial statements. GAAP may require management to make estimates and assumptions that affect the reported amounts and disclosures in the consolidated financial statements. Actual results may differ from those estimates.
The Fund may, consistent with its principal investment strategies, invest up to 25% of its total assets in a wholly-owned subsidiary of the Fund organized as a company under the laws of the Cayman Islands, VIF Growth Cayman Portfolio, Ltd. (the "Subsidiary"). The Subsidiary may invest in bitcoin indirectly through cash settled futures or indirectly through investments in Grayscale Bitcoin Trust (BTC) ("GBTC"), a privately offered investment vehicle that invests in bitcoin. The Fund is the sole shareholder of the Subsidiary, and it is not currently expected that shares of the Subsidiary will be sold or offered to other investors. The consolidated portfolio of investments and consolidated financial statements include the positions and accounts of the Fund and the Subsidiary. All intercompany accounts and transactions of the Fund and the Subsidiary have been eliminated in consolidation and all accounting policies of the Subsidiary are consistent with those of the Fund. As of December 31, 2021, the Subsidiary represented approximately $9,367,000 or approximately 0.93% of the total net assets of the Fund.
Investments in the Subsidiary are expected to provide the Fund with exposure to bitcoin within the limitations of Subchapter M of the Code and recent Internal Revenue Service ("IRS") revenue rulings, which require that a mutual fund receive no more than ten percent of its gross income from such investments in order to receive favorable tax treatment as a regulated investment company ("RIC"). Tax treatment of the income received from the Subsidiary may potentially be affected by changes in legislation, regulations or other legally binding authority, which could affect the character, timing and amount of the Fund's taxable income and distributions. If such changes occur, the Fund may need to significantly change its investment strategy and recognize unrealized gains in order to remain qualified for taxation as a RIC, which could adversely affect the Fund.
1. Security Valuation: (1) An equity portfolio security listed or traded on an exchange is valued at its latest reported sales price (or at the exchange official closing price if such exchange reports an official closing price), and if there were no sales on a given day and if there is no official exchange closing price for that day, the security is valued at the mean between the last reported bid and asked prices if such bid and asked prices are available on the relevant exchanges. If only bid prices are available then the latest bid price may be used. Listed equity securities not traded on the valuation date with no reported bid and asked prices available on the exchange are valued at the mean between the current bid and asked prices obtained from one or more reputable brokers or dealers. In cases where a security is traded on more than one exchange, the security is valued on the exchange designated as the primary market; (2) all other equity portfolio securities for which over-the-counter ("OTC") market quotations are readily available are valued at the latest reported sales price (or at the market official closing price if such market reports an official closing price), and if there was no trading in the security on a given day and if there is no official closing price from relevant markets for that day, the security is valued at the mean between the last reported bid and asked prices if such bid and asked prices are available on the relevant markets. An unlisted equity security that does not trade on the valuation date and for which bid and asked prices from the relevant markets are unavailable is valued at the mean between the current bid and asked prices obtained from one or more reputable brokers or dealers; (3) listed options are valued at the last reported sales price on the exchange on which they are listed (or at the exchange official closing price if such exchange reports an official closing price). If an official closing price or last reported sales price is unavailable, the
13
Morgan Stanley Variable Insurance Fund, Inc.
Annual Report – December 31, 2021
Notes to Consolidated Financial Statements (cont'd)
listed option should be fair valued at the mean between its latest bid and ask prices. Unlisted options are valued at the mean between their latest bid and ask prices from a broker/dealer or valued by a pricing service/vendor; (4) certain portfolio securities may be valued by an outside pricing service/vendor approved by the Company's Board of Directors (the "Directors"). The pricing service/vendor may employ a pricing model that takes into account, among other things, bids, yield spreads and/or other market data and specific security characteristics. Alternatively, if a valuation is not available from an outside pricing service/vendor, and the security trades on an exchange, the security may be valued at its latest reported sale price (or at the exchange official closing price if such exchange reports an official closing price), prior to the time when assets are valued. If there are no sales on a given day and if there is no official exchange closing price for that day, the security is valued at the mean between the last reported bid and asked prices if such bid and asked prices are available in the relevant exchanges. If only bid prices are available then the latest bid price may be used. If Morgan Stanley Investment Management Inc. (the "Adviser"), a wholly-owned subsidiary of Morgan Stanley, determines that the price provided by the outside pricing service/vendor or exchange does not reflect the security's fair value or is unable to provide a price, prices from brokers or dealers may also be utilized. In these circumstances, the value of the security will be the mean of bid and asked prices obtained from brokers or dealers; (5) when market quotations are not readily available, including circumstances under which the Adviser determines that the closing price, last sale price or the mean between the last reported bid and asked prices are not reflective of a security's market value, portfolio securities are valued at their fair value as determined in good faith under procedures established by and under the general supervision of the Directors. Occasionally, developments affecting the closing prices of securities and other assets may occur between the times at which valuations of such securities are determined (that is, close of the foreign market on which the securities trade) and the close of business of the New York Stock Exchange ("NYSE"). If developments occur during such periods that are expected to materially affect the value of such securities, such valuations may be adjusted to reflect the estimated fair value of such securities as of the close of the NYSE, as determined in good faith by the Directors or by the Adviser using a pricing service and/or procedures approved by the Directors; (6) quotations of foreign portfolio securities, other assets and liabilities and forward contracts stated in foreign currency are translated into U.S. dollar
equivalents at the prevailing market rates prior to the close of the NYSE; (7) Private Investment in Public Equity ("PIPE") investments may be valued based on the underlying stock price less a discount until the commitment is fulfilled and shares are registered; and (8) investments in mutual funds, including the Morgan Stanley Institutional Liquidity Funds, are valued at the net asset value ("NAV") as of the close of each business day.
The Directors have responsibility for determining in good faith the fair value of the investments, and the Directors may appoint others, such as the Company's Adviser or a valuation committee, to assist the Directors in determining fair value and to make the actual calculations pursuant to the fair valuation methodologies previously approved by the Directors. Under procedures approved by the Directors, the Company's Adviser has formed a Valuation Committee whose members are approved by the Directors. The Valuation Committee provides administration and oversight of the Company's valuation policies and procedures, which are reviewed at least annually by the Directors. These procedures allow the Company to utilize independent pricing services, quotations from securities and financial instrument dealers and other market sources to determine fair value.
2. Fair Value Measurement: Financial Accounting Standards Board ("FASB") Accounting Standards CodificationTM ("ASC") 820, "Fair Value Measurement" ("ASC 820"), defines fair value as the value that the Fund would receive to sell an investment or pay to transfer a liability in a timely transaction with an independent buyer in the principal market, or in the absence of a principal market, the most advantageous market for the investment or liability. ASC 820 establishes a three-tier hierarchy to distinguish between (1) inputs that reflect the assumptions market participants would use in valuing an asset or liability developed based on market data obtained from sources independent of the reporting entity (observable inputs) and (2) inputs that reflect the reporting entity's own assumptions about the assumptions market participants would use in valuing an asset or liability developed based on the best information available in the circumstances (unobservable inputs) and to establish classification of fair value measurements for disclosure purposes. Various inputs are used in determining the value of the Fund's investments. The inputs are summarized in the three broad levels listed below:
• Level 1 – unadjusted quoted prices in active markets for identical investments
14
Morgan Stanley Variable Insurance Fund, Inc.
Annual Report – December 31, 2021
Notes to Consolidated Financial Statements (cont'd)
• Level 2 – other significant observable inputs (including quoted prices for similar investments, interest rates, prepayment speeds, credit risk, etc.)
• Level 3 – significant unobservable inputs including the Fund's own assumptions in determining the fair value of investments. Factors considered in making this determination may include, but are not limited to, information obtained by contacting the issuer, analysts, or the appropriate stock exchange (for exchange-traded securities), analysis of the issuer's financial statements or other available documents and, if necessary, available information concerning other securities in similar circumstances.
The inputs or methodology used for valuing securities are not necessarily an indication of the risk associated with investing in those securities and the determination of the significance of a particular input to the fair value measurement in its entirety requires judgment and considers factors specific to each security.
The following is a summary of the inputs used to value the Fund's investments as of December 31, 2021:
Investment Type | | Level 1
Unadjusted
quoted
prices
(000) | | Level 2
Other
significant
observable
inputs
(000) | | Level 3
Significant
unobservable
inputs
(000) | | Total
(000) | |
Assets: | |
Common Stocks | |
Automobiles | | $ | 6,351 | | | $ | — | | | $ | — | | | $ | 6,351 | | |
Biotechnology | | | 7,858 | | | | — | | | | — | | | | 7,858 | | |
Capital Markets | | | 9,699 | | | | — | | | | — | | | | 9,699 | | |
Entertainment | | | 84,642 | | | | — | | | | — | | | | 84,642 | | |
Health Care
Equipment &
Supplies | | | 4,785 | | | | — | | | | — | | | | 4,785 | | |
Health Care
Providers &
Services | | | 21,863 | | | | — | | | | — | | | | 21,863 | | |
Health Care Technology | | | 34,561 | | | | — | | | | — | | | | 34,561 | | |
Hotels, Restaurants &
Leisure | | | 24,190 | | | | — | | | | — | | | | 24,190 | | |
Information Technology
Services | | | 320,583 | | | | — | | | | — | | | | 320,583 | | |
Interactive Media &
Services | | | 90,457 | | | | — | | | | — | | | | 90,457 | | |
Internet & Direct
Marketing Retail | | | 96,495 | | | | — | | | | — | | | | 96,495 | | |
Life Sciences Tools &
Services | | | 10,648 | | | | — | | | | — | | | | 10,648 | | |
Pharmaceuticals | | | 29,882 | | | | — | | | | — | | | | 29,882 | | |
Real Estate
Management &
Development | | | 16,298 | | | | — | | | | — | | | | 16,298 | | |
Software | | | 170,006 | | | | 3,957 | | | | — | | | | 173,963 | | |
Investment Type | | Level 1
Unadjusted
quoted
prices
(000) | | Level 2
Other
significant
observable
inputs
(000) | | Level 3
Significant
unobservable
inputs
(000) | | Total
(000) | |
Common Stocks (Cont'd) | |
Specialty Retail | | $ | 21,749 | | | $ | — | | | $ | — | | | $ | 21,749 | | |
Total Common Stocks | | | 950,067 | | | | 3,957 | | | | — | | | | 954,024 | | |
Preferred Stocks | |
Electronic Equipment,
Instruments &
Components | | | — | | | | — | | | | — | † | | | — | † | |
Software | | | — | | | | — | | | | 9,175 | | | | 9,175 | | |
Total Preferred Stocks | | | — | | | | — | | | | 9,175 | † | | | 9,175 | † | |
Investment Company | | | 8,965 | | | | — | | | | — | | | | 8,965 | | |
Call Options Purchased | | | — | | | | 1,335 | | | | — | | | | 1,335 | | |
Short-Term Investments | |
Investment Company | | | 33,895 | | | | — | | | | — | | | | 33,895 | | |
Repurchase Agreements | | | — | | | | 388 | | | | — | | | | 388 | | |
Total Short-Term
Investments | | | 33,895 | | | | 388 | | | | — | | | | 34,283 | | |
Total Assets | | $ | 992,927 | | | $ | 5,680 | | | $ | 9,175 | † | | $ | 1,007,782 | † | |
† Includes a security valued at zero.
Transfers between investment levels may occur as the markets fluctuate and/or the availability of data used in an investment's valuation changes.
Following is a reconciliation of investments in which significant unobservable inputs (Level 3) were used in determining fair value:
| | | Common
Stock
(000) | | Preferred
Stocks
(000) | |
Beginning Balance | | $ | 1,982 | | | $ | 439 | † | |
Purchases | | | — | | | | 8,310 | | |
Sales | | | — | | | | — | | |
Amortization of discount | | | — | | | | — | | |
Transfers in | | | — | | | | — | | |
Transfers out | | | (1,982 | )†† | | | — | | |
Corporate actions | | | — | | | | — | | |
Change in unrealized
appreciation (depreciation) | | | — | | | | 426 | | |
Realized gains (losses) | | | — | | | | — | | |
Ending Balance | | $ | — | | | $ | 9,175 | † | |
Net change in unrealized appreciation
(depreciation) from investments still
held as of December 31, 2021 | | $ | — | | | $ | 426 | | |
† Includes a security valued at zero.
†† A security transferred out of level 3 due to an Initial Public Offering.
15
Morgan Stanley Variable Insurance Fund, Inc.
Annual Report – December 31, 2021
Notes to Consolidated Financial Statements (cont'd)
The following table presents additional information about valuation techniques and inputs used for investments that are measured at fair value and categorized within Level 3 as of December 31, 2021. Various valuation techniques were used in the valuation of certain investments and weighted based on the level of significance. The Fund calculated the weighted averages of the unobservable inputs relative to each investment's fair value as of December 31, 2021.
| | | Fair Value at
December 31, 2021
(000) | | Valuation
Technique | | Unobservable
Input | | Amount or Range/
Weighted Average* | | Impact to
Valuation from an
Increase in Input** | |
Preferred Stocks | | $ | 9,175 | | | Market Transaction
Method | | Precedent Transaction | | $ | 220.45 | | | Increase | |
| | | | | Discounted Cash Flow | | Weighted Average
Cost of Capital | | | 10.0%–13.5%/11.1% | | | Decrease | |
| | | | | | Perpetual Growth Rate | | | 3.0%–4.0%/3.5% | | | Increase | |
| | | | | Market Comparable
Companies | | Enterprise Value/
Revenue | | | 2.3x–49.7x/36.3x | | | Increase | |
| | | | | | | Discount for Lack of
Marketability | | | 12.0%–13.0%/12.1% | | | Decrease | |
* Amount is indicative of the weighted average.
** Represents the expected directional change in the fair value of the Level 3 investments that would result from an increase in the corresponding input. A decrease to the unobservable input would have the opposite effect. Significant changes in these inputs could result in significantly higher or lower fair value measurements.
3. Repurchase Agreements: The Fund may enter into repurchase agreements under which the Fund lends cash and takes possession of securities with an agreement that the counterparty will repurchase such securities. In connection with transactions in repurchase agreements, a bank as custodian for the Fund takes possession of the underlying securities which are held as collateral, with a market value at least equal to the amount of the repurchase transaction, including principal and accrued interest. To the extent that any repurchase transaction exceeds one business day, the value of the collateral is marked-to-market on a daily basis to determine that the value of the collateral does not decrease below the repurchase price plus accrued interest as earned. If such a decrease occurs, additional collateral will be requested and, when received, will be added to the account to maintain full collateralization. In the event of default on the obligation to repurchase, the Fund has the right to liquidate the collateral and apply the proceeds in satisfaction of the obligation. In the event of default or bankruptcy by the counterparty to the agreement, realization of the collateral proceeds may be subject to cost and delays. The Fund, along with other affiliated investment companies, may utilize a joint trading account for the purpose of entering into repurchase agreements.
4. Foreign Currency Translation and Foreign Investments: The books and records of the Fund are maintained in U.S. dollars. Foreign currency amounts are translated into U.S. dollars as follows:
— investments, other assets and liabilities at the prevailing rate of exchange on the valuation date;
— investment transactions and investment income at the prevailing rates of exchange on the dates of such transactions.
Although the net assets of the Fund are presented at the foreign exchange rates and market values at the close of the period, the Fund does not isolate that portion of the results of operations arising as a result of changes in the foreign exchange rates from the fluctuations arising from changes in the market prices of securities held at period end. Similarly, the Fund does not isolate the effect of changes in foreign exchange rates from the fluctuations arising from changes in the market prices of securities sold during the period. Accordingly, realized and unrealized foreign currency gains (losses) on investments in securities are included in the reported net realized and unrealized gains (losses) on investment transactions and balances. However, pursuant to U.S. federal income tax regulations, gains and losses from certain foreign currency transactions and the foreign currency portion of gains and losses realized on sales and maturities of foreign
16
Morgan Stanley Variable Insurance Fund, Inc.
Annual Report – December 31, 2021
Notes to Consolidated Financial Statements (cont'd)
denominated debt securities are treated as ordinary income for U.S. federal income tax purposes.
Net realized gains (losses) on foreign currency transactions represent net foreign exchange gains (losses) from foreign currency forward exchange contracts, disposition of foreign currencies, currency gains (losses) realized between the trade and settlement dates on securities transactions, and the difference between the amount of investment income and foreign withholding taxes recorded on the Fund's books and the U.S. dollar equivalent amounts actually received or paid. The change in unrealized currency gains (losses) on foreign currency transactions for the period is reflected in the Consolidated Statement of Operations.
Foreign security and currency transactions may involve certain considerations and risks not typically associated with those of U.S. dollar denominated transactions as a result of, among other factors, fluctuations of exchange rates in relation to the U.S. dollar, the possibility of lower levels of governmental supervision and regulation of foreign securities markets and the possibility of political or economic instability.
Governmental approval for foreign investments may be required in advance of making an investment under certain circumstances in some countries, and the extent of foreign investments in domestic companies may be subject to limitation in other countries. Foreign ownership limitations also may be imposed by the charters of individual companies to prevent, among other concerns, violations of foreign investment limitations. As a result, an additional class of shares (identified as "Foreign" in the Consolidated Portfolio of Investments) may be created and offered for investment. The "local" and "foreign shares" market values may differ. In the absence of trading of the foreign shares in such markets, the Fund values the foreign shares at the closing exchange price of the local shares.
5. Derivatives: The Fund may, but is not required to, use derivative instruments for a variety of purposes, including hedging, risk management, portfolio management or to earn income. Derivatives are financial instruments whose value is based, in part, on the value of an underlying asset, interest rate, index or financial instrument. Prevailing interest rates and volatility levels, among other things, also affect the value of derivative instruments. A derivative instrument often has risks similar to its underlying asset and may have additional risks, including imperfect correlation between the value of the derivative and the underlying asset, risks of default by the counterparty to
certain transactions, magnification of losses incurred due to changes in the market value of the securities, instruments, indices or interest rates to which the derivative instrument relates, risks that the transactions may not be liquid and risks arising from margin requirements. The use of derivatives involves risks that are different from, and possibly greater than, the risks associated with other portfolio investments. Derivatives may involve the use of highly specialized instruments that require investment techniques and risk analyses different from those associated with other portfolio investments. All of the Fund's holdings, including derivative instruments, are marked-to-market each day with the change in value reflected in unrealized appreciation (depreciation). Upon disposition, a realized gain or loss is recognized.
Certain derivative transactions may give rise to a form of leverage. Leverage magnifies the potential for gain and the risk of loss. Leverage associated with derivative transactions may cause the Fund to liquidate portfolio positions when it may not be advantageous to do so to satisfy its obligations or to meet earmarking or segregation requirements, pursuant to applicable Securities and Exchange Commission ("SEC") rules and regulations, or may cause the Fund to be more volatile than if the Fund had not been leveraged. Although the Adviser seeks to use derivatives to further the Fund's investment objectives, there is no assurance that the use of derivatives will achieve this result.
Following is a description of the derivative instruments and techniques that the Fund used during the period and their associated risks:
Options: With respect to options, the Fund is subject to equity risk, interest rate risk and foreign currency exchange risk in the normal course of pursuing its investment objectives. If the Fund buys an option, it buys a legal contract giving it the right to buy or sell a specific amount of the underlying instrument or foreign currency, or futures contract on the underlying instrument or foreign currency, at an agreed-upon price during a period of time or on a specified date typically in exchange for premiums paid by the Fund. The Fund may purchase and/or sell put and call options. Purchasing call options tends to increase the Fund's exposure to the underlying (or similar) instrument. Purchasing put options tends to decrease the Fund's exposure to the underlying (or similar) instrument. When entering into purchased option contracts, the Fund bears the risk of interest or exchange rates or securities prices moving unexpectedly, in which case, the Fund may not achieve the anticipated benefits of the
17
Morgan Stanley Variable Insurance Fund, Inc.
Annual Report – December 31, 2021
Notes to Consolidated Financial Statements (cont'd)
purchased option contracts; however the risk of loss is limited to the premium paid. Purchased options are reported as part of "Total Investments in Securities" in the Consolidated Statement of Assets and Liabilities. Premiums paid for purchasing options which expired are treated as realized losses. If the Fund sells an option, it sells to another party the right to buy from or sell to the Fund a specific amount of the underlying instrument or foreign currency, or futures contract on the underlying instrument or foreign currency, at an agreed-upon price during a period of time or on a specified date typically in exchange for a premium received by the Fund. When options are purchased OTC, the Fund bears the risk that the counterparty that wrote the option will be unable or unwilling to perform its obligations under the option contract. Options may also be illiquid and the Fund may have difficulty closing out its position. A decision as to whether, when and how to use options involves the exercise of skill and judgment and even a well-conceived option transaction may be unsuccessful because of market behavior or unexpected events. The prices of options can be highly volatile and the use of options can lower total returns.
Private Investment in Public Equity: The Fund may acquire equity securities of an issuer that are issued through a private investment in public equity transaction, including on a when-issued basis. PIPE transactions typically involve the purchase of securities directly from a publicly traded company or its affiliates in a private placement transaction, typically at a discount to the market price of the company's securities. The Fund's PIPE investment represents an unfunded subscription agreement in a private investment in public equity. The Fund will earmark or segregate cash or liquid assets or establish a segregated account on the Fund's books in which it will continually maintain cash or cash equivalents or other liquid portfolio securities equal in value to commitments to purchase securities on a forward commitment basis.
As of December 31, 2021, the Fund did not have any open PIPE contract.
FASB ASC 815, "Derivatives and Hedging" ("ASC 815"), is intended to improve financial reporting about derivative instruments by requiring enhanced disclosures to enable investors to better understand how and why the Fund uses derivative instruments, how these derivative instruments are accounted for and their effects on the Fund's financial position and results of operations.
The following table sets forth the fair value of the Fund's derivative contracts by primary risk exposure as of December 31, 2021:
| | | Asset Derivatives
Consolidated
Statement of Assets
and Liabilities
Location | | Primary Risk
Exposure | | Value
(000) | |
Purchased Options
| | Investments, at Value
(Purchased Options) | | Currency Risk | | $ | 1,335 | (a) | |
(a) Amounts are included in Investments in Securities in the Consolidated Statement of Assets and Liabilities.
The following tables set forth by primary risk exposure the Fund's realized gains (losses) and change in unrealized appreciation (depreciation) by type of derivative contract for the year ended December 31, 2021 in accordance with ASC 815:
Realized Gain (Loss) | |
Primary Risk Exposure | | Derivative
Type | | Value
(000) | |
Currency Risk
| | Investments
(Purchased Options) | | $ | (4,218 | )(b) | |
(b) Amounts are included in Realized Gain (Loss) on Investments Sold in the Consolidated Statement of Operations.
Change in Unrealized Appreciation (Depreciation) | |
Primary Risk Exposure | | Derivative
Type | | Value
(000) | |
Currency Risk
| | Investments
(Purchased Options) | | $ | (950 | )(c) | |
(c) Amounts are included in Change in Unrealized Appreciation (Depreciation) on Investments in the Consolidated Statement of Operations.
At December 31, 2021, the Fund's derivative assets and liabilities are as follows:
Gross Amounts of Assets and Liabilities Presented in the Consolidated Statement of Assets and Liabilities | |
Derivatives | | Assets(d)
(000) | | Liabilities(d)
(000) | |
Purchased Options | | $ | 1,335 | (a) | | $ | — | | |
(a) Amounts are included in Investments in Securities in the Consolidated Statement of Assets and Liabilities.
(d) Absent an event of default or early termination, OTC derivative assets and liabilities are presented gross and not offset in the Consolidated Statement of Assets and Liabilities.
The Fund typically enters into International Swaps and Derivatives Association, Inc. Master Agreements ("ISDA Master Agreements") or similar master agreements (collectively, "Master Agreements") with its contract counterparties for certain OTC derivatives in order to, among other things, reduce its credit risk to counterparties. ISDA Master Agreements include provisions for general obligations, representations, collateral and events of default or termination. Under an ISDA Master Agreement,
18
Morgan Stanley Variable Insurance Fund, Inc.
Annual Report – December 31, 2021
Notes to Consolidated Financial Statements (cont'd)
the Fund typically may offset with the counterparty certain OTC derivative financial instruments' payables and/or receivables with collateral held and/or posted and create one single net payment (close-out netting) in the event of default, termination and/or potential deterioration in the credit quality of the counterparty. Various Master Agreements govern the terms of certain transactions with counterparties, including transactions such as swap, forward, repurchase and reverse repurchase agreements. These Master Agreements typically attempt to reduce the counterparty risk associated with such transactions by specifying credit protection mechanisms and providing standardization that improves legal certainty. Cross-termination provisions under Master Agreements typically provide that a default in connection with one transaction between the Fund and a counterparty gives the non-defaulting party the right to terminate any other transactions in place with the defaulting party to create one single net payment due to/due from the defaulting party and may be a feature in certain Master Agreements. In the event the Fund exercises its right to terminate a Master Agreement after a counterparty experiences a termination event as defined in the Master Agreement, the return of collateral with market value in excess of the Fund's net liability may be delayed or denied.
The following table presents derivative financial instruments that are subject to enforceable netting arrangements as of December 31, 2021:
Gross Amounts Not Offset in the Consolidated Statement
of Assets and Liabilities | |
Counterparty | | Gross Asset
Derivatives
Presented
in the
Consolidated
Statement of
Assets and
Liabilities(a)
(000) | | Financial
Instrument
(000) | | Collateral
Received(e)
(000) | | Net
Amount
(not less
than $0)
(000) | |
BNP Paribas | | $ | — | @ | | $ | — | | | $ | (— | @) | | $ | 0 | | |
Goldman Sachs
International | | | 783 | | | | — | | | | (783 | ) | | | 0 | | |
JP Morgan Chase
Bank NA | | | 552 | | | | — | | | | (552 | ) | | | 0 | | |
Total | | $ | 1,335 | | | $ | — | | | $ | (1,335 | ) | | $ | 0 | | |
@ Value is less than $500.
(a) Amounts are included in Investments in Securities in the Consolidated Statement of Assets and Liabilities.
(e) In some instances, the actual collateral received may be more than the amount shown here due to overcollateralization.
For the year ended December 31, 2021, the approximate average monthly amount outstanding for each derivative type is as follows:
Purchased Options: | |
| Average monthly notional amount | | | 1,019,591,000 | | |
Derivative Contract — PIPE: | |
Average monthly notional amount | | $ | 3,173,000 | | |
6. Securities Lending: The Fund lends securities to qualified financial institutions, such as broker-dealers, to earn additional income. Any increase or decrease in the fair value of the securities loaned that might occur and any interest earned or dividends declared on those securities during the term of the loan would remain in the Fund. The Fund would receive cash or securities as collateral in an amount equal to or exceeding 100% of the current fair value of the loaned securities. The collateral is marked-to-market daily by State Street Bank and Trust Company ("State Street"), the securities lending agent, to ensure that a minimum of 100% collateral coverage is maintained.
Based on pre-established guidelines, the securities lending agent invests any cash collateral that is received in an affiliated money market portfolio and repurchase agreements. Securities lending income is generated from the earnings on the invested collateral and borrowing fees, less any rebates owed to the borrowers and compensation to the lending agent, and is recorded as "Income from Securities Loaned — Net" in the Fund's Consolidated Statement of Operations. Risks in securities lending transactions are that a borrower may not provide additional collateral when required or return the securities when due, and that the value of the short-term investments will be less than the amount of cash collateral plus any rebate that is required to be returned to the borrower.
The Fund has the right under the securities lending agreement to recover the securities from the borrower on demand.
19
Morgan Stanley Variable Insurance Fund, Inc.
Annual Report – December 31, 2021
Notes to Consolidated Financial Statements (cont'd)
The following table presents financial instruments that are subject to enforceable netting arrangements as of December 31, 2021:
Gross Amounts Not Offset in the Consolidated
Statement of Assets and Liabilities | |
Gross Asset
Amounts
Presented
in the
Consolidated
Statement of
Assets and
Liabilities
(000) | | Financial
Instrument
(000) | | Collateral
Received
(000) | | Net Amount
(not less
than $0)
(000) | |
| $ | 2,183 | (f) | | $ | — | | | $ | (2,183 | )(g)(h) | | $ | 0 | | |
(f) Represents market value of loaned securities at year end.
(g) The Fund received cash collateral of approximately $2,430,000, of which approximately $2,427,000 was subsequently invested in Repurchase Agreements and Morgan Stanley Institutional Liquidity Funds as reported in the Portfolio of Investments. As of December 31, 2021, there was uninvested cash of approximately $3,000, which is not reflected in the Consolidated Portfolio of Investments.
(h) The actual collateral received is greater than the amount shown here due to overcollateralization.
FASB ASC 860, "Transfers & Servicing: Repurchase-to-Maturity Transactions, Repurchase Financings, and Disclosures", is intended to provide increased transparency about the types of collateral pledged in securities lending transactions and other similar transactions that are accounted for as secured borrowing.
The following table displays a breakdown of transactions accounted for as secured borrowings, the gross obligations by class of collateral pledged and the remaining contractual maturity of those transactions as of December 31, 2021:
| | | Remaining Contractual Maturity of the Agreements | |
| | | Overnight and
Continuous
(000) | | <30 days
(000) | | Between
30 &
90 days
(000) | | >90 days
(000) | | Total
(000) | |
Securities Lending
Transactions | |
Common Stock | | $ | 2,430 | | | $ | — | | | $ | — | | | $ | — | | | $ | 2,430 | | |
Total Borrowings | | $ | 2,430 | | | $ | — | | | $ | — | | | $ | — | | | $ | 2,430 | | |
Gross amount of
recognized liabilities
for securities lending
transactions | | $ | 2,430 | | |
7. Restricted Securities: The Fund invests in unregistered or otherwise restricted securities. The term "restricted securities" refers to securities that are unregistered or are held by control persons of the issuer and securities that are subject to contractual restrictions on their resale.
As a result, restricted securities may be more difficult to value and the Fund may have difficulty disposing of such assets either in a timely manner or for a reasonable price. In order to dispose of an unregistered security, the Fund, where it has contractual rights to do so, may have to cause such security to be registered. A considerable period may elapse between the time the decision is made to sell the security and the time the security is registered so that the Fund can sell it. Contractual restrictions on the resale of securities vary in length and scope and are generally the result of a negotiation between the issuer and the acquirer of the securities. The Fund would, in either case, bear market risks during that period. Restricted securities are identified in the Consolidated Portfolio of Investments.
8. Indemnifications: The Company enters into contracts that contain a variety of indemnifications. The Company's maximum exposure under these arrangements is unknown. However, the Company has not had prior claims or losses pursuant to these contracts and expects the risk of loss to be remote.
9. Security Transactions, Income and Expenses: Security transactions are accounted for on the trade date (date the order to buy or sell is executed). Realized gains and losses on the sale of investment securities are determined on the specific identified cost method. Dividend income and other distributions are recorded on the ex-dividend date (except for certain foreign dividends which may be recorded as soon as the Fund is informed of such dividends) net of applicable withholding taxes. Interest income is recognized on the accrual basis net of applicable withholding taxes except where collection is in doubt. Discounts are accreted and premiums are amortized over the life of the respective securities. Most expenses of the Company can be directly attributed to a particular Fund. Expenses which cannot be directly attributed are apportioned among the Funds based upon relative net assets or other appropriate methods. Income, expenses (other than class specific expenses) and realized and unrealized gains or losses are allocated to each class of shares based upon their relative net assets.
10. Dividends and Distributions to Shareholders: Dividends and distributions to shareholders are recorded on the ex-dividend date. Dividends from net investment income, if any, are declared and paid annually. Net realized capital gains, if any, are distributed at least annually.
B. Advisory Fees: The Adviser, a wholly-owned subsidiary of Morgan Stanley, provides the Fund with advisory services
20
Morgan Stanley Variable Insurance Fund, Inc.
Annual Report – December 31, 2021
Notes to Consolidated Financial Statements (cont'd)
under the terms of an Investment Advisory Agreement, paid quarterly, at the annual rate based on the daily net assets as follows:
First $1
billion | | Next $1
billion | | Next $1
billion | | Over $3
billion | |
| | 0.50 | % | | | 0.45 | % | | | 0.40 | % | | | 0.35 | % | |
For the year ended December 31, 2021, the advisory fee rate (net of waiver/rebate) was equivalent to an annual effective rate of 0.32% of the Fund's average daily net assets.
The Adviser has agreed to reduce its advisory fee and/or reimburse the Fund so that total annual Fund operating expenses, excluding certain investment related expenses, taxes, interest and other extraordinary expenses (including litigation), will not exceed 0.57% for Class I shares and 0.82% for Class II shares. The fee waivers and/or expense reimbursements will continue for at least one year from the date of the Fund's prospectus or until such time as the Directors act to discontinue all or a portion of such waivers and/or reimbursements when they deem such action is appropriate. For the year ended December 31, 2021, approximately $1,917,000 of advisory fees were waived pursuant to this arrangement.
The Adviser provides investment advisory services to the Subsidiary pursuant to the Subsidiary Investment Management Agreement (the "Agreement"). Under the Agreement, the Subsidiary will pay the Adviser at the end of each fiscal quarter, calculated by applying a quarterly rate, based on the annual rate of 0.05%, to the average daily net assets of the Subsidiary.
The Adviser has agreed to waive its advisory fees by the amount of advisory fees it receives from the Subsidiary.
C. Administration Fees: The Adviser also serves as Administrator to the Company and provides administrative services pursuant to an Administration Agreement for an annual fee, accrued daily and paid monthly, of 0.08% of the Fund's average daily net assets.
Under a Sub-Administration Agreement between the Administrator and State Street, State Street provides certain administrative services to the Company. For such services, the Administrator pays State Street a portion of the fee the Administrator receives from the Fund.
D. Servicing Fees: The Company accrues daily and pays quarterly a servicing fee of up to 0.17% of the average daily value of shares of the Fund held in an insurance company's account. Certain insurance companies have entered into a servicing agreement with the Company to provide administrative and other contract-owner related services on behalf of the Fund.
E. Distribution Fees: Morgan Stanley Distribution, Inc. ("MSDI" or the "Distributor"), a wholly-owned subsidiary of the Adviser and an indirect subsidiary of Morgan Stanley, serves as the Distributor of the Fund and provides the Fund's Class II shareholders with distribution services pursuant to a Distribution Plan (the "Plan") in accordance with Rule 12b-1 under the Act. Under the Plan, the Fund is authorized to pay the Distributor a distribution fee, which is accrued daily and paid monthly, at an annual rate of 0.25% of the Fund's average daily net assets attributable to Class II shares.
F. Dividend Disbursing and Transfer Agent: The Company's dividend disbursing and transfer agent is DST Asset Manager Solutions, Inc. ("DST"). Pursuant to a Transfer Agency Agreement, the Company pays DST a fee based on the number of classes, accounts and transactions relating to the Funds of the Company.
G. Custodian Fees: State Street (the "Custodian") also serves as Custodian for the Company in accordance with a Custodian Agreement. The Custodian holds cash, securities and other assets of the Company as required by the Act. Custody fees are payable monthly based on assets held in custody, investment purchases and sales activity and account maintenance fees, plus reimbursement for certain out-of-pocket expenses.
H. Security Transactions and Transactions with Affiliates: For the year ended December 31, 2021, purchases and sales of investment securities for the Fund, other than long-term U.S. Government securities and short-term investments were approximately $642,602,000 and $728,046,000, respectively. There were no purchases and sales of long-term U.S. Government securities for the year ended December 31, 2021.
The Fund invests in the Institutional Class of the Morgan Stanley Institutional Liquidity Funds -Treasury Securities Portfolio (the "Liquidity Funds"), an open-end management investment company managed by the Adviser, both directly and as a portion of the securities held as collateral on loaned securities. Advisory fees paid by the Fund are reduced by an amount equal to its pro-rata share of the advisory and administration fees paid by the Fund due to its investment in the Liquidity Funds. For the year ended December 31, 2021, advisory fees paid were reduced by approximately $15,000 relating to the Fund's investment in the Liquidity Funds.
21
Morgan Stanley Variable Insurance Fund, Inc.
Annual Report – December 31, 2021
Notes to Consolidated Financial Statements (cont'd)
A summary of the Fund's transactions in shares of affiliated investments during the year ended December 31, 2021 is as follows:
Affiliated
Investment
Company | | Value
December 31,
2020
(000) | | Purchases
at Cost
(000) | | Proceeds
from Sales
(000) | | Dividend
Income
(000) | |
Liquidity Funds | | $ | 72,673 | | | $ | 441,959 | | | $ | 480,737 | | | $ | 4 | | |
Affiliated
Investment
Company (cont'd) | | Realized
Gain (Loss)
(000) | | Change in
Unrealized
Appreciation
(Depreciation)
(000) | | Value
December 31,
2021
(000) | |
Liquidity Funds | | $ | — | | | $ | — | | | $ | 33,895 | | |
The Fund is permitted to purchase and sell securities ("cross-trade") from and to other Morgan Stanley funds as well as other funds and client accounts for which the Adviser or an affiliate of the Adviser serves as investment adviser, pursuant to procedures approved by the Directors in compliance with Rule 17a-7 under the Act (the "Rule"). Each cross-trade is executed at the current market price in compliance with provisions of the Rule. For the year ended December 31, 2021, the Fund did not engage in any cross-trade transactions.
The Fund has an unfunded Deferred Compensation Plan (the "Compensation Plan"), which allows each independent Director to defer payment of all, or a portion, of the fees he or she receives for serving on the Board of Directors. Each eligible Director generally may elect to have the deferred amounts credited with a return equal to the total return on one or more of the Morgan Stanley funds that are offered as investment options under the Compensation Plan. Appreciation/depreciation and distributions received from these investments are recorded with an offsetting increase/decrease in the deferred compensation obligation and do not affect the NAV of the Fund.
I. Federal Income Taxes: It is the Fund's intention to continue to qualify as a regulated investment company and distribute all of its taxable and tax-exempt income. Accordingly, no provision for federal income taxes is required in the consolidated financial statements.
The Fund may be subject to taxes imposed by countries in which it invests. Such taxes are generally based on income and/or capital gains earned or repatriated. Taxes are accrued based on net investment income, net realized gains and net unrealized appreciation as such income and/or gains are earned. Taxes may also be based on transactions in foreign currency and are accrued based on the value of investments denominated in such currency.
FASB ASC 740-10, "Income Taxes — Overall", sets forth a minimum threshold for consolidated financial statement recognition of the benefit of a tax position taken or expected to be taken in a tax return. Management has concluded there are no significant uncertain tax positions that would require recognition in the consolidated financial statements. If applicable, the Fund recognizes interest accrued related to unrecognized tax benefits in "Interest Expense" and penalties in "Other Expenses" in the Consolidated Statement of Operations. The Fund files tax returns with the U.S. Internal Revenue Service, New York and various states. Generally, each of the tax years in the four-year period ended December 31, 2021 remains subject to examination by taxing authorities.
The tax character of distributions paid may differ from the character of distributions shown for GAAP purposes due to short-term capital gains being treated as ordinary income for tax purposes. The tax character of distributions paid during fiscal years 2021 and 2020 was as follows:
2021 Distributions
Paid From: | | 2020 Distributions
Paid From: | |
Ordinary
Income
(000) | | Long-Term
Capital Gain
(000) | | Ordinary
Income
(000) | | Long-Term
Capital Gain
(000) | |
| $ | 34,650 | | | $ | 250,363 | | | $ | 13,028 | | | $ | 77,000 | | |
The amount and character of income and gains to be distributed are determined in accordance with income tax regulations which may differ from GAAP. These book/tax differences are either considered temporary or permanent in nature.
Temporary differences are attributable to differing book and tax treatments for the timing of the recognition of gains (losses) on certain investment transactions and the timing of the deductibility of certain expenses.
The Fund had no permanent differences causing reclassifications among the components of net assets for the year ended December 31, 2021.
At December 31, 2021, the components of distributable earnings for the Fund on a tax basis were as follows:
Undistributed
Ordinary
Income
(000) | | Undistributed
Long-Term
Capital Gain
(000) | |
| $ | 9,134 | | | $ | 272,400 | | |
J. Credit Facility: The Company and other Morgan Stanley funds participated in a $300,000,000 committed, unsecured revolving line of credit facility (the "Facility") with State Street. This Facility is to be used for temporary emergency purposes or funding of shareholder redemption requests. The interest rate on borrowings is based on the federal funds rate
22
Morgan Stanley Variable Insurance Fund, Inc.
Annual Report – December 31, 2021
Notes to Consolidated Financial Statements (cont'd)
or 1 month LIBOR rate plus a spread. Effective April 19, 2021, the interest rate on borrowings is based on the federal funds effective rate or overnight bank funding rate plus a spread. The Facility also has a commitment fee of 0.25% per annum based on the unused portion of the Facility. During the year ended December 31, 2021, the Fund did not have any borrowings under the Facility.
K. Other: At December 31, 2021, the Fund had record owners of 10% or greater. Investment activities of these shareholders could have a material impact on the Fund. The aggregate percentage of such owners was 64.1%.
L. Market Risk and Risks Relating to Certain Financial Instruments:
Bitcoin: The Fund may have exposure to bitcoin indirectly through investments in GBTC, a privately offered investment vehicle that invests in bitcoin. Cryptocurrencies (also referred to as "virtual currencies" and "digital currencies") are digital assets designed to act as a medium of exchange. Although cryptocurrency is an emerging asset class, there are thousands of cryptocurrencies, the most well-known of which is bitcoin. Cryptocurrency facilitates decentralized, peer-to-peer financial exchange and value storage that is used like money, without the oversight of a central authority or banks. The value of cryptocurrency is not backed by any government, corporation, or other identified body. Similar to fiat currencies (i.e., a currency that is backed by a central bank or a national, supra-national or quasi-national organization), cryptocurrencies are susceptible to theft, loss and destruction. For example, the bitcoin held by GBTC (and the Fund's indirect exposure to such bitcoin) is also susceptible to these risks. The value of the GBTC investments in cryptocurrency is subject to fluctuations in the value of the cryptocurrency, which have been and may in the future be highly volatile. The value of cryptocurrencies is determined by the supply and demand for cryptocurrency in the global market for the trading of cryptocurrency, which consists primarily of transactions on electronic exchanges. The price of bitcoin could drop precipitously (including to zero) for a variety of reasons, including, but not limited to, regulatory changes, a crisis of confidence, flaw or operational issue in the bitcoin network or a change in user preference to competing cryptocurrencies. The GBTC exposure to cryptocurrency could result in substantial losses to the Fund.
Market: The outbreak of the coronavirus ("COVID-19") and the recovery responses could adversely impact the operations of the Fund and its service providers and financial performance of the Fund and the Fund's investments. The extent of such impact depends on future developments, including
(i) the duration and spread of the outbreak, (ii) the restrictions and advisories, (iii) the effects on the financial markets, (iv) government and regulatory responses, and (v) the effects on the economy overall as a result of developments such as disruption to consumer demand, economic output and supply chains. The duration and extent of COVID-19 and associated economic and market conditions and uncertainty over the long term cannot be reasonably estimated at this time. The ultimate impact of COVID-19 and the extent to which the associated conditions impact the Fund will also depend on future developments, which are highly uncertain, difficult to accurately predict and subject to change at any time. If the financial performance of the Fund's investments is impacted because of these factors for an extended period, the Fund's investment results may be adversely affected.
Special Purpose Acquisition Companies ("SPAC"): The Fund may invest in stock, warrants, and other securities of SPACs or similar special purpose entities. A SPAC is typically a publicly traded company that raises investment capital via an initial public offering ("IPO") for the purpose of acquiring the equity securities of one or more existing companies (or interests therein) via merger, combination, acquisition or other similar transactions. The Fund may acquire an interest in a SPAC in an IPO or a secondary market transaction.
Unless and until an acquisition is completed, a SPAC generally invests its assets (less a portion retained to cover expenses) in U.S. government securities, money market securities and cash. To the extent the SPAC is invested in cash or similar securities, this may negatively affect the Fund's performance. Because SPACs and similar entities are in essence blank check companies without operating history or ongoing business other than seeking acquisitions, the value of their securities is particularly dependent on the ability of the entity's management to identify and complete a profitable acquisition. There is no guarantee that the SPACs in which the Fund invests will complete an acquisition or that any acquisitions that are completed will be profitable. Some SPACs may pursue acquisitions only within certain industries or regions, which may increase the volatility of their prices. In addition, these securities, which are typically traded in the over-the-counter market, may be considered illiquid and/or be subject to restrictions on resale.
Other risks of investing in SPACs include that a significant portion of the monies raised by the SPAC may be expended during the search for a target transaction; an attractive transaction may not be identified at all (or any requisite approvals may not be obtained) and the SPAC may dissolve and be required to return any remaining monies to shareholders, causing the Fund to incur the opportunity cost of missed
23
Morgan Stanley Variable Insurance Fund, Inc.
Annual Report – December 31, 2021
Notes to Consolidated Financial Statements (cont'd)
investment opportunities the Fund otherwise could have benefited from; a transaction once identified or effected may prove unsuccessful and an investment in the SPAC may lose value; the warrants or other rights with respect to the SPAC held by the Fund may expire worthless or may be repurchased or retired by the SPAC at an unfavorable price; and an investment in a SPAC may be diluted by additional later offerings of interests in the SPAC or by other investors exercising existing rights to purchase shares of the SPAC. In addition, a SPAC target company may have limited operating experience, a smaller size, limited product lines, markets, distribution channels and financial and managerial resources. Investing in the securities of smaller companies involves greater risk, and portfolio price volatility.
Private Investment in Public Equity: The Fund may acquire equity securities of an issuer that are issued through a PIPE transaction, including on a when-issued basis. The Fund will generally earmark an amount of cash or high quality securities equal (on a daily mark to market basis) to the amount of its commitment to purchase the when-issued securities. PIPE transactions typically involve the purchase of securities directly from a publicly traded company or its affiliates in a private placement transaction, including through a SPAC, typically at a discount to the market price of the company's securities. There is a risk that if the market price of the securities drops below a set threshold, the company may have to issue additional stock at a significantly reduced price, which may dilute the value of the Fund's investment. Shares in PIPEs generally are not registered with the SEC until after a certain time period from the date the private sale is completed. This restricted period can last many months. Until the public registration process is completed, PIPEs are restricted as to resale and the Fund cannot freely trade the securities. Generally, such restrictions cause the PIPEs to be illiquid during this time. PIPEs may contain provisions that the issuer will pay specified financial penalties to the holder if the issuer does not publicly register the restricted equity securities within a specified period of time, but there is no assurance that the restricted equity securities will be publicly registered, or that the registration will remain in effect.
24
Morgan Stanley Variable Insurance Fund, Inc.
Annual Report – December 31, 2021
Report of Independent Registered Public Accounting Firm
To the Shareholders and Board of Directors of
Morgan Stanley Variable Insurance Fund, Inc. —
Growth Portfolio
Opinion on the Financial Statements
We have audited the accompanying consolidated statement of assets and liabilities of Growth Portfolio (the "Fund") (one of the funds constituting Morgan Stanley Variable Insurance Fund, Inc. (the "Company")), including the consolidated portfolio of investments, as of December 31, 2021, and the related consolidated statements of operations and changes in net assets for the year then ended and the statement of changes in net assets for the year ended December 31, 2020, the consolidated financial highlights for the year ended December 31, 2021 and the financial highlights for each of the four years in the period ended December 31, 2020 and the related notes (collectively referred to as the "financial statements"). In our opinion, the financial statements present fairly, in all material respects, the consolidated financial position of Growth Portfolio (one of the funds constituting Morgan Stanley Variable Insurance Fund, Inc.) at December 31, 2021, the consolidated results of its operations and the consolidated changes in its net assets for the year then ended and the changes in its net assets for the year ended December 31, 2020 and its consolidated financial highlights for the year ended December 31, 2021 and its financial highlights for each of the four years in the period ended December 31, 2020, in conformity with U.S. generally accepted accounting principles.
Basis for Opinion
These consolidated financial statements are the responsibility of the Company's management. Our responsibility is to express an opinion on the Fund's consolidated financial statements based on our audits. We are a public accounting firm registered with the Public Company Accounting Oversight Board (United States) ("PCAOB") and are required to be independent with respect to the Company in accordance with the U.S. federal securities law and the applicable rules and regulations of the Securities and Exchange Commission and the PCAOB.
We conducted our audits in accordance with the standards of the PCAOB. Those standards require that we plan and perform the audit to obtain reasonable assurance about whether the financial statements are free of material misstatement, whether due to error or fraud. The Company is not required to have, nor were we engaged to perform, an audit of the Company's internal control over financial reporting. As part of our audits, we are required to obtain an understanding of internal control over financial reporting, but not for the purpose of expressing an opinion on the effectiveness of the Company's internal control over financial reporting. Accordingly, we express no such opinion.
Our audits included performing procedures to assess the risks of material misstatement of the consolidated financial statements, whether due to error or fraud, and performing procedures that respond to those risks. Such procedures included examining, on a test basis, evidence regarding the amounts and disclosures in the consolidated financial statements. Our procedures included confirmation of securities owned as of December 31, 2021 by correspondence with the custodian and others or by other appropriate auditing procedures where replies from others were not received. Our audits also included evaluating the accounting principles used and significant estimates made by management, as well as evaluating the overall presentation of the consolidated financial statements. We believe that our audits provide a reasonable basis for our opinion.

We have served as the auditor of one or more Morgan Stanley investment companies since 2000.
Boston, Massachusetts
February 18, 2022
25
Morgan Stanley Variable Insurance Fund, Inc.
Annual Report – December 31, 2021
Liquidity Risk Management Program (unaudited)
In compliance with Rule 22e-4 under the Investment Company Act of 1940, as amended (the "Liquidity Rule"), the Fund has adopted and implemented a liquidity risk management program (the "Program"), which is reasonably designed to assess and manage the risk that the Fund could not meet requests to redeem shares issued by the Fund without significant dilution of remaining investors' interests in the Fund (i.e., liquidity risk). The Fund's Board of Directors (the "Board") previously approved the designation of the Liquidity Risk Subcommittee (the "LRS") as Program administrator. The LRS is comprised of representatives from various divisions within Morgan Stanley Investment Management.
At a meeting held on March 3-4, 2021, the Board reviewed a written report prepared by the LRS that addressed the Program's operation and assessed its adequacy, and effectiveness of implementation for the period from January 1, 2020, through December 31, 2020, as required under the Liquidity Rule, and discussed the impact of the COVID-19 pandemic on liquidity and the LRS's assessment of liquidity risk during the reporting period, including during the distressed market environment caused by the onset of the COVID-19 pandemic. The report concluded that the Program operated effectively and was adequately and effectively implemented in all material aspects, and that the relevant controls and safeguards were appropriately designed to enable the LRS to administer the Program in compliance with the Liquidity Rule.
In accordance with the Program, the LRS assessed each Fund's liquidity risk no less frequently than annually taking into consideration certain factors, as applicable, such as (i) investment strategy and liquidity of portfolio investments, (ii) short-term and long-term cash flow projections and (iii) holdings of cash and cash equivalents and borrowing arrangements and other funding sources. Certain factors are considered under both normal and reasonably foreseeable stressed conditions.
Each Fund portfolio investment is classified into one of four liquidity categories, which classification is assessed at least monthly by the LRS. The classification is based on a determination of the number of days it is reasonably expected to take to convert the investment into cash, or sell or dispose of the investment, in current market conditions without significantly changing the market value of the investment. Liquidity classification determinations take into account various market, trading and investment-specific considerations, as well as market depth, and in some cases utilize third-party vendor data.
The Liquidity Rule limits a fund's investments in illiquid investments to 15% of its net assets and requires funds that do not primarily hold assets that are highly liquid investments to determine and maintain a minimum percentage of the fund's net assets to be invested in highly liquid investments (highly liquid investment minimum or "HLIM"). The LRS believes that the Program includes provisions reasonably designed to review, monitor and comply with the 15% limit on illiquid investments and for determining, periodically reviewing and complying with the HLIM requirement, as applicable.
There can be no assurance that the Program will achieve its objectives under all circumstances in the future. Please refer to the Fund's prospectus for more information regarding the Fund's exposure to liquidity risk and other risks to which it may be subject.
26
Morgan Stanley Variable Insurance Fund, Inc.
Annual Report – December 31, 2021
Federal Tax Notice (unaudited)
For federal income tax purposes, the following information is furnished with respect to the distributions paid by the Fund during its taxable year ended December 31, 2021. For corporate shareholders 0.15% of the dividends qualified for the dividends received deduction.
The Fund designated and paid approximately $250,363,000 as a long-term capital gain distribution.
For federal income tax purposes, the following information is furnished with respect to the Fund's earnings for its taxable year ended December 31, 2021. When distributed, certain earnings may be subject to a maximum tax rate of 15% as provided for by the Jobs and Growth Tax Relief Reconciliation Act of 2003. The Fund designated up to a maximum of approximately $51,000 as taxable at this lower rate.
In January, the Fund provides tax information to shareholders for the preceding calendar year.
27
Morgan Stanley Variable Insurance Fund, Inc.
Annual Report – December 31, 2021
Director and Officer Information (unaudited)
Independent Directors:
Name, Address and Birth
Year of Independent Director | | Position(s)
Held with
Registrant | | Length of
Time
Served* | | Principal Occupation(s) During Past 5 Years and
Other Relevant Professional Experience | | Number of
Funds
in Fund
Complex
Overseen
by
Independent
Director** | | Other Directorships Held by Independent
Director During Past 5 Years*** | |
Frank L. Bowman
c/o Perkins Coie LLP
Counsel to the Independent
Directors
1155 Avenue of the Americas
22nd Floor
New York, NY 10036
Birth Year: 1944 | | Director | | Since August 2006 | | President, Strategic Decisions, LLC (consulting) (since February 2009); Director or Trustee of various Morgan Stanley Funds (since August 2006); Chairperson of the Compliance and Insurance Committee (since October 2015); formerly, Chairperson of the Insurance Sub-Committee of the Compliance and Insurance Committee (2007-2015); served as President and Chief Executive Officer of the Nuclear Energy Institute (policy organization) (February 2005-November 2008); retired as Admiral, U.S. Navy after serving over 38 years on active duty including 8 years as Director of the Naval Nuclear Propulsion Program in the Department of the Navy and the U.S. Department of Energy (1996-2004); served as Chief of Naval Personnel (July 1994-September 1996) and on the Joint Staff as Director of Political Military Affairs (June 1992-July 1994); knighted as Honorary Knight Commander of the Most Excellent Order of the British Empire; awarded the Officier de l'Orde National du Mérite by the French Government; elected to the National Academy of Engineering (2009). | | | 77 | | | Director of Naval and Nuclear Technologies LLP; Director Emeritus of the Armed Services YMCA; Member of the National Security Advisory Council of the Center for U.S. Global Engagement and a member of the CNA Military Advisory Board; Chairman of Fairhaven United Methodist Church; Member of the Board of Advisors of the Dolphin Scholarship Foundation; Director of other various nonprofit organizations; formerly, Director of BP, plc (November 2010-May 2019). | |
Kathleen A. Dennis
c/o Perkins Coie LLP
Counsel to the Independent Directors
1155 Avenue of the Americas
22nd Floor
New York, NY 10036
Birth Year: 1953 | | Director | | Since August 2006 | | Chairperson of the Governance Committee (since January 2021), Chairperson of the Liquidity and Alternatives Sub-Committee of the Investment Committee (2006-2020) and Director or Trustee of various Morgan Stanley Funds (since August 2006); President, Cedarwood Associates (mutual fund and investment management consulting) (since July 2006); formerly, Senior Managing Director of Victory Capital Management (1993-2006). | | | 77 | | | Board Member, University of Albany Foundation (2012-present); Board Member, Mutual Funds Directors Forum (2014-present); Director of various non-profit organizations. | |
Nancy C. Everett
c/o Perkins Coie LLP
Counsel to the Independent Directors
1155 Avenue of the Americas
22nd Floor
New York, NY 10036
Birth Year: 1955 | | Director | | Since January 2015 | | Chairperson of the Equity Investment Committee (since January 2021); Director or Trustee of various Morgan Stanley Funds (since January 2015); Chief Executive Officer, Virginia Commonwealth University Investment Company (since November 2015); Owner, OBIR, LLC (institutional investment management consulting) (since June 2014); formerly, Managing Director, BlackRock, Inc. (February 2011-December 2013) and Chief Executive Officer, General Motors Asset Management (a/k/a Promark Global Advisors, Inc.) (June 2005-May 2010). | | | 78 | | | Formerly, Member of Virginia Commonwealth University School of Business Foundation (2005-2016); Member of Virginia Commonwealth University Board of Visitors (2013-2015); Member of Committee on Directors for Emerging Markets Growth Fund, Inc. (2007-2010); Chairperson of Performance Equity Management, LLC (2006-2010); and Chairperson, GMAM Absolute Return Strategies Fund, LLC (2006-2010). | |
28
Morgan Stanley Variable Insurance Fund, Inc.
Annual Report – December 31, 2021
Director and Officer Information (unaudited) (cont'd)
Independent Directors (cont'd):
Name, Address and Birth
Year of Independent Director | | Position(s)
Held with
Registrant | | Length of
Time
Served* | | Principal Occupation(s) During Past 5 Years and
Other Relevant Professional Experience | | Number of
Funds
in Fund
Complex
Overseen
by
Independent
Director** | | Other Directorships Held by Independent
Director During Past 5 Years*** | |
Jakki L. Haussler
c/o Perkins Coie LLP
Counsel to the Independent Directors
1155 Avenue of the Americas
22nd Floor
New York, NY 10036
Birth Year: 1957 | | Director | | Since January
2015 | | Director or Trustee of various Morgan Stanley Funds (since January 2015); Chairman, Opus Capital Group (since 1996); formerly, Chief Executive Officer, Opus Capital Group (1996-2019); Director, Capvest Venture Fund, LP (May 2000-December 2011); Partner, Adena Ventures, LP (July 1999-December 2010); Director, The Victory Funds (February 2005-July 2008). | | | 78 | | | Director, Barnes Group Inc. (since July 2021); Director of Cincinnati Bell Inc. and Member, Audit Committee and Chairman, Governance and Nominating Committee; Director of Service Corporation International and Member, Audit Committee and Investment Committee; Director of Northern Kentucky University Foundation and Member, Investment Committee; Member of Chase College of Law Transactional Law Practice Center Board of Advisors; Director of Best Transport; Director of Chase College of Law Board of Visitors; formerly, Member, University of Cincinnati Foundation Investment Committee; Member, Miami University Board of Visitors (2008-2011); Trustee of Victory Funds (2005-2008) and Chairman, Investment Committee (2007-2008) and Member, Service Provider Committee (2005-2008). | |
Dr. Manuel H. Johnson
c/o Johnson Smick International, Inc.
220 I Street, NE Suite 200
Washington, D.C. 20002
Birth Year: 1949 | | Director | | Since July 1991 | | Senior Partner, Johnson Smick International, Inc. (consulting firm); Chairperson of the Fixed Income, Liquidity and Alternatives Investment Committee (since January 2021), Chairperson of the Investment Committee (2006-2020) and Director or Trustee of various Morgan Stanley Funds (since July 1991); Co-Chairman and a founder of the Group of Seven Council (G7C) (international economic commission); formerly, Chairperson of the Audit Committee (July 1991-September 2006); Vice Chairman of the Board of Governors of the Federal Reserve System and Assistant Secretary of the U.S. Treasury. | | | 77 | | | Director of NVR, Inc. (home construction). | |
Joseph J. Kearns
c/o Perkins Coie LLP
Counsel to the Independent Directors
1155 Avenue of the Americas
22nd Floor
New York, NY 10036
Birth Year: 1942 | | Director | | Since August 1994 | | Senior Adviser, Kearns & Associates LLC (investment consulting); Chairperson of the Audit Committee (since October 2006) and Director or Trustee of various Morgan Stanley Funds (since August 1994); formerly, Deputy Chairperson of the Audit Committee (July 2003-September 2006) and Chairperson of the Audit Committee of various Morgan Stanley Funds (since August 1994); CFO of the J. Paul Getty Trust (1982-1999). | | | 78 | | | Director, Rubicon Investments (since February 2019); Prior to August 2016, Director of Electro Rent Corporation (equipment leasing); Prior to December 31, 2013, Director of The Ford Family Foundation. | |
Michael F. Klein
c/o Perkins Coie LLP
Counsel to the Independent Directors
1155 Avenue of the Americas
22nd Floor
New York, NY 10036
Birth Year: 1958 | | Director | | Since August 2006 | | Chairperson of the Risk Committee (since January 2021); Managing Director, Aetos Alternatives Management, LP (since March 2000); Co-President, Aetos Alternatives Management, LP (since January 2004) and Co-Chief Executive Officer of Aetos Alternatives Management, LP (since August 2013); Chairperson of the Fixed Income Sub-Committee of the Investment Committee (2006-2020) and Director or Trustee of various Morgan Stanley Funds (since August 2006); formerly, Managing Director, Morgan Stanley & Co. Inc. and Morgan Stanley Dean Witter Investment Management and President, various Morgan Stanley Funds (June 1998-March 2000); Principal, Morgan Stanley & Co. Inc. and Morgan Stanley Dean Witter Investment Management (August 1997-December 1999). | | | 77 | | | Director of certain investment funds managed or sponsored by Aetos Alternatives Management, LP; Director of Sanitized AG and Sanitized Marketing AG (specialty chemicals). | |
29
Morgan Stanley Variable Insurance Fund, Inc.
Annual Report – December 31, 2021
Director and Officer Information (unaudited) (cont'd)
Independent Directors (cont'd):
Name, Address and Birth
Year of Independent Director | | Position(s)
Held with
Registrant | | Length of
Time
Served* | | Principal Occupation(s) During Past 5 Years and
Other Relevant Professional Experience | | Number of
Funds
in Fund
Complex
Overseen
by
Independent
Director** | | Other Directorships Held by Independent
Director During Past 5 Years*** | |
Patricia A. Maleski
c/o Perkins Coie LLP
Counsel to the Independent Directors
1155 Avenue of the Americas
22nd Floor
New York, NY 10036
Birth Year: 1960 | | Director | | Since January 2017 | | Director or Trustee of various Morgan Stanley Funds (since January 2017); Managing Director, JPMorgan Asset Management (2004-2016); Oversight and Control Head of Fiduciary and Conflicts of Interest Program (2015-2016); Chief Control Officer — Global Asset Management (2013-2015); President, JPMorgan Funds (2010-2013); Chief Administrative Officer (2004-2013); various other positions including Treasurer and Board Liaison (since 2001). | | | 78 | | | Trustee, Nutley Family Service Bureau, Inc. (since January 2022). | |
W. Allen Reed
c/o Perkins Coie LLP
Counsel to the Independent Directors
1155 Avenue of the Americas
22nd Floor
New York, NY 10036
Birth Year: 1947 | | Chair of the Board and Director | | Chair of the Board since August 2020 and Director since August 2006 | | Chair of the Boards of various Morgan Stanley Funds (since August 2020); Director or Trustee of various Morgan Stanley Funds (since August 2006); formerly, Vice Chair of the Boards of various Morgan Stanley Funds (January 2020-August 2020); President and Chief Executive Officer of General Motors Asset Management; Chairman and Chief Executive Officer of the GM Trust Bank and Corporate Vice President of General Motors Corporation (August 1994-December 2005). | | | 77 | | | Formerly, Director of Legg Mason, Inc. (2006-2019); and Director of the Auburn University Foundation (2010-2015). | |
Frances L. Cashman
c/o Perkins Coie LLP
Counsel to the Independent Directors
1155 Avenue of the Americas
22nd Floor
New York, NY 10036
Birth Year: 1961 | | Advisory Board Member | | Advisory Board Member Since January 2022 | | Chief Executive Officer, Asset Management Division, Euromoney Institutional Investor PLC (financial information) (May 2021-Present); Executive Vice President and various other roles, Legg Mason & Co. (asset management) (2010-2020); Managing Director, Stifel Nicolaus (2005-2010). | | | 78 | | | Trustee and Investment Committee Member, Georgia Tech Foundation (Since June 2019); Trustee and Chair of Marketing Committee, Loyola Blakefield (Since September 2017); Trustee, MMI Gateway Foundation (since September 2017); Director and Investment Committee Member, Catholic Community Foundation Board (2012-2018); Director and Investment Committee Member, St. Ignatius Loyola Academy (2011-2017). | |
Eddie A. Grier
c/o Perkins Coie LLP
Counsel to the Independent Directors
1155 Avenue of the Americas
22nd Floor
New York, NY 10036
Birth Year: 1955 | | Advisory Board Member | | Advisory Board Member Since January 2022 | | Dean, Santa Clara University Leavey School of Business (since April 2021); Dean, Virginia Commonwealth University School of Business (2010-2021); President and various other roles, Walt Disney Company (entertainment and media) (1981-2010). | | | 78 | | | Director, Witt/Keiffer, Inc. (executive search) (since 2016); Director, NuStar GP, LLC (energy) (since August 2021); Director, Sonida Senior Living, Inc. (residential community operator) (2016-2021); Director, NVR, Inc. (homebuilding) (2013-2020); Director, Middleburg Trust Company (wealth management) (2014-2019); Director, Colonial Williamsburg Company (since 2012); Regent, University of Massachusetts Global (since 2021); Director and Chair, ChildFund International (2012-2021); Trustee, Brandman University (2010-2021); Director, Richmond Forum (2012-2019). | |
* This is the earliest date the Director began serving the Morgan Stanley Funds. Each Director serves an indefinite term, until his or her successor is elected.
** The Fund Complex includes (as of December 31, 2021) all open-end and closed-end funds (including all of their portfolios) advised by Morgan Stanley Investment Management Inc. (the "Adviser") and any funds that have an adviser that is an affiliated person of the Adviser (including, but not limited to, Morgan Stanley AIP GP LP).
*** This includes any directorships at public companies and registered investment companies held by the Director at any time during the past five years.
30
Morgan Stanley Variable Insurance Fund, Inc.
Annual Report – December 31, 2021
Director and Officer Information (unaudited) (cont'd)
Executive Officers:
Name, Address and Birth Year of
Executive Officer | | Position(s)
Held with
Registrant | | Length of
Time Served* | | Principal Occupation(s) During Past 5 Years | |
John H. Gernon
522 Fifth Avenue
New York, NY 10036
Birth Year: 1963 | | President and Principal Executive Officer | | Since September 2013 | | President and Principal Executive Officer of the Equity and Fixed Income Funds and the Morgan Stanley AIP Funds (since September 2013) and the Liquidity Funds and various money market funds (since May 2014) in the Fund Complex; Managing Director of the Adviser. | |
Deidre A. Downes
1633 Broadway
New York, NY 10019
Birth Year: 1977 | | Chief Compliance Officer | | Since November 2021 | | Executive Director of the Adviser (since January 2021) and Chief Compliance Officer of various Morgan Stanley Funds (since November 2021). Formerly, Vice President and Corporate Counsel at PGIM and Prudential Financial (October 2016-December 2020). | |
Francis J. Smith
522 Fifth Avenue
New York, NY 10036
Birth Year: 1965 | | Treasurer and Principal Financial Officer | | Treasurer since July 2003 and Principal Financial Officer since September 2002 | | Managing Director of the Adviser and various entities affiliated with the Adviser; Treasurer (since July 2003) and Principal Financial Officer of various Morgan Stanley Funds (since September 2002). | |
Mary E. Mullin
1633 Broadway
New York, NY 10019
Birth Year: 1967 | | Secretary | | Since June 1999 | | Managing Director of the Adviser; Secretary of various Morgan Stanley Funds (since June 1999). | |
Michael J. Key
522 Fifth Avenue
New York, NY 10036
Birth Year: 1979 | | Vice President | | Since June 2017 | | Vice President of the Equity and Fixed Income Funds, Liquidity Funds, various money market funds and the Morgan Stanley AIP Funds in the Fund Complex (since June 2017); Executive Director of the Adviser; Head of Product Development for Equity and Fixed Income Funds (since August 2013). | |
* This is the earliest date the officer began serving the Morgan Stanley Funds. Each officer serves an indefinite term, until his or her successor is elected.
31
Morgan Stanley Variable Insurance Fund, Inc.
Annual Report – December 31, 2021
Adviser and Administrator
Morgan Stanley Investment Management Inc.
522 Fifth Avenue
New York, New York 10036
Distributor
Morgan Stanley Distribution, Inc.
522 Fifth Avenue
New York, New York 10036
Dividend Disbursing and Transfer Agent
DST Asset Manager Solutions, Inc.
2000 Crown Colony Drive
Quincy, Massachusetts 02169
Custodian
State Street Bank and Trust Company
One Lincoln Street
Boston, Massachusetts 02111
Legal Counsel
Dechert LLP
1095 Avenue of the Americas
New York, New York 10036
Counsel to the Independent Directors
Perkins Coie LLP
1155 Avenue of the Americas,
22nd Floor
New York, New York 10036
Independent Registered Public Accounting Firm
Ernst & Young LLP
200 Clarendon Street
Boston, Massachusetts 02116
Reporting to Shareholders
Each Morgan Stanley fund provides a complete schedule of portfolio holdings in its Semi-Annual and the Annual Reports within 60 days of the end of the fund's second and fourth fiscal quarters. The Semi-Annual and Annual Reports are filed electronically with the Securities and Exchange Commission ("SEC") on Form N-CSRS and Form N-CSR, respectively. Morgan Stanley also delivers the Semi-Annual and Annual Reports to fund shareholders and makes these reports available on its public website, www.morganstanley.com/im/shareholderreports. Each Morgan Stanley non-money market fund also files a complete schedule of portfolio holdings with the SEC for the fund's first and third fiscal quarters as an attachment to Form N-PORT. Morgan Stanley does not deliver the reports for the first and third fiscal quarters to shareholders, but makes the complete schedule of portfolio holdings for the fund's first and third fiscal quarters available on its public website. The holdings for each money market fund are also posted to the Morgan Stanley public website. You may obtain the Form N-PORT filings (as well as the Form N-CSR and N-CSRS filings) by accessing the SEC's website, www.sec.gov. You can also request copies of these materials, upon payment of a duplicating fee, by electronic request at the SEC's email address (publicinfo@sec.gov).
Proxy Voting Policies and Procedures and Proxy Voting Record
You may obtain a copy of the Company's Proxy Voting Policy and Procedures and information regarding how the Company voted proxies relating to portfolio securities during the most recent twelve-month period ended June 30, without charge, upon request, by calling toll free 1 (800) 548-7786 or by visiting our website at www.morganstanley.com/im/shareholderreports. This information is also available on the SEC's website at www.sec.gov.
This report is submitted for the general information of the shareholders of the Fund. For more detailed information about the Fund, its fees and expenses and other pertinent information, please read its Prospectus. The Company's Statement of Additional Information contains additional information about the Fund, including its Directors. It is available, without charge, by calling 1 (800) 548-7786.
Householding Notice
To reduce printing and mailing costs, the Fund attempts to eliminate duplicate mailings to the same address. The Fund delivers a single copy of certain shareholder documents, including shareholder reports, prospectuses and proxy materials, to investors with the same last name who reside at the same address. Your participation in this program will continue for an unlimited period of time unless you instruct us otherwise. You can request multiple copies of these documents by calling (800) 548-7786, 8:00 a.m. to 6:00 p.m., ET. Once our Customer Service Center has received your instructions, we will begin sending individual copies for each account within 30 days.
This report is not authorized for distribution to prospective investors in the Fund unless preceded or accompanied by an effective Prospectus. Read the Prospectus carefully before investing.
UIFCGANN
3997799 EXP 02.28.23

Morgan Stanley Variable Insurance Fund, Inc.
Annual Report – December 31, 2021
U.S. Real Estate Portfolio
The Fund is intended to be a funding vehicle for variable annuity contracts and variable life insurance policies offered by the separate accounts of certain life insurance companies.
Morgan Stanley Variable Insurance Fund, Inc.
Annual Report – December 31, 2021
Expense Example | | | 2 | | |
Investment Overview | | | 3 | | |
Portfolio of Investments | | | 5 | | |
Statement of Assets and Liabilities | | | 6 | | |
Statement of Operations | | | 7 | | |
Statements of Changes in Net Assets | | | 8 | | |
Financial Highlights | | | 9 | | |
Notes to Financial Statements | | | 11 | | |
Report of Independent Registered Public Accounting Firm | | | 17 | | |
Liquidity Risk Management Program | | | 18 | | |
Federal Tax Notice | | | 19 | | |
Director and Officer Information | | | 20 | | |
1
Morgan Stanley Variable Insurance Fund, Inc.
Annual Report – December 31, 2021
Expense Example (unaudited)
U.S. Real Estate Portfolio
As a shareholder of the U.S. Real Estate Portfolio (the "Fund"), you incur two types of costs: (1) insurance company charges; and (2) ongoing costs, which may include advisory fees, administration fees, distribution (12b-1) fees and other Fund expenses. This example is intended to help you understand your ongoing costs (in dollars) of investing in the Fund and to compare these costs with the ongoing costs of investing in other mutual funds.
This example is based on an investment of $1,000 invested at the beginning of the six-month period ended December 31, 2021 and held for the entire six-month period.
Actual Expenses
The table below provides information about actual account values and actual expenses. You may use the information in this table, together with the amount you invested, to estimate the expenses that you paid over the period. Simply divide your account value by $1,000 (for example, an $8,600 account value divided by $1,000 = 8.6), then multiply the result by the number in the table under the heading entitled "Actual Expenses Paid During Period" to estimate the expenses you paid on your account during this period.
Hypothetical Example for Comparison Purposes
The table below provides information about hypothetical account values and hypothetical expenses based on the Fund's actual expense ratio and an assumed rate of return of 5% per year before expenses, which is not the Fund's actual return. The hypothetical account values and expenses may not be used to estimate the actual ending account balance or expenses you paid for the period. You may use this information to compare the ongoing costs of investing in the Fund and other funds. To do so, compare this 5% hypothetical example with the 5% hypothetical examples that appear in the shareholder reports of the other funds.
Please note that the expenses shown in the table are meant to highlight your ongoing costs only and do not reflect any insurance company charges. Therefore, the table below is useful in comparing ongoing costs, but will not help you determine the relative total cost of owning different funds. In addition, if these insurance company charges were included, your costs would have been higher.
| | | Beginning
Account Value
7/1/21 | | Actual Ending
Account Value
12/31/21 | | Hypothetical
Ending
Account Value | | Actual
Expenses Paid
During Period* | | Hypothetical
Expenses Paid
During Period* | | Net Expense
Ratio During
Period** | |
U.S. Real Estate Portfolio Class I | | $ | 1,000.00 | | | $ | 1,155.80 | | | $ | 1,021.07 | | | $ | 4.46 | | | $ | 4.18 | | | | 0.82 | % | |
U.S. Real Estate Portfolio Class II | | | 1,000.00 | | | | 1,153.80 | | | | 1,019.81 | | | | 5.81 | | | | 5.45 | | | | 1.07 | | |
* Expenses are calculated using each Fund Class' annualized net expense ratio (as disclosed), multiplied by the average account value over the period and multiplied by 184/365 (to reflect the most recent one-half year period).
** Annualized.
2
Morgan Stanley Variable Insurance Fund, Inc.
Annual Report – December 31, 2021
Investment Overview (unaudited)
U.S. Real Estate Portfolio
The Fund seeks to provide above average current income and long-term capital appreciation by investing primarily in equity securities of companies in the U.S. real estate industry, including real estate investment trusts ("REITs").
Performance
For the fiscal year ended December 31, 2021, the Fund's Class I shares had a total return based on net asset value and reinvestment of distributions per share of 39.80%, net of fees, and 39.44%, net of fees, for Class II shares. The Fund's Class I and Class II shares underperformed the Fund's benchmark, the FTSE Nareit (National Association of Real Estate Investment Trusts) Equity REITs Index (the "Index"), which returned 43.24%, and outperformed the S&P 500® Index, which returned 28.71%.
Factors Affecting Performance
• In the U.S., after a strong start to 2021 in more economically sensitive sectors such as office, lodging and retail, rising concerns regarding COVID-19 and the delta and omicron variants led investors to question the sustainability of economic growth, which resulted in sector leadership rotation. Ultimately the more defensive and secularly favored sectors, such as storage, apartments and industrial, outperformed and posted strong returns for the year. An exception to this sector leadership rotation was within retail, where regional malls posted the best returns for the year on continued strength in retail sales and robust discretionary spending. In contrast, health care and office companies underperformed.
• The Fund's overweight to storage, underweight to skilled nursing health care and REIT hotels, and security selection in industrial were top relative contributors for the year. Key detractors included the underweights to regional malls and industrial; security selection within and the underweight to apartments; overweight to "big 3" health care companies; and security selection in data centers and NYC office.
Management Strategies
• The team uses internal proprietary research to invest in public real estate companies that we believe offer the best value relative to their underlying assets and growth prospects. The team combines a bottom-up approach, assessing the intrinsic value, equity multiples and growth prospects of each security, with a top-down view that incorporates fundamental inflection points, macroeconomic considerations and geopolitical risk. By incorporating both an equity market valuation and a more traditional real estate valuation with a top-down overlay, we believe the Fund will be better prepared to identify securities with the best expected total returns.
• Forecasted market strength in the asset class is supported by a number of macro and fundamental factors, including continued vaccine distribution, the reopening and/or anticipated reopening of economies around the world, and growing demand for real estate. We believe the relative valuation of real estate securities is attractive compared to investable alternatives, including the broader equity market, fixed income and direct property investment. Fundamental recovery and strength, coupled with attractive relative valuations, appear to be supportive of above-trend growth over the next several years. We believe continued merger and acquisition activity and privatizations are possible given discounts to private market valuations observed across sectors. Transaction volumes are expected to increase given the growing clarity on the recovery in fundamentals across most major sectors. However, an elevated risk premium should be expected for assets with operational, leasing or repositioning risk.
• Rising inflation and related rising interest rates could dampen value appreciation in the near term. However, we believe inflation pressures will likely moderate throughout the year and interest rates are likely to remain low versus history. More important is the expectation for continued economic expansion and strong gross domestic product growth, coupled with an expectation for limited new supply additions, strong credit availability and increasing investor interest in real estate investing, which could lead to above-trend levels of cash flow growth and value appreciation in the sector.
3
Morgan Stanley Variable Insurance Fund, Inc.
Annual Report – December 31, 2021
Investment Overview (unaudited) (cont'd)
U.S. Real Estate Portfolio

In accordance with SEC regulations, the Fund's performance shown assumes that all recurring fees (including management fees) were deducted and all dividends and distributions were reinvested. The performance of Class II shares will vary from the performance of Class I shares based upon its different inception date and will be negatively impacted by additional fees assessed to that class.
Performance Compared to the FTSE Nareit Equity REITs Index(1) and the S&P 500® Index(2)
| | | Period Ended December 31, 2021 | |
| | | Total Returns(3) | |
| | | | | Average Annual | |
| | | One
Year | | Five
Years | | Ten
Years | | Since
Inception(6) | |
Fund – Class I(4) | | | 39.80 | % | | | 5.64 | % | | | 8.21 | % | | | 9.19 | % | |
FTSE Nareit Equity REITs Index | | | 43.24 | | | | 10.75 | | | | 11.38 | | | | 9.93 | | |
S&P 500® Index | | | 28.71 | | | | 18.47 | | | | 16.55 | | | | 9.50 | | |
Fund – Class II(5) | | | 39.44 | | | | 5.37 | | | | 7.94 | | | | 9.78 | | |
FTSE Nareit Equity REITs Index | | | 43.24 | | | | 10.75 | | | | 11.38 | | | | 11.24 | | |
S&P 500® Index | | | 28.71 | | | | 18.47 | | | | 16.55 | | | | 11.20 | | |
Performance data quoted represents past performance, which is no guarantee of future results, and current performance may be lower or higher than the figures shown. Performance assumes that all dividends and distributions, if any, were reinvested. For the most recent month-end performance figures, please contact the issuing insurance company or speak with your financial advisor. Investment return and principal value will fluctuate so that Fund shares, when redeemed, may be worth more or less than their original cost. Total returns do not reflect the deduction of taxes that a shareholder would pay on Fund distributions or the redemption of Fund shares. Performance shown does not reflect fees and expenses imposed by your insurance company's separate account. If performance information included the effect of these additional charges, the total returns would be lower. Please keep in mind that double-digit returns for the Fund are highly unusual and cannot be sustained.
(1) The FTSE Nareit (National Association of Real Estate Investment Trusts) Equity REITs Index is free float-adjusted market capitalization weighted index of tax-qualified REITs listed on the New York Stock Exchange, NYSE Amex and the NASDAQ National Market Systems. The Index is unmanaged and its returns do not include any sales charges or fees. Such costs would lower performance. It is not possible to invest directly in an index.
(2) The Standard and Poor's 500® Index (S&P 500® Index) measures the performance of the large cap segment of the U.S. equities market, covering approximately 80% of the U.S. equities market. The Index includes 500 leading companies in leading industries of the U.S. economy. The Index is unmanaged and its returns do not include any sales charges or fees. Such costs would lower performance. It is not possible to invest directly in an index.
(3) Total returns for the Fund reflect fees waived and expenses reimbursed, if applicable, by the Adviser (as defined herein). Without such waivers and reimbursements, total returns would have been lower.
(4) Commenced operations on March 3, 1997.
(5) Commenced offering on November 5, 2002.
(6) For comparative purposes, average annual since inception returns listed for the Indexes refer to the inception date or initial offering of the respective share class of the Fund, not the inception of the Index.
4
Morgan Stanley Variable Insurance Fund, Inc.
Annual Report – December 31, 2021
Portfolio of Investments
U.S. Real Estate Portfolio
| | | Shares | | Value
(000) | |
Common Stocks (100.4%) | |
Apartments (13.5%) | |
Equity Residential REIT | | | 205,172 | | | $ | 18,568 | | |
Mid-America Apartment Communities, Inc. REIT | | | 82,679 | | | | 18,970 | | |
UDR, Inc. REIT | | | 310,713 | | | | 18,640 | | |
| | | | 56,178 | | |
Data Centers (7.4%) | |
Digital Realty Trust, Inc. REIT | | | 129,911 | | | | 22,977 | | |
GDS Holdings Ltd. ADR (China) (a) | | | 31,263 | | | | 1,475 | | |
Switch, Inc., Class A | | | 218,571 | | | | 6,260 | | |
| | | | 30,712 | | |
Free Standing (6.2%) | |
Agree Realty Corp. REIT | | | 59,796 | | | | 4,267 | | |
NETSTREIT Corp. REIT | | | 262,991 | | | | 6,023 | | |
Realty Income Corp. REIT | | | 214,516 | | | | 15,357 | | |
| | | | 25,647 | | |
Health Care (13.2%) | |
Healthcare Trust of America, Inc., Class A REIT | | | 166,630 | | | | 5,564 | | |
Healthpeak Properties, Inc. REIT | | | 398,370 | | | | 14,377 | | |
Medical Properties Trust, Inc. REIT | | | 333,497 | | | | 7,880 | | |
Ventas, Inc. REIT | | | 158,634 | | | | 8,109 | | |
Welltower, Inc. REIT | | | 221,308 | | | | 18,982 | | |
| | | | 54,912 | | |
Industrial (16.3%) | |
ProLogis, Inc. REIT | | | 317,331 | | | | 53,426 | | |
Rexford Industrial Realty, Inc. REIT | | | 177,296 | | | | 14,380 | | |
| | | | 67,806 | | |
Lodging/Resorts (2.1%) | |
Boyd Gaming Corp. (a) | | | 88,999 | | | | 5,836 | | |
Caesars Entertainment, Inc. (a) | | | 32,538 | | | | 3,043 | | |
| | | | 8,879 | | |
Manufactured Homes (3.8%) | |
Sun Communities, Inc. REIT | | | 75,045 | | | | 15,757 | | |
Office (5.0%) | |
Alexandria Real Estate Equities, Inc. REIT | | | 60,169 | | | | 13,415 | | |
Kilroy Realty Corp. REIT | | | 114,989 | | | | 7,642 | | |
| | | | 21,057 | | |
Regional Malls (3.0%) | |
Simon Property Group, Inc. REIT | | | 78,724 | | | | 12,578 | | |
Self Storage (13.7%) | |
Extra Space Storage, Inc. REIT | | | 74,740 | | | | 16,946 | | |
Life Storage, Inc. REIT | | | 58,067 | | | | 8,894 | | |
Public Storage REIT | | | 83,276 | | | | 31,192 | | |
| | | | 57,032 | | |
Shopping Centers (8.3%) | |
Brixmor Property Group, Inc. REIT | | | 357,733 | | | | 9,090 | | |
Kite Realty Group Trust REIT | | | 427,937 | | | | 9,321 | | |
| RPT Realty REIT | | | 396,946 | | | | 5,311 | | |
SITE Centers Corp. REIT | | | 676,003 | | | | 10,701 | | |
| | | | 34,423 | | |
| | | Shares | | Value
(000) | |
Single Family Homes (2.8%) | |
Invitation Homes, Inc. REIT | | | 260,169 | | | $ | 11,796 | | |
Specialty (5.1%) | |
Outfront Media, Inc. REIT | | | 352,805 | | | | 9,462 | | |
SBA Communications Corp. REIT | | | 10,863 | | | | 4,226 | | |
VICI Properties, Inc. REIT | | | 247,038 | | | | 7,439 | | |
| | | | 21,127 | | |
Total Common Stocks (Cost $331,080) | | | 417,904 | | |
Short-Term Investment (0.1%) | |
Investment Company (0.1%) | |
Morgan Stanley Institutional Liquidity
Funds — Treasury Portfolio —
Institutional Class (See Note H)
(Cost $425) | | | 424,882 | | | | 425 | | |
| Total Investments (100.5%) (Cost $331,505) (b) | | | 418,329 | | |
Liabilities in Excess of Other Assets (–0.5%) | | | (1,934 | ) | |
Net Assets (100.0%) | | $ | 416,395 | | |
(a) Non-income producing security.
(b) At December 31, 2021, the aggregate cost for federal income tax purposes is approximately $331,909,000. The aggregate gross unrealized appreciation is approximately $89,875,000 and the aggregate gross unrealized depreciation is approximately $3,287,000, resulting in net unrealized appreciation of approximately $86,588,000.
ADR American Depositary Receipt.
REIT Real Estate Investment Trust.
Portfolio Composition
Classification | | Percentage of
Total Investments | |
Industrial | | | 16.2 | % | |
Self Storage | | | 13.6 | | |
Apartments | | | 13.4 | | |
Health Care | | | 13.1 | | |
Other* | | | 11.8 | | |
Shopping Centers | | | 8.2 | | |
Data Centers | | | 7.4 | | |
Free Standing | | | 6.1 | | |
Specialty | | | 5.1 | | |
Office | | | 5.1 | | |
Total Investments | | | 100.0 | % | |
* Industries and/or investment types representing less than 5% of total investments.
The accompanying notes are an integral part of the financial statements.
5
Morgan Stanley Variable Insurance Fund, Inc.
Annual Report – December 31, 2021
U.S. Real Estate Portfolio
Statement of Assets and Liabilities | | December 31, 2021
(000) | |
Assets: | |
Investments in Securities of Unaffiliated Issuers, at Value (Cost $331,080) | | $ | 417,904 | | |
Investment in Security of Affiliated Issuer, at Value (Cost $425) | | | 425 | | |
Total Investments in Securities, at Value (Cost $331,505) | | | 418,329 | | |
Foreign Currency, at Value (Cost $21) | | | 21 | | |
Dividends Receivable | | | 937 | | |
Receivable for Fund Shares Sold | | | 65 | | |
Receivable from Affiliate | | | — | @ | |
Other Assets | | | 35 | | |
Total Assets | | | 419,387 | | |
Liabilities: | |
Payable for Fund Shares Redeemed | | | 2,130 | | |
Payable for Advisory Fees | | | 539 | | |
Payable for Servicing Fees | | | 149 | | |
Payable for Distribution Fees — Class II Shares | | | 46 | | |
Payable for Professional Fees | | | 42 | | |
Payable for Administration Fees | | | 27 | | |
Payable for Custodian Fees | | | 10 | | |
Payable for Transfer Agency Fees | | | 2 | | |
Other Liabilities | | | 47 | | |
Total Liabilities | | | 2,992 | | |
NET ASSETS | | $ | 416,395 | | |
Net Assets Consist of: | |
Paid-in-Capital | | $ | 253,303 | | |
Total Distributable Earnings | | | 163,092 | | |
Net Assets | | $ | 416,395 | | |
CLASS I: | |
Net Assets | | $ | 194,007 | | |
Net Asset Value, Offering and Redemption Price Per Share Applicable to 8,267,458 Outstanding
$0.001 Par Value Shares (Authorized 500,000,000 Shares) | | $ | 23.47 | | |
CLASS II: | |
Net Assets | | $ | 222,388 | | |
Net Asset Value, Offering and Redemption Price Per Share Applicable to 9,534,961 Outstanding
$0.001 Par Value Shares (Authorized 500,000,000 Shares) | | $ | 23.32 | | |
@ Amount is less than $500.
The accompanying notes are an integral part of the financial statements.
6
Morgan Stanley Variable Insurance Fund, Inc.
Annual Report – December 31, 2021
U.S. Real Estate Portfolio
Statement of Operations | | Year Ended
December 31, 2021
(000) | |
Investment Income: | |
Dividends from Securities of Unaffiliated Issuers (Net of $2 of Foreign Taxes Withheld) | | $ | 7,662 | | |
Non-Cash Dividends from Securities of Unaffiliated Issuers | | | 680 | | |
Dividends from Security of Affiliated Issuer (Note H) | | | — | @ | |
Income from Securities Loaned — Net | | | — | @ | |
Total Investment Income | | | 8,342 | | |
Expenses: | |
Advisory Fees (Note B) | | | 2,683 | | |
Servicing Fees (Note D) | | | 554 | | |
Distribution Fees — Class II Shares (Note E) | | | 515 | | |
Administration Fees (Note C) | | | 307 | | |
Professional Fees | | | 130 | | |
Shareholder Reporting Fees | | | 20 | | |
Custodian Fees (Note G) | | | 15 | | |
Transfer Agency Fees (Note F) | | | 14 | | |
Directors' Fees and Expenses | | | 8 | | |
Pricing Fees | | | 3 | | |
Other Expenses | | | 15 | | |
Total Expenses | | | 4,264 | | |
Waiver of Advisory Fees (Note B) | | | (607 | ) | |
Rebate from Morgan Stanley Affiliate (Note H) | | | (2 | ) | |
Net Expenses | | | 3,655 | | |
Net Investment Income | | | 4,687 | | |
Realized Gain: | |
Investments Sold | | | 114,747 | | |
Foreign Currency Translation | | | 2 | | |
Net Realized Gain | | | 114,749 | | |
Change in Unrealized Appreciation (Depreciation): | |
Investments | | | 8,475 | | |
Foreign Currency Translation | | | (— | @) | |
Net Change in Unrealized Appreciation (Depreciation) | | | 8,475 | | |
Net Realized Gain and Change in Unrealized Appreciation (Depreciation) | | | 123,224 | | |
Net Increase in Net Assets Resulting from Operations | | $ | 127,911 | | |
@ Amount is less than $500.
The accompanying notes are an integral part of the financial statements.
7
Morgan Stanley Variable Insurance Fund, Inc.
Annual Report – December 31, 2021
U.S. Real Estate Portfolio
Statements of Changes in Net Assets | | Year Ended
December 31, 2021
(000) | | Year Ended
December 31, 2020
(000) | |
Increase (Decrease) in Net Assets: | |
Operations: | |
Net Investment Income | | $ | 4,687 | | | $ | 6,687 | | |
Net Realized Gain (Loss) | | | 114,749 | | | | (36,828 | ) | |
Net Change in Unrealized Appreciation (Depreciation) | | | 8,475 | | | | (37,337 | ) | |
Net Increase (Decrease) in Net Assets Resulting from Operations | | | 127,911 | | | | (67,478 | ) | |
Dividends and Distributions to Shareholders: | |
Class I | | | (3,597 | ) | | | (9,097 | ) | |
Class II | | | (3,799 | ) | | | (9,892 | ) | |
Total Dividends and Distributions to Shareholders | | | (7,396 | ) | | | (18,989 | ) | |
Capital Share Transactions:(1) | |
Class I: | |
Subscribed | | | 8,959 | | | | 28,573 | | |
Distributions Reinvested | | | 3,597 | | | | 9,097 | | |
Redeemed | | | (43,565 | ) | | | (28,557 | ) | |
Class II: | |
Subscribed | | | 9,915 | | | | 28,140 | | |
Distributions Reinvested | | | 3,799 | | | | 9,892 | | |
Redeemed | | | (46,670 | ) | | | (29,553 | ) | |
Net Increase (Decrease) in Net Assets Resulting from Capital Share Transactions | | | (63,965 | ) | | | 17,592 | | |
Total Increase (Decrease) in Net Assets | | | 56,550 | | | | (68,875 | ) | |
Net Assets: | |
Beginning of Period | | | 359,845 | | | | 428,720 | | |
End of Period | | $ | 416,395 | | | $ | 359,845 | | |
(1) Capital Share Transactions: | |
Class I: | |
Shares Subscribed | | | 451 | | | | 1,848 | | |
Shares Issued on Distributions Reinvested | | | 174 | | | | 616 | | |
Shares Redeemed | | | (2,241 | ) | | | (1,728 | ) | |
Net Increase (Decrease) in Class I Shares Outstanding | | | (1,616 | ) | | | 736 | | |
Class II: | |
Shares Subscribed | | | 499 | | | | 1,846 | | |
Shares Issued on Distributions Reinvested | | | 185 | | | | 673 | | |
Shares Redeemed | | | (2,337 | ) | | | (1,795 | ) | |
Net Increase (Decrease) in Class II Shares Outstanding | | | (1,653 | ) | | | 724 | | |
The accompanying notes are an integral part of the financial statements.
8
Morgan Stanley Variable Insurance Fund, Inc.
Annual Report – December 31, 2021
Financial Highlights
U.S. Real Estate Portfolio
| | | Class I | |
| | | Year Ended December 31, | |
Selected Per Share Data and Ratios | | 2021 | | 2020 | | 2019 | | 2018 | | 2017 | |
Net Asset Value, Beginning of Period | | $ | 17.13 | | | $ | 21.93 | | | $ | 19.52 | | | $ | 21.72 | | | $ | 21.39 | | |
Income (Loss) from Investment Operations: | |
Net Investment Income(1) | | | 0.27 | | | | 0.35 | | | | 0.51 | | | | 0.51 | | | | 0.45 | | |
Net Realized and Unrealized Gain (Loss) | | | 6.49 | | | | (4.20 | ) | | | 3.15 | | | | (2.13 | ) | | | 0.20 | | |
Total from Investment Operations | | | 6.76 | | | | (3.85 | ) | | | 3.66 | | | | (1.62 | ) | | | 0.65 | | |
Distributions from and/or in Excess of: | |
Net Investment Income | | | (0.42 | ) | | | (0.48 | ) | | | (0.42 | ) | | | (0.58 | ) | | | (0.32 | ) | |
Net Realized Gain | | | — | | | | (0.47 | ) | | | (0.83 | ) | | | — | | | | — | | |
Total Distributions | | | (0.42 | ) | | | (0.95 | ) | | | (1.25 | ) | | | (0.58 | ) | | | (0.32 | ) | |
Net Asset Value, End of Period | | $ | 23.47 | | | $ | 17.13 | | | $ | 21.93 | | | $ | 19.52 | | | $ | 21.72 | | |
Total Return(2) | | | 39.80 | % | | | (16.85 | )% | | | 18.94 | % | | | (7.71 | )% | | | 3.11 | % | |
Ratios to Average Net Assets and Supplemental Data: | |
Net Assets, End of Period (Thousands) | | $ | 194,007 | | | $ | 169,291 | | | $ | 200,635 | | | $ | 185,191 | | | $ | 228,487 | | |
Ratio of Expenses Before Expense Limitation | | | 0.98 | % | | | 0.99 | % | | | 0.97 | % | | | 1.03 | % | | | 1.07 | % | |
Ratio of Expenses After Expense Limitation | | | 0.82 | %(3) | | | 0.82 | %(3) | | | 0.82 | %(3) | | | 0.86 | %(3)(4) | | | 0.92 | %(3)(5) | |
Ratio of Net Investment Income | | | 1.36 | %(3) | | | 2.07 | %(3) | | | 2.36 | %(3) | | | 2.47 | %(3) | | | 2.13 | %(3) | |
Ratio of Rebate from Morgan Stanley Affiliates | | | 0.00 | %(6) | | | 0.00 | %(6) | | | 0.00 | %(6) | | | 0.00 | %(6) | | | 0.00 | %(6) | |
Portfolio Turnover Rate | | | 129 | % | | | 50 | % | | | 20 | % | | | 40 | % | | | 44 | % | |
(1) Per share amount is based on average shares outstanding.
(2) Calculated based on the net asset value as of the last business day of the period. Performance does not reflect fees and expenses imposed by your insurance company's separate account. If performance information included the effect of these additional charges, the total return would be lower.
(3) The Ratio of Expenses After Expense Limitation and Ratio of Net Investment Income reflect the rebate of certain Fund expenses in connection with the investments in Morgan Stanley affiliates during the period. The effect of the rebate on the ratios is disclosed in the above table as "Ratio of Rebate from Morgan Stanley Affiliates."
(4) Effective July 1, 2018, the Adviser has agreed to limit the ratio of expenses to average net assets to the maximum ratio of 0.82% for Class I shares. Prior to July 1, 2018, the maximum ratio was 0.90% for Class I shares.
(5) Effective July 1, 2017, the Adviser has agreed to limit the ratio of expenses to average net assets to the maximum ratio of 0.90% for Class I shares. Prior to July 1, 2017, the maximum ratio was 0.95% for Class I shares.
(6) Amount is less than 0.005%.
The accompanying notes are an integral part of the financial statements.
9
Morgan Stanley Variable Insurance Fund, Inc.
Annual Report – December 31, 2021
Financial Highlights
U.S. Real Estate Portfolio
| | | Class II | |
| | | Year Ended December 31, | |
Selected Per Share Data and Ratios | | 2021 | | 2020 | | 2019 | | 2018 | | 2017 | |
Net Asset Value, Beginning of Period | | $ | 17.03 | | | $ | 21.80 | | | $ | 19.40 | | | $ | 21.59 | | | $ | 21.26 | | |
Income (Loss) from Investment Operations: | |
Net Investment Income(1) | | | 0.22 | | | | 0.30 | | | | 0.45 | | | | 0.46 | | | | 0.40 | | |
Net Realized and Unrealized Gain (Loss) | | | 6.44 | | | | (4.17 | ) | | | 3.14 | | | | (2.13 | ) | | | 0.20 | | |
Total from Investment Operations | | | 6.66 | | | | (3.87 | ) | | | 3.59 | | | | (1.67 | ) | | | 0.60 | | |
Distributions from and/or in Excess of: | |
Net Investment Income | | | (0.37 | ) | | | (0.43 | ) | | | (0.36 | ) | | | (0.52 | ) | | | (0.27 | ) | |
Net Realized Gain | | | — | | | | (0.47 | ) | | | (0.83 | ) | | | — | | | | — | | |
Total Distributions | | | (0.37 | ) | | | (0.90 | ) | | | (1.19 | ) | | | (0.52 | ) | | | (0.27 | ) | |
Net Asset Value, End of Period | | $ | 23.32 | | | $ | 17.03 | | | $ | 21.80 | | | $ | 19.40 | | | $ | 21.59 | | |
Total Return(2) | | | 39.44 | % | | | (17.10 | )% | | | 18.68 | % | | | (7.97 | )% | | | 2.87 | % | |
Ratios to Average Net Assets and Supplemental Data: | |
Net Assets, End of Period (Thousands) | | $ | 222,388 | | | $ | 190,554 | | | $ | 228,085 | | | $ | 218,290 | | | $ | 283,481 | | |
Ratio of Expenses Before Expense Limitation | | | 1.23 | % | | | 1.24 | % | | | 1.22 | % | | | 1.28 | % | | | 1.32 | % | |
Ratio of Expenses After Expense Limitation | | | 1.07 | %(3) | | | 1.07 | %(3) | | | 1.07 | %(3) | | | 1.11 | %(3)(4) | | | 1.17 | %(3)(5) | |
Ratio of Net Investment Income | | | 1.11 | %(3) | | | 1.82 | %(3) | | | 2.11 | %(3) | | | 2.22 | %(3) | | | 1.88 | %(3) | |
Ratio of Rebate from Morgan Stanley Affiliates | | | 0.00 | %(6) | | | 0.00 | %(6) | | | 0.00 | %(6) | | | 0.00 | %(6) | | | 0.00 | %(6) | |
Portfolio Turnover Rate | | | 129 | % | | | 50 | % | | | 20 | % | | | 40 | % | | | 44 | % | |
(1) Per share amount is based on average shares outstanding.
(2) Calculated based on the net asset value as of the last business day of the period. Performance does not reflect fees and expenses imposed by your insurance company's separate account. If performance information included the effect of these additional charges, the total return would be lower.
(3) The Ratio of Expenses After Expense Limitation and Ratio of Net Investment Income reflect the rebate of certain Fund expenses in connection with the investments in Morgan Stanley affiliates during the period. The effect of the rebate on the ratios is disclosed in the above table as "Ratio of Rebate from Morgan Stanley Affiliates."
(4) Effective July 1, 2018, the Adviser has agreed to limit the ratio of expenses to average net assets to the maximum ratio of 1.07% for Class II shares. Prior to July 1, 2018, the maximum ratio was 1.15% for Class II shares.
(5) Effective July 1, 2017, the Adviser has agreed to limit the ratio of expenses to average net assets to the maximum ratio of 1.15% for Class II shares. Prior to July 1, 2017, the maximum ratio was 1.20% for Class II shares.
(6) Amount is less than 0.005%.
The accompanying notes are an integral part of the financial statements.
10
Morgan Stanley Variable Insurance Fund, Inc.
Annual Report – December 31, 2021
Notes to Financial Statements
Morgan Stanley Variable Insurance Fund, Inc. (the "Company") is registered under the Investment Company Act of 1940, as amended (the "Act"), as an open-end management investment company. The Company is comprised of ten separate active, diversified and non-diversified funds (individually referred to as a "Fund," collectively as the "Funds"). The Company applies investment company accounting and reporting guidance.
The accompanying financial statements relate to the U.S. Real Estate Portfolio. The Fund seeks to provide above average current income and long-term capital appreciation by investing primarily in equity securities of companies in the U.S. real estate industry, including real estate investment trusts ("REITs"). The Fund offers two classes of shares — Class I and Class II. Both classes of shares have identical voting rights (except that shareholders of a Class have exclusive voting rights regarding any matter relating solely to that Class of shares), dividend, liquidation and other rights.
The Company is intended to be a funding vehicle for variable annuity contracts and variable life insurance policies offered by the separate accounts of certain life insurance companies.
A. Significant Accounting Policies: The following significant accounting policies are in conformity with U.S. generally accepted accounting principles ("GAAP"). Such policies are consistently followed by the Company in the preparation of its financial statements. GAAP may require management to make estimates and assumptions that affect the reported amounts and disclosures in the financial statements. Actual results may differ from those estimates.
1. Security Valuation: (1) An equity portfolio security listed or traded on an exchange is valued at its latest reported sales price (or at the exchange official closing price if such exchange reports an official closing price), and if there were no sales on a given day and if there is no official exchange closing price for that day, the security is valued at the mean between the last reported bid and asked prices if such bid and asked prices are available on the relevant exchanges. If only bid prices are available then the latest bid price may be used. Listed equity securities not traded on the valuation date with no reported bid and asked prices available on the exchange are valued at the mean between the current bid and asked prices obtained from one or more reputable brokers or dealers. In cases where a security is traded on more than one exchange, the security is valued on the exchange designated as the primary market; (2) all other equity portfolio securities for which over-the-counter ("OTC") market quotations are readily available are valued at the latest reported sales price (or at the market official closing price if such
market reports an official closing price), and if there was no trading in the security on a given day and if there is no official closing price from relevant markets for that day, the security is valued at the mean between the last reported bid and asked prices if such bid and asked prices are available on the relevant markets. An unlisted equity security that does not trade on the valuation date and for which bid and asked prices from the relevant markets are unavailable is valued at the mean between the current bid and asked prices obtained from one or more reputable brokers or dealers; (3) certain portfolio securities may be valued by an outside pricing service/vendor approved by the Company's Board of Directors (the "Directors"). The pricing service/vendor may employ a pricing model that takes into account, among other things, bids, yield spreads and/or other market data and specific security characteristics. Alternatively, if a valuation is not available from an outside pricing service/vendor, and the security trades on an exchange, the security may be valued at its latest reported sale price (or at the exchange official closing price if such exchange reports an official closing price), prior to the time when assets are valued. If there are no sales on a given day and if there is no official exchange closing price for that day, the security is valued at the mean between the last reported bid and asked prices if such bid and asked prices are available in the relevant exchanges. If only bid prices are available then the latest bid price may be used. If Morgan Stanley Investment Management Inc. (the "Adviser"), a wholly-owned subsidiary of Morgan Stanley, determines that the price provided by the outside pricing service/vendor or exchange does not reflect the security's fair value or is unable to provide a price, prices from brokers or dealers may also be utilized. In these circumstances, the value of the security will be the mean of bid and asked prices obtained from brokers or dealers; (4) when market quotations are not readily available, including circumstances under which the Adviser determines that the closing price, last sale price or the mean between the last reported bid and asked prices are not reflective of a security's market value, portfolio securities are valued at their fair value as determined in good faith under procedures established by and under the general supervision of the Directors. Occasionally, developments affecting the closing prices of securities and other assets may occur between the times at which valuations of such securities are determined (that is, close of the foreign market on which the securities trade) and the close of business of the New York Stock Exchange ("NYSE"). If developments occur during such periods that are expected to materially affect the value of such securities, such valuations may be adjusted to reflect the
11
Morgan Stanley Variable Insurance Fund, Inc.
Annual Report – December 31, 2021
Notes to Financial Statements (cont'd)
estimated fair value of such securities as of the close of the NYSE, as determined in good faith by the Directors or by the Adviser using a pricing service and/or procedures approved by the Directors; and (5) investments in mutual funds, including the Morgan Stanley Institutional Liquidity Funds, are valued at the net asset value ("NAV") as of the close of each business day.
The Directors have responsibility for determining in good faith the fair value of the investments, and the Directors may appoint others, such as the Company's Adviser or a valuation committee, to assist the Directors in determining fair value and to make the actual calculations pursuant to the fair valuation methodologies previously approved by the Directors. Under procedures approved by the Directors, the Company's Adviser has formed a Valuation Committee whose members are approved by the Directors. The Valuation Committee provides administration and oversight of the Company's valuation policies and procedures, which are reviewed at least annually by the Directors. These procedures allow the Company to utilize independent pricing services, quotations from securities and financial instrument dealers and other market sources to determine fair value.
The Fund invests a significant portion of its assets in securities of REITs. The market's perception of prospective declines in private real estate values and other financial assets may result in increased volatility of market prices that can negatively impact the valuation of certain issuers held by the Fund.
2. Fair Value Measurement: Financial Accounting Standards Board ("FASB") Accounting Standards CodificationTM ("ASC") 820, "Fair Value Measurement" ("ASC 820"), defines fair value as the value that the Fund would receive to sell an investment or pay to transfer a liability in a timely transaction with an independent buyer in the principal market, or in the absence of a principal market, the most advantageous market for the investment or liability. ASC 820 establishes a three-tier hierarchy to distinguish between (1) inputs that reflect the assumptions market participants would use in valuing an asset or liability developed based on market data obtained from sources independent of the reporting entity (observable inputs) and (2) inputs that reflect the reporting entity's own assumptions about the assumptions market participants would use in valuing an asset or liability developed based on the best information available in the circumstances (unobservable inputs) and to establish classification of fair value measurements for disclosure purposes. Various inputs are used in determining the value of the
Fund's investments. The inputs are summarized in the three broad levels listed below:
• Level 1 – unadjusted quoted prices in active markets for identical investments
• Level 2 – other significant observable inputs (including quoted prices for similar investments, interest rates, prepayment speeds, credit risk, etc.)
• Level 3 – significant unobservable inputs including the Fund's own assumptions in determining the fair value of investments. Factors considered in making this determination may include, but are not limited to, information obtained by contacting the issuer, analysts, or the appropriate stock exchange (for exchange-traded securities), analysis of the issuer's financial statements or other available documents and, if necessary, available information concerning other securities in similar circumstances.
The inputs or methodology used for valuing securities are not necessarily an indication of the risk associated with investing in those securities and the determination of the significance of a particular input to the fair value measurement in its entirety requires judgment and considers factors specific to each security.
The following is a summary of the inputs used to value the Fund's investments as of December 31, 2021:
Investment Type | | Level 1
Unadjusted
quoted
prices
(000) | | Level 2
Other
significant
observable
inputs
(000) | | Level 3
Significant
unobservable
inputs
(000) | | Total
(000) | |
Assets: | |
Common Stocks | |
Apartments | | $ | 56,178 | | | $ | — | | | $ | — | | | $ | 56,178 | | |
Data Centers | | | 30,712 | | | | — | | | | — | | | | 30,712 | | |
Free Standing | | | 25,647 | | | | — | | | | — | | | | 25,647 | | |
Health Care | | | 54,912 | | | | — | | | | — | | | | 54,912 | | |
Industrial | | | 67,806 | | | | — | | | | — | | | | 67,806 | | |
Lodging/Resorts | | | 8,879 | | | | — | | | | — | | | | 8,879 | | |
Manufactured Homes | | | 15,757 | | | | — | | | | — | | | | 15,757 | | |
Office | | | 21,057 | | | | — | | | | — | | | | 21,057 | | |
Regional Malls | | | 12,578 | | | | — | | | | — | | | | 12,578 | | |
Self Storage | | | 57,032 | | | | — | | | | — | | | | 57,032 | | |
Shopping Centers | | | 34,423 | | | | — | | | | — | | | | 34,423 | | |
Single Family Homes | | | 11,796 | | | | — | | | | — | | | | 11,796 | | |
Specialty | | | 21,127 | | | | — | | | | — | | | | 21,127 | | |
Total Common Stocks | | | 417,904 | | | | — | | | | — | | | | 417,904 | | |
Short-Term Investment | |
Investment Company | | | 425 | | | | — | | | | — | | | | 425 | | |
Total Assets | | $ | 418,329 | | | $ | — | | | $ | — | | | $ | 418,329 | | |
12
Morgan Stanley Variable Insurance Fund, Inc.
Annual Report – December 31, 2021
Notes to Financial Statements (cont'd)
Transfers between investment levels may occur as the markets fluctuate and/or the availability of data used in an investment's valuation changes.
3. Foreign Currency Translation and Foreign Investments: The books and records of the Fund are maintained in U.S. dollars. Foreign currency amounts are translated into U.S. dollars as follows:
— investments, other assets and liabilities at the prevailing rate of exchange on the valuation date;
— investment transactions and investment income at the prevailing rates of exchange on the dates of such transactions.
Although the net assets of the Fund are presented at the foreign exchange rates and market values at the close of the period, the Fund does not isolate that portion of the results of operations arising as a result of changes in the foreign exchange rates from the fluctuations arising from changes in the market prices of securities held at period end. Similarly, the Fund does not isolate the effect of changes in foreign exchange rates from the fluctuations arising from changes in the market prices of securities sold during the period. Accordingly, realized and unrealized foreign currency gains (losses) on investments in securities are included in the reported net realized and unrealized gains (losses) on investment transactions and balances. However, pursuant to U.S. federal income tax regulations, gains and losses from certain foreign currency transactions and the foreign currency portion of gains and losses realized on sales and maturities of foreign denominated debt securities are treated as ordinary income for U.S. federal income tax purposes.
Net realized gains (losses) on foreign currency transactions represent net foreign exchange gains (losses) from foreign currency forward exchange contracts, disposition of foreign currencies, currency gains (losses) realized between the trade and settlement dates on securities transactions, and the difference between the amount of investment income and foreign withholding taxes recorded on the Fund's books and the U.S. dollar equivalent amounts actually received or paid. The change in unrealized currency gains (losses) on foreign currency transactions for the period is reflected in the Statement of Operations.
Foreign security and currency transactions may involve certain considerations and risks not typically associated with those of U.S. dollar denominated transactions as a result of, among other factors, fluctuations of exchange rates in relation to the U.S. dollar, the possibility of lower
levels of governmental supervision and regulation of foreign securities markets and the possibility of political or economic instability.
Governmental approval for foreign investments may be required in advance of making an investment under certain circumstances in some countries, and the extent of foreign investments in domestic companies may be subject to limitation in other countries. Foreign ownership limitations also may be imposed by the charters of individual companies to prevent, among other concerns, violations of foreign investment limitations. As a result, an additional class of shares (identified as "Foreign" in the Portfolio of Investments) may be created and offered for investment. The "local" and "foreign shares" market values may differ. In the absence of trading of the foreign shares in such markets, the Fund values the foreign shares at the closing exchange price of the local shares.
4. Securities Lending: The Fund lends securities to qualified financial institutions, such as broker-dealers, to earn additional income. Any increase or decrease in the fair value of the securities loaned that might occur and any interest earned or dividends declared on those securities during the term of the loan would remain in the Fund. The Fund would receive cash or securities as collateral in an amount equal to or exceeding 100% of the current fair value of the loaned securities. The collateral is marked-to-market daily by State Street Bank and Trust Company ("State Street"), the securities lending agent, to ensure that a minimum of 100% collateral coverage is maintained.
Based on pre-established guidelines, the securities lending agent invests any cash collateral that is received in an affiliated money market portfolio and repurchase agreements. Securities lending income is generated from the earnings on the invested collateral and borrowing fees, less any rebates owed to the borrowers and compensation to the lending agent, and is recorded as "Income from Securities Loaned — Net" in the Fund's Statement of Operations. Risks in securities lending transactions are that a borrower may not provide additional collateral when required or return the securities when due, and that the value of the short-term investments will be less than the amount of cash collateral plus any rebate that is required to be returned to the borrower.
The Fund has the right under the securities lending agreement to recover the securities from the borrower on demand.
13
Morgan Stanley Variable Insurance Fund, Inc.
Annual Report – December 31, 2021
Notes to Financial Statements (cont'd)
At December 31, 2021, the Fund did not have any outstanding securities on loan.
5. Indemnifications: The Company enters into contracts that contain a variety of indemnifications. The Company's maximum exposure under these arrangements is unknown. However, the Company has not had prior claims or losses pursuant to these contracts and expects the risk of loss to be remote.
6. Security Transactions, Income and Expenses: Security transactions are accounted for on the trade date (date the order to buy or sell is executed). Realized gains and losses on the sale of investment securities are determined on the specific identified cost method. Dividend income and other distributions are recorded on the ex-dividend date (except for certain foreign dividends which may be recorded as soon as the Fund is informed of such dividends) net of applicable withholding taxes. Non-cash dividends received in the form of stock, if any, are recognized on the ex-dividend date and recorded as non-cash dividend income at fair value. Interest income is recognized on the accrual basis net of applicable withholding taxes except where collection is in doubt. Discounts are accreted and premiums are amortized over the life of the respective securities. Most expenses of the Company can be directly attributed to a particular Fund. Expenses which cannot be directly attributed are apportioned among the Funds based upon relative net assets or other appropriate methods. Income, expenses (other than class specific expenses) and realized and unrealized gains or losses are allocated to each class of shares based upon their relative net assets.
The Fund owns shares of REITs which report information on the source of their distributions annually in the following calendar year. A portion of distributions received from REITs during the year is estimated to be a return of capital and is recorded as a reduction of their cost.
7. Dividends and Distributions to Shareholders: Dividends and distributions to shareholders are recorded on the ex-dividend date. Dividends from net investment income, if any, are declared and paid annually. Net realized capital gains, if any, are distributed at least annually.
B. Advisory Fees: The Adviser, a wholly-owned subsidiary of Morgan Stanley, provides the Fund with advisory services under the terms of an Investment Advisory Agreement, paid quarterly, at the annual rate based on the daily net assets as follows:
First $500
million | | Next $500
million | | Over $1
billion | |
| | 0.70 | % | | | 0.65 | % | | | 0.60 | % | |
For the year ended December 31, 2021, the advisory fee rate (net of waiver/rebate) was equivalent to an annual effective rate of 0.54% of the Fund's average daily net assets.
The Adviser has agreed to reduce its advisory fee and/or reimburse the Fund so that total annual Fund operating expenses, excluding certain investment related expenses, taxes, interest and other extraordinary expenses (including litigation), will not exceed 0.82% for Class I shares and 1.07% for Class II shares. The fee waivers and/or expense reimbursements will continue for at least one year from the date of the Fund's prospectus or until such time as the Directors act to discontinue all or a portion of such waivers and/or reimbursements when they deem such action is appropriate. For the year ended December 31, 2021, approximately $607,000 of advisory fees were waived pursuant to this arrangement.
C. Administration Fees: The Adviser also serves as Administrator to the Company and provides administrative services pursuant to an Administration Agreement for an annual fee, accrued daily and paid monthly, of 0.08% of the Fund's average daily net assets.
Under a Sub-Administration Agreement between the Administrator and State Street, State Street provides certain administrative services to the Company. For such services, the Administrator pays State Street a portion of the fee the Administrator receives from the Fund.
D. Servicing Fees: The Company accrues daily and pays quarterly a servicing fee of up to 0.17% of the average daily value of shares of the Fund held in an insurance company's account. Certain insurance companies have entered into a servicing agreement with the Company to provide administrative and other contract-owner related services on behalf of the Fund.
E. Distribution Fees: Morgan Stanley Distribution, Inc. ("MSDI" or the "Distributor"), a wholly-owned subsidiary of the Adviser and an indirect subsidiary of Morgan Stanley, serves as the Distributor of the Fund and provides the Fund's Class II shareholders with distribution services pursuant to a Distribution Plan (the "Plan") in accordance with Rule 12b-1 under the Act. Under the Plan, the Fund is authorized to pay the Distributor a distribution fee, which is accrued daily and paid monthly, at an annual rate of 0.25% of the Fund's average daily net assets attributable to Class II shares.
F. Dividend Disbursing and Transfer Agent: The Company's dividend disbursing and transfer agent is DST Asset Manager Solutions, Inc. ("DST"). Pursuant to a Transfer Agency Agreement, the Company pays DST a fee based on the number of classes, accounts and transactions relating to the Funds of the Company.
14
Morgan Stanley Variable Insurance Fund, Inc.
Annual Report – December 31, 2021
Notes to Financial Statements (cont'd)
G. Custodian Fees: State Street (the "Custodian") also serves as Custodian for the Company in accordance with a Custodian Agreement. The Custodian holds cash, securities and other assets of the Company as required by the Act. Custody fees are payable monthly based on assets held in custody, investment purchases and sales activity and account maintenance fees, plus reimbursement for certain out-of-pocket expenses.
H. Security Transactions and Transactions with Affiliates: For the year ended December 31, 2021, purchases and sales of investment securities for the Fund, other than long-term U.S. Government securities and short-term investments were approximately $488,970,000 and $541,828,000, respectively. There were no purchases and sales of long-term U.S. Government securities for the year ended December 31, 2021.
The Fund invests in the Institutional Class of the Morgan Stanley Institutional Liquidity Funds — Treasury Portfolio (the "Liquidity Funds"), an open-end management investment company managed by the Adviser, both directly and as a portion of the securities held as collateral on loaned securities. Advisory fees paid by the Fund are reduced by an amount equal to its pro-rata share of the advisory and administration fees paid by the Fund due to its investment in the Liquidity Funds. For the year ended December 31, 2021, advisory fees paid were reduced by approximately $2,000 relating to the Fund's investment in the Liquidity Funds.
A summary of the Fund's transactions in shares of affiliated investments during the year ended December 31, 2021 is as follows:
Affiliated
Investment
Company | | Value
December 31,
2020
(000) | | Purchases
at Cost
(000) | | Proceeds
from Sales
(000) | | Dividend
Income
(000) | |
Liquidity Funds | | $ | 5,321 | | | $ | 129,473 | | | $ | 134,369 | | | $ | — | @ | |
Affiliated
Investment
Company (cont'd) | | Realized
Gain (Loss)
(000) | | Change in
Unrealized
Appreciation
(Depreciation)
(000) | | Value
December 31,
2021
(000) | |
Liquidity Funds | | $ | — | | | $ | — | | | $ | 425 | | |
@ Amount is less than $500.
The Fund is permitted to purchase and sell securities ("cross-trade") from and to other Morgan Stanley funds as well as other funds and client accounts for which the Adviser or an affiliate of the Adviser serves as investment adviser, pursuant to procedures approved by the Directors in compliance with
Rule 17a-7 under the Act (the "Rule"). Each cross-trade is executed at the current market price in compliance with provisions of the Rule. For the year ended December 31, 2021, the Fund did not engage in any cross-trade transactions.
The Fund has an unfunded Deferred Compensation Plan (the "Compensation Plan"), which allows each independent Director to defer payment of all, or a portion, of the fees he or she receives for serving on the Board of Directors. Each eligible Director generally may elect to have the deferred amounts credited with a return equal to the total return on one or more of the Morgan Stanley funds that are offered as investment options under the Compensation Plan. Appreciation/depreciation and distributions received from these investments are recorded with an offsetting increase/decrease in the deferred compensation obligation and do not affect the NAV of the Fund.
I. Federal Income Taxes: It is the Fund's intention to continue to qualify as a regulated investment company and distribute all of its taxable and tax-exempt income. Accordingly, no provision for federal income taxes is required in the financial statements.
The Fund may be subject to taxes imposed by countries in which it invests. Such taxes are generally based on income and/or capital gains earned or repatriated. Taxes are accrued based on net investment income, net realized gains and net unrealized appreciation as such income and/or gains are earned. Taxes may also be based on transactions in foreign currency and are accrued based on the value of investments denominated in such currency.
FASB ASC 740-10, "Income Taxes — Overall", sets forth a minimum threshold for financial statement recognition of the benefit of a tax position taken or expected to be taken in a tax return. Management has concluded there are no significant uncertain tax positions that would require recognition in the financial statements. If applicable, the Fund recognizes interest accrued related to unrecognized tax benefits in "Interest Expense" and penalties in "Other Expenses" in the Statement of Operations. The Fund files tax returns with the U.S. Internal Revenue Service, New York and various states. Generally, each of the tax years in the four-year period ended December 31, 2021 remains subject to examination by taxing authorities.
The tax character of distributions paid may differ from the character of distributions shown for GAAP purposes due to short-term capital gains being treated as ordinary income for
15
Morgan Stanley Variable Insurance Fund, Inc.
Annual Report – December 31, 2021
Notes to Financial Statements (cont'd)
tax purposes. The tax character of distributions paid during fiscal years 2021 and 2020 was as follows:
2021 Distributions
Paid From: | | 2020 Distributions
Paid From: | |
Ordinary
Income
(000) | | Long-Term
Capital Gain
(000) | | Ordinary
Income
(000) | | Long-Term
Capital Gain
(000) | |
| $ | 7,396 | | | $ | — | | | $ | 9,512 | | | $ | 9,477 | | |
The amount and character of income and gains to be distributed are determined in accordance with income tax regulations which may differ from GAAP. These book/tax differences are either considered temporary or permanent in nature.
Temporary differences are attributable to differing book and tax treatments for the timing of the recognition of gains (losses) on certain investment transactions and the timing of the deductibility of certain expenses.
The Fund had no permanent differences causing reclassifications among the components of net assets for the year ended December 31, 2021.
At December 31, 2021, the components of distributable earnings for the Fund on a tax basis were as follows:
Undistributed
Ordinary
Income
(000) | | Undistributed
Long-Term
Capital Gain
(000) | |
| $ | 33,500 | | | $ | 43,031 | | |
During the year ended December 31, 2021, the Fund utilized capital loss carryforwards for U.S. federal income tax purposes of approximately $35,808,000.
J. Credit Facility: The Company and other Morgan Stanley funds participated in a $300,000,000 committed, unsecured revolving line of credit facility (the "Facility") with State Street. This Facility is to be used for temporary emergency purposes or funding of shareholder redemption requests. The interest rate on borrowings is based on the federal funds rate or 1 month LIBOR rate plus a spread. Effective April 19, 2021, the interest rate on borrowings is based on the federal funds effective rate or overnight bank funding rate plus a spread. The Facility also has a commitment fee of 0.25% per annum based on the unused portion of the Facility. During the year ended December 31, 2021, the Fund did not have any borrowings under the Facility.
K. Other: At December 31, 2021, the Fund had record owners of 10% or greater. Investment activities of these shareholders could have a material impact on the Fund. The aggregate percentage of such owners was 62.6%.
L. Market Risk: The outbreak of the coronavirus ("COVID-19") and the recovery responses could adversely
impact the operations of the Fund and its service providers and financial performance of the Fund and the Fund's investments. The extent of such impact depends on future developments, including (i) the duration and spread of the outbreak, (ii) the restrictions and advisories, (iii) the effects on the financial markets, (iv) government and regulatory responses, and (v) the effects on the economy overall as a result of developments such as disruption to consumer demand, economic output and supply chains. The duration and extent of COVID-19 and associated economic and market conditions and uncertainty over the long term cannot be reasonably estimated at this time. The ultimate impact of COVID-19 and the extent to which the associated conditions impact the Fund will also depend on future developments, which are highly uncertain, difficult to accurately predict and subject to change at any time. If the financial performance of the Fund's investments is impacted because of these factors for an extended period, the Fund's investment results may be adversely affected.
16
Morgan Stanley Variable Insurance Fund, Inc.
Annual Report – December 31, 2021
Report of Independent Registered Public Accounting Firm
To the Shareholders and Board of Directors of
Morgan Stanley Variable Insurance Fund, Inc. —
U.S. Real Estate Portfolio
Opinion on the Financial Statements
We have audited the accompanying statement of assets and liabilities of U.S. Real Estate Portfolio (the "Fund") (one of the funds constituting Morgan Stanley Variable Insurance Fund, Inc. (the "Company")), including the portfolio of investments, as of December 31, 2021, and the related statement of operations for the year then ended, the statements of changes in net assets for each of the two years in the period then ended, the financial highlights for each of the five years in the period then ended and the related notes (collectively referred to as the "financial statements"). In our opinion, the financial statements present fairly, in all material respects, the financial position of U.S. Real Estate Portfolio (one of the funds constituting Morgan Stanley Variable Insurance Fund, Inc.) at December 31, 2021, the results of its operations for the year then ended, the changes in its net assets for each of the two years in the period then ended and its financial highlights for each of the five years in the period then ended, in conformity with U.S. generally accepted accounting principles.
Basis for Opinion
These financial statements are the responsibility of the Company's management. Our responsibility is to express an opinion on the Fund's financial statements based on our audits. We are a public accounting firm registered with the Public Company Accounting Oversight Board (United States) ("PCAOB") and are required to be independent with respect to the Company in accordance with the U.S. federal securities law and the applicable rules and regulations of the Securities and Exchange Commission and the PCAOB.
We conducted our audits in accordance with the standards of the PCAOB. Those standards require that we plan and perform the audit to obtain reasonable assurance about whether the financial statements are free of material misstatement, whether due to error or fraud. The Company is not required to have, nor were we engaged to perform, an audit of the Company's internal control over financial reporting. As part of our audits, we are required to obtain an understanding of internal control over financial reporting, but not for the purpose of expressing an opinion on the effectiveness of the Company's internal control over financial reporting. Accordingly, we express no such opinion.
Our audits included performing procedures to assess the risks of material misstatement of the financial statements, whether due to error or fraud, and performing procedures that respond to those risks. Such procedures included examining, on a test basis, evidence regarding the amounts and disclosures in the financial statements. Our procedures included confirmation of securities owned as of December 31, 2021 by correspondence with the custodian and others or by other appropriate auditing procedures where replies from others were not received. Our audits also included evaluating the accounting principles used and significant estimates made by management, as well as evaluating the overall presentation of the financial statements. We believe that our audits provide a reasonable basis for our opinion.

We have served as the auditor of one or more Morgan Stanley investment companies since 2000.
Boston, Massachusetts
February 18, 2022
17
Morgan Stanley Variable Insurance Fund, Inc.
Annual Report – December 31, 2021
Liquidity Risk Management Program (unaudited)
In compliance with Rule 22e-4 under the Investment Company Act of 1940, as amended (the "Liquidity Rule"), the Fund has adopted and implemented a liquidity risk management program (the "Program"), which is reasonably designed to assess and manage the risk that the Fund could not meet requests to redeem shares issued by the Fund without significant dilution of remaining investors' interests in the Fund (i.e., liquidity risk). The Fund's Board of Directors (the "Board") previously approved the designation of the Liquidity Risk Subcommittee (the "LRS") as Program administrator. The LRS is comprised of representatives from various divisions within Morgan Stanley Investment Management.
At a meeting held on March 3-4, 2021, the Board reviewed a written report prepared by the LRS that addressed the Program's operation and assessed its adequacy, and effectiveness of implementation for the period from January 1, 2020, through December 31, 2020, as required under the Liquidity Rule, and discussed the impact of the COVID-19 pandemic on liquidity and the LRS's assessment of liquidity risk during the reporting period, including during the distressed market environment caused by the onset of the COVID-19 pandemic. The report concluded that the Program operated effectively and was adequately and effectively implemented in all material aspects, and that the relevant controls and safeguards were appropriately designed to enable the LRS to administer the Program in compliance with the Liquidity Rule.
In accordance with the Program, the LRS assessed each Fund's liquidity risk no less frequently than annually taking into consideration certain factors, as applicable, such as (i) investment strategy and liquidity of portfolio investments, (ii) short-term and long-term cash flow projections and (iii) holdings of cash and cash equivalents and borrowing arrangements and other funding sources. Certain factors are considered under both normal and reasonably foreseeable stressed conditions.
Each Fund portfolio investment is classified into one of four liquidity categories, which classification is assessed at least monthly by the LRS. The classification is based on a determination of the number of days it is reasonably expected to take to convert the investment into cash, or sell or dispose of the investment, in current market conditions without significantly changing the market value of the investment. Liquidity classification determinations take into account various market, trading and investment-specific considerations, as well as market depth, and in some cases utilize third-party vendor data.
The Liquidity Rule limits a fund's investments in illiquid investments to 15% of its net assets and requires funds that do not primarily hold assets that are highly liquid investments to determine and maintain a minimum percentage of the fund's net assets to be invested in highly liquid investments (highly liquid investment minimum or "HLIM"). The LRS believes that the Program includes provisions reasonably designed to review, monitor and comply with the 15% limit on illiquid investments and for determining, periodically reviewing and complying with the HLIM requirement, as applicable.
There can be no assurance that the Program will achieve its objectives under all circumstances in the future. Please refer to the Fund's prospectus for more information regarding the Fund's exposure to liquidity risk and other risks to which it may be subject.
18
Morgan Stanley Variable Insurance Fund, Inc.
Annual Report – December 31, 2021
Federal Tax Notice (unaudited)
For federal income tax purposes, the following information is furnished with respect to the distributions paid by the Fund during its taxable year ended December 31, 2021.
The Fund designated approximately $6,518,000 of its distributions paid as qualified business income.
In January, the Fund provides tax information to shareholders for the preceding calendar year.
19
Morgan Stanley Variable Insurance Fund, Inc.
Annual Report – December 31, 2021
Director and Officer Information (unaudited)
Independent Directors:
Name, Address and Birth
Year of Independent Director | | Position(s)
Held with
Registrant | | Length of
Time
Served* | | Principal Occupation(s) During Past 5 Years and
Other Relevant Professional Experience | | Number of
Funds
in Fund
Complex
Overseen
by
Independent
Director** | | Other Directorships Held by Independent
Director During Past 5 Years*** | |
Frank L. Bowman
c/o Perkins Coie LLP
Counsel to the Independent Directors
1155 Avenue of the Americas
22nd Floor
New York, NY 10036
Birth Year: 1944 | | Director | | Since August 2006 | | President, Strategic Decisions, LLC (consulting) (since February 2009); Director or Trustee of various Morgan Stanley Funds (since August 2006); Chairperson of the Compliance and Insurance Committee (since October 2015); formerly, Chairperson of the Insurance Sub-Committee of the Compliance and Insurance Committee (2007-2015); served as President and Chief Executive Officer of the Nuclear Energy Institute (policy organization) (February 2005-November 2008); retired as Admiral, U.S. Navy after serving over 38 years on active duty including 8 years as Director of the Naval Nuclear Propulsion Program in the Department of the Navy and the U.S. Department of Energy (1996-2004); served as Chief of Naval Personnel (July 1994-September 1996) and on the Joint Staff as Director of Political Military Affairs (June 1992-July 1994); knighted as Honorary Knight Commander of the Most Excellent Order of the British Empire; awarded the Officier de l'Orde National du Mérite by the French Government; elected to the National Academy of Engineering (2009). | | | 77 | | | Director of Naval and Nuclear Technologies LLP; Director Emeritus of the Armed Services YMCA; Member of the National Security Advisory Council of the Center for U.S. Global Engagement and a member of the CNA Military Advisory Board; Chairman of Fairhaven United Methodist Church; Member of the Board of Advisors of the Dolphin Scholarship Foundation; Director of other various nonprofit organizations; formerly, Director of BP, plc (November 2010-May 2019). | |
Kathleen A. Dennis
c/o Perkins Coie LLP
Counsel to the Independent Directors
1155 Avenue of the Americas
22nd Floor
New York, NY 10036
Birth Year: 1953 | | Director | | Since August 2006 | | Chairperson of the Governance Committee (since January 2021), Chairperson of the Liquidity and Alternatives Sub-Committee of the Investment Committee (2006-2020) and Director or Trustee of various Morgan Stanley Funds (since August 2006); President, Cedarwood Associates (mutual fund and investment management consulting) (since July 2006); formerly, Senior Managing Director of Victory Capital Management (1993-2006). | | | 77 | | | Board Member, University of Albany Foundation (2012-present); Board Member, Mutual Funds Directors Forum (2014-present); Director of various non-profit organizations. | |
Nancy C. Everett
c/o Perkins Coie LLP
Counsel to the Independent Directors
1155 Avenue of the Americas
22nd Floor
New York, NY 10036
Birth Year: 1955 | | Director | | Since January 2015 | | Chairperson of the Equity Investment Committee (since January 2021); Director or Trustee of various Morgan Stanley Funds (since January 2015); Chief Executive Officer, Virginia Commonwealth University Investment Company (since November 2015); Owner, OBIR, LLC (institutional investment management consulting) (since June 2014); formerly, Managing Director, BlackRock, Inc. (February 2011-December 2013) and Chief Executive Officer, General Motors Asset Management (a/k/a Promark Global Advisors, Inc.) (June 2005-May 2010). | | | 78 | | | Formerly, Member of Virginia Commonwealth University School of Business Foundation (2005-2016); Member of Virginia Commonwealth University Board of Visitors (2013-2015); Member of Committee on Directors for Emerging Markets Growth Fund, Inc. (2007-2010); Chairperson of Performance Equity Management, LLC (2006-2010); and Chairperson, GMAM Absolute Return Strategies Fund, LLC (2006-2010). | |
20
Morgan Stanley Variable Insurance Fund, Inc.
Annual Report – December 31, 2021
Director and Officer Information (unaudited) (cont'd)
Independent Directors (cont'd):
Name, Address and Birth
Year of Independent Director | | Position(s)
Held with
Registrant | | Length of
Time
Served* | | Principal Occupation(s) During Past 5 Years and
Other Relevant Professional Experience | | Number of
Funds
in Fund
Complex
Overseen
by
Independent
Director** | | Other Directorships Held by Independent
Director During Past 5 Years*** | |
Jakki L. Haussler
c/o Perkins Coie LLP
Counsel to the Independent Directors
1155 Avenue of the Americas
22nd Floor
New York, NY 10036
Birth Year: 1957 | | Director | | Since January 2015 | | Director or Trustee of various Morgan Stanley Funds (since January 2015); Chairman, Opus Capital Group (since 1996); formerly, Chief Executive Officer, Opus Capital Group (1996-2019); Director, Capvest Venture Fund, LP (May 2000-December 2011); Partner, Adena Ventures, LP (July 1999-December 2010); Director, The Victory Funds (February 2005-July 2008). | | | 78 | | | Director, Barnes Group Inc. (since July 2021); Director of Cincinnati Bell Inc. and Member, Audit Committee and Chairman, Governance and Nominating Committee; Director of Service Corporation International and Member, Audit Committee and Investment Committee; Director of Northern Kentucky University Foundation and Member, Investment Committee; Member of Chase College of Law Transactional Law Practice Center Board of Advisors; Director of Best Transport; Director of Chase College of Law Board of Visitors; formerly, Member, University of Cincinnati Foundation Investment Committee; Member, Miami University Board of Visitors (2008-2011); Trustee of Victory Funds (2005-2008) and Chairman, Investment Committee (2007-2008) and Member, Service Provider Committee (2005-2008). | |
Dr. Manuel H. Johnson
c/o Johnson Smick
International, Inc.
220 I Street, NE Suite 200
Washington, D.C. 20002
Birth Year: 1949 | | Director | | Since
July
1991 | | Senior Partner, Johnson Smick International, Inc. (consulting firm); Chairperson of the Fixed Income, Liquidity and Alternatives Investment Committee (since January 2021), Chairperson of the Investment Committee (2006-2020) and Director or Trustee of various Morgan Stanley Funds (since July 1991); Co-Chairman and a founder of the Group of Seven Council (G7C) (international economic commission); formerly, Chairperson of the Audit Committee (July 1991-September 2006); Vice Chairman of the Board of Governors of the Federal Reserve System and Assistant Secretary of the U.S. Treasury. | | | 77 | | | Director of NVR, Inc. (home construction). | |
Joseph J. Kearns
c/o Perkins Coie LLP
Counsel to the Independent Directors
1155 Avenue of the Americas
22nd Floor
New York, NY 10036
Birth Year: 1942 | | Director | | Since
August 1994 | | Senior Adviser, Kearns & Associates LLC (investment consulting); Chairperson of the Audit Committee (since October 2006) and Director or Trustee of various Morgan Stanley Funds (since August 1994); formerly, Deputy Chairperson of the Audit Committee (July 2003-September 2006) and Chairperson of the Audit Committee of various Morgan Stanley Funds (since August 1994); CFO of the J. Paul Getty Trust (1982-1999). | | | 78 | | | Director, Rubicon Investments (since February 2019); Prior to August 2016, Director of Electro Rent Corporation (equipment leasing); Prior to December 31, 2013, Director of The Ford Family Foundation. | |
Michael F. Klein
c/o Perkins Coie LLP
Counsel to the Independent Directors
1155 Avenue of the Americas
22nd Floor
New York, NY 10036
Birth Year: 1958 | | Director | | Since
August 2006 | | Chairperson of the Risk Committee (since January 2021); Managing Director, Aetos Alternatives Management, LP (since March 2000); Co-President, Aetos Alternatives Management, LP (since January 2004) and Co-Chief Executive Officer of Aetos Alternatives Management, LP (since August 2013); Chairperson of the Fixed Income Sub-Committee of the Investment Committee (2006-2020) and Director or Trustee of various Morgan Stanley Funds (since August 2006); formerly, Managing Director, Morgan Stanley & Co. Inc. and Morgan Stanley Dean Witter Investment Management and President, various Morgan Stanley Funds (June 1998-March 2000); Principal, Morgan Stanley & Co. Inc. and Morgan Stanley Dean Witter Investment Management (August 1997-December 1999). | | | 77 | | | Director of certain investment funds managed or sponsored by Aetos Alternatives Management, LP; Director of Sanitized AG and Sanitized Marketing AG (specialty chemicals). | |
21
Morgan Stanley Variable Insurance Fund, Inc.
Annual Report – December 31, 2021
Director and Officer Information (unaudited) (cont'd)
Independent Directors (cont'd):
Name, Address and Birth
Year of Independent Director | | Position(s)
Held with
Registrant | | Length of
Time
Served* | | Principal Occupation(s) During Past 5 Years and
Other Relevant Professional Experience | | Number of
Funds
in Fund
Complex
Overseen
by
Independent
Director** | | Other Directorships Held by Independent
Director During Past 5 Years*** | |
Patricia A. Maleski
c/o Perkins Coie LLP
Counsel to the Independent Directors
1155 Avenue of the Americas
22nd Floor
New York, NY 10036
Birth Year: 1960 | | Director | | Since
January 2017 | | Director or Trustee of various Morgan Stanley Funds (since January 2017); Managing Director, JPMorgan Asset Management (2004-2016); Oversight and Control Head of Fiduciary and Conflicts of Interest Program (2015-2016); Chief Control Officer — Global Asset Management (2013-2015); President, JPMorgan Funds (2010-2013); Chief Administrative Officer (2004-2013); various other positions including Treasurer and Board Liaison (since 2001). | | | 78 | | | Trustee, Nutley Family Service Bureau, Inc. (since January 2022). | |
W. Allen Reed
c/o Perkins Coie LLP
Counsel to the Independent Directors
1155 Avenue of the Americas
22nd Floor
New York, NY 10036
Birth Year: 1947 | | Chair of the Board and Director | | Chair of the Board since August 2020 and Director since August 2006 | | Chair of the Boards of various Morgan Stanley Funds (since August 2020); Director or Trustee of various Morgan Stanley Funds (since August 2006); formerly, Vice Chair of the Boards of various Morgan Stanley Funds (January 2020-August 2020); President and Chief Executive Officer of General Motors Asset Management; Chairman and Chief Executive Officer of the GM Trust Bank and Corporate Vice President of General Motors Corporation (August 1994-December 2005). | | | 77 | | | Formerly, Director of Legg Mason, Inc. (2006-2019); and Director of the Auburn University Foundation (2010-2015). | |
Frances L. Cashman
c/o Perkins Coie LLP
Counsel to the Independent Directors
1155 Avenue of the Americas
22nd Floor
New York, NY 10036
Birth Year: 1961 | | Advisory Board Member | | Advisory Board Member Since January 2022 | | Chief Executive Officer, Asset Management Division, Euromoney Institutional Investor PLC (financial information) (May 2021-Present); Executive Vice President and various other roles, Legg Mason & Co. (asset management) (2010-2020); Managing Director, Stifel Nicolaus (2005-2010). | | | 78 | | | Trustee and Investment Committee Member, Georgia Tech Foundation (Since June 2019); Trustee and Chair of Marketing Committee, Loyola Blakefield (Since September 2017); Trustee, MMI Gateway Foundation (since September 2017); Director and Investment Committee Member, Catholic Community Foundation Board (2012-2018); Director and Investment Committee Member, St. Ignatius Loyola Academy (2011-2017). | |
Eddie A. Grier
c/o Perkins Coie LLP
Counsel to the Independent Directors
1155 Avenue of the Americas
22nd Floor
New York, NY 10036
Birth Year: 1955 | | Advisory Board Member | | Advisory Board Member Since January 2022 | | Dean, Santa Clara University Leavey School of Business (since April 2021); Dean, Virginia Commonwealth University School of Business (2010-2021); President and various other roles, Walt Disney Company (entertainment and media) (1981-2010). | | | 78 | | | Director, Witt/Keiffer, Inc. (executive search) (since 2016); Director, NuStar GP, LLC (energy) (since August 2021); Director, Sonida Senior Living, Inc. (residential community operator) (2016-2021); Director, NVR, Inc. (homebuilding) (2013-2020); Director, Middleburg Trust Company (wealth management) (2014-2019); Director, Colonial Williamsburg Company (since 2012); Regent, University of Massachusetts Global (since 2021); Director and Chair, ChildFund International (2012-2021); Trustee, Brandman University (2010-2021); Director, Richmond Forum (2012-2019). | |
* This is the earliest date the Director began serving the Morgan Stanley Funds. Each Director serves an indefinite term, until his or her successor is elected.
** The Fund Complex includes (as of December 31, 2021) all open-end and closed-end funds (including all of their portfolios) advised by Morgan Stanley Investment Management Inc. (the "Adviser") and any funds that have an adviser that is an affiliated person of the Adviser (including, but not limited to, Morgan Stanley AIP GP LP).
*** This includes any directorships at public companies and registered investment companies held by the Director at any time during the past five years.
22
Morgan Stanley Variable Insurance Fund, Inc.
Annual Report – December 31, 2021
Director and Officer Information (unaudited) (cont'd)
Executive Officers:
Name, Address and Birth Year of
Executive Officer | | Position(s)
Held with
Registrant | | Length of
Time Served* | | Principal Occupation(s) During Past 5 Years | |
John H. Gernon
522 Fifth Avenue
New York, NY 10036
Birth Year: 1963 | | President and Principal Executive Officer | | Since September 2013 | | President and Principal Executive Officer of the Equity and Fixed Income Funds and the Morgan Stanley AIP Funds (since September 2013) and the Liquidity Funds and various money market funds (since May 2014) in the Fund Complex; Managing Director of the Adviser. | |
Deidre A. Downes
1633 Broadway
New York, NY 10019
Birth Year: 1977 | | Chief Compliance Officer | | Since November 2021 | | Executive Director of the Adviser (since January 2021) and Chief Compliance Officer of various Morgan Stanley Funds (since November 2021). Formerly, Vice President and Corporate Counsel at PGIM and Prudential Financial (October 2016-December 2020). | |
Francis J. Smith
522 Fifth Avenue
New York, NY 10036
Birth Year: 1965 | | Treasurer and Principal Financial Officer | | Treasurer since July 2003 and Principal Financial Officer since September 2002 | | Managing Director of the Adviser and various entities affiliated with the Adviser; Treasurer (since July 2003) and Principal Financial Officer of various Morgan Stanley Funds (since September 2002). | |
Mary E. Mullin
1633 Broadway
New York, NY 10019
Birth Year: 1967 | | Secretary | | Since June 1999 | | Managing Director of the Adviser; Secretary of various Morgan Stanley Funds (since June 1999). | |
Michael J. Key
522 Fifth Avenue
New York, NY 10036
Birth Year: 1979 | | Vice President | | Since June 2017 | | Vice President of the Equity and Fixed Income Funds, Liquidity Funds, various money market funds and the Morgan Stanley AIP Funds in the Fund Complex (since June 2017); Executive Director of the Adviser; Head of Product Development for Equity and Fixed Income Funds (since August 2013). | |
* This is the earliest date the officer began serving the Morgan Stanley Funds. Each officer serves an indefinite term, until his or her successor is elected.
23
Morgan Stanley Variable Insurance Fund, Inc.
Annual Report – December 31, 2021
Adviser and Administrator
Morgan Stanley Investment Management Inc.
522 Fifth Avenue
New York, New York 10036
Distributor
Morgan Stanley Distribution, Inc.
522 Fifth Avenue
New York, New York 10036
Dividend Disbursing and Transfer Agent
DST Asset Manager Solutions, Inc.
2000 Crown Colony Drive
Quincy, Massachusetts 02169
Custodian
State Street Bank and Trust Company
One Lincoln Street
Boston, Massachusetts 02111
Legal Counsel
Dechert LLP
1095 Avenue of the Americas
New York, New York 10036
Counsel to the Independent Directors
Perkins Coie LLP
1155 Avenue of the Americas,
22nd Floor
New York, New York 10036
Independent Registered Public Accounting Firm
Ernst & Young LLP
200 Clarendon Street
Boston, Massachusetts 02116
Reporting to Shareholders
Each Morgan Stanley fund provides a complete schedule of portfolio holdings in its Semi-Annual and the Annual Reports within 60 days of the end of the fund's second and fourth fiscal quarters. The Semi-Annual and Annual Reports are filed electronically with the Securities and Exchange Commission ("SEC") on Form N-CSRS and Form N-CSR, respectively. Morgan Stanley also delivers the Semi-Annual and Annual Reports to fund shareholders and makes these reports available on its public website, www.morganstanley.com/im/shareholderreports. Each Morgan Stanley non-money market fund also files a complete schedule of portfolio holdings with the SEC for the fund's first and third fiscal quarters as an attachment to Form N-PORT. Morgan Stanley does not deliver the reports for the first and third fiscal quarters to shareholders, but makes the complete schedule of portfolio holdings for the fund's first and third fiscal quarters available on its public website. The holdings for each money market fund are also posted to the Morgan Stanley public website. You may obtain the Form N-PORT filings (as well as the Form N-CSR and N-CSRS filings) by accessing the SEC's website, www.sec.gov. You can also request copies of these materials, upon payment of a duplicating fee, by electronic request at the SEC's email address (publicinfo@sec.gov).
Proxy Voting Policies and Procedures and Proxy Voting Record
You may obtain a copy of the Company's Proxy Voting Policy and Procedures and information regarding how the Company voted proxies relating to portfolio securities during the most recent twelve-month period ended June 30, without charge, upon request, by calling toll free 1 (800) 548-7786 or by visiting our website at www.morganstanley.com/im/shareholderreports. This information is also available on the SEC's website at www.sec.gov.
This report is submitted for the general information of the shareholders of the Fund. For more detailed information about the Fund, its fees and expenses and other pertinent information, please read its Prospectus. The Company's Statement of Additional Information contains additional information about the Fund, including its Directors. It is available, without charge, by calling 1 (800) 548-7786.
Householding Notice
To reduce printing and mailing costs, the Fund attempts to eliminate duplicate mailings to the same address. The Fund delivers a single copy of certain shareholder documents, including shareholder reports, prospectuses and proxy materials, to investors with the same last name who reside at the same address. Your participation in this program will continue for an unlimited period of time unless you instruct us otherwise. You can request multiple copies of these documents by calling (800) 548-7786, 8:00 a.m. to 6:00 p.m., ET. Once our Customer Service Center has received your instructions, we will begin sending individual copies for each account within 30 days.
This report is not authorized for distribution to prospective investors in the Fund unless preceded or accompanied by an effective Prospectus. Read the Prospectus carefully before investing.
UIFREIANN
3997802 EXP 02.28.23
Item 2. Code of Ethics.
(a) The registrant has adopted a code of ethics (the "Code of Ethics") that applies to its principal executive officer, principal financial officer, principal accounting officer or controller, or persons performing similar functions, regardless of whether these individuals are employed by the registrant or a third party.
(b) No information need be disclosed pursuant to this paragraph.
(c) Not applicable.
(d) Not applicable.
(e) Not applicable.
(f)
(1) The registrant’s Code of Ethics is attached hereto as Exhibit 13 A.
(2) Not applicable.
(3) Not applicable.
Item 3. Audit Committee Financial Expert.
The registrant's Board of Directors has determined that Joseph J. Kearns, an “independent” Trustee, is an “audit committee financial expert" serving on its audit committee. Under applicable securities laws, a person who is determined to be an audit committee financial expert will not be deemed an "expert" for any purpose, including without limitation for the purposes of Section 11 of the Securities Act of 1933, as a result of being designated or identified as an audit committee financial expert. The designation or identification of a person as an audit committee financial expert does not impose on such person any duties, obligations, or liabilities that are greater than the duties, obligations, and liabilities imposed on such person as a member of the audit committee and Board of Directors in the absence of such designation or identification.
Item 4. Principal Accountant Fees and Services.
(a)(b)(c)(d) and (g). Based on fees billed for the periods shown:
| 2021 | | Registrant | | | Covered Entities(1) | |
| Audit Fees | | $ | 560,695 | | | | N/A | |
| | | | | | | | | |
| Non-Audit Fees | | | | | | | | |
| Audit-Related Fees | | $ | — | (2) | | $ | — | (2) |
| Tax Fees | | $ | | (3) | | $ | — | (4) |
| All Other Fees | | $ | — | | | $ | 26,678,468 | (5) |
| Total Non-Audit Fees | | $ | | | | $ | 26,678,468 | |
| | | | | | | | | |
| Total | | $ | 560,695 | | | $ | 26,678,468 | |
| 2020 | | Registrant | | | Covered Entities(1) | |
| Audit Fees | | $ | 531,866 | | | | N/A | |
| | | | | | | | | |
| Non-Audit Fees | | | | | | | | |
| Audit-Related Fees | | $ | — | (2) | | $ | — | (2) |
| Tax Fees | | $ | — | (3) | | $ | 231,320 | (4) |
| All Other Fees | | $ | — | | | $ | — | (5) |
| Total Non-Audit Fees | | $ | — | | | $ | 231,320 | |
| | | | | | | | | |
| Total | | $ | 531,866 | | | $ | 231,320 | |
N/A- Not applicable, as not required by Item 4.
| (1) | Covered Entities include the Adviser (excluding sub-advisors) and any entity controlling, controlled by or under common control with the Adviser that provides ongoing services to the Registrant. |
| (2) | Audit-Related Fees represent assurance and related services provided that are reasonably related to the performance of the audit of the financial statements of the Covered Entities' and funds advised by the Adviser or its affiliates, specifically data verification and agreed-upon procedures related to asset securitizations and agreed-upon procedures engagements. |
| (3) | Tax Fees represent tax compliance, tax planning and tax advice services provided in connection with the preparation and review of the Registrant’s tax returns. |
| (4) | Tax Fees represent tax compliance, tax planning and tax advice services provided in connection with the review of Covered Entities' tax returns. |
| (5) | The fees included under “All Other Fees” are for services provided by Ernst & Young LLP related to surprise examinations for certain investment accounts to satisfy SEC Custody Rules and consulting services related to merger integration for sister entity to the Adviser. |
(e)(1) The audit committee’s pre-approval policies and procedures are as follows:
AUDIT COMMITTEE
AUDIT AND NON-AUDIT SERVICES
PRE-APPROVAL POLICY AND PROCEDURES
OF THE
MORGAN STANLEY FUNDS
AS ADOPTED AND AMENDED JULY 23, 2004 AND JUNE 12 AND 13, 20193
| 1. | Statement of Principles |
The Audit Committee of the Board is required to review and, in its sole discretion, pre-approve all Covered Services to be provided by the Independent Auditors to the Fund and Covered Entities in order to assure that services performed by the Independent Auditors do not impair the auditor’s independence from the Fund.
The SEC has issued rules specifying the types of services that an independent auditor may not provide to its audit client, as well as the audit committee’s administration of the engagement of the independent auditor. The SEC’s rules establish two different approaches to pre-approving services, which the SEC considers to be equally valid. Proposed services either: may be pre-approved without consideration of specific case-by-case services by the Audit Committee (“general pre-approval”); or require the specific pre-approval of the Audit Committee or its delegate (“specific pre-approval”). The Audit Committee believes that the combination of these two approaches in this Policy will result in an effective and efficient procedure to pre-approve services performed by the Independent Auditors. As set forth in this Policy, unless a type of service has received general pre-approval, it will require specific pre-approval by the Audit Committee (or by any member of the Audit Committee to which pre-approval authority has been delegated) if it is to be provided by the Independent Auditors. Any proposed services exceeding pre-approved cost levels or budgeted amounts will also require specific pre-approval by the Audit Committee.
The appendices to this Policy describe the Audit, Audit-related, Tax and All Other services that have the general pre-approval of the Audit Committee. The term of any general pre-approval is 12 months from the date of pre-approval, unless the Audit Committee considers and provides a different period and states otherwise. The Audit Committee will annually review and pre-approve the services that may be provided by the Independent Auditors without obtaining specific pre-approval from the Audit Committee. The Audit Committee will add to or subtract from the list of general pre-approved services from time to time, based on subsequent determinations.
The purpose of this Policy is to set forth the policy and procedures by which the Audit Committee intends to fulfill its responsibilities. It does not delegate the Audit Committee’s responsibilities to pre-approve services performed by the Independent Auditors to management.
The Fund’s Independent Auditors have reviewed this Policy and believes that implementation of the Policy will not adversely affect the Independent Auditors’ independence.
3 This Audit Committee Audit and Non-Audit Services Pre-Approval Policy and Procedures (the “Policy”), adopted as of the date above, supersedes and replaces all prior versions that may have been adopted from time to time.
As provided in the Act and the SEC’s rules, the Audit Committee may delegate either type of pre-approval authority to one or more of its members. The member to whom such authority is delegated must report, for informational purposes only, any pre-approval decisions to the Audit Committee at its next scheduled meeting.
The annual Audit services engagement terms and fees are subject to the specific pre-approval of the Audit Committee. Audit services include the annual financial statement audit and other procedures required to be performed by the Independent Auditors to be able to form an opinion on the Fund’s financial statements. These other procedures include information systems and procedural reviews and testing performed in order to understand and place reliance on the systems of internal control, and consultations relating to the audit. The Audit Committee will approve, if necessary, any changes in terms, conditions and fees resulting from changes in audit scope, Fund structure or other items.
In addition to the annual Audit services engagement approved by the Audit Committee, the Audit Committee may grant general pre-approval to other Audit services, which are those services that only the Independent Auditors reasonably can provide. Other Audit services may include statutory audits and services associated with SEC registration statements (on Forms N-1A, N-2, N-3, N-4, etc.), periodic reports and other documents filed with the SEC or other documents issued in connection with securities offerings.
The Audit Committee has pre-approved the Audit services in Appendix A. All other Audit services not listed in Appendix A must be specifically pre-approved by the Audit Committee (or by any member of the Audit Committee to which pre-approval has been delegated).
Audit-related services are assurance and related services that are reasonably related to the performance of the audit or review of the Fund’s financial statements and, to the extent they are Covered Services, the Covered Entities or that are traditionally performed by the Independent Auditors. Because the Audit Committee believes that the provision of Audit-related services does not impair the independence of the auditor and is consistent with the SEC’s rules on auditor independence, the Audit Committee may grant general pre-approval to Audit-related services. Audit-related services include, among others, accounting consultations related to accounting, financial reporting or disclosure matters not classified as “Audit services”; assistance with understanding and implementing new accounting and financial reporting guidance from rulemaking authorities; agreed-upon or expanded audit procedures related to accounting and/or billing records required to respond to or comply with financial, accounting or regulatory reporting matters; and assistance with internal control reporting requirements under Forms N-CEN and/or N-CSR.
The Audit Committee has pre-approved the Audit-related services in Appendix A. All other Audit-related services not listed in Appendix A must be specifically pre-approved by the Audit Committee (or by any member of the Audit Committee to which pre-approval has been delegated).
The Audit Committee believes that the Independent Auditors can provide Tax services to the Fund and, to the extent they are Covered Services, the Covered Entities, such as tax compliance, tax planning and tax advice without impairing the auditor’s independence, and the SEC has stated that the Independent Auditors may provide such services.
Pursuant to the preceding paragraph, the Audit Committee has pre-approved the Tax Services in Appendix A. All Tax services in Appendix A must be specifically pre-approved by the Audit Committee (or by any member of the Audit Committee to which pre-approval has been delegated).
The Audit Committee believes, based on the SEC’s rules prohibiting the Independent Auditors from providing specific non-audit services, that other types of non-audit services are permitted. Accordingly, the Audit Committee believes it may grant general pre-approval to those permissible non-audit services classified as All Other services that it believes are routine and recurring services, would not impair the independence of the auditor and are consistent with the SEC’s rules on auditor independence.
The Audit Committee has pre-approved the All Other services in Appendix A. Permissible All Other services not listed in Appendix A must be specifically pre-approved by the Audit Committee (or by any member of the Audit Committee to which pre-approval has been delegated).
| 7. | Pre-Approval Fee Levels or Budgeted Amounts |
Pre-approval fee levels or budgeted amounts for all services to be provided by the Independent Auditors will be established annually by the Audit Committee. Any proposed services exceeding these levels or amounts will require specific pre-approval by the Audit Committee. The Audit Committee is mindful of the overall relationship of fees for audit and non-audit services in determining whether to pre-approve any such services.
All requests or applications for services to be provided by the Independent Auditors that do not require specific approval by the Audit Committee will be submitted to the Fund’s Principal Financial and Accounting Officer and must include a detailed description of the services to be rendered. The Fund’s Principal Financial and Accounting Officer will determine whether such services are included within the list of services that have received the general pre-approval of the Audit Committee. The Audit Committee will be informed on a timely basis of any such services rendered by the Independent Auditors. Requests or applications to provide services that require specific approval by the Audit Committee or Chairperson of the Audit Committee will be submitted to the Audit Committee by the Fund's Principal Financial and Accounting Officer, who, after consultation with the Independent Auditors, will discuss whether, the request or application is consistent with the SEC’s rules on auditor independence.
The Audit Committee has designated the Fund’s Principal Financial and Accounting Officer to monitor the performance of all services provided by the Independent Auditors and to determine whether such services are in compliance with this Policy. The Fund’s Principal Financial and Accounting Officer will report to the Audit Committee on a periodic basis on the results of its monitoring. Both the Fund’s Principal Financial and Accounting Officer and management will immediately report to the Chairperson of the Audit Committee any breach of this Policy that comes to the attention of the Fund’s Principal Financial and Accounting Officer or any member of management.
| 9. | Additional Requirements |
The Audit Committee has determined to take additional measures on an annual basis to meet its responsibility to oversee the work of the Independent Auditors and to assure the auditor’s independence from the Fund, such as reviewing a formal written statement from the Independent Auditors delineating all relationships between the Independent Auditors and the Fund, consistent with the PCAOB’s Ethics and Independence Rule 3526, and discussing with the Independent Auditors its methods and procedures for ensuring independence.
Covered Entities include the Fund’s investment adviser(s) and any entity controlling, controlled by or under common control with the Fund’s investment adviser(s) that provides ongoing services to the Fund(s). Beginning with non-audit service contracts entered into on or after May 6, 2003, the Fund’s audit committee must pre-approve non-audit services provided not only to the Fund but also to the Covered Entities if the engagements relate directly to the operations and financial reporting of the Fund. This list of Covered Entities would include:
Morgan Stanley Funds
Morgan Stanley & Co. LLC
Morgan Stanley Investment Management Inc.
Morgan Stanley Investment Management Limited
Morgan Stanley Investment Management Private Limited
Morgan Stanley Asset & Investment Trust Management Co., Limited
Morgan Stanley Investment Management Company
Morgan Stanley Services Company, Inc.
Morgan Stanley Distribution, Inc.
Morgan Stanley AIP GP LP
Morgan Stanley Alternative Investment Partners LP
Morgan Stanley Smith Barney LLC
Morgan Stanley Capital Management LLC
Morgan Stanley Asia Limited
Morgan Stanley Services Group
(e)(2) Beginning with non-audit service contracts entered into on or after May 6, 2003, the audit committee also is required to pre-approve services to Covered Entities to the extent that the services are determined to have a direct impact on the operations or financial reporting of the Registrant. 100% of such services were pre-approved by the audit committee pursuant to the Audit Committee’s pre-approval policies and procedures (attached hereto).
(f) Not applicable.
(g) See table above.
(h) The audit committee of the Board of Directors has considered whether the provision of services other than audit services performed by the auditors to the Registrant and Covered Entities is compatible with maintaining the auditors' independence in performing audit services.
APPENDIX A
Pre-Approved Audit Services
Service Range of Fees | |
| | The Fund(s) | Covered
Entities |
Statutory audits or financial audits for the Funds | For a complete list of fees, please contact the legal department ** | N/A |
Services associated with SEC registration statements (including new fund filings/seed audits), periodic reports and other documents filed with the SEC or other documents issued in connection with securities offerings (e.g., comfort letters for closed-end fund offerings, consents), and assistance in responding to SEC comment letters | * | * |
Consultations by the Fund’s management as to the accounting or disclosure treatment of transactions or events and/or the actual or potential impact of final or proposed rules, standards or interpretations by the SEC, FASB, or other regulatory or standard setting bodies (Note: Under SEC rules, some consultations may be “audit related” services rather than “audit” services) | * | * |
Pre-Approved Audit-Related Services
Service Range of Fees | |
| | The Fund(s) | Covered
Entities |
| Attest procedures not required by statute or regulation | * | * |
Due diligence services pertaining to potential fund mergers | * | * |
Consultations by the Fund’s management as to the accounting or disclosure treatment of transactions or events and/or the actual or potential impact of final or proposed rules, standards or interpretations by the SEC, FASB, or other regulatory or standard-setting bodies (Note: Under SEC rules, some consultations may be “audit” services rather than “audit-related” services) | * | * |
General assistance with implementation of the requirements of SEC rules or listing standards promulgated pursuant to the Sarbanes-Oxley Act | * | * |
Pre-Approved Tax Services
Service Range of Fees | |
| | The Fund(s) | Covered
Entities |
U.S. federal, state and local tax planning and advice | * | * |
U.S. federal, state and local tax compliance | * | * |
International tax planning and advice | * | * |
International tax compliance | * | * |
Review/preparation of federal, state, local and international income, franchise, and other tax returns | $450,000 PwC | N/A |
Identification of Passive Foreign Investment Companies | $150,000 PwC | |
PwC ITV Tool – assist in determining which Fund holdings have foreign capital gains tax exposure | $125,000 PwC | |
| Foreign Tax Services - Preparation of local foreign tax returns and assistance with local tax compliance issues (including maintenance of transaction schedules, assistance in periodic tax remittances, tax registration, representing funds before foreign revenue authorities and assistance with assessment orders) | $500,000 PwC | * |
Assistance with tax audits and appeals before the IRS and similar state, local and foreign agencies | * | * |
Tax advice and assistance regarding statutory, regulatory or administrative developments (e.g., excise tax reviews, evaluation of Fund’s tax compliance function) | * | * |
Pre-Approved All Other Services
Service Range of Fees | |
| | The Fund(s) | Covered
Entities |
Risk management advisory services, e.g., assessment and testing of security infrastructure controls | * | * |
*Aggregate fees related to the pre-approved services will be limited to 10% of the 2021/2022 annual fees for audit and tax services (see fee schedule distributed by the Auditors).
** Audit and tax services for new funds/portfolios will be subject to the maximum audit and tax fee for a fund/portfolio on fee schedule distributed by the Auditors.
Prohibited Non-Audit Services
| ● | Bookkeeping or other services related to the accounting records or financial statements of the audit client |
| ● | Financial information systems design and implementation |
| ● | Appraisal or valuation services, fairness opinions or contribution-in-kind reports |
| ● | Internal audit outsourcing services |
| ● | Broker-dealer, investment adviser or investment banking services |
| ● | Expert services unrelated to the audit |
Item 5. Audit Committee of Listed Registrants.
(a) The registrant has a separately-designated standing audit committee established in accordance with Section 3(a)(58)(A) of the Exchange Act whose members are:
Joseph J. Kearns, Nancy C. Everett and Jakki L. Haussler.
(b) Not applicable.
Item 6. Schedule of Investments
(a) Refer to Item 1.
(b) Not applicable.
Item 7. Disclosure of Proxy Voting Policies and Procedures for Closed-End Management Investment Companies.
Applicable only to reports filed by closed-end funds.
Item 8. Portfolio Managers of Closed-End Management Investment Companies
Applicable only to reports filed by closed-end funds.
Item 9. Closed-End Fund Repurchases
Applicable only to reports filed by closed-end funds.
Item 10. Submission of Matters to a Vote of Security Holders
There have been no material changes to the procedures by which shareholders may recommend nominee to the Fund’s Board of Directors since the Fund last provided disclosure in response to this item.
Item 11. Controls and Procedures
(a) The registrant’s principal executive officer and principal financial officer have concluded that the registrant’s disclosure controls and procedures are sufficient to ensure that information required to be disclosed by the registrant in this Form N-CSR was recorded, processed, summarized and reported within the time periods specified in the Securities and Exchange Commission's rules and forms, based upon such officers' evaluation of these controls and procedures as of a date within 90 days of the filing date of the report.
(b) There were no changes in the registrant's internal control over financial reporting that occurred during the second fiscal quarter of the period covered by this report that has materially affected, or is reasonably likely to materially affect, the registrant's internal control over financial reporting.
Item 12. Disclosure of Securities Lending Activities for Closed End Management Investment Companies.
Not Applicable
Item 13. Exhibits
(a) The Code of Ethics for Principal Executive and Senior Financial Officers.
(b) A separate certification for each principal executive officer and principal financial officer of the registrant as part of EX-99.CERT
(c) Section 906 Certification.
SIGNATURES
Pursuant to the requirements of the Securities Exchange Act of 1934 and the Investment Company Act of 1940, the registrant has duly caused this report to be signed on its behalf by the undersigned, thereunto duly authorized.
Morgan Stanley Variable Insurance Fund, Inc.
| /s/ John H. Gernon | |
| John H. Gernon | |
| Principal Executive Officer | |
February 16, 2022
Pursuant to the requirements of the Securities Exchange Act of 1934 and the Investment Company Act of 1940, this report has been signed by the following persons on behalf of the registrant and in the capacities and on the dates indicated.
| /s/ John H. Gernon | |
| John H. Gernon | |
| Principal Executive Officer | |
February 16, 2022
| /s/ Francis J. Smith | |
| Francis J. Smith | |
| Principal Financial Officer | |
February 16, 2022