Item 1: Report to Shareholders| Mid-Cap Value Fund | June 30, 2005 |
The views and opinions in this report were current as of June 30, 2005. They are not guarantees of performance or investment results and should not be taken as investment advice. Investment decisions reflect a variety of factors, and the managers reserve the right to change their views about individual stocks, sectors, and the markets at any time. As a result, the views expressed should not be relied upon as a forecast of the fund’s future investment intent. The report is certified under the Sarbanes-Oxley Act of 2002, which requires mutual funds and other public companies to affirm that, to the best of their knowledge, the information in their financial reports is fairly and accurately stated in all material respects.
REPORTS ON THE WEB
Sign up for our E-mail Program, and you can begin to receive updated fund reports and prospectuses online rather than through the mail. Log in to your account at troweprice.com for more information.
Fellow Shareholders
The stock market turned in a mixed performance in the first half of 2005. Corporate profitability and balance sheets improved, the economy grew at a moderate pace—with some sectors, such as housing and energy, experiencing robust growth—and inflation remained moderate. Concerns regarding the impact of high oil and natural gas prices and rising short-term interest rates restrained the equity markets, however. Large-company averages such as the S&P 500 Index and Dow Jones Industrial Average moved lower, while most indexes of small- and medium-sized companies recorded small gains.
| PERFORMANCE COMPARISON |
| | | |
| Periods Ended 6/30/05 | 6 Months | 12 Months |
| Mid-Cap Value Fund | 0.48% | 12.35% |
| Mid-Cap Value Fund– | | |
| Advisor Class | 0.39 | 12.10 |
| Mid-Cap Value Fund–R Class | 0.26 | 11.83 |
| S&P MidCap 400 Index | 3.85 | 14.03 |
| Lipper Mid-Cap Core Funds Index | 1.88 | 11.47 |
| Russell Midcap Value Index | 5.51 | 21.80 |
Your fund returned 0.48% for the six months ended June 30, 2005, and 12.35% for the one-year period. The portfolio’s performance lagged that of its benchmarks in the last six months due largely to its greater allocation to paper and forest product and traditional media stocks—sectors that lagged the market. A below-benchmark allocation to the energy sector also detracted. Returns for the fund’s Advisor and R Class shares were slightly lower due to their different fee structures.
(As we noted in our last letter, while Lipper began classifying our fund as Mid-Cap Core late last year, this does not reflect any change in our investment process or mandate. The formula Lipper uses to classify funds was affected by the lower earnings—and hence, higher price-to-earnings ratio—of some of the holdings in our portfolio. We have always tended to construct portfolios of companies whose financial performance may be depressed for a period, but where we see long-term value and a prospect for improvement in earnings and cash flow.)
MARKET ENVIRONMENT
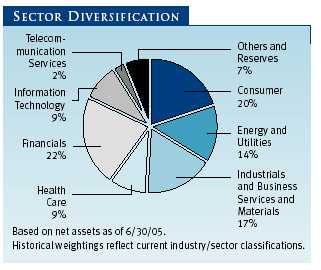
Many believed that the market would change course this year, if not in its overall direction, then in terms of the types of stocks that performed best. In fact, this turned out to be only partially true. Some changes in sector leadership did occur. In the mid-cap universe, the health care sector, which had lagged last year, surged to join energy and utilities among the best-performing market segments. Meanwhile, the industrials and materials sectors, which had performed well in 2004, reversed course and headed lower, while the information technology sector continued to trail. Little changed in terms of the relative performance of growth versus value, however: as measured by various Russell indexes, value stocks continued to outperform their growth counterparts across all market capitalizations.
| VALUE VS. GROWTH |
| | | | |
| Periods Ended 6/30/05 | 6 Months | 12 Months |
| Russell Midcap Value Index | 5.51% | 21.80% |
| Russell Midcap Growth Index | 1.70 | 10.86 |
PORTFOLIO AND STRATEGY REVIEW
While stocks never move up and down in unison, the wide range of returns was particularly notable over the past six months. The performance of our holdings reflected this uneven market environment. Even as business conditions were favorable for many firms, others continued to struggle with slack demand even as the economy entered its fourth year of expansion. Generally, the companies in our portfolio that were able to enjoy some degree of pricing power fared well, while those that relied on an upsurge in particular types of consumer spending and business investment saw their shares decline.
The utilities sector fit firmly into the former category. Increased electricity rates and better operating margins meant improved profits for a wide range of electric utilities and independent power producers. TECO Energy, a Florida utility that also mines coal and operates transport barges, was a particularly strong performer for the portfolio. NRG Energy was another coal-focused independent power generator that did well, while natural gas-focused CMS Energy also contributed substantially to our results as favorable regulatory treatment aided its earnings prospects. Duke Energy, another top performer, benefited from improved margins in its unregulated businesses and from a proposed merger with Cinergy Corp. (Please refer to our portfolio of investments for a complete listing of our holdings and the amount each represents of the portfolio.)
The energy sector continued to thrive in 2005 as oil prices built on last year’s gains and moved to record highs. As we mentioned, our relatively small allocation to this sector hurt performance relative to our benchmarks, and we owned only a single oil and gas producer, Murphy Oil. We did own a number of equipment and services firms, however. These were able to charge producers high rates for their assistance in exploring for new wells and keeping existing ones in production. Diamond Offshore Drilling was one of our top performers. A leader in deepwater drilling, the company was able to charge healthy rates for its services as oil companies struggled to meet growing world demand.
Several health care providers in our portfolio benefited from greater certainty regarding the pricing for their products and services. AmerisourceBergen is a wholesale distributor of drugs. The company’s management is adjusting the company’s business model so that it will earn a fee for its services, providing for a more stable revenue stream. Tenet Healthcare, which runs hospitals, is enjoying better reimbursements from the government for its patient care, while at the same time seeing improvements in bad debt expense.
Our disappointments over the past six months stemmed largely from companies suffering from slack demand. Newspapers have been hit hard by concerns over eroding circulation and new sources of competition for advertiser dollars—above all, the Internet. The papers’ problems were compounded by the advertising environment, which remained surprisingly sluggish, and the New York Times, Dow Jones, Washington Post, and Tribune Company all moved lower. We still believe these companies offer unique content to readers and have powerful resources in their archives of proprietary material, but this value has yet to be recognized in their business operations or reflected in their share prices.
Materials companies also performed poorly early in the first part of the year. A growing world economy, and demand from China in particular, led to rising prices for a wide range of commodities in 2004. Demand growth appeared to falter a bit this year, however, and this sent the prices of many commodities sharply lower. This problem was compounded for commodity producers that consume large amounts of high-cost energy in the production process. This category included several of the paper and forest companies in the portfolio, such as South Carolina-based Bowater and Canadian producer Domtar.
Finally, several companies simply failed to turn their operations around as we had hoped. Information technology and government consulting firm BearingPoint was in the process of an extended restructuring of its operations when it announced another management change and later indicated it would need further financial resources. With the company’s future further clouded, we liquidated our investment.
OUTLOOK
As you know, the Mid-Cap Value Fund was closed to new investors earlier this year. We took this action to reflect the smaller pool of inexpensively valued mid-cap opportunities we were beginning to see relative to the past, and to assure that new cash flows into the portfolio could be invested effectively. The divergence among market sectors over the past six months has allowed us more flexibility to add to existing fund positions and provided us a somewhat longer list of potential candidates for inclusion in the portfolio. Some of our recent purchases have included stocks in the chemicals, waste management, regional bank, and specialty pharmaceutical sectors.
While the performance of the fund this year has lagged that of its benchmarks, we remain firmly committed to our strategy of seeking out-of-favor, attractively valued shares and taking a longer-term investment approach.
Respectfully submitted,

David J. Wallack
Chairman of the fund’s Investment Advisory Committee
July 19, 2005
The committee chairman has day-to-day responsibility for managing the portfolio and works with committee members in developing and executing the fund’s investment program.
RISKS OF INVESTING
The fund’s share price can fall because of weakness in the stock or bond markets, a particular industry, or specific holdings. Stock markets can decline for many reasons, including adverse political or economic developments, changes in investor psychology, or heavy institutional selling. The prospects for an industry or company may deteriorate because of a variety of factors, including disappointing earnings or changes in the competitive environment. In addition, the investment manager’s assessment of companies held in a fund may prove incorrect, resulting in losses or poor performance even in rising markets.
Mid-caps typically offer greater return potential than larger, established firms and involve less risk than small-caps. Value investors seek to invest in companies whose stock prices are low in relation to their real worth or future prospects. By identifying companies whose stocks are currently out of favor or misunderstood, value investors hope to realize significant appreciation as other investors recognize the stock’s intrinsic value and the price rises accordingly. The value approach carries the risk that the market will not recognize a security’s intrinsic value for a long time, or that a stock judged to be undervalued may actually be appropriately priced.
GLOSSARY
Lipper indexes: Fund benchmarks that consist of a small number of the largest mutual funds in a particular category as tracked by Lipper Inc.
S&P MidCap 400 Index: Unmanaged index that tracks the stocks of 400 mid-size U.S. companies.
Russell Midcap Growth Index: Unmanaged index that measures the performance of those Russell mid-cap companies with higher price-to-book ratios and higher forecasted growth values.
Russell Midcap Value Index: Unmanaged index that measures the performance of those Russell mid-cap companies with lower price-to-book ratios and lower forecasted growth values.
| PORTFOLIO HIGHLIGHTS | |
| |
| TWENTY-FIVE LARGEST HOLDINGS | |
| | Percent of |
| | Net Assets |
| | 6/30/05 |
| |
| St. Paul Companies | 1.7% |
| TECO Energy | 1.7 |
| NiSource | 1.7 |
| Tenet Healthcare | 1.7 |
| Diamond Offshore Drilling | 1.5 |
| Allied Waste Industries | 1.3 |
| Cooper Cameron | 1.3 |
| Marsh & McLennan | 1.3 |
| Mattel | 1.3 |
| NRG Energy | 1.3 |
| Nalco Holding | 1.3 |
| Chiron | 1.2 |
| Campbell Soup | 1.2 |
| HealthSouth | 1.2 |
| New York Times | 1.2 |
| AmerisourceBergen | 1.2 |
| Intuit | 1.2 |
| MedImmune | 1.2 |
| Domtar | 1.1 |
| Laidlaw International | 1.1 |
| Southwest Airlines | 1.1 |
| Synovus Financial | 1.1 |
| Novellus Systems | 1.1 |
| Molex | 1.1 |
| Outback Steakhouse | 1.0 |
| Total | 32.1% |
| |
| Note: Table excludes investments in the T. Rowe Price Reserve Investment Fund. | |
| PORTFOLIO HIGHLIGHTS |
| |
| MAJOR PORTFOLIO CHANGES | |
| Listed in descending order of size | |
| |
| 6 Months Ended 6/30/05 | |
| |
| Largest Purchases | Largest Sales |
| |
| MCI * | Diamond Offshore Drilling |
| Gold Fields * | MCI ** |
| RadioShack * | BearingPoint ** |
| IAC/InterActiveCorp | McKesson ** |
| Cooper Cameron | Harmony Gold ** |
| Domtar | Qwest Communications International |
| Hasbro * | AmeriTrade ** |
| Pinnacle West Capital | Dillards |
| Anglo Platinum * | CSX |
| Smurfit-Stone Container * | CMS Energy |
| |
| ** Position added | |
| ** Position eliminated | |
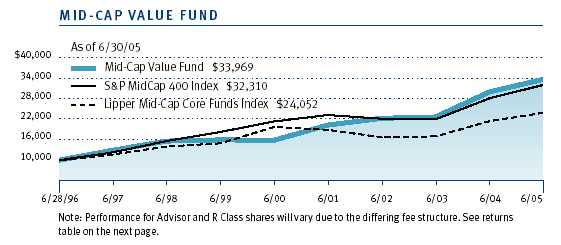
This chart shows the value of a hypothetical $10,000 investment in the fund over the past 10 fiscal year periods or since inception (for funds lacking 10-year records). The result is compared with benchmarks, which may include a broad-based market index and a peer group average or index. Market indexes do not include expenses, which are deducted from fund returns as well as mutual fund averages and indexes.
| AVERAGE ANNUAL COMPOUND TOTAL RETURN |
This table shows how the fund and its benchmarks would have performed if their actual (or cumulative) returns for the periods shown had been earned at a constant rate.
| | | | Since | Inception |
| Periods Ended 6/30/05 | 1 Year | 5 Years | Inception | Date |
| Mid-Cap Value Fund | 12.35% | 16.36% | 14.54% | 6/28/96 |
| S&P MidCap 400 Index | 14.03 | 8.49 | 13.91 | – |
| Russell Midcap Value Index | 21.80 | 14.86 | 13.51 | – |
| Lipper Mid-Cap Core Funds Index | 11.47 | 3.92 | 10.24 | – |
| Mid-Cap Value Fund–Advisor Class | 12.10 | – | 24.39 | 9/30/02 |
| Mid-Cap Value Fund–R Class | 11.83 | – | 24.02 | 9/30/02 |
| S&P MidCap 400 Index | 14.03 | – | 22.23 | – |
| Russell Midcap Value Index | 21.80 | – | 27.01 | – |
| Lipper Mid-Cap Core Funds Index | 11.47 | – | 21.61 | – |
| Current performance may be higher or lower than the quoted past performance, which can- |
| not guarantee future results. Share price, principal value, and return will vary, and you may |
| have a gain or loss when you sell your shares. For the most recent month-end performance |
| information, please visit our Web site (troweprice.com) or contact a T. Rowe Price represen- |
| tative at 1-800-225-5132. | | | | |
| Average annual total return figures include changes in principal value, reinvested dividends, and capital |
| gain distributions. Returns do not reflect taxes that the shareholder may pay on fund distributions or the |
| redemption of fund shares. When assessing performance, investors should consider both short- and |
| long-term returns. | | | | |
As a mutual fund shareholder, you may incur two types of costs: (1) transaction costs such as redemption fees or sales loads and (2) ongoing costs, including management fees, distribution and service (12b-1) fees, and other fund expenses. The following example is intended to help you understand your ongoing costs (in dollars) of investing in the fund and to compare these costs with the ongoing costs of investing in other mutual funds. The example is based on an investment of $1,000 invested at the beginning of the most recent six-month period and held for the entire period.
Please note that the fund has three share classes: The original share class (“investor class”) charges no distribution and service (12b-1) fee; Advisor Class shares are offered only through unaffiliated brokers and other financial intermediaries and charge a 0.25% 12b-1 fee; R Class shares are available to retirement plans serviced by intermediaries and charge a 0.50% 12b-1 fee. Each share class is presented separately in the table.
Actual Expenses
The first line of the following table (“Actual”) provides information about actual account values and expenses based on the fund’s actual returns. You may use the information in this line, together with your account balance, to estimate the expenses that you paid over the period. Simply divide your account value by $1,000 (for example, an $8,600 account value divided by $1,000 = 8.6), then multiply the result by the number in the first line under the heading “Expenses Paid During Period” to estimate the expenses you paid on your account during this period.
Hypothetical Example for Comparison Purposes
The information on the second line of the table (“Hypothetical”) is based on hypothetical account values and expenses derived from the fund’s actual expense ratio and an assumed 5% per year rate of return before expenses (not the fund’s actual return). You may compare the ongoing costs of investing in the fund with other funds by contrasting this 5% hypothetical example and the 5% hypothetical examples that appear in the shareholder reports of the other funds. The hypothetical account values and expenses may not be used to estimate the actual ending account balance or expenses you paid for the period.
Note: T. Rowe Price charges an annual small-account maintenance fee of $10, generally for accounts with less than $2,000 ($500 for UGMA/UTMA). The fee is waived for any investor whose T. Rowe Price mutual fund accounts total $25,000 or more, accounts employing automatic investing, and IRAs and other retirement plan accounts that utilize a prototype plan sponsored by T. Rowe Price (although a separate custodial or administrative fee may apply to such accounts). This fee is not included in the accompanying table. If you are subject to the fee, keep it in mind when you are estimating the ongoing expenses of investing in the fund and when comparing the expenses of this fund with other funds.
You should also be aware that the expenses shown in the table highlight only your ongoing costs and do not reflect any transaction costs, such as redemption fees or sales loads. Therefore, the second line of the table is useful in comparing ongoing costs only and will not help you determine the relative total costs of owning different funds. To the extent a fund charges transaction costs, however, the total cost of owning that fund is higher.
| T. ROWE PRICE MID-CAP VALUE FUND |
| |
| | Beginning | Ending | Expenses Paid |
| | Account Value | Account Value | During Period* |
| | 1/1/05 | 6/30/05 | 1/1/05 to 6/30/05 |
| Investor Class | | | |
| Actual | $1,000.00 | $1,004.80 | $4.13 |
| Hypothetical (assumes 5% | | | |
| return before expenses) | 1,000.00 | 1,020.68 | 4.16 |
| Advisor Class | | | |
| Actual | 1,000.00 | 1,003.90 | 5.37 |
| Hypothetical (assumes 5% | | | |
| return before expenses) | 1,000.00 | 1,019.44 | 5.41 |
| R Class | | | |
| Actual | 1,000.00 | 1,002.60 | 6.45 |
| Hypothetical (assumes 5% | | | |
| return before expenses) | 1,000.00 | 1,018.35 | 6.51 |
| * Expenses are equal to the fund’s annualized expense ratio for the six-month period, multiplied by the |
| * average account value over the period, multiplied by the number of days in the most recent fiscal half |
| * year (181) divided by the days in the year (365) to reflect the half-year period. The annualized expense |
| * ratio of the Investor Class was 0.83%, the Advisor Class was 1.08%, and the R Class was 1.30%. |
Unaudited
| FINANCIAL HIGHLIGHTS | | | | For a share outstanding throughout each period |
| |
| Investor class | | | | | | | | | | | | |
| | | 6 Months | | Year | | | | | | | | |
| | | Ended | | Ended | | | | | | | | |
| | | 6/30/05** | | 12/31/04 | | 12/31/03 | | 12/31/02 | | 12/31/01 | | 12/31/00 |
| NET ASSET VALUE | | | | | | | | | | | | |
| Beginning of period | $ | 22.99 | $ | 20.34 | $ | 15.00 | $ | 16.40 | $ | 15.64 | $ | 13.37 |
|
|
| |
| Investment activities | | | | | | | | | | | | |
| Net investment | | | | | | | | | | | | |
| income (loss) | | 0.06 | | 0.10 | | 0.13 | | 0.13 | | 0.13 | | 0.18 |
| Net realized and | | | | | | | | | | | | |
| unrealized gain (loss) | | 0.05 | | 4.05 | | 5.70 | | (1.34) | | 2.07 | | 2.82 |
|
|
| Total from | | | | | | | | | | | | |
| investment activities | | 0.11 | | 4.15 | | 5.83 | | (1.21) | | 2.20 | | 3.00 |
|
|
| |
| Distributions | | | | | | | | | | | | |
| Net investment income | | – | | (0.10) | | (0.13) | | (0.12) | | (0.13) | | (0.17) |
| Net realized gain | | – | | (1.40) | | (0.36) | | (0.07) | | (1.31) | | (0.56) |
|
|
| Total distributions | | – | | (1.50) | | (0.49) | | (0.19) | | (1.44) | | (0.73) |
|
|
| |
| NET ASSET VALUE | | | | | | | | | | | | |
| End of period | $ | 23.10 | $ | 22.99 | $ | 20.34 | $ | 15.00 | $ | 16.40 | $ | 15.64 |
|
|
| |
| |
| Ratios/Supplemental Data | | | | | | | | | | | | |
| Total return^ | | 0.48% | | 20.56% | | 39.00% | | (7.38)% | | 14.36% | | 22.75% |
| Ratio of total expenses to | | | | | | | | | | | | |
| average net assets | | 0.83%† | | 0.84% | | 0.91% | | 0.96% | | 0.98% | | 0.99% |
| Ratio of net investment | | | | | | | | | | | | |
| income (loss) to average | | | | | | | | | | | | |
| net assets | | 0.51%† | | 0.63% | | 0.91% | | 0.98% | | 0.95% | | 1.33% |
| Portfolio turnover rate | | 33.4%† | | 50.0% | | 50.4% | | 51.1% | | 57.5% | | 31.9% |
| Net assets, end of period | | | | | | | | | | | | |
| (in millions) | $ | 5,174 | $ | 4,571 | $ | 1,879 | $ | 991 | $ | 503 | $ | 282 |
| ** Per share amounts calculated using average shares outstanding method. |
| ^ | Total return reflects the rate that an investor would have earned on an investment in the fund during each period, |
| | assuming reinvestment of all distributions. |
| † | Annualized |
| |
| The accompanying notes are an integral part of these financial statements. |
Unaudited
| FINANCIAL HIGHLIGHTS | | | | For a share outstanding throughout each period |
| |
| Advisor Class | | | | | | | | |
| | | 6 Months | | Year | | | | 9/30/02 |
| | | Ended | | Ended | | | | Through |
| | | 6/30/05** | | 12/31/04 | | 12/31/03 | | 12/31/02 |
| NET ASSET VALUE | | | | | | | | |
| Beginning of period | $ | 22.91 | $ | 20.31 | $ | 14.99 | $ | 13.97 |
|
|
| |
| Investment activities | | | | | | | | |
| Net investment income (loss) | | 0.03 | | 0.12 | | 0.13 | | 0.04* |
| Net realized and unrealized | | | | | | | | |
| gain (loss) | | 0.06 | | 3.96 | | 5.68 | | 1.17++ |
|
|
| Total from investment activities | | 0.09 | | 4.08 | | 5.81 | | 1.21 |
|
|
| |
| Distributions | | | | | | | | |
| Net investment income | | – | | (0.08) | | (0.13) | | (0.12) |
| Net realized gain | | – | | (1.40) | | (0.36) | | (0.07) |
|
|
| Total distributions | | – | | (1.48) | | (0.49) | | (0.19) |
| |
| NET ASSET VALUE | | | | | | | | |
| End of period | $ | 23.00 | $ | 22.91 | $ | 20.31 | $ | 14.99 |
|
|
| |
| |
| Ratios/Supplemental Data | | | | | | | | |
| Total return^ | | 0.39% | | 20.24% | | 38.89% | | 8.66%* |
| Ratio of total expenses to | | | | | | �� | | |
| average net assets | | 1.08%† | | 1.06% | | 1.08% | | 1.10%*† |
| Ratio of net investment | | | | | | | | |
| income (loss) to average | | | | | | | | |
| net assets | | 0.27%† | | 0.42% | | 0.64% | | 1.29%*† |
| Portfolio turnover rate | | 33.4%† | | 50.0% | | 50.4% | | 51.1% |
| Net assets, end of period | | | | | | | | |
| (in thousands) | $ | 371,683 | $ | 310,755 | $ | 67,383 | $ | 1,528 |
| ** | Per share amounts calculated using average shares outstanding method. |
| * | Excludes expenses in excess of a 1.10% contractual expense limitation in effect through 4/30/06. |
| ++ | The amount presented is calculated pursuant to a methodology prescribed by the Securities and Exchange |
| | Commission for a share outstanding throughout the period. This amount is inconsistent with the fund’s aggre- |
| | gate gains and losses because of the timing of sales and redemptions of fund shares in relation to fluctuating |
| | market values for the investment portfolio. |
| ^ | Total return reflects the rate that an investor would have earned on an investment in the fund during each period, |
| | assuming reinvestment of all distributions. |
| † | Annualized |
| |
| The accompanying notes are an integral part of these financial statements. |
Unaudited
| FINANCIAL HIGHLIGHTS | | | | For a share outstanding throughout each period |
| |
| R Class | | | | | | | | |
| | | 6 Months | | Year | | | | 9/30/02 |
| | | Ended | | Ended | | | | Through |
| | | 6/30/05** | | 12/31/04 | | 12/31/03 | | 12/30/02 |
| NET ASSET VALUE | | | | | | | | |
| Beginning of period | $ | 22.78 | $ | 20.23 | $ | 15.00 | $ | 13.97 |
|
|
| |
| Investment activities | | | | | | | | |
| Net investment income (loss) | | 0.01 | | 0.10 | | 0.11 | | 0.03* |
| Net realized and unrealized | | | | | | | | |
| gain (loss) | | 0.05 | | 3.91 | | 5.61 | | 1.18++ |
|
|
| Total from investment activities | | 0.06 | | 4.01 | | 5.72 | | 1.21 |
|
|
| |
| Distributions | | | | | | | | |
| Net investment income | | – | | (0.06) | | (0.13) | | (0.11) |
| Net realized gain | | – | | (1.40) | | (0.36) | | (0.07) |
|
|
| Total distributions | | – | | (1.46) | | (0.49) | | (0.18) |
|
|
| |
| NET ASSET VALUE | | | | | | | | |
| End of period | $ | 22.84 | $ | 22.78 | $ | 20.23 | $ | 15.00 |
|
|
| |
| |
| Ratios/Supplemental Data | | | | | | | | |
| Total return^ | | 0.26% | | 19.97% | | 38.26% | | 8.66%* |
| Ratio of total expenses to | | | | | | | | |
| average net assets | | 1.30%† | | 1.32% | | 1.38% | | 1.40%*† |
| Ratio of net investment | | | | | | | | |
| income (loss) to average | | | | | | | | |
| net assets | | 0.06%† | | 0.18% | | 0.36% | | 0.84%*† |
| Portfolio turnover rate | | 33.4%† | | 50.0% | | 50.4% | | 51.1% |
| Net assets, end of period | | | | | | | | |
| (in thousands) | $ | 271,680 | $ | 189,350 | $ | 19,195 | $ | 109 |
| ** | Per share amounts calculated using average shares outstanding method. |
| * | Excludes expenses in excess of a 1.40% contractual expense limitation in effect through 4/30/06. |
| ++ | The amount presented is calculated pursuant to a methodology prescribed by the Securities and Exchange |
| | Commission for a share outstanding throughout the period. This amount is inconsistent with the fund’s aggre- |
| | gate gains and losses because of the timing of sales and redemptions of fund shares in relation to fluctuating |
| | market values for the investment portfolio. |
| ^ | Total return reflects the rate that an investor would have earned on an investment in the fund during each period, |
| | assuming reinvestment of all distributions. |
| † | Annualized |
| |
| The accompanying notes are an integral part of these financial statements. |
Unaudited
| PORTFOLIO OF INVESTMENTS (1) | Shares/$ Par | Value |
| (Cost and value in $ 000s) | | |
| | | |
| COMMON STOCKS 92.3% | | |
| |
| CONSUMER DISCRETIONARY 18.0% | | |
| Auto Components 0.2% | | |
| TRW * | 481,000 | 11,789 |
| | | 11,789 |
| Diversified Consumer Services 0.7% | | |
| ServiceMaster | 1,003,000 | 13,440 |
| Weight Watchers * | 510,000 | 26,321 |
| | | 39,761 |
| Hotels, Restaurants & Leisure 1.1% | | |
| Outback Steakhouse | 1,350,000 | 61,074 |
| | | 61,074 |
| Household Durables 1.0% | | |
| Newell Rubbermaid | 2,420,000 | 57,693 |
| | | 57,693 |
| Leisure Equipment & Products 2.1% | | |
| Hasbro | 2,275,000 | 47,297 |
| Mattel | 4,120,000 | 75,396 |
| | | 122,693 |
| Media 8.9% | | |
| Cablevision Systems, Class A * | 1,475,000 | 47,495 |
| Cox Radio, Class A * | 1,257,400 | 19,804 |
| Dow Jones | 1,278,900 | 45,337 |
| Entercom Communications * | 1,721,600 | 57,312 |
| Hearst-Argyle Television | 258,300 | 6,328 |
| Meredith | 866,000 | 42,486 |
| New York Times, Class A | 2,260,000 | 70,399 |
| Pearson (GBP) | 4,010,000 | 47,069 |
| Reuters (GBP) | 3,425,000 | 24,157 |
| Scholastic * | 1,120,400 | 43,191 |
| Tribune | 1,170,000 | 41,161 |
| Univision Communications, Class A * | 1,940,000 | 53,447 |
| Washington Post, Class B | 25,905 | 21,632 |
| | | 519,818 |
| Multiline Retail 1.7% | | |
| Big Lots * | 456,500 | 6,044 |
| Dillards, Class A | 580,000 | 13,584 |
| Family Dollar Stores | 1,806,400 | 47,147 |
| Kohl's * | 600,000 | 33,546 |
| | | 100,321 |
| Specialty Retail 2.3% | | |
| AnnTaylor Stores * | 1,425,000 | 34,599 |
| GAP | 2,706,000 | 53,444 |
| RadioShack | 2,085,000 | 48,309 |
| | | 136,352 |
| Total Consumer Discretionary | | 1,049,501 |
| |
| CONSUMER STAPLES 2.0% | | |
| Food Products 2.0% | | |
| Campbell Soup | 2,343,700 | 72,115 |
| Heinz | 1,166,000 | 41,300 |
| Total Consumer Staples | | 113,415 |
| |
| ENERGY 5.0% | | |
| Energy Equipment & Services 4.4% | | |
| Cooper Cameron * | 1,252,400 | 77,711 |
| Diamond Offshore Drilling | 1,610,000 | 86,022 |
| Grant Prideco * | 2,055,300 | 54,363 |
| Hanover Compressor * | 2,731,500 | 31,440 |
| Petroleum Geo-Services ADR * | 195,000 | 4,616 |
| | | 254,152 |
| Oil, Gas & Consumable Fuels 0.6% | | |
| Murphy Oil | 680,000 | 35,516 |
| | | 35,516 |
| Total Energy | | 289,668 |
| |
| FINANCIALS 21.5% | | |
| Capital Markets 4.2% | | |
| Charles Schwab | 5,080,800 | 57,311 |
| Federated Investors, Class B | 1,165,000 | 34,962 |
| Janus Capital Group | 3,578,900 | 53,827 |
| LaBranche & Co. * | 2,071,100 | 13,048 |
| Lazard * | 1,368,600 | 31,820 |
| Northern Trust | 1,184,000 | 53,978 |
| | | 244,946 |
| Commercial Banks 5.6% | | |
| Amegy Bancorp | 1,300,000 | 29,094 |
| Citizens Banking | 500,000 | 15,110 |
| Commerce Bancshares | 412,411 | 20,790 |
| First Horizon National | 1,100,000 | 46,420 |
| Huntington Bancshares | 2,405,000 | 58,057 |
| PNC Financial Services Group | 1,020,000 | 55,549 |
| Regions Financial | 1,050,000 | 35,574 |
| Synovus Financial | 2,245,000 | 64,364 |
| | | 324,958 |
| Consumer Finance 0.9% | | |
| Moneygram International | 2,681,100 | 51,263 |
| | | 51,263 |
| Diversified Financial Services 0.2% | | |
| Groupe Bruxelles Lambert (EUR) | 120,000 | 10,367 |
| | | 10,367 |
| Insurance 9.1% | | |
| Aon | 1,831,900 | 45,871 |
| Axis Capital Holdings | 1,876,300 | 53,099 |
| Genworth Financial, Class A | 1,870,000 | 56,530 |
| Jefferson Pilot | 1,035,000 | 52,185 |
| Marsh & McLennan | 2,730,000 | 75,621 |
| Ohio Casualty | 1,218,000 | 29,451 |
| Protective Life | 425,000 | 17,943 |
| SAFECO | 439,300 | 23,872 |
| St. Paul Companies | 2,546,975 | 100,682 |
| UnumProvident | 2,467,700 | 45,208 |
| XL Capital | 403,200 | 30,006 |
| | | 530,468 |
| Real Estate 1.1% | | |
| Apartment Investment & Management, Class A, REIT | 1,200,000 | 49,104 |
| Equity Office Properties, REIT | 465,000 | 15,392 |
| | | 64,496 |
| Thrifts & Mortgage Finance 0.4% | | |
| Radian | 535,000 | 25,263 |
| | | 25,263 |
| Total Financials | | 1,251,761 |
| |
| HEALTH CARE 8.8% | | |
| Biotechnology 3.4% | | |
| Amylin Pharmaceuticals * | 300,000 | 6,279 |
| Cephalon * | 625,000 | 24,881 |
| Chiron * | 2,071,200 | 72,264 |
| Human Genome Sciences * | 1,200,000 | 13,896 |
| MedImmune * | 2,535,000 | 67,735 |
| Vertex Pharmaceuticals * | 820,000 | 13,809 |
| | | 198,864 |
| Health Care Providers & Services 5.2% | | |
| AmerisourceBergen | 1,010,000 | 69,842 |
| Health Management, Class A | 230,000 | 6,021 |
| HealthSouth * | 12,733,400 | 71,307 |
| Lincare Holdings * | 1,440,000 | 58,810 |
| Tenet Healthcare * | 8,010,000 | 98,042 |
| | | 304,022 |
| Pharmaceuticals 0.2% | | |
| Valeant Pharmaceuticals | 600,000 | 10,578 |
| | | 10,578 |
| Total Health Care | | 513,464 |
| |
| INDUSTRIALS & BUSINESS SERVICES 9.0% | | |
| Aerospace & Defense 1.6% | | |
| Raytheon | 1,329,000 | 51,990 |
| Rockwell Collins | 792,200 | 37,772 |
| | | 89,762 |
| Airlines 1.1% | | |
| Southwest Airlines | 4,690,000 | 65,332 |
| | | 65,332 |
| Commercial Services & Supplies 3.7% | | |
| Allied Waste Industries * | 7,005,000 | 55,550 |
| Cintas | 800,000 | 30,880 |
| Equifax | 1,650,000 | 58,922 |
| Herman Miller | 680,100 | 20,974 |
| Manpower | 1,240,000 | 49,327 |
| | | 215,653 |
| Road & Rail 2.6% | | |
| CSX | 940,000 | 40,100 |
| Laidlaw International * | 2,750,000 | 66,275 |
| Union Pacific | 700,000 | 45,360 |
| | | 151,735 |
| Total Industrials & Business Services | | 522,482 |
| |
| INFORMATION TECHNOLOGY 9.2% | | |
| Electronic Equipment & Instruments 2.6% | | |
| AVX | 3,511,100 | 42,555 |
| Jabil Circuit * | 1,485,000 | 45,634 |
| Molex, Class A | 2,616,200 | 61,428 |
| | | 149,617 |
| Internet Software & Services 0.9% | | |
| IAC/InterActiveCorp * | 2,285,000 | 54,954 |
| | | 54,954 |
| IT Services 0.9% | | |
| BISYS Group * | 3,650,000 | 54,531 |
| | | 54,531 |
| Semiconductor & Semiconductor Equipment 1.6% | | |
| KLA-Tencor | 675,000 | 29,498 |
| Novellus Systems * | 2,553,590 | 63,099 |
| | | 92,597 |
| Software 3.2% | | |
| BMC Software * | 2,572,000 | 46,168 |
| Intuit * | 1,520,000 | 68,567 |
| Novell * | 2,900,000 | 17,980 |
| Synopsys * | 3,185,000 | 53,094 |
| | | 185,809 |
| Total Information Technology | | 537,508 |
| |
| MATERIALS 8.0% | | |
| Chemicals 1.6% | | |
| Great Lakes Chemical | 705,900 | 22,215 |
| Nalco Holding * | 3,718,000 | 72,984 |
| | | 95,199 |
| Containers & Packaging 0.6% | | |
| Smurfit-Stone Container * | 3,150,000 | 32,036 |
| | | 32,036 |
| Metals & Mining 2.9% | | |
| Anglo American Platinum (ZAR) | 1,000,000 | 44,394 |
| Barrick Gold | 1,200,000 | 30,036 |
| Gold Fields ADR | 4,805,000 | 54,537 |
| Meridian Gold * | 2,342,800 | 42,170 |
| | | 171,137 |
| Paper & Forest Products 2.9% | | |
| Abitibi Consolidated | 3,500,000 | 15,680 |
| Bowater | 1,315,000 | 42,566 |
| Domtar | 200,000 | 1,478 |
| Domtar (CAD) | 8,779,500 | 64,895 |
| MeadWestvaco | 1,150,200 | 32,252 |
| Potlatch | 194,700 | 10,189 |
| | | 167,060 |
| Total Materials | | 465,432 |
| |
| TELECOMMUNICATION SERVICES 2.0% | | |
| Diversified Telecommunication Services 0.7% | | |
| Qwest Communications International * | 4,071,600 | 15,106 |
| Telus (CAD) | 387,000 | 13,596 |
| Telus (Non-voting shares) | 264,700 | 9,002 |
| | | 37,704 |
| Wireless Telecommunication Services 1.3% | | |
| Crown Castle International * | 116,200 | 2,361 |
| Nextel Partners, Class A * | 1,250,000 | 31,462 |
| Telephone & Data Systems | 464,000 | 18,936 |
| Telephone & Data Systems (Special Shares) | 363,100 | 13,921 |
| U. S. Cellular * | 203,100 | 10,143 |
| | | 76,823 |
| Total Telecommunication Services | | 114,527 |
| |
| UTILITIES 8.3% | | |
| Electric Utilities 3.5% | | |
| El Paso Electric * | 230,000 | 4,704 |
| FirstEnergy | 543,200 | 26,133 |
| Pinnacle West Capital | 1,344,500 | 59,763 |
| Teco Energy | 5,236,900 | 99,030 |
| XCEL Energy | 712,300 | 13,904 |
| | | 203,534 |
| Gas Utilities 1.7% | | |
| NiSource | 3,987,600 | 98,613 |
| | | 98,613 |
| Independent Power Producers & Energy Traders 2.5% | | |
| Duke Energy | 1,515,000 | 45,041 |
| Dynegy, Class A * | 7,885,000 | 38,321 |
| NRG Energy * | 1,612,500 | 60,630 |
| | | 143,992 |
| Multi-Utilities 0.6% | | |
| CMS Energy * | 2,340,000 | 35,241 |
| | | 35,241 |
| Total Utilities | | 481,380 |
| Total Miscellaneous Common Stock 0.5% ** | | 27,812 |
| | | |
| Total Common Stocks (Cost $4,759,403) | | 5,366,950 |
| | | |
| CONVERTIBLE PREFERRED STOCKS 0.6% | | |
| | | |
| Allied Waste Industries | 91,900 | 22,875 |
| NRG Energy, 144A | 12,000 | 13,085 |
| Total Convertible Preferred Stocks (Cost $34,524) | | 35,960 |
| | | |
| CONVERTIBLE BONDS 0.0% | | |
| | | |
| XCEL Energy, 144A, 7.50%, 11/21/07 | 1,365,000 | 2,176 |
| Total Convertible Bonds (Cost $1,365) | | 2,176 |
| | | |
| SHORT-TERM INVESTMENTS 4.7% | | |
| | | |
| Money Market Fund 4.7% | | |
| T. Rowe Price Reserve Investment Fund, 3.14% #† | 275,189,714 | 275,190 |
| Total Short-Term Investments (Cost $275,190) | | 275,190 |
| | | |
| Total Investments in Securities | | |
| 97.6% of Net Assets (Cost $5,070,482) | $ | 5,680,276 |
| (1) | Denominated in U.S. dollars unless other- | ADR | American Depository Receipts |
| | wise noted | CAD | Canadian dollar |
| # | Seven-day yield | EUR | Euro |
| * | Non-income producing | GBP | British pound |
| ** | The identity of certain securities has been | REIT | Real Estate Investment Trust |
| | concealed to protect the fund while it com- | ZAR | South African rand |
| | pletes a purchase or selling program for | | |
| | the securities | | |
| † | Affiliated company – See Note 4 | | |
| 144A | Security was purchased pursuant to Rule | | |
| | 144A under the Securities Act of 1933 and | | |
| | may be resold in transactions exempt from | | |
| | registration only to qualified institutional | | |
| | buyers—total value of such securities at | | |
| | period-end amounts to $15,261 and repre- | | |
| | sents 0.3% of net assets | | |
| |
| The accompanying notes are an integral part of these financial statements. |
Unaudited
| STATEMENT OF ASSETS AND LIABILITIES |
| (In thousands except shares and per share amounts) | | |
| Assets | | |
| Investments in securities, at value | | |
| Affiliated companies (cost $275,190) | $ | 275,190 |
| Non-affiliated companies (cost $4,795,292) | | 5,405,086 |
|
|
| Total investments in securities | | 5,680,276 |
| Cash | | 3 |
| Dividends and interest receivable | | 5,335 |
| Receivable for investment securities sold | | 42,694 |
| Receivable for shares sold | | 113,463 |
| Other assets | | 45 |
|
|
| Total assets | | 5,841,816 |
|
|
| |
| Liabilities | | |
| Investment management fees payable | | 3,087 |
| Payable for investment securities purchased | | 15,178 |
| Payable for shares redeemed | | 5,444 |
| Due to affiliates | | 451 |
| Other liabilities | | 615 |
|
|
| Total liabilities | | 24,775 |
|
|
| |
| NET ASSETS | $ | 5,817,041 |
|
|
| | | |
| Net Assets Consist of: | | |
| Undistributed net investment income (loss) | $ | 13,462 |
| Undistributed net realized gain (loss) | | 141,582 |
| Net unrealized gain (loss) | | 609,804 |
| Paid-in-capital applicable to 252,012,024 shares of | | |
| $0.0001 par value capital stock outstanding; | | |
| 1,000,000,000 shares authorized | | 5,052,193 |
|
|
| |
| NET ASSETS | $ | 5,817,041 |
|
|
| |
| NET ASSET VALUE PER SHARE | | |
| Investor Class | | |
| ($5,173,678,251/223,954,511 shares outstanding) | $ | 23.10 |
|
|
| Advisor Class | | |
| ($371,682,804/16,161,420 shares outstanding) | $ | 23.00 |
|
|
| R Class | | |
| ($271,679,835/11,896,093 shares outstanding) | $ | 22.84 |
|
|
The accompanying notes are an integral part of these financial statements.
Unaudited
| STATEMENT OF OPERATIONS |
| ($ 000s) | | |
| | | 6 Months |
| | | Ended |
| | | 6/30/05 |
| Investment Income (Loss) | | |
| Income | | |
| Dividend | $ | 36,079 |
| Interest | | 51 |
|
|
| Total income | | 36,130 |
|
|
| Expenses | | |
| Investment management | | 17,796 |
| Shareholder servicing | | |
| Investor Class | | 3,372 |
| Advisor Class | | 216 |
| R Class | | 141 |
| Rule 12b-1 fees | | |
| Advisor Class | | 425 |
| R Class | | 581 |
| Prospectus and shareholder reports | | |
| Investor Class | | 300 |
| Advisor Class | | 40 |
| R Class | | 5 |
| Registration | | 206 |
| Custody and accounting | | 166 |
| Proxy and annual meeting | | 35 |
| Legal and audit | | 14 |
| Directors | | 8 |
| Miscellaneous | | 4 |
|
|
| Total expenses | | 23,309 |
| Expenses paid indirectly | | (7) |
|
|
| Net expenses | | 23,302 |
|
|
| Net investment income (loss) | | 12,828 |
|
|
| |
| Realized and Unrealized Gain (Loss) | | |
| Net realized gain (loss) | | |
| Securities | | 86,904 |
| Foreign currency transactions | | (274) |
|
|
| Net realized gain (loss) | | 86,630 |
|
|
| | | |
| Change in net unrealized gain (loss) | | |
| Securities | | (55,638) |
| Other assets and liabilities | | |
| denominated in foreign currencies | | 5 |
|
|
| Change in net unrealized gain (loss) | | (55,633) |
|
|
| Net realized and unrealized gain (loss) | | 30,997 |
|
|
| |
| INCREASE (DECREASE) IN NET | | |
| ASSETS FROM OPERATIONS | $ | 43,825 |
|
|
The accompanying notes are an integral part of these financial statements.
Unaudited
| STATEMENT OF CHANGES IN NET ASSETS |
| ($ 000s) | | | | |
| | | 6 Months | | Year |
| | | Ended | | Ended |
| | | 6/30/05 | | 12/31/04 |
| |
| Increase (Decrease) in Net Assets | | | | |
| Operations | | | | |
| Net investment income (loss) | $ | 12,828 | $ | 20,200 |
| Net realized gain (loss) | | 86,630 | | 296,516 |
| Change in net unrealized gain (loss) | | (55,633) | | 386,620 |
|
|
| Increase (decrease) in net assets from operations | | 43,825 | | 703,336 |
|
|
| |
| Distributions to shareholders | | | | |
| Net investment income | | | | |
| Investor Class | | – | | (18,142) |
| Advisor Class | | – | | (975) |
| R Class | | – | | (449) |
| Net realized gain | | | | |
| Investor Class | | – | | (254,015) |
| Advisor Class | | – | | (17,062) |
| R Class | | – | | (10,477) |
|
|
| Decrease in net assets from distributions | | – | | (301,120) |
|
|
| |
| Capital share transactions * | | | | |
| Shares sold | | | | |
| Investor Class | | 1,117,189 | | 2,599,210 |
| Advisor Class | | 121,259 | | 243,964 |
| R Class | | 104,576 | | 166,379 |
| Distributions reinvested | | | | |
| Investor Class | | – | | 253,230 |
| Advisor Class | | – | | 15,027 |
| R Class | | – | | 10,925 |
| Shares redeemed | | | | |
| Investor Class | | (551,960) | | (533,337) |
| Advisor Class | | (63,508) | | (35,310) |
| R Class | | (25,129) | | (17,528) |
|
|
| Increase (decrease) in net assets from | | | | |
| capital share transactions | | 702,427 | | 2,702,560 |
|
|
| |
| Net Assets | | | | |
| Increase (decrease) during period | | 746,252 | | 3,104,776 |
| Beginning of period | | 5,070,789 | | 1,966,013 |
|
|
| |
| End of period | $ | 5,817,041 | $ | 5,070,789 |
|
|
| (Including undistributed net investment income of | | | | |
| $13,462 at 6/30/05 and $634 at 12/31/04) | | | | |
| | | | | |
| *Share information | | | | |
| Shares sold | | | | |
| Investor Class | | 49,677 | | 119,836 |
| Advisor Class | | 5,428 | | 11,206 |
| R Class | | 4,706 | | 7,682 |
| Distributions reinvested | | | | |
| Investor Class | | – | | 11,249 |
| Advisor Class | | – | | 670 |
| R Class | | – | | 490 |
| Shares redeemed | | | | |
| Investor Class | | (24,577) | | (24,620) |
| Advisor Class | | (2,831) | | (1,631) |
| R Class | | (1,124) | | (807) |
| |
|
| Increase (decrease) in shares outstanding | | 31,279 | | 124,075 |
The accompanying notes are an integral part of these financial statements.
Unaudited
| NOTES TO FINANCIAL STATEMENTS |
NOTE 1 - SIGNIFICANT ACCOUNTING POLICIES
T. Rowe Price Mid-Cap Value Fund, Inc. (the fund) is registered under the Investment Company Act of 1940 (the 1940 Act) as a diversified, open-end management investment company. The fund seeks to provide long-term capital appreciation by investing primarily in mid-size companies that appear to be undervalued. The fund has three classes of shares: the Mid-Cap Value Fund original share class, referred to in this report as the Investor Class, offered since June 28, 1996, Mid-Cap Value Fund—Advisor Class (Advisor Class), offered since September 30, 2002, and Mid-Cap Value Fund—R Class (R Class), offered since September 30, 2002. Advisor Class shares are sold only through unaffiliated brokers and other unaffiliated financial intermediaries, and R Class shares are available to retirement plans serviced by intermediaries. The Advisor Class and R Class each operate under separate Board-approved Rule 12b-1 plans, pursuant to which each class compensates financial intermediaries for distribution, shareholder servicing, and/or certain administrative services. Each class has exclusive voting rights on matters related solely to that class, separate voting rights on matters that relate to all classes, and, in all other respects, the same rights and obligations as the other classes.
The accompanying financial statements were prepared in accordance with accounting principles generally accepted in the United States of America, which require the use of estimates made by fund management. Fund management believes that estimates and security valuations are appropriate; however actual results may differ from those estimates, and the security valuations reflected in the financial statements may differ from the value the fund receives upon sale of the securities.
Valuation The fund values its investments and computes its net asset value per share at the close of the New York Stock Exchange (NYSE), normally 4 p.m. ET, each day that the NYSE is open for business. Equity securities listed or regularly traded on a securities exchange or in the over-the-counter market are valued at the last quoted sale price or, for certain markets, the official closing price at the time the valuations are made, except for OTC Bulletin Board securities, which are valued at the mean of the latest bid and asked prices. A security that is listed or traded on more than one exchange is valued at the quotation on the exchange determined to be the primary market for such security. Listed securities not traded on a particular day are valued at the mean of the latest bid and asked prices for domestic securities and the last quoted sale price for international securities.
Debt securities are generally traded in the over-the-counter market. Securities with original maturities of one year or more are valued at prices furnished by dealers who make markets in such securities or by an independent pricing service, which considers yield or price of bonds of comparable quality, coupon, maturity, and type, as well as prices quoted by dealers who make markets in such securities. Securities with original maturities of less than one year are valued at amortized cost in local currency, which approximates fair value when combined with accrued interest.
Investments in mutual funds are valued at the mutual fund’s closing net asset value per share on the day of valuation.
Other investments, including restricted securities, and those for which the above valuation procedures are inappropriate or are deemed not to reflect fair value are stated at fair value as determined in good faith by the T. Rowe Price Valuation Committee, established by the fund’s Board of Directors.
Most foreign markets close before the close of trading on the NYSE. If the fund determines that developments between the close of a foreign market and the close of the NYSE will, in its judgment, materially affect the value of some or all of its portfolio securities, which in turn will affect the fund’s share price, the fund will adjust the previous closing prices to reflect the fair value of the securities as of the close of the NYSE, as determined in good faith by the T. Rowe Price Valuation Committee, established by the fund’s Board of Directors. A fund may also fair value securities in other situations, such as when a particular foreign market is closed but the fund is open. In deciding whether to make fair value adjustments, the fund reviews a variety of factors, including developments in foreign markets, the performance of U.S. securities markets, and the performance of instruments trading in U. S. markets that represent foreign securities and baskets of foreign securities. The fund uses outside pricing services to provide it with closing market prices and information used for adjusting those prices. The fund cannot predict when and how often it will use closing prices and when it will adjust those prices to reflect fair value. As a means of evaluating its fair value process, the fund routinely compares closing market prices, the next day’s opening prices in the same markets, and adjusted prices.
Currency Translation Assets, including investments, and liabilities denominated in foreign currencies are translated into U.S. dollar values each day at the prevailing exchange rate, using the mean of the bid and asked prices of such currencies against U.S. dollars as quoted by a major bank. Purchases and sales of securities, income, and expenses are translated into U.S. dollars at the prevailing exchange rate on the date of the transaction. The effect of changes in foreign currency exchange rates on realized and unrealized security gains and losses is reflected as a component of security gains and losses.
Class Accounting The Advisor Class and R Class each pay distribution, shareholder servicing, and/or certain administrative expenses in the form of Rule 12b-1 fees, in an amount not exceeding 0.25% and 0.50%, respectively, of the class’s average daily net assets. Shareholder servicing, prospectus, and shareholder report expenses incurred by each class are charged directly to the class to which they relate. Expenses common to all classes, investment income, and realized and unrealized gains and losses are allocated to the classes based upon the relative daily net assets of each class.
Rebates and Credits Subject to best execution, the fund may direct certain security trades to brokers who have agreed to rebate a portion of the related brokerage commission to the fund in cash. Commission rebates are included in realized gain on securities in the accompanying financial statements and totaled $439,000 for the six months ended June 30, 2005. Additionally, the fund earns credits on temporarily uninvested cash balances at the custodian that reduce the fund’s custody charges. Custody expense in the accompanying financial statements is presented before reduction for credits, which are reflected as expenses paid indirectly.
Investment Transactions, Investment Income, and Distributions Income and expenses are recorded on the accrual basis. Premiums and discounts on debt securities are amortized for financial reporting purposes. Dividends received from mutual fund investments are reflected as dividend income; capital gain distributions are reflected as realized gain/loss. Dividend income and capital gain distributions are recorded on the ex-dividend date. Investment transactions are accounted for on the trade date. Realized gains and losses are reported on the identified cost basis. Paydown gains and losses are recorded as an adjustment to interest income. Distributions to shareholders are recorded on the ex-dividend date. Income distributions are declared and paid by each class on an annual basis. Capital gain distributions, if any, are declared and paid by the fund, typically on an annual basis.
NOTE 2 - INVESTMENT TRANSACTIONS
Consistent with its investment objective, the fund engages in the following practices to manage exposure to certain risks or enhance performance. The investment objective, policies, program, and risk factors of the fund are described more fully in the fund’s prospectus and Statement of Additional Information.
Restricted Securities The fund may invest in securities that are subject to legal or contractual restrictions on resale. Although certain of these securities may be readily sold, for example, under Rule 144A, others may be illiquid, their sale may involve substantial delays and additional costs, and prompt sale at an acceptable price may be difficult.
Other Purchases and sales of portfolio securities, other than short-term securities, aggregated $1,586,221,000 and $840,882,000, respectively, for the six months ended June 30, 2005.
NOTE 3 - FEDERAL INCOME TAXES
No provision for federal income taxes is required since the fund intends to continue to qualify as a regulated investment company under Subchapter M of the Internal Revenue Code and distribute to shareholders all of its taxable income and gains. Federal income tax regulations differ from generally accepted accounting principles; therefore, distributions determined in accordance with tax regulations may differ in amount or character from net investment income and realized gains for financial reporting purposes. Financial reporting records are adjusted for permanent book/tax differences to reflect tax character. Financial records are not adjusted for temporary differences. The amount and character of tax-basis distributions and composition of net assets are finalized at fiscal year-end; accordingly, tax-basis balances have not been determined as of June 30, 2005.
At June 30, 2005, the cost of investments for federal income tax purposes was $5,070,482,000. Net unrealized gain aggregated $609,804,000 at period-end, of which $759,710,000 related to appreciated investments and $149,906,000 related to depreciated investments.
NOTE 4 - RELATED PARTY TRANSACTIONS
The fund is managed by T. Rowe Price Associates, Inc. (the manager or Price Associates), a wholly owned subsidiary of T. Rowe Price Group, Inc. The investment management agreement between the fund and the manager provides for an annual investment management fee, which is computed daily and paid monthly. The fee consists of an individual fund fee, equal to 0.35% of the fund’s average daily net assets, and a group fee. The group fee rate is calculated based on the combined net assets of certain mutual funds sponsored by Price Associates (the group) applied to a graduated fee schedule, with rates ranging from 0.48% for the first $1 billion of assets to 0.29% for assets in excess of $160 billion. Prior to May 1, 2005, the maximum group fee rate in the graduated fee schedule had been 0.295% for assets in excess of $120 billion. The fund’s group fee is determined by applying the group fee rate to the fund’s average daily net assets. At June 30, 2005, the effective annual group fee ra te was 0.31%.
The Advisor Class and R Class are also subject to a contractual expense limitation through the limitation dates indicated in the table below. During the limitation period, the manager is required to waive its management fee and reimburse a class for any expenses, excluding interest, taxes, brokerage commissions, and extraordinary expenses, that would otherwise cause the class’s ratio of total expenses to average net assets (expense ratio) to exceed its expense limitation. Each class is required to repay the manager for expenses previously reimbursed and management fees waived to the extent the class’s net assets have grown or expenses have declined sufficiently to allow repayment without causing the class’s expense ratio to exceed its expense limitation. However, no repayment will be made more than three years after the date of any reimbursement or waiver or later than the repayment dates indicated in the table below.
| | Advisor Class | R Class |
| Expense Limitation | 1.10% | 1.40% |
| Limitation Date | 4/30/06 | 4/30/06 |
| Repayment Date | 4/30/08 | 4/30/08 |
Pursuant to this agreement, at June 30, 2005, there were no amounts subject to repayment. For the six months ended June 30, 2005, each class operated below its expense limitation.
In addition, the fund has entered into service agreements with Price Associates and two wholly owned subsidiaries of Price Associates (collectively, Price). Price Associates computes the daily share prices and maintains the financial records of the fund. T. Rowe Price Services, Inc., provides shareholder and administrative services in its capacity as the fund’s transfer and dividend disbursing agent. T. Rowe Price Retirement Plan Services, Inc., provides subaccounting and recordkeeping services for certain retirement accounts invested in the Investor Class and R Class. For the six months ended June 30, 2005, expenses incurred pursuant to these service agreements were $41,000 for Price Associates, $1,357,000 for T. Rowe Price Services, Inc., and $448,000 for T. Rowe Price Retirement Plan Services, Inc. The total amount payable at period end pursuant to these service agreements is reflected as due to affiliates in the accompanying financial statements.
Additionally, the fund is one of several mutual funds in which certain college savings plans managed by Price Associates may invest. As approved by the fund’s Board of Directors, shareholder servicing costs associated with each college savings plan are borne by the fund in proportion to the average daily value of its shares owned by the college savings plan. For the six months ended June 30, 2005, the fund was charged $145,000 for shareholder servicing costs related to the college savings plans, of which $108,000 was for services provided by Price. The amount payable at period end pursuant to this agreement is included in Due to Affiliates in the accompanying financial statements. At June 30, 2005, approximately 2.4% of the outstanding shares of the Investor Class were held by college savings plans.
The fund is also one of several mutual funds sponsored by Price Associates (underlying Price funds) in which the T. Rowe Price Spectrum Funds (Spectrum Funds) and T. Rowe Price Retirement Funds (Retirement Funds) may invest. Neither the Spectrum Funds nor the Retirement Funds invest in the underlying Price funds for the purpose of exercising management or control. Pursuant to separate, special servicing agreements, expenses associated with the operation of the Spectrum and Retirement Funds are borne by each underlying Price fund to the extent of estimated savings to it and in proportion to the average daily value of its shares owned by the Spectrum and Retirement Funds, respectively. Expenses allocated under these agreements are reflected as shareholder servicing expenses in the accompanying financial statements. For the six months ended June 30, 2005, the fund was allocated $181,000 of Spectrum Funds’ expenses and $279,000 of Retirement Funds’ expenses. Of these amounts, $346,000 related to services provided by Price. The amount payable at period end pursuant to this agreement is included in Due to Affiliates in the accompanying financial statements. At June 30, 2005, approximately 3.5% of the outstanding shares of the Investor Class were held by the Spectrum Funds and 4.0% were held by the Retirement Funds.
The fund may invest in the T. Rowe Price Reserve Investment Fund and the T. Rowe Price Government Reserve Investment Fund (collectively, the T. Rowe Price Reserve Funds), open-end management investment companies managed by Price Associates and affiliates of the fund. The T. Rowe Price Reserve Funds are offered as cash management options to mutual funds, trusts, and other accounts managed by Price Associates and/or its affiliates, and are not available for direct purchase by members of the public. The T. Rowe Price Reserve Funds pay no investment management fees. During the six months ended June 30, 2005, dividend income from the T. Rowe Price Reserve Funds totaled $5,332,000, and the value of shares of the T. Rowe Price Reserve Funds held at June 30, 2005 and December 31, 2004 was $275,190,000 and $421,778,000, respectively.
As of June 30, 2005, T. Rowe Price Group, Inc. and/or its wholly owned subsidiaries owned 196,390 shares of the Investor Class representing less than 1% of the fund’s net assets.
| INFORMATION ON PROXY VOTING POLICIES, PROCEDURES, AND RECORDS |
A description of the policies and procedures used by T. Rowe Price funds and portfolios to determine how to vote proxies relating to portfolio securities is available in each fund’s Statement of Additional Information, which you may request by calling 1-800-225-5132 or by accessing the SEC’s Web site, www.sec.gov. The description of our proxy voting policies and procedures is also available on our Web site, www.troweprice.com. To access it, click on the words “Company Info” at the top of our homepage for individual investors. Then, in the window that appears, click on the “Proxy Voting Policy” navigation button in the top left corner.
Each fund’s most recent annual proxy voting record is available on our Web site and through the SEC’s Web site. To access it through our Web site, follow the directions above, then click on the words “Proxy Voting Record” at the bottom of the Proxy Voting Policy page.
| HOW TO OBTAIN QUARTERLY PORTFOLIO HOLDINGS |
The fund files a complete schedule of portfolio holdings with the Securities and Exchange Commission for the first and third quarters of each fiscal year on Form N-Q. The fund’s Form N-Q is available electronically on the SEC’s Web site (www.sec.gov); hard copies may be reviewed and copied at the SEC’s Public Reference Room, 450 Fifth St. N.W., Washington, DC 20549. For more information on the Public Reference Room, call 1-800-SEC-0330.
| APPROVAL OF INVESTMENT MANAGEMENT AGREEMENT |
On March 2, 2005, the fund’s Board of Directors unanimously approved the investment advisory contract (“Contract”) between the fund and its investment manager, T. Rowe Price Associates, Inc. (“Manager”). The Board considered a variety of factors in connection with its review of the Contract, also taking into account information provided by the Manager during the course of the year, as discussed below:
Services Provided by the Manager
The Board considered the nature, quality, and extent of the services provided to the fund by the Manager. These services included, but were not limited to, management of the fund’s portfolio and a variety of activities related to portfolio management. The Board also reviewed the background and experience of the Manager’s senior management team and investment personnel involved in the management of the fund. The Board concluded that it was satisfied with the nature, quality, and extent of the services provided by the Manager.
Investment Performance of the Fund
The Board reviewed the fund’s average annual total return over the 1-, 3-, and 5-year periods as well as the fund’s year-by-year returns and compared these returns to previously agreed upon comparable performance measures and market data, including those supplied by Lipper and Morningstar, which are independent providers of mutual fund data. On the basis of this evaluation and the Board’s ongoing review of investment results, the Board concluded that the fund’s performance was satisfactory.
Costs, Benefits, Profits, and Economies of Scale
The Board reviewed detailed information regarding the revenues received by the Manager under the Contract and other benefits that the Manager (and its affiliates) may have realized from its relationship with the fund, including research received under “soft dollar” agreements. The Board also received information on the estimated costs incurred and profits realized by the Manager and its affiliates from advising T. Rowe Price mutual funds, as well as estimates of the gross profits realized from managing the fund in particular. The Board concluded that the Manager’s profits were reasonable in light of the services provided to the fund. The Board also considered whether the fund or other funds benefit under the fee levels set forth in the Contract from any economies of scale realized by the Manager. Under the Contract, the fund pays a fee to the Manager composed of two components—a group fee rate based on the aggregate assets of certain T. Rowe Price mutual funds (including the fund) that declines at certain asset levels and an individual fund fee rate that is assessed on the assets of the fund. The Board concluded that an additional breakpoint should be added to the group fee component of the fees paid by the fund under the Contract at a level of $160 billion. The Board further concluded that, with this change, the advisory fee structure for the fund continued to provide for a reasonable sharing of benefits from any economies of scale with the fund’s investors.
Fees
The Board reviewed the fund’s management fee rate, operating expenses, and total expense ratio (for the Advisor Class and R Class) and compared them to fees and expenses of other comparable funds based on information and data supplied by Lipper. The information provided to the Board indicated that the fund’s management fee rate was above the median for certain groups of comparable funds but below the median for other groups of comparable funds. The information also indicated that the fund’s expense ratio (for both classes) was generally below the median for comparable funds. The Board also reviewed the fee schedules for comparable privately managed accounts of the Manager and its affiliates. Management informed the Board that the Manager’s responsibilities for privately managed accounts are more limited than its responsibilities for the fund and other T. Rowe Price mutual funds that it or its affiliates advise. On the basis of the information provided, the Board concluded that the fees paid by the fund under the Contract were reasonable.
Approval of the Contract
As noted, the Board approved the continuation of the Contract as amended to add an additional breakpoint to the group fee rate. No single factor was considered in isolation or to be determinative to the decision. Rather, the Board concluded, in light of a weighting and balancing of all factors considered, that it was in the best interests of the fund to approve the continuation of the Contract, including the fees to be charged for services thereunder.
Item 2. Code of Ethics.A code of ethics, as defined in Item 2 of Form N-CSR, applicable to its principal executive officer, principal financial officer, principal accounting officer or controller, or persons performing similar functions is filed as an exhibit to the registrant’s annual Form N-CSR. No substantive amendments were approved or waivers were granted to this code of ethics during the registrant’s most recent fiscal half-year.
Item 3. Audit Committee Financial Expert.
Disclosure required in registrant’s annual Form N-CSR.
Item 4. Principal Accountant Fees and Services.
Disclosure required in registrant’s annual Form N-CSR.
Item 5. Audit Committee of Listed Registrants.
Not applicable.
Item 6. Schedule of Investments.
Not applicable. The complete schedule of investments is included in Item 1 of this Form N-CSR.
Item 7. Disclosure of Proxy Voting Policies and Procedures for Closed-End Management Investment Companies.
Not applicable.
Item 8. Portfolio Managers of Closed-End Management Investment Companies.
Not applicable.
Item 9. Purchases of Equity Securities by Closed-End Management Investment Company and Affiliated Purchasers.
Not applicable.
Item 10. Submission of Matters to a Vote of Security Holders.
Not applicable.
Item 11. Controls and Procedures.
(a) The registrant’s principal executive officer and principal financial officer have evaluated the registrant’s disclosure controls and procedures within 90 days of this filing and have concluded that the registrant’s disclosure controls and procedures were effective, as of that date, in ensuring that information required to be disclosed by the registrant in this Form N-CSR was recorded, processed, summarized, and reported timely.
(b) The registrant’s principal executive officer and principal financial officer are aware of no change in the registrant’s internal control over financial reporting that occurred during the registrant’s second fiscal quarter covered by this report that has materially affected, or is reasonably likely to materially affect, the registrant’s internal control over financial reporting.
Item 12. Exhibits.
(a)(1) The registrant’s code of ethics pursuant to Item 2 of Form N-CSR is filed with the registrant’s annual Form N-CSR.
(2) Separate certifications by the registrant's principal executive officer and principal financial officer, pursuant to Section 302 of the Sarbanes-Oxley Act of 2002 and required by Rule 30a-2(a) under the Investment Company Act of 1940, are attached.
(3) Written solicitation to repurchase securities issued by closed-end companies: not applicable.
(b) A certification by the registrant's principal executive officer and principal financial officer, pursuant to Section 906 of the Sarbanes-Oxley Act of 2002 and required by Rule 30a-2(b) under the Investment Company Act of 1940, is attached.
| | |
| SIGNATURES |
| |
| | Pursuant to the requirements of the Securities Exchange Act of 1934 and the Investment |
| Company Act of 1940, the registrant has duly caused this report to be signed on its behalf by the |
| undersigned, thereunto duly authorized. |
| |
| T. Rowe Price Mid-Cap Value Fund, Inc. |
| |
| By | /s/ James S. Riepe |
| | James S. Riepe |
| | Principal Executive Officer |
| |
| Date | August 18, 2005 |
| |
| |
| | Pursuant to the requirements of the Securities Exchange Act of 1934 and the Investment |
| Company Act of 1940, this report has been signed below by the following persons on behalf of |
| the registrant and in the capacities and on the dates indicated. |
| |
| |
| By | /s/ James S. Riepe |
| | James S. Riepe |
| | Principal Executive Officer |
| |
| Date | August 18, 2005 |
| |
| |
| |
| By | /s/ Joseph A. Carrier |
| | Joseph A. Carrier |
| | Principal Financial Officer |
| |
| Date | August 18, 2005 |