Item 1: Report to Shareholders| Mid-Cap Value Fund | June 30, 2007 |
The views and opinions in this report were current as of June 30, 2007. They are not guarantees of performance or investment results and should not be taken as investment advice. Investment decisions reflect a variety of factors, and the managers reserve the right to change their views about individual stocks, sectors, and the markets at any time. As a result, the views expressed should not be relied upon as a forecast of the fund’s future investment intent. The report is certified under the Sarbanes-Oxley Act, which requires mutual funds and other public companies to affirm that, to the best of their knowledge, the information in their financial reports is fairly and accurately stated in all material respects.
REPORTS ON THE WEB
Sign up for our E-mail Program, and you can begin to receive updated fund reports and prospectuses online rather than through the mail. Log in to your account at troweprice.com for more information.
Manager’s Letter
Fellow Shareholders
Despite a substantial economic slowdown early in the year, the stock market continued its winning ways in the first half of 2007. Thanks in part to good growth overseas, corporate profits continued to expand, albeit at a slower pace than in recent years. A dramatic rise in merger and acquisition (M&A) activity also had a significant impact on the market and the portfolio as private-equity buyers and others helped bid up stock prices. Indeed, more than a dozen of the fund’s holdings have been subject to takeovers in the past 12 months, more than triple the pace of an average year for the portfolio. The fund enjoyed a very solid return in this environment, but we are mindful that M&A activity has had a noticeable impact on the valuation of mid-cap stocks by encouraging investors to attempt to anticipate the next target.
HIGHLIGHTS
• Robust economic growth overseas and an active takeover market helped stock prices rise in the first half of 2007, and mid-cap shares outpaced small- and large-caps.
• The fund recorded a good return in this environment that slightly lagged that of its peer group while outpacing the Russell MidCap Value Index; the fund outpaced both benchmarks over the past year.
• Results benefited as several longtime holdings “popped” over the past year—business conditions improved and the market recognized the value in the franchise.
• Good profit growth and healthy balance sheets are reasons for optimism, but we are mindful that mid-cap valuations have become extended, due in part to takeover activity.

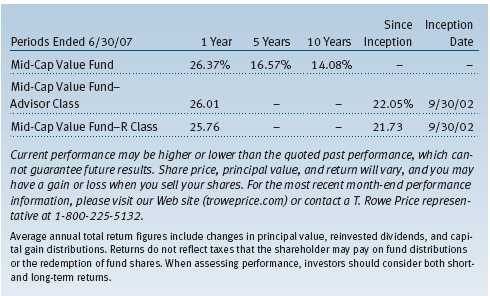
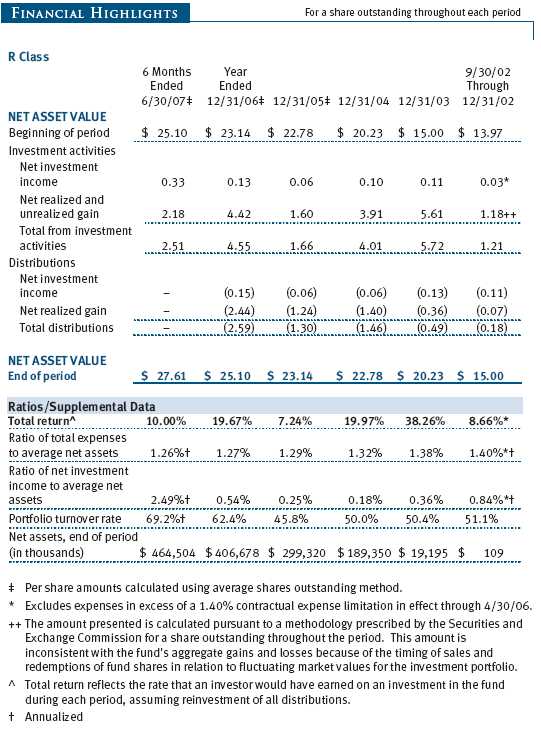
Your fund returned 10.27% for the six months ended June 30, 2007, and 26.37% for the one-year period. As shown in the table, the portfolio slightly lagged the Lipper Mid-Cap Core Funds Index for the six months while outpacing it over the year. The fund outperformed the Russell Midcap Value Index over both periods. Returns for the fund’s Advisor and R Class shares were slightly lower due to their different cost structures.
The fund’s long-term performance remains favorable, as recognized by Morningstar’s overall five-star rating, as well as its rank well within the top quartile of competitive funds as tracked by Lipper over all time periods. (The Mid-Cap Value Fund received an Overall Morningstar RatingTM of five stars for its risk-adjusted performance. This rating is derived from a weighted average of the performance figures associated with a fund’s 3-, 5-, and 10-year (if applicable) Morningstar RatingTM metrics. The fund was rated among 276, 276, 202, and 58 mid-cap value funds for the overall rating and the 3-, 5-, and 10-year periods ended June 30, 2007, respectively. Based on cumulative total return, Lipper ranked the Mid-Cap Value Fund 28 out of 329, 49 out of 261, 17 out of 220, and 14 out of 71 mid-cap core funds for the 1-, 3-, 5-, and 10-year periods ended June 30, 2007, respectively. Results will vary for other periods. Past performance cannot guarantee future results.)
IMPORTANT INFORMATION ABOUT MORNINGSTAR RATINGS
For funds with at least a 3-year history, a Morningstar Rating™ is based on a risk-adjusted return measure (including the effects of sales charges, loads, and redemption fees) with emphasis on downward variations and consistent performance. The top 10% of funds in each category receive 5 stars, the next 22.5% 4 stars, the next 35% 3 stars, the next 22.5% 2 stars, and the bottom 10% 1 star. Each share class is counted as a fraction of one fund within this scale and rated separately. Morningstar Rating™ is for the retail share class only; other classes may have different performance characteristics. The fund received 4 stars for the 3-year period and 5 stars for the 5- and 10-year periods as of June 30, 2007.
©2007 Morningstar, Inc. All Rights Reserved. The information contained herein: (1) is proprietary to Morningstar and/or its content providers; (2) may not be copied or distributed; and (3) is not warranted to be accurate, complete, or timely. Neither Morningstar nor its content providers are responsible for any damages or losses arising from any use of this information.
MARKET ENVIRONMENT
The U.S. economy slowed sharply in the first quarter, with gross domestic product expanding by a mere 0.7%, its slowest pace in four years. Despite some hopeful signs at the end of 2006, the housing sector continued to act as a drag on overall growth. New home sales fell, and home prices declined on a national basis. Rising defaults and bankruptcies among subprime mortgage lenders became an added concern for the sector early in the year. Then, as spring progressed, rising subprime loan defaults began affecting other financial firms and the broader economy.
While the housing sector remained very weak, manufacturing and capital spending appeared to be accelerating as the second quarter progressed. Most major economies overseas were humming, providing improved opportunities for American exporters. Thanks in part to good export growth, the domestic job market also remained strong, with the unemployment rate hovering around 4.5%. Healthy paychecks helped consumers weather high energy prices, although consumer confidence began to moderate as the period ended.
The shift in the character of the economic expansion was reflected in market patterns. Generally, companies that received a greater share of their revenues and profits from exports or overseas operations fared better than those that relied on the spending habits of American consumers. The former category included many larger, traditionally growth-oriented firms, while smaller companies clustered in the latter. Partly as a result, growth shares outpaced value shares in the period. Within the value area, mid-cap shares outpaced small-caps and even outperformed large-caps, thanks in part to strong takeover demand for medium-sized firms.

PORTFOLIO AND STRATEGY REVIEW
A prized colleague of ours, Hugh Evans, has compared value investing to frying popcorn in a skillet: Some kernels pop right away, some pop after a while, and some never pop at all. Our goal has always been to try to identify good values in the stock market for our investors, but we can never really predict which will “pop”—in other words, when or if stocks in the portfolio will reflect their true, underlying value.
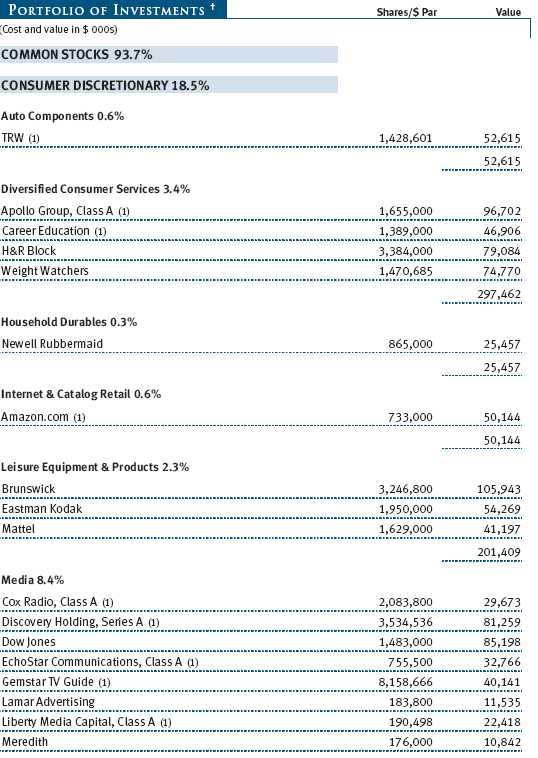
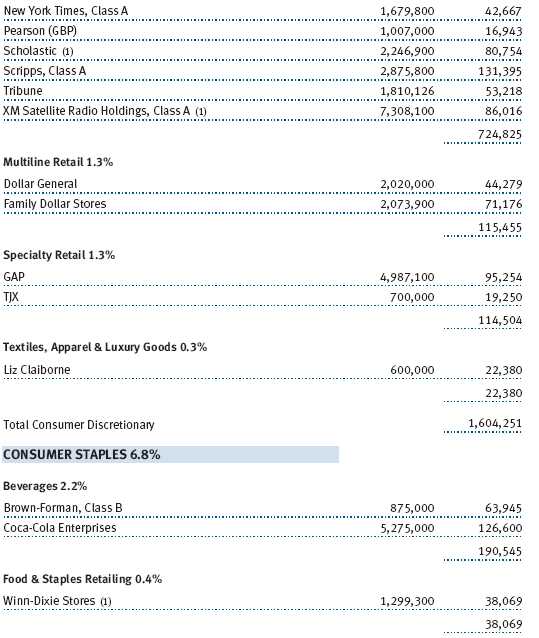
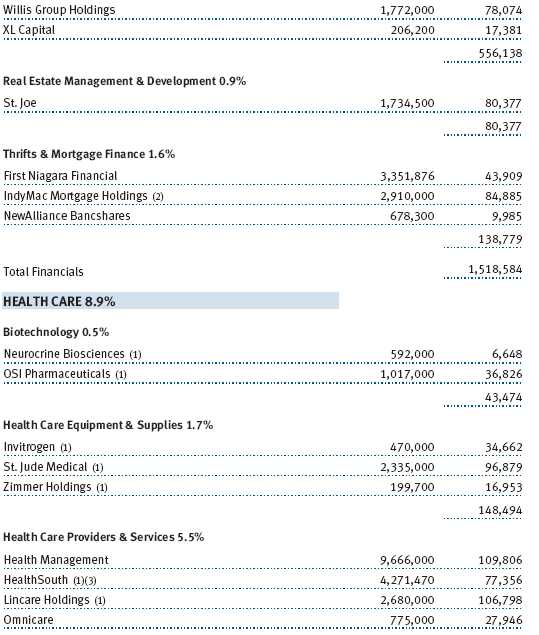
The first half of the year fit well with our colleague’s analogy. Online retailer Amazon.com delivered its rewards quickly. Last summer, when we made our first purchases, shares in the innovative company sold for a multiple of sales that is accorded to many mature—or even troubled—traditional brick-and-mortar retailers. While a multiyear, billion-dollar investment in research and development to build out its capabilities had depressed Amazon’s profits and stock price, it positioned the company to grow its share of the market. The benefits of these investments became apparent in the course of the first half of 2007, as profits significantly exceeded expectations, and Amazon’s shares more than doubled. (Please refer to our portfolio of investments for a complete listing of our holdings and the amount each represents in the portfolio.)
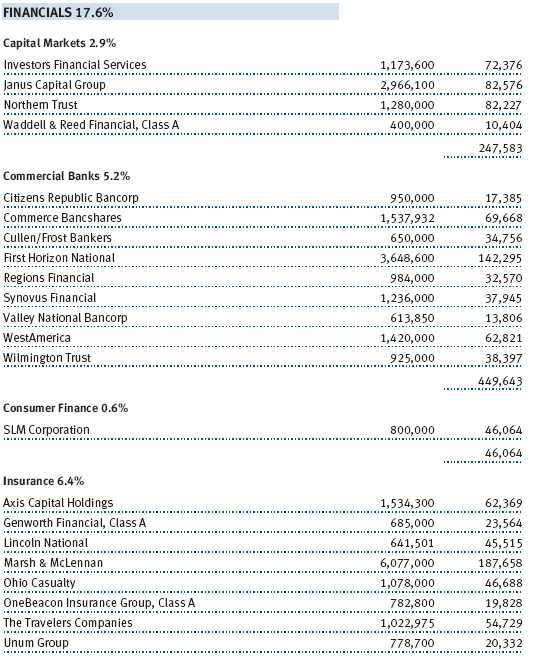
Some of the best performers in the first half were stocks we have owned for years. These included asset manager Janus, an investment we made back in the bear market early in the decade. At that time, we reasoned that the Janus brand, while tarnished, had retained significant value and that the company would likely be fixed through improved oversight of its business processes. Five years later, the efforts of Janus to improve its mutual and institutional funds’ performance and execution in its markets have been impressive. After a long period of trading sideways, its shares rose by a third in the first half before retreating slightly.
Dow Jones is another kernel that took its time frying in the skillet before “popping.” This media firm has been part of the Mid-Cap Value Fund for roughly four years, during which time we have continued to increase our position. Despite the well-known challenges facing the newspaper market, we have held the belief that Dow Jones possesses a marquee media franchise in The Wall Street Journal that would, in our view, be fully exploited by its current management or eventually sold to a third party. In fact, Dow Jones received a takeover bid by News Corporation in May, which made it one of the biggest contributors to the portfolio in the first half.
Other important contributors to the fund included MedImmune, another longstanding holding, which received a takeover bid from European pharmaceutical manufacturer AstraZeneca; Apollo Group, the nation’s largest for-profit education company, which recovered from a slowdown in admissions and profit margin pressures; and Winn-Dixie, the Florida-based grocer whose shares we acquired upon its exit from bankruptcy last year and which saw a dramatic improvement in its profitability.
Naturally, not all of our investment ideas work out as expected. In some cases, fundamentals evolve poorly, or the unforeseen occurs, hurting the stock price and sometimes damaging the underlying value of the business. We are vigilant about recognizing the deterioration of fundamentals in any of the businesses in which we invest, and we are prepared to change our mind if needed. But we have often observed that the stock market’s response to such adversity is excessive. If our confidence in a business remains, and the discrepancy between intrinsic value and stock market price is acute, we are likely to be buyers at lower prices.

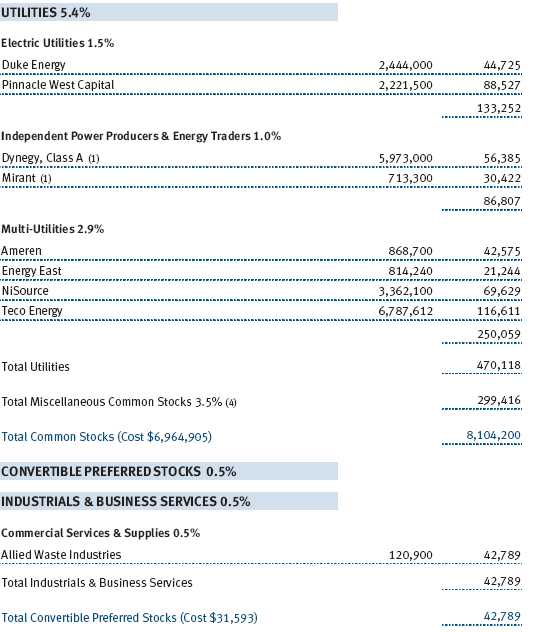
Several of the portfolio’s worst performers in the first half reflect this philosophy. Pinnacle West, an Arizona-based utility holding company, faced an adverse state regulatory environment, which lowered the allowed return on investment for its electric utilities and made the stock our worst performer in the first half. AngloGold, the world’s largest gold producer, was hit by falling bullion prices and concerns about the liquidation of the remaining shares of its former parent, Anglo American. Leading physical therapy provider HealthSouth wrestled with government reimbursement pressures in its core business and costs associated with divestitures. In all cases, we are confident that even under such adverse scenarios, the business fundamentals are supportive of our investment, and the shares of these companies are undervalued. As a result, we have been disappointed by the stock declines but have used them as opportunities to add to our positions in these companies.
Recent additions to the portfolio include some market leaders in a variety of industry sectors. Car rental firm Hertz Global Holdings is one example. We are impressed by the power of the Hertz brand, management’s focus on growing its share of the market, and the company’s valuation relative to its earnings potential. Scripps is another leading company in its markets. Its HGTV and Food Network cable channels dominate their market niches, and substantial value exists within its remaining portfolio of Internet, television, and newspaper properties. St. Joe is a large owner of developed and undeveloped property in Florida. This state’s real estate markets are notoriously volatile, and the recent downturn has been savage and swift. However, we believe St. Joe’s properties represent great value to investors with a long-term time horizon who can wait through even an extended downturn.
The fund eliminated a number of positions that reached what we determined to be full value. Manpower’s management prepared the company well during a slow period in the staffing industry and reaped its reward in the past several years as the global professional labor markets tightened. Reliant Energy is a hybrid electric distribution and merchant energy company that has staged a dramatic recovery in profitability since the power industry recession of the early 2000s. Hornbeck Energy Services, an operator of offshore supply vessels and tugboats, bounced back from a lull in drilling activity in the Gulf of Mexico. TCF Financial was eliminated when other, more attractive risk/reward opportunities among regional bank stocks emerged.
OUTLOOK
The stock market has climbed a proverbial “wall of worry” this year, weathering challenges such as rising interest rates and inflationary pressures, a recession in the U.S. housing sector, violence in the Middle East, and terrorism threats, among other concerns. Despite these challenges, the global economy appears to be on a reasonable footing, corporate profits continue to expand at a moderate pace, and balance sheets are strong. The one missing dimension for mid-cap investors is low valuation, as larger companies now appear more undervalued by most measures than their mid-cap counterparts. The increased appetite of private-equity firms for medium-sized companies, while a benefit to funds such as yours on the one hand, has driven up values in many sectors as investors anticipate further takeover offers. As a result, values still exist in the mid-cap sphere, but there are generally fewer anomalies to exploit than in years past. Regardless of t he market environment, however, we remain committed to seeking out the best risk/return candidates for your portfolio.
Respectfully submitted,

David J. Wallack
Chairman of the fund’s Investment Advisory Committee
July 20, 2007
The committee chairman has day-to-day responsibility for managing the portfolio and works with committee members in developing and executing the fund’s investment program.
SUPPLEMENT TO PROSPECTUS DATED MAY 1, 2007 ERRATUM
Effective May 1, 2007, the fund’s operating policy that sets forth the percentage of the fund’s “total bond assets” that may be invested in noninvestment-grade securities is hereby corrected to remove the word “bond” and refer to “total assets” instead.
RISKS OF INVESTING
The fund’s share price can fall because of weakness in the stock or bond markets, a particular industry, or specific holdings. Stock markets can decline for many reasons, including adverse political or economic developments, changes in investor psychology, or heavy institutional selling. The prospects for an industry or company may deteriorate because of a variety of factors, including disappointing earnings or changes in the competitive environment. In addition, the investment manager’s assessment of companies held in a fund may prove incorrect, resulting in losses or poor performance even in rising markets.
Mid-caps typically offer greater return potential than larger established firms and involve less risk than small-caps. Value investors seek to invest in companies whose stock prices are low in relation to their real worth or future prospects. By identifying companies whose stocks are currently out of favor or misunderstood, value investors hope to realize significant appreciation as other investors recognize the stock’s intrinsic value and the price rises accordingly. The value approach carries the risk that the market will not recognize a security’s intrinsic value for a long time, or that a stock judged to be undervalued may actually be appropriately priced.
GLOSSARY
Lipper indexes: Fund benchmarks that consist of a small number of the largest mutual funds in a particular category as tracked by Lipper Inc.
Russell Midcap Growth Index: Unmanaged index that measures the performance of those Russell Midcap companies with higher price-to-book ratios and higher forecasted growth values.
Russell Midcap Value Index: Unmanaged index that measures the performance of those Russell Midcap companies with lower price-to-book ratios and lower forecasted growth values.
S&P 400 MidCap Index: Unmanaged index that tracks the stocks of 400 mid-size U.S. companies.


Performance and Expenses
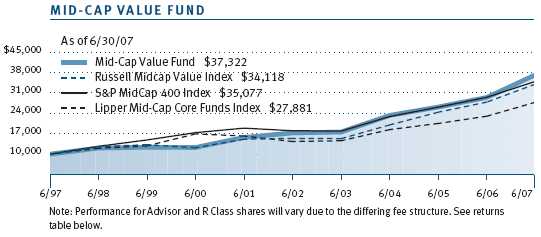
This chart shows the value of a hypothetical $10,000 investment in the fund over the past 10 fiscal year periods or since inception (for funds lacking 10-year records). The result is compared with benchmarks, which may include a broad-based market index and a peer group average or index. Market indexes do not include expenses, which are deducted from fund returns as well as mutual fund averages and indexes.
| AVERAGE ANNUAL COMPOUND TOTAL RETURN |
This table shows how the fund would have performed each year if its actual (or cumulative) returns had been earned at a constant rate.

As a mutual fund shareholder, you may incur two types of costs: (1) transaction costs, such as redemption fees or sales loads, and (2) ongoing costs, including management fees, distribution and service (12b-1) fees, and other fund expenses. The following example is intended to help you understand your ongoing costs (in dollars) of investing in the fund and to compare these costs with the ongoing costs of investing in other mutual funds. The example is based on an investment of $1,000 invested at the beginning of the most recent six-month period and held for the entire period.
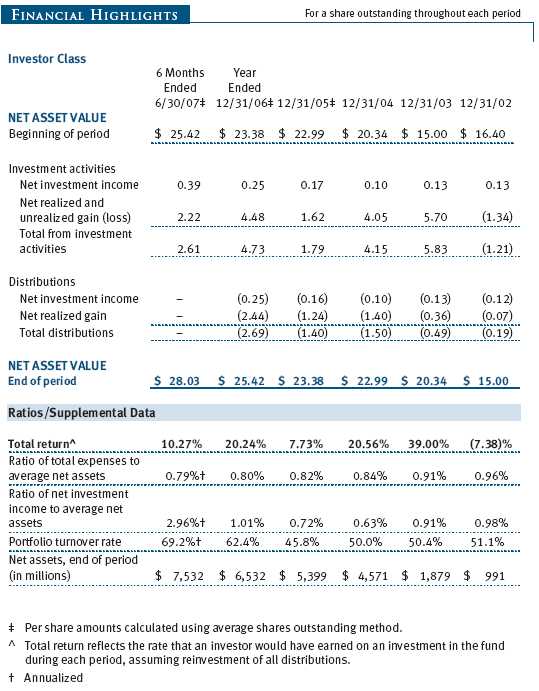
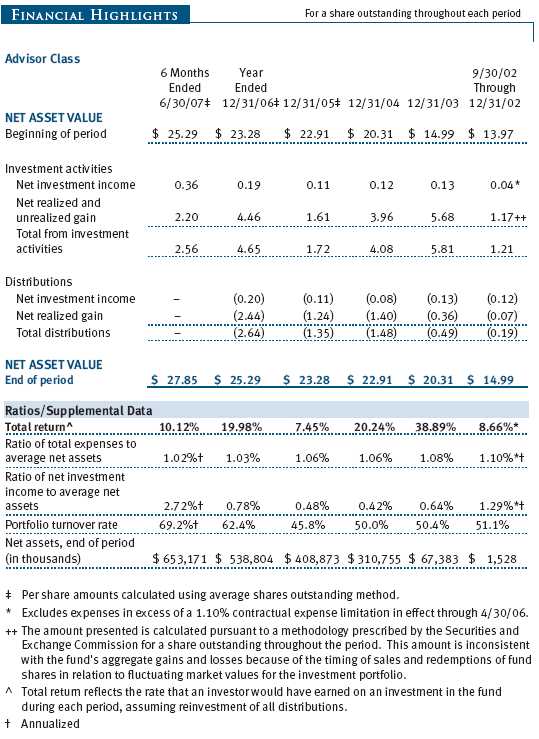
Please note that the fund has three share classes: The original share class (“investor class”) charges no distribution and service (12b-1) fee; Advisor Class shares are offered only through unaffiliated brokers and other financial intermediaries and charge a 0.25% 12b-1 fee; R Class shares are available to retirement plans serviced by intermediaries and charge a 0.50% 12b-1 fee. Each share class is presented separately in the table.
Actual Expenses
The first line of the following table (“Actual”) provides information about actual account values and expenses based on the fund’s actual returns. You may use the information in this line, together with your account balance, to estimate the expenses that you paid over the period. Simply divide your account value by $1,000 (for example, an $8,600 account value divided by $1,000 = 8.6), then multiply the result by the number in the first line under the heading “Expenses Paid During Period” to estimate the expenses you paid on your account during this period.
Hypothetical Example for Comparison Purposes
The information on the second line of the table (“Hypothetical”) is based on hypothetical account values and expenses derived from the fund’s actual expense ratio and an assumed 5% per year rate of return before expenses (not the fund’s actual return). You may compare the ongoing costs of investing in the fund with other funds by contrasting this 5% hypothetical example and the 5% hypothetical examples that appear in the shareholder reports of the other funds. The hypothetical account values and expenses may not be used to estimate the actual ending account balance or expenses you paid for the period.
Note: T. Rowe Price charges an annual small-account maintenance fee of $10, generally for accounts with less than $2,000 ($500 for UGMA/UTMA). The fee is waived for any investor whose T. Rowe Price mutual fund accounts total $25,000 or more, accounts employing automatic investing, and IRAs and other retirement plan accounts that utilize a prototype plan sponsored by T. Rowe Price (although a separate custodial or administrative fee may apply to such accounts). This fee is not included in the accompanying table. If you are subject to the fee, keep it in mind when you are estimating the ongoing expenses of investing in the fund and when comparing the expenses of this fund with other funds.
You should also be aware that the expenses shown in the table highlight only your ongoing costs and do not reflect any transaction costs, such as redemption fees or sales loads. Therefore, the second line of the table is useful in comparing ongoing costs only and will not help you determine the relative total costs of owning different funds. To the extent a fund charges transaction costs, however, the total cost of owning that fund is higher.

Unaudited
The accompanying notes are an integral part of these financial statements.
Unaudited
The accompanying notes are an integral part of these financial statements.
Unaudited
The accompanying notes are an integral part of these financial statements.
Unaudited


The accompanying notes are an integral part of these financial statements.
Unaudited

The accompanying notes are an integral part of these financial statements.
Unaudited

The accompanying notes are an integral part of these financial statements.
Unaudited

The accompanying notes are an integral part of these financial statements.
Unaudited
| NOTES TO FINANCIAL STATEMENTS |
NOTE 1 - SIGNIFICANT ACCOUNTING POLICIES
T. Rowe Price Mid-Cap Value Fund, Inc. (the fund), is registered under the Investment Company Act of 1940 (the 1940 Act) as a diversified, open-end management investment company. The fund seeks to provide long-term capital appreciation by investing primarily in mid-sized companies that appear to be undervalued. The fund has three classes of shares: the Mid-Cap Value Fund original share class, referred to in this report as the Investor Class, offered since June 28, 1996; the Mid-Cap Value Fund—Advisor Class (Advisor Class), offered since September 30, 2002; and the Mid-Cap Value Fund—R Class (R Class), offered since September 30, 2002. Advisor Class shares are sold only through unaffiliated brokers and other unaffiliated financial intermediaries, and R Class shares are available to retirement plans serviced by intermediaries. The Advisor Class and R Class each operate under separate Board-approved Rule 12b-1 plans, pursuant to which each class compensates financial intermediaries for distribution, shareholder servicing, and/or certain administrative services. Each class has exclusive voting rights on matters related solely to that class, separate voting rights on matters that relate to all classes, and, in all other respects, the same rights and obligations as the other classes.
The accompanying financial statements were prepared in accordance with accounting principles generally accepted in the United States of America, which require the use of estimates made by fund management. Fund management believes that estimates and security valuations are appropriate; however, actual results may differ from those estimates, and the security valuations reflected in the financial statements may differ from the value the fund ultimately realizes upon sale of the securities.
Valuation The fund values its investments and computes its net asset value per share at the close of the New York Stock Exchange (NYSE), normally 4 p.m. ET, each day that the NYSE is open for business. Equity securities listed or regularly traded on a securities exchange or in the over-the-counter (OTC) market are valued at the last quoted sale price or, for certain markets, the official closing price at the time the valuations are made, except for OTC Bulletin Board securities, which are valued at the mean of the latest bid and asked prices. A security that is listed or traded on more than one exchange is valued at the quotation on the exchange determined to be the primary market for such security. Listed securities not traded on a particular day are valued at the mean of the latest bid and asked prices for domestic securities and the last quoted sale price for international securities.
Debt securities are generally traded in the over-the-counter market. Securities with original maturities of one year or more are valued at prices furnished by dealers who make markets in such securities or by an independent pricing service, which considers yield or price of bonds of comparable quality, coupon, maturity, and type, as well as prices quoted by dealers who make markets in such securities. Securities with original maturities of less than one year are valued at amortized cost in local currency, which approximates fair value when combined with accrued interest.
Investments in mutual funds are valued at the mutual fund’s closing net asset value per share on the day of valuation.
Other investments, including restricted securities, and those for which the above valuation procedures are inappropriate or are deemed not to reflect fair value are stated at fair value as determined in good faith by the T. Rowe Price Valuation Committee, established by the fund’s Board of Directors.
Most foreign markets close before the close of trading on the NYSE. If the fund determines that developments between the close of a foreign market and the close of the NYSE will, in its judgment, materially affect the value of some or all of its portfolio securities, which in turn will affect the fund’s share price, the fund will adjust the previous closing prices to reflect the fair value of the securities as of the close of the NYSE, as determined in good faith by the T. Rowe Price Valuation Committee, established by the fund’s Board of Directors. A fund may also fair value securities in other situations, such as when a particular foreign market is closed but the fund is open. In deciding whether to make fair value adjustments, the fund reviews a variety of factors, including developments in foreign markets, the performance of U.S. securities markets, and the performance of instruments trading in U.S. markets that represent foreign securities and baskets of foreign securities. The fund uses outside pricing services to provide it with closing market prices and information used for adjusting those prices. The fund cannot predict when and how often it will use closing prices and when it will adjust those prices to reflect fair value. As a means of evaluating its fair value process, the fund routinely compares closing market prices, the next day’s opening prices in the same markets, and adjusted prices.
Currency Translation Assets, including investments, and liabilities denominated in foreign currencies are translated into U.S. dollar values each day at the prevailing exchange rate, using the mean of the bid and asked prices of such currencies against U.S. dollars as quoted by a major bank. Purchases and sales of securities, income, and expenses are translated into U.S. dollars at the prevailing exchange rate on the date of the transaction. The effect of changes in foreign currency exchange rates on realized and unrealized security gains and losses is reflected as a component of security gains and losses.
Class Accounting The Advisor Class and R Class each pay distribution, shareholder servicing, and/or certain administrative expenses in the form of Rule 12b-1 fees, in an amount not exceeding 0.25% and 0.50%, respectively, of the class’s average daily net assets. Shareholder servicing, prospectus, and shareholder report expenses incurred by each class are charged directly to the class to which they relate. Expenses common to all classes, investment income, and realized and unrealized gains and losses are allocated to the classes based upon the relative daily net assets of each class.
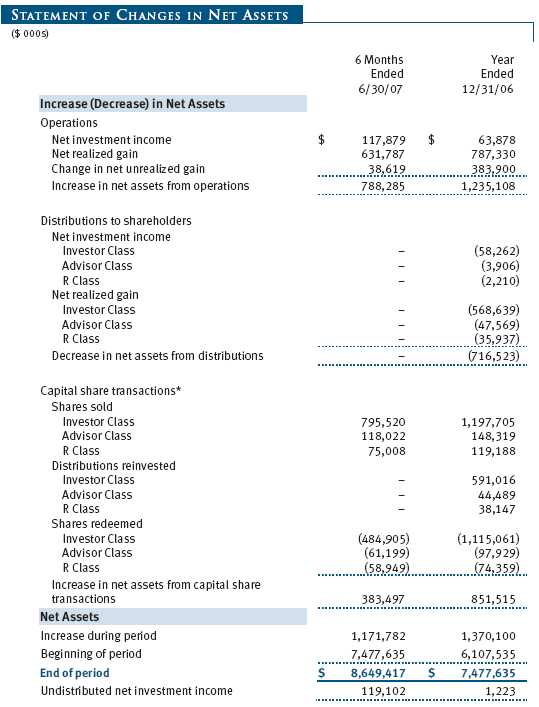
Rebates and Credits Subject to best execution, the fund may direct certain security trades to brokers who have agreed to rebate a portion of the related brokerage commission to the fund in cash. Commission rebates are reflected as realized gain on securities in the accompanying financial statements and totaled $193,000 for the six months ended June 30, 2007. Additionally, the fund earns credits on temporarily uninvested cash balances at the custodian that reduce the fund’s custody charges. Custody expense in the accompanying financial statements is presented before reduction for credits, which are reflected as expenses paid indirectly.
Investment Transactions, Investment Income, and Distributions Income and expenses are recorded on the accrual basis. Premiums and discounts on debt securities are amortized for financial reporting purposes. Dividends received from mutual fund investments are reflected as dividend income; capital gain distributions are reflected as realized gain/loss. Dividend income and capital gain distributions are recorded on the ex-dividend date. Any income tax-related interest and penalties would be classified as income tax expense. Investment transactions are accounted for on the trade date. Realized gains and losses are reported on the identified cost basis. Distributions to shareholders are recorded on the ex-dividend date. Income distributions are declared and paid by each class on an annual basis. Capital gain distributions, if any, are declared and paid by the fund, typically on an annual basis.
New Accounting Pronouncements Effective June 29, 2007, the fund adopted Financial Accounting Standards Board (“FASB”) Interpretation No. 48 (“FIN 48”), Accounting for Uncertainty in Income Taxes, a clarification of FASB Statement No. 109, Accounting for Income Taxes. FIN 48 establishes financial accounting and disclosure requirements for recognition and measurement of tax positions taken or expected to be taken on an income tax return. The adoption of FIN 48 had no impact on the fund’s net assets or results of operations.
In September 2006, the FASB released the Statement of Financial Accounting Standard No. 157 (“FAS 157”), Fair Value Measurements. FAS 157 clarifies the definition of fair value and establishes the framework for measuring fair value, as well as proper disclosure of this methodology in the financial statements. It will be effective for the fund’s fiscal year beginning January 1, 2008. Management is evaluating the effects of FAS 157; however, it is not expected to have a material impact on the fund’s net assets or results of operations.
NOTE 2 - INVESTMENT TRANSACTIONS
Consistent with its investment objective, the fund engages in the following practices to manage exposure to certain risks or to enhance performance. The investment objective, policies, program, and risk factors of the fund are described more fully in the fund’s prospectus and Statement of Additional Information.
Restricted Securities The fund may invest in securities that are subject to legal or contractual restrictions on resale. Although certain of these securities may be readily sold, for example, under Rule 144A, others may be illiquid, their sale may involve substantial delays and additional costs, and prompt sale at an acceptable price may be difficult.
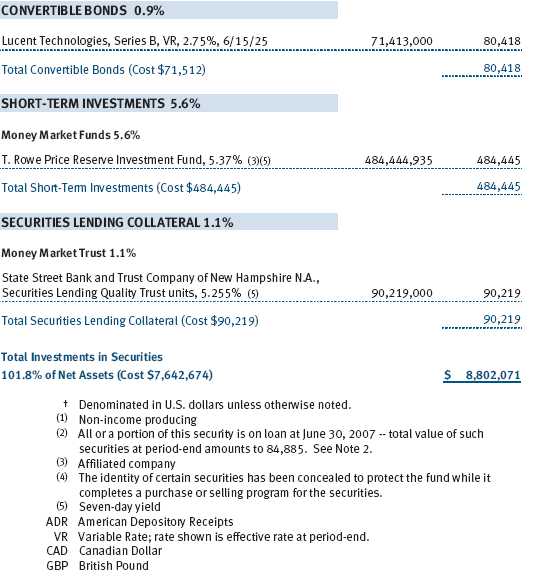
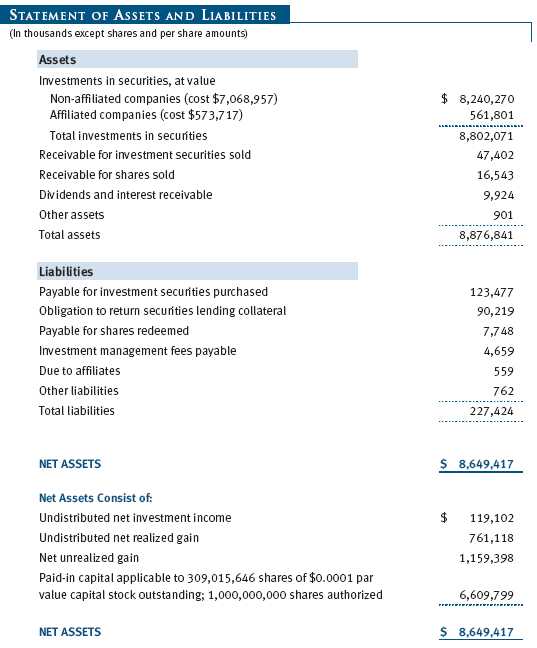
Securities Lending The fund lends its securities to approved brokers to earn additional income. It receives as collateral cash and U.S. government securities valued at 102% to 105% of the value of the securities on loan. Cash collateral is invested in a money market pooled trust managed by the fund’s lending agent in accordance with investment guidelines approved by fund management. Collateral is maintained over the life of the loan in an amount not less than the value of loaned securities, as determined at the close of fund business each day; any additional collateral required due to changes in security values is delivered to the fund the next business day. Although risk is mitigated by the collateral, the fund could experience a delay in recovering its securities and a possible loss of income or value if the borrower fails to return the securities. Securities lending revenue recognized by the fund consists of earnings on invested collateral and borrowing fees, net of any rebates to the borrower and compensation to the lending agent. At June 30, 2007, the value of loaned securities was $84,885,000; aggregate collateral consisted of $90,219,000 in the money market pooled trust.
Other Purchases and sales of portfolio securities, other than short-term securities, aggregated $3,240,650,000 and $2,623,967,000, respectively, for the six months ended June 30, 2007.
NOTE 3 - FEDERAL INCOME TAXES
No provision for federal income taxes is required since the fund intends to continue to qualify as a regulated investment company under Subchapter M of the Internal Revenue Code and distribute to shareholders all of its taxable income and gains. Federal income tax regulations differ from generally accepted accounting principles; therefore, distributions determined in accordance with tax regulations may differ in amount or character from net investment income and realized gains for financial reporting purposes. Financial reporting records are adjusted for permanent book/tax differences to reflect tax character. Financial records are not adjusted for temporary differences. The amount and character of tax-basis distributions and composition of net assets are finalized at fiscal year-end; accordingly, tax-basis balances have not been determined as of June 30, 2007.
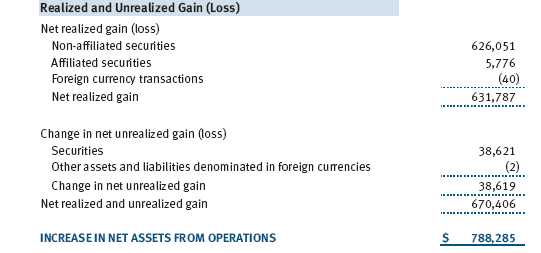
At June 30, 2007, the cost of investments for federal income tax purposes was $7,642,674,000. Net unrealized gain aggregated $1,159,398,000 at period-end, of which $1,357,340,000 related to appreciated investments and $197,942,000 related to depreciated investments.
NOTE 4 - RELATED PARTY TRANSACTIONS
The fund is managed by T. Rowe Price Associates, Inc. (the manager or Price Associates), a wholly owned subsidiary of T. Rowe Price Group, Inc. The investment management agreement between the fund and the manager provides for an annual investment management fee, which is computed daily and paid monthly. The fee consists of an individual fund fee, equal to 0.35% of the fund’s average daily net assets, and a group fee. The group fee rate is calculated based on the combined net assets of certain mutual funds sponsored by Price Associates (the group) applied to a graduated fee schedule, with rates ranging from 0.48% for the first $1 billion of assets to 0.285% for assets in excess of $220 billion. The fund’s group fee is determined by applying the group fee rate to the fund’s average daily net assets. At June 30, 2007, the effective annual group fee rate was 0.30%.
In addition, the fund has entered into service agreements with Price Associates and two wholly owned subsidiaries of Price Associates (collectively, Price). Price Associates computes the daily share prices and provides certain other administrative services to the fund. T. Rowe Price Services, Inc., provides shareholder and administrative services in its capacity as the fund’s transfer and dividend disbursing agent. T. Rowe Price Retirement Plan Services, Inc., provides subaccounting and recordkeeping services for certain retirement accounts invested in the Investor Class and R Class. For the six months ended June 30, 2007, expenses incurred pursuant to these service agreements were $64,000 for Price Associates, $1,192,000 for T. Rowe Price Services, Inc., and $746,000 for T. Rowe Price Retirement Plan Services, Inc. The total amount payable at period-end pursuant to these service agreements is reflected as Due to Affiliates in the accompanying financial statements.
Additionally, the fund is one of several mutual funds in which certain college savings plans managed by Price Associates may invest. As approved by the fund’s Board of Directors, shareholder servicing costs associated with each college savings plan are borne by the fund in proportion to the average daily value of its shares owned by the college savings plan. For the six months ended June 30, 2007, the fund was charged $208,000 for shareholder servicing costs related to the college savings plans, of which $155,000 was for services provided by Price. The amount payable at period-end pursuant to this agreement is reflected as Due to Affiliates in the accompanying financial statements. At June 30, 2007, approximately 3% of the outstanding shares of the Investor Class were held by college savings plans.
The fund is also one of several mutual funds sponsored by Price Associates (underlying Price funds) in which the T. Rowe Price Spectrum Funds (Spectrum Funds) and T. Rowe Price Retirement Funds (Retirement Funds) may invest. Neither the Spectrum Funds nor the Retirement Funds invest in the underlying Price funds for the purpose of exercising management or control. Pursuant to separate special servicing agreements, expenses associated with the operation of the Spectrum and Retirement Funds are borne by each underlying Price fund to the extent of estimated savings to it and in proportion to the average daily value of its shares owned by the Spectrum and Retirement Funds, respectively. Expenses allocated under these agreements are reflected as shareholder servicing expenses in the accompanying financial statements. For the six months ended June 30, 2007, the fund was allocated $147,000 of Spectrum Funds’ expenses and $833,000 of Retirement Funds’ expenses. Of these amounts, $740,000 related to services provided by Price. The amount payable at period-end pursuant to this agreement is reflected as Due to Affiliates in the accompanying financial statements. At June 30, 2007, approximately 3% of the outstanding shares of the Investor Class were held by the Spectrum Funds and 11% were held by the Retirement Funds.
The fund may invest in the T. Rowe Price Reserve Investment Fund and the T. Rowe Price Government Reserve Investment Fund (collectively, the T. Rowe Price Reserve Investment Funds), open-end management investment companies managed by Price Associates and affiliates of the fund. The T. Rowe Price Reserve Investment Funds are offered as cash management options to mutual funds, trusts, and other accounts managed by Price Associates and/or its affiliates, and are not available for direct purchase by members of the public. The T. Rowe Price Reserve Investment Funds pay no investment management fees.
As of June 30, 2007, T. Rowe Price Group, Inc., and/or its wholly owned subsidiaries owned 152,569 shares of the Investor Class, representing less than 1% of the fund’s net assets.
| INFORMATION ON PROXY VOTING POLICIES, PROCEDURES, AND RECORDS |
A description of the policies and procedures used by T. Rowe Price funds and portfolios to determine how to vote proxies relating to portfolio securities is available in each fund’s Statement of Additional Information, which you may request by calling 1-800-225-5132 or by accessing the SEC’s Web site, www.sec.gov. The description of our proxy voting policies and procedures is also available on our Web site, www.troweprice.com. To access it, click on the words “Company Info” at the top of our homepage for individual investors. Then, in the window that appears, click on the “Proxy Voting Policy” navigation button in the top left corner.
Each fund’s most recent annual proxy voting record is available on our Web site and through the SEC’s Web site. To access it through our Web site, follow the directions above, then click on the words “Proxy Voting Record” at the bottom of the Proxy Voting Policy page.
| HOW TO OBTAIN QUARTERLY PORTFOLIO HOLDINGS |
The fund files a complete schedule of portfolio holdings with the Securities and Exchange Commission for the first and third quarters of each fiscal year on Form N-Q. The fund’s Form N-Q is available electronically on the SEC’s Web site (www.sec.gov); hard copies may be reviewed and copied at the SEC’s Public Reference Room, 450 Fifth St. N.W., Washington, DC 20549. For more information on the Public Reference Room, call 1-800-SEC-0330.
| APPROVAL OF INVESTMENT MANAGEMENT AGREEMENT |
On March 7, 2007, the fund’s Board of Directors (Board) unanimously approved the investment advisory contract (Contract) between the fund and its investment manager, T. Rowe Price Associates, Inc. (Manager). The Board considered a variety of factors in connection with its review of the Contract, also taking into account information provided by the Manager during the course of the year, as discussed below:
Services Provided by the Manager
The Board considered the nature, quality, and extent of the services provided to the fund by the Manager. These services included, but were not limited to, management of the fund’s portfolio and a variety of related activities, as well as financial and administrative services, reporting, and communications. The Board also reviewed the background and experience of the Manager’s senior management team and investment personnel involved in the management of the fund. The Board concluded that it was satisfied with the nature, quality, and extent of the services provided by the Manager.
Investment Performance of the Fund
The Board reviewed the fund’s average annual total return over the 1-, 3-, 5-, and 10-year periods as well as the fund’s year-by-year returns and compared these returns with previously agreed upon comparable performance measures and market data, including those supplied by Lipper and Morningstar, which are independent providers of mutual fund data. On the basis of this evaluation and the Board’s ongoing review of investment results, the Board concluded that the fund’s performance was satisfactory.
Costs, Benefits, Profits, and Economies of Scale
The Board reviewed detailed information regarding the revenues received by the Manager under the Contract and other benefits that the Manager (and its affiliates) may have realized from its relationship with the fund, including research received under “soft dollar” agreements. The Board noted that soft dollars were not used to pay for third-party, non-broker research. The Board also received information on the estimated costs incurred and profits realized by the Manager and its affiliates from advising T. Rowe Price mutual funds, as well as estimates of the gross profits realized from managing the fund in particular. The Board concluded that the Manager’s profits were reasonable in light of the services provided to the fund. The Board also considered whether the fund or other funds benefit under the fee levels set forth in the Contract from any economies of scale realized by the Manager. Under the Contract, the fund pays a fee to the Manager composed of two components—a group fee rate based on the aggregate assets of certain T. Rowe Price mutual funds (including the fund) that declines at certain asset levels and an individual fund fee rate that is assessed on the assets of the fund. The Board concluded that the advisory fee structure for the fund continued to provide for a reasonable sharing of benefits from any economies of scale with the fund’s investors.
Fees
The Board reviewed the fund’s management fee rate, operating expenses, and total expense ratio (for the Investor Class, Advisor Class, and R Class) and compared them with fees and expenses of other comparable funds based on information and data supplied by Lipper. The information provided to the Board indicated that the fund’s management fee rate (for all three classes) was generally at or below the median for comparable funds. The information also indicated that the fund’s expense ratio for the Investor Class and the Advisor Class was below the median for comparable funds and that the fund’s expense ratio for the R Class was above the median for comparable funds. The Board also reviewed the fee schedules for comparable privately managed accounts of the Manager and its affiliates. Management informed the Board that the Manager’s responsibilities for privately managed accounts are more limited than its responsibilities for the fund and other T. Rowe Price mutual funds that it or its affiliates advise. On the basis of the information provided, the Board concluded that the fees paid by the fund under the Contract were reasonable.
Approval of the Contract
As noted, the Board approved the continuation of the Contract. No single factor was considered in isolation or to be determinative to the decision. Rather, the Board concluded, in light of a weighting and balancing of all factors considered, that it was in the best interests of the fund to approve the continuation of the Contract, including the fees to be charged for services thereunder.
Item 2. Code of Ethics.
A code of ethics, as defined in Item 2 of Form N-CSR, applicable to its principal executive officer, principal financial officer, principal accounting officer or controller, or persons performing similar functions is filed as an exhibit to the registrant’s annual Form N-CSR. No substantive amendments were approved or waivers were granted to this code of ethics during the registrant’s most recent fiscal half-year.
Item 3. Audit Committee Financial Expert.
Disclosure required in registrant’s annual Form N-CSR.
Item 4. Principal Accountant Fees and Services.
Disclosure required in registrant’s annual Form N-CSR.
Item 5. Audit Committee of Listed Registrants.
Not applicable.
Item 6. Schedule of Investments.
Not applicable. The complete schedule of investments is included in Item 1 of this Form N-CSR.
Item 7. Disclosure of Proxy Voting Policies and Procedures for Closed-End Management Investment Companies.
Not applicable.
Item 8. Portfolio Managers of Closed-End Management Investment Companies.
Not applicable.
Item 9. Purchases of Equity Securities by Closed-End Management Investment Company and Affiliated Purchasers.
Not applicable.
Item 10. Submission of Matters to a Vote of Security Holders.
Not applicable.
Item 11. Controls and Procedures.
(a) The registrant’s principal executive officer and principal financial officer have evaluated the registrant’s disclosure controls and procedures within 90 days of this filing and have concluded that the registrant’s disclosure controls and procedures were effective, as of that date, in ensuring that information required to be disclosed by the registrant in this Form N-CSR was recorded, processed, summarized, and reported timely.
(b) The registrant’s principal executive officer and principal financial officer are aware of no change in the registrant’s internal control over financial reporting that occurred during the registrant’s second fiscal quarter covered by this report that has materially affected, or is reasonably likely to materially affect, the registrant’s internal control over financial reporting.
Item 12. Exhibits.(a)(1) The registrant’s code of ethics pursuant to Item 2 of Form N-CSR is filed with the registrant’s annual Form N-CSR.
(2) Separate certifications by the registrant's principal executive officer and principal financial officer, pursuant to Section 302 of the Sarbanes-Oxley Act of 2002 and required by Rule 30a-2(a) under the Investment Company Act of 1940, are attached.
(3) Written solicitation to repurchase securities issued by closed-end companies: not applicable.
(b) A certification by the registrant's principal executive officer and principal financial officer, pursuant to Section 906 of the Sarbanes-Oxley Act of 2002 and required by Rule 30a-2(b) under the Investment Company Act of 1940, is attached.
| | |
SIGNATURES |
| |
| | Pursuant to the requirements of the Securities Exchange Act of 1934 and the Investment |
| Company Act of 1940, the registrant has duly caused this report to be signed on its behalf by the |
| undersigned, thereunto duly authorized. |
| |
| T. Rowe Price Mid-Cap Value Fund, Inc. |
| |
| |
| By | /s/ Edward C. Bernard |
| | Edward C. Bernard |
| | Principal Executive Officer |
| |
| Date | August 17, 2007 |
| |
| |
| |
| | Pursuant to the requirements of the Securities Exchange Act of 1934 and the Investment |
| Company Act of 1940, this report has been signed below by the following persons on behalf of |
| the registrant and in the capacities and on the dates indicated. |
| |
| |
| By | /s/ Edward C. Bernard |
| | Edward C. Bernard |
| | Principal Executive Officer |
| |
| Date | August 17, 2007 |
| |
| |
| |
| By | /s/ Joseph A. Carrier |
| | Joseph A. Carrier |
| | Principal Financial Officer |
| |
| Date | August 17, 2007 |