| UNITED STATES |
| SECURITIES AND EXCHANGE COMMISSION |
| Washington, D.C. 20549 |
| |
FORM N-CSR |
| |
CERTIFIED SHAREHOLDER REPORT OF REGISTERED |
MANAGEMENT INVESTMENT COMPANIES |
| |
| |
| |
| Investment Company Act File Number: 811-07605 |
|
| |
| T. Rowe Price Mid-Cap Value Fund, Inc. |
|
| (Exact name of registrant as specified in charter) |
| |
| 100 East Pratt Street, Baltimore, MD 21202 |
|
| (Address of principal executive offices) |
| |
| David Oestreicher |
| 100 East Pratt Street, Baltimore, MD 21202 |
|
| (Name and address of agent for service) |
| |
| |
| Registrant’s telephone number, including area code: (410) 345-2000 |
| |
| |
| Date of fiscal year end: December 31 |
| |
| |
| Date of reporting period: June 30, 2010 |
Item 1: Report to Shareholders| Mid-Cap Value Fund | June 30, 2010 |
The views and opinions in this report were current as of June 30, 2010. They are not guarantees of performance or investment results and should not be taken as investment advice. Investment decisions reflect a variety of factors, and the managers reserve the right to change their views about individual stocks, sectors, and the markets at any time. As a result, the views expressed should not be relied upon as a forecast of the fund’s future investment intent. The report is certified under the Sarbanes-Oxley Act, which requires mutual funds and other public companies to affirm that, to the best of their knowledge, the information in their financial reports is fairly and accurately stated in all material respects.
REPORTS ON THE WEB
Sign up for our E-mail Program, and you can begin to receive updated fund reports and prospectuses online rather than through the mail. Log in to your account at troweprice.com for more information.
Manager’s Letter
Fellow Shareholders
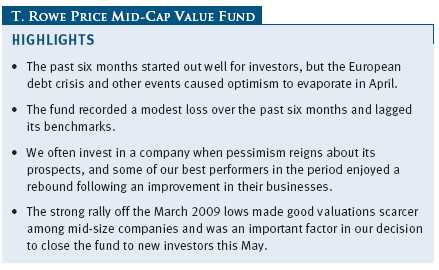
The first half of 2010 started out well for equity market investors. The rally in equities that emerged from the dark days of the biggest bear market in decades propelled many indexes, including those for mid-cap stocks, to levels double those of the market lows. Evidence accumulated through the first quarter that the economy had reached a sustainable bottom. Though unemployment levels remained stubbornly high, the housing market rebounded, industrial activity picked up sharply, consumers opened their purses, and government spending kicked in to help stabilize the economy. Corporate profit margins reached record levels in the first quarter, and it looked to many as if the momentum could continue. But the optimists’ bubble burst in April when the European debt crisis, a deceleration in China’s growth, and a decline in housing activity called into question the sustainability of the rebound, and the market finished June at its low for the year. The Mid-Cap Value Fund recorded a modest loss in this environment as cyclical holdings, in particular, suffered from fears over a renewed slowdown.
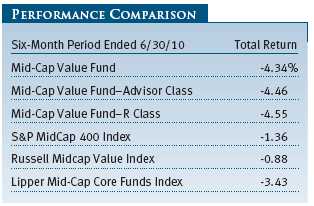
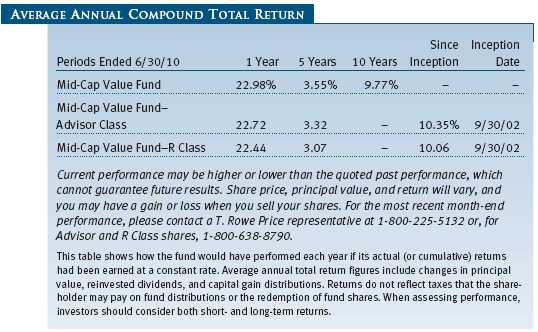
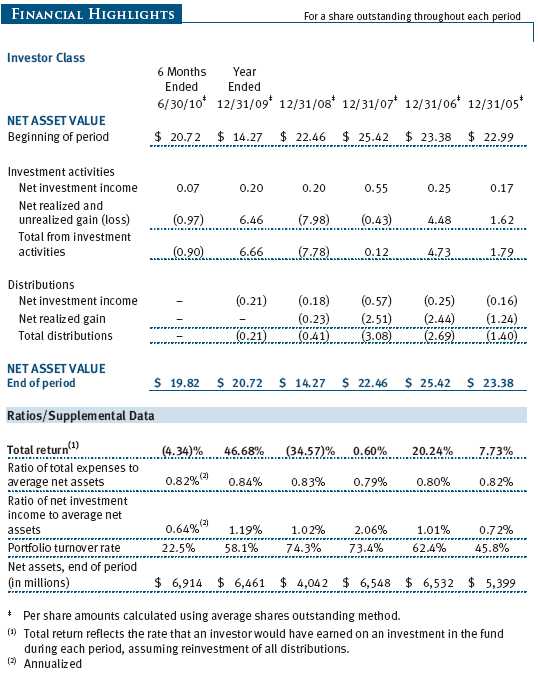
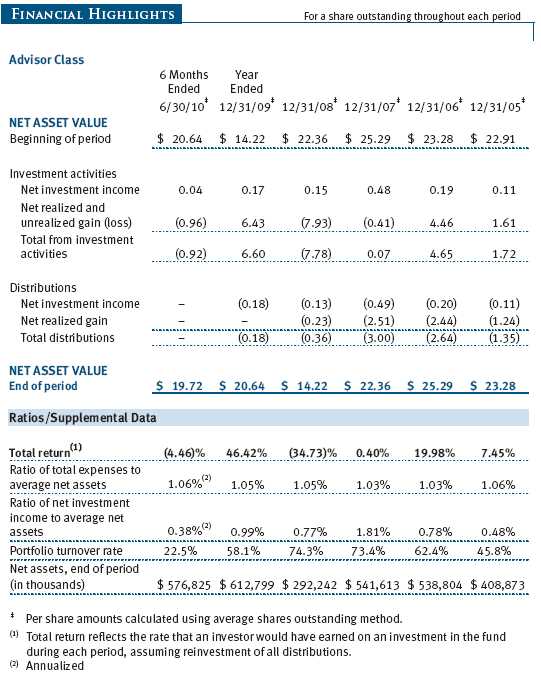
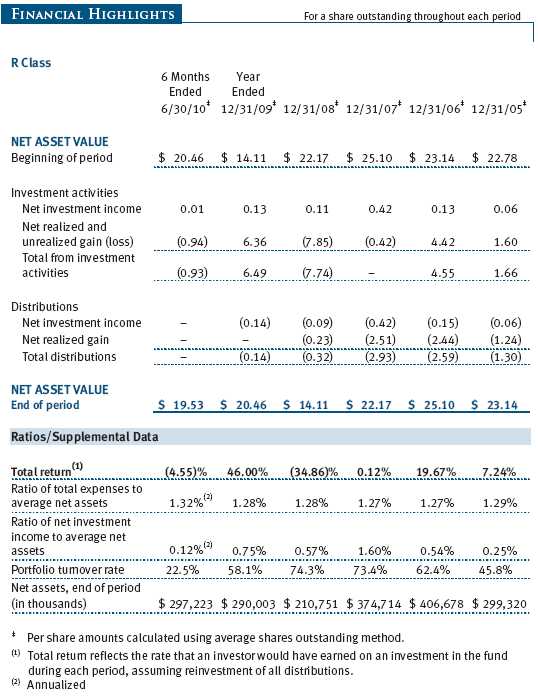
The Mid-Cap Value Fund returned -4.34% for the six months ended June 30, 2010. As shown in the Performance Comparison table, the portfolio declined somewhat more than its benchmarks for the six-month period. (Please note that Lipper classifies the fund as “core” rather than “value.” Lipper’s fund classification has alternated between core and value in the past.) Returns for the fund’s Advisor and R Class shares were slightly lower due to their different cost structures.
Despite lagging its benchmarks recently, the fund’s long-term performance remains favorable, in relative terms, as recognized by Morningstar’s overall rating, as well as its rank among competitive funds as tracked by Lipper over longer time periods. The Mid-Cap Value Fund received an Overall Morningstar Rating™ of four stars for its risk-adjusted performance. This rating is derived from a weighted average of the performance figures associated with a fund’s 3-, 5-, and 10-year (if applicable) Morningstar Rating™ metrics. The fund was rated among 345, 345, 259, and 87 mid-cap value funds for the overall rating and the 3-, 5-, and 10-year periods ended June 30, 2010, respectively. (Please refer to page 10 for additional information about Morningstar ratings.) Based on cumulative total return, Lipper ranked the Mid-Cap Value Fund 159 out of 415, 70 out of 342, 33 out of 276, and 2 out of 128 mid-cap core funds for the 1-, 3-, 5-, and 10-year periods ended June 30, 2010, respectively. Results will vary for other periods. Past performance cannot guarantee future results.
MARKET ENVIRONMENT
Stock prices around the world headed sharply lower in late April as investors reacted to revelations about a growing sovereign debt crisis in Greece, which threatened for a time to provoke a broader credit crisis in Europe and drag the world back into recession. As it turned out, Germany, France, and other large European nations coordinated a rescue package for Greece and other heavily indebted nations in the euro zone. Nevertheless, new austerity measures in Europe and a steep drop in the euro appeared likely to shut down one engine of the global economic recovery.
U.S. markets might have weathered the Greek debt crisis significantly better had concerns been confined to Europe alone, given that exports to the Continent account for only a small part of the overall U.S. economy. Over the past few months, however, investors were also barraged by worrisome news about tighter monetary policy and lending practices in China, rising military tensions between North and South Korea, a mysterious “flash crash” in U.S. stock prices on May 6, 2010, and the potential impact on profits of U.S. financial reforms. Most dramatically, on April 22, only days before the downgrade of Greece’s debt to junk status, the Deepwater Horizon drilling rig in the Gulf of Mexico sank following an explosion, setting off one of the largest environmental disasters in U.S. history.
Although conclusive data on U.S. economic growth in the second quarter has yet to become available, it appears that the springtime turmoil led to some heightened caution on the part of employers and consumers. After expanding sharply in April, private payroll growth, retail spending, and consumer confidence all decelerated or declined in May and June. The housing market appeared to lose momentum as well. New home sales jumped in March by their highest percentage since 1963 as buyers rushed to take advantage of tax incentives. By May, sales of both existing and new homes were falling, which raised fears about how the sector would fare when homebuyer credits expired. The manufacturing sector, boosted by inventory restocking and exports, remained the bright spot in the recovery.

Corporate profits expanded at a healthy clip early in the year and appeared likely to maintain much of their momentum in the second quarter due to cost-cutting, rising worker productivity, and healthy export markets. Still, stock market sell-offs late in the period due to economic concerns led to broad declines for the six months. Small- and mid-cap shares declined much less than large-caps in the last six months while value stocks modestly outperformed growth stocks across all market capitalizations, as measured by various Russell indexes. Despite the sharp pullback, most major indexes remained more than 50% above their March 2009 nadir.
PORTFOLIO AND STRATEGY REVIEW
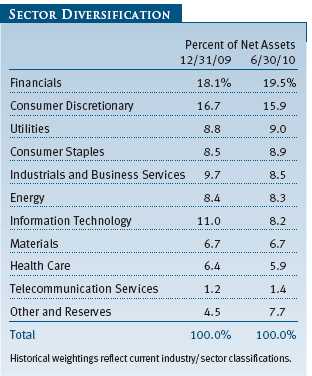
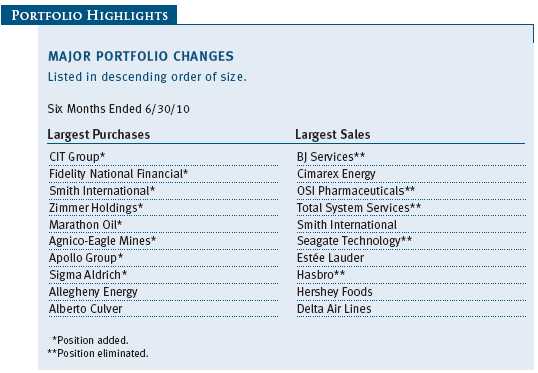
Diversification has always been an important feature of the Mid-Cap Value Fund. Holding a portfolio of many stocks among many industries with diverse characteristics limits the risk of significant loss from any single investment or concentrated industry exposure and allows for more consistent performance over time. But diversification is not the ultimate goal of the fund; rather, it is the result of many independent investment decisions across a wide variety of industry groups. Our ultimate objective, of course, is to seek out and invest in undervalued companies until they are fully valued—stocks with good risk/reward characteristics where the upside, if our analysis is correct, is proportionally larger than the risk of loss. Despite your fund’s diverse holdings, there is a certain consistency in our investment approach that is independent of industries and companies. Some of the better performers in the first half are reflective of this emphasis on minimizing risk while maximizing reward.
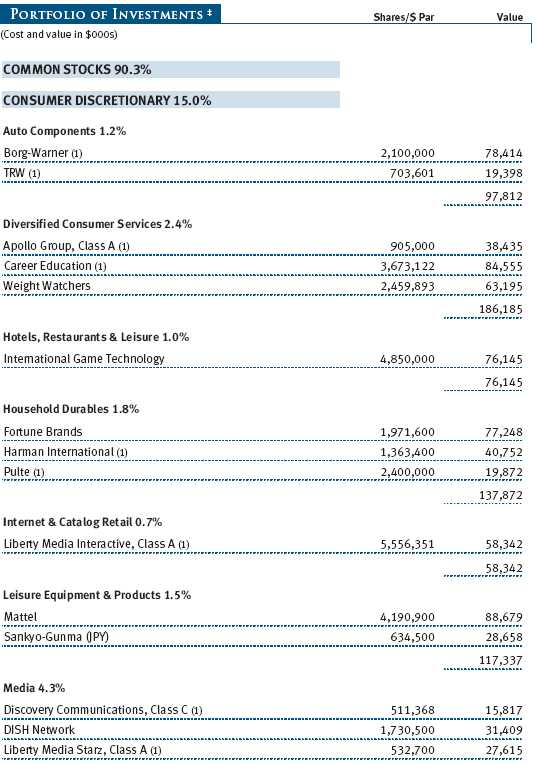
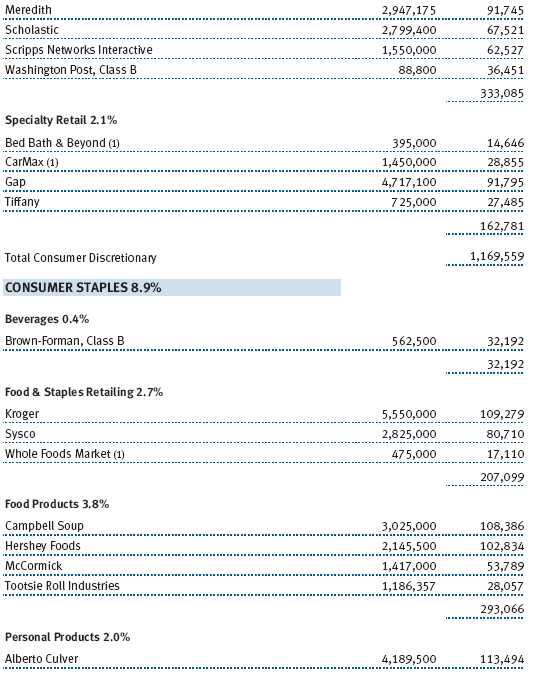
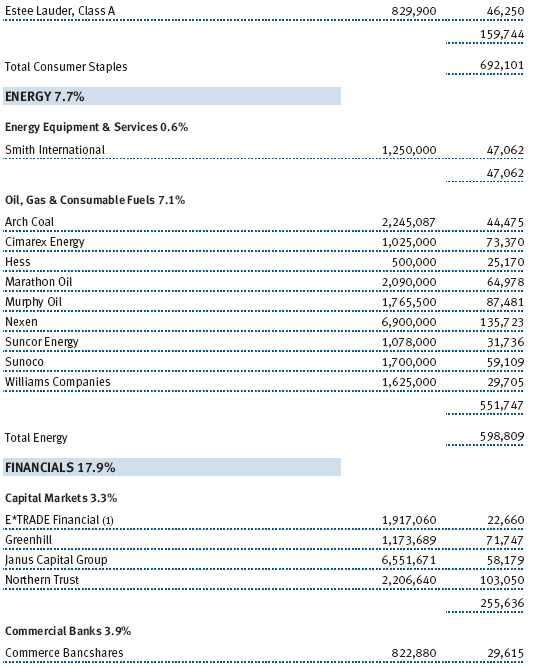
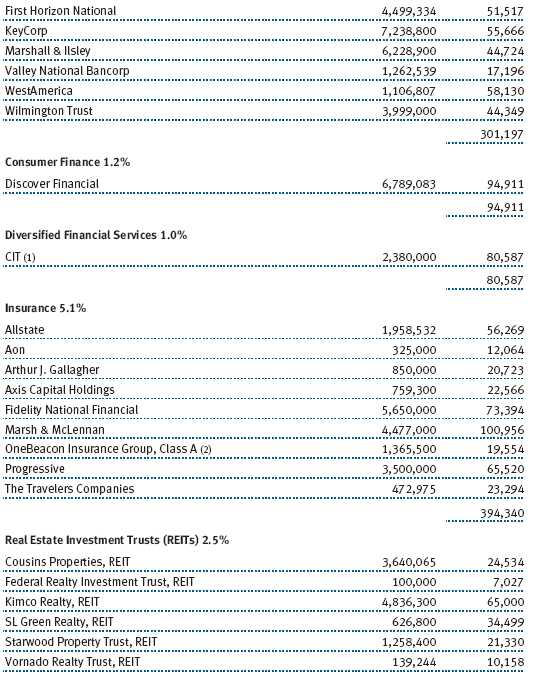
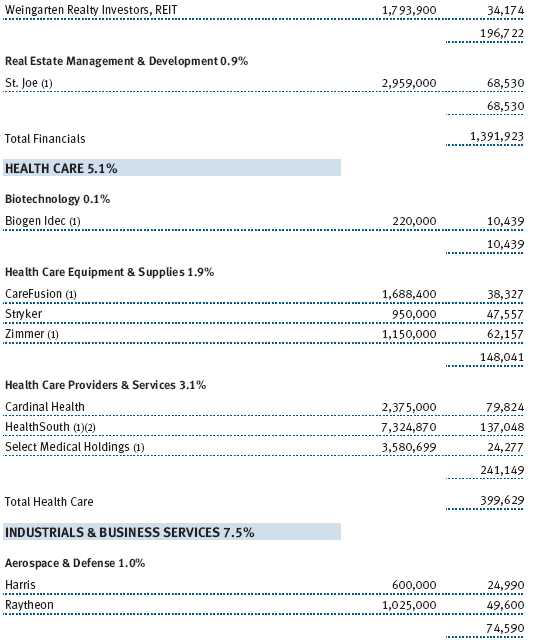
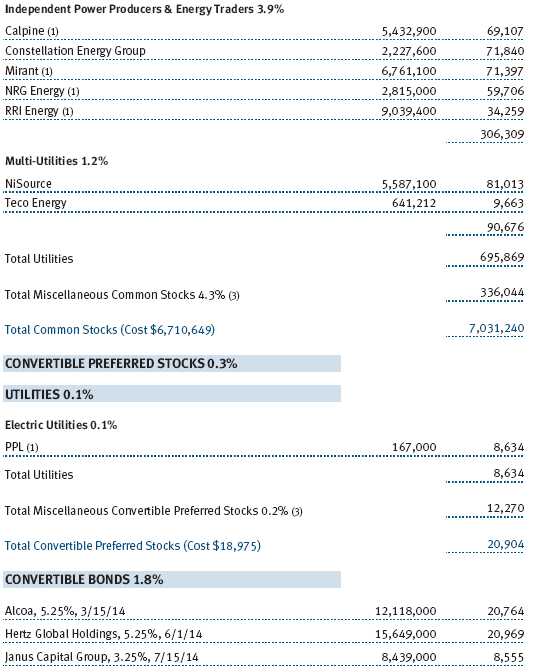
The Mid-Cap Value Fund’s best contributor was Cimarex Energy, a Denver-based oil and gas exploration company where our initial investment was made several years ago. This producer and its predecessor companies historically operated in the mature, rather staid Mid-Continent and Permian Basin regions of the United States. The conservatism of Cimarex’s management and the company’s low financial leverage were unusual for its industry. The company used its cash flow to extend its reserve life and routinely drilled a handful of larger exploration wells in the Gulf Coast—some successful and some not—over the years. The stock generated little interest and essentially went nowhere for some time, and its discounted valuation reflected little optimism about its future prospects. That all changed when the company applied a new oilfield technology known as multistage horizontal well fracturing to a known but previously neglected formation in western Oklahoma known as the Cana Woodford shale. This so-called “shale play” has emerged as one of the most rapidly growing natural gas producing areas in the country, and Cimarex’s shares have tripled from their lows. (Please refer to the portfolio of investments for a complete listing of fund holdings and the amount each represents in the portfolio.)
Did we predict the runaway success of the Cana Woodford shale? We’d like to say so, but the answer is not really. There was an element of luck at work here. Importantly, however, when we purchased Cimarex, its valuation reflected deep pessimism about the future, and we reasoned that its long-lived oil and gas reserves, thoughtful management, and good balance sheet would limit our downside risk. Further, and just as significantly, we judged that at its then-current price, we were not paying for the potential of any future good fortune in exploration success, higher energy prices, or any other such favorable developments. In the end, our analysis and attention to price prepared us for a good outcome. As Louis Pasteur once observed, “fortune favors the prepared mind.”
Hershey Foods was a good contributor for the portfolio in the first half and another example, in a completely different industry, of investing in a good business while pessimism reigned. This iconic franchise possesses some of the highest brand name recognition among American consumers, and the company has been enormously successful over the last 80 years. However, in the early part of the past decade, Hershey invested sparingly in innovation and advertising. Its earnings and stock price rose for a time, but its prosperity was false. When the winds of commodity price inflation and increased competition blew, Hershey was ill prepared, and its lack of investment in the future caused its earnings to falter and the stock to tumble. A new, seemingly capable management then arrived and laid out a path to success, which included reinvigorating the brands through increased advertising and investment in new plants and equipment. Success was far from assured, and any improvement was likely to take time, but the valuation of Hershey’s stock reflected this. We made our first investment three years ago, believing we were well informed about the risks and some of the potential opportunities, protected by good value, and well positioned should success visit the company. Our patience has been rewarded in the past two years as Hershey’s results have markedly improved, and the stock has been one of the fund’s best performers.
While the business itself could not be more different, the investment appeal at Sunoco, another good performer during the first half, was not dissimilar at the time of our purchases. Sunoco is one of the country’s largest independent refiners. The refining industry is in the midst of a brutal cyclical downturn, and the company’s stock recently sold at levels 80% below its cycle-peak levels. Our experience with cyclical companies tells us that eventually, new capacity additions will cease, underperforming assets will be shuttered, and demand will return to balance the refining business and lead to better pricing. We aren’t sure when that will occur but are pretty sure, just as the sun rises and sets, that it will happen.
However, there was more to our Sunoco investment than the refining cycle. The company also owns a large coke manufacturing operation, which produces a critical raw material used in steelmaking. Further, it maintains preferential ownership rights in a publicly traded limited partnership—Sunoco Logistics Partners, SXL—which operates a large network of terminal, pipelines, and storage facilities used to store and transport refined petroleum products. Finally, the company operates the well-known Sunoco brand retail service stations. These assets exhibit steadier cash flows than the volatile refining business. Our assessment at the time of our investment was that the value of Sunoco’s pieces was more than the trading value of its shares in the stock market and that we were paying little for any positive future developments, such as an improvement in refining or the spinoff of one of its businesses. Recently, management announced that it would be taking steps to unlock the value of the coking business by separating it from the rest of the company. This step, combined with an uptick in refining industry profitability in the first half, led the stock to be one of the better performers in the portfolio.
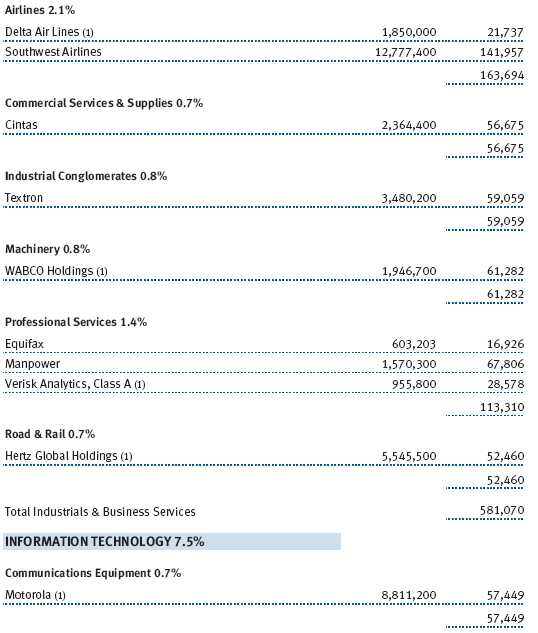
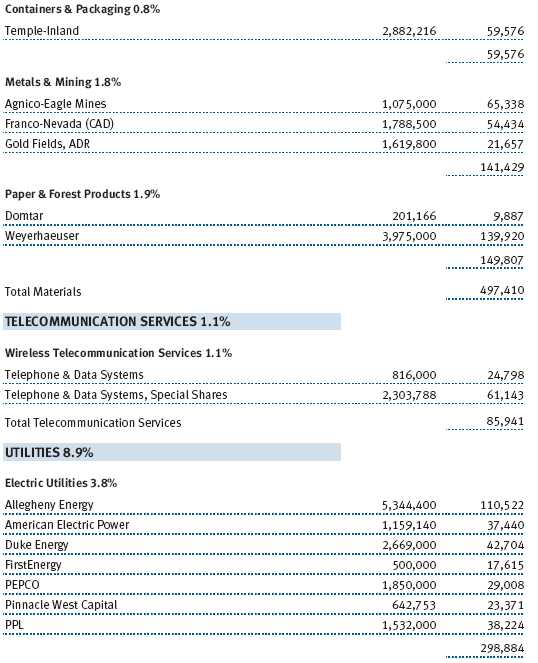
Some of the other favorable contributors to the fund’s performance included Franco-Nevada, a Canadian gold royalty company that benefited from rising gold bullion prices; Calpine Corporation, a large independent power producer that announced a well-priced acquisition of generating plants; Wabco, one of the world’s largest manufacturers of truck brakes and a beneficiary of growth in emerging markets transportation; and Alberto Culver, the Chicago-based consumer products company, which continued to deliver favorable results from its Nexxus and TRESemmé shampoo brands.
For these successes, there were a number of stocks in the portfolio to lament. Many of the first-half’s detractors were of the more cyclical variety. Weyerhaeuser, the country’s largest private owner of timber and one of our largest holdings, performed admirably until May, when homebuilding activity declined following the expiration of the federal mortgage tax credit. Housing starts and remodeling activity remain sluggish, more than 50% off of their 30-year historical averages. This period is painful and necessary to correct excess inventories and cause capacity to exit the forest products industry. While we do not know when demand will recover, current replacement rate levels likely are not sustainable over the long run. Meanwhile, Weyerhaeuser’s operating results have improved, it is moving forward with plans to become a timber real estate investment trust—a tax-efficient structure, which should release trapped value for shareholders—and it is trading below what we deem to be its private market value. We have added to our position.
Nexen, a Canadian oil and gas producer with high-quality producing assets around the world, has suffered from teething problems associated with the start-up of its Long Lake oil sands operation in Western Canada. These problems persisted in the first half, and the stock underperformed. The Canadian oil sands are among the world’s last frontiers of undeveloped oil. Their reserves are vast and have been known to geologists for decades, but only recently have the technologies been developed to exploit these deposits and produce the oil they contain at reasonable cost. We think Nexen will eventually prevail, and that if and when it does, its shares will be worth significantly more than their current price.
Investment manager Janus’s shares fell when it announced that it would invest to expand its distribution network, disappointing some who had expected a cost reduction campaign to boost profit margins. The weakness was exacerbated by the downturn in the stock market this spring. Still, we like what we see at Janus. Its resurrection from the post “tech-bubble” period—during which its funds’ performance lagged, management turnover spiked, and earnings collapsed—has been quite impressive. The Janus funds, in aggregate, have bested those of most competitors over the past three and five years. We think the company has value substantially above its share price, and the stock remains a top holding in your fund.
Career Education’s stock dropped as concerns mounted that punitive new federal regulation of the private education industry might be promulgated. Education stocks have fallen out of favor with investors from time to time as regulators and legislators have questioned the efficacy of government spending on education, and with budgetary concerns at the forefront in Washington, the industry has been under review again. Though some additional regulation is possible, there is a need for privately owned education companies to fill the void left behind by public universities as they cut enrollments due to budget constraints. In our view, Career Education is well positioned to provide students a quality education with a compelling return on their investment, particularly given the growing labor market advantages offered to the well educated. The company has benefited from the attention of new management, which has improved educational outcomes for its students and graduates and boosted operating and financial performance. We have added to the fund’s position, and the stock remains a significant holding.
IN CLOSING
The fund’s first-half results were not representative of what we hope to achieve over the long run, but some of the fund’s best performers demonstrate the consistency for which we strive. By analyzing a diverse range of businesses, appraising their managements, quantifying their financial potential, and making an honest appraisal of the risks, we hope to prepare our investors for good outcomes while attempting to minimize risks.
In this light, a few words are appropriate on the closing of the fund to new investors, which was effective this May. We are still finding opportunities in a diverse group of sectors, ranging from insurance to diversified energy to pharmaceuticals, but the rise in the stock market over the past 15 months has made good values scarcer among medium-sized companies. We want to assure you that the fund is always focused on good value, and for this reason, we felt it necessary to close the fund. We remain steadfastly committed to doing our best for you.
Respectfully submitted,

David J. Wallack
President of the fund and chairman of its Investment Advisory Committee

Heather M. McPherson
Executive vice president of the fund
July 19, 2010
The committee chairman has day-to-day responsibility for managing the portfolio and works with committee members in developing and executing the fund’s investment program.
RISKS OF INVESTING
The fund’s share price can fall because of weakness in the stock or bond markets, a particular industry, or specific holdings. Stock markets can decline for many reasons, including adverse political or economic developments, changes in investor psychology, or heavy institutional selling. The prospects for an industry or company may deteriorate because of a variety of factors, including disappointing earnings or changes in the competitive environment. In addition, the investment manager’s assessment of companies held in a fund may prove incorrect, resulting in losses or poor performance even in rising markets.
Mid-caps typically offer greater return potential than larger established firms and involve less risk than small-caps. Value investors seek to invest in companies whose stock prices are low in relation to their real worth or future prospects. By identifying companies whose stocks are currently out of favor or misunderstood, value investors hope to realize significant appreciation as other investors recognize the stock’s intrinsic value and the price rises accordingly. The value approach carries the risk that the market will not recognize a security’s intrinsic value for a long time or that a stock judged to be undervalued may actually be appropriately priced.
GLOSSARY
Lipper indexes: Fund benchmarks that consist of a small number of the largest mutual funds in a particular category as tracked by Lipper Inc.
Russell 1000 Index: Measures the performance of the 1,000 largest companies in the Russell 3000 Index.
Russell 2000 Index: An unmanaged index that tracks the stocks of 2,000 small U.S. companies.
Russell Midcap Growth Index: Unmanaged index that measures the performance of those Russell Midcap Index companies with higher price-to-book ratios and higher forecasted growth values.
Russell Midcap Value Index: Unmanaged index that measures the performance of those Russell Midcap Index companies with lower price-to-book ratios and lower forecasted growth values.
S&P MidCap 400 Index: Unmanaged index that tracks the stocks of 400 mid-size U.S. companies.
IMPORTANT INFORMATION ABOUT MORNINGSTAR RATINGS
For funds with at least a 3-year history, a Morningstar Rating™ is based on a risk-adjusted return measure (including the effects of sales charges, loads, and redemption fees) with emphasis on downward variations and consistent performance. The top 10% of funds in each category receive 5 stars, the next 22.5% 4 stars, the next 35% 3 stars, the next 22.5% 2 stars, and the bottom 10% 1 star. Each share class is counted as a fraction of 1 fund within this scale and rated separately. The Morningstar Rating™ is for the retail share class only; other classes may have different performance characteristics. The fund received 4 stars for the 3-, 5-, and 10-year periods as of June 30, 2010.
©2010 Morningstar, Inc. All Rights Reserved. The information contained herein: (1) is proprietary to Morningstar and/or its content providers; (2) may not be copied or distributed; and (3) is not warranted to be accurate, complete, or timely. Neither Morningstar nor its content providers are responsible for any damages or losses arising from any use of this information.
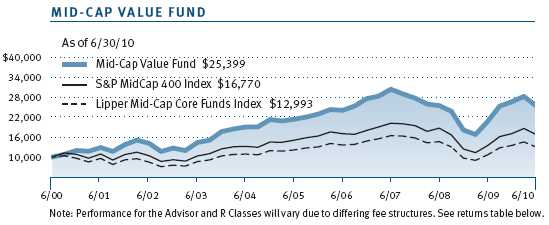
Performance and Expenses
This chart shows the value of a hypothetical $10,000 investment in the fund over the past 10 fiscal year periods or since inception (for funds lacking 10-year records). The result is compared with benchmarks, which may include a broad-based market index and a peer group average or index. Market indexes do not include expenses, which are deducted from fund returns as well as mutual fund averages and indexes.
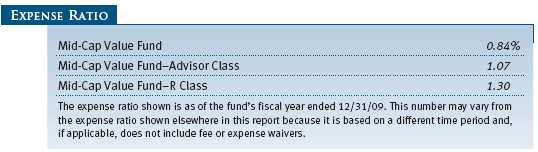
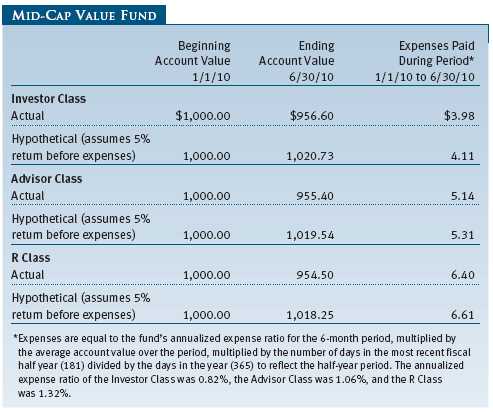
As a mutual fund shareholder, you may incur two types of costs: (1) transaction costs, such as redemption fees or sales loads, and (2) ongoing costs, including management fees, distribution and service (12b-1) fees, and other fund expenses. The following example is intended to help you understand your ongoing costs (in dollars) of investing in the fund and to compare these costs with the ongoing costs of investing in other mutual funds. The example is based on an investment of $1,000 invested at the beginning of the most recent six-month period and held for the entire period.
Please note that the fund has three share classes: The original share class (“investor class”) charges no distribution and service (12b-1) fee, Advisor Class shares are offered only through unaffiliated brokers and other financial intermediaries and charge a 0.25% 12b-1 fee, and R Class shares are available to retirement plans serviced by intermediaries and charge a 0.50% 12b-1 fee. Each share class is presented separately in the table.
Actual Expenses
The first line of the following table (“Actual”) provides information about actual account values and expenses based on the fund’s actual returns. You may use the information in this line, together with your account balance, to estimate the expenses that you paid over the period. Simply divide your account value by $1,000 (for example, an $8,600 account value divided by $1,000 = 8.6), then multiply the result by the number in the first line under the heading “Expenses Paid During Period” to estimate the expenses you paid on your account during this period.
Hypothetical Example for Comparison Purposes
The information on the second line of the table (“Hypothetical”) is based on hypothetical account values and expenses derived from the fund’s actual expense ratio and an assumed 5% per year rate of return before expenses (not the fund’s actual return). You may compare the ongoing costs of investing in the fund with other funds by contrasting this 5% hypothetical example and the 5% hypothetical examples that appear in the shareholder reports of the other funds. The hypothetical account values and expenses may not be used to estimate the actual ending account balance or expenses you paid for the period.
Note: T. Rowe Price charges an annual small-account maintenance fee of $10, generally for accounts with less than $2,000 ($500 for UGMA/UTMA). The fee is waived for any investor whose T. Rowe Price mutual fund accounts total $25,000 or more, accounts employing automatic investing, and IRAs and other retirement plan accounts that utilize a prototype plan sponsored by T. Rowe Price (although a separate custodial or administrative fee may apply to such accounts). This fee is not included in the accompanying table. If you are subject to the fee, keep it in mind when you are estimating the ongoing expenses of investing in the fund and when comparing the expenses of this fund with other funds.
You should also be aware that the expenses shown in the table highlight only your ongoing costs and do not reflect any transaction costs, such as redemption fees or sales loads. Therefore, the second line of the table is useful in comparing ongoing costs only and will not help you determine the relative total costs of owning different funds. To the extent a fund charges transaction costs, however, the total cost of owning that fund is higher.
Unaudited
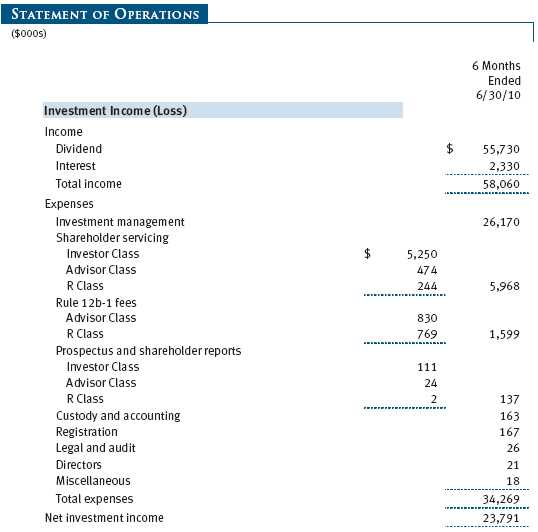
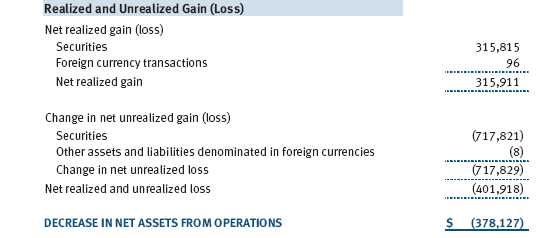
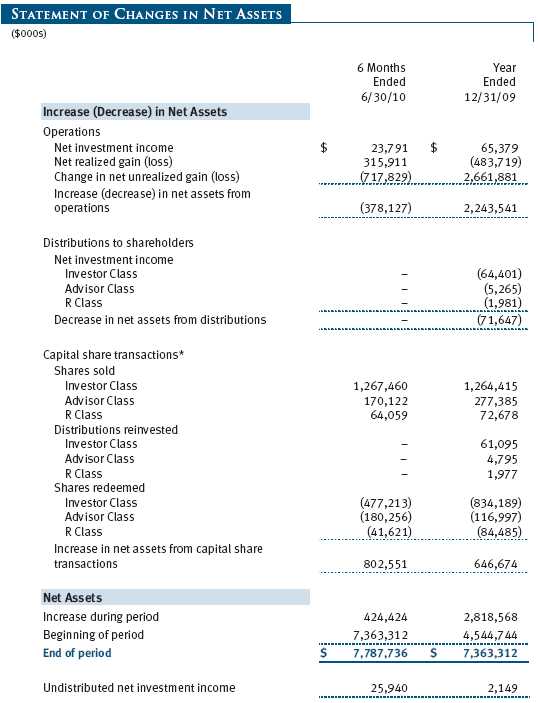
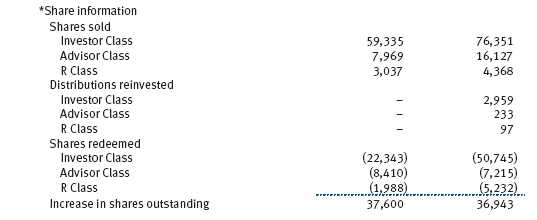
The accompanying notes are an integral part of these financial statements.
Unaudited
The accompanying notes are an integral part of these financial statements.
Unaudited
The accompanying notes are an integral part of these financial statements.
Unaudited
The accompanying notes are an integral part of these financial statements.
Unaudited
The accompanying notes are an integral part of these financial statements.
Unaudited
The accompanying notes are an integral part of these financial statements.
Unaudited
The accompanying notes are an integral part of these financial statements.
Unaudited
| NOTES TO FINANCIAL STATEMENTS |
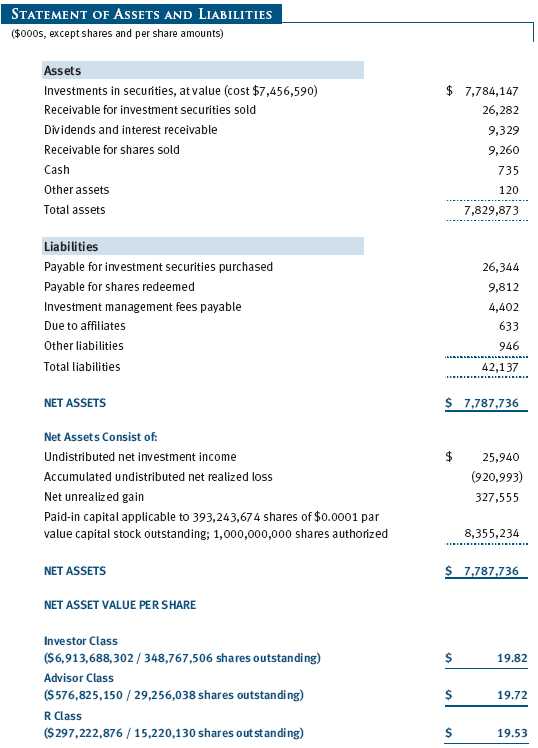
T. Rowe Price Mid-Cap Value Fund, Inc. (the fund), is registered under the Investment Company Act of 1940 (the 1940 Act) as a diversified, open-end management investment company. The fund seeks to provide long-term capital appreciation by investing primarily in mid-sized companies that appear to be undervalued. The fund has three classes of shares: the Mid-Cap Value Fund original share class, referred to in this report as the Investor Class, offered since June 28, 1996; the Mid-Cap Value Fund – Advisor Class (Advisor Class), offered since September 30, 2002; and the Mid-Cap Value Fund – R Class (R Class), offered since September 30, 2002. Advisor Class shares are sold only through unaffiliated brokers and other unaffiliated financial intermediaries, and R Class shares are available to retirement plans serviced by intermediaries. The Advisor Class and R Class each operate under separate Board-approved Rule 12b-1 plans, pursuant to which each class compensates financial intermediaries for distribution, shareholder servicing, and/or certain administrative services. Each class has exclusive voting rights on matters related solely to that class; separate voting rights on matters that relate to all classes; and, in all other respects, the same rights and obligations as the other classes.
NOTE 1 - SIGNIFICANT ACCOUNTING POLICIES
Basis of Preparation The accompanying financial statements were prepared in accordance with accounting principles generally accepted in the United States of America (GAAP), which require the use of estimates made by fund management. Fund management believes that estimates and valuations are appropriate; however, actual results may differ from those estimates, and the valuations reflected in the accompanying financial statements may differ from the value ultimately realized upon sale of securities.
Investment Transactions, Investment Income, and Distributions Income and expenses are recorded on the accrual basis. Premiums and discounts on debt securities are amortized for financial reporting purposes. Dividends received from mutual fund investments are reflected as dividend income; capital gain distributions are reflected as realized gain/loss. Dividend income and capital gain distributions are recorded on the ex-dividend date. Income tax-related interest and penalties, if incurred, would be recorded as income tax expense. Investment transactions are accounted for on the trade date. Realized gains and losses are reported on the identified cost basis. Distributions to shareholders are recorded on the ex-dividend date. Income distributions are declared and paid by each class annually. Capital gain distributions, if any, are generally declared and paid by the fund annually.
Currency Translation Assets, including investments, and liabilities denominated in foreign currencies are translated into U.S. dollar values each day at the prevailing exchange rate, using the mean of the bid and asked prices of such currencies against U.S. dollars as quoted by a major bank. Purchases and sales of securities, income, and expenses are translated into U.S. dollars at the prevailing exchange rate on the date of the transaction. The effect of changes in foreign currency exchange rates on realized and unrealized security gains and losses is reflected as a component of security gains and losses.
Class Accounting The Advisor Class and R Class each pay distribution, shareholder servicing, and/or certain administrative expenses in the form of Rule 12b-1 fees, in an amount not exceeding 0.25% and 0.50%, respectively, of the class’s average daily net assets. Shareholder servicing, prospectus, and shareholder report expenses incurred by each class are charged directly to the class to which they relate. Expenses common to all classes, investment income, and realized and unrealized gains and losses are allocated to the classes based upon the relative daily net assets of each class.
Rebates and Credits Subject to best execution, the fund may direct certain security trades to brokers who have agreed to rebate a portion of the related brokerage commission to the fund in cash. Commission rebates are reflected as realized gain on securities in the accompanying financial statements and totaled $206,000 for the six months ended June 30, 2010. Additionally, the fund earns credits on temporarily uninvested cash balances held at the custodian, which reduce the fund’s custody charges. Custody expense in the accompanying financial statements is presented before reduction for credits.
New Accounting Pronouncement On January 1, 2010, the fund adopted new accounting guidance that requires enhanced disclosures about fair value measurements in the financial statements. Adoption of this guidance had no impact on the fund’s net assets or results of operations.
NOTE 2 - VALUATION
The fund’s investments are reported at fair value as defined by GAAP. The fund determines the values of its assets and liabilities and computes its net asset value per share at the close of the New York Stock Exchange (NYSE), normally 4 p.m. ET, each day that the NYSE is open for business.
Valuation Methods Equity securities listed or regularly traded on a securities exchange or in the over-the-counter (OTC) market are valued at the last quoted sale price or, for certain markets, the official closing price at the time the valuations are made, except for OTC Bulletin Board securities, which are valued at the mean of the latest bid and asked prices. A security that is listed or traded on more than one exchange is valued at the quotation on the exchange determined to be the primary market for such security. Listed securities not traded on a particular day are valued at the mean of the latest bid and asked prices for domestic securities and the last quoted sale price for international securities.
Debt securities are generally traded in the OTC market. Securities with remaining maturities of one year or more at the time of acquisition are valued at prices furnished by dealers who make markets in such securities or by an independent pricing service, which considers the yield or price of bonds of comparable quality, coupon, maturity, and type, as well as prices quoted by dealers who make markets in such securities. Securities with remaining maturities of less than one year at the time of acquisition generally use amortized cost in local currency to approximate fair value. However, if amortized cost is deemed not to reflect fair value or the fund holds a significant amount of such securities with remaining maturities of more than 60 days, the securities are valued at prices furnished by dealers who make markets in such securities or by an independent pricing service.
Investments in mutual funds are valued at the mutual fund’s closing net asset value per share on the day of valuation.
Other investments, including restricted securities, and those financial instruments for which the above valuation procedures are inappropriate or are deemed not to reflect fair value are stated at fair value as determined in good faith by the T. Rowe Price Valuation Committee, established by the fund’s Board of Directors.
For valuation purposes, the last quoted prices of non-U.S. equity securities may be adjusted under the circumstances described below. If the fund determines that developments between the close of a foreign market and the close of the NYSE will, in its judgment, materially affect the value of some or all of its portfolio securities, the fund will adjust the previous closing prices to reflect what it believes to be the fair value of the securities as of the close of the NYSE. In deciding whether it is necessary to adjust closing prices to reflect fair value, the fund reviews a variety of factors, including developments in foreign markets, the performance of U.S. securities markets, and the performance of instruments trading in U.S. markets that represent foreign securities and baskets of foreign securities. A fund may also fair value securities in other situations, such as when a particular foreign market is closed but the fund is open. The fund uses outside pricing services to provide it with closing prices and information to evaluate and/or adjust those prices. The fund cannot predict how often it will use closing prices and how often it will determine it necessary to adjust those prices to reflect fair value. As a means of evaluating its security valuation process, the fund routinely compares closing prices, the next day’s opening prices in the same markets, and adjusted prices.
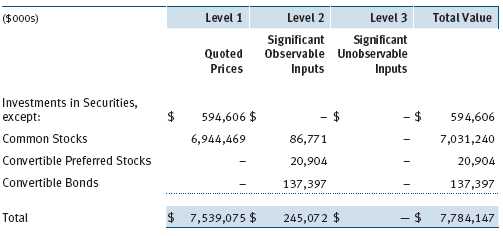
Valuation Inputs Various inputs are used to determine the value of the fund’s financial instruments. These inputs are summarized in the three broad levels listed below:
Level 1 – quoted prices in active markets for identical financial instruments
Level 2 – observable inputs other than Level 1 quoted prices (including, but not limited to, quoted prices for similar financial instruments, interest rates, prepayment speeds, and credit risk)
Level 3 – unobservable inputs
Observable inputs are those based on market data obtained from sources independent of the fund, and unobservable inputs reflect the fund’s own assumptions based on the best information available. The input levels are not necessarily an indication of the risk or liquidity associated with financial instruments at that level. For example, non-U.S. equity securities actively traded in foreign markets generally are reflected in Level 2 despite the availability of closing prices because the fund evaluates and determines whether those closing prices reflect fair value at the close of the NYSE or require adjustment, as described above. The following table summarizes the fund’s financial instruments, based on the inputs used to determine their values on June 30, 2010:
NOTE 3 - OTHER INVESTMENT TRANSACTIONS
Purchases and sales of portfolio securities other than short-term securities aggregated $2,227,931,000 and $1,665,870,000, respectively, for the six months ended June 30, 2010.
NOTE 4 - FEDERAL INCOME TAXES
No provision for federal income taxes is required since the fund intends to continue to qualify as a regulated investment company under Subchapter M of the Internal Revenue Code and distribute to shareholders all of its taxable income and gains. Distributions determined in accordance with federal income tax regulations may differ in amount or character from net investment income and realized gains for financial reporting purposes. Financial reporting records are adjusted for permanent book/tax differences to reflect tax character but are not adjusted for temporary differences. The amount and character of tax-basis distributions and composition of net assets are finalized at fiscal year-end; accordingly, tax-basis balances have not been determined as of the date of this report.
In accordance with federal tax regulations, the fund recognized capital losses in the current period for tax purposes that had been recognized in the prior fiscal year for financial reporting purposes. Such deferrals relate to net capital losses realized between November 1, 2009 and December 31, 2009 and totaled $31,949,000. The fund intends to retain realized gains to the extent of available capital loss carryforwards. As of December 31, 2009, the fund had $1,087,328,000 of unused capital loss carryforwards, which expire: $340,260,000 in fiscal 2016 and $747,068,000 in fiscal 2017.
At June 30, 2010, the cost of investments for federal income tax purposes was $7,456,590,000. Net unrealized gain aggregated $327,555,000 at period-end, of which $885,044,000 related to appreciated investments and $557,489,000 related to depreciated investments.
NOTE 5 - RELATED PARTY TRANSACTIONS
The fund is managed by T. Rowe Price Associates, Inc. (the manager or Price Associates), a wholly owned subsidiary of T. Rowe Price Group, Inc. The investment management agreement between the fund and the manager provides for an annual investment management fee, which is computed daily and paid monthly. The fee consists of an individual fund fee, equal to 0.35% of the fund’s average daily net assets, and a group fee. The group fee rate is calculated based on the combined net assets of certain mutual funds sponsored by Price Associates (the group) applied to a graduated fee schedule, with rates ranging from 0.48% for the first $1 billion of assets to 0.285% for assets in excess of $220 billion. The fund’s group fee is determined by applying the group fee rate to the fund’s average daily net assets. At June 30, 2010, the effective annual group fee rate was 0.30%.
In addition, the fund has entered into service agreements with Price Associates and two wholly owned subsidiaries of Price Associates (collectively, Price). Price Associates computes the daily share prices and provides certain other administrative services to the fund. T. Rowe Price Services, Inc., provides shareholder and administrative services in its capacity as the fund’s transfer and dividend disbursing agent. T. Rowe Price Retirement Plan Services, Inc., provides subaccounting and recordkeeping services for certain retirement accounts invested in the Investor Class and R Class. For the six months ended June 30, 2010, expenses incurred pursuant to these service agreements were $55,000 for Price Associates; $943,000 for T. Rowe Price Services, Inc.; and $730,000 for T. Rowe Price Retirement Plan Services, Inc. The total amount payable at period-end pursuant to these service agreements is reflected as Due to Affiliates in the accompanying financial statements.
Additionally, the fund is one of several mutual funds in which certain college savings plans managed by Price Associates may invest. As approved by the fund’s Board of Directors, shareholder servicing costs associated with each college savings plan are borne by the fund in proportion to the average daily value of its shares owned by the college savings plan. For the six months ended June 30, 2010, the fund was charged $206,000 for shareholder servicing costs related to the college savings plans, of which $154,000 was for services provided by Price. The amount payable at period-end pursuant to this agreement is reflected as Due to Affiliates in the accompanying financial statements. At June 30, 2010, approximately 3% of the outstanding shares of the Investor Class were held by college savings plans.
The fund is also one of several mutual funds sponsored by Price Associates (underlying Price funds) in which the T. Rowe Price Spectrum Funds (Spectrum Funds) and T. Rowe Price Retirement Funds (Retirement Funds) may invest. Neither the Spectrum Funds nor the Retirement Funds invest in the underlying Price funds for the purpose of exercising management or control. Pursuant to separate special servicing agreements, expenses associated with the operation of the Spectrum and Retirement Funds are borne by each underlying Price fund to the extent of estimated savings to it and in proportion to the average daily value of its shares owned by the Spectrum and Retirement Funds, respectively. Expenses allocated under these agreements are reflected as shareholder servicing expenses in the accompanying financial statements. For the six months ended June 30, 2010, the fund was allocated $85,000 of Spectrum Funds’ expenses and $1,670,000 of Retirement Funds’ expenses. Of these amounts, $1,101,000 related to services provided by Price. The amount payable at period-end pursuant to this agreement is reflected as Due to Affiliates in the accompanying financial statements. At June 30, 2010, approximately 2% of the outstanding shares of the Investor Class were held by the Spectrum Funds and 23% were held by the Retirement Funds.
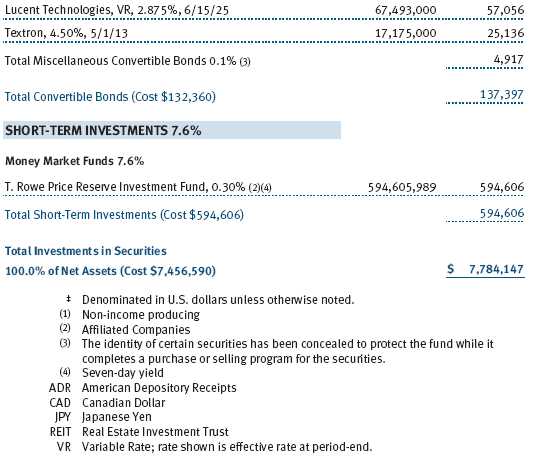
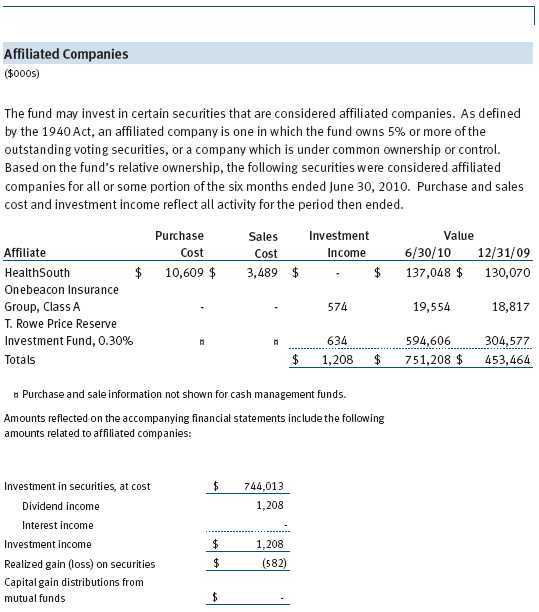
The fund may invest in the T. Rowe Price Reserve Investment Fund and the T. Rowe Price Government Reserve Investment Fund (collectively, the T. Rowe Price Reserve Investment Funds), open-end management investment companies managed by Price Associates and considered affiliates of the fund. The T. Rowe Price Reserve Investment Funds are offered as cash management options to mutual funds, trusts, and other accounts managed by Price Associates and/or its affiliates and are not available for direct purchase by members of the public. The T. Rowe Price Reserve Investment Funds pay no investment management fees.
As of June 30, 2010, T. Rowe Price Group, Inc., and/or its wholly owned subsidiaries owned 169,796 shares of the Investor Class, representing less than 1% of the fund’s net assets.
| INFORMATION ON PROXY VOTING POLICIES, PROCEDURES, AND RECORDS |
A description of the policies and procedures used by T. Rowe Price funds and portfolios to determine how to vote proxies relating to portfolio securities is available in each fund’s Statement of Additional Information, which you may request by calling 1-800-225-5132 or by accessing the SEC’s Web site, www.sec.gov. The description of our proxy voting policies and procedures is also available on our Web site, www.troweprice.com. To access it, click on the words “Our Company” at the top of our corporate homepage. Then, when the next page appears, click on the words “Proxy Voting Policies” on the left side of the page.
Each fund’s most recent annual proxy voting record is available on our Web site and through the SEC’s Web site. To access it through our Web site, follow the directions above, then click on the words “Proxy Voting Records” on the right side of the Proxy Voting Policies page.
| HOW TO OBTAIN QUARTERLY PORTFOLIO HOLDINGS |
The fund files a complete schedule of portfolio holdings with the Securities and Exchange Commission for the first and third quarters of each fiscal year on Form N-Q. The fund’s Form N-Q is available electronically on the SEC’s Web site (www.sec.gov); hard copies may be reviewed and copied at the SEC’s Public Reference Room, 450 Fifth St. N.W., Washington, DC 20549. For more information on the Public Reference Room, call 1-800-SEC-0330.
| APPROVAL OF INVESTMENT MANAGEMENT AGREEMENT |
On March 9, 2010, the fund’s Board of Directors (Board) unanimously approved the continuation of the investment advisory contract (Contract) between the fund and its investment manager, T. Rowe Price Associates, Inc. (Adviser). The Board considered a variety of factors in connection with its review of the Contract, also taking into account information provided by the Adviser during the course of the year, as discussed below:
Services Provided by the Adviser
The Board considered the nature, quality, and extent of the services provided to the fund by the Adviser. These services included, but were not limited to, management of the fund’s portfolio and a variety of related activities, as well as financial and administrative services, reporting, and communications. The Board also reviewed the background and experience of the Adviser’s senior management team and investment personnel involved in the management of the fund. The Board concluded that it was satisfied with the nature, quality, and extent of the services provided by the Adviser.
Investment Performance of the Fund
The Board reviewed the fund’s average annual total returns over the 1-, 3-, 5-, and 10-year periods, as well as the fund’s year-by-year returns, and compared these returns with a wide variety of previously agreed upon comparable performance measures and market data, including those supplied by Lipper and Morningstar, which are independent providers of mutual fund data. On the basis of this evaluation and the Board’s ongoing review of investment results, and factoring in the severity of the market turmoil during 2008 and 2009, the Board concluded that the fund’s performance was satisfactory.
Costs, Benefits, Profits, and Economies of Scale
The Board reviewed detailed information regarding the revenues received by the Adviser under the Contract and other benefits that the Adviser (and its affiliates) may have realized from its relationship with the fund, including research received under “soft dollar” agreements and commission-sharing arrangements with broker-dealers. The Board considered that the Adviser may receive some benefit from its soft-dollar arrangements pursuant to which it receives research from broker-dealers that execute the applicable fund’s portfolio transactions. The Board also received information on the estimated costs incurred and profits realized by the Adviser and its affiliates from advising T. Rowe Price mutual funds, as well as estimates of the gross profits realized from managing the fund in particular. The Board concluded that the Adviser’s profits were reasonable in light of the services provided to the fund. The Board also considered whether the fund or other funds benefit under the fee levels set forth in the Contract from any economies of scale realized by the Adviser. Under the Contract, the fund pays a fee to the Adviser composed of two components—a group fee rate based on the aggregate assets of certain T. Rowe Price mutual funds (including the fund) that declines at certain asset levels and an individual fund fee rate that is assessed on the assets of the fund. The Board concluded that the advisory fee structure for the fund continued to provide for a reasonable sharing of benefits from any economies of scale with the fund’s investors.
Fees
The Board reviewed the fund’s management fee rate, operating expenses, and total expense ratio (for the Investor Class, Advisor Class, and R Class) and compared them with fees and expenses of other comparable funds based on information and data supplied by Lipper. The information provided to the Board indicated that the fund’s management fee rate was above the median for certain groups of comparable funds but at or below the median for other groups of comparable funds. The information also indicated that the fund’s total expense ratio for the Investor Class was above the median for certain groups of comparable funds but below the median for other groups of comparable funds, the total expense ratio for the Advisor Class was below the median for comparable funds, and the total expense ratio for the R Class was above the median for comparable funds. The Board also reviewed the fee schedules for institutional accounts of the Adviser and its affiliates with smaller mandates. Management informed the Board that the Adviser’s responsibilities for institutional accounts are more limited than its responsibilities for the fund and other T. Rowe Price mutual funds that it or its affiliates advise and that the Adviser performs significant additional services and assumes greater risk for the fund and other T. Rowe Price mutual funds that it advises than it does for institutional accounts. On the basis of the information provided, the Board concluded that the fees paid by the fund under the Contract were reasonable.
Approval of the Contract
As noted, the Board approved the continuation of the Contract. No single factor was considered in isolation or to be determinative to the decision. Rather, the Board was assisted by the advice of independent legal counsel and concluded, in light of a weighting and balancing of all factors considered, that it was in the best interests of the fund to approve the continuation of the Contract, including the fees to be charged for services thereunder.
Item 2. Code of Ethics.
A code of ethics, as defined in Item 2 of Form N-CSR, applicable to its principal executive officer, principal financial officer, principal accounting officer or controller, or persons performing similar functions is filed as an exhibit to the registrant’s annual Form N-CSR. No substantive amendments were approved or waivers were granted to this code of ethics during the registrant’s most recent fiscal half-year.
Item 3. Audit Committee Financial Expert.
Disclosure required in registrant’s annual Form N-CSR.
Item 4. Principal Accountant Fees and Services.
Disclosure required in registrant’s annual Form N-CSR.
Item 5. Audit Committee of Listed Registrants.
Not applicable.
Item 6. Investments.
(a) Not applicable. The complete schedule of investments is included in Item 1 of this Form N-CSR.
(b) Not applicable.
Item 7. Disclosure of Proxy Voting Policies and Procedures for Closed-End Management Investment Companies.
Not applicable.
Item 8. Portfolio Managers of Closed-End Management Investment Companies.
Not applicable.
Item 9. Purchases of Equity Securities by Closed-End Management Investment Company and Affiliated Purchasers.
Not applicable.
Item 10. Submission of Matters to a Vote of Security Holders.
Not applicable.
Item 11. Controls and Procedures.
(a) The registrant’s principal executive officer and principal financial officer have evaluated the registrant’s disclosure controls and procedures within 90 days of this filing and have concluded that the registrant’s disclosure controls and procedures were effective, as of that date, in ensuring that information required to be disclosed by the registrant in this Form N-CSR was recorded, processed, summarized, and reported timely.
(b) The registrant’s principal executive officer and principal financial officer are aware of no change in the registrant’s internal control over financial reporting that occurred during the registrant’s second fiscal quarter covered by this report that has materially affected, or is reasonably likely to materially affect, the registrant’s internal control over financial reporting.
Item 12. Exhibits.
(a)(1) The registrant’s code of ethics pursuant to Item 2 of Form N-CSR is filed with the registrant’s annual Form N-CSR.
(2) Separate certifications by the registrant's principal executive officer and principal financial officer, pursuant to Section 302 of the Sarbanes-Oxley Act of 2002 and required by Rule 30a-2(a) under the Investment Company Act of 1940, are attached.
(3) Written solicitation to repurchase securities issued by closed-end companies: not applicable.
(b) A certification by the registrant's principal executive officer and principal financial officer, pursuant to Section 906 of the Sarbanes-Oxley Act of 2002 and required by Rule 30a-2(b) under the Investment Company Act of 1940, is attached.
| | |
SIGNATURES |
| |
| | Pursuant to the requirements of the Securities Exchange Act of 1934 and the Investment |
| Company Act of 1940, the registrant has duly caused this report to be signed on its behalf by the |
| undersigned, thereunto duly authorized. |
| |
| T. Rowe Price Mid-Cap Value Fund, Inc. |
| |
| |
| |
| By | /s/ Edward C. Bernard |
| | Edward C. Bernard |
| | Principal Executive Officer |
| |
| Date | August 17, 2010 |
| |
| |
| |
| | Pursuant to the requirements of the Securities Exchange Act of 1934 and the Investment |
| Company Act of 1940, this report has been signed below by the following persons on behalf of |
| the registrant and in the capacities and on the dates indicated. |
| |
| |
| By | /s/ Edward C. Bernard |
| | Edward C. Bernard |
| | Principal Executive Officer |
| |
| Date | August 17, 2010 |
| |
| |
| |
| By | /s/ Gregory K. Hinkle |
| | Gregory K. Hinkle |
| | Principal Financial Officer |
| |
| Date | August 17, 2010 |