| UNITED STATES |
| SECURITIES AND EXCHANGE COMMISSION |
| Washington, D.C. 20549 |
| |
FORM N-CSR |
| |
CERTIFIED SHAREHOLDER REPORT OF REGISTERED |
MANAGEMENT INVESTMENT COMPANIES |
| |
| |
| |
| Investment Company Act File Number: 811-07605 |
|
| |
| T. Rowe Price Mid-Cap Value Fund, Inc. |
|
| (Exact name of registrant as specified in charter) |
| |
| 100 East Pratt Street, Baltimore, MD 21202 |
|
| (Address of principal executive offices) |
| |
| David Oestreicher |
| 100 East Pratt Street, Baltimore, MD 21202 |
|
| (Name and address of agent for service) |
| |
| |
| Registrant’s telephone number, including area code: (410) 345-2000 |
| |
| |
| Date of fiscal year end: December 31 |
| |
| |
| Date of reporting period: June 30, 2011 |
Item 1: Report to Shareholders| Mid-Cap Value Fund | June 30, 2011 |
The views and opinions in this report were current as of June 30, 2011. They are not guarantees of performance or investment results and should not be taken as investment advice. Investment decisions reflect a variety of factors, and the managers reserve the right to change their views about individual stocks, sectors, and the markets at any time. As a result, the views expressed should not be relied upon as a forecast of the fund’s future investment intent. The report is certified under the Sarbanes-Oxley Act, which requires mutual funds and other public companies to affirm that, to the best of their knowledge, the information in their financial reports is fairly and accurately stated in all material respects.
REPORTS ON THE WEB
Sign up for our E-mail Program, and you can begin to receive updated fund reports and prospectuses online rather than through the mail. Log in to your account at troweprice.com for more information.
Manager’s Letter
Fellow Shareholders
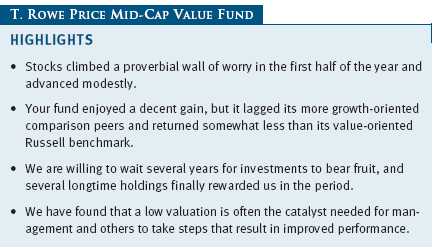
To be sure, there was plenty to worry about in the first half of 2011. A budding U.S. housing recovery faltered, and home prices in many regions fell again. The high rate of domestic unemployment did not budge. A tragic earthquake in Japan produced much human suffering and economic damage. Growth in China slowed. A debt crisis began to brew again in peripheral economies of Europe, especially Greece, and unrest in the Middle East spread throughout the region. Yet, in spite of it all, the U.S. stock market climbed this proverbial wall of worry and advanced modestly in the first half of the year. Our fund recorded gains that were roughly in line with the major indexes.
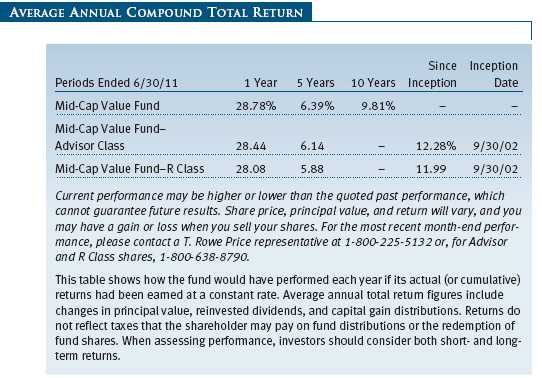
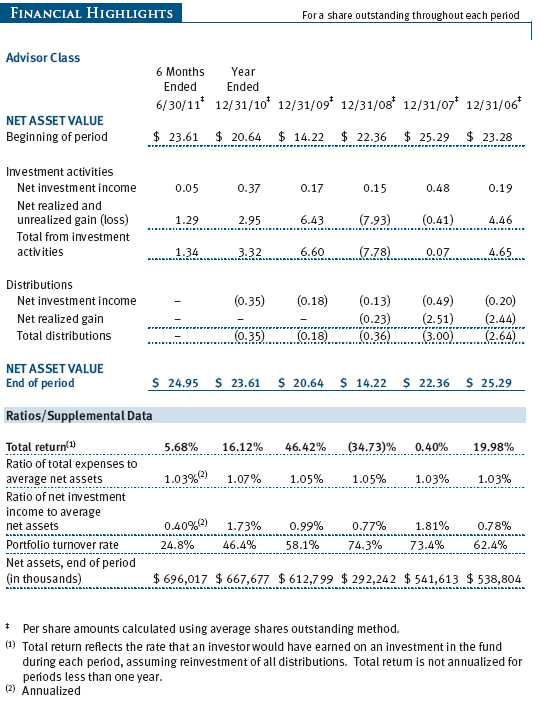
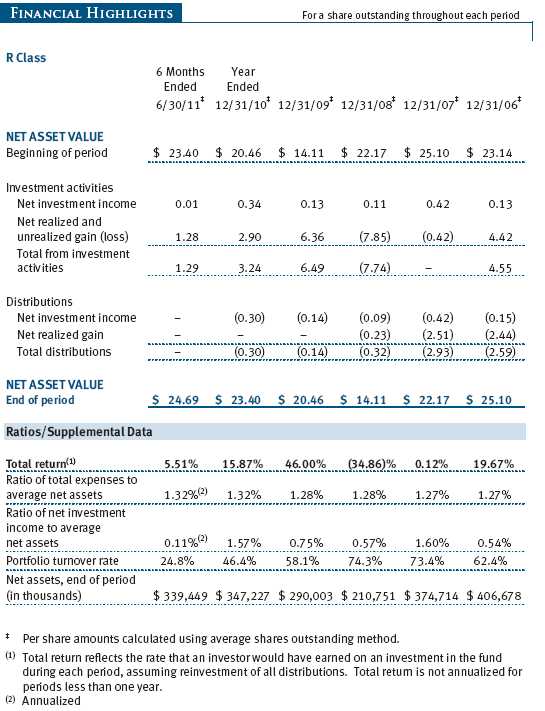
The Mid-Cap Value Fund returned 5.78% for the six months ended June 30, 2011. As shown in the Performance Comparison table, the fund lagged its value indexes a bit, while trailing indexes with a growth component by a somewhat greater extent. Returns for the fund’s Advisor and R Class shares were slightly lower due to their different cost structures.
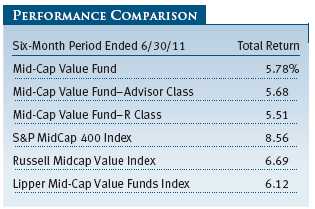
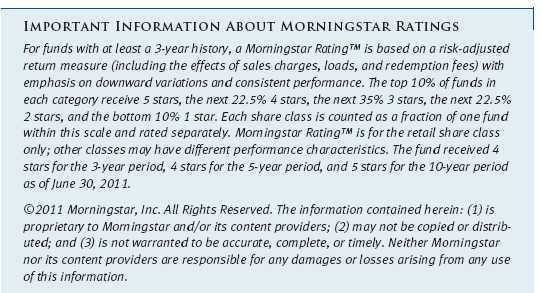
Despite lagging its benchmarks recently, the fund’s long-term performance remains favorable, in relative terms, as recognized by Morningstar’s overall five-star rating, as well as its rank among competitive funds as tracked by Lipper over longer time periods. The Mid-Cap Value Fund received an Overall Morningstar RatingTM of five stars for its risk-adjusted performance. This rating is derived from a weighted average of the performance figures associated with a fund’s 3-, 5-, and 10-year (if applicable) Morningstar RatingTM metrics. The fund was rated among 348, 348, 281, and 124 mid-cap value funds for the overall rating and the 3-, 5-, and 10-year periods ended June 30, 2011, respectively. (Please see below for additional information about Morningstar ratings.) Based on cumulative total return, Lipper ranked the Mid-Cap Value Fund 191 of 216, 44 of 184, 14 of 144, and 10 of 71 mid-cap value funds for the 1-, 3-, 5-, and 10-year periods ended June 30, 2011, respectively. Results will vary for other periods. Past performance cannot guarantee future results.
MARKET ENVIRONMENT
The U.S. economy continued on a path of continued if frustratingly slow and uneven recovery in the first half of 2011. Healthy exports boosted the manufacturing sector early in the year, while subdued growth in consumer income and spending helped the service sector expand at a more modest pace. After struggling through much of the latter half of 2010, the labor market gained some momentum early in 2011. The housing market remained especially weak, with home construction falling to record-low levels, although there were tentative signs that the sector’s decline was leveling off. Corporate profit growth remained robust despite the slow pace of the recovery, helping many stocks reach new highs in April. A rising number of mergers and acquisitions and the Federal Reserve’s stimulative “QE2” bond purchases also boosted sentiment.
Investors’ enthusiasm evaporated late in the spring, however, as the recovery failed to pick up speed. Most distressingly, job growth decelerated sharply in May and June, and the unemployment rate began to climb again after months of declines. In a replay of 2010, worrisome developments overseas appeared partly to blame for the slowdown. Political turmoil in North Africa and the Middle East led to a surge in oil and gasoline prices early in the year that took a bite out of household budgets and weighed on consumer confidence. Another factor clearly was the devastating earthquake and tsunami that struck northeastern Japan in March, which caused problems in global manufacturing supply chains, particularly in the auto sector. Additionally, European officials scrambled to develop and agree upon new financial assistance to prevent Greece from defaulting on or restructuring its sovereign debt. As the period came to a close, many economists were joining the Federal Reserve in lowering growth estimates.
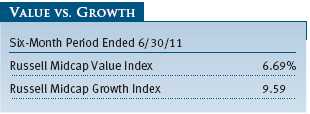
Mid-cap value stocks recorded decent gains but trailed their growth counterparts over the past six months. Mid-caps outperformed large- and small-caps, however. Defensive sectors such as consumer staples, health care, and utilities outperformed more cyclical sectors such as energy and industrials and business services. Financials and information technology stocks generally lagged.
PORTFOLIO AND STRATEGY REVIEW
A colleague and friend of ours is an avid gardener. He is a patient and thoughtful individual with a long-term time horizon. He carefully plans and envisions the potential in his fruit and vegetable plants, waters and weeds regularly, and awaits the harvest. But rewards do not always come in one growing season—he has pointed out to us that some plantings require several seasons to fully produce good fruit. Tending a garden is an apt analogy to the way we manage this portfolio. We study with care, plan for the long term, plant seeds and monitor progress, weed out the underperformers, and expect some failures, but we anticipate a good overall crop. We think we have some ability to determine the size of the harvest, but we are never certain of the timing with any precision.
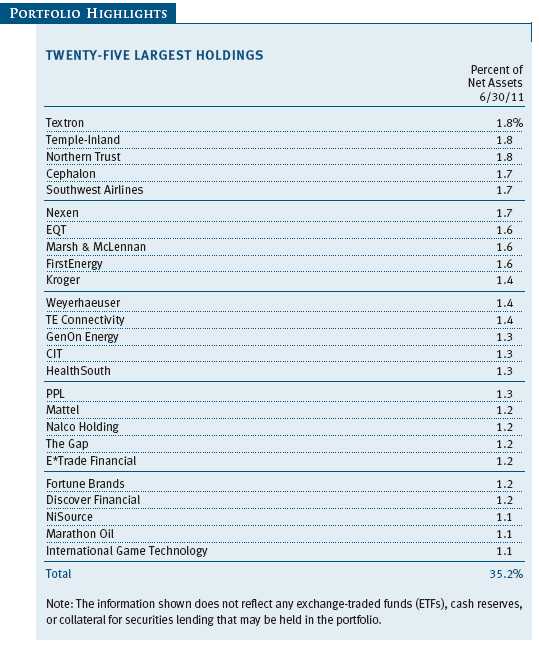
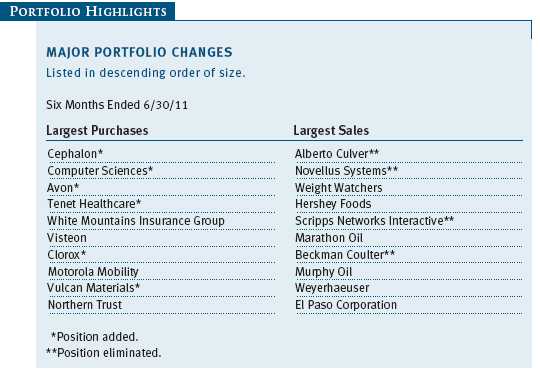
Indeed, some of our investments bear fruit quickly—one example is Cephalon, a biopharmaceutical company and successful holding of the fund many years ago. The company appeared on our radar screen again last year after concerns about upcoming generic drug competition for its highly profitable branded products and worries about excessive spending on research and development depressed its stock price. We have found that a low valuation is often the most effective catalyst for a stock, as it tends to galvanize management, the Board of Directors, activists, and potential suitors to take steps to close the gap between market price and intrinsic value. As history would have it, an initial bid for Cephalon by Valeant Pharmaceuticals was topped by a final offer by Teva, a large global pharmaceutical manufacturer, at a 39% premium to where the shares had traded earlier in the year. We did not anticipate a significant return in Cephalon so soon after our initial purchase, but this episode demonstrates that a focus on value will bear good fruit in the course of time. (Please refer to the fund’s portfolio of investments for a complete list of our holdings and the amount each represents in the portfolio.)
Two of the fund’s best performers were energy stocks, as both companies announced plans to unlock value by separating their main businesses. Marathon Oil possessed a solid base of producing oil and gas wells, prospective exploration projects, a unique network of refining and energy transportation assets, and a successful program of divesting assets for good prices. A proposal to split the business between its “upstream” (exploration and production) and “downstream” (refining and transportation) components had been contemplated by its Board of Directors some years ago but was shelved when the global economy turned down. With energy prices buoyant again and its financial position improved, Marathon dusted off this plan and announced such a separation, allowing each new company to chart a separate course and pushing its shares higher. Similarly, El Paso Corporation had in the past discussed its potential interest in splitting its world class pipeline division from its oil and gas exploration and production business but had expressed a desire to finish some important pipeline construction projects before doing so. The company surprised investors by announcing a split sooner than expected, and the market responded favorably to the news.
Each of these holdings had been in the fund for less than a year. We would like to tell you that we could both identify the undervaluation of their shares and predict the timing of the significant move in each stock, but that is not the case. Mindful that some holdings will take many seasons to bear fruit, we typically invest in companies with a multiyear investment horizon. We try to buy stocks below what we deem them to be worth and expect that market forces will eventually produce the realization of underlying value. In some cases, this realization comes through an internal focus by the management and Board to unlock value; in others, through the approach of outside parties, such as activist owners or potential acquirers.
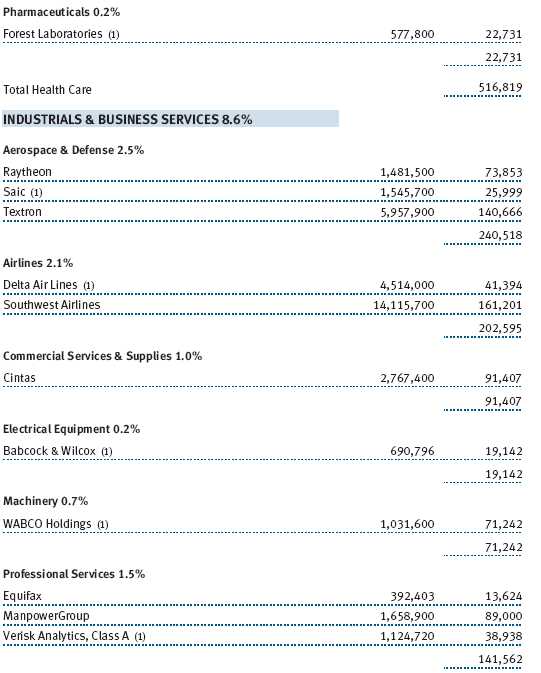
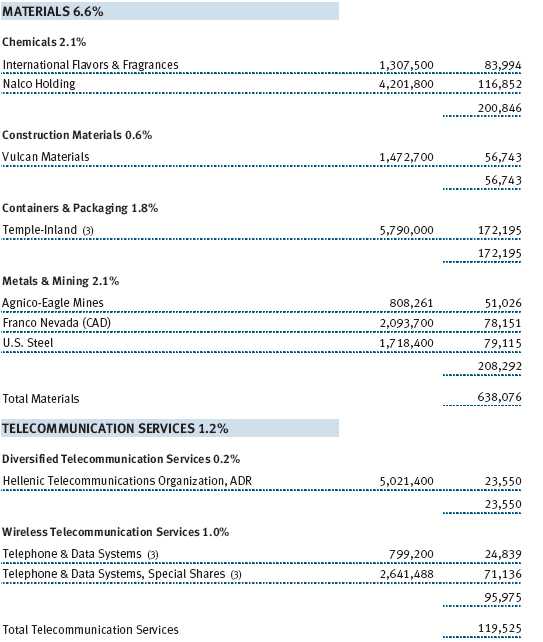
A more typical time horizon for our investments was exemplified by Temple-Inland, owned by the fund for over two years and also the subject of a takeover bid. Temple is one of few remaining public companies among the shrinking ranks of paper manufacturers. Our first purchases of Temple were in the winter of 2009. Its management was ably steering the company through a difficult time in the economy by closing excess capacity, lowering costs, and paying down debt. Its shares were trading significantly below “replacement value,” or what it would take to rebuild its assets from scratch. Temple-Inland continued to execute well from an operational standpoint as the paper industry consolidated around it. Eventually, it drew the attention of its current suitor, International Paper, resulting in an offer some 35% above where the stock had been trading.
Some of our investments take even longer to come to fruition. The best performer in the first half is such an example. Weight Watchers has been a holding of the Mid-Cap Value Fund for seven years. This company possessed many attractive characteristics at the time of our first purchase: a growing market; good brand; opportunities for internal investment; strong cash flows; and last, but not least, a low valuation. We did not expect Weight Watchers’ shares to trade sideways for the ensuing six years, but that is essentially what happened. Though attendance at its meetings remained anemic, the company’s online offering became more robust, its ancillary product sales remained strong, and cash flows were used to repurchase shares and reduce debt. Earnings compounded at a good clip as the stock stayed depressed. Over the past six months, much went right at Weight Watchers: realigned marketing efforts paid off, meeting attendance rose, the online business hit its stride, and earnings exceeded expectations. Its shares more than tripled from its lows, making a seven-year wait well worthwhile.
Another big contributor to the fund was DISH Network. Owned by the fund for four years, DISH is the nation’s second-largest satellite television provider and is run by an entrepreneur, Charles Ergen, who began his career selling satellite dishes from the back of a truck and is now one of the country’s most successful businesspeople. DISH’s shares were depressed for several years as the proliferation of other forms of media—digital streaming, Internet, pay-per-view television, and the like—threatened its core business. The company generated good financial results despite the recession, but its stock underperformed as investors grew more concerned about the long-term prospects forsatellite TV and assumed the company lacked the flexibility and initiative to prepare for the evolution in the media world. As it turned out, the market underestimated Mr. Ergen, as the company’s opportunistic acquisition in the first half of several financially distressed businesses—including spectrum owners DBSD and Terrestar, as well as the assets of Blockbuster, a video/DVD rental chain—highlighted the potential for a revival in its fortunes and a future beyond satellite television.

Three other stocks with long tenure in the fund were also among its best performers in the first half. Weyerhaeuser, the country’s largest owner of timber and manufacturer of wood products, completed its tax-efficient conversion to a real estate investment trust and benefited from a surging log export market. The shares of HealthSouth, the nation’s largest outpatient rehabilitation company, rose as its financial performance continued to reflect a focus on improved productivity, tight financial controls, and selective acquisitions and new center openings.
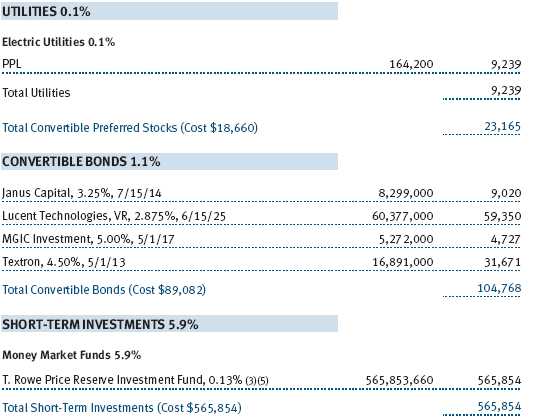
Financial companies represented the most challenging sector for the portfolio in the first half. Greenhill, a boutique investment bank, posted weaker-than-expected results and a decline in market share. We had expected the company to fare better but note that fluctuations in market share are common over short time periods. We believe that Greenhill’s strong balance sheet, pure focus on advisory work, and well-regarded management position it well for an improving environment for mergers and acquisitions. Northern Trust, which has been owned by the fund since inception, has recently stepped up its spending on new employees and technology to grow its market share. This investment, combined with low interest rates that squeezed its net interest margin, has crimped its earnings and hurt its stock price. We think that this century-old, financially strong, storied franchise—which has always been managed with an eye on long-term results—will make the right decisions for its business and that its shares will trade at a wide discount to their underlying value. Finally, Janus, also a long-term holding for the fund, experienced lower-than-anticipated flows into its mutual funds and institutional portfolios. Its performance in the stock market has been disappointing, but we think Janus’s shares trade well below what we think they are worth. The fund added to positions in all three of these financial stocks in the quarter.
Southwest Airlines made good progress in the first half of the year, beginning the process of integrating its acquisition of AirTran Holdings, introducing a new frequent flier program, and producing decent financial results. Still, concerns about high jet fuel prices and a potentially weakening outlook for passenger volumes caused its shares to underperform. As noted in our previous letters, we believe that the airline industry is on its best footing in a generation, and we feel Southwest’s unique and consistently well-ranked service, strong financial position, and low operating costs position it well to improve on its financial results. Southwest remains among the fund’s top holdings.
The Gap was among the detractors for the first half, and it, too, has been a longstanding fund holding. Gap’s shares were hurt by rising cotton prices, which put pressure on the firm’s profit margins, and anemic results at its core Gap-branded stores. Its established brand names—including Banana Republic, Old Navy, and Athleta—and recent changes made to merchandising and product design, along with improved raw materials sourcing, should position it well to turn around its fortunes. In the meantime, the company has repurchased a third of its shares in the past decade, demonstrating its financial strength and belief that its shares are undervalued. We think it is appropriate to be patient with this investment and added to the fund’s position in the first half.
IN CLOSING
We are never sure when our investments will become fruitful. Some bear fruit quickly; others take time to ripen on the vine; and, of course, some never ripen at all. But a focus on good businesses acquired at good prices has been a hallmark of this fund’s strategy, and it will remain so. We will keep tilling the soil and working hard to produce a good harvest. Thank you for your continued investment.

David J. Wallack
President of the fund and chairman of its Investment Advisory Committee

Heather M. McPherson
Executive vice president of the fund
July 20, 2011
The committee chairman has day-to-day responsibility for managing the portfolio and works with committee members in developing and executing the fund’s investment program.
RISKS OF INVESTING
The fund’s share price can fall because of weakness in the stock or bond markets, a particular industry, or specific holdings. Stock markets can decline for many reasons, including adverse political or economic developments, changes in investor psychology, or heavy institutional selling. The prospects for an industry or company may deteriorate because of a variety of factors, including disappointing earnings or changes in the competitive environment. In addition, the investment manager’s assessment of companies held in a fund may prove incorrect, resulting in losses or poor performance even in rising markets.
Mid-caps typically offer greater return potential than larger, established firms and involve less risk than small-caps. Value investors seek to invest in companies whose stock prices are low in relation to their real worth or future prospects. By identifying companies whose stocks are currently out of favor or misunderstood, value investors hope to realize significant appreciation as other investors recognize the stock’s intrinsic value and the price rises accordingly. The value approach carries the risk that the market will not recognize a security’s intrinsic value for a long time or that a stock judged to be undervalued may actually be appropriately priced.
GLOSSARY
Lipper indexes: Fund benchmarks that consist of a small number of the largest mutual funds in a particular category as tracked by Lipper Inc.
Russell 1000 Index: Measures the performance of the 1,000 largest companies in the Russell 3000 Index.
Russell 2000 Index: An unmanaged index that tracks the stocks of 2,000 small U.S. companies.
Russell Midcap Growth Index: Unmanaged index that measures the performance of those Russell Midcap companies with higher price-to-book ratios and higher forecasted growth values.
Russell Midcap Value Index: Unmanaged index that measures the performance of those Russell Midcap companies with lower price-to-book ratios and lower forecasted growth values.
S&P MidCap 400 Index: Unmanaged index that tracks the stocks of 400 mid-size U.S. companies.
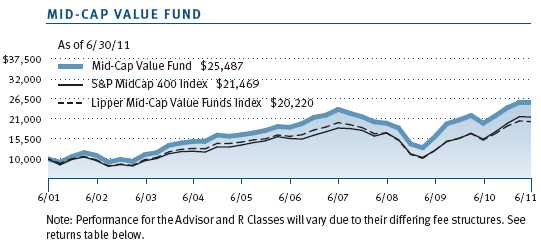
Performance and Expenses
This chart shows the value of a hypothetical $10,000 investment in the fund over the past 10 fiscal year periods or since inception (for funds lacking 10-year records). The result is compared with benchmarks, which may include a broad-based market index and a peer group average or index. Market indexes do not include expenses, which are deducted from fund returns as well as mutual fund averages and indexes.
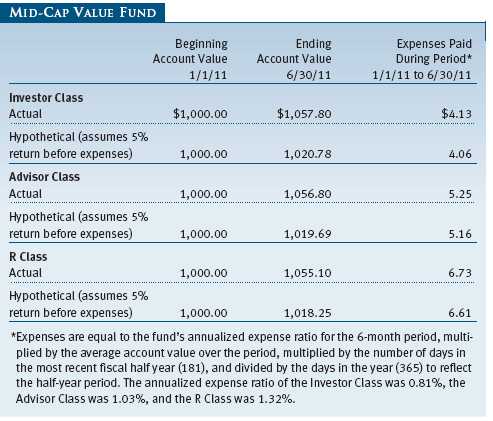
As a mutual fund shareholder, you may incur two types of costs: (1) transaction costs, such as redemption fees or sales loads, and (2) ongoing costs, including management fees, distribution and service (12b-1) fees, and other fund expenses. The following example is intended to help you understand your ongoing costs (in dollars) of investing in the fund and to compare these costs with the ongoing costs of investing in other mutual funds. The example is based on an investment of $1,000 invested at the beginning of the most recent six-month period and held for the entire period.
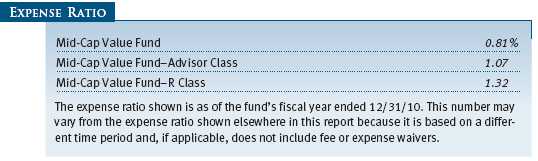
Please note that the fund has three share classes: The original share class (“investor class”) charges no distribution and service (12b-1) fee, Advisor Class shares are offered only through unaffiliated brokers and other financial intermediaries and charge a 0.25% 12b-1 fee, and R Class shares are available to retirement plans serviced by intermediaries and charge a 0.50% 12b-1 fee. Each share class is presented separately in the table.
Actual Expenses
The first line of the following table (“Actual”) provides information about actual account values and expenses based on the fund’s actual returns. You may use the information on this line, together with your account balance, to estimate the expenses that you paid over the period. Simply divide your account value by $1,000 (for example, an $8,600 account value divided by $1,000 = 8.6), then multiply the result by the number on the first line under the heading “Expenses Paid During Period” to estimate the expenses you paid on your account during this period.
Hypothetical Example for Comparison Purposes
The information on the second line of the table (“Hypothetical”) is based on hypothetical account values and expenses derived from the fund’s actual expense ratio and an assumed 5% per year rate of return before expenses (not the fund’s actual return). You may compare the ongoing costs of investing in the fund with other funds by contrasting this 5% hypothetical example and the 5% hypothetical examples that appear in the shareholder reports of the other funds. The hypothetical account values and expenses may not be used to estimate the actual ending account balance or expenses you paid for the period.
Note: T. Rowe Price charges an annual account service fee of $20, generally for accounts with less than $10,000 ($1,000 for UGMA/UTMA). The fee is waived for any investor whose T. Rowe Price mutual fund accounts total $50,000 or more; accounts employing automatic investing; accounts electing to receive electronic delivery of account statements, transaction confirmations, and prospectuses and shareholder reports; accounts of an investor who is a T. Rowe Price Preferred Services, Personal Services, or Enhanced Personal Services client (enrollment in these programs generally requires T. Rowe Price assets of at least $100,000); and IRAs and other retirement plan accounts that utilize a prototype plan sponsored by T. Rowe Price (although a separate custodial or administrative fee may apply to such accounts). This fee is not included in the accompanying table. If you are subject to the fee, keep it in mind when you are estimating the ongoing expenses of investing in the fund and when comparing the expenses of this fund with other funds.
You should also be aware that the expenses shown in the table highlight only your ongoing costs and do not reflect any transaction costs, such as redemption fees or sales loads. Therefore, the second line of the table is useful in comparing ongoing costs only and will not help you determine the relative total costs of owning different funds. To the extent a fund charges transaction costs, however, the total cost of owning that fund is higher.
Unaudited

The accompanying notes are an integral part of these financial statements.
Unaudited
The accompanying notes are an integral part of these financial statements.
Unaudited
The accompanying notes are an integral part of these financial statements.
Unaudited


The accompanying notes are an integral part of these financial statements.
Unaudited

The accompanying notes are an integral part of these financial statements.
Unaudited

The accompanying notes are an integral part of these financial statements.
Unaudited
The accompanying notes are an integral part of these financial statements.
Unaudited
| NOTES TO FINANCIAL STATEMENTS |
T. Rowe Price Mid-Cap Value Fund, Inc. (the fund), is registered under the Investment Company Act of 1940 (the 1940 Act) as a diversified, open-end management investment company. The fund seeks to provide long-term capital appreciation by investing primarily in mid-sized companies that appear to be undervalued. The fund has three classes of shares: the Mid-Cap Value Fund original share class, referred to in this report as the Investor Class, offered since June 28, 1996; the Mid-Cap Value Fund—Advisor Class (Advisor Class), offered since September 30, 2002; and the Mid-Cap Value Fund—R Class (R Class), offered since September 30, 2002. Advisor Class shares are sold only through unaffiliated brokers and other unaffiliated financial intermediaries, and R Class shares are available to retirement plans serviced by intermediaries. The Advisor Class and R Class each operate under separate Board-approved Rule 12b-1 plans, pursuant to which each class compensates financial intermediaries for distribution, shareholder servicing, and/or certain administrative services. Each class has exclusive voting rights on matters related solely to that class; separate voting rights on matters that relate to all classes; and, in all other respects, the same rights and obligations as the other classes.
NOTE 1 - SIGNIFICANT ACCOUNTING POLICIES
Basis of Preparation The accompanying financial statements were prepared in accordance with accounting principles generally accepted in the United States of America (GAAP), which require the use of estimates made by management. Management believes that estimates and valuations are appropriate; however, actual results may differ from those estimates, and the valuations reflected in the accompanying financial statements may differ from the value ultimately realized upon sale or maturity.
Investment Transactions, Investment Income, and Distributions Income and expenses are recorded on the accrual basis. Premiums and discounts on debt securities are amortized for financial reporting purposes. Dividends received from mutual fund investments are reflected as dividend income; capital gain distributions are reflected as realized gain/loss. Dividend income and capital gain distributions are recorded on the ex-dividend date. Income tax-related interest and penalties, if incurred, would be recorded as income tax expense. Investment transactions are accounted for on the trade date. Realized gains and losses are reported on the identified cost basis. Distributions to shareholders are recorded on the ex-dividend date. Income distributions are declared and paid by each class annually. Capital gain distributions, if any, are generally declared and paid by the fund annually.
Currency Translation Assets, including investments, and liabilities denominated in foreign currencies are translated into U.S. dollar values each day at the prevailing exchange rate, using the mean of the bid and asked prices of such currencies against U.S. dollars as quoted by a major bank. Purchases and sales of securities, income, and expenses are translated into U.S. dollars at the prevailing exchange rate on the date of the transaction. The effect of changes in foreign currency exchange rates on realized and unrealized security gains and losses is reflected as a component of security gains and losses.
Class Accounting The Advisor Class and R Class each pay distribution, shareholder servicing, and/or certain administrative expenses in the form of Rule 12b-1 fees, in an amount not exceeding 0.25% and 0.50%, respectively, of the class’s average daily net assets. Shareholder servicing, prospectus, and shareholder report expenses incurred by each class are charged directly to the class to which they relate. Expenses common to all classes, investment income, and realized and unrealized gains and losses are allocated to the classes based upon the relative daily net assets of each class.
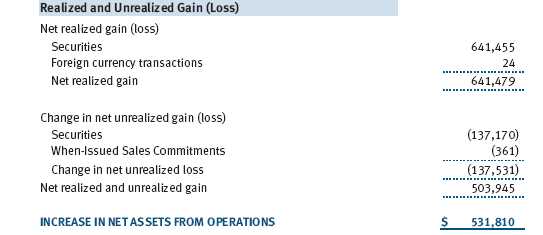
Rebates and Credits Subject to best execution, the fund may direct certain security trades to brokers who have agreed to rebate a portion of the related brokerage commission to the fund in cash. Commission rebates are reflected as realized gain on securities in the accompanying financial statements and totaled $138,000 for the six months ended June 30, 2011. Additionally, the fund earns credits on temporarily uninvested cash balances held at the custodian, which reduce the fund’s custody charges. Custody expense in the accompanying financial statements is presented before reduction for credits, which are reflected as expenses paid indirectly.
NOTE 2 - VALUATION
The fund’s financial instruments are reported at fair value as defined by GAAP. The fund determines the values of its assets and liabilities and computes each class’s net asset value per share at the close of the New York Stock Exchange (NYSE), normally 4 p.m. ET, each day that the NYSE is open for business.
Valuation Methods Equity securities listed or regularly traded on a securities exchange or in the over-the-counter (OTC) market are valued at the last quoted sale price or, for certain markets, the official closing price at the time the valuations are made, except for OTC Bulletin Board securities, which are valued at the mean of the latest bid and asked prices. A security that is listed or traded on more than one exchange is valued at the quotation on the exchange determined to be the primary market for such security. Listed securities not traded on a particular day are valued at the mean of the latest bid and asked prices for domestic securities and the last quoted sale price for international securities.
Debt securities are generally traded in the OTC market. Securities with remaining maturities of one year or more at the time of acquisition are valued at prices furnished by dealers who make markets in such securities or by an independent pricing service, which considers the yield or price of bonds of comparable quality, coupon, maturity, and type, as well as prices quoted by dealers who make markets in such securities. Securities with remaining maturities of less than one year at the time of acquisition generally use amortized cost in local currency to approximate fair value. However, if amortized cost is deemed not to reflect fair value or the fund holds a significant amount of such securities with remaining maturities of more than 60 days, the securities are valued at prices furnished by dealers who make markets in such securities or by an independent pricing service.
Investments in mutual funds are valued at the mutual fund’s closing net asset value per share on the day of valuation.
Other investments, including restricted securities, and those financial instruments for which the above valuation procedures are inappropriate or are deemed not to reflect fair value are stated at fair value as determined in good faith by the T. Rowe Price Valuation Committee, established by the fund’s Board of Directors.
For valuation purposes, the last quoted prices of non-U.S. equity securities may be adjusted under the circumstances described below. If the fund determines that developments between the close of a foreign market and the close of the NYSE will, in its judgment, materially affect the value of some or all of its portfolio securities, the fund will adjust the previous closing prices to reflect what it believes to be the fair value of the securities as of the close of the NYSE. In deciding whether it is necessary to adjust closing prices to reflect fair value, the fund reviews a variety of factors, including developments in foreign markets, the performance of U.S. securities markets, and the performance of instruments trading in U.S. markets that represent foreign securities and baskets of foreign securities. A fund may also fair value securities in other situations, such as when a particular foreign market is closed but the fund is open. The fund uses outside pricing services to provide it with closing prices and information to evaluate and/or adjust those prices. The fund cannot predict how often it will use closing prices and how often it will determine it necessary to adjust those prices to reflect fair value. As a means of evaluating its security valuation process, the fund routinely compares closing prices, the next day’s opening prices in the same markets, and adjusted prices.
Valuation Inputs Various inputs are used to determine the value of the fund’s financial instruments. These inputs are summarized in the three broad levels listed below:
Level 1 – quoted prices in active markets for identical financial instruments
Level 2 – observable inputs other than Level 1 quoted prices (including, but not limited to, quoted prices for similar financial instruments, interest rates, prepayment speeds, and credit risk)
Level 3 – unobservable inputs
Observable inputs are those based on market data obtained from sources independent of the fund, and unobservable inputs reflect the fund’s own assumptions based on the best information available. The input levels are not necessarily an indication of the risk or liquidity associated with financial instruments at that level. For example, non-U.S. equity securities actively traded in foreign markets generally are reflected in Level 2 despite the availability of closing prices because the fund evaluates and determines whether those closing prices reflect fair value at the close of the NYSE or require adjustment, as described above. The following table summarizes the fund’s financial instruments, based on the inputs used to determine their values on June 30, 2011:

NOTE 3 - OTHER INVESTMENT TRANSACTIONS
Consistent with its investment objective, the fund engages in the following practices to manage exposure to certain risks and/or to enhance performance. The investment objective, policies, program, and risk factors of the fund are described more fully in the fund’s prospectus and Statement of Additional Information.
Restricted Securities The fund may invest in securities that are subject to legal or contractual restrictions on resale. Prompt sale of such securities at an acceptable price may be difficult and may involve substantial delays and additional costs.
American and Global Depository Receipts The fund may invest in American Depository Receipts (ADRs) and/or Global Depository Receipts (GDRs), certificates issued by U.S. and international banks that represent ownership of foreign securities held by the issuing bank. ADRs and GDRs are transferable, trade on established markets, and entitle the holder to all dividends and capital gains paid by the underlying foreign security. Issuing banks generally charge a security administration fee. Such fees are included in custody and accounting expense in the accompanying Statement of Operations; there were no such fees for the six months ended June 30, 2011.
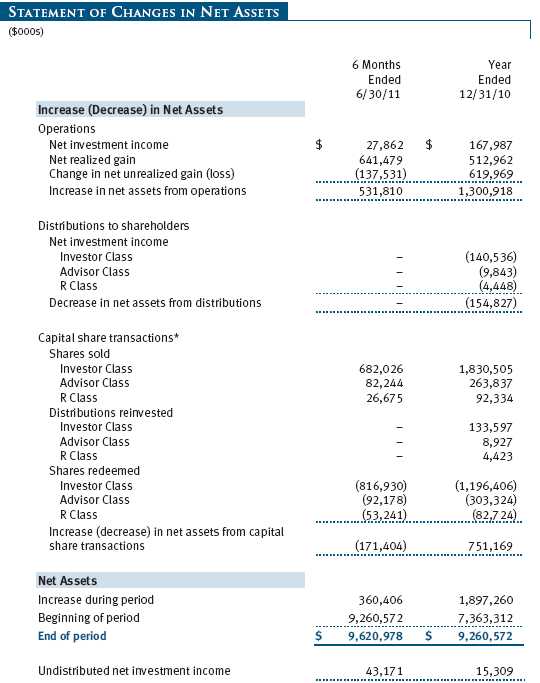
Other Purchases and sales of portfolio securities other than short-term securities aggregated $2,284,010,000 and $2,219,733,000, respectively, for the six months ended June 30, 2011.
NOTE 4 - FEDERAL INCOME TAXES
No provision for federal income taxes is required since the fund intends to continue to qualify as a regulated investment company under Subchapter M of the Internal Revenue Code and distribute to shareholders all of its taxable income and gains. Distributions determined in accordance with federal income tax regulations may differ in amount or character from net investment income and realized gains for financial reporting purposes. Financial reporting records are adjusted for permanent book/tax differences to reflect tax character but are not adjusted for temporary differences. The amount and character of tax-basis distributions and composition of net assets are finalized at fiscal year-end; accordingly, tax-basis balances have not been determined as of the date of this report.
In accordance with federal tax regulations, the fund recognized capital losses in the current period for tax purposes that had been recognized in the prior fiscal year for financial reporting purposes. Such deferrals relate to net capital losses realized between November 1, 2010 and December 31, 2010, and totaled $1,768,000. The fund intends to retain realized gains to the extent of available capital loss carryforwards. As of December 31, 2010, the fund had $650,233,000 of unused capital loss carryforwards, which all expire in 2017.
At June 30, 2011, the cost of investments for federal income tax purposes was $8,081,439,000. Net unrealized gain aggregated $1,527,817,000 at period-end, of which $1,808,272,000 related to appreciated investments and $280,450,000 related to depreciated investments.
NOTE 5 - RELATED PARTY TRANSACTIONS
The fund is managed by T. Rowe Price Associates, Inc. (Price Associates), a wholly owned subsidiary of T. Rowe Price Group, Inc. (Price Group). The investment management agreement between the fund and Price Associates provides for an annual investment management fee, which is computed daily and paid monthly. The fee consists of an individual fund fee, equal to 0.35% of the fund’s average daily net assets, and a group fee. The group fee rate is calculated based on the combined net assets of certain mutual funds sponsored by Price Associates (the group) applied to a graduated fee schedule, with rates ranging from 0.48% for the first $1 billion of assets to 0.28% for assets in excess of $300 billion. The fund’s group fee is determined by applying the group fee rate to the fund’s average daily net assets. At June 30, 2011, the effective annual group fee rate was 0.30%.
In addition, the fund has entered into service agreements with Price Associates and two wholly owned subsidiaries of Price Associates (collectively, Price). Price Associates computes the daily share prices and provides certain other administrative services to the fund. T. Rowe Price Services, Inc., provides shareholder and administrative services in its capacity as the fund’s transfer and dividend disbursing agent. T. Rowe Price Retirement Plan Services, Inc., provides subaccounting and recordkeeping services for certain retirement accounts invested in the Investor Class and R Class. For the six months ended June 30, 2011, expenses incurred pursuant to these service agreements were $62,000 for Price Associates; $1,003,000 for T. Rowe Price Services, Inc.; and $823,000 for T. Rowe Price Retirement Plan Services, Inc. The total amount payable at period-end pursuant to these service agreements is reflected as Due to Affiliates in the accompanying financial statements.
Additionally, the fund is one of several mutual funds in which certain college savings plans managed by Price Associates may invest. As approved by the fund’s Board of Directors, shareholder servicing costs associated with each college savings plan are borne by the fund in proportion to the average daily value of its shares owned by the college savings plan. For the six months ended June 30, 2011, the fund was charged $220,000 for shareholder servicing costs related to the college savings plans, of which $162,000 was for services provided by Price. The amount payable at period-end pursuant to this agreement is reflected as Due to Affiliates in the accompanying financial statements. At June 30, 2011, approximately 3% of the outstanding shares of the Investor Class were held by college savings plans.
The fund is also one of several mutual funds sponsored by Price Associates (underlying Price funds) in which the T. Rowe Price Spectrum Funds (Spectrum Funds) and T. Rowe Price Retirement Funds (Retirement Funds) may invest. Neither the Spectrum Funds nor the Retirement Funds invest in the underlying Price funds for the purpose of exercising management or control. Pursuant to separate special servicing agreements, expenses associated with the operation of the Spectrum and Retirement Funds are borne by each underlying Price fund to the extent of estimated savings to it and in proportion to the average daily value of its shares owned by the Spectrum and Retirement Funds, respectively. Expenses allocated under these agreements are reflected as shareholder servicing expenses in the accompanying financial statements. For the six months ended June 30, 2011, the fund was allocated $88,000 of Spectrum Funds’ expenses and $1,992,000 of Retirement Funds’ expenses. Of these amounts, $1,200,000 related to services provided by Price. The amount payable at period-end pursuant to this agreement is reflected as Due to Affiliates in the accompanying financial statements. At June 30, 2011, approximately 1% of the outstanding shares of the Investor Class were held by the Spectrum Funds and 24% were held by the Retirement Funds.
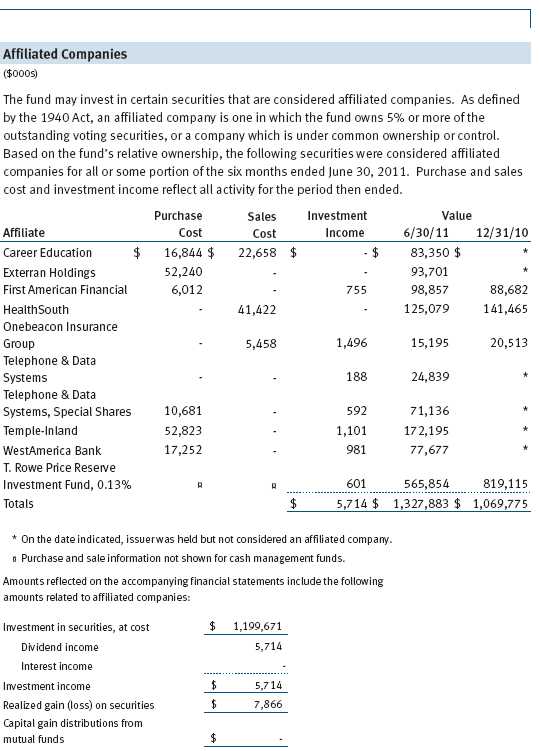
The fund may invest in the T. Rowe Price Reserve Investment Fund and the T. Rowe Price Government Reserve Investment Fund (collectively, the T. Rowe Price Reserve Investment Funds), open-end management investment companies managed by Price Associates and considered affiliates of the fund. The T. Rowe Price Reserve Investment Funds are offered as cash management options to mutual funds, trusts, and other accounts managed by Price Associates and/or its affiliates and are not available for direct purchase by members of the public. The T. Rowe Price Reserve Investment Funds pay no investment management fees.
NOTE 6 - LITIGATION
The fund expects to be included as a named defendant or in a class of defendants in a lawsuit that the Unsecured Creditors Committee (the Committee) of the Tribune Company has filed in Delaware bankruptcy court. The Committee is seeking to recover all payments made to beneficial owners of common stock in connection with a leveraged buyout of Tribune, including those made in connection with a 2007 tender offer in which the fund participated. The fund also expects to be included as a named defendant or in a class of defendants in parallel litigation asserting state law constructive fraudulent transfer claims to recover stock redemption payments made to shareholders. The complaints allege no misconduct by the fund and management intends to vigorously defend the lawsuits. The value of the proceeds received by the fund is $70,070,000 (0.73% of net assets) and the fund will incur legal expenses. Management is currently assessing the case and has not yet determined the effect, if any, on the fund’s net assets and results of operations.
| INFORMATION ON PROXY VOTING POLICIES, PROCEDURES, AND RECORDS |
A description of the policies and procedures used by T. Rowe Price funds and portfolios to determine how to vote proxies relating to portfolio securities is available in each fund’s Statement of Additional Information, which you may request by calling 1-800-225-5132 or by accessing the SEC’s website, sec.gov. The description of our proxy voting policies and procedures is also available on our website, troweprice.com. To access it, click on the words “Our Company” at the top of our corporate homepage. Then, when the next page appears, click on the words “Proxy Voting Policies” on the left side of the page.
Each fund’s most recent annual proxy voting record is available on our website and through the SEC’s website. To access it through our website, follow the directions above, then click on the words “Proxy Voting Records” on the right side of the Proxy Voting Policies page.
| HOW TO OBTAIN QUARTERLY PORTFOLIO HOLDINGS |
The fund files a complete schedule of portfolio holdings with the Securities and Exchange Commission for the first and third quarters of each fiscal year on Form N-Q. The fund’s Form N-Q is available electronically on the SEC’s website (sec.gov); hard copies may be reviewed and copied at the SEC’s Public Reference Room, 450 Fifth St. N.W., Washington, DC 20549. For more information on the Public Reference Room, call 1-800-SEC-0330.
| APPROVAL OF INVESTMENT MANAGEMENT AGREEMENT |
On March 9, 2011, the fund’s Board of Directors (Board) unanimously approved the continuation of the investment advisory contract (Contract) between the fund and its investment advisor, T. Rowe Price Associates, Inc. (Advisor). The Board considered a variety of factors in connection with its review of the Contract, also taking into account information provided by the Advisor during the course of the year, as discussed below:
Services Provided by the Advisor
The Board considered the nature, quality, and extent of the services provided to the fund by the Advisor. These services included, but were not limited to, management of the fund’s portfolio and a variety of related activities, as well as financial and administrative services, reporting, and communications. The Board also reviewed the background and experience of the Advisor’s senior management team and investment personnel involved in the management of the fund. The Board concluded that it was satisfied with the nature, quality, and extent of the services provided by the Advisor.
Investment Performance of the Fund
The Board reviewed the fund’s average annual total returns over the 1-, 3-, 5-, and 10-year periods, as well as the fund’s year-by-year returns, and compared these returns with a wide variety of previously agreed upon comparable performance measures and market data, including those supplied by Lipper and Morningstar, which are independent providers of mutual fund data. On the basis of this evaluation and the Board’s ongoing review of investment results, and factoring in the relative market conditions during certain of the performance periods, the Board concluded that the fund’s performance was satisfactory.
Costs, Benefits, Profits, and Economies of Scale
The Board reviewed detailed information regarding the revenues received by the Advisor under the Contract and other benefits that the Advisor (and its affiliates) may have realized from its relationship with the fund, including research received under “soft dollar” agreements and commission-sharing arrangements with broker-dealers. The Board considered that the Advisor may receive some benefit from soft-dollar arrangements pursuant to which research is received from broker-dealers that execute the applicable fund’s portfolio transactions. The Board also received information on the estimated costs incurred and profits realized by the Advisor and its affiliates from advising T. Rowe Price mutual funds, as well as estimates of the gross profits realized from managing the fund in particular. The Board concluded that the Advisor’s profits were reasonable in light of the services provided to the fund. The Board also considered whether the fund or other funds benefit under the fee levels set forth in the Contract from any economies of scale realized by the Advisor. Under the Contract, the fund pays a fee to the Advisor composed of two components—a group fee rate based on the aggregate assets of certain T. Rowe Price mutual funds (including the fund) that declines at certain asset levels and an individual fund fee rate that is assessed on the assets of the fund. The Board determined that it would be appropriate to introduce another breakpoint into the group fee rate, effective May 1, 2011, to allow fund shareholders to participate in additional economies of scale. The Board concluded that the advisory fee structure for the fund continued to provide for a reasonable sharing of benefits from any economies of scale with the fund’s investors.
Fees
The Board reviewed the fund’s management fee rate, operating expenses, and total expense ratio (for the Investor Class, Advisor Class, and R Class) and compared them with fees and expenses of other comparable funds based on information and data supplied by Lipper. The information provided to the Board indicated that the fund’s management fee rate was above the median for certain groups of comparable funds but at or below the median for other groups of comparable funds. The information also indicated that the total expense ratio for the Investor Class was above the median for certain groups of comparable funds but below the median for other groups of comparable funds, the total expense ratio for the Advisor Class was below the median for comparable funds, and the total expense ratio for the R Class was above the median for comparable funds. The Board also reviewed the fee schedules for institutional accounts of the Advisor and its affiliates with similar mandates. Management provided the Board with information about the Advisor’s responsibilities and services provided to institutional account clients, which are more limited than its responsibilities for the fund and other T. Rowe Price mutual funds that it advises, and showing that the Advisor performs significant additional services and assumes greater risk for the fund and other T. Rowe Price mutual funds that it advises than it does for institutional account clients. On the basis of the information provided, the Board concluded that the fees paid by the fund under the Contract were reasonable.
Approval of the Contract
As noted, the Board approved the continuation of the Contract. No single factor was considered in isolation or to be determinative to the decision. Rather, the Board was assisted by the advice of independent legal counsel and concluded, in light of a weighting and balancing of all factors considered, that it was in the best interests of the fund to approve the continuation of the Contract (including the fees to be charged for services thereunder).
Item 2. Code of Ethics.
A code of ethics, as defined in Item 2 of Form N-CSR, applicable to its principal executive officer, principal financial officer, principal accounting officer or controller, or persons performing similar functions is filed as an exhibit to the registrant’s annual Form N-CSR. No substantive amendments were approved or waivers were granted to this code of ethics during the registrant’s most recent fiscal half-year.
Item 3. Audit Committee Financial Expert.
Disclosure required in registrant’s annual Form N-CSR.
Item 4. Principal Accountant Fees and Services.
Disclosure required in registrant’s annual Form N-CSR.
Item 5. Audit Committee of Listed Registrants.
Not applicable.
Item 6. Investments.
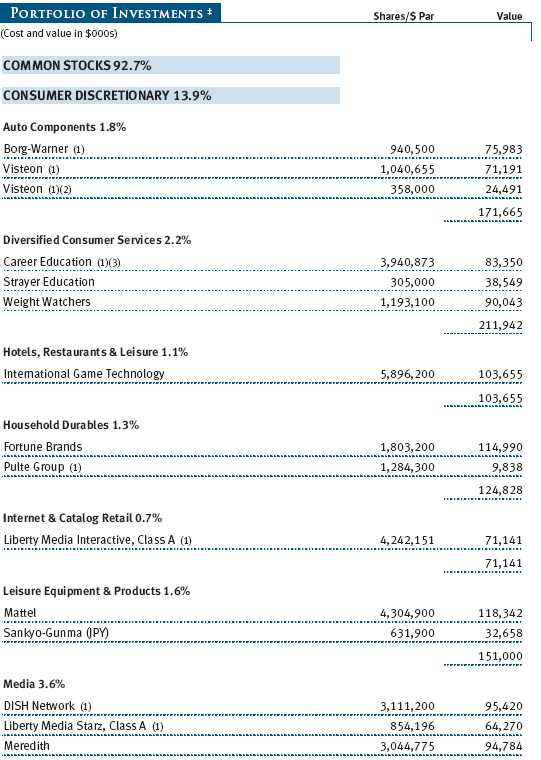
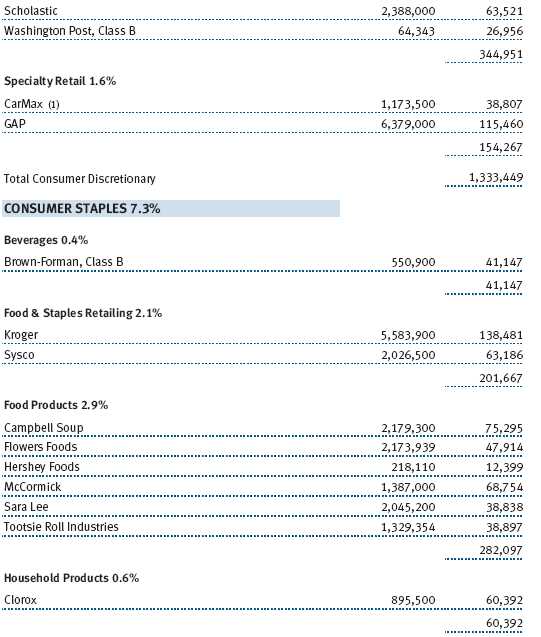
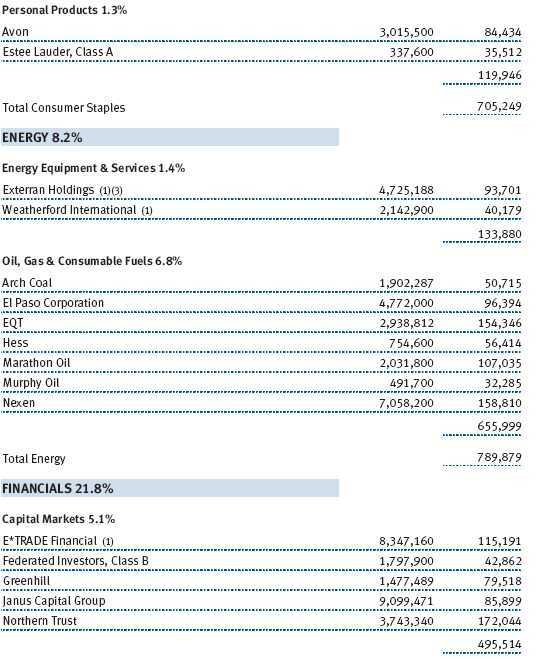
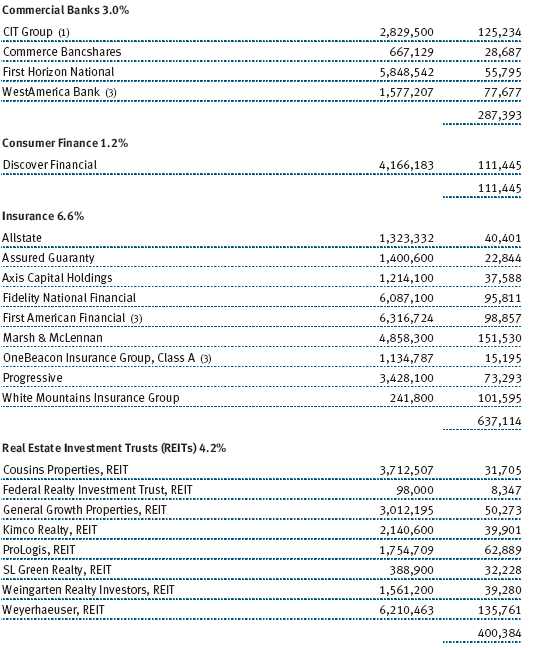
(a) Not applicable. The complete schedule of investments is included in Item 1 of this Form N-CSR.
(b) Not applicable.
Item 7. Disclosure of Proxy Voting Policies and Procedures for Closed-End Management Investment Companies.
Not applicable.
Item 8. Portfolio Managers of Closed-End Management Investment Companies.
Not applicable.
Item 9. Purchases of Equity Securities by Closed-End Management Investment Company and Affiliated Purchasers.
Not applicable.
Item 10. Submission of Matters to a Vote of Security Holders.
Not applicable.
Item 11. Controls and Procedures.
(a) The registrant’s principal executive officer and principal financial officer have evaluated the registrant’s disclosure controls and procedures within 90 days of this filing and have concluded that the registrant’s disclosure controls and procedures were effective, as of that date, in ensuring that information required to be disclosed by the registrant in this Form N-CSR was recorded, processed, summarized, and reported timely.
(b) The registrant’s principal executive officer and principal financial officer are aware of no change in the registrant’s internal control over financial reporting that occurred during the registrant’s second fiscal quarter covered by this report that has materially affected, or is reasonably likely to materially affect, the registrant’s internal control over financial reporting.
Item 12. Exhibits.
(a)(1) The registrant’s code of ethics pursuant to Item 2 of Form N-CSR is filed with the registrant’s annual Form N-CSR.
(2) Separate certifications by the registrant's principal executive officer and principal financial officer, pursuant to Section 302 of the Sarbanes-Oxley Act of 2002 and required by Rule 30a-2(a) under the Investment Company Act of 1940, are attached.
(3) Written solicitation to repurchase securities issued by closed-end companies: not applicable.
(b) A certification by the registrant's principal executive officer and principal financial officer, pursuant to Section 906 of the Sarbanes-Oxley Act of 2002 and required by Rule 30a-2(b) under the Investment Company Act of 1940, is attached.
| | |
SIGNATURES |
| |
| | Pursuant to the requirements of the Securities Exchange Act of 1934 and the Investment |
| Company Act of 1940, the registrant has duly caused this report to be signed on its behalf by the |
| undersigned, thereunto duly authorized. |
| |
| T. Rowe Price Mid-Cap Value Fund, Inc. |
| |
| |
| |
| By | /s/ Edward C. Bernard |
| | Edward C. Bernard |
| | Principal Executive Officer |
| |
| Date | August 17, 2011 |
| |
| |
| |
| | Pursuant to the requirements of the Securities Exchange Act of 1934 and the Investment |
| Company Act of 1940, this report has been signed below by the following persons on behalf of |
| the registrant and in the capacities and on the dates indicated. |
| |
| |
| By | /s/ Edward C. Bernard |
| | Edward C. Bernard |
| | Principal Executive Officer |
| |
| Date | August 17, 2011 |
| |
| |
| |
| By | /s/ Gregory K. Hinkle |
| | Gregory K. Hinkle |
| | Principal Financial Officer |
| |
| Date | August 17, 2011 |