![](https://capedge.com/proxy/10-K/0000946275-17-000012/image00008.jpg)
![](https://capedge.com/proxy/10-K/0000946275-17-000012/image00009.jpg)
![](https://capedge.com/proxy/10-K/0000946275-17-000012/image00025.jpg)
![](https://capedge.com/proxy/10-K/0000946275-17-000012/image00026.jpg)
![](https://capedge.com/proxy/10-K/0000946275-17-000012/image00012.jpg)
![](https://capedge.com/proxy/10-K/0000946275-17-000012/image00013.jpg)
![](https://capedge.com/proxy/10-K/0000946275-17-000012/image00014.jpg)
![](https://capedge.com/proxy/10-K/0000946275-17-000012/image00015.jpg)
![](https://capedge.com/proxy/10-K/0000946275-17-000012/image00007.jpg)
2016 CONSOLIDATED FINANCIAL REPORT | |
MANAGEMENT'S DISCUSSION & ANALYSIS | 8 |
MANAGEMENT'S REPORT ON INTERNAL CONTROL OVER FINANCIAL REPORTING | 27 |
REPORTS OF INDEPENDENT REGISTERED PUBLIC ACCOUNTING FIRM | 28 |
CONSOLIDATED BALANCE SHEETS | 30 |
CONSOLIDATED STATEMENTS OF INCOME | 31 |
CONSOLIDATED STATEMENTS OF COMPREHENSIVE INCOME | 32 |
CONSOLIDATED STATEMENTS OF STOCKHOLDERS' EQUITY | 33 |
CONSOLIDATED STATEMENTS OF CASH FLOWS | 34 |
NOTES TO CONSOLIDATED FINANCIAL STATEMENTS | 36 |
INVESTOR INFORMATION | 81 |
NORWOOD FINANCIAL CORP - 2016 CONSOLIDATED FINANCIAL REPORT
MANAGEMENT'S DISCUSSION AND ANALYSIS
Introduction
This Management's Discussion and Analysis and related financial data are presented to assist in the understanding and evaluation of the financial condition and results of operations for Norwood Financial Corp (the Company), and its subsidiary Wayne Bank (the Bank), as of December 31, 2016 and 2015, and for the years ended December 31, 2016, 2015, and 2014. This section should be read in conjunction with the consolidated financial statements and related footnotes.
Forward-Looking Statements
The Private Securities Litigation Reform Act of 1995 contains safe harbor provisions regarding forward-looking statements. When used in this discussion, the words believes, anticipates, contemplates, expects, and similar expressions are intended to identify forward-looking statements. Such statements are subject to certain risks and uncertainties, which could cause actual results to differ materially from those projected. Those risks and uncertainties include changes in Federal and State laws, changes in interest rates, risks associated with the acquisition of Delaware Bancshares, Inc., the ability to control costs and expenses, demand for real estate, government fiscal policies, cybersecurity and general economic conditions. The Company undertakes no obligation to publicly release the results of any revisions to those forward-looking statements which may be made to reflect events or circumstances after the date hereof or to reflect the occurrence of unanticipated events.
Critical Accounting Policies
Note 2 to the Company's consolidated financial statements (incorporated by reference in Item 8 of the Form 10-K) lists significant accounting policies used in the development and presentation of its financial statements. This discussion and analysis, the significant accounting policies, and other financial statement disclosures identify and address key variables and other qualitative and quantitative factors that are necessary for an understanding and evaluation of the Company and its results of operations.
Material estimates that are particularly susceptible to significant change in the near term relate to the determination of the allowance for loan losses, the valuation of deferred tax assets, the determination of other-than-temporary impairment on securities, the determination of goodwill impairment and the fair value of financial instruments. Please refer to the discussion of the allowance for loan losses calculation under "Allowance for Loan Losses and Non-performing Assets" in the "Financial Condition" section.
The deferred income taxes reflect temporary differences in the recognition of the revenue and expenses for tax reporting and financial statement purposes, principally because certain items are recognized in different periods for financial reporting and tax return purposes. Although realization is not assured, the Company believes it is more likely than not that all deferred tax assets will be realized.
In estimating other-than-temporary impairment losses on securities, the Company considers 1) the length of time and extent to which the fair value has been less than cost and 2) the financial condition of the issuer. The Company does not have the intent to sell these securities and it is more likely than not that it will not sell the securities before recovery of their cost basis. The Company believes that any unrealized losses at December 31, 2016 and 2015 represent temporary impairment of the securities.
The fair value of financial instruments is based upon quoted market prices, when available. For those instances where a quoted price is not available, fair values are based upon observable market based parameters as well as unobservable parameters. Any such valuation is applied consistently over time.
8
NORWOOD FINANCIAL CORP - 2016 CONSOLIDATED FINANCIAL REPORT
In connection with the acquisition of North Penn Bancorp, Inc. in 2011, we recorded goodwill in the amount of $9.7 million, representing the excess of amounts paid over the fair value of the net assets of the institution acquired at the date of acquisition. In connection with the acquisition of Delaware Bancshares, Inc. in 2016, we recorded goodwill in the amount of $1.6 million, representing the excess of amounts paid over the fair value of the net assets of the institution acquired at the date of acquisition. Goodwill is tested annually and deemed impaired when the carrying value of goodwill exceeds its implied fair value.
Results of Operations – Summary
Net income for the Company for the year ended December 31, 2016 was $6,711,000 which was $803,000 higher than the $5,908,000 earned in 2015. Basic and diluted earnings per share were $1.74 and $1.73, respectively, in 2016 compared to $1.60 per share for basic and diluted in 2015. The return on average assets (ROA) for the year ended December 31, 2016 was 0.74% and the return on average equity (ROE) was 6.17% compared to an ROA of 0.80% and an ROE of 5.83% in the prior year. The improvement in earnings over the prior year was the result of the benefits realized from the acquisition of Delaware Bancshares, Inc. ("Delaware") on July 31, 2016. Net interest income increased $4,069,000 and the provision for loan losses decreased $2,530,000 in 2016 which offset increased expenses related to the acquisition, including $1,806,000 of one-time merger costs.
Net interest income (fully taxable equivalent, or fte) totaled $30,339,000 which was an increase of $4,457,000 from the 2015 total. Average loans outstanding increased $96.9 million in 2016 which resulted in an increase in fte interest income of $4,476,000, while an 11 basis point decrease in the yield earned impacted earnings negatively by $672,000. The reduced yield was due to loan production at current market rates. Average loan balances and loan yields were also impacted by the $112.1 million of loans acquired from Delaware. Total average securities increased $55.6 million in 2016 due primarily to the Delaware acquisition which contributed to a $1,023,000 increase in fte interest income. Average interest-bearing deposits with banks were $8.2 million in 2016 and interest income in this area increased $26,000. Average interest-bearing deposits increased $106.5 million due to the acquisition and resulted in a $182,000 increase in interest expense. The cost of borrowed funds increased $214,000 compared to the prior year due primarily to a $7.8 million increase in average long-term borrowings. The resulting fte net interest margin decreased 15 basis points to 3.60% in 2016 as a 20 basis point reduction in the yield earned was only partially offset by a 5 basis point decrease in the cost of funds.
Loans receivable increased $154.0 million from the prior year-end due primarily to the $112.1 million of loans acquired from Delaware. Organic growth included a $22.8 million increase in commercial loans due primarily to an $18.6 million increase in commercial real estate loans. Residential mortgage loans and construction loans increased $5.4 million internally after the sale of $1.7 million in fixed-rate residential mortgage loans for the purpose of interest rate risk management. Consumer loans increased $13.7 million internally in 2016 due to a $16.5 million increase in indirect auto and marine financing. Total non-performing loans decreased from $7.1 million and 1.27% of total loans at the end of 2015 to $1.8 million, or 0.25% of total loans on December 31, 2016. The significant decrease includes the transfer of one loan relationship with a balance of $5,015,000 on December 31, 2015 to foreclosed real estate owned in 2016. Net charge-offs totaled $2,885,000 in 2016 which was a decrease from the $3,157,000 recorded in 2015. Based on management's analysis, the Company determined that it would be appropriate to allocate $2,050,000 to the allowance for loan losses in 2016 which resulted in a decrease in the ratio of the allowance for loan losses to total loans outstanding to 0.91% compared to 1.30% on December 31, 2015. The decrease in the ratio of the allowance for loan losses to total loans outstanding reflects the impact of the loans acquired from Delaware with no allowance. Based on the improvement in credit quality, the allowance for loan losses represented 336% of total non-performing loans on December 31, 2016 compared to 102% as of December 31, 2015.
9
NORWOOD FINANCIAL CORP - 2016 CONSOLIDATED FINANCIAL REPORT
Other income for the year ended December 31, 2016 totaled $5,179,000 compared to $4,699,000 in the prior year, an increase of $480,000. Gains on the sale of loans and investment securities decreased $392,000 in the aggregate, while all other items of other income increased $872,000, net. Service charges and fees collected from the expanded customer base contributed to this increase.
Other expenses were $23,124,000 in 2016 compared to $17,100,000 for the similar period in 2015, an increase of $6,024,000. Salaries and benefits costs increased $2,393,000 in 2016 while occupancy and furniture and equipment costs increased $543,000 and all other operating expenses increased $3,088,000, net, due to costs related to the acquisition and the operation of twelve new community offices. Included in the increased expenses are $1.8 million of one-time merger related expenses. Income tax expense for the year totaled $1,884,000 which was an increase of $252,000 from the prior year. The effective tax rate in 2016 was 21.9% compared to 21.6% in 2015.
The following table sets forth changes in net income (in thousands):
Net income 2015 | $ | 5,908 | ||
Net interest income | 4,069 | |||
Provision for loan losses | 2,530 | |||
Net gains on sales of loans and securities | (392 | ) | ||
Other income | 872 | |||
Salaries and employee benefits | (2,393 | ) | ||
Occupancy, furniture and equipment | (543 | ) | ||
Foreclosed real estate owned | 231 | |||
Merger related | (1,806 | ) | ||
Other expenses | (1,513 | ) | ||
Income tax expense | (252 | ) | ||
Net income for 2016 | $ | 6,711 |
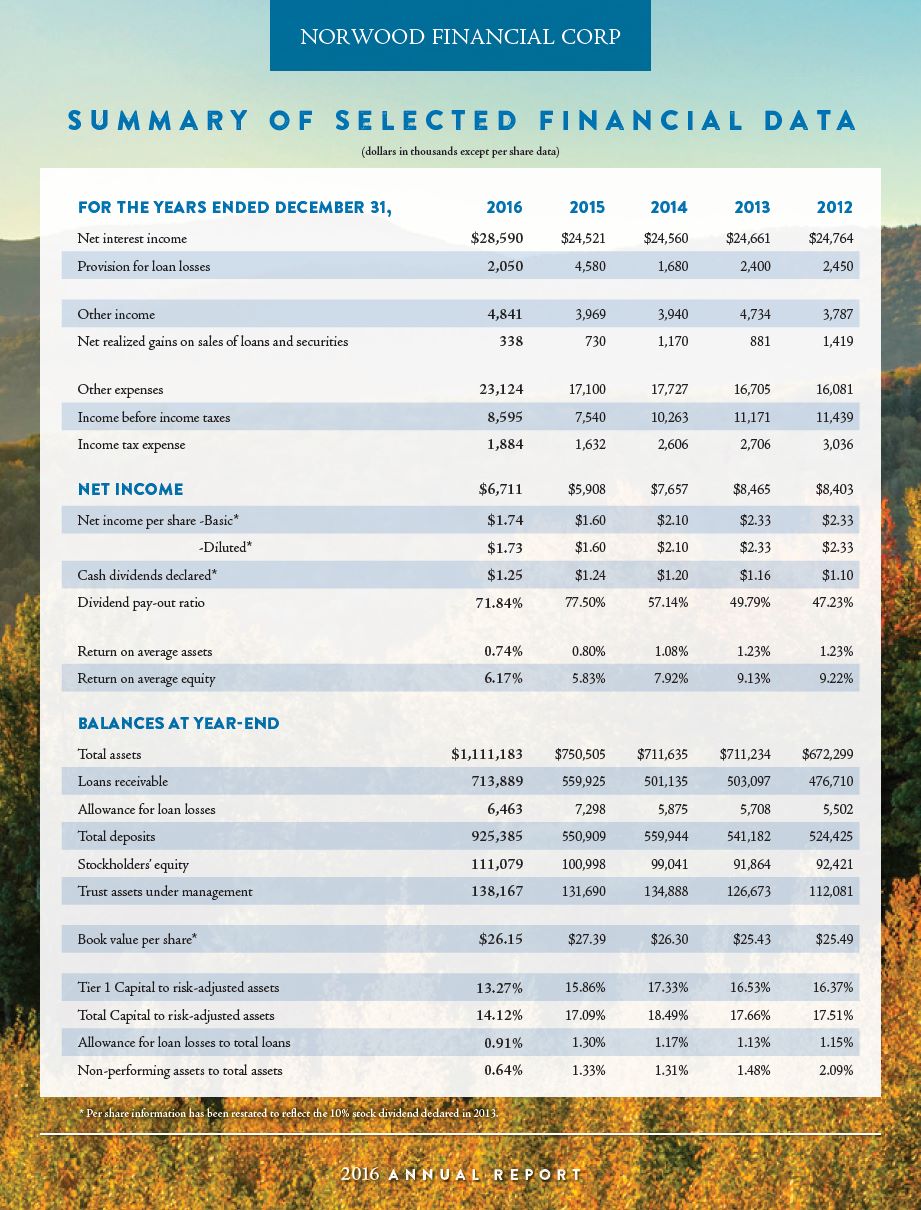
Net income for the year ended December 31, 2015 was $5,908,000 which was $1,749,000 lower than the $7,657,000 earned in 2014. Basic and diluted earnings per share were $1.60 in 2015 compared to $2.10 per share in 2014. The return on average assets (ROA) for the year ended December 31, 2015 was 0.80% and the return on average equity (ROE) was 5.83% compared to an ROA of 1.08% and an ROE of 7.92% in the prior year. The reduction in earnings from the prior year was the result of increased provision for loan losses and a decrease in net gains recognized on the sale of loans and securities which was partially offset by a decrease in expenses related to foreclosed properties.
Net interest income (fte) totaled $25,882,000 which was an increase of $64,000 from the 2014 total. Average loans outstanding increased $29.0 million in 2015 but a 21 basis point decrease in the yield earned limited the increase in fte interest income to $288,000. The reduced yield was due to loan production at current market rates. Total average securities decreased $4.9 million in 2015 which contributed to a $178,000 decrease in fte interest income. Average interest-bearing deposits with banks were $3.5 million higher in 2015 and interest income in this area increased $9,000. Growth of the funding base led to a $50,000 increase in interest expense. A 2 basis point reduction in the cost of interest-bearing deposits lead to reduced interest expense on deposits of $42,000 despite a $19.1 million increase in average total deposits. The cost of borrowed funds increased $92,000 compared to the prior year due primarily to a $5.8 million increase in average long-term borrowings. The resulting fte net interest margin decreased 15 basis points to 3.75% in 2015 as a 16 basis point reduction in the yield earned was only partially offset by a 1 basis point decrease in the cost of funds.
10
NORWOOD FINANCIAL CORP - 2016 CONSOLIDATED FINANCIAL REPORT
Loans receivable increased $58.8 million from the prior year-end due primarily to a $28.6 million increase in commercial loans which includes a $21.3 million increase in municipal financing. Commercial real estate loans also increased $17.2 million in 2015. Residential mortgage loans and construction loans increased $3.4 million, net, after the sale of $4.3 million of fixed-rate residential mortgage loans for the purpose of interest rate risk management. Consumer loans increased $9.5 million in 2015 due primarily to a $9.2 million increase in indirect auto and marine financing. Total non-performing loans increased from $5.6 million and 1.12% of total loans at the end of 2014 to $7.1 million, or 1.27% of total loans on December 31, 2015. Net charge-offs totaled $3,157,000 in 2015 which was an increase from the $1,513,000 recorded in 2014. Based on the level of charge-offs and non-performing loans, the Company determined that it would be appropriate to allocate $4,580,000 to the allowance for loan losses to reserve for potential future losses which resulted in an increase in the ratio of the allowance for loan losses to total loans outstanding to 1.30% compared to 1.17% on December 31, 2014.
Other income for the year ended December 31, 2015 totaled $4,699,000 compared to $5,110,000 in the prior year, a decrease of $411,000. Gains on the sale of loans and investment securities decreased $572,000 in the aggregate, while all other items of other income increased $161,000, net.
Other expenses were $17,100,000 in 2015 compared to $17,727,000 for the similar period in 2014, a decrease of $627,000. Salaries and benefits costs decreased $81,000 in 2015 due primarily to reduced incentive compensation. Occupancy and furniture and equipment costs decreased $35,000. Foreclosed real estate costs decreased $644,000 from the prior period. All other operating expenses increased $133,000, net. Income tax expense for the year totaled $1,632,000 which was a decrease of $974,000 from the prior year. The effective tax rate in 2015 was 21.6% compared to 25.4% in 2014 due primarily to a higher proportion of tax-exempt income.
The following table sets forth changes in net income (in thousands):
Net income 2014 | $ | 7,657 | ||
Net interest income | (39 | ) | ||
Provision for loan losses | (2,900 | ) | ||
Net gains on sales of loans and securities | (572 | ) | ||
Other income | 161 | |||
Salaries and employee benefits | 81 | |||
Occupancy, furniture and equipment | 35 | |||
Foreclosed real estate owned | 644 | |||
Other expenses | (133 | ) | ||
Income tax expense | 974 | |||
Net income for 2015 | $ | 5,908 | ||
11
NORWOOD FINANCIAL CORP - 2016 CONSOLIDATED FINANCIAL REPORT
FINANCIAL CONDITION
Total Assets
Total assets as of December 31, 2016, were $1.1 billion compared to $750.5 million as of year-end 2015, an increase of $360.6 million. Growth related to the acquisition of Delaware Bancshares was $368.6 million.
Loans Receivable
As of December 31, 2016, loans receivable totaled $713.9 million compared to $559.9 million as of year-end 2015, an increase of $154.0 million. Growth related to the acquisition totaled $112.1 million. Commercial loans grew $55.5 million, while retail loans increased $98.5 million during the year.
Residential real estate loans, which include home equity lending, totaled $237.2 million as of December 31, 2016, compared to $161.8 million as of year-end 2015, an increase of $75.4 million. The Company does not originate any non-traditional mortgage products such as interest-only loans or option adjustable rate mortgages and has no sub-prime mortgage exposure. The Company evaluates sales of its long-term, fixed-rate residential loan production for interest rate risk management, with $1.7 million of long-term, fixed-rate loans sold into the secondary market during 2016. In the current interest rate environment, the Company expects to continue selling mortgage loans in 2017. The Company's home equity loan portfolio, which is included in residential real estate loans, increased $9.1 million in 2016.
Commercial loans consist principally of loans made to small businesses within the Company's market and are usually secured by real estate or other assets of the borrower. Commercial real estate loans totaled $320.2 million as of December 31, 2016, increasing from $279.1 million as of December 31, 2015. The terms for commercial real estate loans are typically 15 to 20 years, with adjustable rates based on a spread to the prime rate or fixed for the initial three to five year period then adjusting to a spread to the prime rate. The majority of the Company's commercial real estate portfolio is owner occupied and includes the personal guarantees of the principals. Commercial loans consisting principally of lines of credit and term loans secured by equipment or other assets increased $14.4 million to $85.5 million as of December 31, 2016.
The Company's indirect lending portfolio (included in consumer loans to individuals) increased $17.9 million to $41.5 million as of December 31, 2016.
Allowance for Loan Losses and Non-Performing Assets
The allowance for loan losses totaled $6,463,000 as of December 31, 2016 and represented 0.91% of total loans receivable compared to $7,298,000 and 1.30% of total loans as of year-end 2015. The decrease in the ratio of the allowance for loan losses to total loans outstanding reflects the impact of the loans acquired from Delaware with no allowance. Net charge-offs for 2016 totaled $2,885,000 and represented 0.46% of average loans compared to $3,157,000 and 0.60% of average loans in 2015.
Non-performing assets consist of non-performing loans and real estate owned as a result of foreclosure, which is held for sale. Loans are placed on non-accrual status when management believes that a borrower's financial condition is such that collection of interest is doubtful. Commercial and real estate related loans are generally placed on non-accrual when interest is 90 days delinquent. When loans are placed on non-accrual, accrued interest is reversed from current earnings.
12
NORWOOD FINANCIAL CORP - 2016 CONSOLIDATED FINANCIAL REPORT
As of December 31, 2016, non-performing loans totaled $1,927,000 and represented 0.25% of total loans compared to $7,132,000 or 1.27% as of December 31, 2015. The significant decrease in the level of non-performing loans is due to the transfer of one loan relationship with a balance of $5.0 million on December 31, 2015 to foreclosed real estate owned in 2016. Based on management's analysis, the Company added $2,050,000 to the allowance for loan losses for the year ended December 31, 2016 compared to $4,580,000 in 2015.
Foreclosed real estate owned totaled $5,302,000 as of December 31, 2016 and $2,847,000 as of December 31, 2015. The increase is due primarily to the transfer of one loan relationship with a carrying value of $5.0 million as of December 31, 2015 which was partially offset by a subsequent write down of $2.4 million. During 2016, eight properties with a carrying value of $595,000 were disposed of through sales. The Company recorded a net gain of $61,000 from the sale of the properties.
Management assesses the adequacy of the allowance for loan losses on a quarterly basis. The process includes a review of the risks inherent in the loan portfolio. It includes an analysis of impaired loans and a historical review of losses. Other factors considered in the analysis include: concentrations of credit in specific industries in the commercial portfolio, the local and regional economic condition, trends in delinquencies, internal risk rating classifications, and growth in the portfolio. For loans acquired, including those that are not deemed impaired at acquisition, credit discounts representing the principal losses expected over the life of the loan are a component of the initial fair value. Subsequent to the purchase date, the methods utilized to estimate the required allowance for credit losses for these loans is similar to originated loans; however, the Company records a provision for loan losses only when the required allowance exceeds any remaining credit discounts.
The Company has limited exposure to higher-risk loans. The Company does not originate option ARM products, interest only loans, sub-prime loans or loans with initial teaser rates in its residential real estate portfolio. The Company has $8.3 million of junior lien home equity loans. For 2016, net charge-offs for this portfolio totaled $43,000.
As of December 31, 2016, the Company considered its concentration of credit risk profile to be acceptable. The highest concentrations are in commercial rentals and the hospitality lodging industry.
During 2016, the Company recognized a decrease in its adversely classified loans. The Company assesses a loss factor against the classified loans, which is based on prior experience. Classified loans which are considered impaired are measured on a loan by loan basis. The Company values such loans by either the present value of expected cash flows, the loan's obtainable market price or the fair value of collateral if the loan is collateral dependent.
At December 31, 2016, the recorded investment in impaired loans, not requiring an allowance for loan losses was $2,624,000 (net of charge-offs against the allowance for loan losses of $831,000). There were no loans requiring an allowance. The recorded investment in impaired loans not requiring an allowance for loan losses was $2,855,000 (net of charge-offs of $1,971,000) and $6,373,000 for impaired loans requiring an allowance for loan losses as of December 31, 2015.
As a result of its analysis, after applying these factors, management considers the allowance as of December 31, 2016, adequate. However, there can be no assurance that the allowance for loan losses will be adequate to cover significant losses, that might be incurred in the future.
13
NORWOOD FINANCIAL CORP - 2016 CONSOLIDATED FINANCIAL REPORT
The following table sets forth information with respect to the Company's allowance for loan losses at the dates indicated:
Year ended December 31, | |||||||||||||||
(dollars in thousands) | |||||||||||||||
2016 | 2015 | 2014 | 2013 | 2012 | |||||||||||
Allowance balance at beginning of period | $ | 7,298 | $ | 5,875 | $ | 5,708 | $ | 5,502 | $ | 5,458 | |||||
Charge-offs: | |||||||||||||||
Real Estate loans | |||||||||||||||
Residential | (123) | (224) | (270) | (603) | (541) | ||||||||||
Commercial | (2,711) | (2,883) | (1,196) | (1,488) | (1,632) | ||||||||||
Construction | - | - | - | (40) | (181) | ||||||||||
Commercial loans | (15) | - | - | (4) | (24) | ||||||||||
Consumer loans | (102) | (91) | (80) | (90) | (59) | ||||||||||
Total | (2,951) | (3,198) | (1,546) | (2,225) | (2,437) | ||||||||||
Recoveries: | |||||||||||||||
Real Estate loans | |||||||||||||||
Residential | 6 | 20 | - | 9 | 7 | ||||||||||
Commercial | 15 | - | 2 | - | - | ||||||||||
Construction | - | - | - | - | - | ||||||||||
Commercial loans | - | - | - | - | - | ||||||||||
Consumer loans | 45 | 21 | 31 | 22 | 24 | ||||||||||
Total | 66 | 41 | 33 | 31 | 31 | ||||||||||
Provision expense | 2,050 | 4,580 | 1,680 | 2,400 | 2,450 | ||||||||||
Allowance balance at end of period | $ | 6,463 | $ | 7,298 | $ | 5,875 | $ | 5,708 | $ | 5,502 | |||||
Allowance for loan losses as a percent | |||||||||||||||
of total loans outstanding | 0.91 | % | 1.30 | % | 1.17 | % | 1.13 | % | 1.15 | % | |||||
Net loans charged off as a percent of | |||||||||||||||
average loans outstanding | 0.46 | % | 0.60 | % | 0.30 | % | 0.45 | % | 0.50 | % | |||||
Allowance coverage of non-performing loans | 3.4 | x | 1.0 | x | 1.1 | x | 0.6 | x | 0.4 | x |
The following table sets forth information regarding non-performing assets.
December 31, | |||||||||||||||
(dollars in thousands) | |||||||||||||||
2016 | 2015 | 2014 | 2013 | 2012 | |||||||||||
Non-accrual loans: | |||||||||||||||
Real Estate loans | |||||||||||||||
Residential | $ | 1,136 | $ | 440 | $ | 1,675 | $ | 1,704 | $ | 2,846 | |||||
Commercial | 762 | 6,649 | 3,921 | 7,843 | 10,026 | ||||||||||
Construction | 28 | — | — | — | — | ||||||||||
Commercial loans | — | 43 | — | — | 328 | ||||||||||
Consumer loans | — | — | 4 | — | — | ||||||||||
Total | 1,926 | 7,132 | 5,600 | 9,547 | 13,200 | ||||||||||
Accruing loans which are contractually | |||||||||||||||
past due 90 days or more | 1 | — | — | — | — | ||||||||||
Total non-performing loans | 1,927 | 7,132 | 5,600 | 9,547 | 13,200 | ||||||||||
Foreclosed real estate | 5,302 | 2,847 | 3,726 | 1,009 | 852 | ||||||||||
Total non-performing assets | $ | 7,229 | $ | 9,979 | $ | 9,326 | $ | 10,556 | $ | 14,052 | |||||
Non-performing loans to total loans | 0.25 | % | 1.27 | % | 1.12 | % | 1.90 | % | 2.77 | % | |||||
Non-performing loans to total assets | 0.17 | % | 0.95 | % | 0.79 | % | 1.34 | % | 1.96 | % | |||||
Non-performing assets to total assets | 0.64 | % | 1.33 | % | 1.31 | % | 1.48 | % | 2.09 | % |
14
NORWOOD FINANCIAL CORP - 2016 CONSOLIDATED FINANCIAL REPORT
Securities
The securities portfolio consists of issues of United States Treasury securities, United States Government agencies, including mortgage-backed securities, municipal obligations, and corporate debt. The Company classifies its investments into two categories: held to maturity (HTM) and available for sale (AFS). The Company does not have trading securities. Securities classified as HTM are those in which the Company has the ability and the intent to hold the security until contractual maturity. As of December 31, 2016, there were no securities carried in the HTM portfolio. Securities classified as AFS are eligible to be sold due to liquidity needs or interest rate risk management. These securities are adjusted to and carried at their fair value with any unrealized gains or losses recorded net of deferred income taxes, as an adjustment to capital and reported in the equity section of the Consolidated Balance Sheet as other comprehensive income. As of December 31, 2016, $302.6 million of securities were so classified and carried at their fair value, with unrealized losses, net of tax, of $4,438,000 included in accumulated other comprehensive income as a component of stockholders' equity.
As of December 31, 2016, the average life of the portfolio was 5.5 years. The Company has maintained a relatively short average life in the portfolio in order to generate cash flow to support loan growth and maintain liquidity levels. During 2016, the portfolio increased $163.7 million as a result of the acquisition of Delaware. Purchases for the year totaled $101.0 million, while maturities and cash flow totaled $26.2 million and proceeds from sales were $110.7 million. The purchases were funded principally by cash flow generated from the portfolio and excess overnight liquidity. The sales include securities that were acquired from Delaware which were sold immediately for a variety of factors, including non-conformance with Company policies.
The carrying value of the securities portfolio at December 31 is as follows:
2016 | 2015 | |||||||||||||||
(dollars in thousands) | ||||||||||||||||
Carrying | % of | Carrying | % of | |||||||||||||
Value | portfolio | Value | portfolio | |||||||||||||
U.S. Treasury securities | $ | 1,997 | 0.7 | % | $ | — | — | % | ||||||||
U.S. Government agencies | — | — | % | 9,169 | 6.6 | % | ||||||||||
States and political subdivisions | 125,101 | 41.4 | % | 60,755 | 43.8 | % | ||||||||||
Corporate obligations | 10,112 | 3.3 | % | 4,974 | 3.5 | % | ||||||||||
Mortgage-backed securities – government sponsored entities | 164,930 | 54.5 | % | 63,569 | 45.8 | % | ||||||||||
Equity securities – financial services | 424 | 0.1 | % | 384 | 0.3 | % | ||||||||||
Total | $ | 302,564 | 100.0 | % | $ | 138,851 | 100.0 | % |
The portfolio had no adjustable-rate instruments as of December 31, 2016 and 2015. The portfolio contained no private label mortgage backed securities, collateralized debt obligations (CDOs), or trust preferred securities, and no off-balance sheet derivatives were in use. As of December 31, 2016, the portfolio did not contain any step-up bonds. The mortgage-backed securities portfolio includes pass-through bonds and collateralized mortgage obligations (CMO's) with Fannie Mae, Freddie Mac and the Government National Mortgage Association (GNMA).
The Company evaluates the securities in its portfolio for other-than-temporary-impairment (OTTI) as fair value declines below cost. In estimating OTTI management considers (1) the length of time and the extent of the decline in fair value and (2) the financial condition and near-term prospects of the issuer. As of December 31, 2016, the Company held 247 investment securities in a loss position which had a combined unrealized loss of $7.8 million. Management believes that these losses are principally due to changes in interest rates and represent temporary impairment as the Company does not have the intent to sell these securities and it is more likely than
15
NORWOOD FINANCIAL CORP - 2016 CONSOLIDATED FINANCIAL REPORT
not that it will not have to sell the securities before recovery of their cost basis. The Company also holds a small portfolio of equity securities of other financial institutions. As of December 31, 2016, none of these equity securities were in an unrealized loss position. No impairment charges have been recognized in 2016, 2015 and 2014.
FAIR VALUE OF FINANCIAL INSTRUMENTS
The Company uses fair value measurements to record fair value adjustments to certain financial instruments and determine fair value disclosures (see Note 14 of Notes to the Consolidated Financial Statements).
Approximately $302.6 million, which represents 27.2% of total assets at December 31, 2016, consisted of financial instruments recorded at fair value on a recurring basis. This amount consists entirely of the Company's available for sale securities portfolio. The Company uses valuation methodologies involving market-based or market-derived information, collectively Level 1 and 2 measurements, to measure fair value. There were no transfers into or out of Level 3 for any instruments for the years ending December 31, 2016 and 2015.
The Company utilizes a third party provider to perform valuations of the investments. Methods used to perform the valuations include: pricing models that vary based on asset class, available trade and bid information, actual transacted prices, and proprietary models for valuations of state and municipal obligations. In addition, the Company has a sample of fixed-income securities valued by another independent source. The Company does not adjust values received from its providers, unless it is evident that fair value measurement is not consistent with the Company's policies.
The Company also utilizes a third party provider to provide the fair value of certain loan servicing rights. Fair value for the purpose of this measurement is defined as the amount at which the asset could be exchanged in a current transaction between willing parties, other than in a forced liquidation. The fair value of mortgage servicing rights as of December 31, 2016 and 2015 was $250,000 and $291,000, respectively.
DEPOSITS
The Company, through the community offices of the Bank, provides a full range of deposit products to its retail and business customers. These products include interest-bearing and non-interest bearing transaction accounts, statement savings and money market accounts. Time deposits consist of certificates of deposit (CDs) with terms of up to five years and include Individual Retirement Accounts. The Bank participates in the Jumbo CD ($100,000 and over) markets with local municipalities and school districts, which are typically awarded on a competitive bid basis. The Company has no brokered deposits nor does it participate in the Certificate of Deposit Account Registry Service (CDARS).
Total deposits as of December 31, 2016, totaled $925.4 million, increasing $374.5 million from year-end 2015. The increase included $327.3 million of deposits which were acquired from Delaware. Organic growth included a $17.0 million increase in non-interest bearing demand balances and a $27.5 million increase in certificates of deposit. The large increase in certificates of deposit includes deposits of local municipalities and school districts which were held in more liquid accounts at year-end 2015.
Time deposits of $250,000 or more, which consist principally of school district funds, other public funds and short-term deposits from large commercial customers with maturities generally less than one year, totaled $59.0 million as of December 31, 2016, compared to $22.0 million at year-end 2015. These deposits are subject to competitive bid and the Company bases its bid on current interest rates, loan demand, investment portfolio structure and the relative cost of other funding sources.
16
NORWOOD FINANCIAL CORP - 2016 CONSOLIDATED FINANCIAL REPORT
As of December 31, 2016, non-interest bearing demand deposits totaled $191.5 million compared to $107.8 million at year-end 2015. Cash management accounts in the form of securities sold under agreements to repurchase included in short-term borrowings, totaled $32.8 million at year end 2016 compared to $33.6 million as of December 31, 2015. These balances represent commercial and municipal customers' funds invested in overnight securities. The Company considers these accounts as a source of core funding.
MARKET RISK
Interest rate sensitivity and the repricing characteristics of assets and liabilities are managed by the Asset and Liability Management Committee (ALCO). The principal objective of the ALCO is to maximize net interest income within acceptable levels of risk, which are established by policy. Interest rate risk is monitored and managed by using financial modeling techniques to measure the impact of changes in interest rates.
Net interest income, which is the primary source of the Company's earnings, is impacted by changes in interest rates and the relationship of different interest rates. To manage the impact of the rate changes, the balance sheet should be structured so that repricing opportunities exist for both assets and liabilities at approximately the same time intervals. The Company uses net interest simulation to assist in interest rate risk management. The process includes simulating various interest rate environments and their impact on net interest income. As of December 31, 2016, the level of net interest income at risk in a ± 200 basis points increase was within the Company's policy limit of a decline less than 8% of net interest income.
Imbalances in repricing opportunities at a given point in time reflect interest-sensitivity gaps measured as the difference between rate-sensitive assets and rate-sensitive liabilities. These are static gap measurements that do not take into account any future activity, and as such are principally used as early indicators of potential interest rate exposures over specific intervals.
At December 31, 2016, the Bank had a positive 90-day interest sensitivity gap of $34.7 million or 3.1% of total assets. A positive gap indicates that the balance sheet has a higher level of rate-sensitive assets (RSA) than rate-sensitive liabilities (RSL) at the specific time interval. This would indicate that in an increasing rate environment, the yield on interest-earning assets would increase faster than the cost of interest-bearing liabilities in the 90 day time frame. The level of RSA and RSL for an interval is managed by ALCO strategies, including adjusting the average life of the investment portfolio through purchases and sales, pricing of deposit liabilities to attract long or short term time deposits, utilizing borrowings to fund loan growth, loan pricing to encourage variable rate products and evaluation of loan sales of long term fixed rate mortgages.
The Company analyzes and measures the time periods in which RSA and RSL will mature or reprice in accordance with their contractual terms and assumptions. Management believes that the assumptions used are reasonable. The interest rate sensitivity of assets and liabilities could vary substantially if differing assumptions were used or if actual experience differs from the assumptions used in the analysis. For example, although certain assets and liabilities may have similar maturities or periods to repricing, they may react in differing degrees to changes in market interest rates. The interest rates on certain types of assets and liabilities may fluctuate in advance of changes in market interest rates, while interest rates on other types may lag behind changes in market rates. Interest rates may change at different rates changing the shape of the yield curve. The level of rates on the investment securities may also be affected by the spread relationship between different investments. Further, in the event of a significant change in interest rates, prepayment and early withdrawal levels would likely deviate significantly from those assumed. Finally, the ability of borrowers to service their adjustable-rate debt may decrease in the event of an interest rate increase. It should be noted that the operating results of the Company are not subject to foreign currency exchange or commodity price risk.
17
NORWOOD FINANCIAL CORP - 2016 CONSOLIDATED FINANCIAL REPORT
The following table displays interest-sensitivity as of December 31, 2016 (in thousands):
3 Months | 3-12 | Over | ||||||||||||
Or Less | Months | 1-3 Years | 3 Years | Total | ||||||||||
Federal funds sold and | ||||||||||||||
interest-bearing deposits | $ | 2,174 | $ | — | $ | 100 | $ | — | $ | 2,274 | ||||
Securities | 7,476 | 21,583 | 59,163 | 214,342 | 302,564 | |||||||||
Loans Receivable | 158,060 | 165,189 | 199,137 | 191,503 | 713,889 | |||||||||
Total Rate Sensitive Assets (RSA) | $ | 167,710 | $ | 186,772 | $ | 258,400 | $ | 405,845 | $ | 1,018,727 | ||||
Non-maturity interest-bearing deposits | $ | 65,059 | $ | 64,050 | $ | 170,069 | $ | 139,206 | $ | 438,384 | ||||
Time Deposits | 48,730 | 126,075 | 88,233 | 32,518 | 295,556 | |||||||||
Borrowings | 19,252 | 18,092 | 23,391 | 4,077 | 64,812 | |||||||||
Total Rate Sensitive Liabilities (RSL) | $ | 133,041 | $ | 208,217 | $ | 281,693 | $ | 175,801 | $ | 798,752 | ||||
Interest sensitivity gap | $ | 34,669 | $ | (21,445) | $ | (23,293) | $ | 230,044 | $ | 219,975 | ||||
Cumulative gap | 34,669 | 13,224 | (10,069) | 219,975 | ||||||||||
RSA/RSL-cumulative | 126.1 | % | 103.9 | % | 98.4 | % | 127.5 | % | ||||||
As of December 31, 2015 | ||||||||||||||
Interest sensitivity gap | $ | 38,817 | $ | 11,614 | $ | (57,114) | $ | 168,269 | $ | 161,586 | ||||
Cumulative gap | 38,817 | 50,431 | (6,683) | 161,586 | ||||||||||
RSA/RSL-cumulative | 140.9 | % | 122.8 | % | 98.5 | % | 130.1 | % |
Certain interest-bearing deposits with no stated maturity dates are included in the interest-sensitivity table above. The balances allocated to the respective time periods represent an estimate of the total outstanding balance that has the potential to migrate either through withdrawal or transfer to time deposits, thereby impacting the interest-sensitivity position of the Company. The estimates were derived from a non-maturity deposit study which was prepared by an independent third party provider in 2016. The purpose of the study was to estimate the average lives of various deposit types and their pricing sensitivity to movements in market interest rates.
LIQUIDITY
Liquidity is the ability to fund customers' borrowing needs and their deposit withdrawal requests while supporting asset growth. The Company's primary sources of liquidity include deposit generation, asset maturities, cash flow from payments on loans and securities and access to borrowing from the Federal Home Loan Bank and other correspondent banks.
As of December 31, 2016, the Company had cash and cash equivalents of $17.2 million in the form of cash, due from banks, balances with the Federal Reserve Bank, and short-term deposits with other institutions. In addition, the Company had total securities available for sale of $302.6 million, which could be used for liquidity needs. This totals $319.8 million and represents 28.8% of total assets compared to $148.9 million and 19.8% of total assets as of December 31, 2015. The Company also monitors other liquidity measures, all of which were within the Company's policy guidelines as of December 31, 2016. Based upon these measures, the Company believes its liquidity position is adequate.
The Company maintains established lines of credit with the Federal Home Loan Bank of Pittsburgh (FHLB), the Atlantic Community Bankers Bank (ACBB) and other correspondent banks, which support liquidity needs. The total available under all the lines was $356.8 million, with $0 outstanding at December 31, 2016 and $19.7
18
NORWOOD FINANCIAL CORP - 2016 CONSOLIDATED FINANCIAL REPORT
million outstanding at December 31, 2015. The maximum borrowing capacity from FHLB was $316.8 million. As of December 31, 2016, the Company had $32.0 million in term borrowings from the FHLB, compared to $41.1 million at December 31, 2015.
OFF-BALANCE SHEET ARRANGEMENTS
The Company's financial statements do not reflect various commitments that are made in the normal course of business, which may involve some liquidity risk. These commitments consist mainly of unfunded loans and letters of credit made under the same standards as on-balance sheet instruments. Unused commitments, as of December 31, 2016 totaled $82.6 million. They consisted of $22.2 million of commitments for residential and commercial real estate, construction and land developments loans, $24.7 million in unused home equity lines of credit, $5.6 million in performance and standby letters of credit and $30.1 million in other unused commitments, principally commercial lines of credit. Because these instruments have fixed maturity dates and many of them will expire without being drawn upon, they do not represent any significant liquidity risk.
Management believes that any amounts actually drawn upon can be funded in the normal course of operations. The Company has no investment in or financial relationship with any unconsolidated entities that are reasonably likely to have a material effect on liquidity or the availability of capital resources.
The following table represents the aggregate of on and off-balance sheet contractual obligations to make future payments (in thousands):
CONTRACTUAL OBLIGATIONS
December 31, 2016 | ||||||||||||||||||||
Total | Less than 1 year | 1-3 years | 4-5 years | Over 5 years | ||||||||||||||||
Time deposits | $ | 295,557 | $ | 174,814 | $ | 88,233 | $ | 32,331 | $ | 179 | ||||||||||
Long-term debt | 32,001 | 14,025 | 2,296 | 11,112 | 4,568 | |||||||||||||||
Operating leases | 3,470 | 381 | 767 | 705 | 1,617 | |||||||||||||||
$ | 331,028 | $ | 189,220 | $ | 91,296 | $ | 44,148 | $ | 6,364 |
RESULTS OF OPERATIONS
NET INTEREST INCOME
Net interest income is the most significant source of revenue for the Company and represented 84.7% of total revenue for the year ended December 31, 2016. Net interest income (fte) totaled $30,339,000 for the year ended December 31, 2016 compared to $25,882,000 for 2015, an increase of $4,457,000. The resulting fte net interest spread and net interest margin were 3.46% and 3.60%, respectively, in 2016 compared to 3.61% and 3.75%, respectively, in 2015.
Interest income (fte) for the year ended December 31, 2016 totaled $33,993,000 compared to $29,140,000 in 2015. The fte yield on average earning assets was 4.03%, decreasing 20 basis points from the 4.23% reported last year. The low interest rate environment impacted the yield earned as new loan production was added at historically low rates. This impacted loan yields which earned 4.50% in 2016 compared to 4.61% in the prior year. The reduced yield was offset by a $96.9 million increase in average loans outstanding due primarily to loans acquired from Delaware, and interest income (fte) from loans increased $3.8 million. The yield on securities decreased 33 basis points in 2016 due primarily to the lower yielding portfolio acquired from Delaware. A $55.6 million increase in average securities outstanding offset the lower yield, and interest income (fte) from the portfolio improved $1.0 million.
19
NORWOOD FINANCIAL CORP - 2016 CONSOLIDATED FINANCIAL REPORT
Interest expense was $3,654,000 in 2016 which resulted in an average cost of interest-bearing liabilities of 0.57% compared to total interest expense of $3,258,000 in 2015 with an average cost of 0.62%. The continued low rate environment also impacted rates paid on deposits as the Company reduced rates paid on time deposits to market levels. Total interest-bearing deposits cost 0.46% in 2016 which was 6 basis points lower than the 0.52% cost in the prior year. Time certificates of deposit repriced to current market rates upon maturity and new growth was added at the reduced levels. Time deposits acquired from Delaware also impacted the cost of deposits. Long-term borrowings also repriced downward in 2016 reflecting a the impact from low-cost borrowings originated in recent years.
Net interest income represented 83.9% of total revenue for the year ended December 31, 2015. Net interest income (fte) totaled $25,882,000 for the year ended December 31, 2015 compared to $25,818,000 for 2014, an increase of $64,000. The resulting fte net interest spread and net interest margin were 3.61% and 3.75%, respectively, in 2015 compared to 3.76% and 3.90%, respectively, in 2014.
Interest income (fte) for the year ended December 31, 2015 totaled $29,140,000 compared to $29,026,000 in 2014. The fte yield on average earning assets was 4.23%, decreasing 16 basis points from the 4.39% reported last year. The continued low interest rate environment impacted the yield earned as new loan production was added at historically low rates. This impacted loan yields which earned 4.61% in 2015 compared to 4.82% in the prior year. The reduced yield was partially offset by a $29.0 million increase in average loans outstanding, resulting in a $288,000 increase in loan income. The yield on securities decreased 2 basis points in 2015, and combined with a $4.8 million decrease in the average balance, resulted in a $178,000 decrease in interest income.
Interest expense was $3,258,000 in 2015 which resulted in an average cost of interest-bearing liabilities of 0.62% compared to total interest expense of $3,208,000 in 2014 with an average cost of 0.63%. The continued low rate environment also impacted rates paid on deposits as the Company reduced rates paid on time deposits to market levels. Total interest-bearing deposits cost 0.52% in 2015 which was 2 basis points lower than the 0.54% cost in the prior year due primarily to a 14 basis point reduction in time deposits as certificates repriced to current market rates upon maturity and new growth was added at the reduced levels. Long-term borrowings also repriced downward in 2015 reflecting the impact from low-cost borrowings originated in recent years.
OTHER INCOME
Other income totaled $5,179,000 for the year ended December 31, 2016 compared to $4,699,000 in 2015, an increase of $480,000. Gains from the sales of loans and securities decreased $392,000 from the prior year, while all other items of other income increased $872,000, net. The increase reflects the increased fees related to the Delaware acquisition.
Other income totaled $4,699,000 for the year ended December 31, 2015 compared to $5,110,000 in 2014, a decrease of $411,000. Gains from the sales of loans and securities decreased $572,000 from the prior year, while all other items of other income increased $161,000, net.
20
NORWOOD FINANCIAL CORP - 2016 CONSOLIDATED FINANCIAL REPORT
Other Income (dollars in thousands)
For the year ended December 31
2016 | 2015 | 2014 | ||||||||||
Service charges on deposit accounts | $ | 200 | $ | 168 | $ | 176 | ||||||
ATM Fees | 258 | 220 | 206 | |||||||||
NSF Fees | 1,171 | 850 | 932 | |||||||||
Safe deposit box rental | 66 | 62 | 63 | |||||||||
Loan related service fees | 319 | 451 | 370 | |||||||||
Debit card | 874 | 660 | 620 | |||||||||
Fiduciary activities | 448 | 439 | 437 | |||||||||
Commissions on mutual funds & annuities | 143 | 143 | 94 | |||||||||
Gain on sales of mortgage loans | 54 | 104 | 132 | |||||||||
Earnings on and proceeds from bank-owned life insurance | 888 | 664 | 685 | |||||||||
Other income | 474 | 312 | 225 | |||||||||
4,895 | 4,073 | 3,940 | ||||||||||
Net realized gains on sales of securities | 284 | 626 | 1,170 | |||||||||
Total | $ | 5,179 | $ | 4,699 | $ | 5,110 |
OTHER EXPENSES
Other expenses totaled $23,124,000 for the year ended December 31, 2016 compared to $17,100,000 in the prior year. The $6,024,000 increase in costs includes $1,806,000 of one-time merger expenses plus the costs of acquiring and operating twelve new community offices. Salaries and benefits costs increased $2,393,000 in 2016 while occupancy and equipment costs increased $543,000. All other operating expenses increased $3,088,000, net, which includes $1,806,000 of one-time merger expenses. The Company's efficiency ratio, which measures total other expenses as a percentage of net interest income (fte) plus other income, was 65.1% in 2016 compared to 55.9% in 2015. Merger costs contributed to the increased ratio.
Other expenses totaled $17,100,000 for the year ended December 31, 2015 compared to $17,727,000 in the prior year. The $627,000 decrease in costs includes a $644,000 decrease in expenses related to foreclosed real estate owned. Salaries and benefits costs decreased $81,000 in 2015 while occupancy and equipment costs decreased $35,000. All other operating expenses increased $133,000, net. The Company's efficiency ratio, which measures total other expenses as a percentage of net interest income (fte) plus other income, was 55.9% in 2015 compared to 57.3% in 2014.
Other Expenses (dollars in thousands)
For the year ended December 31
2016 | 2015 | 2014 | ||||||||||
Salaries | $ | 7,054 | $ | 5,752 | $ | 5,744 | ||||||
Employee benefits | 3,874 | 2,783 | 2,872 | |||||||||
Occupancy | 2,077 | 1,660 | 1,676 | |||||||||
Furniture and equipment | 548 | 422 | 441 | |||||||||
Data processing and related operations | 1,337 | 943 | 929 | |||||||||
Federal Deposit Insurance Corporation insurance assessment | 412 | 411 | 420 | |||||||||
Advertising | 283 | 240 | 224 | |||||||||
Professional fees | 836 | 730 | 671 | |||||||||
Postage and telephone | 566 | 436 | 414 | |||||||||
Office supplies | 379 | 255 | 278 | |||||||||
Taxes, other than income | 731 | 711 | 649 | |||||||||
Foreclosed real estate | 680 | 911 | 1,555 | |||||||||
Amortization of intangible assets | 122 | 105 | 121 | |||||||||
Merger related | 1,806 | - | - | |||||||||
Other | 2,419 | 1,741 | 1,733 | |||||||||
Total | $ | 23,124 | $ | 17,100 | $ | 17,727 |
21
NORWOOD FINANCIAL CORP - 2016 CONSOLIDATED FINANCIAL REPORT
INCOME TAXES
Income tax expense for the year ended December 31, 2016 totaled $1,884,000 which resulted in an effective tax rate of 21.9% compared to $1,632,000 and 21.6% for 2015.
Income tax expense for the year ended December 31, 2015 totaled $1,632,000 which resulted in an effective tax rate of 21.6% compared to $2,606,000 and 25.4% for 2014. The decrease in the effective rate reflects a higher proportion of tax-exempt income.
CAPITAL AND DIVIDENDS
Total stockholders' equity as of December 31, 2016, was $111.1 million, compared to $101.0 million as of year-end 2015. The increase was due primarily to a $12.2 million increase resulting from additional common shares issued in connection with the Delaware acquisition. As of December 31, 2016 the Company had a leverage capital ratio of 9.16%, a Tier 1 risk-based capital ratio of 13.27%, a common equity Tier 1 risk-based capital ratio of 13.27% and a total risk-based capital ratio of 14.12% compared to 12.40%, 15.86%, 15.86% and 17.09%, respectively, at December 31, 2015. The reduced ratios reflect the impact from the acquisition of Delaware.
The Company's common stock is traded on the Nasdaq Global Market under the symbol, NWFL. As of December 31, 2016, there were approximately 2,700 shareholders based on transfer agent mailings.
The following table sets forth the price range and cash dividends declared per share regarding common stock for the periods indicated:
Closing Price Range | Cash dividends | |||||||
High | Low | Declared per share | ||||||
Year 2016 | ||||||||
First Quarter | $ | 30.90 | $ | 26.25 | $ | 0.31 | ||
Second Quarter | 29.00 | 27.51 | 0.31 | |||||
Third Quarter | 29.75 | 27.60 | 0.31 | |||||
Fourth Quarter | 34.50 | 28.53 | 0.32 | |||||
Year 2015 | ||||||||
First Quarter | $ | 30.00 | $ | 27.69 | $ | 0.31 | ||
Second Quarter | 30.90 | 27.88 | 0.31 | |||||
Third Quarter | 30.64 | 28.01 | 0.31 | |||||
Fourth Quarter | 29.30 | 27.69 | 0.31 |
The book value of the common stock was $26.15 per share as of December 31, 2016 compared to $27.39 as of December 31, 2015. As of year-end 2016, the closing stock price was $33.14 per share, compared to $28.75 as of December 31, 2015.
NON-GAAP FINANCIAL MEASURES
This annual report contains or references tax-equivalent interest income and net interest income, which are non-GAAP financial measures. Tax-equivalent interest income and net interest income are derived from GAAP interest income and net interest income using an assumed tax rate of 34%. We believe the presentation of interest income and net interest income on a tax-equivalent basis ensures comparability of interest income and net interest income arising from both taxable and tax-exempt sources and is consistent with industry practice. Tax-equivalent net interest income is reconciled to GAAP net interest income on page 25. Although the Company believes that these non-GAAP financial measures enhance investors' understanding of our business and performance, these non-GAAP financial measures should not be considered an alternative to GAAP measures.
22
NORWOOD FINANCIAL CORP - 2016 CONSOLIDATED FINANCIAL REPORT
STOCK PERFORMANCE GRAPH
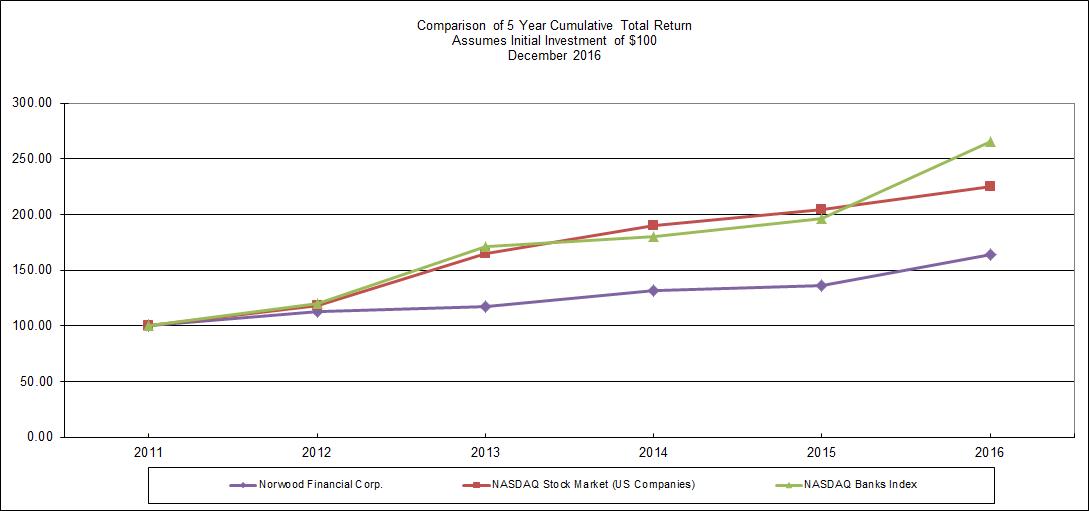
Set forth below is a stock performance graph comparing the cumulative total shareholder return on the Common Stock with (a) the cumulative total stockholder return on stocks included in the Nasdaq Stock Market index and (b) the cumulative total stockholder return on stocks included in the Nasdaq Bank index, as prepared by Zack's Investment Research, Inc. using data from the Center for Research in Securities Prices (CRSP) at the University of Chicago. All three investment comparisons assume the investment of $100 at the market close on December 31, 2011 and the reinvestment of dividends paid. The graph provides comparison at December 31, 2011 and each fiscal year through December 31, 2016.
![](https://capedge.com/proxy/10-K/0000946275-17-000012/image0.jpg)
There can be no assurance that the Company's future stock performance will be the same or similar to the historical performance shown in the above graph. The Company neither makes nor endorses any predictions as to stock performance.
LEGEND
Symbol | CRSP Total Returns Index for: | 12/31/11 | 12/31/12 | 12/31/13 | 12/31/14 | 12/31/15 | 12/31/16 |
♦ | Norwood Financial Corp | $100.00 | $112.93 | $116.88 | $131.58 | $135.82 | $163.54 |
■ | CRSP Nasdaq U.S. Index | 100.00 | 118.26 | 164.83 | 190.07 | 204.70 | 224.75 |
▲ | Nasdaq Bank Index | 100.00 | 119.64 | 171.23 | 179.93 | 195.98 | 265.31 |
Notes: A. Data complete through last fiscal year. B. Corporate Performance Graph with peer group only performance (excludes only company). C. Peer group indices use beginning of period market capitalization weighting. D. Prepared by Zacks Investment Research, Inc. Used with permission. All rights reserved. Copyright 1980-2017. E. Index Data: Calculated (or Derived) based from CRSP NASDAQ Stock Market (US Companies) and CRSP NASDAQ Banks Index, Center for Research in Security Prices (CRSP®), Graduate School of Business, The University of Chicago. Copyright 2017. Used with permission. All rights reserved. |
23
NORWOOD FINANCIAL CORP - 2016 CONSOLIDATED FINANCIAL REPORT
NORWOOD FINANCIAL CORP
SUMMARY OF QUARTERLY RESULTS (UNAUDITED)
(Dollars in thousands, except per share amounts)
2016 | December 31 | September 30 | June 30 | March 31 | |||||||
Interest income | $ | 9,456 | $ | 8,528 | $ | 7,234 | $ | 7,026 | |||
Interest expense | 1,005 | 958 | 840 | 851 | |||||||
Net interest income | 8,451 | 7,570 | 6,394 | 6,175 | |||||||
Provision for loan losses | 450 | 450 | 700 | 450 | |||||||
Other income | 1,475 | 1,399 | 1,018 | 1,003 | |||||||
Net realized gains on sales of securities | 15 | - | 205 | 64 | |||||||
Other expense | 6,568 | 7,679 | 4,528 | 4,349 | |||||||
Income before income taxes | 2,923 | 840 | 2,389 | 2,443 | |||||||
Income tax expense | 577 | 228 | 511 | 567 | |||||||
NET INCOME | $ | 2,346 | $ | 612 | $ | 1,878 | $ | 1,876 | |||
Basic earnings per share | $ | 0.57 | $ | 0.15 | $ | 0.51 | $ | 0.51 | |||
Diluted earnings per share | $ | 0.56 | $ | 0.15 | $ | 0.51 | $ | 0.51 | |||
2015 | |||||||||||
December 31 | September 30 | June 30 | March 31 | ||||||||
Interest income | $ | 6,936 | $ | 6,872 | $ | 6,882 | $ | 7,088 | |||
Interest expense | 824 | 819 | 833 | 781 | |||||||
Net interest income | 6,112 | 6,053 | 6,049 | 6,307 | |||||||
Provision for loan losses | 2,820 | 720 | 420 | 620 | |||||||
Other income | 1,098 | 1,008 | 999 | 968 | |||||||
Net realized gains on sales of securities | 118 | 63 | 134 | 311 | |||||||
Other expense | 4,674 | 4,070 | 4,168 | 4,187 | |||||||
Income (loss) before income taxes | (166) | 2,334 | 2,594 | 2,779 | |||||||
Income tax expense (benefit) | (294) | 557 | 631 | 738 | |||||||
NET INCOME | $ | 128 | $ | 1,777 | $ | 1,963 | $ | 2,041 | |||
Basic earnings per share | $ | 0.04 | $ | 0.48 | $ | 0.53 | $ | 0.55 | |||
Diluted earnings per share | $ | 0.04 | $ | 0.48 | $ | 0.53 | $ | 0.55 | |||
24
NORWOOD FINANCIAL CORP - 2016 CONSOLIDATED FINANCIAL REPORT
NORWOOD FINANCIAL CORP CONSOLIDATED AVERAGE BALANCE SHEETS WITH
RESULTANT INTEREST AND RATES
(Tax-Equivalent Basis, dollars in thousands)
Year Ended December 31 | 2016 | 2015 | 2014 | |||||||||||||||||||||
Average | Average | Average | Average | Average | Average | |||||||||||||||||||
Balance | Interest | Rate | Balance | Interest | Rate | Balance | Interest | Rate | ||||||||||||||||
(2) | (1) | (2) | (1) | (2) | (1) | |||||||||||||||||||
ASSETS | ||||||||||||||||||||||||
Interest-earning assets: | ||||||||||||||||||||||||
Interest bearing deposits with banks | $ | 8,182 | $ | 42 | 0.51 | % | $ | 6,392 | $ | 16 | 0.25 | % | $ | 2,910 | $ | 7 | 0.24 | % | ||||||
Securities held-to-maturity | — | — | — | — | — | — | 57 | 5 | 8.77 | |||||||||||||||
Securities available for sale: | ||||||||||||||||||||||||
Taxable | 123,364 | 2,375 | 1.93 | 93,294 | 1,918 | 2.06 | 100,393 | 2,032 | 2.02 | |||||||||||||||
Tax-exempt | 85,170 | 3,358 | 3.94 | 59,659 | 2,792 | 4.68 | 57,362 | 2,856 | 4.98 | |||||||||||||||
Total securities available for sale | 208,534 | 5,733 | 2.75 | 152,953 | 4,710 | 3.08 | 157,755 | 4,888 | 3.10 | |||||||||||||||
Loans receivable (3)(4) | 626,907 | 28,218 | 4.50 | 529,989 | 24,414 | 4.61 | 500,960 | 24,126 | 4.82 | |||||||||||||||
Total interest earning assets | 843,623 | 33,993 | 4.03 | 689,334 | 29,140 | 4.23 | 661,682 | 29,026 | 4.39 | |||||||||||||||
Non-interest earning assets: | ||||||||||||||||||||||||
Cash and due from banks | 11,275 | 8,638 | 8,606 | |||||||||||||||||||||
Allowance for loan losses | (6,719) | (5,945) | (5,832) | |||||||||||||||||||||
Other assets | 62,069 | 44,794 | 45,278 | |||||||||||||||||||||
Total non-interest earning assets | 66,625 | 47,487 | 48,052 | |||||||||||||||||||||
TOTAL ASSETS | $ | 910,248 | $ | 736,821 | $ | 709,734 | ||||||||||||||||||
LIABILITIES AND STOCKHOLDERS' EQUITY | ||||||||||||||||||||||||
Interest bearing liabilities: | ||||||||||||||||||||||||
Interest bearing demand and money market | $ | 208,373 | 336 | 0.16 | $ | 177,104 | 301 | 0.17 | $ | 174,558 | 304 | 0.17 | ||||||||||||
Savings | 125,904 | 66 | 0.05 | 74,753 | 37 | 0.05 | 71,612 | 35 | 0.05 | |||||||||||||||
Time | 234,026 | 2,201 | 0.94 | 209,930 | 2,083 | 0.99 | 206,231 | 2,124 | 1.03 | |||||||||||||||
Total interest bearing deposits | 568,303 | 2,603 | 0.46 | 461,787 | 2,421 | 0.52 | 452,401 | 2,463 | 0.54 | |||||||||||||||
Short-term borrowings | 41,593 | 174 | 0.42 | 34,022 | 85 | 0.25 | 36,514 | 77 | 0.21 | |||||||||||||||
Other borrowings | 36,509 | 877 | 2.40 | 28,742 | 752 | 2.62 | 22,987 | 668 | 2.91 | |||||||||||||||
Total interest bearing liabilities | 646,405 | 3,654 | 0.57 | 524,551 | 3,258 | 0.62 | 511,902 | 3,208 | 0.63 | |||||||||||||||
Non-interest bearing liabilities: | ||||||||||||||||||||||||
Non-interest bearing demand deposits | 146,578 | 106,601 | 96,870 | |||||||||||||||||||||
Other liabilities | 8,482 | 4,305 | 4,262 | |||||||||||||||||||||
Total non-interest bearing liabilities | 155,060 | 110,906 | 101,132 | |||||||||||||||||||||
Stockholders' equity | 108,783 | 101,364 | 96,700 | |||||||||||||||||||||
TOTAL LIABILITIES AND STOCKHOLDERS' EQUITY | $ | 910,248 | $ | 736,821 | $ | 709,734 | ||||||||||||||||||
Net Interest Income | ||||||||||||||||||||||||
(tax equivalent basis) | 30,339 | 3.46 | % | 25,882 | 3.61 | % | 25,818 | 3.76 | % | |||||||||||||||
Tax-equivalent basis adjustment | (1,749) | (1,361) | (1,258) | |||||||||||||||||||||
Net Interest Income | $ | 28,590 | $ | 24,521 | $ | 24,560 | ||||||||||||||||||
Net interest margin | ||||||||||||||||||||||||
(tax equivalent basis) | 3.60 | % | 3.75 | % | 3.90 | % |
(1) | Interest and yields are presented on a tax-equivalent basis using a marginal tax rate of 34%. |
(2) | Average balances have been calculated based on daily balances. |
(3) | Loan balances include non-accrual loans and are net of unearned income. |
(4) | Loan yields include the effect of amortization of purchased credit marks and deferred fees net of costs. |
25
NORWOOD FINANCIAL CORP - 2016 CONSOLIDATED FINANCIAL REPORT
RATE/VOLUME ANALYSIS
The following table shows the fully taxable equivalent effect of changes in volumes and rates on interest income and interest expense.
Increase/(Decrease) | |||||||||||||||||
(dollars in thousands) | 2016 compared to 2015 | 2015 compared to 2014 | |||||||||||||||
Variance due to | Variance due to | ||||||||||||||||
Volume | Rate | Net | Volume | Rate | Net | ||||||||||||
INTEREST EARNING ASSETS: | |||||||||||||||||
Interest bearing deposits | $ | 8 | $ | 18 | $ | 26 | $ | 8 | $ | 1 | $ | 9 | |||||
Securities available for sale: | |||||||||||||||||
Taxable | 609 | (152) | 457 | (150) | 36 | (114) | |||||||||||
Tax-exempt securities | 1,122 | (556) | 566 | 109 | (178) | (69) | |||||||||||
Total securities available for sale | 1,731 | (708) | 1,023 | (41) | (142) | (183) | |||||||||||
Loans receivable | 4,476 | (672) | 3,804 | 1,372 | (1,084) | 288 | |||||||||||
Total interest earning assets | 6,215 | (1,362) | 4,853 | 1,339 | (1,225) | 114 | |||||||||||
INTEREST BEARING LIABILITIES | |||||||||||||||||
Interest-bearing demand and money market | 54 | (19) | 35 | (3) | - | (3) | |||||||||||
Savings | 29 | - | 29 | 2 | - | 2 | |||||||||||
Time | 232 | (114) | 118 | 39 | (80) | (41) | |||||||||||
Total interest-bearing deposits | 315 | (133) | 182 | 38 | (80) | (42) | |||||||||||
Short-term borrowings | 28 | 61 | 89 | (6) | 14 | 8 | |||||||||||
Other borrowings | 199 | (74) | 125 | 162 | (78) | 84 | |||||||||||
Total interest bearing liabilities | 542 | (146) | 396 | 194 | (144) | 50 | |||||||||||
Net interest income (tax-equivalent basis) | $ | 5,673 | $ | (1,216) | $ | 4,457 | $ | 1,145 | $ | (1,081) | $ | 64 |
Changes in net interest income that could not be specifically identified as either a rate or volume change were allocated proportionately to changes in volume and changes in rate.
26
NORWOOD FINANCIAL CORP - 2016 CONSOLIDATED FINANCIAL REPORT
REPORT ON MANAGEMENT'S ASSESSMENT OF INTERNAL
CONTROL OVER FINANCIAL REPORTING
TO THE STOCKHOLDERS OF NORWOOD FINANCIAL CORP
Management of Norwood Financial Corp and its subsidiary (Norwood) is responsible for establishing and maintaining adequate internal control over financial reporting as defined in Rules 13a-15(f) and 15d-15(f) under the Securities Exchange Act of 1934. Norwood's internal control over financial reporting is designed to provide reasonable assurance regarding the reliability of financial reporting and the preparation of the consolidated financial statements for external purposes in accordance with accounting principles generally accepted in the United States of America.
Norwood's internal control over financial reporting includes those policies and procedures that (1) pertain to the maintenance of records that, in reasonable detail, accurately and fairly reflect the transactions and dispositions of the assets of Norwood; (2) provide reasonable assurance that transactions are recorded as necessary to permit preparation of financial statements in accordance with generally accepted accounting principles, and that our receipts and expenditures are being made only in accordance with authorizations of Norwood's management and directors; and (3) provide reasonable assurance regarding prevention or timely detection of unauthorized acquisition, use or disposition of Norwood's assets that could have a material effect on the consolidated financial statements.
Because of its inherent limitations, internal control over financial reporting may not prevent or detect misstatements. Also, projections of any evaluation of effectiveness to future periods are subject to the risk that controls may become inadequate because of changes in conditions, or that the degree of compliance with the policies or procedures may deteriorate.
Management assessed the effectiveness of Norwood's internal control over financial reporting as of December 31, 2016. In making this assessment, management used the criteria established in Internal Control – Integrated Framework as set forth by the Committee of Sponsoring Organizations of the Treadway Commission in 2013. Based upon its assessment, management has concluded that, as of December 31, 2016, the Company's internal control over financial reporting, including controls over the preparation of regulatory financial statements in accordance with all federal and state laws and regulations, is effective based on the criteria established in the Internal Control – Integrated Framework.
Norwood's independent registered certified public accounting firm has audited the effectiveness of Norwood's internal control over financial reporting. Their report appears on page 29.
![]() | ![]() | |
Lewis J. Critelli | William S. Lance | |
President and | Executive Vice President and | |
Chief Executive Officer | Chief Financial Officer |
27
NORWOOD FINANCIAL CORP - 2016 CONSOLIDATED FINANCIAL REPORT
![](https://capedge.com/proxy/10-K/0000946275-17-000012/image00028.jpg)
REPORT OF INDEPENDENT REGISTERED PUBLIC ACCOUNTING FIRM
Board of Directors and Stockholders
Norwood Financial Corp.
Honesdale, Pennsylvania
We have audited the accompanying consolidated balance sheet of Norwood Financial Corp. and subsidiaries as of December 31, 2016 and 2015, and the related consolidated statements of income, comprehensive income, stockholders' equity, and cash flows for each of the three years in the period ended December 31, 2016. These consolidated financial statements are the responsibility of Norwood Financial Corp.'s management. Our responsibility is to express an opinion on these consolidated financial statements based on our audits.
We conducted our audits in accordance with the standards of the Public Company Accounting Oversight Board (United States). Those standards require that we plan and perform the audits to obtain reasonable assurance about whether the financial statements are free of material misstatement. An audit includes examining, on a test basis, evidence supporting the amounts and disclosures in the financial statements. An audit also includes assessing the accounting principles used and significant estimates made by management, as well as evaluating the overall financial statement presentation. We believe that our audits provide a reasonable basis for our opinion.
In our opinion, the consolidated financial statements referred to above present fairly, in all material respects, the consolidated financial position of Norwood Financial Corp. and subsidiaries as of December 31, 2016 and 2015, and the consolidated results of their operations and their cash flows for each of the three years in the period ended December 31, 2016, in conformity with U.S. generally accepted accounting principles.
We have also audited, in accordance with the standards of the Public Company Accounting Oversight Board (United States), Norwood Financial Corp. and subsidiaries' internal control over financial reporting as of December 31, 2016, based on criteria established in Internal Control – Integrated Framework issued by the Committee of Sponsoring Organizations of the Treadway Commission in 2013, and our report dated March 14, 2017, expressed an unqualified opinion on the effectiveness of Norwood Financial Corp.'s internal control over financial reporting.
![](https://capedge.com/proxy/10-K/0000946275-17-000012/image00024.jpg)
Cranberry Township, Pennsylvania
March 14, 2017
![](https://capedge.com/proxy/10-K/0000946275-17-000012/image00027.jpg)
28
NORWOOD FINANCIAL CORP - 2016 CONSOLIDATED FINANCIAL REPORT
![](https://capedge.com/proxy/10-K/0000946275-17-000012/image00028.jpg)
REPORT OF INDEPENDENT REGISTERED PUBLIC ACCOUNTING FIRM
To the Board of Directors and Stockholders
Norwood Financial Corp.
Honesdale, Pennsylvania
We have audited Norwood Financial Corp. and subsidiaries' internal control over financial reporting as of December 31, 2016, based on criteria established in Internal Control — Integrated Framework issued by the Committee of Sponsoring Organizations of the Treadway Commission ("COSO") in 2013. Norwood Financial Corp.'s management is responsible for maintaining effective internal control over financial reporting and for its assessment of the effectiveness of internal control over financial reporting included in the accompanying Report on Management's Assessment of Internal Control over Financial Reporting. Our responsibility is to express an opinion on Norwood Financial Corp.'s internal control over financial reporting based on our audit.
We conducted our audit in accordance with the standards of the Public Company Accounting Oversight Board (United States). Those standards require that we plan and perform the audit to obtain reasonable assurance about whether effective internal control over financial reporting was maintained in all material respects. Our audit included obtaining an understanding of internal control over financial reporting, assessing the risk that a material weakness exists, and testing and evaluating the design and operating effectiveness of internal control based on the assessed risk. Our audit also included performing such other procedures as we considered necessary in the circumstances. We believe that our audit provides a reasonable basis for our opinion.
A company's internal control over financial reporting is a process designed to provide reasonable assurance regarding the reliability of financial reporting and the preparation of financial statements for external purposes in accordance with generally accepted accounting principles. A company's internal control over financial reporting includes those policies and procedures that (a) pertain to the maintenance of records that, in reasonable detail, accurately and fairly reflect the transactions and dispositions of the assets of the company; (b) provide reasonable assurance that transactions are recorded, as necessary, to permit preparation of financial statements in accordance with generally accepted accounting principles, and that receipts and expenditures of the company are being made only in accordance with authorizations of management and directors of the company; and (c) provide reasonable assurance regarding prevention or timely detection of unauthorized acquisition, use, or disposition of the company's assets that could have a material effect on the financial statements.
Because of its inherent limitations, internal control over financial reporting may not prevent or detect misstatements. Also, projections of any evaluation of effectiveness to future periods are subject to the risk that controls may become inadequate because of changes in conditions, or that the degree of compliance with the policies or procedures may deteriorate.
In our opinion, Norwood Financial Corp. maintained, in all material respects, effective internal control over financial reporting as of December 31, 2016, based on criteria established in Internal Control — Integrated Framework issued by COSO in 2013.
We have also audited, in accordance with the standards of the Public Company Accounting Oversight Board (United States), the consolidated balance sheet of Norwood Financial Corp. and subsidiaries as of December 31, 2016 and 2015, and the related consolidated statements of income, comprehensive income, stockholders' equity, and cash flows for each of the three years in the period ended December 31, 2016, and our report dated March 14, 2017, expressed an unqualified opinion.
![](https://capedge.com/proxy/10-K/0000946275-17-000012/image00024.jpg)
Cranberry Township, Pennsylvania
March 14, 2017
![](https://capedge.com/proxy/10-K/0000946275-17-000012/image00027.jpg)
29
NORWOOD FINANCIAL CORP - 2016 CONSOLIDATED FINANCIAL REPORT
CONSOLIDATED BALANCE SHEETS
December 31, | |||||
2016 | 2015 | ||||
(In Thousands Except Share and Per Share Data) | |||||
ASSETS | |||||
Cash and due from banks | $ | 14,900 | $ | 9,744 | |
Interest bearing deposits with banks | 2,274 | 266 | |||
Cash and cash equivalents | 17,174 | 10,010 | |||
Securities available for sale | 302,564 | 138,851 | |||
Loans receivable (net of allowance for loan losses 2016: $6,463; 2015: $7,298) | 707,426 | 552,627 | |||
Regulatory stock, at cost | 2,119 | 3,412 | |||
Premises and equipment, net | 13,531 | 6,472 | |||
Bank owned life insurance | 36,133 | 18,820 | |||
Accrued interest receivable | 3,643 | 2,363 | |||
Foreclosed real estate owned | 5,302 | 2,847 | |||
Goodwill | 11,331 | 9,715 | |||
Other intangibles | 612 | 285 | |||
Deferred tax asset | 8,989 | 3,669 | |||
Other assets | 2,359 | 1,434 | |||
Total Assets | $ | 1,111,183 | $ | 750,505 | |
LIABILITIES AND STOCKHOLDERS' EQUITY | |||||
LIABILITIES | |||||
Deposits: | |||||
Non-interest bearing demand | $ | 191,445 | $ | 107,814 | |
Interest-bearing demand | 93,485 | 52,040 | |||
Money market deposit accounts | 153,020 | 119,028 | |||
Savings | 191,878 | 75,280 | |||
Time | 295,557 | 196,747 | |||
Total Deposits | 925,385 | 550,909 | |||
Short-term borrowings | 32,811 | 53,235 | |||
Other borrowings | 32,001 | 41,126 | |||
Accrued interest payable | 1,069 | 957 | |||
Other liabilities | 8,838 | 3,280 | |||
Total Liabilities | 1,000,104 | 649,507 | |||
STOCKHOLDERS' EQUITY | |||||
Common stock, $.10 par value, authorized 10,000,000 shares, | |||||
issued: 2016: 4,164,723 shares, 2015: 3,724,668 shares | 416 | 373 | |||
Surplus | 47,682 | 35,351 | |||
Retained earnings | 67,225 | 65,412 | |||
Treasury stock at cost: 2016: 4,509 shares, 2015: 23,311 shares | (125) | (626) | |||
Accumulated other comprehensive income (loss) | (4,119) | 488 | |||
Total Stockholders' Equity | 111,079 | 100,998 | |||
Total Liabilities and Stockholders' Equity | $ | 1,111,183 | $ | 750,505 |
See notes to consolidated financial statements
30
NORWOOD FINANCIAL CORP - 2016 CONSOLIDATED FINANCIAL REPORT
CONSOLIDATED STATEMENTS OF INCOME
Years Ended December 31, | ||||||||
2016 | 2015 | 2014 | ||||||
(In Thousands, Except per Share Data) | ||||||||
INTEREST INCOME | ||||||||
Loans receivable, including fees | $ | 27,611 | $ | 24,002 | $ | 23,841 | ||
Securities | ||||||||
Taxable | 2,375 | 1,918 | 2,032 | |||||
Tax exempt | 2,216 | 1,843 | 1,888 | |||||
Other | 42 | 16 | 7 | |||||
Total Interest Income | 32,244 | 27,779 | 27,768 | |||||
INTEREST EXPENSE | ||||||||
Deposits | 2,603 | 2,421 | 2,463 | |||||
Short-term borrowings | 130 | 85 | 77 | |||||
Other borrowings | 921 | 752 | 668 | |||||
Total Interest Expense | 3,654 | 3,258 | 3,208 | |||||
Net Interest Income | 28,590 | 24,521 | 24,560 | |||||
PROVISION FOR LOAN LOSSES | 2,050 | 4,580 | 1,680 | |||||
Net Interest Income After | ||||||||
Provision for Loan Losses | 26,540 | 19,941 | 22,880 | |||||
OTHER INCOME | ||||||||
Service charges and fees | 2,951 | 2,440 | 2,350 | |||||
Income from fiduciary activities | 449 | 439 | 437 | |||||
Net realized gains on sales of securities | 284 | 626 | 1,170 | |||||
Net gain on sale of loans | 54 | 104 | 132 | |||||
Earnings and proceeds on life insurance policies | 888 | 665 | 685 | |||||
Other | 553 | 425 | 336 | |||||
Total Other Income | 5,179 | 4,699 | 5,110 | |||||
OTHER EXPENSES | ||||||||
Salaries and employee benefits | 10,928 | 8,535 | 8,616 | |||||
Occupancy | 2,077 | 1,660 | 1,676 | |||||
Furniture and equipment | 548 | 422 | 441 | |||||
Data processing and related operations | 1,337 | 943 | 929 | |||||
Federal Deposit Insurance Corporation insurance assessment | 412 | 411 | 420 | |||||
Advertising | 283 | 240 | 224 | |||||
Professional fees | 836 | 730 | 671 | |||||
Postage and telephone | 566 | 436 | 414 | |||||
Taxes, other than income | 731 | 711 | 649 | |||||
Foreclosed real estate | 680 | 911 | 1,555 | |||||
Amortization of intangible asssets | 122 | 105 | 121 | |||||
Merger related | 1,806 | - | - | |||||
Other | 2,798 | 1,996 | 2,011 | |||||
Total Other Expenses | 23,124 | 17,100 | 17,727 | |||||
Income before Income Taxes | 8,595 | 7,540 | 10,263 | |||||
INCOME TAX EXPENSE | 1,884 | 1,632 | 2,606 | |||||
Net income | $ | 6,711 | $ | 5,908 | $ | 7,657 | ||
EARNINGS PER SHARE | ||||||||
BASIC | $ | 1.74 | $ | 1.60 | $ | 2.10 | ||
DILUTED | $ | 1.73 | $ | 1.60 | $ | 2.10 |
See notes to consolidated financial statements
31
NORWOOD FINANCIAL CORP - 2016 CONSOLIDATED FINANCIAL REPORT
CONSOLIDATED STATEMENTS OF COMPREHENSIVE INCOME
(in thousands)
Years Ended December 31, | ||||||||||||
2016 | 2015 | 2014 | ||||||||||
NET INCOME | $ | 6,711 | $ | 5,908 | $ | 7,657 | ||||||
Other comprehensive income (loss): | ||||||||||||
Unrealized gain on pension liability | 490 | - | - | |||||||||
Tax Effect | (172 | ) | - | - | ||||||||
Investment securities available for sale: | ||||||||||||
Unrealized holding gains (losses) | (7,180 | ) | 656 | 5,820 | ||||||||
Tax Effect | 2,440 | (217 | ) | (1,984 | ) | |||||||
Reclassification of gains from sale of securities | (284 | ) | (626 | ) | (1,170 | ) | ||||||
Tax Effect | 99 | 213 | 398 | |||||||||
Net of tax amount | (4,607 | ) | 26 | 3,064 | ||||||||
COMPREHENSIVE INCOME | $ | 2,104 | $ | 5,934 | $ | 10,721 |
See notes to consolidated financial statements
32
NORWOOD FINANCIAL CORP - 2016 CONSOLIDATED FINANCIAL REPORT
CONSOLIDATED STATEMENTS OF STOCKHOLDERS' EQUITY
Years Ended December 31, 2016, 2015 and 2014 | |||||||||||||||||||||||
Accumulated | |||||||||||||||||||||||
Other | |||||||||||||||||||||||
Common Stock | Retained | Treasury Stock | Comprehensive | ||||||||||||||||||||
Shares | Amount | Surplus | Earnings | Shares | Amount | Income (Loss) | Total | ||||||||||||||||
(Dollars in Thousands, Except Per Share Data) | |||||||||||||||||||||||
BALANCE - DECEMBER 31, 2013 | 3,708,718 | $ | 371 | $ | 35,010 | $ | 60,798 | 64,628 | $ | (1,713) | $ | (2,602) | $ | 91,864 | |||||||||
Net Income | - | - | - | 7,657 | - | - | - | 7,657 | |||||||||||||||
Other comprehensive income | - | - | - | - | - | - | 3,064 | 3,064 | |||||||||||||||
Cash dividends declared ($1.20 per share) | - | - | - | (4,377) | - | - | - | (4,377) | |||||||||||||||
Acquisition of treasury stock | - | - | - | - | 6,669 | (179) | - | (179) | |||||||||||||||
Stock options exercised | - | - | 13 | - | (25,577) | 678 | - | 691 | |||||||||||||||
Tax benefit on stock options exercised | - | - | 17 | - | - | - | - | 17 | |||||||||||||||
Sale of treasury stock for ESOP | - | - | 13 | - | (5,144) | 137 | - | 150 | |||||||||||||||
Compensation expense related to | |||||||||||||||||||||||
stock options | - | - | 154 | - | - | - | - | 154 | |||||||||||||||
Restricted stock awards | 9,300 | 1 | (1) | - | - | - | - | - | |||||||||||||||
BALANCE - DECEMBER 31, 2014 | 3,718,018 | 372 | 35,206 | 64,078 | 40,576 | (1,077) | 462 | 99,041 | |||||||||||||||
Net Income | - | - | - | 5,908 | - | - | - | 5,908 | |||||||||||||||
Other comprehensive income | - | - | - | - | - | - | 26 | 26 | |||||||||||||||
Cash dividends declared ($1.24 per share) | - | - | - | (4,574) | - | - | - | (4,574) | |||||||||||||||
Acquisition of treasury stock | - | - | - | - | 4,374 | (127) | - | (127) | |||||||||||||||
Stock options exercised | - | - | (9) | - | (16,859) | 450 | - | 441 | |||||||||||||||
Tax benefit on stock options exercised | - | - | 16 | - | - | - | - | 16 | |||||||||||||||
Sale of treasury stock for ESOP | - | - | 10 | - | (5,060) | 136 | - | 146 | |||||||||||||||
Compensation expense related to | |||||||||||||||||||||||
stock options | - | - | 66 | - | - | - | - | 66 | |||||||||||||||
Restricted stock awards | 6,650 | 1 | 62 | - | 280 | (8) | - | 55 | |||||||||||||||
BALANCE - DECEMBER 31, 2015 | 3,724,668 | 373 | 35,351 | 65,412 | 23,311 | (626) | 488 | 100,998 | |||||||||||||||
Net Income | - | - | - | 6,711 | - | - | - | 6,711 | |||||||||||||||
Other comprehensive loss | - | - | - | - | - | - | (4,607) | (4,607) | |||||||||||||||
Cash dividends declared ($1.25 per share) | - | - | - | (4,898) | - | - | - | (4,898) | |||||||||||||||
Acquisition of treasury stock | - | - | - | - | 15,538 | (447) | - | (447) | |||||||||||||||
Stock options exercised | - | - | (8) | - | (30,823) | 851 | - | 843 | |||||||||||||||
Tax benefit on stock options exercised | - | - | 38 | - | - | - | - | 38 | |||||||||||||||
Sale of treasury stock for ESOP | - | - | 21 | - | (3,967) | 110 | - | 131 | |||||||||||||||
Compensation expense related to | |||||||||||||||||||||||
stock options | - | - | 71 | - | - | - | - | 71 | |||||||||||||||
Restricted stock awards | 8,450 | - | 102 | - | 450 | (13) | - | 89 | |||||||||||||||
Delaware Bancshares acquisition | 431,605 | 43 | 12,107 | - | - | - | - | 12,150 | |||||||||||||||
BALANCE - DECEMBER 31, 2016 | 4,164,723 | $ | 416 | $ | 47,682 | $ | 67,225 | 4,509 | $ | (125) | $ | (4,119) | $ | 111,079 |
33
NORWOOD FINANCIAL CORP - 2016 CONSOLIDATED FINANCIAL REPORT
CONSOLIDATED STATEMENTS OF CASH FLOWS | ||||||||
Years Ended December 31, | ||||||||
2016 | 2015 | 2014 | ||||||
(In Thousands) | ||||||||
CASH FLOWS FROM OPERATING ACTIVITIES | ||||||||
Net income | $ | 6,711 | $ | 5,908 | $ | 7,657 | ||
Adjustments to reconcile net income to net cash provided by operating activities: | ||||||||
Provision for loan losses | 2,050 | 4,580 | 1,680 | |||||
Depreciation | 726 | 551 | 572 | |||||
Amortization of intangible assets | 122 | 105 | 121 | |||||
Deferred income taxes | 746 | (387) | (51) | |||||
Net amortization of securities premiums and discounts | 1,648 | 936 | 860 | |||||
Net realized gains on sales of securities | (284) | (626) | (1,170) | |||||
Earnings and proceeds on life insurance policies | (888) | (665) | (685) | |||||
Loss on sales of fixed assets and foreclosed real estate owned | 11 | 427 | 920 | |||||
Net gain on sale of mortgage loans | (54) | (113) | (150) | |||||
Mortgage loans originated for sale | (1,685) | (4,297) | (4,269) | |||||
Proceeds from sale of mortgage loans originated for sale | 1,739 | 4,410 | 4,419 | |||||
Compensation expense related to stock options | 71 | 66 | 154 | |||||
Compensation expense related to restricted stock | 89 | 55 | - | |||||
Decrease (increase) in accrued interest receivable | 346 | (24) | 83 | |||||
Increase (decrease) in accrued interest payable | 17 | (9) | (57) | |||||
Other, net | (27) | (419) | 447 | |||||
Net Cash Provided by Operating Activities | 11,338 | 10,498 | 10,531 | |||||
CASH FLOWS FROM INVESTING ACTIVITIES | ||||||||
Securities available for sale: | ||||||||
Proceeds from sales | 110,748 | 44,976 | 66,263 | |||||
Proceeds from maturities and principal reductions on mortgage-backed securities | 26,182 | 22,853 | 14,859 | |||||
Purchases | (100,982) | (50,565) | (74,426) | |||||
Proceeds from maturities on securities held-to-maturity | - | - | 175 | |||||
Purchase of regulatory stock | (2,883) | (4,095) | (1,963) | |||||
Redemption of regulatory stock | 4,455 | 2,397 | 3,126 | |||||
Net increase in loans | (43,468) | (65,830) | (4,270) | |||||
Proceeds from bank-owned life insurance | 205 | - | 75 | |||||
Purchase of bank-owned life insurance | (2,000) | - | - | |||||
Purchase of premises and equipment | (511) | (290) | (193) | |||||
Proceeds from sales of foreclosed real estate owned and fixed assets | 685 | 4,310 | 1,045 | |||||
Acquisition, net of cash and cash equivalents acquired | 11,112 | - | - | |||||
Net Cash Provided by (Used in) Investing Activities | 3,543 | (46,244) | 4,691 | |||||
CASH FLOWS FROM FINANCING ACTIVITIES | ||||||||
Net increase (decrease) in deposits | 47,213 | (9,035) | 18,762 | |||||
Net (decrease) increase in short-term borrowings | (21,800) | 27,540 | (24,219) | |||||
Repayments of other borrowings | (28,981) | (10,074) | (1,561) | |||||
Proceeds from other borrowings | - | 29,000 | - | |||||
Stock options exercised | 843 | 441 | 691 | |||||
Tax benefit of stock options exercised | 38 | 16 | 17 | |||||
ESOP purchase of shares from treasury stock | 131 | 146 | 150 | |||||
Purchase of treasury stock | (447) | (127) | (179) | |||||
Cash dividends paid | (4,714) | (4,527) | (4,370) | |||||
Net Cash (Used in) Provided by Financing Activities | (7,717) | 33,380 | (10,709) | |||||
Net Increase (Decrease) in Cash and Cash Equivalents | 7,164 | (2,366) | 4,513 | |||||
CASH AND CASH EQUIVALENTS - BEGINNING | 10,010 | 12,376 | 7,863 | |||||
CASH AND CASH EQUIVALENTS - ENDING | $ | 17,174 | $ | 10,010 | $ | 12,376 | ||
34
NORWOOD FINANCIAL CORP - 2016 CONSOLIDATED FINANCIAL REPORT
CONSOLIDATED STATEMENTS OF CASH FLOWS (CONTINUED)
Years Ended December 31, | ||||||||
2016 | 2015 | 2014 | ||||||
(In Thousands) | ||||||||
Supplemental Disclosures of Cash Flow Information | ||||||||
Cash payments for: | ||||||||
Interest paid | $ | 3,542 | $ | 3,267 | $ | 3,264 | ||
Income taxes paid, net of refunds | $ | 1,535 | $ | 2,315 | $ | 2,645 | ||
Supplemental Schedule of Noncash Investing Activities | ||||||||
Transfers of loans to foreclosed real estate owned and repossession of other assets | $ | 3,246 | $ | 3,880 | $ | 4,704 | ||
Dividends payable | $ | 1,331 | $ | 1,147 | $ | 1,100 | ||
Merger with Delaware Bancshares, Inc. | ||||||||
Noncash assets acquired: | ||||||||
Securities available-for-sale | $ | 208,488 | ||||||
Regulatory stock | 279 | |||||||
Loans | 116,674 | |||||||
Premises and equipment, net | 7,292 | |||||||
Accrued interest receivable | 1,626 | |||||||
Bank-owned life insurance | 14,762 | |||||||
Core deposit intangible | 449 | |||||||
Deferred tax assets | 3,034 | |||||||
Other assets | 3,281 | |||||||
Goodwill | 1,616 | |||||||
$ | 357,501 | |||||||
Liabilities assumed: | ||||||||
Time deposits | $ | 71,342 | ||||||
Deposits other than time deposits | 255,921 | |||||||
Borrowings | 21,232 | |||||||
Accrued interest payable | 95 | |||||||
Other liabilities | 7,873 | |||||||
356,463 | ||||||||
Net Noncash Assets Acquired | 1,038 | |||||||
Cash Acquired | $ | 14,977 |
See notes to consolidated financial statements
35
NORWOOD FINANCIAL CORP - 2016 CONSOLIDATED FINANCIAL REPORT
NOTES TO CONSOLIDATED FINANCIAL STATEMENTS
NOTE 1 - NATURE OF OPERATIONS
Norwood Financial Corp (Company) is a one bank holding company. Wayne Bank (Bank) is a wholly-owned subsidiary of the Company. The Bank is a state-chartered bank located in Honesdale, Pennsylvania. The Company derives substantially all of its income from bank-related services which include interest earnings on commercial mortgages, residential real estate mortgages, commercial and consumer loans, as well as interest earnings on investment securities and fees from deposit services to its customers. The Company is subject to regulation and supervision by the Federal Reserve Board while the Bank is subject to regulation and supervision by the Federal Deposit Insurance Corporation and the Pennsylvania Department of Banking and Securities.
NOTE 2 - SUMMARY OF SIGNIFICANT ACCOUNTING POLICIES
Principles of Consolidation
The consolidated financial statements include the accounts of the Company and its wholly-owned subsidiary, the Bank, and the Bank's wholly-owned subsidiaries, WCB Realty Corp., Norwood Investment Corp., Norwood Settlement Services, LLC and WTRO Properties. All significant intercompany accounts and transactions have been eliminated in consolidation.
Estimates
The preparation of financial statements in conformity with accounting principles generally accepted in the United States of America requires management to make estimates and assumptions that affect the reported amounts of assets and liabilities and disclosure of contingent assets and liabilities at the date of the financial statements and the reported amounts of revenues and expenses during the reporting period. Actual results could differ from those estimates. Material estimates that are particularly susceptible to significant change in the near term relate to the determination of the allowance for loan losses, the valuation of deferred tax assets, the determination of other-than-temporary impairment on securities, the determination of goodwill impairment and the fair value of financial instruments.
Significant Group Concentrations of Credit Risk
Most of the Company's activities are with customers located within its markets in northeastern Pennsylvania and the Southern Tier of New York. Note 3 discusses the types of securities that the Company invests in. Note 4 discusses the types of lending that the Company engages in. The Company does not have any significant concentrations to any one industry or customer.
Concentrations of Credit Risk
The Bank operates primarily in Wayne, Pike, Lackawanna and Monroe Counties, Pennsylvania and Delaware and Sullivan Counties, New York. Accordingly, the Bank has extended credit primarily to commercial entities and individuals in these areas whose ability to honor their contracts is influenced by the region's economy. These customers are also the primary depositors of the Bank. The Bank is limited in extending credit by legal lending limits to any single borrower or group of related borrowers.
Securities
Securities classified as available for sale are those securities that the Company intends to hold for an indefinite period of time but not necessarily to maturity. Any decision to sell a security classified as available for sale would be based on various factors, including significant movement in interest rates, changes in maturity mix of the Company's assets and liabilities, liquidity needs, regulatory capital considerations and other similar factors. Securities available for sale are carried at fair value. Unrealized gains and losses are reported in other comprehensive income, net of the related deferred tax effect. Realized gains or losses, determined on the basis of
36
NORWOOD FINANCIAL CORP - 2016 CONSOLIDATED FINANCIAL REPORT
NOTE 2 - SUMMARY OF SIGNIFICANT ACCOUNTING POLICIES (CONTINUED)
the cost of the specific securities sold, are included in earnings. Premiums and discounts are recognized in interest income using a method which approximates the interest method over the term of the security.
Bonds, notes and debentures for which the Company has the positive intent and ability to hold to maturity are reported at cost, adjusted for premiums and discounts that are recognized in interest income using the interest method over the term of the security.
Management determines the appropriate classification of debt securities at the time of purchase and re-evaluates such designation as of each Consolidated Balance Sheet date.
Declines in the fair value of held to maturity and available for sale securities below their cost that are deemed to be other than temporary are reflected in earnings as realized losses. In estimating other-than-temporary impairment losses, management considers (1) the length of time and the extent to which the fair value has been less than cost, (2) the financial condition and near-term prospects of the issuer, and (3) the intent of the Company to not sell the securities and it is more likely than not that it will not have to sell the securities before recovery of their cost basis.
Regulatory Stock
The Company, as a member of the Federal Home Loan Bank (FHLB) system is required to maintain an investment in capital stock of its district FHLB according to a predetermined formula. This regulatory stock has no quoted market value and is carried at cost.
Management evaluates the regulatory stock for impairment. Management's determination of whether these investments are impaired is based on their assessment of the ultimate recoverability of their cost rather than by recognizing temporary declines in value. The determination of whether a decline affects the ultimate recoverability of their cost is influenced by criteria such as (1) the significance of the decline in net assets of the FHLB as compared to the capital stock amount for the FHLB and the length of time this situation has persisted, (2) commitments by the FHLB to make payments required by law or regulation and the level of such payments in relation to the operating performance of the FHLB, and (3) the impact of legislative and regulatory changes on institutions and, accordingly, on the customer base of the FHLB. Management considers the FHLB's regulatory capital ratios, liquidity, and the fact that new shares of FHLB stock continue to change hands at the $100 par value. Management believes no impairment charge is necessary related to FHLB stock as of December 31, 2016.
Loans Receivable
Loans receivable that management has the intent and ability to hold for the foreseeable future or until maturity or payoff are stated at their outstanding unpaid principal balances, net of an allowance for loan losses and any deferred fees. Interest income is accrued on the unpaid principal balance. Loan origination fees are deferred and recognized as an adjustment of the yield (interest income) of the related loans. The Company is generally amortizing these amounts over the contractual life of the loan.
The accrual of interest is generally discontinued when the contractual payment of principal or interest has become 90 days past due or management has serious doubts about further collectability of principal or interest, even though the loan is currently performing. A loan may remain on accrual status if it is in the process of collection and is either guaranteed or well secured. When a loan is placed on nonaccrual status, unpaid interest credited to income in the current year is reversed and unpaid interest accrued in prior years is charged against the allowance for loan losses. Interest received on nonaccrual loans generally is either applied against principal or reported as interest income, according to management's judgment as to the collectability of principal.
37
NORWOOD FINANCIAL CORP - 2016 CONSOLIDATED FINANCIAL REPORT
NOTE 2 - SUMMARY OF SIGNIFICANT ACCOUNTING POLICIES (CONTINUED)
Generally, loans are restored to accrual status when the obligation is brought current, has performed in accordance with the contractual terms for a reasonable period of time and the ultimate collectability of the total contractual principal and interest is no longer in doubt.
Troubled Debt Restructurings
A loan is considered to be a troubled debt restructuring (TDR) loan when the Company grants a concession to the borrower because of the borrower's financial condition that it would not otherwise consider. Such concessions include the reduction of interest rates, forgiveness of principal or interest, or other modifications of interest rates that are less than the current market rate for new obligations with similar risk.
Loans Acquired
Loans acquired including loans that have evidence of deterioration of credit quality since origination and for which it is probable, at acquisition, that the Company will be unable to collect all contractually required payments receivable, are initially recorded at fair value (as determined by the present value of expected future cash flows) with no valuation allowance. Loans are evaluated individually to determine if there is evidence of deterioration of credit quality since origination. The difference between the undiscounted cash flows expected at acquisition and the investment in the loan, or the "accretable yield," is recognized as interest income on a level-yield method over the life of the loan. Contractually required payments for interest and principal that exceed the undiscounted cash flows expected at acquisition, or the "non-accretable difference," are not recognized as a yield adjustment or as a loss accrual or a valuation allowance. Increases in expected cash flows subsequent to the initial investment are recognized prospectively through adjustment of the yield on the loan over its remaining estimated life. Decreases in expected cash flows are recognized immediately as impairment. Any valuation allowances on these impaired loans reflect only losses incurred after the acquisition.
For purchased loans acquired that are not deemed impaired at acquisition, credit discounts representing the principal losses expected over the life of the loan are a component of the initial fair value. Loans may be aggregated and accounted for as a pool of loans if the loans being aggregated have common risk characteristics. Subsequent to the purchase date, the methods utilized to estimate the required allowance for credit losses for these loans is similar to originated loans; however, the Company records a provision for loan losses only when the required allowance exceeds any remaining credit discounts. The remaining differences between the purchase price and the unpaid principal balance at the date of acquisition are recorded in interest income over the life of the loans.
Mortgage Servicing Rights
Servicing assets are recognized as separate assets when rights are acquired through purchase or through the sale of financial assets. Capitalized servicing rights are reported in other assets and are amortized into noninterest income in proportion to, and over the period of, the estimated future net servicing income of the underlying financial assets. Servicing assets are evaluated for impairment based upon a third party appraisal. Fair value is determined using prices for similar assets with similar characteristics, when available, or based upon discounted cash flows using market-based assumptions. Impairment is recognized through a valuation allowance to the extent that fair value is less than the capitalized amount. The Company's loan servicing assets at December 31, 2016 and 2015, respectively, were not impaired. Total servicing assets included in other assets as of December 31, 2016 and 2015, were $232,000 and $261,000, respectively.
Allowance for Loan Losses
The allowance for loan losses is established through provisions for loan losses charged against income. Loans deemed to be uncollectible are charged against the allowance for loan losses, and subsequent recoveries, if any, are credited to the allowance.
38
NORWOOD FINANCIAL CORP - 2016 CONSOLIDATED FINANCIAL REPORT
NOTE 2 - SUMMARY OF SIGNIFICANT ACCOUNTING POLICIES (CONTINUED)
The allowance for loan losses is maintained at a level considered adequate to provide for losses that can be reasonably anticipated. Management's periodic evaluation of the adequacy of the allowance is based on the Company's past loan loss experience, known and inherent risks in the portfolio, adverse situations that may affect the borrower's ability to repay, the estimated value of any underlying collateral, composition of the loan portfolio, current economic conditions and other relevant factors. This evaluation is inherently subjective as it requires material estimates that may be susceptible to significant revision as more information becomes available.
The allowance consists of specific and general components. The specific component relates to loans that are classified as substandard. For such loans that are also classified as impaired, an allowance is established when the discounted cash flows (or collateral value or observable market price) of the impaired loan is lower than the carrying value of that loan. The general component covers non-classified loans and is based on historical loss experience adjusted for qualitative factors.
A loan is considered impaired when, based on current information and events, it is probable that the Company will be unable to collect the scheduled payments of principal or interest when due according to the contractual terms of the loan agreement. Factors considered by management in determining impairment include payment status, collateral value and the probability of collecting scheduled principal and interest payments when due. Loans that experience insignificant payment delays and payment shortfalls generally are not classified as impaired. Management determines the significance of payment delays and payment shortfalls on a case-by-case basis, taking into consideration all of the circumstances surrounding the loan and the borrower, including the length of the delay, the reasons for the delay, the borrower's prior payment record and the amount of the shortfall in relation to the principal and interest owed. Impairment is measured on a loan by loan basis for commercial and construction loans by either the present value of expected future cash flows discounted at the loan's effective interest rate, the loan's obtainable market price or the fair value of the collateral if the loan is collateral dependent.
Large groups of smaller balance homogeneous loans are collectively evaluated for impairment. Accordingly, the Company does not separately identify individual consumer and residential real estate loans for impairment disclosures, unless such loans were acquired with impairment or are the subject of a restructuring agreement.
Premises and Equipment
Land is carried at cost. Premises and equipment are stated at cost less accumulated depreciation. Depreciation expense is calculated principally on the straight-line method over the respective assets estimated useful lives as follows:
Years | ||||
Buildings and improvements | 10 - 40 | |||
Furniture and equipment | 3 - 10 |
Transfers of Financial Assets
Transfers of financial assets, including loan and loan participation sales, are accounted for as sales, when control over the assets has been surrendered. Control over transferred assets is deemed to be surrendered when (1) the assets have been isolated from the Company, (2) the transferee obtains the right (free of conditions that constrain it from taking advantage of that right) to pledge or exchange the transferred assets and (3) the Company does not maintain effective control over the transferred assets through an agreement to repurchase them before their maturity or the ability to unilaterally cause the holder to return specific assets.
39
NORWOOD FINANCIAL CORP - 2016 CONSOLIDATED FINANCIAL REPORT
NOTE 2 - SUMMARY OF SIGNIFICANT ACCOUNTING POLICIES (CONTINUED)
Foreclosed Real Estate
Real estate properties acquired through, or in lieu of, loan foreclosure are to be sold and are initially recorded at fair value less cost to sell at the date of foreclosure establishing a new cost basis. After foreclosure, valuations are periodically performed by management and the real estate is carried at the lower of its carrying amount or fair value less cost to sell. Revenue and expenses from operations and changes in the valuation allowance are included in other expenses.
Bank Owned Life Insurance
The Company invests in bank owned life insurance (BOLI) as a source of funding for employee benefit expenses. BOLI involves the purchasing of life insurance by the Bank on a select group of employees. The Company is the owner and beneficiary of the policies. This life insurance investment is carried at the cash surrender value of the underlying policies. Income from the increase in cash surrender value of the policies or from death benefits realized is included in other income on the Consolidated Statements of Income.
Goodwill
In connection with two acquisitions the Company recorded goodwill in the amount of $11.3 million, representing the excess of amounts paid over the fair value of net assets of the institutions acquired. Goodwill is tested and deemed impaired when the carrying value of goodwill exceeds its implied fair value. The value of the goodwill can change in the future. We expect the value of the goodwill to decrease if there is a significant decrease in the franchise value of the Bank. If an impairment loss is determined in the future, we will reflect the loss as an expense for the period in which the impairment is determined, leading to a reduction of our net income for that period by the amount of the impairment loss. No impairment was recognized for the years ended December 31, 2016, 2015 and 2014.
Other Intangible Assets
At December 31, 2016, the Company had other intangible assets of $612,000 which is net of accumulated amortization of $732,000. These intangible assets will continue to be amortized using the sum-of-the-years digits method of amortization over ten years. At December 31, 2015, the Company had other intangible assets of $285,000 which was net of accumulated amortization of $610,000. Amortization expense related to other intangible assets was $122,000, $105,000 and $121,000 for the years ended December 31, 2016, 2015 and 2014.
As of December 31, 2016, the estimated future amortization expense for the core deposit intangible is as follows (in thousands):
2017 | $ | 150 | |
2018 | 126 | ||
2019 | 101 | ||
2020 | 77 | ||
2021 | 52 | ||
Thereafter | 106 | ||
$ | 612 | ||
Income Taxes
Deferred income tax assets and liabilities are determined based on the differences between financial statement carrying amounts and the tax basis of existing assets and liabilities. These differences are measured at the enacted tax rates that will be in effect when these differences reverse. Deferred tax assets are reduced by a valuation allowance when, in the opinion of management, it is more likely than not that some portion of the
40
NORWOOD FINANCIAL CORP - 2016 CONSOLIDATED FINANCIAL REPORT
NOTE 2 - SUMMARY OF SIGNIFICANT ACCOUNTING POLICIES (CONTINUED)
deferred tax assets will not be realized. As changes in tax laws or rates are enacted, deferred tax assets and liabilities are adjusted through the provision for income taxes. The Company and its subsidiary file a consolidated federal income tax return. The Company recognizes interest and penalties on income taxes as a component of income tax expense.
The Company analyzes each tax position taken in its tax returns and determines the likelihood that the position will be realized. Only tax positions that are "more-likely-than-not" to be realized can be recognized in an entity's financial statements. For tax positions that do not meet this recognition threshold, an entity will record an unrecognized tax benefit for the difference between the position taken on the tax return and the amount recognized in the financial statements. The Company does not have any unrecognized tax benefits at December 31, 2016 or 2015 or during the years then ended. No unrecognized tax benefits are expected to arise within the next twelve months.
Advertising Costs
Advertising costs are expensed as incurred.
Earnings per Share
Basic earnings per share represents income available to common stockholders divided by the weighted average number of common shares outstanding during the period less any unvested restricted shares. Diluted earnings per share reflects additional common shares that would have been outstanding if dilutive potential common shares had been issued, as well as any adjustment to income that would result from the assumed issuance. Potential common shares that may be issued by the Company relate solely to outstanding stock options and are determined using the treasury stock method. Treasury shares are not deemed outstanding for earnings per share calculations.
Employee Benefit Plans
The Company has a defined contributory profit-sharing plan which includes provisions of a 401 (k) plan. The Company's contributions are expensed as the cost is incurred.
The Company has several supplemental executive retirement plans. To fund the benefits under these plans, the Company is the owner of single premium life insurance policies on the particiapants.
The Company provides pension benefits to eligible employees. The Company's funding policy is to contribute the minimum required contributions annually.
Stock Option Plans
The Company recognizes the value of share-based payment transactions as compensation costs in the financial statements over the period that an employee provides service in exchange for the award. The fair value of the share-based payments for stock options is estimated using the Black-Scholes option-pricing model. The Company used the modified-prospective transition method to record compensation expense. Under the modified prospective method, companies are required to record compensation cost for new and modified awards over the related vesting period of such awards and record compensation cost prospectively for the unvested portion, at the date of adoption, of previously issued and outstanding awards over the remaining vesting period of such awards. No change to prior periods presented is permitted under the modified prospective method.
41
NORWOOD FINANCIAL CORP - 2016 CONSOLIDATED FINANCIAL REPORT
NOTE 2 - SUMMARY OF SIGNIFICANT ACCOUNTING POLICIES (CONTINUED)
Restricted Stock
The Company recognizes compensation cost related to restricted stock based on the market price of the stock at the grant date over the vesting period. The product of the number of shares granted and the grant date market price of the Company's common stock determines the fair value of restricted stock under the Company's 2014 Equity Incentive Plan. The Company recognizes compensation expense for the fair value of the restricted stock on a straight-line basis over the requisite service period for the entire award.
Cash Flow Information
For the purposes of reporting cash flows, cash and cash equivalents include cash on hand, amounts due from banks, interest-bearing deposits with banks and federal funds sold.
Off-Balance Sheet Financial Instruments
In the ordinary course of business, the Company has entered into off-balance sheet financial instruments consisting of commitments to extend credit, letters of credit and commitments to sell loans. Such financial instruments are recorded on the balance sheets when they become receivable or payable.
Trust Assets
Assets held by the Company in a fiduciary capacity for customers are not included in the financial statements since such items are not assets of the Company. Trust income is reported on the accrual method.
Treasury Stock
Common shares repurchased are recorded as treasury stock at cost.
Comprehensive Income
Accounting principles generally require that recognized revenue, expenses, gains and losses be included in net income. Certain changes in assets and liabilities, such as unrealized gains and losses on available for sale securities and defined benefit pension obligations, are reported as a separate component of the equity section of the balance sheet. Such items, along with net income, are components of comprehensive income as presented in the Consolidated Statement of Comprehensive Income.
Segment Reporting
The Company acts as an independent community financial services provider and offers traditional banking related financial services to individual, business and government customers. Through its branch and automated teller machine network, the Company offers a full array of commercial and retail financial services, including the taking of time, savings and demand deposits; the making of commercial, consumer and mortgage loans; and the providing of safe deposit services. The Company also performs personal, corporate, pension and fiduciary services through its Trust Department.
Management does not separately allocate expenses, including the cost of funding loan demand, between the commercial, retail, mortgage banking and trust operations of the Company. As such, discrete information is not available and segment reporting would not be meaningful.
New Accounting Standards
In May 2014, the FASB issued ASU 2014-09, Revenue from Contracts with Customers (a new revenue recognition standard). The Update's core principle is that a company will recognize revenue to depict the transfer of goods or services to customers in an amount that reflects the consideration to which the entity expects to be entitled in exchange for those goods or services. In addition, this Update specifies the accounting for certain costs to obtain or fulfill a contract with a customer and expands disclosure requirements for revenue recognition. This Update is effective for annual reporting periods beginning after December 15, 2016, including interim periods within that reporting period. The Company is currently evaluating the impact the adoption of the standard will have on the Company's financial position or results of operations.
42
NORWOOD FINANCIAL CORP - 2016 CONSOLIDATED FINANCIAL REPORT
NOTE 2 - SUMMARY OF SIGNIFICANT ACCOUNTING POLICIES (CONTINUED)
entitled in exchange for those goods or services. In addition, this Update specifies the accounting for certain costs to obtain or fulfill a contract with a customer and expands disclosure requirements for revenue recognition. This Update is effective for annual reporting periods beginning after December 15, 2016, including interim periods within that reporting period. The Company is currently evaluating the impact the adoption of the standard will have on the Company's financial position or results of operations.
In January 2016, the FASB issued ASU 2016-01, Financial Instruments – Overall (Subtopic 825-10): Recognition and Measurement of Financial Assets and Financial Liabilities. This Update applies to all entities that hold financial assets or owe financial liabilities and is intended to provide more useful information on the recognition, measurement, presentation, and disclosure of financial instruments. Among other things, this Update (a) requires equity investments (except those accounted for under the equity method of accounting or those that result in consolidation of the investee) to be measured at fair value with changes in fair value recognized in net income; (b) simplifies the impairment assessment of equity investments without readily determinable fair values by requiring a qualitative assessment to identify impairment; (c) eliminates the requirement to disclose the fair value of financial instruments measured at amortized cost for entities that are not public business entities; (d) eliminates the requirement for public business entities to disclose the method(s) and significant assumptions used to estimate the fair value that is required to be disclosed for financial instruments measured at amortized cost on the balance sheet; (e) requires public business entities to use the exit price notion when measuring the fair value of financial instruments for disclosure purposes; (f) requires separate presentation of financial assets and financial liabilities by measurement category and form of financial asset (that is, securities or loans and receivables) on the balance sheet or the accompanying notes to the financial statements; and (g) clarifies that an entity should evaluate the need for a valuation allowance on a deferred tax asset related to available-for-sale securities in combination with the entity's other deferred tax assets. For public business entities, the amendments in this Update are effective for fiscal years beginning after December 15, 2017, including interim periods within those fiscal years. For all other entities, including not-for-profit entities and employee benefit plans within the scope of Topics 960 through 965 on plan accounting, the amendments in this Update are effective for fiscal years beginning after December 15, 2018, and interim periods within fiscal years beginning after December 15, 2019. All entities that are not public business entities may adopt the amendments in this Update earlier as of the fiscal years beginning after December 15, 2017, including interim periods within those fiscal years. The Company is currently evaluating the impact the adoption of the standard will have on the Company's financial position or results of operations.
In February 2016, the FASB issued ASU 2016-02, Leases (Topic 842). The standard requires lessees to recognize the assets and liabilities that arise from leases on the balance sheet. A lessee should recognize in the statement of financial position a liability to make lease payments (the lease liability) and a right-of-use asset representing its right to use the underlying asset for the lease term. A short-term lease is defined as one in which (a) the lease term is 12 months or less and (b) there is not an option to purchase the underlying asset that the lessee is reasonably certain to exercise. For short-term leases, lessees may elect to recognize lease payments over the lease term on a straight-line basis. For public business entities, the amendments in this Update are effective for fiscal years beginning after December 15, 2018, and interim periods within those years. For all other entities, the amendments in this Update are effective for fiscal years beginning after December 15, 2019, and for interim periods within fiscal years beginning after December 15, 2020. The amendments should be applied at the beginning of the earliest period presented using a modified retrospective approach with earlier application permitted as of the beginning of an interim or annual reporting period. The Company is currently assessing practical expedients it may elect at adoption, but does not anticipate the amendments will have a significant
43
NORWOOD FINANCIAL CORP - 2016 CONSOLIDATED FINANCIAL REPORT
NOTE 2 - SUMMARY OF SIGNIFICANT ACCOUNTING POLICIES (CONTINUED)
impact to the financial statements. Based on the Company's preliminary analysis of its current portfolio, the impact to the Company's balance sheet is estimated to result in less than a 1% increase in assets and liabilities. The Company also anticipates additional disclosures to be provided at adoption.
In March 2016, the FASB issued ASU 2016-09, Compensation – Stock Compensation (Topic 718). The amendments in this Update affect all entities that issue share-based payment awards to their employees. The standards in this Update provide simplification for several aspects of the accounting for share-based payment transactions, including the income tax consequences, classification of awards as with equity or liabilities, and classification on the statement of cash flows. Some of the areas for simplification apply only to nonpublic entities. In addition to those simplifications, the amendments eliminate the guidance in Topic 718 that was indefinitely deferred shortly after the issuance of FASB Statement No. 123 (revised 2004), Share-Based Payment. This should not result in a change in practice because the guidance that is being superseded was never effective. For public business entities, the amendments in this Update are effective for annual periods beginning after December 15, 2016, and interim periods within those annual periods. For all other entities, the amendments are effective for annual periods beginning after December 15, 2017, and interim periods within annual periods beginning after December 15, 2018. Early adoption is permitted for any entity in any interim or annual period. The Company is currently evaluating the impact the adoption of the standard will have on the Company's financial position or results of operations.
In June 2016, the FASB issued ASU 2016-13, Financial Instruments - Credit Losses: Measurement of Credit Losses on Financial Instruments ("ASU 2016-13"), which changes the impairment model for most financial assets. This Update is intended to improve financial reporting by requiring timelier recording of credit losses on loans and other financial instruments held by financial institutions and other organizations. The underlying premise of the Update is that financial assets measured at amortized cost should be presented at the net amount expected to be collected, through an allowance for credit losses that is deducted from the amortized cost basis. The allowance for credit losses should reflect management's current estimate of credit losses that are expected to occur over the remaining life of a financial asset. The income statement will be effected for the measurement of credit losses for newly recognized financial assets, as well as the expected increases or decreases of expected credit losses that have taken place during the period. ASU 2016-13 is effective for annual and interim periods beginning after December 15, 2019, and early adoption is permitted for annual and interim periods beginning after December 15, 2018. With certain exceptions, transition to the new requirements will be through a cumulative effect adjustment to opening retained earnings as of the beginning of the first reporting period in which the guidance is adopted. The Company is currently evaluating the impact the adoption of the standard will have on the Company's financial position or results of operations.
In August 2016, the FASB issued ASU 2016-15, Statement of Cash Flows (Topic 230): Classification of Certain Cash Receipts and Cash Payments ("ASU 2016-15"), which addresses eight specific cash flow issues with the objective of reducing diversity in practice. Among these include recognizing cash payments for debt prepayment or debt extinguishment as cash outflows for financing activities; cash proceeds received from the settlement of insurance claims should be classified on the basis of the related insurance coverage; and cash proceeds received from the settlement of bank-owned life insurance policies should be classified as cash inflows from investing activities while the cash payments for premiums on bank-owned policies may be classified as cash outflows for investing activities, operating activities, or a combination of investing and operating activities. The amendments in this Update are effective for public business entities for fiscal years beginning after December 15, 2017, and
44
NORWOOD FINANCIAL CORP - 2016 CONSOLIDATED FINANCIAL REPORT
NOTE 2 - SUMMARY OF SIGNIFICANT ACCOUNTING POLICIES (CONTINUED)
interim periods within those fiscal years. For all other entities, the amendments are effective for fiscal years beginning after December 15, 2018, and interim periods within fiscal years beginning after December 15, 2019. Early adoption is permitted, including adoption in an interim period. If an entity early adopts the amendments in an interim period, any adjustments should be reflected as of the beginning of the fiscal year that includes that interim period. An entity that elects early adoption must adopt all of the amendments in the same period. The amendments in this Update should be applied using a retrospective transition method to each period presented. If it is impracticable to apply the amendments retrospectively for some of the issues, the amendments for those issues would be applied prospectively as of the earliest date practicable. The Company is currently evaluating the impact the adoption of the standard will have on the Company's statement of cash flows.
In October 2016, the FASB issued ASU 2016-18, Statement of Cash Flows (Topic 230) ("ASU 2016-18"), which requires that a statement of cash flows explains the change during the period in the total of cash, cash equivalents, and amounts generally described as restricted cash or restricted cash equivalents. Therefore, amounts generally described as restricted cash and restricted cash equivalents should be included with cash and cash equivalents when reconciling the beginning-of-period and end-of-period total amounts shown on the statement of cash flows. The amendments in this Update are effective for public business entities for fiscal years beginning after December 15, 2017, and interim periods within those fiscal years. For all other entities, the amendments are effective for fiscal years beginning after December 15, 2018, and interim periods within fiscal years beginning after December 15, 2019. Early adoption is permitted, including adoption in an interim period. If an entity early adopts the amendments in an interim period, any adjustments should be reflected as of the beginning of the fiscal year that includes that interim period. The amendments in this Update should be applied using a retrospective transition method to each period presented. The Company is currently evaluating the impact the adoption of the standard will have on the Company's statement of cash flows.
In December 2016, the FASB issued ASU 2016-19, Technical Corrections and Improvements, which represents changes to clarify, correct errors, or make minor improvements to the Accounting Standards Codification. The amendments make the Accounting Standards Codification easier to understand and easier to apply by eliminating inconsistencies and providing clarifications. Most of the amendments in this Update do not require transition guidance and are effective upon issuance of this Update. This Update is not expected to have a significant impact on the Company's financial statements.
45
NORWOOD FINANCIAL CORP - 2016 CONSOLIDATED FINANCIAL REPORT
NOTE 3 - SECURITIES
The amortized cost, gross unrealized gains and losses, and fair value of securities were as follows:
December 31, 2016 | ||||||||||||
Gross | Gross | |||||||||||
Amortized | Unrealized | Unrealized | Fair | |||||||||
Cost | Gains | Losses | Value | |||||||||
(In Thousands) | ||||||||||||
AVAILABLE FOR SALE: | ||||||||||||
U.S. Treasury securities | $ | 2,005 | $ | - | $ | (8) | $ | 1,997 | ||||
States and political subdivisions | 127,585 | 884 | (3,368) | 125,101 | ||||||||
Corporate obligations | 10,255 | 37 | (180) | 10,112 | ||||||||
Mortgage-backed securities- | ||||||||||||
government sponsored entities | 169,124 | 26 | (4,220) | 164,930 | ||||||||
Total debt securities | 308,969 | 947 | (7,776) | 302,140 | ||||||||
Equity securities-financial services | 320 | 104 | - | 424 | ||||||||
$ | 309,289 | $ | 1,051 | $ | (7,776) | $ | 302,564 | |||||
December 31, 2015 | ||||||||||||
Gross | Gross | |||||||||||
Amortized | Unrealized | Unrealized | Fair | |||||||||
Cost | Gains | Losses | Value | |||||||||
(In Thousands) | ||||||||||||
AVAILABLE FOR SALE: | ||||||||||||
U.S. Government agencies | $ | 9,275 | $ | 2 | $ | (108) | $ | 9,169 | ||||
States and political subdivisions | 59,120 | 1,747 | (112) | 60,755 | ||||||||
Corporate obligations | 4,933 | 45 | (4) | 4,974 | ||||||||
Mortgage-backed securities- | ||||||||||||
government sponsored entities | 64,491 | 23 | (945) | 63,569 | ||||||||
Total debt securities | 137,819 | 1,817 | (1,169) | 138,467 | ||||||||
Equity securities-financial services | 292 | 92 | - | 384 | ||||||||
$ | 138,111 | $ | 1,909 | $ | (1,169) | $ | 138,851 | |||||
46
NORWOOD FINANCIAL CORP - 2016 CONSOLIDATED FINANCIAL REPORT
NOTE 3 - SECURITIES (CONTINUED)
The following tables show the Company's investments' gross unrealized losses and fair value aggregated by security type and length of time that individual securities have been in a continuous unrealized loss position (in thousands):
December 31, 2016 | ||||||||||||||||||||||||
Less than 12 Months | 12 Months or More | Total | ||||||||||||||||||||||
Fair Value | Unrealized Losses | Fair Value | Unrealized Losses | Fair Value | Unrealized Losses | |||||||||||||||||||
U.S. Treasury securities | $ | 1,997 | $ | (8 | ) | $ | - | $ | - | $ | 1,997 | $ | (8 | ) | ||||||||||
States and political subdivisions | 90,109 | (3,362 | ) | 205 | (6 | ) | 90,314 | (3,368 | ) | |||||||||||||||
Corporate obligations | 6,895 | (180 | ) | - | - | 6,895 | (180 | ) | ||||||||||||||||
Mortgage-backed securities-government sponsored entities | 152,614 | (3,912 | ) | 9,967 | (308 | ) | 162,581 | (4,220 | ) | |||||||||||||||
$ | 251,615 | $ | (7,462 | ) | $ | 10,172 | $ | (314 | ) | $ | 261,787 | $ | (7,776 | ) |
December 31, 2015 | ||||||||||||||||||||||||
Less than 12 Months | 12 Months or More | Total | ||||||||||||||||||||||
Fair Value | Unrealized Losses | Fair Value | Unrealized Losses | Fair Value | Unrealized Losses | |||||||||||||||||||
U.S. Government agencies | $ | 6,058 | $ | (71 | ) | $ | 2,109 | $ | (37 | ) | $ | 8,167 | $ | (108 | ) | |||||||||
States and political subdivisions | 9,086 | (99 | ) | 1,417 | (13 | ) | 10,503 | (112 | ) | |||||||||||||||
Corporate obligations | 2,221 | (4 | ) | - | - | 2,221 | (4 | ) | ||||||||||||||||
Mortgage-backed securities-government sponsored entities | 40,300 | (432 | ) | 16,595 | (513 | ) | 56,895 | (945 | ) | |||||||||||||||
$ | 57,665 | $ | (606 | ) | $ | 20,121 | $ | (563 | ) | $ | 77,786 | $ | (1,169 | ) |
The Company has 235 debt securities in the less than twelve month category and 12 debt securities in the twelve months or more category as of December 31, 2016. In management's opinion, the unrealized losses on securities reflect changes in interest rates subsequent to the acquisition of specific securities. No other-than-temporary-impairment charges were recorded in 2016. Management believes that all other unrealized losses represent temporary impairment of the securities, and it is more likely than not that it will not have to sell the securities before recovery of their cost basis.
The amortized cost and fair value of debt securities as of December 31, 2016 by contractual maturity, are shown below. Expected maturities may differ from contractual maturities because borrowers may have the right to prepay obligations with or without call or prepayment penalties.
Amortized | Fair | ||||
Cost | Value | ||||
(In Thousands) | |||||
Due in one year or less | $ | 2,240 | $ | 2,243 | |
Due after one year through five years | 24,272 | 23,996 | |||
Due after five years through ten years | 45,285 | 43,577 | |||
Due after ten years | 68,048 | 67,394 | |||
139,845 | 137,210 | ||||
Mortgage-backed securities - government sponsored entities | 169,124 | 164,930 | |||
$ | 308,969 | $ | 302,140 |
47
NORWOOD FINANCIAL CORP - 2016 CONSOLIDATED FINANCIAL REPORT
NOTE 3 - SECURITIES (CONTINUTED)
Gross realized gains and gross realized losses on sales of securities available for sale were $284,000 and $0, respectively, in 2016, compared to $626,000 and $0, respectively, in 2015, and $1,199,000 and $29,000, respectively, in 2014. The proceeds from the sales of securities totaled $110,748,000, $44,976,000 and $66,263,000 for the years ended December 31, 2016, 2015 and 2014, respectively.
Securities with a carrying value of $230,263,000 and $97,671,000 at December 31, 2016 and 2015, respectively, were pledged to secure public deposits, securities sold under agreements to repurchase and for other purposes as required or permitted by law. The increase reflects pledging requirements resulting from the acquisition of Delaware.
NOTE 4 - LOANS RECEIVABLE AND ALLOWANCE FOR LOAN LOSSES
Set forth below is selected data relating to the composition of the loan portfolio at December 31:
Types of Loans | |||||||||||
(dollars in thousands) | |||||||||||
December 31, 2016 | December 31, 2015 | ||||||||||
Real Estate: | |||||||||||
Residential | $ | 237,177 | 33.2 | % | $ | 161,820 | 28.9 | % | |||
Commercial | 320,187 | 44.8 | 279,123 | 49.8 | |||||||
Construction | 19,709 | 2.8 | 18,987 | 3.4 | |||||||
Commercial, financial and agricultural | 85,508 | 12.0 | 71,090 | 12.7 | |||||||
Consumer loans to individuals | 51,524 | 7.2 | 29,231 | 5.2 | |||||||
Total loans | 714,105 | 100.0 | % | 560,251 | 100.0 | % | |||||
Deferred fees, net | (216) | (326) | |||||||||
Total loans receivable | 713,889 | 559,925 | |||||||||
Allowance for loan losses | (6,463) | (7,298) | |||||||||
Net loans receivable | $ | 707,426 | $ | 552,627 |
The following table presents the components of the purchase accounting adjustments related to the purchased credit-impaired loans acquired:
(In Thousands) | July 31, 2016 | ||
Contractually required principal and interest | $ | 2,621 | |
Non-accretable discount | (1,014) | ||
Expected cash flows | 1,607 | ||
Accretable discount | (239) | ||
Estimated fair value | $ | 1,368 | |
48
NORWOOD FINANCIAL CORP - 2016 CONSOLIDATED FINANCIAL REPORT
NOTE 4 - LOANS RECEIVABLE AND ALLOWANCE FOR LOAN LOSSES (CONTINUED)
Changes in the accretable yield for purchased credit-impaired loans were as follows for the twelve months ended December 31:
(In thousands) | 2016 | 2015 | 2014 | |||||
Balance at beginning of period | $ | - | $ | 8 | $ | 20 | ||
Additions | 239 | - | - | |||||
Accretion | (30) | (1) | (12) | |||||
Reclassification and other | (1) | (7) | - | - | ||||
Balance at end of period | $ | 208 | $ | - | $ | 8 |
The following table presents additional information regarding loans acquired and accounted for in accordance with ASC 310-30 (in thousands):
December 31, 2016 | December 31, 2015 | ||||
Outstanding Balance | $ | 1,821 | $ | 498 | |
Carrying Amount | $ | 1,386 | $ | 498 |
There were no material increases or decreases in the expected cash flows of these loans since the acquisition date. There has been no allowance for loan losses recorded for acquired loans with specific evidence of deterioration in credit quality. As of December 31, 2016, for loans that were acquired prior to 2016 with or without specific evidence of deterioration in credit quality, adjustments to the allowance for loan losses have been accounted for through the allowance for loan loss adequacy calculation. For loans that were acquired in 2016 with or without specific evidence of deterioration in credit quality, there were no adjustments to the allowance for loan losses calculation.
The Company maintains a loan review system, which allows for a periodic review of our loan portfolio and the early identification of potential impaired loans. The system takes into consideration, among other things, delinquency status, size of loans, type and market value of collateral and financial condition of the borrowers. Specific loan loss allowances are established for identified losses based on a review of such information. A loan evaluated for impairment is considered to be impaired when, based on current information and events, it is probable that we will be unable to collect all amounts due according to the contractual terms of the loan agreement. All loans identified as impaired are evaluated independently. The Company does not aggregate such loans for evaluation purposes. Impairment is measured on a loan-by-loan basis for commercial and construction loans by the present value of expected future cash flows discounted at the loan's effective interest rate, the loan's obtainable market price, or the fair value of the collateral if the loan is collateral-dependent.
Large groups of smaller balance homogeneous loans are collectively evaluated for impairment. Accordingly, the Company does not separately identify individual consumer and residential mortgage loans for impairment disclosures, unless such loans are part of a larger relationship that is impaired, or are classified as a troubled debt restructuring.
49
NORWOOD FINANCIAL CORP - 2016 CONSOLIDATED FINANCIAL REPORT
NOTE 4 - LOANS RECEIVABLE AND ALLOWANCE FOR LOAN LOSSES (CONTINUED)
The following tables show the amount of loans in each category that were individually and collectively evaluated for impairment at the dates indicated:
Real Estate Loans | Commercial | Consumer | ||||||||||||||||||||||
Residential | Commercial | Construction | Loans | Loans | Total | |||||||||||||||||||
(In thousands) | ||||||||||||||||||||||||
December 31, 2016 | ||||||||||||||||||||||||
Individually evaluated for impairment | $ | 23 | $ | 2,601 | $ | - | $ | - | $ | - | $ | 2,624 | ||||||||||||
Loans acquired with deteriorated credit quality | 821 | 565 | - | - | - | 1,386 | ||||||||||||||||||
Collectively evaluated for impairment | 236,333 | 317,021 | 19,709 | 85,508 | 51,524 | 710,095 | ||||||||||||||||||
Total Loans | $ | 237,177 | $ | 320,187 | $ | 19,709 | $ | 85,508 | $ | 51,524 | $ | 714,105 |
Real Estate Loans | Commercial | Consumer | ||||||||||||||||||||||
Residential | Commercial | Construction | Loans | Loans | Total | |||||||||||||||||||
(In thousands) | ||||||||||||||||||||||||
December 31, 2015 | ||||||||||||||||||||||||
Individually evaluated for impairment | $ | 28 | $ | 8,659 | $ | - | $ | 43 | $ | - | $ | 8,730 | ||||||||||||
Loans acquired with deteriorated credit quality | 140 | 358 | - | - | - | 498 | ||||||||||||||||||
Collectively evaluated for impairment | 161,652 | 270,106 | 18,987 | 71,047 | 29,231 | 551,023 | ||||||||||||||||||
Total Loans | $ | 161,820 | $ | 279,123 | $ | 18,987 | $ | 71,090 | $ | 29,231 | $ | 560,251 |
50
NORWOOD FINANCIAL CORP - 2016 CONSOLIDATED FINANCIAL REPORT
NOTE 4 - LOANS RECEIVABLE AND ALLOWANCE FOR LOAN LOSSES (CONTINUED)
The following table includes the recorded investment and unpaid principal balances for impaired loans with the associated allowance amount, if applicable.
Unpaid | ||||||||
Recorded | Principal | Associated | ||||||
Investment | Balance | Allowance | ||||||
December 31, 2016 | (In thousands) | |||||||
With no related allowance recorded: | ||||||||
Real Estate Loans | ||||||||
Residential | $ | 23 | $ | 28 | $ | - | ||
Commercial | 2,601 | 3,427 | - | |||||
Subtotal | 2,624 | 3,455 | - | |||||
Total: | ||||||||
Real Estate Loans | ||||||||
Residential | 23 | 28 | - | |||||
Commercial | 2,601 | 3,427 | - | |||||
Total Impaired Loans | $ | 2,624 | $ | 3,455 | $ | - |
Unpaid | ||||||||
Recorded | Principal | Associated | ||||||
Investment | Balance | Allowance | ||||||
December 31, 2015 | (In thousands) | |||||||
With no related allowance recorded: | ||||||||
Real Estate Loans | ||||||||
Residential | $ | 168 | $ | 173 | $ | - | ||
Commercial | 2,644 | 4,610 | - | |||||
Commercial, financial and agricultural | 43 | 43 | ||||||
Subtotal | 2,855 | 4,826 | - | |||||
With an allowance recorded: | ||||||||
Real Estate Loans | ||||||||
Commercial | 6,373 | 6,446 | 1,613 | |||||
Subtotal | 6,373 | 6,446 | 1,613 | |||||
Total: | ||||||||
Real Estate Loans | ||||||||
Residential | 168 | 173 | - | |||||
Commercial | 9,017 | 11,056 | 1,613 | |||||
Commercial, financial and agricultural | 43 | 43 | - | |||||
Total Impaired Loans | $ | 9,228 | $ | 11,272 | $ | 1,613 | ||
The following information for impaired loans is presented for the years ended December 31, 2016, 2015 and 2014:
Average Recorded | Interest Income | |||||||||||||||||||||||
Investment | Recognized | |||||||||||||||||||||||
2016 | 2015 | 2014 | 2016 | 2015 | 2014 | |||||||||||||||||||
(In thousands) | ||||||||||||||||||||||||
Total: | ||||||||||||||||||||||||
Real Estate Loans | ||||||||||||||||||||||||
Residential | $ | 25 | $ | 159 | $ | 233 | $ | - | $ | 4 | $ | 5 | ||||||||||||
Commercial | 2,671 | 8,847 | 7,492 | 91 | 526 | 503 | ||||||||||||||||||
Commercial Loans | - | 9 | - | - | 2 | - | ||||||||||||||||||
Total Loans | $ | 2,696 | $ | 9,015 | $ | 7,725 | $ | 91 | $ | 532 | $ | 508 |
51
NORWOOD FINANCIAL CORP - 2016 CONSOLIDATED FINANCIAL REPORT
NOTE 4 - LOANS RECEIVABLE AND ALLOWANCE FOR LOAN LOSSES (CONTINUED)
Troubled debt restructured loans are those loans whose terms have been renegotiated to provide a reduction or deferral of principal or interest as a result of financial difficulties experienced by the borrower, who could not obtain comparable terms from alternate financing sources. As of December 31, 2016, troubled debt restructured loans totaled $1.5 million and resulted in specific reserves of $0. During 2016, there were no new loan relationships identified as troubled debt restructurings, while one loan with a balance of $5.0 million as of December 31, 2015 was transferred to Foreclosed Real Estate Owned during 2016 as a result of foreclosure on the property and one loan relationship with a balance of $82,000 as of December 31, 2015 was charged-off in 2016. During 2016, the Company recognized charge-offs totaling $2.6 million on loans classified as troubled debt restructurings.
As of December 31, 2015, troubled debt restructured loans totaled $6.8 million and resulted in specific reserves of $1,613,000. During 2015, there were two new loan relationships identified as troubled debt restructurings totaling $176,000 based on executed modification agreements, while one loan with a balance of $1.7 million as of December 31, 2014 was transferred to Foreclosed Real Estate Owned during 2015 as a result of foreclosure on the property. During 2015, the Company recognized charge-offs totaling $1.3 million on loans classified as troubled debt restructurings. Additionally, the Company recognized expenses of $322,000 in foreclosed real estate owned expense related to a property which was previously classified as a troubled debt restructuring.
Foreclosed assets acquired in settlement of loans are carried at fair value less estimated costs to sell and are included in foreclosed real estate owned on the Consolidated Balance Sheets. As of December 31, 2016 and 2015, foreclosed real estate owned totaled $5,302,000 and $2,847,000, respectively. As of December 31, 2016, included within foreclosed real estate owned is $297,000 of consumer residential mortgages that were foreclosed on or received via a deed in lieu transaction prior to the period end. As of December 31, 2016, the Company has initiated formal foreclosure proceedings on $421,000 of consumer residential mortgage loans.
Management uses an eight point internal risk rating system to monitor the credit quality of the overall loan portfolio. The first four categories are considered not criticized, and are aggregated as "Pass" rated. The criticized rating categories utilized by management generally follow bank regulatory definitions. The Special Mention category includes assets that are currently protected but are potentially weak, resulting in an undue and unwarranted credit risk, but not to the point of justifying a Substandard classification. Loans in the Substandard category have well-defined weaknesses that jeopardize the liquidation of the debt, and have a distinct possibility that some loss will be sustained if the weaknesses are not corrected. All loans greater than 90 days past due are considered Substandard. Any portion of a loan that has been charged off is placed in the Loss category.
To help ensure that risk ratings are accurate and reflect the present and future capacity of borrowers to repay a loan as agreed, the Company has a structured loan rating process with several layers of internal and external oversight. Generally, consumer and residential mortgage loans are included in the Pass categories unless a specific action, such as nonperformance, repossession, or death occurs to raise awareness of a possible credit event. The Company's Loan Review Department is responsible for the timely and accurate risk rating of the loans on an ongoing basis. Every credit which must be approved by Loan Committee or the Board of Directors is assigned a risk rating at time of consideration. Loan Review also annually reviews relationships of $1,000,000 and over to assign or re-affirm risk ratings. Loans in the Substandard categories that are collectively evaluated for impairment are given separate consideration in the determination of the allowance.
52
NORWOOD FINANCIAL CORP - 2016 CONSOLIDATED FINANCIAL REPORT
NOTE 4 - LOANS RECEIVABLE AND ALLOWANCE FOR LOAN LOSSES (CONTINUED)
The following table presents the classes of the loan portfolio summarized by the aggregate Pass and the criticized categories of Special Mention, Substandard, Doubtful and Loss within the internal risk rating system as of December 31, 2016 and December 31, 2015 (in thousands):
Special | |||||||||||||||||
Pass | Mention | Substandard | Doubtful | Loss | Total | ||||||||||||
December 31, 2016 | |||||||||||||||||
Commercial real estate loans | $ | 310,432 | $ | 5,432 | $ | 4,323 | $ | - | $ | - | $ | 320,187 | |||||
Commercial | 84,600 | 885 | 23 | - | - | 85,508 | |||||||||||
Total | $ | 395,032 | $ | 6,317 | $ | 4,346 | $ | - | $ | - | $ | 405,695 |
Special | |||||||||||||||||
Pass | Mention | Substandard | Doubtful | Loss | Total | ||||||||||||
December 31, 2015 | |||||||||||||||||
Commercial real estate loans | $ | 267,892 | $ | 1,837 | $ | 9,394 | $ | - | $ | - | $ | 279,123 | |||||
Commercial | 71,047 | - | 43 | - | - | 71,090 | |||||||||||
Total | $ | 338,939 | $ | 1,837 | $ | 9,437 | $ | - | $ | - | $ | 350,213 |
For residential real estate loans, construction loans and consumer loans, the Company evaluates credit quality based on the performance of the individual credits. Nonperforming loans include loans that have been placed on nonaccrual status and loans remaining in accrual status on which the contractual payment of principal and interest has become 90 days past due. The following table presents the recorded investment in the loan classes based on payment activity as of December 31, 2016 and December 31, 2015 (in thousands):
Performing | Nonperforming | Total | ||||||
December 31, 2016 | ||||||||
Residential real estate loans | $ | 235,829 | $ | 1,137 | $ | 237,177 | ||
Construction | 19,681 | 28 | 19,709 | |||||
Consumer loans to individuals | 51,524 | - | 51,524 | |||||
Total | $ | 307,034 | $ | 1,165 | $ | 308,410 |
Performing | Nonperforming | Total | ||||||
December 31, 2015 | ||||||||
Residential real estate loans | $ | 161,380 | $ | 440 | $ | 161,820 | ||
Construction | 18,987 | - | 18,987 | |||||
Consumer loans to individuals | 29,231 | - | 29,231 | |||||
Total | $ | 209,598 | $ | 440 | $ | 210,038 |
53
NORWOOD FINANCIAL CORP - 2016 CONSOLIDATED FINANCIAL REPORT
NOTE 4 - LOANS RECEIVABLE AND ALLOWANCE FOR LOAN LOSSES (CONTINUED)
Management further monitors the performance and credit quality of the loan portfolio by analyzing the age of the portfolio as determined by the length of time a recorded payment is past due. The following table presents the classes of the loan portfolio summarized by the aging categories of performing loans and nonaccrual loans as of December 31, 2016 and December 31, 2015 (in thousands):
Current | 31-60 Days Past Due | 61-90 Days Past Due | Greater than 90 Days Past Due and still accruing | Non-Accrual | Total Past Due and Non-Accrual | Total Loans | ||||||||||||||
December 31, 2016 | ||||||||||||||||||||
Real Estate loans | ||||||||||||||||||||
Residential | $ | 234,790 | $ | 986 | $ | 264 | $ | 1 | $ | 1,136 | $ | 2,387 | $ | 237,177 | ||||||
Commercial | 318,979 | 445 | 1 | - | 762 | 1,208 | 320,187 | |||||||||||||
Construction | 19,681 | - | - | - | 28 | 28 | 19,709 | |||||||||||||
Commercial loans | 85,355 | 143 | 10 | - | - | 153 | 85,508 | |||||||||||||
Consumer loans | 51,456 | 39 | 29 | - | - | 68 | 51,524 | |||||||||||||
Total | $ | 710,261 | $ | 1,613 | $ | 304 | $ | 1 | $ | 1,926 | $ | 3,844 | $ | 714,105 |
Current | 31-60 Days Past Due | 61-90 Days Past Due | Greater than 90 Days Past Due and still accruing | Non-Accrual | Total Past Due and Non-Accrual | Total Loans | ||||||||||||||
December 31, 2015 | ||||||||||||||||||||
Real Estate loans | ||||||||||||||||||||
Residential | $ | 160,683 | $ | 646 | $ | 51 | $ | - | $ | 440 | $ | 1,137 | $ | 161,820 | ||||||
Commercial | 272,125 | 310 | 39 | - | 6,649 | 6,998 | 279,123 | |||||||||||||
Construction | 18,959 | 28 | - | - | - | 28 | 18,987 | |||||||||||||
Commercial loans | 71,043 | 4 | - | - | 43 | 47 | 71,090 | |||||||||||||
Consumer loans | 29,179 | 41 | 11 | - | - | 52 | 29,231 | |||||||||||||
Total | $ | 551,989 | $ | 1,029 | $ | 101 | $ | - | $ | 7,132 | $ | 8,262 | $ | 560,251 |
54
NORWOOD FINANCIAL CORP - 2016 CONSOLIDATED FINANCIAL REPORT
NOTE 4 - LOANS RECEIVABLE AND ALLOWANCE FOR LOAN LOSSES (CONTINUED)
The following table presents the allowance for loan losses by the classes of the loan portfolio:
(In thousands) | Residential Real Estate | Commercial Real Estate | Construction | Commercial | Consumer | Total | |||||||||||
Beginning balance, December 31, 2015 | $ | 1,069 | $ | 5,506 | $ | 90 | $ | 397 | $ | 236 | $ | 7,298 | |||||
Charge Offs | (123) | (2,711) | - | (15) | (102) | (2,951) | |||||||||||
Recoveries | 6 | 15 | - | - | 45 | 66 | |||||||||||
Provision for loan losses | 140 | 1,813 | (12) | (75) | 184 | 2,050 | |||||||||||
Ending balance, December 31, 2016 | $ | 1,092 | $ | 4,623 | $ | 78 | $ | 307 | $ | 363 | $ | 6,463 | |||||
Ending balance individually evaluated for impairment | $ | - | $ | 3 | $ | - | $ | - | $ | - | $ | 3 | |||||
Ending balance collectively evaluated for impairment | $ | 1,092 | $ | 4,620 | $ | 78 | $ | 307 | $ | 363 | $ | 6,460 |
(In thousands) | Residential Real Estate | Commercial Real Estate | Construction | Commercial | Consumer | Total | |||||||||||
Beginning balance, December 31, 2014 | $ | 1,323 | $ | 3,890 | $ | 222 | $ | 256 | $ | 184 | $ | 5,875 | |||||
Charge Offs | (224) | (2,883) | - | - | (91) | (3,198) | |||||||||||
Recoveries | 20 | - | - | - | 21 | 41 | |||||||||||
Provision for loan losses | (50) | 4,499 | (132) | 141 | 122 | 4,580 | |||||||||||
Ending balance, December 31, 2015 | $ | 1,069 | $ | 5,506 | $ | 90 | $ | 397 | $ | 236 | $ | 7,298 | |||||
Ending balance individually evaluated for impairment | $ | - | $ | 1,613 | $ | - | $ | - | $ | - | $ | 1,613 | |||||
Ending balance collectively evaluated for impairment | $ | 1,069 | $ | 3,893 | $ | 90 | $ | 397 | $ | 236 | $ | 5,685 |
(In thousands) | Residential Real Estate | Commercial Real Estate | Construction | Commercial | Consumer | Total | |||||||||||
Beginning balance, December 31, 2013 | $ | 1,441 | $ | 3,025 | $ | 898 | $ | 184 | $ | 160 | $ | 5,708 | |||||
Charge Offs | (270) | (1,196) | - | - | (80) | (1,546) | |||||||||||
Recoveries | - | 2 | - | - | 31 | 33 | |||||||||||
Provision for loan losses | 152 | 2,059 | (676) | 72 | 73 | 1,680 | |||||||||||
Ending balance, December 31, 2014 | $ | 1,323 | $ | 3,890 | $ | 222 | $ | 256 | $ | 184 | $ | 5,875 | |||||
Ending balance individually evaluated for impairment | $ | - | $ | 293 | $ | - | $ | - | $ | - | $ | 293 | |||||
Ending balance collectively evaluated for impairment | $ | 1,323 | $ | 3,597 | $ | 222 | $ | 256 | $ | 184 | $ | 5,582 |
55
NORWOOD FINANCIAL CORP - 2016 CONSOLIDATED FINANCIAL REPORT
NOTE 4 - LOANS RECEIVABLE AND ALLOWANCE FOR LOAN LOSSES (CONTINUED)
The recorded investment in impaired loans, not requiring an allowance for loan losses was $2,624,000 (net of charge-offs against the allowance for loan losses of $831,000) and $2,855,000 (net of charge-offs against the allowance for loan losses of $1,971,000) at December 31, 2016 and 2015, respectively. The recorded investment in impaired loans requiring an allowance for loan losses was $0 and $6,373,000 (net of a charge-off against the allowance for loan losses of $73,000) at December 31, 2016 and 2015, respectively. The specific reserve related to impaired loans was $0 for 2016 and $1,613,000 for 2015. For the years ended December 31, 2016 and 2015, the average recorded investment in these impaired loans was $2,696,000, and $9,015,000, respectively, and the interest income recognized on these impaired loans was $91,000 and $532,000, respectively.
During the period ended December 31, 2016, the allowance for commercial real estate loans decreased from $5,506,000 to $4,623,000. This $883,000 decrease in the required allowance was due to a $1,610,000 decrease in the specific reserve component resulting from the transfer of an impaired loan with a specific reserve allowance of $1,596,000 at December 31, 2015 to foreclosed real estate during 2016. This reduction was partially offset by a $419,000 increase in the allowance for commercial real estate loans due to an increase in the historical loss factor from 0.70% at December 31, 2015 to 0.80% on December 31, 2016.
During the period ended December 31, 2015, the allowance for residential real estate loans decreased from $1,323,000 to $1,069,000. This $254,000 decrease in the required allowance was due primarily to a decrease in the historical loss factor from 0.30% at December 31, 2014 to 0.23% on December 31, 2015. During the same period, the required allowance for commercial real estate loans increased from $3,890,000 at December 31, 2014 to $5,506,000 on December 31, 2015. This increase can be attributed to a $1,320,000 increase in the specific reserve component.
Interest income that would have been recorded on loans accounted for on a non-accrual basis under the original terms of the loans was $163,000, $515,000 and $451,000 for 2016, 2015 and 2014, respectively.
As of December 31, 2016 and 2015, the Company considered its concentration of credit risk to be acceptable. As of December 31, 2016, the highest concentrations are in commercial rentals and the hospitality lodging industry, with loans outstanding of $71.8 million, or 70.7% of bank capital, to commercial rentals, and $50.9 million, or 50.1% of bank capital to the hospitality and lodging industry. Charge-offs on loans within these concentrations were $31,000, $643,000 and $422,000 for the years ended December 31, 2016, 2015 and 2014, respectively.
Gross realized gains and gross realized losses on sales of residential mortgage loans were $54,000 and $0, respectively, in 2016 compared to $113,000 and $0, respectively, in 2015 and $150,000 and $0, respectively, in 2014. The proceeds from the sales of residential mortgage loans totaled $1.7 million, $4.4 million and $4.4 million for the years ended December 31, 2016, 2015 and 2014, respectively. As of December 31, 2016 and 2015, the outstanding value of loans serviced for others totaled $35.5 million and $32.9 million, respectively.
56
NORWOOD FINANCIAL CORP - 2016 CONSOLIDATED FINANCIAL REPORT
NOTE 5 - PREMISES AND EQUIPMENT
Components of premises and equipment at December 31 are as follows:
2016 | 2015 | ||||
(In Thousands) | |||||
Land and improvements | $ | 2,925 | $ | 2,316 | |
Buildings and improvements | 17,662 | 9,857 | |||
Furniture and equipment | 6,351 | 4,415 | |||
26,938 | 16,588 | ||||
Accumulated depreciation | (13,407) | (10,116) | |||
$ | 13,531 | $ | 6,472 |
Depreciation expense totaled $726,000, $551,000 and $572,000 for the years ended December 31, 2016, 2015 and 2014, respectively.
Certain facilities are leased under various operating leases. Rental expense for these leases was $367,000, $341,000 and $338,000, respectively, for the years ended December 31, 2016, 2015 and 2014. Future minimum rental commitments under noncancellable leases as of December 31, 2016 were as follows (in thousands):
2017 | $ | 381 |
2018 | 381 | |
2019 | 386 | |
2020 | 394 | |
2021 | 311 | |
Thereafter | 1,617 | |
$ | 3,470 |
NOTE 6 - DEPOSITS
Aggregate time deposits in denominations of $250,000 or more were $63,982,000 and $22,041,000 at December 31, 2016 and 2015, respectively. Included in deposit accounts are deposits of three customer relationships totaling $84,095,000 at December 31, 2016.
At December 31, 2016, the scheduled maturities of time deposits are as follows (in thousands):
2017 | $ | 174,814 |
2018 | 53,523 | |
2019 | 34,710 | |
2020 | 15,464 | |
2021 | 16,867 | |
Thereafter | 179 | |
$ | 295,557 |
NOTE 7 – BORROWINGS
Short-term borrowings at December 31 consist of the following:
2016 | 2015 | ||||
(In Thousands) | |||||
Securities sold under agreements to repurchase | $ | 32,811 | $ | 33,563 | |
Federal Home Loan Bank short-term borrowings | - | 19,672 | |||
$ | 32,811 | $ | 53,235 |
57
NORWOOD FINANCIAL CORP - 2016 CONSOLIDATED FINANCIAL REPORT
The outstanding balances and related information of short-term borrowings are summarized as follows:
Years Ended December 31, | |||||||
2016 | 2015 | ||||||
(Dollars In Thousands) | |||||||
Average balance during the year | $ | 41,593 | $ | 34,057 | |||
Average interest rate during the year | 0.31 | % | 0.25 | % | |||
Maximum month-end balance during the year | $ | 52,672 | $ | 55,183 | |||
Weighted average interest rate at the end of the year | 0.32 | % | 0.36 | % |
Securities sold under agreements to repurchase generally mature within one day to one year from the transaction date. Securities with an amortized cost and fair value of $35,770,000 and $35,147,000 at December 31, 2016 and $36,797,000 and $36,316,000 at December 31, 2015, respectively, were pledged as collateral for these agreements. The securities underlying the agreements were under the Company's control.
The collateral pledged for repurchase agreements that are classified as secured borrowings is summarized as follows (in thousands):
As of December 31, 2016 | |||||||||||
Remaining Contractual Maturity of the Agreements | |||||||||||
Overnight and continuous | Up to 30 days | 30-90 days | Greater than 90 days | Total | |||||||
Repurchase Agreements: | |||||||||||
Obligations of U.S. Government agencies | $34,917 | $0 | $0 | $230 | $35,147 | ||||||
Total liability recognized for repurchase agreements | $32,811 |
As of December 31, 2015 | |||||||||||
Remaining Contractual Maturity of the Agreements | |||||||||||
Overnight and continuous | Up to 30 days | 30-90 days | �� | Greater than 90 days | Total | ||||||
Repurchase Agreements: | |||||||||||
Obligations of U.S. Government agencies | $35,515 | $139 | $277 | $385 | $36,316 | ||||||
Total liability recognized for repurchase agreements | $33,563 |
The Company has a line of credit commitment available from the FHLB of Pittsburgh for borrowings of up to $146,517,000 which expires in May, 2017. There were no borrowings under this line of credit at December 31, 2016. At December 31, 2015, there were $19,672,000 of borrowings outstanding on this line. The Company has a line of credit commitment available from Atlantic Community Bankers Bank for $7,000,000 which expires on June 30, 2017. There were no borrowings under this line of credit at December 31, 2016 and 2015. The Company has a line of credit commitment available from PNC Bank for $16,000,000 at December 31, 2016. There were no borrowings under this line of credit at December 31, 2016 and December 31, 2015. The Company also has a line of credit commitment from Zions Bank for $17,000,000. There were no borrowings under this line of credit at December 31, 2016 and December 31, 2015.
58
NORWOOD FINANCIAL CORP - 2016 CONSOLIDATED FINANCIAL REPORT
NOTE 7 – BORROWINGS (CONTINUED)
Other borrowings consisted of the following at December 31, 2016 and 2015:
2016 | 2015 | ||||
(In Thousands) | |||||
Notes with the FHLB: | |||||
Convertible note due January 2017 at 4.71% | $ | 10,000 | $ | 10,000 | |
Amortizing fixed rate borrowing due December 2017 at 1.27% | 4,025 | 8,000 | |||
Amortizing fixed rate borrowing due January 2018 at 0.91% | 662 | 1,267 | |||
Amortizing fixed rate borrowing due December 2018 at 1.42% | 1,634 | 2,434 | |||
Amortizing fixed rate borrowing due June 2020 at 1.49% | 7,078 | 9,033 | |||
Amortizing fixed rate borrowing due December 2020 at 1.71% | 4,034 | 5,000 | |||
Amortizing fixed rate borrowing due March 2022 at 1.75% | 4,568 | 5,392 | |||
$ | 32,001 | $ | 41,126 |
The convertible note contains an option which allows the FHLB, at quarterly intervals, to change the note to an adjustable-rate advance at three-month LIBOR plus 17 basis points. If the note is converted, the option allows the Bank to put the funds back to the FHLB at no charge.
Contractual maturities and scheduled cash flows of other borrowings at December 31, 2016 are as follows (in thousands):
2017 | $ | 19,253 |
2018 | 4,741 | |
2019 | 3,930 | |
2020 | 2,951 | |
2021 | 899 | |
2022 | 227 | |
$ | 32,001 |
The Bank's maximum borrowing capacity with the FHLB was $316,832,000 of which $32,001,000 was outstanding at December 31, 2016. Advances from the FHLB are secured by qualifying assets of the Bank.
NOTE 8 – EMPLOYEE BENEFIT PLANS
The Company has a defined contributory profit-sharing plan which includes provisions of a 401(k) plan. The plan permits employees to make pre-tax contributions up to 15% of the employee's compensation, not to exceed the limits set by the Internal Revenue Service. The amount of contributions to the plan, including matching contributions, is at the discretion of the Board of Directors. All employees over the age of 21 are eligible to participate in the plan and receive Company contributions after one year of employment. Eligible employees are able to contribute to the Plan at the beginning of the first quarterly period after their date of employment. Employee contributions vest immediately, and any Company contributions are fully vested after five years. The Company's contributions are expensed as the cost is incurred, funded currently, and amounted to $538,000, $445,000 and $445,000 for the years ended December 31, 2016, 2015 and 2014, respectively.
The Company has a non-qualified supplemental executive retirement plan for the benefit of certain executive officers. At December 31, 2016 and 2015, other liabilities include $1,410,000 and $1,427,000 accrued under the Plan. Compensation expense includes approximately $121,000, $122,000 and $124,000 relating to the supplemental executive retirement plan for 2016, 2015 and 2014, respectively. To fund the benefits under this plan, the Company is the owner of single premium life insurance policies on participants in the non-qualified retirement plan. At December 31, 2016 and 2015, the cash value of these policies was $36,133,000 and $18,820,000, respectively.
59
NORWOOD FINANCIAL CORP - 2016 CONSOLIDATED FINANCIAL REPORT
NOTE 8 – EMPLOYEE BENEFIT PLANS (CONTINUED)
As a result of its acquisition of Delaware, the Company has several Supplemental Executive Retirement Plans ("SERPs") intended as a long-term incentive to designated officers and key employees. These SERPs provide for annual payments to these individuals after retirement. The Company's expense pertaining to these plans amounted to $38,000 in 2016. At December 31, 2016, other liabilities included $1,563,000 related to these plans.
The Company provides postretirement benefits in the form of split-dollar life arrangements to employees who meet the eligibility requirements. The net periodic postretirement benefit expense included in salaries and employee benefits was $26,000, $89,000 and $87,000 for the years ended December 31, 2016, 2015 and 2014, respectively.
Through its acquisition of Delaware, the Company also has a plan that provides certain retiring executives, at normal retirement age of 65 or early retirement at age 60, if certain criteria are met, a yearly supplemental benefit at a fixed dollar amount. The Company expensed $15,000 under this plan in 2016. At December 31, 2016, the liability under this plan was $602,000.
Through its acquisition of Delaware, the Company also has certain director fee deferral and continuation plans. These plans allow directors to defer current director fees and provide a benefit payment for a period of five to fifteen years. The Company expensed $1,000 under these plans in 2016. At December 31, 2016, the liability under these plans was $413,000.
Certain key executives have change in control agreements with the Company. These agreements provide certain potential benefits in the event of termination of employment following a change in control.
The Company participates in the Pentegra Mulitemployer Defined Benefit Pension Plan (EIN 13-5645888 and Plan # 333) as a result of its acquisition of North Penn. As of December 31, 2016 and 2015, the Company's Plan was 80.0% and 79.9% funded, respectively, and total contributions made are not more than 5% of the total contributions to the Plan. The Company's expense related to the Plan was $54,000 in 2016, $48,000 in 2015 and $17,000 in 2014. During the plan years ending December 31, 2016, 2015 and 2014, the Company made contributions of $54,000, $48,000 and $17,000, respectively.
As a result of its acquisition of Delaware, the Company is a member of the New York State Bankers Retirement System. Substantially all full-time employees who were former employees of Delaware are covered under this defined benefit pension plan (the "Delaware Plan"). The Company's funding policy is to contribute the minimum required contribution annually. Pension cost is computed using the projected unit credit actuarial cost method. Effective December 31, 2012, the Plan was closed to new participants and accrued benefits were frozen.
60
NORWOOD FINANCIAL CORP - 2016 CONSOLIDATED FINANCIAL REPORT
NOTE 8 – EMPLOYEE BENEFIT PLANS (CONTINUED)
The following table sets forth the projected benefit obligation and change in plan assets for the defined benefit pension plan at December 31:
(in Thousands of Dollars) | 2016 | ||
Change in projected benefit obligation: | |||
Projected benefit obligation at beginning of year | $ | - | |
Projected benefit obligation acquired | (8,843) | ||
Service cost | (28) | ||
Interest cost | (113) | ||
Actuarial loss | 662 | ||
Benefits paid | 238 | ||
Benefit obligation at end of year | $ | (8,084) | |
Change in plan assets: | |||
Fair value of plan assets at beginning of year | $ | - | |
Fair value acquired | 6,932 | ||
Actual return on plan assets | 12 | ||
Benefits paid | (242) | ||
Fair value of assets at end of year | 6,702 | ||
Funded status at end of year | $ | (1,382) |
The Plan paid $238,000 in benefit payments in 2016. Estimated benefit payments under the Plan are expected to be approximately $482,000, $490,000, $480,000, $481,000 and $471,000 for the next five years. Payments are expected to be approximately $2,263,000 in total for the five-year period ending December 31, 2026. No contributions were made in 2016. The Company is not required to make any contributions to the Plan in 2017. The decrease in the projected discount rate contributed approximately $117,000 to the overall increase in the projected benefit obligation for the year ended December 31, 2016.
The accumulated benefit obligation for the defined benefit pension plan was $8,084,000 at December 31, 2016.
The following table sets forth the amounts recognized in accumulated other comprehensive income (in thousands):
Transition asset | $ | - | |
Prior service credit | - | ||
Gain | 490 | ||
Total | $ | 490 |
Net pension cost included the following components:
(in Thousands of Dollars) | 2016 | ||
Service cost benefits earned during the period | $ | 28 | |
Interest cost on projected benefit obligaion | 113 | ||
Actual return on assets | (180) | ||
Net amortization and deferral | - | ||
NET PERIODIC PENSION COST | $ | (39) |
The weighted average assumptions used to determine the benefit obligation at December 31 are as follows:
2016 | |||
Discount rate | 3.90 | % |
61
NORWOOD FINANCIAL CORP - 2016 CONSOLIDATED FINANCIAL REPORT
NOTE 8 – EMPLOYEE BENEFIT PLANS (CONTINUED)
The weighted average assumptions used to determine the net periodic pension cost at December 31 are as follows:
2016 | |||
Discount rate | 3.18 | % | |
Expected long-term return on plan assets | 6.50 | % | |
Rate of compensation increase | 0.00 | % |
The expected long-term return on plan assets was determined based upon expected returns on individual asset types included in the asset portfolio.
The Plan's weighted-average asset allocations at December 31, by asset category, are as follows:
2016 | |||
Cash equivalents | 6.1 | % | |
Equity securities | 47.9 | % | |
Fixed income securities | 42.6 | % | |
Other | 3.4 | % | |
100.00 | % |
The Plan's overall investment strategy is to achieve a mix of approximately 97 percent of investments for long-term growth and 3 percent for near-term benefit payments with a wide diversification of asset types, fund strategies, and fund managers. The target allocation for pension assets is 0 to 20 percent cash equivalents, 40 to 60 percent equity securities, 40 to 60 percent fixed income securities, and 0 to 5 percent other. Cash equivalents consist primarily of government issues and short-term investment funds. Equity securities primarily include investments in common stock, depository receipts, preferred stock, and real estate investment trusts. Fixed income securities include corporate bonds, government issues, mortgaged backed securities, municipals, and other asset backed securities.
The fair value of the Plan's assets, by asset category, is as follows:
December 31, 2016 | ||||||||||||
Quoted Market | Other | |||||||||||
Price in | Observable | Unobservable | ||||||||||
Active Markets | Inputs | Inputs | ||||||||||
Total | (Level 1) | (Level 2) | (Level 3) | |||||||||
(in Thousands of Dollars) | ||||||||||||
Cash equivalents: | ||||||||||||
Foreign currencies | $ | 11 | $ | 11 | $ | - | $ | - | ||||
Short-term investment funds | 33 | - | 33 | - | ||||||||
Equity securities: | ||||||||||||
Common stock | 1,430 | 1,430 | - | - | ||||||||
Depository receipts | 42 | 42 | - | - | ||||||||
Commingled Pension Trust Fund | 1,680 | - | 1,680 | - | ||||||||
Fixed income securities: | ||||||||||||
Corporate bonds | 307 | - | 307 | - | ||||||||
Government issue | 1,112 | - | 1,112 | - | ||||||||
Mortgage-backed securities | 4 | - | 4 | - | ||||||||
Collateralized mortgage obligations | 68 | - | 68 | - | ||||||||
Commingled Pension Trust Fund | 1,732 | - | 1,732 | - | ||||||||
Other | 283 | - | - | 283 | ||||||||
Total | $ | 6,702 | $ | 1,483 | $ | 4,936 | $ | 283 |
62
NORWOOD FINANCIAL CORP - 2016 CONSOLIDATED FINANCIAL REPORT
NOTE 8 – EMPLOYEE BENEFIT PLANS (CONTINUED)
The following table sets forth a summary of the changes in the Level 3 assets for the year ended December 31, 2016 (in thousands of dollars).
2016 | ||||
Balance, December 31, 2015 | $ | - | ||
Purchase | - | |||
Unrealized gain | 283 | |||
Balance, December 31, 2016 | $ | 283 |
FASB authoritative guidance on accounting for deferred compensation and postretirement benefit aspects of endorsement split-dollar life insurance arrangements requires the recognition of a liability and related compensation expense for endorsement split-dollar life insurance that provides a benefit to an employee that extends to postretirement periods. The life insurance policies purchased for the purpose of providing such benefits do not effectively settle an entity's obligation to the employee. Accordingly, the entity must recognize a liability and related compensation expense during the employee's active service period based on the future cost of insurance to be incurred during the employee's retirement. This expense is included in the SERP plan expense for 2016 discussed above. If the entity has agreed to provide the employee with a death benefit, then the liability for the future death benefit should be recognized by following the FASB authoritative guidance on employer's accounting for postretirement benefits other than pensions. The accumulated postretirement benefit obligation was $405,000 at December 31, 2016.
NOTE 9 - INCOME TAXES
The components of the provision for federal income taxes are as follows:
Years Ended December 31, | ||||||||
2016 | 2015 | 2014 | ||||||
(In Thousands) | ||||||||
Current | $ | 1,138 | $ | 2,019 | $ | 2,657 | ||
Deferred | 746 | (387) | (51) | |||||
$ | 1,884 | $ | 1,632 | $ | 2,606 |
Deferred income taxes reflect temporary differences in the recognition of revenue and expenses for tax reporting and financial statement purposes, principally because certain items, such as, the allowance for loan losses and loan fees are recognized in different periods for financial reporting and tax return purposes. A valuation allowance has not been established for deferred tax assets. Realization of the deferred tax assets is dependent on generating sufficient taxable income. Although realization is not assured, management believes it is more likely than not that all of the deferred tax asset will be realized. Deferred tax assets are recorded in other assets.
Income tax expense of the Company is less than the amounts computed by applying statutory federal income tax rates to income before income taxes because of the following:
Percentage of Income | ||||||||
before Income Taxes | ||||||||
Years Ended December 31, | ||||||||
2016 | 2015 | 2014 | ||||||
Tax at statutory rates | 35.0 | % | 34.0 | % | 34.0 | % | ||
Tax exempt interest income, net of interest expense disallowance | (13.1) | (11.3) | (7.7) | |||||
Nondeductible merger expenses | 2.7 | - | - | |||||
Incentive stock options | 0.3 | 0.3 | 0.4 | |||||
Earnings and proceeds on life insurance | (2.8) | (1.8) | (1.5) | |||||
Other | (0.2) | 0.4 | 0.2 | |||||
21.9 | % | 21.6 | % | 25.4 | % |
63
NORWOOD FINANCIAL CORP - 2016 CONSOLIDATED FINANCIAL REPORT
NOTE 9 - INCOME TAXES (CONTINUED)
The net deferred tax asset included in other assets in the accompanying Consolidated Balance Sheets includes the following amounts of deferred tax assets and liabilities:
2016 | 2015 | ||||
(In Thousands) | |||||
Deferred tax assets: | |||||
Allowance for loan losses | $ | 2,197 | $ | 2,481 | |
Deferred compensation | 1,430 | 485 | |||
Purchase price adjustment | - | 884 | |||
Core deposit intangible | 485 | - | |||
Prepaid expenses | 267 | - | |||
Pension liability | 655 | - | |||
Foreclosed real estate valuation allowance | 19 | 305 | |||
AMT tax credit carryforward | 260 | - | |||
Net operating loss carryforward | 2,147 | - | |||
Net unrealized loss on securities | 2,286 | - | |||
Other | 310 | 182 | |||
Total Deferred Tax Assets | 10,056 | 4,337 | |||
Deferred tax liabilities: | |||||
Premises and equipment | 347 | 245 | |||
Deferred loan fees | 192 | 172 | |||
Net unrealized gains on securities | - | 251 | |||
Net unrealized gain on pension liability | 171 | - | |||
Purchase price adjustment | 357 | - | |||
Total Deferred Tax Liabilities | 1,067 | 668 | |||
Net Deferred Tax Asset | $ | 8,989 | $ | 3,669 |
The Company's federal and state income tax returns for taxable years through 2013 have been closed for purposes of examination by the Internal Revenue Service and the Pennsylvania Department of Revenue.
NOTE 10 - REGULATORY MATTERS AND STOCKHOLDERS' EQUITY
The Company and Bank are subject to various regulatory capital requirements administered by the federal banking agencies. Failure to meet minimum capital requirements can initiate certain mandatory and possibly additional discretionary actions by regulators that, if undertaken, could have a direct material effect on the Company's financial statements. Under capital adequacy guidelines and the regulatory framework for prompt corrective action, the Company must meet specific capital guidelines that involve quantitative measures of the Company's assets, liabilities and certain off-balance sheet items as calculated under regulatory accounting practices. The Company's capital amounts and classification are also subject to qualitative judgments by the regulators about components, risk-weightings and other factors.
Quantitative measures established by regulation to ensure capital adequacy require the Company and the Bank to maintain minimum amounts and ratios (set forth in the table below) of Total, Tier 1 and Common Equity Tier 1 capital (as defined in the regulations) to risk-weighted assets, and of Tier 1 capital to average assets. Management believes, as of December 31, 2016 and 2015, that the Company and the Bank meet all capital adequacy requirements to which they are subject.
64
NORWOOD FINANCIAL CORP - 2016 CONSOLIDATED FINANCIAL REPORT
NOTE 10 - REGULATORY MATTERS AND STOCKHOLDERS' EQUITY (CONTINUED)
As of December 31, 2016, the most recent notification from the regulators has categorized the Bank as well capitalized under the regulatory framework for prompt corrective action. There are no conditions or events since that notification that management believes have changed the Bank's category.
The Company's actual capital amounts and ratios are presented in the table:
To be Well Capitalized | |||||||||||||||
under Prompt | |||||||||||||||
For Capital Adequacy | Corrective Action | ||||||||||||||
Actual | Purposes | Provision | |||||||||||||
Amount | Ratio | Amount | Ratio | Amount | Ratio | ||||||||||
(Dollars in Thousands) | |||||||||||||||
As of December 31, 2016: | |||||||||||||||
Total capital (to risk-weighted assets) | $ | 107,765 | 14.12 | % | ≥$61,057 | ≥8.00 | % | ≥$76,321 | ≥10.00 | % | |||||
Tier 1 capital (to risk-weighted assets) | 101,302 | 13.27 | ≥45,793 | ≥6.00 | ≥61,057 | ≥8.00 | |||||||||
Common Equity Tier 1 capital (to risk-weighted assets) | 101,302 | 13.27 | ≥34,344 | ≥4.50 | ≥49,609 | ≥6.50 | |||||||||
Tier 1 capital (to average assets) | 101,302 | 9.16 | ≥44,251 | ≥4.00 | ≥55,314 | ≥5.00 | |||||||||
As of December 31, 2015: | |||||||||||||||
Total capital (to risk-weighted assets) | $ | 97,750 | 17.09 | % | ≥$45,751 | ≥8.00 | % | ≥$57,189 | ≥10.00 | % | |||||
Tier 1 capital (to risk-weighted assets) | 90,681 | 15.86 | ≥34,313 | ≥6.00 | ≥45,751 | ≥8.00 | |||||||||
Common Equity Tier 1 capital (to risk-weighted assets) | 90,681 | 15.86 | ≥25,735 | ≥4.50 | ≥37,173 | ≥6.50 | |||||||||
Tier 1 capital (to average assets) | 90,681 | 12.40 | ≥29,252 | ≥4.00 | ≥36,565 | ≥5.00 |
The Bank's ratios do not differ significantly from the Company's ratios presented above.
Effective January 1, 2015, the Company and the Bank became subject to new regulatory capital rules which, among other things, impose a new common equity Tier 1 minimum capital requirement (4.5% of risk-weighted assets), set the minimum leverage ratio for all banking organizations at a uniform 4% of total assets, increased the minimum Tier 1 capital to risk-based assets requirement (from 4% to 6% of risk-weighted assets) and assigned a higher risk-weight (150%) to exposures that are more than 90 days past due or are on nonaccrual status and to certain commercial real estate facilities that finance the acquisition, development or construction of real property. The new rules also require unrealized gains and losses on certain "available-for-sale" securities holdings to be included for purposes of calculating regulatory capital requirements unless a one-time opt out is exercised, which the Company and the Bank have done. The final rule limits a banking organization's dividends, stock repurchases and other capital distributions, and certain discretionary bonus payments to executive officers, if the banking organization does not hold a "capital conservation buffer" consisting of 2.5% of common equity Tier 1 capital to risk-weighted assets above regulatory minimum risk-based requirements. The capital conservation buffer requirements will be phased in beginning January 1, 2016 and ending January 1, 2019, when the full capital conservation buffer will be effective. The Company and the Bank are in compliance with their respective new capital requirements, including the capital conservation buffer, as of December 31, 2016.
The Bank is required to maintain average cash reserve balances in vault cash or with the Federal Reserve Bank. The amount of these restricted cash reserve balances at December 31, 2016 and 2015 was approximately $1,099,000 and $437,000, respectively.
65
NORWOOD FINANCIAL CORP - 2016 CONSOLIDATED FINANCIAL REPORT
NOTE 10 - REGULATORY MATTERS AND STOCKHOLDERS' EQUITY (CONTINUED)
Under Pennsylvania banking law, the Bank is subject to certain restrictions on the amount of dividends that it may declare without prior regulatory approval. At December 31, 2016, $63,246,000 of retained earnings were available for dividends without prior regulatory approval, subject to the regulatory capital requirements discussed above. Under Federal Reserve regulations, the Bank is limited as to the amount it may lend affiliates, including the Company, unless such loans are collateralized by specific obligations.
NOTE 11 - STOCK BASED COMPENSATION
The Company's shareholders approved the Norwood Financial Corp 2006 Stock Option Plan at the Annual Meeting on April 26, 2006. An aggregate of 275,000 shares of authorized but unissued Common Stock of the Company were reserved for future issuance under the Plan. This includes up to 44,000 shares for awards to outside directors. Under this plan, the Company granted 7,423 options to employees in 2015, 12,500 options to employees in 2014, and 28,600 options, which included 4,000 options granted to outside directors in 2013. No options were granted under this plan in 2016. As of December 31, 2016, there were 4,058 shares available for stock option awards to outside directors.
At the Annual Meeting held on April 22, 2014, the Company's shareholders approved the Norwood Financial Corp 2014 Equity Incentive Plan. An aggregate of 250,000 shares of authorized but unissued Common Stock of the Company were reserved for future issuance under the Plan. This includes up to 40,000 shares for awards to outside directors. The Plan also authorized the Company to award restricted stock to officers and outside directors, limited to 42,000 shares of restricted stock awards for officers and 8,000 shares of restricted stock awards for outside directors. Under this plan, the Company granted 24,450 shares in 2016 which included 16,000 options to employees, 6,000 shares of restricted stock to officers and 2,450 shares of restricted stock to directors. In 2015, the Company granted 13,727 shares which included 7,077 options to employees, 4,250 shares of restricted stock to officers and 2,400 shares of restricted stock to directors. In 2014, the Company granted 9,300 shares, which included 2,800 shares of restricted stock to outside directors. All shares granted in 2014 were for restricted stock. The restricted shares vest over a five-year period. The product of the number of shares granted and the grant date market price of the Company's common stock determine the fair value of restricted stock under the company's restricted stock plan. Management recognizes compensation expense for the fair value of restricted stock on a straight-line basis over the requisite service period for the entire award. As of December 31, 2016, there were 202,523 shares available for future awards under this plan, which includes 170,173 shares available for officer awards and 32,350 shares available for awards to outside directors. Included in these totals are 25,250 shares available for restricted stock awards to officers and 350 shares available for restricted stock awards to outside directors.
Total unrecognized compensation cost related to stock options was $93,000 as of December 31, 2016, $71,000 as of December 31, 2015 and $66,000 as of December 31, 2014. Salaries and employee benefits expense includes $71,000, $66,000 and $154,000 of compensation costs related to options for the years ended December 31, 2016, 2015 and 2014, respectively. Compensation costs related to restricted stock amounted to $89,000, $55,000 and $0 for the years ended December 31, 2016, 2015 and 2014, respectively. The expected future compensation expense relating to non-vested restricted stock outstanding as of December 31, 2016 and 2015 was $579,000 and $398,000 respectively. Net income was reduced by $130,000, $92,000 and $146,000 for the years ended December 31, 2016, 2015 and 2014, respectively.
66
NORWOOD FINANCIAL CORP - 2016 CONSOLIDATED FINANCIAL REPORT
NOTE 11 - STOCK BASED COMPENSATION (CONTINUED)
A summary of the Company's stock option activity and related information for the years ended December 31 follows:
2016 | 2015 | 2014 | |||||||||||||||||||||
Weighted | Weighted | Weighted | |||||||||||||||||||||
Average | Average | Average | |||||||||||||||||||||
Exercise | Intrinsic | Exercise | Intrinsic | Exercise | Intrinsic | ||||||||||||||||||
Options | Price | Value | Options | Price | Value | Options | Price | Value | |||||||||||||||
Outstanding, | |||||||||||||||||||||||
beginning of year | 194,521 | $ | 26.91 | 206,463 | $ | 26.74 | 219,540 | $ | 26.64 | ||||||||||||||
Granted | 16,000 | 33.56 | 14,500 | 28.55 | 12,500 | 29.08 | |||||||||||||||||
Exercised | (30,823) | 27.34 | (16,859) | 26.19 | (25,577) | 27.05 | |||||||||||||||||
Forfeited | (19,269) | 27.86 | (9,583) | 27.02 | - | - | |||||||||||||||||
Outstanding, | |||||||||||||||||||||||
end of year | 160,429 | $ | 27.37 | $ | 931,963 | 194,521 | $ | 26.91 | $ | 362,754 | 206,463 | $ | 26.74 | $ | 477,640 | ||||||||
Exercisable, | |||||||||||||||||||||||
end of year | 144,429 | $ | 26.39 | $ | 931,963 | 180,021 | $ | 26.78 | $ | 359,854 | 193,963 | $ | 26.59 | $ | 477,640 |
Exercise prices for options outstanding as of December 31, 2016 ranged from $24.44 to $33.56 per share. The weighted average remaining contractual life is 5.6 years.
The fair value of each option grant is estimated on the date of grant using the Black-Scholes option pricing model with the following weighted average assumptions:
Years Ended December 31, | ||||||||
2016 | 2015 | 2014 | ||||||
Dividend yield | 3.93% | 3.77% | 3.57% | |||||
Expected life | 10 years | 10 years | 10 years | |||||
Expected volatility | 24.84% | 24.35% | 24.97% | |||||
Risk-free interest rate | 2.44% | 2.28% | 2.17% | |||||
Weighted average fair value of options granted | $ | 5.79 | $ | 4.89 | $ | 5.30 |
The expected volatility is based on historical volatility. The risk-free interest rates for periods within the contractual life of the awards are based on the U.S. Treasury yield curve in effect at the time of the grant. The expected life is based on historical exercise experience. The dividend yield assumption is based on the Company's history and expectation of dividend payouts.
Proceeds from stock option exercises totaled $843,000 in 2016. Shares issued in connection with stock option exercises are issued from available treasury shares. If no treasury shares are available, new shares are issued from available authorized shares. During 2016, all the shares issued in connection with stock option exercises, 30,823 shares in total, were issued from available treasury shares.
67
NORWOOD FINANCIAL CORP - 2016 CONSOLIDATED FINANCIAL REPORT
NOTE 11 - STOCK BASED COMPENSATION (CONTINUED)
As of December 31, 2016, outstanding stock options consist of the following:
Average | Average | ||||||||||
Options | Exercise | Remaining | Options | Exercise | |||||||
Outstanding | Price | Life, Years | Exercisable | Price | |||||||
12,650 | $ | 28.41 | 1.0 | 12,650 | $ | 28.41 | |||||
13,200 | 25.00 | 2.0 | 13,200 | 25.00 | |||||||
12,650 | 25.99 | 3.0 | 12,650 | 25.99 | |||||||
1,100 | 24.44 | 3.2 | 1,100 | 24.44 | |||||||
15,229 | 25.25 | 4.0 | 15,229 | 25.25 | |||||||
19,800 | 24.97 | 5.0 | 19,800 | 24.97 | |||||||
21,450 | 27.05 | 6.0 | 21,450 | 27.05 | |||||||
1,100 | 27.55 | 6.0 | 1,100 | 27.55 | |||||||
2,000 | 28.95 | 6.7 | 2,000 | 28.95 | |||||||
21,250 | 26.90 | 7.0 | 21,250 | 26.90 | |||||||
10,000 | 29.08 | 8.0 | 10,000 | 29.08 | |||||||
14,000 | 28.55 | 9.0 | 14,000 | 28.55 | |||||||
16,000 | 33.56 | 10.0 | - | - | |||||||
Total | 160,429 | 144,429 |
A summary of the Company's restricted stock activity and related information for the years ended December 31 is as follows:
2016 | 2015 | |||||||
Weighted-Average | Weighted-Average | |||||||
Number of | Grant Date | Number of | Grant Date | |||||
Shares | Fair Value | Shares | Fair Value | |||||
Non-vested, beginning of year | 13,810 | $28.82 | 9,300 | $29.08 | ||||
Granted | 8,450 | 33.56 | 6,650 | 28.55 | ||||
Vested | (3,120) | 28.85 | (1,860) | 29.08 | ||||
Forfeited | (450) | 28.80 | (280) | 29.08 | ||||
Non-vested at December 31 | 18,690 | $30.96 | 13,810 | $28.82 |
NOTE 12 - EARNINGS PER SHARE
The following table sets forth the computations of basic and diluted earnings per share:
Years Ended December 31, | ||||||||
2016 | 2015 | 2014 | ||||||
(In Thousands, Except Per Share Data) | ||||||||
Numerator, net income | $ | 6,711 | $ | 5,908 | $ | 7,657 | ||
Denominator: | ||||||||
Weighted average shares outstanding | 3,877 | 3,682 | 3,645 | |||||
Less: Weighted average unvested restricted shares | (14) | (9) | - | |||||
Denominator: Basic earnings per share | 3,863 | 3,673 | 3,645 | |||||
Weighted average shares outstanding | 3,863 | 3,682 | 3,645 | |||||
Add: Dilutive effect of stock options | 22 | 9 | 12 | |||||
Denominator: Diluted earnings per share | 3,885 | 3,691 | 3,657 | |||||
Basic earnings per common share | $ | 1.74 | $ | 1.60 | $ | 2.10 | ||
Diluted earnings per common share | $ | 1.73 | $ | 1.60 | $ | 2.10 |
68
NORWOOD FINANCIAL CORP - 2016 CONSOLIDATED FINANCIAL REPORT
NOTE 12 - EARNINGS PER SHARE (CONTINUED)
Stock options which had no intrinsic value because their effect would be anti-dilutive and therefore would not be included in the diluted EPS calculation were 16,000, 14,000, and 12,500 for the years ended December 31, 2016, 2015 and 2014, respectively, based on the closing price of the Company's common stock which was $33.14, $28.75 and $29.05 at December 31, 2016, 2015 and 2014, respectively.
NOTE 13 - OFF-BALANCE SHEET FINANCIAL INSTRUMENTS
The Bank is a party to financial instruments with off-balance-sheet risk in the normal course of business to meet the financing needs of its customers. These financial instruments include commitments to extend credit and letters of credit. Those instruments involve, to varying degrees, elements of credit and interest rate risk in excess of the amount recognized in the balance sheets.
The Bank's exposure to credit loss in the event of nonperformance by the other party to the financial instrument for commitments to extend credit and letters of credit is represented by the contractual amount of those instruments. The Bank uses the same credit policies in making commitments and conditional obligations as it does for on-balance sheet instruments.
A summary of the Bank's financial instrument commitments is as follows:
December 31, | |||||
2016 | 2015 | ||||
(In Thousands) | |||||
Commitments to grant loans | $ | 22,210 | $ | 19,704 | |
Unfunded commitments under lines of credit | 54,789 | 48,641 | |||
Standby letters of credit | 5,642 | 5,286 | |||
$ | 82,641 | $ | 73,631 |
Commitments to extend credit are agreements to lend to a customer as long as there is no violation of any condition established in the contract. Commitments generally have fixed expiration dates or other termination clauses and may require payment of a fee. Since some of the commitments are expected to expire without being drawn upon, the total commitment amount does not necessarily represent future cash requirements. The Bank evaluates each customer's credit worthiness on a case-by-case basis. The amount of collateral obtained, if deemed necessary by the Bank upon extension of credit, is based on management's credit evaluation of the customer and generally consists of real estate.
Standby letters of credit are conditional commitments issued by the Bank to guarantee the performance of a customer to a third party. The majority of these standby letters of credit expire within the next twelve months. The credit risk involved in issuing letters of credit is essentially the same as that involved in extending other loan commitments. The Bank requires collateral supporting these letters of credit when deemed necessary. Management believes that the proceeds obtained through a liquidation of such collateral would be sufficient to cover the maximum potential amount of future payments required under the corresponding guarantees.
NOTE 14 – FAIR VALUES OF FINANCIAL INSTRUMENTS
Management uses its best judgment in estimating the fair value of the Company's financial instruments; however, there are inherent weaknesses in any estimation technique. Therefore, for substantially all financial instruments, the fair value estimates herein are not necessarily indicative of the amounts the Company could have realized in a sale transaction on the dates indicated. The estimated fair value amounts have been measured as of their respective year ends and have not been re-evaluated or updated for purposes of these consolidated financial statements subsequent to those respective dates. As such, the estimated fair values of these financial instruments subsequent to the respective reporting dates may be different than the amounts reported at each year end.
69
NORWOOD FINANCIAL CORP - 2016 CONSOLIDATED FINANCIAL REPORT
NOTE 14 – FAIR VALUES OF FINANCIAL INSTRUMENTS (CONTINUED)
The fair value hierarchy prioritizes the inputs to valuation methods used to measure fair value. The hierarchy gives the highest priority to unadjusted quoted prices in active markets for identical assets or liabilities (Level 1 measurements) and the lowest priority to unobservable inputs (Level 3 measurements). The three levels of the fair value hierarchy are as follows:
Level 1: | Unadjusted quoted prices in active markets that are accessible at the measurement date for identical, unrestricted assets or liabilities. | |
Level 2: | Quoted prices in markets that are not active, or inputs that are observable either directly or indirectly, for substantially the full term of the asset or liability. | |
Level 3: | Prices or valuation techniques that require inputs that are both significant to the fair value measurement and are unobservable (i.e. supported with little or no market activity). |
An asset's or liability's level within the fair value hierarchy is based on the lowest level of input that is significant to the fair value measurement.
For financial assets measured at fair value on a recurring basis, the fair value measurements by level within the fair value hierarchy used at December 31, 2016 and 2015 are as follows (in thousands):
Fair Value Measurement Reporting Date using | ||||||||||||
Description | Total | Level 1 | Level 2 | Level 3 | ||||||||
December 31, 2016 | ||||||||||||
Available for Sale: | ||||||||||||
U.S. Treasury securities | $ | 1,997 | $ | - | $ | 1,997 | $ | - | ||||
States and political subdivisions | 125,101 | - | 125,101 | - | ||||||||
Corporate obligations | 10,112 | - | 10,112 | - | ||||||||
Mortgage-backed securities-government | ||||||||||||
sponsored entities | 164,930 | - | 164,930 | - | ||||||||
Equity securities-financial services | 424 | 424 | - | - | ||||||||
Total available for sale | $ | 302,564 | $ | 424 | $ | 302,140 | $ | - | ||||
December 31, 2015 | ||||||||||||
Available for Sale: | ||||||||||||
U.S. Government agencies | $ | 9,169 | $ | - | $ | 9,169 | $ | - | ||||
States and political subdivisions | 60,755 | - | 60,755 | - | ||||||||
Corporate obligations | 4,974 | - | 4,974 | - | ||||||||
Mortgage-backed securities-government | ||||||||||||
sponsored entities | 63,569 | - | 63,569 | - | ||||||||
Equity securities-financial services | 384 | 384 | - | - | ||||||||
Total available for sale | $ | 138,851 | $ | 384 | $ | 138,467 | $ | - |
70
NORWOOD FINANCIAL CORP - 2016 CONSOLIDATED FINANCIAL REPORT
NOTE 14 – FAIR VALUES OF FINANCIAL INSTRUMENTS (CONTINUED)
For financial assets measured at fair value on a nonrecurring basis, the fair value measurements by level within the fair value hierarchy used at December 31, 2016 and 2015 are as follows (in thousands):
Fair Value Measurement Reporting Date using | ||||||||||||
Description | Total | Level 1 | Level 2 | Level 3 | ||||||||
December 31, 2016 | ||||||||||||
Impaired Loans | $ | 2,624 | $ | - | $ | - | $ | 2,624 | ||||
Foreclosed real estate | 5,302 | - | - | 5,302 | ||||||||
December 31, 2015 | ||||||||||||
Impaired Loans | $ | 7,615 | $ | - | $ | - | $ | 7,615 | ||||
Foreclosed real estate | 2,847 | - | - | 2,847 |
The following tables present additional quantitative information about assets measured at fair value on a nonrecurring basis and for which the Company has utilized Level 3 inputs to determine fair value:
Quantitative Information about Level 3 Fair Value Measurements | |||||||
(dollars in thousands) | Fair Value Estimate | Valuation Techniques | Unobservable Input | Range (Weighted Average) | |||
December 31, 2016 | |||||||
Impaired loans | $ | 1,473 | Appraisal of collateral(1) | Appraisal adjustments(2) | 10% (10%) | ||
Impaired loans | $ | 1,151 | Present value of future cash flows | Loan discount rate | 4-5.25% (5.11%) | ||
Probability of default | 0% | ||||||
Foreclosed real estate owned | $ | 5,302 | Appraisal of collateral(1) | Liquidation Expenses(2) | 10% |
December 31, 2015 | |||||||
Impaired loans | $ | 2,574 | Appraisal of collateral(1) | Appraisal adjustments(2) | 10% (10%) | ||
Impaired loans | $ | 5,041 | Present value of future cash flows | Loan discount rate | 4-7% (5.61%) | ||
Probability of default | 0% | ||||||
Foreclosed real estate owned | $ | 2,847 | Appraisal of collateral(1) | Liquidation Expenses(2) | 10% |
(1) Fair value is generally determined through independent appraisals of the underlying collateral, which generally include various level 3 inputs which are not identifiable,
less any associated allowance.
(2) Appraisals may be adjusted by management for qualitative factors such as economic conditions and estimated liquidation expenses. The range and weighted average of
liquidation expenses and other appraisal adjustments are presented as a percent of the appraisal.
71
NORWOOD FINANCIAL CORP - 2016 CONSOLIDATED FINANCIAL REPORT
NOTE 14 – FAIR VALUES OF FINANCIAL INSTRUMENTS (CONTINUED)
The following information should not be interpreted as an estimate of the fair value of the entire Company since a fair value calculation is only provided for a limited portion of the Company's assets and liabilities. Due to a wide range of valuation techniques and the degree of subjectivity used in making the estimates, comparisons between the Company's disclosures and those of other companies may not be meaningful.
The following methods and assumptions were used to estimate the fair values of the Company's financial instruments at December 31, 2016 and 2015.
Cash and cash equivalents (carried at cost):
The carrying amounts reported in the consolidated balance sheet for cash and short-term instruments approximate those assets' fair values.
Securities:
The fair value of securities available for sale (carried at fair value) are determined by obtaining quoted market prices on nationally recognized securities exchanges (Level 1), or matrix pricing (Level 2), which is a mathematical technique used widely in the industry to value debt securities without relying exclusively on quoted market prices for the specific securities but rather by relying on the securities' relationship to other benchmark quoted prices. For certain securities which are not traded in active markets or are subject to transfer restrictions, valuations are adjusted to reflect illiquidity and/or non-transferability, and such adjustments are generally based on available market evidence (Level 3). In the absence of such evidence, management's best estimate is used. Management's best estimate consists of both internal and external support on certain Level 3 investments. Internal cash flow models using a present value formula that includes assumptions market participants would use along with indicative exit pricing obtained from broker/dealers (where available) are used to support fair values of certain Level 3 investments, if applicable.
Loans receivable (carried at cost):
The fair values of loans are estimated using discounted cash flow analyses, using market rates at the balance sheet date that reflect the credit and interest rate-risk inherent in the loans. Projected future cash flows are calculated based upon contractual maturity or call dates, projected repayments and prepayments of principal. Generally, for variable rate loans that reprice frequently and with no significant change in credit risk, fair values are based on carrying values.
Impaired loans (generally carried at fair value):
The Company measures impairment generally based on the fair value of the loan's collateral. Fair value is generally determined based upon independent third-party appraisals of the properties, or discounted cash flows based upon the lowest level of input that is significant to the fair value measurements.
As of December 31, 2016, the fair value investment in impaired loans totaled $2,624,000 which included seven loans which did not require a valuation allowance since the estimated realizable value of the collateral exceeded the recorded investment in the loan. As of December 31, 2016, the Company has recognized charge-offs against the allowance for loan losses on these impaired loans in the amount of $831,000 over the life of the loans.
72
NORWOOD FINANCIAL CORP - 2016 CONSOLIDATED FINANCIAL REPORT
NOTE 14 – FAIR VALUES OF FINANCIAL INSTRUMENTS (CONTINUED)
As of December 31, 2015, the fair value investment in impaired loans totaled $9,228,000 which included three loans for $6,373,000 for which a valuation allowance of $1,613,000 had been provided based on the estimated value of the collateral or the present value of estimated cash flows, and twenty loans for $2,855,000 which did not require a valuation allowance since the estimated realizable value of the collateral exceeded the recorded investment in the loan. As of December 31, 2015, the Company has recognized charge-offs against the allowance for loan losses on these impaired loans in the amount of $2,044,000 over the life of the loans.
Mortgage Servicing Rights (generally carried at cost):
The Company utilizes a third party provider to estimate the fair value of certain loan servicing rights. Fair value for the purpose of this measurement is determined by estimating potential revenues and expenses of the various loan pools to arrive at a net cash flow stream, and then utilize present value methodologies on the cash flow stream at a current market yield.
Foreclosed real estate owned (carried at fair value):
Real estate properties acquired through, or in lieu of loan foreclosure are to be sold and are carried at fair value less estimated cost to sell. Fair value is based upon independent market prices, appraised value of the collateral or management's estimation of the value of the collateral. These assets are included in Level 3 fair value based upon the lowest level of input that is significant to the fair value measurement.
Restricted investment in Federal Home Loan Bank stock (carried at cost):
The Company, as a member of the Federal Home Loan Bank (FHLB) system is required to maintain an investment in capital stock of its district FHLB according to a predetermined formula. This regulatory stock has no quoted market value and is carried at cost.
Bank owned life insurance (carried at cost):
The fair value is equal to the cash surrender value of the Bank owned life insurance.
Accrued interest receivable and payable (carried at cost):
The carrying amount of accrued interest receivable and accrued interest payable approximates its fair value.
Deposit liabilities (carried at cost except certificates of deposit which are at fair value):
The fair values disclosed for demand deposits (e.g., interest and noninterest checking, passbook savings and money market accounts) are, by definition, equal to the amount payable on demand at the reporting date (i.e., their carrying amounts). Fair values for fixed-rate certificates of deposit are estimated using a discounted cash flow calculation that applies interest rates currently being offered in the market on certificates to a schedule of aggregated expected monthly maturities on time deposits.
Short-term borrowings (carried at cost):
The carrying amounts of short-term borrowings approximate their fair values.
Other borrowings (carried at cost):
Fair values of FHLB advances are estimated using discounted cash flow analysis, based on quoted prices for new FHLB advances with similar credit risk characteristics, terms and remaining maturity. These prices obtained from this active market represent a market value that is deemed to represent the transfer price if the liability were assumed by a third party.
73
NORWOOD FINANCIAL CORP - 2016 CONSOLIDATED FINANCIAL REPORT
NOTE 14 – FAIR VALUES OF FINANCIAL INSTRUMENTS (CONTINUED)
Off-balance sheet financial instruments (disclosed at cost):
Fair values for the Company's off-balance sheet financial instruments (lending commitments and letters of credit) are based on fees currently charged in the market to enter into similar agreements, taking into account, the remaining terms of the agreements and the counterparties' credit standing.
The estimated fair values of the Bank's financial instruments were as follows at December 31, 2016 and December 31, 2015 (In thousands):
Fair Value Measurements at December 31, 2016 | ||||||||||||||
Carrying | Fair | |||||||||||||
Amount | Value | Level 1 | Level 2 | Level 3 | ||||||||||
Financial assets: | ||||||||||||||
Cash and cash equivalents | $ | 17,174 | $ | 17,174 | $ | 17,174 | $ | - | $ | - | ||||
Securities | 302,564 | 302,564 | 424 | 302,140 | - | |||||||||
Loans receivable, net | 707,426 | 716,661 | - | - | 716,661 | |||||||||
Mortgage servicing rights | 232 | 250 | - | - | 250 | |||||||||
Regulatory stock | 2,119 | 2,119 | 2,119 | - | - | |||||||||
Bank owned life insurance | 36,133 | 36,133 | 36,133 | - | - | |||||||||
Accrued interest receivable | 3,643 | 3,643 | 3,643 | - | - | |||||||||
Financial liabilities: | ||||||||||||||
Deposits | 925,385 | 925,561 | 629,829 | - | 295,732 | |||||||||
Short-term borrowings | 32,811 | 32,811 | 32,811 | - | - | |||||||||
Other borrowings | 32,001 | 31,863 | - | - | 31,863 | |||||||||
Accrued interest payable | 1,069 | 1,069 | 1,069 | - | - | |||||||||
Off-balance sheet financial instruments: | ||||||||||||||
Commitments to extend credit and outstanding letters of credit | - | - | - | - | - |
Fair Value Measurements at December 31, 2015 | ||||||||||||||
Carrying | Fair | |||||||||||||
Amount | Value | Level 1 | Level 2 | Level 3 | ||||||||||
Financial assets: | ||||||||||||||
Cash and cash equivalents | $ | 10,010 | $ | 10,010 | $ | 10,010 | $ | - | $ | - | ||||
Securities | 138,851 | 138,851 | 384 | 138,467 | - | |||||||||
Loans receivable, net | 552,627 | 559,416 | - | - | 559,416 | |||||||||
Mortgage servicing rights | 261 | 291 | - | - | 291 | |||||||||
Regulatory stock | 3,412 | 3,412 | 3,412 | - | - | |||||||||
Bank owned life insurance | 18,820 | 18,820 | 18,820 | - | - | |||||||||
Accrued interest receivable | 2,363 | 2,363 | 2,363 | - | - | |||||||||
Financial liabilities: | ||||||||||||||
Deposits | 550,909 | 551,175 | 354,162 | - | 197,013 | |||||||||
Short-term borrowings | 53,235 | 53,235 | 53,235 | - | - | |||||||||
Other borrowings | 41,126 | 41,260 | - | - | 41,260 | |||||||||
Accrued interest payable | 957 | 957 | 957 | - | - | |||||||||
Off-balance sheet financial instruments: | ||||||||||||||
Commitments to extend credit and outstanding letters of credit | - | - | - | - | - |
74
NORWOOD FINANCIAL CORP - 2016 CONSOLIDATED FINANCIAL REPORT
NOTE 15 – ACCUMULATED OTHER COMPREHENSIVE INCOME
The following tables present the changes in accumulated other comprehensive income (loss) (in thousands) by component, net of tax, for the years ended December 31, 2016 and 2015:
Unrealized gains (losses) | ||||||
on available for sale | Unrealized gain on | |||||
securities (a) | pension liability (a) | Total (a) | ||||
Balance as of December 31, 2015 | $ | 488 | $ | - | $ | 488 |
Other comprehensive loss before reclassification | (4,740) | 318 | (4,422) | |||
Amount reclassified from accumulated other comprehensive income | (185) | - | (185) | |||
Total other comprehensive loss | (4,925) | 318 | (4,607) | |||
Balance as of December 31, 2016 | $ | (4,437) | $ | 318 | $ | (4,119) |
Unrealized gains (losses) on | ||||||
available for sale | ||||||
securities (a) | ||||||
Balance as of December 31, 2014 | $ | 462 | ||||
Other comprehensive income before reclassification | 439 | |||||
Amount reclassified from accumulated other comprehensive income | (413) | |||||
Total other comprehensive income | 26 | |||||
Balance as of December 31, 2015 | $ | 488 |
(a) All amounts are net of tax. Amounts in parentheses indicate debits.
The following table presents significant amounts reclassified out of each component of accumulated other comprehensive income (loss) (in thousands) for the year ended December 31, 2016:
Amount Reclassified | ||||||||
From Accumulated | Affected Line Item in | |||||||
Other | Consolidated | |||||||
Comprehensive | Statement of | |||||||
Details about other comprehensive income | Income (Loss) (a) | Income | ||||||
Twelve months | Twelve months | |||||||
ended | ended | |||||||
December 31, | December 31, | |||||||
2016 | 2015 | |||||||
Unrealized gains on available for sale securities | $ | 284 | $ | 626 | Net realized gains on sales of securities | |||
(99) | (213) | Income tax expense | ||||||
$ | 185 | $ | 413 | Net of tax |
(a) | Amounts in parentheses indicate debits to net income. |
75
NORWOOD FINANCIAL CORP - 2016 CONSOLIDATED FINANCIAL REPORT
NOTE 16 – ACQUISITION OF DELAWARE BANCSHARES, INC.
On July 31, 2016, Norwood Financial Corp. (the "Company") closed on its acquisition of Delaware Bancshares, Inc. ("Delaware") pursuant to the terms of the Agreement and Plan of Merger, dated March 10, 2016, by and among the Company, Wayne Bank, Delaware and The National Bank of Delaware County (the "Merger Agreement").
Pursuant to the terms of the Merger Agreement, Delaware was merged with and into the Company, with the Company as the surviving corporation of the merger (the "Merger"). At the effective time of the Merger, each outstanding share of the common stock of Delaware was converted into, at the election of the holder but subject to the limitations and allocation and proration provisions set forth in the Merger Agreement, either $16.68 in cash or 0.6221 of a share of the common stock, par value $0.10 per share (the "Common Stock") of the Company. In the aggregate, the merger consideration paid to Delaware shareholders consisted of approximately $3,860,000 in cash and 431,605 shares of Norwood common stock. Immediately following the Merger, The National Bank of Delaware County ("NBDC") was merged with and into Wayne Bank, a wholly-owned subsidiary of the Company, with Wayne Bank as the surviving entity.
In connection with the Merger, the Company assumed the obligations of Delaware under the Indenture, dated as of October 31, 2007, by and between Delaware, as issuer, and Wells Fargo Bank, National Association, as trustee (the "Indenture") and Delaware's Junior Subordinated Debt Securities, due January 1, 2038 (the "Debt Securities") issued thereunder. The Debt Securities were issued by Delaware in connection with a private placement completed on October 31, 2007 of $8.0 million of trust preferred securities issued through the Delaware Bancshares Capital Trust I (the "Trust"). The proceeds from the initial sale of the trust preferred securities were used by the Trust to purchase the Debt Securities. The Debt Securities bore interest at a variable rate which reset quarterly at LIBOR plus 2.4%, and were redeemable, in whole or in part, without penalty, at the option of the Company, beginning on January 1, 2013 and on any January 1, April 1, July 1 or October 1 thereafter. The interest payments on the Debt Securities made by the Company were used to pay the quarterly distributions payable by the Trust to the holders of the trust preferred securities. On October 3, 2016, the Company redeemed the Debt Securities and the trust preferred securities in full.
The acquired assets and assumed liabilities were measured at estimated fair values. Management made significant estimates and exercised significant judgment in accounting for the acquisition. Management measured loan fair values based on loan file reviews, appraised collateral values, expected cash flows, and historical loss factors of NBDC. The Company also recorded an identifiable intangible asset representing the core deposit base of NBDC based on management's evaluation of the cost of such deposits relative to alternative funding sources. Management used significant estimates including the average lives of depository accounts, future interest rate levels, and the cost of servicing various depository products. Management used market quotations to determine the fair value of investment securities.
The business combination resulted in the acquisition of loans with and without evidence of credit quality deterioration. NBDC loans were deemed impaired at the acquisition date if the Company did not expect to receive all contractually required cash flows due to concerns about credit quality. Such loans were fair valued and the difference between contractually required payments at the acquisition date and cash flows expected to be collected was recorded as a non-accretable difference. At the acquisition date, the Company recorded $1,410,000 of purchased credit-impaired loans subject to a non-accretable difference of $260,000. The method of measuring carrying value of purchased loans differs from loans originated by the Company (originated loans), and as such, the Company identifies purchased loans and purchased loans with a credit quality discount and originated loans at amortized cost.
76
NORWOOD FINANCIAL CORP - 2016 CONSOLIDATED FINANCIAL REPORT
NOTE 16 – ACQUISITION OF DELAWARE BANCSHARES, INC. (CONTINUED)
NBDC's loans without evidence of credit deterioration were fair valued by discounting both expected principal and interest cash flows using an observable discount rate for similar instruments that a market participant would consider in determining fair value. Additionally, consideration was given to management's best estimates of default rates and payment speeds. At acquisition, NBDC's loan portfolio without evidence of deterioration totaled $111,307,000 and was recorded at a fair value of $109,693,000.
The following table summarizes the purchase of Delaware Bancshares, Inc. as of July 31, 2016:
(Dollars in Thousands, Except Per Share Data) | ||||||
Purchase Price Consideration in Common Stock | ||||||
Delaware Bancshares, Inc. common shares settled for stock | 694,114 | |||||
Exchange Ratio | 0.6221 | |||||
Norwood Financial Corp. shares issued | 431,605 | |||||
Value assigned to Norwood Financial Corp. common share | $ | 28.15 | ||||
Purchase price assigned to Delaware Bancshares, Inc. common shares | $ | 12,150 | ||||
exchanged for Norwood Financial Corp. | ||||||
Purchase Price Consideration - Cash for Common Stock | ||||||
Delaware Bancshares, Inc. shares exchanged for cash | 231,385 | |||||
Purchase price paid to each Delaware Bancshares, Inc. common share exchanged for cash | $ | 16.68 | ||||
Purchase price assigned to Delaware Bancshares, Inc. common shares exchanged for cash | $ | 3,860 | ||||
Purchase price consideration - Cash-in-lieu of Fractional Shares | 6 | |||||
Total Purchase Price | $ | 16,016 | ||||
Net Assets Acquired: | ||||||
Delaware Bancshares, Inc. shareholders' equity | $ | 19,357 | ||||
Delaware Bancshares, Inc. goodwill and intangibles | (7,640) | |||||
Total tangible equity | 11,717 | |||||
Adjustments to reflect assets acquired at fair value: | ||||||
Investments | 219 | |||||
Loans | ||||||
Interest rate | 1,486 | |||||
General credit | (1,614) | |||||
Specific credit - non-amortizing | (260) | |||||
Specific credit - amortizing | (239) | |||||
Core deposit intangible | 449 | |||||
Deferred loan fees | (296) | |||||
Premises and equipment | 3,053 | |||||
Allowance for loan and lease losses | 1,651 | |||||
Deferred tax assets | (1,417) | |||||
Other | (97) | |||||
Adjustments to reflect liabilities acquired at fair value: | ||||||
Time deposits | (252) | |||||
14,400 | ||||||
Goodwill resulting from merger | $ | 1,616 |
77
NORWOOD FINANCIAL CORP - 2016 CONSOLIDATED FINANCIAL REPORT
NOTE 16 – ACQUISITION OF DELAWARE BANCSHARES, INC. (CONTINUED)
The following condensed statement reflects the values assigned to Delaware Bancshares, Inc. net assets as of acquisition date:
(In Thousands)
Total purchase price | $ | 16,016 | ||||
Net assets acquired: | ||||||
Cash | $ | 14,977 | ||||
Securities available for sale | 208,488 | |||||
Loans | 116,674 | |||||
Premises and equipment, net | 7,292 | |||||
Regulatory stock | 279 | |||||
Accrued interest receivable | 1,626 | |||||
Bank-owned life insurance | 14,762 | |||||
Core deposit intangible | 449 | |||||
Deferred tax assets | 3,034 | |||||
Other assets | 3,282 | |||||
Time deposits | (71,342) | |||||
Deposits other than time deposits | (255,921) | |||||
Borrowings | (21,232) | |||||
Accrued interest payable | (95) | |||||
Other liabilities | (7,873) | |||||
14,400 | ||||||
Goodwill resulting from Delaware Bancshares, Inc. Merger | $ | 1,616 |
The Company recorded goodwill and other intangibles associated with the purchase of Delaware Bancshares, Inc. totaling $1,616,000. Goodwill is not amortized, but is periodically evaluated for impairment. The Company did not recognize any impairment during the twelve months ended December 31, 2016. The carrying amount of the goodwill at December 31, 2016 related to the Delaware acquisition was $1,616,000.
Identifiable intangibles are amortized to their estimated residual values over the expected useful lives. The core deposit intangible recorded with the purchase of Delaware is being amortized over ten years. Such lives are also periodically reassessed to determine if any amortization period adjustments are required. During the twelve months ended December 31, 2016, no such adjustments were recorded. The identifiable intangible assets consist of a core deposit intangible which is being amortized on an accelerated basis over the useful life of such assets. The gross carrying amount of the core deposit intangible at December 31, 2016 was $449,000 with $14,000 accumulated amortization as of that date.
As of December 31, 2016, the current year and estimated future amortization expense for the core deposit intangible is:
(In thousands) | ||
2017 | $ | 30 |
2018 | 30 | |
2019 | 30 | |
2020 | 30 | |
2021 | 30 | |
After five years | 299 | |
$ | 449 |
78
NORWOOD FINANCIAL CORP - 2016 CONSOLIDATED FINANCIAL REPORT
NOTE 16 – ACQUISITION OF DELAWARE BANCSHARES, INC. (CONTINUED)
Results of operations for Delaware Bancshares, Inc. prior to the acquisition date are not included in the Consolidated Statement of Income for the year ended December 31, 2016. Due to the significant amount of fair value adjustments, historical results of Delaware Bancshares, Inc. are not relevant to the Company's results of operations. Therefore, no pro forma information is presented.
The following table presents financial information regarding the former Delaware Bancshares, Inc. operations included in our Consolidated Statement of Income from the date of acquisition through December 31, 2016 under the column "Actual from acquisition date through December 31, 2016". In addition, the following table presents unaudited pro forma information as if the acquisition of Delaware Bancshares, Inc. had occurred on January 1, 2016 and 2015 under the "Pro Forma" columns. The table below has been prepared for comparative purposes only and is not necessarily indicative of the actual results that would have been attained had the acquisition occurred as of the beginning of the periods presented, nor is it indicative of future results. Furthermore, the unaudited pro-forma information does not reflect management's estimate of any revenue-enhancing opportunities nor anticipated cost savings as a result of the integration and consolidation of the acquisition. Merger and acquisition integration costs and amortization of fair value adjustments are included in the numbers below.
Actual From | ||||||||
Acquisition Date | ||||||||
Through | Pro Forma | |||||||
December 31, | Year Ended December 31, | |||||||
(In Thousands, Except Per Share Data) | 2016 | 2016 | 2015 | |||||
Net interest income | $ | 3,900 | $ | 37,199 | $ | 33,787 | ||
Non-interest income | 893 | 6,487 | 7,939 | |||||
Net income | 750 | 3,588 | 6,944 | |||||
Pro forma earnings per share: | ||||||||
Basic | $ | 0.18 | $ | 0.87 | $ | 1.69 | ||
Diluted | $ | 0.18 | $ | 0.87 | $ | 1.68 |
Nonrecurring merger and acquisition integration costs included in the pro-forma table above are:
Professional Fees | $ | - | 1,602 | $ | 80 | |||
Data Processing related | - | 639 | ||||||
Other | - | 810 | ||||||
79
NORWOOD FINANCIAL CORP - 2016 CONSOLIDATED FINANCIAL REPORT
NOTE 17 - NORWOOD FINANCIAL CORP (PARENT COMPANY ONLY) FINANCIAL INFORMATION
BALANCE SHEETS
December 31, | ||||||||
2016 | 2015 | |||||||
(In Thousands) | ||||||||
ASSETS | ||||||||
Cash on deposit in bank subsidiary | $ | 3,005 | $ | 2,151 | ||||
Securities available for sale | 397 | 384 | ||||||
Investment in bank subsidiary | 105,138 | 95,895 | ||||||
Other assets | 4,539 | 4,113 | ||||||
Total assets | $ | 113,079 | $ | 102,543 | ||||
LIABILITIES AND STOCKHOLDERS' EQUITY | ||||||||
Liabilities | $ | 2,000 | $ | 1,545 | ||||
Stockholders' equity | 111,079 | 100,998 | ||||||
Total liabilities and stockholders' equity | $ | 113,079 | $ | 102,543 |
STATEMENTS OF INCOME
Years Ended December 31, | ||||||||||||
2016 | 2015 | 2014 | ||||||||||
Income: | (In Thousands) | |||||||||||
Dividends from bank subsidiary | $ | 28,598 | $ | 4,574 | $ | 4,377 | ||||||
Other interest income | 12 | 11 | 10 | |||||||||
28,610 | 4,585 | 4,387 | ||||||||||
Expenses | 1,347 | 313 | 346 | |||||||||
27,263 | 4,272 | 4,041 | ||||||||||
Income tax benefit | (225 | ) | (103 | ) | (114 | ) | ||||||
27,488 | 4,375 | 4,155 | ||||||||||
Equity in undistributed earnings of subsidiary | (20,777 | ) | 1,533 | 3,502 | ||||||||
Net Income | $ | 6,711 | $ | 5,908 | $ | 7,657 | ||||||
Comprehensive Income | $ | 2,104 | $ | 5,934 | $ | 10,721 |
STATEMENTS OF CASH FLOWS
Years Ended December 31, | ||||||||||||
2016 | 2015 | 2014 | ||||||||||
(In Thousands) | ||||||||||||
CASH FLOWS FROM OPERATING ACTIVITIES | ||||||||||||
Net income | $ | 6,711 | $ | 5,908 | $ | 7,657 | ||||||
Adjustments to reconcile net income to | ||||||||||||
net cash provided by operating activities: | ||||||||||||
Undistributed earnings of bank subsidiary | 20,777 | (1,533 | ) | (3,502 | ) | |||||||
Other, net | (305 | ) | (19 | ) | 177 | |||||||
Net Cash Provided by Operating Activities | 27,183 | 4,356 | 4,332 | |||||||||
CASH FLOWS FROM INVESTING ACTIVITIES | ||||||||||||
Outlays for business acquisitions | (2,324 | ) | - | - | ||||||||
Net Cash Used in Investing Activities | (2,324 | ) | - | - | ||||||||
CASH FLOWS FROM FINANCING ACTIVITIES | ||||||||||||
Repayment of borrowings | (19,856 | ) | - | - | ||||||||
Stock options exercised | 843 | 441 | 691 | |||||||||
Tax benefit of stock options exercised | 38 | 16 | 17 | |||||||||
ESOP purchase of shares from treasury stock | 131 | 146 | 150 | |||||||||
Purchase of treasury stock | (447 | ) | (127 | ) | (179 | ) | ||||||
Cash dividends paid | (4,714 | ) | (4,527 | ) | (4,370 | ) | ||||||
Net Cash Used in Financing Activities | (24,005 | ) | (4,051 | ) | (3,691 | ) | ||||||
Net Increase in Cash and Cash Equivalents | 854 | 305 | 641 | |||||||||
CASH AND CASH EQUIVALENTS - BEGINNING | 2,151 | 1,846 | 1,205 | |||||||||
CASH AND CASH EQUIVALENTS - ENDING | $ | 3,005 | $ | 2,151 | $ | 1,846 |
80
NORWOOD FINANCIAL CORP - 2016 CONSOLIDATED FINANCIAL REPORT
INVESTOR INFORMATION
STOCK LISTING
Norwood Financial Corp stock is traded on the Nasdaq Global Market under the symbol NWFL. The following firms are known to make a market in the Company's stock:
Boenning & Scattergood, Inc. West Conshohocken, PA 19428 800-883-1212 | RBC Capital Markets Philadelphia, PA 19103 888-848-4677 | |
Janney Montgomery Scott, LLC Scranton, PA 18503 800-638-4417 | Stifel Nicolaus St,. Louis, MO 63102 314-342-2000 |
TRANSFER AGENT
Computershare, P.O. Box 30170, College Station, TX 77842. Stockholders who may have questions regarding their stock ownership should contact the Transfer Agent at 800-662-7232.
DIVIDEND CALENDAR
Dividends on Norwood Financial Corp common stock, if approved by the Board of Directors are customarily paid on or about February 1, May 1, August 1 and November 1.
AUTOMATIC DIVIDEND REINVESTMENT PLAN
The Plan, open to all shareholders, provides the opportunity to have dividends automatically reinvested into Norwood stock. Participants in the Plan may also elect to make cash contributions to purchase additional shares of common stock. Please contact the transfer agent for additional information.
SEC REPORTS AND ADDITIONAL INFORMATION
A copy of the Company's annual report on Form 10-K for its fiscal year ended December 31, 2016 including financial statements and schedules thereto, required to be filed with the Securities and Exchange Commission is available on the Company's website at www.waynebank.com under the Stockholder Services tab. A copy of the report may be obtained upon written request of any stockholder, investor or analyst by contacting William S. Lance, Executive Vice President, Chief Financial Officer and Secretary, Norwood Financial Corp., 717 Main Street, PO Box 269, Honesdale, PA 18431, 570-253-1455.
81
![](https://capedge.com/proxy/10-K/0000946275-17-000012/image00018.jpg)
![](https://capedge.com/proxy/10-K/0000946275-17-000012/image00019.jpg)